Verdict - Mager en lichter met enkele compromissen
De Dell 16 Plus 2-in-1 is zowel een upgrade als een downgrade ten opzichte van de Inspiron 16 7640 2-in-1. Het is iets lichter en dunner met veel snellere grafische prestaties dan voorheen, wat gunstig kan zijn voor reizigers, casual gamers of GPU-versnelde taken.
Sommige veranderingen ten opzichte van vorig jaar zijn misschien niet voor iedereen geschikt. Vooral de overgang van Core Ultra-H naar Core Ultra-V processors heeft de ruwe verwerkingskracht met een behoorlijke marge verminderd. Ondertussen is de herschikking van de poorten waarschijnlijk ten nadele, omdat beide USB-C poorten nu dicht op elkaar zitten, wat de ergonomie van het docken beïnvloedt. De batterijcapaciteit is ook aanzienlijk verminderd, tot het punt waar de batterijduur korter is dan op de Inspiron 16 7640 2-in-1, ook al wordt het oudere systeem geleverd met de snellere Core Ultra-H CPU.
Evenwichtige gebruikers die het geïntegreerde numpad en de relatief snelle iGPU kunnen waarderen, geven misschien de voorkeur aan de nieuwere Dell 16 Plus 2-in-1. Anders zullen power-gebruikers die afhankelijk zijn van de kracht van de CPU misschien toch de voorkeur geven aan de oudere Inspiron 16 7640 2-in-1, vooral omdat beide modellen exact dezelfde panelen hebben voor een identieke kijkervaring.
Pro
Contra
Prijs en beschikbaarheid
Dell levert de Dell 16 Plus 2-in-1 nu vanaf 950 dollar met een IPS-paneel of 1500 dollar met mini-LED.
- $999.99Dell 16 Plus 2-in-1 Business Laptop, 16" FHD+ Touchscreen, Intel Core Ultra 7 256V(8 Cores, up to 4.8 GHz) Intel Arc Graphics, 16GB DDR5, 512GB SSD, Backlit, Windows 11 Home, with SVT Stylus Pen Hub
- $1,079.99Dell 16 Plus LDB06250 AI Business 2-in-1 Laptop 16'' Touch WQXGA Display
- $1,199.00Dell Plus 16" FHD 2-in-1 Touchscreen Laptop, Intel Core Ultra 7 256V, 16GB RAM, 2TB Storage(1TB SSD+1TB Docking Station Set), Backlit Keyboard, Webcam, Wi-Fi 7, Copilot, Win 11 Pro, Ice Blue
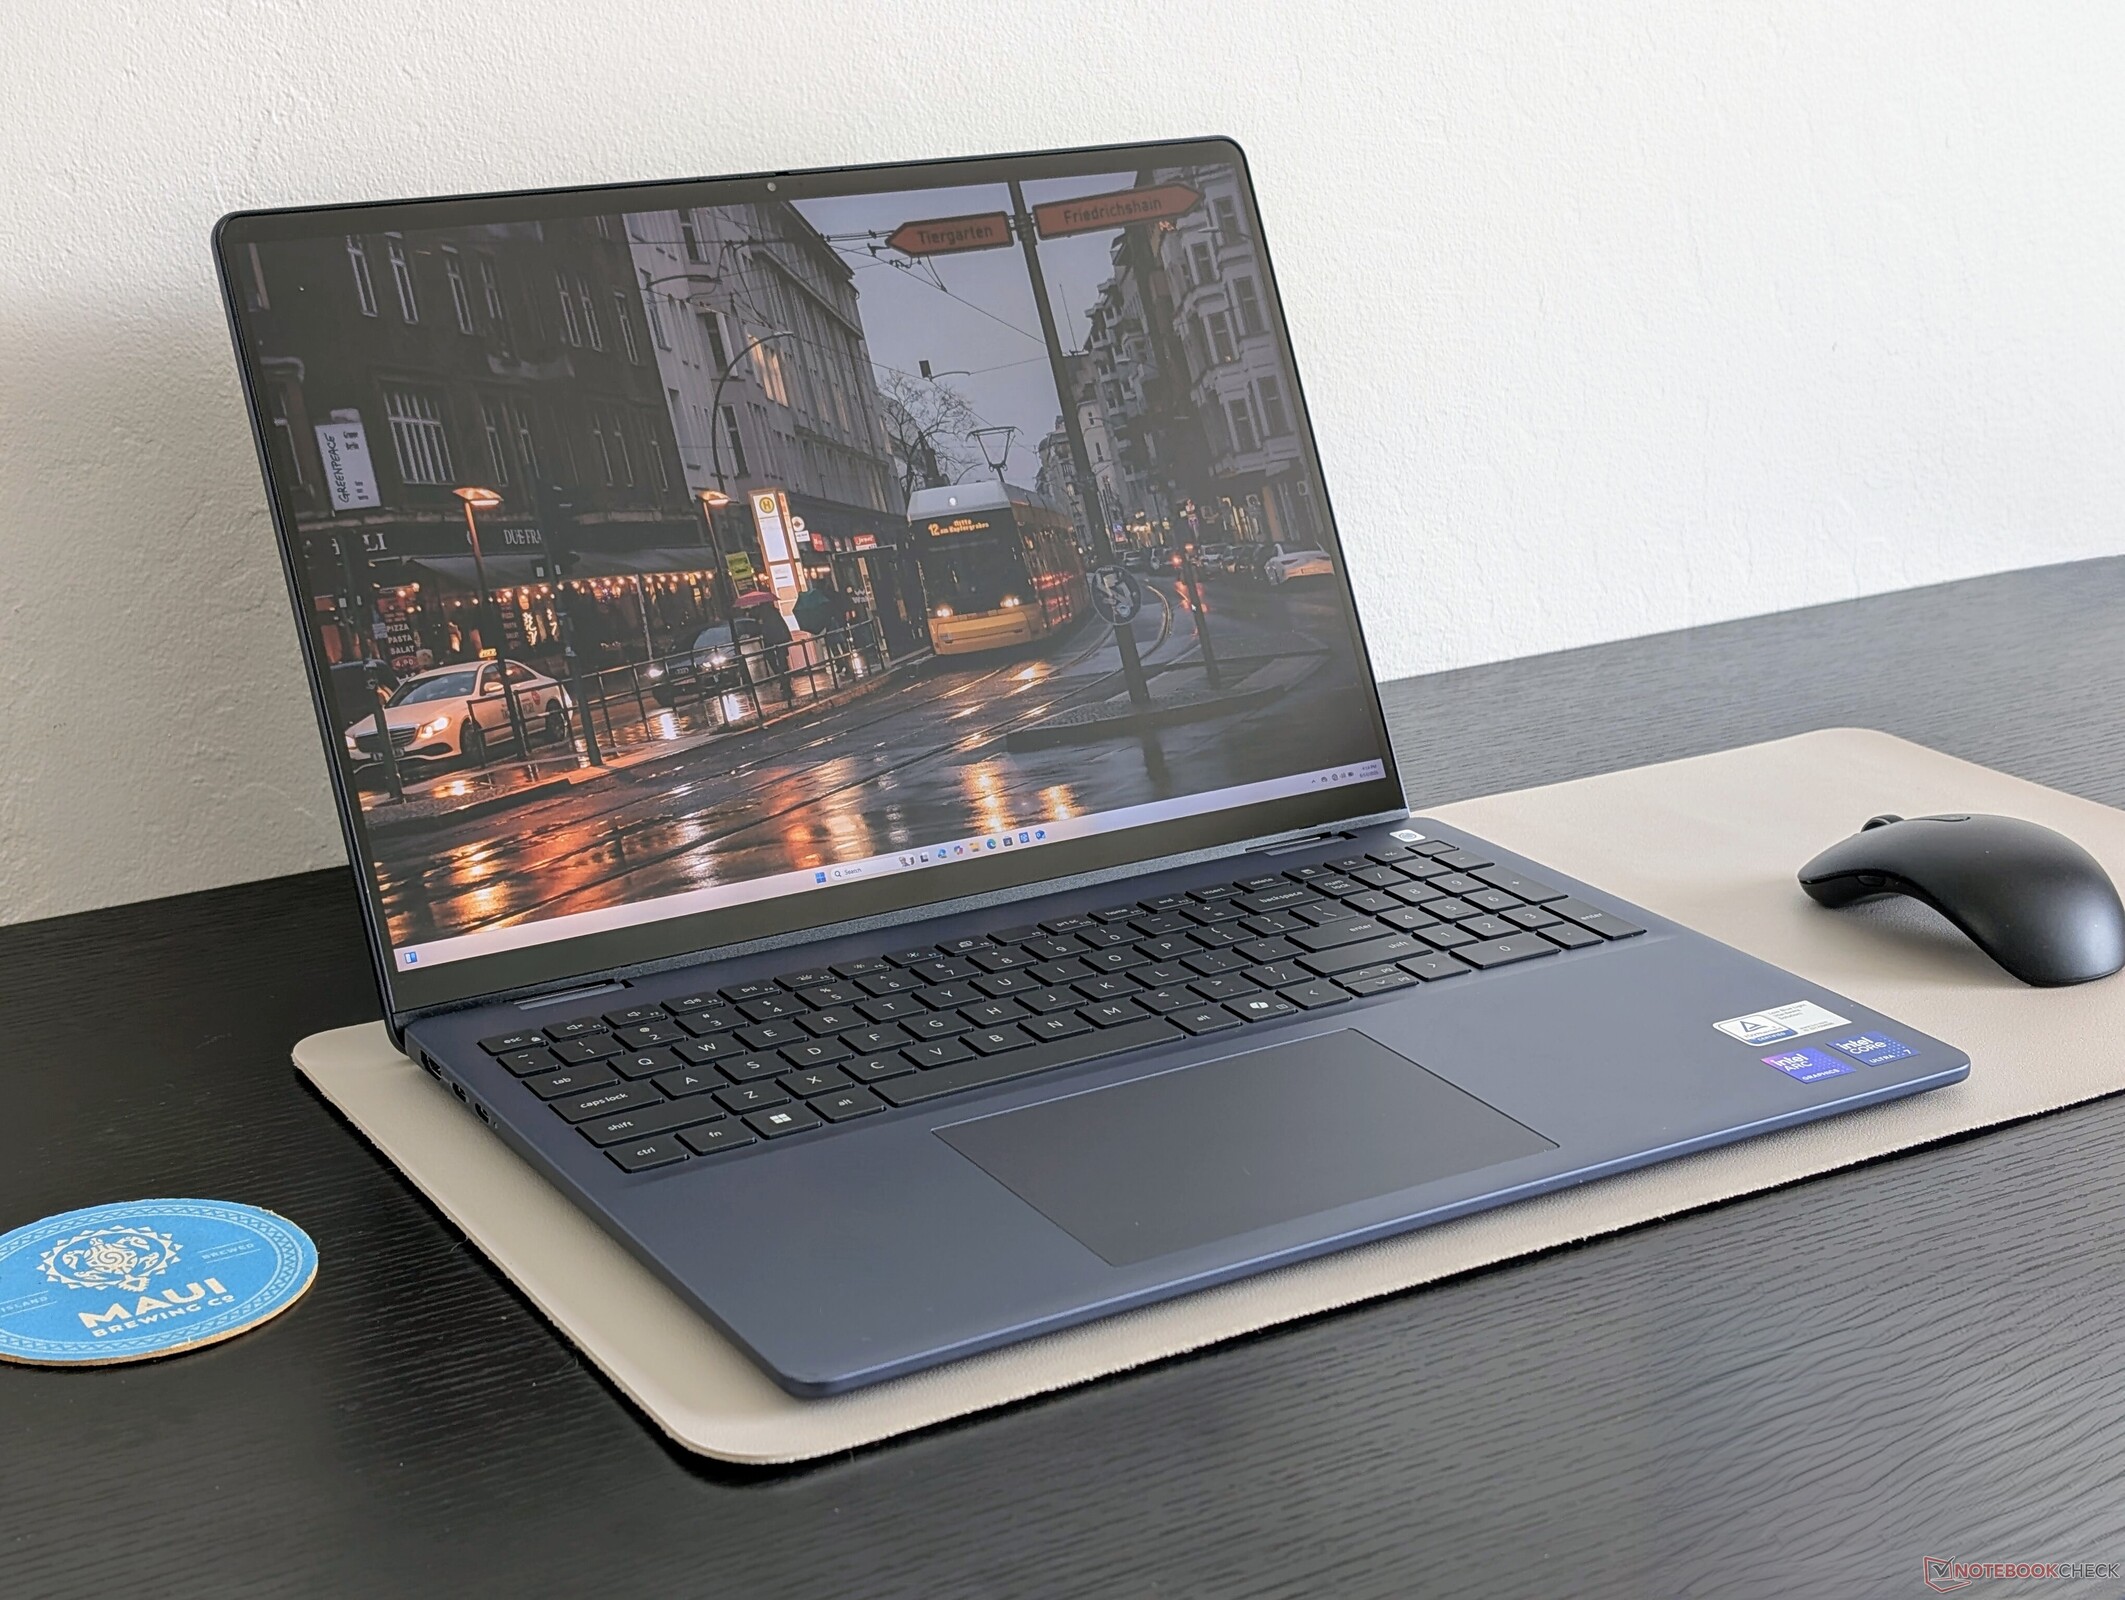
De Dell 16 Plus 2-in-1 is de convertible versie van de Dell 16 Plus clamshell en de directe opvolger van de 2024 Inspiron 16 7640 2-in-1. Het is het begin van een nieuwe generatie mainstream laptops die de oude Inspiron naamgeving moet vervangen.
Onze testunit is een middelste configuratie met de Core Ultra 7 256V CPU en een 2,5K 90 Hz Mini-LED touchscreen voor ongeveer 1400 USD. De goedkopere SKU's worden mogelijk geleverd met een traditioneler FHD IPS aanraakscherm, terwijl de duurdere SKU's worden geleverd met de Core Ultra 9 288V.
Concurrenten voor de Dell 16 Plus 2-in-1 zijn andere 16-inch multimedia convertibles zoals de HP Envy x360 2-in-1 16, Lenovo Yoga 7 2-in-1 16ILL10of Samsung Galaxy Book5 Pro 360.
Meer Dell beoordelingen:
Specificaties
Zaak
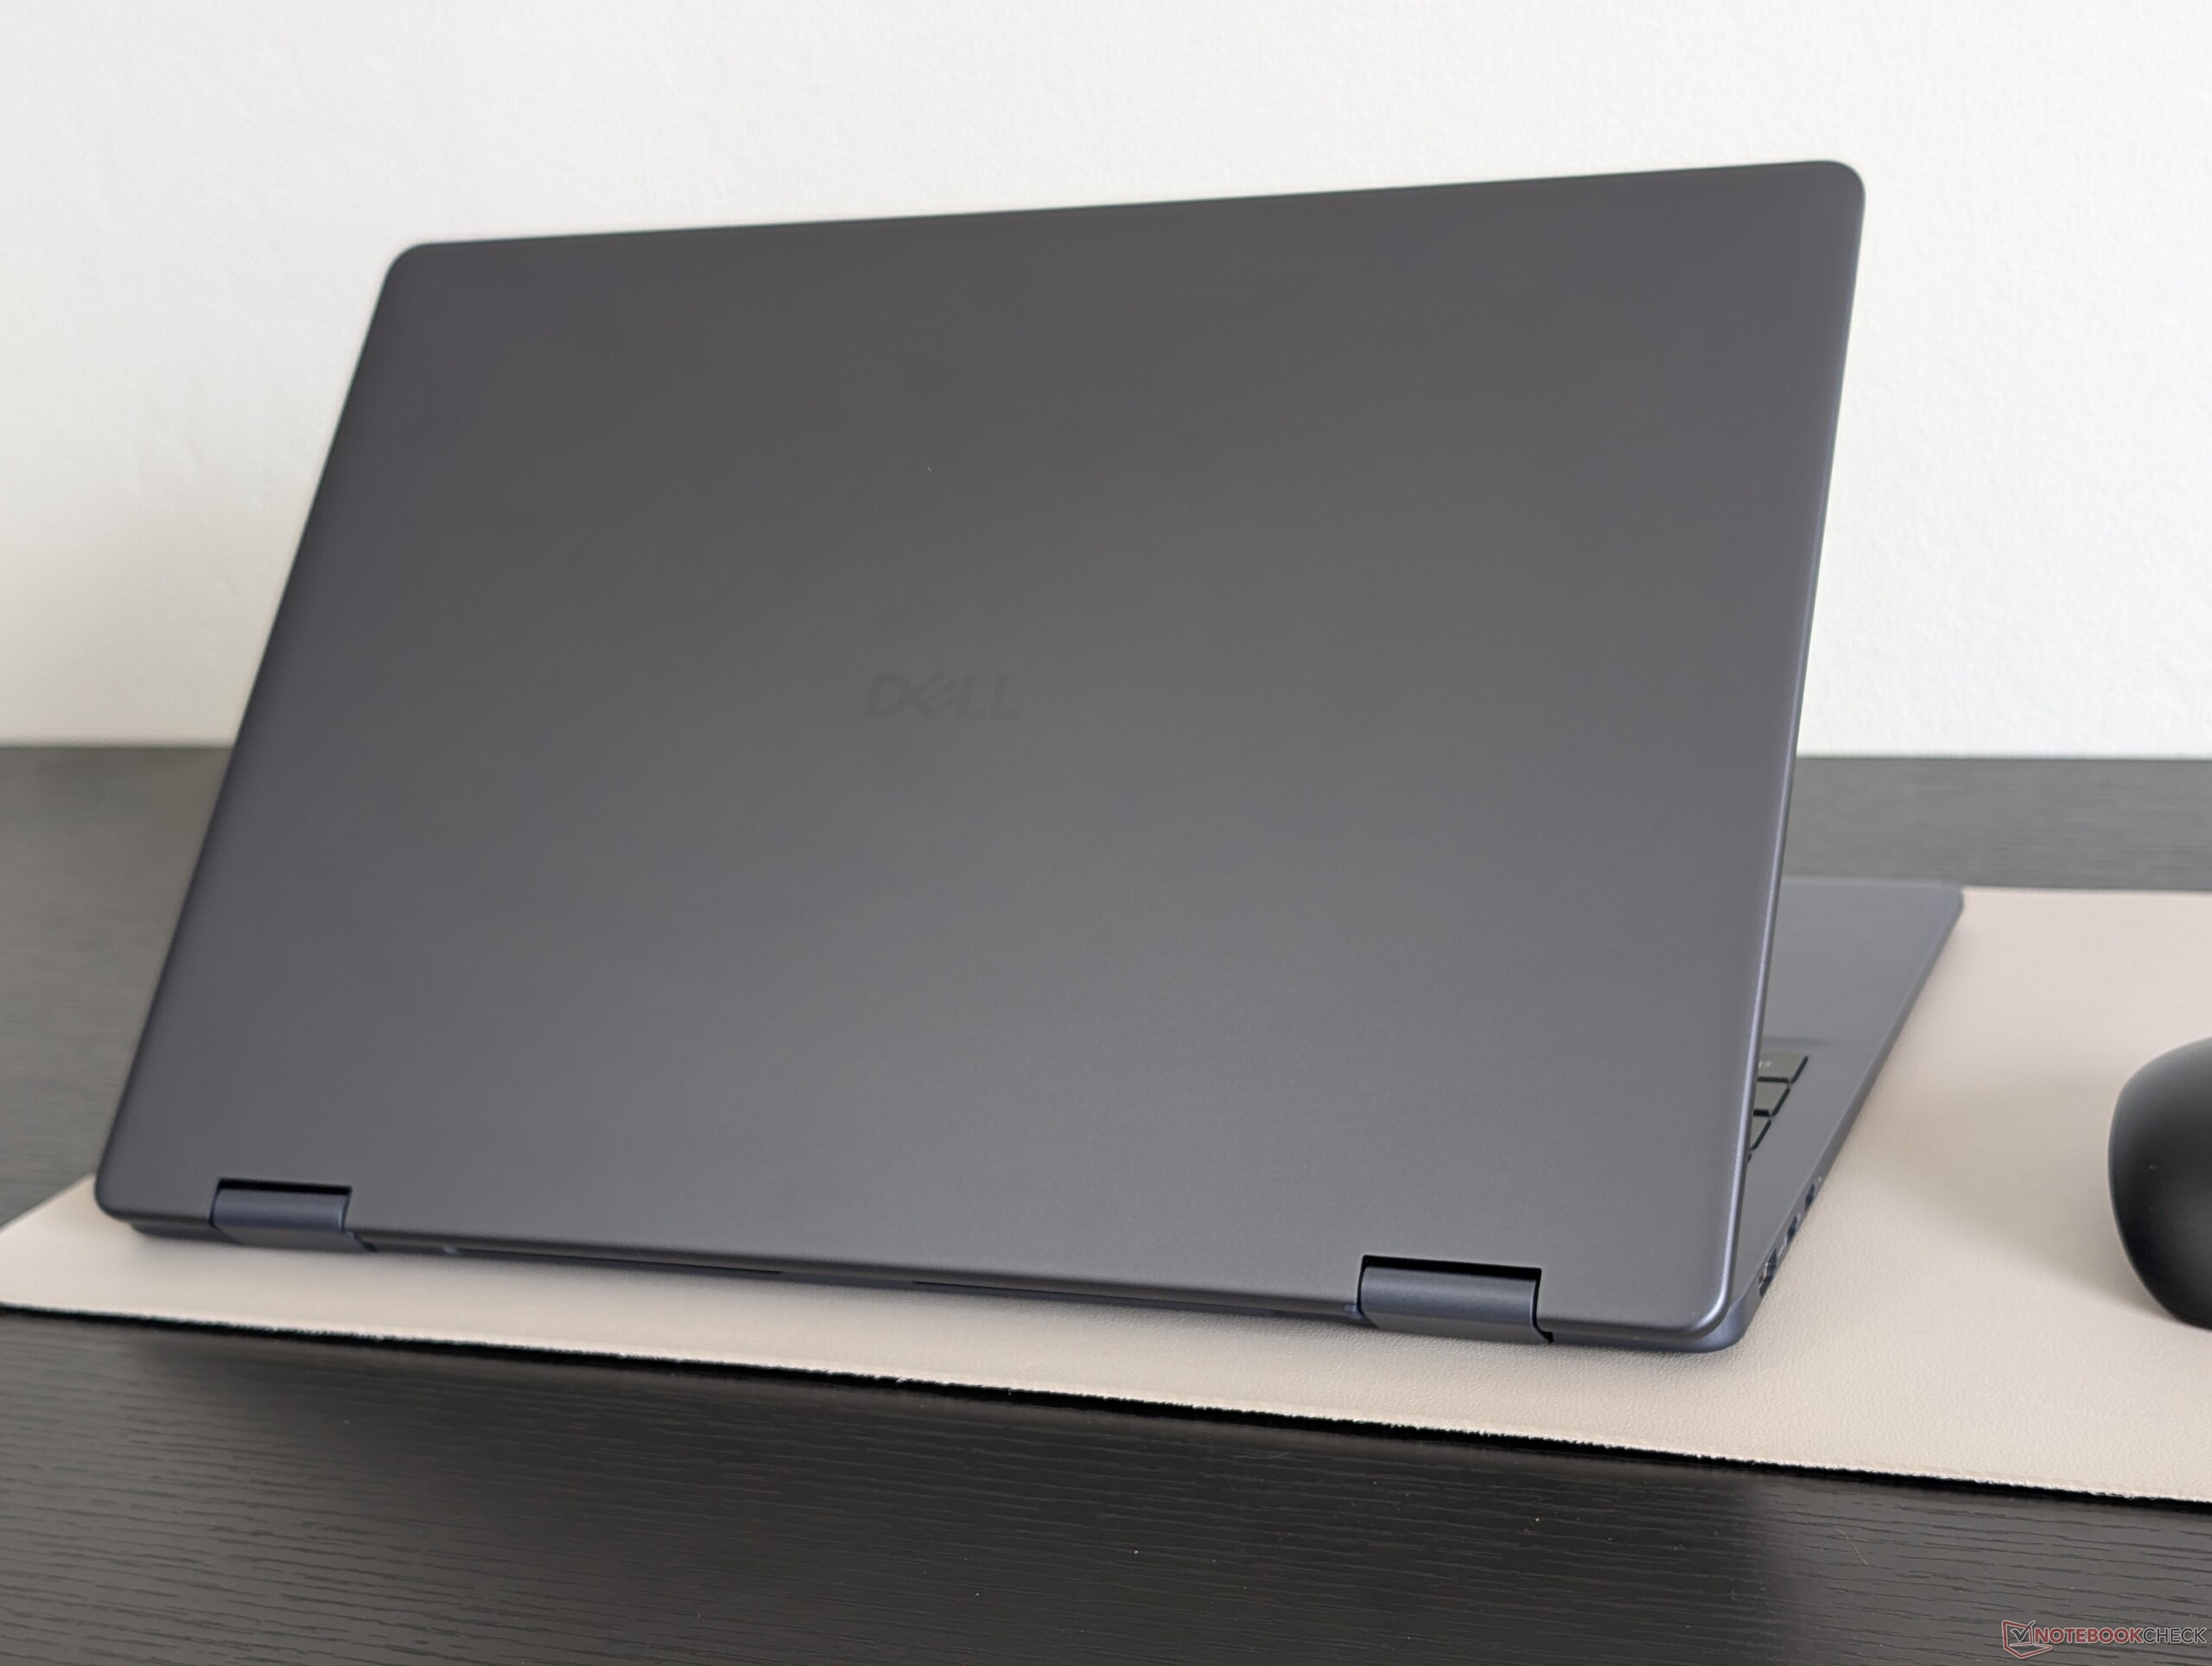
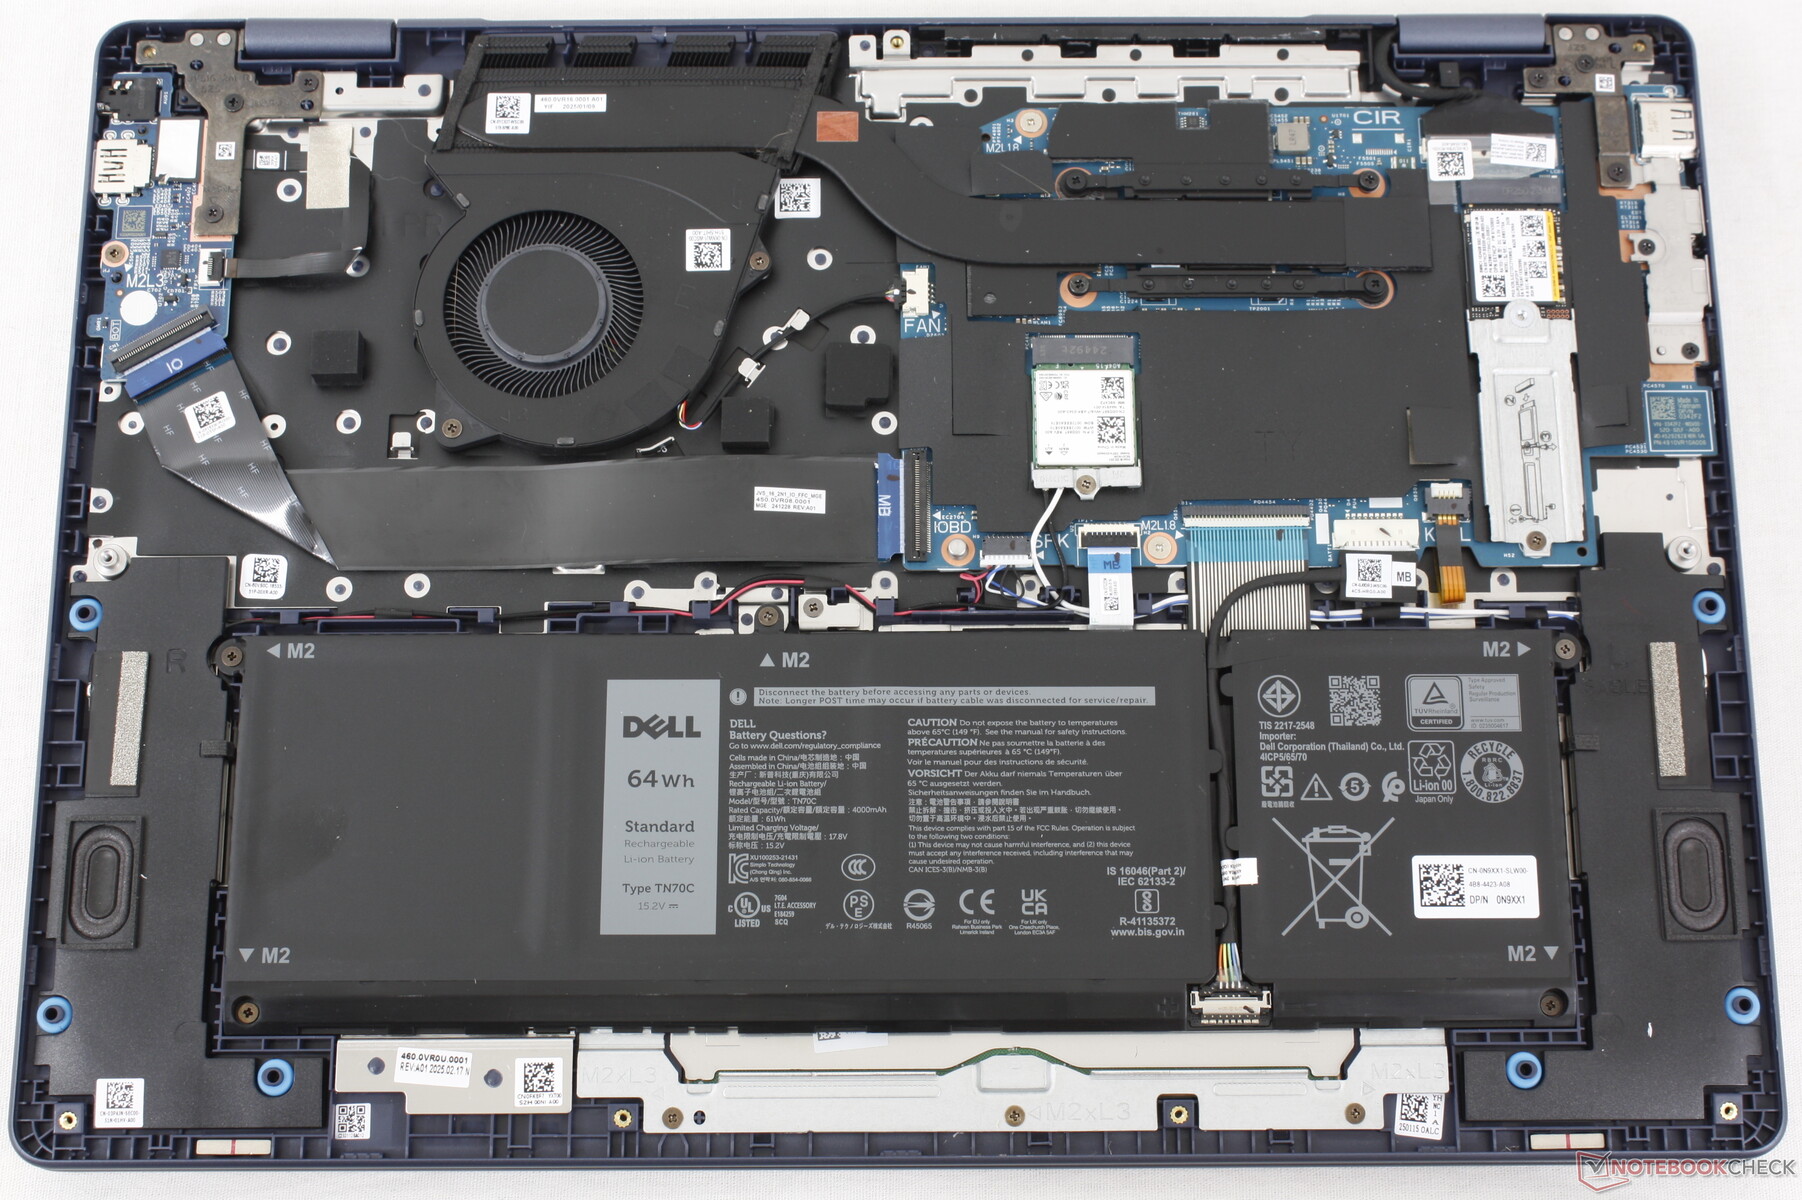
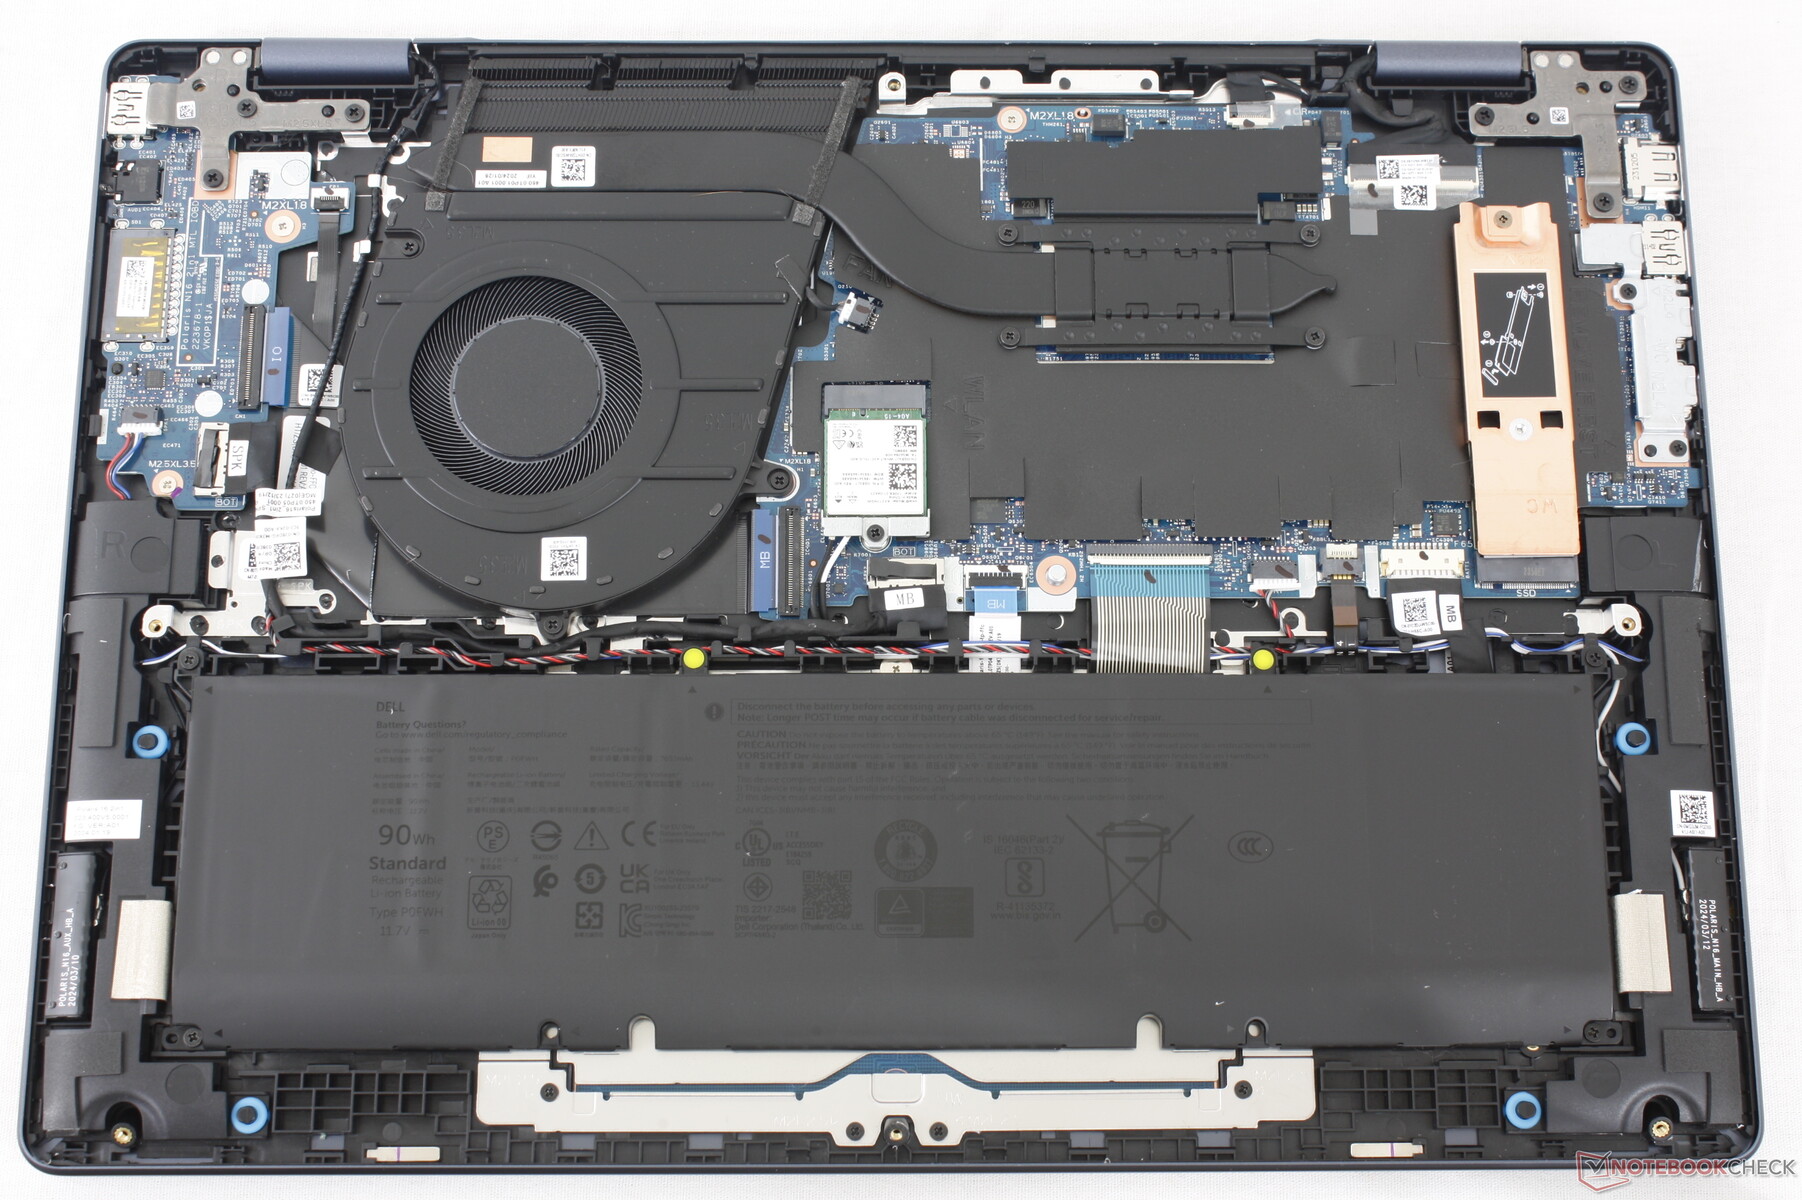
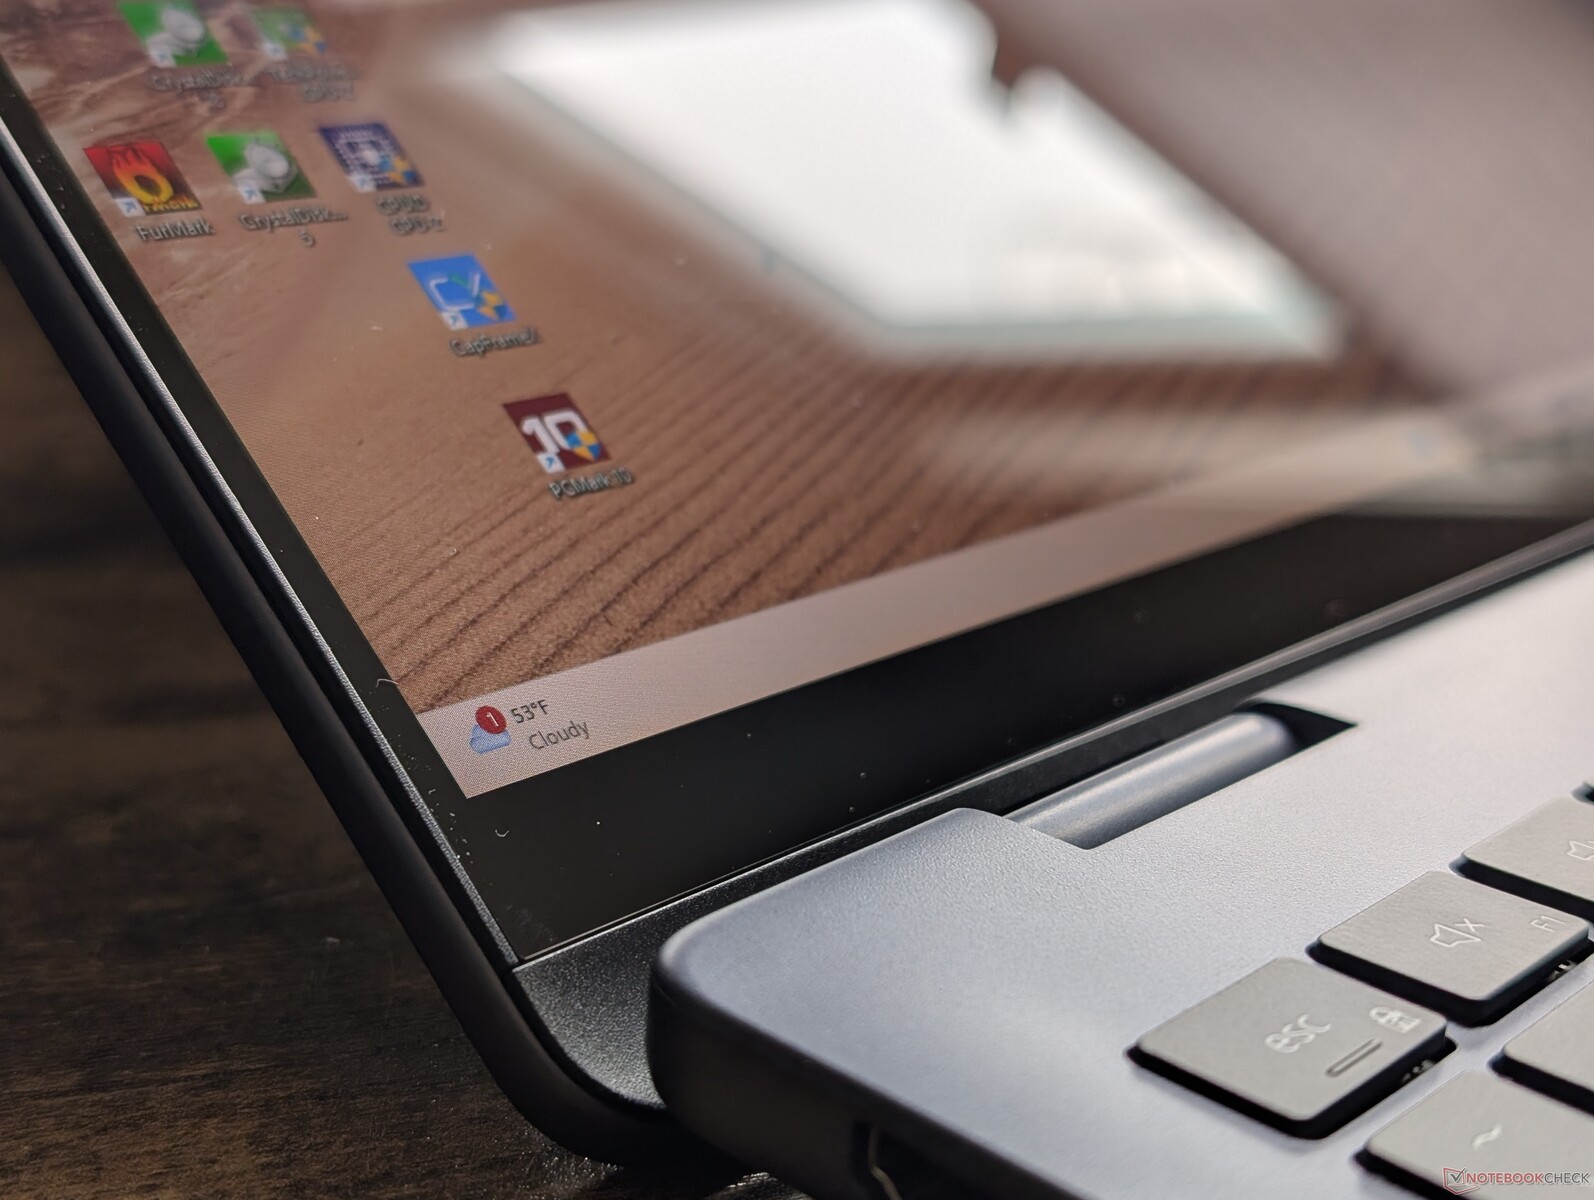
De behuizing is een voortzetting van de Inspiron 16 7640 2-in-1 en maakt gebruik van vergelijkbare aluminium en plastic materialen voor dat vertrouwde "Inspiron"-gevoel en kwaliteit. Afmetingen en gewicht zijn vervolgens bijna identiek tussen de twee modellen, met uitzondering van het iets dunnere profiel van het nieuwere model.
Connectiviteit
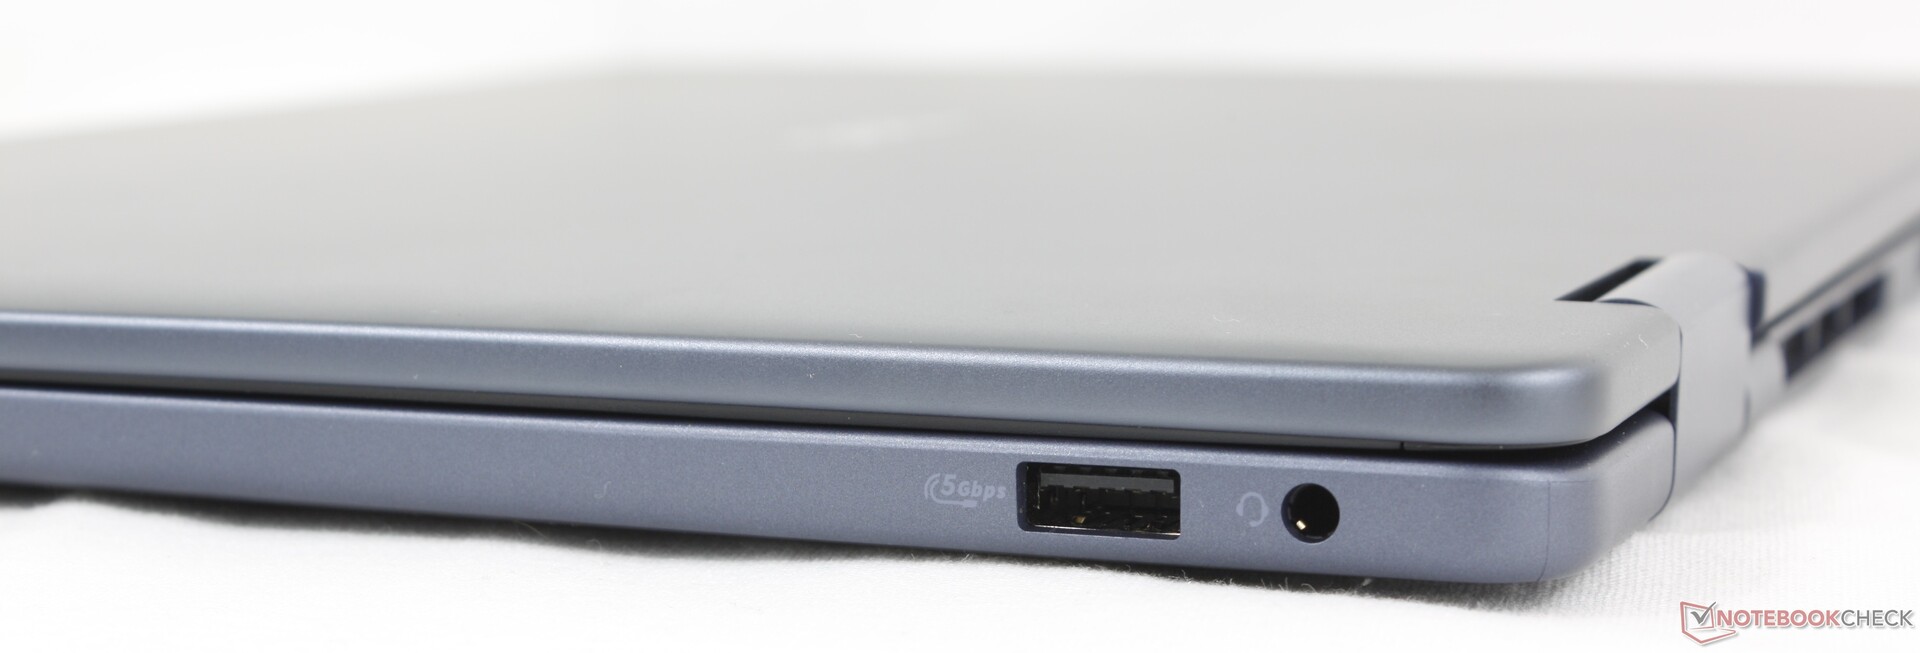
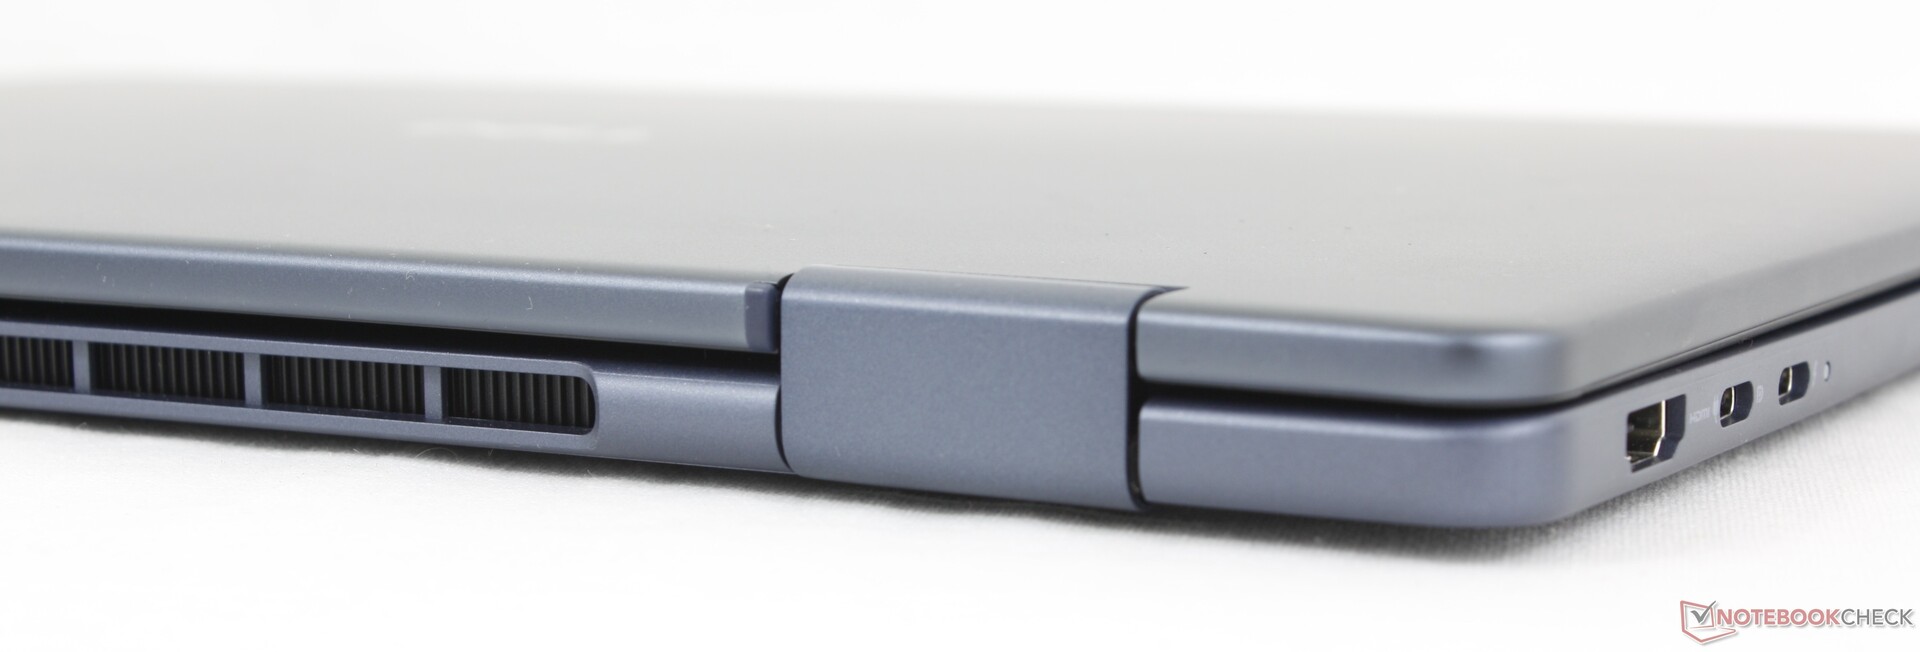
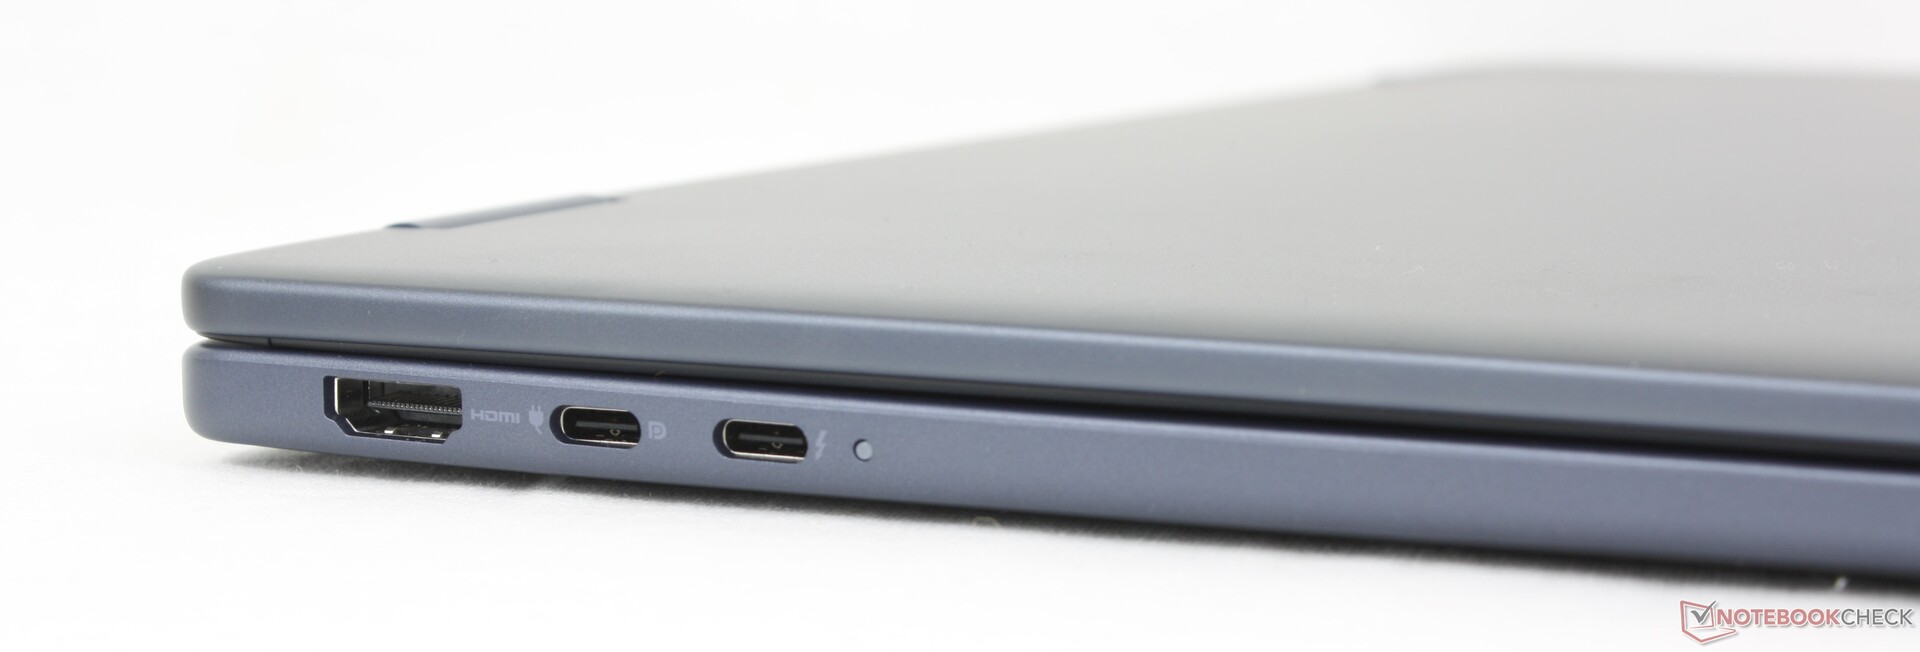
De poortopties zijn identiek aan die van de Inspiron van vorig jaar, zij het met één belangrijk verschil: het ontbreken van een geïntegreerde SD-kaartlezer. De twee USB-C poorten zijn ook anders ingedeeld, waarschijnlijk ten kwade, want u kunt het systeem niet langer langs de rechterkant opladen.
Communicatie
Webcam
Een 2 MP webcam wordt standaard geleverd met fysieke sluiter en zonder IR.


Onderhoud
Duurzaamheid
Dell vermeldt niet expliciet welke gerecyclede materialen zijn gebruikt tijdens de productie van de Dell 16 Plus 2-in-1. Voor de verpakking is geen plastic gebruikt, zodat recycling eenvoudiger is.
Accessoires en garantie
De detailhandeldoos bevat de AC-adapter en papierwerk. Bij aankoop in de VS geldt de gebruikelijke fabrieksgarantie van één jaar.
Invoerapparaten
Toetsenbord en touchpad
Het toetsenbord en clickpad zijn 1:1 met de Dell 16 Plus clamshell voor een identieke ervaring. Het is een upgrade in termen van productiviteit ten opzichte van de Inspiron 16 7640 2-in-1 van vorig jaar, die grote luidsprekerroosters verkoos boven een geïntegreerd numeriek toetsenblok.
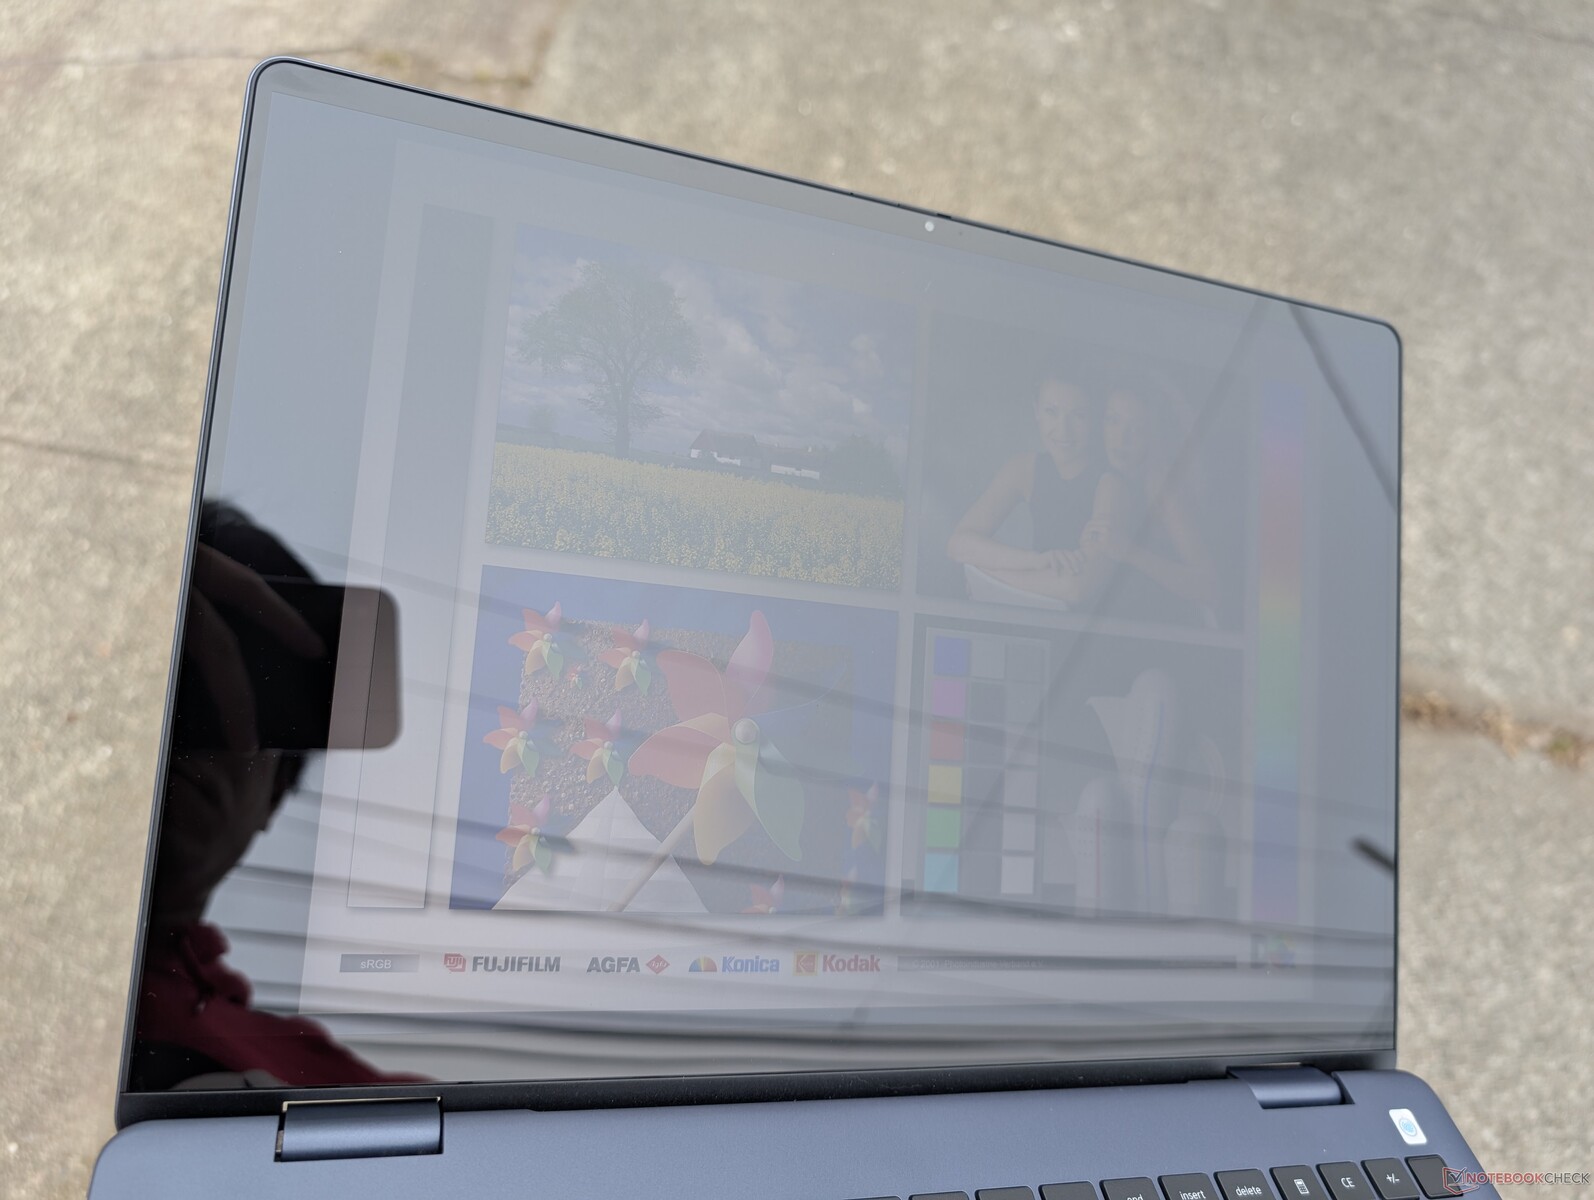
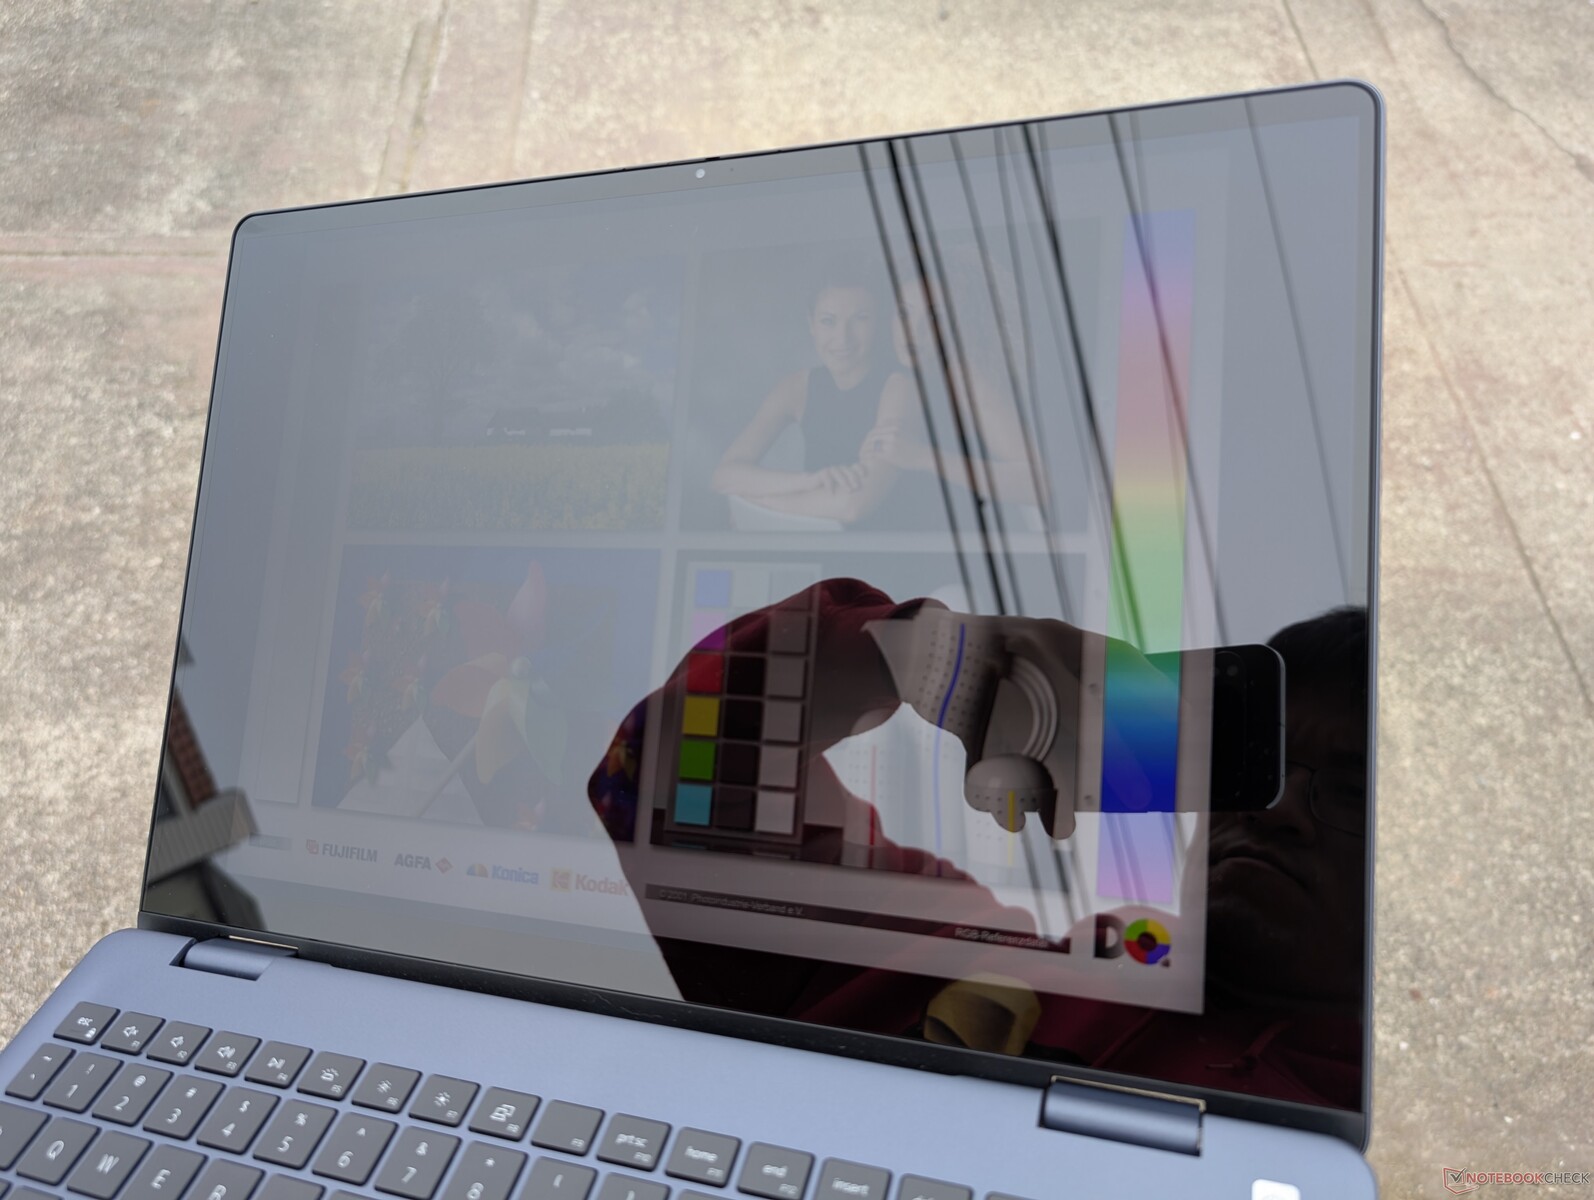
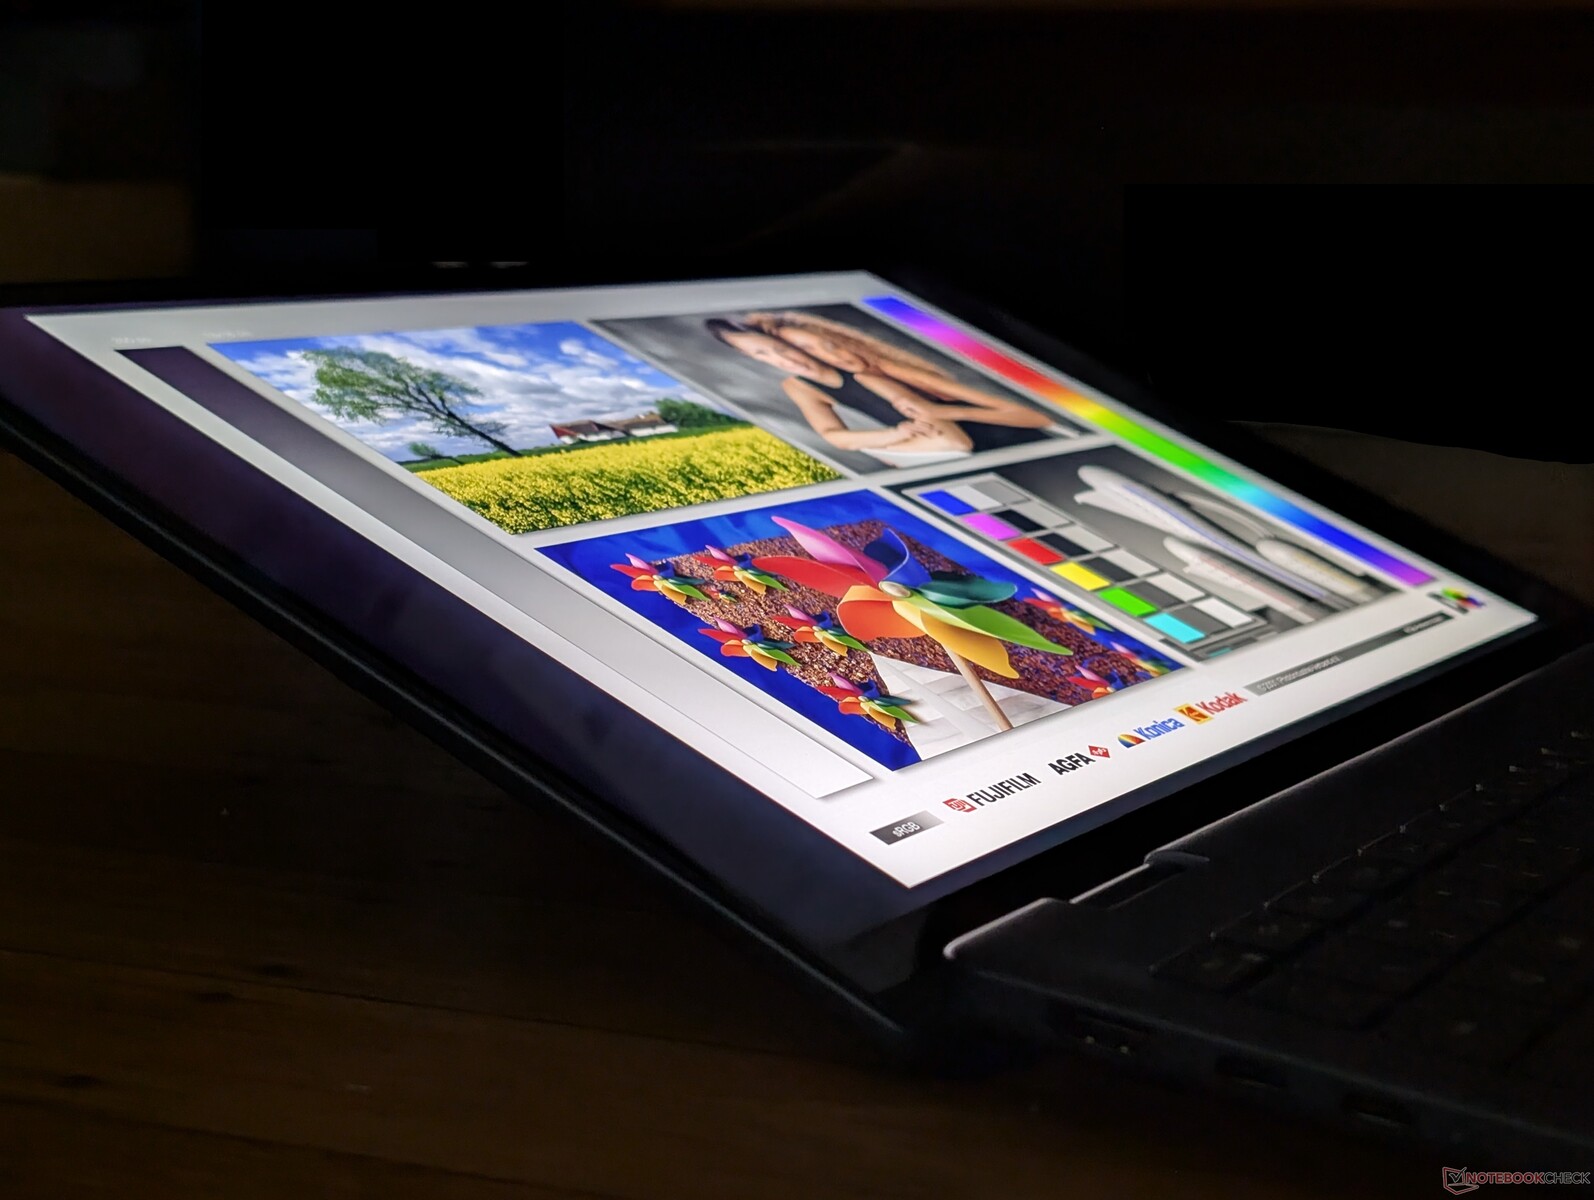
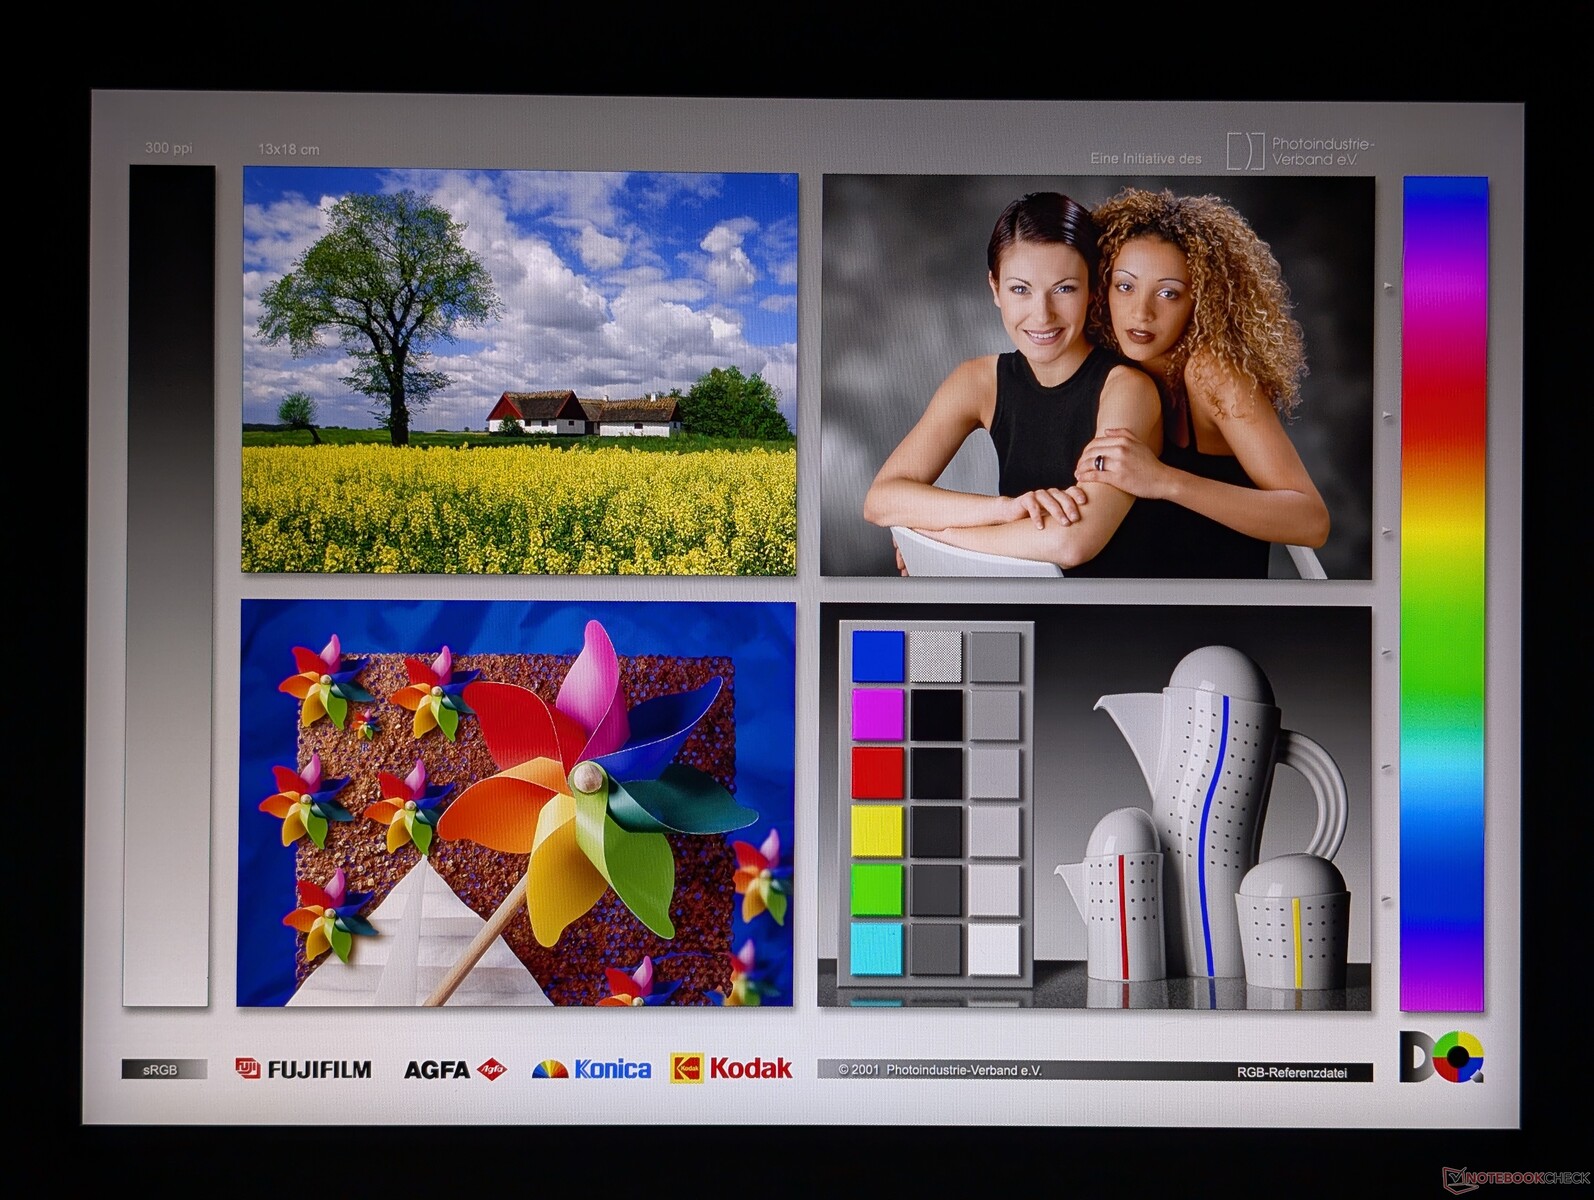
Weergave
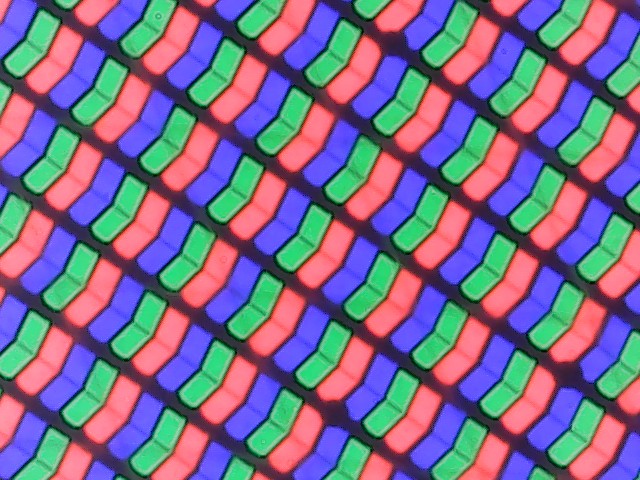
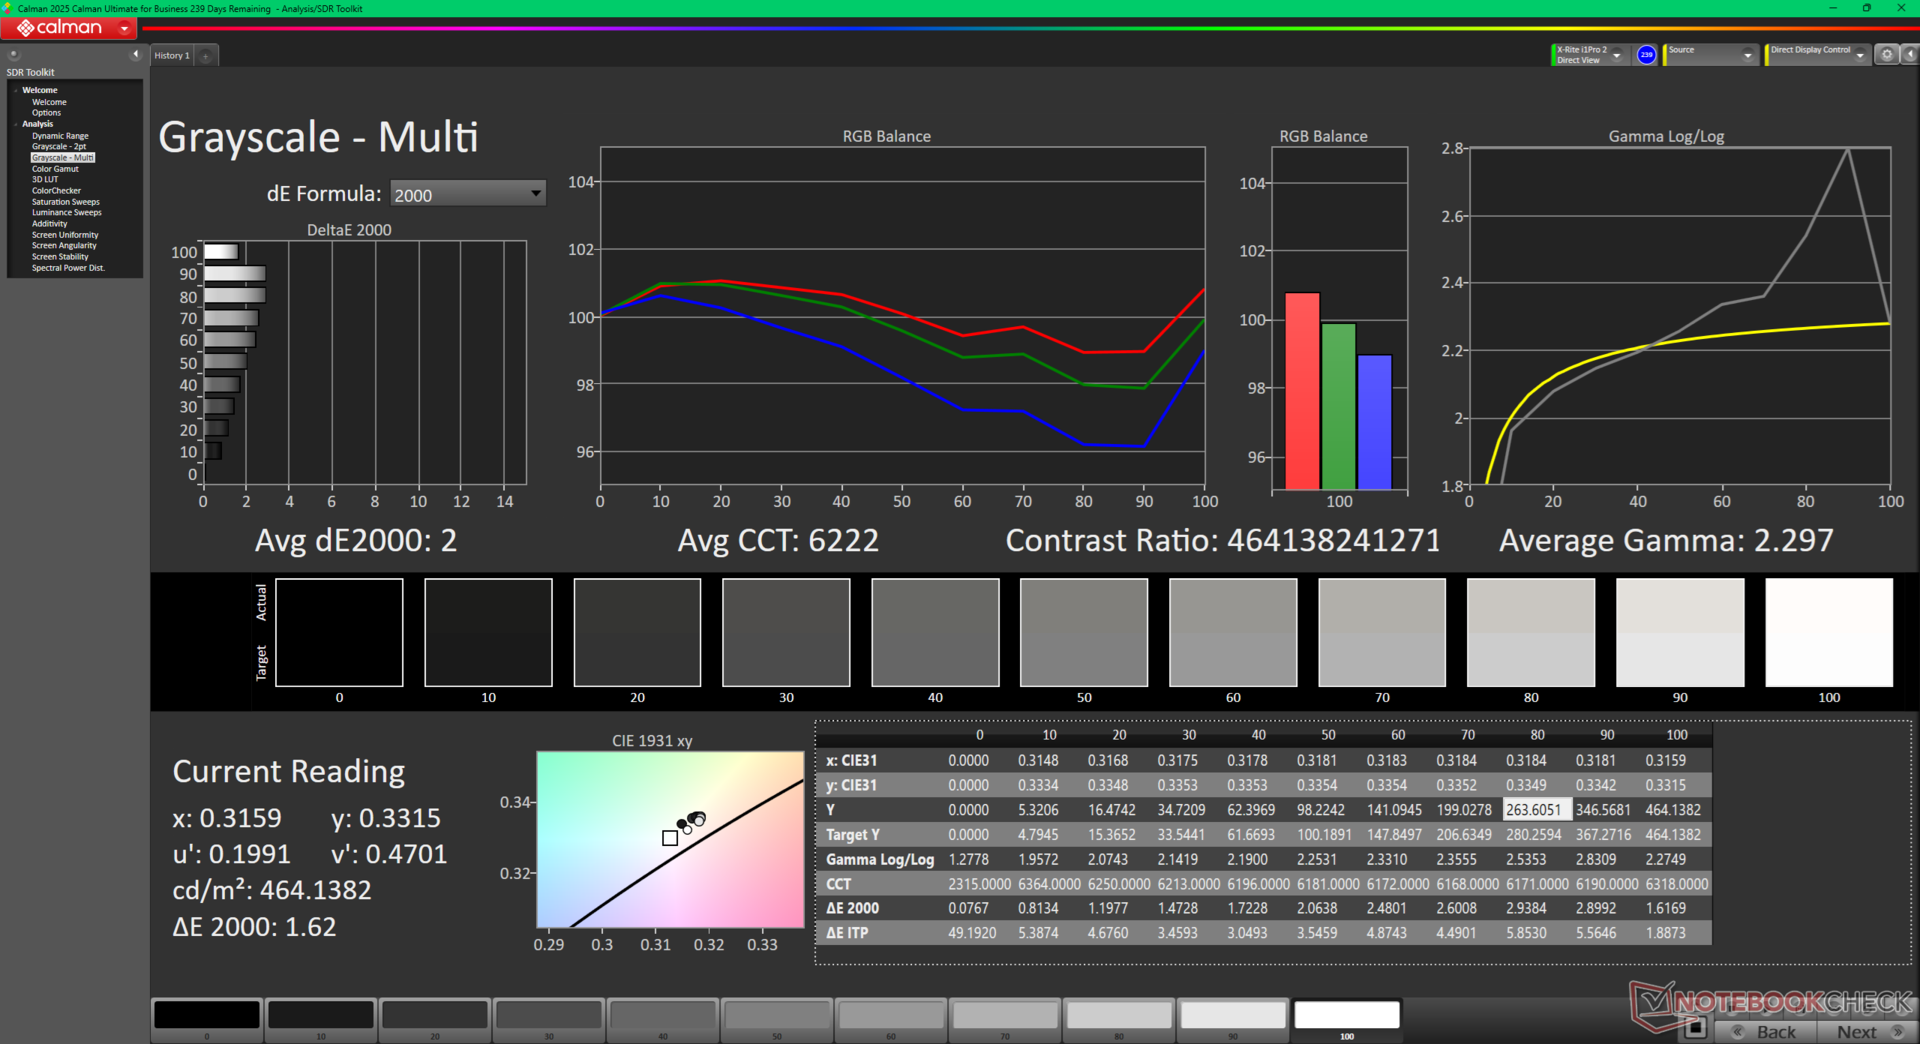
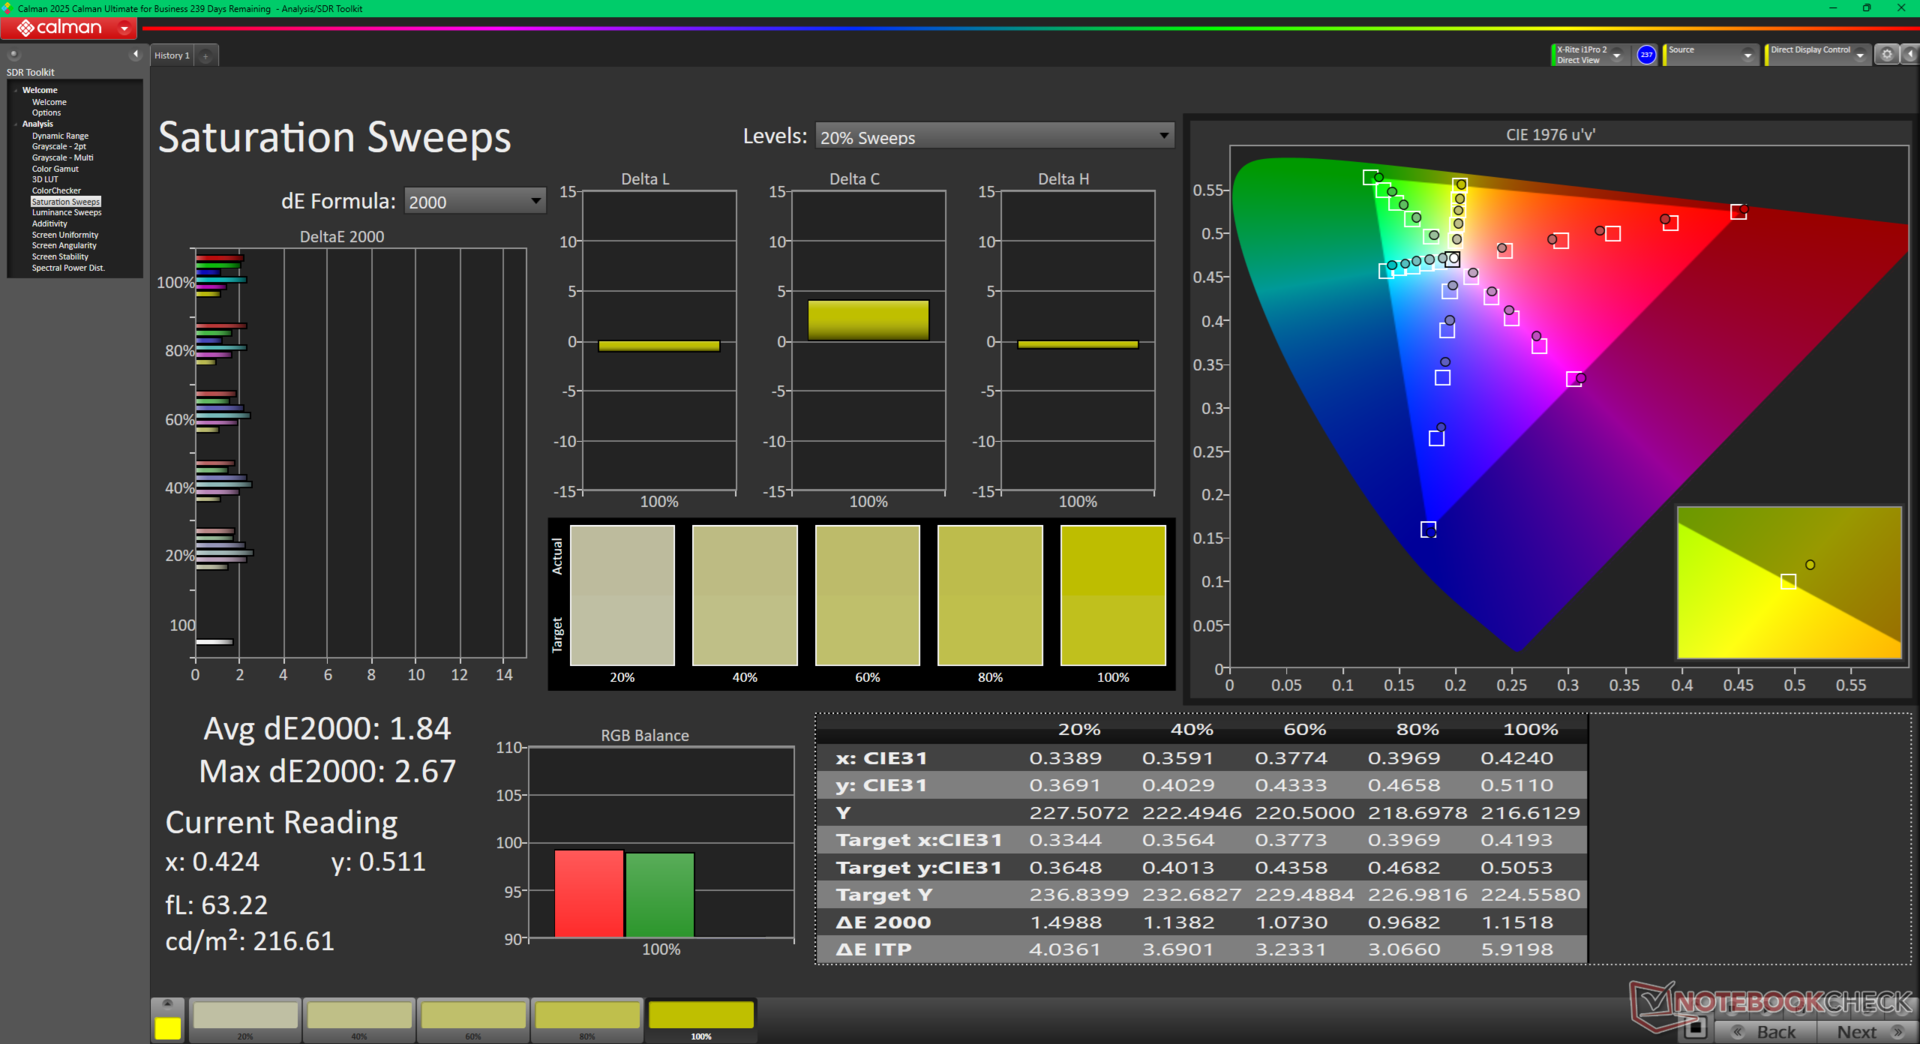
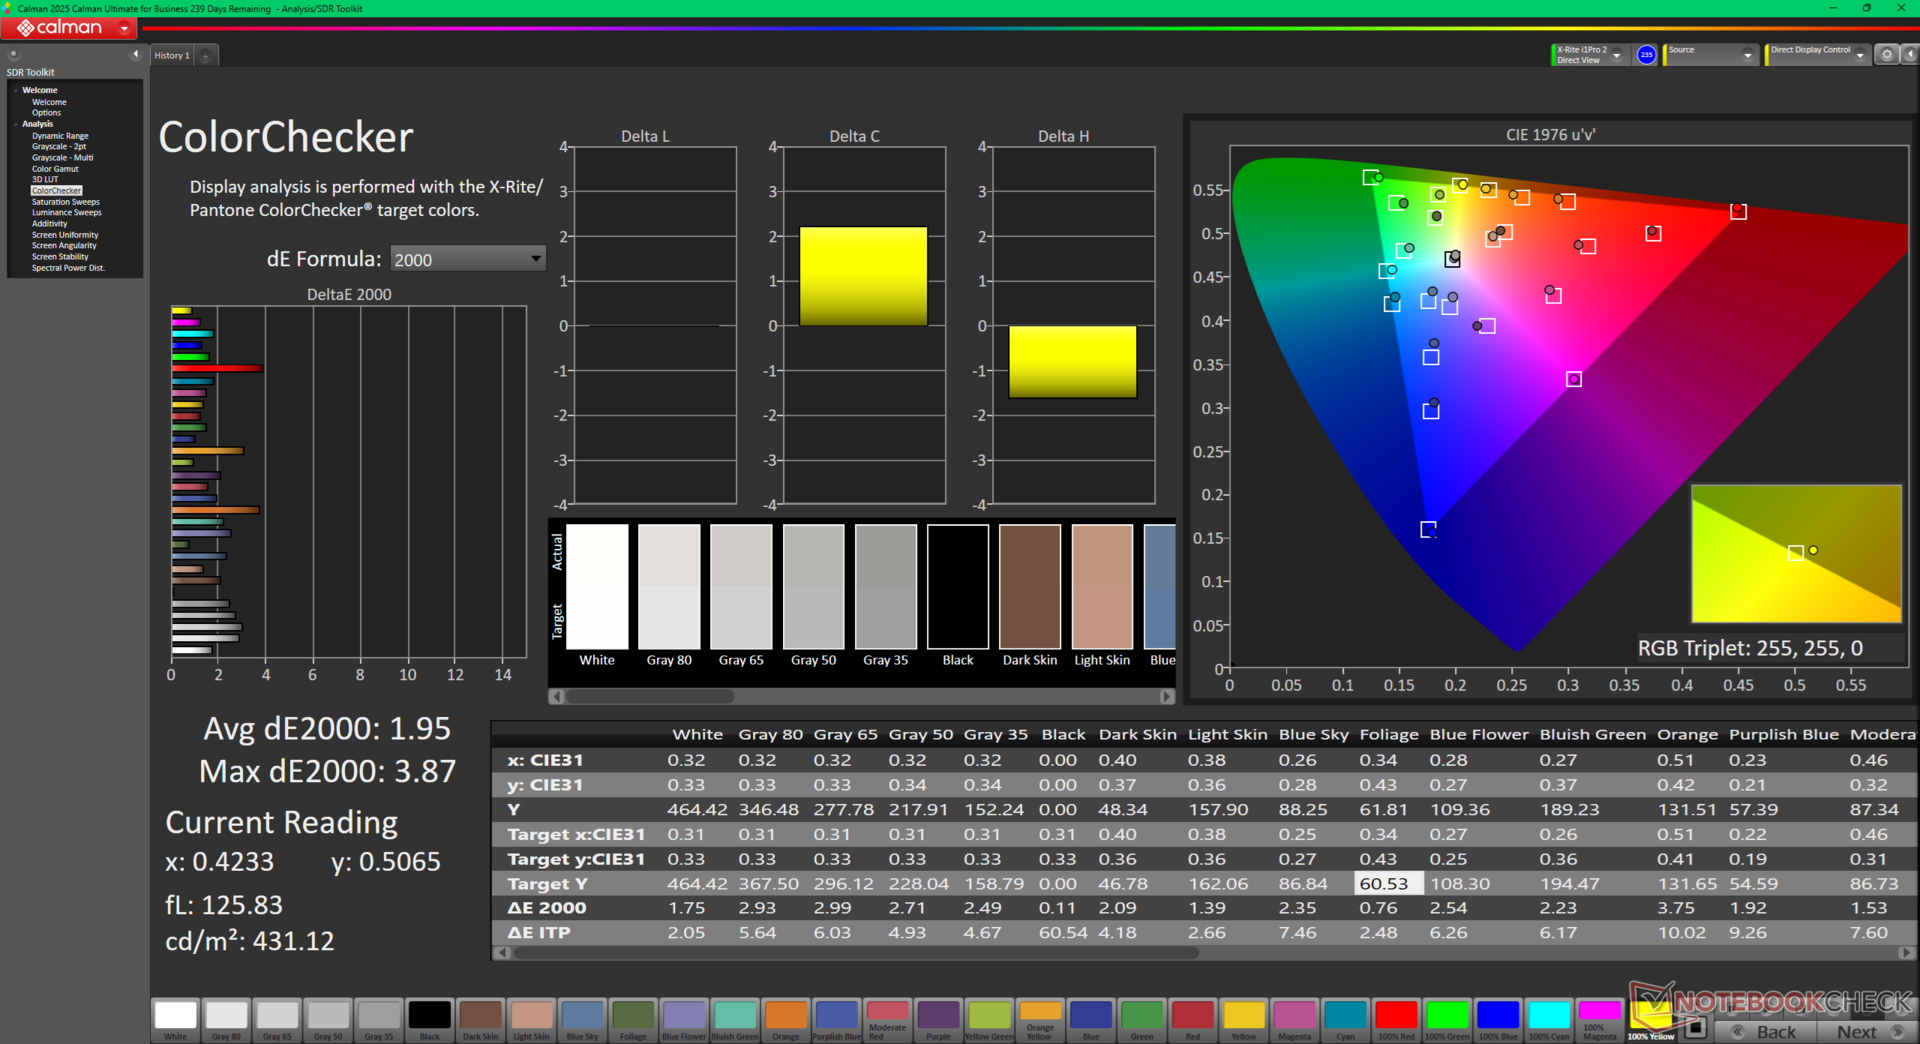
Het systeem maakt gebruik van exact hetzelfde AU Optronics B160QAT mini-LED paneel als dat van de Inspiron 16 7640 2-in-1 van vorig jaar, voor dezelfde kijkervaring tussen de twee modellen. Mini-LED-panelen zijn meestal helderder en hebben diepere kleuren dan de meeste IPS-panelen voor betere HDR-ondersteuning, maar ze kunnen halo-effecten en zwakkere zwartniveaus vertonen die anders niet aanwezig zijn op OLED-panelen.
De maximale helderheid kan 642 nits bereiken wanneer HDR is ingeschakeld of 432 nits in de standaard SDR-modus.
| |||||||||||||||||||||||||
Helderheidsverdeling: 97 %
Helderheid in Batterij-modus: 432.1 cd/m²
Contrast: ∞:1 (Zwart: 0 cd/m²)
ΔE ColorChecker Calman: 1.95 | ∀{0.5-29.43 Ø4.71}
calibrated: 1.16
ΔE Greyscale Calman: 2 | ∀{0.09-98 Ø4.96}
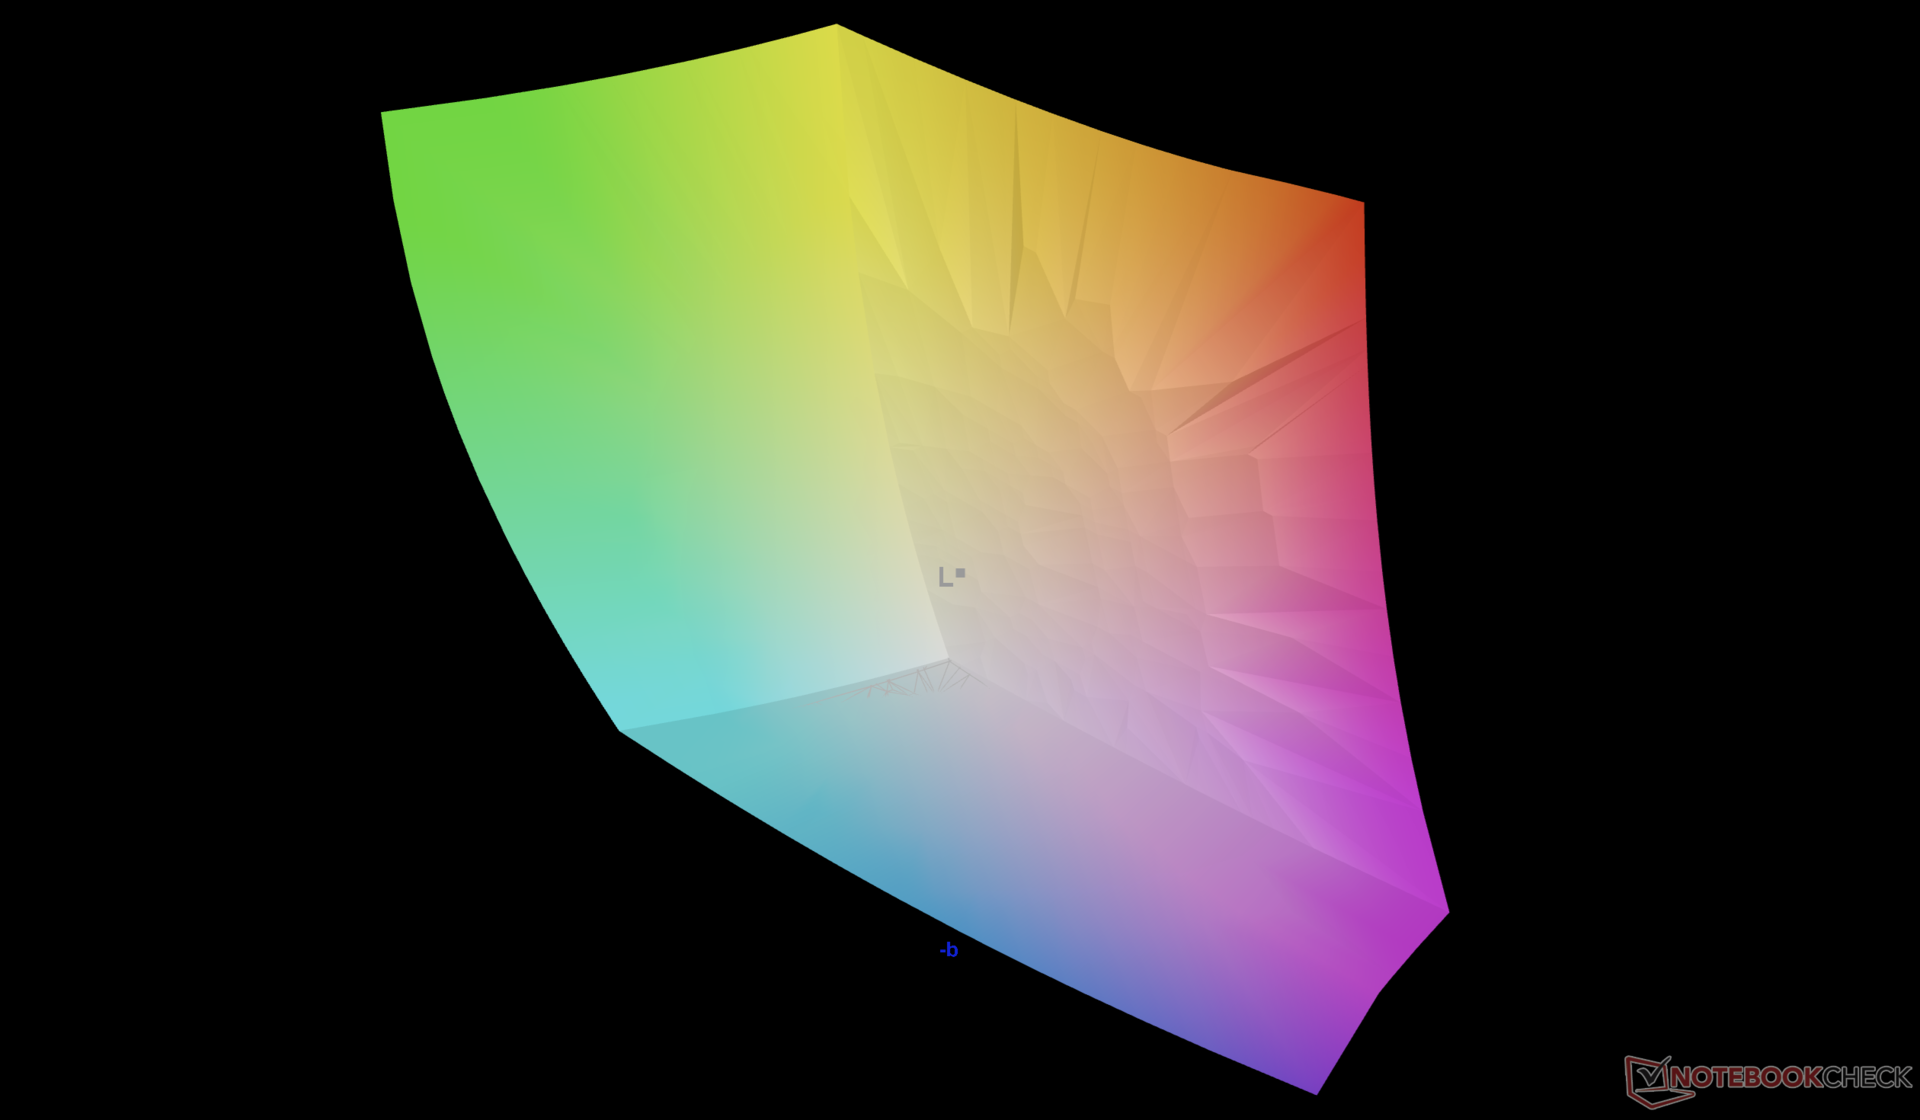
94.2% AdobeRGB 1998 (Argyll 3D)
100% sRGB (Argyll 3D)
99.5% Display P3 (Argyll 3D)
Gamma: 2.3
CCT: 6222 K
| Dell 16 Plus 2-in-1 AU Optronics B160QAT, Mini-LED, 2560x1600, 16", 90 Hz | Dell Inspiron 16 7640 2-in-1 AU Optronics B160QAT, Mini-LED, 2560x1600, 16", 90 Hz | Lenovo Yoga 7 2-in-1 16ILL10 LEN160WUM, IPS, 1920x1200, 16", 60 Hz | Samsung Galaxy Book5 Pro 360 ATNA60CL09-0, OLED, 2880x1800, 16", 120 Hz | MSI Summit A16 AI Plus A3HMTG AU Optronics B16QAN02.N, IPS, 2560x1600, 16", 165 Hz | HP Envy x360 2-in-1 16-ad0097nr Samsung SDC41A6, OLED, 2880x1800, 16", 120 Hz | |
|---|---|---|---|---|---|---|
| Display | -1% | -53% | 1% | -4% | 1% | |
| Display P3 Coverage (%) | 99.5 | 99.4 0% | 39.7 -60% | 99.9 0% | 96.8 -3% | 99.6 0% |
| sRGB Coverage (%) | 100 | 100 0% | 57.9 -42% | 100 0% | 99.8 0% | 100 0% |
| AdobeRGB 1998 Coverage (%) | 94.2 | 92.5 -2% | 41 -56% | 96.6 3% | 84.7 -10% | 96.5 2% |
| Response Times | 32% | 50% | 73% | 80% | 98% | |
| Response Time Grey 50% / Grey 80% * (ms) | 48.8 ? | 15.4 ? 68% | 30 ? 39% | 0.48 ? 99% | 12.9 ? 74% | 0.8 ? 98% |
| Response Time Black / White * (ms) | 57.6 ? | 60.6 ? -5% | 22.5 ? 61% | 0.64 ? 99% | 8.9 ? 85% | 0.89 ? 98% |
| PWM Frequency (Hz) | 2807 ? | 2753.7 ? | 240 ? | 491.8 ? | ||
| PWM Amplitude * (%) | 50 | 40 20% | ||||
| Screen | -49% | -169% | 16% | -22% | -19% | |
| Brightness middle (cd/m²) | 432.1 | 413 -4% | 317.9 -26% | 387 -10% | 475.4 10% | 399.4 -8% |
| Brightness (cd/m²) | 426 | 409 -4% | 304 -29% | 392 -8% | 440 3% | 405 -5% |
| Brightness Distribution (%) | 97 | 97 0% | 90 -7% | 98 1% | 89 -8% | 98 1% |
| Black Level * (cd/m²) | 0.14 | 0.25 | 0.36 | |||
| Colorchecker dE 2000 * | 1.95 | 3.48 -78% | 7.39 -279% | 1 49% | 2.99 -53% | 4.05 -108% |
| Colorchecker dE 2000 max. * | 3.87 | 6.97 -80% | 21.43 -454% | 1.9 51% | 7.64 -97% | 6.69 -73% |
| Colorchecker dE 2000 calibrated * | 1.16 | 3.06 -164% | 0.74 36% | 1.02 12% | ||
| Greyscale dE 2000 * | 2 | 4.5 -125% | 6.5 -225% | 1.7 15% | 2.9 -45% | 1.1 45% |
| Gamma | 2.3 96% | 2.15 102% | 2.22 99% | 2.25 98% | 2.31 95% | 2.27 97% |
| CCT | 6222 104% | 6446 101% | 6140 106% | 6325 103% | 6472 100% | 6419 101% |
| Contrast (:1) | 2950 | 1272 | 1321 | |||
| Totaal Gemiddelde (Programma / Instellingen) | -6% /
-21% | -57% /
-104% | 30% /
27% | 18% /
-1% | 27% /
5% |
* ... kleiner is beter

Responstijd Scherm
| ↔ Responstijd Zwart naar Wit | ||
|---|---|---|
| 57.6 ms ... stijging ↗ en daling ↘ gecombineerd | ↗ 50.4 ms stijging |  |
| ↘ 7.2 ms daling | ||
| Het scherm vertoonde trage responstijden in onze tests en is misschien te traag voor games. Ter vergelijking: alle testtoestellen variëren van 0.1 (minimum) tot 240 (maximum) ms. » 99 % van alle toestellen zijn beter. Dit betekent dat de gemeten responstijd slechter is dan het gemiddelde (19.8 ms) van alle geteste toestellen. | ||
| ↔ Responstijd 50% Grijs naar 80% Grijs | ||
| 48.8 ms ... stijging ↗ en daling ↘ gecombineerd | ↗ 33.6 ms stijging | 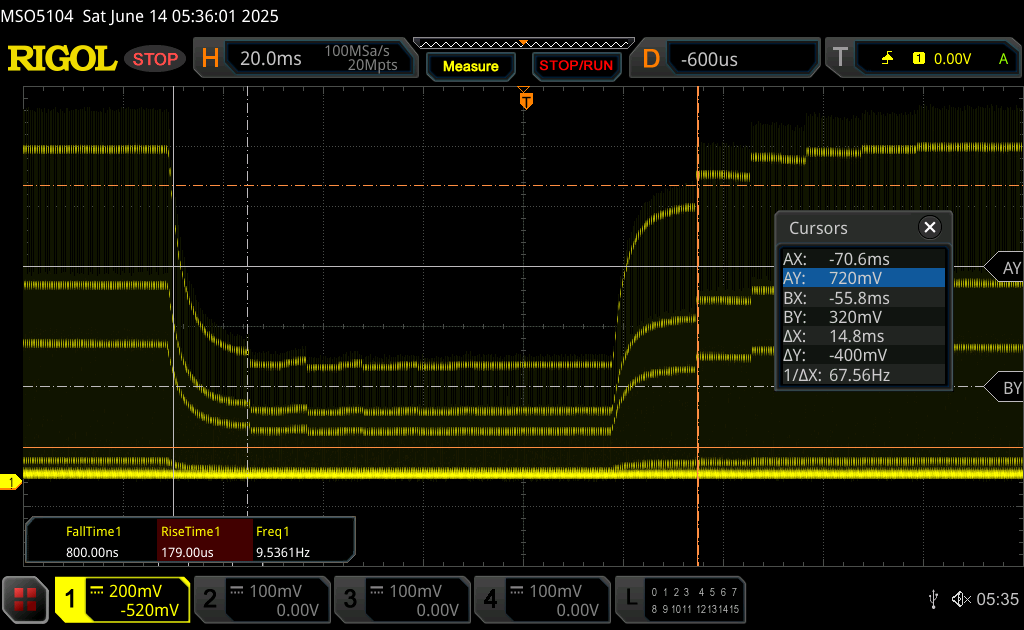 |
| ↘ 15.2 ms daling | ||
| Het scherm vertoonde trage responstijden in onze tests en is misschien te traag voor games. Ter vergelijking: alle testtoestellen variëren van 0.165 (minimum) tot 636 (maximum) ms. » 84 % van alle toestellen zijn beter. Dit betekent dat de gemeten responstijd slechter is dan het gemiddelde (30.9 ms) van alle geteste toestellen. | ||
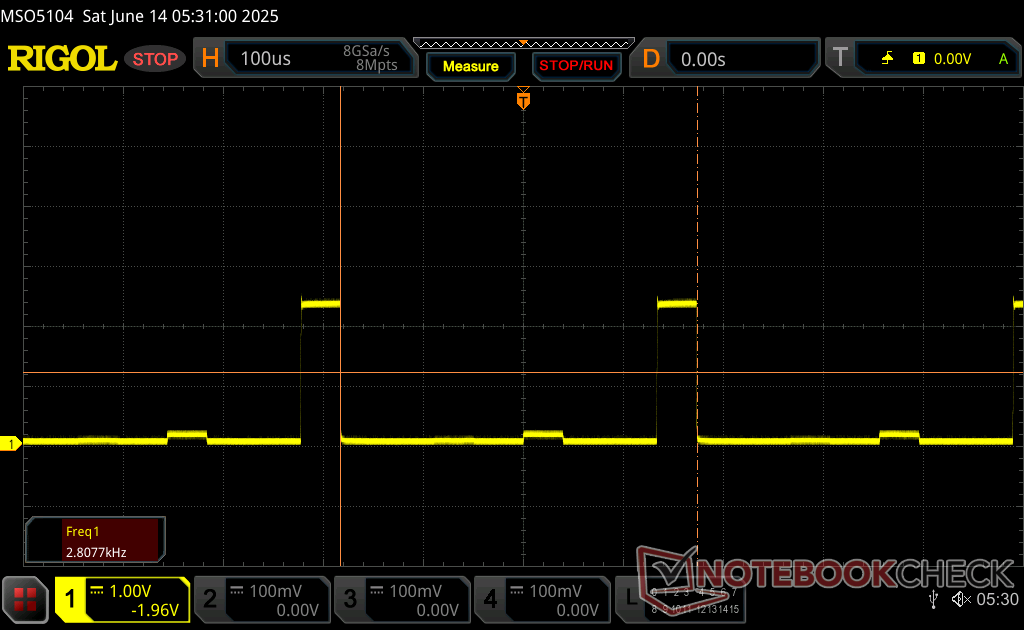
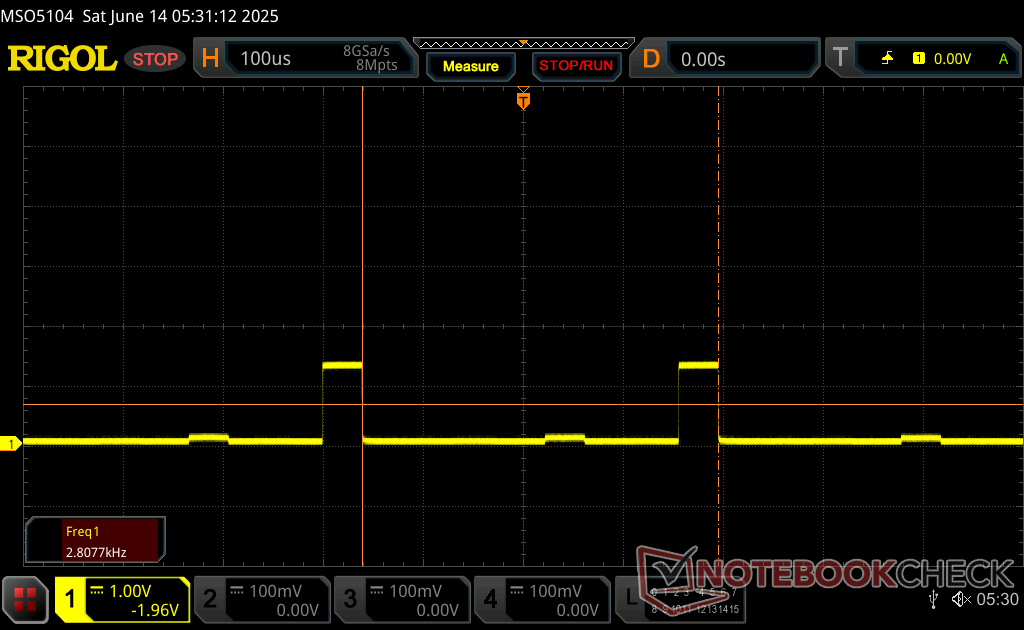
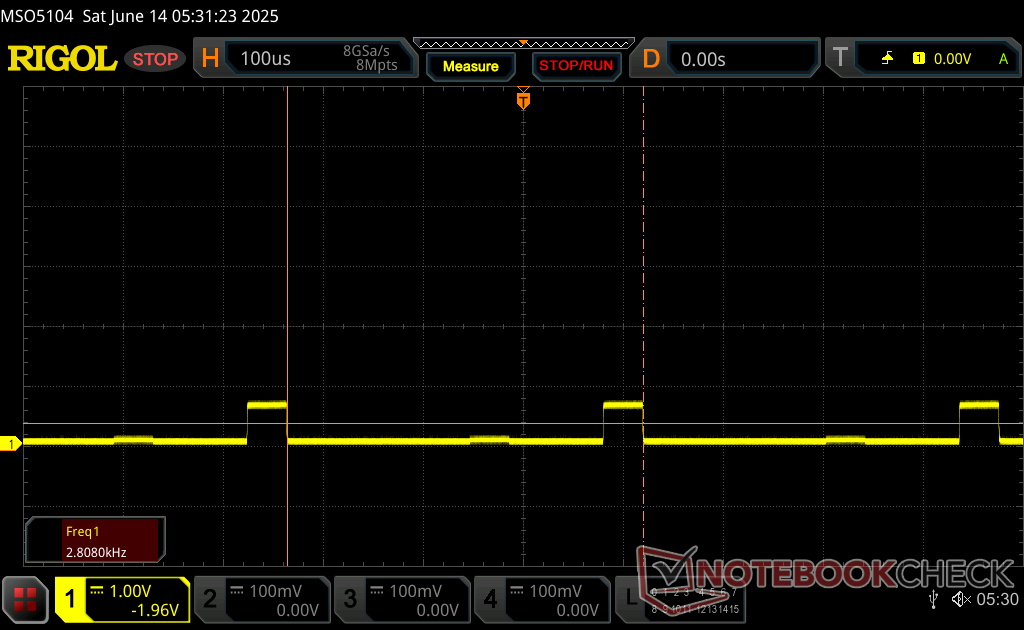
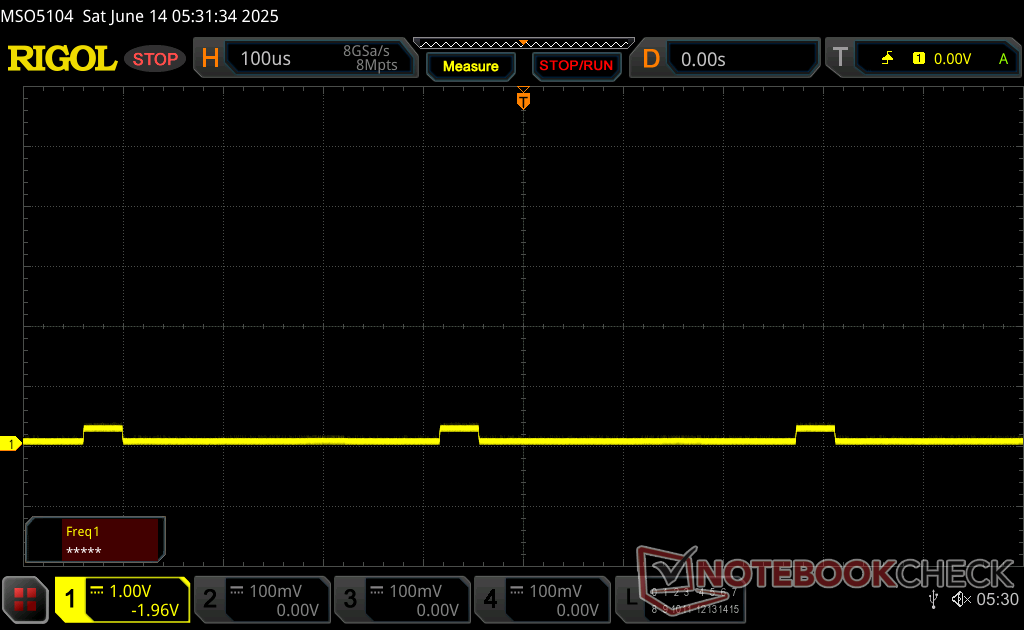
Screen Flickering / PWM (Pulse-Width Modulation)
| Screen flickering / PWM waargenomen | 2807 Hz Amplitude: 50 % | ≤ 100 % helderheid instelling | 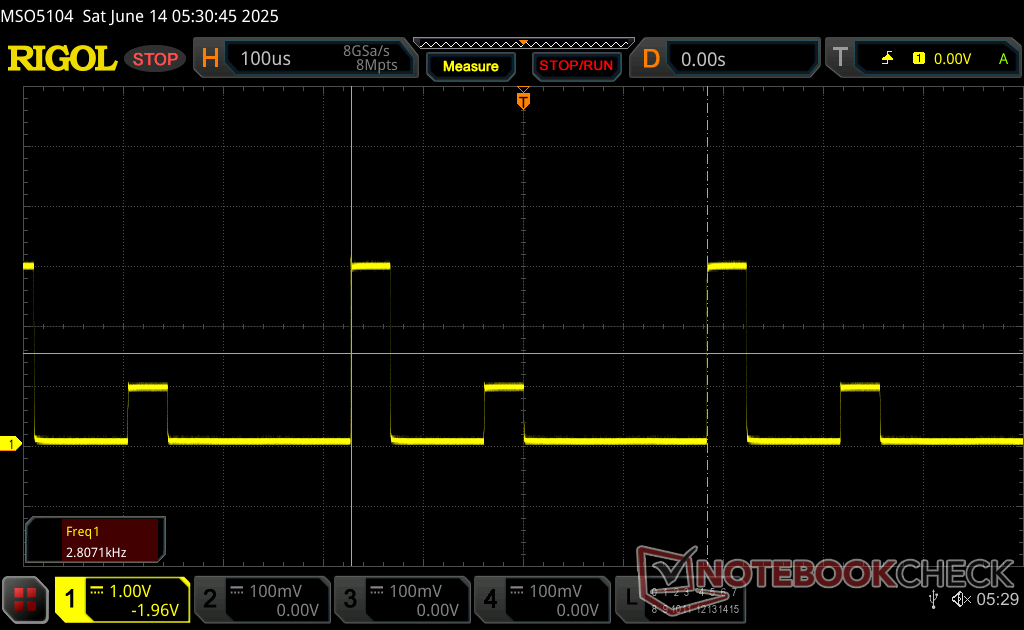 |
De achtergrondverlichting van het scherm flikkert op 2807 Hz (in het slechtste geval, bijvoorbeeld bij gebruik van PWM) aan een helderheid van 100 % en lager. Boven deze helderheid zou er geen flickering / PWM mogen optreden. De frequentie van 2807 Hz is redelijk hoog en de meeste mensen die gevoelig zijn aan flickering zouden dit dus niet mogen waarnemen of geïrriteerde ogen krijgen. Ter vergelijking: 52 % van alle geteste toestellen maakten geen gebruik van PWM om de schermhelderheid te verlagen. Als het wel werd gebruikt, werd een gemiddelde van 7748 (minimum: 5 - maximum: 343500) Hz waargenomen. | |||

Prestaties

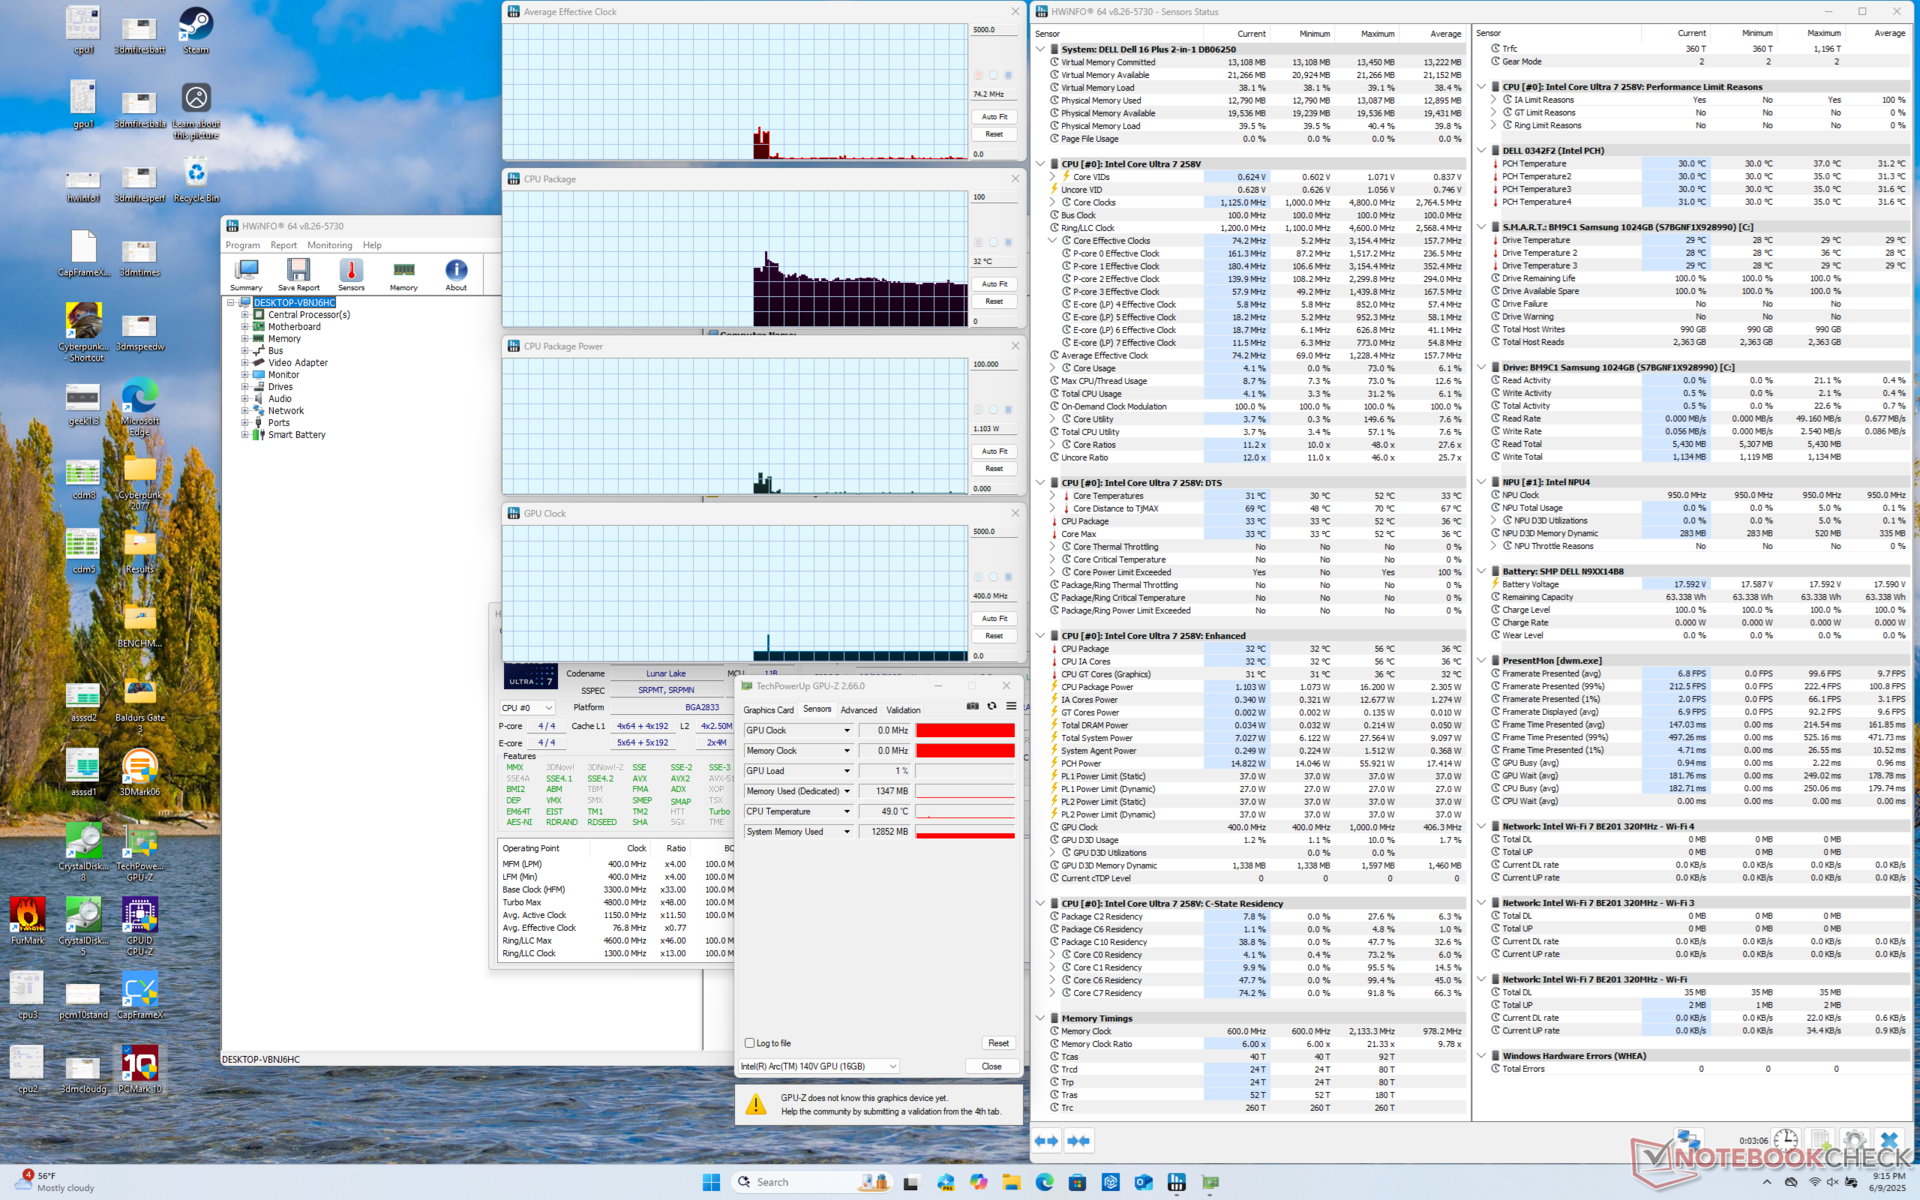
Testomstandigheden
We hebben Dell Optimizer ingesteld op de modus Prestaties voordat we de onderstaande benchmarks uitvoerden.
Processor
De Core Ultra 7 256V legt de nadruk op prestaties-per-watt boven rauwe prestaties en biedt dus erg weinig ten opzichte van de vorige generatie Core Ultra 7 155U of zelfs de Core i7-1355U als gebruikers geen gebruik maken van de geïntegreerde NPU. Misschien wel het meest opvallend is dat upgraden naar de duurdere Core Ultra 9 288V configuratie zal naar verwachting de prestaties in het beste geval slechts met een miezerige 5 procent verbeteren, gebaseerd op onze ervaringen met de Acer Swift 16 AI. De Core Ultra 7 155H in de Inspiron 16 7640 2-in-1 van vorig jaar is ruwweg 1,5x sneller dan onze Core Ultra 256V.
Cinebench R15 Multi Loop
Cinebench R23: Multi Core | Single Core
Cinebench R20: CPU (Multi Core) | CPU (Single Core)
Cinebench R15: CPU Multi 64Bit | CPU Single 64Bit
Blender: v2.79 BMW27 CPU
7-Zip 18.03: 7z b 4 | 7z b 4 -mmt1
Geekbench 6.7: Multi-Core | Single-Core
Geekbench 5.5: Multi-Core | Single-Core
HWBOT x265 Benchmark v2.2: 4k Preset
LibreOffice : 20 Documents To PDF
R Benchmark 2.5: Overall mean
* ... kleiner is beter
AIDA64: FP32 Ray-Trace | FPU Julia | CPU SHA3 | CPU Queen | FPU SinJulia | FPU Mandel | CPU AES | CPU ZLib | FP64 Ray-Trace | CPU PhotoWorxx
| Performance rating | |
| MSI Summit A16 AI Plus A3HMTG | |
| HP Envy x360 2-in-1 16-ad0097nr | |
| Dell Inspiron 16 7640 2-in-1 | |
| Dell 16 Plus 2-in-1 | |
| Lenovo Yoga 7 2-in-1 16ILL10 | |
| Gemiddeld Intel Core Ultra 7 258V | |
| Samsung Galaxy Book5 Pro 360 | |
| AIDA64 / FP32 Ray-Trace | |
| MSI Summit A16 AI Plus A3HMTG | |
| HP Envy x360 2-in-1 16-ad0097nr | |
| Dell Inspiron 16 7640 2-in-1 | |
| Dell 16 Plus 2-in-1 | |
| Samsung Galaxy Book5 Pro 360 | |
| Lenovo Yoga 7 2-in-1 16ILL10 | |
| Gemiddeld Intel Core Ultra 7 258V (8454 - 12781, n=26) | |
| AIDA64 / FPU Julia | |
| MSI Summit A16 AI Plus A3HMTG | |
| HP Envy x360 2-in-1 16-ad0097nr | |
| Dell Inspiron 16 7640 2-in-1 | |
| Samsung Galaxy Book5 Pro 360 | |
| Lenovo Yoga 7 2-in-1 16ILL10 | |
| Dell 16 Plus 2-in-1 | |
| Gemiddeld Intel Core Ultra 7 258V (40875 - 63401, n=26) | |
| AIDA64 / CPU SHA3 | |
| MSI Summit A16 AI Plus A3HMTG | |
| HP Envy x360 2-in-1 16-ad0097nr | |
| Dell Inspiron 16 7640 2-in-1 | |
| Lenovo Yoga 7 2-in-1 16ILL10 | |
| Gemiddeld Intel Core Ultra 7 258V (1930 - 2817, n=26) | |
| Samsung Galaxy Book5 Pro 360 | |
| Dell 16 Plus 2-in-1 | |
| AIDA64 / CPU Queen | |
| HP Envy x360 2-in-1 16-ad0097nr | |
| MSI Summit A16 AI Plus A3HMTG | |
| Dell Inspiron 16 7640 2-in-1 | |
| Dell 16 Plus 2-in-1 | |
| Lenovo Yoga 7 2-in-1 16ILL10 | |
| Gemiddeld Intel Core Ultra 7 258V (48816 - 49818, n=24) | |
| Samsung Galaxy Book5 Pro 360 | |
| AIDA64 / FPU SinJulia | |
| MSI Summit A16 AI Plus A3HMTG | |
| HP Envy x360 2-in-1 16-ad0097nr | |
| Dell Inspiron 16 7640 2-in-1 | |
| Lenovo Yoga 7 2-in-1 16ILL10 | |
| Dell 16 Plus 2-in-1 | |
| Gemiddeld Intel Core Ultra 7 258V (3817 - 4440, n=26) | |
| Samsung Galaxy Book5 Pro 360 | |
| AIDA64 / FPU Mandel | |
| MSI Summit A16 AI Plus A3HMTG | |
| HP Envy x360 2-in-1 16-ad0097nr | |
| Dell Inspiron 16 7640 2-in-1 | |
| Samsung Galaxy Book5 Pro 360 | |
| Lenovo Yoga 7 2-in-1 16ILL10 | |
| Dell 16 Plus 2-in-1 | |
| Gemiddeld Intel Core Ultra 7 258V (21670 - 33565, n=26) | |
| AIDA64 / CPU AES | |
| Dell Inspiron 16 7640 2-in-1 | |
| HP Envy x360 2-in-1 16-ad0097nr | |
| MSI Summit A16 AI Plus A3HMTG | |
| Dell 16 Plus 2-in-1 | |
| Lenovo Yoga 7 2-in-1 16ILL10 | |
| Gemiddeld Intel Core Ultra 7 258V (30957 - 40753, n=26) | |
| Samsung Galaxy Book5 Pro 360 | |
| AIDA64 / CPU ZLib | |
| MSI Summit A16 AI Plus A3HMTG | |
| Dell Inspiron 16 7640 2-in-1 | |
| HP Envy x360 2-in-1 16-ad0097nr | |
| Lenovo Yoga 7 2-in-1 16ILL10 | |
| Dell 16 Plus 2-in-1 | |
| Gemiddeld Intel Core Ultra 7 258V (422 - 632, n=26) | |
| Samsung Galaxy Book5 Pro 360 | |
| AIDA64 / FP64 Ray-Trace | |
| MSI Summit A16 AI Plus A3HMTG | |
| HP Envy x360 2-in-1 16-ad0097nr | |
| Dell Inspiron 16 7640 2-in-1 | |
| Samsung Galaxy Book5 Pro 360 | |
| Dell 16 Plus 2-in-1 | |
| Lenovo Yoga 7 2-in-1 16ILL10 | |
| Gemiddeld Intel Core Ultra 7 258V (4258 - 6930, n=26) | |
| AIDA64 / CPU PhotoWorxx | |
| Dell 16 Plus 2-in-1 | |
| Gemiddeld Intel Core Ultra 7 258V (44223 - 59245, n=26) | |
| Lenovo Yoga 7 2-in-1 16ILL10 | |
| MSI Summit A16 AI Plus A3HMTG | |
| Samsung Galaxy Book5 Pro 360 | |
| Dell Inspiron 16 7640 2-in-1 | |
| HP Envy x360 2-in-1 16-ad0097nr | |
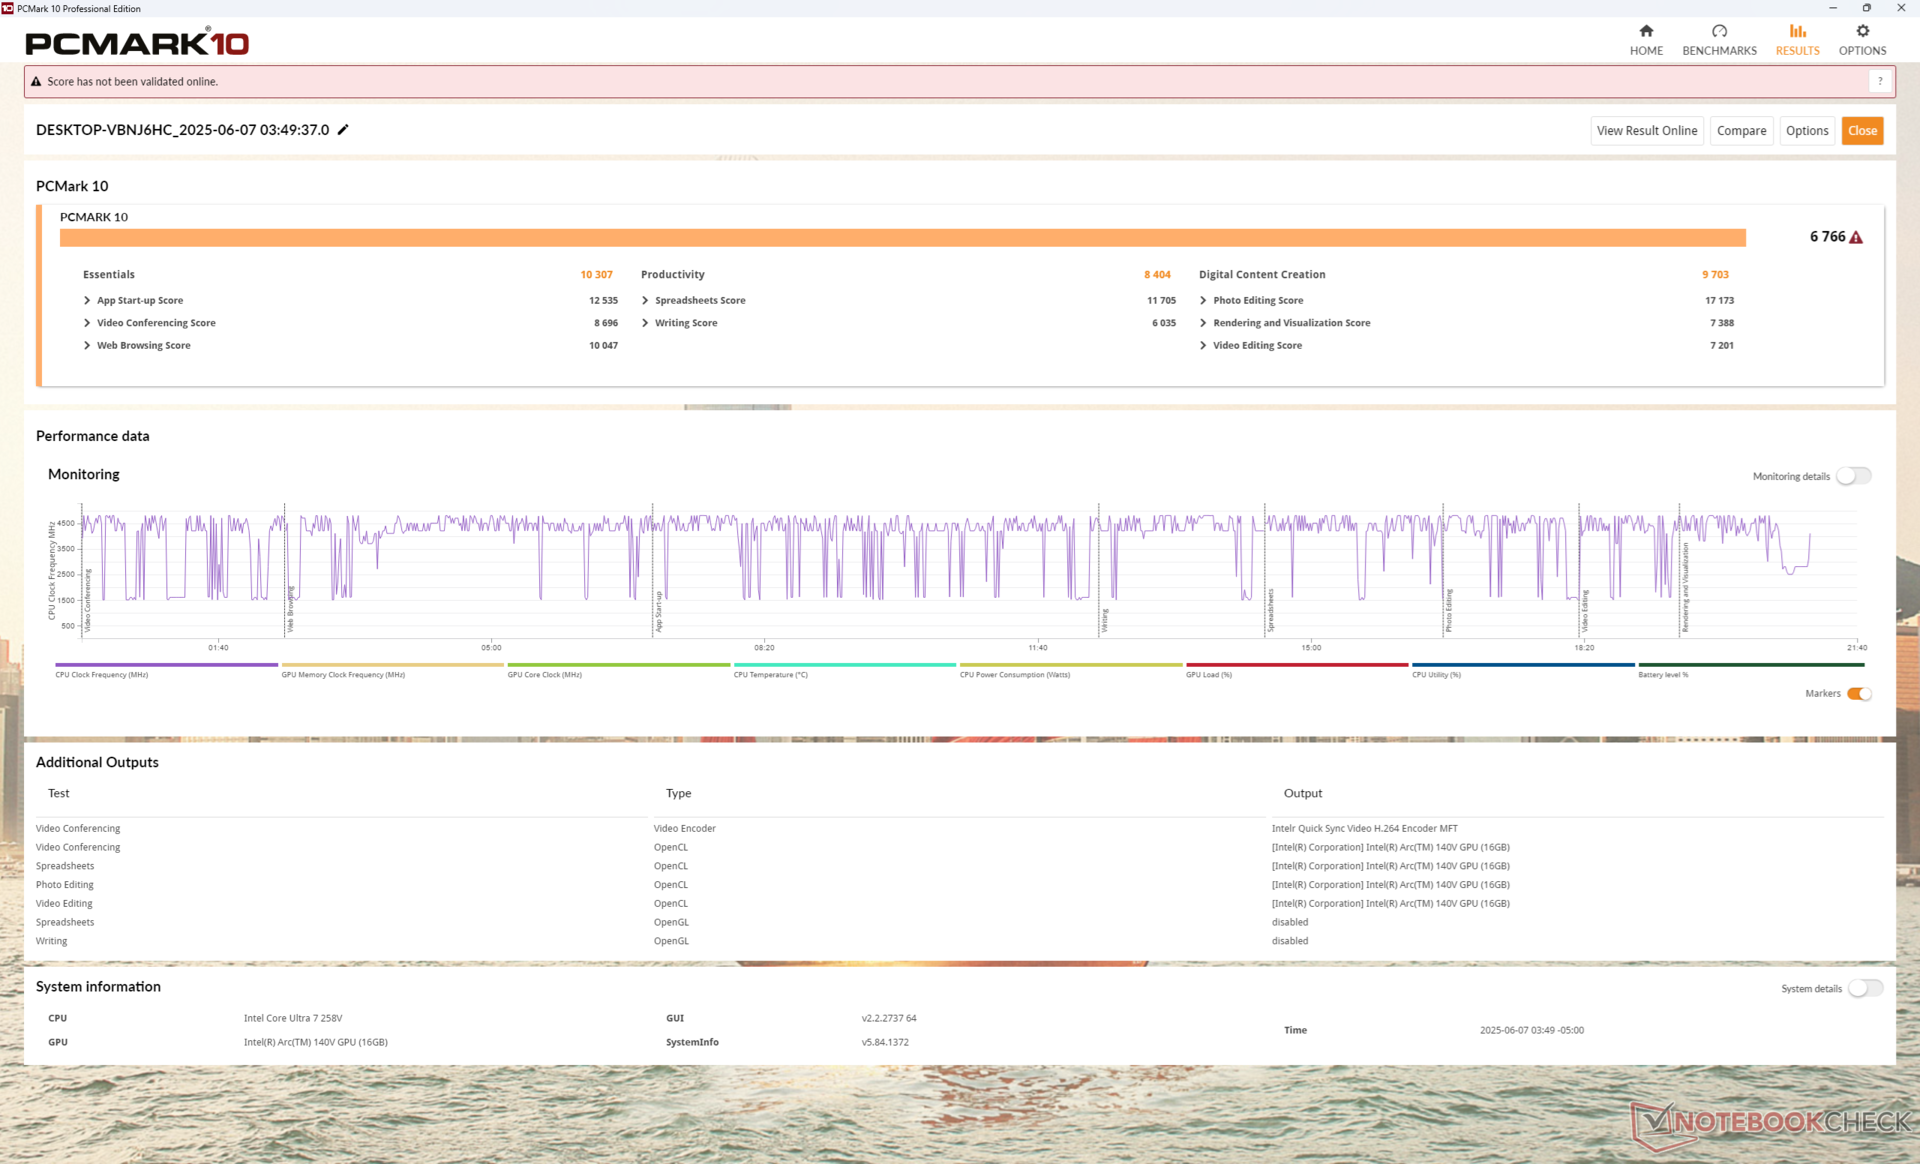
Systeemprestaties
De resultaten van PCMark 10 zijn iets maar consistent lager dan op de Lenovo Yoga 7 2-in-1 16ILL10. De RAM prestaties zijn verder erg snel dankzij de on-die architectuur van Lunar Lake.
PCMark 10: Score | Essentials | Productivity | Digital Content Creation
CrossMark: Overall | Productivity | Creativity | Responsiveness
WebXPRT 3: Overall
WebXPRT 4: Overall
Mozilla Kraken 1.1: Total
| Performance rating | |
| MSI Summit A16 AI Plus A3HMTG | |
| Lenovo Yoga 7 2-in-1 16ILL10 | |
| Dell Inspiron 16 7640 2-in-1 | |
| Dell 16 Plus 2-in-1 | |
| Gemiddeld Intel Core Ultra 7 258V, Intel Arc Graphics 140V | |
| HP Envy x360 2-in-1 16-ad0097nr | |
| Samsung Galaxy Book5 Pro 360 | |
| PCMark 10 / Score | |
| MSI Summit A16 AI Plus A3HMTG | |
| Lenovo Yoga 7 2-in-1 16ILL10 | |
| Dell Inspiron 16 7640 2-in-1 | |
| HP Envy x360 2-in-1 16-ad0097nr | |
| Gemiddeld Intel Core Ultra 7 258V, Intel Arc Graphics 140V (6265 - 7420, n=23) | |
| Dell 16 Plus 2-in-1 | |
| Samsung Galaxy Book5 Pro 360 | |
| PCMark 10 / Essentials | |
| Lenovo Yoga 7 2-in-1 16ILL10 | |
| MSI Summit A16 AI Plus A3HMTG | |
| Dell Inspiron 16 7640 2-in-1 | |
| HP Envy x360 2-in-1 16-ad0097nr | |
| Gemiddeld Intel Core Ultra 7 258V, Intel Arc Graphics 140V (9295 - 11467, n=23) | |
| Dell 16 Plus 2-in-1 | |
| Samsung Galaxy Book5 Pro 360 | |
| PCMark 10 / Productivity | |
| HP Envy x360 2-in-1 16-ad0097nr | |
| MSI Summit A16 AI Plus A3HMTG | |
| Lenovo Yoga 7 2-in-1 16ILL10 | |
| Gemiddeld Intel Core Ultra 7 258V, Intel Arc Graphics 140V (7357 - 13600, n=23) | |
| Samsung Galaxy Book5 Pro 360 | |
| Dell Inspiron 16 7640 2-in-1 | |
| Dell 16 Plus 2-in-1 | |
| PCMark 10 / Digital Content Creation | |
| MSI Summit A16 AI Plus A3HMTG | |
| Lenovo Yoga 7 2-in-1 16ILL10 | |
| Dell Inspiron 16 7640 2-in-1 | |
| Gemiddeld Intel Core Ultra 7 258V, Intel Arc Graphics 140V (8160 - 10308, n=23) | |
| Dell 16 Plus 2-in-1 | |
| Samsung Galaxy Book5 Pro 360 | |
| HP Envy x360 2-in-1 16-ad0097nr | |
| CrossMark / Overall | |
| MSI Summit A16 AI Plus A3HMTG | |
| Lenovo Yoga 7 2-in-1 16ILL10 | |
| Dell Inspiron 16 7640 2-in-1 | |
| Dell 16 Plus 2-in-1 | |
| Gemiddeld Intel Core Ultra 7 258V, Intel Arc Graphics 140V (1275 - 1742, n=22) | |
| HP Envy x360 2-in-1 16-ad0097nr | |
| Samsung Galaxy Book5 Pro 360 | |
| CrossMark / Productivity | |
| Lenovo Yoga 7 2-in-1 16ILL10 | |
| Dell Inspiron 16 7640 2-in-1 | |
| Dell 16 Plus 2-in-1 | |
| HP Envy x360 2-in-1 16-ad0097nr | |
| Gemiddeld Intel Core Ultra 7 258V, Intel Arc Graphics 140V (1267 - 1684, n=22) | |
| MSI Summit A16 AI Plus A3HMTG | |
| Samsung Galaxy Book5 Pro 360 | |
| CrossMark / Creativity | |
| MSI Summit A16 AI Plus A3HMTG | |
| Lenovo Yoga 7 2-in-1 16ILL10 | |
| Dell Inspiron 16 7640 2-in-1 | |
| Dell 16 Plus 2-in-1 | |
| Gemiddeld Intel Core Ultra 7 258V, Intel Arc Graphics 140V (1393 - 1977, n=22) | |
| HP Envy x360 2-in-1 16-ad0097nr | |
| Samsung Galaxy Book5 Pro 360 | |
| CrossMark / Responsiveness | |
| Dell Inspiron 16 7640 2-in-1 | |
| MSI Summit A16 AI Plus A3HMTG | |
| HP Envy x360 2-in-1 16-ad0097nr | |
| Lenovo Yoga 7 2-in-1 16ILL10 | |
| Samsung Galaxy Book5 Pro 360 | |
| Gemiddeld Intel Core Ultra 7 258V, Intel Arc Graphics 140V (999 - 1411, n=22) | |
| Dell 16 Plus 2-in-1 | |
| WebXPRT 3 / Overall | |
| MSI Summit A16 AI Plus A3HMTG | |
| Lenovo Yoga 7 2-in-1 16ILL10 | |
| HP Envy x360 2-in-1 16-ad0097nr | |
| Dell 16 Plus 2-in-1 | |
| Dell Inspiron 16 7640 2-in-1 | |
| Gemiddeld Intel Core Ultra 7 258V, Intel Arc Graphics 140V (219 - 317, n=22) | |
| Samsung Galaxy Book5 Pro 360 | |
| WebXPRT 4 / Overall | |
| Lenovo Yoga 7 2-in-1 16ILL10 | |
| Dell 16 Plus 2-in-1 | |
| Gemiddeld Intel Core Ultra 7 258V, Intel Arc Graphics 140V (199.5 - 291, n=22) | |
| MSI Summit A16 AI Plus A3HMTG | |
| Samsung Galaxy Book5 Pro 360 | |
| Dell Inspiron 16 7640 2-in-1 | |
| HP Envy x360 2-in-1 16-ad0097nr | |
| Mozilla Kraken 1.1 / Total | |
| HP Envy x360 2-in-1 16-ad0097nr | |
| Dell Inspiron 16 7640 2-in-1 | |
| Samsung Galaxy Book5 Pro 360 | |
| Gemiddeld Intel Core Ultra 7 258V, Intel Arc Graphics 140V (468 - 559, n=24) | |
| Dell 16 Plus 2-in-1 | |
| Lenovo Yoga 7 2-in-1 16ILL10 | |
| MSI Summit A16 AI Plus A3HMTG | |
* ... kleiner is beter
| PCMark 10 Score | 6766 punten | |
Help | ||
| AIDA64 / Memory Copy | |
| Gemiddeld Intel Core Ultra 7 258V (104408 - 114336, n=24) | |
| Dell 16 Plus 2-in-1 | |
| Samsung Galaxy Book5 Pro 360 | |
| Lenovo Yoga 7 2-in-1 16ILL10 | |
| MSI Summit A16 AI Plus A3HMTG | |
| Dell Inspiron 16 7640 2-in-1 | |
| HP Envy x360 2-in-1 16-ad0097nr | |
| AIDA64 / Memory Read | |
| MSI Summit A16 AI Plus A3HMTG | |
| Lenovo Yoga 7 2-in-1 16ILL10 | |
| Dell 16 Plus 2-in-1 | |
| Gemiddeld Intel Core Ultra 7 258V (82846 - 89417, n=24) | |
| Samsung Galaxy Book5 Pro 360 | |
| Dell Inspiron 16 7640 2-in-1 | |
| HP Envy x360 2-in-1 16-ad0097nr | |
| AIDA64 / Memory Write | |
| Lenovo Yoga 7 2-in-1 16ILL10 | |
| Dell 16 Plus 2-in-1 | |
| Gemiddeld Intel Core Ultra 7 258V (108824 - 117989, n=24) | |
| Samsung Galaxy Book5 Pro 360 | |
| MSI Summit A16 AI Plus A3HMTG | |
| HP Envy x360 2-in-1 16-ad0097nr | |
| Dell Inspiron 16 7640 2-in-1 | |
| AIDA64 / Memory Latency | |
| Dell Inspiron 16 7640 2-in-1 | |
| HP Envy x360 2-in-1 16-ad0097nr | |
| MSI Summit A16 AI Plus A3HMTG | |
| Dell 16 Plus 2-in-1 | |
| Lenovo Yoga 7 2-in-1 16ILL10 | |
| Gemiddeld Intel Core Ultra 7 258V (95 - 101.7, n=24) | |
| Samsung Galaxy Book5 Pro 360 | |
* ... kleiner is beter
DPC latentie
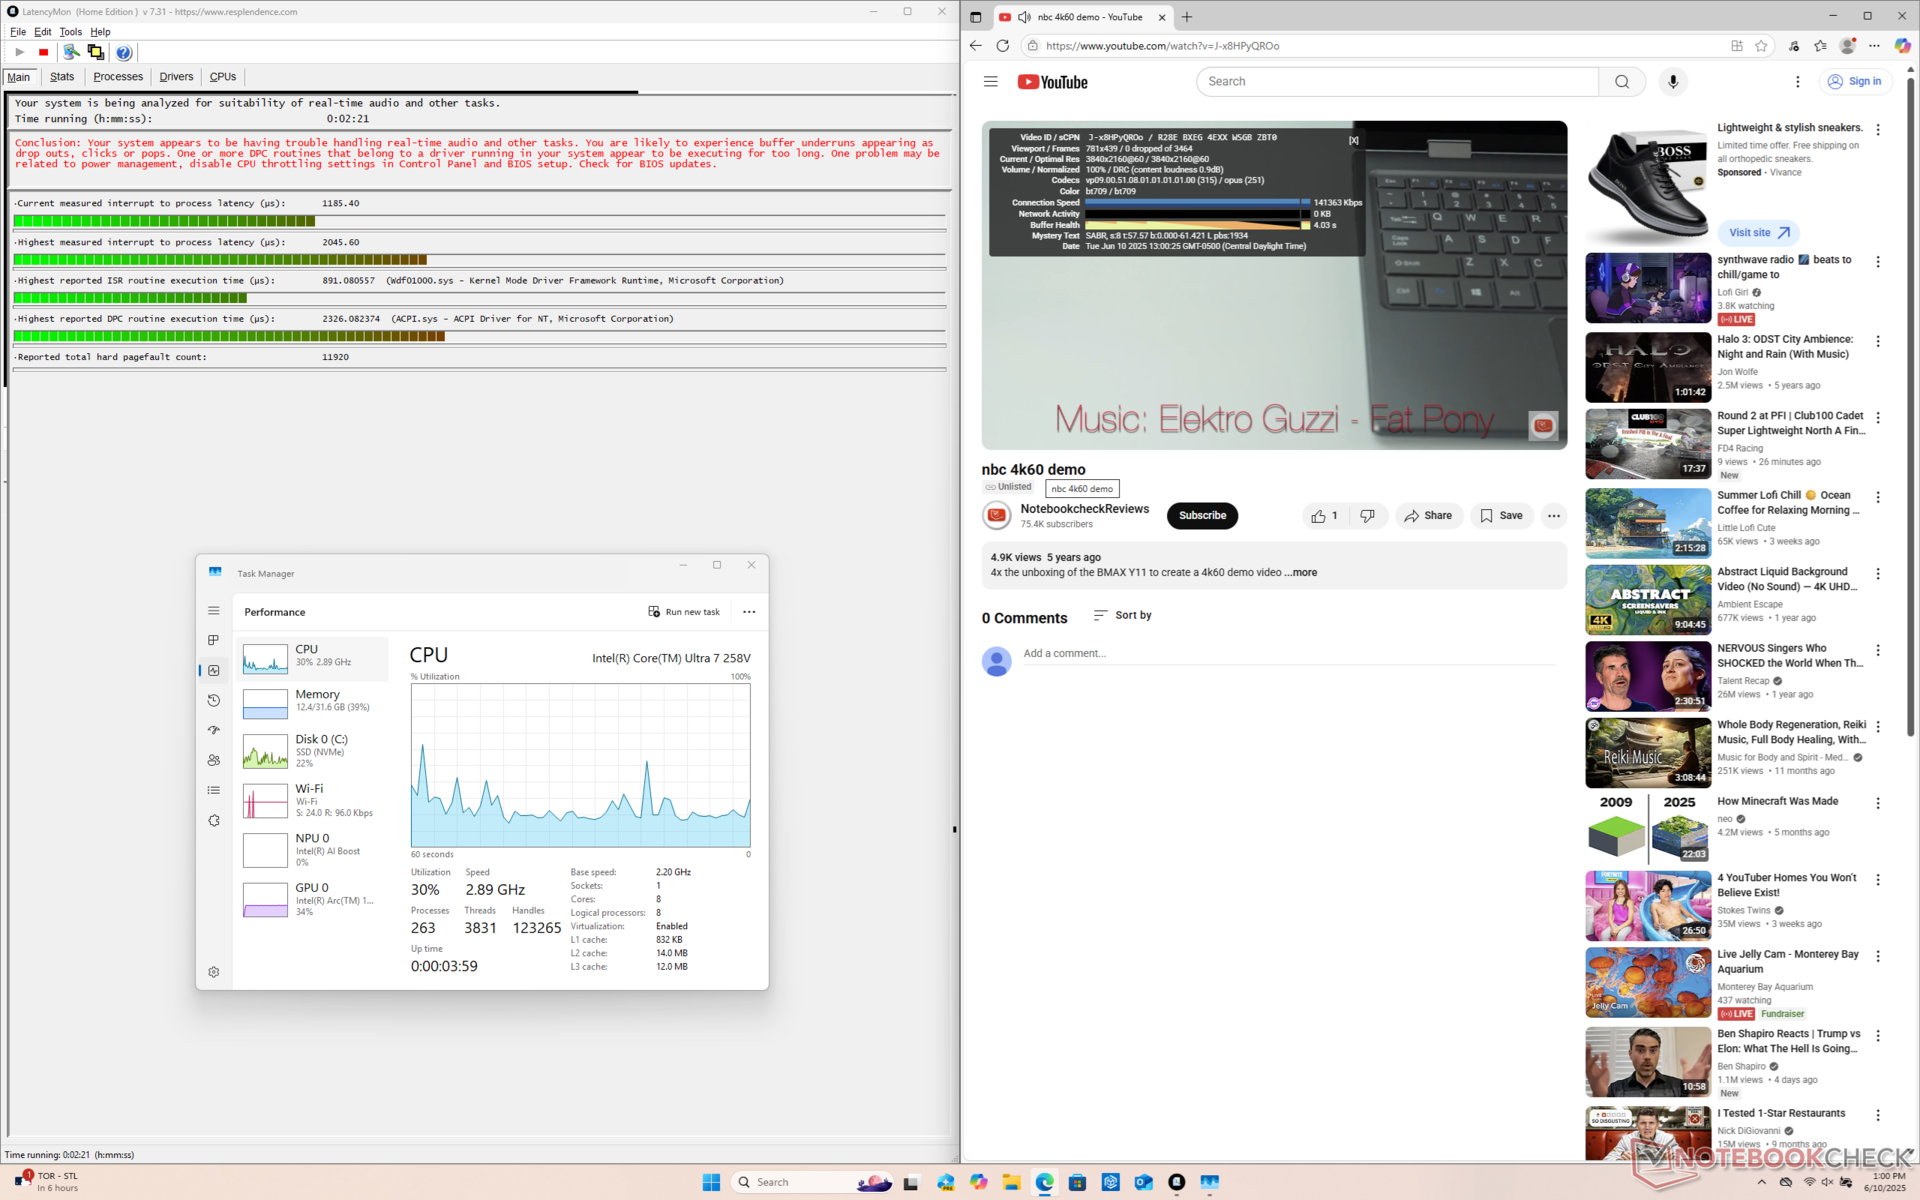
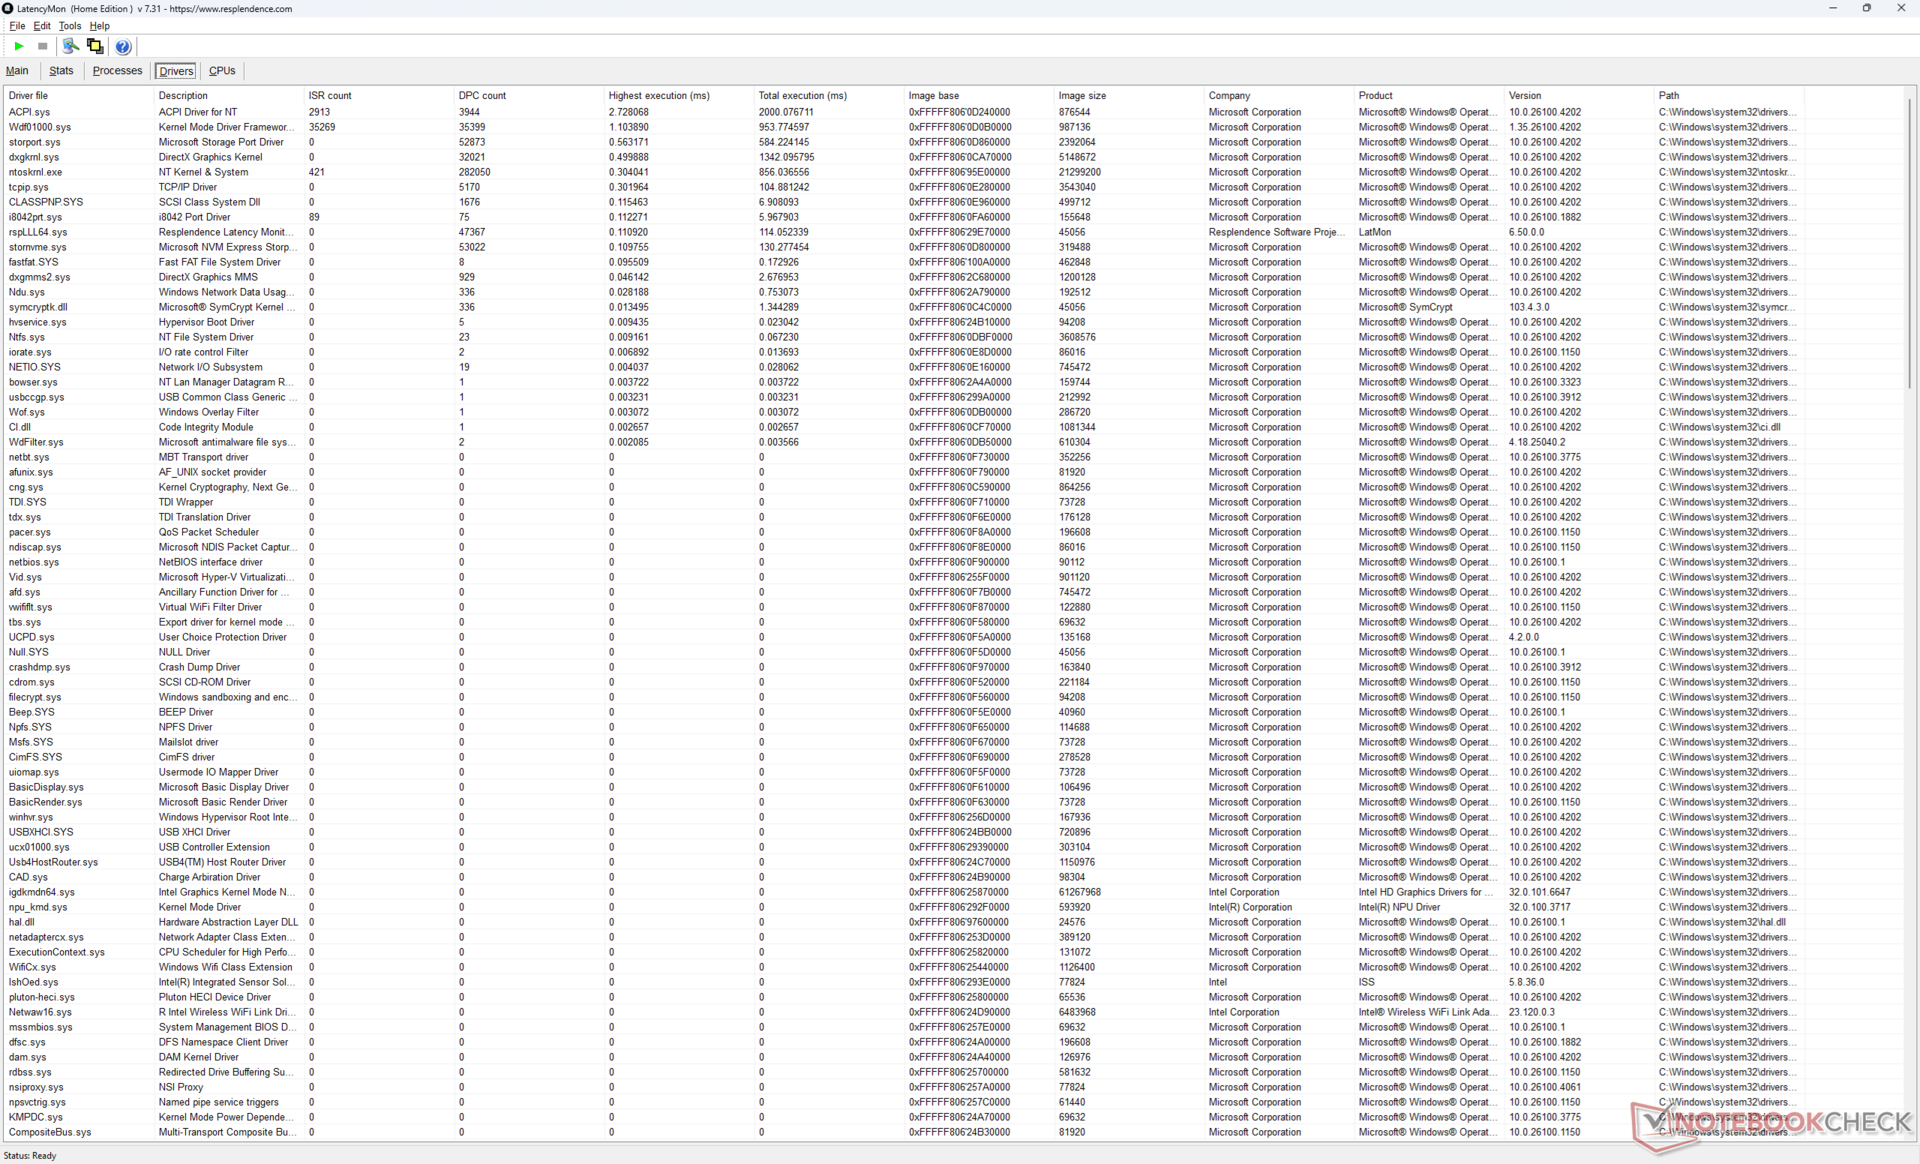
LatencyMon toont kleine DPC-problemen bij het openen van meerdere browsertabbladen van onze startpagina. het afspelen van 4K-video's bij 60 Hz is verder perfect en er zijn geen dropped frames geregistreerd.
| DPC Latencies / LatencyMon - interrupt to process latency (max), Web, Youtube, Prime95 | |
| MSI Summit A16 AI Plus A3HMTG | |
| Dell 16 Plus 2-in-1 | |
| HP Envy x360 2-in-1 16-ad0097nr | |
| Dell Inspiron 16 7640 2-in-1 | |
| Samsung Galaxy Book5 Pro 360 | |
| Lenovo Yoga 7 2-in-1 16ILL10 | |
* ... kleiner is beter
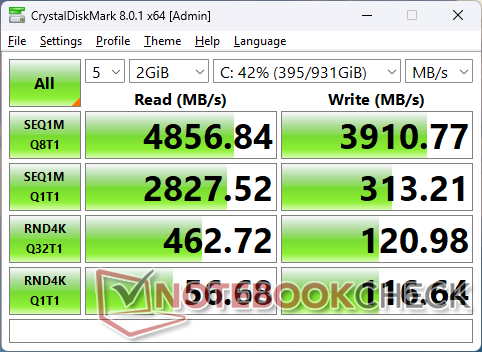
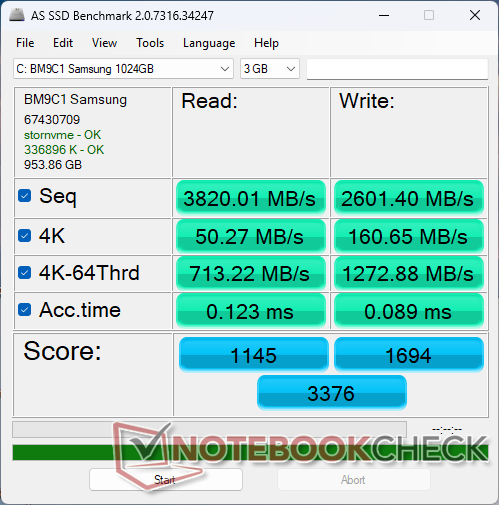
Opslagapparaten
De Samsung BM9C1 PCIe4 NVMe SSD langzamer dan de Micron 2550 in het model van vorig jaar, maar hij heeft ook de neiging om te haperen. Overdrachtsnelheden schommelden tussen 3400 MB/s en 4700 MB/s in vergelijking met de stabielere ~5000 MB/s op de Inspiron 16 7640 2-in-1 bij het uitvoeren van onze DiskSpd loop-test, zoals blijkt uit de onderstaande grafiek.

| Drive Performance rating - Percent | |
| Samsung Galaxy Book5 Pro 360 | |
| Dell Inspiron 16 7640 2-in-1 | |
| Lenovo Yoga 7 2-in-1 16ILL10 | |
| MSI Summit A16 AI Plus A3HMTG | |
| Dell 16 Plus 2-in-1 | |
| HP Envy x360 2-in-1 16-ad0097nr | |
* ... kleiner is beter
Disk Throttling: DiskSpd Read Loop, Queue Depth 8
GPU-prestaties
Terwijl de Core Ultra 7 258V langzamer is dan de Core Ultra 7 255H in de Inspiron van vorig jaar als het aankomt op processorprestaties, is het tegenovergestelde het geval als u de Arc 140V met de Arc 8. De Dell 16 Plus 2-in-1 is in staat om veeleisende games zoals Final Fantasy XV of Cyberpunk 2077 35 tot 50 procent sneller te draaien, ondanks de langzamere processorprestaties.
| Vermogen Profiel | Grafische Score | Fysieke Score | Gecombineerde score |
| Prestatiemodus | 10163 | 19741 | 3139 |
| Evenwichtige modus | 8556 (-16%) | 16859 (-15%) | 2576 (-18%) |
| Batterijvoeding | 9568 (-6%) | 16911 (-14%) | 2651 (-16%) |
De prestaties dalen met ongeveer 15 procent als de modus Gebalanceerd wordt gebruikt in plaats van de modus Prestaties, zoals onze bovenstaande tabel met resultaten op Fire Strike laat zien.

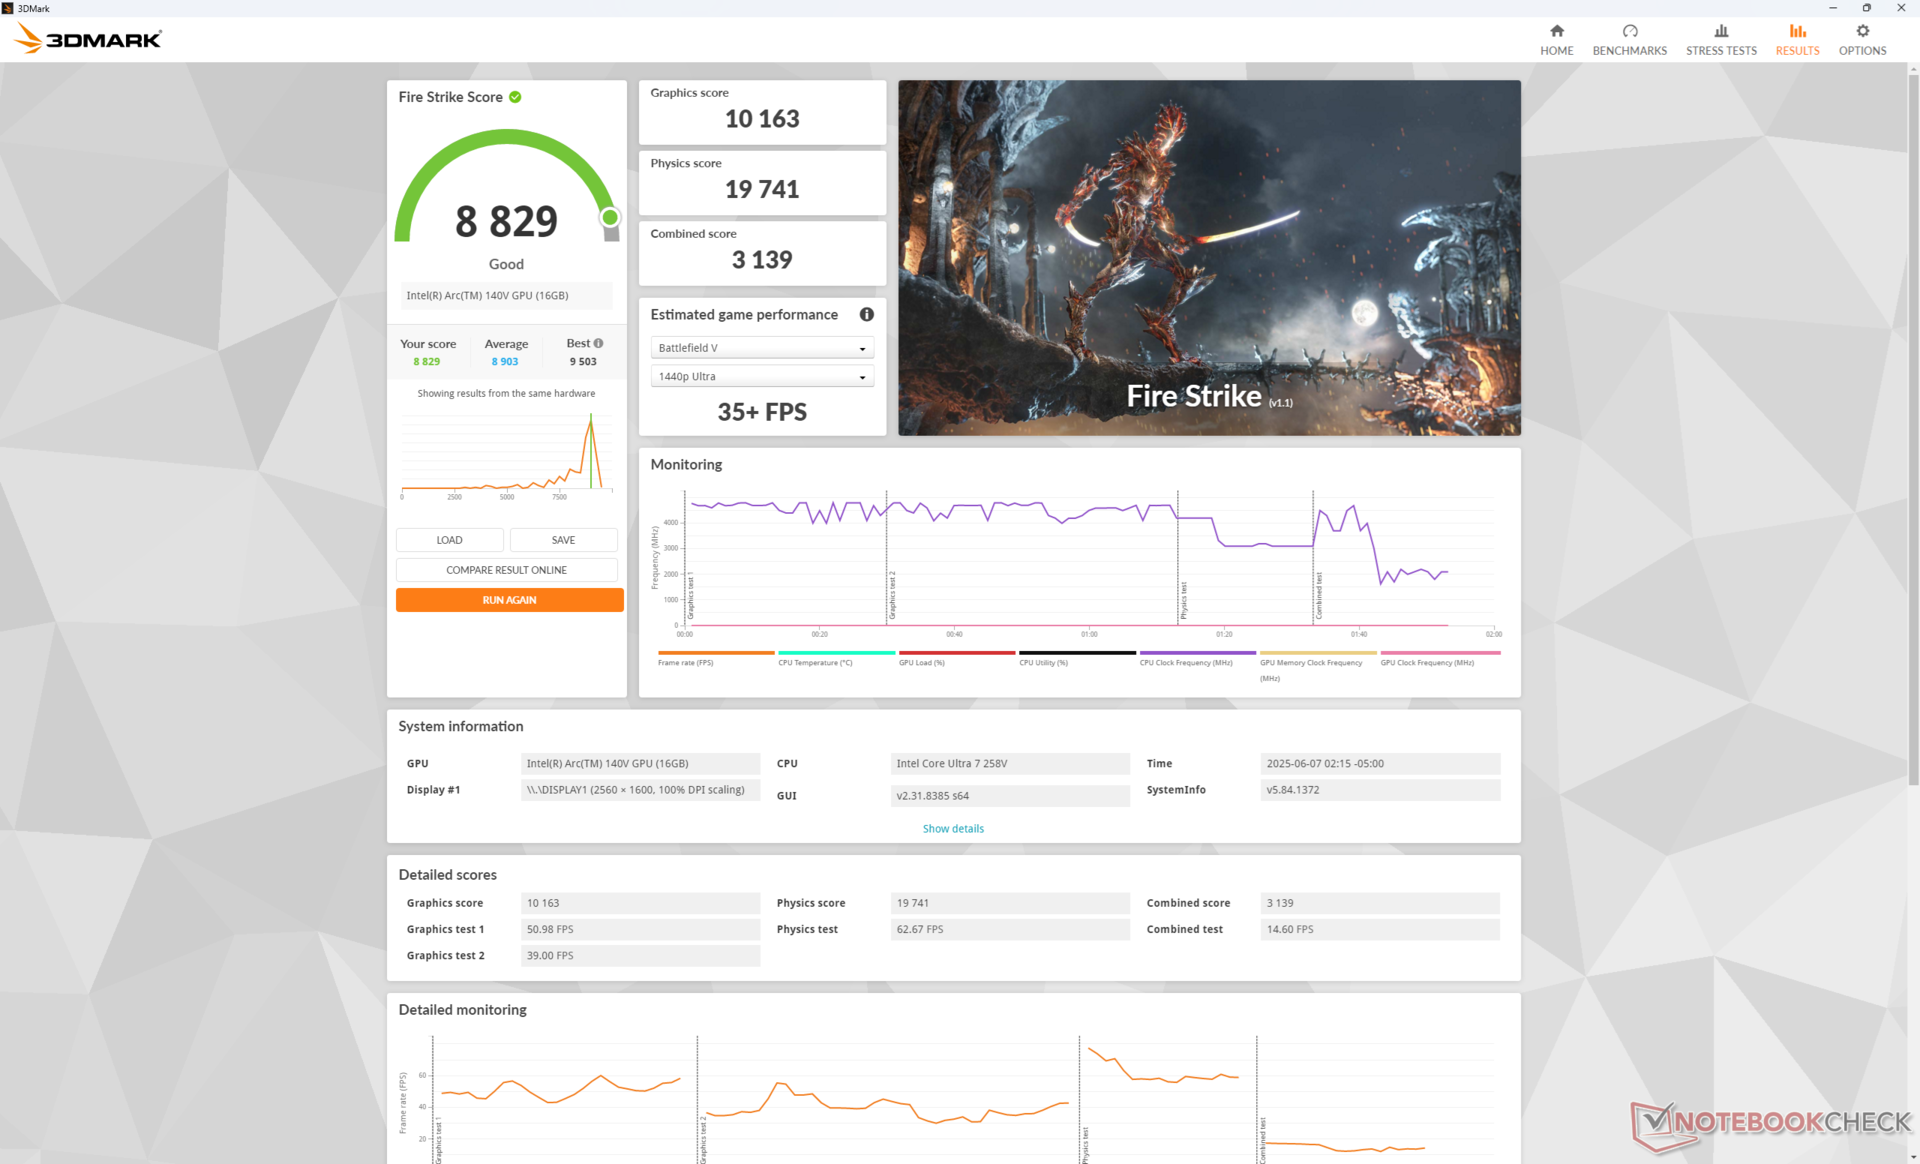
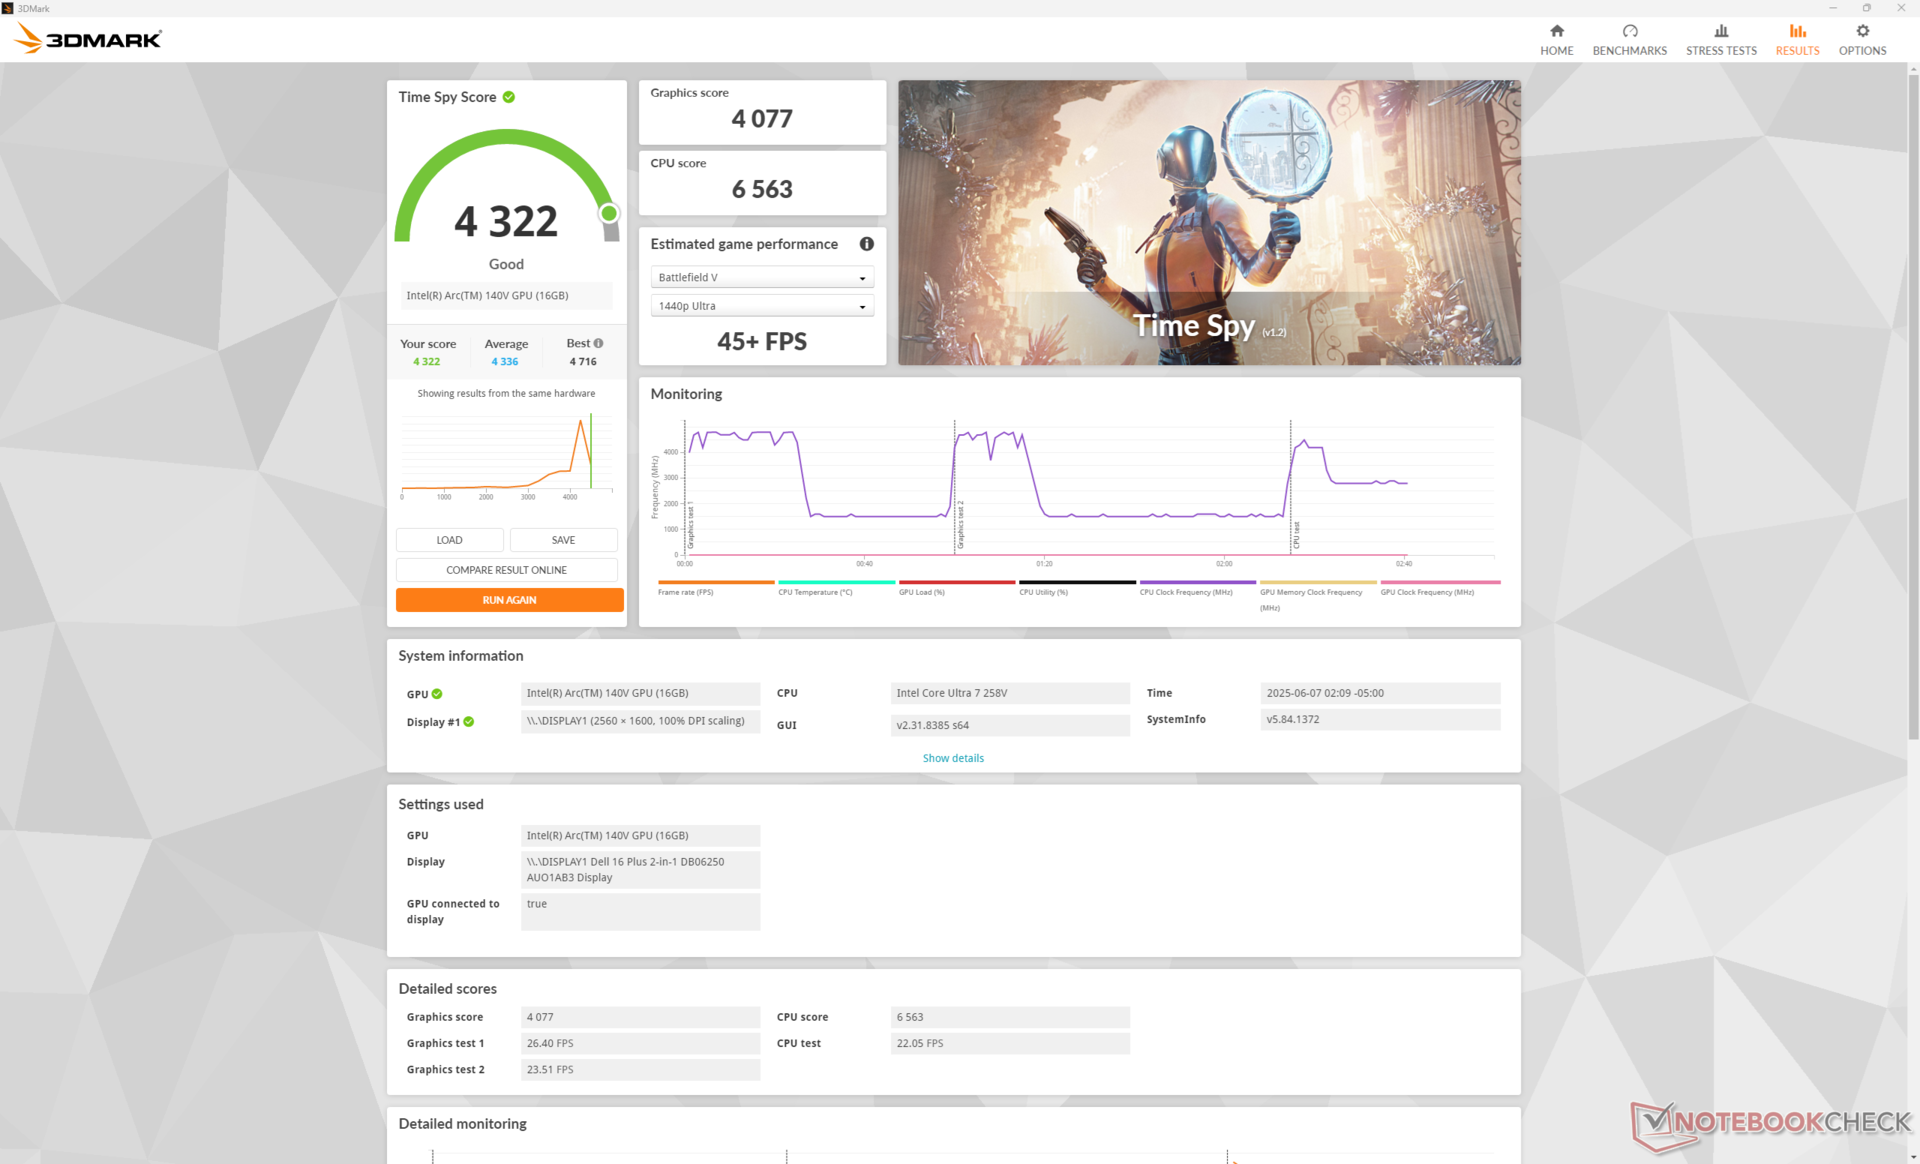
| 3DMark 11 Performance | 10966 punten | |
| 3DMark Fire Strike Score | 8829 punten | |
| 3DMark Time Spy Score | 4322 punten | |
Help | ||
* ... kleiner is beter
| F1 24 | |
| 1920x1080 Low Preset AA:T AF:16x | |
| Lenovo Yoga 7 2-in-1 16ILL10 | |
| Dell 16 Plus 2-in-1 | |
| Gemiddeld Intel Arc Graphics 140V (54 - 99, n=25) | |
| Lenovo ThinkPad T16 Gen 3 21MN005XGE | |
| 1920x1080 Medium Preset AA:T AF:16x | |
| Lenovo Yoga 7 2-in-1 16ILL10 | |
| Dell 16 Plus 2-in-1 | |
| Gemiddeld Intel Arc Graphics 140V (49.2 - 88.2, n=24) | |
| Lenovo ThinkPad T16 Gen 3 21MN005XGE | |
| 1920x1080 High Preset AA:T AF:16x | |
| Dell 16 Plus 2-in-1 | |
| Lenovo Yoga 7 2-in-1 16ILL10 | |
| Gemiddeld Intel Arc Graphics 140V (34.4 - 66.4, n=27) | |
| Lenovo ThinkPad T16 Gen 3 21MN005XGE | |
| 1920x1080 Ultra High Preset AA:T AF:16x | |
| Lenovo Yoga 7 2-in-1 16ILL10 | |
| Dell 16 Plus 2-in-1 | |
| Gemiddeld Intel Arc Graphics 140V (14.6 - 22, n=25) | |
| Lenovo ThinkPad T16 Gen 3 21MN005XGE | |
Cyberpunk 2077 ultra FPS Chart
| lage | gem. | hoge | ultra | |
|---|---|---|---|---|
| Dota 2 Reborn (2015) | 105.1 | 88.2 | 87.7 | 86 |
| Final Fantasy XV Benchmark (2018) | 83.5 | 48.2 | 35.4 | |
| X-Plane 11.11 (2018) | 46.7 | 37.9 | 31.2 | |
| Strange Brigade (2018) | 228 | 70 | 61 | 54.7 |
| Baldur's Gate 3 (2023) | 42.4 | 35.4 | 31.4 | 31 |
| Cyberpunk 2077 (2023) | 47.7 | 38.8 | 32.9 | 29 |
| F1 24 (2024) | 84.4 | 77.4 | 60.4 | 19.7 |
Uitstoot
Systeemgeluid
De onder- en bovengrens van het ventilatorgeluid zijn in wezen ongewijzigd ten opzichte van wat we bij het model van vorig jaar hebben waargenomen, ondanks de verschillen in CPU- en iGPU-prestaties. De ventilator in de Dell 16 Plus 2-in-1 reageert echter langzamer op belasting van het scherm, waardoor het systeem langer stil kan blijven voordat hogere RPM's nodig zijn.
Geluidsniveau
| Onbelast |
| 23 / 23 / 24.7 dB (A) |
| Belasting |
| 32.5 / 45.6 dB (A) |
 | ||
30 dB stil 40 dB(A) hoorbaar 50 dB(A) luid |
||
min: | ||
| Dell 16 Plus 2-in-1 Arc 140V, Core Ultra 7 258V, Samsung BM9C1 1024GB | Dell Inspiron 16 7640 2-in-1 Arc 8-Core, Ultra 7 155H, Micron 2550 1TB | Lenovo Yoga 7 2-in-1 16ILL10 Arc 140V, Core Ultra 7 256V, WD PC SN7100S SDFPMSL-512G-1101 | Samsung Galaxy Book5 Pro 360 Arc 130V, Core Ultra 5 226V, Samsung PM9B1 512GB MZVL4512HBLU | MSI Summit A16 AI Plus A3HMTG Radeon 880M, Ryzen AI 9 365, Samsung PM9C1 MZVL81T0HELB-00BTW | HP Envy x360 2-in-1 16-ad0097nr Radeon 780M, R7 8840HS, KIOXIA BG5 KBG50ZNV1T02 | |
|---|---|---|---|---|---|---|
| Noise | -6% | -3% | 3% | -12% | 7% | |
| uit / omgeving * (dB) | 23.2 | 22.9 1% | 23.3 -0% | 23.6 -2% | 23.8 -3% | 22.9 1% |
| Idle Minimum * (dB) | 23 | 22.9 -0% | 23.3 -1% | 23.6 -3% | 25 -9% | 23 -0% |
| Idle Average * (dB) | 23 | 22.9 -0% | 23.3 -1% | 23.6 -3% | 25 -9% | 23 -0% |
| Idle Maximum * (dB) | 24.7 | 25 -1% | 25.7 -4% | 23.6 4% | 29.5 -19% | 23 7% |
| Load Average * (dB) | 32.5 | 45.1 -39% | 40.2 -24% | 29.4 10% | 37.5 -15% | 23.8 27% |
| Cyberpunk 2077 ultra * (dB) | 42.6 | 44.9 -5% | 41.6 2% | 40.6 5% | 46.5 -9% | |
| Load Maximum * (dB) | 45.6 | 44.9 2% | 41.6 9% | 40.6 11% | 56.1 -23% | 43.8 4% |
| Witcher 3 ultra * (dB) | 43.8 |
* ... kleiner is beter
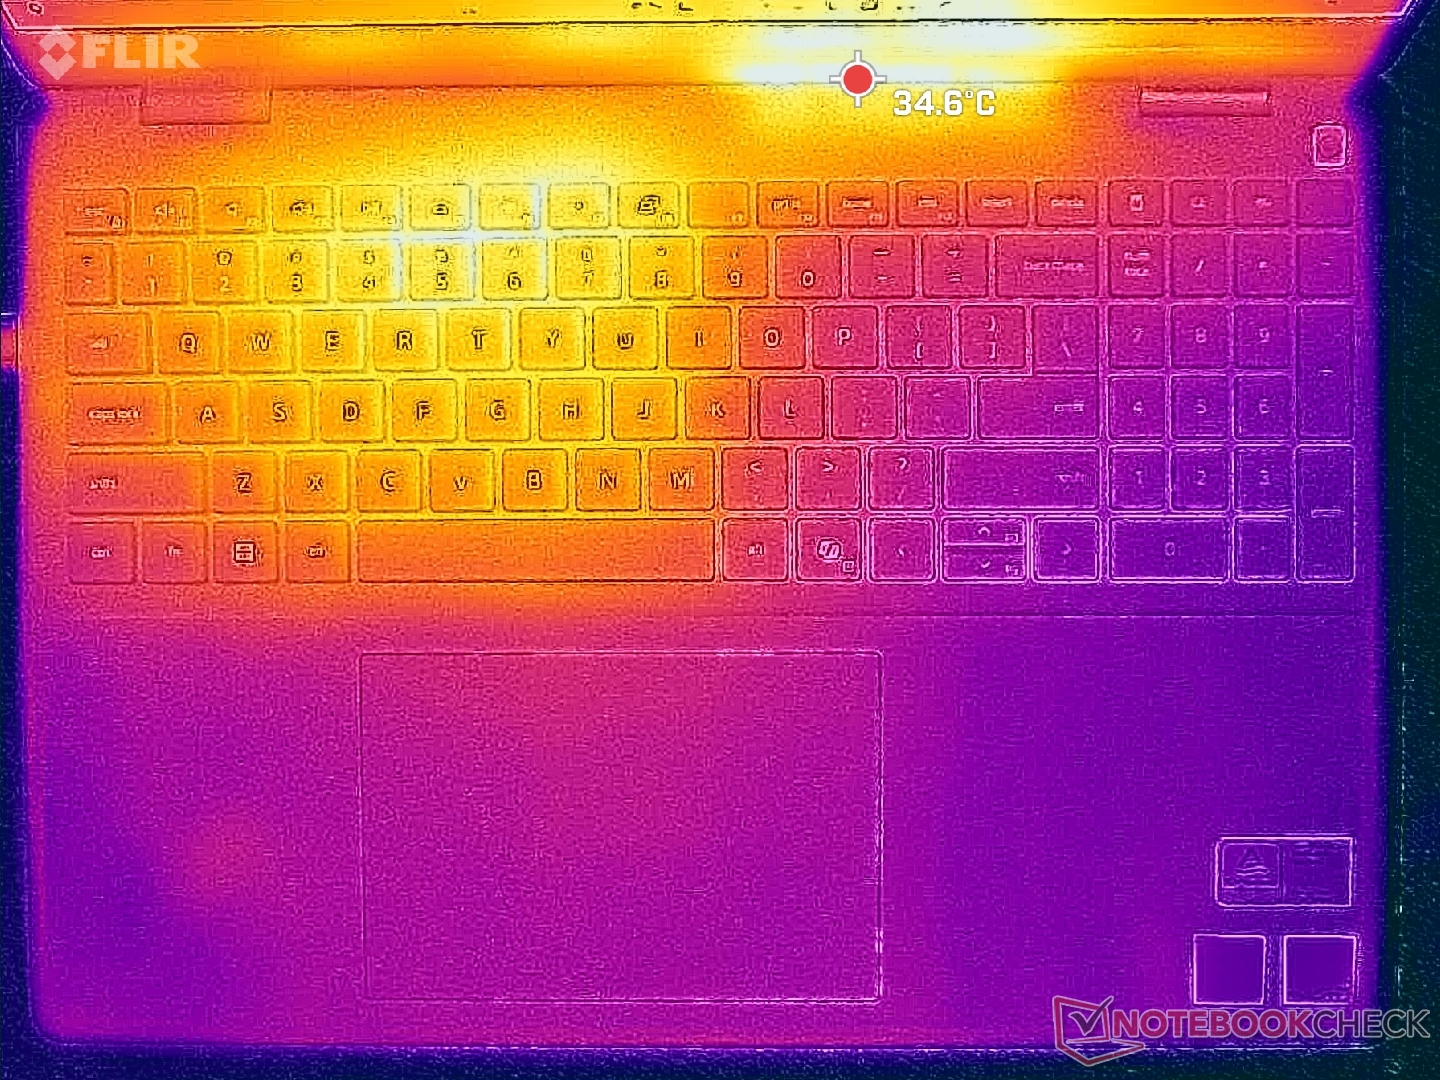
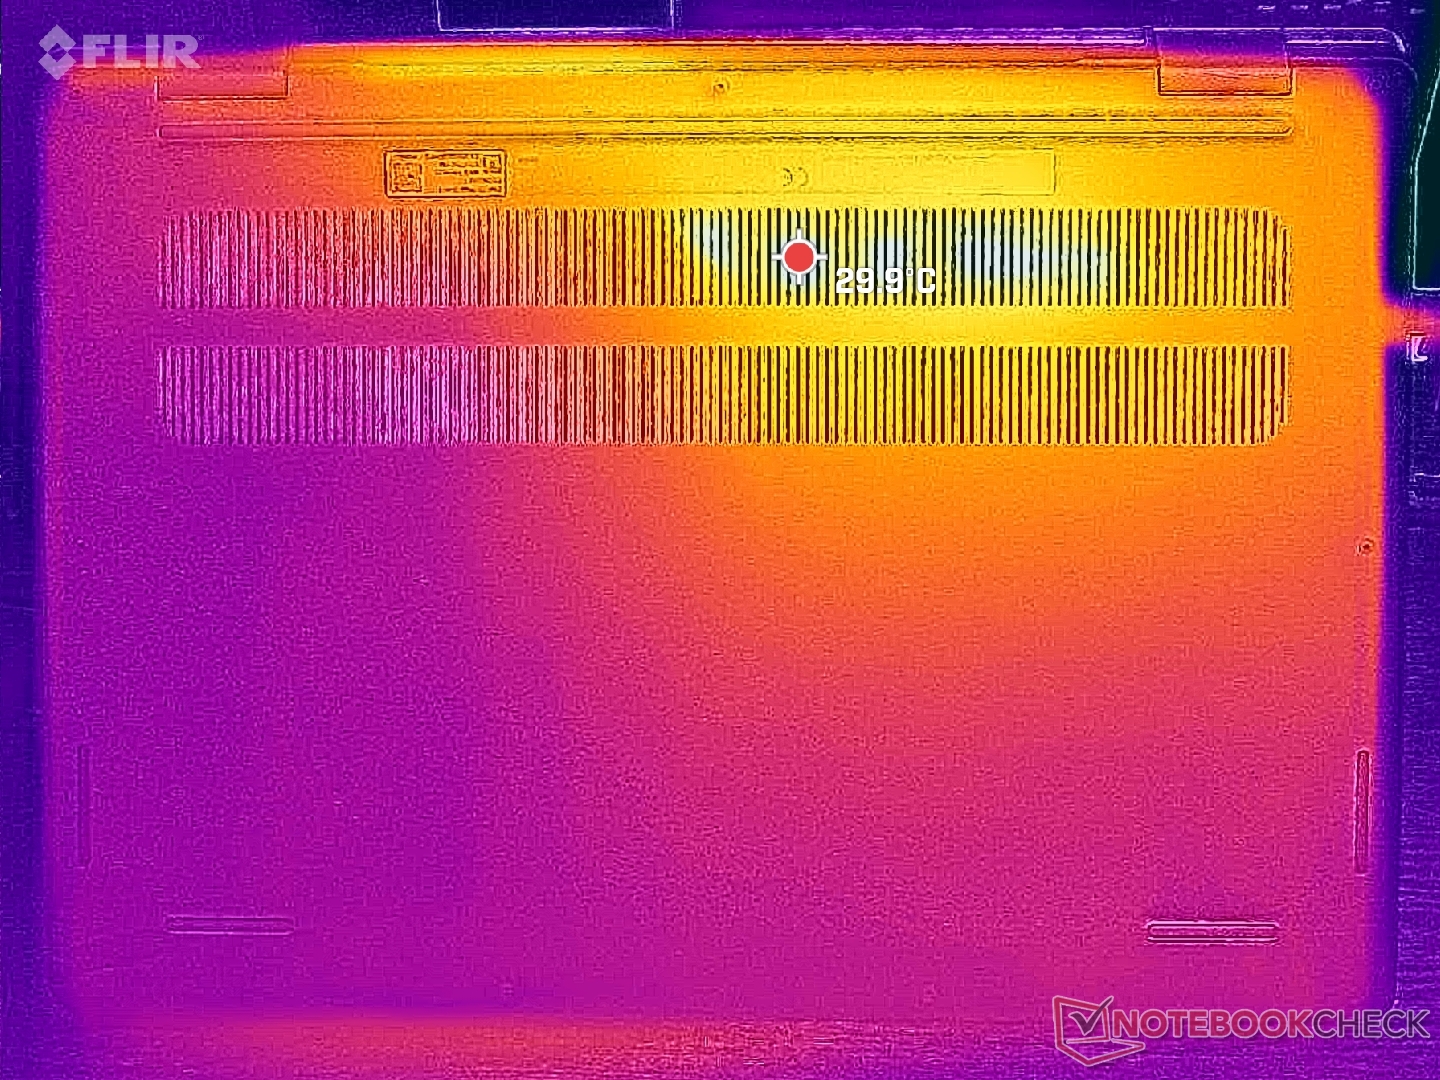
Temperatuur
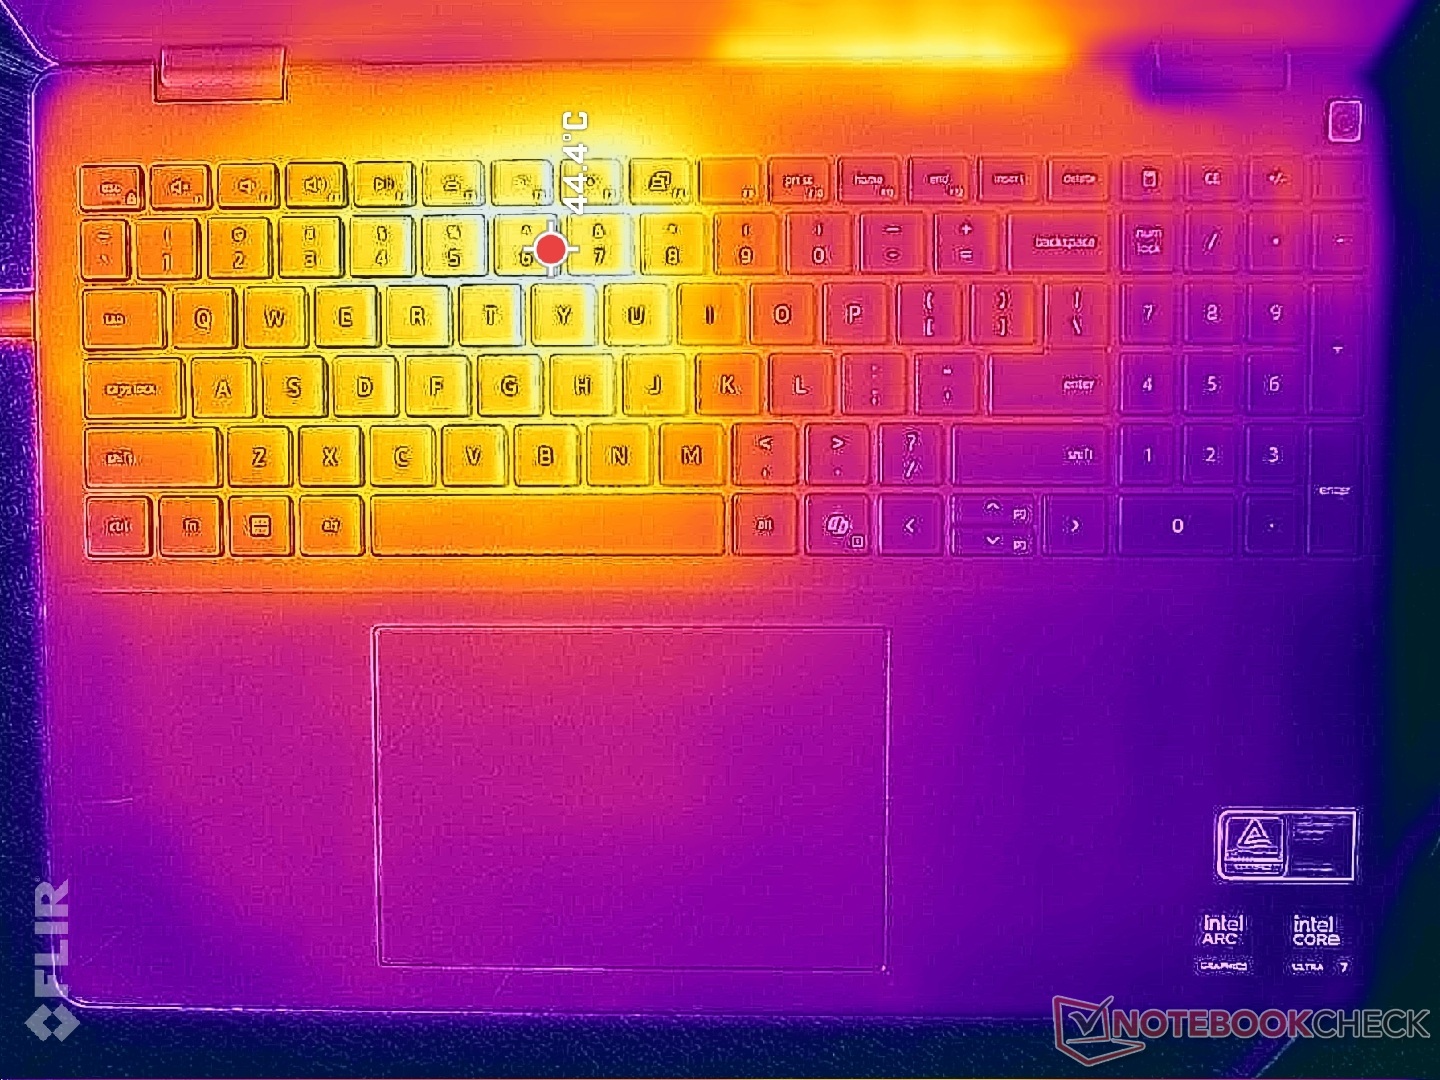
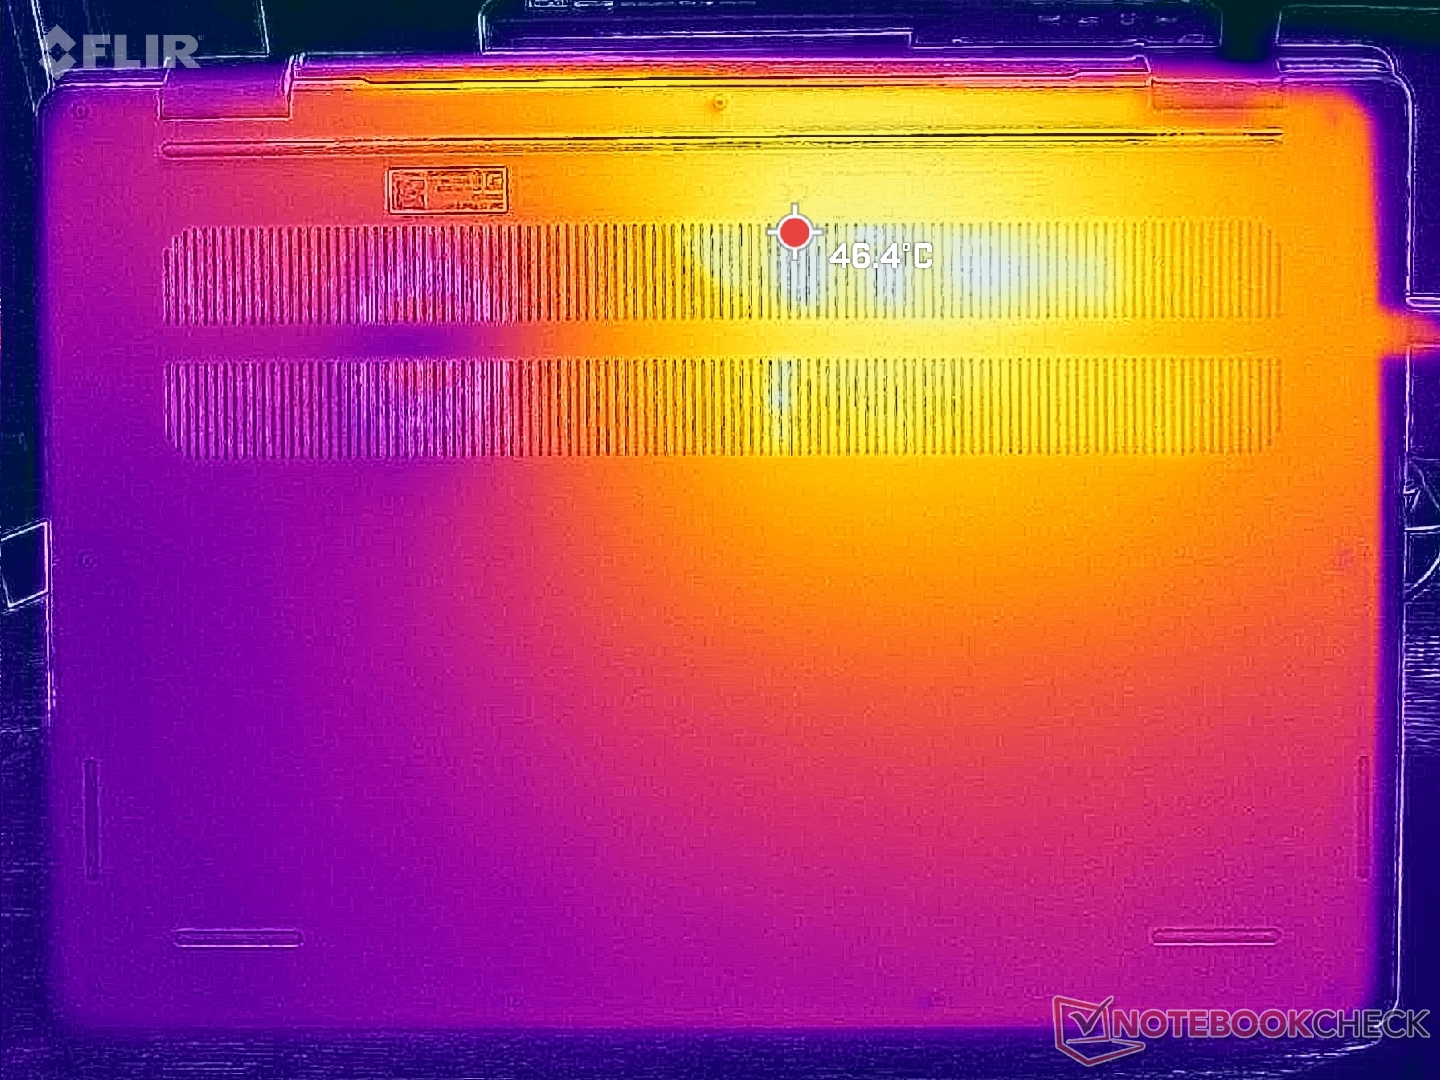
De hotspots van de oppervlaktetemperatuur kunnen oplopen tot iets meer dan 44 C en 39 C op respectievelijk het toetsenbord en het onderpaneel, wat net iets warmer is dan wat we hebben gemeten op de concurrerende Lenovo Yoga 7 2-in-1 16ILL10.
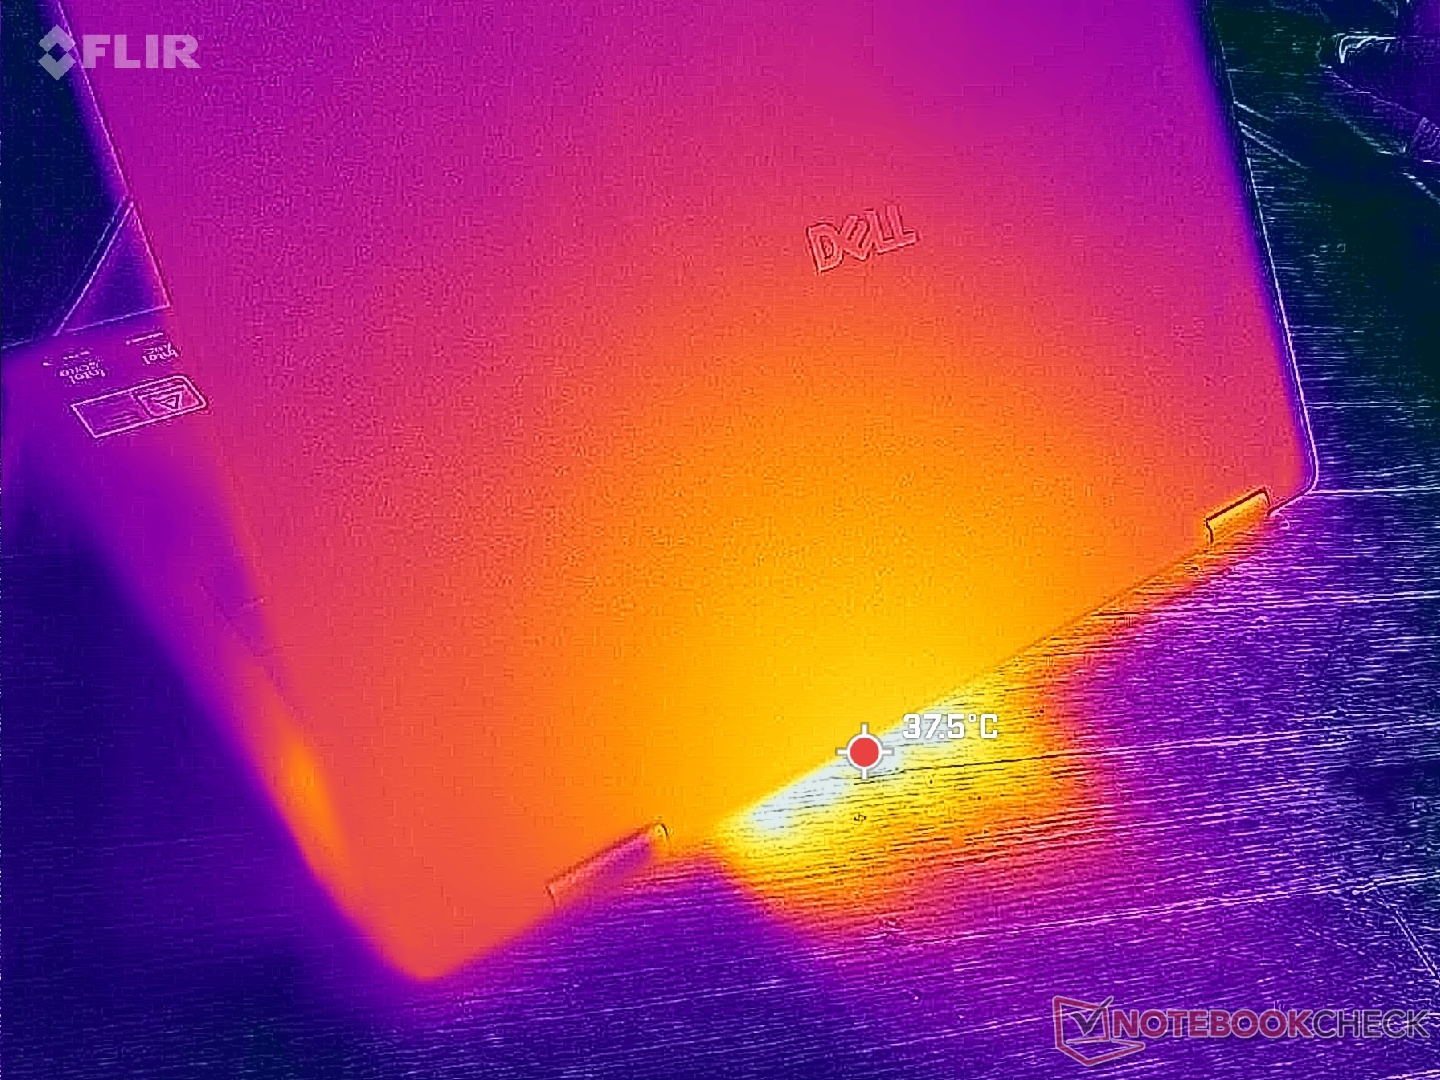
(±) De maximumtemperatuur aan de bovenzijde bedraagt 44 °C / 111 F, vergeleken met het gemiddelde van 35.4 °C / 96 F, variërend van 19.6 tot 60 °C voor de klasse Convertible.
(+) De bodem warmt op tot een maximum van 39.4 °C / 103 F, vergeleken met een gemiddelde van 36.9 °C / 98 F
(+) Bij onbelast gebruik bedraagt de gemiddelde temperatuur voor de bovenzijde 28.7 °C / 84 F, vergeleken met het apparaatgemiddelde van 30.3 °C / 87 F.
(+) De palmsteunen en het touchpad zijn met een maximum van ###max## °C / 80.2 F koeler dan de huidtemperatuur en voelen daarom koel aan.
(±) De gemiddelde temperatuur van de handpalmsteun van soortgelijke toestellen bedroeg 28 °C / 82.4 F (+1.2 °C / 2.2 F).
| Dell 16 Plus 2-in-1 Intel Core Ultra 7 258V, Intel Arc Graphics 140V | Dell Inspiron 16 7640 2-in-1 Intel Core Ultra 7 155H, Intel Arc 8-Core iGPU | Lenovo Yoga 7 2-in-1 16ILL10 Intel Core Ultra 7 256V, Intel Arc Graphics 140V | Samsung Galaxy Book5 Pro 360 Intel Core Ultra 5 226V, Intel Arc Graphics 130V | MSI Summit A16 AI Plus A3HMTG AMD Ryzen AI 9 365, AMD Radeon 880M | HP Envy x360 2-in-1 16-ad0097nr AMD Ryzen 7 8840HS, AMD Radeon 780M | |
|---|---|---|---|---|---|---|
| Heat | -4% | 12% | 12% | -3% | 4% | |
| Maximum Upper Side * (°C) | 44 | 46.8 -6% | 42.6 3% | 40.9 7% | 52.8 -20% | 42.6 3% |
| Maximum Bottom * (°C) | 39.4 | 45.6 -16% | 36.8 7% | 45.1 -14% | 42 -7% | 47.8 -21% |
| Idle Upper Side * (°C) | 31.8 | 32.2 -1% | 26.4 17% | 23.8 25% | 30.6 4% | 27.4 14% |
| Idle Bottom * (°C) | 34.2 | 31.4 8% | 26.6 22% | 23.5 31% | 29.6 13% | 27.8 19% |
* ... kleiner is beter
Stresstest
Bij het starten van Prime95 stress, verhoogde de CPU naar 3,4 GHz en 38 W totdat hij enkele seconden later 93 C bereikte. Daarna daalden de prestaties naar 2,5 GHz en 22 W om een koelere kerntemperatuur van 72 C te handhaven. Dit is bijna 15 C koeler in vergelijking met de Inspiron 16 7640 2-in-1 onder vergelijkbare omstandigheden, maar vergeet niet dat de Dell 16 Plus 2-in-1 ook met een langzamere processor wordt geleverd.
De kerntemperatuur bij het uitvoeren van Cyberpunk 2077 om typische gamingbelastingen weer te geven, zou ook aanzienlijk koeler zijn dan op de Inspiron van vorig jaar, terwijl het betere gamingprestaties biedt.
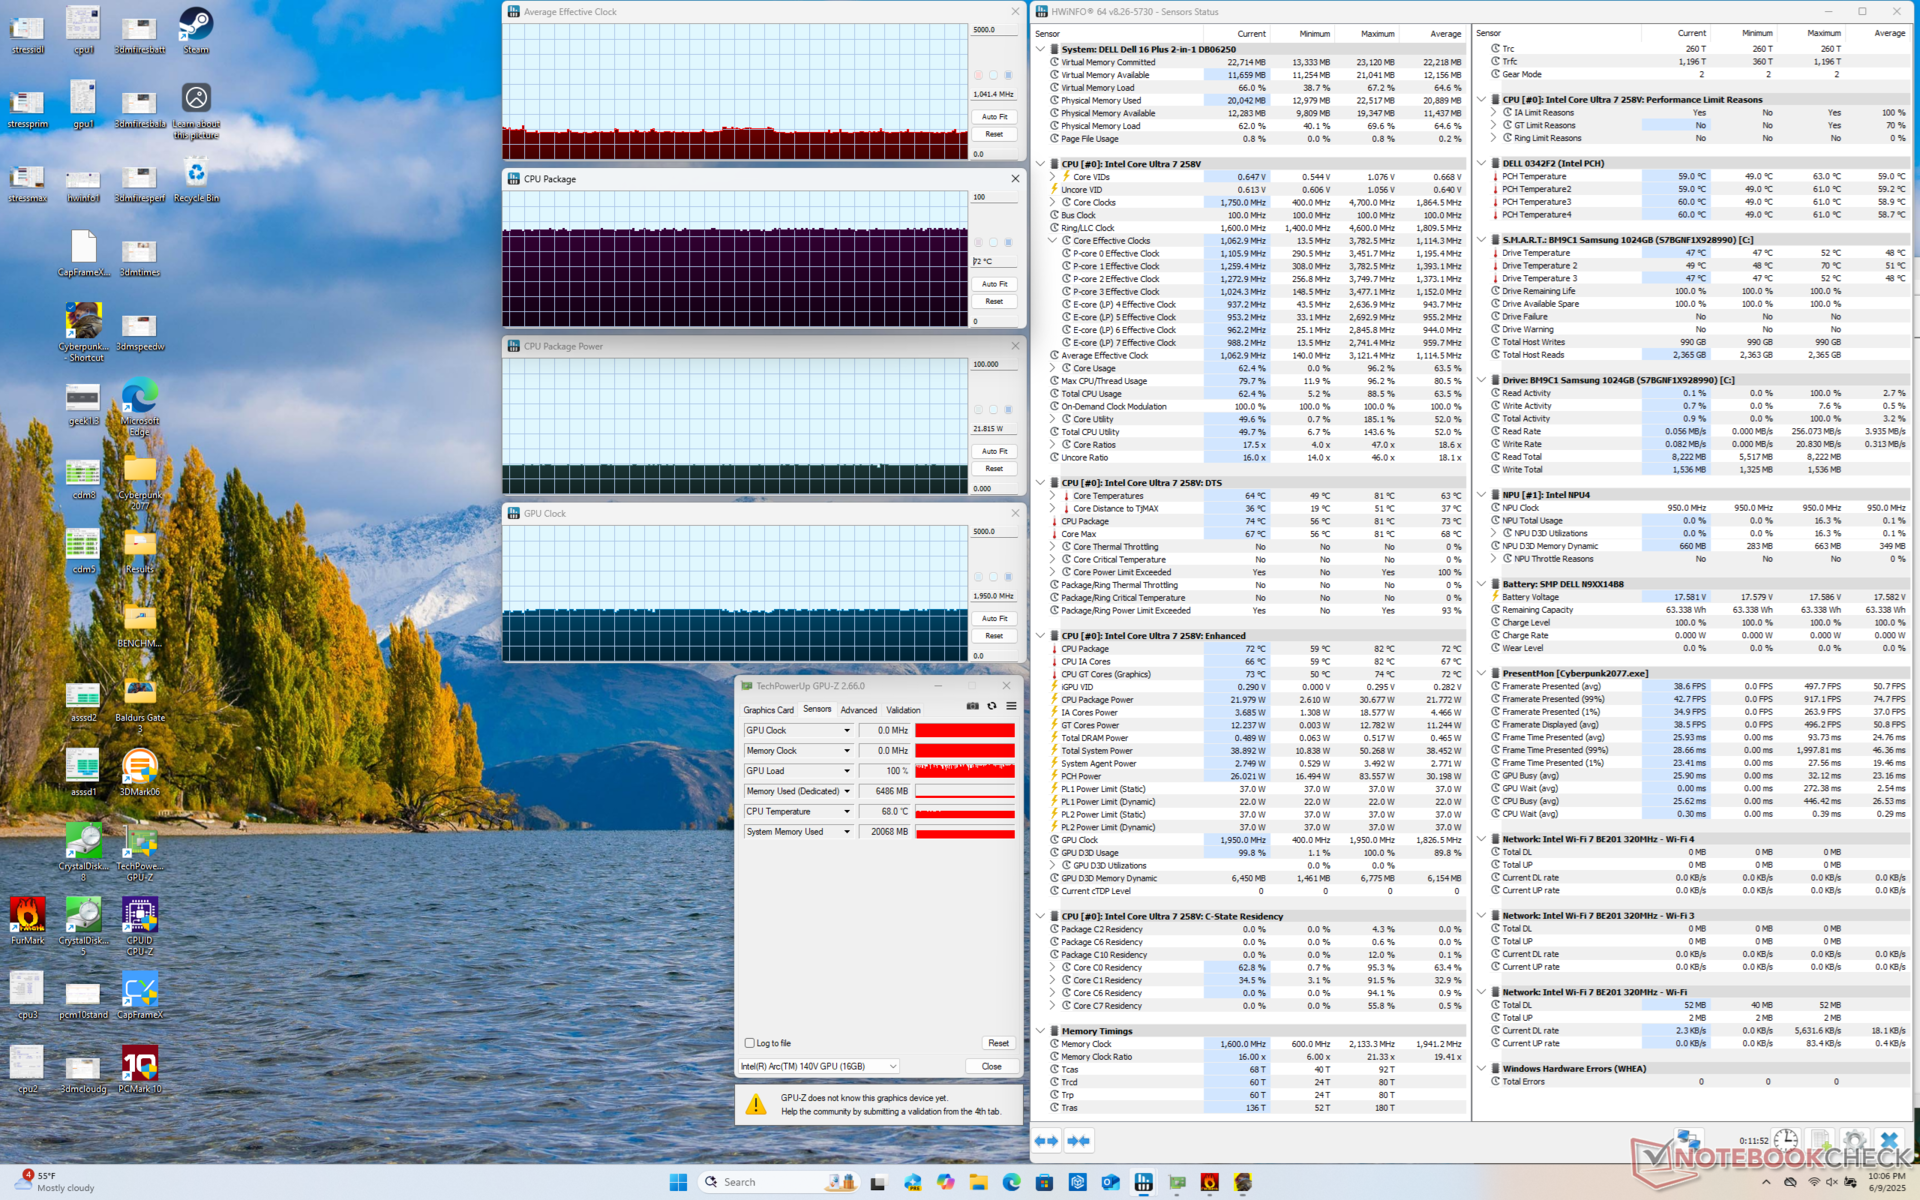
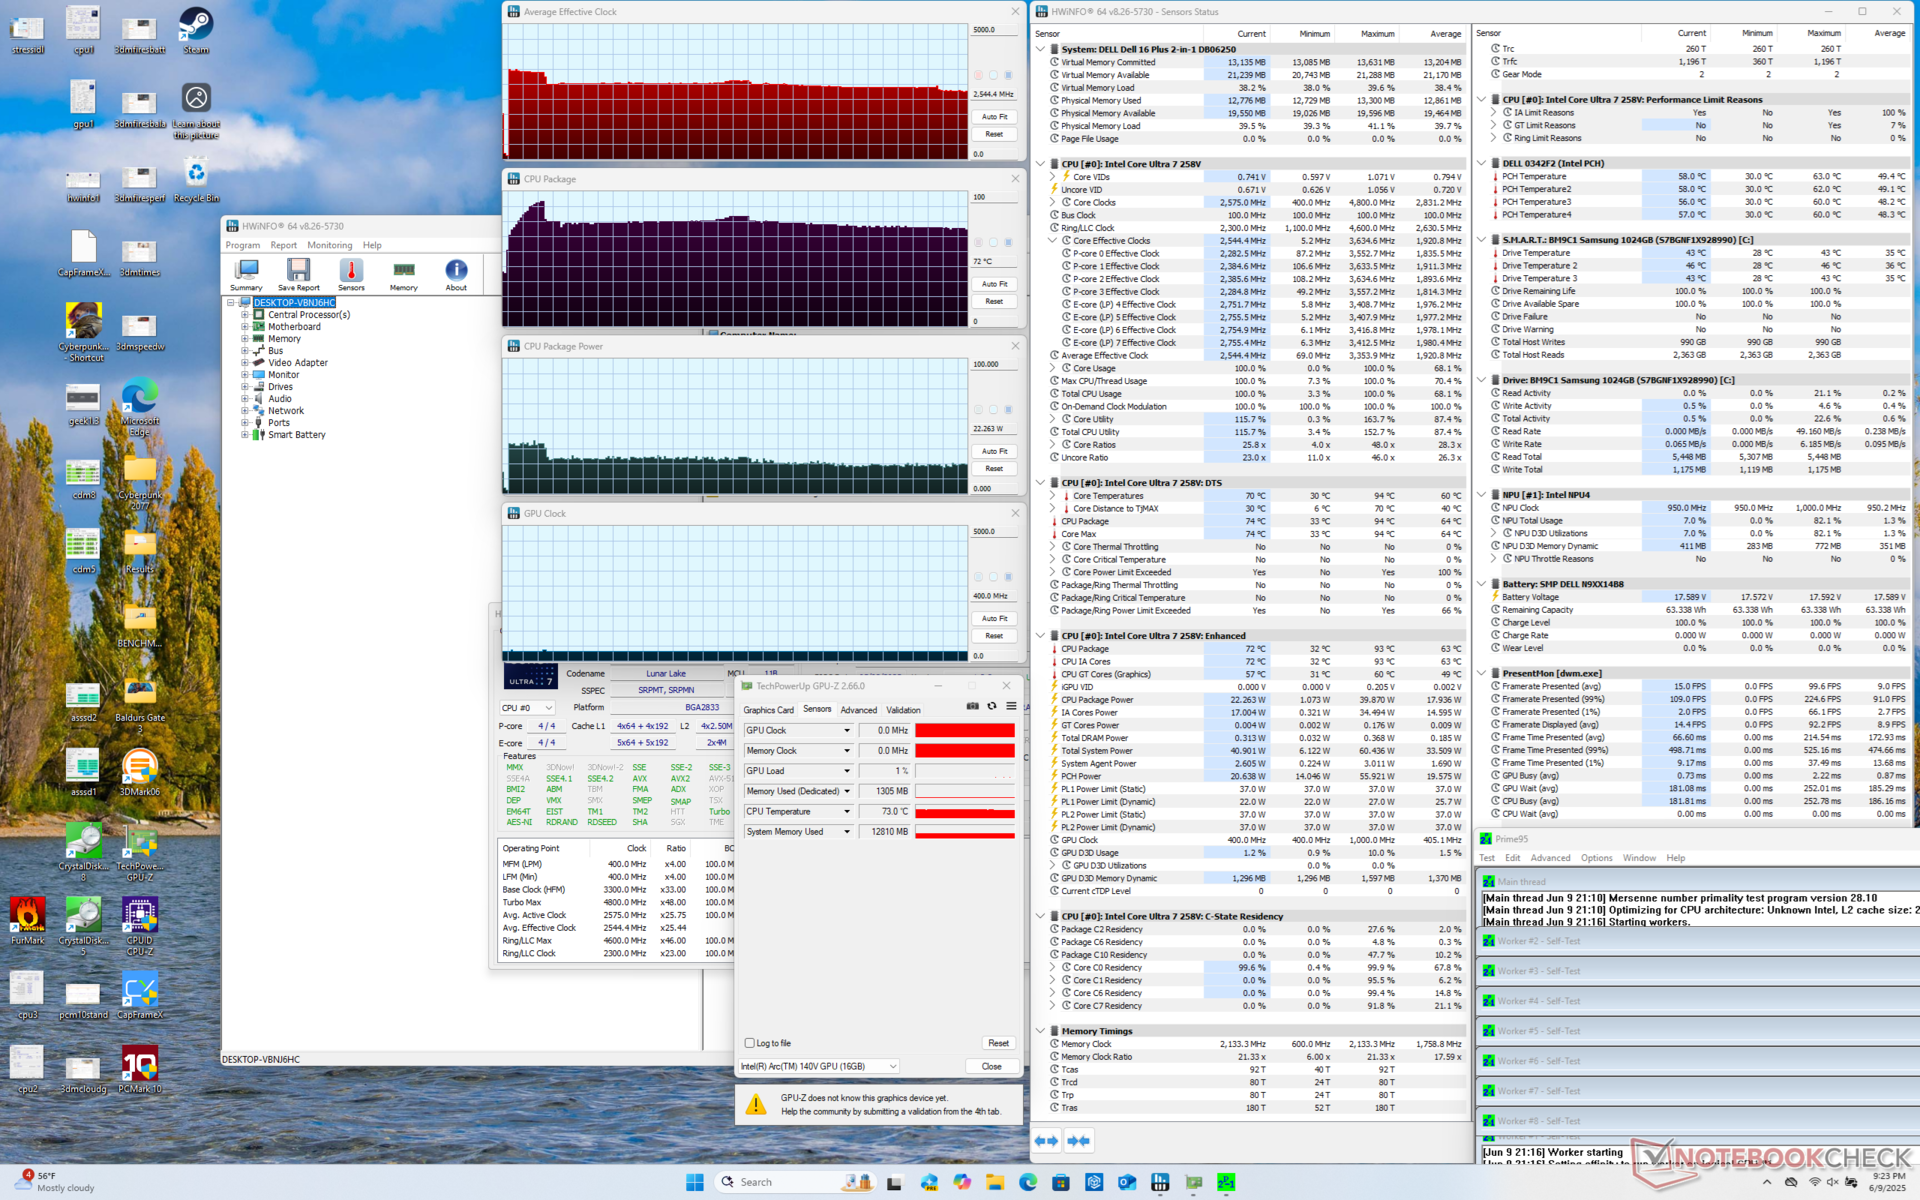
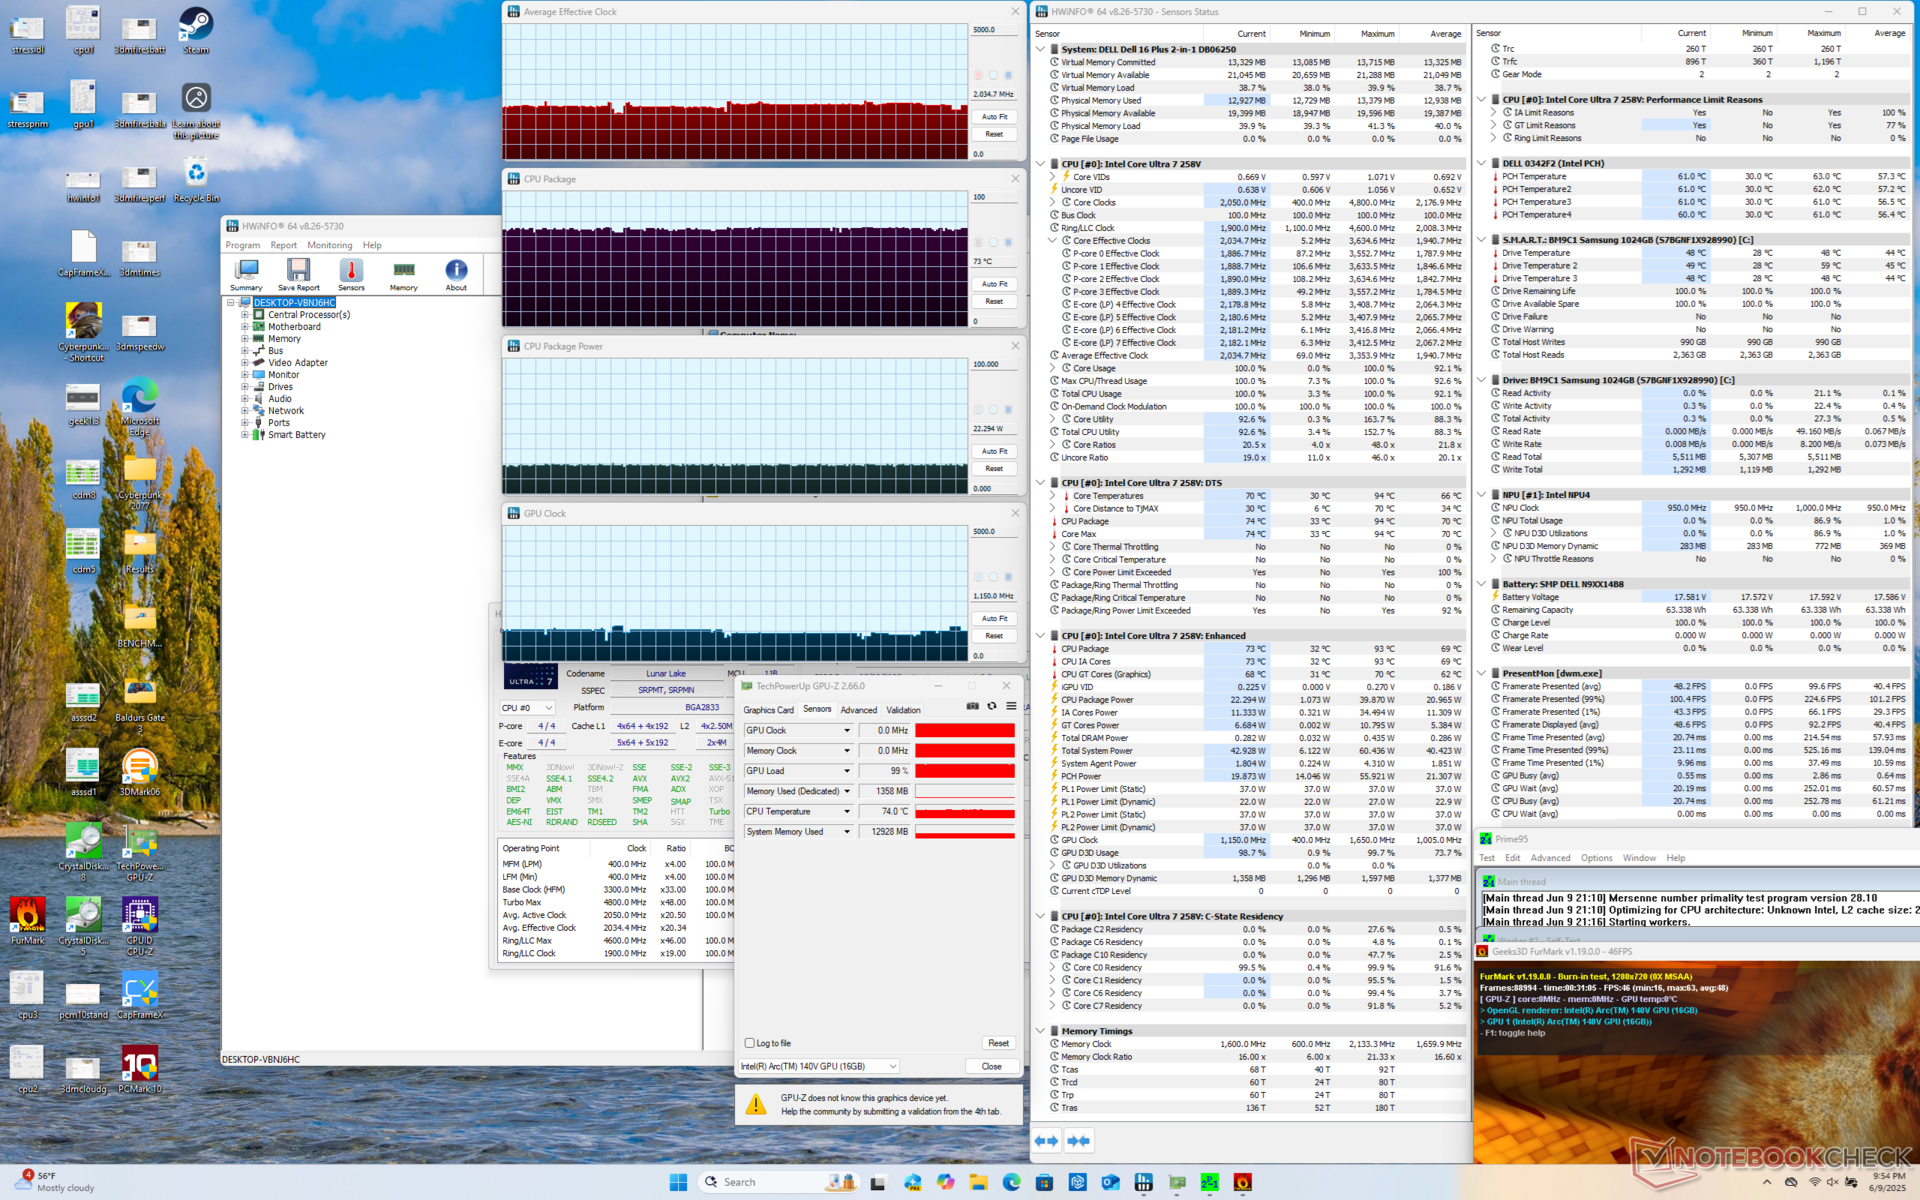
| Gemiddelde CPU-klok (GHz) | GPU-klok (MHz) | Gemiddelde CPU-temperatuur (°C) | |
| Systeem inactief | -- | -- | 32 |
| Prime95 Stress | 2.5 | 400 | 72 |
| Prime95 + FurMark Stress | 2.0 | 1150 | 73 |
| Cyberpunk 2077 Stress | 1.0 | 1950 | 72 |
Luidsprekers
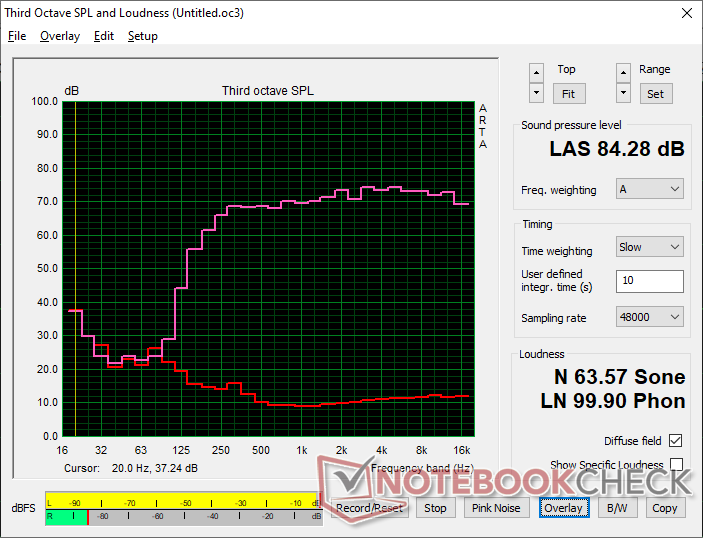
Dell 16 Plus 2-in-1 audioanalyse
(+) | luidsprekers kunnen relatief luid spelen (82.5 dB)
Bas 100 - 315 Hz
(-) | bijna geen lage tonen - gemiddeld 16.2% lager dan de mediaan
(±) | lineariteit van de lage tonen is gemiddeld (12.1% delta ten opzichte van de vorige frequentie)
Midden 400 - 2000 Hz
(+) | evenwichtige middens - slechts 0.8% verwijderd van de mediaan
(+) | de middentonen zijn lineair (1.8% delta ten opzichte van de vorige frequentie)
Hoog 2 - 16 kHz
(+) | evenwichtige hoogtepunten - slechts 2.4% verwijderd van de mediaan
(+) | de hoge tonen zijn lineair (2.9% delta naar de vorige frequentie)
Algemeen 100 - 16.000 Hz
(+) | het totale geluid is lineair (10.5% verschil met de mediaan)
Vergeleken met dezelfde klasse
» 7% van alle geteste apparaten in deze klasse waren beter, 2% vergelijkbaar, 91% slechter
» De beste had een delta van 6%, het gemiddelde was 20%, de slechtste was 57%
Vergeleken met alle geteste toestellen
» 5% van alle geteste apparaten waren beter, 1% gelijk, 93% slechter
» De beste had een delta van 4%, het gemiddelde was 23%, de slechtste was 134%
Apple MacBook Pro 16 2021 M1 Pro audioanalyse
(+) | luidsprekers kunnen relatief luid spelen (84.7 dB)
Bas 100 - 315 Hz
(+) | goede baars - slechts 3.8% verwijderd van de mediaan
(+) | de lage tonen zijn lineair (5.2% delta naar de vorige frequentie)
Midden 400 - 2000 Hz
(+) | evenwichtige middens - slechts 1.3% verwijderd van de mediaan
(+) | de middentonen zijn lineair (2.1% delta ten opzichte van de vorige frequentie)
Hoog 2 - 16 kHz
(+) | evenwichtige hoogtepunten - slechts 1.9% verwijderd van de mediaan
(+) | de hoge tonen zijn lineair (2.7% delta naar de vorige frequentie)
Algemeen 100 - 16.000 Hz
(+) | het totale geluid is lineair (4.6% verschil met de mediaan)
Vergeleken met dezelfde klasse
» 0% van alle geteste apparaten in deze klasse waren beter, 0% vergelijkbaar, 100% slechter
» De beste had een delta van 5%, het gemiddelde was 17%, de slechtste was 45%
Vergeleken met alle geteste toestellen
» 0% van alle geteste apparaten waren beter, 0% gelijk, 100% slechter
» De beste had een delta van 4%, het gemiddelde was 23%, de slechtste was 134%
Energiebeheer
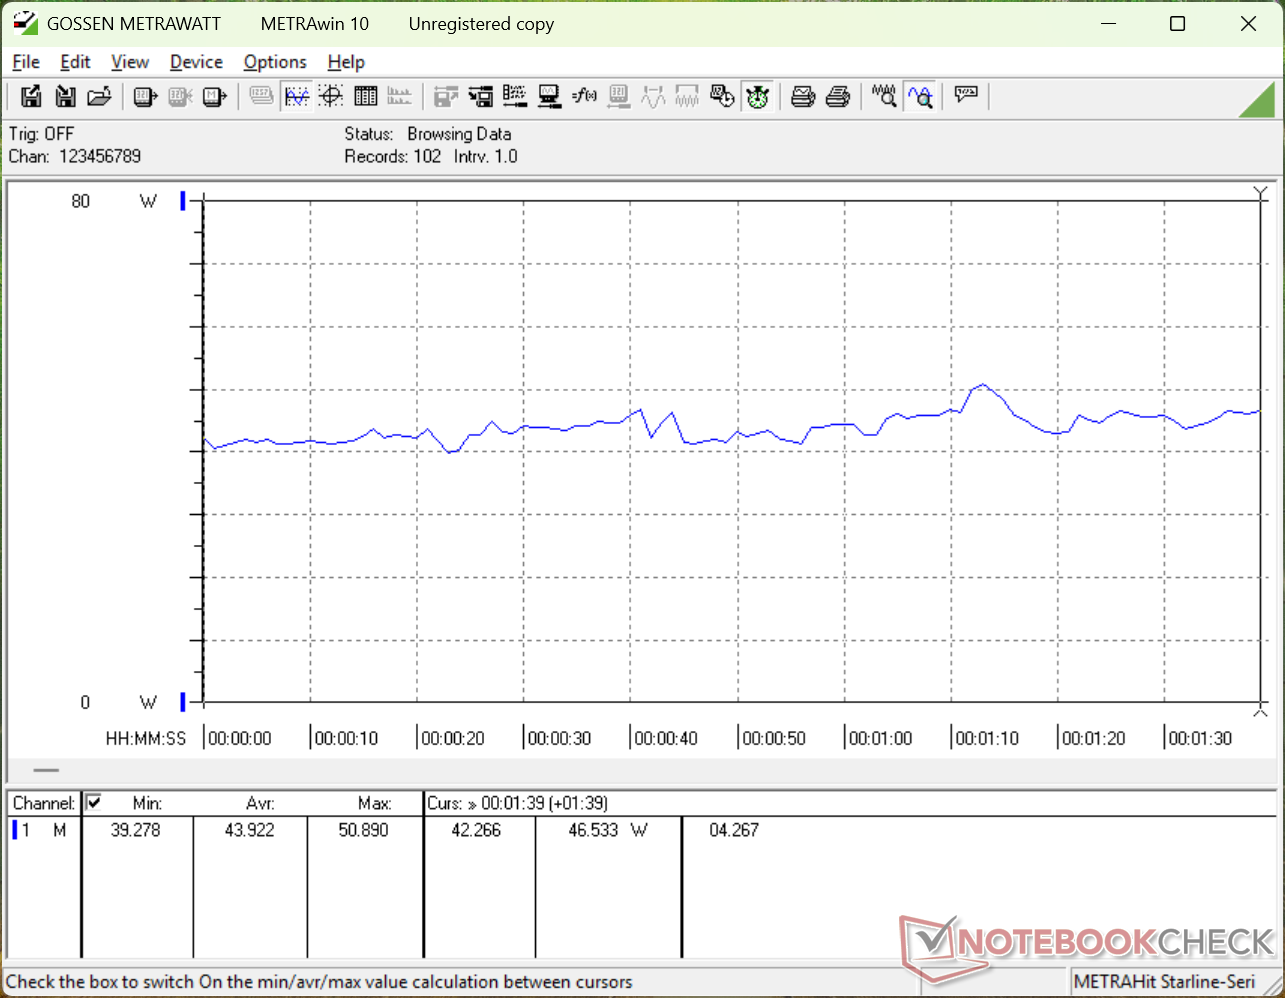
Stroomverbruik
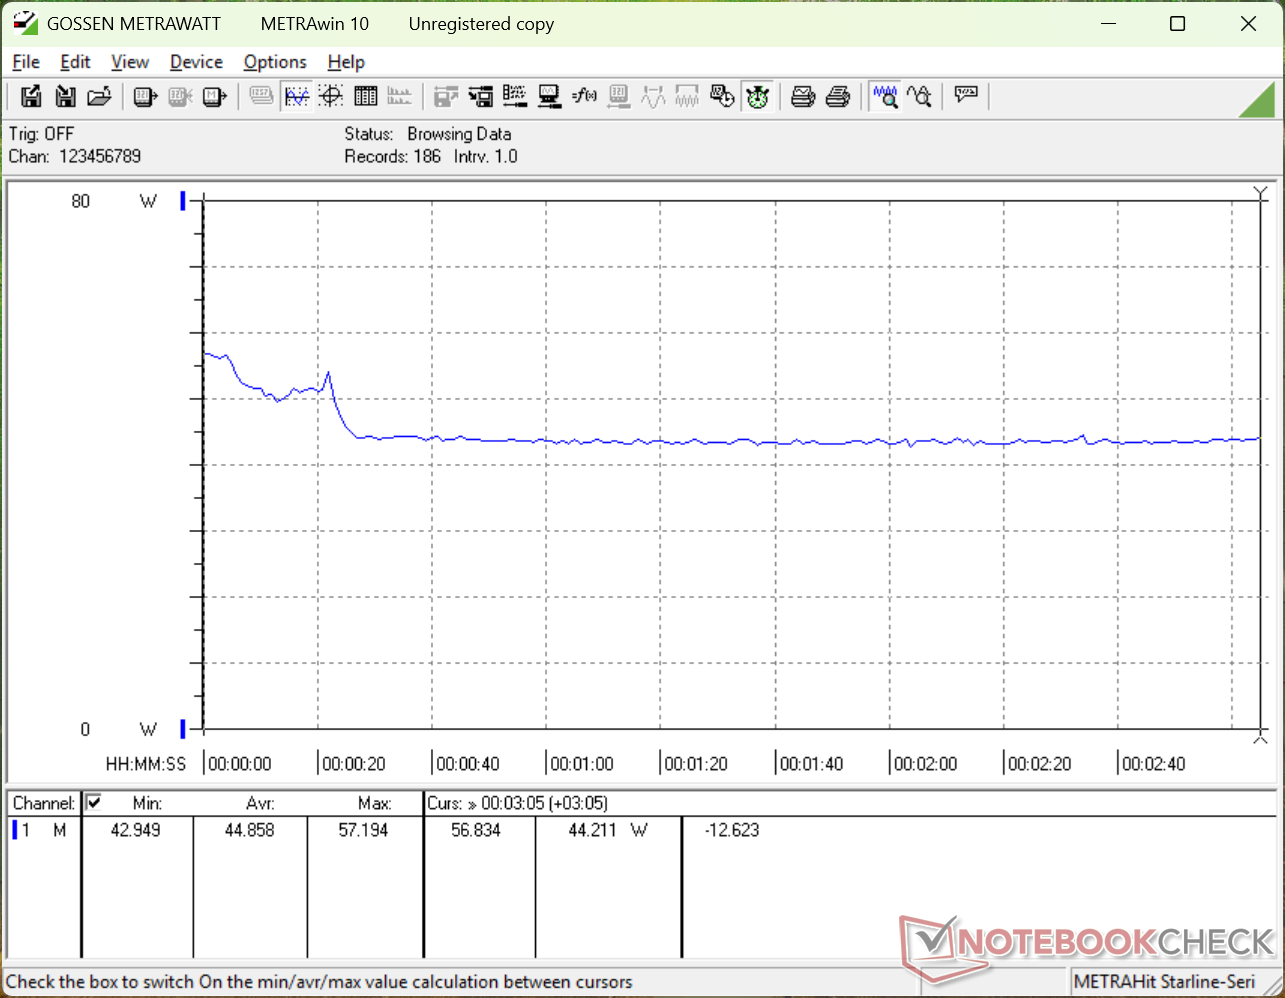
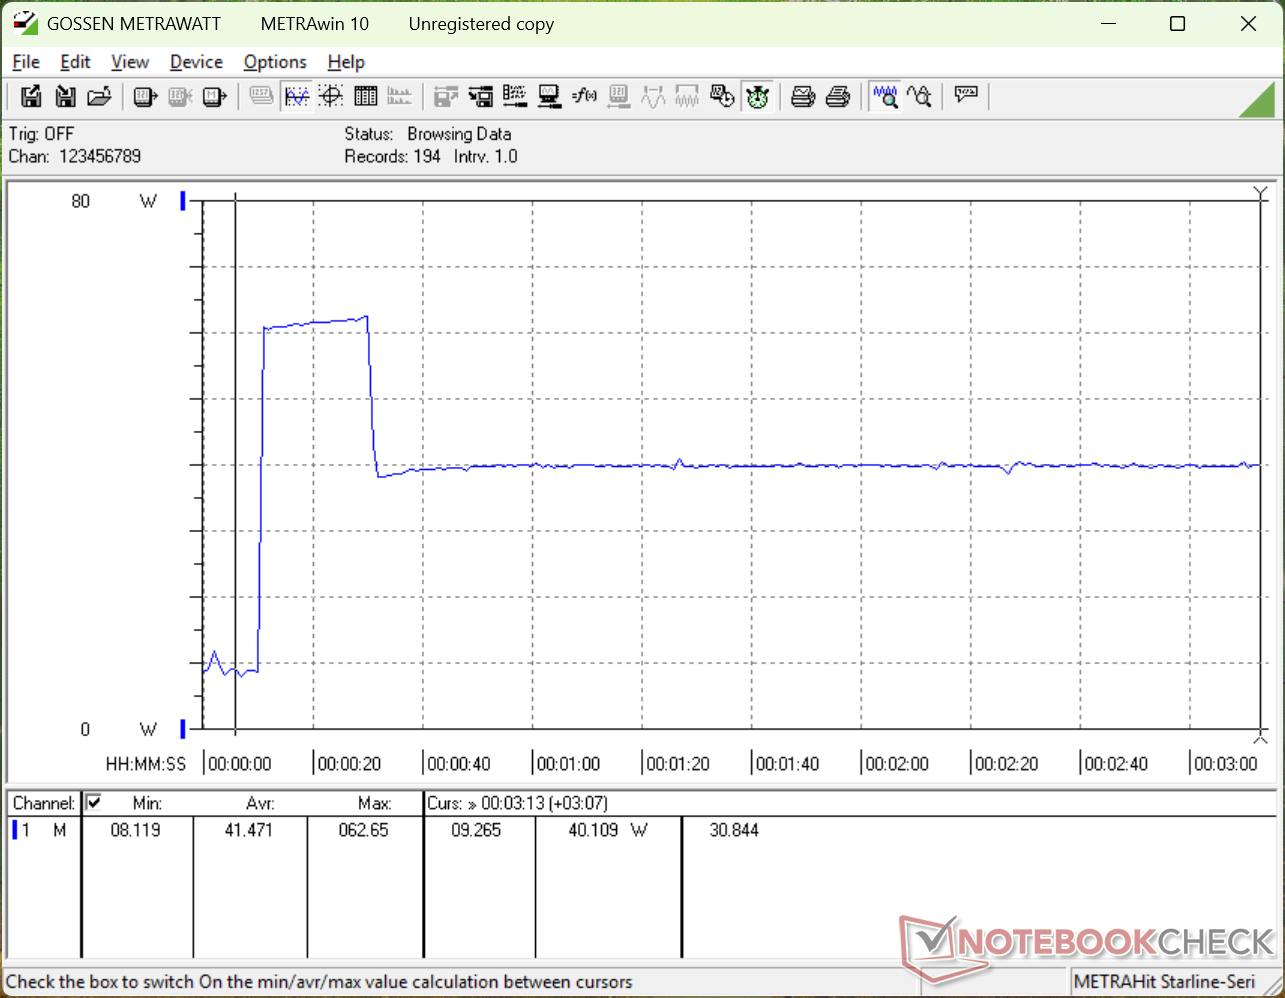
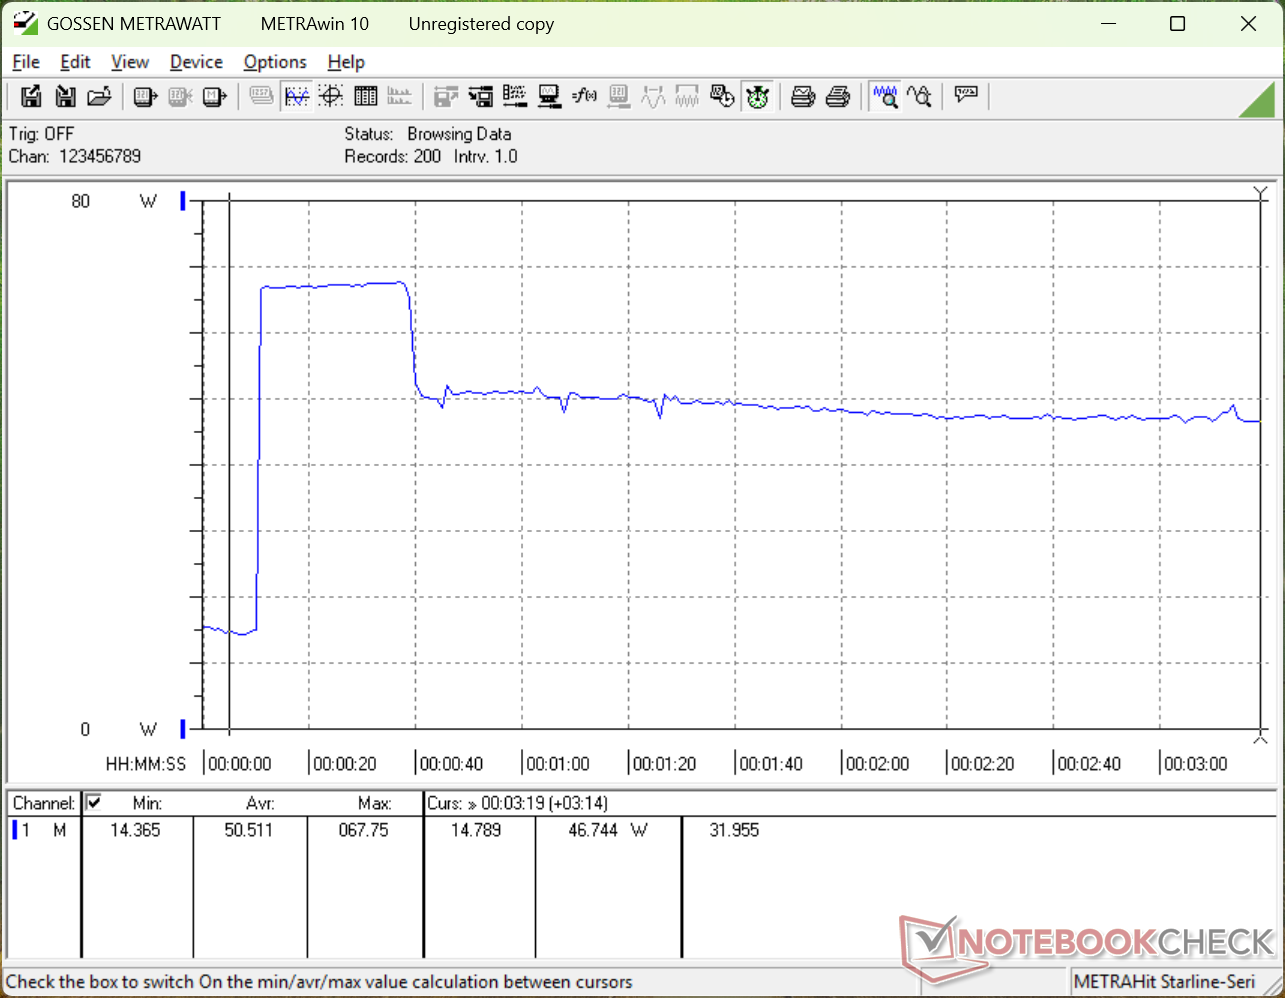
Het verbruik bij stationair draaien is vergelijkbaar met wat we vorig jaar hebben gemeten bij de Inspiron 16 7640 2-in-1 aangezien ze meer dan een paar vergelijkbare onderdelen delen. Bij zwaardere belastingen heeft de Dell 16 Plus 2-in-1 echter veel minder stroom nodig, omdat de Core Ultra 7 258V langzamer en efficiënter is dan de Core Ultra 7 155H.
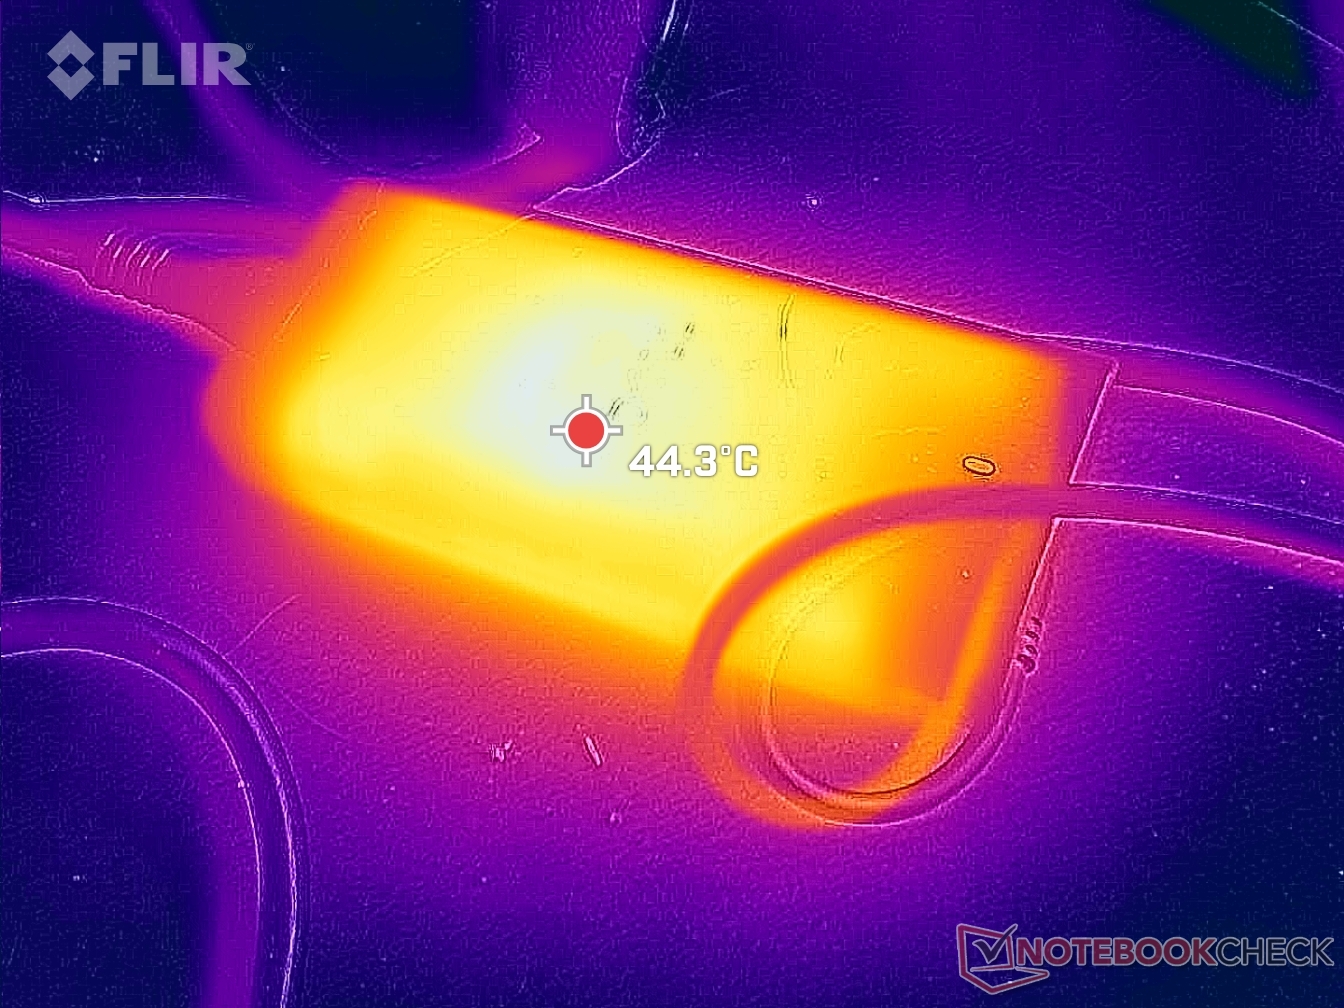
We hebben een maximaal verbruik van 67 W gemeten met de kleine (~11 x 5 x 2,8 cm) USB-C netadapter van 65 W.
| Uit / Standby | |
| Inactief | |
| Belasting |
|
Key:
min: | |
| Dell 16 Plus 2-in-1 Core Ultra 7 258V, Arc 140V, Samsung BM9C1 1024GB, Mini-LED, 2560x1600, 16" | Dell Inspiron 16 7640 2-in-1 Ultra 7 155H, Arc 8-Core, Micron 2550 1TB, Mini-LED, 2560x1600, 16" | Lenovo Yoga 7 2-in-1 16ILL10 Core Ultra 7 256V, Arc 140V, WD PC SN7100S SDFPMSL-512G-1101, IPS, 1920x1200, 16" | Samsung Galaxy Book5 Pro 360 Core Ultra 5 226V, Arc 130V, Samsung PM9B1 512GB MZVL4512HBLU, OLED, 2880x1800, 16" | MSI Summit A16 AI Plus A3HMTG Ryzen AI 9 365, Radeon 880M, Samsung PM9C1 MZVL81T0HELB-00BTW, IPS, 2560x1600, 16" | HP Envy x360 2-in-1 16-ad0097nr R7 8840HS, Radeon 780M, KIOXIA BG5 KBG50ZNV1T02, OLED, 2880x1800, 16" | |
|---|---|---|---|---|---|---|
| Power Consumption | -30% | 17% | 19% | -16% | 12% | |
| Idle Minimum * (Watt) | 7 | 6.1 13% | 4.2 40% | 5.3 24% | 5.4 23% | 5 29% |
| Idle Average * (Watt) | 13.2 | 13.5 -2% | 8.3 37% | 6.7 49% | 11 17% | 6.2 53% |
| Idle Maximum * (Watt) | 13.4 | 13.8 -3% | 9.5 29% | 7.3 46% | 11.2 16% | 14.7 -10% |
| Load Average * (Watt) | 43.9 | 63.6 -45% | 40.3 8% | 37.6 14% | 76.6 -74% | 49.9 -14% |
| Cyberpunk 2077 ultra external monitor * (Watt) | 40.7 | 64.6 -59% | 40.8 -0% | 42.8 -5% | 49.2 -21% | |
| Cyberpunk 2077 ultra * (Watt) | 44.9 | 67 -49% | 47.4 -6% | 44.6 1% | 61.1 -36% | |
| Load Maximum * (Watt) | 67.8 | 109.7 -62% | 59 13% | 64.1 5% | 91.8 -35% | 65 4% |
| Witcher 3 ultra * (Watt) | 54.5 |
* ... kleiner is beter
Power Consumption Cyberpunk / Stress Test
Power Consumption external Monitor
Levensduur batterij
De batterijcapaciteit is kleiner dan die van de Inspiron 16 7640 2-in-1 van vorig jaar, wat een negatieve invloed heeft op de WLAN-werktijd, maar deze is net iets langer dan twee uur.
| Dell 16 Plus 2-in-1 Core Ultra 7 258V, Arc 140V, 64 Wh | Dell Inspiron 16 7640 2-in-1 Ultra 7 155H, Arc 8-Core, 90 Wh | Lenovo Yoga 7 2-in-1 16ILL10 Core Ultra 7 256V, Arc 140V, 70 Wh | Samsung Galaxy Book5 Pro 360 Core Ultra 5 226V, Arc 130V, 76 Wh | MSI Summit A16 AI Plus A3HMTG Ryzen AI 9 365, Radeon 880M, 82 Wh | HP Envy x360 2-in-1 16-ad0097nr R7 8840HS, Radeon 780M, 68 Wh | |
|---|---|---|---|---|---|---|
| Batterijduur | 28% | 125% | 21% | 2% | -13% | |
| WiFi v1.3 (h) | 8.9 | 11.4 28% | 20 125% | 10.8 21% | 9.1 2% | 7.7 -13% |
| Reader / Idle (h) | 21.8 | 15.6 | ||||
| Load (h) | 1.6 | 2.1 | 1.9 | |||
| H.264 (h) | 19.7 |
Notebookcheck Beoordeling
Dell 16 Plus 2-in-1
- 14-06-2025 v8
Allen Ngo
 Total Sustainability Score:
 Potential Competitors in Comparison
Afbeelding | Model / recensie | prijs | Gewicht | Hoogte | Scherm |
|---|---|---|---|---|---|
1. 83.5%  | Dell 16 Plus 2-in-1 Intel Core Ultra 7 258V ⎘ Intel Arc Graphics 140V ⎘ 32 GB Geheugen, 1024 GB SSD | Amazon: $1,149.99 Catalogusprijs: 1500 USD | 2 kg | 16.99 mm | 16.00" 2560x1600 189 PPI Mini-LED |
2. 82.1%  | Dell Inspiron 16 7640 2-in-1 Intel Core Ultra 7 155H ⎘ Intel Arc 8-Core iGPU ⎘ 16 GB Geheugen, 1024 GB SSD | Amazon: Catalogusprijs: 1000 USD | 2.1 kg | 18.99 mm | 16.00" 2560x1600 189 PPI Mini-LED |
3. 84.3%  | Lenovo Yoga 7 2-in-1 16ILL10 Intel Core Ultra 7 256V ⎘ Intel Arc Graphics 140V ⎘ 16 GB Geheugen, 512 GB SSD | Amazon: Catalogusprijs: 1000 USD | 1.9 kg | 15.85 mm | 16.00" 1920x1200 142 PPI IPS |
4. 85.9%  | Samsung Galaxy Book5 Pro 360 Intel Core Ultra 5 226V ⎘ Intel Arc Graphics 130V ⎘ 16 GB Geheugen, 512 GB SSD | Amazon: Catalogusprijs: 1799€ | 1.7 kg | 12.8 mm | 16.00" 2880x1800 212 PPI OLED |
5. 81.9%  | MSI Summit A16 AI Plus A3HMTG AMD Ryzen AI 9 365 ⎘ AMD Radeon 880M ⎘ 32 GB Geheugen, 1024 GB SSD | Amazon: Catalogusprijs: 1600 USD | 2.1 kg | 16.85 mm | 16.00" 2560x1600 189 PPI IPS |
6. 87.2% v7 (old)  | HP Envy x360 2-in-1 16-ad0097nr AMD Ryzen 7 8840HS ⎘ AMD Radeon 780M ⎘ 16 GB Geheugen, 1024 GB SSD | Amazon: 1. $135.99 Replacement for HP Envy x360... 2. $159.88 HPDELGB for HP Envy x360 2-i... 3. $699.99 HP Envy 2-in-1 16" 2K Touch-... Catalogusprijs: 1300 USD | 1.8 kg | 18.3 mm | 16.00" 2880x1800 212 PPI OLED |
Transparantie
De selectie van te beoordelen apparaten wordt gemaakt door onze redactie. Het testexemplaar werd ten behoeve van deze beoordeling door de fabrikant of detailhandelaar in bruikleen aan de auteur verstrekt. De kredietverstrekker had geen invloed op deze recensie, noch ontving de fabrikant vóór publicatie een exemplaar van deze recensie. Er bestond geen verplichting om deze recensie te publiceren. Als onafhankelijk mediabedrijf is Notebookcheck niet onderworpen aan het gezag van fabrikanten, detailhandelaren of uitgevers.
[transparency_disclaimer]Dit is hoe Notebookcheck test
Elk jaar beoordeelt Notebookcheck onafhankelijk honderden laptops en smartphones met behulp van gestandaardiseerde procedures om ervoor te zorgen dat alle resultaten vergelijkbaar zijn. We hebben onze testmethoden al zo'n 20 jaar voortdurend ontwikkeld en daarbij de industriestandaard bepaald. In onze testlaboratoria wordt gebruik gemaakt van hoogwaardige meetapparatuur door ervaren technici en redacteuren. Deze tests omvatten een validatieproces in meerdere fasen. Ons complexe beoordelingssysteem is gebaseerd op honderden goed onderbouwde metingen en benchmarks, waardoor de objectiviteit behouden blijft. Meer informatie over onze testmethoden kunt u hier vinden.

