Conclusie - Hoge prestaties met praktische functies
De Dell Pro Max 16 Plus is een aanzienlijke stap vooruit ten opzichte van de vorige generatie Precision 7680 of 7670. Naast de verwachte prestatieboost krijgt het herziene model extra functies die niet op het oudere model te vinden waren, waaronder OLED met 120 Hz, modulaire USB-C-poorten voor reparatiemogelijkheden, PCIe5 SSD-opties, Thunderbolt 5-ondersteuning, compact opladen via USB-C en een webcam met een hogere resolutie. De verbeteringen wegen ruimschoots op tegen de kleine toename in dikte en voetafdruk.
De nadelen zijn over het algemeen klein. Het stroomverbruik is nu hoger dan voorheen, namelijk 280 W in vergelijking met 240 W of minder op de Precision 7680. Hoewel de Pro Max 16 Plus dus zeker krachtiger is, is hij ook veeleisender voor de koeling en gaat de batterij over het algemeen minder lang mee. Met name de CPU-temperatuur kan oplopen tot 95 C tot 105 C wanneer deze onder druk staat, wat gevolgen heeft voor de Turbo Boost-prestaties van het systeem. Ondertussen heeft de GPU de neiging om zich te stabiliseren op 125 W, ook al is deze berekend op maximaal 175 W. Het is daarom waarschijnlijk dat dezelfde CPU en GPU sneller werken op dikkere of grotere vormfactoren zoals de 18-inch Pro Max 18 Plus. Het Pro Max 16 Plus systeem is niettemin een van de snelste en meest praktische werkstations die verkrijgbaar zijn, ondanks de beperkingen van de koeloplossing.
Pro
Contra
Prijs en beschikbaarheid
Dell levert de Pro Max 16 Plus nu vanaf $3700 USD voor de basisconfiguratie Core Ultra 7, RTX Pro 1000. Onze Core Ultra 9 met RTX Pro 5000 Blackwell is nog niet overal verkrijgbaar.
- $1,574.00Dell Pro Max 16 - Intel Core Ultra 7 255H - Intel Arc Pro 140T GPU - 1TB SSD - 32GB DDR5 RAM - Windows 11 Pro
- $1,899.95Dell Pro 16 Plus PB16250 (Replaces Latitude 5550) AI Business Notebook 16" WUXGA Intel Ultra 7-265U, 32GB RAM DDR5, 1TB SSD, Wi-Fi 6E + BT, Backlit KB, FHD Webcam, RJ-45, Windows 11 Pro - Silver
- $2,799.99Dell Precision 7000 7680 Mobile Workstation Laptop (NVIDIA RTX 2000 Ada 8GB, 16" FHD+, Intel Core i7-13850HX (> Ultra 9-185H), 64GB LPCAMM2 DDR5, 2TB SSD) Pro Max for Engineer, Designer, Win 11 Pro
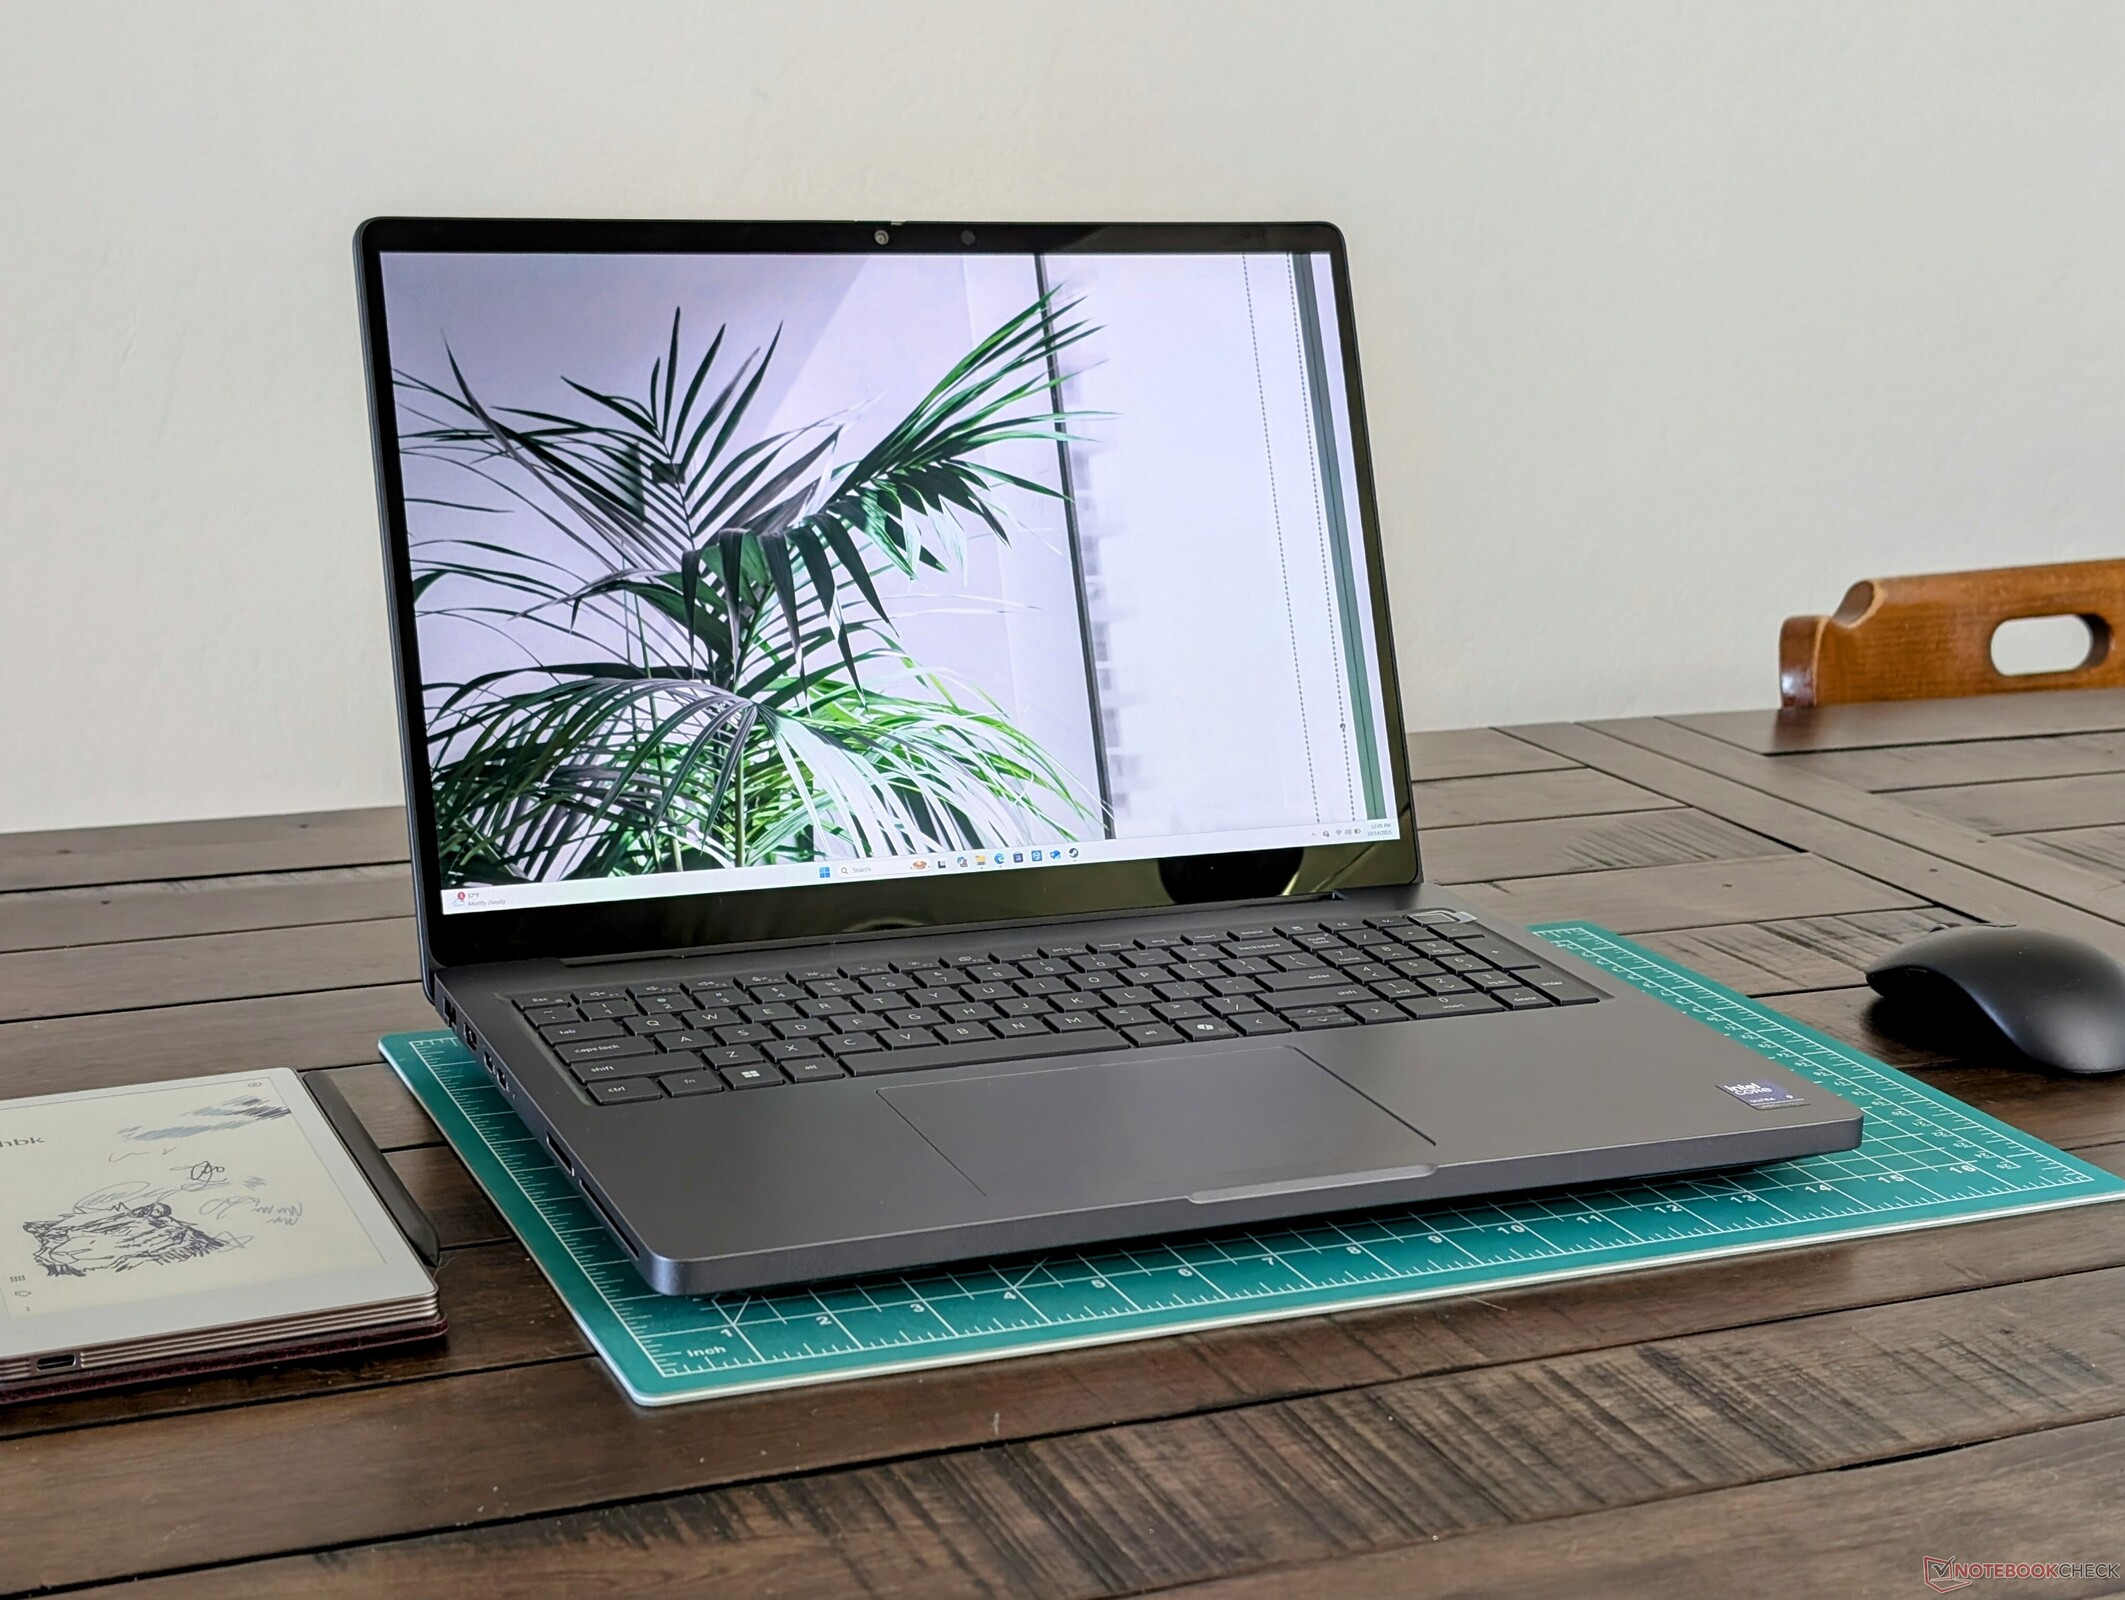
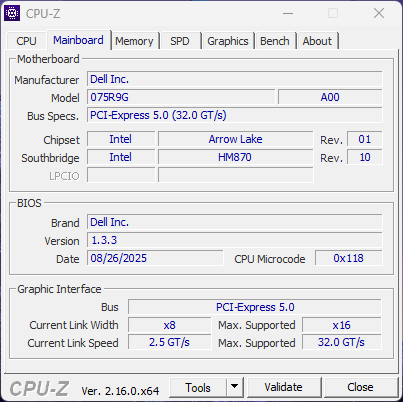
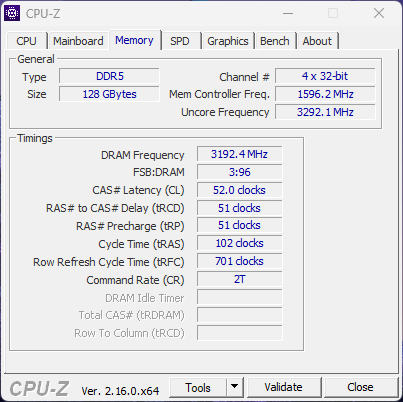
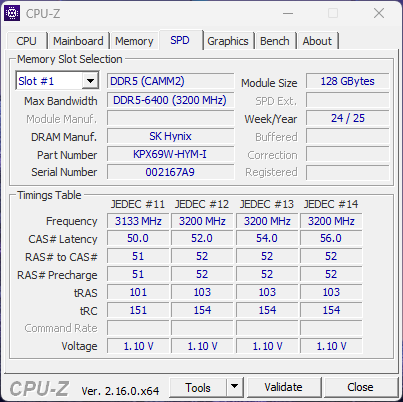
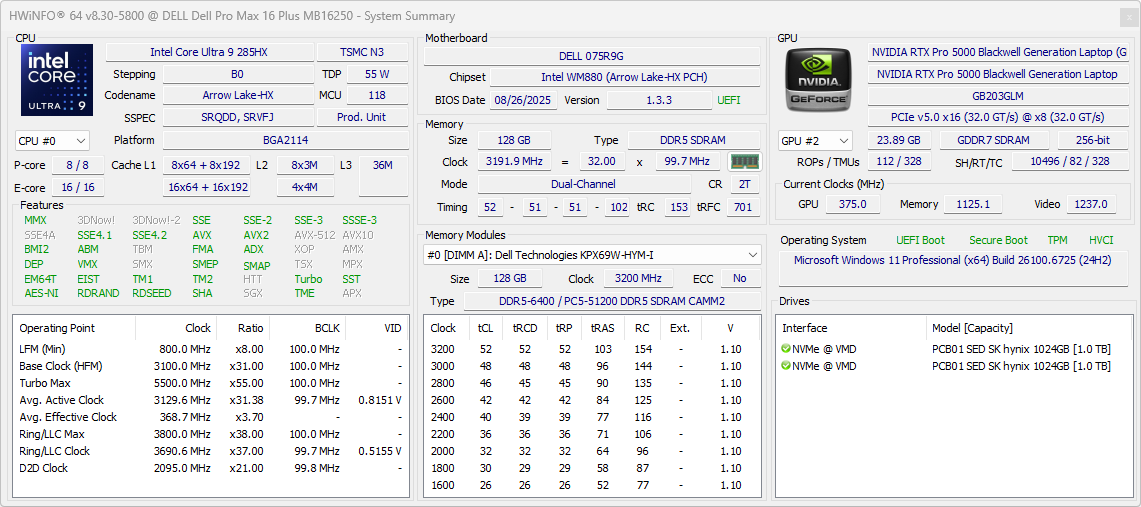
De Dell Pro Max 16 Plus is het nieuwste 16-inch mobiele werkstation van de fabrikant als opvolger van de laatste generatie Precision 7680 series. Het is dan ook een high-end werkstation met geavanceerde processors en functies, waaronder Intel Arrow Lake-HX CPU's, Nvidia Pro Blackwell GPU's en compatibiliteit met gespecialiseerde hardware zoals DGFF- en CAMM2-modules.
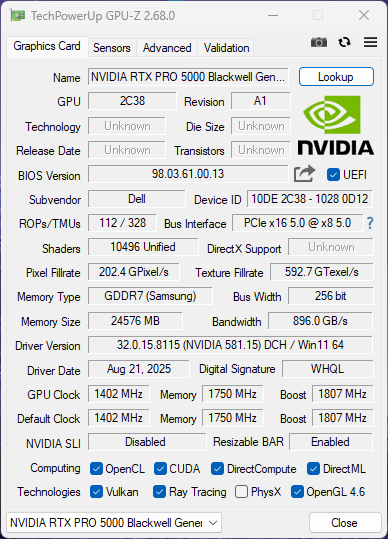
Onze testunit is de meest geavanceerde configuratie met de Core Ultra 9 285HX, RTX Pro 5000 Blackwell, 4K UHD 120 Hz OLED touchscreen, 2 TB PCIe5 SSD en 128 GB CAMM2 RAM voor ongeveer $5000. Kleinere SKU's beginnen met de Core Ultra 5 245HX, 16 GB CSoDIMM, alleen geïntegreerde graphics en een basis FHD+ non-touch scherm voor ongeveer $3700.
Alternatieven op dit gebied zijn andere prestatiegerichte 16-inch werkstations zoals de MSI CreatorPro Z16P, Lenovo ThinkPad P16 Gen 2of de HP ZBook Studio 16.
Meer Dell beoordelingen:
Specificaties
Zaak
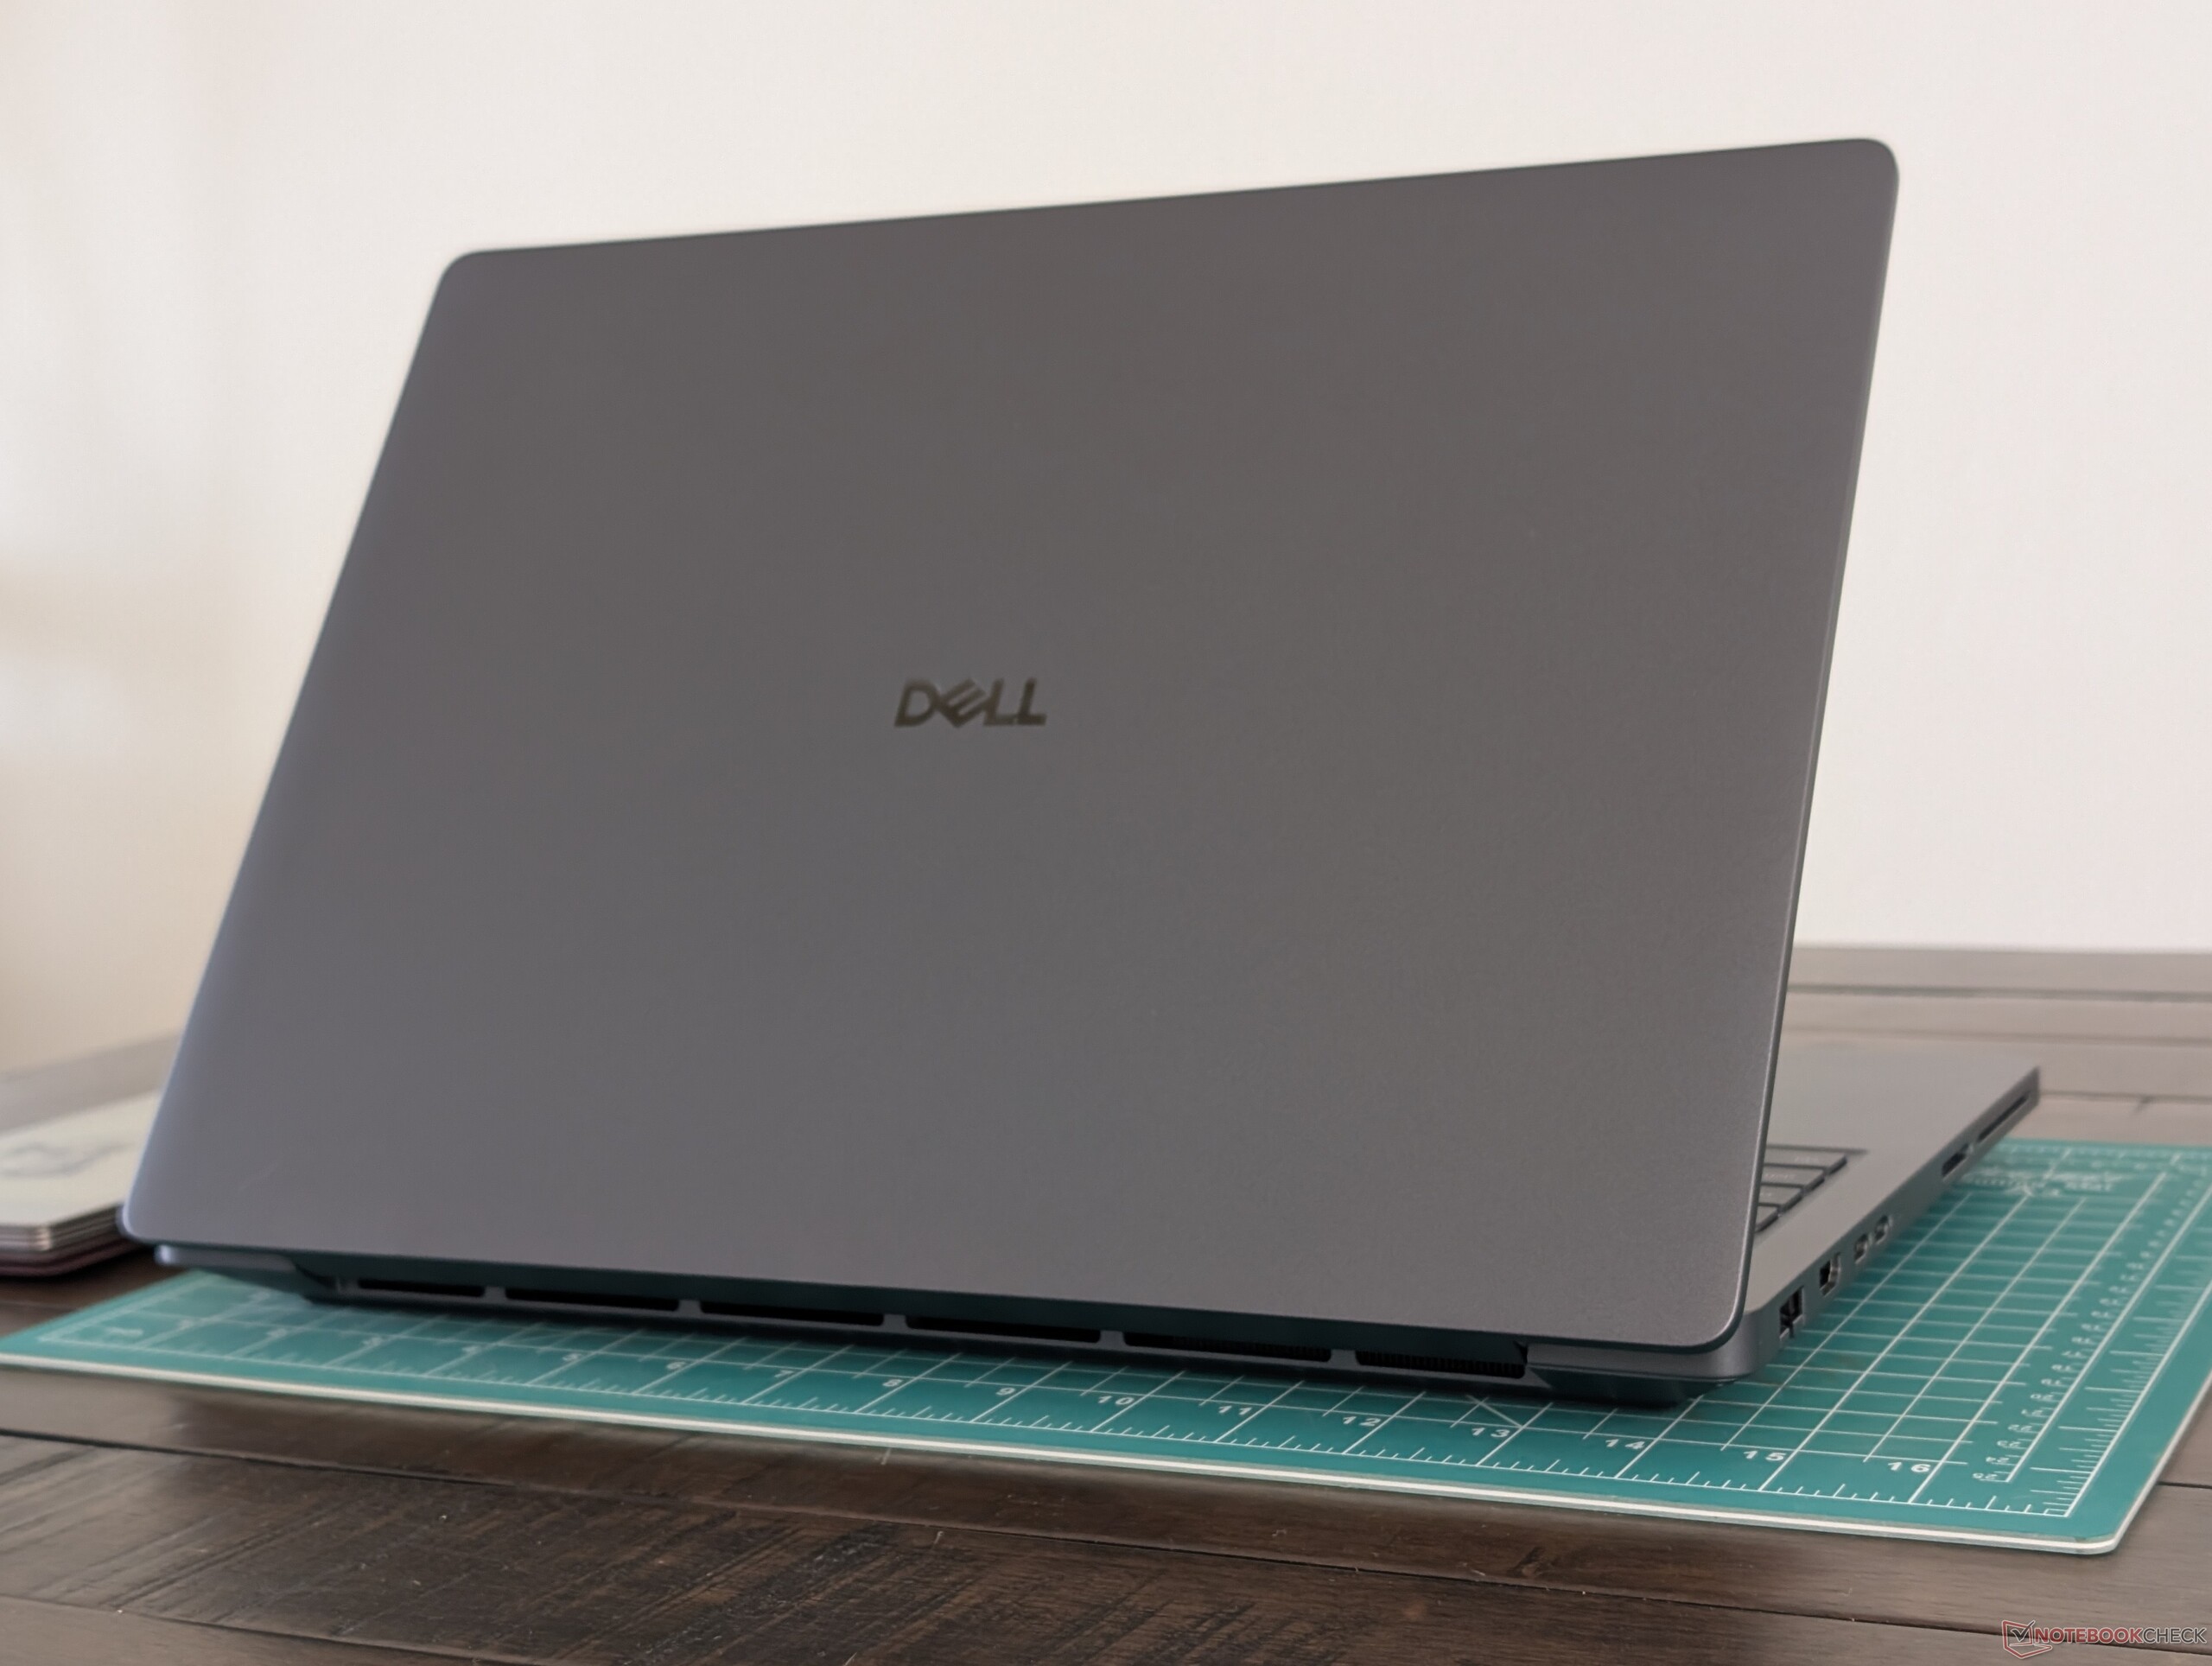
Het model is eigenlijk iets groter en dikker dan de 4 jaar oude Precision 7670. Desondanks maken de solide bouwkwaliteit en professionele functies zoals CAMM2, DGFF en modulaire USB-C repareerbaarheid de grotere afmetingen de investering meer dan waard.


Connectiviteit
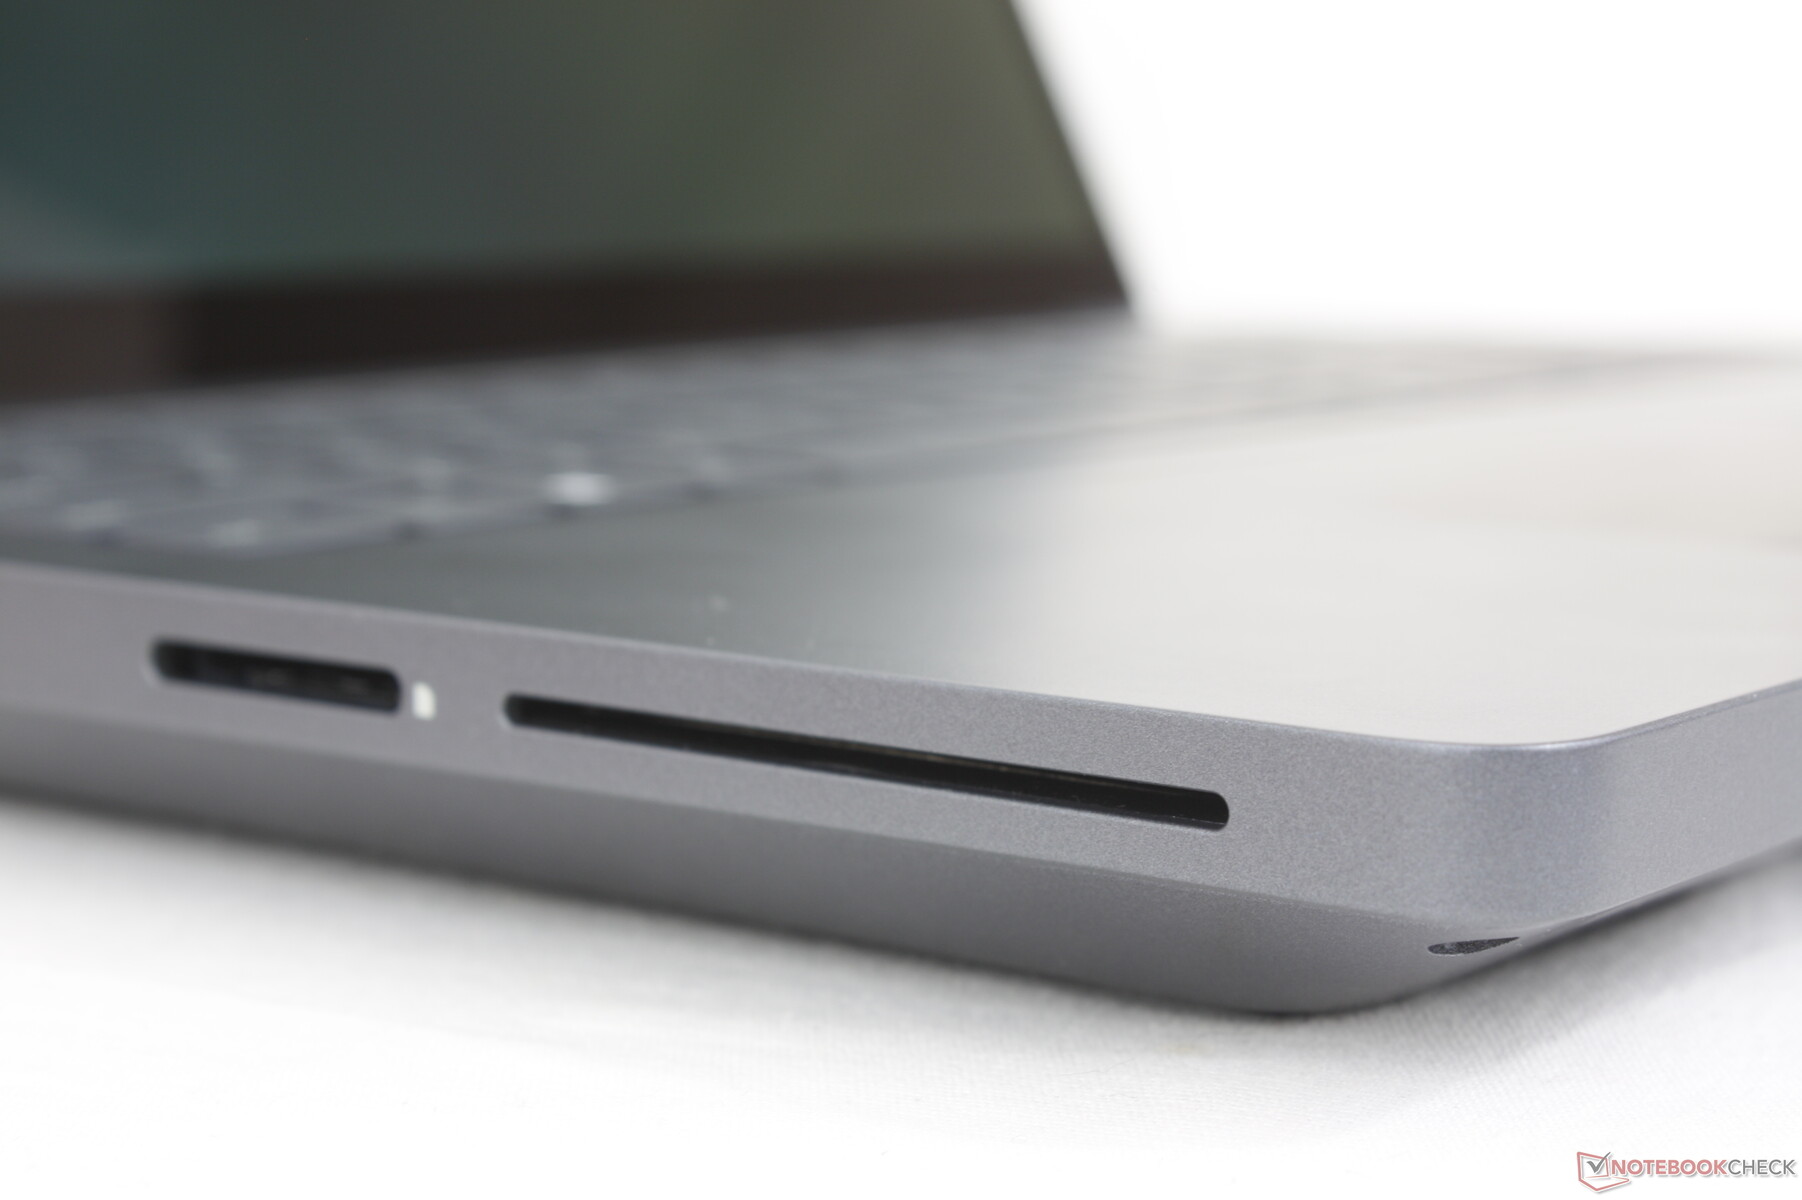
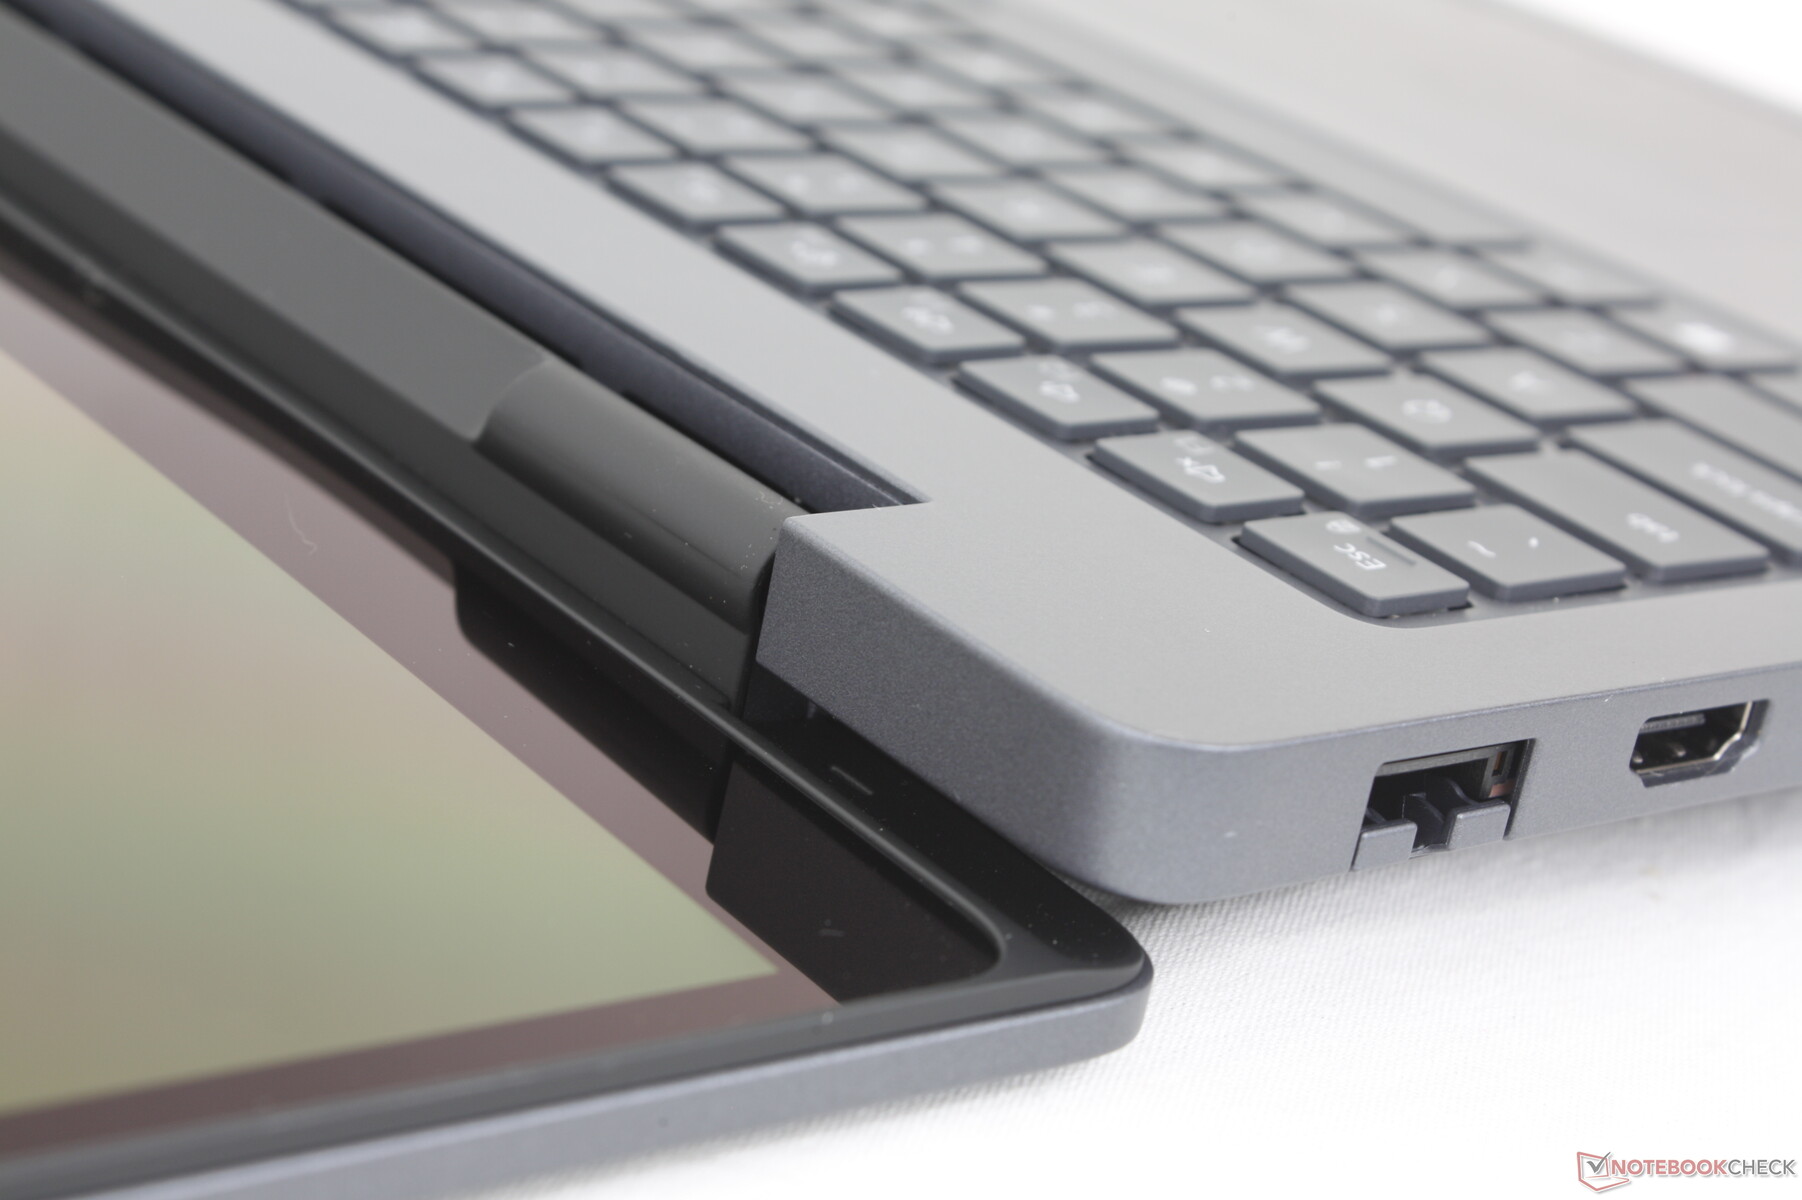
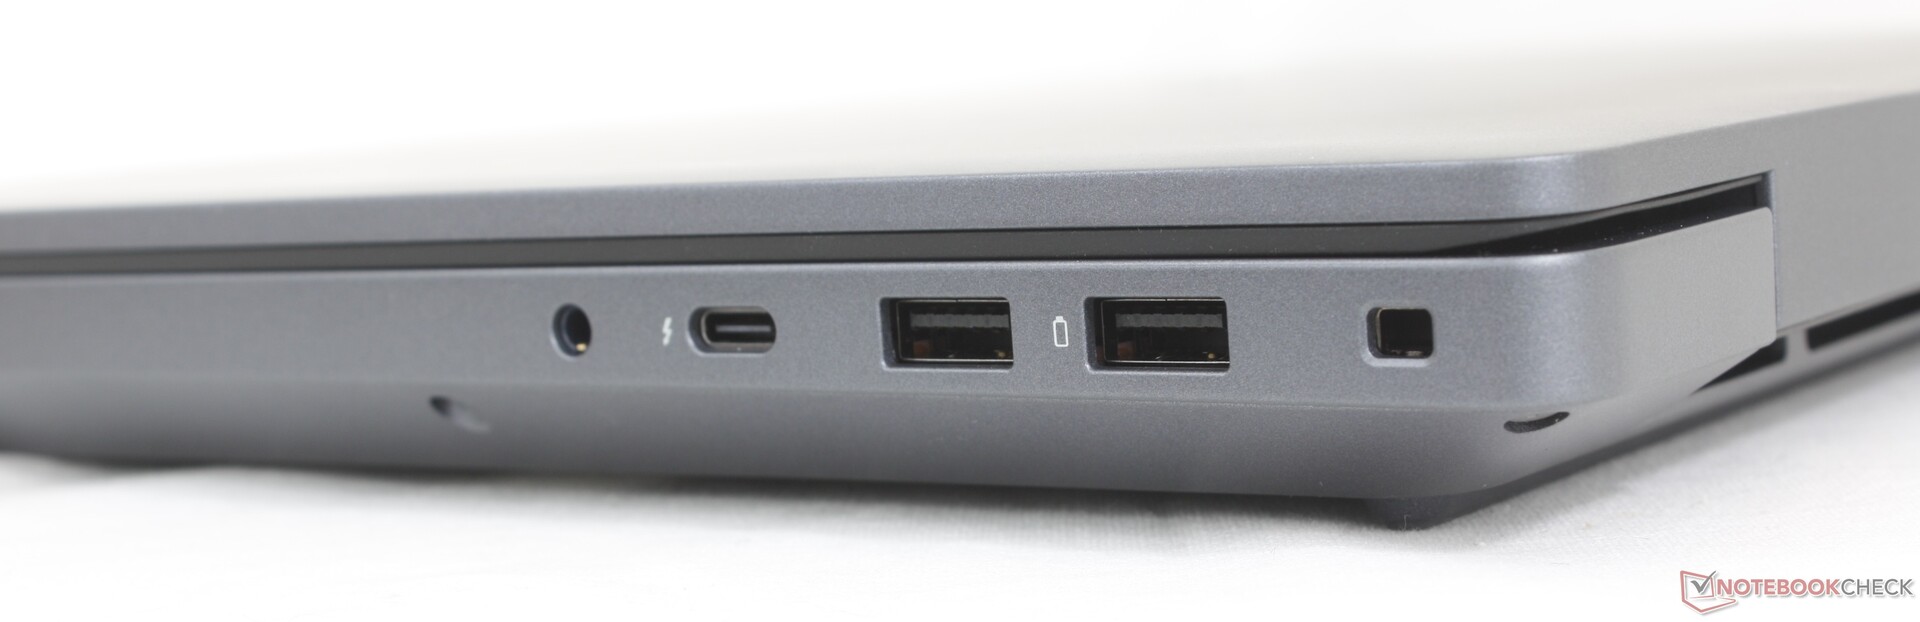
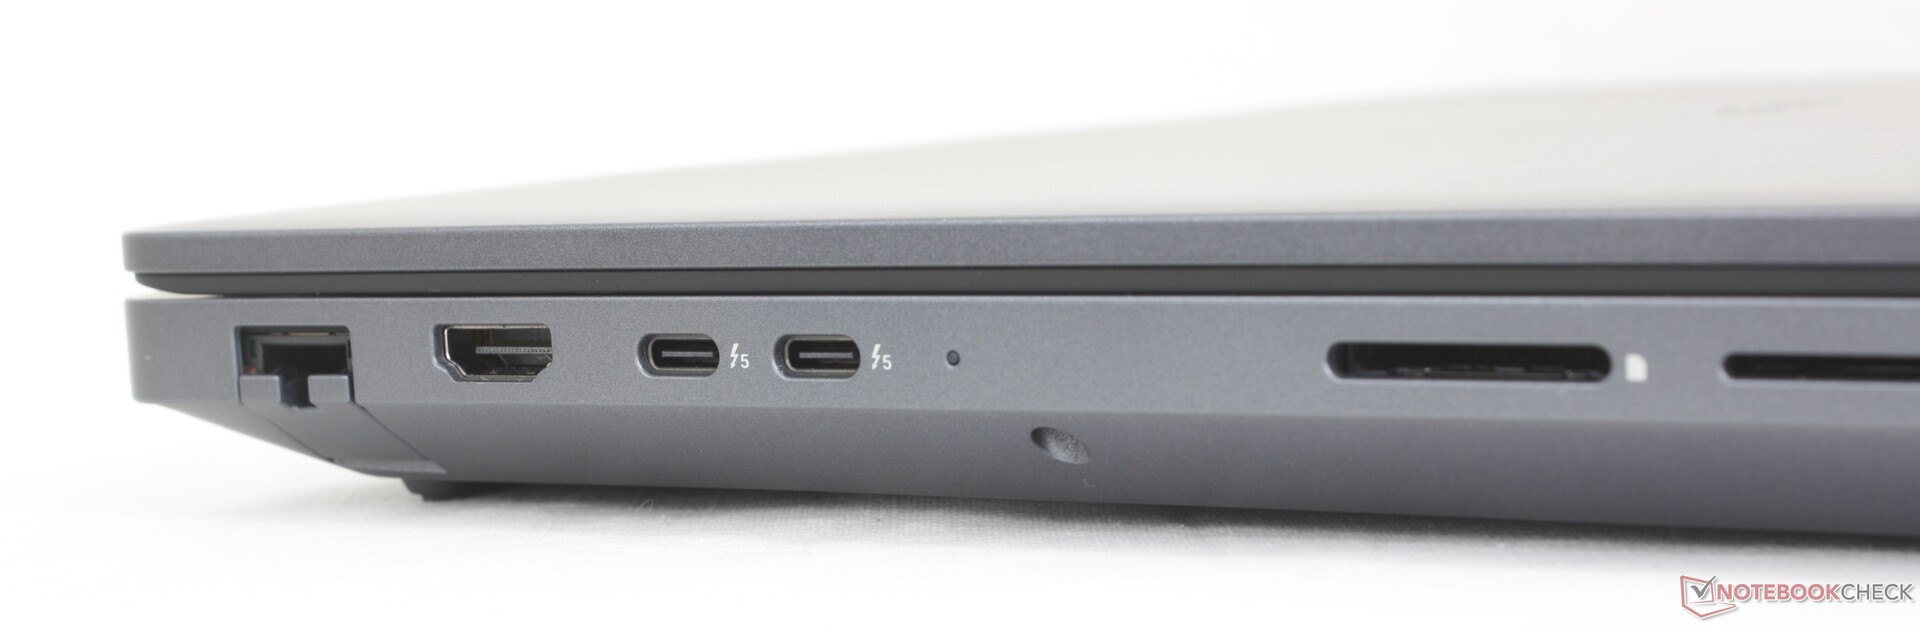
De poortopties zijn grotendeels identiek aan die van de Precision 7680, zij het met enkele belangrijke wijzigingen. De speciale AC-adapterpoort is bijvoorbeeld niet meer aanwezig op de Pro Max 16 Plus, wat betekent dat een van de drie USB-C poorten bijna altijd gebruikt zal worden voor oplaaddoeleinden. Ondertussen is Thunderbolt 5 nu standaard voor meer geavanceerde dockingmogelijkheden.
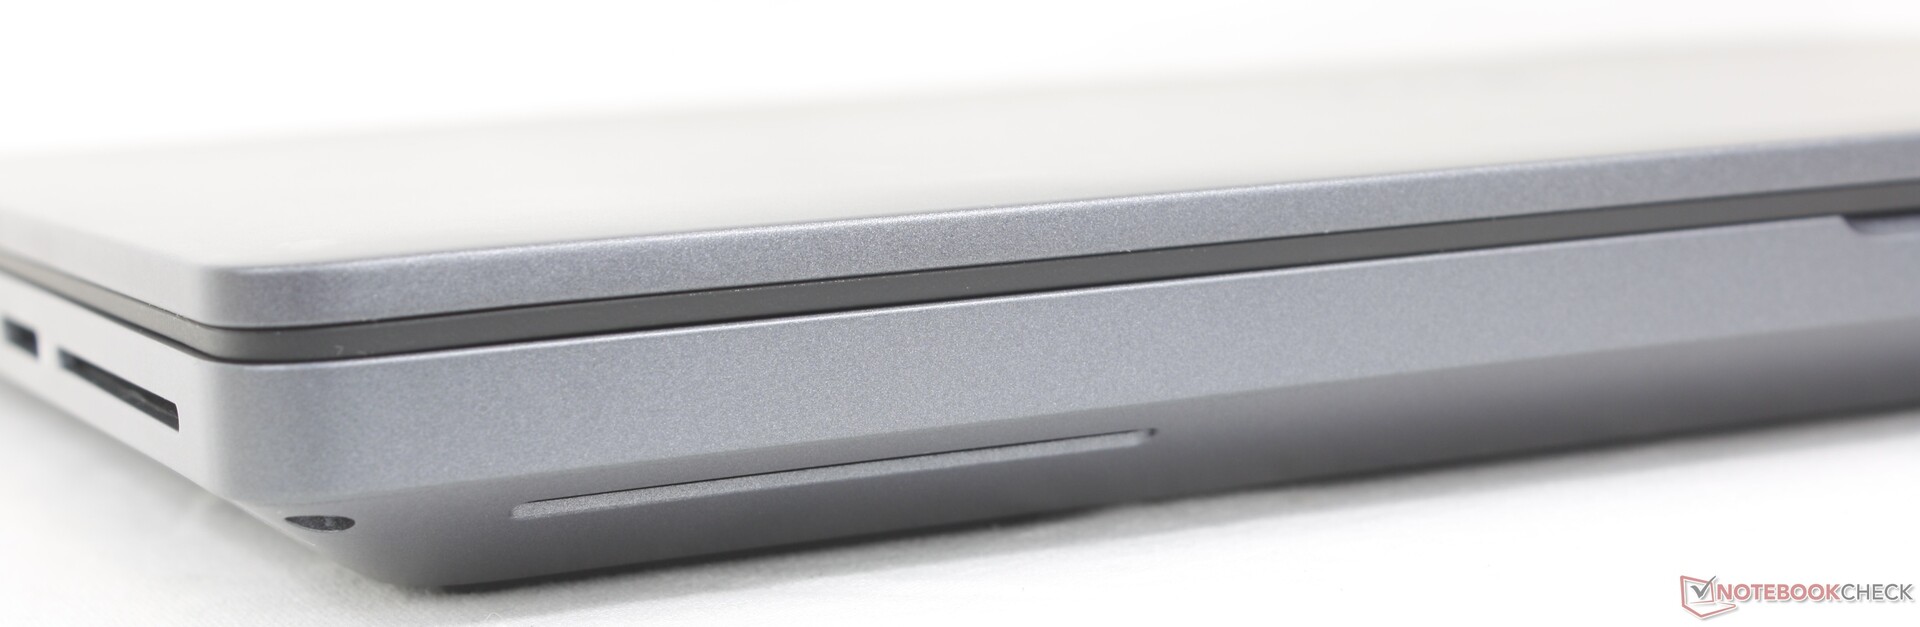

SD-kaartlezer
| SD Card Reader | |
| average JPG Copy Test (av. of 3 runs) | |
| Dell Precision 5000 5680 (Toshiba Exceria Pro SDXC 64 GB UHS-II) | |
| Lenovo ThinkPad P16 Gen 2 (Toshiba Exceria Pro SDXC 64 GB UHS-II) | |
| MSI CreatorPro Z16P B12UKST (AV Pro V60) | |
| Dell Pro Max 16 Plus (Toshiba Exceria Pro SDXC 64 GB UHS-II) | |
| Lenovo ThinkPad P1 Gen 7 21KV001SGE (AV Pro V60) | |
| maximum AS SSD Seq Read Test (1GB) | |
| Dell Precision 5000 5680 (Toshiba Exceria Pro SDXC 64 GB UHS-II) | |
| Dell Pro Max 16 Plus (Toshiba Exceria Pro SDXC 64 GB UHS-II) | |
| Lenovo ThinkPad P1 Gen 7 21KV001SGE (AV Pro V60) | |
| Lenovo ThinkPad P16 Gen 2 (Toshiba Exceria Pro SDXC 64 GB UHS-II) | |
| MSI CreatorPro Z16P B12UKST (AV Pro V60) | |
Communicatie
Webcam
Optionele 8 MP webcam met IR en fysieke sluiter.


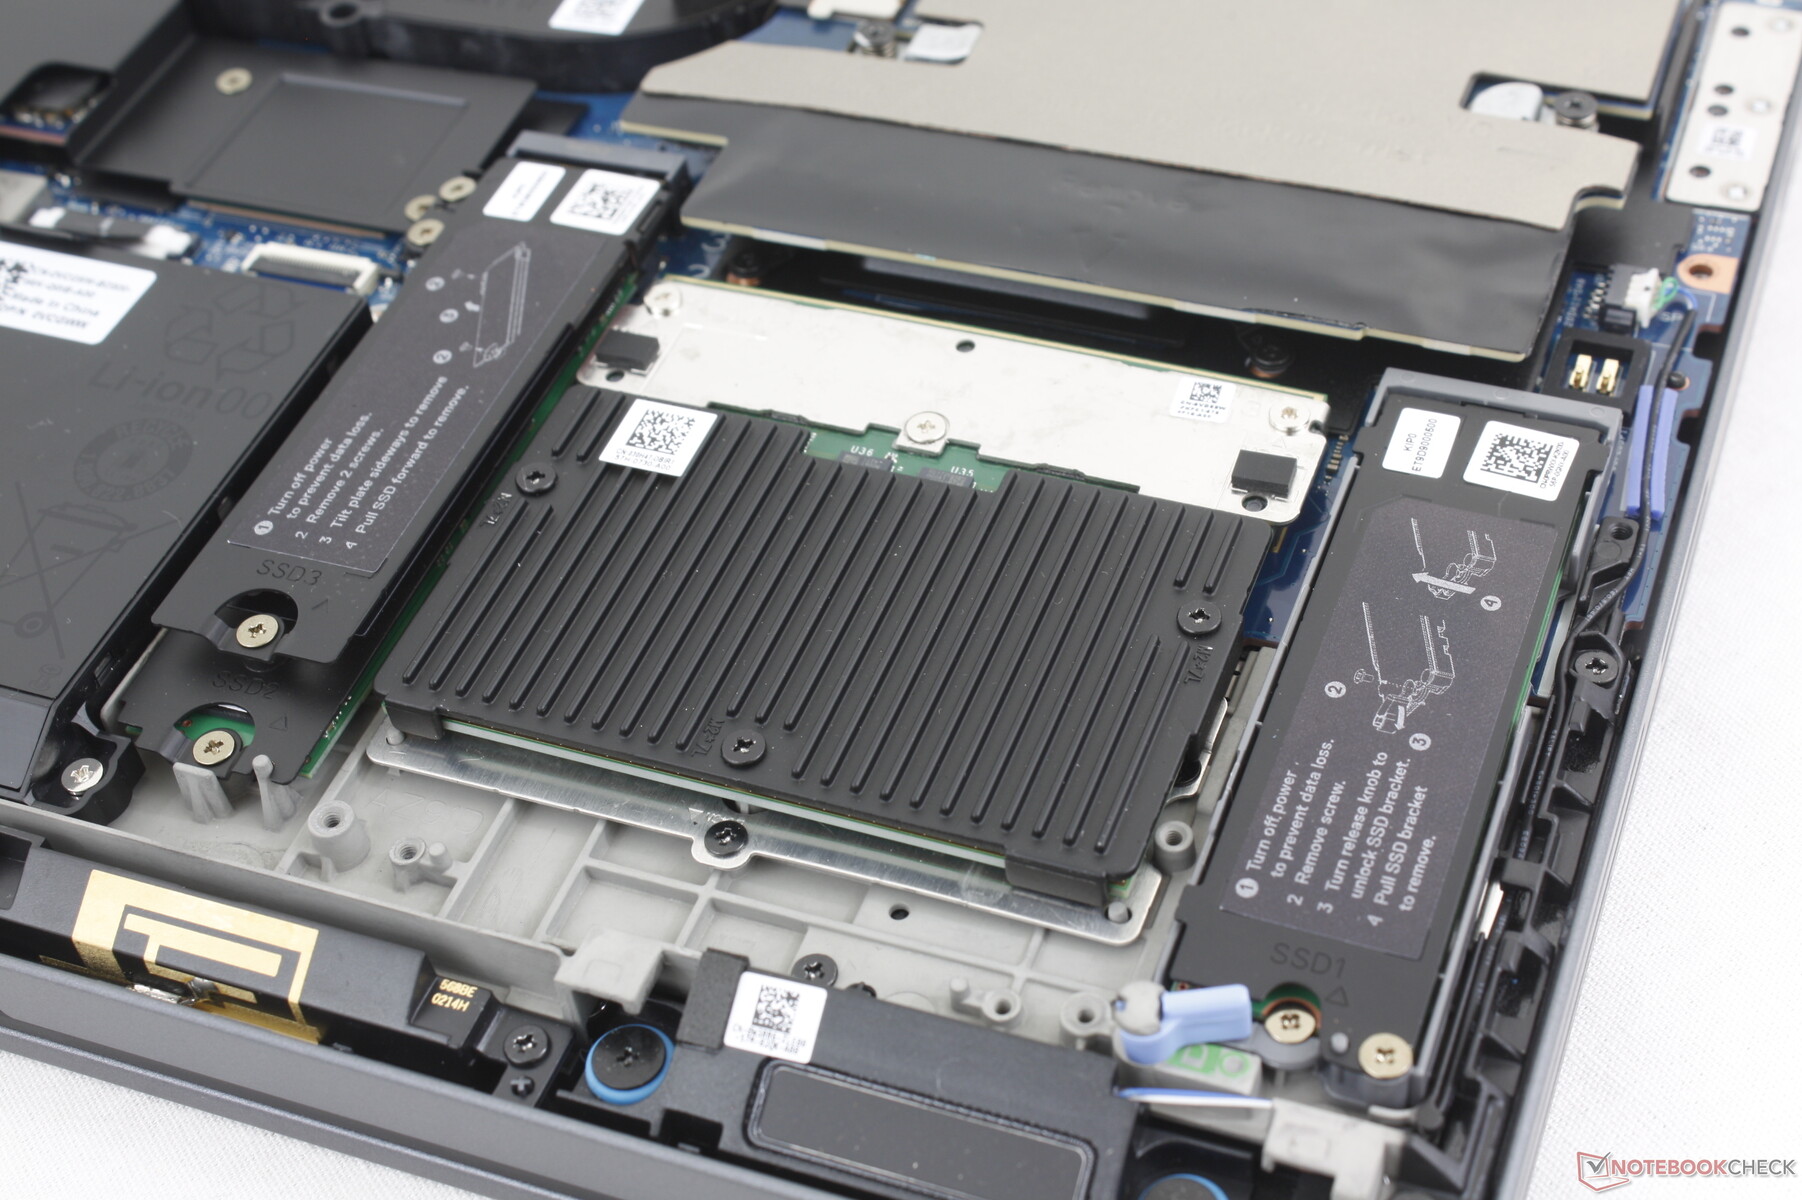
Onderhoud
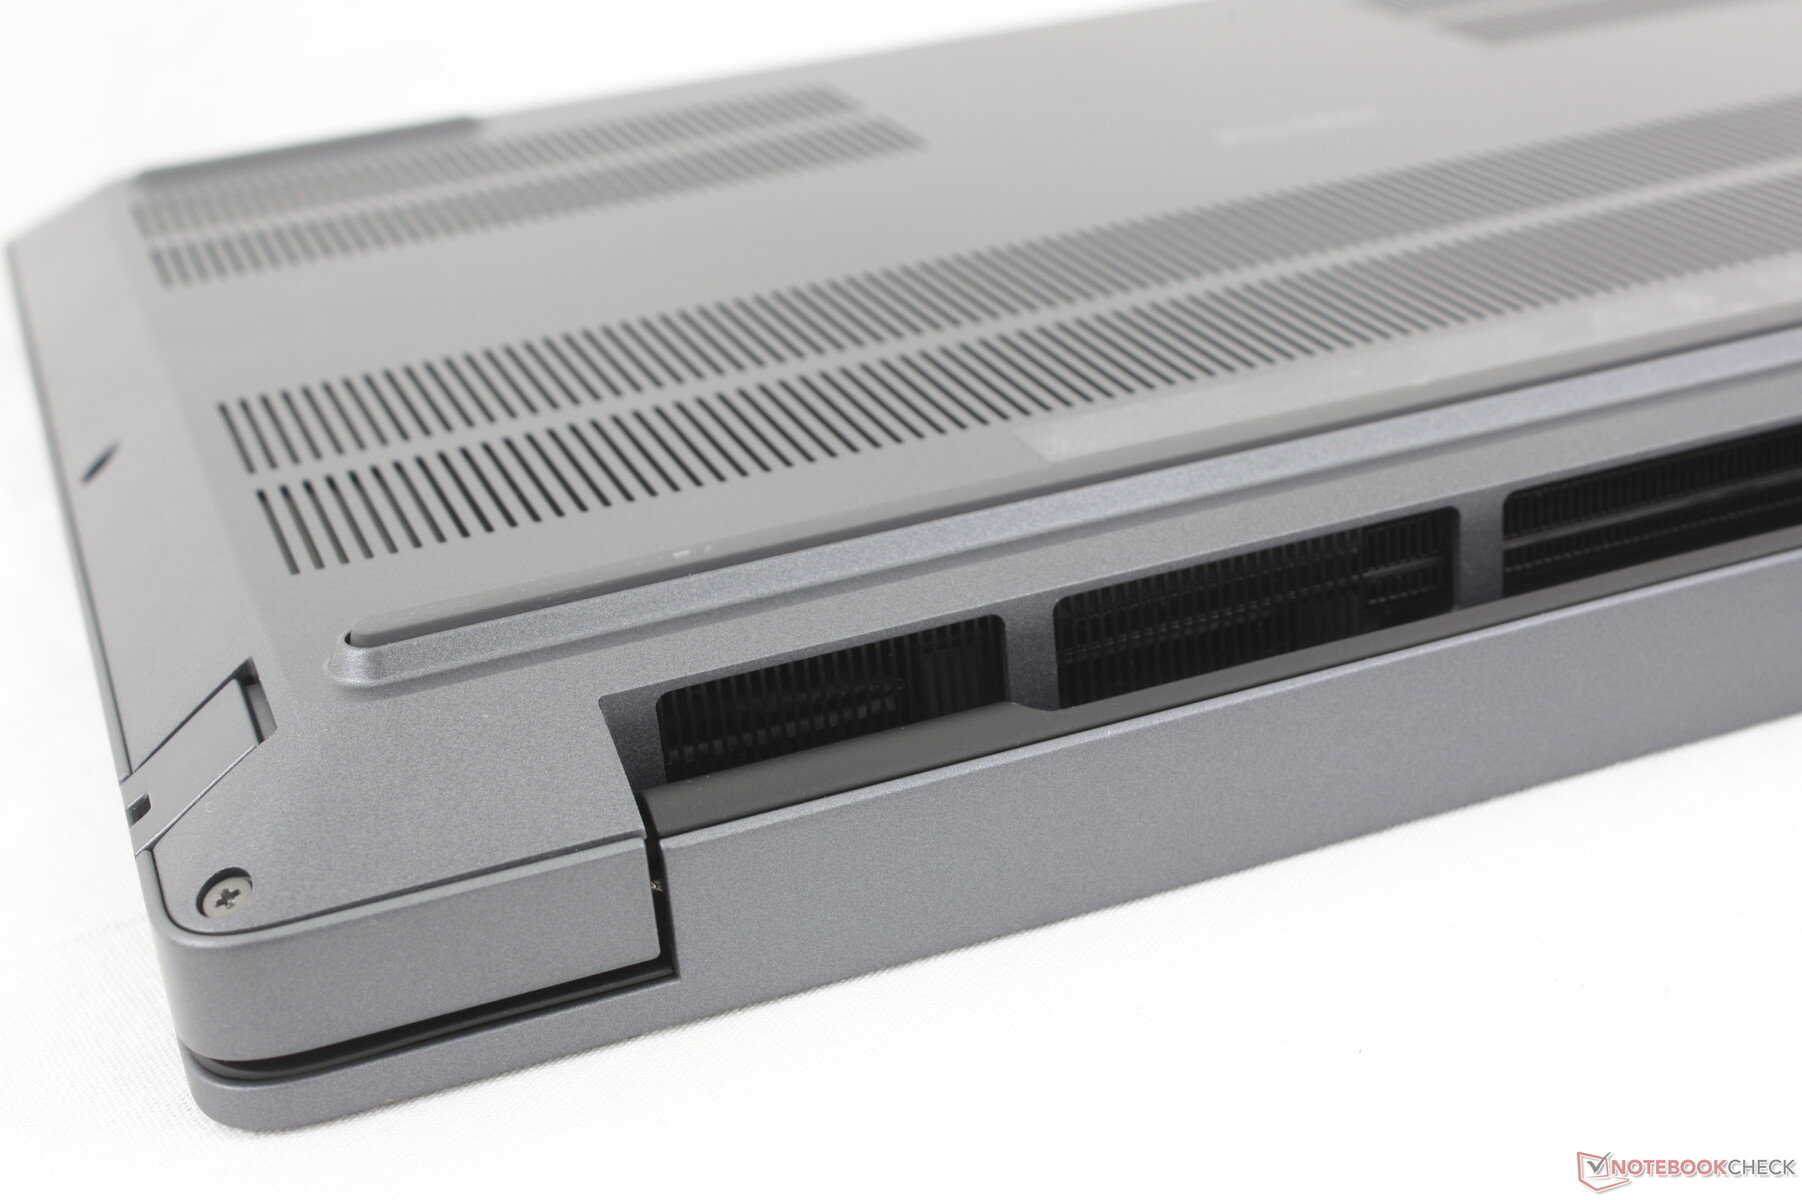
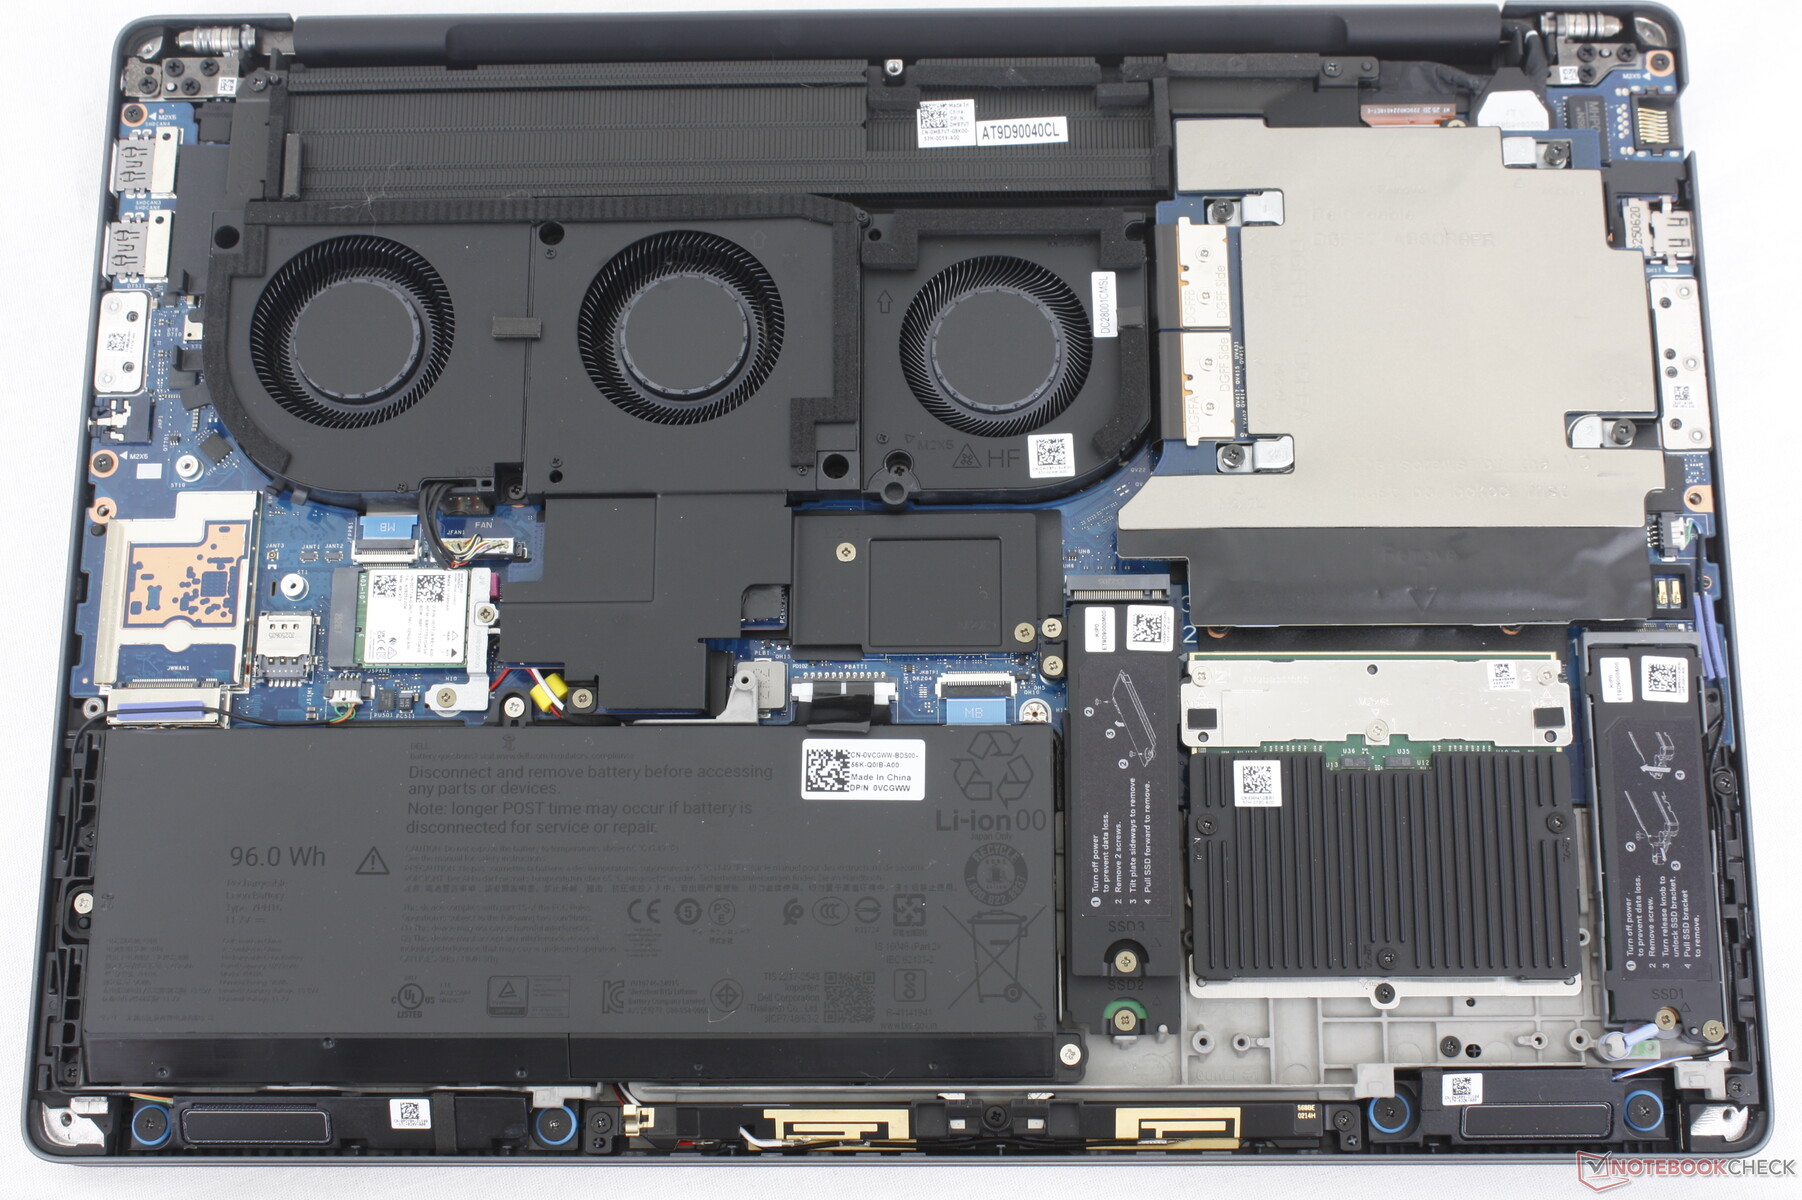
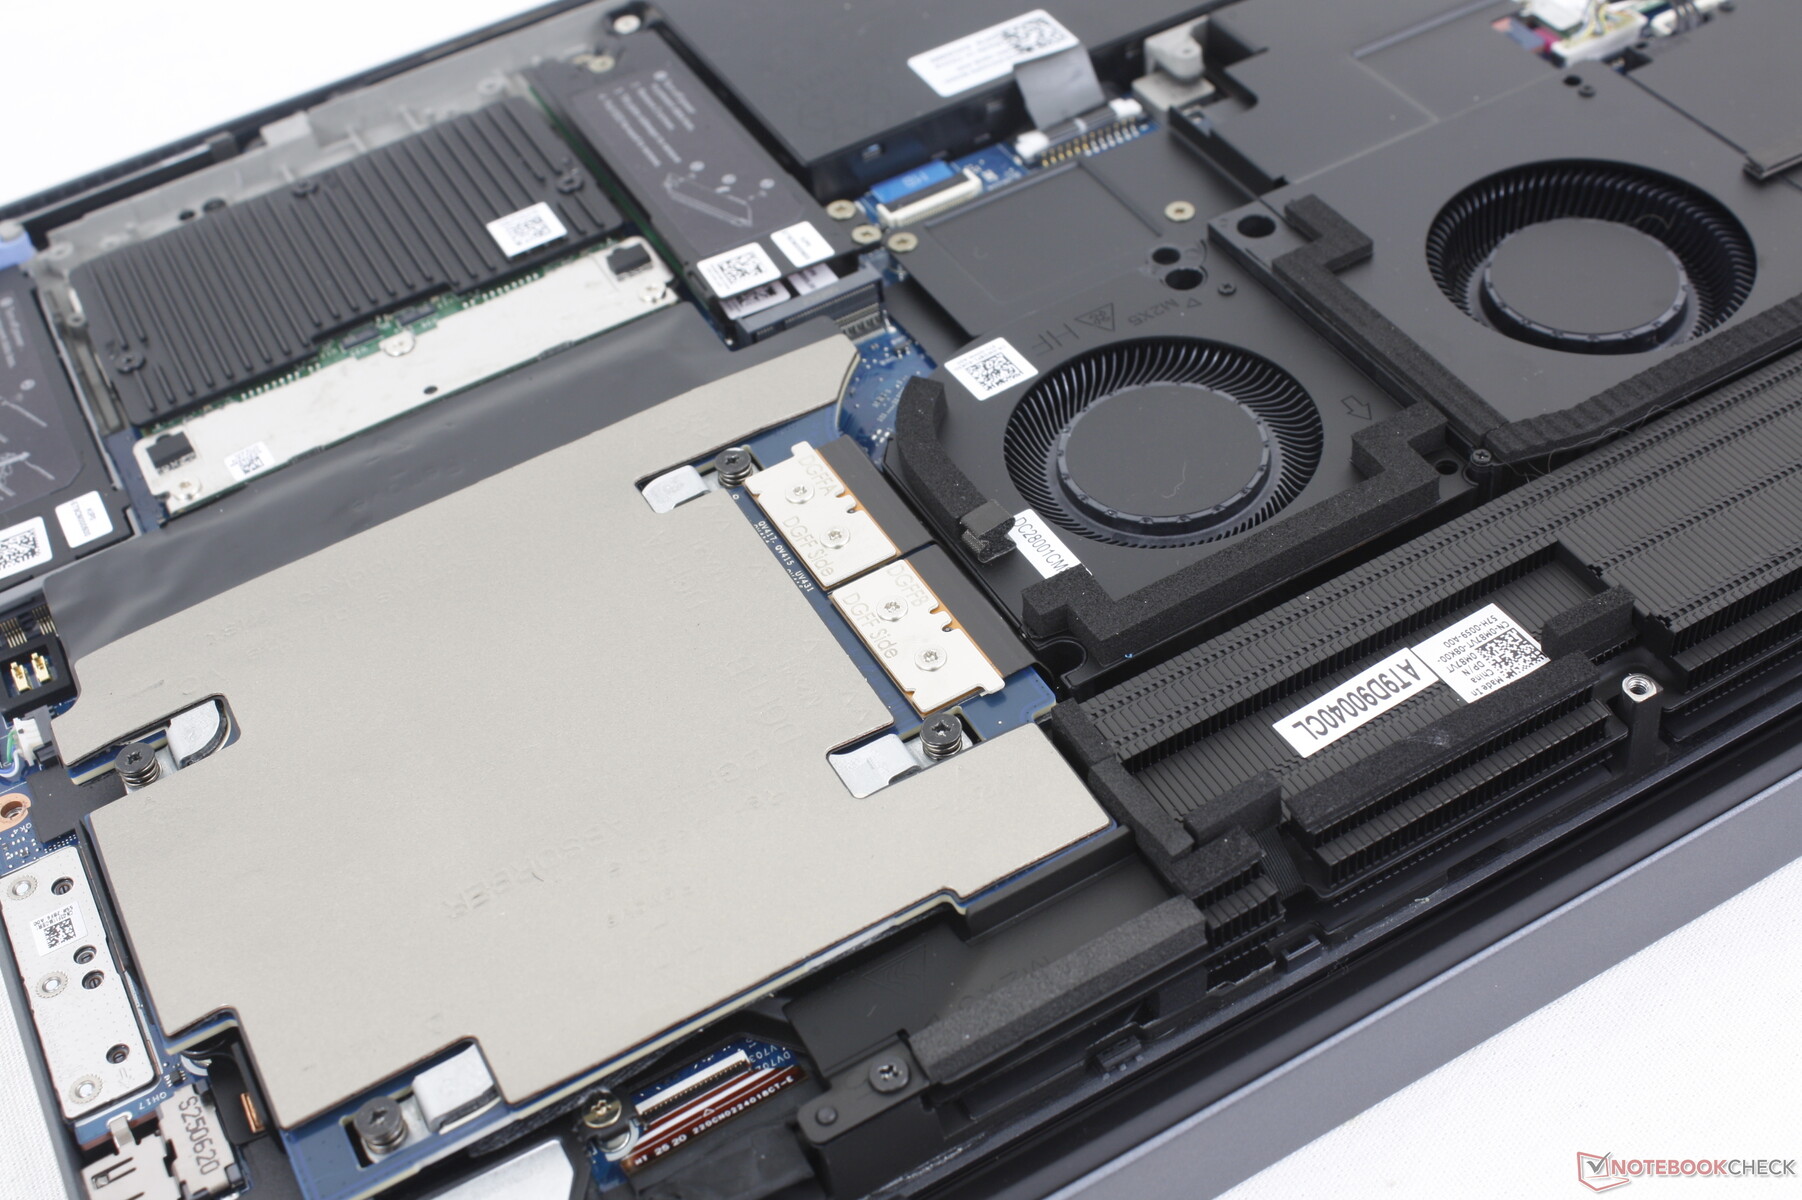
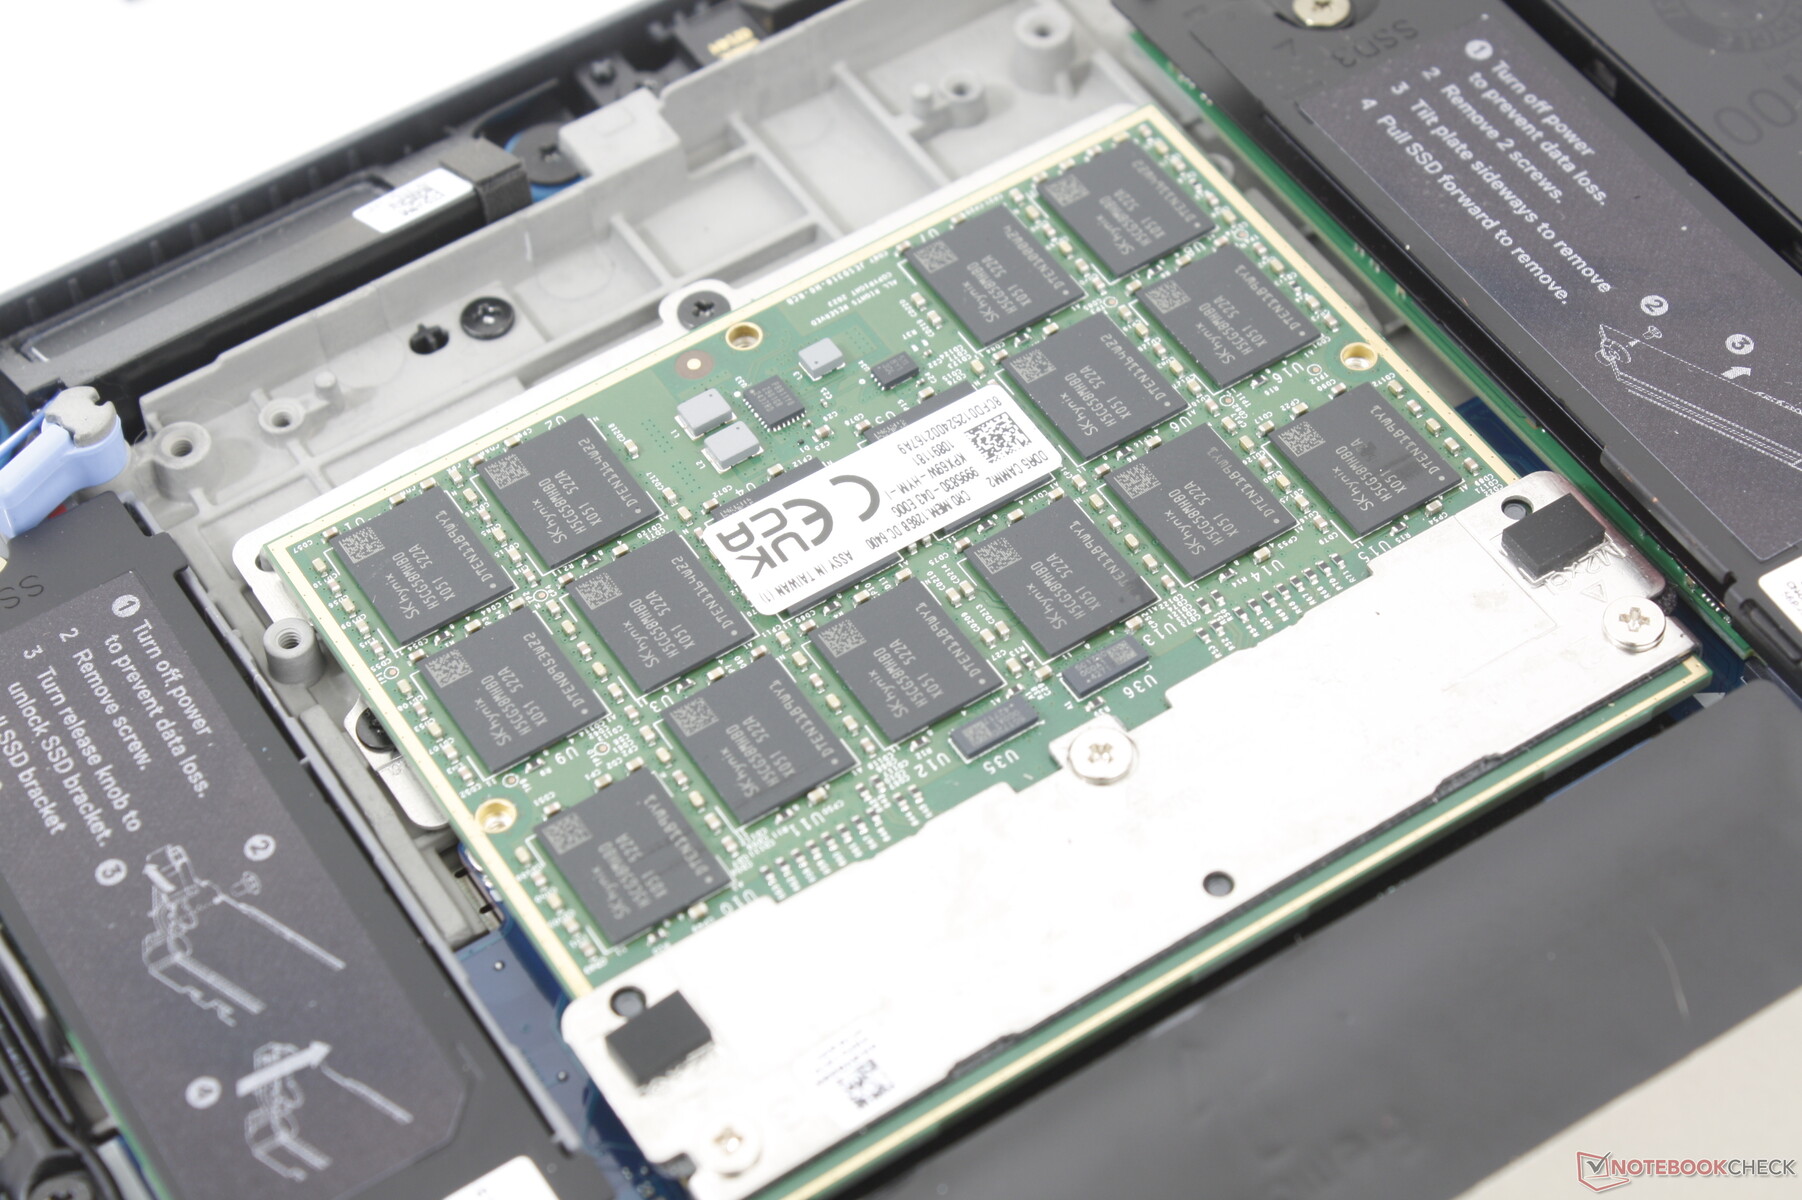
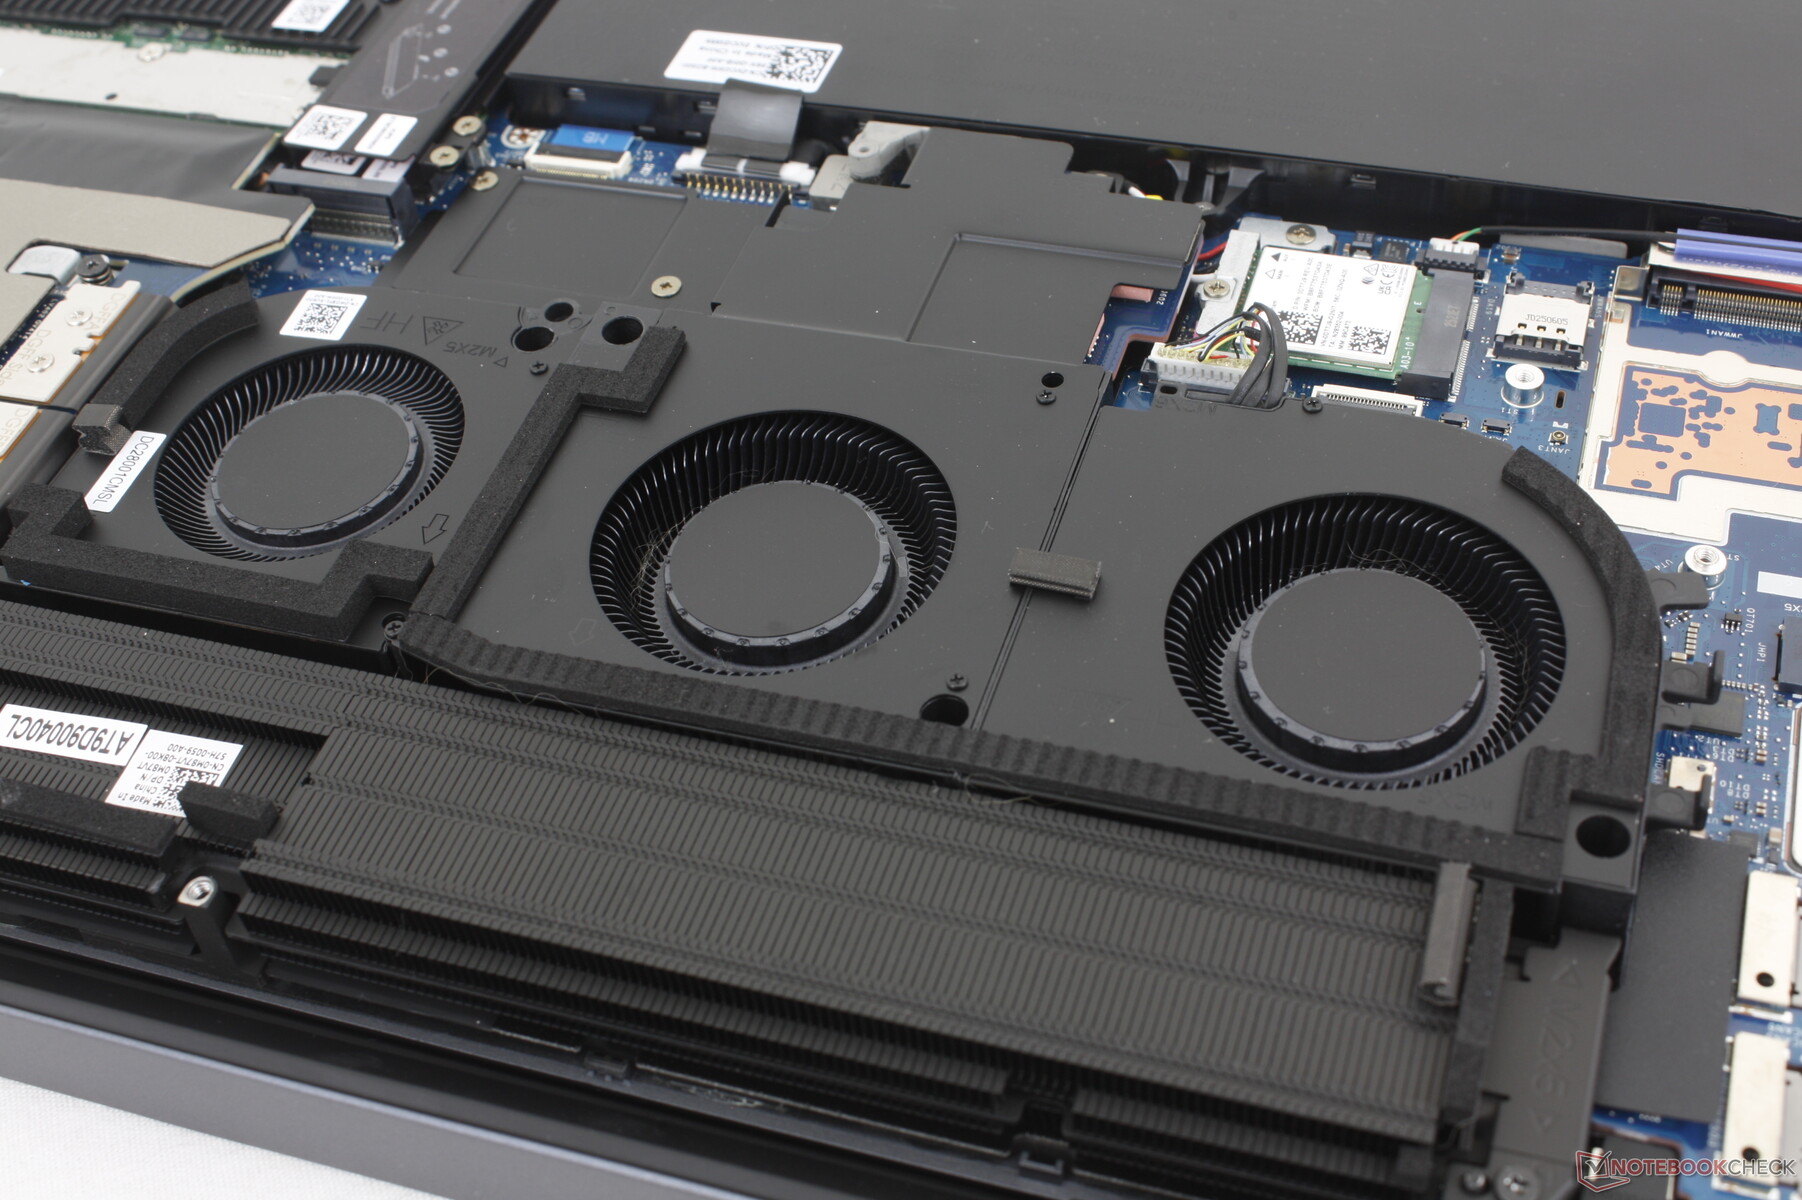
Voor het verwijderen van het onderpaneel is alleen een kruiskopschroevendraaier nodig, zodat u gemakkelijk bij de interne onderdelen kunt komen. De CAMM2-module, twee M.2 2280 SSD-sleuven, WLAN-module en grafische kaart (DGFF) zijn allemaal verwijderbaar.
De SSD "drive deur" die op het oudere Precision 7670/7680 ontwerp zat, is weggelaten.
Duurzaamheid
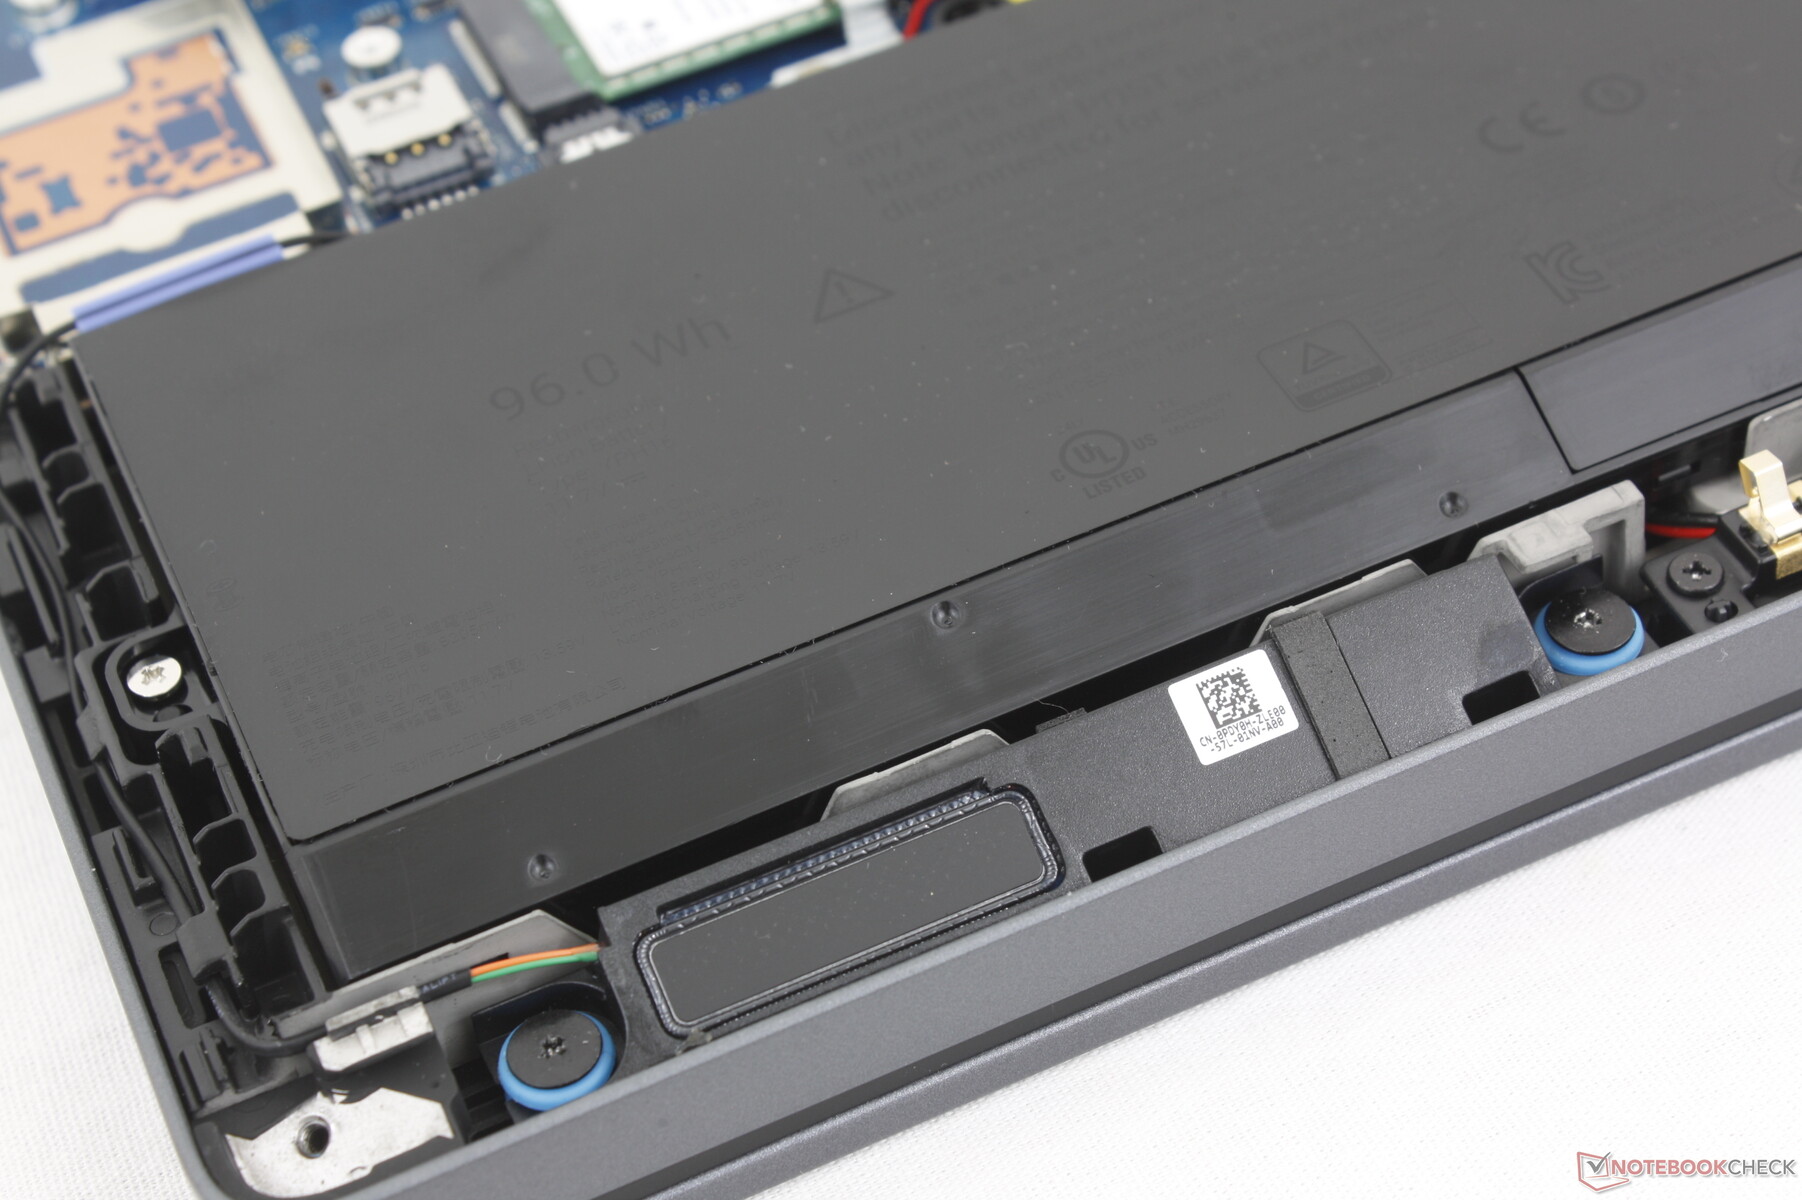
Het chassis bestaat voor 90 procent uit gerecycled magnesium voor de boven- en onderkant, voor 30 procent uit PCC-kunststof voor de handpalmsteunen, voor 46 procent uit biokunststof voor de onderkant van de bumpers en voor 50 procent uit gerecycled kobalt voor de 96 Whr-batterij. Dit model is ook een van de eerste modellen van Dell met modulaire USB-C poorten voor eenvoudige vervanging, mochten de poorten ooit breken of losraken door overmatig gebruik.
Accessoires en garantie
Er zitten geen extra's in de doos behalve de wisselstroomadapter en papierwerk. Standaard krijgt u drie jaar fabrieksgarantie.
Invoerapparaten
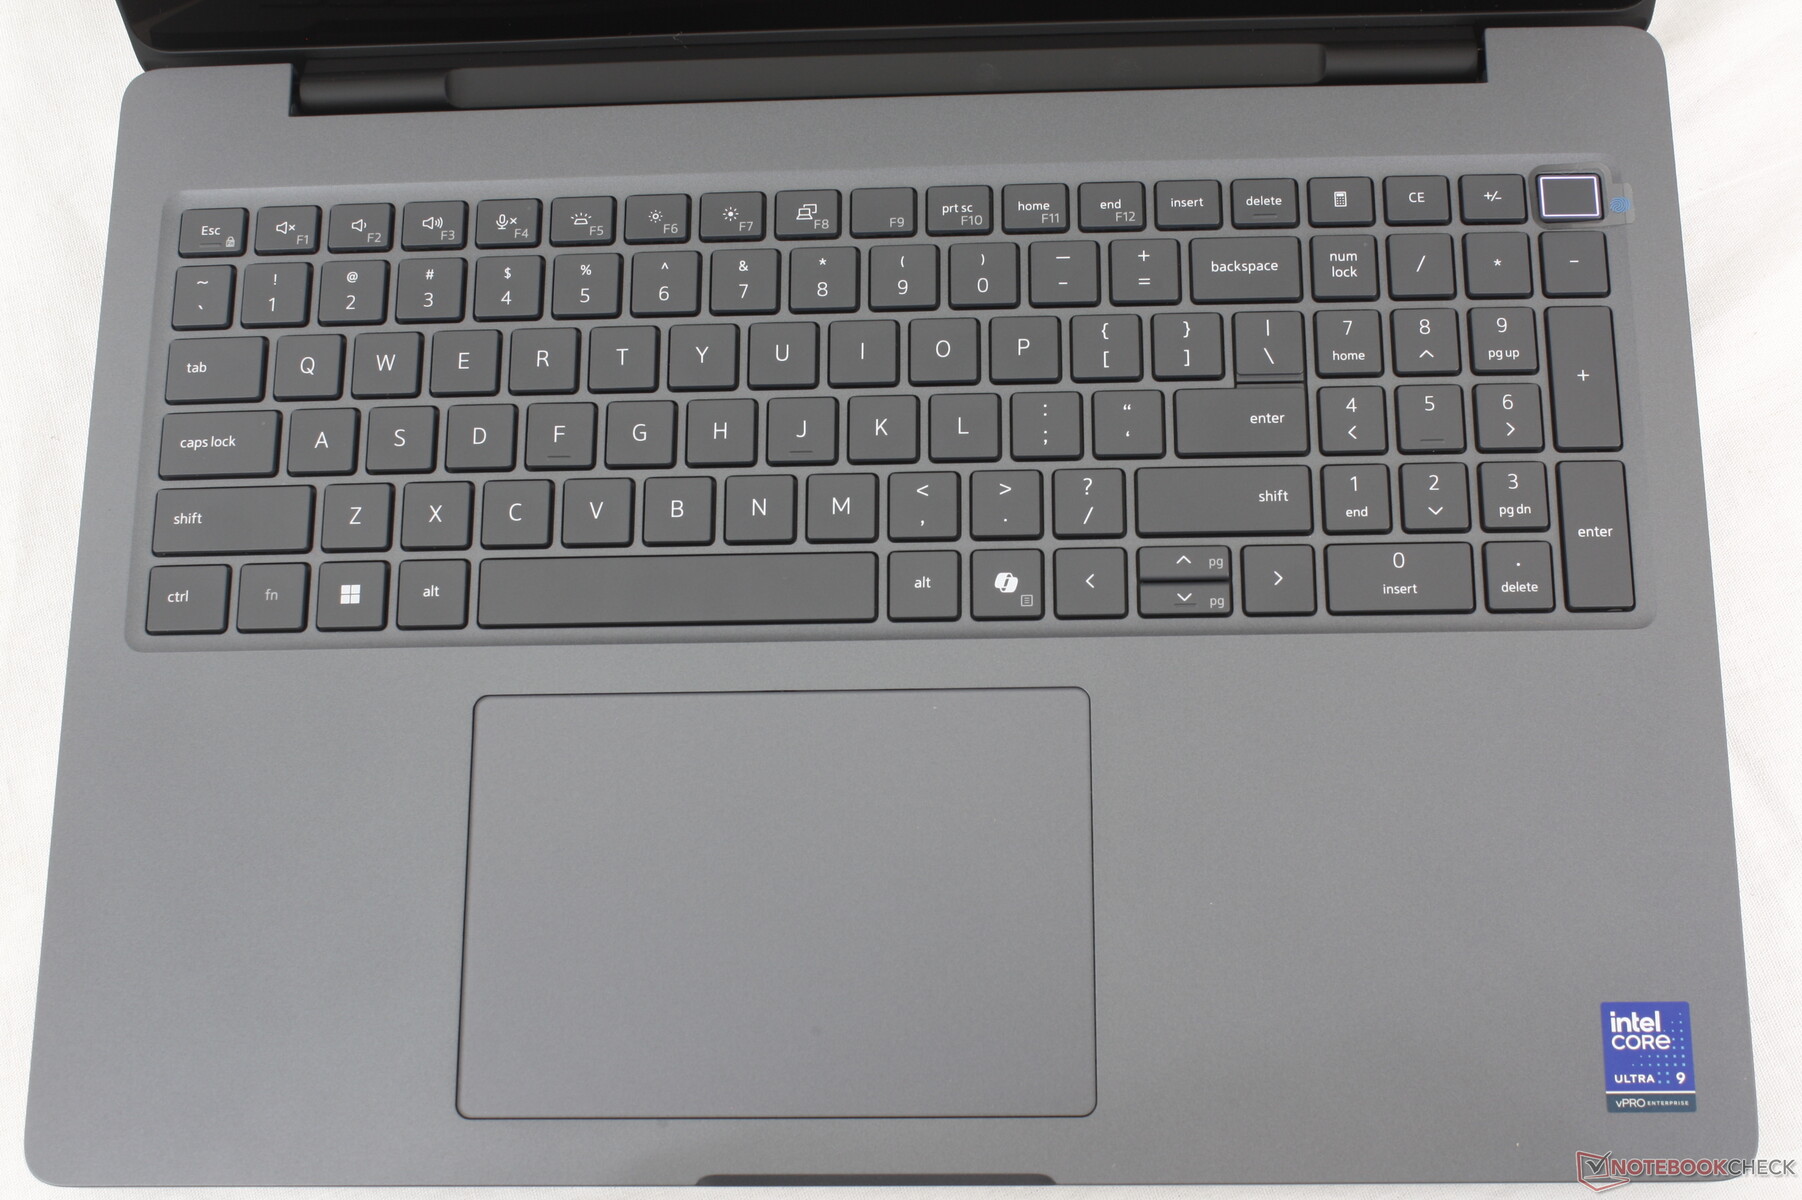
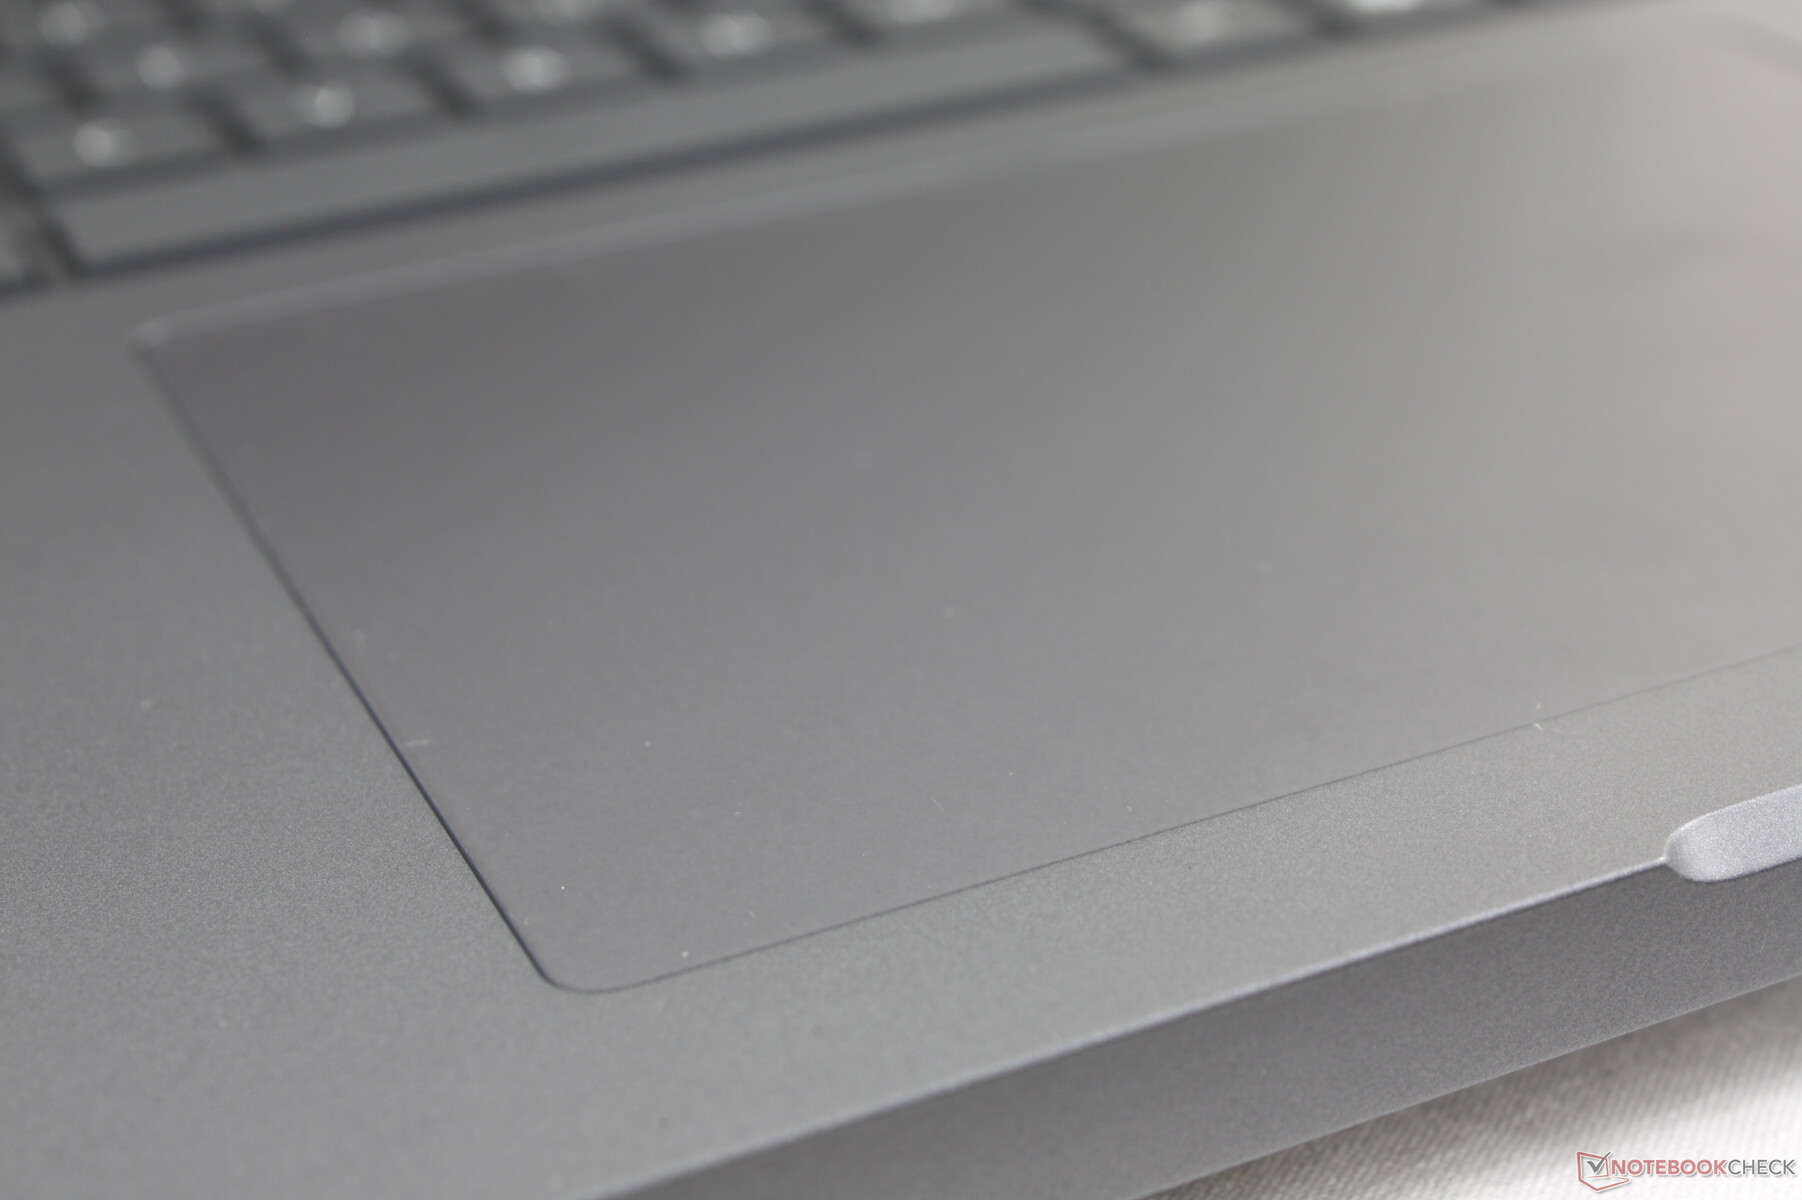
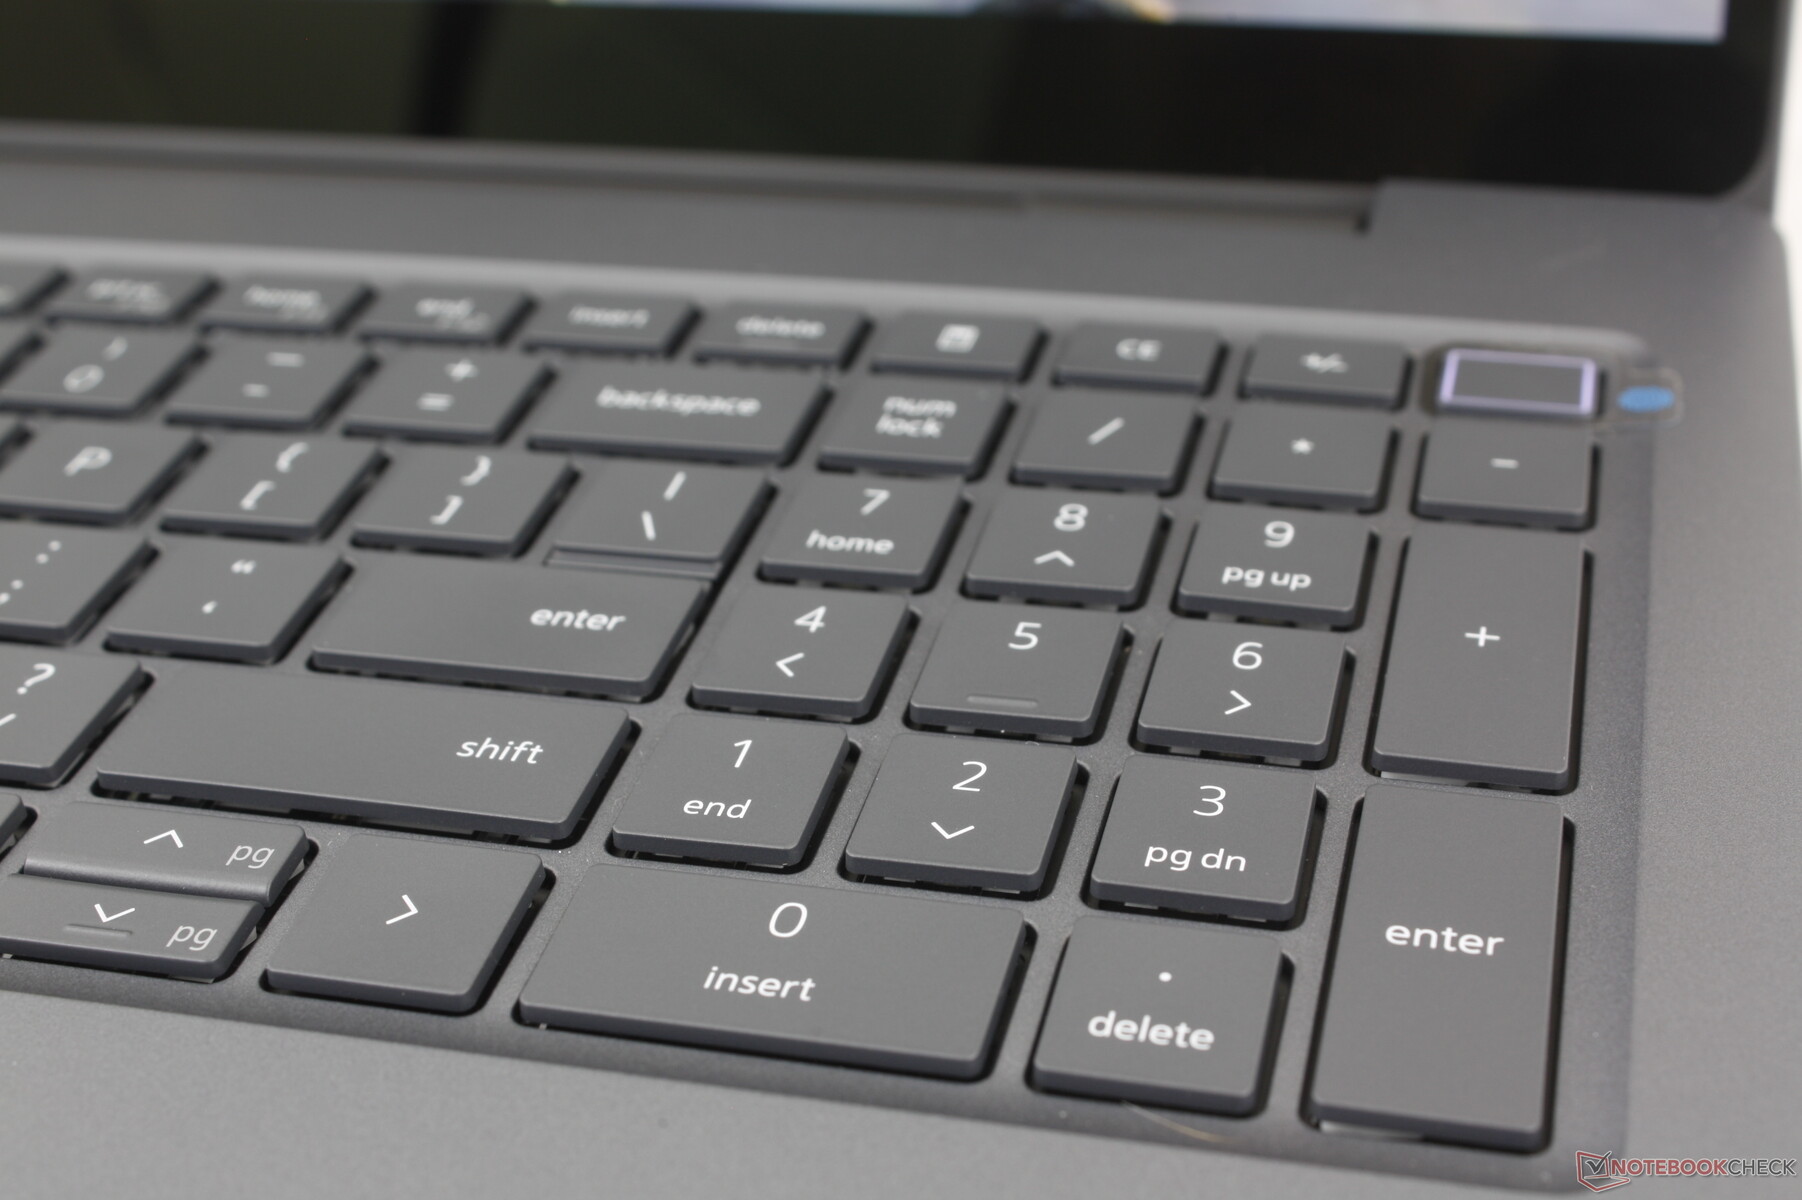
Toetsenbord en touchpad

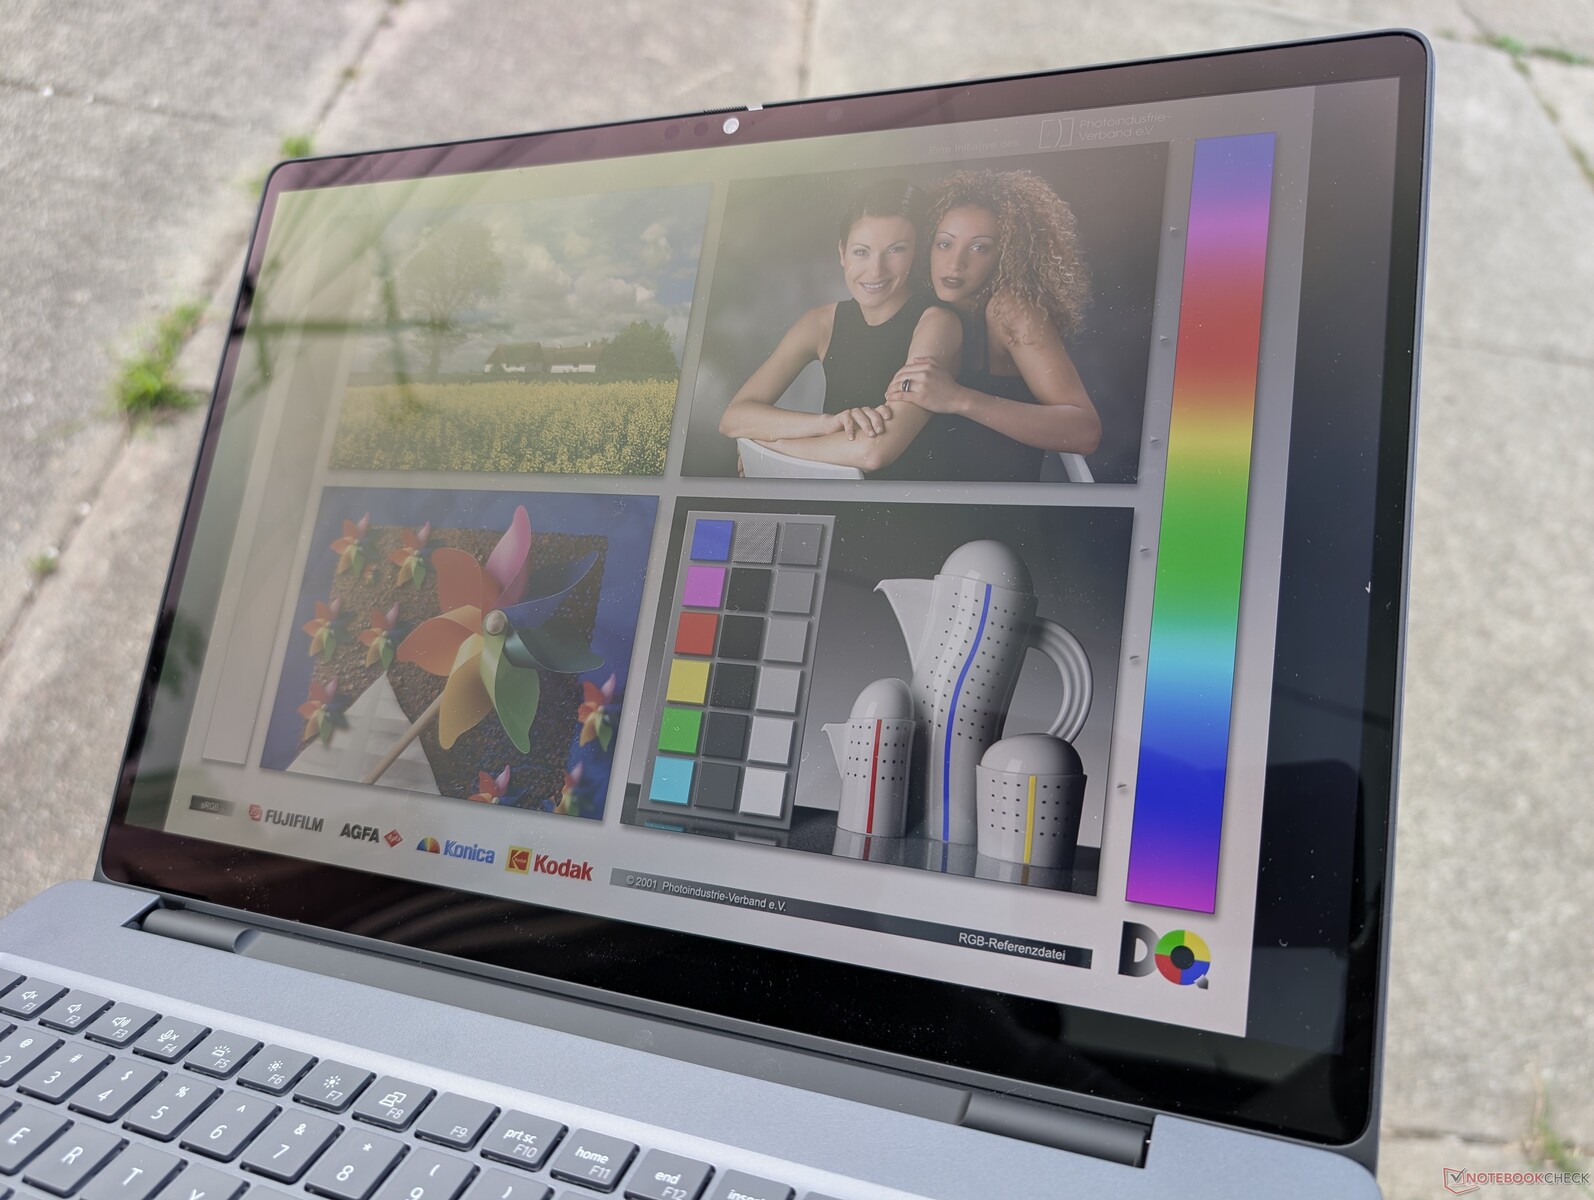
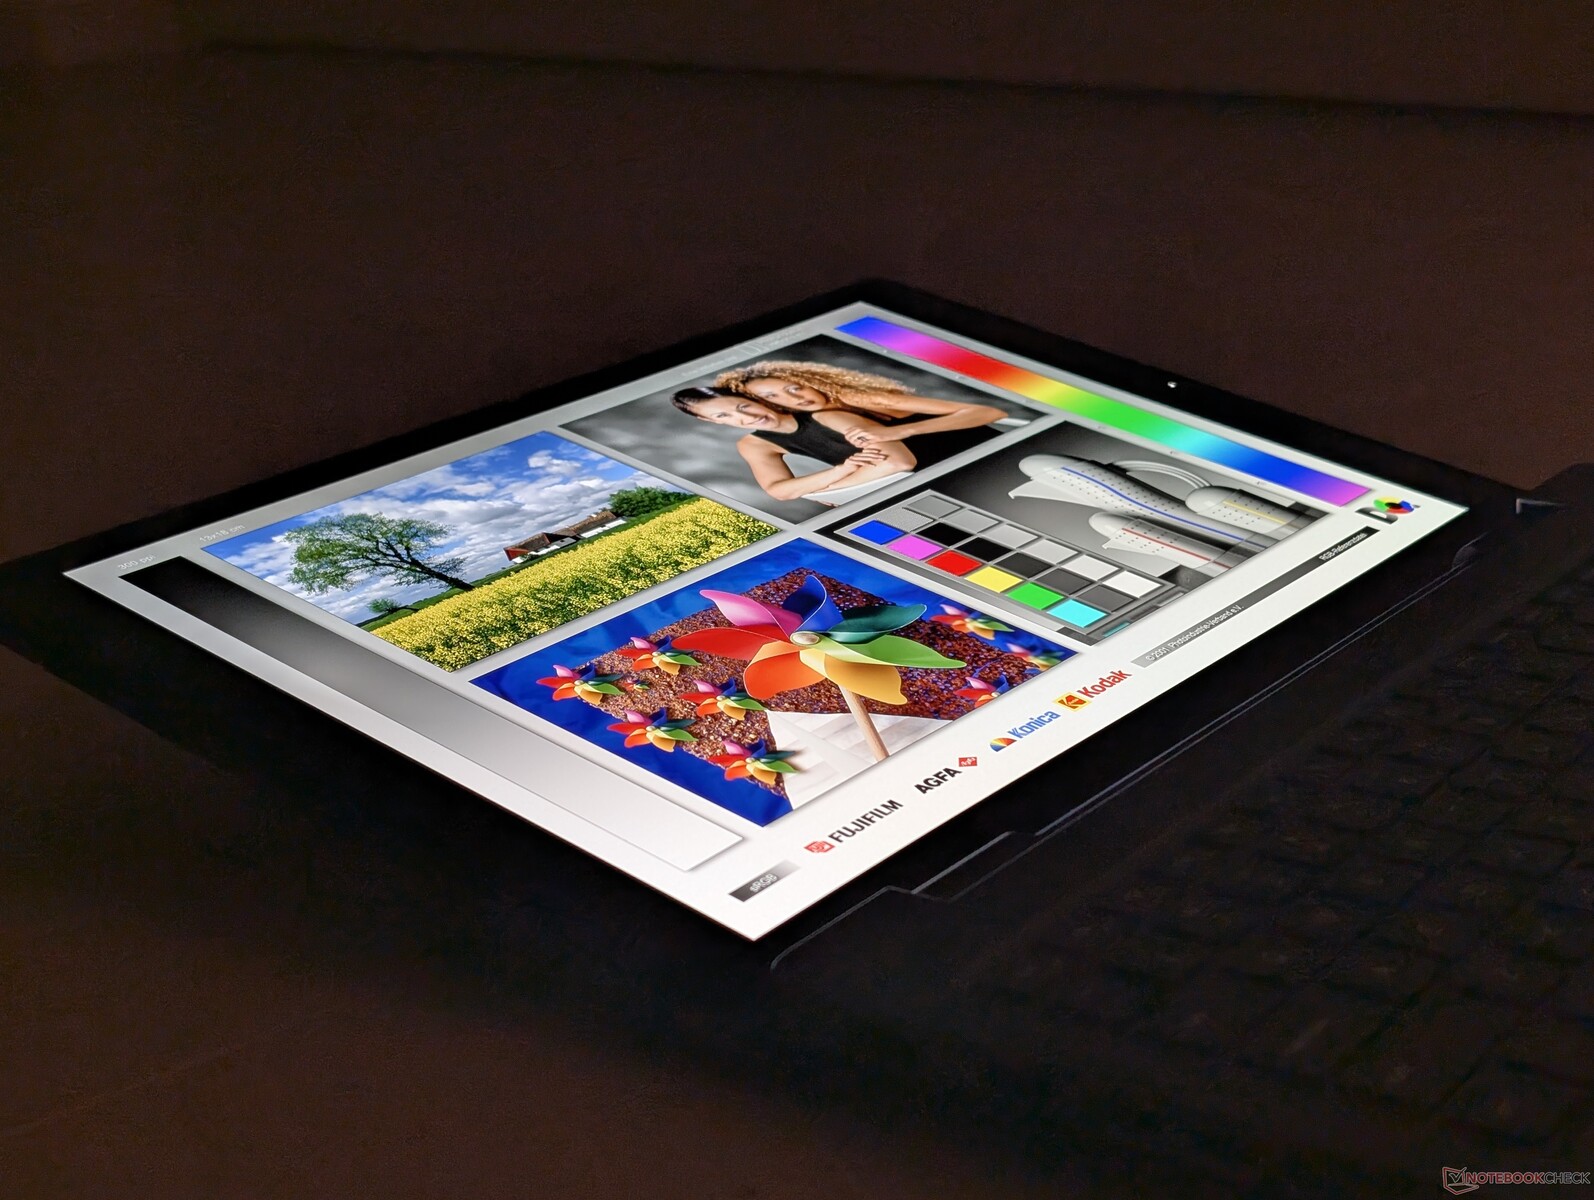
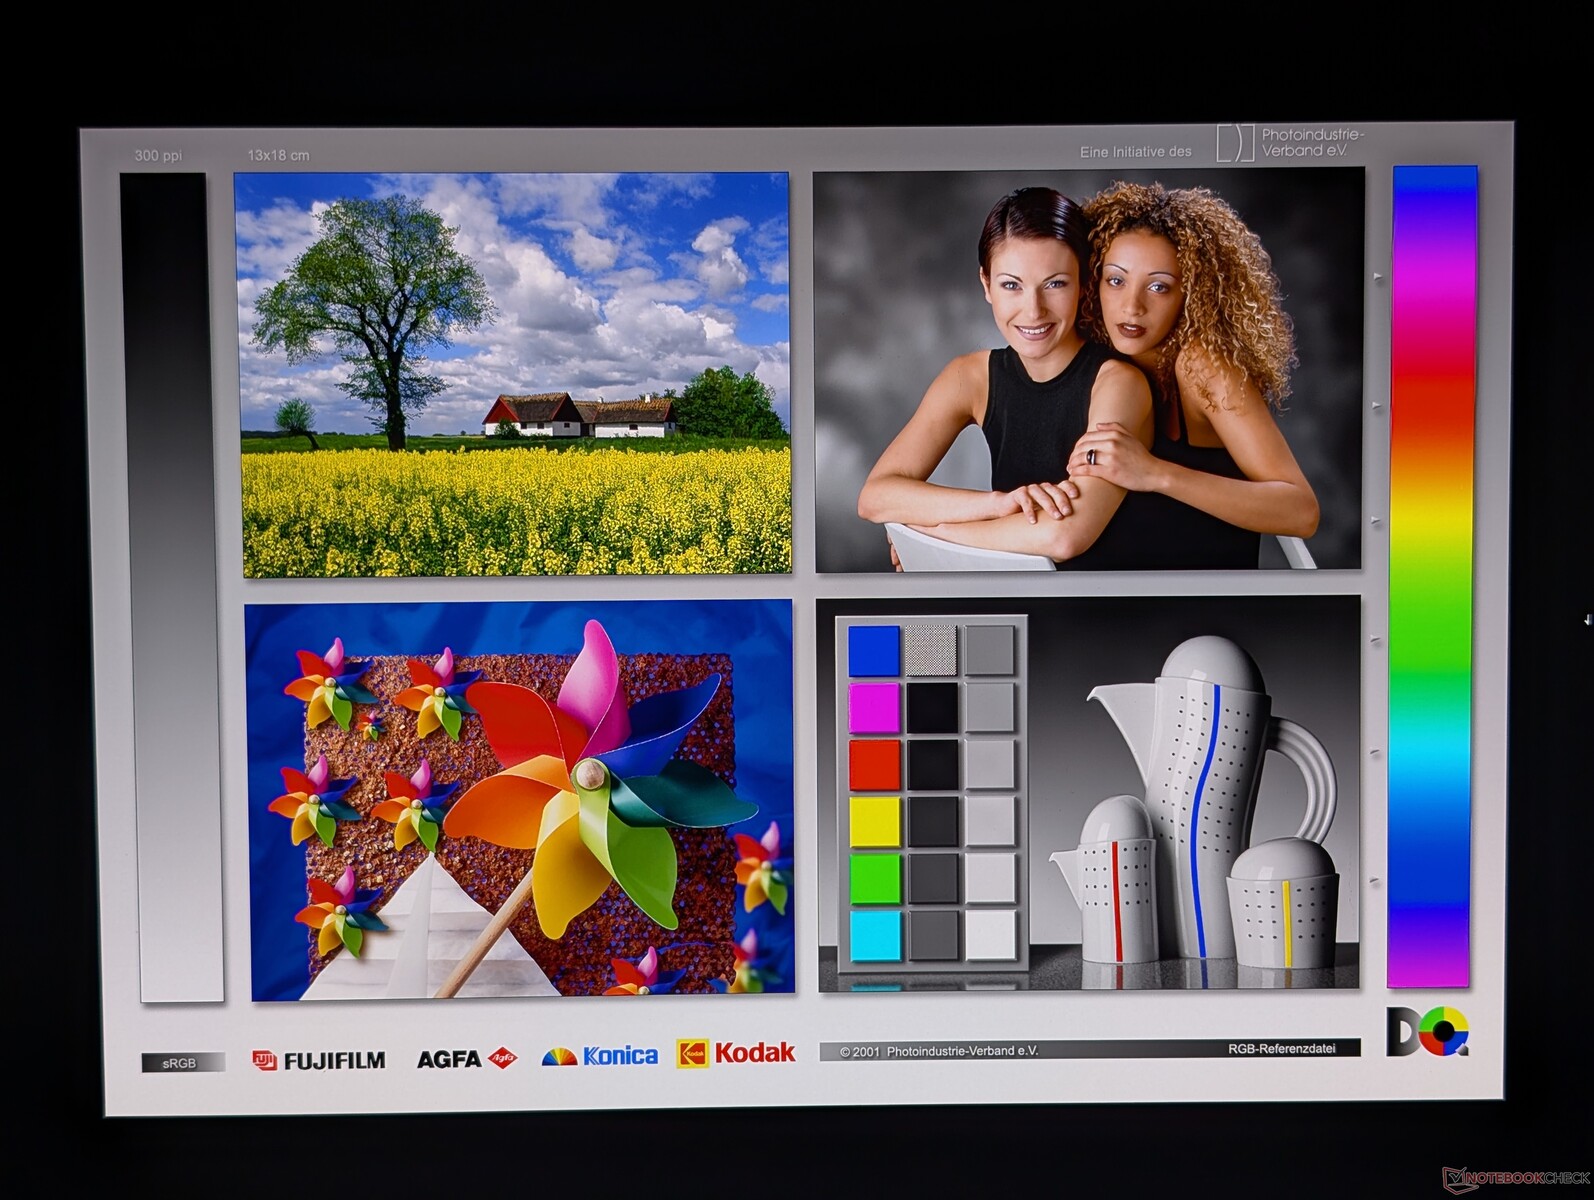
Weergave
Er zijn drie weergaveopties beschikbaar:
- 1920 x 1200, 60 Hz, niet-touch, 300 nits, ~60% sRGB
- 1920 x 1200, 120 Hz, niet-touch, 500 nits, 100% DCI-P3
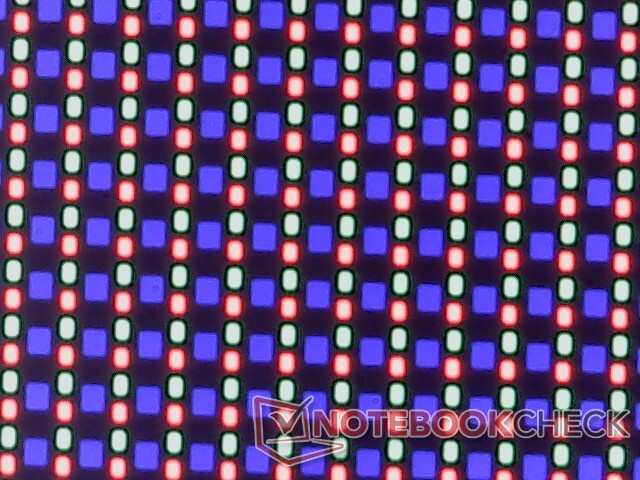
- 3840 x 2400, 120 Hz, OLED, aanraakgevoelig, 500 nits, 100% DCI-P3
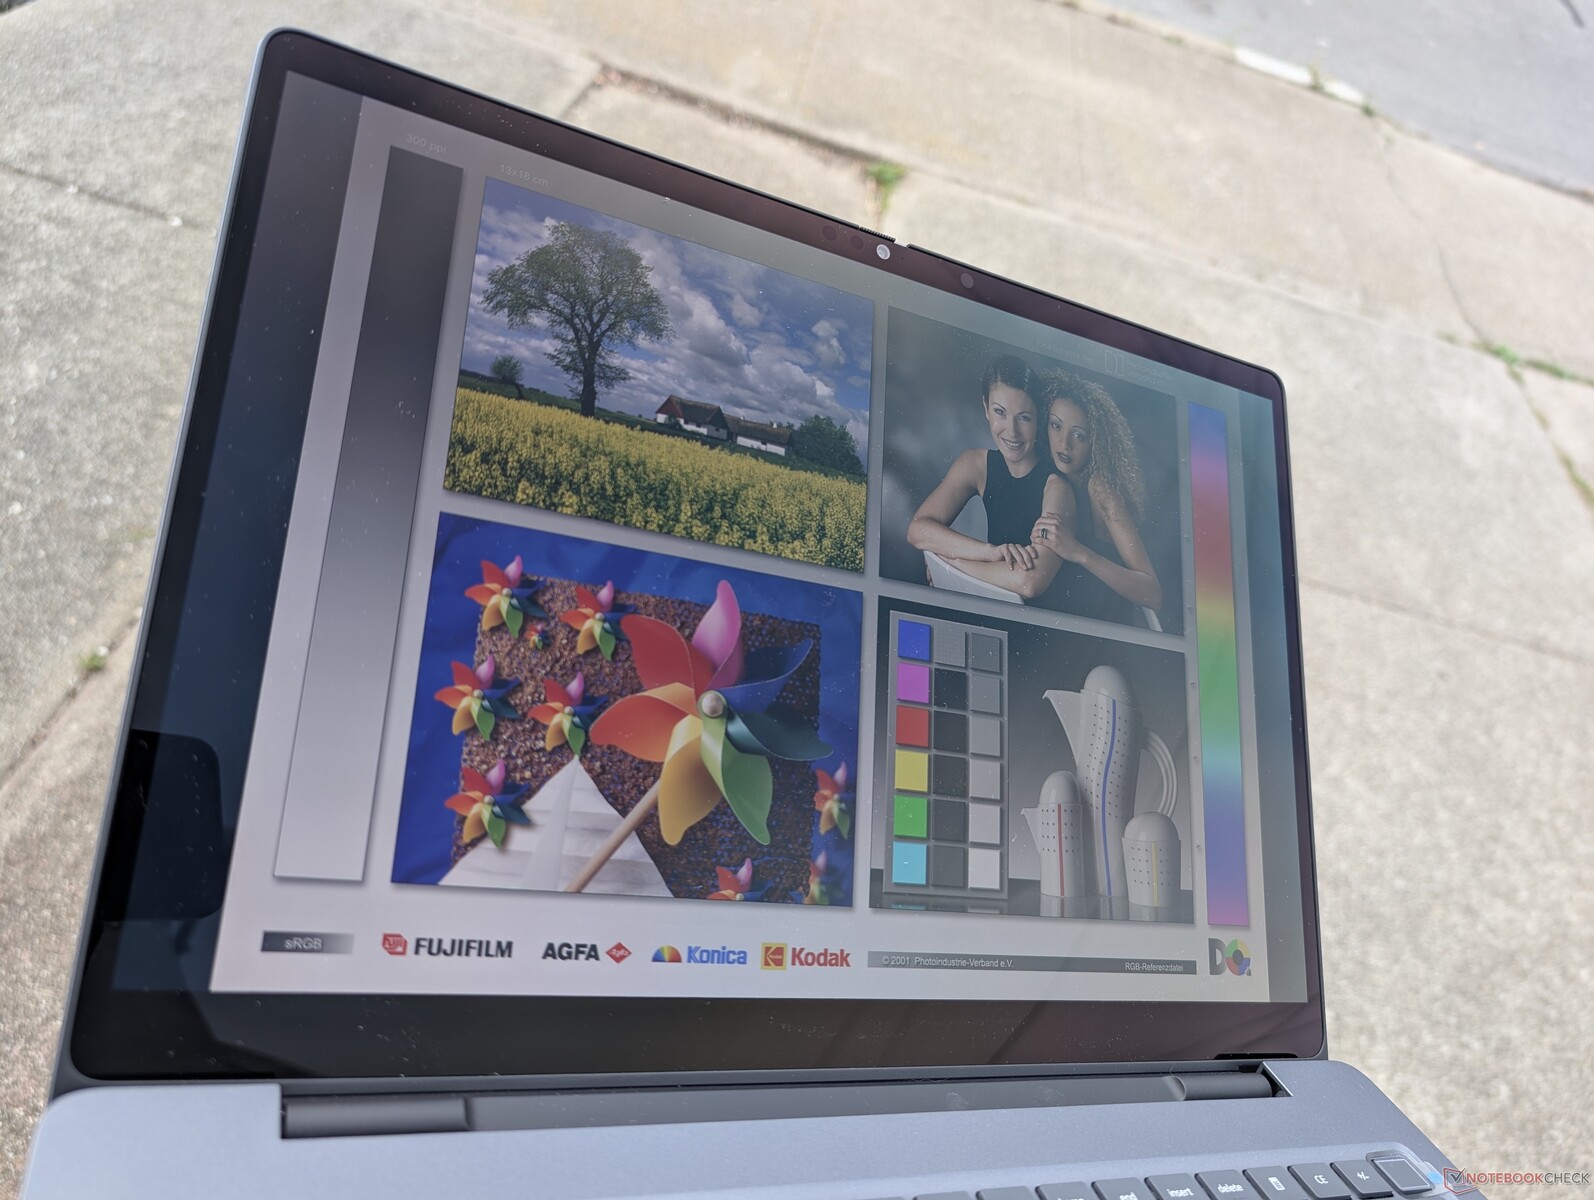
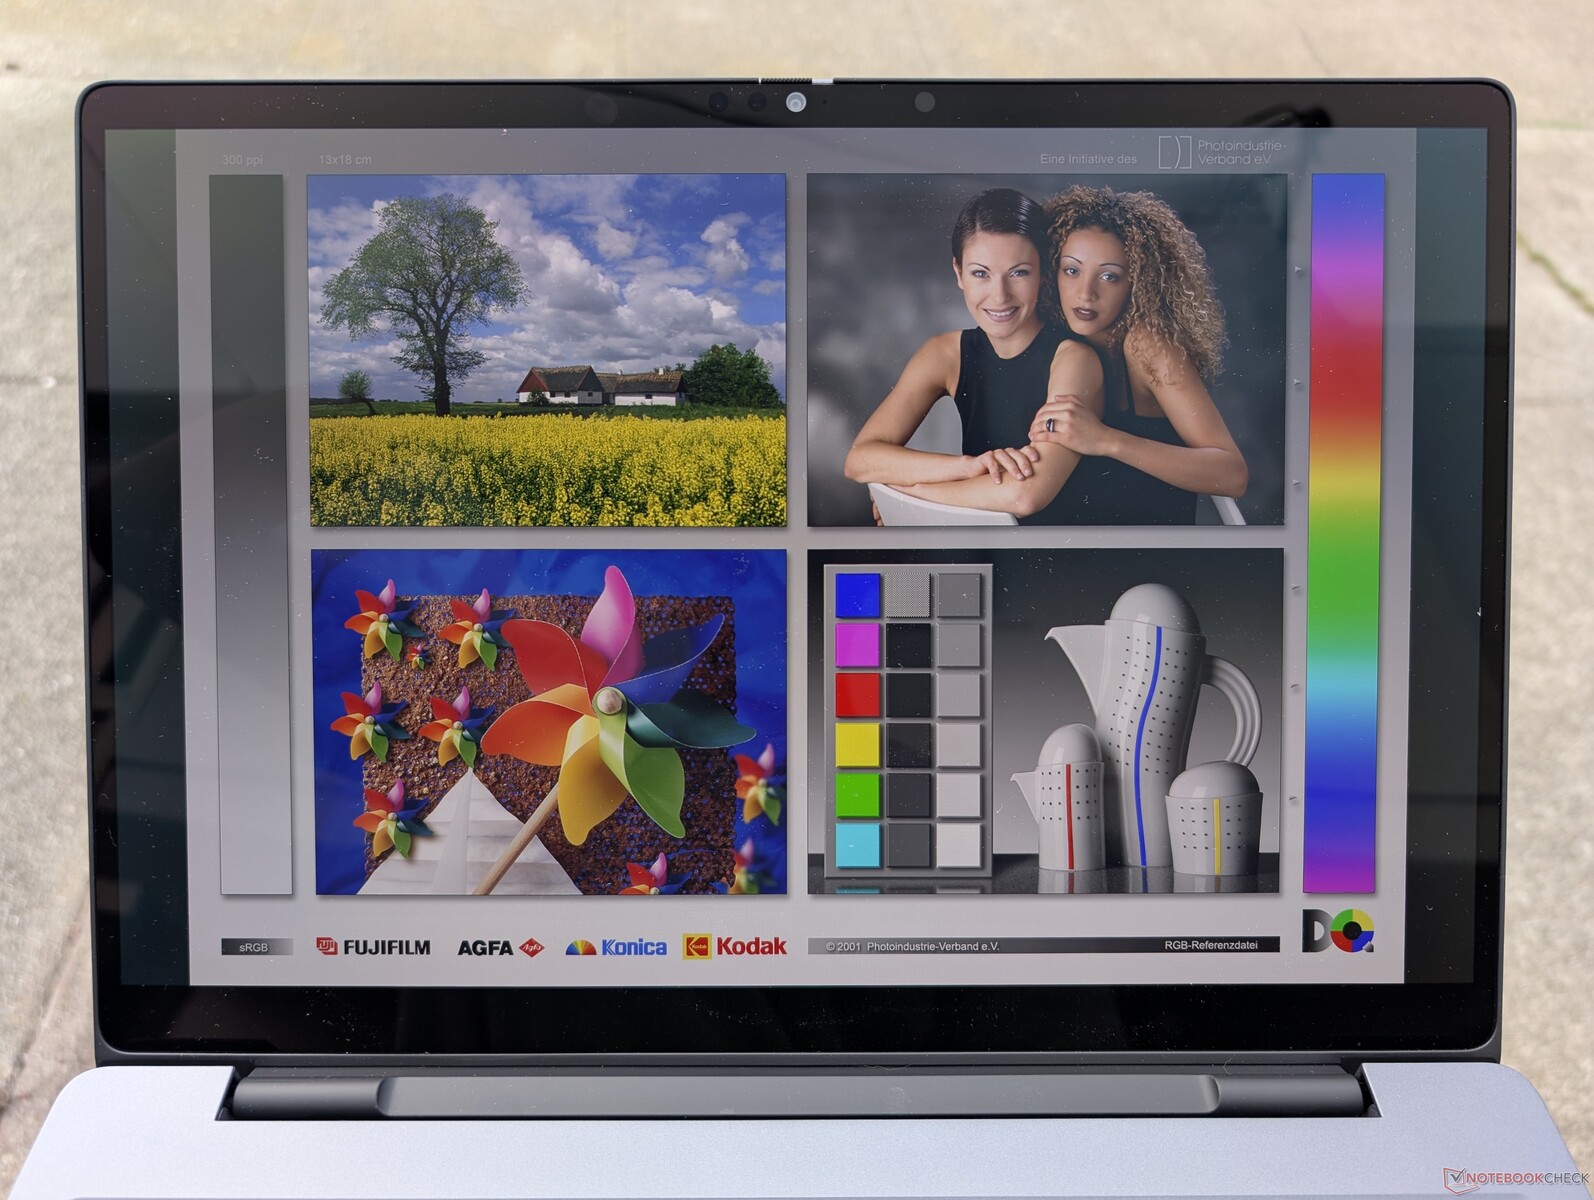
Onze testunit is uitgerust met de vetgedrukte optie hierboven en is een van de weinige 16-inch werkstations met 4K 120 Hz OLED panelen.
De maximale helderheid komt uit op ~550 nits als de SDR-modus is ingeschakeld of 1066 nits als de HDR-modus is ingeschakeld. 4K HDR-weergave is daarom net zo goed of beter dan de meeste consumentenlaptops op enthousiast niveau.
| |||||||||||||||||||||||||
Helderheidsverdeling: 95 %
Helderheid in Batterij-modus: 530.9 cd/m²
Contrast: ∞:1 (Zwart: 0 cd/m²)
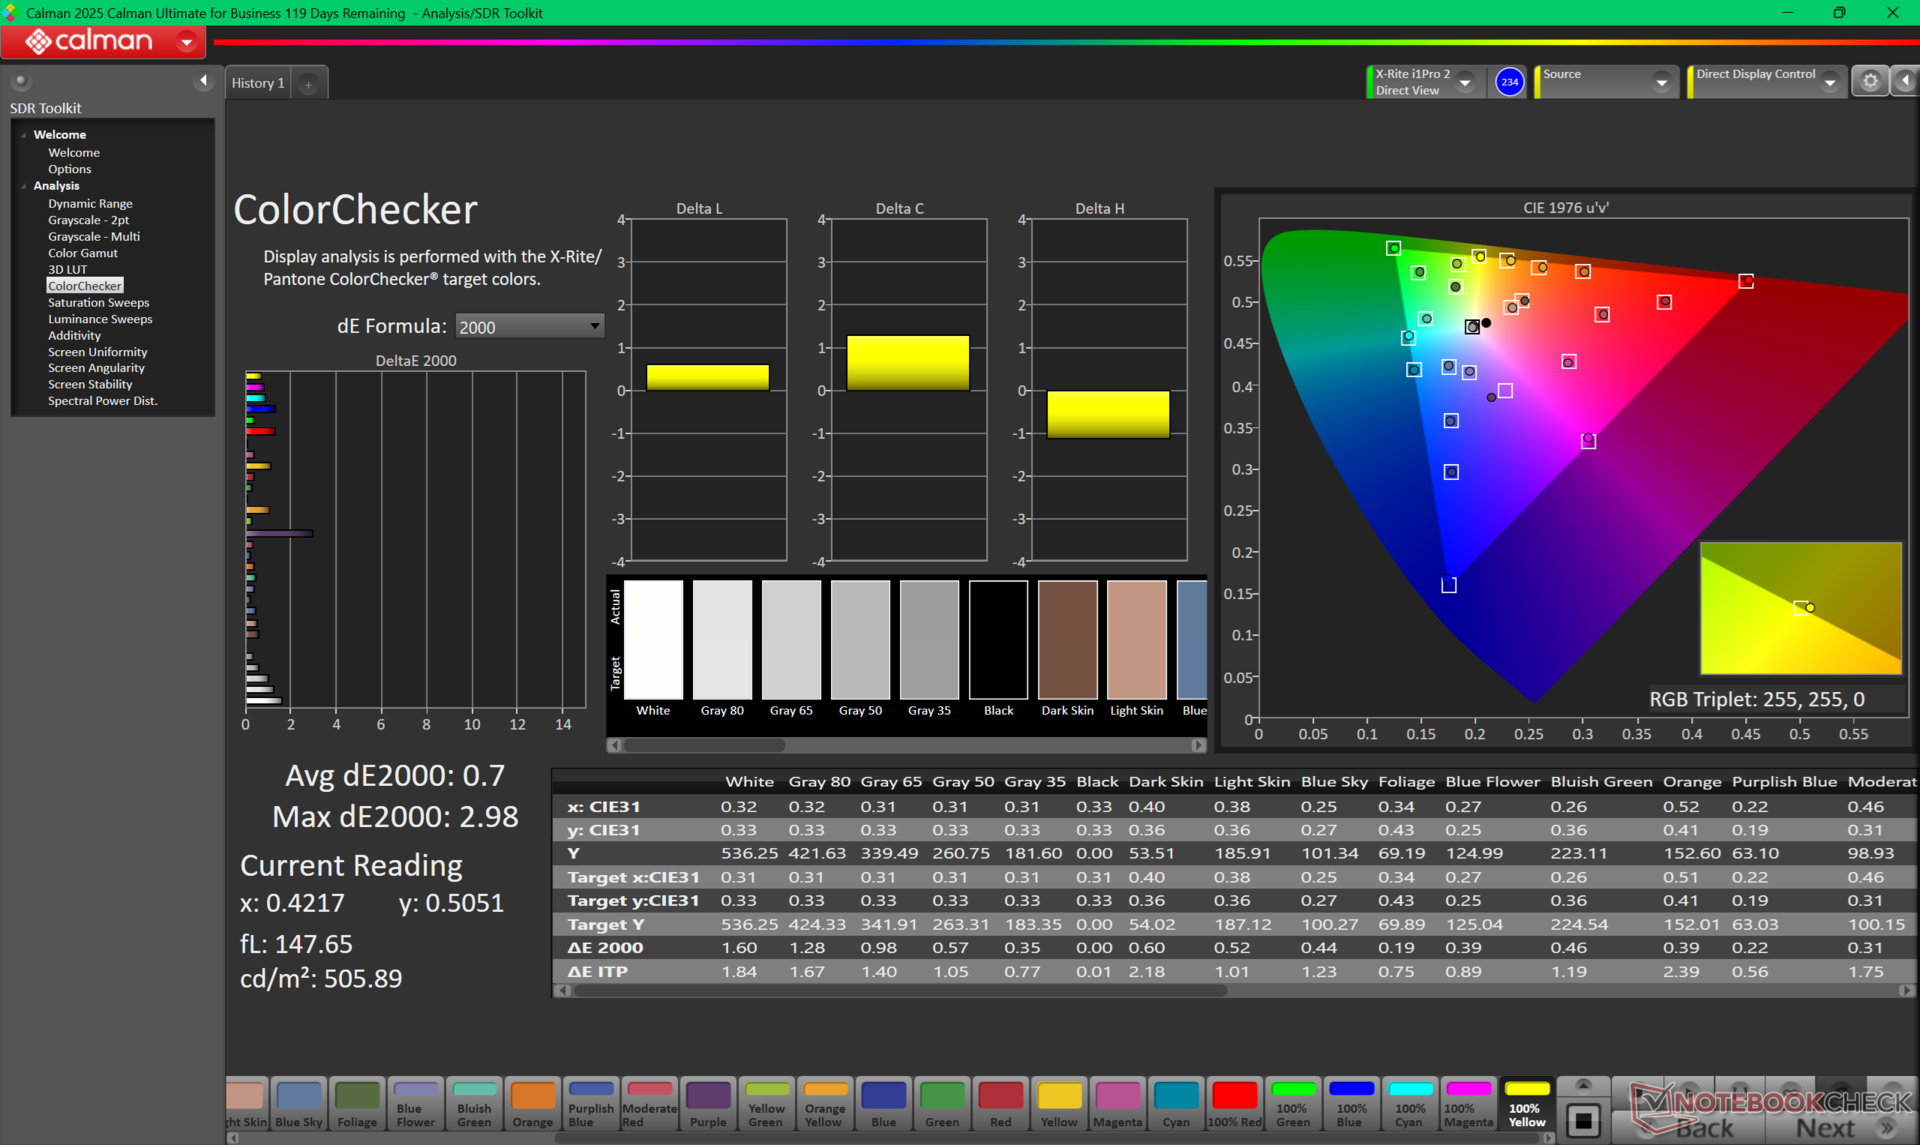
ΔE ColorChecker Calman: 2.42 | ∀{0.5-29.43 Ø4.72}
calibrated: 0.7
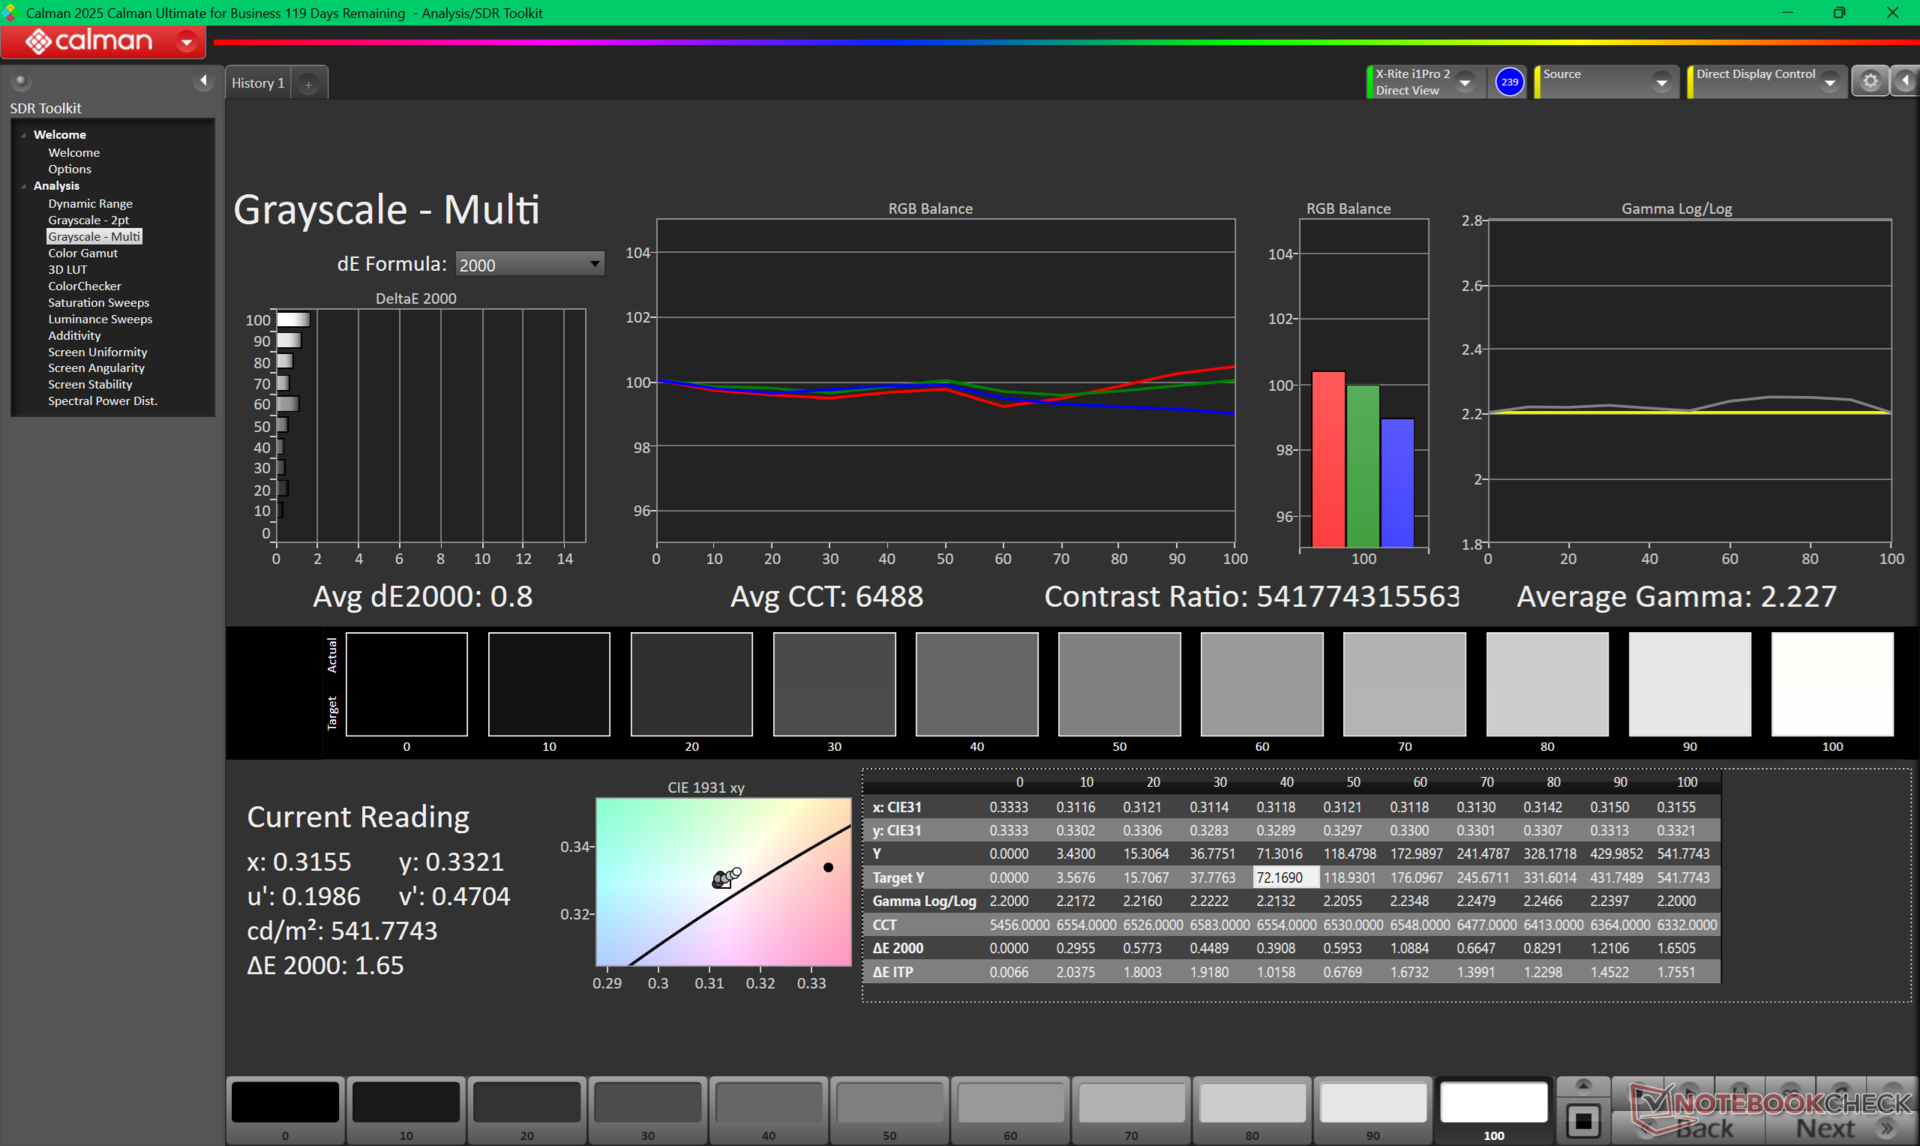
ΔE Greyscale Calman: 0.8 | ∀{0.09-98 Ø4.97}
88.8% AdobeRGB 1998 (Argyll 3D)
100% sRGB (Argyll 3D)
97.3% Display P3 (Argyll 3D)
Gamma: 2.23
CCT: 6488 K
| Dell Pro Max 16 Plus Samsung 160HC01, OLED, 3840x2400, 16", 120 Hz | Dell Precision 5690 Samsung 160YV03, OLED, 3840x2400, 16", 60 Hz | Dell Precision 5000 5680 Samsung 160YV03, OLED, 3840x2400, 16", 60 Hz | Lenovo ThinkPad P16 Gen 2 NE160QDM-NY1, IPS, 2560x1600, 16", 165 Hz | Lenovo ThinkPad P1 Gen 7 21KV001SGE MNG007DA1-9 , IPS LED, 2560x1600, 16", 165 Hz | HP ZBook Studio 16 G11 AUO87A8, IPS, 3840x2400, 16", 120 Hz | MSI CreatorPro Z16P B12UKST B160QAN02.N, IPS, 2560x1600, 16", 165 Hz | |
|---|---|---|---|---|---|---|---|
| Display | 4% | 4% | -18% | -17% | -1% | -1% | |
| Display P3 Coverage (%) | 97.3 | 99.8 3% | 99.9 3% | 68.4 -30% | 69.4 -29% | 97.7 0% | 97.6 0% |
| sRGB Coverage (%) | 100 | 100 0% | 100 0% | 96.9 -3% | 97.6 -2% | 99.9 0% | 99.9 0% |
| AdobeRGB 1998 Coverage (%) | 88.8 | 96.6 9% | 97.5 10% | 70.6 -20% | 71.8 -19% | 85.7 -3% | 87.4 -2% |
| Response Times | -131% | -133% | -1575% | -1385% | -1623% | -1332% | |
| Response Time Grey 50% / Grey 80% * (ms) | 0.63 ? | 1.7 ? -170% | 1.68 ? -167% | 14.1 ? -2138% | 11.2 ? -1678% | 14.2 ? -2154% | 12.8 ? -1932% |
| Response Time Black / White * (ms) | 0.89 ? | 1.7 ? -91% | 1.77 ? -99% | 9.9 ? -1012% | 10.6 ? -1091% | 10.6 ? -1091% | 7.4 ? -731% |
| PWM Frequency (Hz) | 479.9 ? | 60 ? | 60 ? | ||||
| PWM Amplitude * (%) | 28 | ||||||
| Screen | -44% | -67% | 0% | -112% | -44% | -17% | |
| Brightness middle (cd/m²) | 530.9 | 348.1 -34% | 345.7 -35% | 531.5 0% | 516 -3% | 404.3 -24% | 407 -23% |
| Brightness (cd/m²) | 540 | 351 -35% | 349 -35% | 499 -8% | 505 -6% | 405 -25% | 388 -28% |
| Brightness Distribution (%) | 95 | 97 2% | 98 3% | 89 -6% | 89 -6% | 92 -3% | 88 -7% |
| Black Level * (cd/m²) | 0.38 | 0.41 | 0.28 | 0.36 | |||
| Colorchecker dE 2000 * | 2.42 | 4.18 -73% | 3.59 -48% | 1.82 25% | 3.5 -45% | 2.63 -9% | 1.3 46% |
| Colorchecker dE 2000 max. * | 5.76 | 6.68 -16% | 7.02 -22% | 4.1 29% | 8.8 -53% | 4.48 22% | 2.5 57% |
| Colorchecker dE 2000 calibrated * | 0.7 | 0.97 -39% | 0.99 -41% | 0.63 10% | 1.2 -71% | 1.46 -109% | 0.7 -0% |
| Greyscale dE 2000 * | 0.8 | 1.7 -113% | 3.1 -288% | 1.2 -50% | 5.6 -600% | 2.1 -163% | 2.1 -163% |
| Gamma | 2.23 99% | 2.2 100% | 2.13 103% | 2.15 102% | 2.27 97% | 2.3 96% | 2.26 97% |
| CCT | 6488 100% | 6198 105% | 6448 101% | 6484 100% | 6071 107% | 6810 95% | 6437 101% |
| Contrast (:1) | 1399 | 1259 | 1444 | 1131 | |||
| Totaal Gemiddelde (Programma / Instellingen) | -57% /
-46% | -65% /
-60% | -531% /
-267% | -505% /
-300% | -556% /
-297% | -450% /
-232% |
* ... kleiner is beter
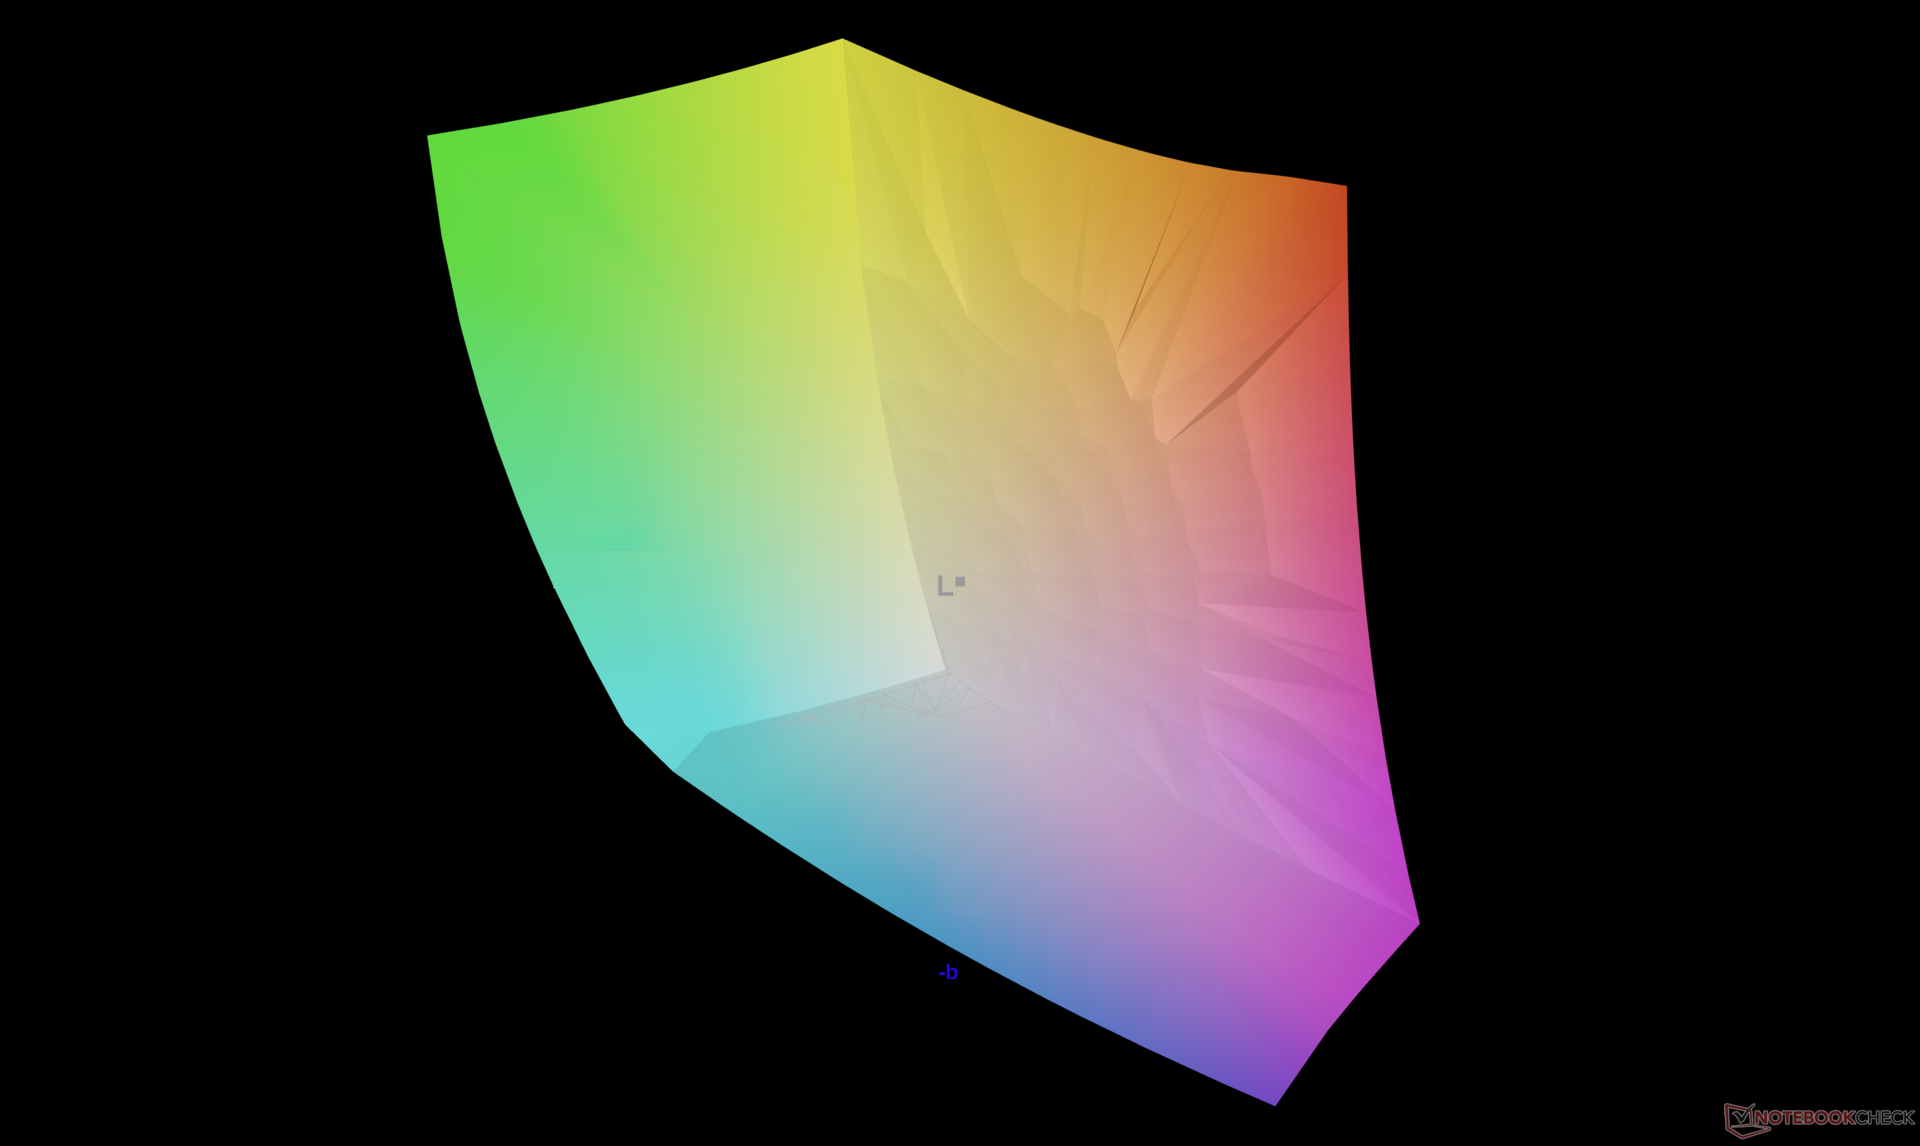
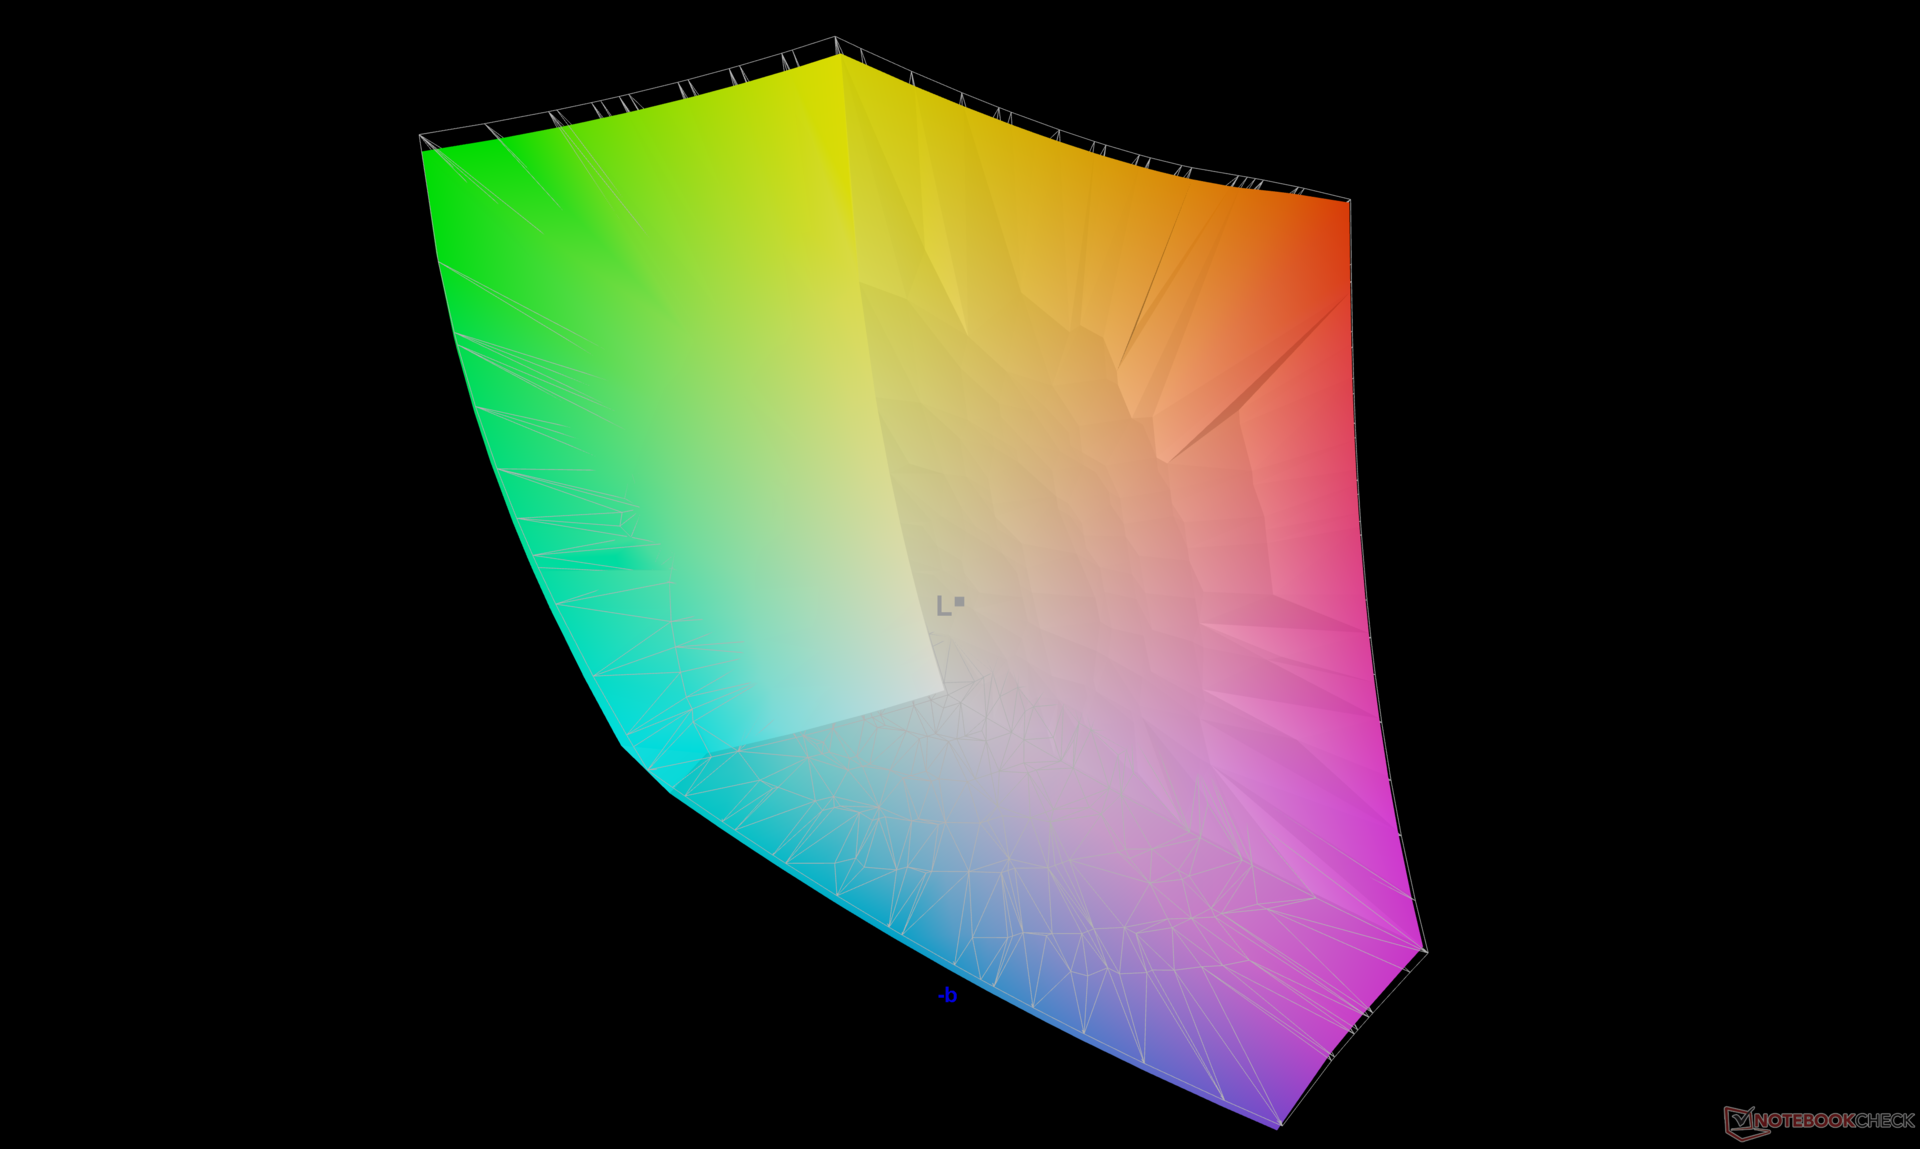
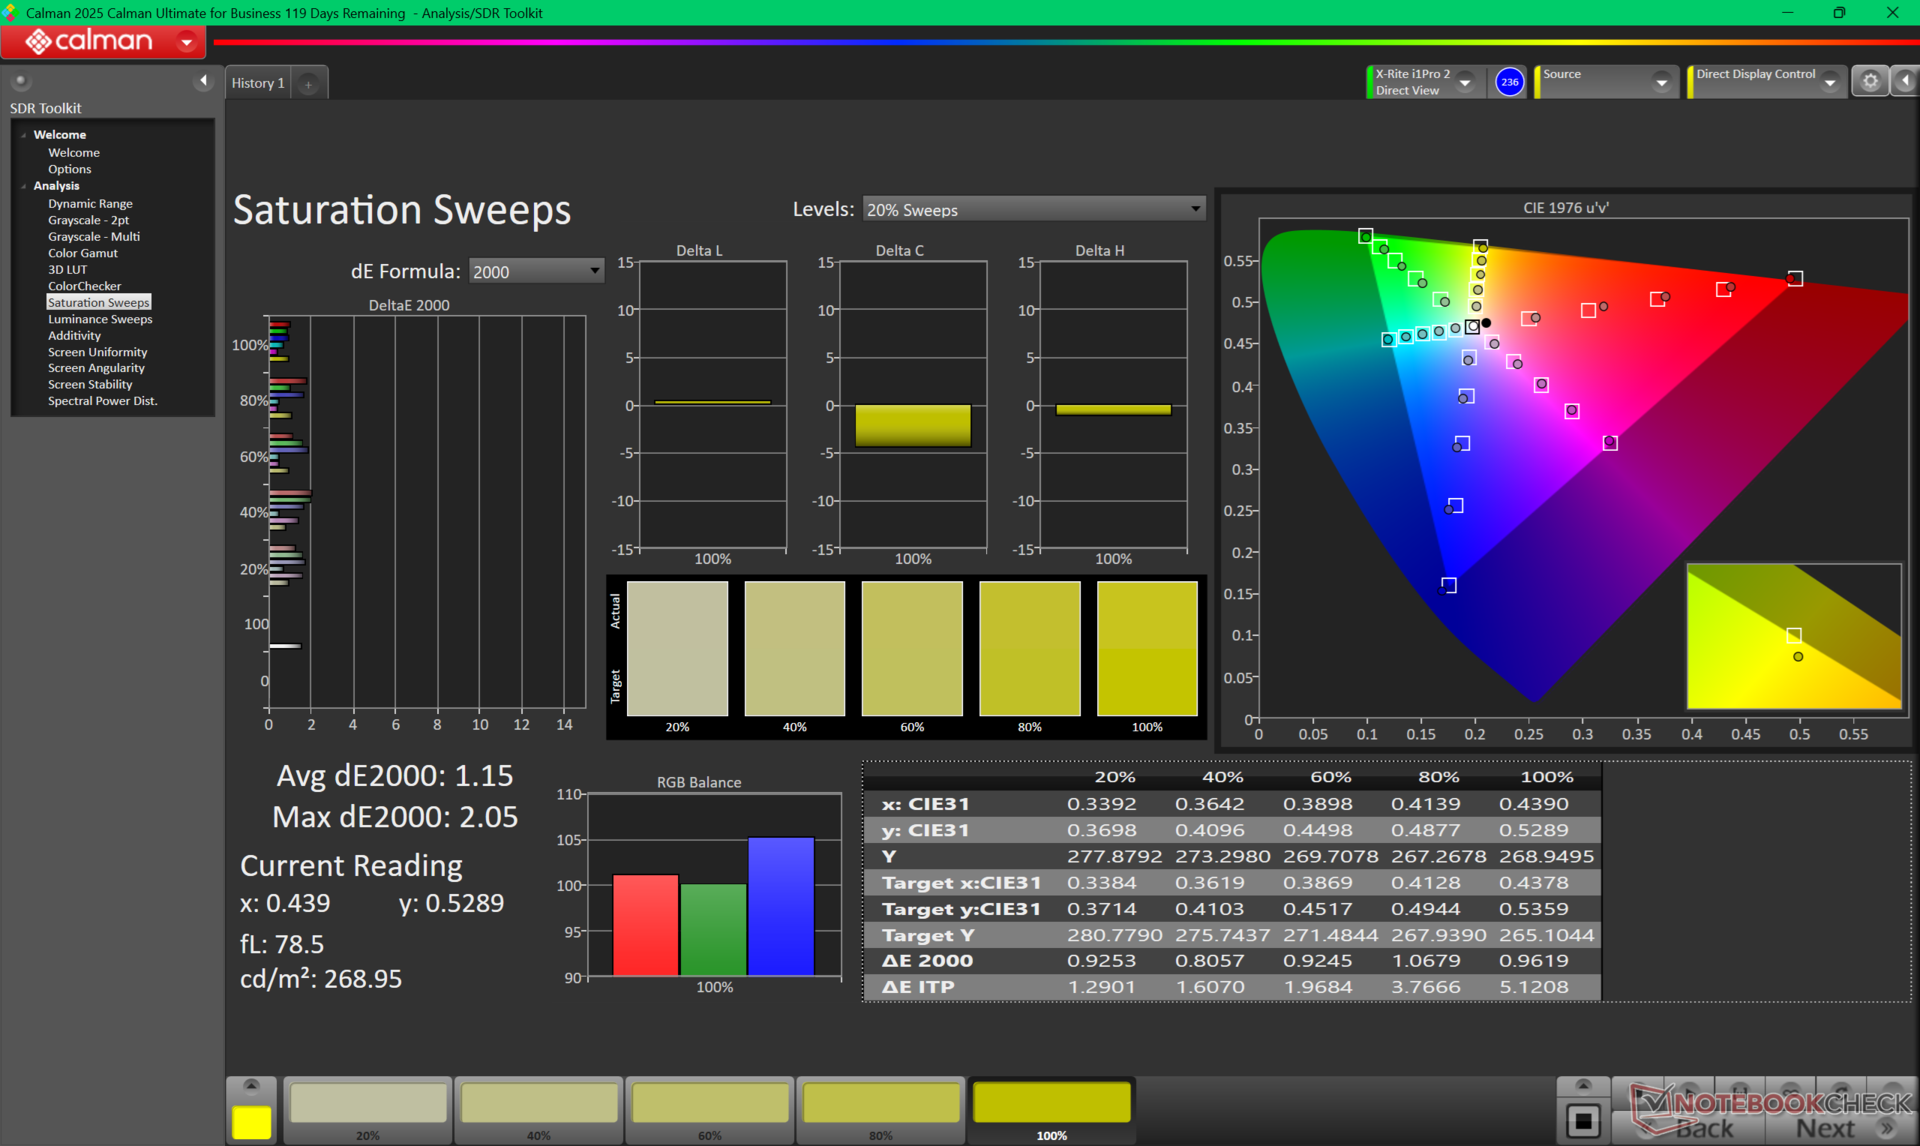
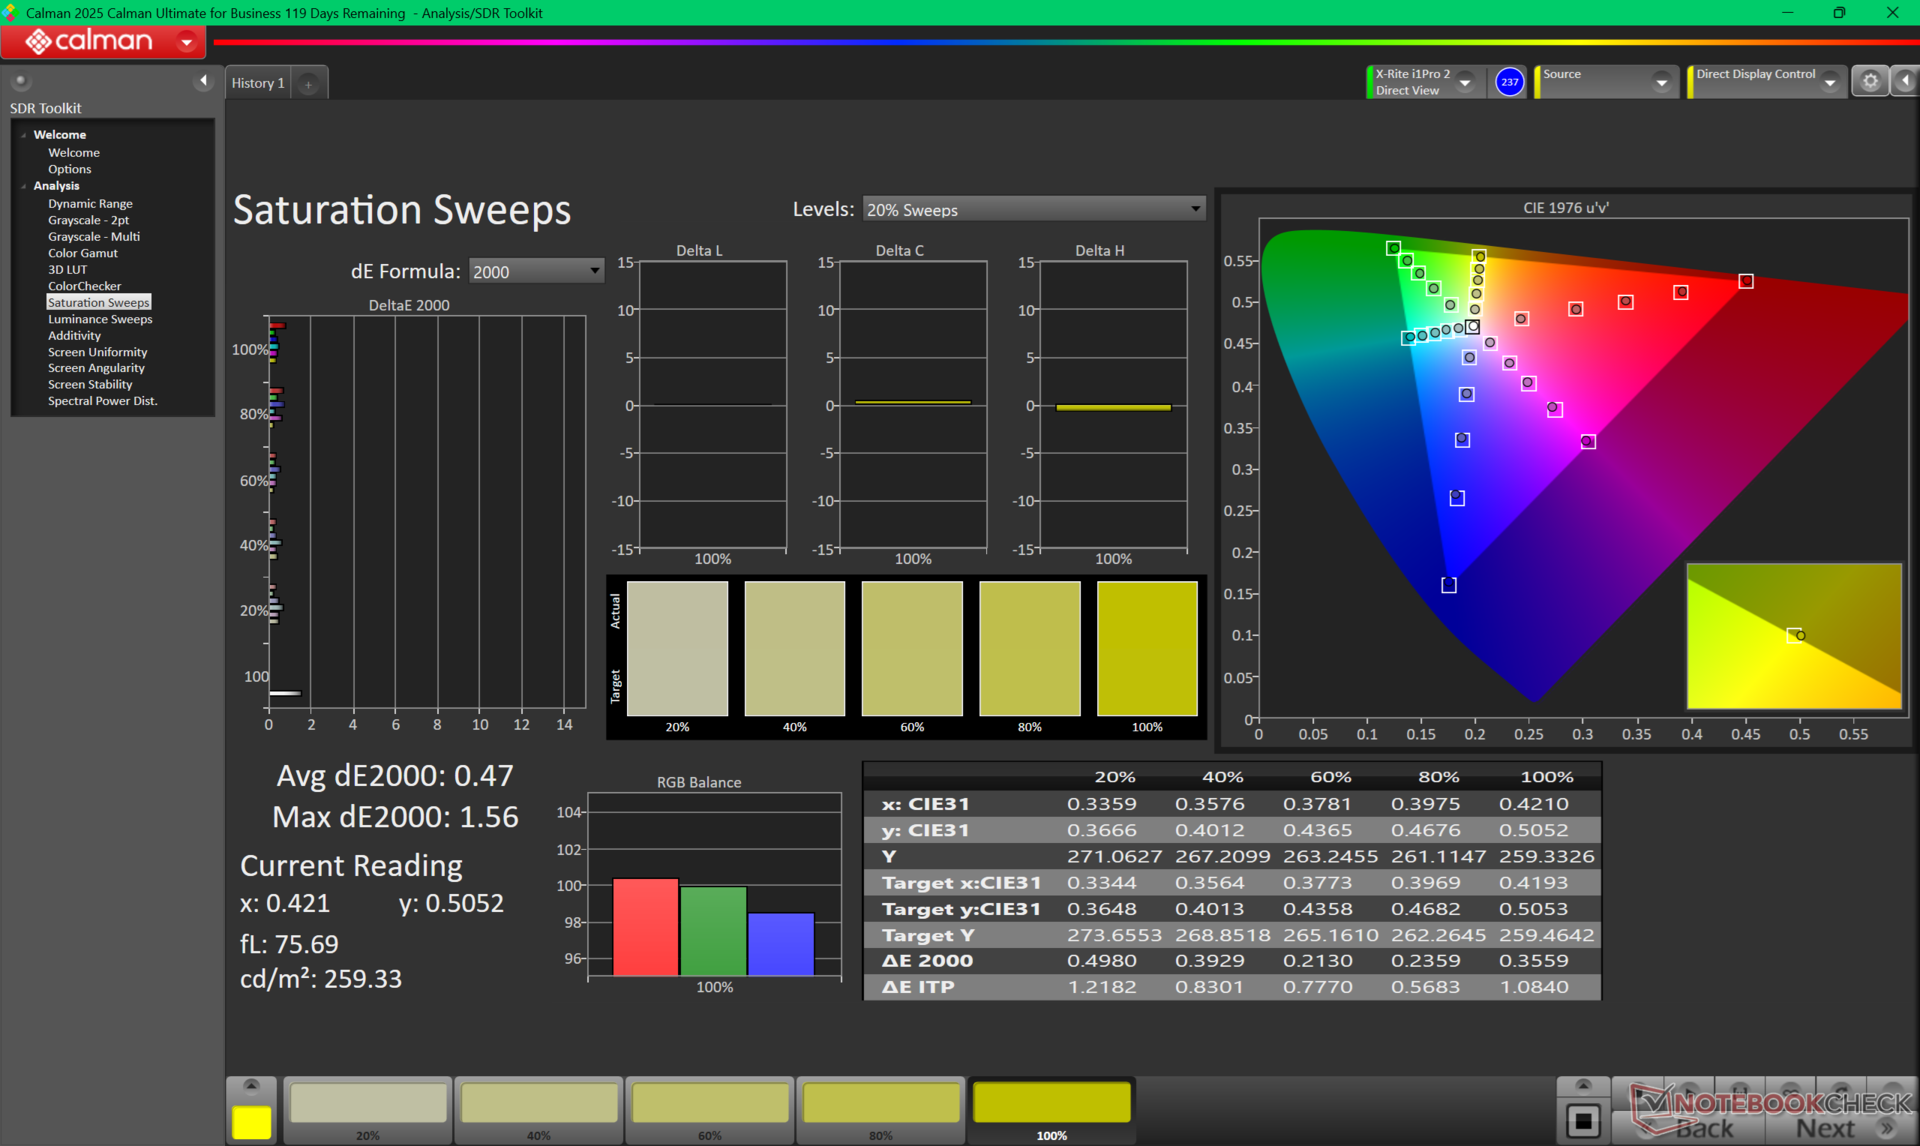
Het beeldscherm is goed gekalibreerd ten opzichte van de P3-standaard met gemiddelde deltaE-waarden voor grijswaarden en kleuren van respectievelijk slechts 0,8 en 2,42.


Responstijd Scherm
| ↔ Responstijd Zwart naar Wit | ||
|---|---|---|
| 0.89 ms ... stijging ↗ en daling ↘ gecombineerd | ↗ 0.42 ms stijging | 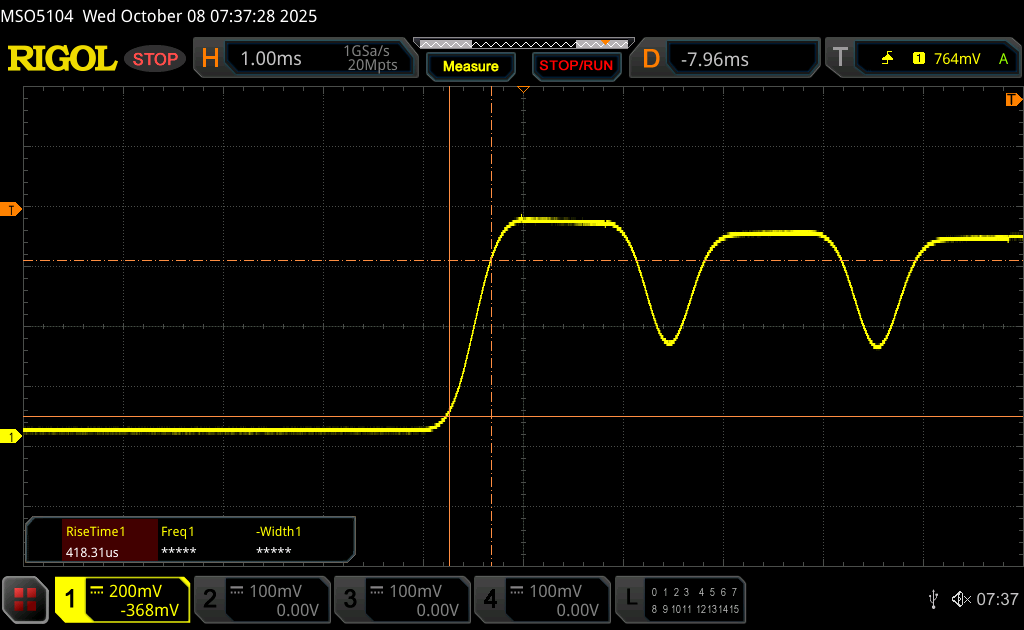 |
| ↘ 0.47 ms daling | ||
| Het scherm vertoonde erg snelle responstijden in onze tests en zou zeer geschikt moeten zijn voor snelle games. Ter vergelijking: alle testtoestellen variëren van 0.1 (minimum) tot 240 (maximum) ms. » 3 % van alle toestellen zijn beter. Dit betekent dat de gemeten responstijd beter is dan het gemiddelde (19.8 ms) van alle geteste toestellen. | ||
| ↔ Responstijd 50% Grijs naar 80% Grijs | ||
| 0.63 ms ... stijging ↗ en daling ↘ gecombineerd | ↗ 0.34 ms stijging | 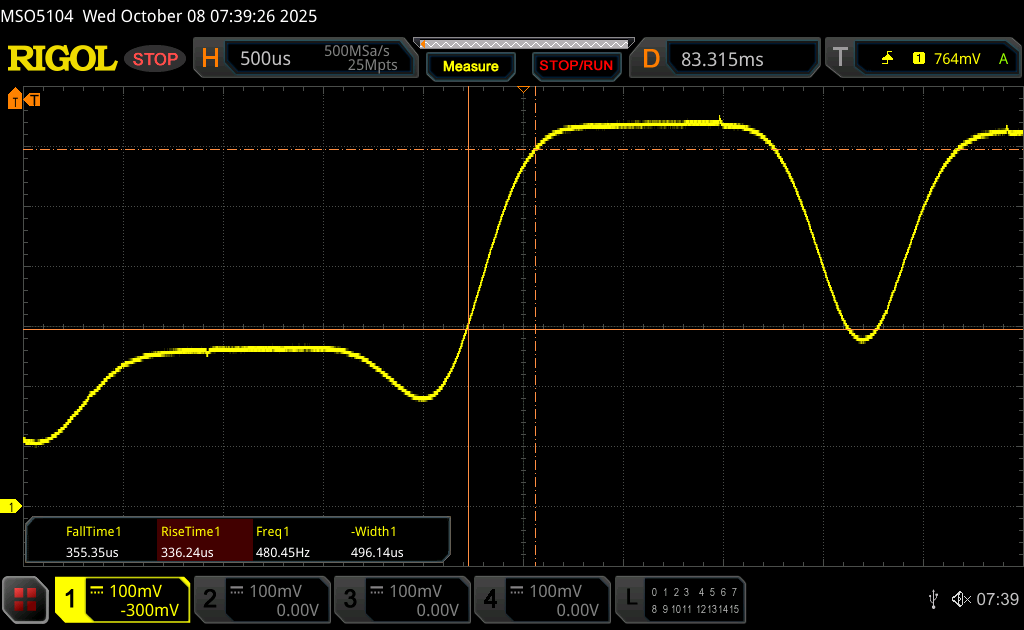 |
| ↘ 0.29 ms daling | ||
| Het scherm vertoonde erg snelle responstijden in onze tests en zou zeer geschikt moeten zijn voor snelle games. Ter vergelijking: alle testtoestellen variëren van 0.165 (minimum) tot 636 (maximum) ms. » 2 % van alle toestellen zijn beter. Dit betekent dat de gemeten responstijd beter is dan het gemiddelde (31 ms) van alle geteste toestellen. | ||
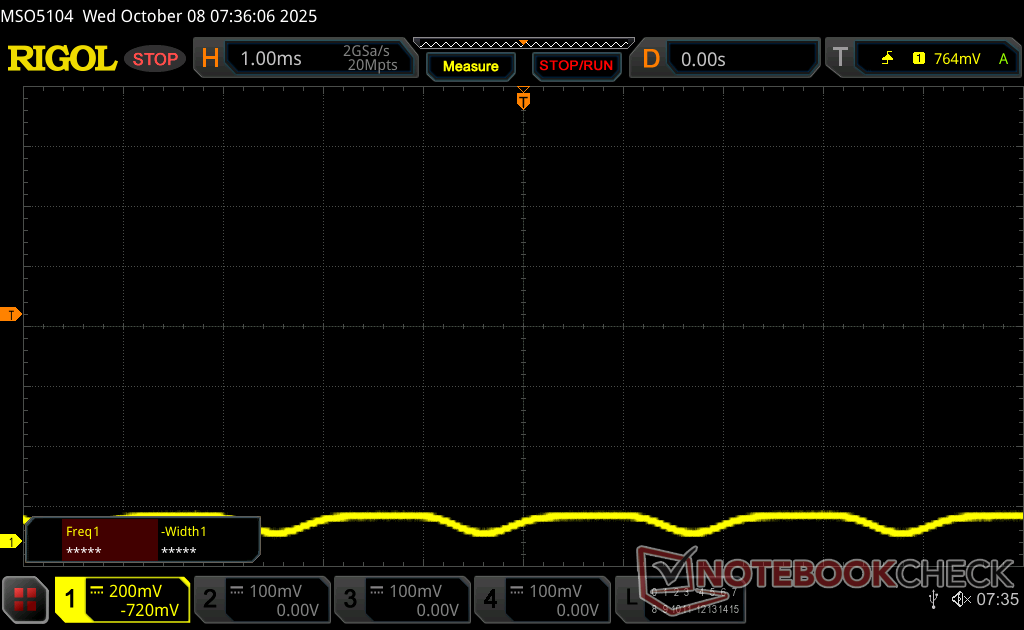
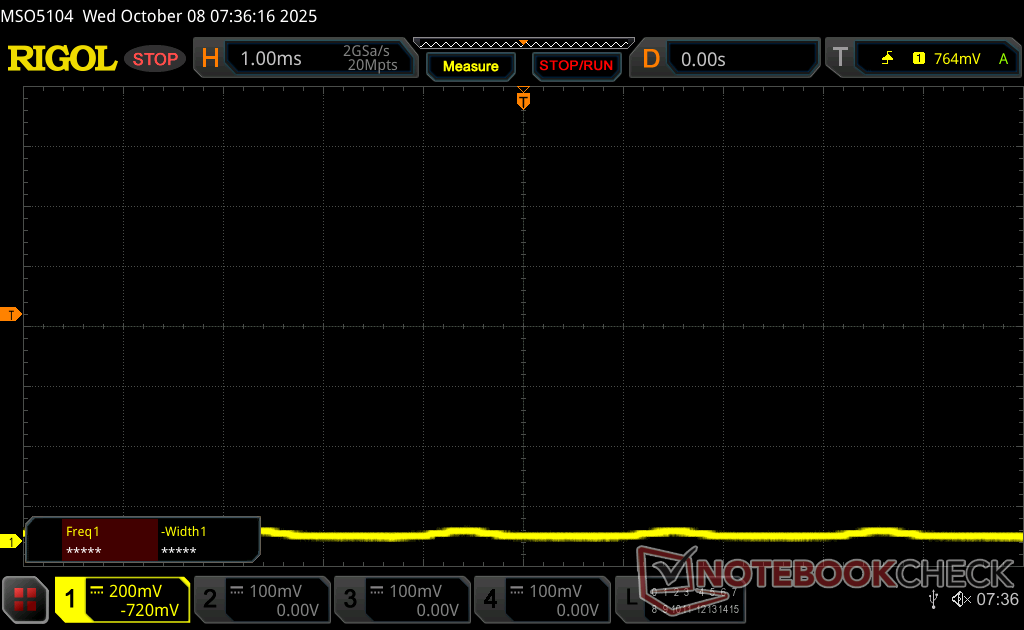
Screen Flickering / PWM (Pulse-Width Modulation)
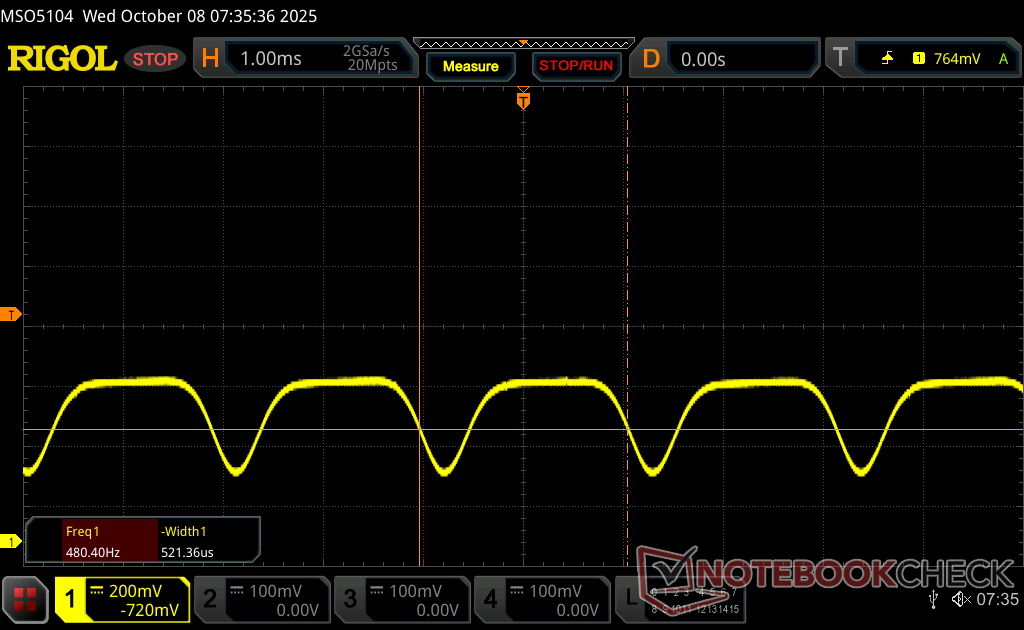
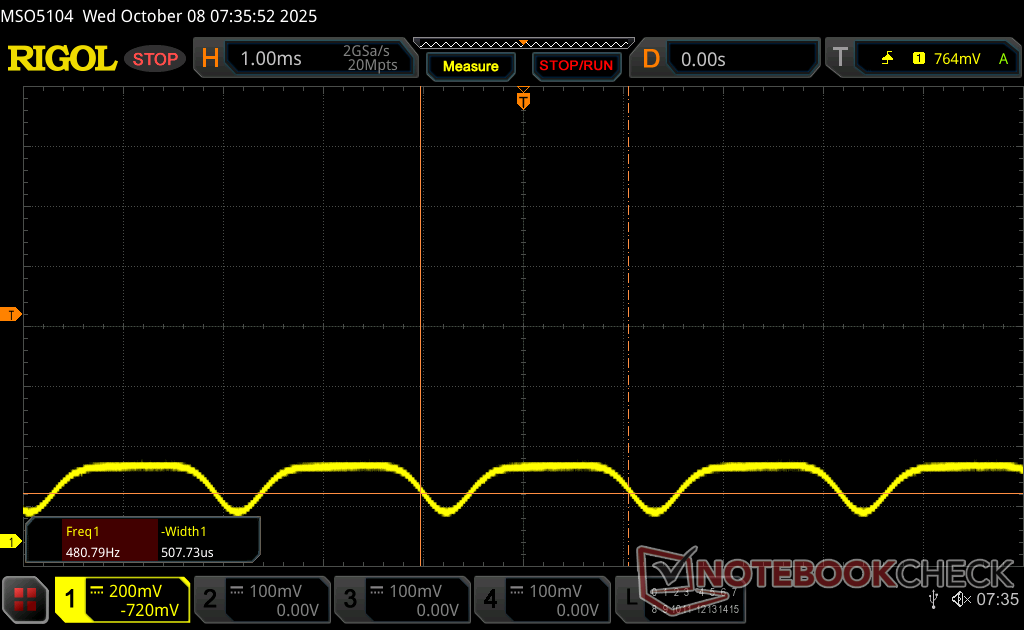
| Screen flickering / PWM waargenomen | 479.9 Hz Amplitude: 28 % | ≤ 100 % helderheid instelling | 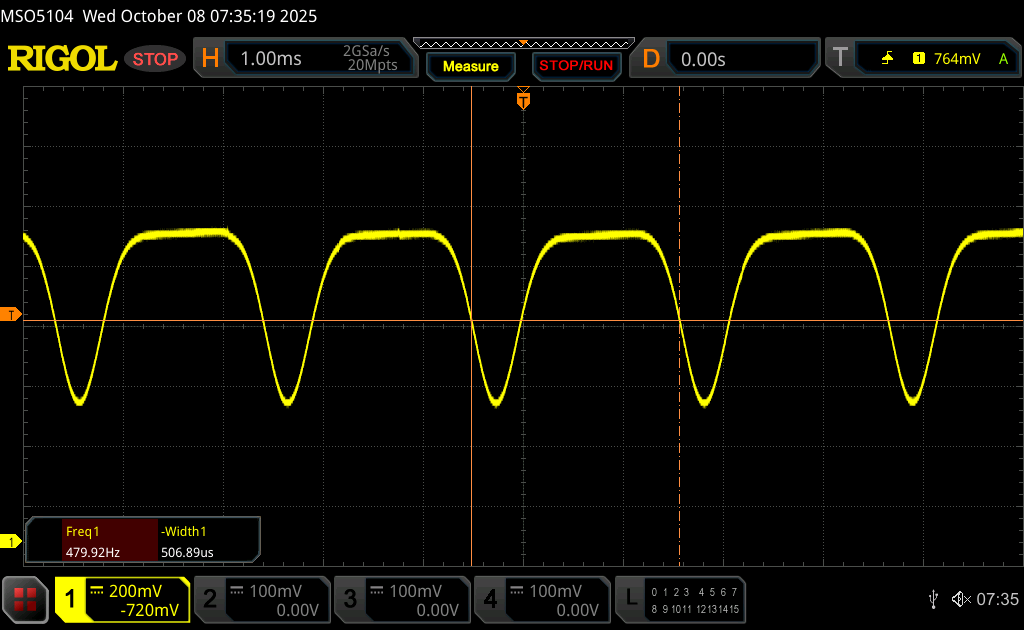 |
De achtergrondverlichting van het scherm flikkert op 479.9 Hz (in het slechtste geval, bijvoorbeeld bij gebruik van PWM) aan een helderheid van 100 % en lager. Boven deze helderheid zou er geen flickering / PWM mogen optreden. De frequentie van 479.9 Hz is relatief hoog en de meeste mensen die gevoelig zijn aan flickering zouden dit dus niet mogen waarnemen of geïrriteerde ogen krijgen. Er zijn echter rapporten die beweren dat sommige mensen toch flickering met 500 Hz en hoger kunnen waarnemen: opgelet dus. Ter vergelijking: 52 % van alle geteste toestellen maakten geen gebruik van PWM om de schermhelderheid te verlagen. Als het wel werd gebruikt, werd een gemiddelde van 7753 (minimum: 5 - maximum: 343500) Hz waargenomen. | |||

Prestaties
Testomstandigheden
We hebben Dell Optimizer ingesteld op de modus Prestaties en Nvidia Control Panel op de modus Discrete graphics voordat we de onderstaande benchmarks uitvoerden. Om te schakelen tussen de modi Optimus en dGPU hoeft u niet opnieuw op te starten.
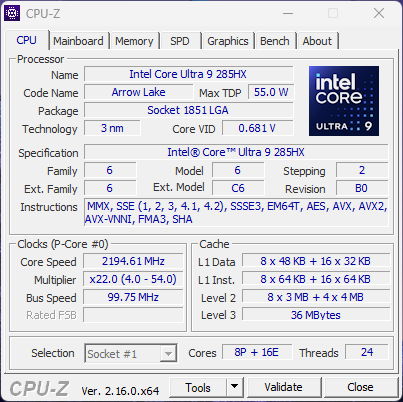
Processor
De Core Ultra 9 285HX is een van de snelste processors die beschikbaar zijn op een mobiel werkstation, met bijna 2x betere prestaties dan de Core Ultra 9 185H in de Precision 5690. De duurzaamheid van de prestaties is echter niet perfect; wanneer CineBench R15 xT bijvoorbeeld in een lus wordt uitgevoerd, nemen de prestaties na verloop van tijd met ongeveer 10 procent af, zoals de onderstaande vergelijkingsgrafiek laat zien.
Cinebench R15 meervoudige lus
Cinebench R23: Multi Core | Single Core
Cinebench R20: CPU (Multi Core) | CPU (Single Core)
Cinebench R15: CPU Multi 64Bit | CPU Single 64Bit
Blender: v2.79 BMW27 CPU
7-Zip 18.03: 7z b 4 | 7z b 4 -mmt1
Geekbench 6.7: Multi-Core | Single-Core
Geekbench 5.5: Multi-Core | Single-Core
HWBOT x265 Benchmark v2.2: 4k Preset
LibreOffice : 20 Documents To PDF
R Benchmark 2.5: Overall mean
| CPU Performance rating | |
| Gemiddeld Intel Core Ultra 9 285HX | |
| Dell Pro Max 16 Plus | |
| HP ZBook Fury 16 G10 | |
| Lenovo ThinkPad P16 Gen 2 | |
| Dell Precision 5000 5680 | |
| Lenovo ThinkPad P16 G2 21FA000FGE -2! | |
| Dell Precision 5690 | |
| HP ZBook Studio 16 G11 | |
| Lenovo ThinkPad P1 Gen 7 21KV001SGE | |
| HP ZBook Studio 16 G9 62U04EA -2! | |
| MSI CreatorPro Z16P B12UKST -2! | |
| Lenovo ThinkPad P16s G2 21K9000CGE | |
| Geekbench 6.7 / Multi-Core | |
| Dell Pro Max 16 Plus | |
| Gemiddeld Intel Core Ultra 9 285HX (18212 - 22104, n=6) | |
| Lenovo ThinkPad P16 Gen 2 | |
| HP ZBook Fury 16 G10 | |
| Dell Precision 5000 5680 | |
| Dell Precision 5690 | |
| HP ZBook Studio 16 G11 | |
| Lenovo ThinkPad P1 Gen 7 21KV001SGE | |
| Lenovo ThinkPad P16s G2 21K9000CGE | |
| Geekbench 6.7 / Single-Core | |
| Gemiddeld Intel Core Ultra 9 285HX (2907 - 3088, n=6) | |
| HP ZBook Fury 16 G10 | |
| Dell Pro Max 16 Plus | |
| Lenovo ThinkPad P16 Gen 2 | |
| Dell Precision 5000 5680 | |
| Dell Precision 5690 | |
| HP ZBook Studio 16 G11 | |
| Lenovo ThinkPad P16s G2 21K9000CGE | |
| Lenovo ThinkPad P1 Gen 7 21KV001SGE | |
* ... kleiner is beter
AIDA64: FP32 Ray-Trace | FPU Julia | CPU SHA3 | CPU Queen | FPU SinJulia | FPU Mandel | CPU AES | CPU ZLib | FP64 Ray-Trace | CPU PhotoWorxx
| Performance rating | |
| Gemiddeld Intel Core Ultra 9 285HX | |
| Dell Pro Max 16 Plus | |
| Lenovo ThinkPad P16 Gen 2 | |
| Dell Precision 5690 | |
| HP ZBook Studio 16 G11 | |
| Lenovo ThinkPad P1 Gen 7 21KV001SGE | |
| MSI CreatorPro Z16P B12UKST | |
| Dell Precision 5000 5680 | |
| AIDA64 / FP32 Ray-Trace | |
| Gemiddeld Intel Core Ultra 9 285HX (29076 - 42341, n=6) | |
| Dell Pro Max 16 Plus | |
| Lenovo ThinkPad P16 Gen 2 | |
| Dell Precision 5690 | |
| Lenovo ThinkPad P1 Gen 7 21KV001SGE | |
| HP ZBook Studio 16 G11 | |
| Dell Precision 5000 5680 | |
| MSI CreatorPro Z16P B12UKST | |
| AIDA64 / FPU Julia | |
| Gemiddeld Intel Core Ultra 9 285HX (161276 - 210885, n=6) | |
| Dell Pro Max 16 Plus | |
| Lenovo ThinkPad P16 Gen 2 | |
| Dell Precision 5690 | |
| HP ZBook Studio 16 G11 | |
| Lenovo ThinkPad P1 Gen 7 21KV001SGE | |
| Dell Precision 5000 5680 | |
| MSI CreatorPro Z16P B12UKST | |
| AIDA64 / CPU SHA3 | |
| Gemiddeld Intel Core Ultra 9 285HX (7757 - 9815, n=6) | |
| Dell Pro Max 16 Plus | |
| Lenovo ThinkPad P16 Gen 2 | |
| Dell Precision 5690 | |
| HP ZBook Studio 16 G11 | |
| Lenovo ThinkPad P1 Gen 7 21KV001SGE | |
| MSI CreatorPro Z16P B12UKST | |
| Dell Precision 5000 5680 | |
| AIDA64 / CPU Queen | |
| Lenovo ThinkPad P16 Gen 2 | |
| Gemiddeld Intel Core Ultra 9 285HX (134345 - 141681, n=6) | |
| Dell Pro Max 16 Plus | |
| Dell Precision 5000 5680 | |
| MSI CreatorPro Z16P B12UKST | |
| Dell Precision 5690 | |
| HP ZBook Studio 16 G11 | |
| Lenovo ThinkPad P1 Gen 7 21KV001SGE | |
| AIDA64 / FPU SinJulia | |
| Lenovo ThinkPad P16 Gen 2 | |
| Gemiddeld Intel Core Ultra 9 285HX (12559 - 14431, n=6) | |
| Dell Pro Max 16 Plus | |
| Dell Precision 5690 | |
| HP ZBook Studio 16 G11 | |
| Lenovo ThinkPad P1 Gen 7 21KV001SGE | |
| Dell Precision 5000 5680 | |
| MSI CreatorPro Z16P B12UKST | |
| AIDA64 / FPU Mandel | |
| Gemiddeld Intel Core Ultra 9 285HX (84053 - 108922, n=6) | |
| Dell Pro Max 16 Plus | |
| Lenovo ThinkPad P16 Gen 2 | |
| Dell Precision 5690 | |
| Lenovo ThinkPad P1 Gen 7 21KV001SGE | |
| HP ZBook Studio 16 G11 | |
| Dell Precision 5000 5680 | |
| MSI CreatorPro Z16P B12UKST | |
| AIDA64 / CPU AES | |
| MSI CreatorPro Z16P B12UKST | |
| Gemiddeld Intel Core Ultra 9 285HX (119553 - 134195, n=6) | |
| Dell Pro Max 16 Plus | |
| Lenovo ThinkPad P16 Gen 2 | |
| Dell Precision 5690 | |
| HP ZBook Studio 16 G11 | |
| Lenovo ThinkPad P1 Gen 7 21KV001SGE | |
| Dell Precision 5000 5680 | |
| AIDA64 / CPU ZLib | |
| Gemiddeld Intel Core Ultra 9 285HX (1886 - 2267, n=6) | |
| Dell Pro Max 16 Plus | |
| Lenovo ThinkPad P16 Gen 2 | |
| Dell Precision 5690 | |
| HP ZBook Studio 16 G11 | |
| Lenovo ThinkPad P1 Gen 7 21KV001SGE | |
| MSI CreatorPro Z16P B12UKST | |
| Dell Precision 5000 5680 | |
| AIDA64 / FP64 Ray-Trace | |
| Gemiddeld Intel Core Ultra 9 285HX (15059 - 22312, n=6) | |
| Dell Pro Max 16 Plus | |
| Lenovo ThinkPad P16 Gen 2 | |
| Dell Precision 5690 | |
| Lenovo ThinkPad P1 Gen 7 21KV001SGE | |
| HP ZBook Studio 16 G11 | |
| Dell Precision 5000 5680 | |
| MSI CreatorPro Z16P B12UKST | |
| AIDA64 / CPU PhotoWorxx | |
| Dell Pro Max 16 Plus | |
| HP ZBook Studio 16 G11 | |
| Dell Precision 5690 | |
| Gemiddeld Intel Core Ultra 9 285HX (39232 - 62611, n=6) | |
| Dell Precision 5000 5680 | |
| MSI CreatorPro Z16P B12UKST | |
| Lenovo ThinkPad P1 Gen 7 21KV001SGE | |
| Lenovo ThinkPad P16 Gen 2 | |
Systeemprestaties
PCMark 10 scores zijn niet opgenomen omdat de benchmark consequent vastliep, zelfs wanneer er bijgewerkt werd naar de nieuwste versie en er verschillende GPU-configuraties geprobeerd werden. Dat gezegd hebbende, de AIDA64 geheugenscores behoren tot de hoogste van alle mobiele werkstations, dankzij de prestatievoordelen van CAMM2 RAM.
CrossMark: Overall | Productivity | Creativity | Responsiveness
WebXPRT 3: Overall
WebXPRT 4: Overall
Mozilla Kraken 1.1: Total
| Performance rating | |
| Gemiddeld Intel Core Ultra 9 285HX, NVIDIA RTX PRO 5000 Blackwell Generation Laptop | |
| Dell Pro Max 16 Plus | |
| Lenovo ThinkPad P16 Gen 2 | |
| Dell Precision 5000 5680 | |
| MSI CreatorPro Z16P B12UKST | |
| Dell Precision 5690 | |
| HP ZBook Studio 16 G11 | |
| Lenovo ThinkPad P1 Gen 7 21KV001SGE | |
| CrossMark / Overall | |
| Dell Pro Max 16 Plus | |
| Gemiddeld Intel Core Ultra 9 285HX, NVIDIA RTX PRO 5000 Blackwell Generation Laptop (2142 - 2267, n=3) | |
| Lenovo ThinkPad P16 Gen 2 | |
| MSI CreatorPro Z16P B12UKST | |
| Dell Precision 5000 5680 | |
| Dell Precision 5690 | |
| HP ZBook Studio 16 G11 | |
| Lenovo ThinkPad P1 Gen 7 21KV001SGE | |
| CrossMark / Productivity | |
| Gemiddeld Intel Core Ultra 9 285HX, NVIDIA RTX PRO 5000 Blackwell Generation Laptop (2016 - 2028, n=3) | |
| Dell Pro Max 16 Plus | |
| Lenovo ThinkPad P16 Gen 2 | |
| MSI CreatorPro Z16P B12UKST | |
| Dell Precision 5000 5680 | |
| Dell Precision 5690 | |
| HP ZBook Studio 16 G11 | |
| Lenovo ThinkPad P1 Gen 7 21KV001SGE | |
| CrossMark / Creativity | |
| Dell Pro Max 16 Plus | |
| Gemiddeld Intel Core Ultra 9 285HX, NVIDIA RTX PRO 5000 Blackwell Generation Laptop (2395 - 2725, n=3) | |
| Lenovo ThinkPad P16 Gen 2 | |
| Dell Precision 5000 5680 | |
| MSI CreatorPro Z16P B12UKST | |
| Dell Precision 5690 | |
| HP ZBook Studio 16 G11 | |
| Lenovo ThinkPad P1 Gen 7 21KV001SGE | |
| CrossMark / Responsiveness | |
| MSI CreatorPro Z16P B12UKST | |
| Gemiddeld Intel Core Ultra 9 285HX, NVIDIA RTX PRO 5000 Blackwell Generation Laptop (1806 - 1858, n=3) | |
| Dell Pro Max 16 Plus | |
| Lenovo ThinkPad P16 Gen 2 | |
| Dell Precision 5000 5680 | |
| Dell Precision 5690 | |
| HP ZBook Studio 16 G11 | |
| Lenovo ThinkPad P1 Gen 7 21KV001SGE | |
| WebXPRT 3 / Overall | |
| Gemiddeld Intel Core Ultra 9 285HX, NVIDIA RTX PRO 5000 Blackwell Generation Laptop (327 - 360, n=3) | |
| Dell Precision 5000 5680 | |
| Lenovo ThinkPad P16 Gen 2 | |
| Dell Pro Max 16 Plus | |
| MSI CreatorPro Z16P B12UKST | |
| HP ZBook Studio 16 G11 | |
| Dell Precision 5690 | |
| Lenovo ThinkPad P1 Gen 7 21KV001SGE | |
| WebXPRT 4 / Overall | |
| Gemiddeld Intel Core Ultra 9 285HX, NVIDIA RTX PRO 5000 Blackwell Generation Laptop (306 - 323, n=3) | |
| Dell Pro Max 16 Plus | |
| Lenovo ThinkPad P16 Gen 2 | |
| Dell Precision 5000 5680 | |
| Dell Precision 5690 | |
| MSI CreatorPro Z16P B12UKST | |
| HP ZBook Studio 16 G11 | |
| Lenovo ThinkPad P1 Gen 7 21KV001SGE | |
| Mozilla Kraken 1.1 / Total | |
| Lenovo ThinkPad P1 Gen 7 21KV001SGE | |
| MSI CreatorPro Z16P B12UKST | |
| HP ZBook Studio 16 G11 | |
| Dell Precision 5690 | |
| Dell Precision 5000 5680 | |
| Lenovo ThinkPad P16 Gen 2 | |
| Dell Pro Max 16 Plus | |
| Gemiddeld Intel Core Ultra 9 285HX, NVIDIA RTX PRO 5000 Blackwell Generation Laptop (411 - 439, n=3) | |
* ... kleiner is beter
| AIDA64 / Memory Copy | |
| Dell Pro Max 16 Plus | |
| Dell Precision 5690 | |
| Gemiddeld Intel Core Ultra 9 285HX (63431 - 93933, n=6) | |
| HP ZBook Studio 16 G11 | |
| Dell Precision 5000 5680 | |
| Lenovo ThinkPad P1 Gen 7 21KV001SGE | |
| Lenovo ThinkPad P16 Gen 2 | |
| MSI CreatorPro Z16P B12UKST | |
| AIDA64 / Memory Read | |
| Dell Pro Max 16 Plus | |
| Dell Precision 5690 | |
| Gemiddeld Intel Core Ultra 9 285HX (67084 - 97565, n=6) | |
| HP ZBook Studio 16 G11 | |
| Lenovo ThinkPad P16 Gen 2 | |
| Dell Precision 5000 5680 | |
| MSI CreatorPro Z16P B12UKST | |
| Lenovo ThinkPad P1 Gen 7 21KV001SGE | |
| AIDA64 / Memory Write | |
| Dell Pro Max 16 Plus | |
| Dell Precision 5000 5680 | |
| Gemiddeld Intel Core Ultra 9 285HX (64112 - 89691, n=6) | |
| HP ZBook Studio 16 G11 | |
| Dell Precision 5690 | |
| MSI CreatorPro Z16P B12UKST | |
| Lenovo ThinkPad P16 Gen 2 | |
| Lenovo ThinkPad P1 Gen 7 21KV001SGE | |
| AIDA64 / Memory Latency | |
| Dell Precision 5690 | |
| Lenovo ThinkPad P1 Gen 7 21KV001SGE | |
| Gemiddeld Intel Core Ultra 9 285HX (104.8 - 151.7, n=6) | |
| HP ZBook Studio 16 G11 | |
| Dell Pro Max 16 Plus | |
| MSI CreatorPro Z16P B12UKST | |
| Lenovo ThinkPad P16 Gen 2 | |
| Dell Precision 5000 5680 | |
* ... kleiner is beter
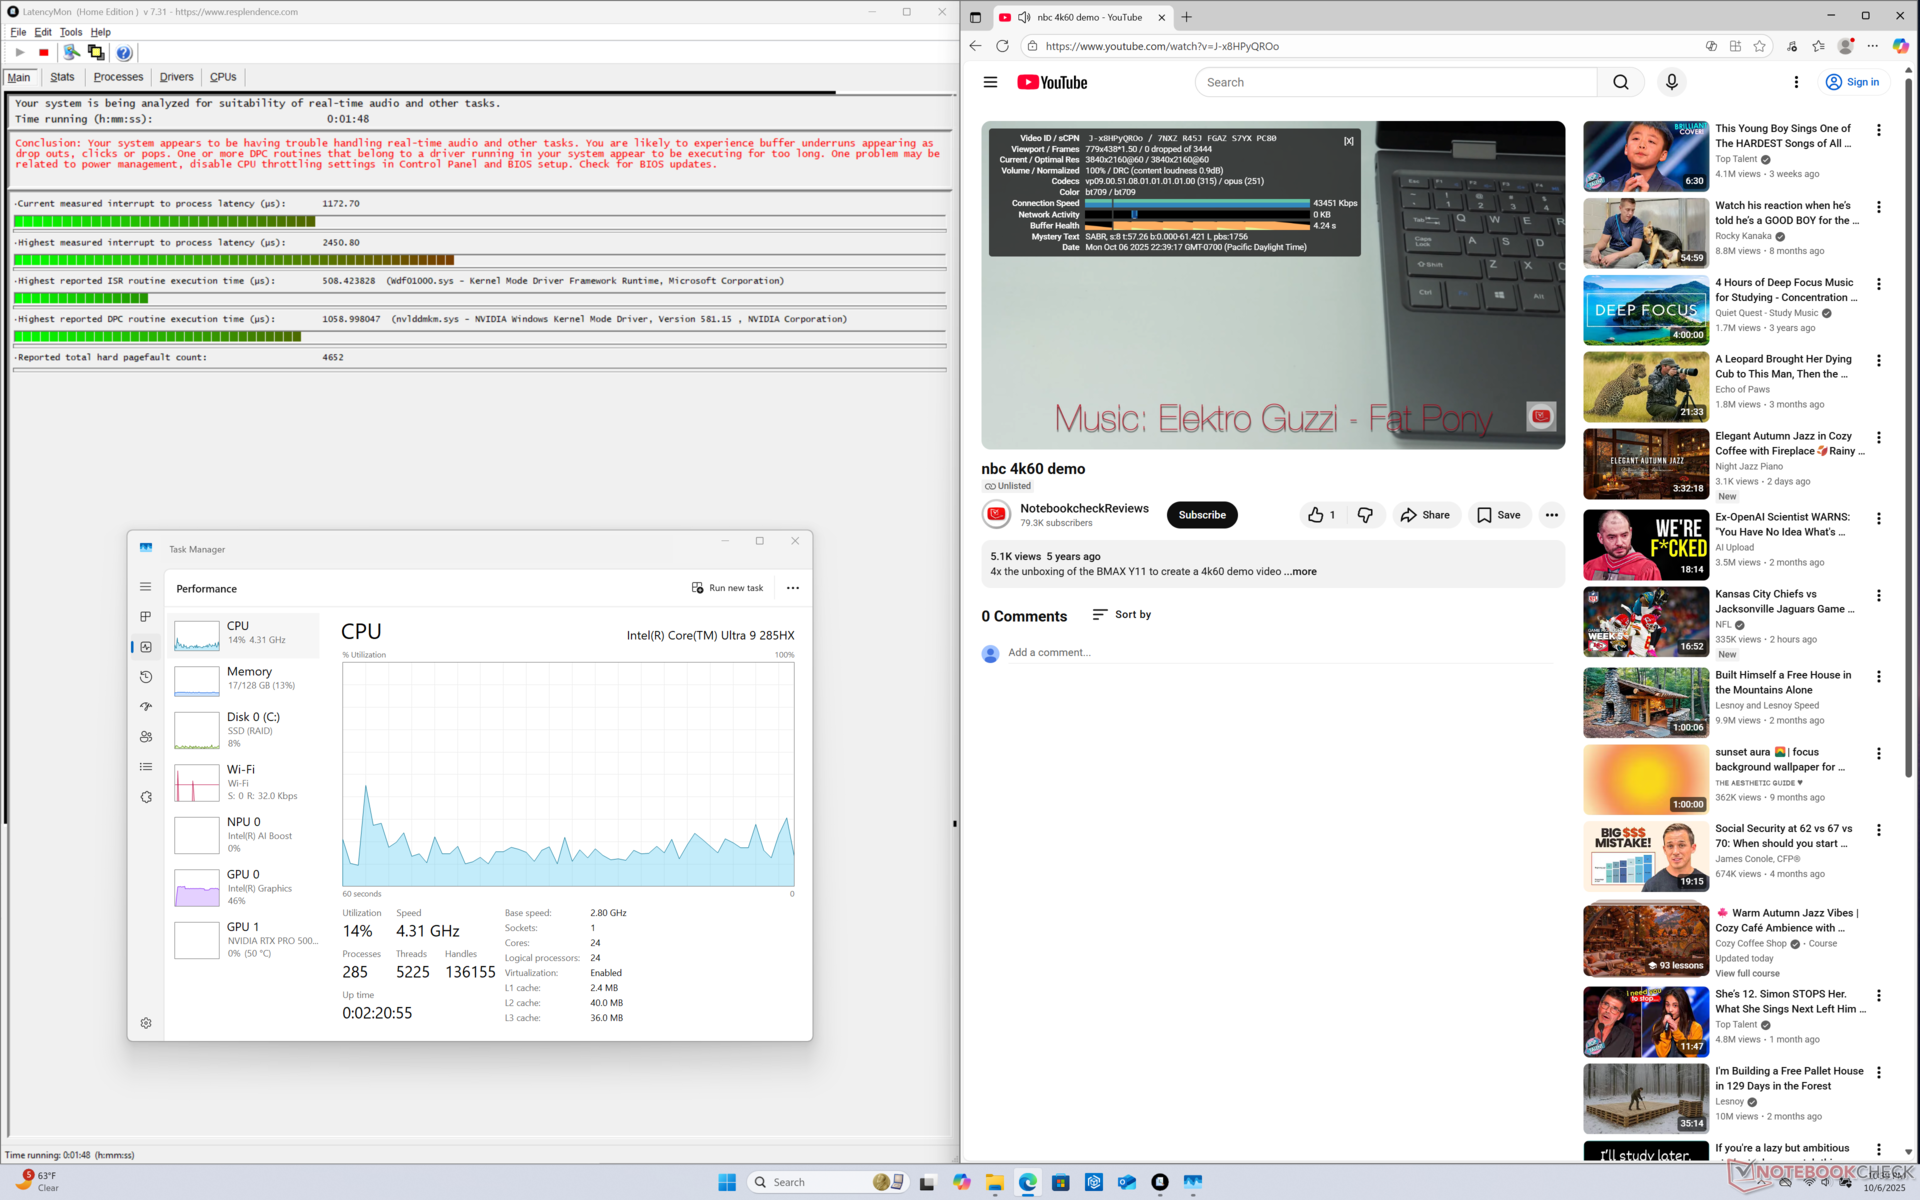
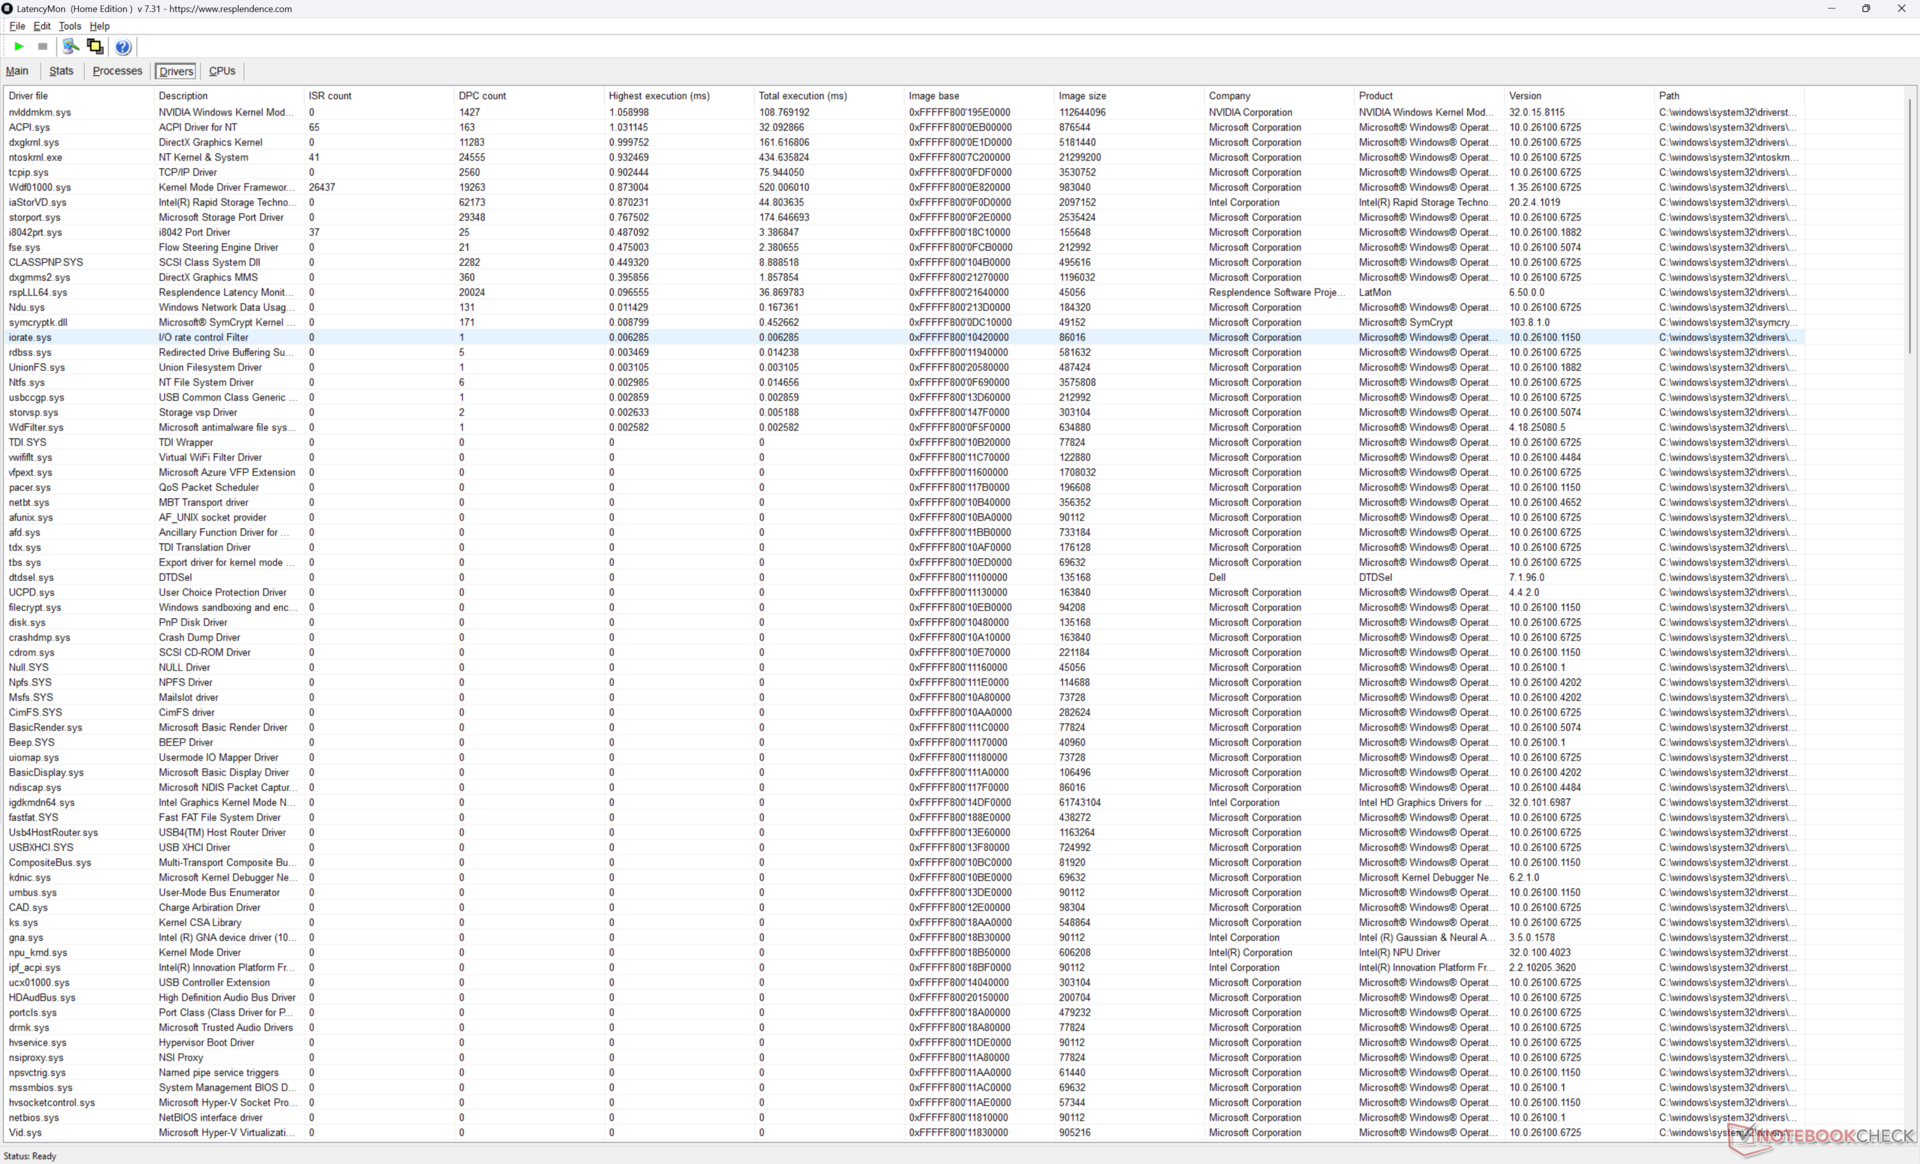
DPC latentie
LatencyMon toont kleine DPC-problemen met verder geen dropped frames tijdens onze 4K60 videoweergavetest.
| DPC Latencies / LatencyMon - interrupt to process latency (max), Web, Youtube, Prime95 | |
| Dell Pro Max 16 Plus | |
| Dell Precision 5000 5680 | |
| Lenovo ThinkPad P1 Gen 7 21KV001SGE | |
| HP ZBook Studio 16 G11 | |
| Lenovo ThinkPad P16 Gen 2 | |
| MSI CreatorPro Z16P B12UKST | |
| Dell Precision 5690 | |
* ... kleiner is beter
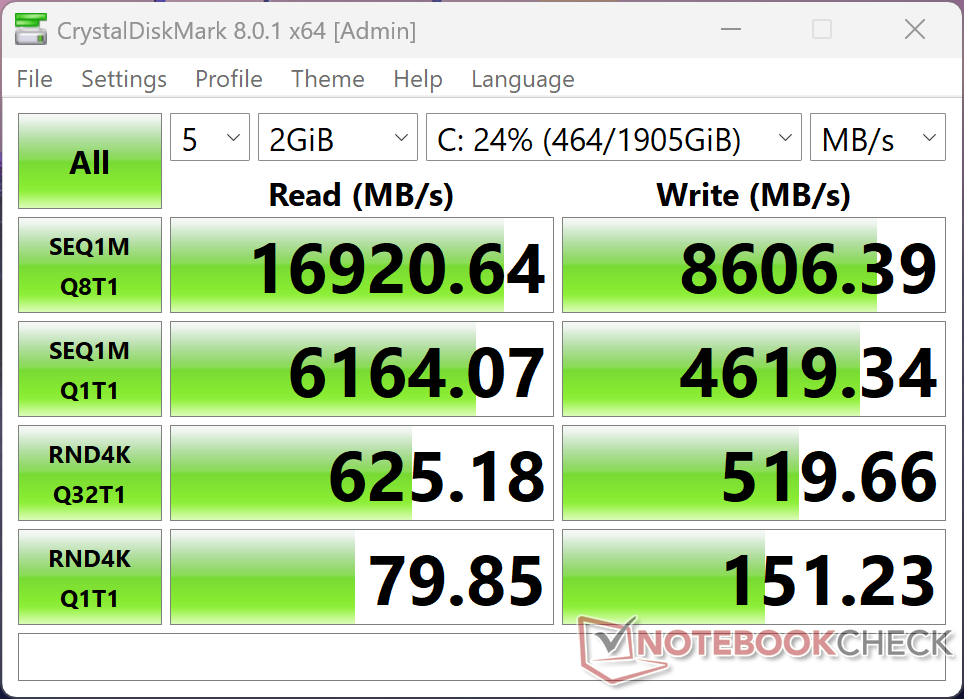
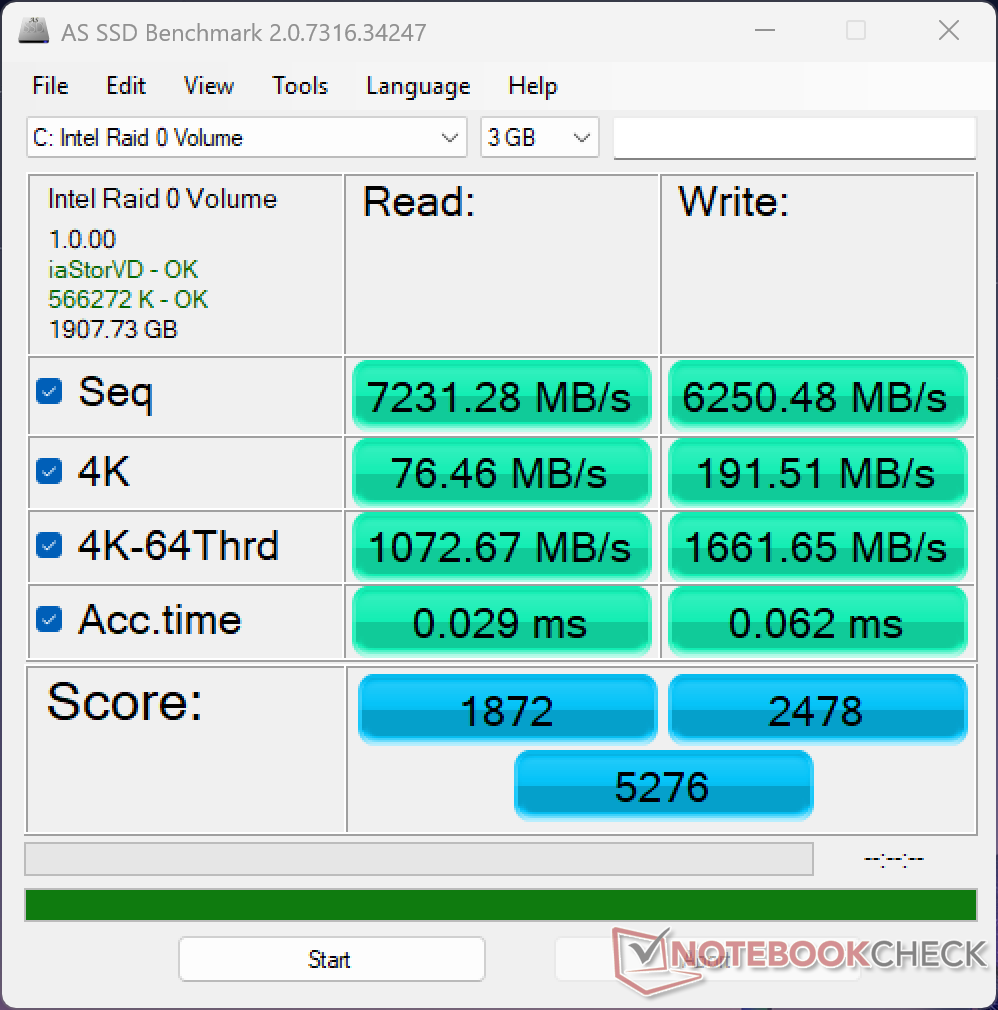
Opslagapparaten
Onze testeenheid wordt geleverd met de SK Hynix PCB01 PCIe5 x4 NVMe SSD voor leessnelheden tot ~16 GB/s. De prestaties daalden licht naar ~13 GB/s na een paar minuten in onze DisKSpd-stresstest, zoals de onderstaande grafiek laat zien.

* ... kleiner is beter
Schijf onderdrukken: DiskSpd Leeslus, wachtrijdiepte 8
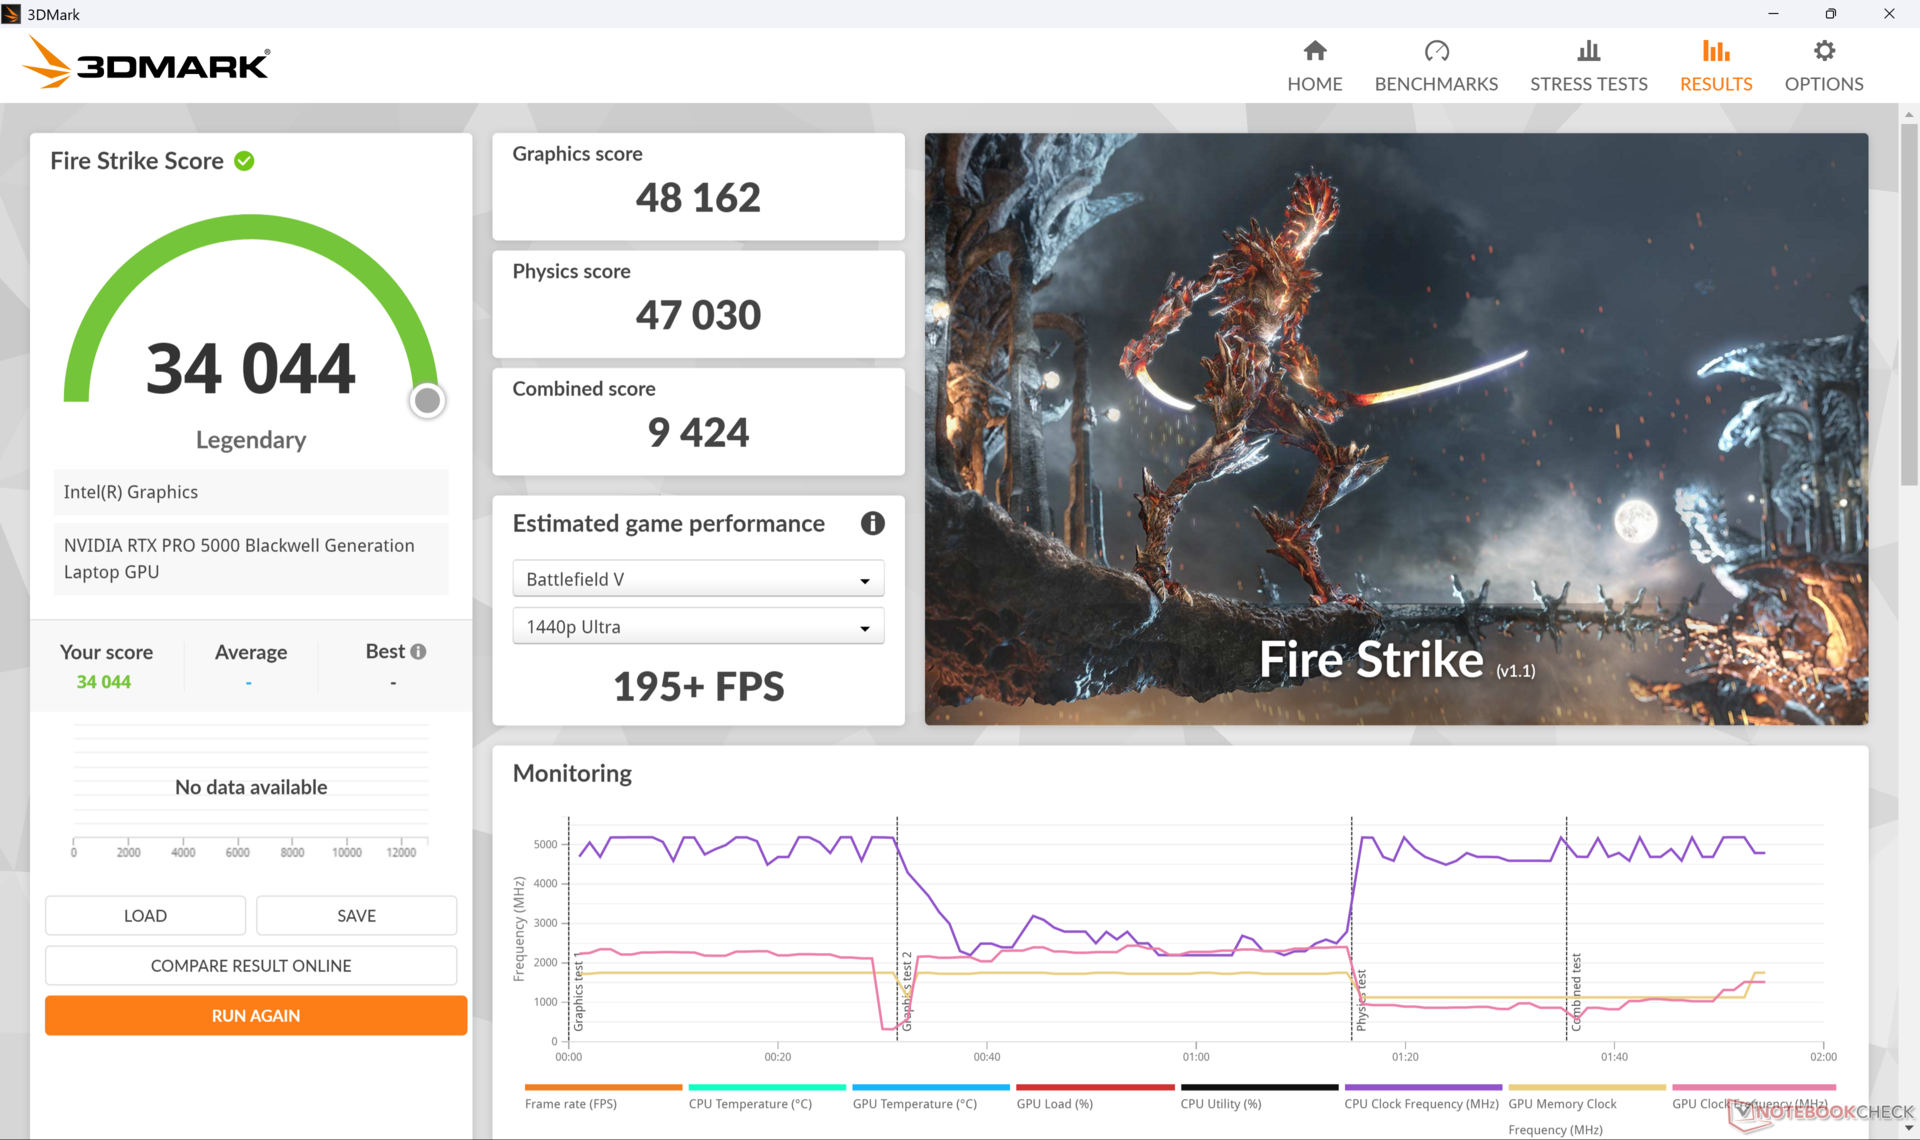
GPU-prestaties
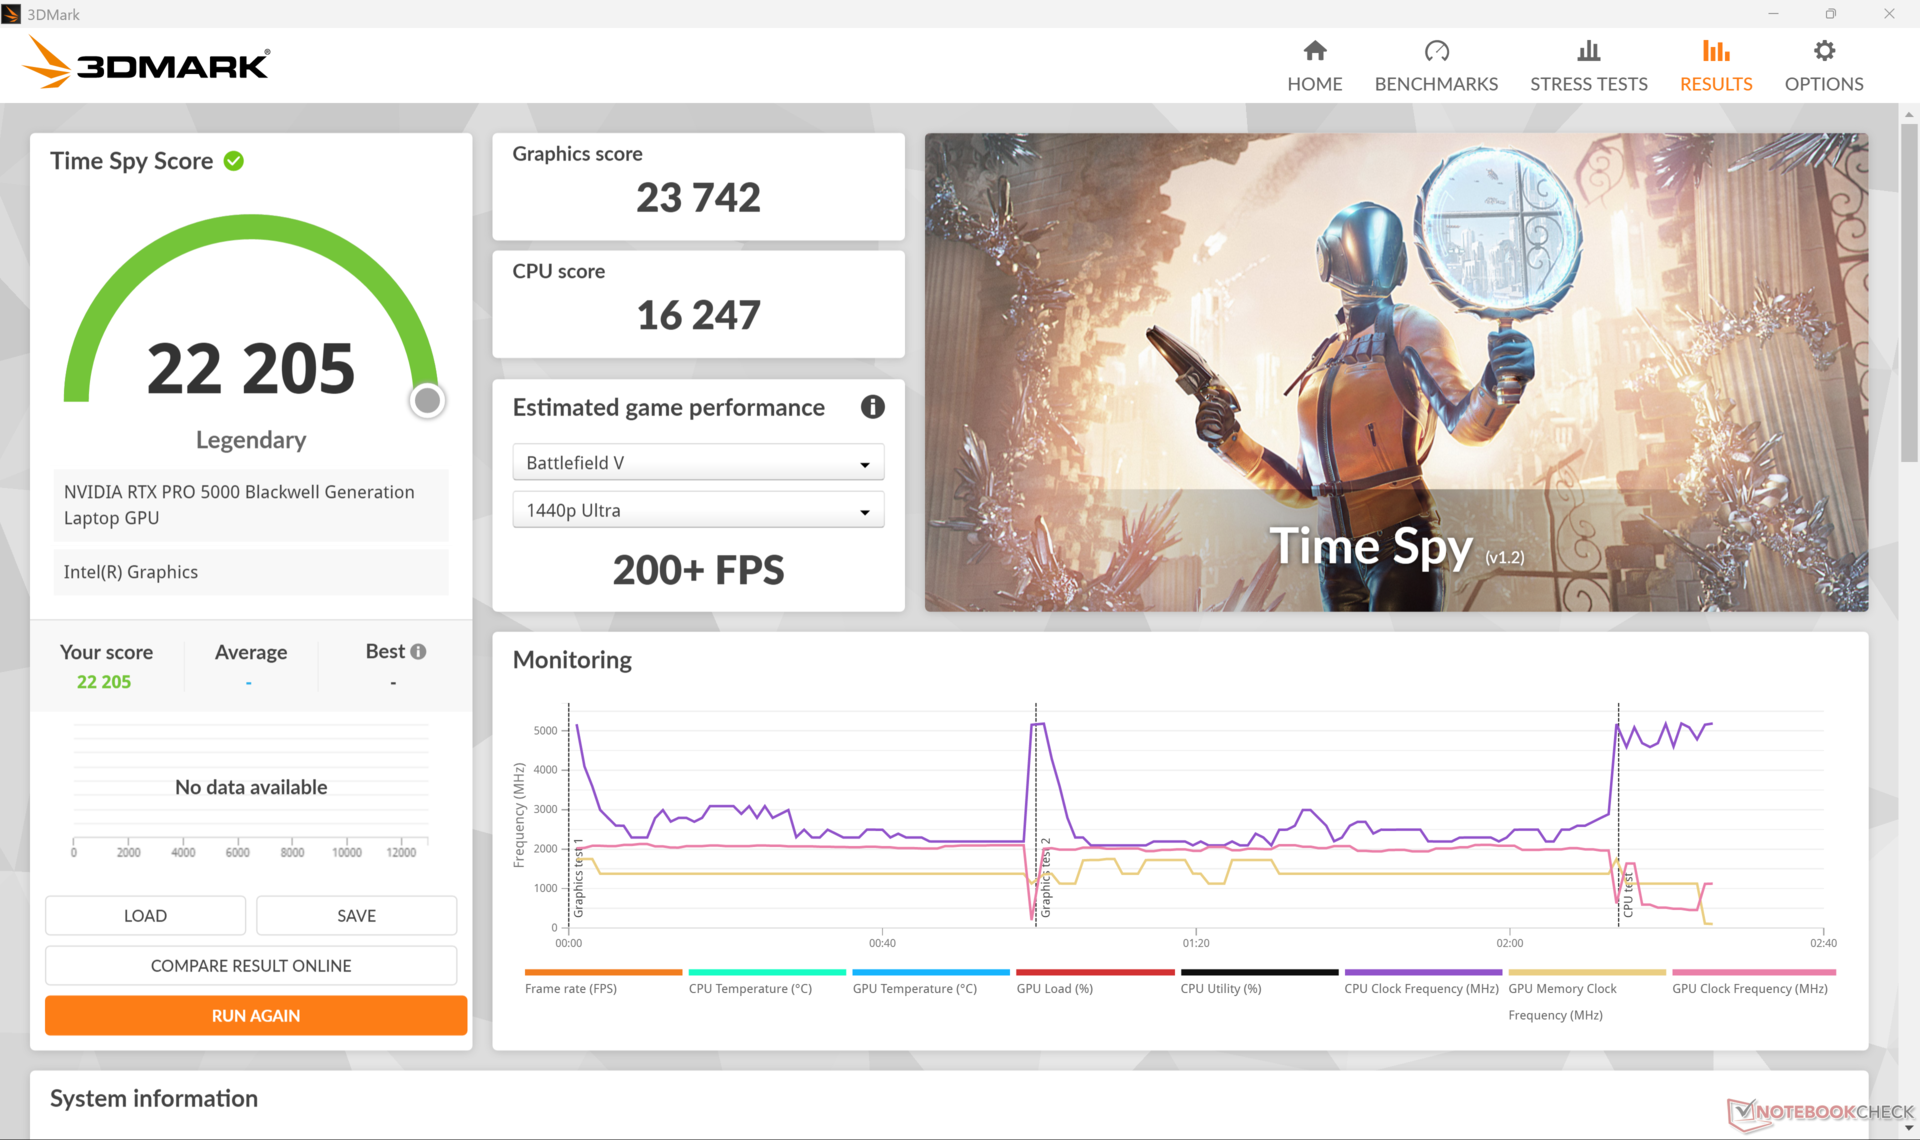
Als eerste werkstation in onze database met de RTX Pro 5000 Blackwellpresteert de GPU duidelijk beter dan de uitgaande RTX 5000 Ada die gebruikelijk was op de vlaggenschip werkstations van de vorige generatie, zoals de HP ZBook Fury 16 G10 met ongeveer 35 tot 50 procent. De voordelen kunnen nog groter zijn als rekening wordt gehouden met Specviewperf resultaten. Door het systeem in de Balanced of Optimized modus te draaien in plaats van in de Performance modus, worden de prestaties volgens 3DMark Fire Strike benchmarks slechts minimaal beïnvloed.
| Energieprofiel | Grafische Score | Fysica Score | Gecombineerde Score |
| Prestatiemodus (~121 W) | 48162 | 47030 | 9424 |
| Gebalanceerde modus (~108 W) | 47134 (-2%) | 45150 (-4%) | 12212 (+30%) |
| Batterijvermogen | 25838 (-46%) | 34253 (-27%) | 6186 (-34%) |
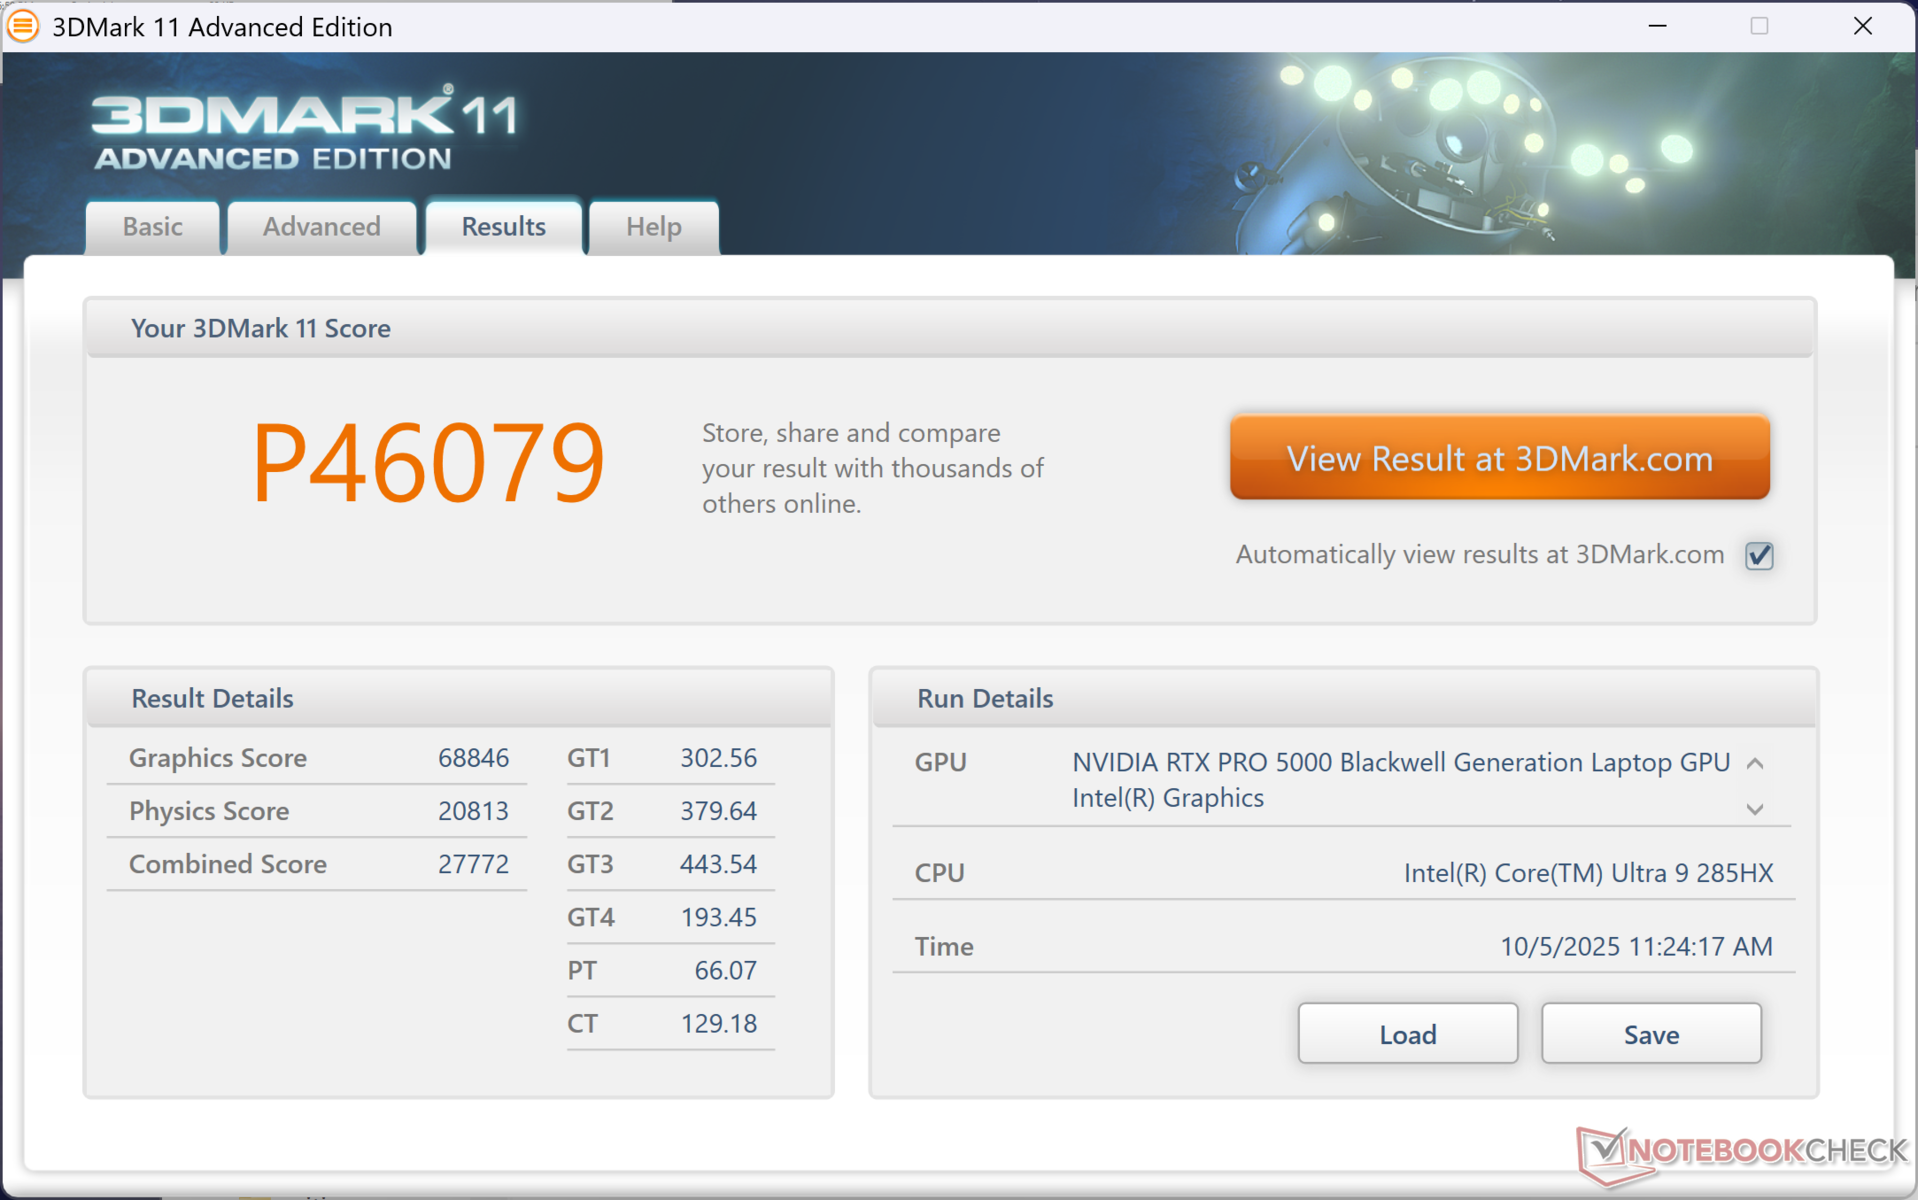

| 3DMark 11 Performance | 46079 punten | |
| 3DMark Cloud Gate Standard Score | 67837 punten | |
| 3DMark Fire Strike Score | 34044 punten | |
| 3DMark Time Spy Score | 22205 punten | |
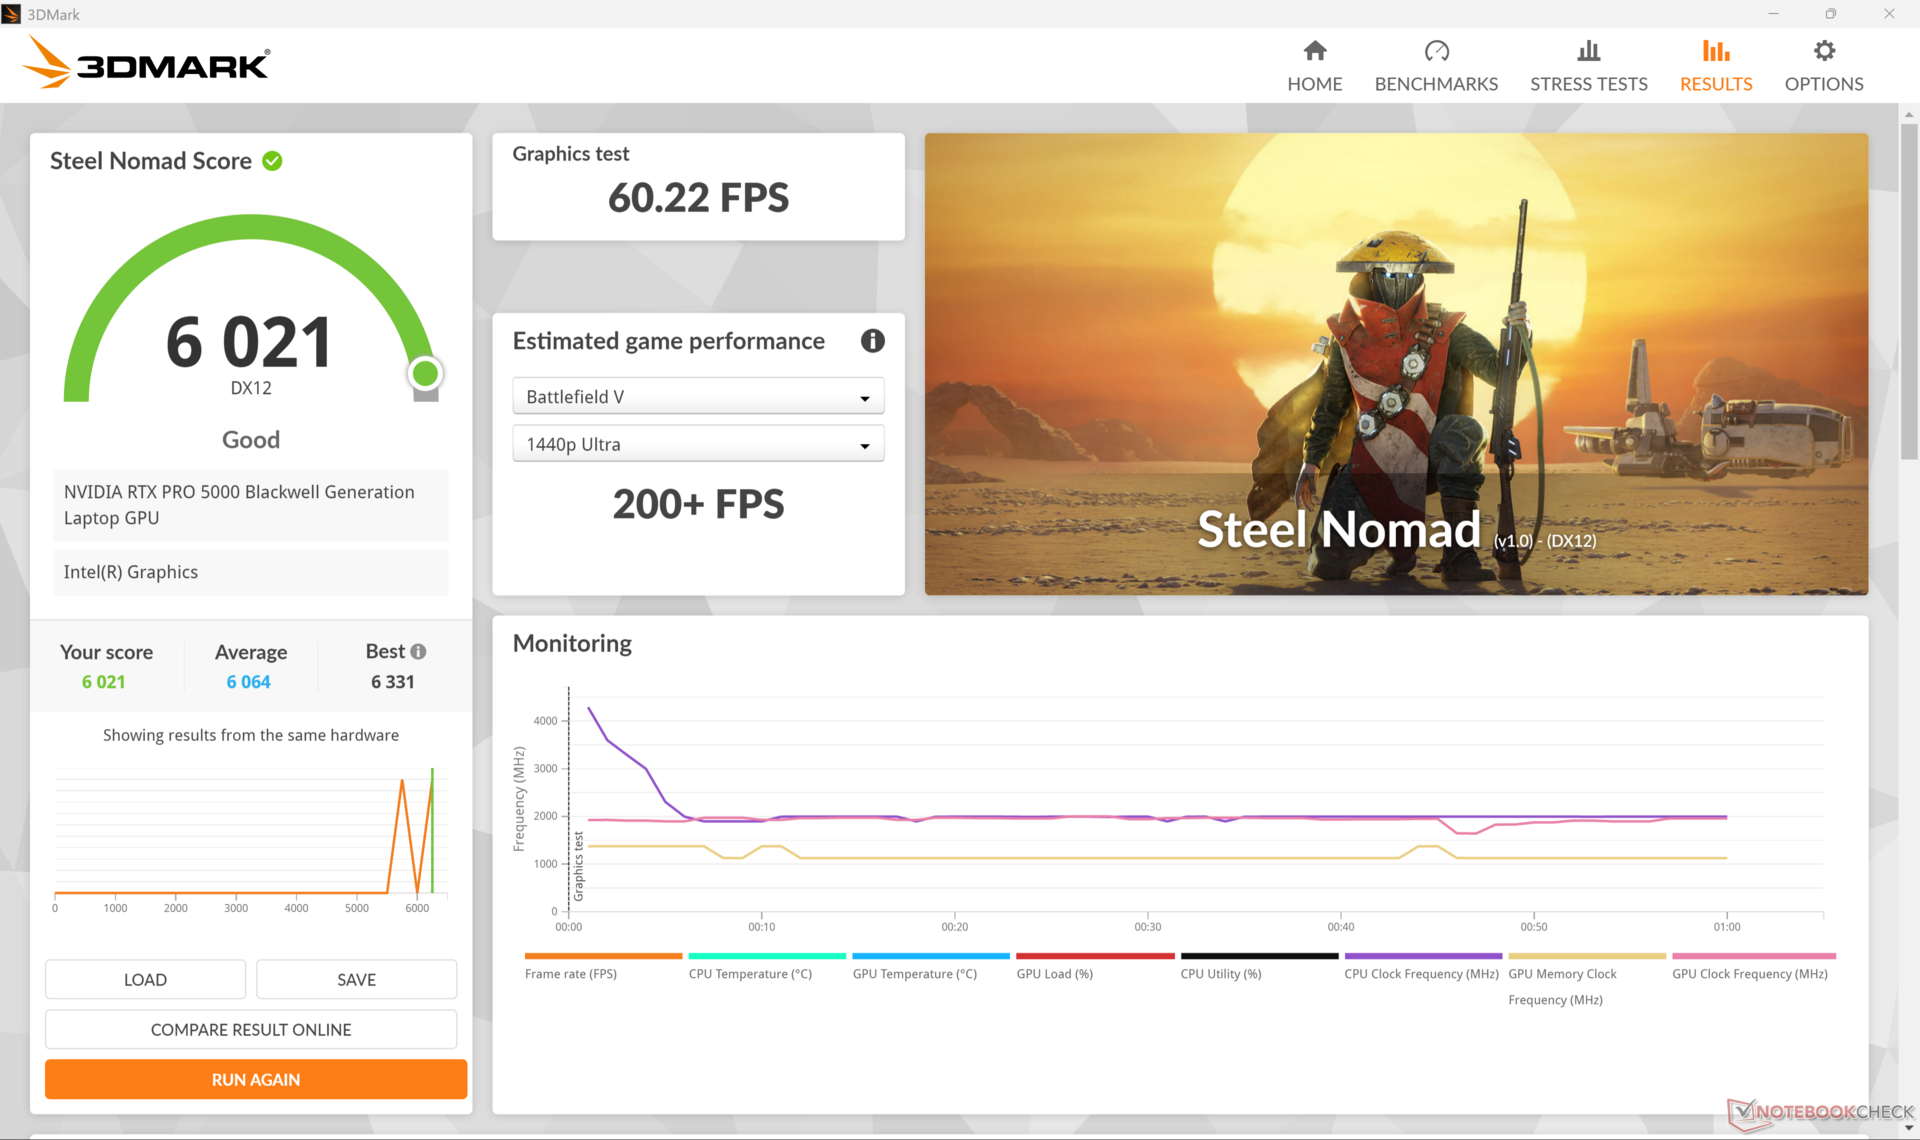
| 3DMark Steel Nomad Score | 6021 punten | |
Help | ||
* ... kleiner is beter
Gaming prestaties
Gamingprestaties zijn grotendeels vergelijkbaar met de mobiele GeForce RTX 5080 wat te verwachten is aangezien de RTX Pro 5000 Blackwell gebaseerd is op de mobiele RTX 5090 chip, maar zonder de optimalisaties voor gaming. Sommige titels draaien slechter of inconsistent op de RTX Pro 5000 Blackwell, waaronder Monster Hunter Wilds.
| Performance rating - Percent | |
| Dell Pro Max 16 Plus | |
| Lenovo ThinkPad P16 Gen 2 | |
| Dell Precision 5000 5680 -3! | |
| Dell Precision 5690 -1! | |
| HP ZBook Studio 16 G11 | |
| MSI CreatorPro Z16P B12UKST -2! | |
| Lenovo ThinkPad P1 Gen 7 21KV001SGE -1! | |
| Cyberpunk 2077 - 1920x1080 Ultra Preset (FSR off) | |
| Dell Pro Max 16 Plus | |
| Dell Precision 5690 | |
| Lenovo ThinkPad P16 Gen 2 | |
| Lenovo ThinkPad P1 Gen 7 21KV001SGE | |
| HP ZBook Studio 16 G11 | |
| Baldur's Gate 3 - 1920x1080 Ultra Preset AA:T | |
| Dell Pro Max 16 Plus | |
| Lenovo ThinkPad P16 Gen 2 | |
| Dell Precision 5690 | |
| HP ZBook Studio 16 G11 | |
| Lenovo ThinkPad P1 Gen 7 21KV001SGE | |
| GTA V - 1920x1080 Highest AA:4xMSAA + FX AF:16x | |
| Dell Pro Max 16 Plus | |
| Lenovo ThinkPad P16 Gen 2 | |
| Dell Precision 5000 5680 | |
| Lenovo ThinkPad P1 Gen 7 21KV001SGE | |
| HP ZBook Studio 16 G11 | |
| MSI CreatorPro Z16P B12UKST | |
| Final Fantasy XV Benchmark - 1920x1080 High Quality | |
| Dell Pro Max 16 Plus | |
| Lenovo ThinkPad P16 Gen 2 | |
| Dell Precision 5690 | |
| Dell Precision 5000 5680 | |
| HP ZBook Studio 16 G11 | |
| Lenovo ThinkPad P1 Gen 7 21KV001SGE | |
| MSI CreatorPro Z16P B12UKST | |
| Strange Brigade - 1920x1080 ultra AA:ultra AF:16 | |
| Lenovo ThinkPad P16 Gen 2 | |
| Dell Pro Max 16 Plus | |
| Dell Precision 5690 | |
| HP ZBook Studio 16 G11 | |
| MSI CreatorPro Z16P B12UKST | |
| Dota 2 Reborn - 1920x1080 ultra (3/3) best looking | |
| Dell Pro Max 16 Plus | |
| Lenovo ThinkPad P16 Gen 2 | |
| MSI CreatorPro Z16P B12UKST | |
| Dell Precision 5000 5680 | |
| HP ZBook Studio 16 G11 | |
| Dell Precision 5690 | |
| Lenovo ThinkPad P1 Gen 7 21KV001SGE | |
| X-Plane 11.11 - 1920x1080 high (fps_test=3) | |
| Lenovo ThinkPad P16 Gen 2 | |
| Dell Pro Max 16 Plus | |
| Dell Precision 5000 5680 | |
| MSI CreatorPro Z16P B12UKST | |
| Dell Precision 5690 | |
| HP ZBook Studio 16 G11 | |
| Lenovo ThinkPad P1 Gen 7 21KV001SGE | |
Cyberpunk 2077 ultra FPS Grafiek
| lage | gem. | hoge | ultra | QHD DLSS | QHD | 4K DLSS | 4K | |
|---|---|---|---|---|---|---|---|---|
| GTA V (2015) | 184.7 | 183.5 | 178.1 | 142.5 | 138 | 170.3 | ||
| Dota 2 Reborn (2015) | 212 | 181 | 184.8 | 166 | 146.4 | |||
| Final Fantasy XV Benchmark (2018) | 233 | 220 | 184.2 | 162.8 | 102.2 | |||
| X-Plane 11.11 (2018) | 144.4 | 125.7 | 103.2 | 82.6 | ||||
| Strange Brigade (2018) | 382 | 285 | 261 | 288 | 300 | 177.3 | ||
| Baldur's Gate 3 (2023) | 204 | 201.8 | 155.2 | 128.1 | 80.1 | |||
| Cyberpunk 2077 (2023) | 133.9 | 121.6 | 120.6 | 119.8 | 116.3 | 105.1 | 51 | |
| F1 24 (2024) | 251 | 243 | 231 | 131.2 | 128.1 | 94.9 | 82 | 47.2 |
| Black Myth: Wukong (2024) | 142 | 72 | 54 | 42 | 36 | 37 | 32 | 26 |
| Monster Hunter Wilds (2025) | 25.4 | 27 | 27.8 | 43.3 | 39 | 33.9 | 35.3 | |
| Assassin's Creed Shadows (2025) | 103 | 98 | 86 | 68 | 67 | 57 | 56 | 42 |
Uitstoot
Systeemgeluid
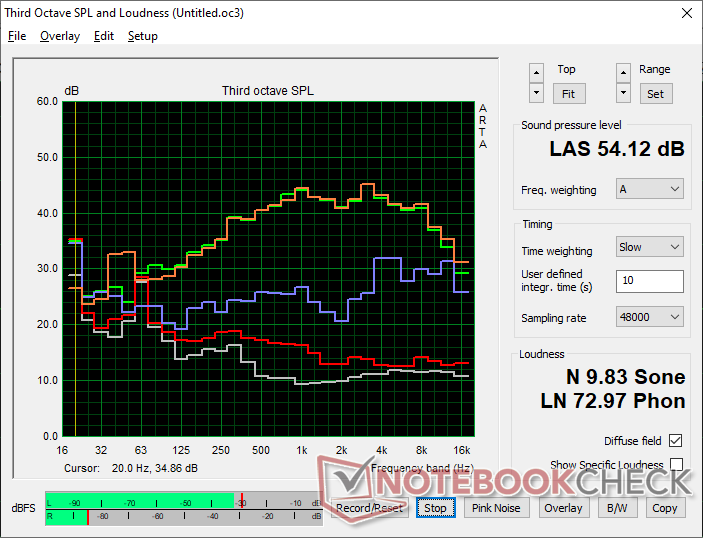
Hoewel de ventilatoren bijna altijd actief zijn, wordt het pulserende gedrag over het algemeen tot een minimum beperkt om scherpe geluidstoenames te beperken. Dit gezegd hebbende, kan het systeem behoorlijk luid zijn met bijna 55 dB(A) bij zware belastingen, wat vergelijkbaar is met wat we hebben gemeten op de Lenovo ThinkPad P1 of HP ZBook Studio 16 G11.
Het ventilatorgeluid bereikt een maximum van 49 dB(A) en 54,3 dB(A) wanneer het systeem is ingesteld op respectievelijk de gebalanceerde modus en de prestatiemodus.
Geluidsniveau
| Onbelast |
| 26.7 / 30.5 / 34 dB (A) |
| Belasting |
| 39.8 / 54.3 dB (A) |
 | ||
30 dB stil 40 dB(A) hoorbaar 50 dB(A) luid |
||
min: | ||
| Dell Pro Max 16 Plus RTX PRO 5000 Blackwell Generation Laptop, Ultra 9 285HX, SK hynix PCB01 HFS001TFM9X186N | Dell Precision 5690 RTX 5000 Ada Generation Laptop, Ultra 9 185H, 2x Samsung PM9A1 1TB (RAID 0) | Dell Precision 5000 5680 RTX 5000 Ada Generation Laptop, i9-13900H, 2x SK hynix PC801 HFS512GEJ9X101N RAID 0 | Lenovo ThinkPad P16 Gen 2 RTX 4000 Ada Generation Laptop, i7-14700HX, SK hynix PC801 HFS001TEJ9X162N | Lenovo ThinkPad P1 Gen 7 21KV001SGE GeForce RTX 4060 Laptop GPU, Ultra 7 155H, Kioxia XG8 KXG8AZNV1T02 | HP ZBook Studio 16 G11 RTX 3000 Ada Generation Laptop, Ultra 9 185H, Kioxia XG8 KXG80ZNV1T02 | MSI CreatorPro Z16P B12UKST RTX A3000 Laptop GPU, i7-12700H, Samsung PM9A1 MZVL21T0HCLR | |
|---|---|---|---|---|---|---|---|
| Noise | 7% | 14% | 1% | 6% | 11% | 5% | |
| uit / omgeving * (dB) | 23.2 | 23.4 -1% | 22.8 2% | 23.9 -3% | 24.7 -6% | 23.8 -3% | 24.1 -4% |
| Idle Minimum * (dB) | 26.7 | 23.6 12% | 23 14% | 29.1 -9% | 24.7 7% | 23.8 11% | 27.1 -1% |
| Idle Average * (dB) | 30.5 | 24.9 18% | 23 25% | 29.1 5% | 24.7 19% | 26.4 13% | 27.1 11% |
| Idle Maximum * (dB) | 34 | 30.9 9% | 23 32% | 29.1 14% | 24.7 27% | 26.4 22% | 27.1 20% |
| Load Average * (dB) | 39.8 | 40.4 -2% | 37.2 7% | 41 -3% | 43.7 -10% | 33.7 15% | 42.9 -8% |
| Cyberpunk 2077 ultra * (dB) | 54.3 | 52.8 3% | 53.2 2% | 46.1 15% | |||
| Load Maximum * (dB) | 54.3 | 51.9 4% | 51 6% | 52.9 3% | 53.3 2% | 53.2 2% | 47 13% |
| Witcher 3 ultra * (dB) | 48.3 | 51 | 44 |
* ... kleiner is beter
Temperatuur
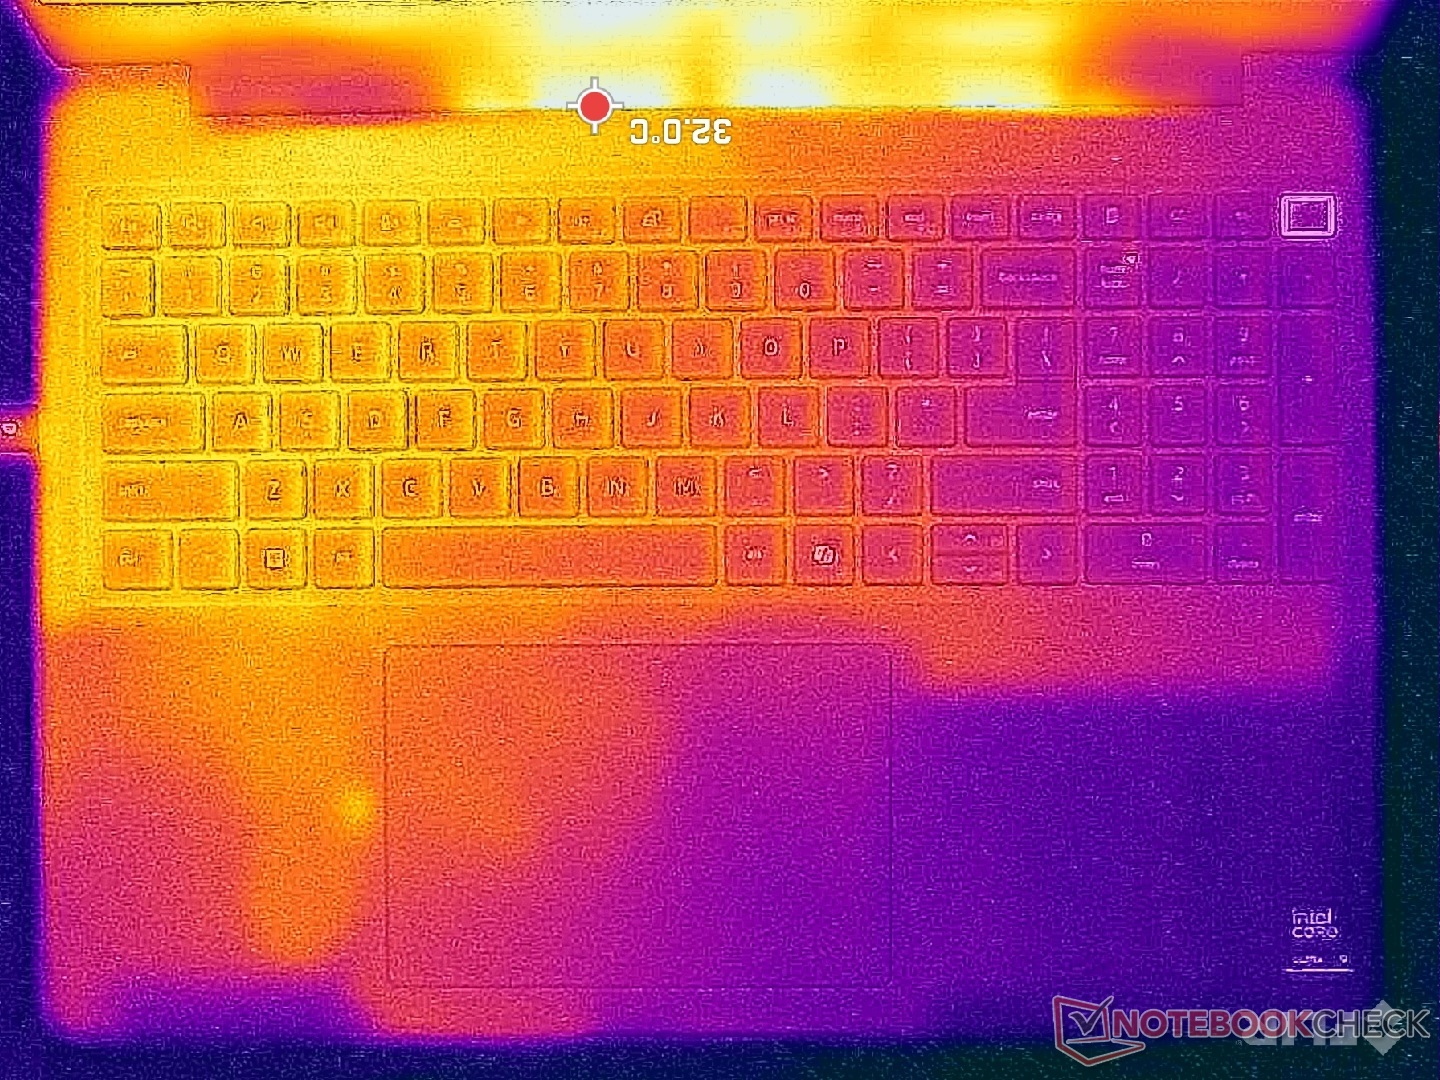
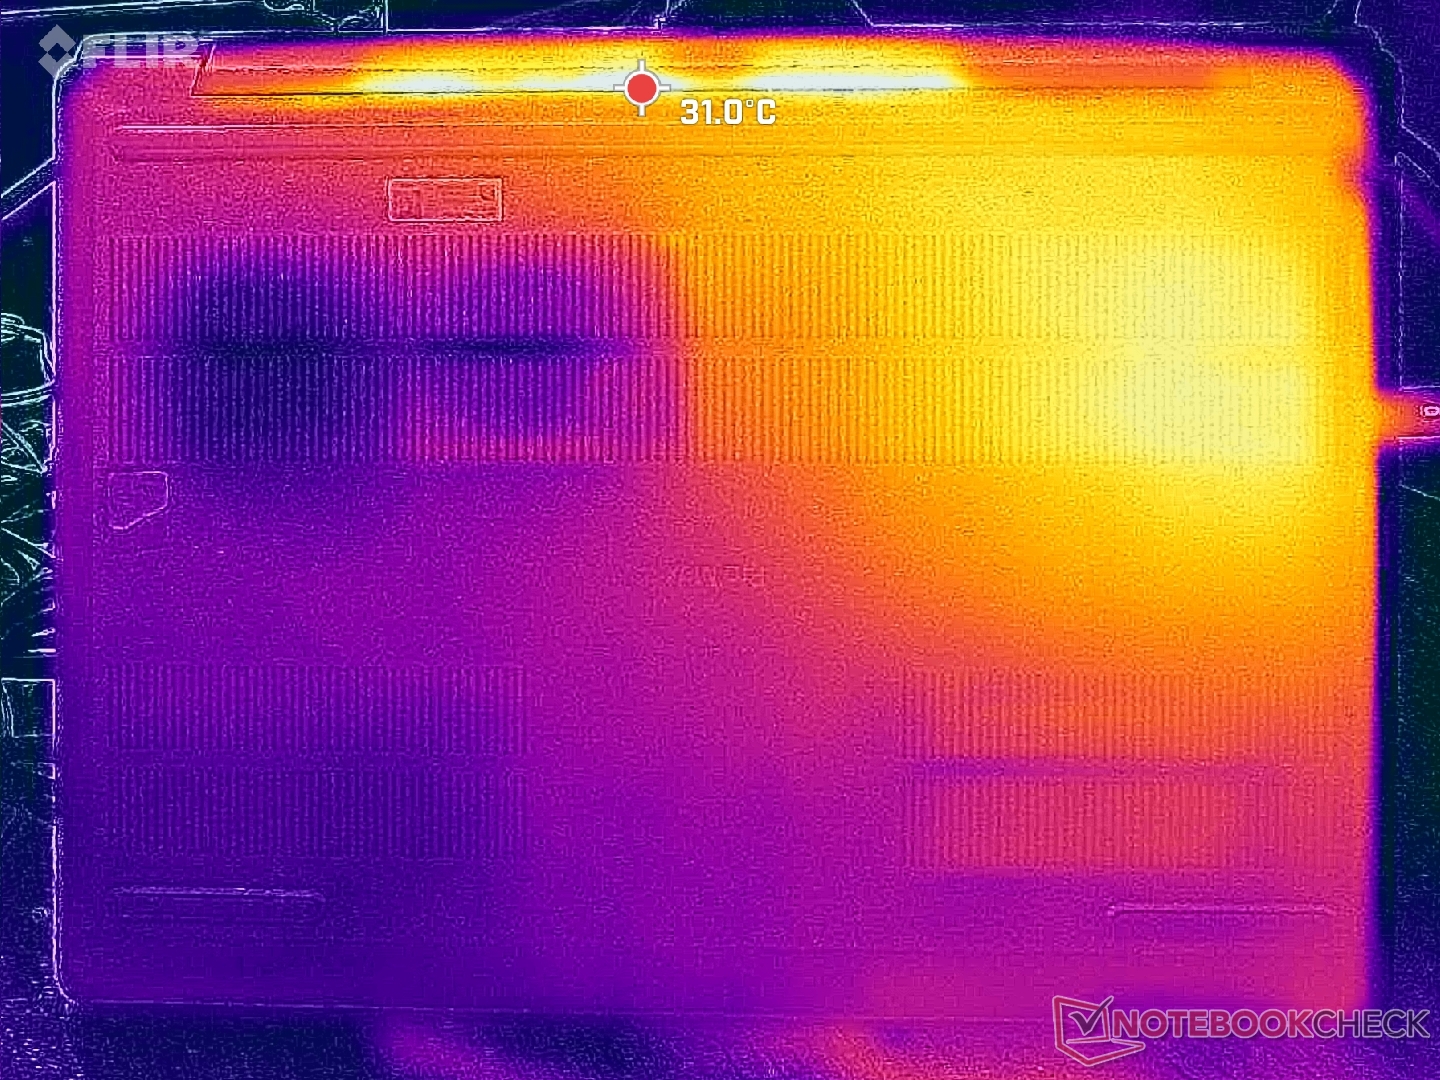
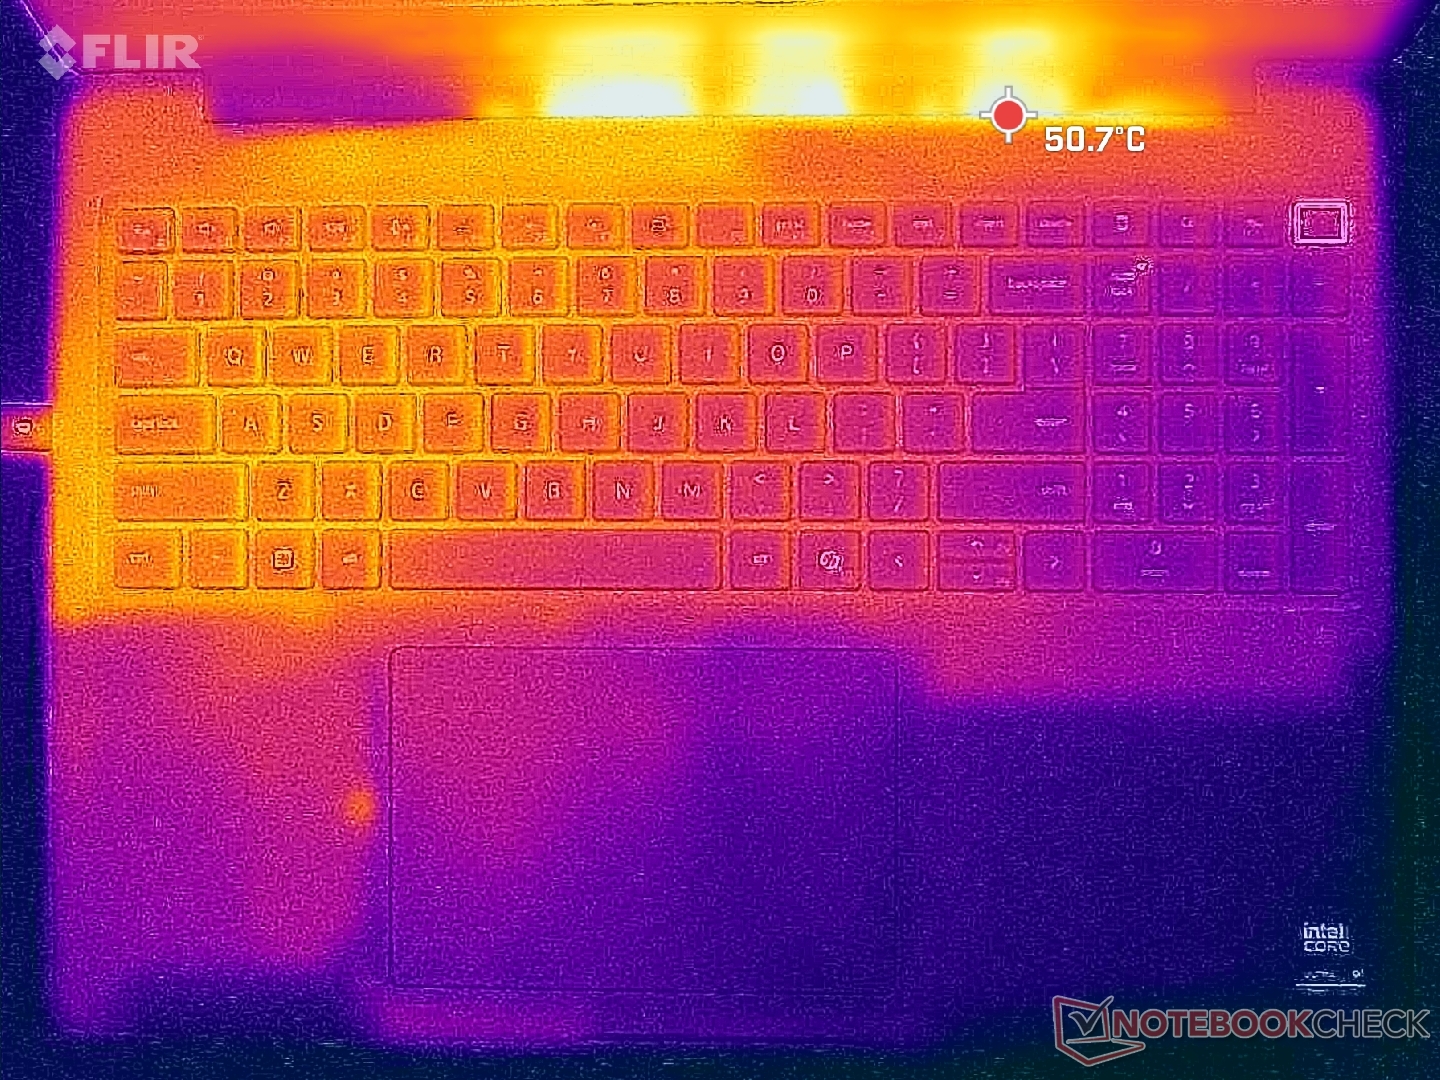
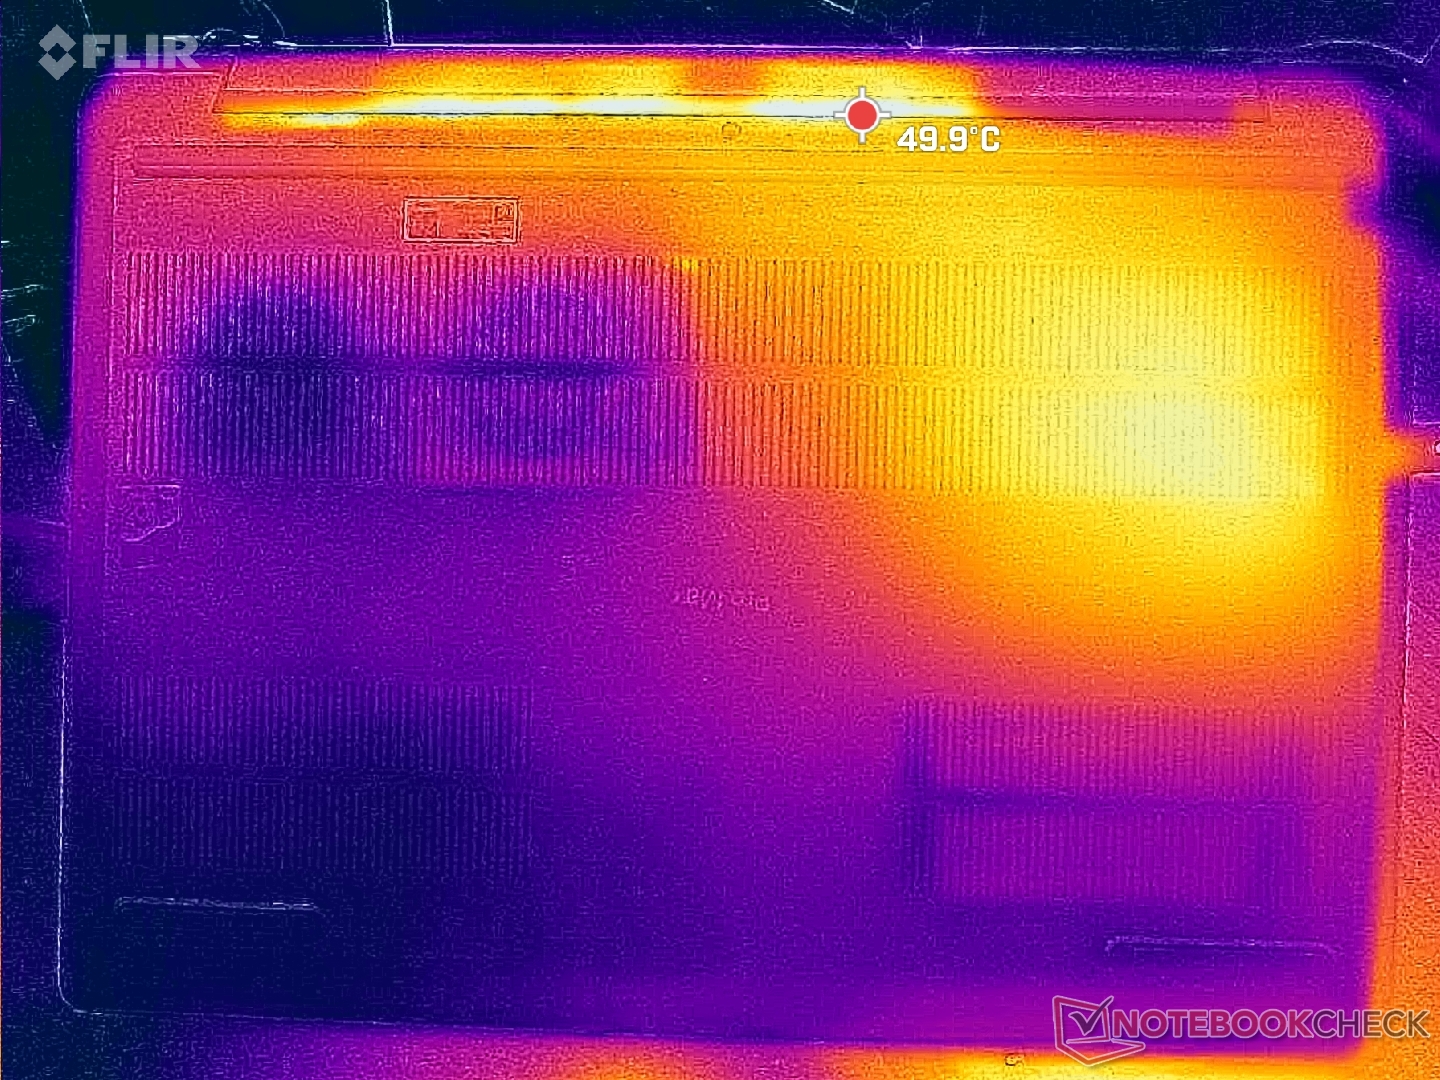
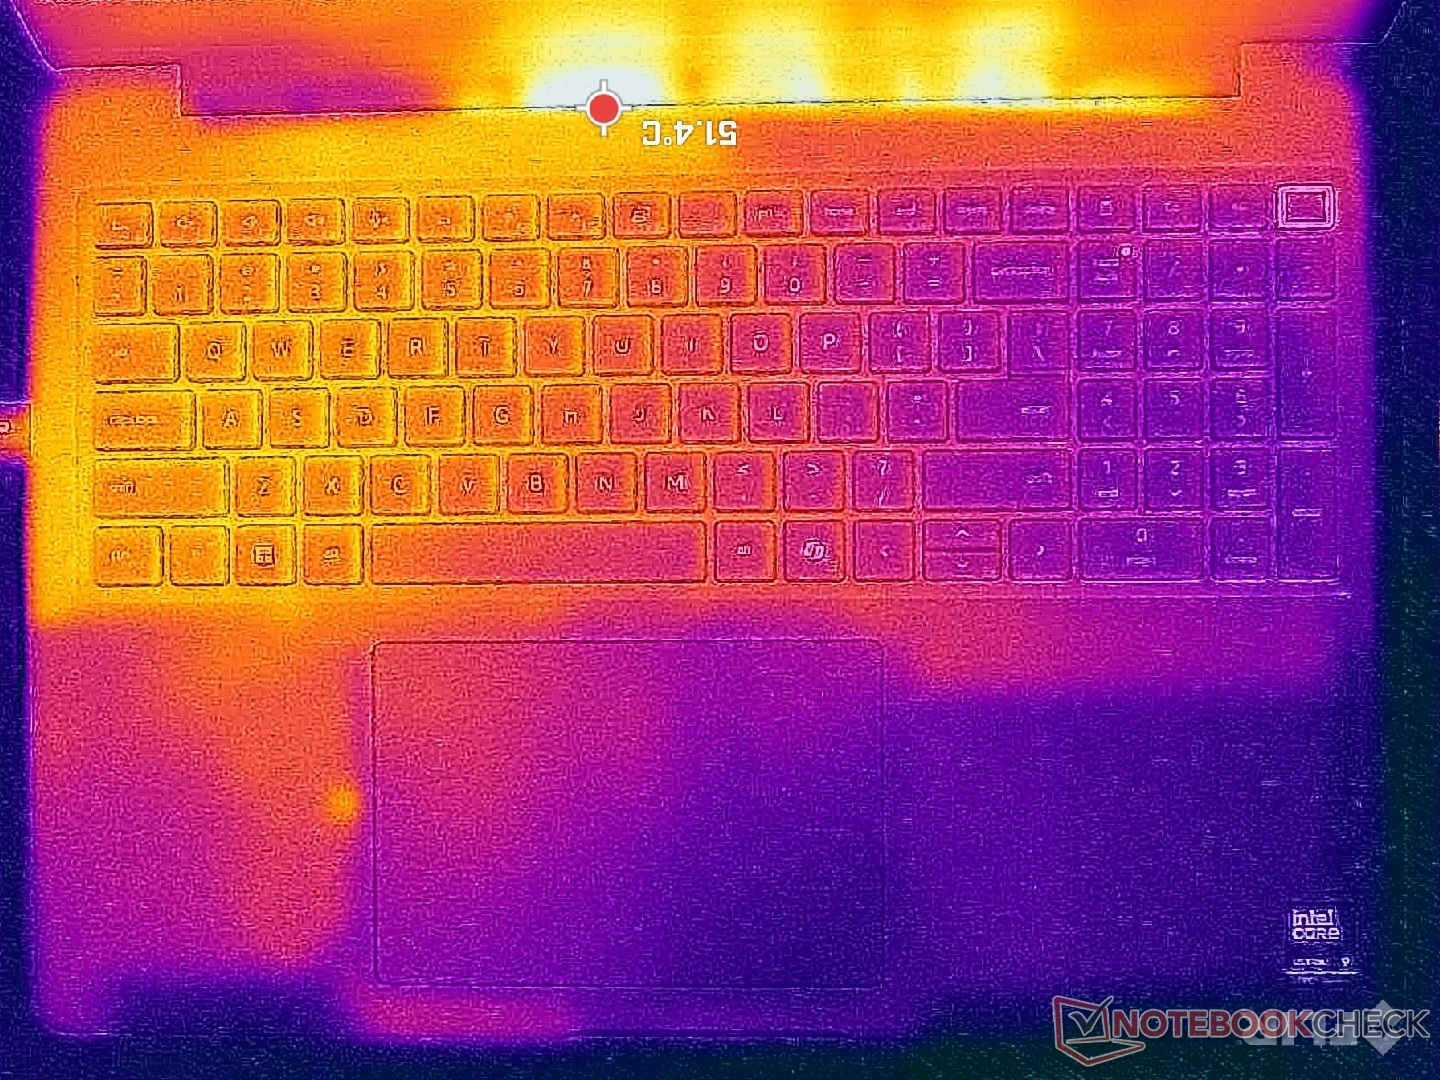
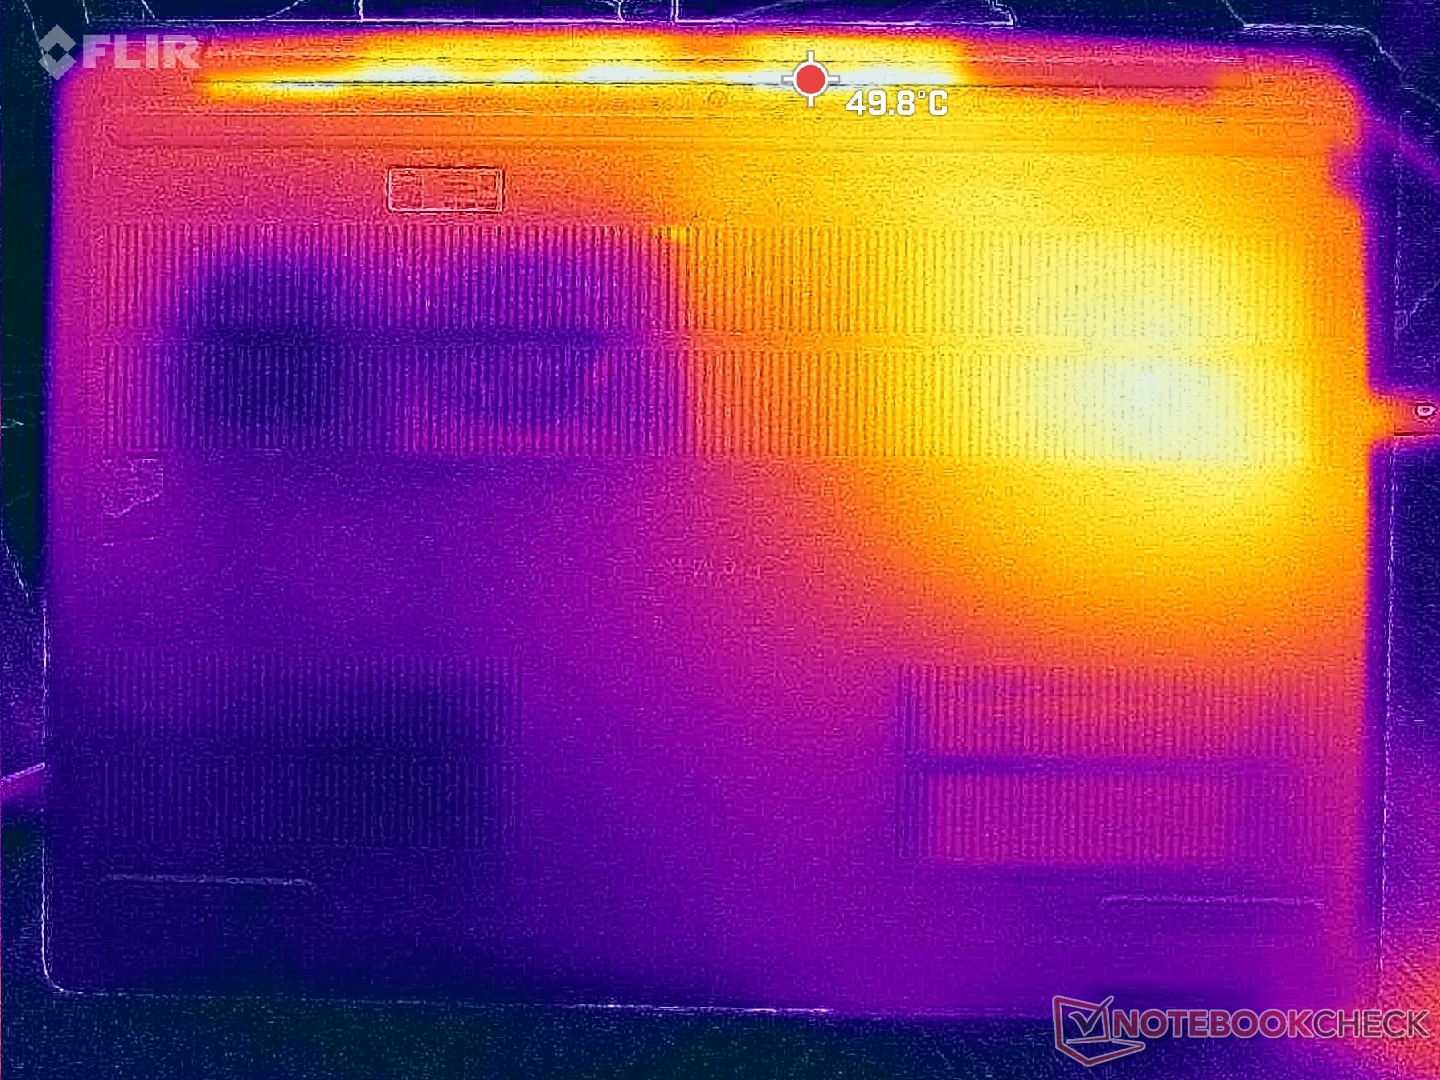
De oppervlaktetemperaturen zijn bijna altijd warm, ongeacht de belasting op het scherm, waarschijnlijk als gevolg van de lethargische ventilatoren en krachtige onderdelen. De linkerhelft van de behuizing wordt merkbaar warmer dan de rechterhelft door de asymmetrische koeloplossing.
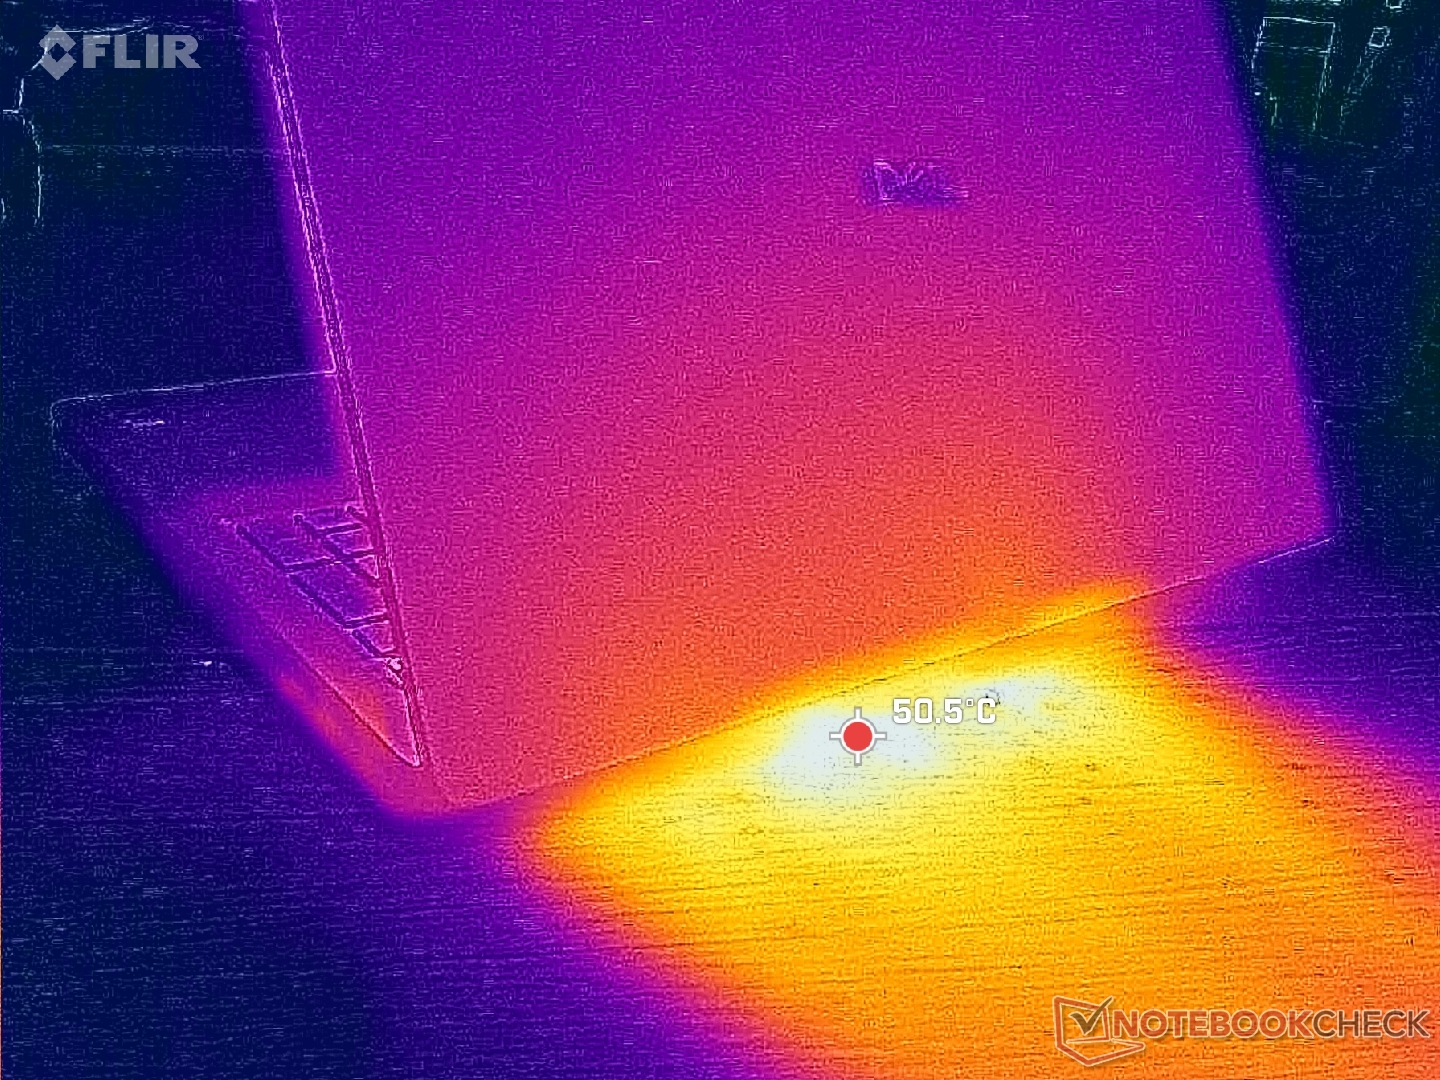
(±) De maximumtemperatuur aan de bovenzijde bedraagt 40.4 °C / 105 F, vergeleken met het gemiddelde van 38.2 °C / 101 F, variërend van 22.2 tot 69.8 °C voor de klasse Workstation.
(-) De bodem warmt op tot een maximum van 45.6 °C / 114 F, vergeleken met een gemiddelde van 41.1 °C / 106 F
(+) Bij onbelast gebruik bedraagt de gemiddelde temperatuur voor de bovenzijde 29.5 °C / 85 F, vergeleken met het apparaatgemiddelde van 32 °C / 90 F.
(±) 3: The average temperature for the upper side is 34.2 °C / 94 F, compared to the average of 32 °C / 90 F for the class Workstation.
(+) De handpalmsteunen en het touchpad bereiken maximaal de huidtemperatuur (33.2 °C / 91.8 F) en zijn dus niet heet.
(-) De gemiddelde temperatuur van de handpalmsteun van soortgelijke toestellen bedroeg 27.8 °C / 82 F (-5.4 °C / -9.8 F).
| Dell Pro Max 16 Plus Intel Core Ultra 9 285HX, NVIDIA RTX PRO 5000 Blackwell Generation Laptop | Dell Precision 5690 Intel Core Ultra 9 185H, NVIDIA RTX 5000 Ada Generation Laptop | Dell Precision 5000 5680 Intel Core i9-13900H, NVIDIA RTX 5000 Ada Generation Laptop | Lenovo ThinkPad P16 Gen 2 Intel Core i7-14700HX, NVIDIA RTX 4000 Ada Generation Laptop | Lenovo ThinkPad P1 Gen 7 21KV001SGE Intel Core Ultra 7 155H, NVIDIA GeForce RTX 4060 Laptop GPU | HP ZBook Studio 16 G11 Intel Core Ultra 9 185H, NVIDIA RTX 3000 Ada Generation Laptop | MSI CreatorPro Z16P B12UKST Intel Core i7-12700H, NVIDIA RTX A3000 Laptop GPU | |
|---|---|---|---|---|---|---|---|
| Heat | 6% | -1% | 5% | 6% | 0% | -11% | |
| Maximum Upper Side * (°C) | 40.4 | 46.6 -15% | 50.2 -24% | 46.6 -15% | 50.3 -25% | 36.6 9% | 56.3 -39% |
| Maximum Bottom * (°C) | 45.6 | 33 28% | 32 30% | 51 -12% | 38 17% | 47.8 -5% | 68.3 -50% |
| Idle Upper Side * (°C) | 32.8 | 32.4 1% | 37.4 -14% | 24.8 24% | 28.3 14% | 31.4 4% | 25.2 23% |
| Idle Bottom * (°C) | 33 | 29.4 11% | 31.2 5% | 25.6 22% | 27.3 17% | 35.6 -8% | 25.9 22% |
* ... kleiner is beter
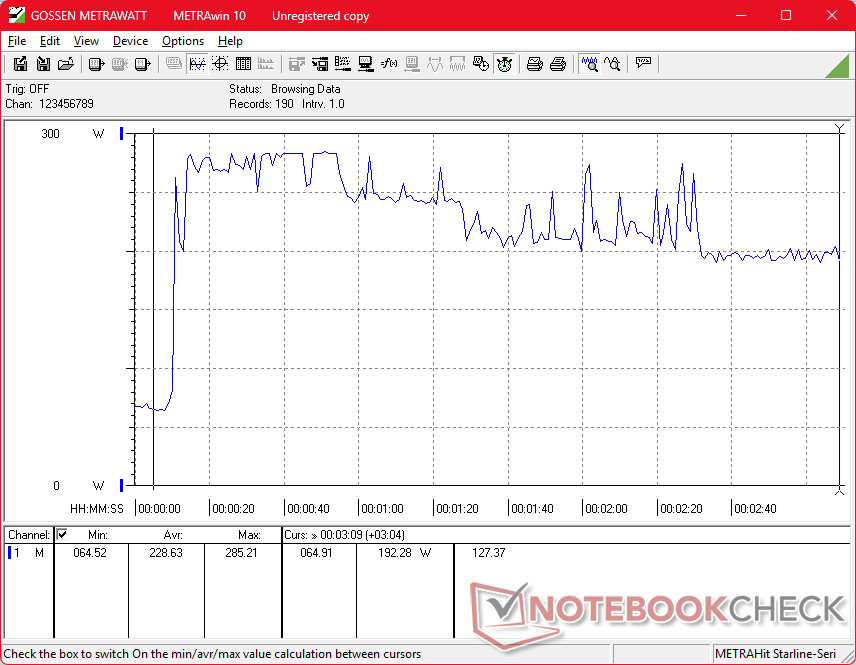
Stresstest
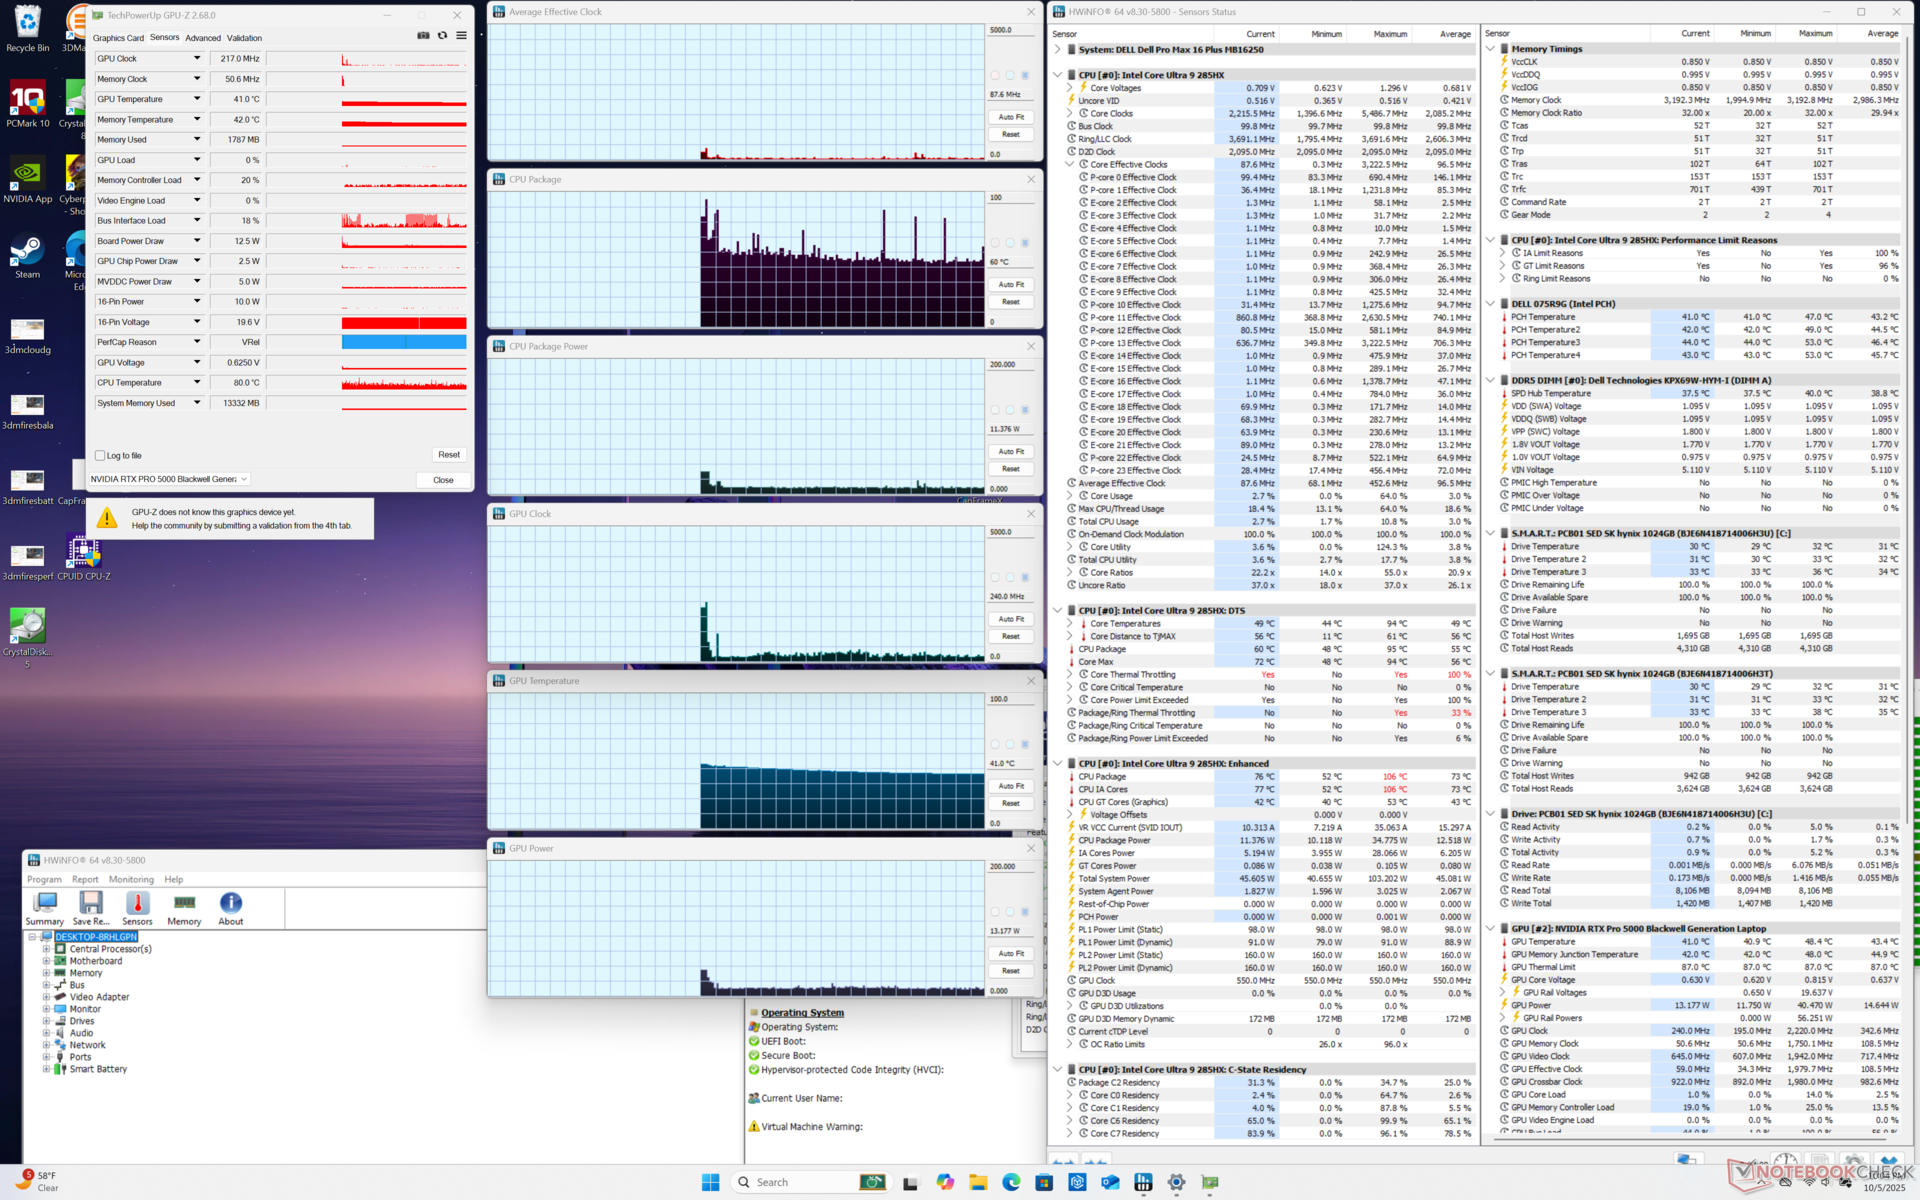
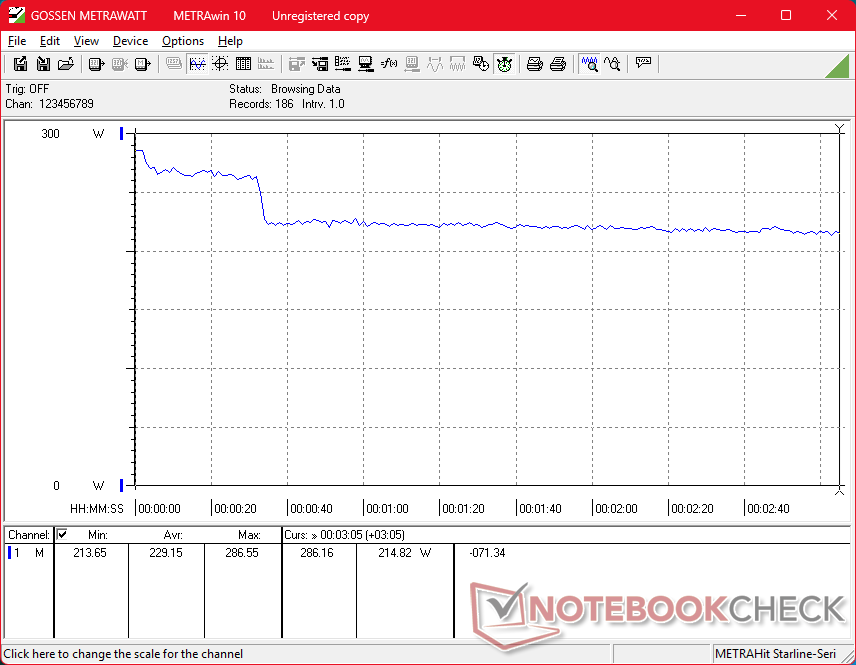
De CPU zou een boost geven tot 3,8 GHz, 159 W en 105 C bij het starten van Prime95 stress, voordat deze snel daalt en stabiliseert op 3,1 GHz, 90 W en 96 C. De kerntemperatuur zou warmer worden dan we zouden willen wanneer deze volledig belast wordt.
Als Cyberpunk 2077 in de modus Prestaties wordt uitgevoerd om meer typische belastende omstandigheden weer te geven, stabiliseert de GPU zich op ~121 W. Als u terugvalt naar de modus Gebalanceerd, wordt het maximale stroomverbruik van de GPU verlaagd naar ~108 W.
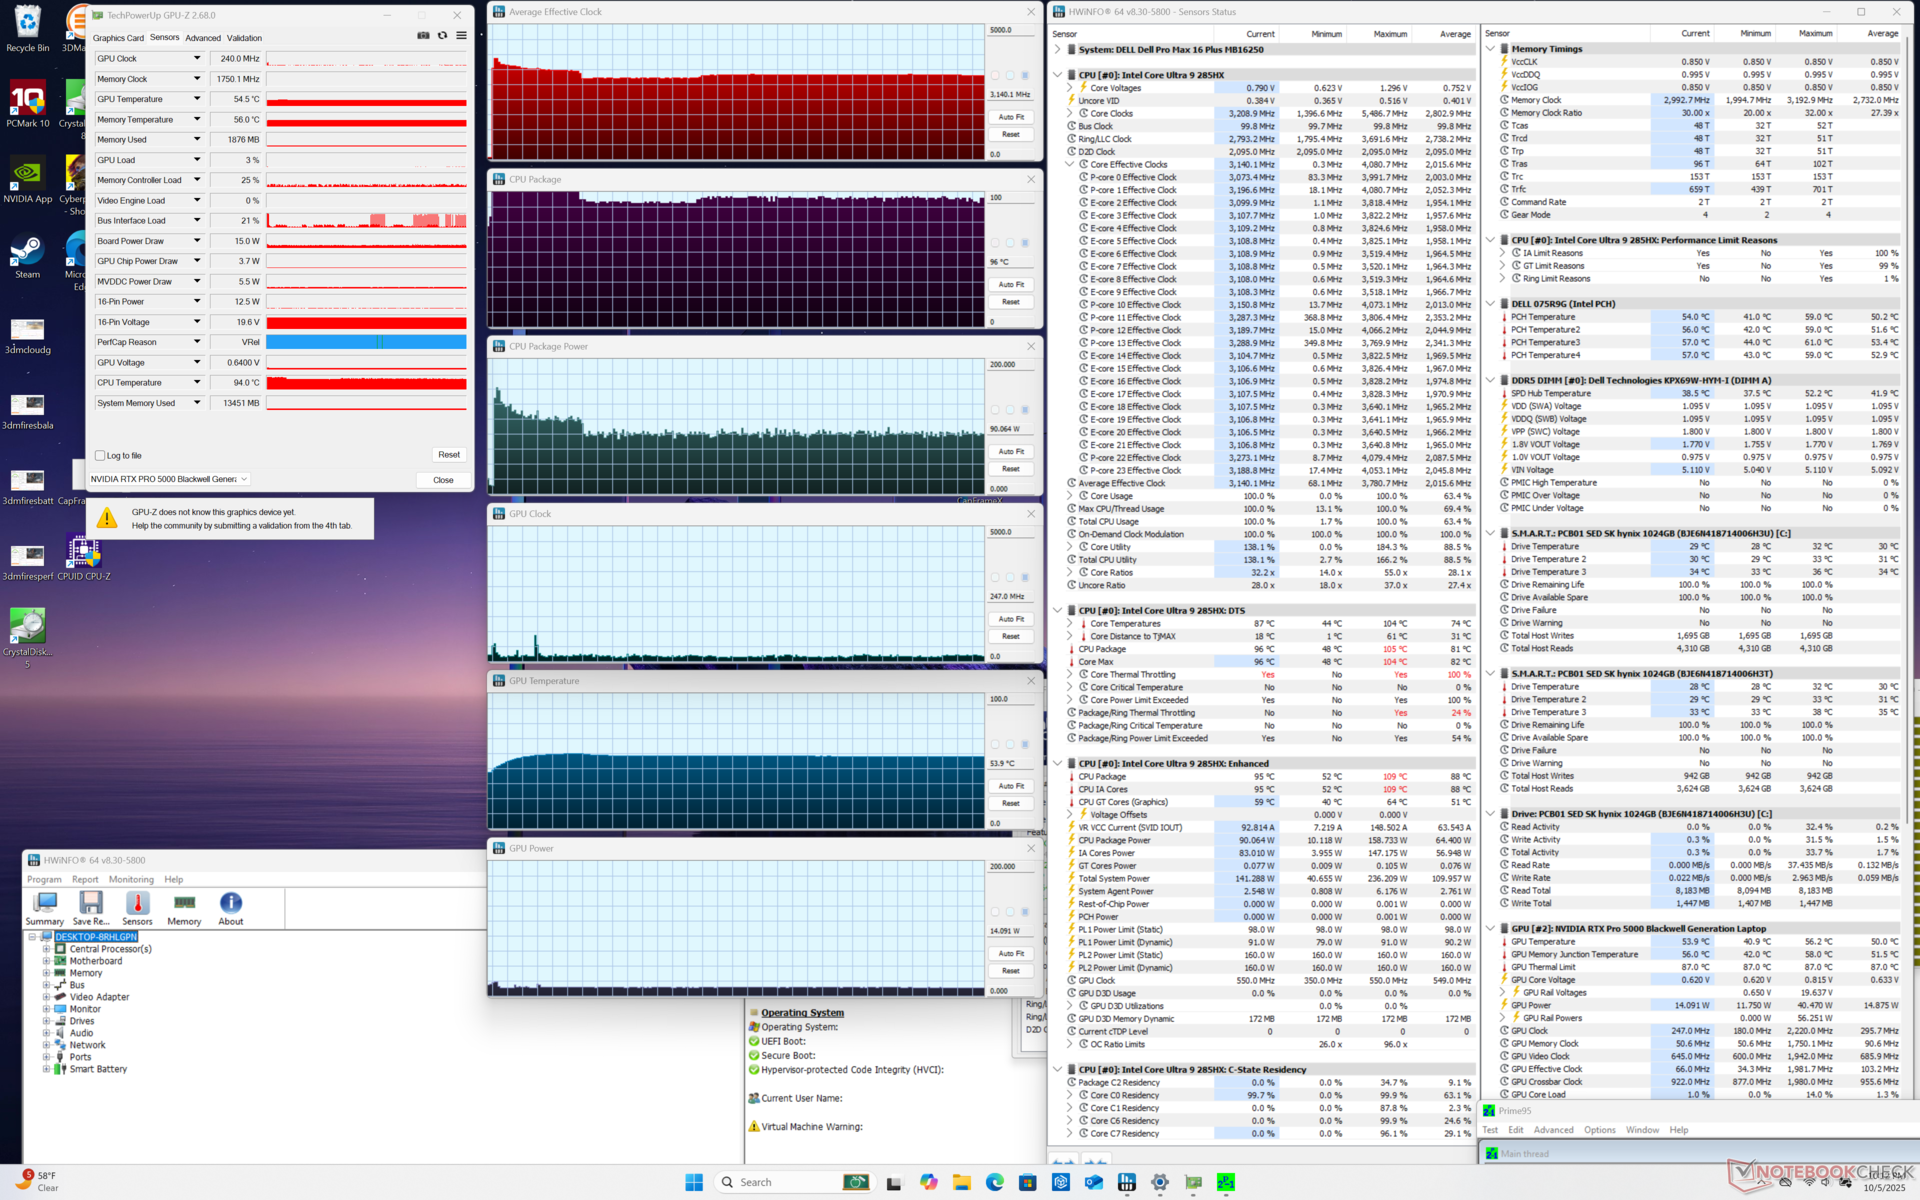
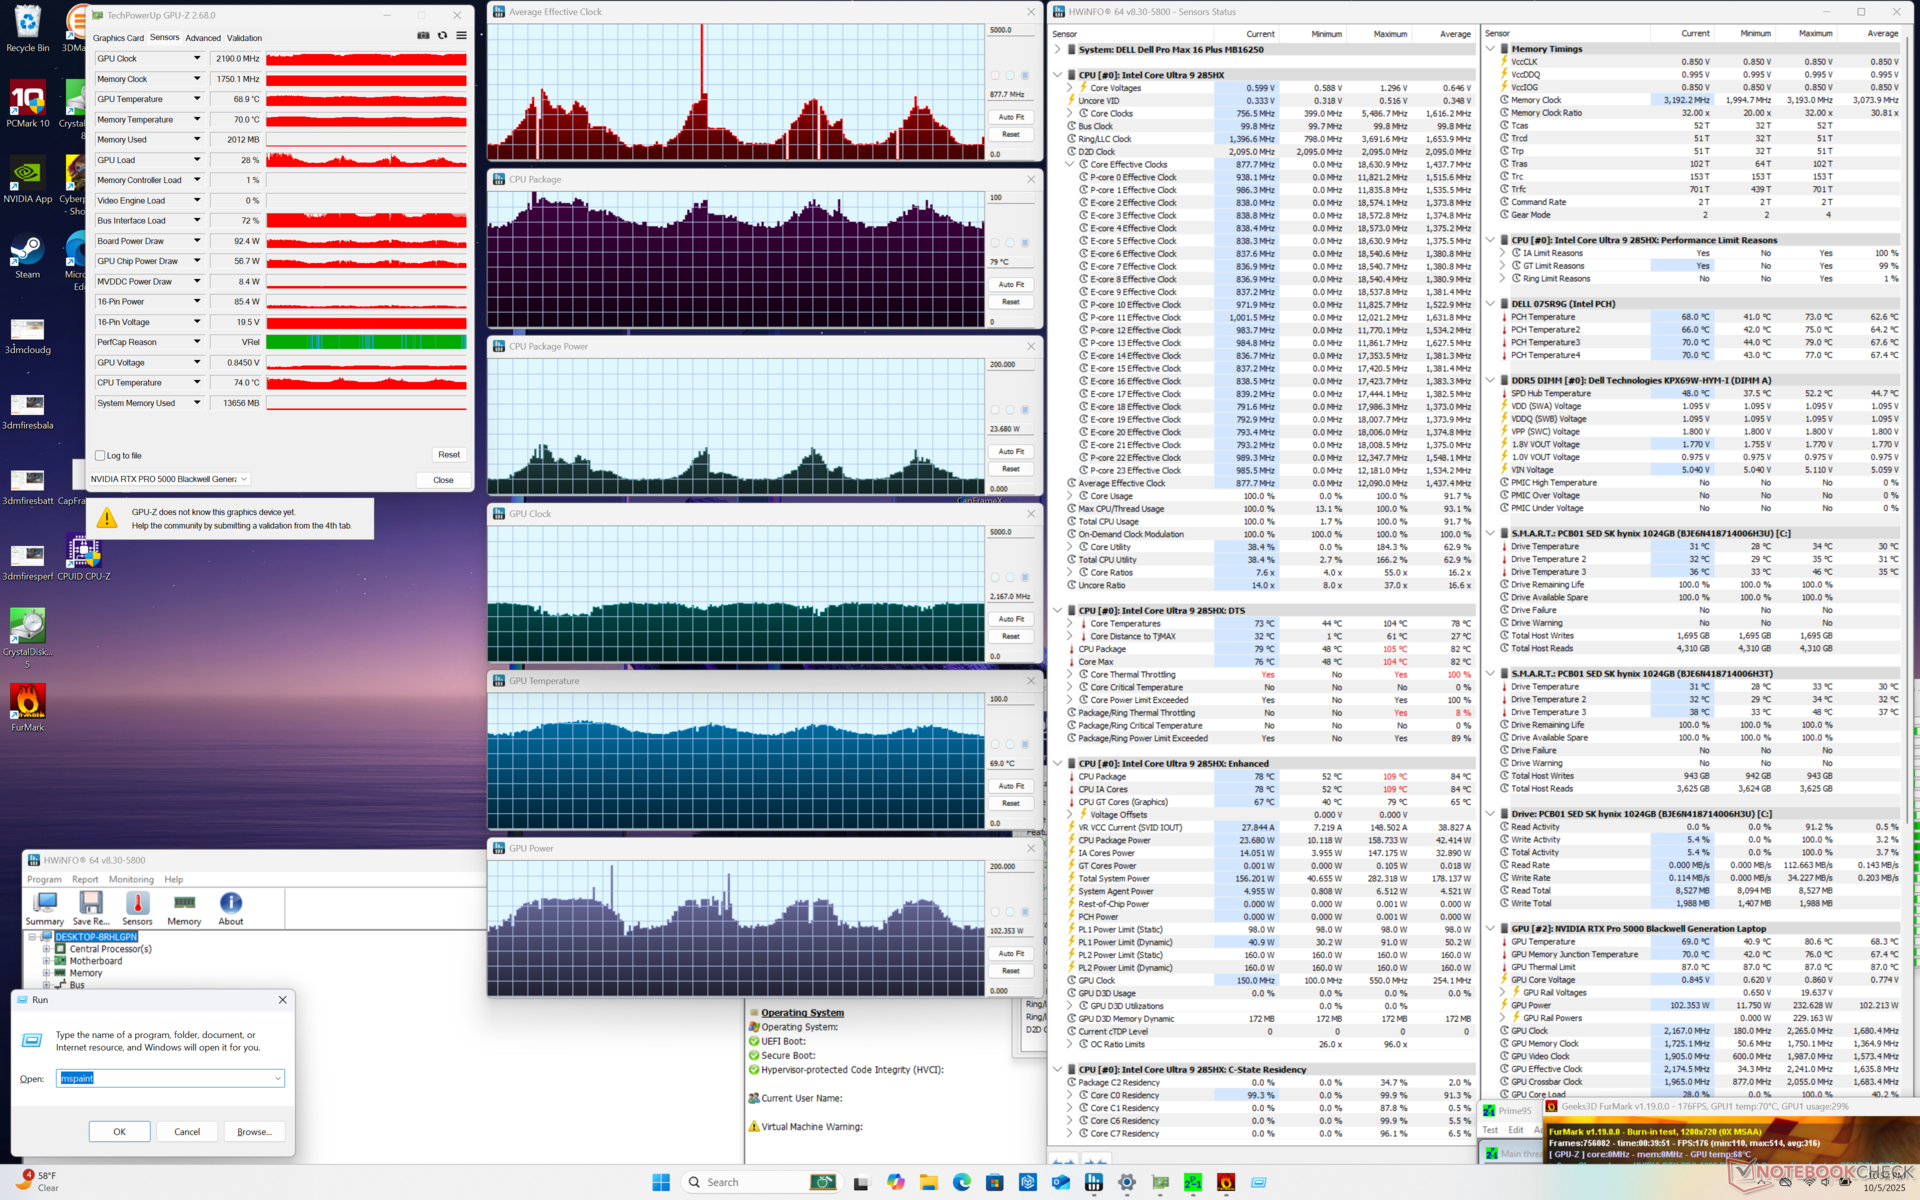
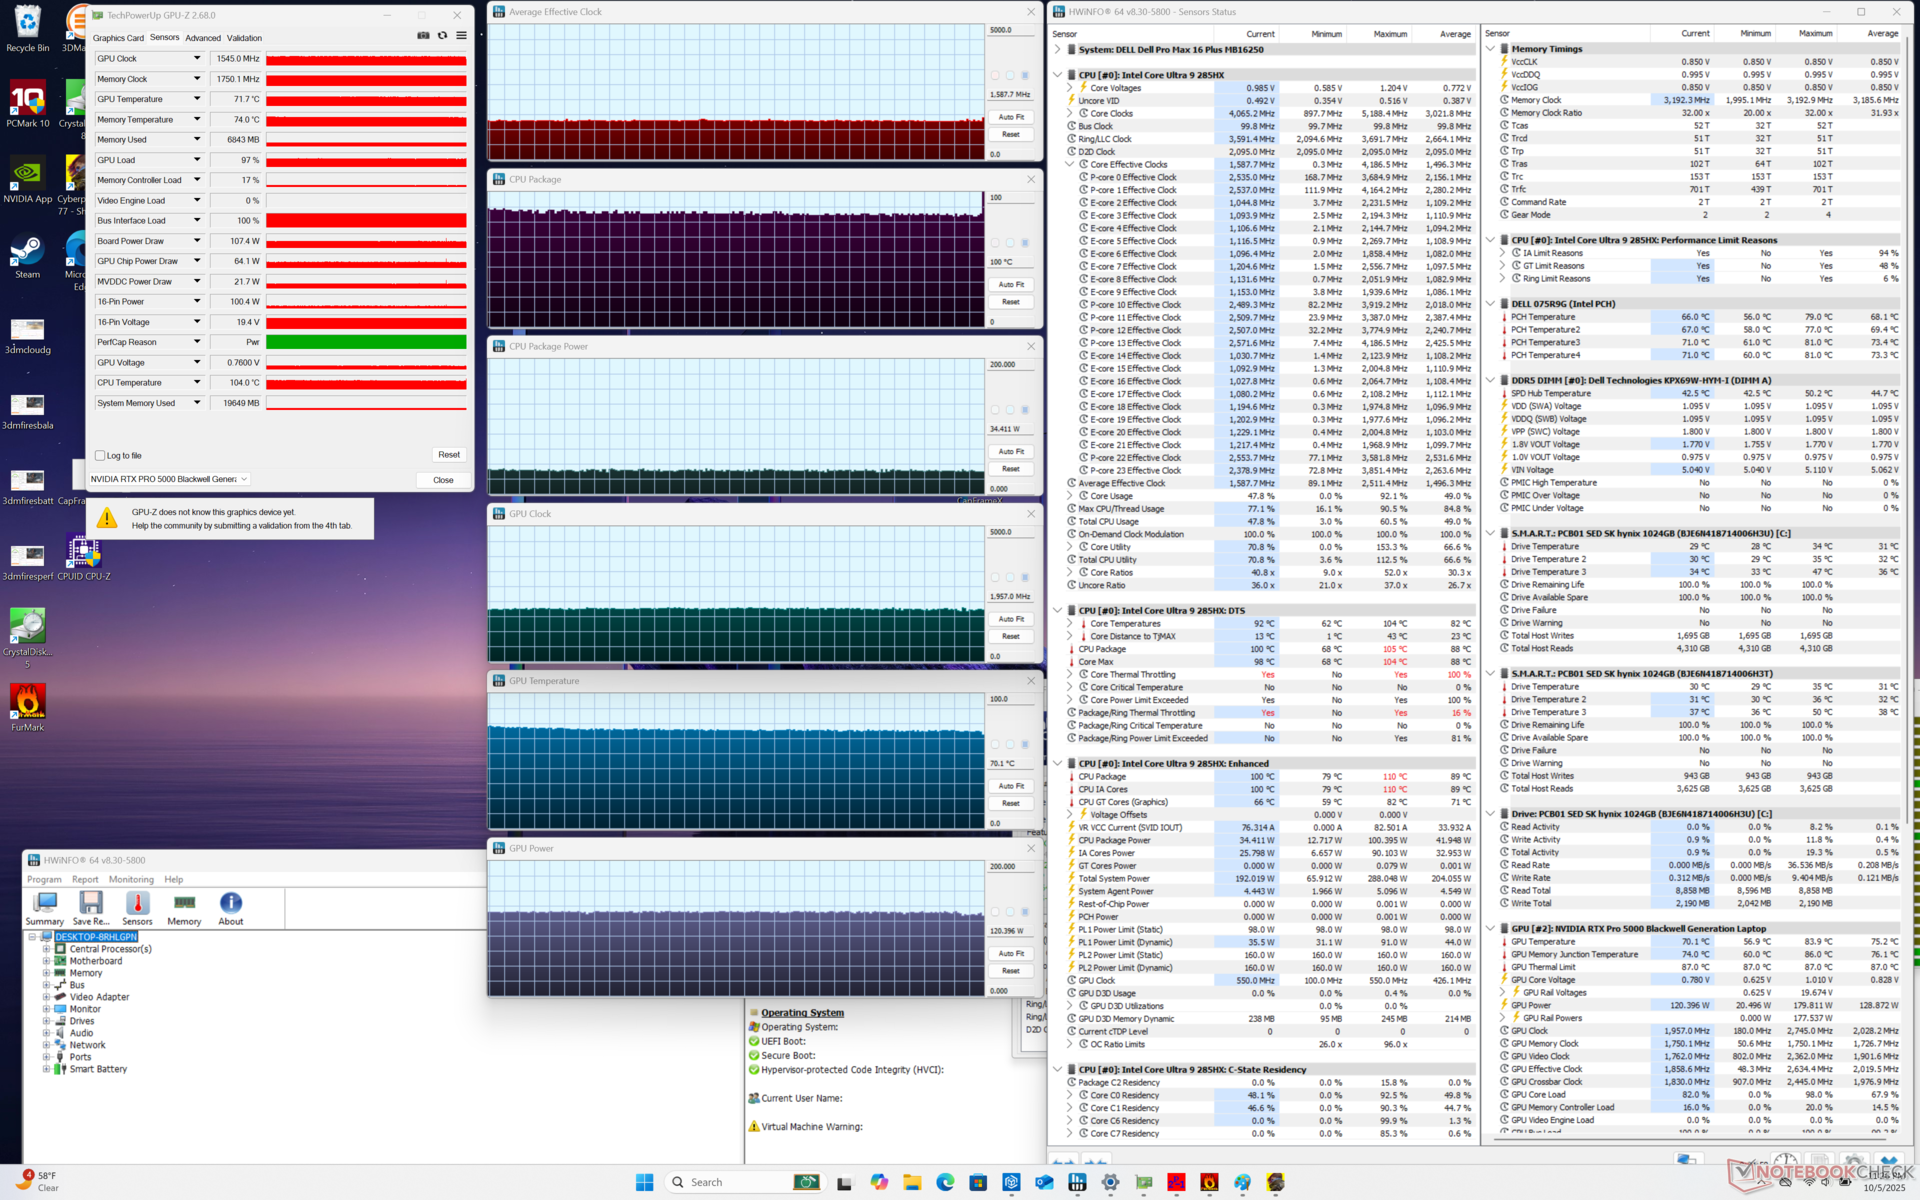
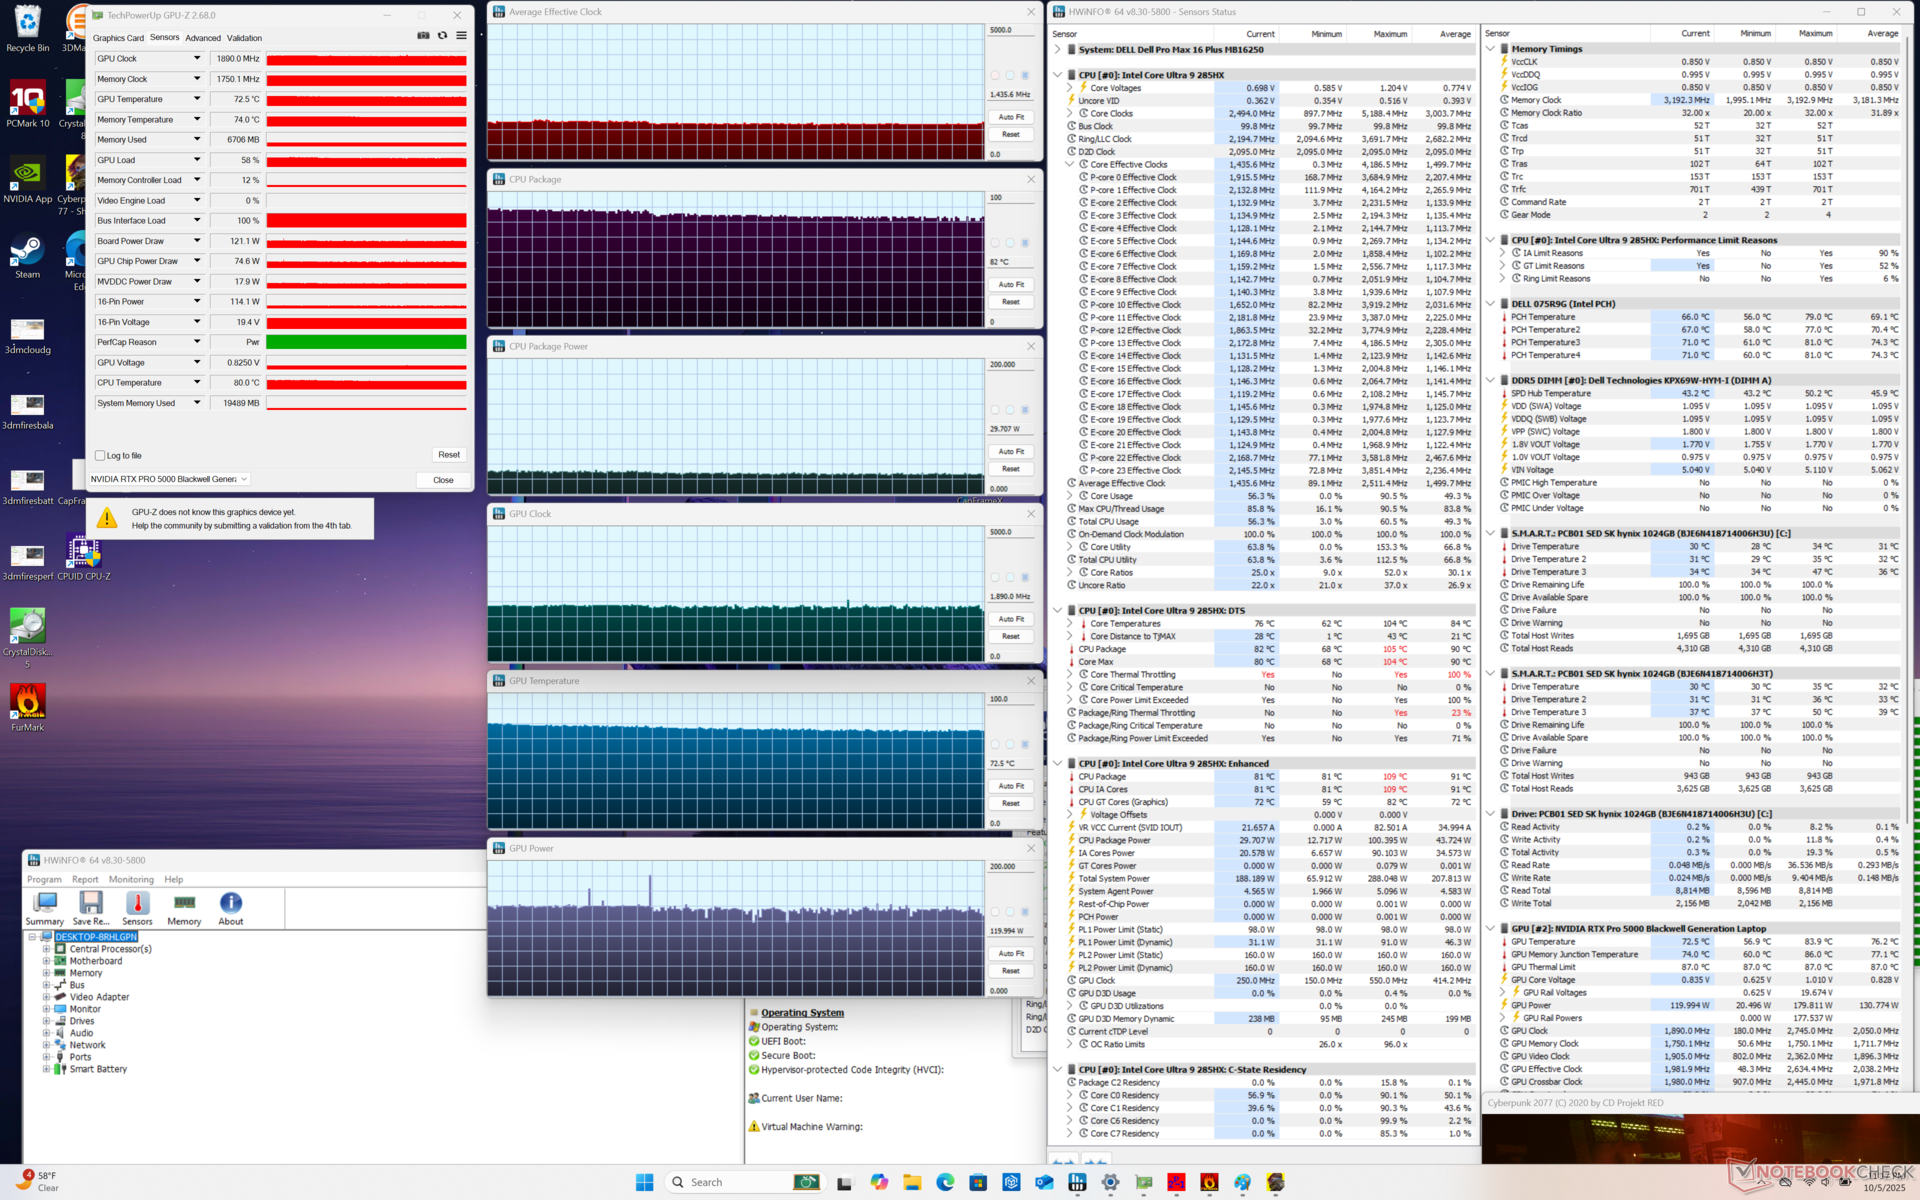
| Gemiddelde CPU-klok (GHz) | GPU-klok (MHz) | Gemiddelde CPU-temperatuur (°C) | Gemiddelde GPU-temperatuur (°C) | |
| Inactief systeem | -- | -- | 55 | 41 |
| Prime95 Stress | 3.1 | -- | 96 | 55 |
| Prime95 + FurMark Stress | 0.5 - 2.8 | 1.7 - 2.2 | 75 - 105 | 70 - 78 |
| Cyberpunk 2077 Stress (Gebalanceerde modus) | ~1.6 | 1545 | 82 | 71 |
| Cyberpunk 2077 Stress (Prestatiemodus) | ~1.4 | 1890 | 82 | 73 |
Luidsprekers
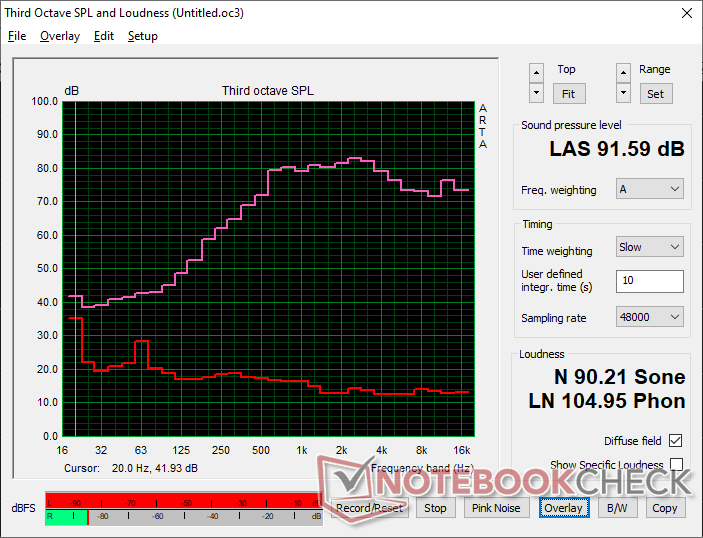
Dell Pro Max 16 Plus audioanalyse
(+) | luidsprekers kunnen relatief luid spelen (91.6 dB)
Bas 100 - 315 Hz
(-) | bijna geen lage tonen - gemiddeld 20.9% lager dan de mediaan
(+) | de lage tonen zijn lineair (5.9% delta naar de vorige frequentie)
Midden 400 - 2000 Hz
(+) | evenwichtige middens - slechts 4.5% verwijderd van de mediaan
(+) | de middentonen zijn lineair (4% delta ten opzichte van de vorige frequentie)
Hoog 2 - 16 kHz
(+) | evenwichtige hoogtepunten - slechts 3.7% verwijderd van de mediaan
(+) | de hoge tonen zijn lineair (2.9% delta naar de vorige frequentie)
Algemeen 100 - 16.000 Hz
(+) | het totale geluid is lineair (14.3% verschil met de mediaan)
Vergeleken met dezelfde klasse
» 30% van alle geteste apparaten in deze klasse waren beter, 4% vergelijkbaar, 67% slechter
» De beste had een delta van 7%, het gemiddelde was 17%, de slechtste was 35%
Vergeleken met alle geteste toestellen
» 17% van alle geteste apparaten waren beter, 4% gelijk, 78% slechter
» De beste had een delta van 4%, het gemiddelde was 23%, de slechtste was 134%
Apple MacBook Pro 16 2021 M1 Pro audioanalyse
(+) | luidsprekers kunnen relatief luid spelen (84.7 dB)
Bas 100 - 315 Hz
(+) | goede baars - slechts 3.8% verwijderd van de mediaan
(+) | de lage tonen zijn lineair (5.2% delta naar de vorige frequentie)
Midden 400 - 2000 Hz
(+) | evenwichtige middens - slechts 1.3% verwijderd van de mediaan
(+) | de middentonen zijn lineair (2.1% delta ten opzichte van de vorige frequentie)
Hoog 2 - 16 kHz
(+) | evenwichtige hoogtepunten - slechts 1.9% verwijderd van de mediaan
(+) | de hoge tonen zijn lineair (2.7% delta naar de vorige frequentie)
Algemeen 100 - 16.000 Hz
(+) | het totale geluid is lineair (4.6% verschil met de mediaan)
Vergeleken met dezelfde klasse
» 0% van alle geteste apparaten in deze klasse waren beter, 0% vergelijkbaar, 100% slechter
» De beste had een delta van 5%, het gemiddelde was 17%, de slechtste was 45%
Vergeleken met alle geteste toestellen
» 0% van alle geteste apparaten waren beter, 0% gelijk, 100% slechter
» De beste had een delta van 4%, het gemiddelde was 23%, de slechtste was 134%
Energiebeheer
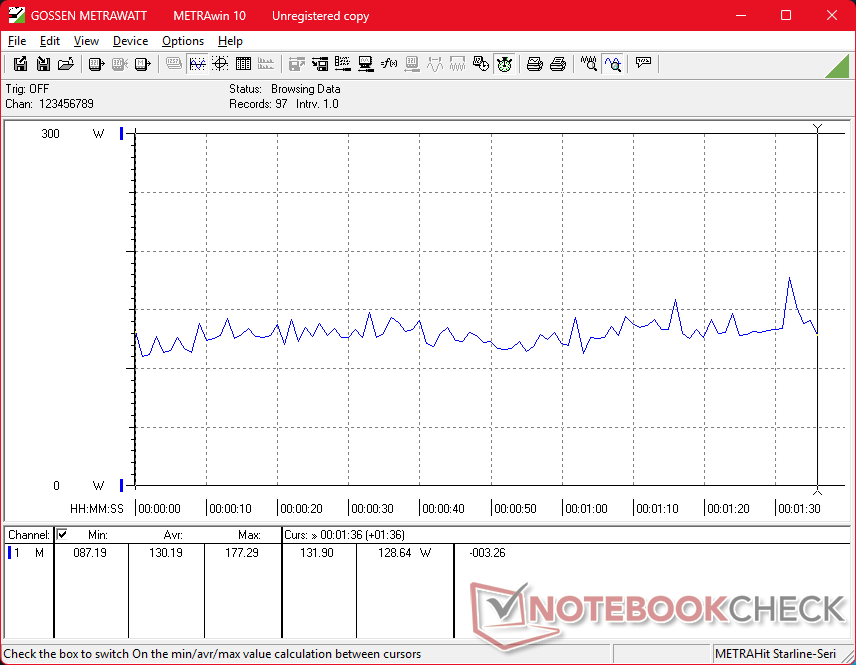
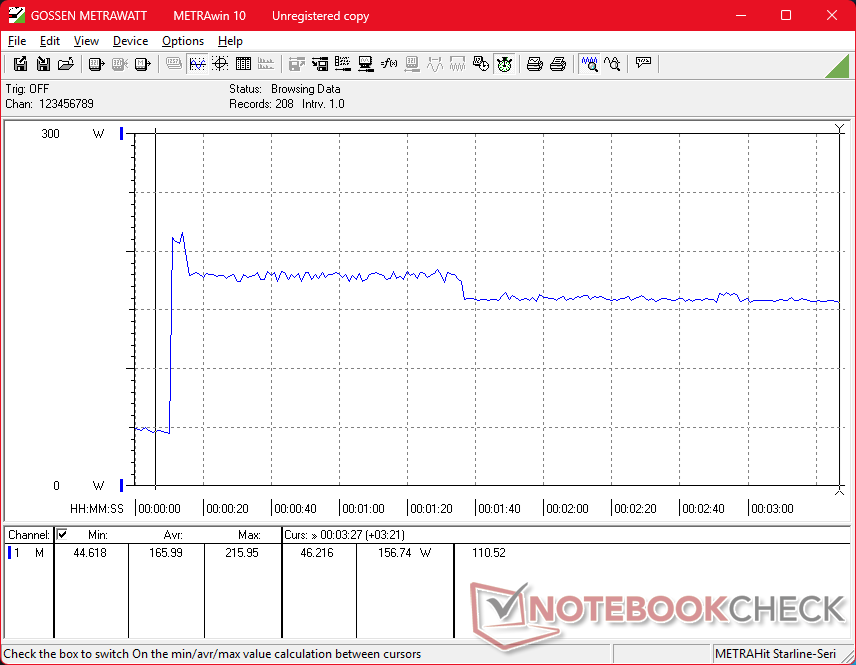
Stroomverbruik
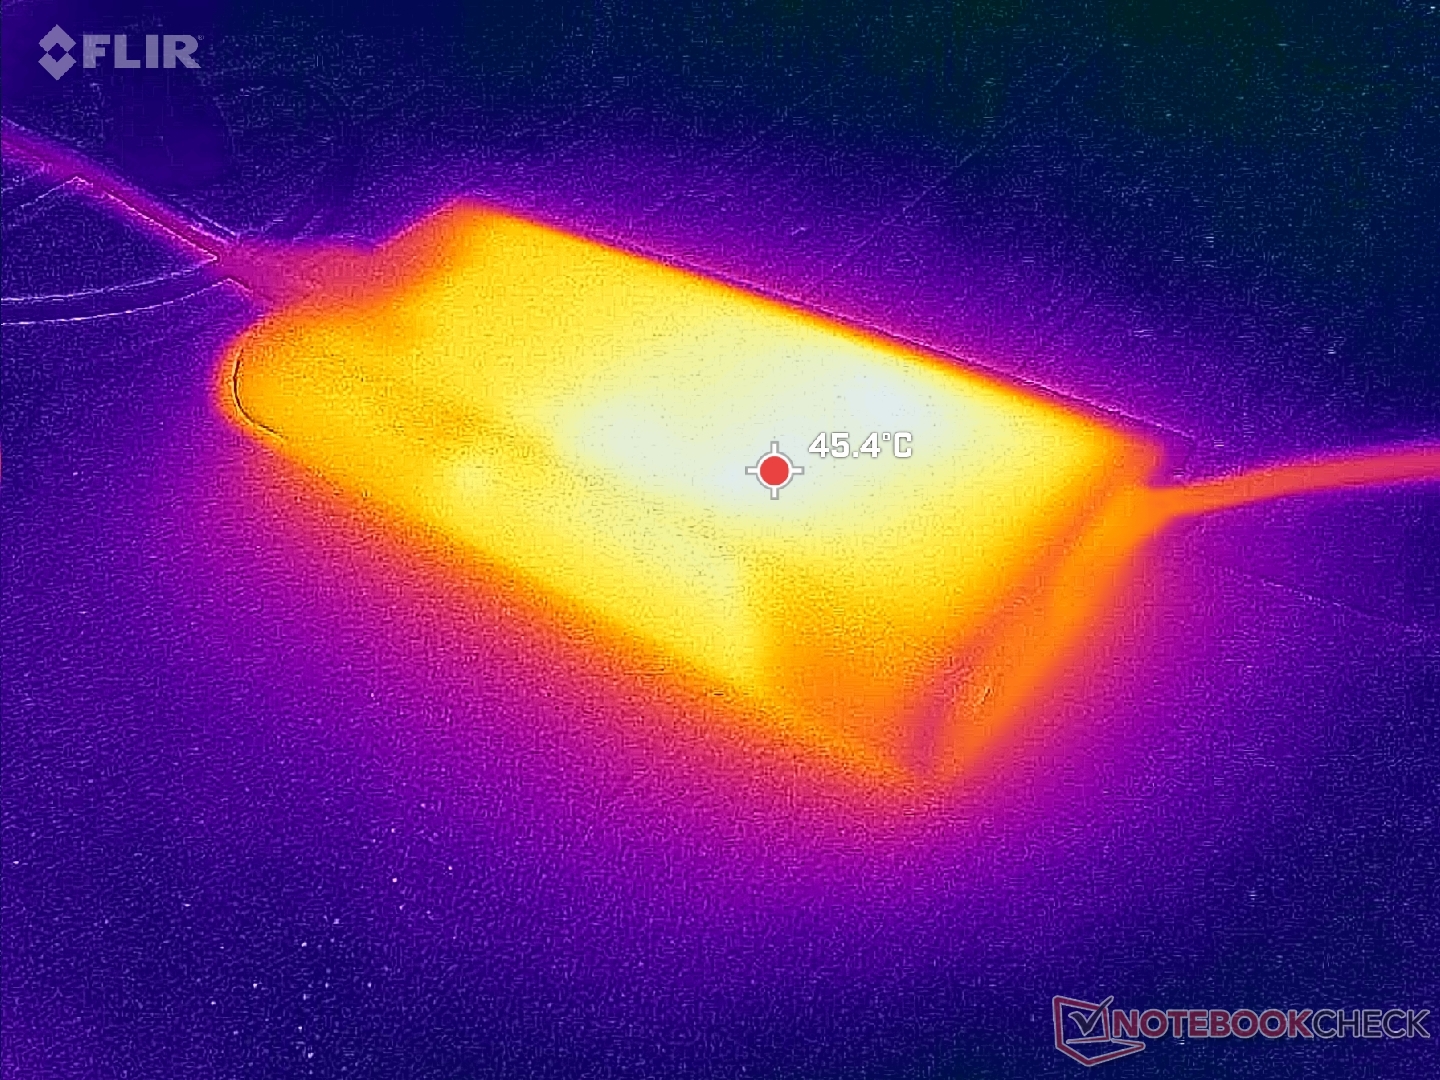
Het verbruik is naar verwachting erg hoog, zelfs als het stationair draait op de desktop, wat bijdraagt aan de kortere levensduur van de batterij en de altijd warme oppervlakken. Het systeem is merkbaar veeleisender dan de uitgaande Precision 5690, maar de prestaties zijn zowel sneller als stabieler om een eerlijke afweging te zijn.
Het is vermeldenswaard dat dit een van de weinige laptops is die wordt geleverd met een slanke (~16 x 7,8 x 2,4 cm) 280 W USB-C AC-adapter, aangezien de meeste andere USB-C adapters maximaal 150 W tot 240 W gebruiken.
| Uit / Standby | |
| Inactief | |
| Belasting |
|
Key:
min: | |
| Dell Pro Max 16 Plus Ultra 9 285HX, RTX PRO 5000 Blackwell Generation Laptop, SK hynix PCB01 HFS001TFM9X186N, OLED, 3840x2400, 16" | Dell Precision 5690 Ultra 9 185H, RTX 5000 Ada Generation Laptop, 2x Samsung PM9A1 1TB (RAID 0), OLED, 3840x2400, 16" | Dell Precision 5000 5680 i9-13900H, RTX 5000 Ada Generation Laptop, 2x SK hynix PC801 HFS512GEJ9X101N RAID 0, OLED, 3840x2400, 16" | Lenovo ThinkPad P16 Gen 2 i7-14700HX, RTX 4000 Ada Generation Laptop, SK hynix PC801 HFS001TEJ9X162N, IPS, 2560x1600, 16" | Lenovo ThinkPad P1 Gen 7 21KV001SGE Ultra 7 155H, GeForce RTX 4060 Laptop GPU, Kioxia XG8 KXG8AZNV1T02, IPS LED, 2560x1600, 16" | HP ZBook Studio 16 G11 Ultra 9 185H, RTX 3000 Ada Generation Laptop, Kioxia XG8 KXG80ZNV1T02, IPS, 3840x2400, 16" | MSI CreatorPro Z16P B12UKST i7-12700H, RTX A3000 Laptop GPU, Samsung PM9A1 MZVL21T0HCLR, IPS, 2560x1600, 16" | |
|---|---|---|---|---|---|---|---|
| Power Consumption | 52% | 55% | 31% | 55% | 47% | 50% | |
| Idle Minimum * (Watt) | 35.1 | 7.9 77% | 8 77% | 7.9 77% | 7.3 79% | 14 60% | 10.8 69% |
| Idle Average * (Watt) | 39.2 | 12 69% | 10.4 73% | 13.1 67% | 12.3 69% | 22.4 43% | 16.3 58% |
| Idle Maximum * (Watt) | 56 | 28.6 49% | 30.5 46% | 24.2 57% | 17.9 68% | 25.7 54% | 16.9 70% |
| Load Average * (Watt) | 130.2 | 98.8 24% | 75.4 42% | 127.4 2% | 78.2 40% | 90.2 31% | 111.7 14% |
| Cyberpunk 2077 ultra external monitor * (Watt) | 213 | 219 -3% | 117.7 45% | 120.3 44% | |||
| Cyberpunk 2077 ultra * (Watt) | 229 | 225 2% | 123.5 46% | 125.4 45% | |||
| Load Maximum * (Watt) | 285.2 | 174.8 39% | 175 39% | 248.5 13% | 167.5 41% | 142 50% | 177.4 38% |
| Witcher 3 ultra * (Watt) | 144.5 | 134 | 152.1 |
* ... kleiner is beter
Stroomverbruik Cyberpunk / Stresstest
Stroomverbruik externe monitor
Levensduur batterij
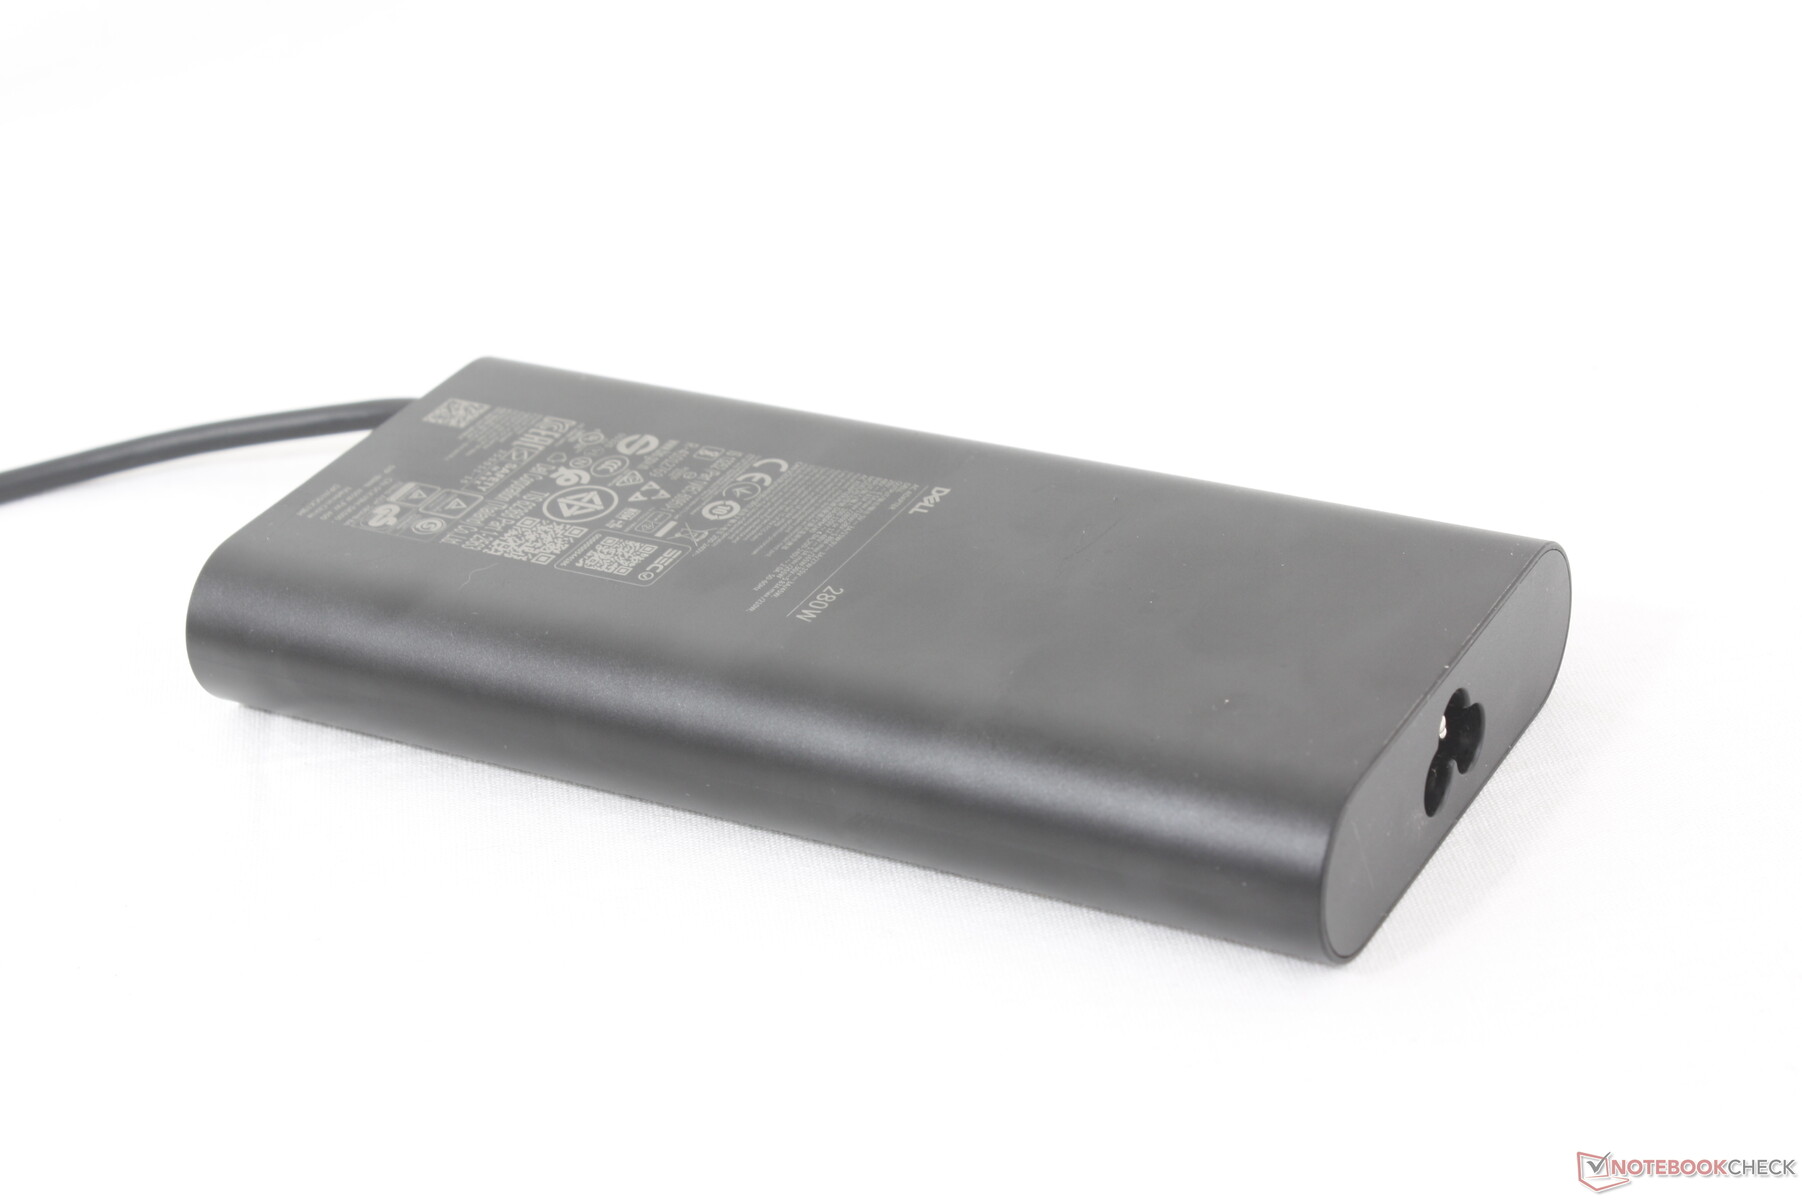
De werktijd van WLAN is met slechts 3,5 uur kort, ondanks de grote capaciteit van de batterij. De oplaadsnelheid is desalniettemin erg snel, vooral voor een USB-C AC-adapter, met iets meer dan een uur van leeg naar volledig opgeladen.
| Dell Pro Max 16 Plus Ultra 9 285HX, RTX PRO 5000 Blackwell Generation Laptop, 96 Wh | Dell Precision 5690 Ultra 9 185H, RTX 5000 Ada Generation Laptop, 98 Wh | Dell Precision 5000 5680 i9-13900H, RTX 5000 Ada Generation Laptop, 98 Wh | Lenovo ThinkPad P16 Gen 2 i7-14700HX, RTX 4000 Ada Generation Laptop, 94 Wh | Lenovo ThinkPad P1 Gen 7 21KV001SGE Ultra 7 155H, GeForce RTX 4060 Laptop GPU, 90 Wh | HP ZBook Studio 16 G11 Ultra 9 185H, RTX 3000 Ada Generation Laptop, 86 Wh | MSI CreatorPro Z16P B12UKST i7-12700H, RTX A3000 Laptop GPU, 90 Wh | |
|---|---|---|---|---|---|---|---|
| Batterijduur | 156% | 175% | -31% | 175% | 33% | 61% | |
| WiFi v1.3 (h) | 3.6 | 9.2 156% | 9.9 175% | 2.5 -31% | 9.9 175% | 4.8 33% | 5.8 61% |
| Reader / Idle (h) | 17.9 | ||||||
| Load (h) | 1.7 | 1.9 |
Notebookcheck Beoordeling
Vlaggenschip Dell workstation met unieke specificaties, waaronder CAMM2 geheugen, 4K 120 Hz OLED, Arrow Lake-HX processors en RTX 5000 Blackwell graphics.
Dell Pro Max 16 Plus
- 14-10-2025 v8
Allen Ngo
 Total Sustainability Score:
 Potentiële concurrenten in vergelijking
Afbeelding | Model / recensie | prijs | Gewicht | Hoogte | Scherm |
|---|---|---|---|---|---|
1. 88.4%  | Dell Pro Max 16 Plus Intel Core Ultra 9 285HX ⎘ NVIDIA RTX PRO 5000 Blackwell Generation Laptop ⎘ 128 GB Geheugen, SSD | Amazon: Catalogusprijs: 5000 USD | 2.8 kg | 30.9 mm | 16.00" 3840x2400 283 PPI OLED |
2. 88.3% v7 (old)  | Dell Precision 5690 Intel Core Ultra 9 185H ⎘ NVIDIA RTX 5000 Ada Generation Laptop ⎘ 32 GB Geheugen, 2048 GB SSD | Amazon: Catalogusprijs: 5900 USD | 2.3 kg | 22.17 mm | 16.00" 3840x2400 283 PPI OLED |
3. 89% v7 (old)  | Dell Precision 5000 5680 Intel Core i9-13900H ⎘ NVIDIA RTX 5000 Ada Generation Laptop ⎘ 32 GB Geheugen, 1024 GB SSD | Amazon: 1. $1,299.99 Dell Precision 5000 5680 Wor... 2. $1,699.00 Dell Precision 5000 5680 16"... 3. $2,200.00 Dell Precision 5000 5680 16"... Catalogusprijs: 6500 USD | 2.3 kg | 22.17 mm | 16.00" 3840x2400 283 PPI OLED |
4. 85.9%  | Lenovo ThinkPad P16 Gen 2 Intel Core i7-14700HX ⎘ NVIDIA RTX 4000 Ada Generation Laptop ⎘ 32 GB Geheugen, 1024 GB SSD | Amazon: Catalogusprijs: 3500 USD | 3.1 kg | 30.23 mm | 16.00" 2560x1600 189 PPI IPS |
5. 83.5%  | Lenovo ThinkPad P1 Gen 7 21KV001SGE Intel Core Ultra 7 155H ⎘ NVIDIA GeForce RTX 4060 Laptop GPU ⎘ 32 GB Geheugen, 1024 GB SSD | Amazon: Catalogusprijs: 3239 Euro | 2 kg | 20.5 mm | 16.00" 2560x1600 189 PPI IPS LED |
6. 84.2%  | HP ZBook Studio 16 G11 Intel Core Ultra 9 185H ⎘ NVIDIA RTX 3000 Ada Generation Laptop ⎘ 64 GB Geheugen, 1024 GB SSD | Amazon: Catalogusprijs: 4300 USD | 1.8 kg | 19 mm | 16.00" 3840x2400 283 PPI IPS |
7. 84.3% v7 (old)  | MSI CreatorPro Z16P B12UKST Intel Core i7-12700H ⎘ NVIDIA RTX A3000 Laptop GPU ⎘ 32 GB Geheugen, 1024 GB SSD | Amazon: Catalogusprijs: 3500€ | 2.4 kg | 19 mm | 16.00" 2560x1600 189 PPI IPS |
Transparantie
De selectie van te beoordelen apparaten wordt gemaakt door onze redactie. Het testexemplaar werd ten behoeve van deze beoordeling door de fabrikant of detailhandelaar in bruikleen aan de auteur verstrekt. De kredietverstrekker had geen invloed op deze recensie, noch ontving de fabrikant vóór publicatie een exemplaar van deze recensie. Er bestond geen verplichting om deze recensie te publiceren. Als onafhankelijk mediabedrijf is Notebookcheck niet onderworpen aan het gezag van fabrikanten, detailhandelaren of uitgevers.
[transparency_disclaimer]Dit is hoe Notebookcheck test
Elk jaar beoordeelt Notebookcheck onafhankelijk honderden laptops en smartphones met behulp van gestandaardiseerde procedures om ervoor te zorgen dat alle resultaten vergelijkbaar zijn. We hebben onze testmethoden al zo'n 20 jaar voortdurend ontwikkeld en daarbij de industriestandaard bepaald. In onze testlaboratoria wordt gebruik gemaakt van hoogwaardige meetapparatuur door ervaren technici en redacteuren. Deze tests omvatten een validatieproces in meerdere fasen. Ons complexe beoordelingssysteem is gebaseerd op honderden goed onderbouwde metingen en benchmarks, waardoor de objectiviteit behouden blijft. Meer informatie over onze testmethoden kunt u hier vinden.

