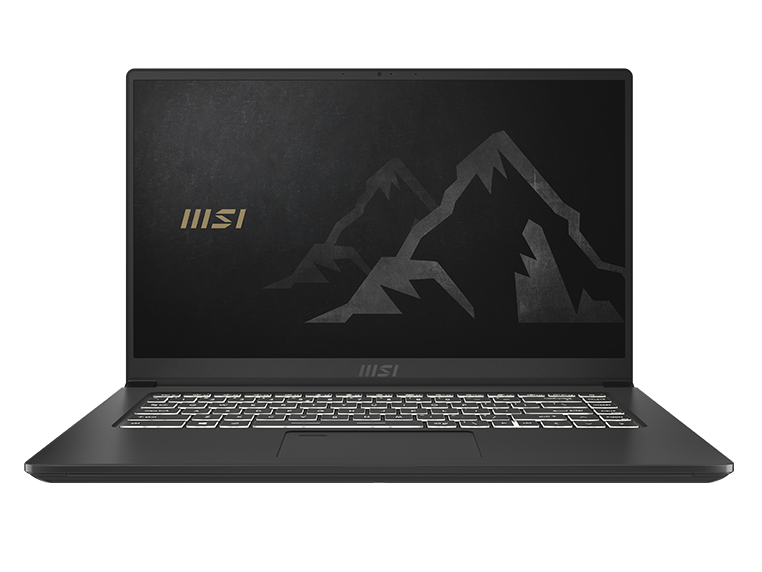
MSI Summit B15 A11M Laptop Review: Iris Xe omarmt boven GeForce MX
MSI onthulde tijdens CES 2021 zijn Summit-serie, die een reeks laptops omvat die zijn ontworpen voor werkplekken, kantoren, contentcreatie en andere semi-professionele tot professionele omgevingen. Top-end modellen zijn onder andere de 13,4-inch Summit E13 en 15,6-inch Summit E15 die elk verkocht worden voor ongeveer $2000 USD.
Het model dat we hier zullen bekijken is een instapmodel in de serie, de Summit B15. In tegenstelling tot de eerder genoemde Summit E modellen, mist de B15 de gouden afwerkingen en discrete GPU opties voor een lichter gewicht en betaalbaarder prijspunt. Voor de rest is hij uitgerust met vergelijkbare 11e generatie Tiger Lake-U processoropties. Directe concurrenten zijn onder andere mid-range tot hogere mid-range prosumer laptops zoals de HP Envy 15, XPG Xenia Xe, Lenovo ThinkBook 15, Microsoft Surface Laptop 4of de LG Gram serie.
Meer MSI beoordelingen:
potential competitors in comparison
Evaluatie | Datum | Model | Gewicht | Hoogte | Formaat | Resolutie | Beste prijs |
|---|---|---|---|---|---|---|---|
| 81.2 % v7 (old) | 05-2021 | MSI Summit B15 A11M i7-1165G7, Iris Xe G7 96EUs | 1.5 kg | 16.9 mm | 15.60" | 1920x1080 | |
| 83.7 % v7 (old) | 02-2021 | MSI Summit E15 A11SCST i7-1185G7, GeForce GTX 1650 Ti Max-Q | 1.8 kg | 16.9 mm | 15.60" | 1920x1080 | |
| 86.8 % v7 (old) | 05-2020 | Dell XPS 15 9500 Core i5 i5-10300H, UHD Graphics 630 | 1.8 kg | 18 mm | 15.60" | 1920x1200 | |
| 85 % v7 (old) | 01-2020 | HP Spectre X360 15-5ZV31AV i7-10510U, GeForce MX250 | 2.1 kg | 19.3 mm | 15.60" | 3840x2160 | |
| 87.5 % v7 (old) | 05-2021 | ADATA XPG Xenia Xe i7-1165G7, Iris Xe G7 96EUs | 1.7 kg | 14.9 mm | 15.60" | 1920x1080 | |
| 85.2 % v7 (old) | 03-2020 | Asus ZenBook 15 UX534FTC-A8190T i7-10510U, GeForce GTX 1650 Max-Q | 1.6 kg | 18.9 mm | 15.60" | 1920x1080 |
Zaak
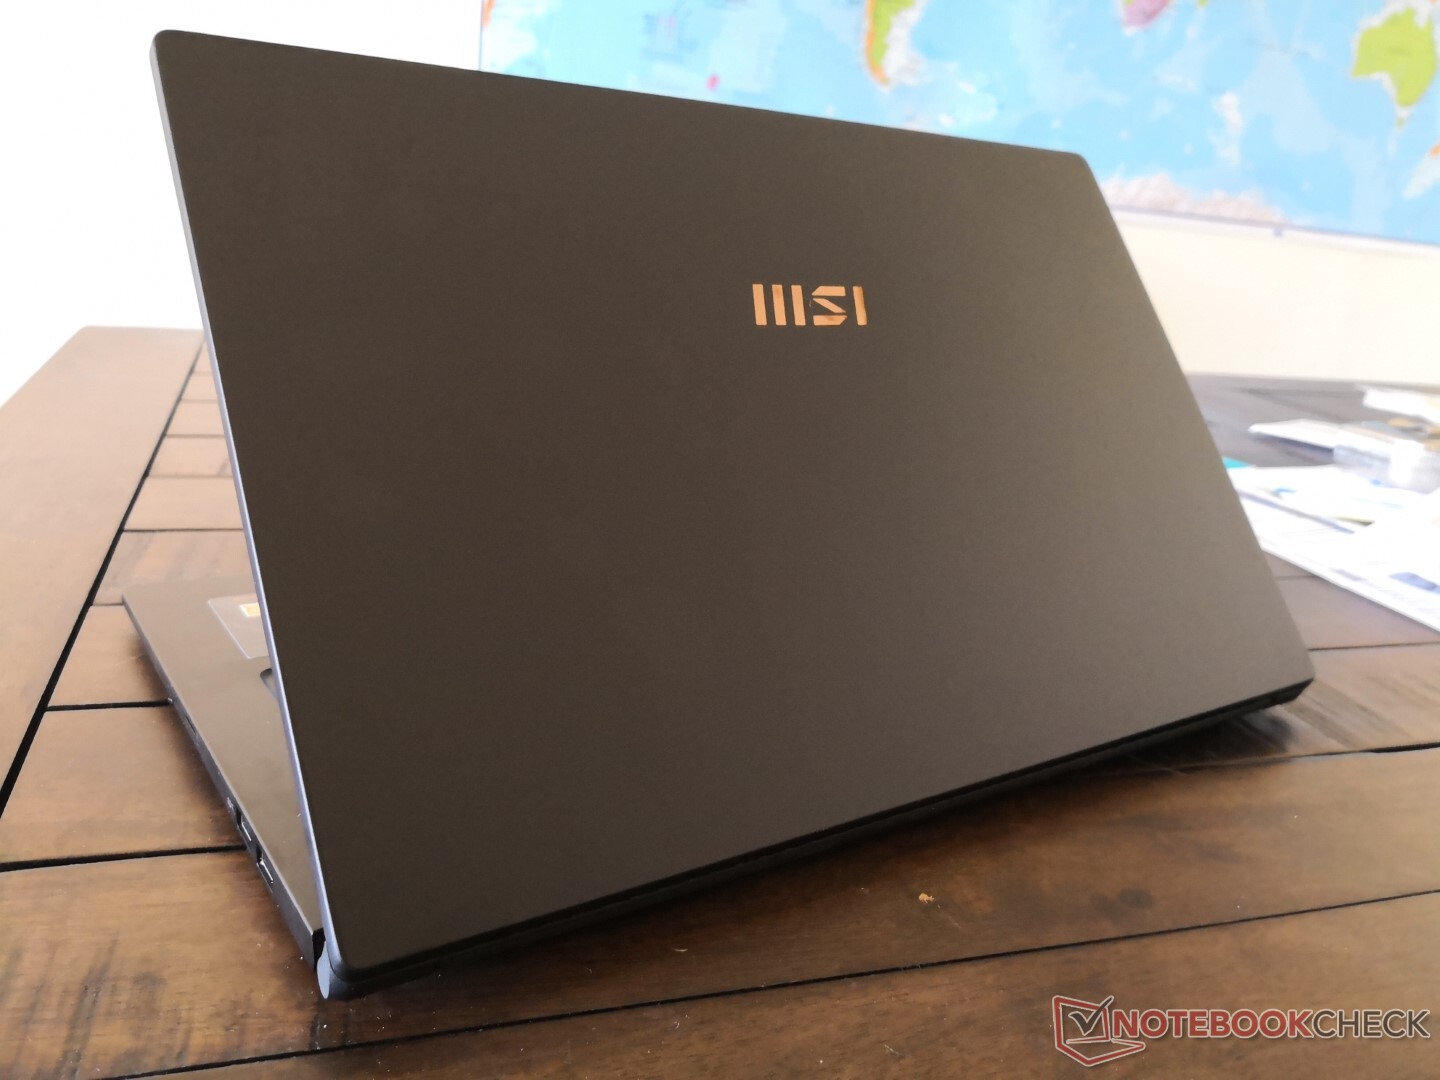
Als de Summit B15 u bekend voorkomt, dan is dat omdat het in wezen een gerebrand 2020 Modern 15 met een nieuw gouden 'MSI' logo op het buitenste deksel. Het chassis en de functies zijn bijna identiek aan die van de Modern 15, zelfs het moederbord binnenin. MSI is momenteel bezig met een herschikking van zijn laptop portfolio en dus zullen zowel de verouderende Modern als Prestige series uiteindelijk worden samengevoegd onder de nieuwere Summit series in de nabije toekomst. De verhuizing moet het uiteindelijk makkelijker maken voor klanten om onderscheid te maken tussen verschillende MSI laptops, aangezien het bedrijf al een model te veel namen heeft om in de gaten te houden
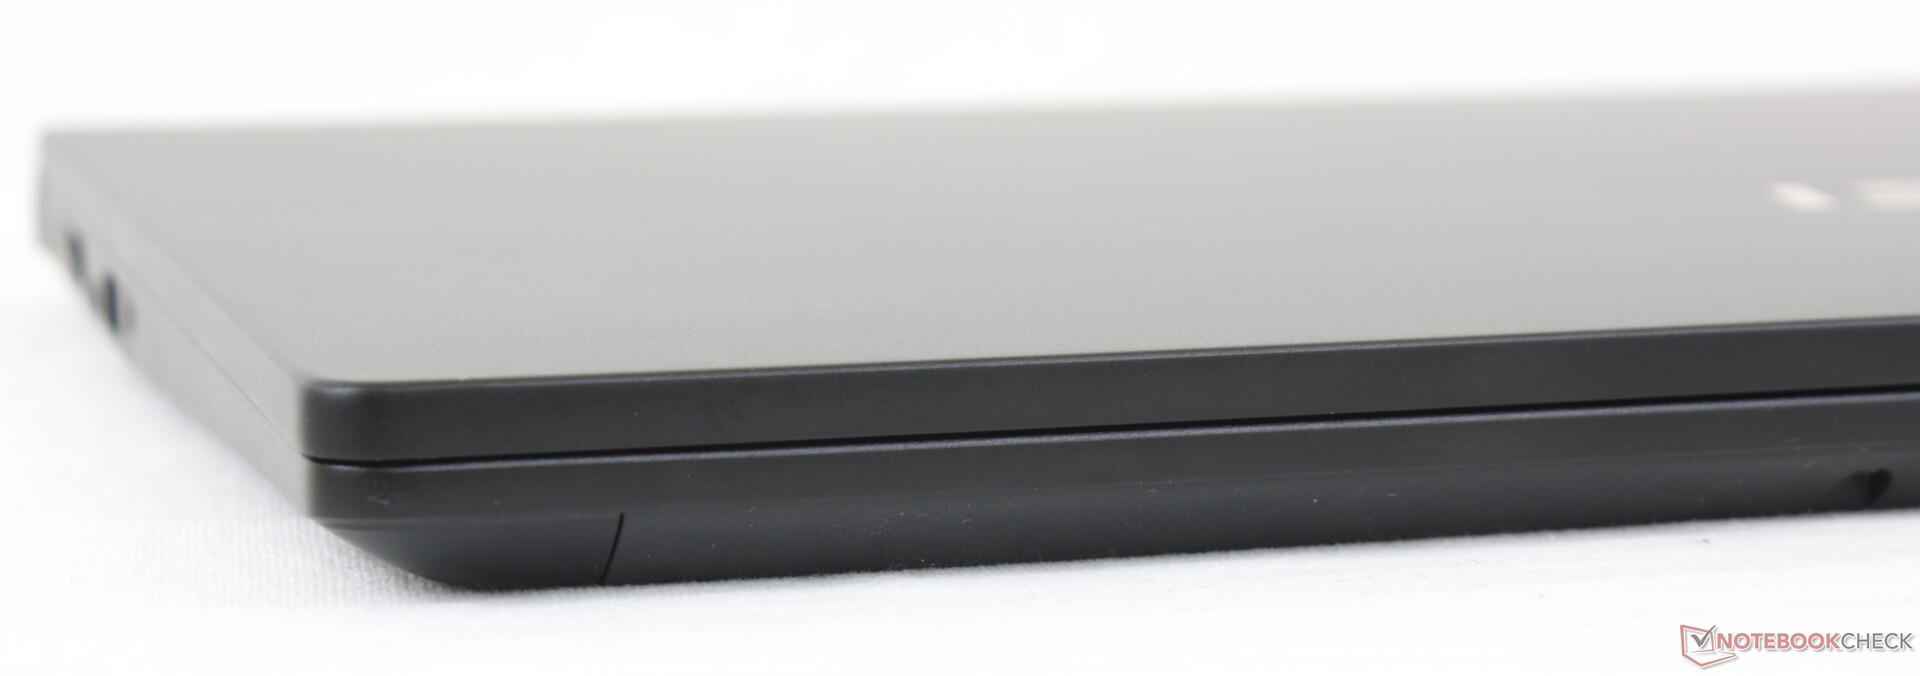
Onze oorspronkelijke indrukken over de Modern 15 van vorig jaar zijn hier van toepassing op de Summit B15. De stevigheid van de basis is nog steeds redelijk goed, terwijl het deksel nog steeds iets meer buigt dan we zouden willen. Full-on business laptops zoals de Dell Latitude, HP EliteBook, of Lenovo ThinkPad zijn zeker prijziger, maar zijn van sterkere kwaliteit.
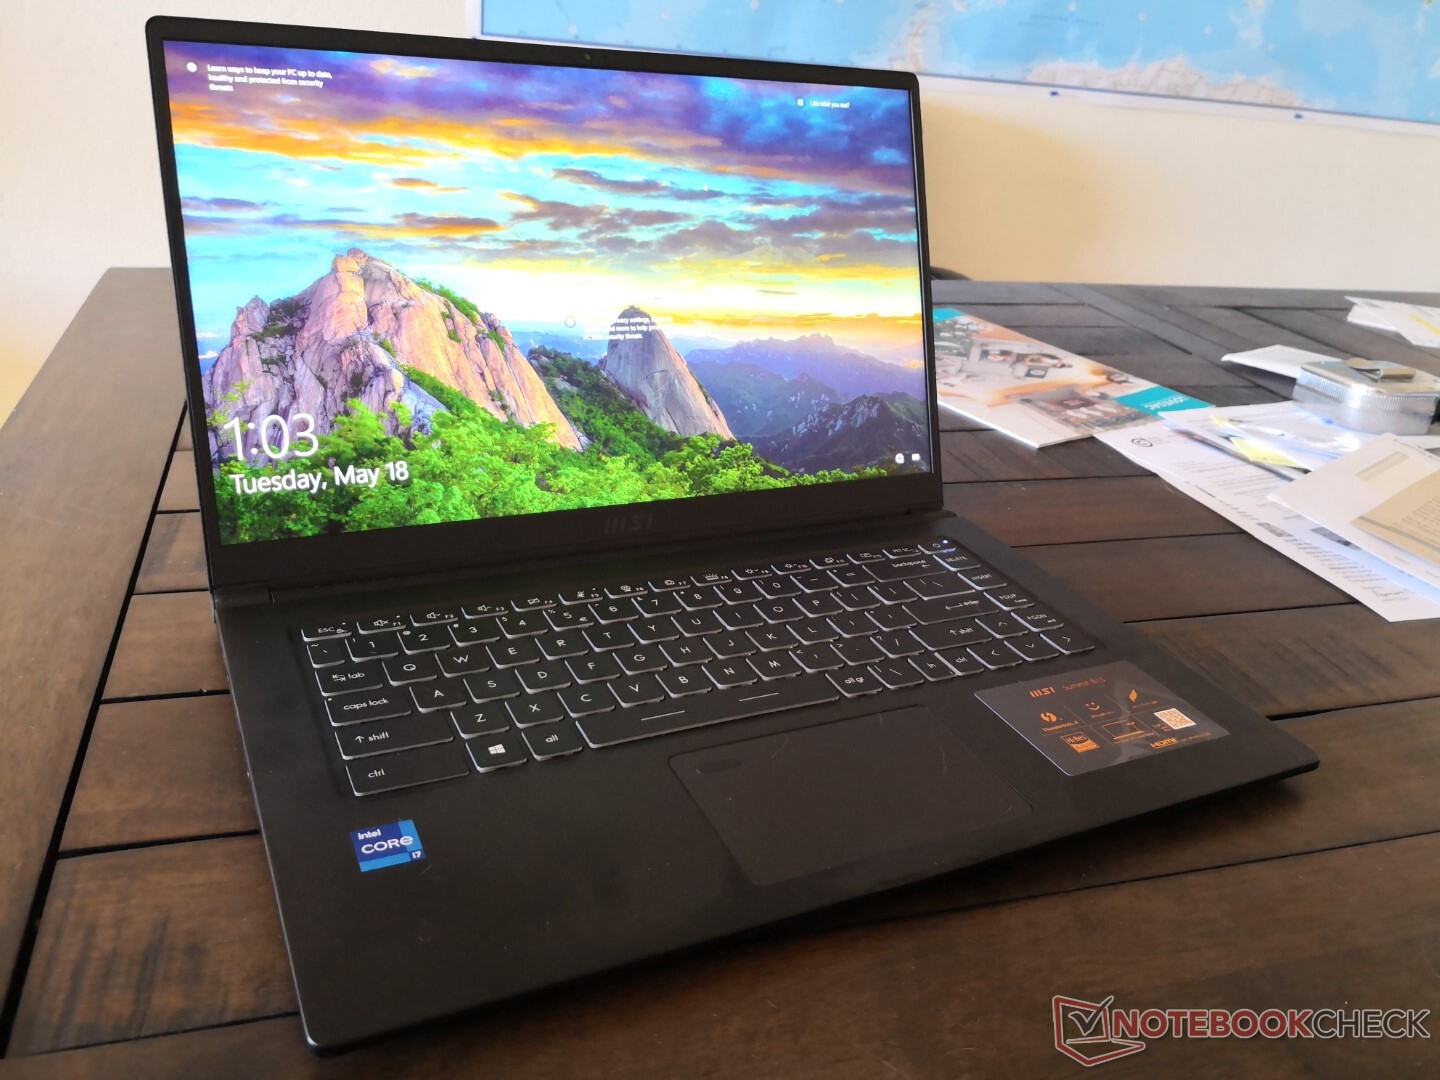
Een belangrijke reden om de Summit B15 (of Modern 15) te verkiezen boven alternatieven van Dell, HP, of anderen is zijn zeer lichte gewicht van slechts 1,5 kg. De concurrerende Lenovo ThinkBook 15 G2 of ADATA XPG Xenia Xe zijn elk ongeveer 200 gram zwaarder in vergelijking, terwijl ze bijna identiek zijn in afmetingen.

Connectiviteit
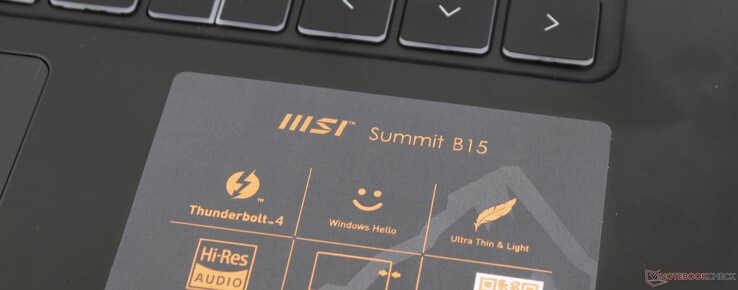
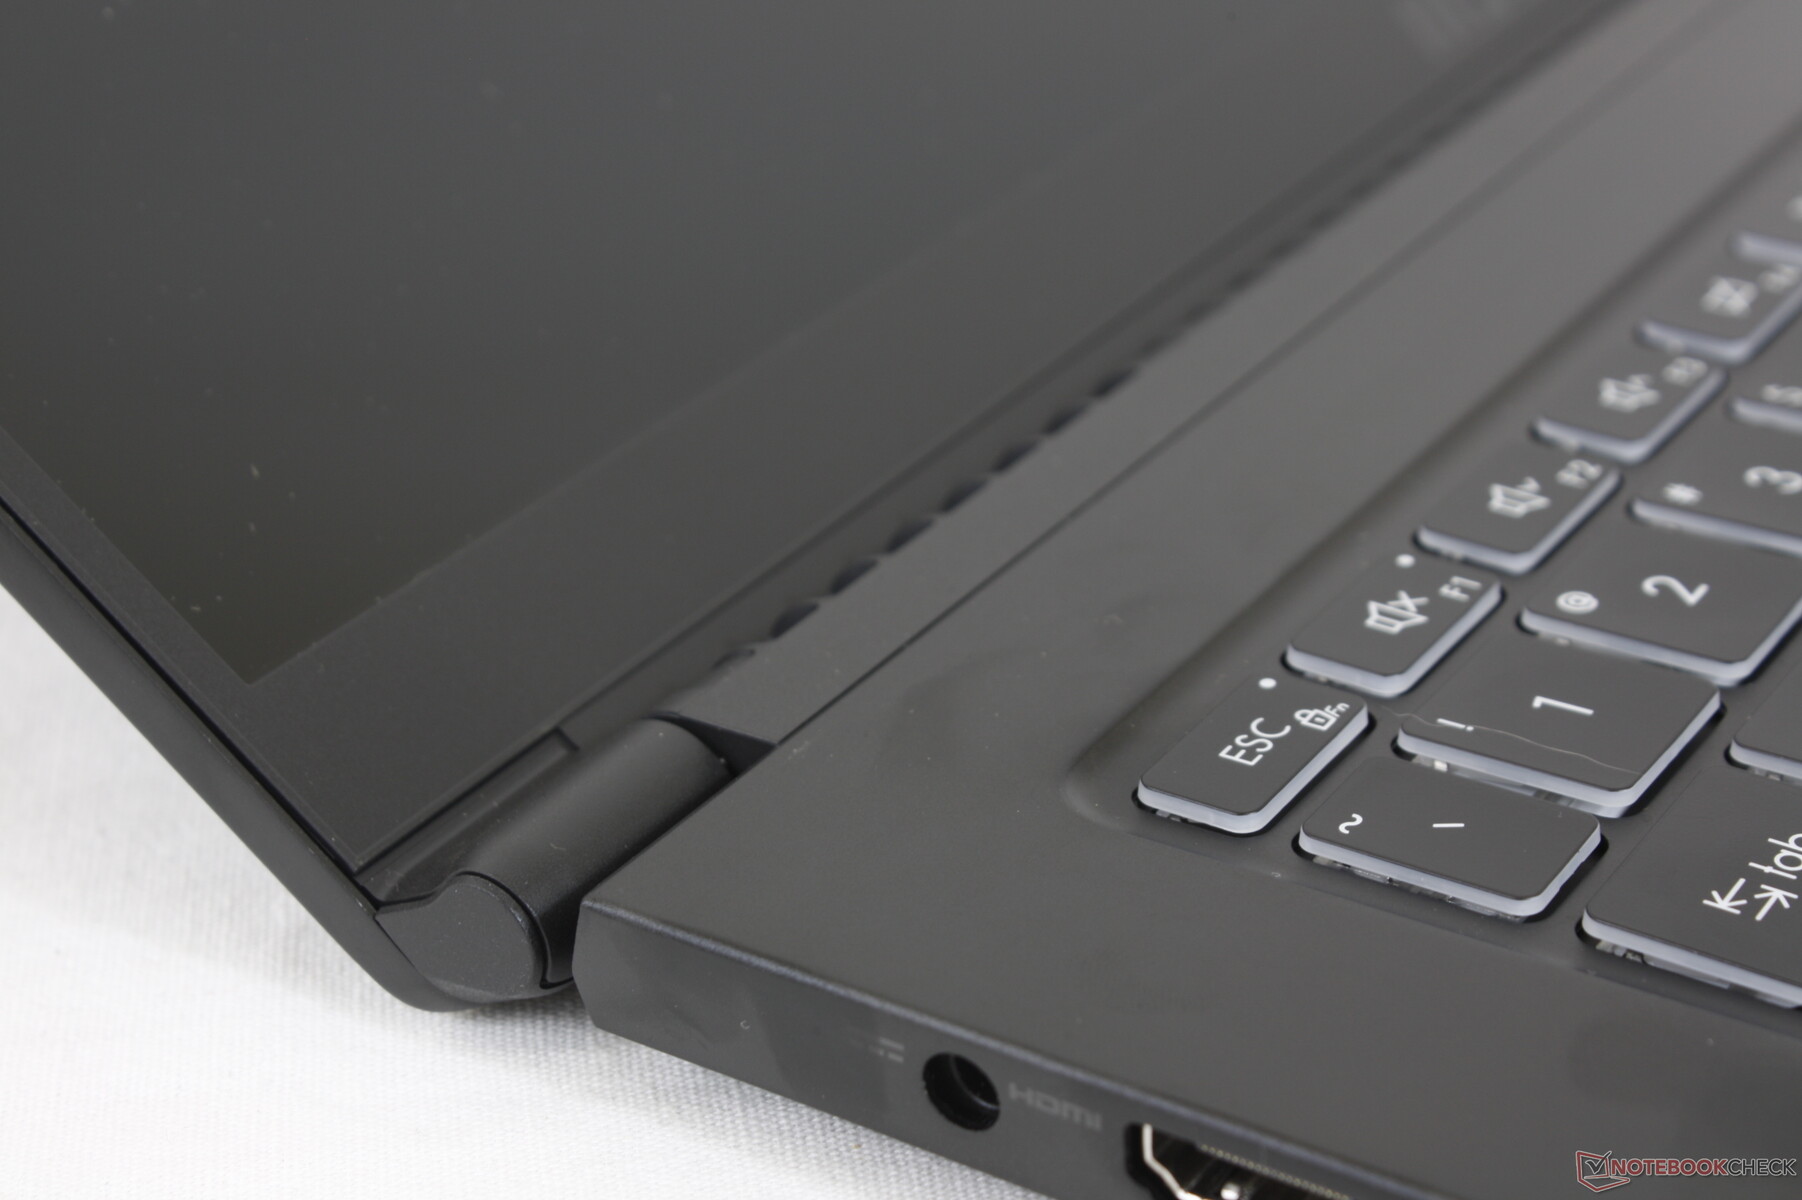
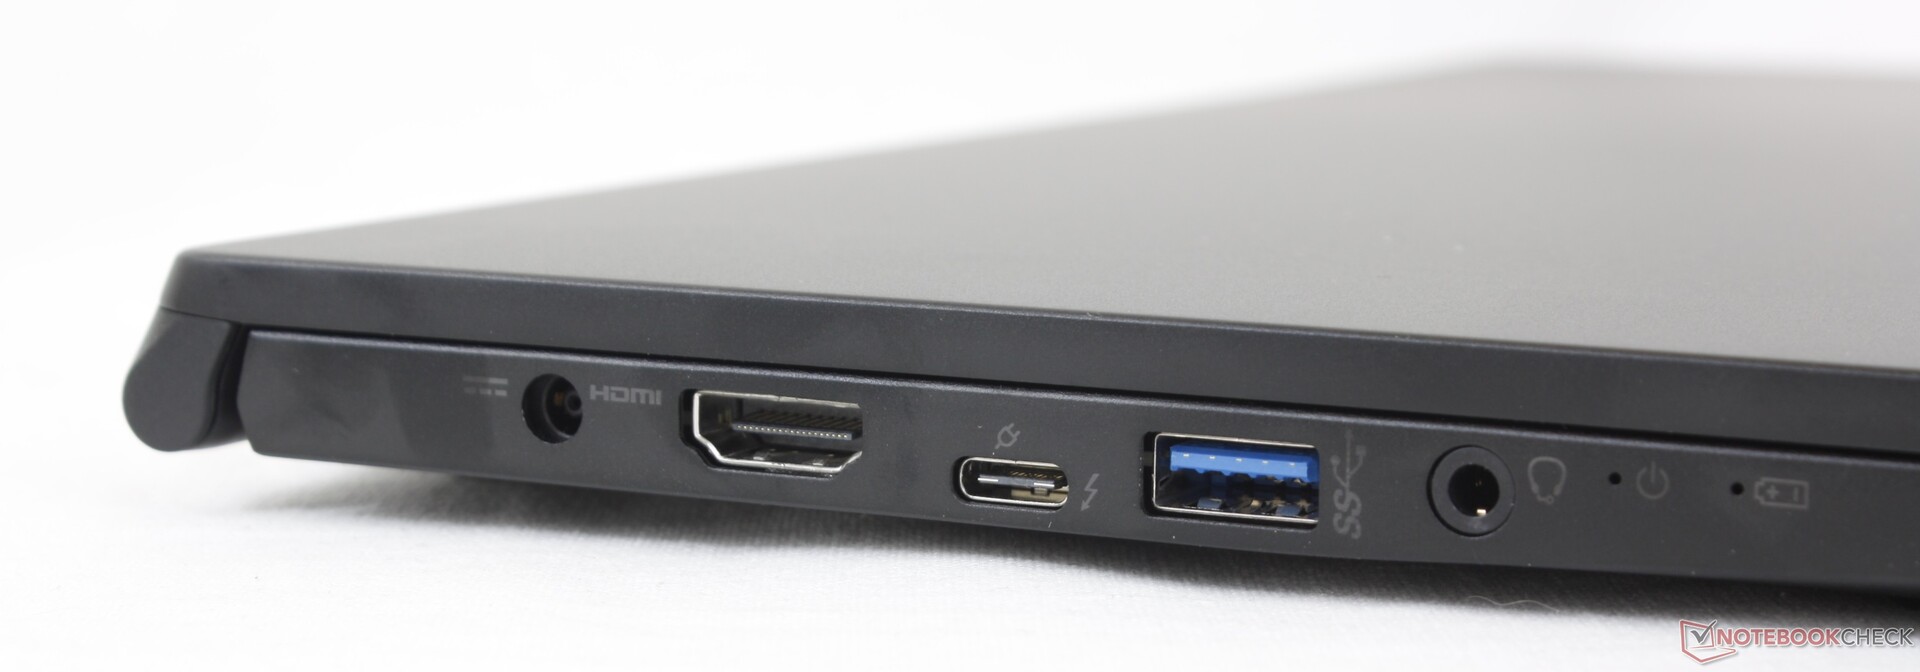
De poortopties blijven ongewijzigd ten opzichte van de Modern 15, op twee belangrijke upgrades na: de HDMI-poort ondersteunt nu 4K60-uitvoer, terwijl de USB-C-poort nu Thunderbolt 4-compatibel is. Gebruikers kunnen externe grafische docks aansluiten op de Summit B15, terwijl dat onmogelijk was op de Modern 15
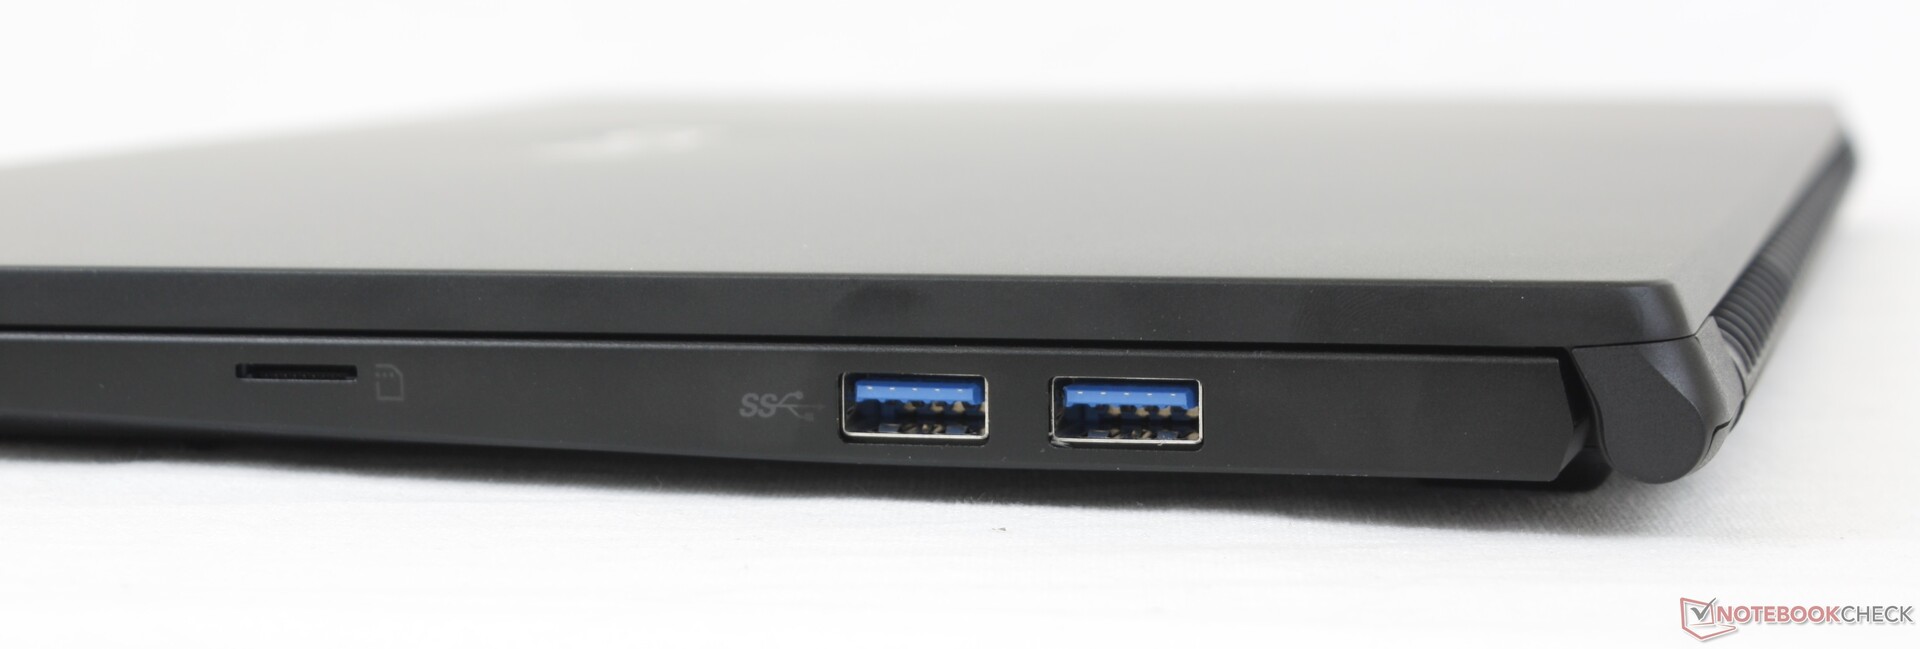
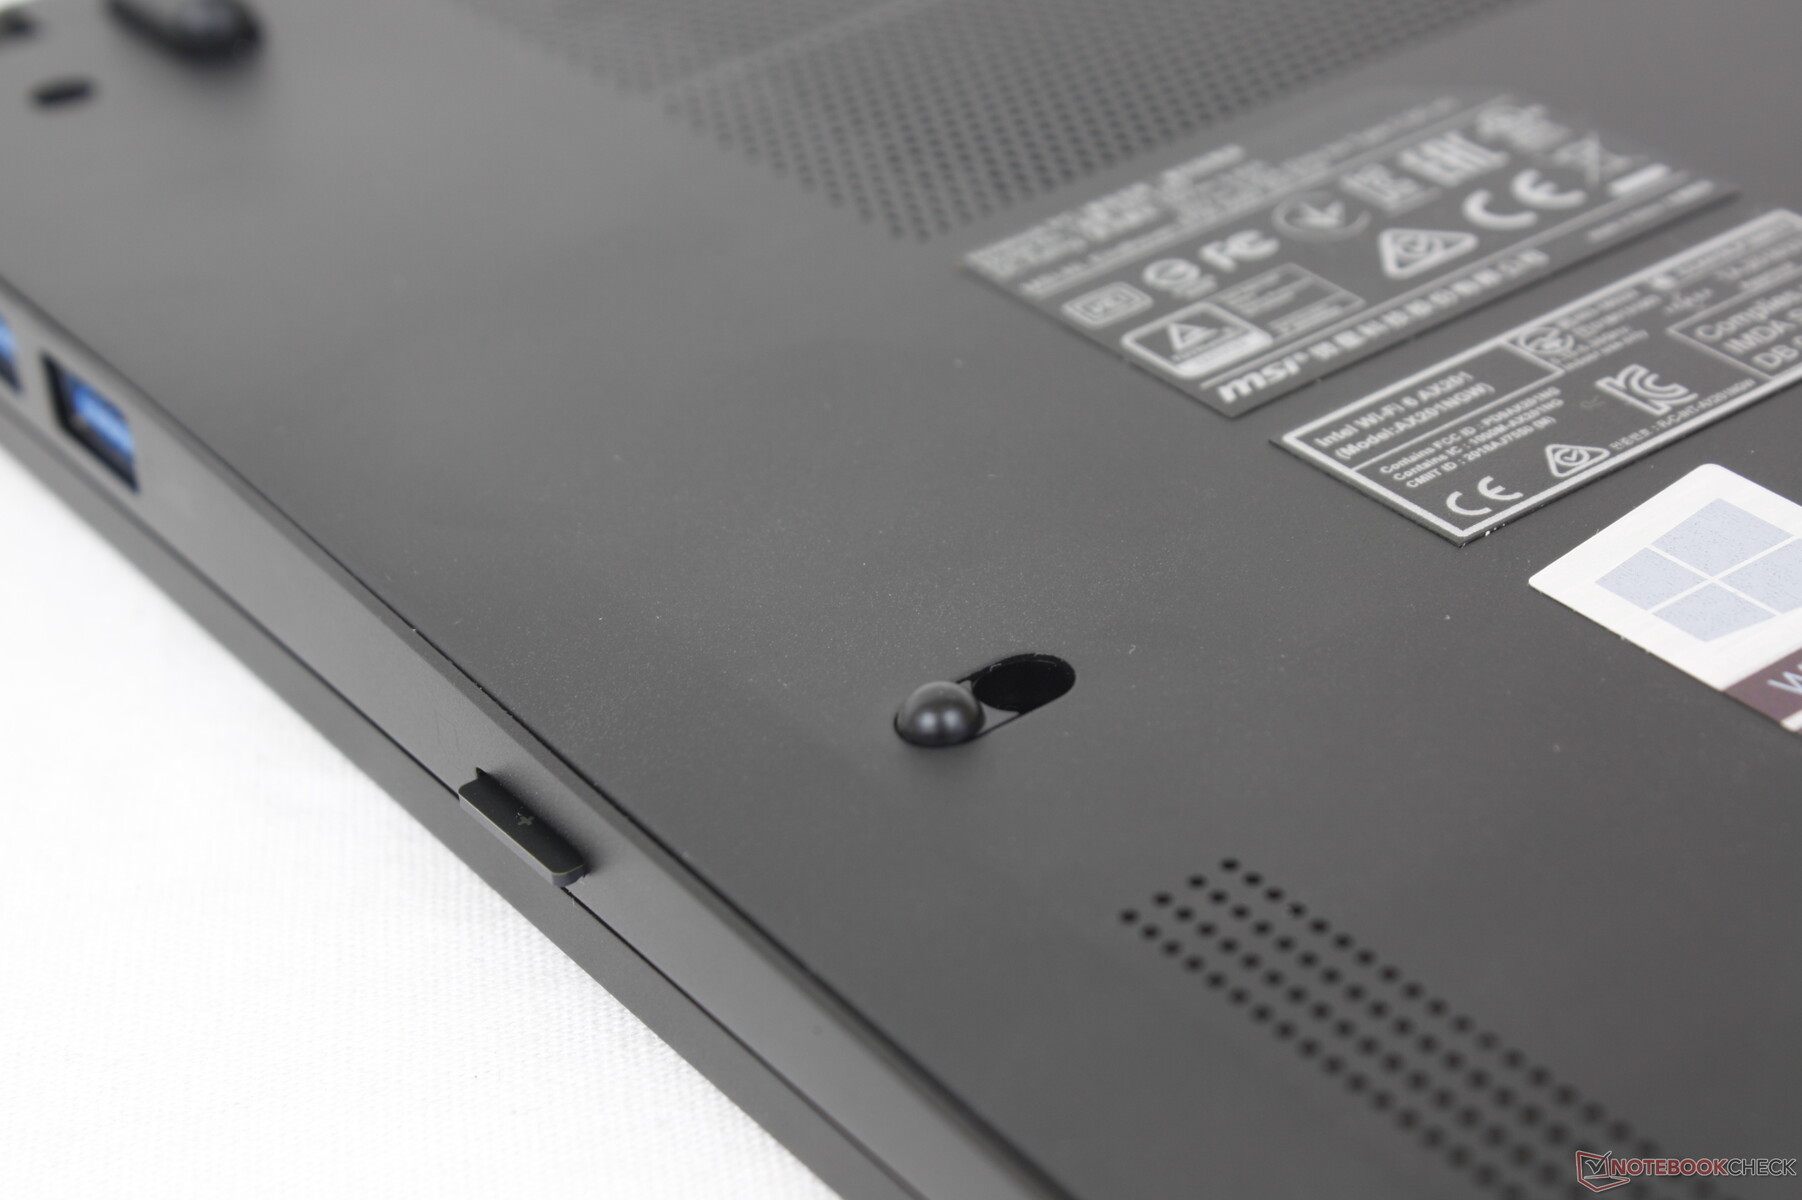
SD-kaartlezer
MSI heeft het MicroSD slot geüpgraded om ongeveer 6x sneller te zijn dan hetzelfde MicroSD slot op de oudere Modern 15. Het verplaatsen van 1 GB aan foto's van onze UHS-II testkaart naar de desktop duurt ongeveer 7 seconden, vergeleken met 40 seconden op het model van vorig jaar.
| SD Card Reader | |
| average JPG Copy Test (av. of 3 runs) | |
| Dell XPS 15 9500 Core i5 (Toshiba Exceria Pro SDXC 64 GB UHS-II) | |
| HP Spectre X360 15-5ZV31AV (Toshiba Exceria Pro M501 UHS-II) | |
| MSI Summit B15 A11M (AV PRO microSD 128 GB V60) | |
| MSI Summit E13 Flip Evo A11MT (AV PRO microSD 128 GB V60) | |
| MSI Modern 15 A10RB (Toshiba Exceria Pro M501 UHS-II) | |
| maximum AS SSD Seq Read Test (1GB) | |
| Dell XPS 15 9500 Core i5 (Toshiba Exceria Pro SDXC 64 GB UHS-II) | |
| MSI Summit B15 A11M (AV PRO microSD 128 GB V60) | |
| HP Spectre X360 15-5ZV31AV (Toshiba Exceria Pro M501 UHS-II) | |
| MSI Summit E13 Flip Evo A11MT (AV PRO microSD 128 GB V60) | |
| MSI Modern 15 A10RB (Toshiba Exceria Pro M501 UHS-II) | |
Communicatie
De Intel AX201 wordt standaard geleverd met Wi-Fi 6 en Bluetooth 5.1 connectiviteit. We hebben geen problemen ondervonden toen we hem koppelden aan onze Netgear RAX200 router.
Webcam


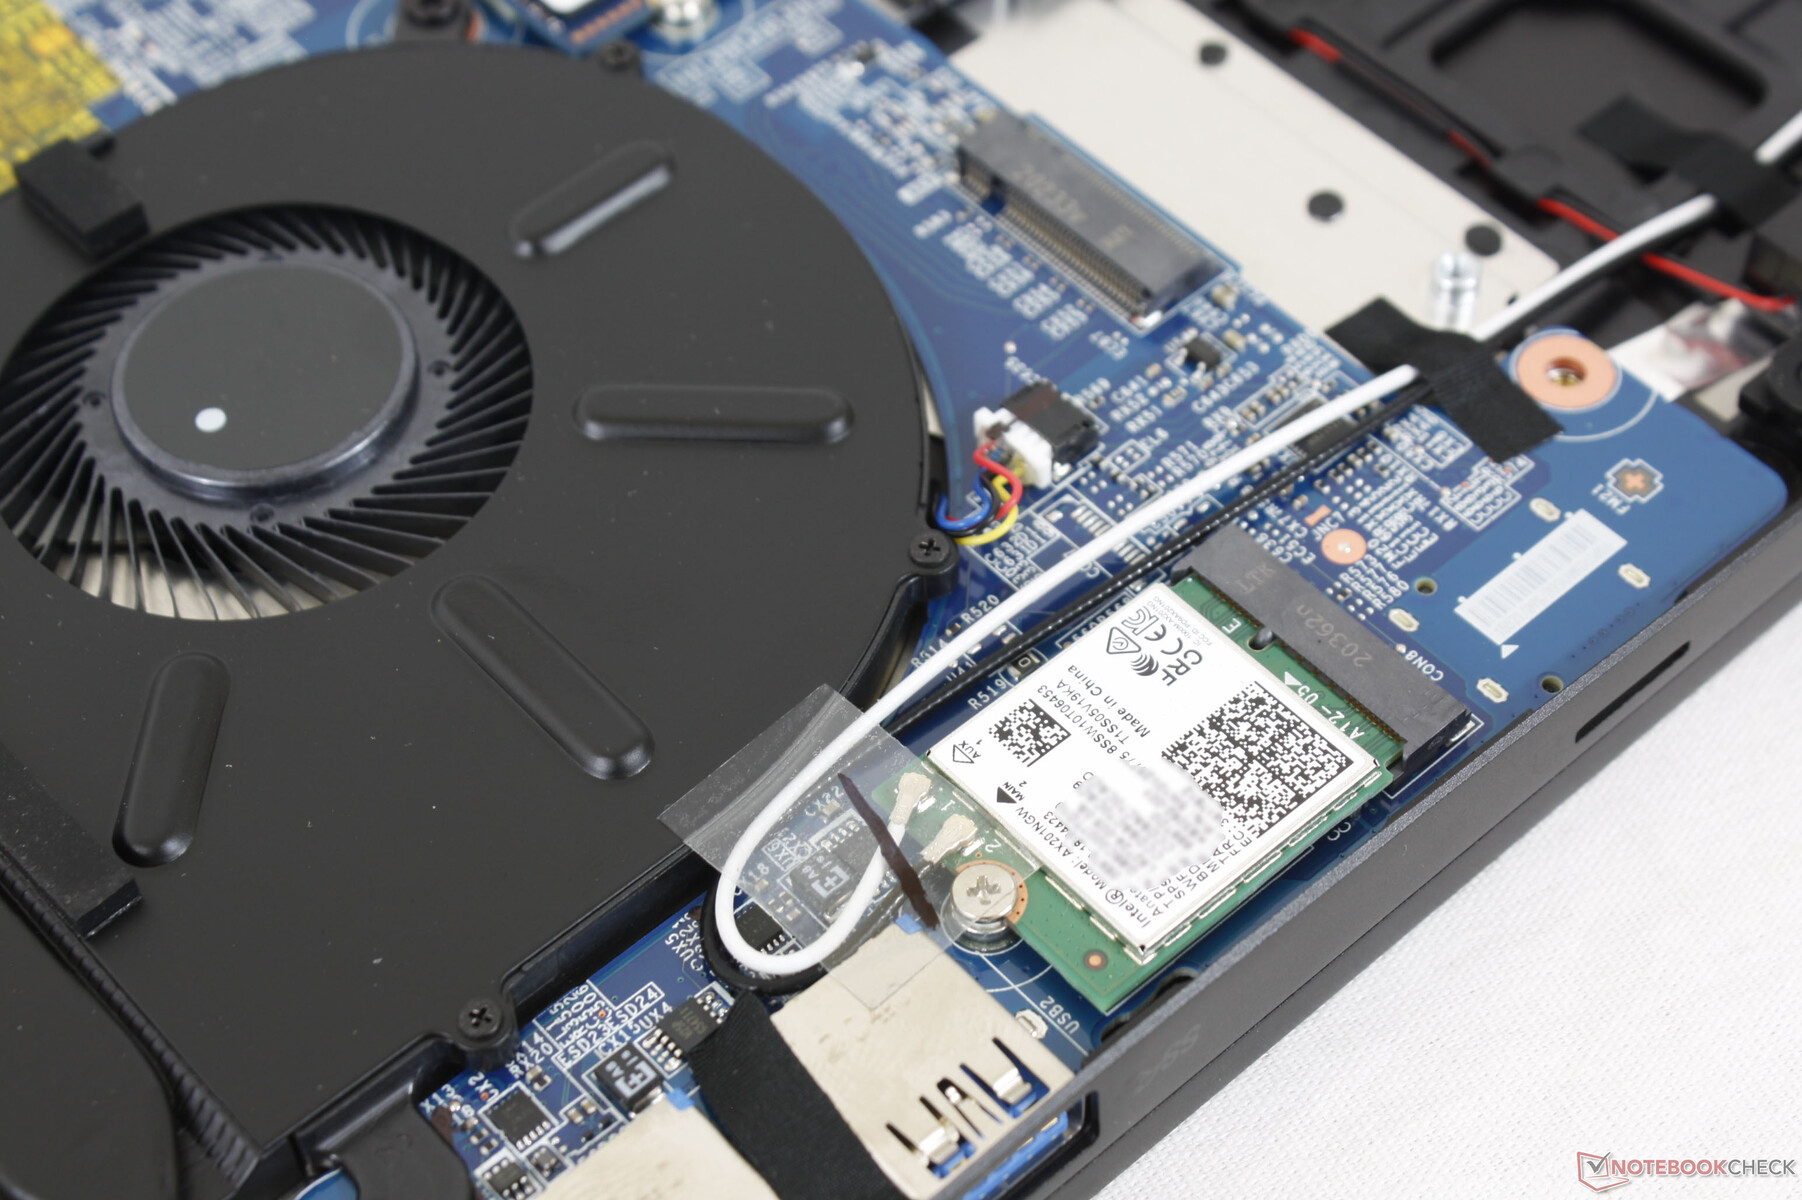
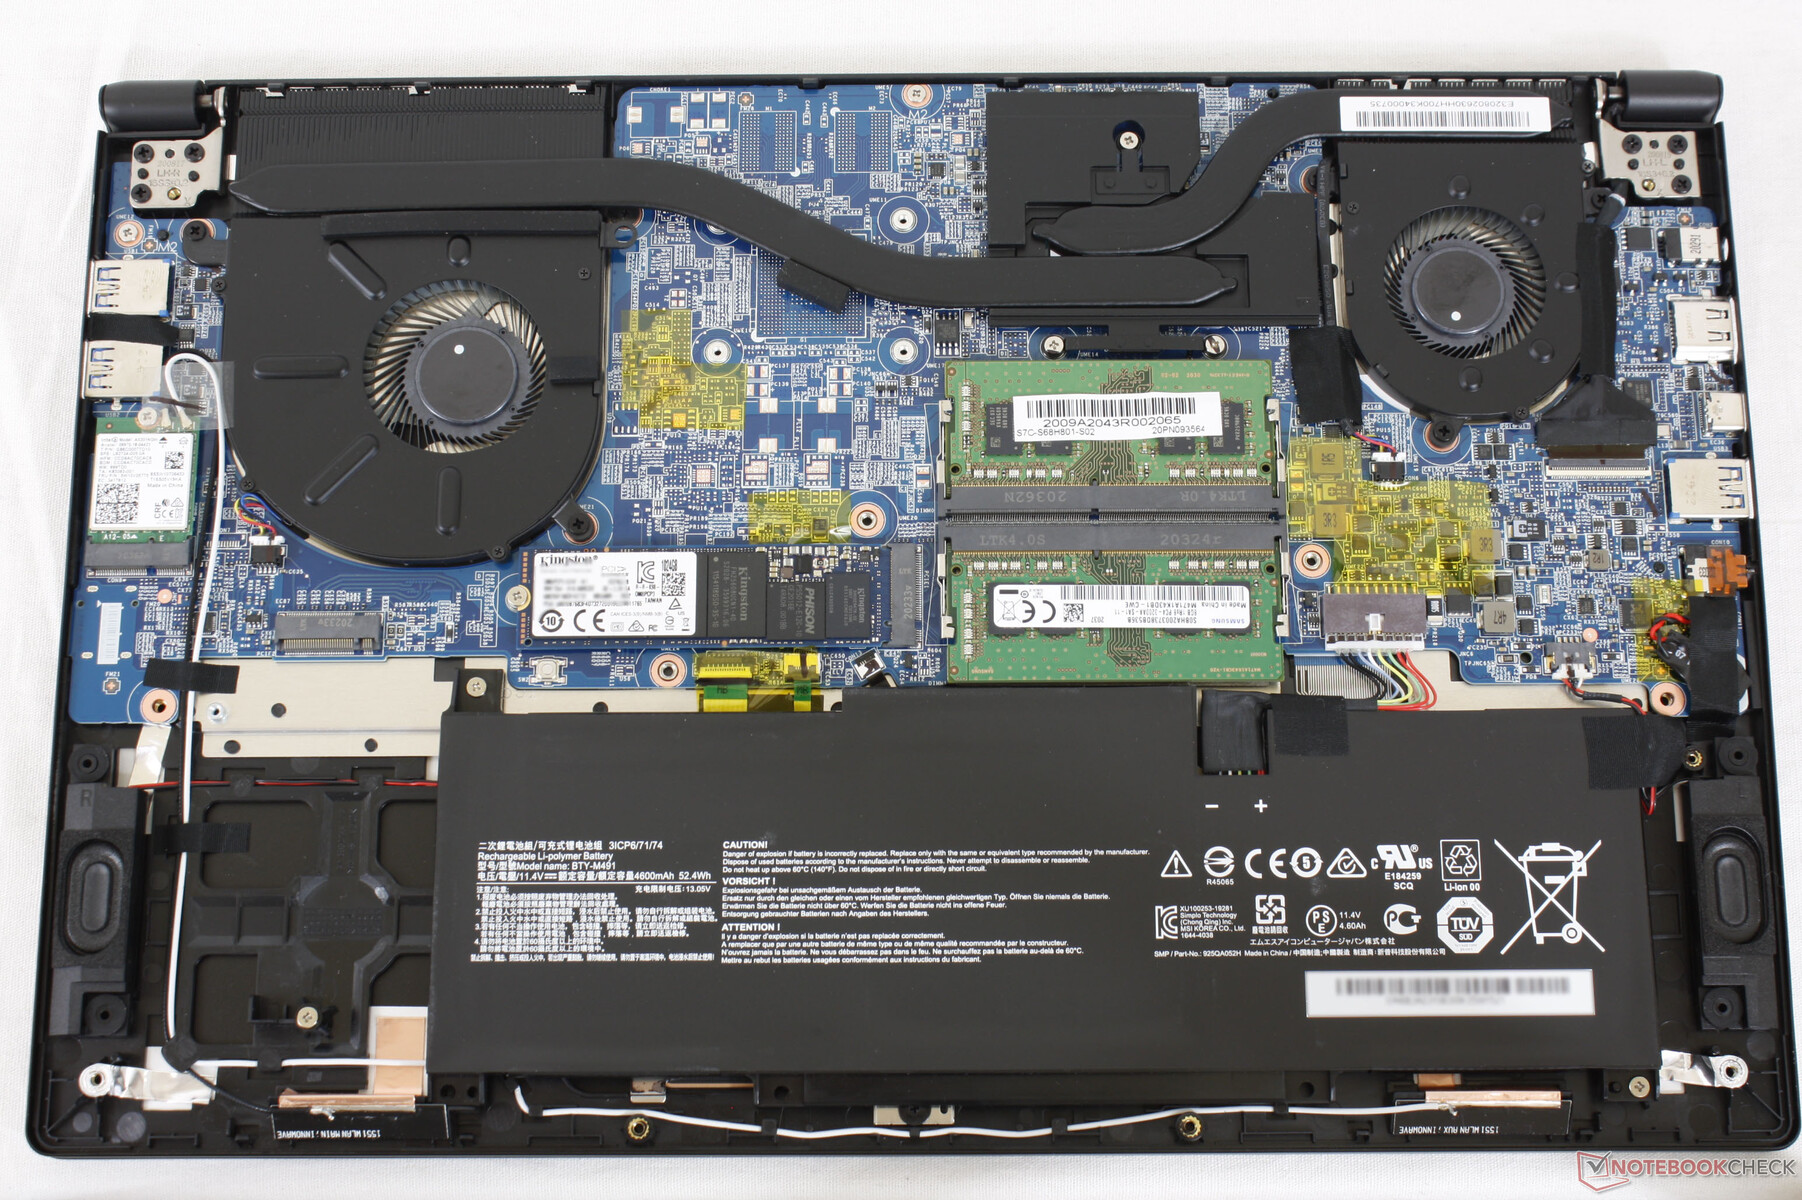
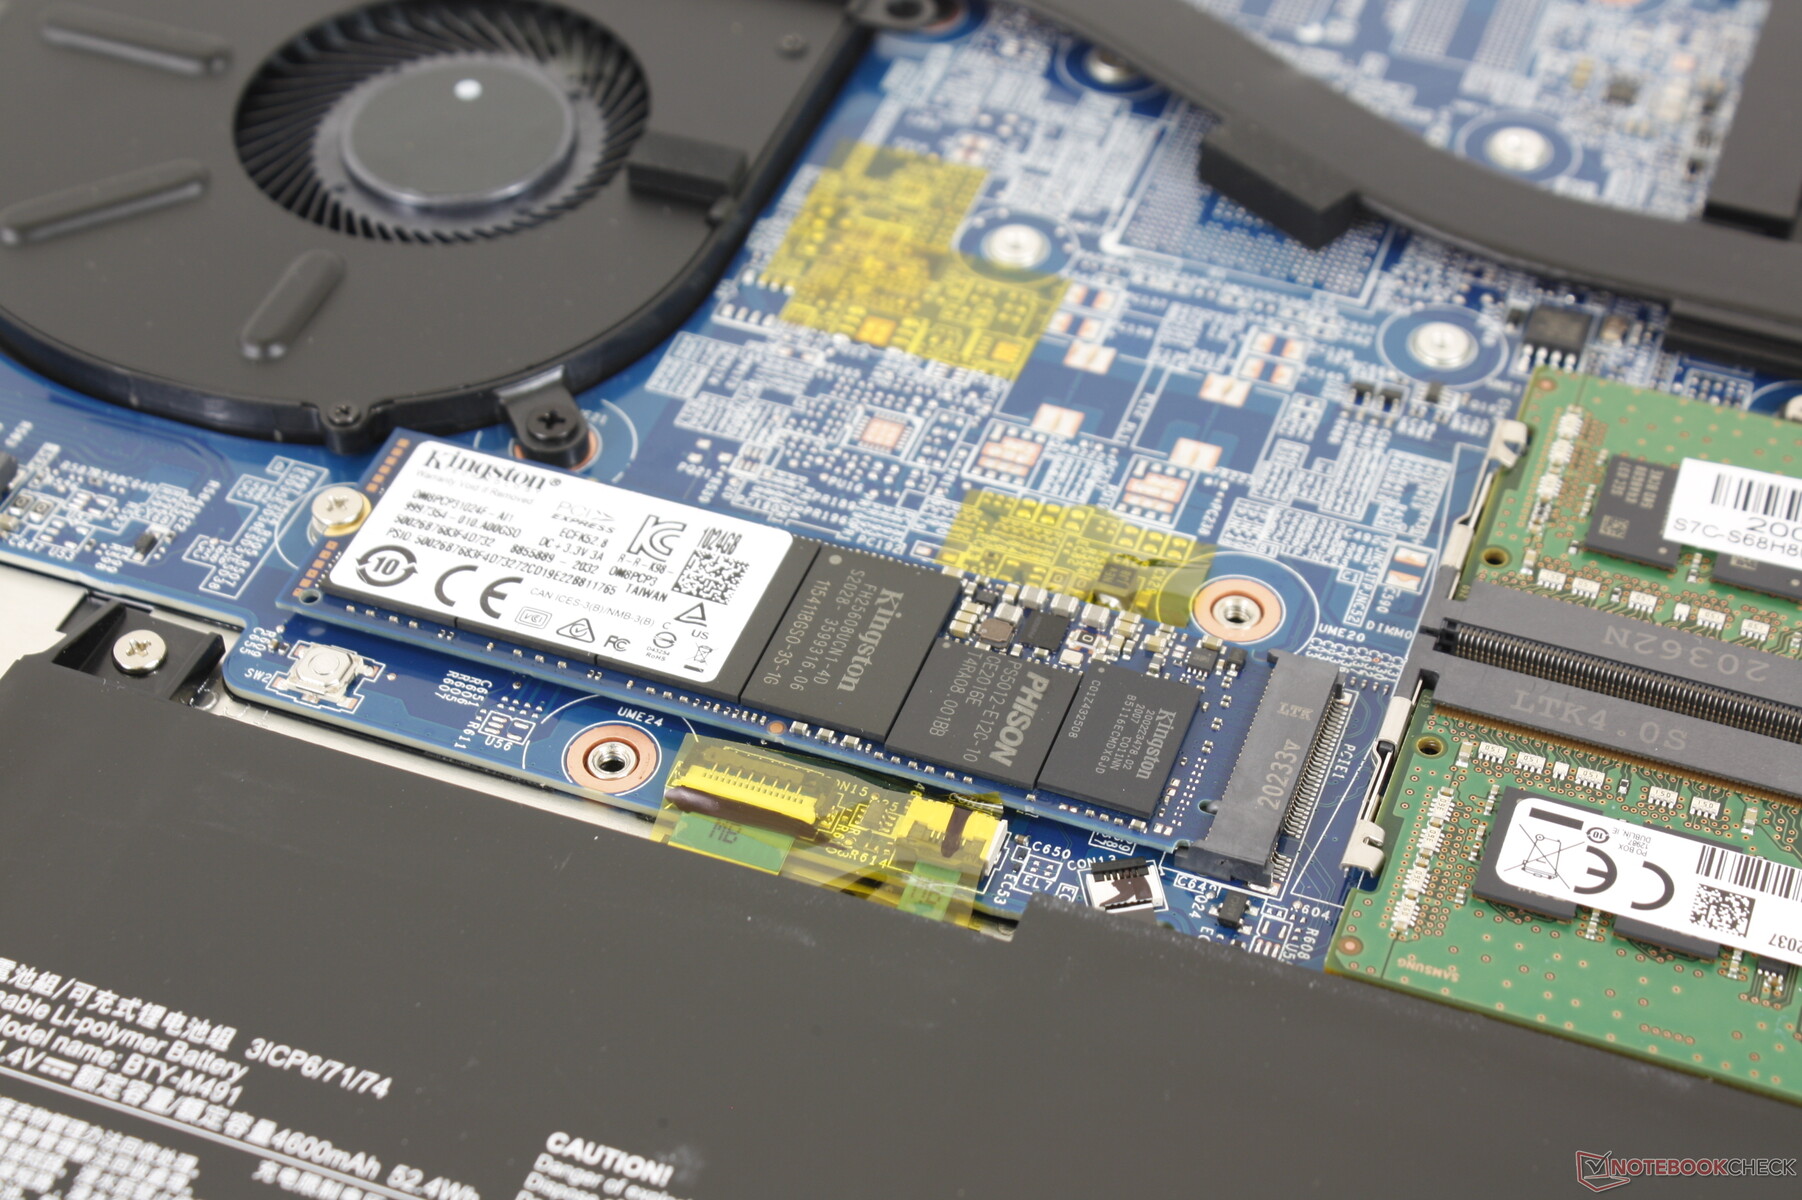
Onderhoud
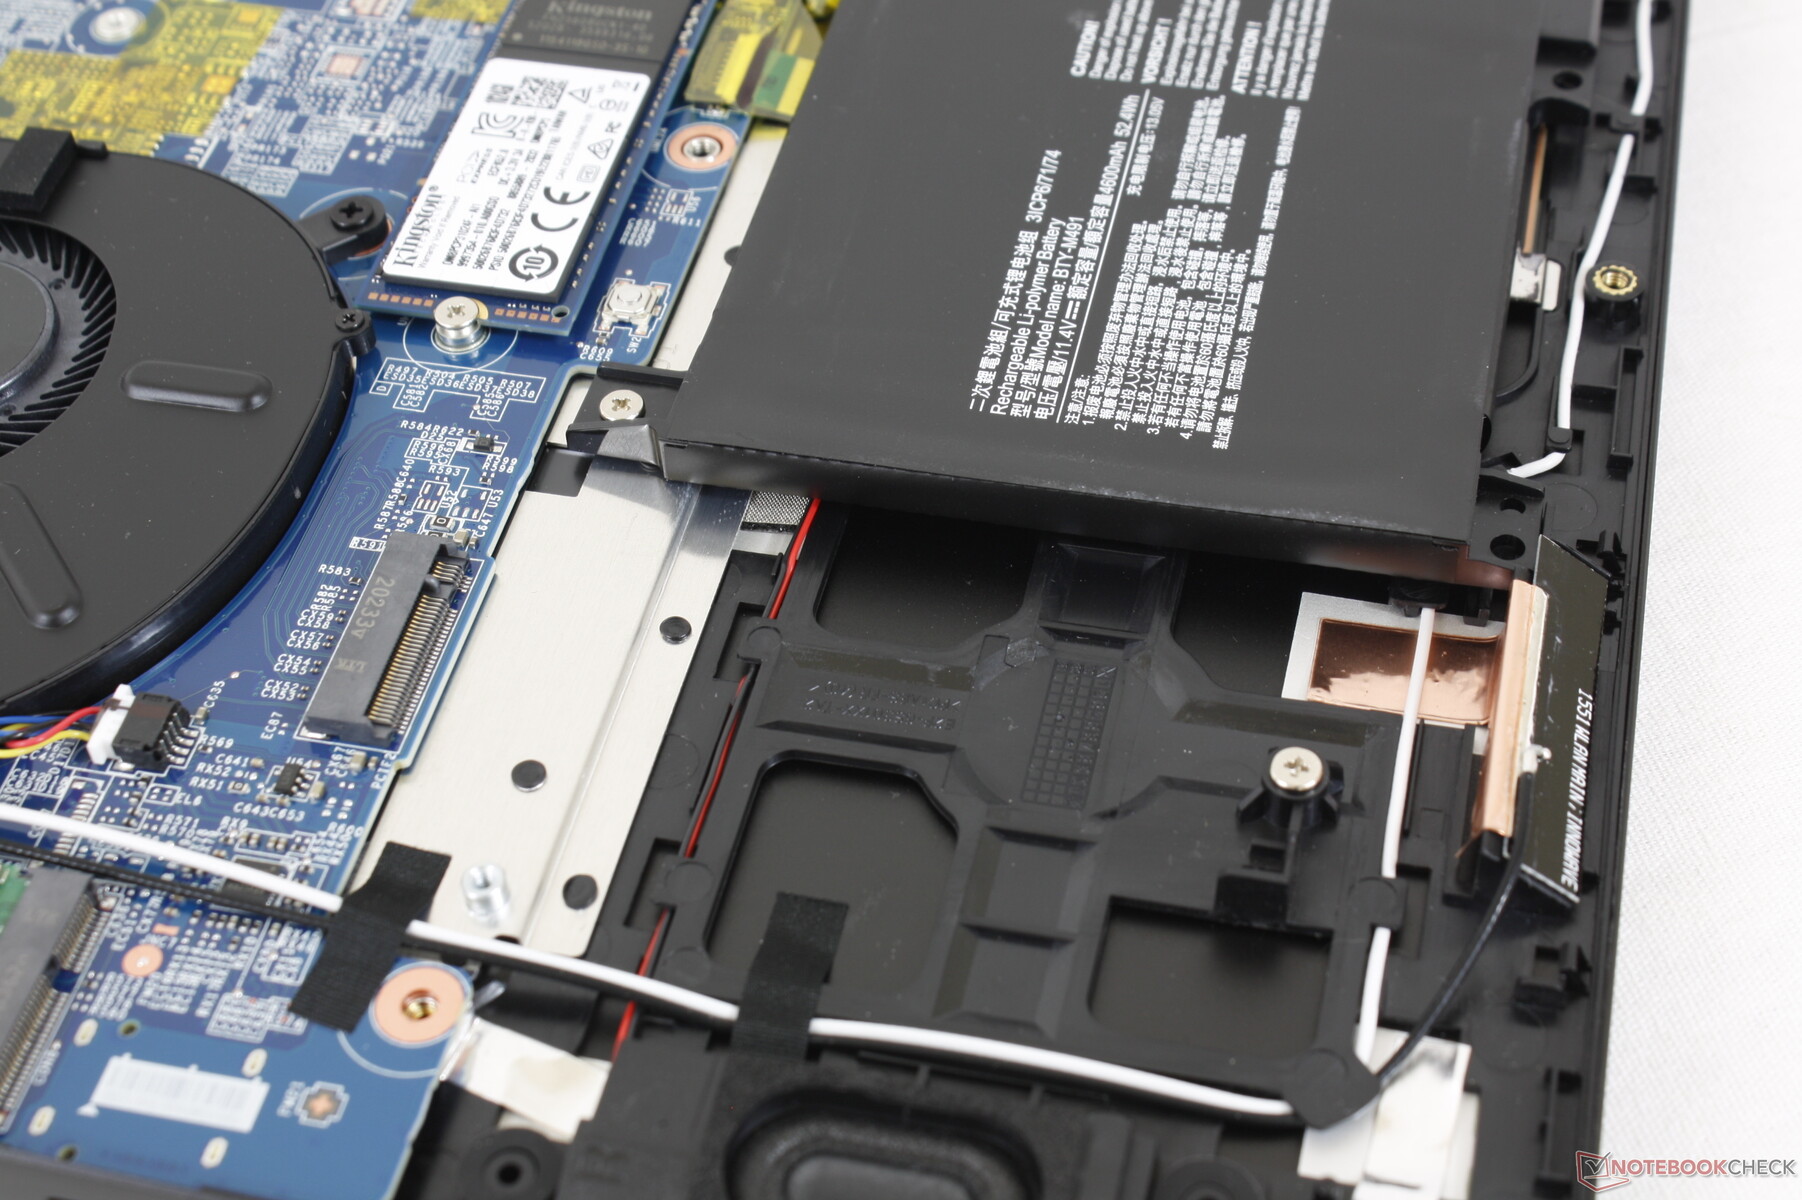
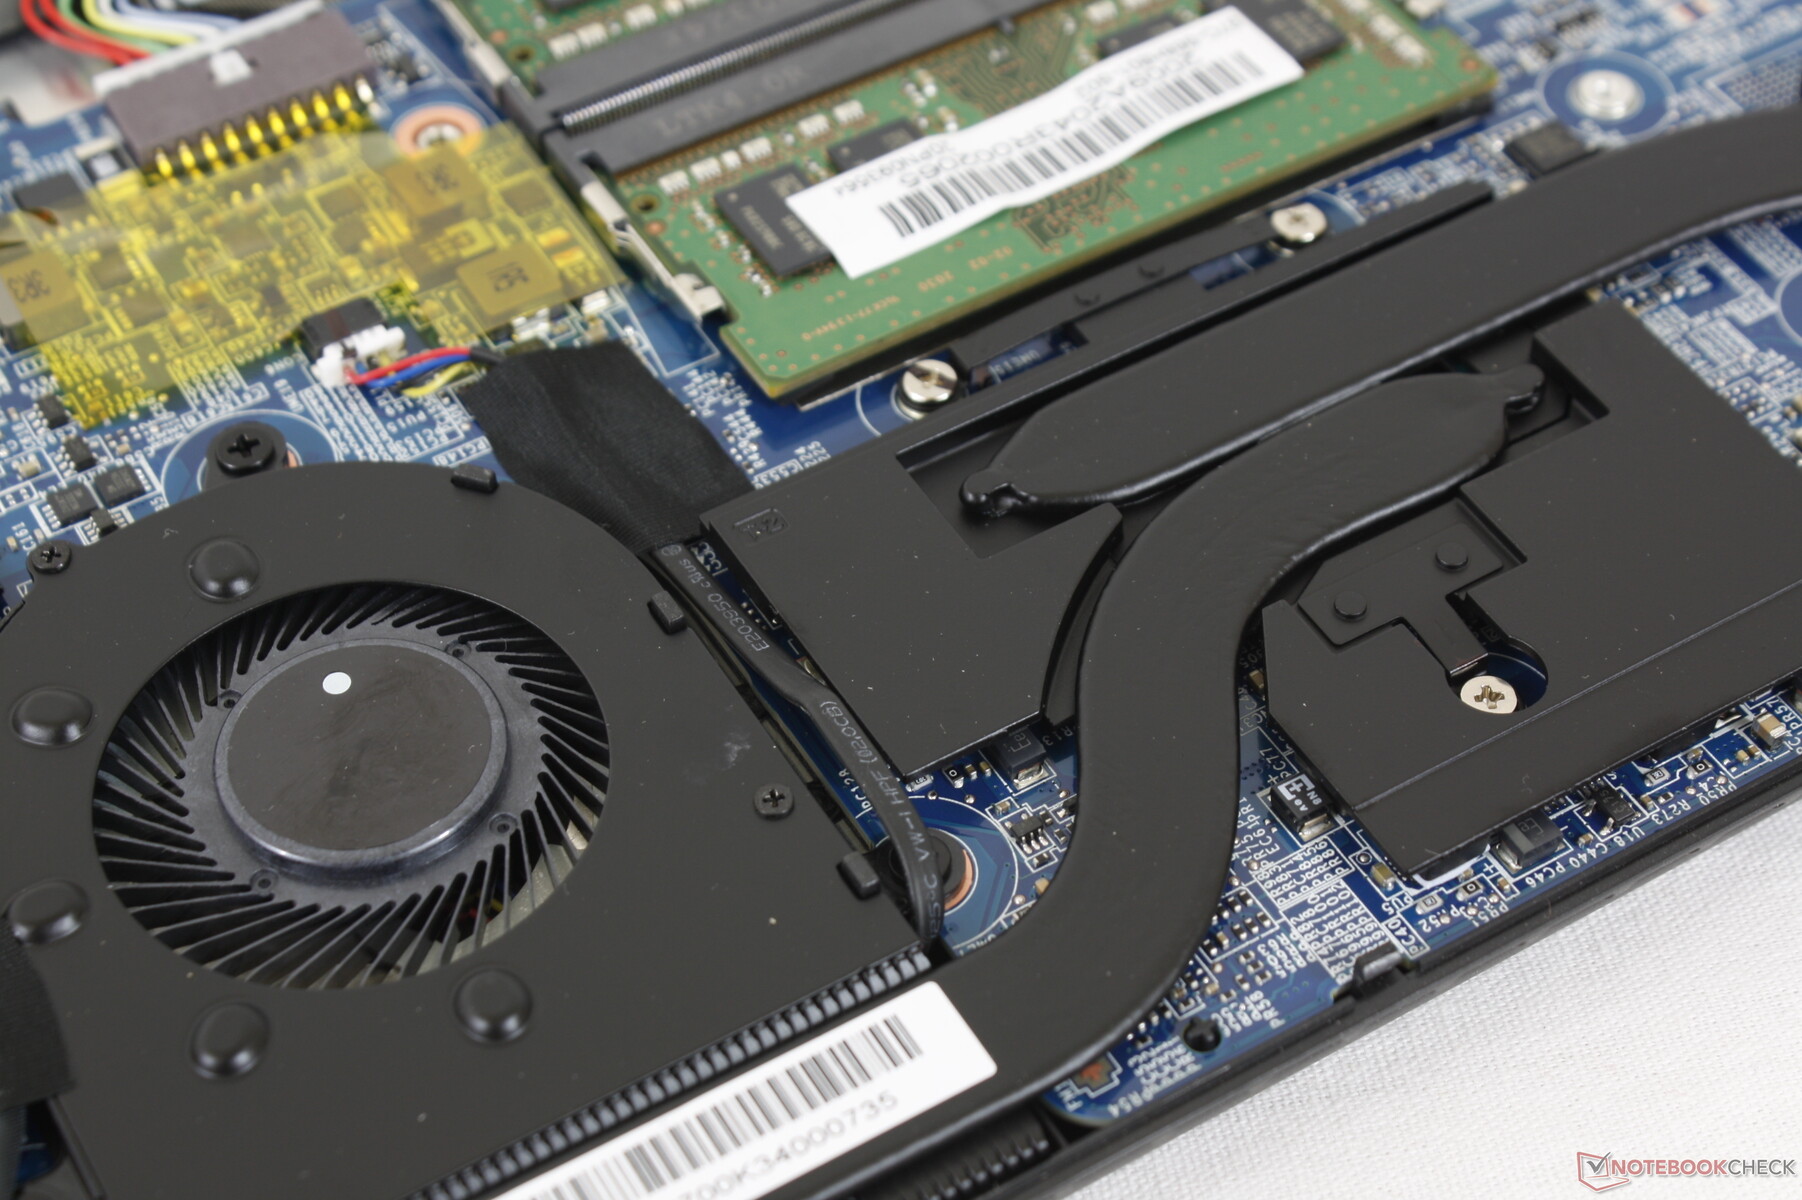
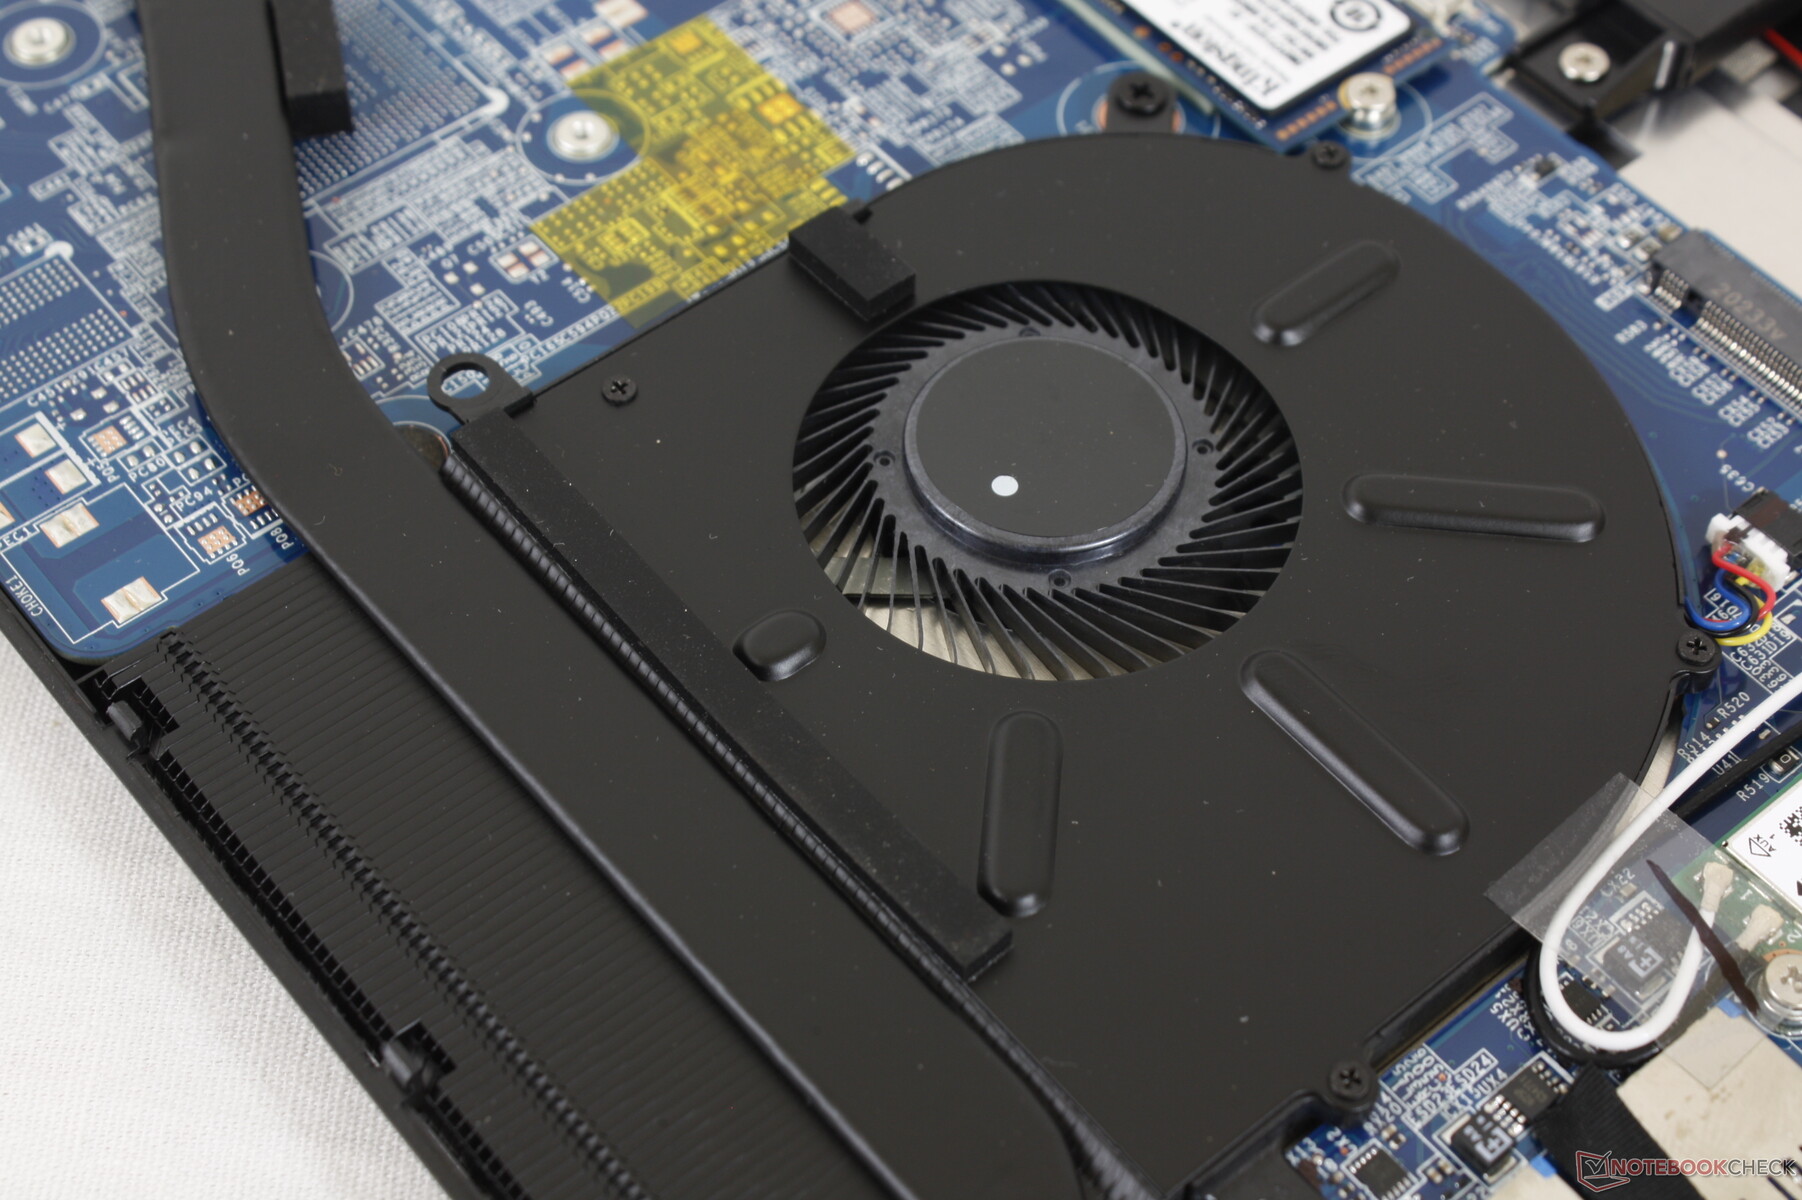
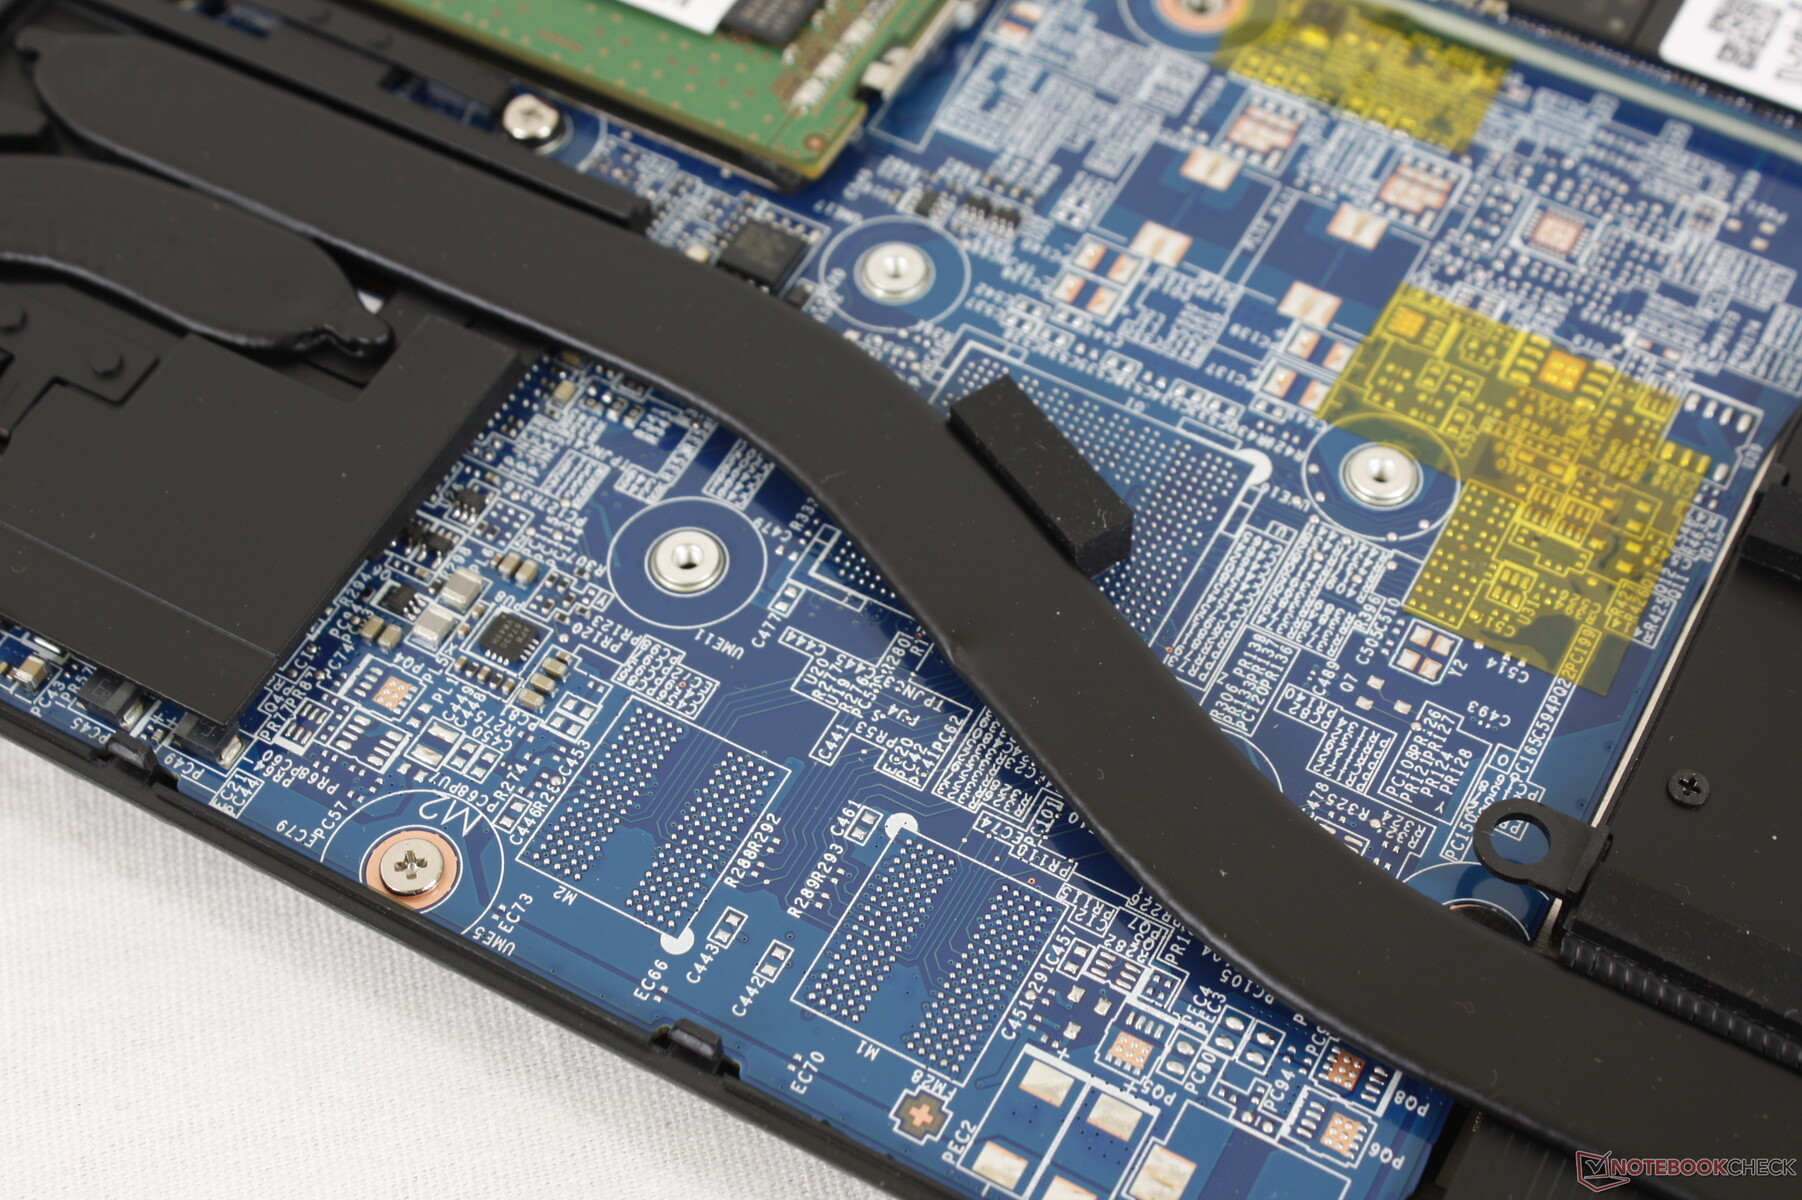
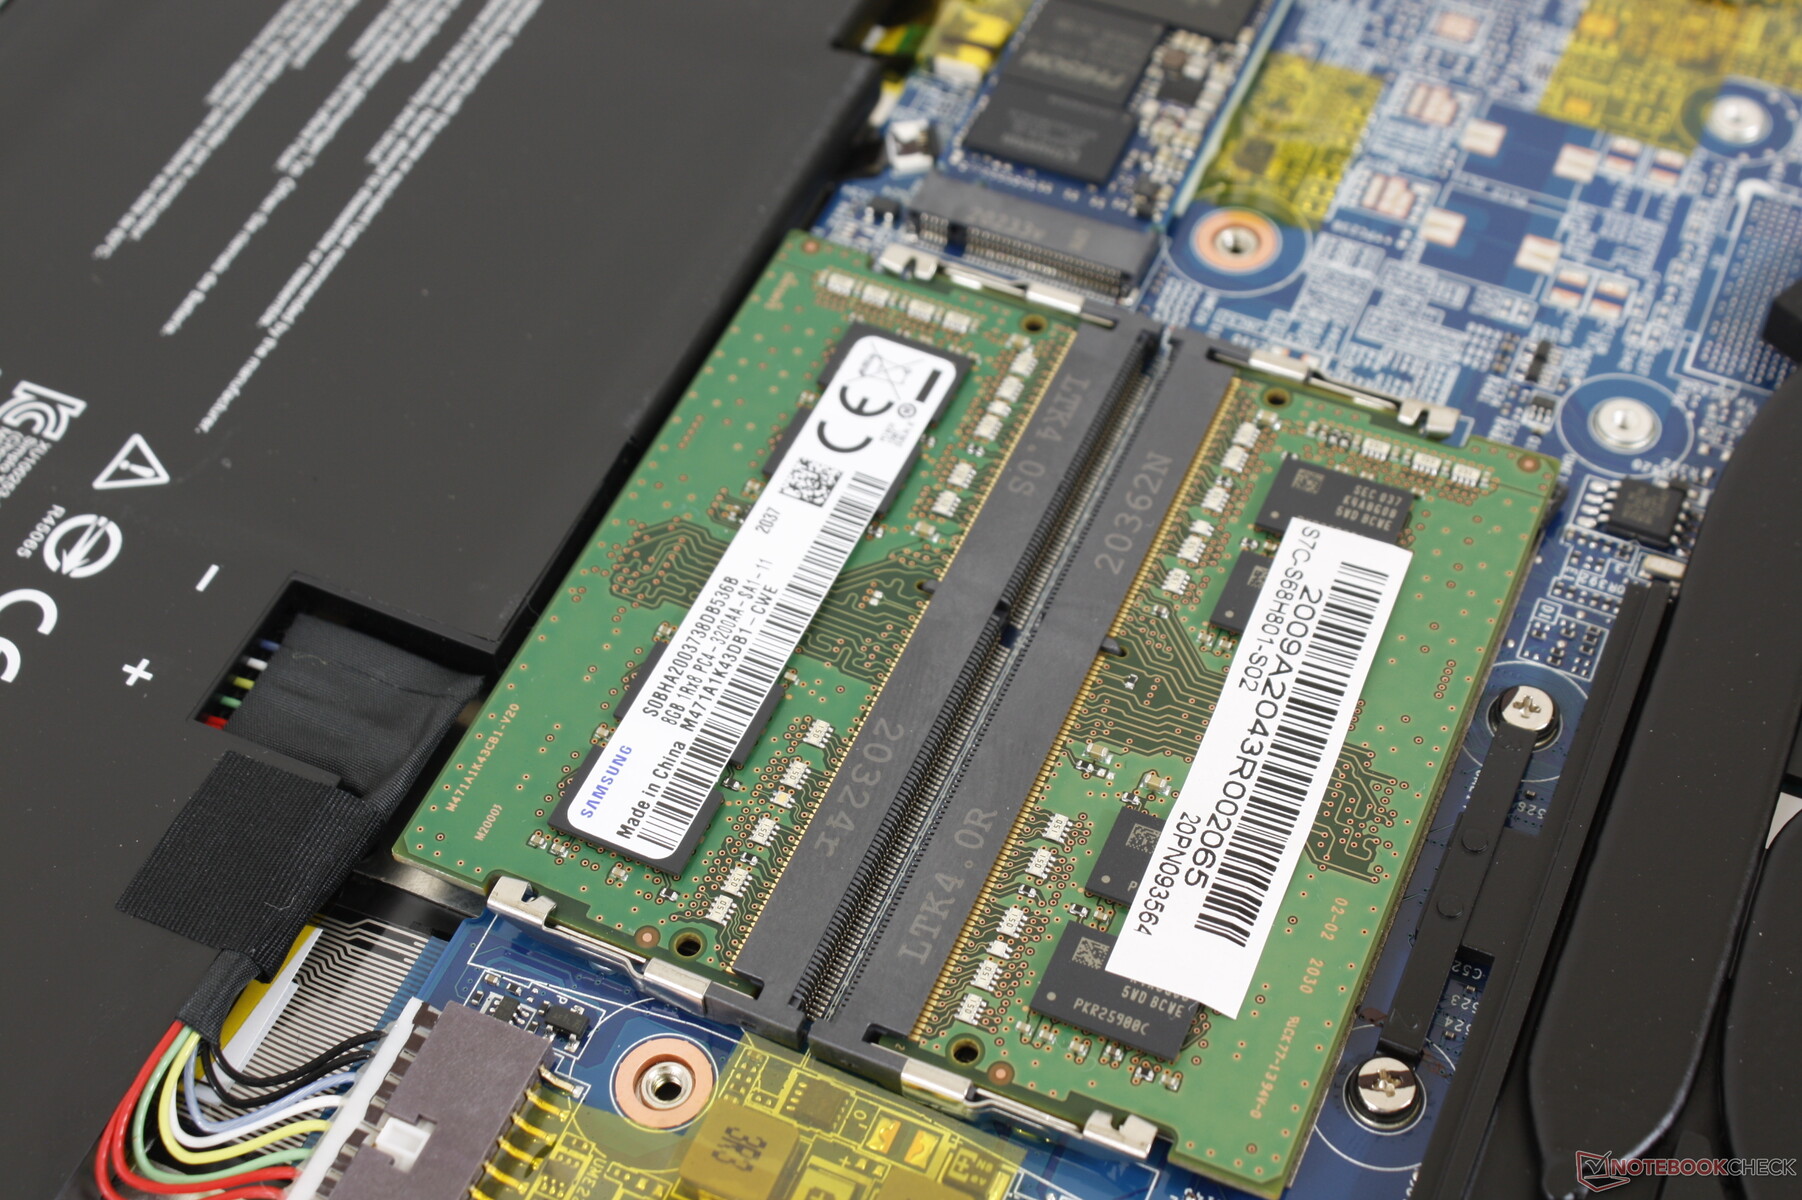
Het bodempaneel kan vrij gemakkelijk worden verwijderd met alleen een Philips schroevendraaier. Houd er wel rekening mee dat eerst een fabriekszegelsticker moet worden verbroken. Eenmaal binnen worden de gelijkenissen tussen de Summit B15 en de Modern 15 van vorig jaar nog duidelijker, zoals blijkt uit de vergelijkende beelden hieronder.
Accessoires en garantie
De doos bevat een USB-A naar RJ-45 adapter, de papieren en de AC-adapter. De standaard beperkte garantie van één jaar is van toepassing met uitbreidingsopties indien gekocht bij Xotic PC.
Invoerapparaten
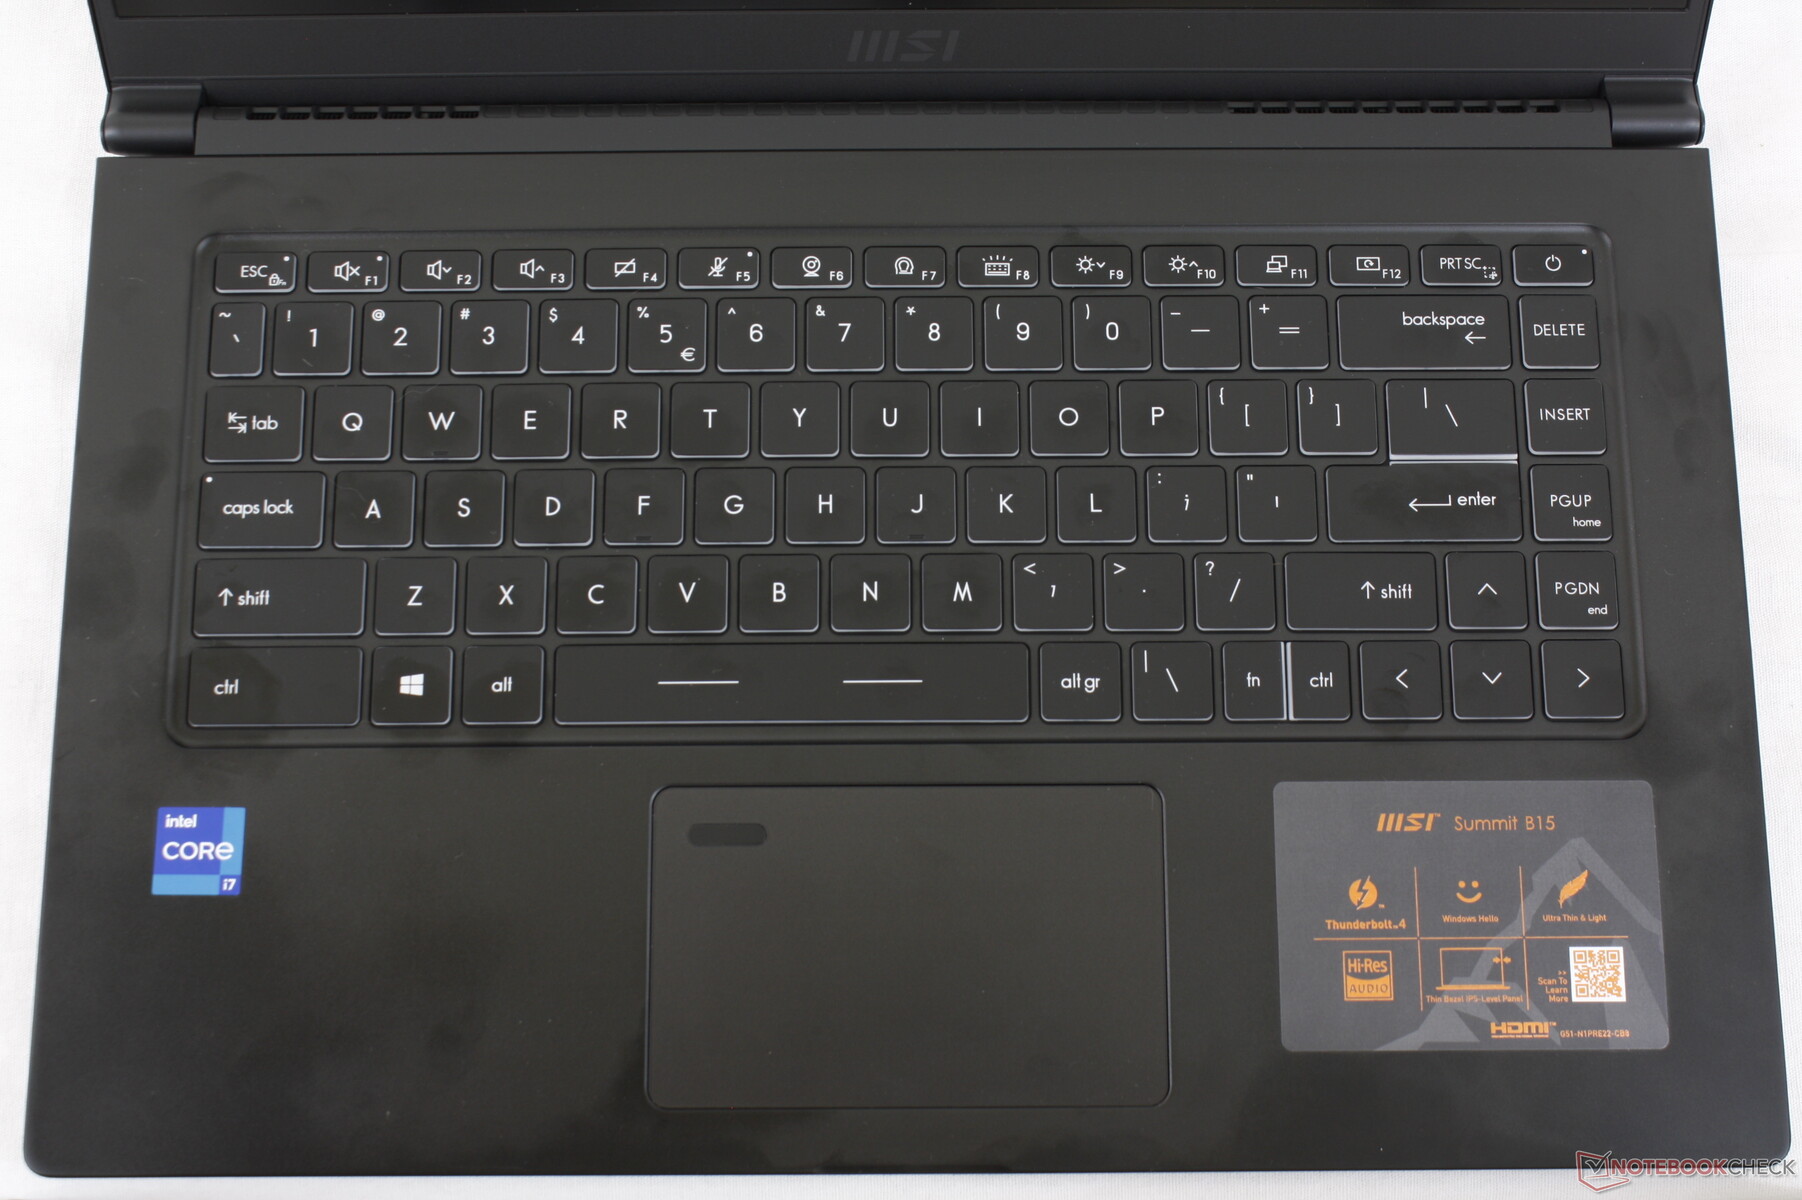
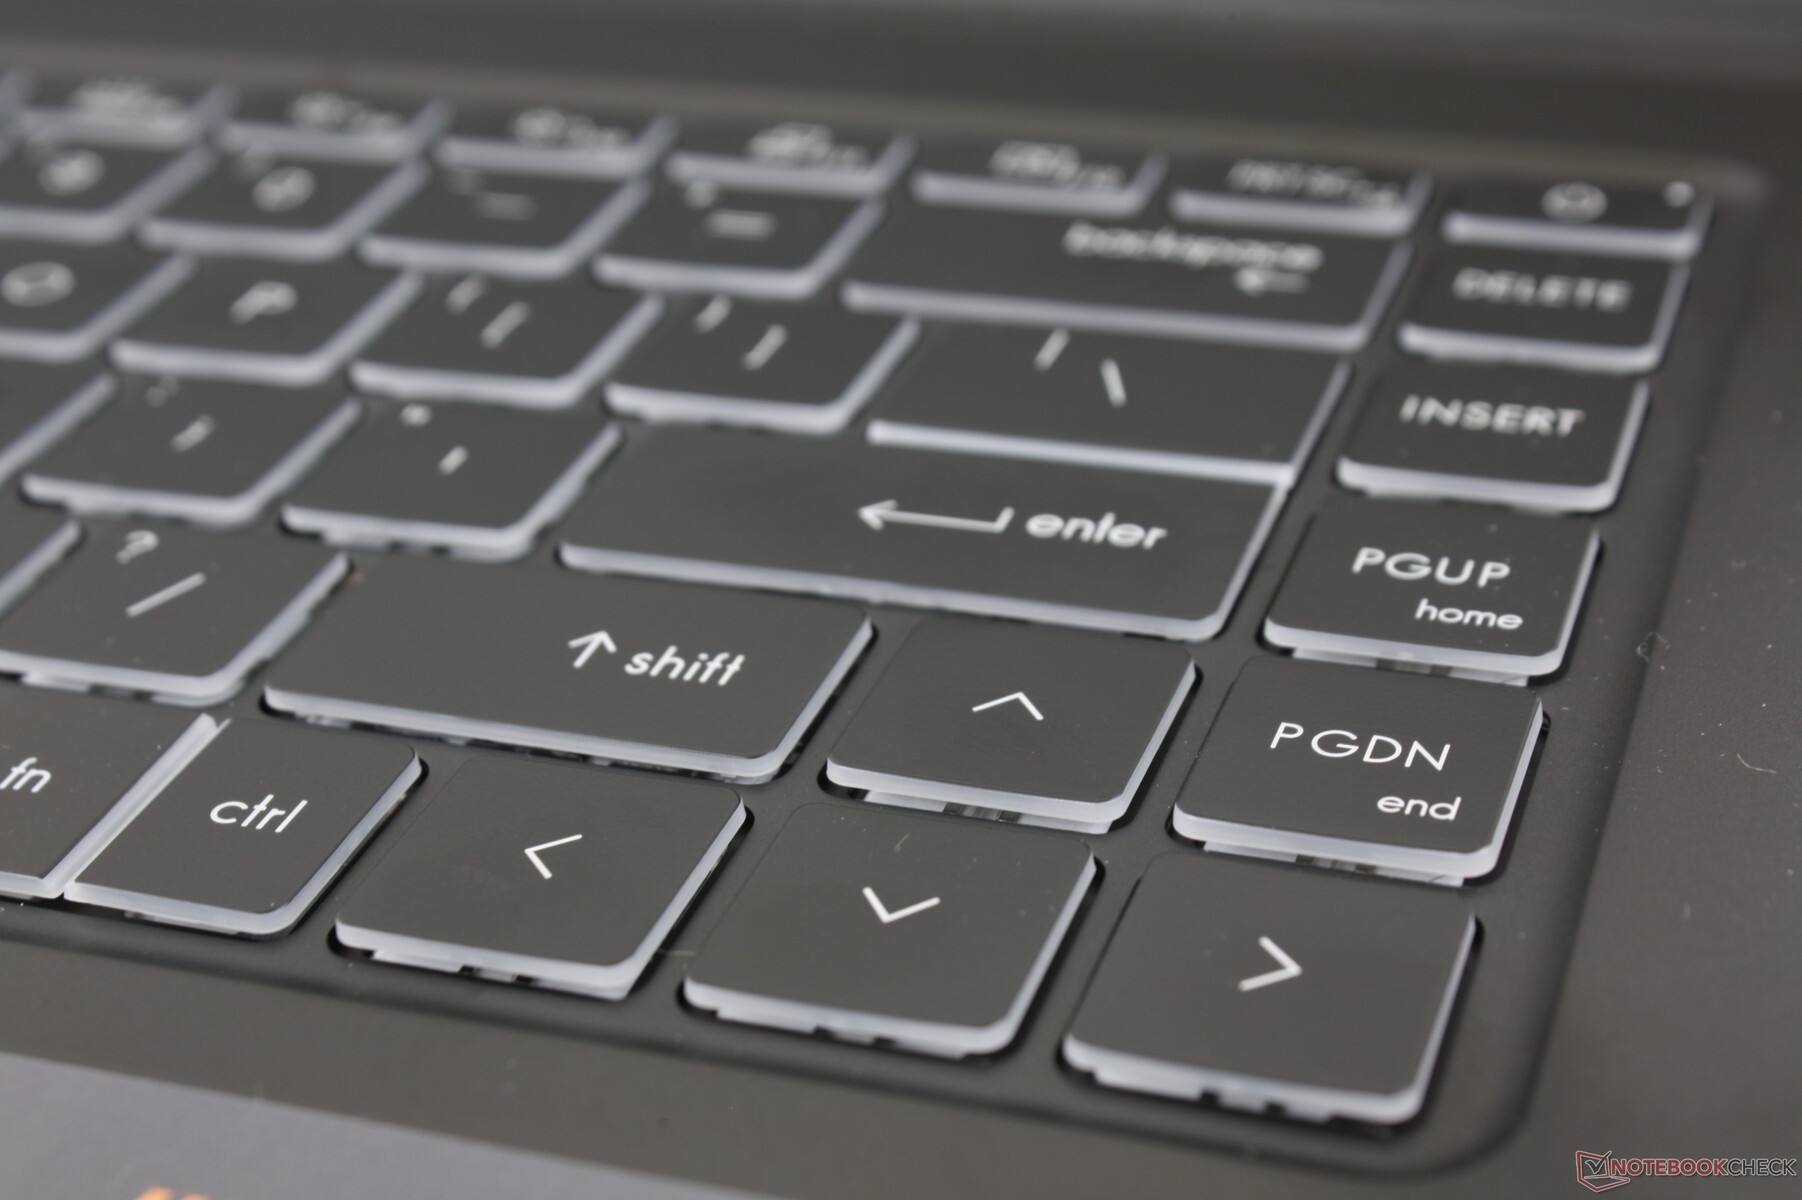
Toetsenbord
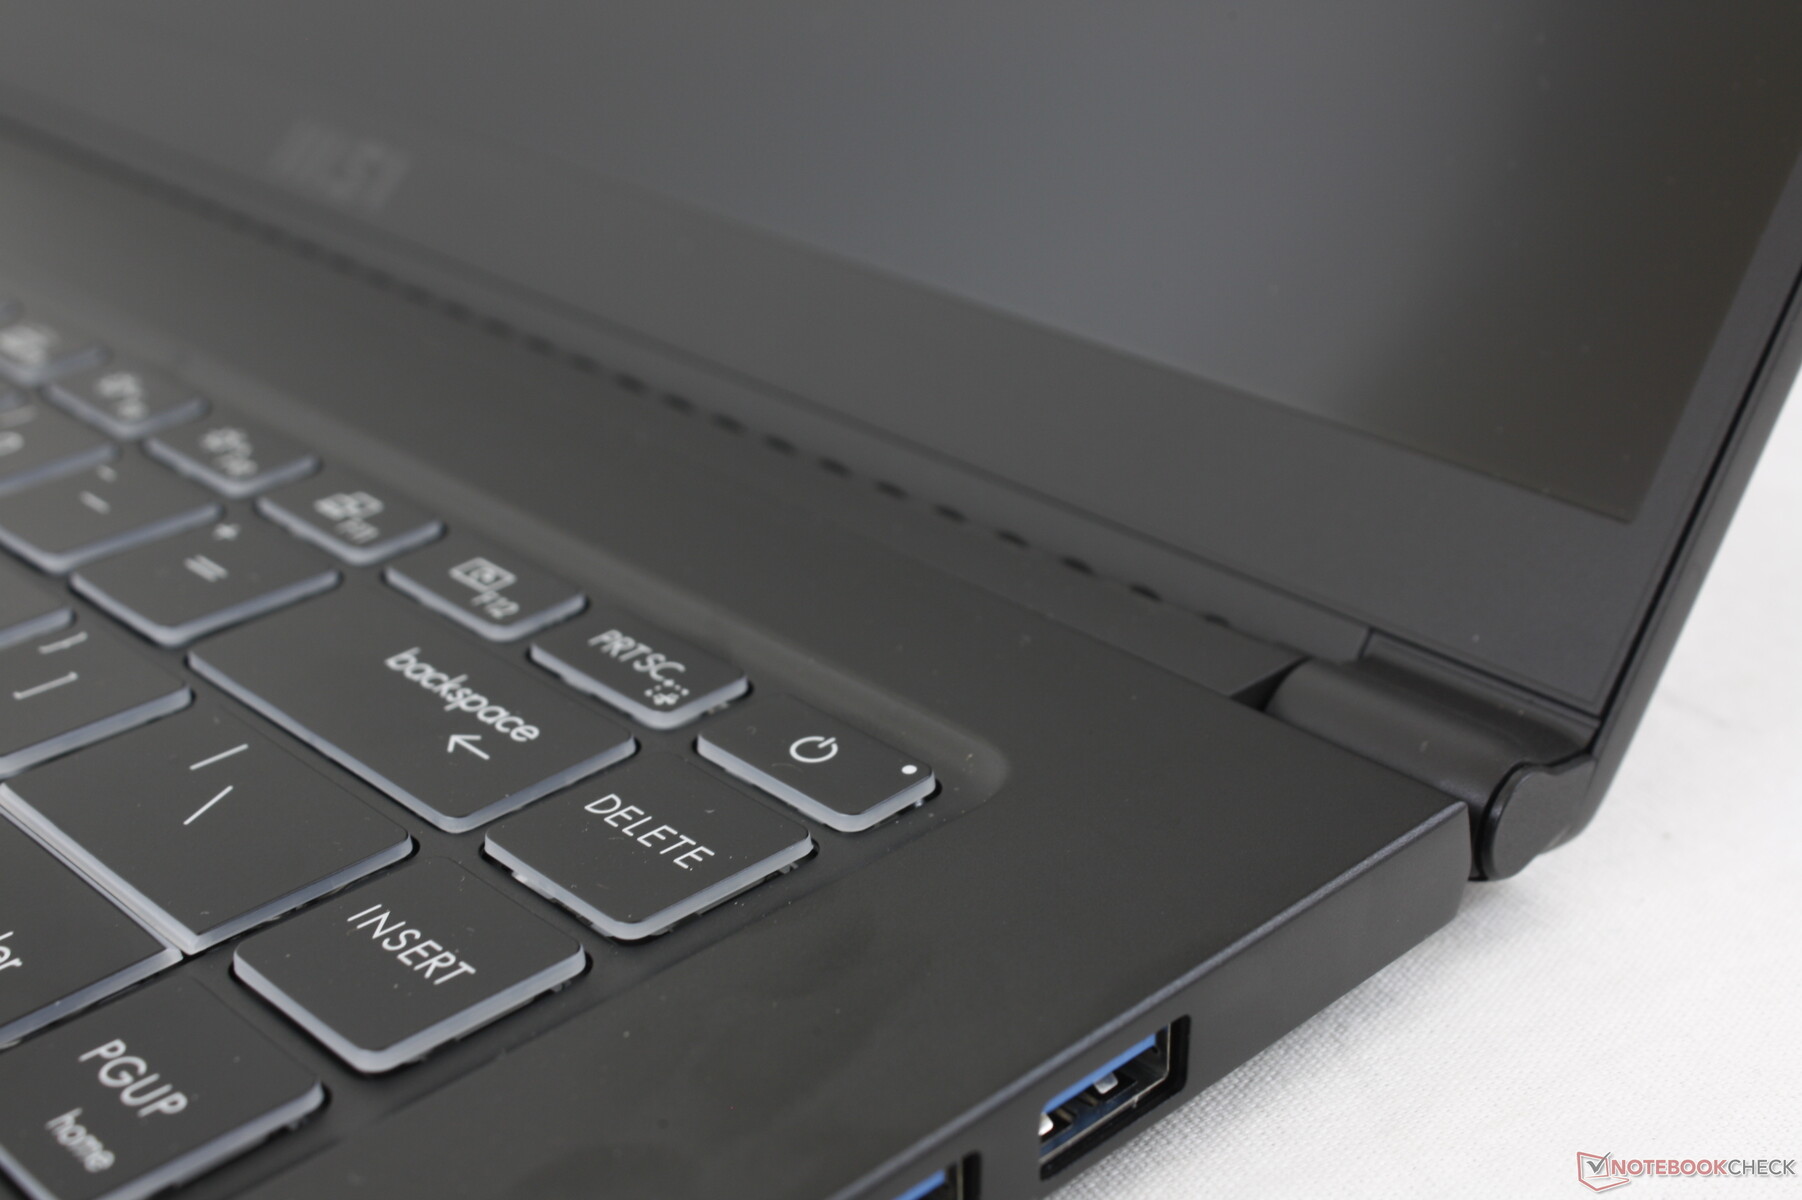
Het lettertype van de toetsen is veranderd ten opzichte van de Modern 15: het is nu scherper en minder vet of cursief. Voor de rest zijn de toets feedback en de lay-out exact hetzelfde gebleven. Toetsen voelen steviger en dieper aan dan op de XPG Xenia Xe enDell XPS 15, respectievelijk, maar het gekletter is iets luider als gevolg daarvan. We waarderen de full-size PgUp, PgDn, Delete en pijltjestoetsen, aangezien deze op de meeste andere laptops vaak worden ingekrompen.
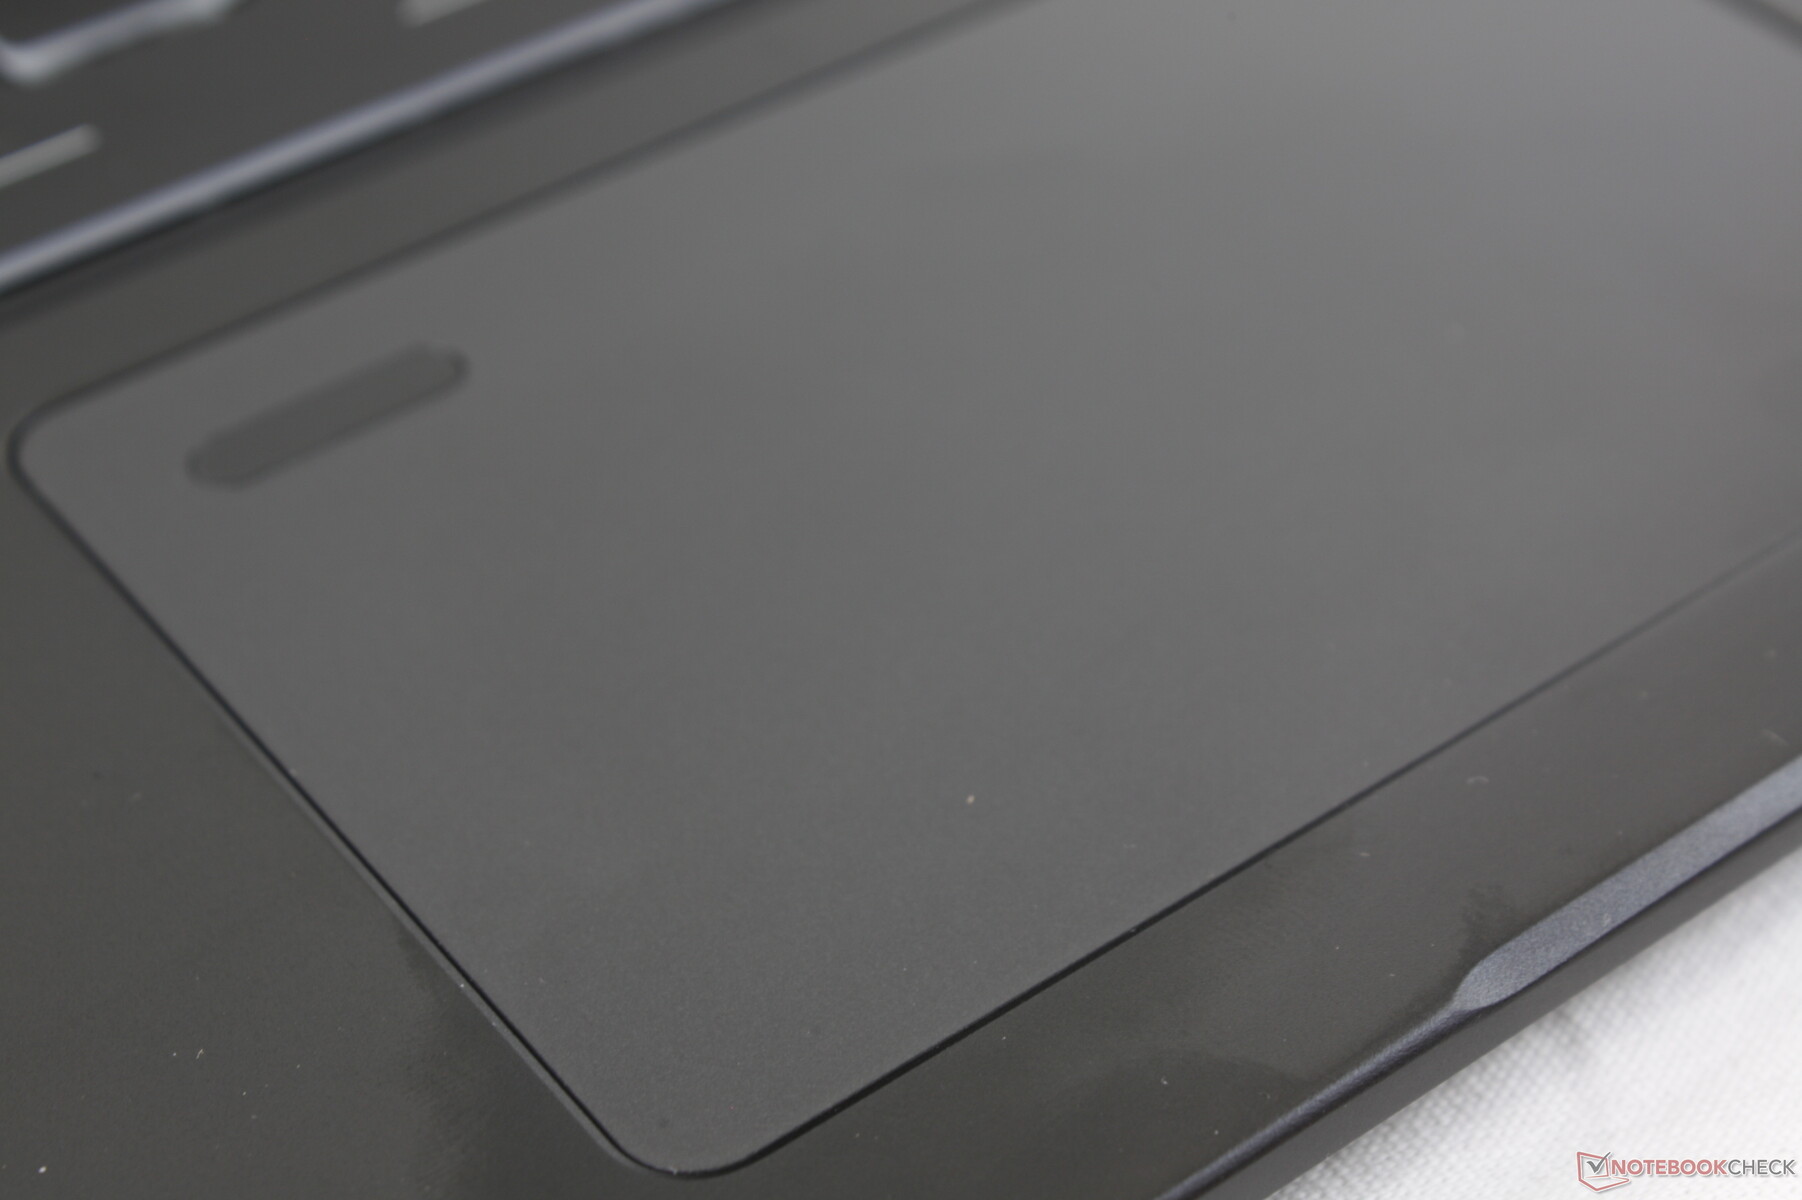
Touchpad
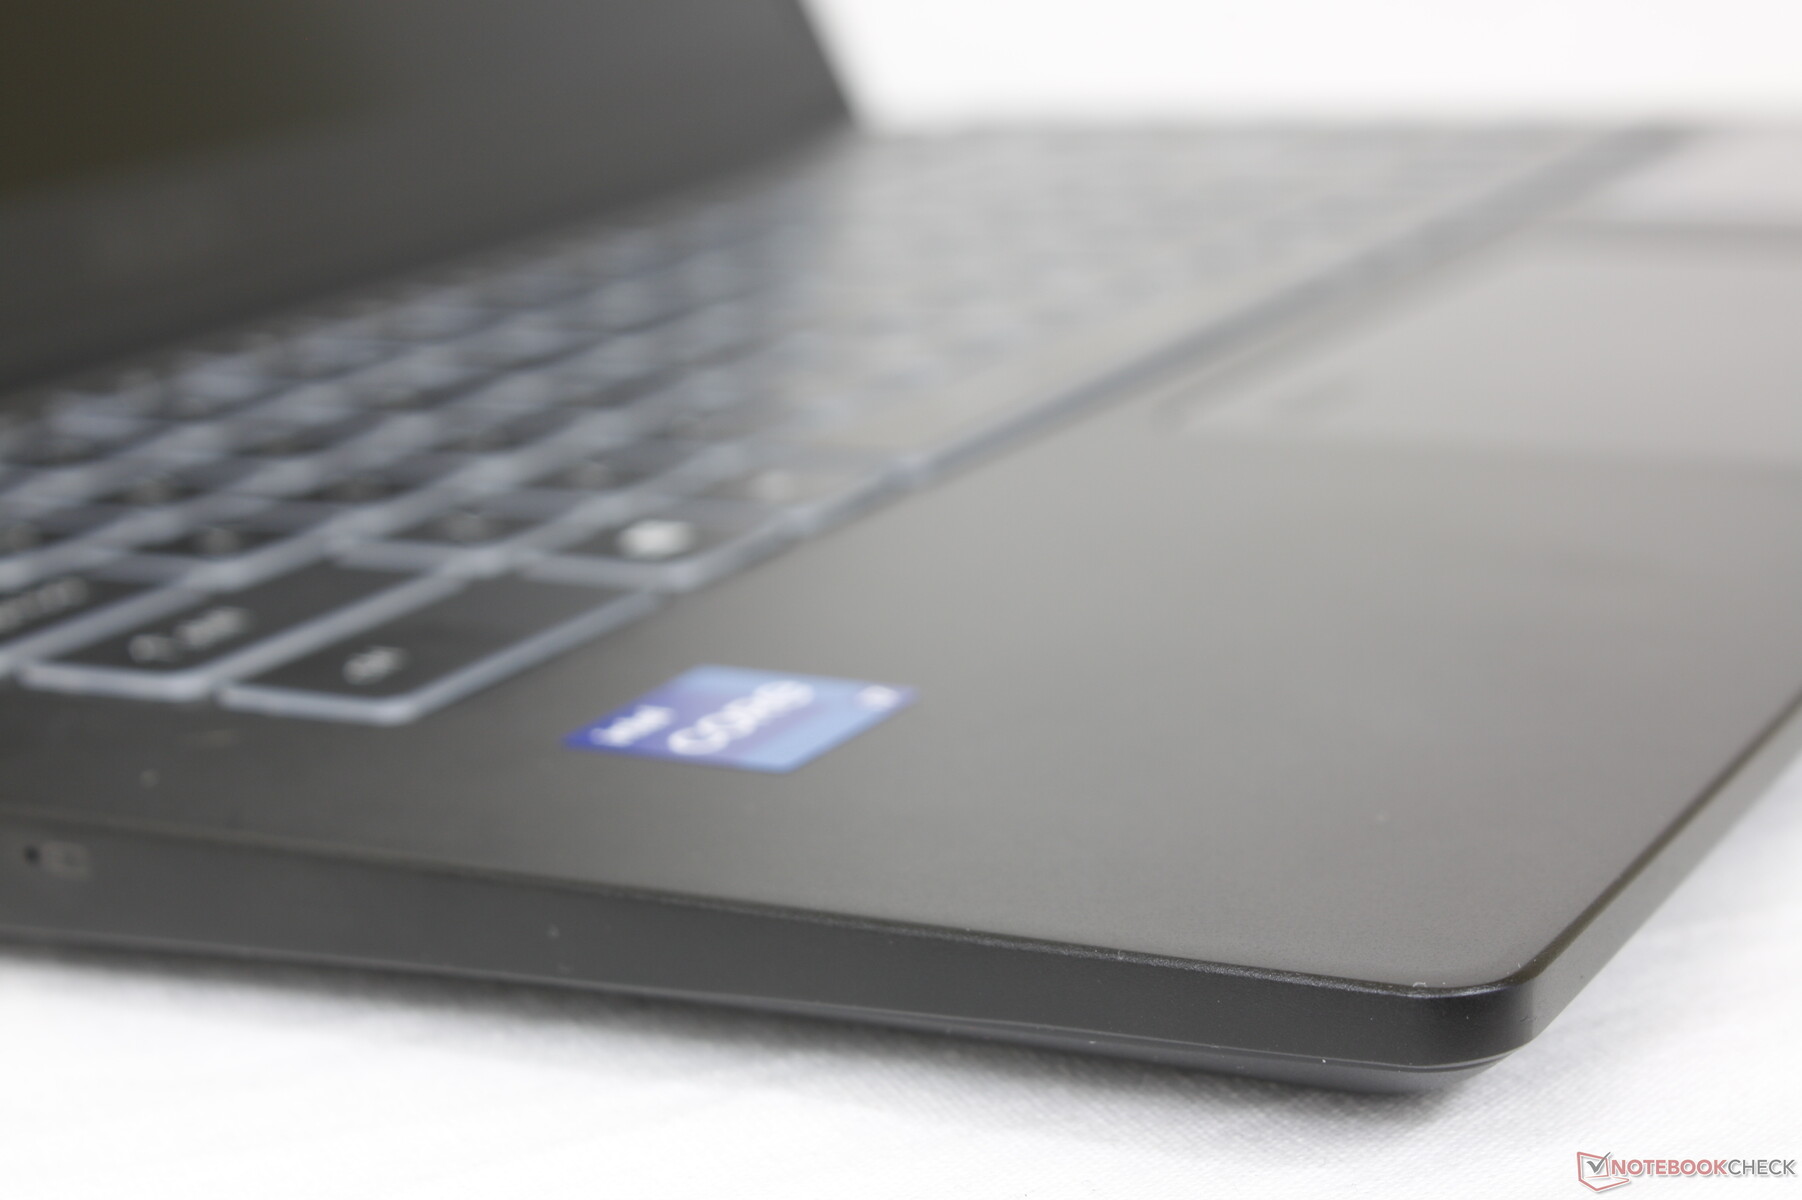
Het clickpad is even groot als dat op de Modern 15 (10,5 x 6,5 cm) met dezelfde gladde textuur en sponsachtige feedback. Het is niet zo zacht als het clickpad op de Xenia Xe, maar het had zeker steviger kunnen zijn voor een meer bevredigende klik.
We vermoeden dat MSI uiteindelijk de vingerafdruklezer zal verplaatsen van het clickpad, zoals we al zien bij Dell, HP, en anderen.

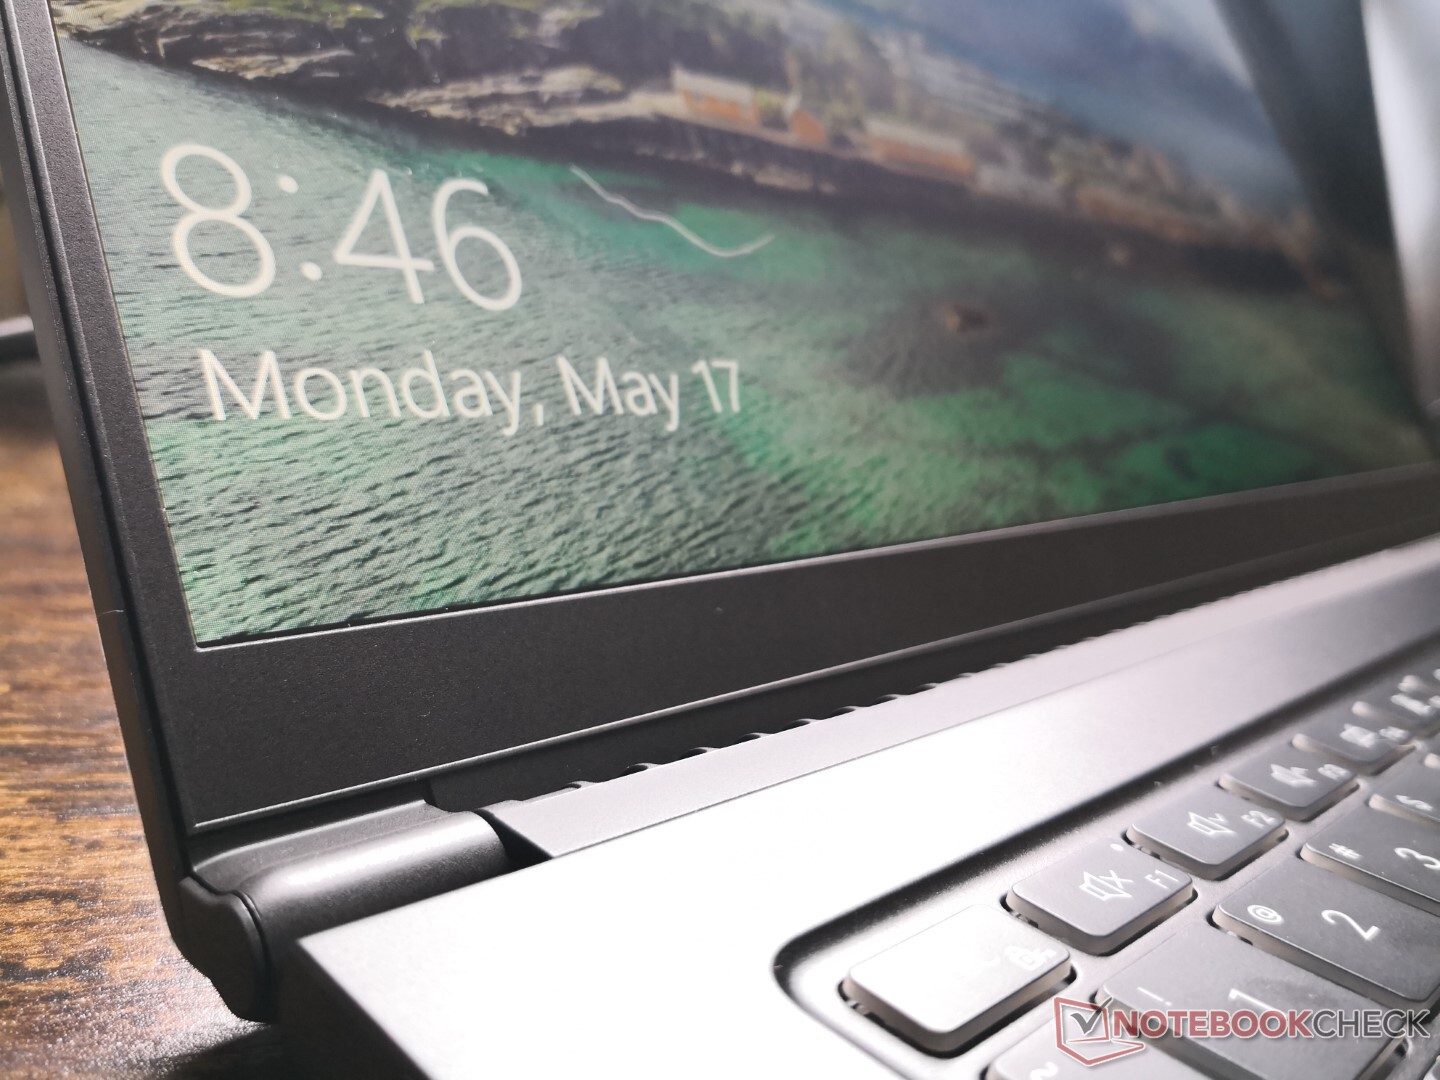
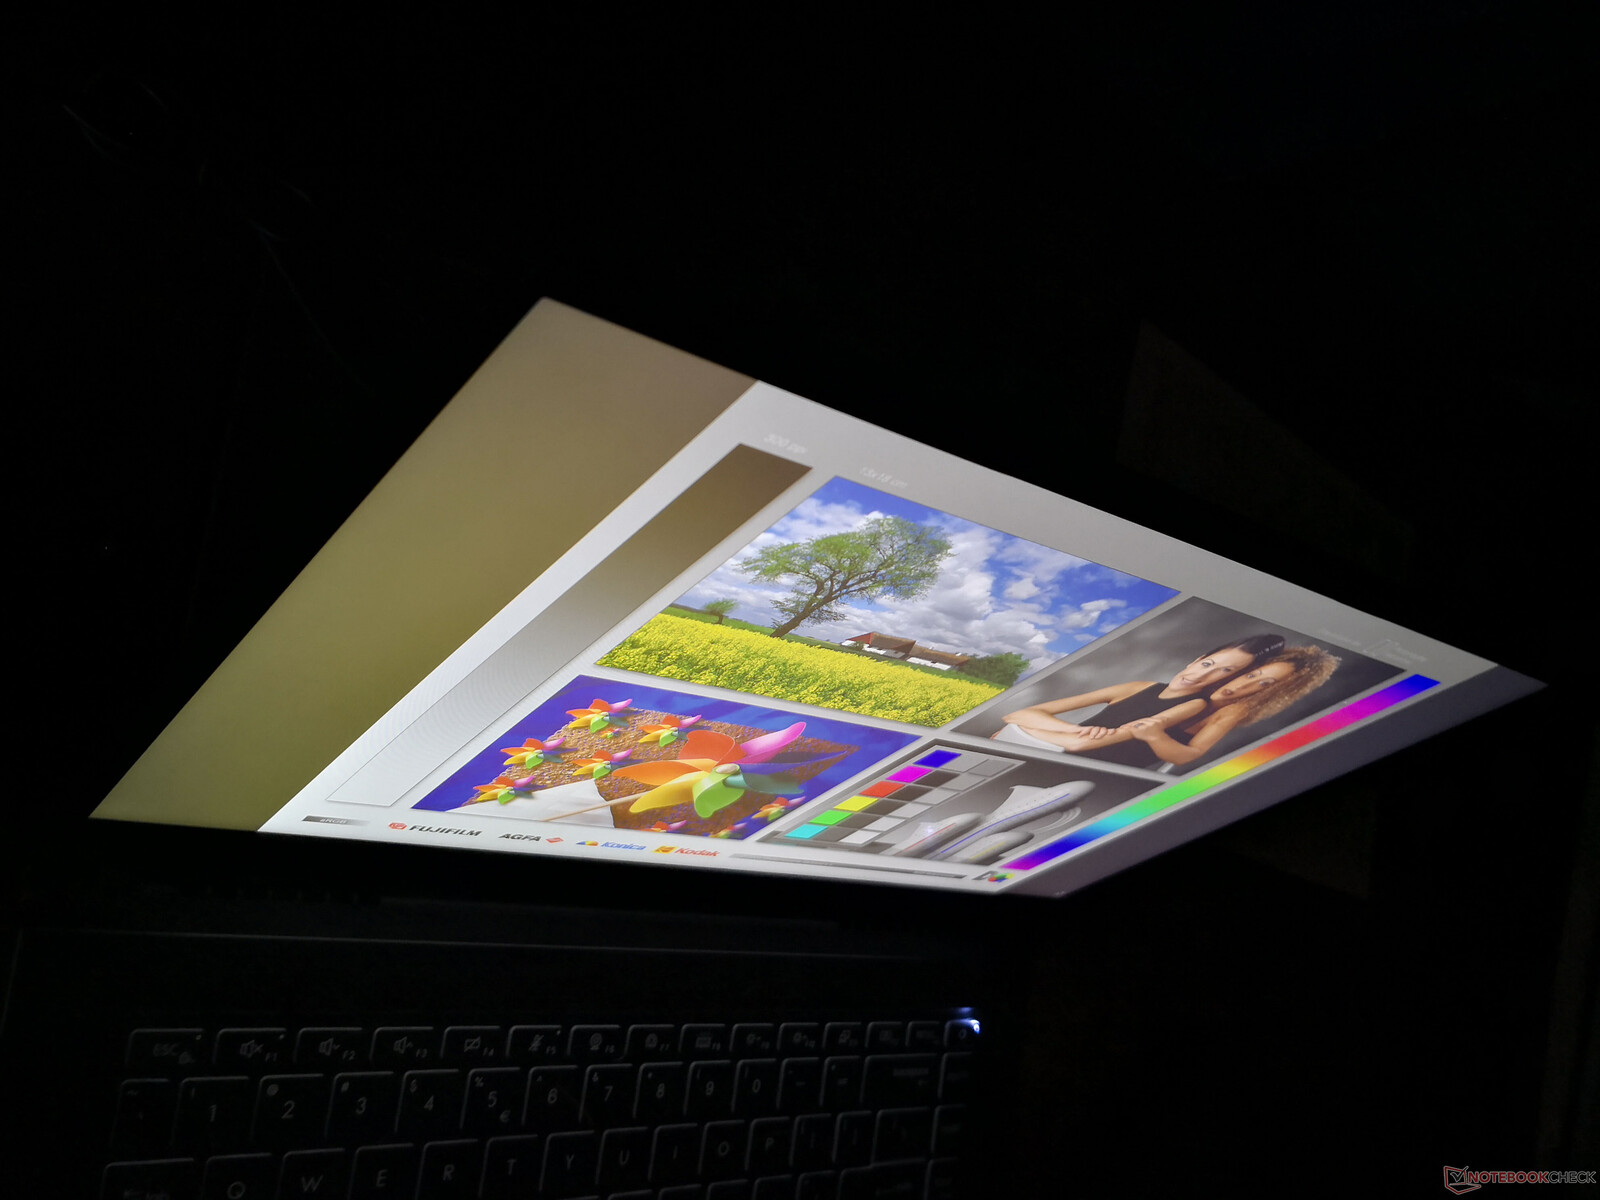
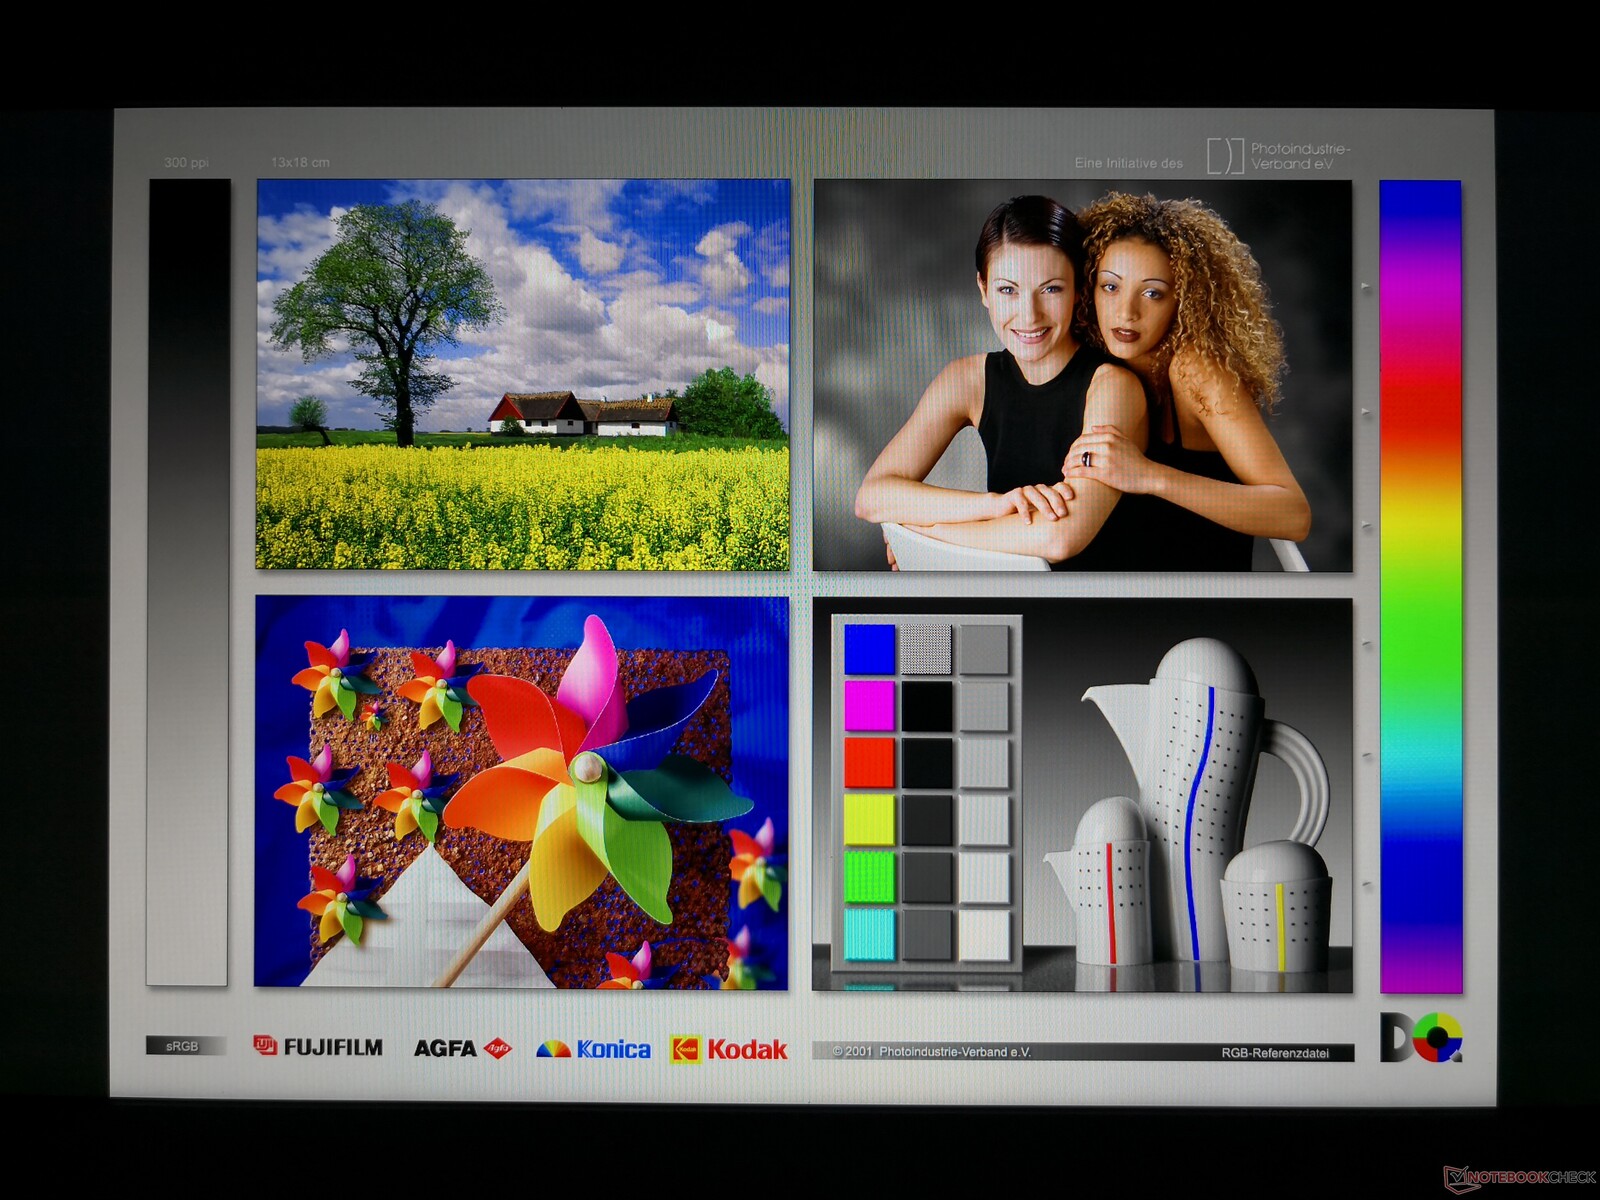
Weergave
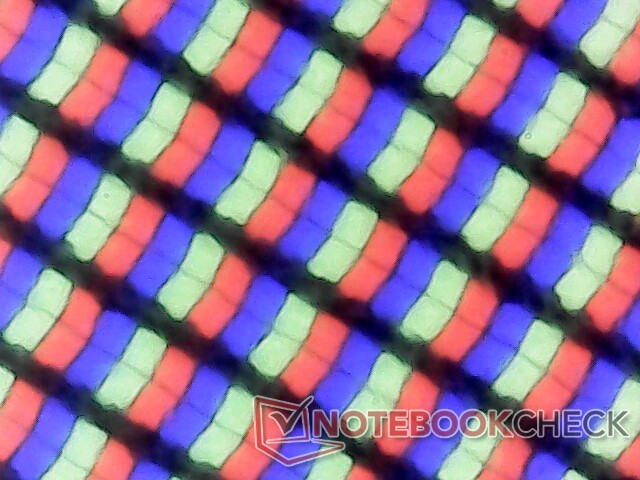
De Summit B15 maakt gebruik van hetzelfde matte Chi Mei N156HCE-EN1 IPS-paneel als gevonden op de 2019 MSI PS63 Modern. In feite is dit exacte paneel heel gebruikelijk op de hogere mid-range 15,6-inch laptops, waaronder de ThinkPad P52, ThinkPad X1 Extreme, Asus ZenBook Pro UX550en zelfs MSI's eigen Modern 15. De beeldkwaliteit is dan ook vergelijkbaar tussen al deze laptops, inclusief de gemiddelde zwart-wit responstijden en fatsoenlijke contrastverhouding. Pulse-width modulation op lagere helderheidsniveaus is ook terug.

| |||||||||||||||||||||||||
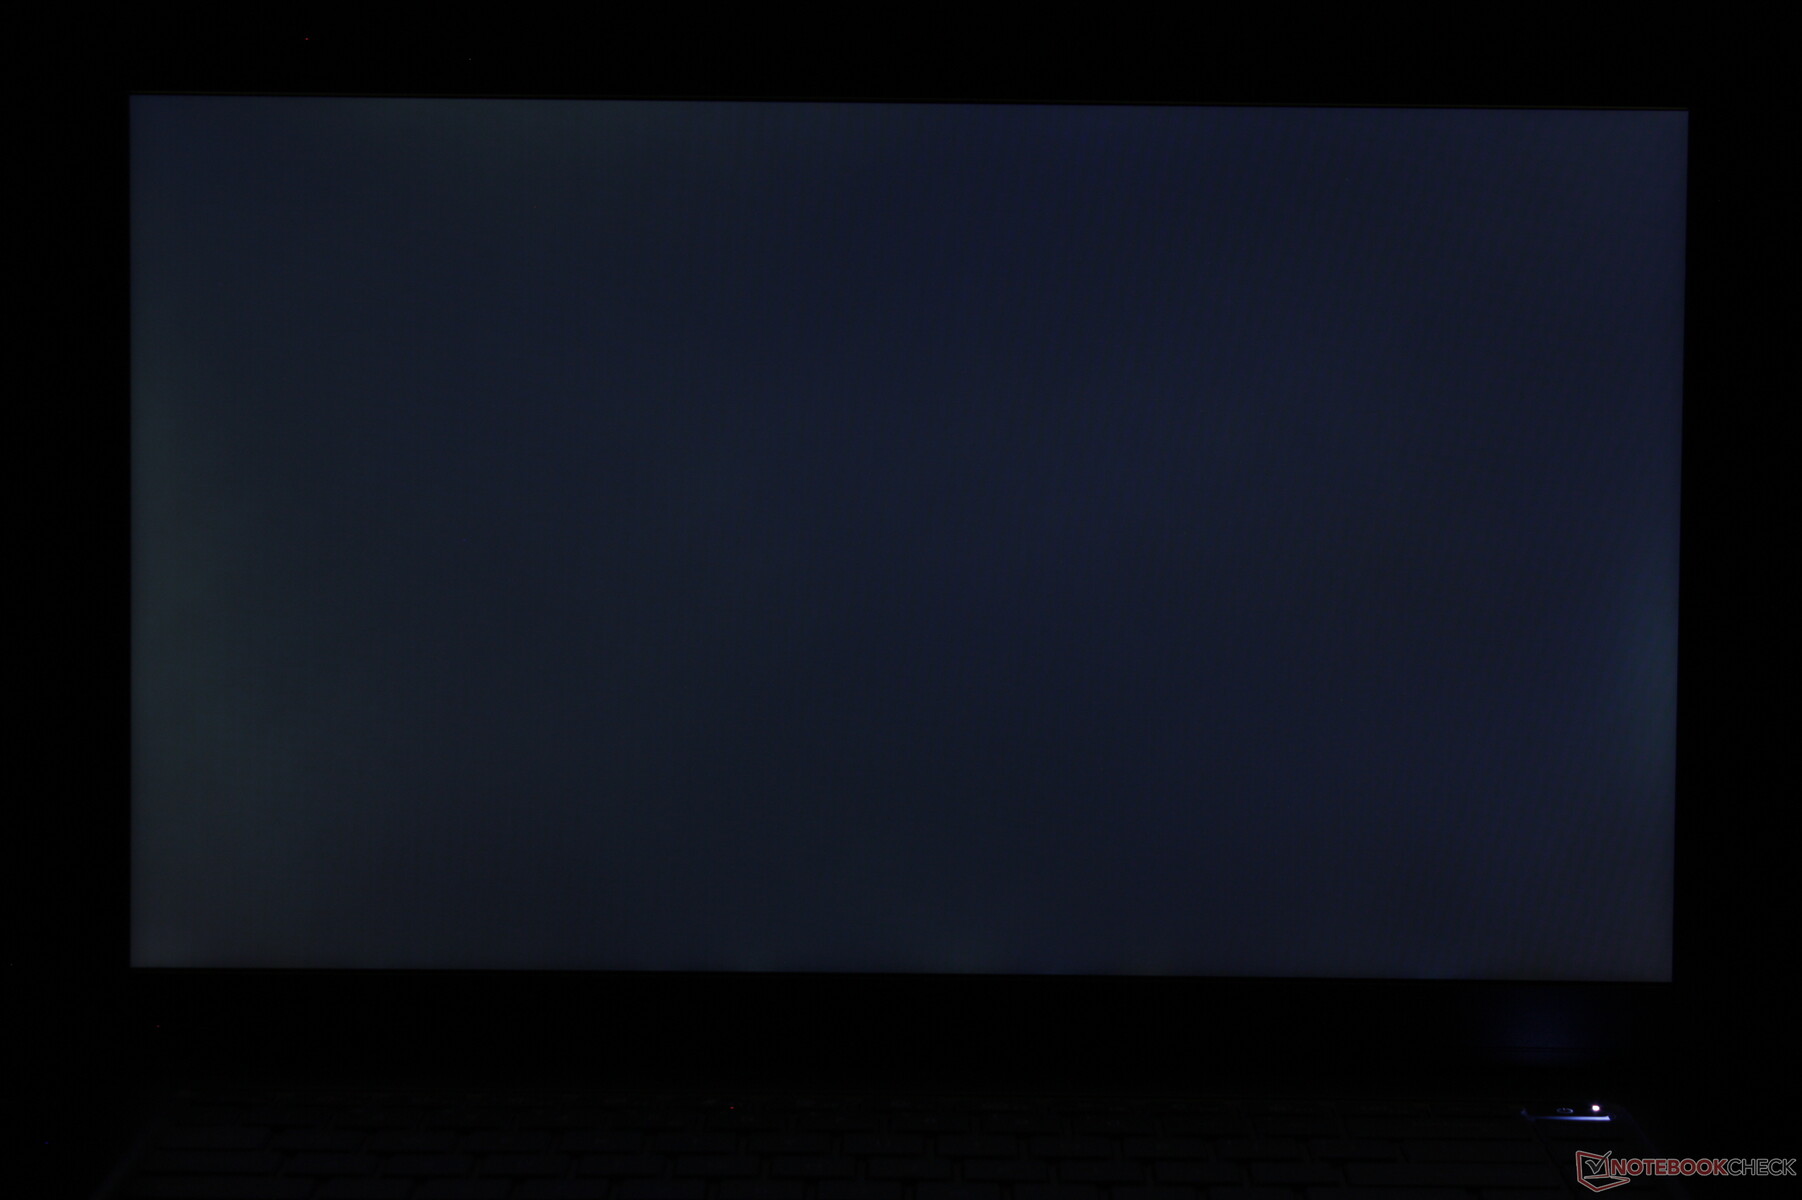
Helderheidsverdeling: 81 %
Helderheid in Batterij-modus: 341.3 cd/m²
Contrast: 758:1 (Zwart: 0.45 cd/m²)
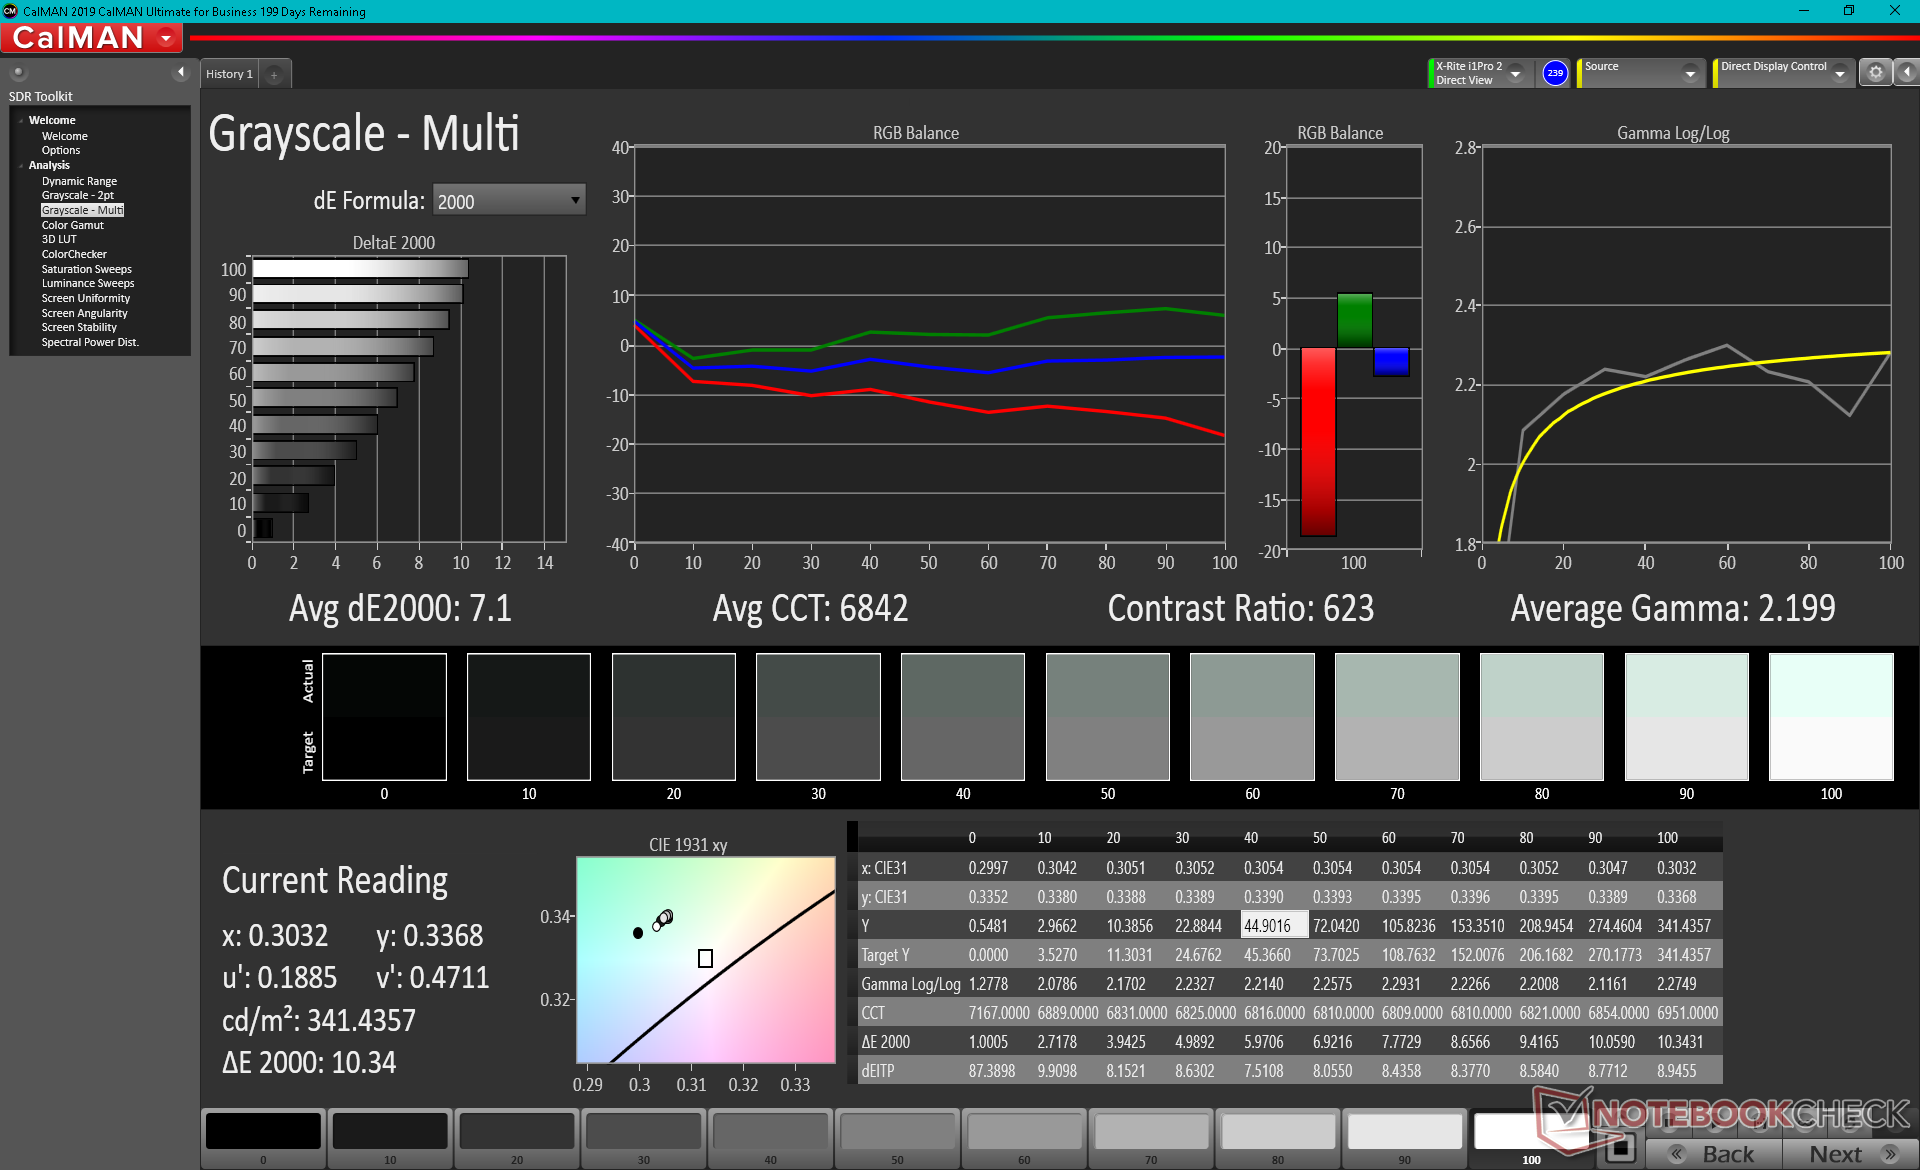
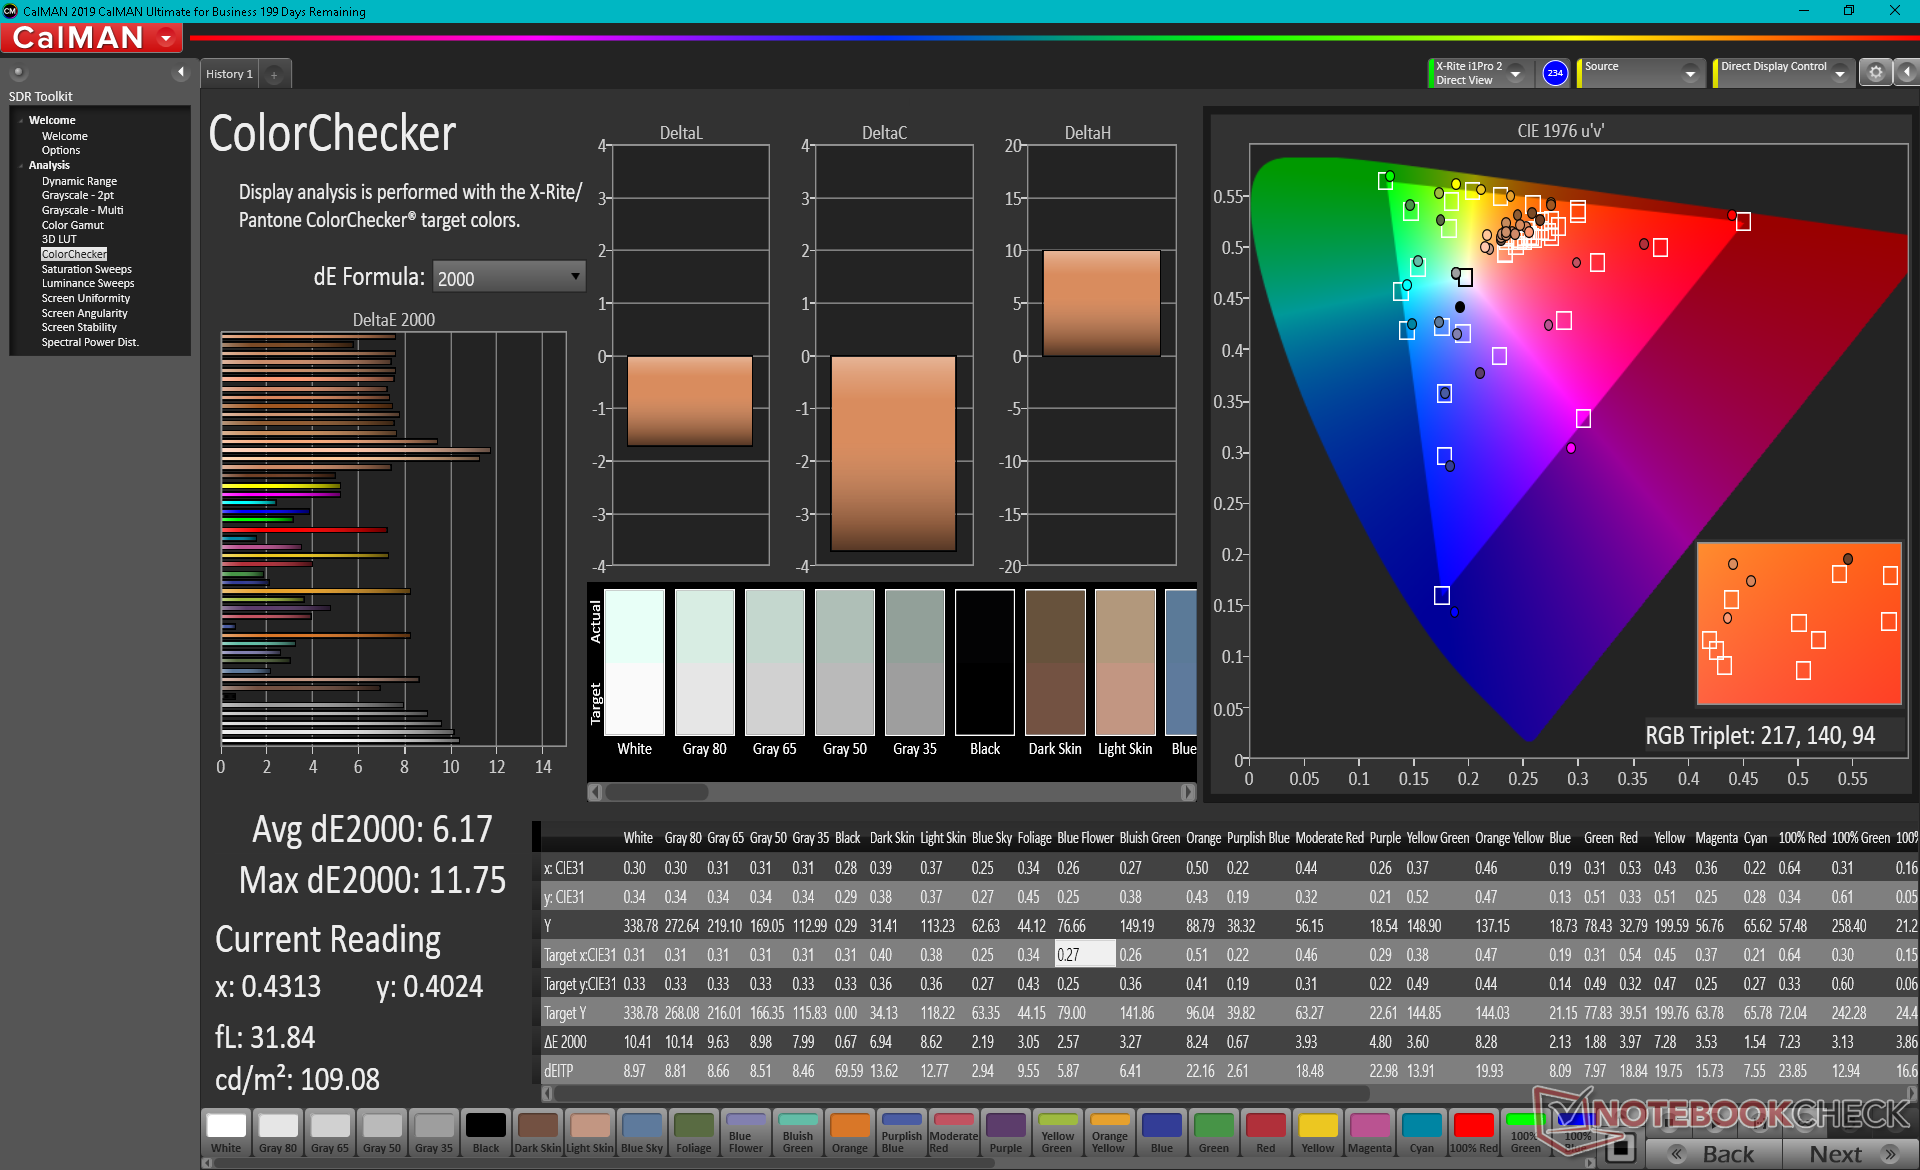
ΔE ColorChecker Calman: 6.17 | ∀{0.5-29.43 Ø4.72}
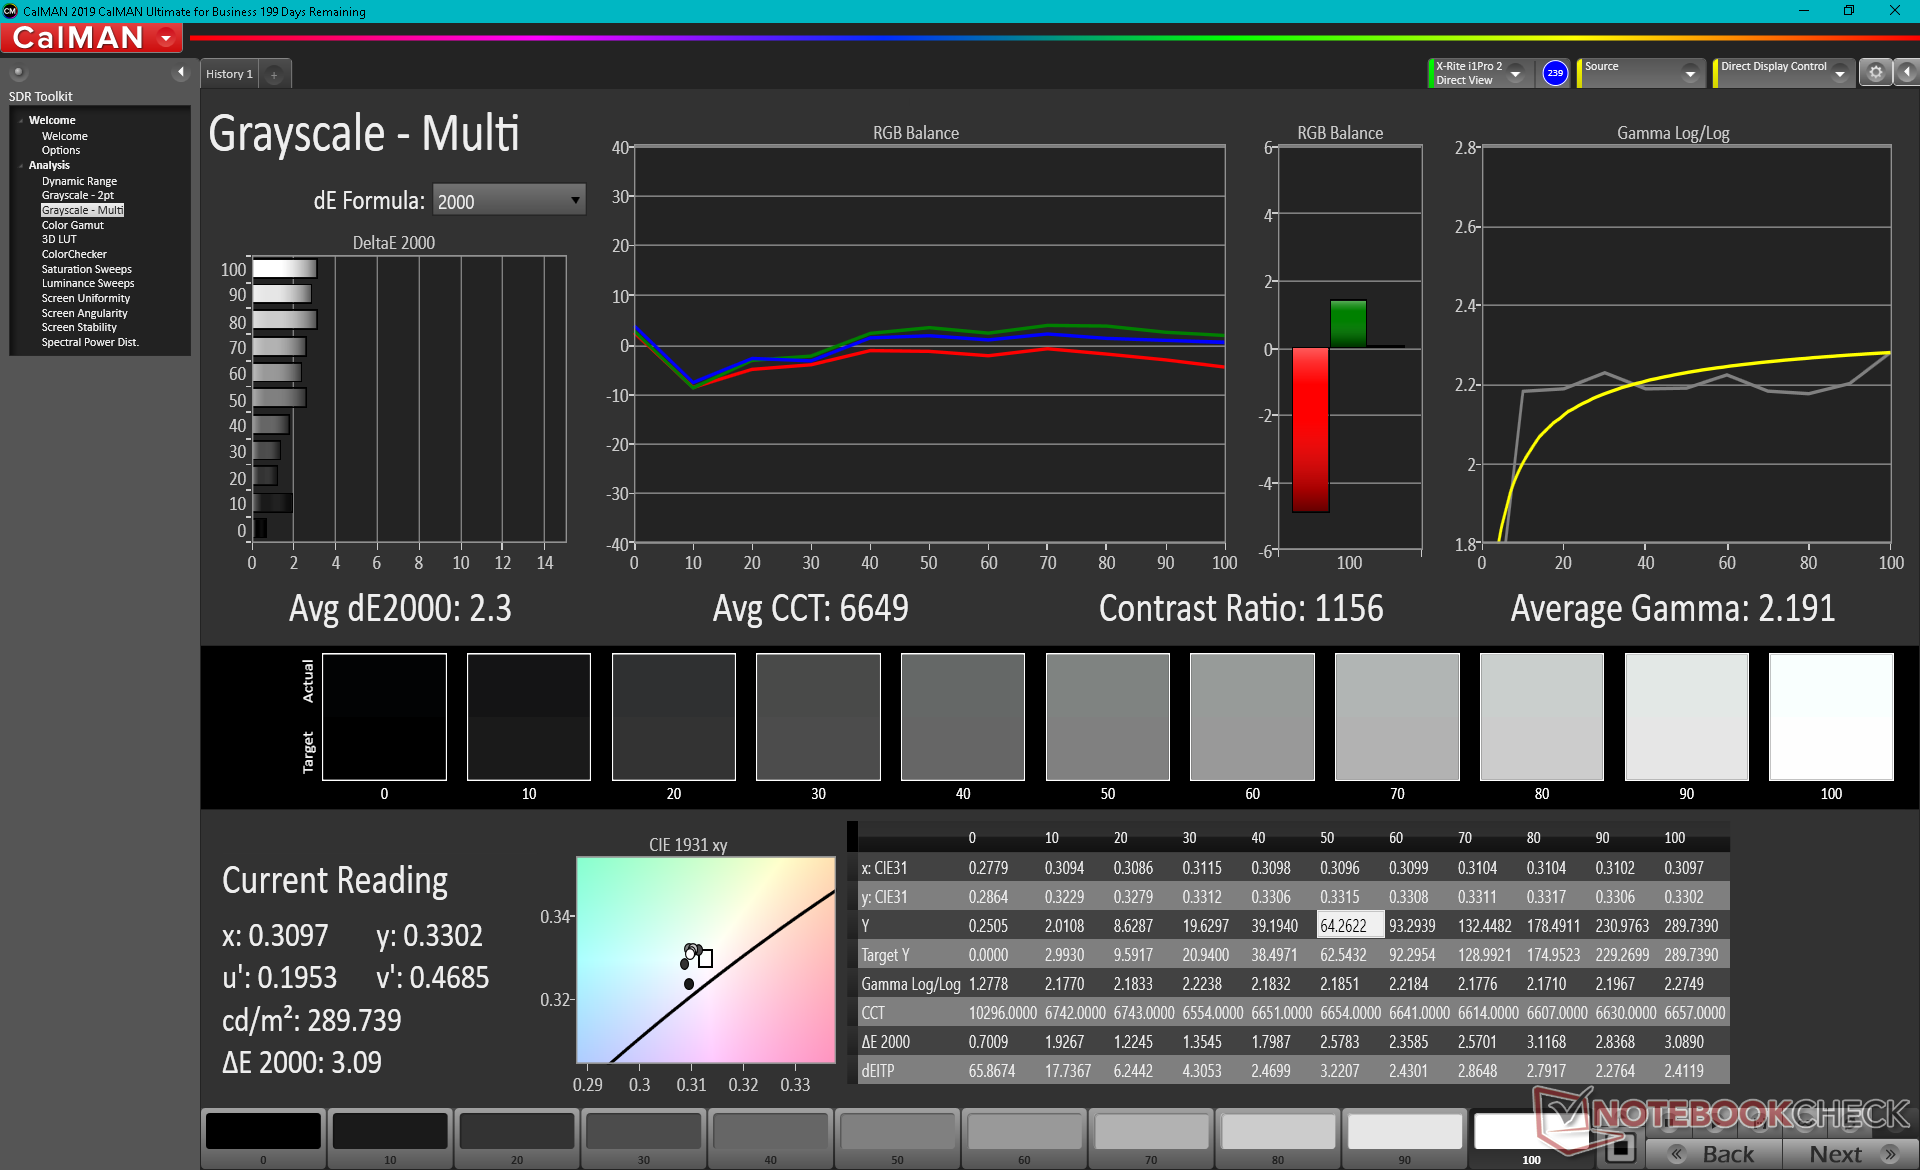
calibrated: 3.3
ΔE Greyscale Calman: 7.1 | ∀{0.09-98 Ø4.97}
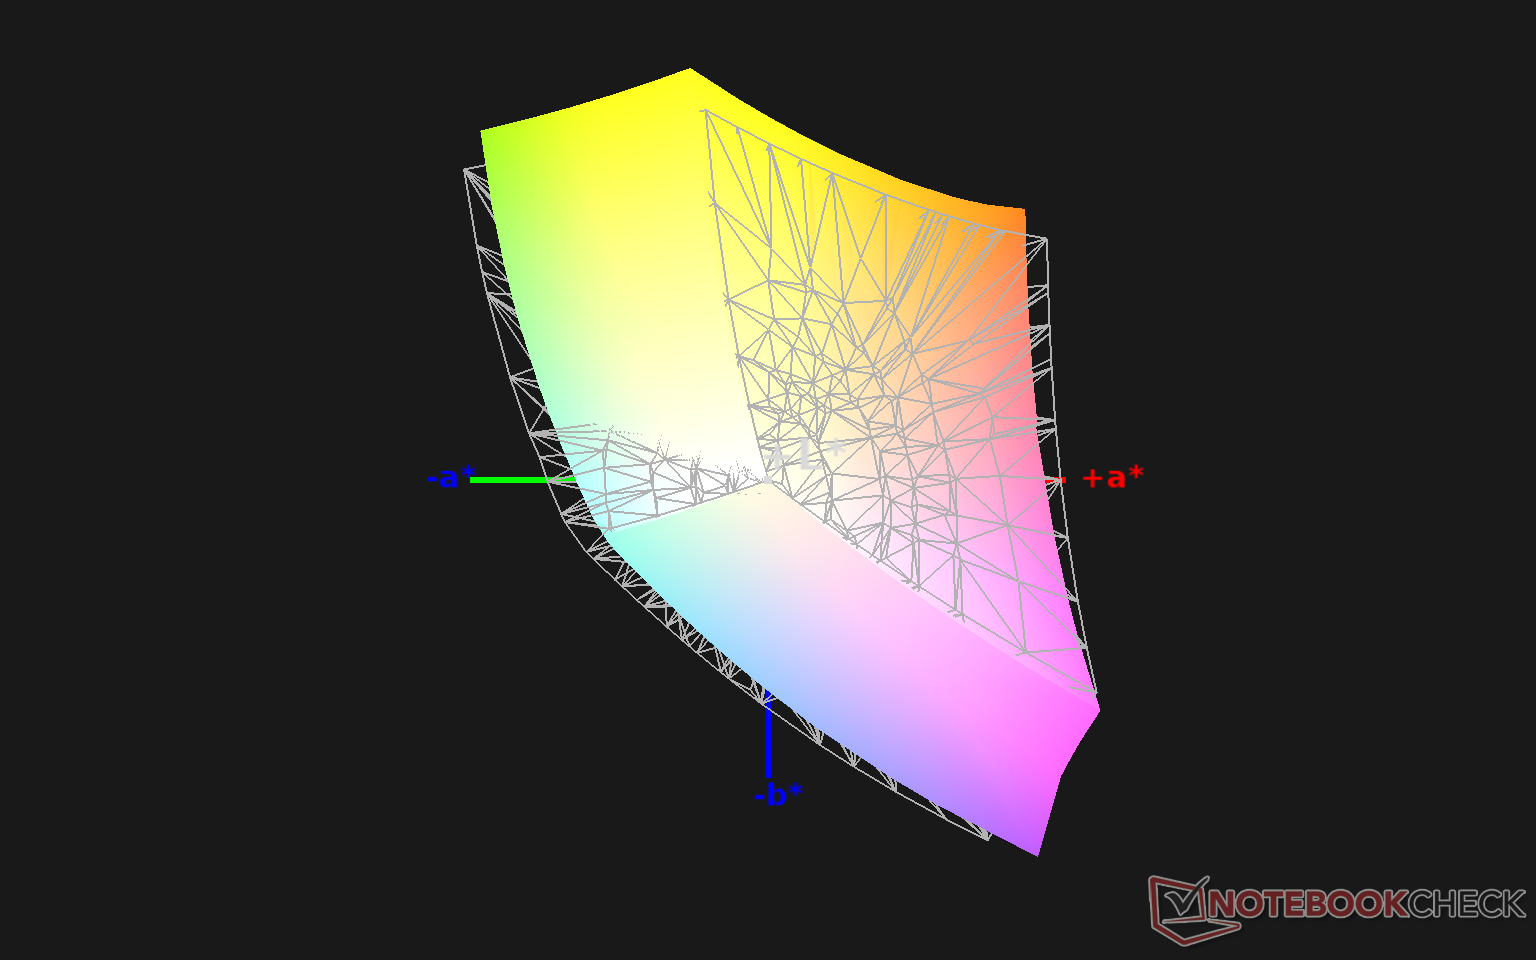
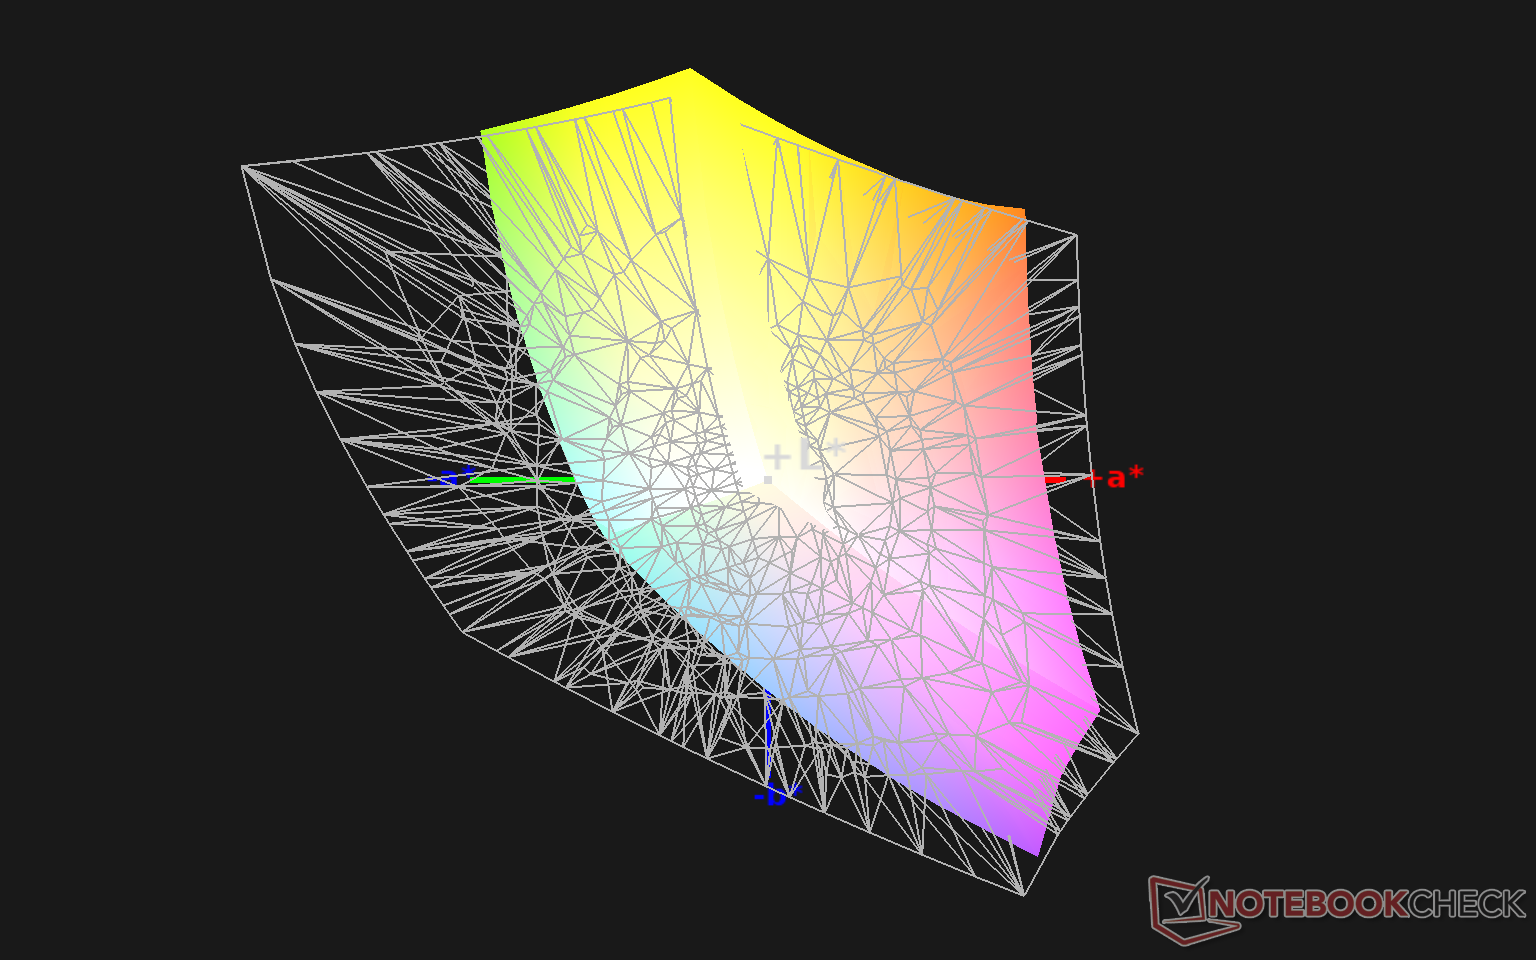
90.1% sRGB (Argyll 1.6.3 3D)
58.7% AdobeRGB 1998 (Argyll 1.6.3 3D)
66% AdobeRGB 1998 (Argyll 3D)
90.6% sRGB (Argyll 3D)
65.7% Display P3 (Argyll 3D)
Gamma: 2.2
CCT: 6842 K
| MSI Summit B15 A11M Chi Mei N156HCE-EN1, IPS, 15.6", 1920x1080 | MSI Summit E15 A11SCST AU Optronics B156HAB03.1, IPS, 15.6", 1920x1080 | Dell XPS 15 9500 Core i5 Sharp LQ156N1, IPS, 15.6", 1920x1200 | HP Spectre X360 15-5ZV31AV AU Optronics AUO30EB, IPS, 15.6", 3840x2160 | ADATA XPG Xenia Xe BOE08F5, IPS, 15.6", 1920x1080 | Asus ZenBook 15 UX534FTC-A8190T BOE CQ NV156FHM-N63, IPS, 15.6", 1920x1080 | |
|---|---|---|---|---|---|---|
| Display | -1% | 18% | 4% | 7% | -4% | |
| Display P3 Coverage (%) | 65.7 | 64.5 -2% | 81.5 24% | 68.3 4% | 70 7% | 65 -1% |
| sRGB Coverage (%) | 90.6 | 89.3 -1% | 100 10% | 94.3 4% | 95.2 5% | 86.2 -5% |
| AdobeRGB 1998 Coverage (%) | 66 | 65.3 -1% | 79.6 21% | 68.4 4% | 71.2 8% | 62.9 -5% |
| Response Times | -1% | 4% | -34% | -31% | -5% | |
| Response Time Grey 50% / Grey 80% * (ms) | 40.4 ? | 43.2 ? -7% | 42 ? -4% | 56.8 ? -41% | 56.8 ? -41% | 45 ? -11% |
| Response Time Black / White * (ms) | 32.4 ? | 30.8 ? 5% | 28.8 ? 11% | 40.8 ? -26% | 38.8 ? -20% | 32 ? 1% |
| PWM Frequency (Hz) | 25510 ? | |||||
| Screen | 20% | 41% | 22% | 39% | 22% | |
| Brightness middle (cd/m²) | 341.3 | 298 -13% | 592 73% | 284.6 -17% | 480.4 41% | 299 -12% |
| Brightness (cd/m²) | 310 | 280 -10% | 565 82% | 285 -8% | 451 45% | 280 -10% |
| Brightness Distribution (%) | 81 | 90 11% | 85 5% | 85 5% | 88 9% | 89 10% |
| Black Level * (cd/m²) | 0.45 | 0.22 51% | 0.46 -2% | 0.25 44% | 0.31 31% | 0.21 53% |
| Contrast (:1) | 758 | 1355 79% | 1287 70% | 1138 50% | 1550 104% | 1424 88% |
| Colorchecker dE 2000 * | 6.17 | 5.41 12% | 3.19 48% | 3.52 43% | 2.53 59% | 4.76 23% |
| Colorchecker dE 2000 max. * | 11.75 | 8.59 27% | 5.45 54% | 5.56 53% | 7.28 38% | 9 23% |
| Colorchecker dE 2000 calibrated * | 3.3 | 2.97 10% | 2.03 38% | 3 9% | 1.69 49% | |
| Greyscale dE 2000 * | 7.1 | 4.1 42% | 3.9 45% | 3.2 55% | 3.8 46% | 3.53 50% |
| Gamma | 2.2 100% | 2.334 94% | 2.25 98% | 2.28 96% | 2.15 102% | 2.3 96% |
| CCT | 6842 95% | 7025 93% | 6522 100% | 7070 92% | 6760 96% | 7228 90% |
| Color Space (Percent of AdobeRGB 1998) (%) | 58.7 | 65 11% | 71.6 22% | 61.1 4% | 63 7% | 56 -5% |
| Color Space (Percent of sRGB) (%) | 90.1 | 90 0% | 100 11% | 93.8 4% | 94.9 5% | 86 -5% |
| Totaal Gemiddelde (Programma / Instellingen) | 6% /
13% | 21% /
32% | -3% /
12% | 5% /
25% | 4% /
13% |
* ... kleiner is beter
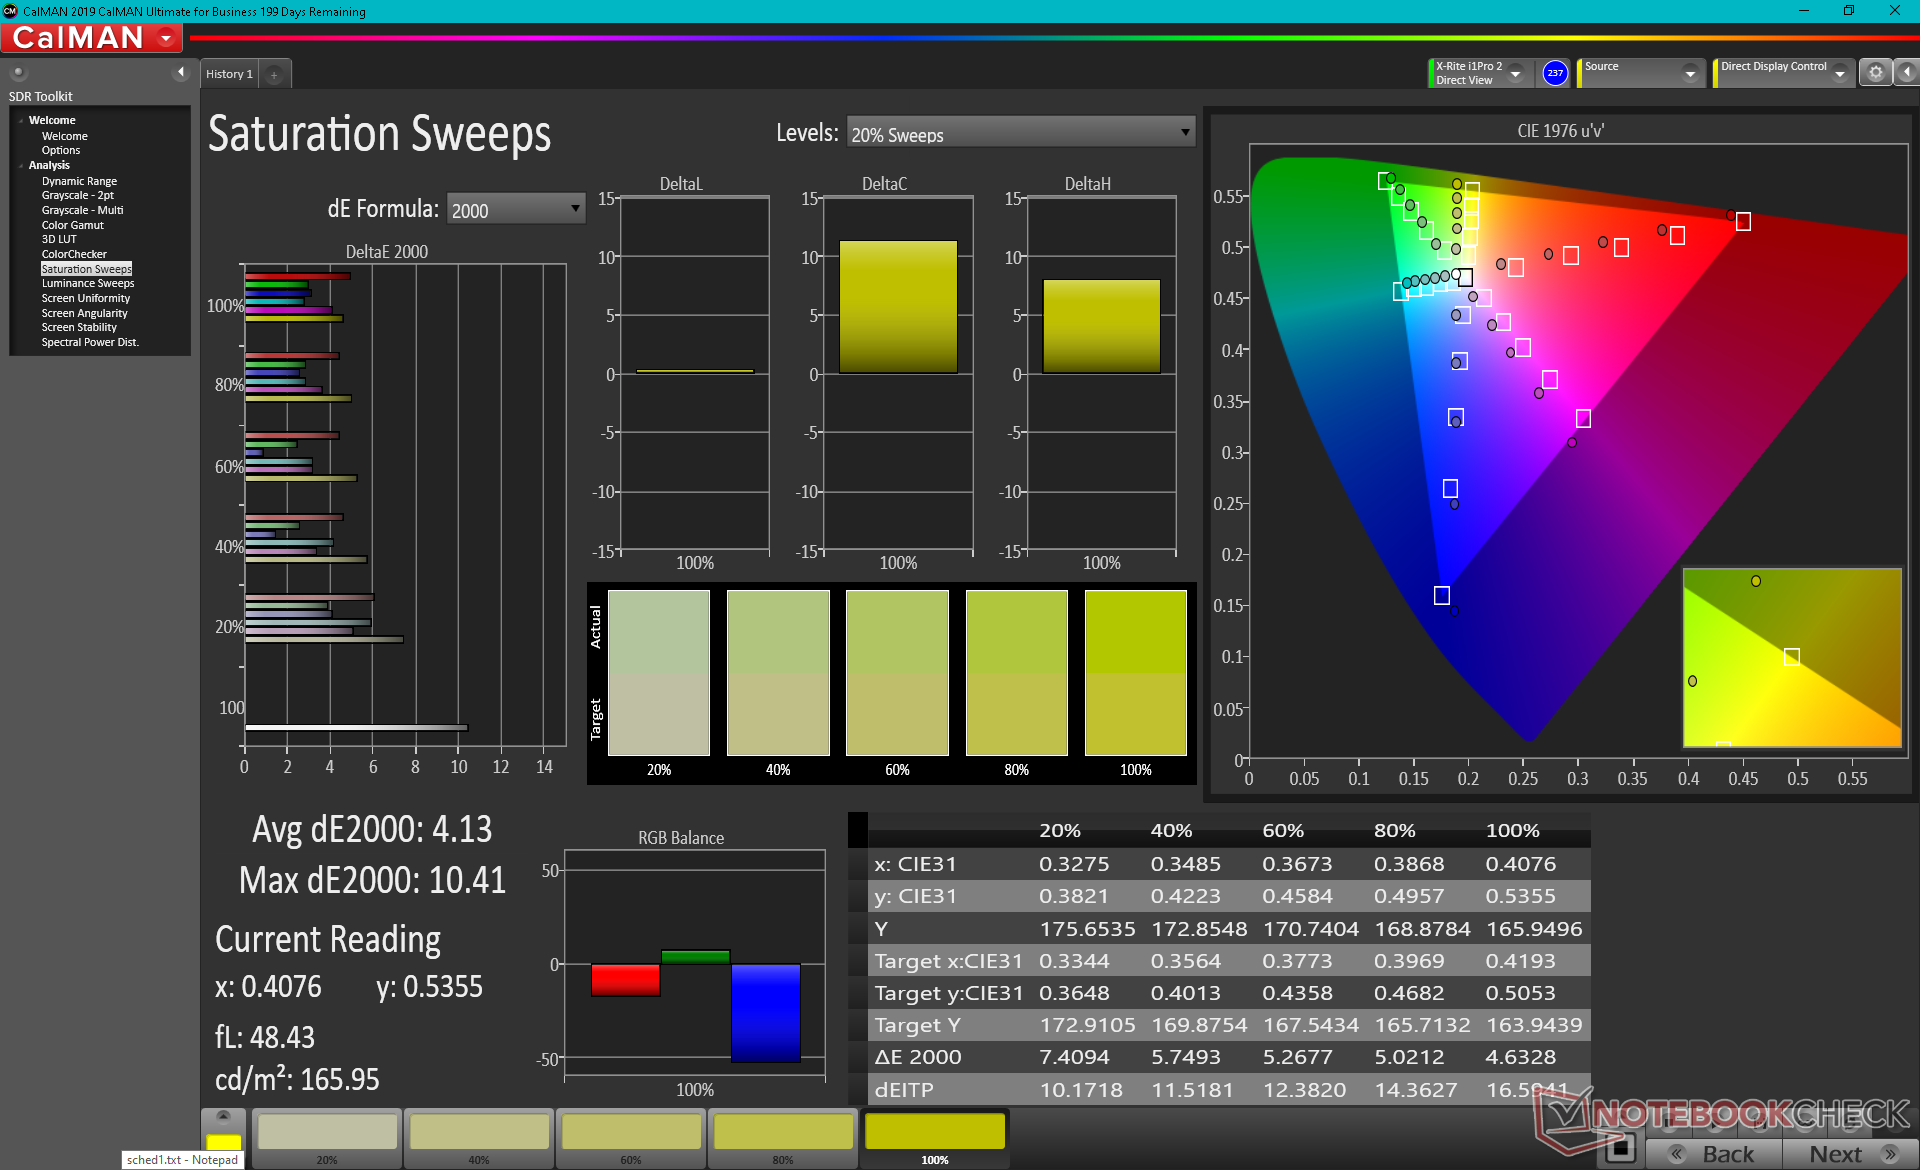
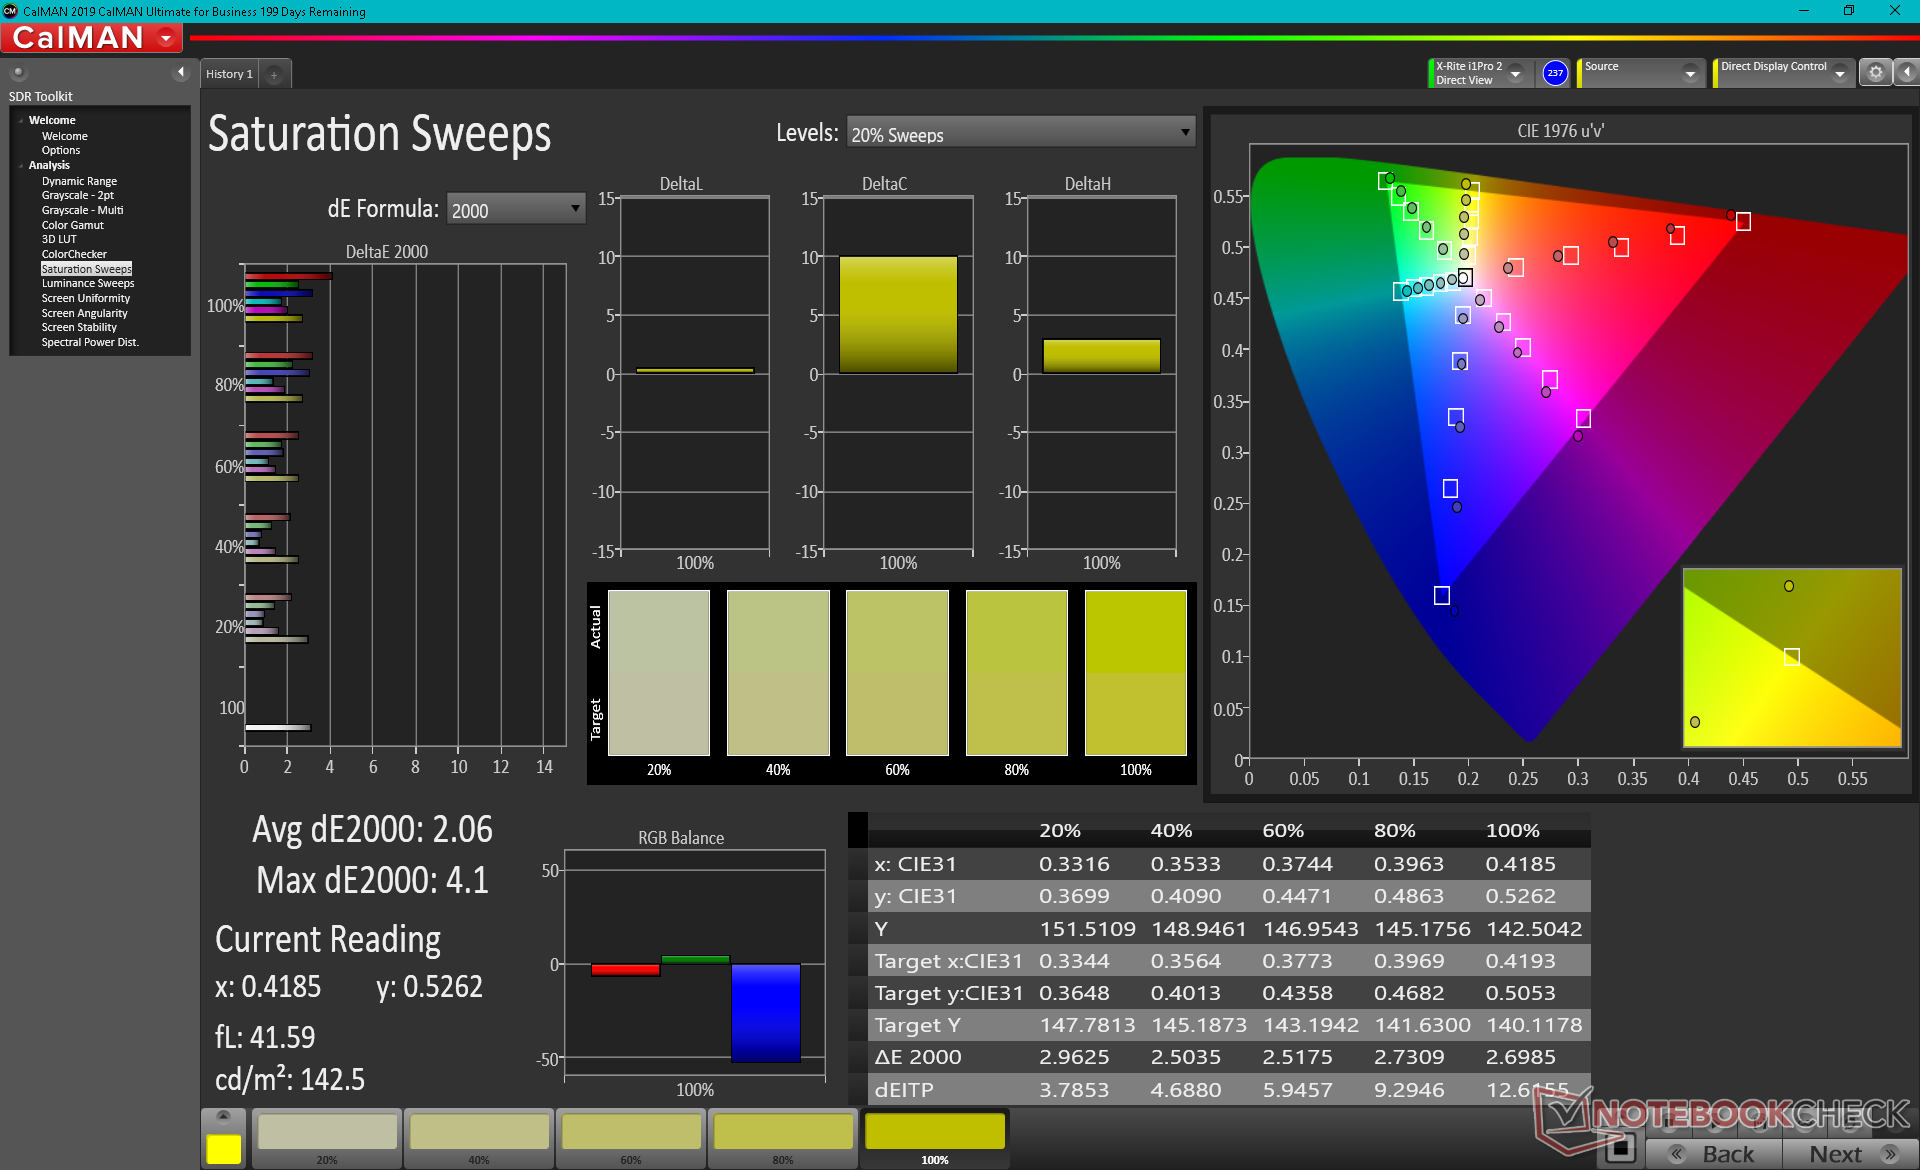
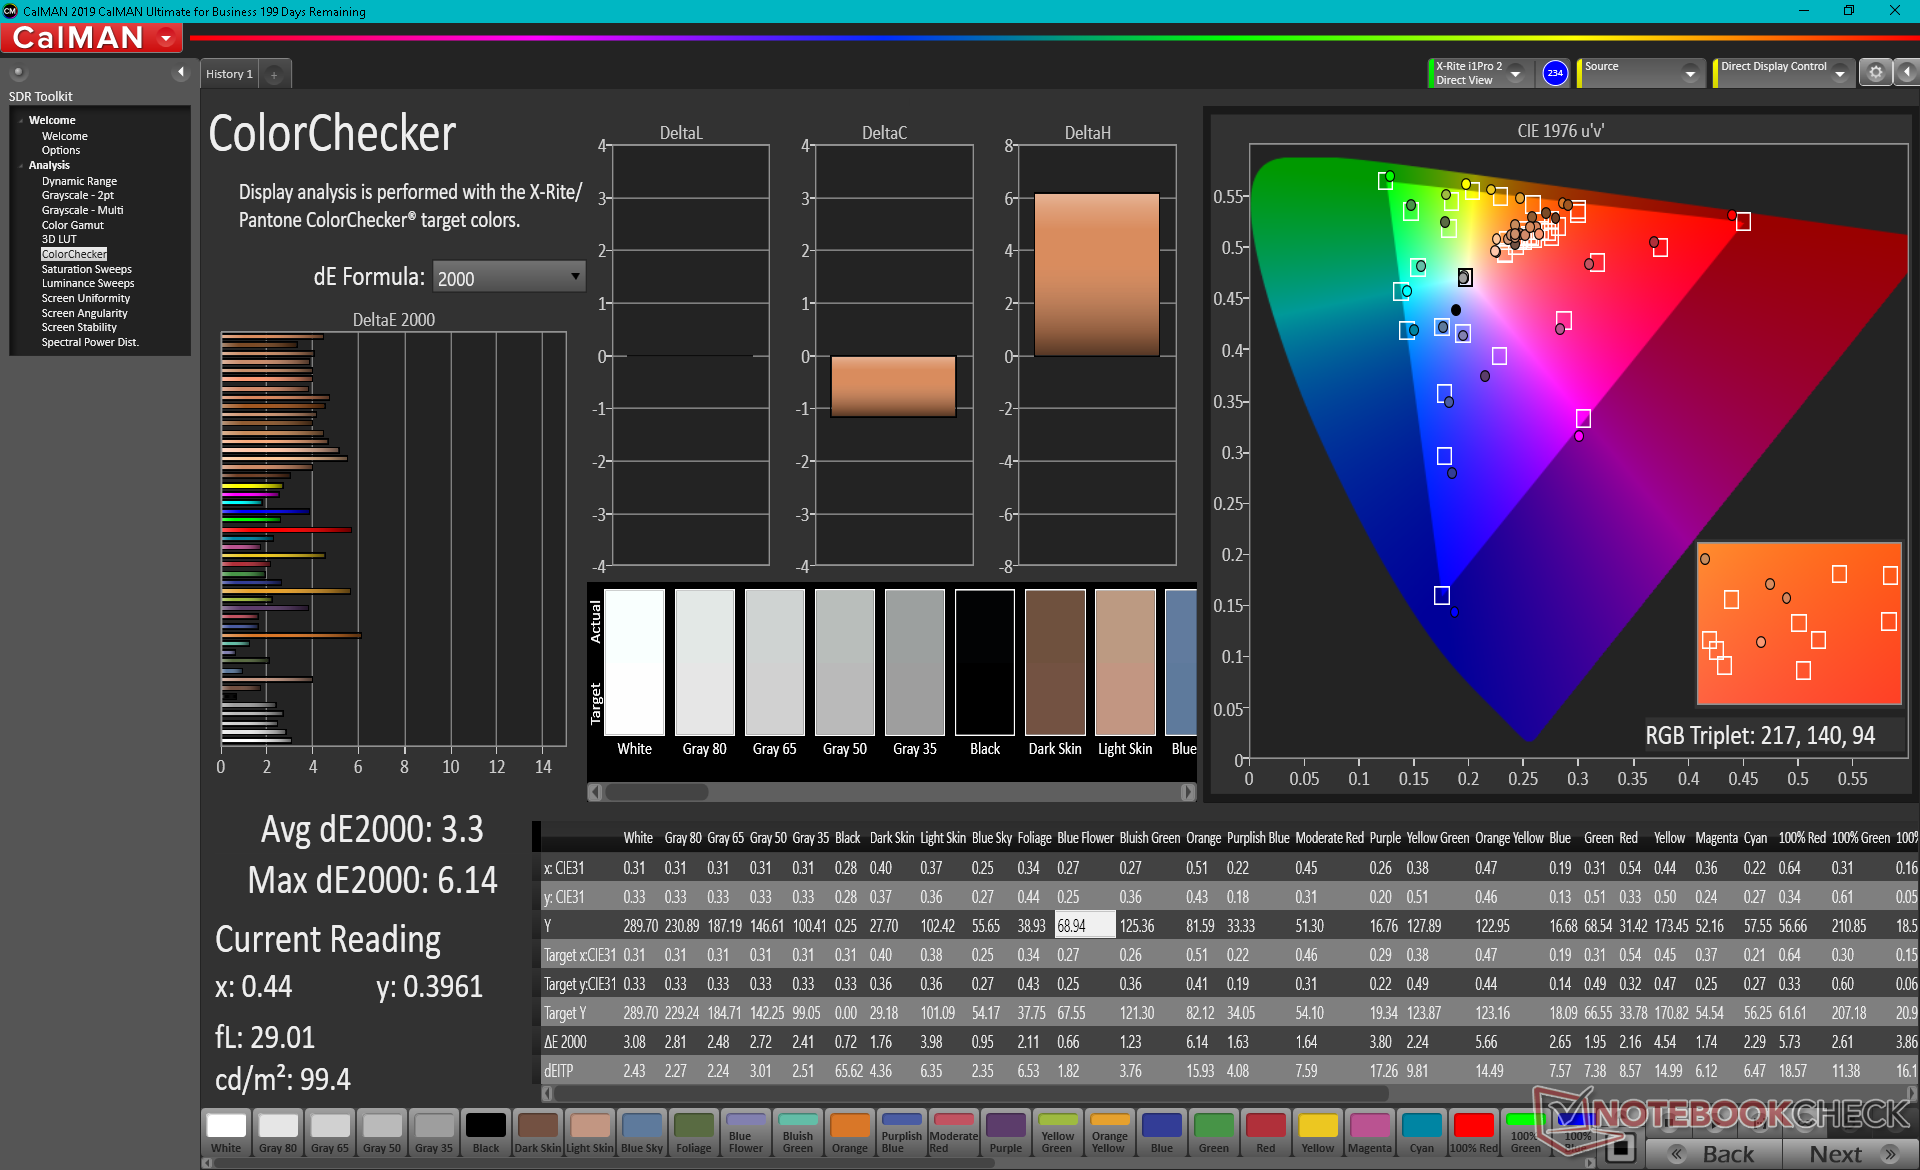
De kleurruimte dekt ongeveer 90 procent van sRGB om goed genoeg te zijn voor de gemiddelde grafische bewerker. U zult meer moeten uitgeven aan alternatieve 4K- of OLED-modellen van Dell, HP of anderen als u AdobeRGB-dekking nastreeft.
X-Rite colorimeter metingen onthullen een te koele kleurtemperatuur uit de doos voor slechte grijstinten en kleurweergave, ondanks de relatief hoge 90 procent sRGB dekking. De gegevens zijn logisch omdat MSI de Summit B15 serie niet vooraf kalibreert in de fabriek. Kleuren en grijstinten verbeteren aanzienlijk na kalibratie met veel lagere gemiddelde DeltaE waarden. Wij raden aan ons gekalibreerde ICM profiel toe te passen voor een meer kleurnauwkeurige weergave.
Responstijd Scherm
| ↔ Responstijd Zwart naar Wit | ||
|---|---|---|
| 32.4 ms ... stijging ↗ en daling ↘ gecombineerd | ↗ 18.4 ms stijging | 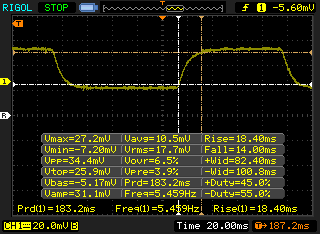 |
| ↘ 14 ms daling | ||
| Het scherm vertoonde trage responstijden in onze tests en is misschien te traag voor games. Ter vergelijking: alle testtoestellen variëren van 0.1 (minimum) tot 240 (maximum) ms. » 88 % van alle toestellen zijn beter. Dit betekent dat de gemeten responstijd slechter is dan het gemiddelde (19.8 ms) van alle geteste toestellen. | ||
| ↔ Responstijd 50% Grijs naar 80% Grijs | ||
| 40.4 ms ... stijging ↗ en daling ↘ gecombineerd | ↗ 20.4 ms stijging | 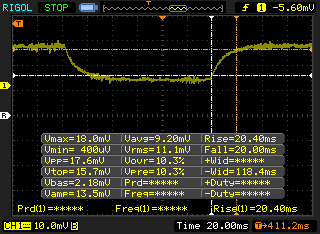 |
| ↘ 20 ms daling | ||
| Het scherm vertoonde trage responstijden in onze tests en is misschien te traag voor games. Ter vergelijking: alle testtoestellen variëren van 0.165 (minimum) tot 636 (maximum) ms. » 64 % van alle toestellen zijn beter. Dit betekent dat de gemeten responstijd slechter is dan het gemiddelde (31 ms) van alle geteste toestellen. | ||
Screen Flickering / PWM (Pulse-Width Modulation)
| Screen flickering / PWM waargenomen | 25510 Hz | ≤ 25 % helderheid instelling | 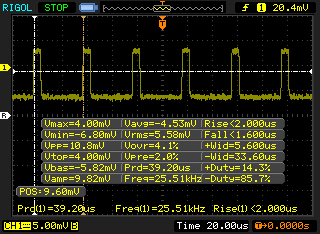 |
De achtergrondverlichting van het scherm flikkert op 25510 Hz (in het slechtste geval, bijvoorbeeld bij gebruik van PWM) aan een helderheid van 25 % en lager. Boven deze helderheid zou er geen flickering / PWM mogen optreden. De frequentie van 25510 Hz is redelijk hoog en de meeste mensen die gevoelig zijn aan flickering zouden dit dus niet mogen waarnemen of geïrriteerde ogen krijgen. Ter vergelijking: 52 % van alle geteste toestellen maakten geen gebruik van PWM om de schermhelderheid te verlagen. Als het wel werd gebruikt, werd een gemiddelde van 7769 (minimum: 5 - maximum: 343500) Hz waargenomen. | |||
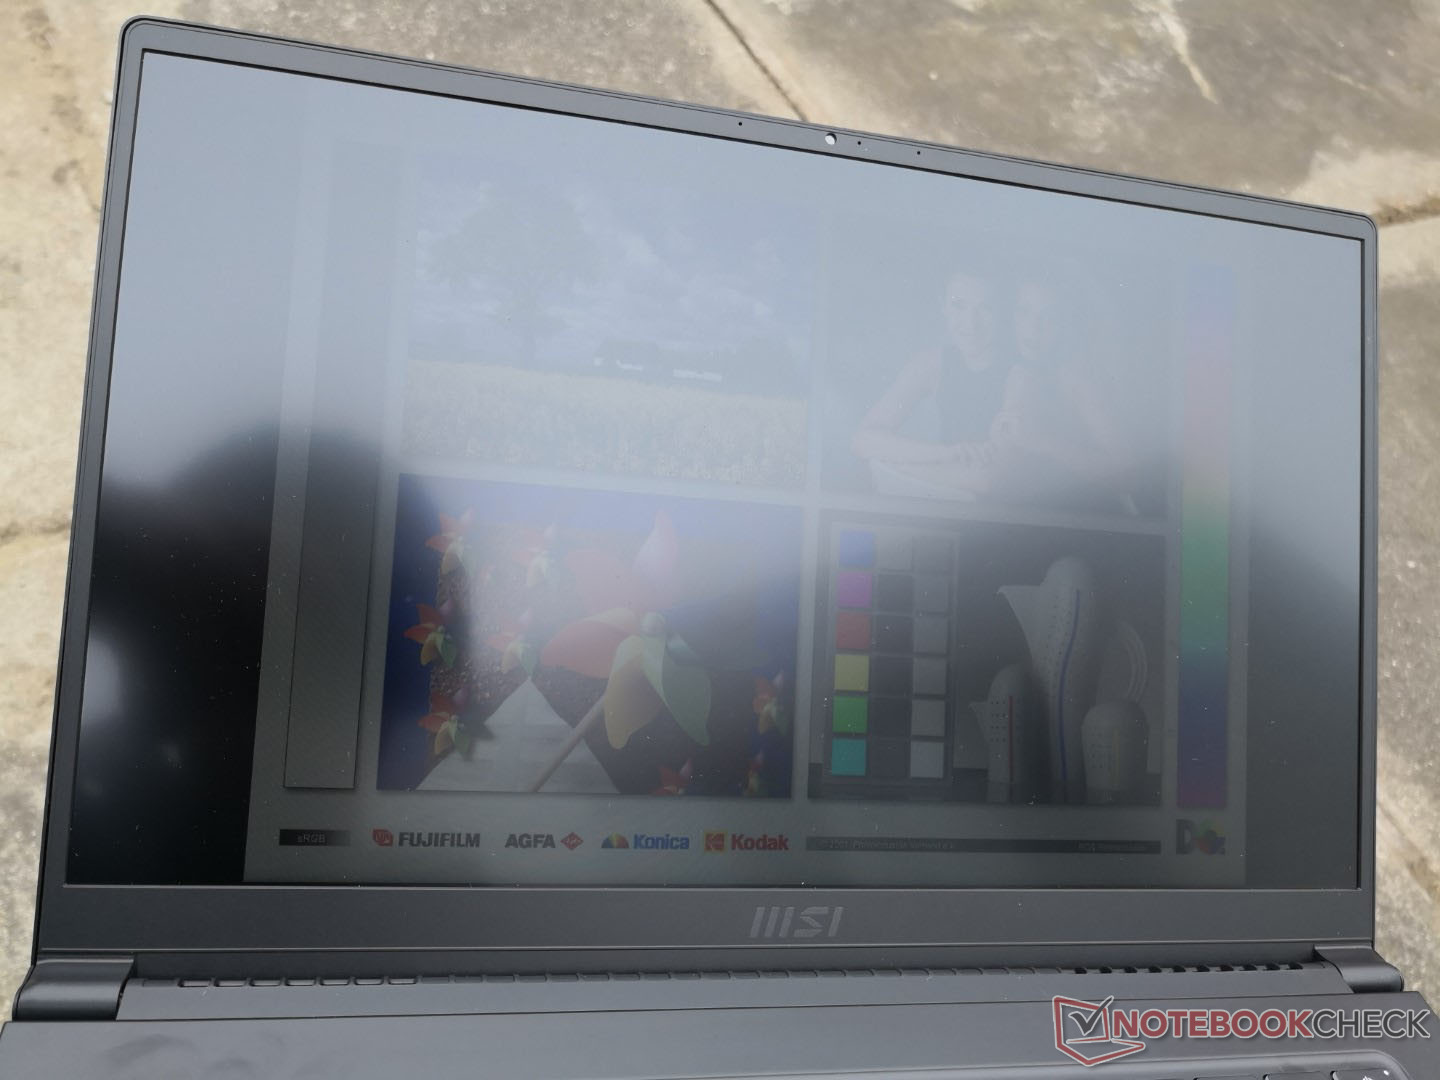
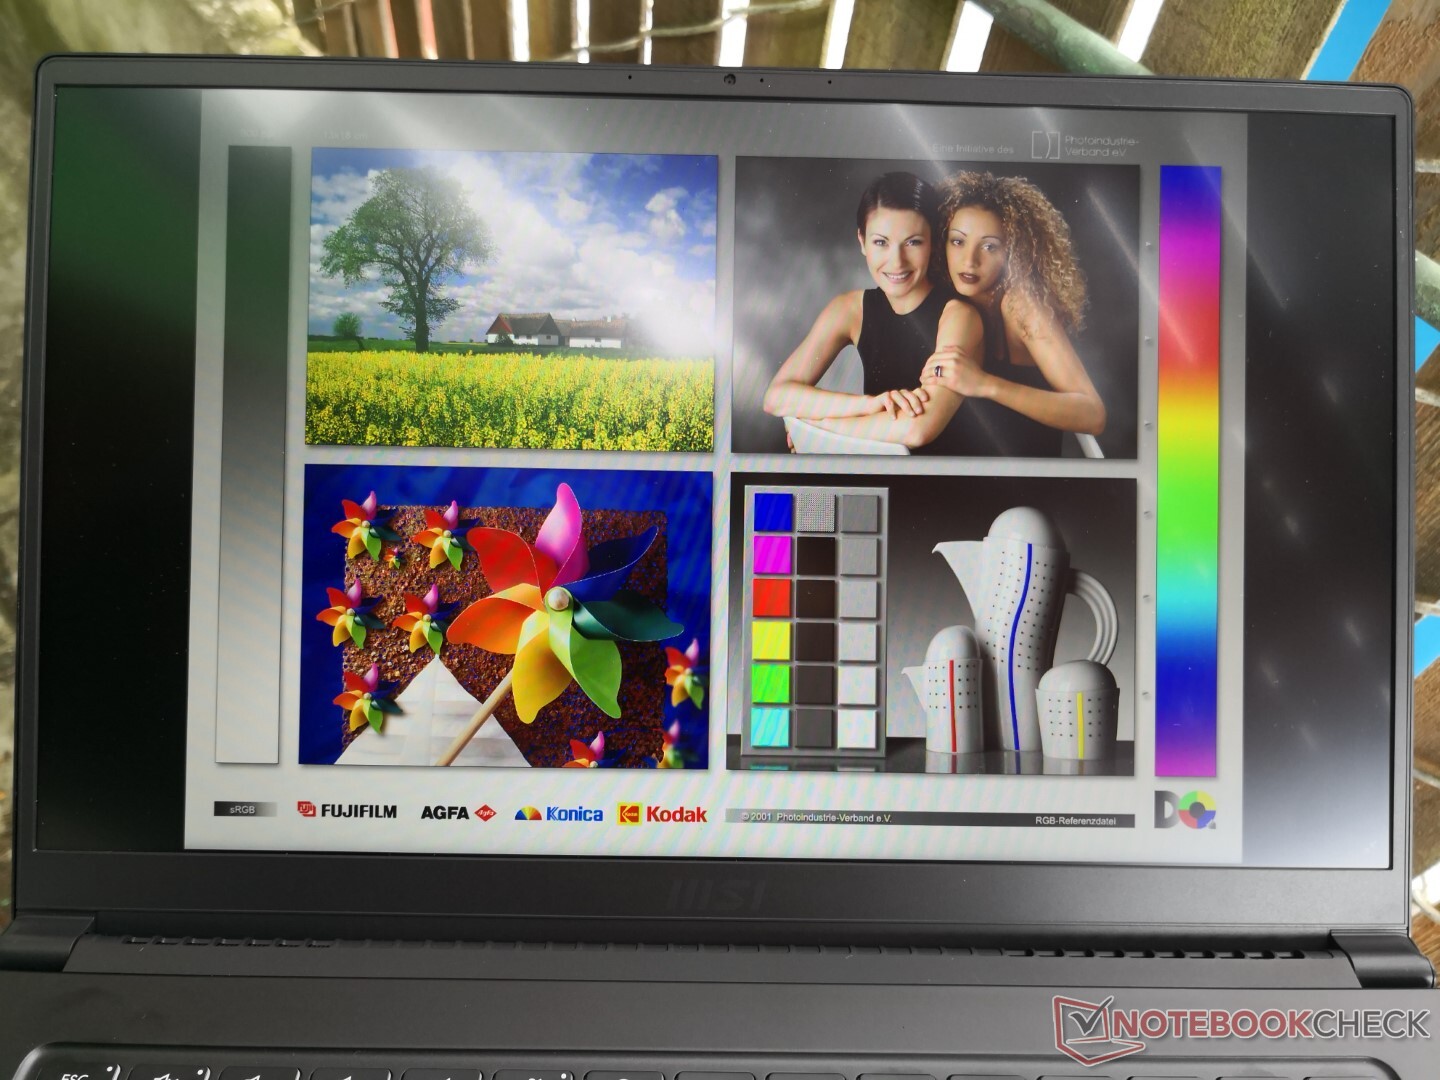
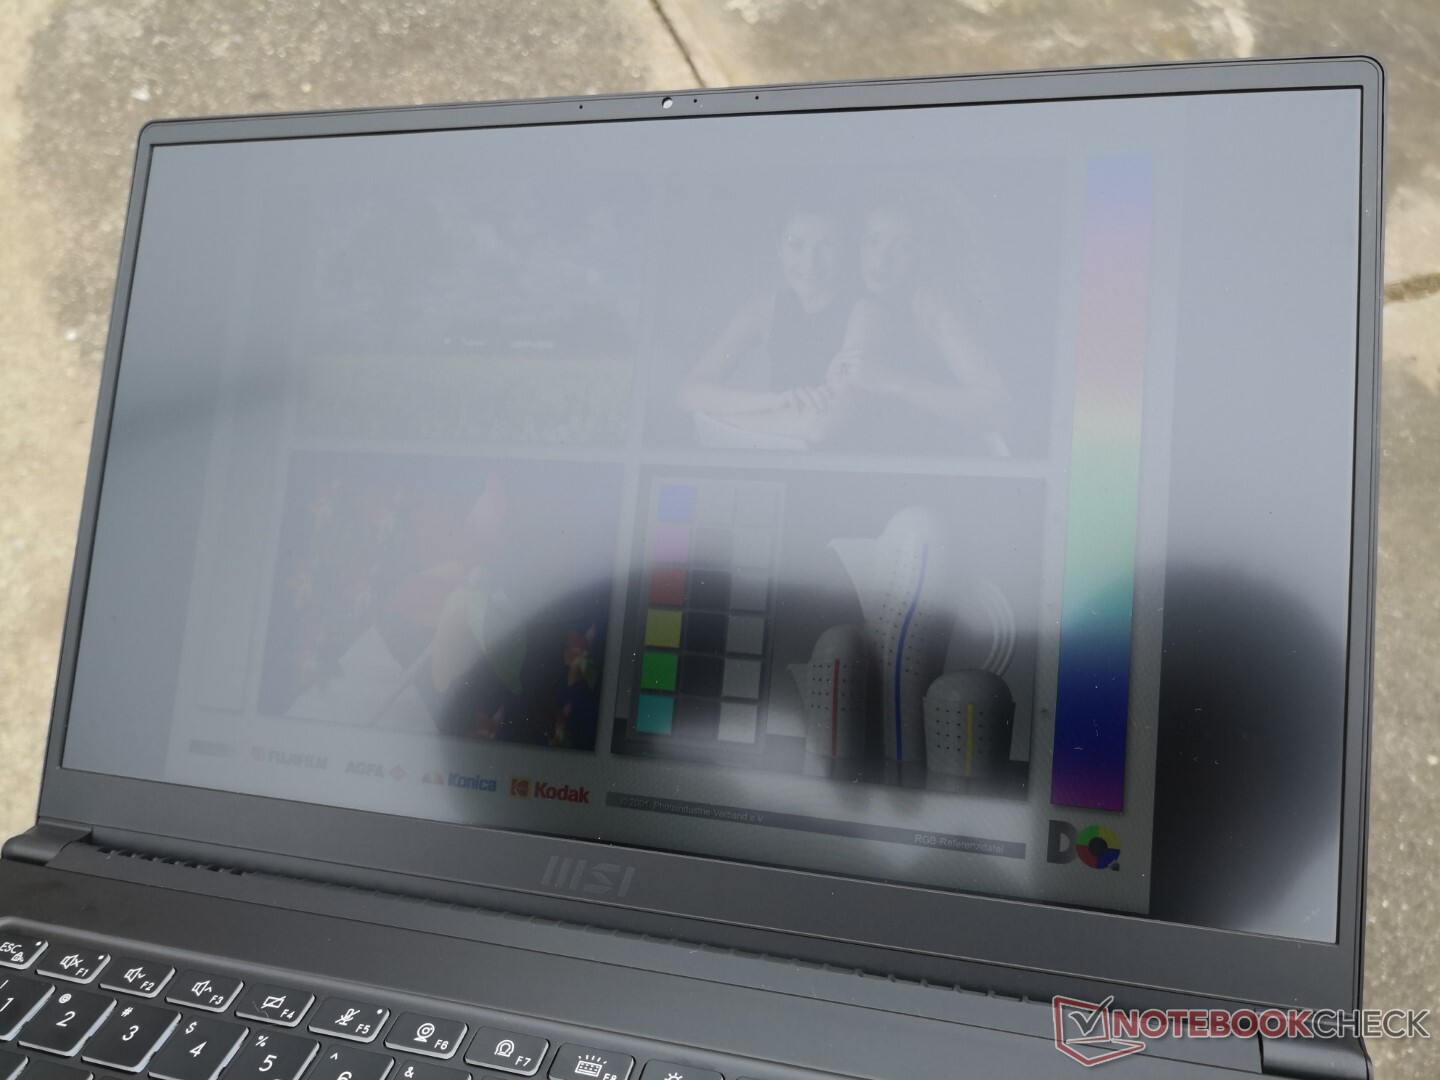
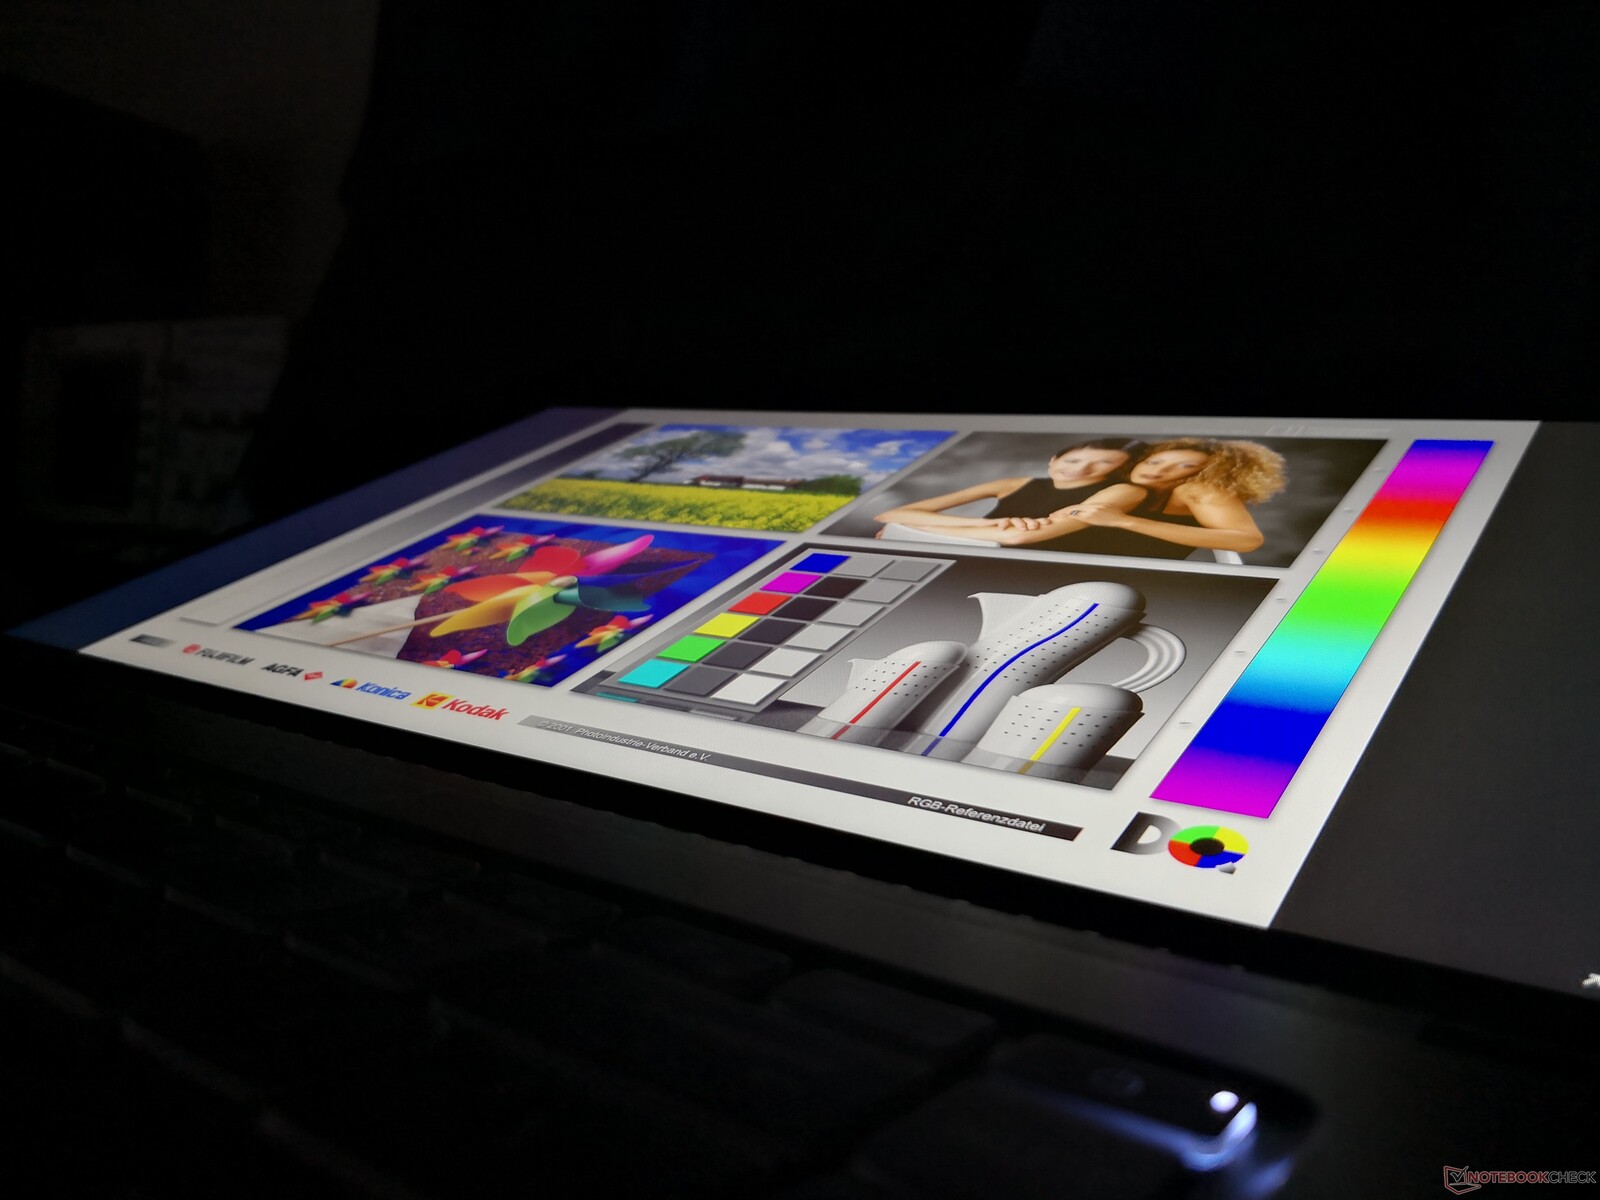
De zichtbaarheid buitenshuis is niet zo goed als bij de Dell XPS 15 of MacBook Pro 15 die beide een merkbaar helderder beeldscherm hebben. Verblinding is niet zo zwaar op de MSI dankzij het matte paneel, maar het scherm is nog steeds moeilijk om comfortabel te zien in de meeste scenario's.
Prestaties
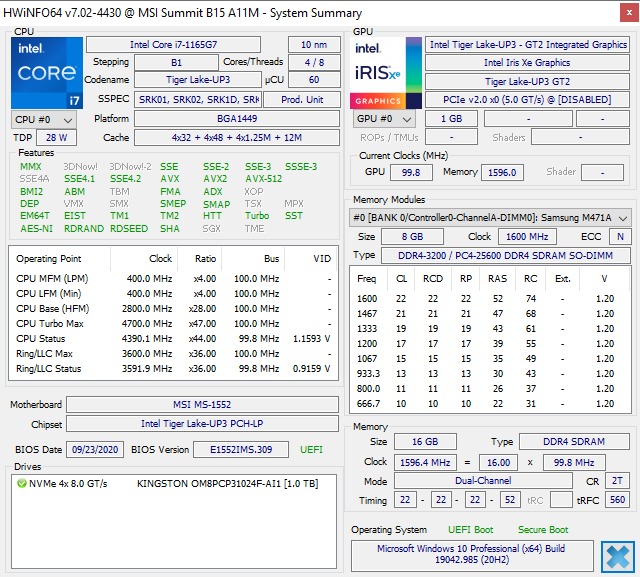
Slechts twee SKU's zijn beschikbaar op het moment van dit schrijven met ofwel de ULV Core i5-1135G7 of Core i7-1165G7. Voor snellere Core H opties, biedt MSI in plaats daarvan de Creator Z16 serie.
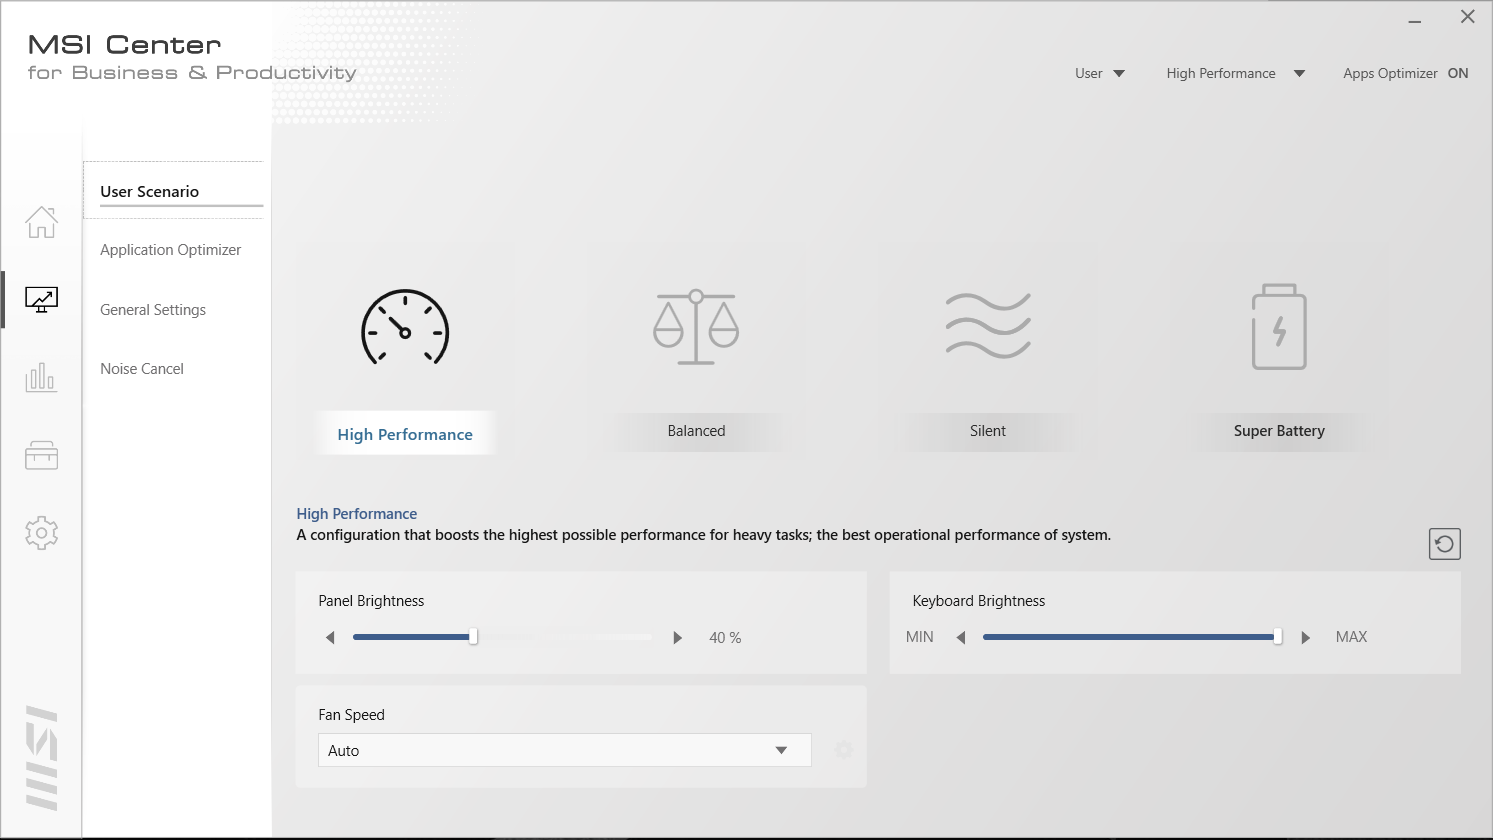
Ons apparaat werd ingesteld op High Performance mode via MSI Center voordat we onderstaande prestatie benchmarks uitvoerden voor de best mogelijke scores. We raden eigenaren aan om bekend te raken met deze software, aangezien MSI-specifieke updates en functies hier te vinden zijn.

Processor
De CPU-prestaties zijn uitstekend met CineBench R15 xT-scores die 12 procent sneller zijn dan de gemiddelde laptop in onze database die is uitgerust met dezelfde CPU. CineBench R20 en R23 scores zijn zelfs nog beter met 23 procent boven het gemiddelde om superieure Turbo Boost duurzaamheid te impliceren dan de meeste andere laptops, aangezien de R20 en R23 benchmarks aanzienlijk langer zijn dan R15. De processor is in staat om consistent beter te presteren dan zowel de 10e generatie Core i7-10510U en Core i5-10300H in de HP Spectre x360 15 en Dell XPS 15, respectievelijk.
Gaan we voor de goedkopere Core i5-1135G7 in plaats van onze Core i7-1165G7 configuratie levert slechts een kleine 7 tot 10 procent minder processorprestaties op, gebaseerd op onze ervaring met andere Core i5-1135G7 laptops.
Cinebench R23: Multi Core | Single Core
Cinebench R15: CPU Multi 64Bit | CPU Single 64Bit
Blender: v2.79 BMW27 CPU
7-Zip 18.03: 7z b 4 -mmt1 | 7z b 4
Geekbench 5.5: Single-Core | Multi-Core
HWBOT x265 Benchmark v2.2: 4k Preset
LibreOffice : 20 Documents To PDF
R Benchmark 2.5: Overall mean
| Cinebench R23 / Multi Core | |
| Lenovo IdeaPad Flex 5 14ALC05 82HU002YUS | |
| Lenovo Yoga Slim 7-14ARE | |
| MSI Summit B15 A11M | |
| MSI Summit E15 A11SCST | |
| Gemiddeld Intel Core i7-1165G7 (2525 - 6862, n=64) | |
| Cinebench R23 / Single Core | |
| MSI Summit B15 A11M | |
| MSI Summit E15 A11SCST | |
| Gemiddeld Intel Core i7-1165G7 (1110 - 1539, n=59) | |
| Lenovo IdeaPad Flex 5 14ALC05 82HU002YUS | |
| Lenovo Yoga Slim 7-14ARE | |
| HWBOT x265 Benchmark v2.2 / 4k Preset | |
| Lenovo Yoga Slim 7-14ARE | |
| Lenovo IdeaPad Flex 5 14ALC05 82HU002YUS | |
| Dell XPS 15 9500 Core i7 4K UHD | |
| Lenovo ThinkPad E15 Gen2-20T9S00K00 | |
| MSI Summit B15 A11M | |
| Dell XPS 15 9500 Core i5 | |
| Lenovo ThinkBook 15 Gen2 ITL | |
| MSI Summit E15 A11SCST | |
| Lenovo IdeaPad 5 15IIL05 | |
| Gemiddeld Intel Core i7-1165G7 (1.39 - 8.47, n=80) | |
| LibreOffice / 20 Documents To PDF | |
| Dell XPS 15 9500 Core i5 | |
| MSI Summit E15 A11SCST | |
| Lenovo IdeaPad Flex 5 14ALC05 82HU002YUS | |
| Lenovo Yoga Slim 7-14ARE | |
| Lenovo ThinkPad E15 Gen2-20T9S00K00 | |
| Lenovo IdeaPad 5 15IIL05 | |
| MSI Summit B15 A11M | |
| Dell XPS 15 9500 Core i7 4K UHD | |
| Gemiddeld Intel Core i7-1165G7 (21.5 - 88.1, n=78) | |
| Lenovo ThinkBook 15 Gen2 ITL | |
Cinebench R23: Multi Core | Single Core
Cinebench R15: CPU Multi 64Bit | CPU Single 64Bit
Blender: v2.79 BMW27 CPU
7-Zip 18.03: 7z b 4 -mmt1 | 7z b 4
Geekbench 5.5: Single-Core | Multi-Core
HWBOT x265 Benchmark v2.2: 4k Preset
LibreOffice : 20 Documents To PDF
R Benchmark 2.5: Overall mean
* ... kleiner is beter
Systeemprestaties
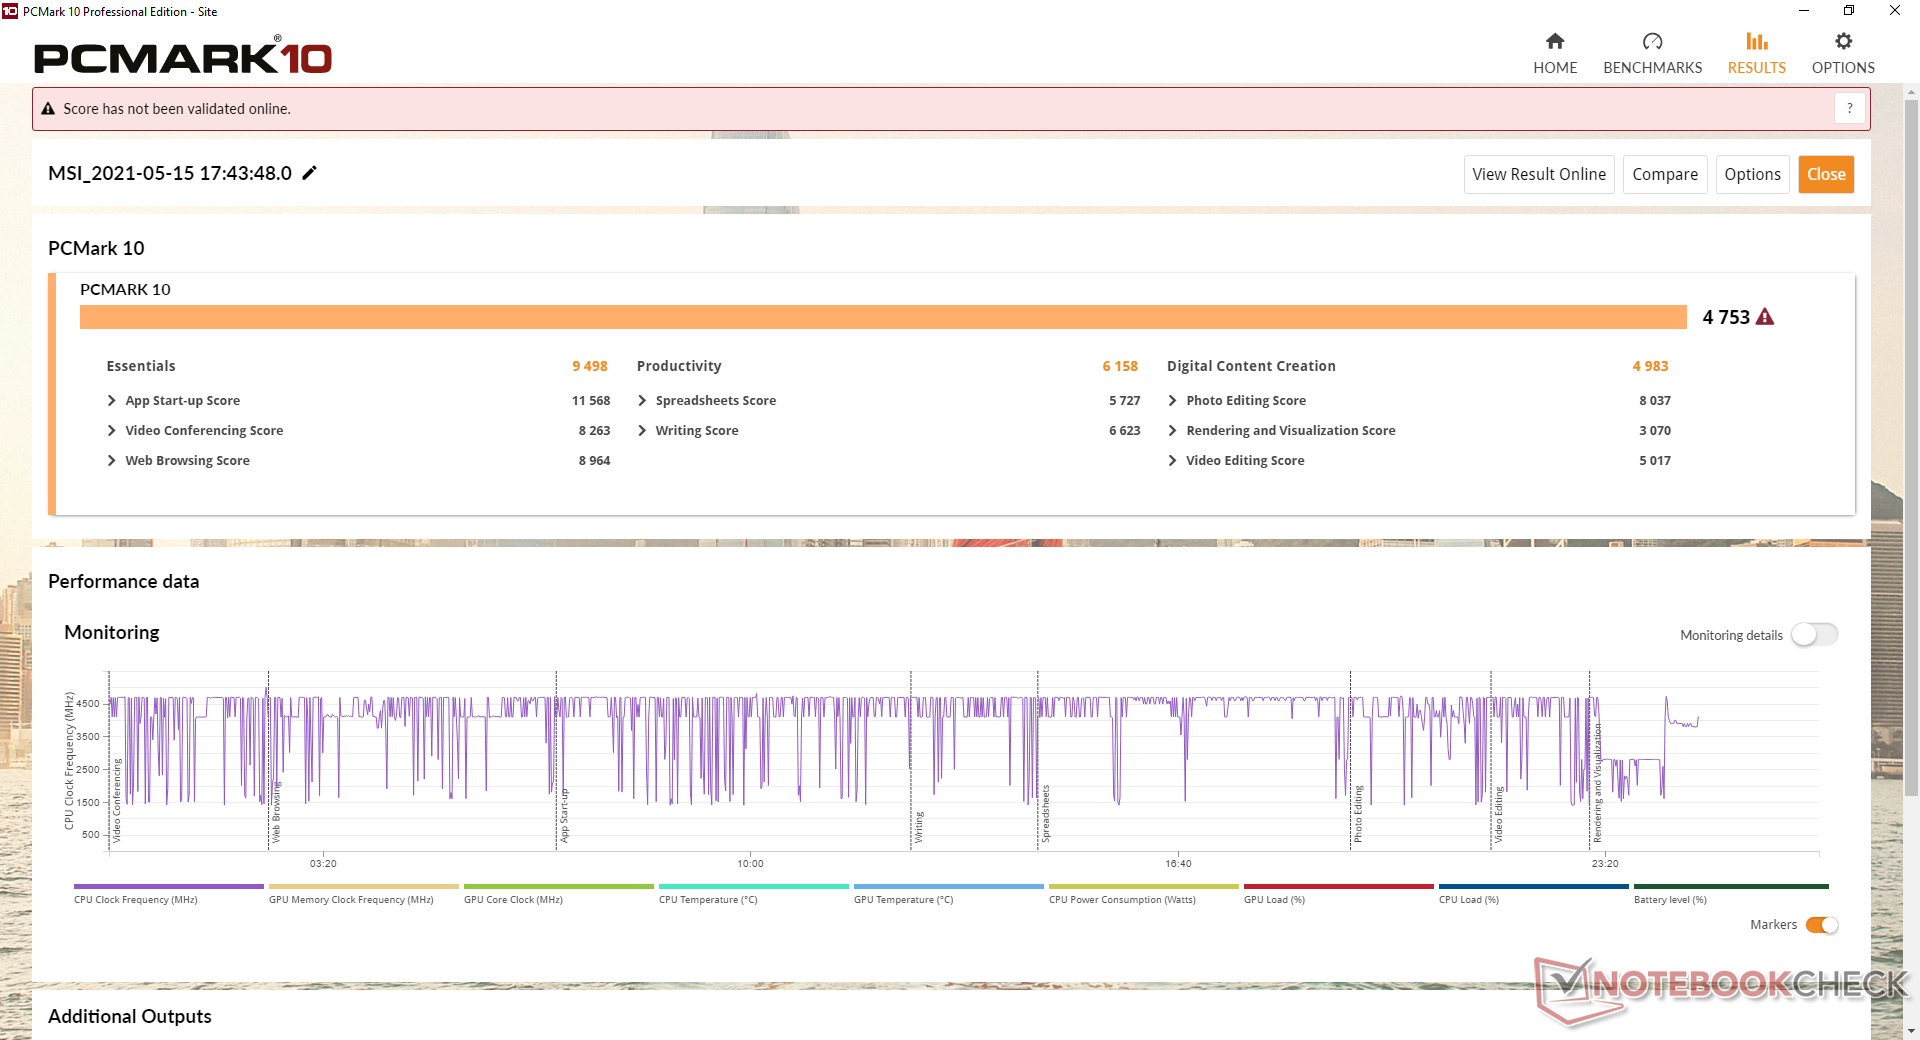
| PCMark 10 Score | 4753 punten | |
Help | ||
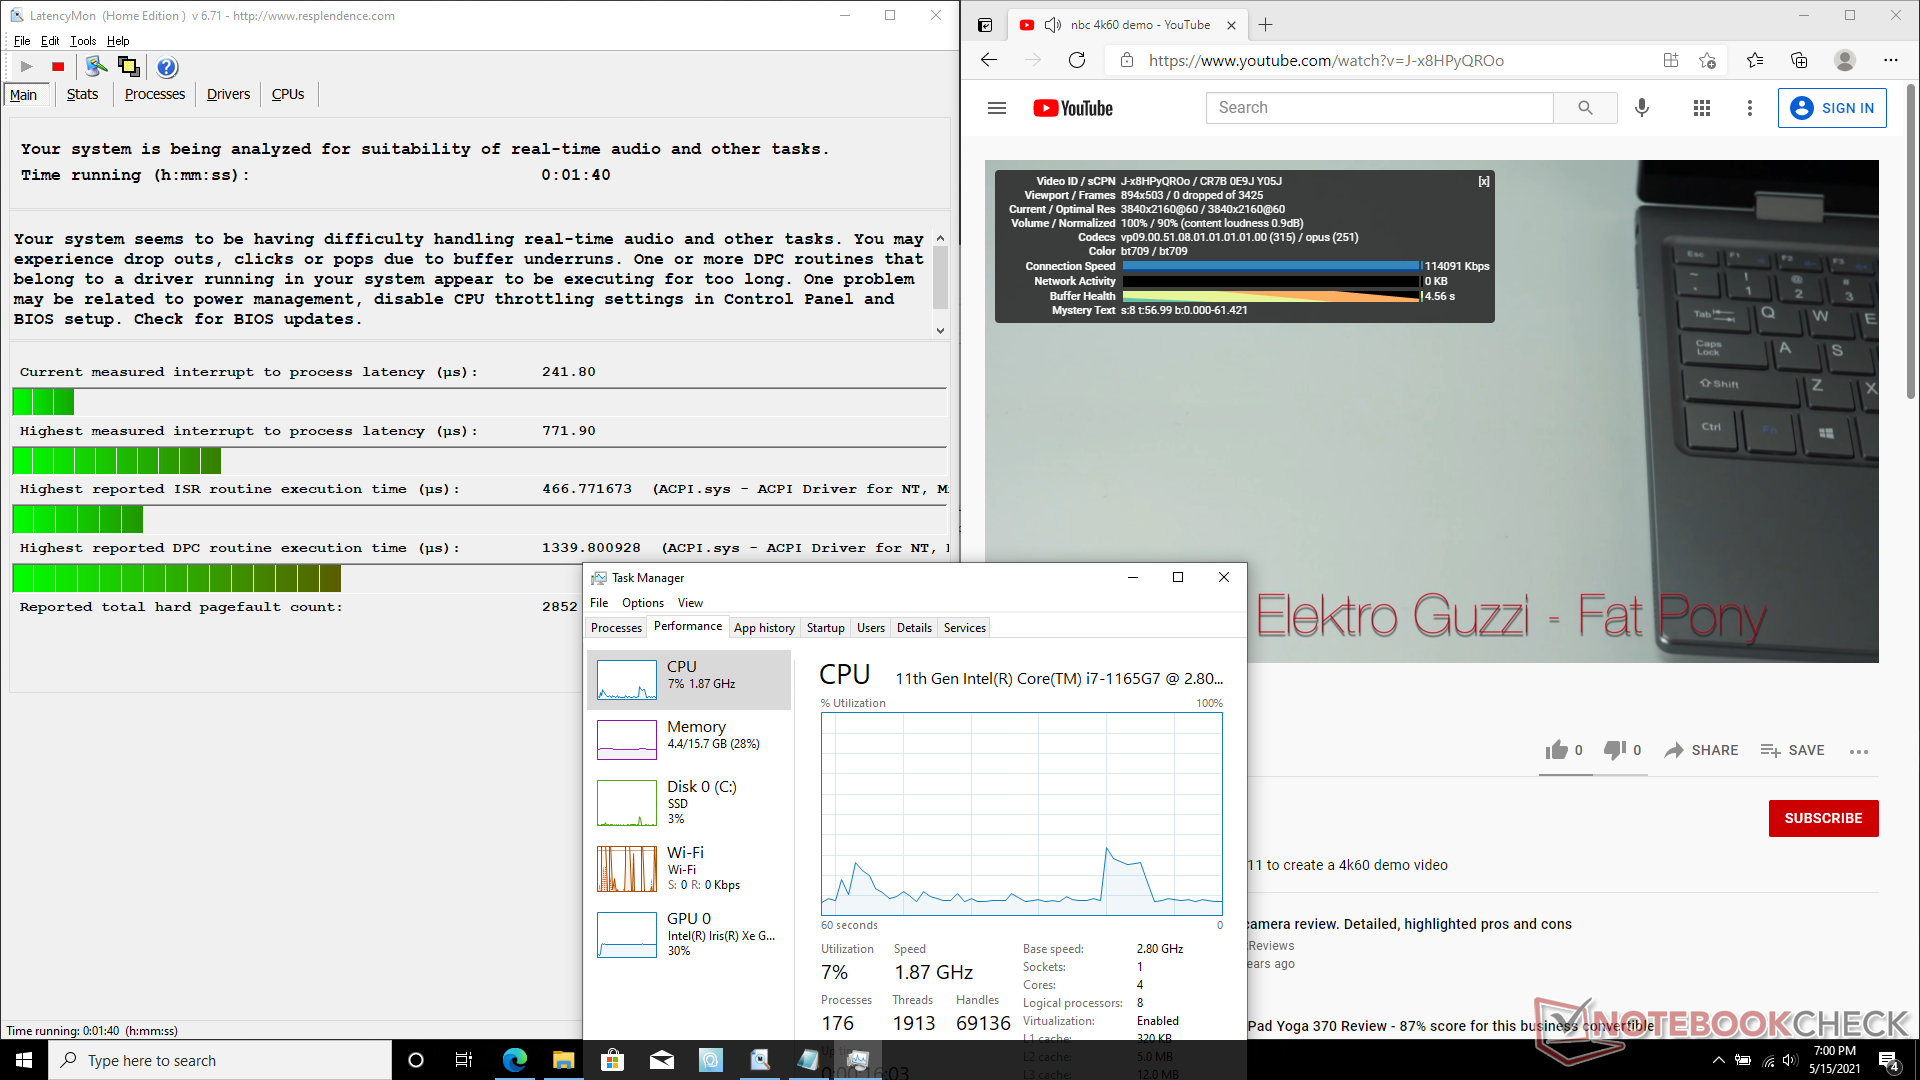
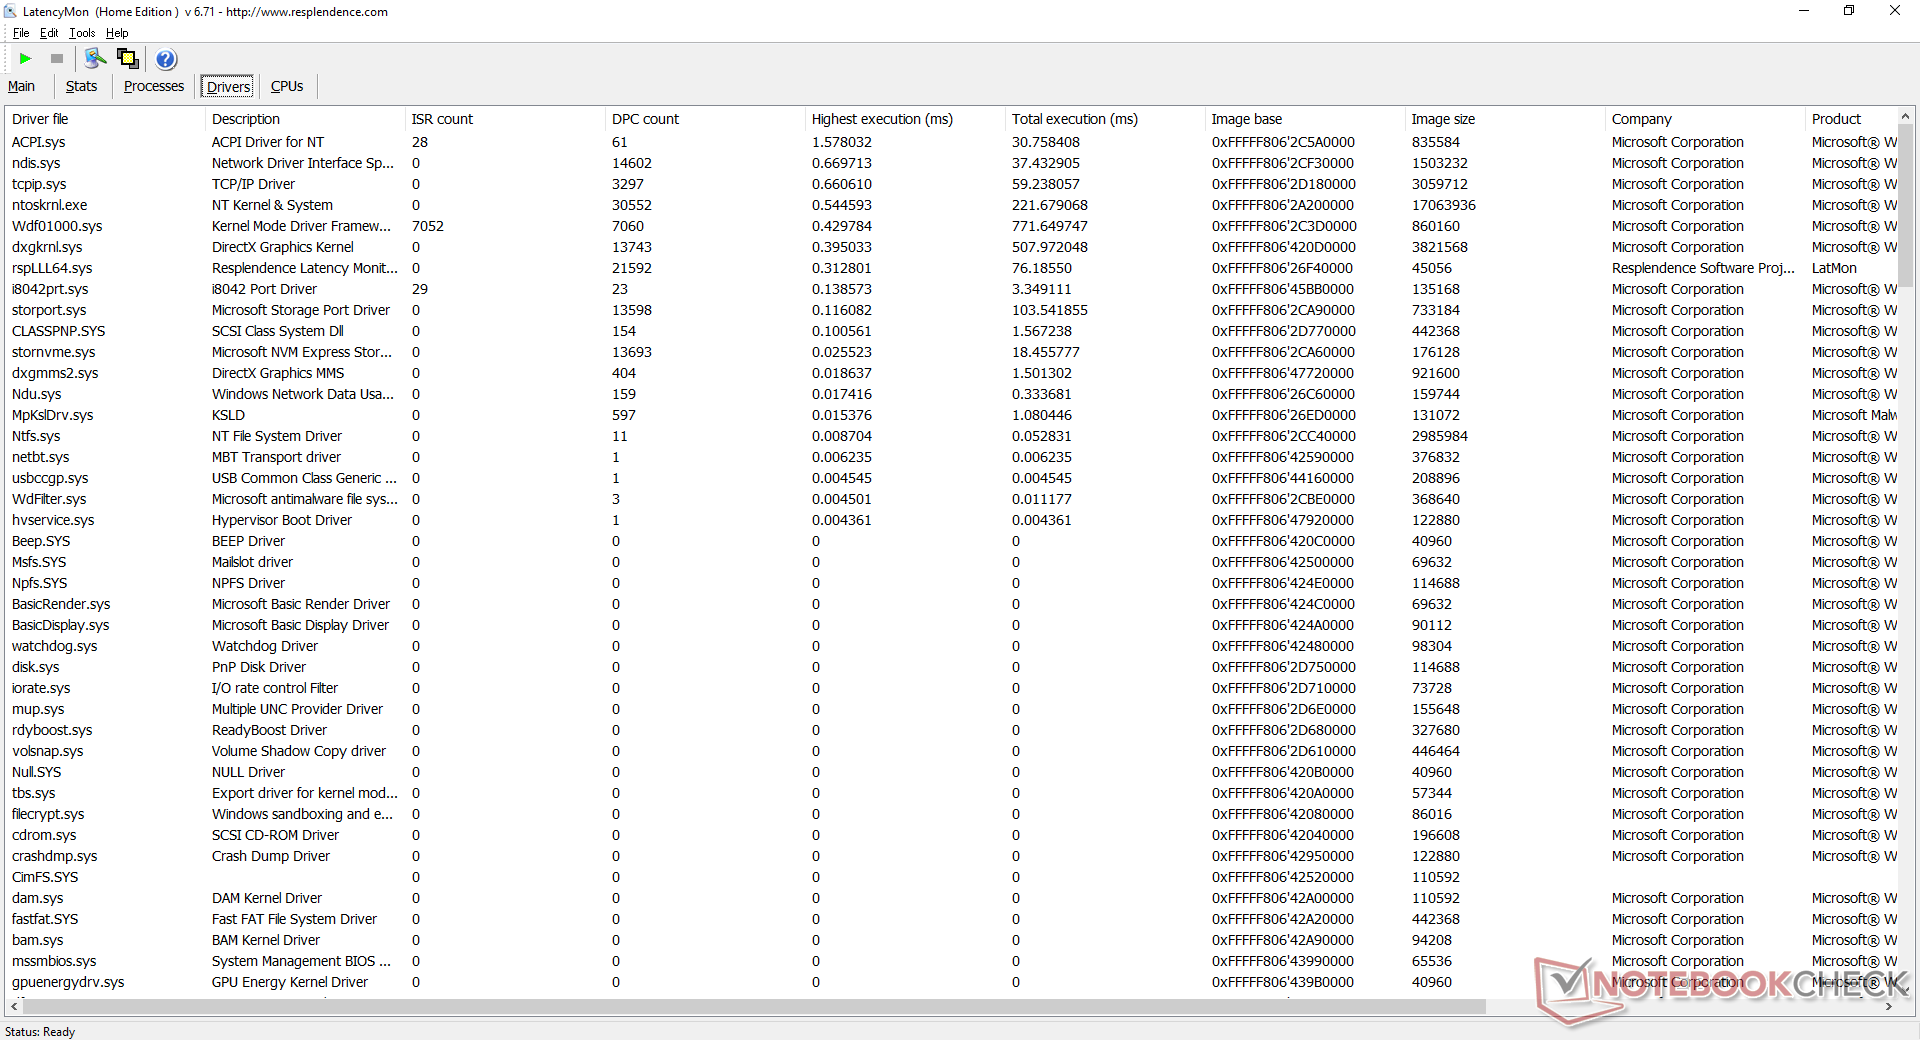
DPC latentie
LatencyMon toont kleine DPC-latentieproblemen bij het openen van meerdere browsertabbladen op onze startpagina. Het afspelen van 4K-video's met 60 FPS verloopt verder vloeiend en zonder wegvallende frames.
| DPC Latencies / LatencyMon - interrupt to process latency (max), Web, Youtube, Prime95 | |
| ADATA XPG Xenia Xe | |
| Dell XPS 15 9500 Core i5 | |
| MSI Summit E15 A11SCST | |
| MSI Summit B15 A11M | |
* ... kleiner is beter
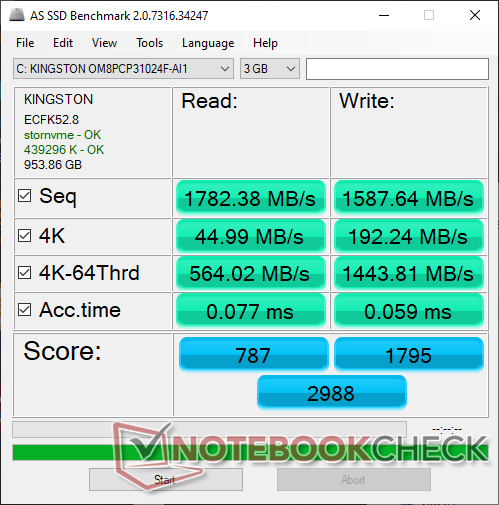
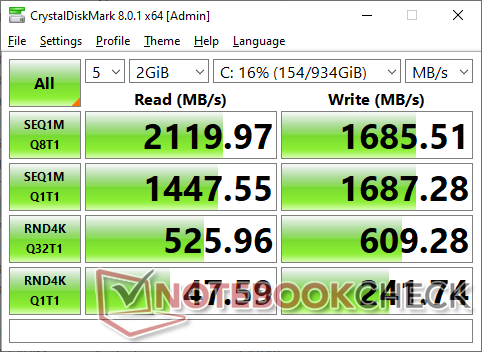
Opslagapparaten
Maximaal twee interne M.2 2280 SSD's worden ondersteund, waarbij een van die slots compatibel is met PCIe 4.0 snelheden. Onze testeenheid wordt geleverd met de 1 TB Kingston OM8PCP31024F, wat een redelijk goedkope PCIe 3.0 NVMe SSD is met gemiddelde overdrachtssnelheden die rond de 2100 MB/s liggen. Natuurlijk kunnen gebruikers snellere SSD's configureren voor aankoop of er zelf een installeren.
| MSI Summit B15 A11M Kingston OM8PCP31024F | MSI Summit E15 A11SCST Phison 1TB SM2801T24GKBB4S-E162 | HP Spectre X360 15-5ZV31AV Intel SSD 660p 2TB SSDPEKNW020T8 | ADATA XPG Xenia Xe ADATA XPG Gammix S50 1TB | |
|---|---|---|---|---|
| AS SSD | 42% | -12% | 25% | |
| Seq Read (MB/s) | 1782 | 3597 102% | 1220 -32% | 3842 116% |
| Seq Write (MB/s) | 1588 | 2101 32% | 1152 -27% | 1601 1% |
| 4K Read (MB/s) | 44.99 | 62.5 39% | 52.3 16% | 51.2 14% |
| 4K Write (MB/s) | 192.2 | 208.9 9% | 146.6 -24% | 260.8 36% |
| 4K-64 Read (MB/s) | 564 | 1145 103% | 652 16% | 1222 117% |
| 4K-64 Write (MB/s) | 1444 | 1482 3% | 847 -41% | 1508 4% |
| Access Time Read * (ms) | 0.077 | 0.05 35% | 0.077 -0% | 0.065 16% |
| Access Time Write * (ms) | 0.059 | 0.019 68% | 0.106 -80% | 0.249 -322% |
| Score Read (Points) | 787 | 1567 99% | 826 5% | 1657 111% |
| Score Write (Points) | 1795 | 1901 6% | 1109 -38% | 1929 7% |
| Score Total (Points) | 2988 | 4207 41% | 2371 -21% | 4329 45% |
| Copy ISO MB/s (MB/s) | 1541 | 2209 43% | 2070 34% | 2166 41% |
| Copy Program MB/s (MB/s) | 641 | 455.2 -29% | 571 -11% | 995 55% |
| Copy Game MB/s (MB/s) | 908 | 1225 35% | 1219 34% | 1844 103% |
| CrystalDiskMark 5.2 / 6 | 42% | -6% | 47% | |
| Write 4K (MB/s) | 235.9 | 242.9 3% | 151.5 -36% | 159.6 -32% |
| Read 4K (MB/s) | 47.06 | 54.6 16% | 59.3 26% | 45.45 -3% |
| Write Seq (MB/s) | 1684 | 2420 44% | 1424 -15% | 2498 48% |
| Read Seq (MB/s) | 1333 | 2300 73% | 1609 21% | 2340 76% |
| Write 4K Q32T1 (MB/s) | 606 | 392.7 -35% | 393.6 -35% | 645 6% |
| Read 4K Q32T1 (MB/s) | 422.8 | 667 58% | 369.4 -13% | 439.4 4% |
| Write Seq Q32T1 (MB/s) | 1688 | 2424 44% | 1946 15% | 4057 140% |
| Read Seq Q32T1 (MB/s) | 2116 | 4944 134% | 1934 -9% | 4960 134% |
| Totaal Gemiddelde (Programma / Instellingen) | 42% /
42% | -9% /
-10% | 36% /
33% |
* ... kleiner is beter

Disk Throttling: DiskSpd Read Loop, Queue Depth 8
GPU prestatie
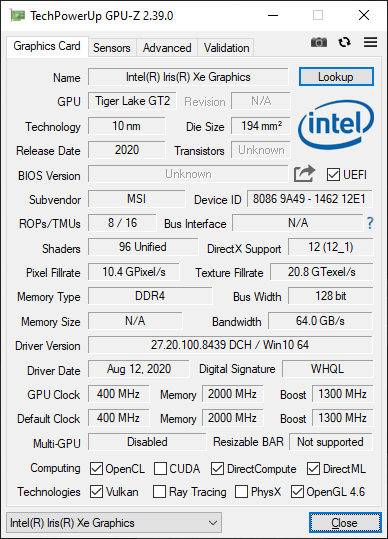
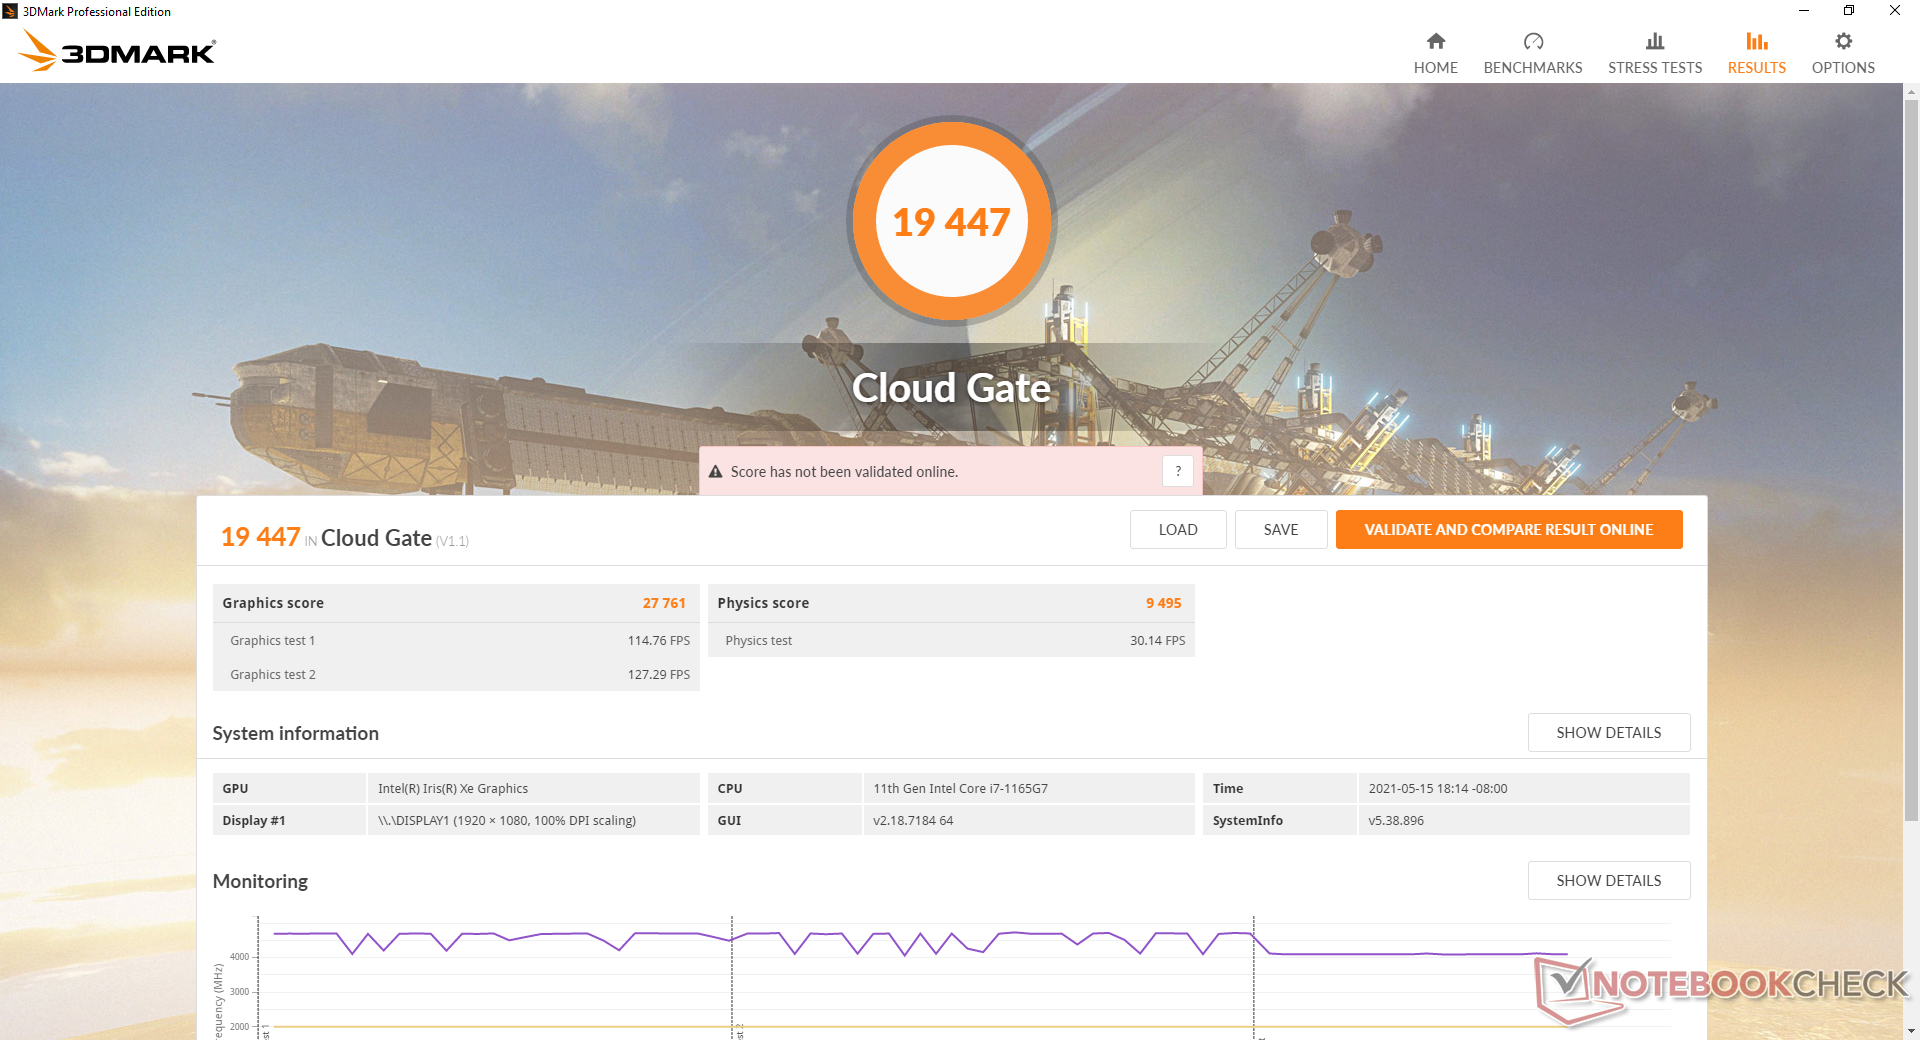
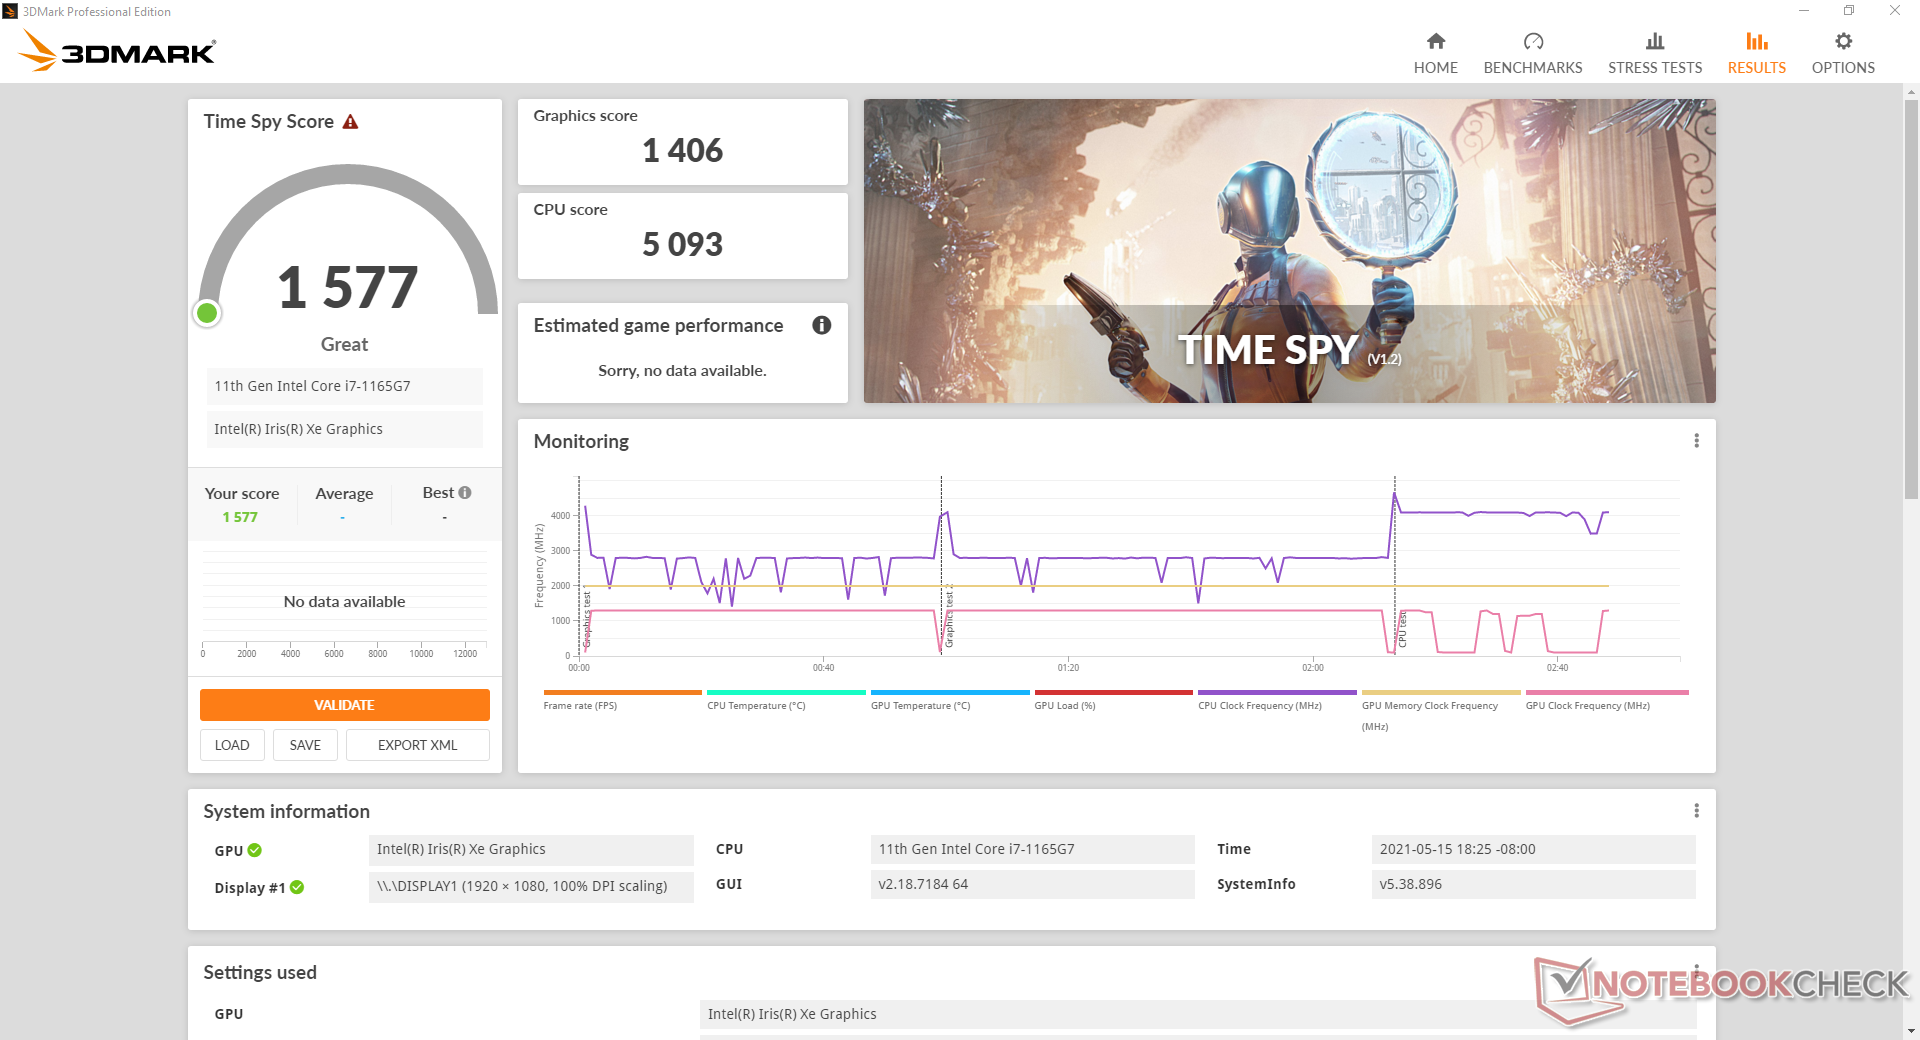
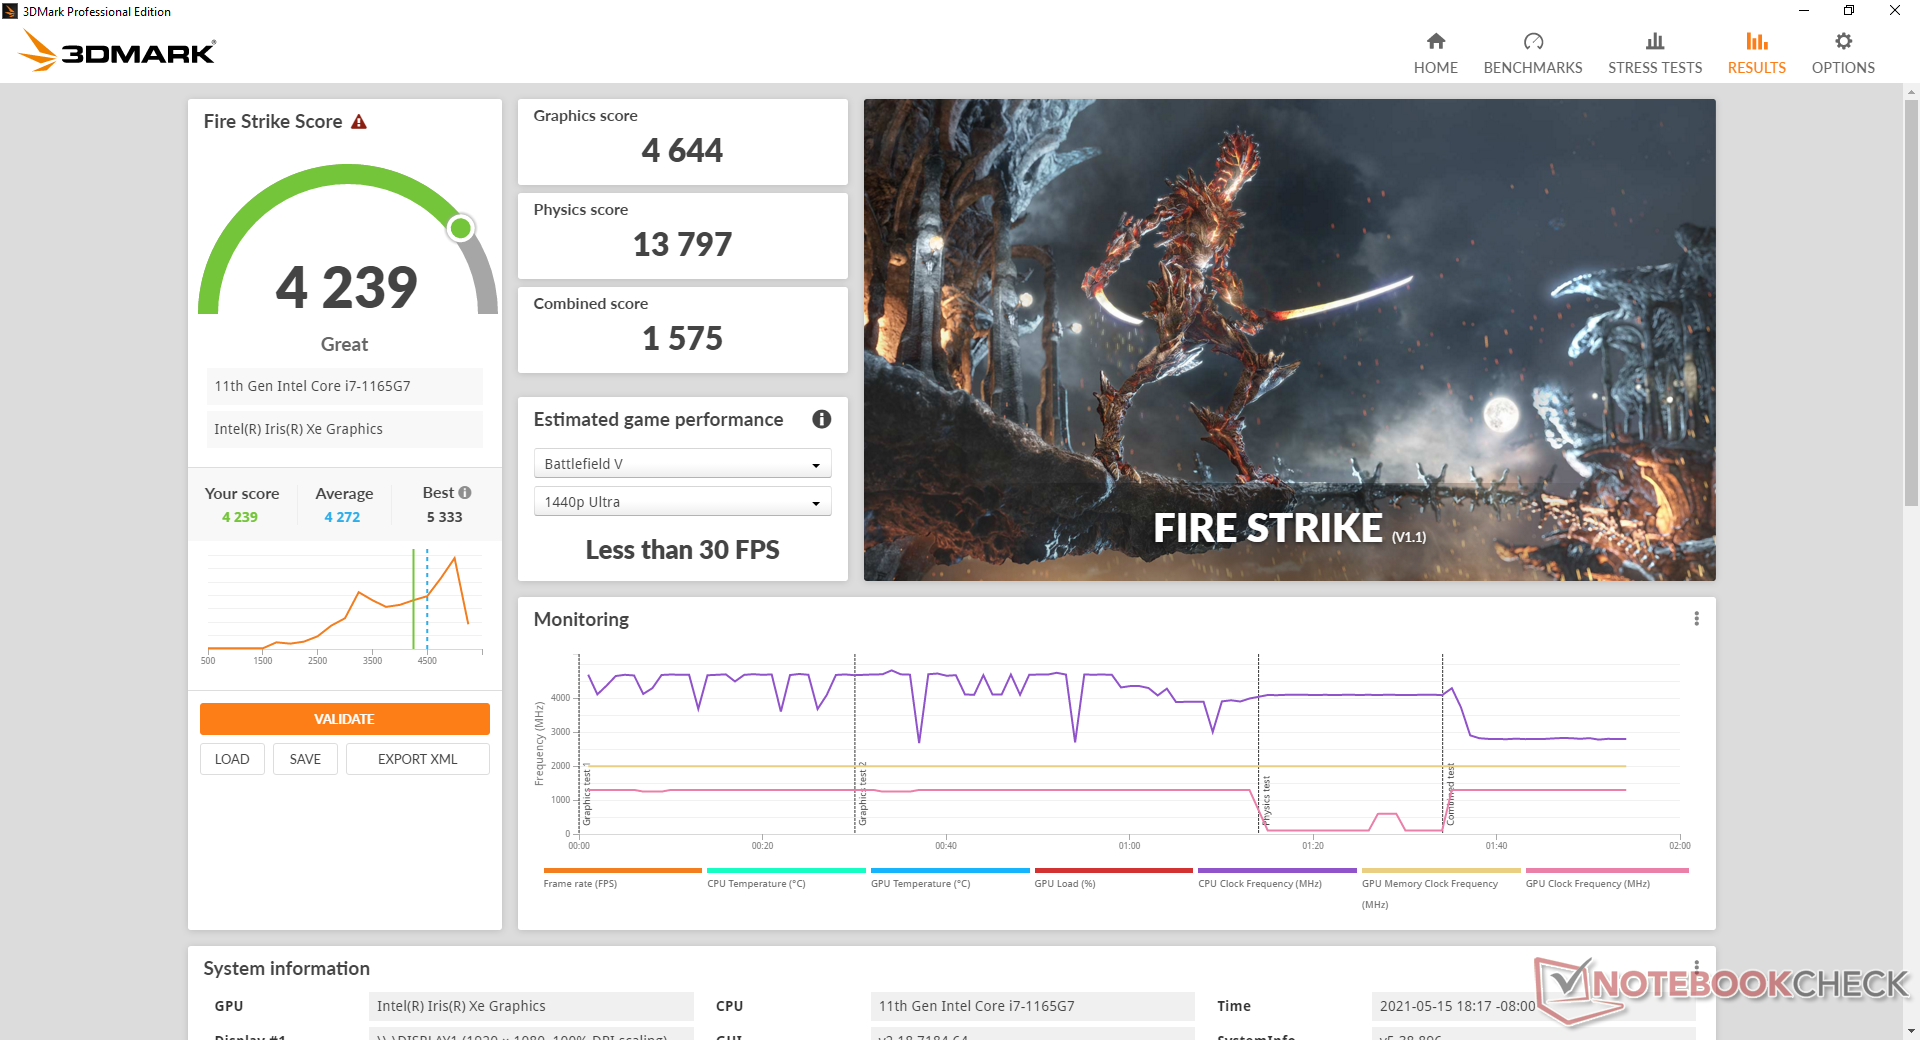
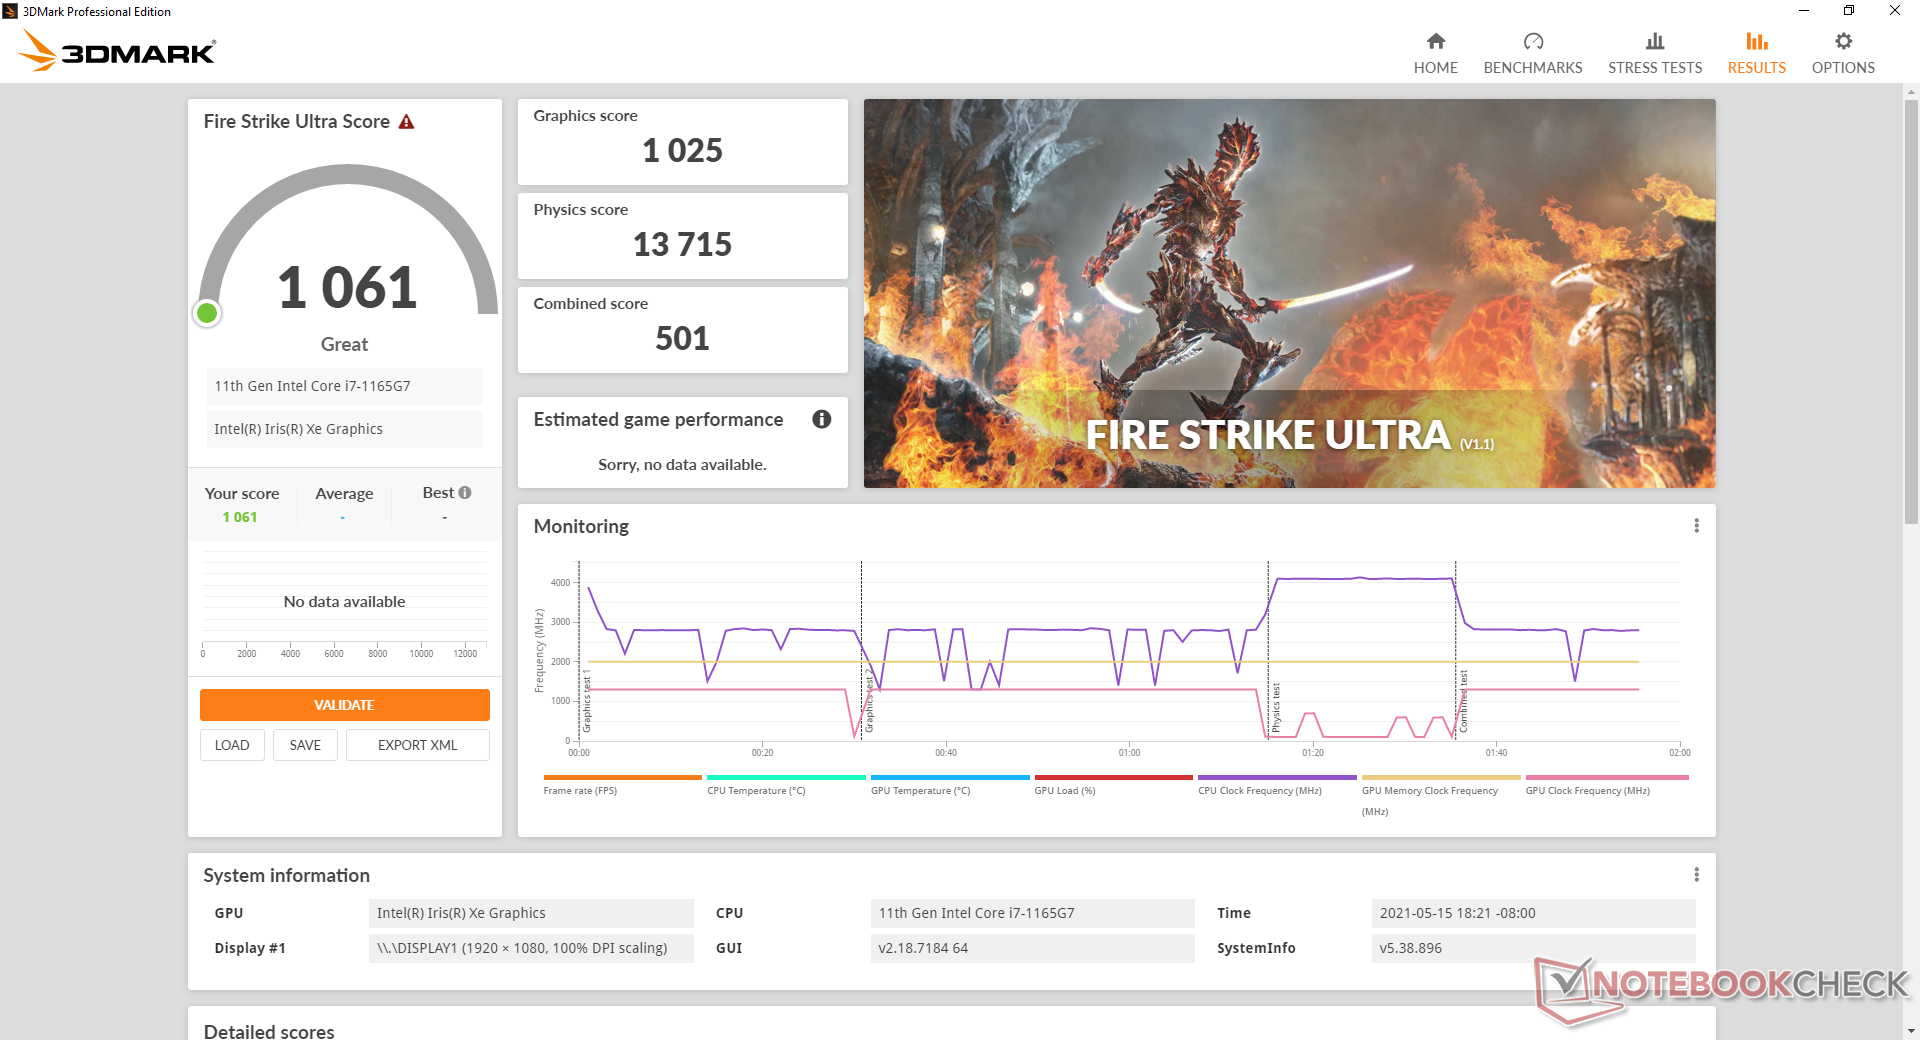
De grafische prestaties liggen binnen een paar procentpunten van de gemiddelde laptop in onze database die is uitgerust met dezelfde Iris Xe 96 EUs GPU. Hoewel 3DMark laat zien dat het beter presteert dan de GeForce MX250/350/450 series, zijn deze Nvidia GPU's nog steeds de betere keus onder echte gaming omstandigheden, grotendeels vanwege de meer volwassen drivers van Nvidia en het hogere energieverbruik dat beschikbaar is voor de CPU wanneer een discrete GPU aanwezig is. Wat betreft geïntegreerde GPU's is de Iris Xe echter de te kloppen keuze.
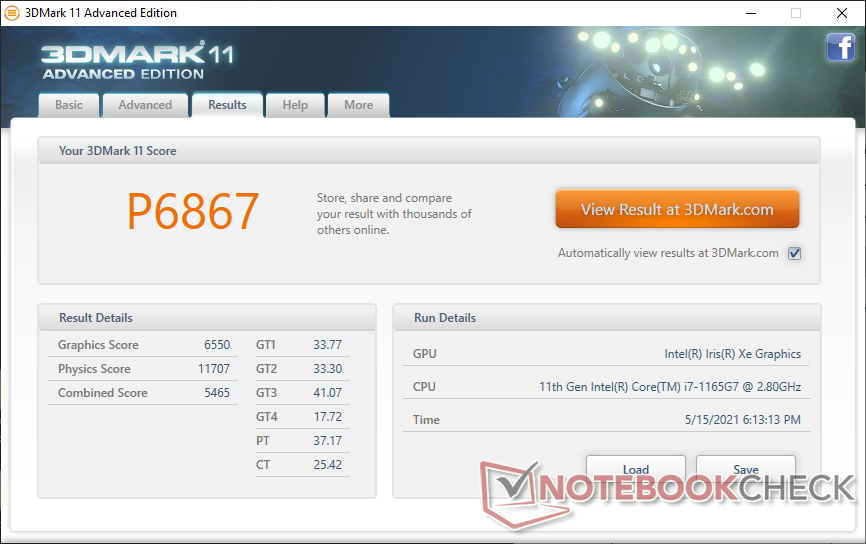
| 3DMark 11 Performance | 6867 punten | |
| 3DMark Cloud Gate Standard Score | 19447 punten | |
| 3DMark Fire Strike Score | 4239 punten | |
| 3DMark Time Spy Score | 1577 punten | |
Help | ||
| lage | gem. | hoge | ultra | |
|---|---|---|---|---|
| The Witcher 3 (2015) | 95.3 | 56.3 | 30.8 | 14.5 |
| Dota 2 Reborn (2015) | 81.5 | 67.3 | 45.4 | 42.3 |
| Final Fantasy XV Benchmark (2018) | 39.1 | 20.4 | 15.8 | |
| X-Plane 11.11 (2018) | 59.3 | 42.3 | 38.5 |
Emissions
Systeemgeluid
Ventilator geluid is nooit echt stil, zelfs niet wanneer het is ingesteld op "Silent" mode op MSI Center. We zijn in staat om een zeer licht ventilatorgeluid van 26,4 dB(A) te registreren tegen een achtergrond van 25,2 dB(A), ongeacht op welke instelling de laptop zou staan.
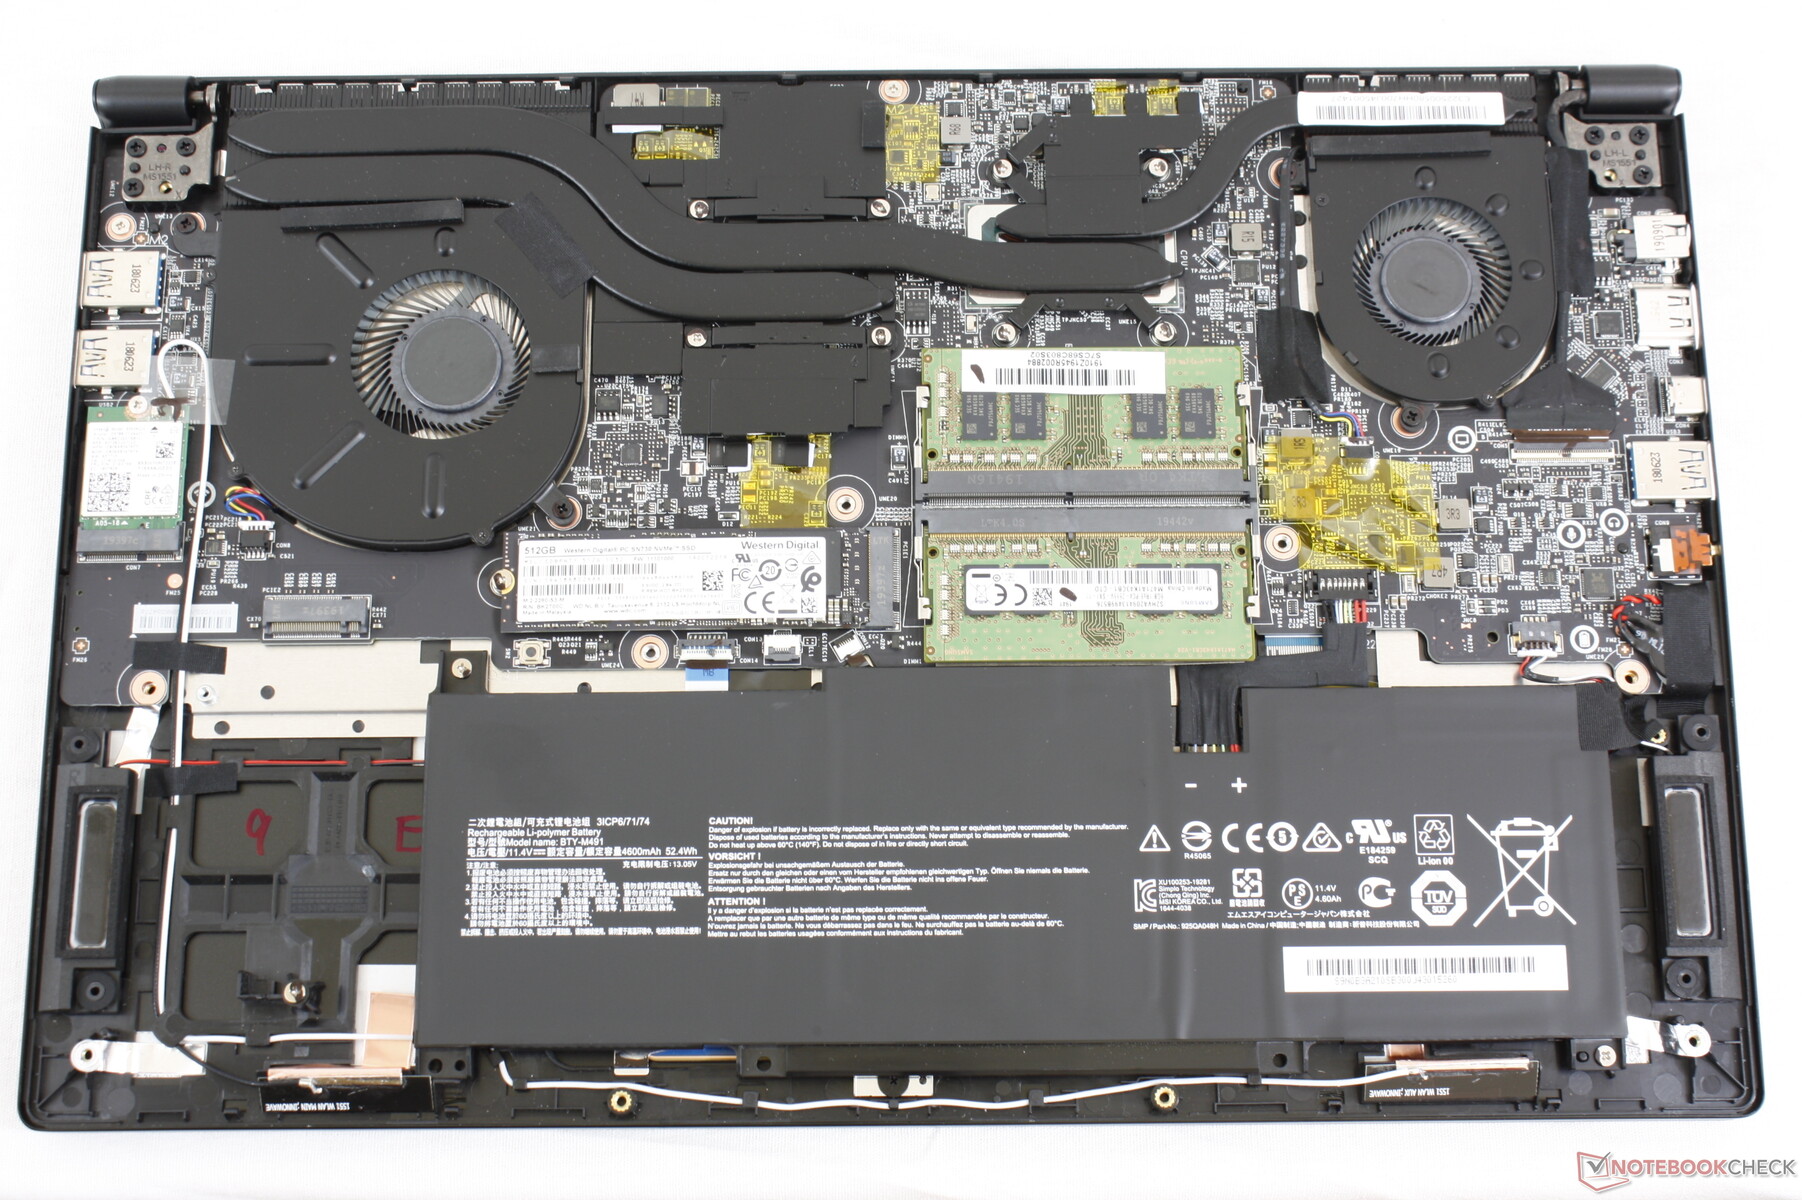
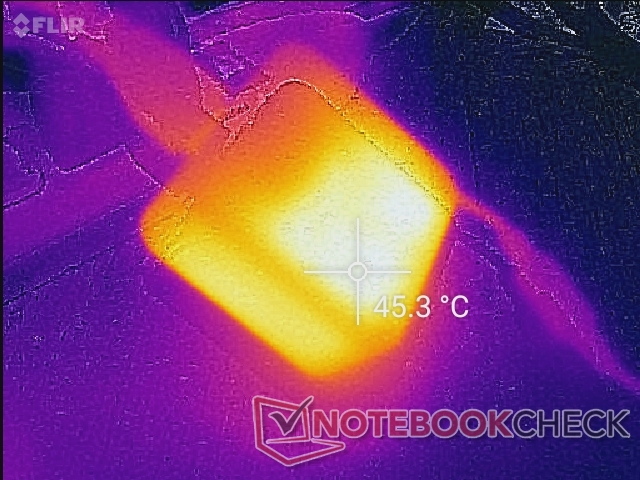
Gelukkig blijven de ventilatoren stil met 26,4 dB(A), zelfs na het draaien van de eerste benchmark scene van 3DMark 06. Dit komt doordat de koeloplossing is ontworpen om zowel een CPU als een discrete GPU te koelen, zoals blijkt uit de onderstaande afbeeldingen, ondanks het feit dat onze Summit B15 geen discrete GPU heeft. De twee interne ventilatoren hoeven dus niet altijd actief te zijn om het systeem zo koel te houden.
Natuurlijk kan het systeem nog steeds erg luid worden bij het draaien van games op hoge framerates waarbij de CPU wordt belast. In dit geval kan het ventilatorgeluid oplopen tot 40 dB(A) of 52,6 dB(A) wanneer Cooler Boost respectievelijk uit of aan staat. Merk op dat Cooler Boost meestal onnodig is voor deze ULV laptop, zoals onze Stress Test sectie hieronder zal laten zien.
Het geluid van de ventilator is erg laag Witcher 3 op Ultra instellingen, omdat de framerates in de enkele cijfers liggen. Bij lage grafische instellingen springt het ventilatorgeluid bijna onmiddellijk naar 40 dB(A) door de toename in CPU prestaties.
| MSI Summit B15 A11M Iris Xe G7 96EUs, i7-1165G7, Kingston OM8PCP31024F | MSI Summit E15 A11SCST GeForce GTX 1650 Ti Max-Q, i7-1185G7, Phison 1TB SM2801T24GKBB4S-E162 | Dell XPS 15 9500 Core i5 UHD Graphics 630, i5-10300H, Toshiba KBG40ZNS256G NVMe | HP Spectre X360 15-5ZV31AV GeForce MX250, i7-10510U, Intel SSD 660p 2TB SSDPEKNW020T8 | ADATA XPG Xenia Xe Iris Xe G7 96EUs, i7-1165G7, ADATA XPG Gammix S50 1TB | |
|---|---|---|---|---|---|
| Noise | -17% | -2% | -14% | -7% | |
| uit / omgeving * (dB) | 25.2 | 24 5% | 28 -11% | 30.1 -19% | 25.2 -0% |
| Idle Minimum * (dB) | 26.4 | 28 -6% | 28 -6% | 30.1 -14% | 25.2 5% |
| Idle Average * (dB) | 26.4 | 29 -10% | 28 -6% | 30.1 -14% | 25.2 5% |
| Idle Maximum * (dB) | 26.4 | 32 -21% | 28 -6% | 30.1 -14% | 25.2 5% |
| Load Average * (dB) | 26.8 | 43 -60% | 28 -4% | 30.1 -12% | 35.7 -33% |
| Witcher 3 ultra * (dB) | 28 | 41 -46% | 39.7 -42% | 39.7 -42% | |
| Load Maximum * (dB) | 52.6 | 44 16% | 41.9 20% | 42 20% | 45.3 14% |
* ... kleiner is beter
Geluidsniveau
| Onbelast |
| 26.4 / 26.4 / 26.4 dB (A) |
| Belasting |
| 26.8 / 52.6 dB (A) |
 | ||
30 dB stil 40 dB(A) hoorbaar 50 dB(A) luid |
||
min: | ||
Temperatuur
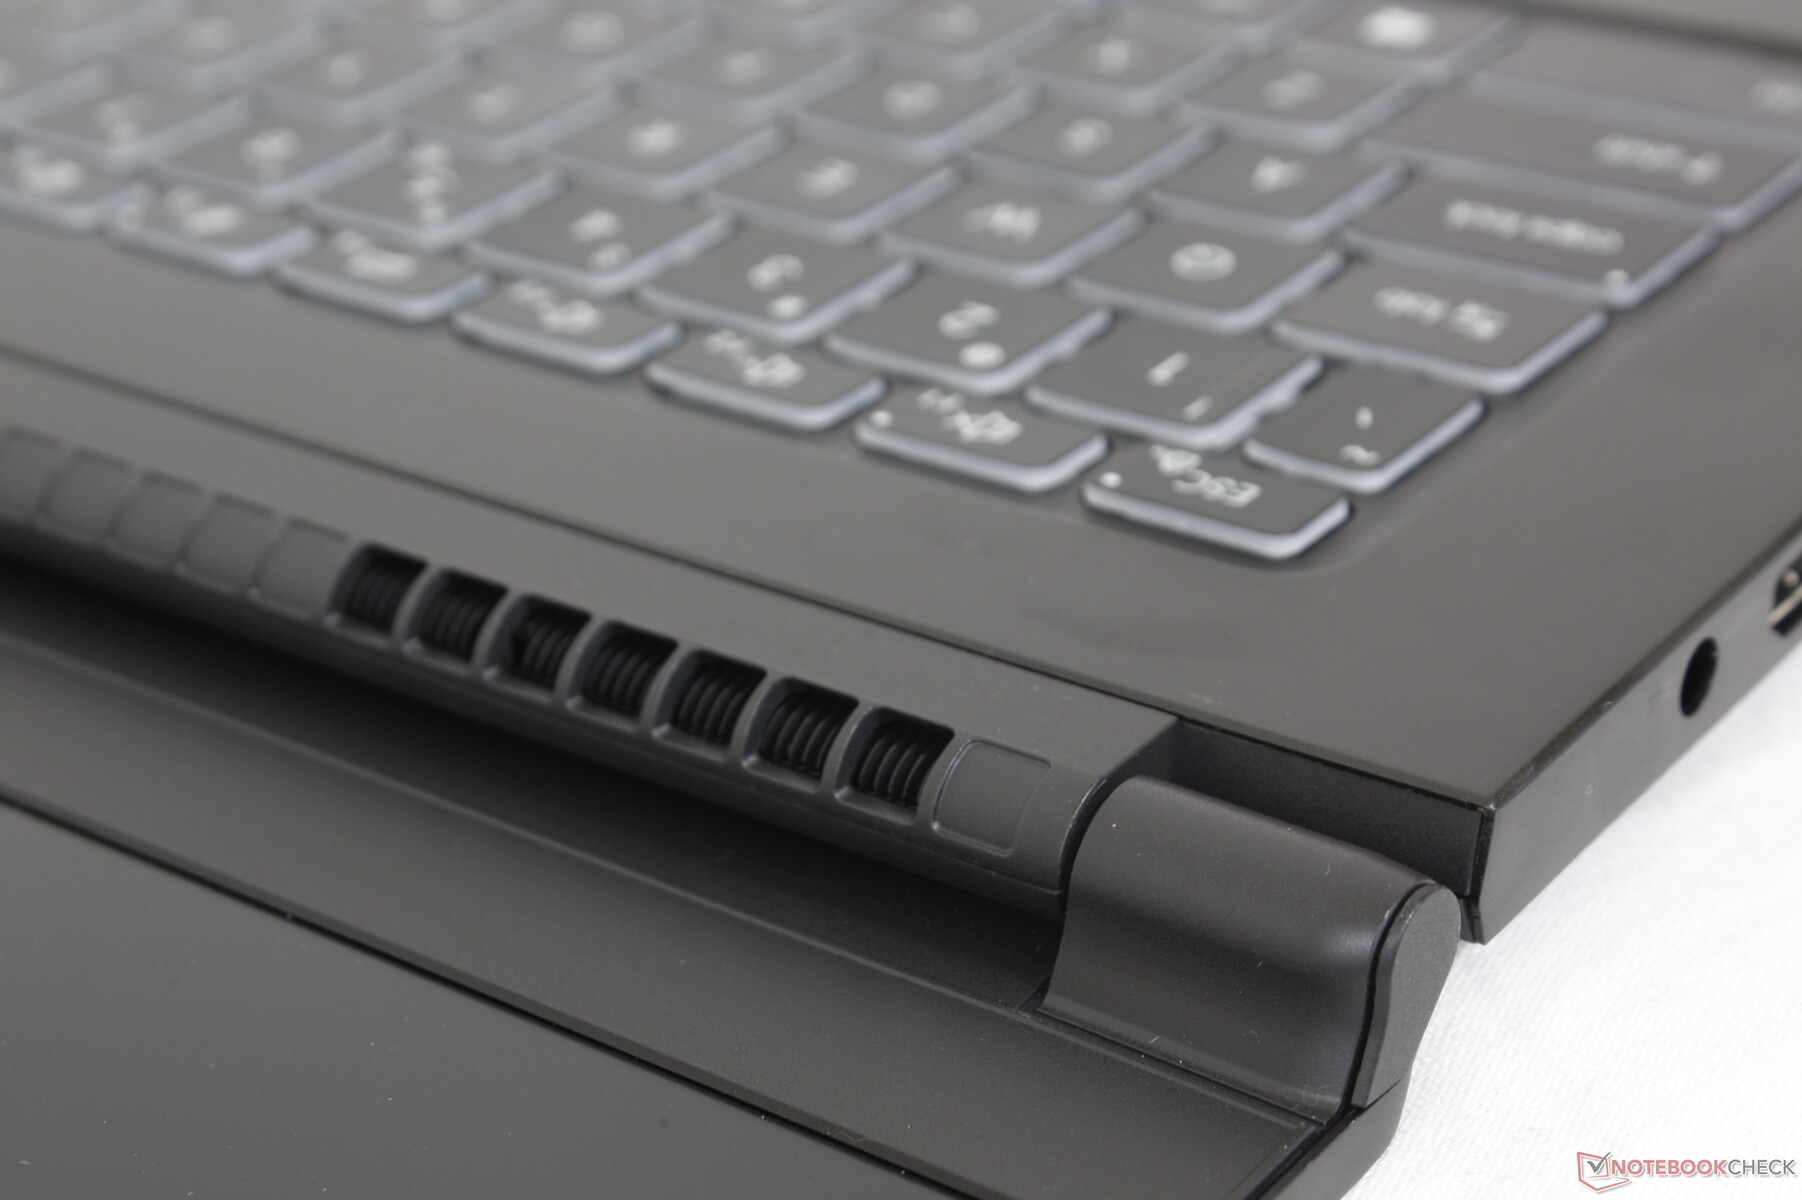
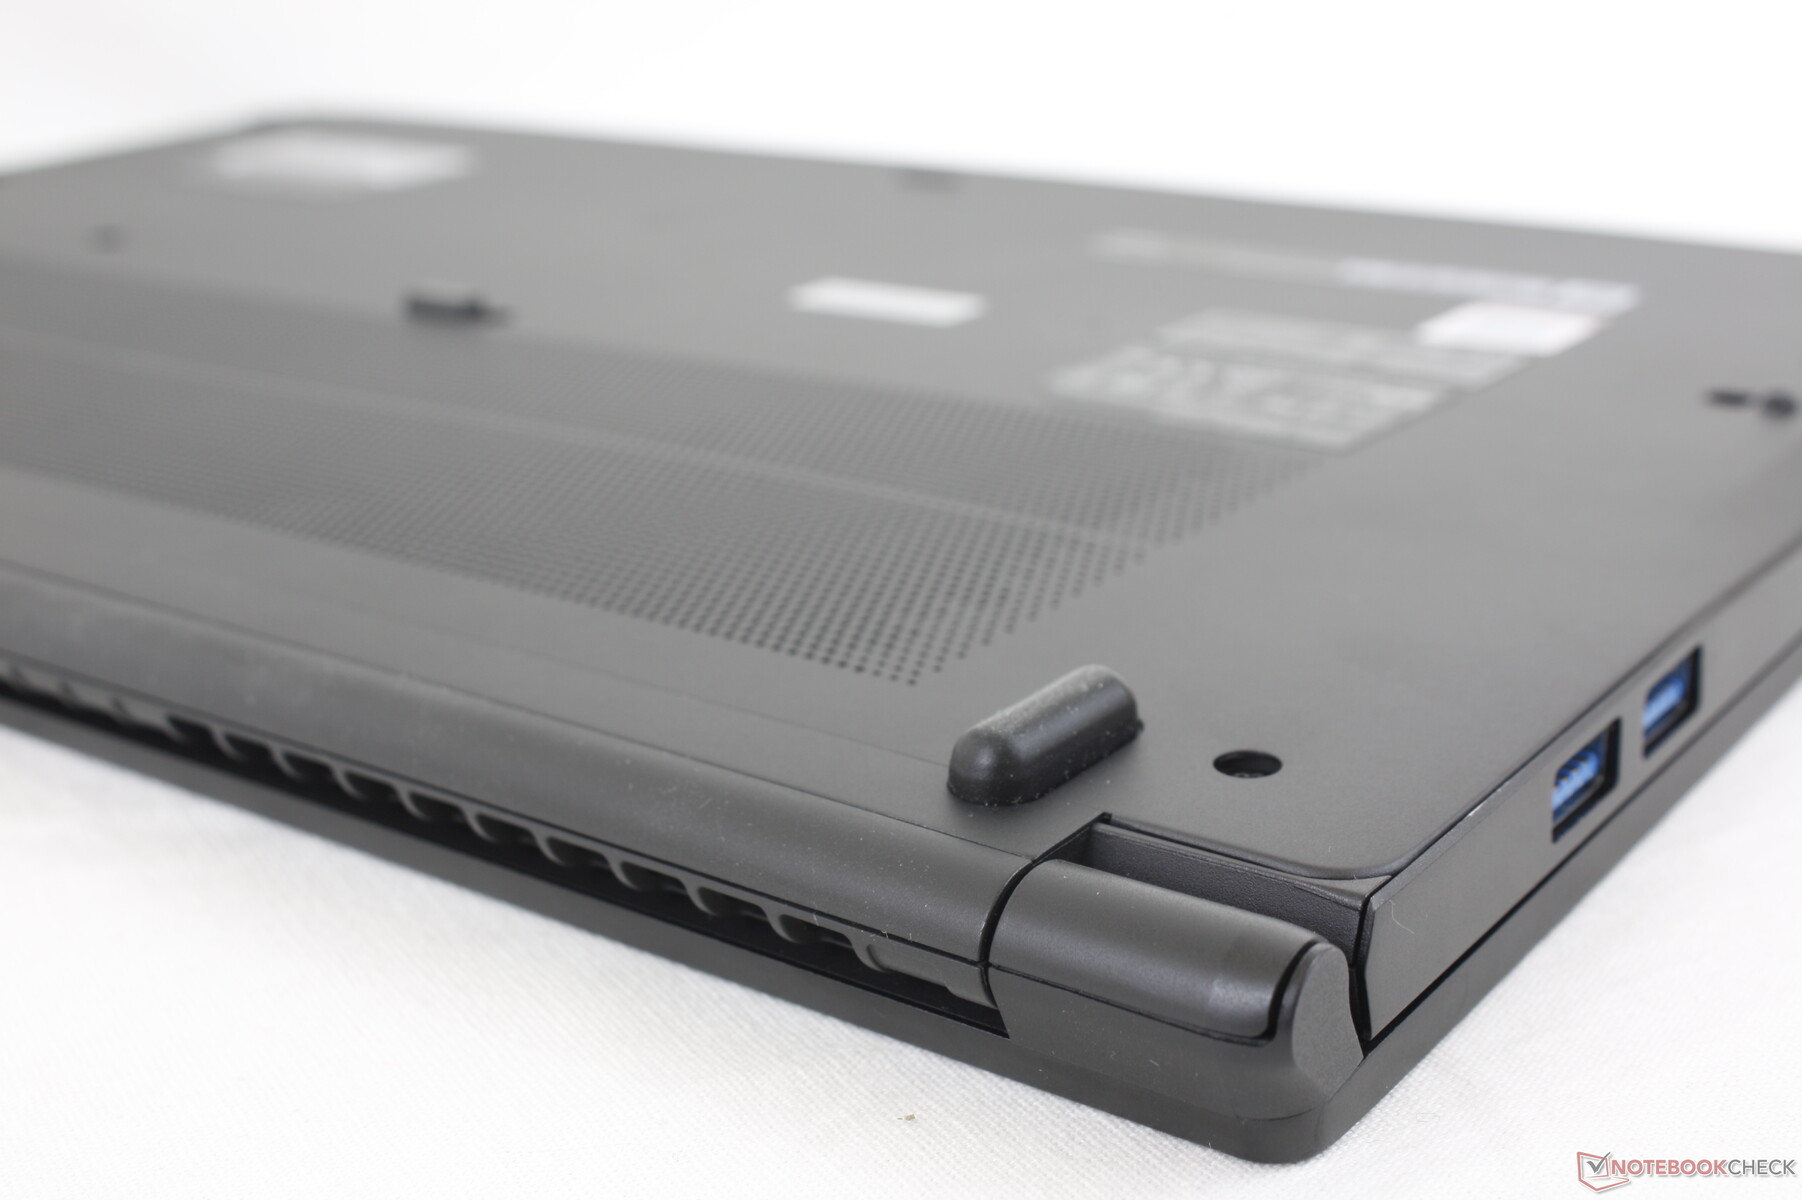
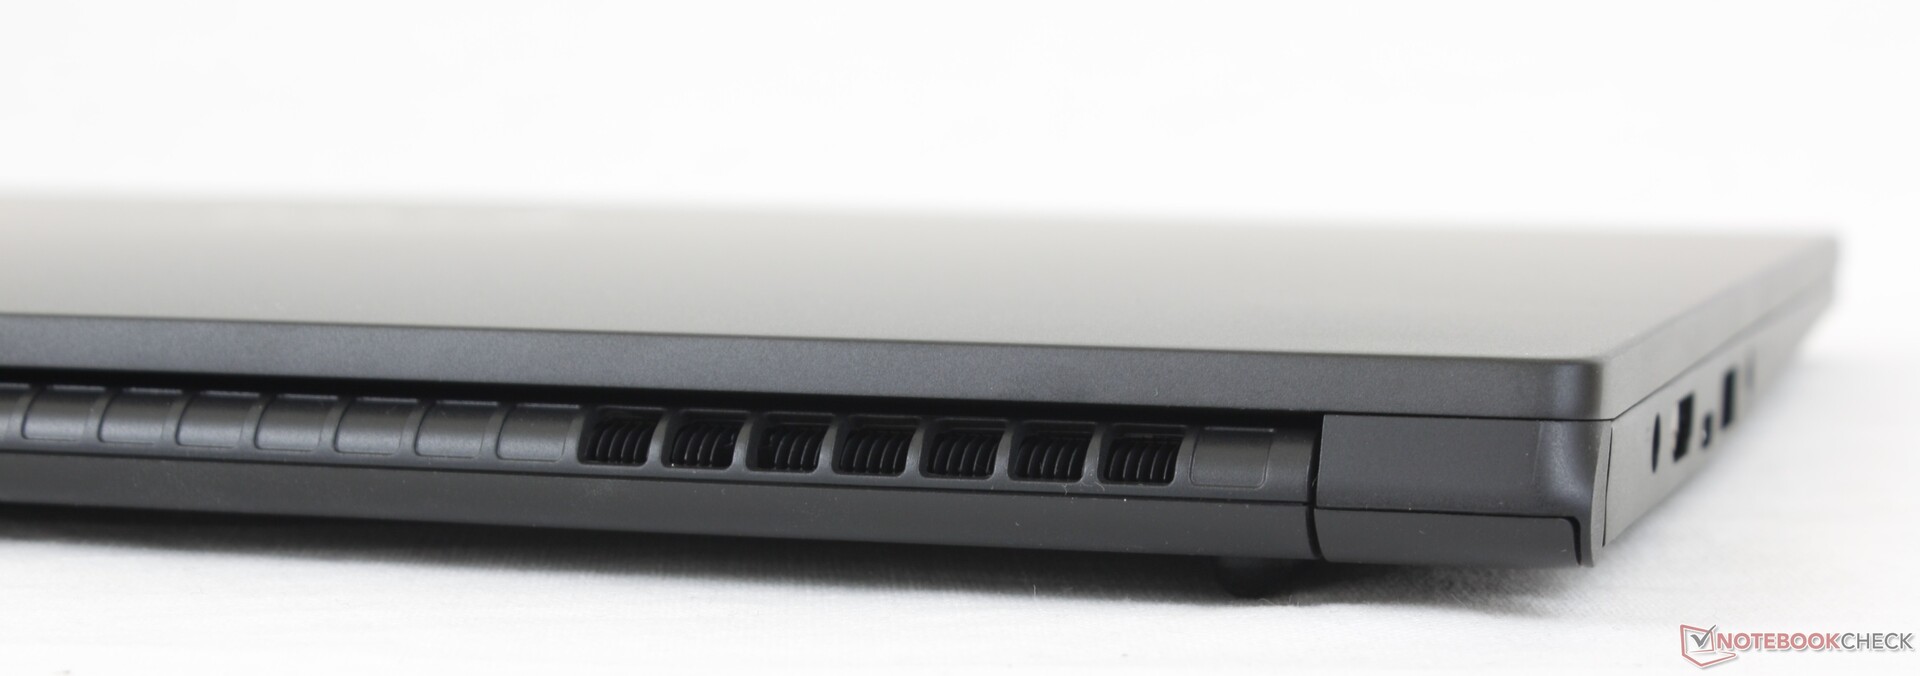
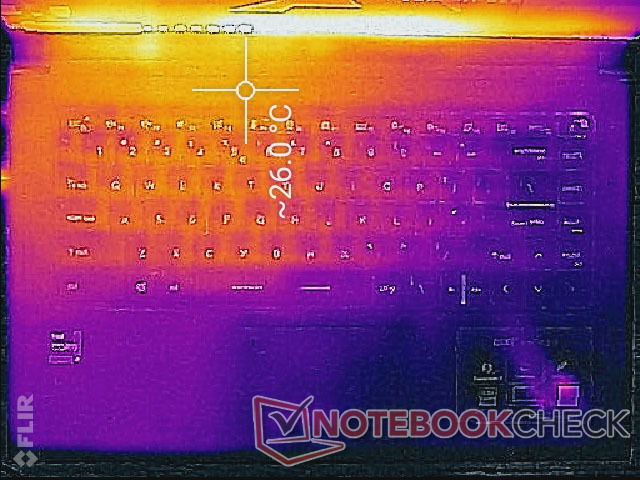
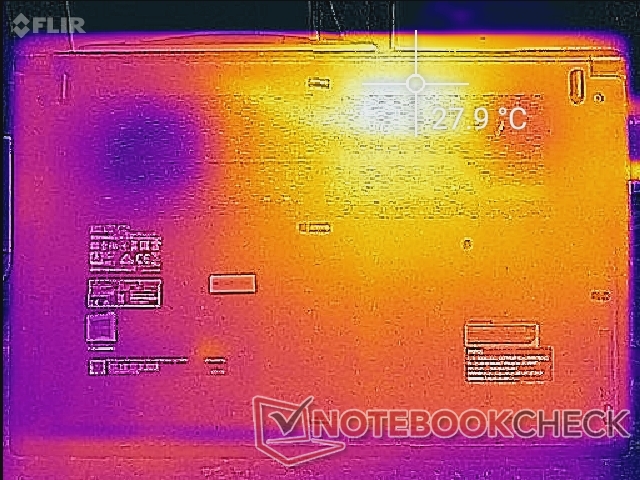
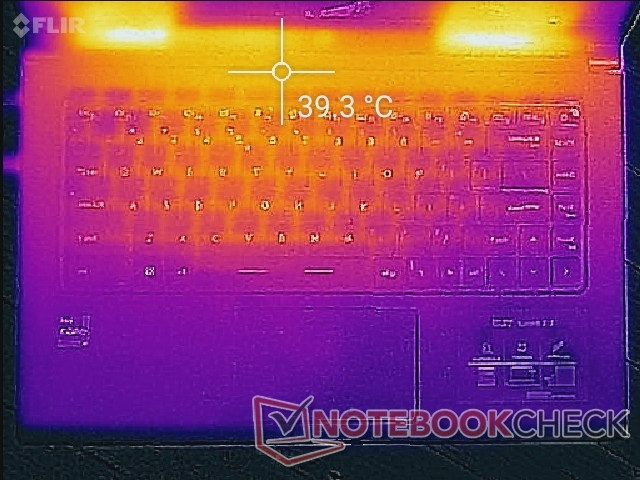
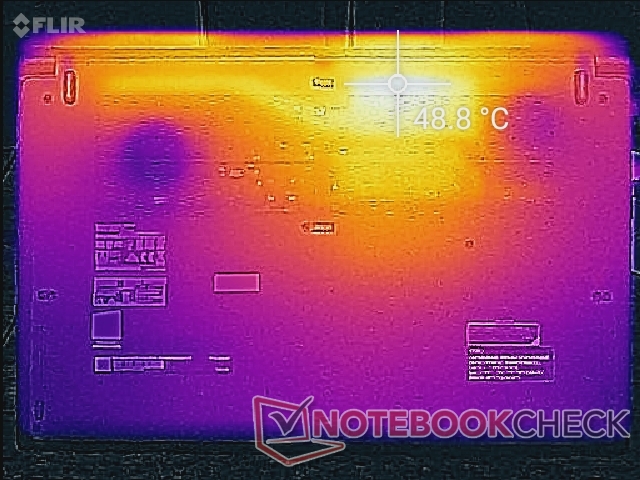
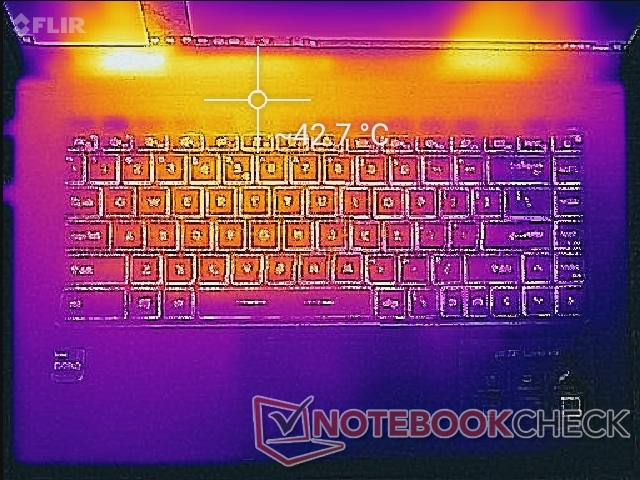
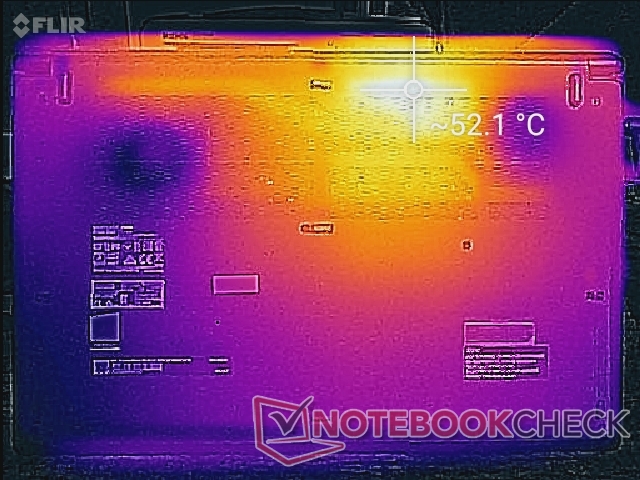
De oppervlaktetemperaturen zijn merkbaar koeler dan wat we waarnamen op de Modern 15, waarschijnlijk omdat onze Summit B15 niet is uitgerust met een discrete GPU. Het midden van het toetsenbord stabiliseert bijvoorbeeld rond de 38 C bij zware verwerkingsbelastingen, vergeleken met 45 C op de Modern 15. Hete plekken aan de onderkant zijn deze keer ook een paar graden koeler. Een groter deel van de onderzijde is gewijd aan ventilatie, in tegenstelling tot de kleine roosters op de Razer Blade Stealth of Blade 15 serie.
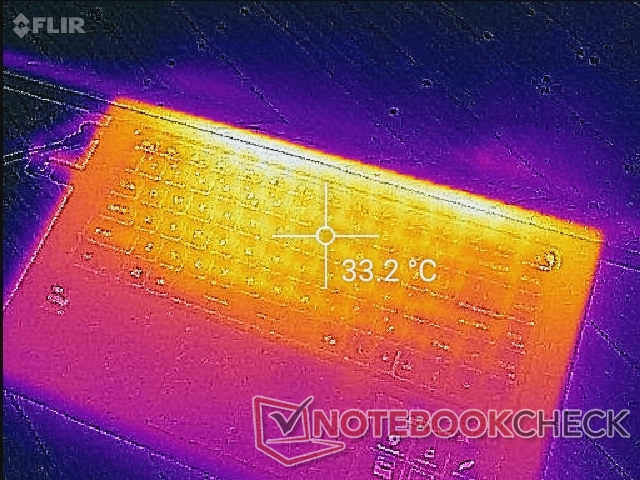
(±) De maximumtemperatuur aan de bovenzijde bedraagt 42.8 °C / 109 F, vergeleken met het gemiddelde van 34.3 °C / 94 F, variërend van 21.2 tot 62.5 °C voor de klasse Office.
(-) De bodem warmt op tot een maximum van 52.2 °C / 126 F, vergeleken met een gemiddelde van 36.8 °C / 98 F
(+) Bij onbelast gebruik bedraagt de gemiddelde temperatuur voor de bovenzijde 24.2 °C / 76 F, vergeleken met het apparaatgemiddelde van 29.5 °C / 85 F.
(+) Bij het spelen van The Witcher 3 is de gemiddelde temperatuur voor de bovenzijde 31.9 °C / 89 F, vergeleken met het apparaatgemiddelde van 29.5 °C / 85 F.
(+) De palmsteunen en het touchpad zijn met een maximum van ###max## °C / 84.6 F koeler dan de huidtemperatuur en voelen daarom koel aan.
(±) De gemiddelde temperatuur van de handpalmsteun van soortgelijke toestellen bedroeg 27.5 °C / 81.5 F (-1.7 °C / -3.1 F).
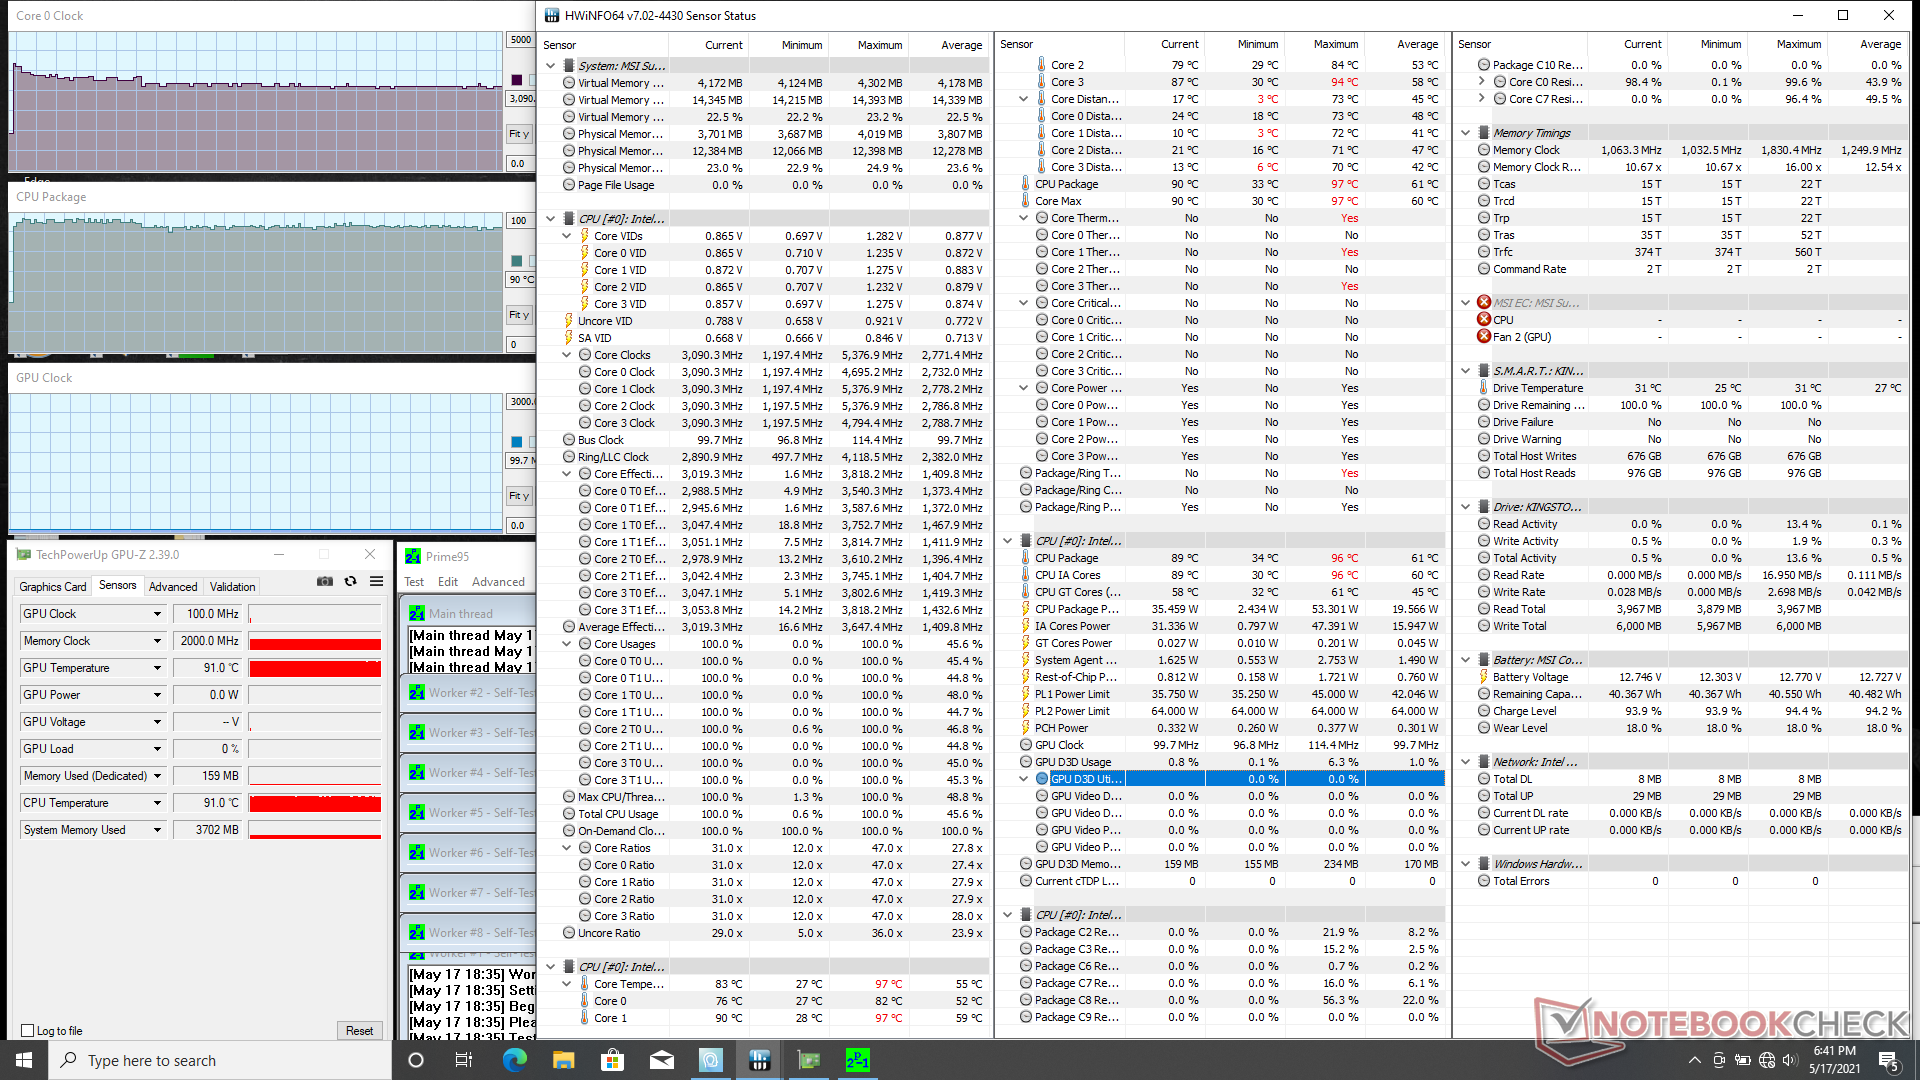
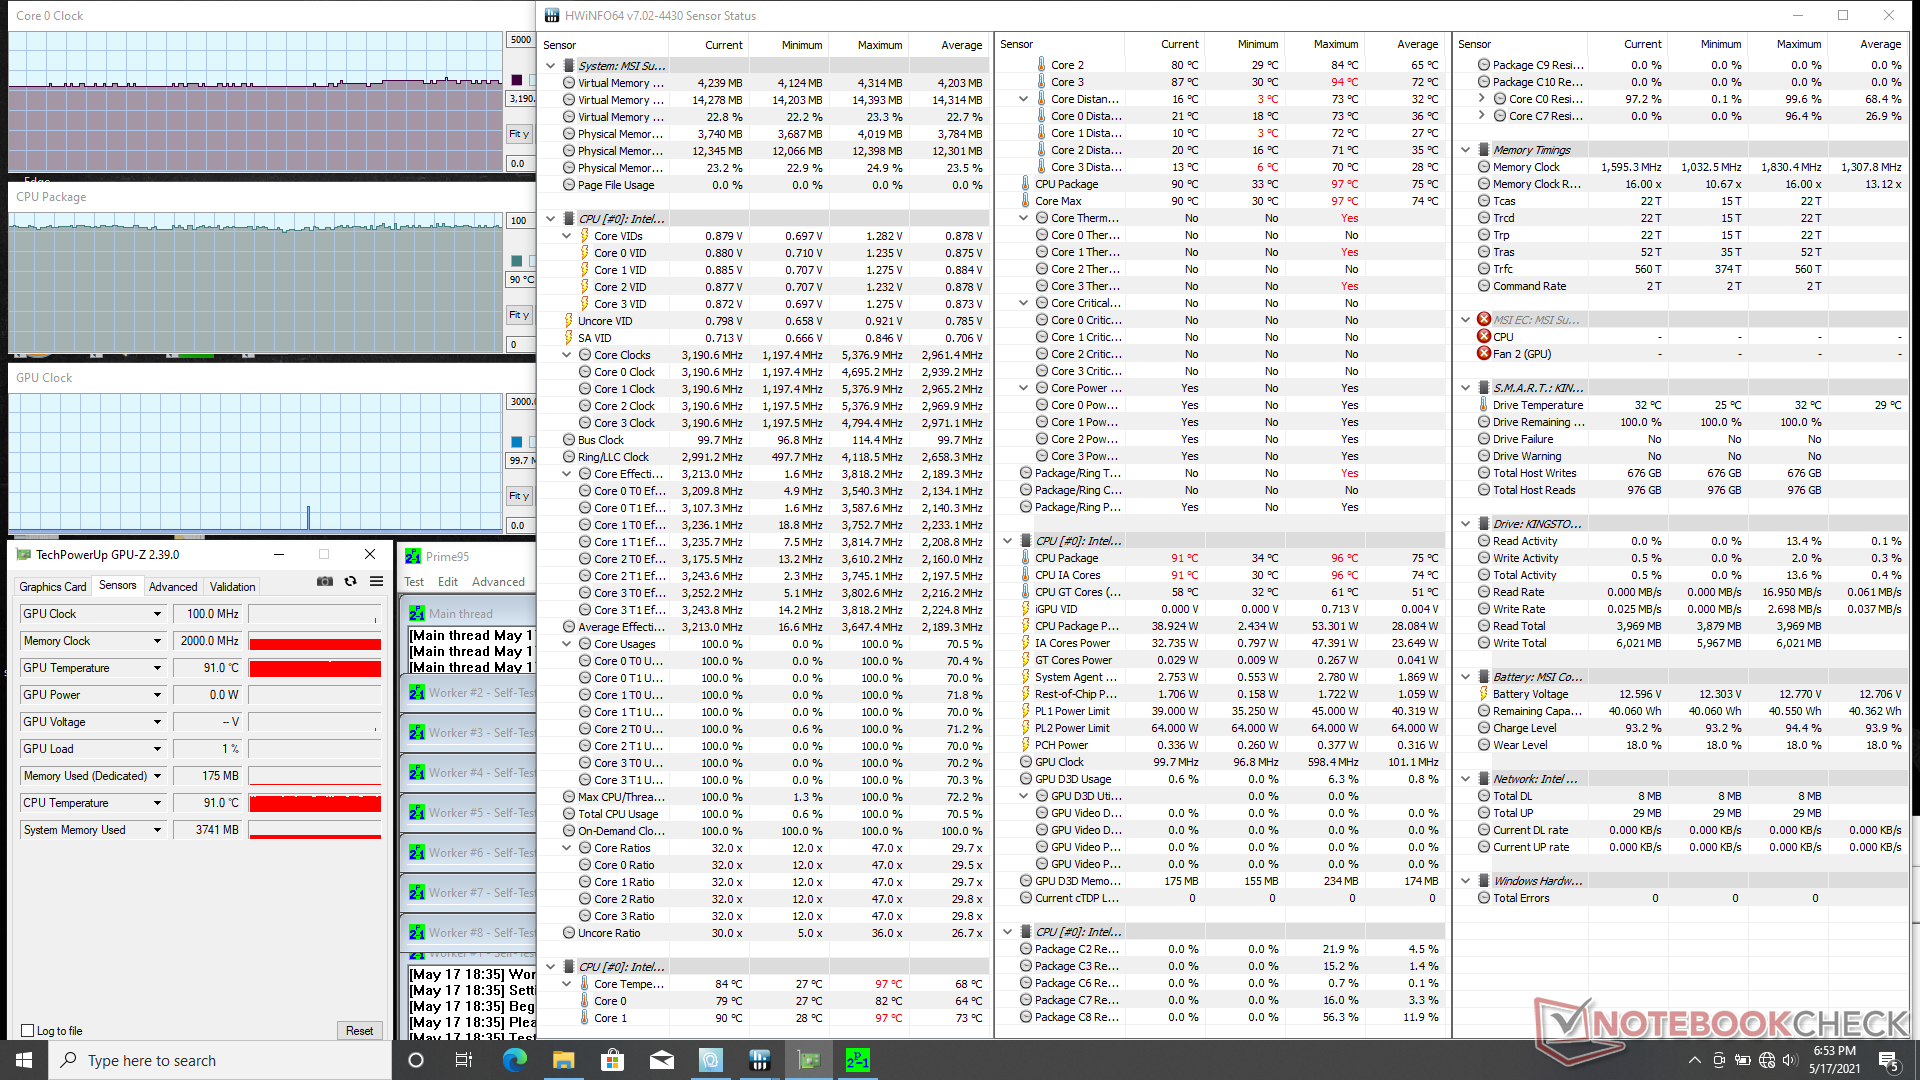
Stresstest
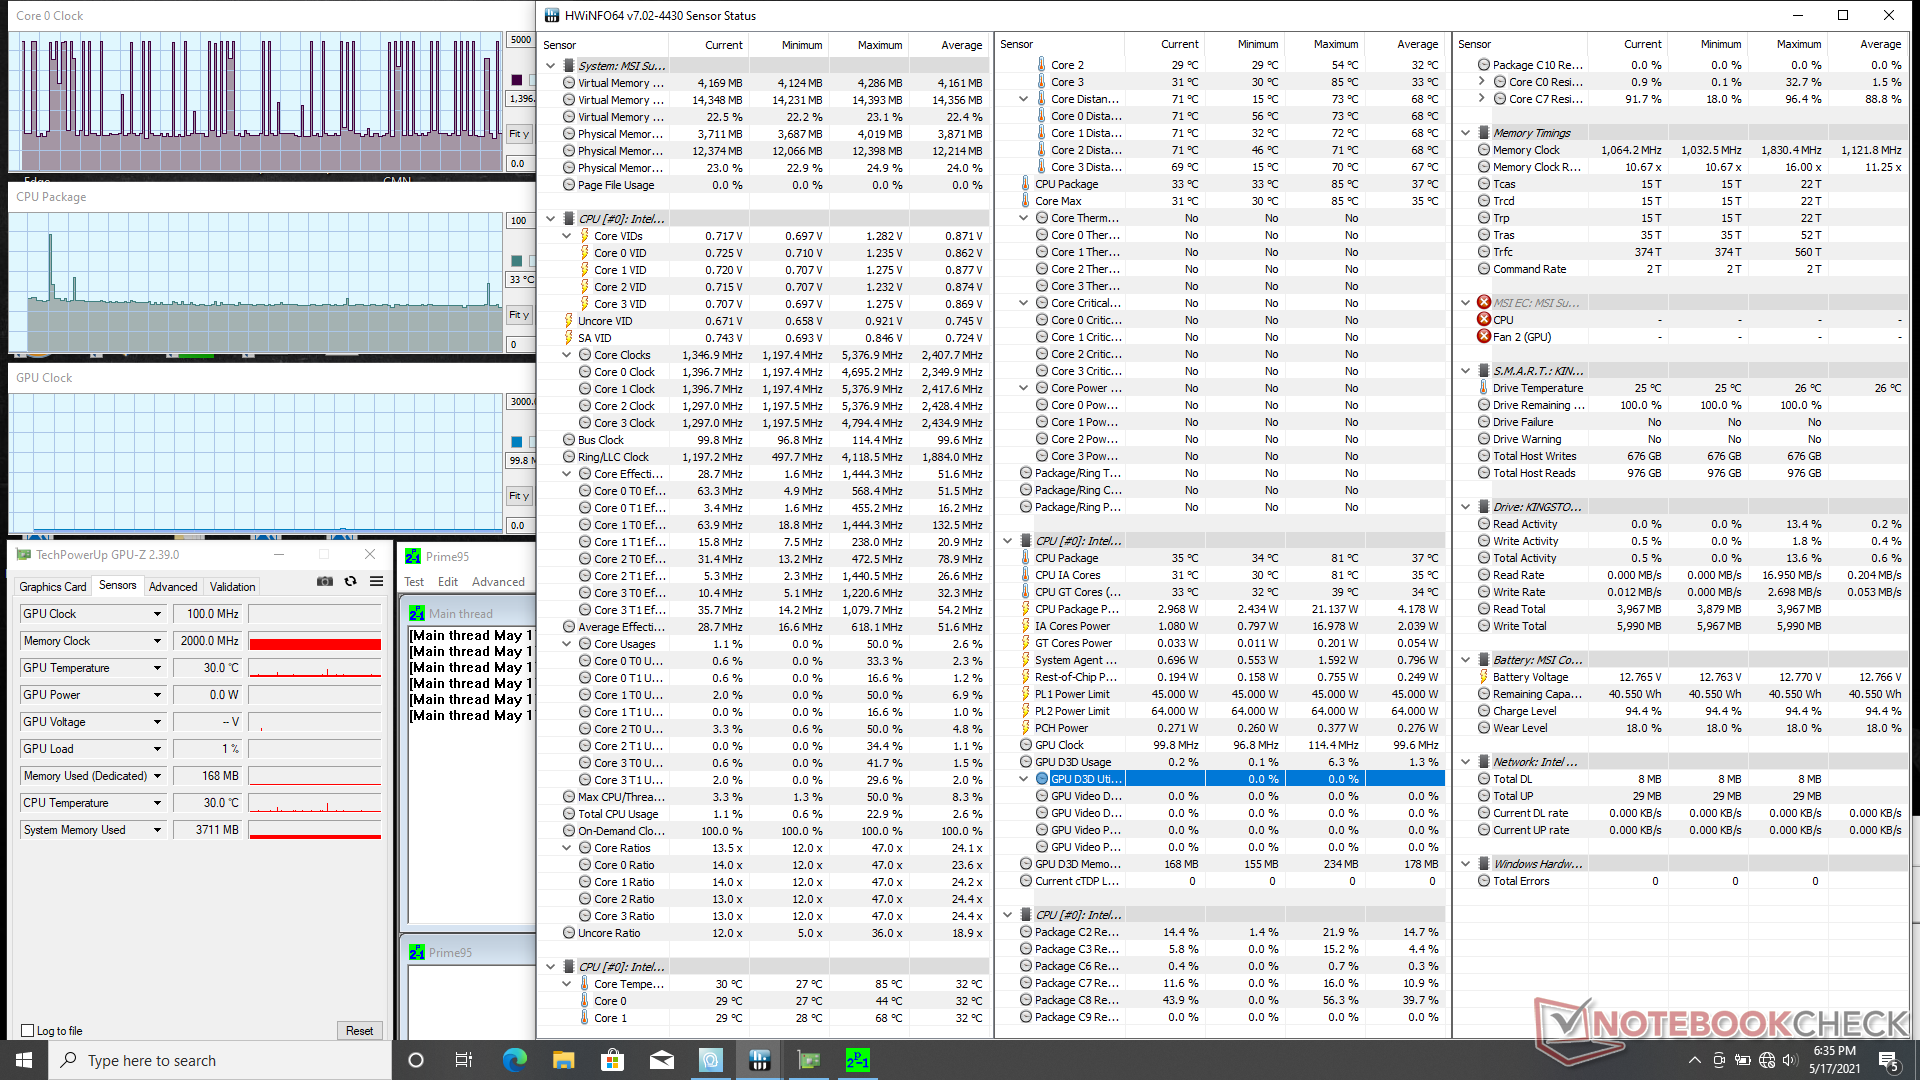
Wanneer de CPU wordt belast met Prime95, zal hij de eerste paar seconden een boost geven tot 3.8 GHz, daarna gestaag afnemen en zich uiteindelijk stabiliseren op 3.0 tot 3.1 GHz. Het inschakelen van de Cooler Boost modus (d.w.z. maximale ventilator modus) zorgt ervoor dat de CPU iets sneller draait op 3.2 tot 3.3 GHz terwijl de kerntemperatuur gelijk blijft op 90 C. De CPU temperatuur op de Modern 15 zou veel koeler zijn op 73 C wanneer deze onder vergelijkbare belasting draait
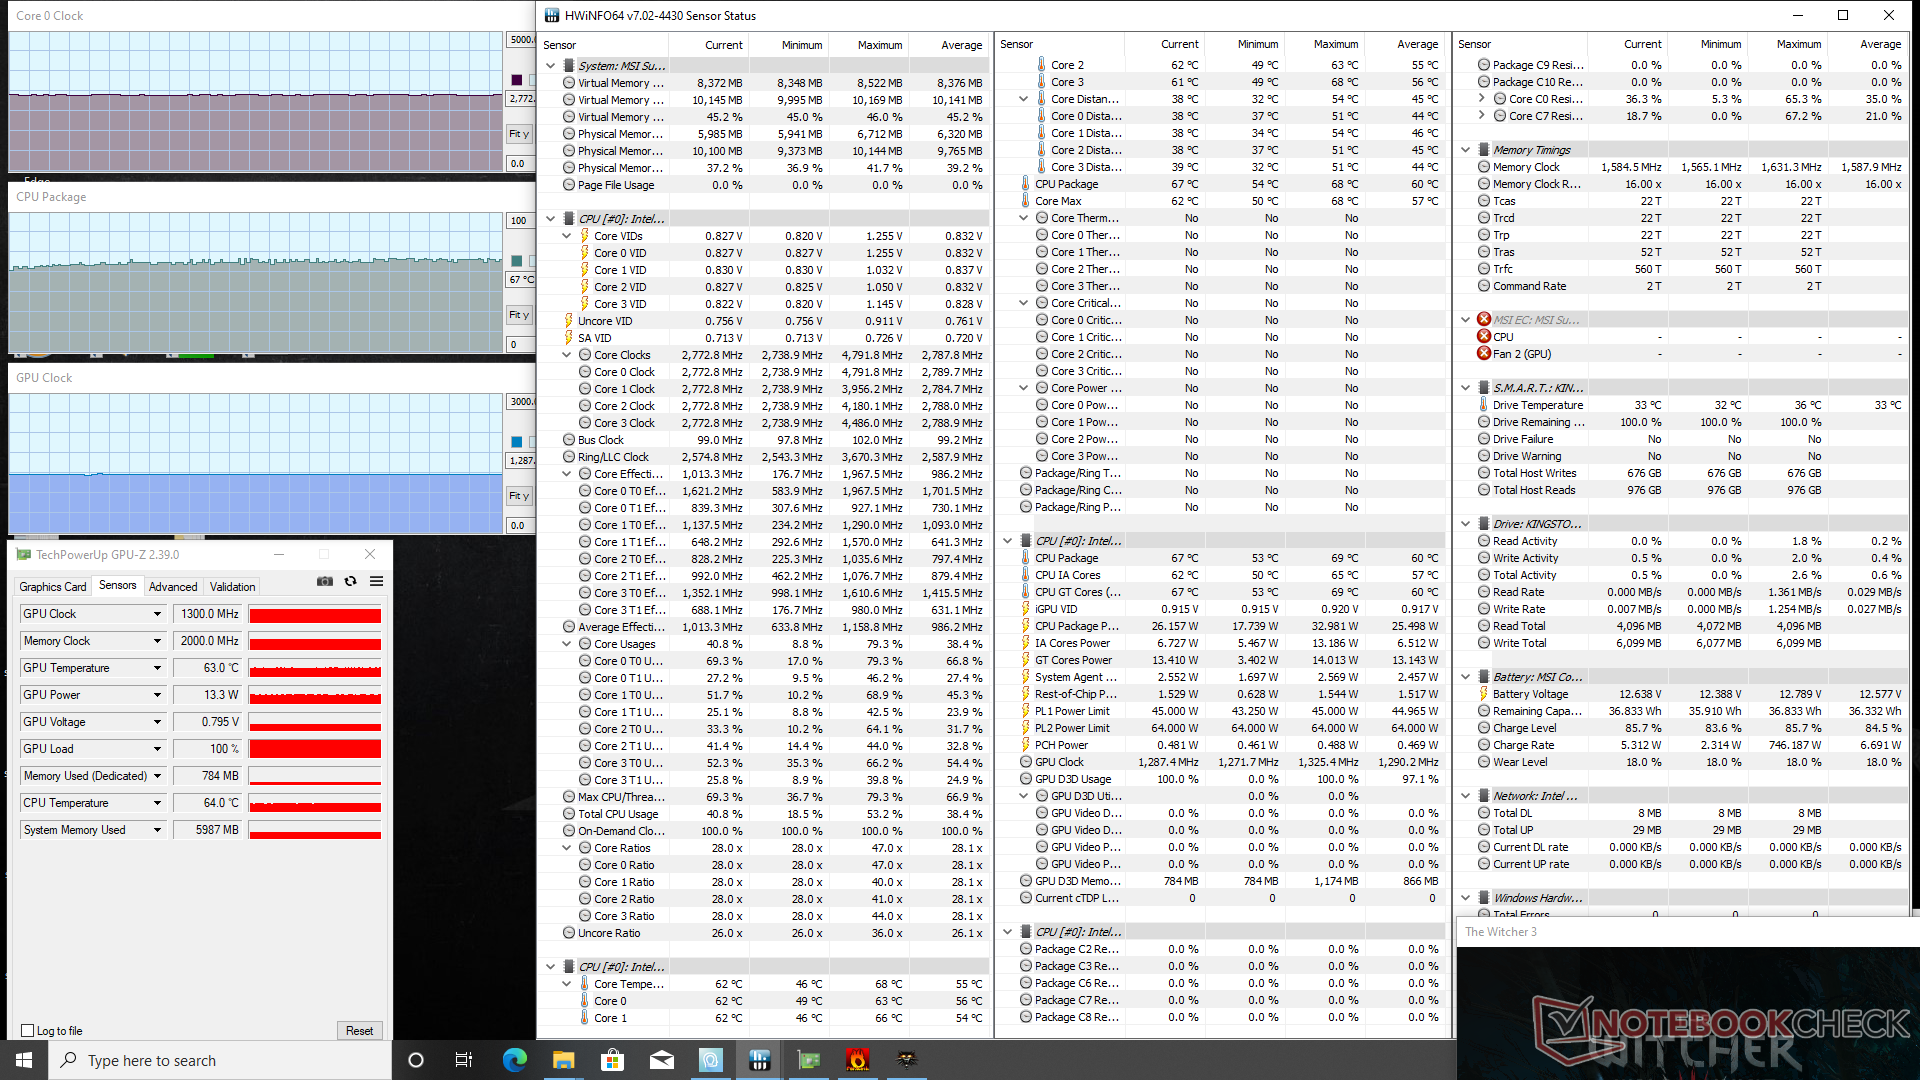
Wanneer we Witcher 3 om echte stressbelastingen weer te geven, zou de CPU stabiliseren op slechts 67 C of zelfs 56 C als Cooler Boost is ingeschakeld. De prestaties blijven echter gelijk, ongeacht de Cooler Boost instelling, wat betekent dat de functie vooral voor temperatuurdoeleinden is
Het werken op batterijen kan de grafische prestaties beïnvloeden. Een 3DMark 11 test op batterijvoeding zou dezelfde Physics score opleveren als op netstroom, maar met een iets lagere grafische score (6550 vs. 6232 punten).
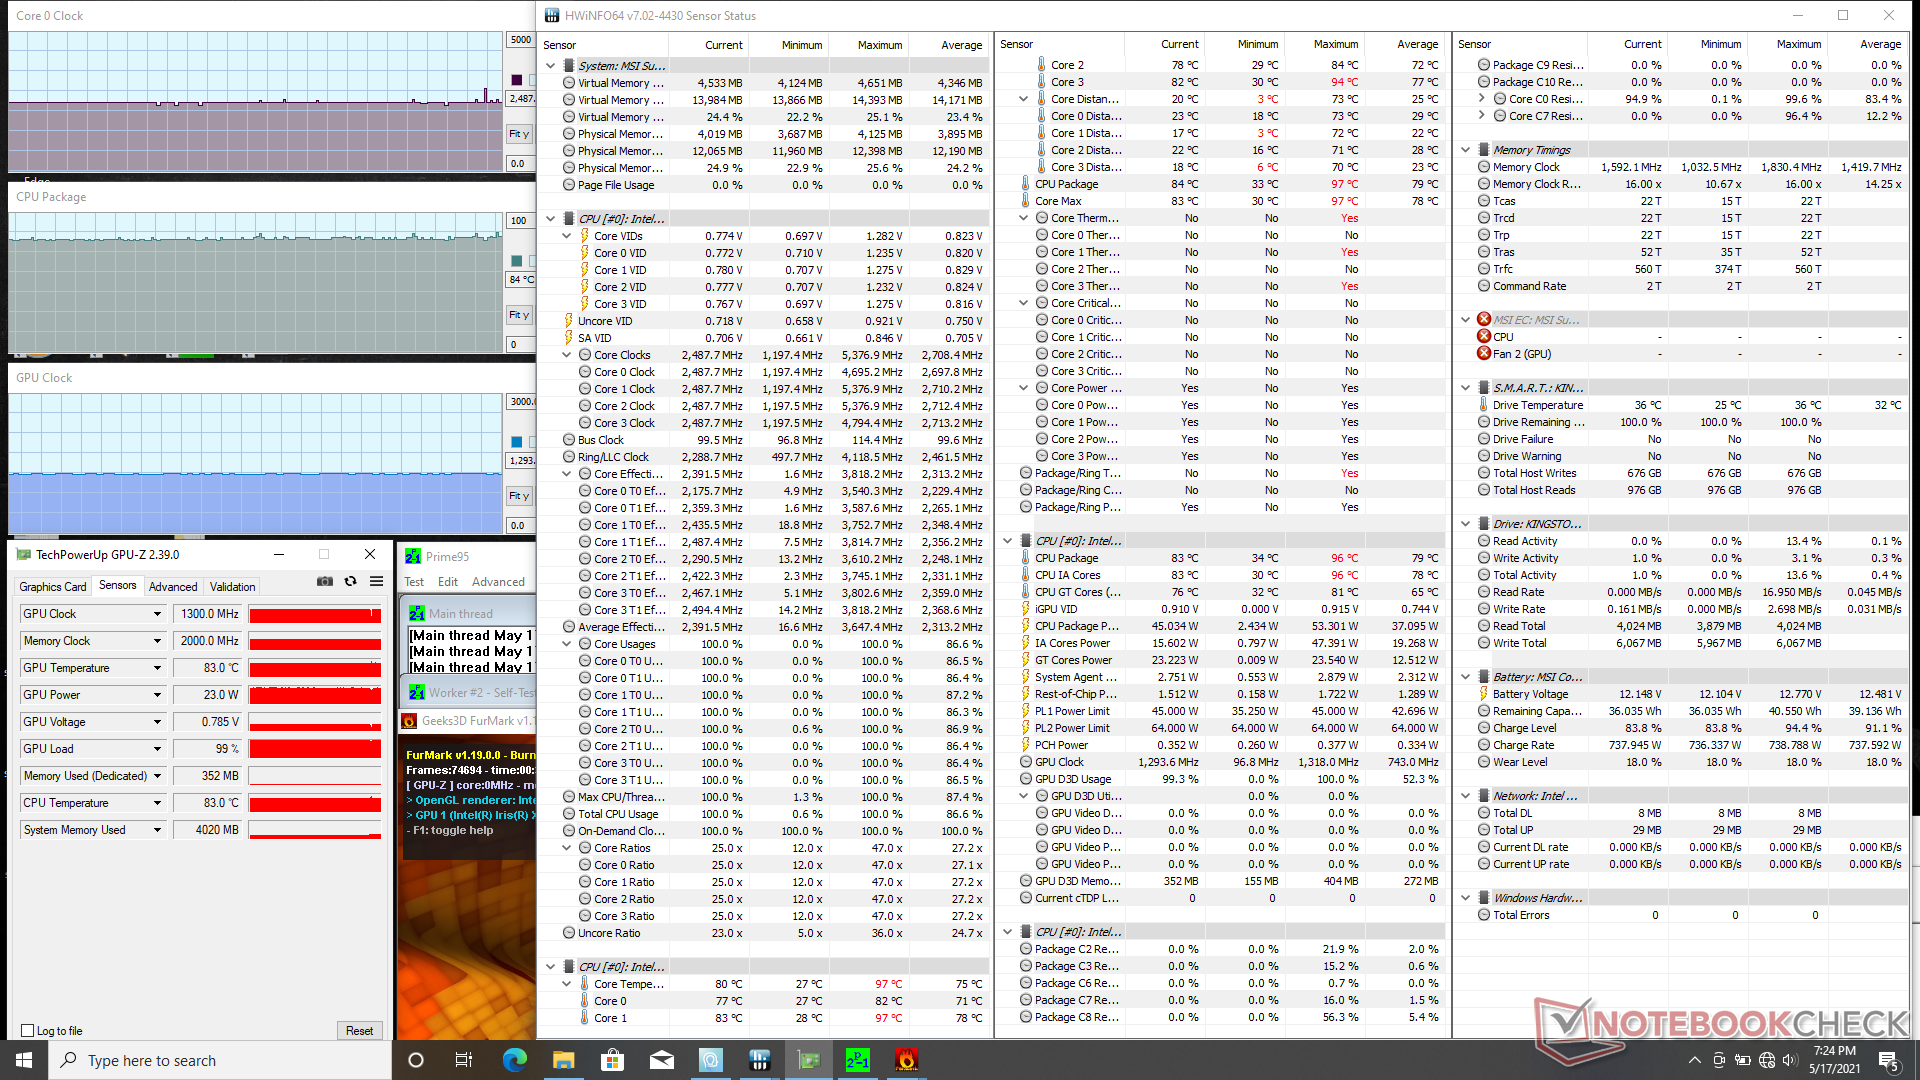

| CPUklok (GHz) GPUklok (MHz) GemiddeldeCPU temperatuur (°C) |
| Systeem in ruststand |
| Prime95 + FurMark Stress (Cooler Boost aan) |
| Prime95 Stress (Cooler Boost uit) |
| Prime95 Stress (Cooler Boost aan) |
| Witcher 3 Stress (Cooler Boost uit) |
| Witcher 3 Stress (Cooler Boost aan) |
Sprekers


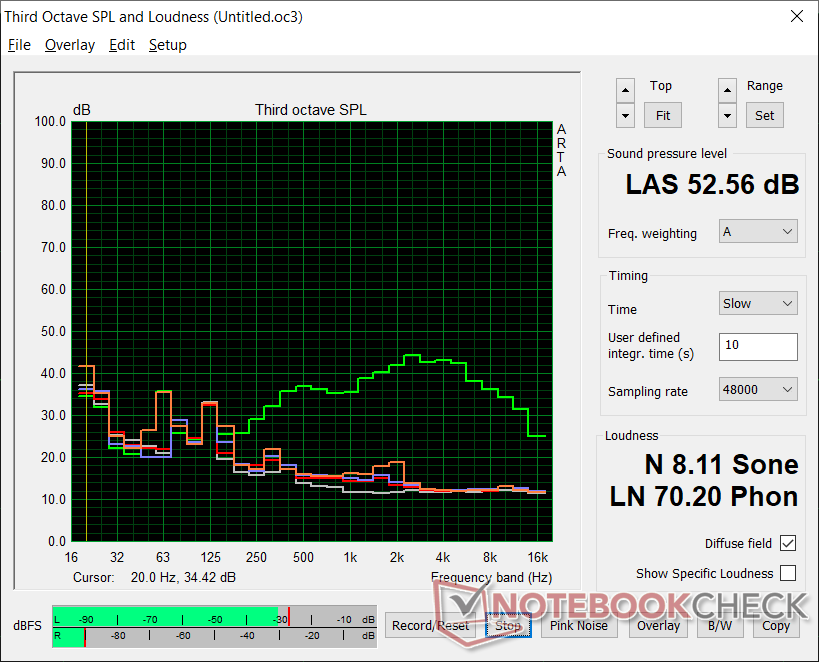
MSI Summit B15 A11M audioanalyse
(+) | luidsprekers kunnen relatief luid spelen (83.9 dB)
Bas 100 - 315 Hz
(-) | bijna geen lage tonen - gemiddeld 18.2% lager dan de mediaan
(±) | lineariteit van de lage tonen is gemiddeld (12.2% delta ten opzichte van de vorige frequentie)
Midden 400 - 2000 Hz
(±) | hogere middens - gemiddeld 9.5% hoger dan de mediaan
(±) | lineariteit van de middentonen is gemiddeld (9.3% delta ten opzichte van de vorige frequentie)
Hoog 2 - 16 kHz
(±) | higher highs - on average 7.5% higher than median
(±) | lineariteit van de hoogtepunten is gemiddeld (7.1% delta ten opzichte van de vorige frequentie)
Algemeen 100 - 16.000 Hz
(±) | lineariteit van het totale geluid is gemiddeld (25.6% verschil met de mediaan)
Vergeleken met dezelfde klasse
» 78% van alle geteste apparaten in deze klasse waren beter, 6% vergelijkbaar, 16% slechter
» De beste had een delta van 7%, het gemiddelde was 21%, de slechtste was 53%
Vergeleken met alle geteste toestellen
» 79% van alle geteste apparaten waren beter, 4% gelijk, 17% slechter
» De beste had een delta van 4%, het gemiddelde was 24%, de slechtste was 134%
Apple MacBook 12 (Early 2016) 1.1 GHz audioanalyse
(+) | luidsprekers kunnen relatief luid spelen (83.6 dB)
Bas 100 - 315 Hz
(±) | verminderde zeebaars - gemiddeld 11.3% lager dan de mediaan
(±) | lineariteit van de lage tonen is gemiddeld (14.2% delta ten opzichte van de vorige frequentie)
Midden 400 - 2000 Hz
(+) | evenwichtige middens - slechts 2.4% verwijderd van de mediaan
(+) | de middentonen zijn lineair (5.5% delta ten opzichte van de vorige frequentie)
Hoog 2 - 16 kHz
(+) | evenwichtige hoogtepunten - slechts 2% verwijderd van de mediaan
(+) | de hoge tonen zijn lineair (4.5% delta naar de vorige frequentie)
Algemeen 100 - 16.000 Hz
(+) | het totale geluid is lineair (10.2% verschil met de mediaan)
Vergeleken met dezelfde klasse
» 7% van alle geteste apparaten in deze klasse waren beter, 2% vergelijkbaar, 91% slechter
» De beste had een delta van 5%, het gemiddelde was 18%, de slechtste was 53%
Vergeleken met alle geteste toestellen
» 5% van alle geteste apparaten waren beter, 1% gelijk, 94% slechter
» De beste had een delta van 4%, het gemiddelde was 24%, de slechtste was 134%
Energy Management
Stroomverbruik
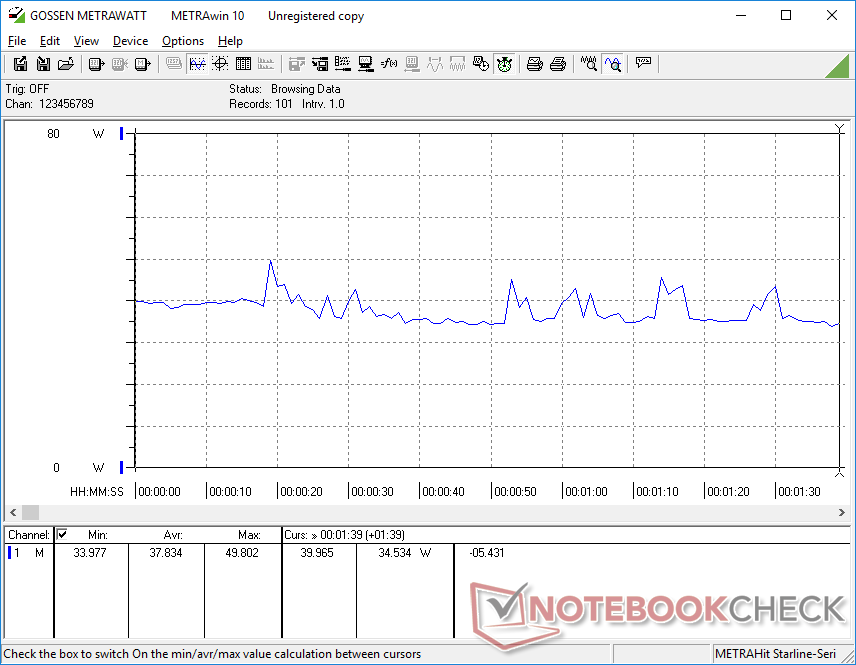
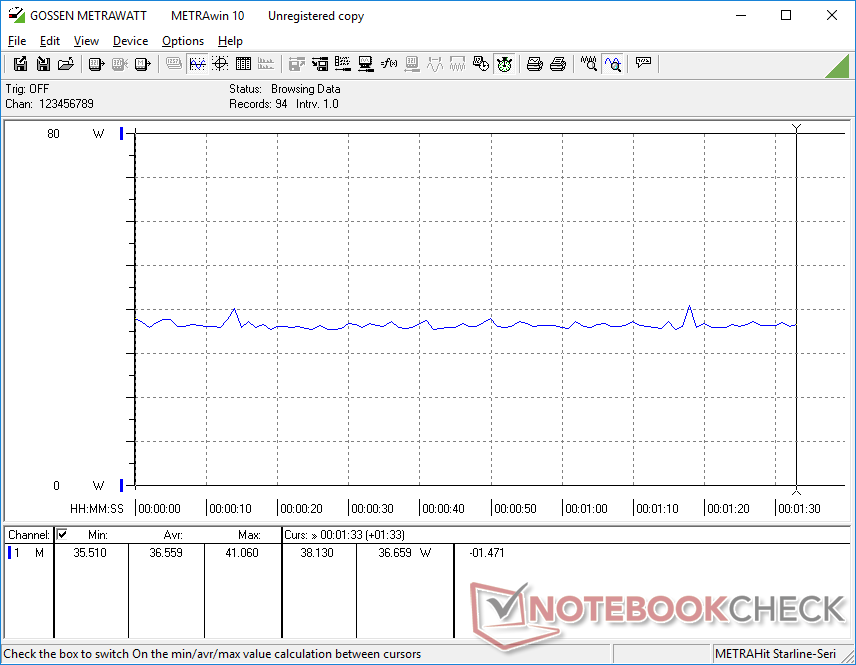
Het stroomverbruik is laag, vooral in vergelijking met de Modern 15 van vorig jaar. Stationair draaien op een desktop verbruikt tussen de 4 W en 9 W, afhankelijk van het helderheidsniveau en stroomprofiel, terwijl de Modern 15 tussen de 6 W en 15 W zou verbruiken. Het draaien van games zou ook slechts 38 W verbruiken op onze Summit B15, vergeleken met 59 W tot 83 W op de Modern 15, ook al kan ons Summit systeem de 10e generatie CPU in de Modern 15 overtreffen, terwijl hij ruwweg op gelijke voet staat met de GeForce MX250
Interessant is dat de XPG Xenia Xe met dezelfde Core i7-1165G7 CPU en Iris Xe GPU iets meer stroom zou verbruiken dan onze Summit B15 tijdens het gamen (44 W vs. 38 W). Het XPG systeem zou echter ook consequent beter presteren dan onze Summit in GPU benchmarks en games
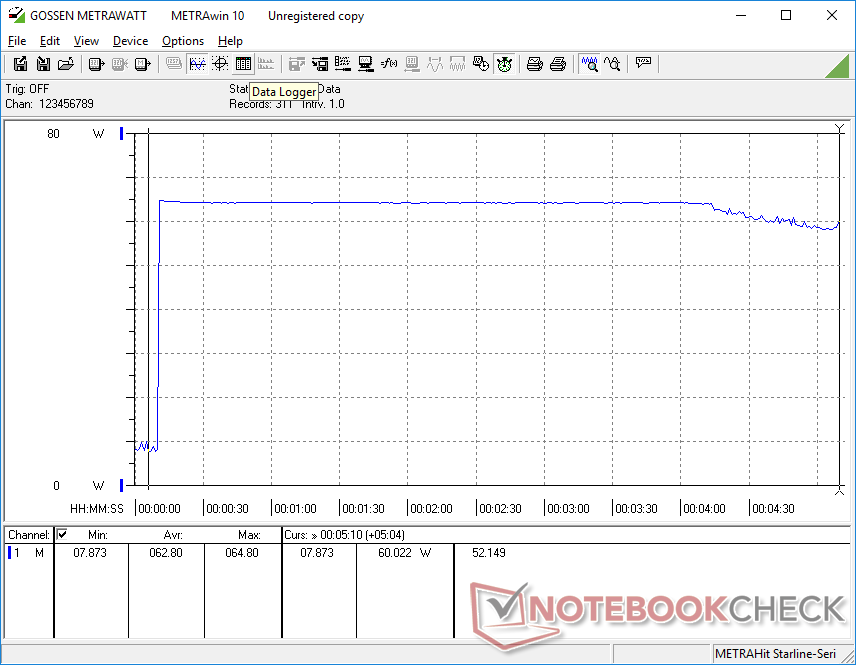
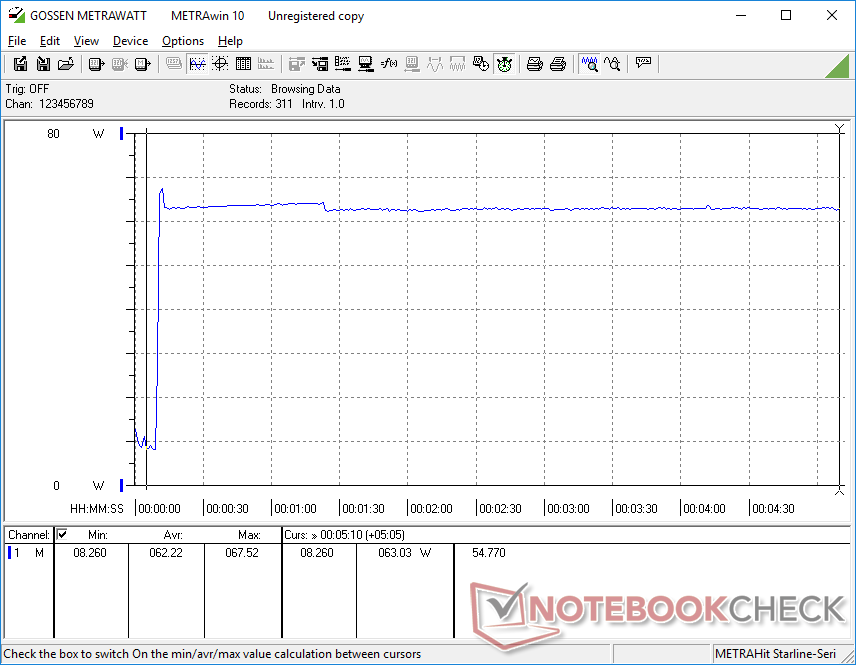
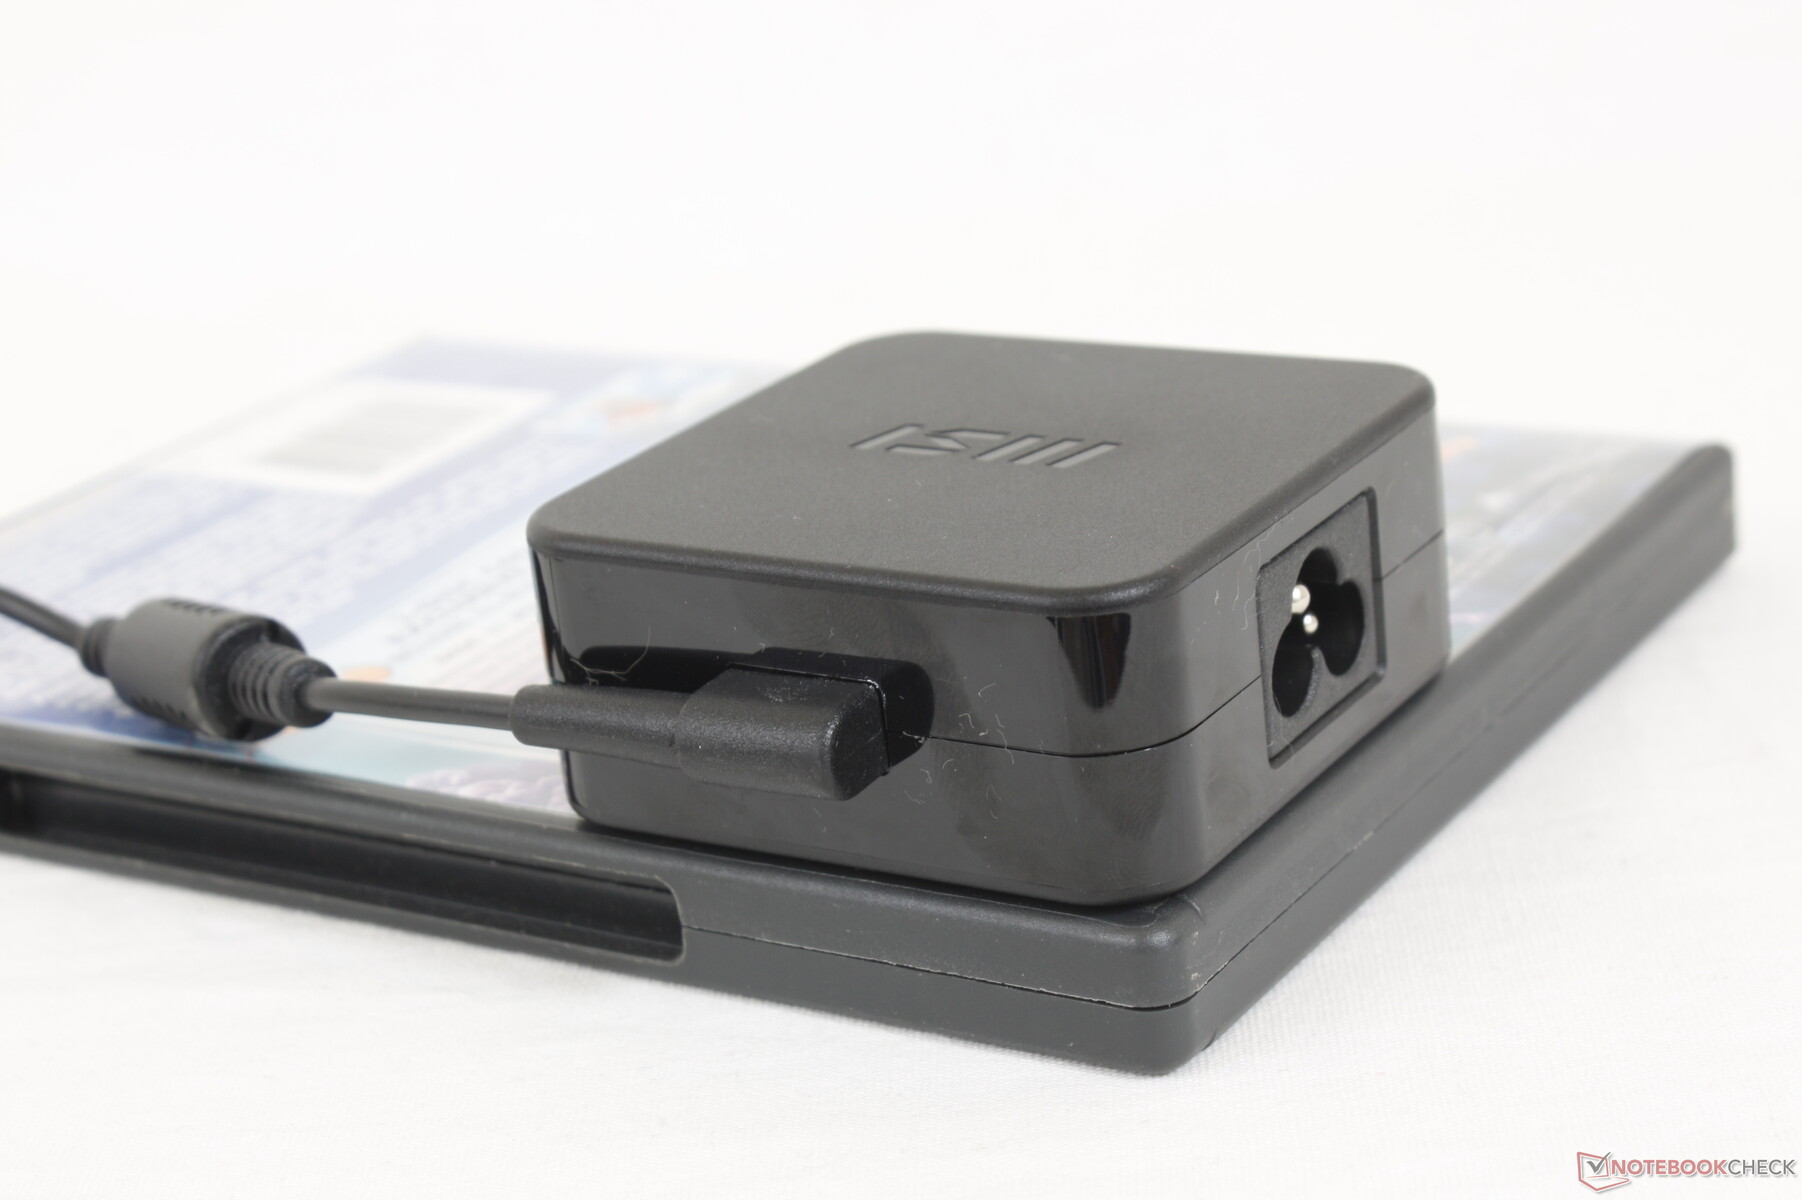
We zijn in staat om een maximale tijdelijke trek van 67,5 W te registreren van de kleine (~6,5 x 6,5 x 2,8 cm) 65 W AC adapter. Het systeem kan zelfs gedurende langere perioden een ruw verbruik van 60 tot 63 W aanhouden wanneer het onder extreme verwerkingsstress staat, om aan te tonen dat een meer capabele wisselstroomadapter misschien nuttig zou zijn geweest.
| Uit / Standby | |
| Inactief | |
| Belasting |
|
Key:
min: | |
| MSI Summit B15 A11M i7-1165G7, Iris Xe G7 96EUs, Kingston OM8PCP31024F, IPS, 1920x1080, 15.6" | MSI Summit E15 A11SCST i7-1185G7, GeForce GTX 1650 Ti Max-Q, Phison 1TB SM2801T24GKBB4S-E162, IPS, 1920x1080, 15.6" | Dell XPS 15 9500 Core i5 i5-10300H, UHD Graphics 630, Toshiba KBG40ZNS256G NVMe, IPS, 1920x1200, 15.6" | HP Spectre X360 15-5ZV31AV i7-10510U, GeForce MX250, Intel SSD 660p 2TB SSDPEKNW020T8, IPS, 3840x2160, 15.6" | ADATA XPG Xenia Xe i7-1165G7, Iris Xe G7 96EUs, ADATA XPG Gammix S50 1TB, IPS, 1920x1080, 15.6" | Asus ZenBook 15 UX534FTC-A8190T i7-10510U, GeForce GTX 1650 Max-Q, Samsung SSD PM981 MZVLB1T0HALR, IPS, 1920x1080, 15.6" | |
|---|---|---|---|---|---|---|
| Power Consumption | -68% | -3% | -34% | 8% | -29% | |
| Idle Minimum * (Watt) | 4.2 | 6 -43% | 2.9 31% | 5.2 -24% | 2.7 36% | 2.8 33% |
| Idle Average * (Watt) | 7.7 | 10 -30% | 7.6 1% | 8.5 -10% | 5.3 31% | 7.7 -0% |
| Idle Maximum * (Watt) | 8.4 | 16 -90% | 8 5% | 8.7 -4% | 7.3 13% | 9.4 -12% |
| Load Average * (Watt) | 37.8 | 84 -122% | 41.7 -10% | 65.6 -74% | 43.6 -15% | 57 -51% |
| Witcher 3 ultra * (Watt) | 36.6 | 69 -89% | 56.5 -54% | 43.5 -19% | 62 -69% | |
| Load Maximum * (Watt) | 67.5 | 90 -33% | 94.8 -40% | 92.4 -37% | 66.8 1% | 116 -72% |
* ... kleiner is beter
Levensduur batterij
De runtimes zijn met ongeveer 6,5 uur real-world WLAN gebruik behoorlijk en daarmee enkele uren korter dan de duurdere Summit E15. Het verschil kan worden toegeschreven aan de kleinere batterijcapaciteit van slechts 52 W in vergelijking met 80 W op het eerder genoemde model.
Het duurt ongeveer 2 uur om het systeem van leeg tot vol op te laden met de AC-loopadapter. Het systeem kan ook worden opgeladen via USB-C AC-adapters van derden. We vermoeden dat toekomstige modellen de eigen AC-poort helemaal zullen laten vallen en zullen overschakelen op opladen via uitsluitend USB-C.
| MSI Summit B15 A11M i7-1165G7, Iris Xe G7 96EUs, 52 Wh | MSI Summit E15 A11SCST i7-1185G7, GeForce GTX 1650 Ti Max-Q, 80.25 Wh | Dell XPS 15 9500 Core i5 i5-10300H, UHD Graphics 630, 56 Wh | HP Spectre X360 15-5ZV31AV i7-10510U, GeForce MX250, 84 Wh | ADATA XPG Xenia Xe i7-1165G7, Iris Xe G7 96EUs, 73.41 Wh | Asus ZenBook 15 UX534FTC-A8190T i7-10510U, GeForce GTX 1650 Max-Q, 71 Wh | |
|---|---|---|---|---|---|---|
| Batterijduur | 41% | 48% | 92% | 77% | 92% | |
| Reader / Idle (h) | 18.4 | 19.5 6% | 26.4 43% | 22.6 23% | 27.2 48% | |
| WiFi v1.3 (h) | 6.6 | 9.1 38% | 9.3 41% | 10.8 64% | 11.7 77% | 12.4 88% |
| Load (h) | 1 | 1.8 80% | 1.6 60% | 2.9 190% | 2.4 140% |
Pro
Contra
Uitspraak

Is de MSI Summit B15 het waard om te kopen in plaats van de oudere Modern 15 ook al zijn beide zeer vergelijkbare laptops? Als je waarde hecht aan Thunderbolt 4, een snellere processor, en over het algemeen stiller ventilatorgeluid, dan is de nieuwere Summit B15 wellicht het overwegen waard. De ruwe prestaties zijn indrukwekkend voor zo'n lichtgewicht 15,6-inch form factor en gebruikers kunnen altijd externe GPU's en monitoren aansluiten voor snellere graphics en betere kleuren, respectievelijk.
Reizigers zullen dol zijn op het superlichte gewicht, de stille ventilatoren en de hoge prestaties in vergelijking met populaire 15,6-inch Ultrabooks zoals de XPS 15, Spectre x360 15, of Lenovo IdeaPad 15. Voor een laptop van >$1000 USD is de stevigheid van het chassis echter niet zo sterk als we zouden willen.
Als uw werkbelasting voornamelijk bestaat uit basis web browsen, video streaming, lichte gaming of minimale bewerking, dan zal de Modern 15 met GeForce MX graphics meer dan genoeg zijn, terwijl hij honderden dollars minder kost. Houd in gedachten dat de twee laptops dezelfde ervaring zullen bieden als het gaat om het beeldscherm, toetsenbord, clickpad en de kwaliteit van het chassis. Je verliest echter wel de lucratieve docking mogelijkheden van Thunderbolt.
Prijs en beschikbaarheid
De MSI Summit B15 is nu overal verkrijgbaar bij de meeste retailers. Onze configuratie is momenteel online te vinden voor ongeveer $1150 USD bij Xotic PC, Amazon, Newegg, Beste Koop, en Walmart
MSI Summit B15 A11M
- 20-05-2021 v7 (old)
Allen Ngo
Price comparison

