Notebookcheck Logo

Apple M3 SoC geanalyseerd: Verbeterde prestaties en efficiëntie

De eerste 3 nm chip is er. Applede nieuwe M3 SoC is de eerste chip die in een 3 nm-proces wordt gemaakt. We hebben de prestatieverhogingen al gezien in onze review van de nieuwe MacBook Pro 14, maar hoe zit het met de efficiëntie van de processor en de grafische kaart? We vergelijken de resultaten ook met de nieuwe Snapdragon X Elite van Qualcomm.
Apple M3: overzicht (Afbeelding: Apple)

Vorige week presenteerde Apple de nieuwe M3 SoC's (M3, M3 Pro & M3 Max), die worden geproduceerd via een modern 3 nm-proces. We hebben het nieuwe instapmodel van de MacBook Pro 14met de nieuwe M3 SoC (als vervanging voor de oude MacBook Pro 13met de Touch Bar) in detail besproken. Nu bekijken we de nieuwe M3, die ook gebruikt zal worden in de komende generatie van de populaire MacBook Air-modellen. We vergelijken ook de prestaties en efficiëntie met CPU's/GPU's van AMD, Intel en Nvidia. Tot slot trekken we een vergelijking met de nieuwe Snapdragon X Elitedie Qualcomm onlangs aan het publiek heeft gepresenteerd. Binnenkort verschijnt er ook een analyseartikel over de M3 Pro/M3 Max.

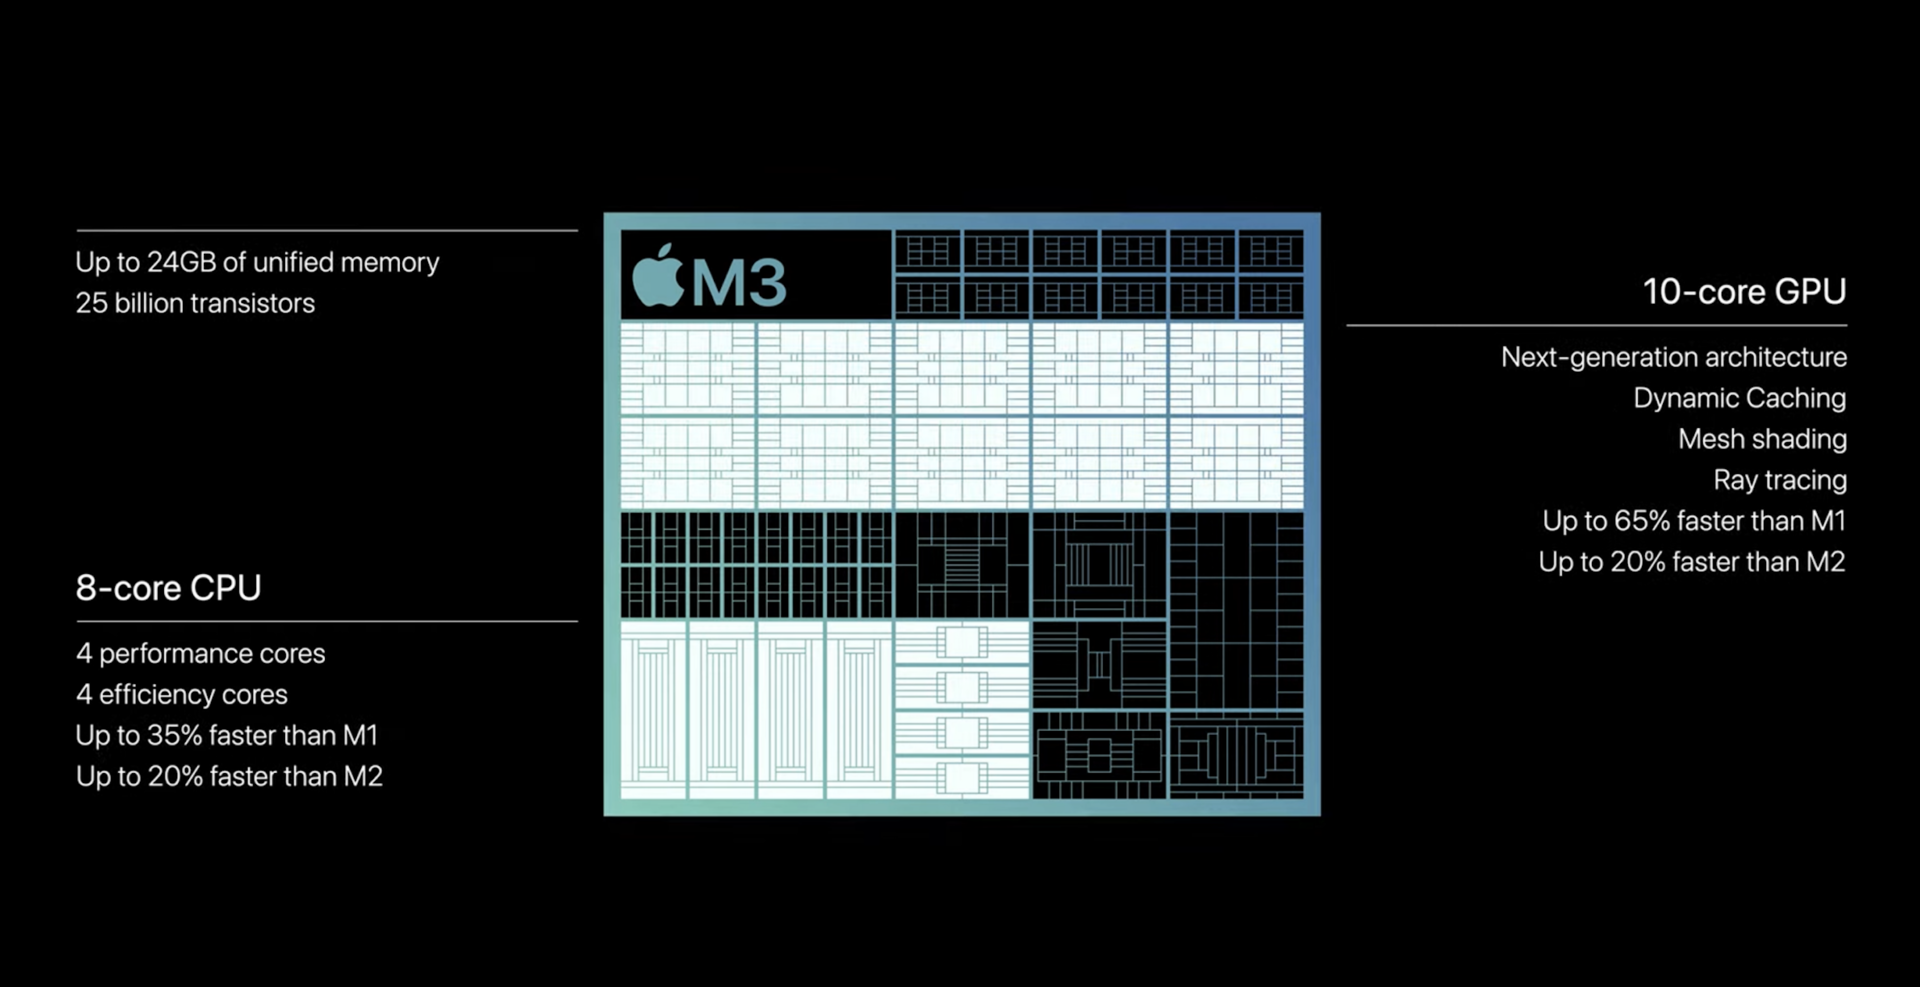
Apple M3 in een oogopslag

Apple M3 (Bild: Apple)

De M3 SoC is Apple's nieuwe instapchip en zal, net als zijn voorganger, worden gebruikt in zowel de MacBook Pro en de desktopcomputers (met actieve koeling) als in de MacBook Air met passieve koeling, zoals het geval was in de laatste twee generaties. Hoewel de configuratie van de kernen is veranderd in de snellereM3 Pro/M3 Max, blijft de configuratie van de basis M3 hetzelfde.

Aan de CPU-kant is er een prestatiecluster met 4 kernen die een maximum van 4,056 GHz bereiken (of ~3,6 GHz als alle kernen worden belast) en een efficiëntiecluster met 4 kernen die een maximum van 2,748 GHz bereiken. Dankzij de nieuwe 3 nm productie (vermoedelijk N3B proces bij TSMC), is Apple in staat geweest om de kloksnelheden aanzienlijk te verhogen zonder grote compromissen te sluiten op het gebied van stroomverbruik. Bovendien is het aantal transistors verhoogd van 20 miljard in deM2 naar 25 miljard.

Er zijn enkele grote wijzigingen aangebracht aan de geïntegreerde grafische kaart. De M3 is er nog steeds in versies met 8 GPU-kernen (gebruikt in de iMac en vermoedelijk in het basismodel van de komende MacBook Air-modellen) en in krachtigere versies met 10 GPU-kernen, zoals in de MacBook Pro 14. Apple heeft echter de hele architectuur van de GPU herzien en maakt nu gebruik van dynamische caching, waarbij cache en geheugen dynamisch worden toegewezen op basis van de daadwerkelijke vereisten van toepassingen. Daarnaast ondersteunt de M3 nu hardware-gebaseerde ray tracing, mesh shading en AV1-decodering. Er kunnen echter maar twee beeldschermen tegelijk worden gebruikt.

Net als de oude

M2 SoCkan de M3 SoC worden uitgerust met 8 GB, 16 GB of maximaal 24 GB RAM.

Testprocedure

Om een zinvolle vergelijking tussen de verschillende laptops te kunnen maken, kijken we niet alleen naar de pure prestaties in de synthetische benchmarks, maar ook naar het stroomverbruik, waaruit we vervolgens de efficiëntie bepalen. De verbruiksmetingen worden altijd uitgevoerd op een extern beeldscherm, zodat we de verschillende interne beeldschermen als beïnvloedende factoren kunnen elimineren. Toch meten we hier het totale verbruik van het systeem en vertrouwen we niet alleen op de weergegeven waarden voor de CPU en GPU.

Single-core prestaties

Apple is erin geslaagd om de single-core prestaties van de nieuwe M3-processor met ongeveer 20% te verhogen ten opzichte van de oudeM2 en ongeveer 18% ten opzichte van de M2 Provergeleken met de oude M1-processoris de M3 30% krachtiger. Het stroomverbruik van de CPU zelf (volgens Power Metrics) lag aan het begin van de benchmarktests rond de 6,5 watt en steeg later naar 5,5 watt, waardoor het stroomverbruik iets is toegenomen ten opzichte van de oude M2. Ondanks de aanzienlijk hogere prestaties is Apple er toch in geslaagd om de efficiëntie met ongeveer 18% te verhogen ten opzichte van de M2 in de MacBook Pro 13, wat een uitstekend resultaat is. De voorsprong op de passief gekoelde MacBook Air modellen is echter kleiner.

Single-Core Performance Rating - Percent
Apple M3
Apple MacBook Pro 14 2023 M3
100 pt
Apple M2 Pro
Apple MacBook Pro 14 2023 M2 Pro
85.1 pt
Apple M2 Pro 10-Core
Apple MacBook Pro 14 2023 M2 Pro Entry
84.3 pt
Apple M2
Apple MacBook Pro 13 2022 M2
82.9 pt
Apple M2
Apple MacBook Air M2 Entry
82.5 pt
Apple M1 Pro
Apple MacBook Pro 16 2021 M1 Pro
78 pt
Apple M1 Pro 8-Core
Apple MacBook Pro 14 2021 M1 Pro Entry
78 pt
Apple M1
Apple MacBook Pro 13 Late 2020 M1 Entry (8 / 256 GB)
76.9 pt
Apple M1
Apple MacBook Air 2020 M1 Entry
76.2 pt
Cinebench R23 - Single Core
Apple M3
Apple MacBook Pro 14 2023 M3
1904 Points
Apple M2 Pro
Apple MacBook Pro 14 2023 M2 Pro
1647 Points -13%
Apple M2 Pro 10-Core
Apple MacBook Pro 14 2023 M2 Pro Entry
1643 Points -14%
Apple M2
Apple MacBook Air M2 Entry
1585 Points -17%
Apple M2
Apple MacBook Pro 13 2022 M2
1581 Points -17%
Apple M1 Pro
Apple MacBook Pro 16 2021 M1 Pro
1534 Points -19%
Apple M1 Pro 8-Core
Apple MacBook Pro 14 2021 M1 Pro Entry
1531 Points -20%
Apple M1
Apple MacBook Pro 13 Late 2020 M1 Entry (8 / 256 GB)
1513 Points -21%
Apple M1
Apple MacBook Air 2020 M1 Entry
1496 Points -21%
Geekbench 5.5 - Single-Core
Apple M3
Apple MacBook Pro 14 2023 M3
2342 Points
Apple M2 Pro
Apple MacBook Pro 14 2023 M2 Pro
1961 Points -16%
Apple M2
Apple MacBook Pro 13 2022 M2
1937 Points -17%
Apple M2 Pro 10-Core
Apple MacBook Pro 14 2023 M2 Pro Entry
1926 Points -18%
Apple M2
Apple MacBook Air M2 Entry
1914 Points -18%
Apple M1 Pro 8-Core
Apple MacBook Pro 14 2021 M1 Pro Entry
1769 Points -24%
Apple M1 Pro
Apple MacBook Pro 16 2021 M1 Pro
1768 Points -25%
Apple M1
Apple MacBook Pro 13 Late 2020 M1 Entry (8 / 256 GB)
1740 Points -26%
Apple M1
Apple MacBook Air 2020 M1 Entry
1727 Points -26%
Power Consumption / Cinebench R23 Single Power Efficiency - external Monitor
Apple M3
Apple MacBook Pro 14 2023 M3
190.4 Points per Watt
Apple M2
Apple MacBook Air M2 Entry
179.3 Points per Watt -6%
Apple M1
Apple MacBook Air 2020 M1 Entry
165.1 Points per Watt -13%
Apple M2
Apple MacBook Pro 13 2022 M2
161.7 Points per Watt -15%
Apple M2 Pro
Apple MacBook Pro 14 2023 M2 Pro
140.8 Points per Watt -26%
Apple M2 Pro 10-Core
Apple MacBook Pro 14 2023 M2 Pro Entry
118.2 Points per Watt -38%
Apple M1 Pro
Apple MacBook Pro 16 2021 M1 Pro
110.4 Points per Watt -42%
Power Consumption / Cinebench R23 Single (external Monitor)
Apple M1 Pro
Apple MacBook Pro 16 2021 M1 Pro
13.9 (12.3min, 13.3P1 - 22.1max) Watt * -39%
Apple M2 Pro 10-Core
Apple MacBook Pro 14 2023 M2 Pro Entry
13.9 (12.2min, 12.7P1 - 16.5max) Watt * -39%
Apple M2 Pro
Apple MacBook Pro 14 2023 M2 Pro
11.7 (9.94min, 10.7P1 - 13.6max) Watt * -17%
Apple M3
Apple MacBook Pro 14 2023 M3
10 (9.53min, 9.57P1 - 12.8max) Watt *
Apple M2
Apple MacBook Pro 13 2022 M2
9.78 (9.13min, 9.21P1 - 11.2max) Watt * +2%
Apple M1
Apple MacBook Air 2020 M1 Entry
9.06 (8.41min, 8.57P1 - 19max) Watt * +9%
Apple M2
Apple MacBook Air M2 Entry
8.84 (8.3min, 8.37P1 - 9.82max) Watt * +12%

* ... kleiner is beter

Multicore prestaties

De multicore prestaties zijn ook met ongeveer 20% toegenomen ten opzichte van de oude M2 in de MacBook Pro 13, hoewel het stroomverbruik van de CPU-kernen ook iets is toegenomen. De M2 verbruikt iets minder dan 20 watt, terwijl de M3 20-21 watt nodig heeft bij volledige belasting. Hiermee ligt de nieuwe M3 net voor op het oude instapmodel M1 Pro met 8 cores, maar alle andere MacBook Pro CPU's zijn nog steeds sneller. Aan de andere kant is de efficiëntie hier ook toegenomen, maar de voorsprong van 8% op de M2 in de MBP 13 is niet zo groot als bij single-core belasting.

Multi-Core Performance Rating - Percent
Apple M2 Pro
Apple MacBook Pro 14 2023 M2 Pro
100 pt
Apple M1 Pro
Apple MacBook Pro 16 2021 M1 Pro
83.9 pt
Apple M2 Pro 10-Core
Apple MacBook Pro 14 2023 M2 Pro Entry
81 pt
Apple M3
Apple MacBook Pro 14 2023 M3
71.6 pt
Apple M1 Pro 8-Core
Apple MacBook Pro 14 2021 M1 Pro Entry
65.9 pt
Apple M2
Apple MacBook Pro 13 2022 M2
59.7 pt
Apple M2
Apple MacBook Air M2 Entry
59.4 pt
Apple M1
Apple MacBook Pro 13 Late 2020 M1 Entry (8 / 256 GB)
52 pt
Apple M1
Apple MacBook Air 2020 M1 Entry
50.6 pt
Cinebench R23 - Multi Core
Apple M2 Pro
Apple MacBook Pro 14 2023 M2 Pro
14787 Points +41%
Apple M1 Pro
Apple MacBook Pro 16 2021 M1 Pro
12370 Points +18%
Apple M2 Pro 10-Core
Apple MacBook Pro 14 2023 M2 Pro Entry
11811 Points +13%
Apple M3
Apple MacBook Pro 14 2023 M3
10454 Points
Apple M1 Pro 8-Core
Apple MacBook Pro 14 2021 M1 Pro Entry
9581 Points -8%
Apple M2
Apple MacBook Pro 13 2022 M2
8745 Points -16%
Apple M2
Apple MacBook Air M2 Entry
8667 Points -17%
Apple M1
Apple MacBook Pro 13 Late 2020 M1 Entry (8 / 256 GB)
7811 Points -25%
Apple M1
Apple MacBook Air 2020 M1 Entry
7409 (6401.39min - 7409.31max) Points -29%
Geekbench 5.5 - Multi-Core
Apple M2 Pro
Apple MacBook Pro 14 2023 M2 Pro
14859 Points +38%
Apple M1 Pro
Apple MacBook Pro 16 2021 M1 Pro
12499 Points +16%
Apple M2 Pro 10-Core
Apple MacBook Pro 14 2023 M2 Pro Entry
12189 Points +13%
Apple M3
Apple MacBook Pro 14 2023 M3
10774 Points
Apple M1 Pro 8-Core
Apple MacBook Pro 14 2021 M1 Pro Entry
9942 Points -8%
Apple M2
Apple MacBook Pro 13 2022 M2
8962 Points -17%
Apple M2
Apple MacBook Air M2 Entry
8951 Points -17%
Apple M1
Apple MacBook Pro 13 Late 2020 M1 Entry (8 / 256 GB)
7590 Points -30%
Apple M1
Apple MacBook Air 2020 M1 Entry
7578 Points -30%
Power Consumption / Cinebench R23 Multi Power Efficiency - external Monitor
Apple M3
Apple MacBook Pro 14 2023 M3
375 (27.4min, 28P1 - 30.7max) Points per Watt
Apple M2
Apple MacBook Pro 13 2022 M2
346 Points per Watt -8%
Apple M2
Apple MacBook Air M2 Entry
343 Points per Watt -9%
Apple M1
Apple MacBook Air 2020 M1 Entry
337 Points per Watt -10%
Apple M1 Pro
Apple MacBook Pro 16 2021 M1 Pro
290 Points per Watt -23%
Apple M2 Pro
Apple MacBook Pro 14 2023 M2 Pro
275 Points per Watt -27%
Apple M2 Pro 10-Core
Apple MacBook Pro 14 2023 M2 Pro Entry
250 Points per Watt -33%
Power Consumption / Cinebench R23 Multi (external Monitor)
Apple M2 Pro
Apple MacBook Pro 14 2023 M2 Pro
53.7 (50.8min, 51.2P1 - 60.8max) Watt * -92%
Apple M2 Pro 10-Core
Apple MacBook Pro 14 2023 M2 Pro Entry
47.2 (45.8min, 46.1P1 - 48.5max) Watt * -69%
Apple M1 Pro
Apple MacBook Pro 16 2021 M1 Pro
42.7 (16.4min, 25.7P1 - 50.1max) Watt * -53%
Apple M3
Apple MacBook Pro 14 2023 M3
27.9 (26.6min, 27P1 - 30max) Watt *
Apple M2
Apple MacBook Pro 13 2022 M2
25.3 (24.4min, 24.5P1 - 27.2max) Watt * +9%
Apple M2
Apple MacBook Air M2 Entry
25.3 (23.2min, 23.5P1 - 27.5max) Watt * +9%
Apple M1
Apple MacBook Air 2020 M1 Entry
22 (18.7min, 18.8P1 - 25.2max) Watt * +21%

* ... kleiner is beter

Apple M3 vs. AMD, Intel & Qualcomm

Nu vergelijken we de Apple M3 met de huidige mobiele processors van AMD, Intel en Qualcomm. Bij het selecteren van de vergelijkingsapparaten hebben we ons voornamelijk gericht op de U-serie chips van AMD en de U/P-serie van Intel. We hebben ook individuele H45- en HS-chips met relatief lage TDP-waarden (max. 50 watt) opgenomen ter vergelijking, ook al vormen deze geen directe concurrentie voor de M3. We hebben ook deSnapdragon 8cx Gen3 in de Microsoft Surface Pro 9 in de tabellen opgenomen.

Beginnend met de single-core prestaties, kunnen we duidelijk zien welke vooruitgang Apple heeft geboekt met de M3. Ondanks het lagere stroomverbruik kan de prestatie-core van de M3 de prestatie-cores van de huidige Raptor Lake CPU's van Intel, die aanzienlijk meer stroom nodig hebben, gemakkelijk bijhouden. Zelfs de meest efficiënte Intel-chip in onze vergelijking, deCore i7-1355Ublijft een factor 3 achter. De huidige Zen4-chips van AMD blijven "slechts" een factor twee achter qua efficiëntie, maar evenaren de prestaties van de M3 evenmin. De Snapdragon 8cx Gen3 kan het maar tot op zekere hoogte bijbenen in de Geekbench test (-28%), maar blijft ver achter in de aanzienlijk langere R23 single test (-68%) en komt maar net voor op de Intel CPU's wat betreft efficiëntie.

Cinebench R23 - Single Core
Intel Core i7-13700H
SCHENKER Vision 14 2023
1912 Points 0%
Apple M3
Apple MacBook Pro 14 2023 M3
1904 Points
Intel Core i7-1360P
Lenovo Yoga 9 14IRP G8
1877 Points -1%
Intel Core i7-1365U
Lenovo ThinkPad X1 Carbon G11-21HNS00000
1877 Points -1%
AMD Ryzen 7 7840S
Lenovo Yoga Slim 7 14APU G8
1761 Points -8%
Intel Core i7-1355U
Asus ExpertBook B9 B9403CVA-KM0153X
1687 Points -11%
AMD Ryzen 7 7840U
HP EliteBook 845 G10 5Z4X0ES
1581 Points -17%
AMD Ryzen 9 PRO 7940HS
HP EliteBook 845 G10 818N0EA
1568 Points -18%
Qualcomm Snapdragon 8cx Gen 3
Microsoft Surface Pro 9, ARM
608 Points -68%
Geekbench 5.5 - Single-Core
Apple M3
Apple MacBook Pro 14 2023 M3
2342 Points
AMD Ryzen 7 7840S
Lenovo Yoga Slim 7 14APU G8
1939 Points -17%
Intel Core i7-1365U
Lenovo ThinkPad X1 Carbon G11-21HNS00000
1938 Points -17%
Intel Core i7-13700H
SCHENKER Vision 14 2023
1830 Points -22%
Intel Core i7-1360P
Lenovo Yoga 9 14IRP G8
1790 Points -24%
AMD Ryzen 9 PRO 7940HS
HP EliteBook 845 G10 818N0EA
1758 Points -25%
Intel Core i7-1355U
Asus ExpertBook B9 B9403CVA-KM0153X
1740 Points -26%
AMD Ryzen 7 7840U
HP EliteBook 845 G10 5Z4X0ES
1723 Points -26%
Qualcomm Snapdragon 8cx Gen 3
Microsoft Surface Pro 9, ARM
1690 Points -28%
Power Consumption - Cinebench R23 Single Power Efficiency - external Monitor
Apple M3
Apple MacBook Pro 14 2023 M3
190.4 Points per Watt
AMD Ryzen 7 7840U
HP EliteBook 845 G10 5Z4X0ES
100.7 Points per Watt -47%
AMD Ryzen 9 PRO 7940HS
HP EliteBook 845 G10 818N0EA
92.2 Points per Watt -52%
Qualcomm Snapdragon 8cx Gen 3
Microsoft Surface Pro 9, ARM
66.7 Points per Watt -65%
Intel Core i7-1355U
Asus ExpertBook B9 B9403CVA-KM0153X
64.7 Points per Watt -66%
Intel Core i7-13700H
SCHENKER Vision 14 2023
53.3 Points per Watt -72%
Intel Core i7-1365U
Lenovo ThinkPad X1 Carbon G11-21HNS00000
49.4 Points per Watt -74%
AMD Ryzen 7 7840S
Lenovo Yoga Slim 7 14APU G8
48.2 Points per Watt -75%
Intel Core i7-1360P
Lenovo Yoga 9 14IRP G8
48 Points per Watt -75%

Het tij keert een beetje in de multicore tests, aangezien sommige concurrenten van AMD en Intel betere prestaties leveren, vooral in de Cinebench R23 test. Aangezien de M3 geen hyperthreading ondersteunt, is het resultaat desondanks nog steeds erg goed. De twee U-serie processors van Intel (slechts twee prestatiekernen) blijven echter achter en de Qualcomm-chip maakt opnieuw geen enkele kans (-68%). In de korte Geekbench-test is de Apple chip beduidend beter en wordt hij maar nipt overtroffen door deAMD Ryzen 7 7840S.

In termen van efficiëntie zijn de verschillen aanzienlijk kleiner dan in de single-core belasting en de Ryzen 7 7840Uligt praktisch op gelijke hoogte. De andere CPU's van AMD en Intel blijven achter en de Qualcomm-chip maakt ook hier geen schijn van kans.

Cinebench R23: Multi Core | Geekbench 5.5: Multi-Core | Power Consumption: Cinebench R23 Multi Power Efficiency - external Monitor
Cinebench R23 / Multi Core
AMD Ryzen 7 7840S
Lenovo Yoga Slim 7 14APU G8
15102 Points +44%
AMD Ryzen 9 PRO 7940HS
HP EliteBook 845 G10 818N0EA
14919 Points +43%
AMD Ryzen 7 7840U
HP EliteBook 845 G10 5Z4X0ES
12385 Points +18%
Intel Core i7-13700H
SCHENKER Vision 14 2023
12275 Points +17%
Intel Core i7-1360P
Lenovo Yoga 9 14IRP G8
11922 Points +14%
Apple M3
Apple MacBook Pro 14 2023 M3
10454 Points
Intel Core i7-1365U
Lenovo ThinkPad X1 Carbon G11-21HNS00000
9343 Points -11%
Intel Core i7-1355U
Asus ExpertBook B9 B9403CVA-KM0153X
7733 Points -26%
Qualcomm Snapdragon 8cx Gen 3
Microsoft Surface Pro 9, ARM
3567 Points -66%
Geekbench 5.5 / Multi-Core
AMD Ryzen 7 7840S
Lenovo Yoga Slim 7 14APU G8
11288 Points +5%
Intel Core i7-1360P
Lenovo Yoga 9 14IRP G8
10785 Points 0%
Apple M3
Apple MacBook Pro 14 2023 M3
10774 Points
Intel Core i7-13700H
SCHENKER Vision 14 2023
10515 Points -2%
AMD Ryzen 9 PRO 7940HS
HP EliteBook 845 G10 818N0EA
9897 Points -8%
AMD Ryzen 7 7840U
HP EliteBook 845 G10 5Z4X0ES
9864 Points -8%
Intel Core i7-1365U
Lenovo ThinkPad X1 Carbon G11-21HNS00000
8709 Points -19%
Intel Core i7-1355U
Asus ExpertBook B9 B9403CVA-KM0153X
7635 Points -29%
Qualcomm Snapdragon 8cx Gen 3
Microsoft Surface Pro 9, ARM
7522 Points -30%
Power Consumption / Cinebench R23 Multi Power Efficiency - external Monitor
Apple M3
Apple MacBook Pro 14 2023 M3
375 (27.4min, 28P1 - 30.7max) Points per Watt
AMD Ryzen 7 7840U
HP EliteBook 845 G10 5Z4X0ES
369 Points per Watt -2%
AMD Ryzen 9 PRO 7940HS
HP EliteBook 845 G10 818N0EA
254 Points per Watt -32%
AMD Ryzen 7 7840S
Lenovo Yoga Slim 7 14APU G8
235 Points per Watt -37%
Intel Core i7-1355U
Asus ExpertBook B9 B9403CVA-KM0153X
209 Points per Watt -44%
Intel Core i7-1365U
Lenovo ThinkPad X1 Carbon G11-21HNS00000
208 Points per Watt -45%
Intel Core i7-13700H
SCHENKER Vision 14 2023
184.9 Points per Watt -51%
Intel Core i7-1360P
Lenovo Yoga 9 14IRP G8
183.7 Points per Watt -51%
Qualcomm Snapdragon 8cx Gen 3
Microsoft Surface Pro 9, ARM
111.5 Points per Watt -70%

GPU-prestaties en -efficiëntie

In alle grafische tests heeft de nieuwe 10-core M3 GPU een voorsprong van 10-22% ten opzichte van de oude 10-core M2 GPUmaar het maximale stroomverbruik is ook gestegen van ~13,5 watt voor de M2 naar ~15 watt voor de M3. Alle vorige Pro GPU's van Apple (of ze nu M1 of M2 zijn) zijn echter nog sneller, zelfs de basisversie 14-core M14 Pro.

Vergeleken met de Windows concurrentie presteert de M3 GPU duidelijk beter dan deAMD Radeon 780Men de Iris Xe Graphics G7in het bijzonder in zowel 3DMark Wildlife Extreme Unlimited als GFXBench, maar de Apple GPU moet zijn nederlaag toegeven aan de Radeon 780M in de Geekbench OpenCL test. Dedicated mid-range Nvidia GPU's (vanaf RTX 3050 en hoger) zijn aanzienlijk krachtiger en verbruiken natuurlijk ook veel meer stroom (vanaf 35 watt). We hebben ook deze resultaten opgenomen voor een betere classificatie.

3DMark / Wild Life Extreme Unlimited
NVIDIA GeForce RTX 4050 Laptop GPU
Lenovo Yoga Pro 9-14IRP G8
15208 Points +83%
Apple M2 Pro 19-Core GPU
Apple MacBook Pro 14 2023 M2 Pro
12968 Points +56%
Apple M2 Pro 16-Core GPU
Apple MacBook Pro 14 2023 M2 Pro Entry
11224 Points +35%
Apple M1 Pro 16-Core GPU
Apple MacBook Pro 16 2021 M1 Pro
10352 Points +25%
NVIDIA GeForce RTX 3050 Ti Laptop GPU
SCHENKER Vision 14 2022 RTX 3050 Ti
9340 Points +13%
Apple M1 Pro 14-Core GPU
Apple MacBook Pro 14 2021 M1 Pro Entry
9267 Points +12%
Apple M3 10-Core GPU
Apple MacBook Pro 14 2023 M3
8302 Points
Apple M2 10-Core GPU
Apple MacBook Air M2 10C GPU
6824 Points -18%
Apple M2 8-Core GPU
Apple MacBook Air M2 Entry
5689 Points -31%
AMD Radeon 780M
Lenovo Yoga Slim 7 14APU G8
5465 Points -34%
Apple M1 8-Core GPU
Apple MacBook Pro 13 Late 2020 M1 Entry (8 / 256 GB)
4997 Points -40%
AMD Radeon 780M
Asus ROG Zephyrus G14 GA402XY
4663 Points -44%
Apple M1 7-Core GPU
Apple MacBook Air 2020 M1 Entry
4515 Points -46%
AMD Radeon 780M
Lenovo ThinkPad T14s G4-21F8002TGE
4332 Points -48%
Intel Iris Xe Graphics G7 96EUs
SCHENKER Vision 14 2023
4304 Points -48%
Intel Iris Xe Graphics G7 96EUs
Lenovo Yoga 9 14IRP G8
4221 Points -49%
Intel Iris Xe Graphics G7 96EUs
Lenovo ThinkPad X1 Carbon G11-21HNS00000
3520 Points -58%
Geekbench 5.5 / Metal Score
Apple M2 Pro 19-Core GPU
Apple MacBook Pro 14 2023 M2 Pro
52054 Points +51%
Apple M2 Pro 16-Core GPU
Apple MacBook Pro 14 2023 M2 Pro Entry
46834 Points +36%
Apple M1 Pro 16-Core GPU
Apple MacBook Pro 16 2021 M1 Pro
42115 Points +22%
Apple M1 Pro 14-Core GPU
Apple MacBook Pro 14 2021 M1 Pro Entry
37319 Points +8%
Apple M3 10-Core GPU
Apple MacBook Pro 14 2023 M3
34398 Points
Apple M2 10-Core GPU
Apple MacBook Air M2 10C GPU
30269 Points -12%
Apple M2 8-Core GPU
Apple MacBook Air M2 Entry
26079 Points -24%
Apple M1 8-Core GPU
Apple MacBook Pro 13 Late 2020 M1 Entry (8 / 256 GB)
21951 Points -36%
Apple M1 7-Core GPU
Apple MacBook Air 2020 M1 Entry
19064 Points -45%
Geekbench 5.5 / OpenCL Score
NVIDIA GeForce RTX 4050 Laptop GPU
Lenovo Yoga Pro 9-14IRP G8
86275 Points +165%
NVIDIA GeForce RTX 3050 6GB Laptop GPU
Lenovo Slim Pro 7 14ARP8
62409 Points +92%
NVIDIA GeForce RTX 3050 Ti Laptop GPU
SCHENKER Vision 14 2022 RTX 3050 Ti
61067 Points +88%
Apple M2 Pro 19-Core GPU
Apple MacBook Pro 14 2023 M2 Pro
46941 Points +44%
Apple M2 Pro 16-Core GPU
Apple MacBook Pro 14 2023 M2 Pro Entry
42483 Points +31%
Apple M1 Pro 16-Core GPU
Apple MacBook Pro 16 2021 M1 Pro
37867 Points +16%
AMD Radeon 780M
Lenovo Yoga Slim 7 14APU G8
36162 Points +11%
Apple M1 Pro 14-Core GPU
Apple MacBook Pro 14 2021 M1 Pro Entry
35173 Points +8%
AMD Radeon 780M
Lenovo ThinkPad T14s G4-21F8002TGE
34161 Points +5%
AMD Radeon 780M
Asus ROG Zephyrus G14 GA402XY
33853 Points +4%
Apple M3 10-Core GPU
Apple MacBook Pro 14 2023 M3
32540 Points
Apple M2 10-Core GPU
Apple MacBook Air M2 10C GPU
27489 Points -16%
Apple M2 8-Core GPU
Apple MacBook Air M2 Entry
23633 Points -27%
Intel Iris Xe Graphics G7 96EUs
Lenovo Yoga 9 14IRP G8
20890 Points -36%
Intel Iris Xe Graphics G7 96EUs
SCHENKER Vision 14 2023
20765 Points -36%
Apple M1 8-Core GPU
Apple MacBook Pro 13 Late 2020 M1 Entry (8 / 256 GB)
19078 Points -41%
Intel Iris Xe Graphics G7 96EUs
Lenovo ThinkPad X1 Carbon G11-21HNS00000
19004 Points -42%
Apple M1 7-Core GPU
Apple MacBook Air 2020 M1 Entry
17029 Points -48%
GFXBench / Aztec Ruins High Tier Offscreen
Apple M2 Pro 19-Core GPU
Apple MacBook Pro 14 2023 M2 Pro
210.4 fps +74%
Apple M2 Pro 16-Core GPU
Apple MacBook Pro 14 2023 M2 Pro Entry
181.1 fps +50%
Apple M1 Pro 16-Core GPU
Apple MacBook Pro 16 2021 M1 Pro
166 fps +37%
Apple M1 Pro 14-Core GPU
Apple MacBook Pro 14 2021 M1 Pro Entry
147 fps +21%
Apple M3 10-Core GPU
Apple MacBook Pro 14 2023 M3
121 fps
Apple M2 10-Core GPU
Apple MacBook Air M2 10C GPU
110 fps -9%
Apple M2 8-Core GPU
Apple MacBook Air M2 Entry
91 fps -25%
Apple M1 8-Core GPU
Apple MacBook Pro 13 Late 2020 M1 Entry (8 / 256 GB)
78.2 fps -35%
Apple M1 7-Core GPU
Apple MacBook Air 2020 M1 Entry
72.4 fps -40%
AMD Radeon 780M
Asus ROG Zephyrus G14 GA402XY
58.3 fps -52%

Bij het onderzoeken van de efficiëntie moeten we min of meer Witcher 3 gebruiken, omdat we de meest vergelijkende waarden hiervoor in onze database hebben opgeslagen en de CPU-belasting vrij laag is. Natuurlijk is dit geen optimaal uitgangspunt voor de MacBooks en zijn de waarden niet helemaal vergelijkbaar met de Windows laptops, omdat alleen de geëmuleerde versie via CrossOver op de Macs draait, wat ook wat prestaties kost. We hebben deze test vorig jaar voor het eerst op MacBooks uitgevoerd, namelijk op de M2 Pro-modellen, en deze namen de eerste plaats in het vergelijkingsveld in en werden later alleen ingehaald door deM2 MacBook Air 15. De nieuwe MacBook Pro 14 M3is 8% efficiënter.

Power Consumption - Witcher 3 ultra Efficiency (external Monitor)
Apple M3 10-Core GPU
Apple MacBook Pro 14 2023 M3
1.207 fps per Watt
Apple M2 10-Core GPU
Apple MacBook Air 15 2023 M2 16 GB
1.116 fps per Watt -8%
Apple M2 Pro 19-Core GPU
Apple MacBook Pro 14 2023 M2 Pro
1.028 fps per Watt -15%
Apple M2 Pro 16-Core GPU
Apple MacBook Pro 14 2023 M2 Pro Entry
0.941 fps per Watt -22%
NVIDIA GeForce RTX 4060 Laptop GPU
Lenovo Legion Slim 7 16APH8
0.773 fps per Watt -36%
NVIDIA GeForce RTX 4060 Laptop GPU
Microsoft Surface Laptop Studio 2 RTX 4060
0.764 fps per Watt -37%
NVIDIA GeForce RTX 4050 Laptop GPU
Asus VivoBook Pro 16 K6602VU
0.703 fps per Watt -42%
AMD Radeon 780M
Lenovo ThinkPad T14s G4-21F8002TGE
0.658 fps per Watt -45%
NVIDIA GeForce RTX 4050 Laptop GPU
SCHENKER XMG Apex 15 (Late 23)
0.616 fps per Watt -49%
NVIDIA GeForce RTX 3050 6GB Laptop GPU
Lenovo Slim Pro 7 14ARP8
0.614 fps per Watt -49%
AMD Radeon RX 6600M
Minisforum Neptune Series HX77G
0.587 fps per Watt -51%
NVIDIA GeForce RTX 2050 Mobile
Acer Aspire 5 A515-57G-53N8
0.57 fps per Watt -53%
AMD Radeon 780M
Lenovo Yoga Slim 7 14APU G8
0.495 fps per Watt -59%
NVIDIA GeForce RTX 3050 Ti Laptop GPU
SCHENKER Vision 14 2022 RTX 3050 Ti
0.4933 fps per Watt -59%
Intel Iris Xe Graphics G7 96EUs
Lenovo ThinkPad X1 Carbon G11 21HNS54T00
0.2782 fps per Watt -77%
Intel Iris Xe Graphics G7 96EUs
Lenovo ThinkPad E14 G5 i7-1355U
0.2569 fps per Watt -79%

Apple M3 vs. Qualcomm Snapdragon X Elite

Kort voor de aankondiging van Apple's nieuwe M3 processors, presenteerde Qualcomm deSnapdragon X Eliteen toonde benchmarks voor twee referentieontwerpen met 23 en 80 watt. Natuurlijk vergelijken we deze resultaten ook met de nieuwe Apple M3, waarvoor we de door Qualcomm gebruikte Cinebench 2024, Geekbench 6.2 en GFXBench benchmarks (Aztec Ruins Normal Tier Offscreen) hebben gebruikt.

Cinebench 2024: CPU Multi Core | CPU Single Core | Geekbench 6.2: Multi-Core | Single-Core
Cinebench 2024 / CPU Multi Core
SD X Elite Reference 80W
SD X Elite Adreno GPU , Snapdragon X Elite
1220 Points +71%
SD X Elite Reference 23W
SD X Elite Adreno GPU , Snapdragon X Elite
950 Points +33%
Lenovo Yoga Slim 7 14APU G8
Radeon 780M, R7 7840S, Samsung PM9A1 MZVL21T0HCLR
853 Points +20%
Apple MacBook Pro 14 2023 M3
M3 10-Core GPU, M3, Apple SSD AP1024Z
712 Points
Lenovo ThinkPad T14s G4-21F8002TGE
Radeon 780M, R7 7840U, Samsung PM9A1a MZVL21T0HDLU
609 Points -14%
Lenovo ThinkPad X1 Carbon G11 21HNS54T00
Iris Xe G7 96EUs, i7-1370P, WDC PC SN810 2TB
366 Points -49%
Cinebench 2024 / CPU Single Core
Apple MacBook Pro 14 2023 M3
M3 10-Core GPU, M3, Apple SSD AP1024Z
140 Points
SD X Elite Reference 80W
SD X Elite Adreno GPU , Snapdragon X Elite
133 Points -5%
SD X Elite Reference 23W
SD X Elite Adreno GPU , Snapdragon X Elite
124 Points -11%
Lenovo Yoga Slim 7 14APU G8
Radeon 780M, R7 7840S, Samsung PM9A1 MZVL21T0HCLR
103 Points -26%
Lenovo ThinkPad T14s G4-21F8002TGE
Radeon 780M, R7 7840U, Samsung PM9A1a MZVL21T0HDLU
97 Points -31%
Lenovo ThinkPad X1 Carbon G11 21HNS54T00
Iris Xe G7 96EUs, i7-1370P, WDC PC SN810 2TB
90 Points -36%
Geekbench 6.2 / Multi-Core
SD X Elite Reference 80W
SD X Elite Adreno GPU , Snapdragon X Elite
15239 Points +27%
SD X Elite Reference 23W
SD X Elite Adreno GPU , Snapdragon X Elite
14056 Points +17%
Lenovo ThinkPad X1 Carbon G11 21HNS54T00
Iris Xe G7 96EUs, i7-1370P, WDC PC SN810 2TB
12891 Points +8%
Lenovo Yoga Slim 7 14APU G8
Radeon 780M, R7 7840S, Samsung PM9A1 MZVL21T0HCLR
12598 Points +5%
Apple MacBook Pro 14 2023 M3
M3 10-Core GPU, M3, Apple SSD AP1024Z
11966 Points
Lenovo ThinkPad T14s G4-21F8002TGE
Radeon 780M, R7 7840U, Samsung PM9A1a MZVL21T0HDLU
10893 Points -9%
Geekbench 6.2 / Single-Core
Apple MacBook Pro 14 2023 M3
M3 10-Core GPU, M3, Apple SSD AP1024Z
3099 Points
SD X Elite Reference 80W
SD X Elite Adreno GPU , Snapdragon X Elite
2966 Points -4%
SD X Elite Reference 23W
SD X Elite Adreno GPU , Snapdragon X Elite
2777 Points -10%
Lenovo ThinkPad X1 Carbon G11 21HNS54T00
Iris Xe G7 96EUs, i7-1370P, WDC PC SN810 2TB
2644 Points -15%
Lenovo Yoga Slim 7 14APU G8
Radeon 780M, R7 7840S, Samsung PM9A1 MZVL21T0HCLR
2605 Points -16%
Lenovo ThinkPad T14s G4-21F8002TGE
Radeon 780M, R7 7840U, Samsung PM9A1a MZVL21T0HDLU
2399 Points -23%

Qualcomm heeft een merkbaar voordeel in multicore prestaties met beide referentiesystemen (afhankelijk van de test, tussen 17-33% met 23 watt of 27-71% met 80 watt). Dit is echter een vergelijking met de langzaamste van de nieuwe M3-chips en we kunnen nu al zien dat de M3 Pro (12 cores) met 28 watt sneller is dan het Qualcomm-referentieontwerp met 80 watt, in ieder geval in Geekbench Multi.

In single-core tests presteert de Apple M3 gemakkelijk beter dan de sterk presterende Snapdragon X Elite. Het zal interessant zijn om te zien hoeveel stroom de Qualcomm-chip daadwerkelijk nodig heeft bij single-core belasting.

GFXBench - 1920x1080 Aztec Ruins Normal Tier Offscreen
Apple MacBook Pro 14 2023 M2 Pro Entry
M2 Pro 16-Core GPU, M2 Pro 10-Core, Apple SSD AP0512Z
493 fps +50%
SD X Elite Reference 80W
SD X Elite Adreno GPU , Snapdragon X Elite
356 fps +8%
Apple MacBook Pro 14 2023 M3
M3 10-Core GPU, M3, Apple SSD AP1024Z
329.6 fps
SD X Elite Reference 23W
SD X Elite Adreno GPU , Snapdragon X Elite
294 fps -11%
Apple Mac Mini M2
M2 10-Core GPU, M2, Apple SSD AP0512Z
289.5 fps -12%
Asus ROG Zephyrus G14 GA402XY
Radeon 780M, R9 7940HS
141 fps -57%
HP ZBook Firefly 14 G10 A
Radeon 760M, R5 PRO 7640HS, Samsung PM9B1 512GB MZVL4512HBLU
123.2 fps -63%
Asus Zenbook S 13 OLED
Radeon 680M, R7 6800U, Samsung PM9A1 MZVL21T0HCLR
120 fps -64%
Asus Chromebook Flip CX5 CX5601FB
Iris Xe G7 96EUs, i7-1255U, Intel SSD 670p SSDPEKNU512GZ
84 fps -75%

In de GPU-benchmark van Qualcomm is het resultaat heel duidelijk, want de 10-core M3 GPU (met een maximaal verbruik van 15 watt) presteert 12% beter dan het kleine referentiesysteem van Qualcomm en ligt slechts 7% achter op het 80-watt systeem. De18-core GPU van de nieuwe M3 Pro is duidelijk superieur met 580 FPS.

Verdict - Apple's eerste 3 nm chip is een compleet succes

Apple M3 SoC in de MacBook Pro 14 2023

Bij de overgang van de M1 naar de M2 verbeterde Apple de prestaties van de chips door hogere kloksnelheden, maar ten koste van een hoger stroomverbruik door hetzelfde fabricageproces (5 nm). Bij de M3 blijft de basiskernconfiguratie identiek voor zowel de CPU als de GPU, maar de kloksnelheden zijn opnieuw hoger. Dankzij het moderne 3 nm fabricageproces heeft dit slechts een minimale invloed op het stroomverbruik en dus heeft Apple zowel de prestaties als de efficiëntie kunnen verbeteren.

Apple was in staat om de processorprestaties met bijna 20% te verbeteren in zowel de single-core als multicore tests. Vooral de single-core prestaties komen nu overeen met de snelle cores van Intels huidige Raptor Lake generatie, die veel meer stroom verbruiken. Het voordeel ten opzichte van AMD's Zen4-processoren is hier ook duidelijk, aangezien deze niet kunnen concurreren met de M3 op het gebied van efficiëntie of pure prestaties. In de multikerntests veranderen de zaken echter en bieden zowel de Zen4-processors (uit de Ryzen 7 U-serie) als de Raptor Lake P-processors van Intel meer prestaties, maar de CPU's van Intel zijn veel minder efficiënt. De U-serie van Intel, zoals de huidige Core i7-1365U, blijft ook achter op het gebied van multi-core prestaties. De Zen4-chips van AMD, zoals de Ryzen 7 7840U, zijn praktisch gelijk wat betreft multi-core efficiëntie. AMD zou Apple wel eens kunnen inhalen met de aankomende Ryzen 8000-chips begin 2024.

Meer prestaties met een hogere efficiëntie - Apple levert met de nieuwe M3 en de aankomende MacBook Air-modellen zullen ook profiteren van de prestatieboost.

Op het gebied van grafische prestaties is er een voordeel tot 20% ten opzichte van de M2. Hoewel het stroomverbruik iets is toegenomen, zien we nog steeds een lichte verbetering in efficiëntie en de huidige iGPU's van AMD (Radeon 780M) en Intel (Iris Xe Graphics G7) blijven aanzienlijk achter. Alleen in de OpenCL test kan de Radeon 780M het gemakkelijk opnemen tegen de M3 GPU.

De vergelijkingen met de nieuweQualcomm Snapdragon X Elite zijn ook erg interessant omdat de Snapdragon in het voordeel lijkt te zijn, vooral op het gebied van multicore prestaties. De grafische prestaties zijn echter zwakker dan die van de Apple M3, althans in het kleine referentieontwerp met 23 watt, en we hebben slechts een zeer beperkt aantal benchmarks die door Qualcomm zijn gepresenteerd. De cijfers laten een enorme verbetering zien ten opzichte van de vorige 8cx Gen3-chipsmaar we zullen moeten afwachten wanneer de eerste apparaten op de markt komen en hoe de prestatiewaarden uiteindelijk zullen uitvallen.

Please share our article, every link counts!
> Overzichten en testrapporten over laptops en mobieltjes > Testrapporten > Apple M3 SoC geanalyseerd: Verbeterde prestaties en efficiëntie
Andreas Osthoff, 2023-11-12 (Update: 2023-11-12)