Apple M2 Pro en M2 Max analyse - GPU is efficiënter, de CPU niet altijd
Iets meer dan een half jaar geleden introduceerde Apple hun nieuwe M2 System on a Chip (SoC), dat wordt gebruikt in deMacBook AirdeMacBook Pro 13en de Mac mini. Net als zijn voorgangerwordt de M2-chip geproduceerd volgens het 5 nm-proces, dat verder is verbeterd. Er zijn ook enkele andere wijzigingen aangebracht, zoals een nieuwe Media Engine - maar de hogere kernkloksnelheden (P-Cores max. 3,48 vs. 3,2 GHz; E-Cores max. 2,4 vs. 2,1 GHz) zijn verantwoordelijk voor de hogere prestaties van de nieuwe chips. De basisconstructie en kernconfiguratie met een prestatiecluster (4 kernen) en een energie-efficiëntiecluster (4 kernen) blijven ongewijzigd. Uit onze analyse blijkt dat Apple erin geslaagd is de prestaties te verbeteren - maar met een toename van het energieverbruik als gevolg. Dit betekent dat de efficiëntie onder hoge belasting slechter is dan die van de M1.
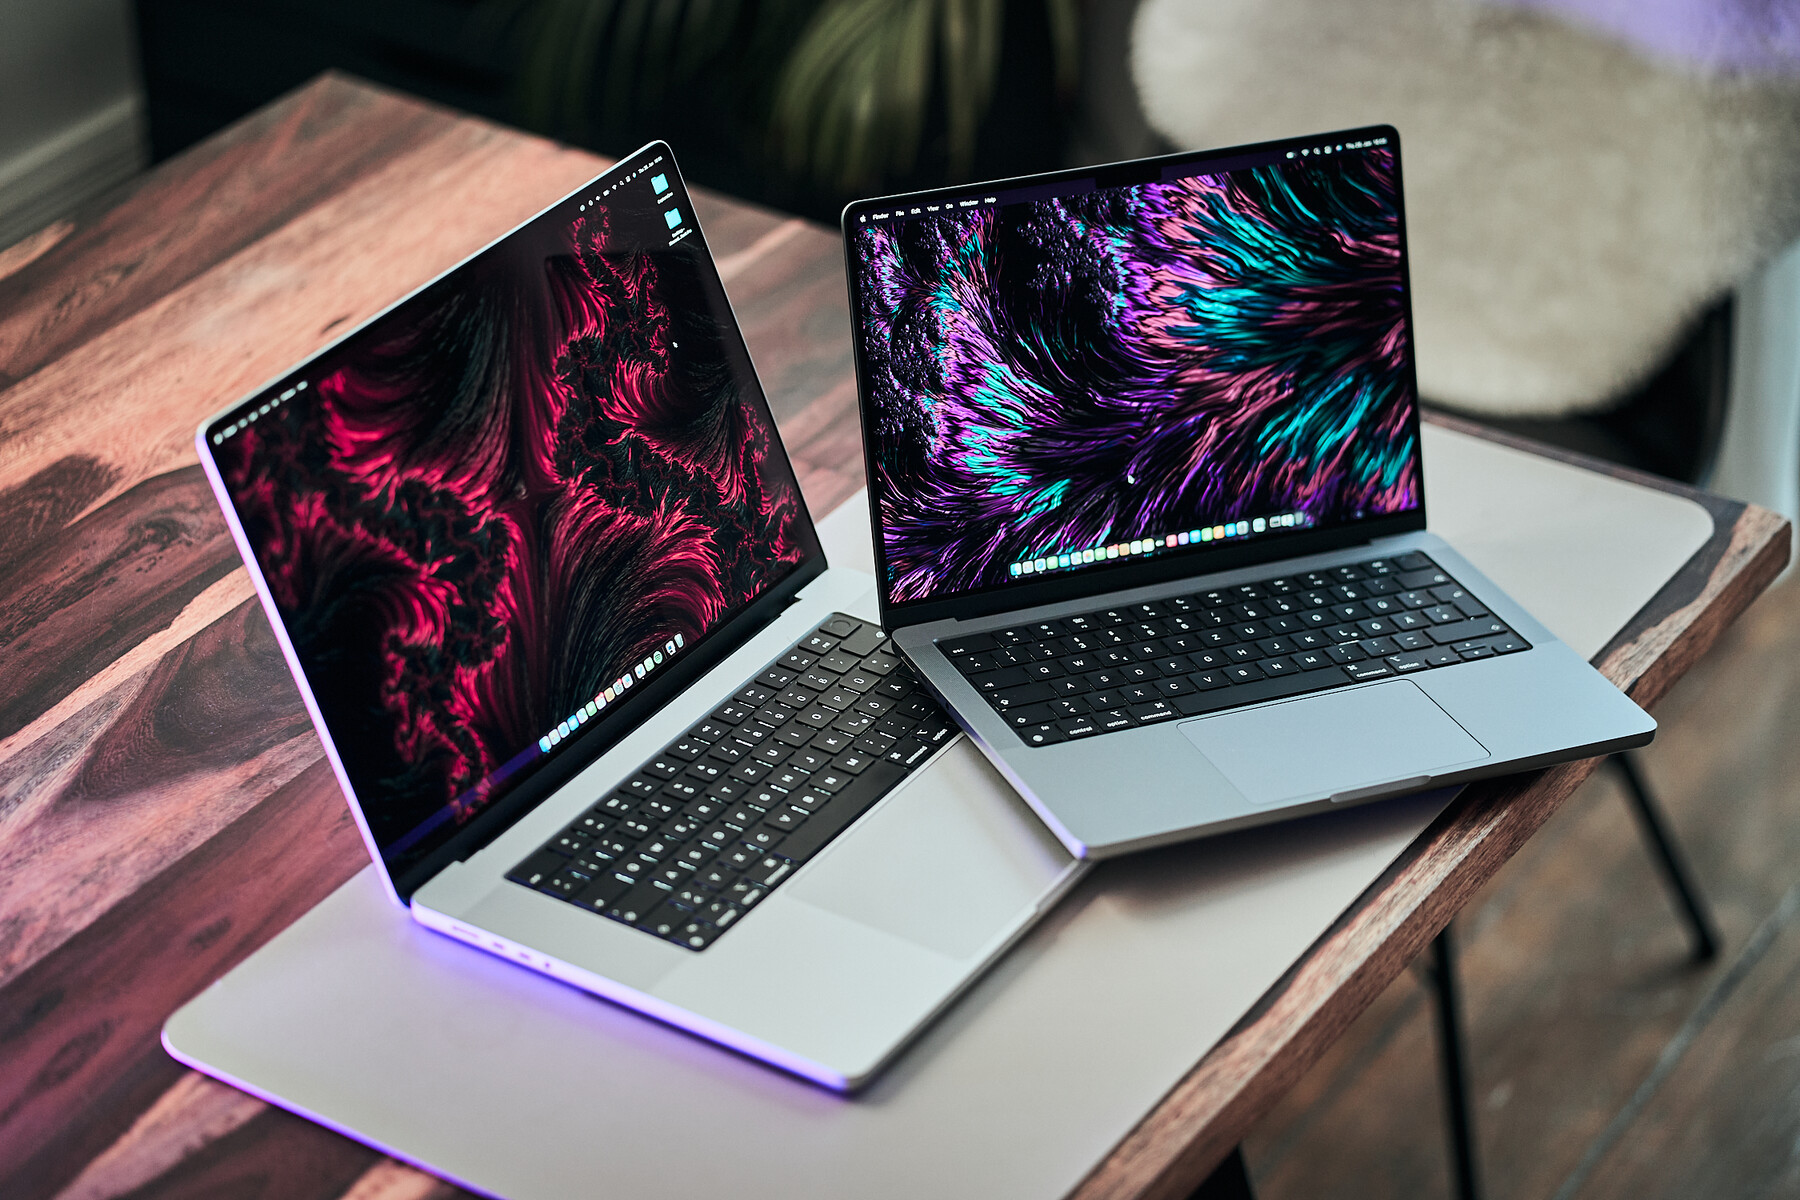
We hadden al verwacht dat de nieuwe M2 Proen M2 Max SoC'sin de herfst van vorig jaar en er waren geruchten over een nieuwe 3 nm productie, die een veel betere efficiëntie had kunnen bieden. De lancering werd echter uitgesteld tot januari 2023 en Apple heeft vastgehouden aan hun 5 nm-chips. Behalve de hogere kloksnelheden zijn er ook meer kernen in de processor en de grafische kaart. We konden de MacBook Pro 14 2023 enMacBook Pro 16 2023in groot detail - maar nu wilden we de nieuwe SoC's van dichterbij bekijken. Ze bieden zeker hogere prestaties, maar heeft dit zijn tol geëist op hun efficiëntie zoals bij de gewone M2-chips?
Apple M2 Pro en M2 Max overzicht
Apple hebben hun processorreeks afgeslankt en bieden nu vier verschillende SoC's aan: twee M2 Pro chips en twee M2 Max SoC's. Alle modellen hebben nu twee extra energiezuinige kernen en behouden zes of acht prestatiekernen. Ook nieuw is de single-core turbo tot 3,69 GHz in de M2 Max en 3,504 in de M2 Pro. In multi-core modus is het maximum 3,264 GHz. Bovendien is de L2-cache verhoogd van 28 naar 36 MB.
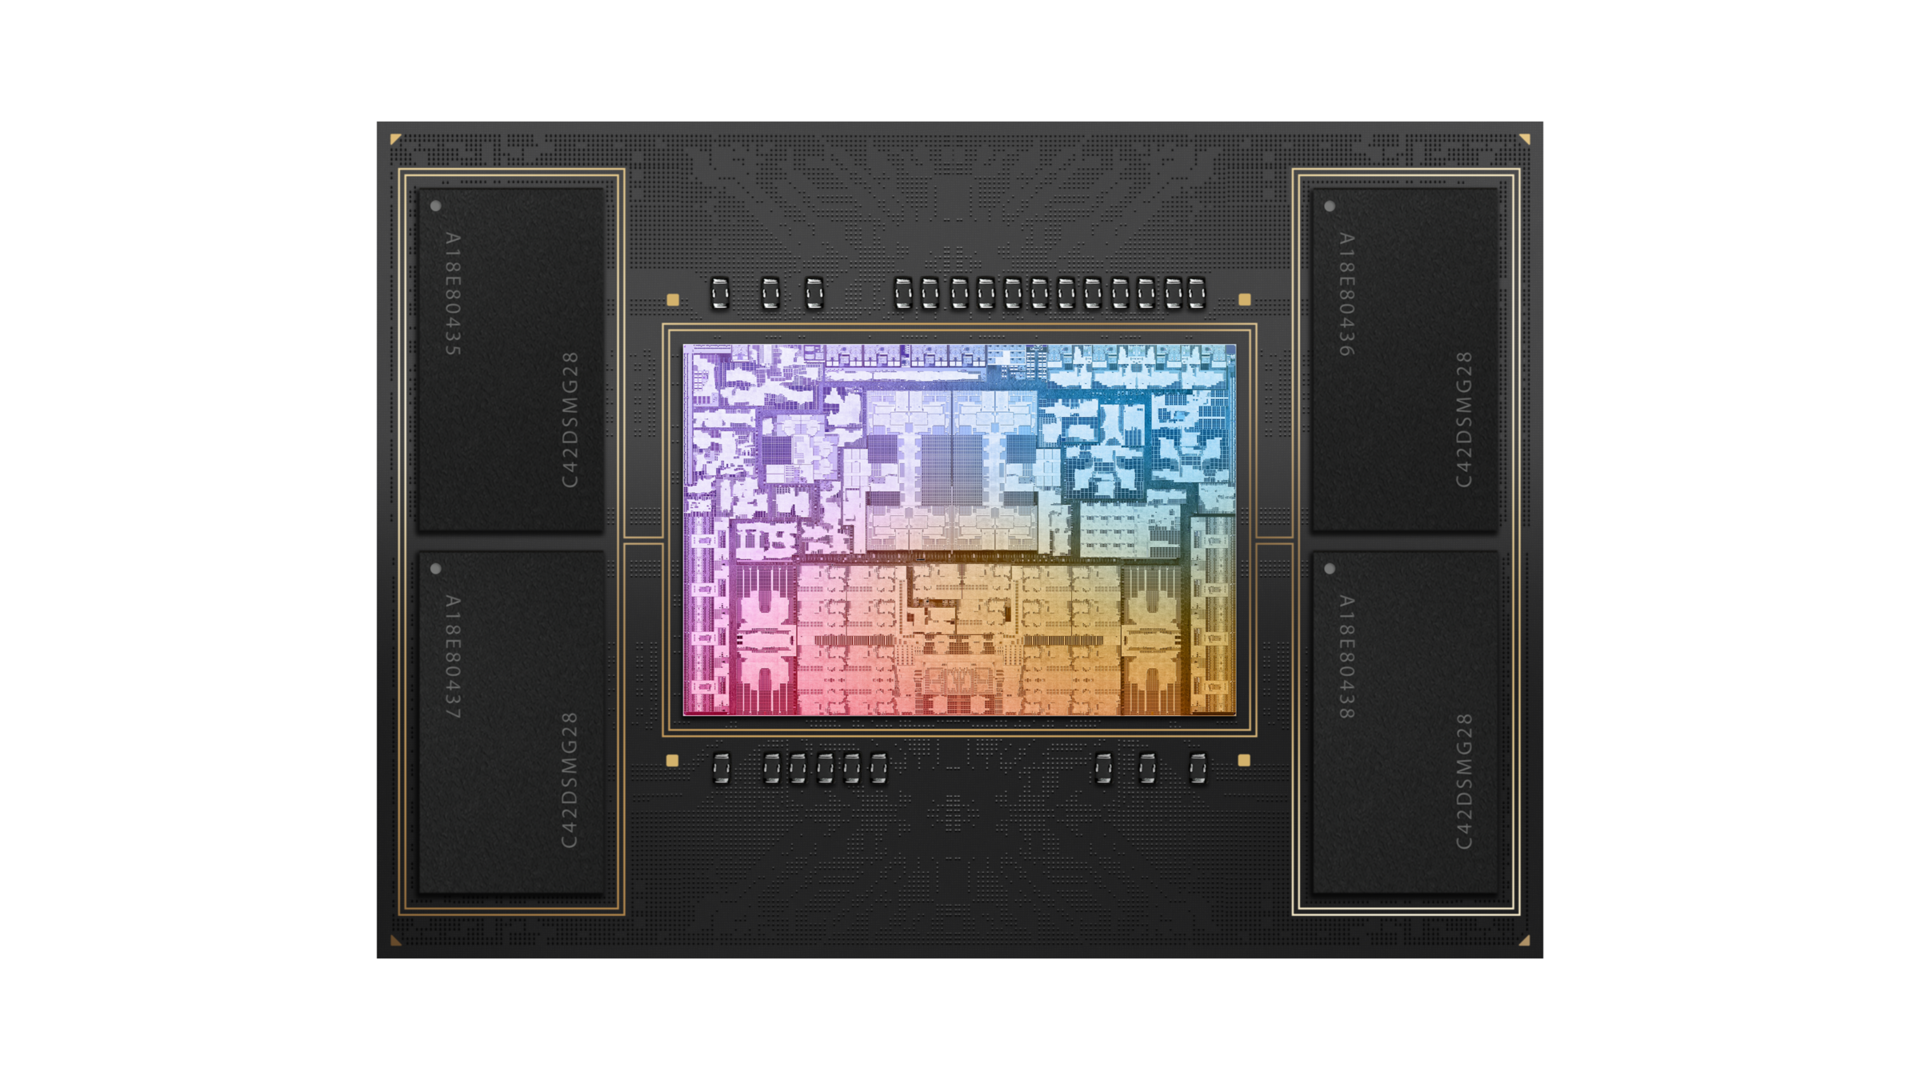
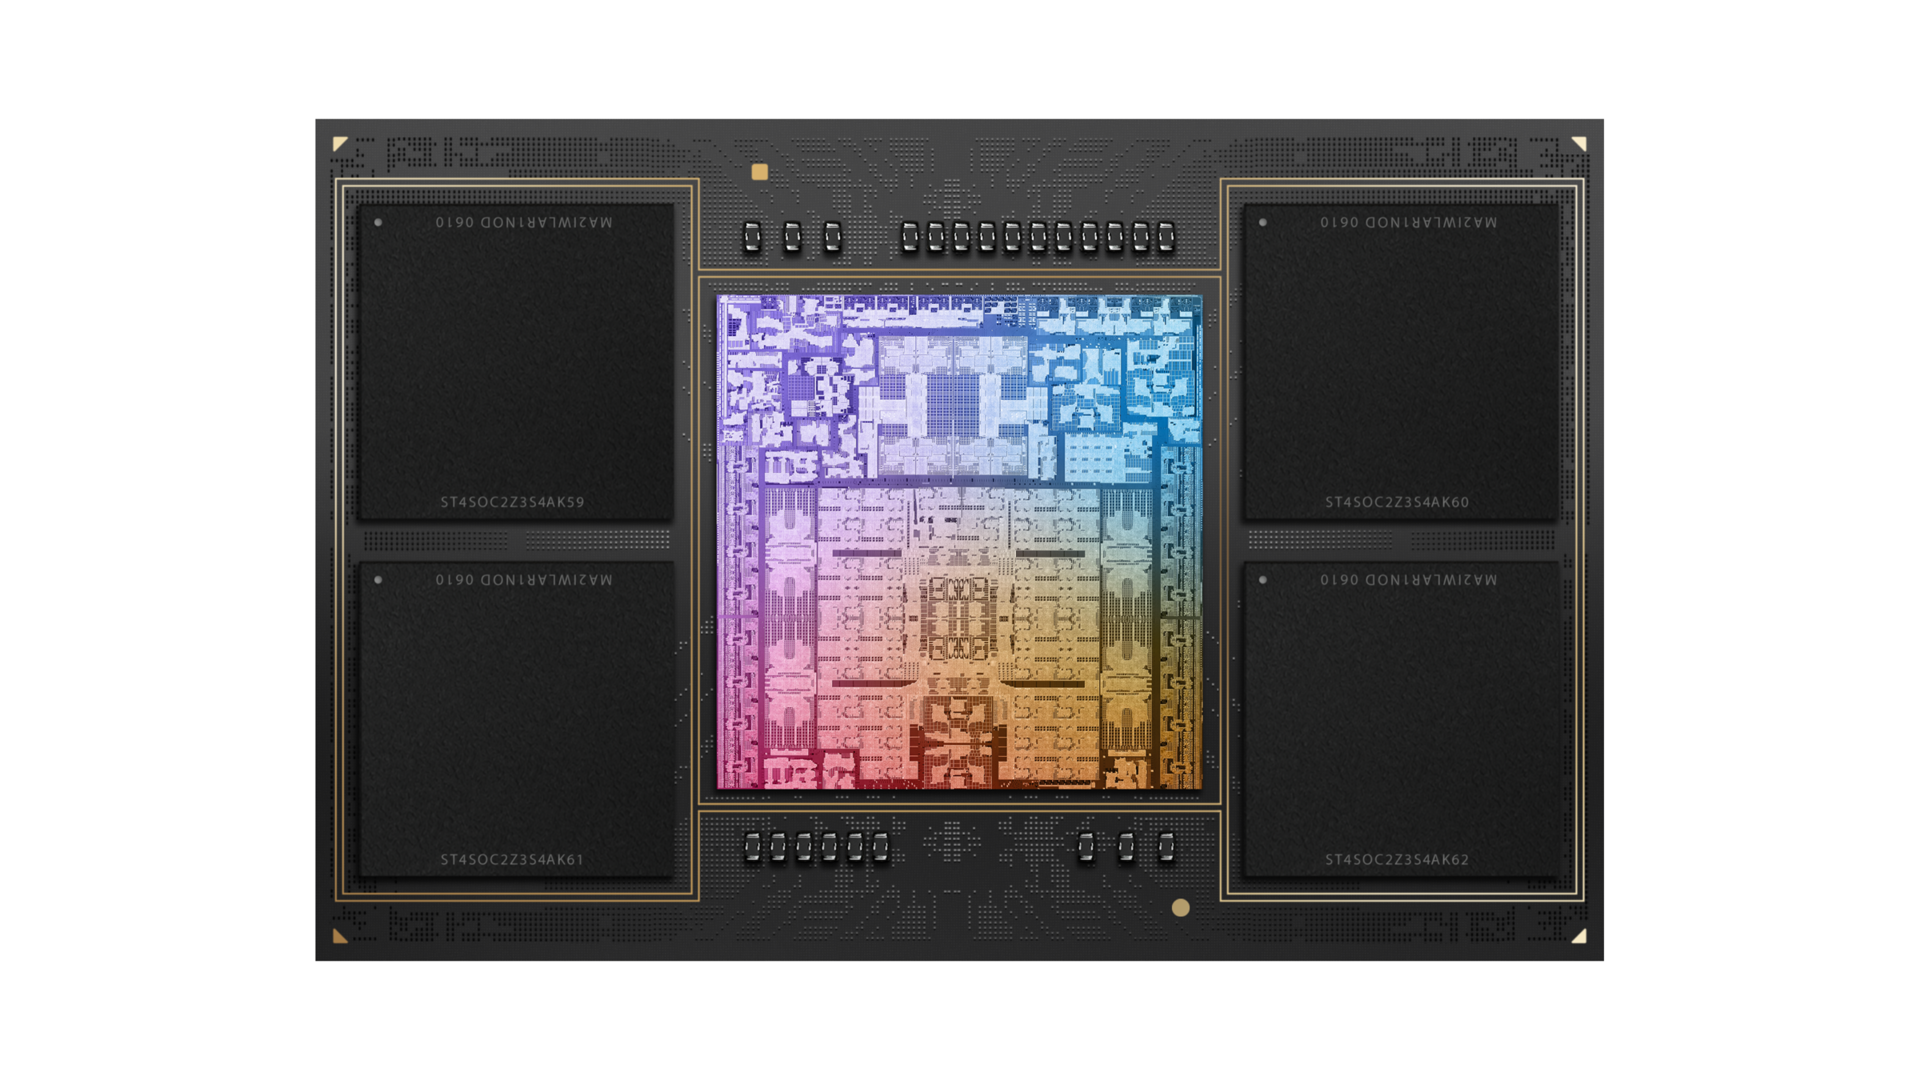
Verder profiteren de grafische kaarten ook van een hoger aantal kernen en hogere kloksnelheden van 1,4 GHz. De M2 Pro heeft 16 of 19 GPU-kernen en de M2 Max heeft 32 of 38 kernen. De afgeslankte M2 Pro-chip is alleen beschikbaar in het basismodel van de kleinere MacBook Pro 14. Apple heeft de maximale hoeveelheid RAM-geheugen verhoogd van 64 naar 96 GB (LPDDR5-6400) - maar alleen in de M2 Max. De M2 Pro is beperkt tot 32 GB RAM.
| SoC | CPU-kernen | GPU-kernen | RAM |
|---|---|---|---|
| M2 Pro | 4 energiezuinige kernen & 6 prestatiekernen | 16 | 16 of 32 GB |
| M2 Pro | 4 energiezuinige kernen & 8 prestatiekernen | 19 | 16 of 32 GB |
| M2 Max | 4 energiezuinige kernen & 8 prestatiekernen | 30 | 32, 64 of 96 GB |
| M2 Max | 4 energiezuinige kernen & 8 prestatiekernen | 38 | 32, 64 of 96 GB |
Afgezien van de base model van de M2 Prozijn de CPU-prestaties vrijwel identiek - wat we al konden vaststellen in onze reviews van de MacBook Pro 14 2023 en de MacBook Pro 16 2023. Het grote verschil zit hem in de grafische prestaties. We zullen nu de prestaties van de nieuwe Apple SoC's controleren en ze vergelijken met processoren en grafische kaarten van AMD, Intel en Nvidia.
Daarnaast zullen we de efficiëntie analyseren - Apple heeft dit echter iets moeilijker gemaakt met de nieuwe M2 modellen, aangezien de geïntegreerde PowerMetrics functie niet meer het pakketvermogen van de chips laat zien (dit geldt ook voor tools als Asitop of MX Power Gadget). In plaats daarvan wordt alleen het werkelijke verbruik van de CPU en GPU getoond. Daarom zullen we de Cinebench R23 benchmark op een externe monitor gebruiken om de efficiëntie te vergelijken, zodat het geïntegreerde paneel kan worden uitgesloten als een beïnvloedende factor. Wat de grafische kaart betreft, zullen we het werkelijke GPU-verbruik in de 3DMark Wild Life Extreme Unlimited benchmark gebruiken om te vergelijken tussen Apple producten, evenals het spel The Witcher 3 om ze te vergelijken met Windows toestellen. Hierover later meer.
Single-core prestaties en efficiëntie
Apple adverteren een verbeterde verwerkingsprestatie tot 20% - dit geldt echter niet voor single-core prestaties. We konden een verbeterde prestatie van 6-8% vaststellen in vergelijking met de oude M1 Pro en M1 Max CPU's - maar dit kan uitsluitend worden toegeschreven aan de hogere kloksnelheden. Vergeleken met de vorige generatie hebben de M2 Pro en de M2 Max een duidelijk voordeel ten opzichte van de gewone M2 processors in deMacBook Pro 13 en de MacBook Air.
| Cinebench R23 - Single Core | |
| Apple M2 Pro | |
| Apple M2 Pro 10-Core | |
| Apple M2 Max | |
| Apple M2 | |
| Apple M2 | |
| Apple M1 Max | |
| Apple M1 Pro | |
| Apple M1 Pro 8-Core | |
| Apple M1 Max | |
| Geekbench 5.5 - Single-Core | |
| Apple M2 Max | |
| Apple M2 Pro | |
| Apple M2 | |
| Apple M2 Pro 10-Core | |
| Apple M2 | |
| Apple M1 Max | |
| Apple M1 Max | |
| Apple M1 Pro 8-Core | |
| Apple M1 Pro | |
| Cinebench R20 - CPU (Single Core) | |
| Apple M2 Max | |
| Apple M2 Pro 10-Core | |
| Apple M2 Pro | |
| Apple M1 Max | |
| Apple M1 Pro | |
| Apple M1 Max | |
| Apple M2 | |
| Apple M2 | |
| Cinebench R15 - CPU Single 64Bit | |
| Apple M2 Max | |
| Apple M2 Pro 10-Core | |
| Apple M2 Pro | |
| Apple M2 | |
| Apple M2 | |
| Apple M1 Pro 8-Core | |
| Apple M1 Pro | |
| Apple M1 Max | |
| Apple M1 Max | |
Het energieverbruik onder single-core belasting is licht gestegen, maar dit verschilt van chip tot chip. Zo zijn beide M2 Pro modellen iets efficiënter in vergelijking met de oude M1 Pro, terwijl de M2 Max achterblijft in vergelijking met de oude M1. De verschillen kunnen hier vrij groot lijken, maar je moet niet vergeten dat we het hebben over een bereik tussen 4-6 watt, wat echt niet veel is in het grotere geheel der dingen.
| Power Consumption / Cinebench R23 Single Power Efficiency - external Monitor | |
| Apple M2 | |
| Apple M2 | |
| Apple M2 Pro | |
| Apple M2 Pro 10-Core | |
| Apple M1 Pro | |
| Apple M1 Max | |
| Apple M2 Max | |
| Power Consumption / Cinebench R23 Single (external Monitor) | |
| Apple M2 Max | |
| Apple M1 Max | |
| Apple M1 Pro | |
| Apple M2 Pro 10-Core | |
| Apple M2 Pro | |
| Apple M2 | |
| Apple M2 | |
* ... kleiner is beter
Dankzij de toename van de single-core prestaties kon Apple het gat met Intel bijna volledig dichten, al varieerde dit per test. In de Geekbench test presteerde de Apple SoC uitstekend en versloeg zelfs de nieuwste Raptor Lake Core i7-1360Pmet 10%. In de Cinebench R23 test bleven de M2 Pro en M2 Max echter op gelijke hoogte met de vorige Alder Lake CPU, en kwam de nieuwe Raptor Lake i7 met 15% als beste uit de bus - dankzij zijn hogere single-core turbo. Apple zegevierde over de oude AMD Ryzen 7 6800Umet Zen 3+ kernen, hoewel dit snel genoeg zou kunnen veranderen met de release van de Zen 4 modellen.
| Performance rating - Percent | |
| Intel Core i7-1360P | |
| Apple M2 Pro | |
| Apple M2 Max | |
| Intel Core i7-12700H | |
| Intel Core i7-1260P | |
| AMD Ryzen 7 6800U | |
| AMD Ryzen 7 PRO 6850U | |
| Cinebench R23 - Single Core | |
| Intel Core i7-1360P | |
| Intel Core i7-12700H | |
| Intel Core i7-1260P | |
| Apple M2 Pro | |
| Apple M2 Max | |
| AMD Ryzen 7 6800U | |
| AMD Ryzen 7 PRO 6850U | |
| Geekbench 5.5 - Single-Core | |
| Apple M2 Max | |
| Apple M2 Pro | |
| Intel Core i7-1360P | |
| Intel Core i7-12700H | |
| Intel Core i7-1260P | |
| AMD Ryzen 7 6800U | |
| AMD Ryzen 7 PRO 6850U | |
Als het gaat om single-core efficiëntie en vergeleken met AMD en Intel, was Apple de duidelijke winnaar met hunM2 Promet een mijl. De M2 Maxwas schijnbaar veel slechter dan de M2 Pro - maar aangezien we te maken hebben met een vrij laag kaliber als het gaat om de prestaties van de Apple chips onder single-core belasting, werd het kleinere extra verbruik hier veel opvallender.
Intel was in staat om hun single-core efficiëntie iets te verbeteren met hun nieuwe Raptor Lake Core i7, maar dit schiet nog steeds tekort in vergelijking met AMD's Zen 3+ chips.
| Power Consumption / Cinebench R23 Single Power Efficiency - external Monitor | |
| Apple M2 Pro | |
| Apple M2 Max | |
| AMD Ryzen 7 PRO 6850U | |
| AMD Ryzen 7 6800U | |
| Intel Core i7-1360P | |
| Intel Core i7-1260P | |
| Intel Core i7-12700H | |
| Power Consumption / Cinebench R23 Single (external Monitor) | |
| Intel Core i7-12700H | |
| Intel Core i7-1260P | |
| Intel Core i7-1360P | |
| AMD Ryzen 7 6800U | |
| AMD Ryzen 7 PRO 6850U | |
| Apple M2 Max | |
| Apple M2 Pro | |
* ... kleiner is beter
Multi-core prestaties en efficiëntie
Alle nieuwe M2 Pro en M2 Max SoC's hebben twee extra energiezuinige kernen gekregen, die uiteraard een positieve invloed hebben op de multi-core prestaties. In het dagelijks gebruik helpen de twee extra kernen ook om de chip efficiënter te maken, omdat de snelle en energieverslindende prestatiekernen minder vaak hoeven te worden gebruikt. Bovendien waren de resultaten van de multi-core tests aanzienlijk beter en in het beste geval leidden de twee extra kernen in combinatie met de eerder genoemde optimalisaties tot een verbetering van de multi-core prestaties met 20% ten opzichte van de oude M1 Pro en M1 Max. Het nieuwe basismodel van de M2 Pro met 10 cores ligt 23% voor op de oude M1 Pro met 8 cores (Cinebench R23) en 5% achter de oude M1 Pro/M1 Max met 10 cores. Beide nieuwe chips met 12 cores zijn 25% sneller dan het basismodel M2 Pro.
Natuurlijk verhogen de extra kernen en hogere kloksnelheden ook het energieverbruik in vergelijking met de M1 Pro wanneer alle kernen in gebruik zijn. Hieruit blijkt dat de nieuwe chips niet echt veel verbetering bieden, want de efficiëntie zakte in de multi-core tests. Zoals verwacht deed de M2 Max met de grootste hoeveelheid RAM het het slechtst binnen de Apple line-up, maar ook de M2 Pro met 12 kernen bleef achter bij zijn voorganger.
Bij het instapmodel M2 Pro met 10 cores steeg het maximale energieverbruik tot ongeveer 28 watt (M1 Pro met 8 cores: 21 watt) - het grotere 12-core model had een verbruik van ongeveer 34 watt (M1 Pro met 10 cores: 27 watt) en de M2 Max had een verbruik van ongeveer 34-36 watt (M1 Max: 29 watt). Zonder die volgende stap in het productieproces te zetten, kan Apple simpelweg geen lager energieverbruik toveren, gezien de twee extra cores en de hogere kloksnelheden.
| Power Consumption / Cinebench R23 Multi Power Efficiency - external Monitor | |
| Apple M2 | |
| Apple M2 | |
| Apple M1 Pro | |
| Apple M2 Pro | |
| Apple M1 Max | |
| Apple M2 Pro 10-Core | |
| Apple M2 Max | |
| Power Consumption / Cinebench R23 Multi (external Monitor) | |
| Apple M2 Max | |
| Apple M2 Pro | |
| Apple M2 Pro 10-Core | |
| Apple M1 Max | |
| Apple M1 Pro | |
| Apple M2 | |
| Apple M2 | |
* ... kleiner is beter
Dankzij de verhoogde prestaties van de chips wist Apple zich te onderscheiden van hun concurrenten in de multi-core tests. In de Geekbench-test lieten de M2-chips sowieso extreem goede prestaties zien - maar ook in de Cinebench R23-test presteerden ze goed. De Apple chip moest alleen de nederlaag toegeven aan de Core i7-12700H in deSchenker Vision 14- die echter ook meer energie verbruikt (60/40 watt). Daarom moet Apple niet bang zijn voor de nieuwe Core i7-1360Pvan Intels nieuwste Raptor Lake-generatie (ondanks het hogere verbruik).
AMD's Zen 3+ chips werden ook verslagen door Apple in de multi-core tests, maar dit zou kunnen veranderen met de komende Zen 4 chips.
| Performance rating - Percent | |
| Apple M2 Max | |
| Apple M2 Pro | |
| Intel Core i7-12700H | |
| Intel Core i7-1360P | |
| AMD Ryzen 9 6900HS | |
| AMD Ryzen 7 6800U | |
| Intel Core i7-1260P | |
| AMD Ryzen 7 PRO 6850U | |
| Cinebench R23 - Multi Core | |
| Intel Core i7-12700H | |
| Apple M2 Pro | |
| Apple M2 Max | |
| AMD Ryzen 9 6900HS | |
| Intel Core i7-1360P | |
| AMD Ryzen 7 6800U | |
| AMD Ryzen 7 PRO 6850U | |
| Intel Core i7-1260P | |
| Geekbench 5.5 - Multi-Core | |
| Apple M2 Max | |
| Apple M2 Pro | |
| Intel Core i7-12700H | |
| Intel Core i7-1360P | |
| Intel Core i7-1260P | |
| AMD Ryzen 9 6900HS | |
| AMD Ryzen 7 6800U | |
| AMD Ryzen 7 PRO 6850U | |
Door de lagere multi-core efficiëntie van de M2 Max bij maximale belasting bleef de chip achter bij de Ryzen 7 Pro 6850U. De M2 Pro kon zijn hoofd nog wel boven water houden, maar de Zen 4 CPU's van de U-serie zouden op het laatst een veel betere efficiëntie moeten bieden en daarmee Apple's ARM SoC's aftroeven. Intel staat momenteel onderaan in de efficiëntiescores.
Uit interesse hebben we de nieuwe Ryzen 9 7945HX (Zen 4, 5 nm)op 35 watt en de resultaten waren 16.872 punten in de Cinebench R23 multitest - dus de AMD-chip is efficiënter dan de M2 Pro.
| Power Consumption / Cinebench R23 Multi Power Efficiency - external Monitor | |
| Apple M2 Pro | |
| AMD Ryzen 7 PRO 6850U | |
| Apple M2 Max | |
| AMD Ryzen 7 6800U | |
| Intel Core i7-1360P | |
| Intel Core i7-1260P | |
| Intel Core i7-12700H | |
| Power Consumption / Cinebench R23 Multi (external Monitor) | |
| Intel Core i7-12700H | |
| Intel Core i7-1360P | |
| Apple M2 Max | |
| Apple M2 Pro | |
| Intel Core i7-1260P | |
| AMD Ryzen 7 6800U | |
| AMD Ryzen 7 PRO 6850U | |
* ... kleiner is beter
GPU-prestaties en -efficiëntie
We zagen al dat Apple schijnbaar meer veranderde bij het bekijken van de normale M2-SoC, aangezien de efficiëntie ook verbeterde samen met de grotere prestaties. In totaal hebben de M2 Pro en de M2 Max nu vier verschillende iGPU's - de M2 Pro heeft 6 of 19 GPU-kernen en de M2 Max heeft 32 of 38 GPU-kernen.
De nieuwe base GPU met 16kernen was ongeveer 20% sneller in de Wild Life Extreme Unlimited test in vergelijking met de oude basismodelen 8% sneller dan de oude 16-core GPU van de M1 Pro. De versie met 19 cores was opnieuw 16% sneller, wat 18% achterligt op de oude M1 Max GPU met 24 cores.
Op dit moment hebben we nog geen benchmarks voor de nieuwe M2 Max met 32 cores, maar die zullen we zo snel mogelijk toevoegen. De supersnelle M2 Max GPU met 38 coresligt 24% voor op de oude top-of-the-range M1 Max met 32 GPU-kernen.
Het bepalen van het energieverbruik van Apple's iGPU's is geen sinecure, en vooral bij de M2 Max (net als bij de M1 Max) is het niet eenvoudig om de iGPU zelfs maar voor langere tijd op zijn maximale belasting te zetten. In de volgende tabel hebben we alle cijfers van het energieverbruik opgesomd. We konden het hoogste energieverbruik van de iGPU's bepalen met de Novabench-test - dit was niet mogelijk met een andere test.
| 3DMark Wild Life Extreme Unlimited | Novabench | |
|---|---|---|
| M1 Pro 16C | ~20 watt | 24 watt |
| M2 Pro 16C | ~23,5 watt | 27,5 watt |
| M2 Pro 19C | ~26 watt | 30 watt |
| M1 Max 32C | ~44 watt | ~49 watt |
| M2 Max 38C | ~48 watt | 64 watt |
We beginnen met de M2 Pro 16C, waarvan de hogere prestaties eigenlijk worden tenietgedaan door het hogere verbruik - uiteindelijk is de efficiëntie identiek aan die van de M1 Pro GPU met 16 kernen. Het nieuwe 19-core model is echter 6% efficiënter.
Het meest indrukwekkend is de nieuwe M2 Max GPU met 38 cores - in onze Wild Life Extreme Unlimited test verbeterde hij met 14%. Dit bevestigt dus onze resultaten van de M2-analyse en het lijkt erop dat Apple meer heeft veranderd dan alleen het aantal cores in hun iGPU's.
| Power Consumption - 3DMark Wild Life Extreme Unlimited GPU Efficiency (internal tool) | |
| Apple M2 10-Core GPU | |
| Apple M2 8-Core GPU | |
| Apple M2 Max 38-Core GPU | |
| Apple M2 Pro 19-Core GPU | |
| Apple M2 Pro 16-Core GPU | |
| Apple M1 Pro 16-Core GPU | |
| Apple M1 Max 32-Core GPU | |
| Apple M1 Max 24-Core GPU | |
In vergelijking met zijn Windows-concurrenten slaagt de M2 Max GPU er ook in om de nieuwe GeForce RTX 4070 laptop in toom te houden, wat een indrukwekkende prestatie is gezien de veel lagere energie-inname. Aan de andere kant zitten beide M2 Pro GPU's tussen de GeForce RTX 3050 Tien de nieuweRTX 4050 laptop - ook een goed resultaat.
| 3DMark - Wild Life Extreme Unlimited | |
| Apple M2 Max 38-Core GPU | |
| NVIDIA GeForce RTX 4070 Laptop GPU | |
| NVIDIA GeForce RTX 4050 Laptop GPU | |
| NVIDIA GeForce RTX 3060 Laptop GPU | |
| Apple M2 Pro 19-Core GPU | |
| Apple M2 Pro 16-Core GPU | |
| NVIDIA GeForce RTX 3050 Ti Laptop GPU | |
| NVIDIA GeForce MX550 | |
| Intel Iris Xe Graphics G7 96EUs | |
| Intel Iris Xe Graphics G7 96EUs | |
| AMD Radeon 680M | |
| GFXBench | |
| 3840x2160 4K Aztec Ruins High Tier Offscreen | |
| Apple M2 Max 38-Core GPU | |
| NVIDIA GeForce RTX 4070 Laptop GPU | |
| NVIDIA GeForce RTX 4060 Laptop GPU | |
| Apple M2 Pro 19-Core GPU | |
| NVIDIA GeForce RTX 4050 Laptop GPU | |
| Intel Arc A730M | |
| Apple M2 Pro 16-Core GPU | |
| AMD Radeon RX 6700S | |
| NVIDIA GeForce MX550 | |
| 2560x1440 Aztec Ruins High Tier Offscreen | |
| Apple M2 Max 38-Core GPU | |
| NVIDIA GeForce RTX 4070 Laptop GPU | |
| NVIDIA GeForce RTX 4060 Laptop GPU | |
| Apple M2 Pro 19-Core GPU | |
| NVIDIA GeForce RTX 4050 Laptop GPU | |
| Intel Arc A730M | |
| AMD Radeon RX 6700S | |
| Apple M2 Pro 16-Core GPU | |
| NVIDIA GeForce MX550 | |
| AMD Radeon 680M | |
De efficiëntie vergelijken is niet zo eenvoudig, omdat we meestal alleen het energieverbruik van Windows-apparaten meten met The Witcher 3. Met de tool CrossOver lukt het ons om The Witcher 3 op de Mac te draaien (heel goed zelfs), zodat we ook hier het energieverbruik kunnen meten. De resultaten zijn echter nog steeds niet 100% vergelijkbaar, omdat we HBAO+ en Nvidia HairWorks op de Mac moesten uitschakelen. Als je bedenkt dat dit spel niet geoptimaliseerd is voor Apple SoC's en hoe goed de Apple-native Resident Evil draait, kunnen we alleen maar hopen dat er in de toekomst meer spellen specifiek voor Apple's processoren worden uitgebracht.
Als we kijken naar het energieverbruik, liggen Apple GPU's ver voor op hun concurrenten - zelfs de nieuwe RTX 40-modellen maken geen schijn van kans
.
Verdict - M2 Pro en M2 Max blijken solide updates, maar grote sprongen in efficiëntie zijn nergens te bekennen
Zelfs als deze update grote sprongen in efficiëntie mist en Apple het 5 nm-proces is blijven gebruiken om de M2 Pro en M2 MaxApple was in staat om zowel de single- als multi-core prestaties van de processoren te verhogen. Bij maximale belasting zorgen de twee extra kernen voor een iets lagere efficiëntie in vergelijking met de M1 Pro en M1 Max, maar over het algemeen hebben de extra energie-efficiënte kernen een positief effect gehad op de chips, omdat de prestatiekernen minder vaak gebruikt hoeven te worden. In totaal kun je zeker een verbetering zien in de totale efficiëntie van de nieuwe CPU's.
Hoewel Intel hogere single-core prestaties biedt met hun Raptor Lake mobiele processoren (13e generatie), kunnen ze niet concurreren met Apple als het gaat om multi-core prestaties en efficiëntie. Dit blijkt iets anders te zijn voor AMD, aangezien deRyzen 9 7945HX's (ook 5 nm) eerste benchmarks laten zien dat het efficiënter is dan de M2 Pro met 35 watt en we verwachten nog betere resultaten te zien van de U-serie chips met Zen 4 (4 nm).
Als het gaat om de geïntegreerde grafische kaart, kunnen Intel noch AMD Apple in het minst bijhouden - in plaats daarvan slaagt Apple er zelfs in het op te nemen tegen dedicated grafische kaarten zoals de RTX 3050 Ti of in het geval van de M2 Max (38 kernen), zelfs de nieuweGeForce RTX 4070 laptop. Naast de verbeterde prestaties is Apple er ook in geslaagd om de efficiëntie van hun geïntegreerde grafische kaart verder te verbeteren.
Vooral in vergelijking met Windows computers moet je twee dingen onthouden: Onder lage belasting is het stroomverbruik van de MacBooks extreem laag en daarnaast kun je zelfs met de M2 Max op maximaal prestatieniveau wegkomen met een beroep op de batterij van de Mac - wat simpelweg niet mogelijk zou zijn met vergelijkbare Windows-componenten.
Het moet ook gezegd worden dat Apple binnenkort wat concurrentie zal krijgen van AMD, tenminste wat processoren betreft. We zijn zeer benieuwd hoe de nieuwe U-serie Zen 4 chips zal presteren en of Apple er binnenkort in zal slagen die sprong voorwaarts te maken met hun 3 nm chips, waar we zo naar verlangen.

