Apple MacBook Pro 14 2023 M3 Max Review - De snelste CPU in een 14-inch laptop
Na het nieuwe instapmodel van de MacBook Pro 14 met de basis M3 SoC (hier in review), bespreken we het nieuwe high-end model. Apple biedt beide M3 Max-versies voor de MacBook Pro 14, waaronder de snelste M3 Max met 16 CPU-cores en 40 GPU-cores. We hebben de extreme prestaties van de M3 Max (vooral CPU) al gezien in de nieuwe MacBook Pro 16maar we zijn benieuwd of de koeloplossing van het kleinere 14-inch model ook met de M3 Max overweg kan.
| MBP 14 M3 | MBP 14 M3 Pro | MBP 14 M3 Pro | MBP 14 M3 Max | MBP 14 M3 Max | |
|---|---|---|---|---|---|
| CPU | Apple M3 8-core CPU (4P & 4E) |
Apple M3 Pro 11-core CPU (5P & 6E) |
Apple M3 Pro 12-core (6P & 6 E) |
Apple M3 Max 14-core CPU (10P & 4E) |
Apple M3 Max 16-core (12P & 4E) |
| GPU | 10-core GPU | 14-core GPU | 18-core | 30-core | 40-core |
| RAM | 8 GB (16/24 GB) | 18 GB (36 GB) | 18 GB (36 GB) | 36 GB (96 GB) | 48 GB (64/128 GB) |
| SSD | 512 GB (1/2 TB) | 512 GB (1/2/4 TB) | 1 TB (2/4 TB) | 1 TB (2/4/8 TB) | 1 TB (2/4/8 TB) |
| Bandbreedte geheugen | 100 GB/s | 150 GB/s | 150 GB/s | 300 GB/s | 400 GB/s |
| Poorten | 2x USB-C 4.0 met Thunderbolt 3 HDMI, SD-kaartlezer |
3x USB-C 4.0 met Thunderbolt 4 HDMI, SD-kaartlezer |
3x USB-C 4.0 met Thunderbolt 4 HDMI, SD-kaartlezer |
3x USB-C 4.0 met Thunderbolt 4.0 w/ Thunderbolt 4 HDMI, SD-kaartlezer |
3x USB-C 4.0 w/ Thunderbolt 4 HDMI, SD-kaartlezer |
| Prijs | vanaf $1599 | vanaf $1999 | vanaf $2399 | vanaf 3199 | vanaf $3699 |
Onze evaluatie-eenheid van de MacBook Pro 14 maakt gebruik van de snelste M3 Max in combinatie met 64 GB RAM en 2 TB SSD-opslag, waardoor de prijs stijgt naar $4299. Naast high-end multimedia laptops hebben we ook twee gaming laptops gebruikt voor onze vergelijkingsgroep. Zowel deAsus ROG Zephyrus G14en deRazer Blade 14bieden krachtige componenten in combinatie met zeer goede schermen, dus het zijn ook interessante opties voor contentmakers.
Potentiële concurrenten in vergelijking
Evaluatie | Datum | Model | Gewicht | Hoogte | Formaat | Resolutie | Beste prijs |
|---|---|---|---|---|---|---|---|
| 92.8 % v7 (old) | 11-2023 | Apple MacBook Pro 14 2023 M3 Max Apple M3 Max 16-Core, M3 Max 40-Core GPU | 1.6 kg | 15.5 mm | 14.20" | 3024x1964 | |
| 85.5 % v7 (old) | 10-2023 | Microsoft Surface Laptop Studio 2 RTX 4060 i7-13700H, GeForce RTX 4060 Laptop GPU | 2 kg | 22 mm | 14.40" | 2400x1600 | |
| 89.8 % v7 (old) | 07-2023 | Lenovo Yoga Pro 9-14IRP G8 i7-13705H, GeForce RTX 4050 Laptop GPU | 1.7 kg | 17.6 mm | 14.50" | 3072x1920 | |
| 89.3 % v7 (old) | 06-2023 | Asus Zenbook Pro 14 OLED UX6404VI i9-13900H, GeForce RTX 4070 Laptop GPU | 1.7 kg | 17.9 mm | 14.50" | 2880x1800 | |
| 87 % v7 (old) | 06-2023 | Asus ZenBook Pro 14 Duo UX8402VV-P1021W i9-13900H, GeForce RTX 4060 Laptop GPU | 1.8 kg | 21 mm | 14.50" | 2880x1800 | |
| 88.7 % v7 (old) | 06-2023 | Razer Blade 14 RTX 4070 R9 7940HS, GeForce RTX 4070 Laptop GPU | 1.8 kg | 17.99 mm | 14.00" | 2560x1600 | |
| 90 % v7 (old) | 05-2023 | Asus ROG Zephyrus G14 GA402XY R9 7940HS, GeForce RTX 4090 Laptop GPU | 1.7 kg | 20.5 mm | 14.00" | 2560x1600 |
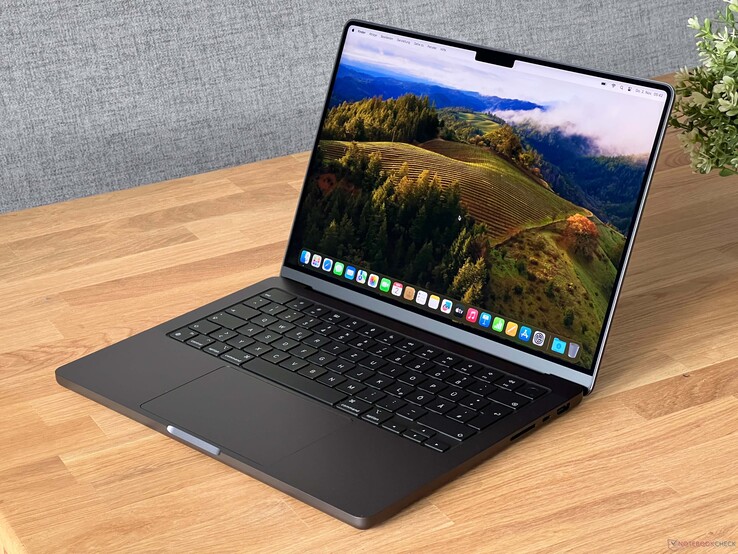
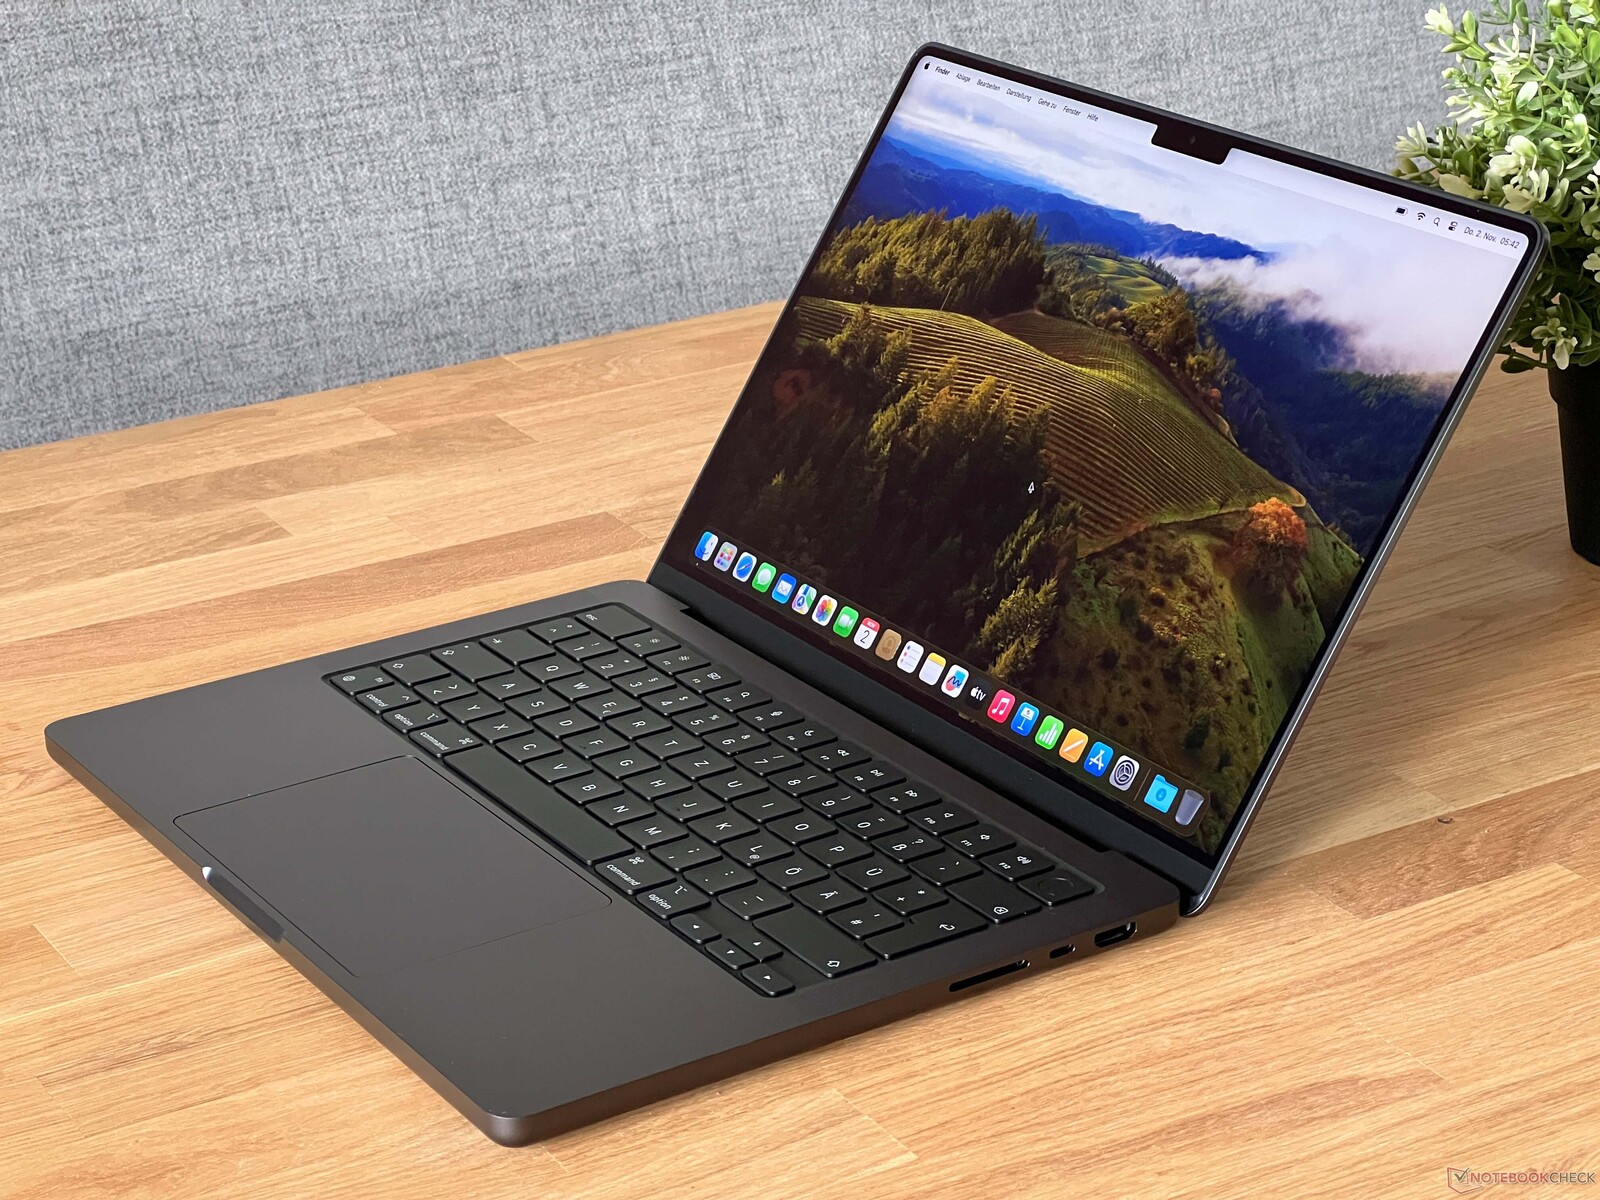
Koffer - MBP 14 in Zilver of Space Zwart
Apple behoudt het vertrouwde chassisontwerp van de twee voorgaande jaren en terwijl het nieuwe instapmodel nog steeds verkrijgbaar is in zilver of spacegrijs - kunnen klanten kiezen tussen zilver en de nieuwe spacezwarte versie op de duurdere M3 Pro & M3 Max SKU's. Onze beoordelingseenheid is het nieuwe ruimtezwarte model, maar het is niet echt zwart en er is altijd een zichtbaar verschil met het zwarte toetsenbord, het is meer een echt donkergrijs (het ziet er ook helderder of donkerder uit, afhankelijk van de lichtomstandigheden). Terwijl de kleinereMacBook Airin de kleur Midnight een pure vingerafdrukmagneet was en u hem steeds moest schoonmaken, is het nieuwe zwarte model in dit opzicht beter, maar u zult nog steeds sneller vingerafdrukken zien in vergelijking met het zilveren model. Apple gebruikt een chemisch proces, dat deel uitmaakt van het anodiseren en niet van een coating. De kwaliteit van het chassis is nog steeds uitstekend en de aluminium behuizing voelt premium en stevig aan. De scharnieren van het scherm laten ook een goede indruk achter, alleen de maximale openingshoek (135 graden) zou groter kunnen zijn.
De harde voorrand van de basiseenheid kan een probleem vormen en in de huid snijden als u hem langere tijd gebruikt. Het ontwerp van de basiseenheid zonder taps toelopende randen zorgt er ook voor dat het vrij volumineus aanvoelt, maar deze subjectieve indruk is misleidend en met 15,5 millimeter is de MBP 14 in feite iets dunner dan de oude MacBook Pro 13 (15,6 mm).
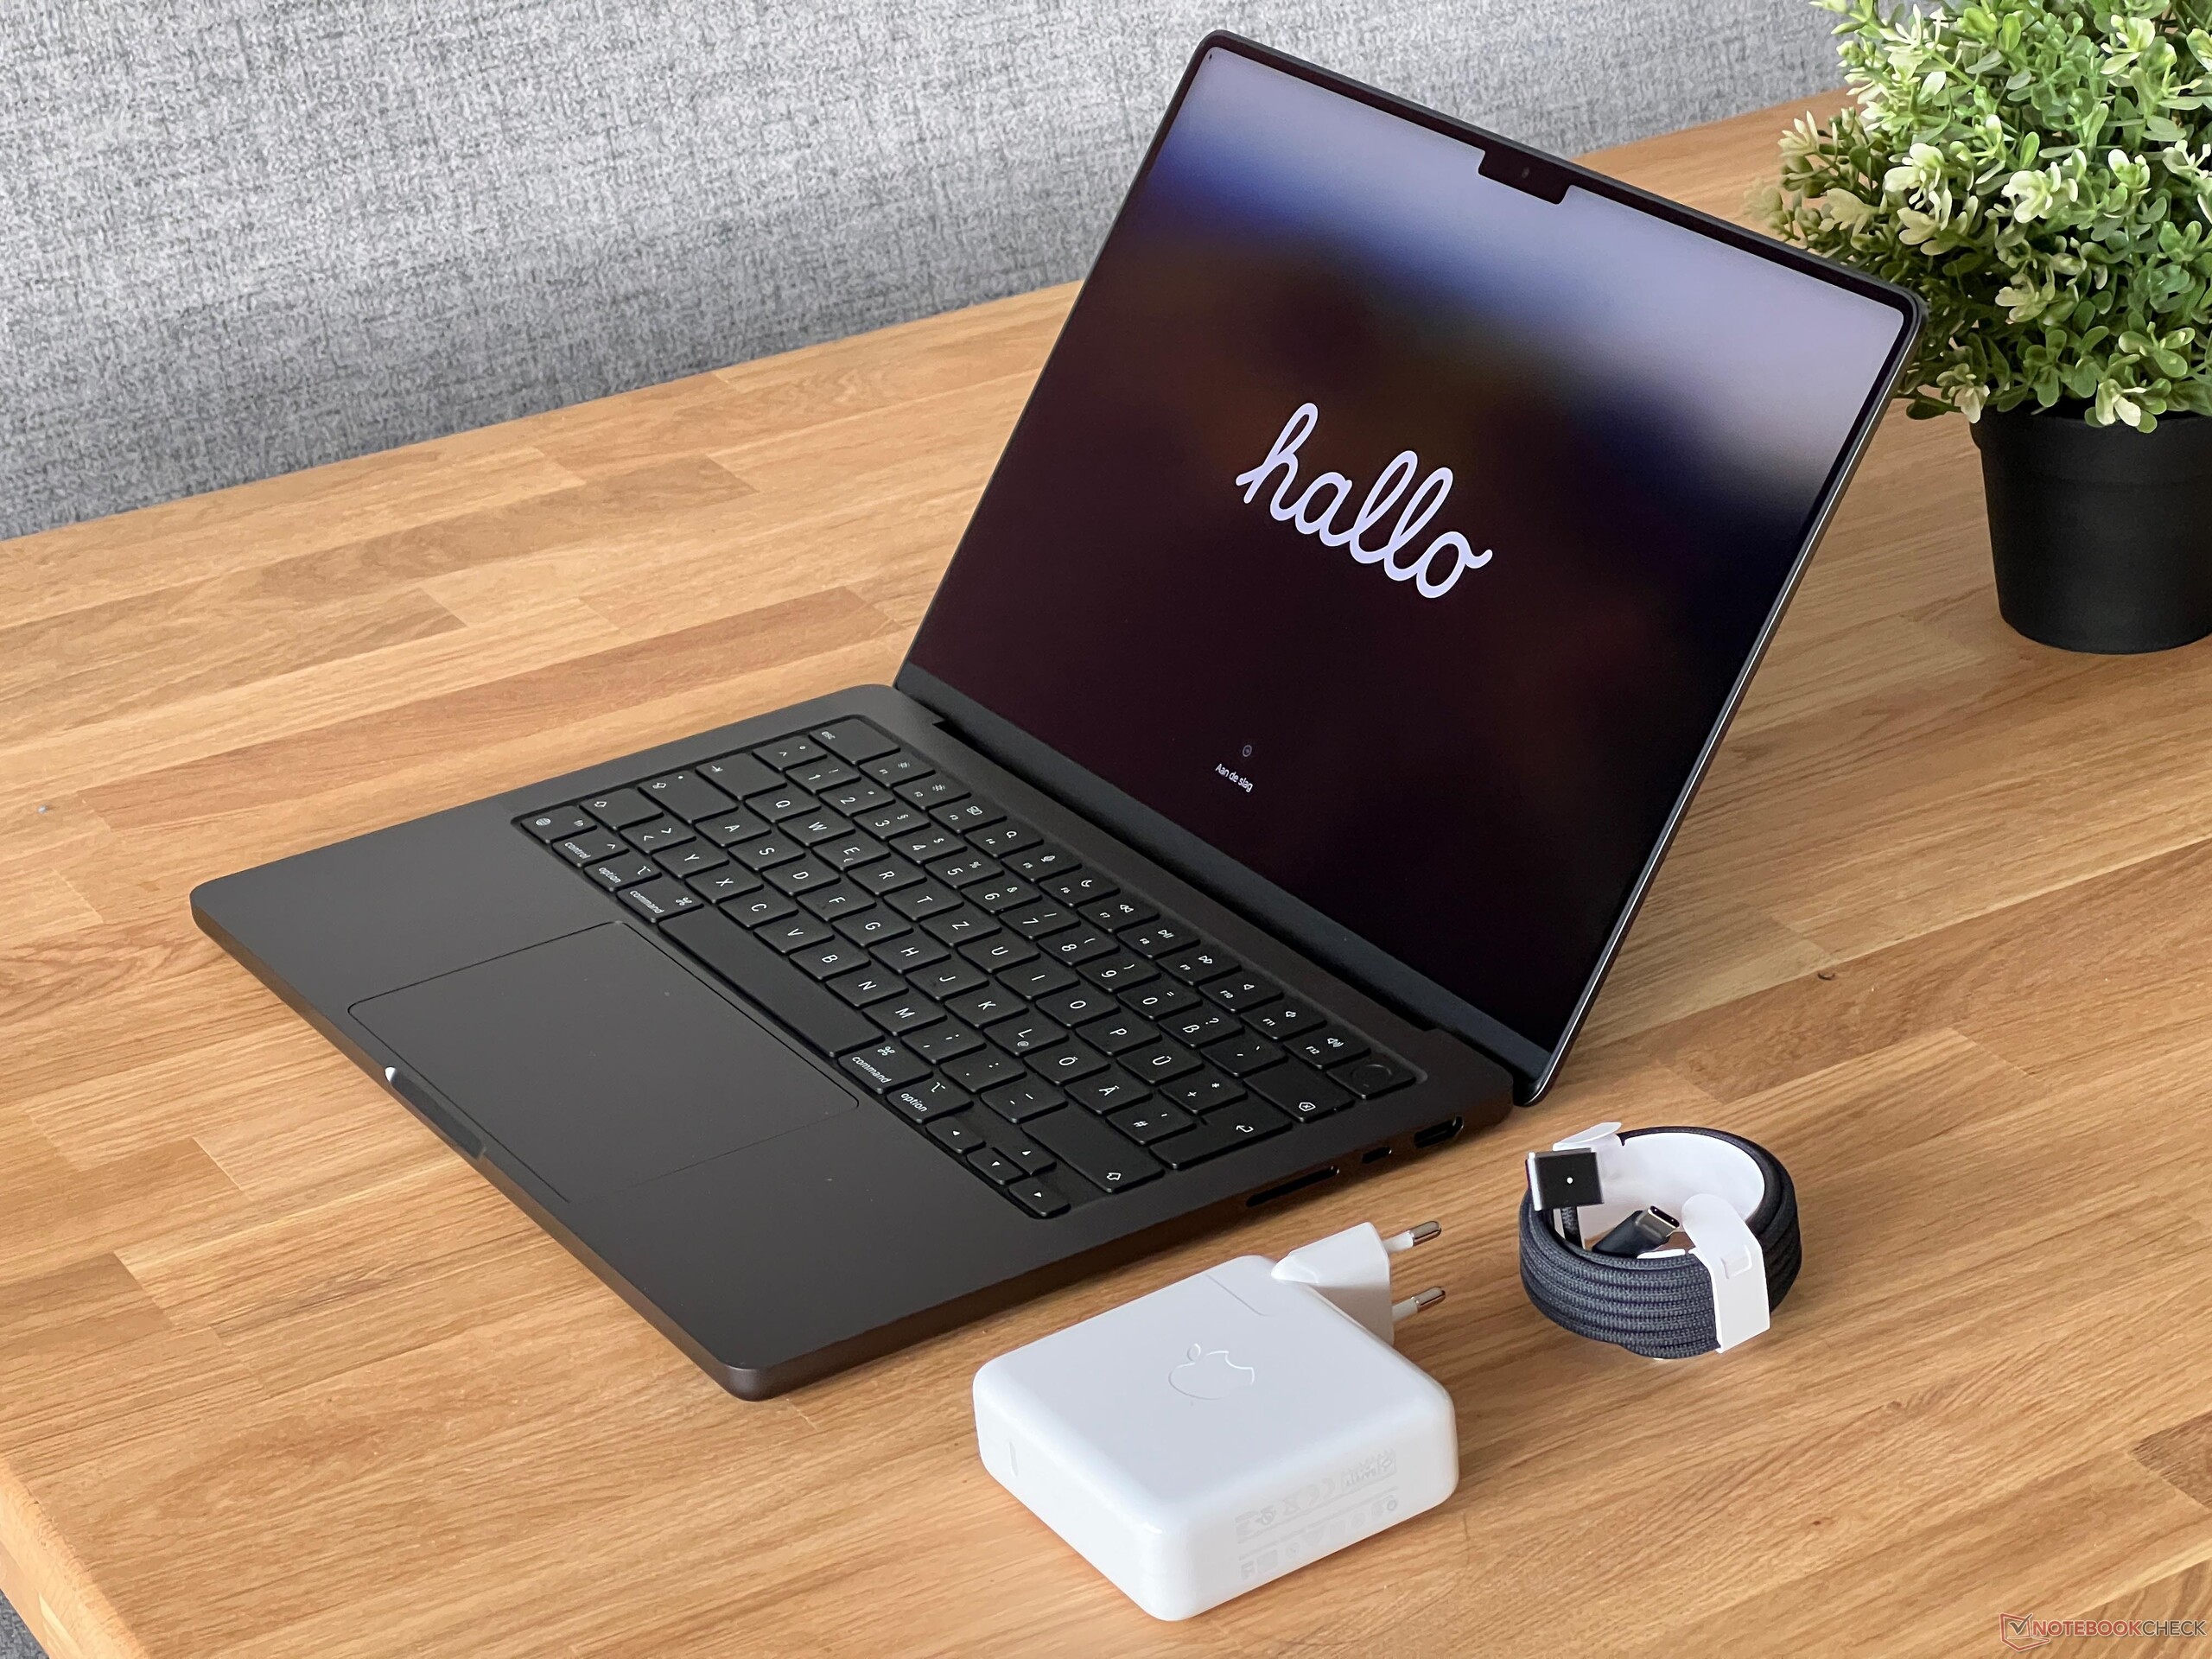
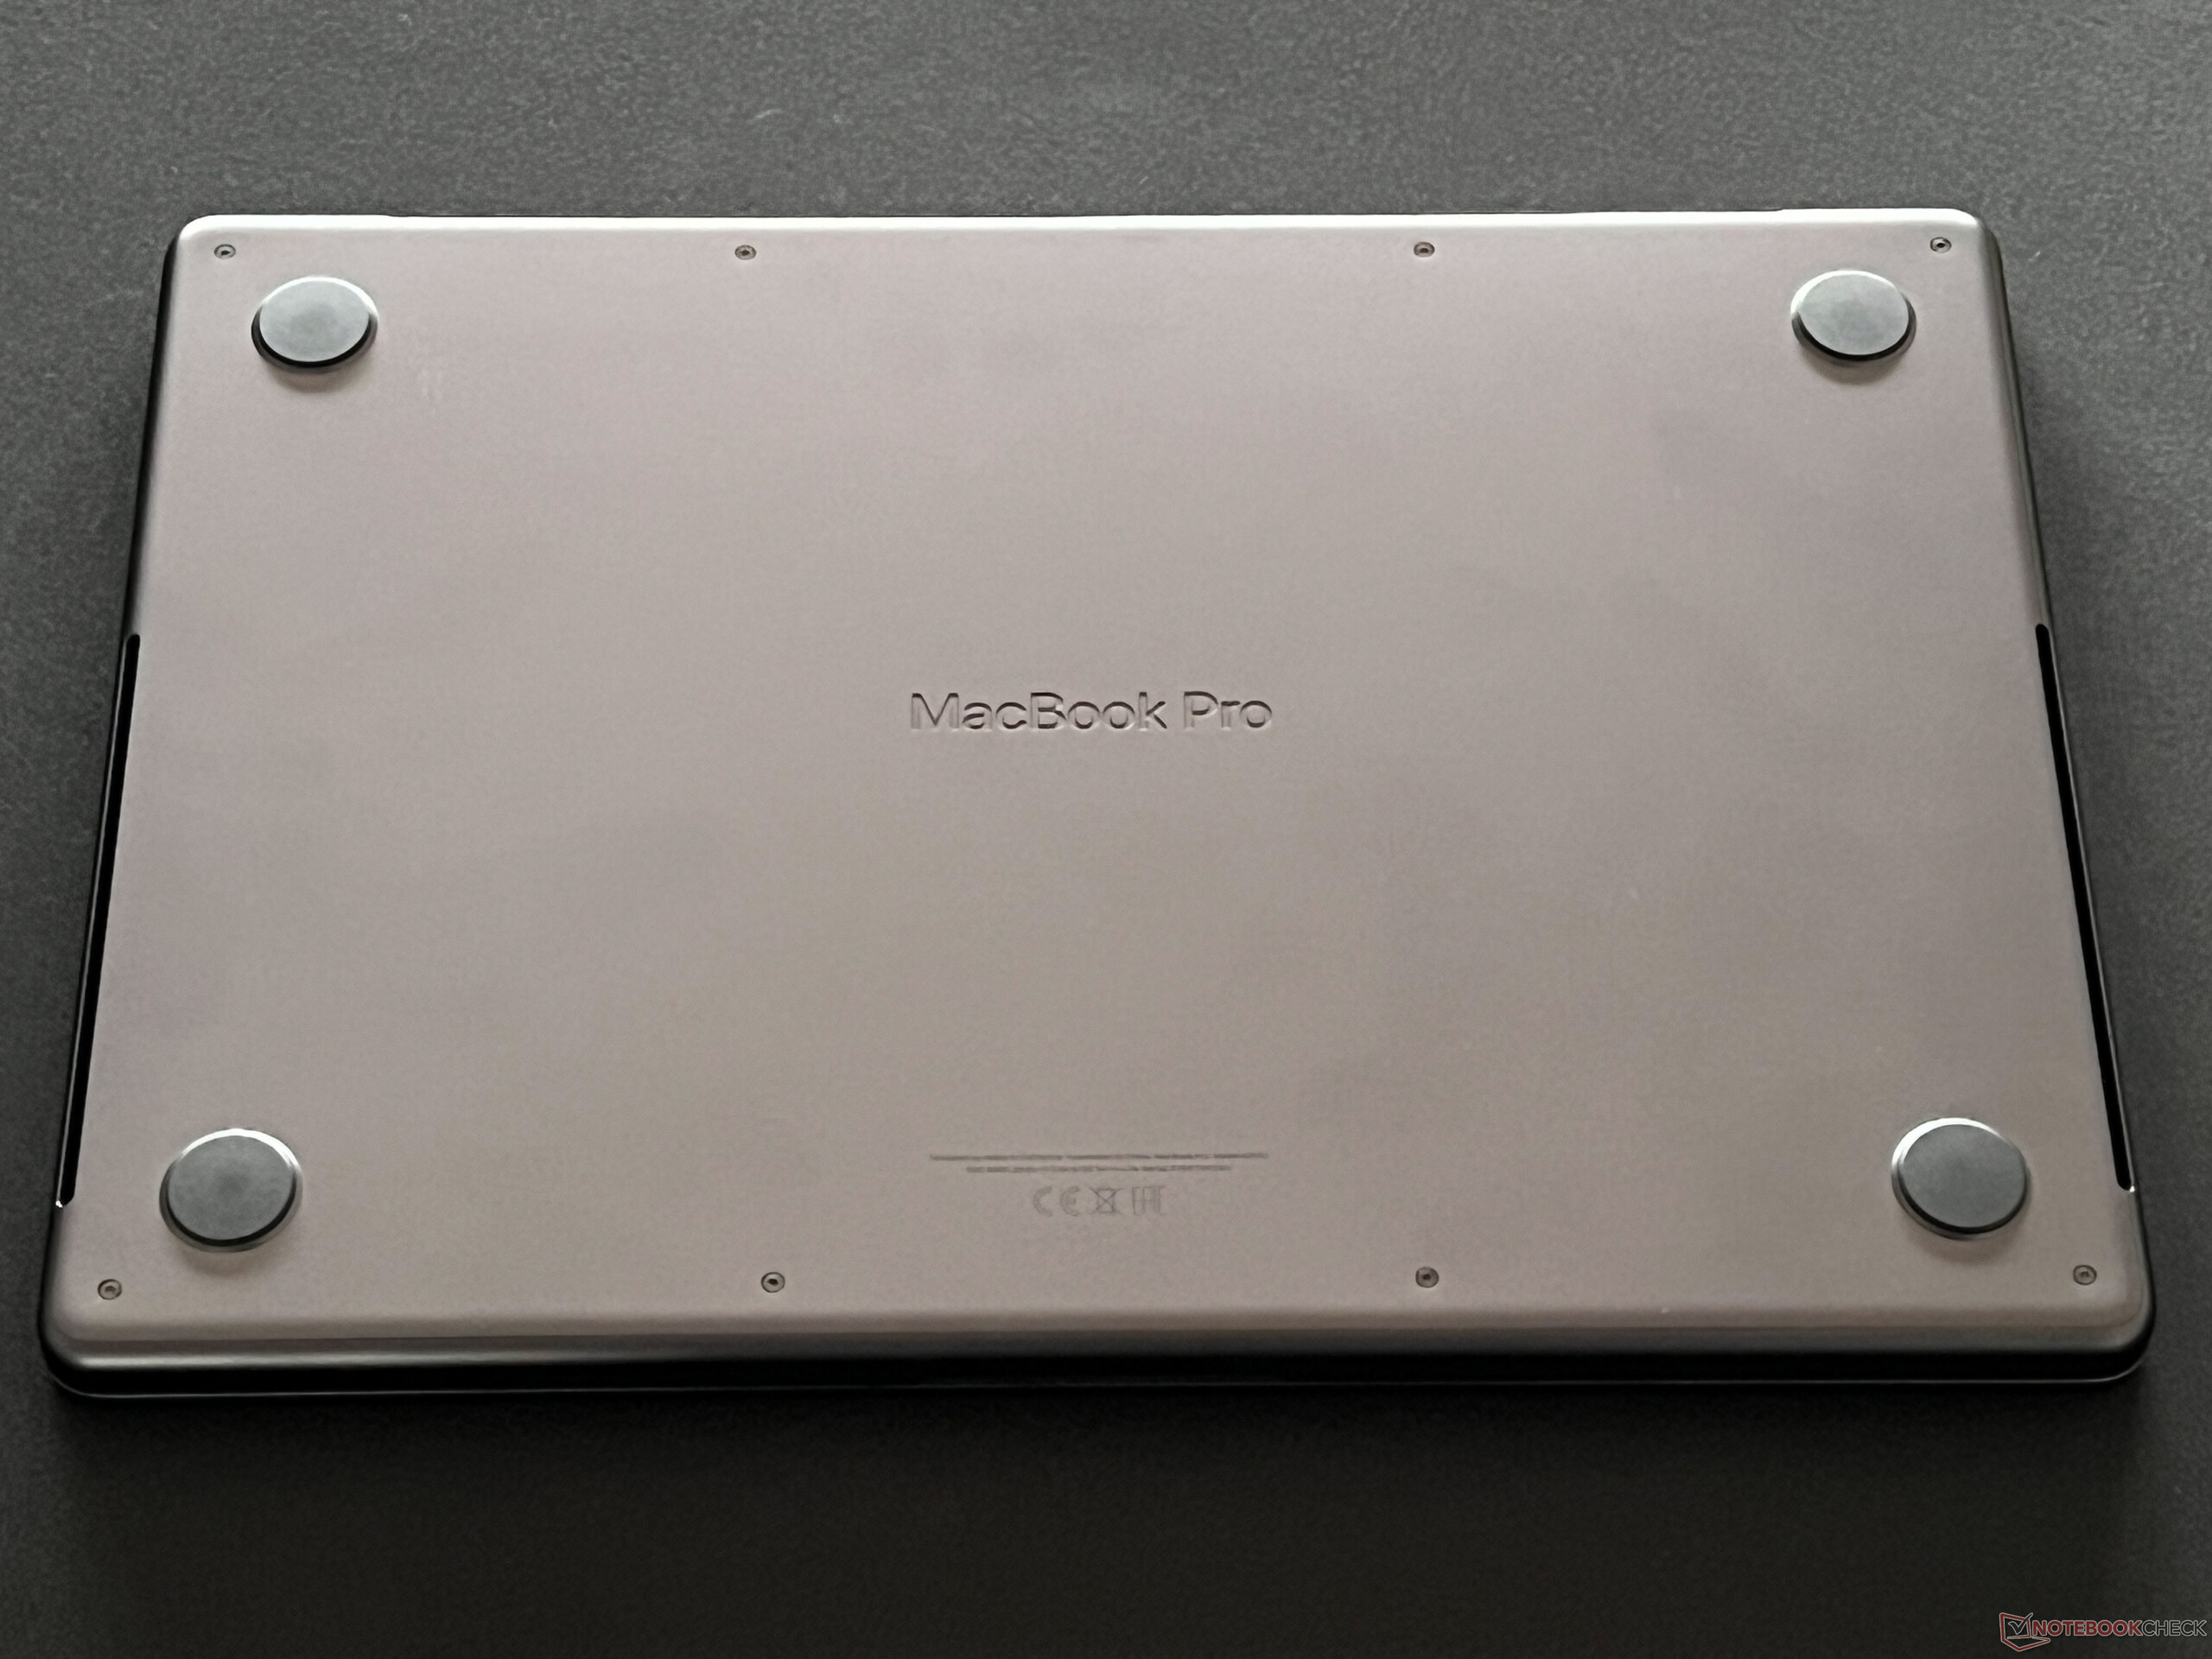
Het high-end model van de MBP 14 legt een gewicht van 1,611 kg op de weegschaal en is daarmee iets zwaarder dan het basismodel met de M3 SoC (1,525 kg), wat voornamelijk komt door de krachtigere koeleenheid. De MBP 14 is nog steeds het lichtste en dunste/compactste apparaat in onze vergelijkingsgroep. De 96W voedingsadapter doet de weegschaal doorslaan naar 366 gram (inclusief MagSafe kabel); het is ook mogelijk om de MacBook via USB-C op te laden.
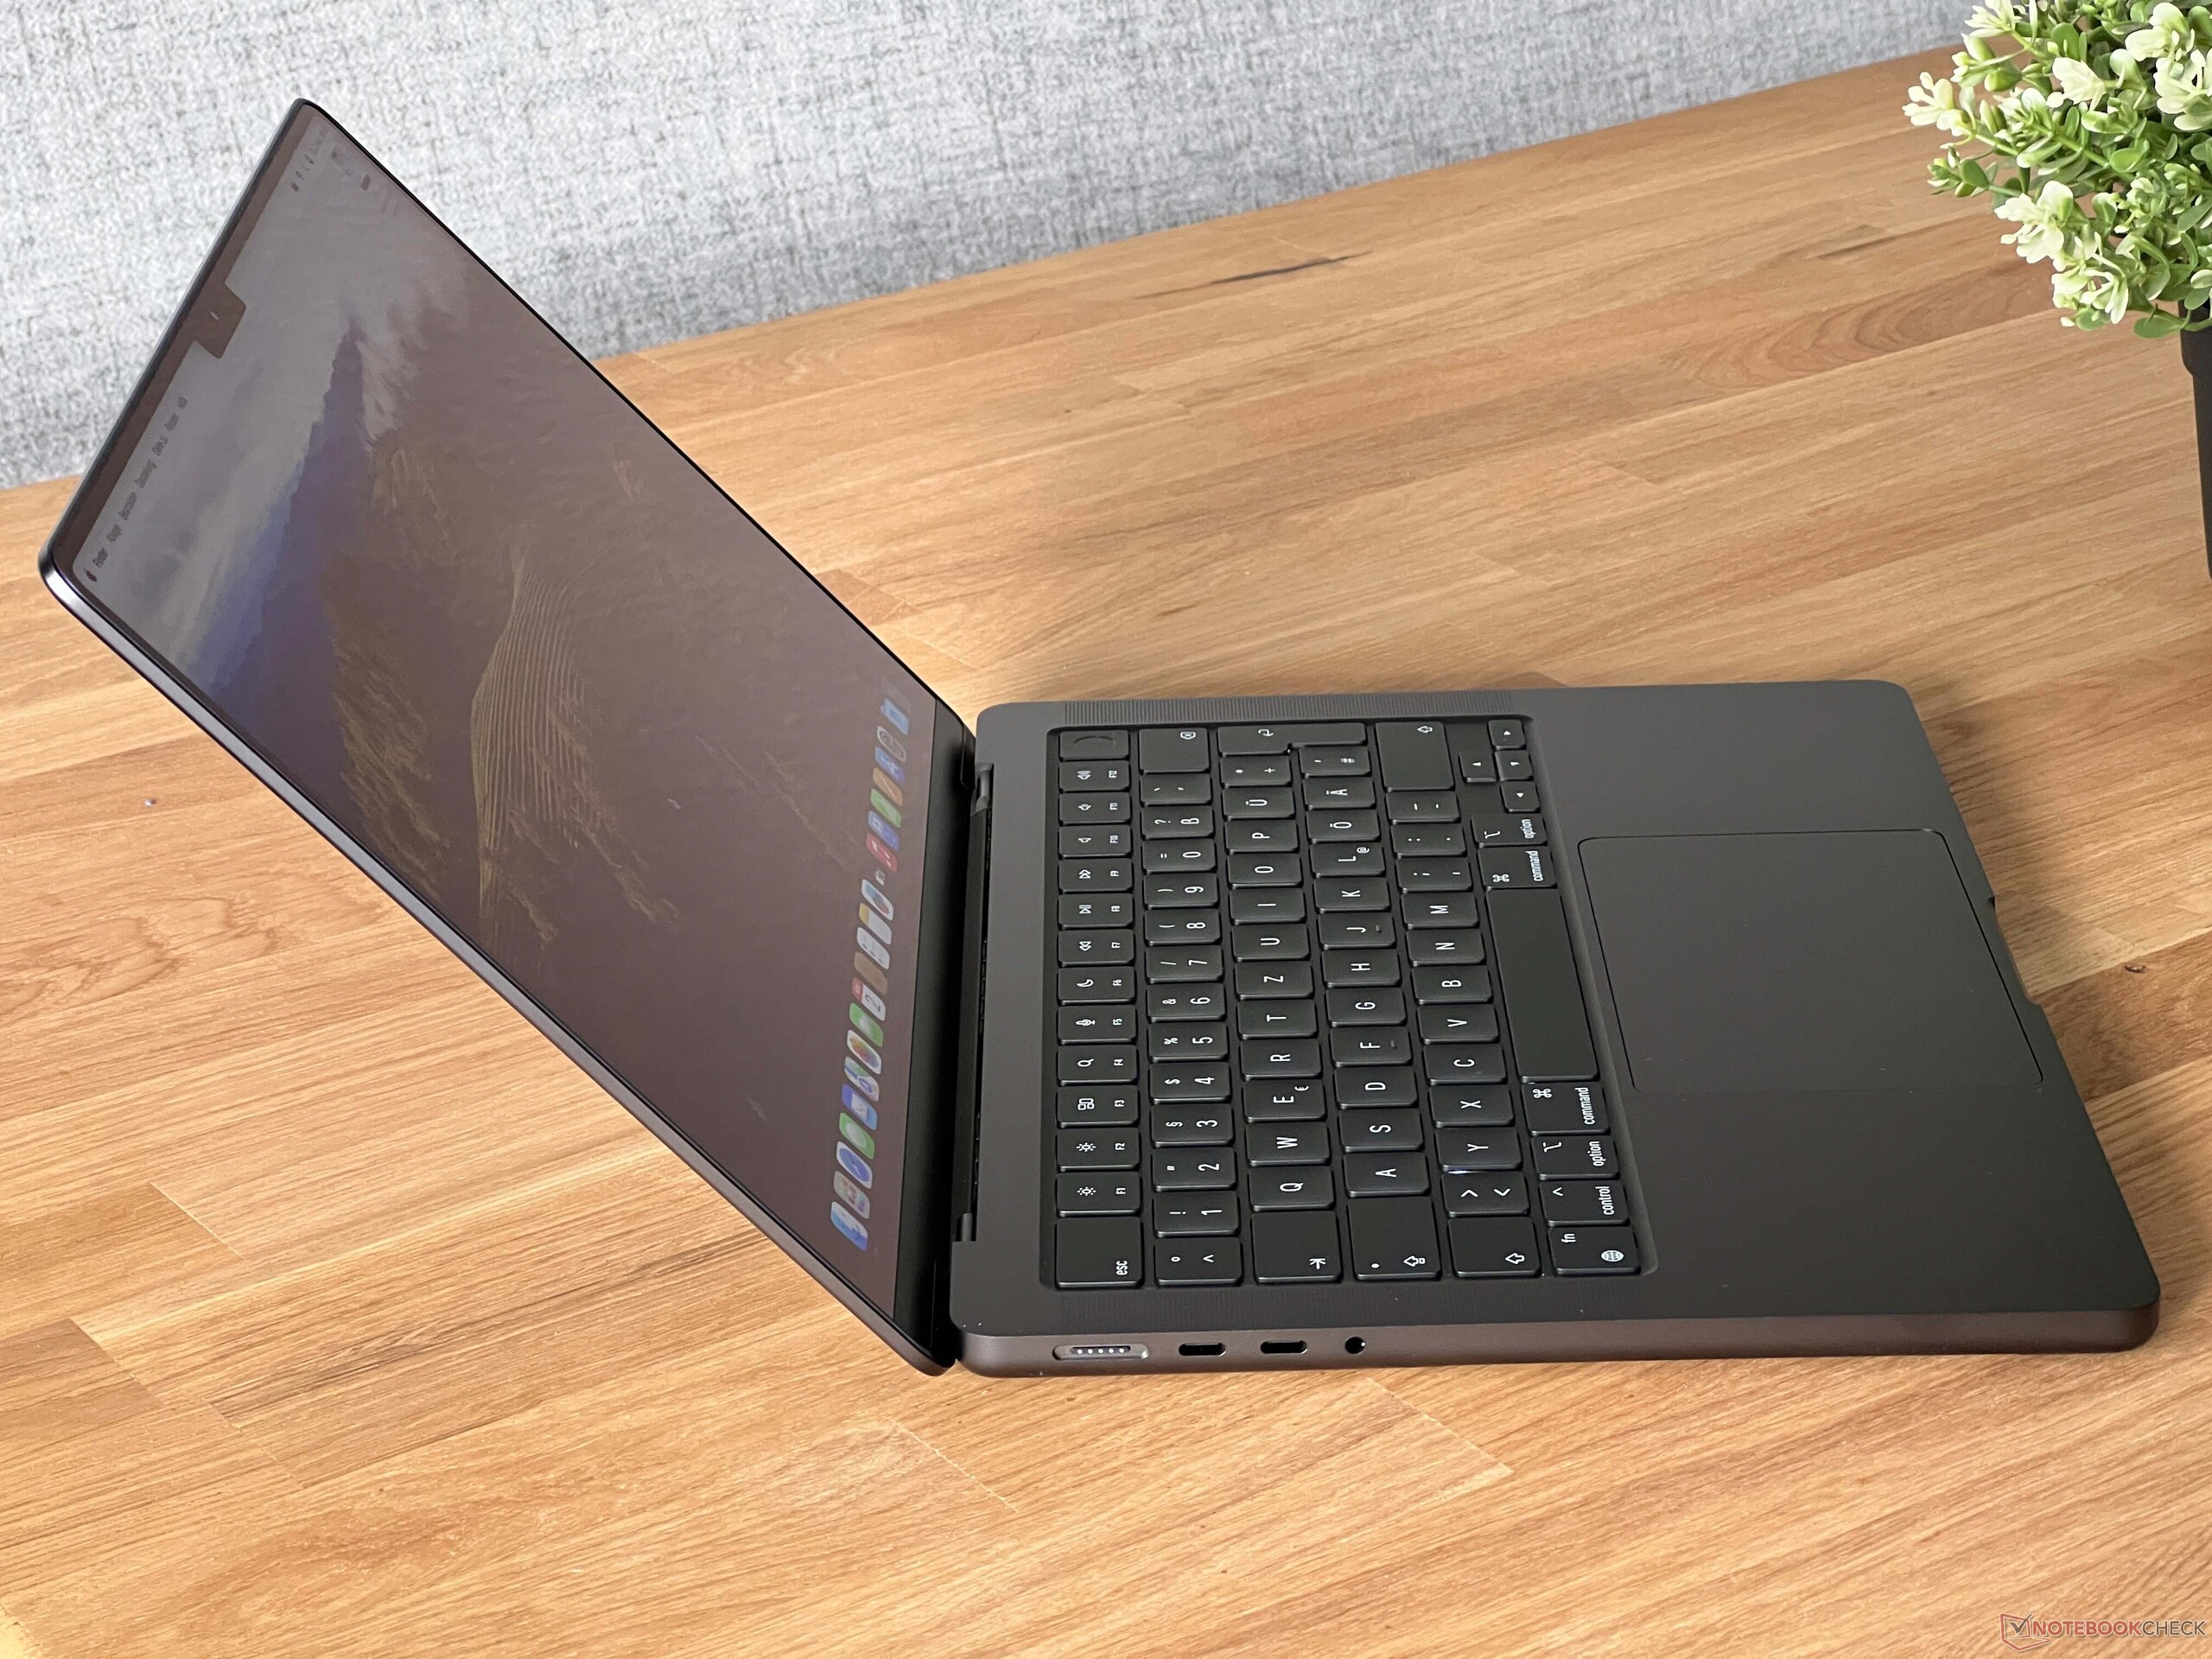
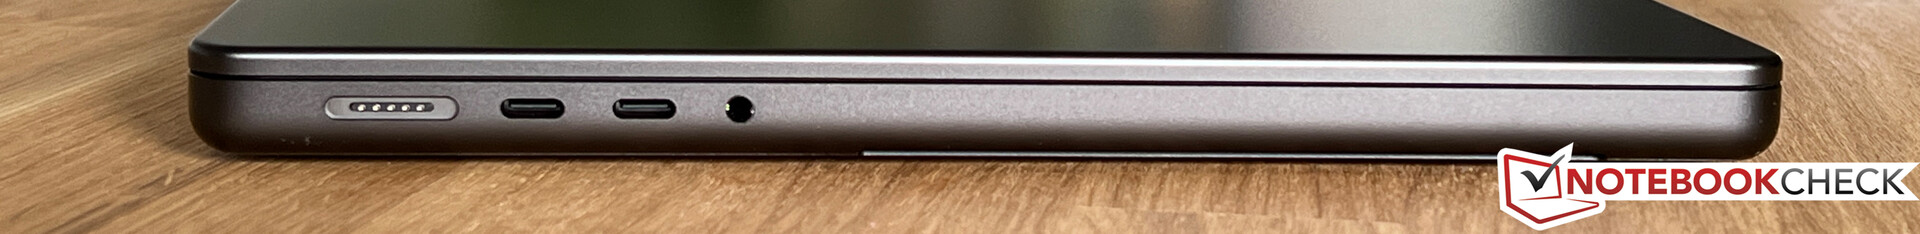
Connectiviteit - Thunderbolt 4 en HDMI 2.1
De poorten zijn niet veranderd ten opzichte van het vorige model en u krijgt nog steeds drie USB-C poorten inclusief Thunderbolt 4 en een moderne HDMI 2.1 uitgang. De MBP 16 met de M3 Max kan tot vier externe beeldschermen tegelijk aansturen (3x 6K @60 Hz via Thunderbolt en 1x 4K @ 144 Hz via HDMI) en de maximale resolutie via HDMI is 8K @60 Hz of 4K @240 Hz. Naast de MagSafe-aansluiting kunt u de grote MBP ook opladen via USB-C en werkt hij met een 65 W voedingsadapter.
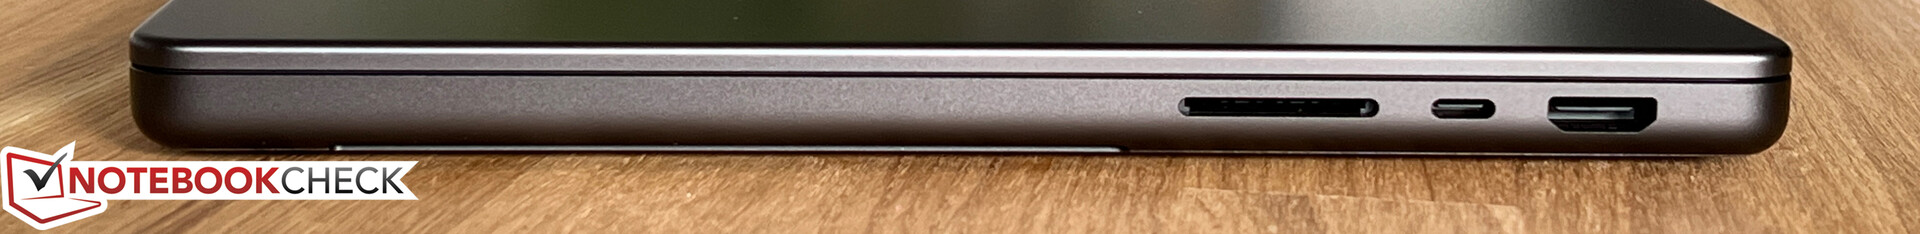
SD-kaartlezer
De SDXC-kaartlezer aan de rechterkant is nog steeds erg snel, en we stelden tot 221 MB/s vast met onze referentiekaart (Angelbird AV Pro V60) en nog steeds 156 MB/s toen we beeldbestanden van de kaart kopieerden, wat ook een goed resultaat is. De geplaatste kaarten steken ongeveer 1,5 cm uit.
| SD Card Reader | |
| average JPG Copy Test (av. of 3 runs) | |
| Microsoft Surface Laptop Studio 2 RTX 4060 (Angelbird AV Pro V60) | |
| Apple MacBook Pro 14 2023 M3 Max (Angelbird AV Pro V60) | |
| Asus ROG Zephyrus G14 GA402XY (Angelibrid AV Pro V60) | |
| Gemiddelde van klas Multimedia (23 - 531, n=37, laatste 2 jaar) | |
| Asus Zenbook Pro 14 OLED UX6404VI (Angelbird AV Pro V60) | |
| Lenovo Yoga Pro 9-14IRP G8 (Angelbird AV Pro V60) | |
| Asus ZenBook Pro 14 Duo UX8402VV-P1021W (AV Pro SD microSD 128 GB V60) | |
| maximum AS SSD Seq Read Test (1GB) | |
| Asus ROG Zephyrus G14 GA402XY (Angelibrid AV Pro V60) | |
| Asus Zenbook Pro 14 OLED UX6404VI (Angelbird AV Pro V60) | |
| Apple MacBook Pro 14 2023 M3 Max (Angelbird AV Pro V60) | |
| Gemiddelde van klas Multimedia (37.3 - 1455, n=36, laatste 2 jaar) | |
| Microsoft Surface Laptop Studio 2 RTX 4060 (Angelbird AV Pro V60) | |
| Lenovo Yoga Pro 9-14IRP G8 (Angelbird AV Pro V60) | |
| Asus ZenBook Pro 14 Duo UX8402VV-P1021W (AV Pro SD microSD 128 GB V60) | |
Communicatie
Apple maakt nog steeds gebruik van de Wi-Fi 6E module van vorig jaar, inclusief Bluetooth 5.3, en de algehele prestaties zijn erg goed met stabiele overdrachtssnelheden in combinatie met onze referentierouter van Asus. We hebben geen problemen ondervonden met grote downloads of slechte ontvangst tijdens onze testperiode. Apple biedt nog geen Wi-Fi 7 modules aan.
| Networking | |
| Apple MacBook Pro 14 2023 M3 Max | |
| iperf3 transmit AXE11000 | |
| iperf3 receive AXE11000 | |
| Microsoft Surface Laptop Studio 2 RTX 4060 | |
| iperf3 transmit AXE11000 | |
| iperf3 receive AXE11000 | |
| Lenovo Yoga Pro 9-14IRP G8 | |
| iperf3 transmit AXE11000 | |
| iperf3 receive AXE11000 | |
| Asus Zenbook Pro 14 OLED UX6404VI | |
| iperf3 transmit AXE11000 | |
| iperf3 receive AXE11000 | |
| Asus ZenBook Pro 14 Duo UX8402VV-P1021W | |
| iperf3 transmit AXE11000 | |
| iperf3 receive AXE11000 | |
| iperf3 transmit AXE11000 6GHz | |
| iperf3 receive AXE11000 6GHz | |
| Razer Blade 14 RTX 4070 | |
| iperf3 transmit AXE11000 | |
| iperf3 receive AXE11000 | |
| iperf3 transmit AXE11000 6GHz | |
| iperf3 receive AXE11000 6GHz | |
| Asus ROG Zephyrus G14 GA402XY | |
| iperf3 transmit AXE11000 | |
| iperf3 receive AXE11000 | |
Webcam
De beeldkwaliteit van de 1080p webcam is nog steeds goed, maar niet vergelijkbaar met frontcamera's op iPads. Face ID of Center Stage zijn ook nog steeds niet beschikbaar.


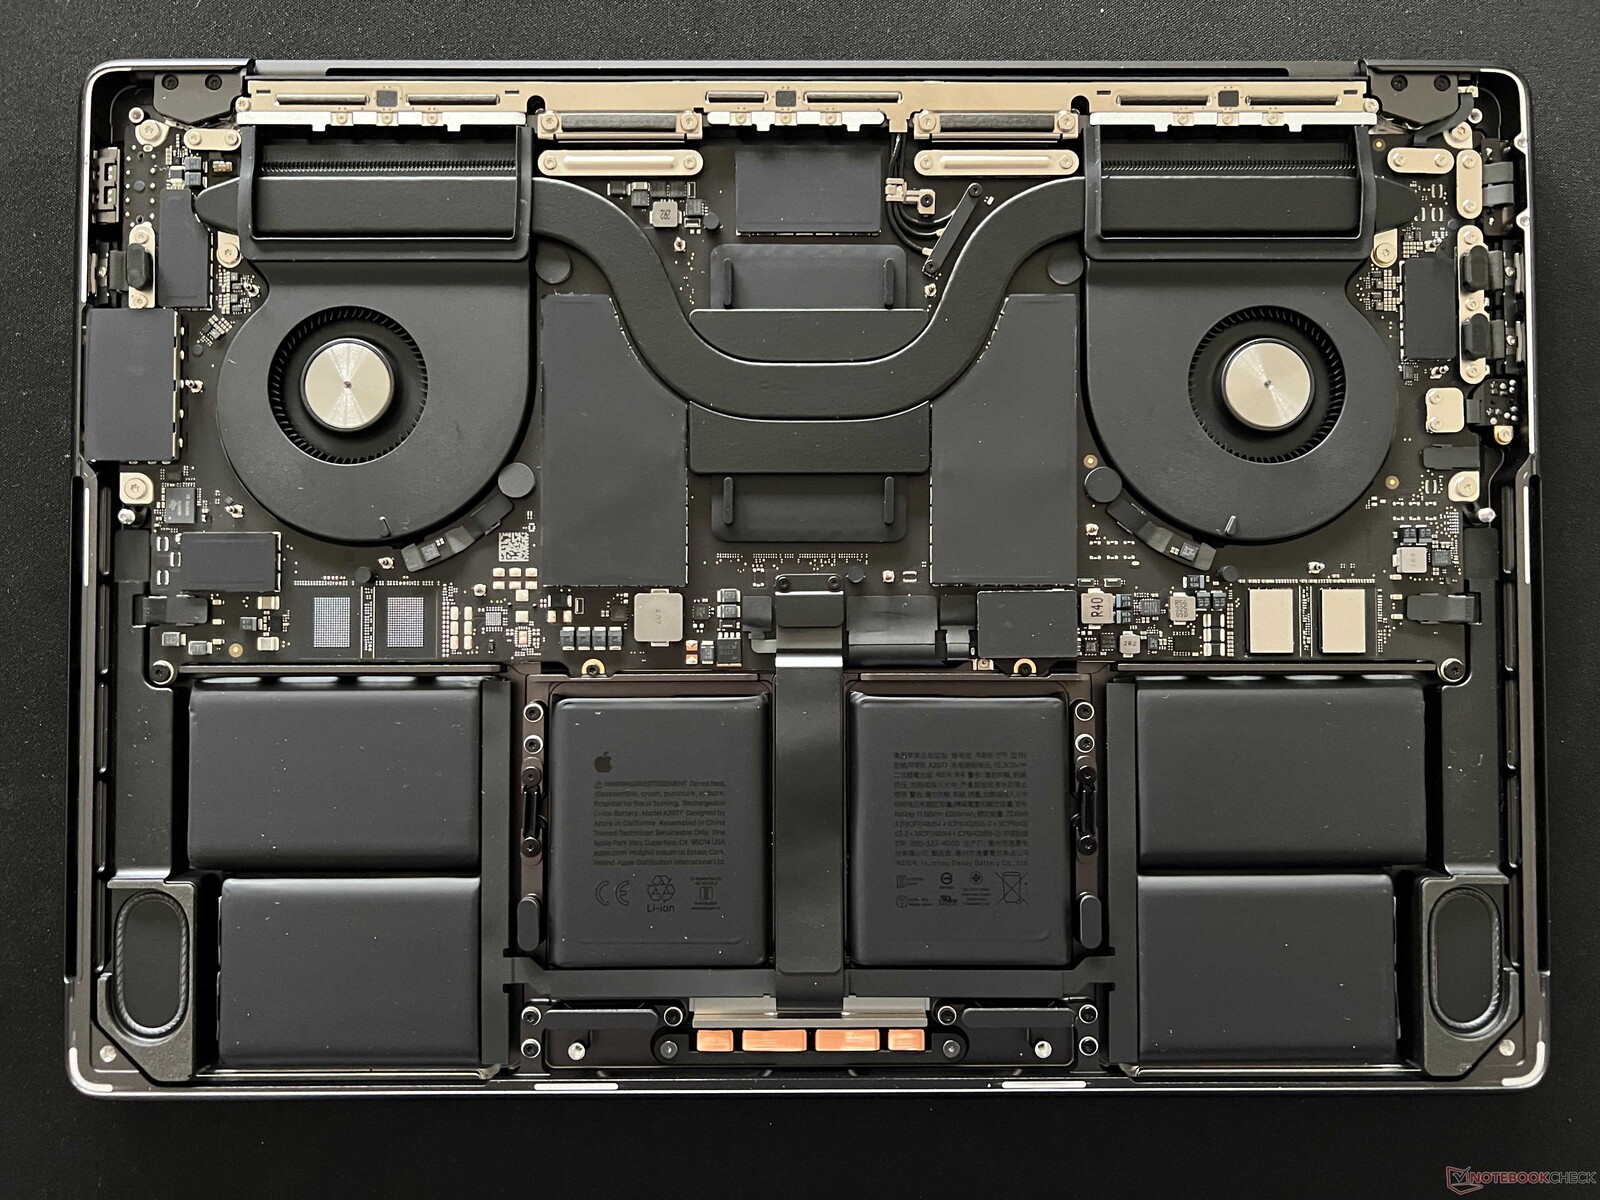
Onderhoud
Het bodempaneel wordt vastgezet met Pentalobe schroeven (P5) en kleine metalen haakjes aan de achterkant, wat betekent dat u het deksel naar voren moet duwen als u alle schroeven verwijderd hebt. Er zijn ook twee klemmen in het midden van de zijkanten die enige kracht vereisen (wij raden een zuignap aan). Er is niet veel te doen als u eenmaal binnen bent, alleen de ventilator kan door de gebruiker worden schoongemaakt. Alle andere onderdelen zijn gesoldeerd en u kunt geen onderdelen upgraden. De batterij is gelijmd, maar kan indien nodig vervangen worden (vereist nieuwe plakstrips).
Garantie
De basisgarantie voor de MacBook Pro is één jaar. U kunt een garantie-uitbreiding kopen (Apple Care+) voor drie jaar, die $279 kost. Hierbij zijn ook de kosten voor onopzettelijke schade inbegrepen (elk met een servicetoeslag van $ 99 voor schermschade of schade aan de externe behuizing, of $ 299 voor andere onopzettelijke schade). Het is ook mogelijk om $99 per jaar te betalen voor AppleCare+.
Invoerapparaten - Perfect TrackPad
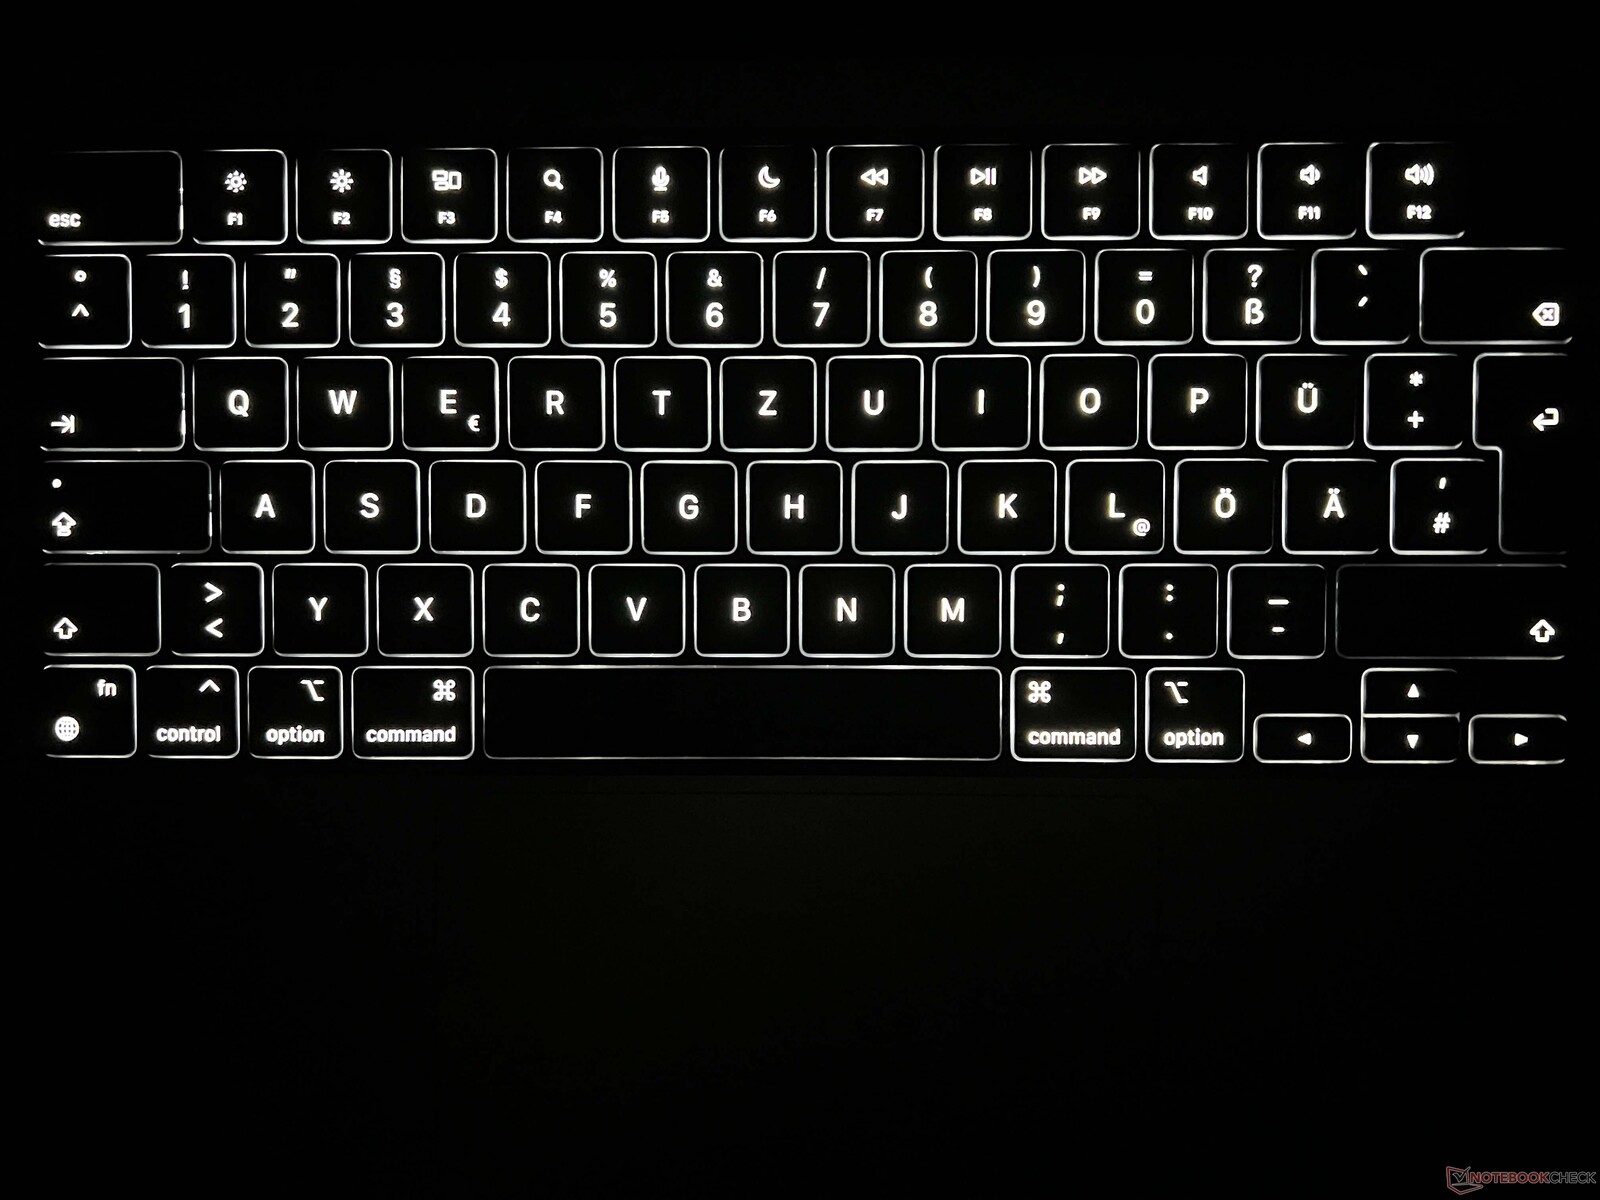
De invoerapparaten zijn onveranderd en het zwarte toetsenbord biedt nog steeds een comfortabele en nauwkeurige type-ervaring, ondanks de relatief ondiepe travel. Er is nog steeds ruimte voor verbetering in vergelijking met de beste zakelijke laptops, maar het is geen probleem om langere perioden te typen. De toetsaanslagen zouden ook wat stiller kunnen en de pijltjestoetsen zijn erg klein. Op het gebied van toetsenbordverlichting is de MacBook nog steeds superieur aan Windows laptops, zelfs na al die jaren. De helderheid kan heel precies worden ingesteld en zowel de automatische activering als de intensiteit op basis van de omgevingsverlichting werken perfect.

Het trackpad is al jaren de benchmark en de implementatie met macOS is gewoon uitstekend. De klikervaring is ook volledig identiek overal waar u het aanraakt, aangezien er geen bewegende delen zijn. macOS biedt ook veel aanpassingsmogelijkheden.
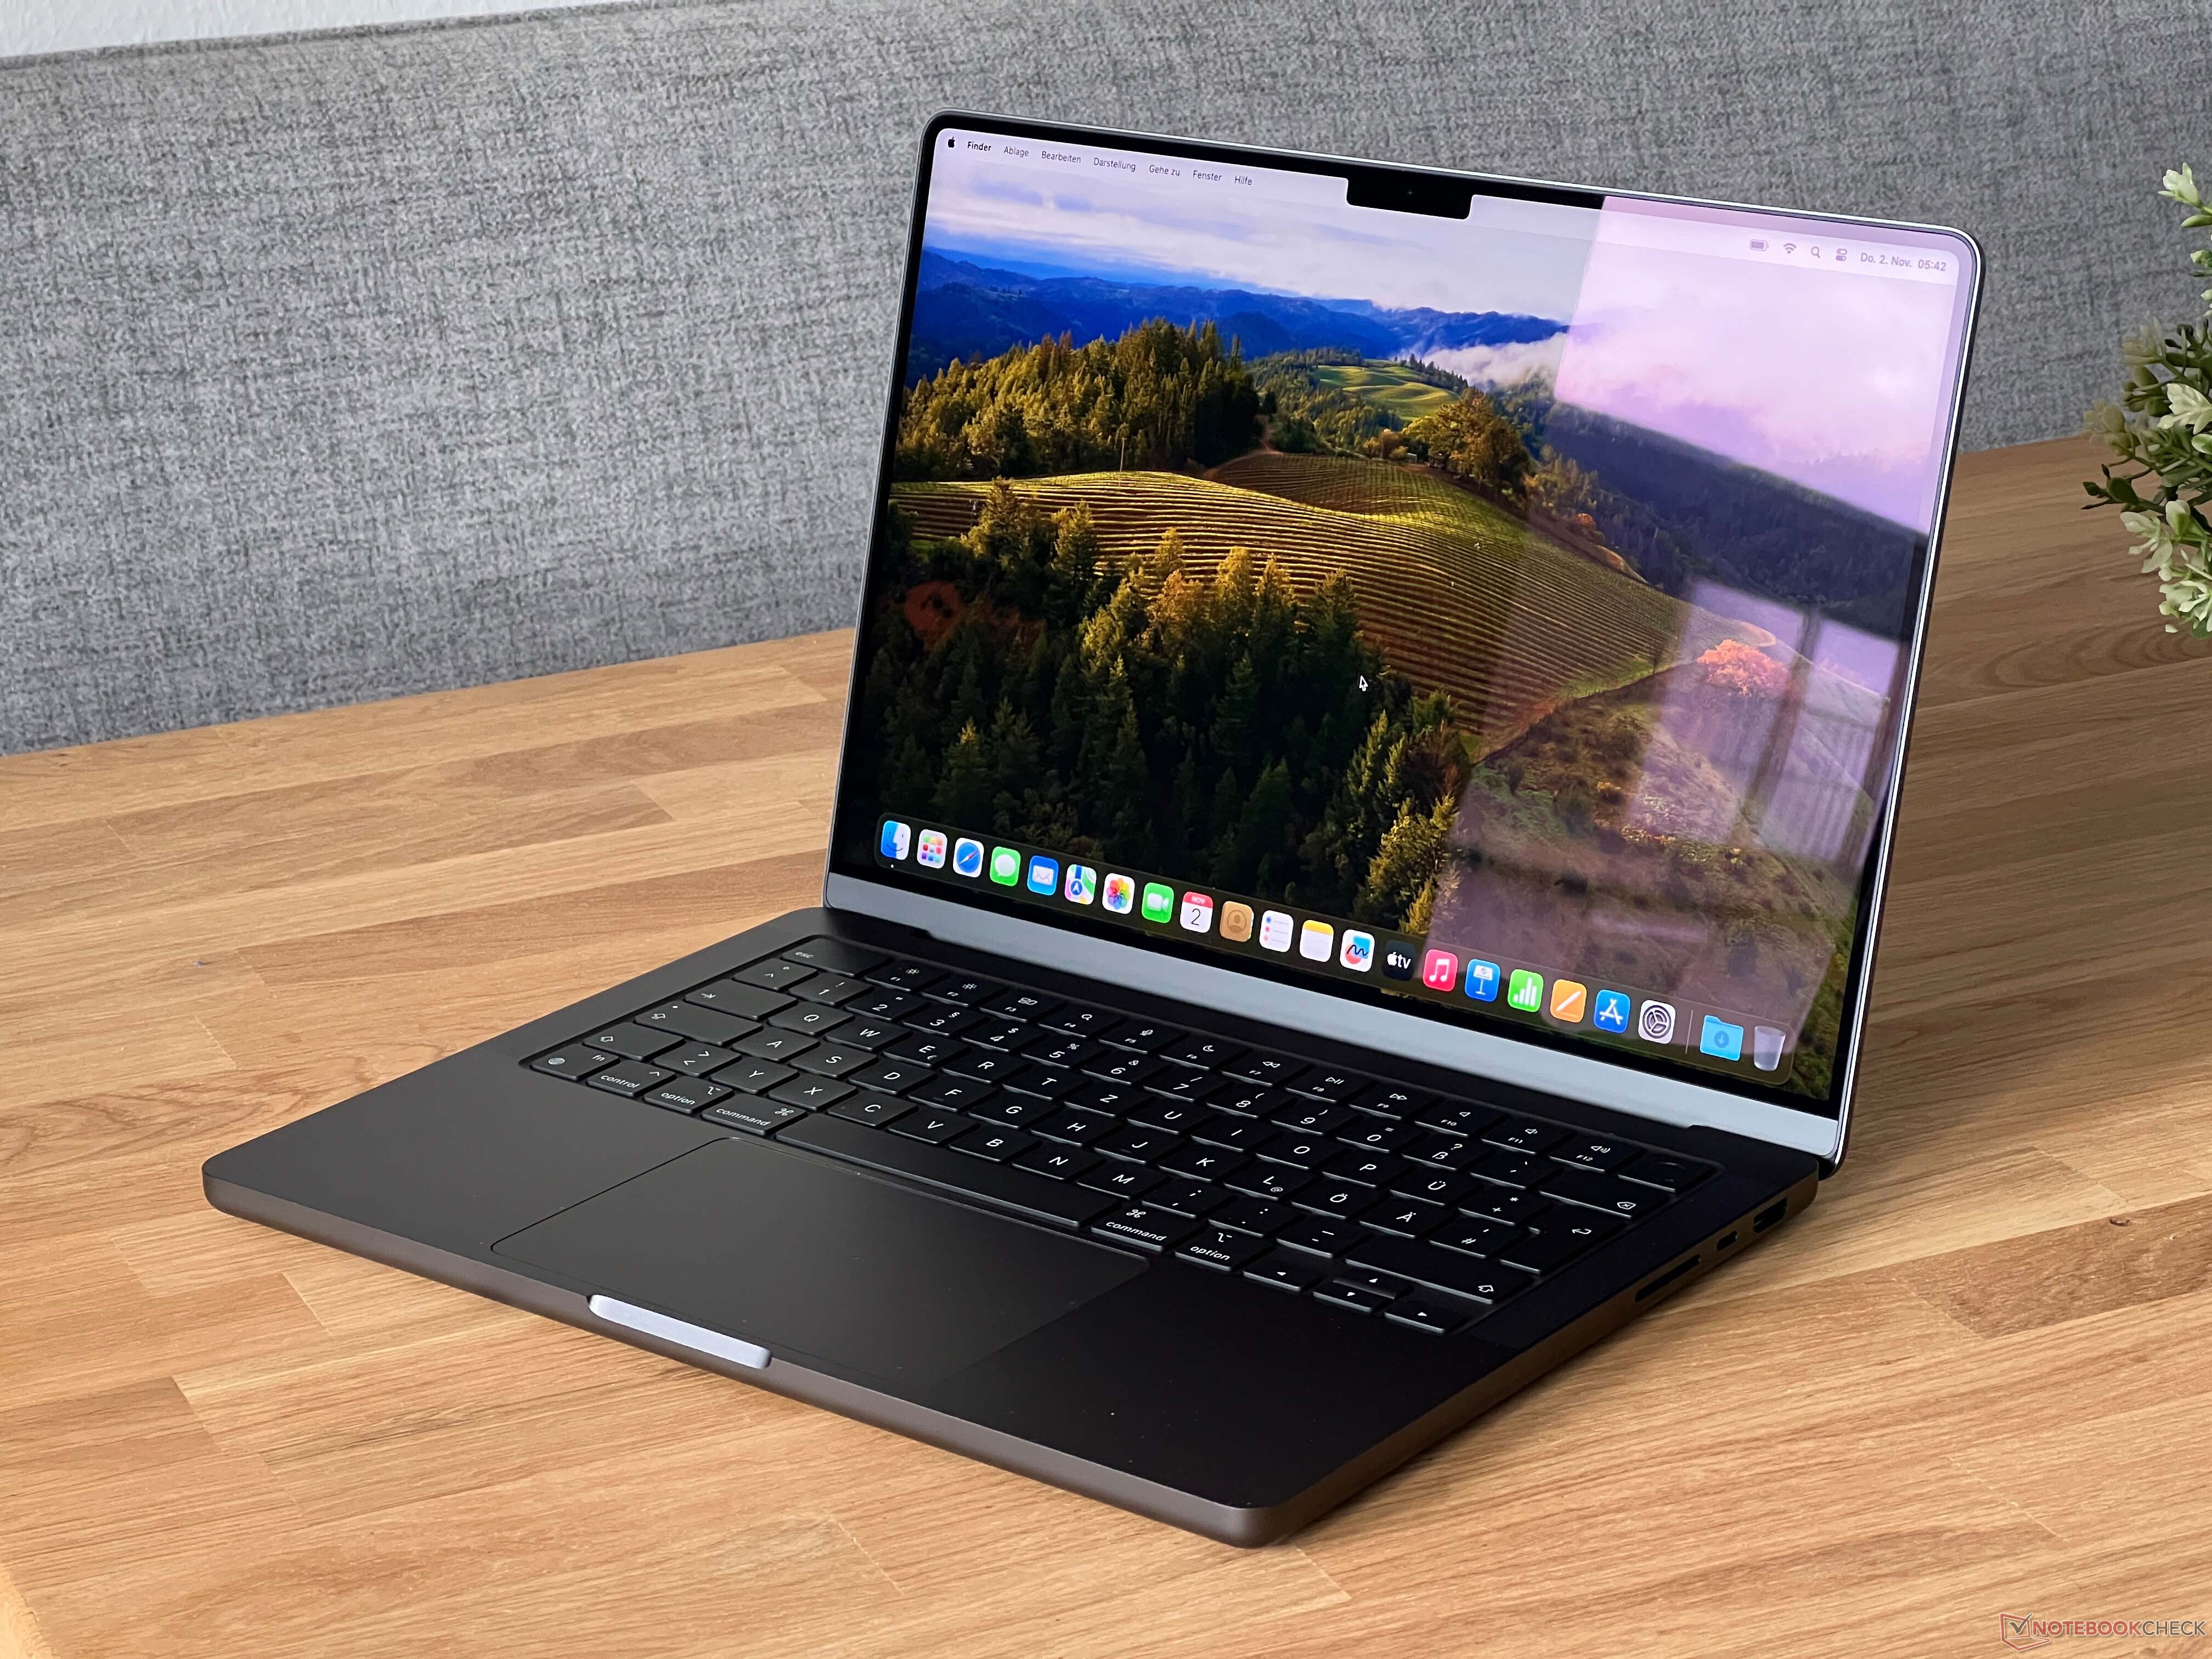
Beeldscherm - Mini-LED nu met hogere SDR-helderheid
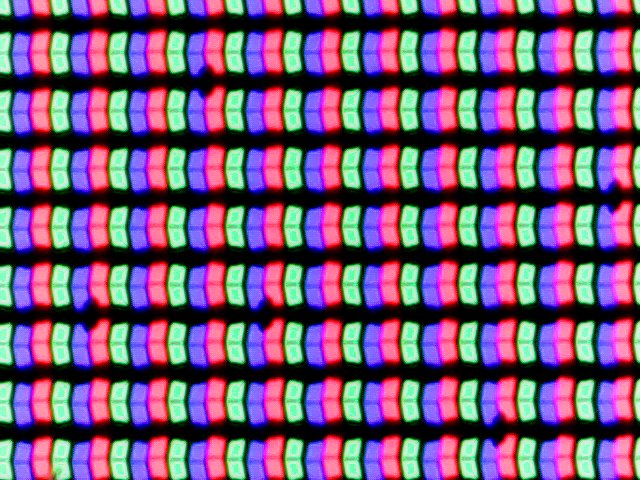
De basisspecificaties van het Mini-LED paneel in de MacBook Pro 16 zijn niet veranderd. De camera-inkeping in het midden ziet er nog steeds niet erg goed uit, maar neemt geen ruimte in van het 16:10-paneel. Het verticale gebied naast de inkeping (dat wordt gebruikt voor menu-elementen) is aan de bovenkant toegevoegd, wat resulteert in een resolutie van 3456 x 2234 pixels. Dit betekent dat u iets meer ruimte hebt in vergelijking met een gewoon 16:10-paneel. De subjectieve beeldkwaliteit is nog steeds uitstekend en profiteert van de hoge vernieuwingsfrequentie (120 Hz), die indien nodig dynamisch door het systeem wordt toegepast. Zwarte inhoud is ook puur zwart (zoals bij OLED-schermen), wat voor een extreem hoge contrastverhouding zorgt. Het enige nadeel is vertroebeling wanneer heldere objecten op een donkere achtergrond verschijnen. Dit is vooral merkbaar wanneer logo's worden weergegeven, en u kunt dit probleem natuurlijk uitlokken, maar in de praktijk is het meestal niet merkbaar. Zowel de helderheid als de kleurtemperatuur (True Tone) kunnen automatisch worden aangepast op basis van de omgevingsverlichting, wat vlekkeloos werkt. Er zijn ook geen schaalproblemen in macOS.
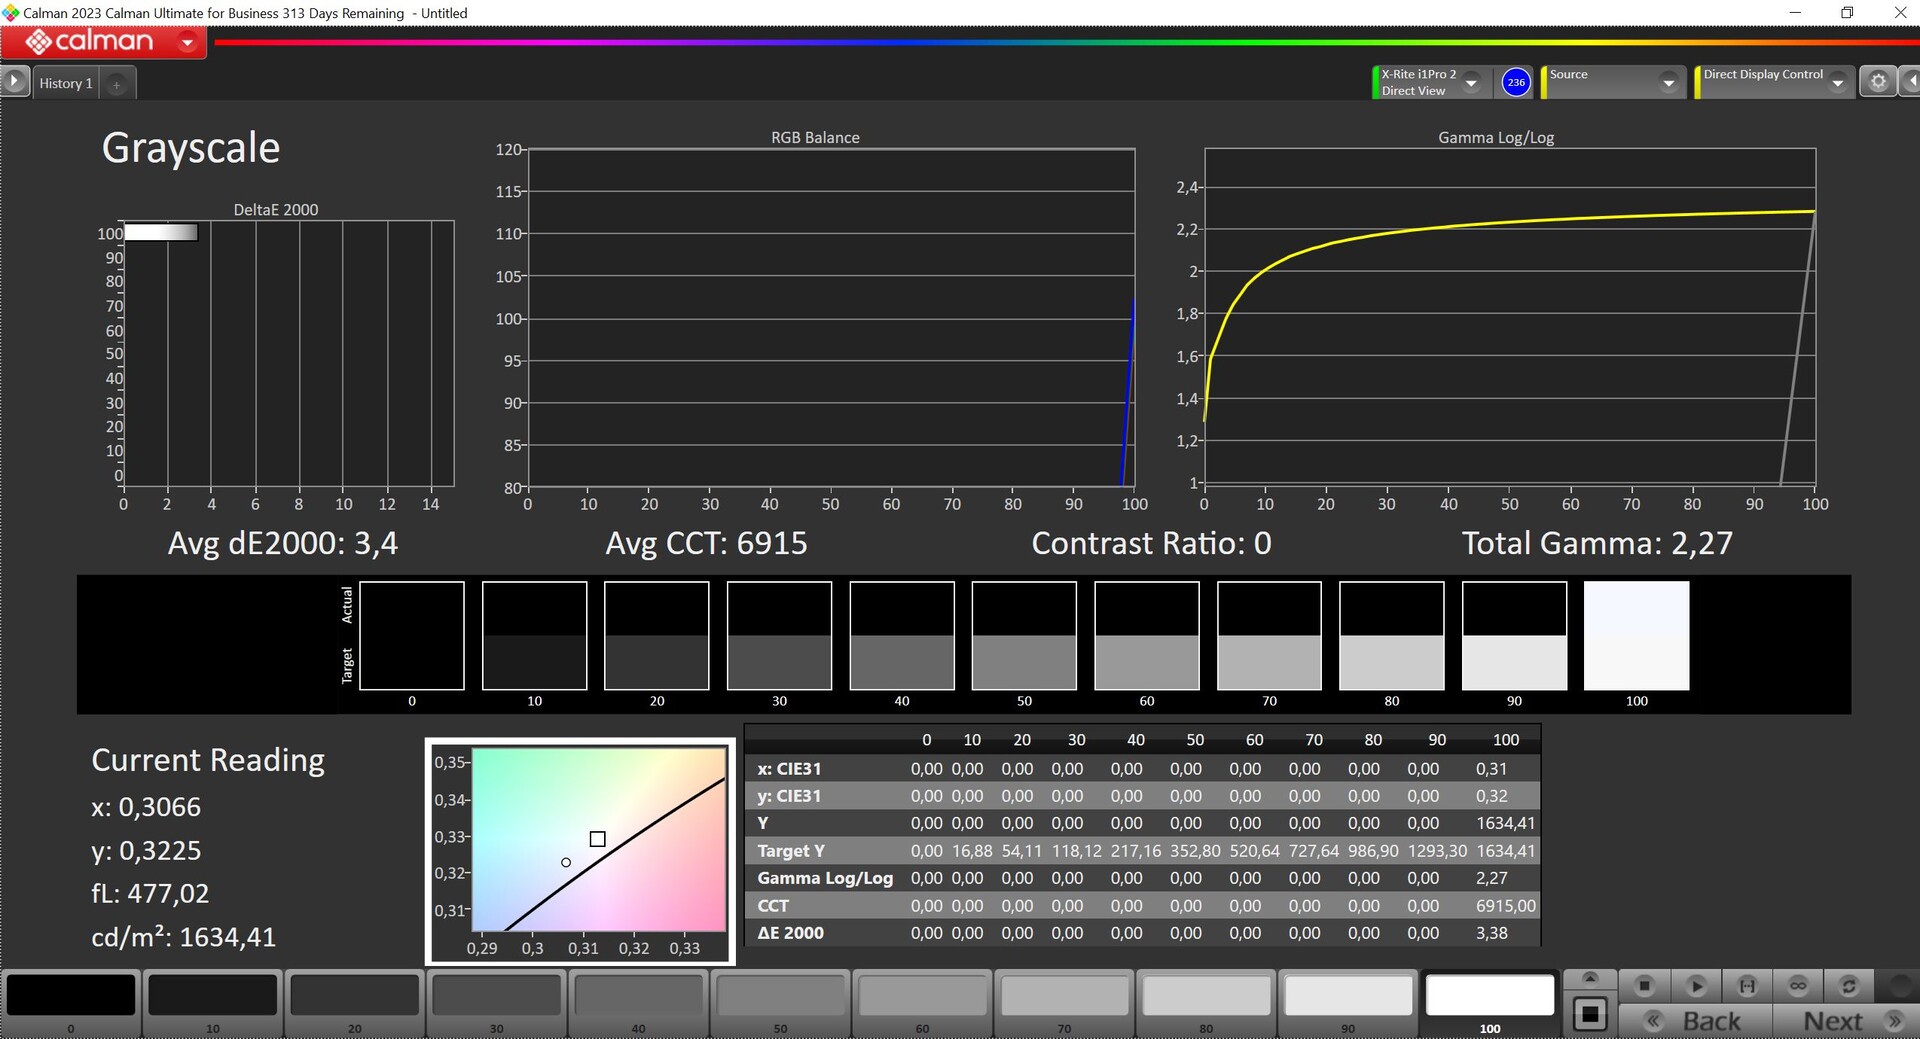
Apple verhoogde de maximale SDR-helderheid van 500 naar 600 nits en we meten tot 610 nits (~600 nits gemiddeld) op ons recensie-apparaat. De zwartwaarde van Mini-LED panelen is 0, wat resulteert in een extreem hoge contrastverhouding. De maximale HDR-helderheid bedraagt tot 1634 nits voor delen van het beeld en nog steeds tot 1178 nits voor beelden op het volledige scherm. Het Mini-LED scherm van de Lenovo Yoga Pro 9i 14 is in sommige opzichten superieur (SDR-helderheid van meer dan 700 nits, HDR-schermvullend tot 1400 nits) en loopt slechts een klein beetje achter wat betreft maximale HDR-helderheid. Apple heeft nog steeds een groot voordeel als het aankomt op het omgaan met HDR-inhoud, omdat het scherm eenvoudig de helderheid verhoogt als HDR-inhoud wordt weergegeven. Windows-gebruikers daarentegen moeten de HDR-modus handmatig activeren.
| |||||||||||||||||||||||||
Helderheidsverdeling: 96 %
Helderheid in Batterij-modus: 609 cd/m²
Contrast: ∞:1 (Zwart: 0 cd/m²)
ΔE ColorChecker Calman: 1.7 | ∀{0.5-29.43 Ø4.71}
ΔE Greyscale Calman: 2.1 | ∀{0.09-98 Ø4.96}
99.2% Display P3 (Argyll 3D)
Gamma: 2.22
CCT: 6874 K
| Apple MacBook Pro 14 2023 M3 Max Mini-LED, 3024x1964, 14.2" | Microsoft Surface Laptop Studio 2 RTX 4060 LQ144P1JX01, IPS, 2400x1600, 14.4" | Lenovo Yoga Pro 9-14IRP G8 CSOT T3 MNE507HZ2-1, Mini-LED, 3072x1920, 14.5" | Asus Zenbook Pro 14 OLED UX6404VI SDC4190, OLED, 2880x1800, 14.5" | Asus ZenBook Pro 14 Duo UX8402VV-P1021W ATNA45AF04-0 , OLED, 2880x1800, 14.5" | Razer Blade 14 RTX 4070 AU Optronics B140QAN06.U, IPS, 2560x1600, 14" | Asus ROG Zephyrus G14 GA402XY B140QAN06.S, Mini-LED, 2560x1600, 14" | |
|---|---|---|---|---|---|---|---|
| Display | -33% | -7% | 0% | 1% | -2% | 0% | |
| Display P3 Coverage (%) | 99.2 | 66.7 -33% | 92 -7% | 99.6 0% | 99.91 1% | 97.3 -2% | 99.6 0% |
| sRGB Coverage (%) | 99 | 99.7 | 100 | 100 | 99.8 | 100 | |
| AdobeRGB 1998 Coverage (%) | 68.9 | 96.9 | 97.5 | 95.35 | 85.3 | 93.4 | |
| Response Times | 30% | 85% | 99% | 98% | 88% | 83% | |
| Response Time Grey 50% / Grey 80% * (ms) | 80.8 ? | 77.6 ? 4% | 12.7 ? 84% | 0.67 ? 99% | 2 ? 98% | 11.9 ? 85% | 17.2 ? 79% |
| Response Time Black / White * (ms) | 78.8 ? | 34.3 ? 56% | 11.4 ? 86% | 0.9 ? 99% | 2 ? 97% | 8 ? 90% | 9.9 ? 87% |
| PWM Frequency (Hz) | 14878 ? | 17600 ? | 6000 ? | 240 | 240 | 5430 | |
| Screen | 24% | -58% | 10% | -14% | -119% | 2% | |
| Brightness middle (cd/m²) | 610 | 511 -16% | 670 10% | 356 -42% | 340 -44% | 559.3 -8% | 535 -12% |
| Brightness (cd/m²) | 600 | 503 -16% | 680 13% | 358 -40% | 340 -43% | 560 -7% | 563 -6% |
| Brightness Distribution (%) | 96 | 89 -7% | 89 -7% | 99 3% | 99 3% | 88 -8% | 91 -5% |
| Black Level * (cd/m²) | 0.26 | 0.19 | 0.002 | 0.44 | |||
| Colorchecker dE 2000 * | 1.7 | 0.5 71% | 4 -135% | 0.8 53% | 1.76 -4% | 4.44 -161% | 1 41% |
| Colorchecker dE 2000 max. * | 2.3 | 1.1 52% | 4.5 -96% | 1.6 30% | 3.2 -39% | 9.3 -304% | 2.8 -22% |
| Greyscale dE 2000 * | 2.1 | 0.8 62% | 4.9 -133% | 0.9 57% | 1.16 45% | 6.8 -224% | 1.8 14% |
| Gamma | 2.22 99% | 2.19 100% | 2.22 99% | 2.19 100% | 2.43 91% | 2.3 96% | 2.24 98% |
| CCT | 6874 95% | 6650 98% | 5735 113% | 6590 99% | 6418 101% | 6242 104% | 6337 103% |
| Contrast (:1) | 1965 | 3526 | 170000 | 1271 | |||
| Colorchecker dE 2000 calibrated * | 1.3 | 1.62 | 0.39 | ||||
| Totaal Gemiddelde (Programma / Instellingen) | 7% /
19% | 7% /
-21% | 36% /
29% | 28% /
13% | -11% /
-60% | 28% /
20% |
* ... kleiner is beter
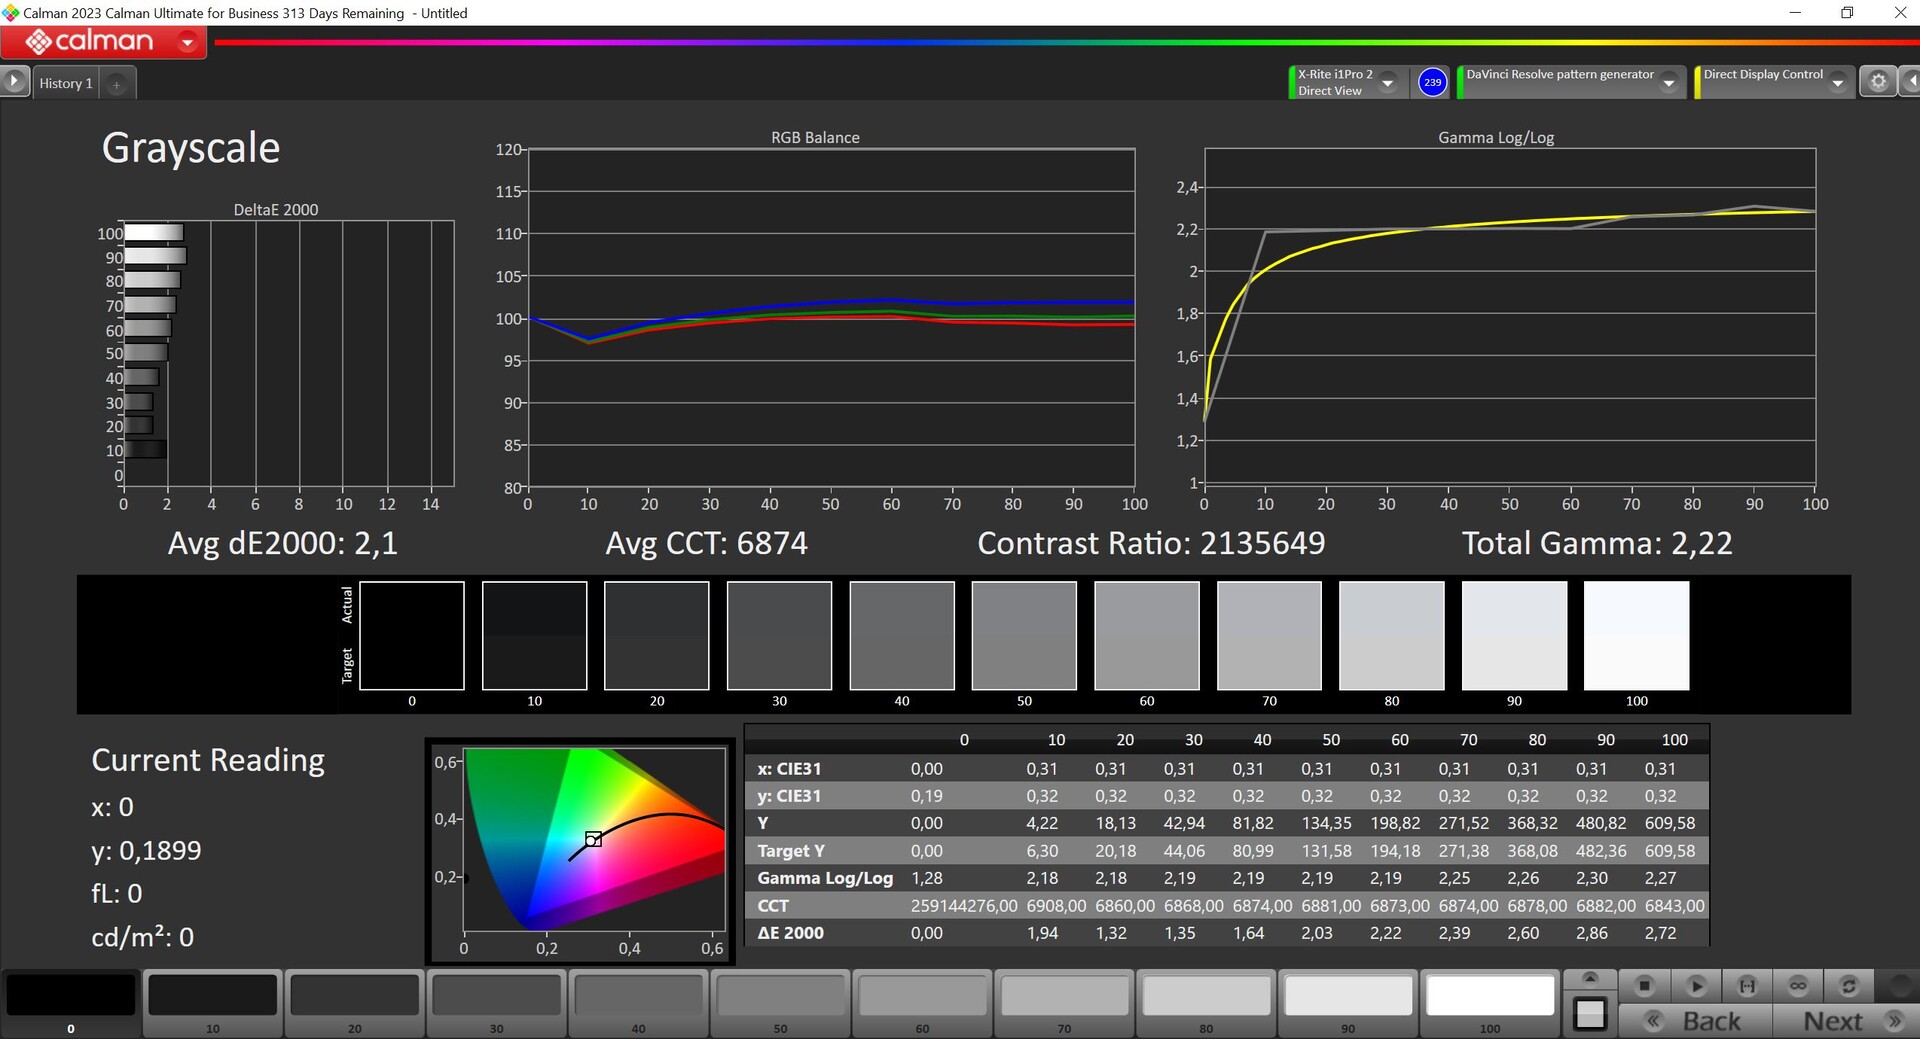
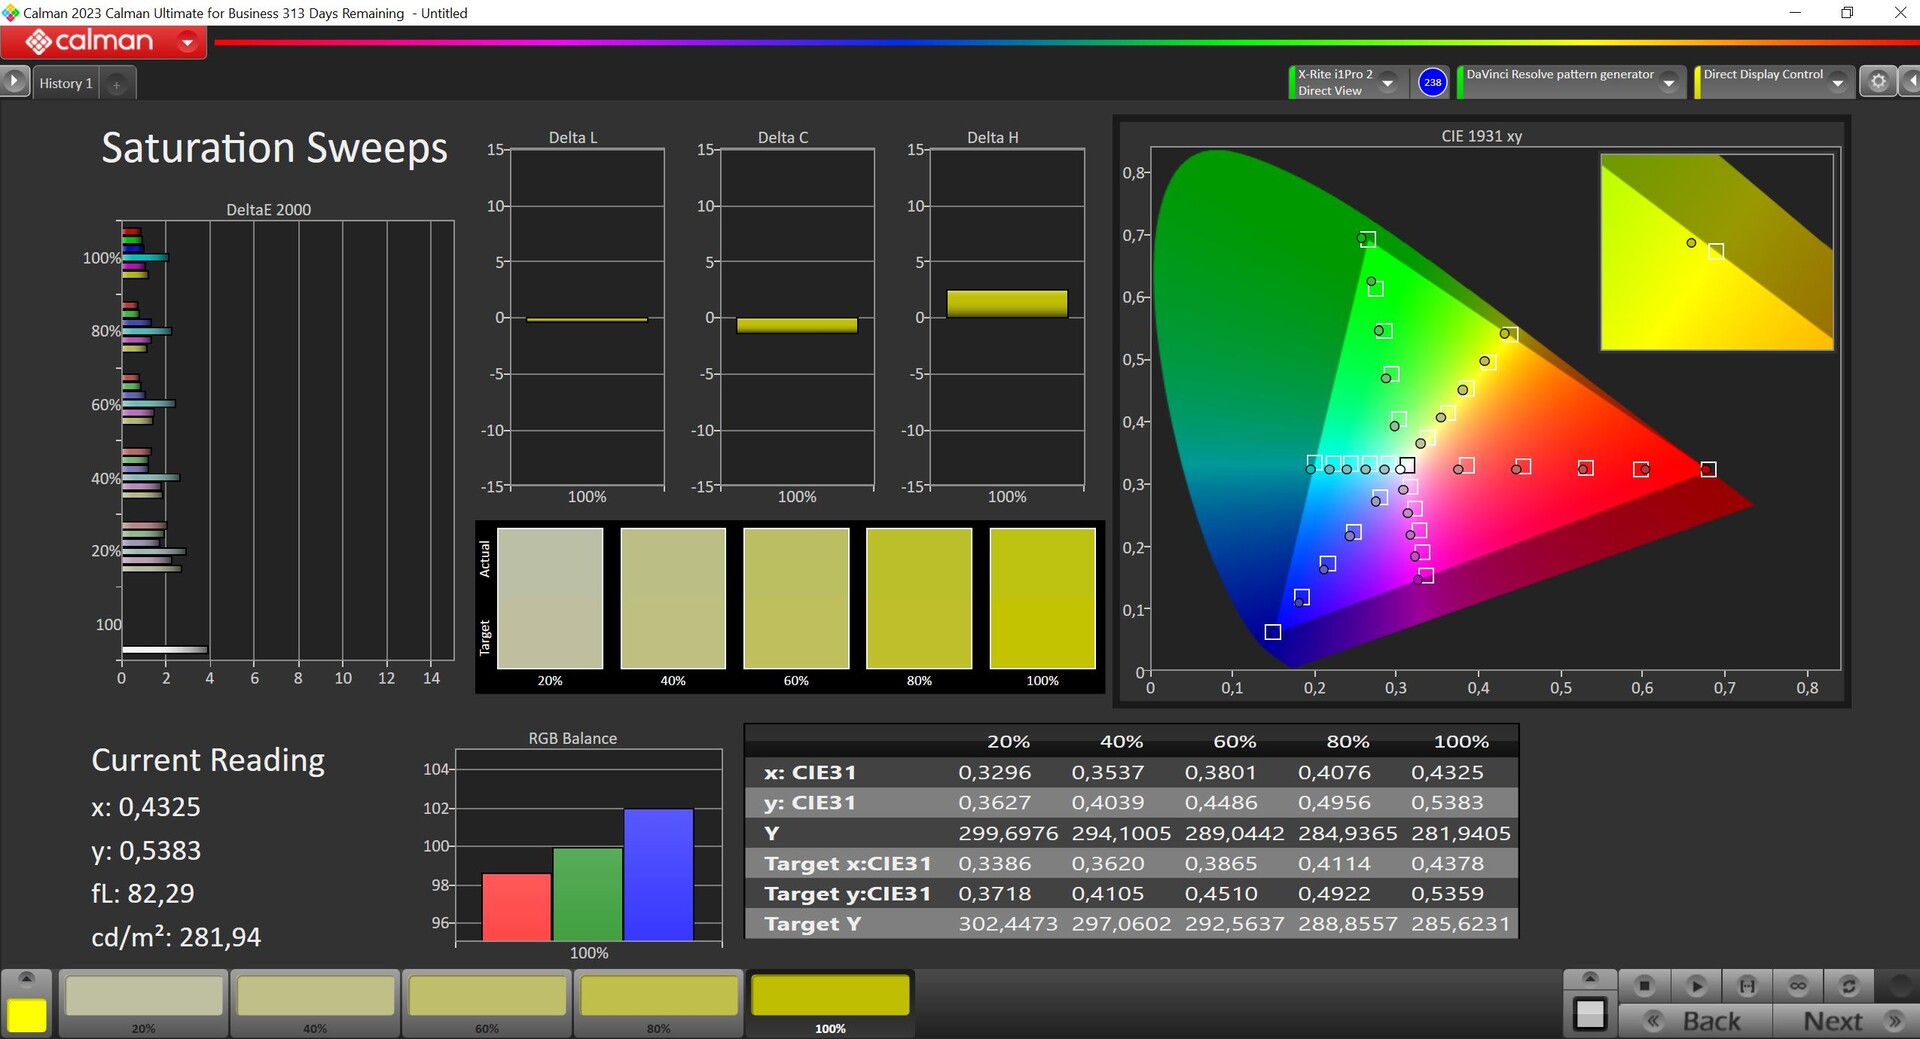
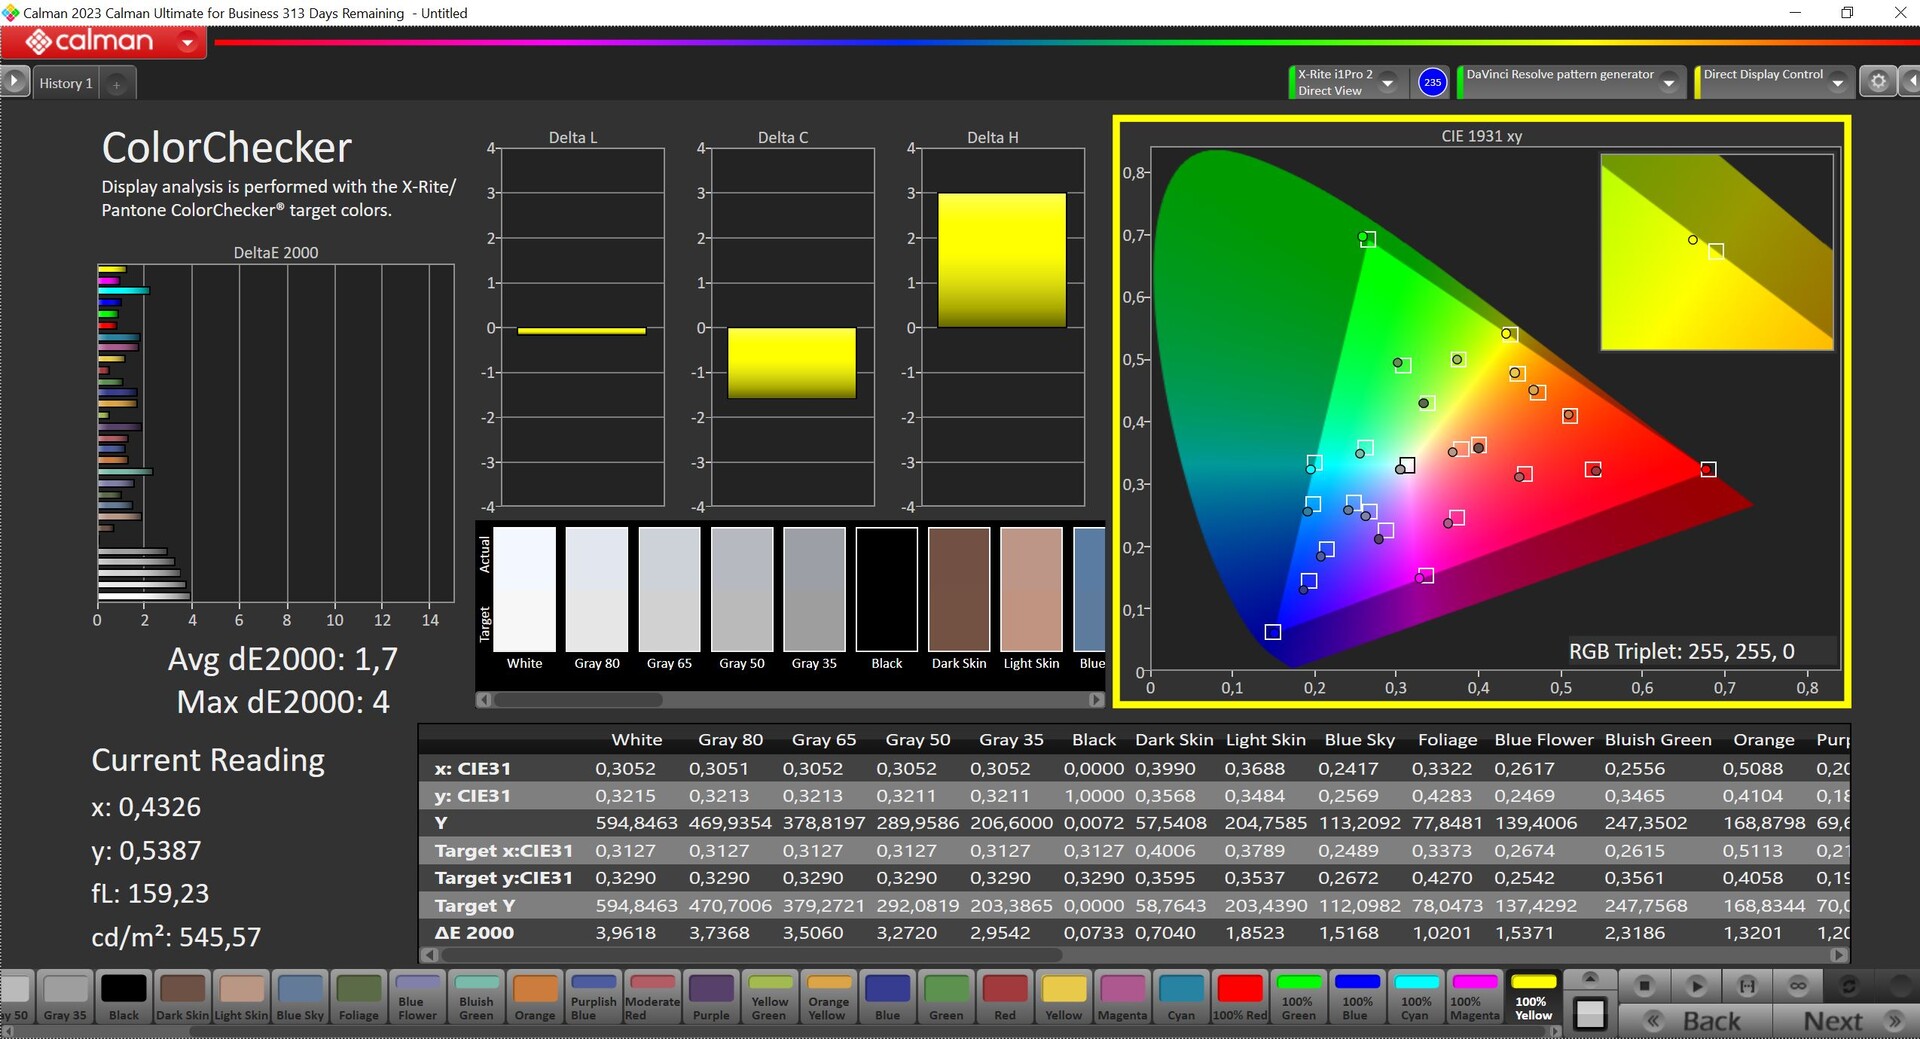
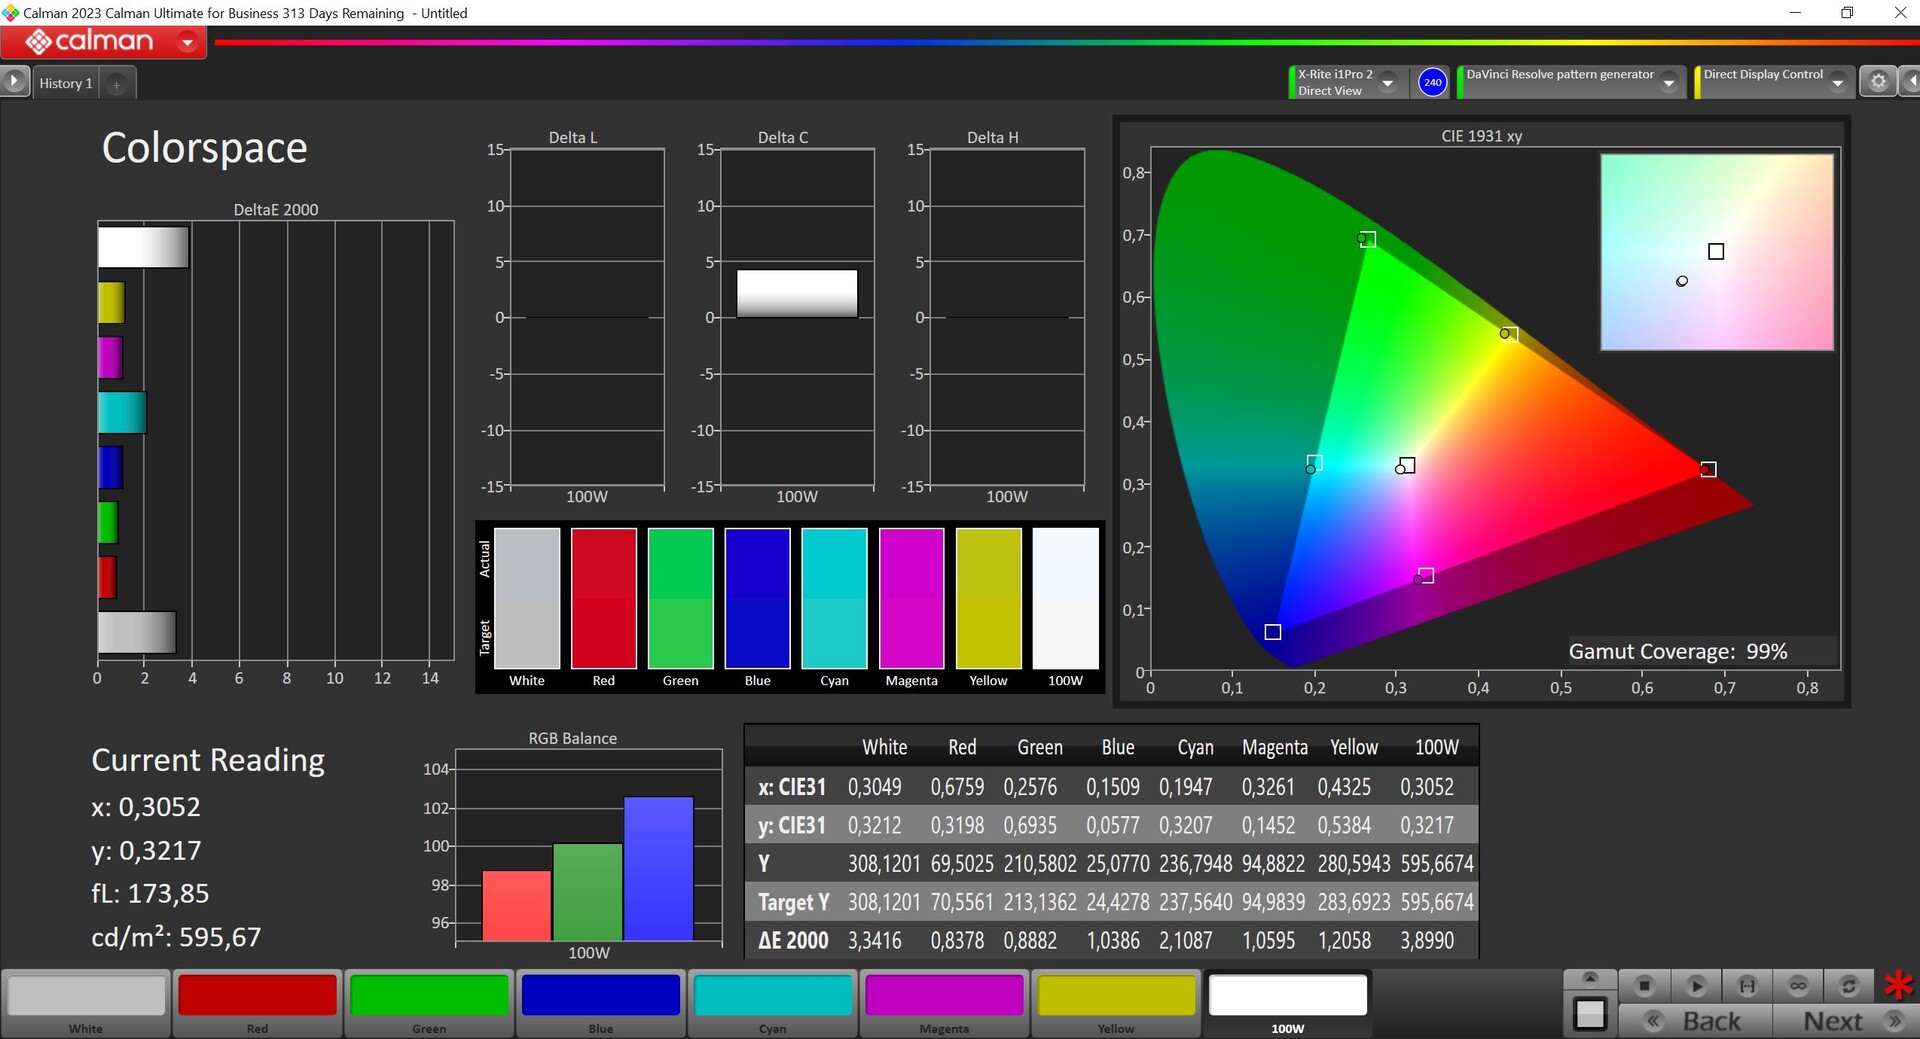
We hebben het beeldscherm geanalyseerd met de professionele CalMAN software (X-Rite i1 Pro 2) en de beeldkwaliteit is beter vergeleken met het instapmodel MBP 14 met de basis M3 SoC, want noch de kleuren, noch de grijswaarden vertonen DeltaE-2000 afwijkingen van meer dan 3 vergeleken met de P3 referentiekleurruimte. We hebben het paneel ook gekalibreerd, maar we konden de beeldkwaliteit niet verder verbeteren, dus we bieden op dit moment geen kleurprofiel aan. De MacBook dekt de P3 referentie met 99,2 procent.
Responstijd Scherm
| ↔ Responstijd Zwart naar Wit | ||
|---|---|---|
| 78.8 ms ... stijging ↗ en daling ↘ gecombineerd | ↗ 49.6 ms stijging | 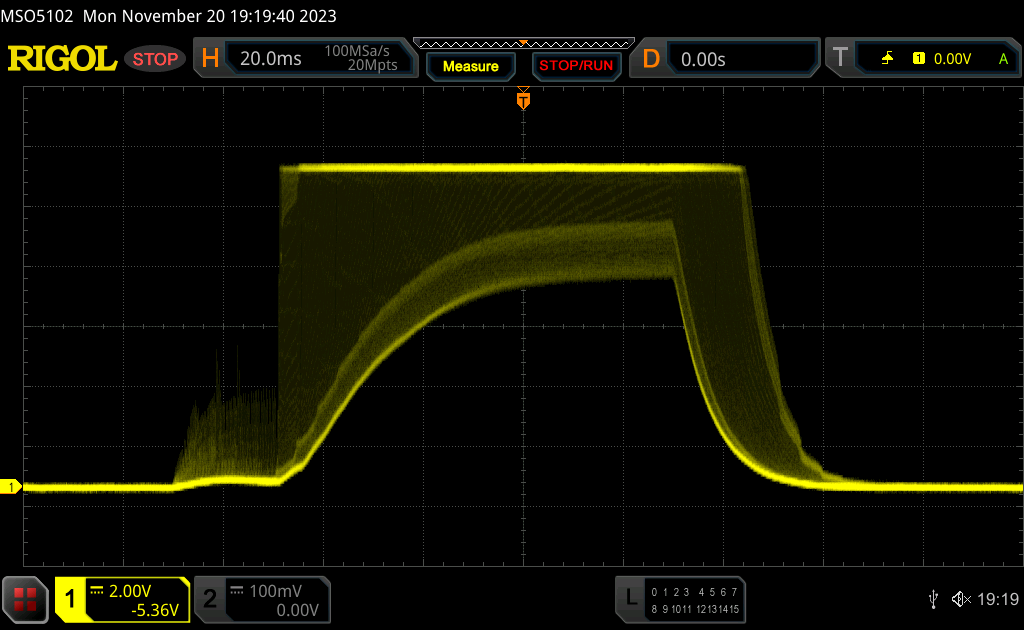 |
| ↘ 29.2 ms daling | ||
| Het scherm vertoonde trage responstijden in onze tests en is misschien te traag voor games. Ter vergelijking: alle testtoestellen variëren van 0.1 (minimum) tot 240 (maximum) ms. » 100 % van alle toestellen zijn beter. Dit betekent dat de gemeten responstijd slechter is dan het gemiddelde (19.8 ms) van alle geteste toestellen. | ||
| ↔ Responstijd 50% Grijs naar 80% Grijs | ||
| 80.8 ms ... stijging ↗ en daling ↘ gecombineerd | ↗ 36.2 ms stijging | 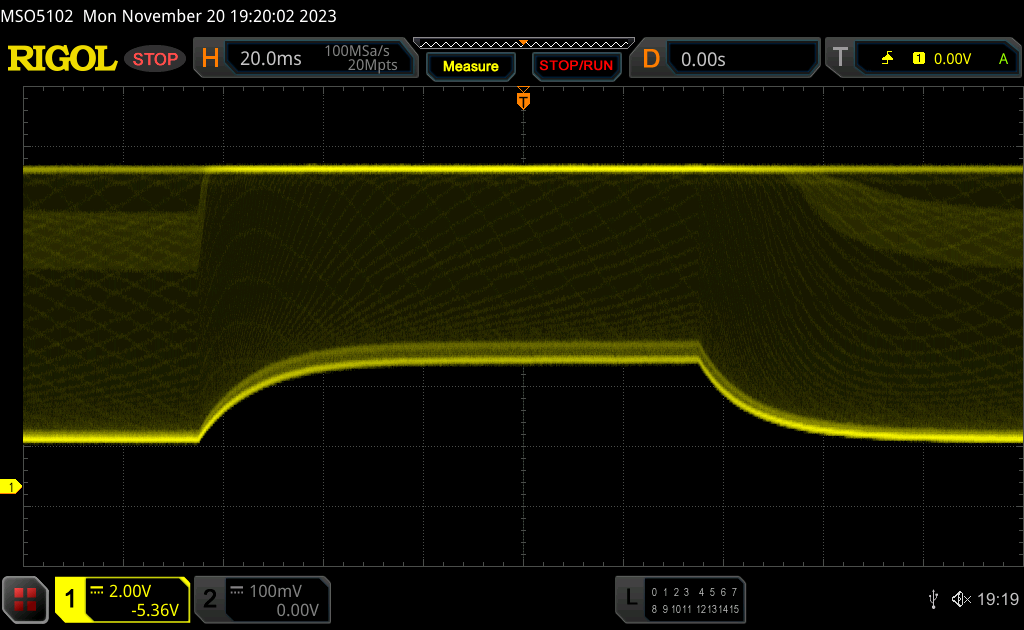 |
| ↘ 44.6 ms daling | ||
| Het scherm vertoonde trage responstijden in onze tests en is misschien te traag voor games. Ter vergelijking: alle testtoestellen variëren van 0.165 (minimum) tot 636 (maximum) ms. » 99 % van alle toestellen zijn beter. Dit betekent dat de gemeten responstijd slechter is dan het gemiddelde (31 ms) van alle geteste toestellen. | ||
Screen Flickering / PWM (Pulse-Width Modulation)
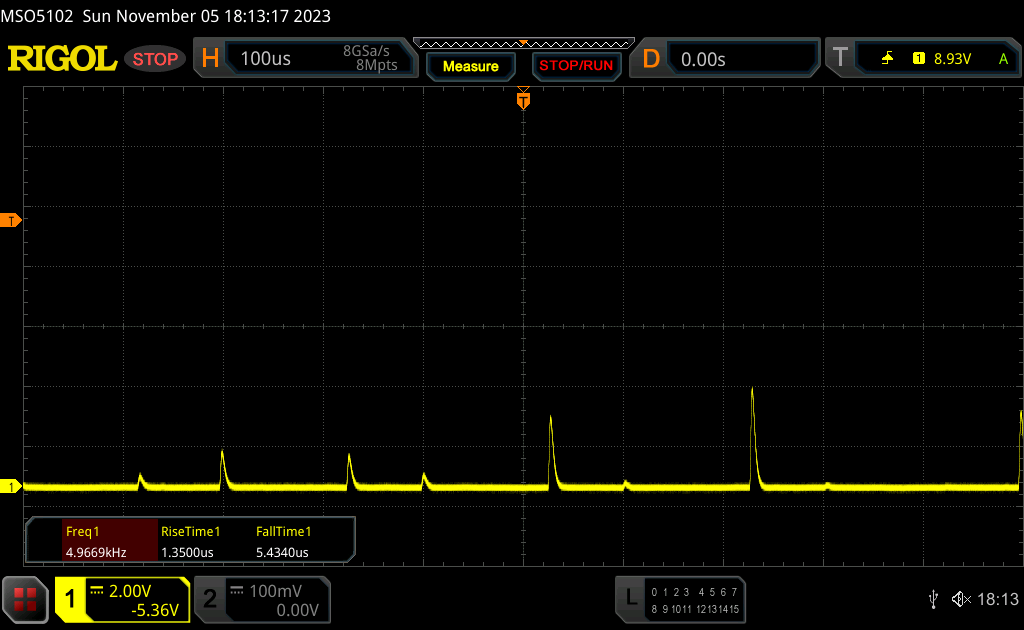
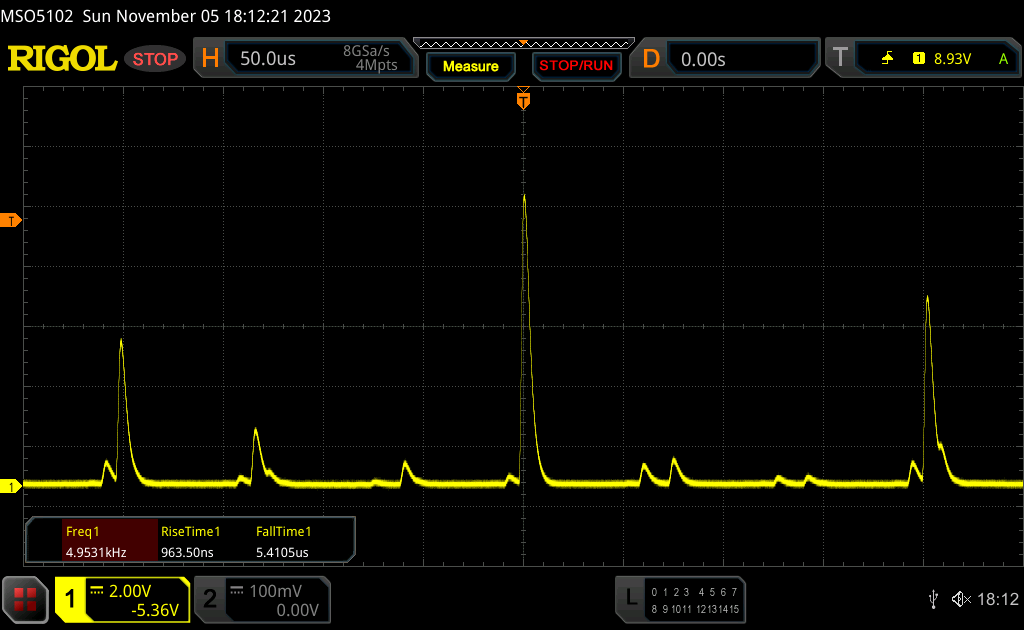
| Screen flickering / PWM waargenomen | 14878 Hz | ≤ 100 % helderheid instelling | 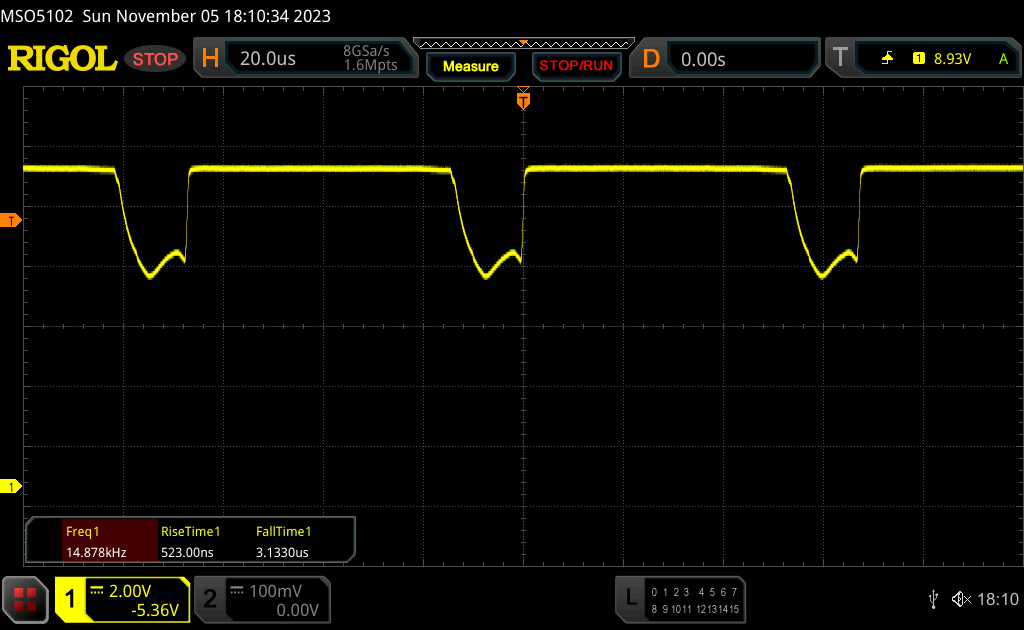 |
De achtergrondverlichting van het scherm flikkert op 14878 Hz (in het slechtste geval, bijvoorbeeld bij gebruik van PWM) aan een helderheid van 100 % en lager. Boven deze helderheid zou er geen flickering / PWM mogen optreden. De frequentie van 14878 Hz is redelijk hoog en de meeste mensen die gevoelig zijn aan flickering zouden dit dus niet mogen waarnemen of geïrriteerde ogen krijgen. Ter vergelijking: 52 % van alle geteste toestellen maakten geen gebruik van PWM om de schermhelderheid te verlagen. Als het wel werd gebruikt, werd een gemiddelde van 7754 (minimum: 5 - maximum: 343500) Hz waargenomen. | |||
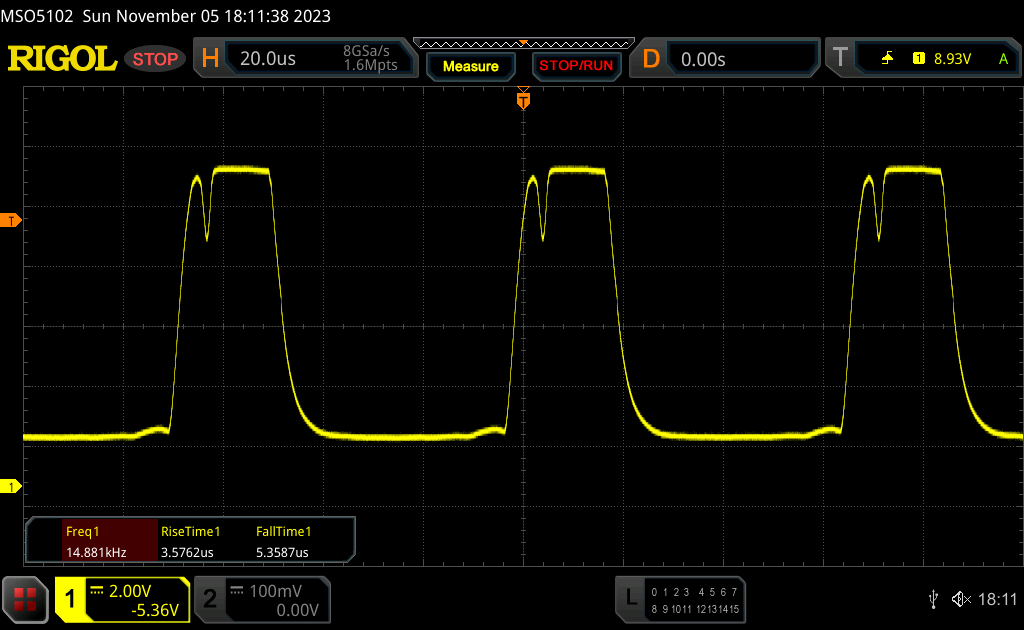
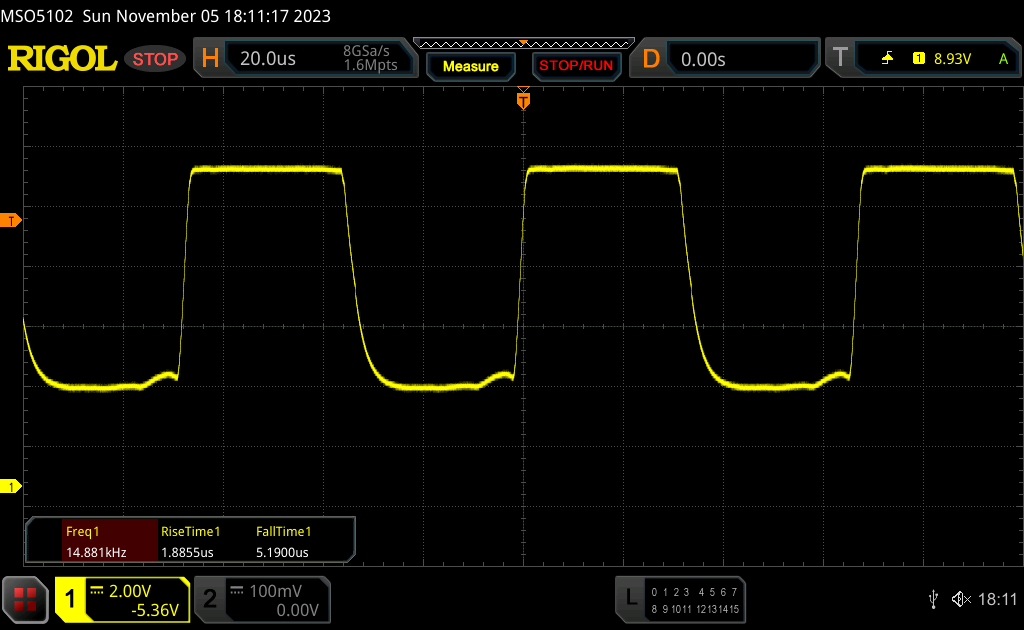
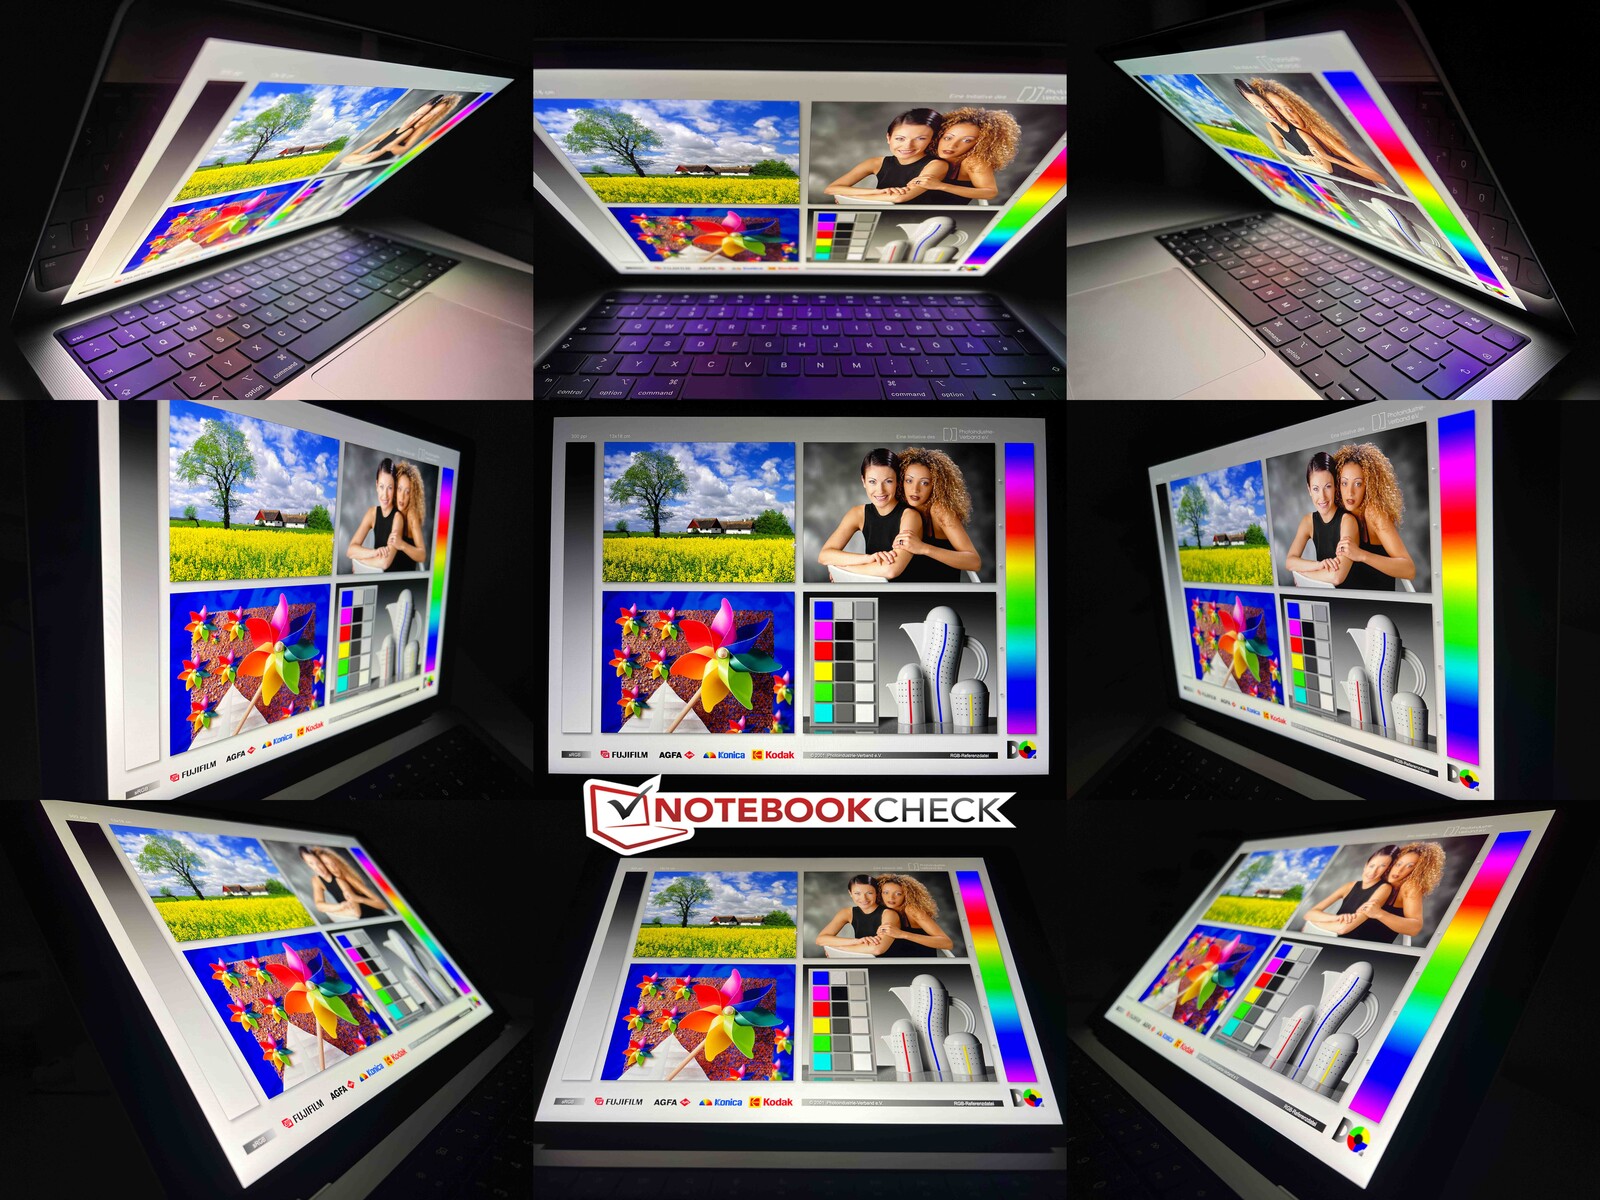
Net als bij het vorige model kunnen we ook bij de nieuwe MacBook Pro 14 een constante flikkering bij 15 kHz meten, maar er zouden geen problemen moeten zijn door de hoge frequentie. Het constante flikkeren maakt het moeilijker om nauwkeurige reactietijden te bepalen en we bepalen vrij trage waarden voor het IPS-paneel met Mini-LED achtergrondverlichting. U kunt wat ghosting zien bij speciale tests, maar het is meestal niet zichtbaar bij dagelijks gebruik en de verhoogde frequentie van 120 Hz helpt zeker. Toch zijn rivalen zoals de Yoga Pro 9i of de OLED-modellen van Asus in dit opzicht superieur.
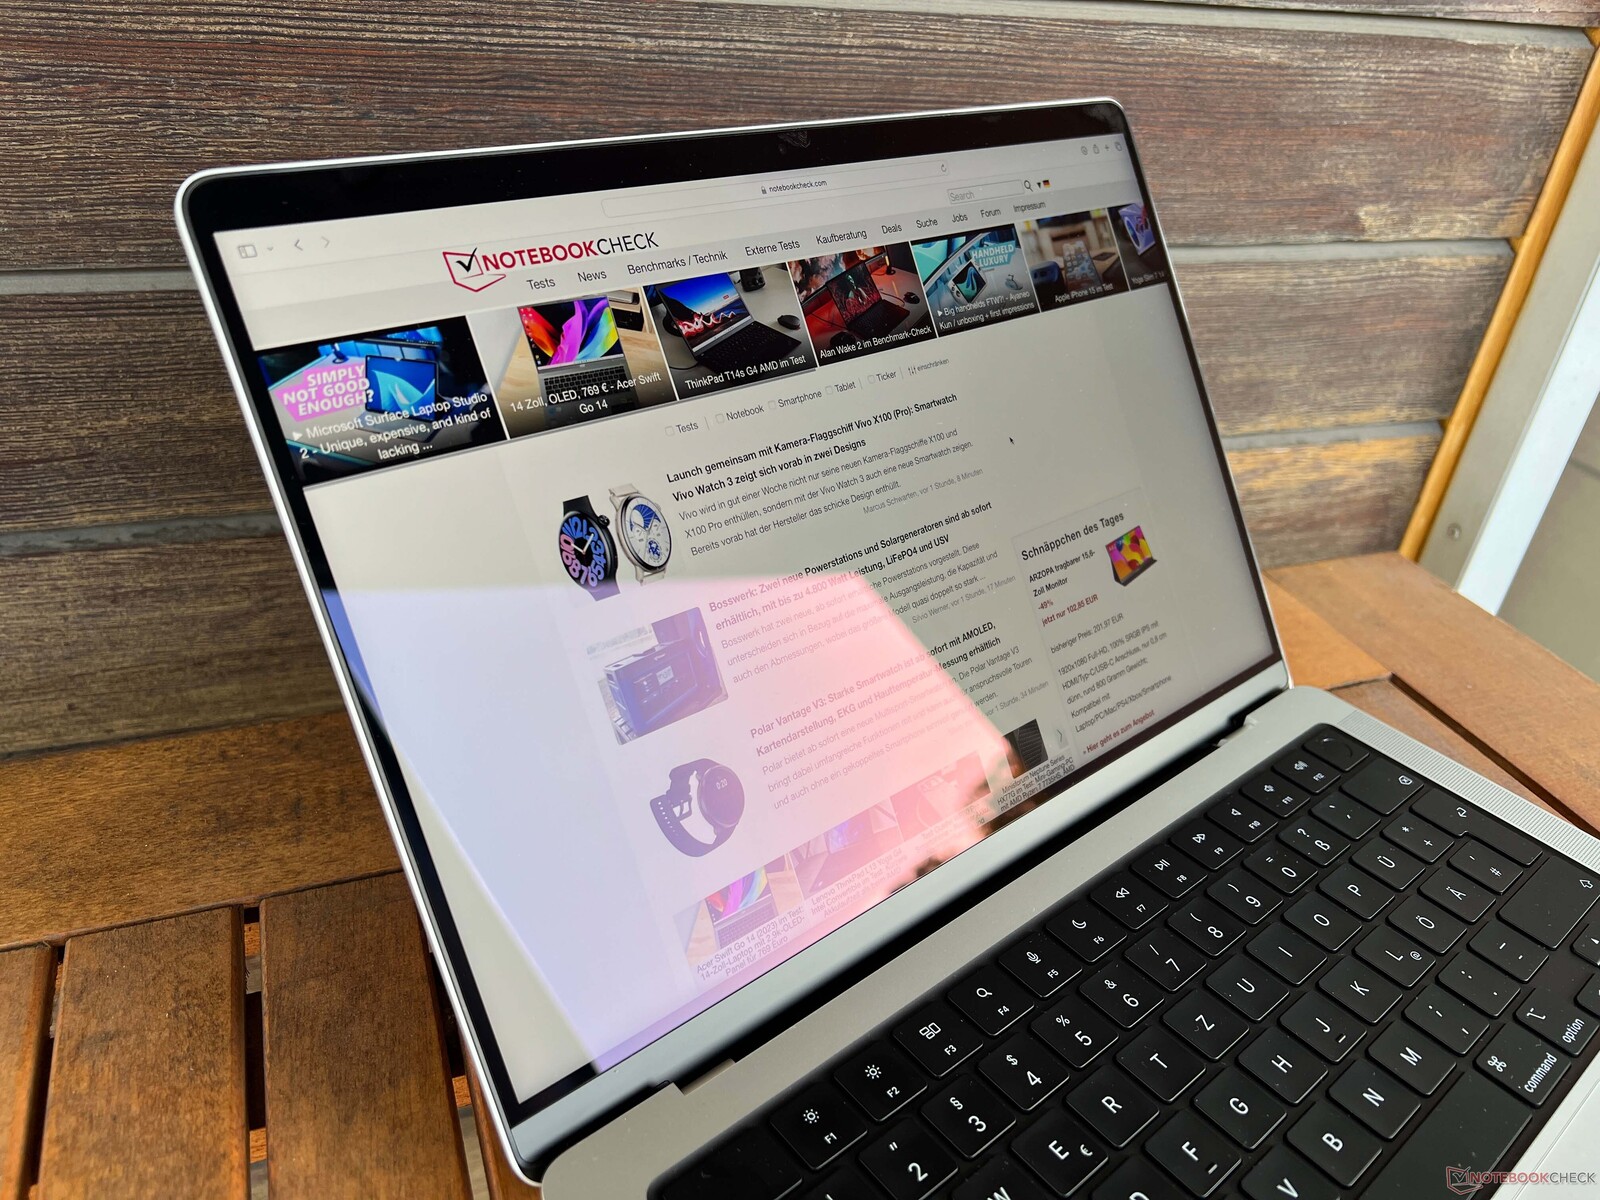
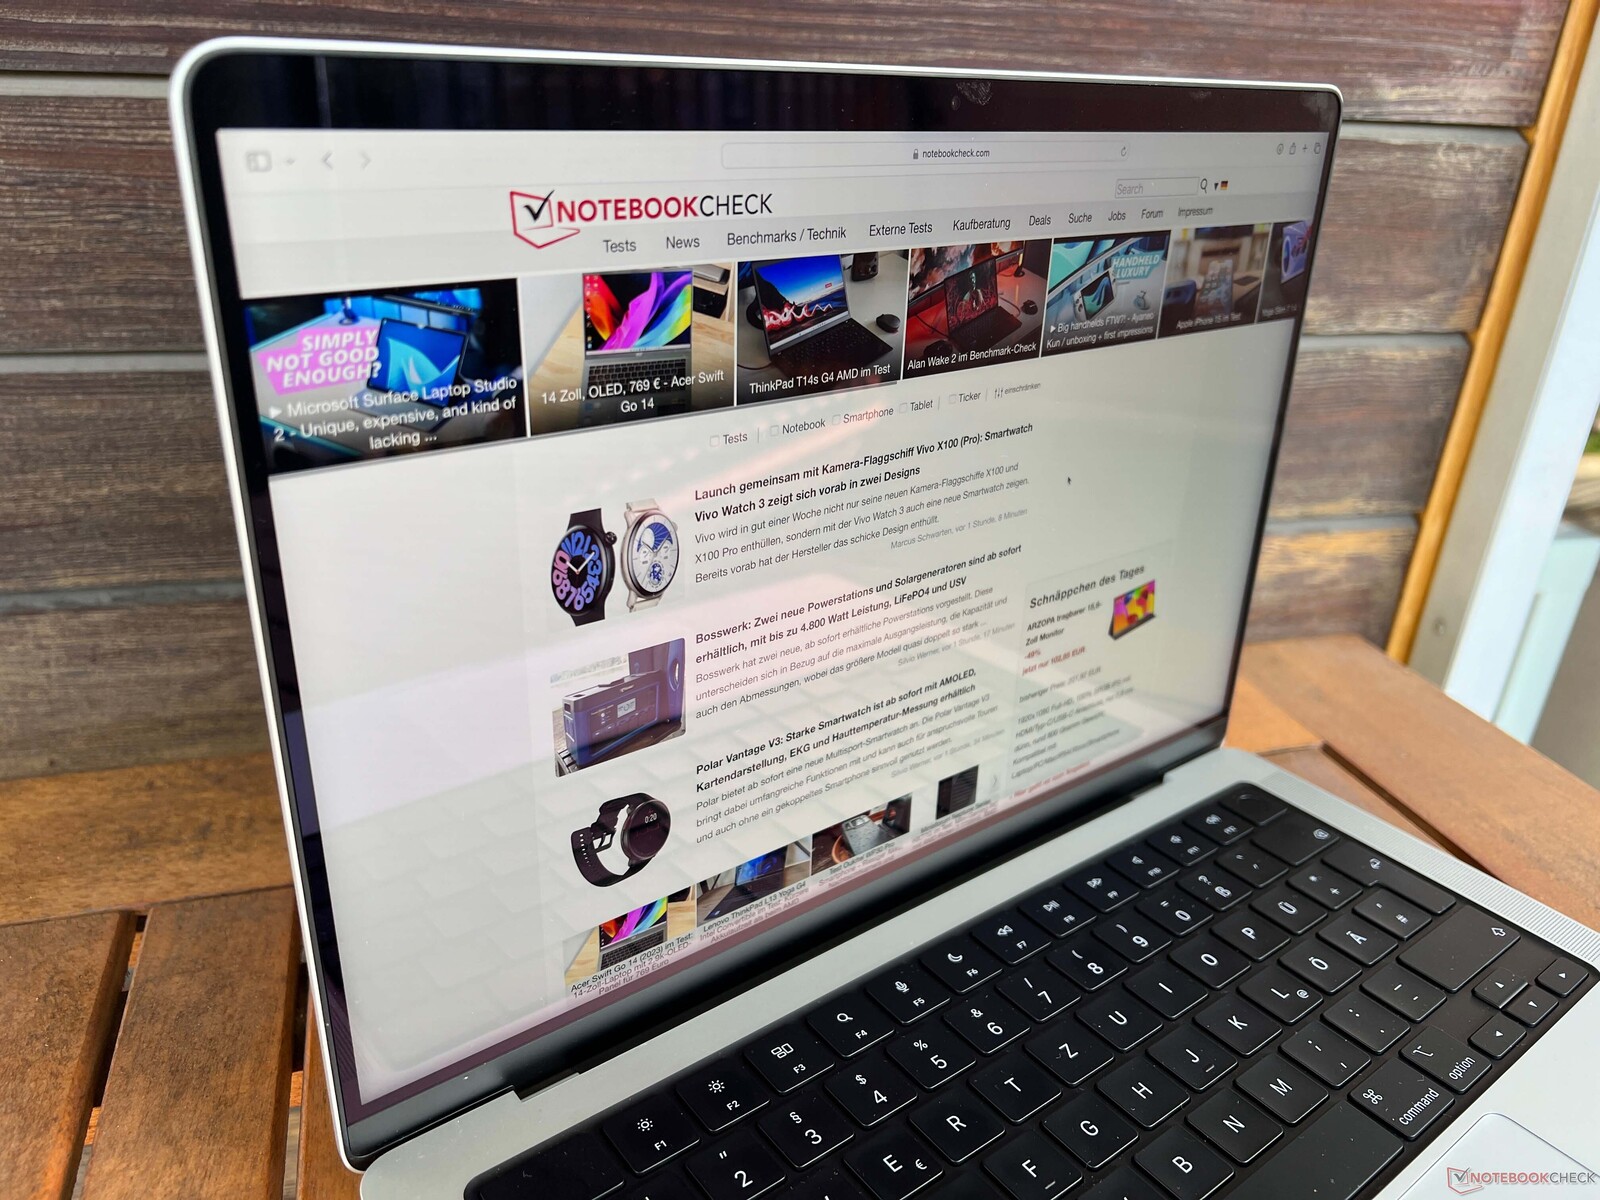
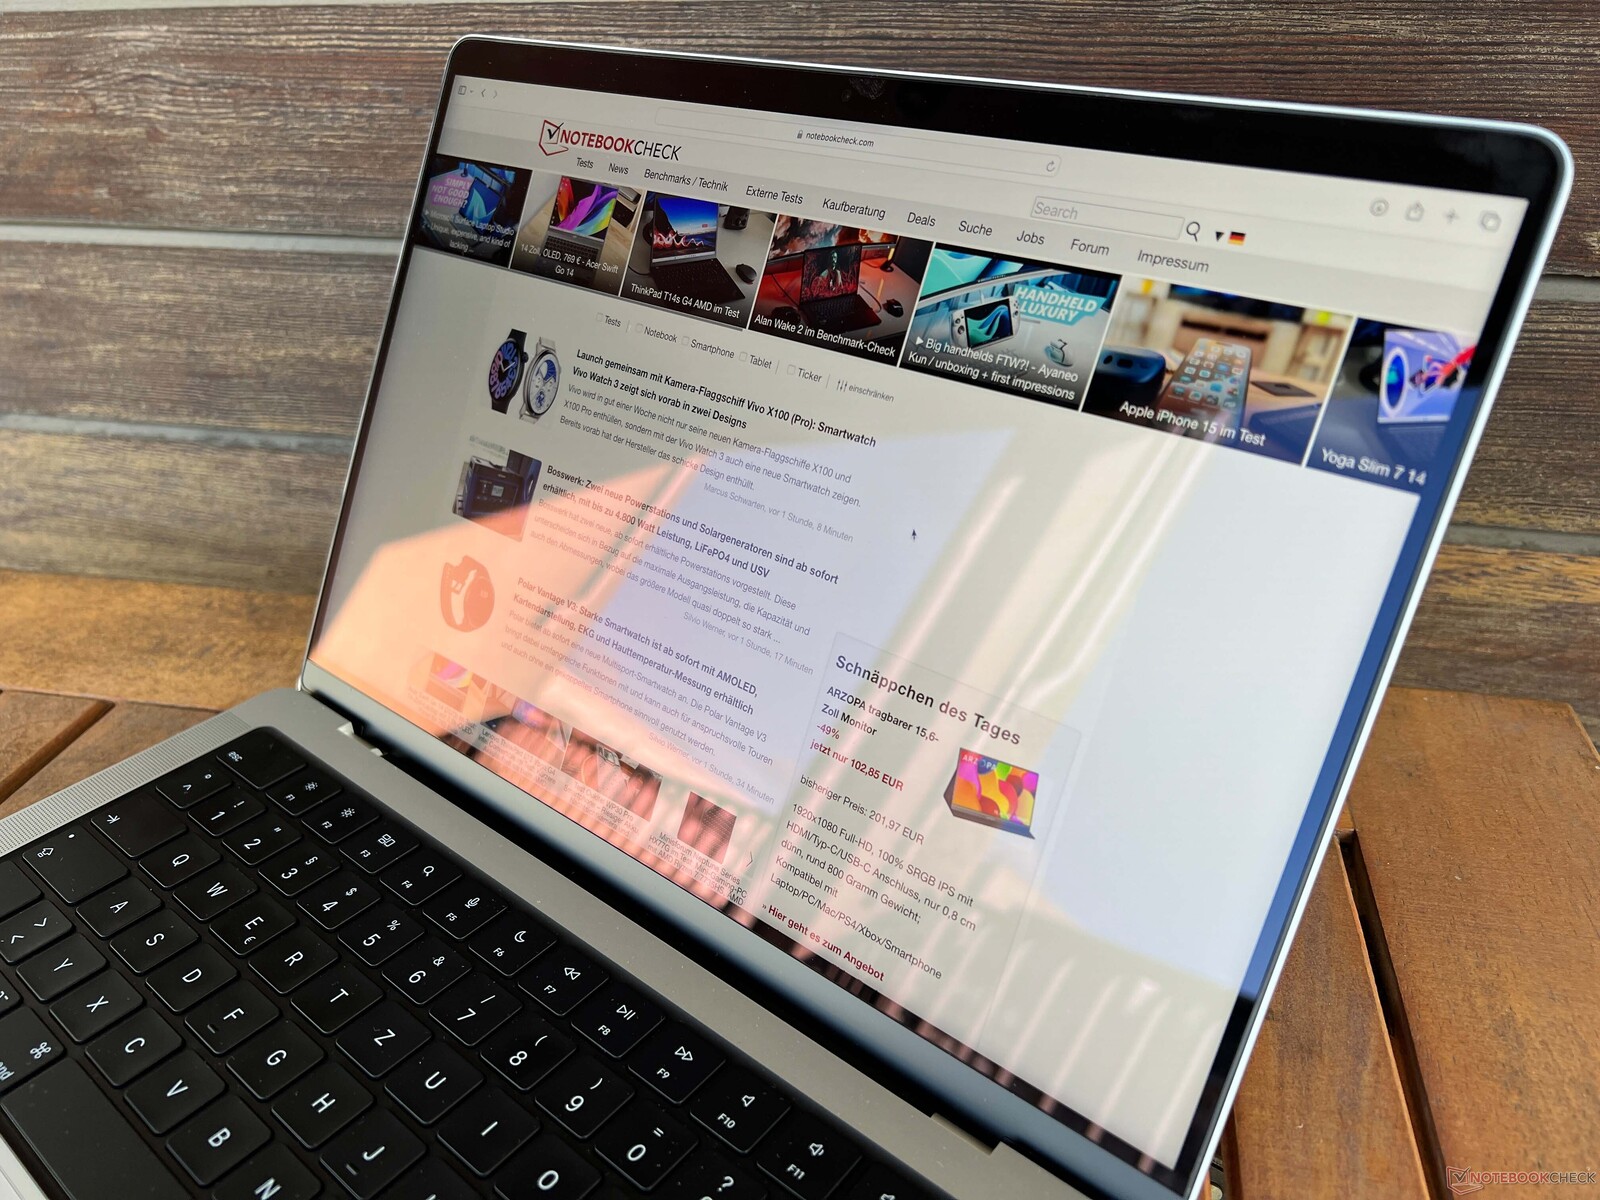
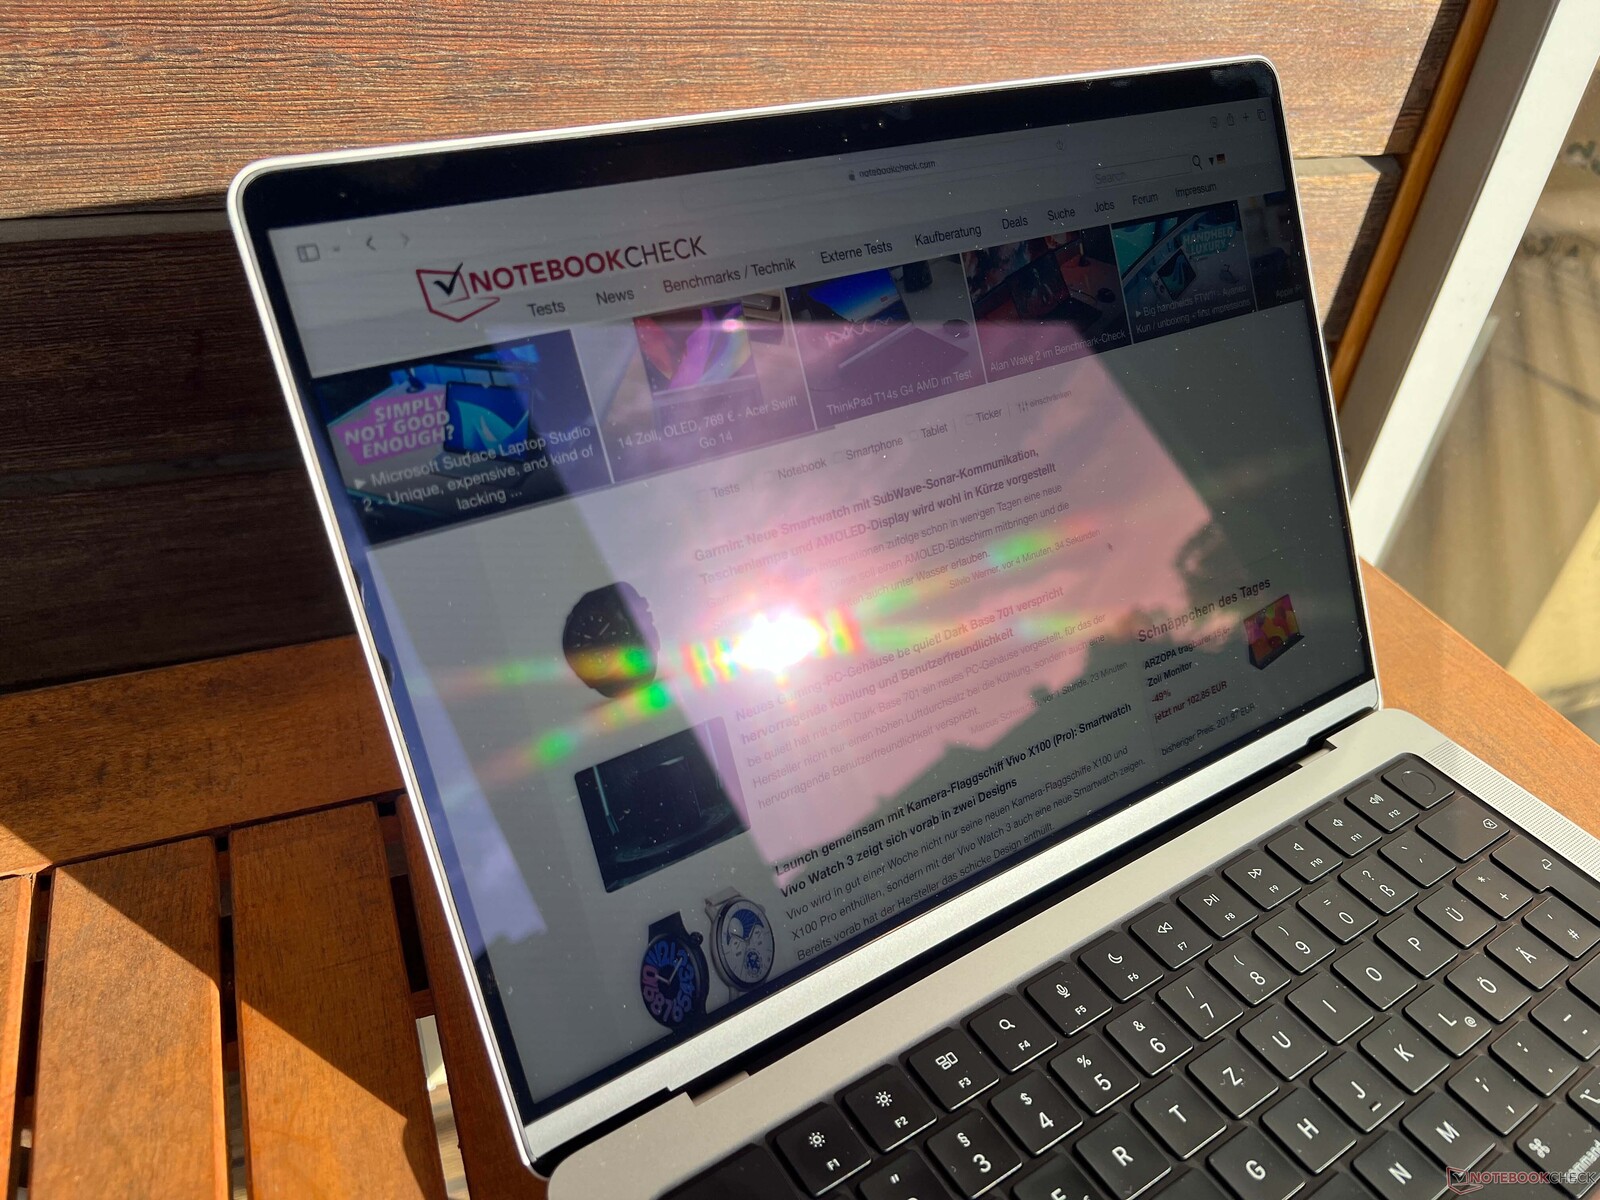
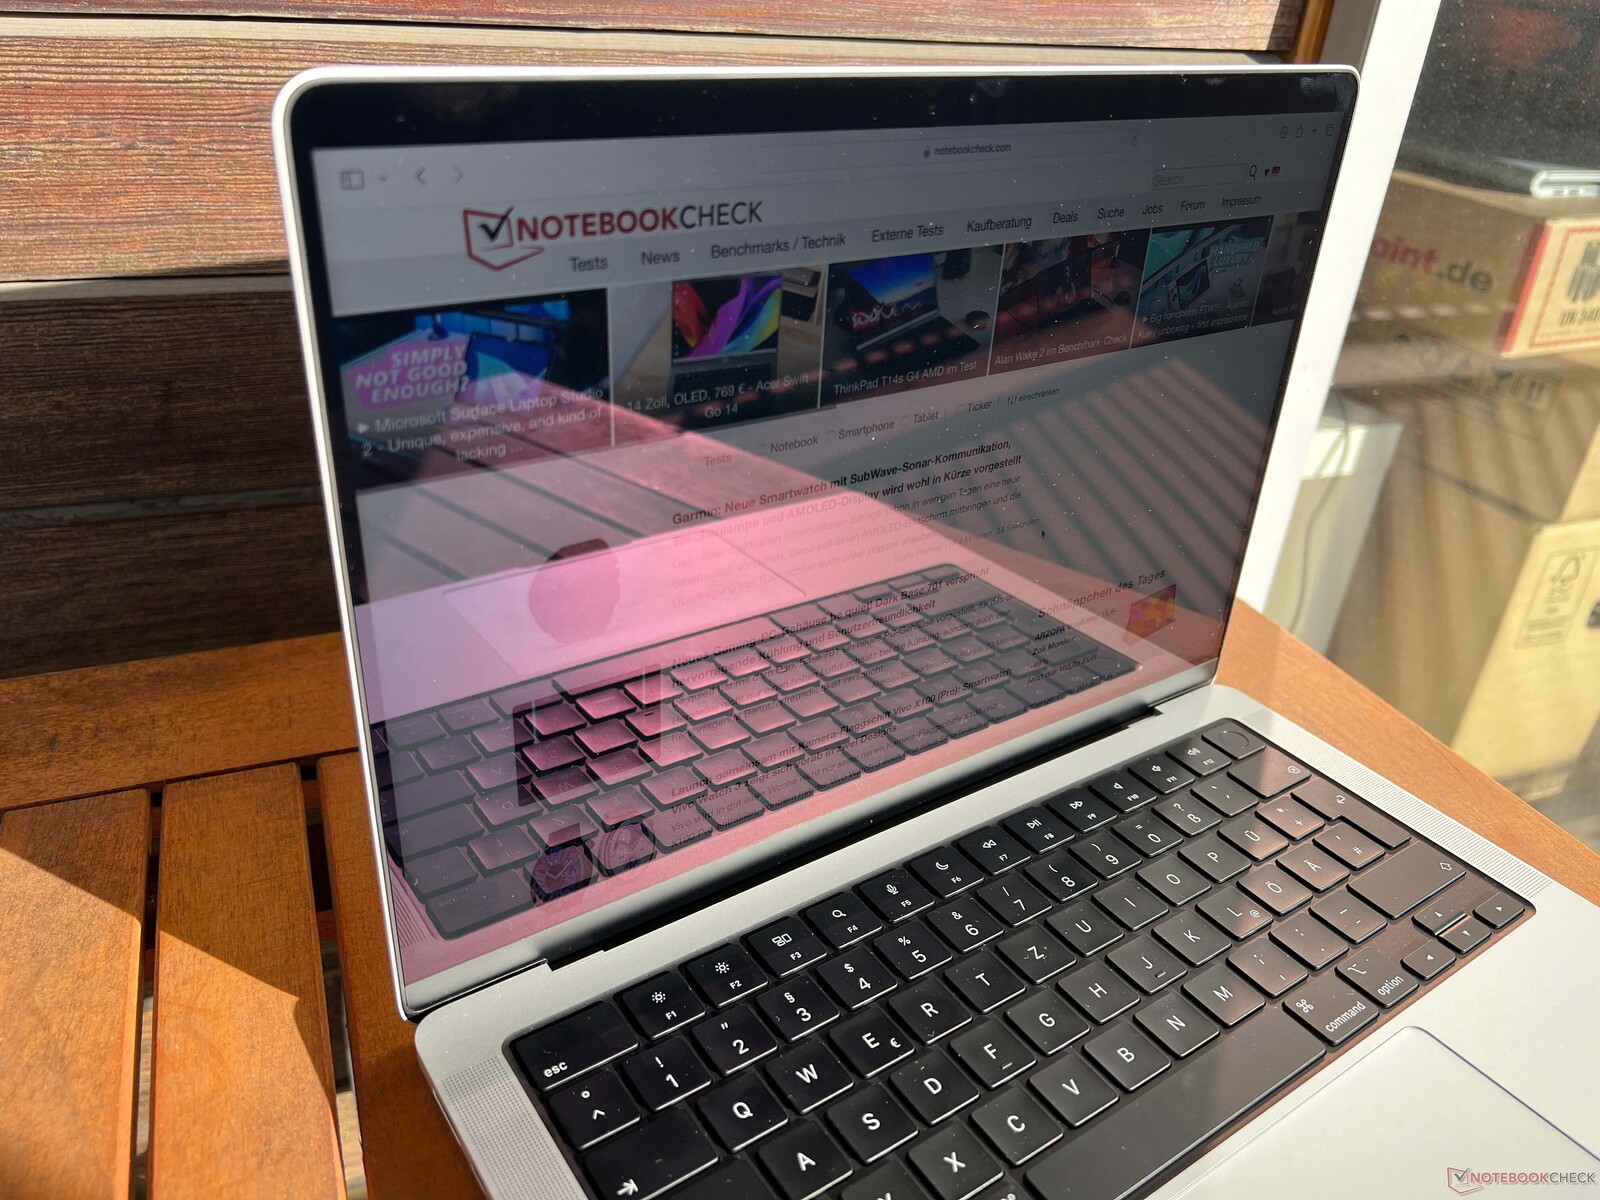
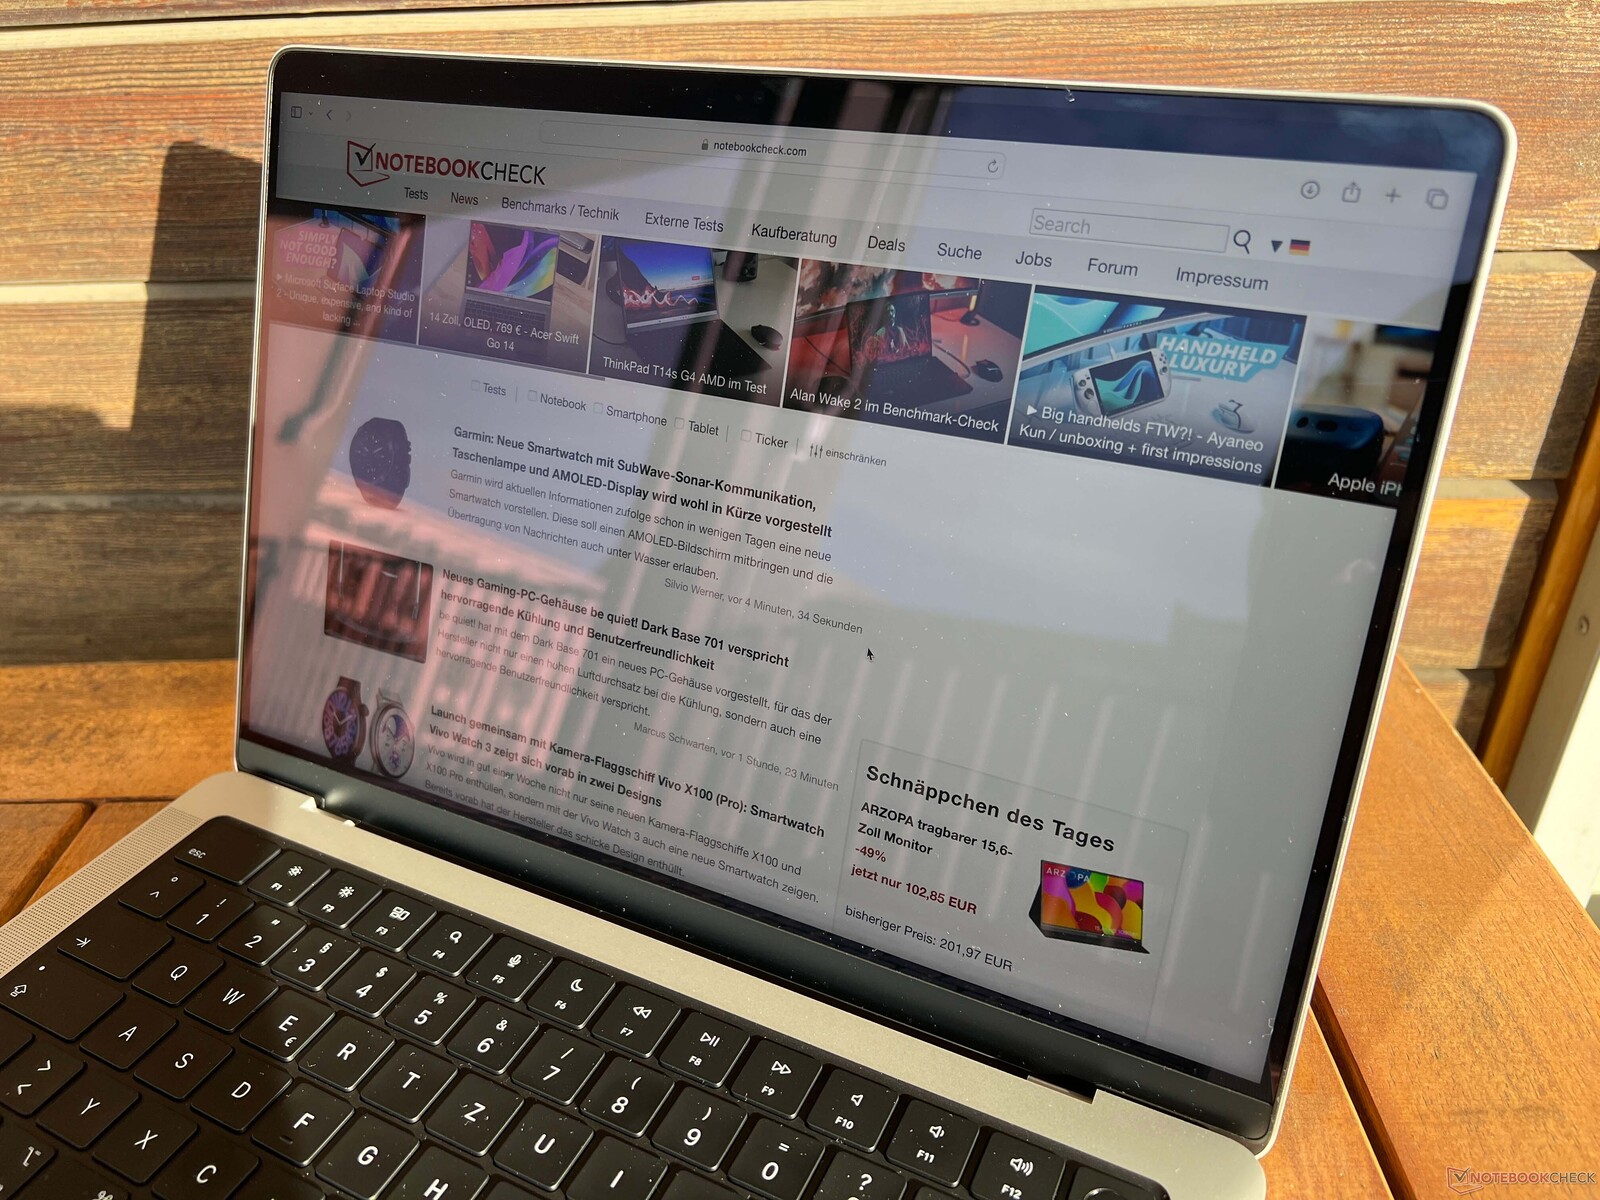
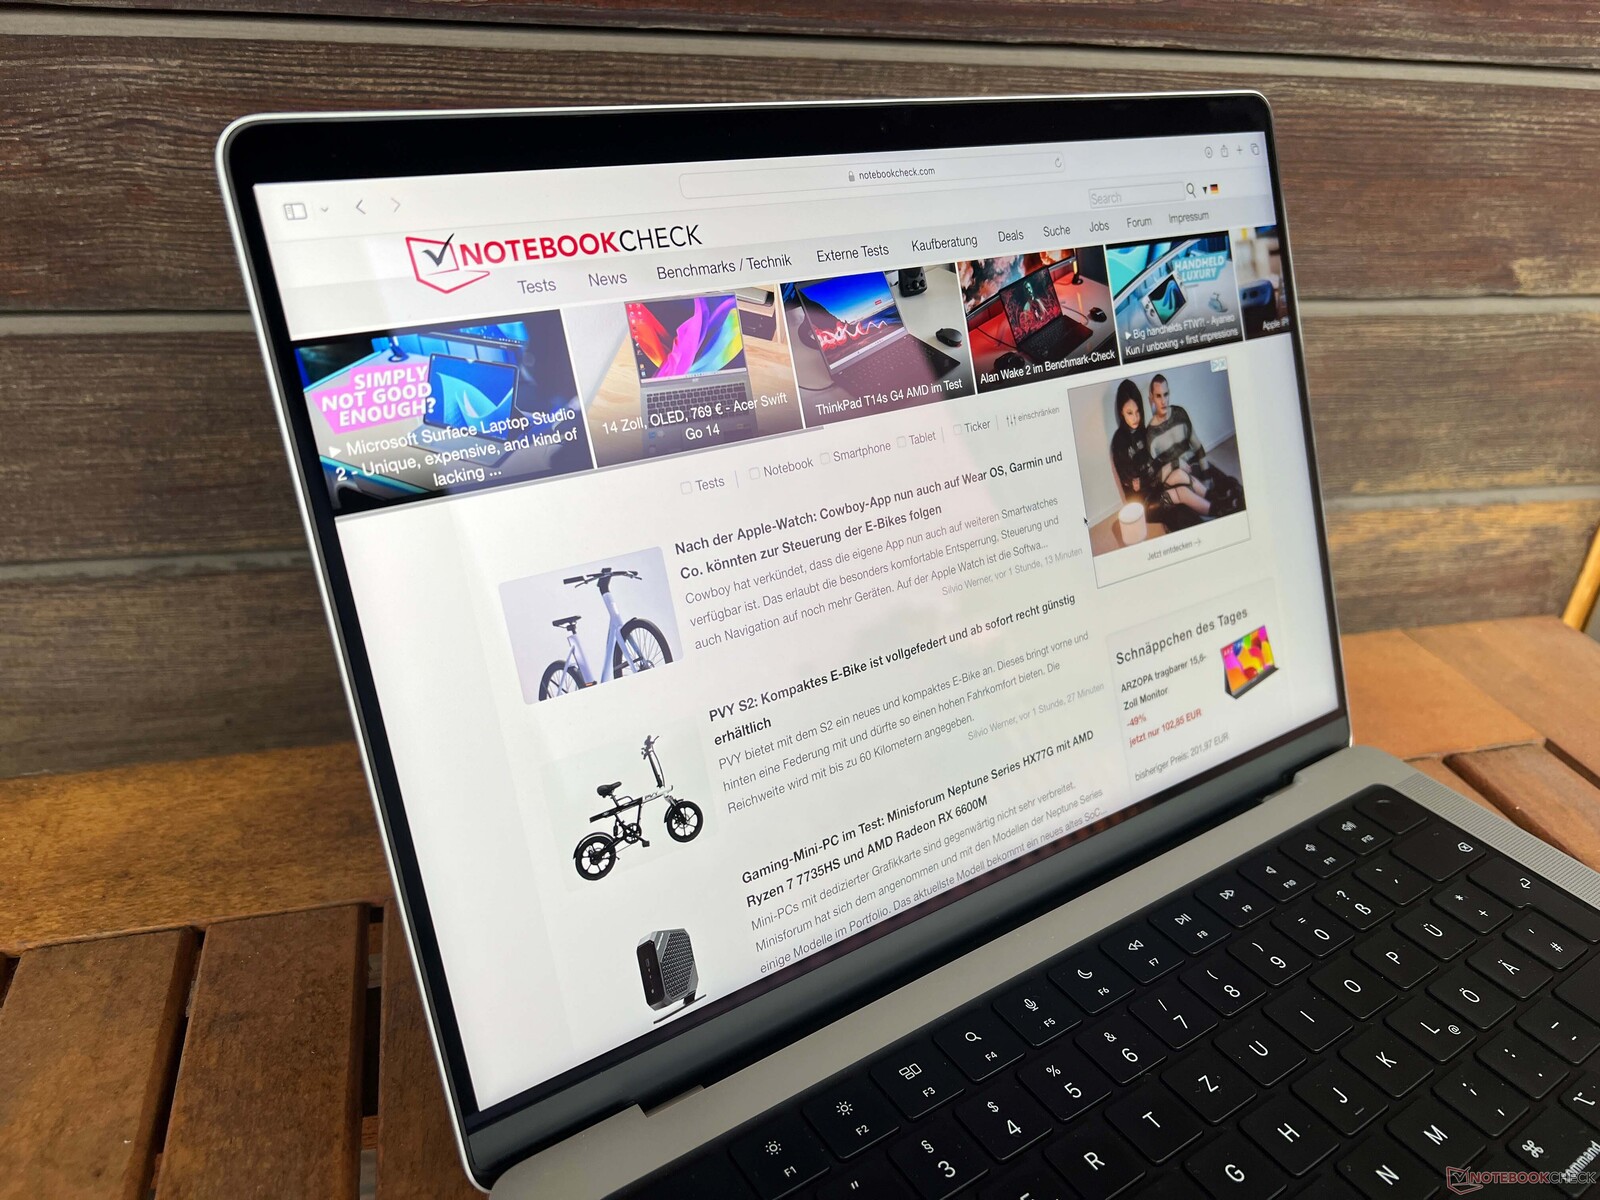
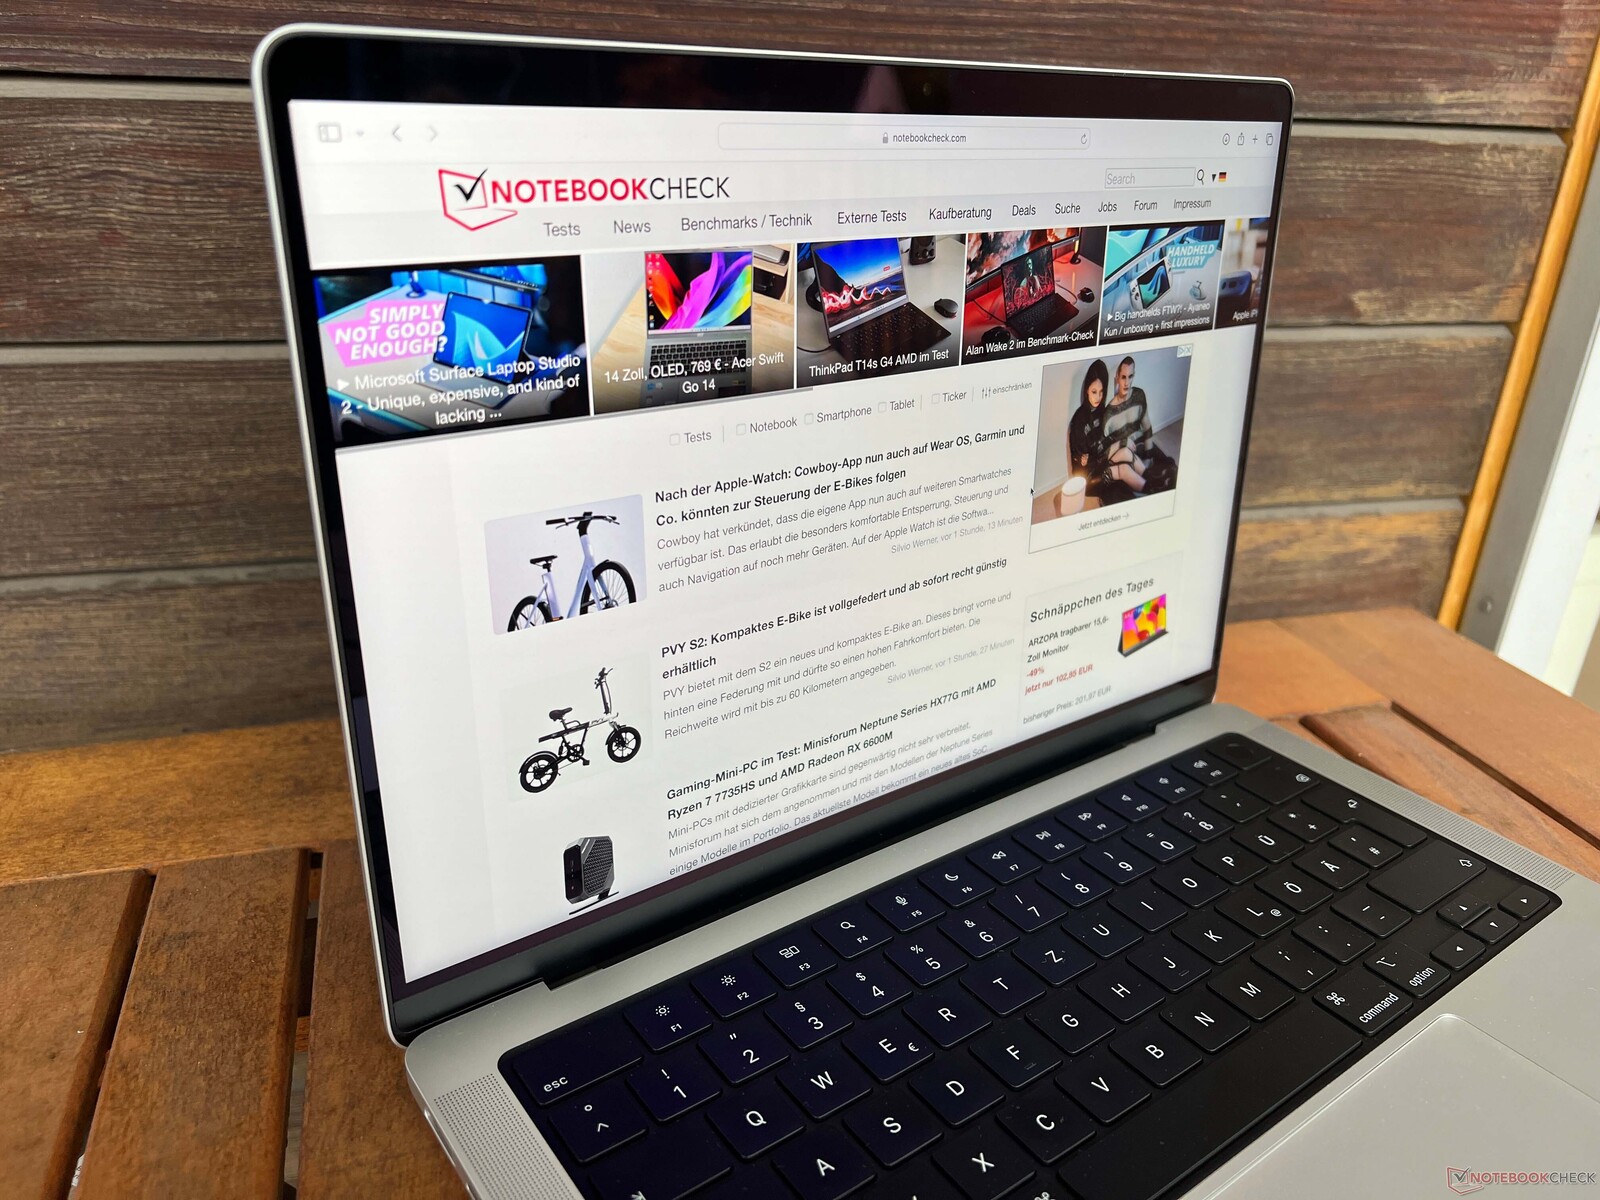
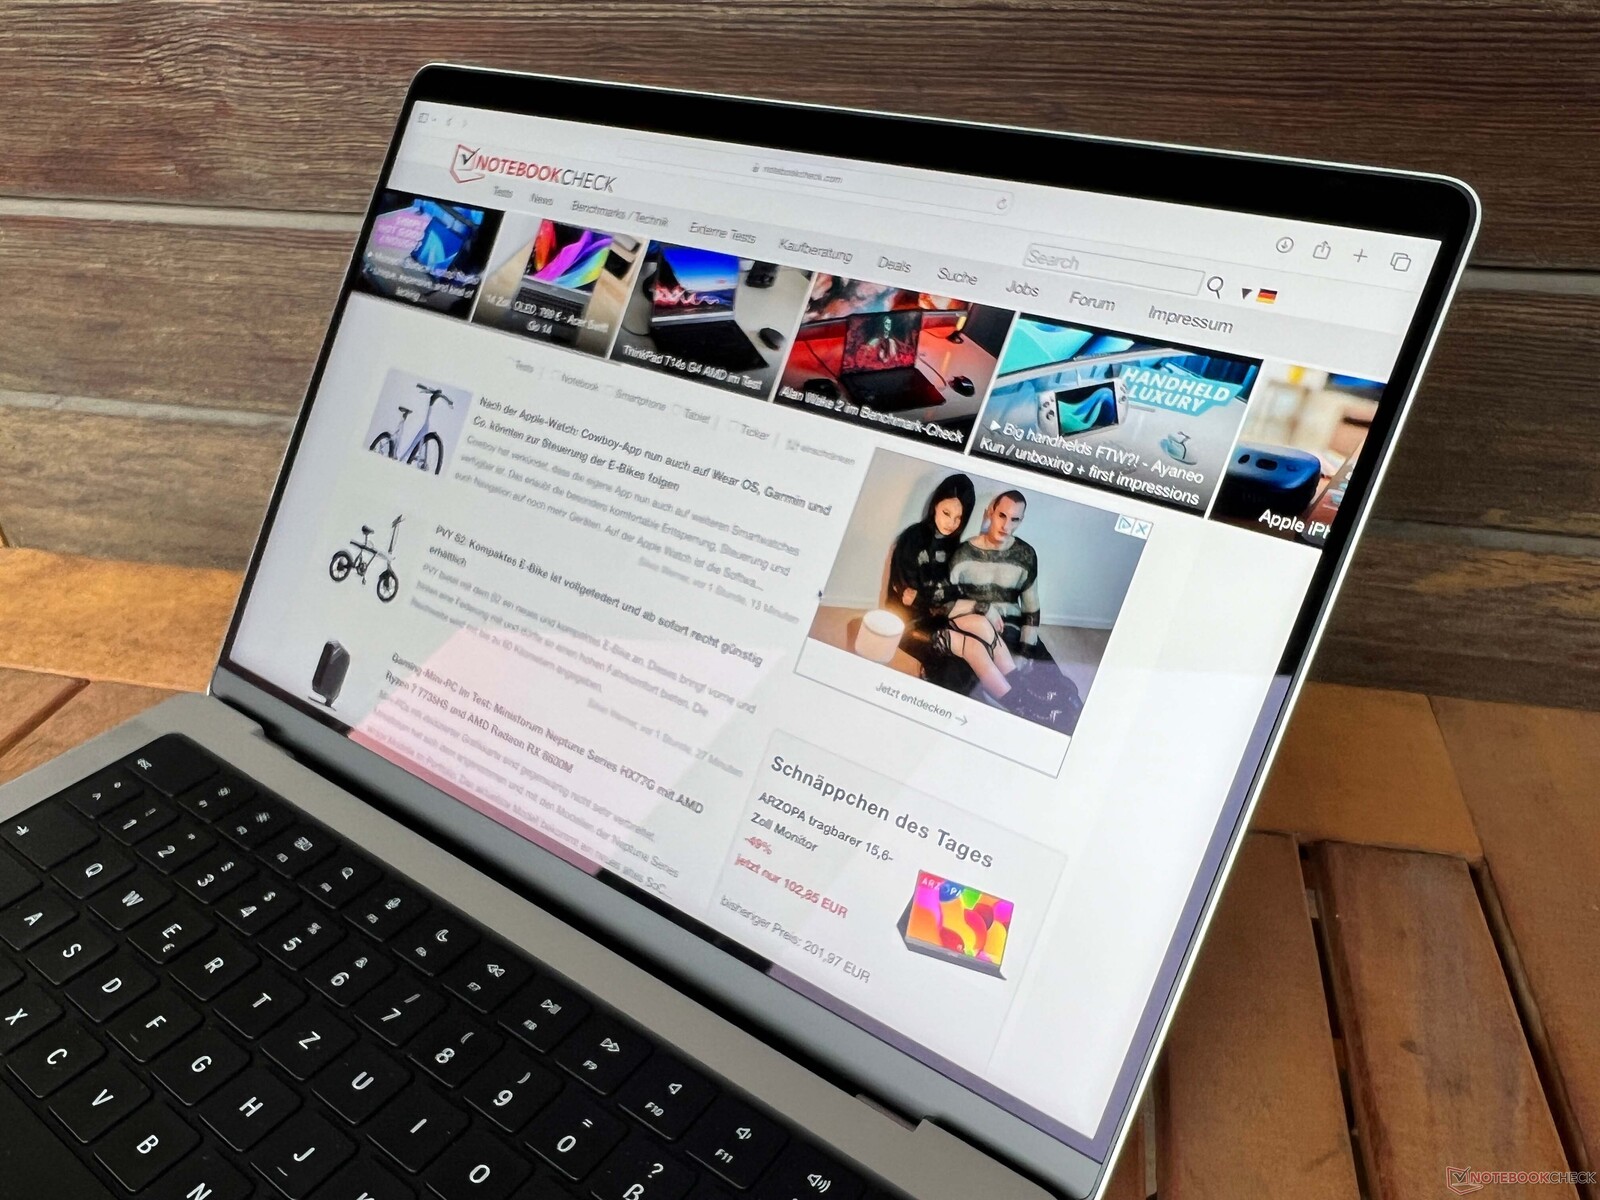
De MacBook Pro 14 heeft een glanzend scherm, maar het is niet zo reflecterend als veel andere glanzende panelen. De hoge waarden voor zowel de helderheid als de contrastverhouding helpen hier natuurlijk ook bij. Onze voorbeeldafbeeldingen (genomen met deMacBook Pro 14 M3) laten zien dat u de MacBook zelfs buiten op zonnige dagen kunt gebruiken, zolang u direct zonlicht vermijdt. Er zijn geen beperkingen wat betreft de stabiliteit van de kijkhoek.
Prestaties - M3 Max met Turbomodus
Herziening Instellingen
De grotere MacBook Pro 16 met de M1 Max of M2 Max bood in het verleden al meerdere prestatiemodi(Lage prestaties, Automatisch, Hoge prestaties), en de kleinere MacBook Pro 14 krijgt nu ook deze modi als u hem specificeert met de M3 Max. De High Performance-modus is vooral merkbaar wanneer u de CPU & GPU tegelijkertijd belast (ten koste van meer ventilatorgeluid). De zuivere CPU/GPU-prestaties zijn daarentegen identiek, dus we hebben de volgende benchmarks en metingen uitgevoerd met de standaard Automatische instelling.
Processor - M3 Max met 16 CPU-kernen
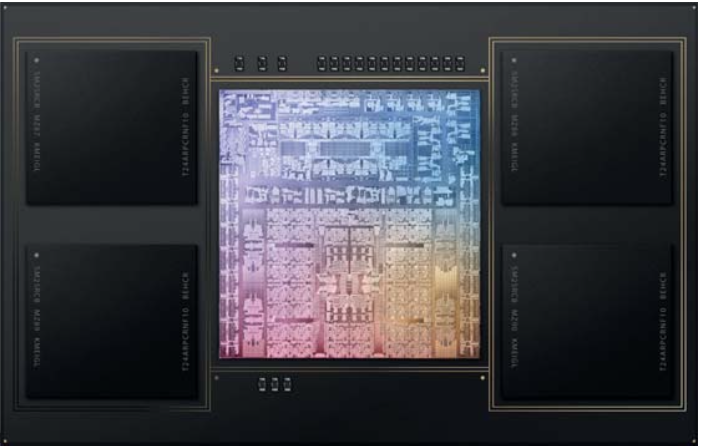
DeM3 Maxis vervaardigd in een geavanceerd 3 nm-proces en het high-end model heeft vier extra prestatiekernen (in totaal 12) ten opzichte van deM2 Max. Naast de vier efficiëntiekernen kan de CPU tot 16 threads tegelijk uitvoeren. Het hogere aantal cores resulteert ook in een aanzienlijke toename van het stroomverbruik, want de M2 Max verbruikte tot 36 Watt in CPU-benchmarks, en de nieuwe M3 Max verbruikt tot 56 Watt.
De prestatie-kernen kunnen tot 4,056 GHz bereiken en ongeveer 3,6 GHz wanneer u alle kernen tegelijkertijd gebruikt. De vier efficiency-kernen bereiken maximaal 2,567 GHz (2,418 GHz onder volledige belasting) en zijn langzamer dan de efficiency-kernen van de basis-M3 SoC.M3 SoC. De prestaties zijn aanzienlijk beter in vergelijking met de oude M2 Max, en we zien een voordeel van 63% in de Cinebench R23 Multi test. Dit betekent dat Apple gemakkelijk de toppositie inneemt onder de 14-inch rivalen en we zien een voordeel van 26% in Cinebench R23 Multi vergeleken met deCore i9-13900Hin deAsus Zenbook Pro 14(120/90 watt) en 32 % ten opzichte van deAMD Ryzen 9 7940HSin deAsus ROG Zephyrus G14(80 watt). Het voordeel voor de M3 Max is nog groter in de eigen Geekbench Tests. Alleen de HX-modellen van AMD en Intel bieden nog meer CPU-prestaties (bij veel hogere TDP-waarden), maar die zijn alleen beschikbaar in laptops van 16 inch en groter.
Cinebench 2024: CPU Multi Core | CPU Single Core
Geekbench 5.5: Multi-Core | Single-Core
Geekbench 6.7: Multi-Core | Single-Core
Blender: v3.3 Classroom CPU
| Cinebench R23 / Multi Core | |
| Apple MacBook Pro 16 2023 M3 Max | |
| Gemiddeld Apple M3 Max 16-Core (24020 - 24024, n=2) | |
| Apple MacBook Pro 14 2023 M3 Max | |
| Asus Zenbook Pro 14 OLED UX6404VI | |
| Asus ROG Zephyrus G14 GA402XY | |
| Lenovo Yoga Pro 9-14IRP G8 | |
| Razer Blade 14 RTX 4070 | |
| Asus ZenBook Pro 14 Duo UX8402VV-P1021W | |
| Gemiddelde van klas Multimedia (4861 - 33362, n=74, laatste 2 jaar) | |
| Microsoft Surface Laptop Studio 2 RTX 4060 | |
| Apple MacBook Pro 14 2023 M2 Pro | |
| Apple MacBook Pro 16 2023 M2 Max | |
| Cinebench R23 / Single Core | |
| Asus Zenbook Pro 14 OLED UX6404VI | |
| Apple MacBook Pro 16 2023 M3 Max | |
| Asus ZenBook Pro 14 Duo UX8402VV-P1021W | |
| Gemiddeld Apple M3 Max 16-Core (1950 - 1968, n=2) | |
| Apple MacBook Pro 14 2023 M3 Max | |
| Gemiddelde van klas Multimedia (1128 - 2459, n=66, laatste 2 jaar) | |
| Microsoft Surface Laptop Studio 2 RTX 4060 | |
| Lenovo Yoga Pro 9-14IRP G8 | |
| Razer Blade 14 RTX 4070 | |
| Asus ROG Zephyrus G14 GA402XY | |
| Apple MacBook Pro 14 2023 M2 Pro | |
| Apple MacBook Pro 16 2023 M2 Max | |
| Cinebench 2024 / CPU Multi Core | |
| Apple MacBook Pro 16 2023 M3 Max | |
| Gemiddeld Apple M3 Max 16-Core (1532 - 1612, n=2) | |
| Apple MacBook Pro 14 2023 M3 Max | |
| Gemiddelde van klas Multimedia (327 - 2437, n=73, laatste 2 jaar) | |
| Asus ROG Zephyrus G14 GA402XY | |
| Cinebench 2024 / CPU Single Core | |
| Apple MacBook Pro 14 2023 M3 Max | |
| Gemiddeld Apple M3 Max 16-Core (139 - 140, n=2) | |
| Apple MacBook Pro 16 2023 M3 Max | |
| Gemiddelde van klas Multimedia (72.5 - 201, n=58, laatste 2 jaar) | |
| Asus ROG Zephyrus G14 GA402XY | |
| Geekbench 5.5 / Multi-Core | |
| Apple MacBook Pro 14 2023 M3 Max | |
| Gemiddeld Apple M3 Max 16-Core (22816 - 23059, n=2) | |
| Apple MacBook Pro 16 2023 M3 Max | |
| Apple MacBook Pro 16 2023 M2 Max | |
| Apple MacBook Pro 14 2023 M2 Pro | |
| Asus Zenbook Pro 14 OLED UX6404VI | |
| Lenovo Yoga Pro 9-14IRP G8 | |
| Gemiddelde van klas Multimedia (4652 - 20422, n=56, laatste 2 jaar) | |
| Microsoft Surface Laptop Studio 2 RTX 4060 | |
| Asus ZenBook Pro 14 Duo UX8402VV-P1021W | |
| Asus ROG Zephyrus G14 GA402XY | |
| Razer Blade 14 RTX 4070 | |
| Geekbench 5.5 / Single-Core | |
| Apple MacBook Pro 16 2023 M3 Max | |
| Gemiddeld Apple M3 Max 16-Core (2318 - 2331, n=2) | |
| Apple MacBook Pro 14 2023 M3 Max | |
| Asus ROG Zephyrus G14 GA402XY | |
| Asus Zenbook Pro 14 OLED UX6404VI | |
| Apple MacBook Pro 16 2023 M2 Max | |
| Razer Blade 14 RTX 4070 | |
| Gemiddelde van klas Multimedia (805 - 2974, n=56, laatste 2 jaar) | |
| Apple MacBook Pro 14 2023 M2 Pro | |
| Asus ZenBook Pro 14 Duo UX8402VV-P1021W | |
| Lenovo Yoga Pro 9-14IRP G8 | |
| Microsoft Surface Laptop Studio 2 RTX 4060 | |
| Geekbench 6.7 / Multi-Core | |
| Apple MacBook Pro 14 2023 M3 Max | |
| Gemiddeld Apple M3 Max 16-Core (21243 - 21264, n=2) | |
| Apple MacBook Pro 16 2023 M3 Max | |
| Gemiddelde van klas Multimedia (4983 - 29415, n=69, laatste 2 jaar) | |
| Lenovo Yoga Pro 9-14IRP G8 | |
| Lenovo Yoga Pro 9-14IRP G8 | |
| Microsoft Surface Laptop Studio 2 RTX 4060 | |
| Asus ROG Zephyrus G14 GA402XY | |
| Geekbench 6.7 / Single-Core | |
| Apple MacBook Pro 14 2023 M3 Max | |
| Gemiddeld Apple M3 Max 16-Core (3096 - 3157, n=2) | |
| Apple MacBook Pro 16 2023 M3 Max | |
| Gemiddelde van klas Multimedia (1534 - 4335, n=68, laatste 2 jaar) | |
| Microsoft Surface Laptop Studio 2 RTX 4060 | |
| Lenovo Yoga Pro 9-14IRP G8 | |
| Lenovo Yoga Pro 9-14IRP G8 | |
| Asus ROG Zephyrus G14 GA402XY | |
| Blender / v3.3 Classroom CPU | |
| Gemiddelde van klas Multimedia (134.5 - 1042, n=62, laatste 2 jaar) | |
| Microsoft Surface Laptop Studio 2 RTX 4060 | |
| Lenovo Yoga Pro 9-14IRP G8 | |
| Apple MacBook Pro 14 2023 M2 Pro | |
| Asus ZenBook Pro 14 Duo UX8402VV-P1021W | |
| Apple MacBook Pro 16 2023 M2 Max | |
| Asus Zenbook Pro 14 OLED UX6404VI | |
| Razer Blade 14 RTX 4070 | |
| Asus ROG Zephyrus G14 GA402XY | |
| Apple MacBook Pro 14 2023 M3 Max | |
| Gemiddeld Apple M3 Max 16-Core (194 - 196, n=2) | |
| Apple MacBook Pro 16 2023 M3 Max | |
* ... kleiner is beter
De single-core prestaties zijn ook merkbaar beter en de nieuwe M3 Max is sneller dan de Ryzen 9 7940HS en de twee H45 Core i7-chips in Cinebench R23, maar de twee Core i9-modellen hebben nog steeds een klein voordeel dankzij hun verhoogde turbofrequenties, maar dit gaat ten koste van een hoger stroomverbruik. De M3 Max staat opnieuw bovenaan het vergelijkingsveld in de Geekbench tests.
Zoals gebruikelijk worden de prestaties van de processor pas verminderd wanneer het batterijniveau tot 3% daalt. Meer CPU-benchmarks vindt u in onze technische sectie en we raden ook ons analyse-artikel van de M3 Pro/M3 Max aan voor meer informatie over de efficiëntie, dat binnenkort zal worden gepubliceerd.
We hebben ook onze Cinebench R15 Multi loop uitgevoerd, maar u moet er rekening mee houden dat deze benchmark geëmuleerd is, wat de prestaties beïnvloedt. De prestaties zijn nog steeds zeer concurrerend en deCore i9-13900Hwordt opnieuw verslagen. Onze loop laat echter ook zien dat de prestaties niet helemaal stabiel zijn, ook al is de daling met minder dan 10% erg klein. Het stroomverbruik van de M3 Max daalt van 56 naar ongeveer 41 Watt in de automatische modus en ongeveer 50 Watt in de High Performance-modus.
Cinebench R15 Multi Loop
Systeemprestaties
Het is nauwelijks verrassend dat de subjectieve prestatie-indruk uitstekend is en de verhoogde single-core prestaties helpen ook mee. Zelfs complexe programma's zoals Adobe Premiere Pro of DaVinci Resolve zijn nauwelijks een uitdaging. Dankzij de geïntegreerde emulatie via Rosetta 2 kunt u ook programma's gebruiken die gemaakt zijn voor Intel Macs (als er bijvoorbeeld nog geen native versie is). Dit werkt ook goed, maar er is een merkbare prestatiedaling in veeleisende apps (zoals Adobe).
We hebben de twee PugetBench tests voor zowel Adobe Photoshop als Premiere Pro opgenomen, maar houd er rekening mee dat de benchmarks alleen werken met de geëmuleerde versies van de programma's. Toch verslaat de MacBook Pro 14 M3 Max met gemak deROG Zephyrus G14met de GeForce RTX 4090 laptop.
Blackmagic RAW Speed Test: 12:1 8K CPU | 12:1 8K Metal
Photoshop PugetBench: Overall Score | GPU Score | General Score | Filter Score
Premiere Pro PugetBench: Overall Score 0.98 | LongGOP 0.98 | Intraframe 0.98 | RAW 0.98 | GPU Effects 0.98
Jetstream 2: 2.0 Total
Speedometer 2.0: Result 2.0
WebXPRT 3: Overall
| CrossMark / Overall | |
| Apple MacBook Pro 16 2023 M3 Max | |
| Gemiddeld Apple M3 Max 16-Core, Apple M3 Max 40-Core GPU (2032 - 2051, n=2) | |
| Apple MacBook Pro 14 2023 M3 Max | |
| Asus Zenbook Pro 14 OLED UX6404VI | |
| Apple MacBook Pro 16 2023 M2 Max | |
| Gemiddelde van klas Multimedia (866 - 2728, n=60, laatste 2 jaar) | |
| Asus ZenBook Pro 14 Duo UX8402VV-P1021W | |
| Lenovo Yoga Pro 9-14IRP G8 | |
| Asus ROG Zephyrus G14 GA402XY | |
| Razer Blade 14 RTX 4070 | |
| Microsoft Surface Laptop Studio 2 RTX 4060 | |
| CrossMark / Productivity | |
| Apple MacBook Pro 14 2023 M3 Max | |
| Gemiddeld Apple M3 Max 16-Core, Apple M3 Max 40-Core GPU (1828 - 1832, n=2) | |
| Apple MacBook Pro 16 2023 M3 Max | |
| Asus Zenbook Pro 14 OLED UX6404VI | |
| Asus ZenBook Pro 14 Duo UX8402VV-P1021W | |
| Gemiddelde van klas Multimedia (931 - 2489, n=60, laatste 2 jaar) | |
| Razer Blade 14 RTX 4070 | |
| Asus ROG Zephyrus G14 GA402XY | |
| Lenovo Yoga Pro 9-14IRP G8 | |
| Apple MacBook Pro 16 2023 M2 Max | |
| Microsoft Surface Laptop Studio 2 RTX 4060 | |
| CrossMark / Creativity | |
| Apple MacBook Pro 16 2023 M3 Max | |
| Gemiddeld Apple M3 Max 16-Core, Apple M3 Max 40-Core GPU (2509 - 2564, n=2) | |
| Apple MacBook Pro 14 2023 M3 Max | |
| Apple MacBook Pro 16 2023 M2 Max | |
| Asus Zenbook Pro 14 OLED UX6404VI | |
| Gemiddelde van klas Multimedia (907 - 3465, n=60, laatste 2 jaar) | |
| Lenovo Yoga Pro 9-14IRP G8 | |
| Asus ZenBook Pro 14 Duo UX8402VV-P1021W | |
| Asus ROG Zephyrus G14 GA402XY | |
| Microsoft Surface Laptop Studio 2 RTX 4060 | |
| Razer Blade 14 RTX 4070 | |
| CrossMark / Responsiveness | |
| Asus Zenbook Pro 14 OLED UX6404VI | |
| Razer Blade 14 RTX 4070 | |
| Asus ZenBook Pro 14 Duo UX8402VV-P1021W | |
| Lenovo Yoga Pro 9-14IRP G8 | |
| Gemiddelde van klas Multimedia (605 - 2024, n=60, laatste 2 jaar) | |
| Apple MacBook Pro 16 2023 M3 Max | |
| Gemiddeld Apple M3 Max 16-Core, Apple M3 Max 40-Core GPU (1474 - 1486, n=2) | |
| Apple MacBook Pro 14 2023 M3 Max | |
| Asus ROG Zephyrus G14 GA402XY | |
| Apple MacBook Pro 16 2023 M2 Max | |
| Microsoft Surface Laptop Studio 2 RTX 4060 | |
| Blackmagic RAW Speed Test / 12:1 8K CPU | |
| Gemiddelde van klas Multimedia (44 - 102, n=7, laatste 2 jaar) | |
| Apple MacBook Pro 16 2023 M3 Max | |
| Apple MacBook Pro 14 2023 M3 Max | |
| Gemiddeld Apple M3 Max 16-Core, Apple M3 Max 40-Core GPU (68 - 68, n=2) | |
| Apple MacBook Pro 16 2023 M2 Max | |
| Blackmagic RAW Speed Test / 12:1 8K Metal | |
| Apple MacBook Pro 14 2023 M3 Max | |
| Gemiddeld Apple M3 Max 16-Core, Apple M3 Max 40-Core GPU (293 - 294, n=2) | |
| Apple MacBook Pro 16 2023 M3 Max | |
| Gemiddelde van klas Multimedia (78 - 430, n=7, laatste 2 jaar) | |
| Apple MacBook Pro 16 2023 M2 Max | |
| Photoshop PugetBench / Overall Score | |
| Apple MacBook Pro 14 2023 M3 Max | |
| Gemiddeld Apple M3 Max 16-Core, Apple M3 Max 40-Core GPU (1425 - 1442, n=2) | |
| Apple MacBook Pro 16 2023 M3 Max | |
| Asus ROG Zephyrus G14 GA402XY | |
| Apple MacBook Pro 16 2023 M2 Max | |
| Microsoft Surface Laptop Studio 2 RTX 4060 | |
| Photoshop PugetBench / GPU Score | |
| Apple MacBook Pro 14 2023 M3 Max | |
| Gemiddeld Apple M3 Max 16-Core, Apple M3 Max 40-Core GPU (145.1 - 146.8, n=2) | |
| Apple MacBook Pro 16 2023 M3 Max | |
| Apple MacBook Pro 16 2023 M2 Max | |
| Asus ROG Zephyrus G14 GA402XY | |
| Microsoft Surface Laptop Studio 2 RTX 4060 | |
| Photoshop PugetBench / General Score | |
| Apple MacBook Pro 14 2023 M3 Max | |
| Gemiddeld Apple M3 Max 16-Core, Apple M3 Max 40-Core GPU (162.6 - 165, n=2) | |
| Apple MacBook Pro 16 2023 M3 Max | |
| Asus ROG Zephyrus G14 GA402XY | |
| Microsoft Surface Laptop Studio 2 RTX 4060 | |
| Apple MacBook Pro 16 2023 M2 Max | |
| Photoshop PugetBench / Filter Score | |
| Apple MacBook Pro 14 2023 M3 Max | |
| Gemiddeld Apple M3 Max 16-Core, Apple M3 Max 40-Core GPU (122.4 - 123.3, n=2) | |
| Apple MacBook Pro 16 2023 M3 Max | |
| Apple MacBook Pro 16 2023 M2 Max | |
| Asus ROG Zephyrus G14 GA402XY | |
| Microsoft Surface Laptop Studio 2 RTX 4060 | |
| Premiere Pro PugetBench / Overall Score 0.98 | |
| Apple MacBook Pro 14 2023 M3 Max | |
| Gemiddeld Apple M3 Max 16-Core, Apple M3 Max 40-Core GPU (760 - 762, n=2) | |
| Apple MacBook Pro 16 2023 M3 Max | |
| Asus ROG Zephyrus G14 GA402XY | |
| Premiere Pro PugetBench / LongGOP 0.98 | |
| Apple MacBook Pro 16 2023 M3 Max | |
| Gemiddeld Apple M3 Max 16-Core, Apple M3 Max 40-Core GPU (84.2 - 85.4, n=2) | |
| Apple MacBook Pro 14 2023 M3 Max | |
| Asus ROG Zephyrus G14 GA402XY | |
| Premiere Pro PugetBench / Intraframe 0.98 | |
| Apple MacBook Pro 14 2023 M3 Max | |
| Gemiddeld Apple M3 Max 16-Core, Apple M3 Max 40-Core GPU (121.3 - 123.9, n=2) | |
| Apple MacBook Pro 16 2023 M3 Max | |
| Asus ROG Zephyrus G14 GA402XY | |
| Premiere Pro PugetBench / RAW 0.98 | |
| Apple MacBook Pro 16 2023 M3 Max | |
| Apple MacBook Pro 14 2023 M3 Max | |
| Gemiddeld Apple M3 Max 16-Core, Apple M3 Max 40-Core GPU (55.9 - 55.9, n=2) | |
| Asus ROG Zephyrus G14 GA402XY | |
| Premiere Pro PugetBench / GPU Effects 0.98 | |
| Asus ROG Zephyrus G14 GA402XY | |
| Apple MacBook Pro 14 2023 M3 Max | |
| Gemiddeld Apple M3 Max 16-Core, Apple M3 Max 40-Core GPU (57.6 - 57.9, n=2) | |
| Apple MacBook Pro 16 2023 M3 Max | |
| Jetstream 2 / 2.0 Total | |
| Gemiddelde van klas Multimedia (287 - 481, n=31, laatste 2 jaar) | |
| Microsoft Surface Laptop Studio 2 RTX 4060 | |
| Apple MacBook Pro 14 2023 M3 Max | |
| Gemiddeld Apple M3 Max 16-Core, Apple M3 Max 40-Core GPU (309 - 311, n=2) | |
| Apple MacBook Pro 16 2023 M3 Max | |
| Asus Zenbook Pro 14 OLED UX6404VI | |
| Lenovo Yoga Pro 9-14IRP G8 | |
| Razer Blade 14 RTX 4070 | |
| Apple MacBook Pro 16 2023 M2 Max | |
| Speedometer 2.0 / Result 2.0 | |
| Gemiddelde van klas Multimedia (337 - 946, n=30, laatste 2 jaar) | |
| Apple MacBook Pro 16 2023 M3 Max | |
| Gemiddeld Apple M3 Max 16-Core, Apple M3 Max 40-Core GPU (560 - 562, n=2) | |
| Apple MacBook Pro 14 2023 M3 Max | |
| Apple MacBook Pro 16 2023 M2 Max | |
| Asus Zenbook Pro 14 OLED UX6404VI | |
| Microsoft Surface Laptop Studio 2 RTX 4060 | |
| Lenovo Yoga Pro 9-14IRP G8 | |
| WebXPRT 3 / Overall | |
| Apple MacBook Pro 16 2023 M3 Max | |
| Gemiddeld Apple M3 Max 16-Core, Apple M3 Max 40-Core GPU (416 - 426, n=2) | |
| Apple MacBook Pro 14 2023 M3 Max | |
| Apple MacBook Pro 16 2023 M2 Max | |
| Gemiddelde van klas Multimedia (136.4 - 596, n=63, laatste 2 jaar) | |
| Asus Zenbook Pro 14 OLED UX6404VI | |
| Asus ROG Zephyrus G14 GA402XY | |
| Razer Blade 14 RTX 4070 | |
| Lenovo Yoga Pro 9-14IRP G8 | |
| Microsoft Surface Laptop Studio 2 RTX 4060 | |
Opslagapparaten
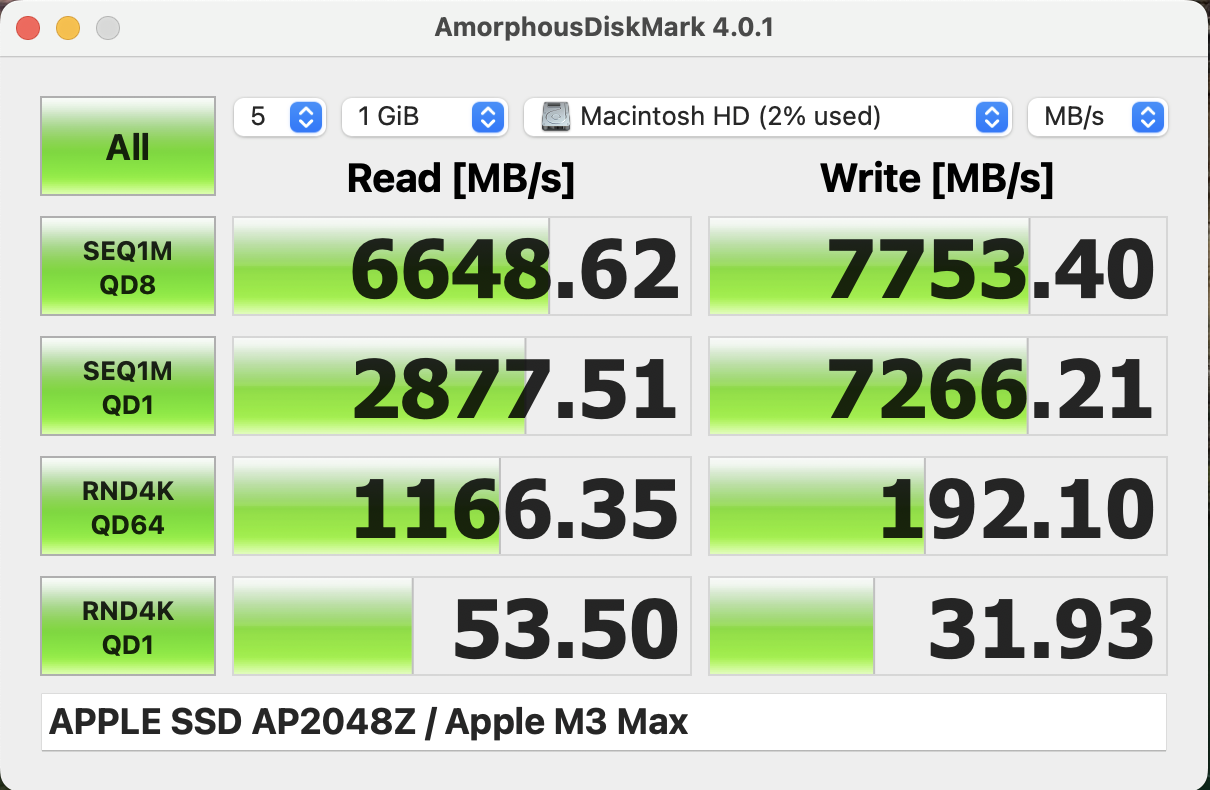
Onze evaluatie-eenheid is uitgerust met de 2 TB SSD (AP2048Z), die we al hebben besproken in de vorigeMacBook Pro 14met de M2 Pro. De overdrachtsnelheden zijn erg goed en er zijn geen prestatieproblemen, maar houd er rekening mee dat u de SSD-capaciteit niet kunt upgraden en dat Apple hoge prijzen rekent voor upgrades. (1 TB naar 2 TB voor $400). Ter vergelijking: De 2 TB Samsung SSD 990 Pro (M.2-2280) wordt verkocht voor ongeveer $140). Het is mogelijk om de M3 max te combineren met de basis 512 GB SSD schijf door de basis M3 Pro SKU te upgraden naar de M3 Max. Meer SSD benchmarks vindt u hier.
GPU-prestaties
De high-endM3 Maxchip is uitgerust met een 40-core GPU, wat betekent dat er twee extra kernen zijn in vergelijking met de vorige 38-core eenheid. We vermoeden ook dat de kernklok hoger is. De prestaties liggen tussen de 13-25% hoger, afhankelijk van de test, maar het maximale stroomverbruik is gedaald van 64 naar 60 Watt. Het grote voordeel van de GPU is nog steeds het gedeelde geheugen, vooral tijdens videobewerking. Wij bewerken onze video's voor YouTube met DaVinci Resolve en lopen tijdens het bewerken af en toe tegen de limiet van 16 GB VRAM van de RTX 4090 aan. Dit is een nog groter probleem op kleinere GPU's met 8 GB VRAM (die veel vaker voorkomen in het 14-inch segment).
In vergelijking met de huidige Nvidia laptop GPU's, kan de M3 Max GPU de RTX 4070 Laptop duidelijk verslaan in de cross-platform benchmark 3DMark WildLife Extreme Unlimited en is slechts 9% langzamer dan deGeForce RTX 4090 laptopbij 125 watt en het voordeel ten opzichte van de M2 Max GPU is 25%. De M3 Max blijft echter achter bij deRTX 4060 laptopvan deSurface Laptop Studio 2in de OpenCL-test van Geekbench.
De GPU-prestaties zijn dus in principe identiek aan die van de grotere MacBook Pro 16, maar de prestaties zijn opnieuw niet helemaal stabiel in de automatische modus. De WildLife Extreme stresstest resulteert in 93,7%, dus een tekort van ongeveer 6%. Het resultaat is beter met 98,2 % als u de High Performance-modus gebruikt. Er zijn geen prestatiebeperkingen op de batterij, wat niet het geval is voor de snelle GeForce GPU's. Meer GPU-benchmarks vindt u hier.
* ... kleiner is beter
Gaming prestaties
Gamen op de Mac wordt steeds interessanter, en het nieuwe macOS 14 (Sonoma) biedt ook een Game-modus als u op volledig scherm speelt. Naast geëmuleerde titels (zoals Shadow of the Tomb Raider en Total War: Three Kingdoms), kunt u CrossOver ook gebruiken om Windows-games te spelen. Afhankelijk van de titel werkt dit goed (zoals GTA V, Far Cry 5), maar soms moet u een beetje experimenteren, en zien we niet altijd de verwachte verschillen ten opzichte van de basisversie.Apple M3-SoC. Soms kan de emulatie niet de volledige prestaties van de hardware benutten, en GTA V laat bijvoorbeeld bijna geen GPU-belasting zien terwijl de CPU de hoofdbelasting voor zijn rekening neemt.
Native games voor Apple's silicium werken duidelijk veel beter, en dit geldt ook voor titels als Resident Evil Village, No Man's Sky of Baldur's gate 3. De prestaties van de nieuwe Apple M3 Max zijn echt indrukwekkend en alle titels draaien volledig soepel op QHD en maximale instellingen. Toch is de MacBook niet echt een gaming laptop en de Windows concurrentie in deze prijsklasse biedt gewoon veel slechtere gaming prestaties en er zijn duidelijk veel meer titels om uit te kiezen.
| Total War Pharaoh | |
| 1920x1080 High Preset | |
| Gemiddeld Apple M3 Max 40-Core GPU (138 - 139, n=2) | |
| Apple MacBook Pro 14 2023 M3 Max | |
| Gemiddelde van klas Multimedia (30.8 - 99.3, n=9, laatste 2 jaar) | |
| 1920x1080 Ultra Preset | |
| Gemiddeld Apple M3 Max 40-Core GPU (97 - 121, n=2) | |
| Apple MacBook Pro 14 2023 M3 Max | |
| Gemiddelde van klas Multimedia (23.4 - 84.1, n=12, laatste 2 jaar) | |
| Total War: Three Kingdoms | |
| 1920x1080 Ultra (incl textures) | |
| Gemiddeld Apple M3 Max 40-Core GPU (80 - 84, n=2) | |
| Apple MacBook Pro 14 2023 M3 Max | |
| Apple MacBook Pro 16 2023 M2 Max | |
| Gemiddelde van klas Multimedia (49.6 - 55, n=2, laatste 2 jaar) | |
| 2560x1440 Ultra (incl textures) | |
| Gemiddeld Apple M3 Max 40-Core GPU (54 - 58, n=2) | |
| Apple MacBook Pro 14 2023 M3 Max | |
| Apple MacBook Pro 16 2023 M2 Max | |
| Gemiddelde van klas Multimedia (31.5 - 35.6, n=2, laatste 2 jaar) | |
| Baldur's Gate 3 | |
| 1920x1080 Ultra Preset AA:T | |
| Apple MacBook Pro 14 2023 M3 Max | |
| Gemiddeld Apple M3 Max 40-Core GPU (n=1) | |
| Gemiddelde van klas Multimedia (7.8 - 158.7, n=64, laatste 2 jaar) | |
| 2560x1440 Ultra Preset AA:T | |
| Gemiddelde van klas Multimedia (28.7 - 121, n=25, laatste 2 jaar) | |
| Apple MacBook Pro 14 2023 M3 Max | |
| Gemiddeld Apple M3 Max 40-Core GPU (n=1) | |
| lage | gem. | hoge | ultra | QHD | |
|---|---|---|---|---|---|
| GTA V (2015) | 79 | 54 | 52 | ||
| The Witcher 3 (2015) | 92 | ||||
| Far Cry 5 (2018) | 53 | 51 | 49 | ||
| Shadow of the Tomb Raider (2018) | 145 | 135 | 118 | 86 | |
| Total War: Three Kingdoms (2019) | 170 | 109 | 80 | 54 | |
| Baldur's Gate 3 (2023) | 96 | 90 | 60 | ||
| Cyberpunk 2077 (2023) | 44.4 | 40.8 | 35.5 | ||
| Total War Pharaoh (2023) | 242 | 207 | 138 | 97 | 82 |
Uitstoot - De koeling van de MBP 14 zit aan zijn limiet
Systeemgeluid
In tegenstelling tot het nieuwe instapmodel MBP 14, blijven de krachtigere SKU's met de M3 Pro en M3 Max de vertrouwde koeloplossing met twee ventilatoren gebruiken, maar u merkt dat het systeem wordt uitgedaagd door de merkbaar snellere M3 Max-chips. Eenvoudige werklasten resulteren meestal helemaal niet in ventilatoractiviteit en de ventilatoren komen vrij laat op gang, wat gebruikelijk is voor Apple apparaten. De ventilatorsnelheid neemt naadloos toe en de eerste fase rond 2500 rpm is bijna onhoorbaar met ~26 dB(A), maar hogere belastingen resulteren al snel in de maximale ventilatorsnelheid van ~5100 rpm in de automatische modus, wat 43,3 dB(A) oplevert. Dit is nog steeds een goed resultaat vergeleken met de Windows rivalen. Als u de High Performance-modus gebruikt, bereiken de ventilatoren hun maximale snelheid bij 53,8 dB(A). Net als op de grotere MBP 16 met de M3 Max, merkten we ook wat gejank van de spoel op tijdens sommige van onze GPU-benchmarks, maar het was erg stil met ~26 dB(A).
Geluidsniveau
| Onbelast |
| 24.8 / 24.8 / 24.8 dB (A) |
| Belasting |
| 25.8 / 43.4 dB (A) |
 | ||
30 dB stil 40 dB(A) hoorbaar 50 dB(A) luid |
||
min: | ||
| Apple MacBook Pro 14 2023 M3 Max M3 Max 40-Core GPU, Apple M3 Max 16-Core, Apple SSD AP2048Z | Microsoft Surface Laptop Studio 2 RTX 4060 GeForce RTX 4060 Laptop GPU, i7-13700H, Kioxia XG8 KXG80ZNV1T02 | Lenovo Yoga Pro 9-14IRP G8 GeForce RTX 4050 Laptop GPU, i7-13705H, Samsung PM9A1 MZVL21T0HCLR | Asus Zenbook Pro 14 OLED UX6404VI GeForce RTX 4070 Laptop GPU, i9-13900H, Micron 3400 2TB MTFDKBA2T0TFH | Asus ZenBook Pro 14 Duo UX8402VV-P1021W GeForce RTX 4060 Laptop GPU, i9-13900H, Samsung PM9A1 MZVL22T0HBLB | Razer Blade 14 RTX 4070 GeForce RTX 4070 Laptop GPU, R9 7940HS, Samsung PM9A1 MZVL21T0HCLR | Asus ROG Zephyrus G14 GA402XY GeForce RTX 4090 Laptop GPU, R9 7940HS, Samsung PM9A1 MZVL21T0HCLR | |
|---|---|---|---|---|---|---|---|
| Noise | -18% | -18% | -7% | -35% | -7% | -21% | |
| uit / omgeving * (dB) | 24.8 | 23.9 4% | 24.8 -0% | 23.3 6% | 25.2 -2% | 22.7 8% | 23.3 6% |
| Idle Minimum * (dB) | 24.8 | 23.9 4% | 24.8 -0% | 23.3 6% | 25.2 -2% | 23.4 6% | 23.6 5% |
| Idle Average * (dB) | 24.8 | 24.4 2% | 24.8 -0% | 23.3 6% | 25.2 -2% | 23.4 6% | 23.6 5% |
| Idle Maximum * (dB) | 24.8 | 26.9 -8% | 24.8 -0% | 23.3 6% | 32.5 -31% | 23.4 6% | 33 -33% |
| Load Average * (dB) | 25.8 | 48.5 -88% | 47.4 -84% | 39.3 -52% | 59.7 -131% | 33 -28% | 49.5 -92% |
| Witcher 3 ultra * (dB) | 43.4 | 51.8 -19% | 52.9 -22% | 48.8 -12% | 51.8 -19% | 52.2 -20% | |
| Load Maximum * (dB) | 43.4 | 51.8 -19% | 52.9 -22% | 48.8 -12% | 60.9 -40% | 55.6 -28% | 52.2 -20% |
* ... kleiner is beter
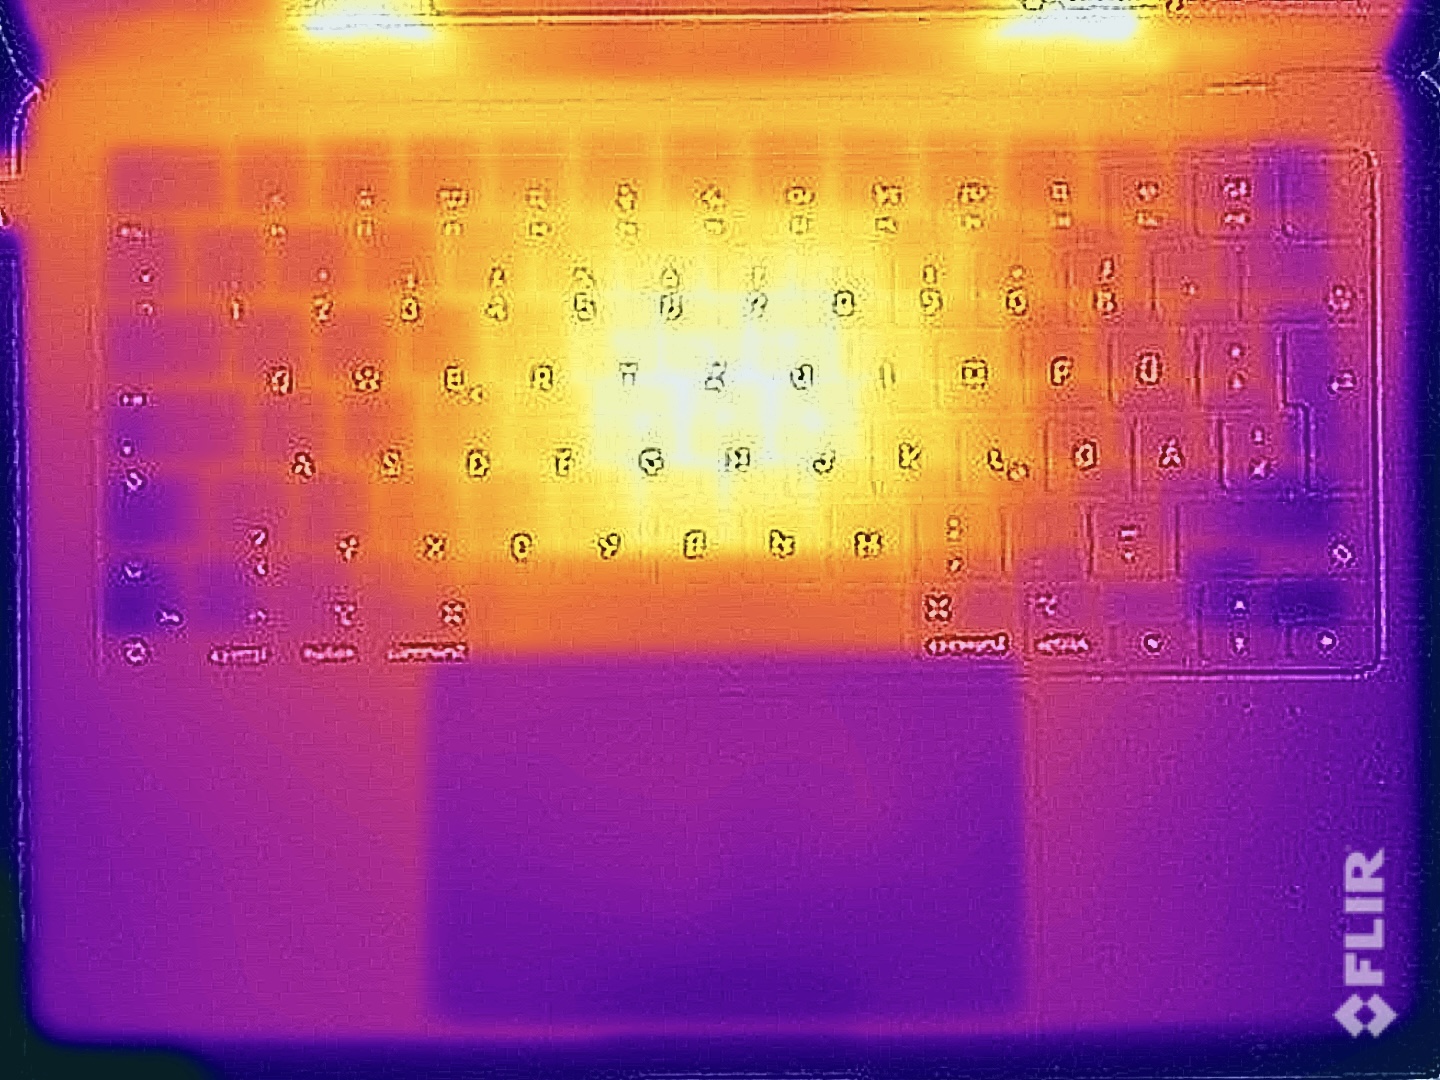
Temperatuur
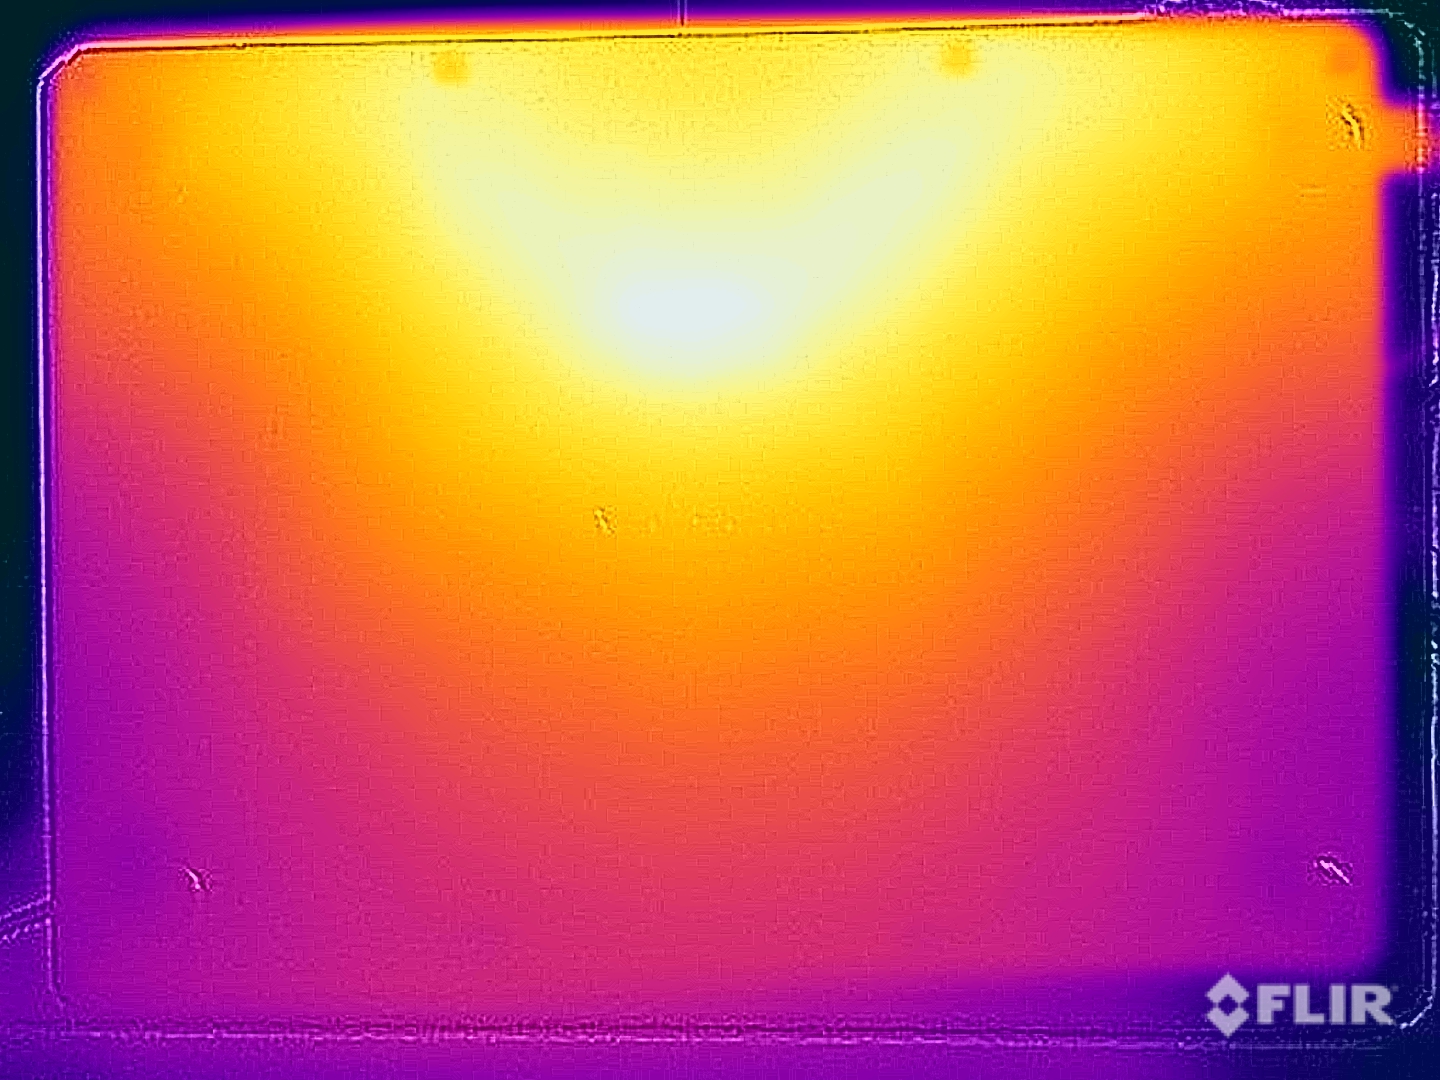
Het aluminium chassis van de MacBook Pro 14 wordt niet echt warm tijdens lichte werkbelasting, maar dat verandert onder belasting. Zoals gebruikelijk bij MacBooks meten we de hoogste oppervlaktetemperaturen aan de bovenkant van de basiseenheid en niet aan de onderkant. Bij Windows-machines is dit meestal andersom.
We stellen tot 42 °C vast aan de achterkant van het middengedeelte van het onderpaneel, dus u kunt de MBP 14 nog steeds zonder beperkingen op uw schoot zetten bij extreme belasting. Het middelste gedeelte van het toetsenbord wordt tot 46 °C warmer, wat zeker merkbaar is en u tijdens het typen warme vingers zult krijgen. De voedingsadapter wordt tot 50 °C warm, wat niet kritisch is.
(-) De maximumtemperatuur aan de bovenzijde bedraagt 45.9 °C / 115 F, vergeleken met het gemiddelde van 36.8 °C / 98 F, variërend van 21 tot 71 °C voor de klasse Multimedia.
(±) De bodem warmt op tot een maximum van 42.1 °C / 108 F, vergeleken met een gemiddelde van 39.1 °C / 102 F
(+) Bij onbelast gebruik bedraagt de gemiddelde temperatuur voor de bovenzijde 23.2 °C / 74 F, vergeleken met het apparaatgemiddelde van 31.3 °C / 88 F.
(±) Bij het spelen van The Witcher 3 is de gemiddelde temperatuur voor de bovenzijde 37.6 °C / 100 F, vergeleken met het apparaatgemiddelde van 31.3 °C / 88 F.
(+) De palmsteunen en het touchpad zijn met een maximum van ###max## °C / 85.6 F koeler dan de huidtemperatuur en voelen daarom koel aan.
(±) De gemiddelde temperatuur van de handpalmsteun van soortgelijke toestellen bedroeg 28.7 °C / 83.7 F (-1.1 °C / -1.9 F).
| Apple MacBook Pro 14 2023 M3 Max Apple M3 Max 16-Core, Apple M3 Max 40-Core GPU | Microsoft Surface Laptop Studio 2 RTX 4060 Intel Core i7-13700H, NVIDIA GeForce RTX 4060 Laptop GPU | Lenovo Yoga Pro 9-14IRP G8 Intel Core i7-13705H, NVIDIA GeForce RTX 4050 Laptop GPU | Asus Zenbook Pro 14 OLED UX6404VI Intel Core i9-13900H, NVIDIA GeForce RTX 4070 Laptop GPU | Asus ZenBook Pro 14 Duo UX8402VV-P1021W Intel Core i9-13900H, NVIDIA GeForce RTX 4060 Laptop GPU | Razer Blade 14 RTX 4070 AMD Ryzen 9 7940HS, NVIDIA GeForce RTX 4070 Laptop GPU | Asus ROG Zephyrus G14 GA402XY AMD Ryzen 9 7940HS, NVIDIA GeForce RTX 4090 Laptop GPU | |
|---|---|---|---|---|---|---|---|
| Heat | -4% | -16% | -14% | -16% | -15% | -10% | |
| Maximum Upper Side * (°C) | 45.9 | 40.4 12% | 41 11% | 40.6 12% | 37.1 19% | 37.4 19% | 47 -2% |
| Maximum Bottom * (°C) | 42.1 | 42.2 -0% | 56.7 -35% | 49.5 -18% | 49.4 -17% | 35.2 16% | 46.5 -10% |
| Idle Upper Side * (°C) | 23.4 | 26.6 -14% | 27.4 -17% | 28.2 -21% | 30 -28% | 33.2 -42% | 25.9 -11% |
| Idle Bottom * (°C) | 23.8 | 27 -13% | 29.1 -22% | 30.6 -29% | 32.4 -36% | 36.2 -52% | 28 -18% |
* ... kleiner is beter
Stresstest
De stresstest met gecombineerde CPU/GPU-belasting is erg interessant en laat opnieuw de zwakkere koeling van de MacBook Pro 14 zien. Het systeem geeft de voorkeur aan de GPU en we kunnen de High Performance-modus aanraden voor dit belastingsscenario, omdat dit een merkbaar prestatievoordeel oplevert (ten koste van meer ventilatorgeluid) en bijna op hetzelfde niveau ligt als de grotere MacBook Pro 16. Het lijkt erop dat de GPU-kernen van de M3 Max veel warmte produceren. Het lijkt erop dat de GPU-kernen van de M3 Max veel warmte produceren, want de MacBook Pro 16 met de M3 Pro (review wordt binnenkort gepubliceerd) kan meer dan 50 watt koelen in de stresstest (gelijke verdeling tussen CPU/GPU).
Luidsprekers
Het luidsprekersysteem van de MacBook Pro 14 met zijn zes modules is nog steeds uitstekend en u hebt vaak geen externe luidsprekers nodig. De concurrentie heeft het gat echter gedicht en zowel de Lenovo Yoga Pro 9i 14 en de Asus ROG Zephyrus G14 bevinden zich ongeveer op hetzelfde niveau.
Apple MacBook Pro 14 2023 M3 Max audioanalyse
(+) | luidsprekers kunnen relatief luid spelen (85 dB)
Bas 100 - 315 Hz
(+) | goede baars - slechts 4.9% verwijderd van de mediaan
(±) | lineariteit van de lage tonen is gemiddeld (8.4% delta ten opzichte van de vorige frequentie)
Midden 400 - 2000 Hz
(+) | evenwichtige middens - slechts 1.2% verwijderd van de mediaan
(+) | de middentonen zijn lineair (2.8% delta ten opzichte van de vorige frequentie)
Hoog 2 - 16 kHz
(+) | evenwichtige hoogtepunten - slechts 2.6% verwijderd van de mediaan
(+) | de hoge tonen zijn lineair (2.6% delta naar de vorige frequentie)
Algemeen 100 - 16.000 Hz
(+) | het totale geluid is lineair (5.6% verschil met de mediaan)
Vergeleken met dezelfde klasse
» 2% van alle geteste apparaten in deze klasse waren beter, 1% vergelijkbaar, 97% slechter
» De beste had een delta van 5%, het gemiddelde was 17%, de slechtste was 45%
Vergeleken met alle geteste toestellen
» 0% van alle geteste apparaten waren beter, 0% gelijk, 100% slechter
» De beste had een delta van 4%, het gemiddelde was 23%, de slechtste was 134%
Lenovo Yoga Pro 9-14IRP G8 audioanalyse
(±) | luidspreker luidheid is gemiddeld maar goed (81.8 dB)
Bas 100 - 315 Hz
(±) | verminderde zeebaars - gemiddeld 5.9% lager dan de mediaan
(±) | lineariteit van de lage tonen is gemiddeld (7.8% delta ten opzichte van de vorige frequentie)
Midden 400 - 2000 Hz
(+) | evenwichtige middens - slechts 2.3% verwijderd van de mediaan
(+) | de middentonen zijn lineair (3.2% delta ten opzichte van de vorige frequentie)
Hoog 2 - 16 kHz
(+) | evenwichtige hoogtepunten - slechts 2.5% verwijderd van de mediaan
(+) | de hoge tonen zijn lineair (3.4% delta naar de vorige frequentie)
Algemeen 100 - 16.000 Hz
(+) | het totale geluid is lineair (7.3% verschil met de mediaan)
Vergeleken met dezelfde klasse
» 6% van alle geteste apparaten in deze klasse waren beter, 1% vergelijkbaar, 94% slechter
» De beste had een delta van 5%, het gemiddelde was 17%, de slechtste was 45%
Vergeleken met alle geteste toestellen
» 1% van alle geteste apparaten waren beter, 0% gelijk, 99% slechter
» De beste had een delta van 4%, het gemiddelde was 23%, de slechtste was 134%
Asus ROG Zephyrus G14 GA402XY audioanalyse
(±) | luidspreker luidheid is gemiddeld maar goed (80 dB)
Bas 100 - 315 Hz
(±) | verminderde zeebaars - gemiddeld 8.8% lager dan de mediaan
(±) | lineariteit van de lage tonen is gemiddeld (9.7% delta ten opzichte van de vorige frequentie)
Midden 400 - 2000 Hz
(+) | evenwichtige middens - slechts 3.3% verwijderd van de mediaan
(+) | de middentonen zijn lineair (5% delta ten opzichte van de vorige frequentie)
Hoog 2 - 16 kHz
(+) | evenwichtige hoogtepunten - slechts 2% verwijderd van de mediaan
(+) | de hoge tonen zijn lineair (4.3% delta naar de vorige frequentie)
Algemeen 100 - 16.000 Hz
(+) | het totale geluid is lineair (10% verschil met de mediaan)
Vergeleken met dezelfde klasse
» 5% van alle geteste apparaten in deze klasse waren beter, 2% vergelijkbaar, 93% slechter
» De beste had een delta van 6%, het gemiddelde was 18%, de slechtste was 132%
Vergeleken met alle geteste toestellen
» 4% van alle geteste apparaten waren beter, 1% gelijk, 94% slechter
» De beste had een delta van 4%, het gemiddelde was 23%, de slechtste was 134%
Energiebeheer - Langere looptijd
Stroomverbruik
De verbruiksmetingen van de MBP 14 met de M3 Max voldoen aan onze verwachtingen en het maximale verbruik in ruststand is slechts iets hoger vergeleken met het vorige M2 Pro model, ook al is de maximale SDR-helderheid verhoogd. Na de review van de grotere MBP 16 speculeerden we dat de 96W voedingsadapter onvoldoende zou kunnen zijn in combinatie met de M3 Max, maar dat is niet het geval. De batterij raakt niet leeg, zelfs niet wanneer we de High Performance-modus gebruiken, en het maximale verbruik is 101 watt, zelfs wanneer we de 140 W voedingsadapter gebruiken. De 96 W voedingsadapter dekt het verbruik onder belasting, maar er is geen ruimte om tegelijkertijd de batterij op te laden.
| Uit / Standby | |
| Inactief | |
| Belasting |
|
Key:
min: | |
| Apple MacBook Pro 14 2023 M3 Max Apple M3 Max 16-Core, M3 Max 40-Core GPU, Apple SSD AP2048Z, Mini-LED, 3024x1964, 14.2" | Microsoft Surface Laptop Studio 2 RTX 4060 i7-13700H, GeForce RTX 4060 Laptop GPU, Kioxia XG8 KXG80ZNV1T02, IPS, 2400x1600, 14.4" | Lenovo Yoga Pro 9-14IRP G8 i7-13705H, GeForce RTX 4050 Laptop GPU, Samsung PM9A1 MZVL21T0HCLR, Mini-LED, 3072x1920, 14.5" | Asus Zenbook Pro 14 OLED UX6404VI i9-13900H, GeForce RTX 4070 Laptop GPU, Micron 3400 2TB MTFDKBA2T0TFH, OLED, 2880x1800, 14.5" | Asus ZenBook Pro 14 Duo UX8402VV-P1021W i9-13900H, GeForce RTX 4060 Laptop GPU, Samsung PM9A1 MZVL22T0HBLB, OLED, 2880x1800, 14.5" | Razer Blade 14 RTX 4070 R9 7940HS, GeForce RTX 4070 Laptop GPU, Samsung PM9A1 MZVL21T0HCLR, IPS, 2560x1600, 14" | Asus ROG Zephyrus G14 GA402XY R9 7940HS, GeForce RTX 4090 Laptop GPU, Samsung PM9A1 MZVL21T0HCLR, Mini-LED, 2560x1600, 14" | Apple MacBook Pro 14 2023 M2 Pro M2 Pro, M2 Pro 19-Core GPU, Apple SSD AP2048Z, Mini-LED, 3024x1964, 14.2" | Gemiddeld Apple M3 Max 40-Core GPU | Gemiddelde van klas Multimedia | |
|---|---|---|---|---|---|---|---|---|---|---|
| Power Consumption | 7% | -85% | -53% | -48% | -174% | -81% | 17% | -22% | -17% | |
| Idle Minimum * (Watt) | 2.6 | 3 -15% | 10.9 -319% | 7.5 -188% | 8.5 -227% | 19.5 -650% | 9.4 -262% | 2.4 8% | 3.9 ? -50% | 5.66 ? -118% |
| Idle Average * (Watt) | 11.8 | 7.1 40% | 17.7 -50% | 11.1 6% | 8.8 25% | 24.7 -109% | 14.2 -20% | 11.3 4% | 14.4 ? -22% | 10.2 ? 14% |
| Idle Maximum * (Watt) | 12.2 | 7.6 38% | 19.3 -58% | 11.6 5% | 16.5 -35% | 27 -121% | 14.5 -19% | 11.5 6% | 14.7 ? -20% | 12.5 ? -2% |
| Load Average * (Watt) | 99.9 | 73.1 27% | 93.3 7% | 91.9 8% | 102 -2% | 83.2 17% | 79 21% | 59.6 40% | 95.2 ? 5% | 65.2 ? 35% |
| Witcher 3 ultra * (Watt) | 92.5 | 113.9 -23% | 129.5 -40% | 132.2 -43% | 101.2 -9% | 165.8 -79% | 172 -86% | 55.9 40% | ||
| Load Maximum * (Watt) | 101.7 | 128.5 -26% | 150.2 -48% | 208 -105% | 140 -38% | 204.5 -101% | 220.8 -117% | 100 2% | 123.4 ? -21% | 113.5 ? -12% |
* ... kleiner is beter
Power Consumption Witcher 3 / Stress test
Power Consumption external screen
Batterijlooptijd
De acculooptijd met de 72,6 Wh batterij is uitstekend, alleen de looptijd onder belasting is slechter dan bij sommige Windows-concurrenten. Dit is echter een beetje misleidend omdat de prestaties van de MacBook niet afnemen (ook al kunt u langere resultaten krijgen met de energiebesparingsmodus), terwijl de prestaties van de Windows-concurrenten meestal aanzienlijk afnemen.
Onze tests bij 150 nits (min 7 grote stappen en 3 kleine stappen van de maximale SDR-helderheid) laten een groot voordeel zien ten opzichte van de Windows-concurrenten in deze prestatieklasse en zelfs de oude MacBook Pro 14 2023 met de M2 Pro wordt verslagen. De videotest duurt bijna 18 uur en de Wi-Fi-test meer dan 15 uur. Bij volledige SDR-helderheid daalt de Wi-Fi-looptijd naar 06:21 uur en het afspelen van een HDR-video bij volledige helderheid is mogelijk voor 05:20 uur.
Het volledig opladen van de batterij met de 96W voedingsadapter duurt iets minder dan twee uur; 80% van de capaciteit is beschikbaar na iets meer dan 50 minuten.
| Apple MacBook Pro 14 2023 M3 Max Apple M3 Max 16-Core, M3 Max 40-Core GPU, 72.6 Wh | Microsoft Surface Laptop Studio 2 RTX 4060 i7-13700H, GeForce RTX 4060 Laptop GPU, 58 Wh | Lenovo Yoga Pro 9-14IRP G8 i7-13705H, GeForce RTX 4050 Laptop GPU, 75 Wh | Asus Zenbook Pro 14 OLED UX6404VI i9-13900H, GeForce RTX 4070 Laptop GPU, 76 Wh | Asus ZenBook Pro 14 Duo UX8402VV-P1021W i9-13900H, GeForce RTX 4060 Laptop GPU, 76 Wh | Razer Blade 14 RTX 4070 R9 7940HS, GeForce RTX 4070 Laptop GPU, 68 Wh | Asus ROG Zephyrus G14 GA402XY R9 7940HS, GeForce RTX 4090 Laptop GPU, 76 Wh | Apple MacBook Pro 14 2023 M2 Pro M2 Pro, M2 Pro 19-Core GPU, 70 Wh | Gemiddelde van klas Multimedia | |
|---|---|---|---|---|---|---|---|---|---|
| Batterijduur | 0% | -32% | -40% | 76% | -38% | -43% | -9% | 5% | |
| H.264 (h) | 18 | 11.3 -37% | 9.1 -49% | 8.5 -53% | 7.2 -60% | 15.3 -15% | 17.1 ? -5% | ||
| WiFi v1.3 (h) | 15.2 | 8.3 -45% | 8 -47% | 7.6 -50% | 9 -41% | 6.2 -59% | 7.5 -51% | 13.5 -11% | 12.2 ? -20% |
| Load (h) | 1.2 | 2.2 83% | 1.2 0% | 1 -17% | 3.5 192% | 1 -17% | 1 -17% | 1.2 0% | 1.664 ? 39% |
| Reader / Idle (h) | 8.6 | 24.9 ? |
Pro
Contra
Verdict - MacBook Pro 14 met de beste CPU-prestaties in het segment
Onze recensie van de grotereMacBook Pro 16m3 Max heeft al laten zien dat Apple in staat was om de CPU-prestaties enorm te verhogen met de nieuwe M3 Max SoC's. Met zijn 12 prestatiecores zijn de multi-core prestaties meer dan 60% hoger in vergelijking met de oude M2 Max. De kleinere MacBook Pro 14 biedt deze prestaties ook, waardoor het de snelste 14-inch laptop is die u kunt kopen op het gebied van multi-core prestaties. Zelfs de Core i9-13900H in de Asus Zenbook Pro 14 (met veel hogere TDP-waarden) blijft ongeveer 20% achter. AMD's huidige Zen4 CPU's zoals de Ryzen 9 7940HS (80 Watt) maken ook geen schijn van kans. Alleen de HX CPU's van Intel en AMD bieden nog meer prestaties, maar die zijn niet beschikbaar voor laptops kleiner dan 16 inch. Apple is er ook in geslaagd om de single-core prestaties met ongeveer 20% te verhogen en blijft net achter bij de snelste Intel-chips, ondanks een aanzienlijk lager stroomverbruik.
De MacBook Pro 14 met de high-end versie van de M3 Max wordt enigszins beperkt door de koelprestaties in vergelijking met zijn broer of zus van 16 inch, omdat noch de CPU-, noch de GPU-prestaties volledig stabiel zijn onder langdurige werkbelastingen. De MBP 14 krijgt nu ook een High Performance-modus (die voorheen was voorbehouden aan de grotere MBP 16) en dat helpt, maar als u de maximale prestaties van de M3 Max wilt, kunt u beter de grotere MacBook Pro 16 nemen.
De nieuwe M3 Max verandert de MacBook Pro 14 in de snelste 14-inch laptop op de markt en verslaat zelfs Intel's Core i9 CPU's in multi-core CPU-tests, maar hij is niet goedkoop.
De grafische prestaties zijn ook ongeveer 20% hoger en het verenigde geheugen is een groot voordeel wanneer u video's wilt bewerken. 14-inch laptops zijn meestal uitgerust met GPU's met 8 GB VRAM, en modellen zoals deROG Zephyrus G14met de RTX 4090 Laptop (16 GB RAM) zijn een uitzondering. U kunt ook games spelen op de MacBook en native titels zoals Baldur's Gate 3 of Resident Evil Village draaien erg goed, maar de MacBook is nog steeds geen hardcore gaminglaptop en de Windowsconcurrentie is gewoon in het voordeel.
Wie zou de MacBook Pro 14 met de M3 Max moeten kopen? Dankzij de enorme toename in CPU-prestaties kan het zelfs een interessante upgrade zijn ten opzichte van de M2 Max en de nieuwe MBP 14 is veruit de krachtigste laptop in het 14-inch segment wat betreft CPU-prestaties, die niet eens minder zijn op de batterij. Alleen HX CPU's van AMD en Intel zijn sneller, maar die zijn gewoonweg niet beschikbaar in zo'n kleine laptop. Als u echter de maximale prestaties van de M3 Max wilt, zelfs onder langdurige werkbelastingen, kunt u beter de grotereMacBook Pro 16.
Als u op zoek bent naar een geweldige multimedia-laptop zonder een Apple op het deksel, raden wij de veel betaalbaardere Lenovo Yoga Pro 9i 14 (2300 euro) aan, met een uitstekend Mini-LED scherm en goede prestatiecijfers, maar de batterijduur is slechter vergeleken met de MacBook. DeAsus ROG Zephyrus G14voor 4000 euro biedt ook een Mini-LED scherm, AMD Zen4 CPU en de GeForce RTX 4090 laptop, die veel beter is voor gaming.
Er zijn zeker alternatieven met voordelen in afzonderlijke disciplines, en de MacBook Pro heeft zeker zijn nadelen (vooral de niet-bestaande onderhoudsmogelijkheden in combinatie met Apple's hoge upgradeprijzen), maar het is nog steeds moeilijk om een beter totaalpakket te vinden.
Prijs en beschikbaarheid
Het basismodel MacBook Pro 14 met de kleine M3 Max (14-core CPU, 30-core GPU) is verkrijgbaar voor $3195 bij Amazon. Het high-end model kan geconfigureerd worden op Apple's website vanaf $3699.
Apple MacBook Pro 14 2023 M3 Max
- 20-11-2023 v7 (old)
Andreas Osthoff
Transparantie
De selectie van te beoordelen apparaten wordt gemaakt door onze redactie. Het testexemplaar werd ten behoeve van deze beoordeling door de fabrikant of detailhandelaar in bruikleen aan de auteur verstrekt. De kredietverstrekker had geen invloed op deze recensie, noch ontving de fabrikant vóór publicatie een exemplaar van deze recensie. Er bestond geen verplichting om deze recensie te publiceren. Als onafhankelijk mediabedrijf is Notebookcheck niet onderworpen aan het gezag van fabrikanten, detailhandelaren of uitgevers.
[transparency_disclaimer]Dit is hoe Notebookcheck test
Elk jaar beoordeelt Notebookcheck onafhankelijk honderden laptops en smartphones met behulp van gestandaardiseerde procedures om ervoor te zorgen dat alle resultaten vergelijkbaar zijn. We hebben onze testmethoden al zo'n 20 jaar voortdurend ontwikkeld en daarbij de industriestandaard bepaald. In onze testlaboratoria wordt gebruik gemaakt van hoogwaardige meetapparatuur door ervaren technici en redacteuren. Deze tests omvatten een validatieproces in meerdere fasen. Ons complexe beoordelingssysteem is gebaseerd op honderden goed onderbouwde metingen en benchmarks, waardoor de objectiviteit behouden blijft. Meer informatie over onze testmethoden kunt u hier vinden.
Price comparison

