Apple MacBook Pro 13 2020 Laptop Review: De instapmodel Pro krijgt ook de M1-prestatieboost
Terwijl de nieuwe MacBook Air nu uitsluitend wordt aangedreven door Apple's eigen ARM-siliconen, krijgen we nog steeds twee compleet verschillende modellen van de duurdere MacBook Pro 13. Apple biedt nog steeds de versie met vier Thunderbolt-poorten en Intel CPU's (28W) in de hogere prijsklasse vanaf $1799, en de vorige instapmodel MBP 13 met twee Thunderbolt-poorten en de langzamere Intel CPU's (15W) is nu uitgerust met de Apple M1-chip. De prijs van de nieuwe MBP 13 M1 begint bij $1299 ($1199 in de onderwijswinkel)
We zullen de nieuwe MacBook Pro 13 uiteraard vergelijken met het duurdere model (4x Thunderbolt), maar ook de MacBook Air M1 hebben we al beoordeeld. De Air heeft wel meer verbeteringen gekregen, dus we willen uitzoeken of de goedkopere MacBook Air misschien zelfs wel de betere keuze is
possible competitors in comparison
Evaluatie | Datum | Model | Gewicht | Hoogte | Formaat | Resolutie | Beste prijs |
|---|---|---|---|---|---|---|---|
| 91.1 % v7 (old) | 12-2020 | Apple MacBook Pro 13 Late 2020 M1 Entry (8 / 256 GB) M1, M1 8-Core GPU | 1.4 kg | 15.6 mm | 13.30" | 2560x1600 | |
| 92.1 % v7 (old) | 06-2020 | Apple MacBook Pro 13 2020 2GHz i5 10th-Gen i5-1038NG7, Iris Plus Graphics G7 (Ice Lake 64 EU) | 1.4 kg | 15.6 mm | 13.30" | 2560x1600 | |
| 90.6 % v7 (old) | 02-2020 | Apple MacBook Pro 13 2019 2TB3 i5-8257U, Iris Plus Graphics 645 | 1.4 kg | 14.9 mm | 13.30" | 2560x1600 | |
| 91.1 % v7 (old) | 12-2020 | Apple MacBook Air 2020 M1 Entry M1, M1 7-Core GPU | 1.3 kg | 16.1 mm | 13.30" | 2560x1600 | |
| 88.1 % v7 (old) | 10-2020 | Dell XPS 13 9310 Core i7 FHD i7-1165G7, Iris Xe G7 96EUs | 1.3 kg | 14.8 mm | 13.40" | 1920x1200 | |
| 87.4 % v7 (old) | 06-2020 | Huawei MateBook X Pro 2020 i7 i7-10510U, GeForce MX250 | 1.3 kg | 14.6 mm | 13.90" | 3000x2000 | |
| 86.6 % v7 (old) | 12-2020 | Razer Book 13 FHD i7-1165G7, Iris Xe G7 96EUs | 1.4 kg | 15.15 mm | 13.40" | 1920x1200 |
Geval - Geen zichtbare verschillen
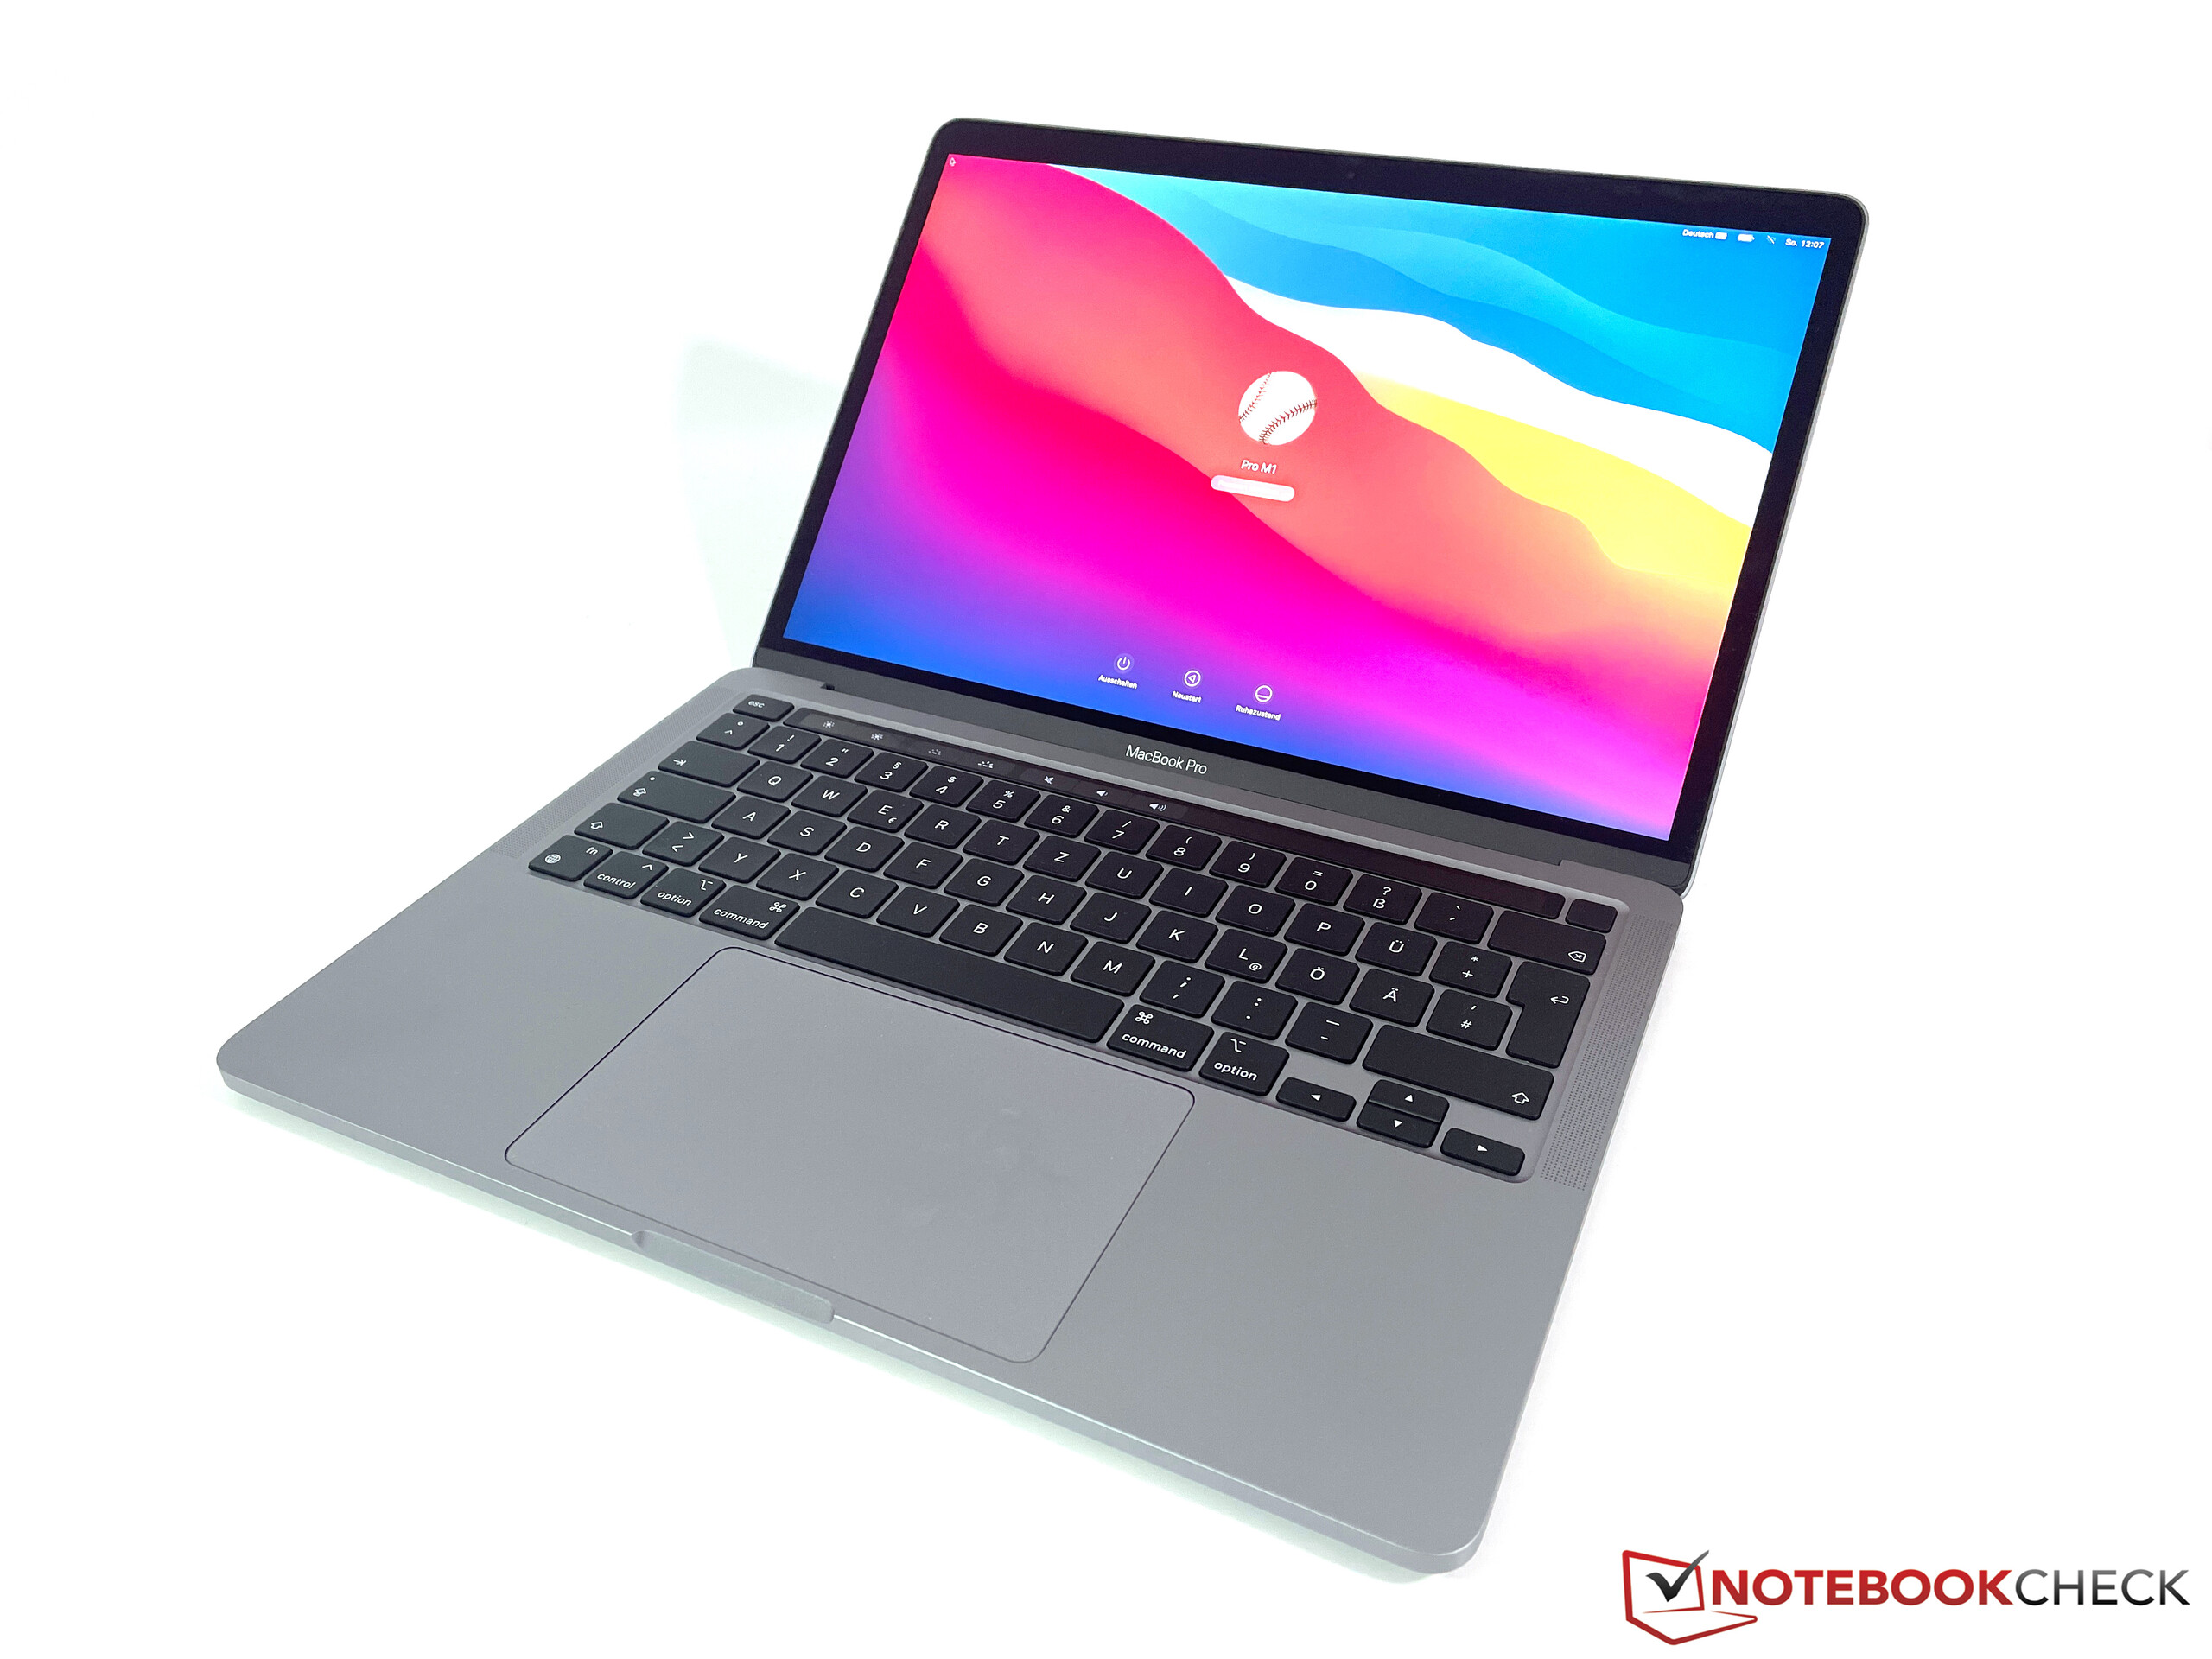
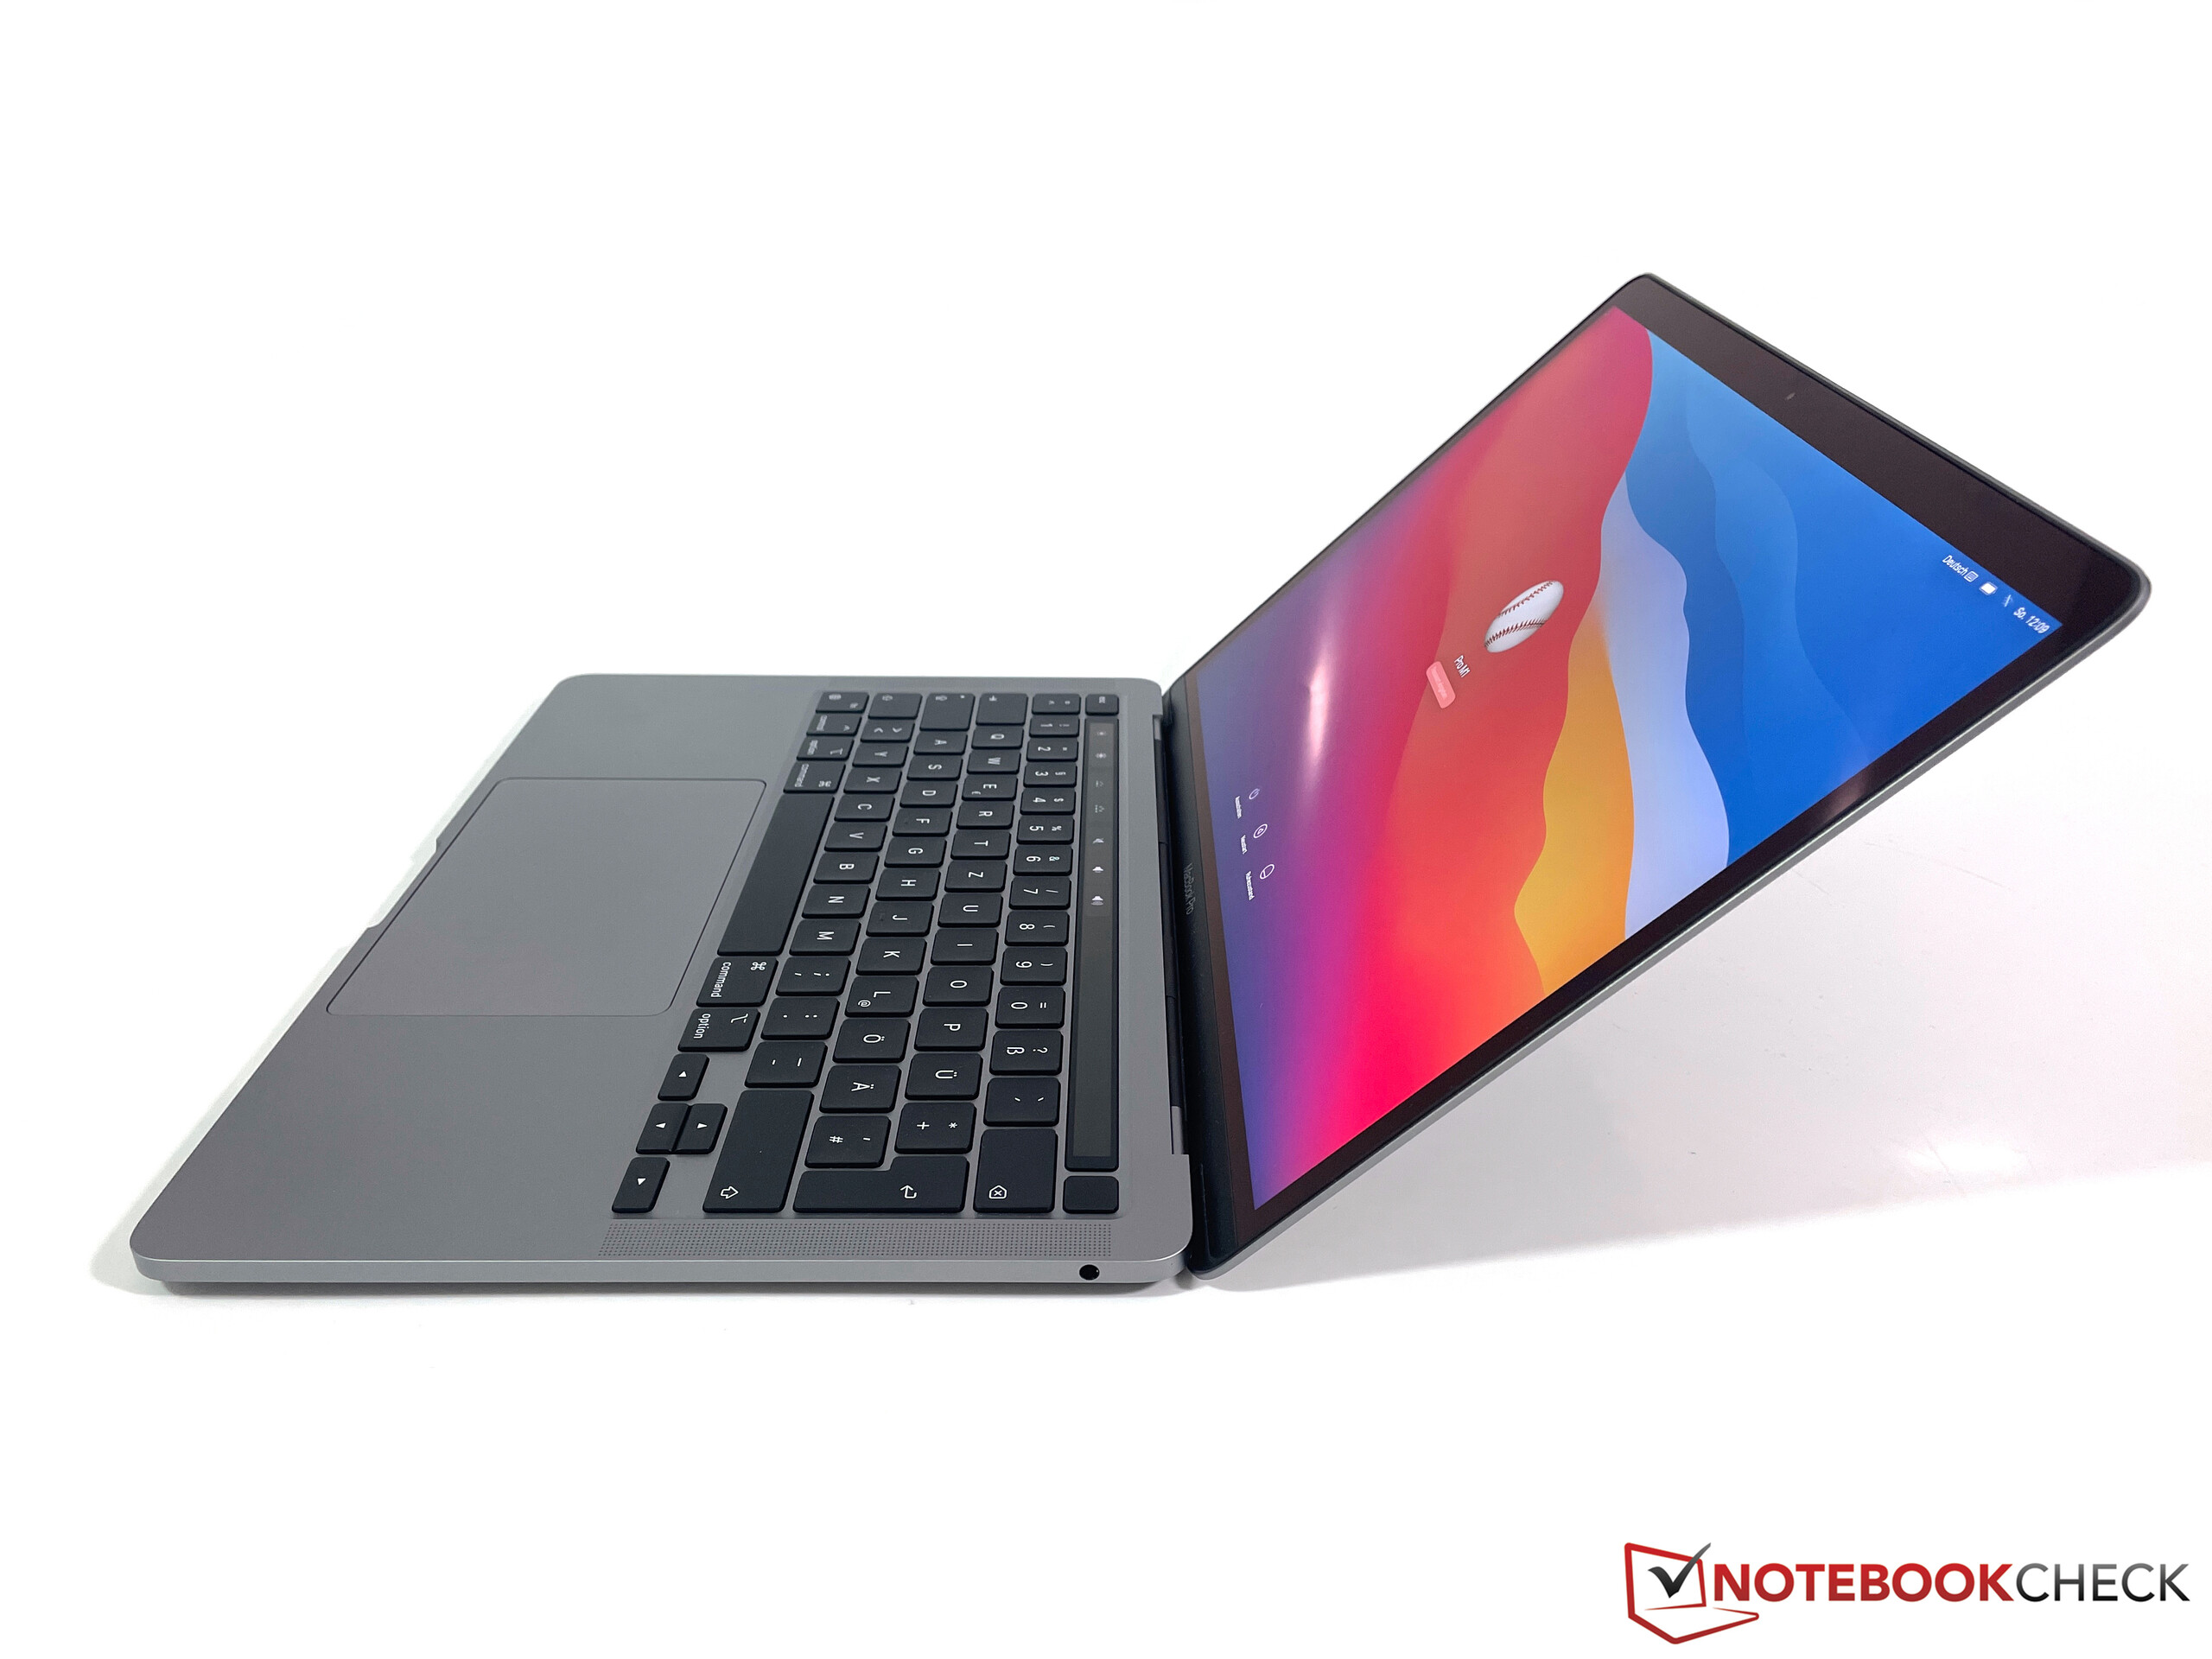
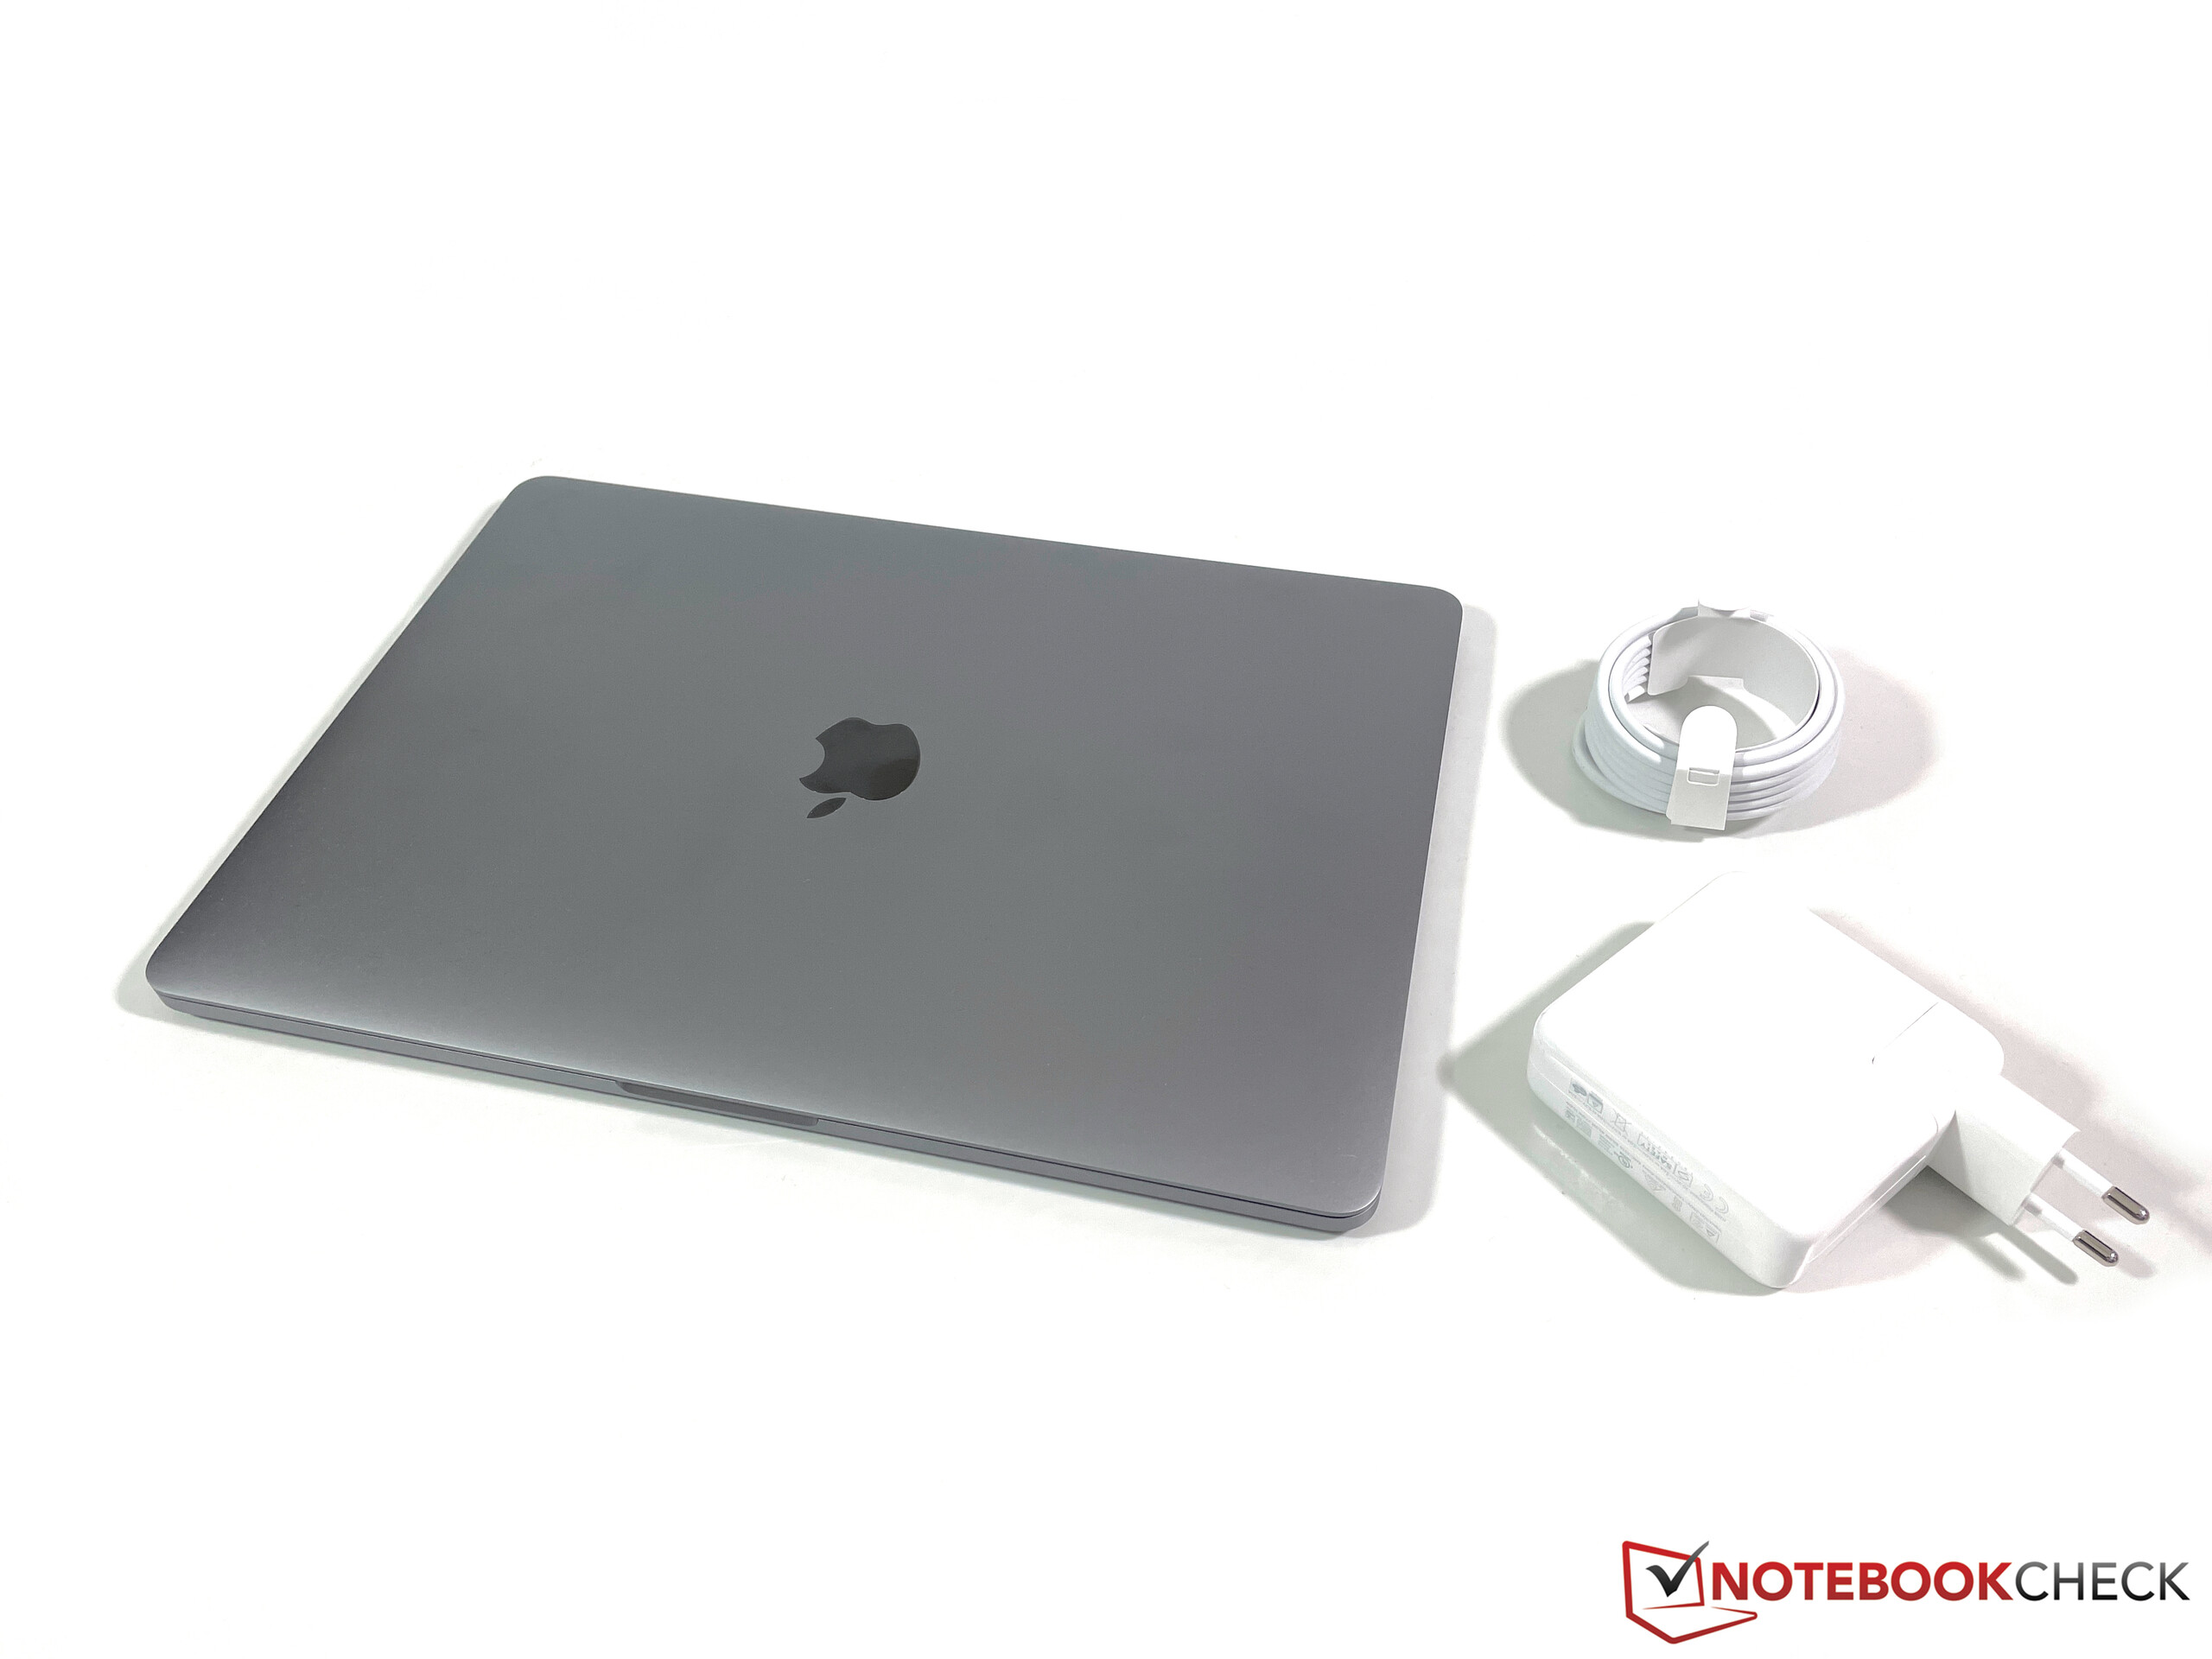
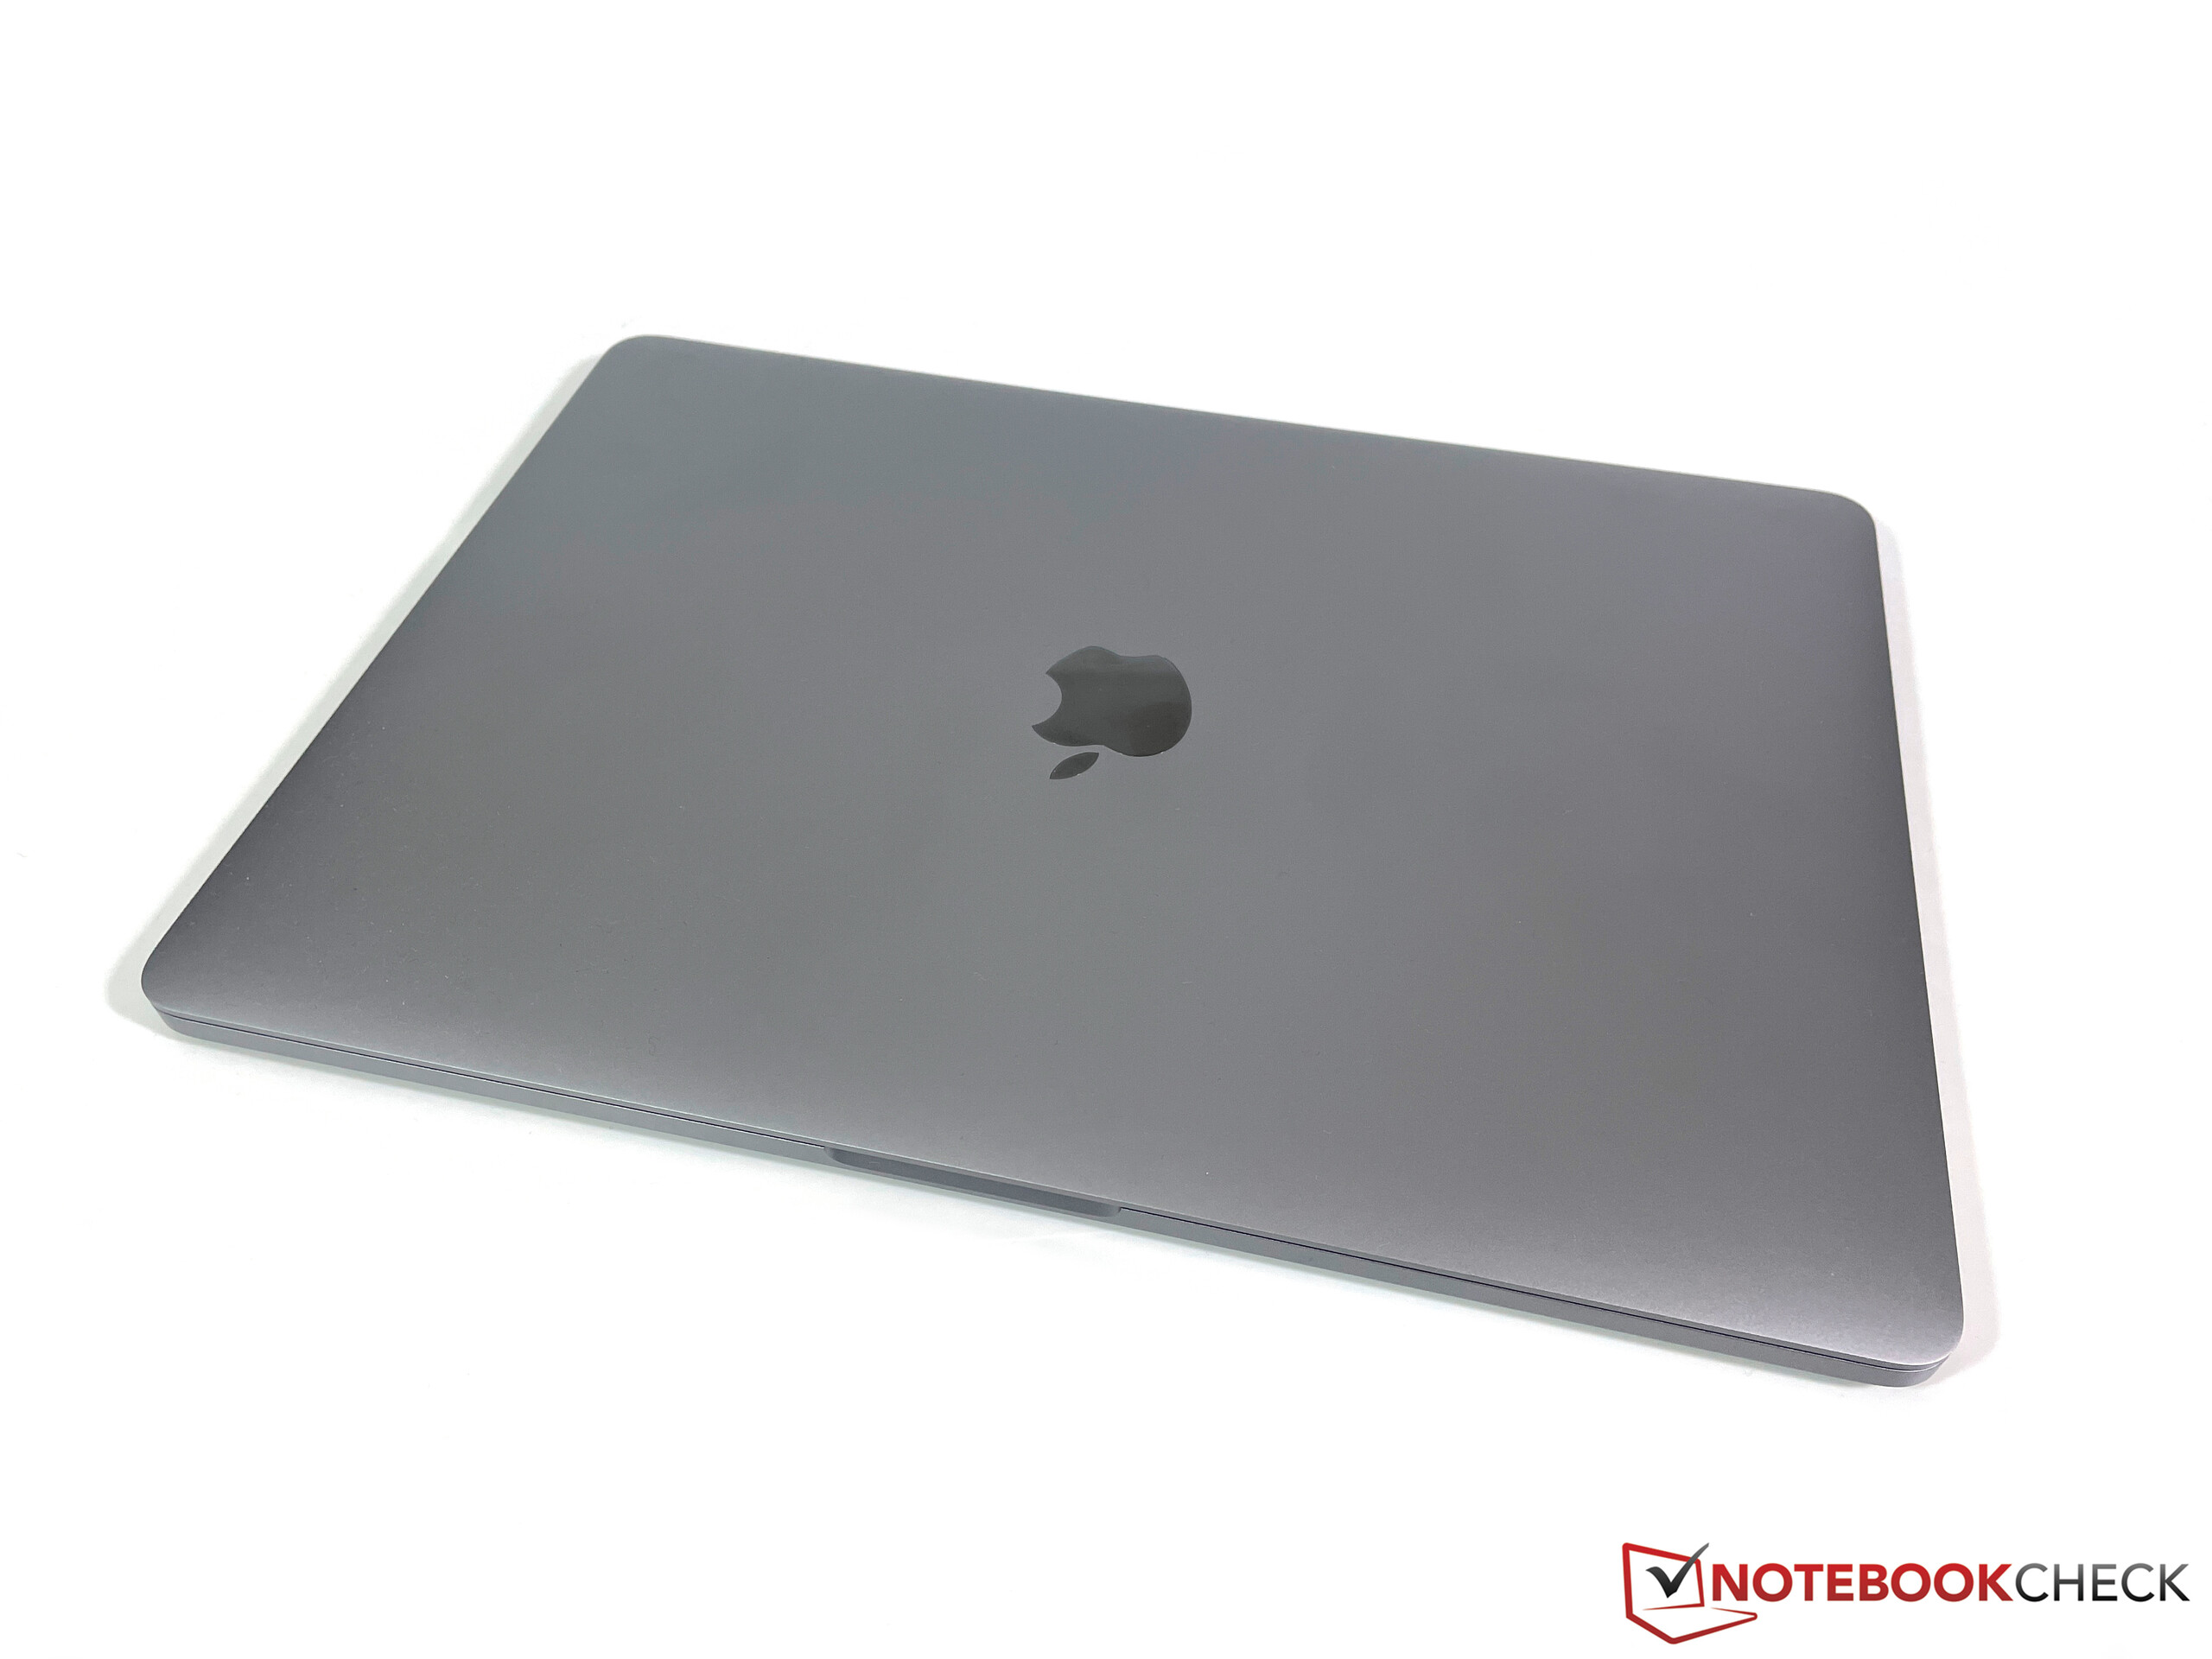
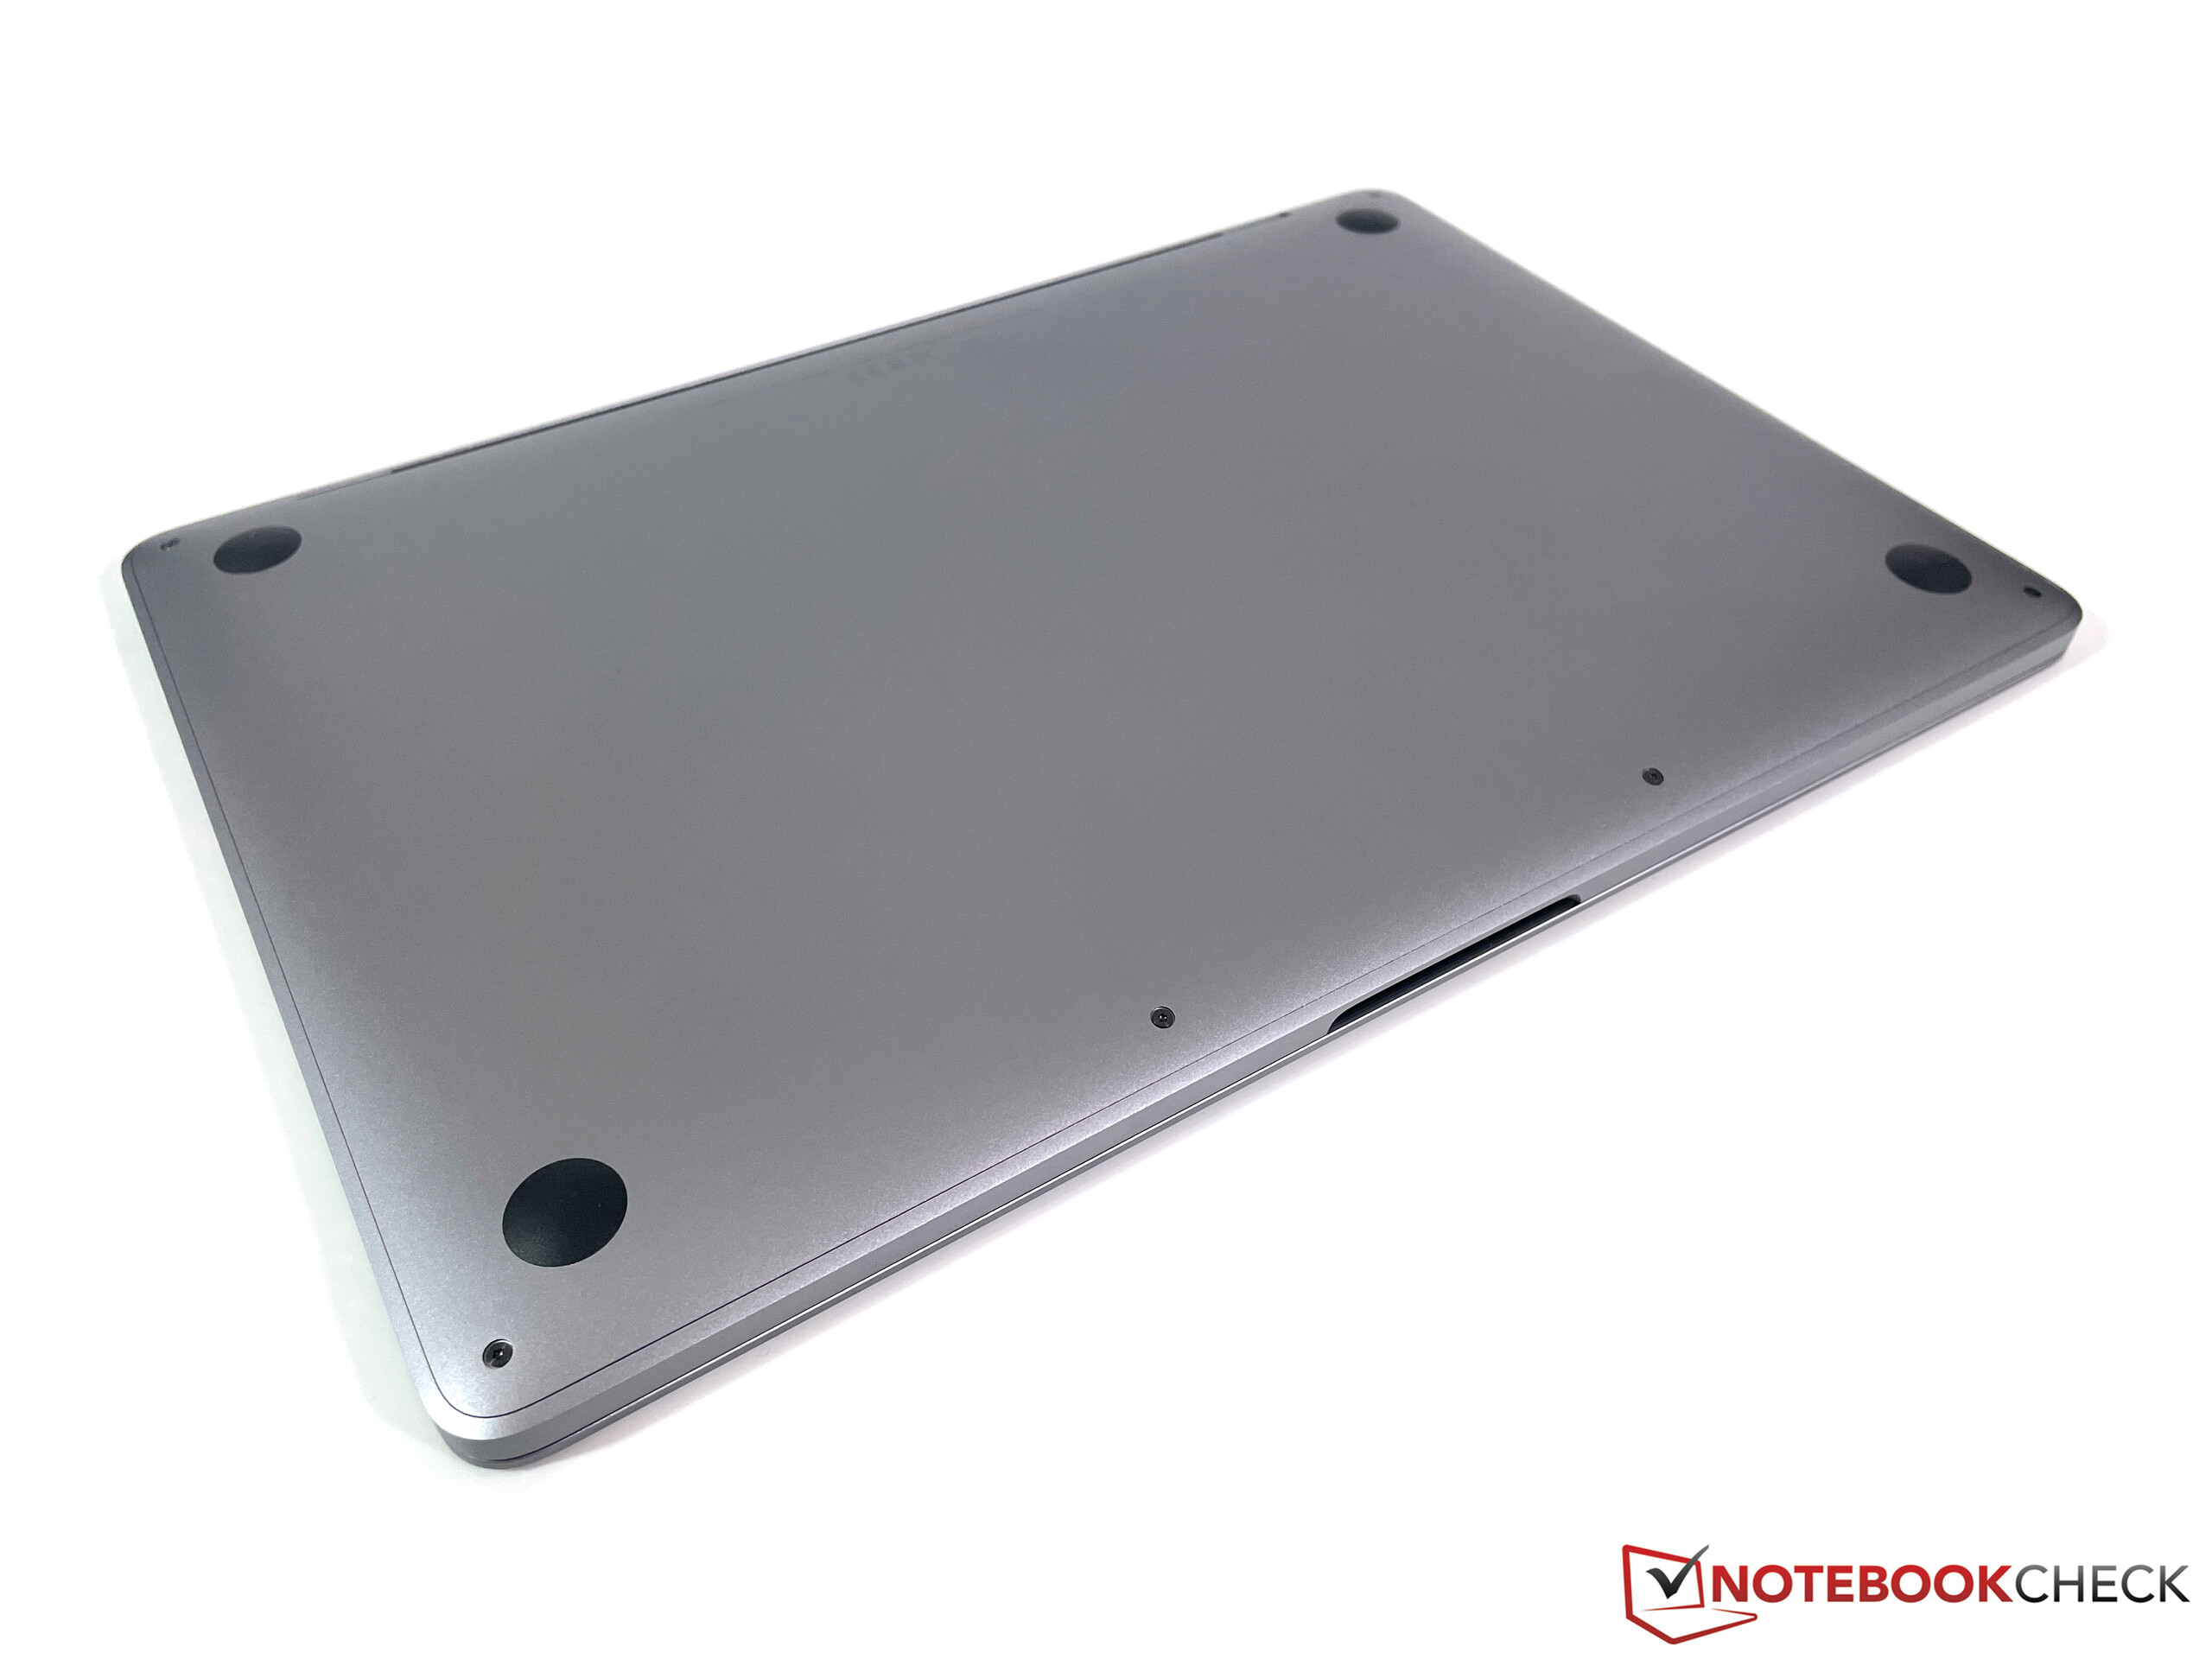
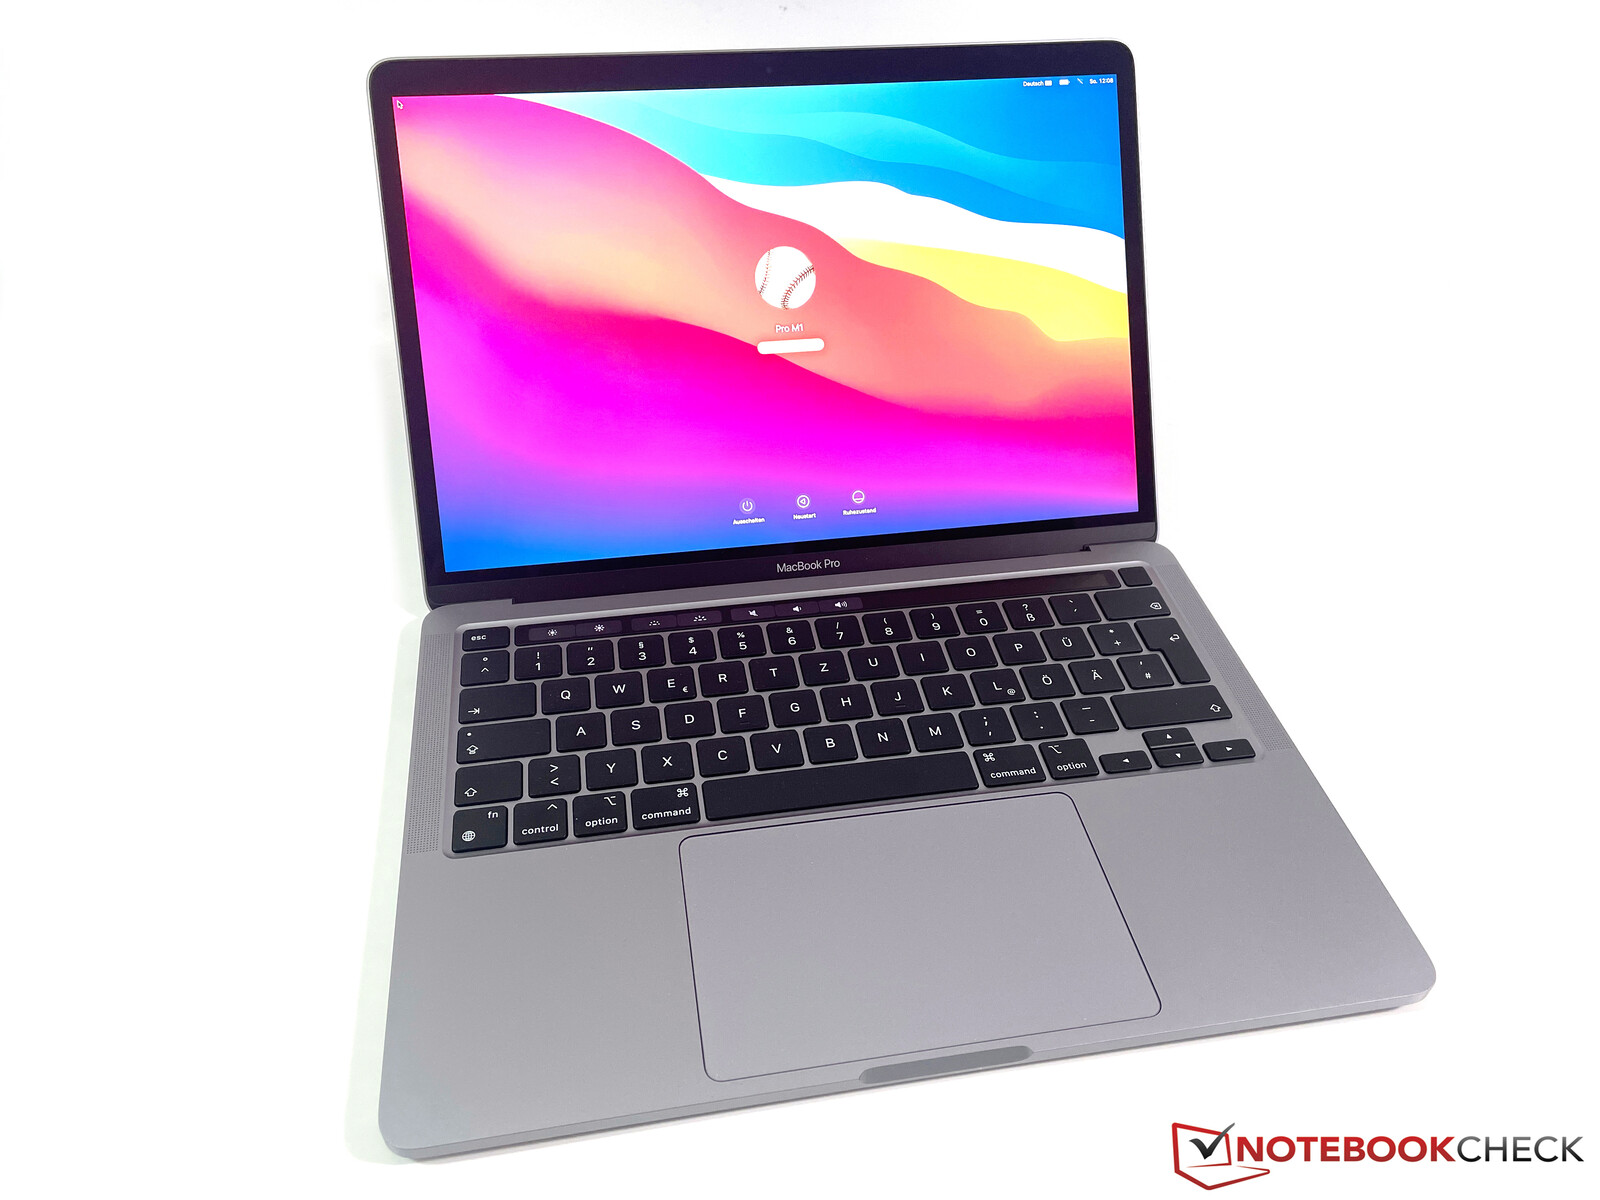
Apple raakte het bekende unibody chassis van het instapmodel MBP 13 niet aan en u kunt nog steeds kiezen tussen zilveren en ruimte grijze modellen. De kwaliteit van de MacBook Pro is nog steeds uitstekend en de oppervlakken zijn in de praktijk niet erg gevoelig voor vuil of vet. Je begint echter de leeftijd van het kofferontwerp op te merken, want de randen zijn vrij breed in vergelijking met rivalen als de Dell XPS 13, bijvoorbeeld
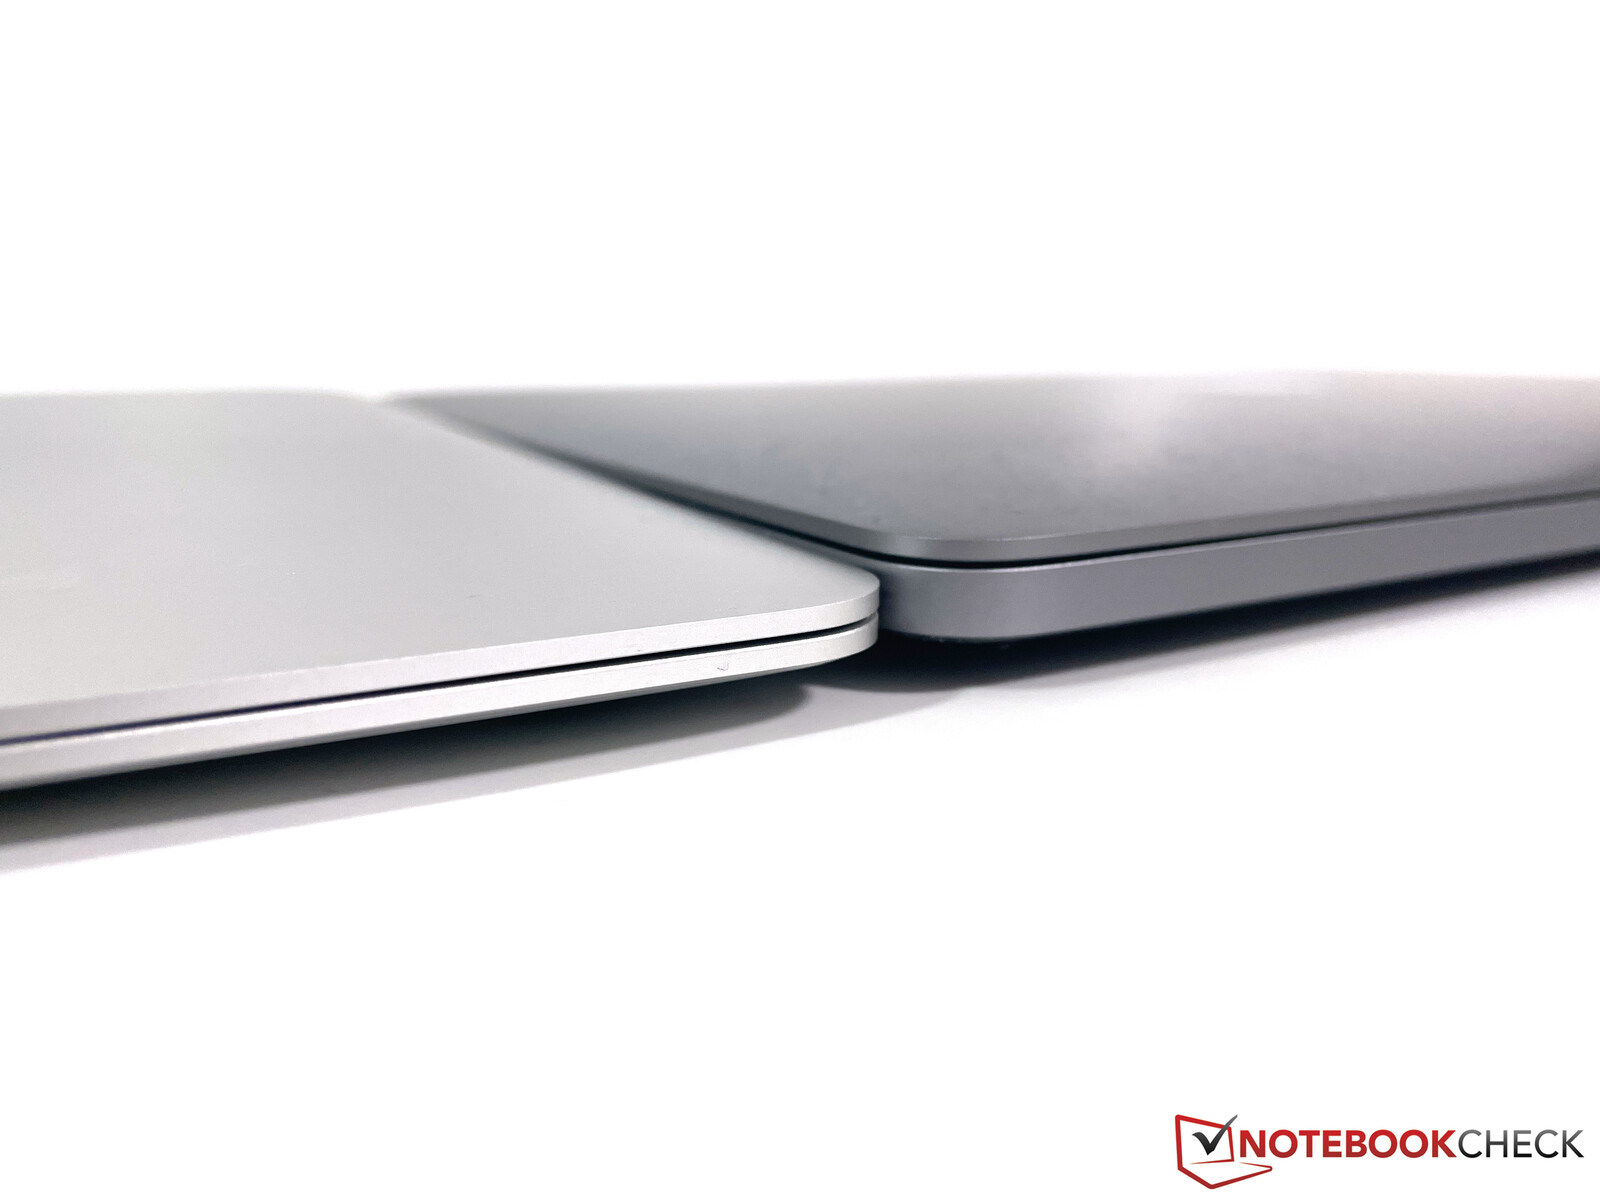
De MacBook Pro 13 en de MacBook Air hebben dezelfde voetafdruk, maar de MacBook Air wordt naar voren toe slanker. Daarom is het wat comfortabeler als je typt, want de voorkant van de MBP 13 is behoorlijk scherp. Het gewichtsvoordeel voor de Air is niet groot bij ~150 gram
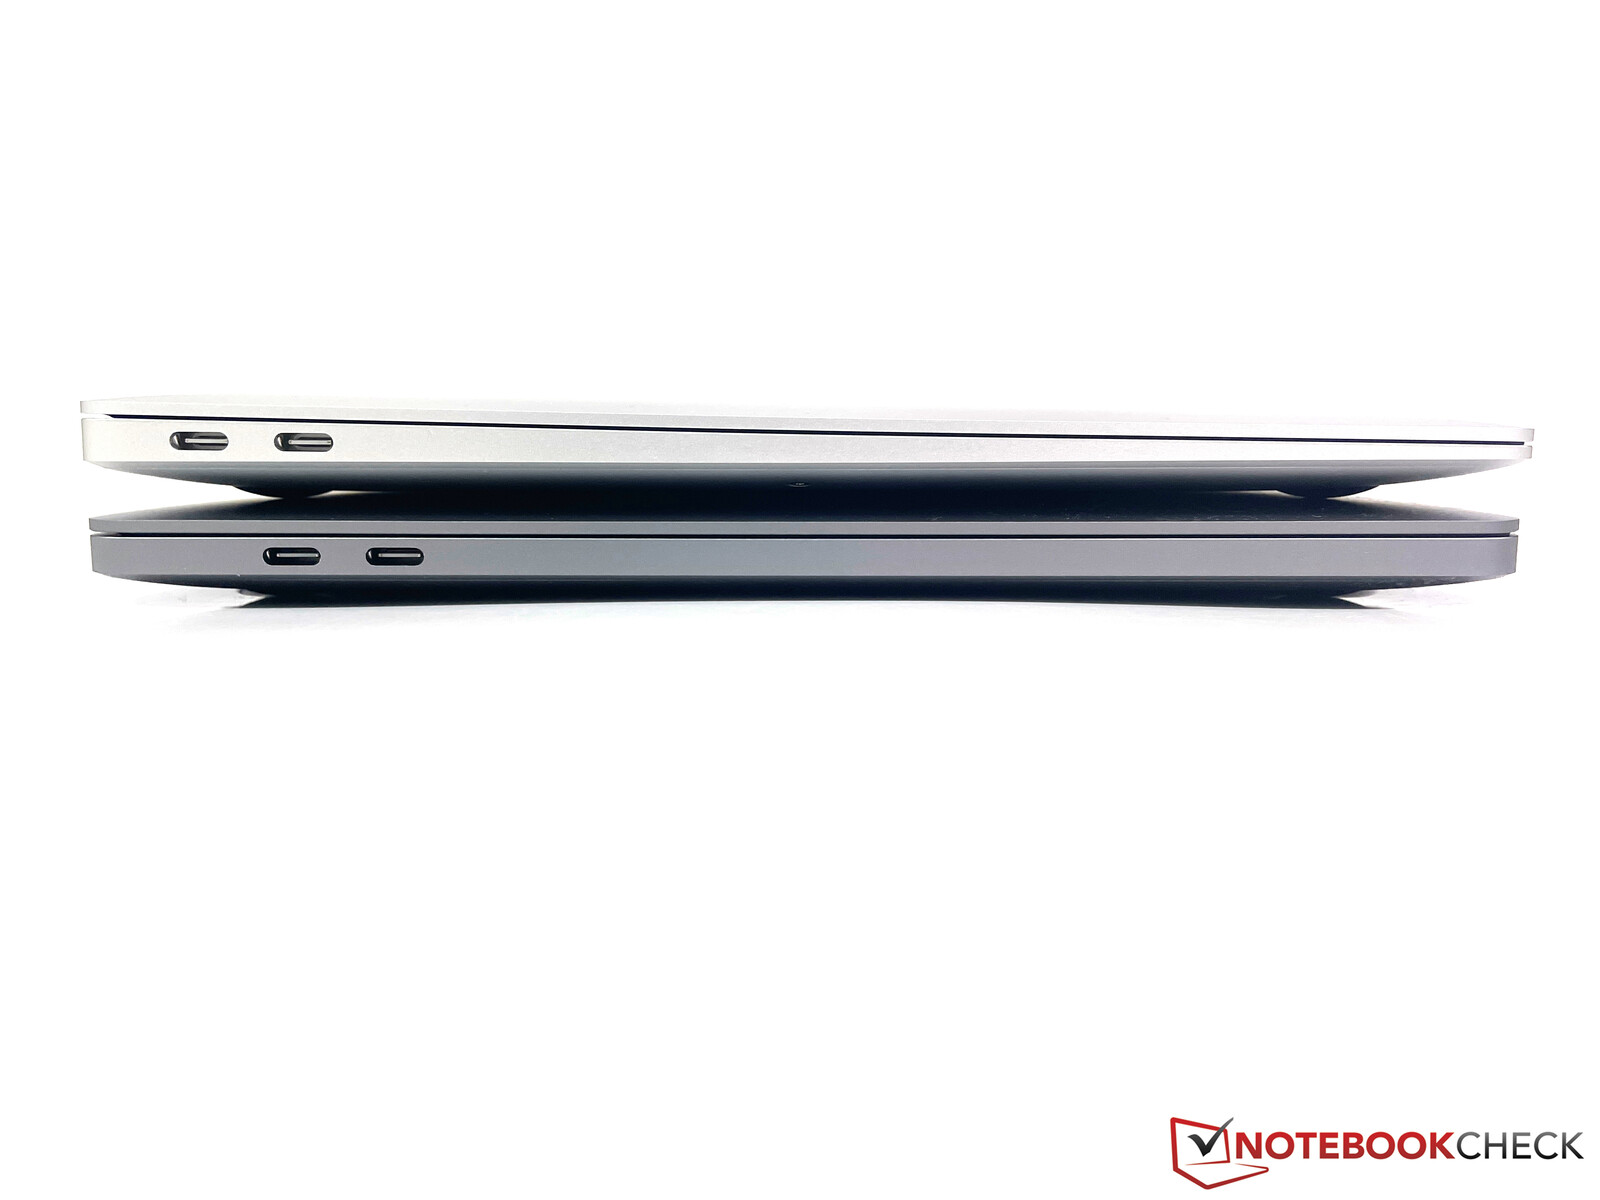
Connectiviteit - MBP 13 M1 met USB 4 en Wi-Fi 6
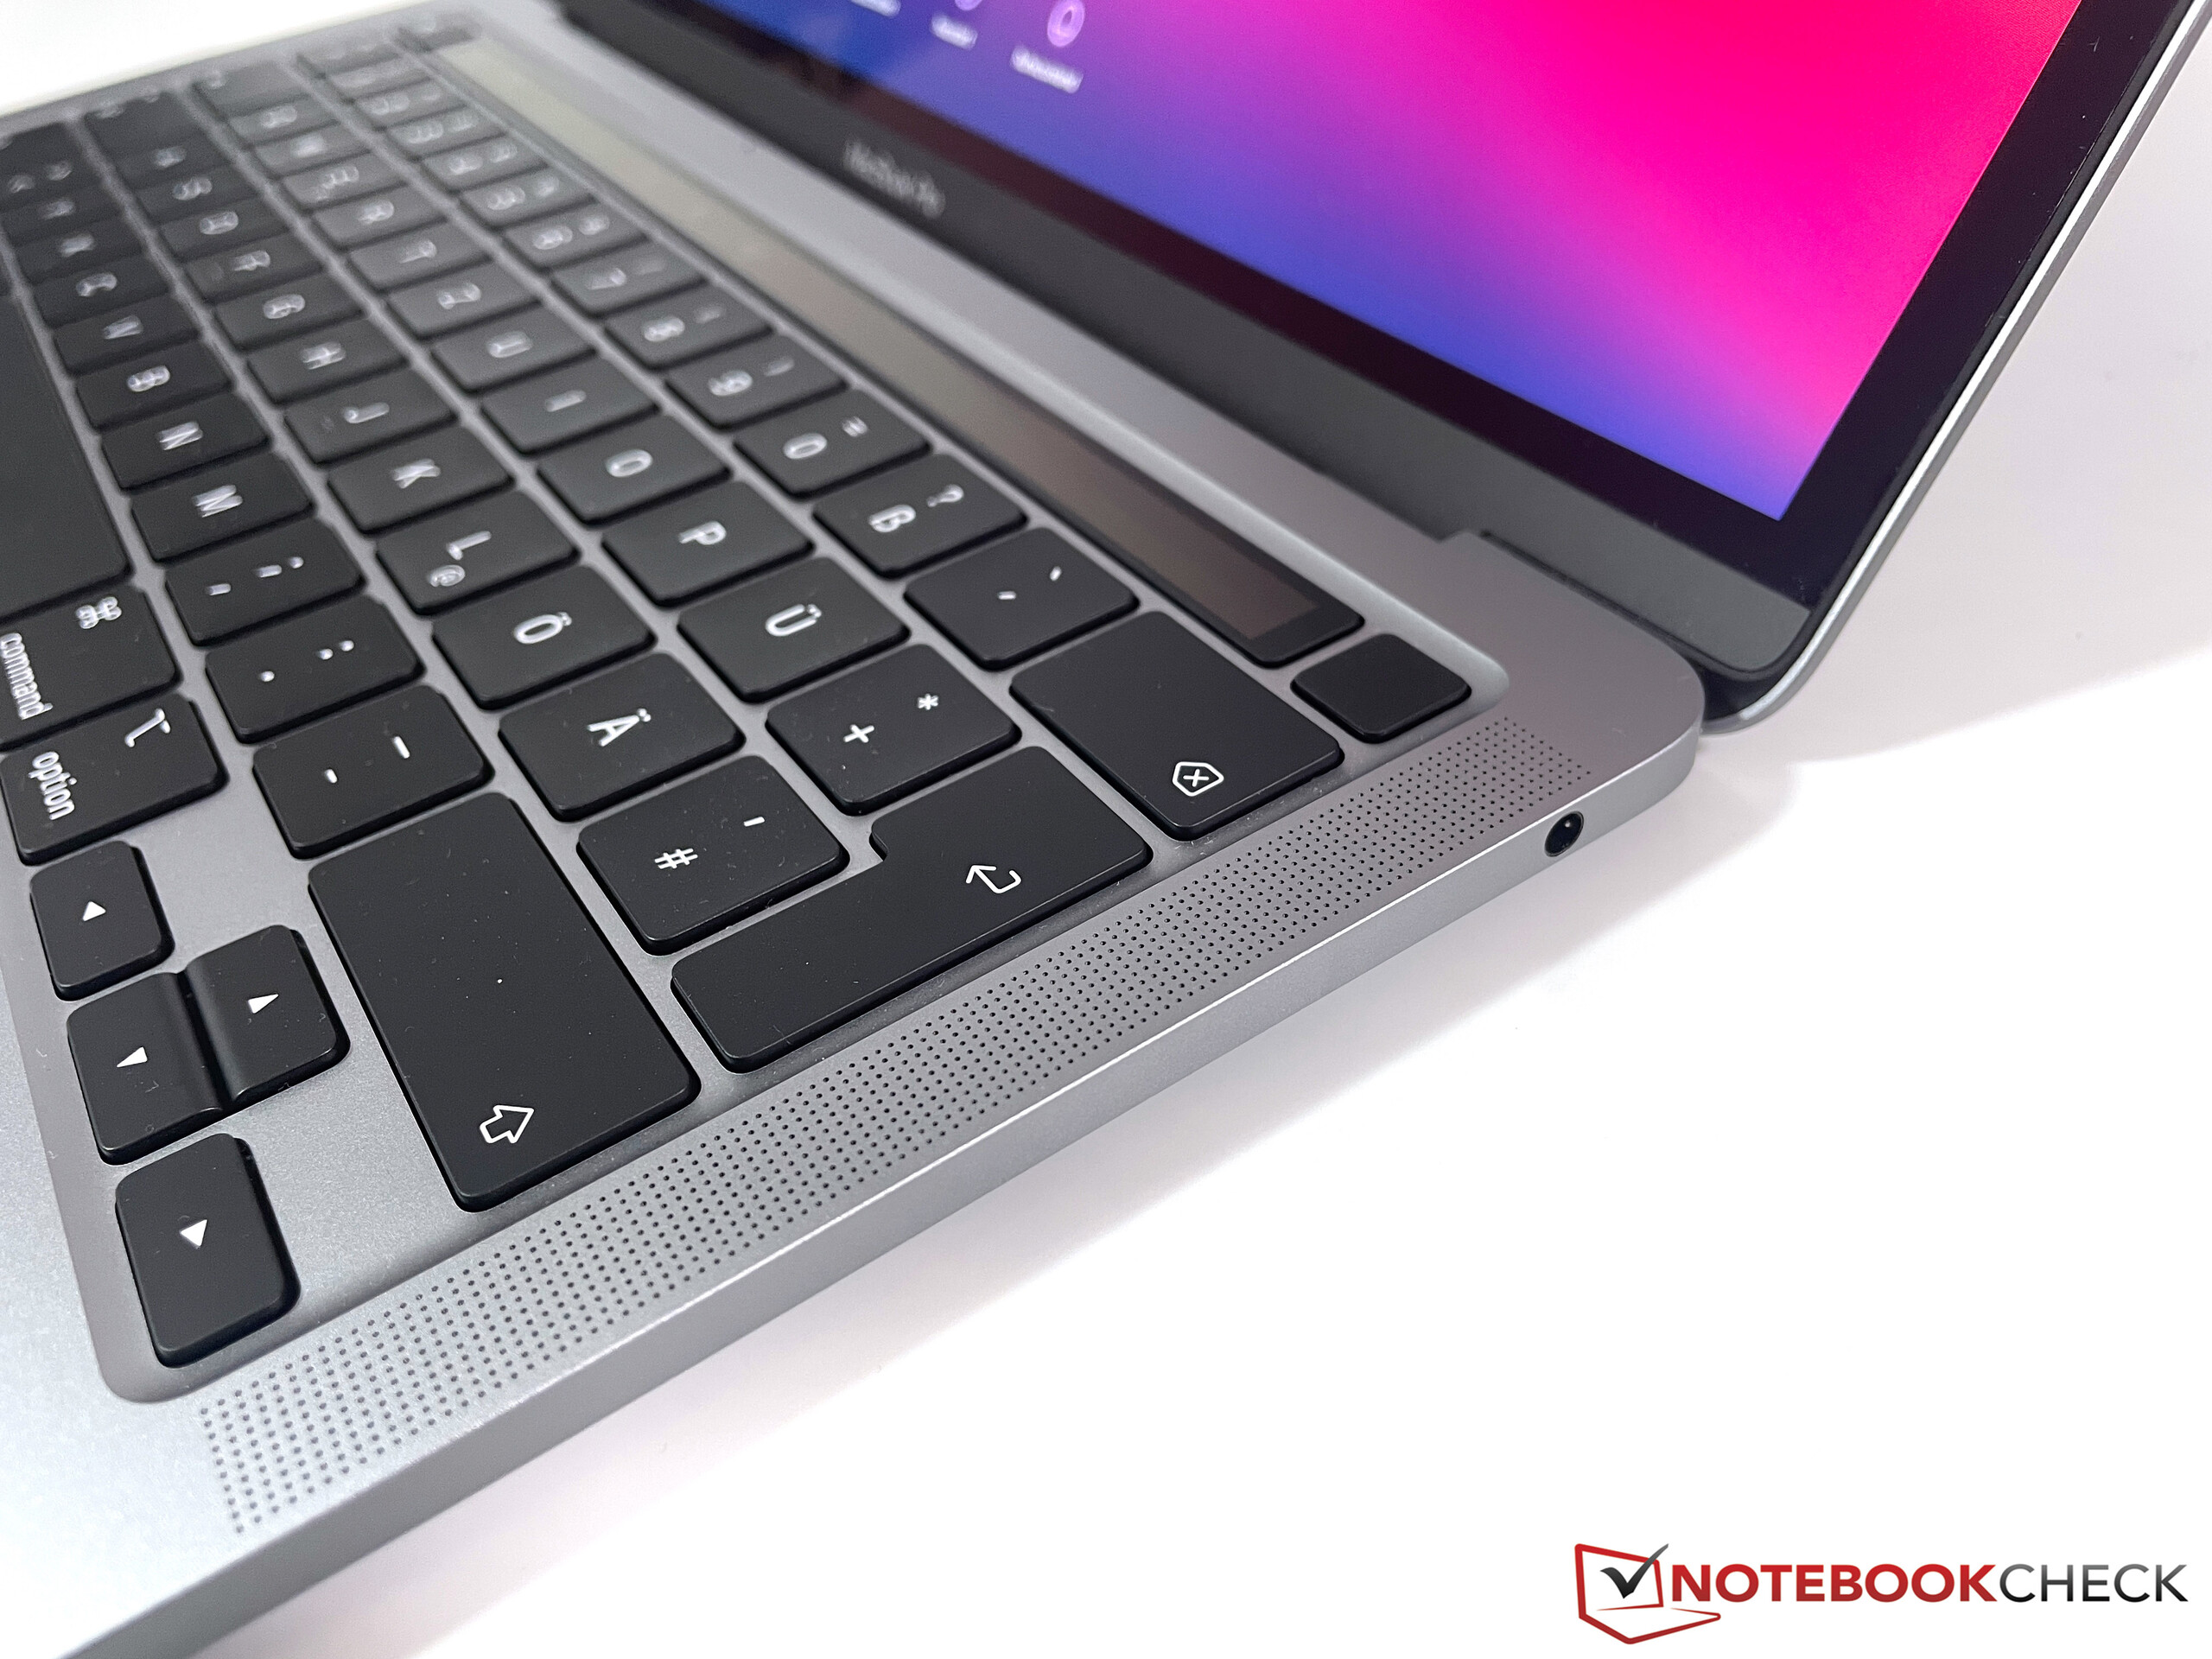
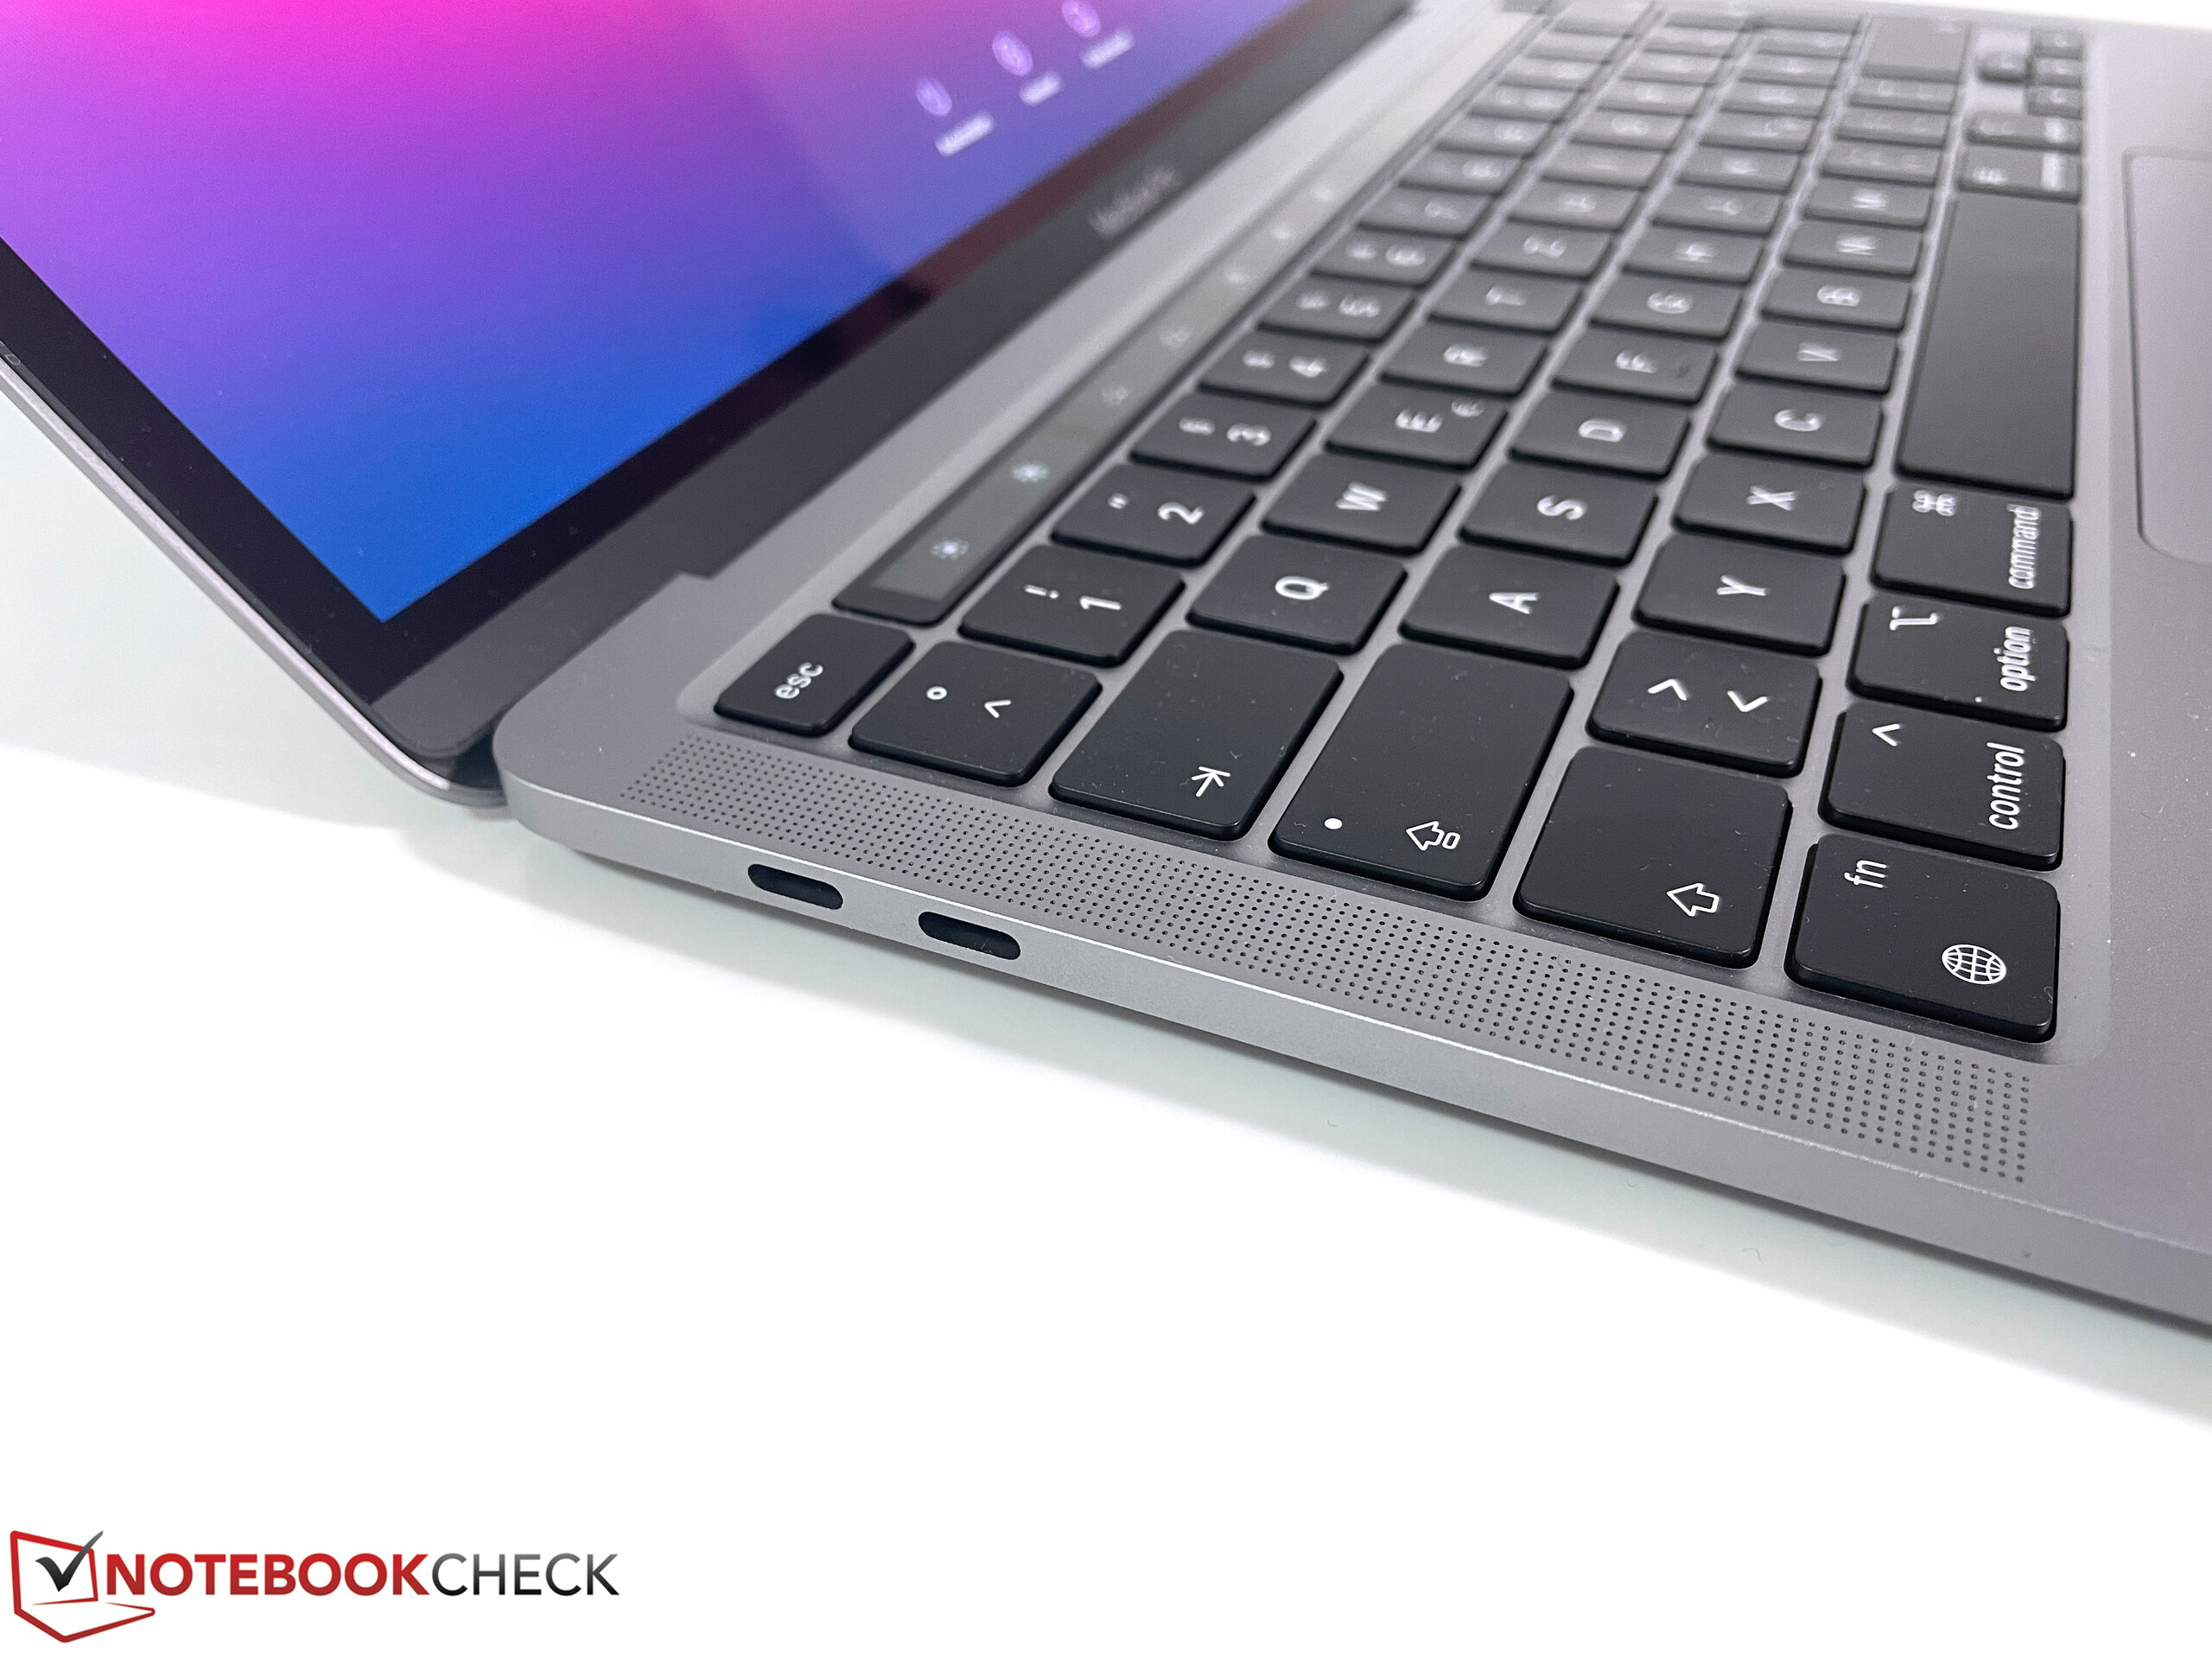
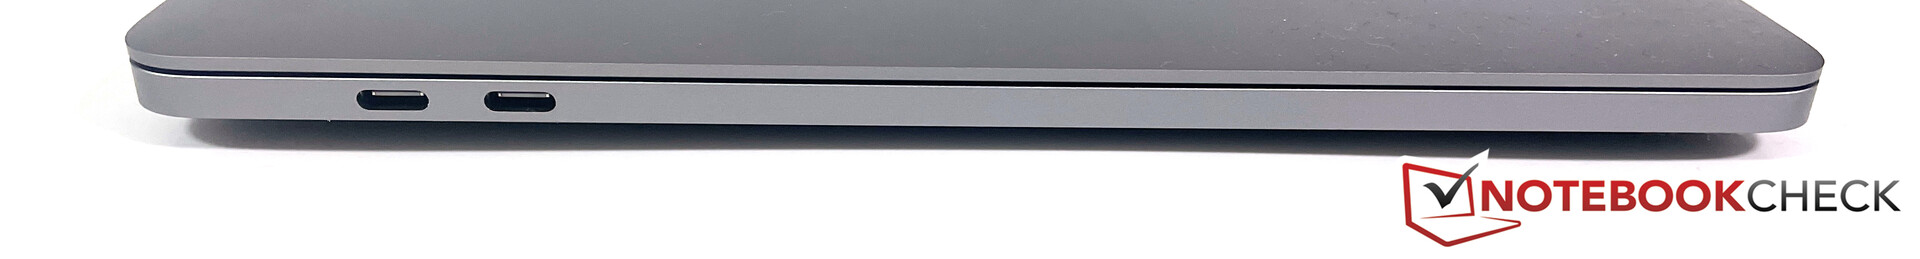
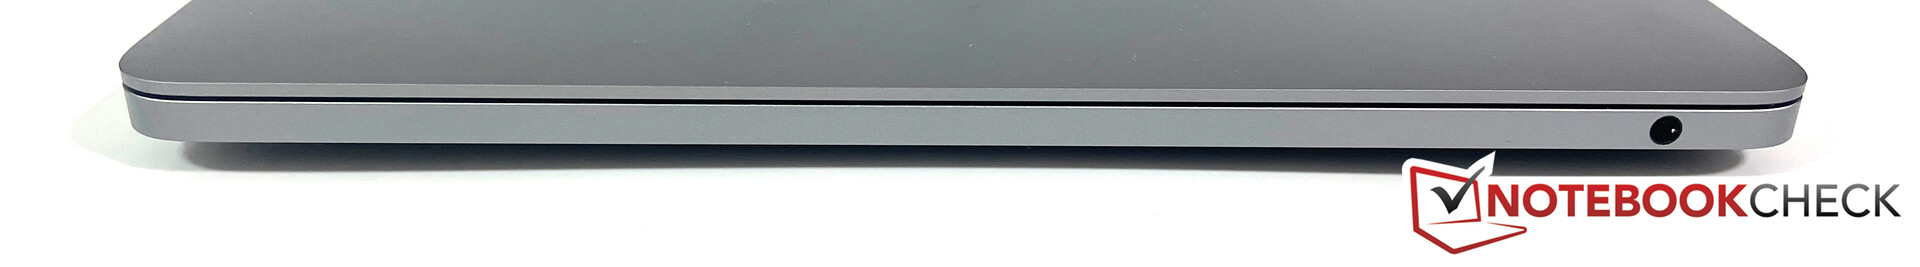
U krijgt nog steeds een 3,5 mm stereo-aansluiting aan de rechterkant en twee Thunderbolt 3 poorten (USB-C-connectoren) aan de linkerkant. Ze ondersteunen nu ook USB 4, maar de overdrachtssnelheid is beperkt tot 10 Gbps, net als bij USB 3.1 Gen.2. Er kunnen nog steeds compatibiliteitsproblemen zijn als je randapparatuur aansluit, zoals we al hebben gezien in onze review van de nieuwe MacBook Air. Een van de twee poorten wordt geblokkeerd door de voedingsadapter, en de poorten liggen ook erg dicht bij elkaar, wat een probleem kan zijn wanneer je bijvoorbeeld bredere duimschijven gebruikt
Communicatie - Alleen 80 MHz Wi-Fi 6
Net als de MacBook Air M1 en andere Apple producten met Wi-Fi 6 (bijvoorbeeld iPads), ondersteunt de Wi-Fi-module (2x2) de snelle 802.11ax-standaard, maar slechts 80 MHz en niet 160 MHz-verbindingen. Daarom zijn de overdrachtsnelheden niet beter dan die van de directe voorganger MBP 13 2020 met de Intel CPU en Wi-Fi 5. De Windows-competitie heeft hier een voordeel, zelfs met oudere Wi-Fi 5-modules (160 MHz)
| Networking | |
| iperf3 transmit AX12 | |
| Huawei MateBook X Pro 2020 i7 | |
| Razer Book 13 FHD | |
| Dell XPS 13 9310 Core i7 FHD | |
| Apple MacBook Pro 13 2020 2GHz i5 10th-Gen | |
| Gemiddeld 802.11 a/b/g/n/ac/ax (405 - 1750, n=103) | |
| Apple MacBook Pro 13 2020 2TB3 i5 | |
| Apple MacBook Pro 13 Late 2020 M1 Entry (8 / 256 GB) | |
| Apple MacBook Air 2020 M1 Entry | |
| iperf3 receive AX12 | |
| Razer Book 13 FHD | |
| Dell XPS 13 9310 Core i7 FHD | |
| Huawei MateBook X Pro 2020 i7 | |
| Apple MacBook Pro 13 2020 2GHz i5 10th-Gen | |
| Gemiddeld 802.11 a/b/g/n/ac/ax (284 - 1414, n=103) | |
| Apple MacBook Pro 13 2020 2TB3 i5 | |
| Apple MacBook Pro 13 Late 2020 M1 Entry (8 / 256 GB) | |
| Apple MacBook Air 2020 M1 Entry | |

 M1 8-Core GPU, M1, Apple SSD AP0256")
 M1 8-Core GPU, M1, Apple SSD AP0256")
Onderhoud
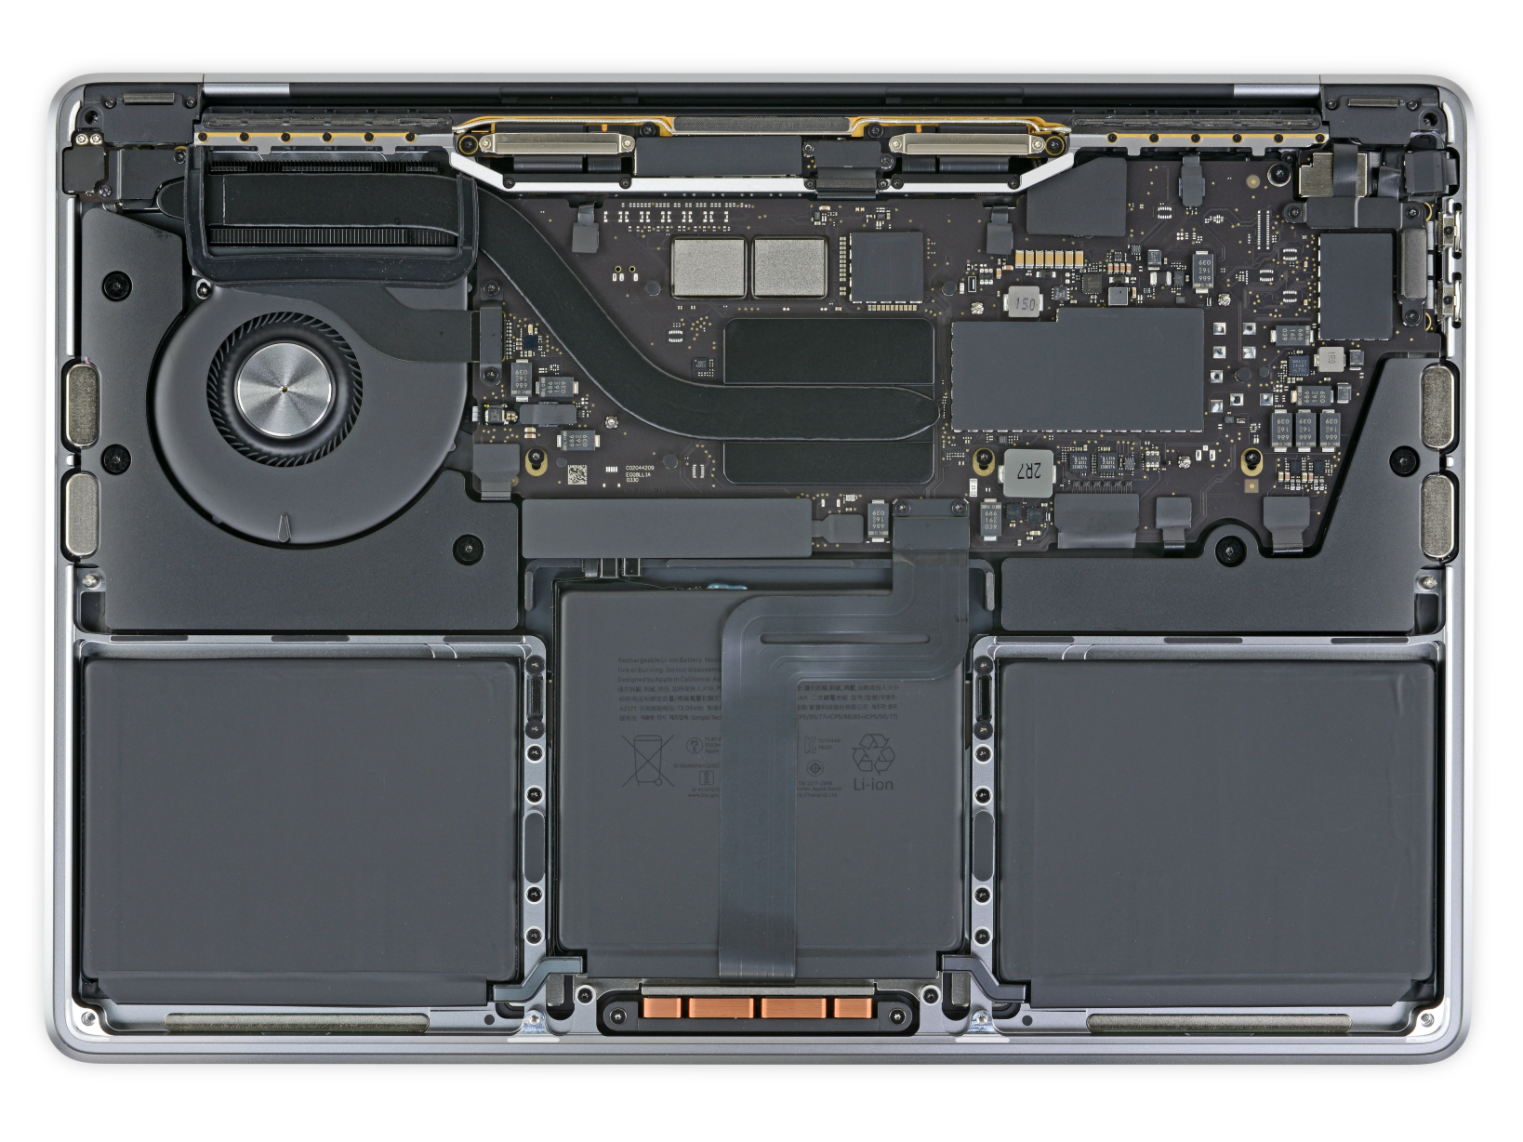
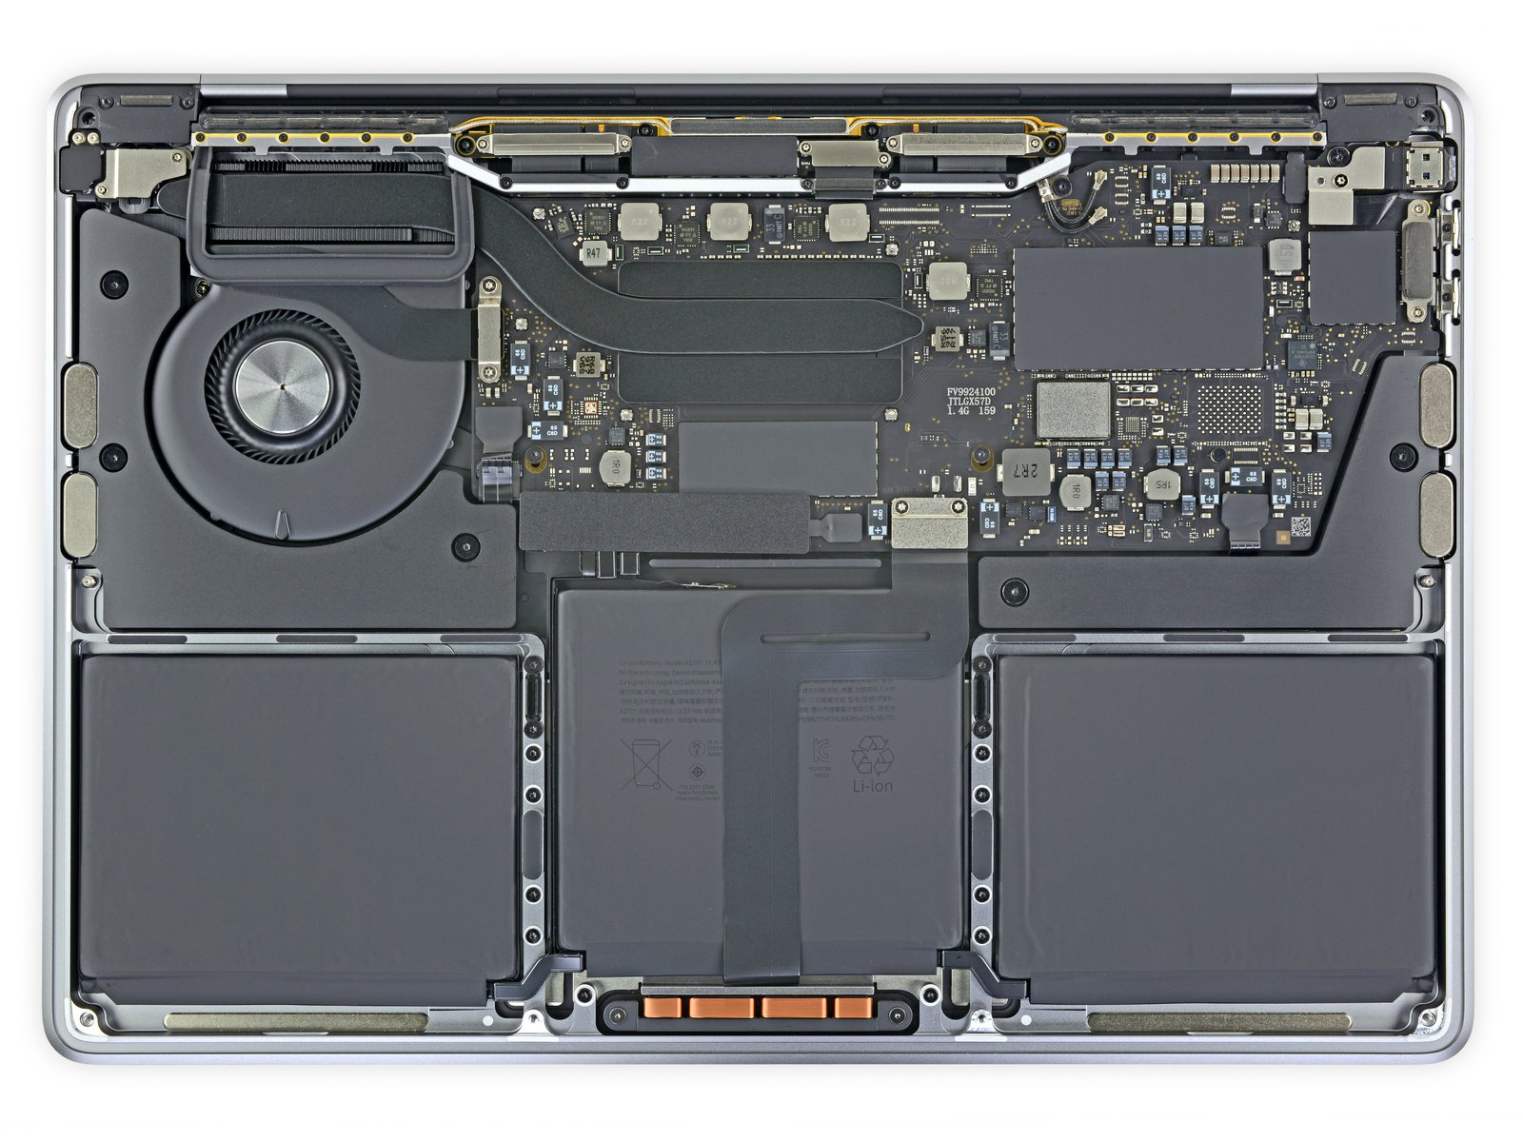
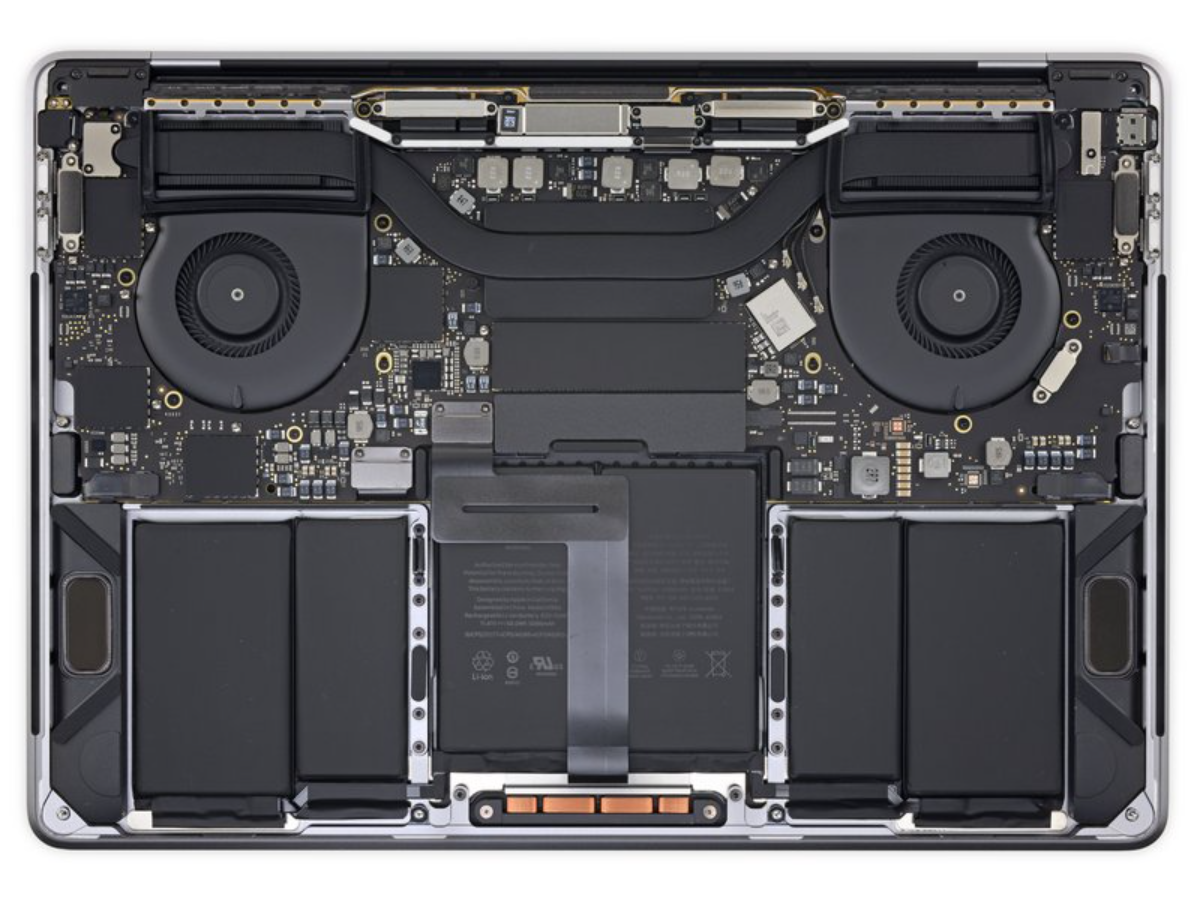
Apple nam vrijwel de interne lay-out van het oude instapmodel met Intel CPU's; zelfs de ventilator is identiek. Dit betekent dat er nog steeds een groot verschil is met de duurdere MacBook Pro 13 4x TB3, die twee ventilatoren heeft. Al met al betekent dit nog steeds dat er in principe niets te doen is op het gebied van gebruikersonderhoud
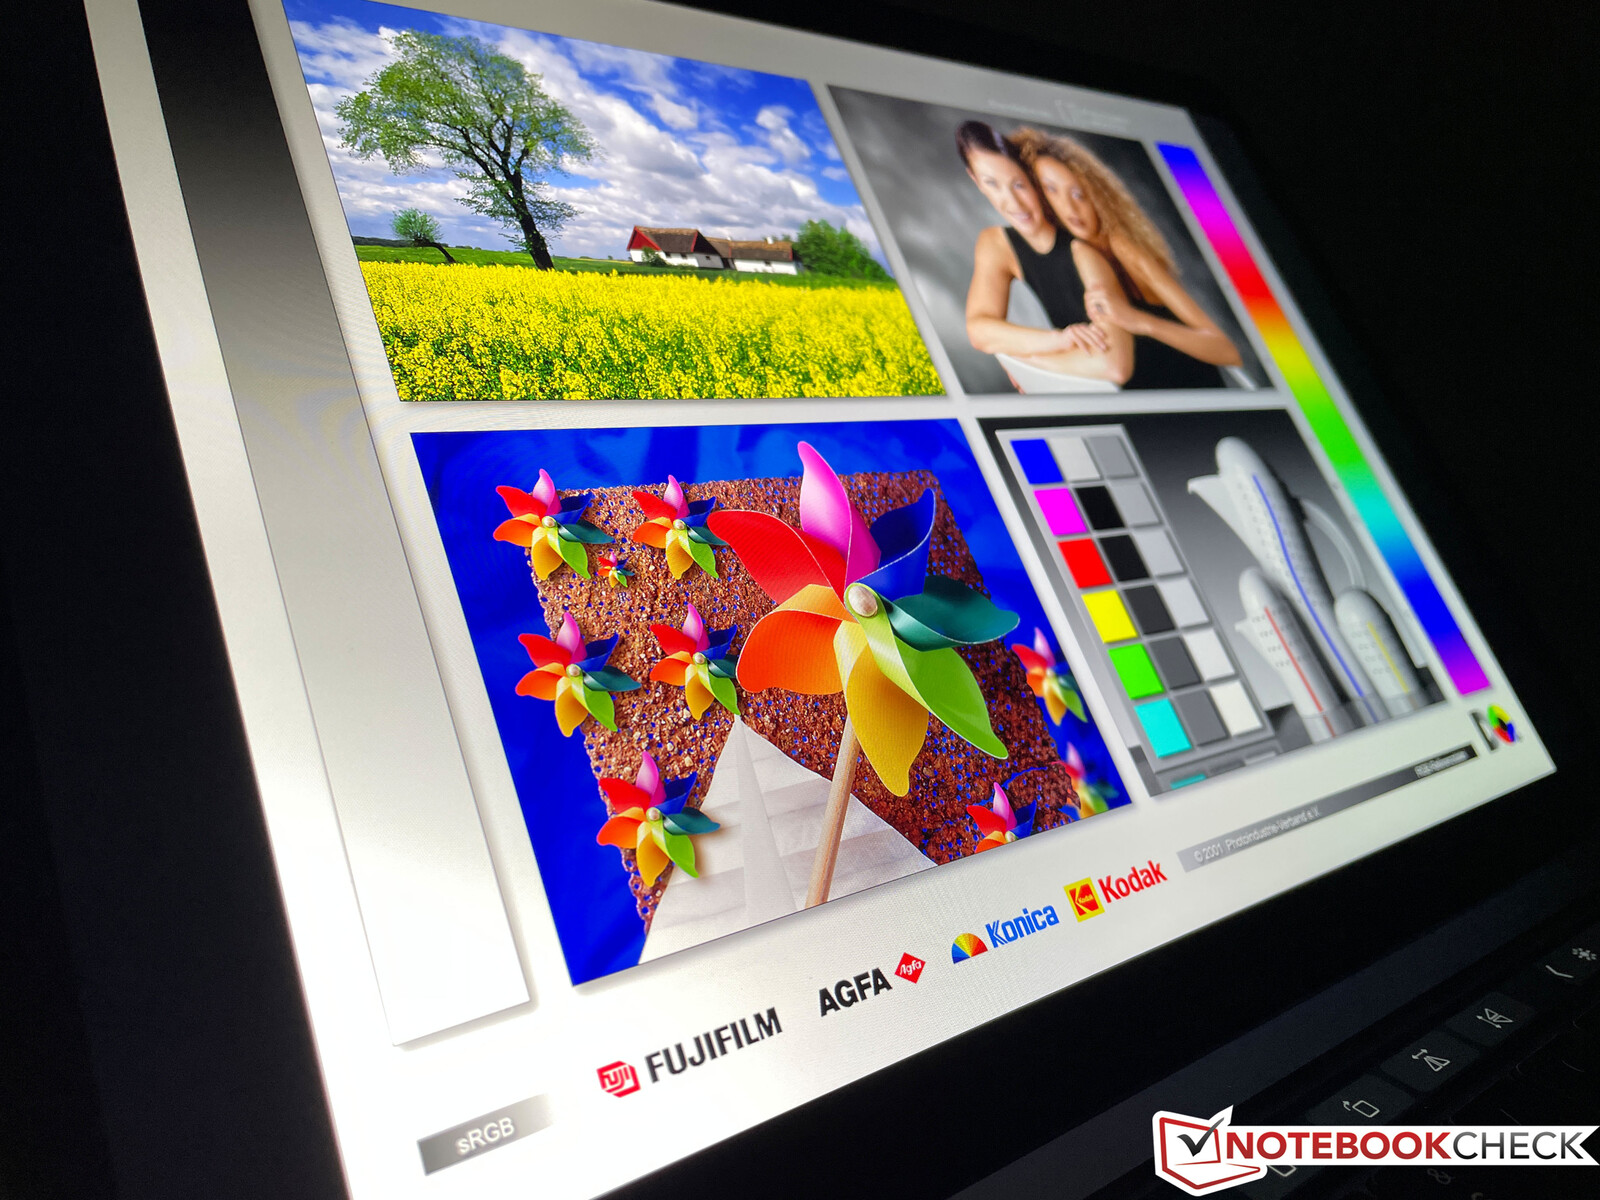
Display - 16:10 IPS-Paneel
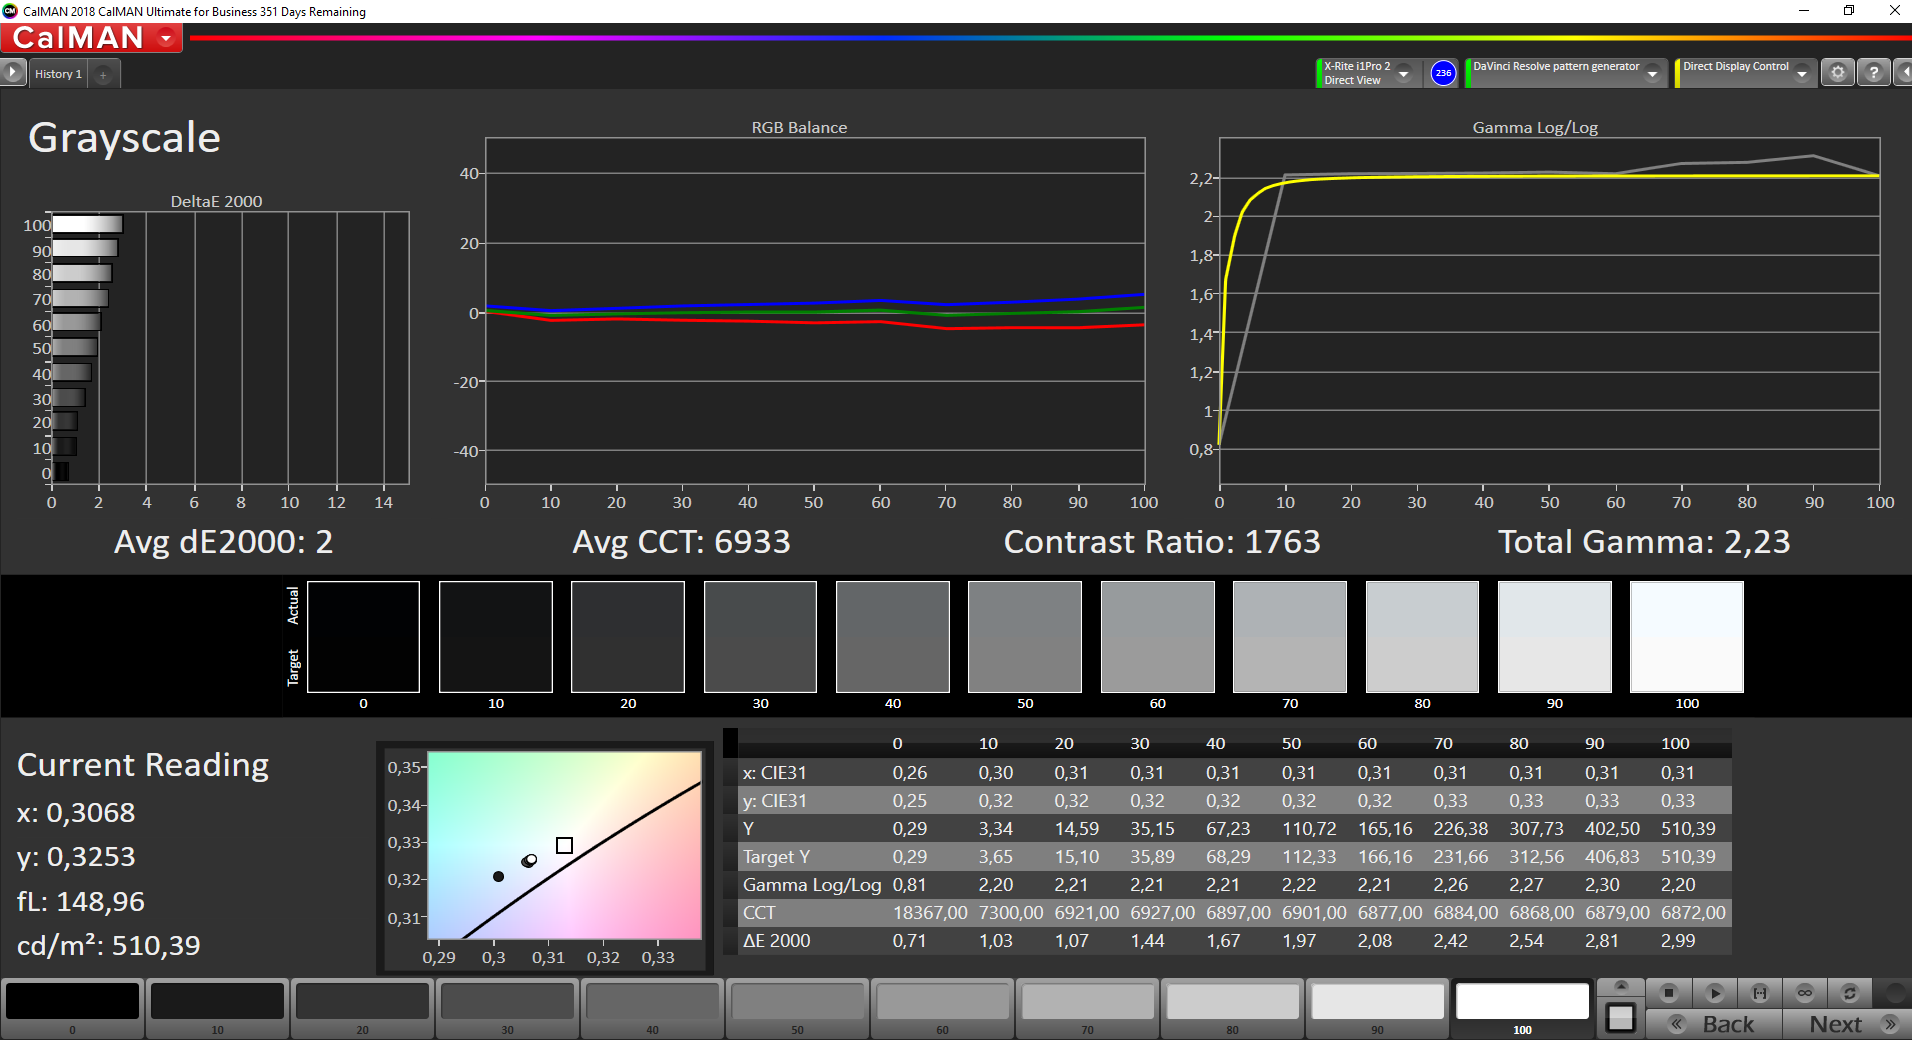
Het display is nog steeds hetzelfde. Je krijgt weer een glanzend IPS-scherm met 2560 x 1600 pixels (227 ppi) en een beeldverhouding van 16:10. Apple adverteert een helderheid van 500 nits, maar dat kunnen we niet op alle meetpunten bevestigen. Al met al is de subjectieve beeldindruk uitstekend. Het apparaat ondersteunt nu ook iOS-apps, dus een touchscreen zou nu zeker zinvoller zijn.
In vergelijking met Windows concurrenten biedt de MacBook Pro 13 nog andere voordelen, zoals de zeer goed werkende omgevingslichtsensor, de automatische aanpassing van de kleurtemperatuur op basis van het omgevingslicht (TrueTone) en de perfecte schaalverdeling in macOS.
De reactietijden zijn behoorlijk, maar we kunnen wel een keer een flikkering van de achtergrondverlichting bepalen bij een helderheid van 49 % of minder. De frequentie is echter zeer hoog bij 122 kHz, dus er zouden geen problemen moeten zijn. We kunnen ook wat fluctuaties zien op de oscilloscoop bij een helderheid van 50 % of meer, maar we kunnen het niet meten. Geweldig: Er is geen zichtbare achtergrondbloeding te zien op een zwarte achtergrond, zelfs niet bij de maximale helderheid
| |||||||||||||||||||||||||
Helderheidsverdeling: 94 %
Helderheid in Batterij-modus: 510 cd/m²
Contrast: 1759:1 (Zwart: 0.29 cd/m²)
ΔE ColorChecker Calman: 1.3 | ∀{0.5-29.43 Ø4.71}
ΔE Greyscale Calman: 2 | ∀{0.09-98 Ø4.96}
100% sRGB (Argyll 1.6.3 3D)
88.3% AdobeRGB 1998 (Argyll 1.6.3 3D)
Gamma: 2.23
CCT: 6933 K
| Apple MacBook Pro 13 Late 2020 M1 Entry (8 / 256 GB) IPS, 2560x1600, 13.3" | Apple MacBook Pro 13 2020 2TB3 i5 2560x1600, 13.3" | Apple MacBook Air 2020 M1 Entry IPS, 2560x1600, 13.3" | Apple MacBook Pro 13 2020 2GHz i5 10th-Gen APPA03D, IPS, 2560x1600, 13.3" | Dell XPS 13 9310 Core i7 FHD Sharp LQ134N1, IPS, 1920x1200, 13.4" | Dell XPS 13 9310 Core i7 4K Sharp LQ134R1, IPS, 3840x2400, 13.4" | Razer Book 13 FHD Sharp LQ134N1JW48, IPS, 1920x1200, 13.4" | |
|---|---|---|---|---|---|---|---|
| Display | |||||||
| Display P3 Coverage (%) | 98.6 | 98.8 | 70.9 | 80.2 | 70.1 | ||
| sRGB Coverage (%) | 100 | 99.9 | 99.1 | 100 | 99.3 | ||
| AdobeRGB 1998 Coverage (%) | 85.9 | 86.4 | 72.9 | 78.9 | 71.6 | ||
| Response Times | -37% | 16% | -13% | -20% | -42% | -36% | |
| Response Time Grey 50% / Grey 80% * (ms) | 48 ? | 35.2 ? 27% | 31 ? 35% | 46 ? 4% | 52 ? -8% | 59.2 ? -23% | 56.8 ? -18% |
| Response Time Black / White * (ms) | 25.2 ? | 50.4 ? -100% | 26.1 ? -4% | 32.4 ? -29% | 33.2 ? -32% | 40.4 ? -60% | 38.8 ? -54% |
| PWM Frequency (Hz) | 122000 ? | 116300 ? | 118000 ? | 113600 ? | 2475 ? | 2137 ? | 2475 ? |
| Screen | -4% | -9% | -7% | -50% | -28% | 1% | |
| Brightness middle (cd/m²) | 510 | 508 0% | 417 -18% | 512 0% | 543.3 7% | 508.7 0% | 545.3 7% |
| Brightness (cd/m²) | 491 | 502 2% | 395 -20% | 491 0% | 524 7% | 479 -2% | 507 3% |
| Brightness Distribution (%) | 94 | 92 -2% | 91 -3% | 91 -3% | 92 -2% | 84 -11% | 88 -6% |
| Black Level * (cd/m²) | 0.29 | 0.4 -38% | 0.39 -34% | 0.32 -10% | 0.38 -31% | 0.3 -3% | 0.31 -7% |
| Contrast (:1) | 1759 | 1270 -28% | 1069 -39% | 1600 -9% | 1430 -19% | 1696 -4% | 1759 0% |
| Colorchecker dE 2000 * | 1.3 | 1.4 -8% | 1.12 14% | 1.7 -31% | 3.02 -132% | 2.72 -109% | 1.39 -7% |
| Colorchecker dE 2000 max. * | 3 | 2.5 17% | 2.71 10% | 3.4 -13% | 7.61 -154% | 4.7 -57% | 2.61 13% |
| Greyscale dE 2000 * | 2 | 1.7 15% | 1.7 15% | 1.9 5% | 5 -150% | 3.4 -70% | 1.3 35% |
| Gamma | 2.23 99% | 2.22 99% | 2207 0% | 2.19 100% | 2.02 109% | 2.11 104% | 2.2 100% |
| CCT | 6933 94% | 6861 95% | 6870 95% | 6817 95% | 6550 99% | 6245 104% | 6476 100% |
| Color Space (Percent of AdobeRGB 1998) (%) | 88.3 | 88.3 0% | 77.4 -12% | 66.8 -24% | 70.7 -20% | 65.9 -25% | |
| Color Space (Percent of sRGB) (%) | 100 | 100 0% | 99.9 0% | 99.6 0% | 100 0% | 99.6 0% | |
| Colorchecker dE 2000 calibrated * | 0.77 | 1 | 1.23 | 1.92 | 2.72 | ||
| Totaal Gemiddelde (Programma / Instellingen) | -21% /
-10% | 4% /
-4% | -10% /
-8% | -35% /
-45% | -35% /
-30% | -18% /
-5% |
* ... kleiner is beter
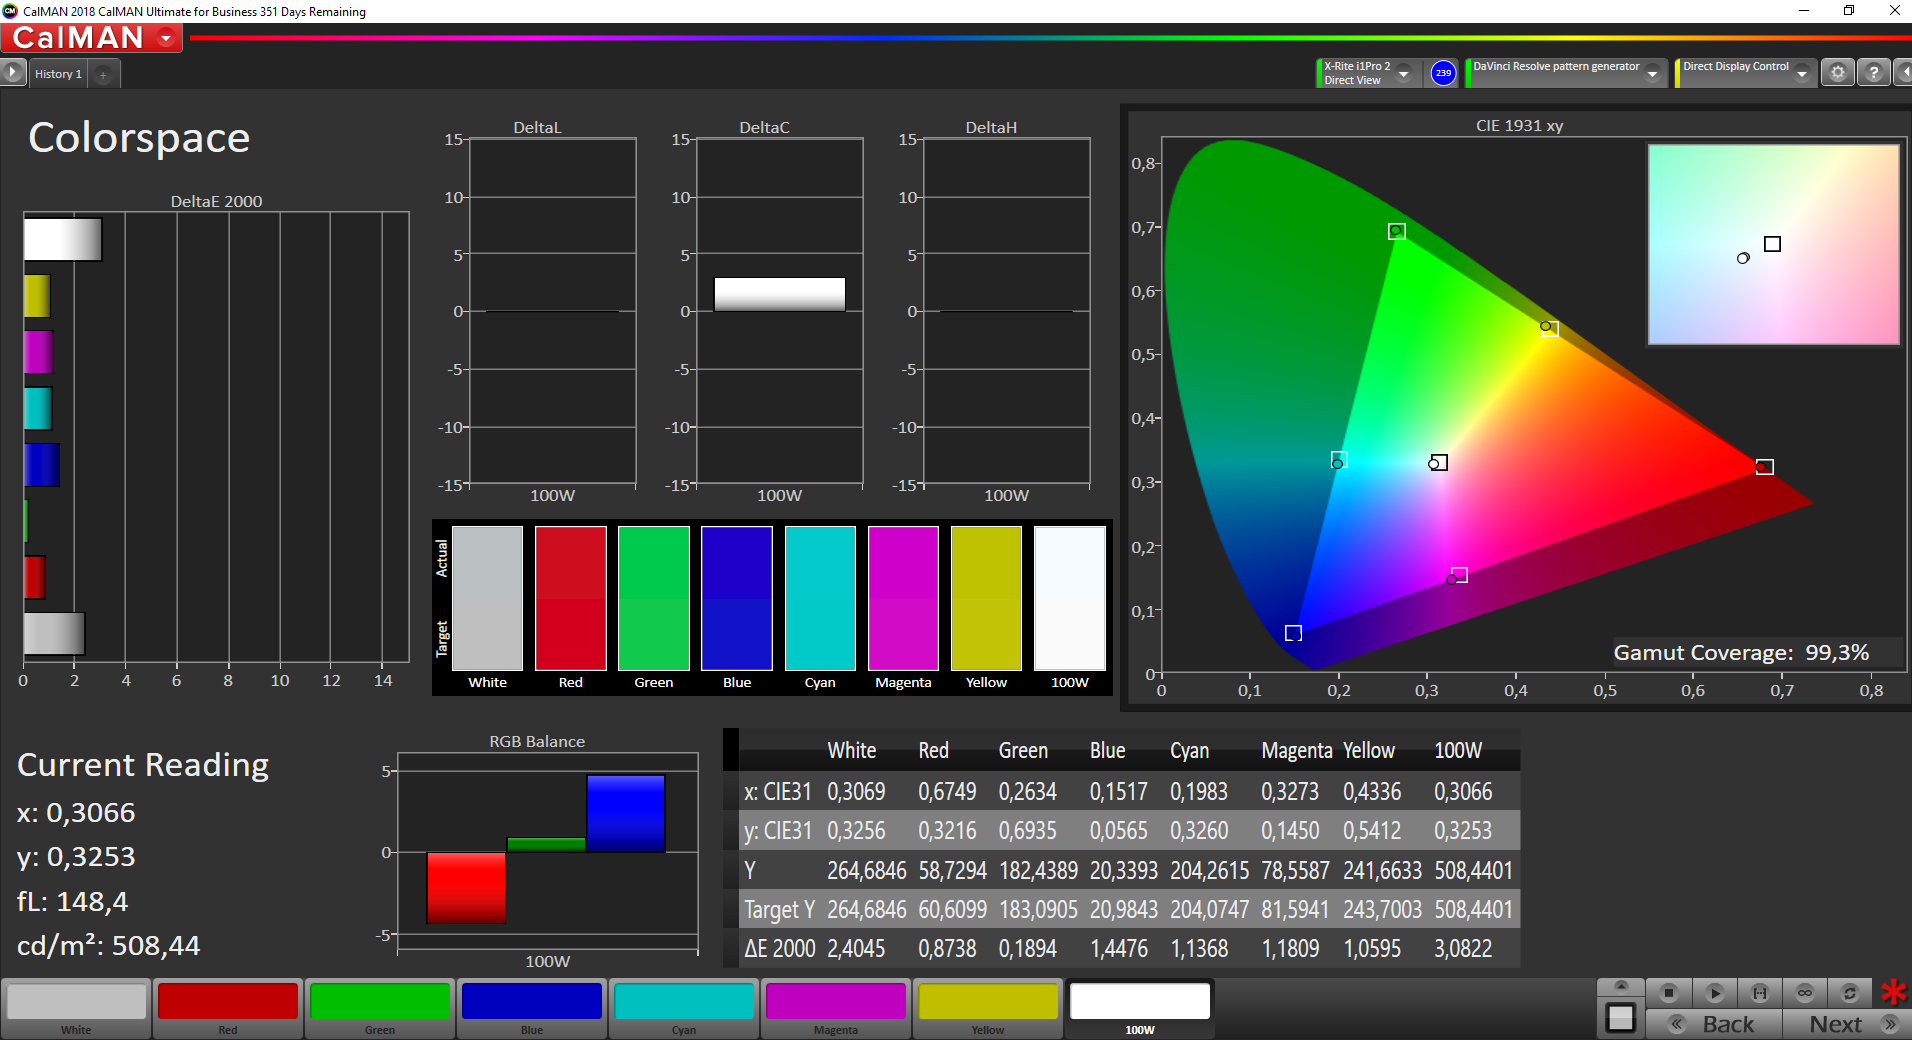
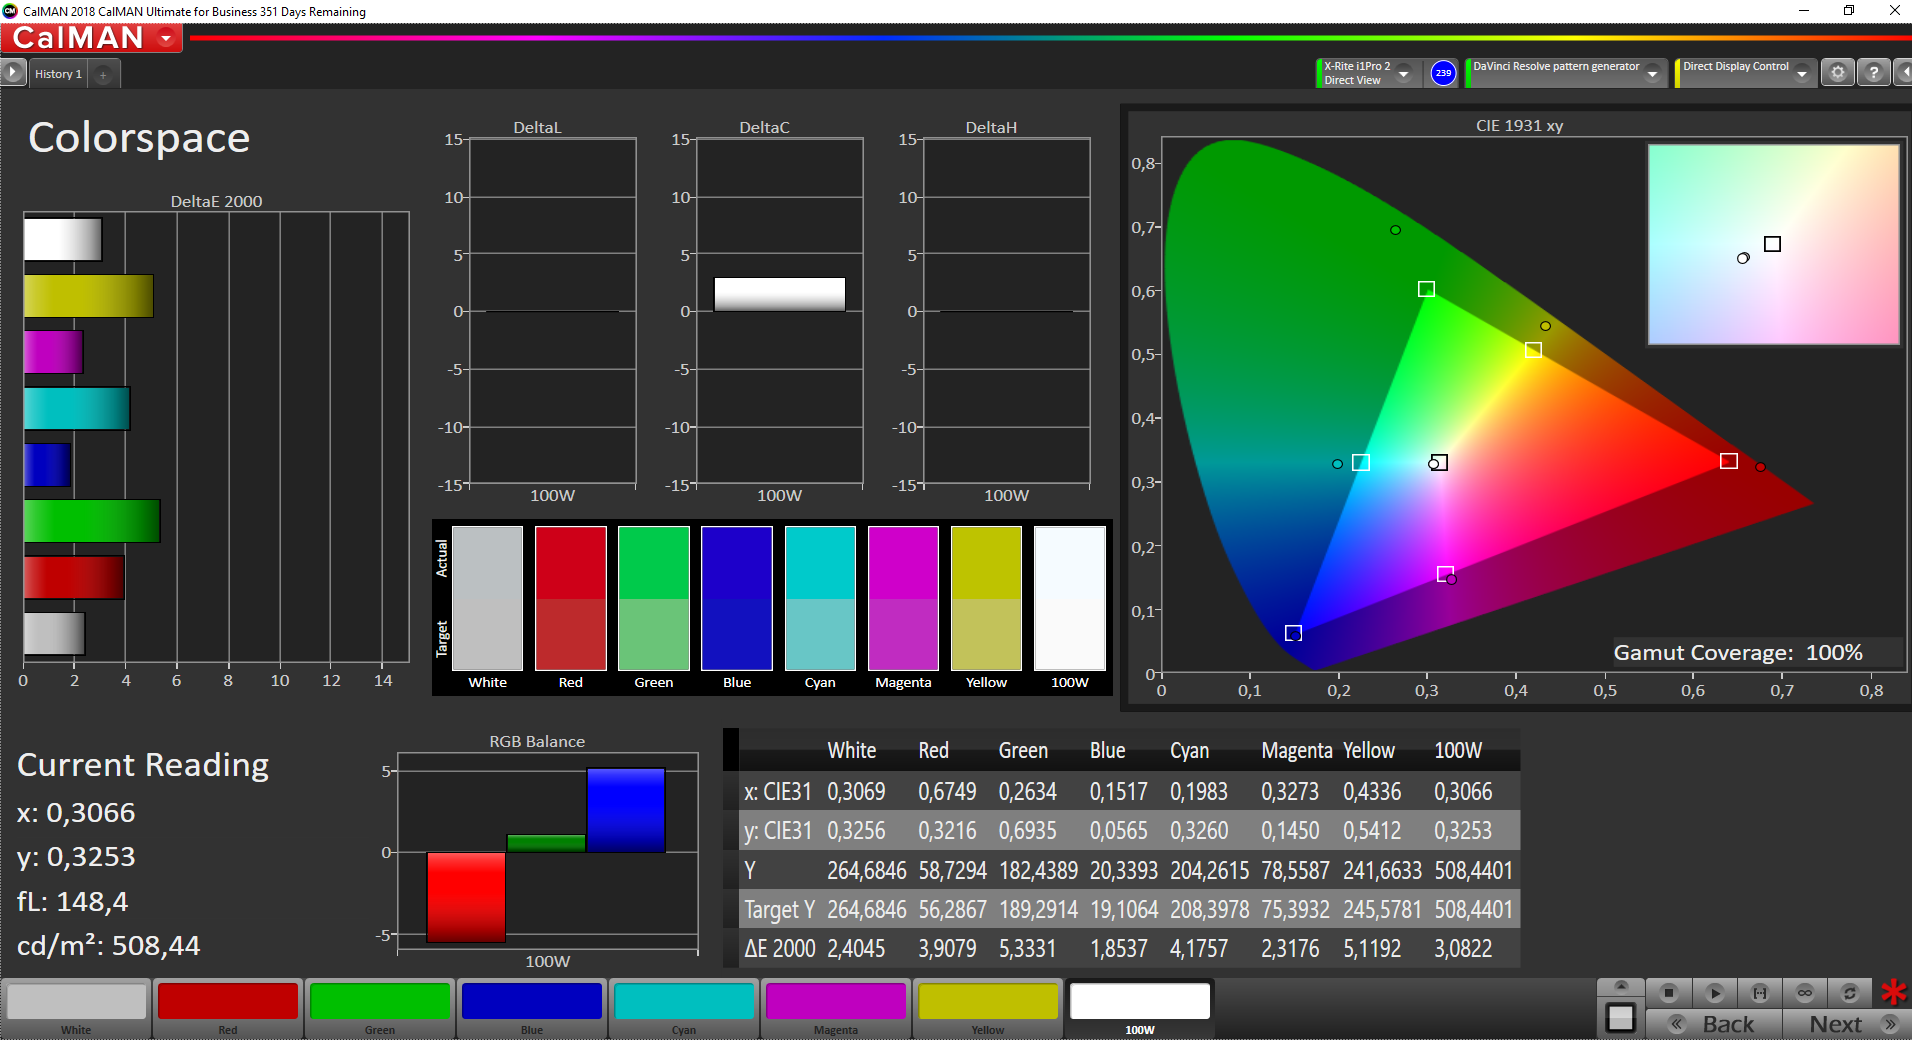
De MacBook Pro 13 is zeer goed gekalibreerd uit de doos. Er is nog wel wat ruimte voor verbetering als we kijken naar de grijsschaalprestaties, maar alle afwijkingen liggen al onder de belangrijke grenswaarde van 3. We hebben de P3-referentiekleurenruimte gebruikt voor onze analyse met de professionele CalMAN-software en de X-Rite i1 Pro 2-spectrofotometer
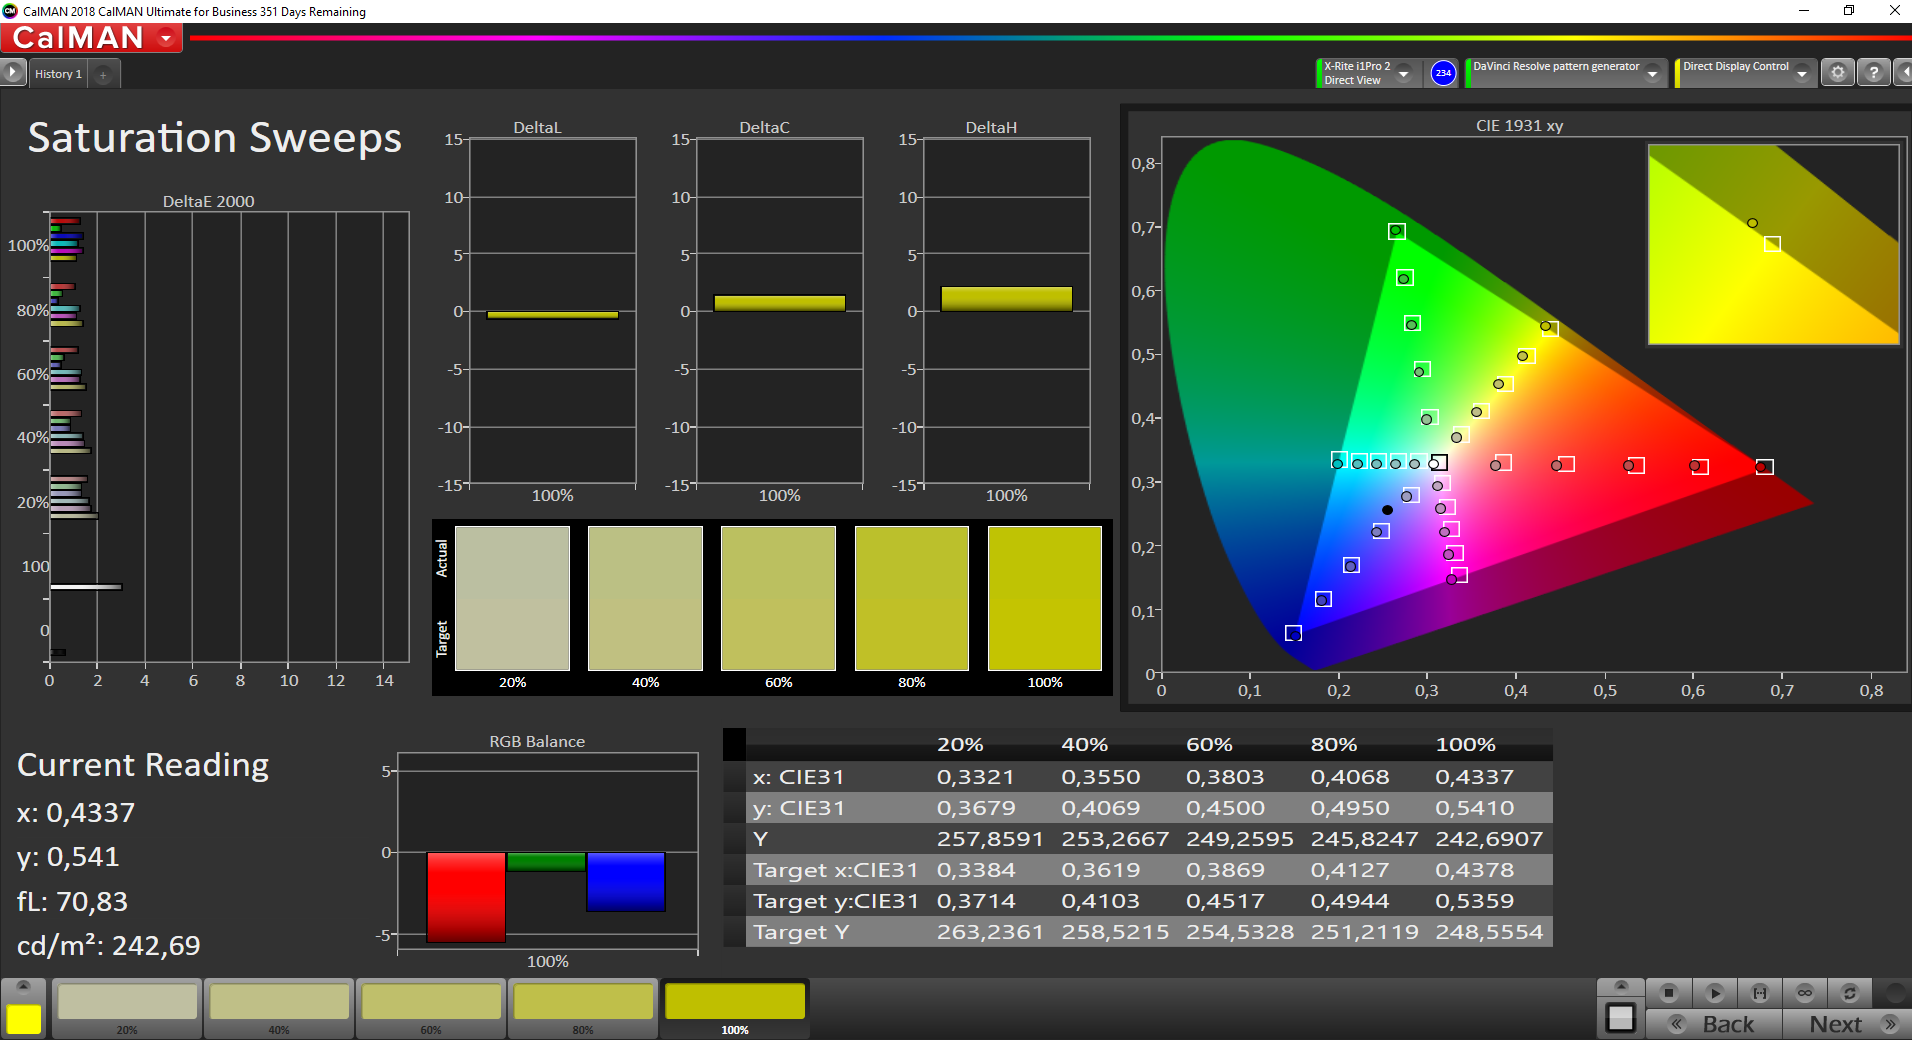

Op dit moment zijn we niet in staat om de nieuwe MacBook Pro 13 M1 te kalibreren vanwege een softwareprobleem. Daarom moeten we de CalMAN-metingen (2D-vergelijking met de referentiekleurruimte) gebruiken om het kleurengamma te bepalen. We kunnen de claim van Apple's over het volledige P3-kleurengamma bevestigen

Responstijd Scherm
| ↔ Responstijd Zwart naar Wit | ||
|---|---|---|
| 25.2 ms ... stijging ↗ en daling ↘ gecombineerd | ↗ 8.4 ms stijging | 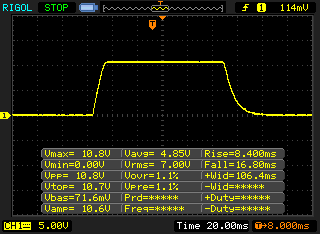 |
| ↘ 16.8 ms daling | ||
| Het scherm vertoonde relatief trage responstijden in onze tests en is misschien te traag voor games. Ter vergelijking: alle testtoestellen variëren van 0.1 (minimum) tot 240 (maximum) ms. » 61 % van alle toestellen zijn beter. Dit betekent dat de gemeten responstijd slechter is dan het gemiddelde (19.8 ms) van alle geteste toestellen. | ||
| ↔ Responstijd 50% Grijs naar 80% Grijs | ||
| 48 ms ... stijging ↗ en daling ↘ gecombineerd | ↗ 18.8 ms stijging | 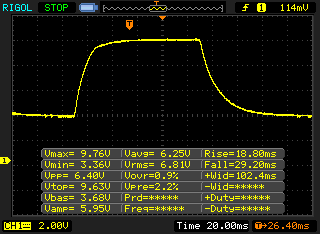 |
| ↘ 29.2 ms daling | ||
| Het scherm vertoonde trage responstijden in onze tests en is misschien te traag voor games. Ter vergelijking: alle testtoestellen variëren van 0.165 (minimum) tot 636 (maximum) ms. » 82 % van alle toestellen zijn beter. Dit betekent dat de gemeten responstijd slechter is dan het gemiddelde (31 ms) van alle geteste toestellen. | ||
Screen Flickering / PWM (Pulse-Width Modulation)
| Screen flickering / PWM waargenomen | 122000 Hz | ≤ 49 % helderheid instelling | 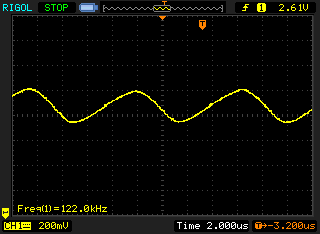 |
De achtergrondverlichting van het scherm flikkert op 122000 Hz (in het slechtste geval, bijvoorbeeld bij gebruik van PWM) aan een helderheid van 49 % en lager. Boven deze helderheid zou er geen flickering / PWM mogen optreden. De frequentie van 122000 Hz is redelijk hoog en de meeste mensen die gevoelig zijn aan flickering zouden dit dus niet mogen waarnemen of geïrriteerde ogen krijgen. Ter vergelijking: 52 % van alle geteste toestellen maakten geen gebruik van PWM om de schermhelderheid te verlagen. Als het wel werd gebruikt, werd een gemiddelde van 7757 (minimum: 5 - maximum: 343500) Hz waargenomen. | |||
De kijkhoekstabiliteit van het IPS-paneel is zeer goed. Het display werkt ook goed buiten en het is zeker niet zo reflecterend als veel andere glanzende schermen. Zolang je directe reflecties van lichtbronnen kunt vermijden, is het geen probleem om de notebook zelfs in lichtere omgevingen te gebruiken


Prestaties - M1 verslaat duidelijk Intel
Het instapmodel van de MacBook Pro 13 is, net als de nieuwe MacBook Air, uitgerust met de nieuwe M1-processor vanApple (8 cores, 4x 3,2 GHz & 4x 2,3 GHz). De chip zelf is in beide apparaten volledig identiek, inclusief de klokken. Het enige verschil is de geïntegreerde GPU, omdat de minder dure Air beschikbaar is met een 7 of 8 GPU cores, krijgt de Pro altijd de snellere 8-core GPU. De MBP 13 M1 heeft ook de actieve koeloplossing, die de prestaties in duurzame belastingscenario's moet stabiliseren.
Processor - Niet sneller dan de MacBook Air in alledaagse scenario's
De prestaties van Apple's nieuwe M1-processor is opnieuw indrukwekkend, niet alleen in vergelijking met de vorige door Intel aangedreven MBP 13 of de duurdere MBP 13 met vier Thunderbolt-poorten. Eerst kijken we naar de prestaties van de processor in native applicaties, in dit geval Cinebench R23. Het single-core resultaat is net iets beter dan dat van de MacBook Air M1, en zelfs de eerste Multi-piloot is slechts 5 % sneller op de Pro. De Air moet de prestaties echter een beetje verminderen (-12 %) wanneer je het apparaat langere tijd belast door de passieve koeloplossing. Toch zul je dit in de praktijk nauwelijks merken.
We zijn erg onder de indruk van het feit dat de MacBook Pro 13 de prestaties kan handhaven. Bijna alle mobiele apparaten (vooral met 15W CPU's) geven meestal merkbaar gas na de eerste 30 seconden. De directe voorganger met de Intel Core i5-8257U is duidelijk geklopt (+51 % Single, +94 % Multi). Ook ons testapparaat verslaat vrijwel alles in de single-core test, waaronder de krachtigste nieuwe Tiger Lake CPU's van Intel, de recente Ryzen mobiele processoren en zelfs de huidige 45W CPU's van Intel maken geen schijn van kans. Alleen de twee gloednieuwe desktop CPU's van AMD hebben een kleine voorsprong.
De prestaties zijn niet minder indrukwekkend in de multi-core test, en Apple's M1-processor wordt alleen verslagen door CPU's met veel meer kernen. Onder de mobiele processoren heeft alleen de AMD Ryzen 7 4800U een voordeel, maar de veel populairdere Ryzen 7 4700U is marginaal langzamer. Alle mobiele Intel CPU's, inclusief de gloednieuwe Tiger Lake processoren, zijn ook langzamer
Apps zonder een native versie voor de M1 CPU, worden geëmuleerd door de app Rosetta, die zeer goed werkt. De emulatie heeft echter wel invloed op de prestaties, dus het voordeel van de nieuwe M1-processor in de oudere Cinebench R15 is bijvoorbeeld wat kleiner. Toch is het algehele resultaat uitstekend
Cinebench R15: CPU Single 64Bit | CPU Multi 64Bit
Blender: v2.79 BMW27 CPU
7-Zip 18.03: 7z b 4 -mmt1 | 7z b 4
Geekbench 5.5: Single-Core | Multi-Core
HWBOT x265 Benchmark v2.2: 4k Preset
LibreOffice : 20 Documents To PDF
R Benchmark 2.5: Overall mean
Cinebench R15: CPU Single 64Bit | CPU Multi 64Bit
Blender: v2.79 BMW27 CPU
7-Zip 18.03: 7z b 4 -mmt1 | 7z b 4
Geekbench 5.5: Single-Core | Multi-Core
HWBOT x265 Benchmark v2.2: 4k Preset
LibreOffice : 20 Documents To PDF
R Benchmark 2.5: Overall mean
* ... kleiner is beter
Systeemprestaties & SSD
Er zijn nog geen systeembenchmarks voor de nieuwe M1 MacBooks, dus we richten ons op de browserbenchmarks en de subjectieve prestatie-indruk. Als je ooit Windows op een ARM-notebook hebt gebruikt, verwacht je waarschijnlijk prestatieproblemen, maar dat is hier gelukkig niet het geval. Subjectief gezien draait macOS zelfs iets beter op de nieuwe M1-processor en bijna alle programma's voor Intel-Macs die we hebben geprobeerd, werkten zonder problemen en de emulatie had geen significante invloed op de prestatie-indruk. De browserbenchmarks leveren ook uitstekende scores op.
De nieuwe MBP 13 met de M1-processor is gewoon een zeer snelle en responsieve machine als je hem gebruikt. Hij profiteert natuurlijk ook van de PCIe SSD; de overdrachtsnelheden zijn goed, alleen het schrijfresultaat is iets lager dan verwacht. Toch heeft dit geen invloed op uw dagelijks gebruik
* ... kleiner is beter
GPU Performance - iGPU met 8 kernen
De MacBook Pro 13 M1 is altijd uitgerust met de snellere 8-core versie van de iGPU, terwijl de instapmodel Air ook verkrijgbaar is met een minder krachtige 7-core iGPU. De prestaties van de synthetische benchmark zijn vrijwel identiek aan die van de MacBook Air met 8 GPU-cores en liggen ongeveer 5-10 % voor op die van de MacBook Air met de 7-core iGPU. Onze MacBook Pro 13 doorstaat ook de 3DMark Wild Life-stresstest zonder dat hij zich in het zweet werkt
Speciale grafische kaarten zoals de GeForce MX350 zijn gemakkelijk te verslaan en de M1 iGPU ligt slechts 24 % achter op de mobiele GeForce GTX 1650 Ti. De OpenCL-prestaties daarentegen zijn vergelijkbaar met de nieuwe Intel Xe Graphics (96 EU's ) van de huidige generatie Tiger Lake. Ook de grafische adapter in de nieuwe iPad Air 2020
is duidelijk geklopt.De MBP 13 M1 heeft geen problemen met iOS-games. Andere titels (zoals Borderlands 3, Shadow of the Tomb Raider) werken wel, maar moeten worden nagebootst. Als er eenmaal native games zijn voor macOS met de M1-processor, verwachten we een aanzienlijke prestatiebom. Je zou ook wat grafische problemen kunnen ervaren, zoals we deden toen we Total War: Three Kingdoms testten
| lage | gem. | hoge | ultra | |
|---|---|---|---|---|
| Shadow of the Tomb Raider (2018) | 66 | 25 | 23 | |
| Total War: Three Kingdoms (2019) | 93.4 | 33 | 20.6 | |
| Borderlands 3 (2019) | 30.4 | 20.3 |
Uitstoot - MacBook Pro 13 blijft koeler
Systeemgeluid
De ventilator is identiek aan de vorige MBP 13 (2x TB3), dus we wilden natuurlijk graag weten of er verschillen zijn op het gebied van ventilatorgeluiden. De nieuwe MacBook Pro 13 met de M1-processor is over het algemeen een stiller apparaat en de ventilator draait niet meer zo vaak als voorheen. Je zult de ventilator waarschijnlijk helemaal niet horen in alledaagse gebruiksscenario's, en het duurt meestal ongeveer een minuut voordat de ventilator onder belasting begint te draaien.
Als we kijken naar belastingsscenario's, moeten we onderscheid maken tussen native en geëmuleerde apps. Als je bijvoorbeeld Cinebench R23 (native) draait, duurt het een paar minuten voordat de ventilator begint te draaien en zal deze uiteindelijk schommelen tussen 30,4-32,1 dB(A). Ter vergelijking: De voorganger bereikte in dit scenario na enkele minuten zijn maximale ventilatorgeluid van 40,8 dB(A). Als je Cinebench R15 daarentegen gebruikt, draait de ventilator veel sneller op de nieuwe MBP 13 M1 en kunnen we na een paar minuten tussen 36,2-41,9 dB(A) meten. De verandering van de snelheid van de ventilator is hier erg langzaam, maar je kunt het merken en we geven de voorkeur aan een constant toerental.
Onze stresstest met Cinebench R23 (native) en Unigine Valley (geëmuleerd) zal resulteren in het maximale ventilatorgeluid van de MBP 13 M1, dat zelfs iets luider is in vergelijking met de voorganger bij 41,9 dB(A). De ventilator is echter volledig uitgeschakeld als u alleen Unigine Valley draait, dus we vermoeden hier een storing. De ventilator bleef erg stil tijdens onze gaming benchmarks en werd vaak uitgeschakeld
| MacBook Pro 13 2020 M1 | MacBook Pro 13 2020 Core i5 | |
|---|---|---|
| Unigine Valley is uitgeschakeld 34 dB(A) | ||
| Cinebench R23 | 30,4-32,1 dB(A) | 40,8 dB(A) |
| Cinebench R15 | 36,2-41,9 dB(A) | 40,8 dB(A) |
| Stresstest (CB R23 + Unigine Valley) | 41,9 dB(A) | 40,8 dB(A) |
Geluidsniveau
| Onbelast |
| 29.2 / 29.2 / 29.2 dB (A) |
| Belasting |
| 32.1 / 41.9 dB (A) |
 | ||
30 dB stil 40 dB(A) hoorbaar 50 dB(A) luid |
||
min: | ||
| Apple MacBook Pro 13 Late 2020 M1 Entry (8 / 256 GB) M1 8-Core GPU, M1, Apple SSD AP0256 | Apple MacBook Pro 13 2020 2TB3 i5 Iris Plus Graphics 645, i5-8257U, Apple SSD AP0512 | Apple MacBook Pro 13 2020 2GHz i5 10th-Gen Iris Plus Graphics G7 (Ice Lake 64 EU), i5-1038NG7, Apple SSD SM0512F | Dell XPS 13 9310 Core i7 FHD Iris Xe G7 96EUs, i7-1165G7, Micron 2300 512GB MTFDHBA512TDV | Huawei MateBook X Pro 2020 i7 GeForce MX250, i7-10510U, Samsung PM981a MZVLB1T0HBLR | Razer Book 13 FHD Iris Xe G7 96EUs, i7-1165G7, Samsung SSD PM981a MZVLB256HBHQ | |
|---|---|---|---|---|---|---|
| Noise | 0% | -2% | 13% | -3% | 6% | |
| uit / omgeving * (dB) | 29.2 | 29.2 -0% | 29.6 -1% | 25.7 12% | 29.6 -1% | 27 8% |
| Idle Minimum * (dB) | 29.2 | 29.2 -0% | 29.6 -1% | 25.7 12% | 29.6 -1% | 27 8% |
| Idle Average * (dB) | 29.2 | 29.2 -0% | 29.6 -1% | 25.7 12% | 29.6 -1% | 27 8% |
| Idle Maximum * (dB) | 29.2 | 29.2 -0% | 29.6 -1% | 25.9 11% | 30.3 -4% | 27.1 7% |
| Load Average * (dB) | 32.1 | 32.9 -2% | 34.4 -7% | 26.2 18% | 38 -18% | 29 10% |
| Load Maximum * (dB) | 41.9 | 40.8 3% | 42.1 -0% | 36.6 13% | 38 9% | 44.8 -7% |
| Witcher 3 ultra * (dB) | 36.1 | 36.5 | 38 | 33.3 |
* ... kleiner is beter
Temperatuur
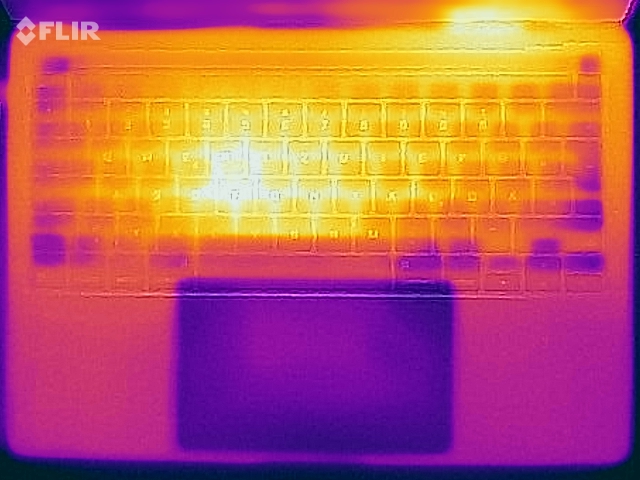
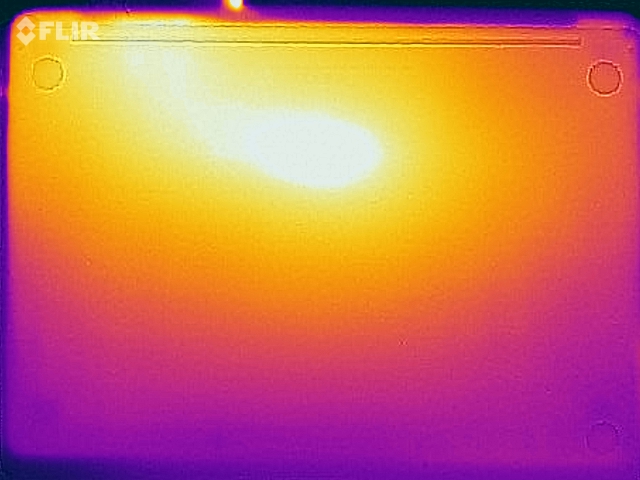
Apple beheert de oppervlaktetemperaturen zeer goed. De MacBook Air M1 was ondanks de passieve koeling al behoorlijk goed. De MacBook Pro 13 is zelfs iets beter dankzij de ventilator. We hebben al gezegd dat de prestaties stabiel zijn, en tegelijkertijd bepalen we slechts iets meer dan 40 °C op sommige meetpunten. De directe voorganger met Intel i5 CPU was een paar graden warmer. Dit betekent dat je de nieuwe MBP 13 M1 comfortabel op schoot kunt zetten zonder dat je je zorgen hoeft te maken. Het is ook erg koel tijdens alledaagse taken
(±) De maximumtemperatuur aan de bovenzijde bedraagt 41 °C / 106 F, vergeleken met het gemiddelde van 35.9 °C / 97 F, variërend van 21.4 tot 59 °C voor de klasse Subnotebook.
(±) De bodem warmt op tot een maximum van 40.4 °C / 105 F, vergeleken met een gemiddelde van 39.2 °C / 103 F
(+) Bij onbelast gebruik bedraagt de gemiddelde temperatuur voor de bovenzijde 23.3 °C / 74 F, vergeleken met het apparaatgemiddelde van 30.8 °C / 87 F.
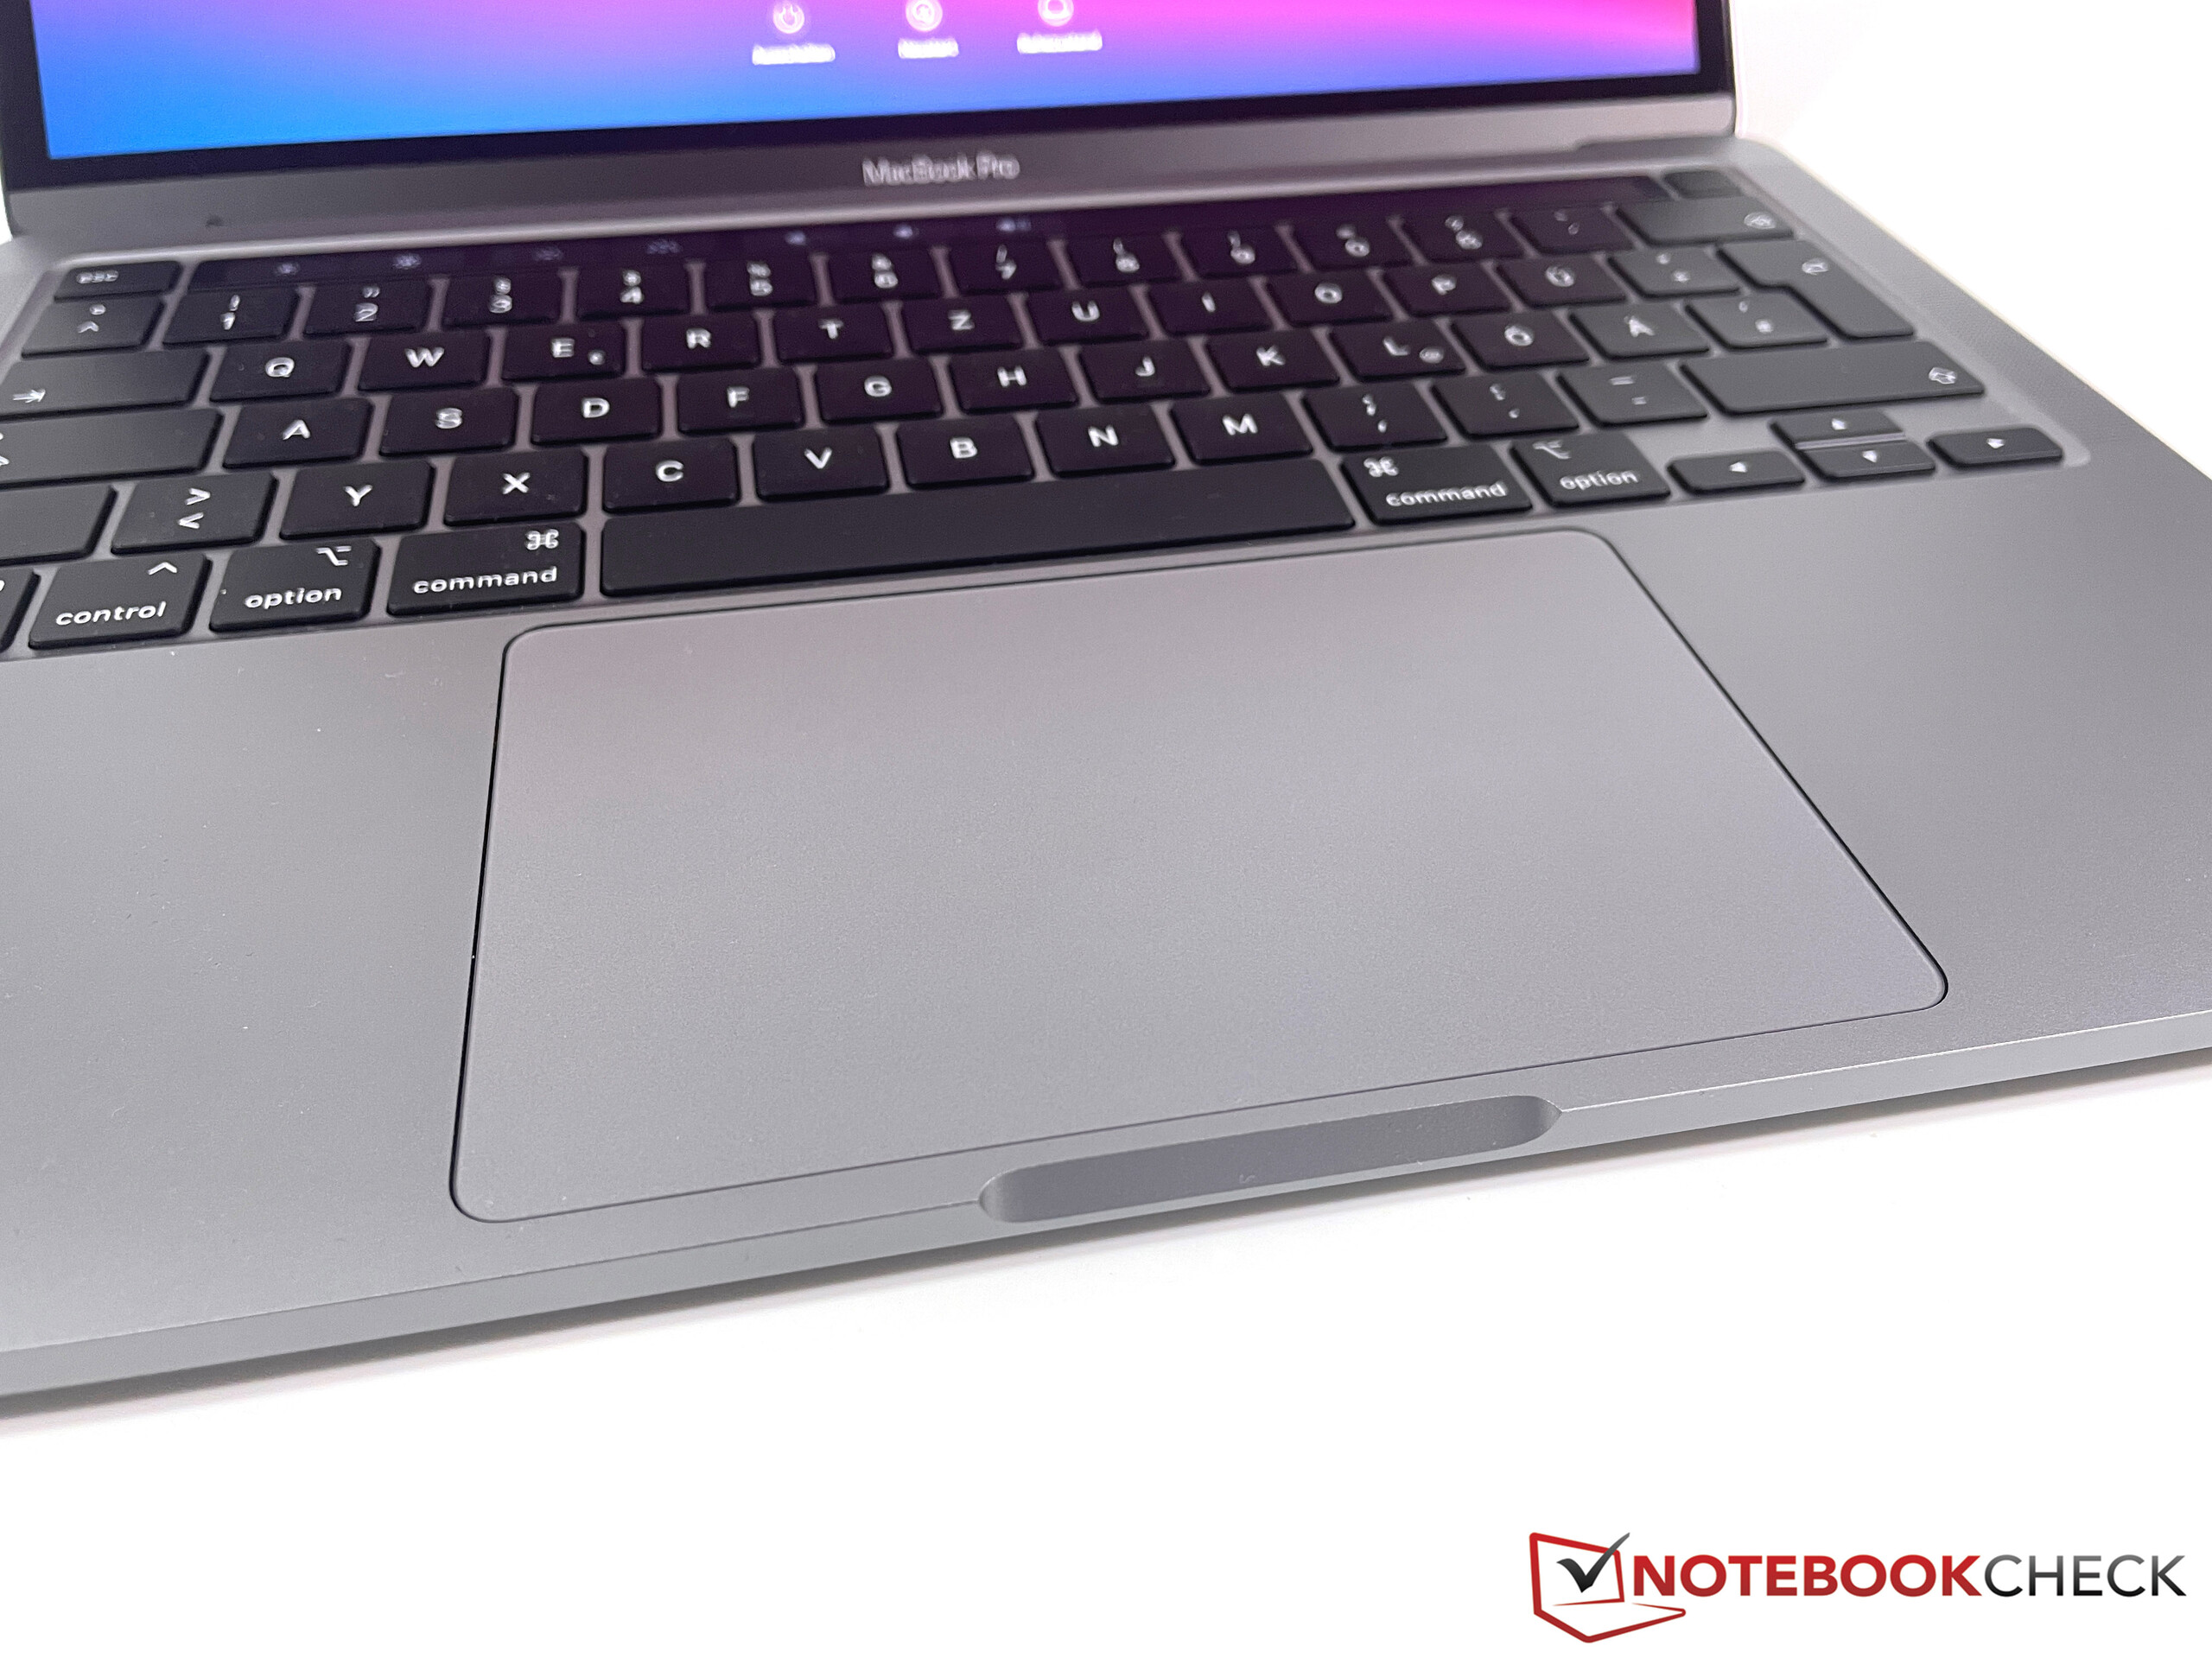
(+) De palmsteunen en het touchpad zijn met een maximum van ###max## °C / 87.8 F koeler dan de huidtemperatuur en voelen daarom koel aan.
(-) De gemiddelde temperatuur van de handpalmsteun van soortgelijke toestellen bedroeg 28.2 °C / 82.8 F (-2.8 °C / -5 F).
Luidsprekers
De luidsprekers zijn identiek aan het vorige model en onze audio-analyse laat ook vrij veel van de exacte waarden zien. Apple's Stereoluidsprekers behoren nog steeds tot de beste in het notebooksegment
Apple MacBook Pro 13 Late 2020 M1 Entry (8 / 256 GB) audioanalyse
(±) | luidspreker luidheid is gemiddeld maar goed (77.5 dB)
Bas 100 - 315 Hz
(±) | verminderde zeebaars - gemiddeld 8.7% lager dan de mediaan
(±) | lineariteit van de lage tonen is gemiddeld (8.6% delta ten opzichte van de vorige frequentie)
Midden 400 - 2000 Hz
(+) | evenwichtige middens - slechts 4.2% verwijderd van de mediaan
(+) | de middentonen zijn lineair (4.2% delta ten opzichte van de vorige frequentie)
Hoog 2 - 16 kHz
(+) | evenwichtige hoogtepunten - slechts 1.2% verwijderd van de mediaan
(+) | de hoge tonen zijn lineair (4% delta naar de vorige frequentie)
Algemeen 100 - 16.000 Hz
(+) | het totale geluid is lineair (12.9% verschil met de mediaan)
Vergeleken met dezelfde klasse
» 20% van alle geteste apparaten in deze klasse waren beter, 5% vergelijkbaar, 75% slechter
» De beste had een delta van 5%, het gemiddelde was 18%, de slechtste was 53%
Vergeleken met alle geteste toestellen
» 12% van alle geteste apparaten waren beter, 3% gelijk, 85% slechter
» De beste had een delta van 4%, het gemiddelde was 23%, de slechtste was 134%
Apple MacBook Pro 13 2020 2TB3 i5 audioanalyse
(±) | luidspreker luidheid is gemiddeld maar goed (77.6 dB)
Bas 100 - 315 Hz
(±) | verminderde zeebaars - gemiddeld 7.7% lager dan de mediaan
(±) | lineariteit van de lage tonen is gemiddeld (7.8% delta ten opzichte van de vorige frequentie)
Midden 400 - 2000 Hz
(+) | evenwichtige middens - slechts 4.8% verwijderd van de mediaan
(+) | de middentonen zijn lineair (2.7% delta ten opzichte van de vorige frequentie)
Hoog 2 - 16 kHz
(+) | evenwichtige hoogtepunten - slechts 1.5% verwijderd van de mediaan
(+) | de hoge tonen zijn lineair (4.9% delta naar de vorige frequentie)
Algemeen 100 - 16.000 Hz
(+) | het totale geluid is lineair (12.9% verschil met de mediaan)
Vergeleken met dezelfde klasse
» 12% van alle geteste apparaten in deze klasse waren beter, 3% vergelijkbaar, 85% slechter
» De beste had een delta van 4%, het gemiddelde was 23%, de slechtste was 134%
Vergeleken met alle geteste toestellen
» 12% van alle geteste apparaten waren beter, 3% gelijk, 85% slechter
» De beste had een delta van 4%, het gemiddelde was 23%, de slechtste was 134%
Energiebeheer - Apple M1 is efficiënter
Stroomverbruik
Het stroomverbruik is verbeterd ten opzichte van de voorganger en de (toch al zeer lage) stationaire waarden zijn deze keer nog beter. De MacBook Air M1 is iets efficiënter, maar heeft ook een iets donkerder scherm. Onder belasting kunnen we tot 47,5W meten, maar na een uur is het vermogen gedaald tot ongeveer 43W. Ondanks het hoge ventilatorgeluid moet de MacBook Pro 13 uiteindelijk de prestaties wat verminderen. De meegeleverde 61W-lichtnetadapter is volledig voldoende en heeft nog steeds voldoende hoofdruimte om de batterij onder belasting op te laden.
Ook de toetsenbordverlichting is zeer efficiënt. Terwijl we op sommige Windows-laptops sprongen tot 2W kunnen zien, verhoogt de hoogste toetsenbordverlichting op de MBP 13 het verbruik slechts met 0,8W
| Uit / Standby | |
| Inactief | |
| Belasting |
|
Key:
min: | |
| Apple MacBook Pro 13 Late 2020 M1 Entry (8 / 256 GB) M1, M1 8-Core GPU, Apple SSD AP0256, IPS, 2560x1600, 13.3" | Apple MacBook Air 2020 M1 Entry M1, M1 7-Core GPU, Apple SSD AP0256Q, IPS, 2560x1600, 13.3" | Apple MacBook Pro 13 2020 2TB3 i5 i5-8257U, Iris Plus Graphics 645, Apple SSD AP0512, , 2560x1600, 13.3" | Apple MacBook Pro 13 2020 2GHz i5 10th-Gen i5-1038NG7, Iris Plus Graphics G7 (Ice Lake 64 EU), Apple SSD SM0512F, IPS, 2560x1600, 13.3" | Dell XPS 13 9310 Core i7 FHD i7-1165G7, Iris Xe G7 96EUs, Micron 2300 512GB MTFDHBA512TDV, IPS, 1920x1200, 13.4" | Huawei MateBook X Pro 2020 i7 i7-10510U, GeForce MX250, Samsung PM981a MZVLB1T0HBLR, LTPS, 3000x2000, 13.9" | Razer Book 13 FHD i7-1165G7, Iris Xe G7 96EUs, Samsung SSD PM981a MZVLB256HBHQ, IPS, 1920x1200, 13.4" | Gemiddeld Apple M1 8-Core GPU | Gemiddelde van klas Subnotebook | |
|---|---|---|---|---|---|---|---|---|---|
| Power Consumption | 8% | -34% | -64% | -30% | -74% | -27% | -50% | -43% | |
| Idle Minimum * (Watt) | 1.67 | 1.9 -14% | 2.3 -38% | 3.8 -128% | 3.9 -134% | 4.3 -157% | 3.3 -98% | 3.34 ? -100% | 3.76 ? -125% |
| Idle Average * (Watt) | 6.7 | 6.4 4% | 7.9 -18% | 8.6 -28% | 5.9 12% | 8.5 -27% | 6.4 4% | 14.6 ? -118% | 6.54 ? 2% |
| Idle Maximum * (Watt) | 7.4 | 7 5% | 8.6 -16% | 10.3 -39% | 6.3 15% | 12 -62% | 7 5% | 13.3 ? -80% | 7.89 ? -7% |
| Load Average * (Watt) | 28 | 25 11% | 46 -64% | 52.1 -86% | 39.7 -42% | 54.8 -96% | 37.3 -33% | 23 ? 18% | 42 ? -50% |
| Load Maximum * (Watt) | 47.5 | 30.3 36% | 64 -35% | 65.2 -37% | 47.5 -0% | 61.5 -29% | 53.7 -13% | 33.2 ? 30% | 64.8 ? -36% |
| Witcher 3 ultra * (Watt) | 48.2 | 34.8 | 47.1 | 36.4 |
* ... kleiner is beter
Batterij looptijd
De accucapaciteit is niet veranderd (58,2 Wh), maar de looptijd van de accu's is merkbaar langer in vergelijking met het vorige Intel-model. De MacBook Air M1 met de kleinere batterij (49,9 Wh) is ook verslagen. We kunnen in onze Wi-Fi-test meer dan 20 uur vaststellen, en nog steeds meer dan 19 uur tijdens het afspelen van video's (beide tests met een aangepaste lichtsterkte van 150 cd/m²). Als we de Wi-Fi test herhalen met de maximale helderheid van het scherm, daalt de looptijd met ongeveer 50% tot iets meer dan 10 uur. Over het geheel genomen zijn dit uitstekende resultaten
| Apple MacBook Pro 13 Late 2020 M1 Entry (8 / 256 GB) M1, M1 8-Core GPU, 58.2 Wh | Apple MacBook Air 2020 M1 Entry M1, M1 7-Core GPU, 49.9 Wh | Apple MacBook Pro 13 2020 2TB3 i5 i5-8257U, Iris Plus Graphics 645, Wh | Apple MacBook Pro 13 2020 2GHz i5 10th-Gen i5-1038NG7, Iris Plus Graphics G7 (Ice Lake 64 EU), 58 Wh | Dell XPS 13 9310 Core i7 FHD i7-1165G7, Iris Xe G7 96EUs, 52 Wh | Huawei MateBook X Pro 2020 i7 i7-10510U, GeForce MX250, 57.4 Wh | Razer Book 13 FHD i7-1165G7, Iris Xe G7 96EUs, 55 Wh | Gemiddelde van klas Subnotebook | |
|---|---|---|---|---|---|---|---|---|
| Batterijduur | ||||||||
| WiFi v1.3 (h) | 20.4 | 16 -22% | 13.4 -34% | 12.1 -41% | 11 -46% | 10.4 -49% | 14.8 -27% | 14 ? -31% |
Pro
Contra
Oordeel - MBP 13 is zeer goed, maar het rechtvaardigt niet de extra prijs over de lucht
We kunnen het oordeel over de nieuwe MacBook Pro 13 met de M1-processor vrij kort houden: hij bouwt voort op de sterke punten van de vorige iteraties en de nieuwe processor verbetert sommige aspecten, zoals de prestaties, het ventilatorgeluid in alledaagse scenario's of de langere looptijd van de batterij. Er zijn echter nog steeds enkele nadelen, zoals het beperkte aantal poorten of de langzame Wi-Fi 6-overdrachtssnelheden. Al met al is het nog steeds een van de beste mobiele apparaten op de markt.
Het probleem is de vergelijking met de nieuwe MacBook Air. Dankzij de M1-update is de Air nu veel krachtiger dan voorheen en kun je in de praktijk geen verschil merken tussen de twee apparaten. De MacBook Pro 13 profiteert alleen van zijn ventilator bij langdurige belasting, maar wij vinden dit niet echt een belangrijk aspect voor de doelgroep. De prestatiedaling van de Air is ook niet zo erg (ongeveer 12 % in Cinebench R23).
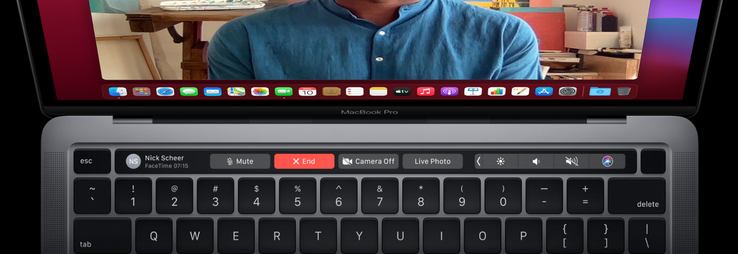
Ook op het gebied van de weergave heeft de Air het gat gedicht. Het is nog steeds iets donkerder dan de Pro (400 vs. 500 nits), maar de Air ondersteunt nu ook het grotere P3 kleurengamma. Beide apparaten ondersteunen dezelfde connectiviteitsfuncties. De looptijd van de batterij is beter op de Pro dankzij de grotere batterij, maar hij is ook zwaarder in ruil. Het enige echte verschil als je het apparaat gebruikt is de Touch Bar van de MacBook Pro 13. Elke gebruiker moet echter beslissen of dit een positief of een negatief aspect is. Om eerlijk te zijn is de Touch Bar zelfs na een paar jaar nog steeds slechts een gimmick en voor basisacties zoals het aanpassen van de helderheid van het scherm of het luidsprekervolume zijn meestal meer ingangen nodig. Persoonlijk geven we de voorkeur aan de fysieke F-toetsen van de MacBook Air.
De MacBook Pro 13 heeft veel baat bij de nieuwe M1-processor en is zeker een van de beste subnotebooks die je kunt krijgen. In vergelijking met de nieuwe MacBook Air missen we echter de "Pro"-functies. Beide modellen komen in het dagelijks gebruik zeer dicht in de buurt, dus we geven zeker de voorkeur aan de goedkopere MacBook Air.
De prijs van de MacBook Pro 13 met een SSD van 256 GB begint bij $1299 en bij een SSD van 512 GB bij $1499. De MacBook Air met de snellere 8-core GPU en 512 GB is verkrijgbaar voor € 1249, dus hij biedt een veel betere prijs-prestatieverhouding.
Al met al lijkt de nieuwe MacBook Pro 13 M1 een vulmiddel te zijn dat weinig zin heeft. We kunnen geen echte argumenten vinden om de Pro te verkiezen boven de nieuwe Air. We vermoeden dat Apple de instapmodel MacBook Pro 13 in de niet al te verre toekomst zal staken en slechts één (en duurdere) MacBook Pro 13 (of misschien MacBook Pro 14) met een krachtigere M1X-processor zal aanbieden
Apple MacBook Pro 13 Late 2020 M1 Entry (8 / 256 GB)
- 18-12-2020 v7 (old)
Andreas Osthoff
Price comparison

