Verdict - MSI's dunste en meest professionele laptop tot nu toe
Net als de transformatie van de 2025 Dell 16 Premium naar de 2026 XPS 16is de 2026 Prestige 16 een slanker, gestroomlijnder en efficiënter apparaat dan de 2025 Prestige 16. Dit is voor een groot deel te danken aan de overstap naar Intel Panther Lake X7, die een aanzienlijke verbetering van de prestaties per watt biedt ten opzichte van de vorige generatie. Vooral de GPU-prestaties zijn indrukwekkend, gezien het feit dat de MSI dunner is dan de meeste andere 16-inch laptops met vergelijkbare processoropties.
Afgezien van de CPU heeft MSI dit jaar belangrijke wijzigingen doorgevoerd, variërend van de poorten tot het beeldscherm. De meeste zijn een sprong voorwaarts, waaronder het 120 Hz OLED-paneel en de professionelere esthetiek, maar de weggevallen poorten en de kleinere batterij zijn een gemixt geheel. De kerntemperatuur is warmer dan bij concurrenten, terwijl de 65 W USB-C wisselstroomadapter zowel Turbo Boost-prestaties als oplaadsnelheden onder bepaalde omstandigheden tegenhoudt.
Gebruikers die een iets dikker en zwaarder systeem niet erg vinden, zullen de XPS 16 een goed alternatief vinden, omdat deze een touchscreen en webcam met een nog hogere resolutie biedt, zij het met minder poortopties en een kortere batterijlevensduur. Ondertussen is de AMD-aangedreven Asus Zenbook S16 nog lichter en kleiner met vergelijkbare CPU-prestaties en paneelopties, maar de ventilatoren zijn luider en de grafische prestaties zijn slechter. Afhankelijk van uw specifieke behoeften kan het ene model beter zijn dan het andere.
Pro
Contra
Prijs en beschikbaarheid
De MSI Prestige 16 AI+ C3MTG clamshell is op het moment van publiceren nog niet overal verkrijgbaar. De Prestige 16 Flip AI+ C3MTG wordt nu verzonden vanaf $2150.
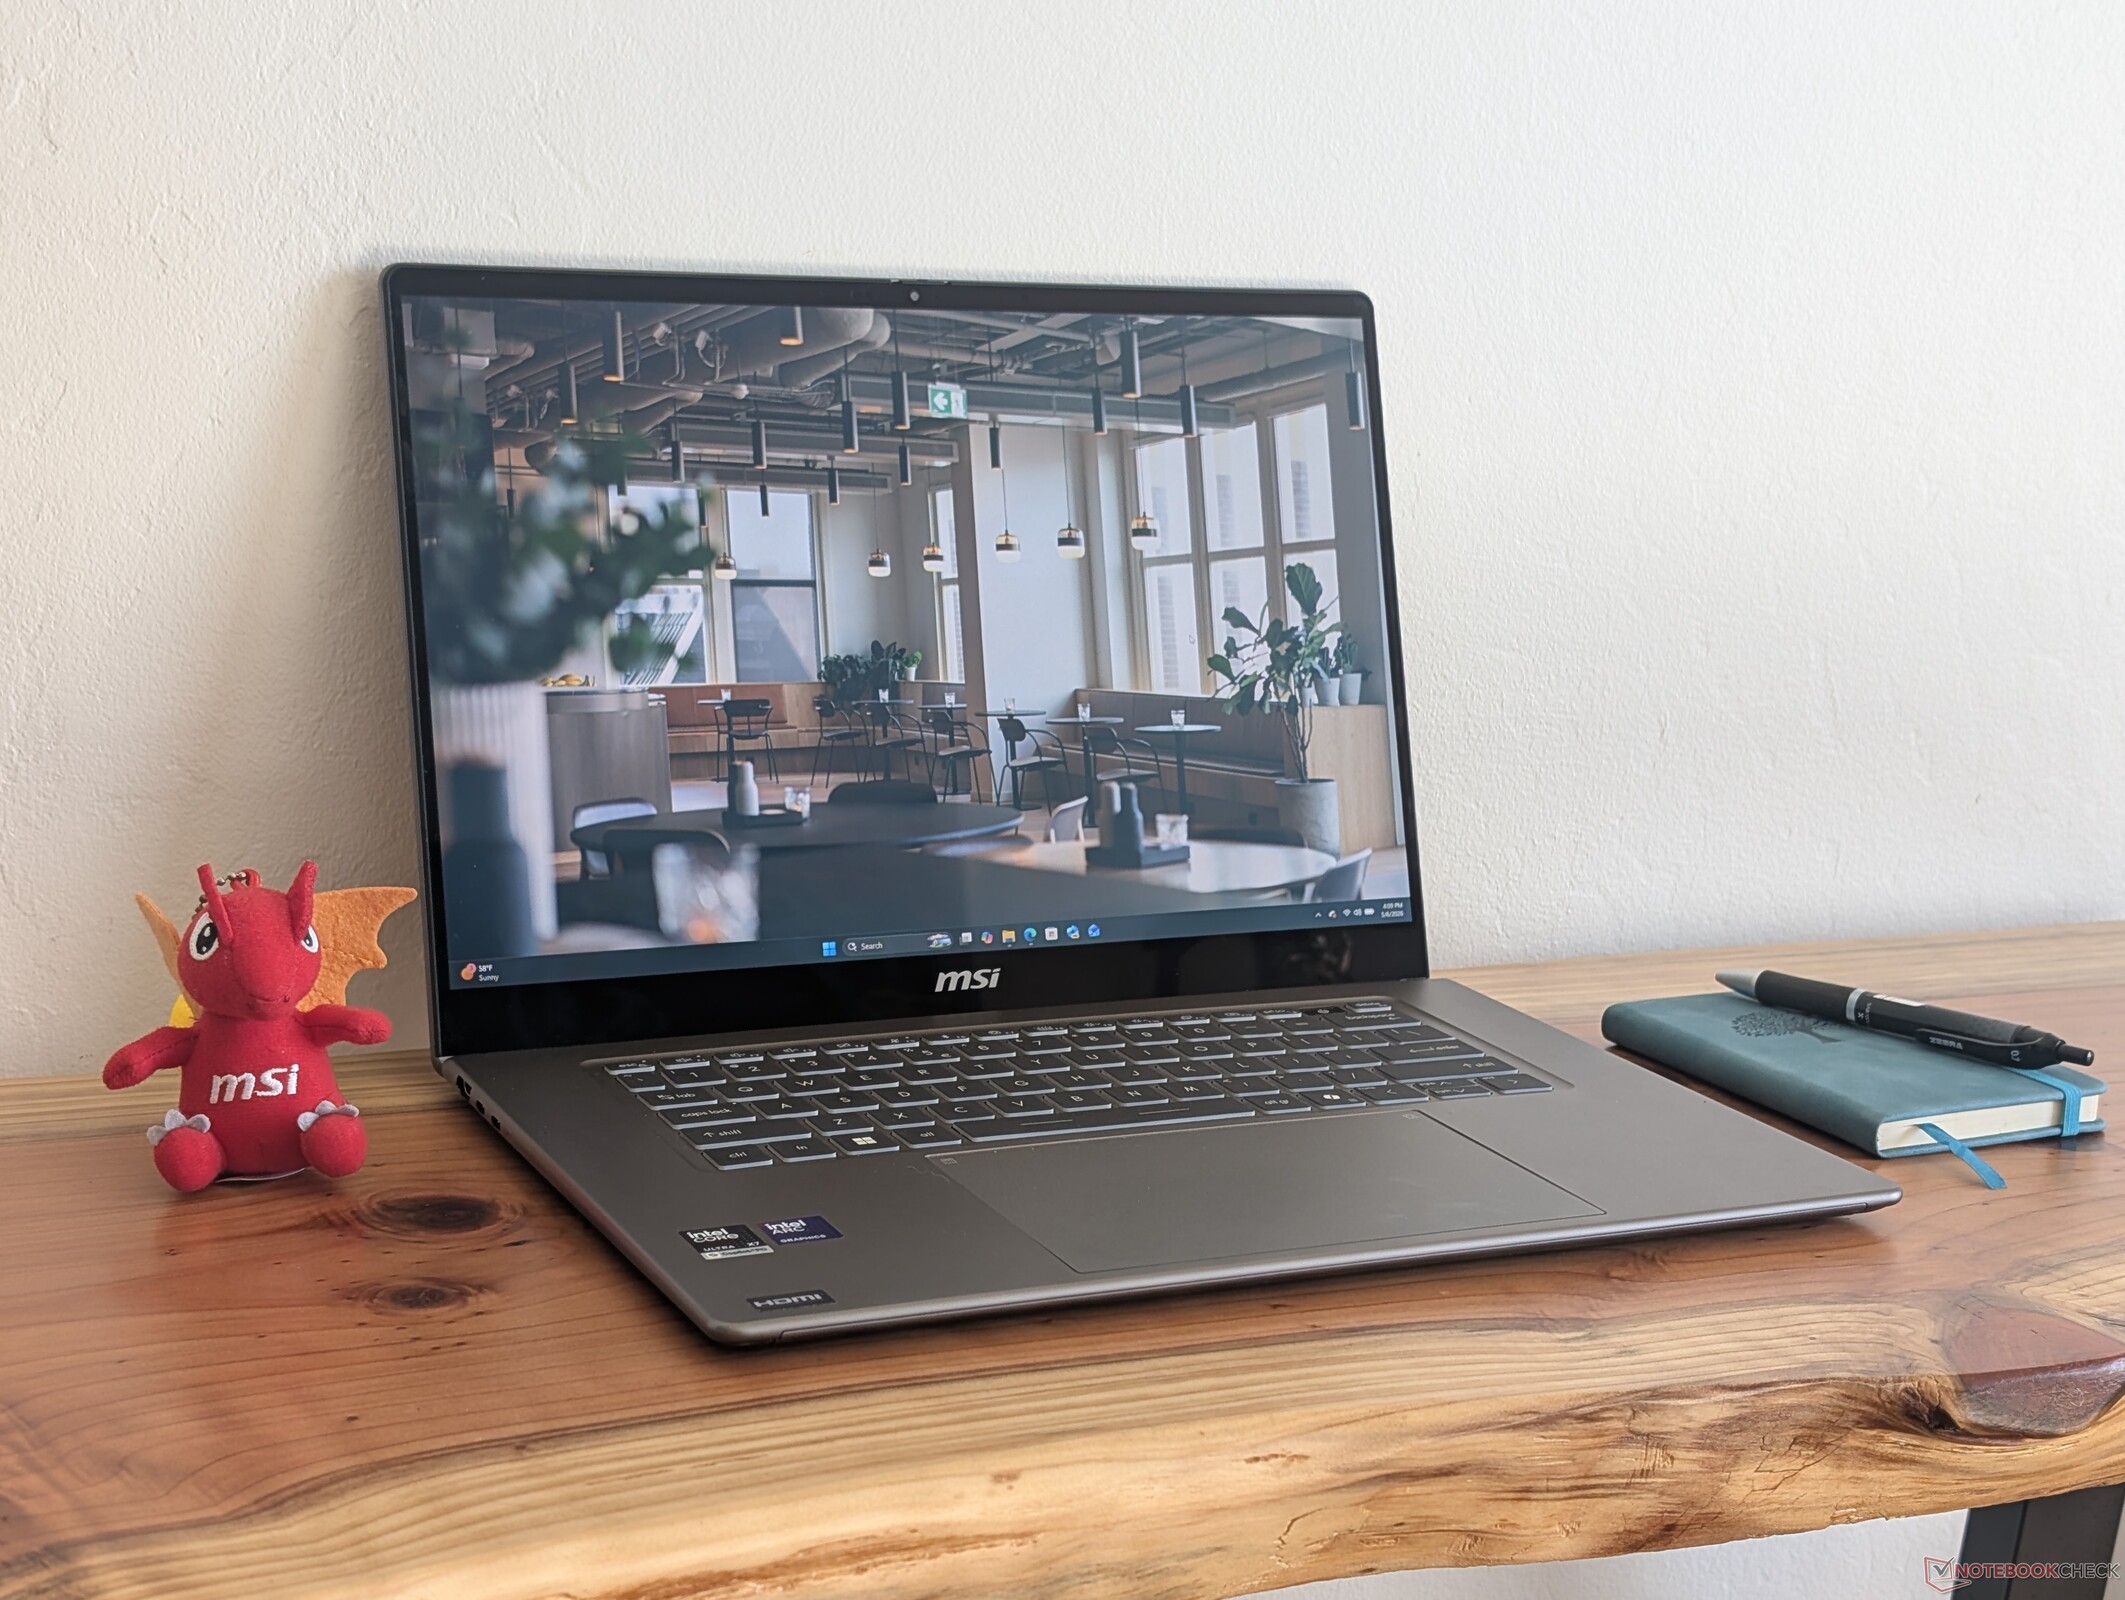
De Prestige 16 AI+ C3MG clamshell werd onthuld op CES 2026 samen met een groot aantal andere Prestige-modellen die allemaal zijn uitgerust met Intel Panther Lake CPU's. Deze nieuwste Prestige 16 is volledig opnieuw ontworpen in vergelijking met het Arrow Lake-aangedreven model van vorig jaar voor een verfriste gebruikerservaring.
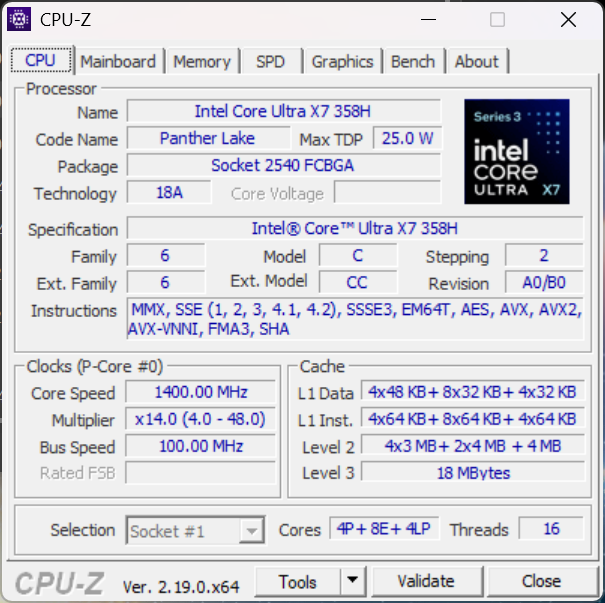
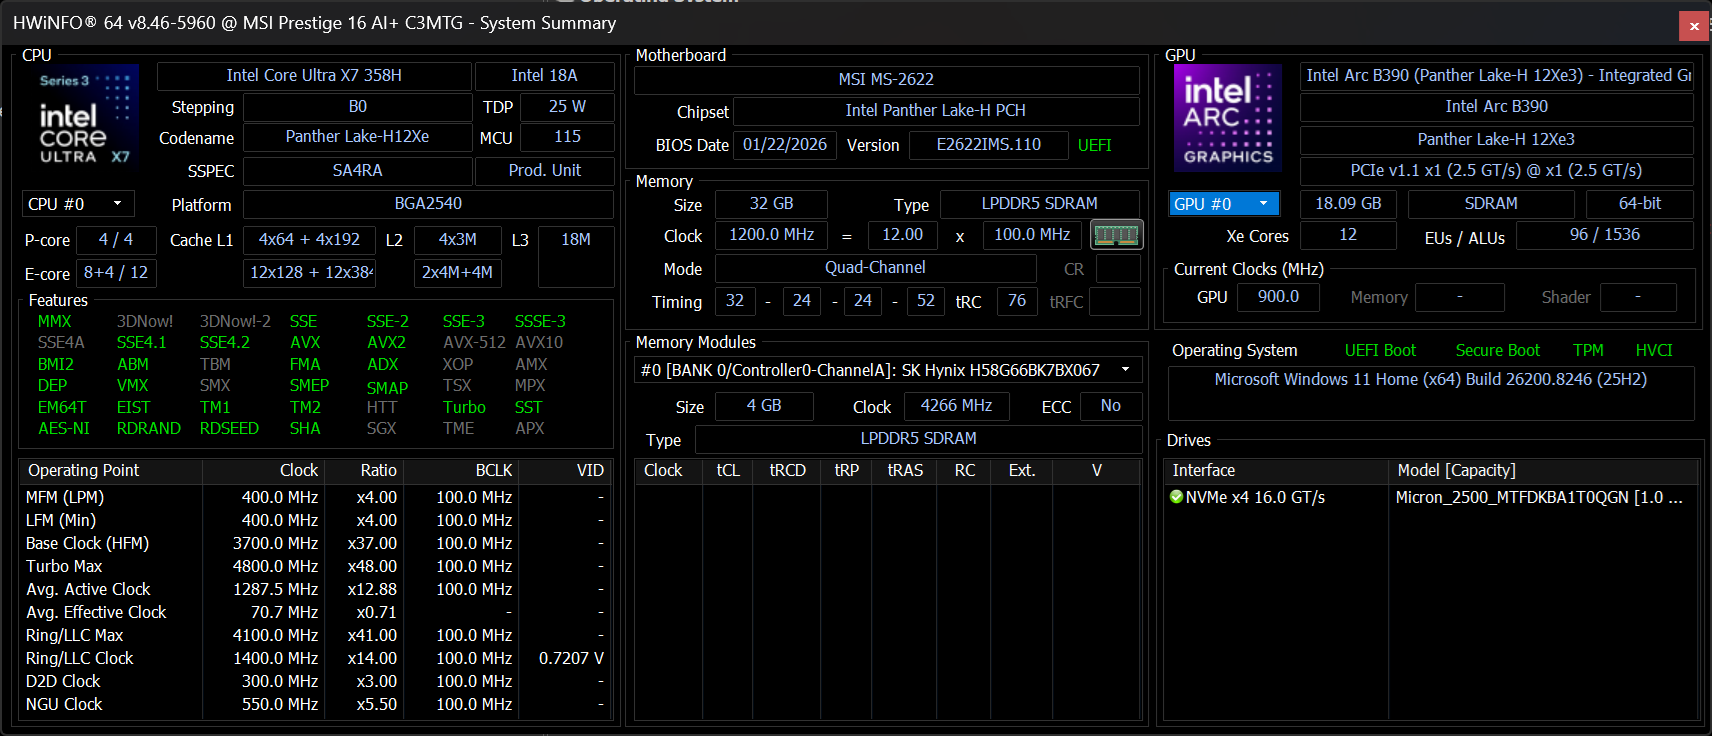
Ons testapparaat is geconfigureerd met de Core Ultra X7 358H CPU, 32 GB RAM en een 1800p OLED-touchscreen en kost ongeveer $2100. Andere SKU's worden mogelijk geleverd met de Core Ultra X9 388H, maar de 1800p OLED en Arc B390 GPU blijven constant.
Concurrerende modellen zijn andere high-end prosumer laptops zoals de Dell XPS 16, Lenovo Pro 9i 16 Auraof de Asus ZenBook S16 serie. Er is ook een convertible versie met 360-graden scharnieren beschikbaar, genaamd de Prestige 16 Flip AI+ C3MG.
Meer MSI beoordelingen:
Specificaties
Zaak
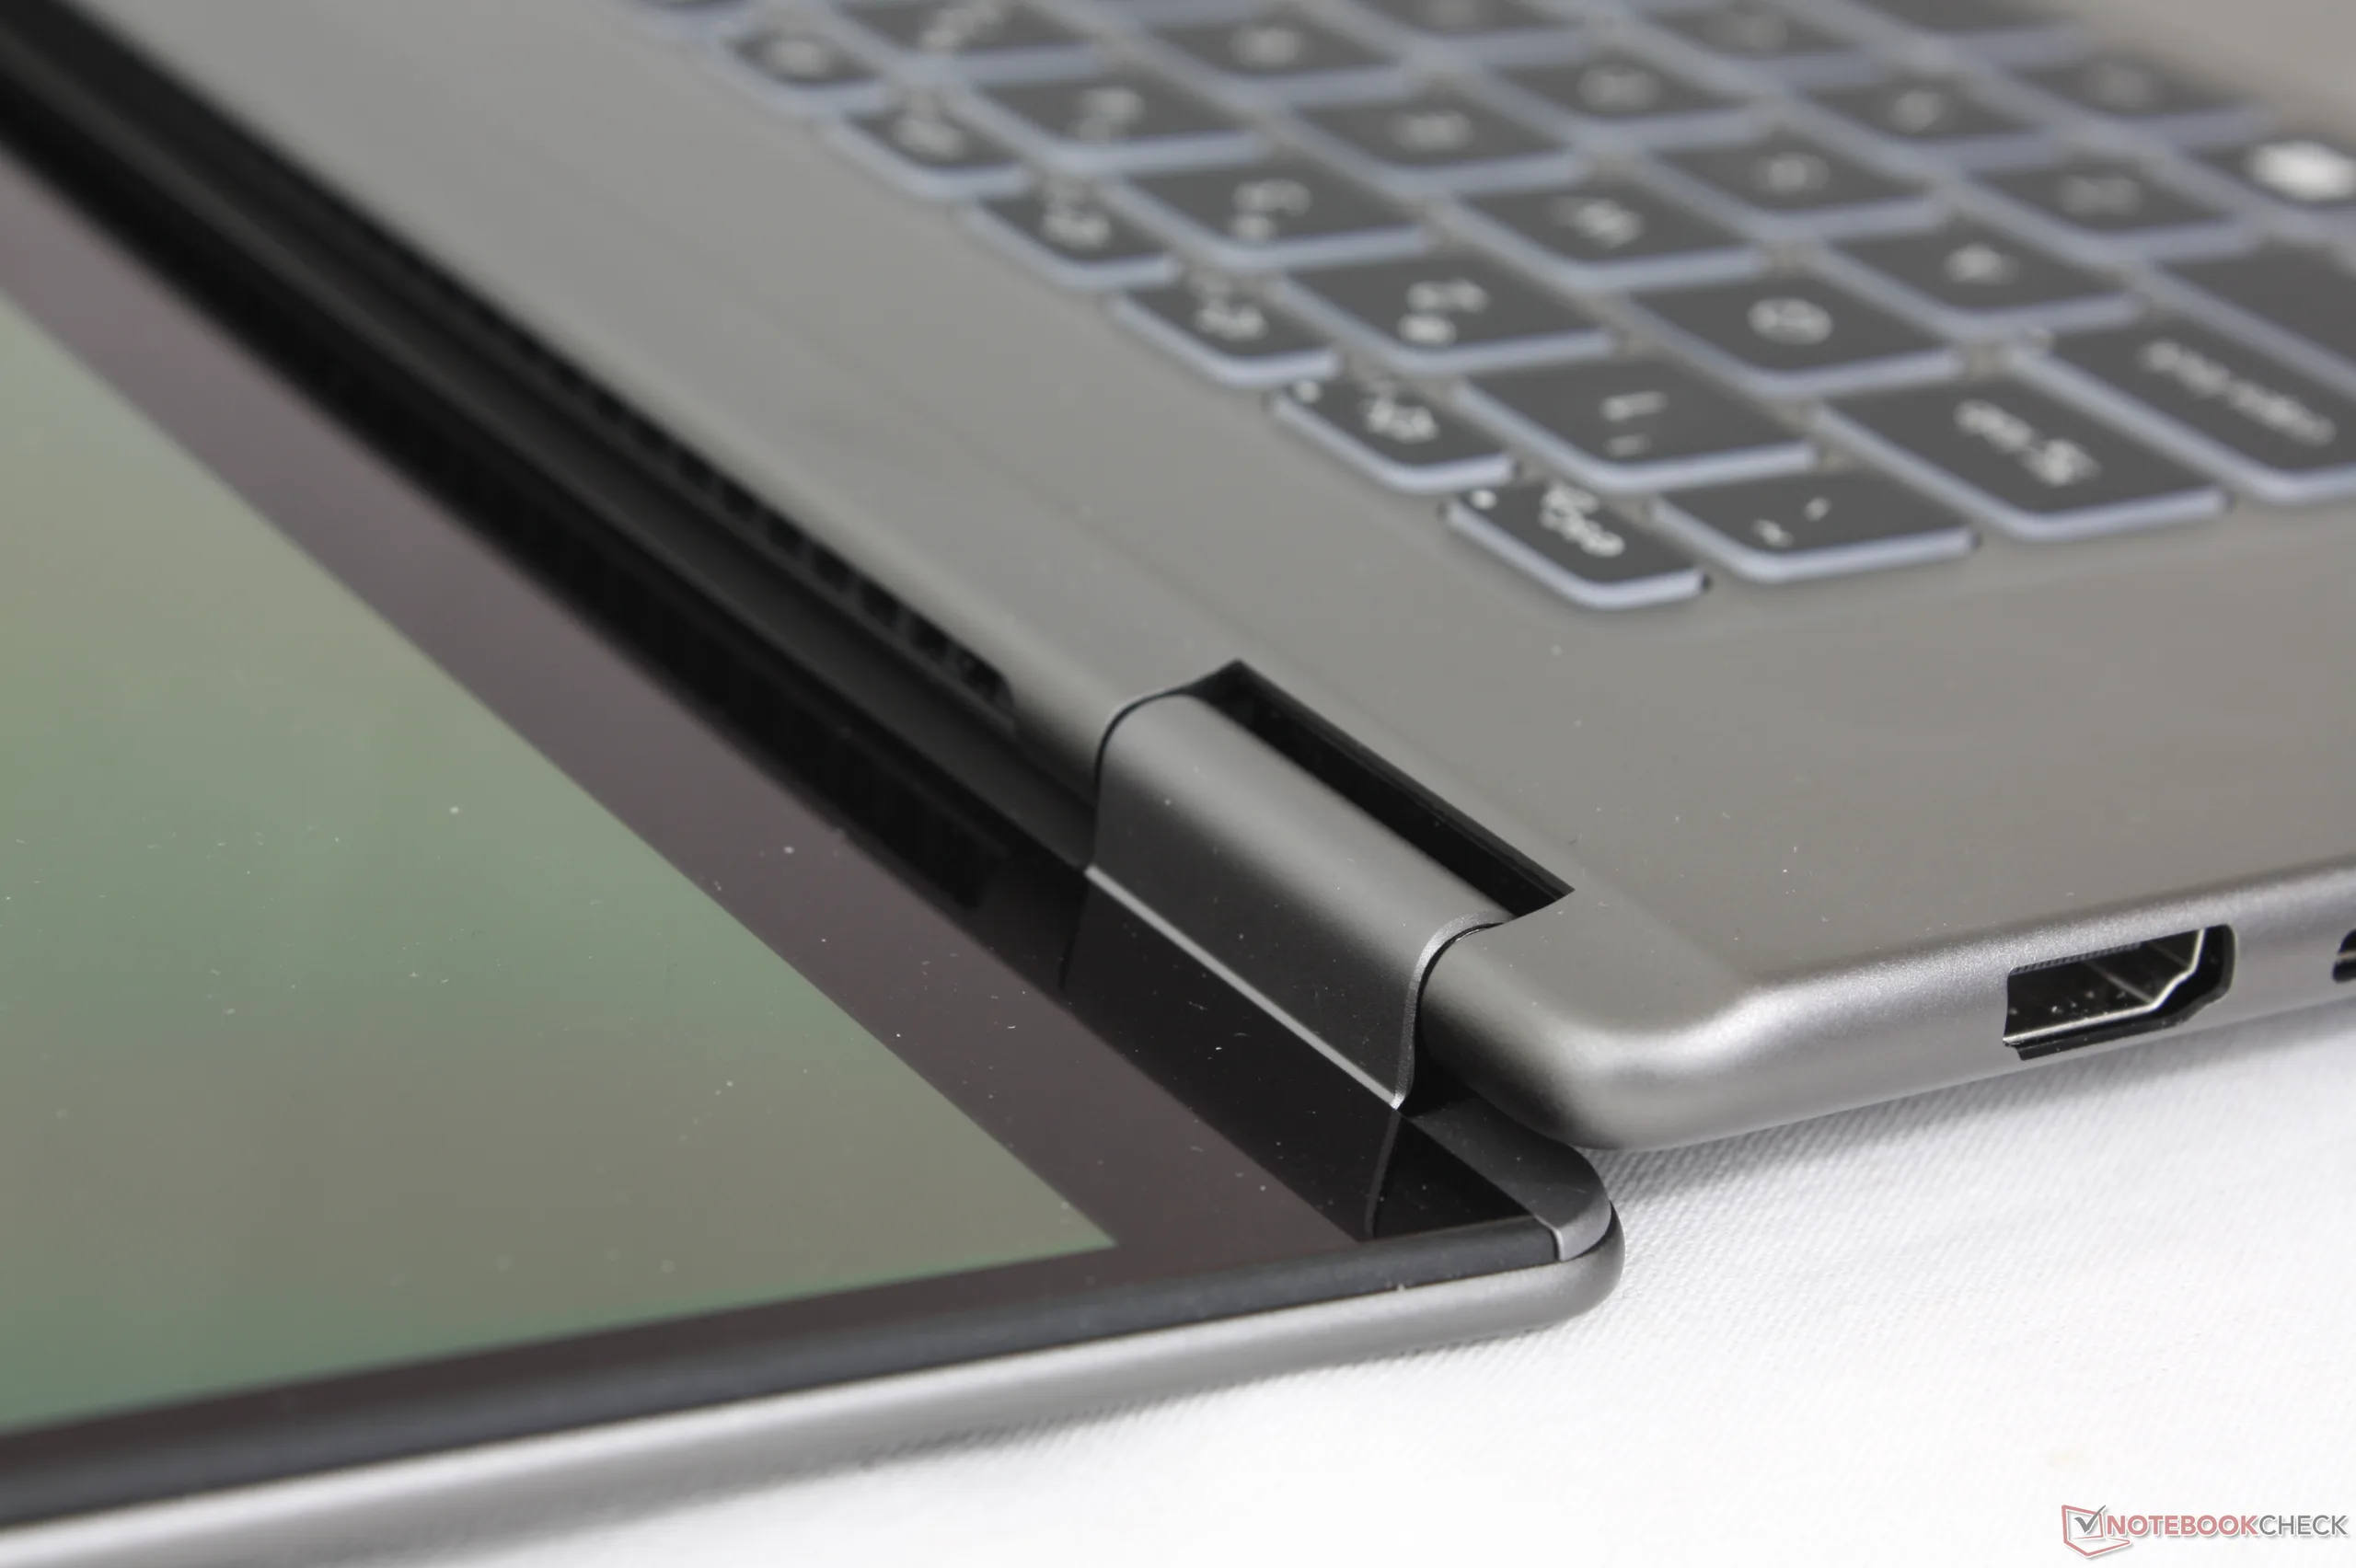
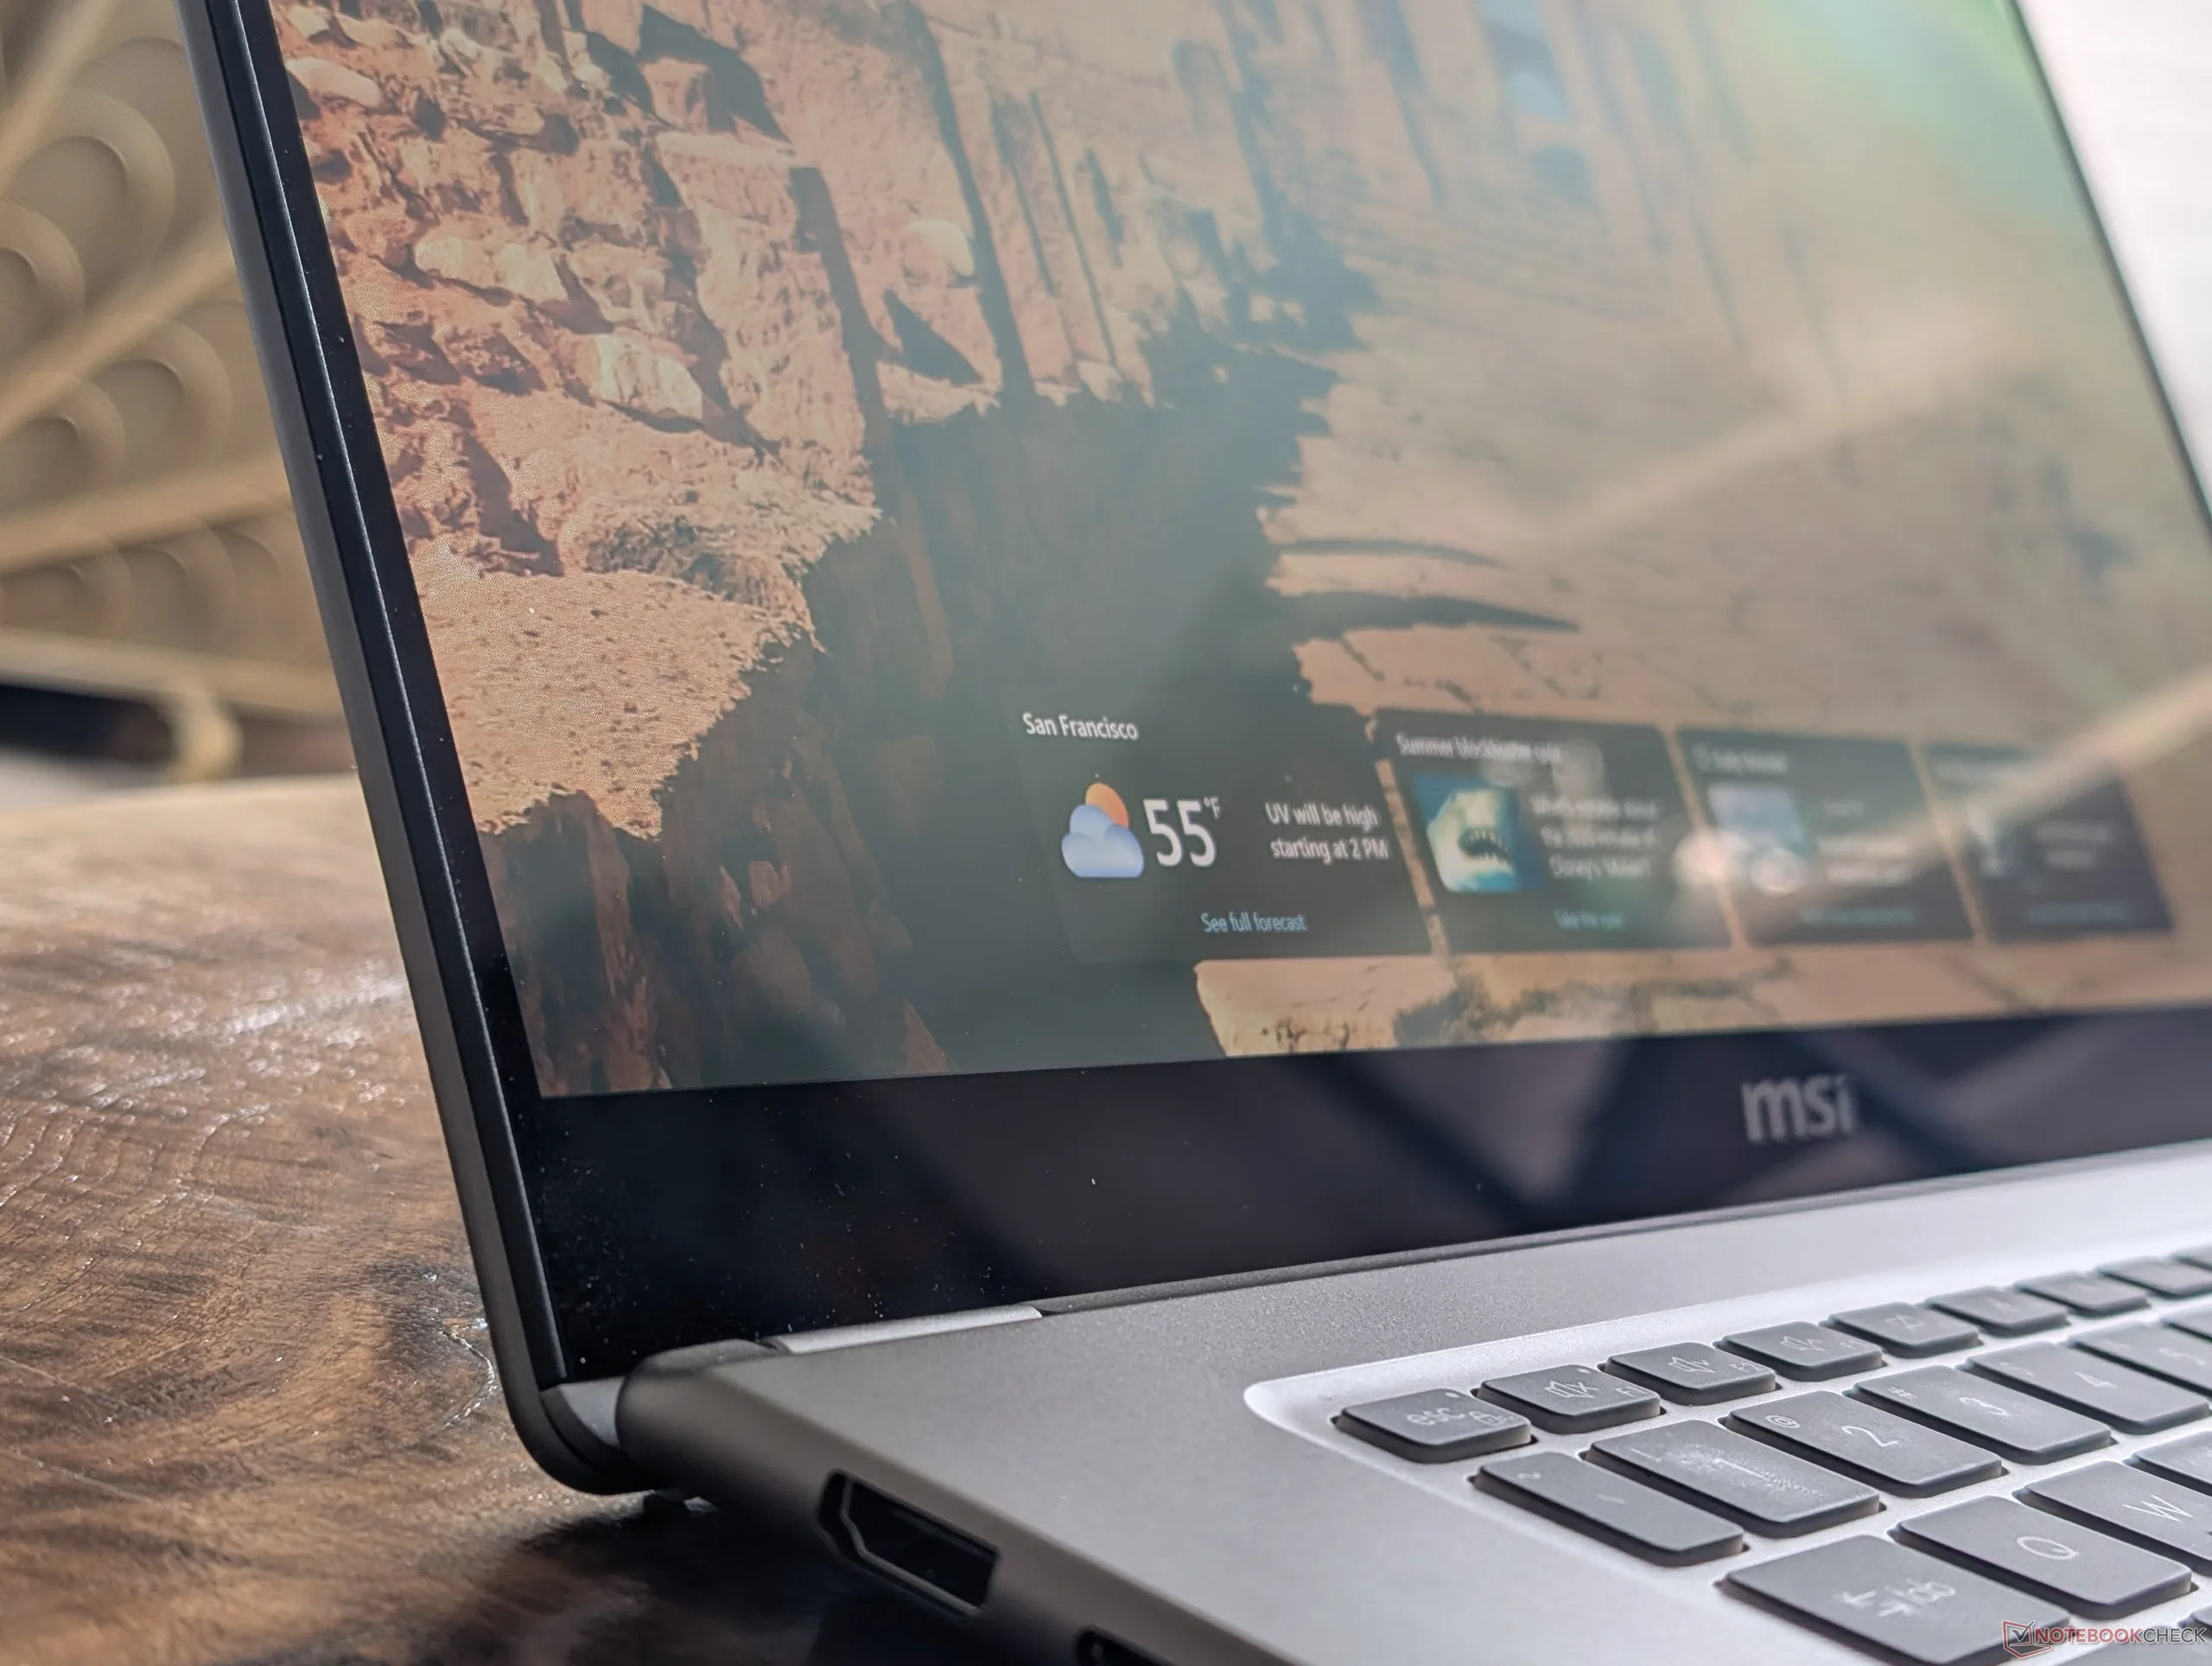
Het chassis van aluminiumlegering is nu dunner en heeft minder hoeken en oppervlakkige lijnen voor een professionelere uitstraling. Vergeleken met het vorige model, is de 2026 Prestige 16 aantoonbaar stijlvoller zonder er te saai of te minimalistisch uit te zien.
De stevigheid van het chassis is sterk, hoewel het iets meer buigt dan de dikkere XPS 16 of Lenovo Pro 9i 16 Aura.
MSI introduceert dit jaar ook een bijgewerkt logo op de buitenklep, te beginnen met de 2026 Prestige line-up. Volgens de fabrikant kan de mooie lasergravure in de nabije toekomst op meer topmodellen verschijnen om ze beter te onderscheiden van MSI's gaming-gerichte oplossingen.
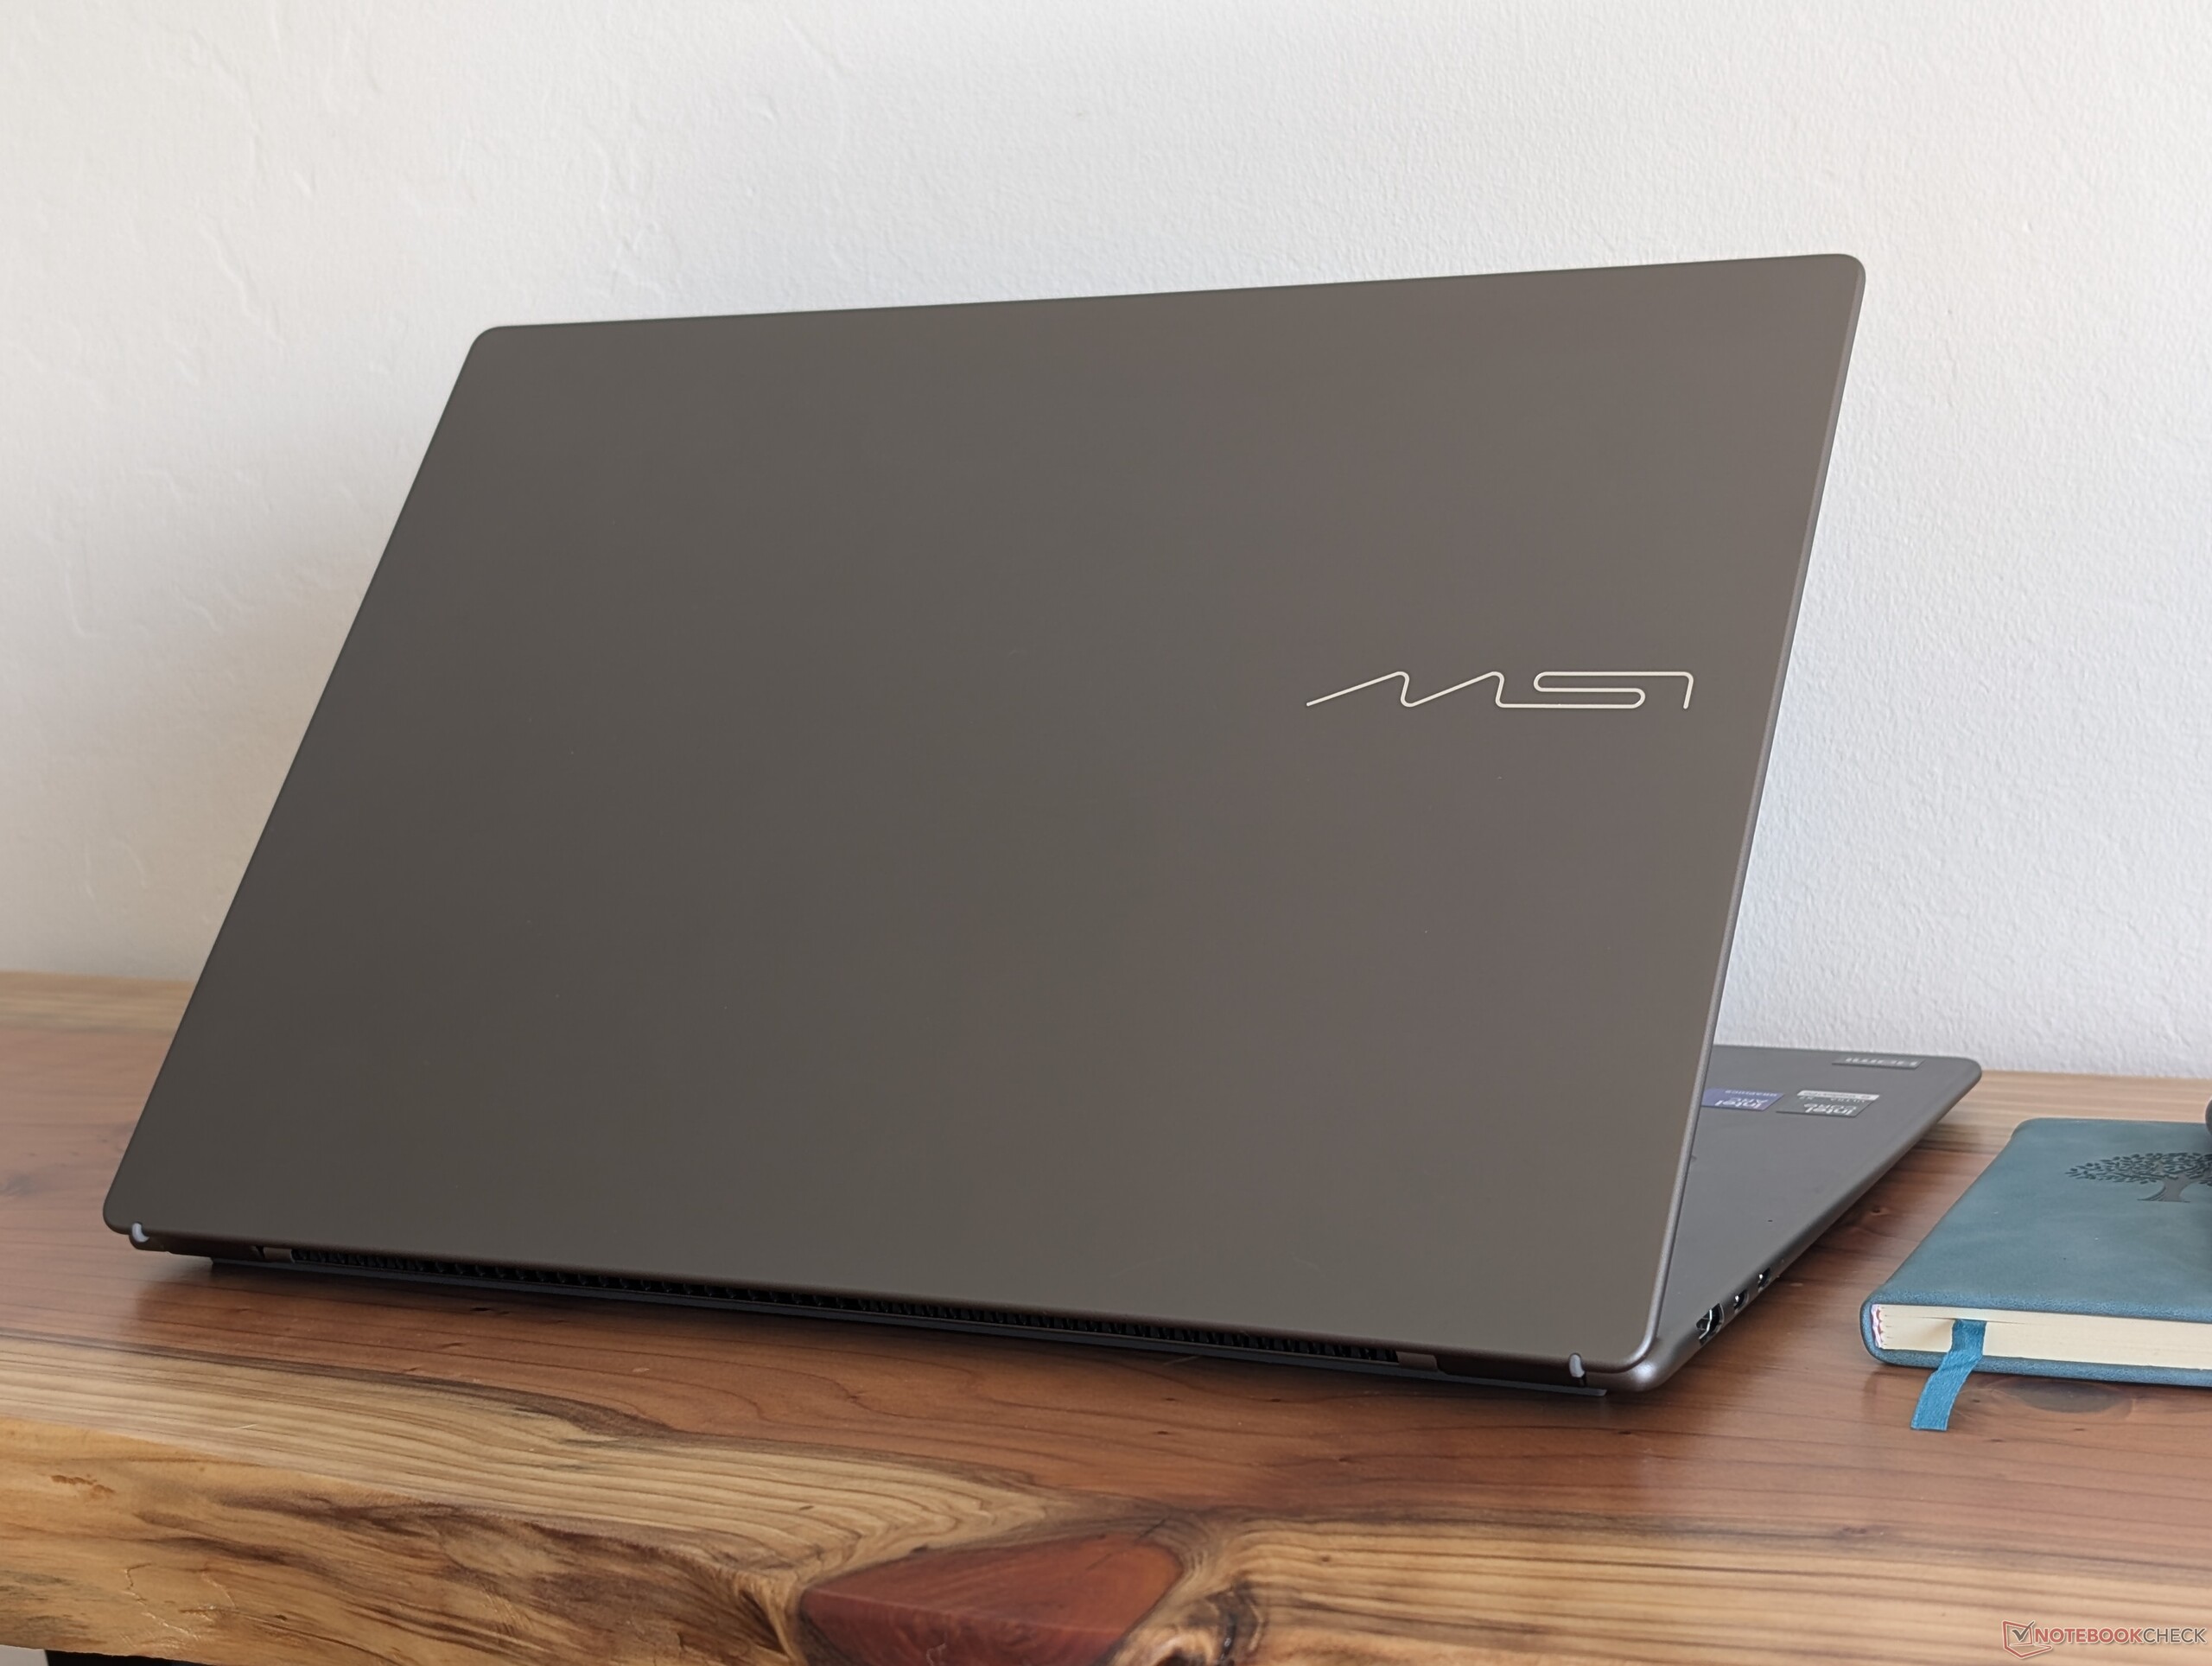
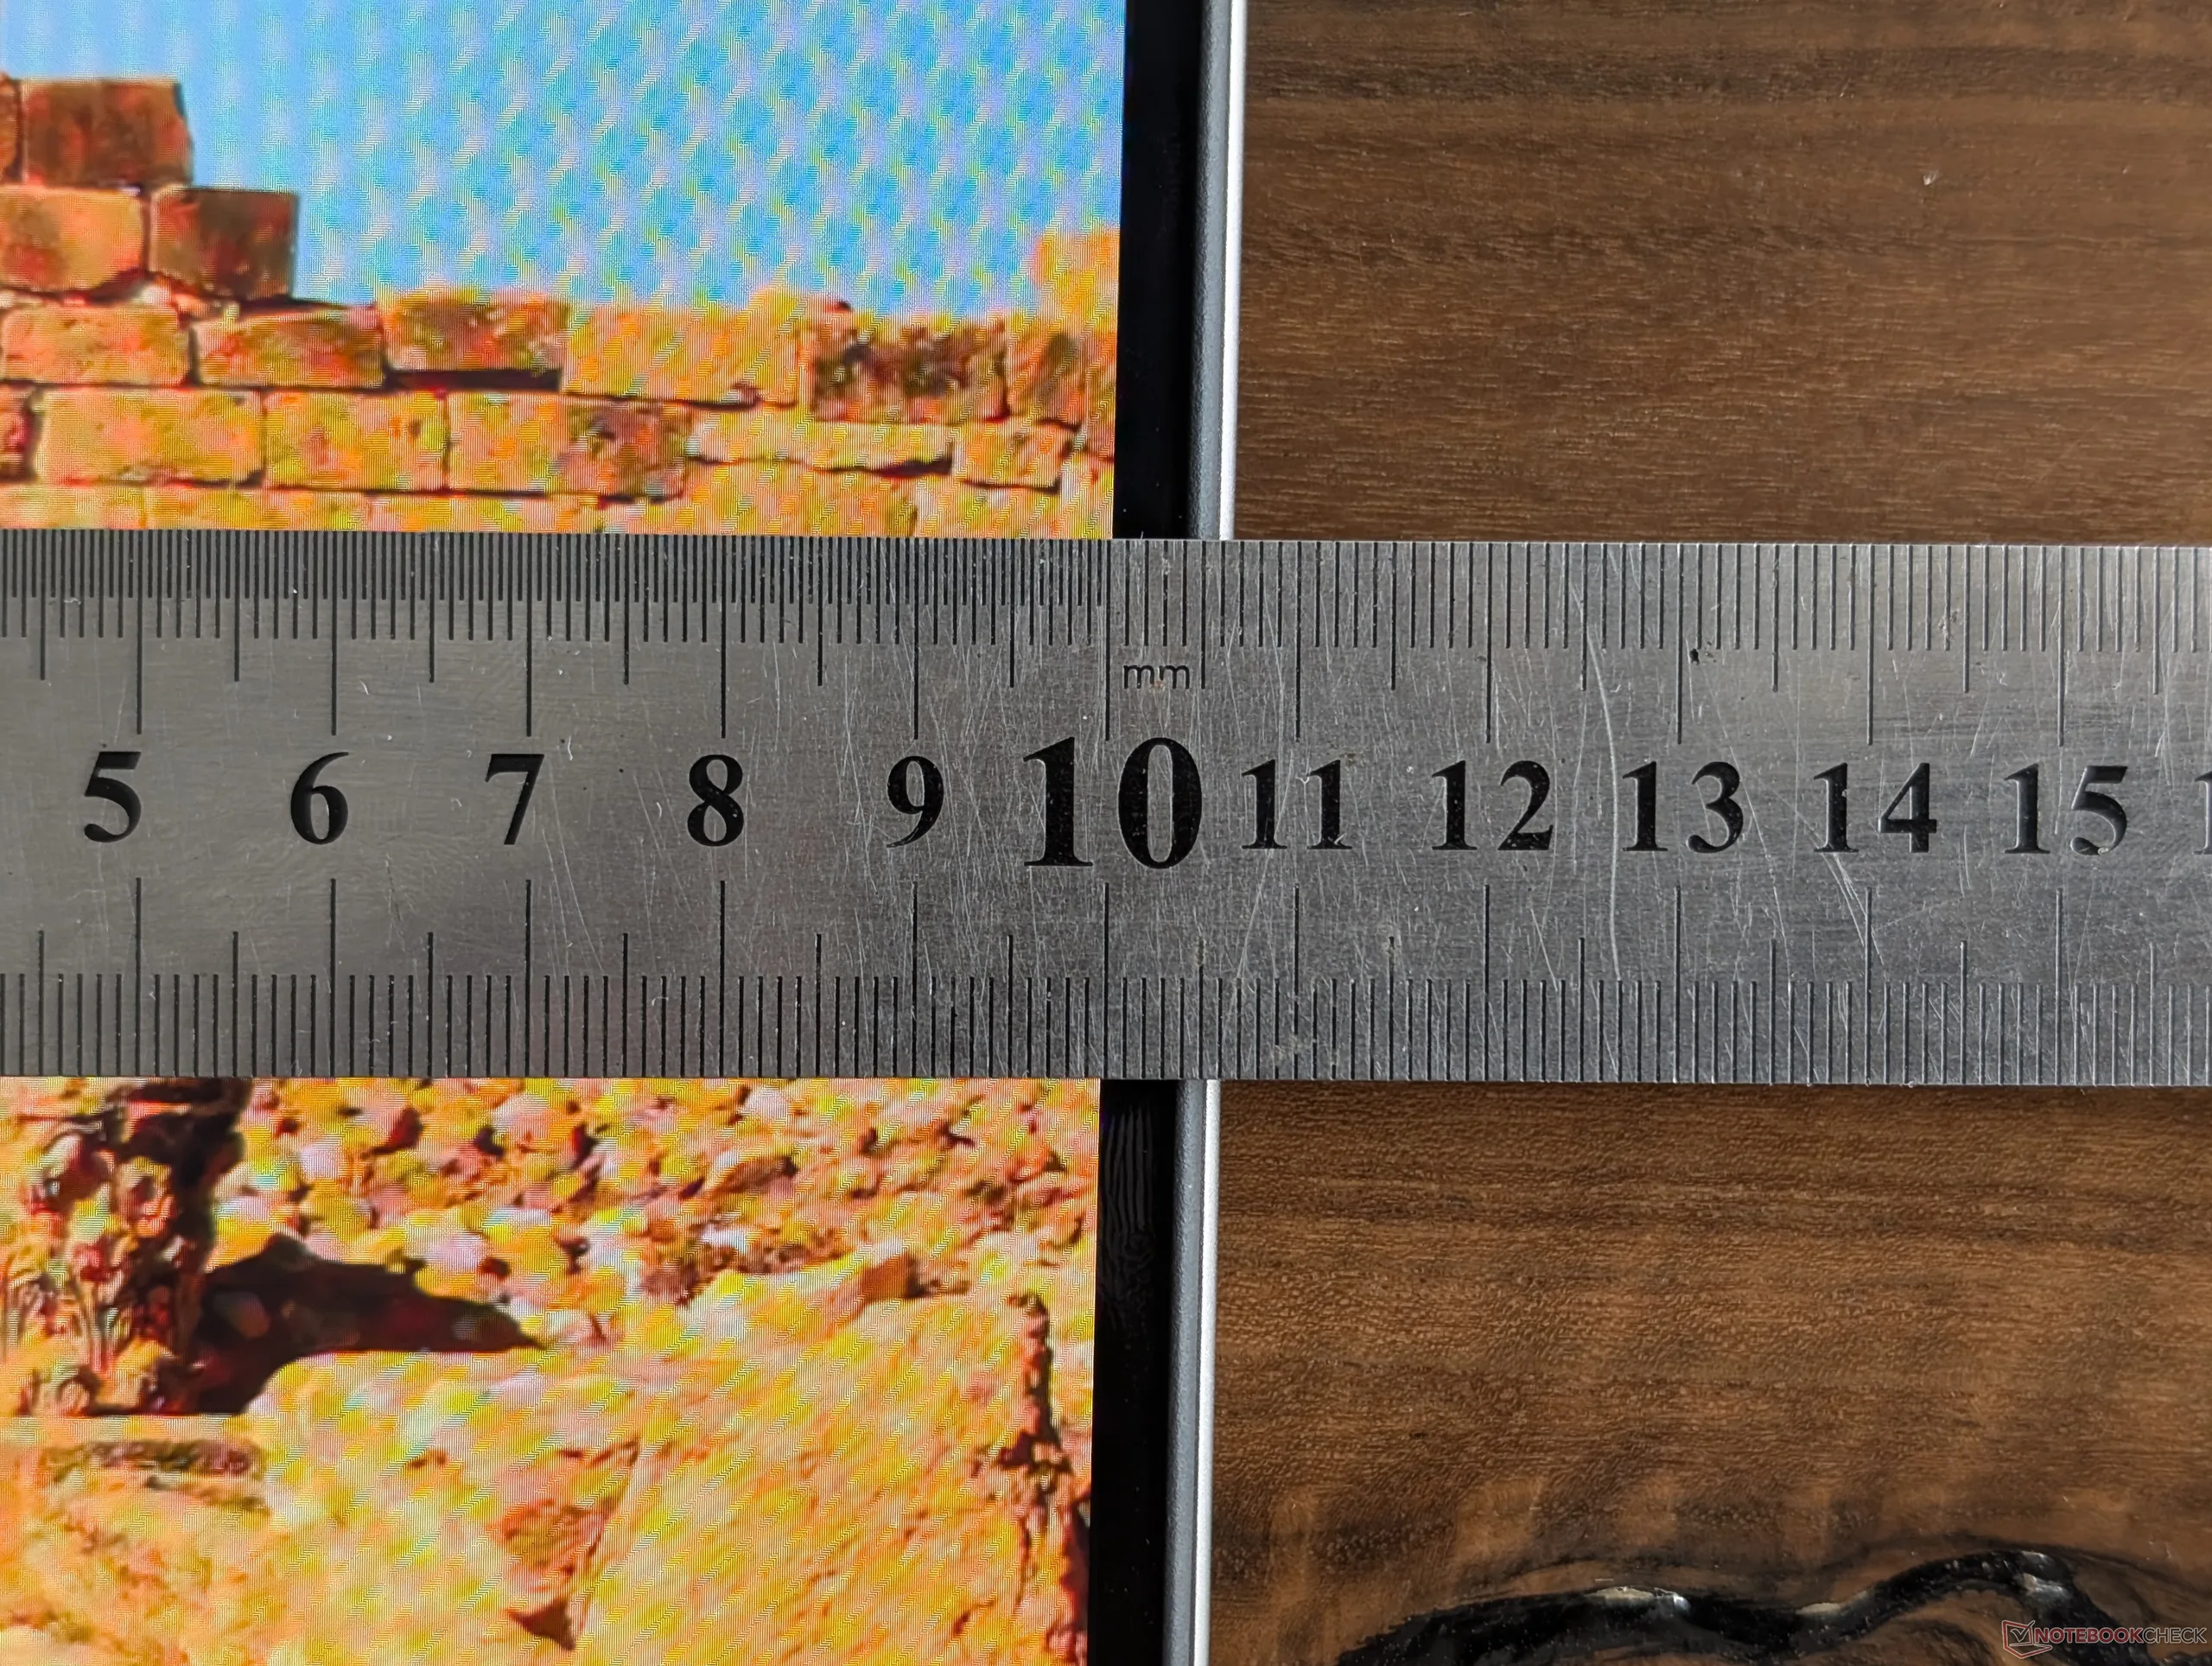
Het systeem is merkbaar dunner dan het ontwerp van vorig jaar, maar met bijna geen gewichtsverandering voor een dichter gevoel. Qua gewicht zit het comfortabel tussen de XPS 16 en ZenBook S16 in, terwijl het qua voetafdruk iets groter is dan beide.
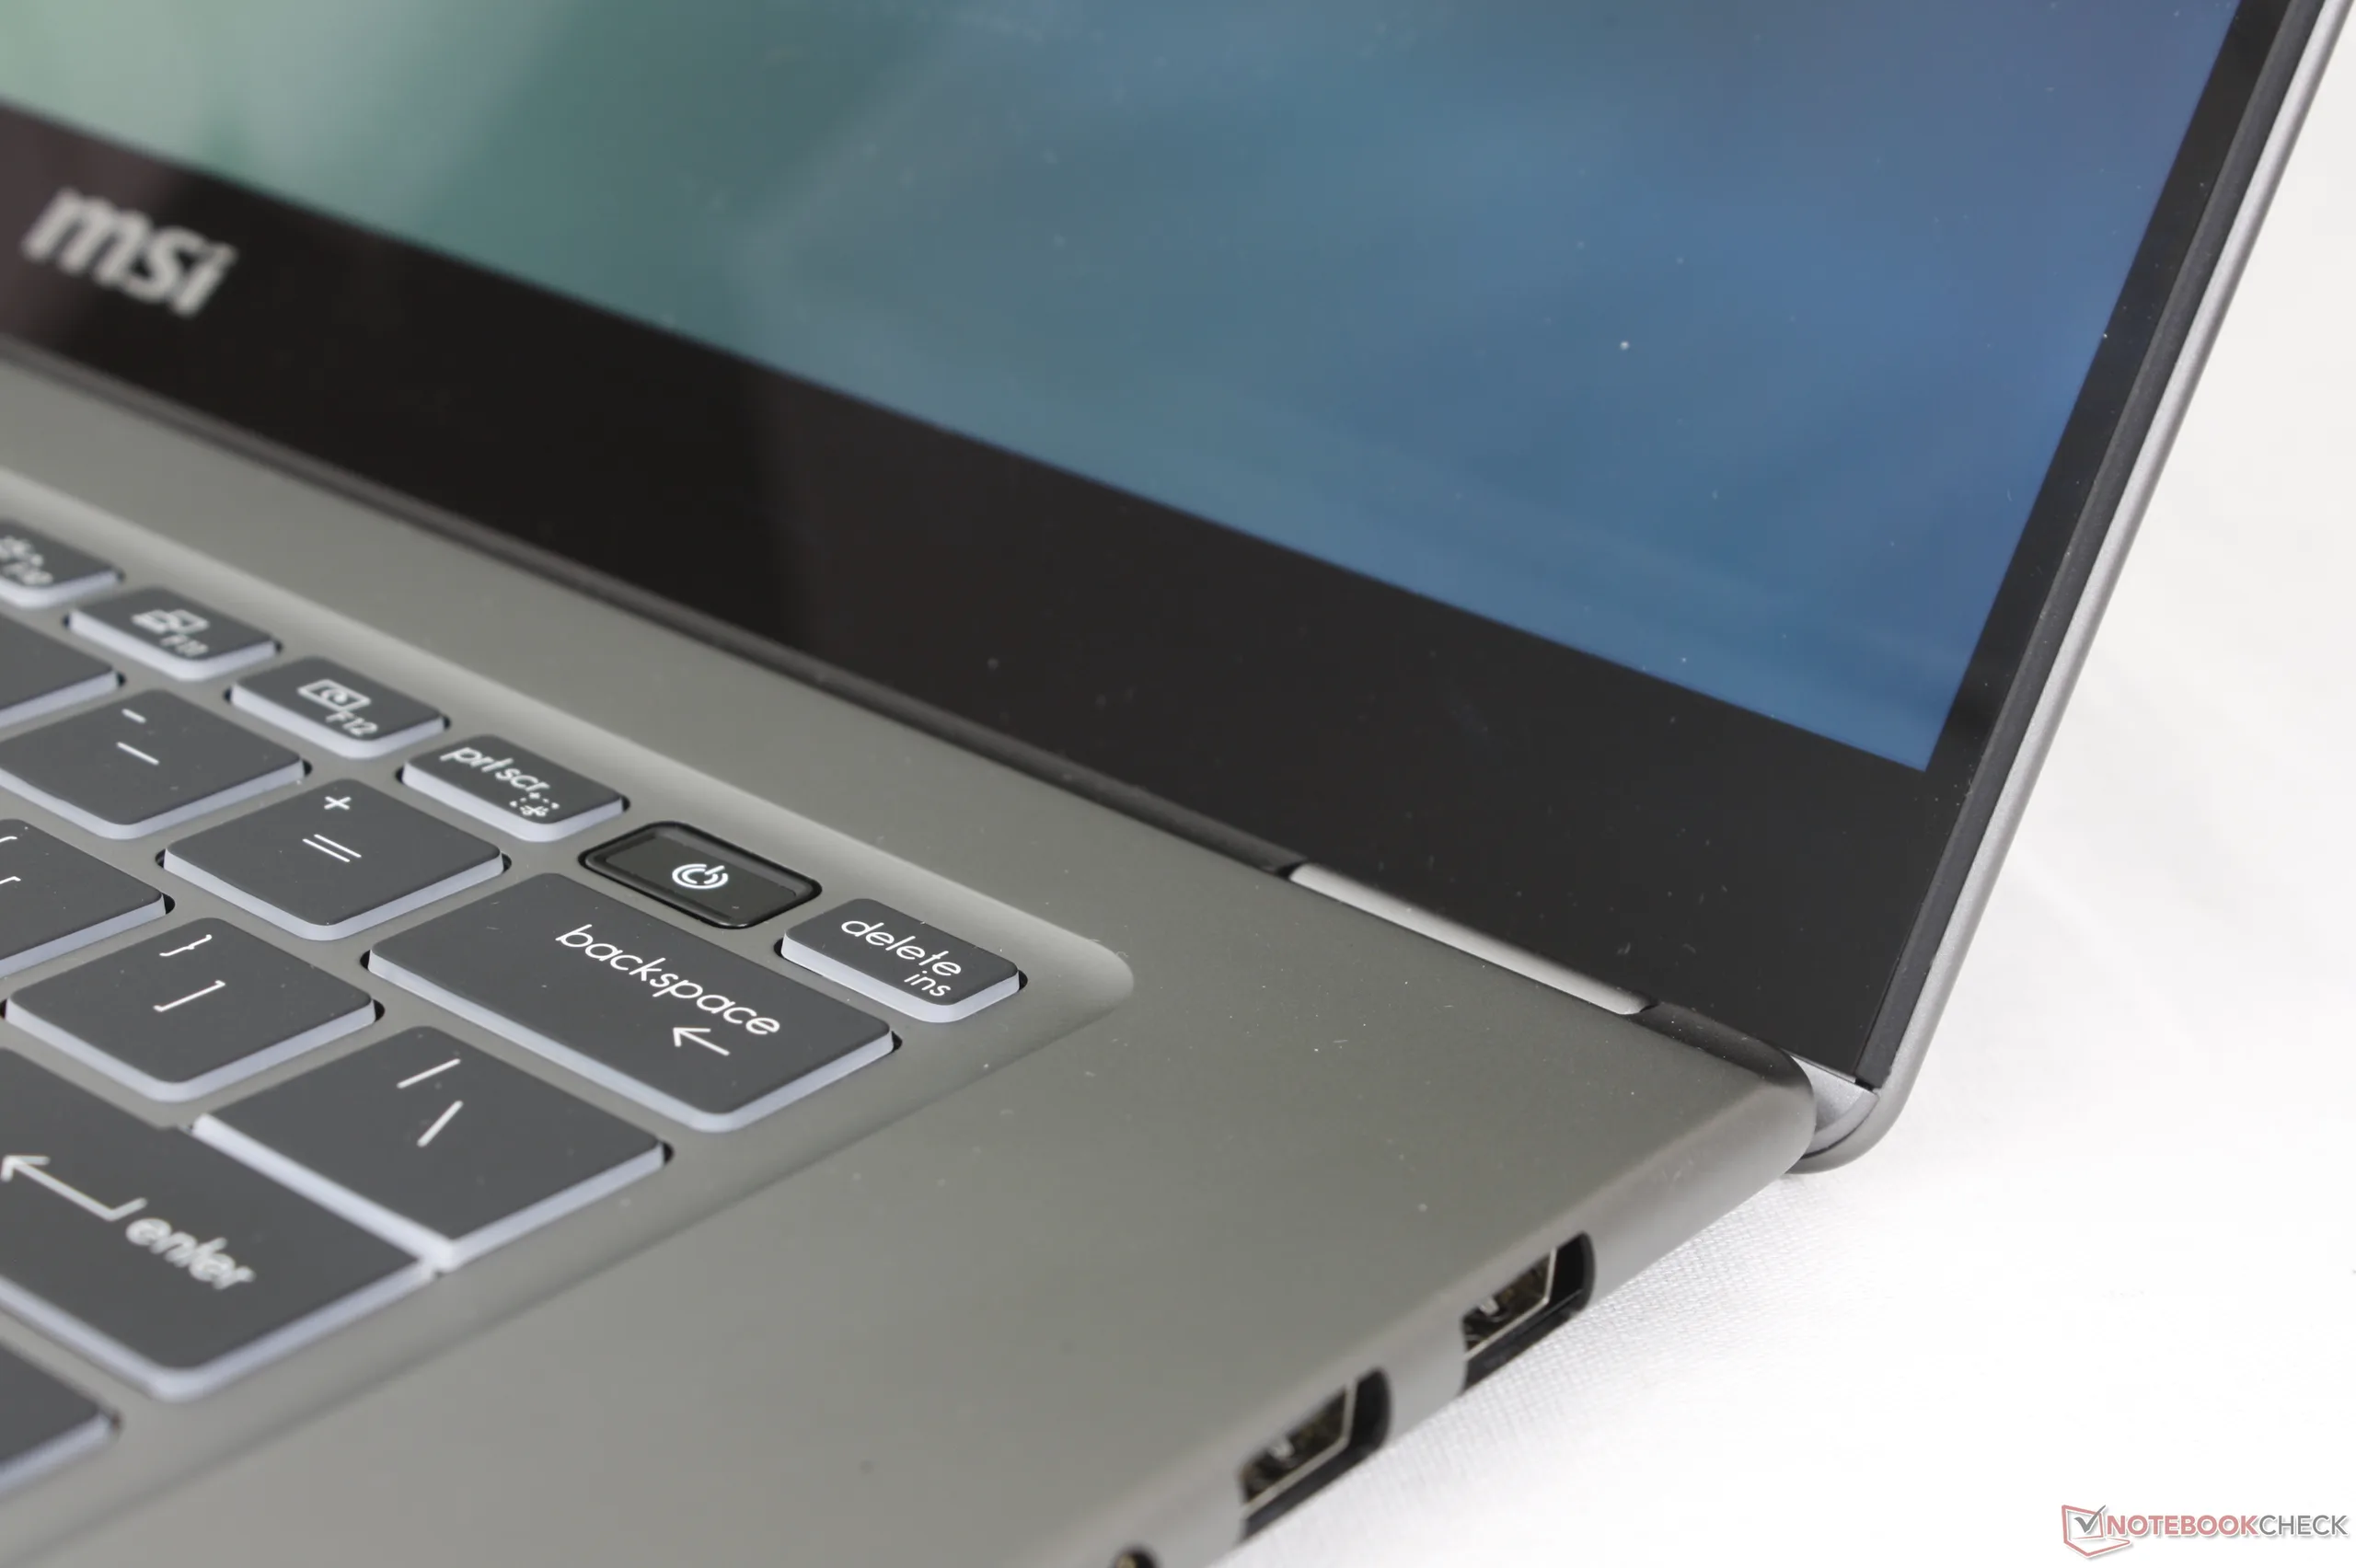
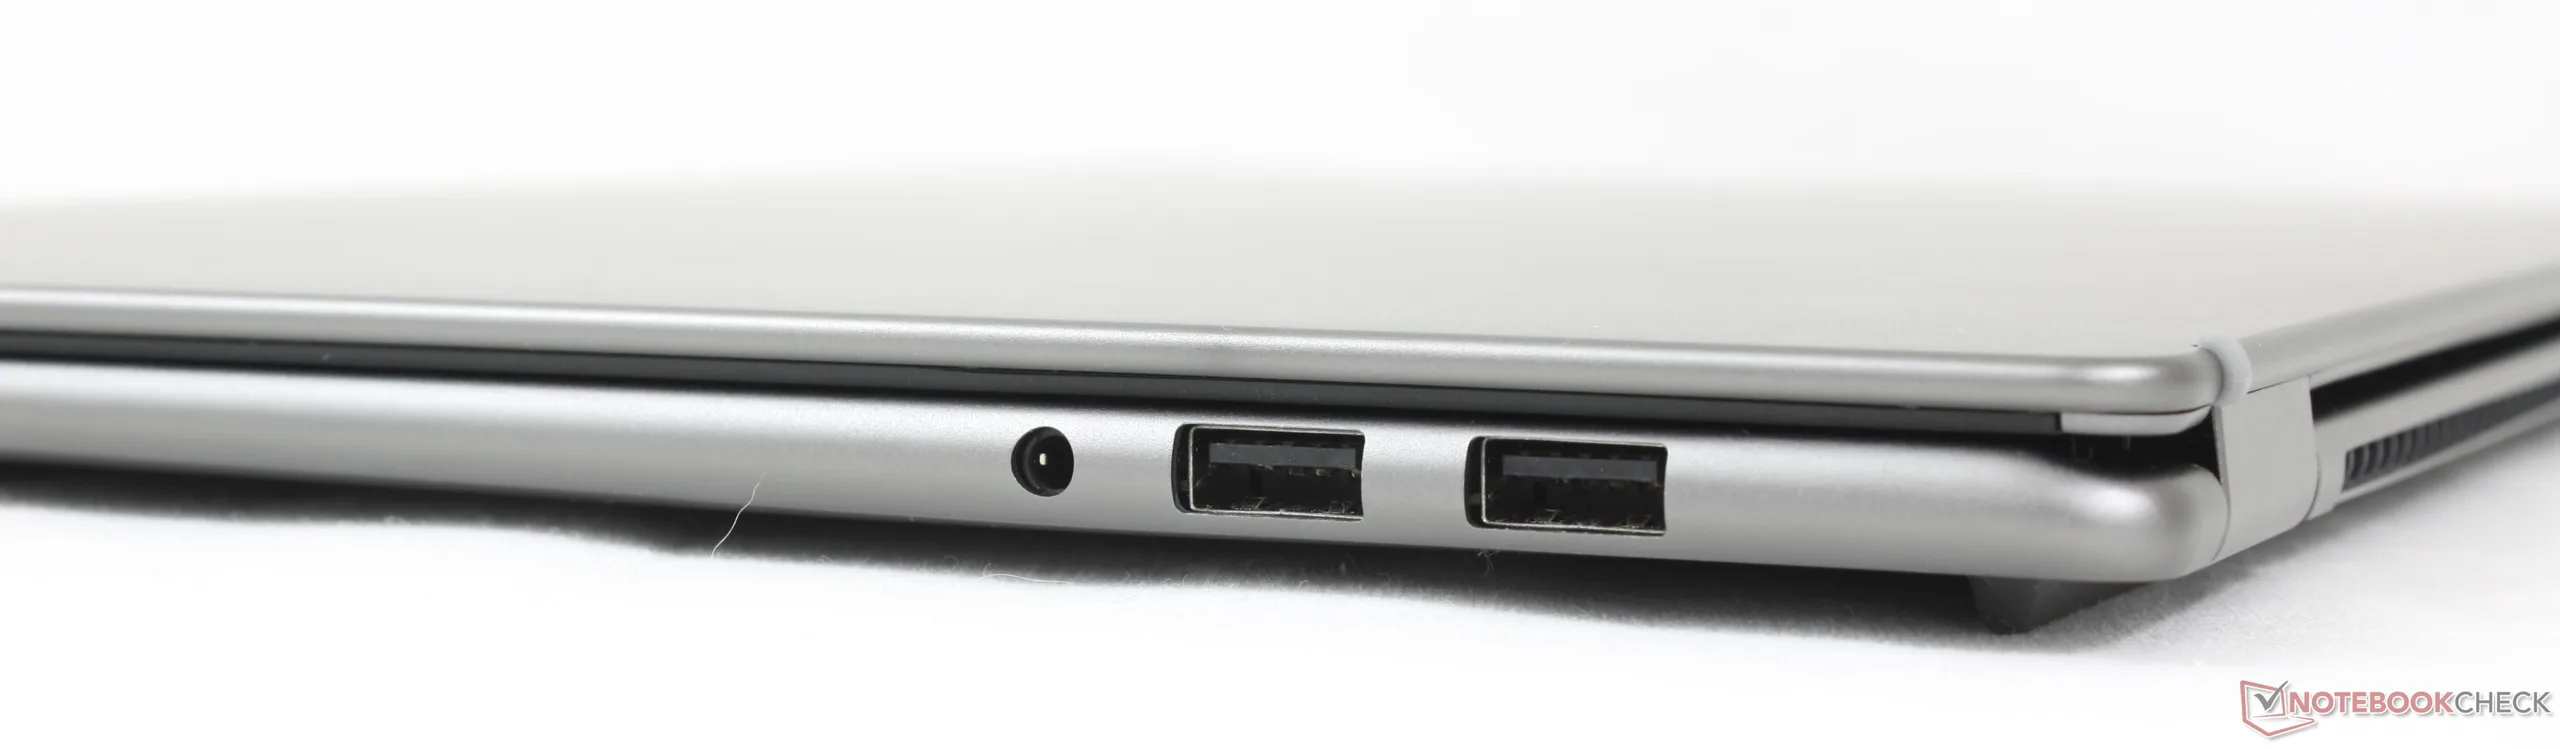
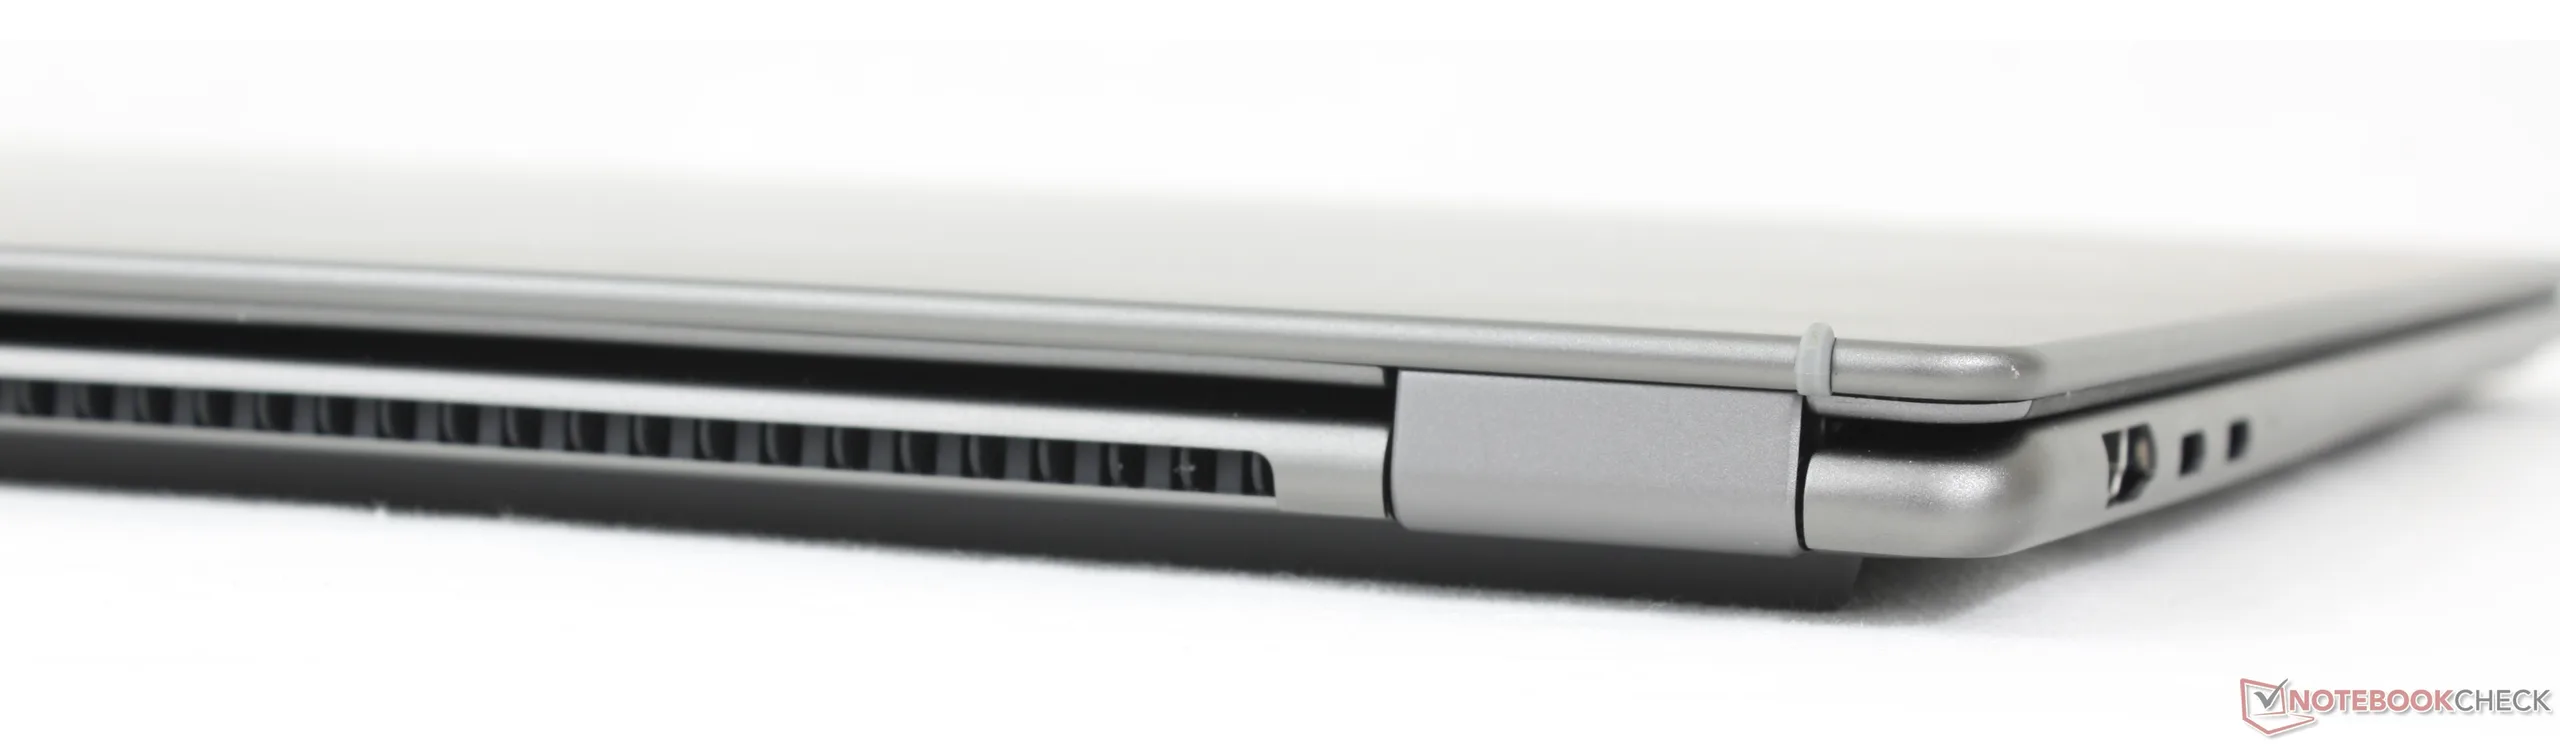
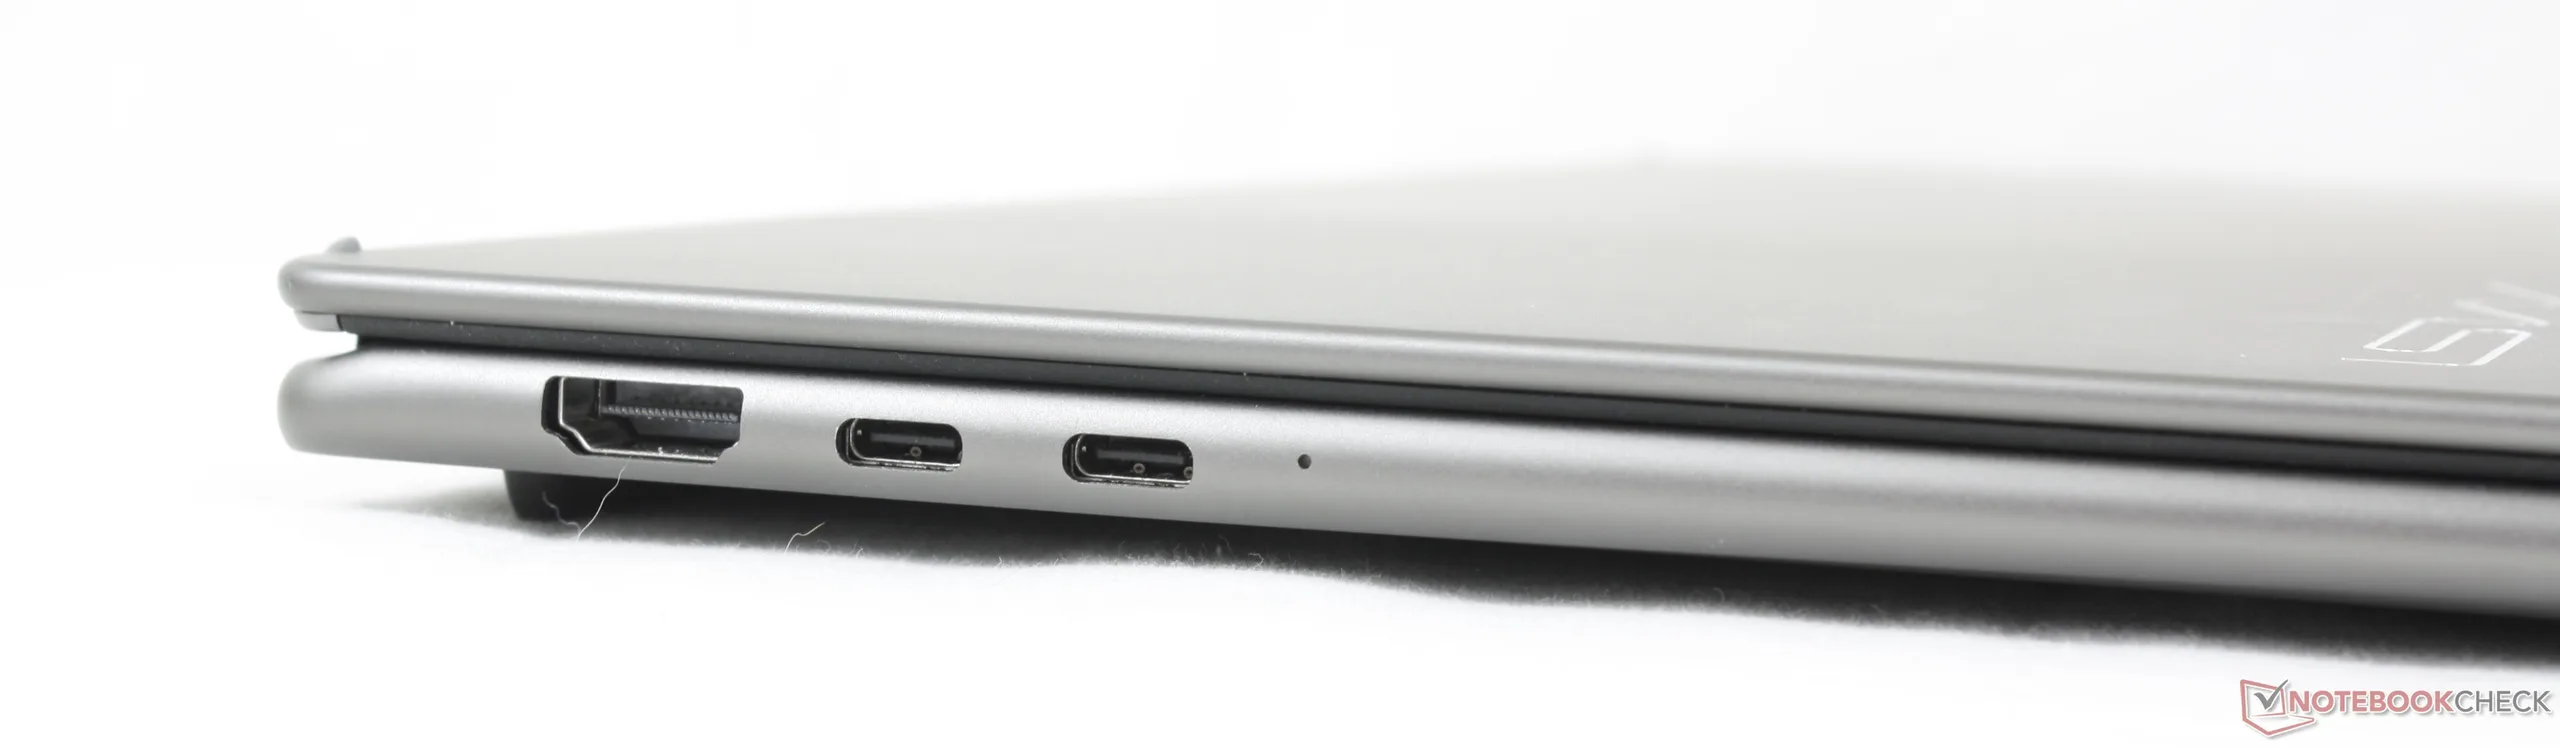
Connectiviteit
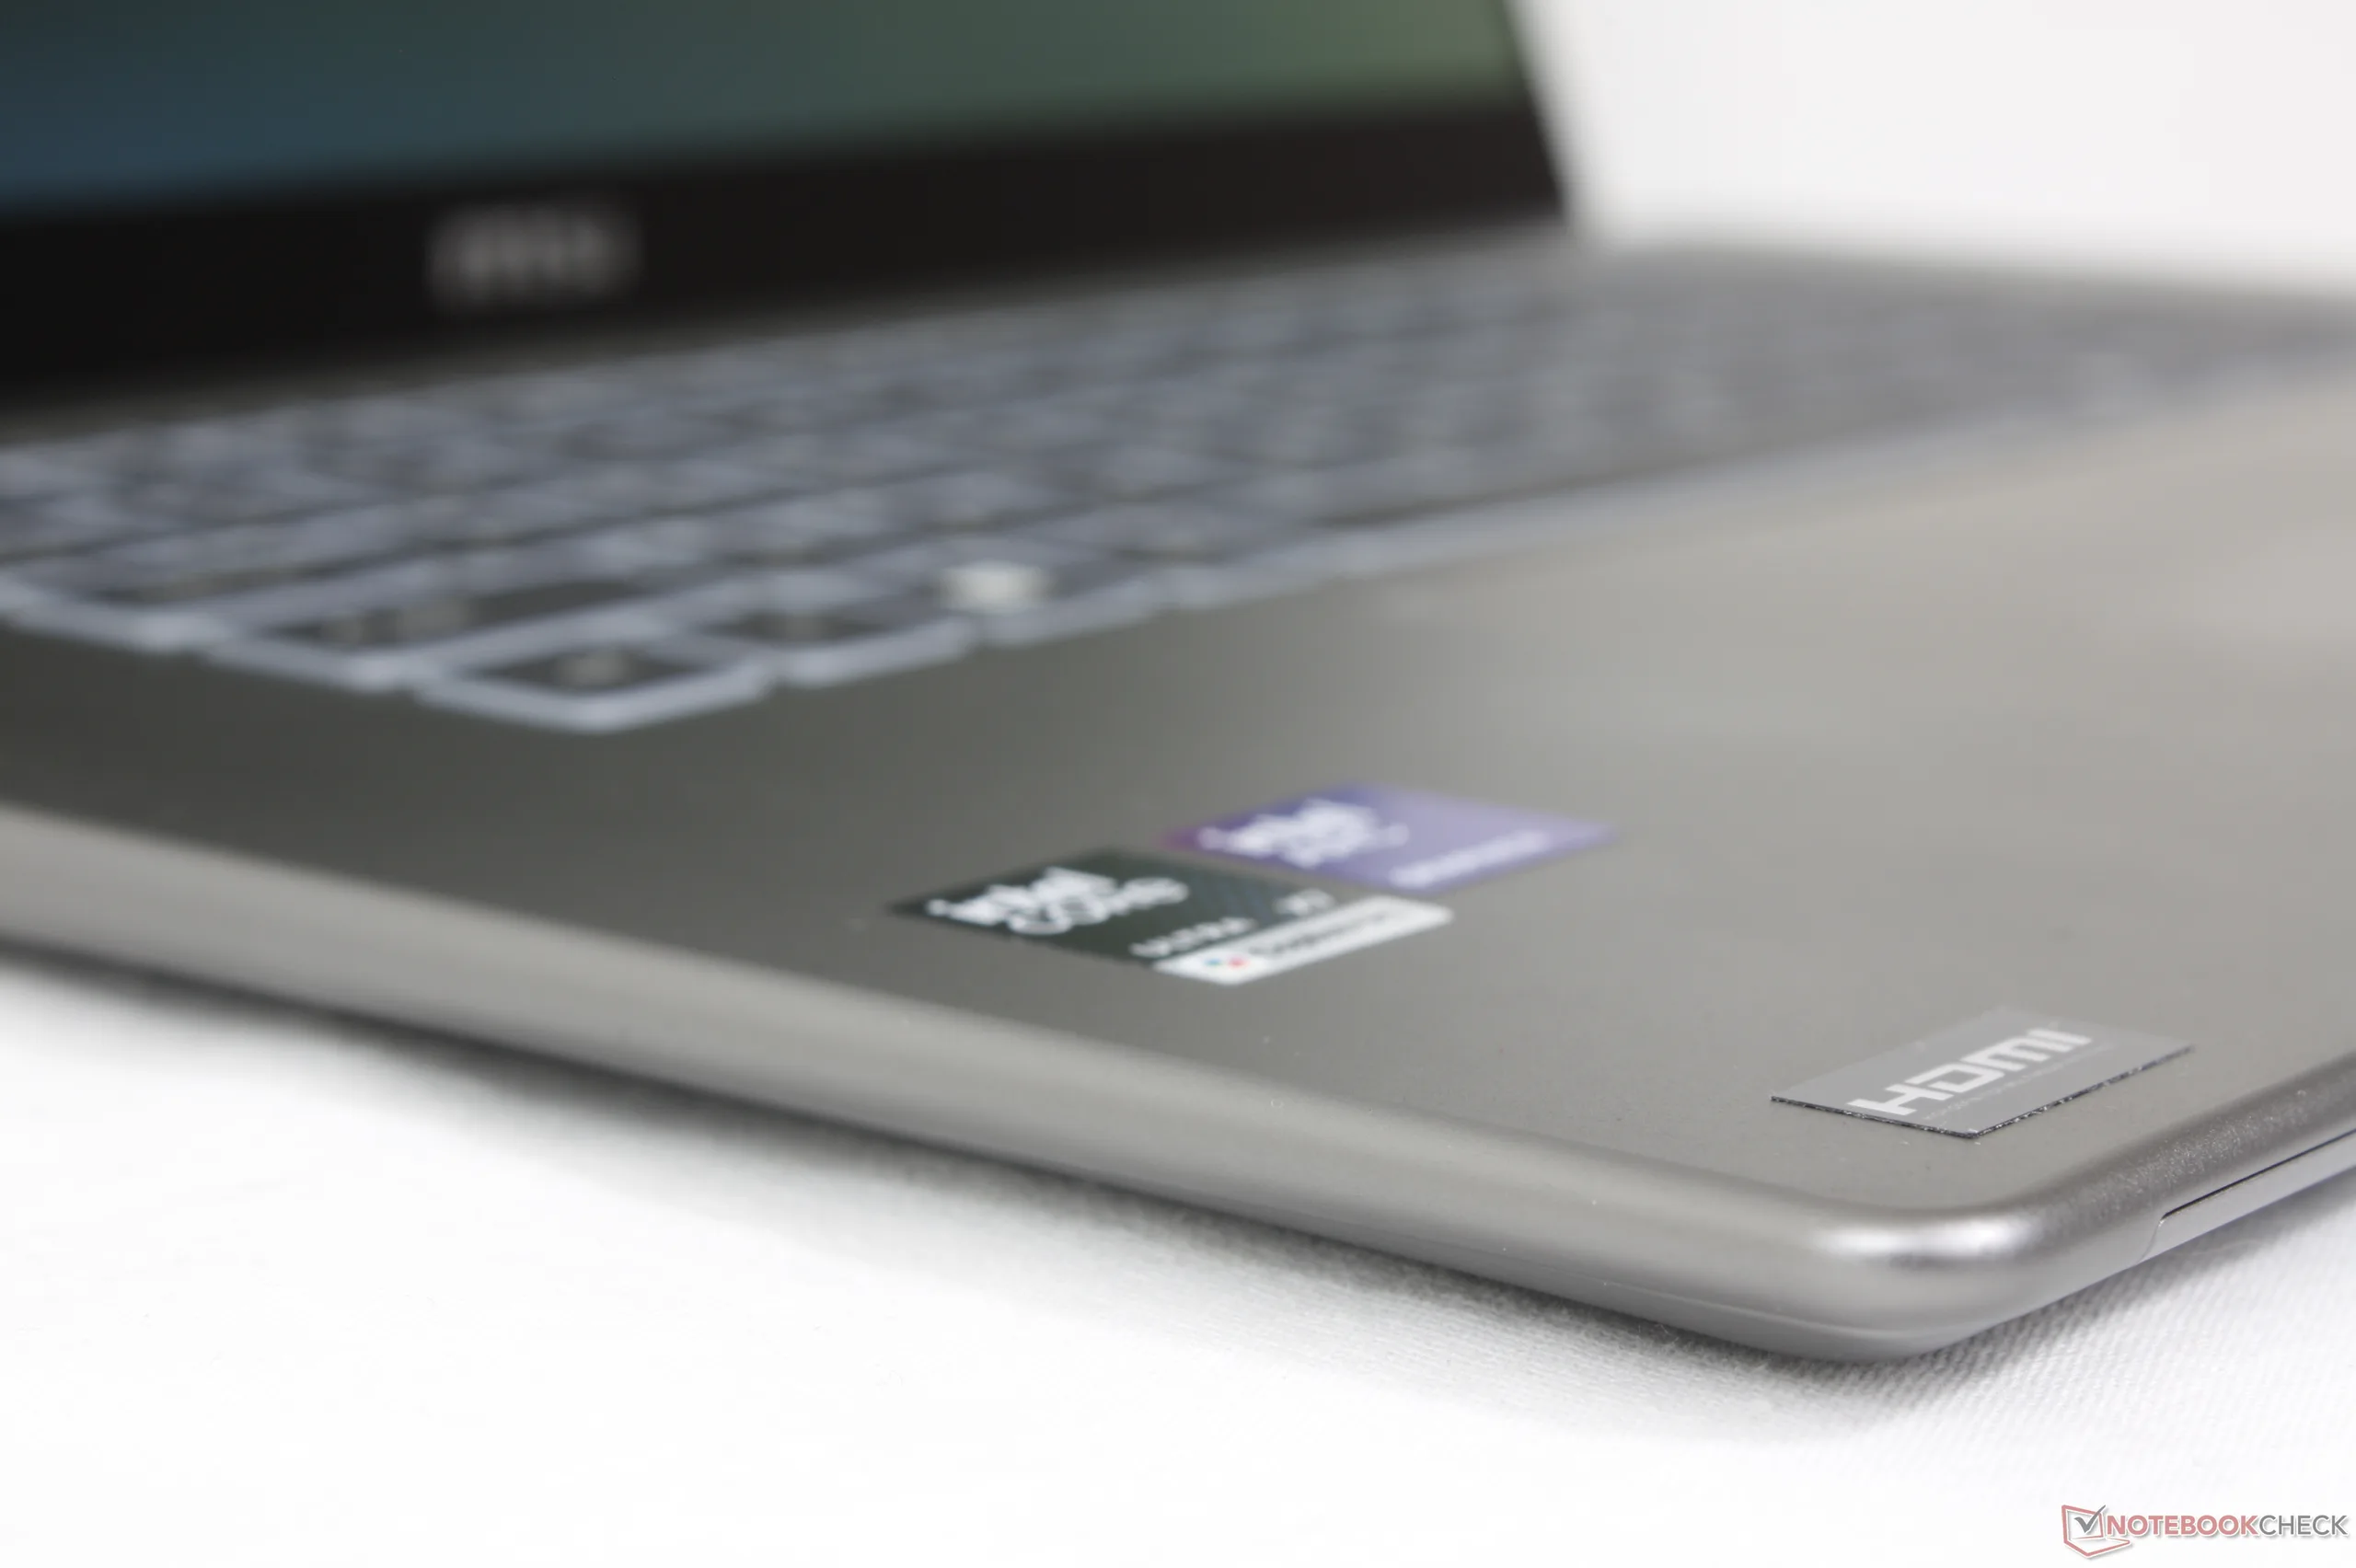
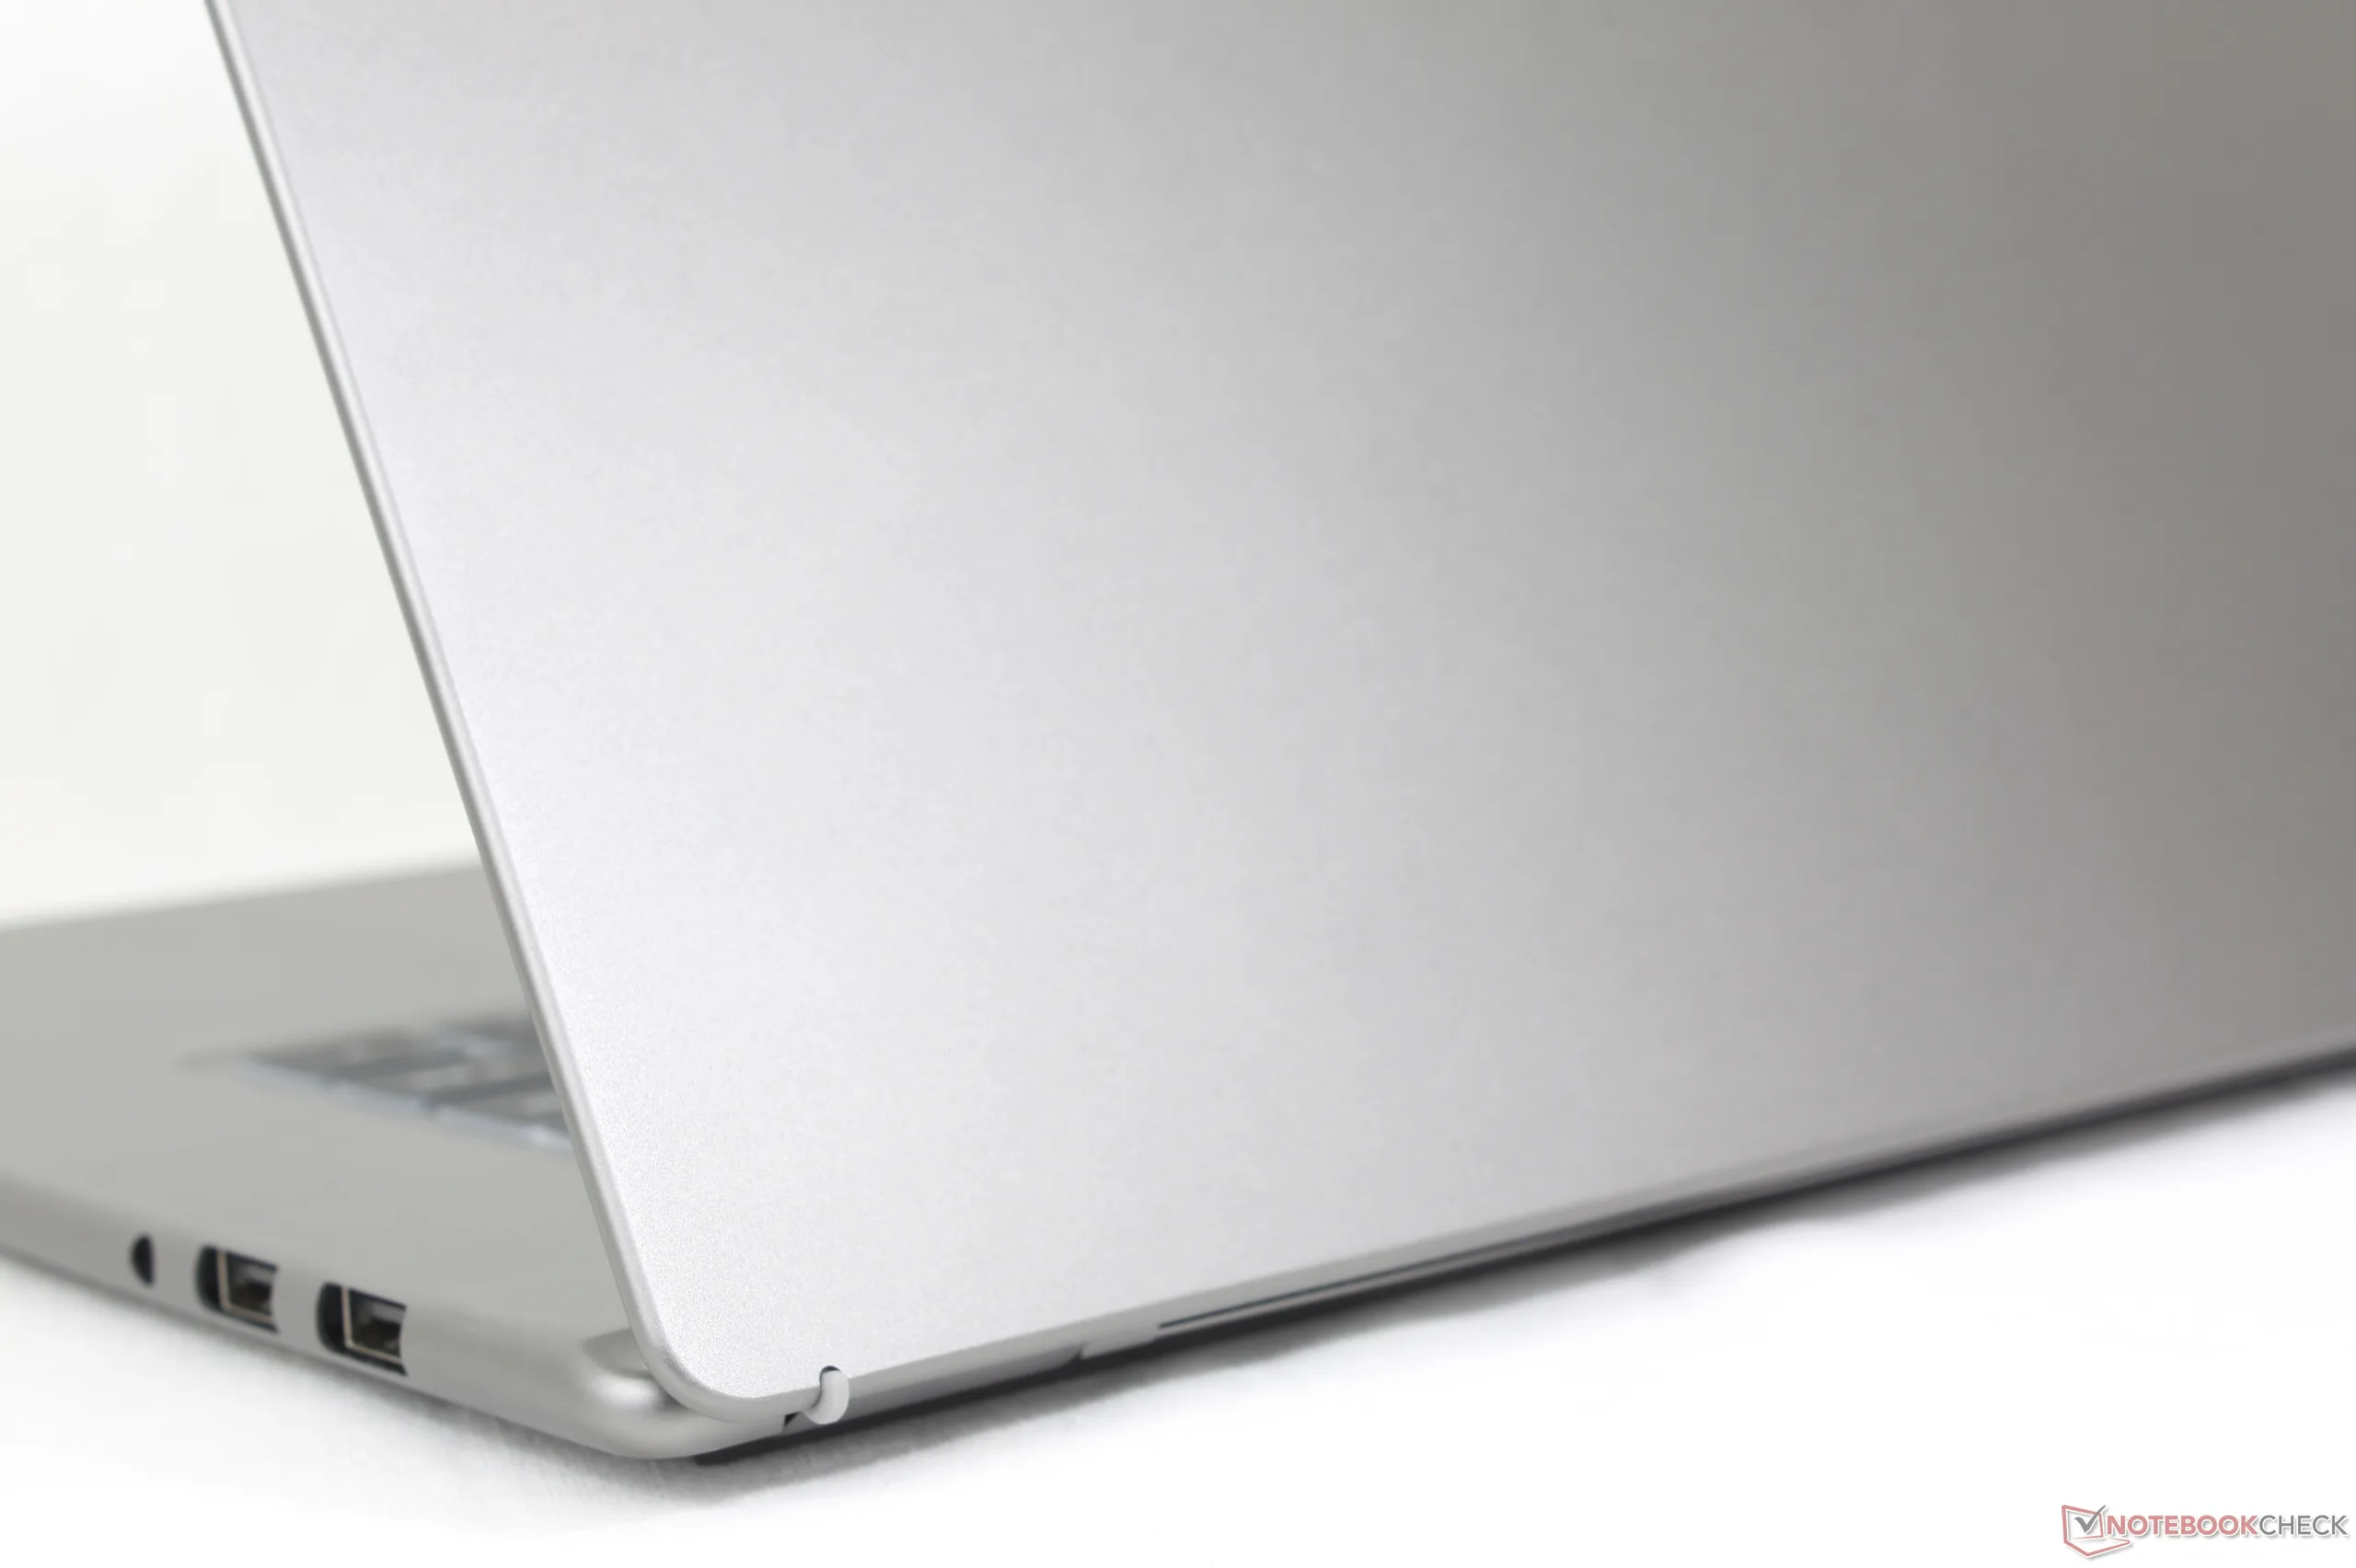
De poortopties zijn veranderd ten opzichte van het model uit 2025. MSI heeft de RJ-45 poort, SD-kaartlezer en Kensington-slot laten vallen, terwijl er een tweede USB-A poort is toegevoegd. De wijzigingen zijn gemengd, afhankelijk van de voorkeuren van de gebruiker.
De plaatsing van de poorten had ook beter gekund, aangezien USB-C opladen beperkt is tot de linkerkant van het systeem.

Communicatie
Webcam
De 2 MP webcam wordt standaard geleverd met zowel IR als een fysieke privacy shutter.


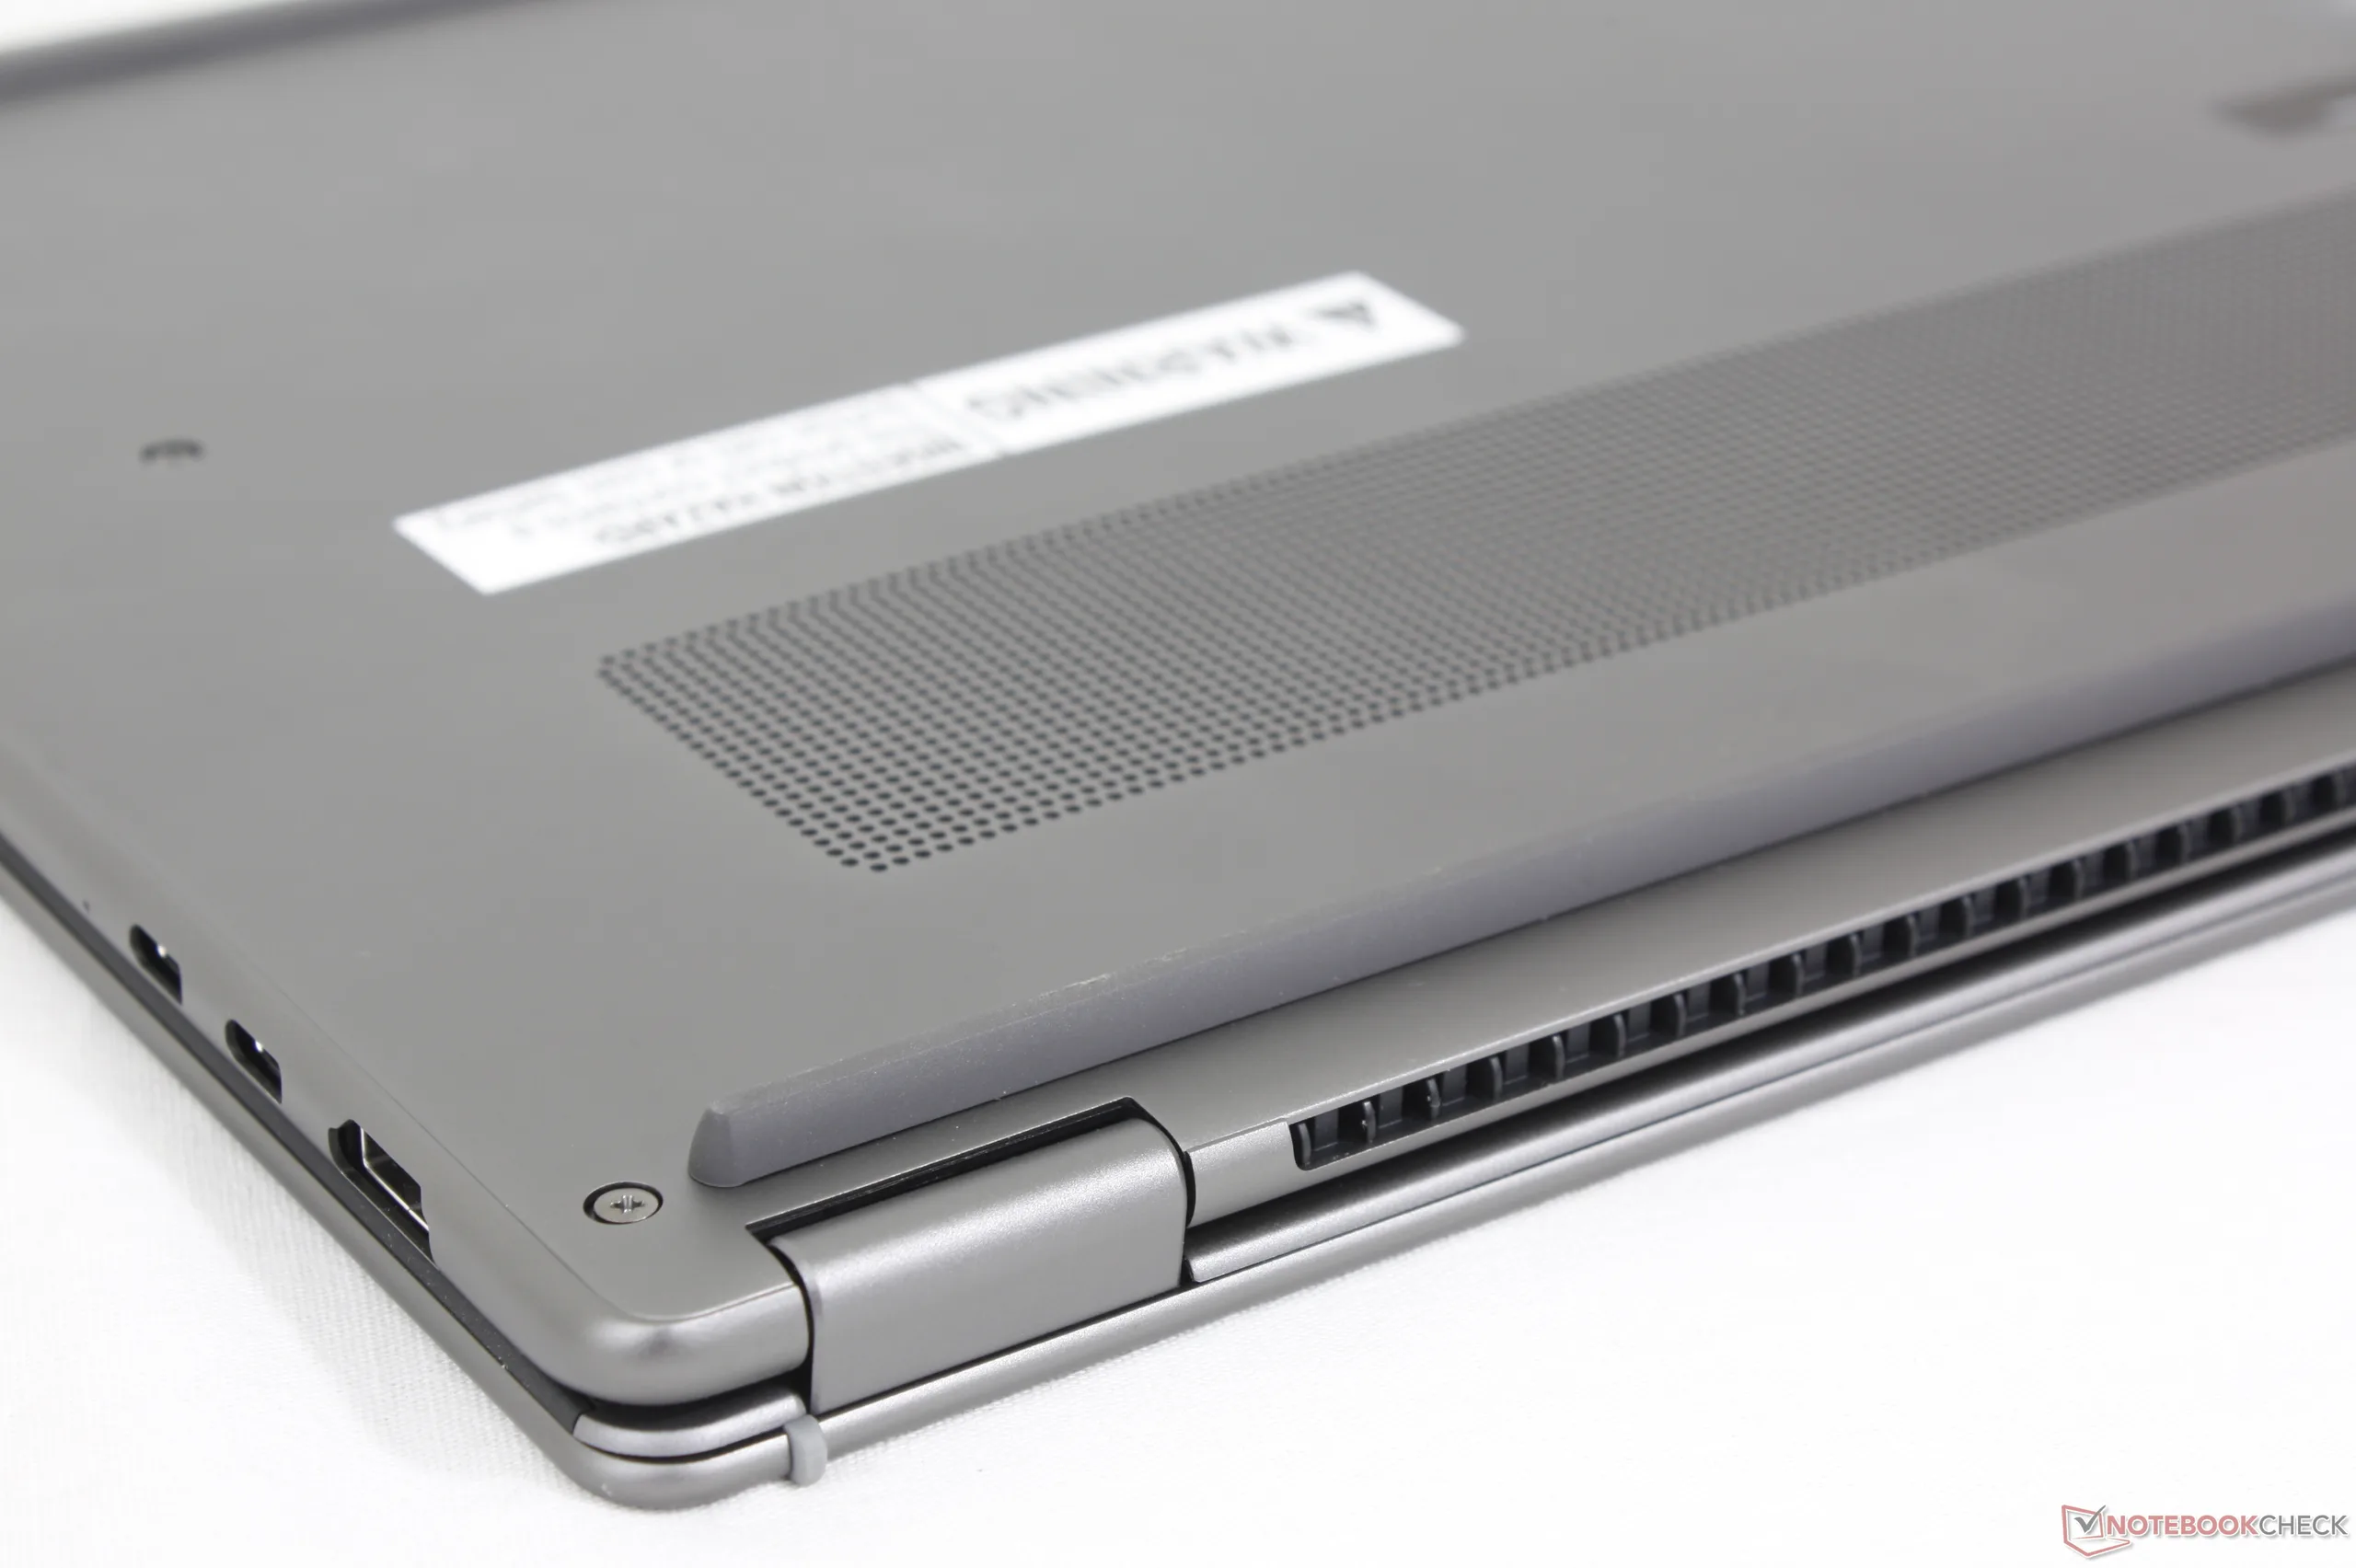
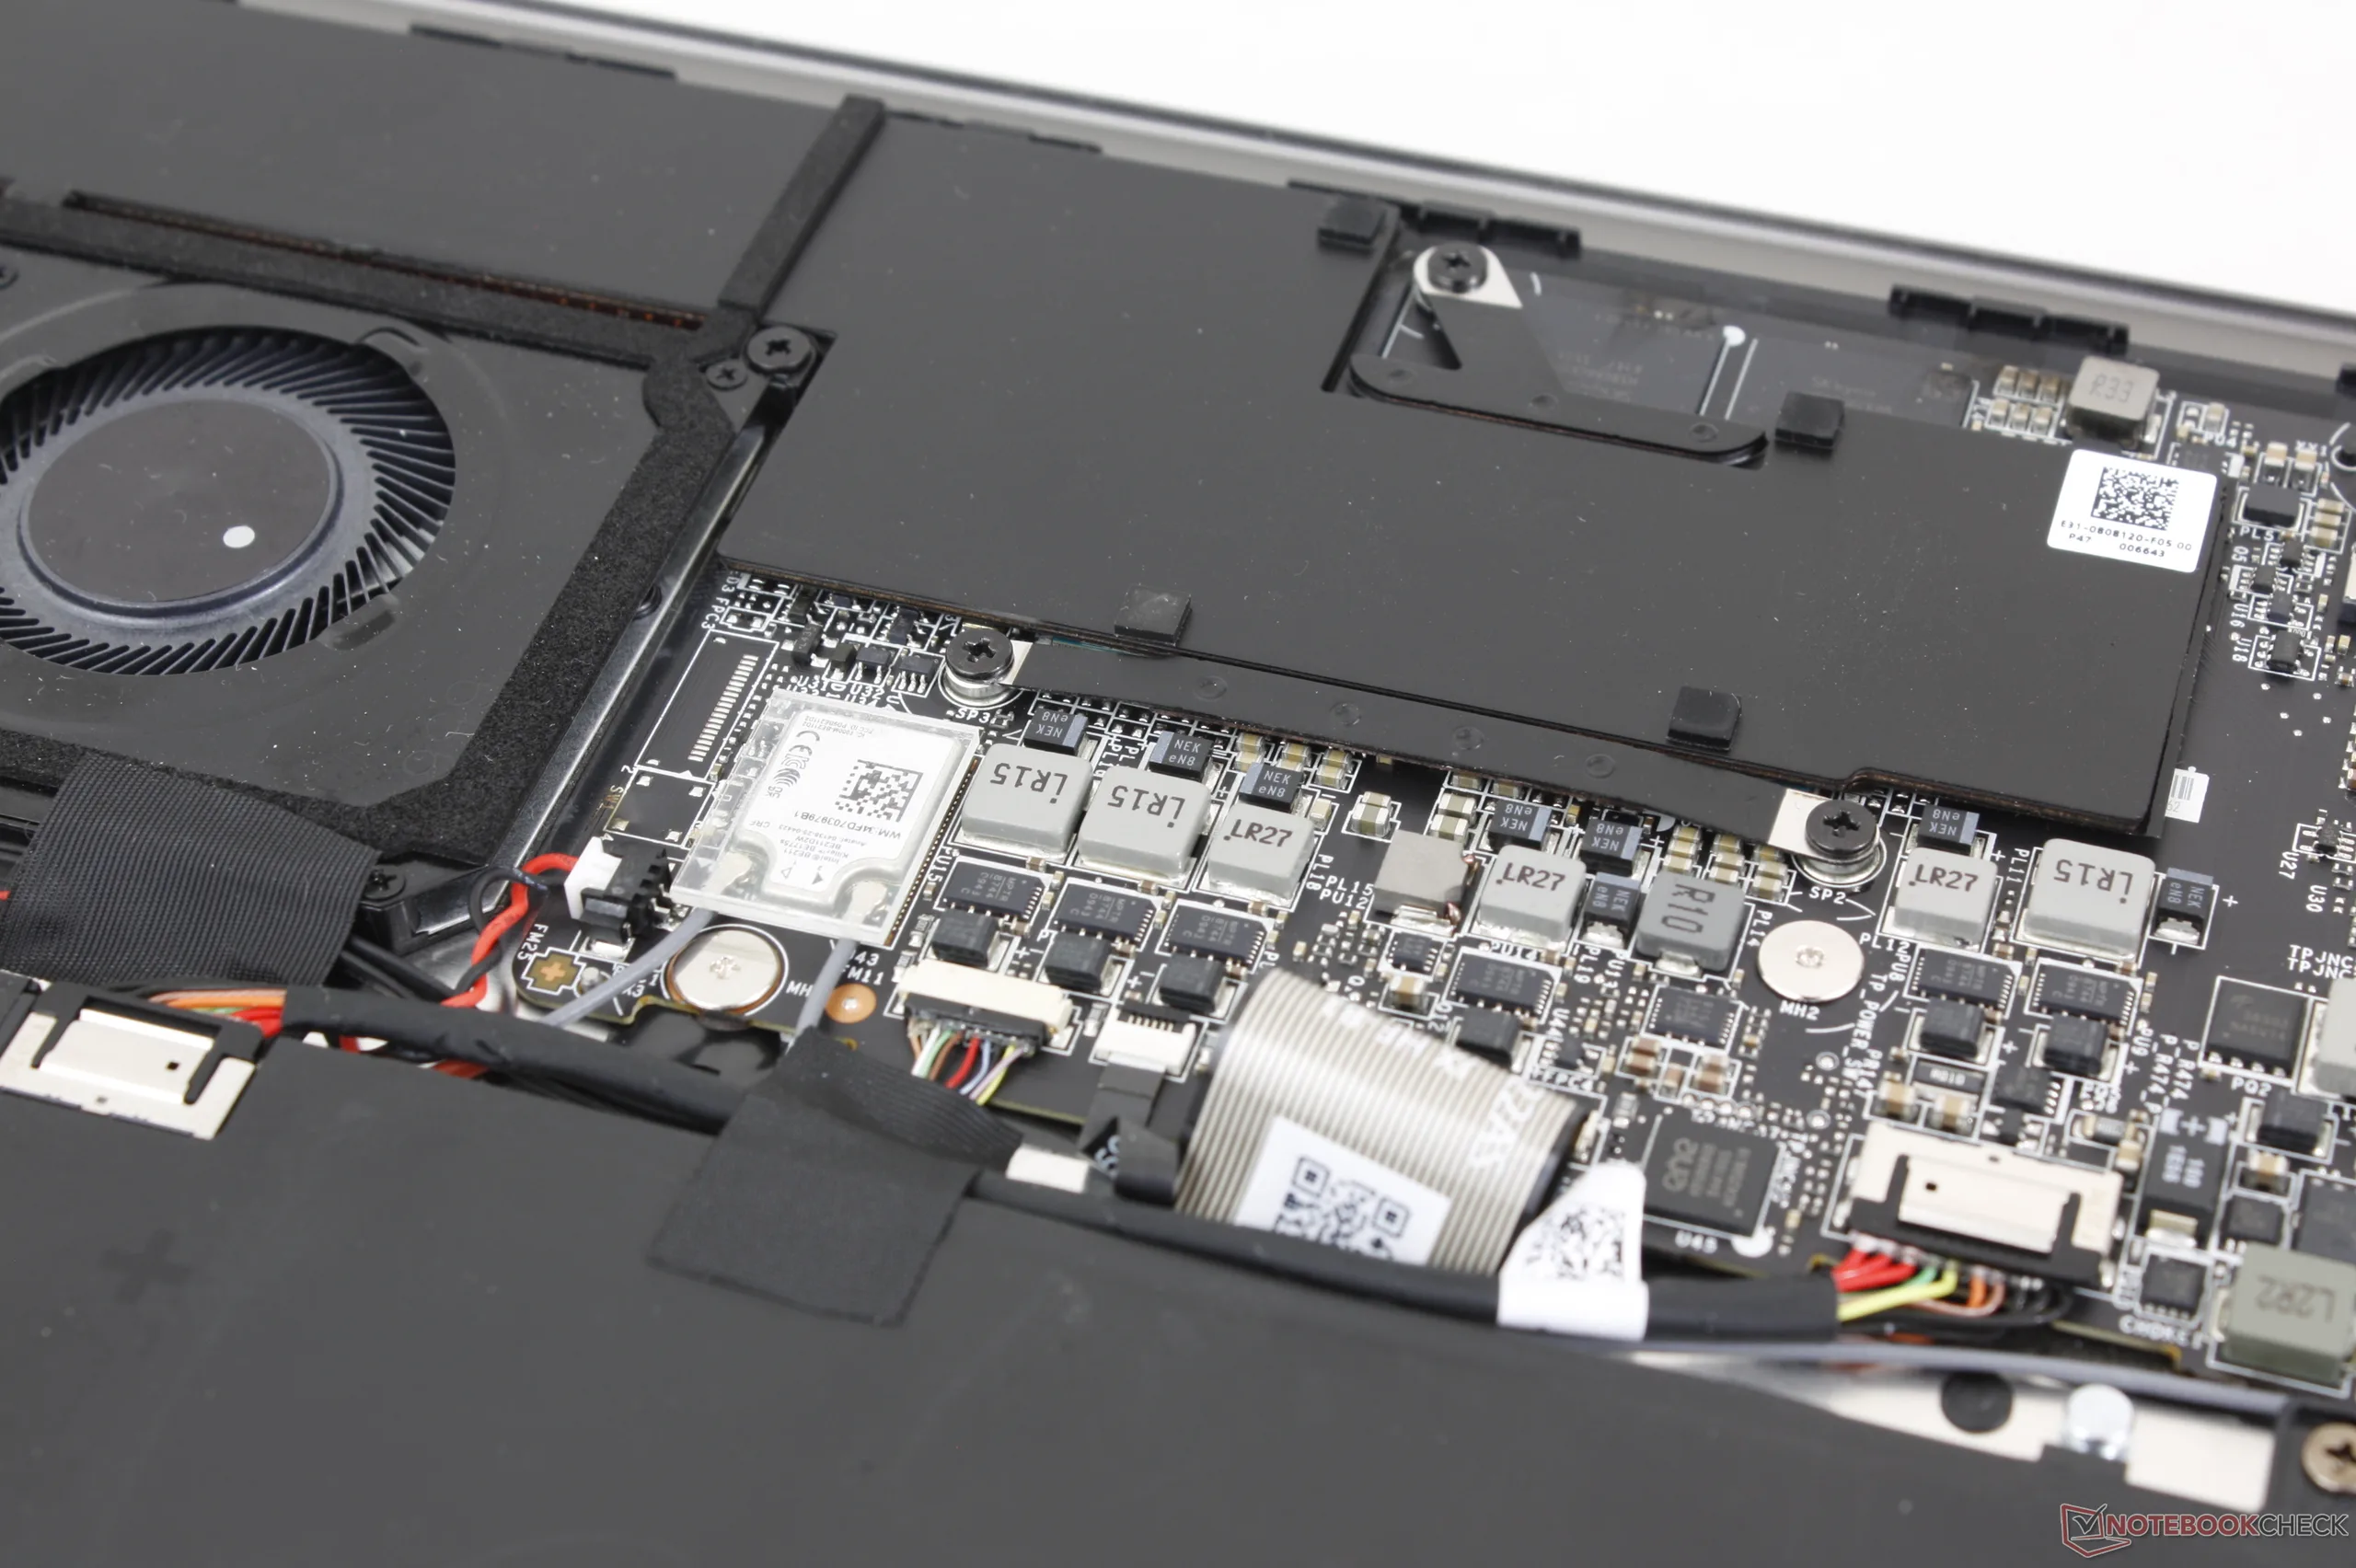
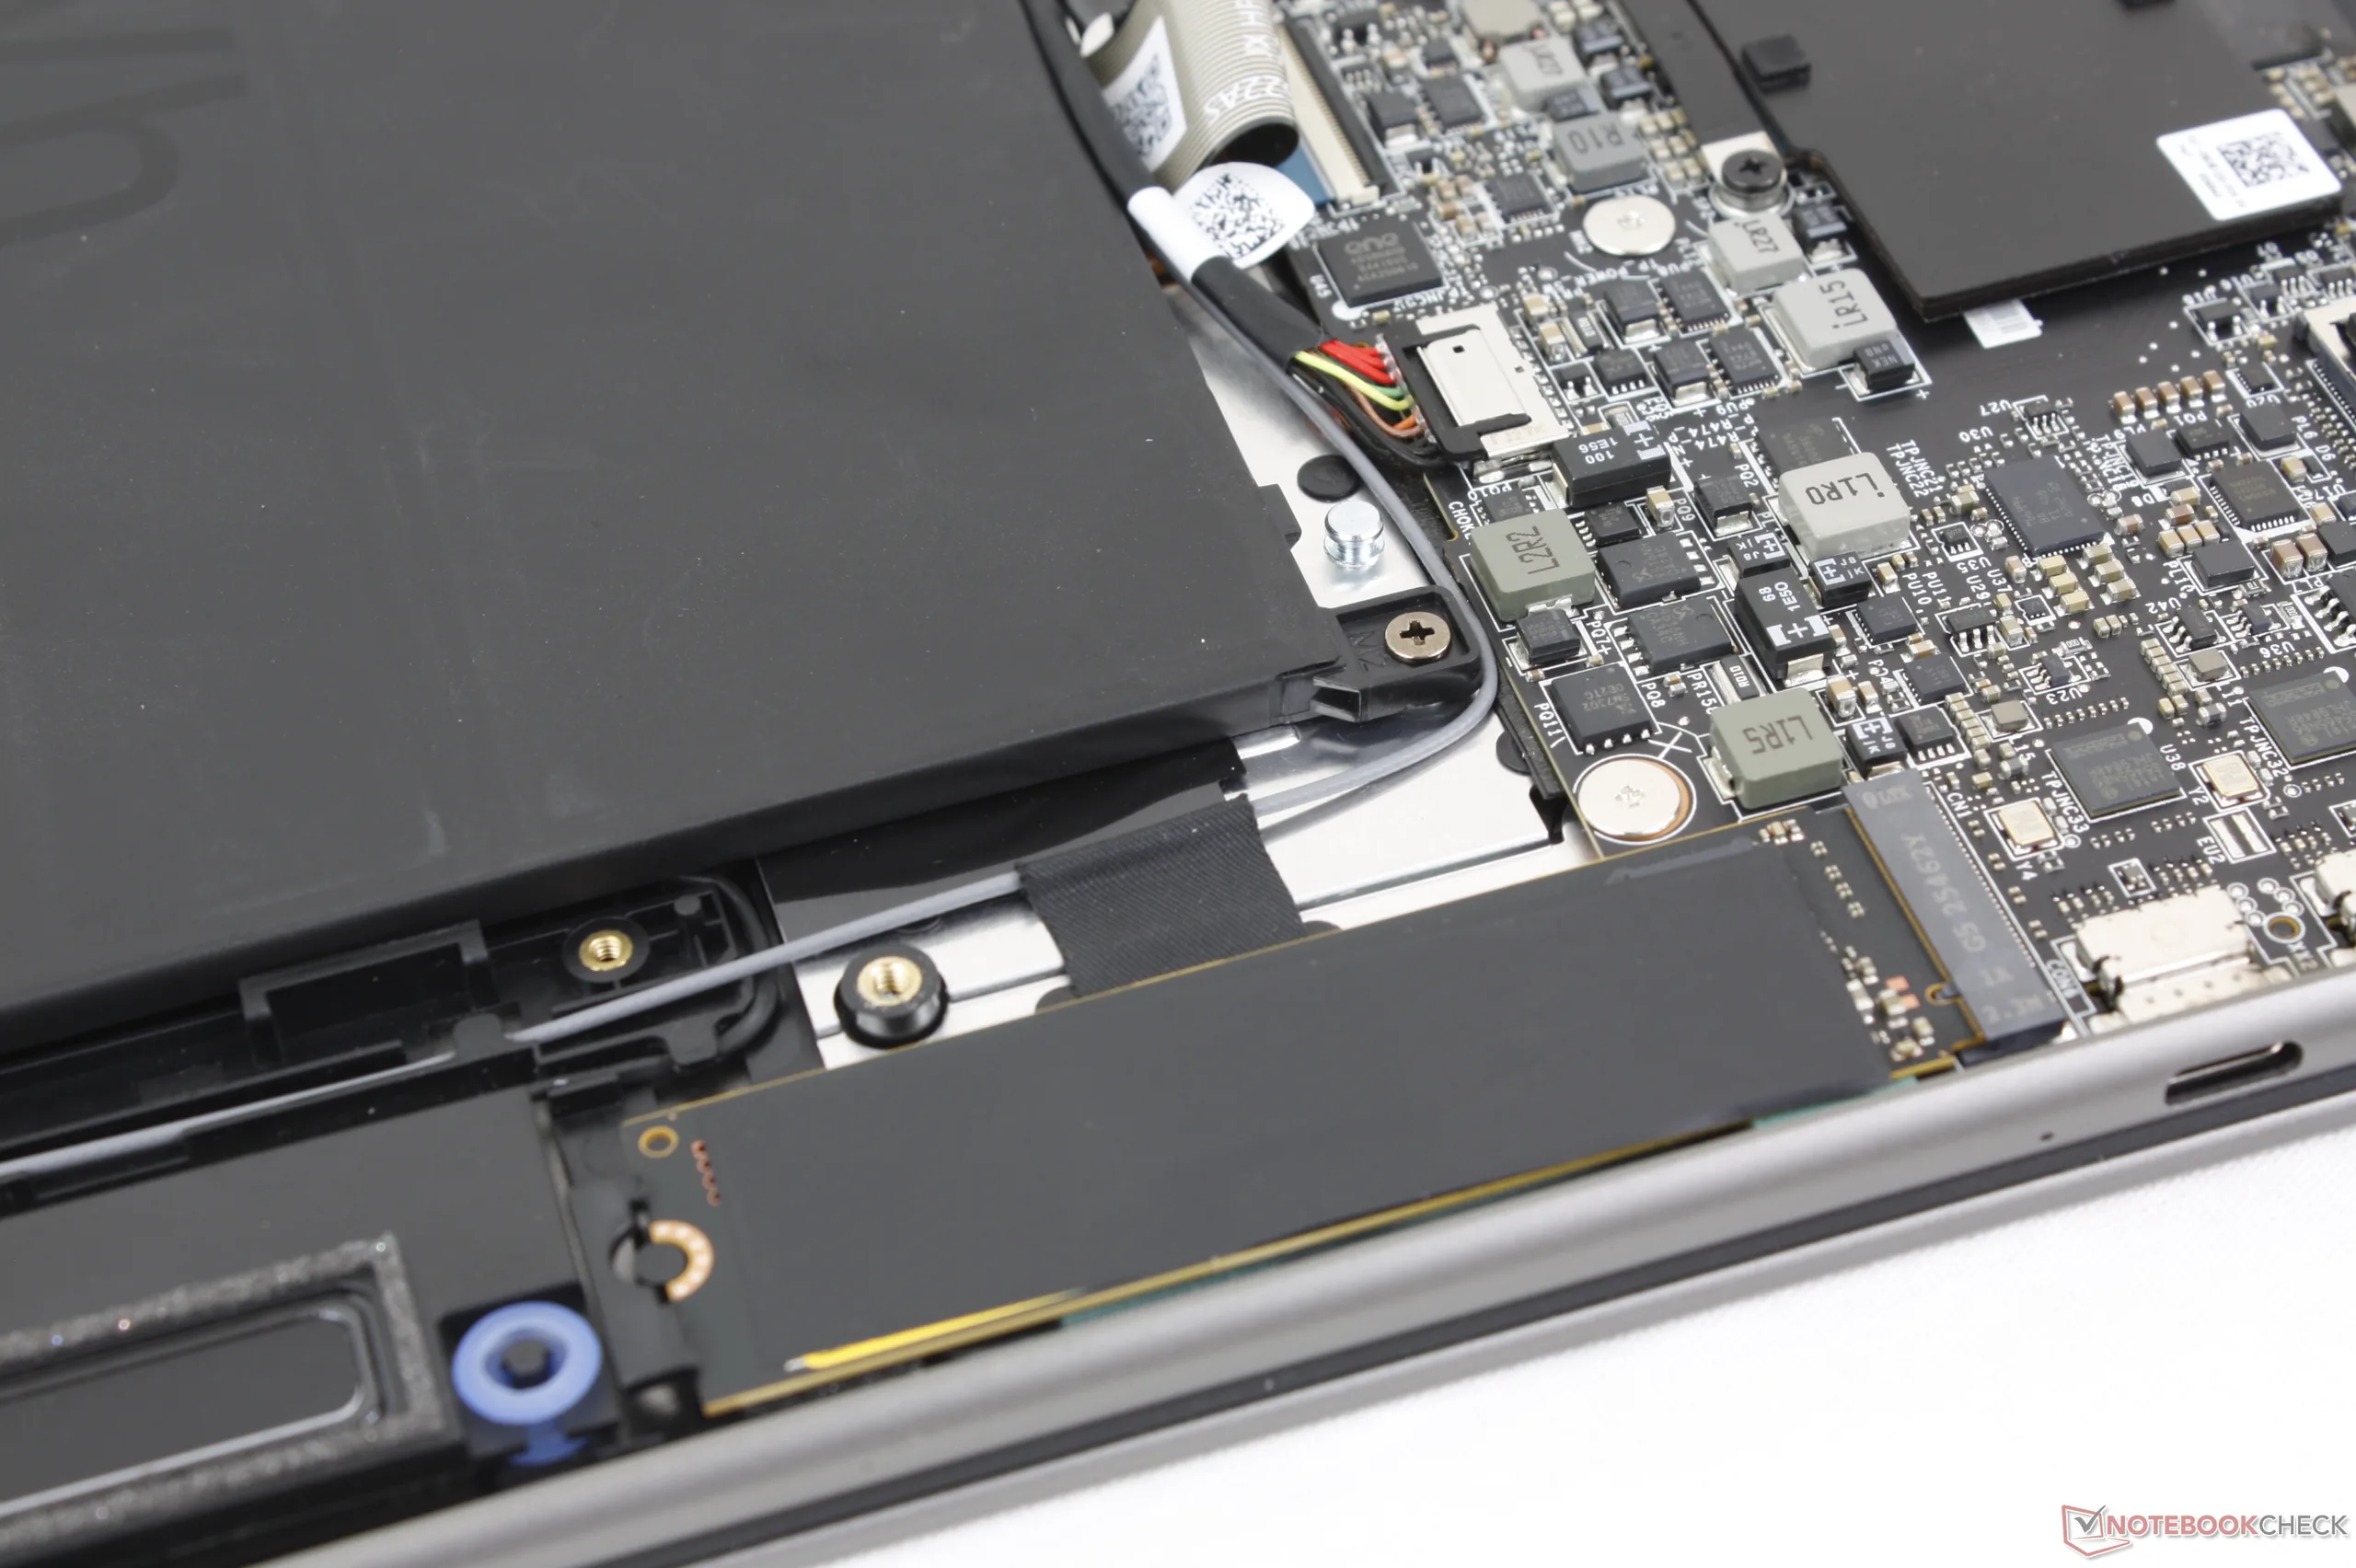
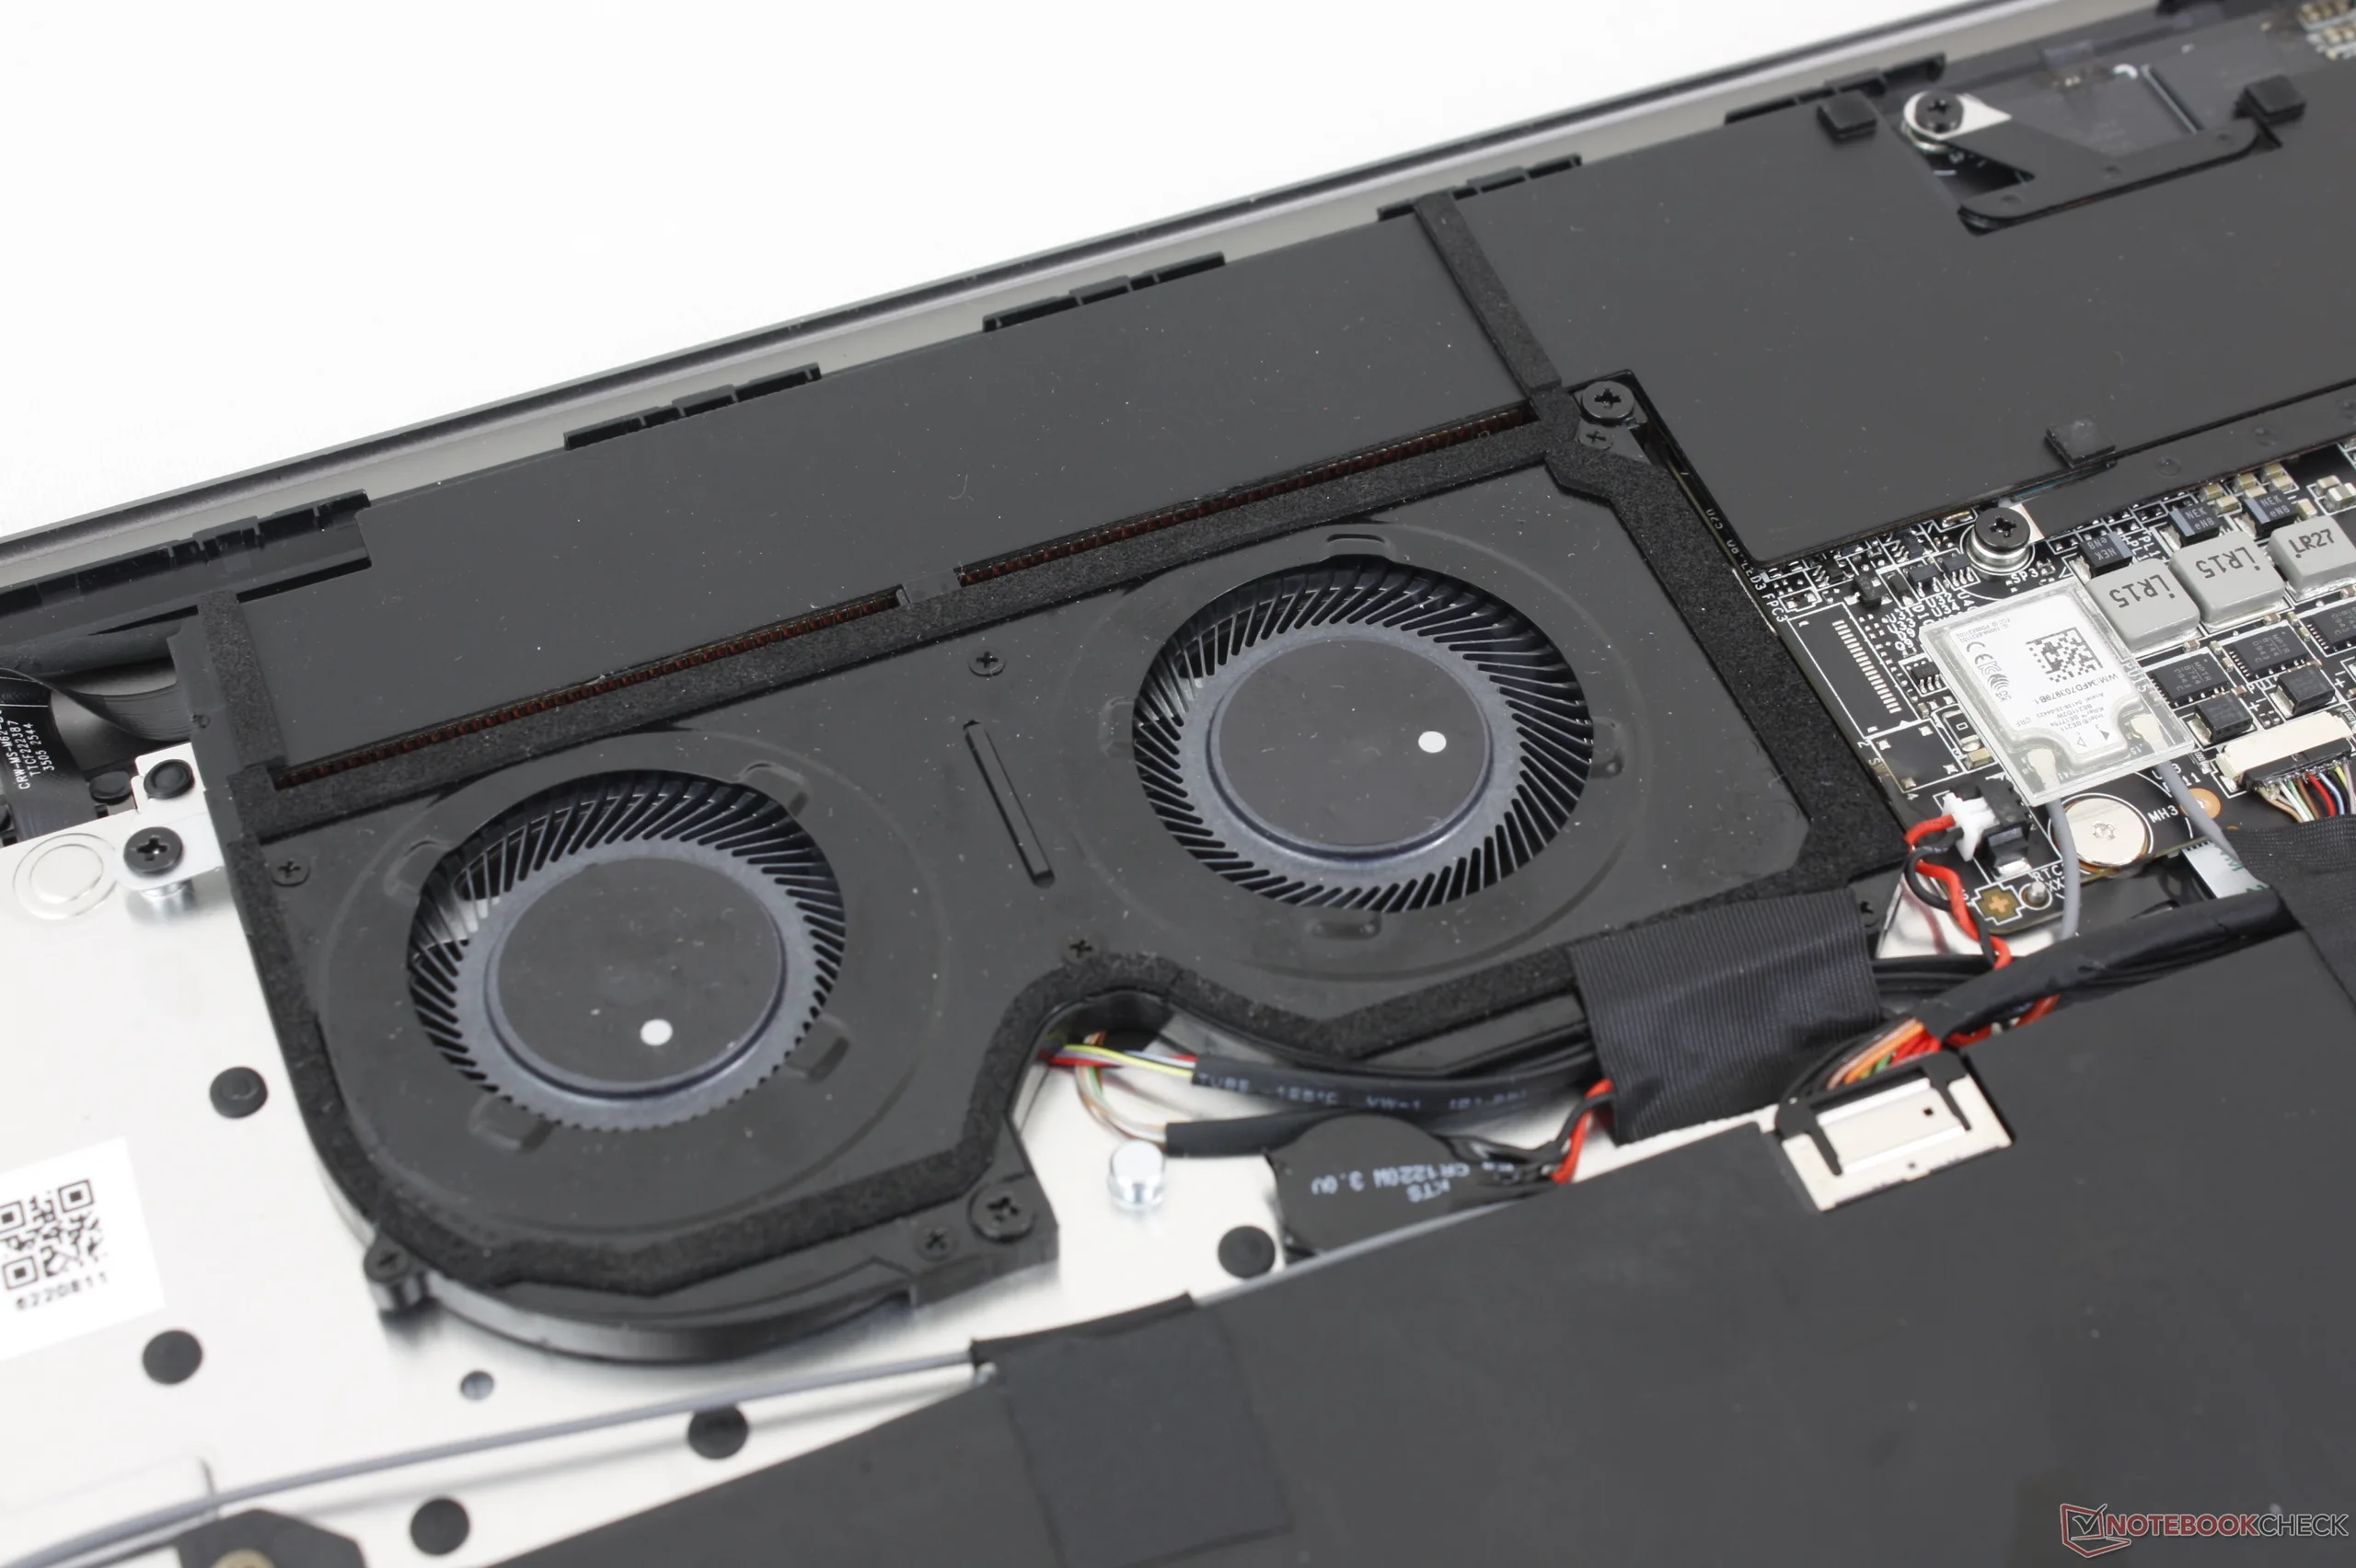
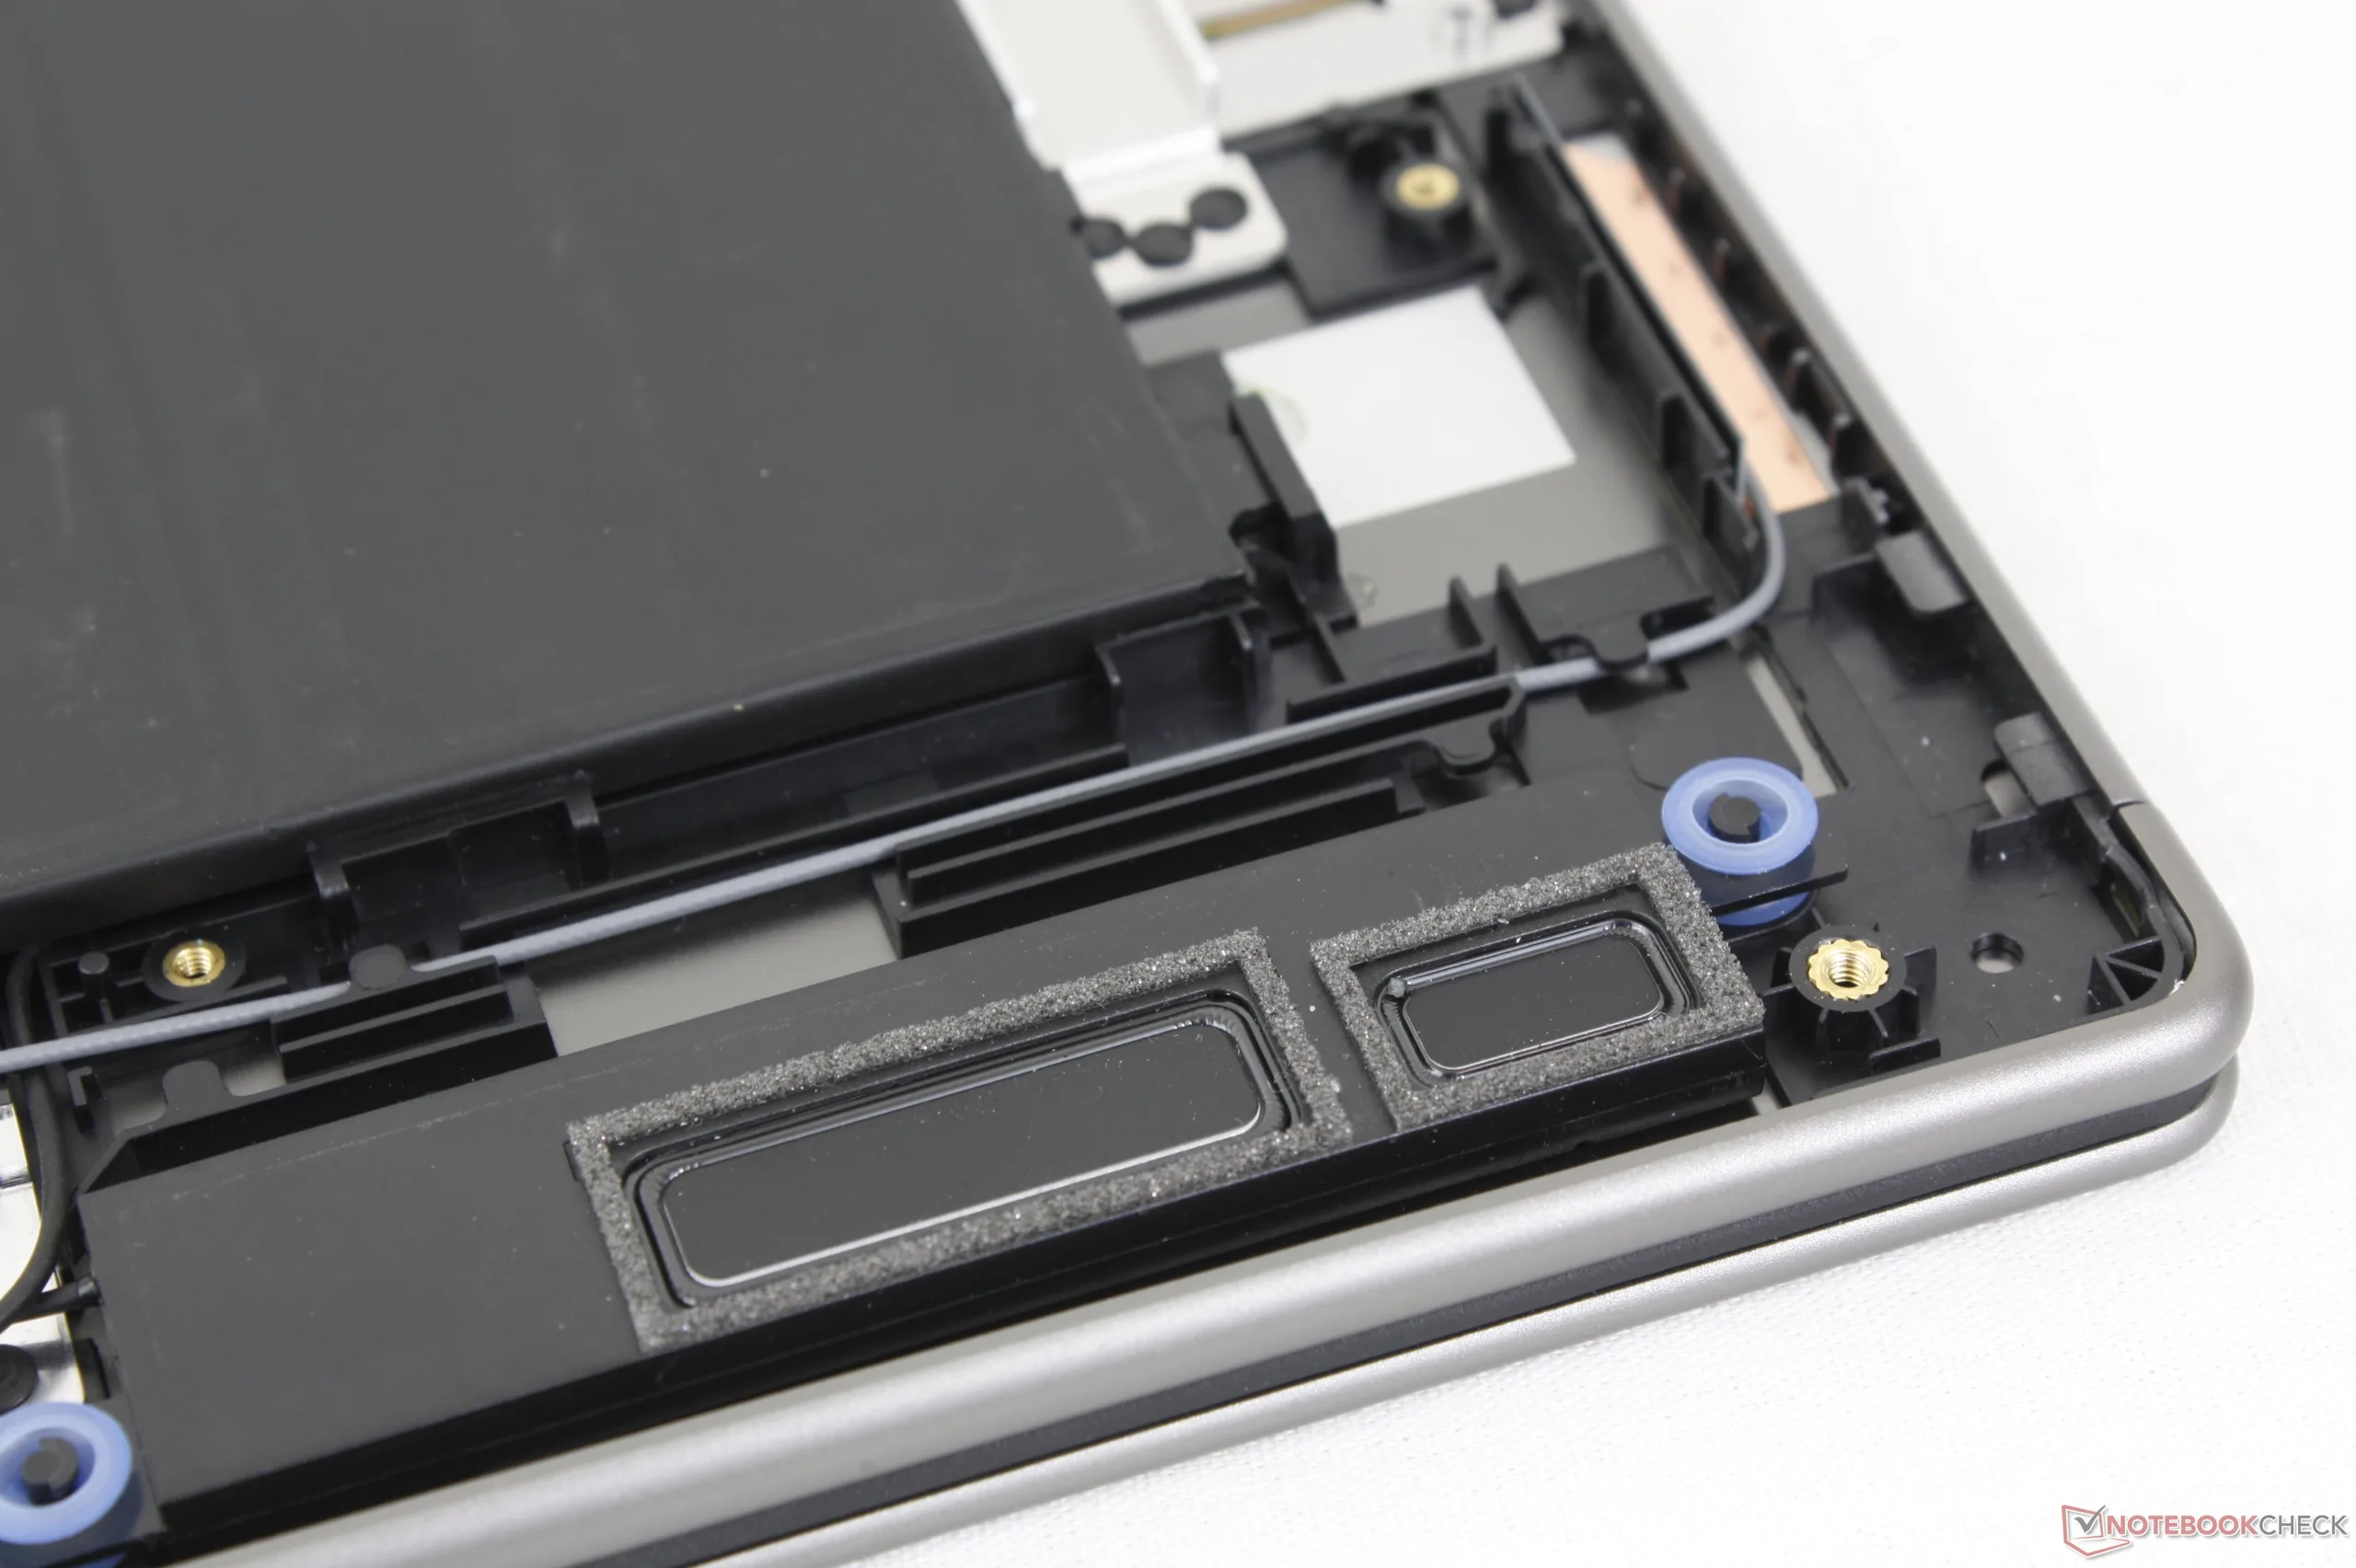
Onderhoud
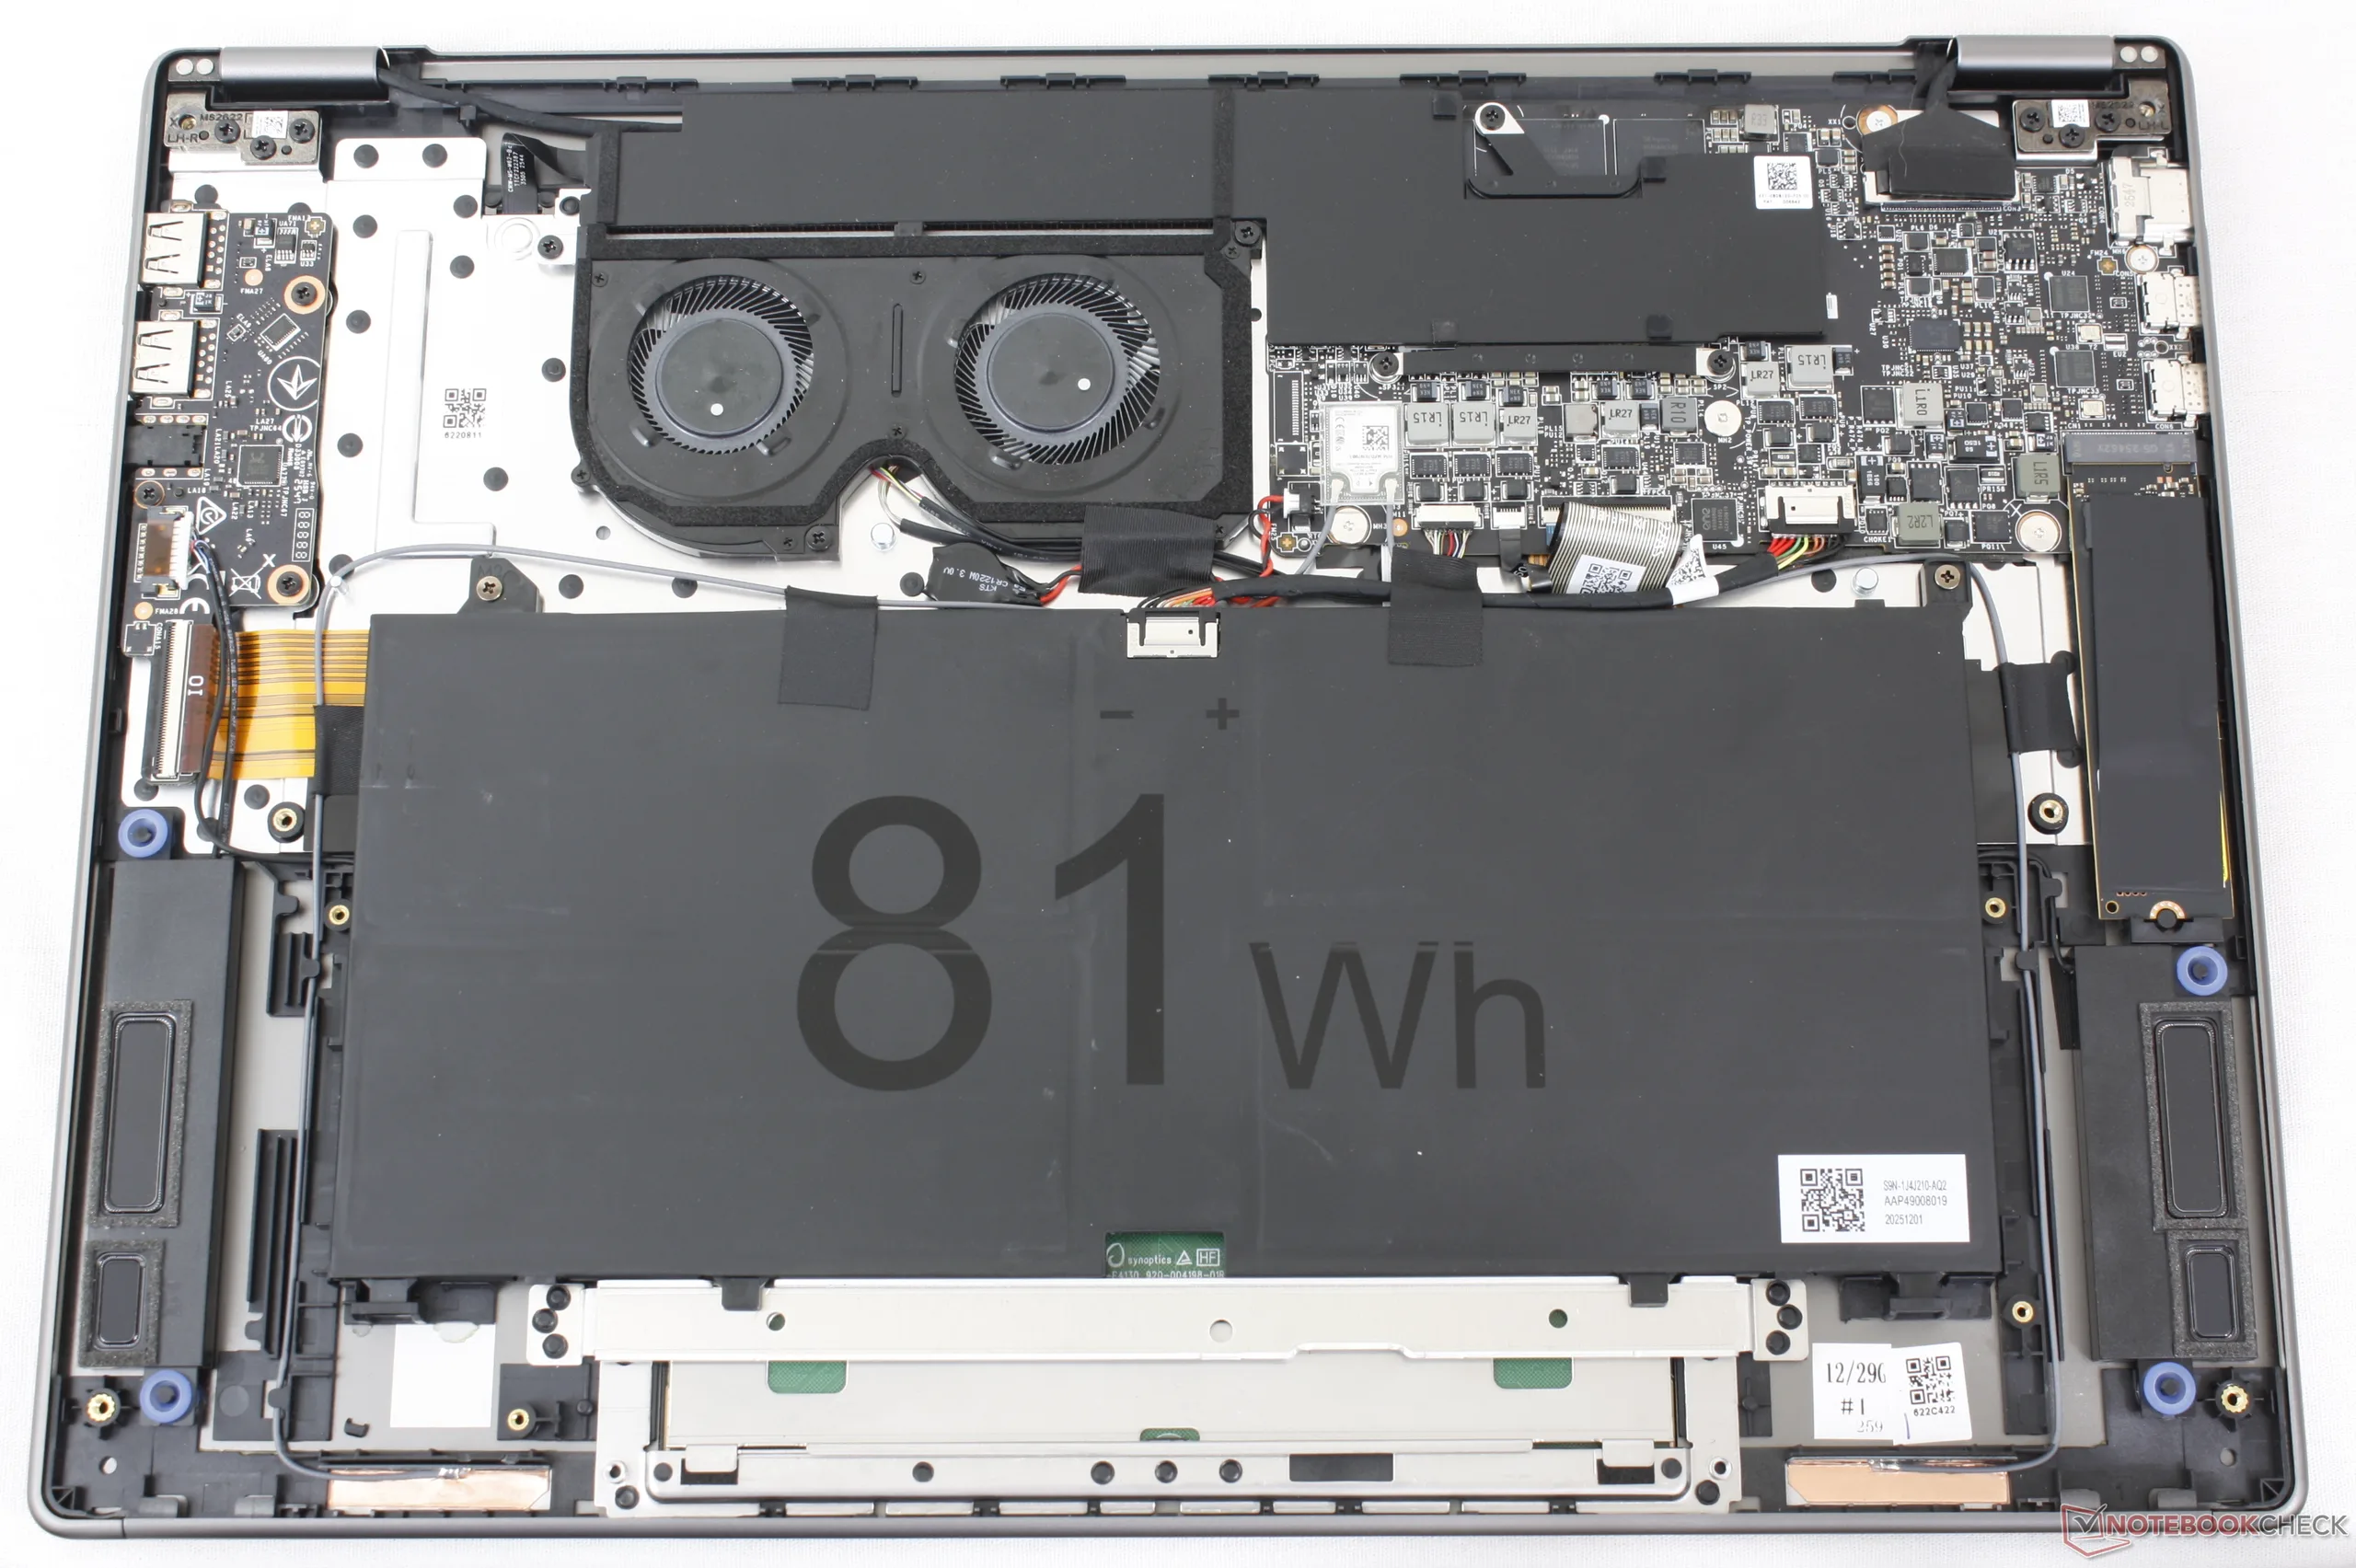
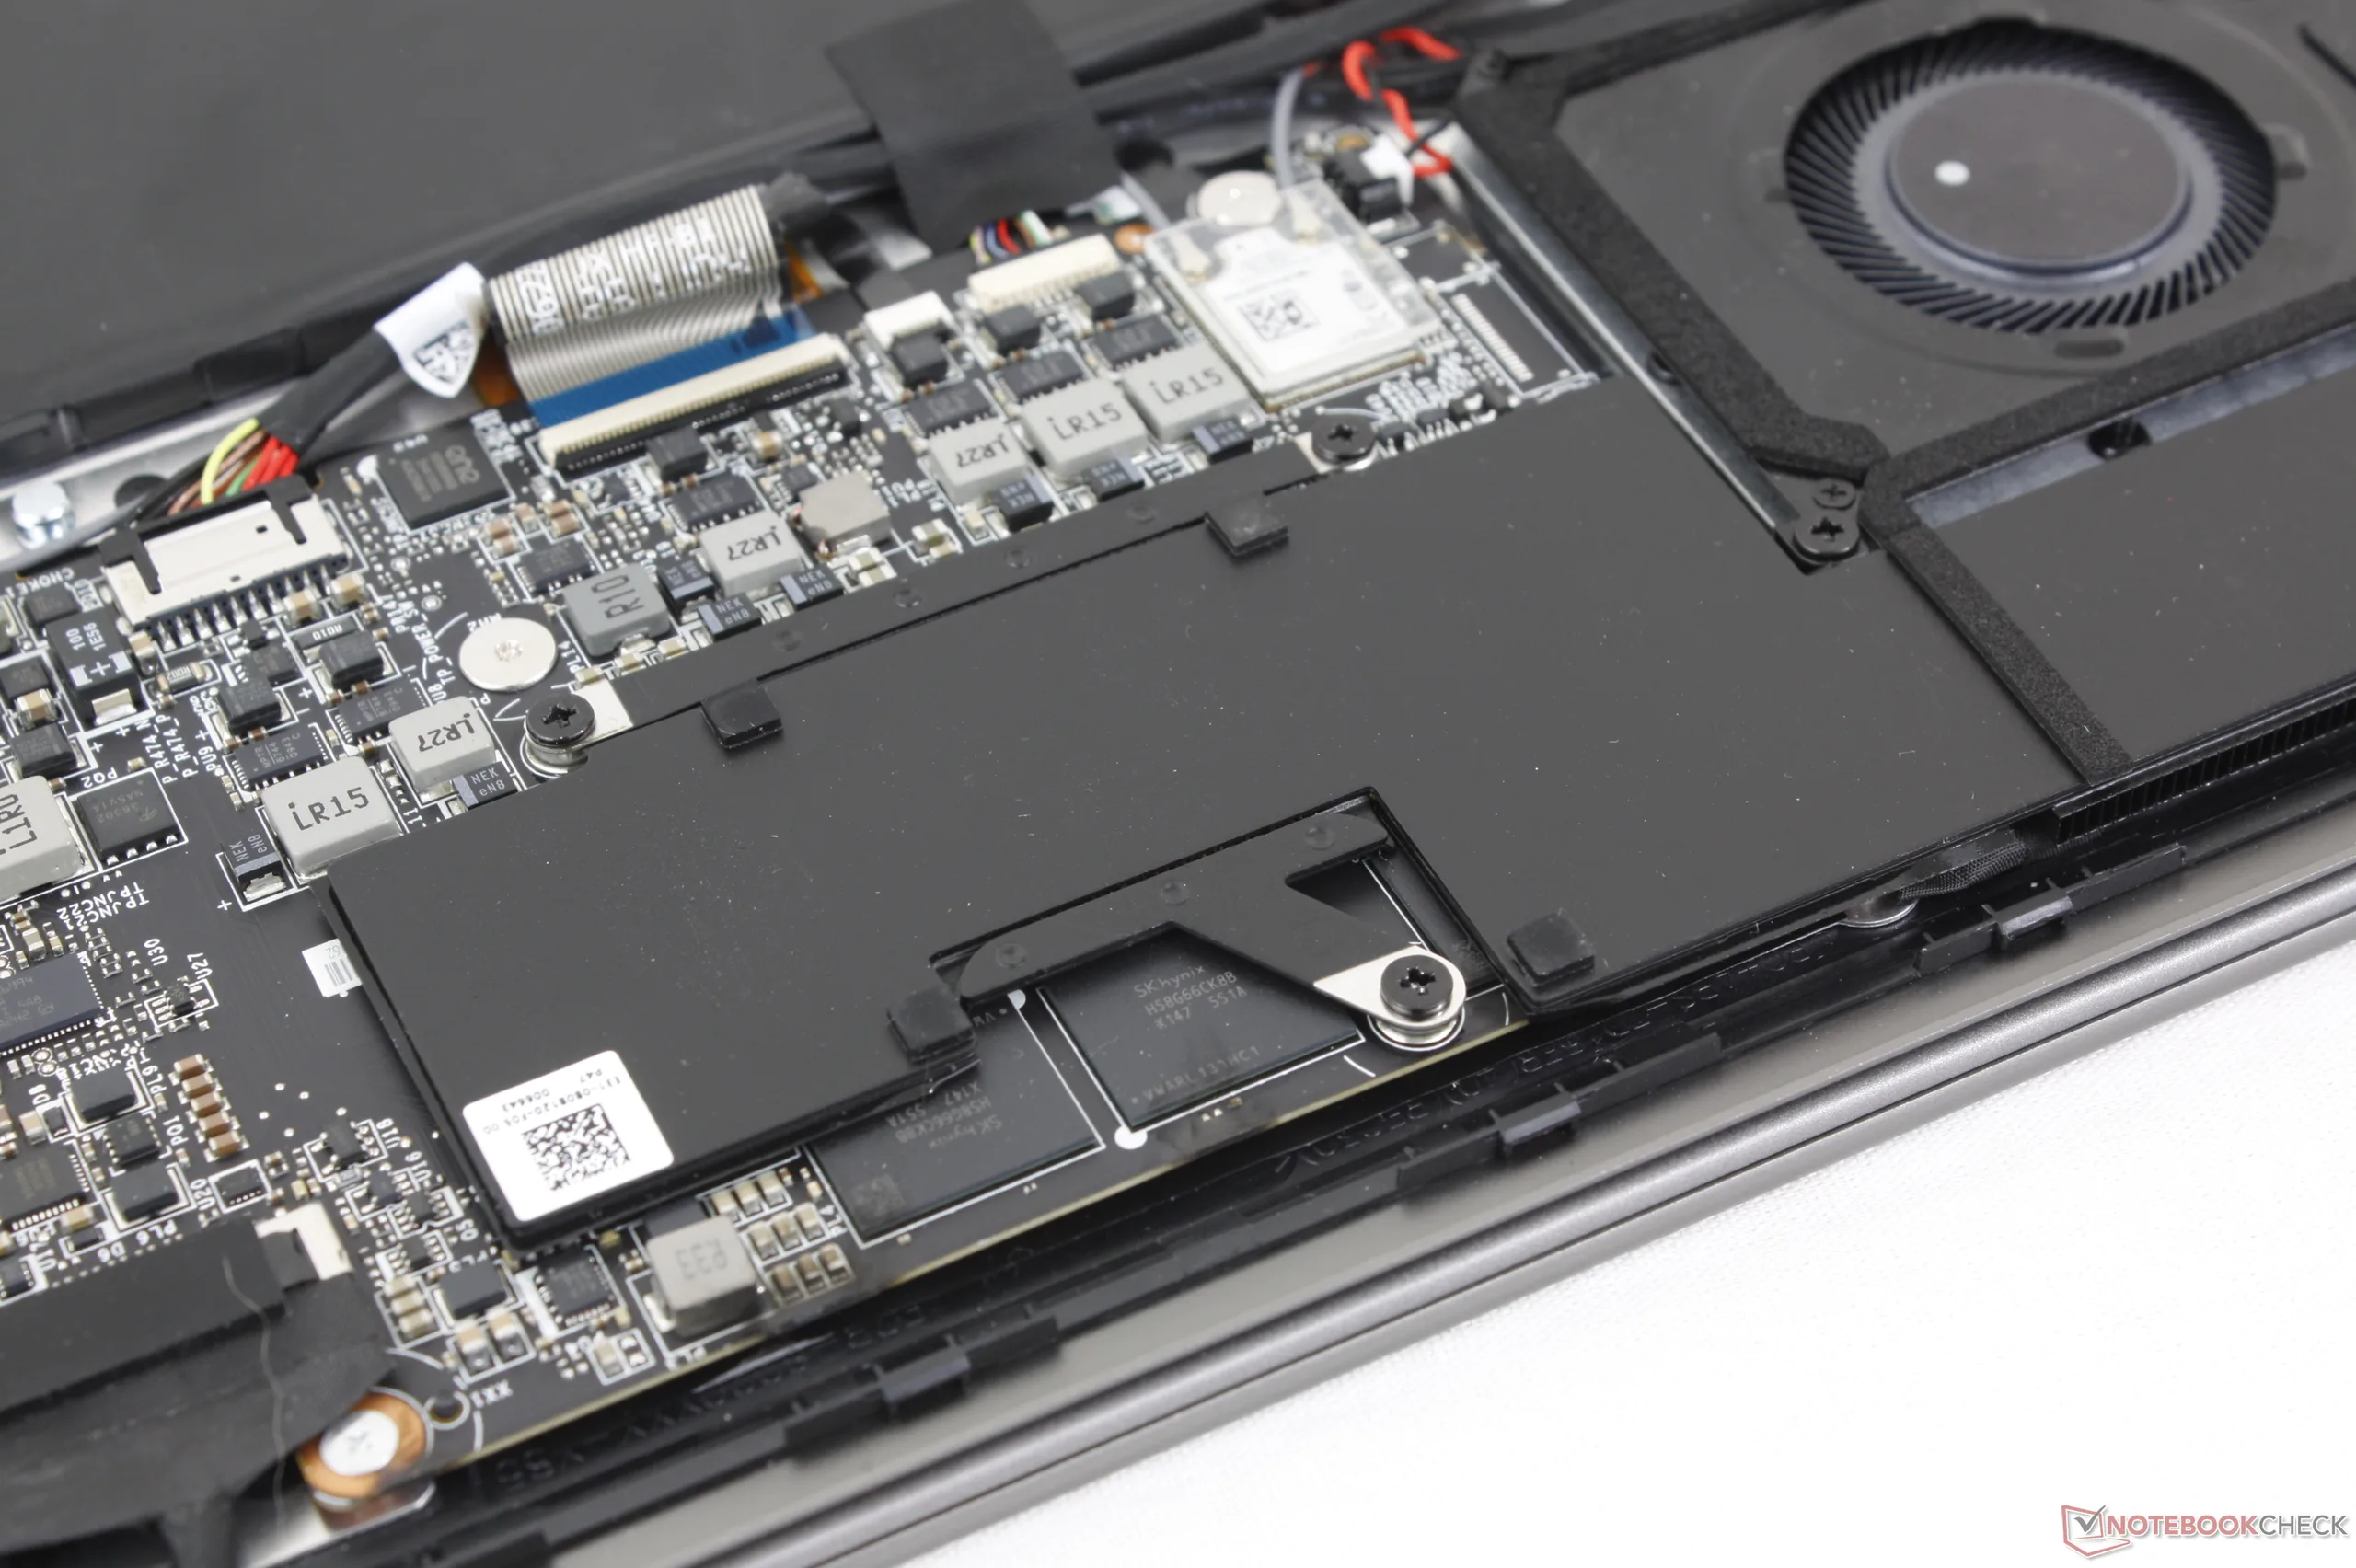
Het bodempaneel is gemakkelijk te verwijderen met slechts een kruiskopschroevendraaier en een scherpe rand. Het moederbord is volledig herzien ten opzichte van het model uit 2025, zoals hieronder te zien is. Het meest opvallende is dat het model nu slechts één M.2 SSD ondersteunt in plaats van twee, terwijl de batterijcapaciteit waarschijnlijk gekrompen is om gewicht te besparen.

Duurzaamheid
Het gebruik van gerecyclede materialen tijdens de productie wordt niet expliciet vermeld door de fabrikant. De verpakking is wel FSC-gecertificeerd en bestaat uit zowel papier als plastic.
Accessoires en garantie
Er zitten geen extra's in de doos behalve de AC-adapter en papierwerk. Bij aankoop in de VS geldt de gebruikelijke beperkte fabrieksgarantie van één jaar.
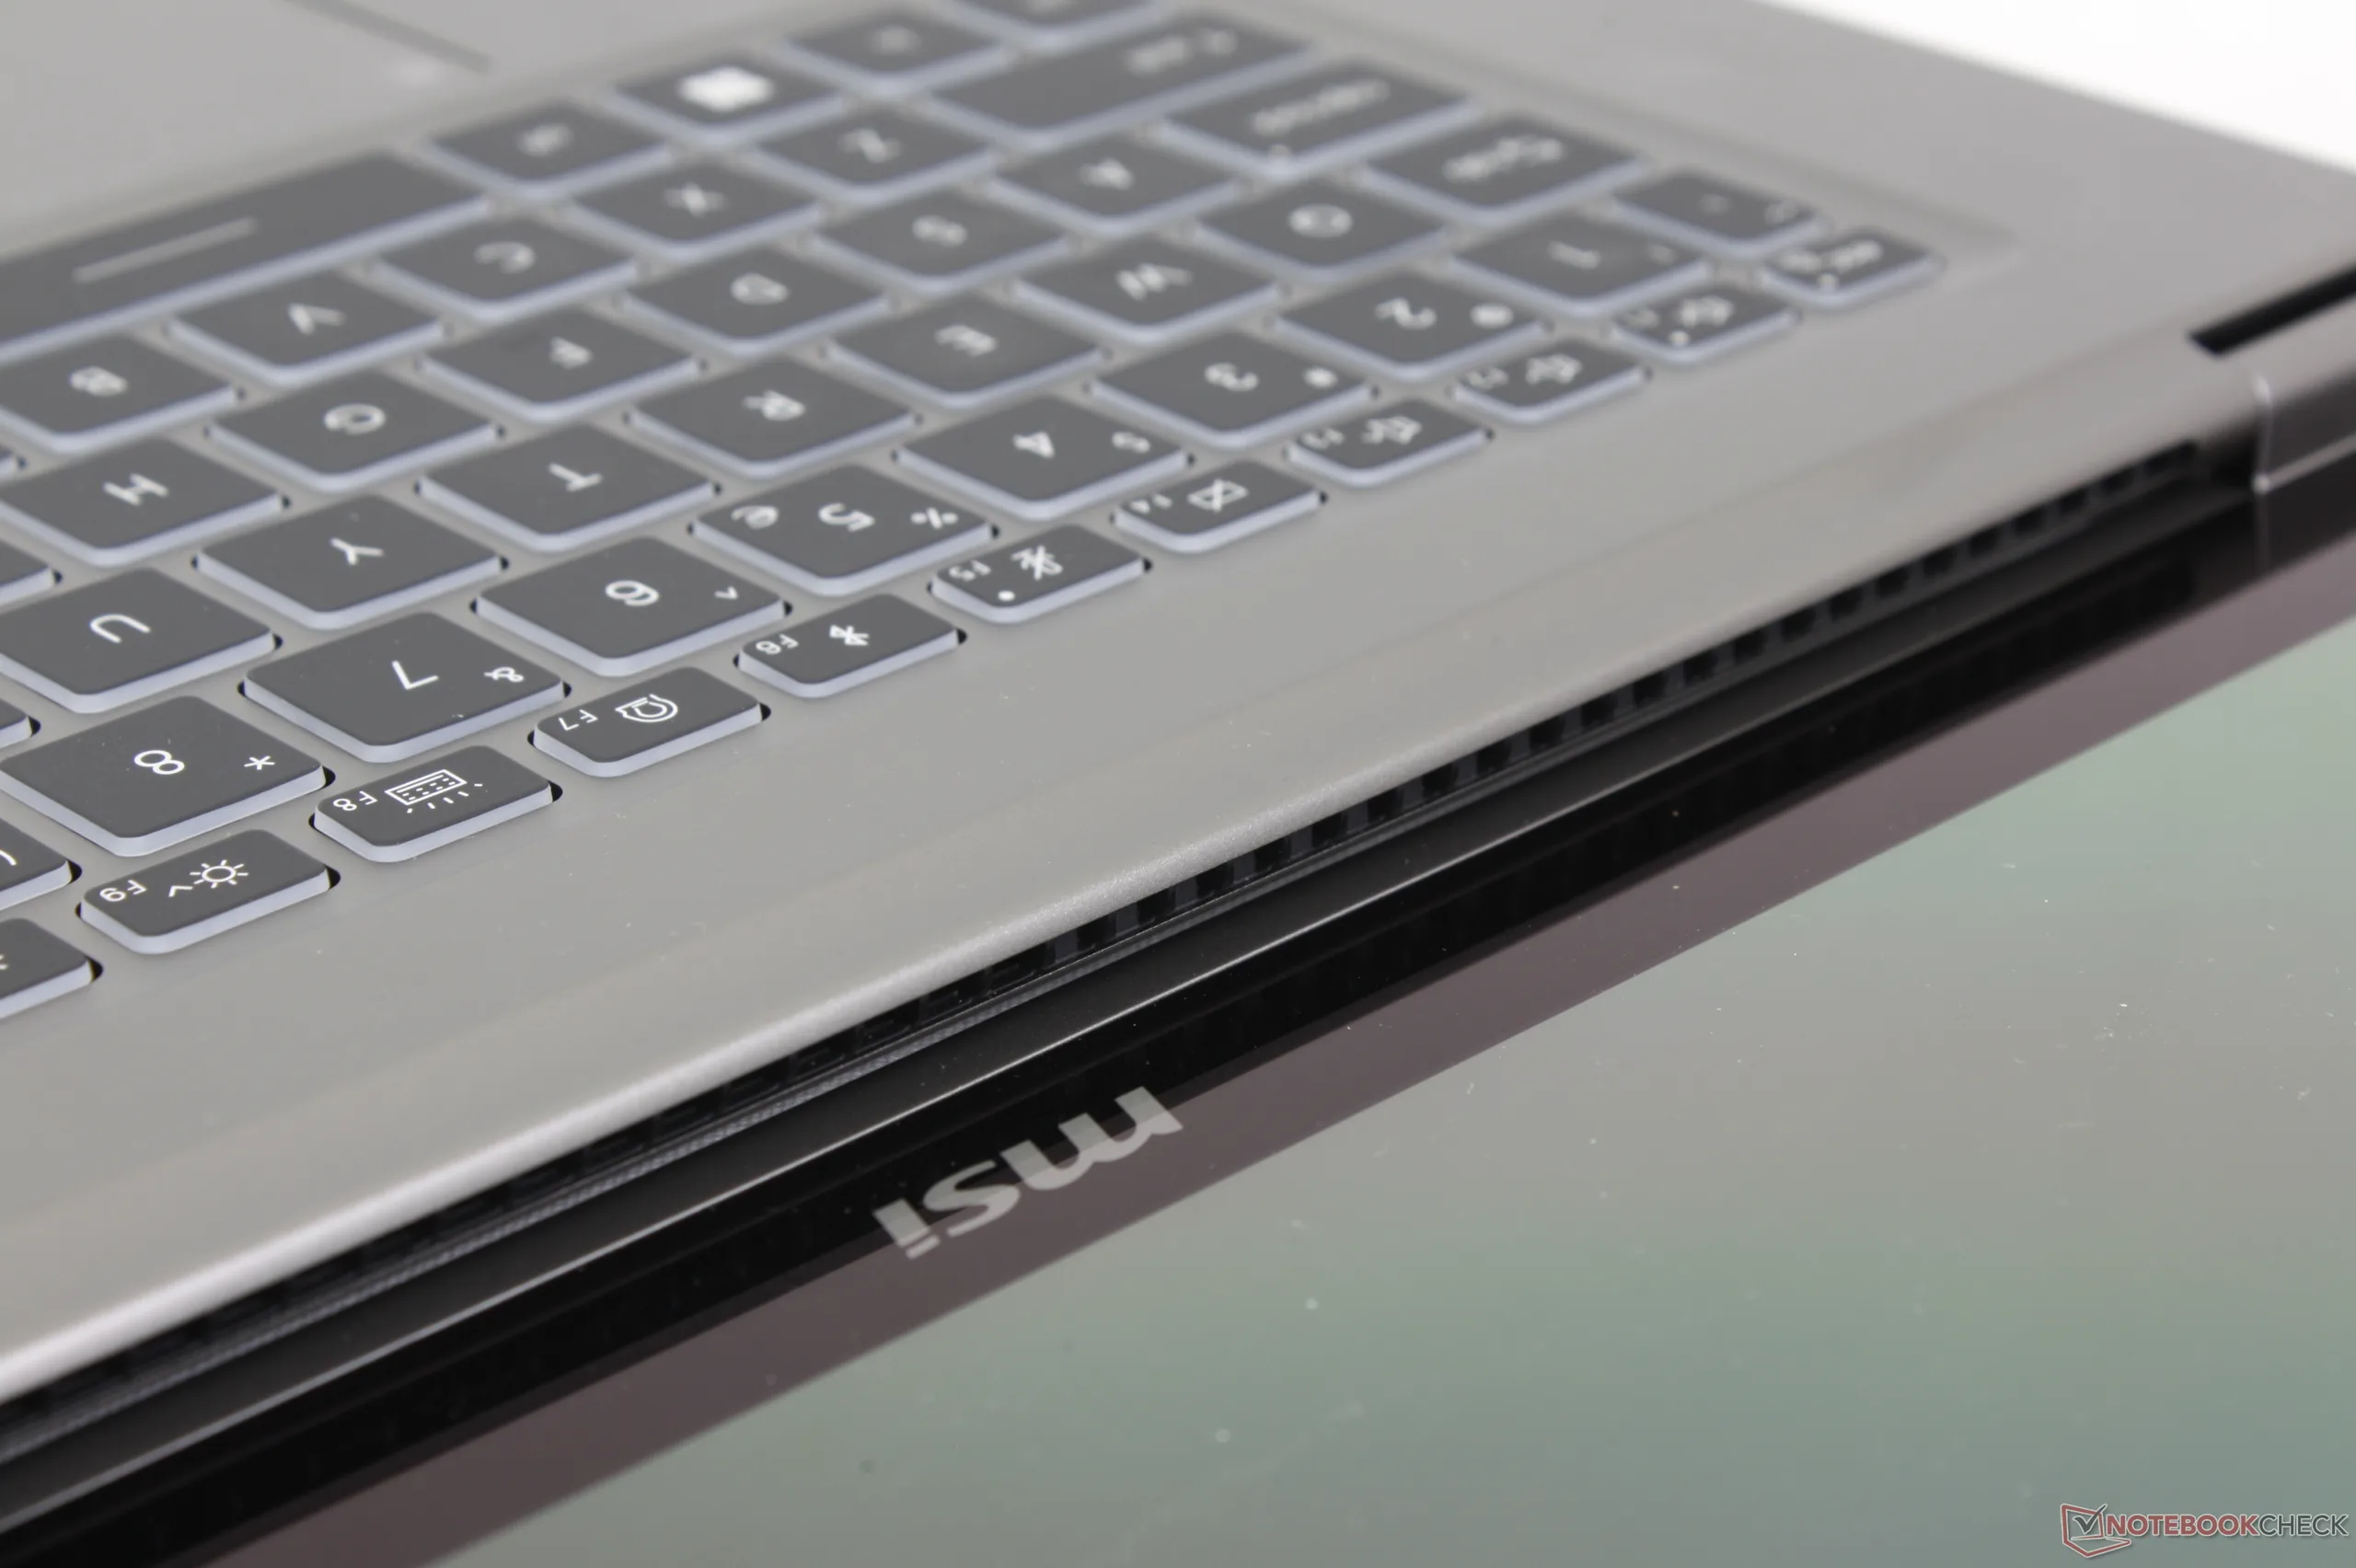
Invoerapparaten
Toetsenbord
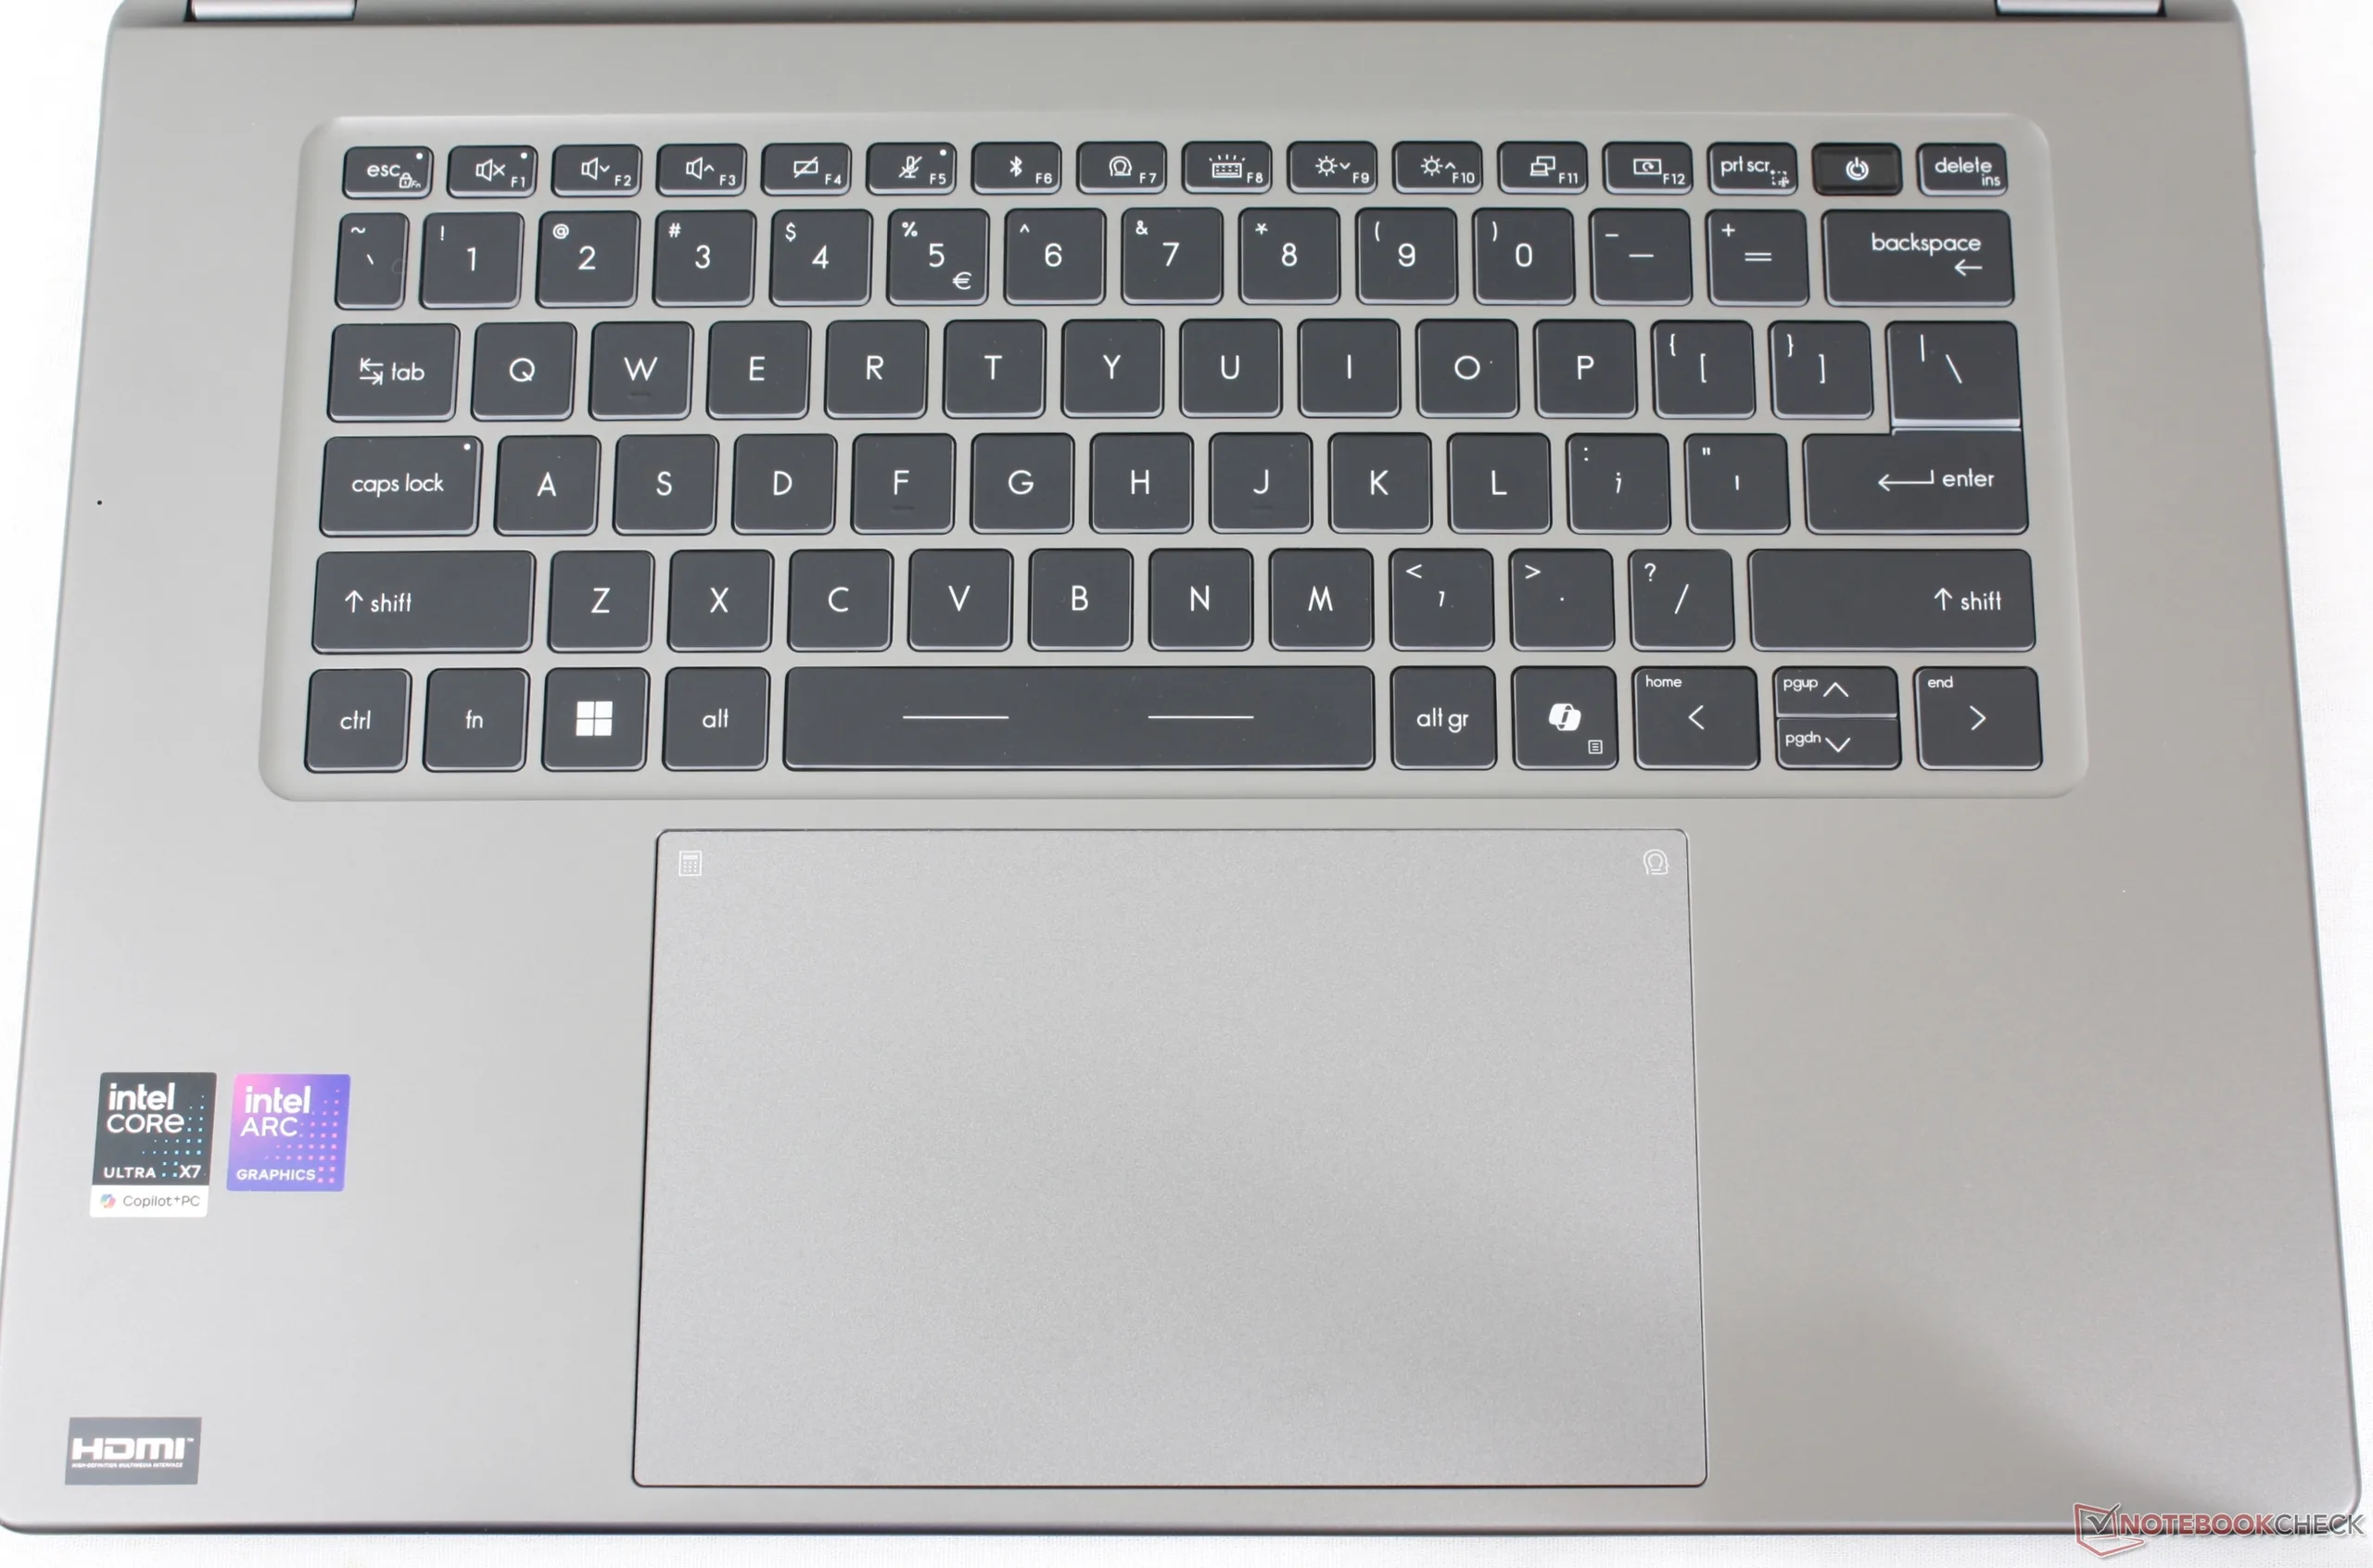
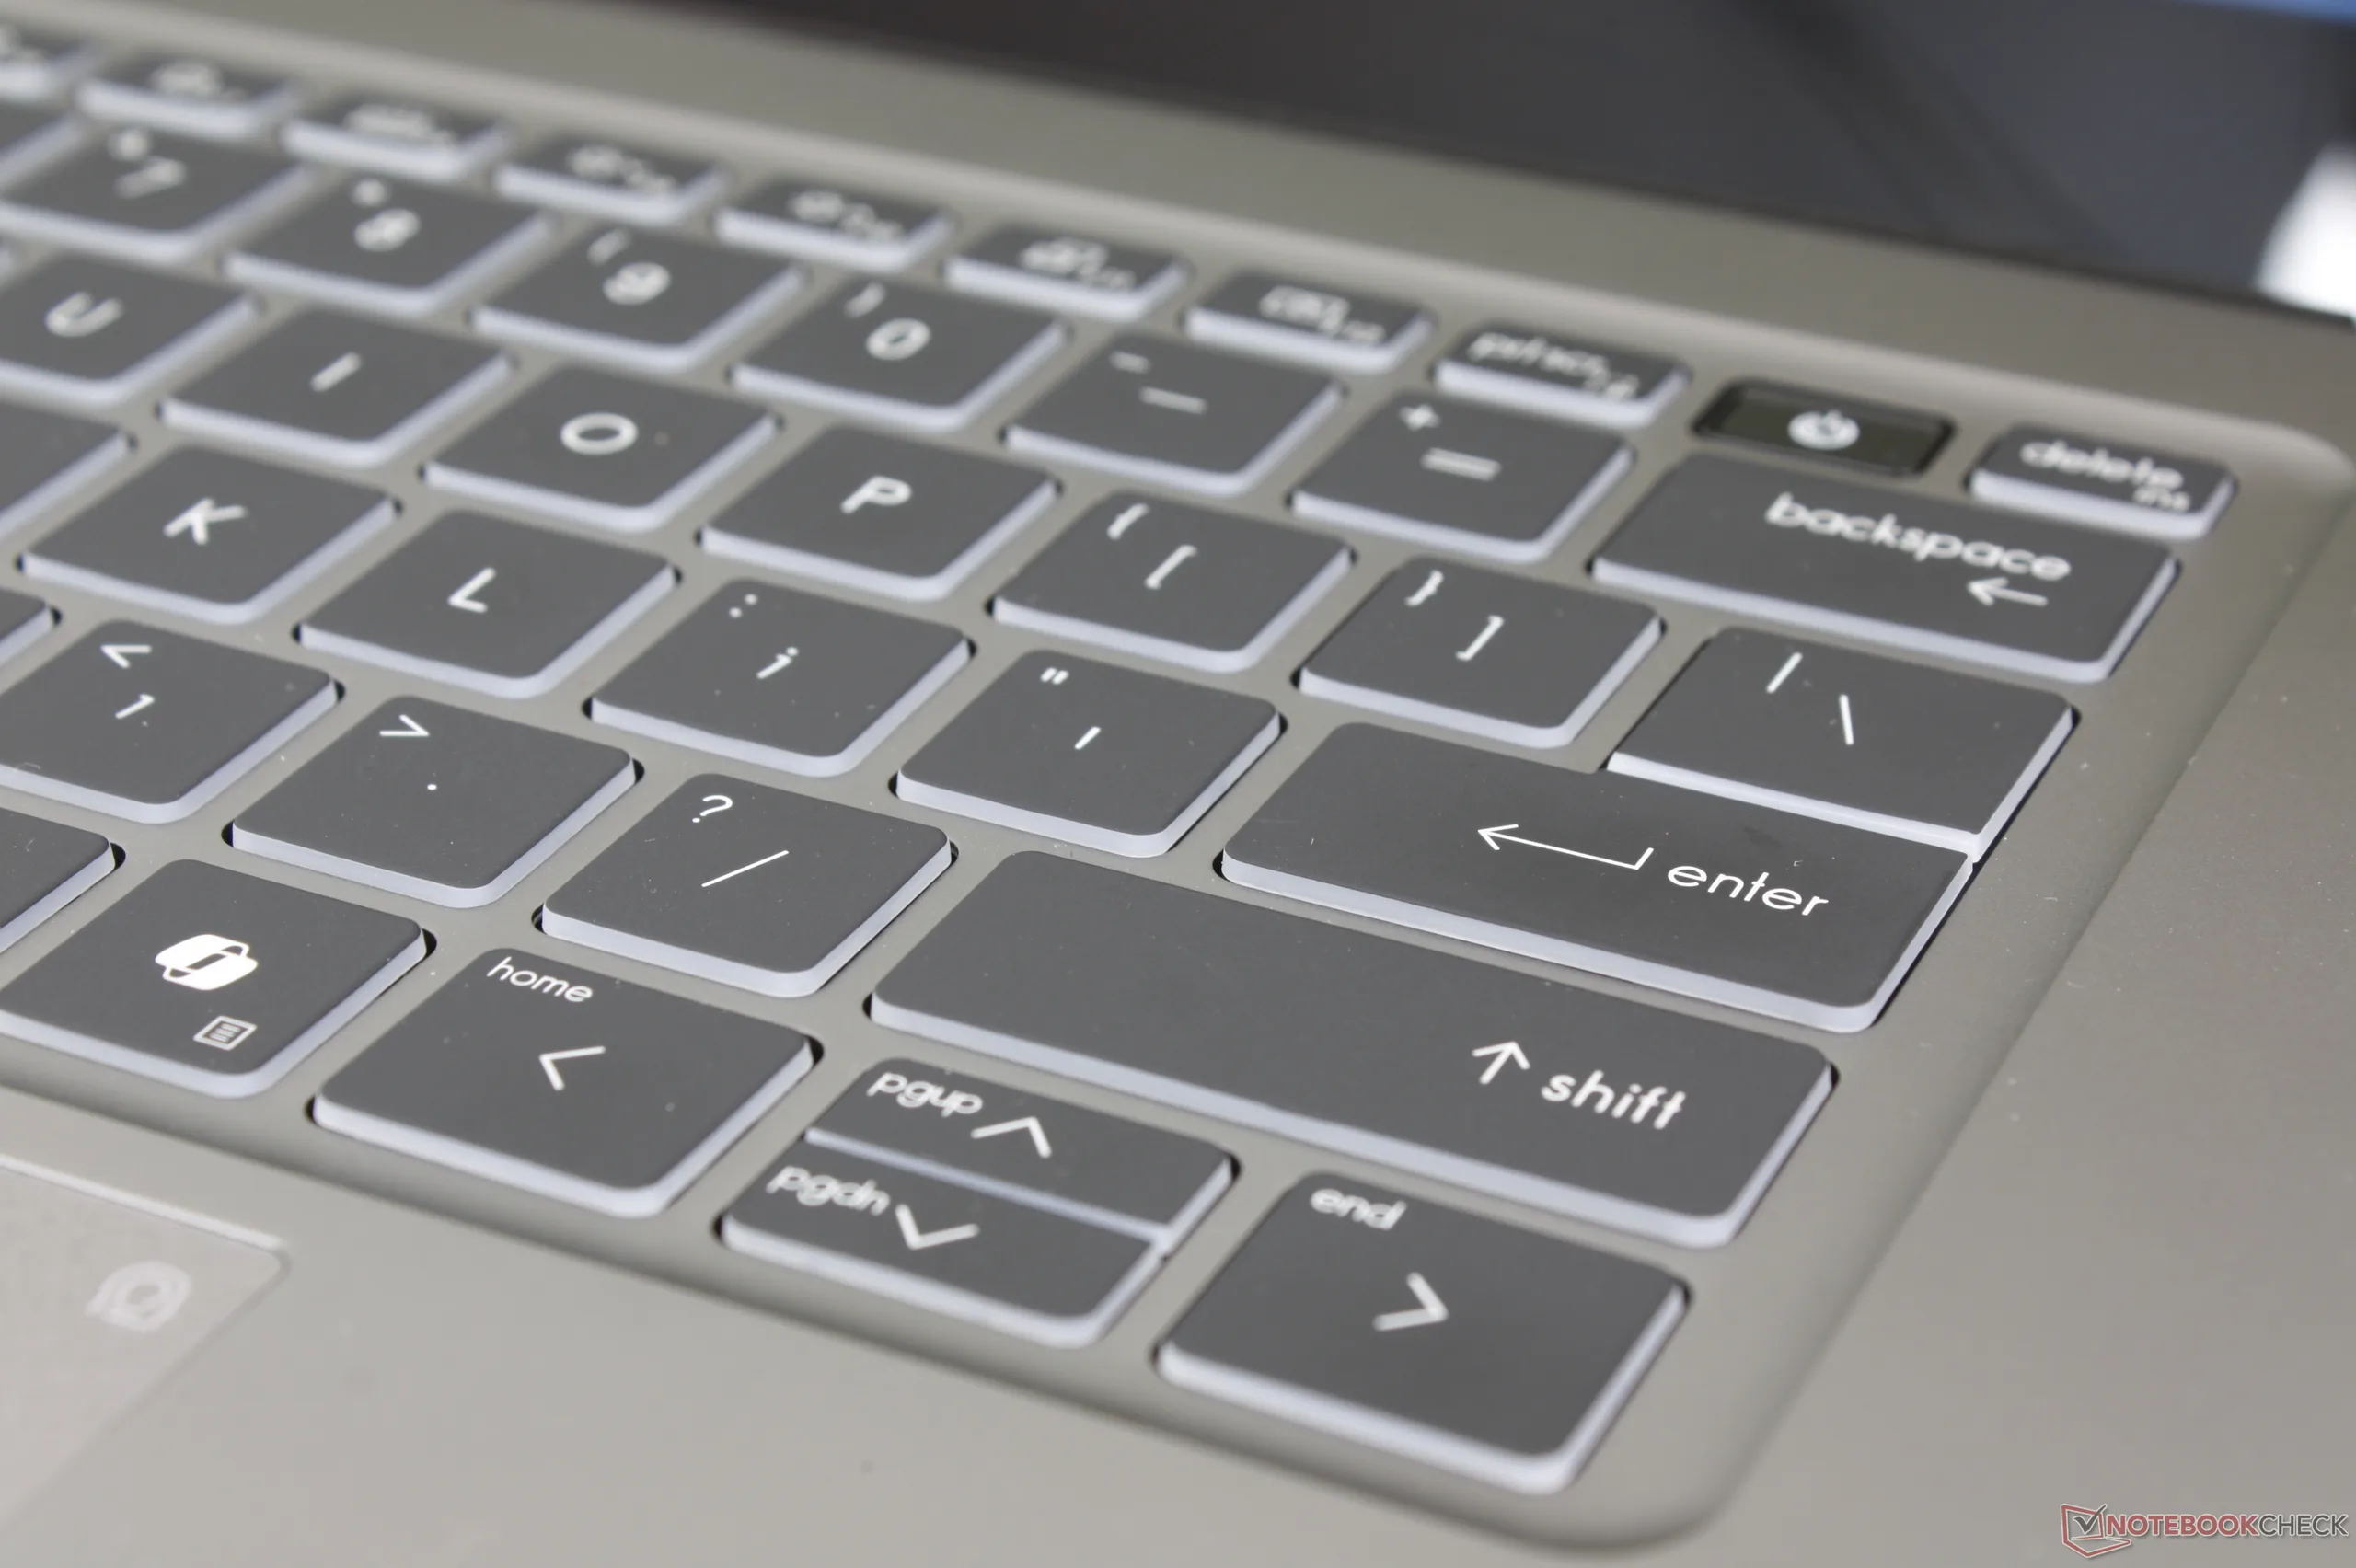
Het numpad is nu verdwenen, ten goede of ten kwade. De type-ervaring voelt verder lichter en met een ondiepere beweging dan klassieke kantoorlaptops uit de Thinkpad T-serie of EliteBook-serie. Typen op de veel goedkopere Venture 16voelt bijvoorbeeld ongeveer hetzelfde aan als op de Prestige serie. Hoewel MSI het algehele ontwerp van het nieuwe Prestige chassis heeft verbeterd, is het toetsenbord nog niet helemaal bij de tijd.
Touchpad
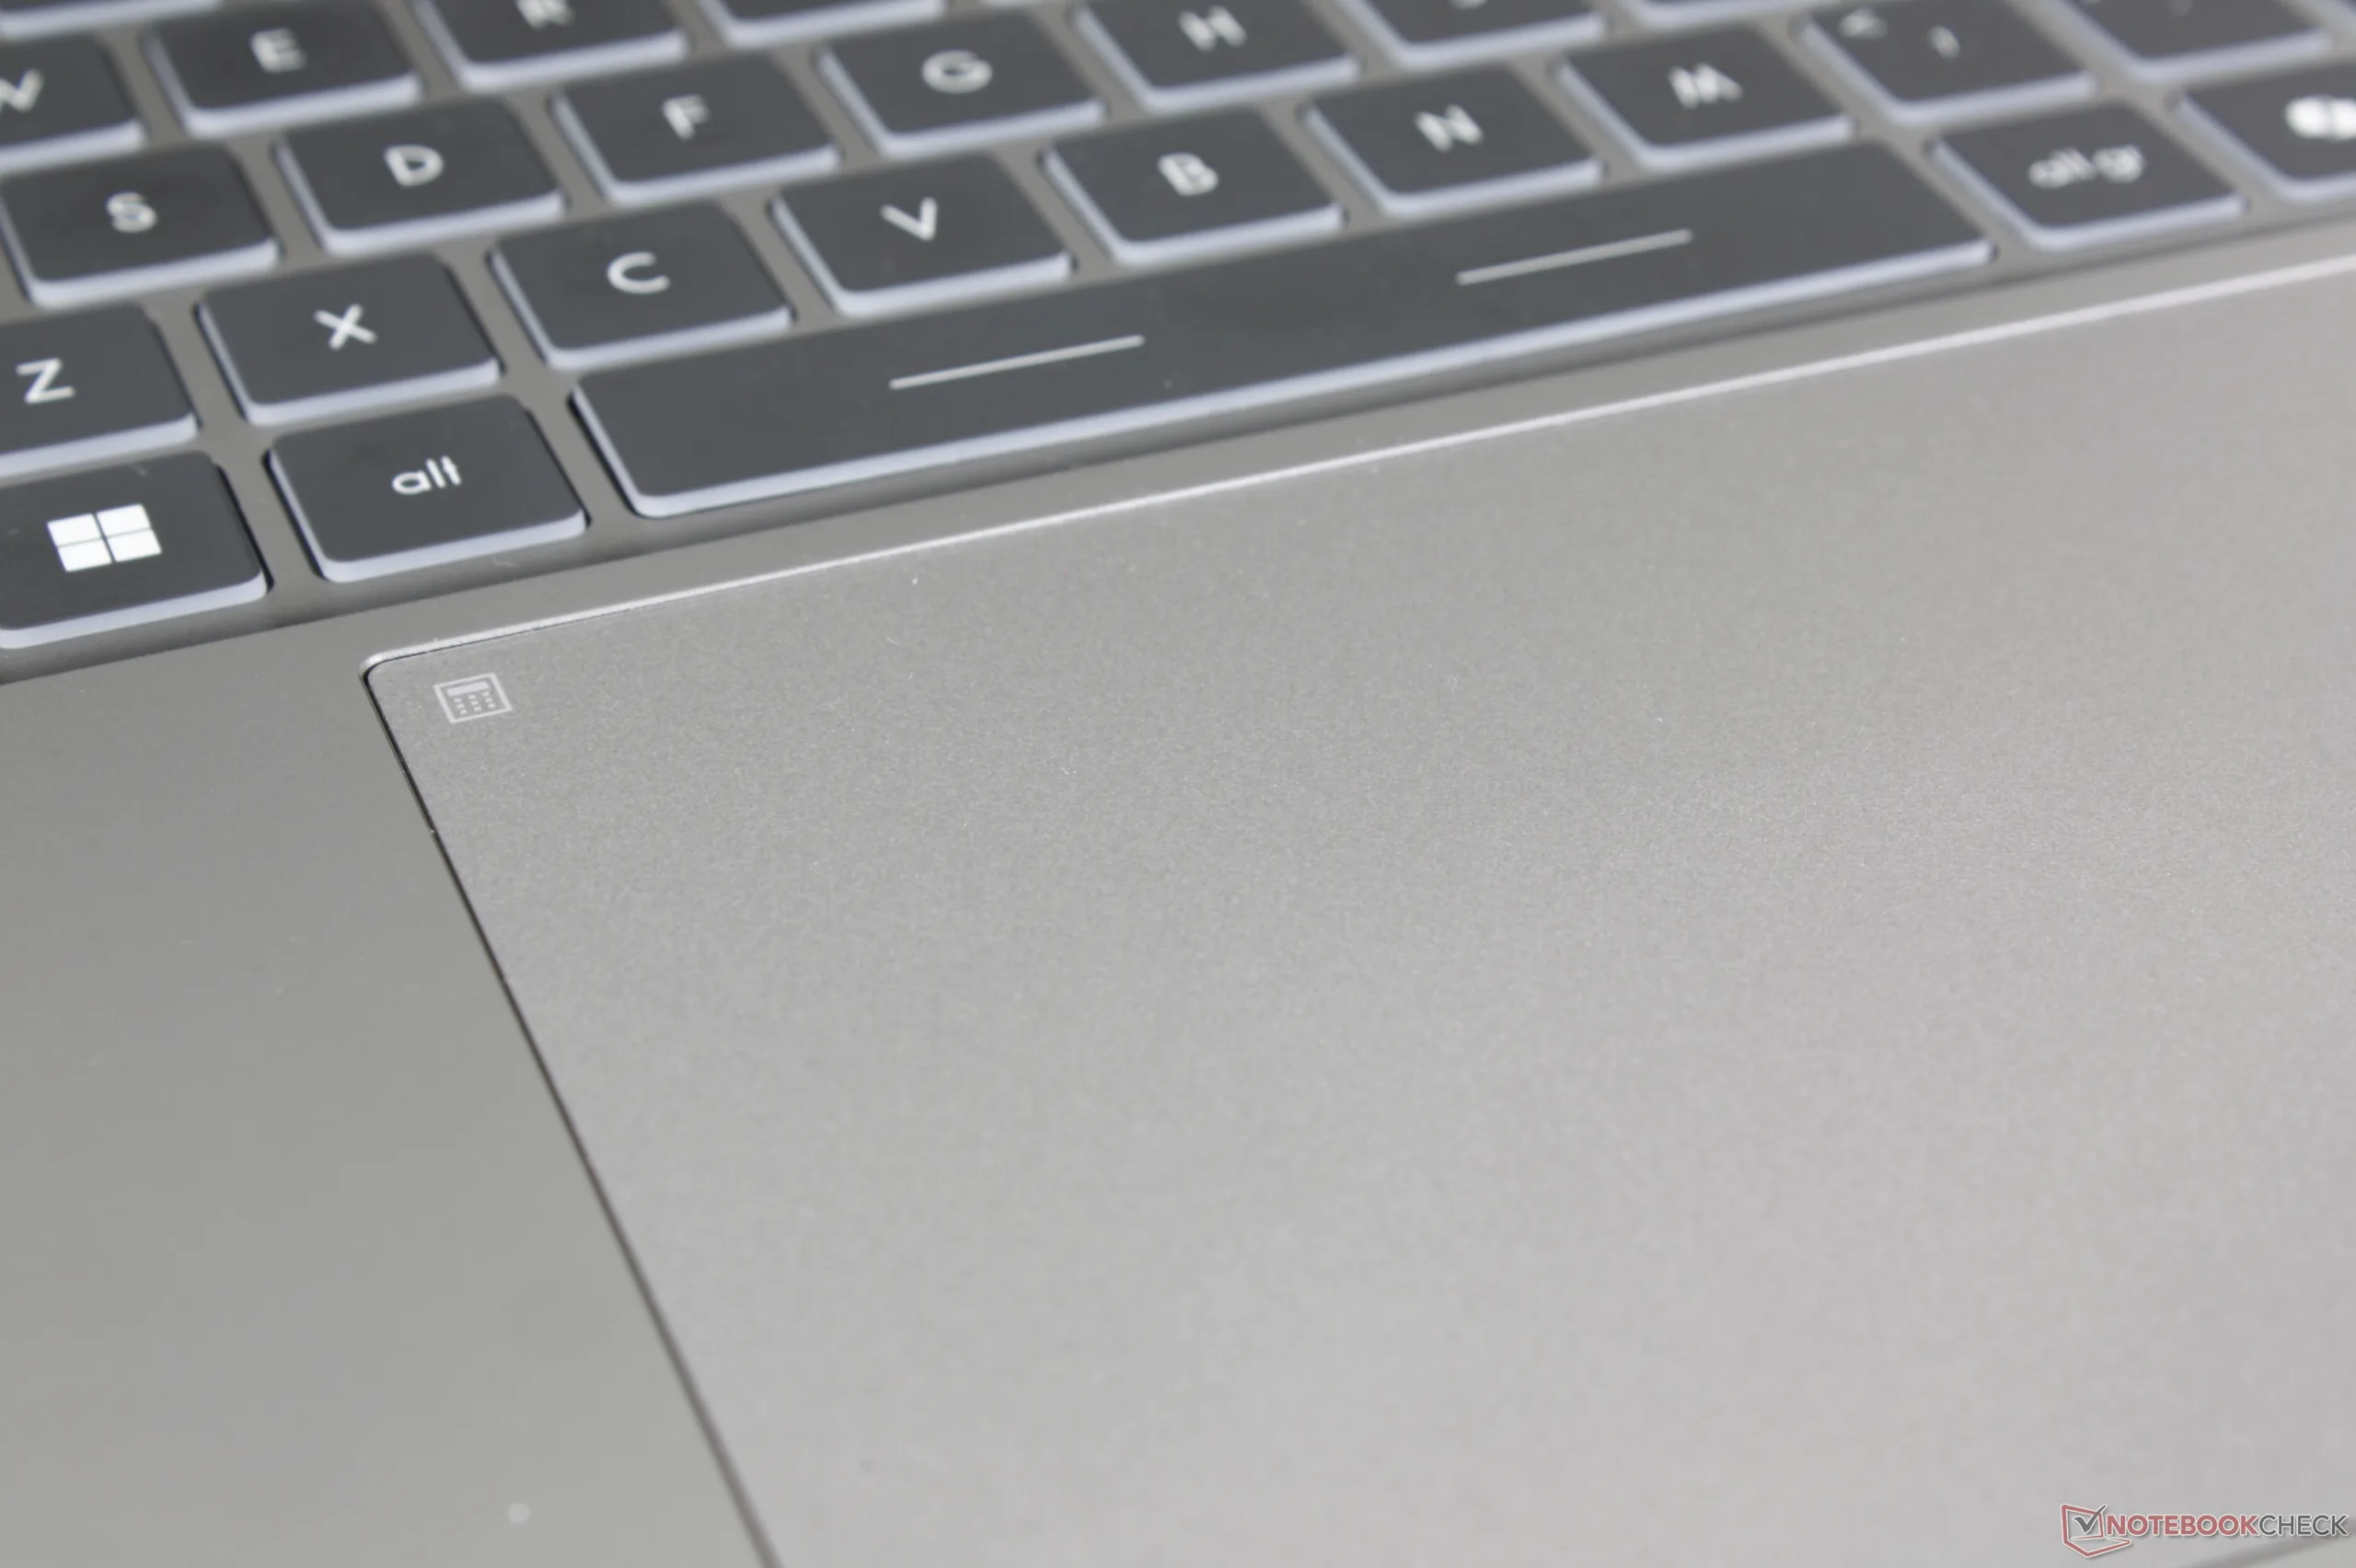
Het clickpad is nog groter dan voorheen, van 15 x 9 cm naar 16 x 10 cm op het nieuwere model. De grip is soepel en nauwkeurig, ongeacht de glijsnelheid, maar de feedback bij het klikken blijft relatief zwak. Klikken is ook alleen comfortabel in de onderste twee hoeken, waar het oppervlak van het clickpad veel gemakkelijker wordt ingedrukt.

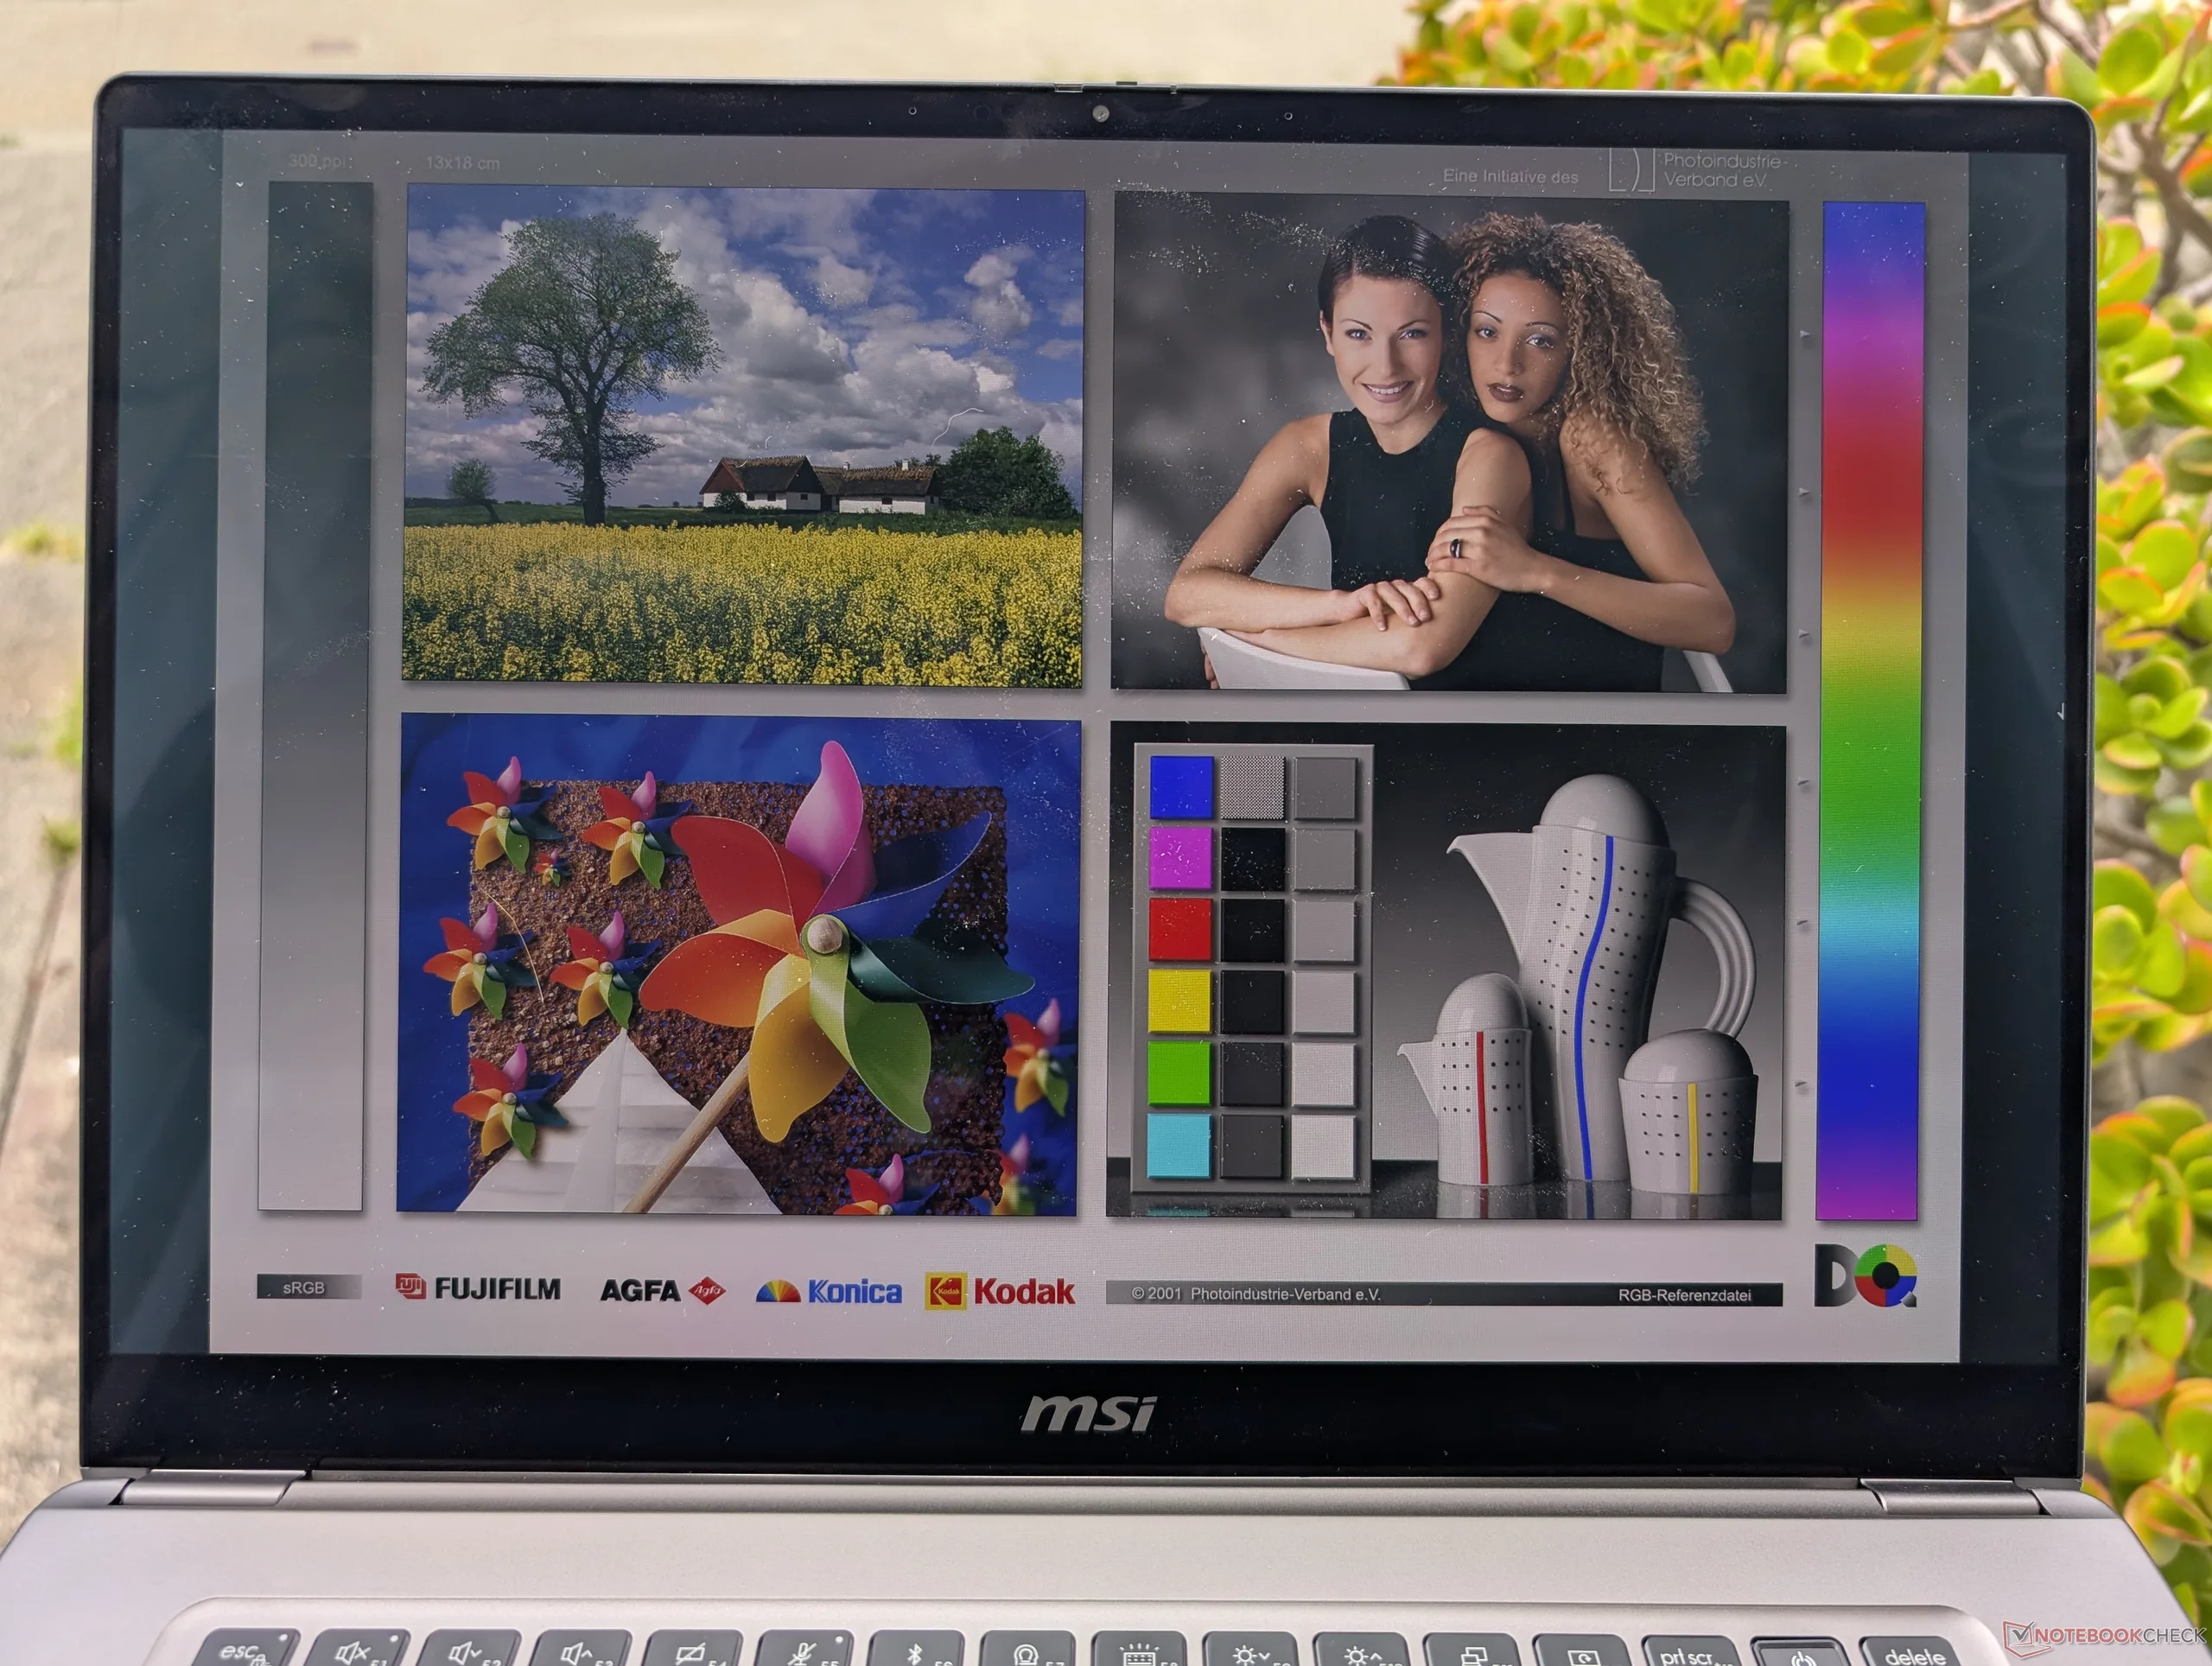
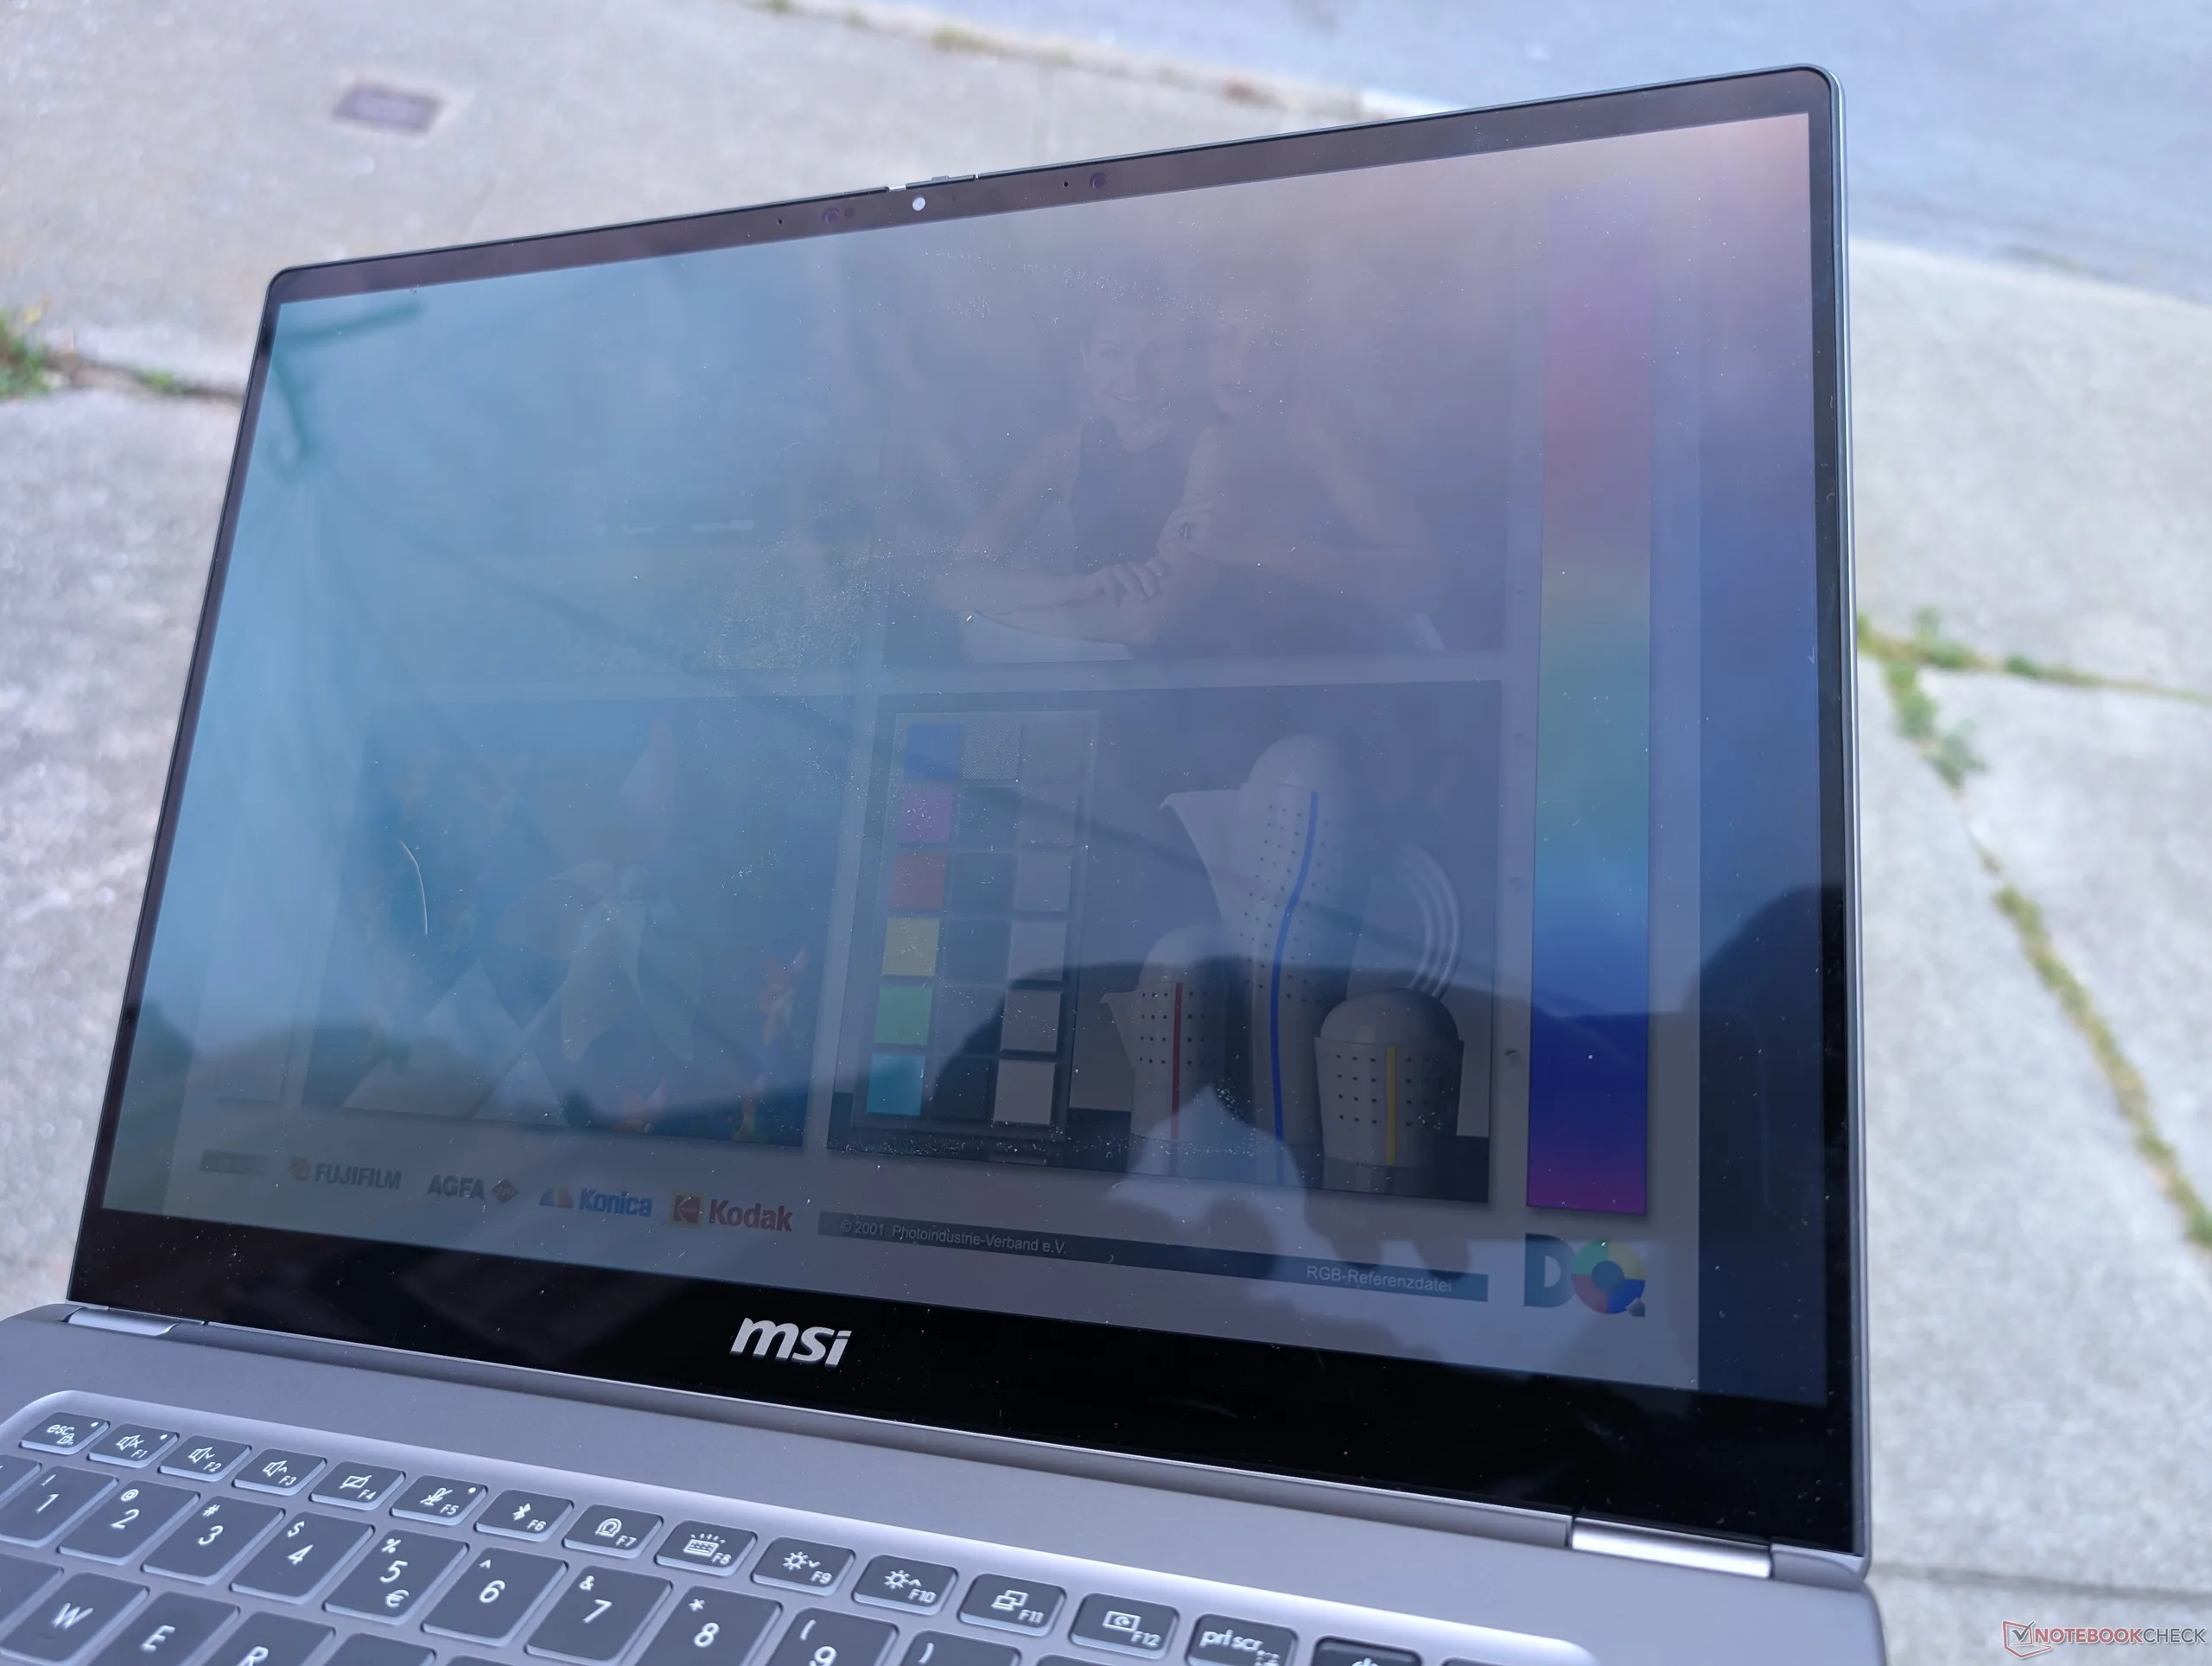
Weergave
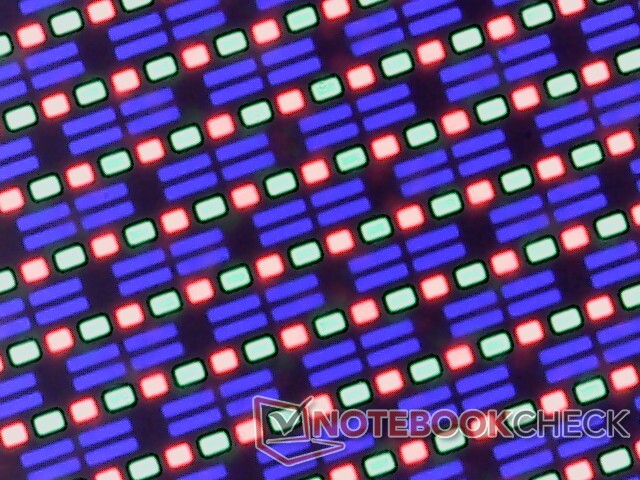
Het Samsung ATNA60CL11-0 OLED paneel lijkt erg op het ATNA60CL10-0 paneel van de ZenBook S16. De verversingssnelheid van 120 Hz en de native resolutie van 1800p zijn een verbetering ten opzichte van het IPS-paneel in het model van vorig jaar. In feite zijn er geen IPS-opties meer, waardoor de Prestige 16-serie in de categorie voor liefhebbers valt.
De helderheid is, hoewel nog steeds uitstekend, minder dan die van het IPS-scherm van de 2025 Prestige 16. Onze tests tonen een maximale helderheid van slechts 383 nits en 422 nits in respectievelijk SDR- en HDR-modus, vergeleken met 471 nits op het model van vorig jaar. Bepaalde configuraties ondersteunen DisplayHDR1000 voor helderdere maxima, mocht u die beschikbaar vinden, maar ons testtoestel hoort daar niet bij.
| |||||||||||||||||||||||||
Helderheidsverdeling: 98 %
Helderheid in Batterij-modus: 375 cd/m²
Contrast: ∞:1 (Zwart: 0 cd/m²)
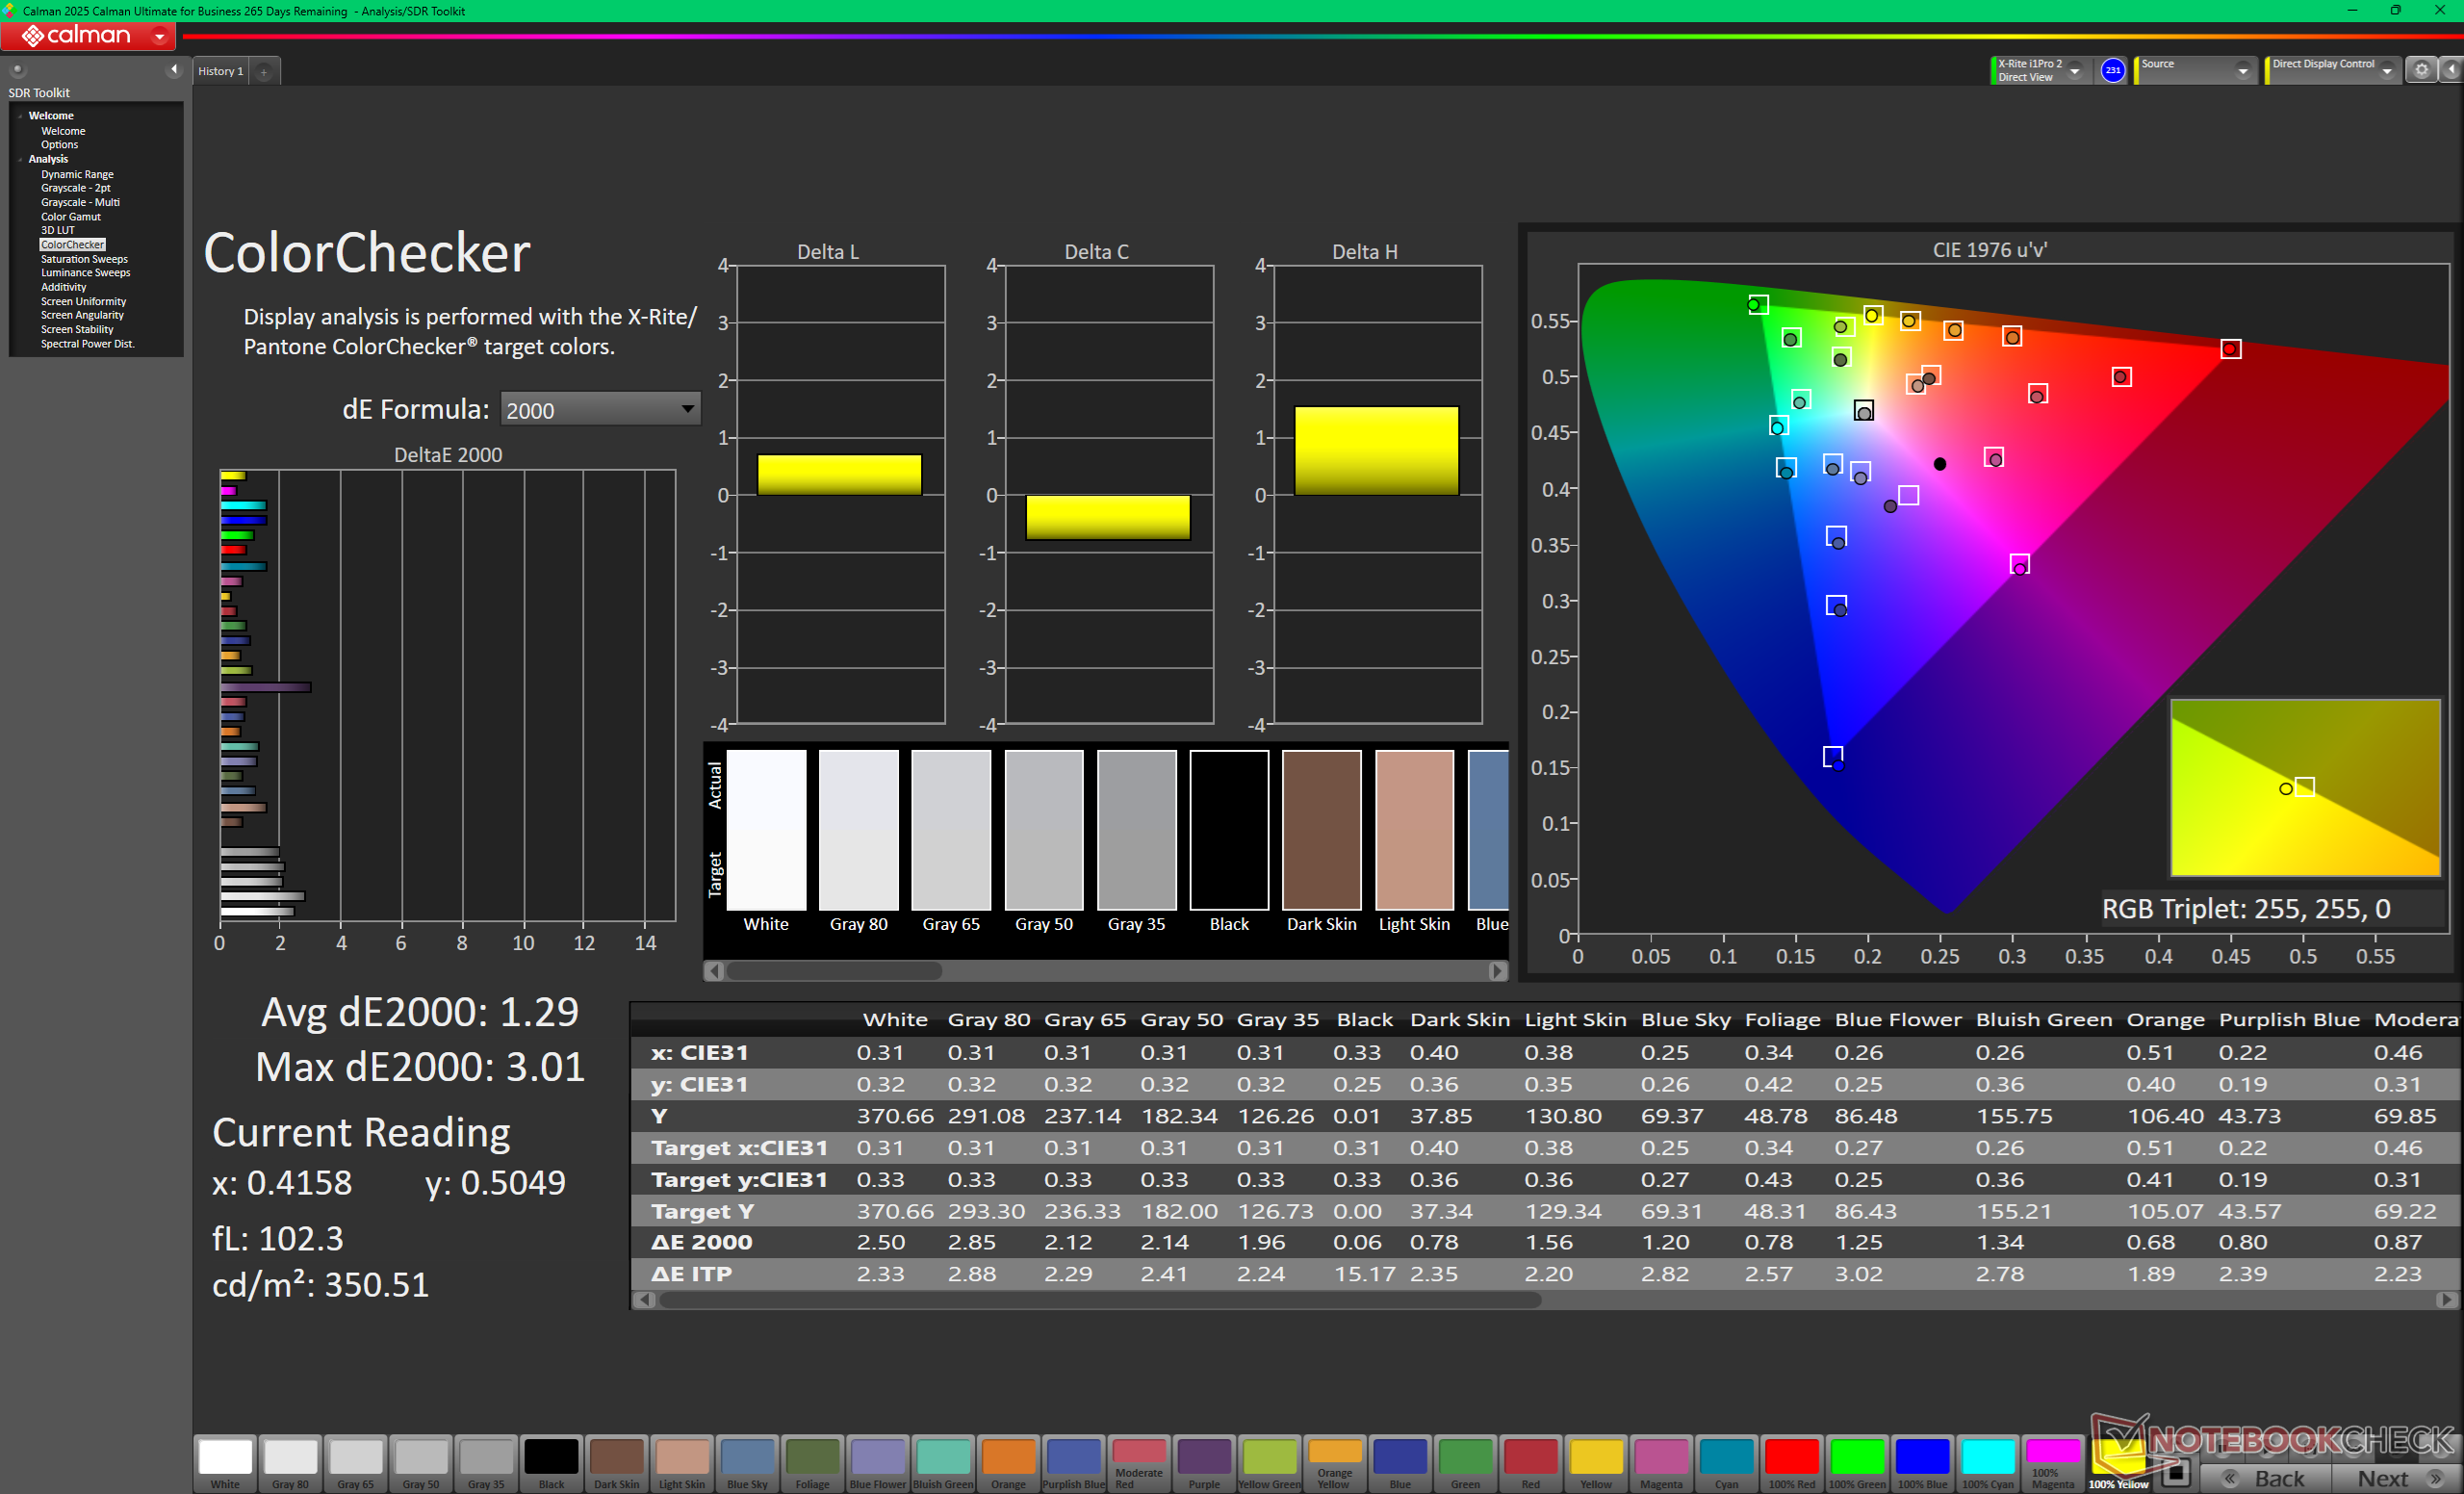
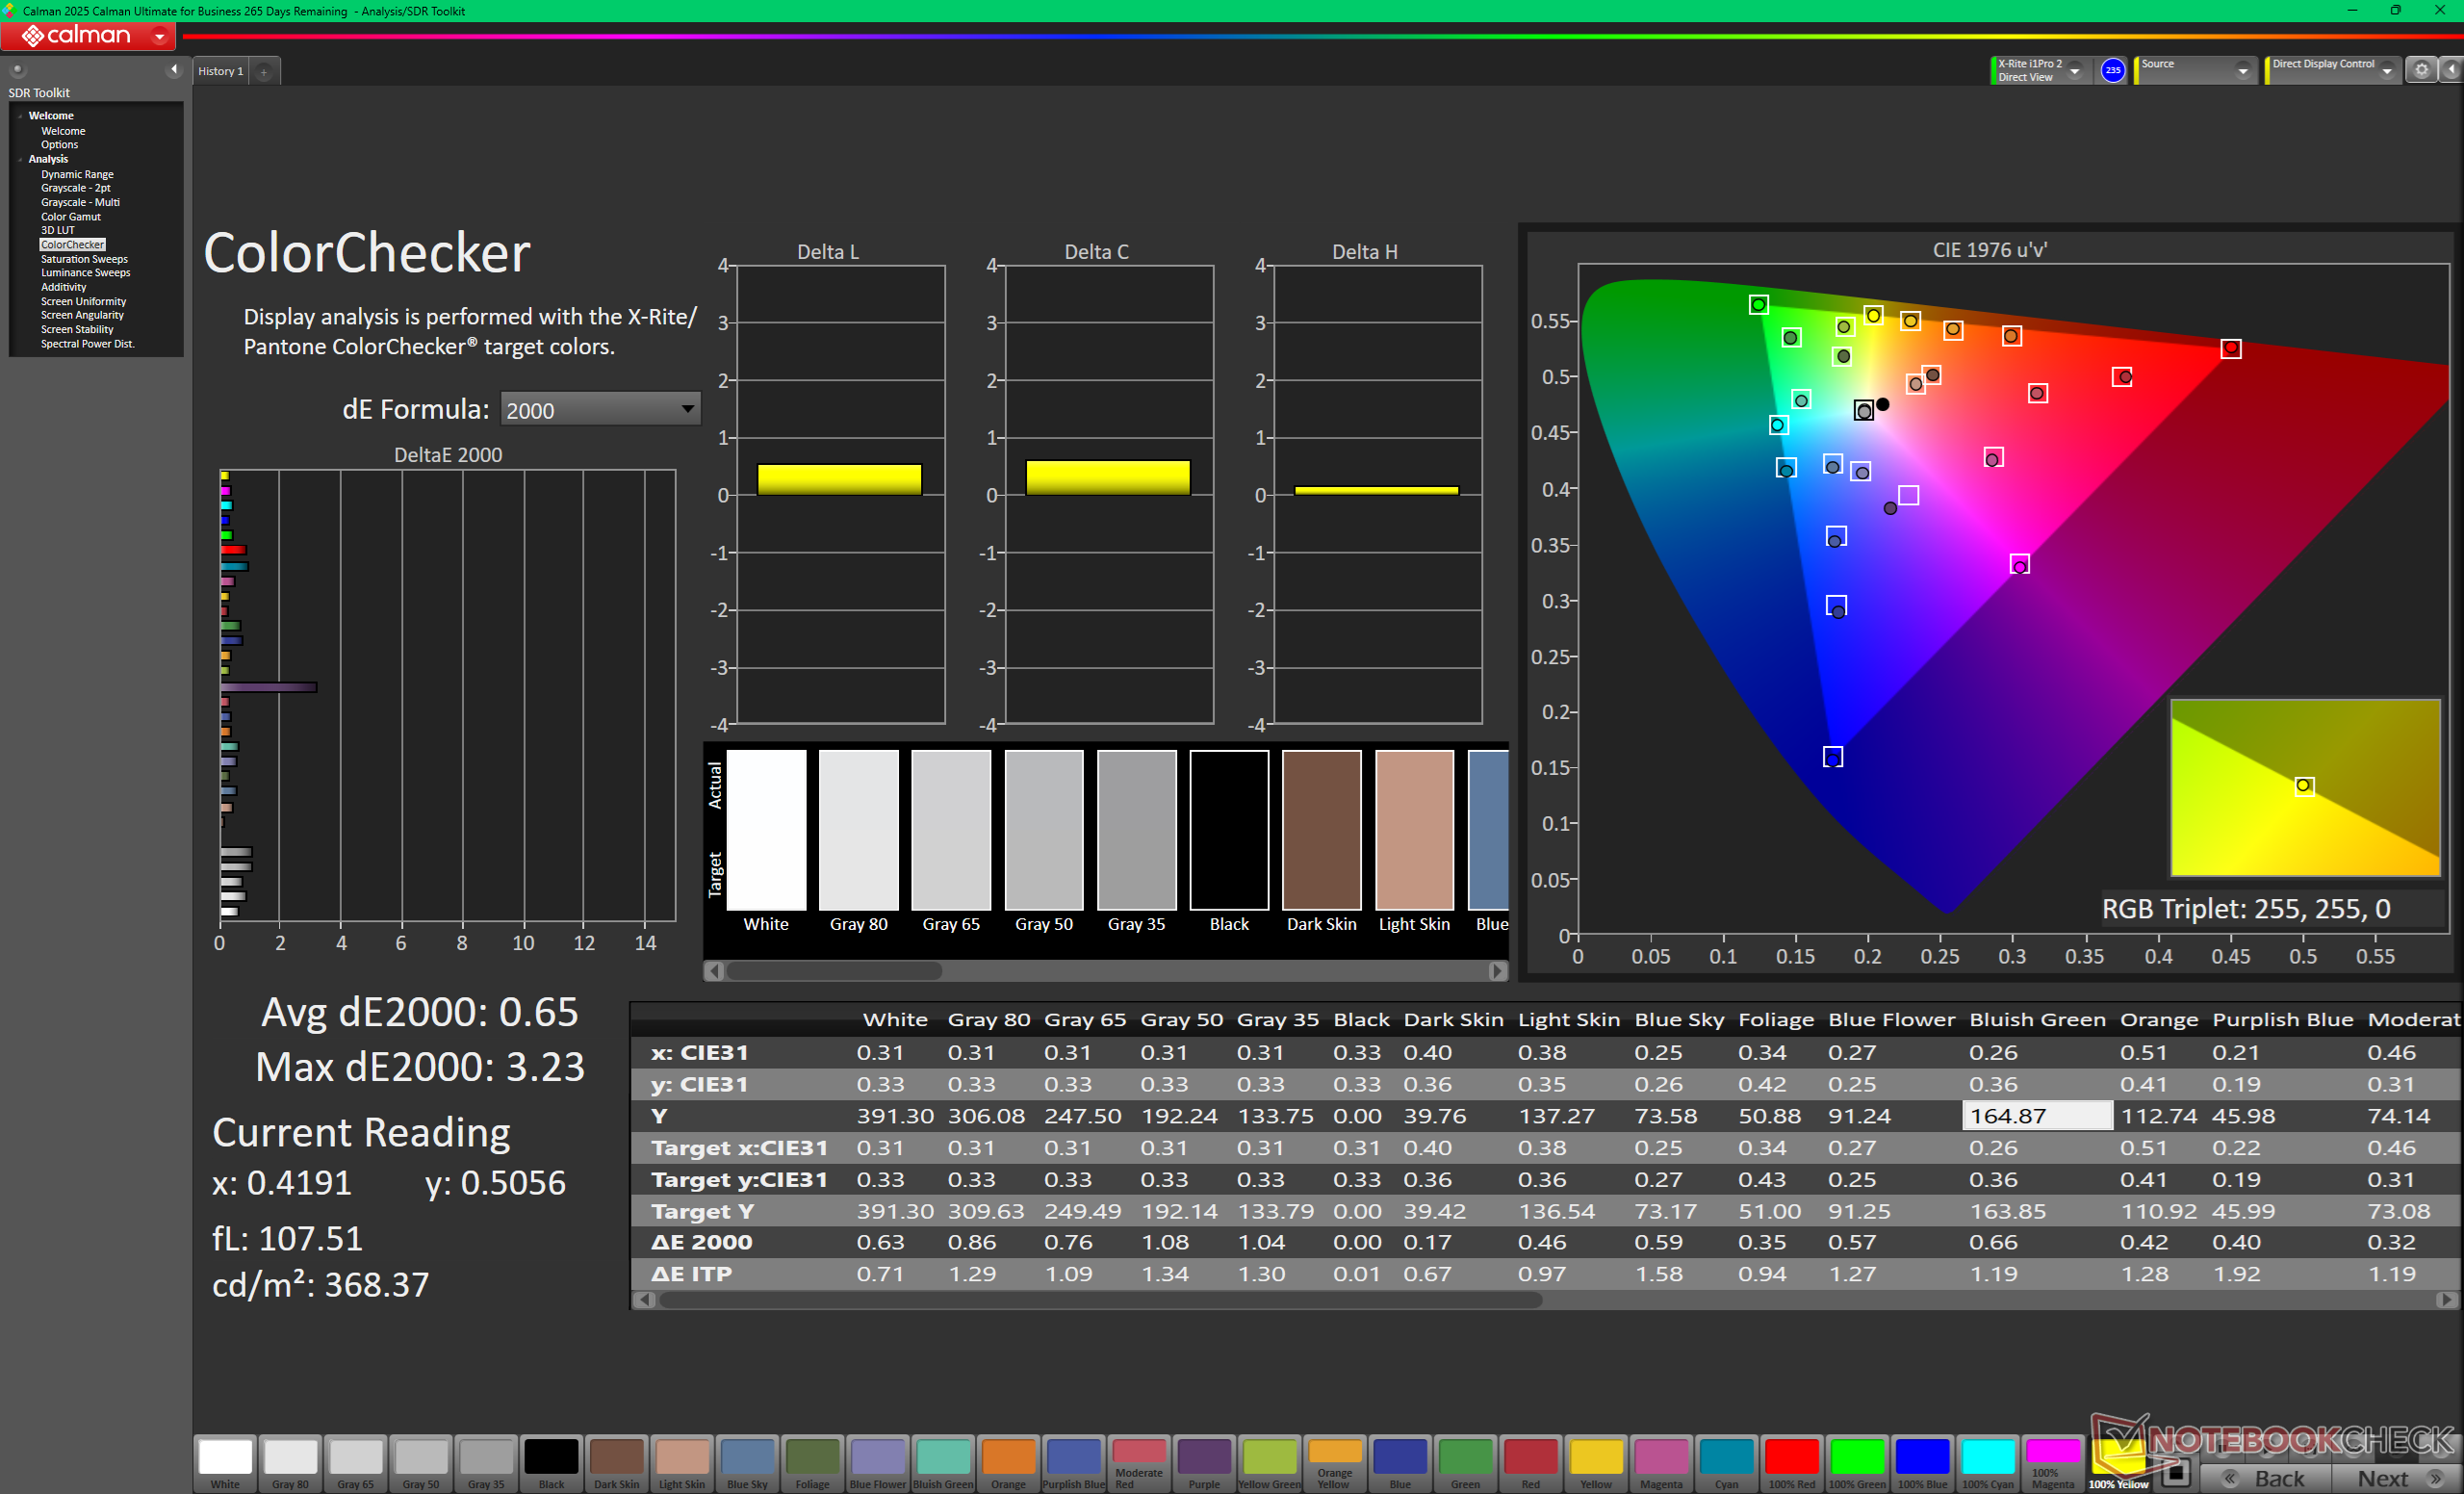
ΔE ColorChecker Calman: 1.29 | ∀{0.5-29.43 Ø4.73}
calibrated: 0.65
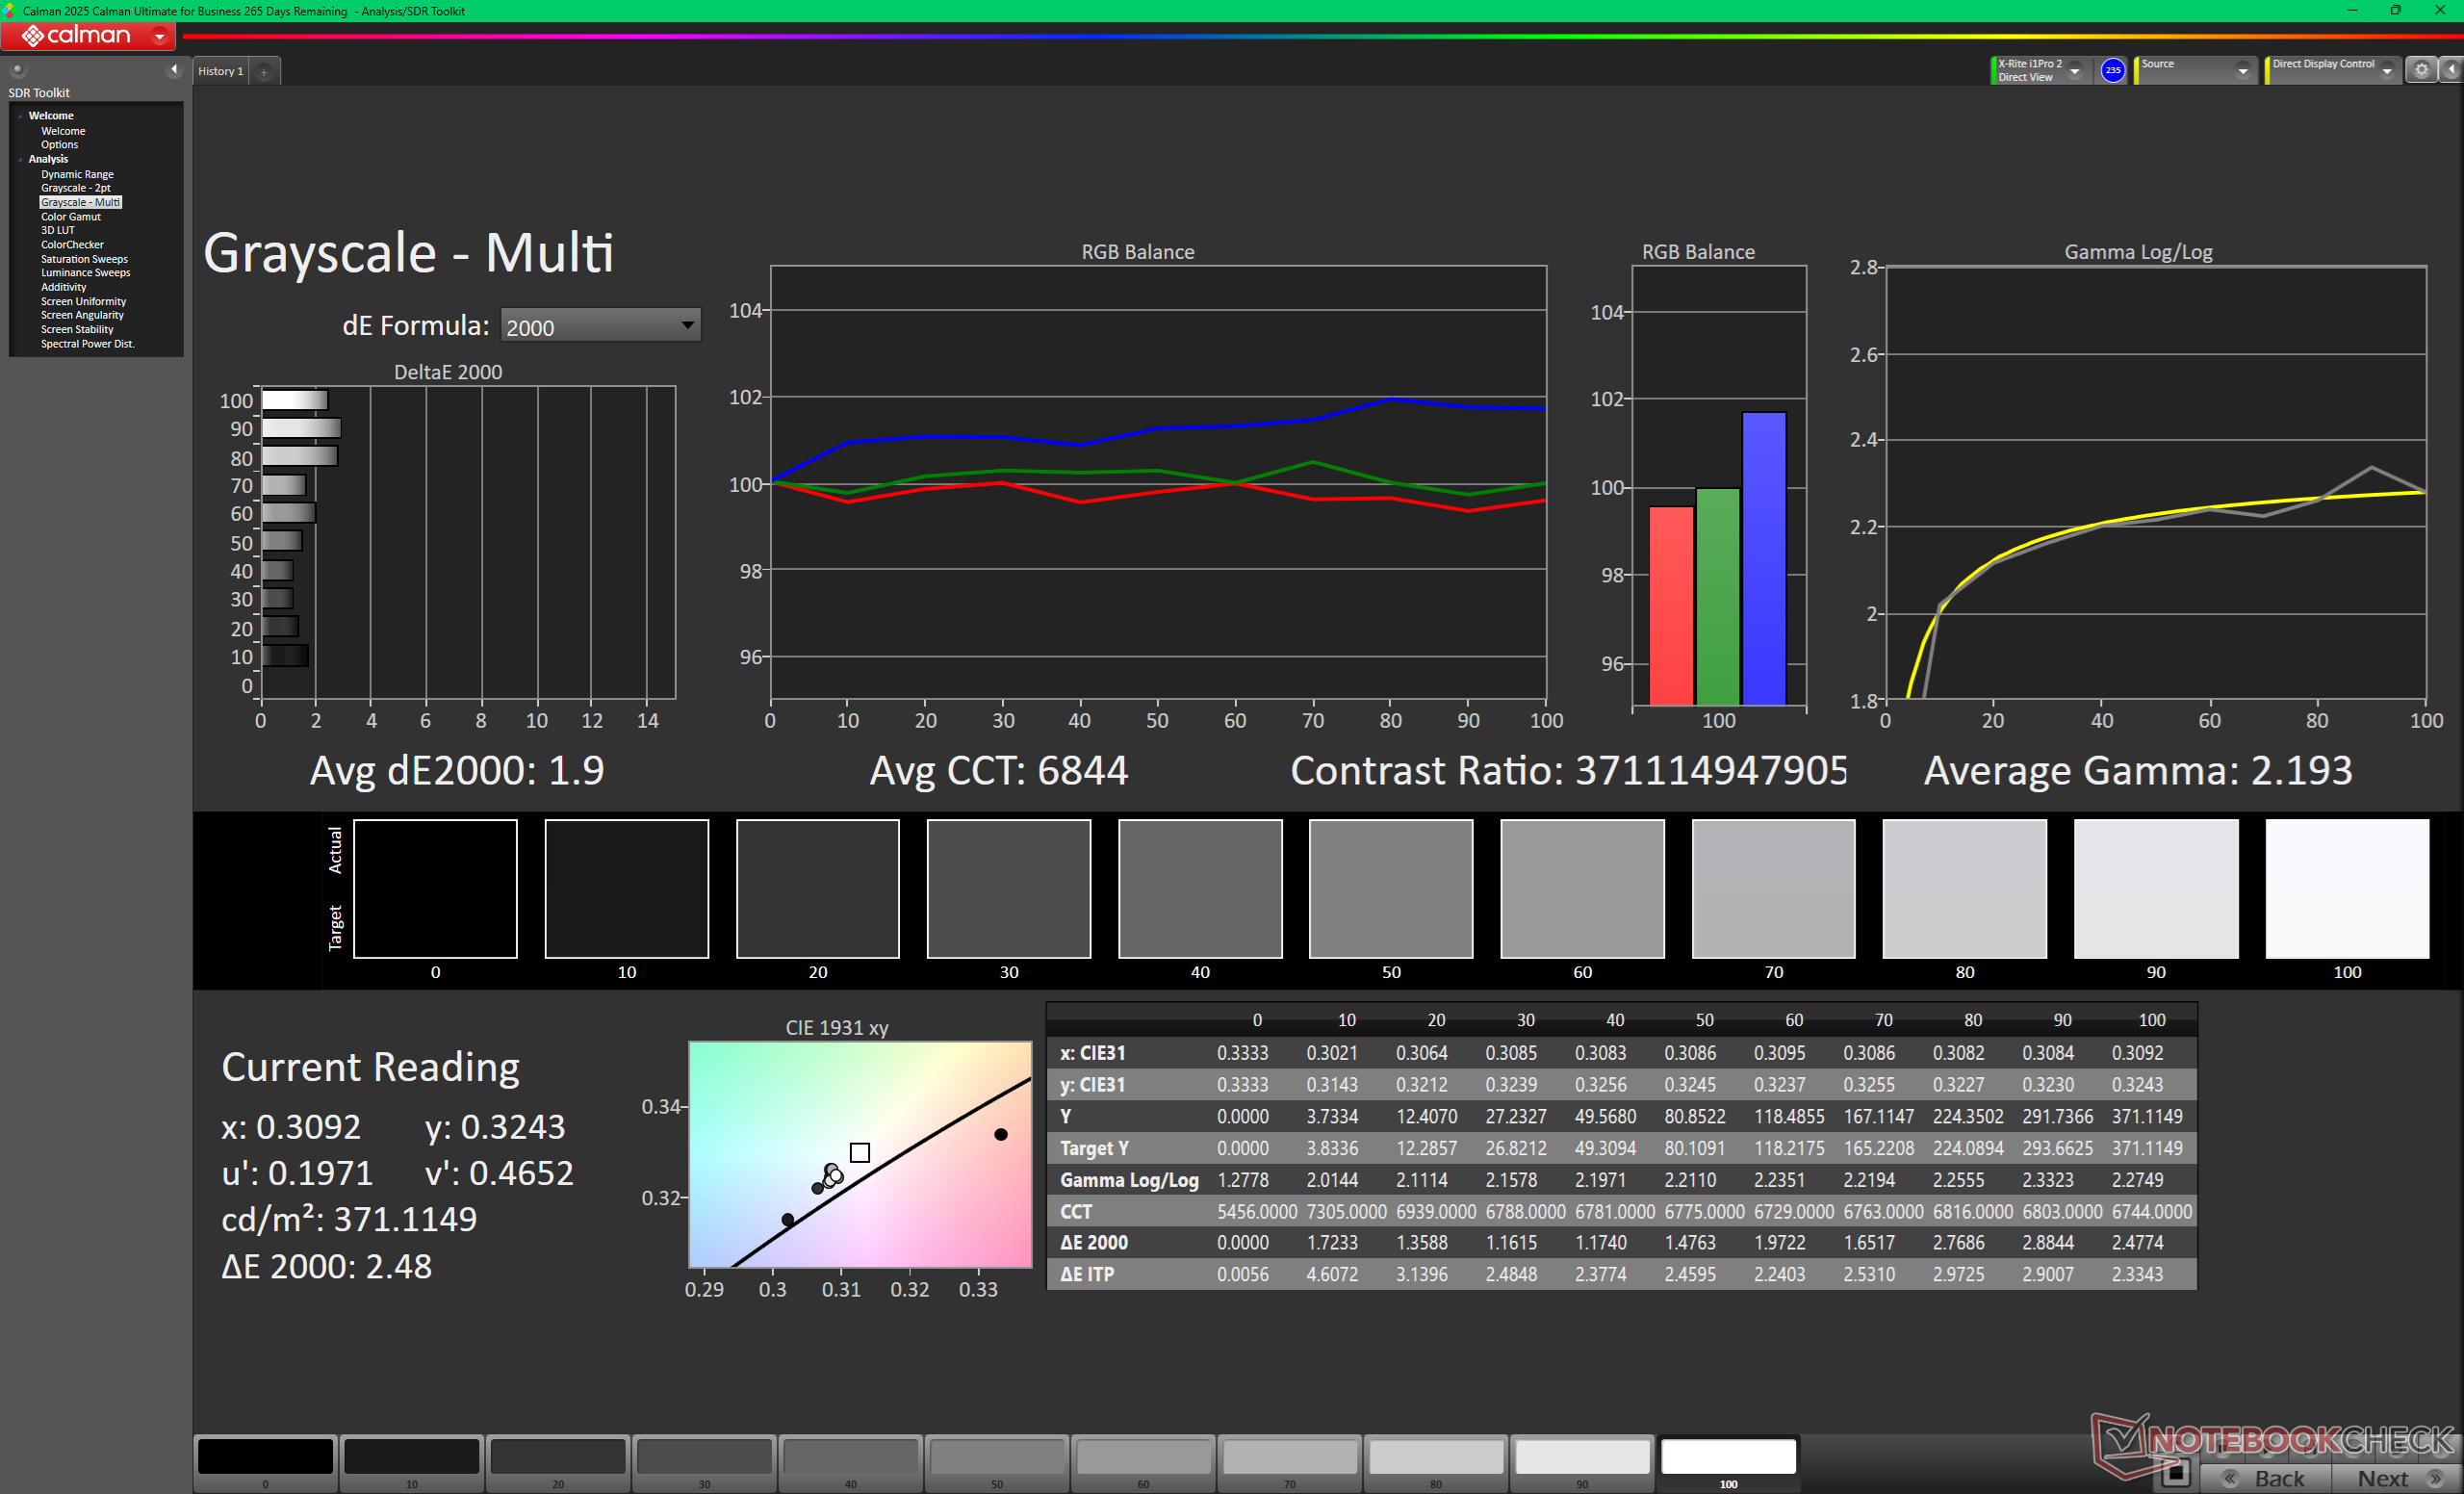
ΔE Greyscale Calman: 1.9 | ∀{0.09-98 Ø4.97}
98% AdobeRGB 1998 (Argyll 3D)
100% sRGB (Argyll 3D)
99.8% Display P3 (Argyll 3D)
Gamma: 2.19
CCT: 6844 K
| MSI Prestige 16 AI C3MTG Samsung ATNA60CL11-0, OLED, 2880x1800, 16", 120 Hz | MSI Prestige 16 AI Evo B2HMG B160QAN03_R, IPS, 2560x1600, 16", 60 Hz | Dell XPS 16 Core Ultra X7 358H LG Philips 160WV1, OLED, 3200x2000, 16", 120 Hz | Asus ZenBook S16 UM5606GA ATNA60HR07-0, OLED, 2880x1800, 16", 120 Hz | Lenovo ThinkBook 16 G7+ AMD LEN160-3.2K, IPS, 3200x2000, 16", 165 Hz | HP Envy x360 2-in-1 16-ad0097nr Samsung SDC41A6, OLED, 2880x1800, 16", 120 Hz | |
|---|---|---|---|---|---|---|
| Display | -6% | -1% | -1% | -5% | -1% | |
| Display P3 Coverage (%) | 99.8 | 96.4 -3% | 99.5 0% | 99.8 0% | 96.3 -4% | 99.6 0% |
| sRGB Coverage (%) | 100 | 99.7 0% | 100 0% | 100 0% | 100 0% | 100 0% |
| AdobeRGB 1998 Coverage (%) | 98 | 84.3 -14% | 96.5 -2% | 94 -4% | 86.9 -11% | 96.5 -2% |
| Response Times | -4924% | -21% | -80% | -1241% | -8% | |
| Response Time Grey 50% / Grey 80% * (ms) | 0.71 ? | 51.5 ? -7154% | 0.65 ? 8% | 1.27 ? -79% | 13.9 ? -1858% | 0.8 ? -13% |
| Response Time Black / White * (ms) | 0.87 ? | 24.3 ? -2693% | 0.87 ? -0% | 0.43 ? 51% | 6.3 ? -624% | 0.89 ? -2% |
| PWM Frequency (Hz) | 460.46 ? | 240.2 ? | 960 ? | 491.8 ? | ||
| PWM Amplitude * (%) | 18 | 31 -72% | 56 -211% | |||
| Screen | -153% | -50% | 12% | -9% | -48% | |
| Brightness middle (cd/m²) | 375 | 471 26% | 395.4 5% | 465 24% | 422 13% | 399.4 7% |
| Brightness (cd/m²) | 380 | 455 20% | 392 3% | 466 23% | 403 6% | 405 7% |
| Brightness Distribution (%) | 98 | 92 -6% | 95 -3% | 99 1% | 93 -5% | 98 0% |
| Black Level * (cd/m²) | 0.2 | 0.3 | ||||
| Colorchecker dE 2000 * | 1.29 | 5.8 -350% | 3.69 -186% | 1 22% | 1.7 -32% | 4.05 -214% |
| Colorchecker dE 2000 max. * | 3.01 | 10.8 -259% | 7.94 -164% | 3 -0% | 3.4 -13% | 6.69 -122% |
| Colorchecker dE 2000 calibrated * | 0.65 | 1.9 -192% | 0.68 -5% | 0.7 -8% | 1.02 -57% | |
| Greyscale dE 2000 * | 1.9 | 7.8 -311% | 1.9 -0% | 1.9 -0% | 2.4 -26% | 1.1 42% |
| Gamma | 2.19 100% | 2.07 106% | 2.28 96% | 2.19 100% | 2.19 100% | 2.27 97% |
| CCT | 6844 95% | 7262 90% | 6274 104% | 6458 101% | 6989 93% | 6419 101% |
| Contrast (:1) | 2355 | 1407 | ||||
| Totaal Gemiddelde (Programma / Instellingen) | -1694% /
-911% | -24% /
-32% | -23% /
-14% | -418% /
-214% | -19% /
-30% |
* ... kleiner is beter
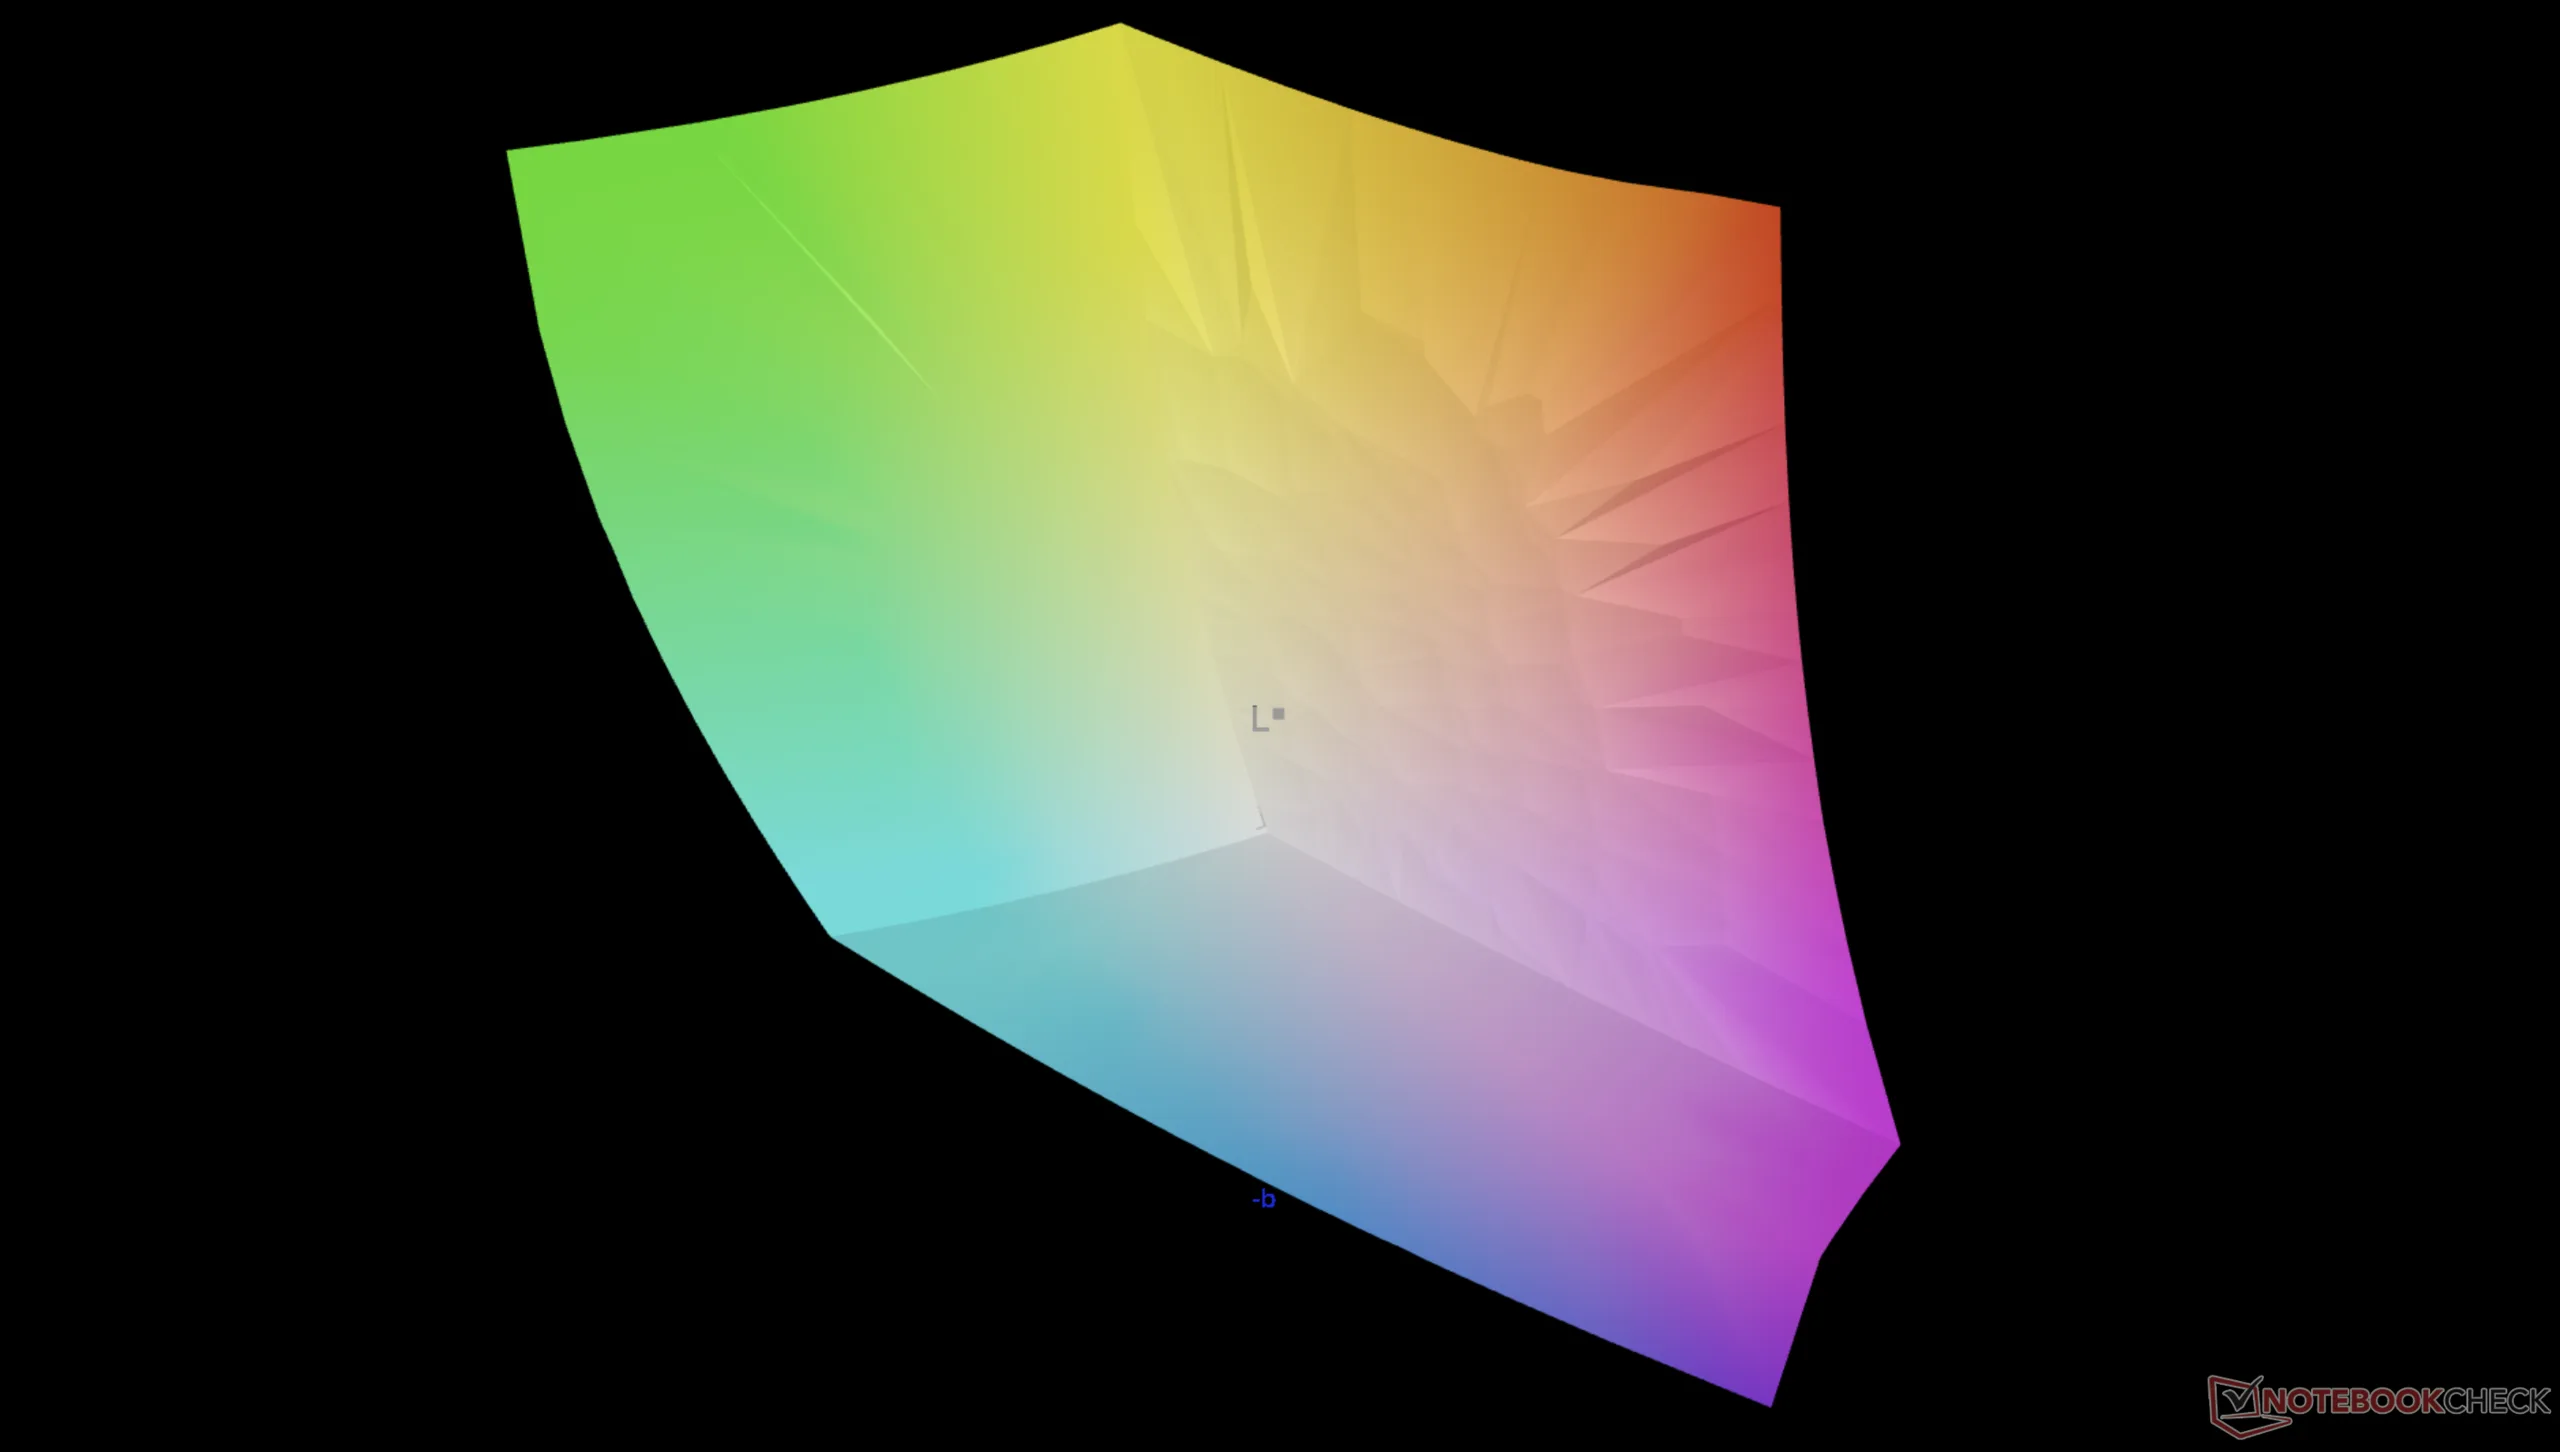
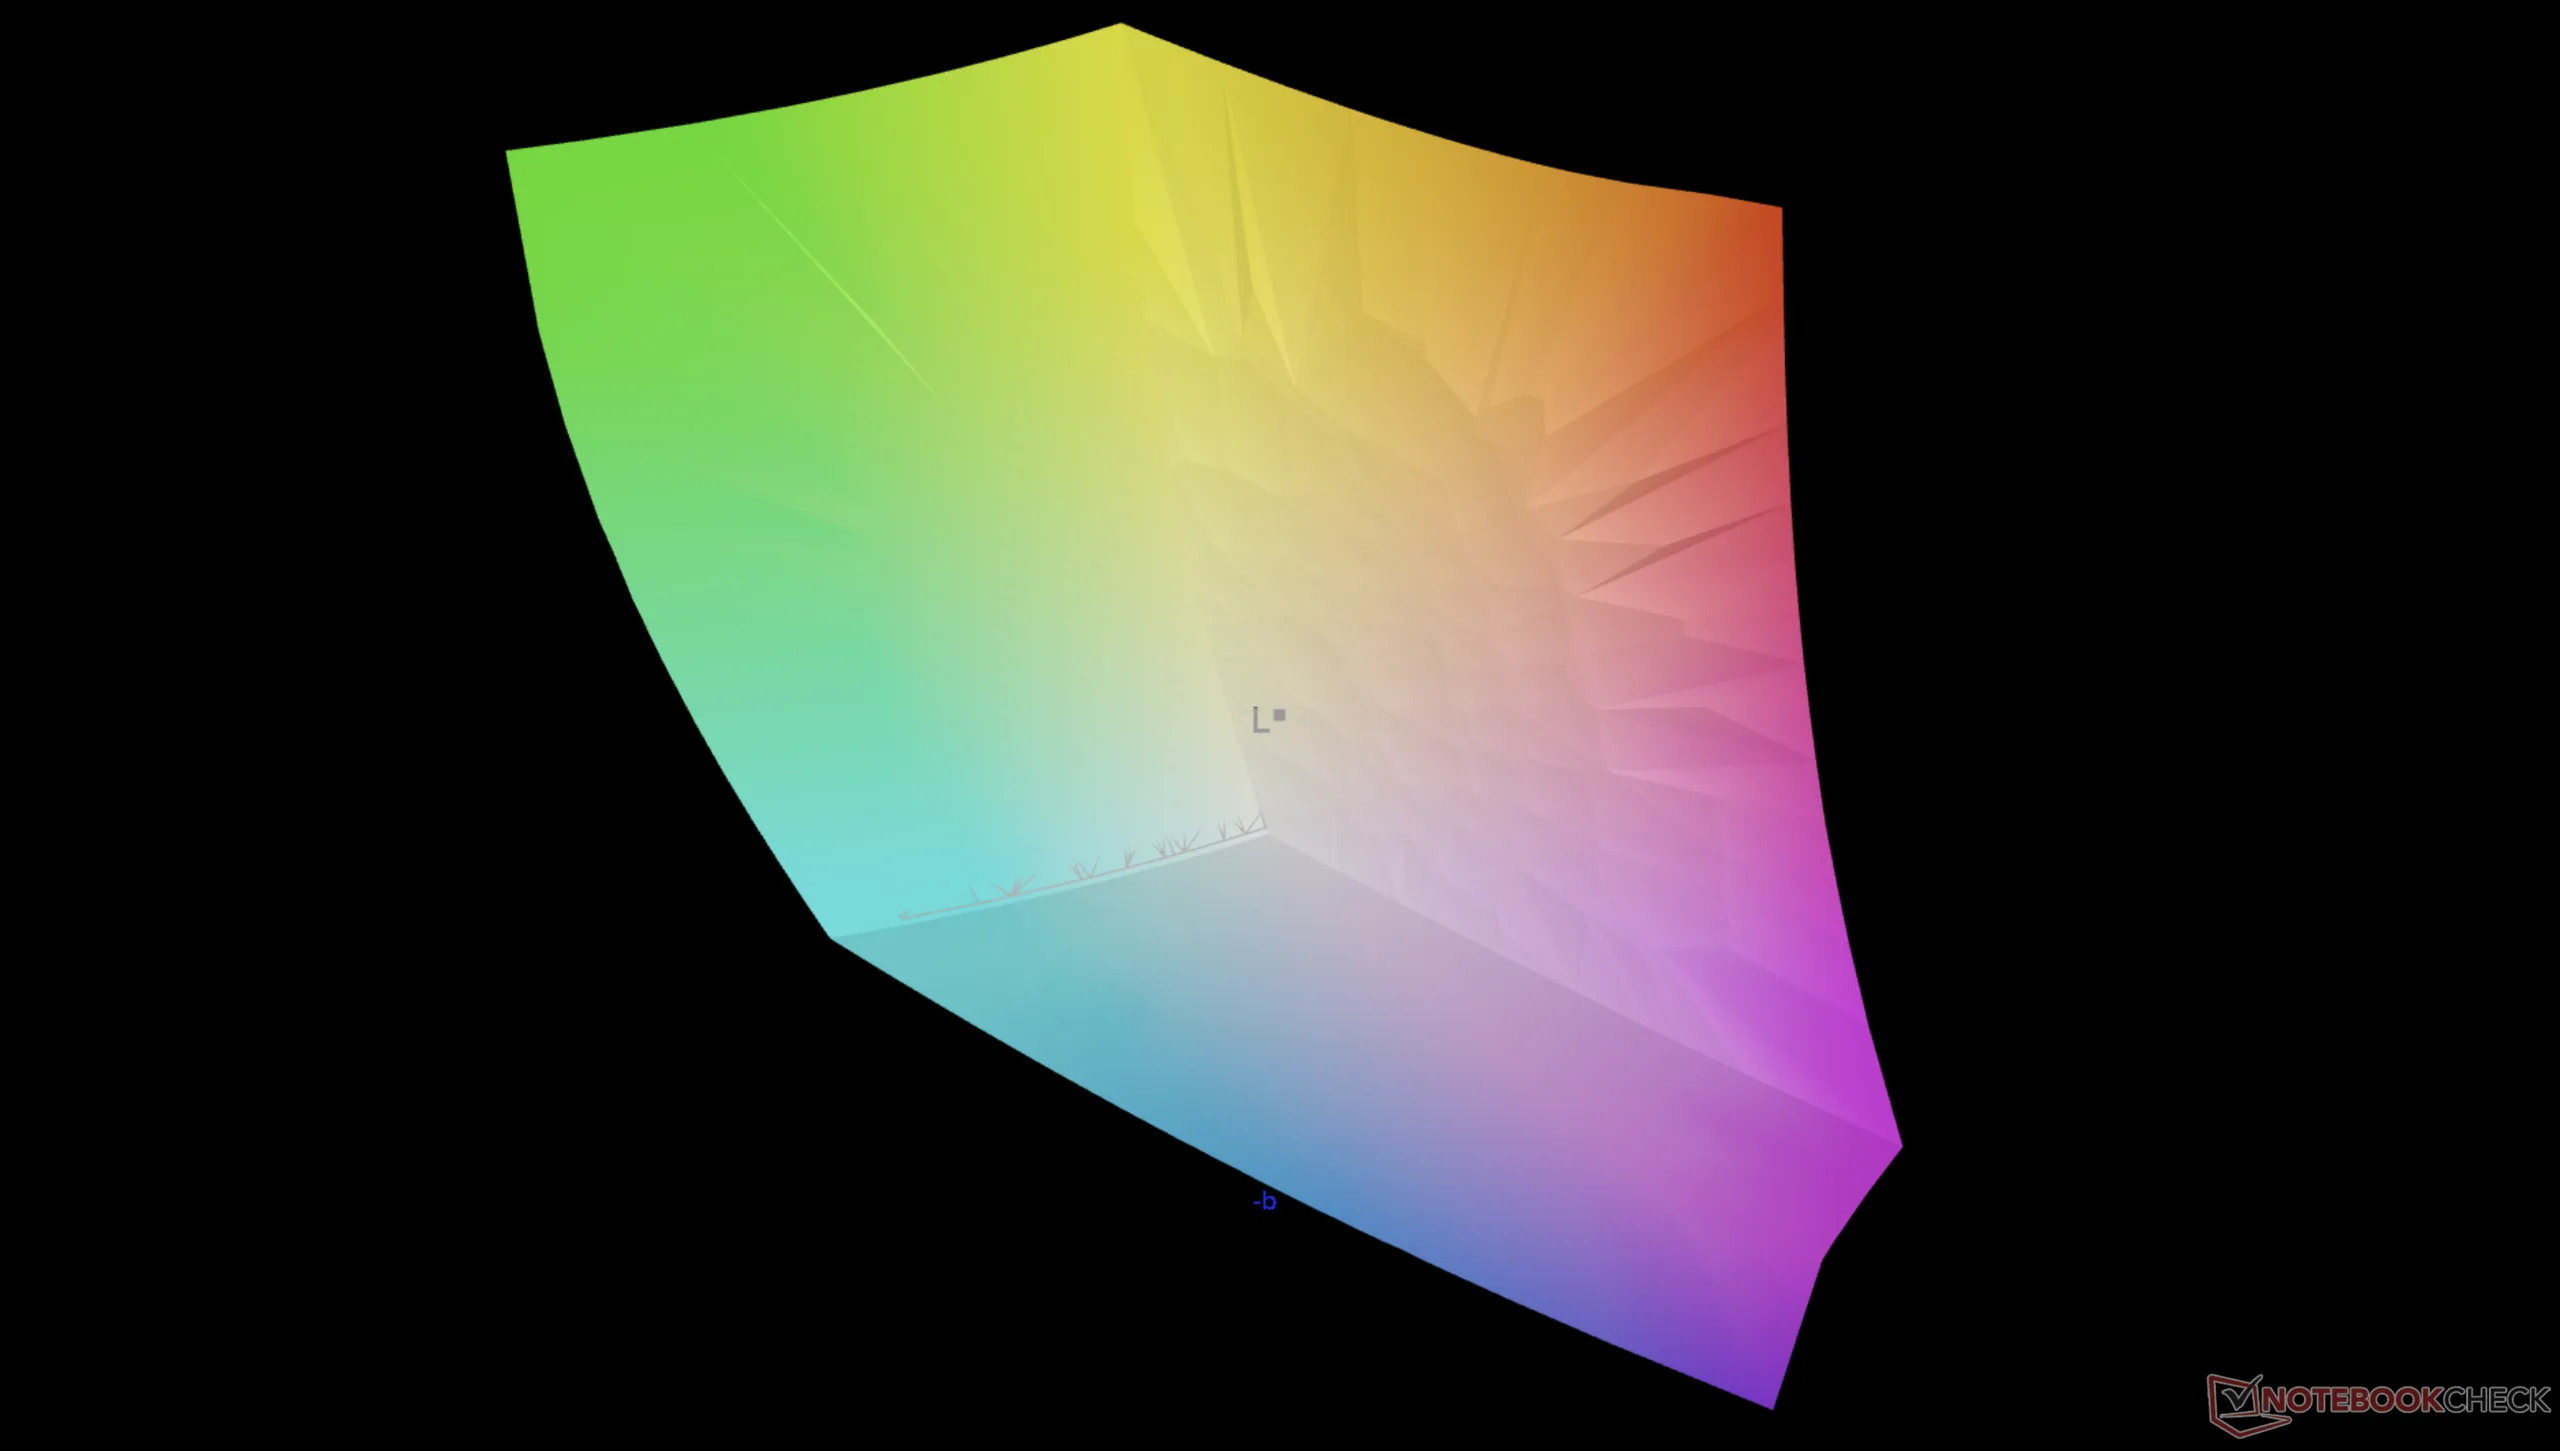
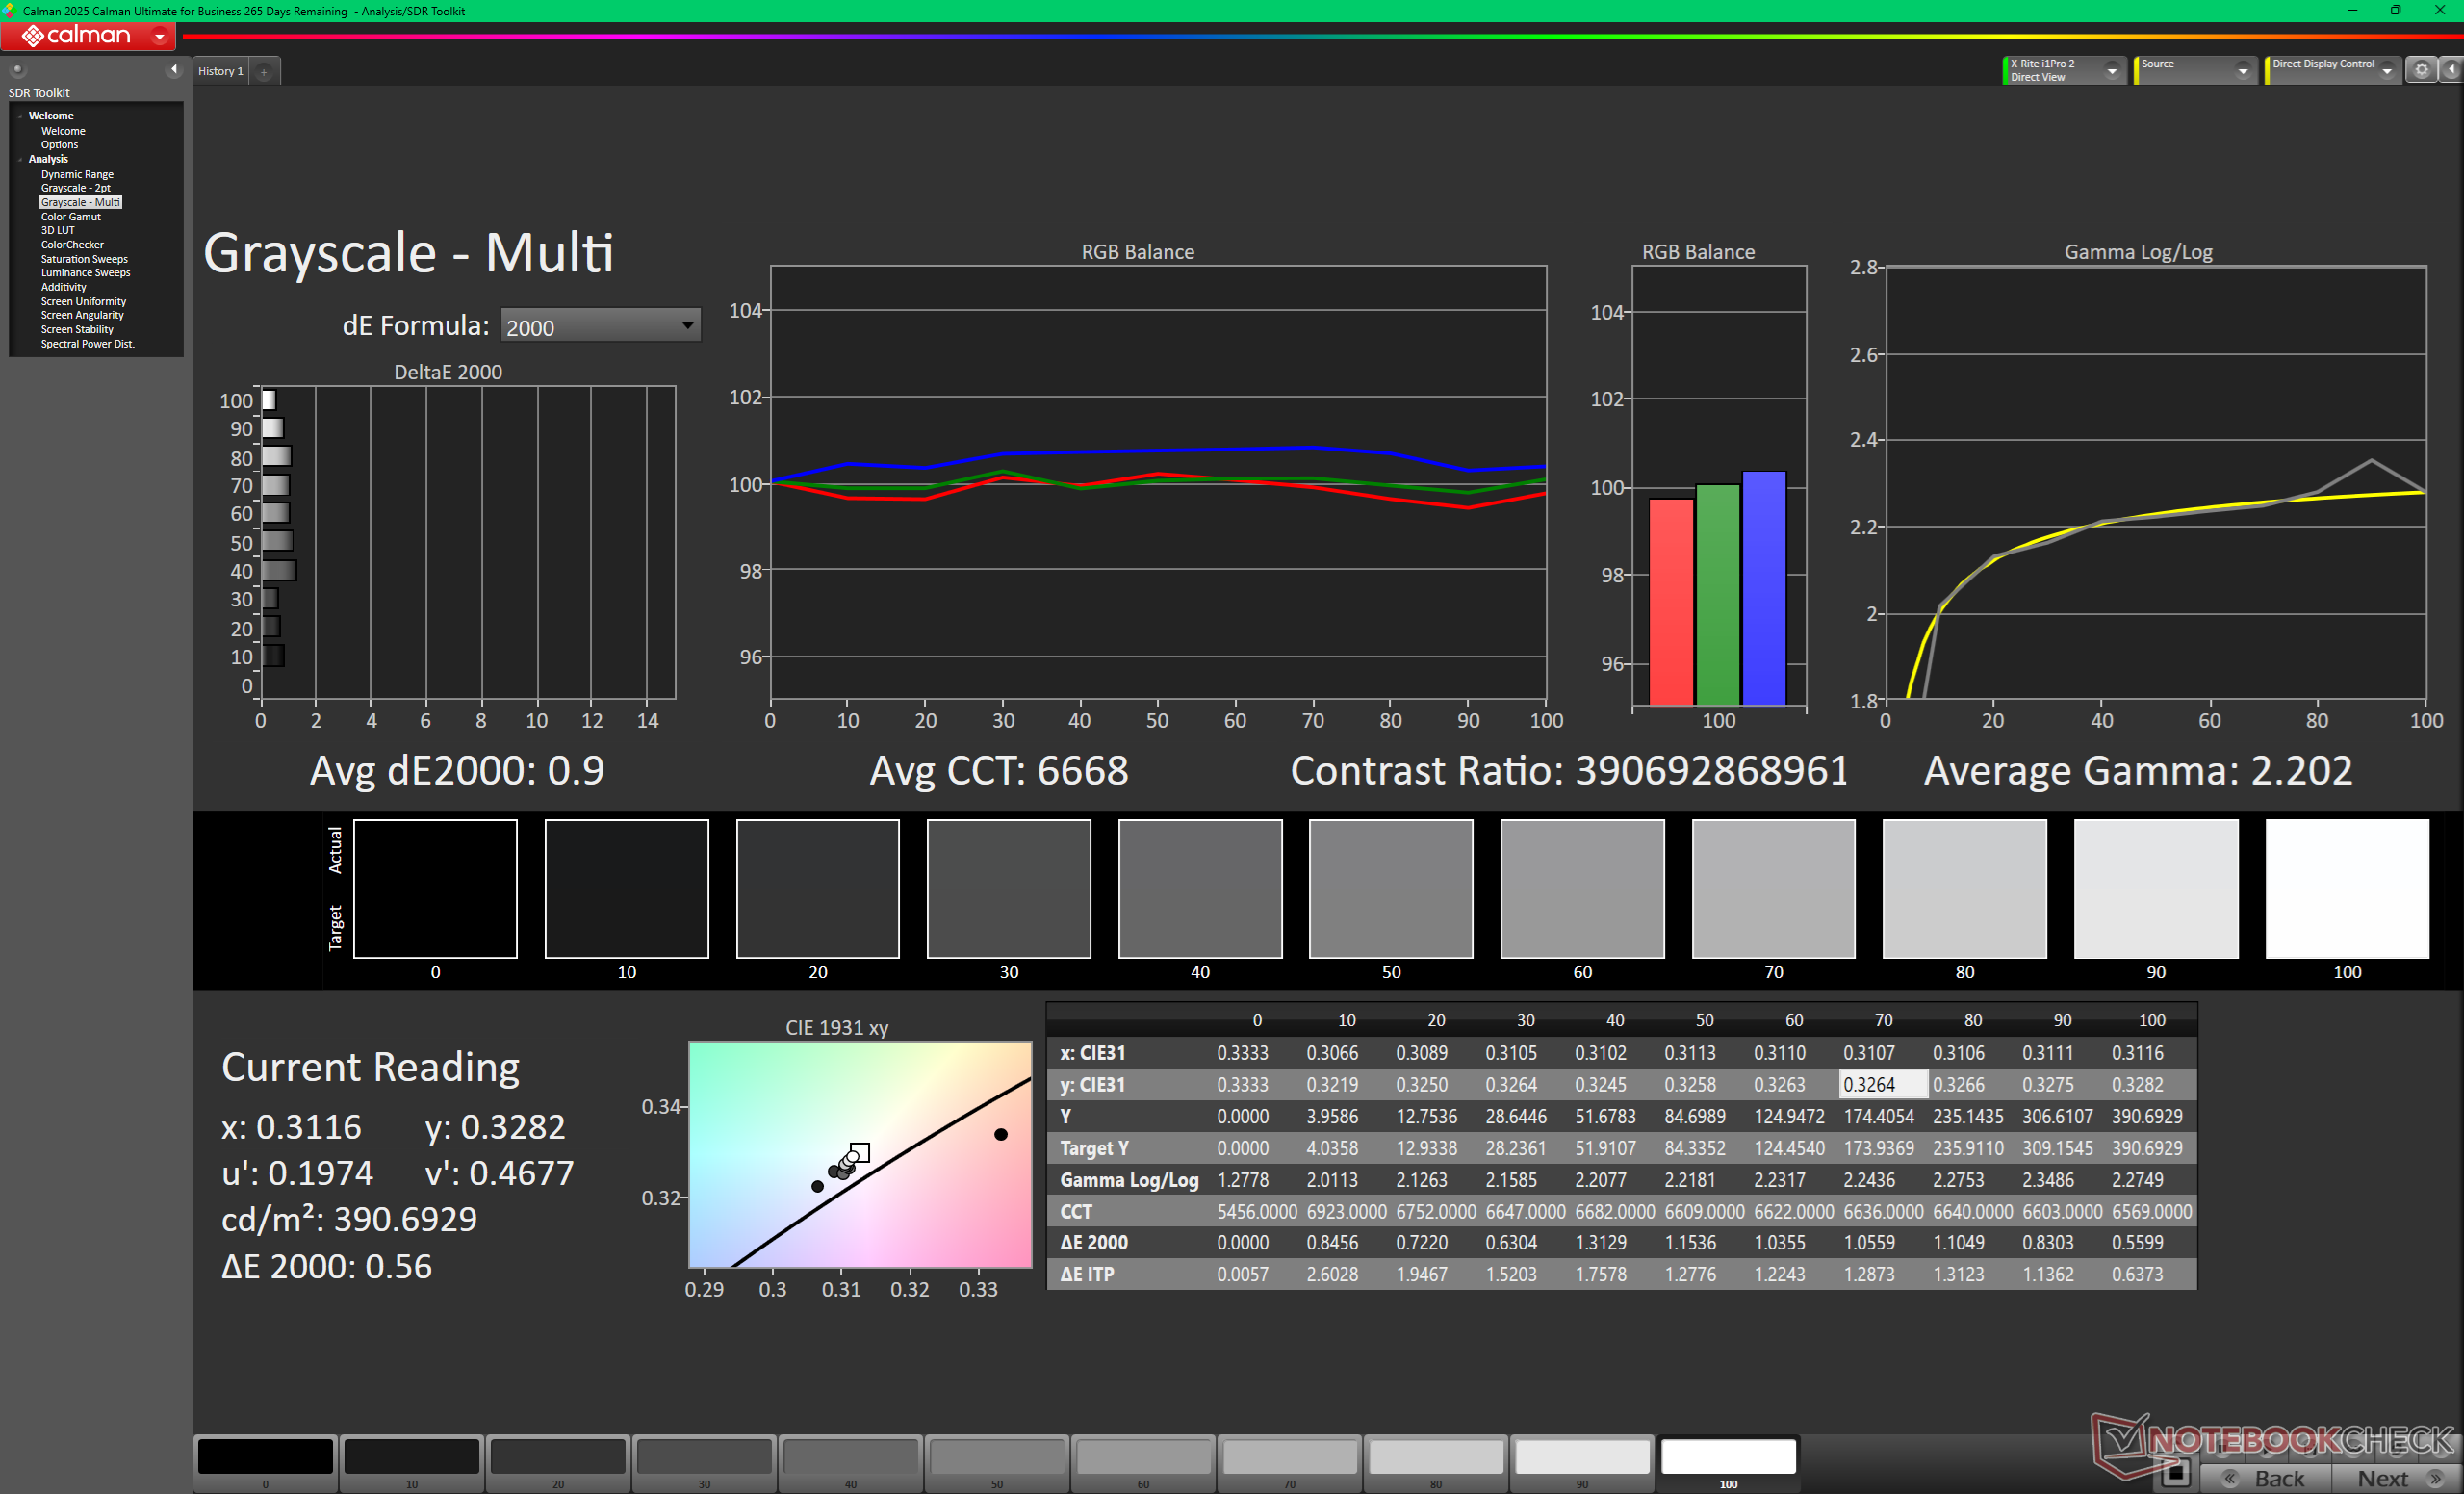
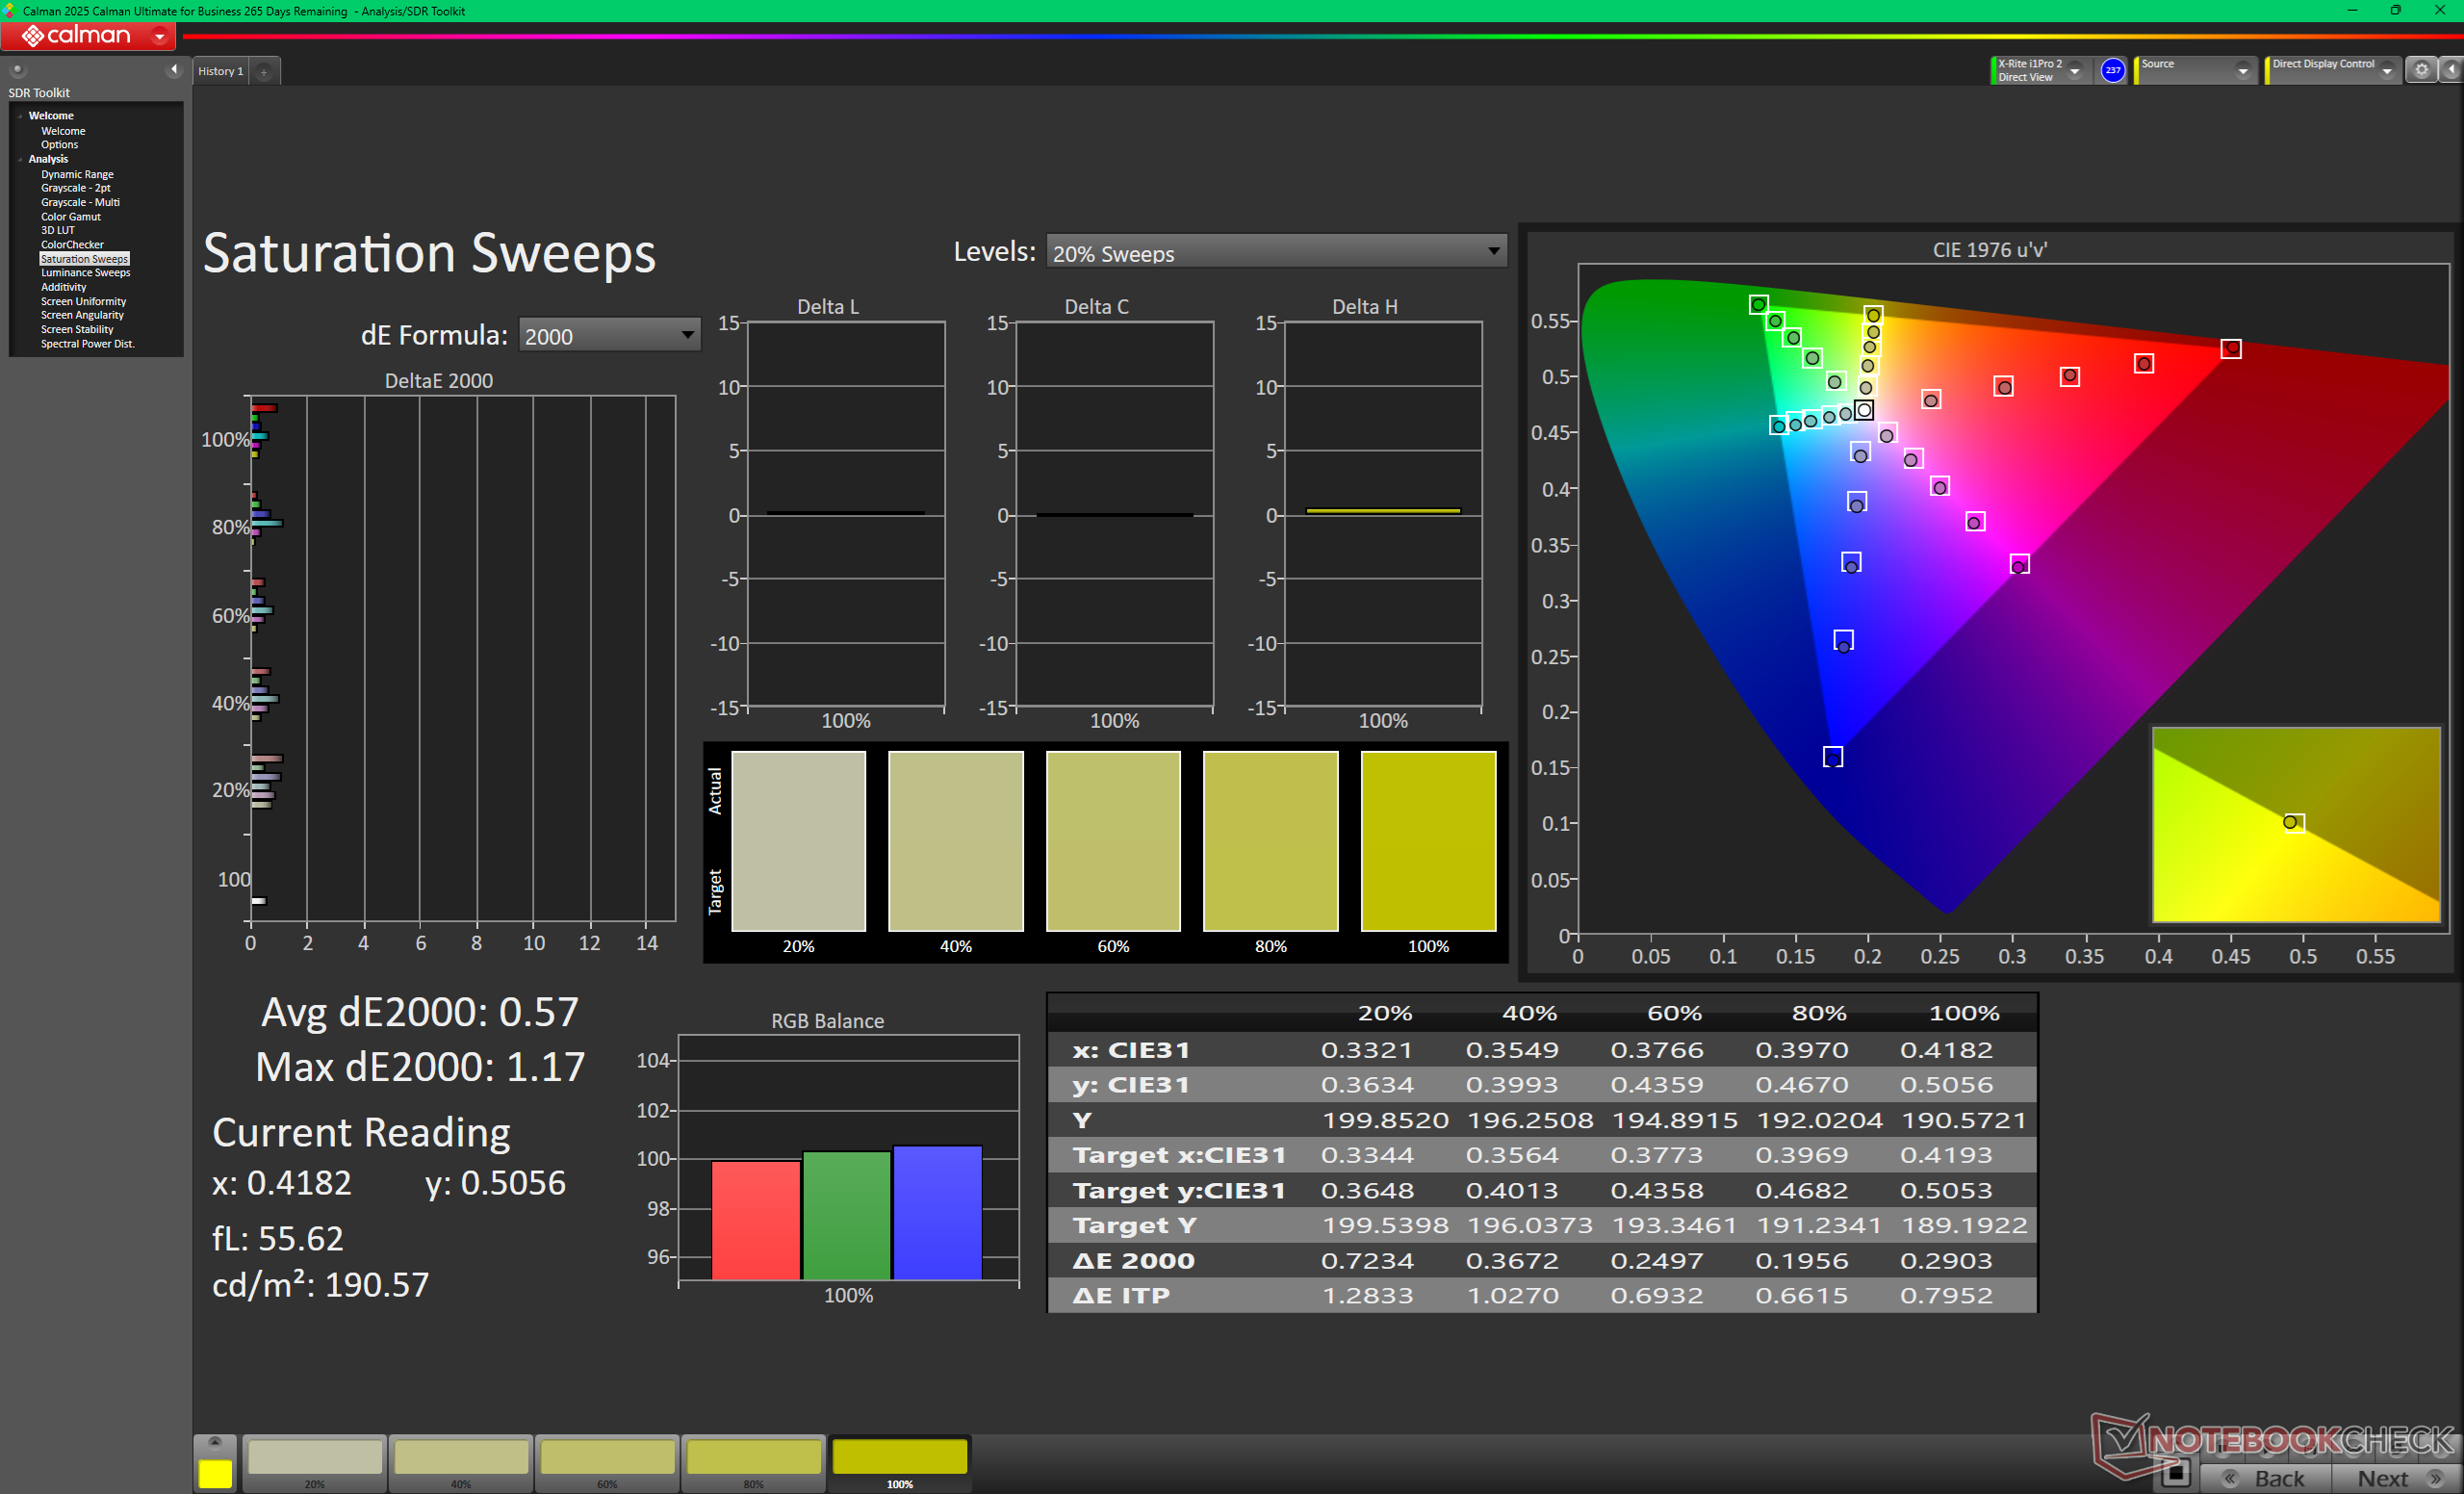
Het systeem is vooraf ingesteld en gekalibreerd op sRGB, ook al ondersteunt het OLED-beeldscherm volledige P3-kleuren. De gemiddelde deltaE-waarden voor grijswaarden en kleuren zijn al zeer nauwkeurig, respectievelijk slechts 1,9 en 1,29, voordat er gekalibreerd is.
Responstijd Scherm
| ↔ Responstijd Zwart naar Wit | ||
|---|---|---|
| 0.87 ms ... stijging ↗ en daling ↘ gecombineerd | ↗ 0.41 ms stijging | 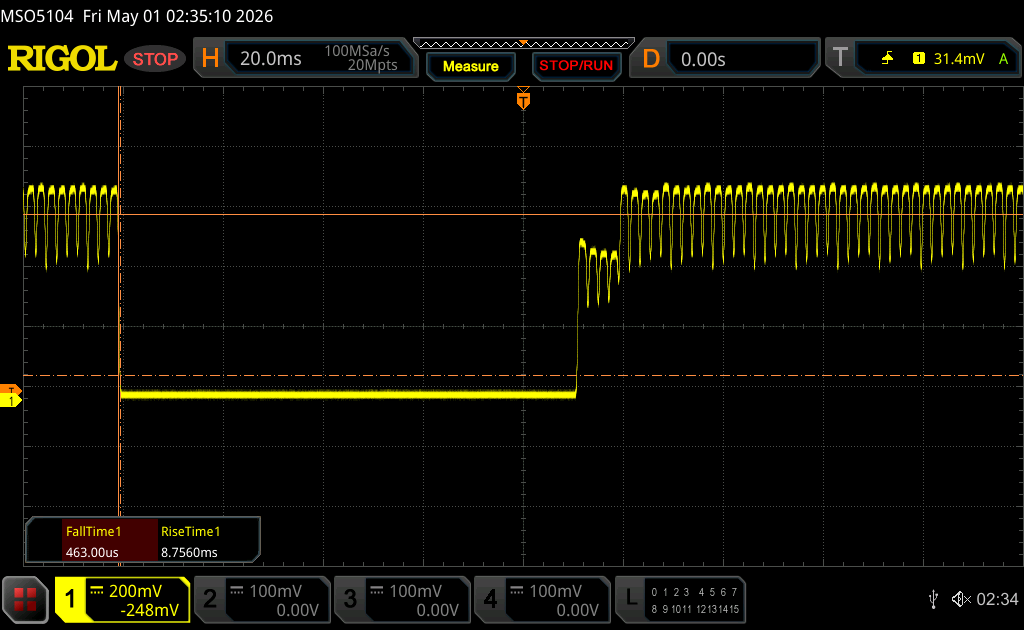 |
| ↘ 0.46 ms daling | ||
| Het scherm vertoonde erg snelle responstijden in onze tests en zou zeer geschikt moeten zijn voor snelle games. Ter vergelijking: alle testtoestellen variëren van 0.1 (minimum) tot 240 (maximum) ms. » 3 % van alle toestellen zijn beter. Dit betekent dat de gemeten responstijd beter is dan het gemiddelde (19.9 ms) van alle geteste toestellen. | ||
| ↔ Responstijd 50% Grijs naar 80% Grijs | ||
| 0.71 ms ... stijging ↗ en daling ↘ gecombineerd | ↗ 0.38 ms stijging | 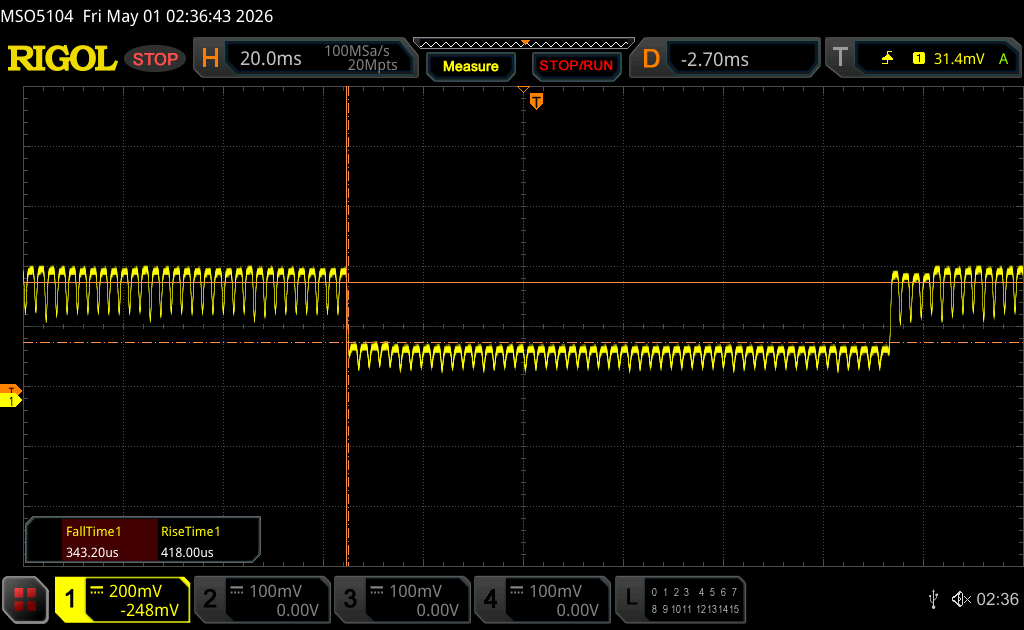 |
| ↘ 0.33 ms daling | ||
| Het scherm vertoonde erg snelle responstijden in onze tests en zou zeer geschikt moeten zijn voor snelle games. Ter vergelijking: alle testtoestellen variëren van 0.165 (minimum) tot 636 (maximum) ms. » 2 % van alle toestellen zijn beter. Dit betekent dat de gemeten responstijd beter is dan het gemiddelde (31.1 ms) van alle geteste toestellen. | ||
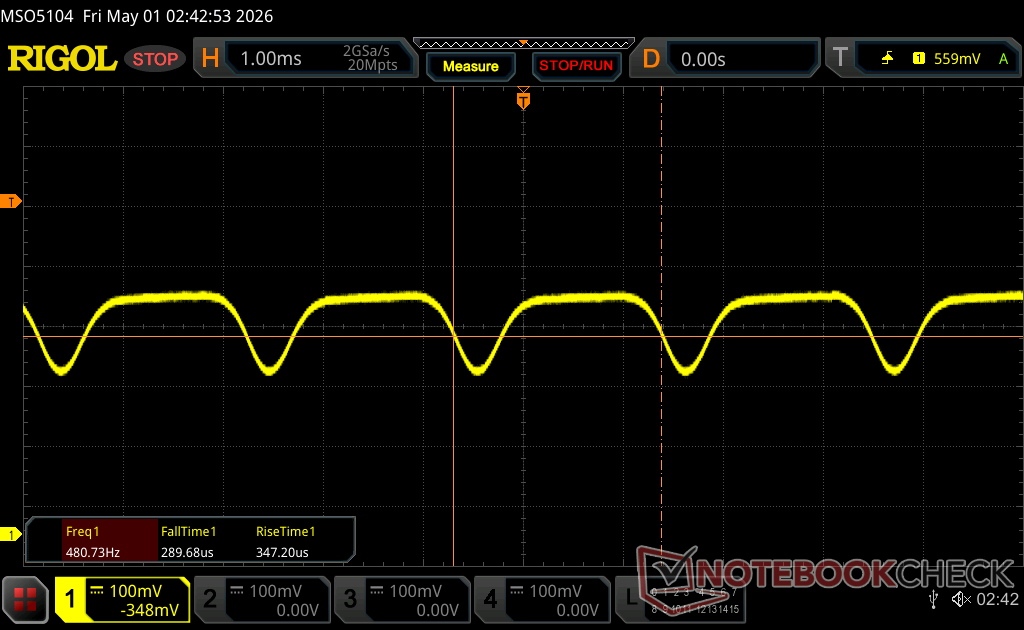
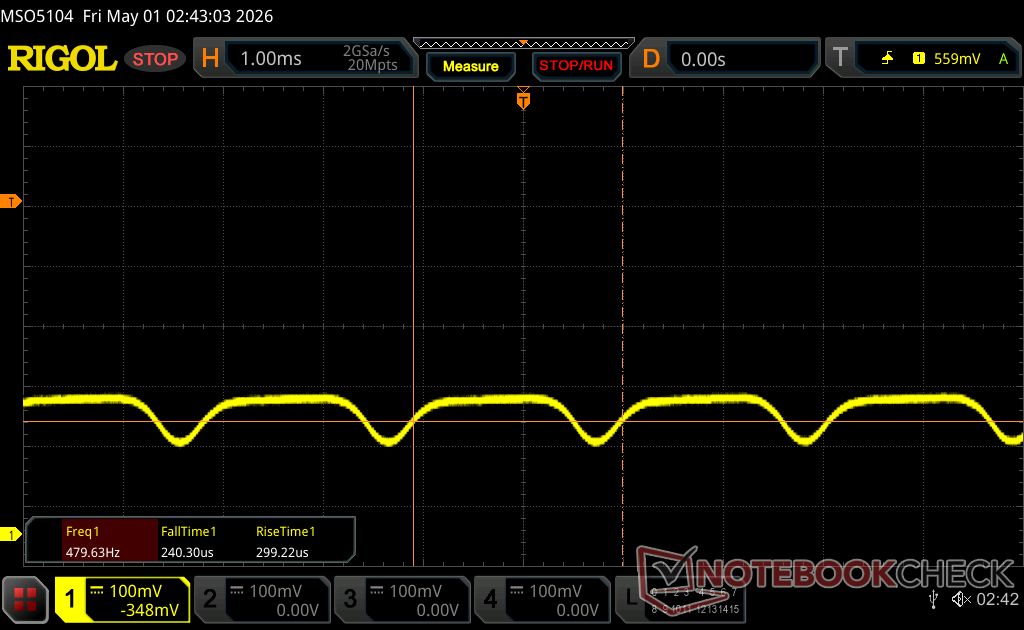
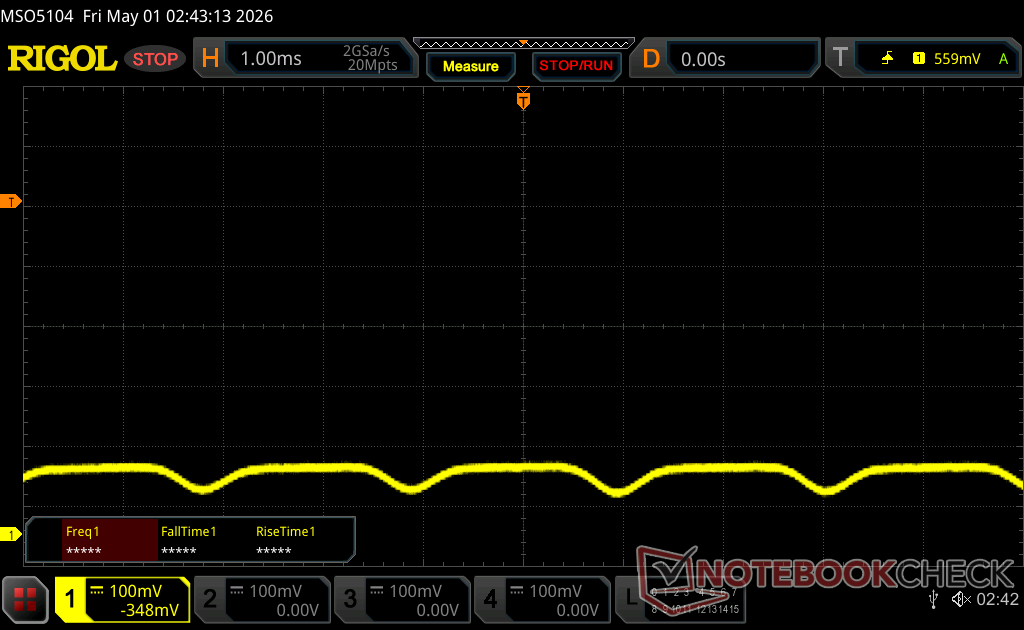
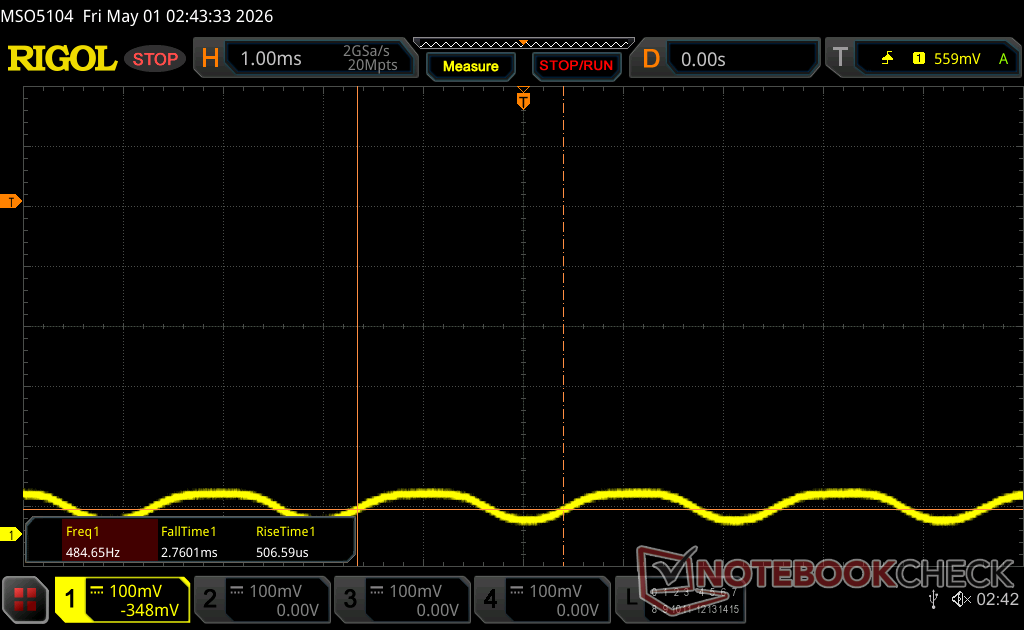
Screen Flickering / PWM (Pulse-Width Modulation)
| Screen flickering / PWM waargenomen | 460.46 Hz Amplitude: 18 % | ≤ 100 % helderheid instelling | 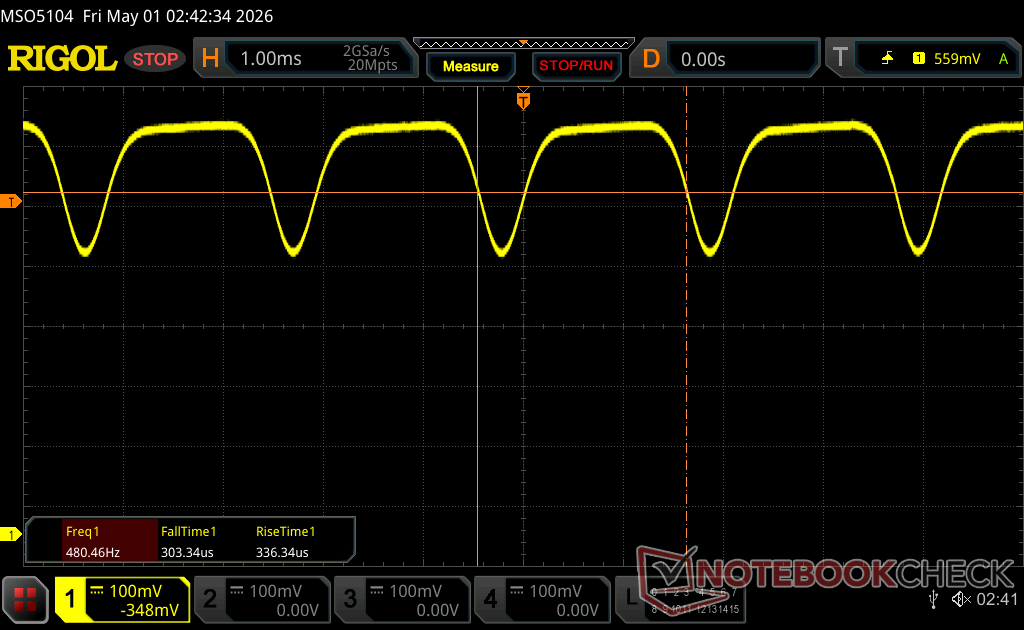 |
De achtergrondverlichting van het scherm flikkert op 460.46 Hz (in het slechtste geval, bijvoorbeeld bij gebruik van PWM) aan een helderheid van 100 % en lager. Boven deze helderheid zou er geen flickering / PWM mogen optreden. De frequentie van 460.46 Hz is relatief hoog en de meeste mensen die gevoelig zijn aan flickering zouden dit dus niet mogen waarnemen of geïrriteerde ogen krijgen. Er zijn echter rapporten die beweren dat sommige mensen toch flickering met 500 Hz en hoger kunnen waarnemen: opgelet dus. Ter vergelijking: 52 % van alle geteste toestellen maakten geen gebruik van PWM om de schermhelderheid te verlagen. Als het wel werd gebruikt, werd een gemiddelde van 7801 (minimum: 5 - maximum: 343500) Hz waargenomen. | |||


Prestaties
Testomstandigheden
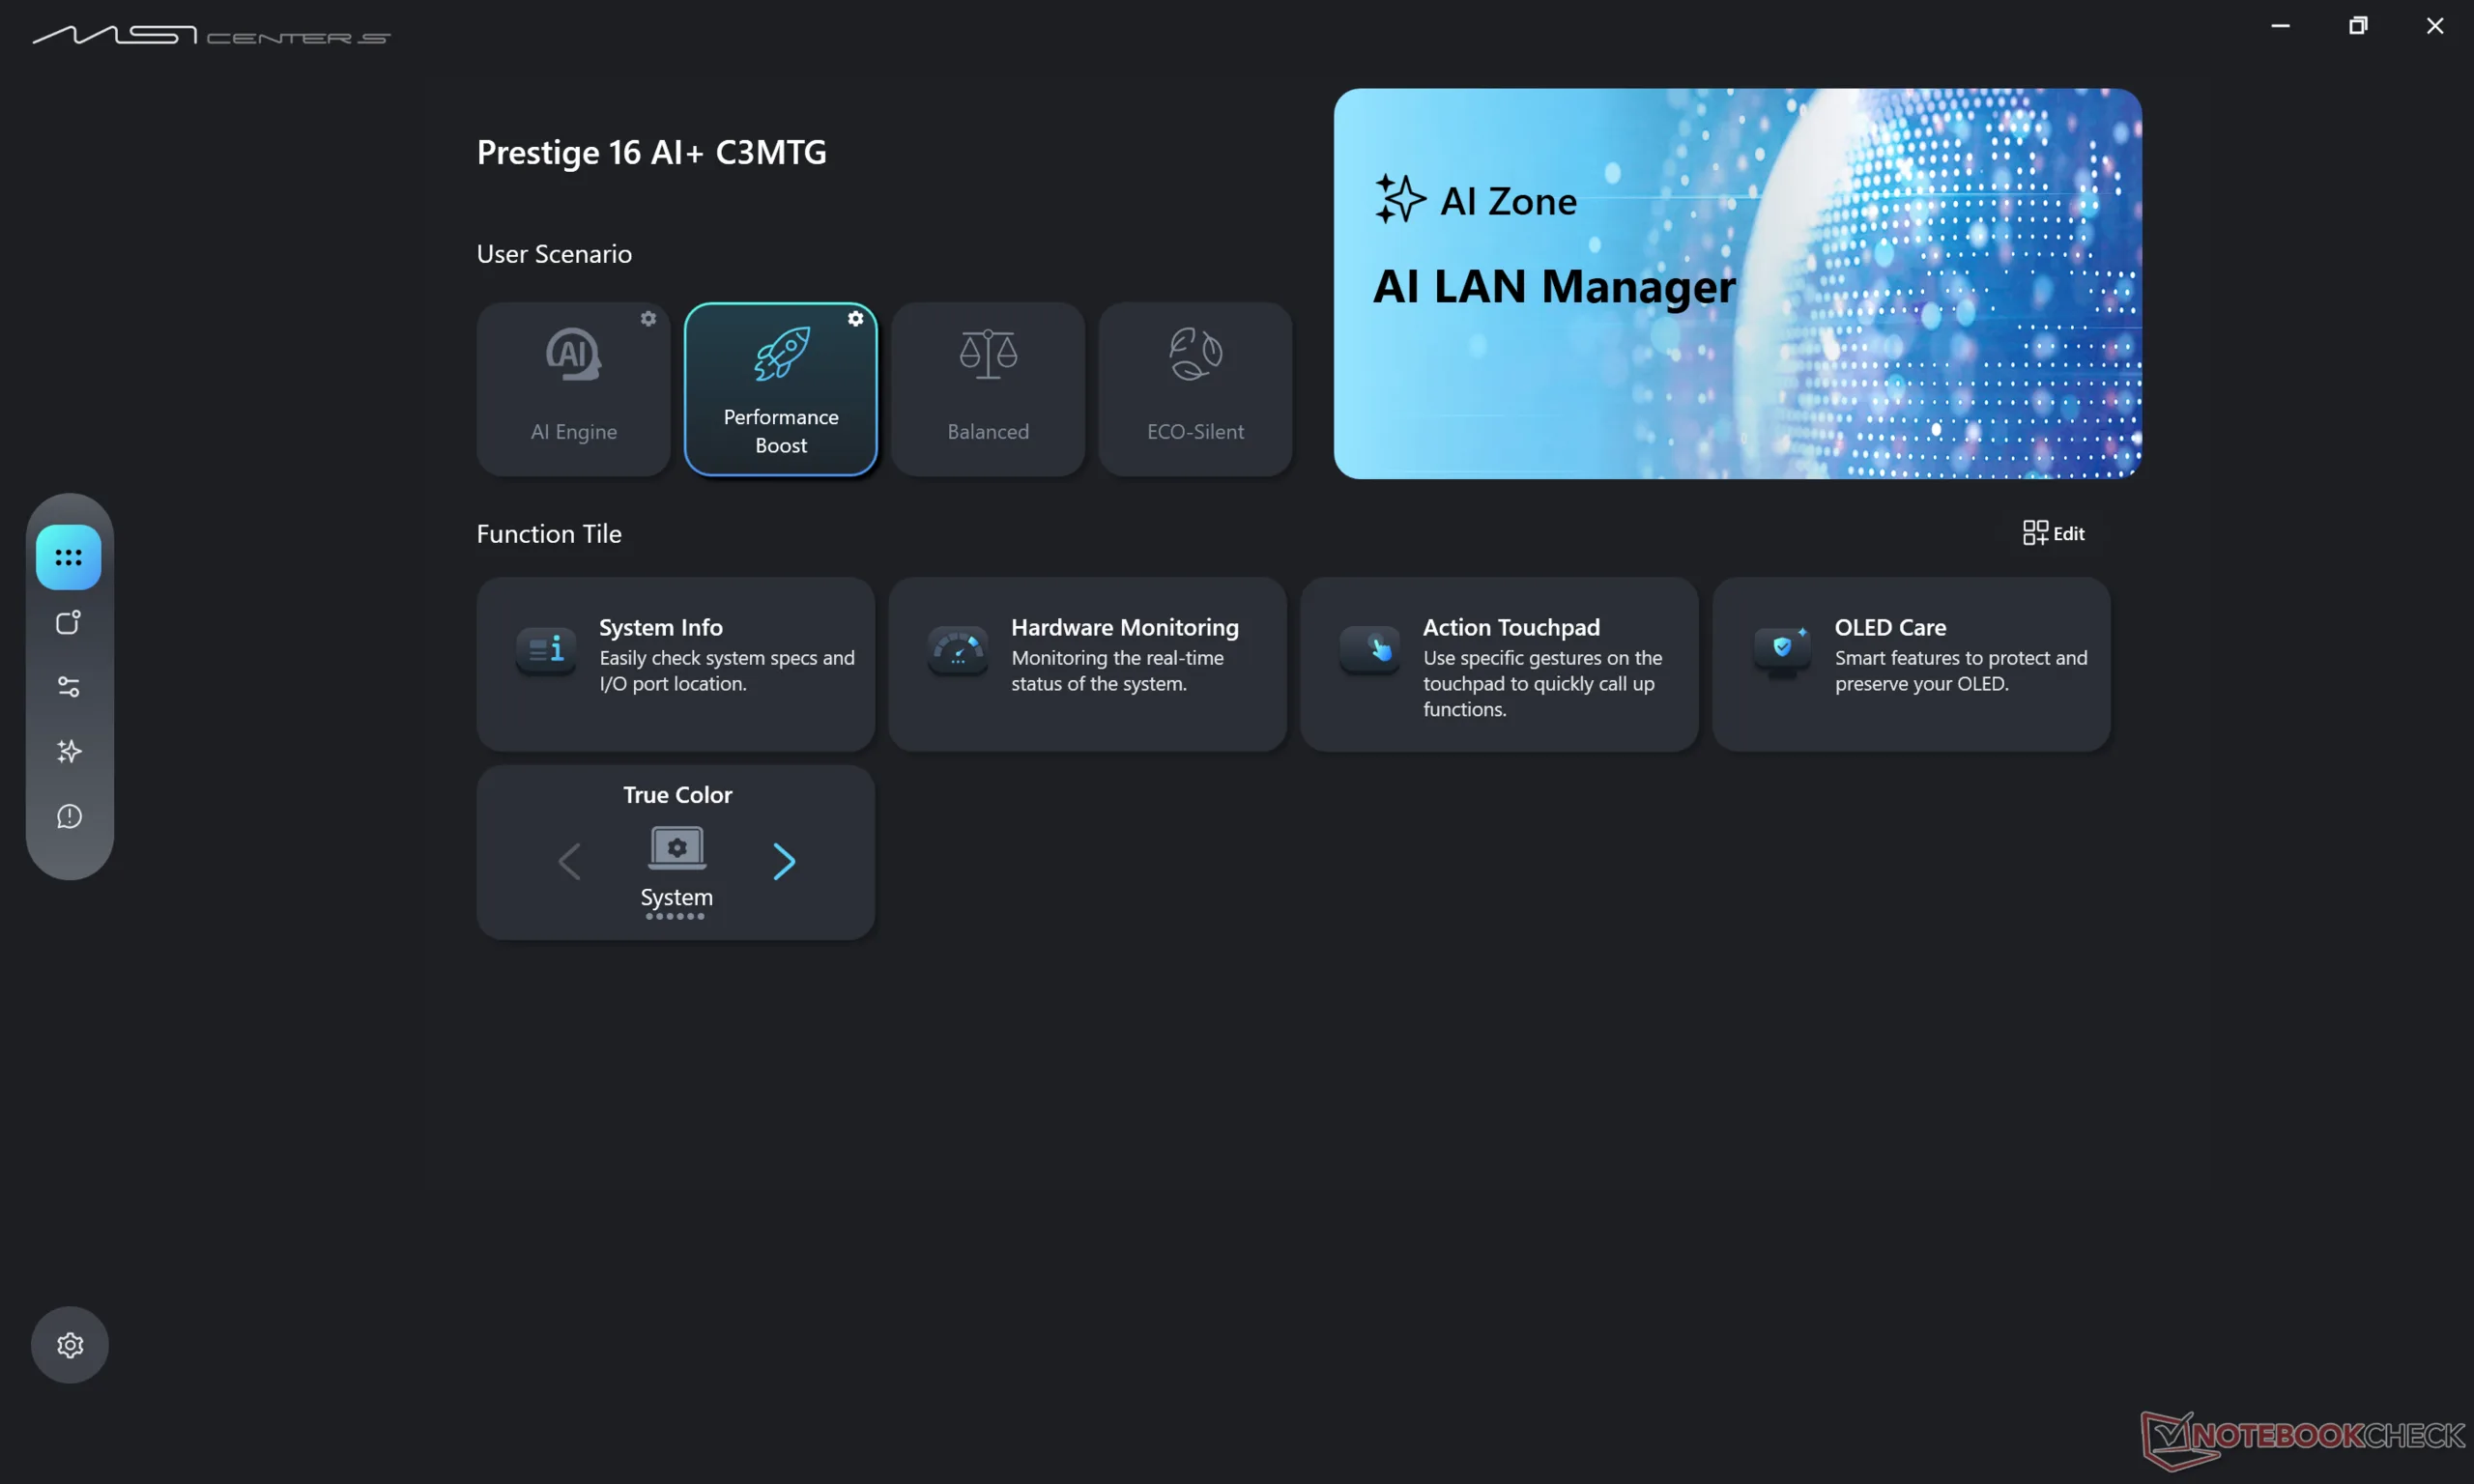
We hebben MSI Center S en Windows in de prestatiemodus gezet voordat we de onderstaande benchmarks uitvoerden.
Processor
De Core Ultra X7 358H biedt consistentere prestaties dan de Core Ultra 9 285H in de 2025 Prestige 16. Terwijl de laatste tot 10 procent sneller kan zijn wanneer Turbo Boost het meest effectief is, is het tegenovergestelde waar nadat Turbo Boost tot rust is gekomen. Dit is te zien bij het draaien van CineBench R15 xT in een loop, waar de 2025 Prestige 16 alleen de eerste minuut de snellere machine is, voordat onze 2026 Prestige 16 hem daarna inhaalt.
Opwaarderen naar de Core Ultra X9 388H zal de multi-thread prestaties naar verwachting met wel 10 procent verhogen, gebaseerd op onze tijd met de Asus ZenBook Duo UX8407AA.
Cinebench R15 meervoudige lus
Cinebench R23: Multi Core | Single Core
Cinebench R20: CPU (Multi Core) | CPU (Single Core)
Cinebench R15: CPU Multi 64Bit | CPU Single 64Bit
Blender: v2.79 BMW27 CPU
7-Zip 18.03: 7z b 4 | 7z b 4 -mmt1
Geekbench 6.7: Multi-Core | Single-Core
Geekbench 5.5: Multi-Core | Single-Core
HWBOT x265 Benchmark v2.2: 4k Preset
LibreOffice : 20 Documents To PDF
R Benchmark 2.5: Overall mean
* ... kleiner is beter
AIDA64: FP32 Ray-Trace | FPU Julia | CPU SHA3 | CPU Queen | FPU SinJulia | FPU Mandel | CPU AES | CPU ZLib | FP64 Ray-Trace | CPU PhotoWorxx | CPU CheckMate
| Performance rating | |
| Asus ZenBook S16 UM5606GA -1! | |
| Lenovo ThinkBook 16 G7+ AMD -1! | |
| Dell XPS 16 Core Ultra X7 358H -1! | |
| HP Envy x360 2-in-1 16-ad0097nr -1! | |
| MSI Prestige 16 AI C3MTG -1! | |
| MSI Prestige 16 AI Evo B2HMG -1! | |
| Gemiddeld Intel Core Ultra X7 358H | |
| AIDA64 / FP32 Ray-Trace | |
| Lenovo ThinkBook 16 G7+ AMD (v6.92.6600) | |
| Asus ZenBook S16 UM5606GA (v6.92.6600) | |
| HP Envy x360 2-in-1 16-ad0097nr (v6.92.6600) | |
| MSI Prestige 16 AI Evo B2HMG (v6.92.6600) | |
| MSI Prestige 16 AI C3MTG (v8.20.8100) | |
| Dell XPS 16 Core Ultra X7 358H (v8.20.8100) | |
| Gemiddeld Intel Core Ultra X7 358H (12221 - 17932, n=8) | |
| AIDA64 / FPU Julia | |
| Lenovo ThinkBook 16 G7+ AMD (v6.92.6600) | |
| Asus ZenBook S16 UM5606GA (v6.92.6600) | |
| MSI Prestige 16 AI Evo B2HMG (v6.92.6600) | |
| HP Envy x360 2-in-1 16-ad0097nr (v6.92.6600) | |
| MSI Prestige 16 AI C3MTG (v8.20.8100) | |
| Dell XPS 16 Core Ultra X7 358H (v8.20.8100) | |
| Gemiddeld Intel Core Ultra X7 358H (29930 - 95525, n=8) | |
| AIDA64 / CPU SHA3 | |
| Lenovo ThinkBook 16 G7+ AMD (v6.92.6600) | |
| Asus ZenBook S16 UM5606GA (v6.92.6600) | |
| Gemiddeld Intel Core Ultra X7 358H (3910 - 4911, n=8) | |
| MSI Prestige 16 AI Evo B2HMG (v6.92.6600) | |
| Dell XPS 16 Core Ultra X7 358H (v8.20.8100) | |
| MSI Prestige 16 AI C3MTG (v8.20.8100) | |
| HP Envy x360 2-in-1 16-ad0097nr (v6.92.6600) | |
| AIDA64 / CPU Queen | |
| HP Envy x360 2-in-1 16-ad0097nr (v6.92.6600) | |
| Asus ZenBook S16 UM5606GA (v6.92.6600) | |
| Lenovo ThinkBook 16 G7+ AMD (v6.92.6600) | |
| MSI Prestige 16 AI Evo B2HMG (v6.92.6600) | |
| Gemiddeld Intel Core Ultra X7 358H (63425 - 63827, n=2) | |
| AIDA64 / FPU SinJulia | |
| Lenovo ThinkBook 16 G7+ AMD (v6.92.6600) | |
| Asus ZenBook S16 UM5606GA (v6.92.6600) | |
| HP Envy x360 2-in-1 16-ad0097nr (v6.92.6600) | |
| MSI Prestige 16 AI Evo B2HMG (v6.92.6600) | |
| Dell XPS 16 Core Ultra X7 358H (v8.20.8100) | |
| MSI Prestige 16 AI C3MTG (v8.20.8100) | |
| Gemiddeld Intel Core Ultra X7 358H (4735 - 7038, n=8) | |
| AIDA64 / FPU Mandel | |
| Lenovo ThinkBook 16 G7+ AMD (v6.92.6600) | |
| Asus ZenBook S16 UM5606GA (v6.92.6600) | |
| MSI Prestige 16 AI Evo B2HMG (v6.92.6600) | |
| HP Envy x360 2-in-1 16-ad0097nr (v6.92.6600) | |
| Dell XPS 16 Core Ultra X7 358H (v8.20.8100) | |
| MSI Prestige 16 AI C3MTG (v8.20.8100) | |
| Gemiddeld Intel Core Ultra X7 358H (14716 - 50734, n=8) | |
| AIDA64 / CPU AES | |
| Asus ZenBook S16 UM5606GA (v6.92.6600) | |
| HP Envy x360 2-in-1 16-ad0097nr (v6.92.6600) | |
| Lenovo ThinkBook 16 G7+ AMD (v6.92.6600) | |
| MSI Prestige 16 AI Evo B2HMG (v6.92.6600) | |
| MSI Prestige 16 AI C3MTG (v8.20.8100) | |
| Dell XPS 16 Core Ultra X7 358H (v8.20.8100) | |
| Gemiddeld Intel Core Ultra X7 358H (5127 - 67510, n=8) | |
| AIDA64 / CPU ZLib | |
| Lenovo ThinkBook 16 G7+ AMD (v6.92.6600) | |
| Asus ZenBook S16 UM5606GA (v6.92.6600) | |
| Gemiddeld Intel Core Ultra X7 358H (932 - 1179, n=8) | |
| MSI Prestige 16 AI Evo B2HMG (v6.92.6600) | |
| MSI Prestige 16 AI C3MTG (v8.20.8100) | |
| Dell XPS 16 Core Ultra X7 358H (v8.20.8100) | |
| HP Envy x360 2-in-1 16-ad0097nr (v6.92.6600) | |
| AIDA64 / FP64 Ray-Trace | |
| Lenovo ThinkBook 16 G7+ AMD (v6.92.6600) | |
| Asus ZenBook S16 UM5606GA (v6.92.6600) | |
| HP Envy x360 2-in-1 16-ad0097nr (v6.92.6600) | |
| MSI Prestige 16 AI Evo B2HMG (v6.92.6600) | |
| MSI Prestige 16 AI C3MTG (v8.20.8100) | |
| Dell XPS 16 Core Ultra X7 358H (v8.20.8100) | |
| Gemiddeld Intel Core Ultra X7 358H (6506 - 9447, n=8) | |
| AIDA64 / CPU PhotoWorxx | |
| Dell XPS 16 Core Ultra X7 358H (v8.20.8100) | |
| MSI Prestige 16 AI C3MTG (v8.20.8100) | |
| Gemiddeld Intel Core Ultra X7 358H (30538 - 88154, n=8) | |
| MSI Prestige 16 AI Evo B2HMG (v6.92.6600) | |
| Asus ZenBook S16 UM5606GA (v6.92.6600) | |
| Lenovo ThinkBook 16 G7+ AMD (v6.92.6600) | |
| HP Envy x360 2-in-1 16-ad0097nr (v6.92.6600) | |
| AIDA64 / CPU CheckMate | |
| Gemiddeld Intel Core Ultra X7 358H (4187 - 4475, n=7) | |
| Dell XPS 16 Core Ultra X7 358H (v8.20.8100) | |
| MSI Prestige 16 AI C3MTG (v8.20.8100) | |
Systeemprestaties
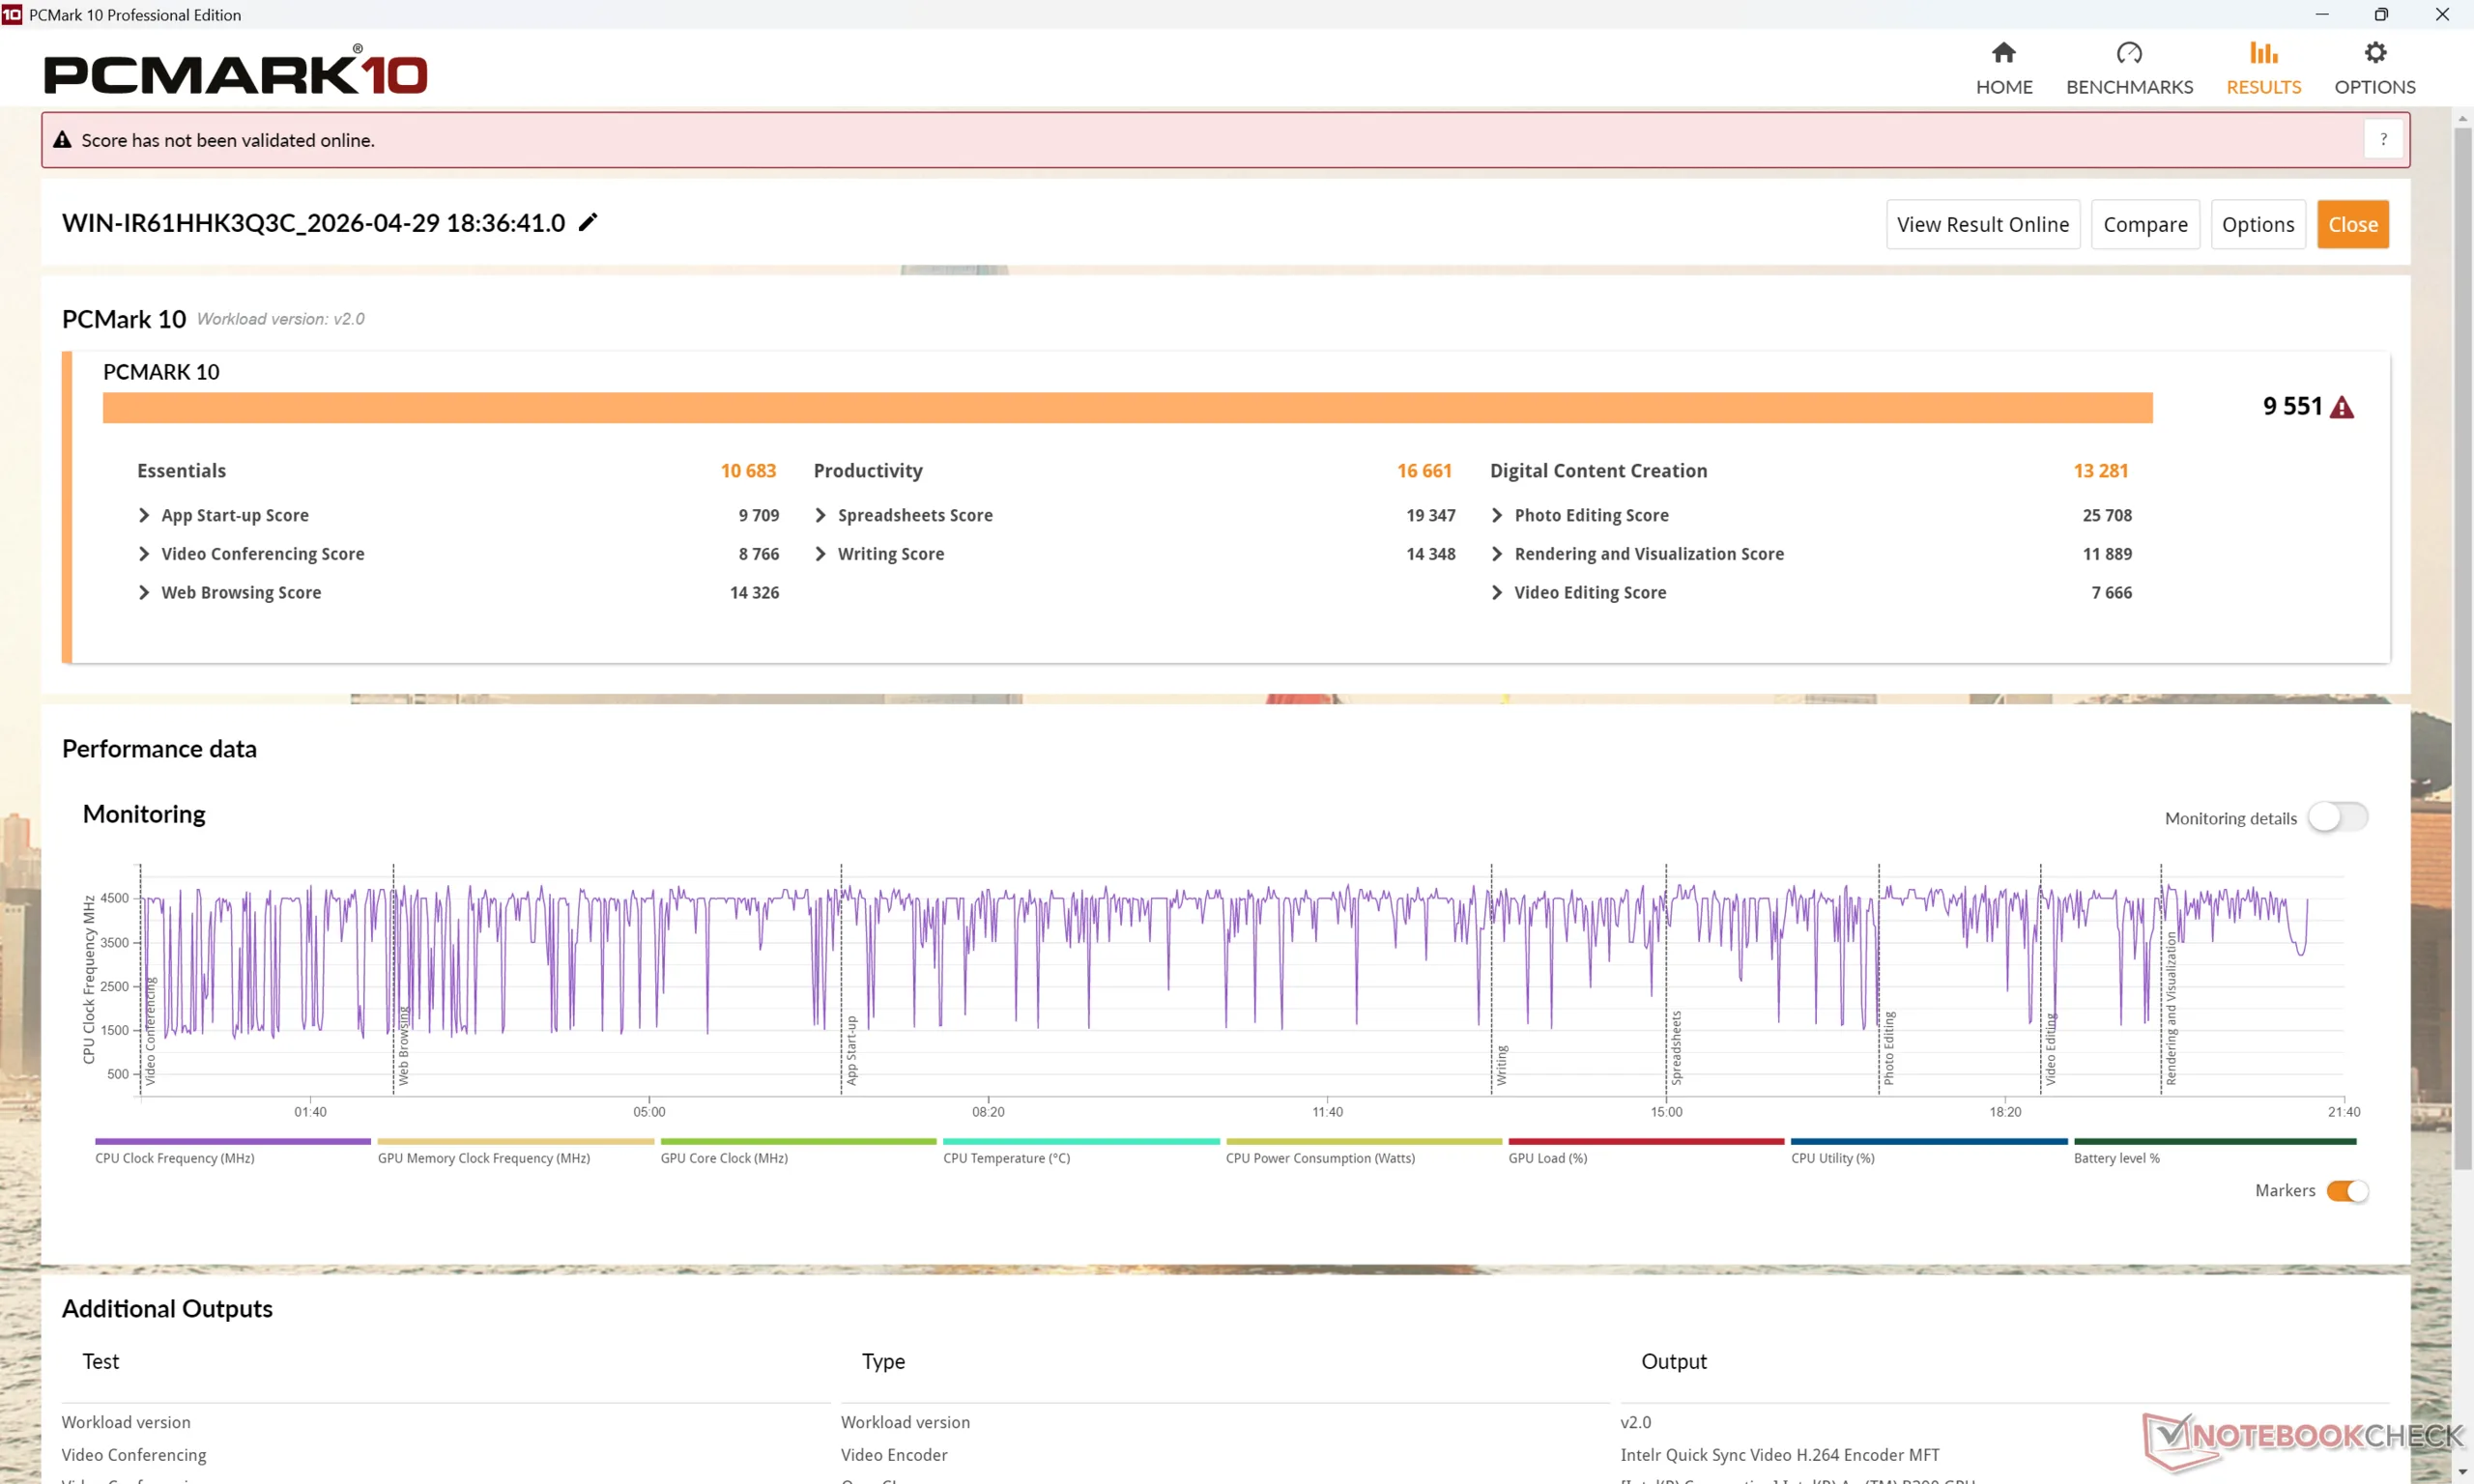
PCMark 10: Score | Essentials | Productivity | Digital Content Creation
CrossMark: Overall | Productivity | Creativity | Responsiveness
WebXPRT 3: Overall
WebXPRT 4: Overall
Mozilla Kraken 1.1: Total
Geekbench AI: Quantized GPU 1.7 | Half Precision GPU 1.7 | Single Precision GPU 1.7
| Performance rating | |
| Dell XPS 16 Core Ultra X7 358H | |
| MSI Prestige 16 AI C3MTG | |
| Gemiddeld Intel Core Ultra X7 358H, Intel Arc B390 12 Xe3 Panther Lake iGPU | |
| MSI Prestige 16 AI Evo B2HMG -3! | |
| Asus ZenBook S16 UM5606GA -3! | |
| Lenovo ThinkBook 16 G7+ AMD -3! | |
| HP Envy x360 2-in-1 16-ad0097nr -3! | |
| PCMark 10 / Score | |
| Dell XPS 16 Core Ultra X7 358H | |
| MSI Prestige 16 AI C3MTG | |
| Gemiddeld Intel Core Ultra X7 358H, Intel Arc B390 12 Xe3 Panther Lake iGPU (8834 - 9880, n=8) | |
| Asus ZenBook S16 UM5606GA | |
| MSI Prestige 16 AI Evo B2HMG | |
| Lenovo ThinkBook 16 G7+ AMD | |
| HP Envy x360 2-in-1 16-ad0097nr | |
| PCMark 10 / Essentials | |
| MSI Prestige 16 AI Evo B2HMG | |
| Dell XPS 16 Core Ultra X7 358H | |
| Gemiddeld Intel Core Ultra X7 358H, Intel Arc B390 12 Xe3 Panther Lake iGPU (10282 - 11263, n=7) | |
| MSI Prestige 16 AI C3MTG | |
| Lenovo ThinkBook 16 G7+ AMD | |
| HP Envy x360 2-in-1 16-ad0097nr | |
| Asus ZenBook S16 UM5606GA | |
| PCMark 10 / Productivity | |
| MSI Prestige 16 AI C3MTG | |
| Dell XPS 16 Core Ultra X7 358H | |
| Asus ZenBook S16 UM5606GA | |
| Gemiddeld Intel Core Ultra X7 358H, Intel Arc B390 12 Xe3 Panther Lake iGPU (13908 - 16780, n=7) | |
| Lenovo ThinkBook 16 G7+ AMD | |
| HP Envy x360 2-in-1 16-ad0097nr | |
| MSI Prestige 16 AI Evo B2HMG | |
| PCMark 10 / Digital Content Creation | |
| Dell XPS 16 Core Ultra X7 358H | |
| Gemiddeld Intel Core Ultra X7 358H, Intel Arc B390 12 Xe3 Panther Lake iGPU (13082 - 13893, n=7) | |
| MSI Prestige 16 AI C3MTG | |
| MSI Prestige 16 AI Evo B2HMG | |
| Lenovo ThinkBook 16 G7+ AMD | |
| Asus ZenBook S16 UM5606GA | |
| HP Envy x360 2-in-1 16-ad0097nr | |
| CrossMark / Overall | |
| MSI Prestige 16 AI Evo B2HMG | |
| Dell XPS 16 Core Ultra X7 358H | |
| MSI Prestige 16 AI C3MTG | |
| Gemiddeld Intel Core Ultra X7 358H, Intel Arc B390 12 Xe3 Panther Lake iGPU (1884 - 2119, n=8) | |
| Lenovo ThinkBook 16 G7+ AMD | |
| Asus ZenBook S16 UM5606GA | |
| HP Envy x360 2-in-1 16-ad0097nr | |
| CrossMark / Productivity | |
| MSI Prestige 16 AI Evo B2HMG | |
| Dell XPS 16 Core Ultra X7 358H | |
| MSI Prestige 16 AI C3MTG | |
| Gemiddeld Intel Core Ultra X7 358H, Intel Arc B390 12 Xe3 Panther Lake iGPU (1678 - 1928, n=8) | |
| Asus ZenBook S16 UM5606GA | |
| HP Envy x360 2-in-1 16-ad0097nr | |
| Lenovo ThinkBook 16 G7+ AMD | |
| CrossMark / Creativity | |
| Dell XPS 16 Core Ultra X7 358H | |
| MSI Prestige 16 AI C3MTG | |
| Gemiddeld Intel Core Ultra X7 358H, Intel Arc B390 12 Xe3 Panther Lake iGPU (2241 - 2529, n=8) | |
| MSI Prestige 16 AI Evo B2HMG | |
| Lenovo ThinkBook 16 G7+ AMD | |
| Asus ZenBook S16 UM5606GA | |
| HP Envy x360 2-in-1 16-ad0097nr | |
| CrossMark / Responsiveness | |
| MSI Prestige 16 AI Evo B2HMG | |
| Dell XPS 16 Core Ultra X7 358H | |
| Gemiddeld Intel Core Ultra X7 358H, Intel Arc B390 12 Xe3 Panther Lake iGPU (1560 - 1837, n=8) | |
| MSI Prestige 16 AI C3MTG | |
| HP Envy x360 2-in-1 16-ad0097nr | |
| Lenovo ThinkBook 16 G7+ AMD | |
| Asus ZenBook S16 UM5606GA | |
| WebXPRT 3 / Overall | |
| MSI Prestige 16 AI Evo B2HMG | |
| MSI Prestige 16 AI C3MTG | |
| Gemiddeld Intel Core Ultra X7 358H, Intel Arc B390 12 Xe3 Panther Lake iGPU (293 - 338, n=8) | |
| Lenovo ThinkBook 16 G7+ AMD | |
| Dell XPS 16 Core Ultra X7 358H | |
| HP Envy x360 2-in-1 16-ad0097nr | |
| Asus ZenBook S16 UM5606GA | |
| WebXPRT 4 / Overall | |
| MSI Prestige 16 AI Evo B2HMG | |
| MSI Prestige 16 AI C3MTG | |
| Dell XPS 16 Core Ultra X7 358H | |
| Gemiddeld Intel Core Ultra X7 358H, Intel Arc B390 12 Xe3 Panther Lake iGPU (278 - 305, n=7) | |
| Lenovo ThinkBook 16 G7+ AMD | |
| HP Envy x360 2-in-1 16-ad0097nr | |
| Asus ZenBook S16 UM5606GA | |
| Mozilla Kraken 1.1 / Total | |
| HP Envy x360 2-in-1 16-ad0097nr | |
| Asus ZenBook S16 UM5606GA | |
| MSI Prestige 16 AI C3MTG | |
| Gemiddeld Intel Core Ultra X7 358H, Intel Arc B390 12 Xe3 Panther Lake iGPU (445 - 460, n=8) | |
| Dell XPS 16 Core Ultra X7 358H | |
| Lenovo ThinkBook 16 G7+ AMD | |
| MSI Prestige 16 AI Evo B2HMG | |
| Geekbench AI / Quantized GPU 1.7 | |
| Dell XPS 16 Core Ultra X7 358H | |
| MSI Prestige 16 AI C3MTG | |
| Gemiddeld Intel Core Ultra X7 358H, Intel Arc B390 12 Xe3 Panther Lake iGPU (6908 - 8011, n=6) | |
| Geekbench AI / Half Precision GPU 1.7 | |
| MSI Prestige 16 AI C3MTG | |
| Dell XPS 16 Core Ultra X7 358H | |
| Gemiddeld Intel Core Ultra X7 358H, Intel Arc B390 12 Xe3 Panther Lake iGPU (16188 - 21963, n=6) | |
| Geekbench AI / Single Precision GPU 1.7 | |
| MSI Prestige 16 AI C3MTG | |
| Dell XPS 16 Core Ultra X7 358H | |
| Gemiddeld Intel Core Ultra X7 358H, Intel Arc B390 12 Xe3 Panther Lake iGPU (9783 - 12255, n=6) | |
* ... kleiner is beter
| PCMark 10 Score | 9551 punten | |
Help | ||
| AIDA64 / Memory Copy | |
| Dell XPS 16 Core Ultra X7 358H | |
| MSI Prestige 16 AI C3MTG | |
| Gemiddeld Intel Core Ultra X7 358H (102745 - 132135, n=7) | |
| MSI Prestige 16 AI Evo B2HMG | |
| Asus ZenBook S16 UM5606GA | |
| Lenovo ThinkBook 16 G7+ AMD | |
| HP Envy x360 2-in-1 16-ad0097nr | |
| AIDA64 / Memory Read | |
| Dell XPS 16 Core Ultra X7 358H | |
| Gemiddeld Intel Core Ultra X7 358H (97755 - 118888, n=8) | |
| MSI Prestige 16 AI C3MTG | |
| Asus ZenBook S16 UM5606GA | |
| Lenovo ThinkBook 16 G7+ AMD | |
| MSI Prestige 16 AI Evo B2HMG | |
| HP Envy x360 2-in-1 16-ad0097nr | |
| AIDA64 / Memory Write | |
| Dell XPS 16 Core Ultra X7 358H | |
| Gemiddeld Intel Core Ultra X7 358H (105984 - 134998, n=8) | |
| MSI Prestige 16 AI C3MTG | |
| Asus ZenBook S16 UM5606GA | |
| Lenovo ThinkBook 16 G7+ AMD | |
| HP Envy x360 2-in-1 16-ad0097nr | |
| MSI Prestige 16 AI Evo B2HMG | |
| AIDA64 / Memory Latency | |
| MSI Prestige 16 AI Evo B2HMG | |
| HP Envy x360 2-in-1 16-ad0097nr | |
| Lenovo ThinkBook 16 G7+ AMD | |
| Asus ZenBook S16 UM5606GA | |
| MSI Prestige 16 AI C3MTG | |
| Dell XPS 16 Core Ultra X7 358H | |
| Gemiddeld Intel Core Ultra X7 358H (84.6 - 101.9, n=8) | |
* ... kleiner is beter
DPC latentie
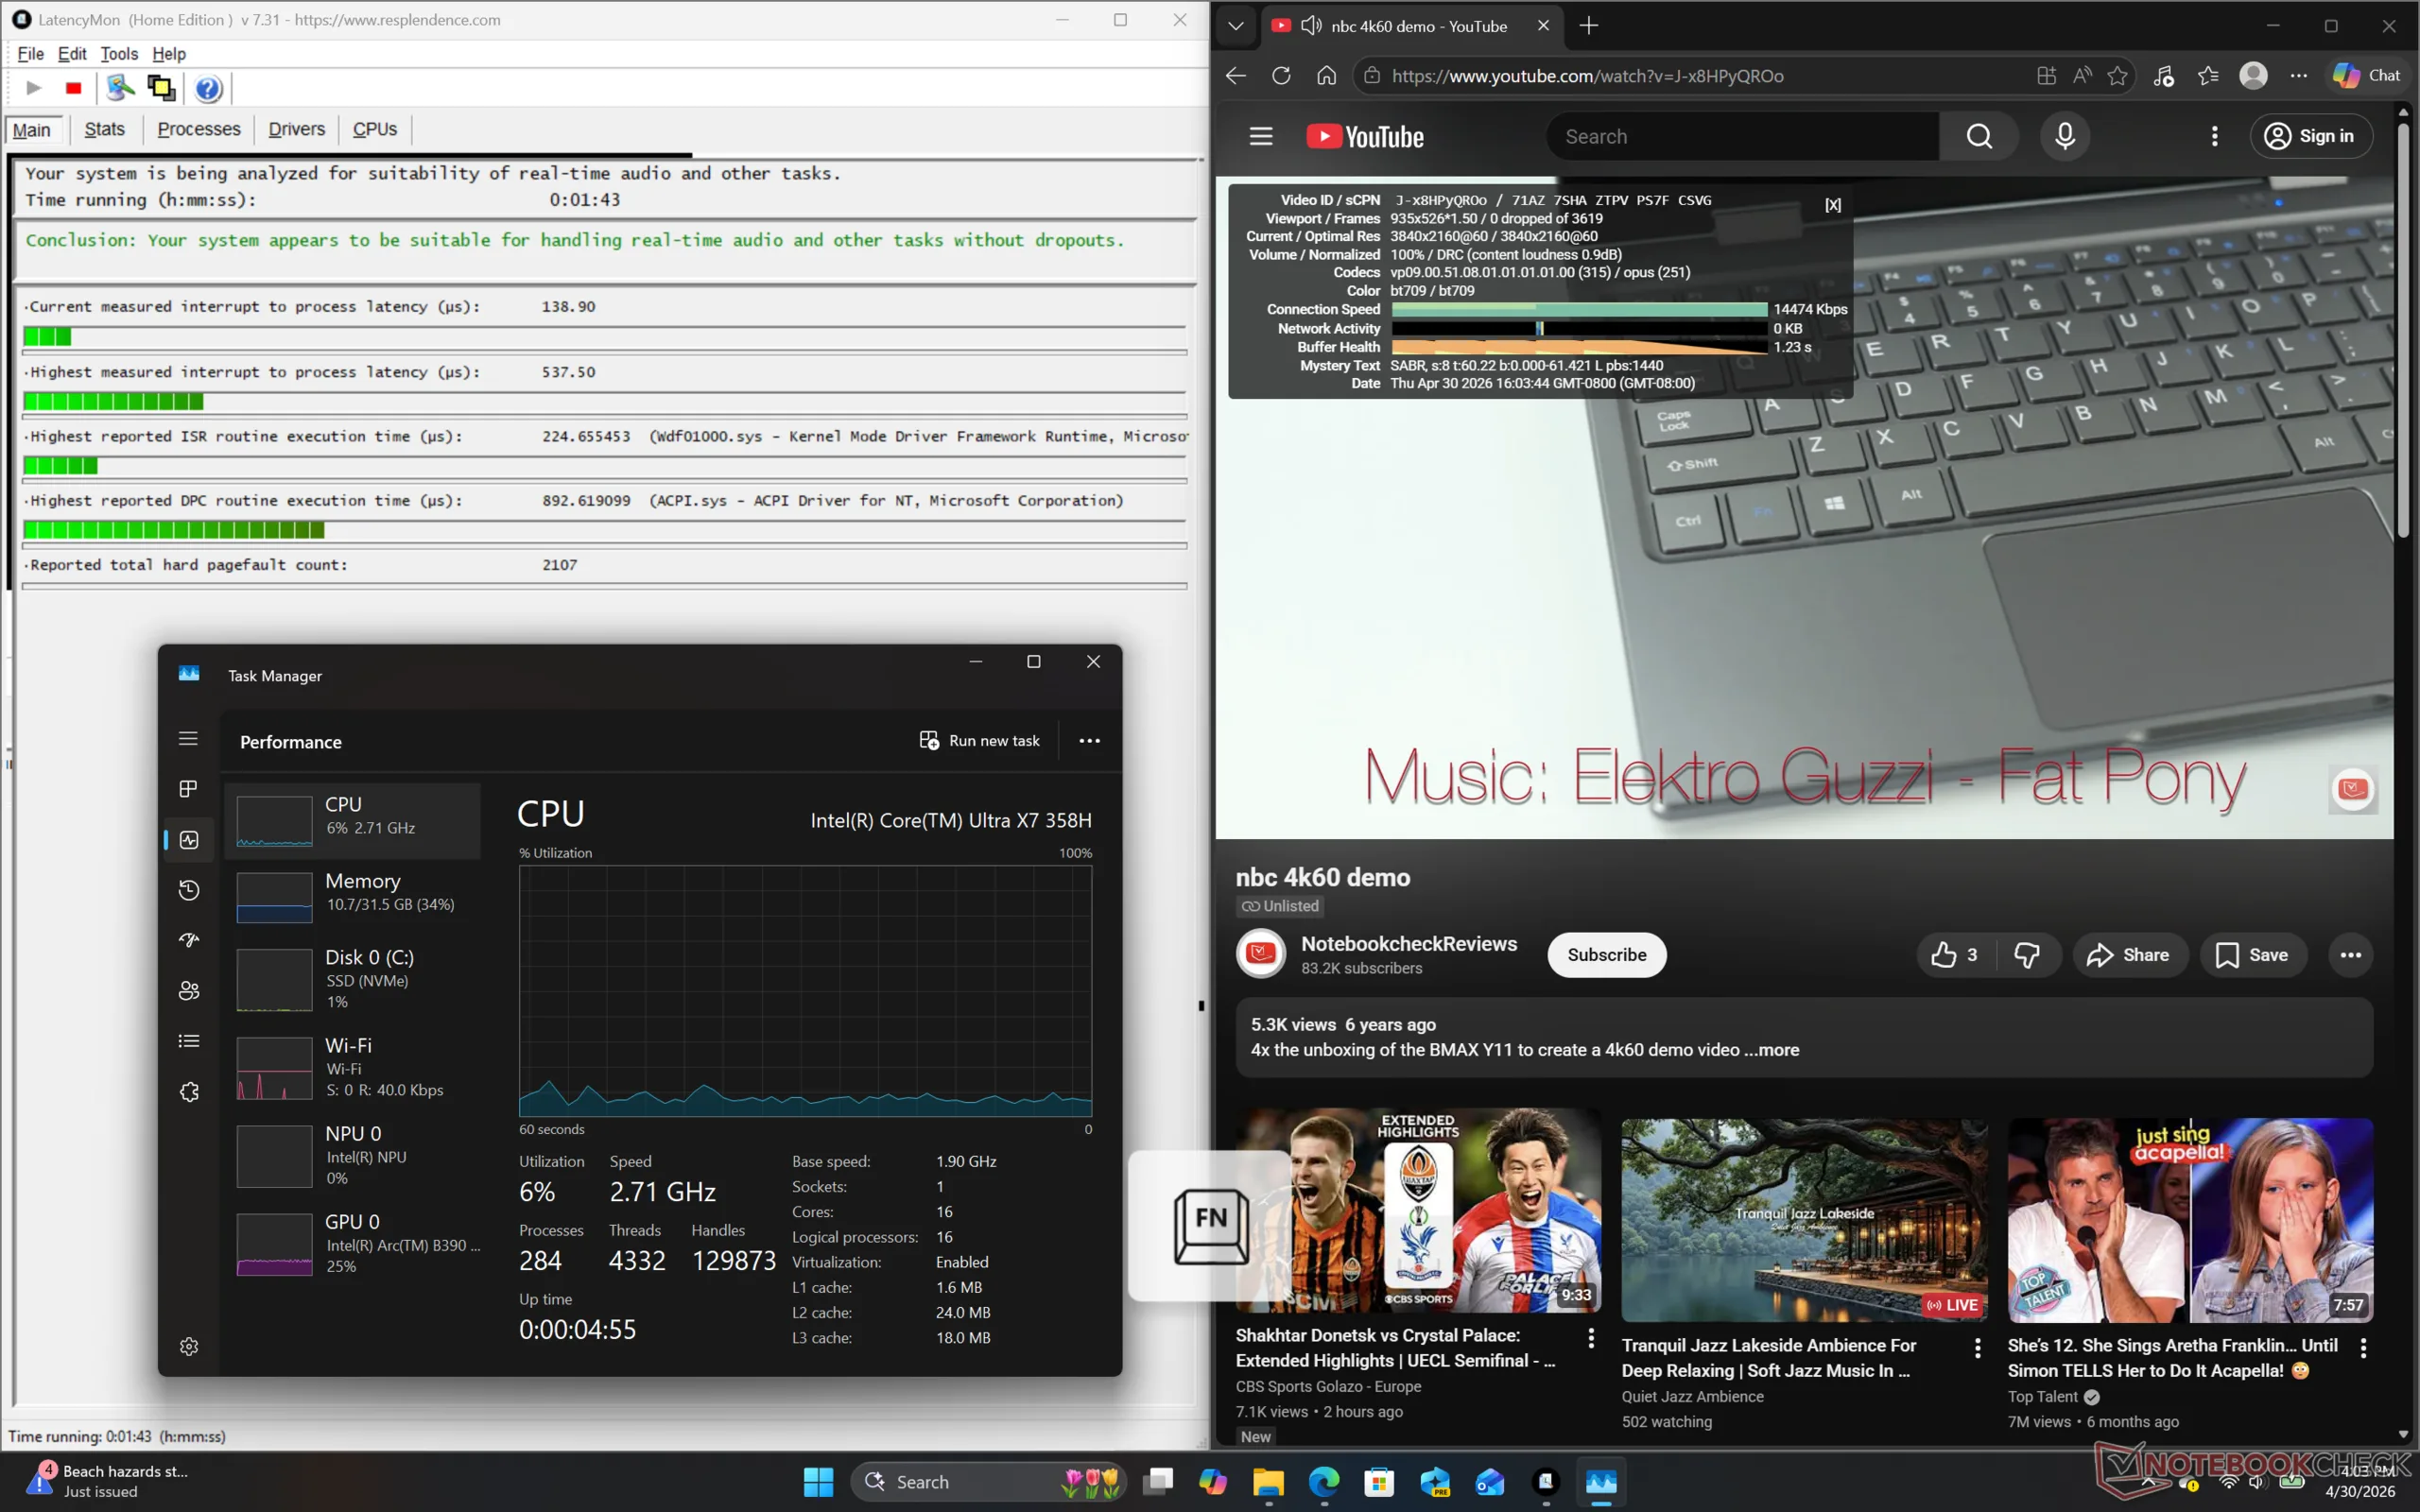
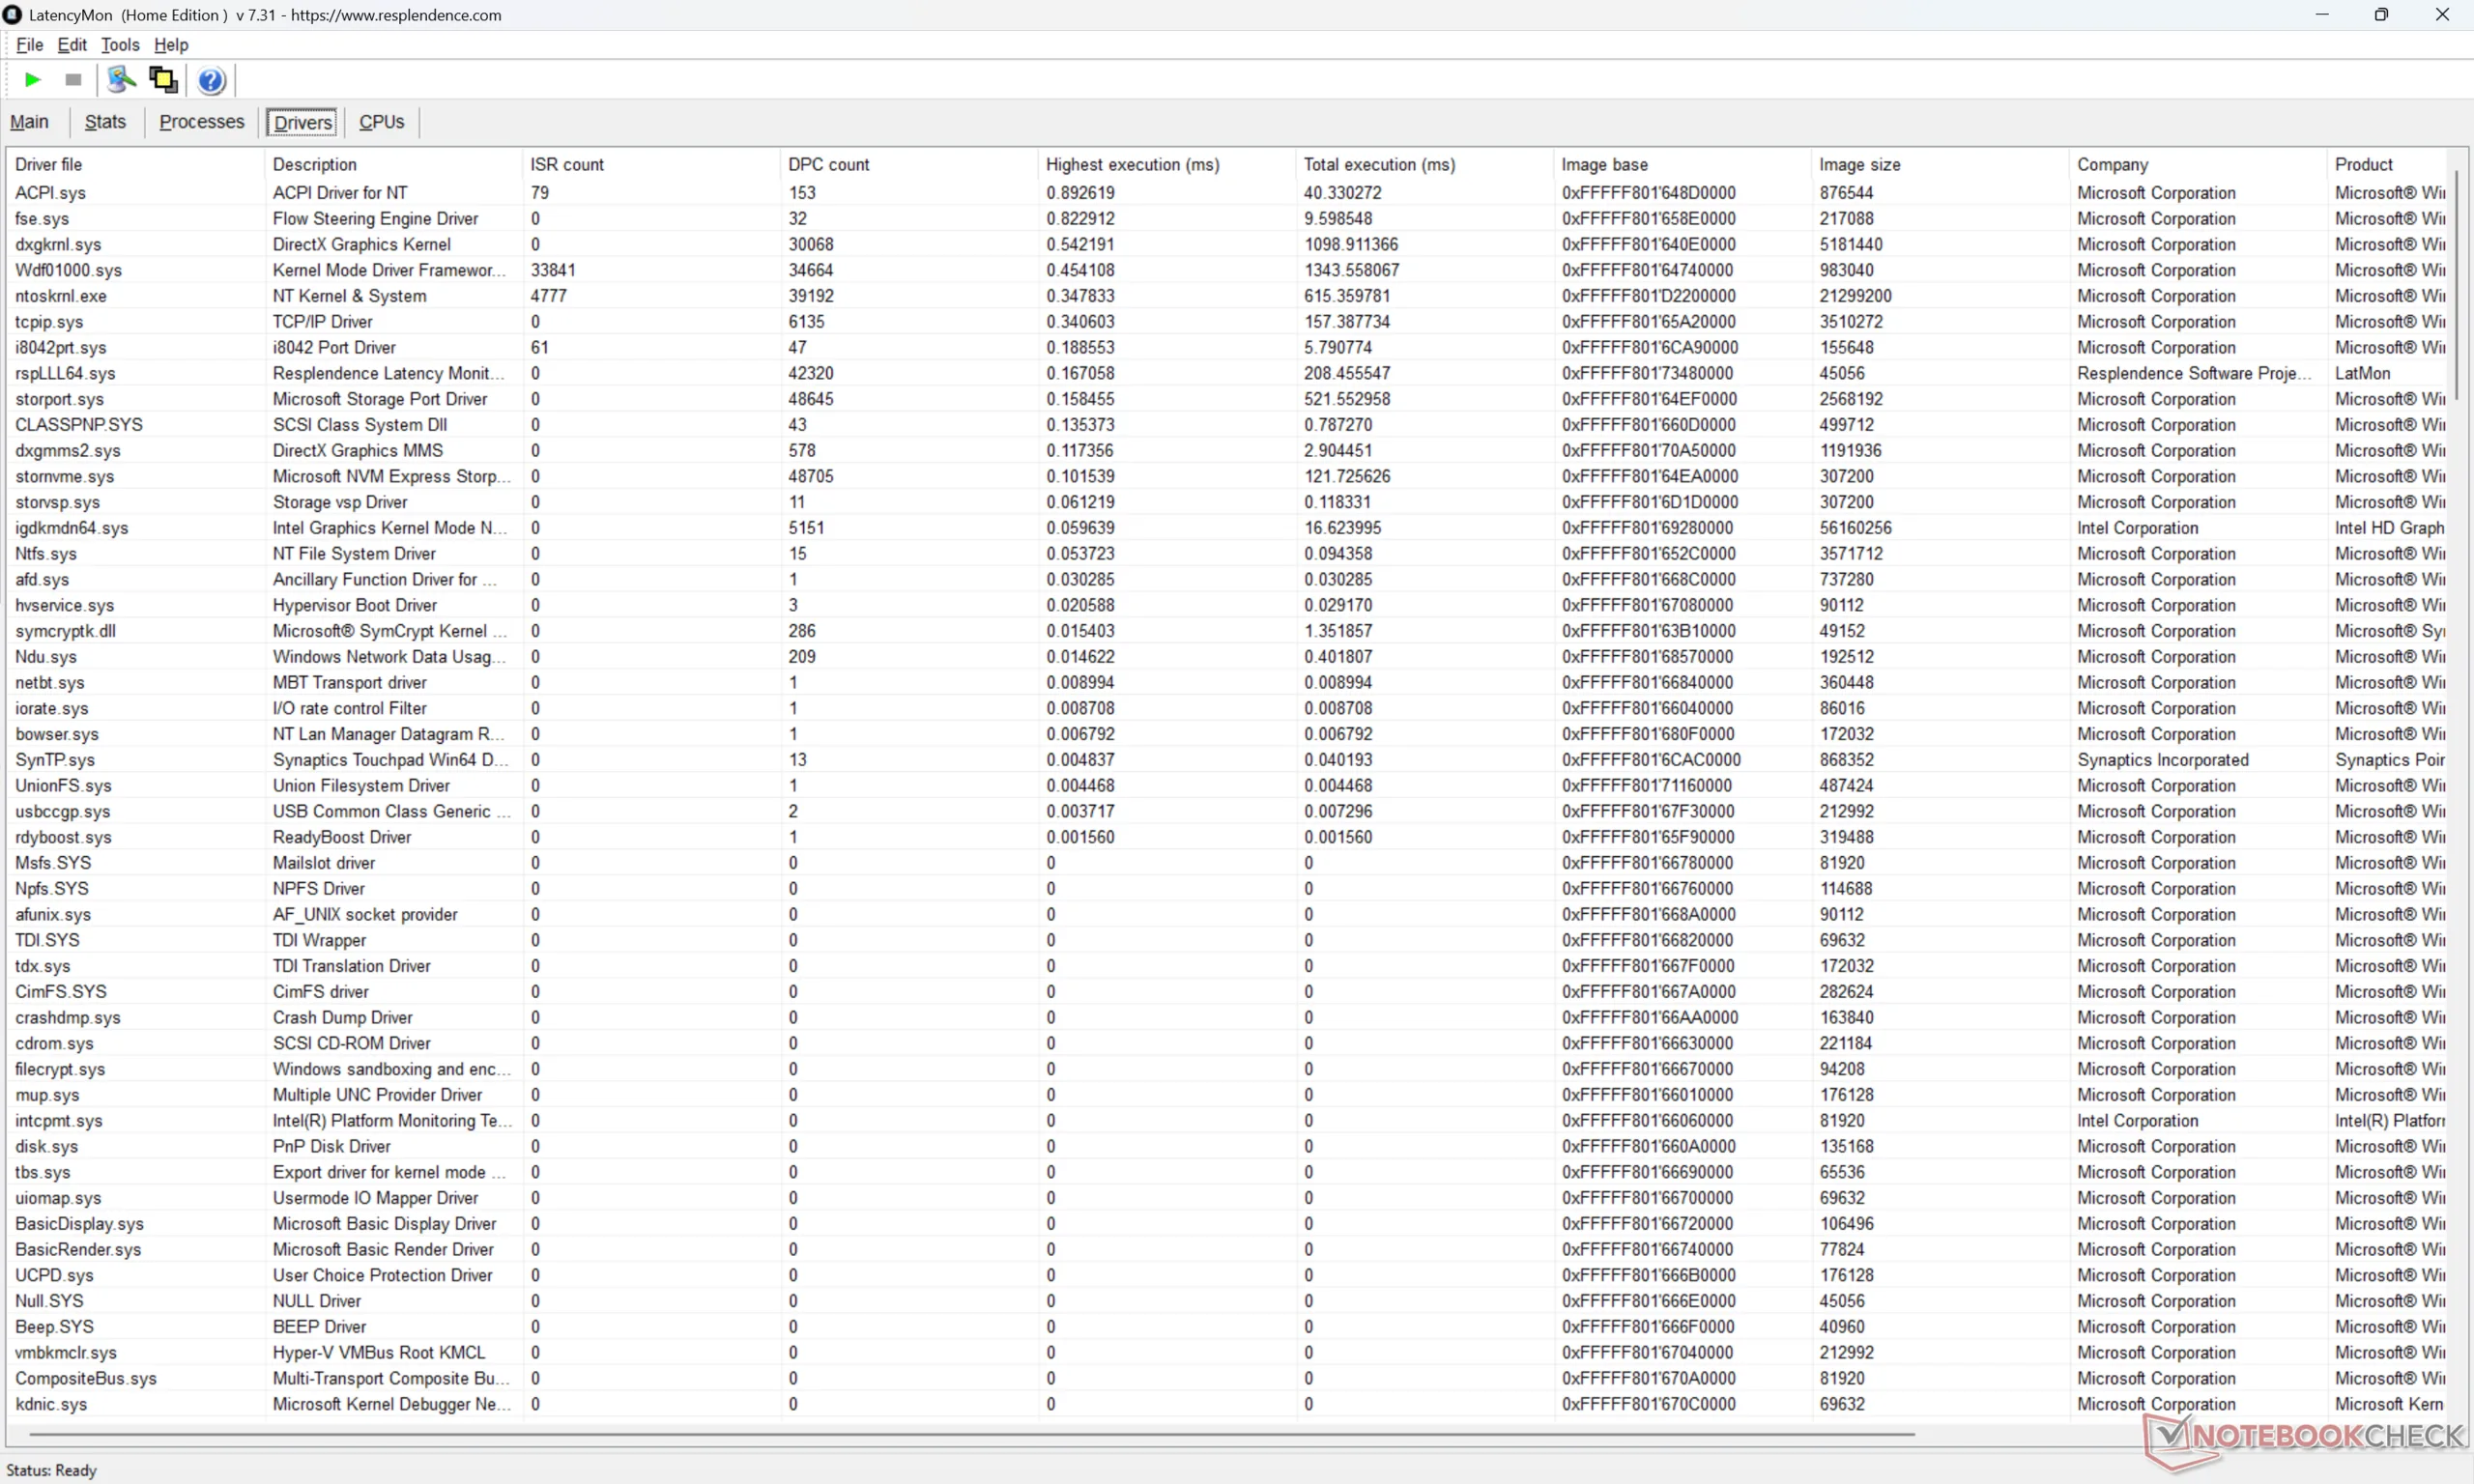
| DPC Latencies / LatencyMon - interrupt to process latency (max), Web, Youtube, Prime95 | |
| MSI Prestige 16 AI Evo B2HMG | |
| HP Envy x360 2-in-1 16-ad0097nr | |
| Lenovo ThinkBook 16 G7+ AMD | |
| Asus ZenBook S16 UM5606GA | |
| MSI Prestige 16 AI C3MTG | |
| Dell XPS 16 Core Ultra X7 358H | |
* ... kleiner is beter
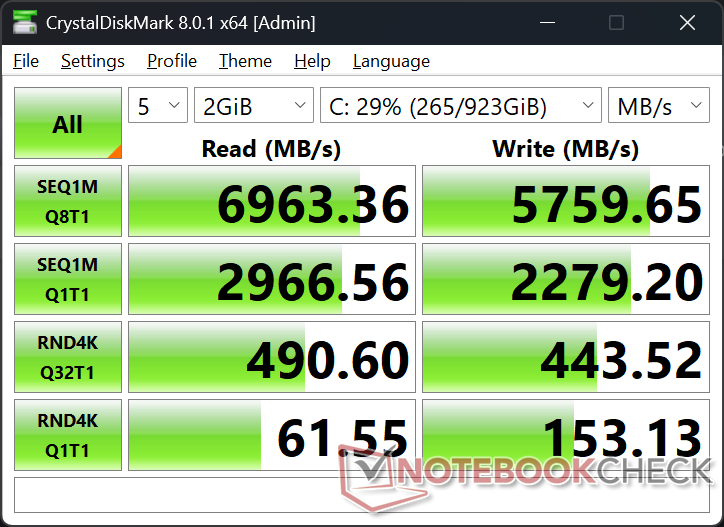
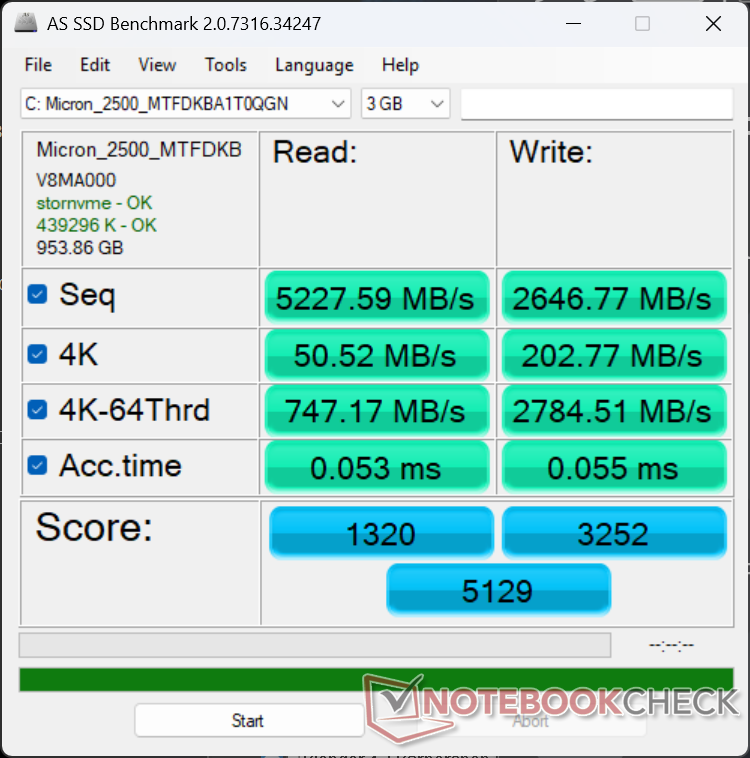
Opslagapparaten
Onze testunit wordt geleverd met dezelfde 1 TB Micron 2500 PCIe4 x4 NVMe SSD als het model van vorig jaar voor vergelijkbare prestatieniveaus en geen noemenswaardig throttling gedrag. Er is geen ondersteuning meer voor secundaire M.2 SSD's, wat een trend lijkt te zijn bij nieuwere 16-inch laptops zoals de XPS 16 of Asus Zenbook S16.

* ... kleiner is beter
Schijf onderdrukken: DiskSpd Leeslus, wachtrijdiepte 8
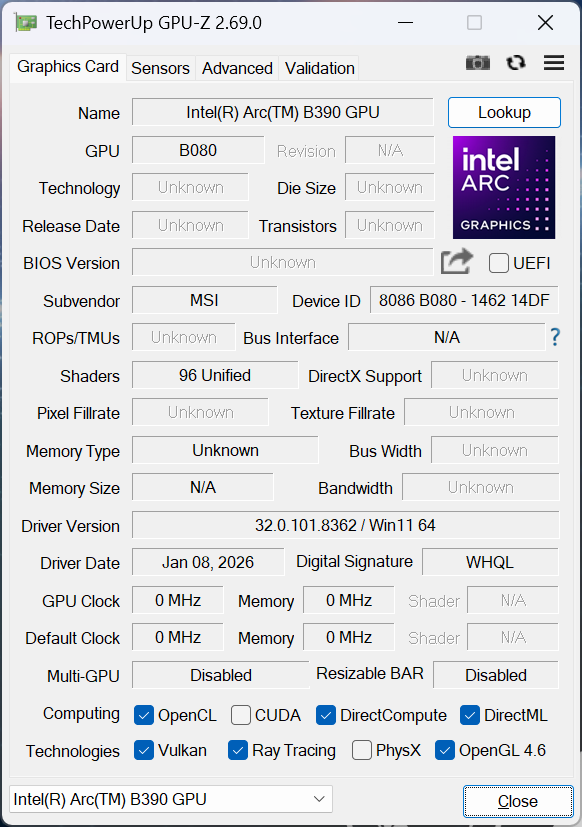
GPU-prestaties
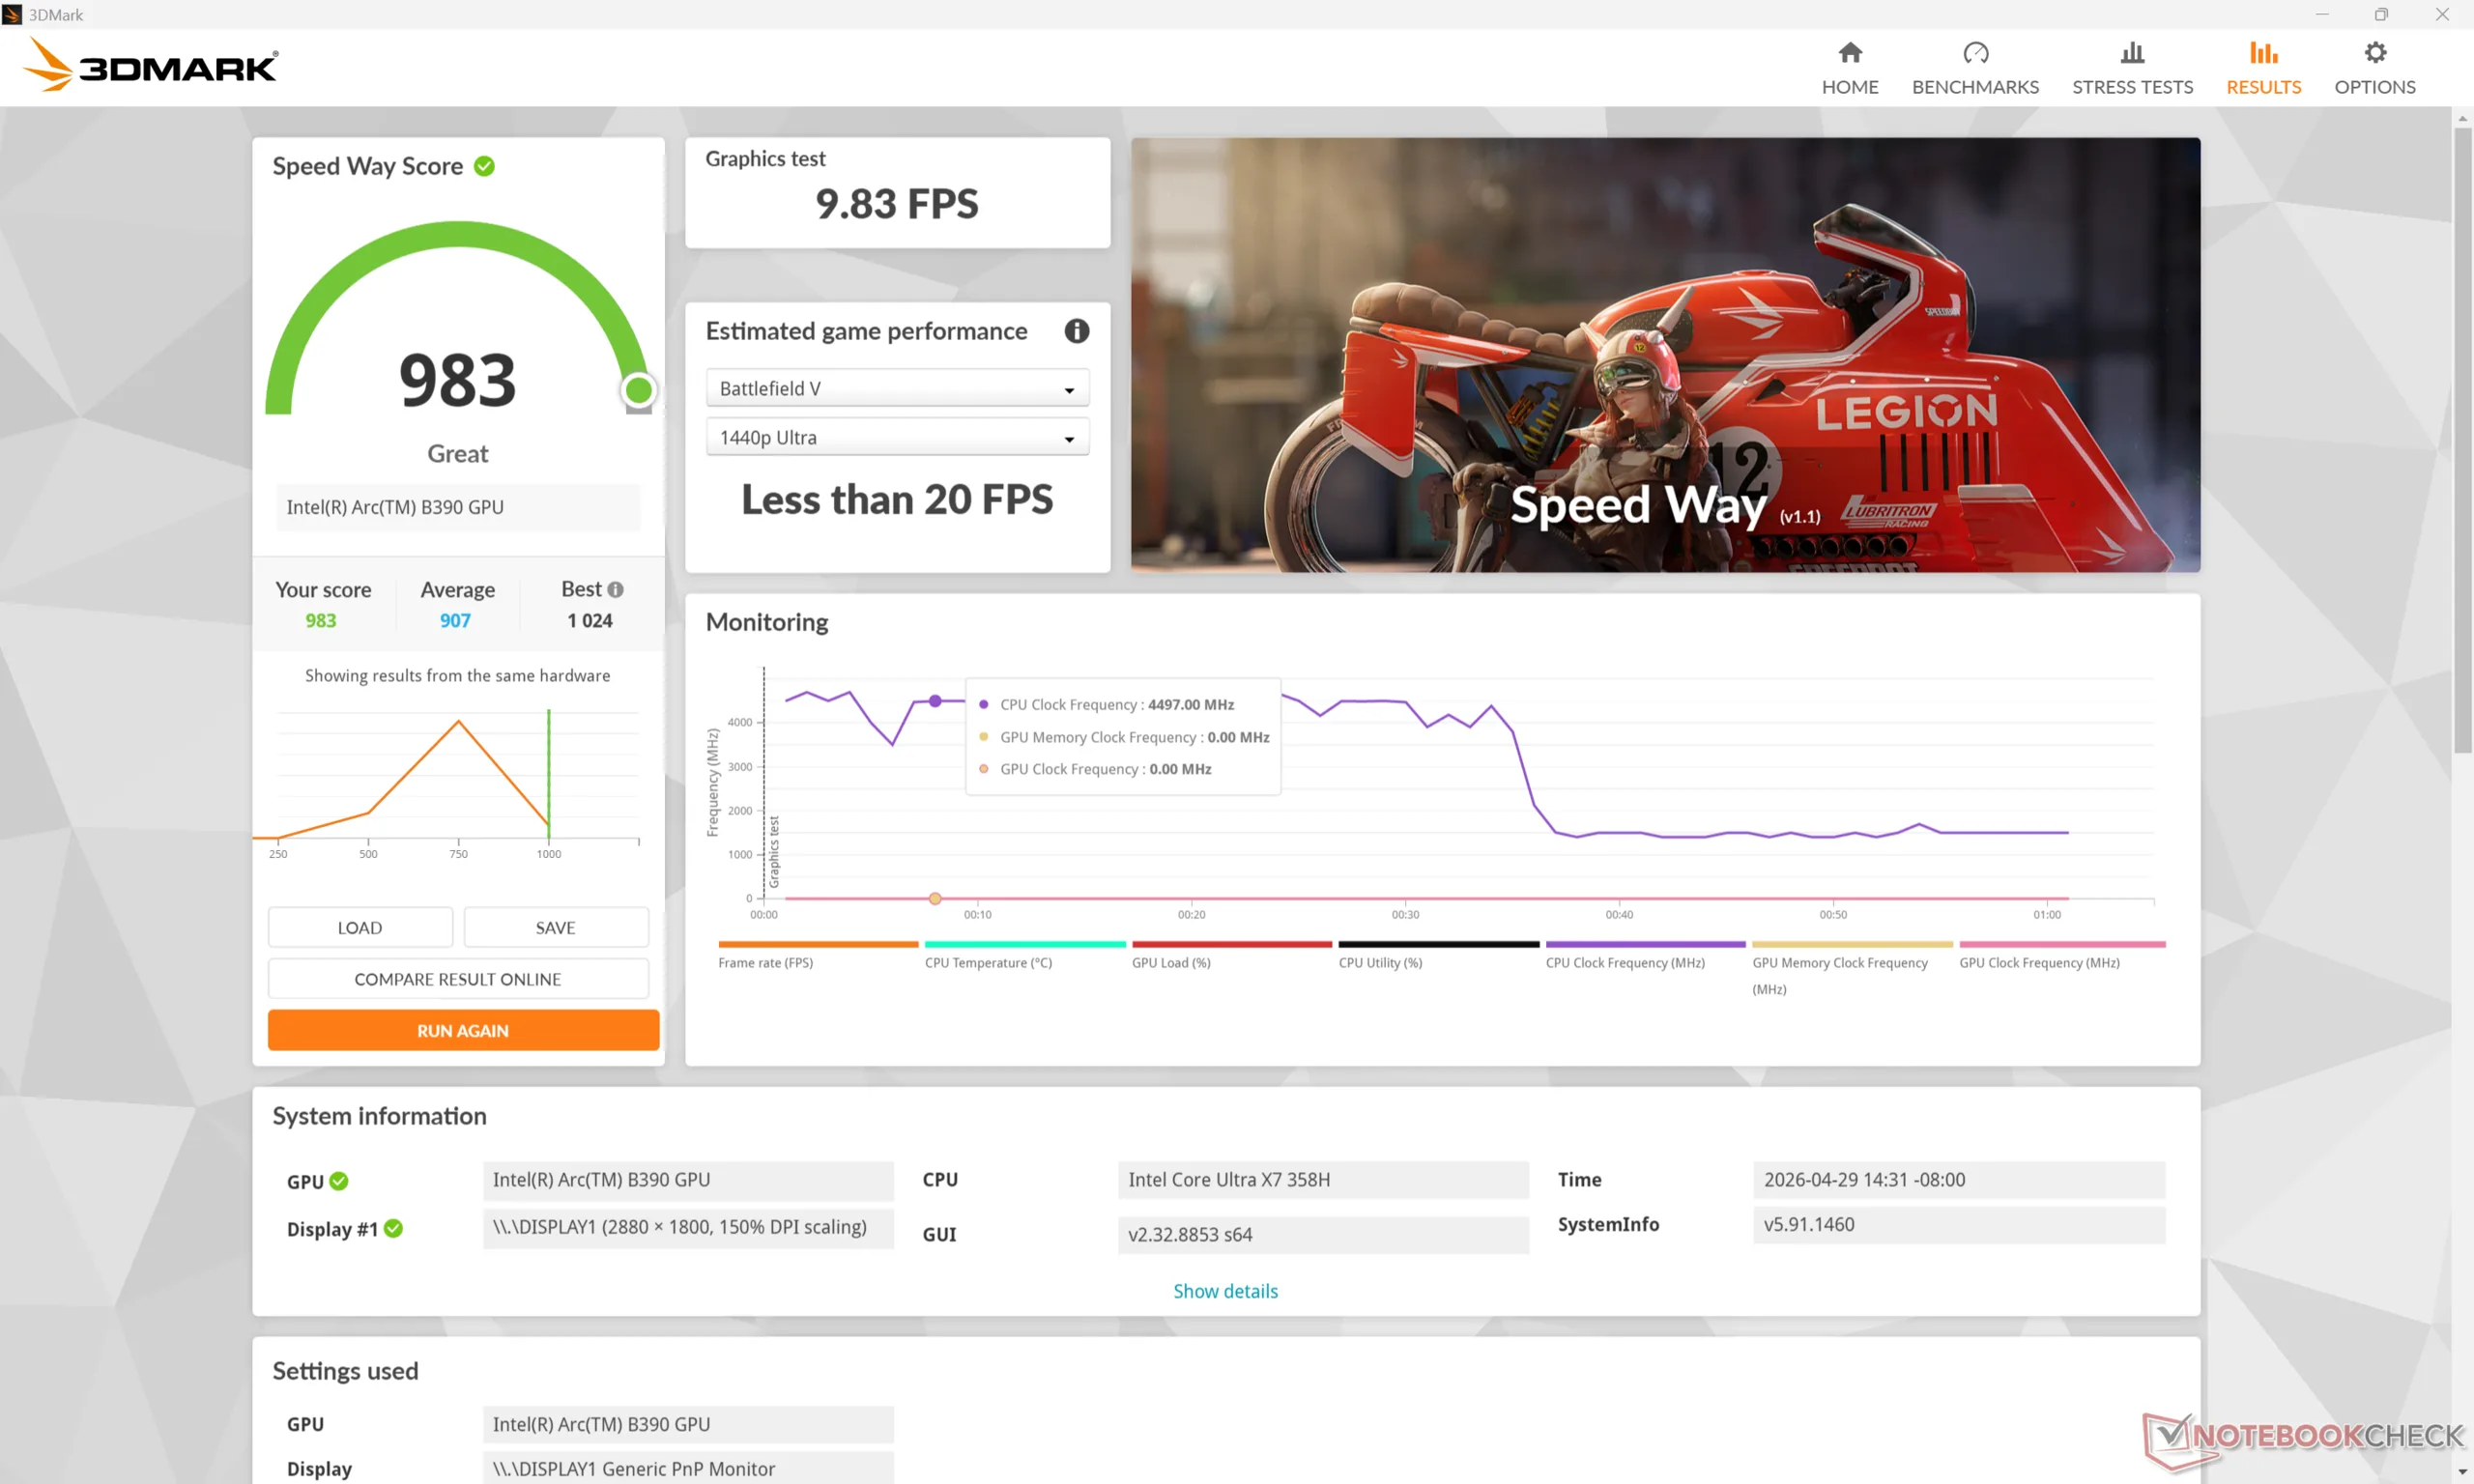
De grafische prestaties zijn waar we ze verwachten in vergelijking met andere pc's met dezelfde Arc B390 GPU, zo niet iets langzamer met een paar procentpunten. De Arc B390 is aanzienlijk sneller dan de Arc 140T op de Prestige 16 van vorig jaar met wel 50 tot 80 procent en het is een van de grootste redenen om te upgraden naar Panther Lake.
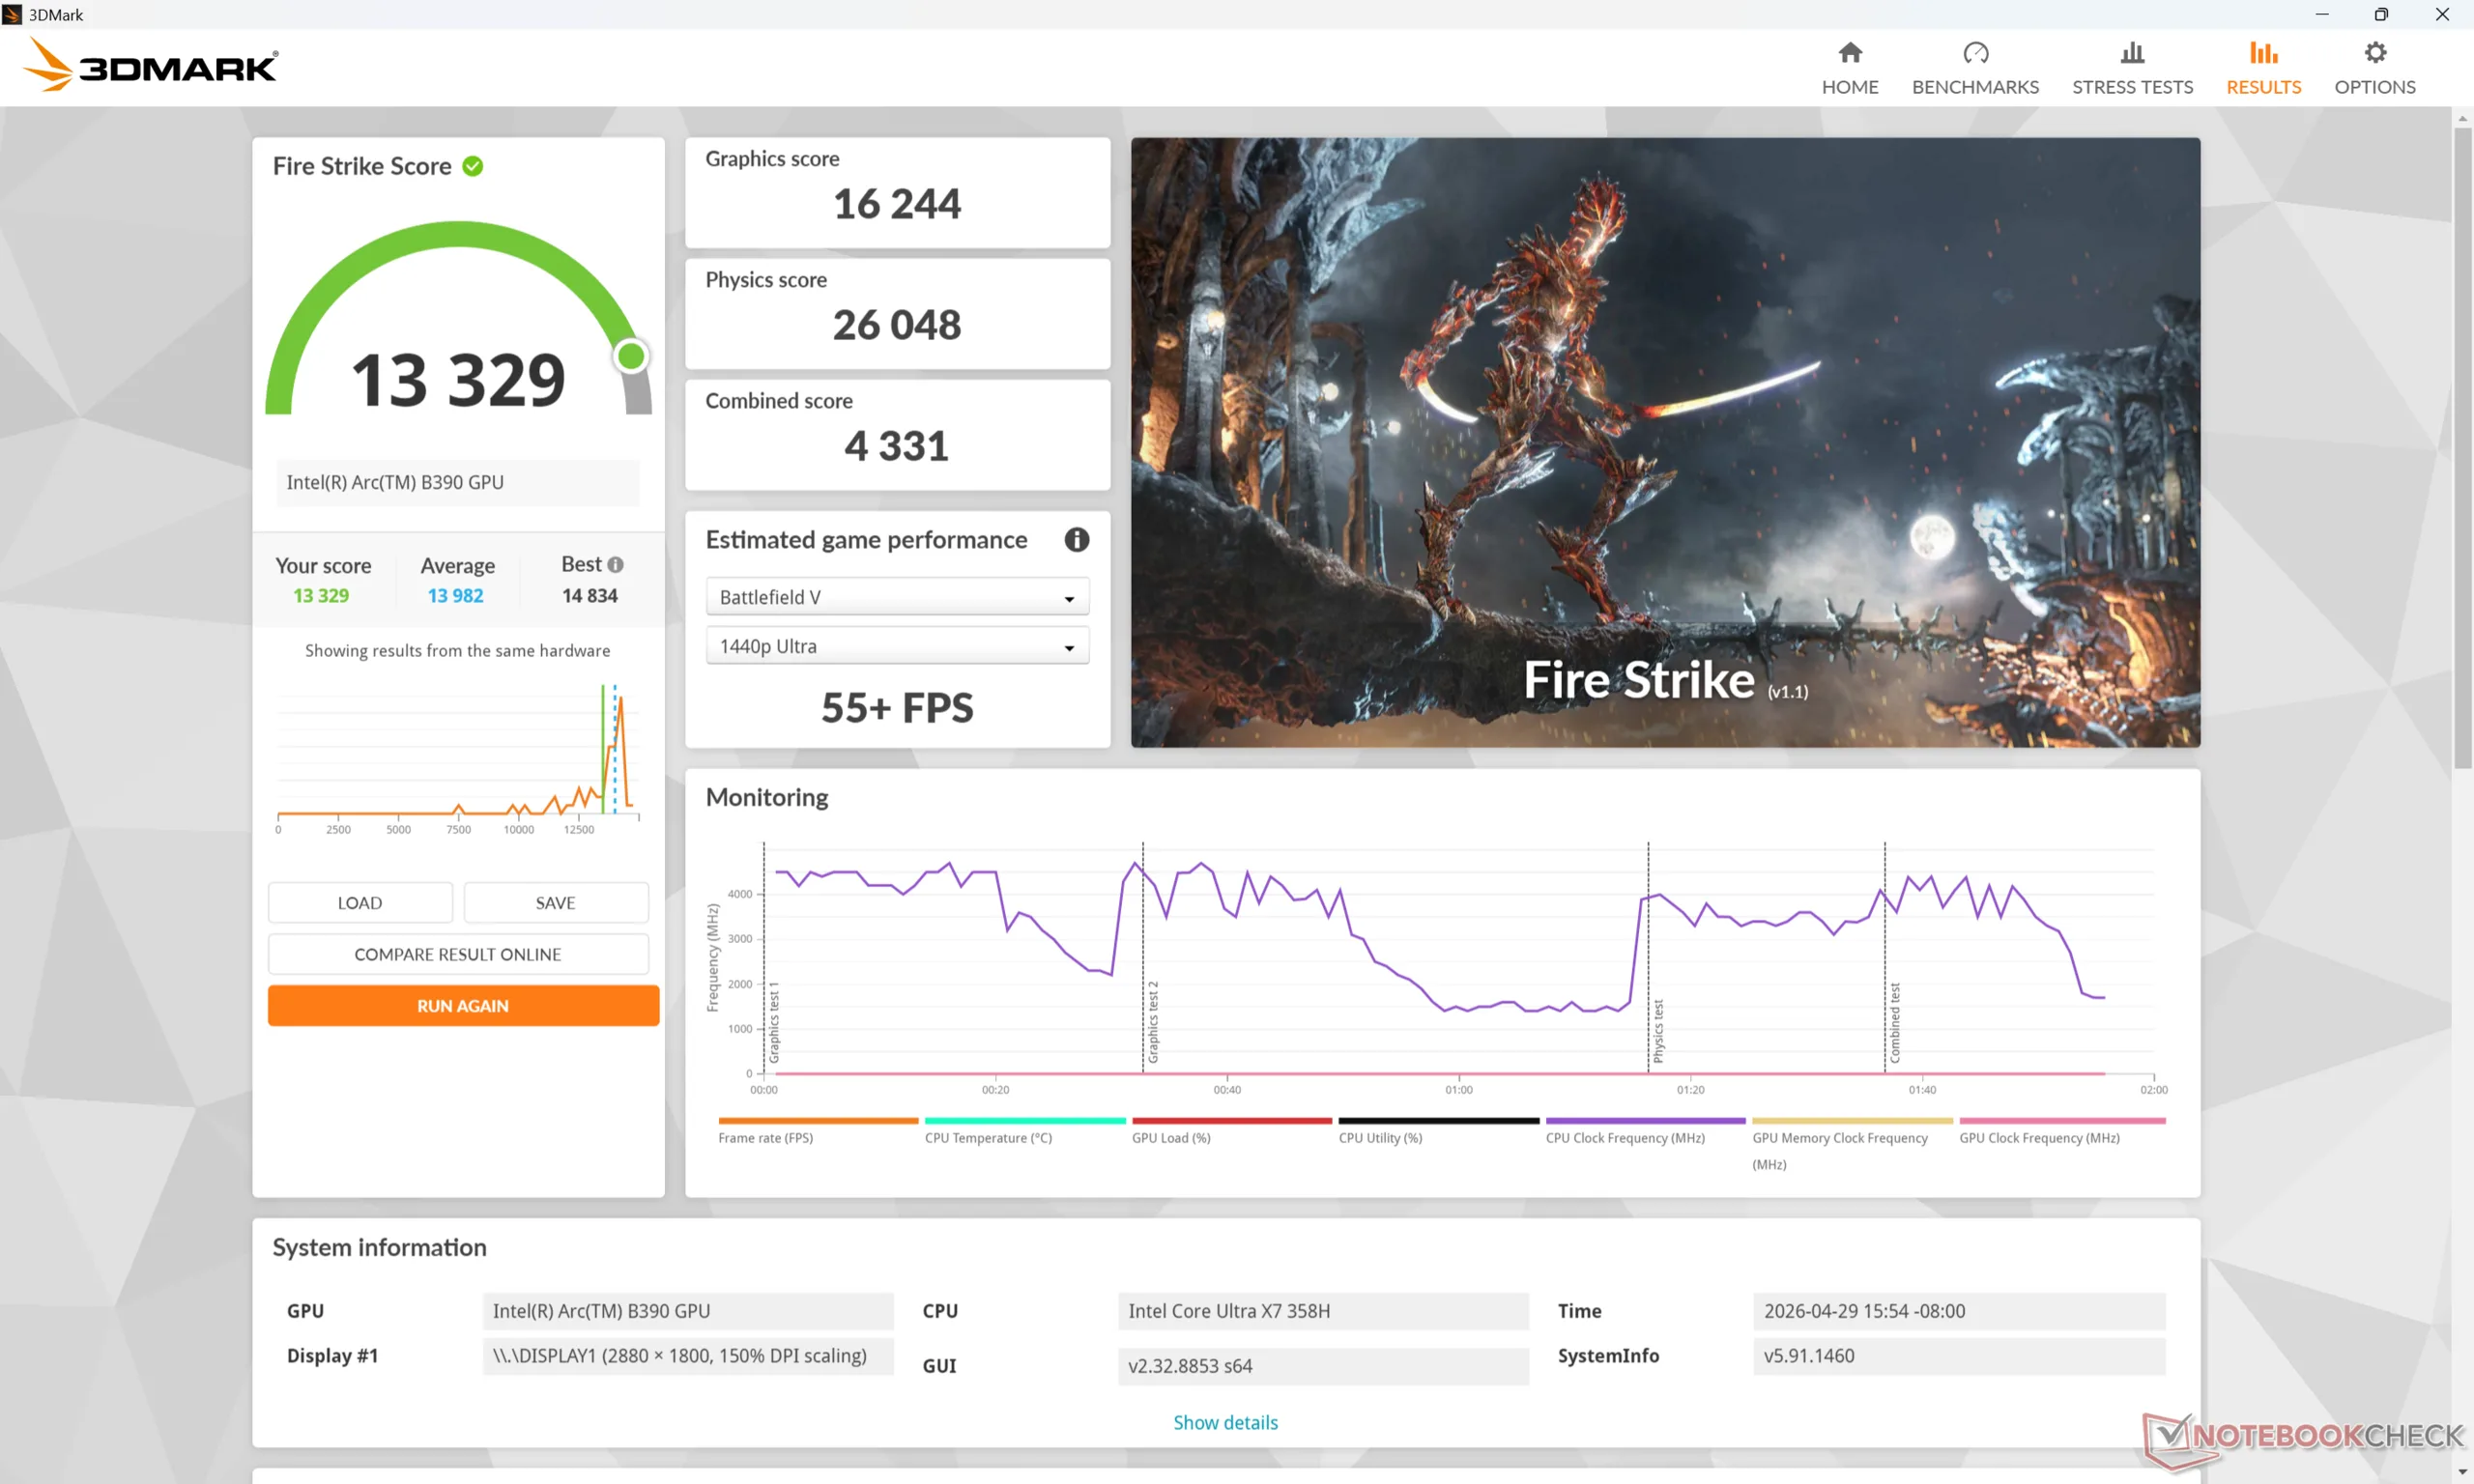
Het draaien in de Balanced-modus in plaats van de Performance-modus zou de prestaties sterker beïnvloeden dan verwacht, tot wel 25 procent, zoals blijkt uit onze onderstaande tabel met Fire Strike resultaten. Dit zou vervolgens invloed hebben op het ventilatorgeluid en de gamingprestaties, zoals onze secties hieronder zullen laten zien.
| Vermogen Profiel | Grafische Score | Fysica Score | Gecombineerde Score |
| Prestatiemodus | 16244 | 26048 | 4331 |
| Evenwichtige modus | 15684 (-3%) | 19912 (-24%) | 4476 (-0%) |
| Batterijvoeding | 16481 (-0%) | 20729 (-20%) | 4794 (-0%) |
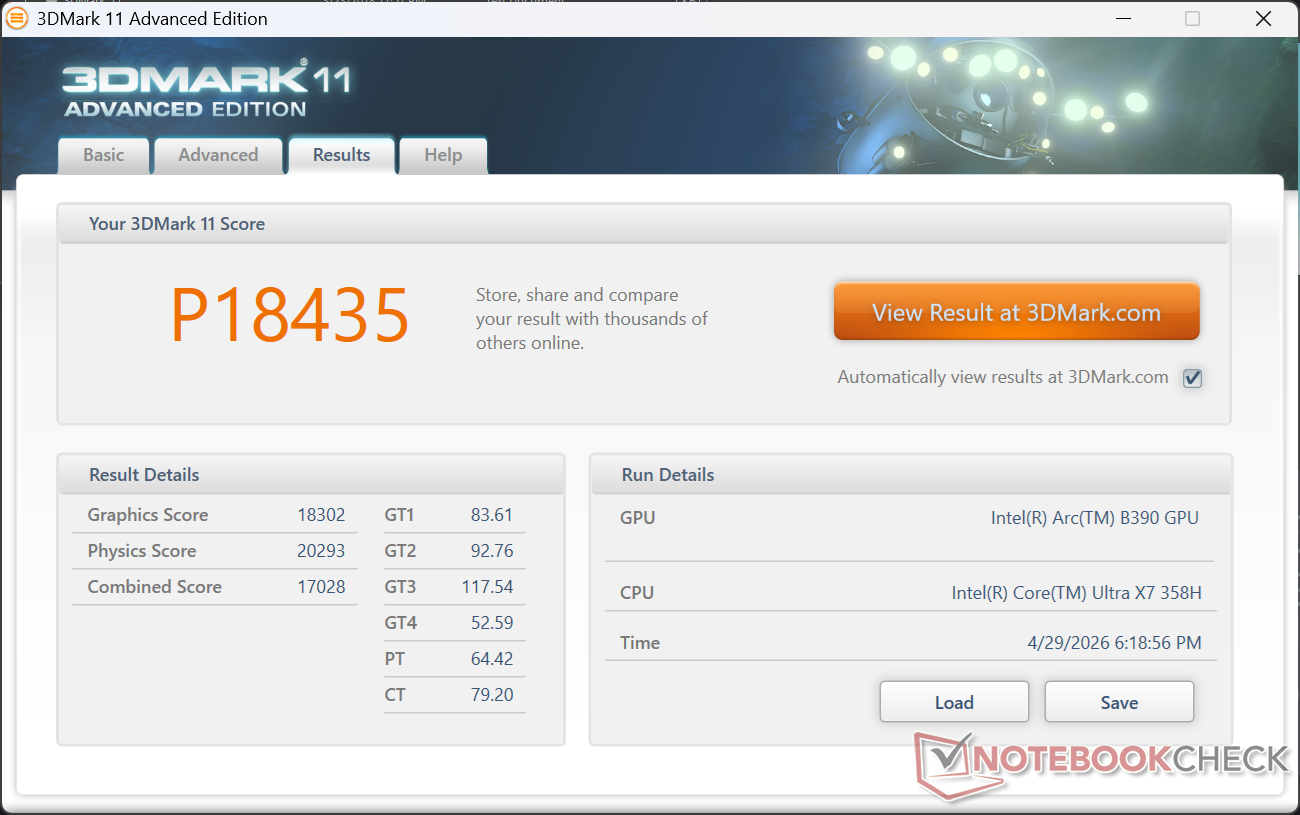
| 3DMark 11 Performance | 18435 punten | |
| 3DMark Cloud Gate Standard Score | 35193 punten | |
| 3DMark Fire Strike Score | 13329 punten | |
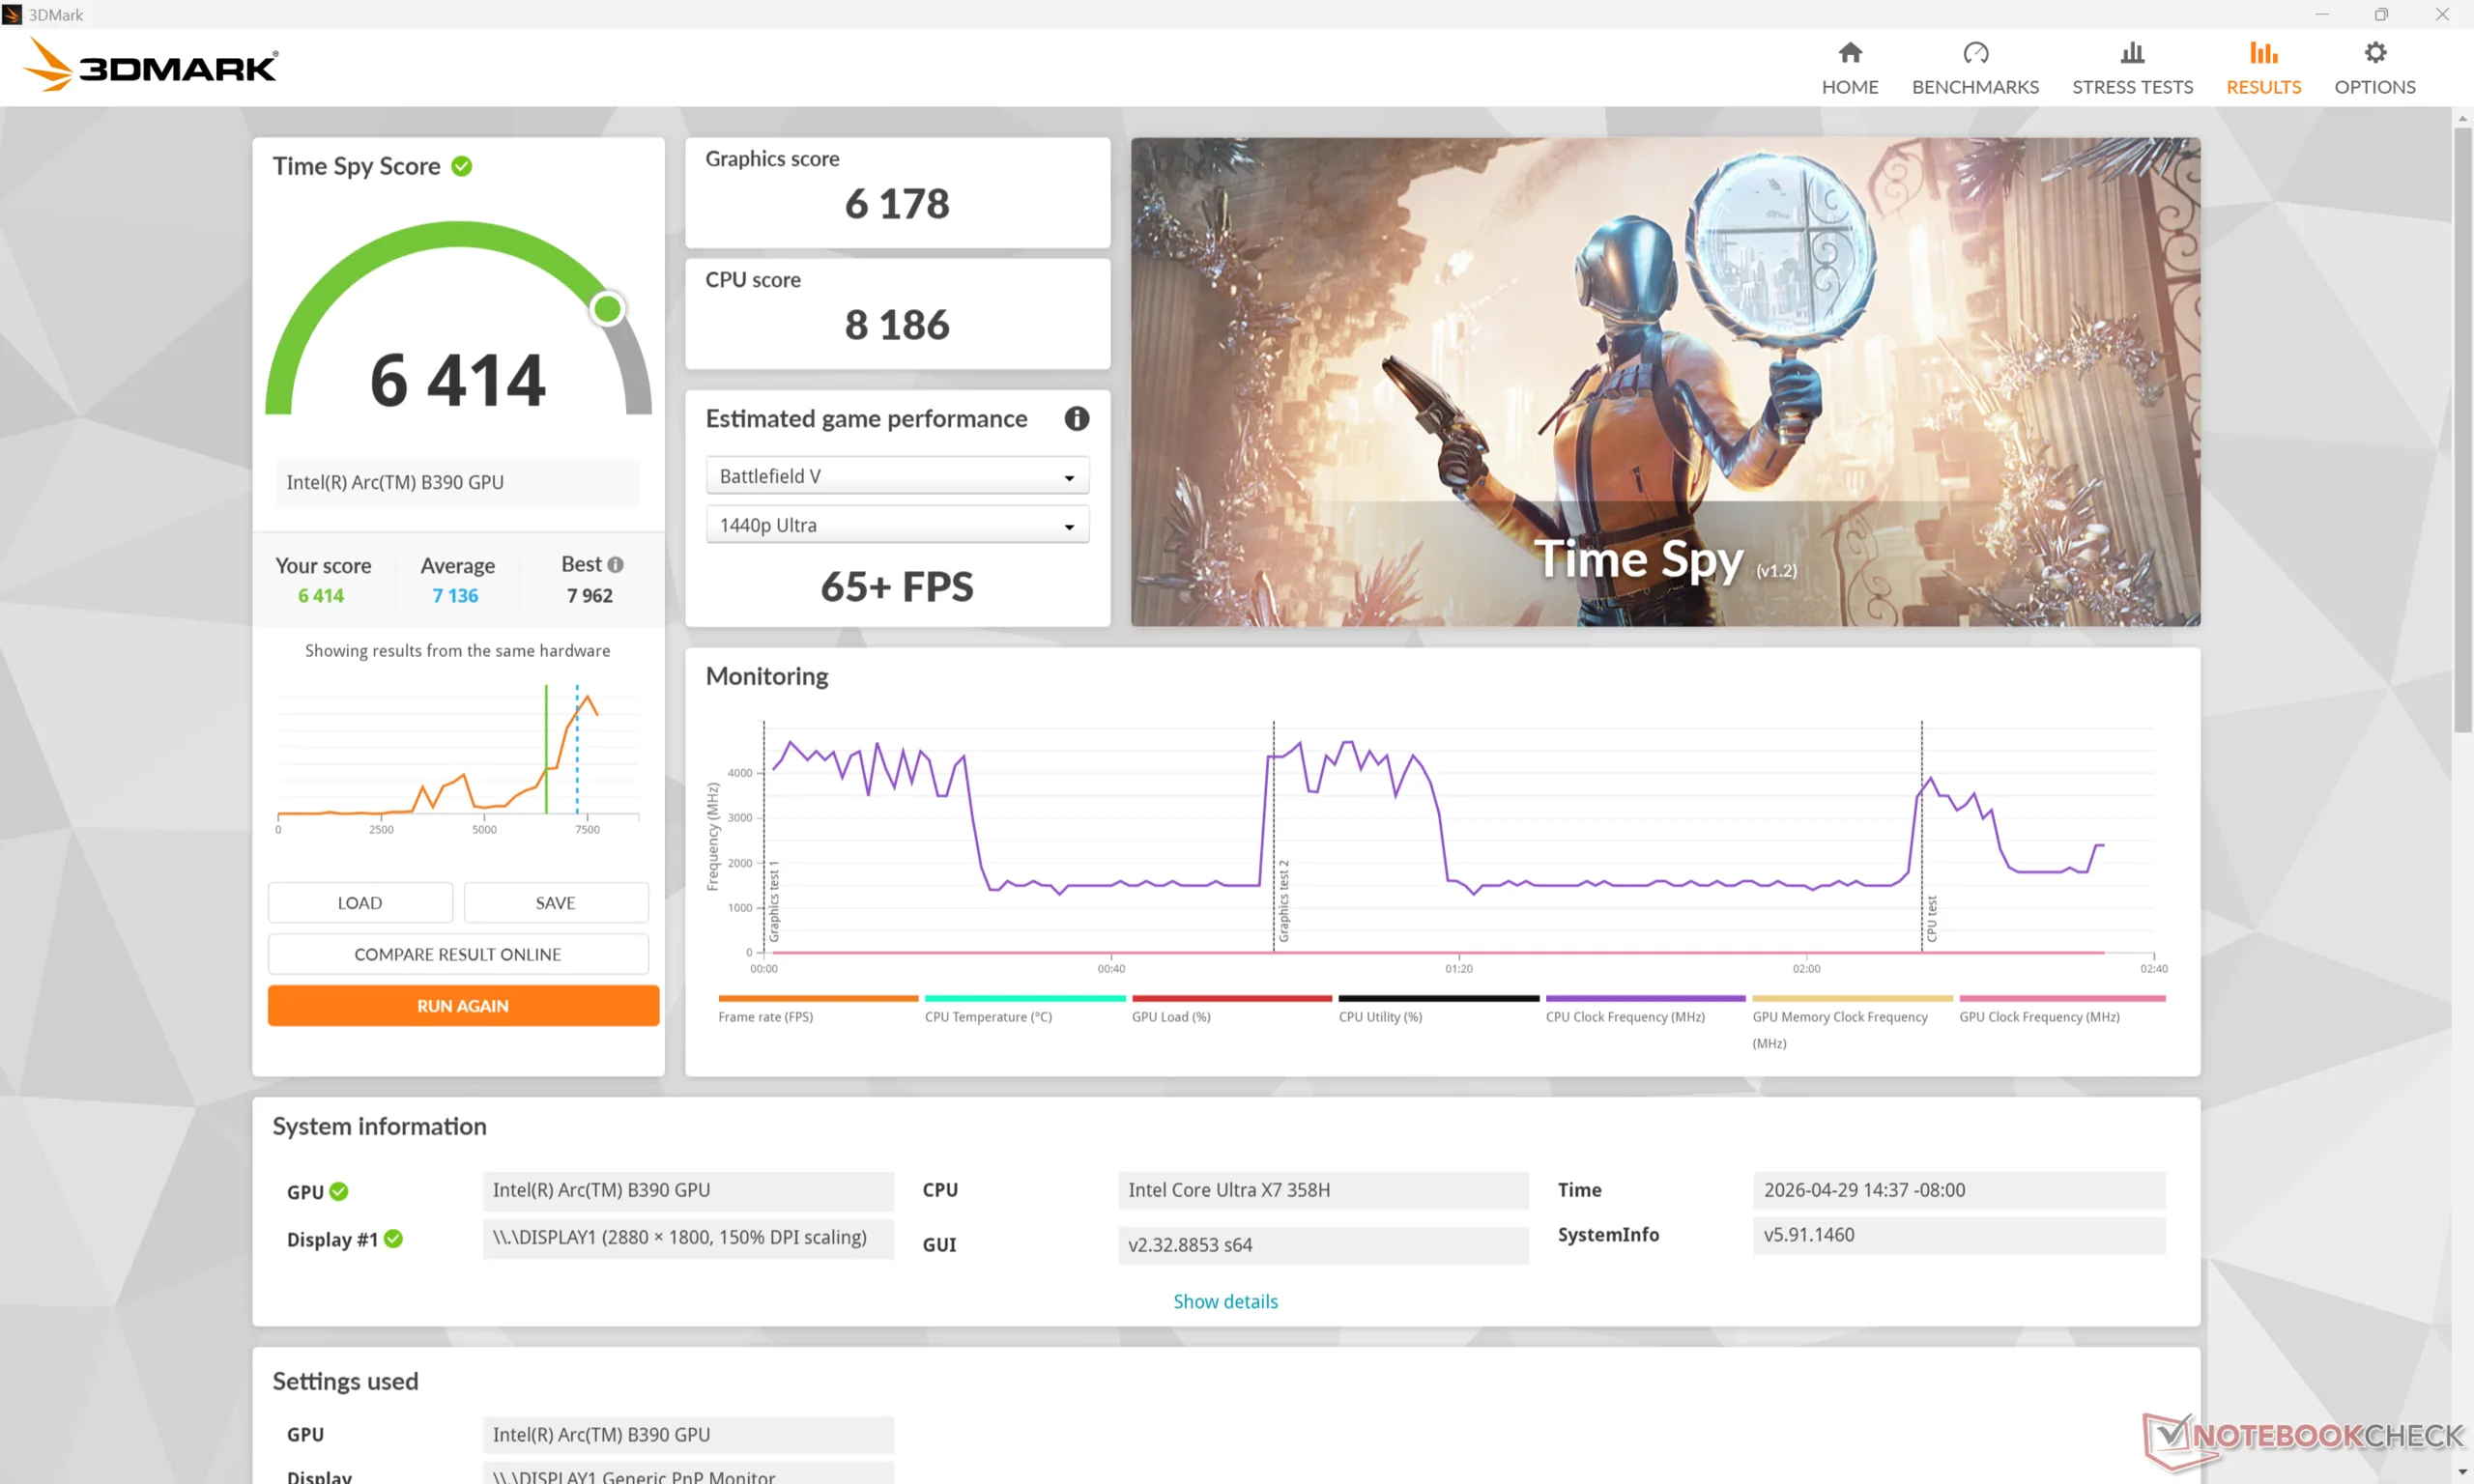
| 3DMark Time Spy Score | 6414 punten | |
Help | ||
* ... kleiner is beter
Gaming prestaties
Hoewel het niet in de eerste plaats een gamingmachine is, zijn laptops met de Arc B390 volledig in staat om zelfs de meest veeleisende titels met fatsoenlijke 1080p instellingen en framerates uit te voeren. Cyberpunk 2077 haalt bijvoorbeeld gemiddeld 45 FPS op 1080p Ultra-instellingen voordat er XeSS-upscaling wordt toegepast.
G-Sync wordt niet ondersteund op het interne beeldscherm.
| Performance rating - Percent | |
| MSI Prestige 16 AI C3MTG | |
| Dell XPS 16 Core Ultra X7 358H | |
| Lenovo ThinkBook 16 G7+ AMD | |
| Asus ZenBook S16 UM5606GA | |
| MSI Prestige 16 AI Evo B2HMG | |
| HP Envy x360 2-in-1 16-ad0097nr -1! | |
| Cyberpunk 2077 - 1920x1080 Ultra Preset (FSR off) | |
| Dell XPS 16 Core Ultra X7 358H | |
| MSI Prestige 16 AI C3MTG | |
| MSI Prestige 16 AI Evo B2HMG | |
| Lenovo ThinkBook 16 G7+ AMD | |
| Asus ZenBook S16 UM5606GA | |
| HP Envy x360 2-in-1 16-ad0097nr | |
| Baldur's Gate 3 - 1920x1080 Ultra Preset AA:T | |
| Dell XPS 16 Core Ultra X7 358H | |
| MSI Prestige 16 AI C3MTG | |
| Lenovo ThinkBook 16 G7+ AMD | |
| Asus ZenBook S16 UM5606GA | |
| MSI Prestige 16 AI Evo B2HMG | |
| HP Envy x360 2-in-1 16-ad0097nr | |
| GTA V - 1920x1080 Highest AA:4xMSAA + FX AF:16x | |
| Dell XPS 16 Core Ultra X7 358H | |
| MSI Prestige 16 AI C3MTG | |
| Lenovo ThinkBook 16 G7+ AMD | |
| Asus ZenBook S16 UM5606GA | |
| MSI Prestige 16 AI Evo B2HMG | |
| Final Fantasy XV Benchmark - 1920x1080 High Quality | |
| Dell XPS 16 Core Ultra X7 358H | |
| MSI Prestige 16 AI C3MTG | |
| Lenovo ThinkBook 16 G7+ AMD | |
| MSI Prestige 16 AI Evo B2HMG | |
| Asus ZenBook S16 UM5606GA | |
| HP Envy x360 2-in-1 16-ad0097nr | |
| Strange Brigade - 1920x1080 ultra AA:ultra AF:16 | |
| Dell XPS 16 Core Ultra X7 358H | |
| MSI Prestige 16 AI C3MTG | |
| MSI Prestige 16 AI Evo B2HMG | |
| Lenovo ThinkBook 16 G7+ AMD | |
| Asus ZenBook S16 UM5606GA | |
| HP Envy x360 2-in-1 16-ad0097nr | |
| Dota 2 Reborn - 1920x1080 ultra (3/3) best looking | |
| MSI Prestige 16 AI C3MTG | |
| Dell XPS 16 Core Ultra X7 358H | |
| Lenovo ThinkBook 16 G7+ AMD | |
| Asus ZenBook S16 UM5606GA | |
| MSI Prestige 16 AI Evo B2HMG | |
| HP Envy x360 2-in-1 16-ad0097nr | |
| X-Plane 11.11 - 1920x1080 high (fps_test=3) | |
| Lenovo ThinkBook 16 G7+ AMD | |
| Asus ZenBook S16 UM5606GA | |
| MSI Prestige 16 AI C3MTG | |
| Dell XPS 16 Core Ultra X7 358H | |
| MSI Prestige 16 AI Evo B2HMG | |
| HP Envy x360 2-in-1 16-ad0097nr | |
Cyberpunk 2077 ultra FPS Grafiek
| lage | gem. | hoge | ultra | |
|---|---|---|---|---|
| GTA V (2015) | 174.7 | 164.7 | 97.9 | 43 |
| Dota 2 Reborn (2015) | 122.1 | 98.4 | 104.3 | 111.8 |
| Final Fantasy XV Benchmark (2018) | 124.3 | 73.9 | 53.4 | |
| X-Plane 11.11 (2018) | 61.7 | 52.4 | 44.5 | |
| Strange Brigade (2018) | 304 | 118.7 | 98.5 | 88.5 |
| Baldur's Gate 3 (2023) | 69.4 | 58.5 | 52.6 | 51.7 |
| Cyberpunk 2077 (2023) | 77.2 | 62.3 | 53.8 | 44.8 |
| F1 24 (2024) | 144.9 | 135.3 | 104.3 | 37.4 |
Uitstoot
Systeemgeluid
De koeloplossing is veel kleiner dan die van de XPS 16, wat bijdraagt aan de opmerkelijke verschillen in kerntemperatuur tussen de twee modellen. Hoewel de ventilatoren van de MSI langer stil kunnen blijven voordat ze moeten opvoeren, blijven ze na verloop van tijd toch op vergelijkbare maxima steken. Het ventilatorgeluid tijdens het draaien van Cyberpunk 2077 in de modus Prestaties zou zich bijvoorbeeld stabiliseren op 41 dB(A) in vergelijking met 42 dB(A) op de Dell.
Merk op dat het ventilatorgeluid aanzienlijk zou afnemen bij gamen in de modus Gebalanceerd in plaats van in de modus Prestaties. Hier zouden de ventilatoren een piek bereiken van net onder de 30 dB(A), wat het bovengenoemde prestatietekort van 20 procent kan rechtvaardigen, afhankelijk van de voorkeur van de gebruiker.
Geluidsniveau
| Onbelast |
| 23.3 / 23.3 / 25.9 dB (A) |
| Belasting |
| 30.1 / 44.7 dB (A) |
 | ||
30 dB stil 40 dB(A) hoorbaar 50 dB(A) luid |
||
min: | ||
| MSI Prestige 16 AI C3MTG Ultra X7 358H, Arc B390 Panther Lake iGPU | MSI Prestige 16 AI Evo B2HMG Ultra 9 285H, Arc 140T | Dell XPS 16 Core Ultra X7 358H Ultra X7 358H, Arc B390 Panther Lake iGPU | Asus ZenBook S16 UM5606GA Ryzen AI 9 465, Radeon 880M | Lenovo ThinkBook 16 G7+ AMD Ryzen AI 9 365, Radeon 880M | HP Envy x360 2-in-1 16-ad0097nr R7 8840HS, Radeon 780M | |
|---|---|---|---|---|---|---|
| Noise | -4% | -4% | -15% | -3% | 6% | |
| uit / omgeving * (dB) | 23.1 | 23.6 -2% | 23.3 -1% | 24.9 -8% | 24.5 -6% | 22.9 1% |
| Idle Minimum * (dB) | 23.3 | 23.6 -1% | 23.4 -0% | 24.9 -7% | 24.5 -5% | 23 1% |
| Idle Average * (dB) | 23.3 | 23.6 -1% | 23.4 -0% | 24.9 -7% | 24.5 -5% | 23 1% |
| Idle Maximum * (dB) | 25.9 | 26.2 -1% | 25.8 -0% | 24.9 4% | 25.9 -0% | 23 11% |
| Load Average * (dB) | 30.1 | 37.1 -23% | 38 -26% | 45.7 -52% | 36.2 -20% | 23.8 21% |
| Cyberpunk 2077 ultra * (dB) | 40.8 | 42.1 -3% | 38.1 7% | 49 -20% | 40.1 2% | |
| Load Maximum * (dB) | 44.7 | 42.1 6% | 48.6 -9% | 50.4 -13% | 40.1 10% | 43.8 2% |
| Witcher 3 ultra * (dB) | 43.8 |
* ... kleiner is beter
Temperatuur
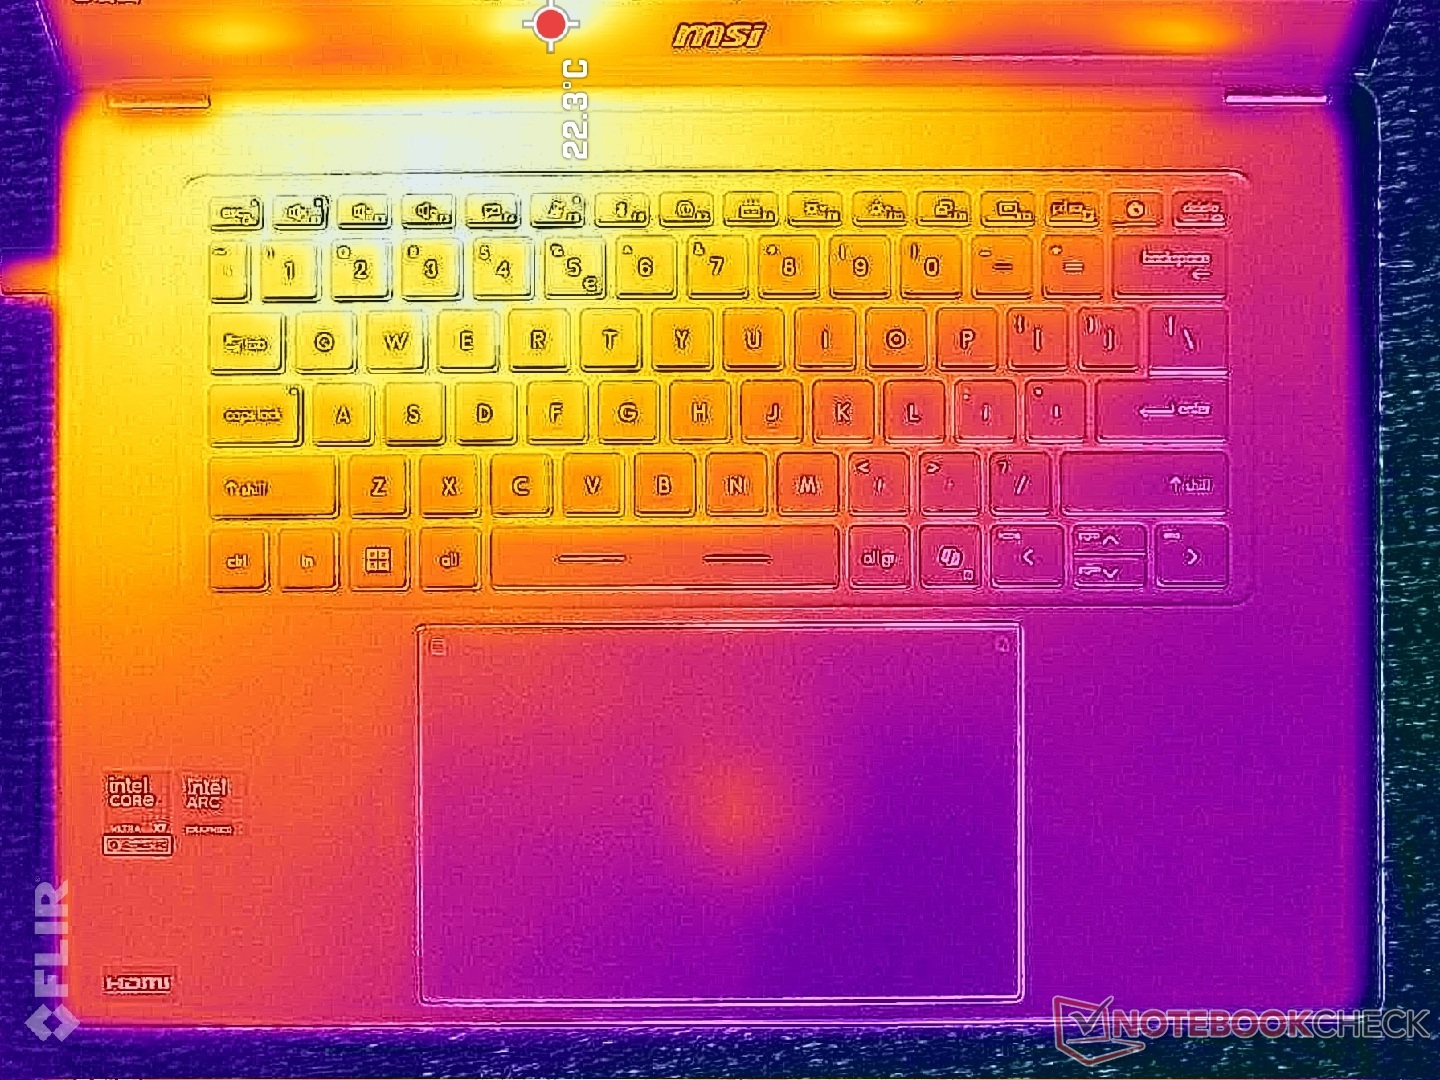
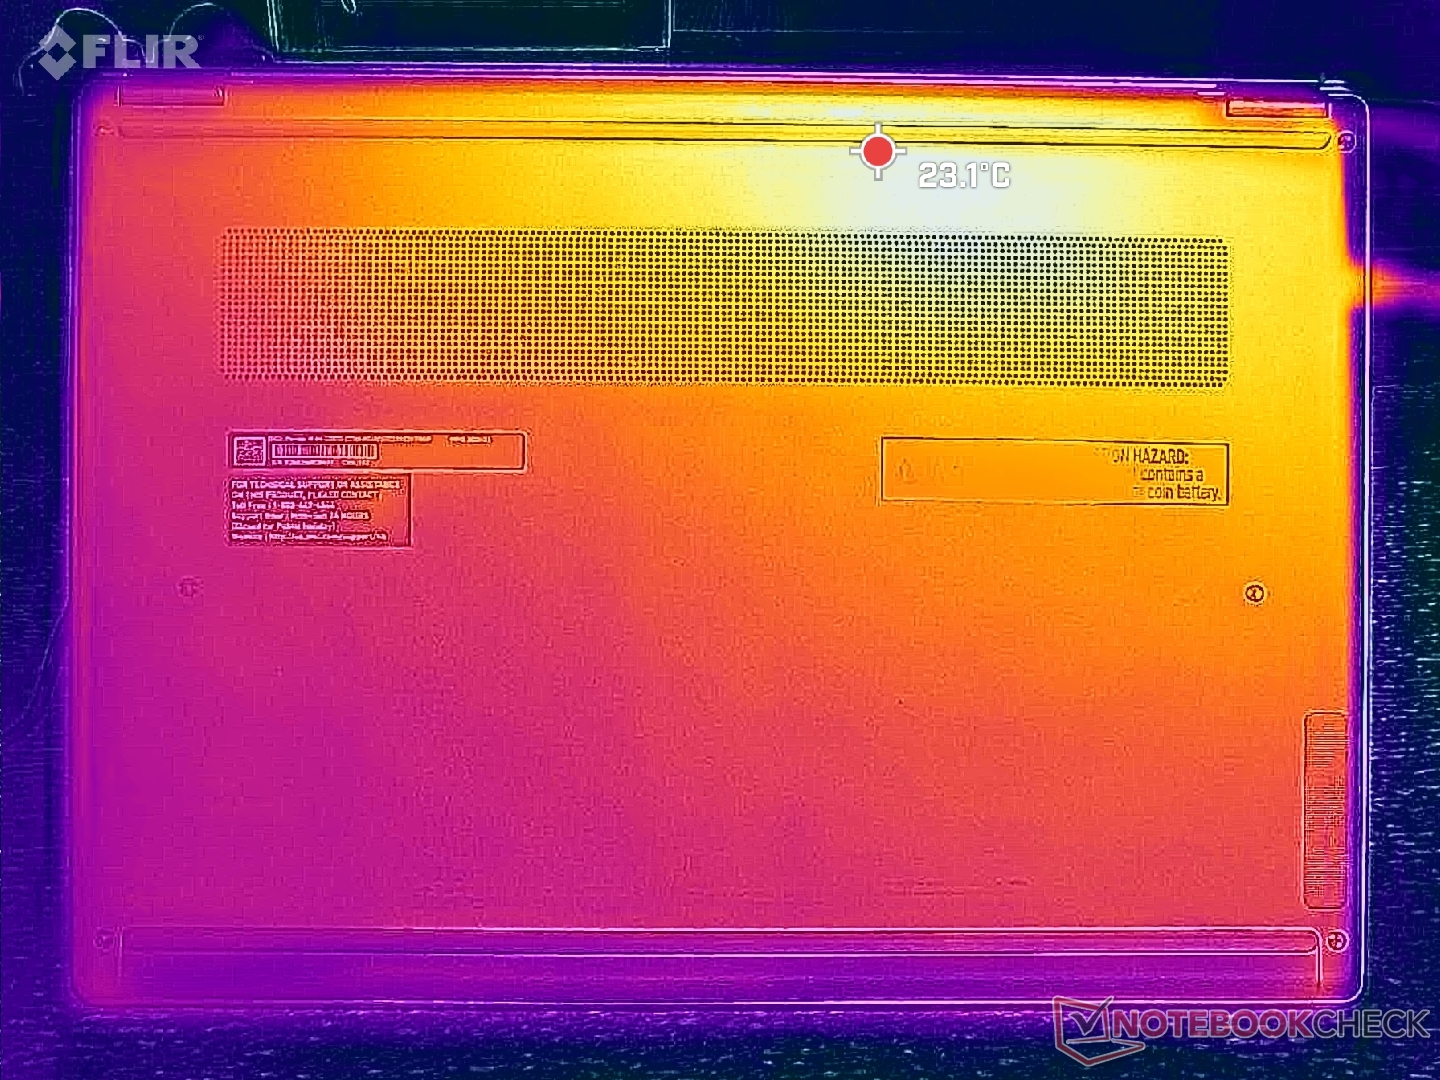
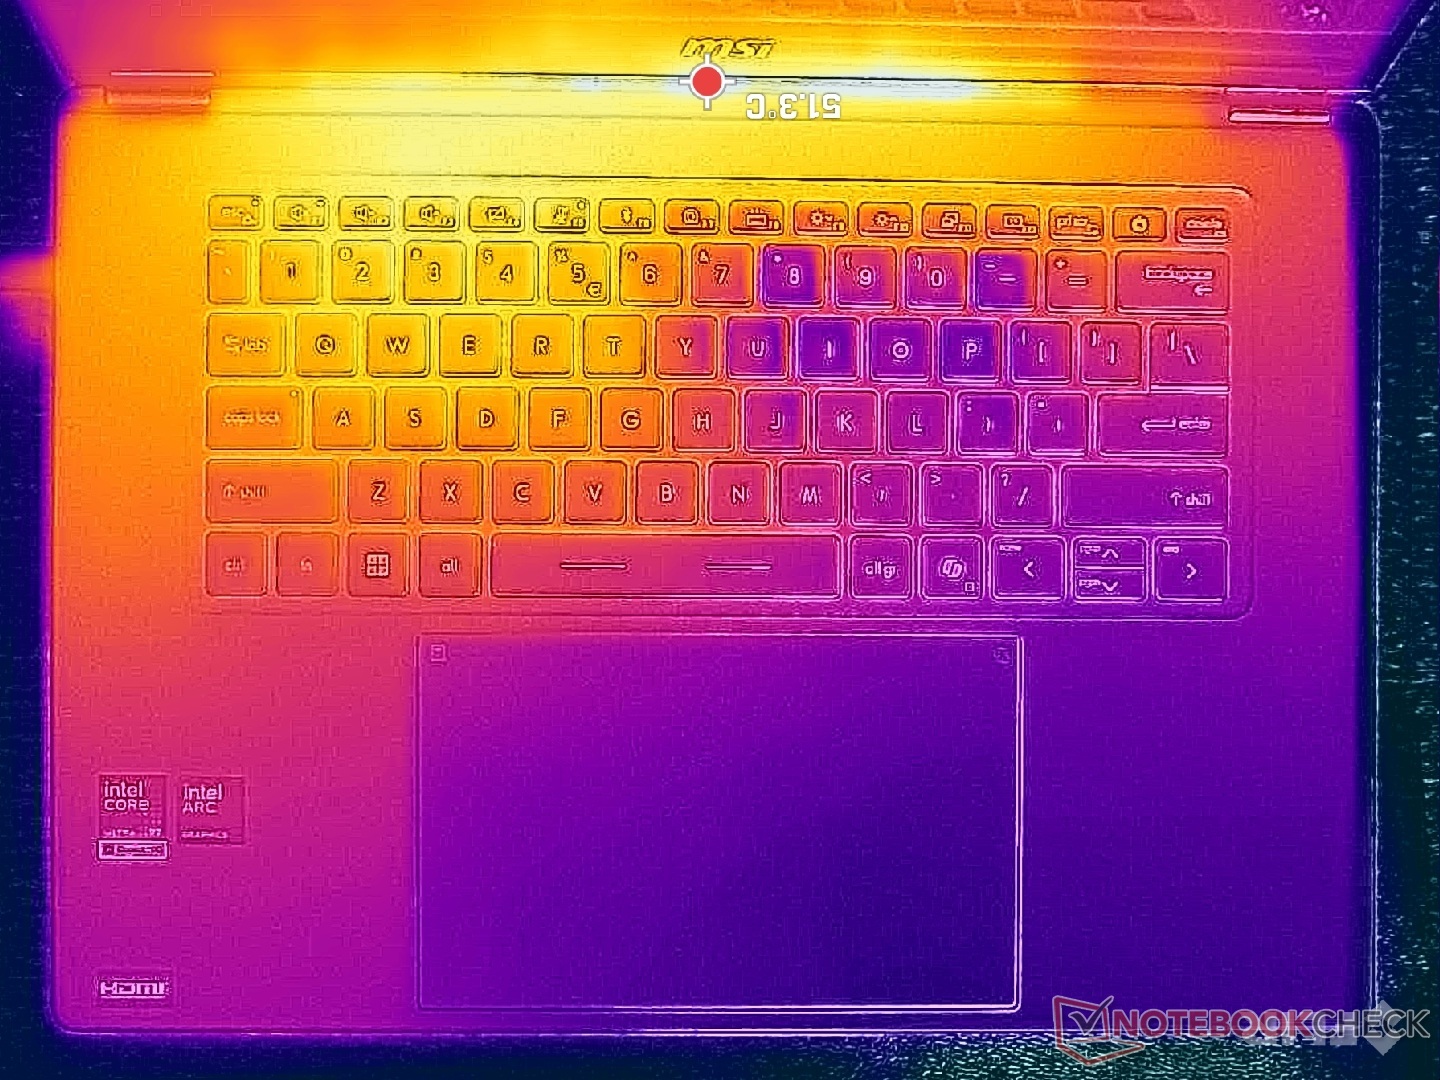
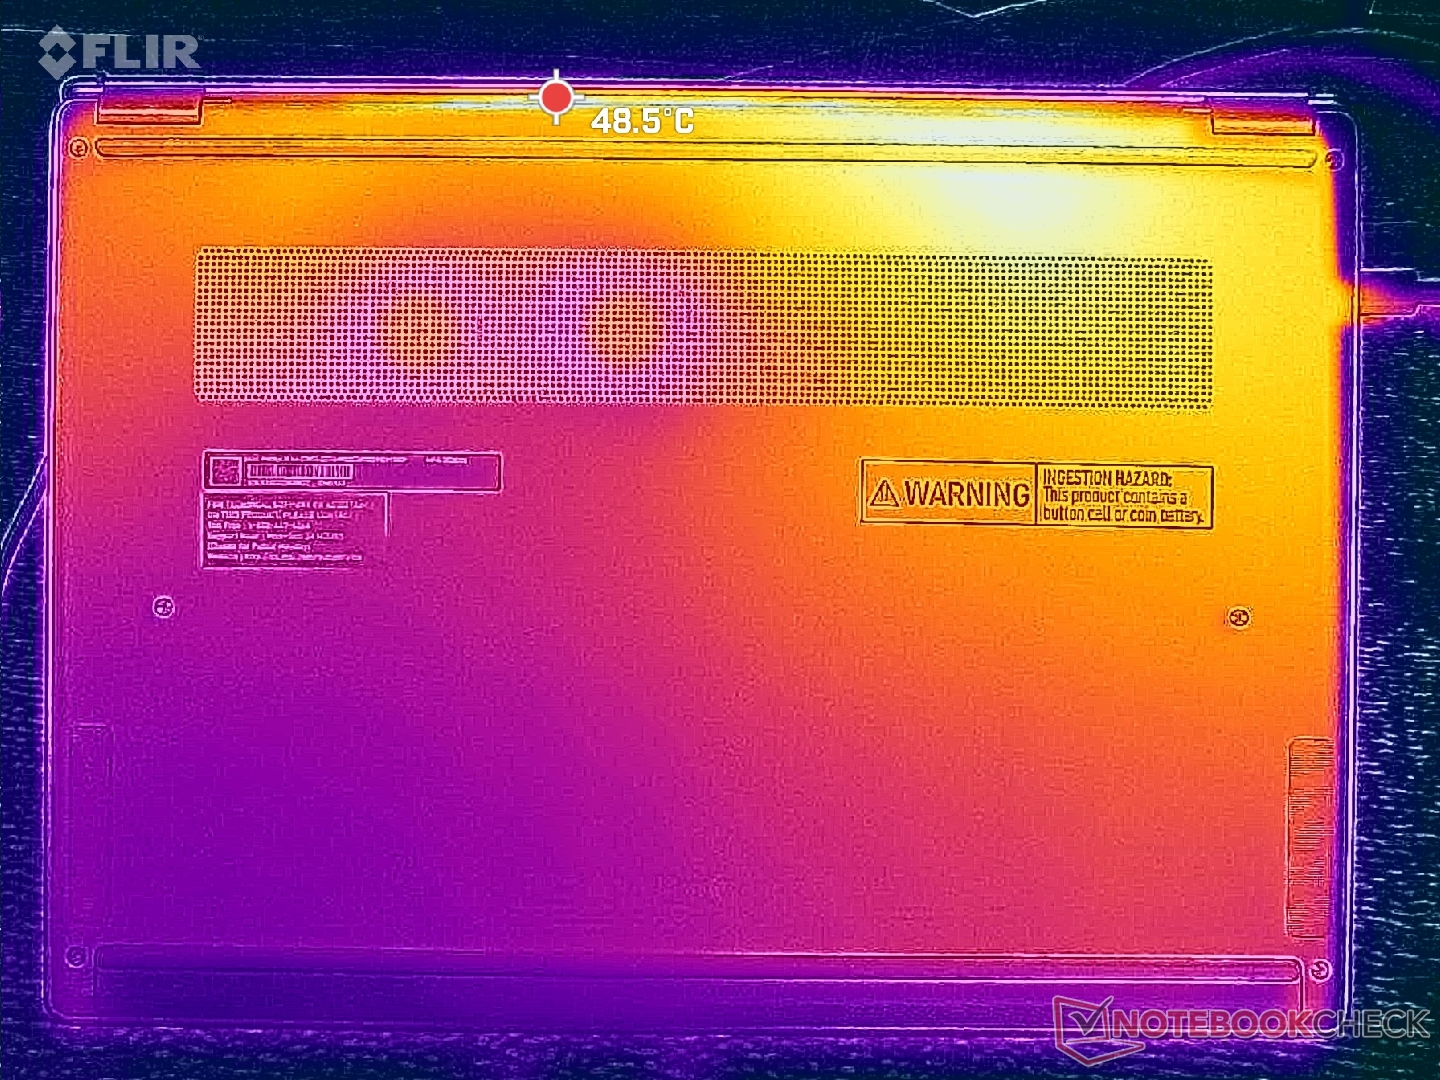
De oppervlaktetemperaturen zijn een verbetering ten opzichte van de vorige generatie. Terwijl de Prestige 16 uit 2025 temperaturen van 47 C tot 52 C bereikte, komt het nieuwere model uit op 40 C tot 47 C. De hete plekken bevinden zich in de achterste hoek van het chassis, waar het contact met de huid minimaal is.
Toch zijn de oppervlaktetemperaturen nog steeds warmer dan op de concurrerende XPS 16 waar de hot spots slechts 41 C bereiken, ongeacht de kant, voor een koeler gemiddelde.
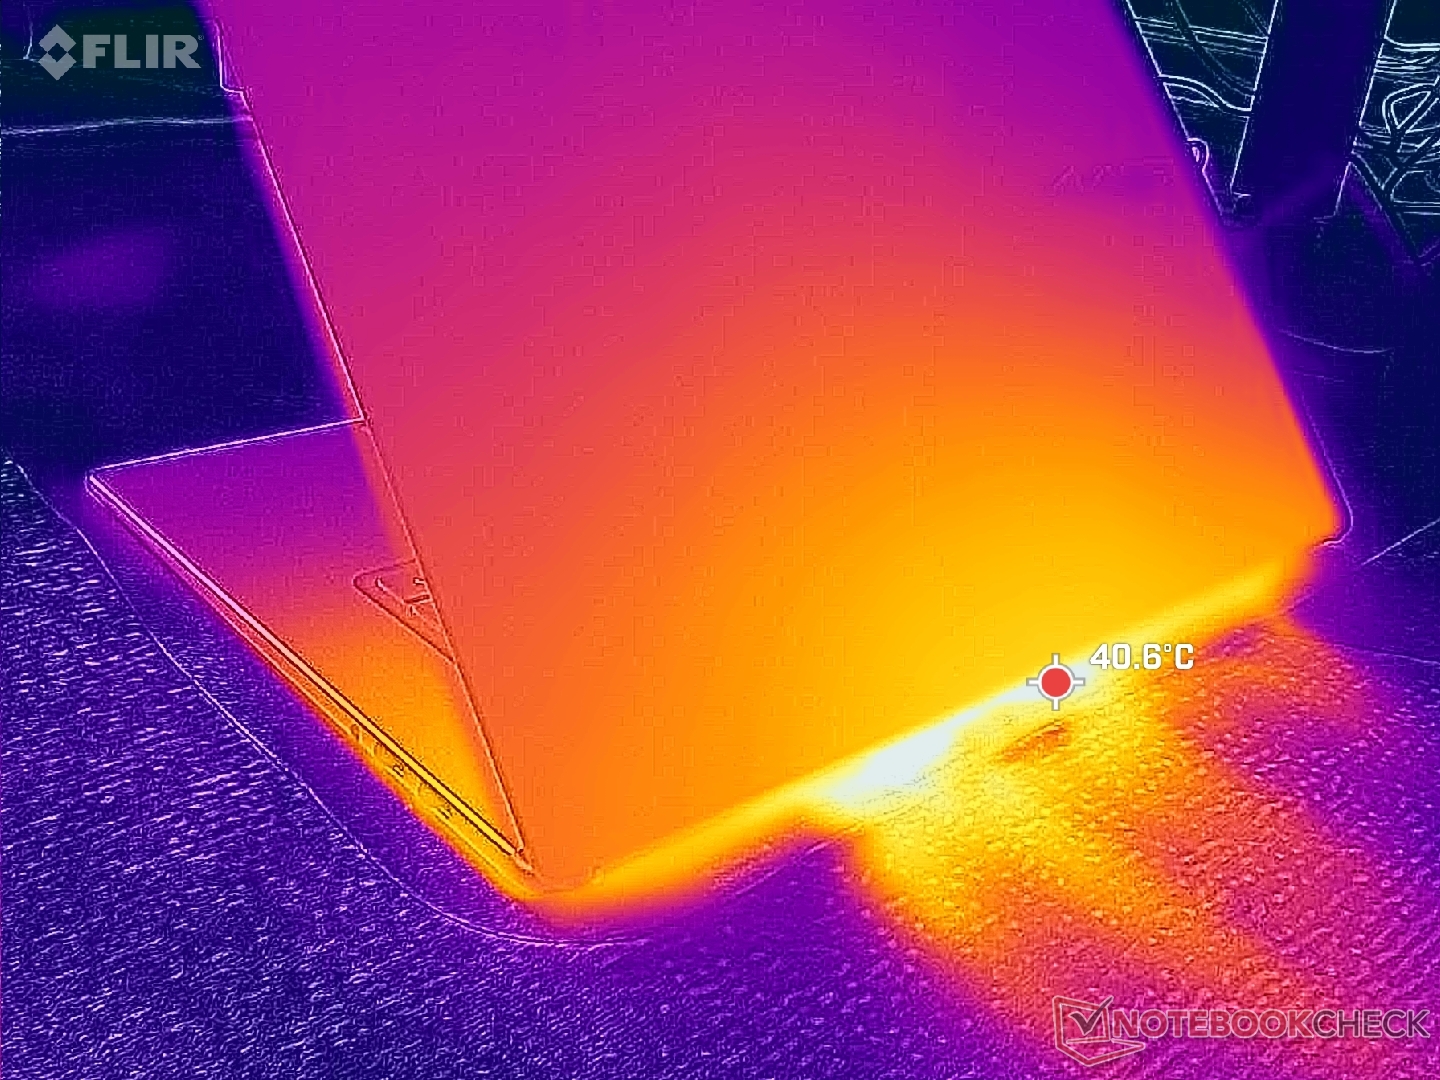
(-) De maximumtemperatuur aan de bovenzijde bedraagt 47 °C / 117 F, vergeleken met het gemiddelde van 36.8 °C / 98 F, variërend van 21 tot 71 °C voor de klasse Multimedia.
(±) De bodem warmt op tot een maximum van 40 °C / 104 F, vergeleken met een gemiddelde van 39.1 °C / 102 F
(+) Bij onbelast gebruik bedraagt de gemiddelde temperatuur voor de bovenzijde 24.8 °C / 77 F, vergeleken met het apparaatgemiddelde van 31.3 °C / 88 F.
(+) De palmsteunen en het touchpad zijn met een maximum van ###max## °C / 86.7 F koeler dan de huidtemperatuur en voelen daarom koel aan.
(±) De gemiddelde temperatuur van de handpalmsteun van soortgelijke toestellen bedroeg 28.7 °C / 83.7 F (-1.7 °C / -3 F).
| MSI Prestige 16 AI C3MTG Ultra X7 358H, Arc B390 Panther Lake iGPU | MSI Prestige 16 AI Evo B2HMG Ultra 9 285H, Arc 140T | Dell XPS 16 Core Ultra X7 358H Ultra X7 358H, Arc B390 Panther Lake iGPU | Asus ZenBook S16 UM5606GA Ryzen AI 9 465, Radeon 880M | Lenovo ThinkBook 16 G7+ AMD Ryzen AI 9 365, Radeon 880M | HP Envy x360 2-in-1 16-ad0097nr R7 8840HS, Radeon 780M | |
|---|---|---|---|---|---|---|
| Heat | -5% | 11% | -1% | 9% | -3% | |
| Maximum Upper Side * (°C) | 47 | 48.1 -2% | 40.6 14% | 43.4 8% | 38.2 19% | 42.6 9% |
| Maximum Bottom * (°C) | 40 | 51.6 -29% | 39.8 1% | 46.2 -16% | 37.9 5% | 47.8 -19% |
| Idle Upper Side * (°C) | 27.4 | 25.9 5% | 23.2 15% | 26.5 3% | 25.4 7% | 27.4 -0% |
| Idle Bottom * (°C) | 27.4 | 25.2 8% | 23.8 13% | 27 1% | 25.7 6% | 27.8 -1% |
* ... kleiner is beter
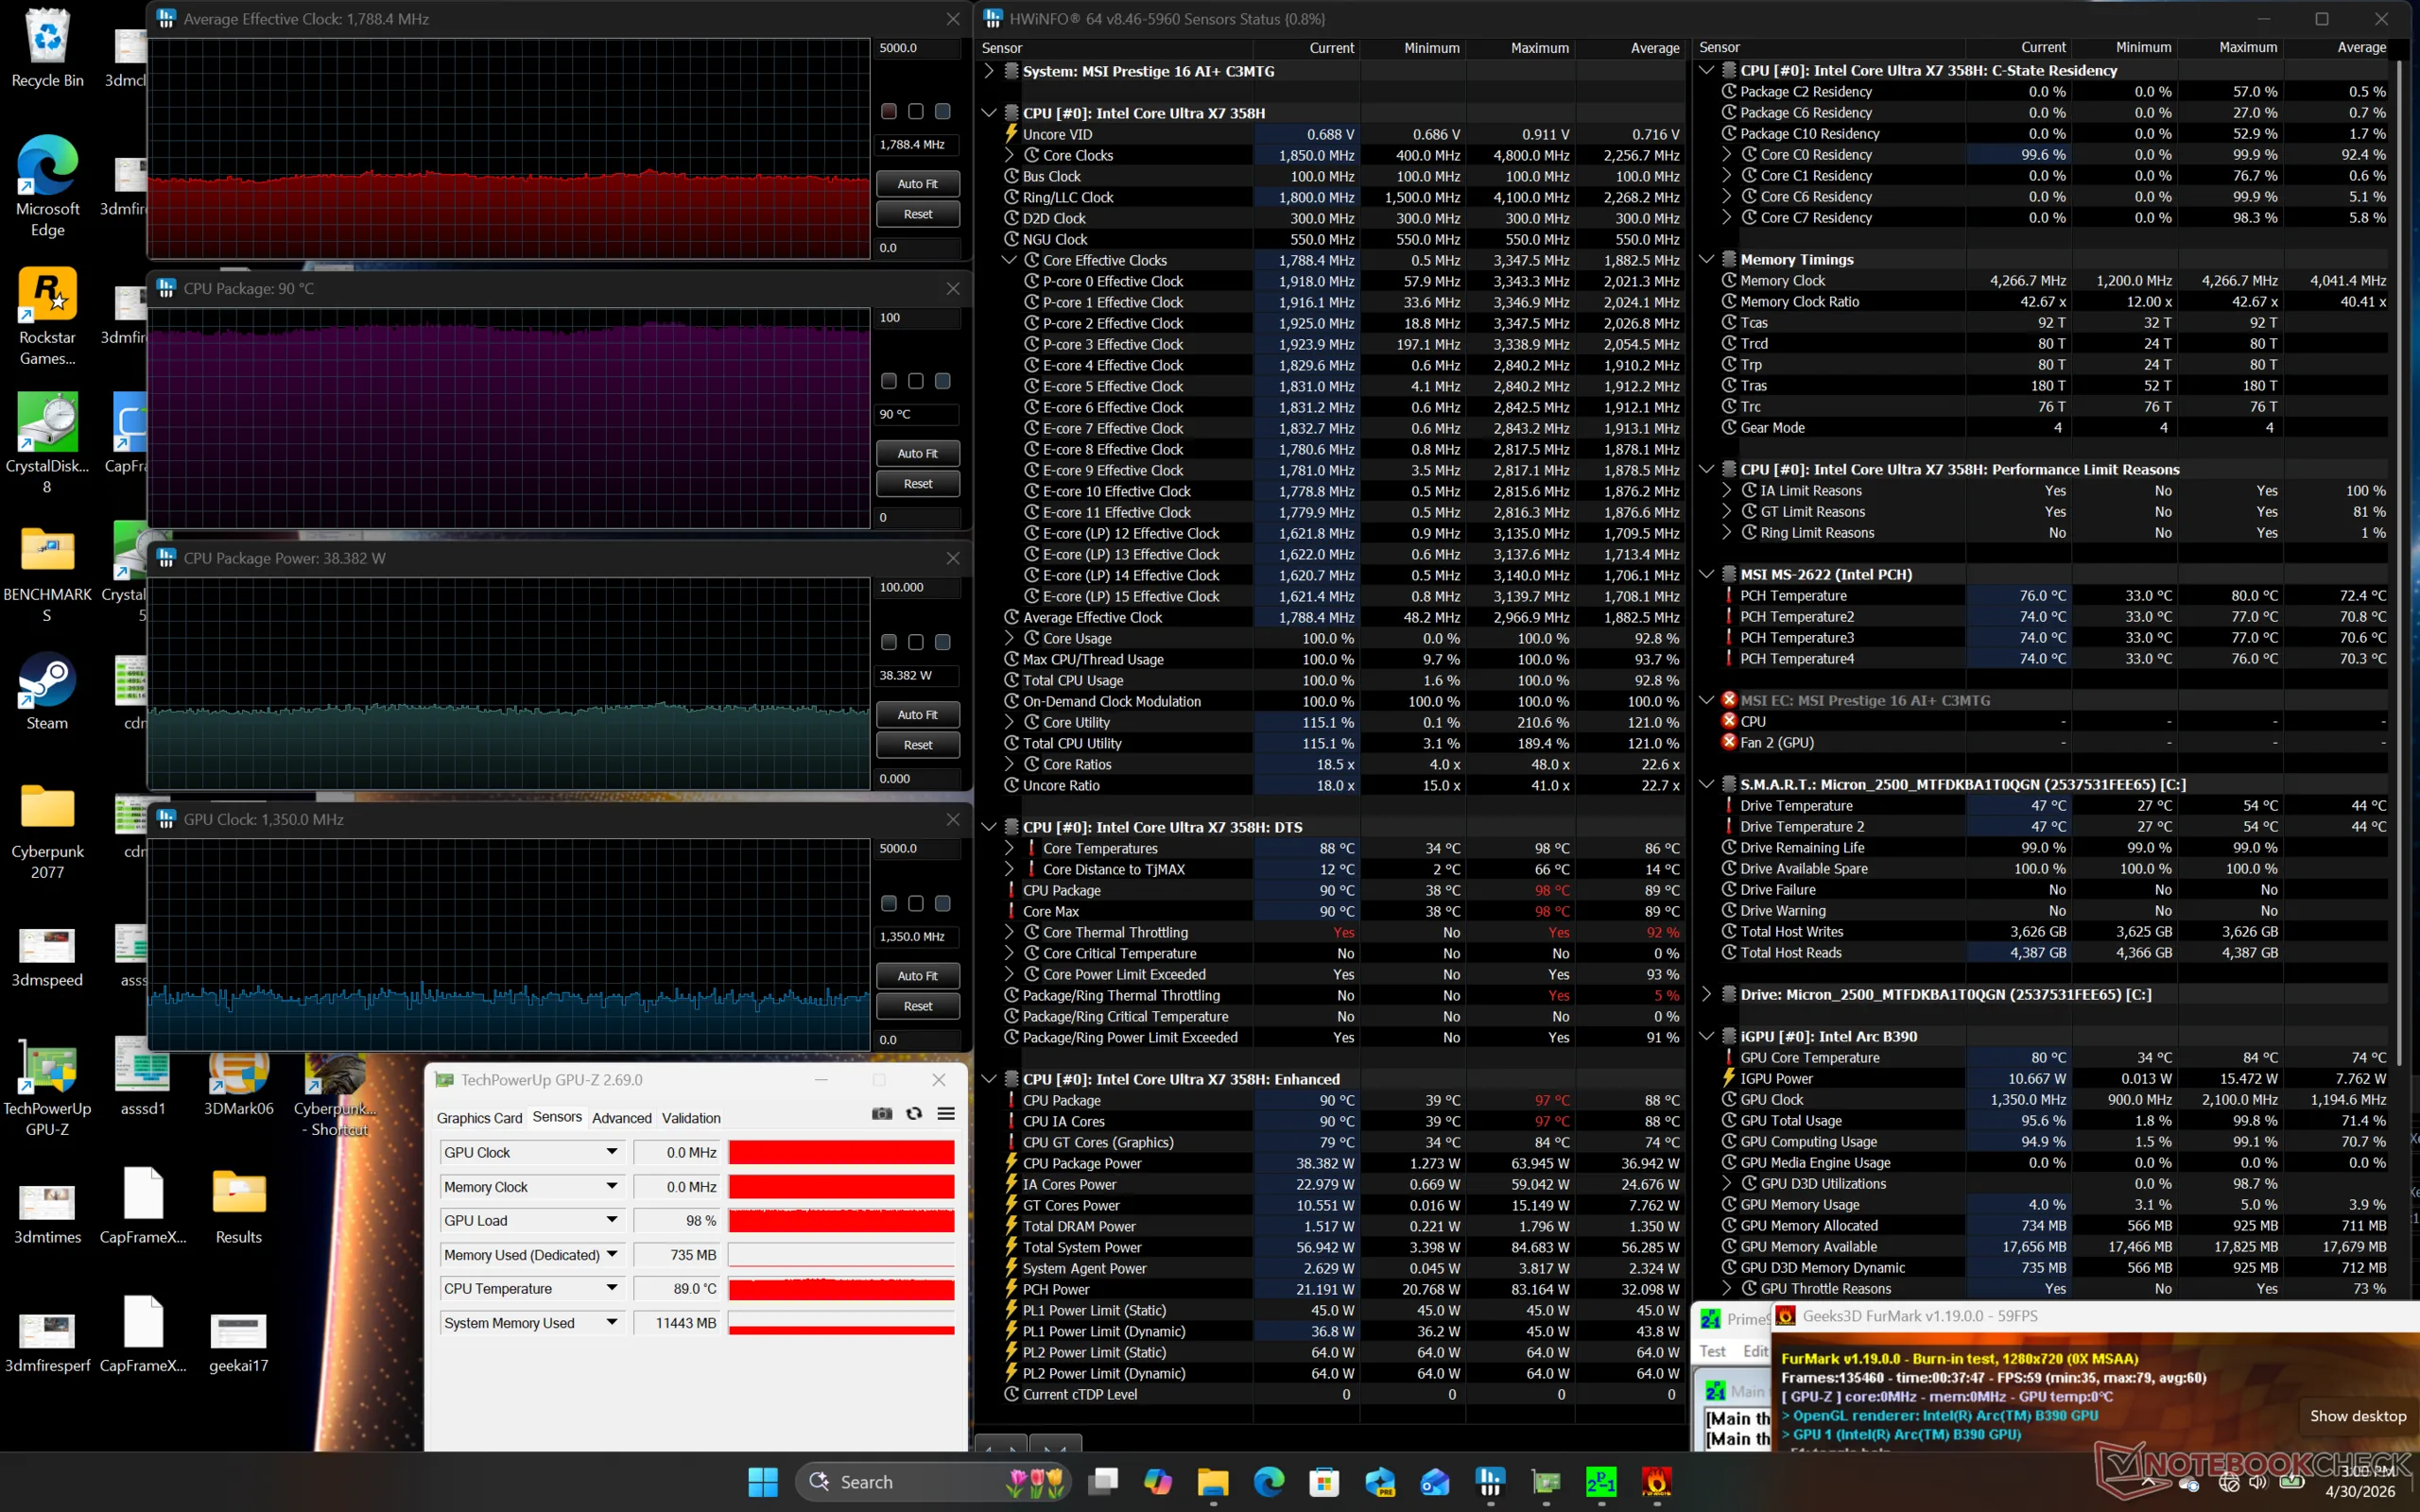
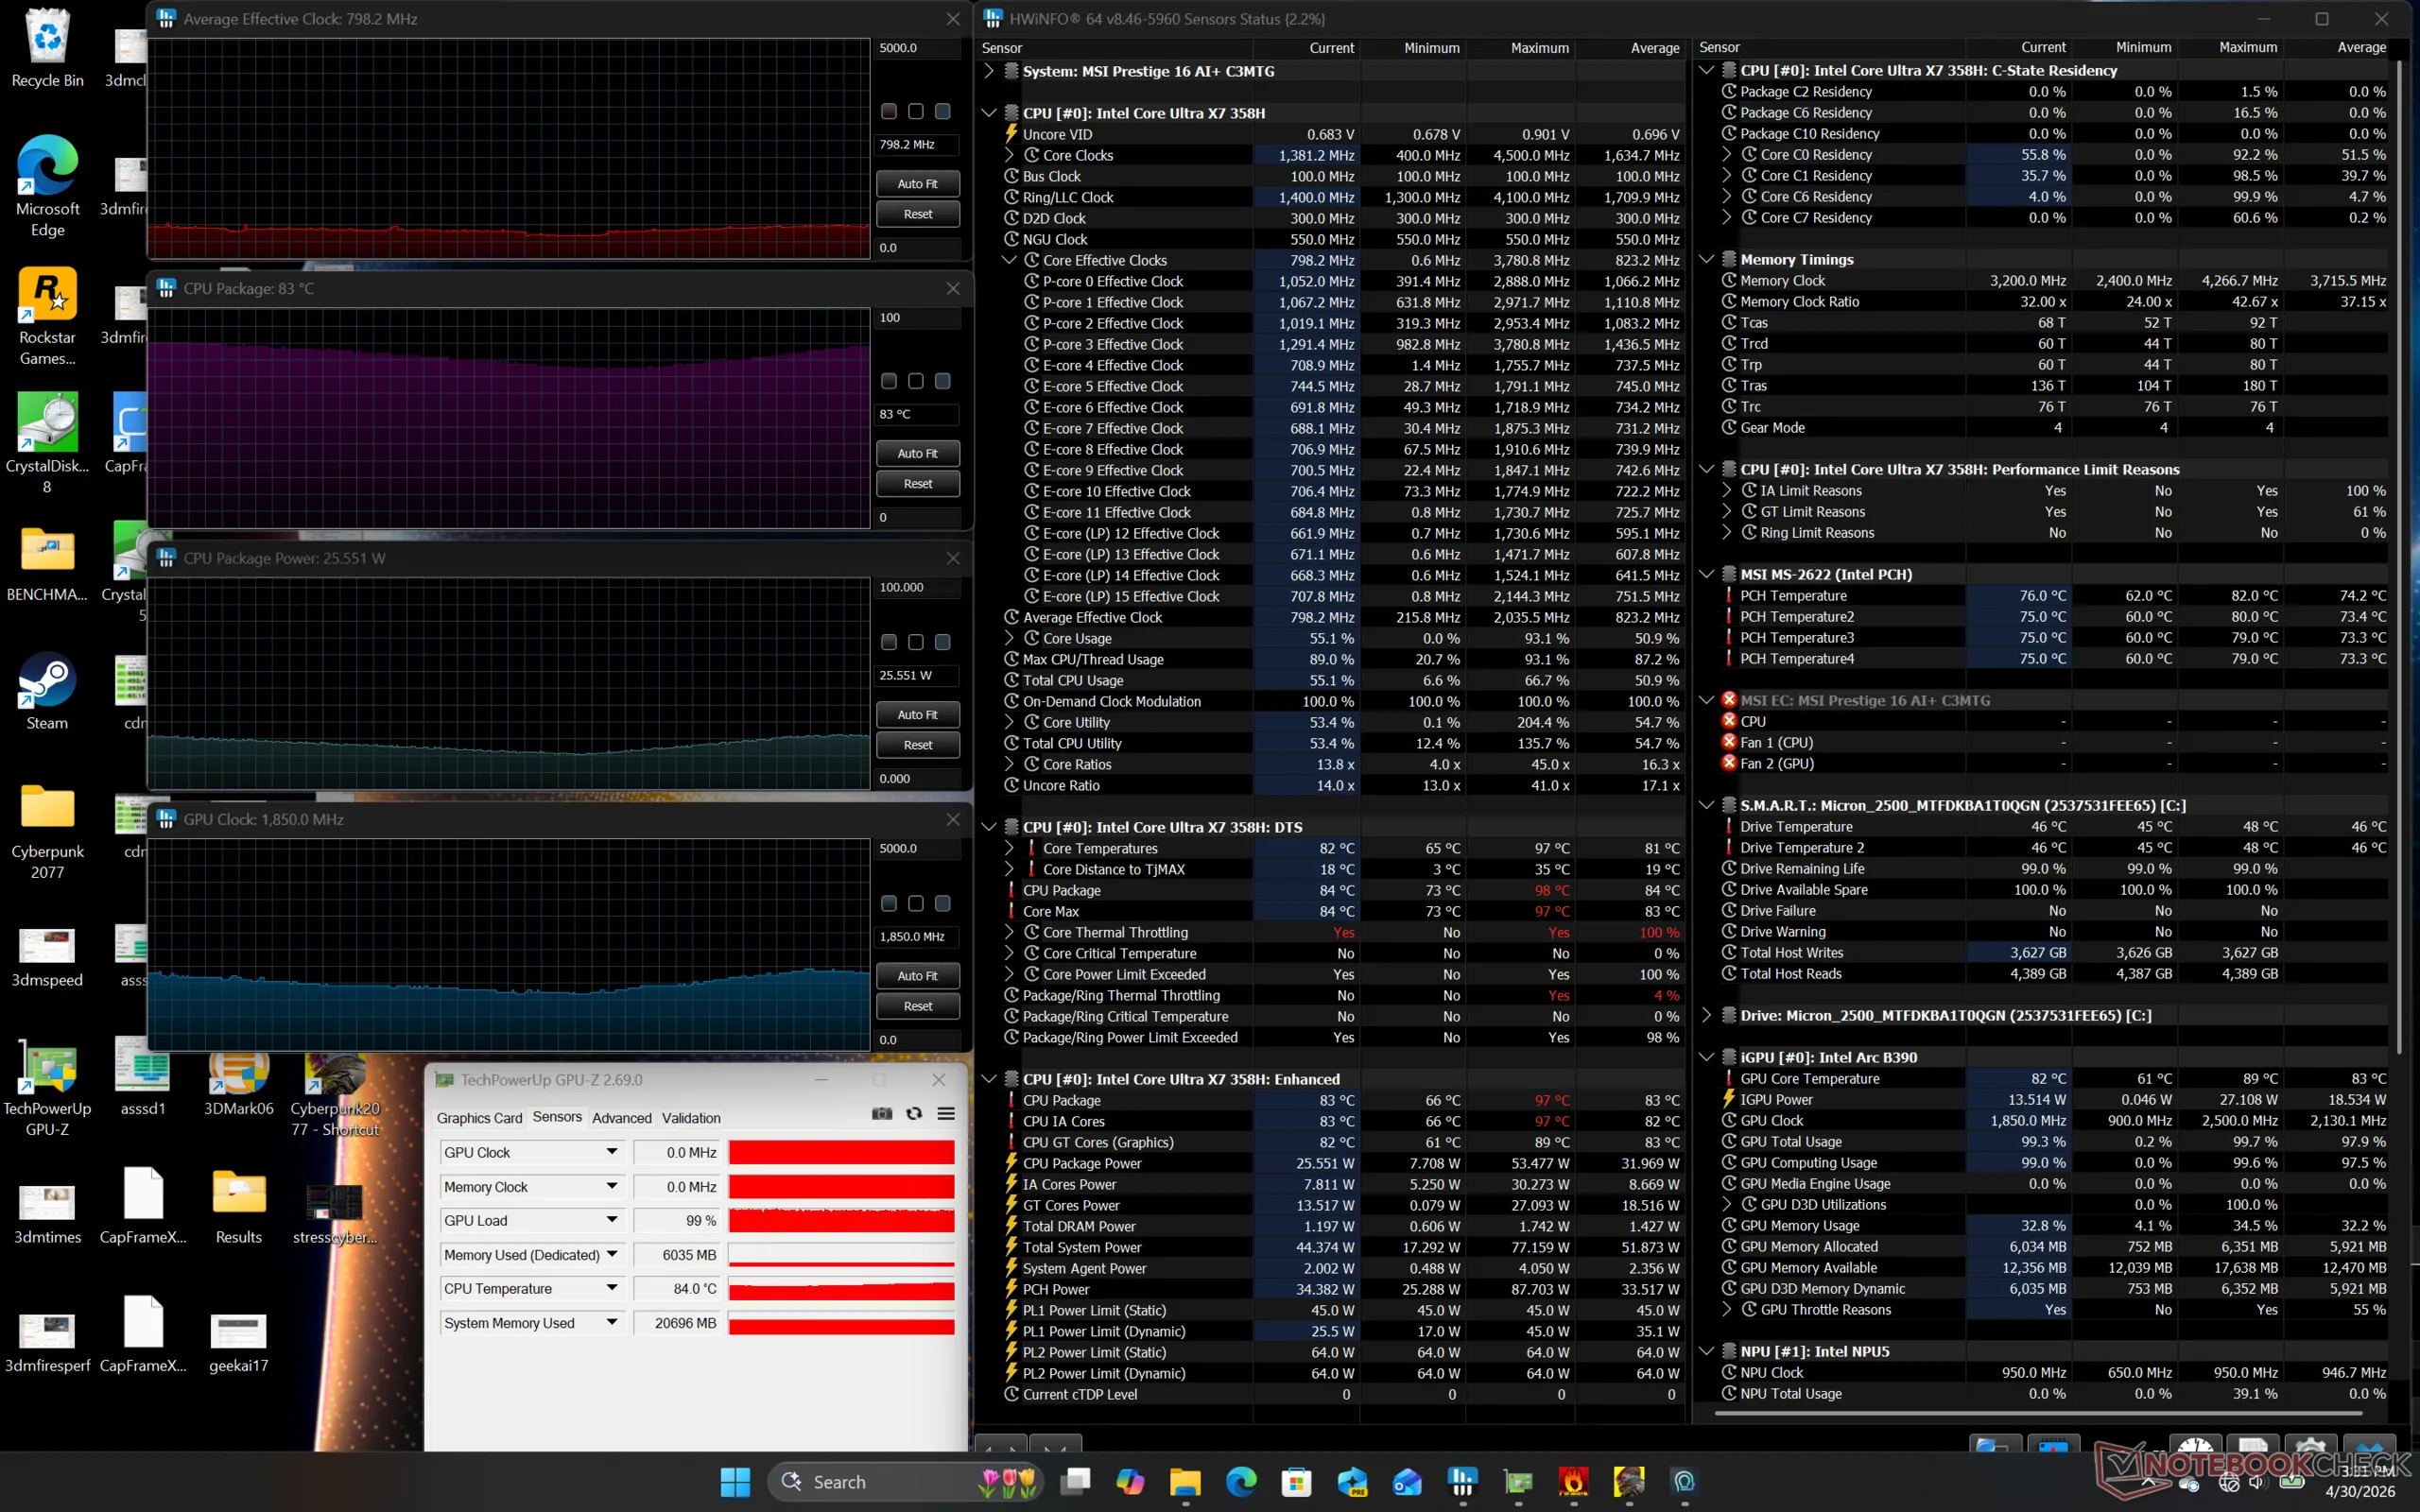
Stresstest
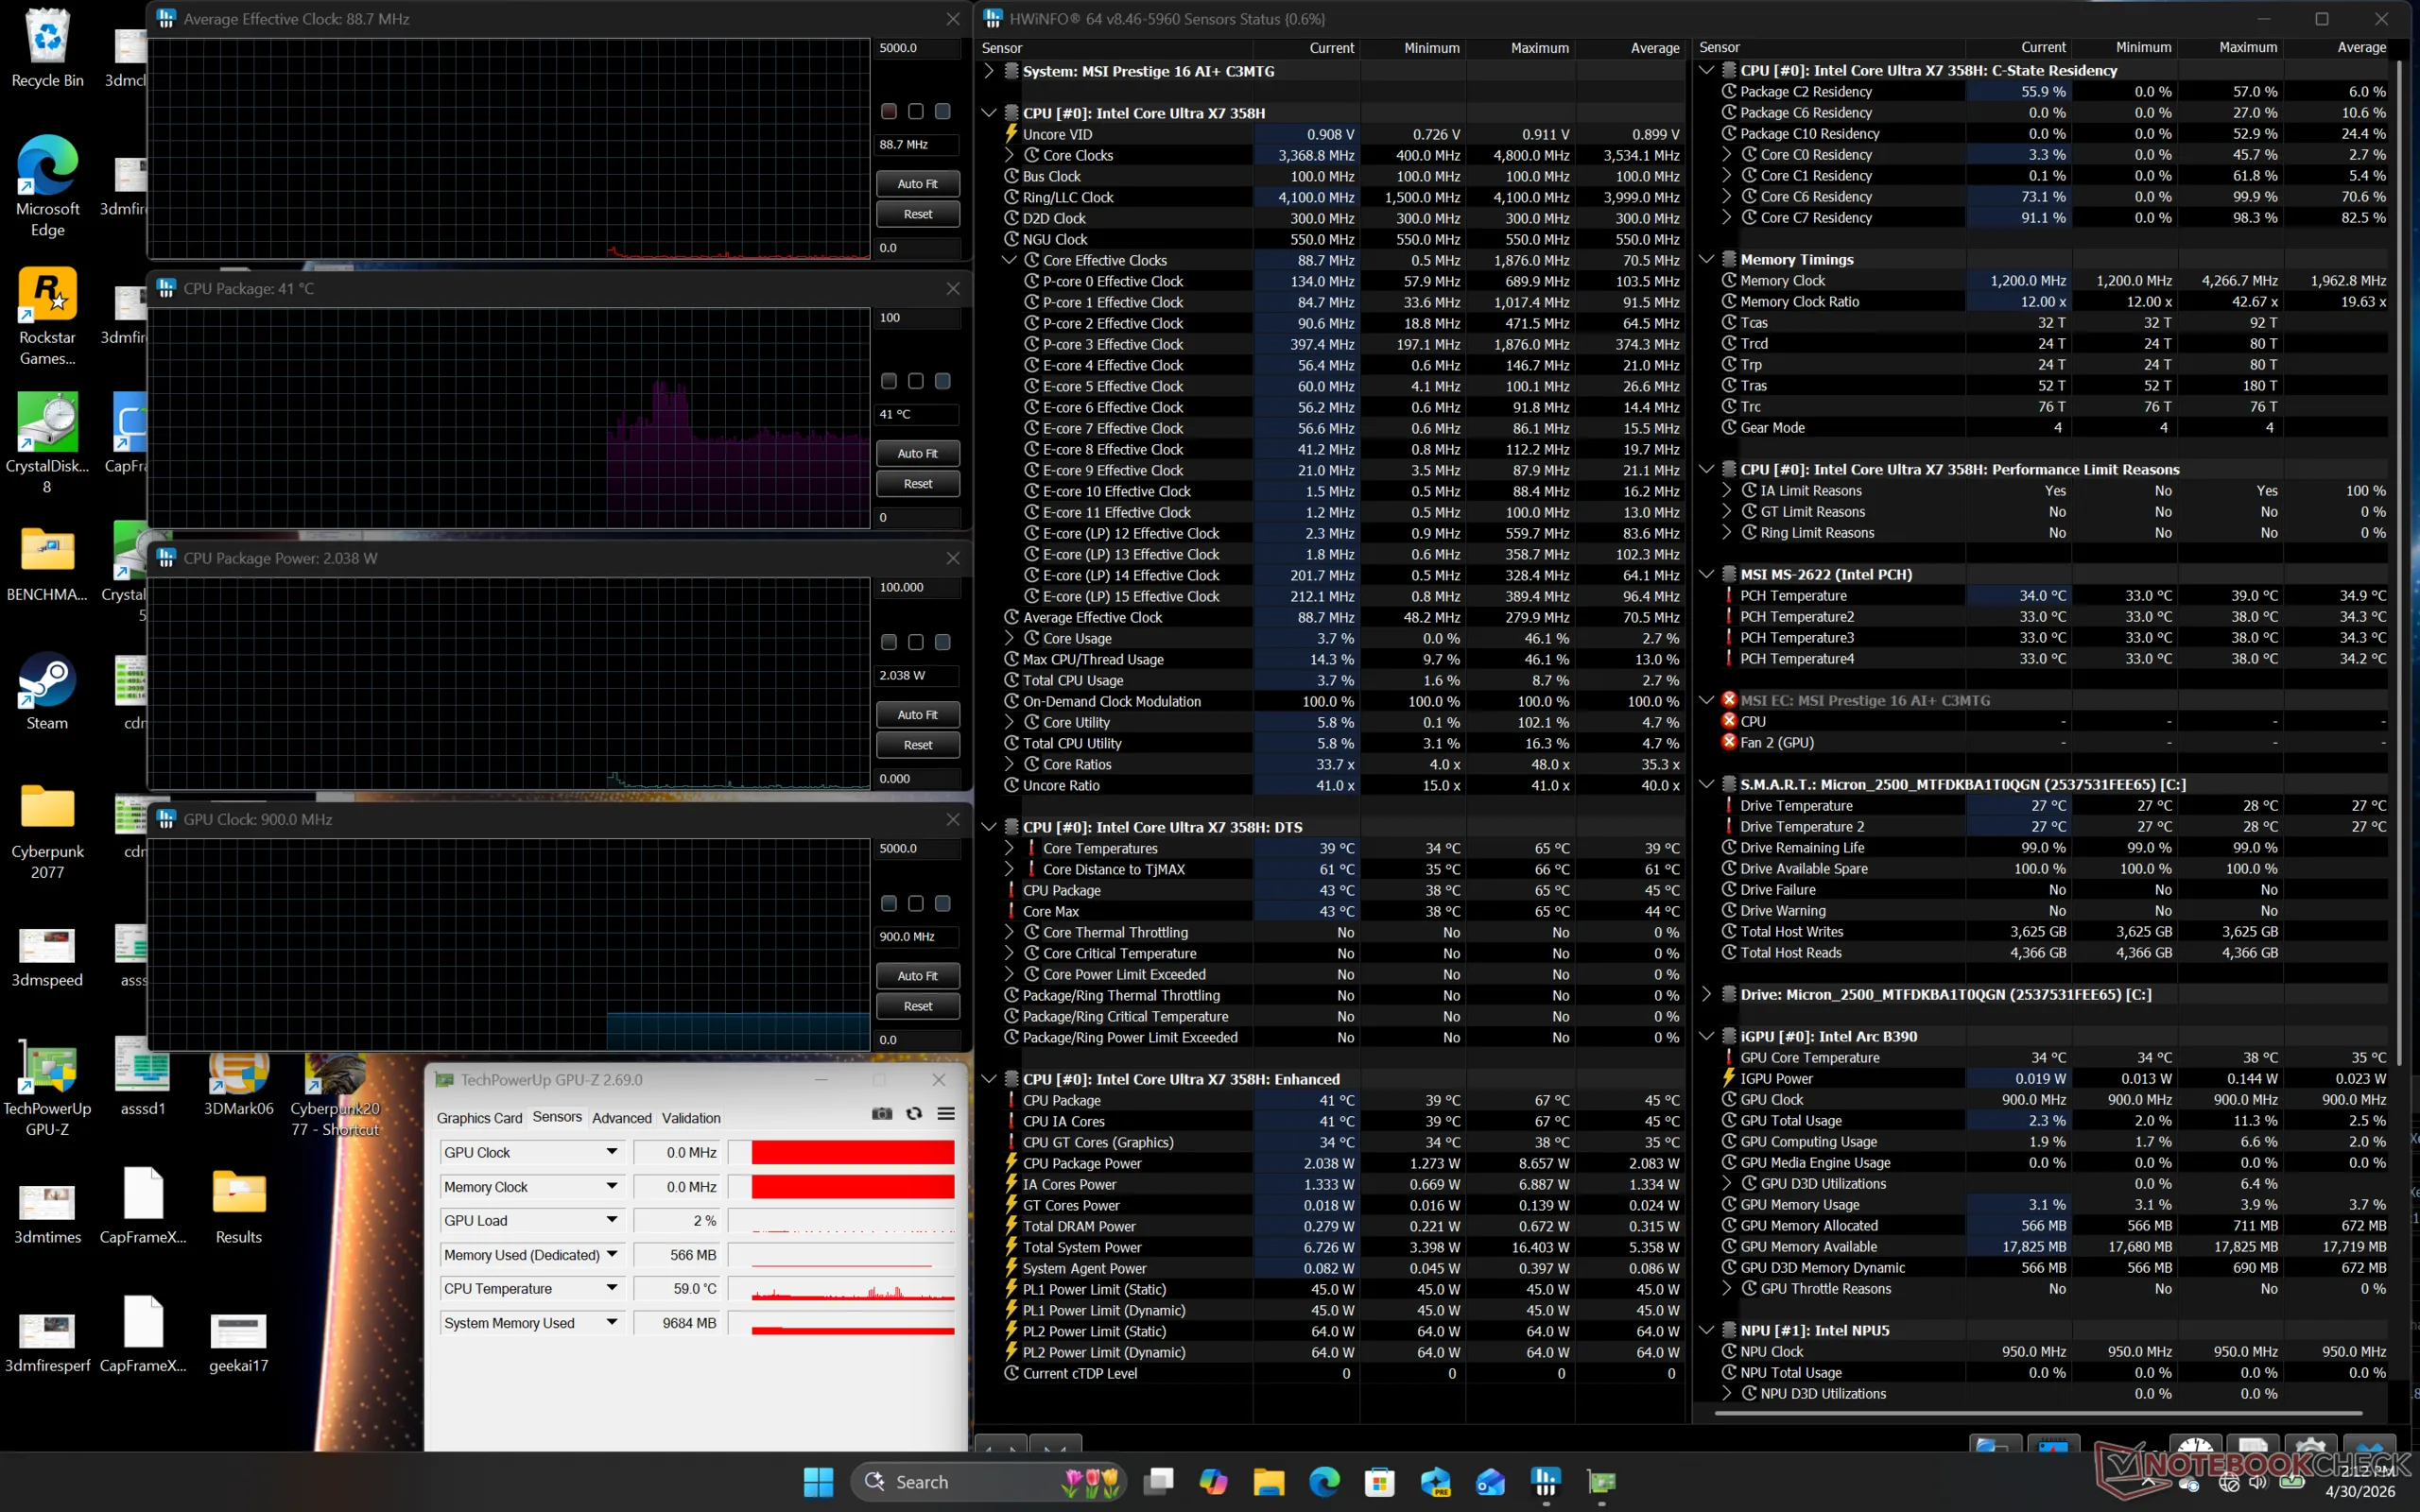
Bij het uitvoeren van Prime95 stress, steeg de CPU naar 3 GHz, 64 W en 97 C voordat hij snel daalde naar 2,3 GHz en 39 W om een stabiele kerntemperatuur van 90 C te handhaven. De resultaten zijn warmer dan wat we registreerden op de XPS 16 met exact dezelfde CPU, waar de kerntemperatuur stabiliseerde op slechts 78 C in vergelijking.
Wanneer Cyberpunk 2077 in de modus Prestaties wordt uitgevoerd om gamingstress weer te geven, stabiliseert de GPU op 2500 MHz, 38 W en 86 C, wat opnieuw veel warmer is dan de eerder genoemde Dell, met meer dan 20 C. Als het systeem wordt teruggeschakeld naar de modus Gebalanceerd, schakelt de GPU tussen 1220 MHz en 1850 MHz en tussen 16 W en 26 W, wat overeenkomt met zowel de langzamere grafische prestaties die hierboven zijn genoemd als het stillere ventilatorgeluid.
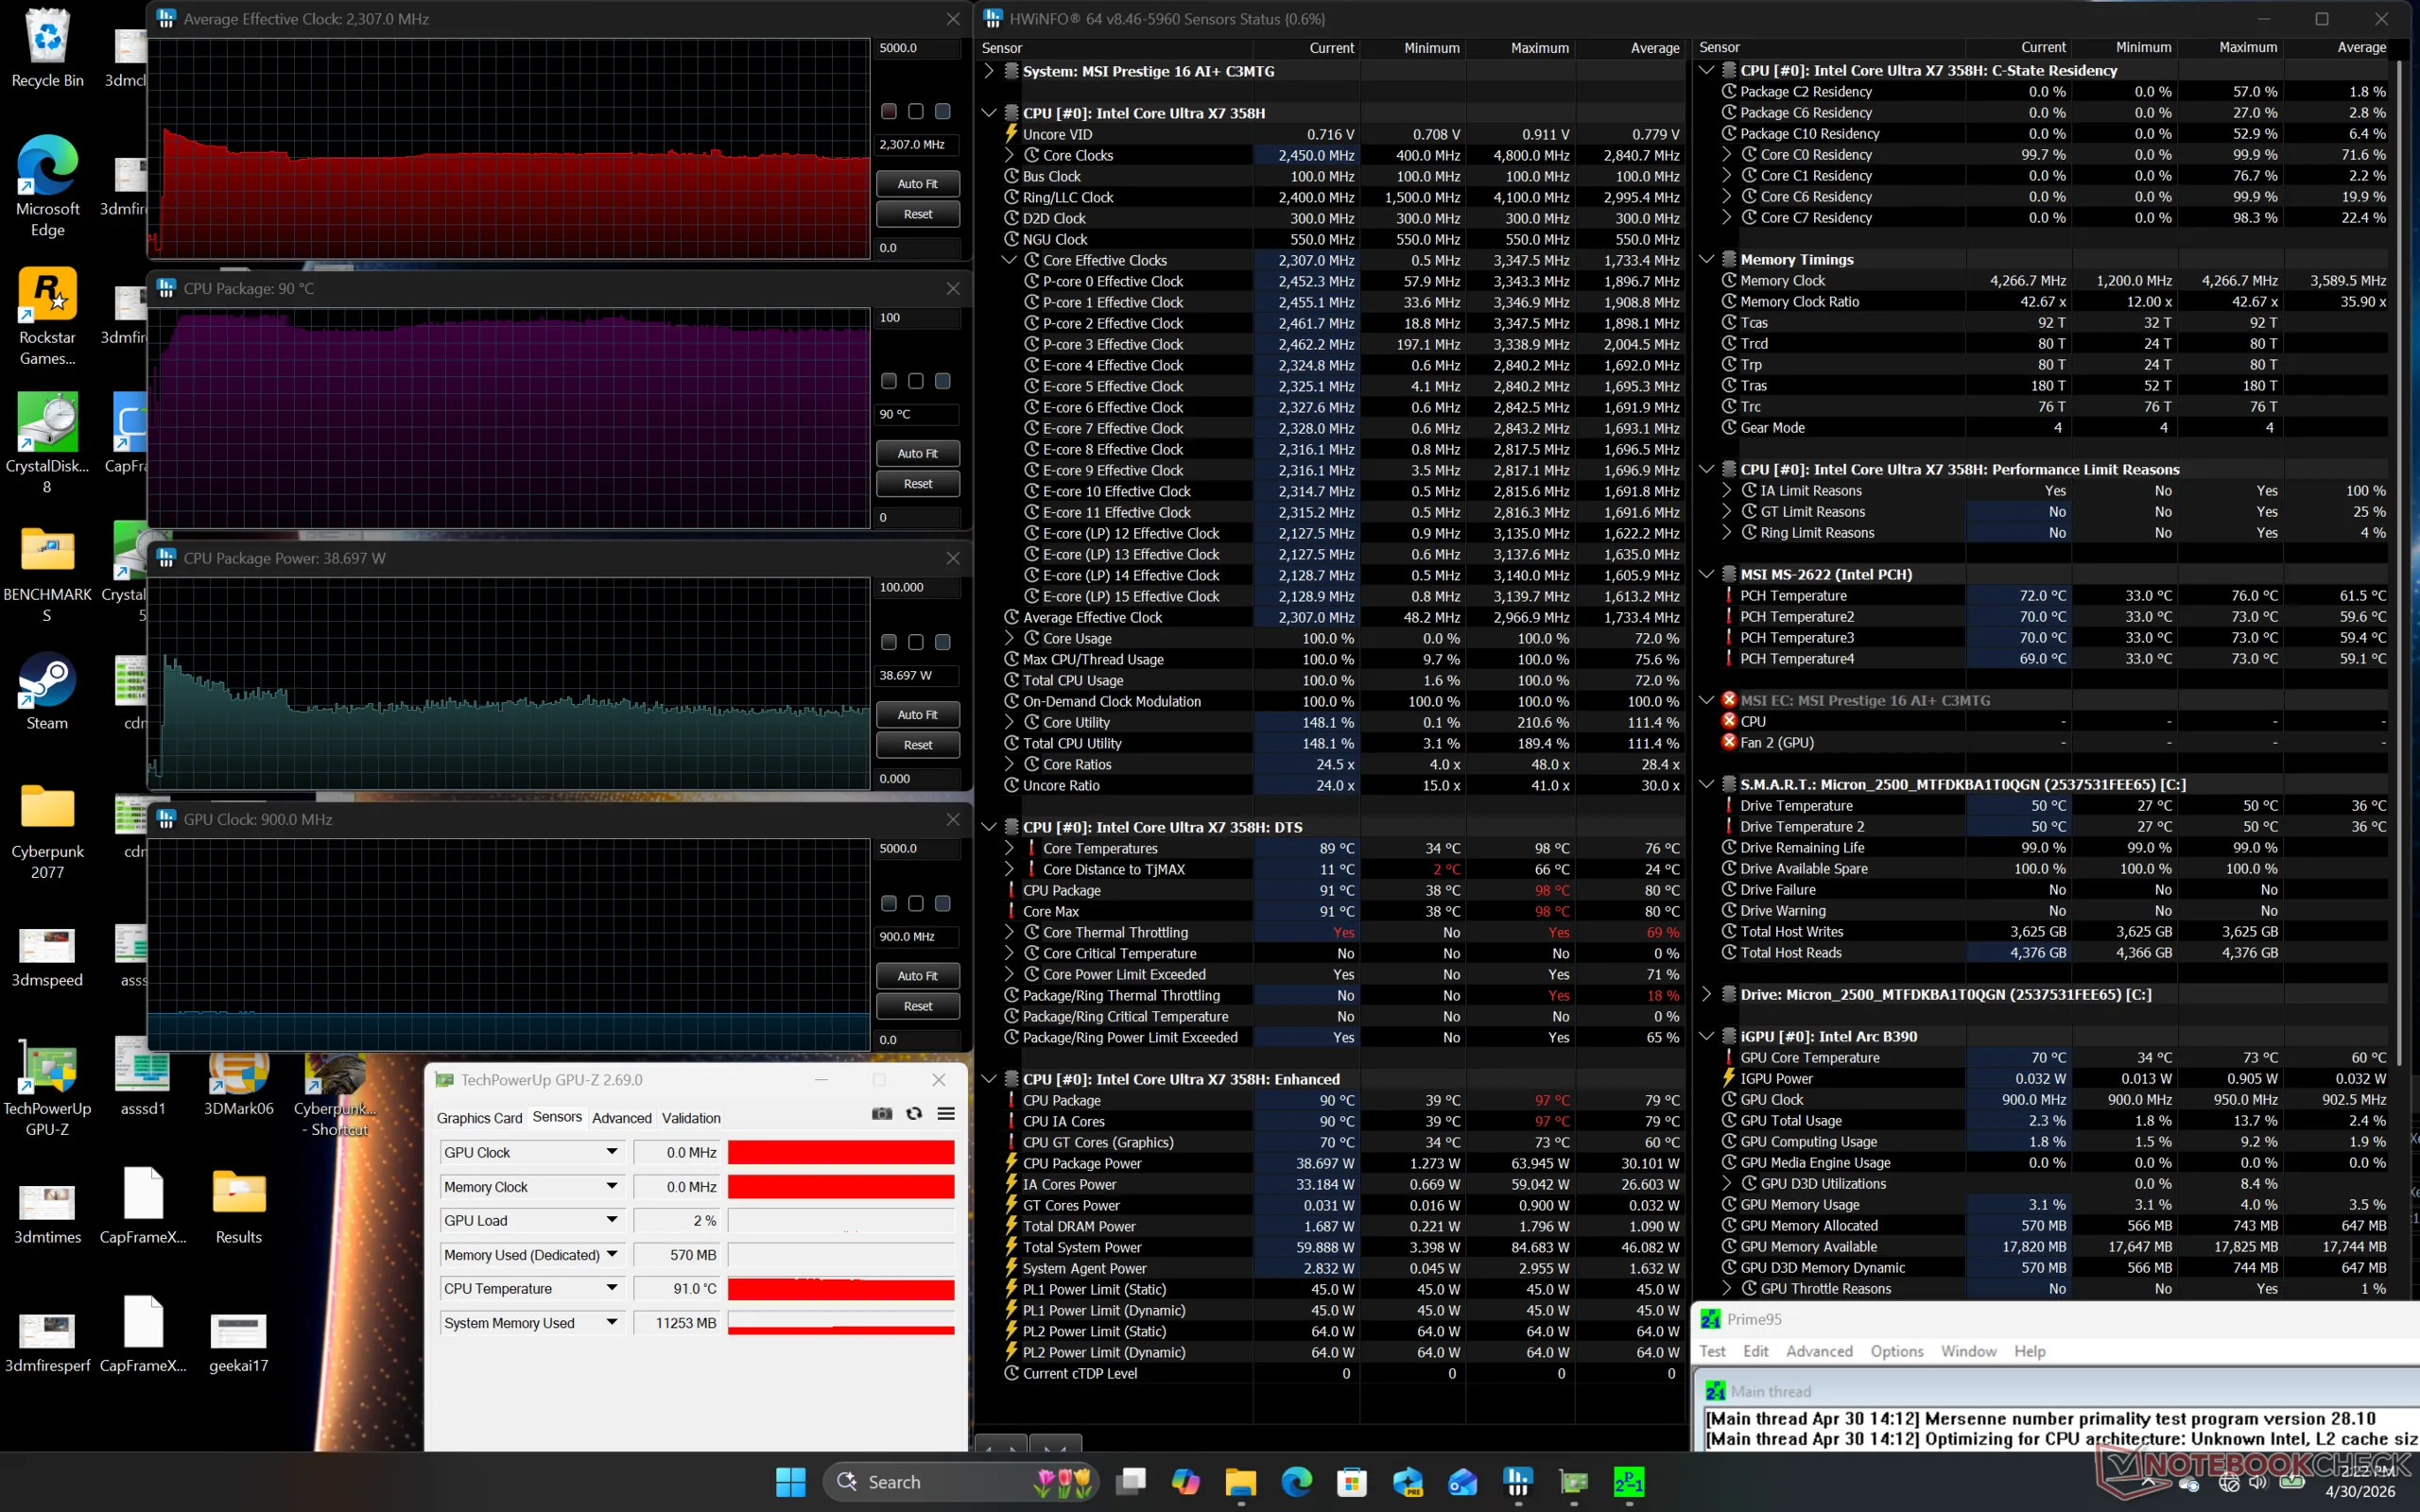
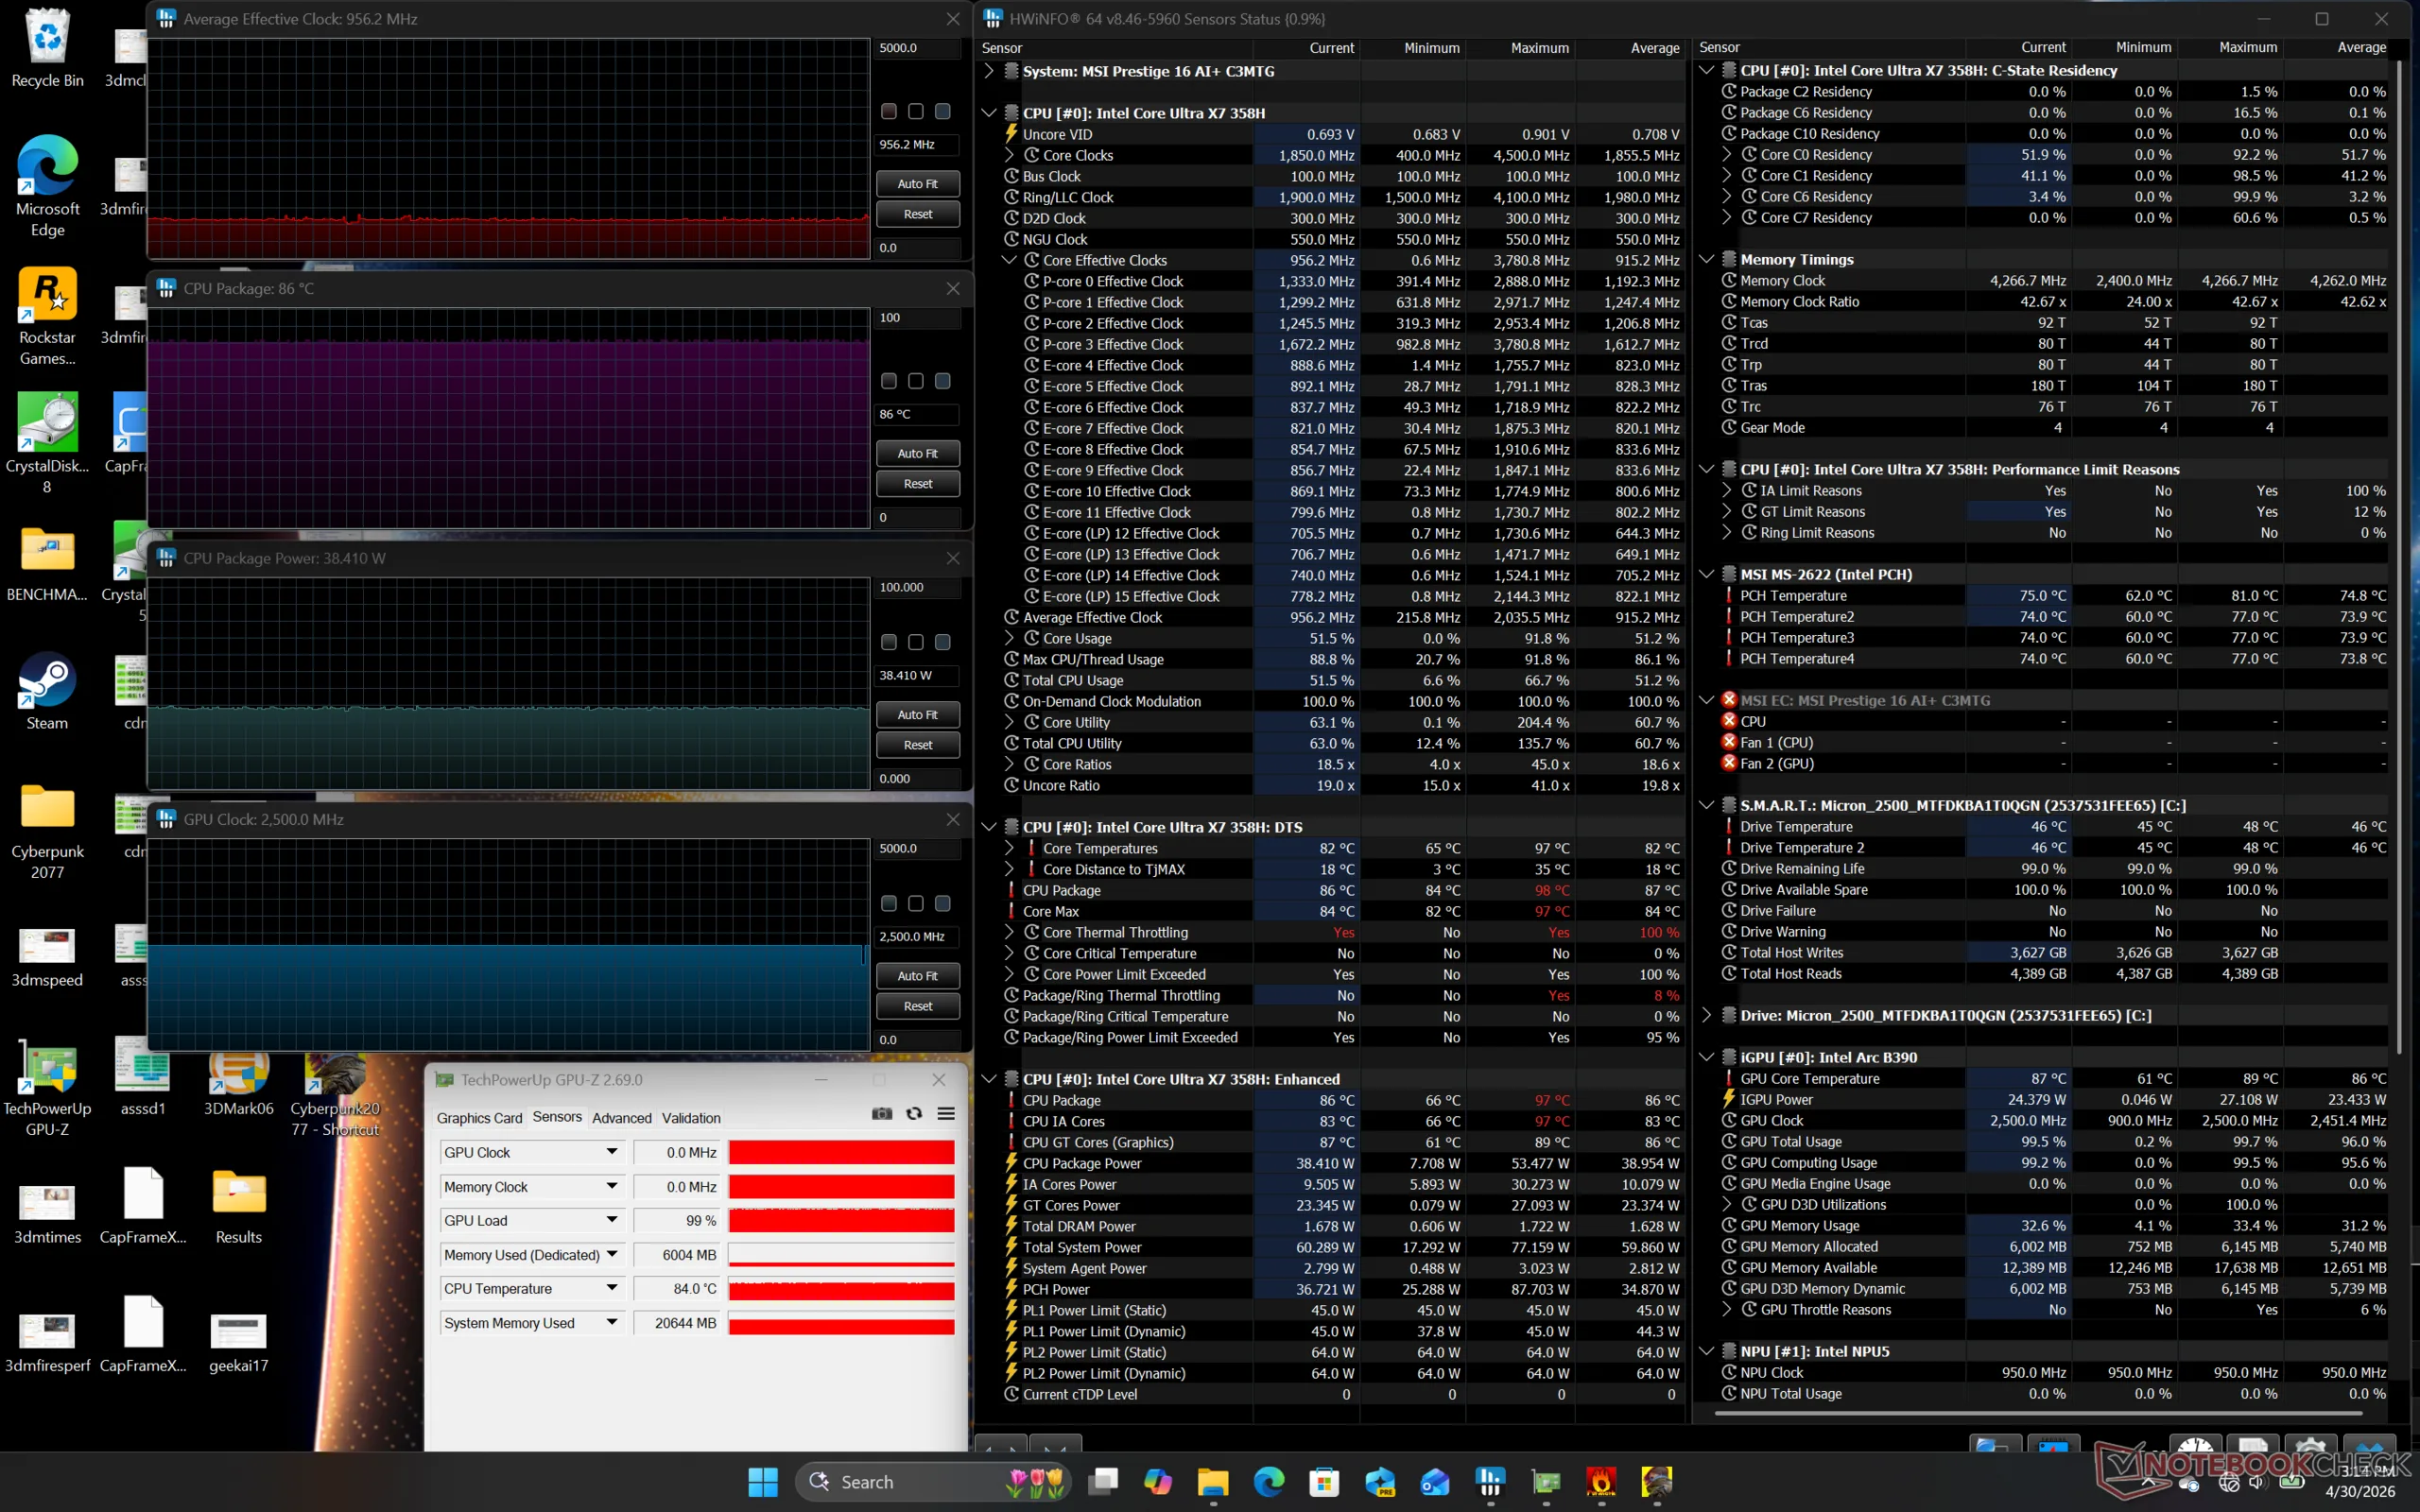
| Gemiddelde CPU-klok (GHz) | GPU-klok (MHz) | Gemiddelde CPU-temperatuur (°C) | |
| Inactief systeem | -- | 900 | 41 |
| Prime95-stress | 2.3 | -- | 90 |
| Prime95 + FurMark Stress | 1.8 | ~1350 | 90 |
| Cyberpunk 2077 Stress (Gebalanceerde modus) | 0.8 | 1220 - 1850 | 83 |
| Cyberpunk 2077 Stress (prestatiemodus) | 1.0 | 2500 | 86 |
Luidsprekers
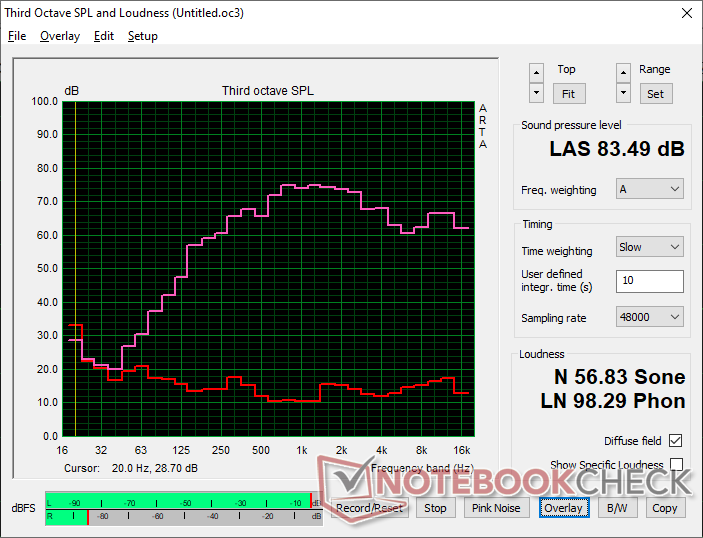
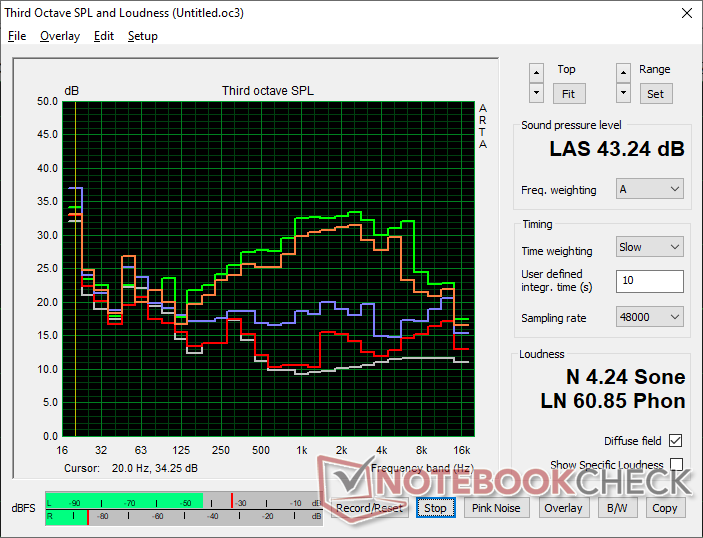
MSI Prestige 16 AI C3MTG audioanalyse
(+) | luidsprekers kunnen relatief luid spelen (83.5 dB)
Bas 100 - 315 Hz
(±) | verminderde zeebaars - gemiddeld 11.2% lager dan de mediaan
(±) | lineariteit van de lage tonen is gemiddeld (9% delta ten opzichte van de vorige frequentie)
Midden 400 - 2000 Hz
(±) | hogere middens - gemiddeld 5.9% hoger dan de mediaan
(+) | de middentonen zijn lineair (4% delta ten opzichte van de vorige frequentie)
Hoog 2 - 16 kHz
(+) | evenwichtige hoogtepunten - slechts 3.3% verwijderd van de mediaan
(+) | de hoge tonen zijn lineair (5.4% delta naar de vorige frequentie)
Algemeen 100 - 16.000 Hz
(+) | het totale geluid is lineair (12.8% verschil met de mediaan)
Vergeleken met dezelfde klasse
» 24% van alle geteste apparaten in deze klasse waren beter, 5% vergelijkbaar, 71% slechter
» De beste had een delta van 5%, het gemiddelde was 17%, de slechtste was 45%
Vergeleken met alle geteste toestellen
» 12% van alle geteste apparaten waren beter, 3% gelijk, 85% slechter
» De beste had een delta van 4%, het gemiddelde was 24%, de slechtste was 134%
Apple MacBook Pro 16 2021 M1 Pro audioanalyse
(+) | luidsprekers kunnen relatief luid spelen (84.7 dB)
Bas 100 - 315 Hz
(+) | goede baars - slechts 3.8% verwijderd van de mediaan
(+) | de lage tonen zijn lineair (5.2% delta naar de vorige frequentie)
Midden 400 - 2000 Hz
(+) | evenwichtige middens - slechts 1.3% verwijderd van de mediaan
(+) | de middentonen zijn lineair (2.1% delta ten opzichte van de vorige frequentie)
Hoog 2 - 16 kHz
(+) | evenwichtige hoogtepunten - slechts 1.9% verwijderd van de mediaan
(+) | de hoge tonen zijn lineair (2.7% delta naar de vorige frequentie)
Algemeen 100 - 16.000 Hz
(+) | het totale geluid is lineair (4.6% verschil met de mediaan)
Vergeleken met dezelfde klasse
» 0% van alle geteste apparaten in deze klasse waren beter, 0% vergelijkbaar, 100% slechter
» De beste had een delta van 5%, het gemiddelde was 17%, de slechtste was 45%
Vergeleken met alle geteste toestellen
» 0% van alle geteste apparaten waren beter, 0% gelijk, 100% slechter
» De beste had een delta van 4%, het gemiddelde was 24%, de slechtste was 134%
Energiebeheer
Stroomverbruik
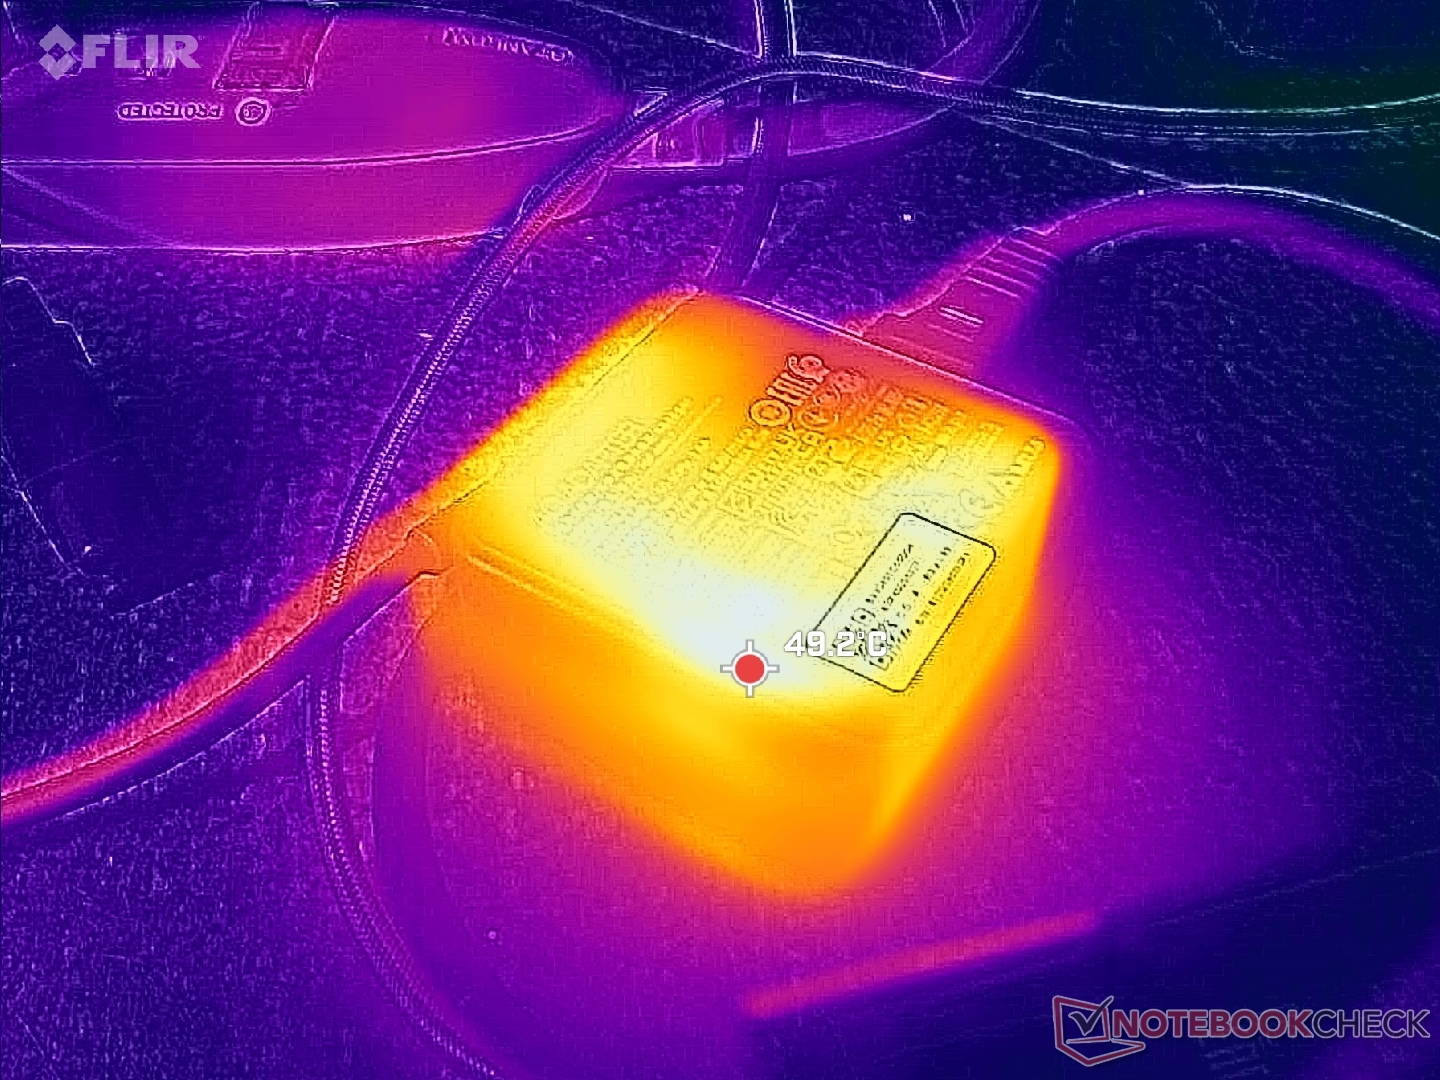
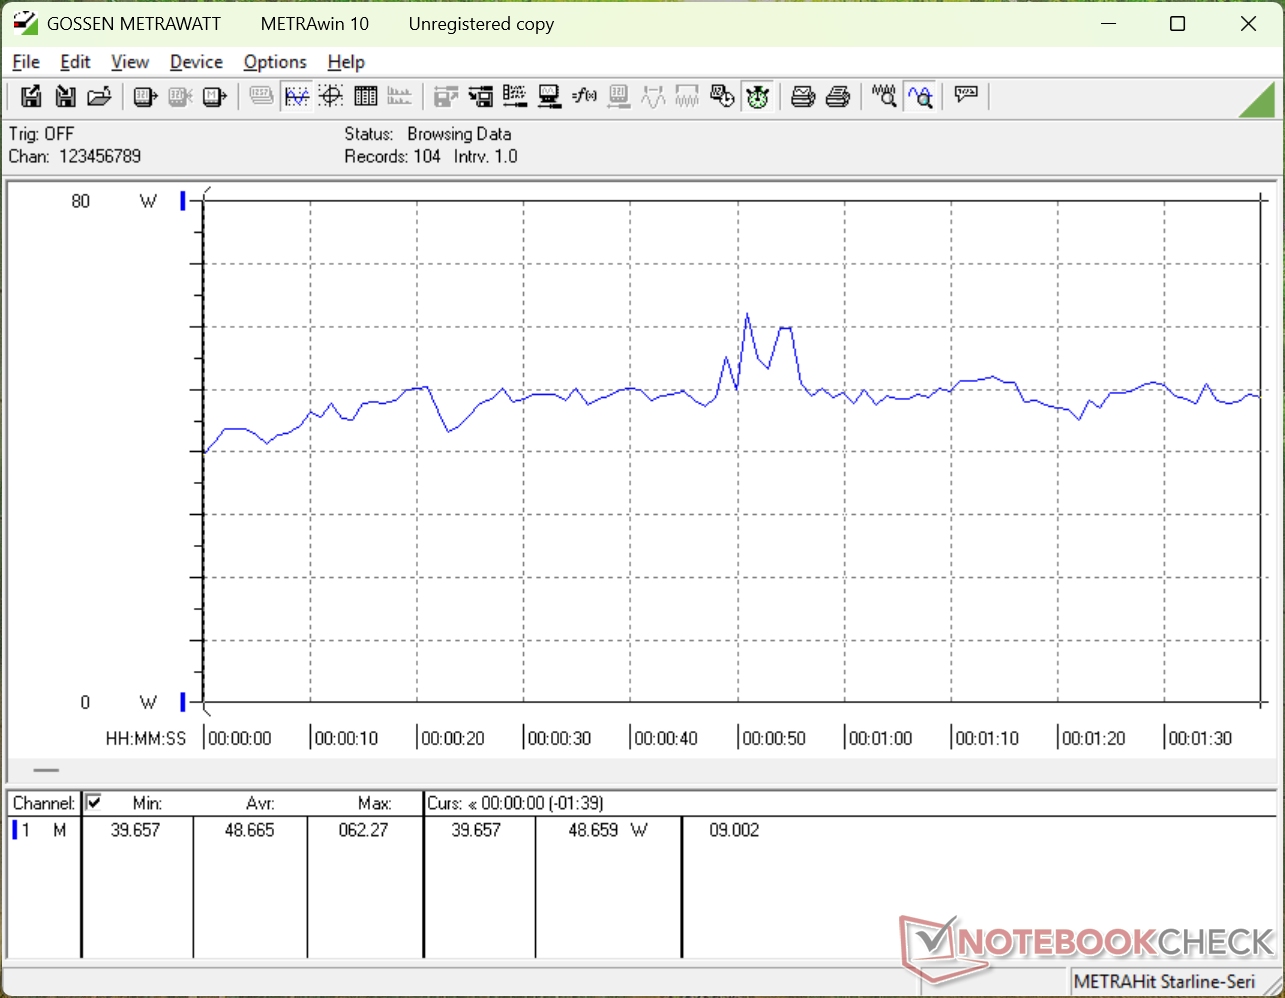
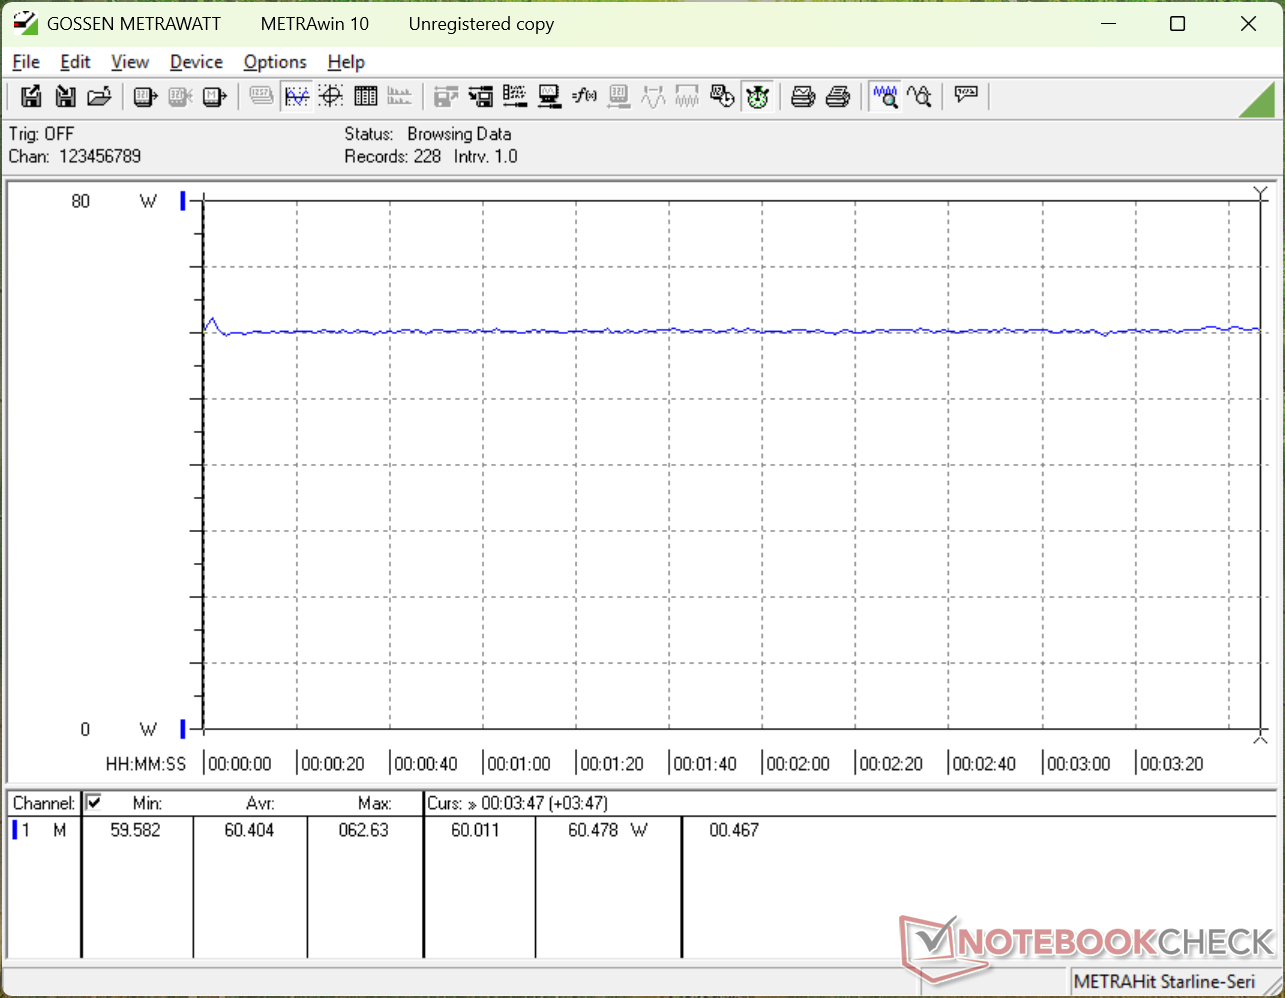
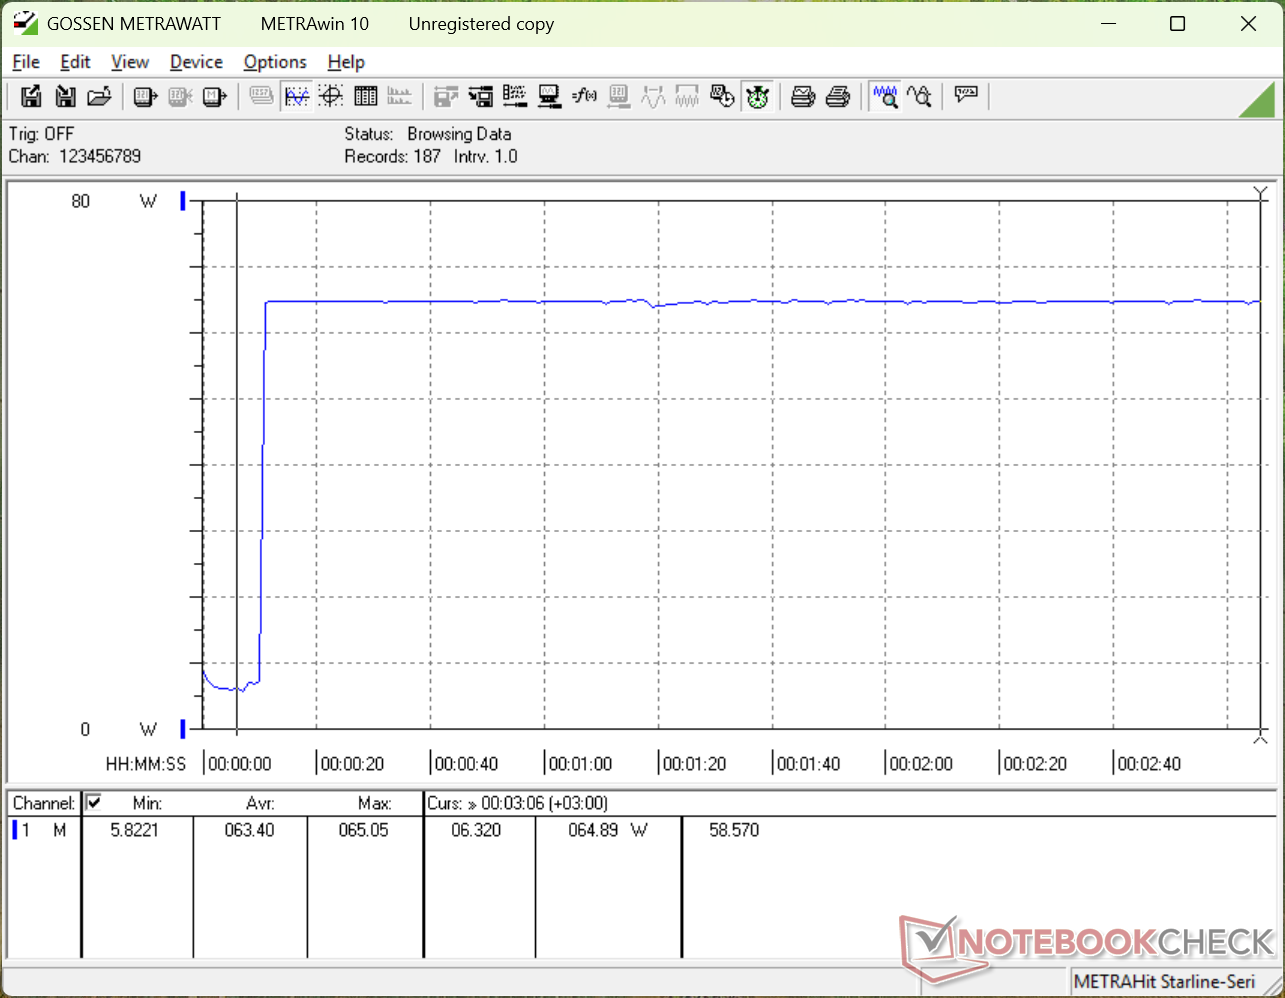
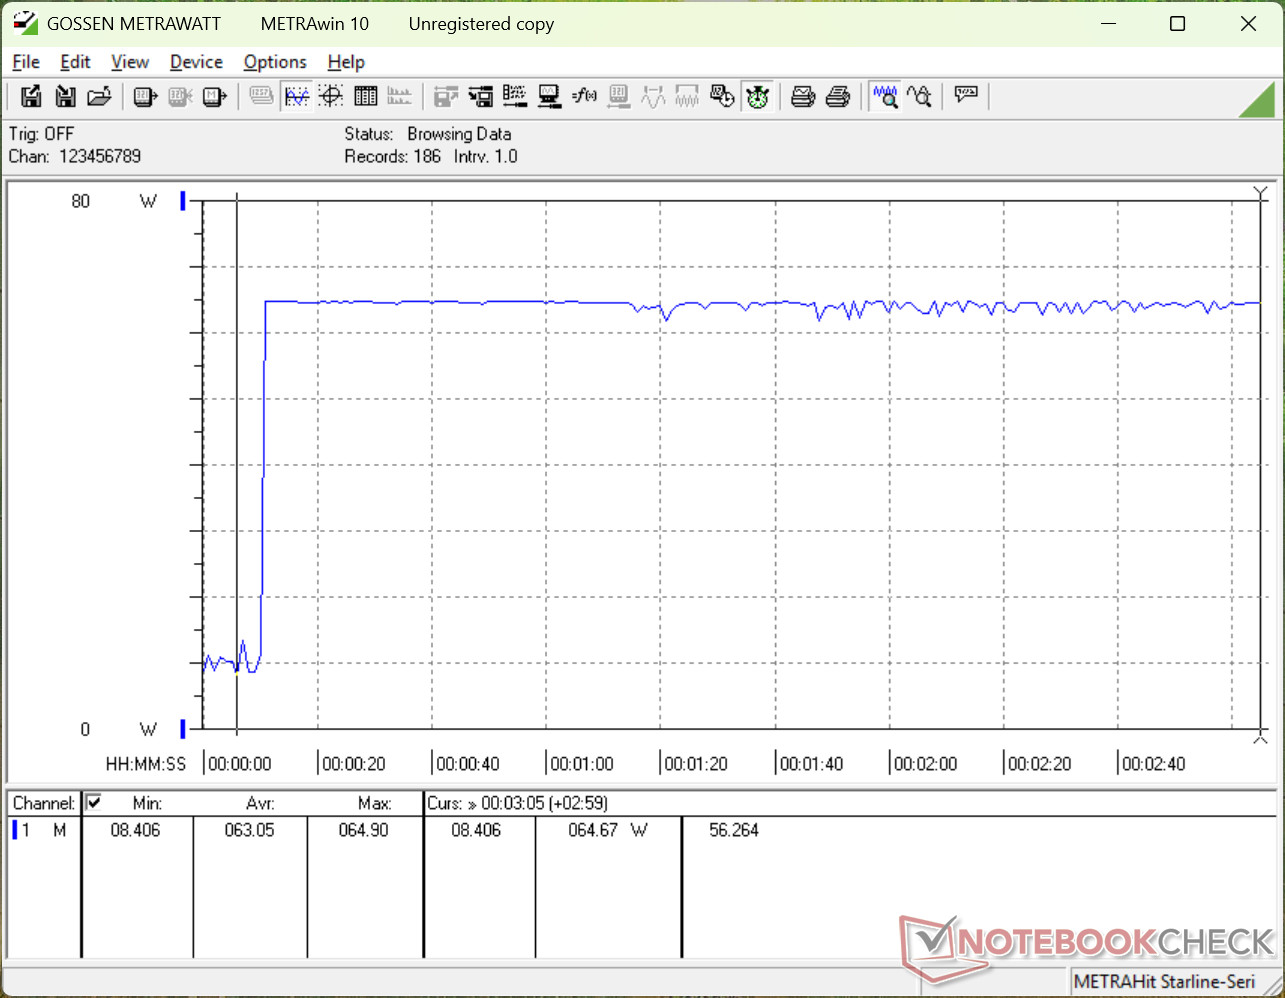
Het model wordt geleverd met een kleinere 65 W USB-C wisselstroomadapter (~6,5 x 6,5 x 3,0 cm) in plaats van de 100 W adapter die bij het 2025 model werd geleverd. Desondanks is het totale verbruik tussen de twee modellen vergelijkbaar, zoals de grafieken hieronder laten zien. De prestaties-per-watt zijn sterk verbeterd op grafisch gebied, want de nieuwe Prestige 16 is tot 80 procent sneller terwijl hij bijna evenveel stroom verbruikt.
Een gevolg van de kleinere 65 W AC-adapter is de lagere Turbo Boost prestatie. Bij het uitvoeren van Prime95 stress, bijvoorbeeld, kon de 2025 Prestige 16 tijdelijk maar liefst 103 W verbruiken, vergeleken met slechts 66 W op onze 2026 Prestige 16. Het oudere model kon dus iets beter presteren dan de 2026 Prestige 16. Het oudere model kan dus iets beter presteren dan het nieuwere model op het gebied van CPU-prestaties tijdens de eerste minuut van de stresstest, wanneer Turbo Boost het meest effectief is.
Houd er rekening mee dat de oplaadsnelheden aanzienlijk vertragen als er tegelijkertijd veeleisende belastingen worden uitgevoerd, aangezien de 65 W netadapter aantoonbaar te weinig vermogen heeft; alleen al het uitvoeren van Cyberpunk 2077 verbruikt meer dan 60 W.
| Uit / Standby | |
| Inactief | |
| Belasting |
|
Key:
min: | |
| MSI Prestige 16 AI C3MTG Ultra X7 358H, Arc B390 Panther Lake iGPU, Micron 2500 1TB MTFDKBA1T0QGN, OLED, 2880x1800, 16" | MSI Prestige 16 AI Evo B2HMG Ultra 9 285H, Arc 140T, Micron 2500 1TB MTFDKBA1T0QGN, IPS, 2560x1600, 16" | Dell XPS 16 Core Ultra X7 358H Ultra X7 358H, Arc B390 Panther Lake iGPU, , OLED, 3200x2000, 16" | Asus ZenBook S16 UM5606GA Ryzen AI 9 465, Radeon 880M, SanDisk PC SN5100S, OLED, 2880x1800, 16" | Lenovo ThinkBook 16 G7+ AMD Ryzen AI 9 365, Radeon 880M, Samsung PM9C1a MZAL81T0HDLB, IPS, 3200x2000, 16" | HP Envy x360 2-in-1 16-ad0097nr R7 8840HS, Radeon 780M, KIOXIA BG5 KBG50ZNV1T02, OLED, 2880x1800, 16" | |
|---|---|---|---|---|---|---|
| Power Consumption | -22% | -0% | -2% | -55% | -10% | |
| Idle Minimum * (Watt) | 3.3 | 4.4 -33% | 4 -21% | 3.7 -12% | 6.4 -94% | 5 -52% |
| Idle Average * (Watt) | 7.4 | 9.2 -24% | 4.4 41% | 7.4 -0% | 14.1 -91% | 6.2 16% |
| Idle Maximum * (Watt) | 13 | 9.5 27% | 10.2 22% | 9.5 27% | 14.3 -10% | 14.7 -13% |
| Load Average * (Watt) | 48.7 | 66.9 -37% | 44.2 9% | 57.9 -19% | 83.4 -71% | 49.9 -2% |
| Cyberpunk 2077 ultra * (Watt) | 60.4 | 68.8 -14% | 62.6 -4% | 58.5 3% | 79.8 -32% | |
| Cyberpunk 2077 ultra external monitor * (Watt) | 60.4 | 67.4 -12% | 62.4 -3% | 57 6% | 77.5 -28% | |
| Load Maximum * (Watt) | 64.8 | 102.9 -59% | 94.6 -46% | 76.9 -19% | 102.9 -59% | 65 -0% |
| Witcher 3 ultra * (Watt) | 54.5 |
* ... kleiner is beter
Stroomverbruik Cyberpunk / Stresstest
Stroomverbruik externe monitor
Levensduur batterij
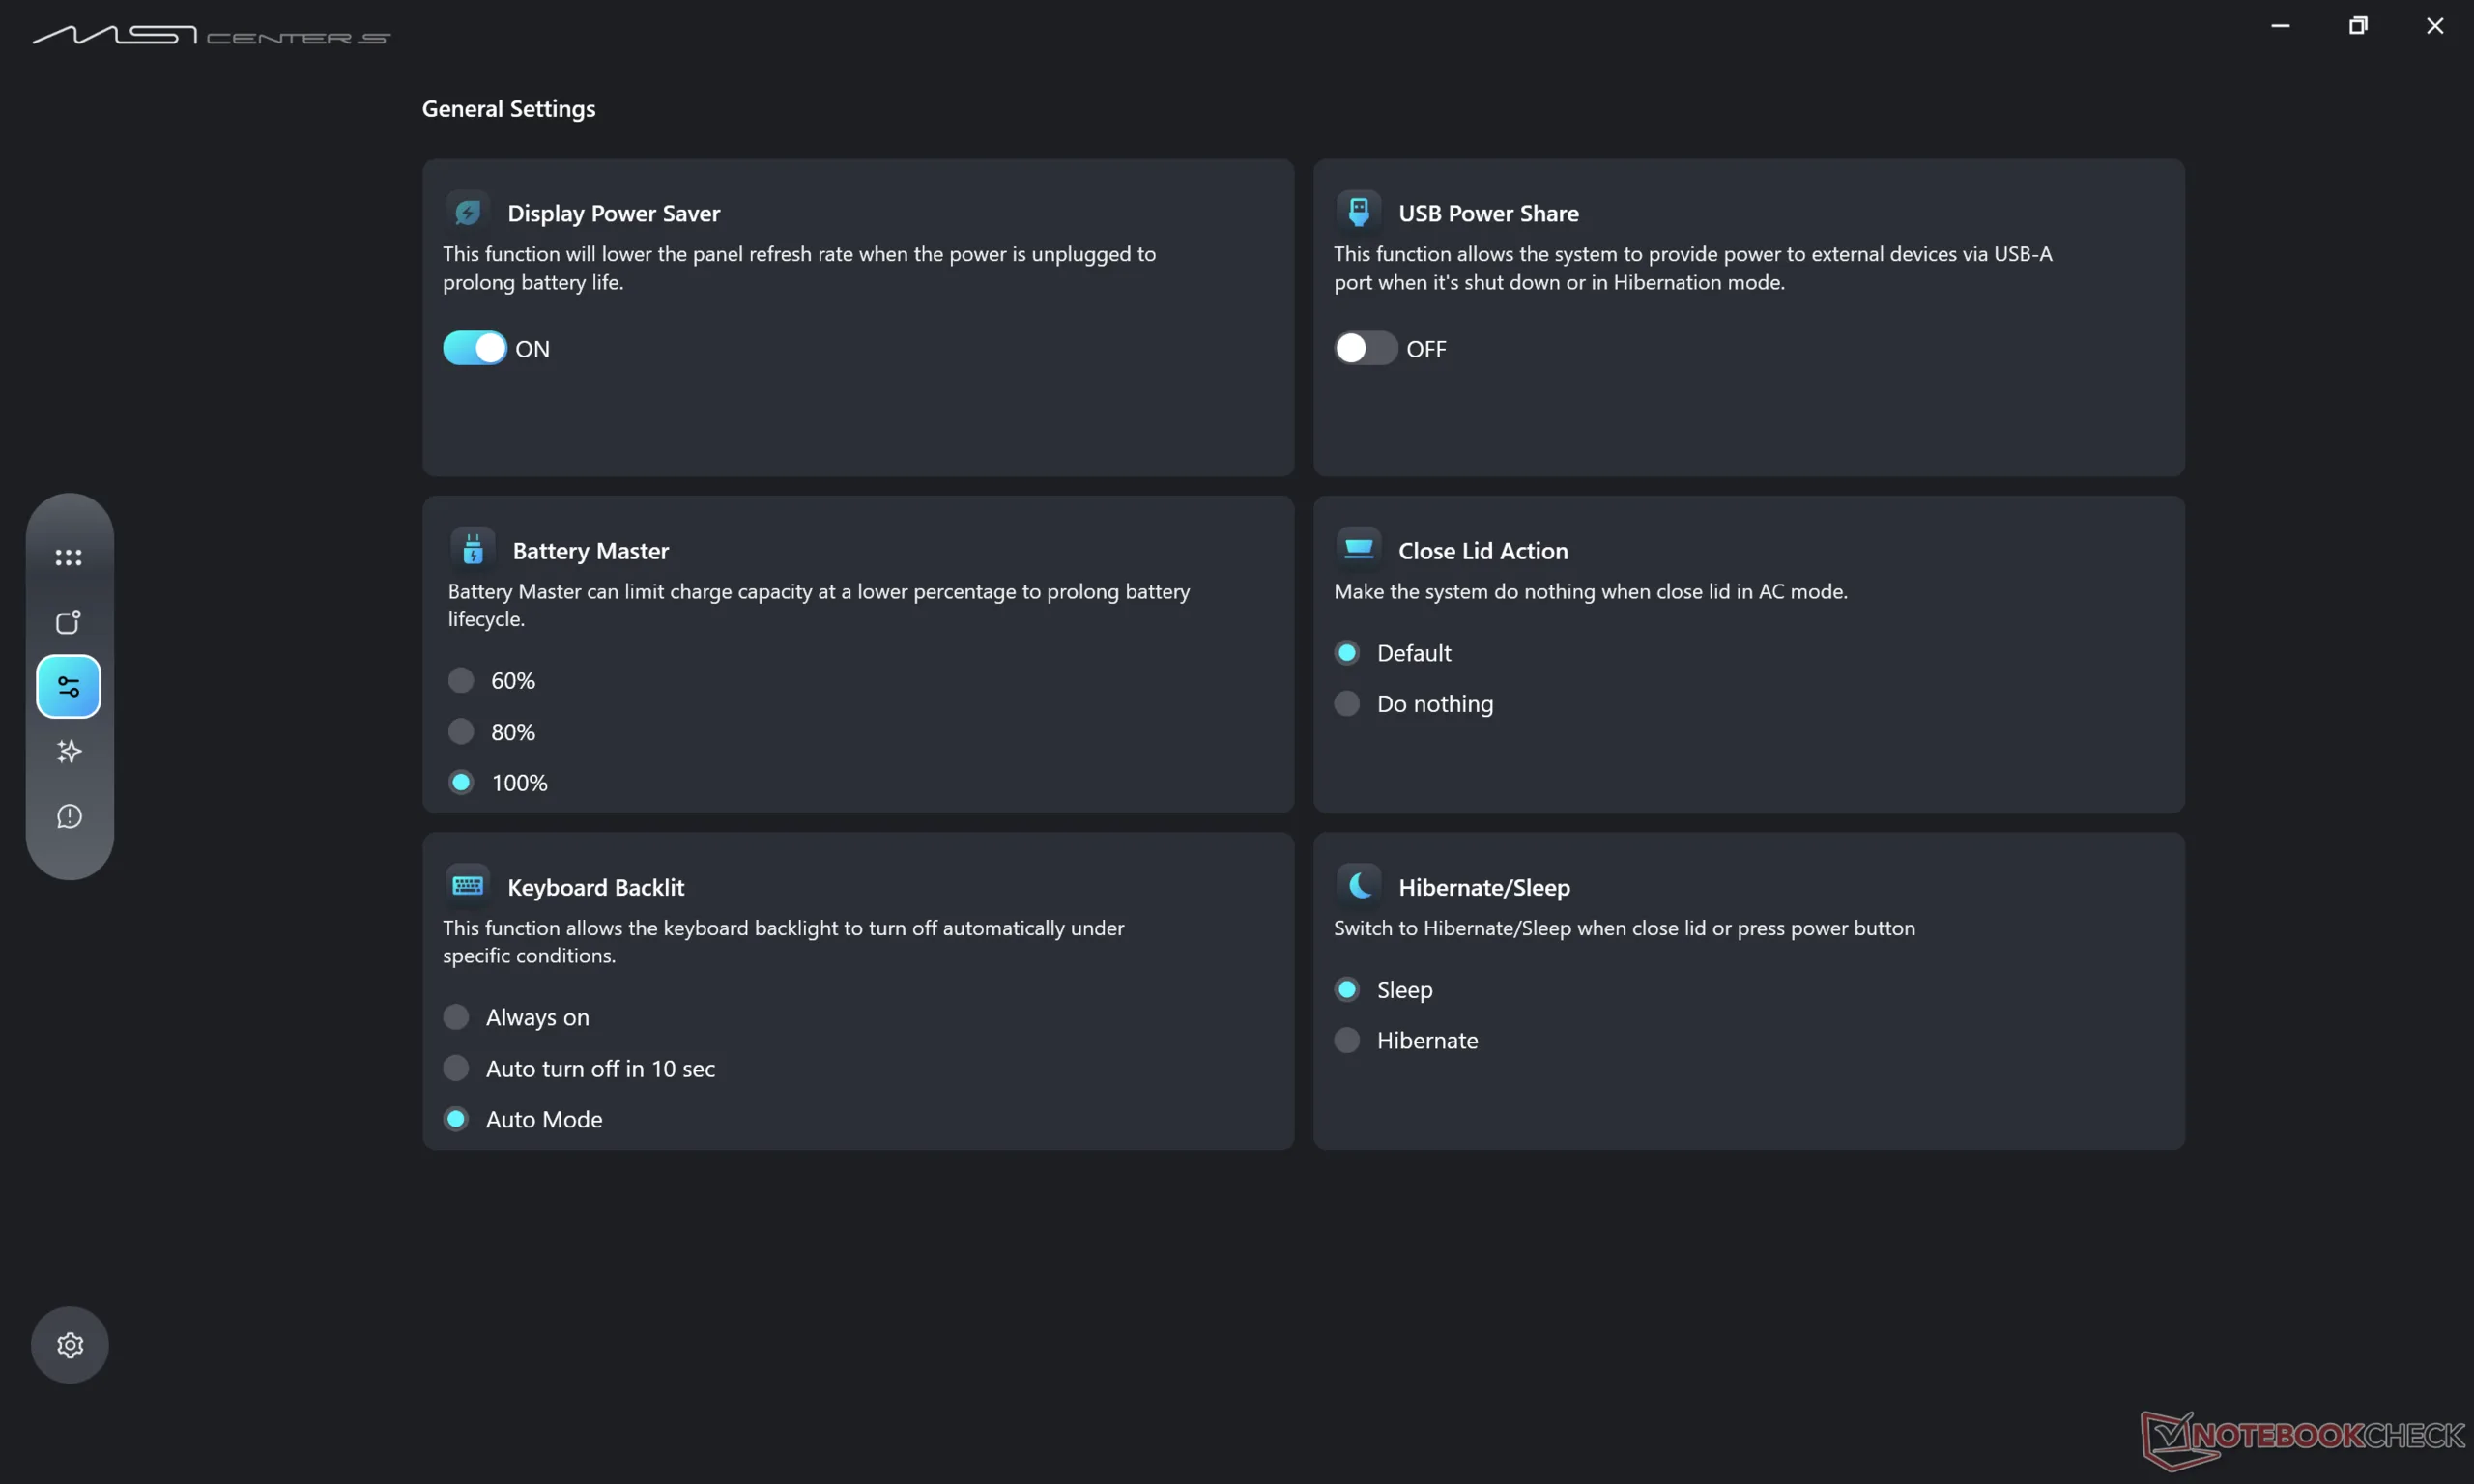
De looptijden zijn dit jaar korter, deels door het kleinere batterijpak (99 Wh vs. 81 Wh) en de overstap van IPS naar OLED. Dit effect wordt echter enigszins gecompenseerd door de efficiëntiewinst die elders in het systeem is geboekt. We kunnen een WLAN-looptijd van bijna 13 uur noteren, wat 3 tot 4 uur korter is dan het model uit 2025.
| MSI Prestige 16 AI C3MTG Ultra X7 358H, Arc B390 Panther Lake iGPU, 81 Wh | MSI Prestige 16 AI Evo B2HMG Ultra 9 285H, Arc 140T, 99.9 Wh | Dell XPS 16 Core Ultra X7 358H Ultra X7 358H, Arc B390 Panther Lake iGPU, 70 Wh | Asus ZenBook S16 UM5606GA Ryzen AI 9 465, Radeon 880M, 83 Wh | Lenovo ThinkBook 16 G7+ AMD Ryzen AI 9 365, Radeon 880M, 85 Wh | HP Envy x360 2-in-1 16-ad0097nr R7 8840HS, Radeon 780M, 68 Wh | |
|---|---|---|---|---|---|---|
| Batterijduur | 31% | -18% | 4% | -14% | -39% | |
| WiFi v1.3 (h) | 12.6 | 16.5 31% | 10.3 -18% | 13.1 4% | 10.8 -14% | 7.7 -39% |
| H.264 (h) | 20.8 | 13.9 | ||||
| Load (h) | 2.4 | 1.9 | ||||
| Reader / Idle (h) | 15.6 |
Notebookcheck Beoordeling
De 2026 MSI Prestige 16 is een van de dunste prosumer laptops met Intel Panther Lake, maar de concurrentie is groot als het gaat om webcamresolutie, schermopties en geïntegreerde poorten.
MSI Prestige 16 AI C3MTG
- 07-05-2026 v8
Allen Ngo
 Total Sustainability Score:
 Potentiële concurrenten in vergelijking
Afbeelding | Model / recensie | prijs | Gewicht | Hoogte | Scherm |
|---|---|---|---|---|---|
1. 86.4%  | MSI Prestige 16 AI C3MTG Intel Core Ultra X7 358H ⎘ Intel Arc B390 12 Xe3 Panther Lake iGPU ⎘ 32 GB Geheugen, 1024 GB SSD | Amazon: Catalogusprijs: 2100 USD | 1.6 kg | 13.9 mm | 16.00" 2880x1800 212 PPI OLED |
2. 82.8%  | MSI Prestige 16 AI Evo B2HMG Intel Core Ultra 9 285H ⎘ Intel Arc Graphics 140T ⎘ 32 GB Geheugen, 1024 GB SSD | Amazon: 1. $1,479.00 MSI Prestige 16 AI+ Evo 16" ... 2. $1,397.87 MSI Prestige 14 AI+ EVO PRE1... 3. $1,199.00 msi Prestige A16 AI+ (2025) ... | 1.6 kg | 18.95 mm | 16.00" 2560x1600 189 PPI IPS |
3. 87.2%  | Dell XPS 16 Core Ultra X7 358H Intel Core Ultra X7 358H ⎘ Intel Arc B390 12 Xe3 Panther Lake iGPU ⎘ 32 GB Geheugen | Amazon: 1. $2,599.00 Dell Premium 16 (XPS 16 2025... 2. $1,977.99 Dell Premium 16 (Previously ... 3. $2,599.00 Dell Premium 16 (XPS 16 2025... Catalogusprijs: 2350 USD | 1.7 kg | 14.62 mm | 16.00" 3200x2000 236 PPI OLED |
4. 86.6%  | Asus ZenBook S16 UM5606GA AMD Ryzen AI 9 465 ⎘ AMD Radeon 880M ⎘ 32 GB Geheugen, 1024 GB SSD | Amazon: Catalogusprijs: 1799€ | 1.5 kg | 12.9 mm | 16.00" 2880x1800 212 PPI OLED |
5. 86.6%  | Lenovo ThinkBook 16 G7+ AMD AMD Ryzen AI 9 365 ⎘ AMD Radeon 880M ⎘ 32 GB Geheugen, 1024 GB SSD | Amazon: 1. $999.95 Lenovo ThinkBook 16 G7 Busin... 2. $1,199.99 Lenovo ThinkBook 16 G7 Busin... 3. $979.95 Oemgenuine Lenovo ThinkBook ... Catalogusprijs: 1399€ | 1.9 kg | 16.9 mm | 16.00" 3200x2000 236 PPI IPS |
6. 87.2% v7 (old)  | HP Envy x360 2-in-1 16-ad0097nr AMD Ryzen 7 8840HS ⎘ AMD Radeon 780M ⎘ 16 GB Geheugen, 1024 GB SSD | Amazon: 1. $149.99 Replacement for HP Envy x360... 2. $256.99 Replacement for HP Envy x360... 3. $695.00 HP Envy x360 2-in-1 Laptop, ... Catalogusprijs: 1300 USD | 1.8 kg | 18.3 mm | 16.00" 2880x1800 212 PPI OLED |
Transparantie
De selectie van te beoordelen apparaten wordt gemaakt door onze redactie. Het testexemplaar werd ten behoeve van deze beoordeling door de fabrikant of detailhandelaar in bruikleen aan de auteur verstrekt. De kredietverstrekker had geen invloed op deze recensie, noch ontving de fabrikant vóór publicatie een exemplaar van deze recensie. Er bestond geen verplichting om deze recensie te publiceren. Als onafhankelijk mediabedrijf is Notebookcheck niet onderworpen aan het gezag van fabrikanten, detailhandelaren of uitgevers.
[transparency_disclaimer]Dit is hoe Notebookcheck test
Elk jaar beoordeelt Notebookcheck onafhankelijk honderden laptops en smartphones met behulp van gestandaardiseerde procedures om ervoor te zorgen dat alle resultaten vergelijkbaar zijn. We hebben onze testmethoden al zo'n 20 jaar voortdurend ontwikkeld en daarbij de industriestandaard bepaald. In onze testlaboratoria wordt gebruik gemaakt van hoogwaardige meetapparatuur door ervaren technici en redacteuren. Deze tests omvatten een validatieproces in meerdere fasen. Ons complexe beoordelingssysteem is gebaseerd op honderden goed onderbouwde metingen en benchmarks, waardoor de objectiviteit behouden blijft. Meer informatie over onze testmethoden kunt u hier vinden.

