Uitspraak - Normen verhogen
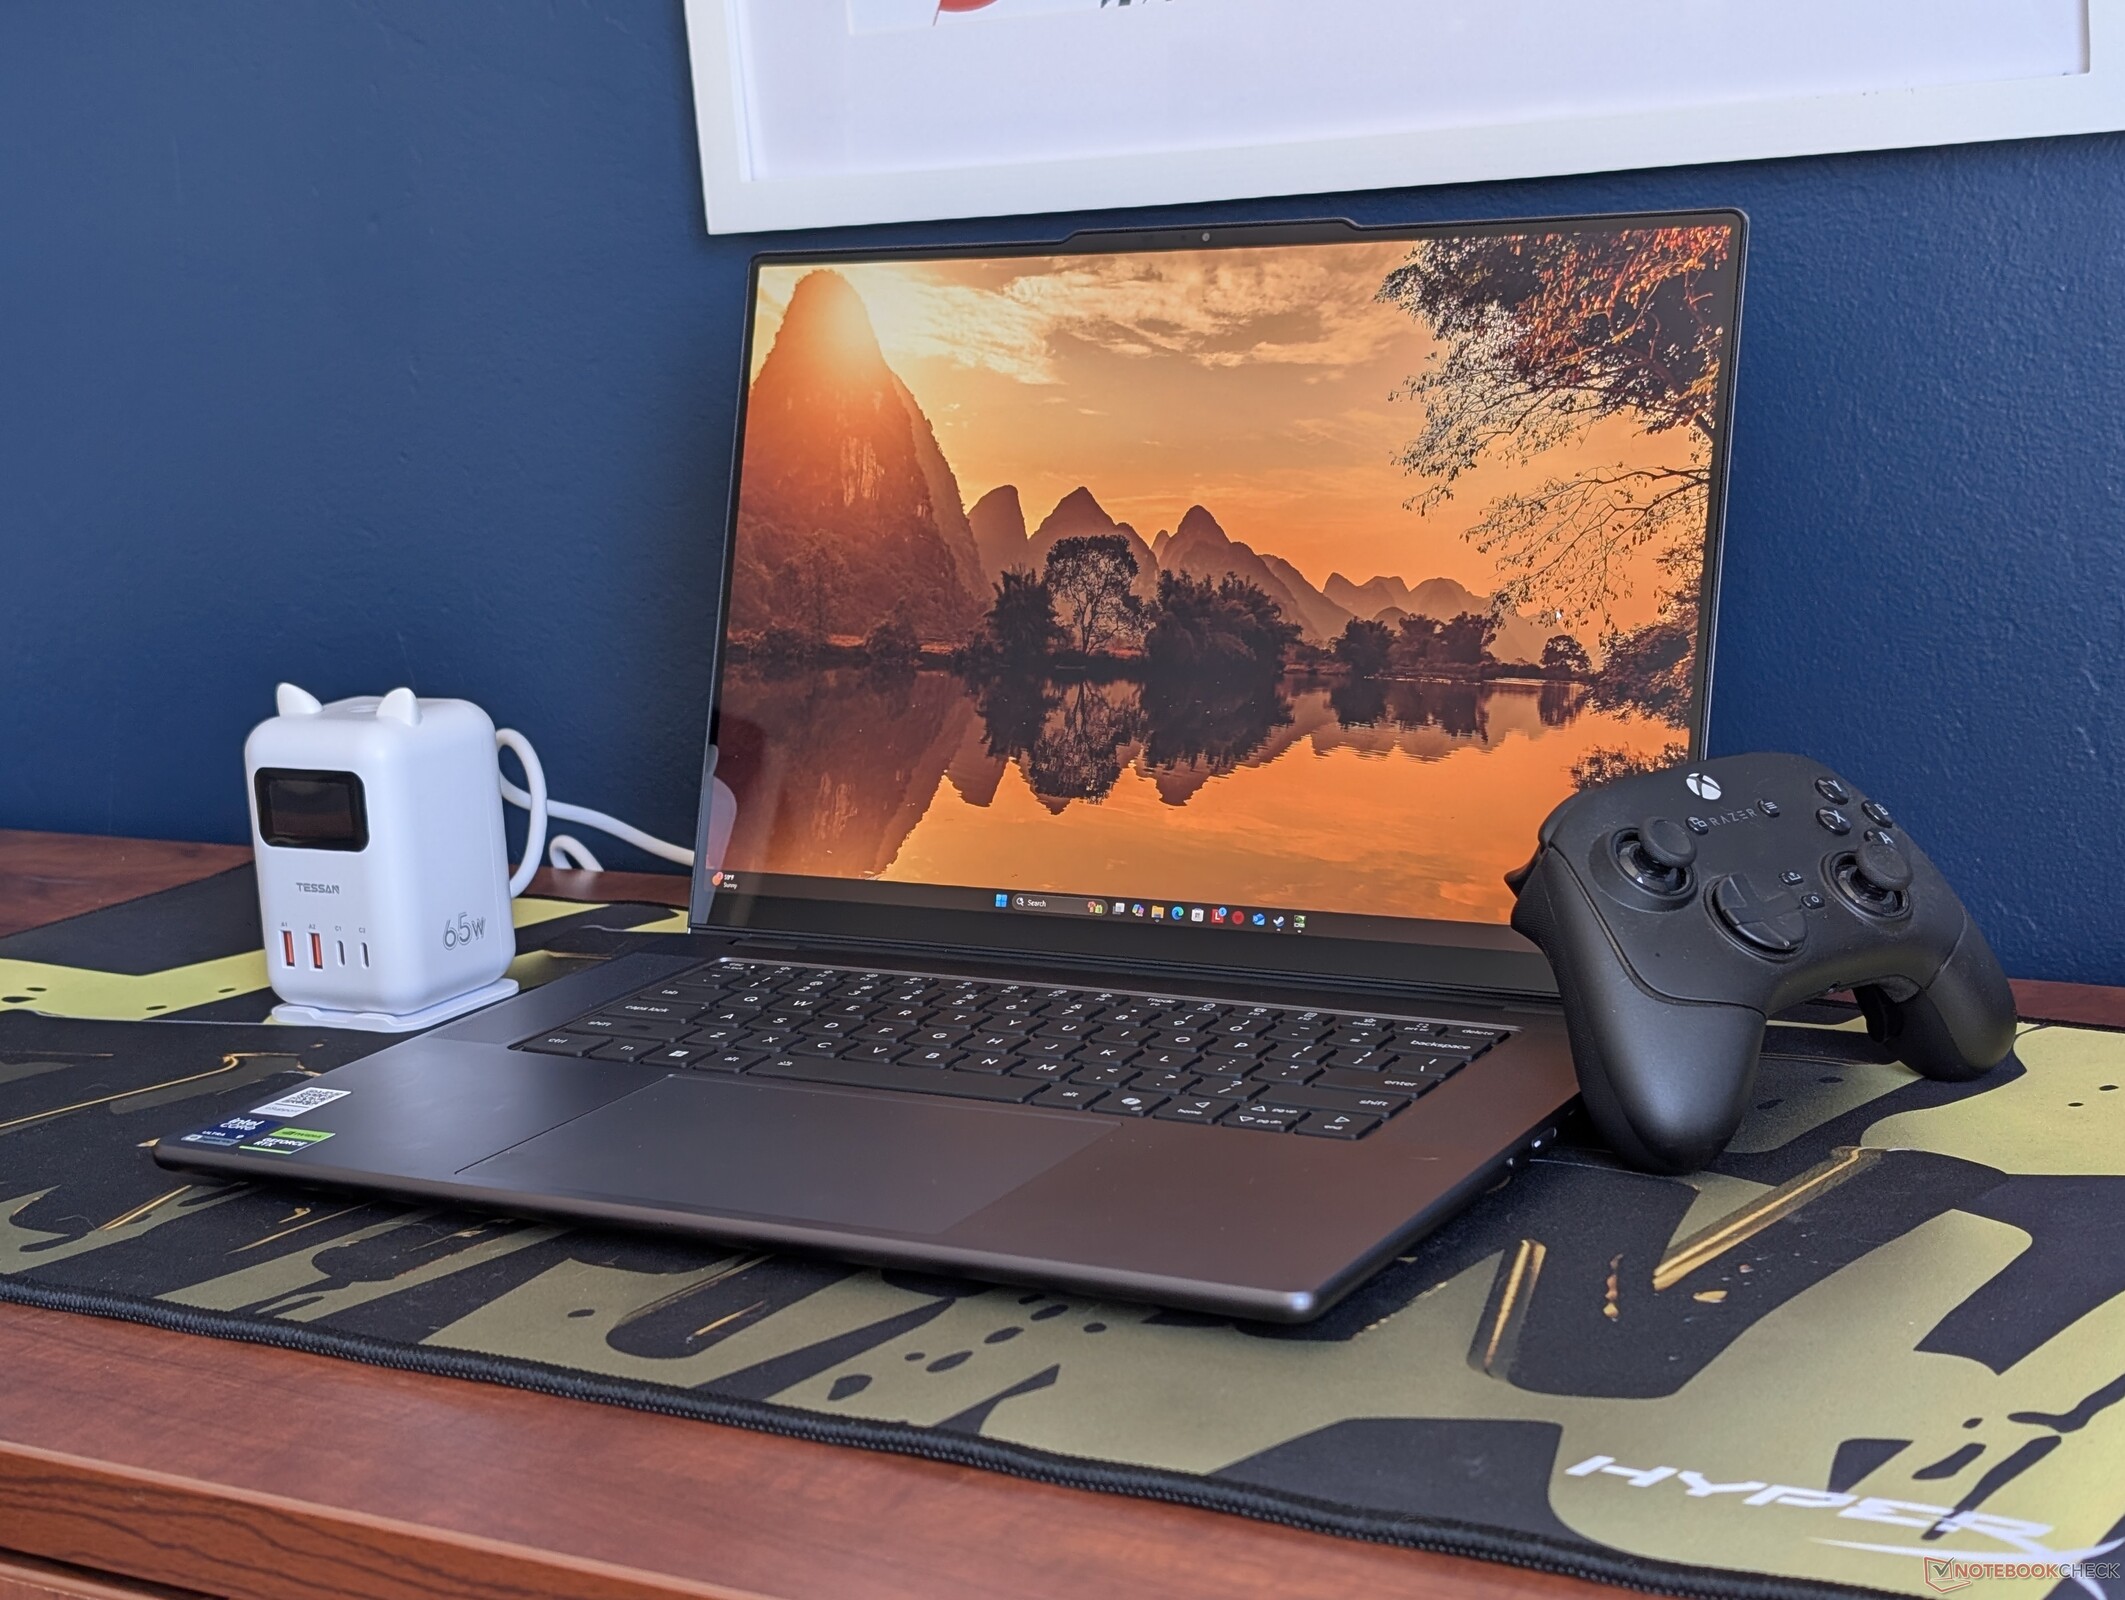
In tegenstelling tot veel traditionele clamshells op de markt, wordt de Lenovo Pro 9 16 G11 Aura geleverd met niet minder dan een Core Ultra 9 CPU, GeForce RTX GPU en een OLED-touchscreen voor een eersteklas gebruikerservaring, ongeacht het configuratieniveau. Het biedt een van de helderste aanraakschermen in zijn klasse en lijkt aan alle eisen te voldoen die u aan een multimedia krachtpatser kunt stellen, inclusief een geïntegreerde kaartlezer, een gezonde selectie poorten, geweldige audio en ondersteuning voor meerdere interne SSD's. We kunnen niet hetzelfde zeggen over de nieuwe Dell XPS 16 die een aantal van deze functies heeft weggelaten voor zijn nieuwste redesign.
Hoewel we waarderen dat het 2026 model iets dunner en lichter is dan het 2025 modelbiedt het verder niet veel prestatieverbeteringen, aangezien de nieuwe Core Ultra 9 386H bijna hetzelfde presteert als de Core Ultra 9 285H van vorig jaar. Zowel de GPU als de schermopties blijven hetzelfde, waardoor de gebruikerservaring ook niet verbetert. Het laten vallen van het numpad ten gunste van grotere luidsprekerroosters kan ook gevolgen hebben voor bepaalde gebruiksscenario's die daarvan afhankelijk zijn.
De meest opvallende nadelen van het model zijn het ventilatorgeluid in de modus Prestaties en zowel het zwaardere gewicht als de kortere batterijlevensduur in vergelijking met de concurrentie, ondanks de upgrade van de batterijcapaciteit. Het volstoppen met zoveel functies en poorten heeft duidelijk gevolgen voor de draagbaarheid. Gebruikers die het zonder discrete graphics of een mooi OLED-scherm kunnen stellen, vinden de Panther Lake XPS 16 of MSI Prestige 16 veel stillere, slankere en reisvriendelijkere alternatieven vinden. Aan de andere kant, als u echt discrete graphics nodig hebt, dan is deze alleskunner van Lenovo nog steeds een van onze favoriete 16-inch multimediamachines die twee jaar achter elkaar verkrijgbaar zijn.
Pro
Contra
Prijs en beschikbaarheid
De Lenovo Pro 9 16IPH11 wordt nu geleverd vanaf $2800 voor de 1800p RTX 5050 basisconfiguratie tot meer dan $3100 voor de 2000p RTX 5060 configuratie uit de review.
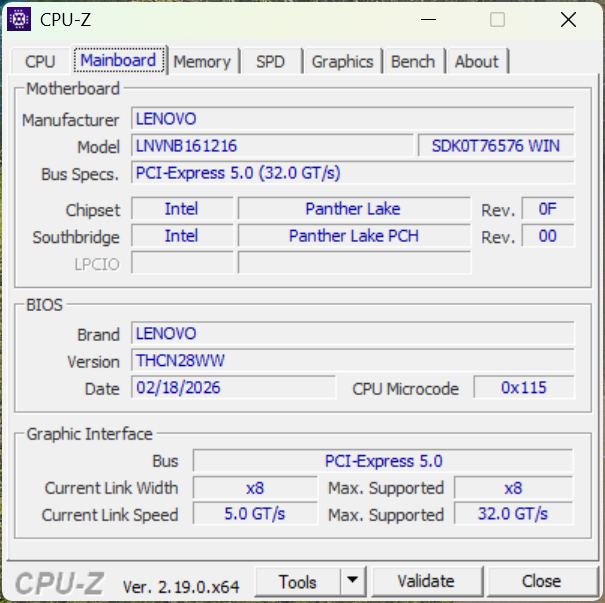
De Lenovo Pro 9 16IPH11 (op de markt gebracht als de Lenovo Pro 9i Aura Edition 16 G11) is de directe opvolger van de Yoga Pro 9i 16IAH G10 Aura van vorig jaar. De fabrikant heeft de Yoga-naam laten vallen en tegelijkertijd het externe ontwerp opgefrist.
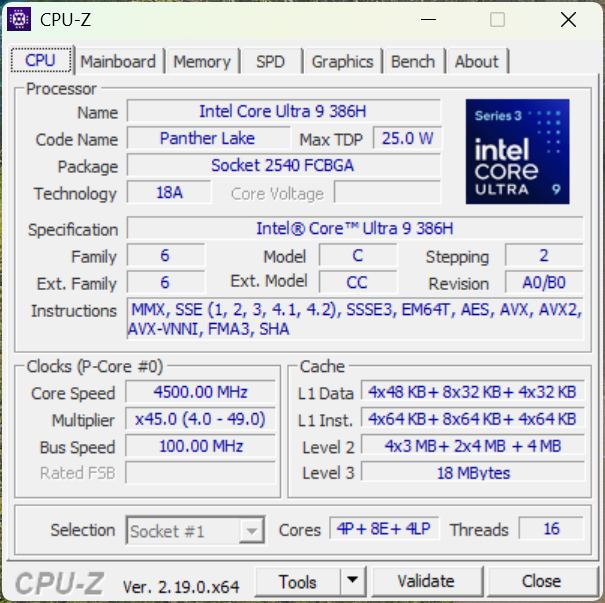
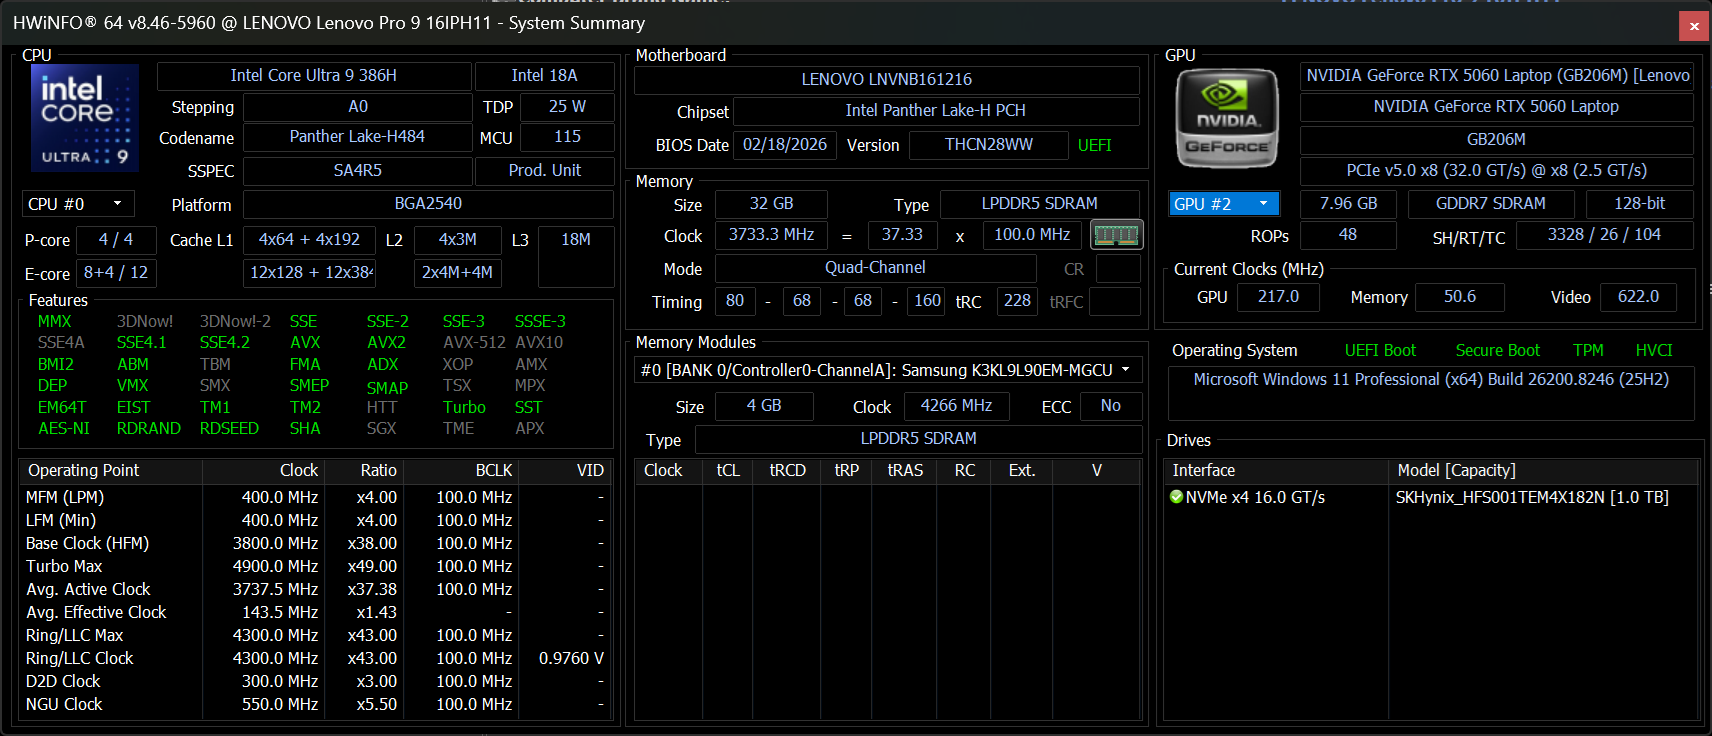
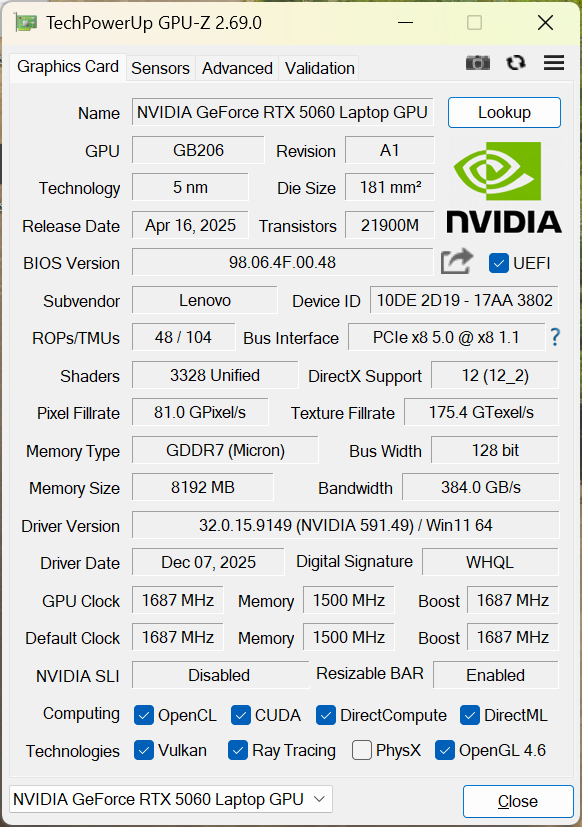
Onze testunit is de topconfiguratie die is uitgerust met de 100 W GeForce RTX 5060 GPU en een 3200 x 2000 Tandem OLED-touchscreen voor ongeveer $3100. De goedkopere SKU's hebben in plaats daarvan de RTX 5050 of 2880 x 1800 OLED, maar alle opties worden geleverd met dezelfde Core Ultra 9 386H Panther Lake CPU.
Dit vlaggenschip van Lenovo concurreert rechtstreeks met andere high-end 16-inch multimediamachines, waaronder de MSI Prestige 16 AI Evo, Asus ZenBook 16 serieen de nieuwe Dell XPS 16.
Meer Lenovo beoordelingen:
Specificaties
Zaak
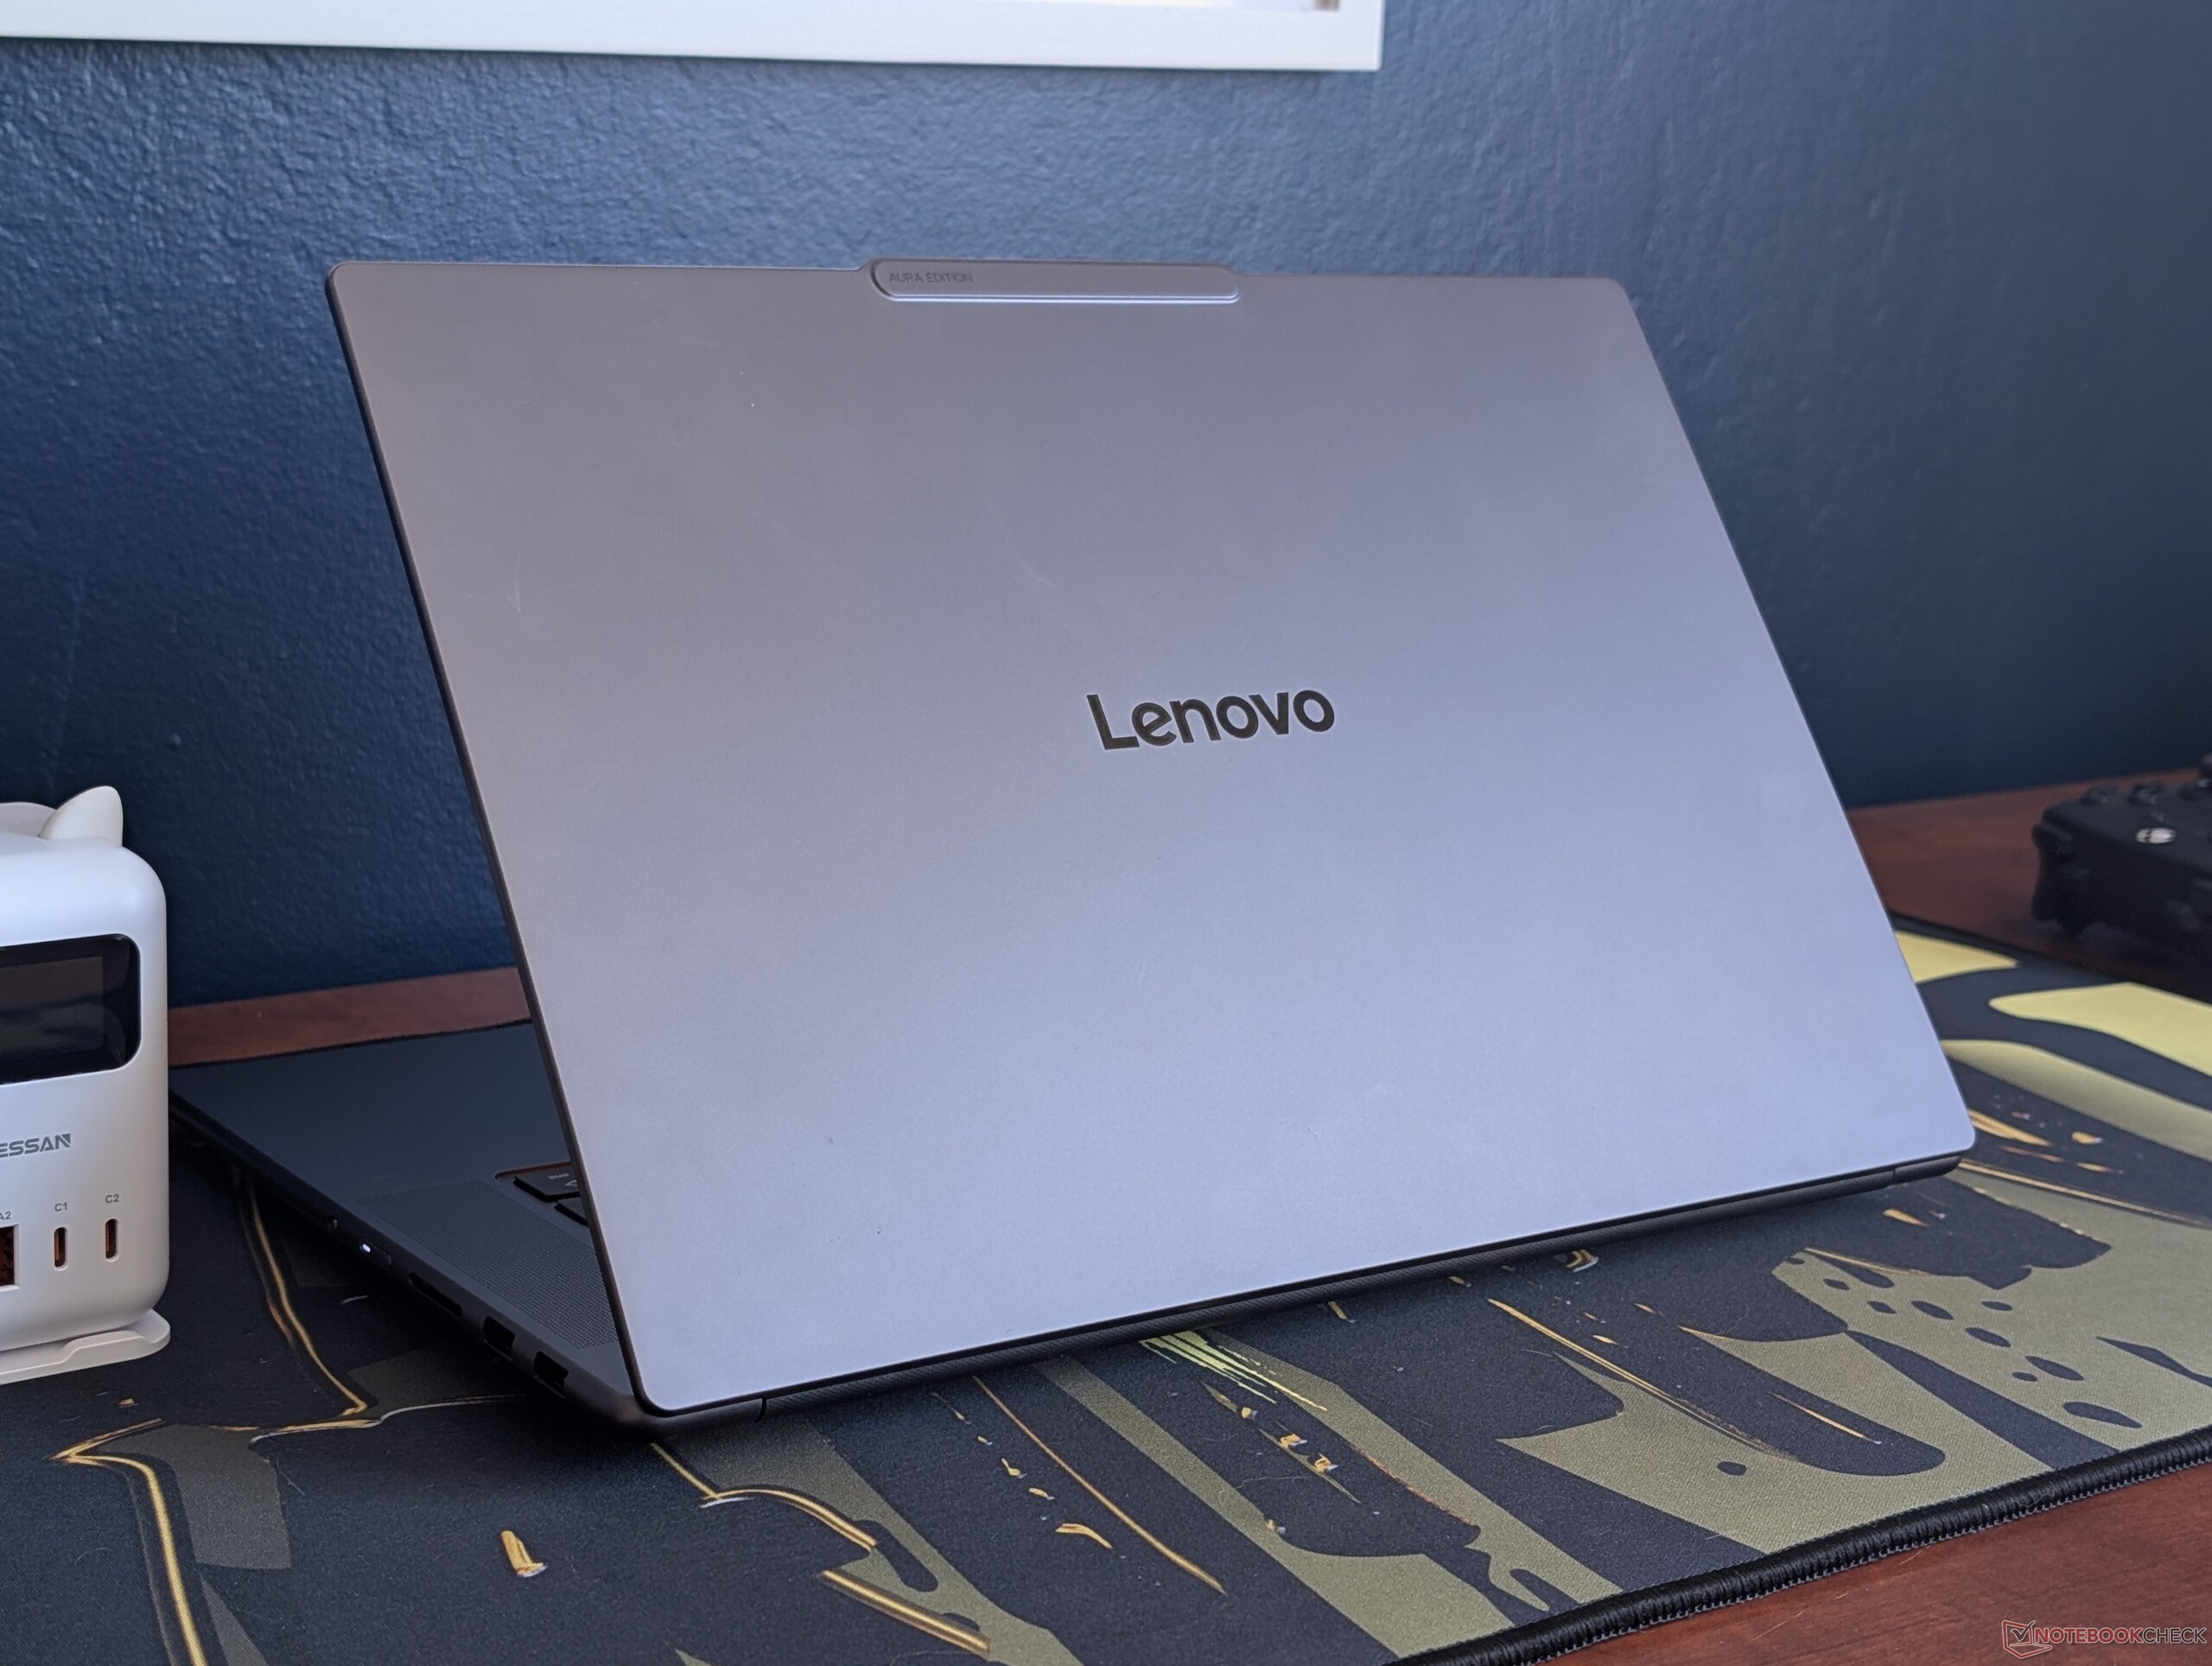
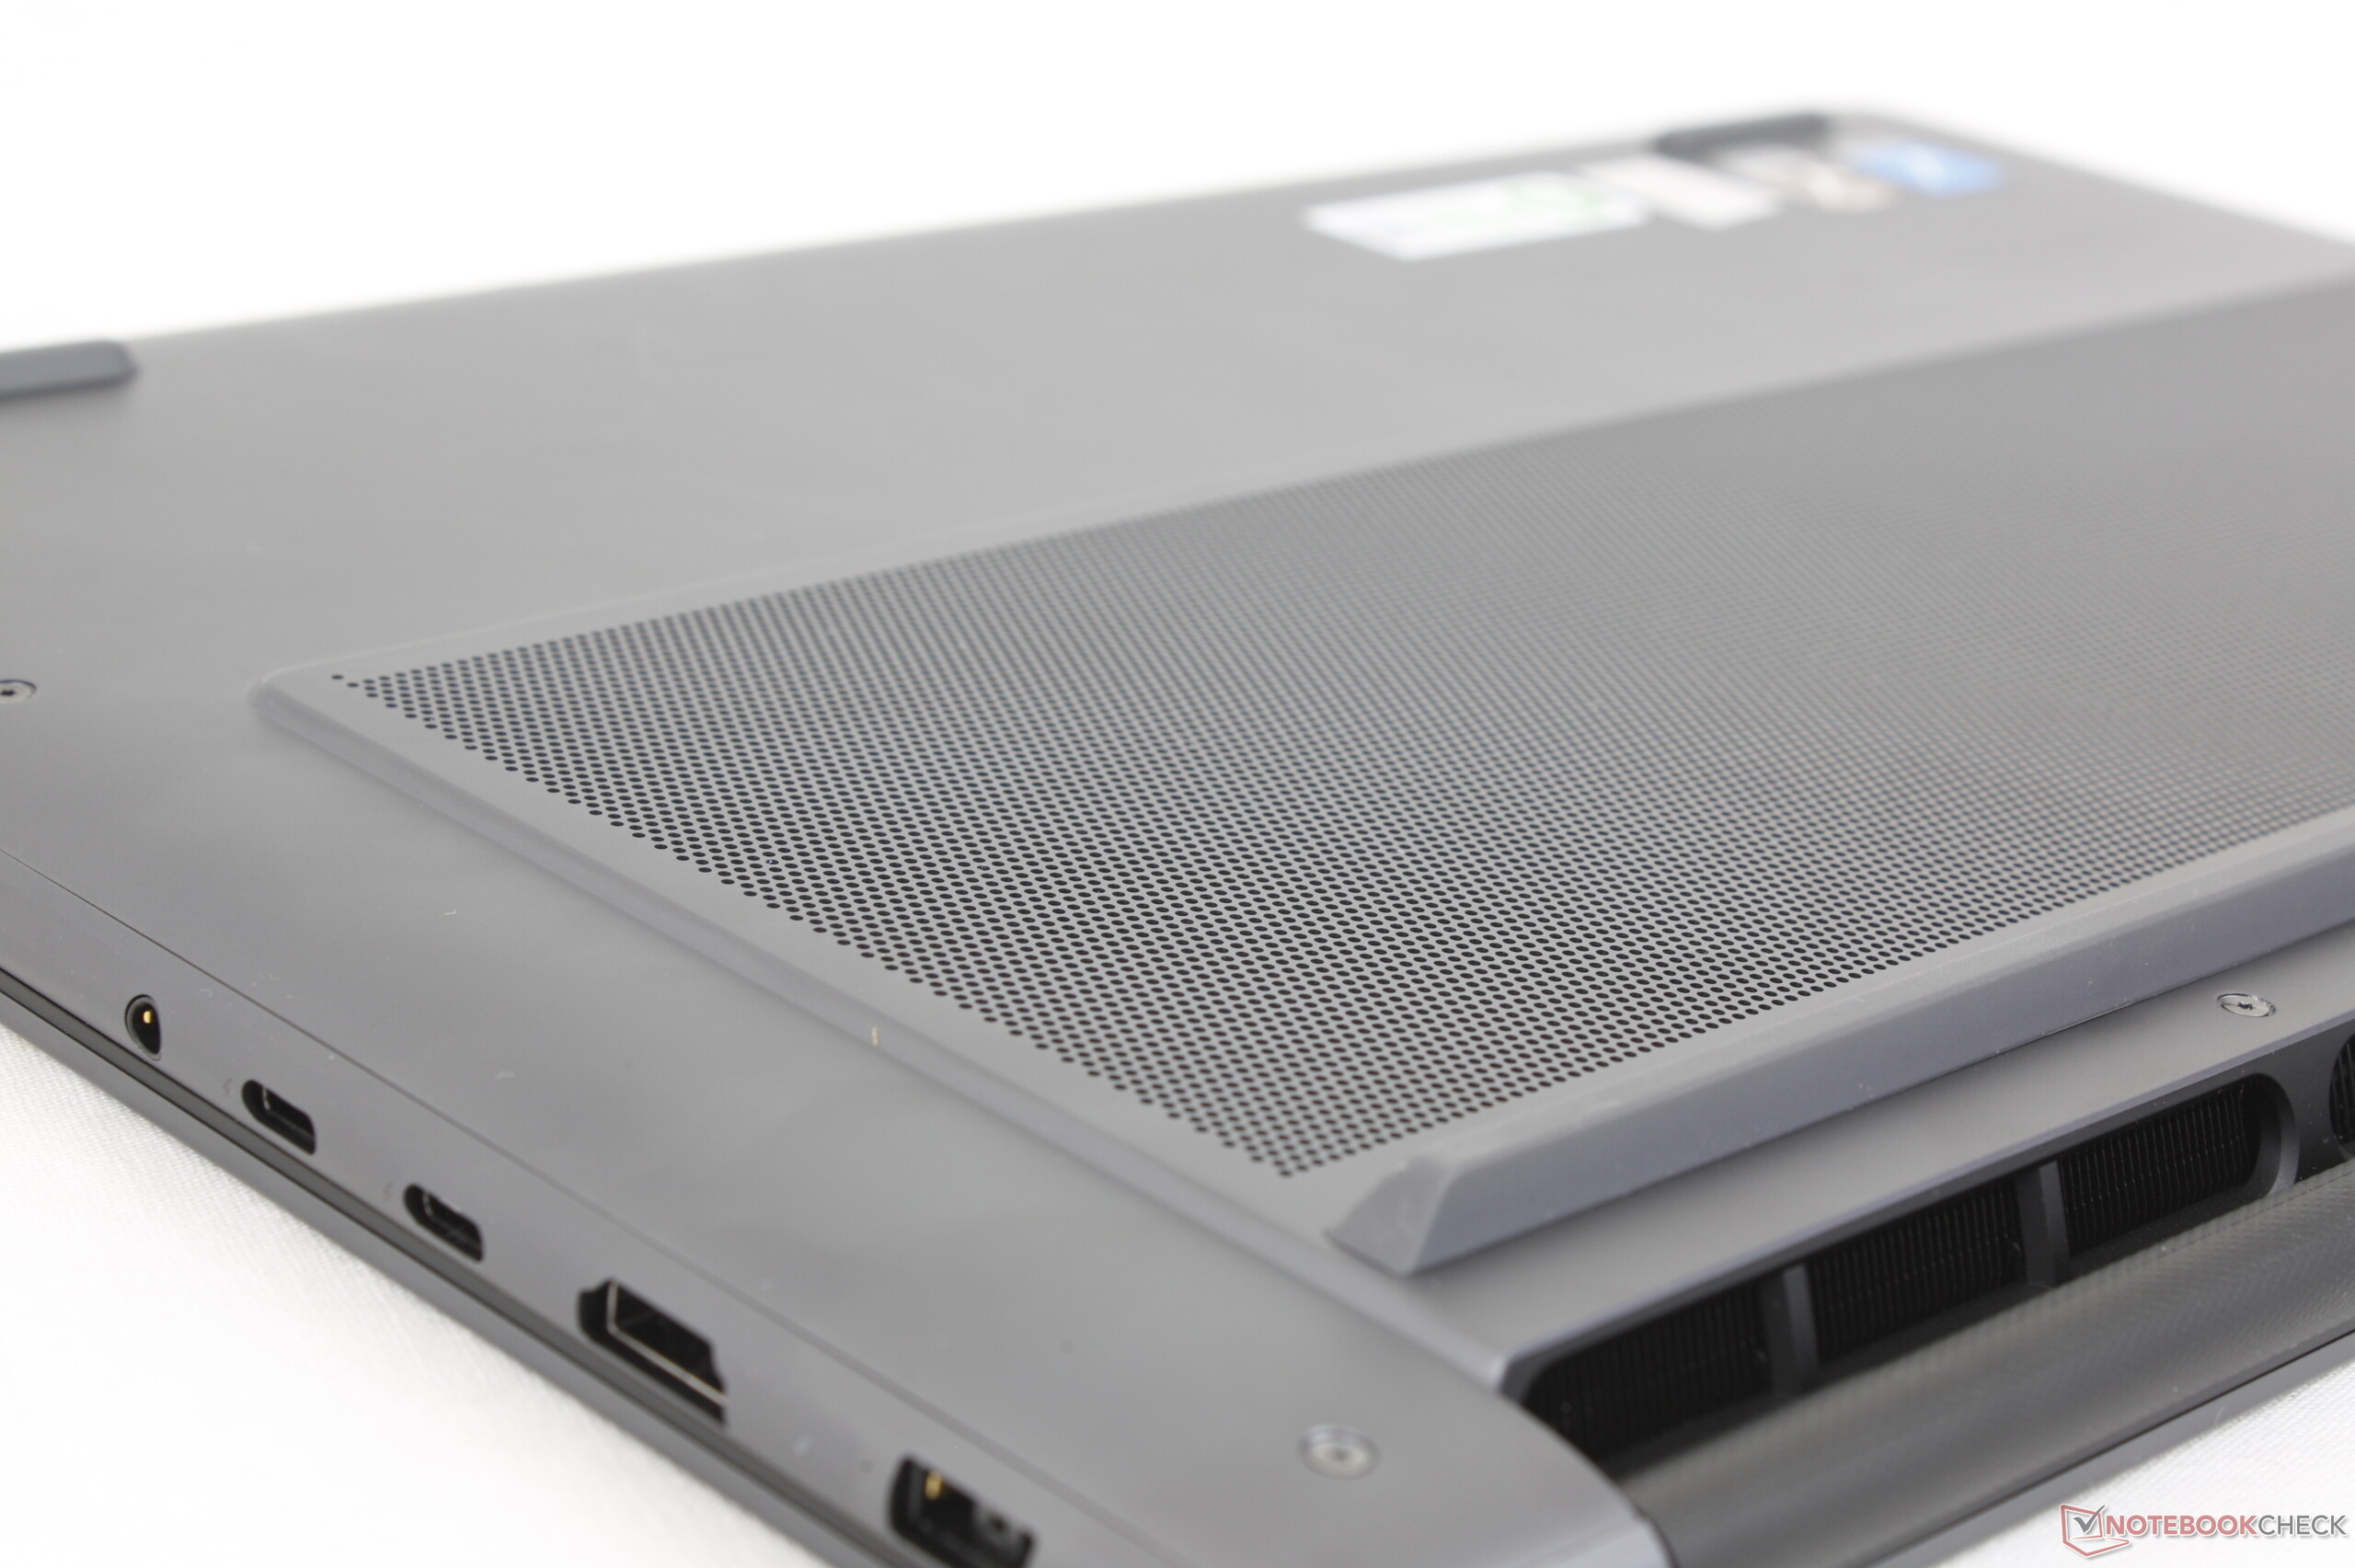
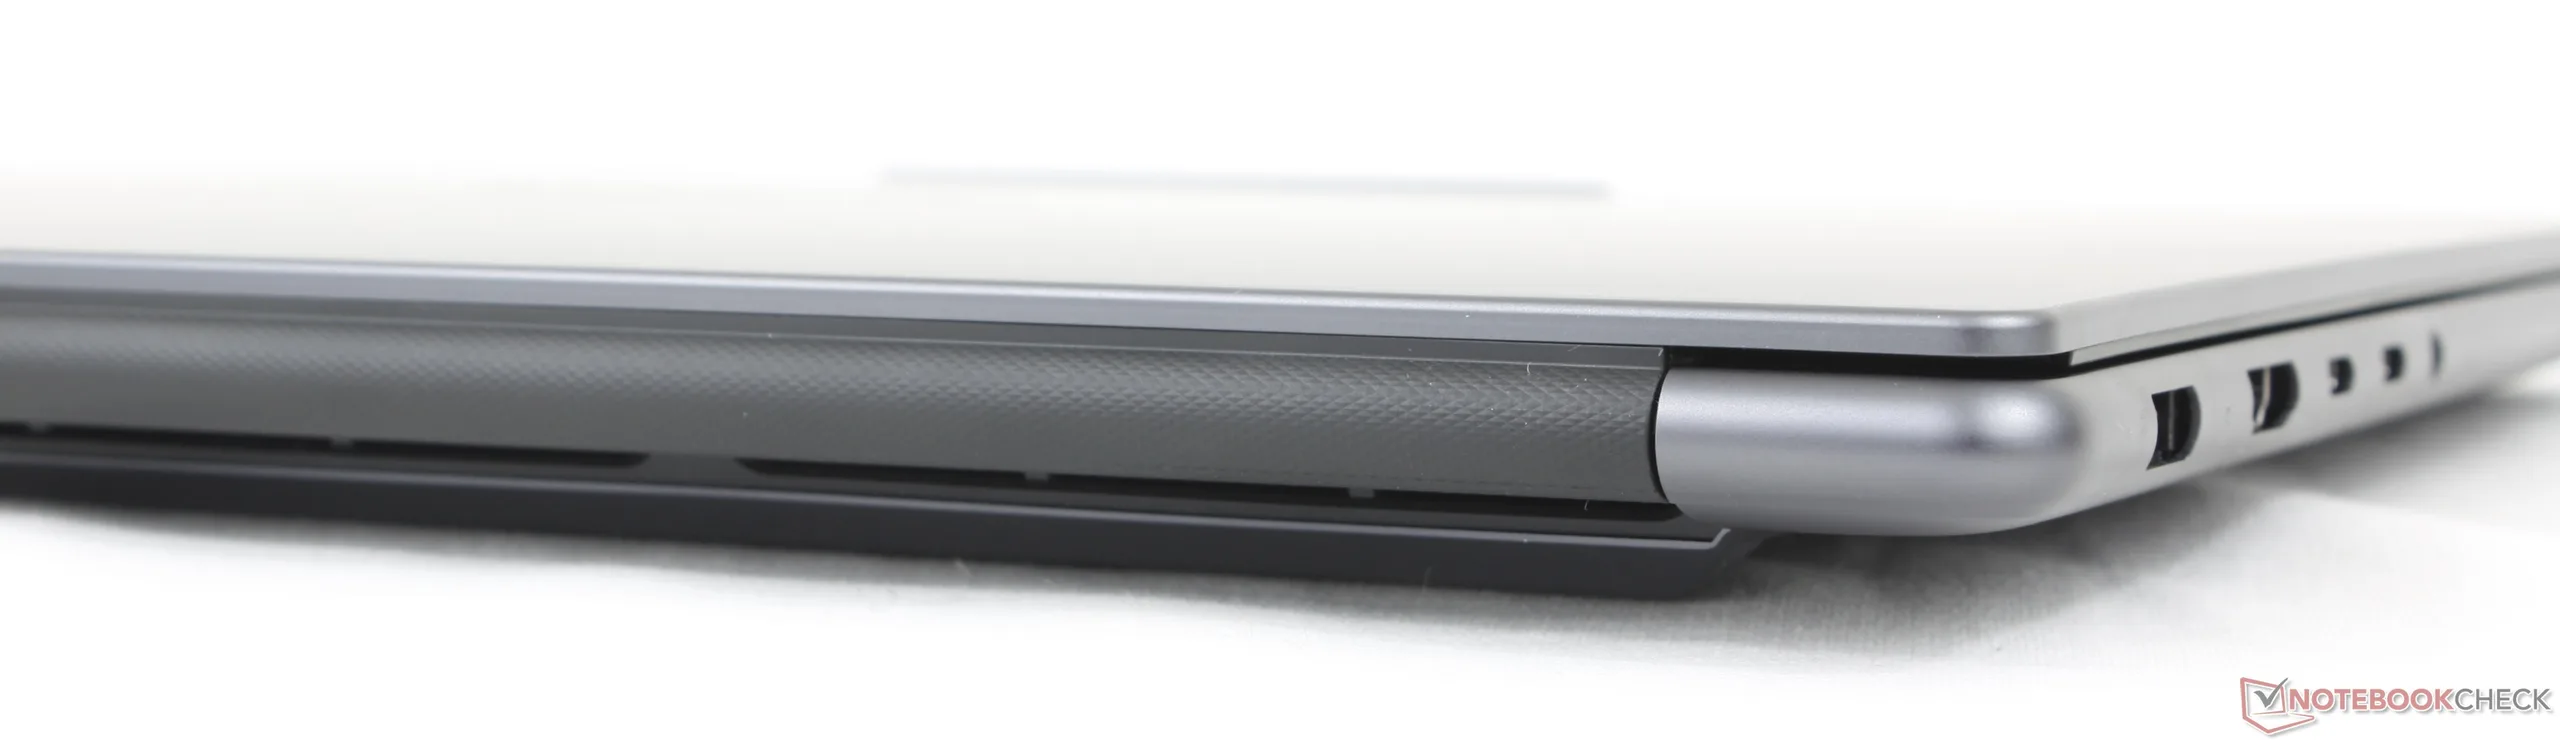
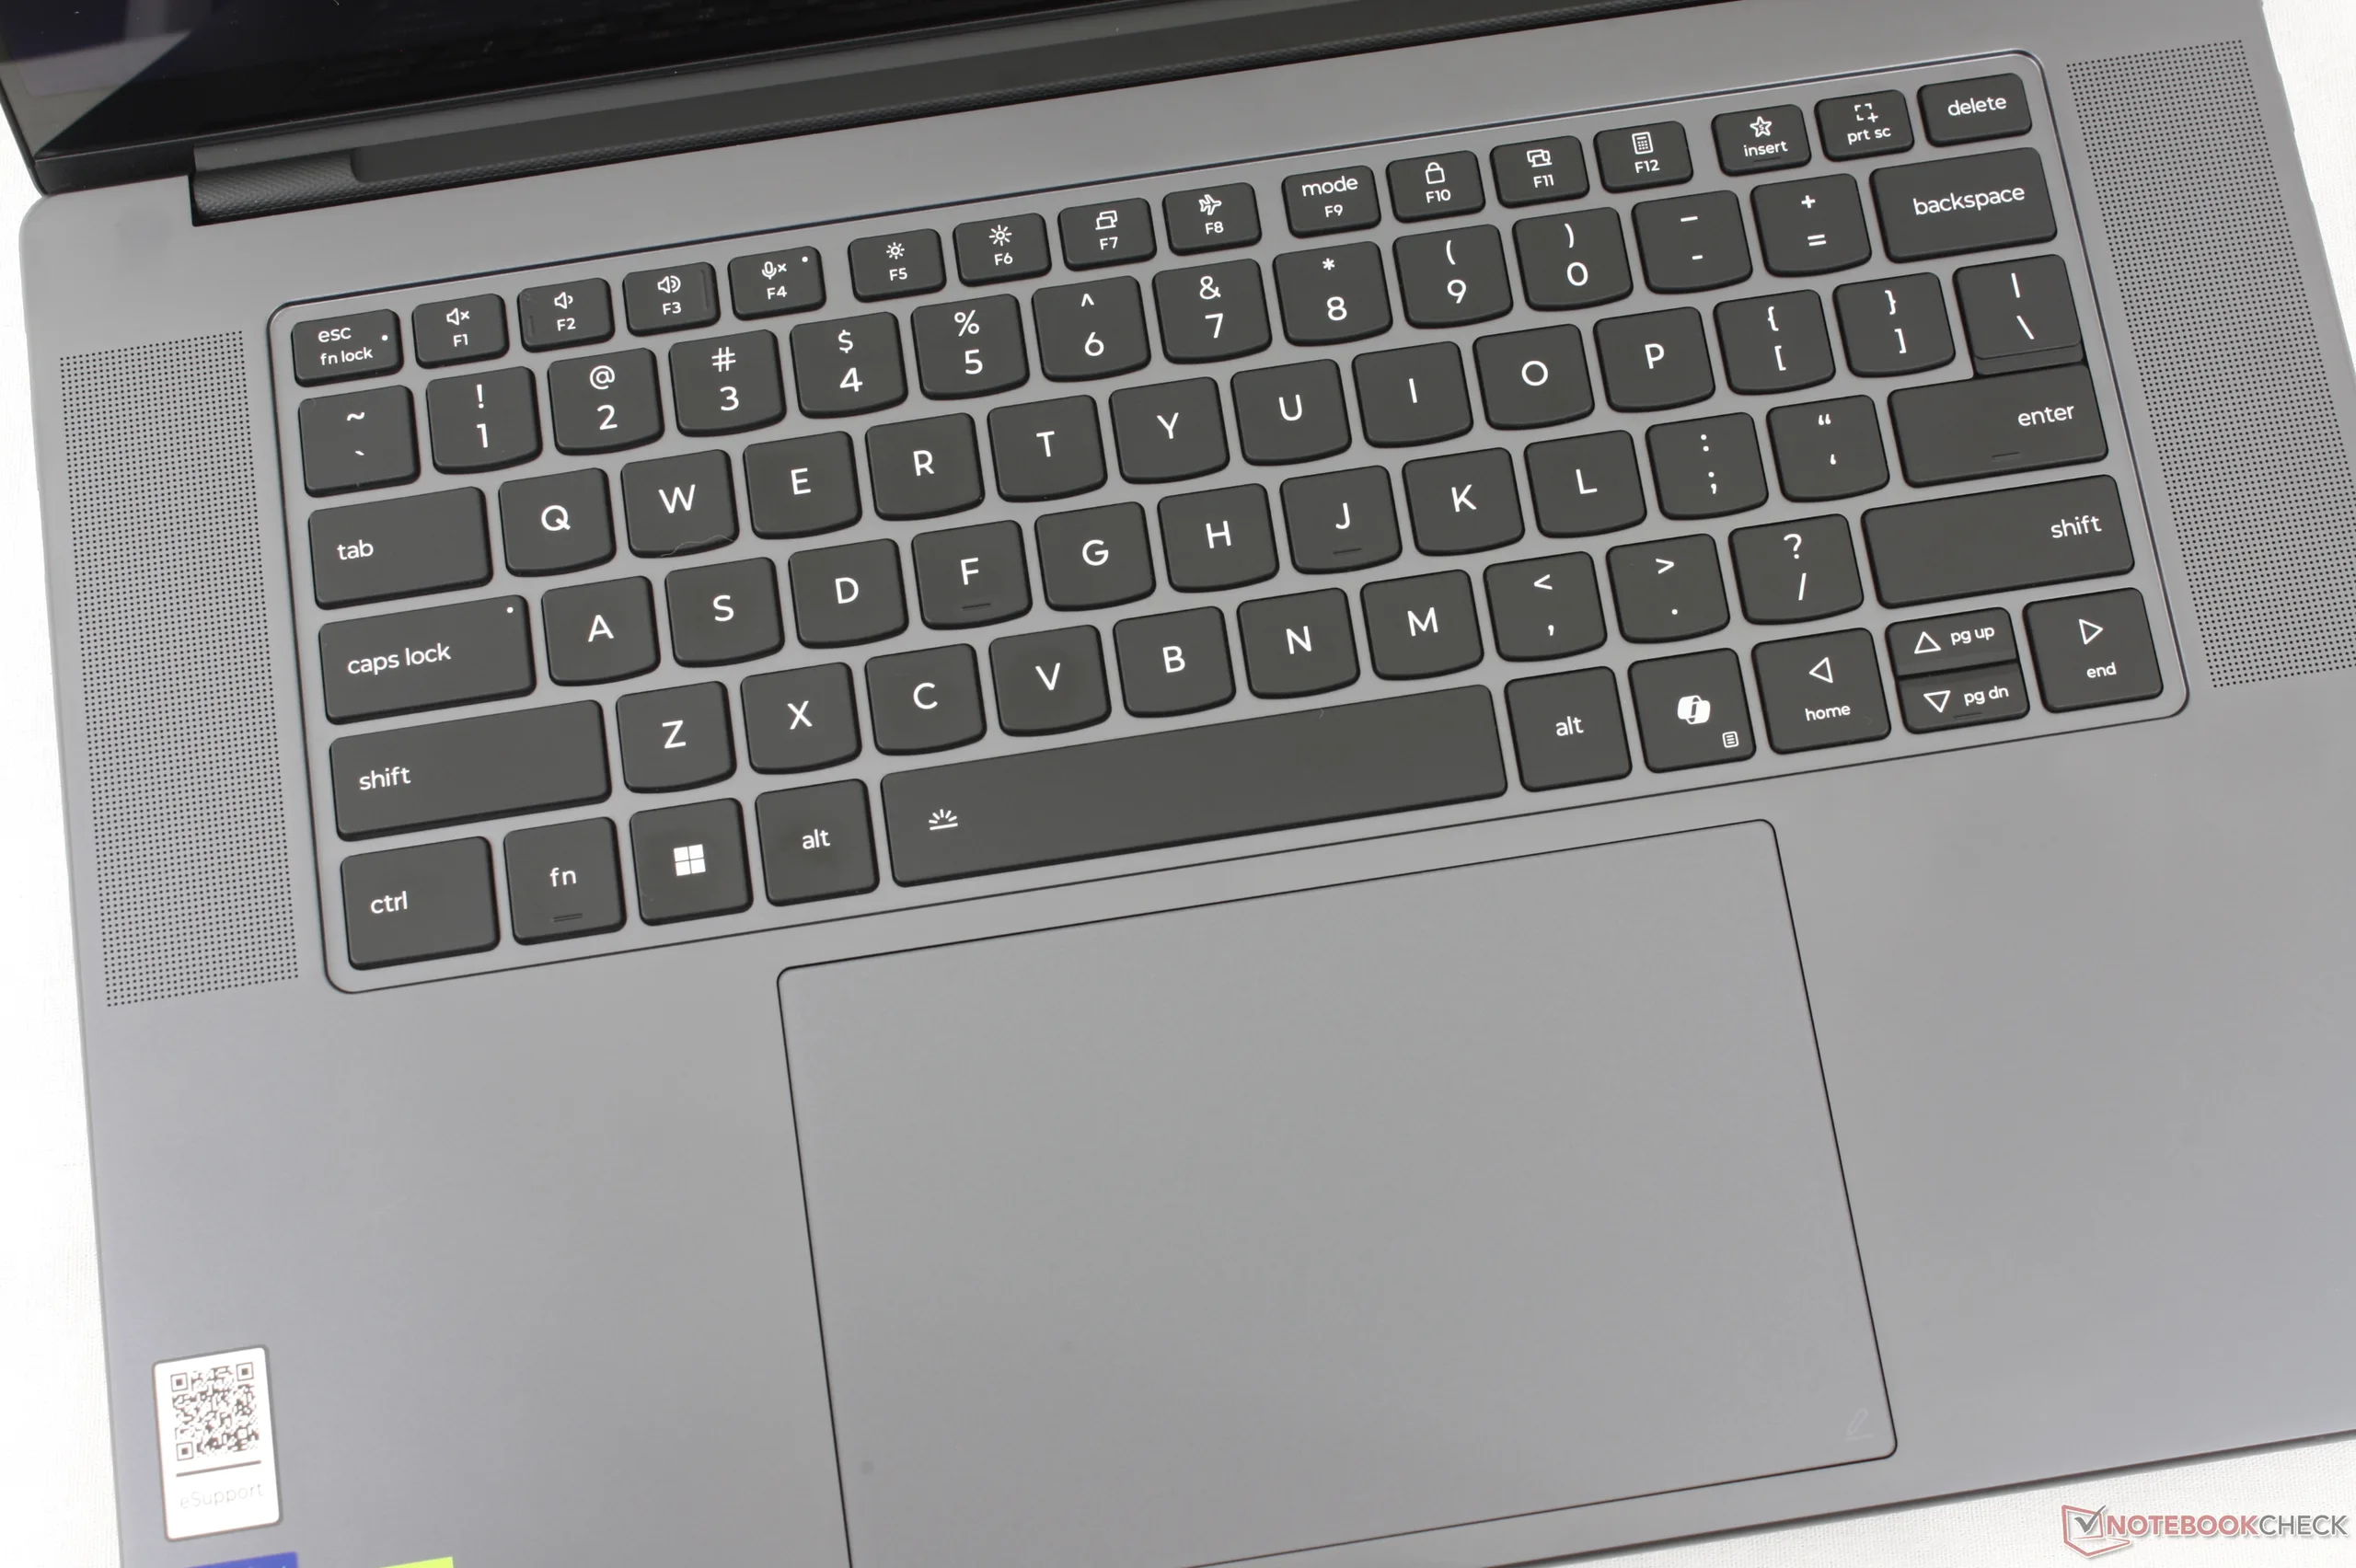
Lenovo heeft een aantal uiterlijke wijzigingen aangebracht ten opzichte van het ontwerp van vorig jaar. De meest opvallende is de verwijdering van het numpad ten gunste van grotere, naar boven gerichte luidsprekerroosters langs de zijkanten van het toetsenbord. Daarnaast is de onderkant van de D-klep niet meer helemaal vlak, omdat de ventilatieroosters nu iets omhoog staan. Het lasergeëtste "Yoga"-label dat zo prominent aanwezig was op het model van vorig jaar, is ook verwijderd omdat Lenovo in plaats daarvan de "Pro"-naamgeving wil benadrukken.
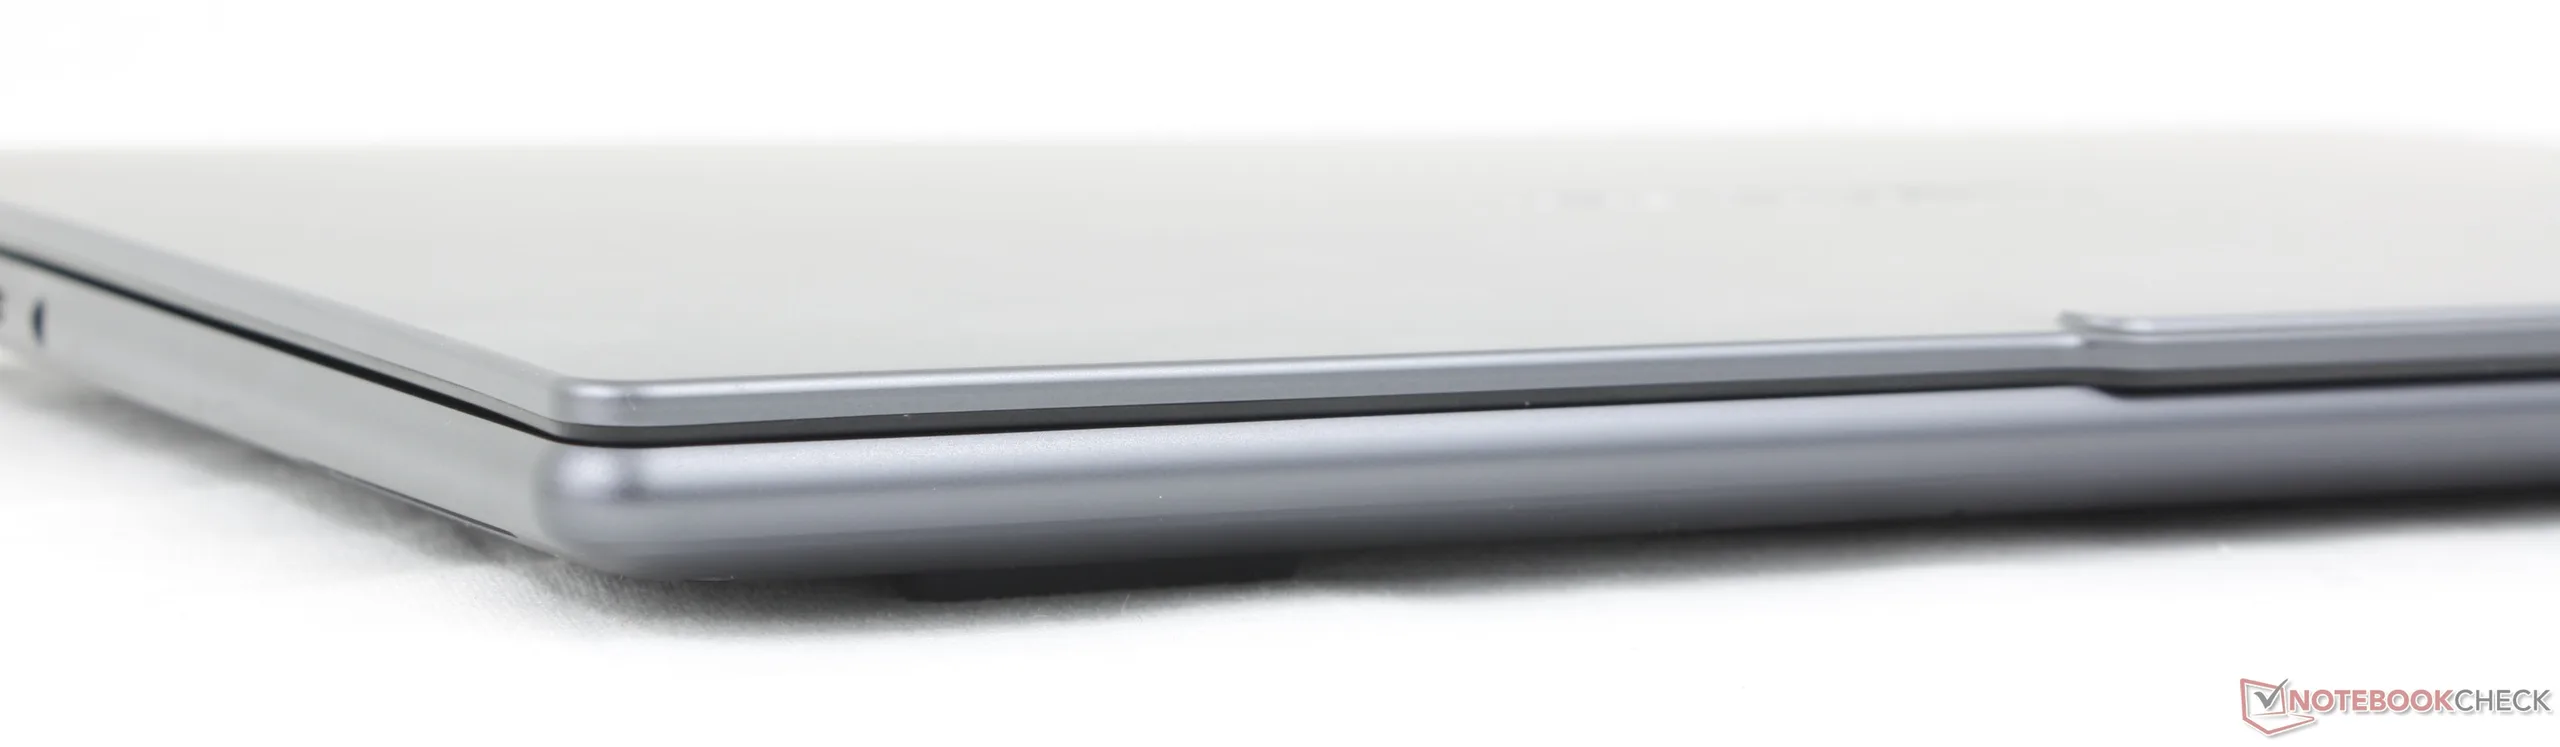
Het nieuwe model is iets dunner, kleiner en lichter dan de vorige generatie, maar met verder dezelfde geanodiseerde aluminium materialen voor een vergelijkbaar kwaliteitsniveau.
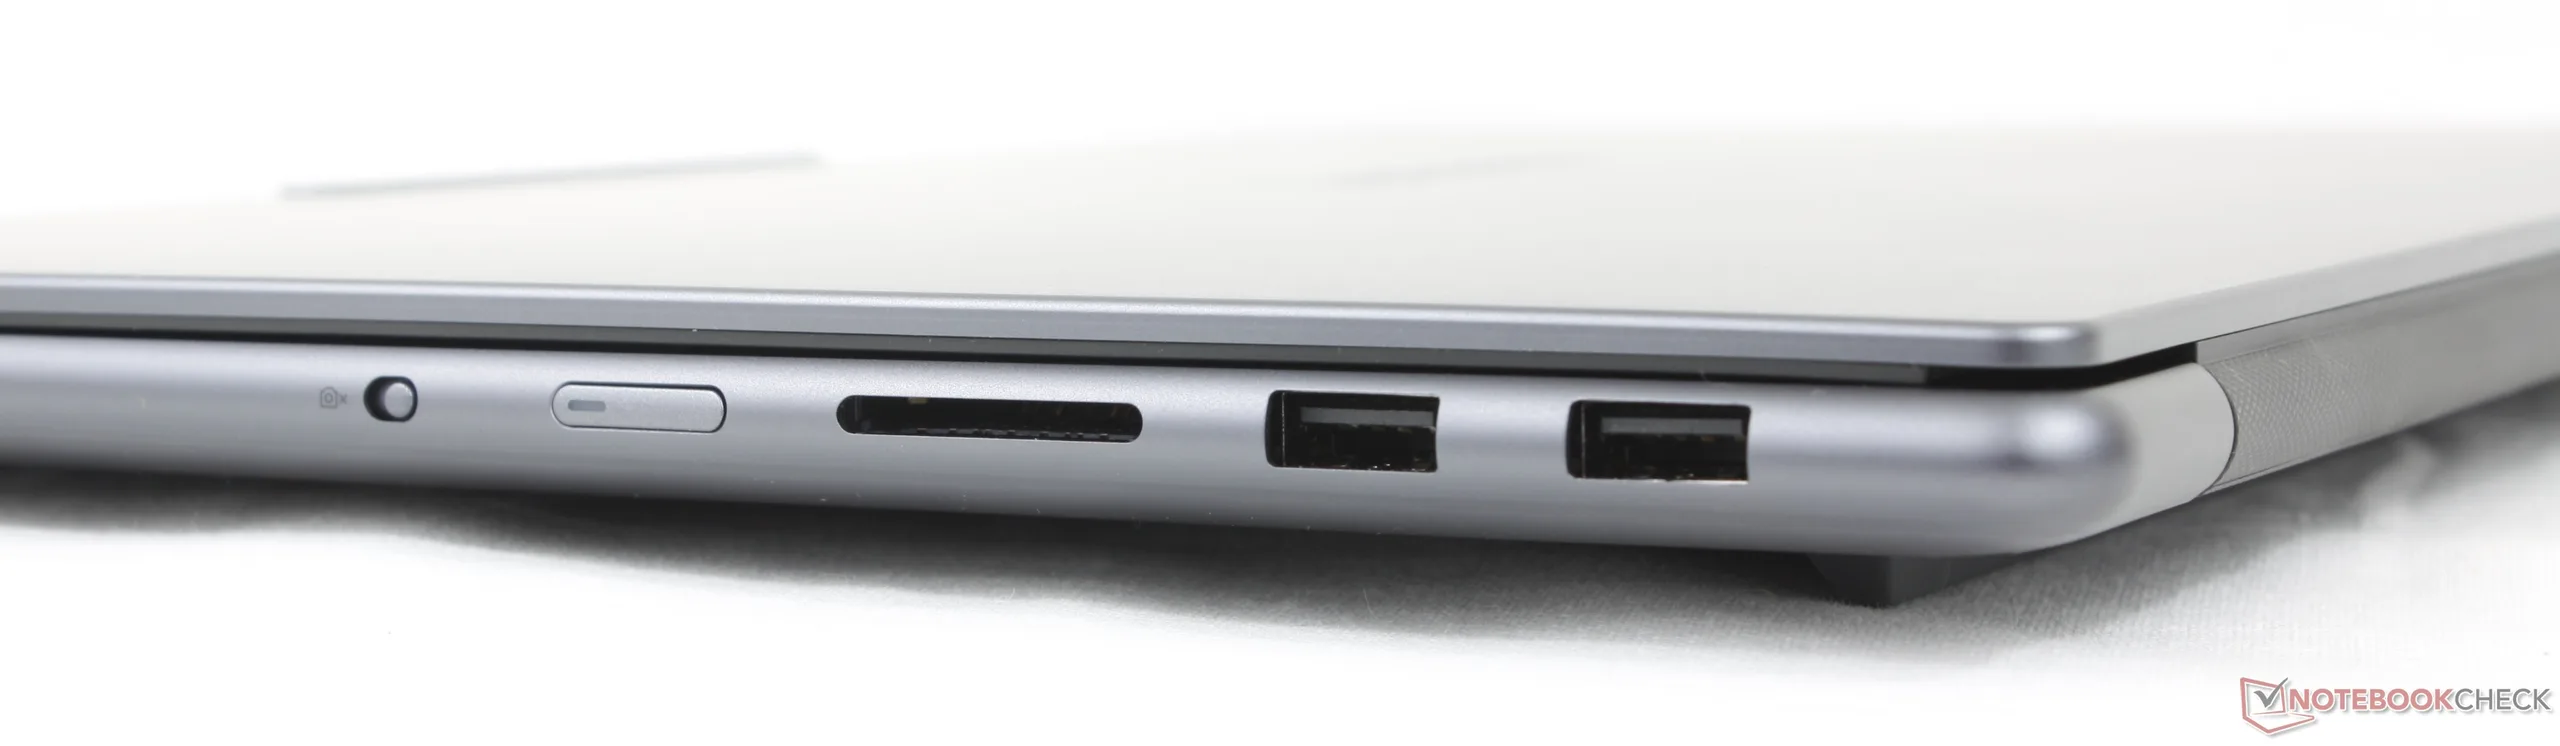
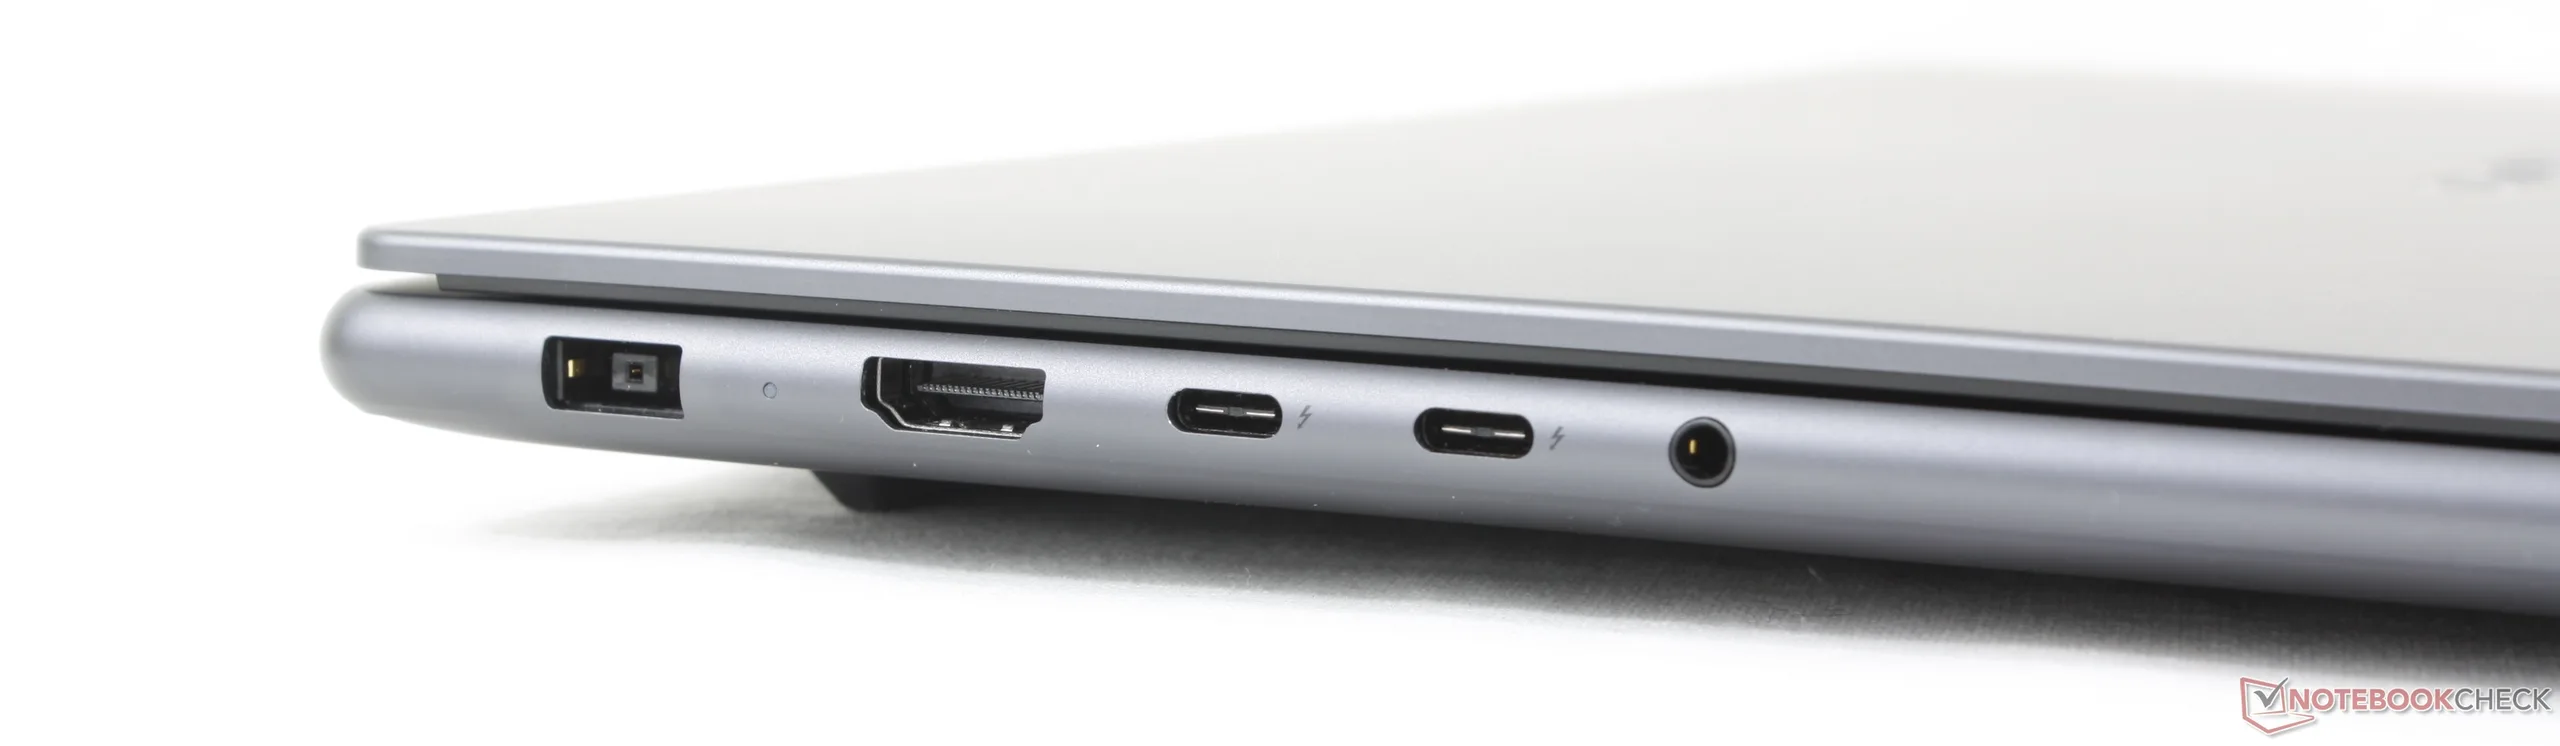
Connectiviteit
Ondanks alle fysieke veranderingen die hierboven genoemd zijn, blijven de poorten hetzelfde als voorheen.
SD-kaartlezer
| SD Card Reader | |
| average JPG Copy Test (av. of 3 runs) | |
| Lenovo Pro 9 16IPH11 (Toshiba Exceria Pro SDXC 64 GB UHS-II) | |
| Asus ProArt P16 H7606WP (Angelbird AV Pro V60) | |
| MSI Prestige 16 AI Evo B2HMG (Angelbird AV Pro V60) | |
| Lenovo Yoga Pro 9 16IAH10 RTX 5050 (Angelbird AV Pro V60) | |
| maximum AS SSD Seq Read Test (1GB) | |
| Asus ProArt P16 H7606WP (Angelbird AV Pro V60) | |
| Lenovo Pro 9 16IPH11 (Toshiba Exceria Pro SDXC 64 GB UHS-II) | |
| Lenovo Yoga Pro 9 16IAH10 RTX 5050 (Angelbird AV Pro V60) | |
| MSI Prestige 16 AI Evo B2HMG (Angelbird AV Pro V60) | |
Communicatie
Webcam


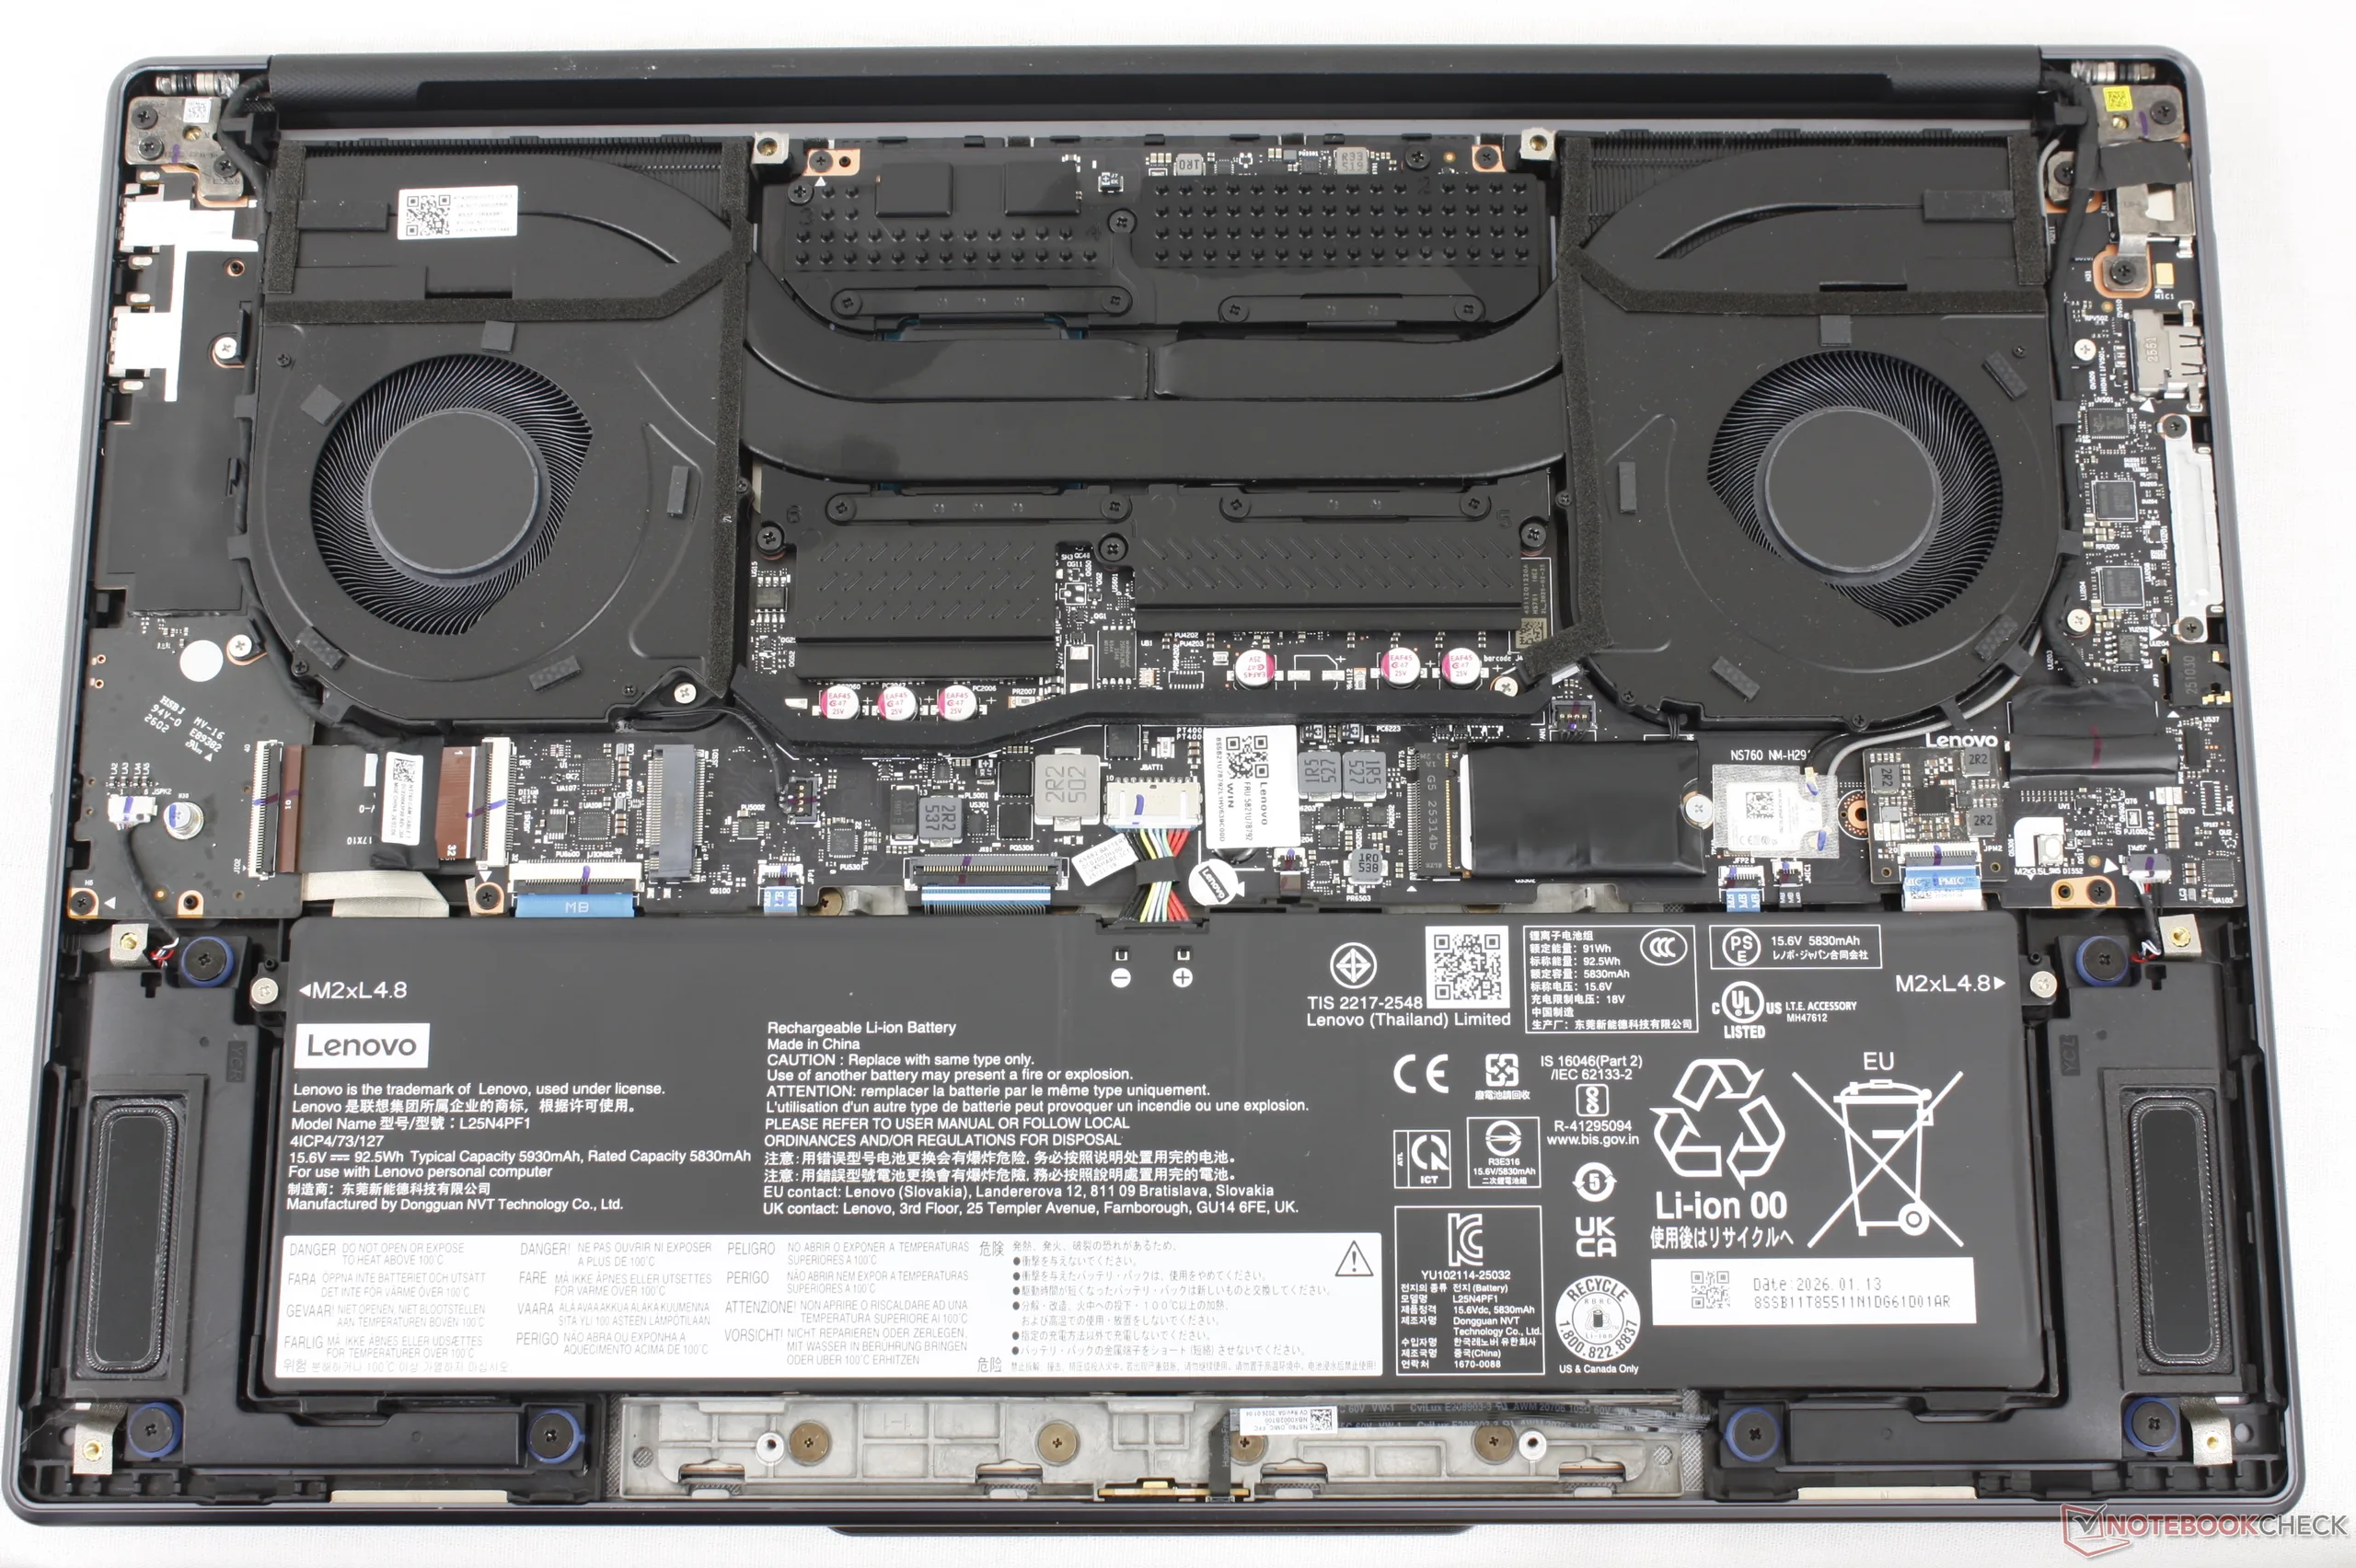
Onderhoud
De interne onderdelen hebben kleine veranderingen ondergaan. Het meest opvallende is de iets grotere batterijcapaciteit (84 Wh naar 93 Wh), maar de SSD-upgradeopties zijn verder hetzelfde als voorheen.

Duurzaamheid
Lenovo geeft geen details over de gerecyclede materialen die tijdens de productie zijn gebruikt. De verpakking bevat verder geen plastic en is volledig recyclebaar.
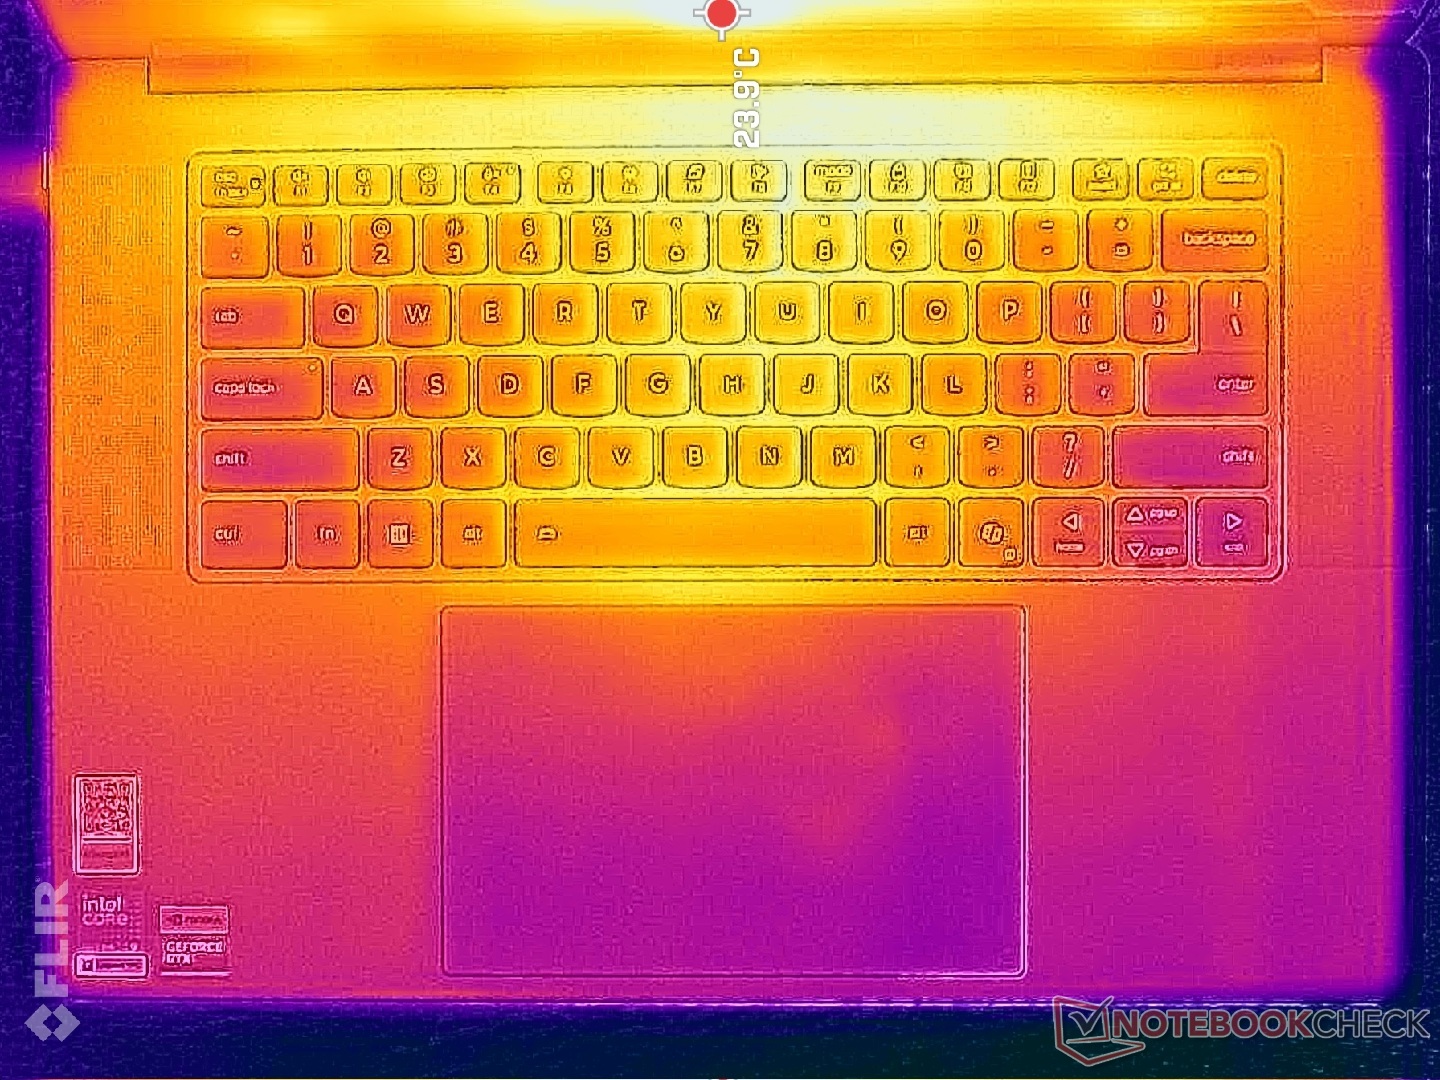
Invoerapparaten
Het lettertype en de opdruk van de toetsen zijn veranderd ten opzichte van het model van vorig jaar: ze zijn groter, gecentreerd en over het algemeen gemakkelijker te zien. De toetsen voelen verder hetzelfde aan, inclusief de veerweg van 1,5 mm en de relatief heldere feedback voor een vergelijkbare type-ervaring, ondanks het ontbreken van een numpad.
Weergave
De twee aanraakschermopties blijven hetzelfde als voorheen:
- 2880 x 1800, OLED, 500 nits SDR (1100 nits HDR), 100% DCI-P3, 120 Hz, Gorilla Glass 3
- 3200 x 2000, Tandem OLED, 1000 nits SDR (1600 nits HDR), 100% DCI-P3, 120 Hz, Gorilla Glass 3
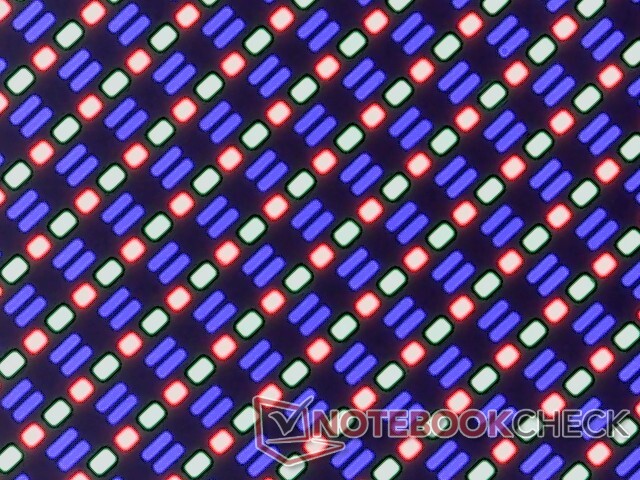
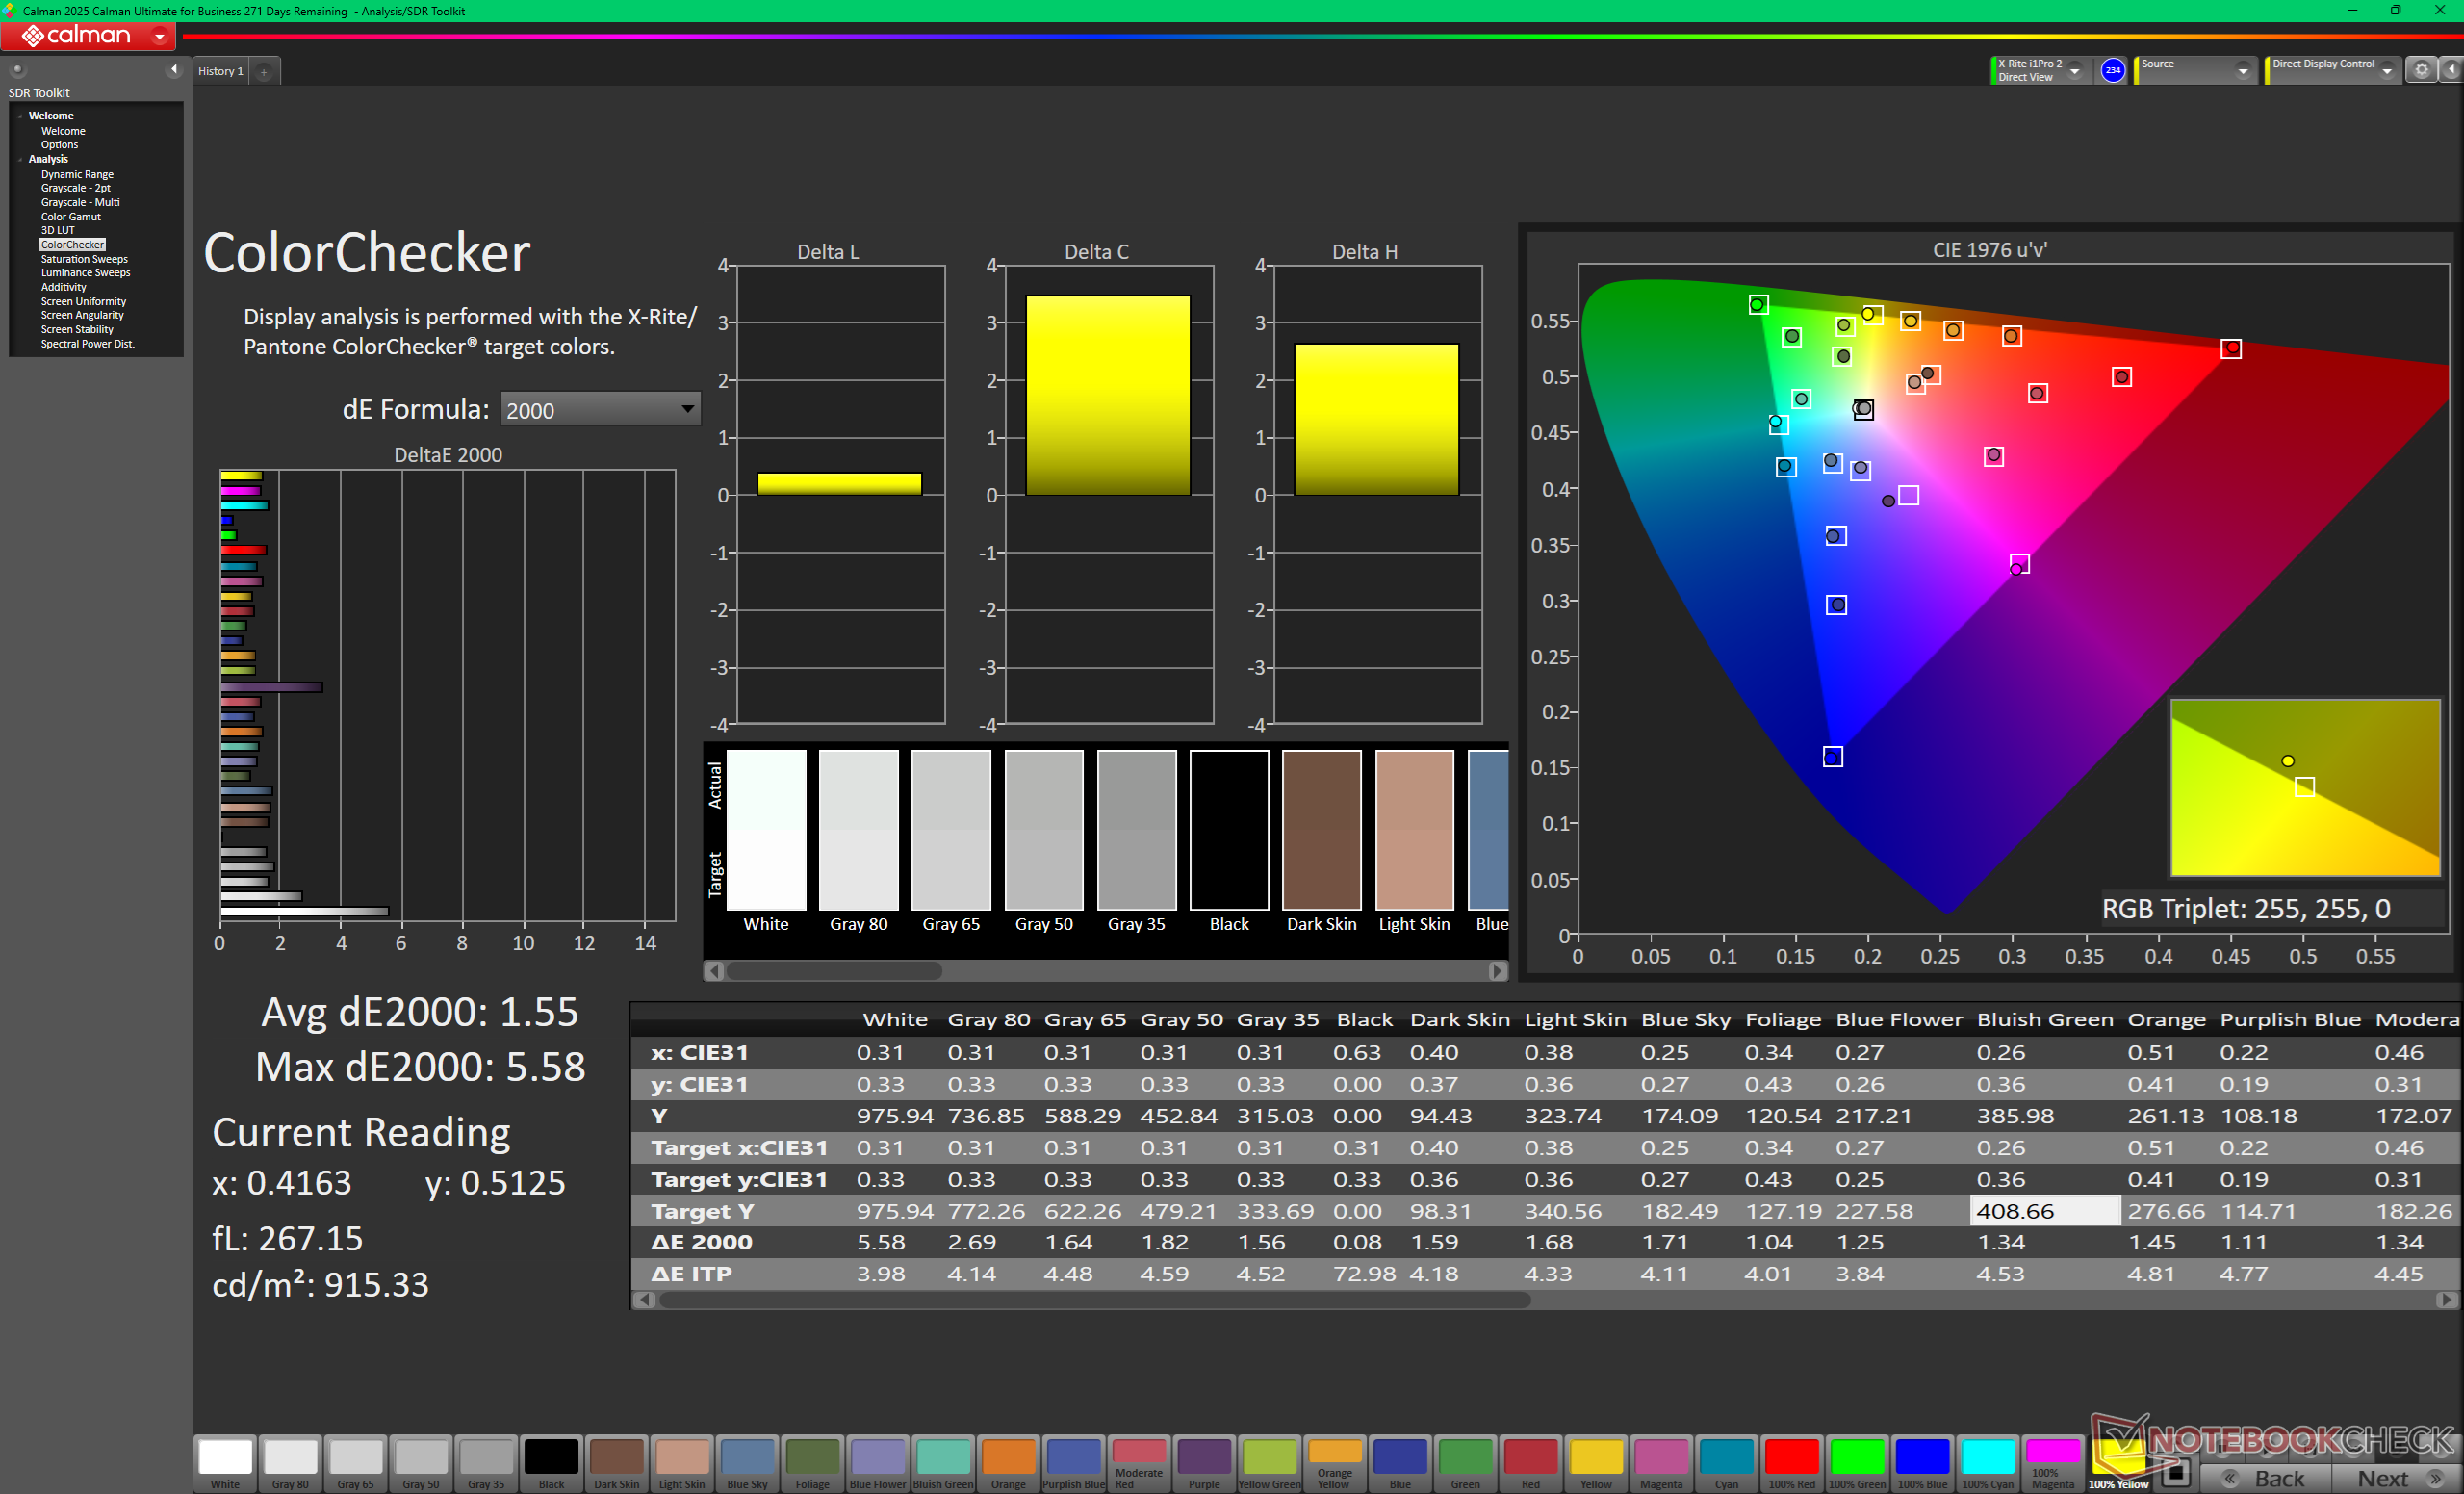
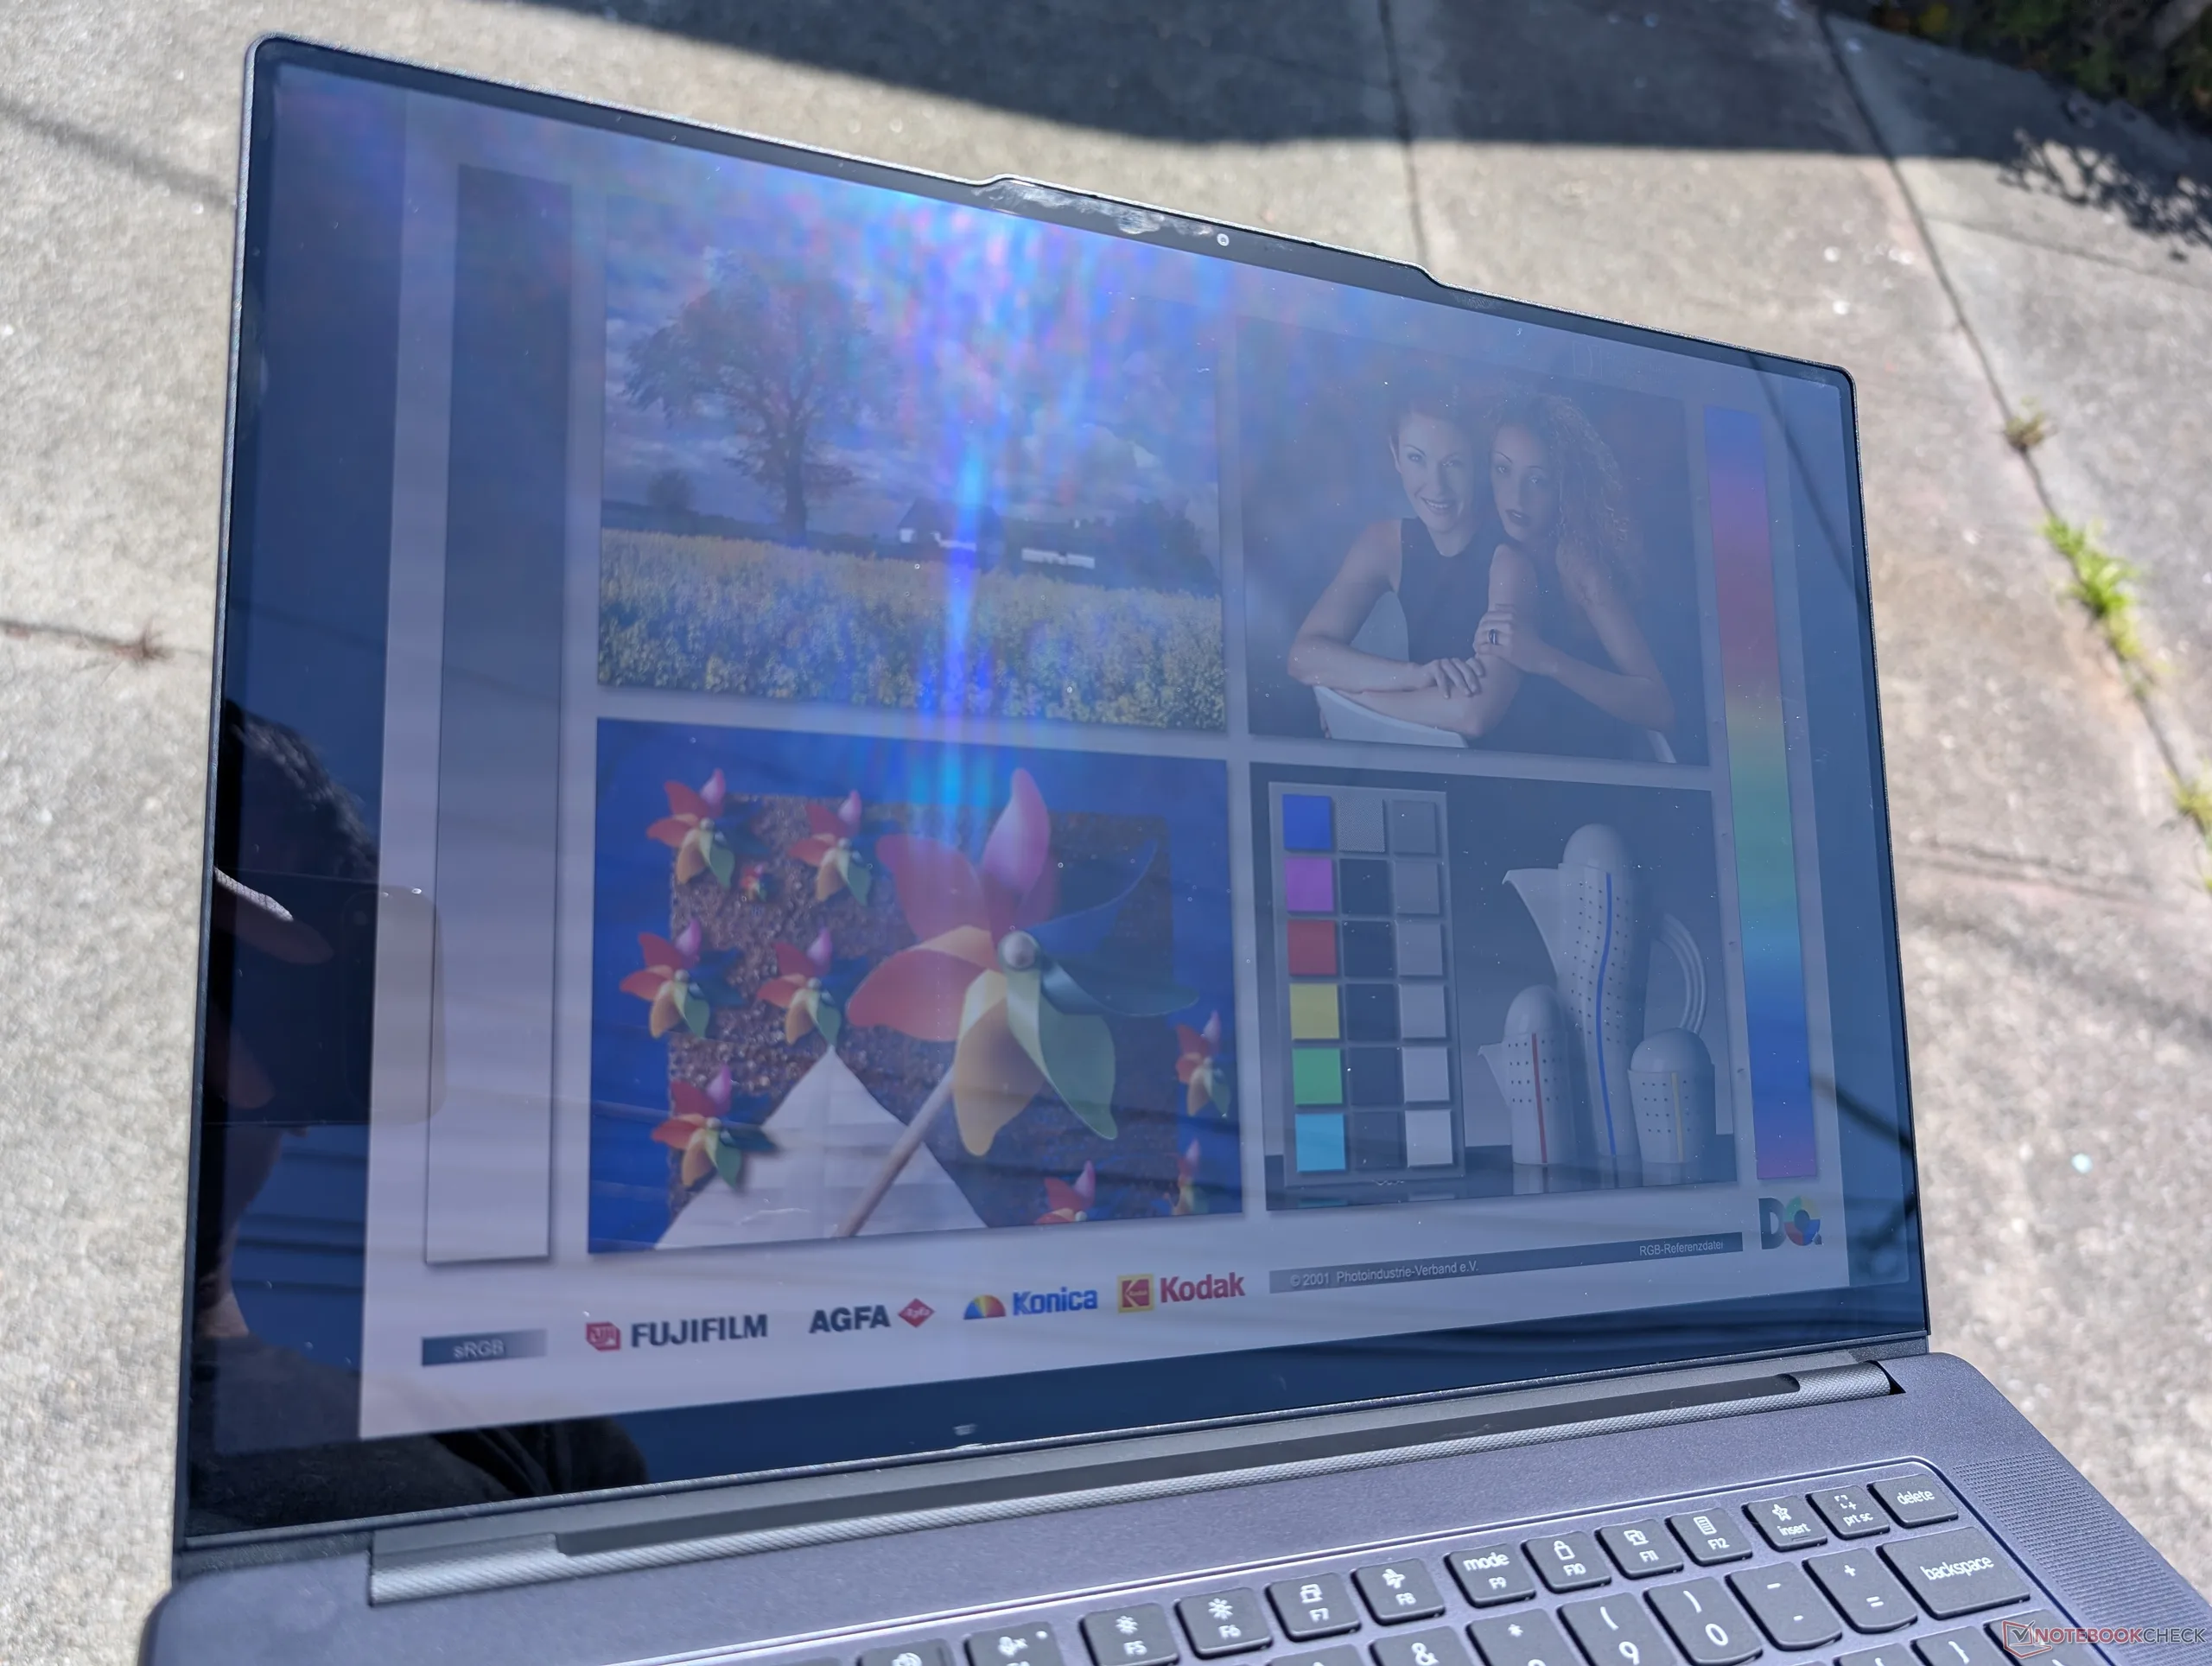
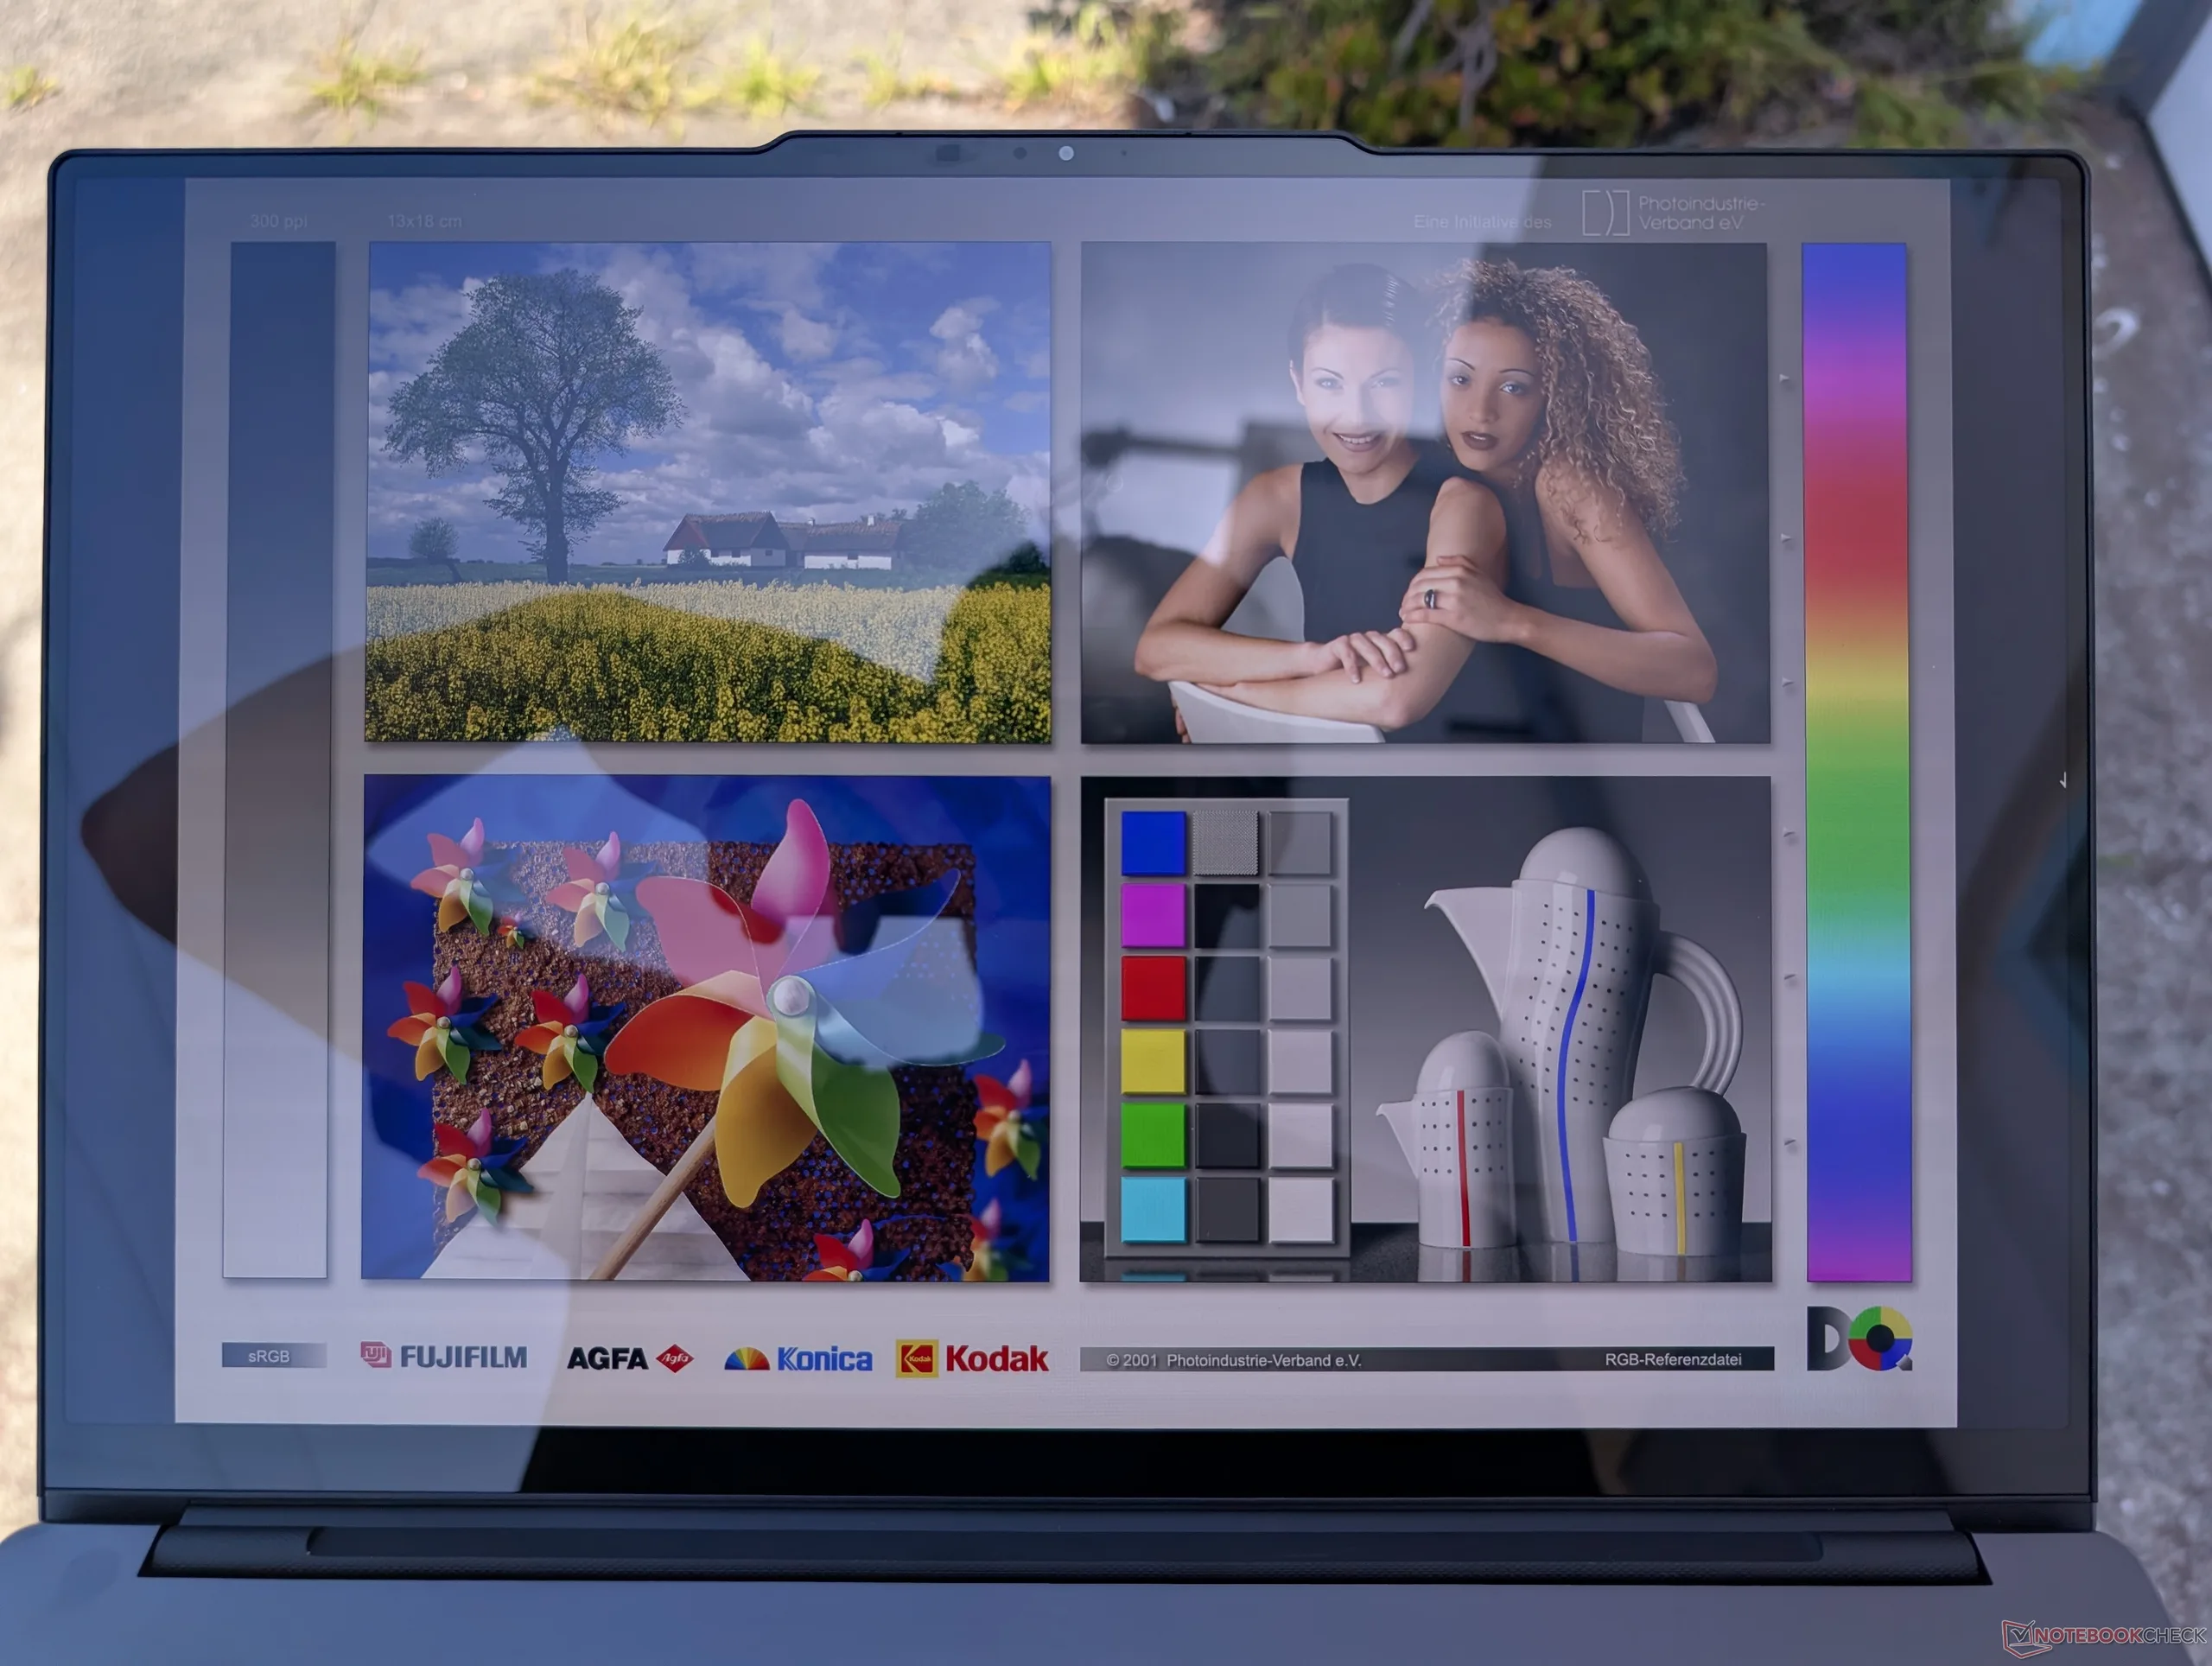
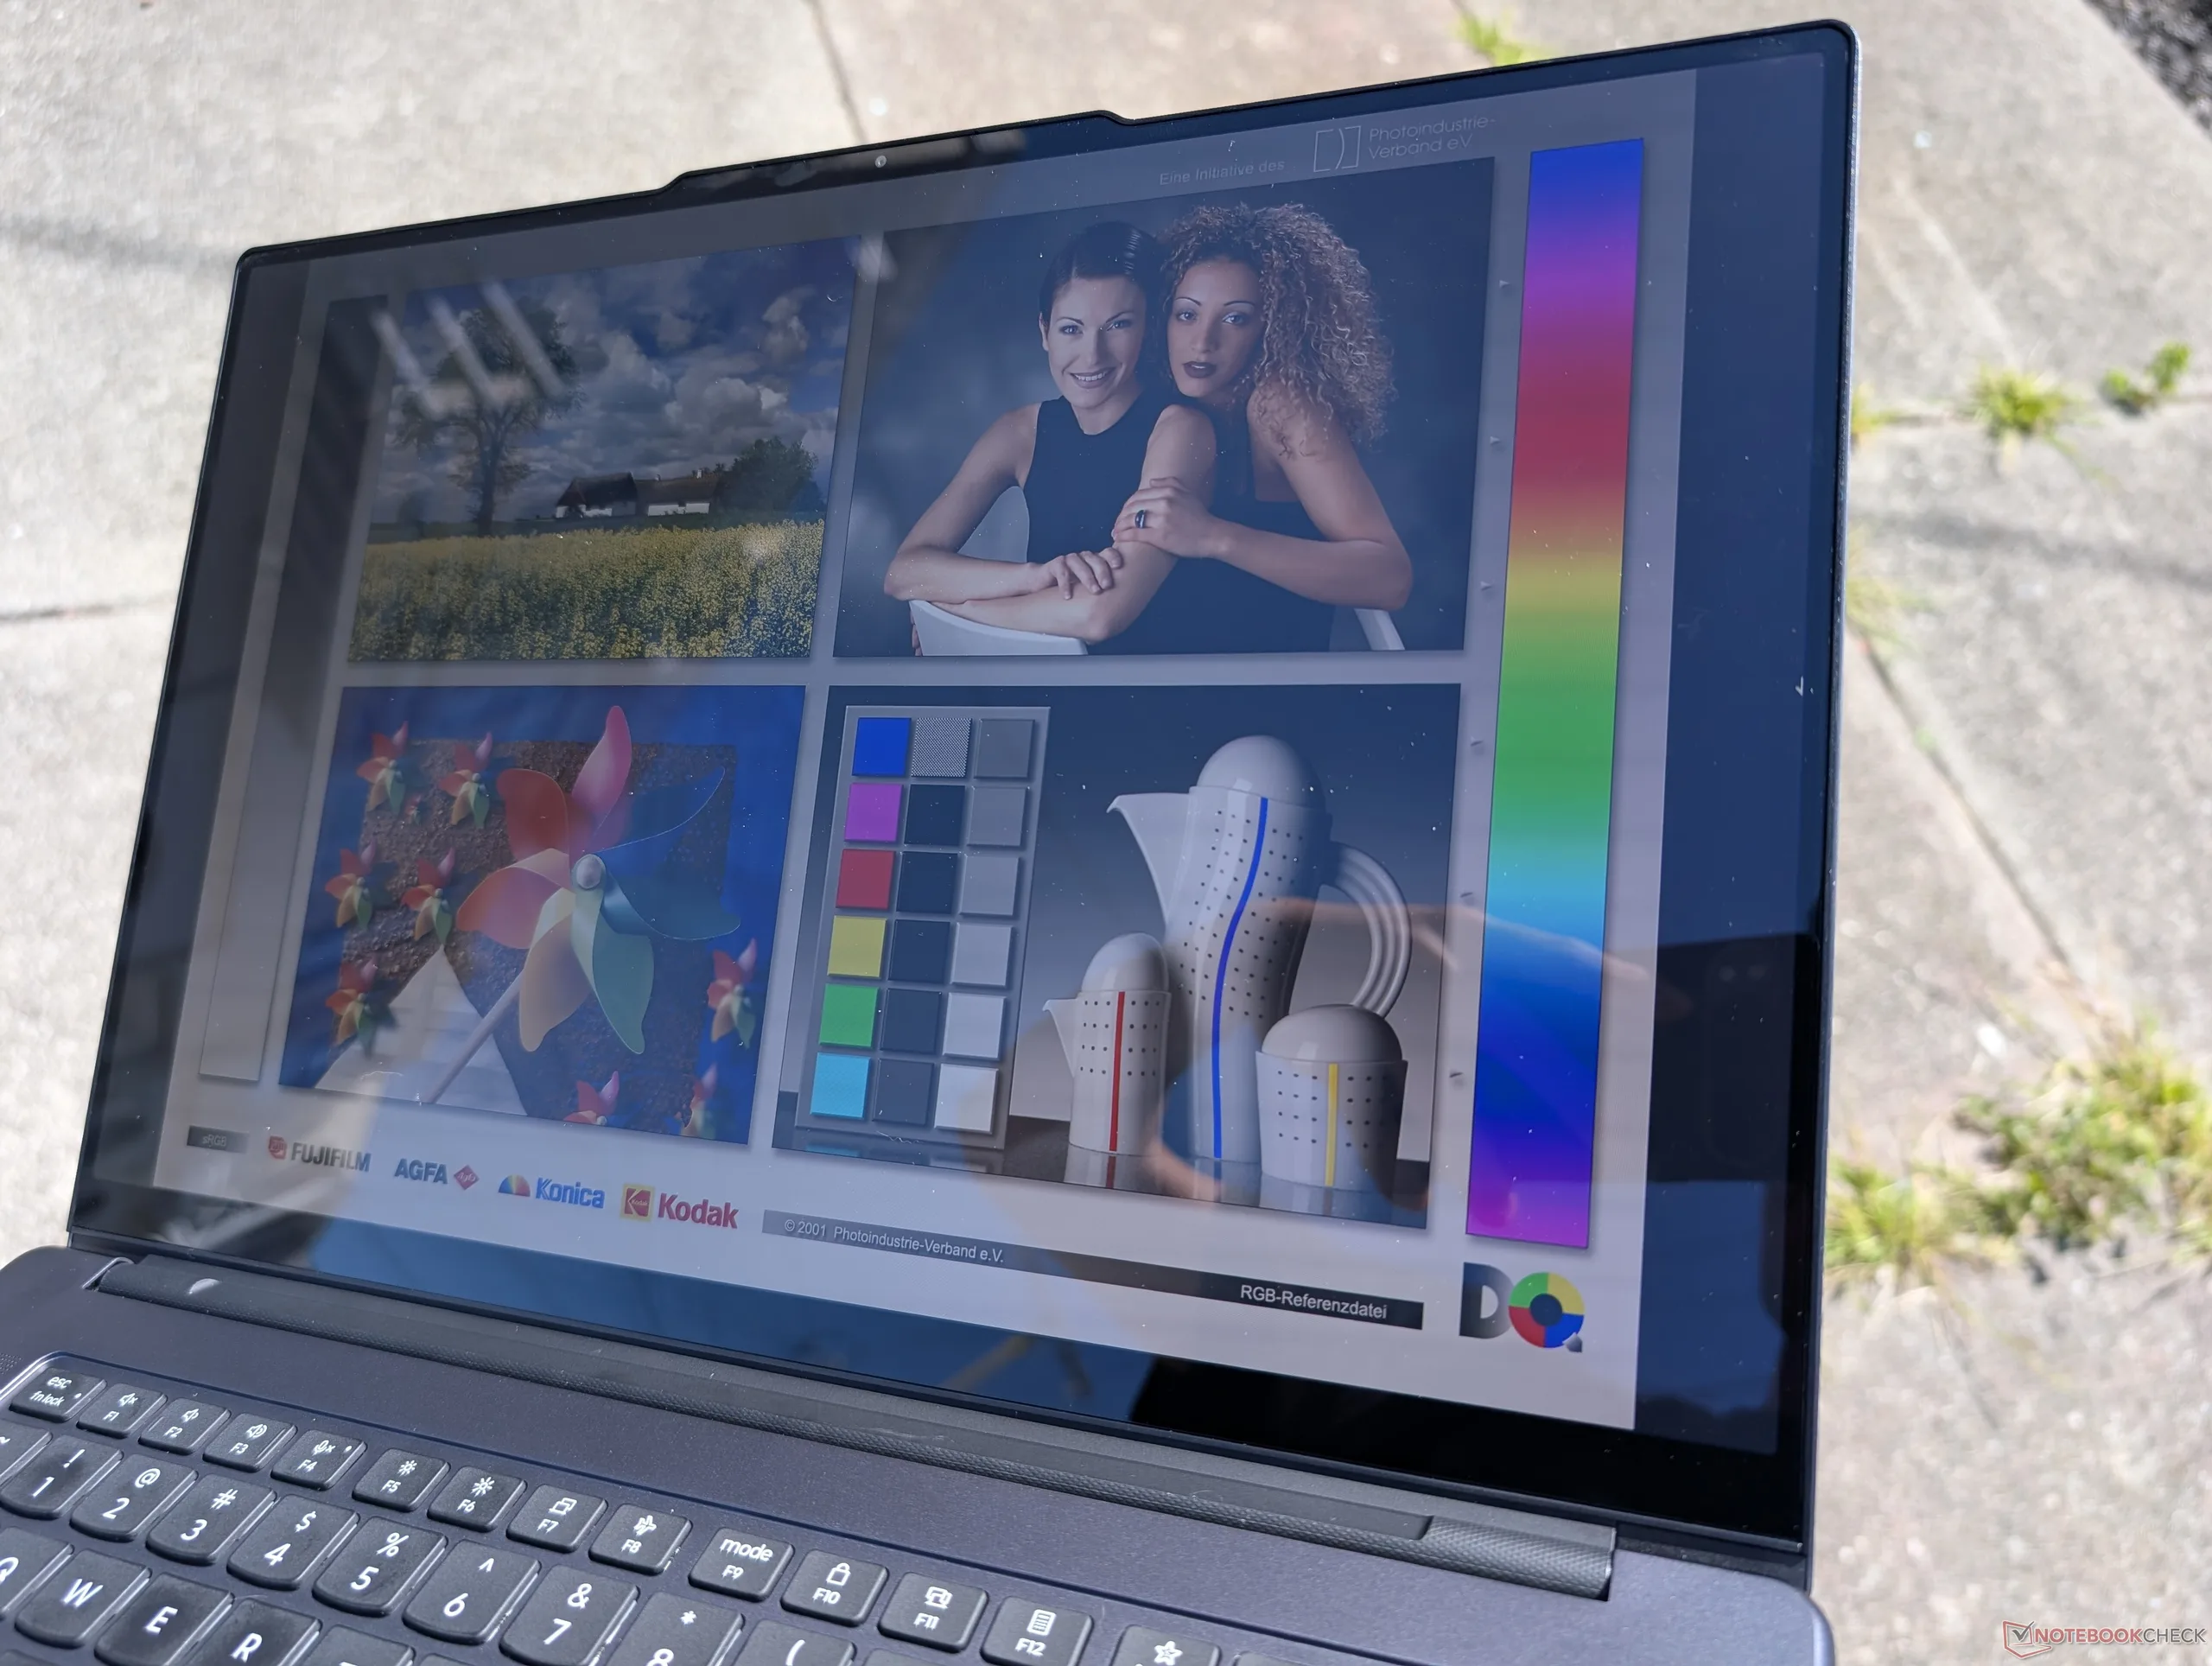
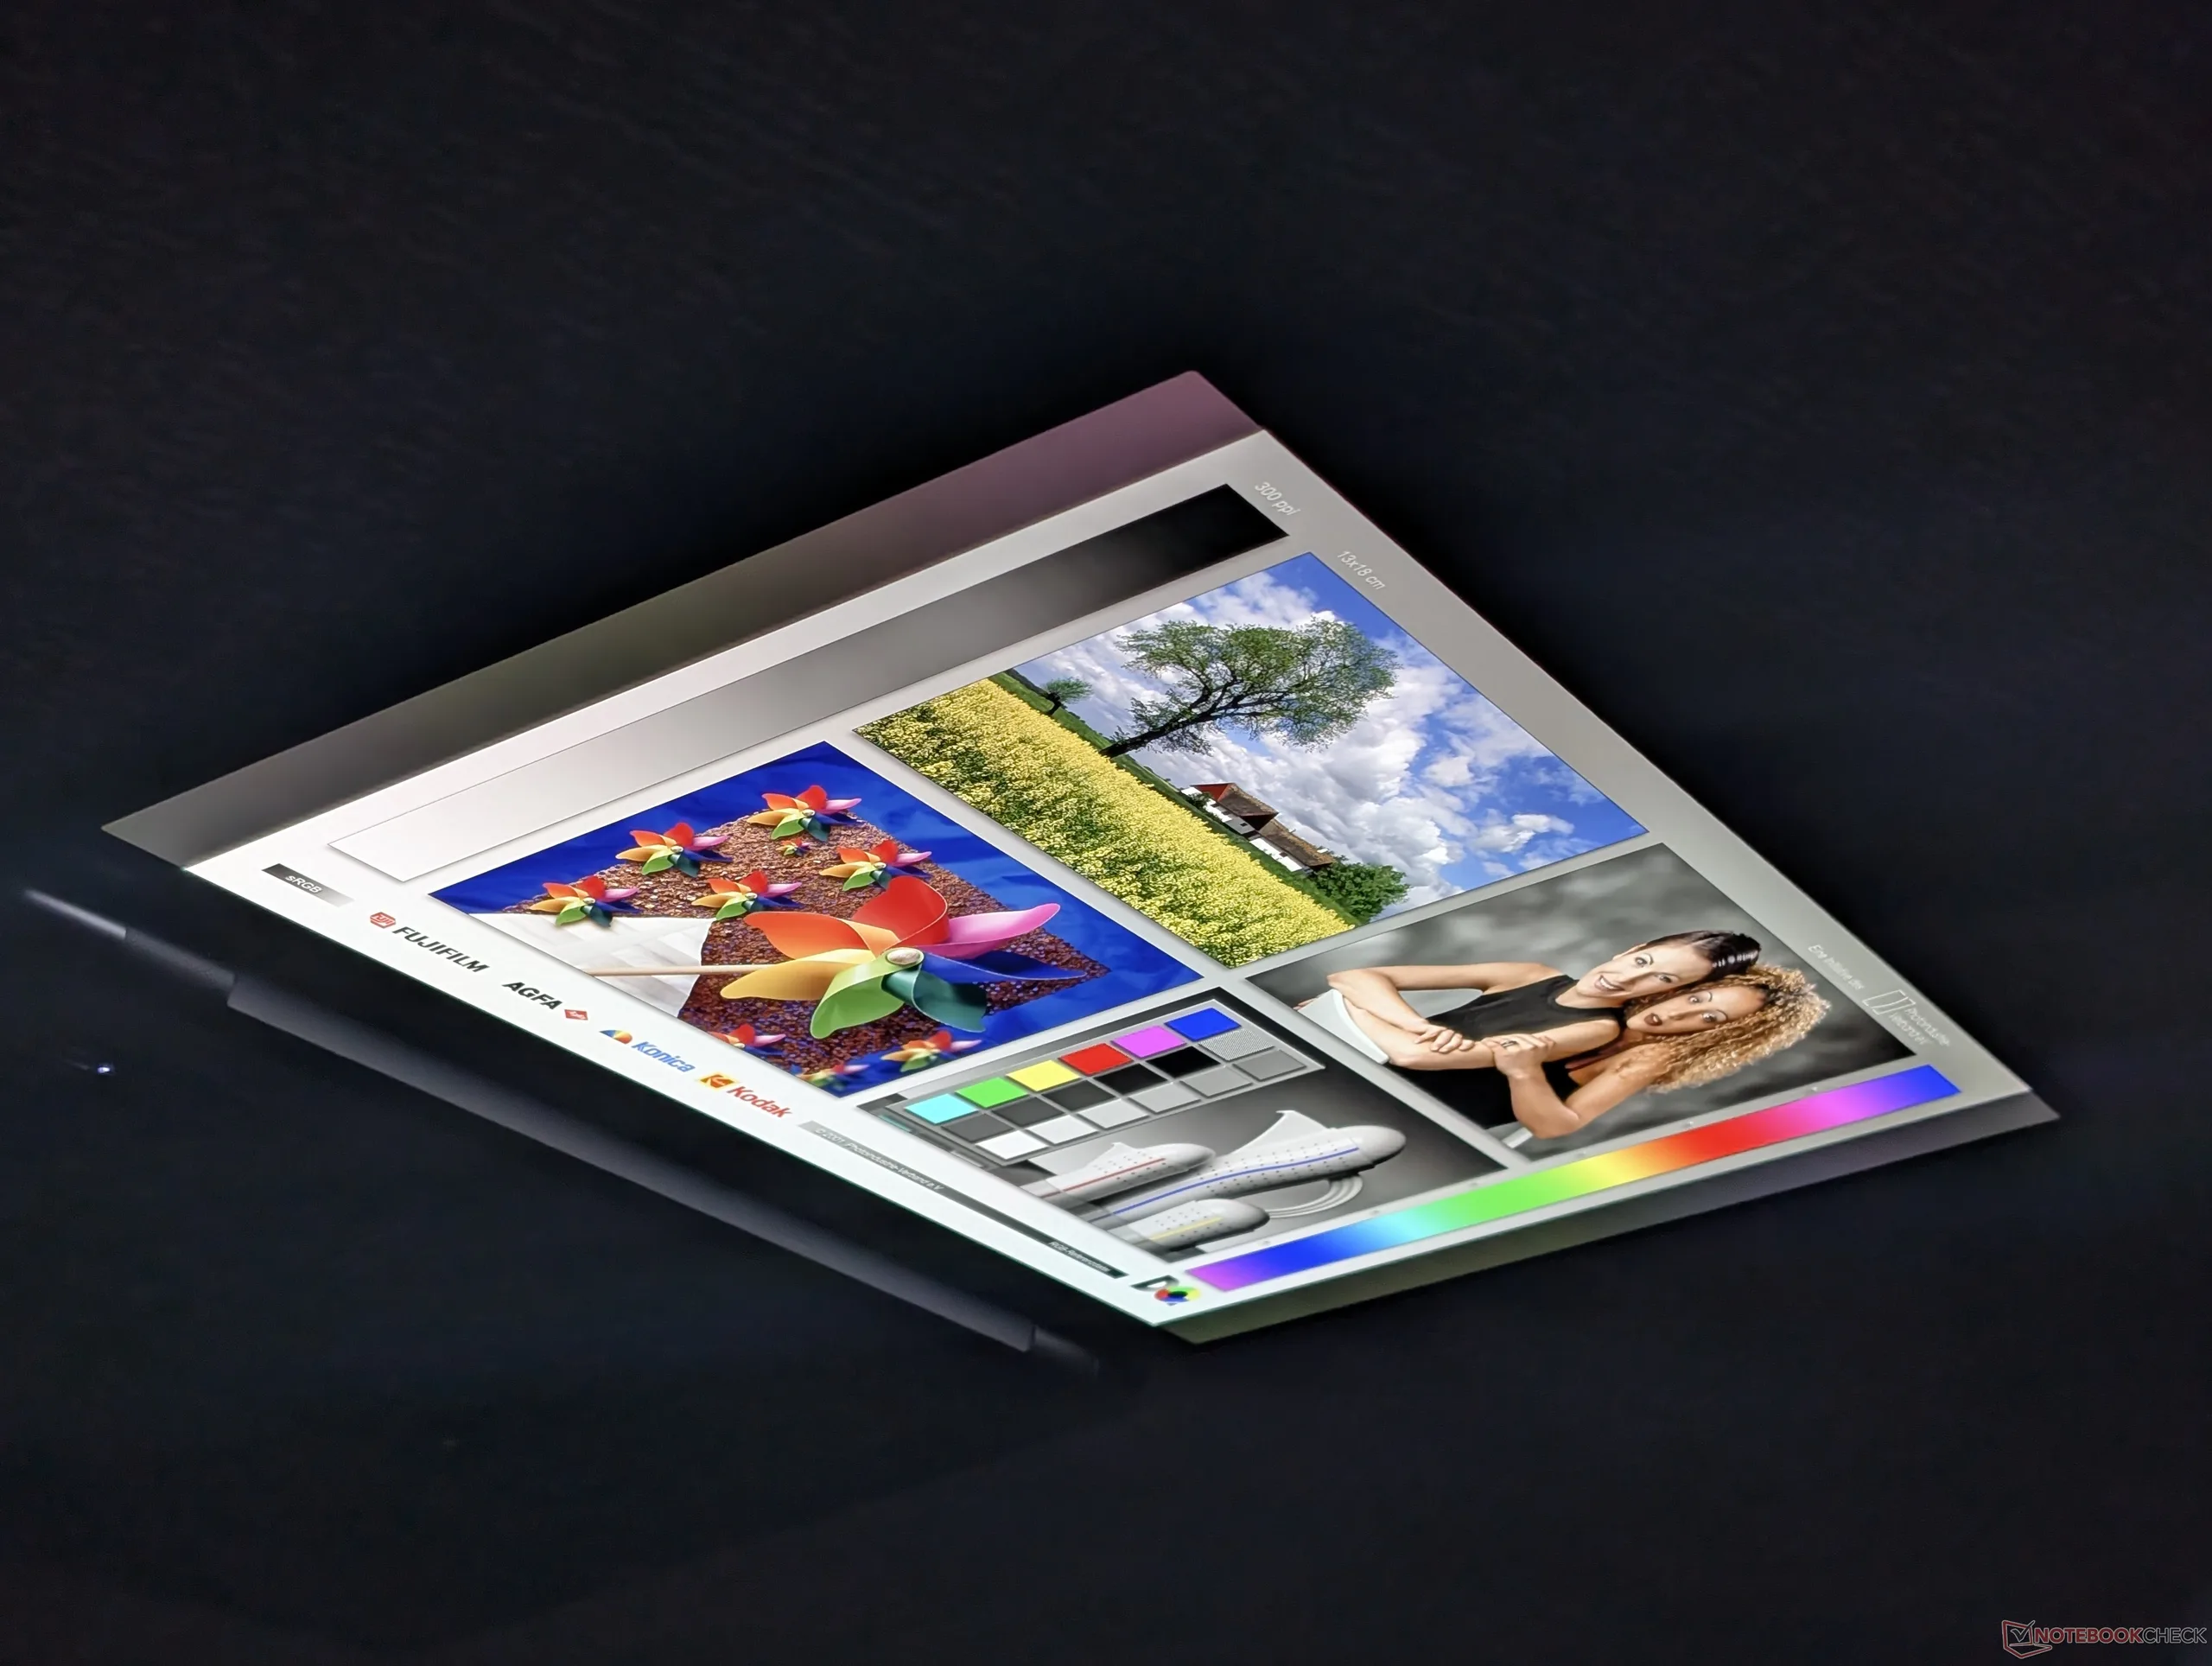
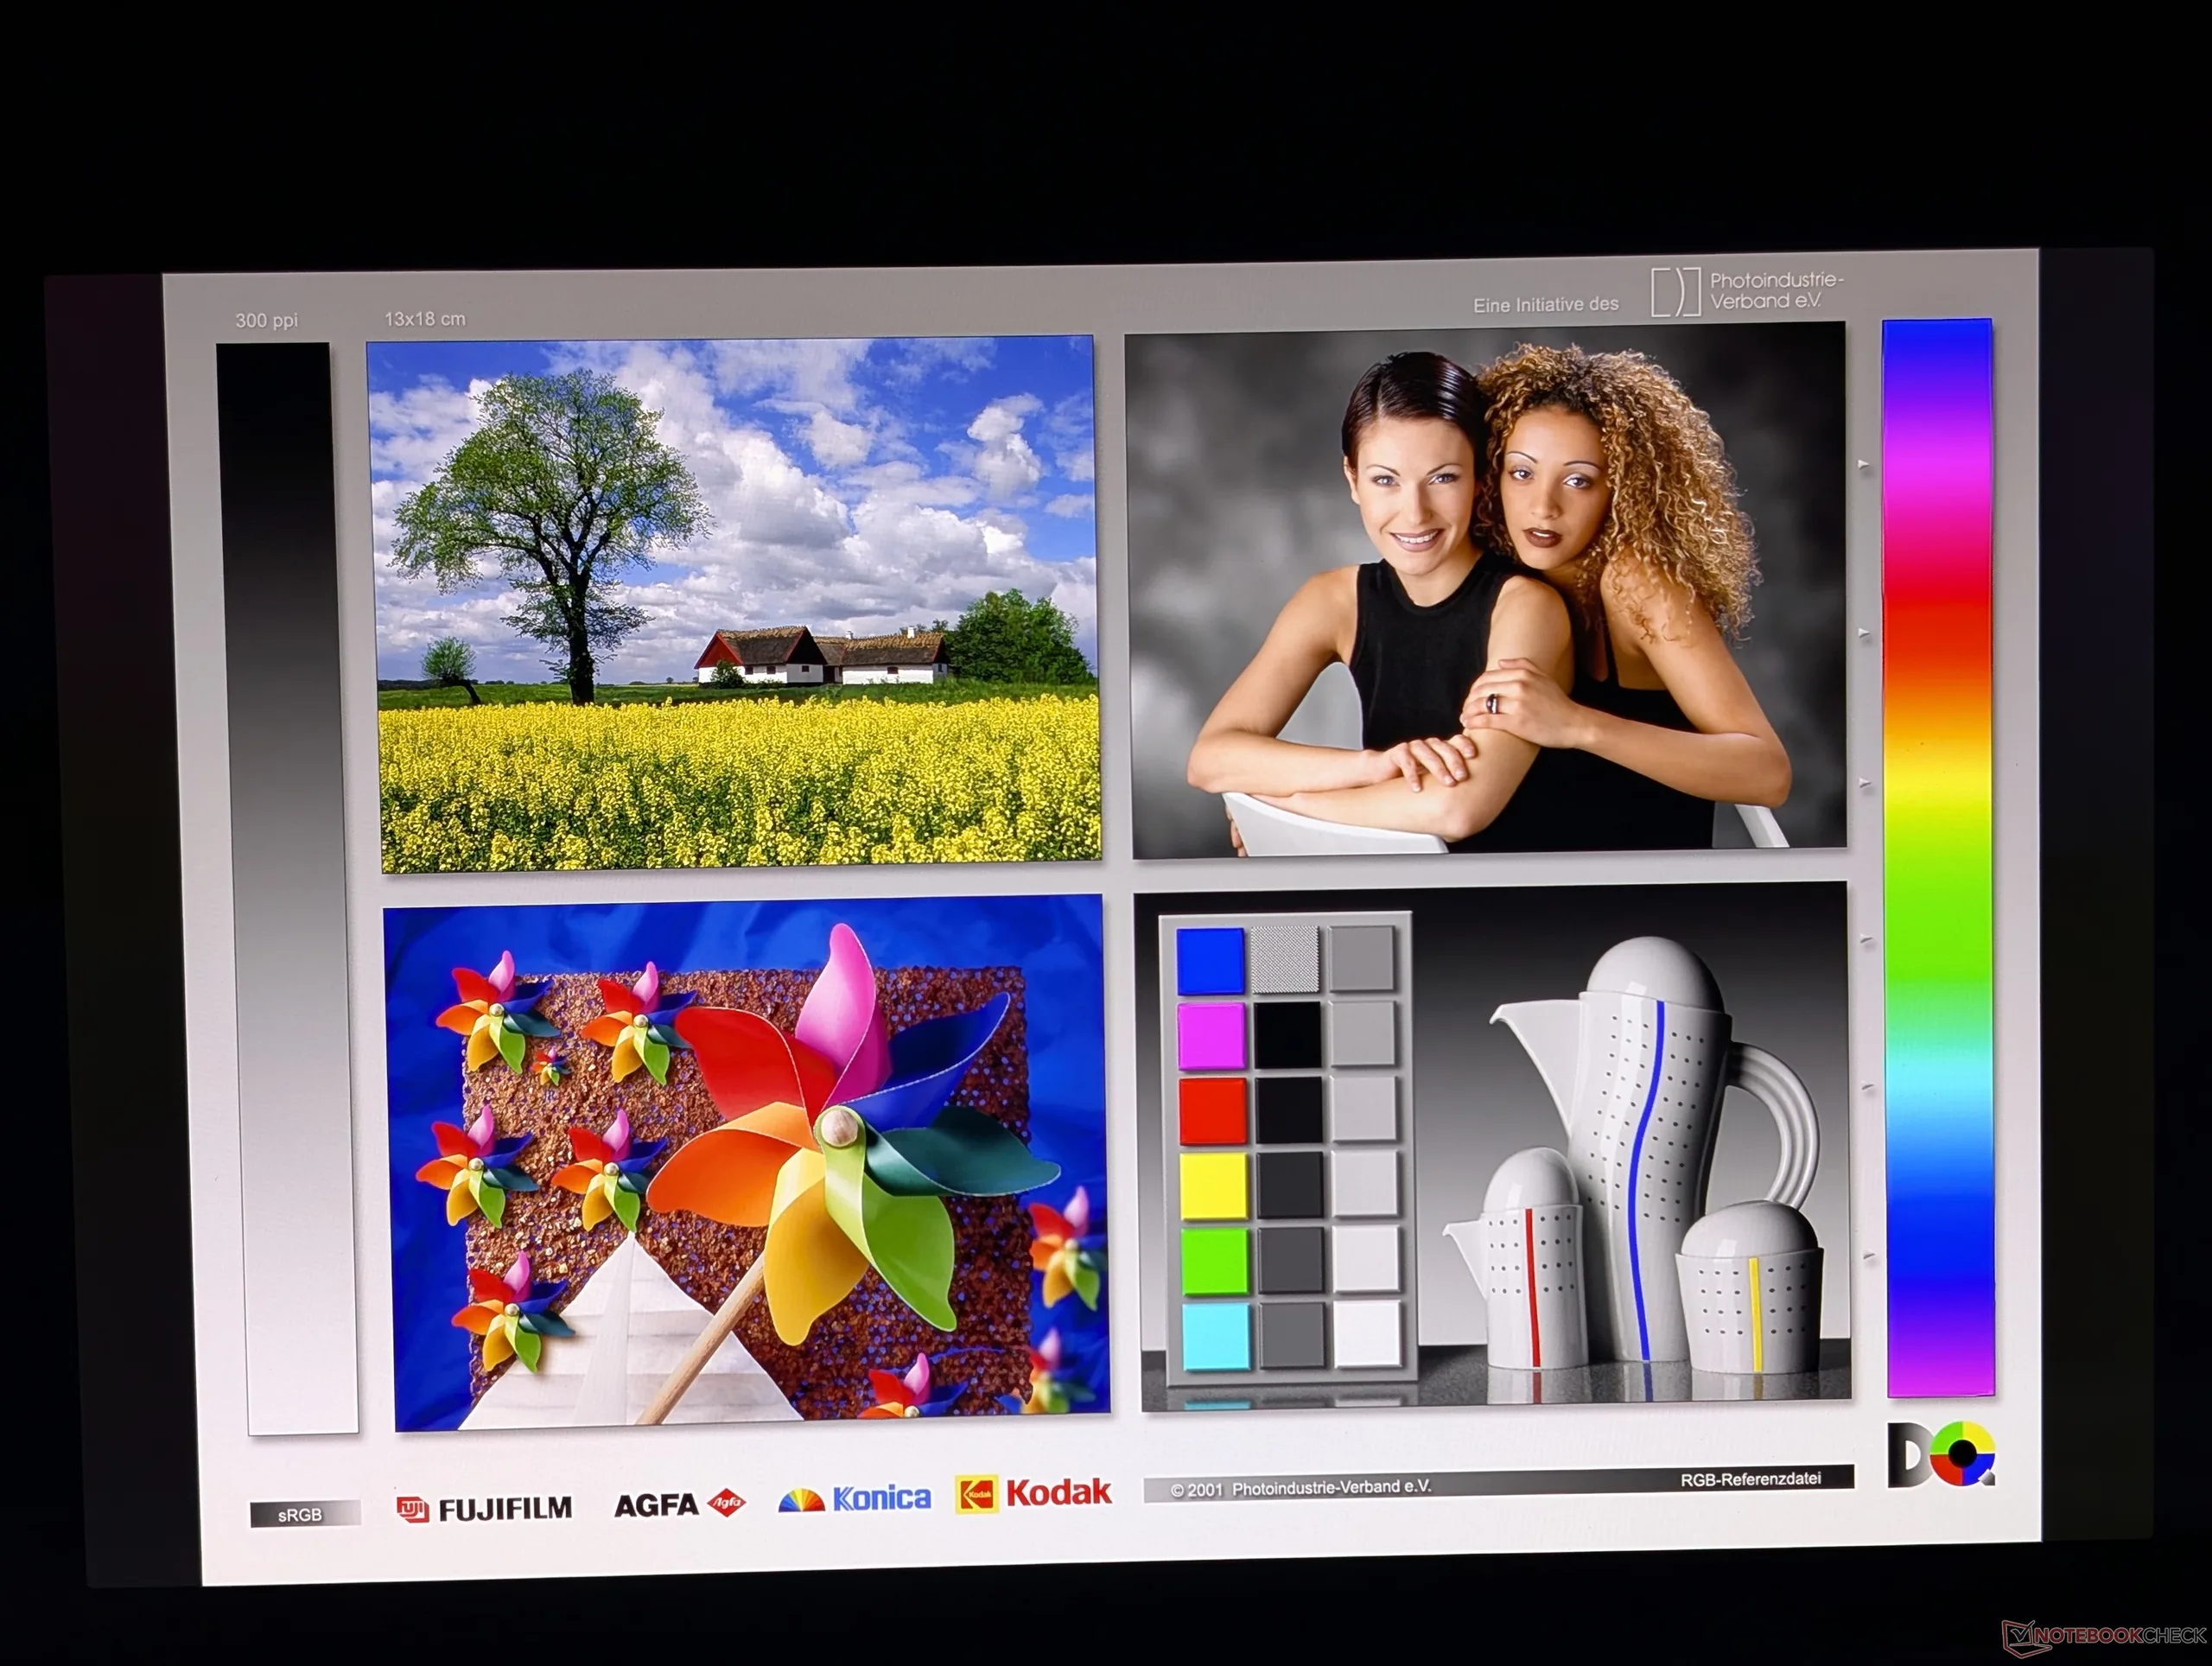
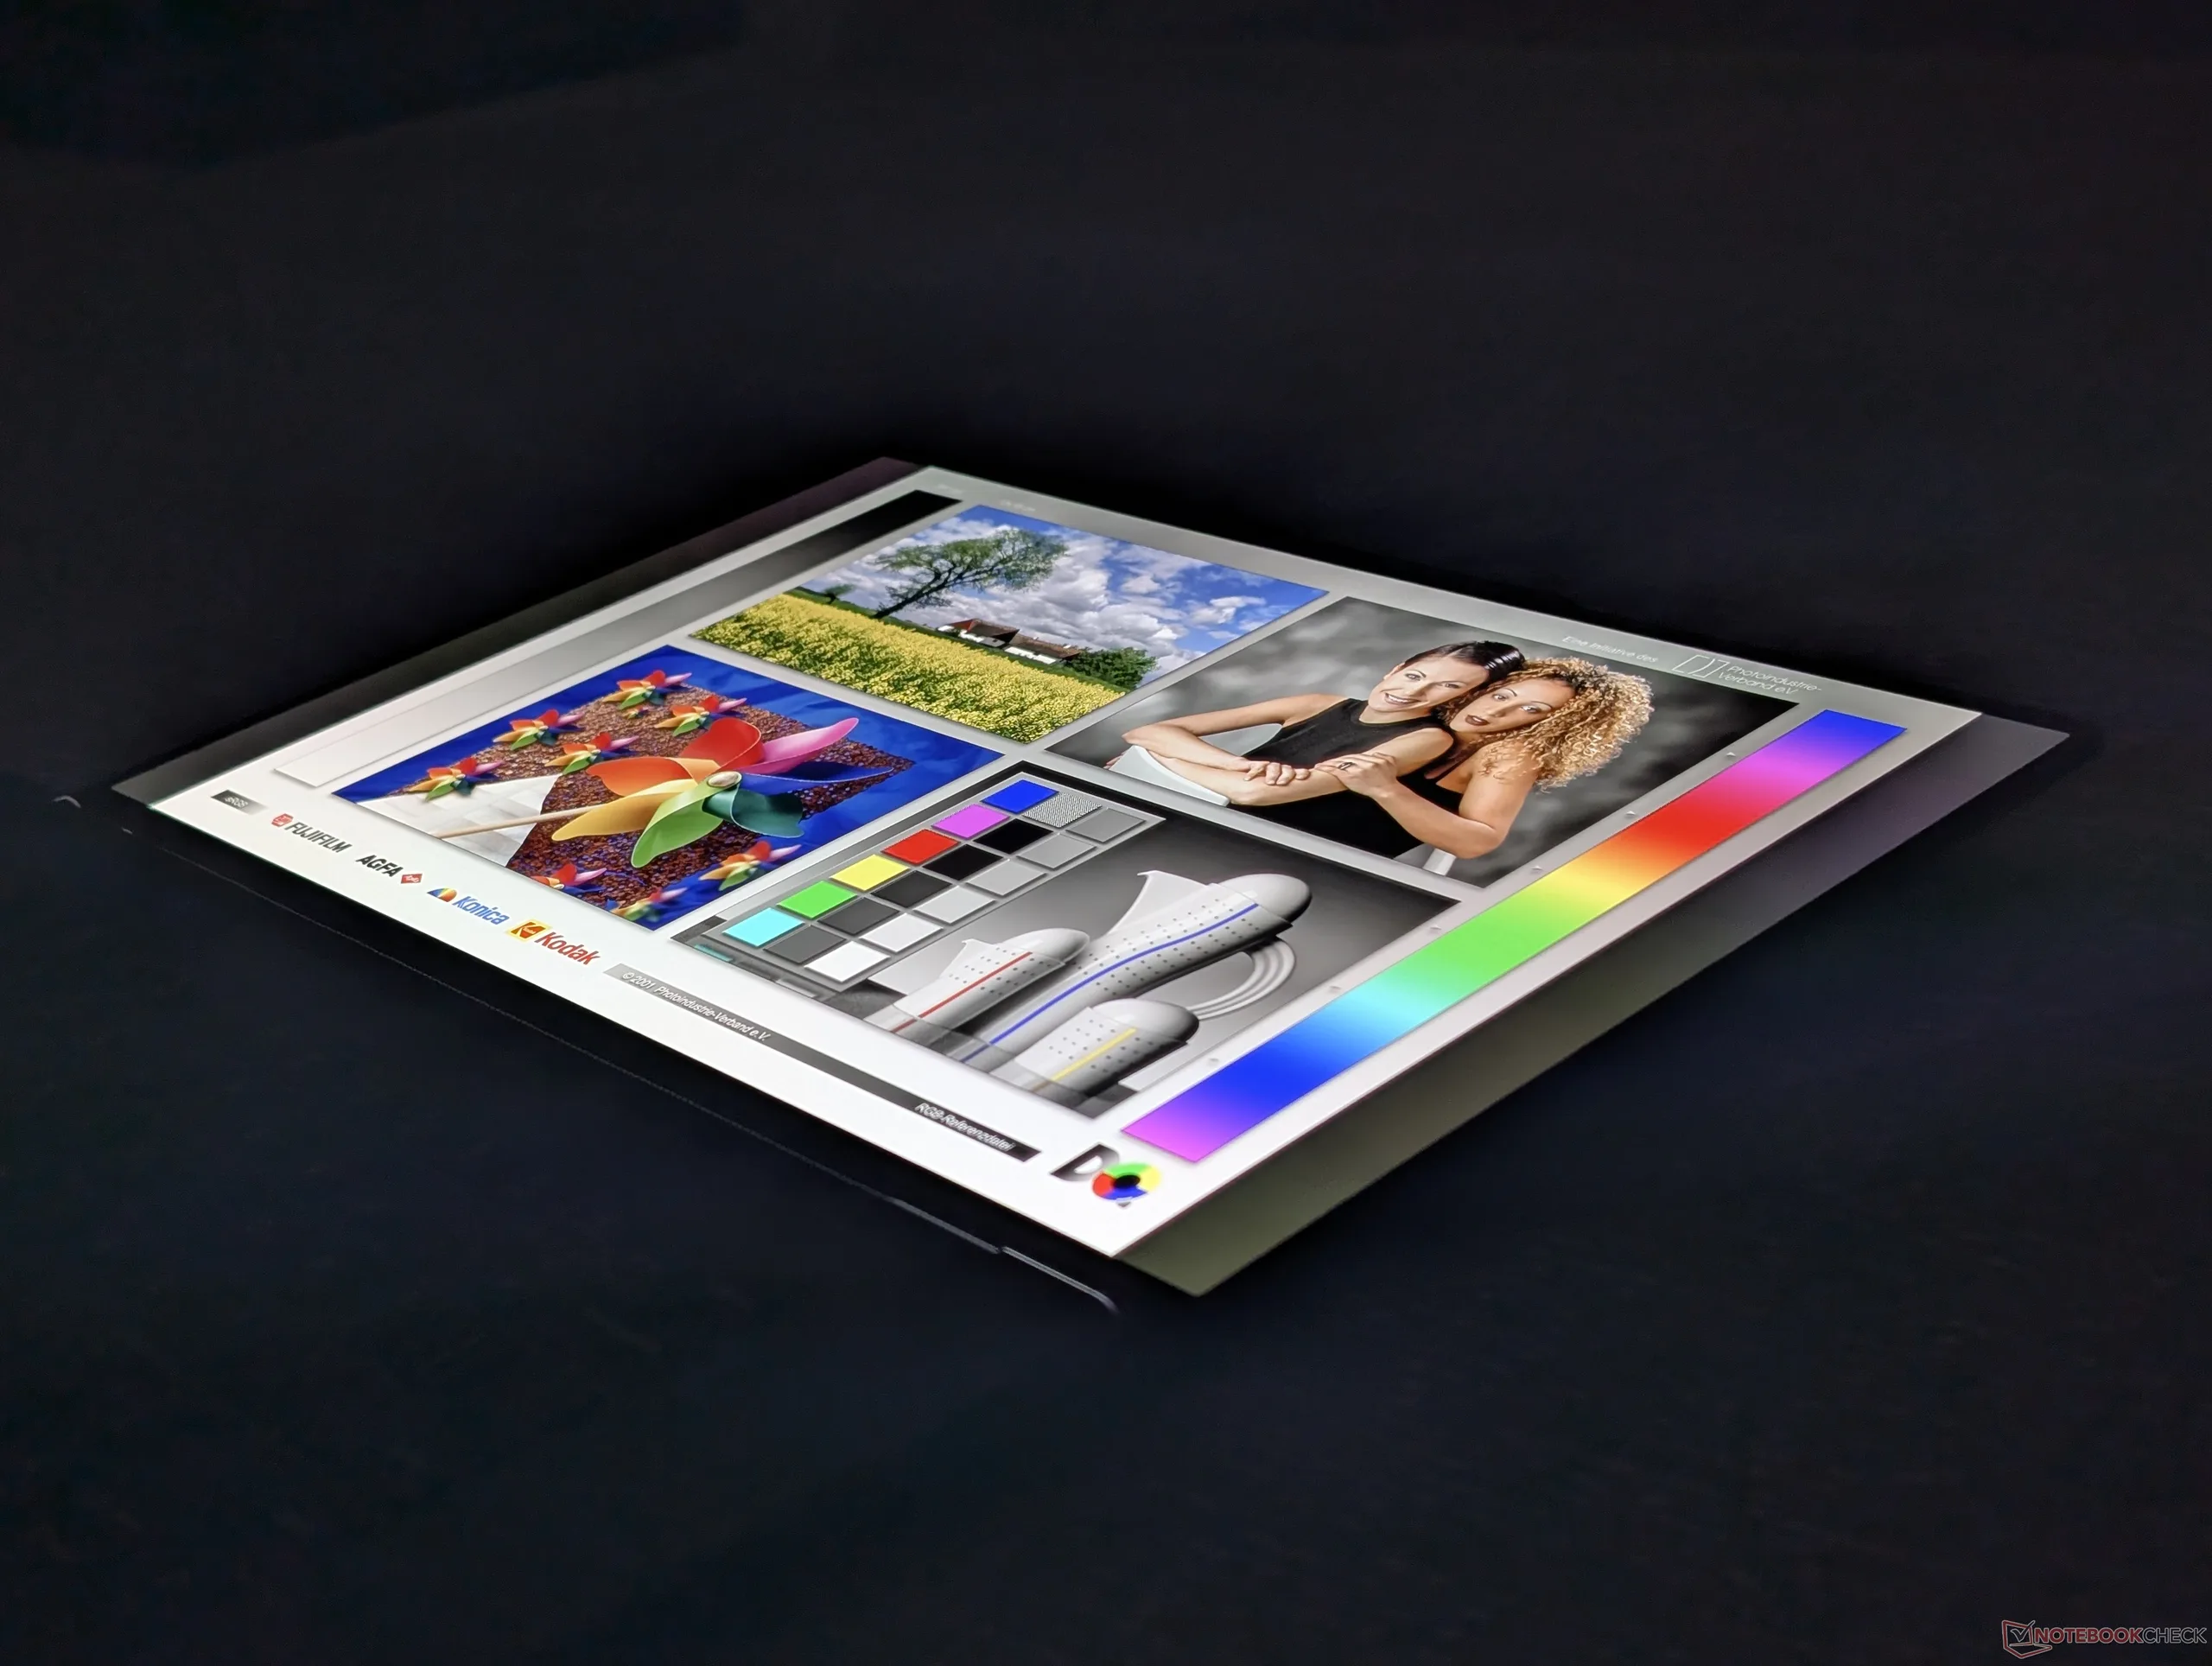
Het OLED-tandemscherm op ons apparaat is exact hetzelfde Samsung ATNA60KA04-0 paneel als op de 2025 Yoga Pro 9i 16 voor dezelfde kijkervaring. Onze eigen metingen onthullen een maximale helderheid in het midden van 931 nits in SDR-modus en 1480 nits in HDR-modus, waardoor dit een van de helderste schermen op een 16-inch laptop is.
Houd er rekening mee dat Advanced Optimus wel wordt ondersteund, maar dat G-Sync nog steeds weggelaten wordt, omdat de Pro 9-serie niet in de eerste plaats voor gaming bedoeld is.
| |||||||||||||||||||||||||
Helderheidsverdeling: 94 %
Helderheid in Batterij-modus: 930.9 cd/m²
Contrast: ∞:1 (Zwart: 0 cd/m²)
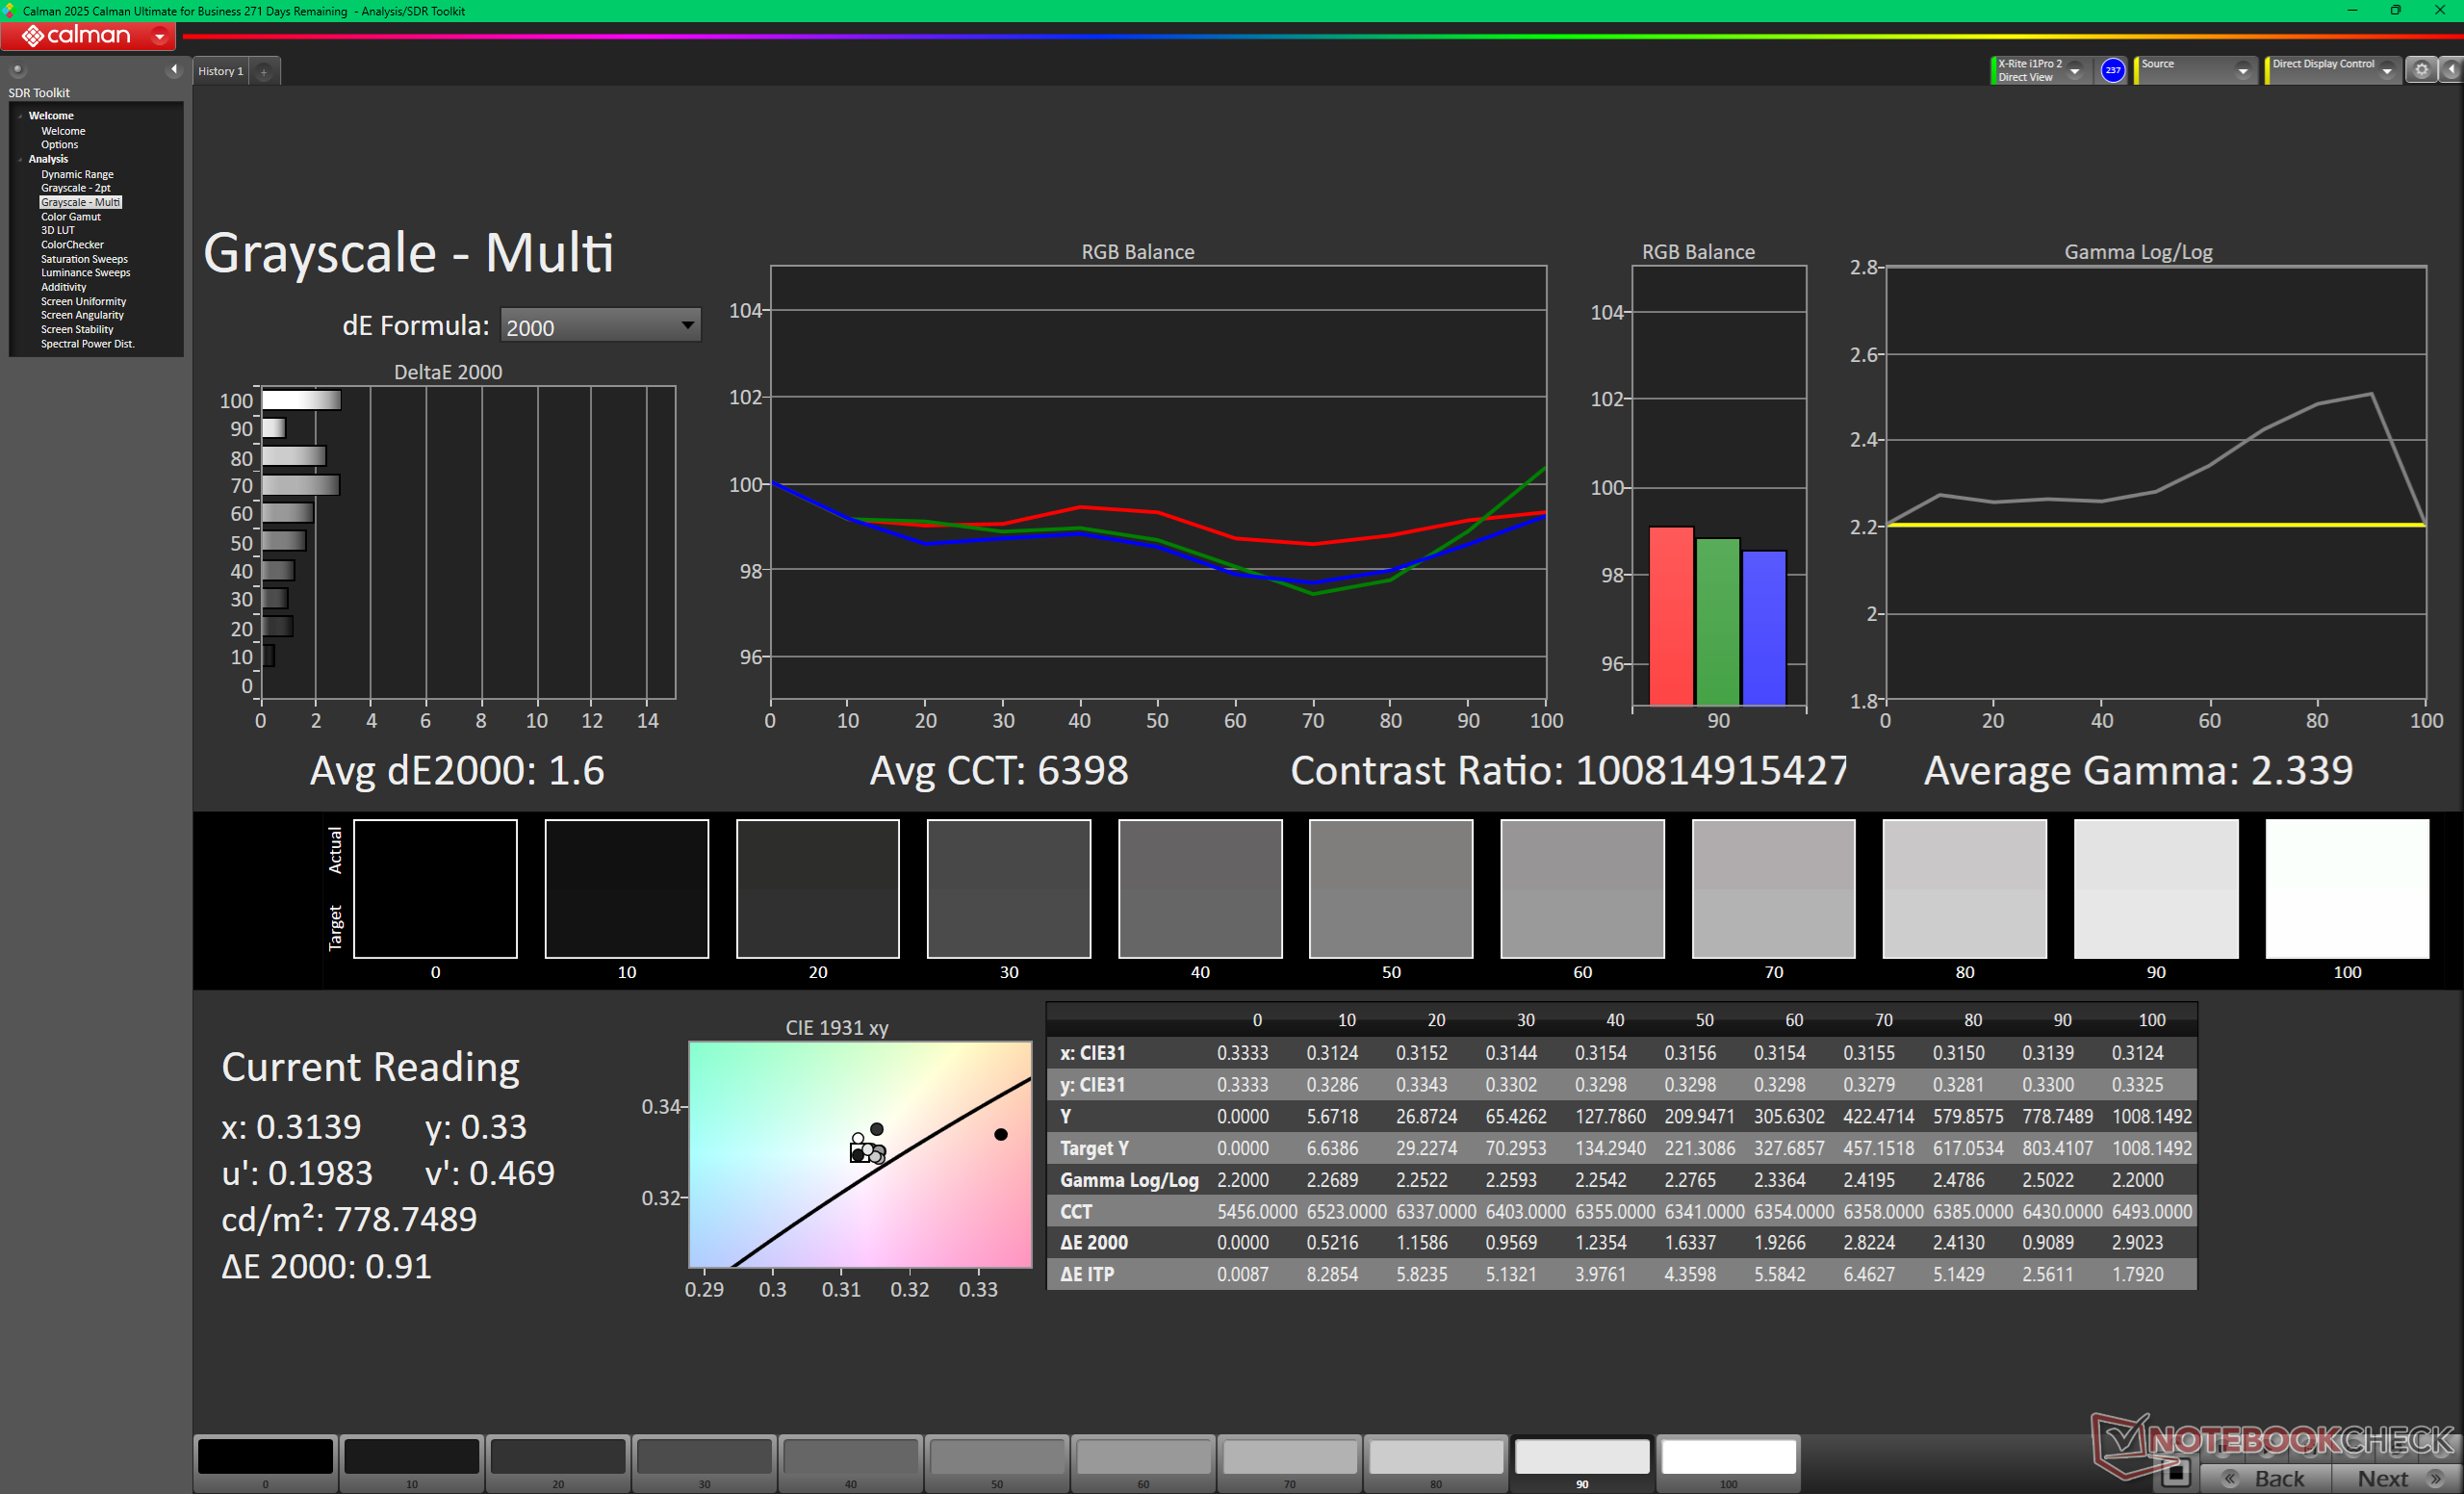
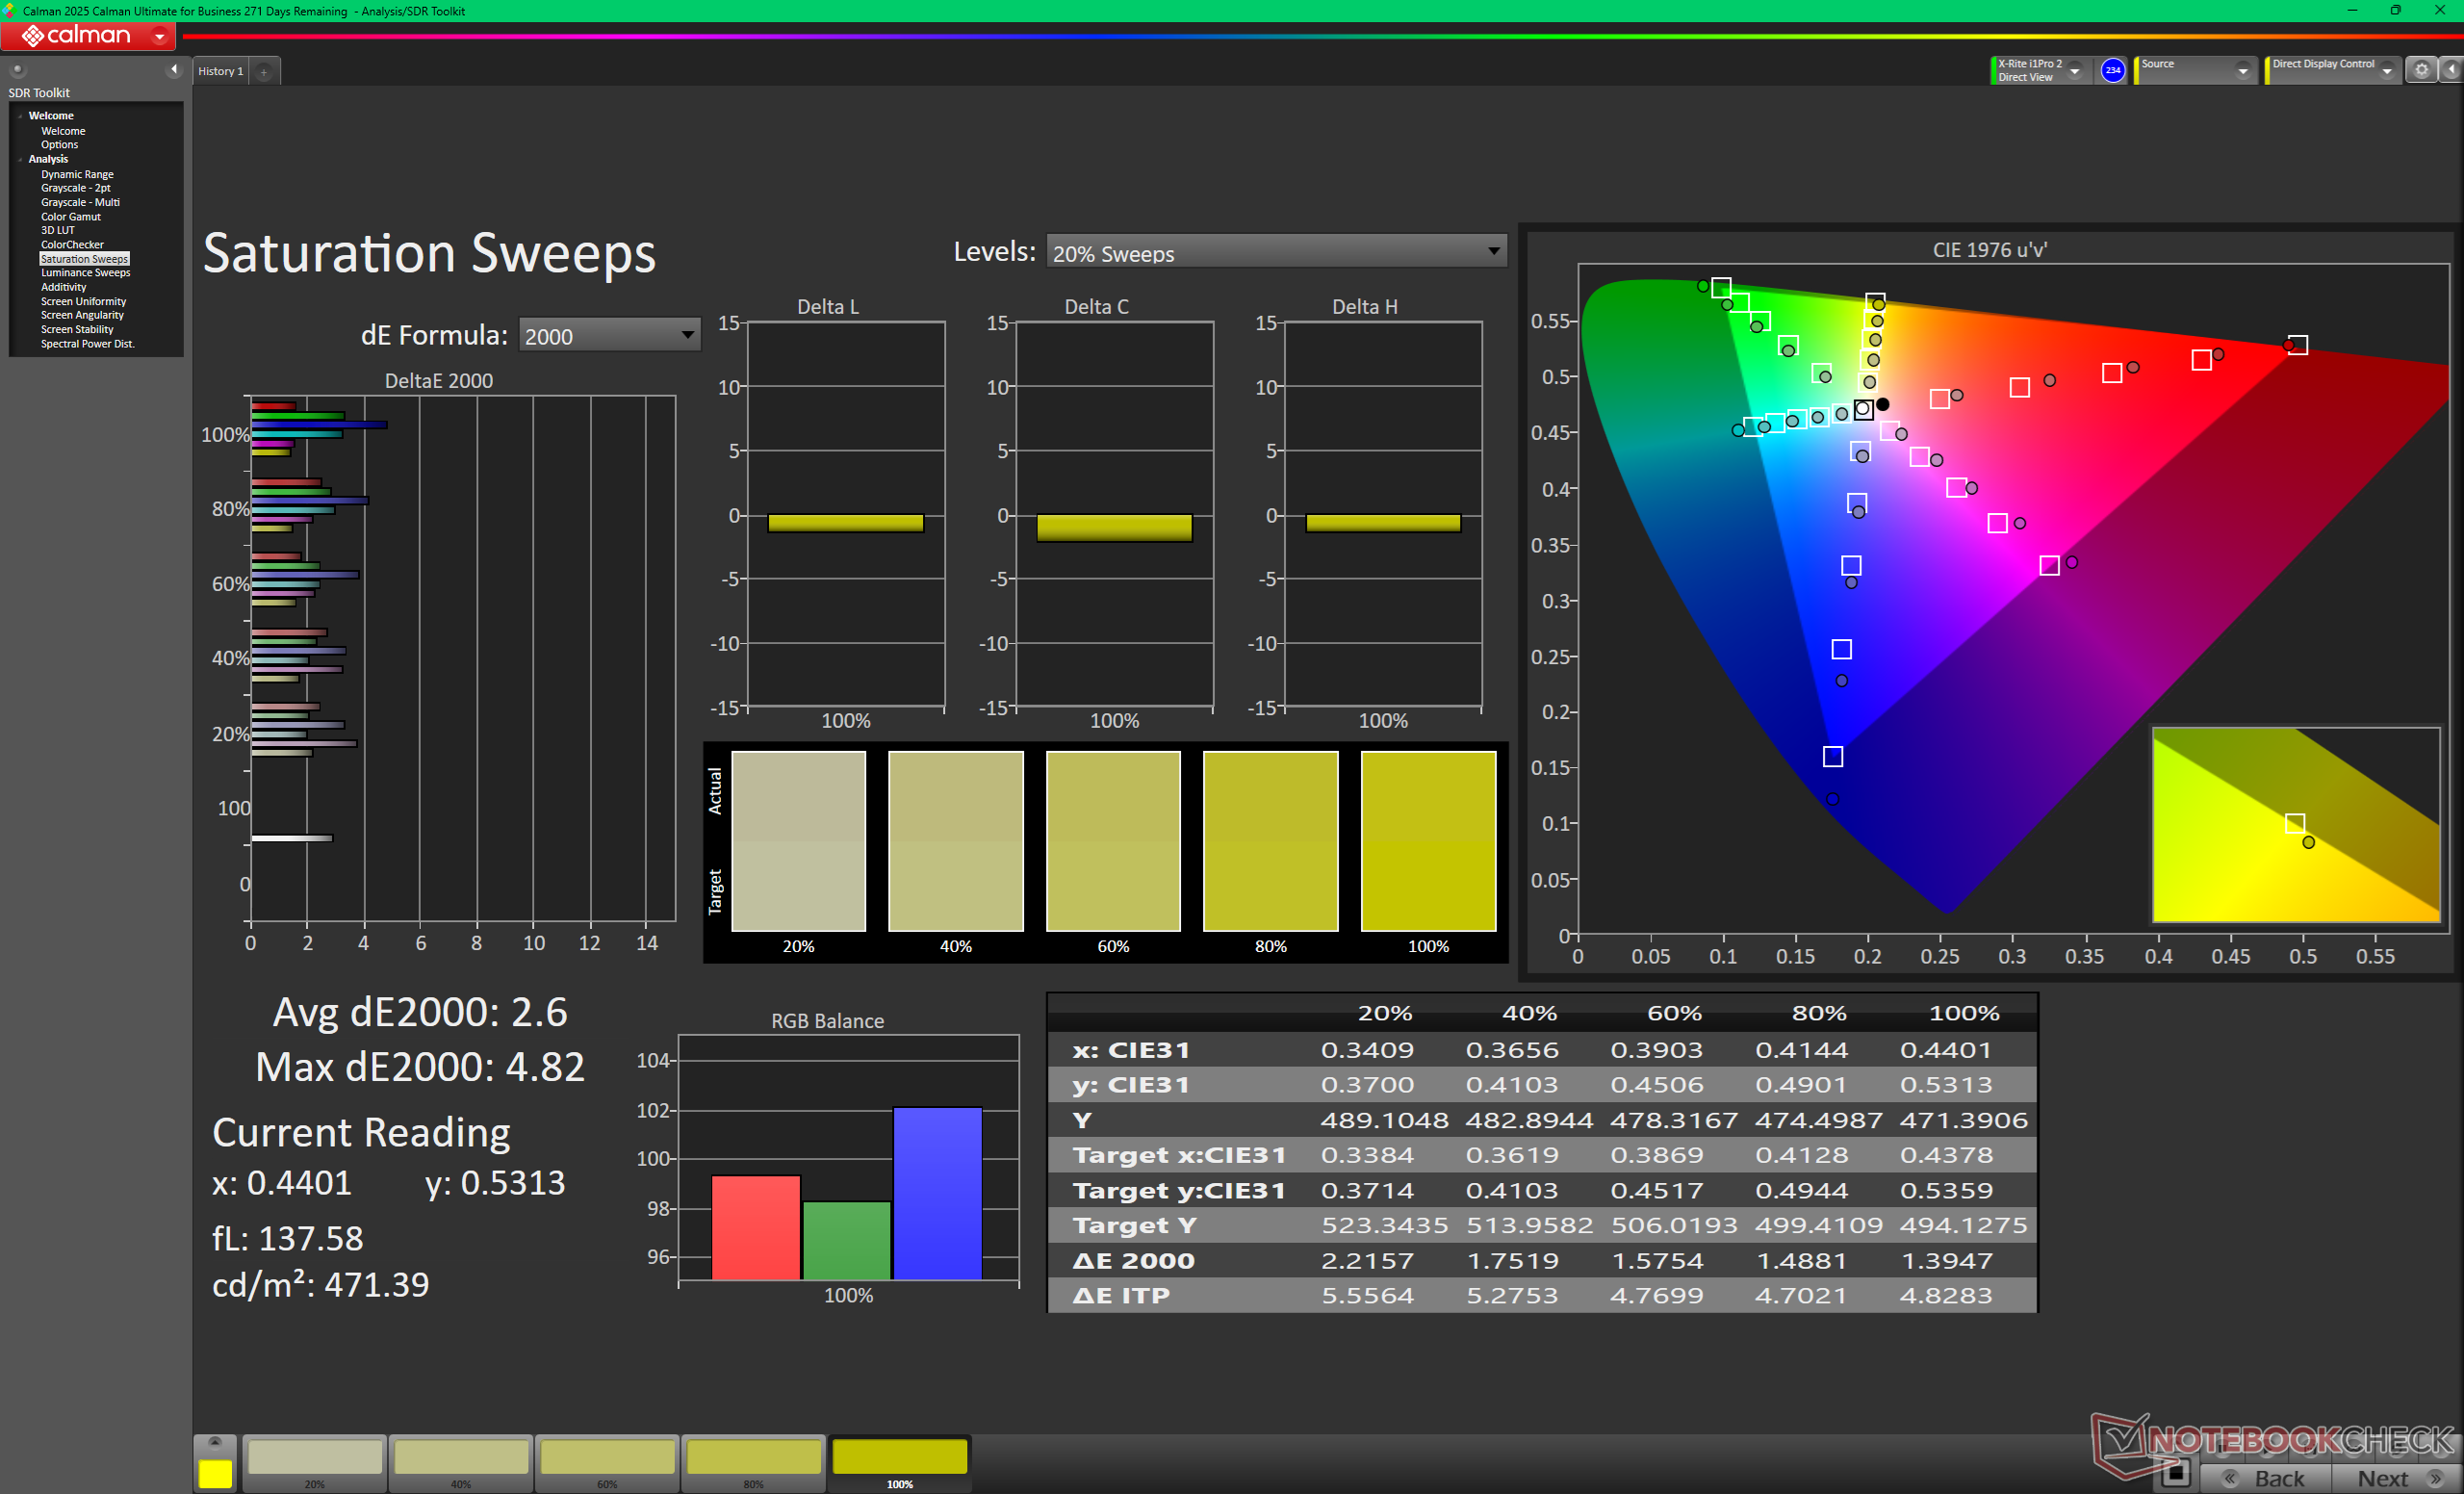
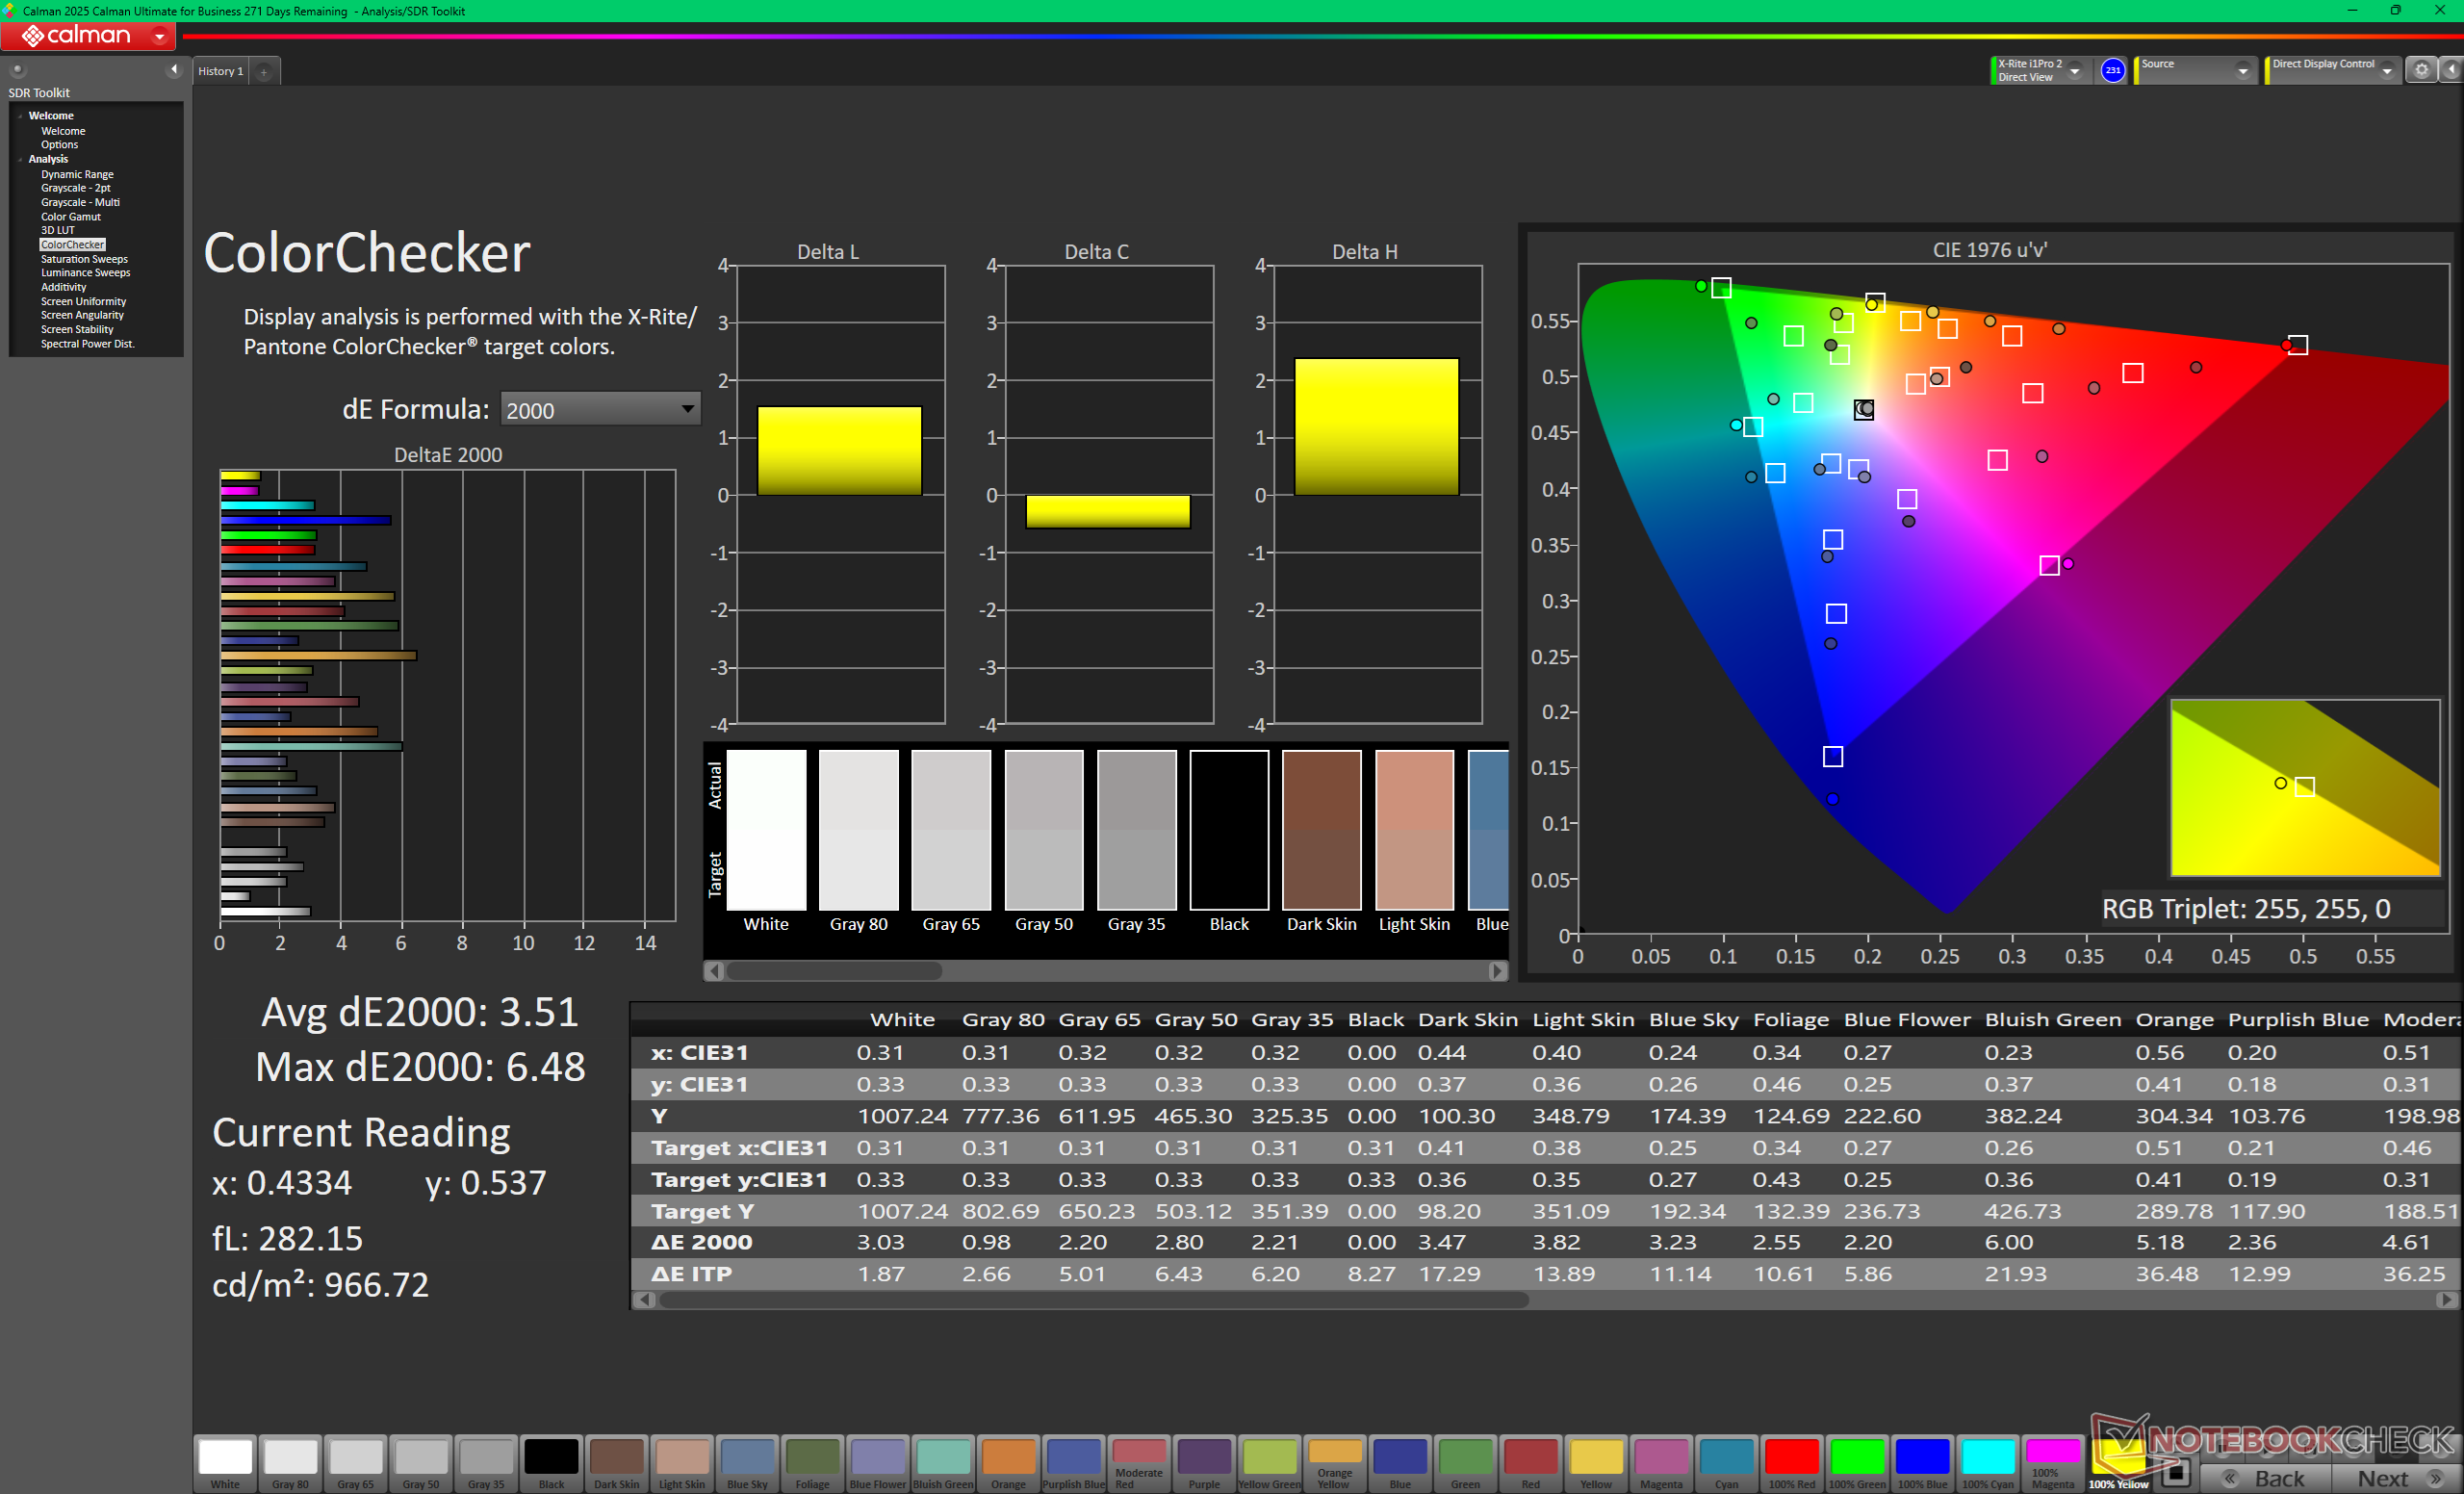
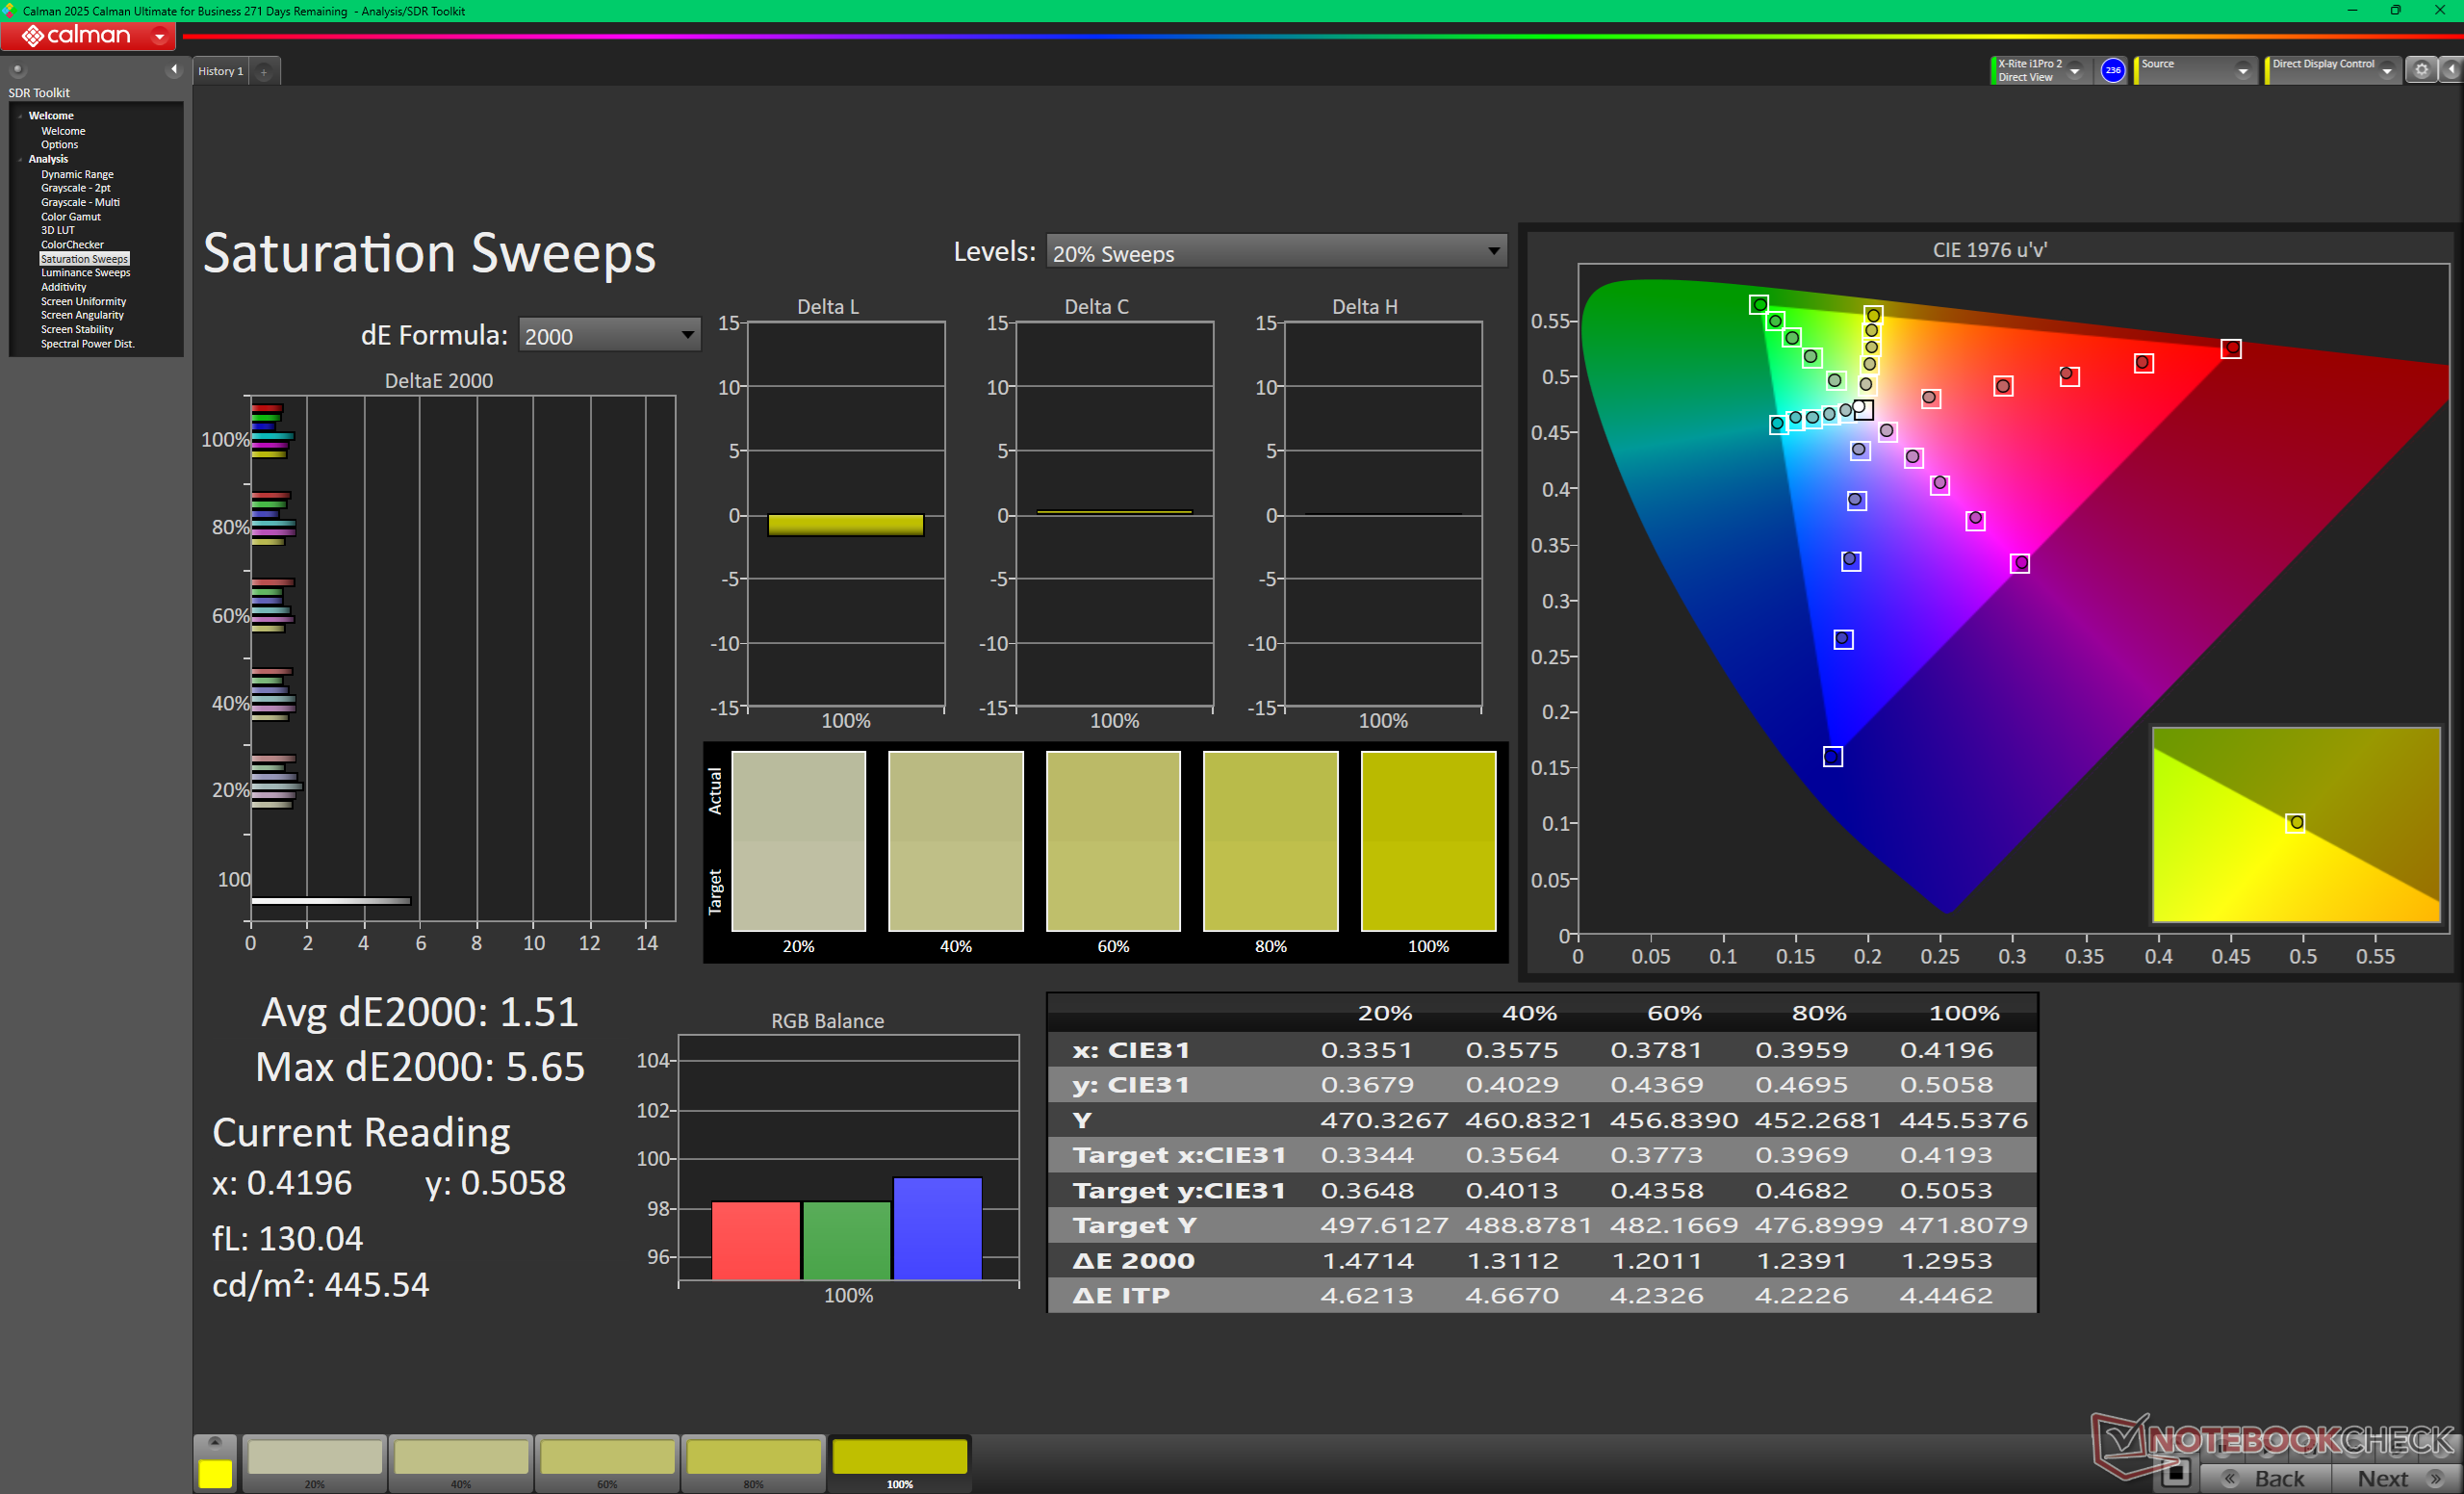
ΔE ColorChecker Calman: 3.51 | ∀{0.5-29.43 Ø4.71}
calibrated: 1.55
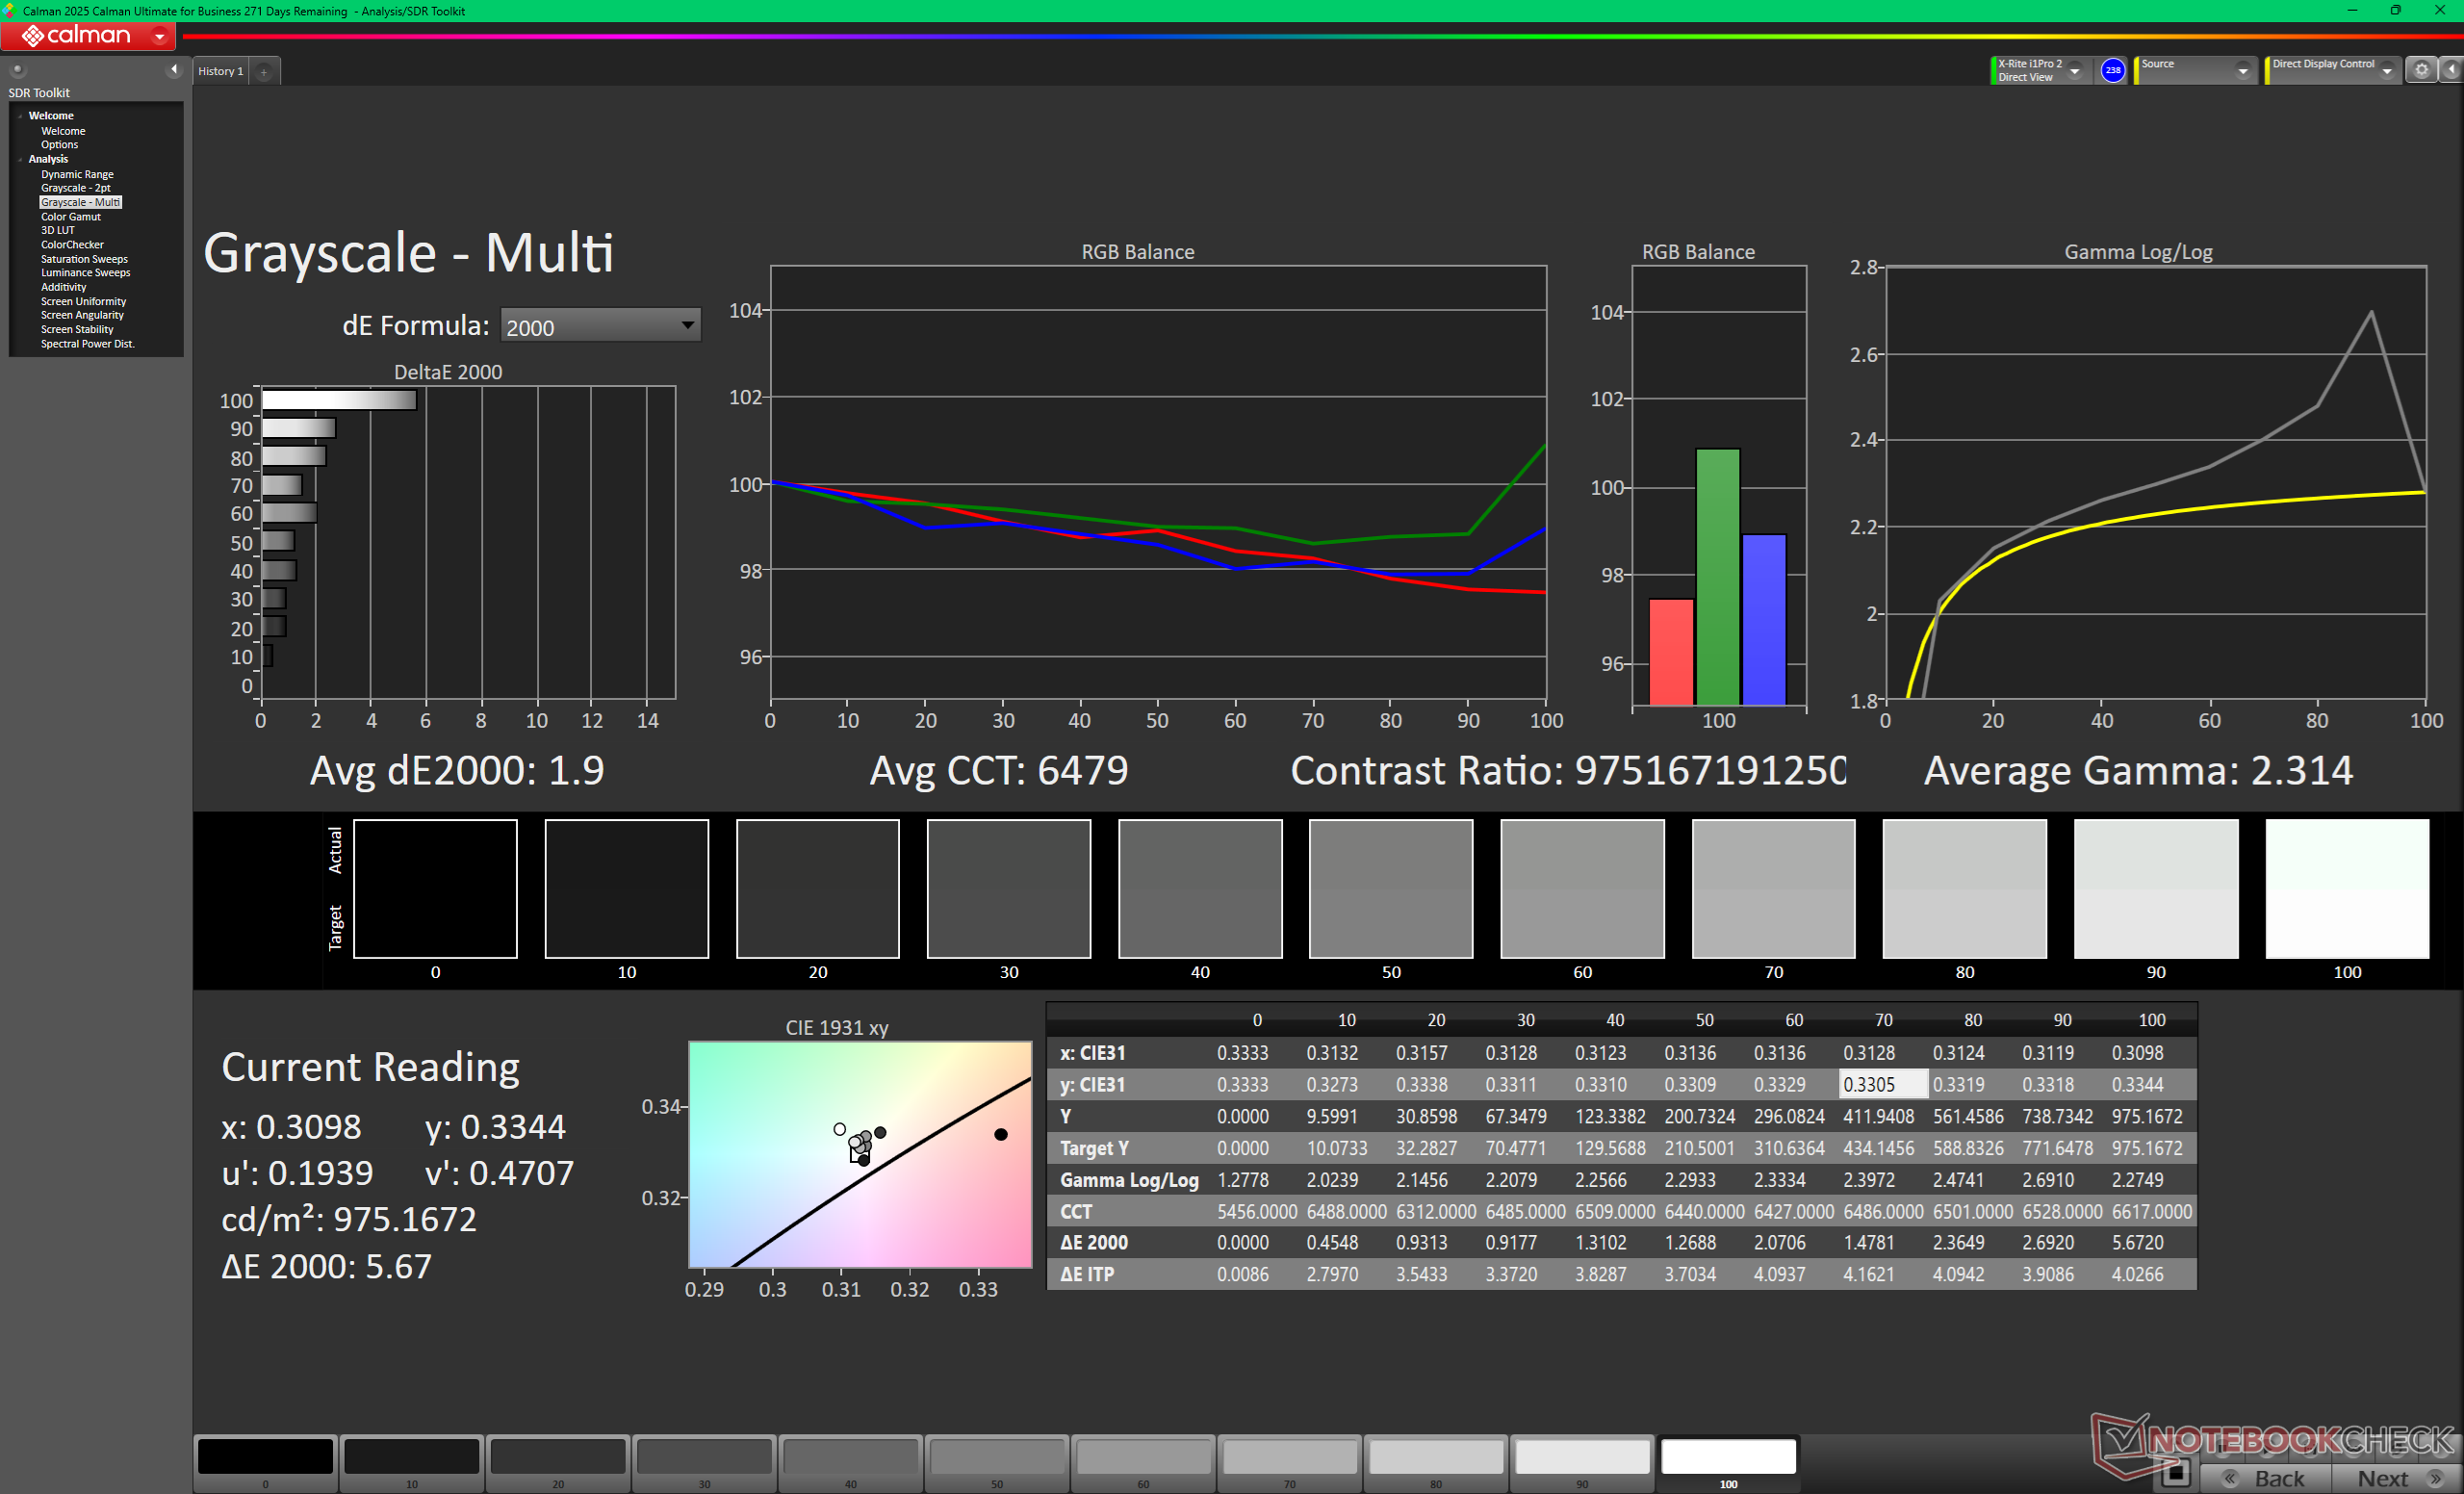
ΔE Greyscale Calman: 1.6 | ∀{0.09-98 Ø4.96}
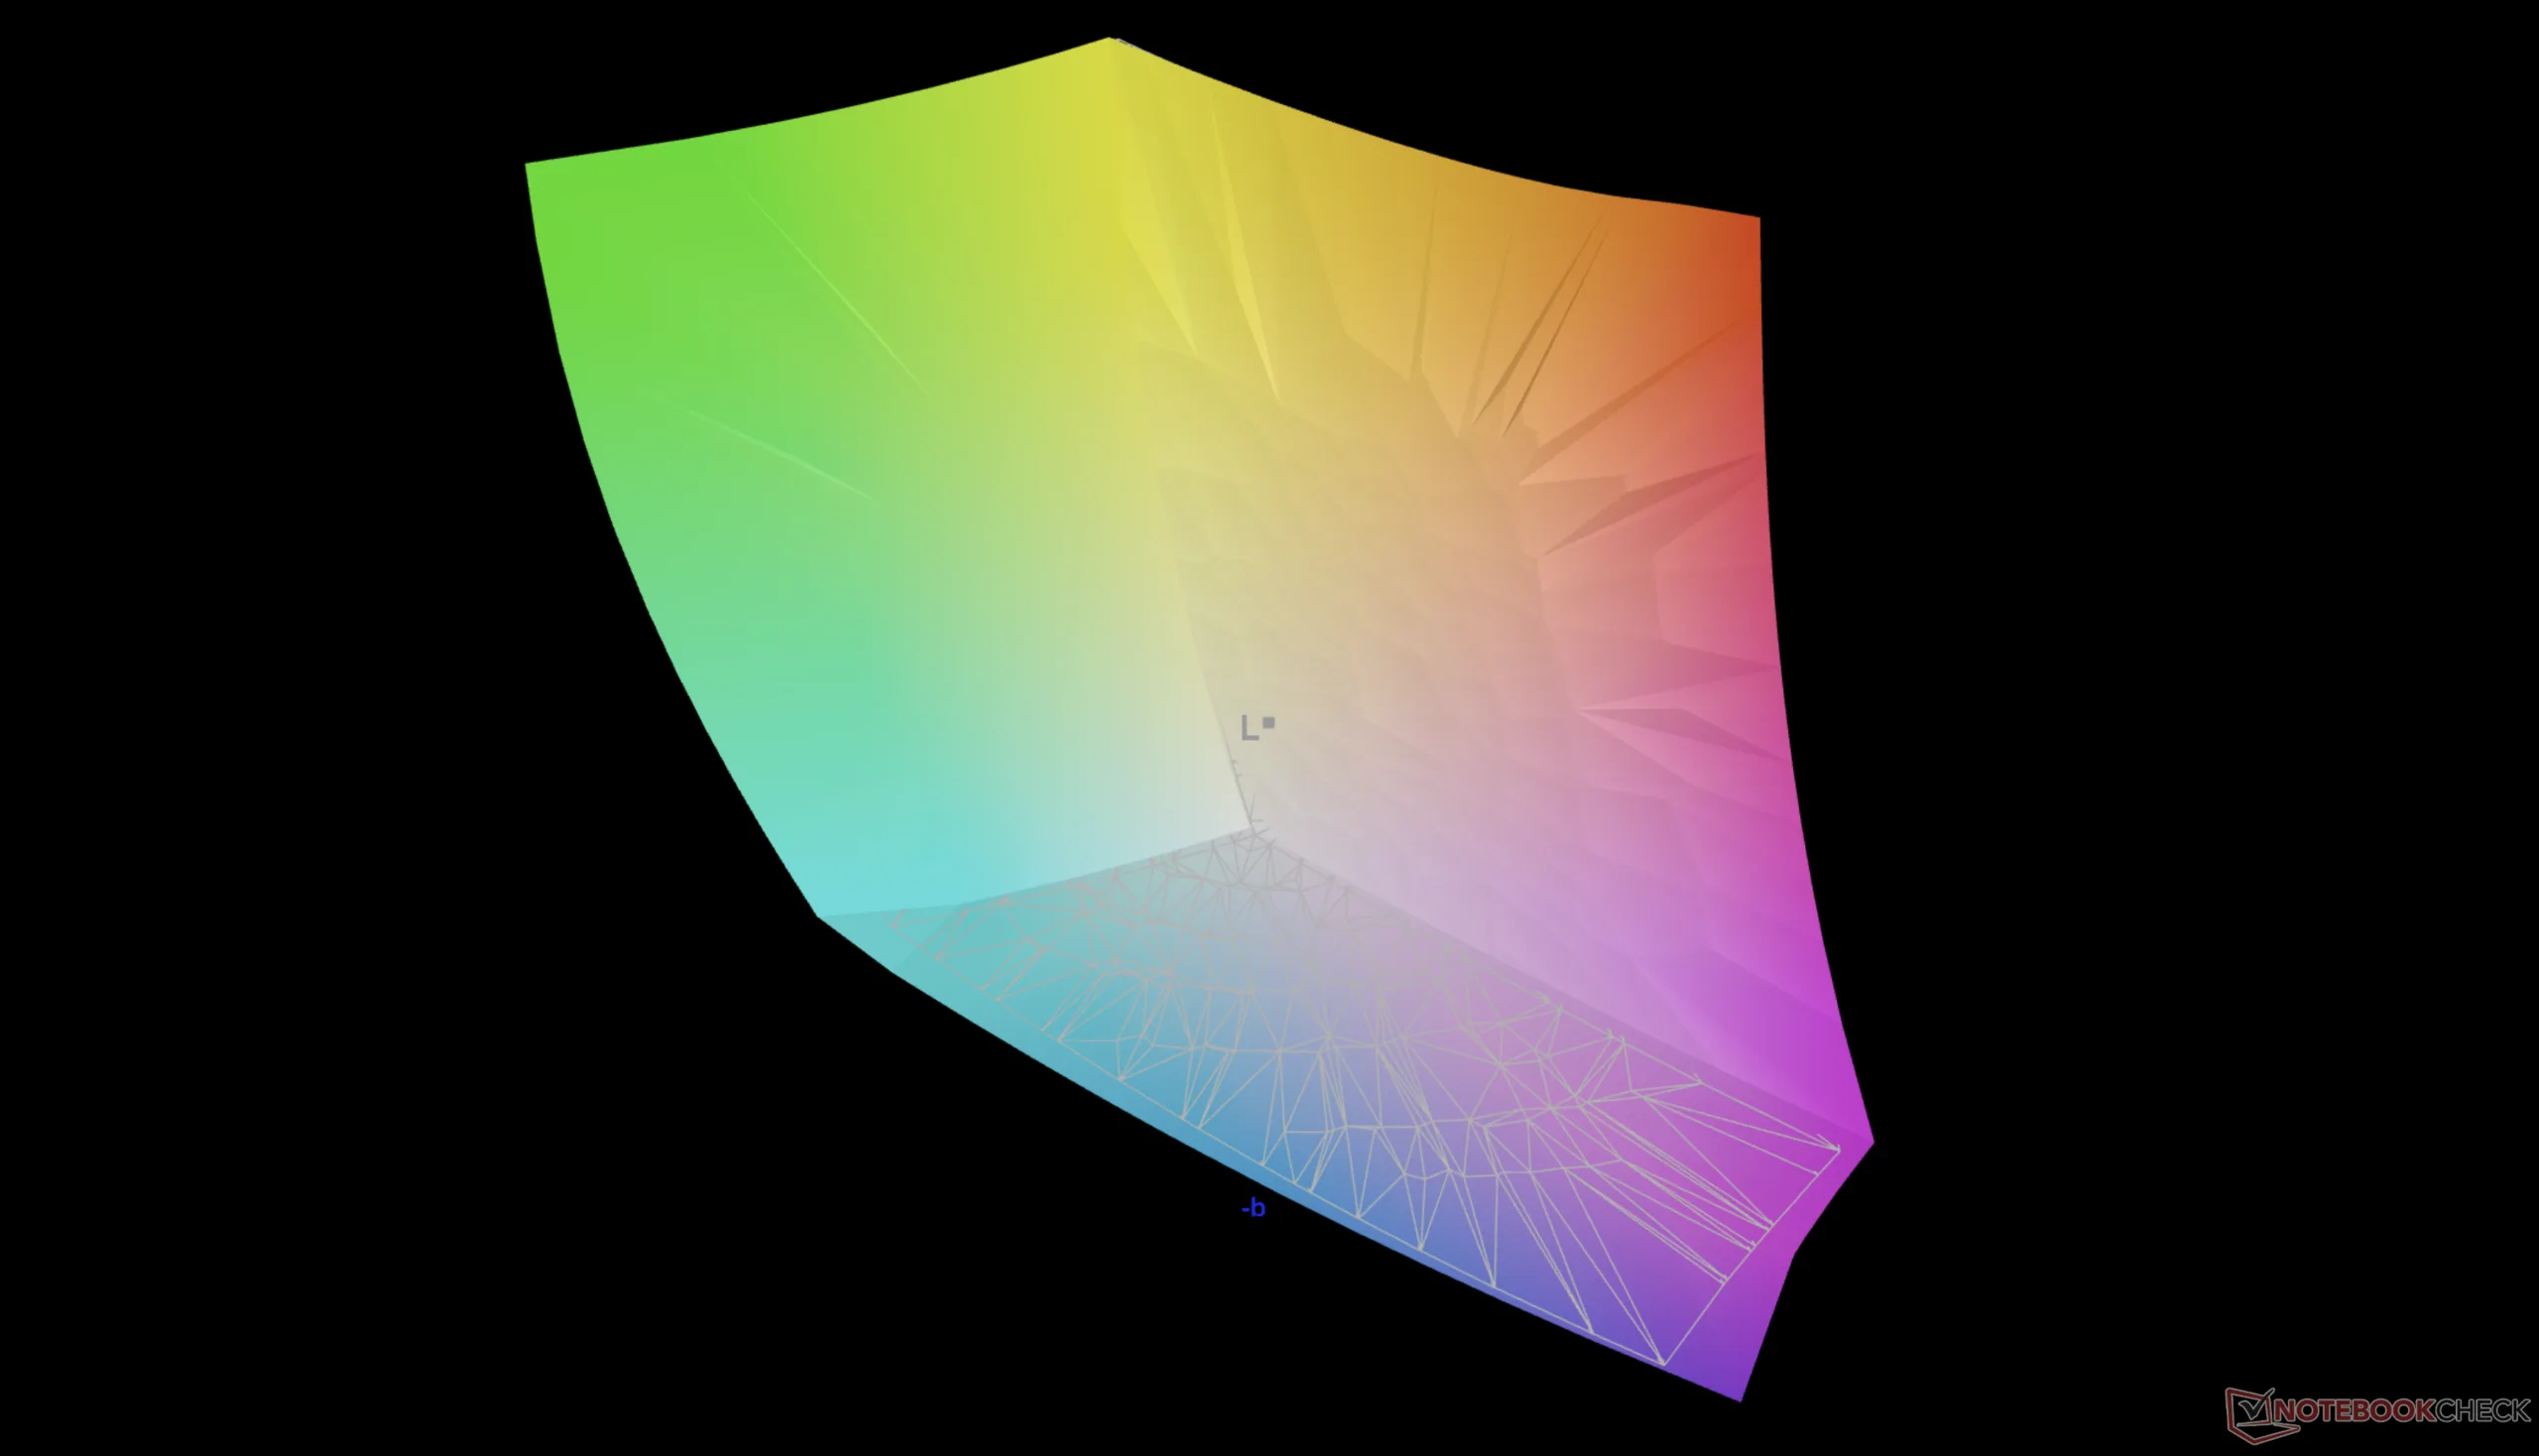
95.7% AdobeRGB 1998 (Argyll 3D)
100% sRGB (Argyll 3D)
98.8% Display P3 (Argyll 3D)
Gamma: 2.34
CCT: 6398 K
| Lenovo Pro 9 16IPH11 Samsung ATNA60KA04-0, Tandem OLED, 3200x2000, 16", 120 Hz | Lenovo Yoga Pro 9 16IAH10 RTX 5050 ATNA60HR04-0, OLED, 2880x1800, 16", 120 Hz | Dell XPS 16 Core Ultra X7 358H LG Philips 160WV1, OLED, 3200x2000, 16", 120 Hz | MSI Prestige 16 AI Evo B2HMG B160QAN03_R, IPS, 2560x1600, 16", 60 Hz | HP Omen Transcend 16-u1095ng ATNA60DL02-0 (SDC41A4), OLED, 2560x1600, 16", 240 Hz | Asus ProArt P16 H7606WP ATNA60CL10-0, OLED, 2880x1800, 16", 120 Hz | |
|---|---|---|---|---|---|---|
| Display | 1% | -5% | 1% | -2% | ||
| Display P3 Coverage (%) | 98.8 | 99.5 1% | 96.4 -2% | 99.8 1% | 99.5 1% | |
| sRGB Coverage (%) | 100 | 100 0% | 99.7 0% | 100 0% | 100 0% | |
| AdobeRGB 1998 Coverage (%) | 95.7 | 96.5 1% | 84.3 -12% | 97 1% | 89.5 -6% | |
| Response Times | -131% | -39% | -5878% | 71% | -17% | |
| Response Time Grey 50% / Grey 80% * (ms) | 0.58 ? | 0.65 ? -12% | 51.5 ? -8779% | 0.2 ? 66% | 0.63 ? -9% | |
| Response Time Black / White * (ms) | 0.79 ? | 0.87 ? -10% | 24.3 ? -2976% | 0.2 ? 75% | 0.63 ? 20% | |
| PWM Frequency (Hz) | 1173.2 | 1200 | 240.2 ? | 120 ? | 480 ? | |
| PWM Amplitude * (%) | 16 | 37 -131% | 31 -94% | 26 -63% | ||
| Screen | -26% | -15% | -92% | -29% | 8% | |
| Brightness middle (cd/m²) | 930.9 | 471.7 -49% | 395.4 -58% | 471 -49% | 390 -58% | 362 -61% |
| Brightness (cd/m²) | 947 | 474 -50% | 392 -59% | 455 -52% | 392 -59% | 363 -62% |
| Brightness Distribution (%) | 94 | 98 4% | 95 1% | 92 -2% | 98 4% | 99 5% |
| Black Level * (cd/m²) | 0.2 | 0.02 | ||||
| Colorchecker dE 2000 * | 3.51 | 3.53 -1% | 3.69 -5% | 5.8 -65% | 1.94 45% | 0.8 77% |
| Colorchecker dE 2000 max. * | 6.48 | 6.31 3% | 7.94 -23% | 10.8 -67% | 4.26 34% | 1.8 72% |
| Colorchecker dE 2000 calibrated * | 1.55 | 0.68 56% | 1.9 -23% | 4.21 -172% | ||
| Greyscale dE 2000 * | 1.6 | 2.6 -63% | 1.9 -19% | 7.8 -388% | 1.5 6% | 1.3 19% |
| Gamma | 2.34 94% | 2.24 98% | 2.28 96% | 2.07 106% | 2.221 99% | 2.2 100% |
| CCT | 6398 102% | 6292 103% | 6274 104% | 7262 90% | 6395 102% | 6741 96% |
| Contrast (:1) | 2355 | 19500 | ||||
| Totaal Gemiddelde (Programma / Instellingen) | -79% /
-41% | -18% /
-17% | -1992% /
-1035% | 14% /
-5% | -4% /
-1% |
* ... kleiner is beter

Responstijd Scherm
| ↔ Responstijd Zwart naar Wit | ||
|---|---|---|
| 0.79 ms ... stijging ↗ en daling ↘ gecombineerd | ↗ 0.37 ms stijging | 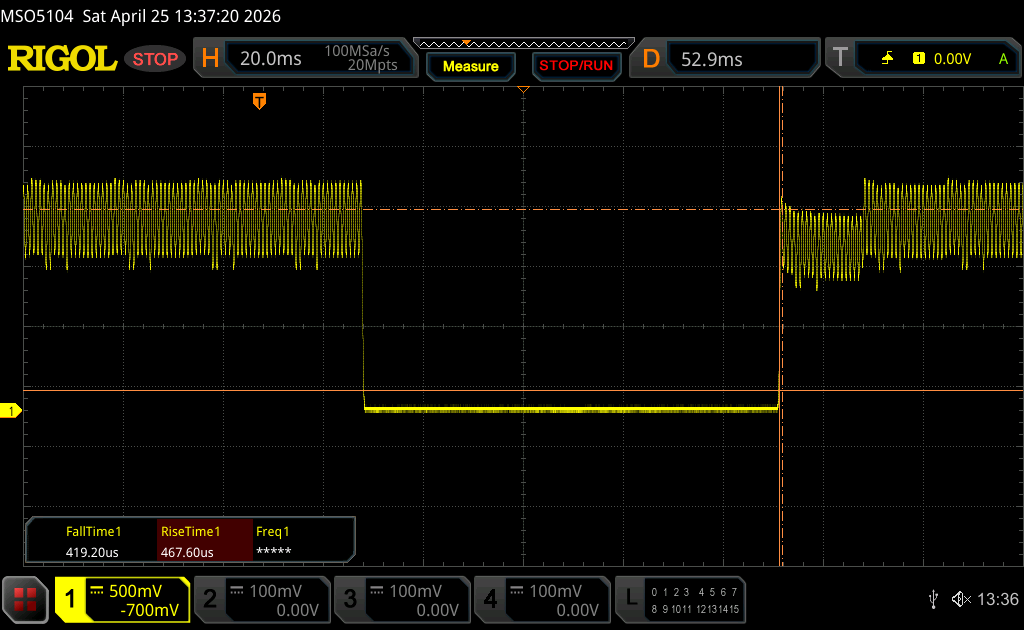 |
| ↘ 0.42 ms daling | ||
| Het scherm vertoonde erg snelle responstijden in onze tests en zou zeer geschikt moeten zijn voor snelle games. Ter vergelijking: alle testtoestellen variëren van 0.1 (minimum) tot 240 (maximum) ms. » 2 % van alle toestellen zijn beter. Dit betekent dat de gemeten responstijd beter is dan het gemiddelde (19.8 ms) van alle geteste toestellen. | ||
| ↔ Responstijd 50% Grijs naar 80% Grijs | ||
| 0.58 ms ... stijging ↗ en daling ↘ gecombineerd | ↗ 0.3 ms stijging | 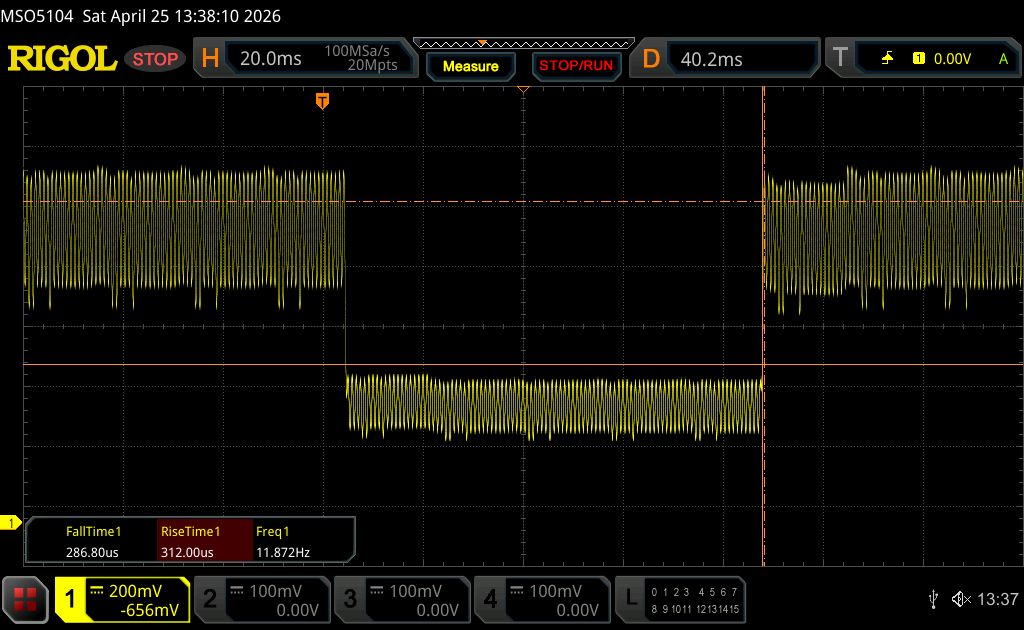 |
| ↘ 0.28 ms daling | ||
| Het scherm vertoonde erg snelle responstijden in onze tests en zou zeer geschikt moeten zijn voor snelle games. Ter vergelijking: alle testtoestellen variëren van 0.165 (minimum) tot 636 (maximum) ms. » 1 % van alle toestellen zijn beter. Dit betekent dat de gemeten responstijd beter is dan het gemiddelde (31 ms) van alle geteste toestellen. | ||
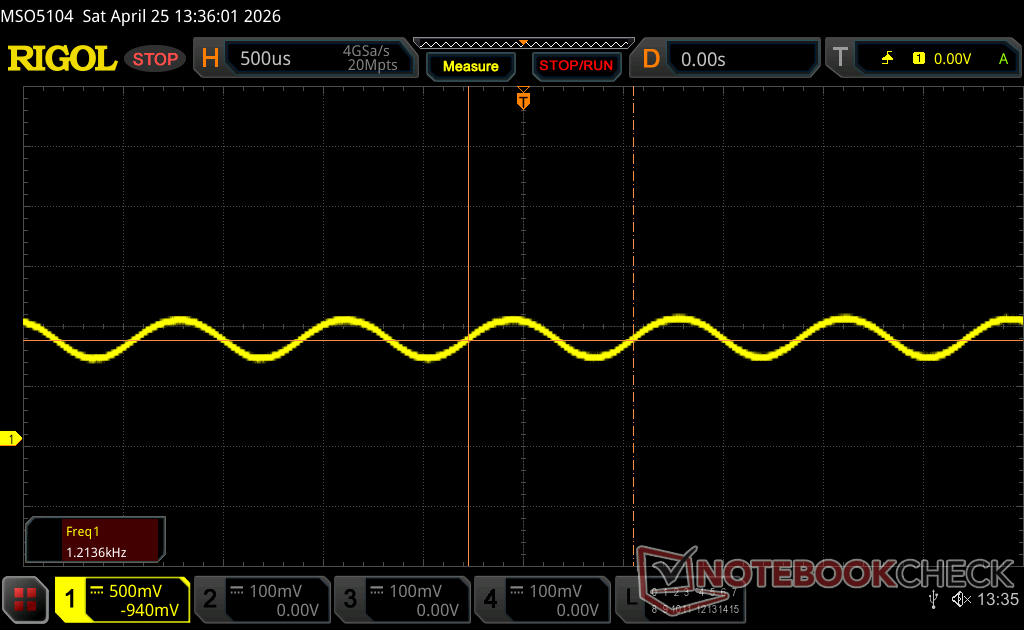
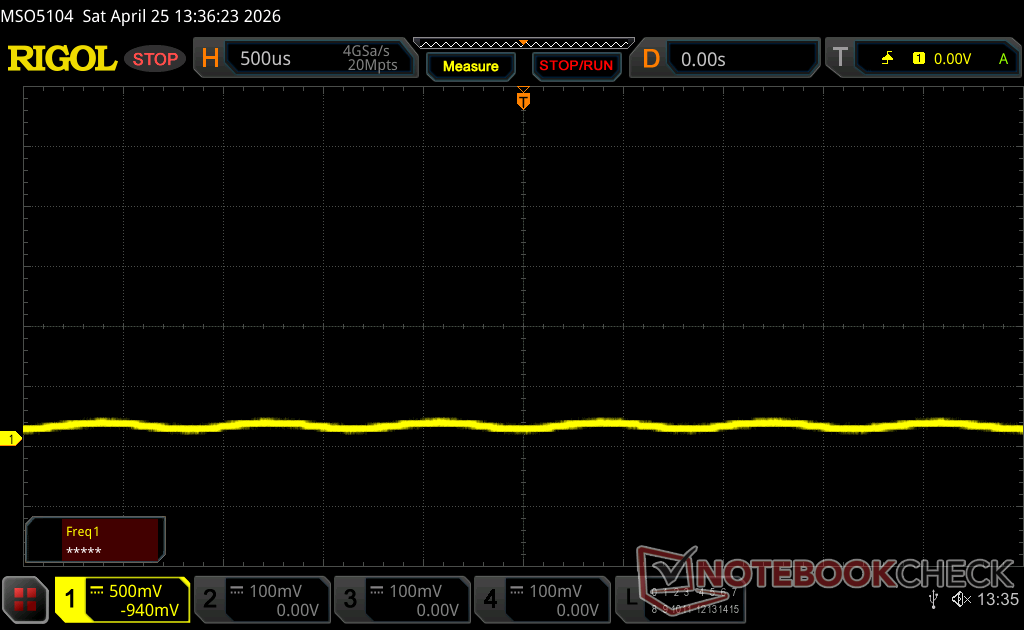
Screen Flickering / PWM (Pulse-Width Modulation)
| Screen flickering / PWM waargenomen | 1173.2 Hz Amplitude: 16 % | 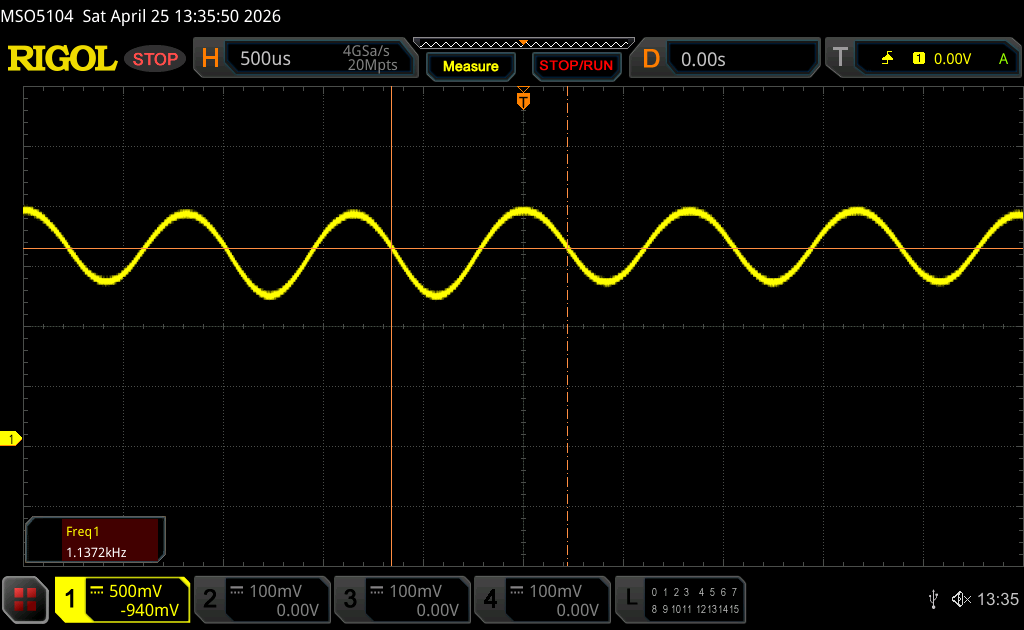 | |
De achtergrondverlichting van het scherm flikkert op 1173.2 Hz (in het slechtste geval, bijvoorbeeld bij gebruik van PWM) . De frequentie van 1173.2 Hz is redelijk hoog en de meeste mensen die gevoelig zijn aan flickering zouden dit dus niet mogen waarnemen of geïrriteerde ogen krijgen. Ter vergelijking: 52 % van alle geteste toestellen maakten geen gebruik van PWM om de schermhelderheid te verlagen. Als het wel werd gebruikt, werd een gemiddelde van 7757 (minimum: 5 - maximum: 343500) Hz waargenomen. | |||


Prestaties
Testomstandigheden
We hebben Windows in de modus Prestaties en discrete grafische modus gezet voordat we de onderstaande benchmarks uitvoerden.
Processor
De nieuwe Core Ultra 9 386H biedt helaas weinig tot geen prestatievoordelen ten opzichte van de vorige generatie Core Ultra 9 285H zoals blijkt uit onze onderstaande vergelijkingstabellen. De nieuwe CPU heeft zelfs minder L2 en L3 cache dan zijn voorganger. Hij maakt dit echter goed met een verbeterde productie-efficiëntie (1,8 nm vs. 5 nm) en snellere geïntegreerde NPU-prestaties (50 vs. 13 TOPS).
Cinebench R15 meervoudige lus
Cinebench R23: Multi Core | Single Core
Cinebench R20: CPU (Multi Core) | CPU (Single Core)
Cinebench R15: CPU Multi 64Bit | CPU Single 64Bit
Blender: v2.79 BMW27 CPU
7-Zip 18.03: 7z b 4 | 7z b 4 -mmt1
Geekbench 6.7: Multi-Core | Single-Core
Geekbench 5.5: Multi-Core | Single-Core
HWBOT x265 Benchmark v2.2: 4k Preset
LibreOffice : 20 Documents To PDF
R Benchmark 2.5: Overall mean
* ... kleiner is beter
AIDA64: FP32 Ray-Trace | FPU Julia | CPU SHA3 | CPU Queen | FPU SinJulia | FPU Mandel | CPU AES | CPU ZLib | FP64 Ray-Trace | CPU PhotoWorxx | CPU CheckMate
| Performance rating | |
| Asus ProArt P16 H7606WP -1! | |
| Lenovo Pro 9 16IPH11 -1! | |
| Lenovo Yoga Pro 9 16IAH10 RTX 5050 -1! | |
| HP Omen Transcend 16-u1095ng -1! | |
| Gemiddeld Intel Core Ultra 9 386H -1! | |
| Dell XPS 16 Core Ultra X7 358H -1! | |
| MSI Prestige 16 AI Evo B2HMG -1! | |
| AIDA64 / FP32 Ray-Trace | |
| Asus ProArt P16 H7606WP (v6.92.6600) | |
| Lenovo Yoga Pro 9 16IAH10 RTX 5050 (v6.92.6600) | |
| Lenovo Pro 9 16IPH11 (v8.20.8100) | |
| MSI Prestige 16 AI Evo B2HMG (v6.92.6600) | |
| Gemiddeld Intel Core Ultra 9 386H (10001 - 21727, n=8) | |
| HP Omen Transcend 16-u1095ng (v6.92.6600) | |
| Dell XPS 16 Core Ultra X7 358H (v8.20.8100) | |
| AIDA64 / FPU Julia | |
| Asus ProArt P16 H7606WP (v6.92.6600) | |
| Lenovo Yoga Pro 9 16IAH10 RTX 5050 (v6.92.6600) | |
| Lenovo Pro 9 16IPH11 (v8.20.8100) | |
| Gemiddeld Intel Core Ultra 9 386H (53370 - 113595, n=8) | |
| MSI Prestige 16 AI Evo B2HMG (v6.92.6600) | |
| HP Omen Transcend 16-u1095ng (v6.92.6600) | |
| Dell XPS 16 Core Ultra X7 358H (v8.20.8100) | |
| AIDA64 / CPU SHA3 | |
| Asus ProArt P16 H7606WP (v6.92.6600) | |
| Lenovo Pro 9 16IPH11 (v8.20.8100) | |
| Lenovo Yoga Pro 9 16IAH10 RTX 5050 (v6.92.6600) | |
| Gemiddeld Intel Core Ultra 9 386H (2776 - 5604, n=8) | |
| MSI Prestige 16 AI Evo B2HMG (v6.92.6600) | |
| HP Omen Transcend 16-u1095ng (v6.92.6600) | |
| Dell XPS 16 Core Ultra X7 358H (v8.20.8100) | |
| AIDA64 / CPU Queen | |
| HP Omen Transcend 16-u1095ng (v6.92.6600) | |
| Asus ProArt P16 H7606WP (v6.92.6600) | |
| MSI Prestige 16 AI Evo B2HMG (v6.92.6600) | |
| Lenovo Yoga Pro 9 16IAH10 RTX 5050 (v6.92.6600) | |
| AIDA64 / FPU SinJulia | |
| Asus ProArt P16 H7606WP (v6.92.6600) | |
| HP Omen Transcend 16-u1095ng (v6.92.6600) | |
| Lenovo Yoga Pro 9 16IAH10 RTX 5050 (v6.92.6600) | |
| MSI Prestige 16 AI Evo B2HMG (v6.92.6600) | |
| Lenovo Pro 9 16IPH11 (v8.20.8100) | |
| Dell XPS 16 Core Ultra X7 358H (v8.20.8100) | |
| Gemiddeld Intel Core Ultra 9 386H (5314 - 7332, n=8) | |
| AIDA64 / FPU Mandel | |
| Asus ProArt P16 H7606WP (v6.92.6600) | |
| Lenovo Yoga Pro 9 16IAH10 RTX 5050 (v6.92.6600) | |
| Lenovo Pro 9 16IPH11 (v8.20.8100) | |
| Gemiddeld Intel Core Ultra 9 386H (28414 - 61578, n=8) | |
| MSI Prestige 16 AI Evo B2HMG (v6.92.6600) | |
| Dell XPS 16 Core Ultra X7 358H (v8.20.8100) | |
| HP Omen Transcend 16-u1095ng (v6.92.6600) | |
| AIDA64 / CPU AES | |
| Asus ProArt P16 H7606WP (v6.92.6600) | |
| HP Omen Transcend 16-u1095ng (v6.92.6600) | |
| Lenovo Yoga Pro 9 16IAH10 RTX 5050 (v6.92.6600) | |
| Lenovo Pro 9 16IPH11 (v8.20.8100) | |
| MSI Prestige 16 AI Evo B2HMG (v6.92.6600) | |
| Gemiddeld Intel Core Ultra 9 386H (46362 - 72112, n=8) | |
| Dell XPS 16 Core Ultra X7 358H (v8.20.8100) | |
| AIDA64 / CPU ZLib | |
| Asus ProArt P16 H7606WP (v6.92.6600) | |
| HP Omen Transcend 16-u1095ng (v6.92.6600) | |
| Lenovo Yoga Pro 9 16IAH10 RTX 5050 (v6.92.6600) | |
| Lenovo Pro 9 16IPH11 (v8.20.8100) | |
| Gemiddeld Intel Core Ultra 9 386H (669 - 1271, n=8) | |
| MSI Prestige 16 AI Evo B2HMG (v6.92.6600) | |
| Dell XPS 16 Core Ultra X7 358H (v8.20.8100) | |
| AIDA64 / FP64 Ray-Trace | |
| Asus ProArt P16 H7606WP (v6.92.6600) | |
| Lenovo Yoga Pro 9 16IAH10 RTX 5050 (v6.92.6600) | |
| Lenovo Pro 9 16IPH11 (v8.20.8100) | |
| MSI Prestige 16 AI Evo B2HMG (v6.92.6600) | |
| Gemiddeld Intel Core Ultra 9 386H (5138 - 11627, n=8) | |
| HP Omen Transcend 16-u1095ng (v6.92.6600) | |
| Dell XPS 16 Core Ultra X7 358H (v8.20.8100) | |
| AIDA64 / CPU PhotoWorxx | |
| Dell XPS 16 Core Ultra X7 358H (v8.20.8100) | |
| Gemiddeld Intel Core Ultra 9 386H (54042 - 89891, n=8) | |
| Lenovo Pro 9 16IPH11 (v8.20.8100) | |
| Lenovo Yoga Pro 9 16IAH10 RTX 5050 (v6.92.6600) | |
| MSI Prestige 16 AI Evo B2HMG (v6.92.6600) | |
| HP Omen Transcend 16-u1095ng (v6.92.6600) | |
| Asus ProArt P16 H7606WP (v6.92.6600) | |
| AIDA64 / CPU CheckMate | |
| Lenovo Pro 9 16IPH11 (v8.20.8100) | |
| Gemiddeld Intel Core Ultra 9 386H (4051 - 4858, n=7) | |
| Dell XPS 16 Core Ultra X7 358H (v8.20.8100) | |
Systeemprestaties
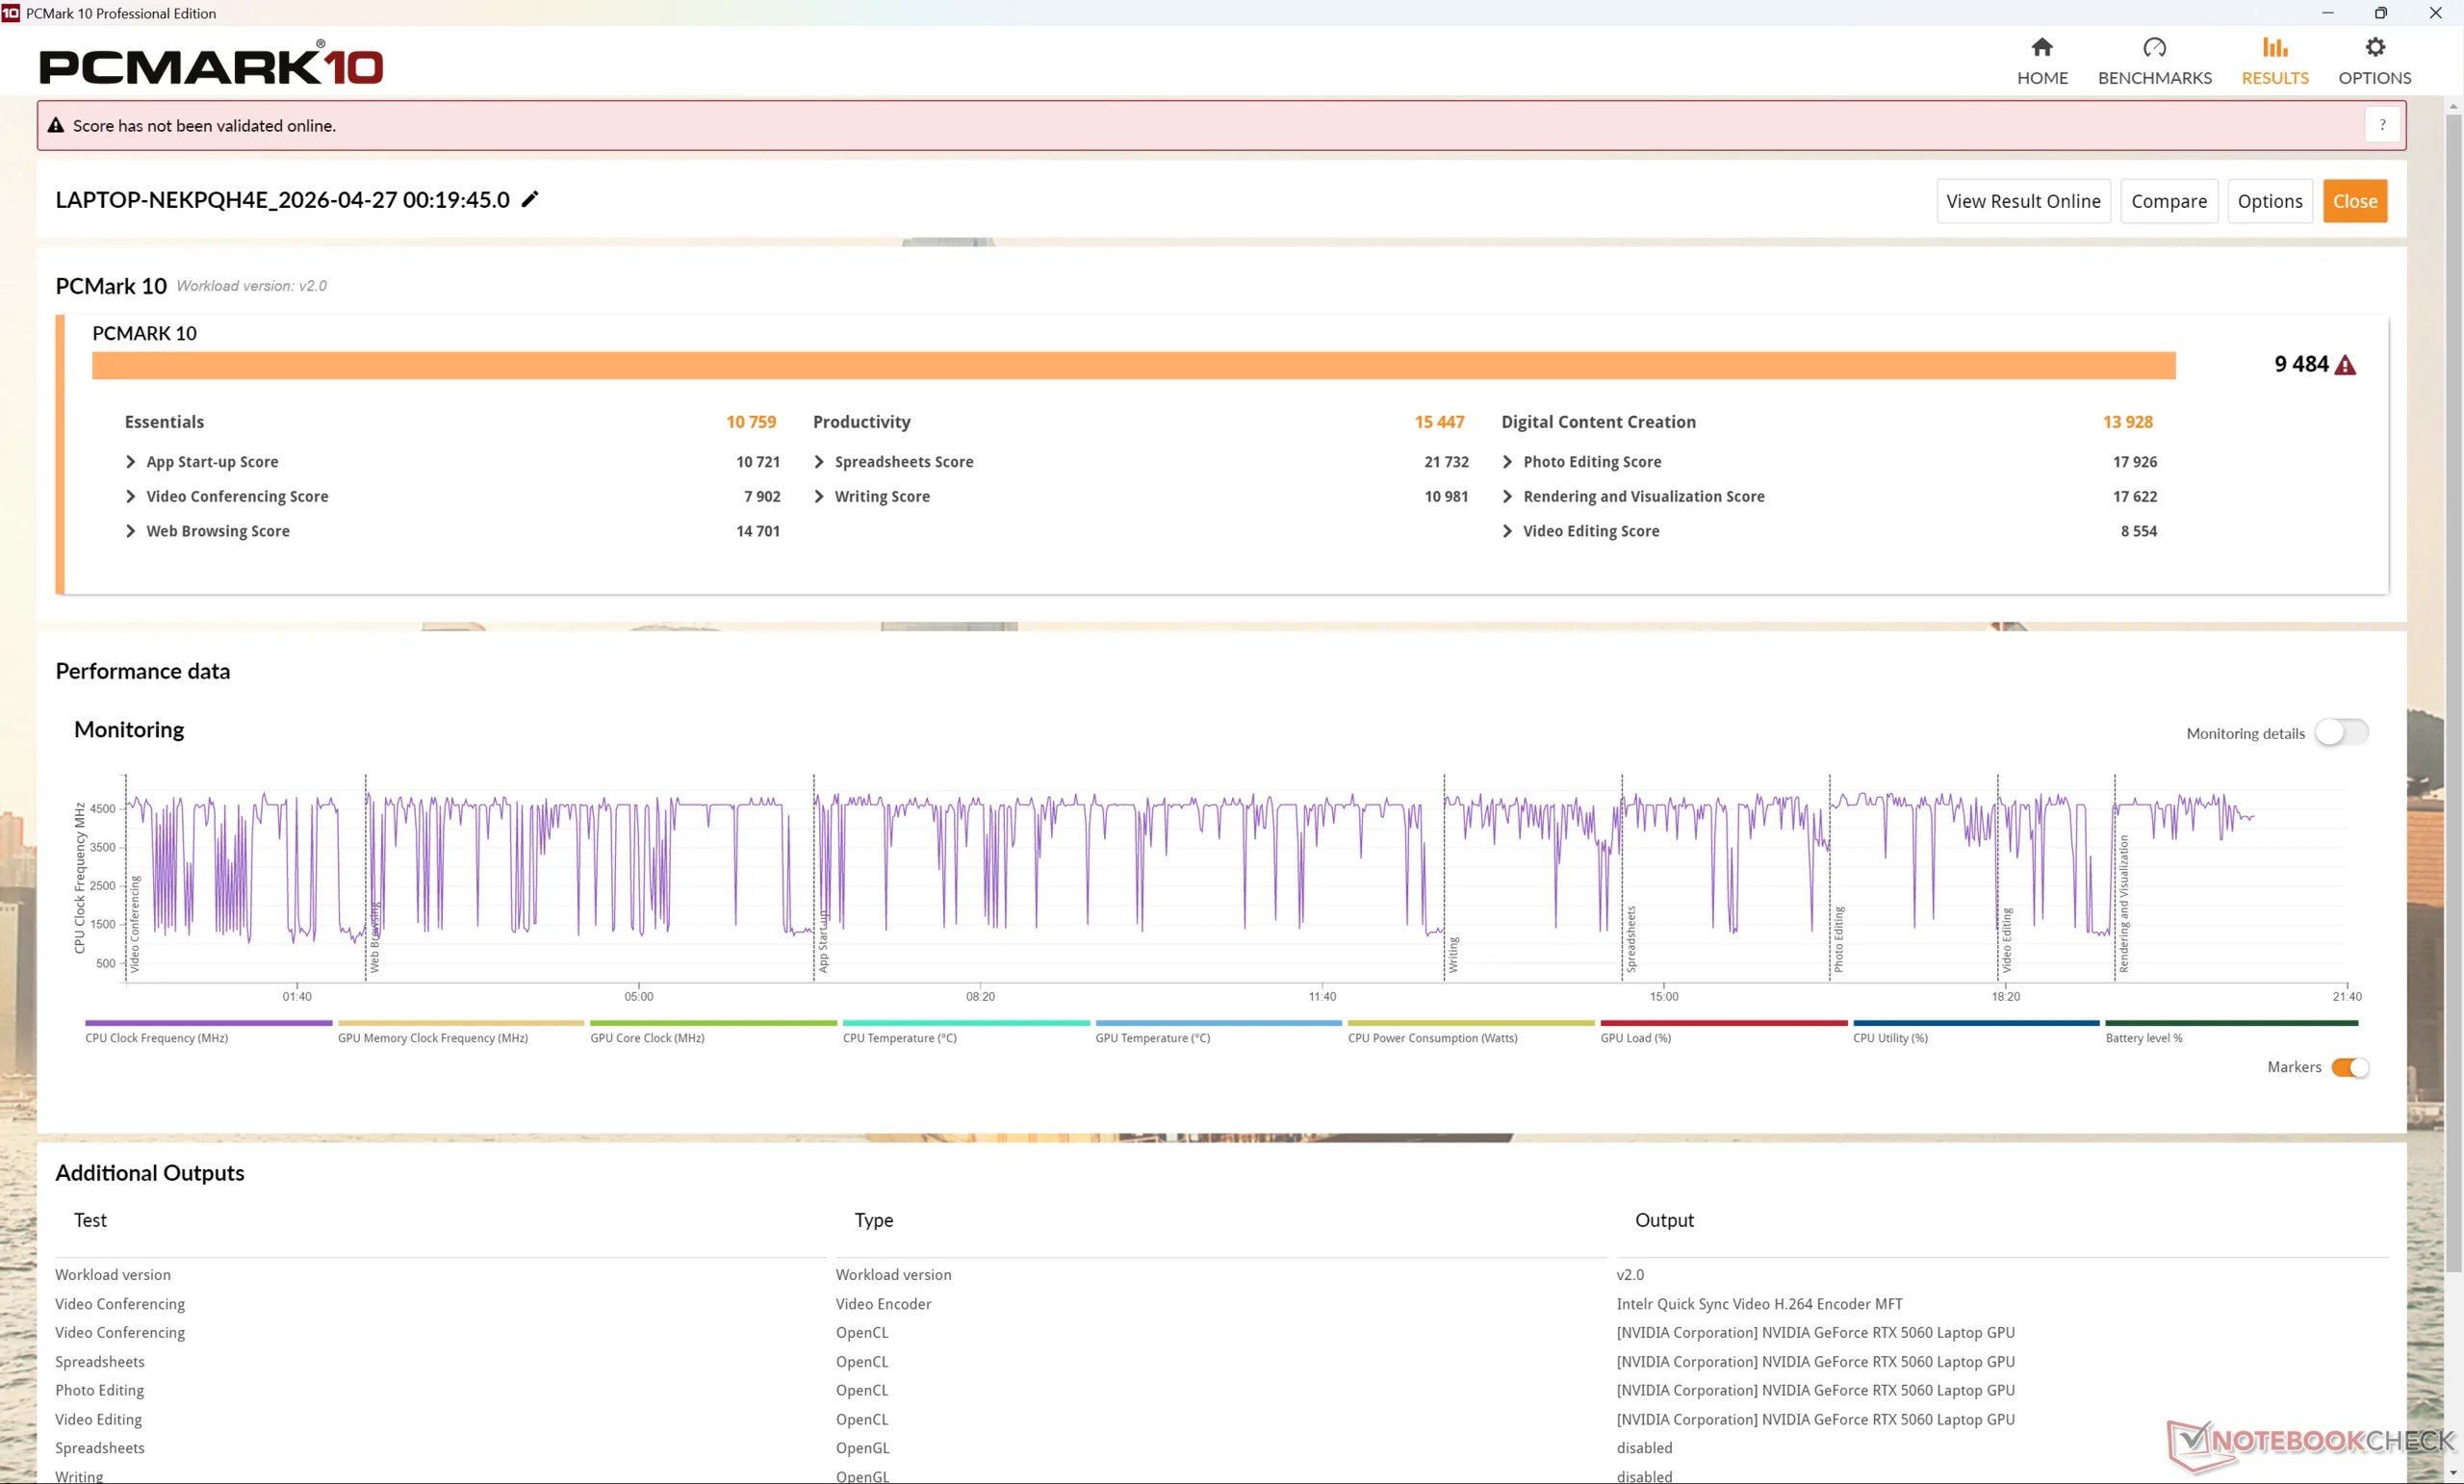
PCMark 10: Score | Essentials | Productivity | Digital Content Creation
CrossMark: Overall | Productivity | Creativity | Responsiveness
WebXPRT 3: Overall
WebXPRT 4: Overall
Mozilla Kraken 1.1: Total
Geekbench AI: Half Precision GPU 1.7 | Single Precision GPU 1.7 | Quantized GPU 1.7
| Performance rating | |
| Gemiddeld Intel Core Ultra 9 386H, NVIDIA GeForce RTX 5060 Laptop | |
| Lenovo Pro 9 16IPH11 | |
| Lenovo Yoga Pro 9 16IAH10 RTX 5050 | |
| MSI Prestige 16 AI Evo B2HMG -3! | |
| Dell XPS 16 Core Ultra X7 358H | |
| Asus ProArt P16 H7606WP -3! | |
| HP Omen Transcend 16-u1095ng -8! | |
| PCMark 10 / Score | |
| Dell XPS 16 Core Ultra X7 358H | |
| Lenovo Yoga Pro 9 16IAH10 RTX 5050 | |
| Lenovo Pro 9 16IPH11 | |
| Gemiddeld Intel Core Ultra 9 386H, NVIDIA GeForce RTX 5060 Laptop (9465 - 9484, n=2) | |
| Asus ProArt P16 H7606WP | |
| HP Omen Transcend 16-u1095ng | |
| MSI Prestige 16 AI Evo B2HMG | |
| PCMark 10 / Essentials | |
| MSI Prestige 16 AI Evo B2HMG | |
| Dell XPS 16 Core Ultra X7 358H | |
| Gemiddeld Intel Core Ultra 9 386H, NVIDIA GeForce RTX 5060 Laptop (10759 - 10841, n=2) | |
| Lenovo Yoga Pro 9 16IAH10 RTX 5050 | |
| Lenovo Pro 9 16IPH11 | |
| Asus ProArt P16 H7606WP | |
| HP Omen Transcend 16-u1095ng | |
| PCMark 10 / Productivity | |
| Lenovo Yoga Pro 9 16IAH10 RTX 5050 | |
| Dell XPS 16 Core Ultra X7 358H | |
| Lenovo Pro 9 16IPH11 | |
| Gemiddeld Intel Core Ultra 9 386H, NVIDIA GeForce RTX 5060 Laptop (15199 - 15447, n=2) | |
| HP Omen Transcend 16-u1095ng | |
| MSI Prestige 16 AI Evo B2HMG | |
| Asus ProArt P16 H7606WP | |
| PCMark 10 / Digital Content Creation | |
| Asus ProArt P16 H7606WP | |
| Gemiddeld Intel Core Ultra 9 386H, NVIDIA GeForce RTX 5060 Laptop (13928 - 13963, n=2) | |
| Lenovo Pro 9 16IPH11 | |
| Dell XPS 16 Core Ultra X7 358H | |
| Lenovo Yoga Pro 9 16IAH10 RTX 5050 | |
| MSI Prestige 16 AI Evo B2HMG | |
| HP Omen Transcend 16-u1095ng | |
| CrossMark / Overall | |
| MSI Prestige 16 AI Evo B2HMG | |
| Gemiddeld Intel Core Ultra 9 386H, NVIDIA GeForce RTX 5060 Laptop (2108 - 2164, n=2) | |
| Dell XPS 16 Core Ultra X7 358H | |
| Lenovo Pro 9 16IPH11 | |
| Lenovo Yoga Pro 9 16IAH10 RTX 5050 | |
| Asus ProArt P16 H7606WP | |
| CrossMark / Productivity | |
| MSI Prestige 16 AI Evo B2HMG | |
| Gemiddeld Intel Core Ultra 9 386H, NVIDIA GeForce RTX 5060 Laptop (1917 - 1973, n=2) | |
| Lenovo Pro 9 16IPH11 | |
| Dell XPS 16 Core Ultra X7 358H | |
| Lenovo Yoga Pro 9 16IAH10 RTX 5050 | |
| Asus ProArt P16 H7606WP | |
| CrossMark / Creativity | |
| Dell XPS 16 Core Ultra X7 358H | |
| Lenovo Pro 9 16IPH11 | |
| Gemiddeld Intel Core Ultra 9 386H, NVIDIA GeForce RTX 5060 Laptop (2442 - 2500, n=2) | |
| MSI Prestige 16 AI Evo B2HMG | |
| Lenovo Yoga Pro 9 16IAH10 RTX 5050 | |
| Asus ProArt P16 H7606WP | |
| CrossMark / Responsiveness | |
| MSI Prestige 16 AI Evo B2HMG | |
| Gemiddeld Intel Core Ultra 9 386H, NVIDIA GeForce RTX 5060 Laptop (1682 - 1988, n=2) | |
| Dell XPS 16 Core Ultra X7 358H | |
| Lenovo Pro 9 16IPH11 | |
| Lenovo Yoga Pro 9 16IAH10 RTX 5050 | |
| Asus ProArt P16 H7606WP | |
| WebXPRT 3 / Overall | |
| MSI Prestige 16 AI Evo B2HMG | |
| HP Omen Transcend 16-u1095ng | |
| Asus ProArt P16 H7606WP | |
| Lenovo Pro 9 16IPH11 | |
| Lenovo Yoga Pro 9 16IAH10 RTX 5050 | |
| Gemiddeld Intel Core Ultra 9 386H, NVIDIA GeForce RTX 5060 Laptop (310 - 326, n=2) | |
| Dell XPS 16 Core Ultra X7 358H | |
| WebXPRT 4 / Overall | |
| MSI Prestige 16 AI Evo B2HMG | |
| Lenovo Yoga Pro 9 16IAH10 RTX 5050 | |
| Lenovo Pro 9 16IPH11 | |
| Dell XPS 16 Core Ultra X7 358H | |
| Gemiddeld Intel Core Ultra 9 386H, NVIDIA GeForce RTX 5060 Laptop (298 - 302, n=2) | |
| Asus ProArt P16 H7606WP | |
| Mozilla Kraken 1.1 / Total | |
| Dell XPS 16 Core Ultra X7 358H | |
| Asus ProArt P16 H7606WP | |
| Gemiddeld Intel Core Ultra 9 386H, NVIDIA GeForce RTX 5060 Laptop (442 - 446, n=2) | |
| Lenovo Pro 9 16IPH11 | |
| HP Omen Transcend 16-u1095ng | |
| Lenovo Yoga Pro 9 16IAH10 RTX 5050 | |
| MSI Prestige 16 AI Evo B2HMG | |
| Geekbench AI / Half Precision GPU 1.7 | |
| Lenovo Yoga Pro 9 16IAH10 RTX 5050 | |
| Lenovo Pro 9 16IPH11 | |
| Gemiddeld Intel Core Ultra 9 386H, NVIDIA GeForce RTX 5060 Laptop (n=1) | |
| Dell XPS 16 Core Ultra X7 358H | |
| Geekbench AI / Single Precision GPU 1.7 | |
| Lenovo Pro 9 16IPH11 | |
| Gemiddeld Intel Core Ultra 9 386H, NVIDIA GeForce RTX 5060 Laptop (n=1) | |
| Lenovo Yoga Pro 9 16IAH10 RTX 5050 | |
| Dell XPS 16 Core Ultra X7 358H | |
| Geekbench AI / Quantized GPU 1.7 | |
| Lenovo Pro 9 16IPH11 | |
| Gemiddeld Intel Core Ultra 9 386H, NVIDIA GeForce RTX 5060 Laptop (n=1) | |
| Lenovo Yoga Pro 9 16IAH10 RTX 5050 | |
| Dell XPS 16 Core Ultra X7 358H | |
* ... kleiner is beter
| PCMark 10 Score | 9484 punten | |
Help | ||
| AIDA64 / Memory Copy | |
| Dell XPS 16 Core Ultra X7 358H | |
| Gemiddeld Intel Core Ultra 9 386H (75437 - 129946, n=8) | |
| Lenovo Pro 9 16IPH11 | |
| Lenovo Yoga Pro 9 16IAH10 RTX 5050 | |
| MSI Prestige 16 AI Evo B2HMG | |
| Asus ProArt P16 H7606WP | |
| HP Omen Transcend 16-u1095ng | |
| AIDA64 / Memory Read | |
| Dell XPS 16 Core Ultra X7 358H | |
| Gemiddeld Intel Core Ultra 9 386H (81021 - 118858, n=8) | |
| Lenovo Pro 9 16IPH11 | |
| Asus ProArt P16 H7606WP | |
| Lenovo Yoga Pro 9 16IAH10 RTX 5050 | |
| HP Omen Transcend 16-u1095ng | |
| MSI Prestige 16 AI Evo B2HMG | |
| AIDA64 / Memory Write | |
| Dell XPS 16 Core Ultra X7 358H | |
| Gemiddeld Intel Core Ultra 9 386H (75959 - 135096, n=8) | |
| Lenovo Yoga Pro 9 16IAH10 RTX 5050 | |
| Lenovo Pro 9 16IPH11 | |
| Asus ProArt P16 H7606WP | |
| HP Omen Transcend 16-u1095ng | |
| MSI Prestige 16 AI Evo B2HMG | |
| AIDA64 / Memory Latency | |
| MSI Prestige 16 AI Evo B2HMG | |
| Lenovo Yoga Pro 9 16IAH10 RTX 5050 | |
| Asus ProArt P16 H7606WP | |
| Lenovo Pro 9 16IPH11 | |
| Gemiddeld Intel Core Ultra 9 386H (87.2 - 116.9, n=8) | |
| HP Omen Transcend 16-u1095ng | |
| Dell XPS 16 Core Ultra X7 358H | |
* ... kleiner is beter
DPC latentie
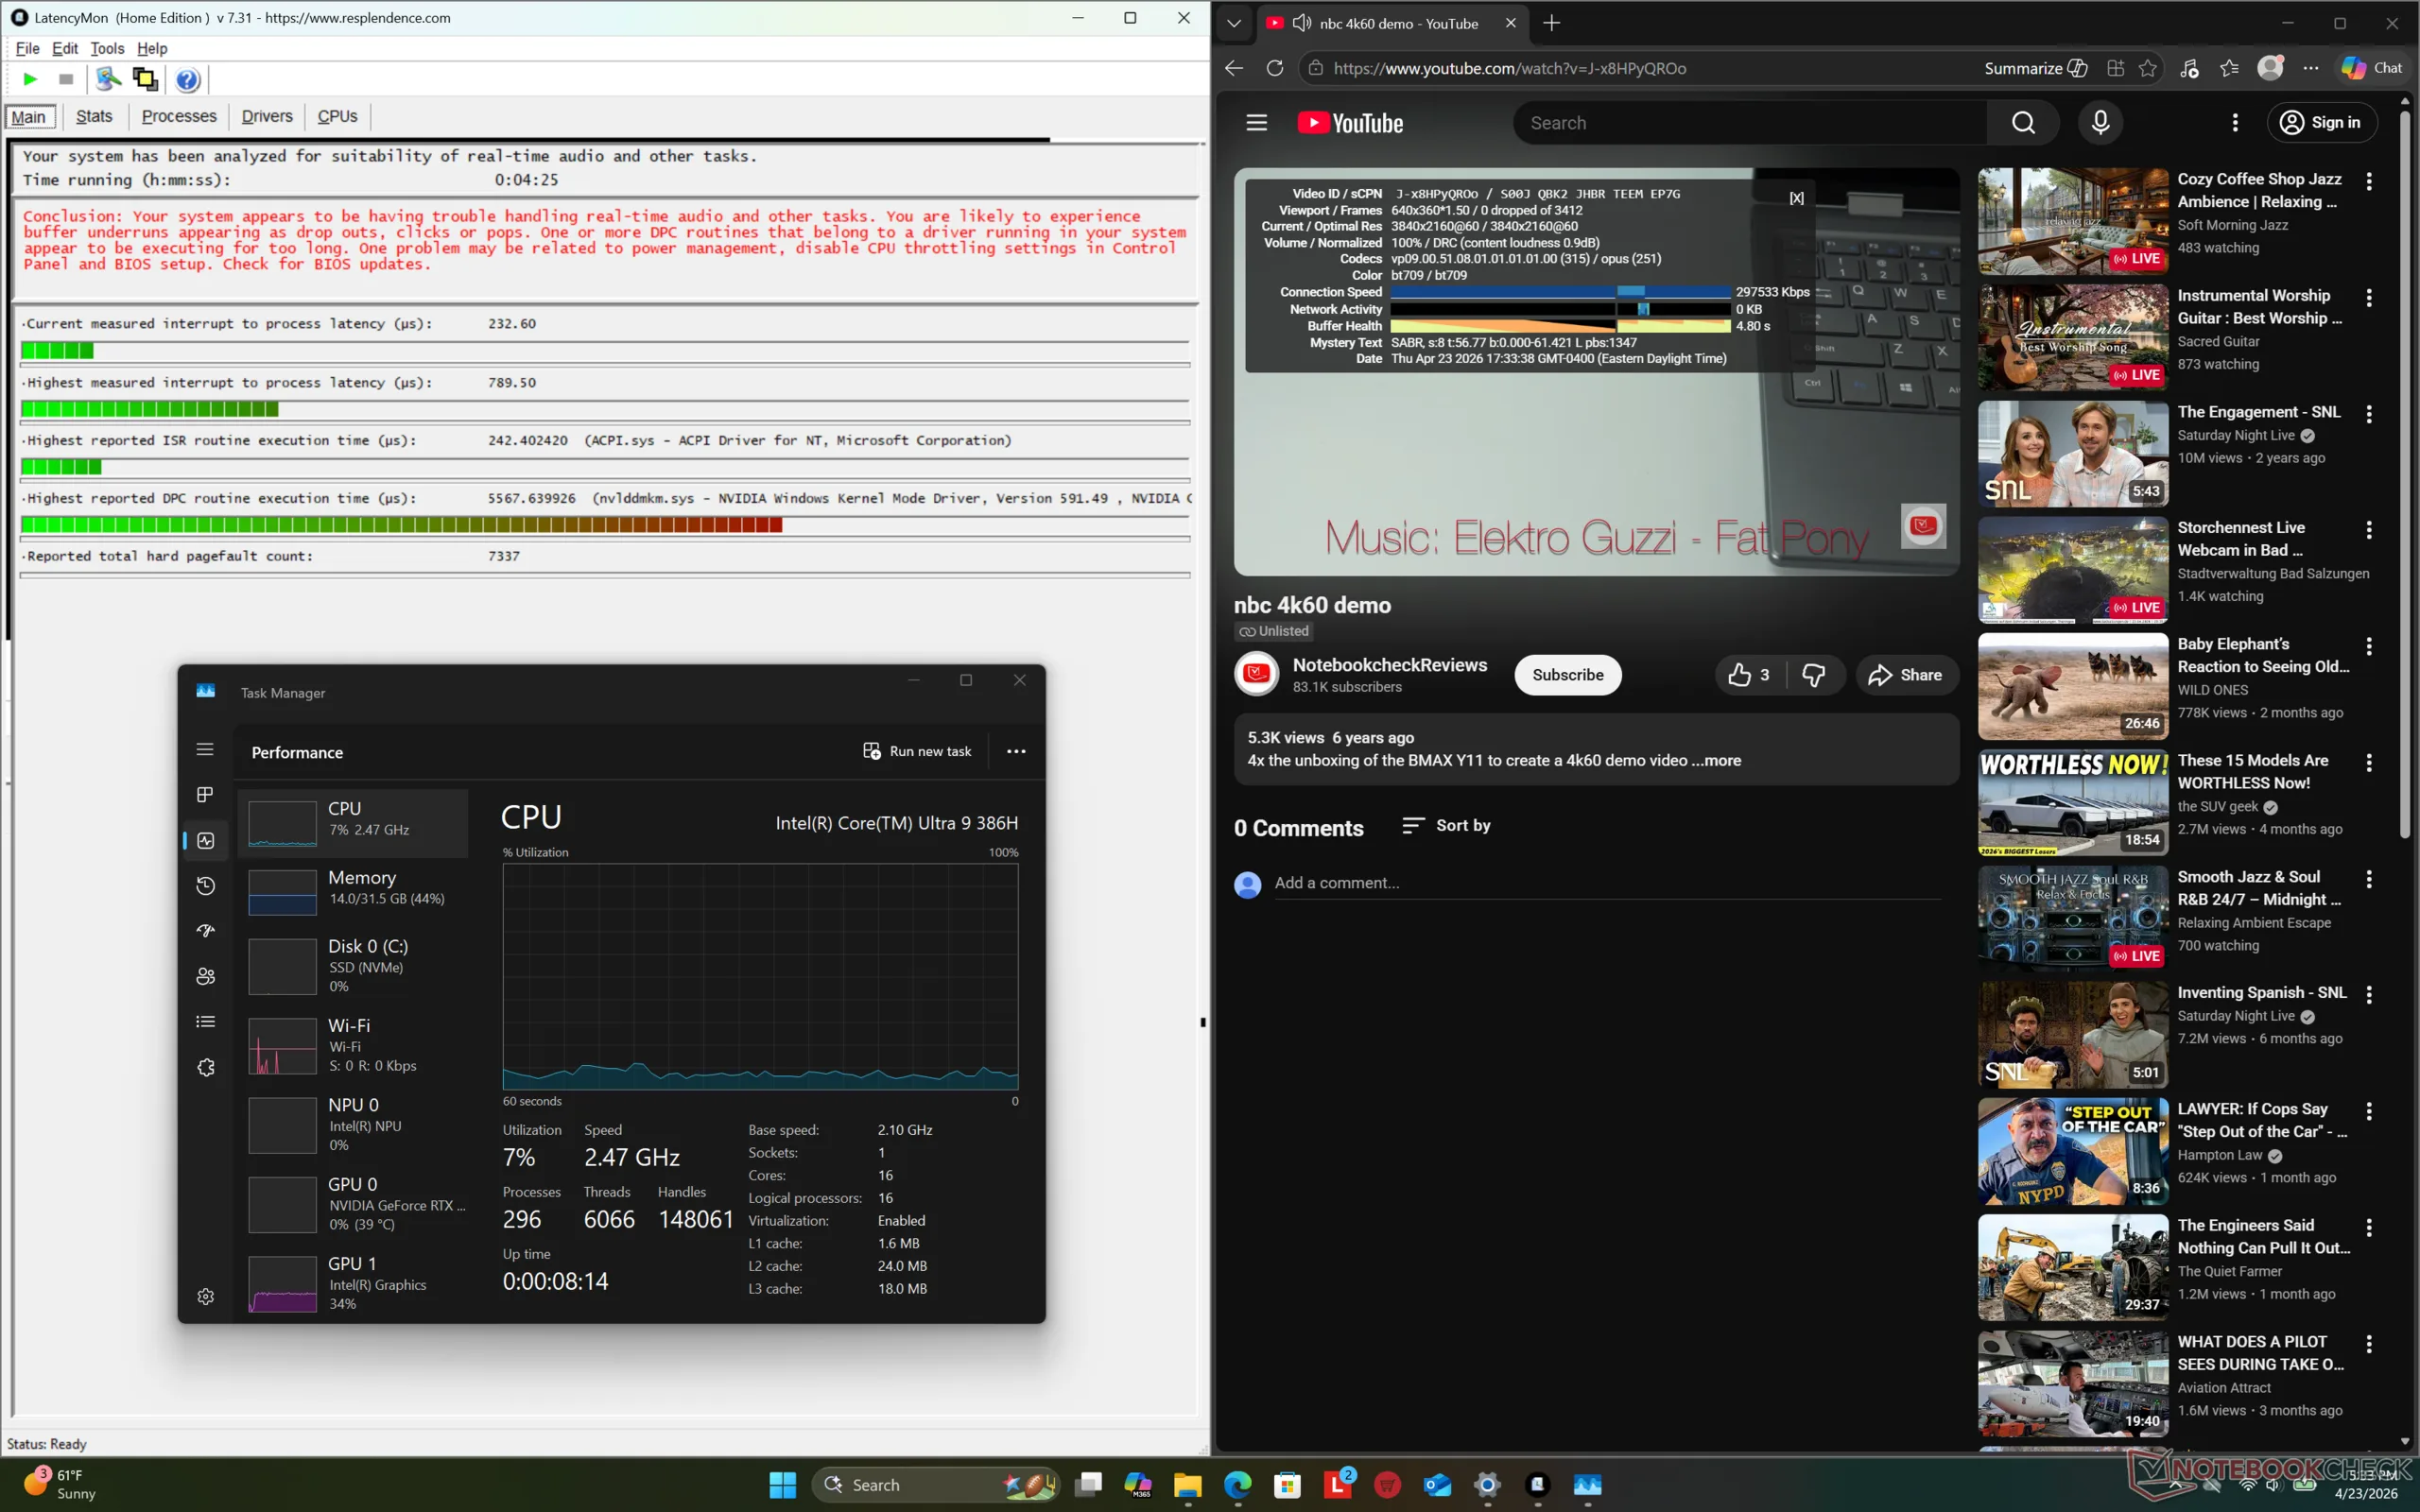
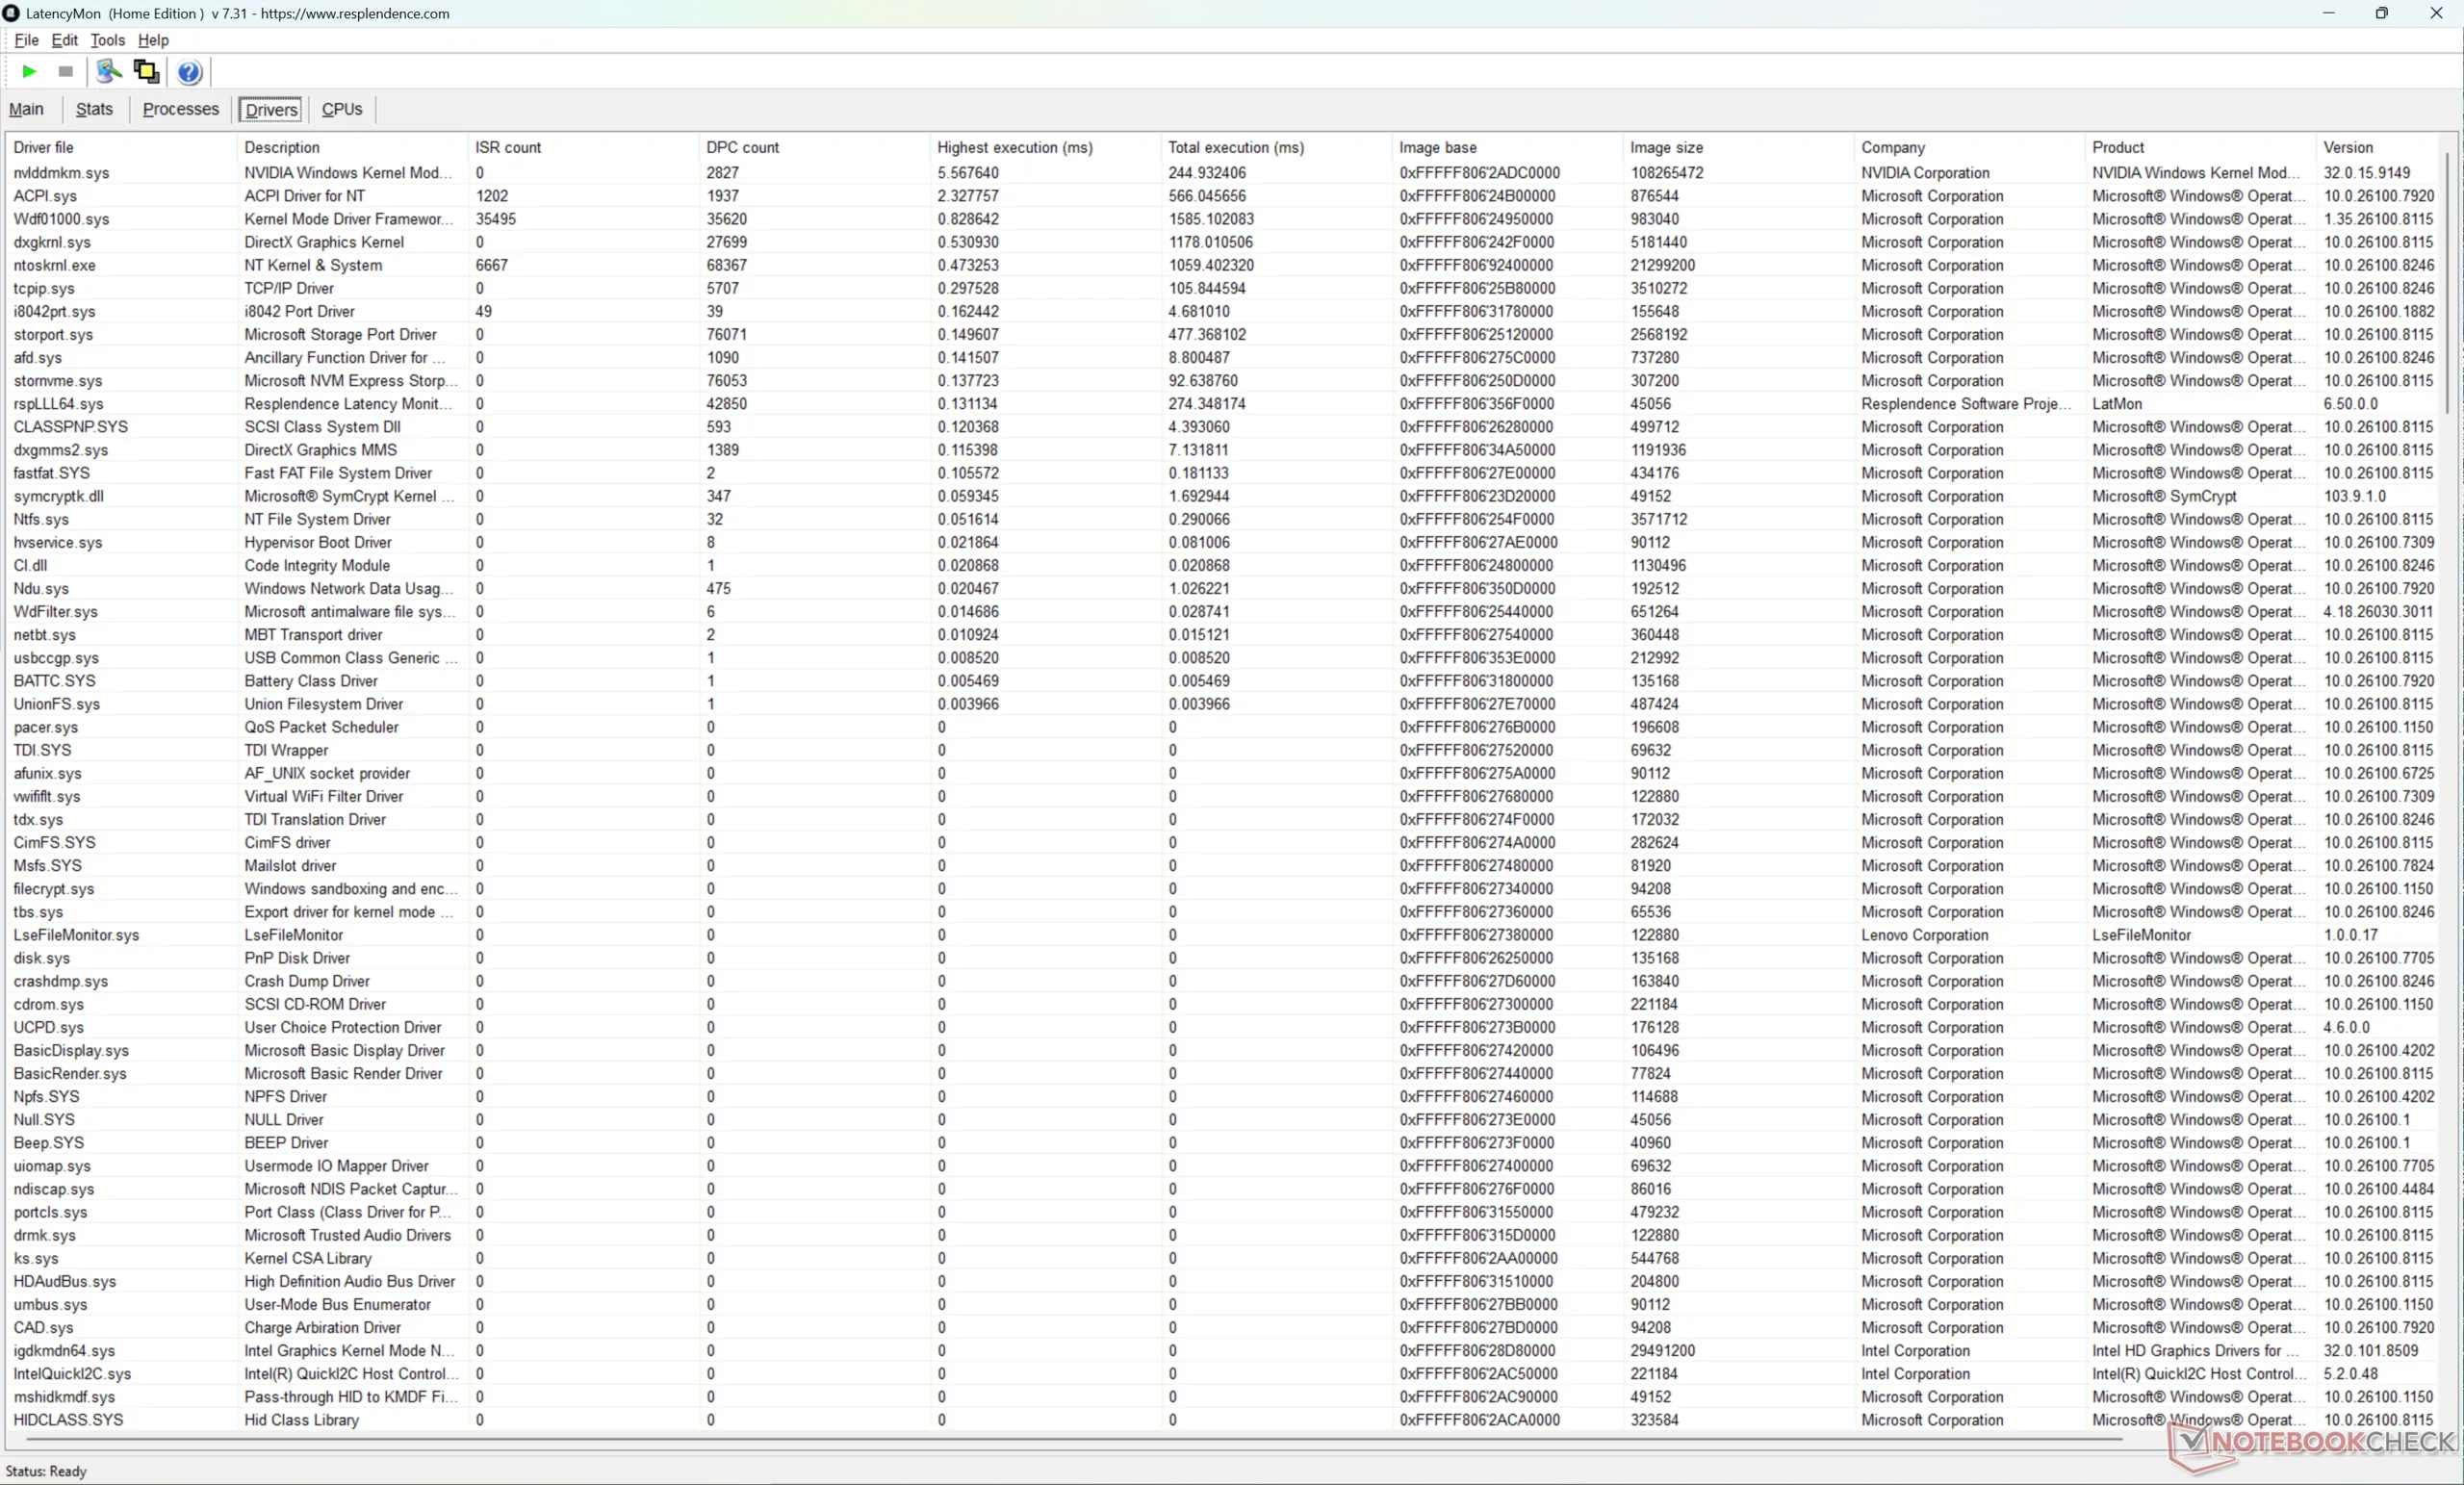
| DPC Latencies / LatencyMon - interrupt to process latency (max), Web, Youtube, Prime95 | |
| Lenovo Yoga Pro 9 16IAH10 RTX 5050 | |
| MSI Prestige 16 AI Evo B2HMG | |
| HP Omen Transcend 16-u1095ng | |
| Lenovo Pro 9 16IPH11 | |
| Asus ProArt P16 H7606WP | |
| Dell XPS 16 Core Ultra X7 358H | |
* ... kleiner is beter
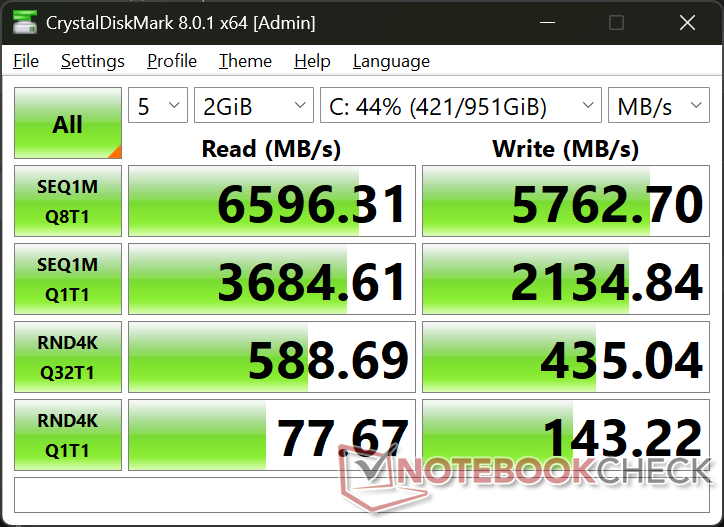
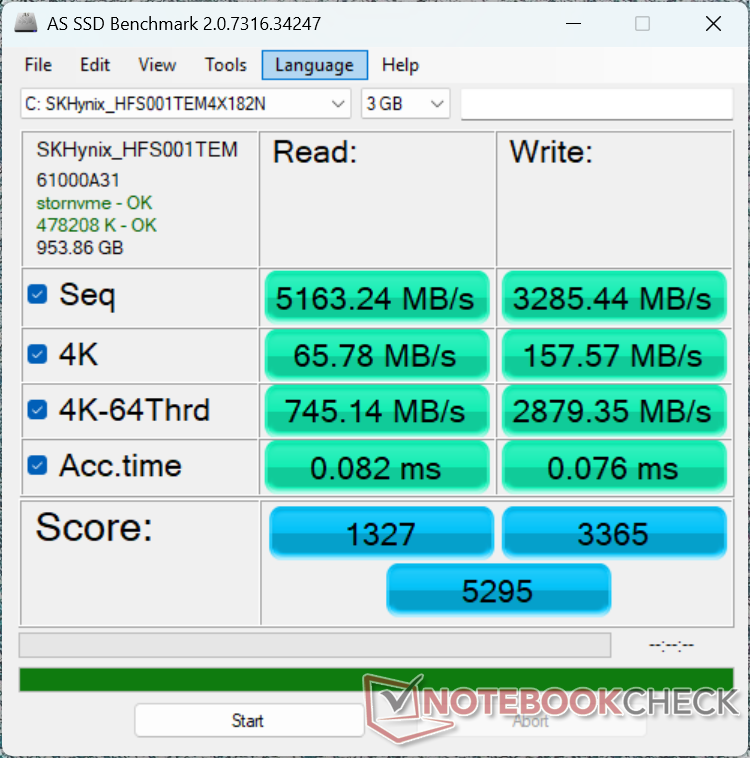
Opslagapparaten
Het systeem ondersteunt maximaal twee PCIe4 x4 NVMe SSD's zonder problemen. Merk op dat PCIe5 SSD-snelheden niet worden ondersteund en dat een van de twee M.2 SSD's van het kortere type 2242 moet zijn.

| Drive Performance rating - Percent | |
| MSI Prestige 16 AI Evo B2HMG | |
| HP Omen Transcend 16-u1095ng | |
| Lenovo Yoga Pro 9 16IAH10 RTX 5050 | |
| Asus ProArt P16 H7606WP | |
| Lenovo Pro 9 16IPH11 | |
| Dell XPS 16 Core Ultra X7 358H | |
* ... kleiner is beter
Schijf onderdrukken: DiskSpd Leeslus, wachtrijdiepte 8
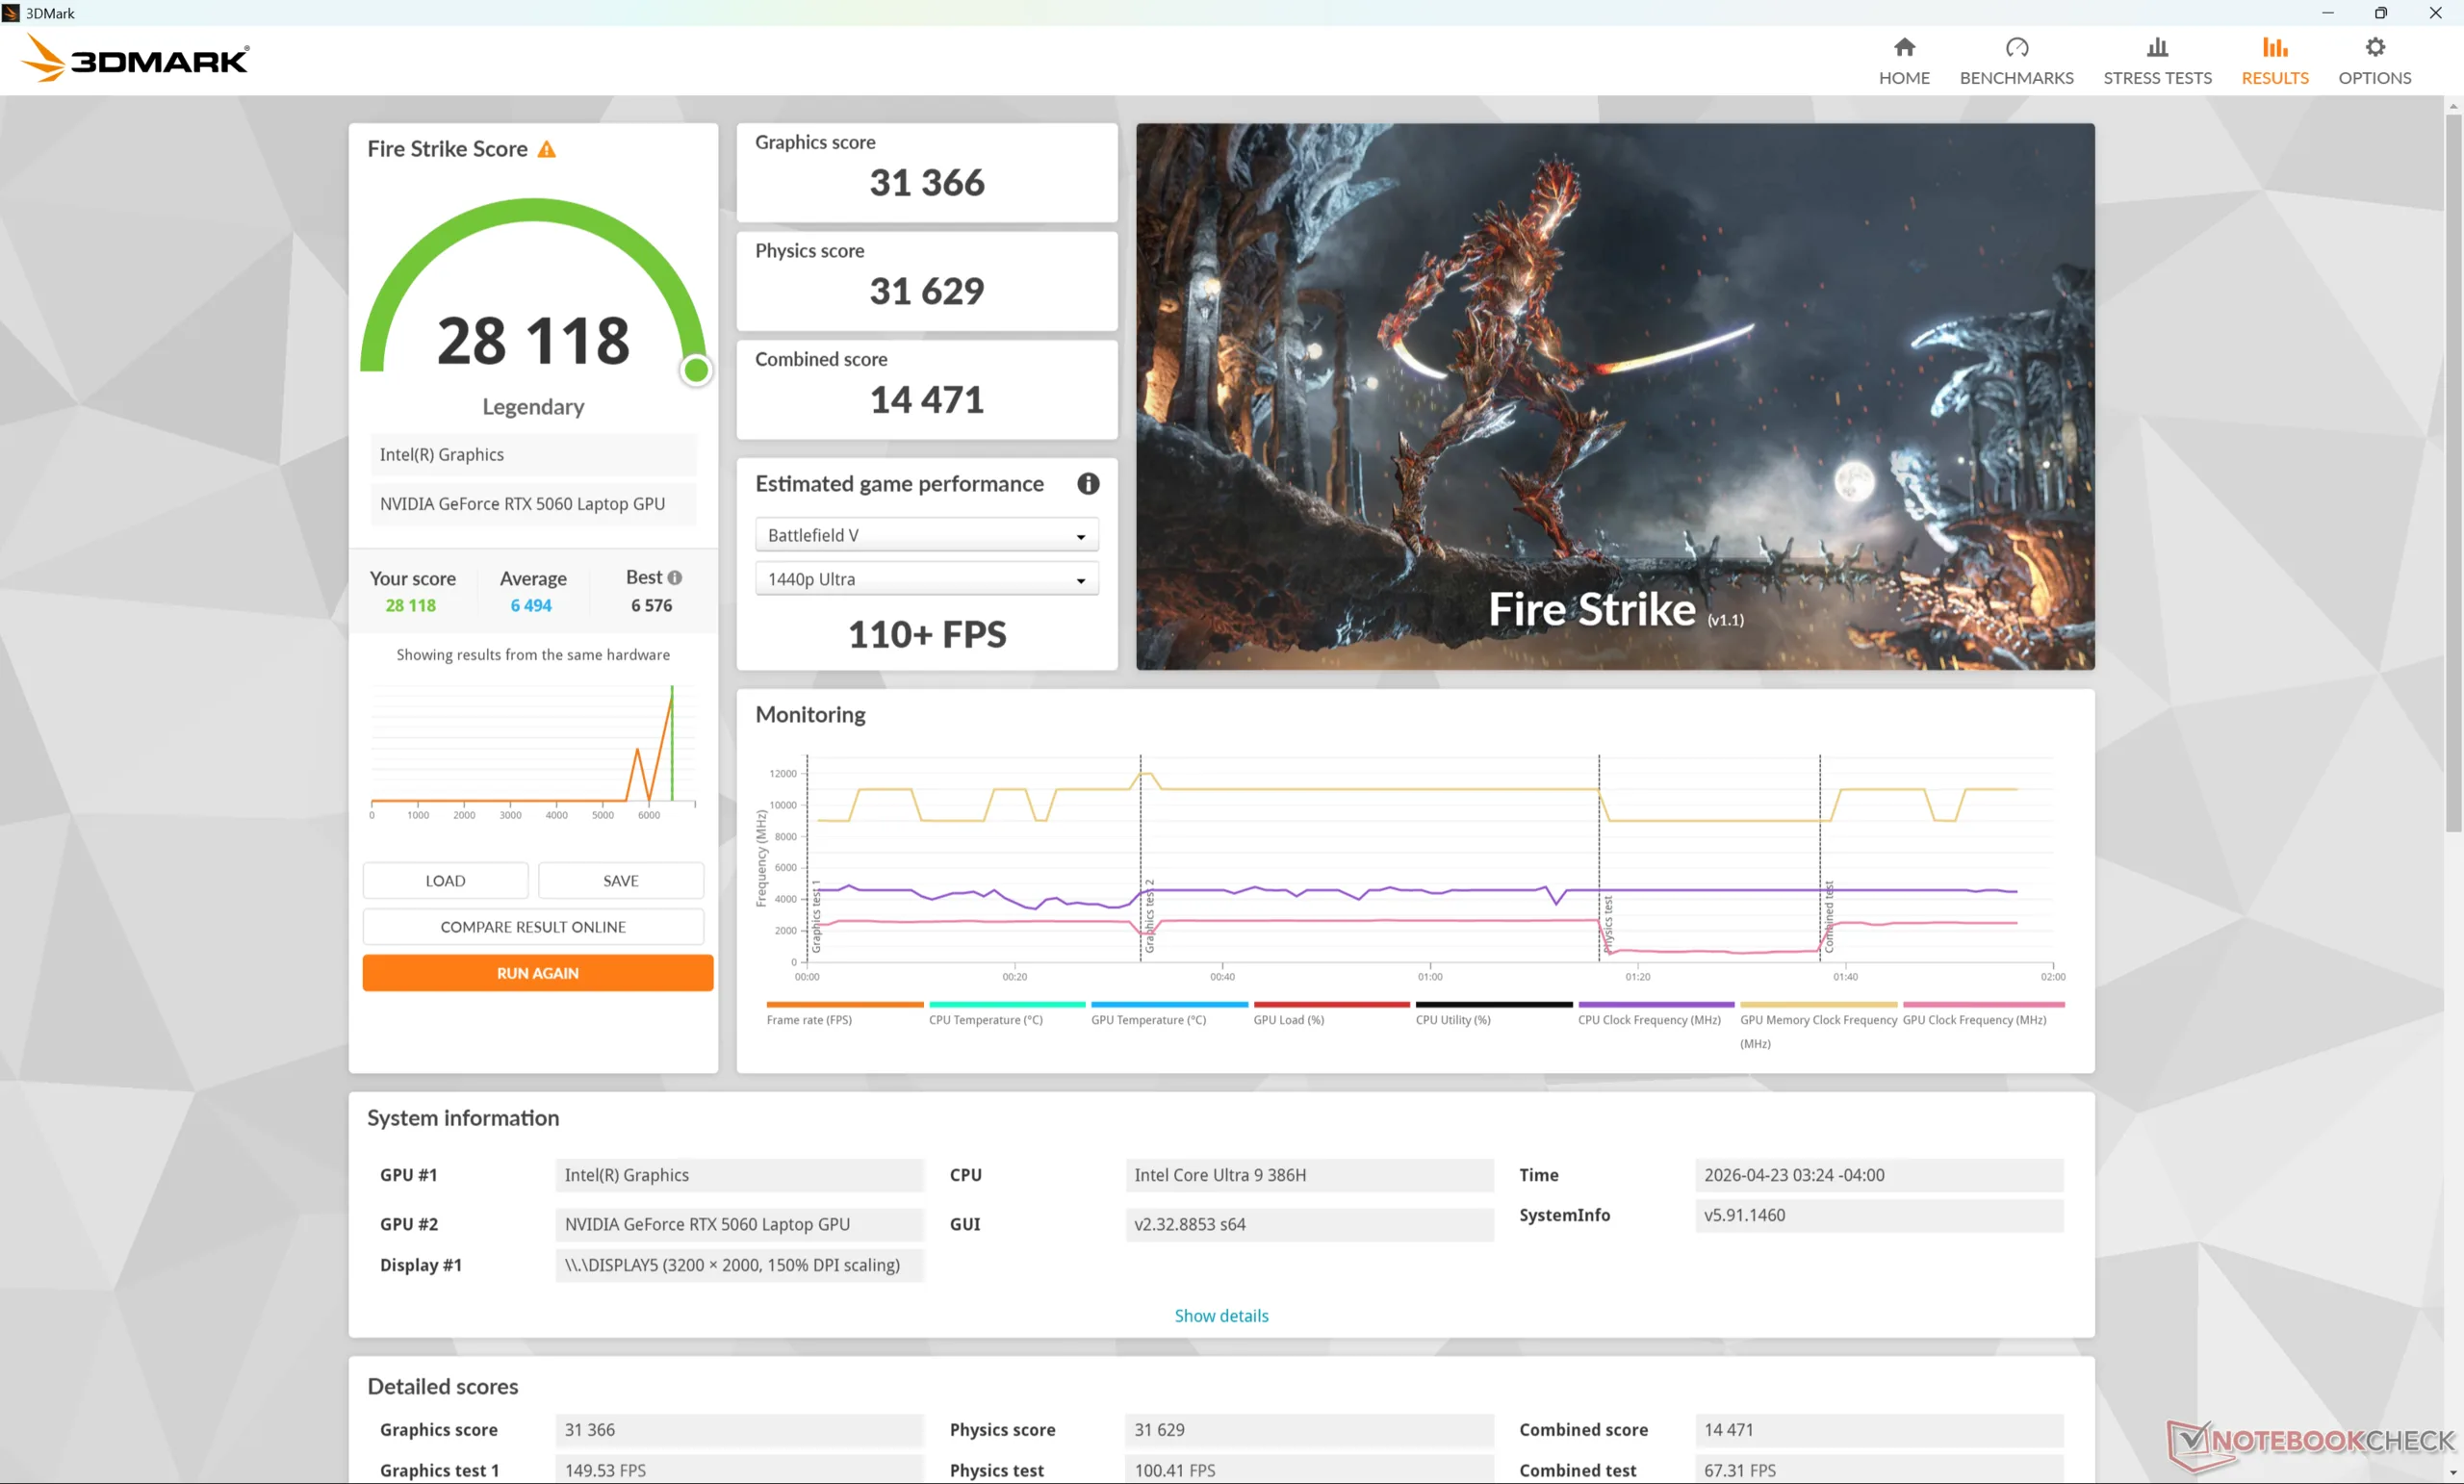
GPU-prestaties
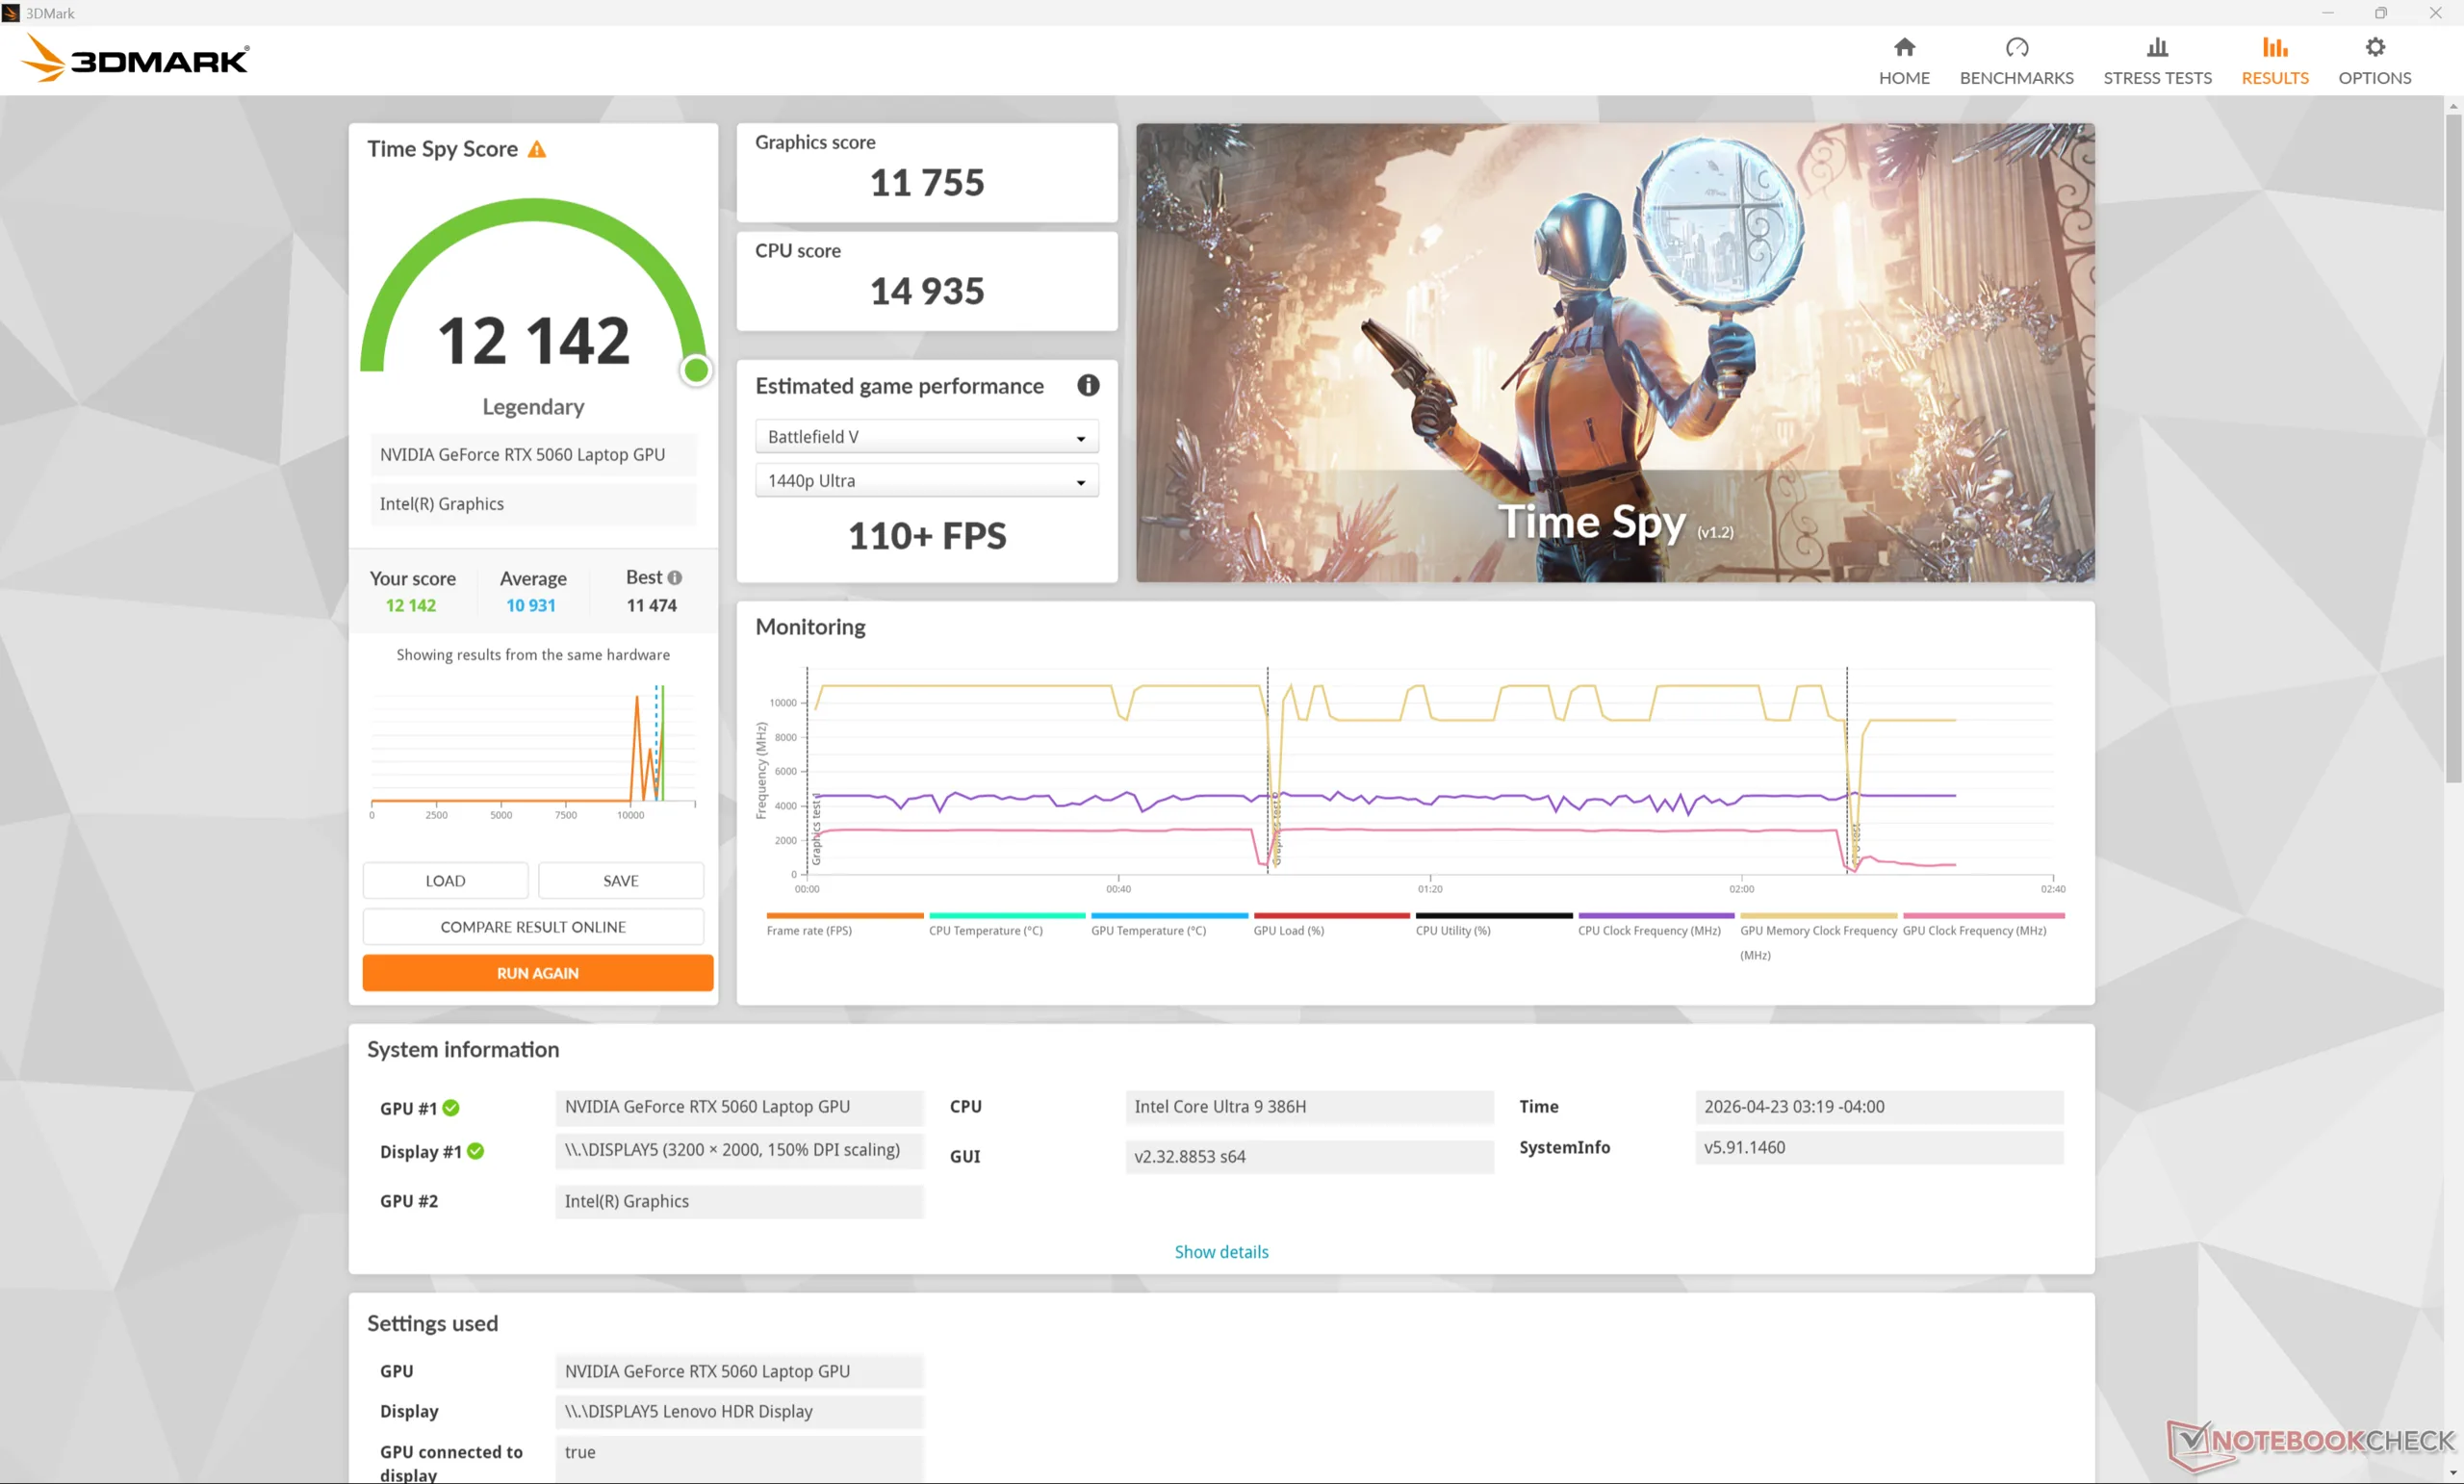
De mobiele GeForce RTX 5060 presteert waar we hem verwachten in vergelijking met andere laptops met dezelfde GPU. De ruwe grafische prestaties blijven iets achter bij de voor gaming geoptimaliseerde Legion 7 16 AGP11 uitgerust met dezelfde RTX 5060 met slechts een paar procentpunten.
Als u het systeem in de modus Gebalanceerd in plaats van in de modus Prestaties zou draaien, zou dit de grafische prestaties met wel 10 procent beïnvloeden, zoals onze onderstaande tabel met Time Spy resultaten laat zien.
Downgraden naar de RTX 5050 configuratie van onze RTX 5060 zal de grafische prestaties naar verwachting met wel 20 tot 25 procent verminderen.
| Vermogen Profiel | Grafische Score | Fysica Score | Gecombineerde Score |
| Prestatiemodus | 11755 | 14935 | 12142 |
| Evenwichtige modus | 10676 (-9%) | 15025 (-0%) | 11160 (-8%) |
| Batterijvermogen | 9886 (-16%) | 12811 (-14%) | 10236 (-16%) |
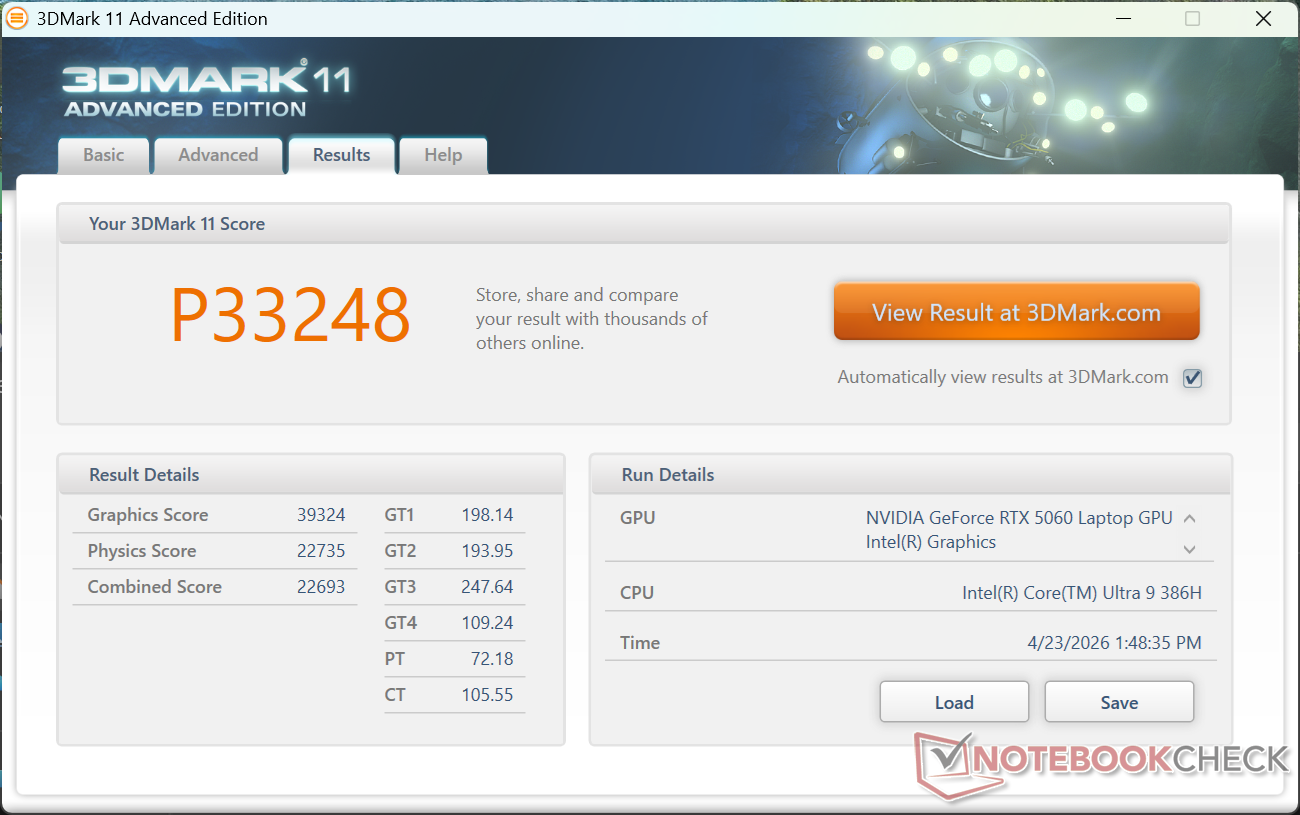
| 3DMark 11 Performance | 33248 punten | |
| 3DMark Cloud Gate Standard Score | 61799 punten | |
| 3DMark Fire Strike Score | 28118 punten | |
| 3DMark Time Spy Score | 12142 punten | |
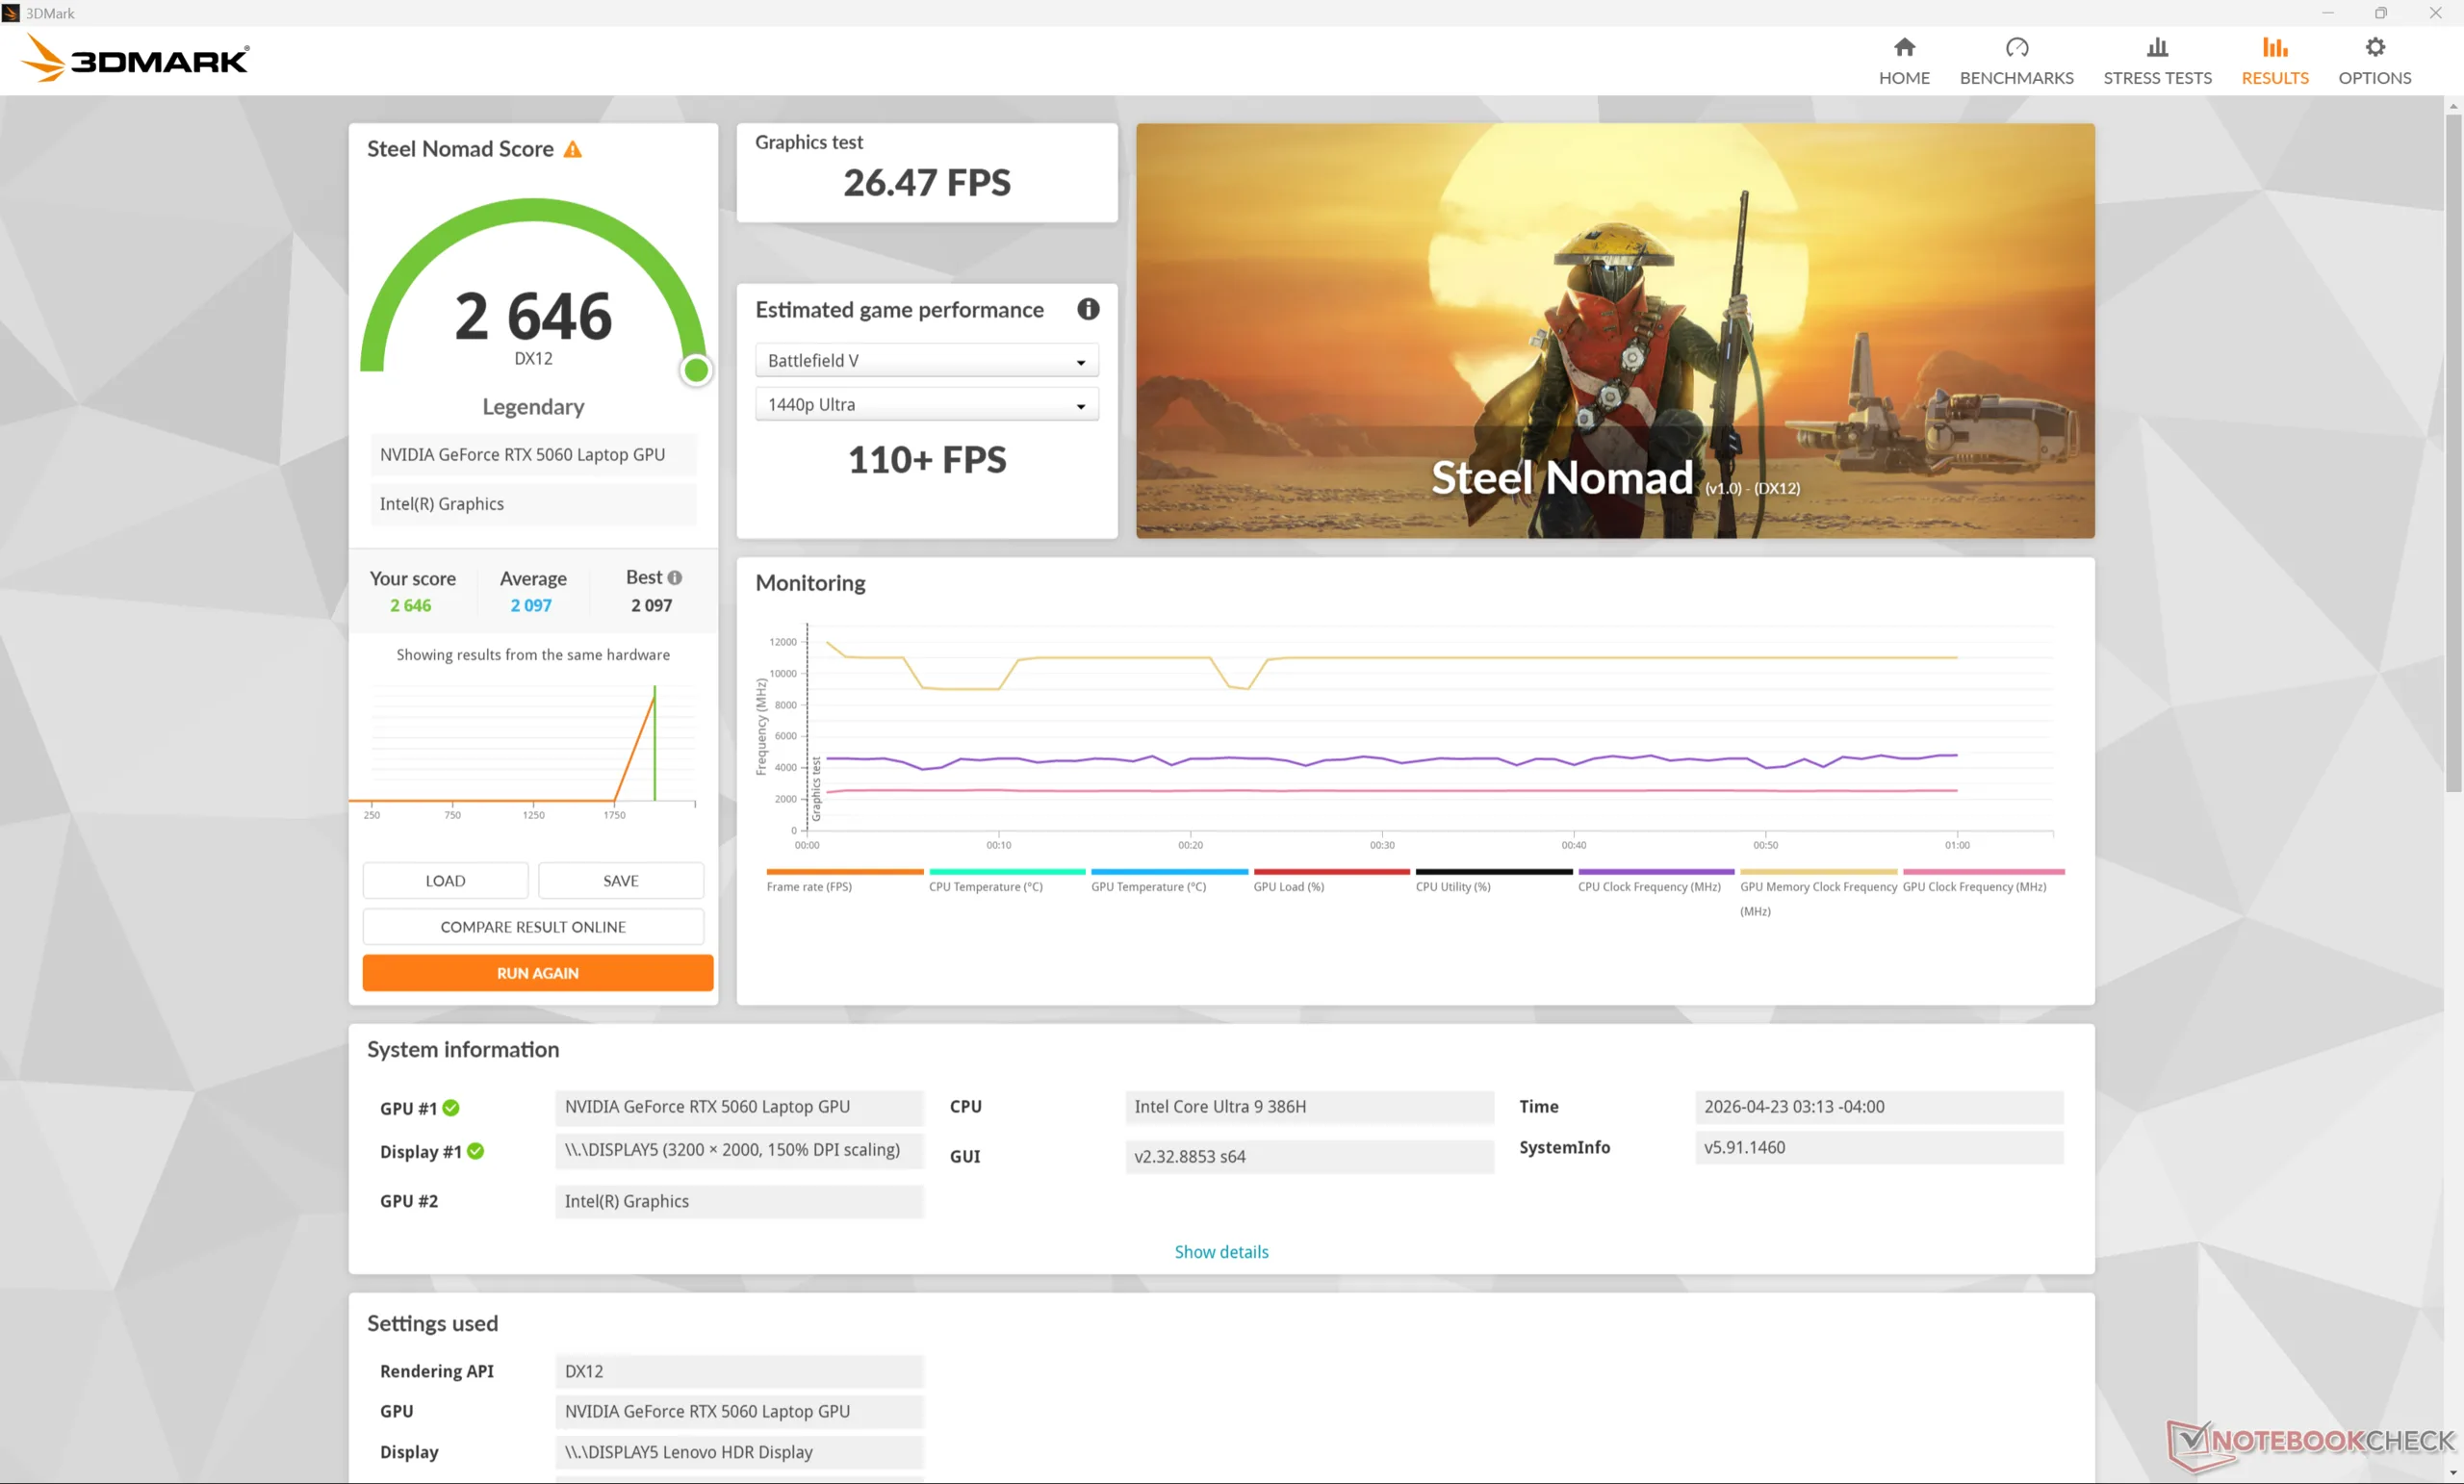
| 3DMark Steel Nomad Score | 2646 punten | |
Help | ||
* ... kleiner is beter
| Cyberpunk 2077 - 1920x1080 Ultra Preset (FSR off) | |
| Asus ProArt P16 H7606WP | |
| Lenovo Pro 9 16IPH11 | |
| Lenovo Yoga Pro 9 16IAH10 RTX 5050 | |
| Dell XPS 16 Core Ultra X7 358H | |
| MSI Prestige 16 AI Evo B2HMG | |
| Baldur's Gate 3 - 1920x1080 Ultra Preset AA:T | |
| Asus ProArt P16 H7606WP | |
| Lenovo Pro 9 16IPH11 | |
| Lenovo Yoga Pro 9 16IAH10 RTX 5050 | |
| Dell XPS 16 Core Ultra X7 358H | |
| MSI Prestige 16 AI Evo B2HMG | |
| GTA V - 1920x1080 Highest AA:4xMSAA + FX AF:16x | |
| Lenovo Pro 9 16IPH11 | |
| Lenovo Yoga Pro 9 16IAH10 RTX 5050 | |
| Asus ProArt P16 H7606WP | |
| HP Omen Transcend 16-u1095ng | |
| Dell XPS 16 Core Ultra X7 358H | |
| MSI Prestige 16 AI Evo B2HMG | |
| Final Fantasy XV Benchmark - 1920x1080 High Quality | |
| Asus ProArt P16 H7606WP | |
| Lenovo Pro 9 16IPH11 | |
| Lenovo Yoga Pro 9 16IAH10 RTX 5050 | |
| HP Omen Transcend 16-u1095ng | |
| Dell XPS 16 Core Ultra X7 358H | |
| MSI Prestige 16 AI Evo B2HMG | |
| Strange Brigade - 1920x1080 ultra AA:ultra AF:16 | |
| Asus ProArt P16 H7606WP | |
| Lenovo Pro 9 16IPH11 | |
| HP Omen Transcend 16-u1095ng | |
| Lenovo Yoga Pro 9 16IAH10 RTX 5050 | |
| Dell XPS 16 Core Ultra X7 358H | |
| MSI Prestige 16 AI Evo B2HMG | |
| Dota 2 Reborn - 1920x1080 ultra (3/3) best looking | |
| HP Omen Transcend 16-u1095ng | |
| Lenovo Yoga Pro 9 16IAH10 RTX 5050 | |
| Lenovo Pro 9 16IPH11 | |
| Asus ProArt P16 H7606WP | |
| Dell XPS 16 Core Ultra X7 358H | |
| MSI Prestige 16 AI Evo B2HMG | |
| X-Plane 11.11 - 1920x1080 high (fps_test=3) | |
| HP Omen Transcend 16-u1095ng | |
| Lenovo Yoga Pro 9 16IAH10 RTX 5050 | |
| Asus ProArt P16 H7606WP | |
| Dell XPS 16 Core Ultra X7 358H | |
| MSI Prestige 16 AI Evo B2HMG | |
| Black Myth: Wukong | |
| 1920x1080 high TSR 100 | |
| Gemiddeld NVIDIA GeForce RTX 5060 Laptop (50 - 58, n=2) | |
| Lenovo Pro 9 16IPH11 | |
| Dell XPS 16 Core Ultra X7 358H | |
| 1920x1080 cinematic TSR 100 | |
| Gemiddeld NVIDIA GeForce RTX 5060 Laptop (28 - 32, n=3) | |
| Lenovo Pro 9 16IPH11 | |
| Dell XPS 16 Core Ultra X7 358H | |
| 2560x1440 cinematic TSR 100 | |
| Gemiddeld NVIDIA GeForce RTX 5060 Laptop (21 - 23, n=3) | |
| Lenovo Pro 9 16IPH11 | |
| 2560x1440 cinematic DLSS 68 | |
| Gemiddeld NVIDIA GeForce RTX 5060 Laptop (32 - 36, n=2) | |
| Lenovo Pro 9 16IPH11 | |
| 2560x1440 cinematic RT: Very High DLSS 68 FG | |
| Lenovo Pro 9 16IPH11 | |
| Gemiddeld NVIDIA GeForce RTX 5060 Laptop (31 - 37, n=2) | |
| F1 24 | |
| 1920x1080 Ultra High Preset AA:T AF:16x | |
| Asus ProArt P16 H7606WP | |
| Lenovo Legion 7 16 AGP11 | |
| Gemiddeld NVIDIA GeForce RTX 5060 Laptop (68.2 - 77.5, n=8) | |
| Lenovo Pro 9 16IPH11 | |
| Lenovo Yoga Pro 9 16IAH10 RTX 5050 | |
| Dell XPS 16 Core Ultra X7 358H | |
| MSI Venture 16 AI A2HMTG | |
| 2560x1440 Ultra High Preset AA:T AF:16x | |
| Asus ProArt P16 H7606WP | |
| Lenovo Legion 7 16 AGP11 | |
| Gemiddeld NVIDIA GeForce RTX 5060 Laptop (39 - 49.1, n=8) | |
| Lenovo Pro 9 16IPH11 | |
| Lenovo Yoga Pro 9 16IAH10 RTX 5050 | |
| 2560x1440 Ultra High Preset + Quality DLSS AF:16x | |
| Lenovo Legion 7 16 AGP11 | |
| Lenovo Pro 9 16IPH11 | |
| Gemiddeld NVIDIA GeForce RTX 5060 Laptop (65 - 74.5, n=7) | |
| Lenovo Yoga Pro 9 16IAH10 RTX 5050 | |
| Monster Hunter Wilds | |
| 1920x1080 high, no upscaling | |
| Lenovo Pro 9 16IPH11 | |
| Gemiddeld NVIDIA GeForce RTX 5060 Laptop (49.7 - 58.8, n=2) | |
| 1920x1080 ultra, RT: high, no upscaling | |
| Lenovo Pro 9 16IPH11 | |
| Gemiddeld NVIDIA GeForce RTX 5060 Laptop (16.6 - 36.5, n=3) | |
| 2560x1440 ultra, RT: high, no upscaling | |
| Lenovo Pro 9 16IPH11 | |
| Gemiddeld NVIDIA GeForce RTX 5060 Laptop (13.9 - 20.9, n=2) | |
Cyberpunk 2077 ultra FPS Grafiek
| lage | gem. | hoge | ultra | QHD DLSS | QHD | |
|---|---|---|---|---|---|---|
| GTA V (2015) | 185.8 | 183.5 | 179.4 | 133.6 | 110.7 | |
| Dota 2 Reborn (2015) | 172.5 | 156.7 | 151.6 | 142.4 | ||
| Final Fantasy XV Benchmark (2018) | 187.9 | 170.4 | 124.1 | 92.3 | ||
| X-Plane 11.11 (2018) | 113 | 102.9 | ||||
| Strange Brigade (2018) | 482 | 314 | 214 | 217 | 125.5 | |
| Baldur's Gate 3 (2023) | 164.6 | 137.8 | 119.9 | 117.8 | 117.5 | 79.4 |
| Cyberpunk 2077 (2023) | 132.3 | 108.2 | 92.3 | 83.3 | 63.2 | 53.4 |
| F1 24 (2024) | 249 | 249 | 207 | 69.5 | 69.3 | 42.8 |
| Black Myth: Wukong (2024) | 85 | 64 | 50 | 28 | 32 | 21 |
| Monster Hunter Wilds (2025) | 74.2 | 63 | 58.8 | 34.8 | 20.9 |
Uitstoot
Systeemgeluid
Het plafond en het gedrag van het ventilatorgeluid komen vrijwel overeen met dat van de Yoga Pro 9 16IAH10 van vorig jaar, aangezien er geen grote veranderingen aan het moederbord zijn aangebracht. Het belangrijkste is misschien wel dat het ventilatorgeluid tijdens het draaien van Cyberpunk 2077 rond de 41 dB(A) schommelt in de Gebalanceerde modus of rond de 50 dB(A) in de Prestatiemodus. De eerder genoemde daling van 10 procent in grafische prestaties bij gamen in de Gebalanceerde modus kan een redelijk compromis zijn voor de veel stillere ventilatoren.
Geluidsniveau
| Onbelast |
| 23.5 / 24 / 24 dB (A) |
| Belasting |
| 32.3 / 50.1 dB (A) |
 | ||
30 dB stil 40 dB(A) hoorbaar 50 dB(A) luid |
||
min: | ||
| Lenovo Pro 9 16IPH11 Ultra 9 386H, GeForce RTX 5060 Laptop | Lenovo Yoga Pro 9 16IAH10 RTX 5050 Ultra 9 285H, GeForce RTX 5050 Laptop | Dell XPS 16 Core Ultra X7 358H Ultra X7 358H, Arc B390 Panther Lake iGPU | MSI Prestige 16 AI Evo B2HMG Ultra 9 285H, Arc 140T | HP Omen Transcend 16-u1095ng i9-14900HX, GeForce RTX 4070 Laptop GPU | Asus ProArt P16 H7606WP Ryzen AI 9 HX 370, GeForce RTX 5070 Laptop | |
|---|---|---|---|---|---|---|
| Noise | -5% | 0% | 1% | -19% | -16% | |
| uit / omgeving * (dB) | 23 | 24.6 -7% | 23.3 -1% | 23.6 -3% | 24 -4% | 23.5 -2% |
| Idle Minimum * (dB) | 23.5 | 24.6 -5% | 23.4 -0% | 23.6 -0% | 29 -23% | 26.7 -14% |
| Idle Average * (dB) | 24 | 24.6 -3% | 23.4 2% | 23.6 2% | 30 -25% | 26.7 -11% |
| Idle Maximum * (dB) | 24 | 26.8 -12% | 25.8 -8% | 26.2 -9% | 31 -29% | 31.1 -30% |
| Load Average * (dB) | 32.3 | 32.8 -2% | 38 -18% | 37.1 -15% | 45 -39% | 44.8 -39% |
| Cyberpunk 2077 ultra * (dB) | 50.1 | 51.8 -3% | 38.1 24% | 42.1 16% | 53.7 -7% | |
| Load Maximum * (dB) | 50.1 | 51.8 -3% | 48.6 3% | 42.1 16% | 47 6% | 53.7 -7% |
| Witcher 3 ultra * (dB) | 44 |
* ... kleiner is beter
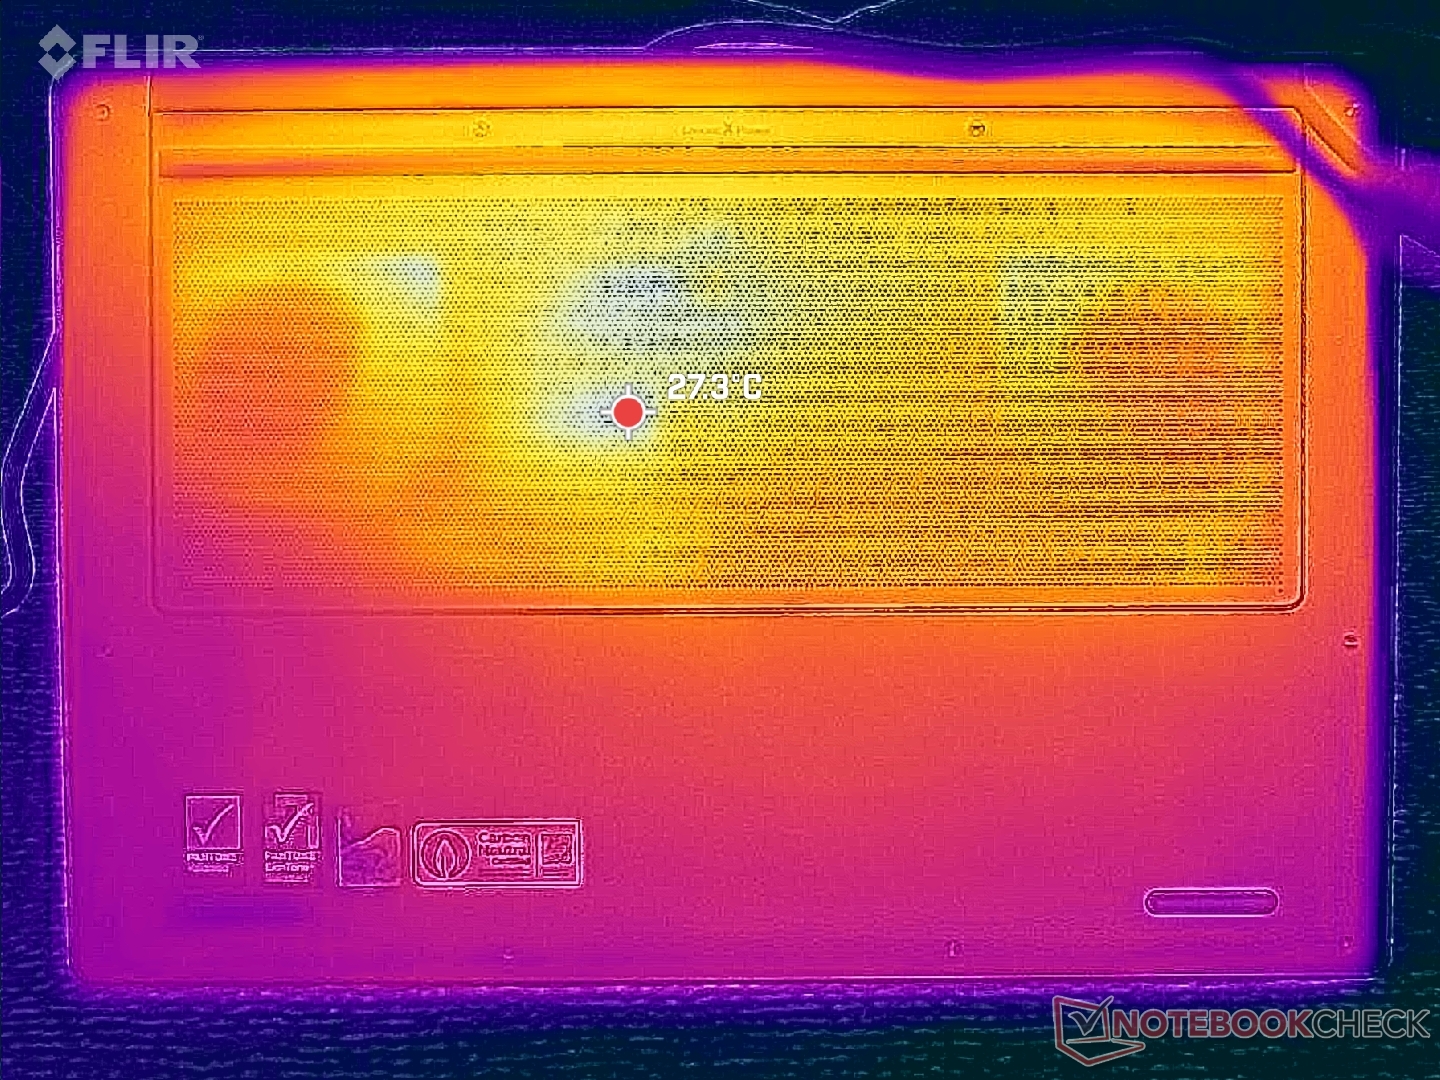
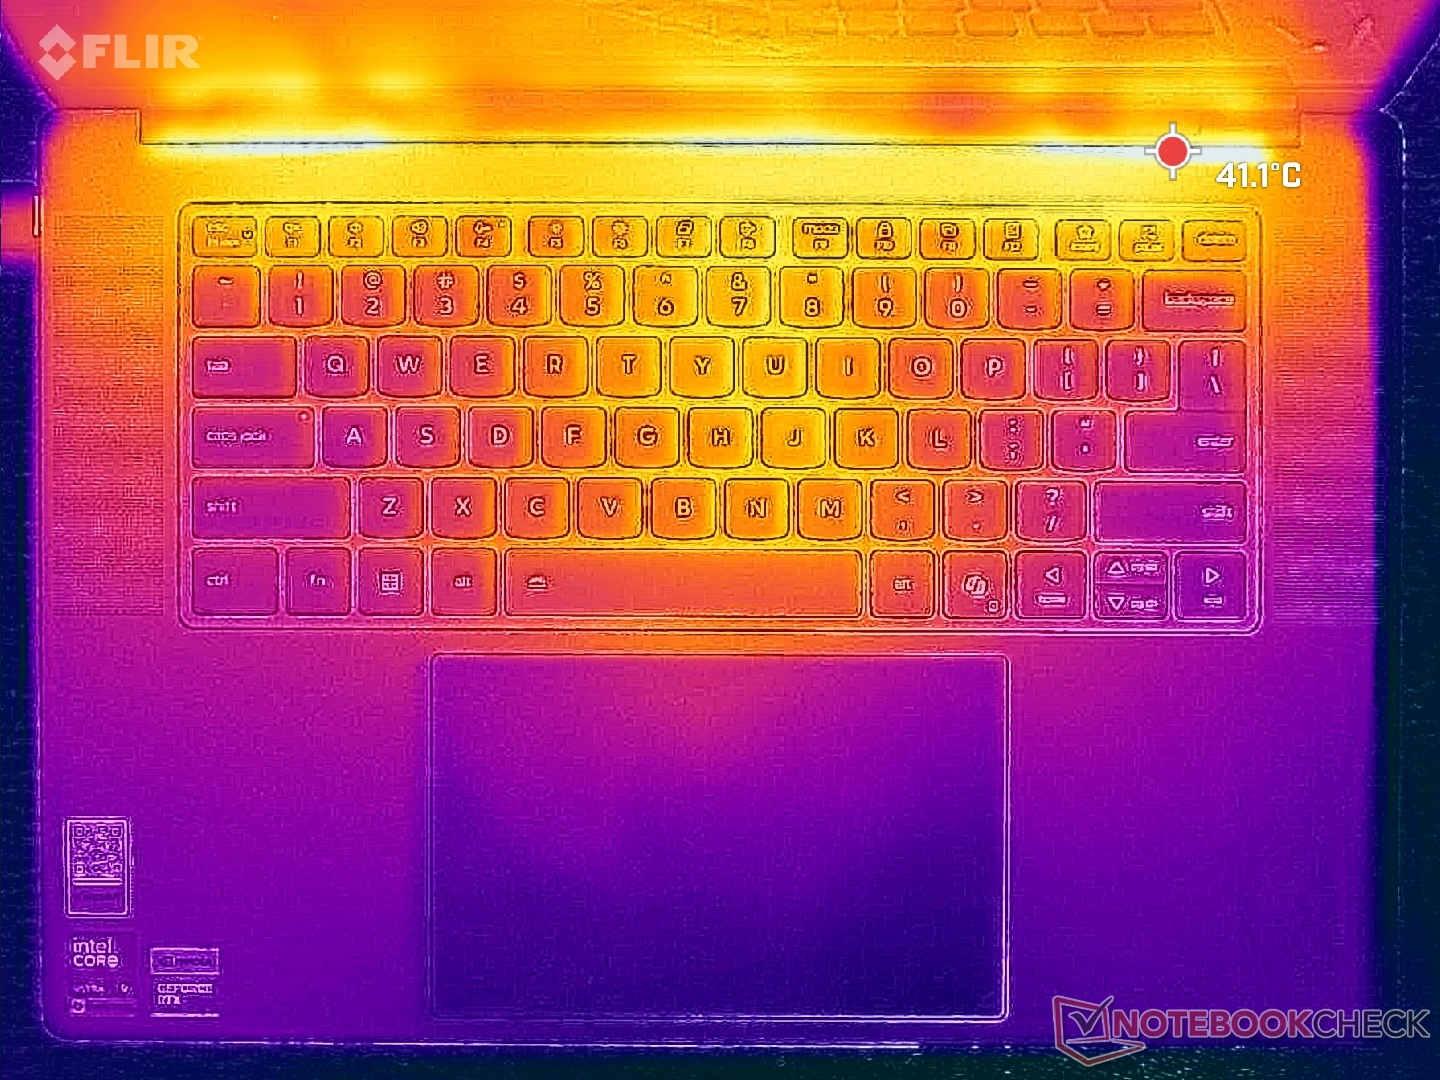
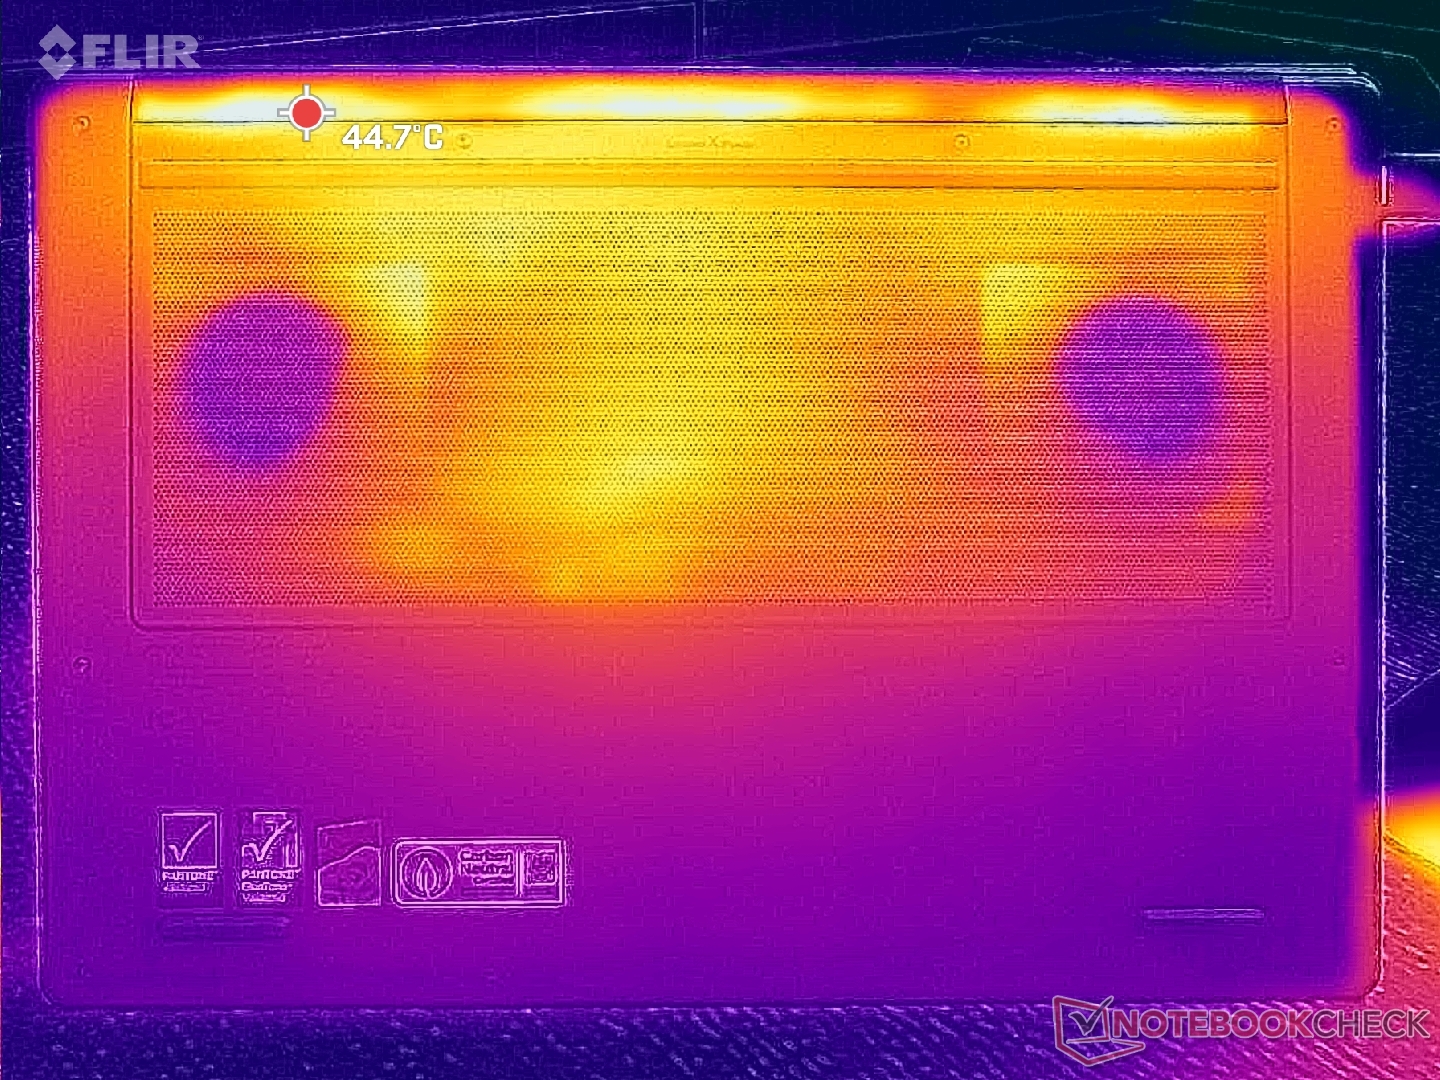
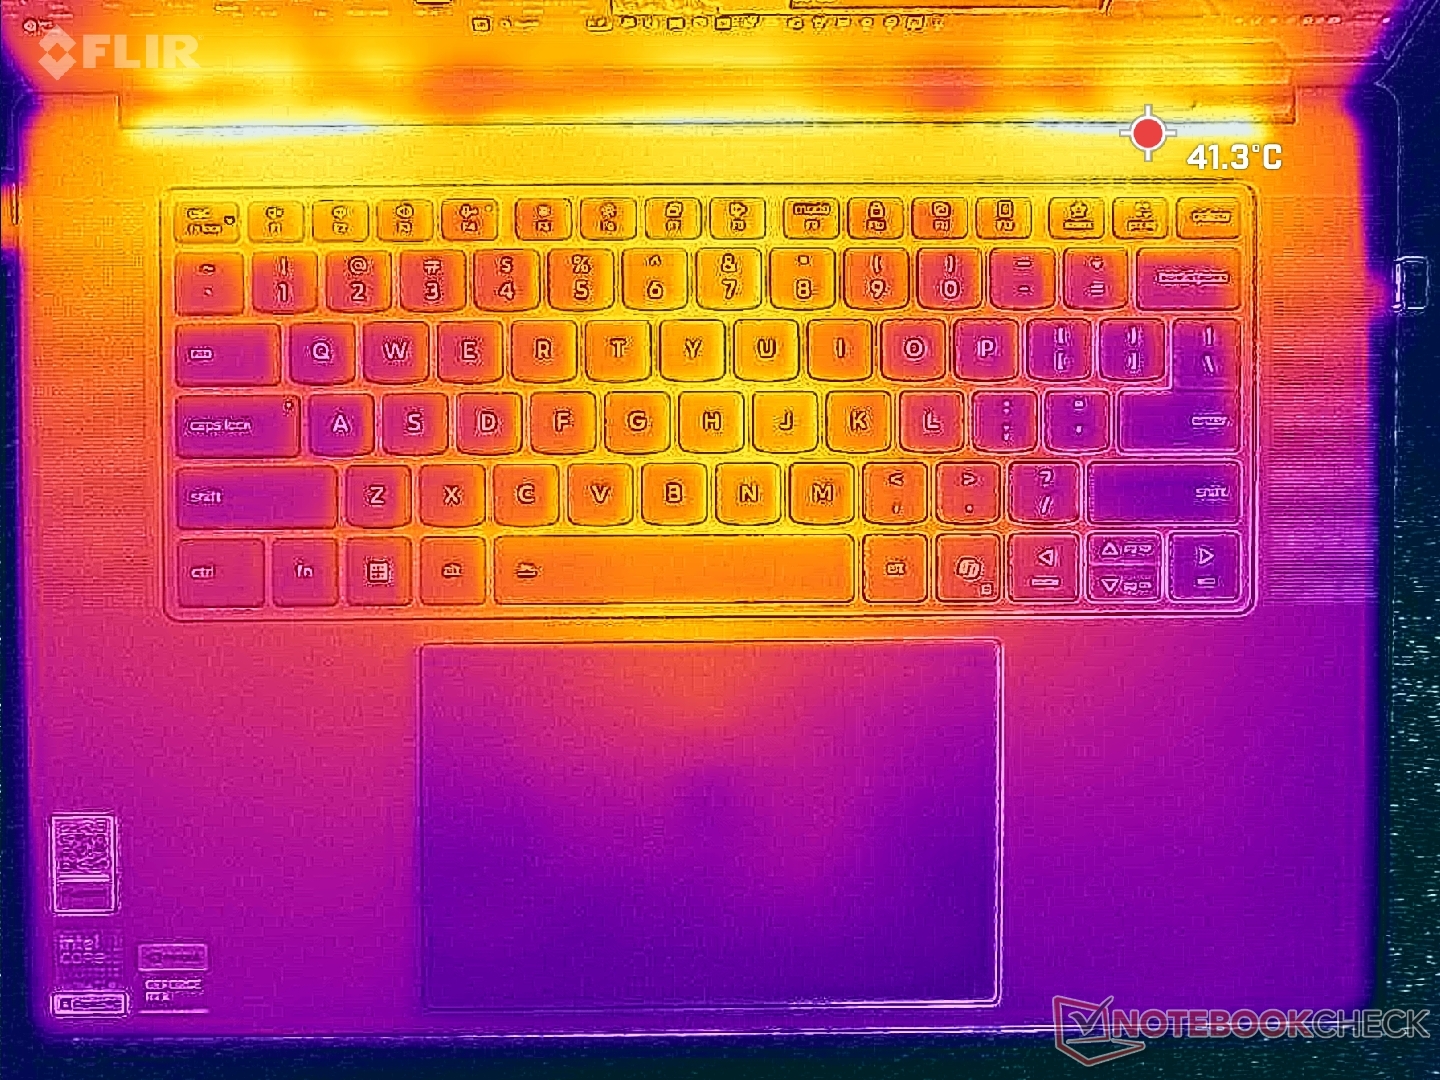
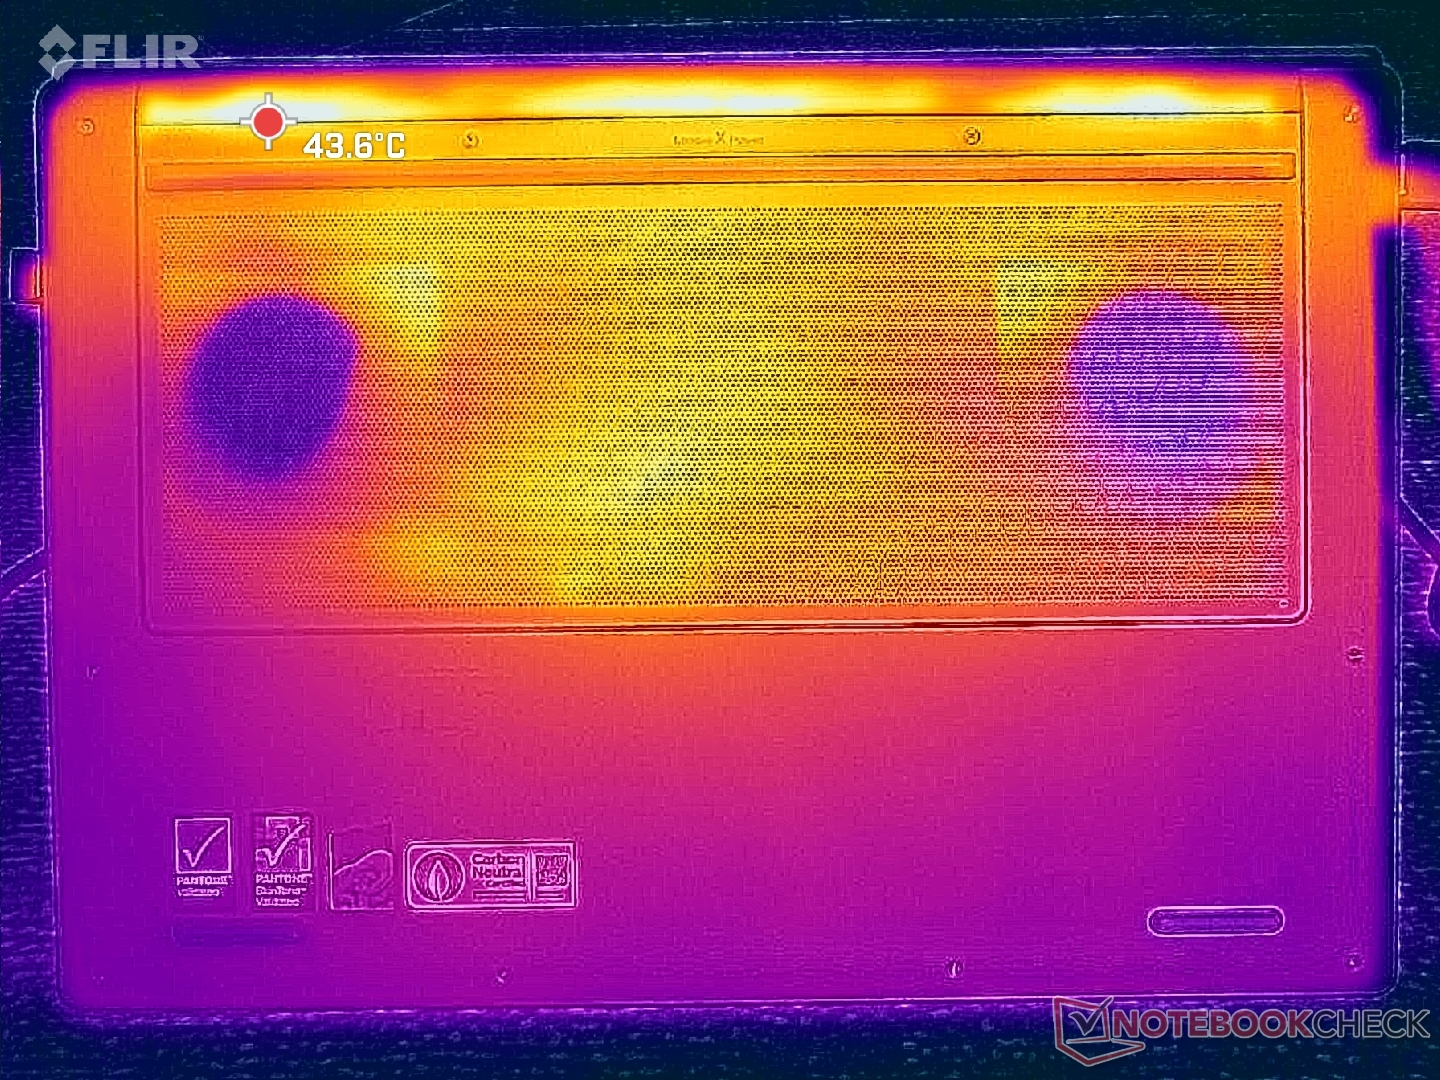
Temperatuur
De oppervlaktetemperaturen zijn merkbaar koeler ondanks de kleinere afmetingen dan bij het vorige model. Bij het uitvoeren van Cyberpunk 2077 bijvoorbeeld, kwamen de temperaturen op ons apparaat uit op slechts 38 C en 41 C, vergeleken met 42 C en 49 C op de Yoga Pro 9i 16IAH G10 Aura met dezelfde Nvidia GPU.
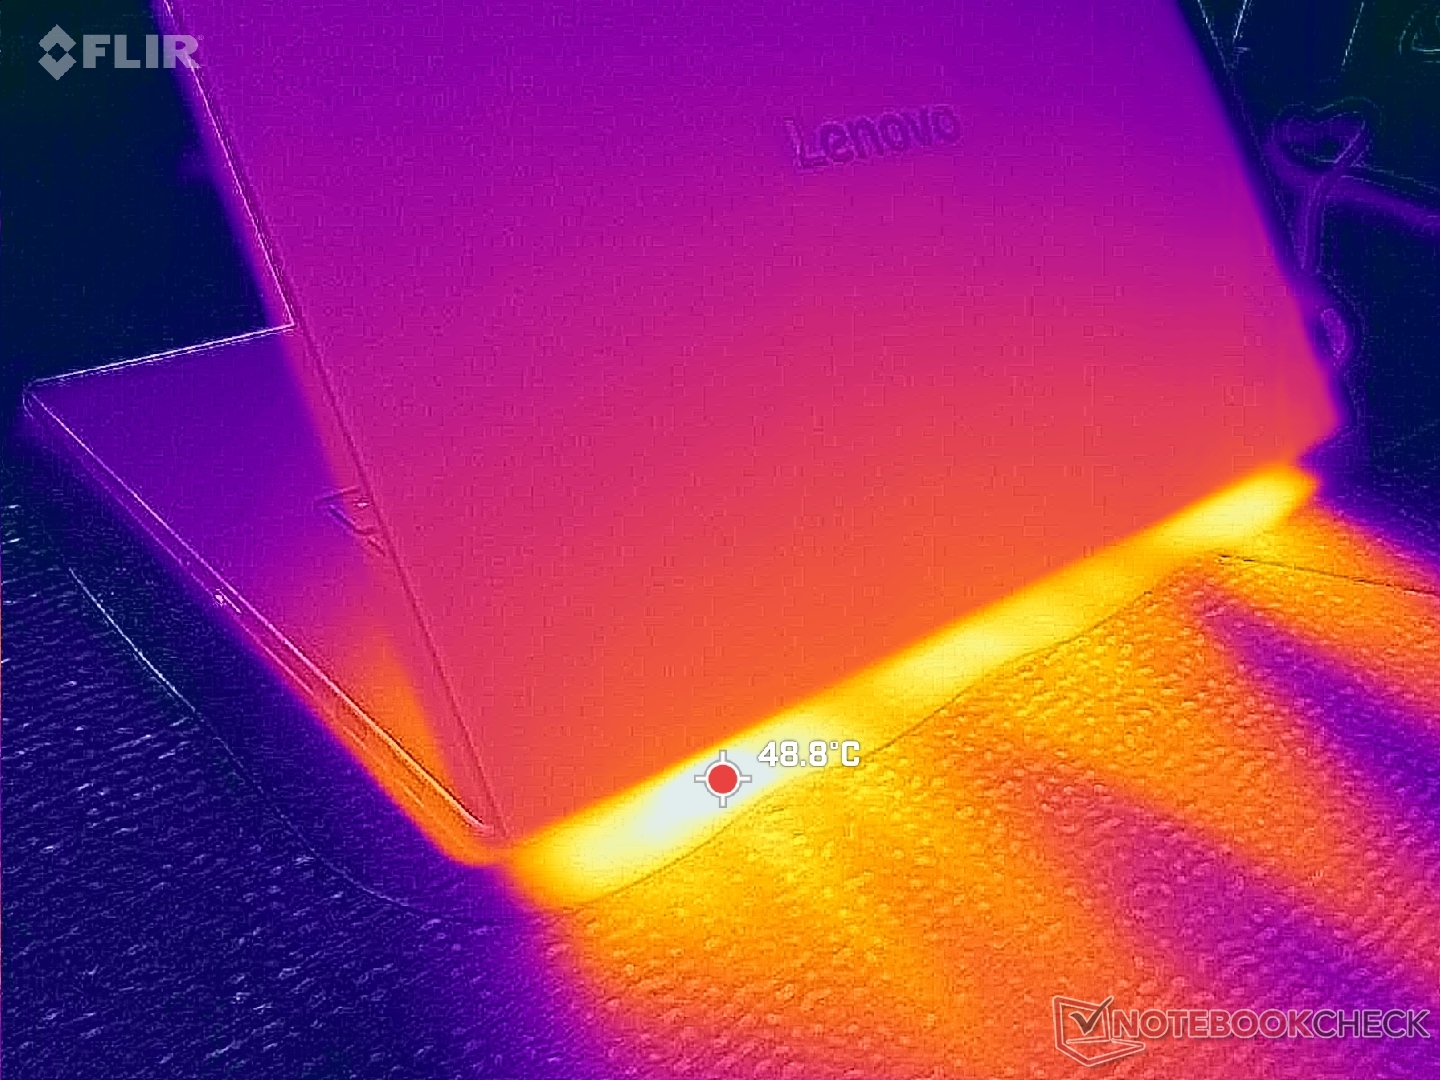
(+) De maximumtemperatuur aan de bovenzijde bedraagt 37.8 °C / 100 F, vergeleken met het gemiddelde van 36.8 °C / 98 F, variërend van 21 tot 71 °C voor de klasse Multimedia.
(+) De bodem warmt op tot een maximum van 38.2 °C / 101 F, vergeleken met een gemiddelde van 39.1 °C / 102 F
(+) Bij onbelast gebruik bedraagt de gemiddelde temperatuur voor de bovenzijde 27.1 °C / 81 F, vergeleken met het apparaatgemiddelde van 31.3 °C / 88 F.
(+) 3: The average temperature for the upper side is 31.7 °C / 89 F, compared to the average of 31.3 °C / 88 F for the class Multimedia.
(+) De palmsteunen en het touchpad zijn met een maximum van ###max## °C / 84.9 F koeler dan de huidtemperatuur en voelen daarom koel aan.
(±) De gemiddelde temperatuur van de handpalmsteun van soortgelijke toestellen bedroeg 28.7 °C / 83.7 F (-0.7 °C / -1.2 F).
| Lenovo Pro 9 16IPH11 Ultra 9 386H, GeForce RTX 5060 Laptop | Lenovo Yoga Pro 9 16IAH10 RTX 5050 Ultra 9 285H, GeForce RTX 5050 Laptop | Dell XPS 16 Core Ultra X7 358H Ultra X7 358H, Arc B390 Panther Lake iGPU | MSI Prestige 16 AI Evo B2HMG Ultra 9 285H, Arc 140T | HP Omen Transcend 16-u1095ng i9-14900HX, GeForce RTX 4070 Laptop GPU | Asus ProArt P16 H7606WP Ryzen AI 9 HX 370, GeForce RTX 5070 Laptop | |
|---|---|---|---|---|---|---|
| Heat | 1% | 9% | -7% | -22% | -5% | |
| Maximum Upper Side * (°C) | 37.8 | 34.4 9% | 40.6 -7% | 48.1 -27% | 49 -30% | 47 -24% |
| Maximum Bottom * (°C) | 38.2 | 41.4 -8% | 39.8 -4% | 51.6 -35% | 63 -65% | 47.4 -24% |
| Idle Upper Side * (°C) | 30.4 | 28.6 6% | 23.2 24% | 25.9 15% | 30 1% | 26.1 14% |
| Idle Bottom * (°C) | 31 | 31.8 -3% | 23.8 23% | 25.2 19% | 29 6% | 26.4 15% |
* ... kleiner is beter
Stresstest
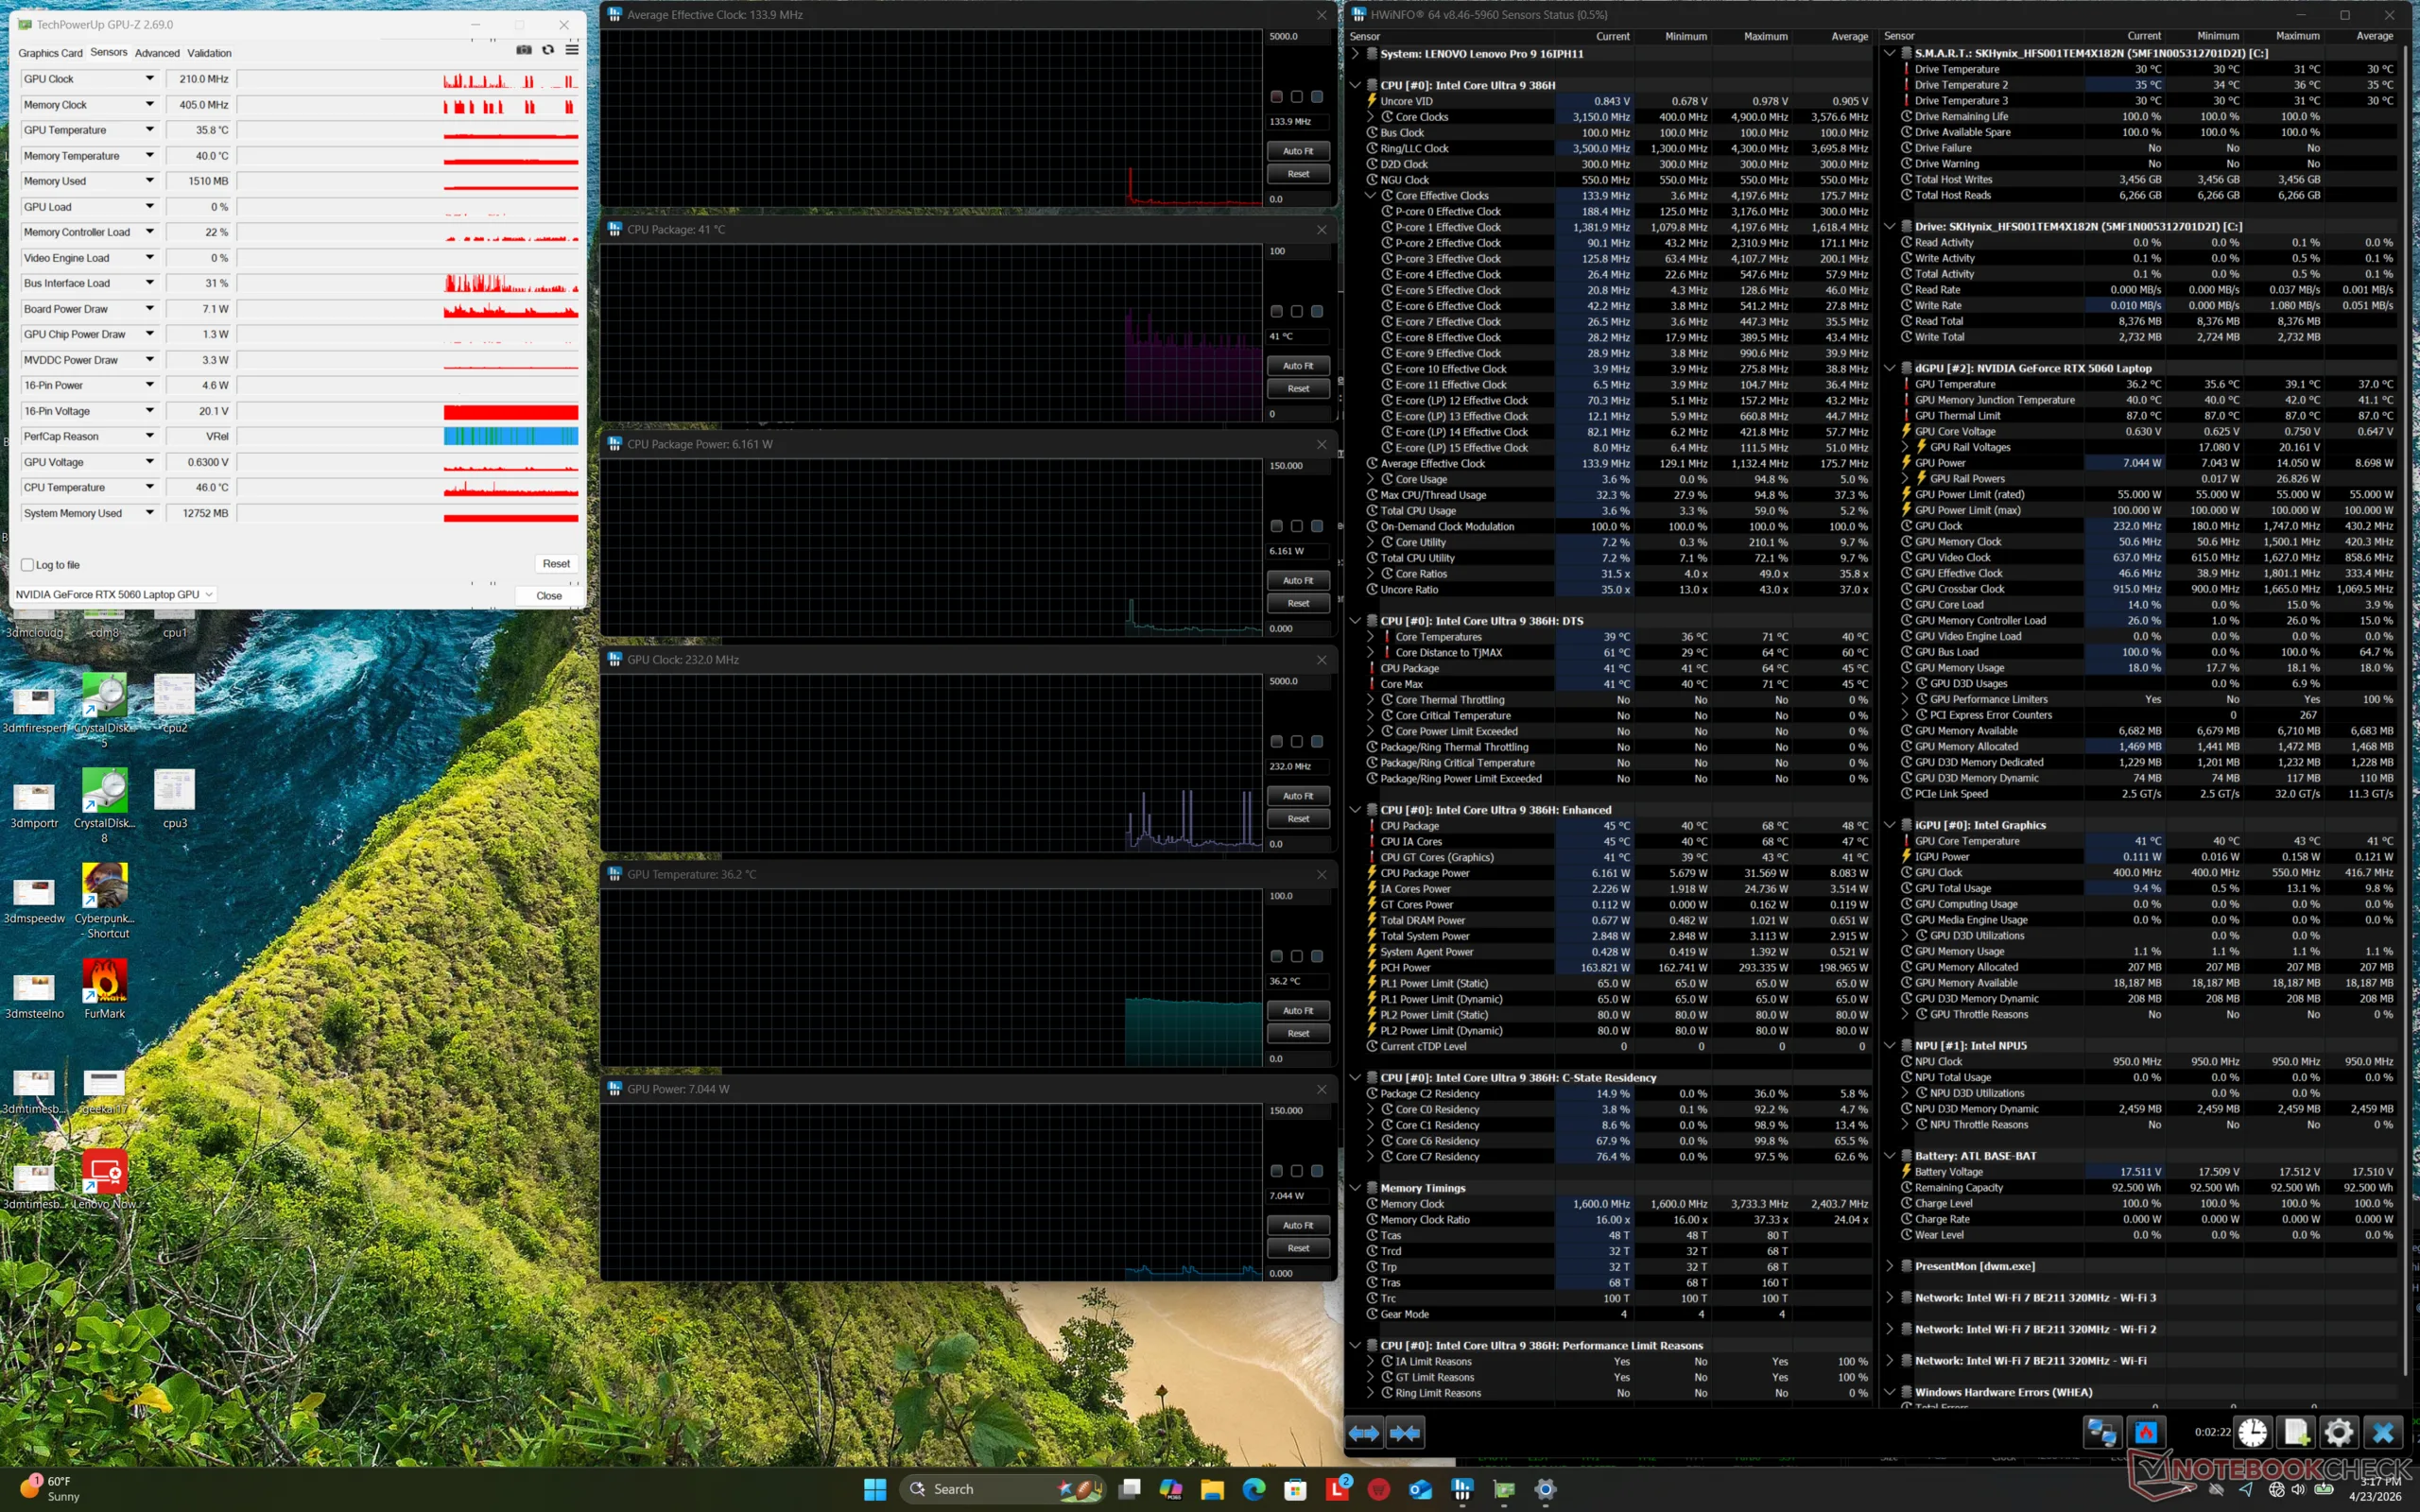
De CPU steeg naar 3,3 GHz, 98 C en 86 W bij het starten van Prime95 stress, voordat hij ongeveer 30 seconden later daalde en stabiliseerde op 3,0 GHz, 90 C en 62 W.
De kerntemperatuur en kloksnelheden veranderden drastisch tussen de modi Balanced en Performance, zoals de schermafbeeldingen hieronder laten zien. Als u bijvoorbeeld Cyberpunk 2077 uitvoert, is de gemiddelde temperatuur van de GPU 2647 MHz, 75 C en 91 W als deze is ingesteld op de modus Prestaties, of 2340 MHz, 68 C en 67 W als deze is ingesteld op de modus Gebalanceerd. De algehele langzamere prestaties in de gebalanceerde modus komen overeen met onze Time SPy-waarnemingen in het GPU-gedeelte hierboven.
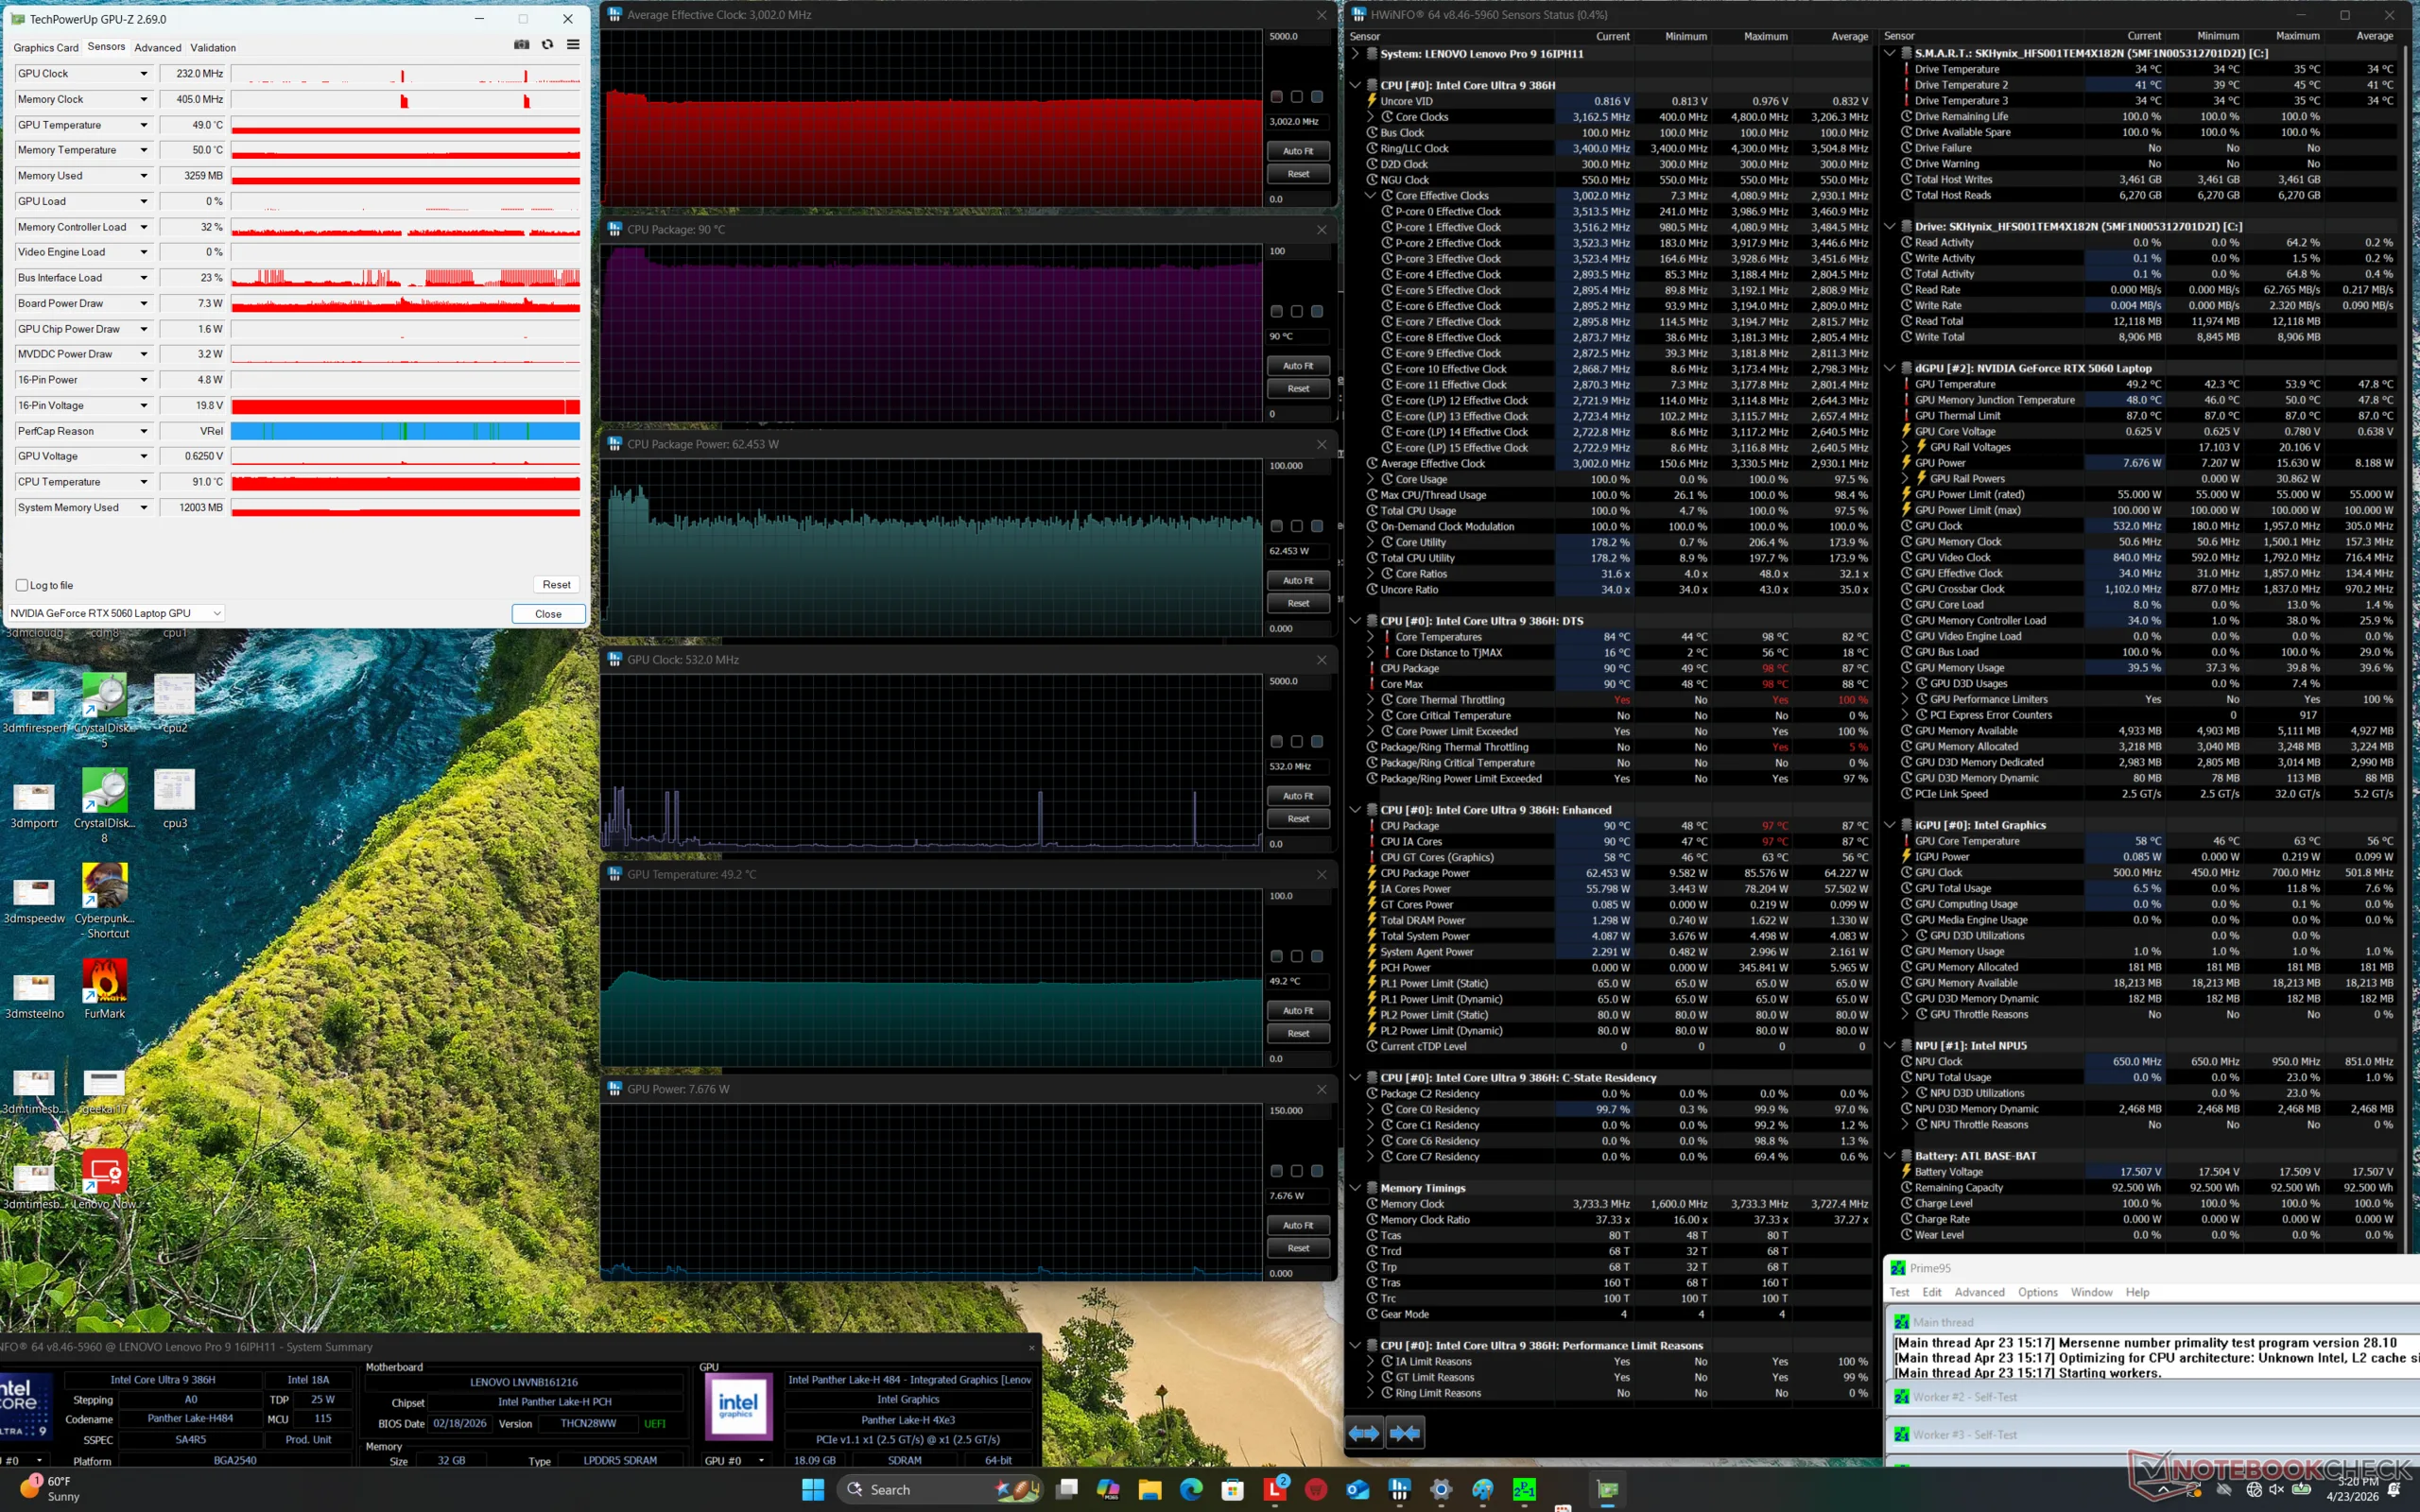
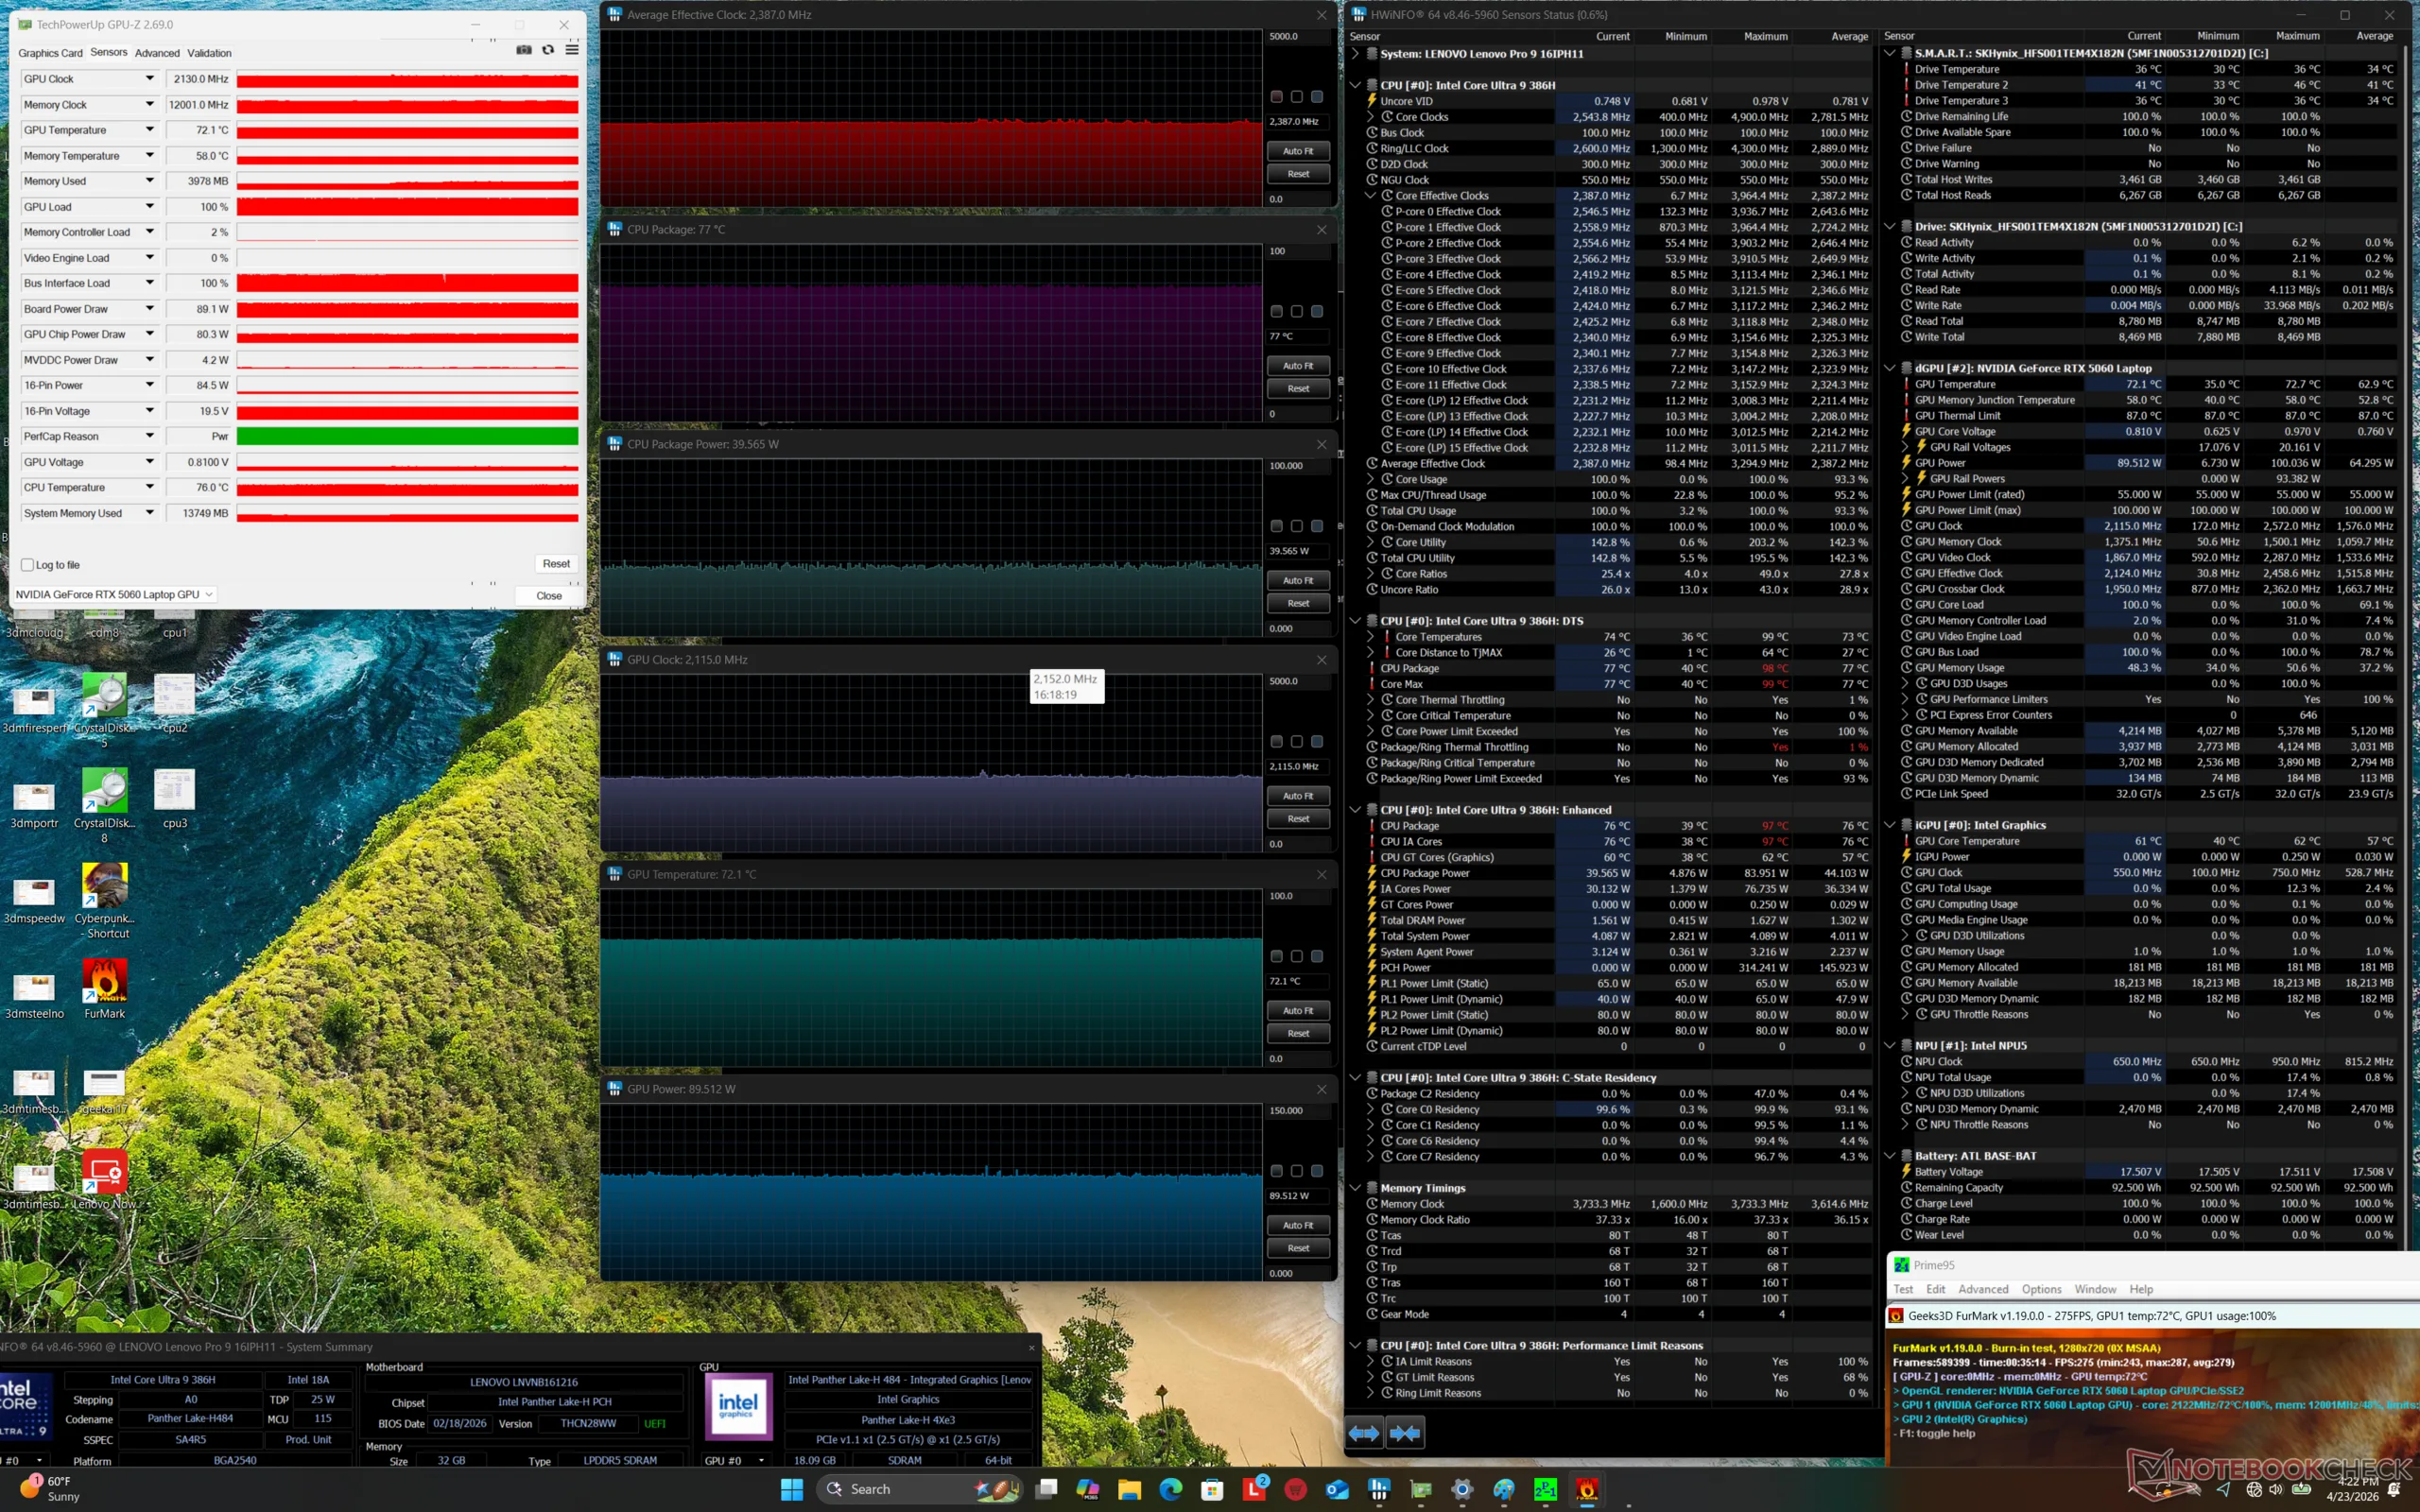
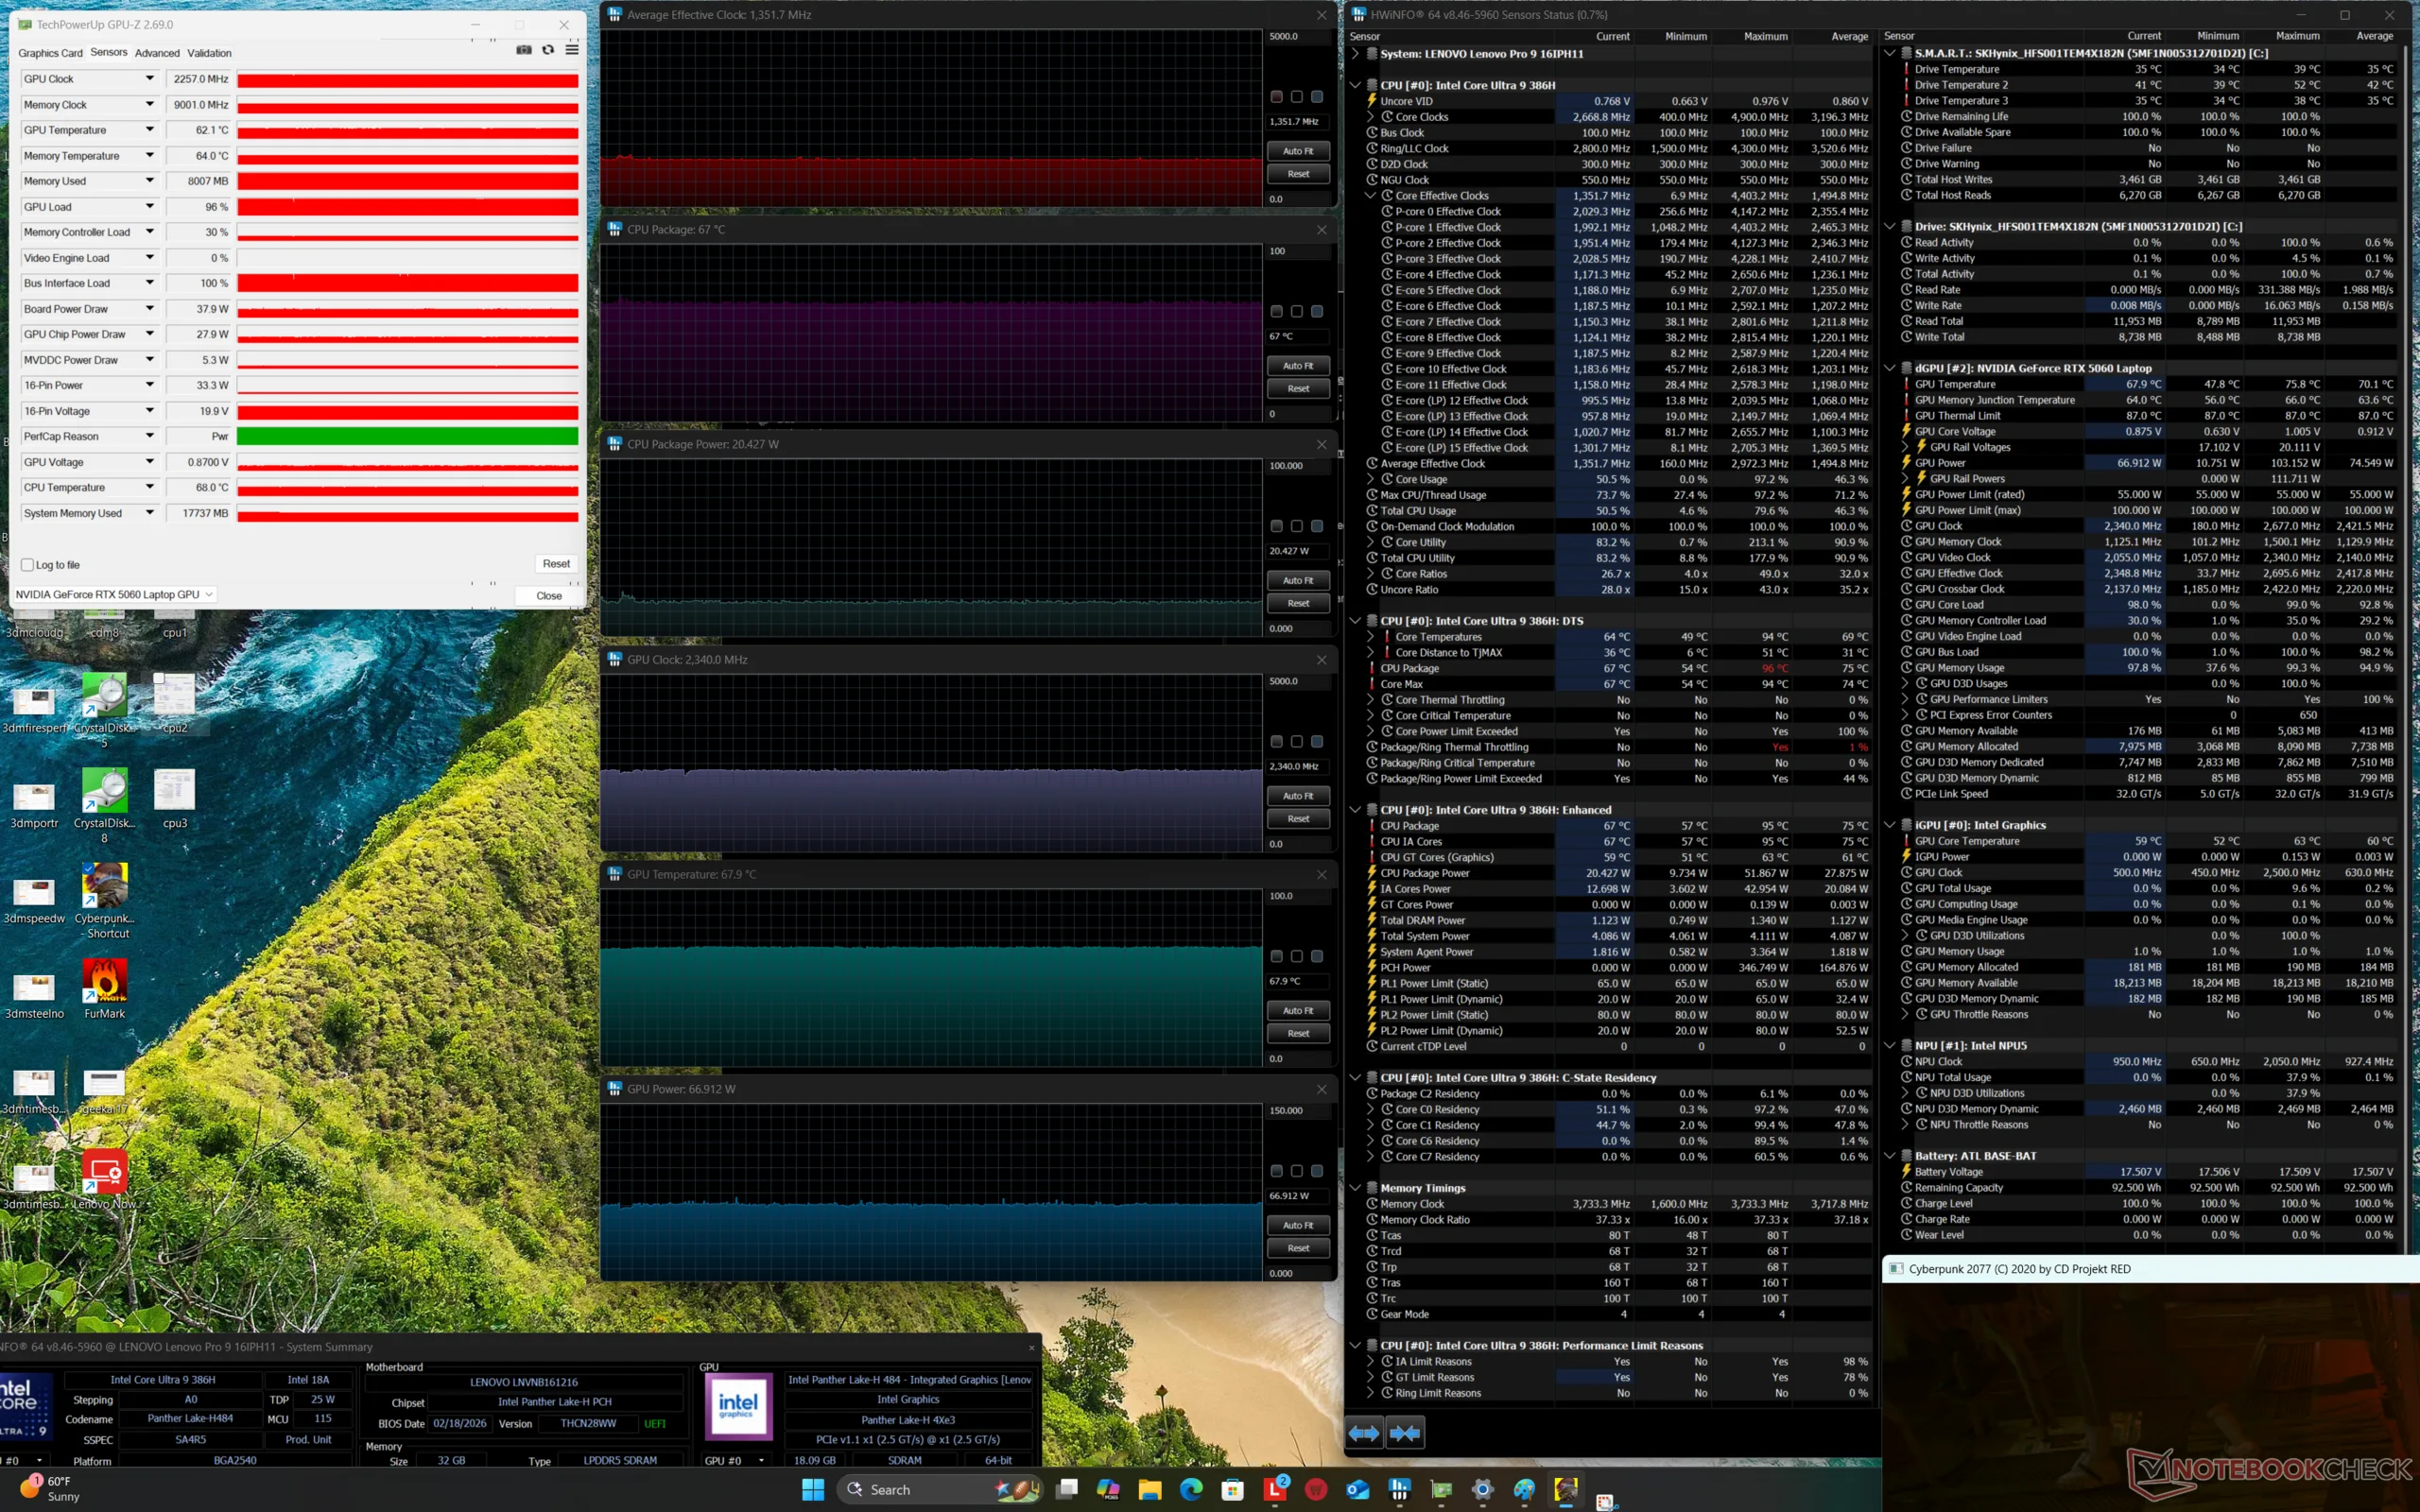
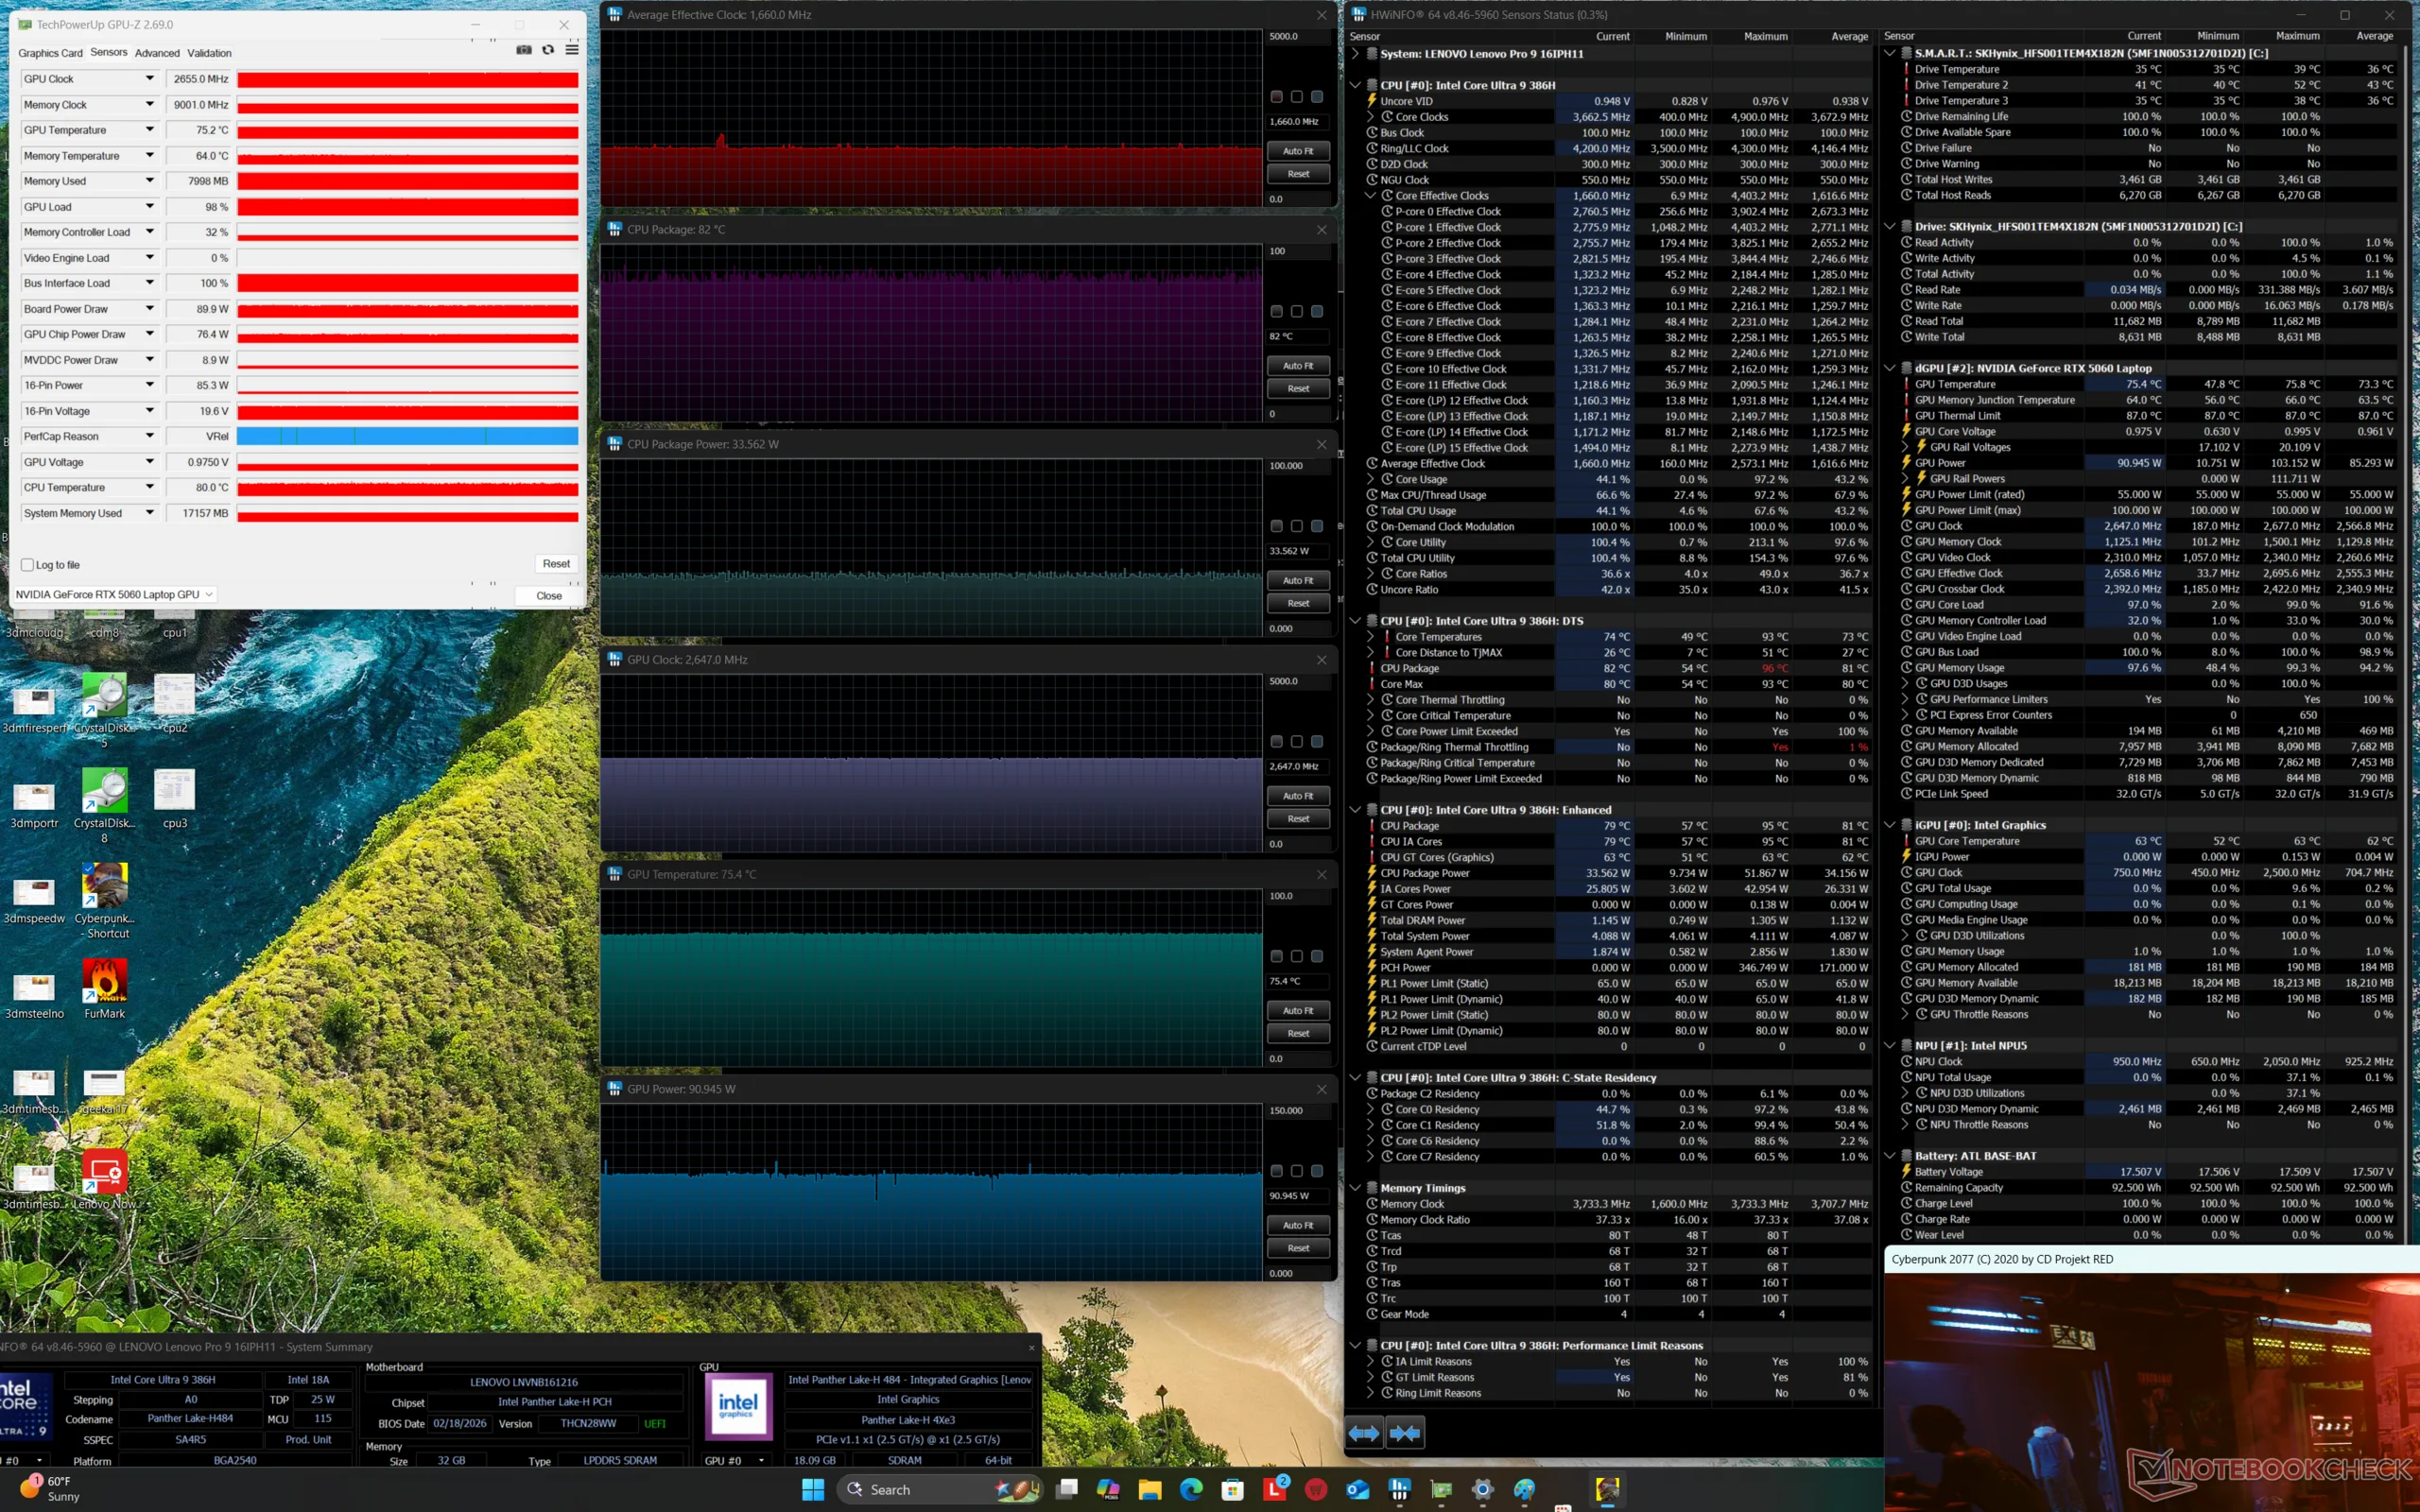
| Gemiddelde CPU-klok (GHz) | GPU-klok (MHz) | Gemiddelde CPU-temperatuur (°C) | Gemiddelde GPU-temperatuur (°C) | |
| Systeem inactief | -- | 232 | 41 | 36 |
| Prime95 Stress | 3.0 | -- | 90 | 49 |
| Prime95 + FurMark Stress | 2.4 | 2115 | 77 | 72 |
| Cyberpunk 2077 Stress (evenwichtige modus) | 1.4 | 2340 | 67 | 68 |
| Cyberpunk 2077 Stress (Prestatiemodus) | 1.7 | 2647 | 82 | 75 |
Luidsprekers
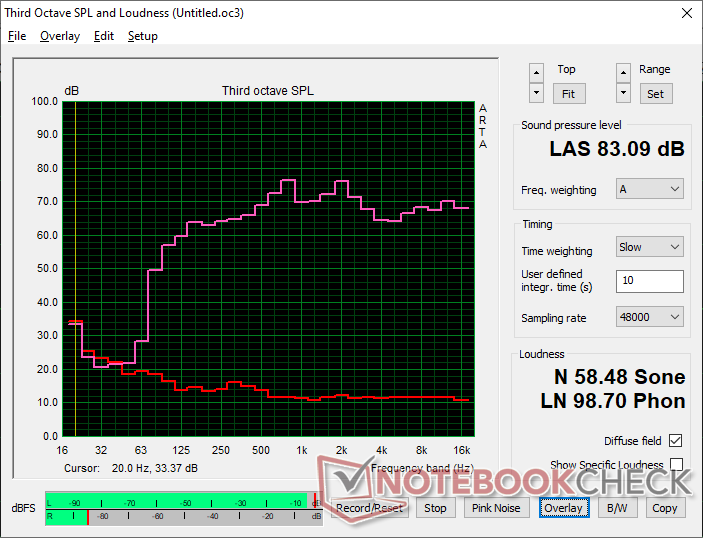
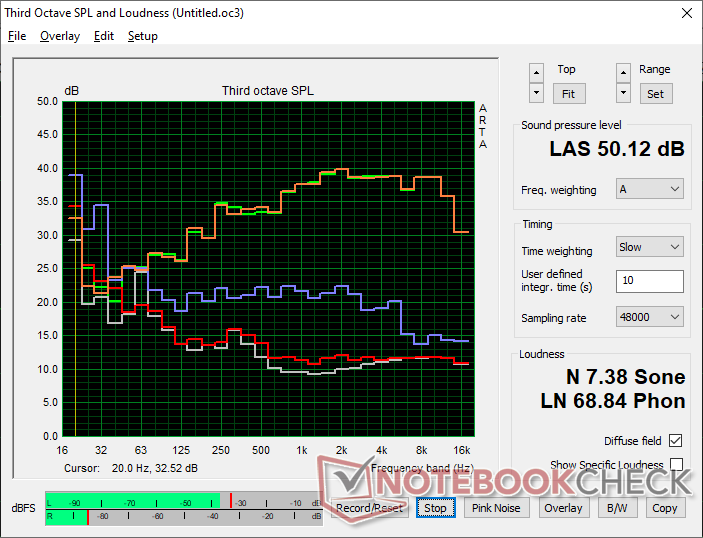
Lenovo Pro 9 16IPH11 audioanalyse
(+) | luidsprekers kunnen relatief luid spelen (83.1 dB)
Bas 100 - 315 Hz
(±) | verminderde zeebaars - gemiddeld 5.7% lager dan de mediaan
(+) | de lage tonen zijn lineair (5.1% delta naar de vorige frequentie)
Midden 400 - 2000 Hz
(+) | evenwichtige middens - slechts 4.2% verwijderd van de mediaan
(+) | de middentonen zijn lineair (5.4% delta ten opzichte van de vorige frequentie)
Hoog 2 - 16 kHz
(+) | evenwichtige hoogtepunten - slechts 1.8% verwijderd van de mediaan
(+) | de hoge tonen zijn lineair (4.4% delta naar de vorige frequentie)
Algemeen 100 - 16.000 Hz
(+) | het totale geluid is lineair (7.7% verschil met de mediaan)
Vergeleken met dezelfde klasse
» 6% van alle geteste apparaten in deze klasse waren beter, 2% vergelijkbaar, 91% slechter
» De beste had een delta van 5%, het gemiddelde was 17%, de slechtste was 45%
Vergeleken met alle geteste toestellen
» 1% van alle geteste apparaten waren beter, 0% gelijk, 98% slechter
» De beste had een delta van 4%, het gemiddelde was 23%, de slechtste was 134%
Apple MacBook Pro 16 2021 M1 Pro audioanalyse
(+) | luidsprekers kunnen relatief luid spelen (84.7 dB)
Bas 100 - 315 Hz
(+) | goede baars - slechts 3.8% verwijderd van de mediaan
(+) | de lage tonen zijn lineair (5.2% delta naar de vorige frequentie)
Midden 400 - 2000 Hz
(+) | evenwichtige middens - slechts 1.3% verwijderd van de mediaan
(+) | de middentonen zijn lineair (2.1% delta ten opzichte van de vorige frequentie)
Hoog 2 - 16 kHz
(+) | evenwichtige hoogtepunten - slechts 1.9% verwijderd van de mediaan
(+) | de hoge tonen zijn lineair (2.7% delta naar de vorige frequentie)
Algemeen 100 - 16.000 Hz
(+) | het totale geluid is lineair (4.6% verschil met de mediaan)
Vergeleken met dezelfde klasse
» 0% van alle geteste apparaten in deze klasse waren beter, 0% vergelijkbaar, 100% slechter
» De beste had een delta van 5%, het gemiddelde was 17%, de slechtste was 45%
Vergeleken met alle geteste toestellen
» 0% van alle geteste apparaten waren beter, 0% gelijk, 100% slechter
» De beste had een delta van 4%, het gemiddelde was 23%, de slechtste was 134%
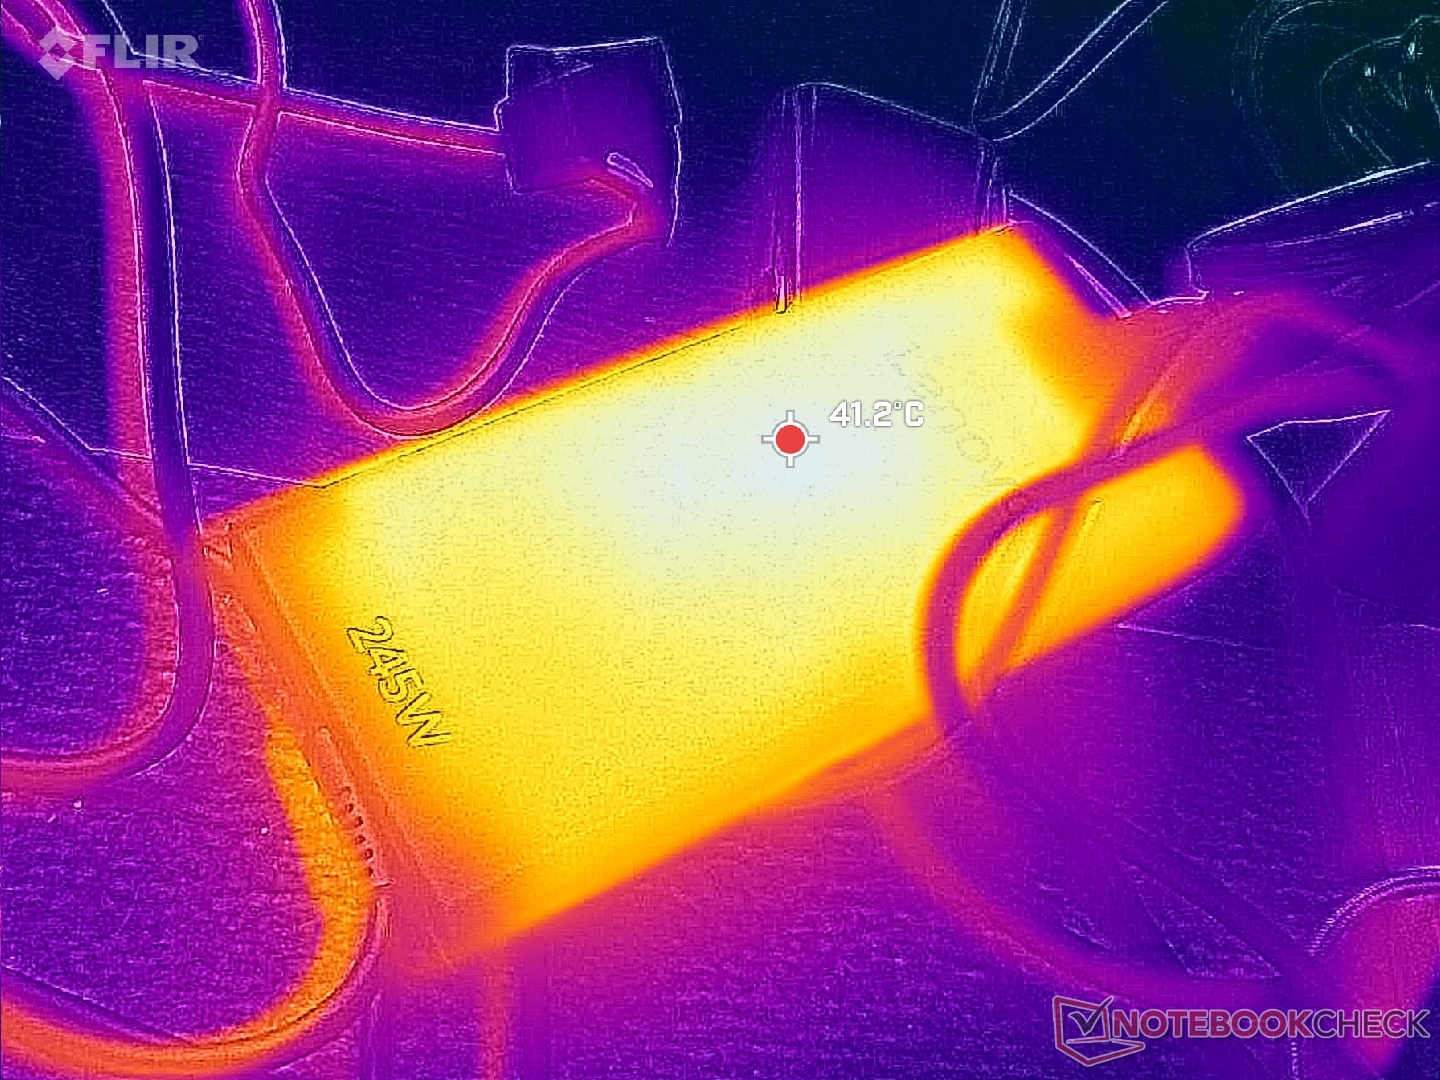
Energiebeheer
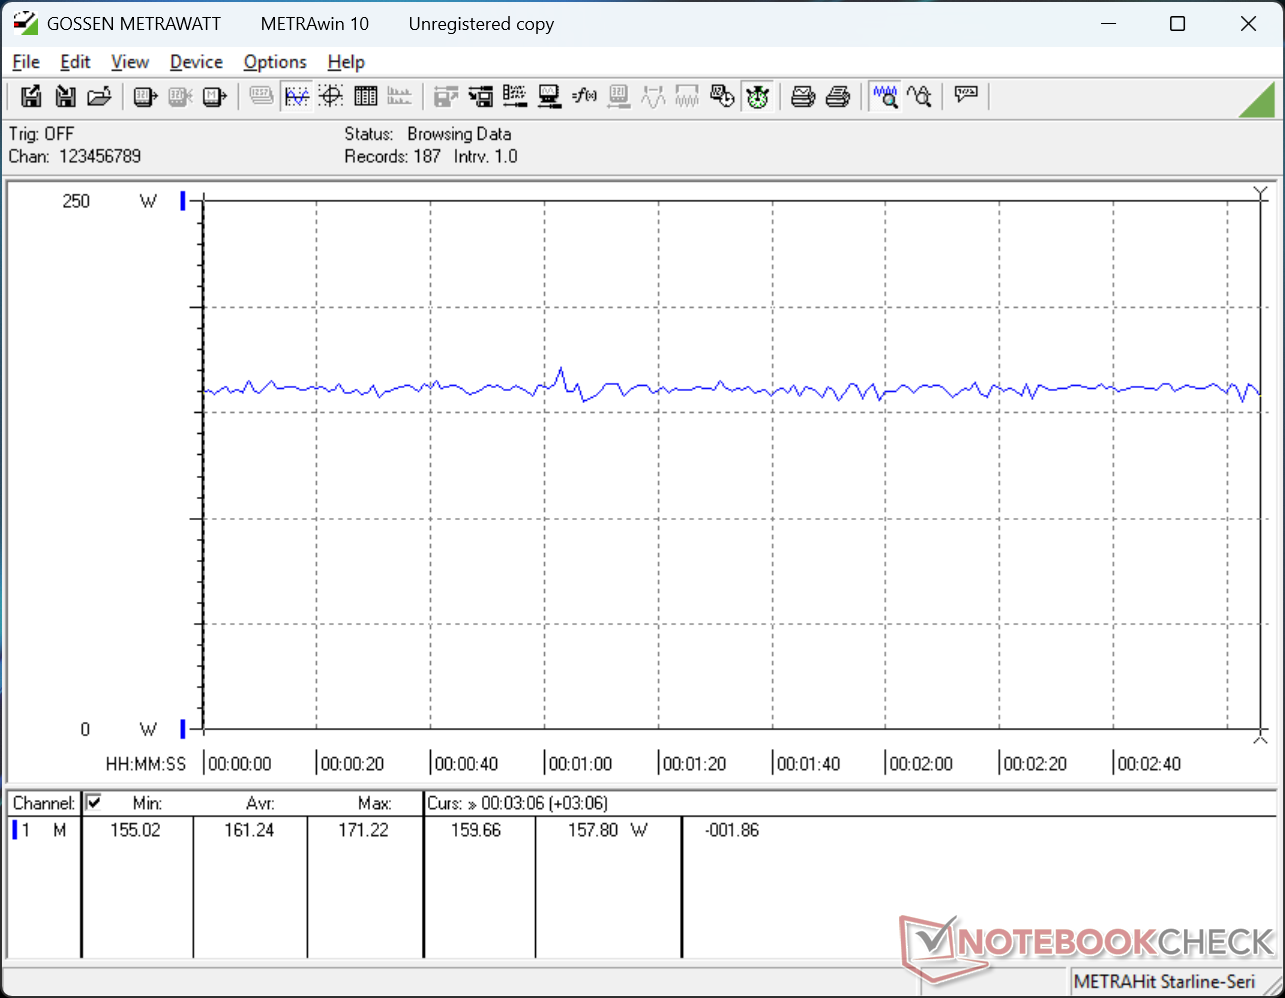
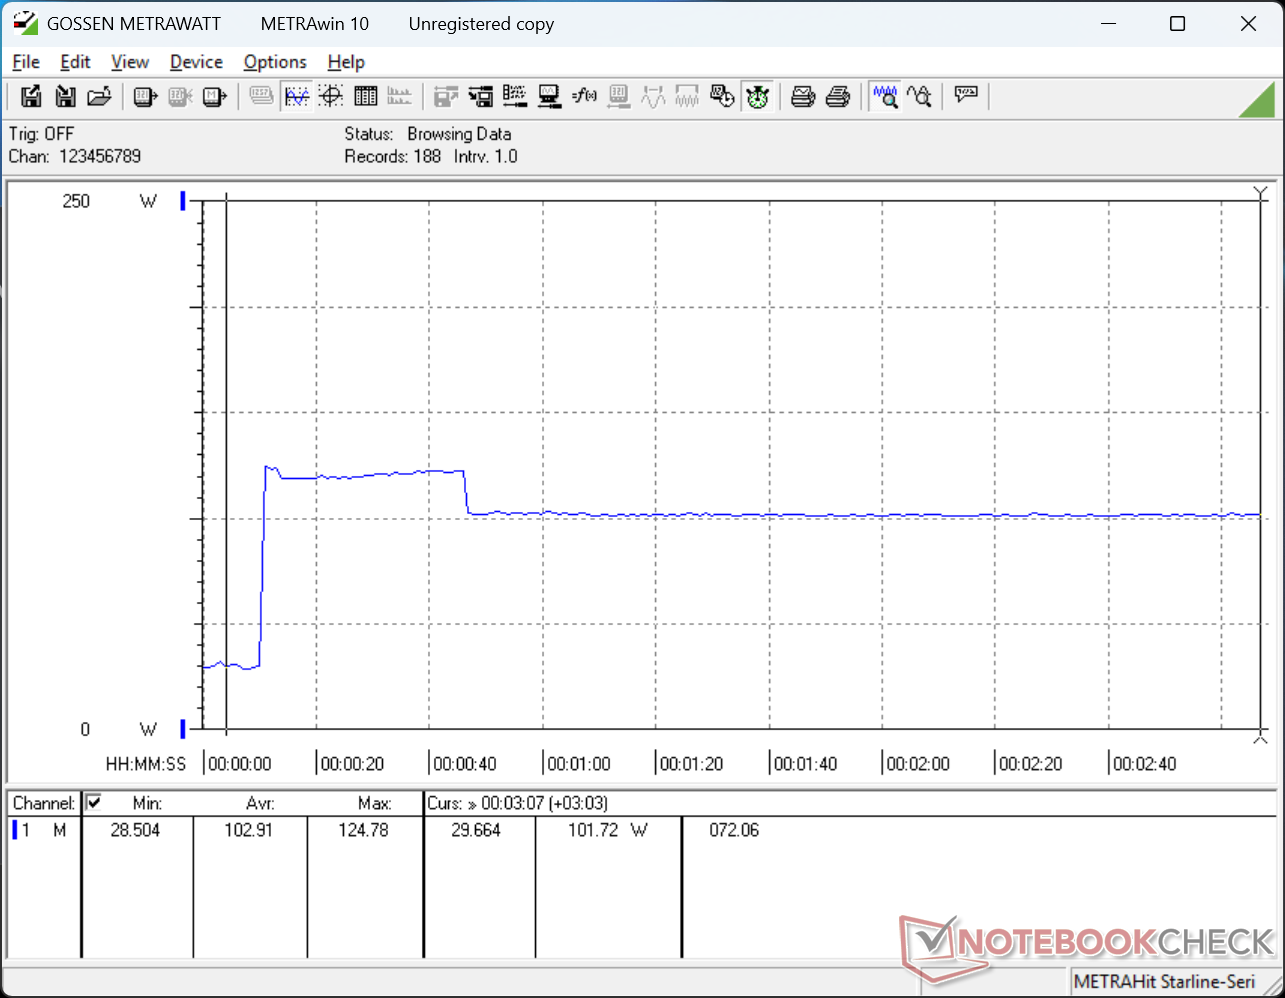
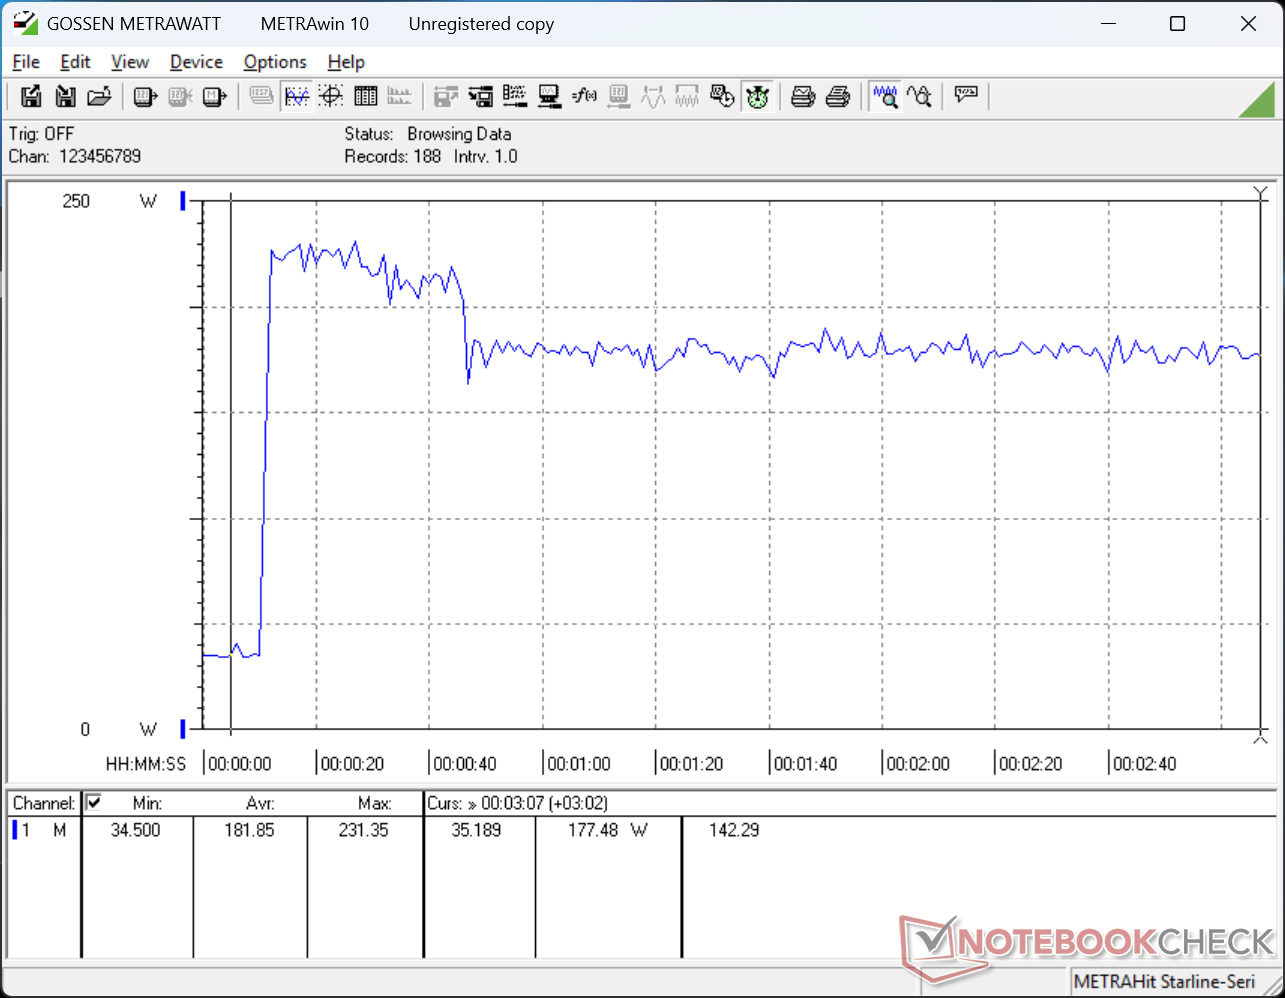
Stroomverbruik
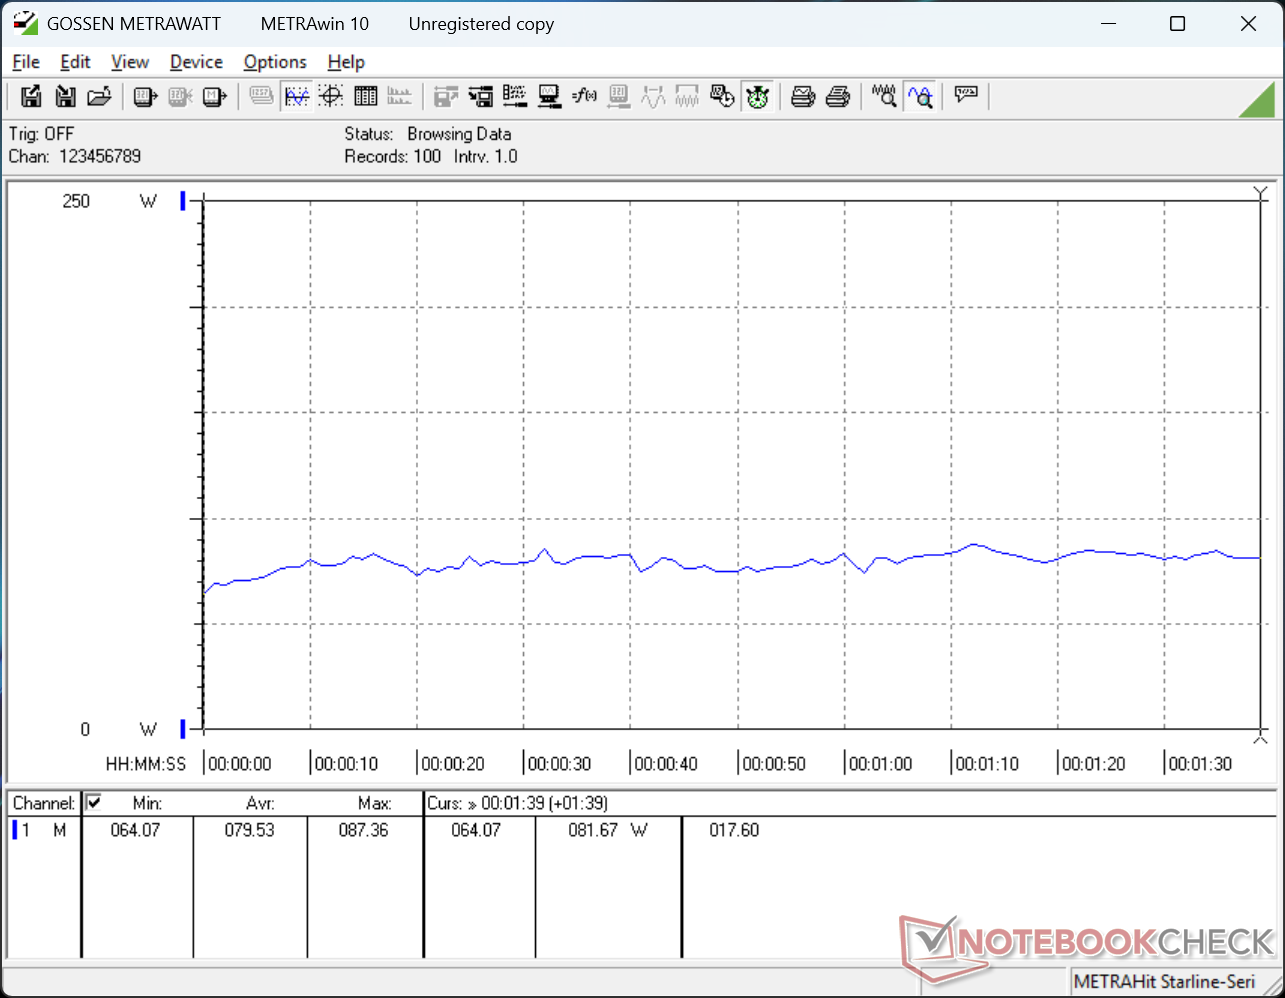
Het Lenovo systeem is een zeer veeleisende machine met een hoog minimum van 15 W, zelfs op de zwakste helderheidsinstelling met Optimus actief, tot 46 W op de helderste instelling met de dGPU actief. Bij het uitvoeren van hogere belastingen, zoals games, verbruikte ons apparaat net zoveel stroom als de Asus ProArt P16 die is uitgerust met de snellere Ryzen AI 9 HX 370 CPU en RTX 5070 GPU.
| Uit / Standby | |
| Inactief | |
| Belasting |
|
Key:
min: | |
| Lenovo Pro 9 16IPH11 Ultra 9 386H, GeForce RTX 5060 Laptop, SK hynix PVC10 HFS001TEM4X182N, Tandem OLED, 3200x2000, 16" | Lenovo Yoga Pro 9 16IAH10 RTX 5050 Ultra 9 285H, GeForce RTX 5050 Laptop, WD PC SN7100S SDFPMSL-1T00-1101, OLED, 2880x1800, 16" | Dell XPS 16 Core Ultra X7 358H Ultra X7 358H, Arc B390 Panther Lake iGPU, , OLED, 3200x2000, 16" | MSI Prestige 16 AI Evo B2HMG Ultra 9 285H, Arc 140T, Micron 2500 1TB MTFDKBA1T0QGN, IPS, 2560x1600, 16" | HP Omen Transcend 16-u1095ng i9-14900HX, GeForce RTX 4070 Laptop GPU, Kioxia XG8 KXG80ZNV1T02, OLED, 2560x1600, 16" | Asus ProArt P16 H7606WP Ryzen AI 9 HX 370, GeForce RTX 5070 Laptop, WD PC SN740 SDDPNQE-2T00, OLED, 2880x1800, 16" | |
|---|---|---|---|---|---|---|
| Power Consumption | 25% | 66% | 58% | 8% | 20% | |
| Idle Minimum * (Watt) | 15.1 | 6.8 55% | 4 74% | 4.4 71% | 10 34% | 9.9 34% |
| Idle Average * (Watt) | 30.4 | 20.1 34% | 4.4 86% | 9.2 70% | 18 41% | 13.6 55% |
| Idle Maximum * (Watt) | 46.2 | 21.6 53% | 10.2 78% | 9.5 79% | 32 31% | 14 70% |
| Load Average * (Watt) | 79.5 | 87.6 -10% | 44.2 44% | 66.9 16% | 128 -61% | 93.8 -18% |
| Cyberpunk 2077 ultra * (Watt) | 161.2 | 148.2 8% | 62.6 61% | 68.8 57% | 162.1 -1% | |
| Cyberpunk 2077 ultra external monitor * (Watt) | 160.7 | 147.9 8% | 62.4 61% | 67.4 58% | 158.3 1% | |
| Load Maximum * (Watt) | 231.4 | 173.5 25% | 94.6 59% | 102.9 56% | 242 -5% | 229 1% |
| Witcher 3 ultra * (Watt) | 148.4 |
* ... kleiner is beter
Stroomverbruik Cyberpunk / Stresstest
Stroomverbruik externe monitor
Levensduur batterij
De looptijden zijn relatief kort, zelfs wanneer deze zijn ingesteld op de gebalanceerde modus met de iGPU actief. De relatief grote 93 Wh-batterij kan slechts 5,5 uur WLAN-browsen aan voordat deze automatisch wordt uitgeschakeld, wat enkele uren korter is dan veel andere multimediamodellen, waaronder Lenovo's eigen Yoga Pro 9i 16IAH G10 Aura.
(Update van 3 mei 2026: De accuduur van Wi-Fi-webbrowsing is opnieuw getest met de helderheid van het beeldscherm ingesteld op 150 nits, een vaste vernieuwingsfrequentie van 60 Hz en Nvidia graphics ingesteld op Automatisch. De resultaten komen met ~10 uur dichter in de buurt van de Yoga Pro 9i 16IAH G10 Aura van vorig jaar. De eindscore is ook bijgewerkt om de langere gebruiksduur weer te geven)
| Lenovo Pro 9 16IPH11 Ultra 9 386H, GeForce RTX 5060 Laptop, 92.5 Wh | Lenovo Yoga Pro 9 16IAH10 RTX 5050 Ultra 9 285H, GeForce RTX 5050 Laptop, 84 Wh | Dell XPS 16 Core Ultra X7 358H Ultra X7 358H, Arc B390 Panther Lake iGPU, 70 Wh | MSI Prestige 16 AI Evo B2HMG Ultra 9 285H, Arc 140T, 99.9 Wh | HP Omen Transcend 16-u1095ng i9-14900HX, GeForce RTX 4070 Laptop GPU, 97 Wh | Asus ProArt P16 H7606WP Ryzen AI 9 HX 370, GeForce RTX 5070 Laptop, 90 Wh | |
|---|---|---|---|---|---|---|
| Batterijduur | 8% | 4% | 67% | -51% | -7% | |
| WiFi v1.3 (h) | 9.9 | 10.7 8% | 10.3 4% | 16.5 67% | 4.9 -51% | 9.2 -7% |
| H.264 (h) | 20.8 | |||||
| Load (h) | 2.4 |
Notebookcheck Beoordeling
Een high-end multimediamachine boordevol prestaties en een superhelder OLED-touchscreen, maar met een korte batterijlevensduur.
Lenovo Pro 9 16IPH11
- 03-05-2026 v8
Allen Ngo
 Total Sustainability Score:
 Potentiële concurrenten in vergelijking
Afbeelding | Model / recensie | prijs | Gewicht | Hoogte | Scherm |
|---|---|---|---|---|---|
1. 91%  | Lenovo Pro 9 16IPH11 Intel Core Ultra 9 386H ⎘ NVIDIA GeForce RTX 5060 Laptop ⎘ 32 GB Geheugen, 1024 GB SSD | Amazon: Catalogusprijs: 3100 USD | 1.9 kg | 17.3 mm | 16.00" 3200x2000 236 PPI Tandem OLED |
2. 88.8%  | Lenovo Yoga Pro 9 16IAH10 RTX 5050 Intel Core Ultra 9 285H ⎘ NVIDIA GeForce RTX 5050 Laptop ⎘ 32 GB Geheugen, 1024 GB SSD | Amazon: Catalogusprijs: 1800 USD | 2 kg | 17.9 mm | 16.00" 2880x1800 212 PPI OLED |
3. 87.2%  | Dell XPS 16 Core Ultra X7 358H Intel Core Ultra X7 358H ⎘ Intel Arc B390 12 Xe3 Panther Lake iGPU ⎘ 32 GB Geheugen | Amazon: 1. $1,977.99 Dell Premium 16 (Previously ... 2. $2,399.99 Dell Premium 16 (Previously ... 3. $2,595.99 Dell Premium 16 (XPS 16 2025... Catalogusprijs: 2350 USD | 1.7 kg | 14.62 mm | 16.00" 3200x2000 236 PPI OLED |
4. 82.8%  | MSI Prestige 16 AI Evo B2HMG Intel Core Ultra 9 285H ⎘ Intel Arc Graphics 140T ⎘ 32 GB Geheugen, 1024 GB SSD | Amazon: 1. $1,149.49 msi Prestige 13 AI Evo Lapto... 2. $2,299.00 msi Prestige 16 Intel Evo AI... 3. $2,599.00 msi Prestige 16 AI Evo Busin... | 1.6 kg | 18.95 mm | 16.00" 2560x1600 189 PPI IPS |
5. 88.4% v7 (old)  | HP Omen Transcend 16-u1095ng Intel Core i9-14900HX ⎘ NVIDIA GeForce RTX 4070 Laptop GPU ⎘ 32 GB Geheugen, 1024 GB SSD | Amazon: Catalogusprijs: 3000 EUR | 2.3 kg | 20 mm | 16.00" 2560x1600 189 PPI OLED |
6. 89.1%  | Asus ProArt P16 H7606WP AMD Ryzen AI 9 HX 370 ⎘ NVIDIA GeForce RTX 5070 Laptop ⎘ 64 GB Geheugen, 2048 GB SSD | Amazon: 1. $4,599.00 HIDevolution [2025] ASUS Pro... 2. $4,924.00 HIDevolution [2025] ASUS Pro... 3. $5,649.00 HIDevolution [2025] ASUS Pro... Catalogusprijs: 3399€ | 1.8 kg | 17.3 mm | 16.00" 2880x1800 212 PPI OLED |
Transparantie
De selectie van te beoordelen apparaten wordt gemaakt door onze redactie. Het testexemplaar werd ten behoeve van deze beoordeling door de fabrikant of detailhandelaar in bruikleen aan de auteur verstrekt. De kredietverstrekker had geen invloed op deze recensie, noch ontving de fabrikant vóór publicatie een exemplaar van deze recensie. Er bestond geen verplichting om deze recensie te publiceren. Als onafhankelijk mediabedrijf is Notebookcheck niet onderworpen aan het gezag van fabrikanten, detailhandelaren of uitgevers.
[transparency_disclaimer]Dit is hoe Notebookcheck test
Elk jaar beoordeelt Notebookcheck onafhankelijk honderden laptops en smartphones met behulp van gestandaardiseerde procedures om ervoor te zorgen dat alle resultaten vergelijkbaar zijn. We hebben onze testmethoden al zo'n 20 jaar voortdurend ontwikkeld en daarbij de industriestandaard bepaald. In onze testlaboratoria wordt gebruik gemaakt van hoogwaardige meetapparatuur door ervaren technici en redacteuren. Deze tests omvatten een validatieproces in meerdere fasen. Ons complexe beoordelingssysteem is gebaseerd op honderden goed onderbouwde metingen en benchmarks, waardoor de objectiviteit behouden blijft. Meer informatie over onze testmethoden kunt u hier vinden.

