Verdict - Het absolute minimum voor op kantoor
Als instapmodel kantoorlaptop voldoet de MSI Venture 16 aan veel van de basisvereisten die voor deze categorie verwacht worden, waaronder eenvoudige onderhoudsmogelijkheden, een geïntegreerd numpad en een grijs, onopvallend ontwerp. Dankzij de relatief dikke bouw kan de Core-H CPU koeler draaien dan normaal, terwijl veel andere zakelijke budgetlaptops in plaats daarvan tragere Core-U of Core-V opties hebben. Alternatieven zoals de Dell 16 Plus of Lenovo ThinkPad E16 G3 zijn elk lichter en hebben meer schermopties dan onze MSI, maar ze worden ook geleverd met langzamere CPU's.
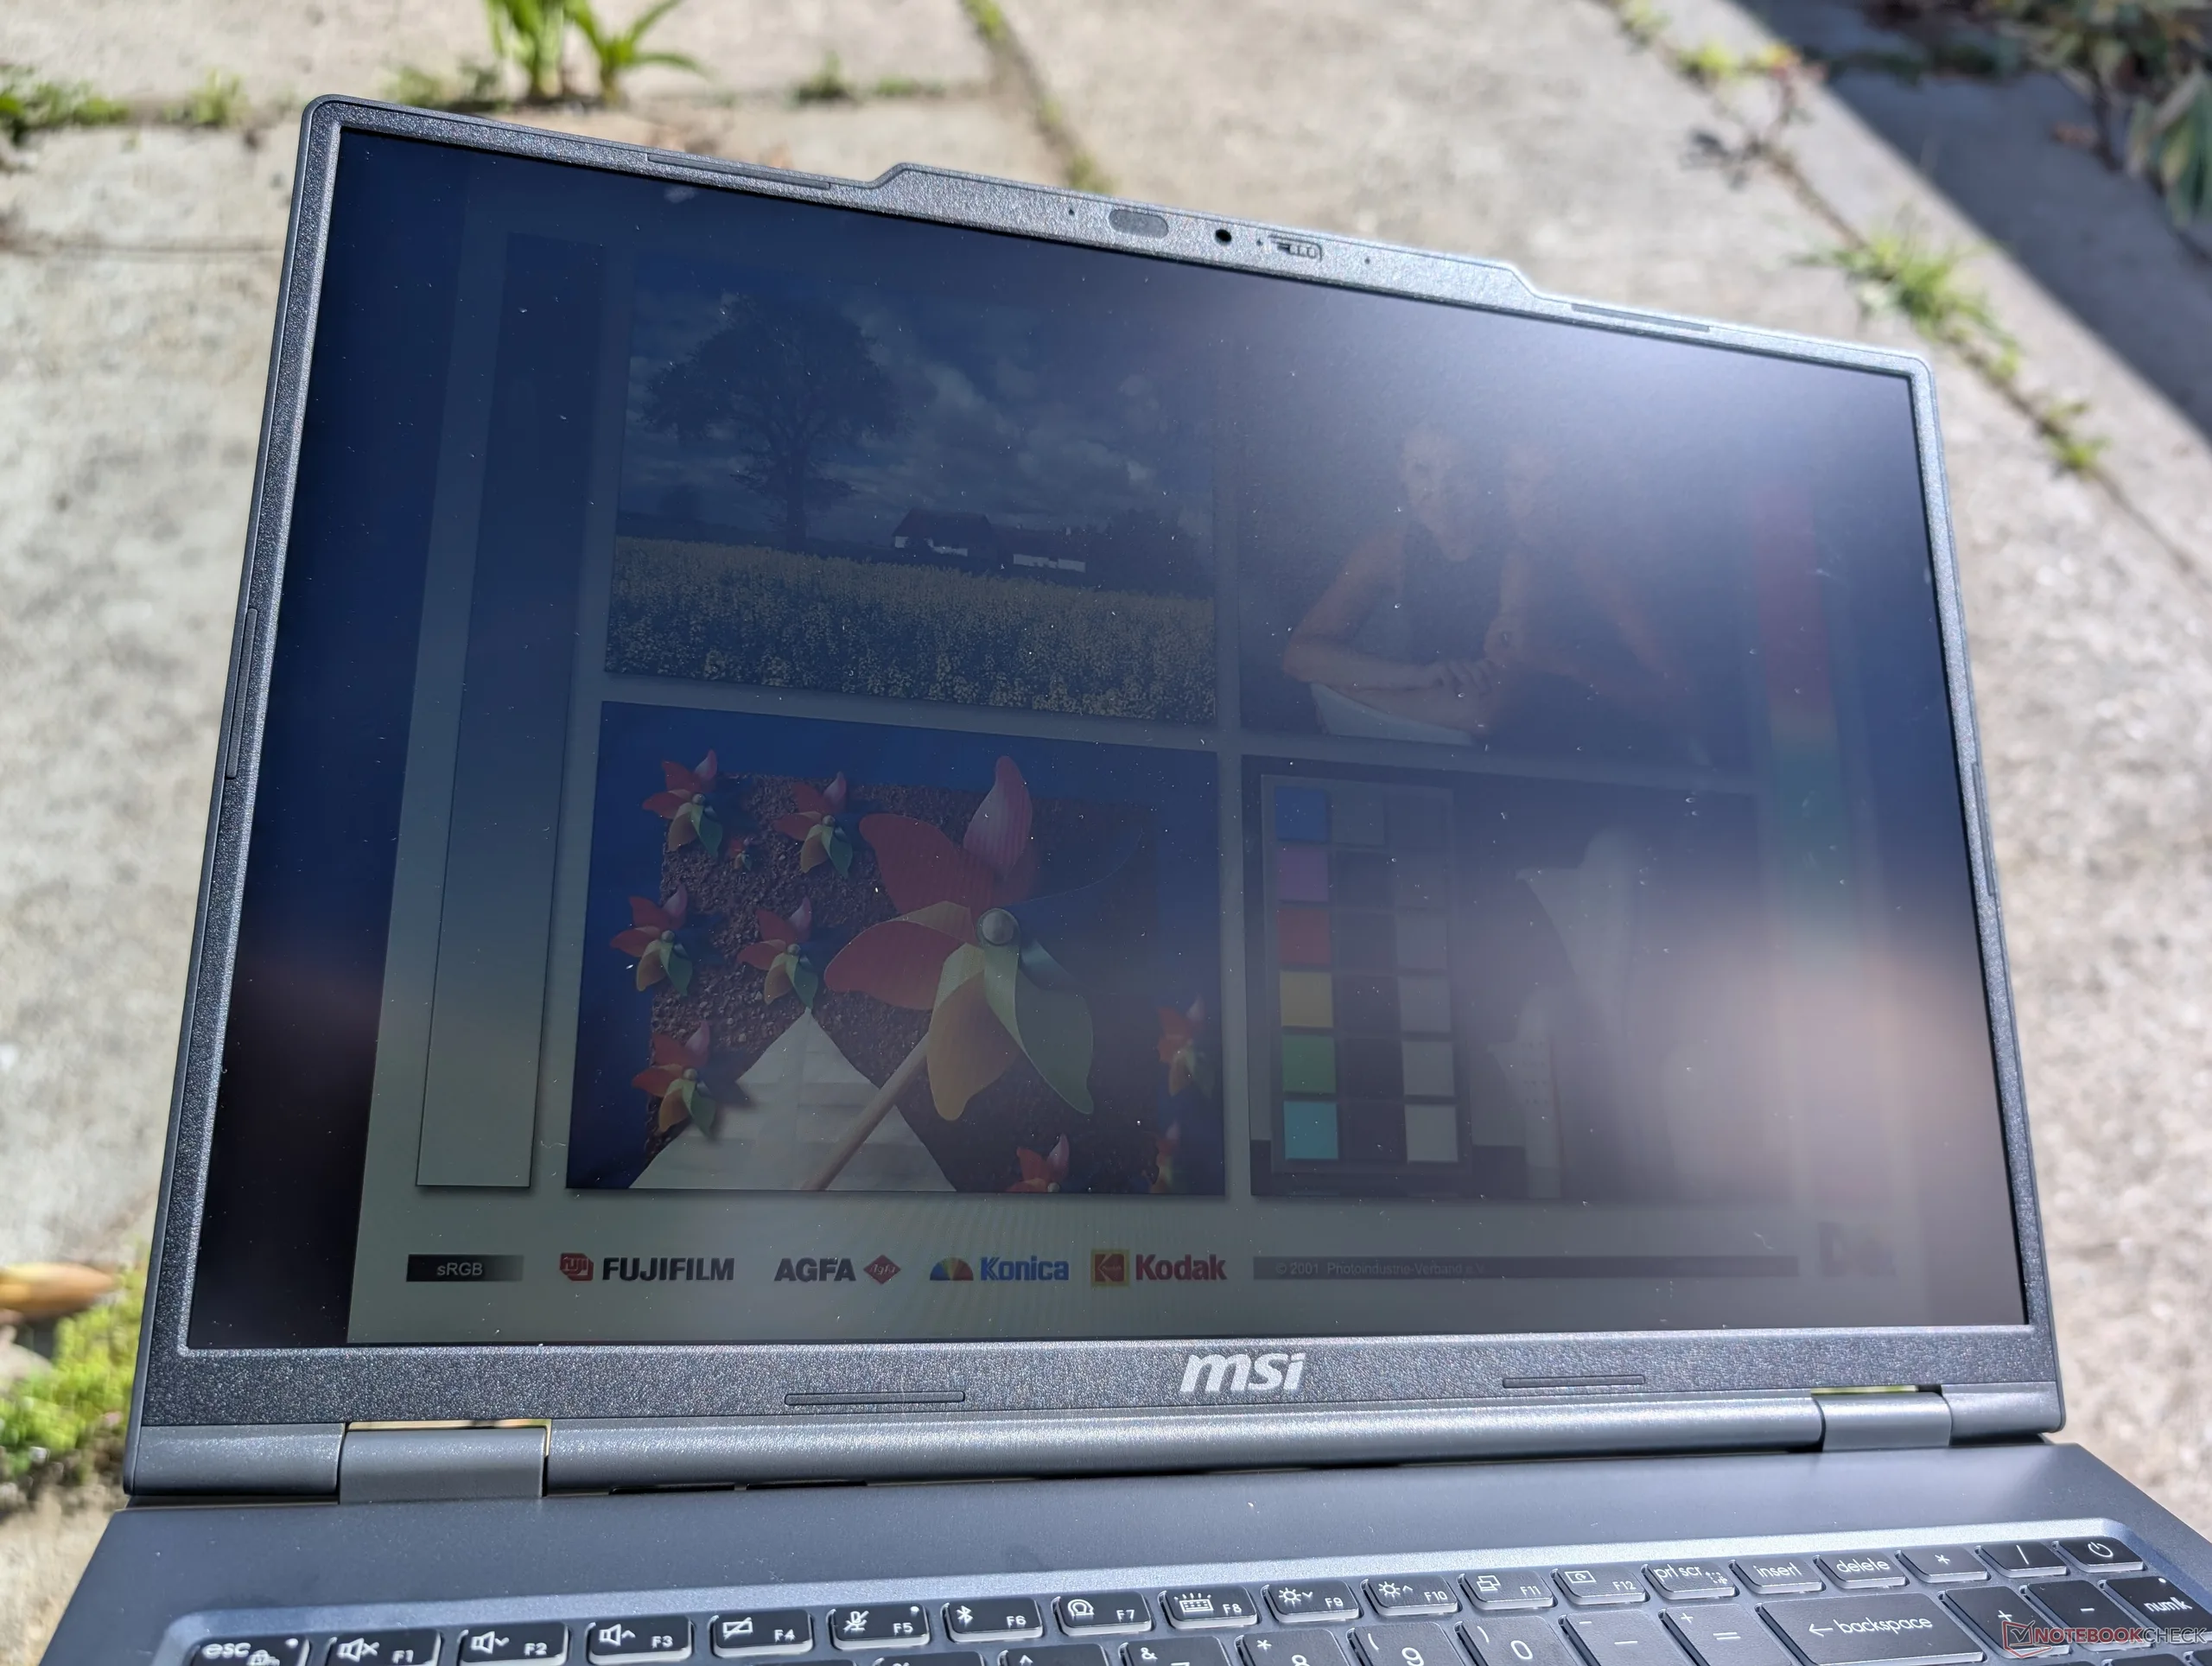
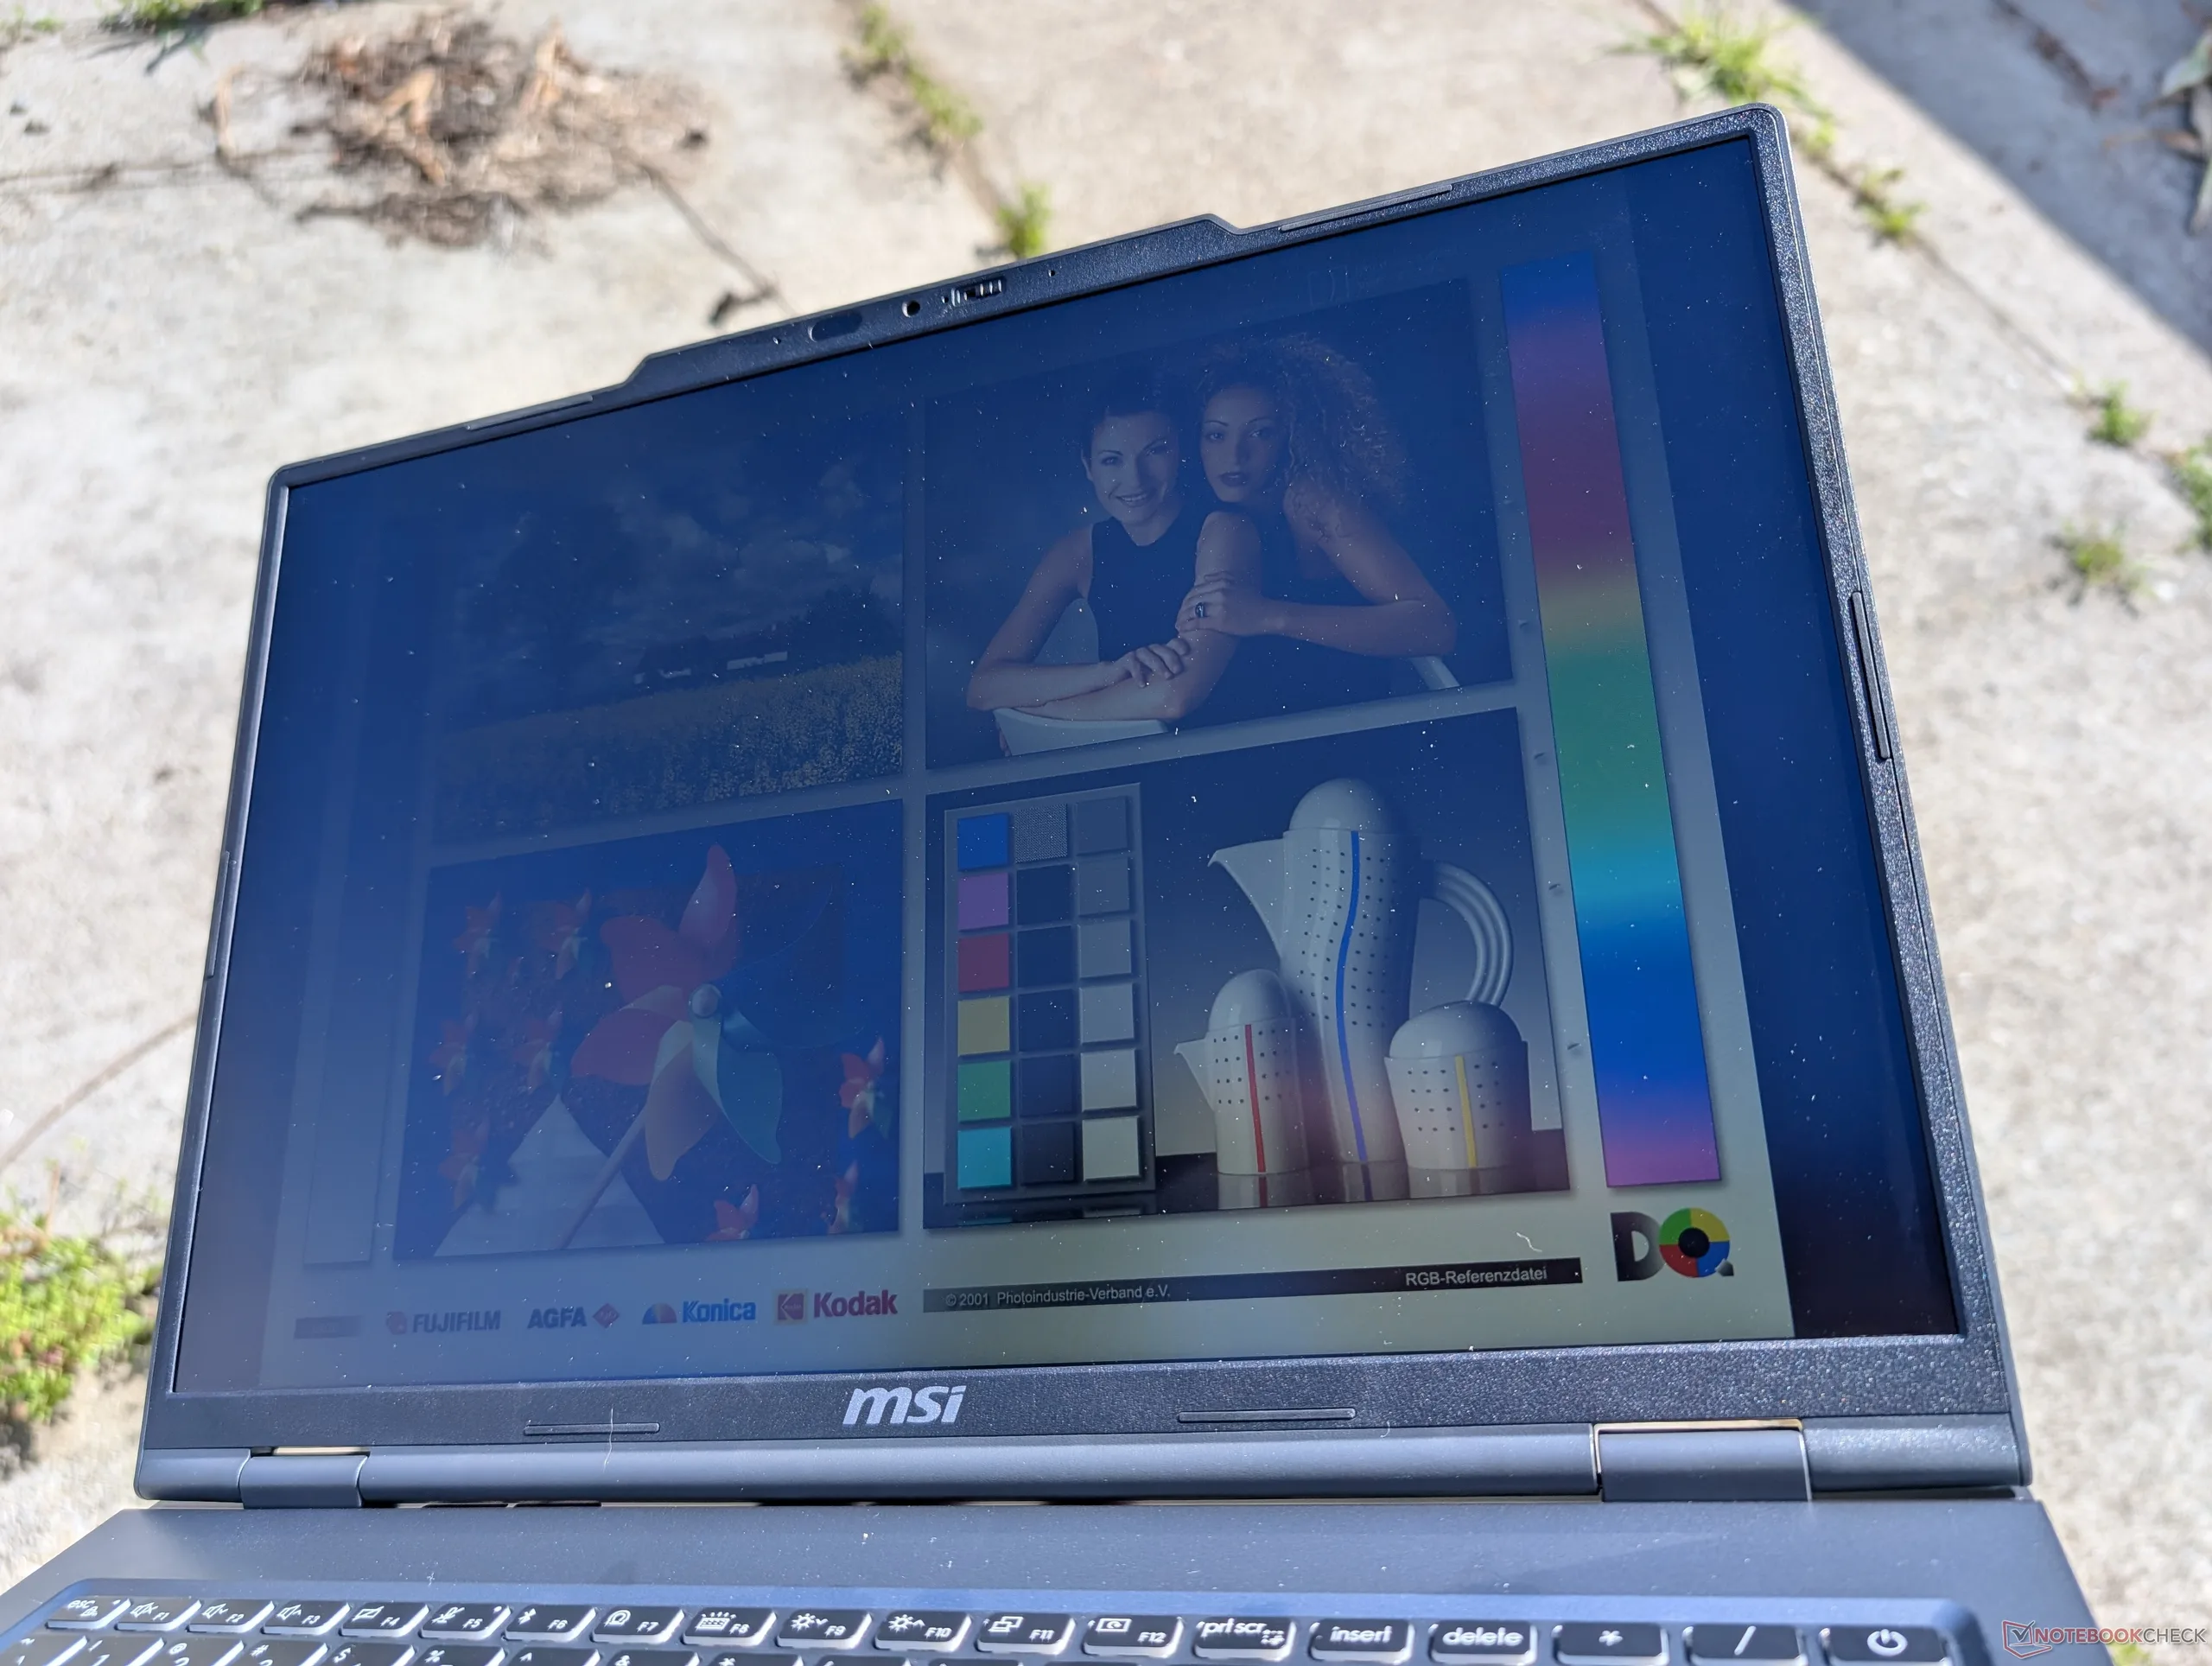
Aan de andere kant kunnen verschillende aspecten van de Venture 16 zelfs vanuit kantoorperspectief teleurstellend aanvoelen. Het relatief zware gewicht, de vreselijke 720p webcam, het gebruik van oudere AC-adapters en het ontbreken van meerdere USB-C poorten kunnen reizigers afschrikken die hun mobiele productiviteit willen verhogen. Bovendien zijn de kleuren op het basis IPS-scherm ongeschikt voor de meeste grafische bewerkingen en daarom raden wij aan om het veel betere OLED-scherm te overwegen, dat ongeveer $200 meer kost.
Pro
Contra
Prijs en beschikbaarheid
De MSI 16 AI met Core Ultra 7 255H, 1200p IPS aanraakscherm, 32 GB RAM en 512 GB SSD vindt u op Amazon voor $1030. Een vergelijkbare configuratie maar met OLED vindt u op Best Buy voor $1200.
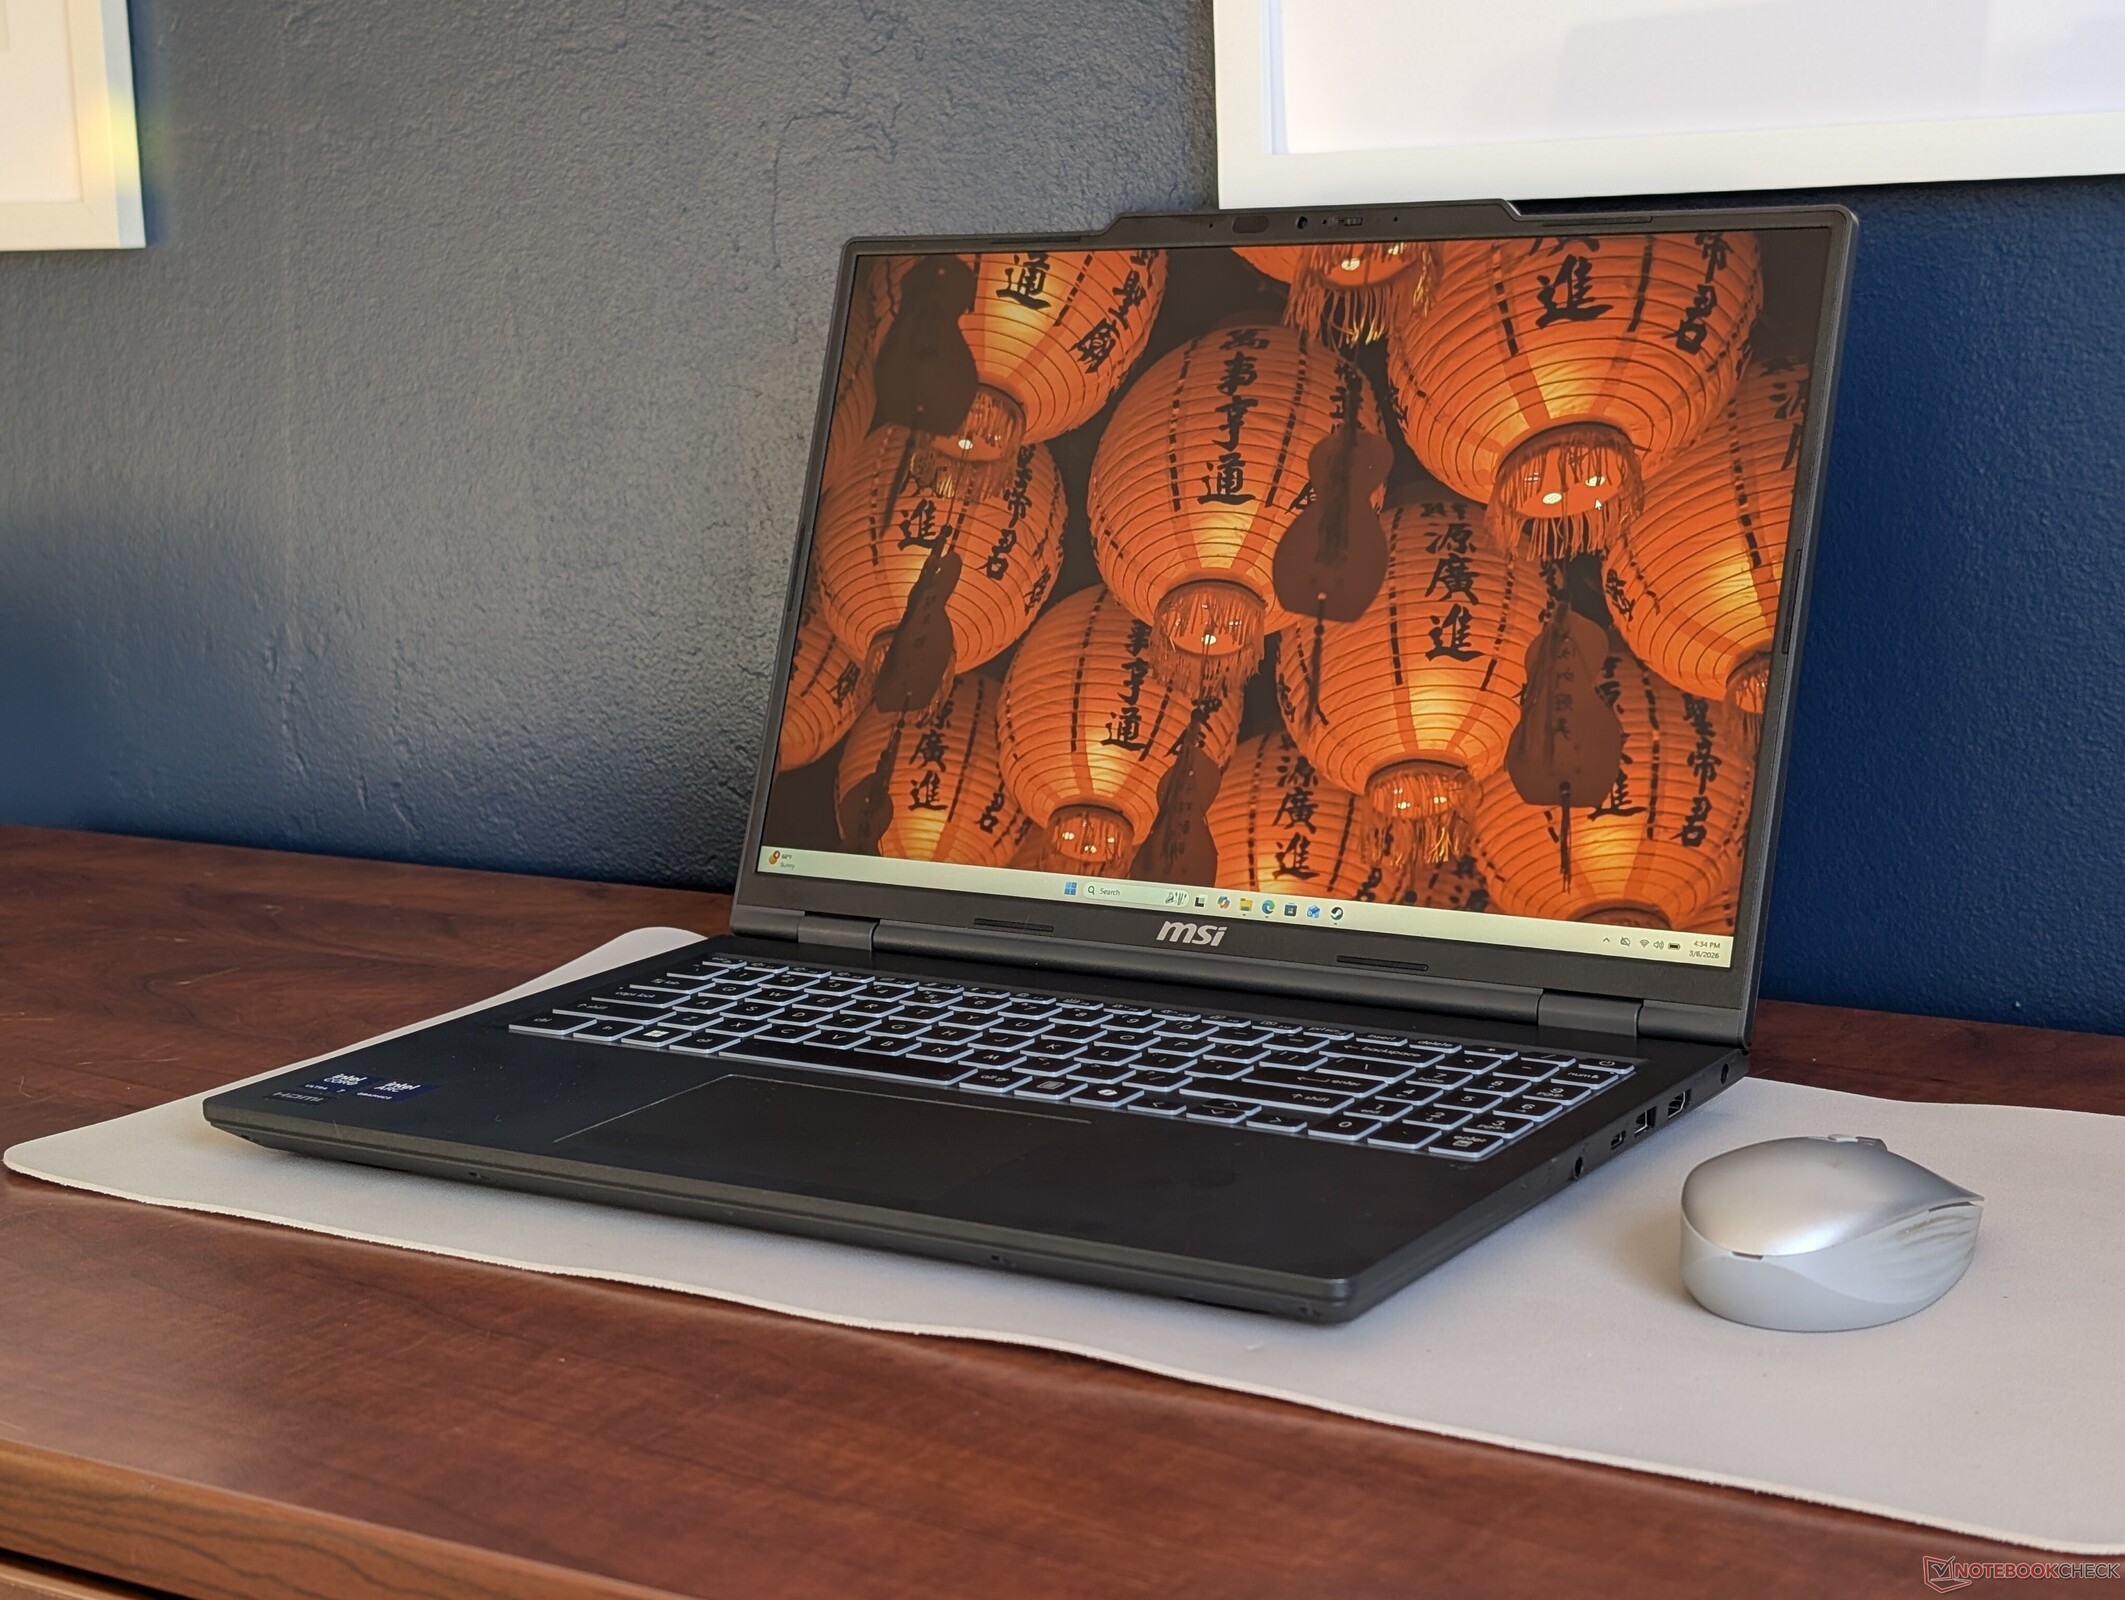
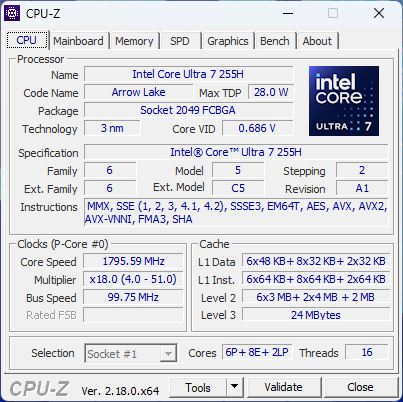
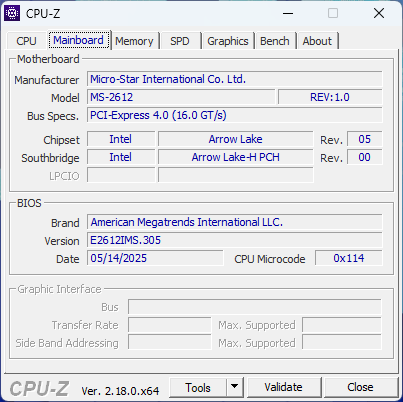
De Venture 16 is MSI's instapmodel kantoorlaptop, ontworpen als aanvulling op de duurdere Prestige-serie. Ons testexemplaar is uitgerust met de Arrow Lake-H Core Ultra 7 255H CPU en 1200p IPS-touchscreen voor een verkoopprijs van ongeveer 900 USD, terwijl configuraties in het hogere segment geleverd kunnen worden met de Core Ultra 9 285H en 1280p OLED-scherm.
Alternatieven voor de Venture 16 zijn andere budgetvriendelijke kantoorlaptops zoals de Dell Inspiron serie, HP ProBook of Pavilion serie, of de Lenovo ThinkPad E serie.
Meer MSI beoordelingen:
Specificaties
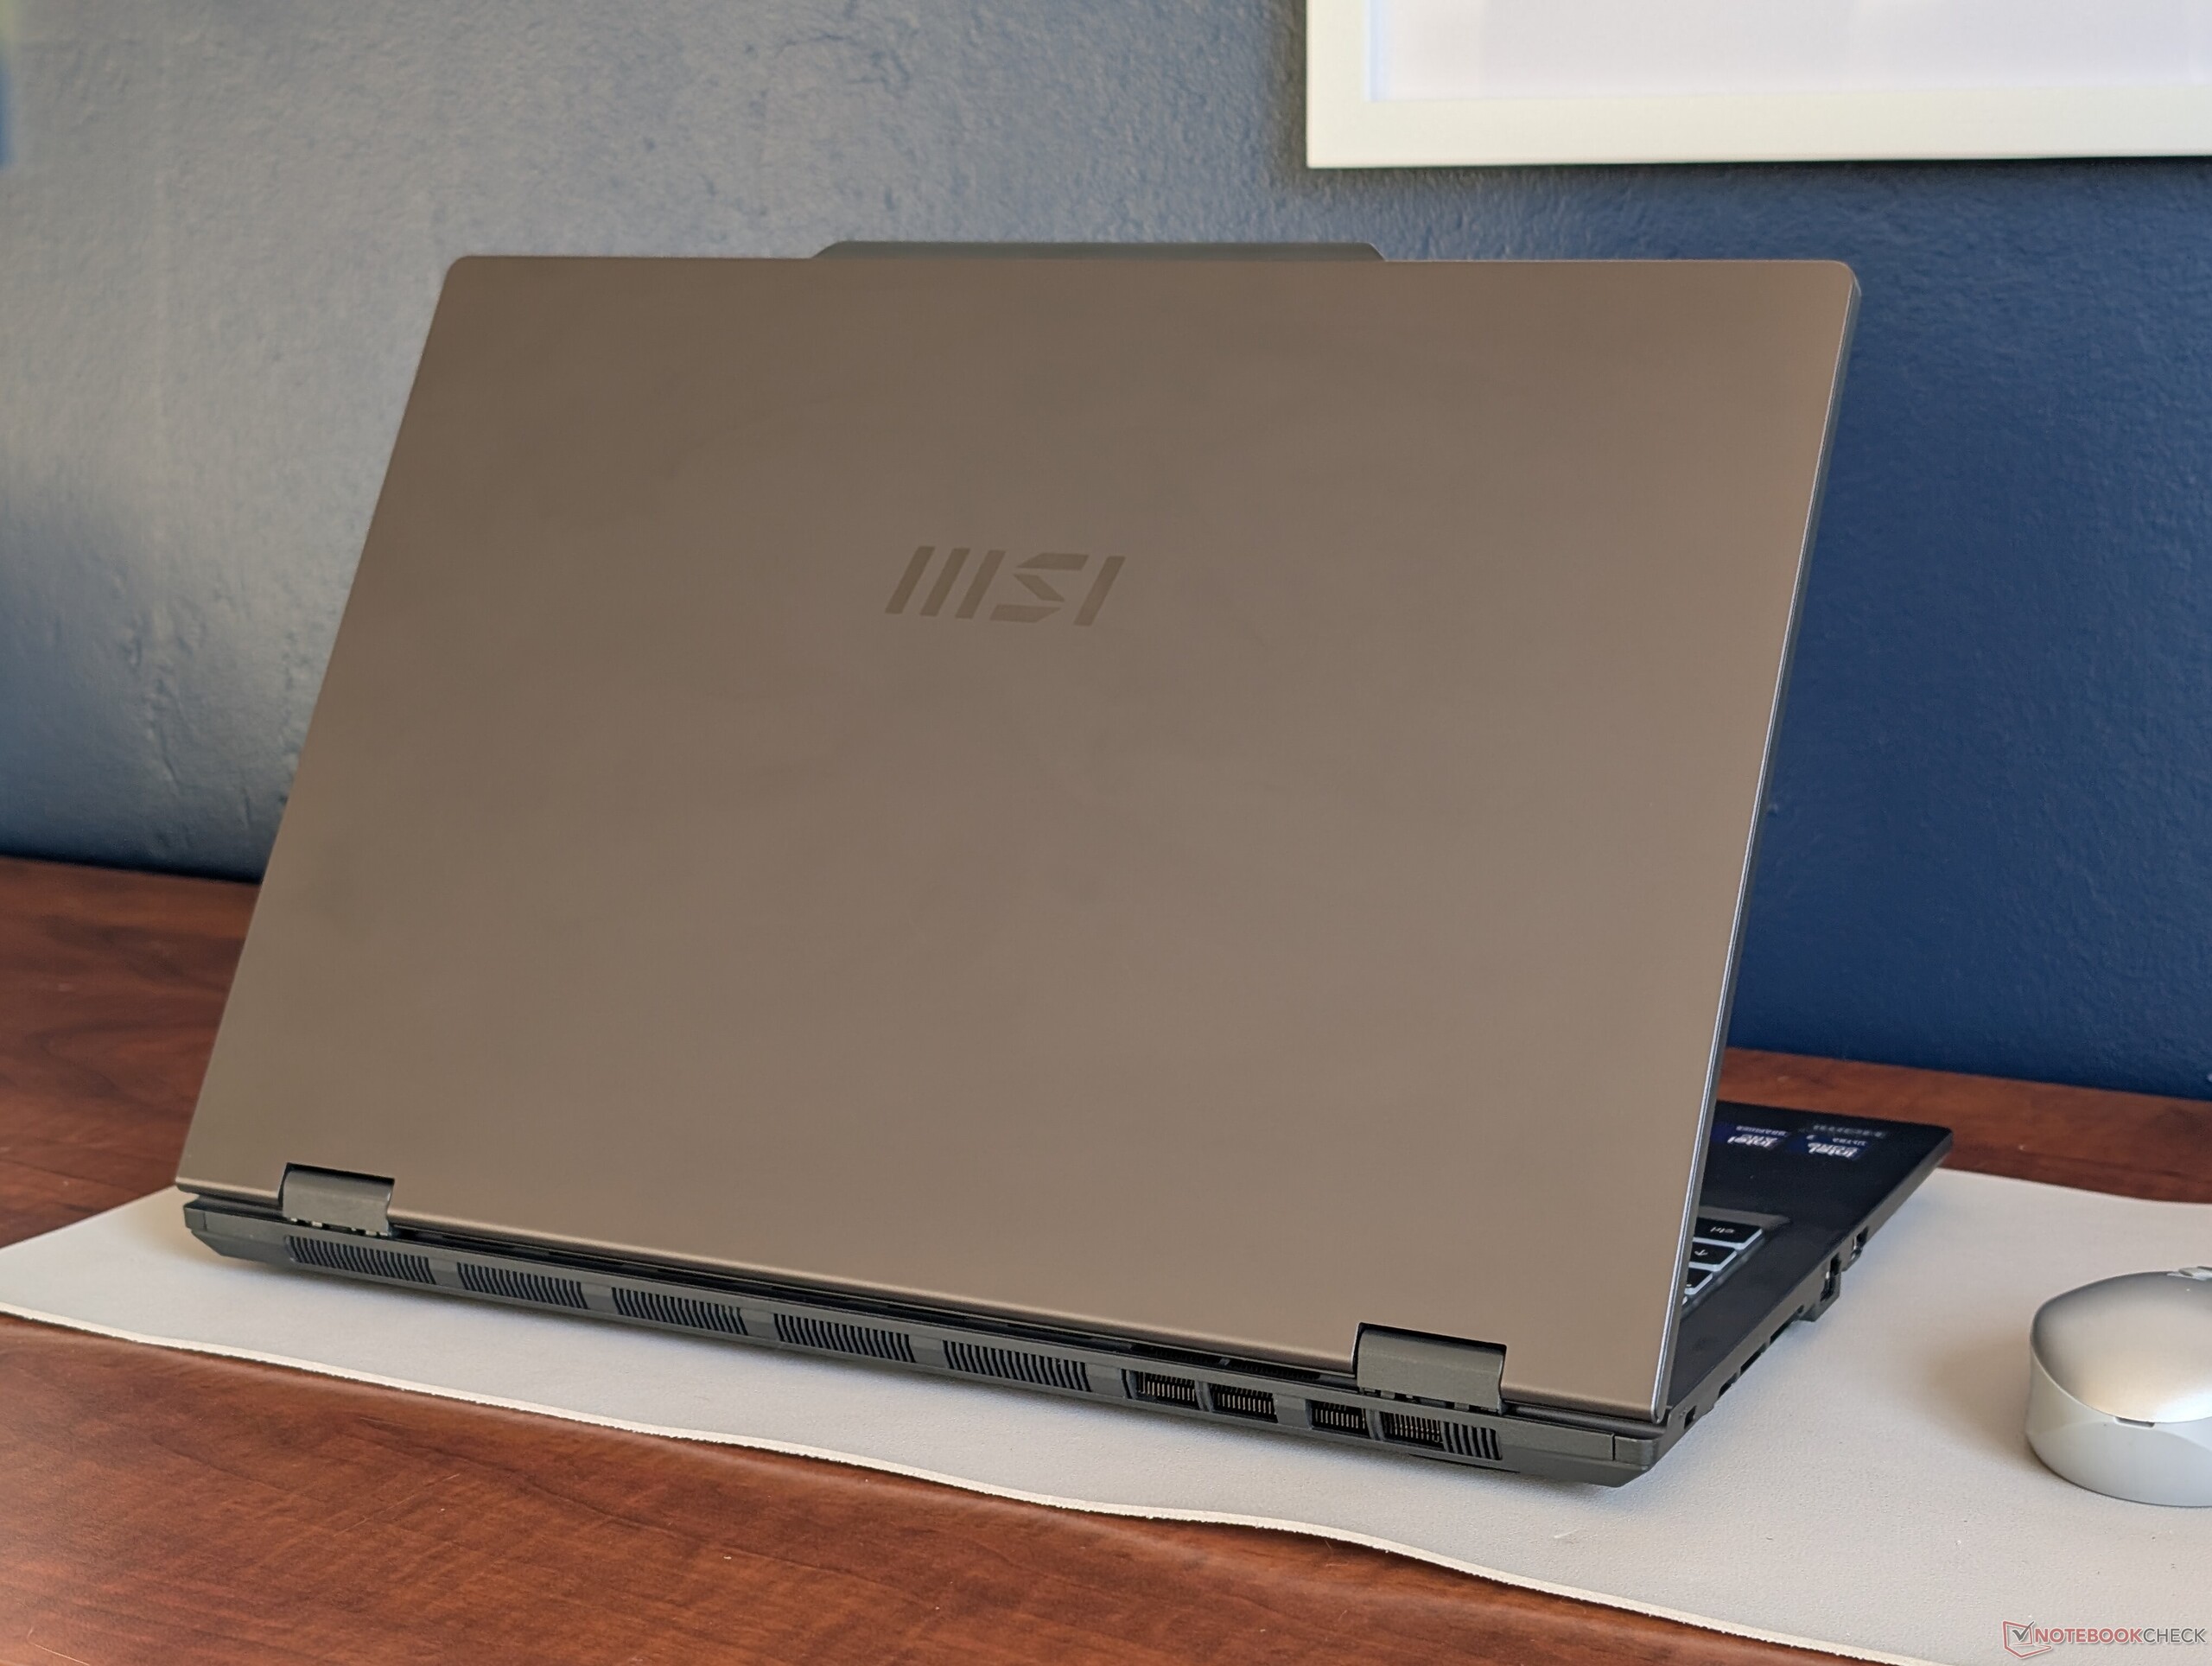
Zaak
Het chassis bestaat voornamelijk uit glad, mat plastic met een behoorlijke stijfheid om de kosten laag te houden. Interessant genoeg is het systeem zwaarder en dikker dan veel andere 16-inch laptops, maar neemt het minder ruimte in beslag dankzij de smallere randen.
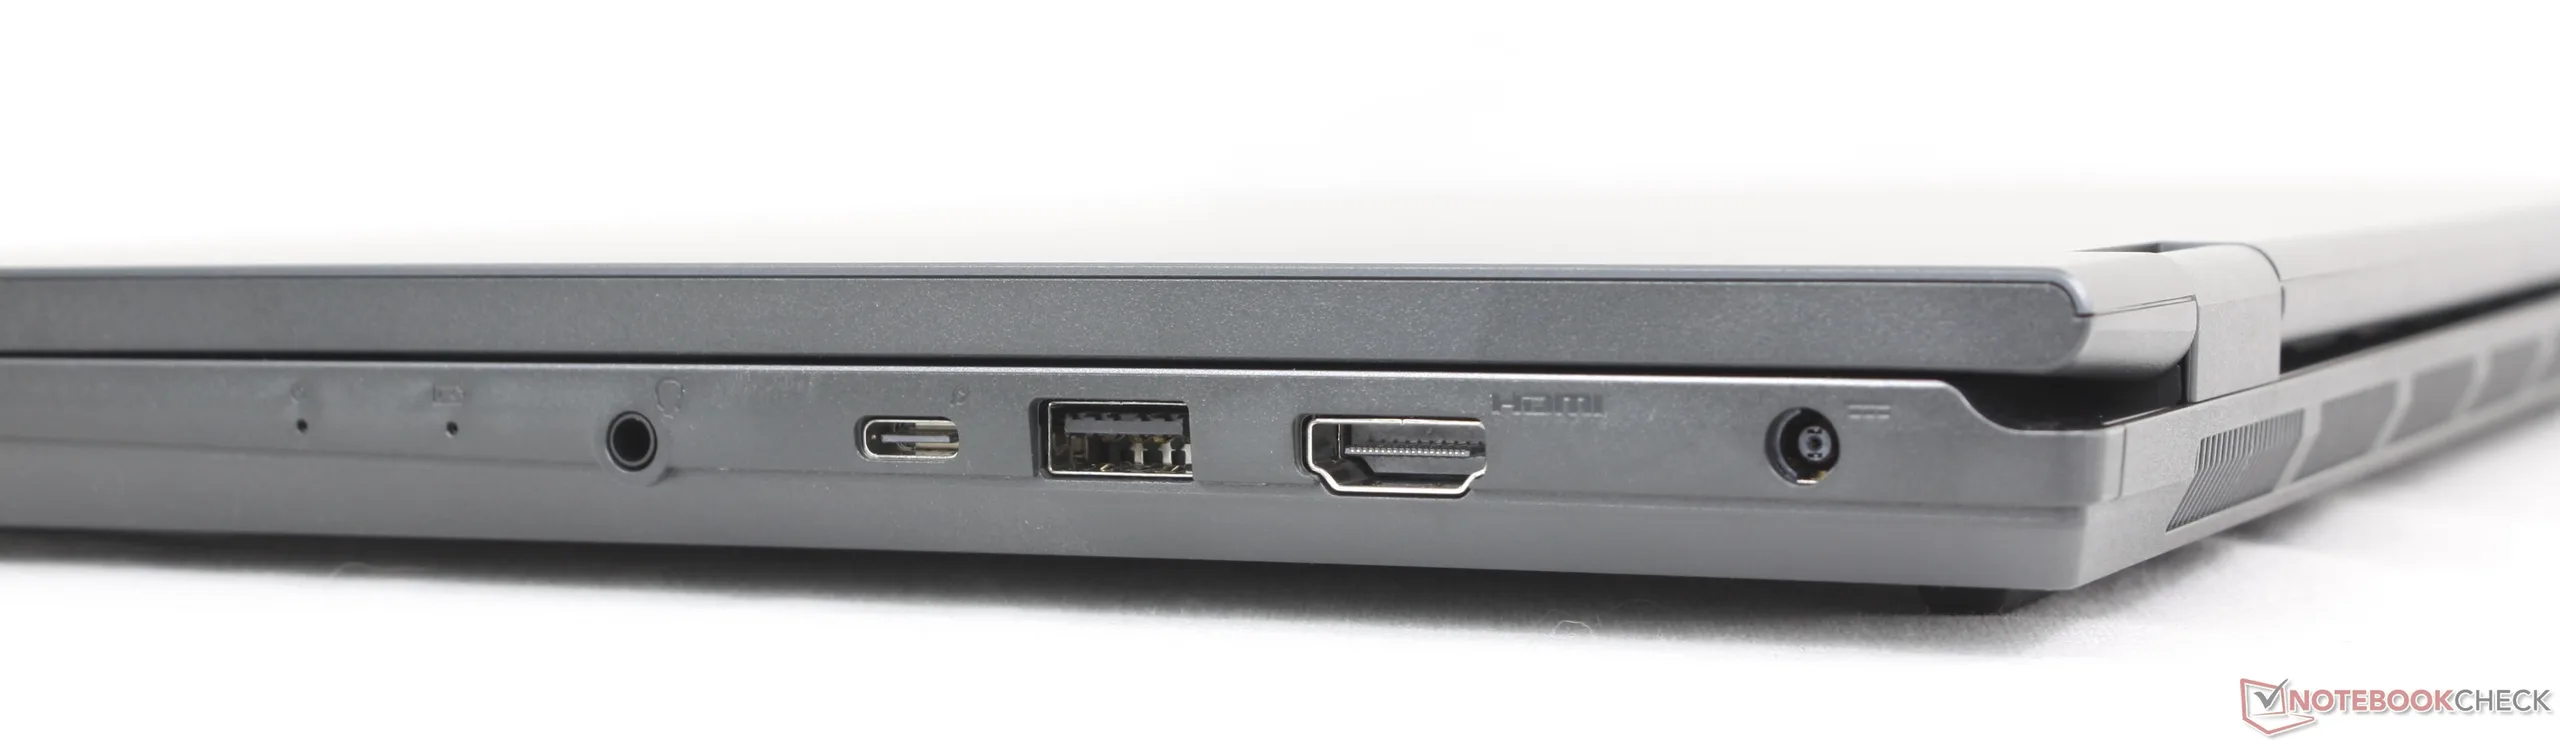
Connectiviteit
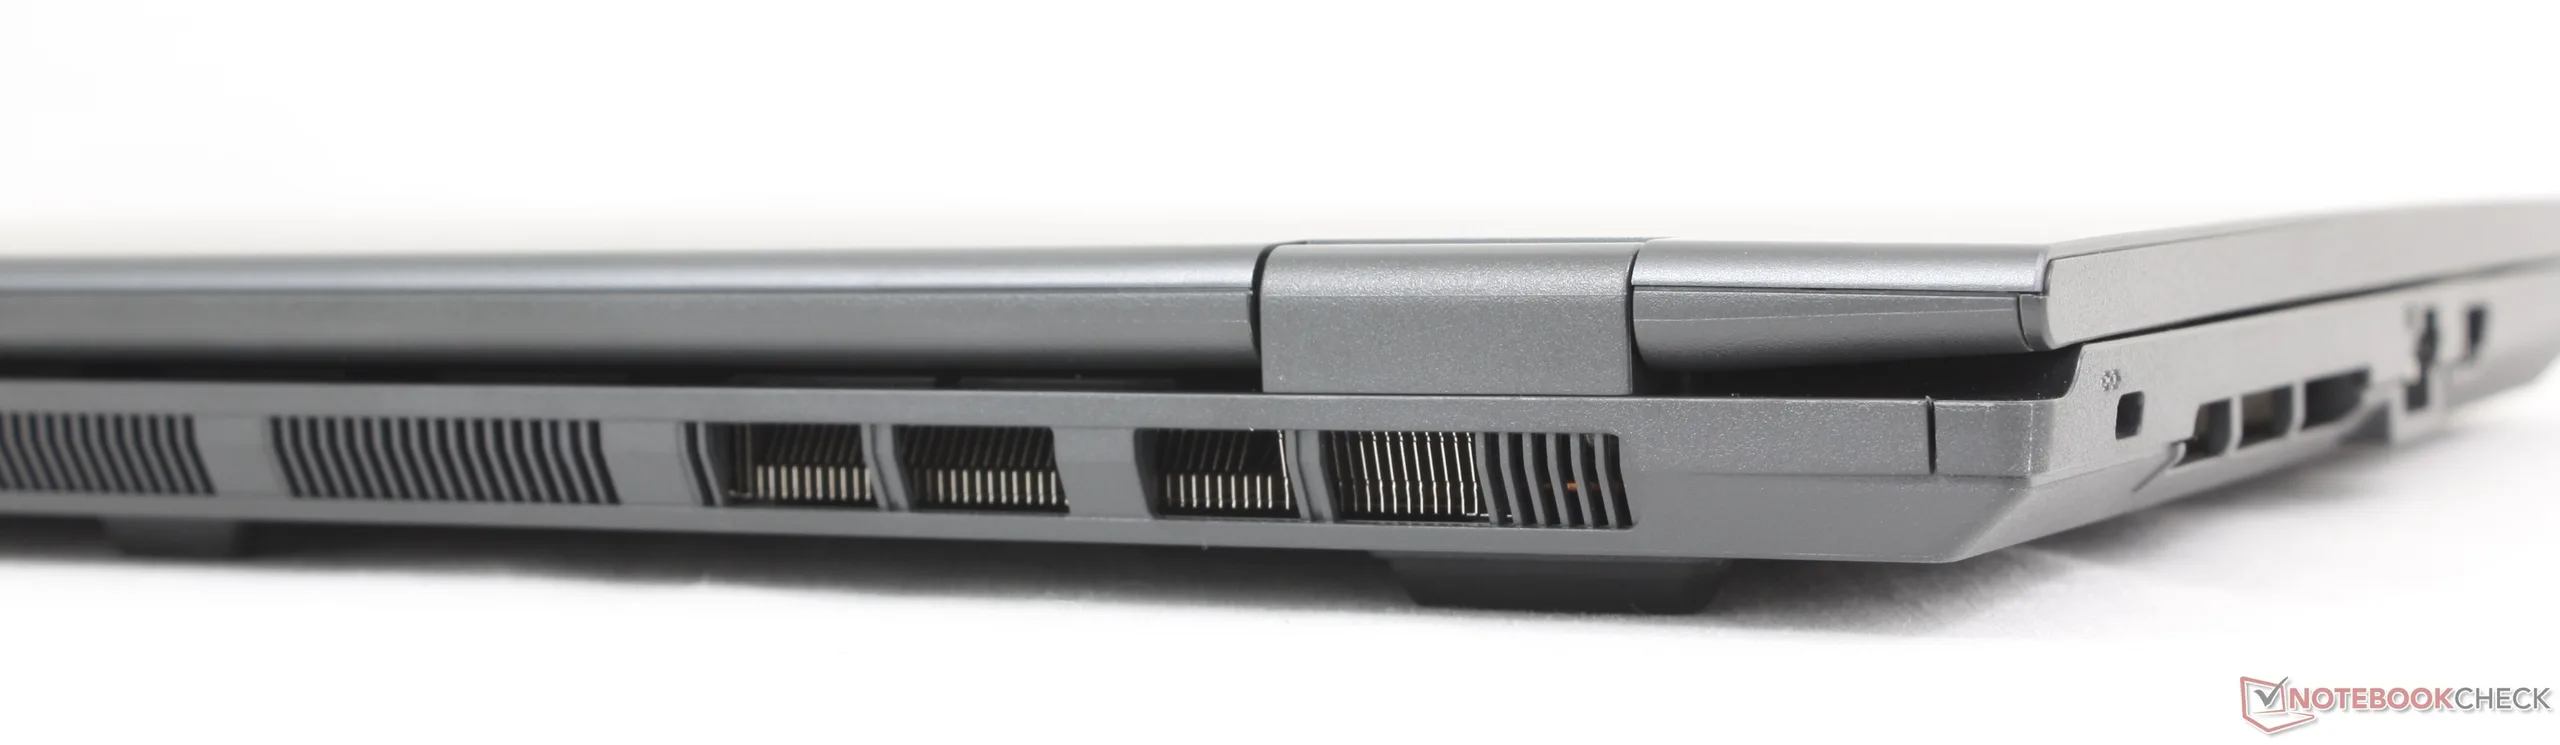
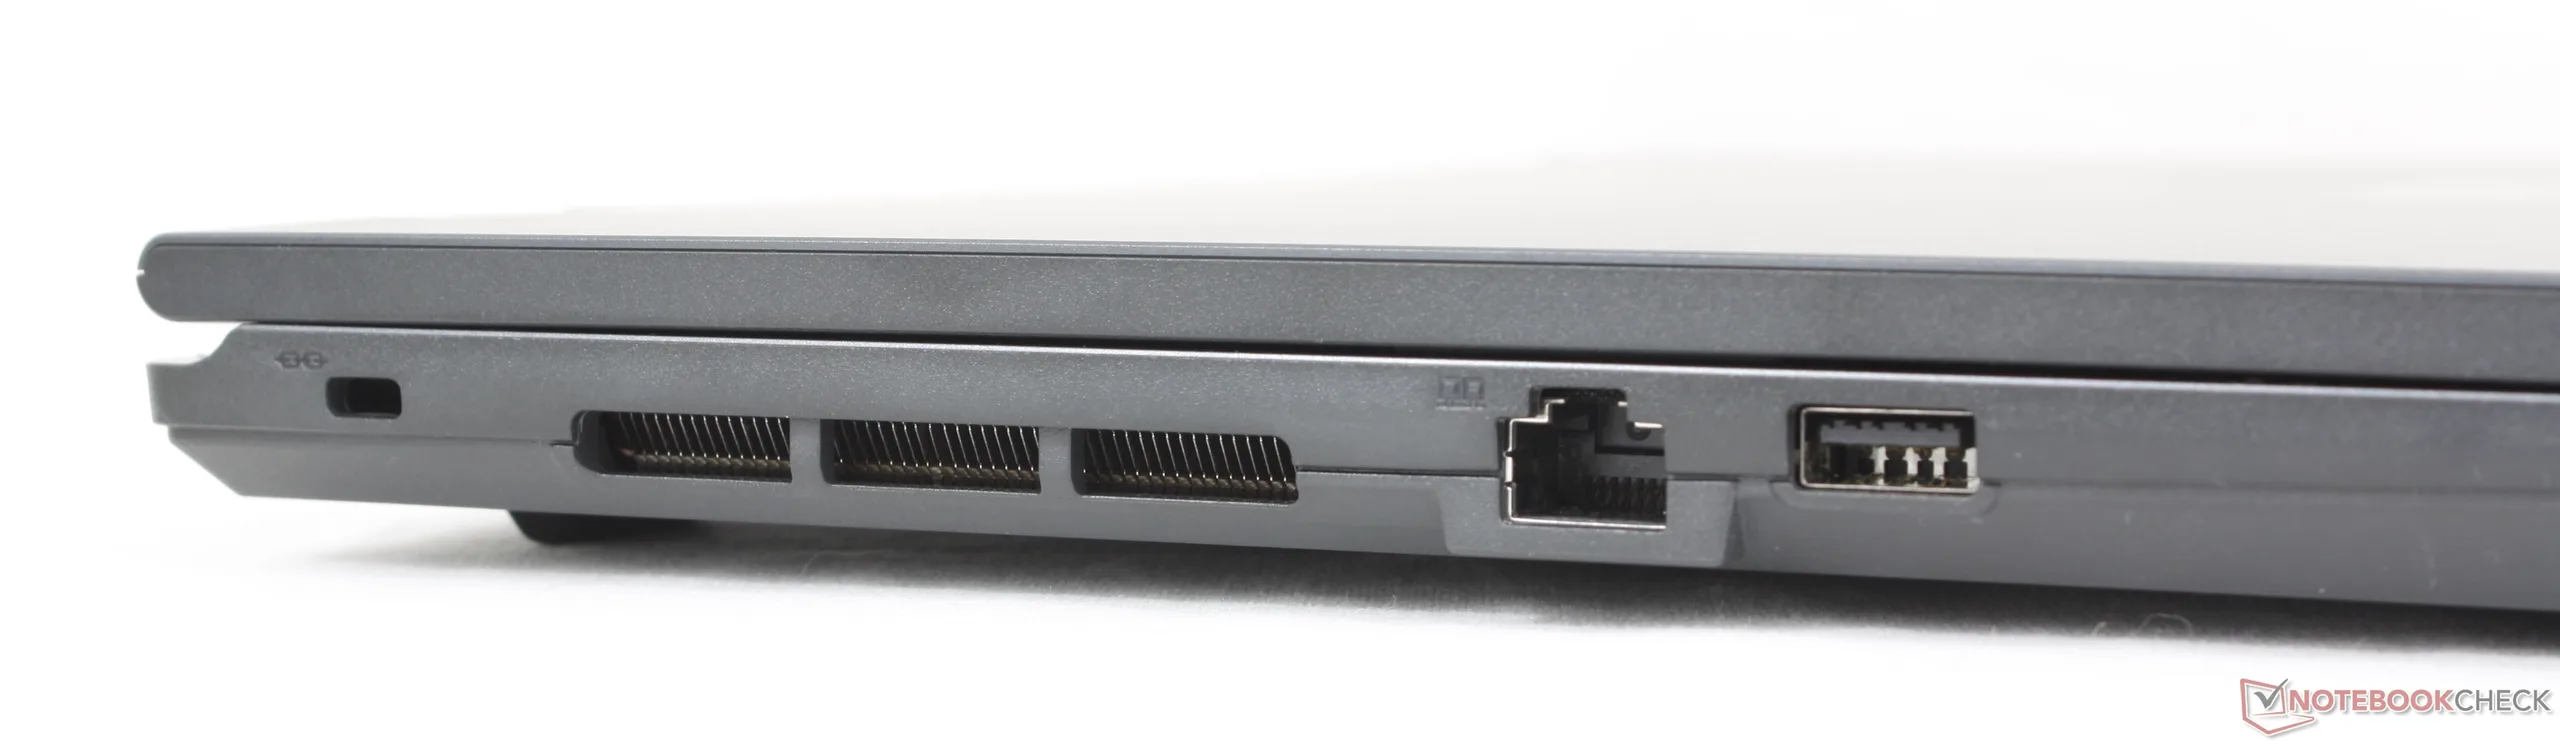
De poortopties zouden beter kunnen, gezien de grote vormfactor van 16 inch. Er is bijvoorbeeld maar één USB-C poort in vergelijking met twee op de meeste andere laptops, waaronder de Dell 16 Plus.
Communicatie
| Networking | |
| iperf3 transmit AXE11000 | |
| Lenovo IdeaPad Slim 5 16AKP10 | |
| Dell 16 Plus 2-in-1 | |
| MSI Prestige 16 B1MG-001US | |
| HP Pavilion 16-ag0057ng | |
| Asus V16 V3607V | |
| MSI Venture 16 AI A2HMTG | |
| iperf3 receive AXE11000 | |
| Lenovo IdeaPad Slim 5 16AKP10 | |
| MSI Prestige 16 B1MG-001US | |
| Dell 16 Plus 2-in-1 | |
| HP Pavilion 16-ag0057ng | |
| Asus V16 V3607V | |
| MSI Venture 16 AI A2HMTG | |
| iperf3 transmit AXE11000 6GHz | |
| Dell 16 Plus 2-in-1 | |
| MSI Prestige 16 B1MG-001US | |
| MSI Venture 16 AI A2HMTG | |
| iperf3 receive AXE11000 6GHz | |
| Dell 16 Plus 2-in-1 | |
| MSI Venture 16 AI A2HMTG | |
| MSI Prestige 16 B1MG-001US | |
Webcam


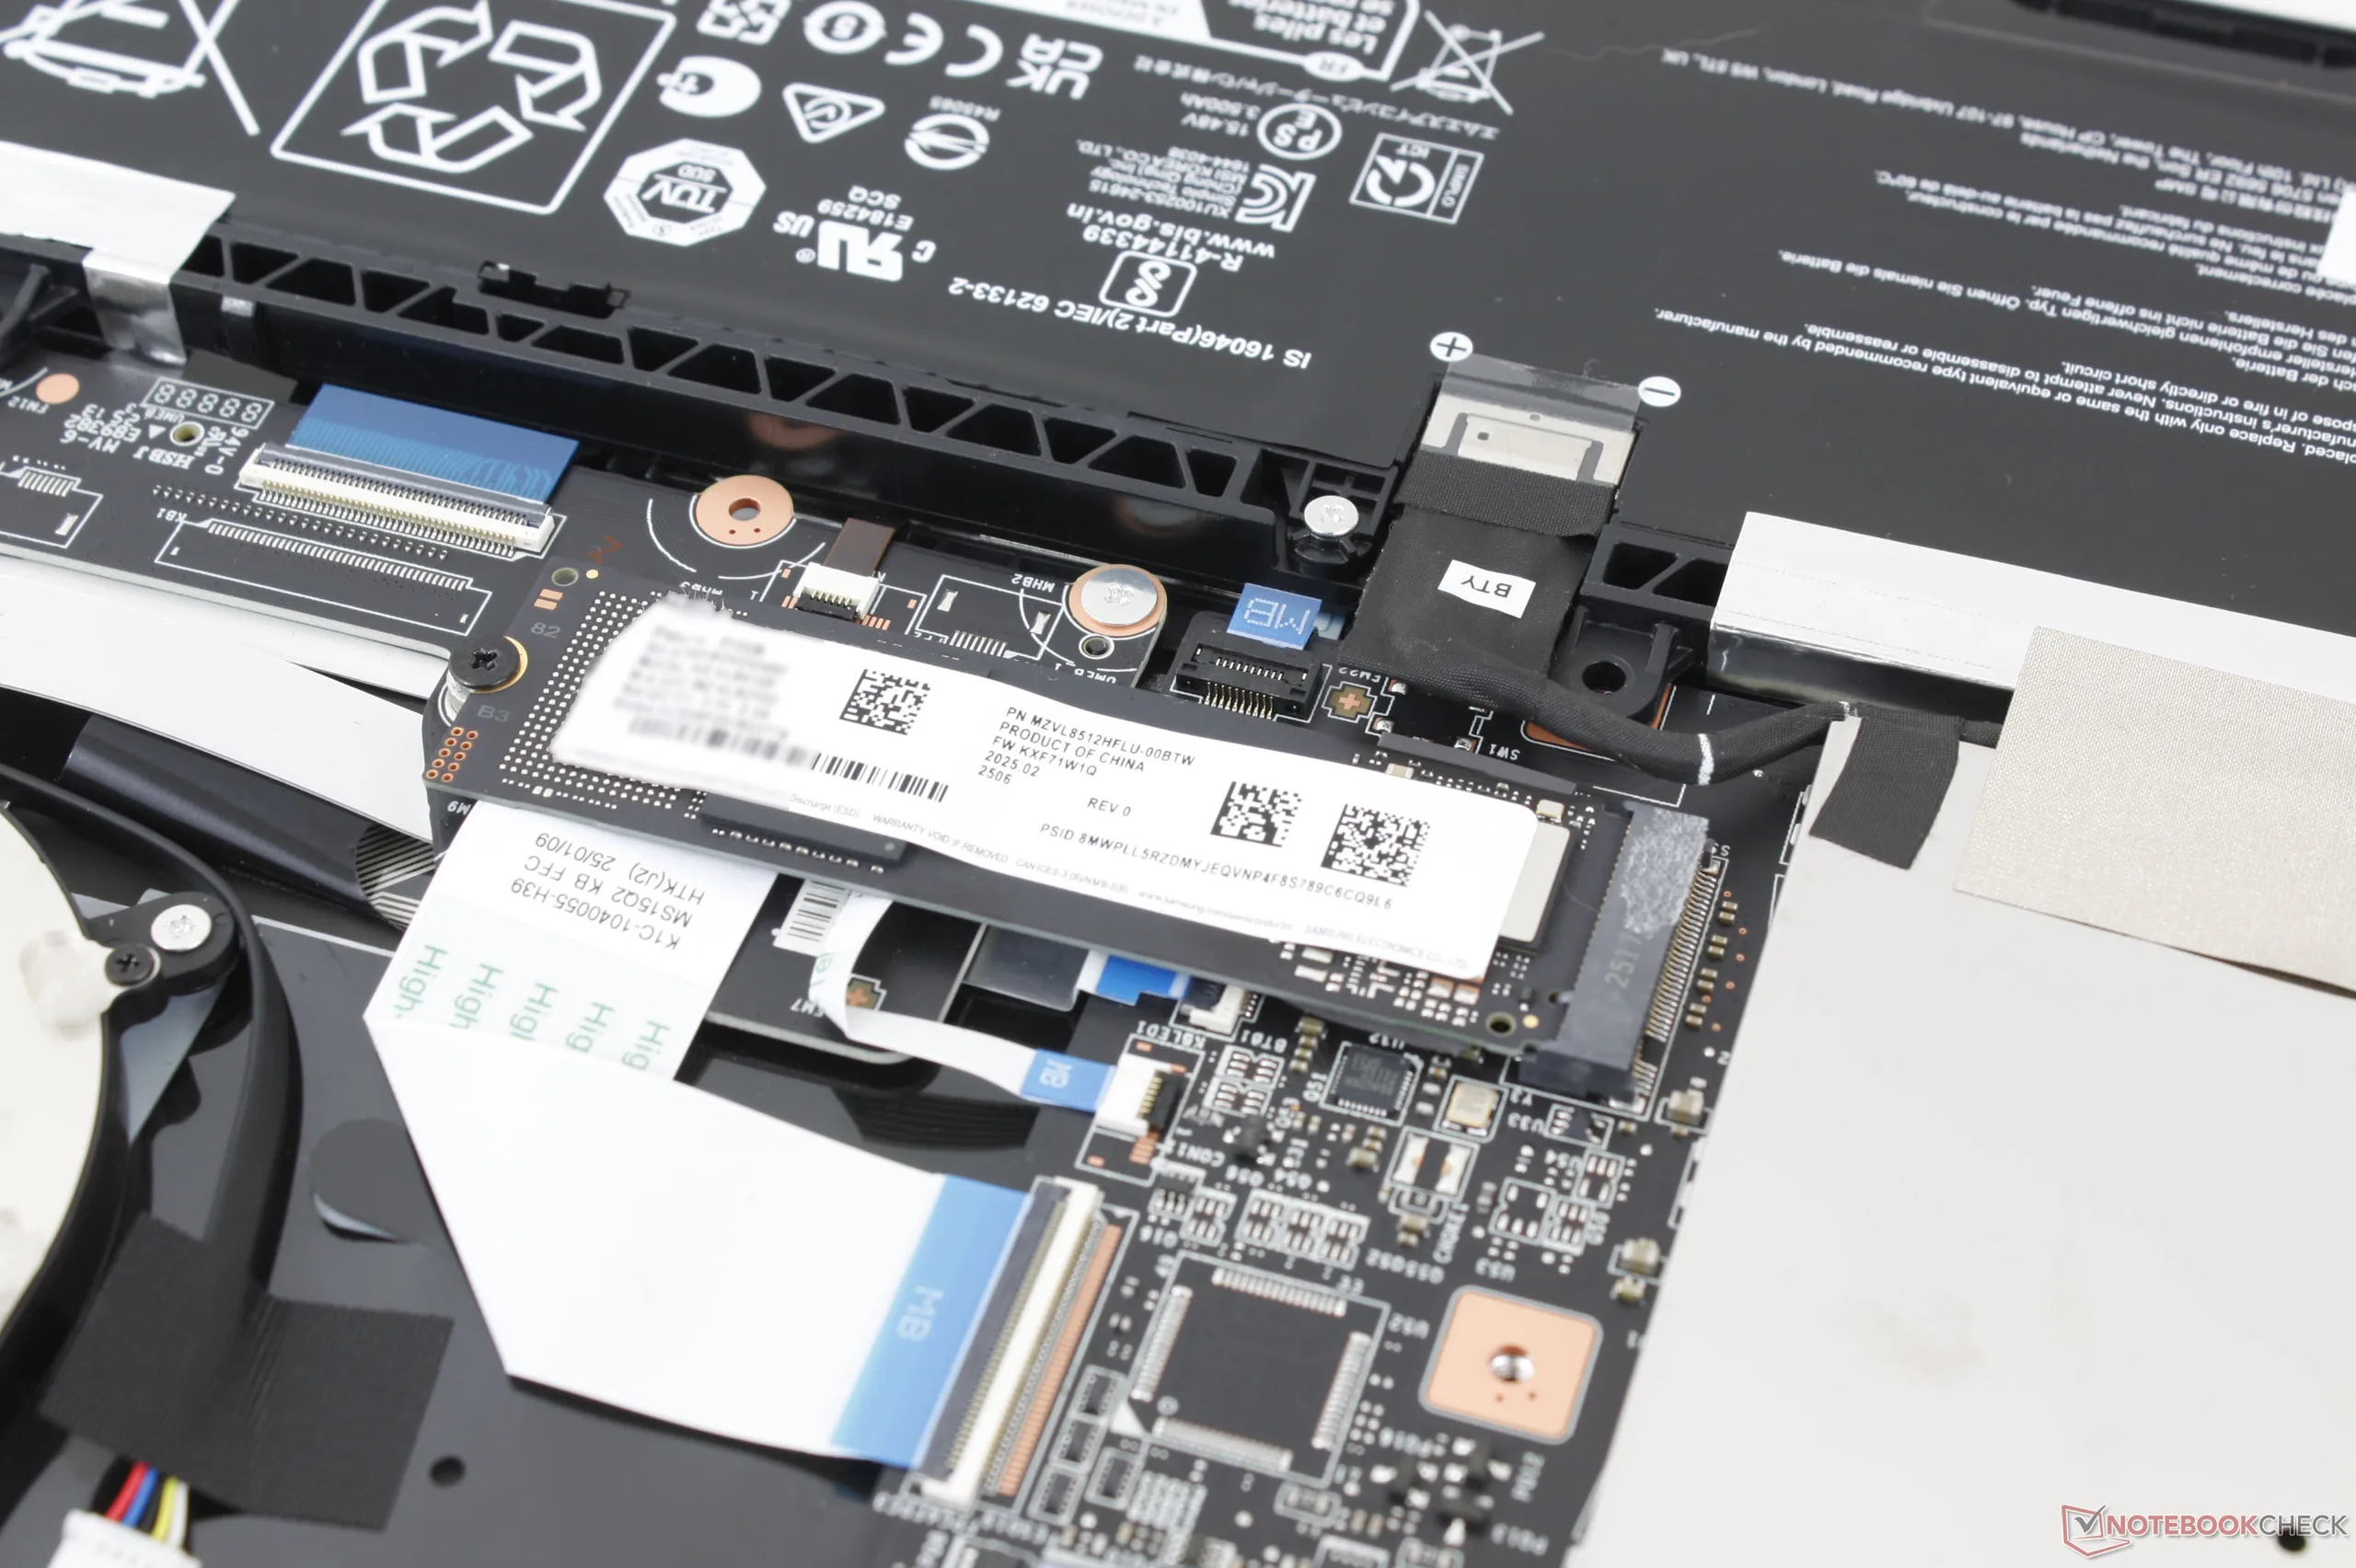
Onderhoud
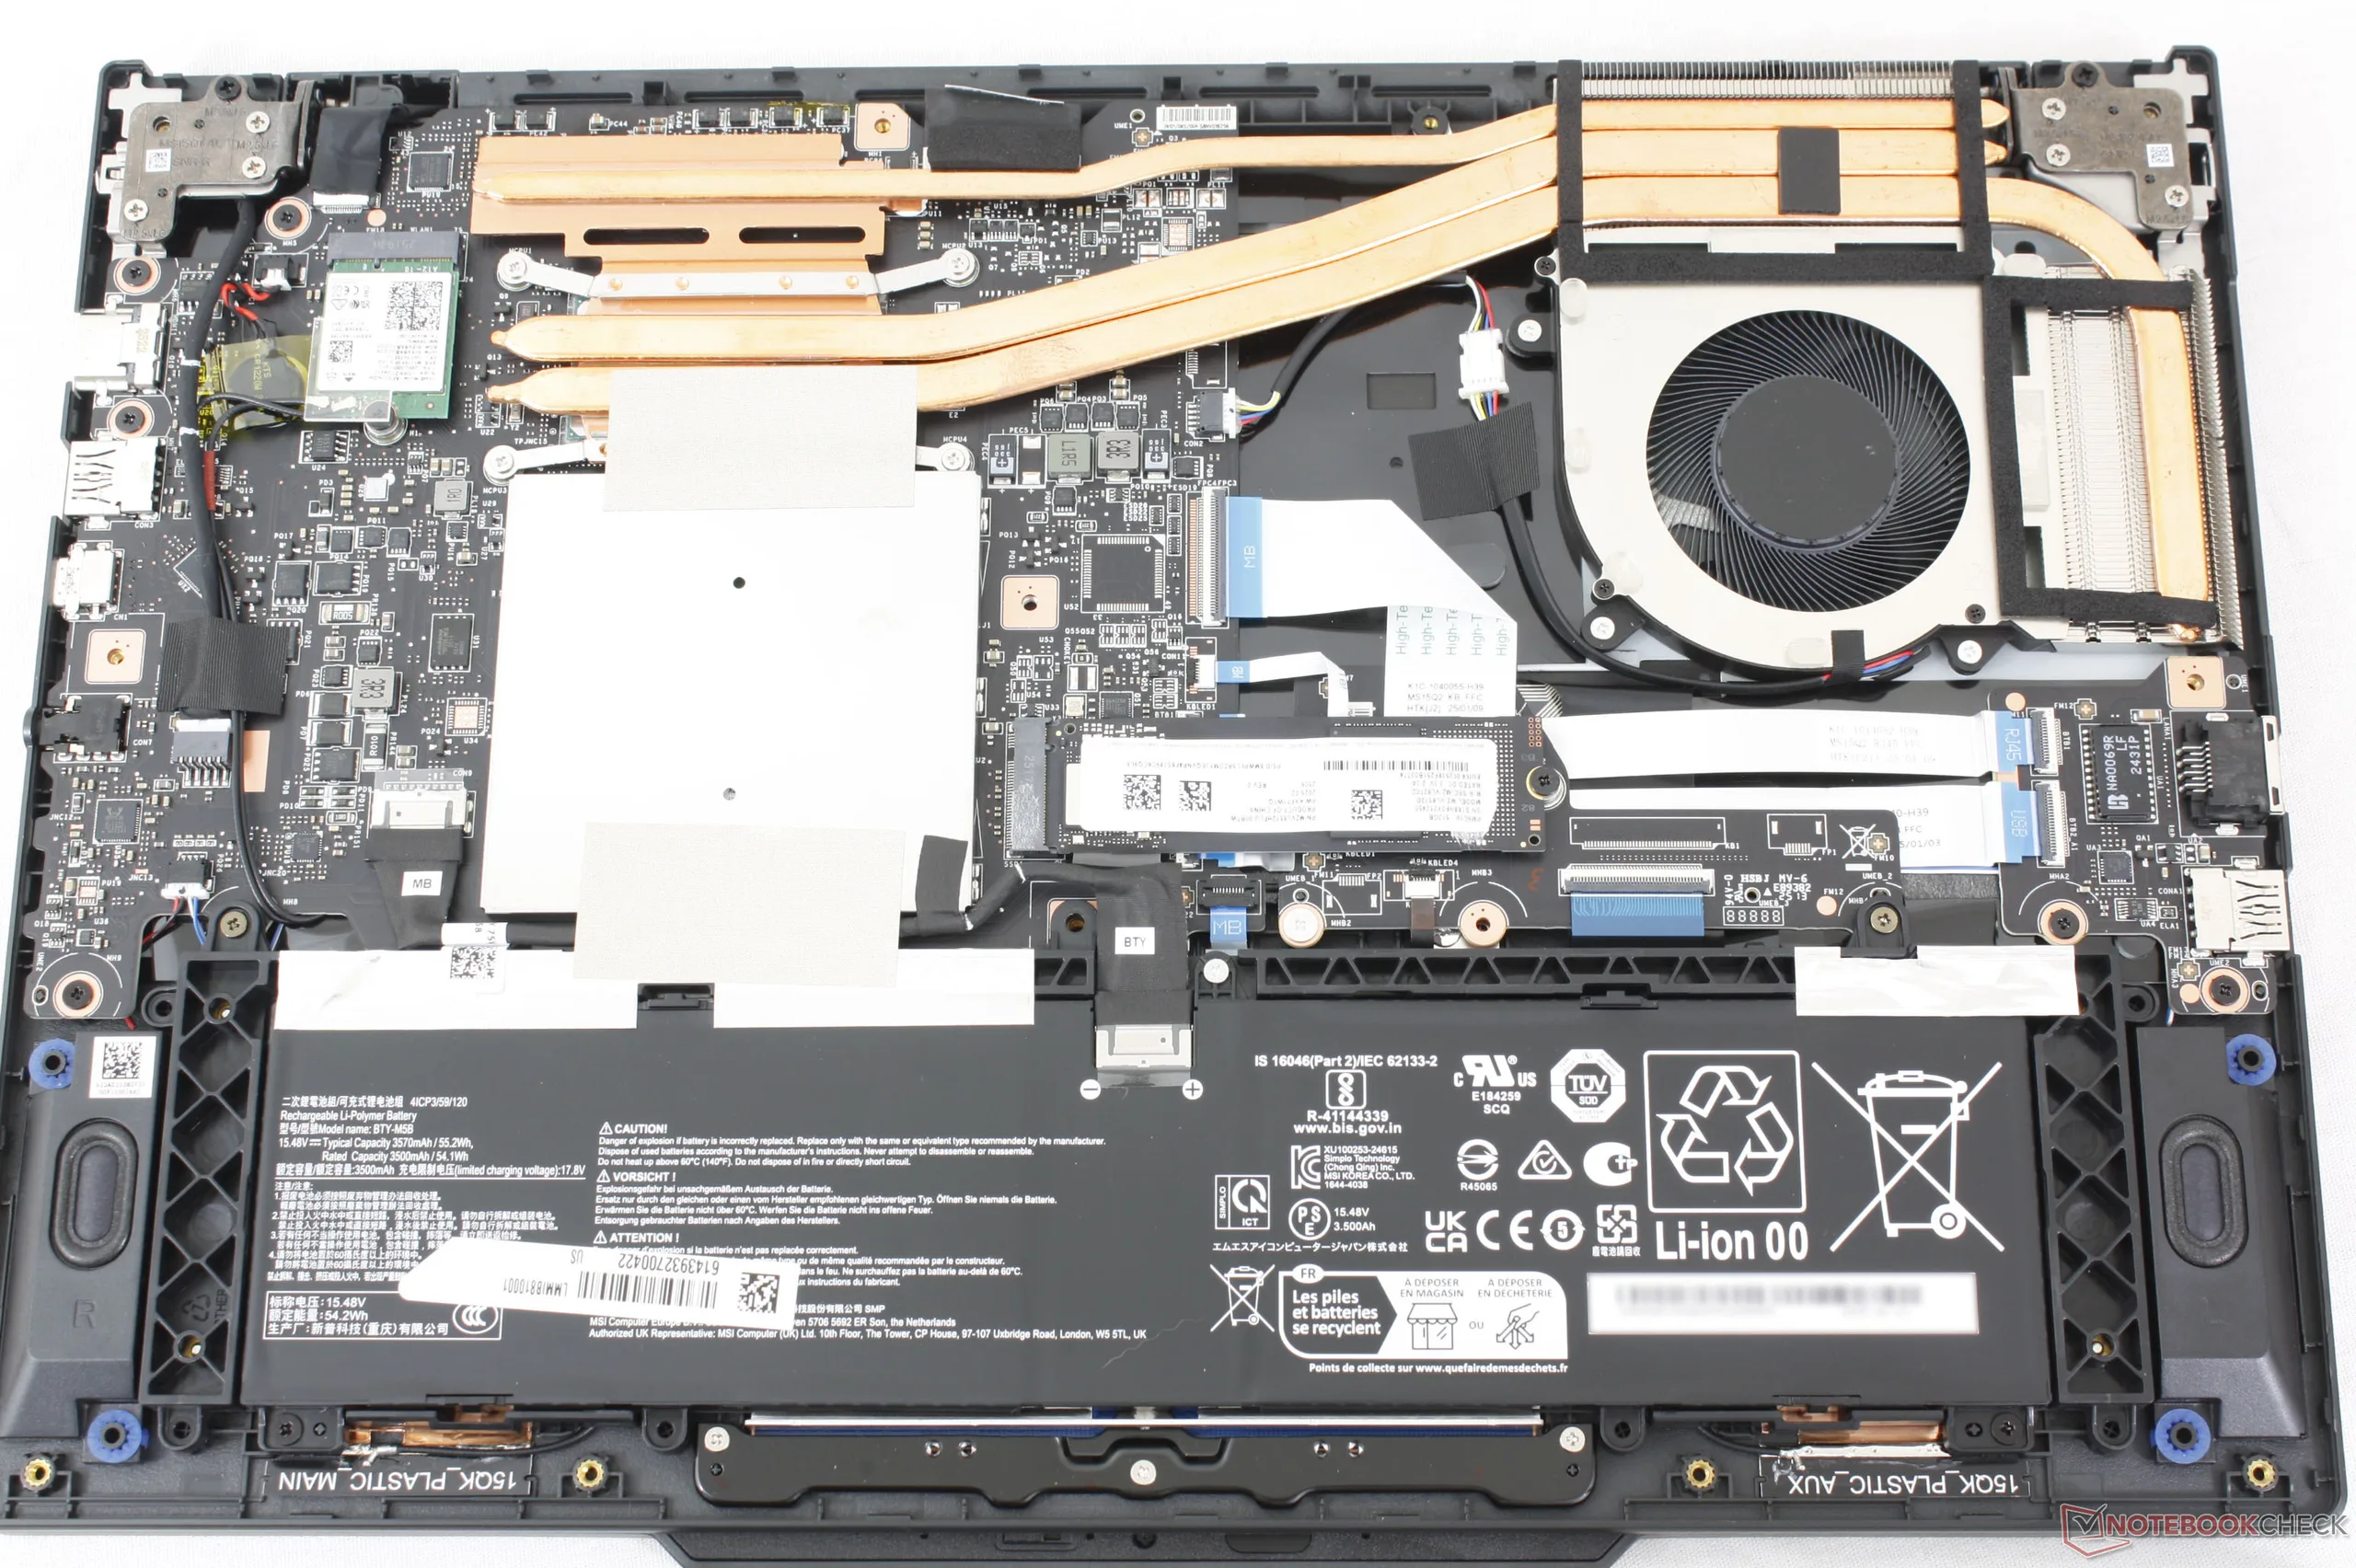
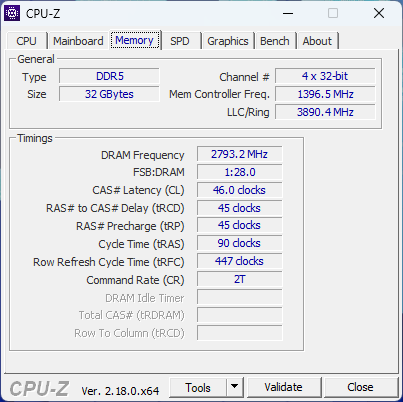
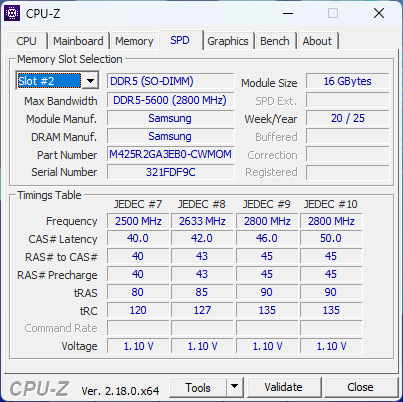
Het bodempaneel kan gemakkelijk worden verwijderd met slechts een Philips schroevendraaier. RAM kan worden geüpgraded via twee DDR5 SODIMM-sleuven, terwijl slechts één M.2 2280 SSD wordt ondersteund.
Duurzaamheid
Hoewel MSI niet expliciet melding maakt van gerecyclede materialen tijdens de productie, erkent het bedrijf wel Energy Star- en FSC-certificeringen. De verpakking maakt gebruik van plastic verpakking voor de laptop en de AC-adapter.
Accessoires en garantie
Er zitten geen extra's in de doos behalve de AC-adapter en papierwerk. Bij aankoop in de VS geldt de gebruikelijke beperkte fabrieksgarantie van één jaar.
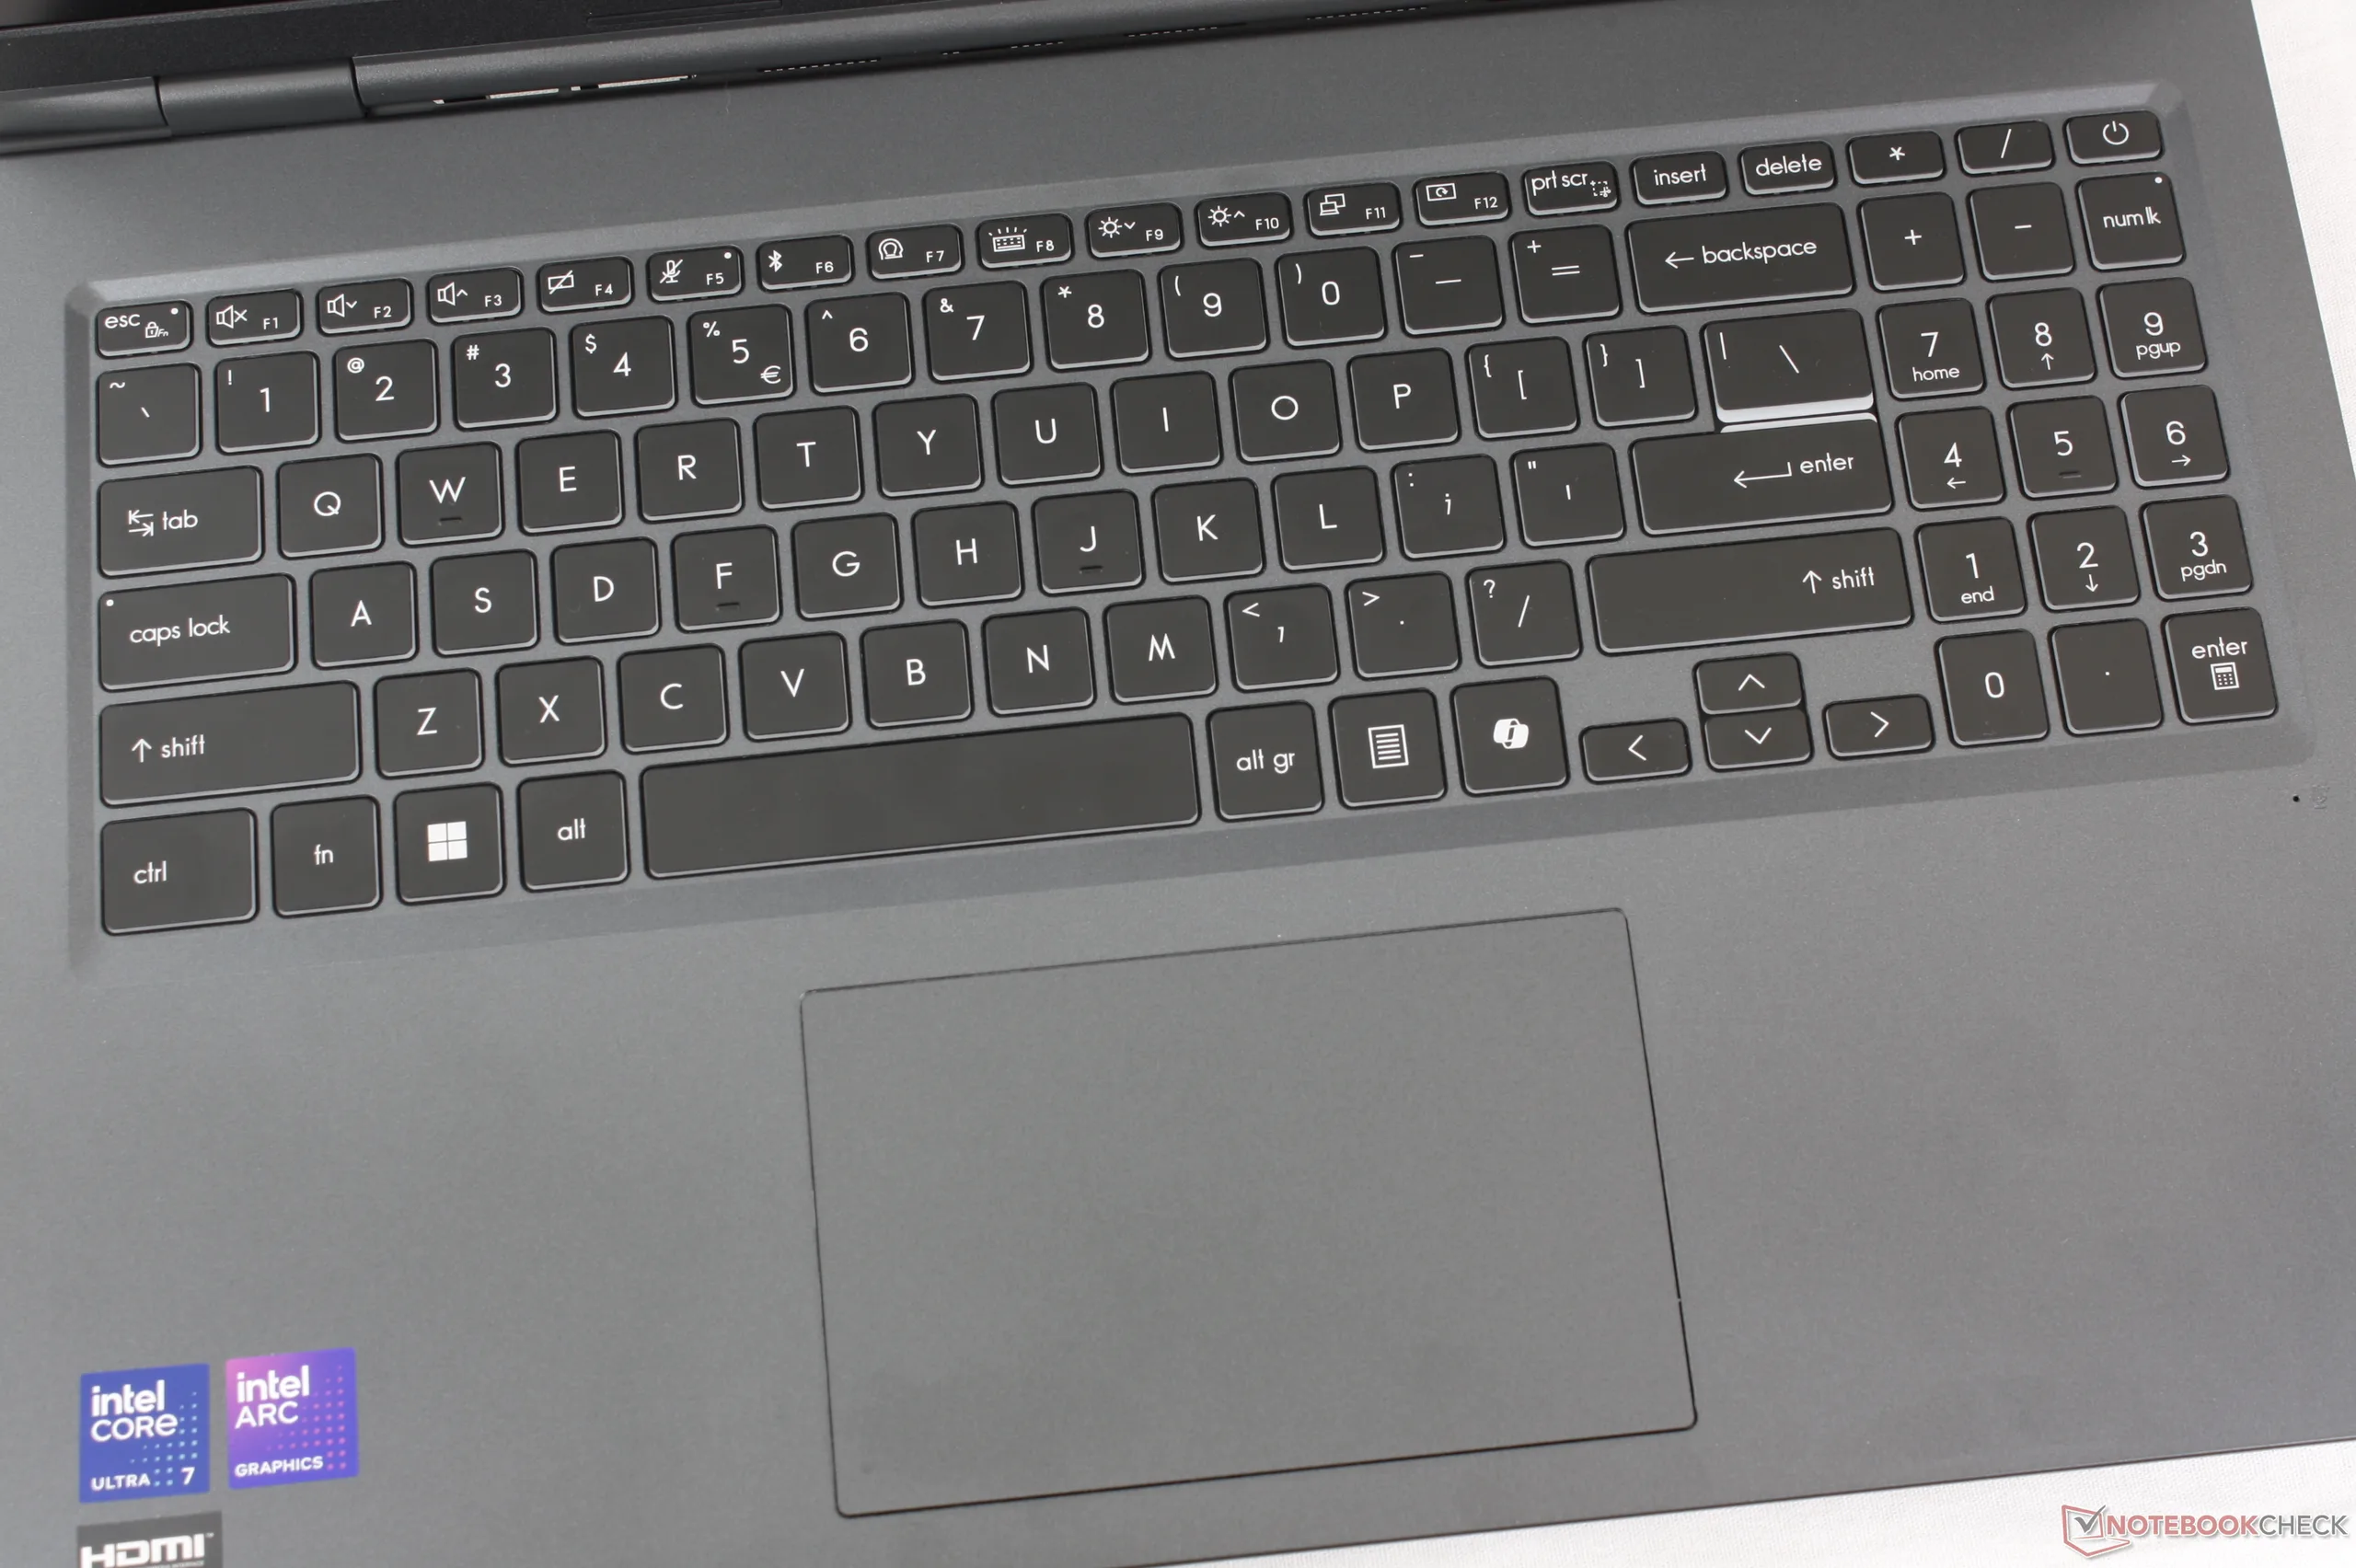
Invoerapparaten
De type-ervaring is bijna hetzelfde als op de Prestige 16 aangezien de Venture 16 vergelijkbare toetsen en onderdelen gebruikt. De feedback is relatief licht met stil gekletter en een ondiepere beweging in vergelijking met een traditionele ThinkPad.
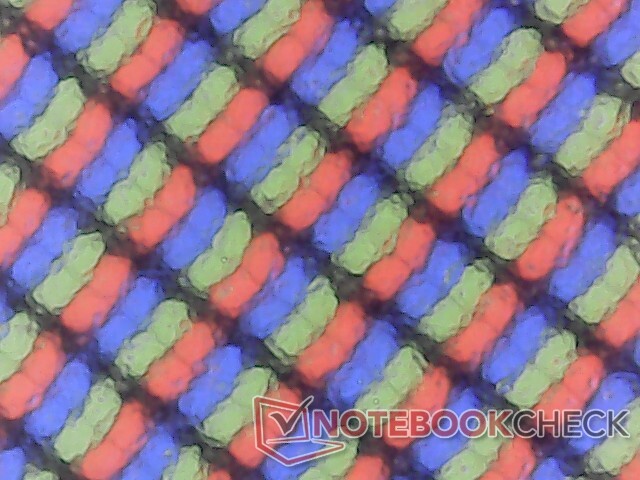
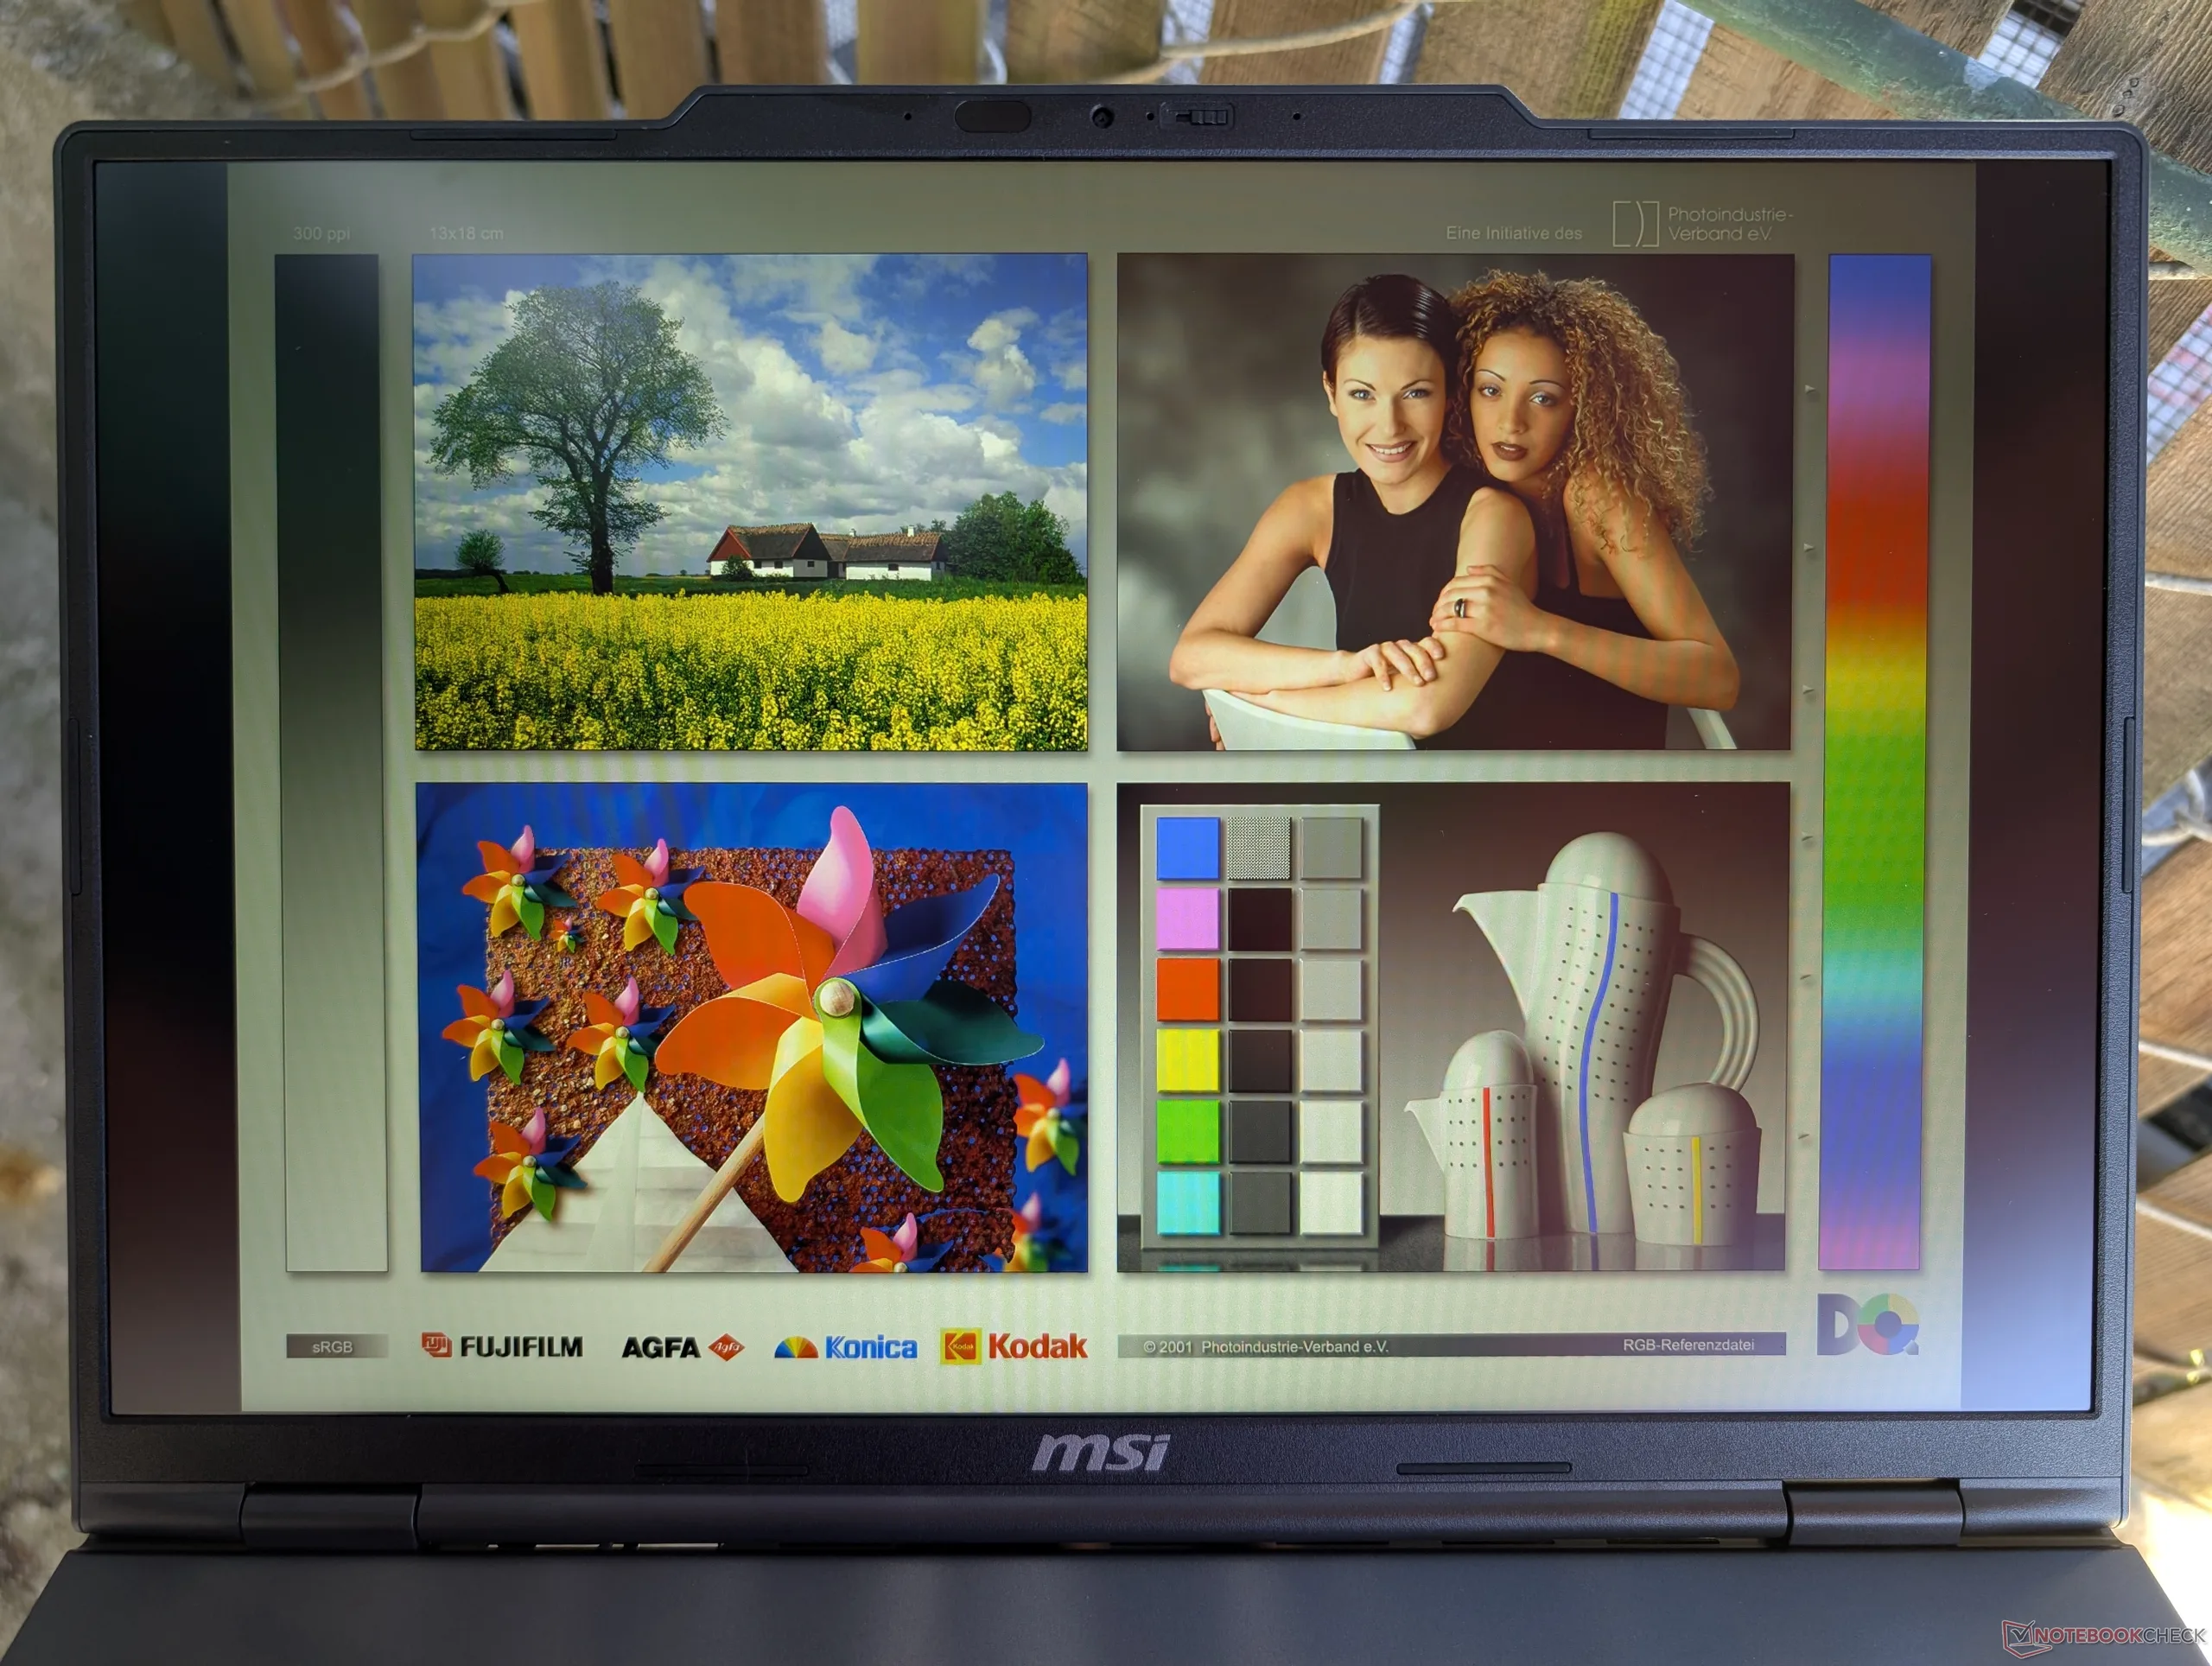
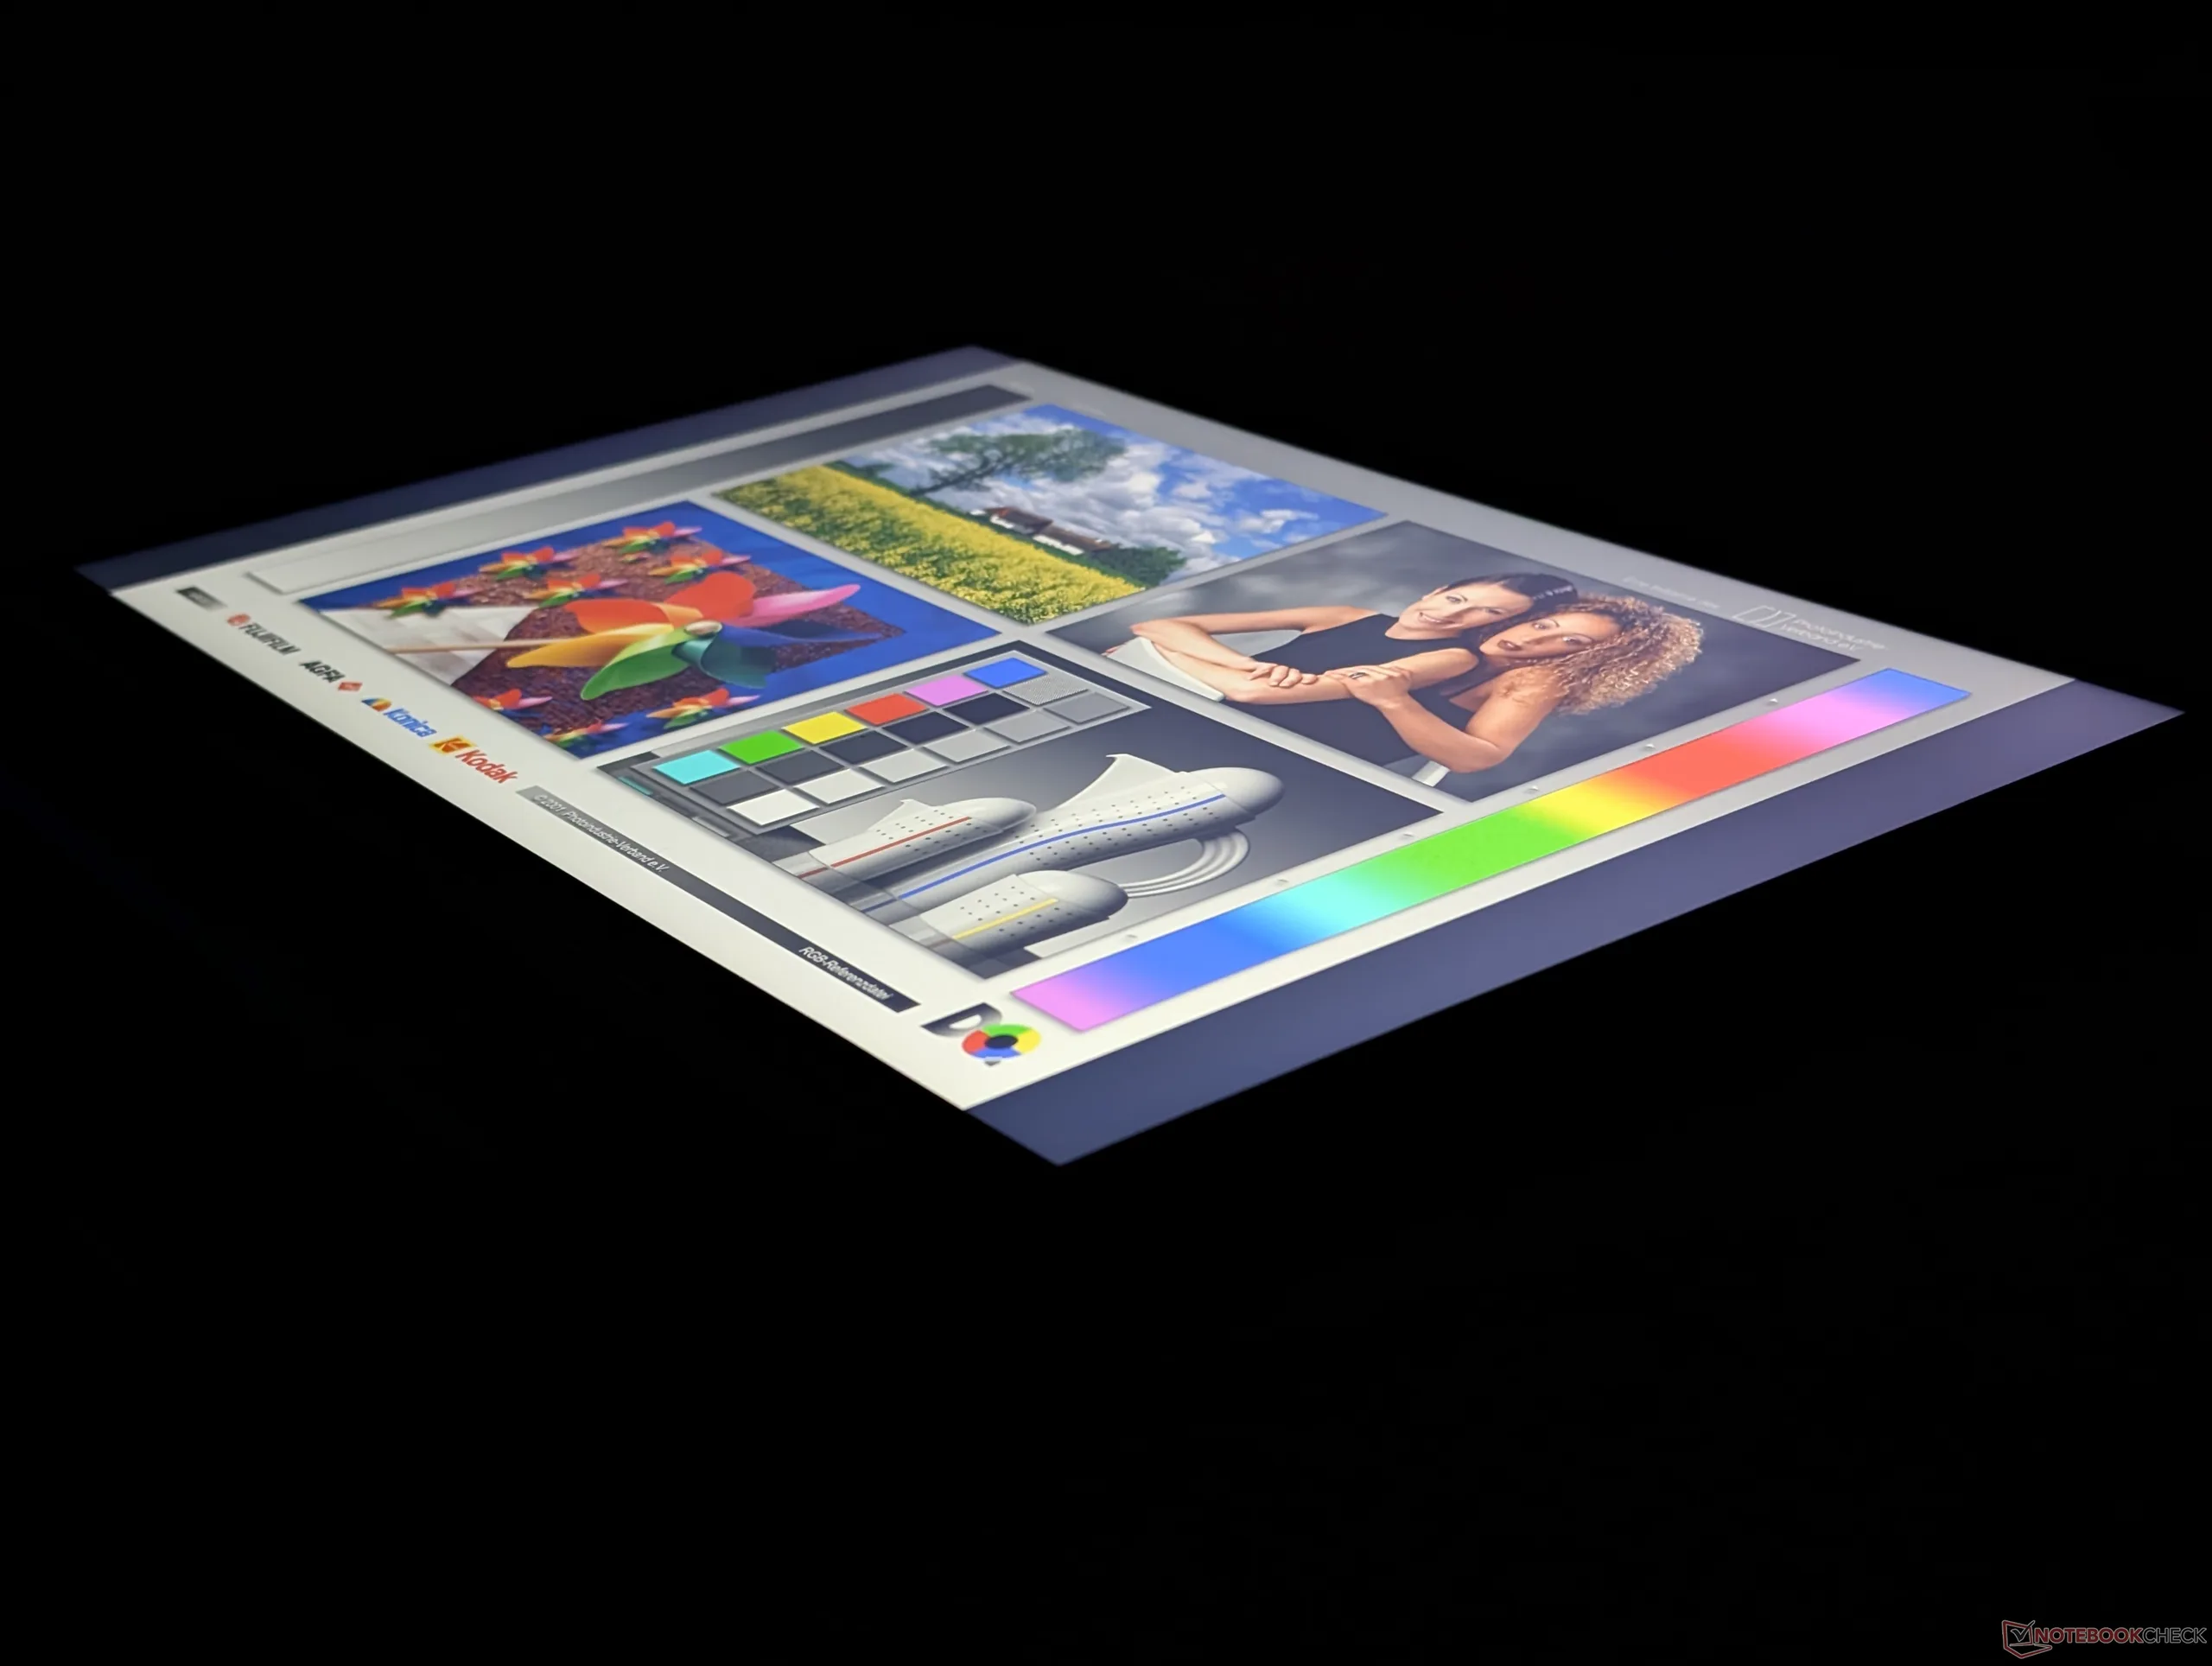
Weergave
Er zijn twee weergaveopties beschikbaar:
- 1920 x 1200, IPS, 60% sRGB, 60 Hz, aanraakscherm
- 2048 x 1280, OLED, 100% DCI-P3, 120 Hz, zonder aanraken
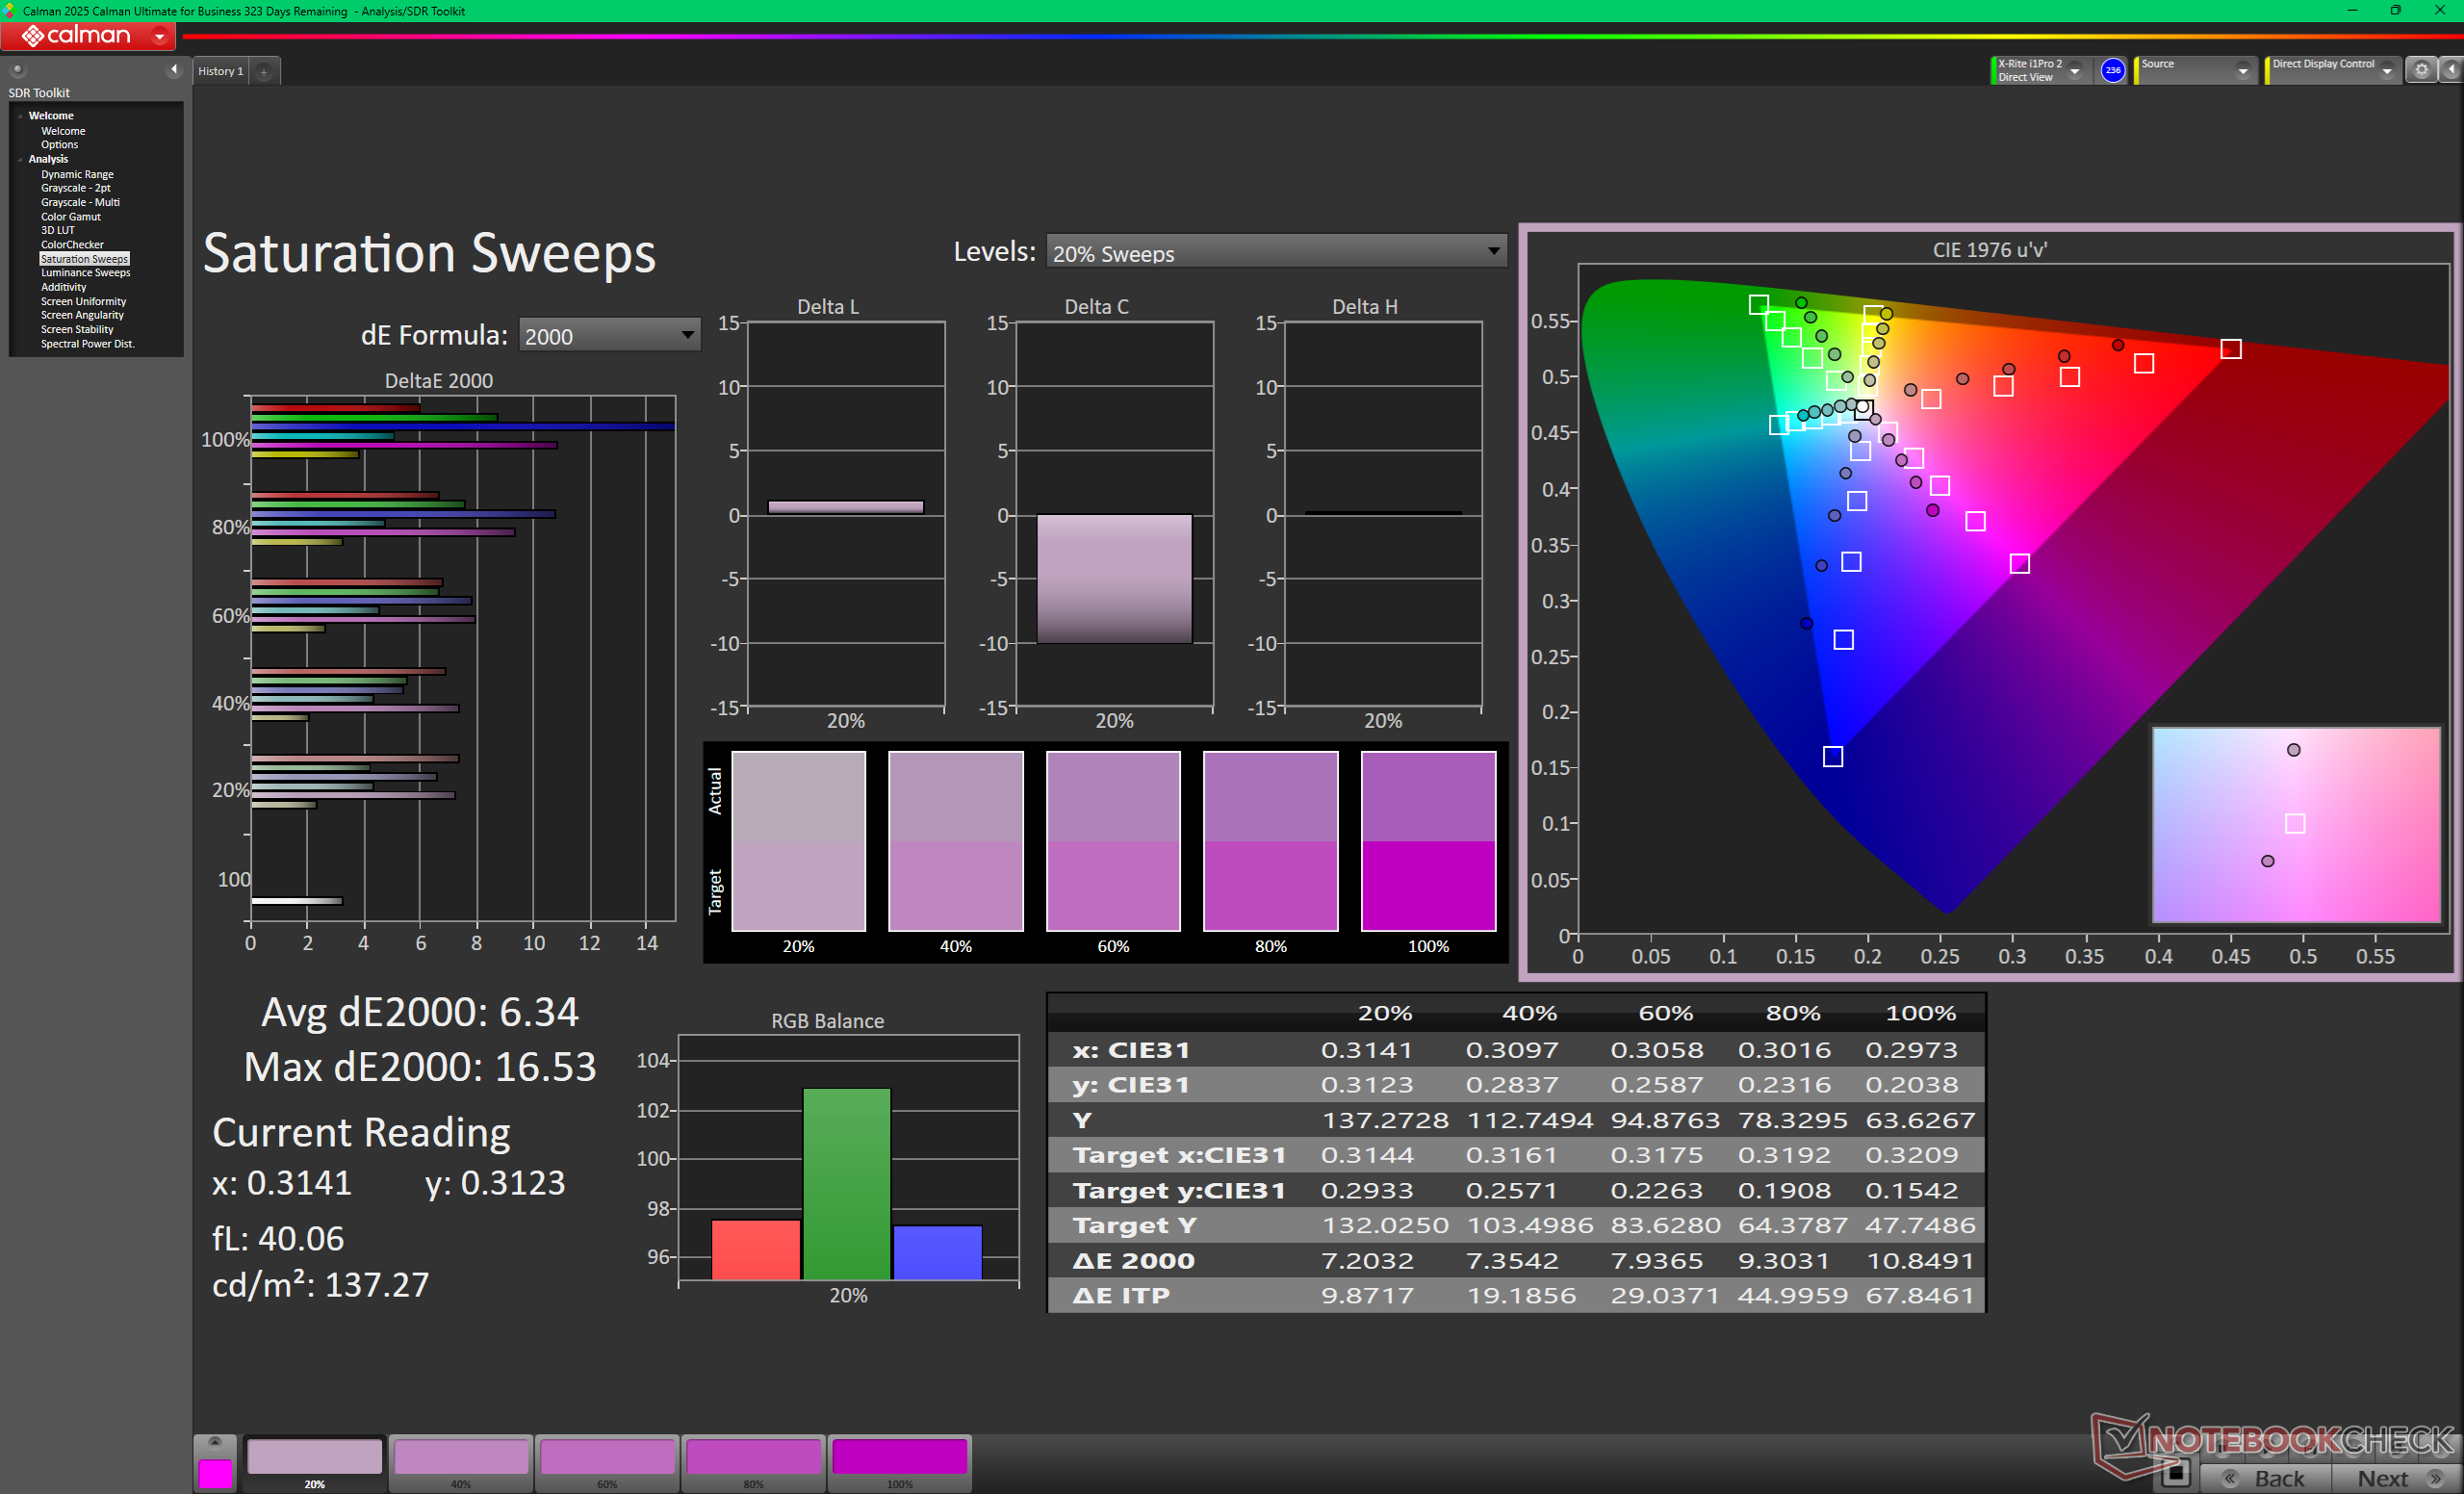
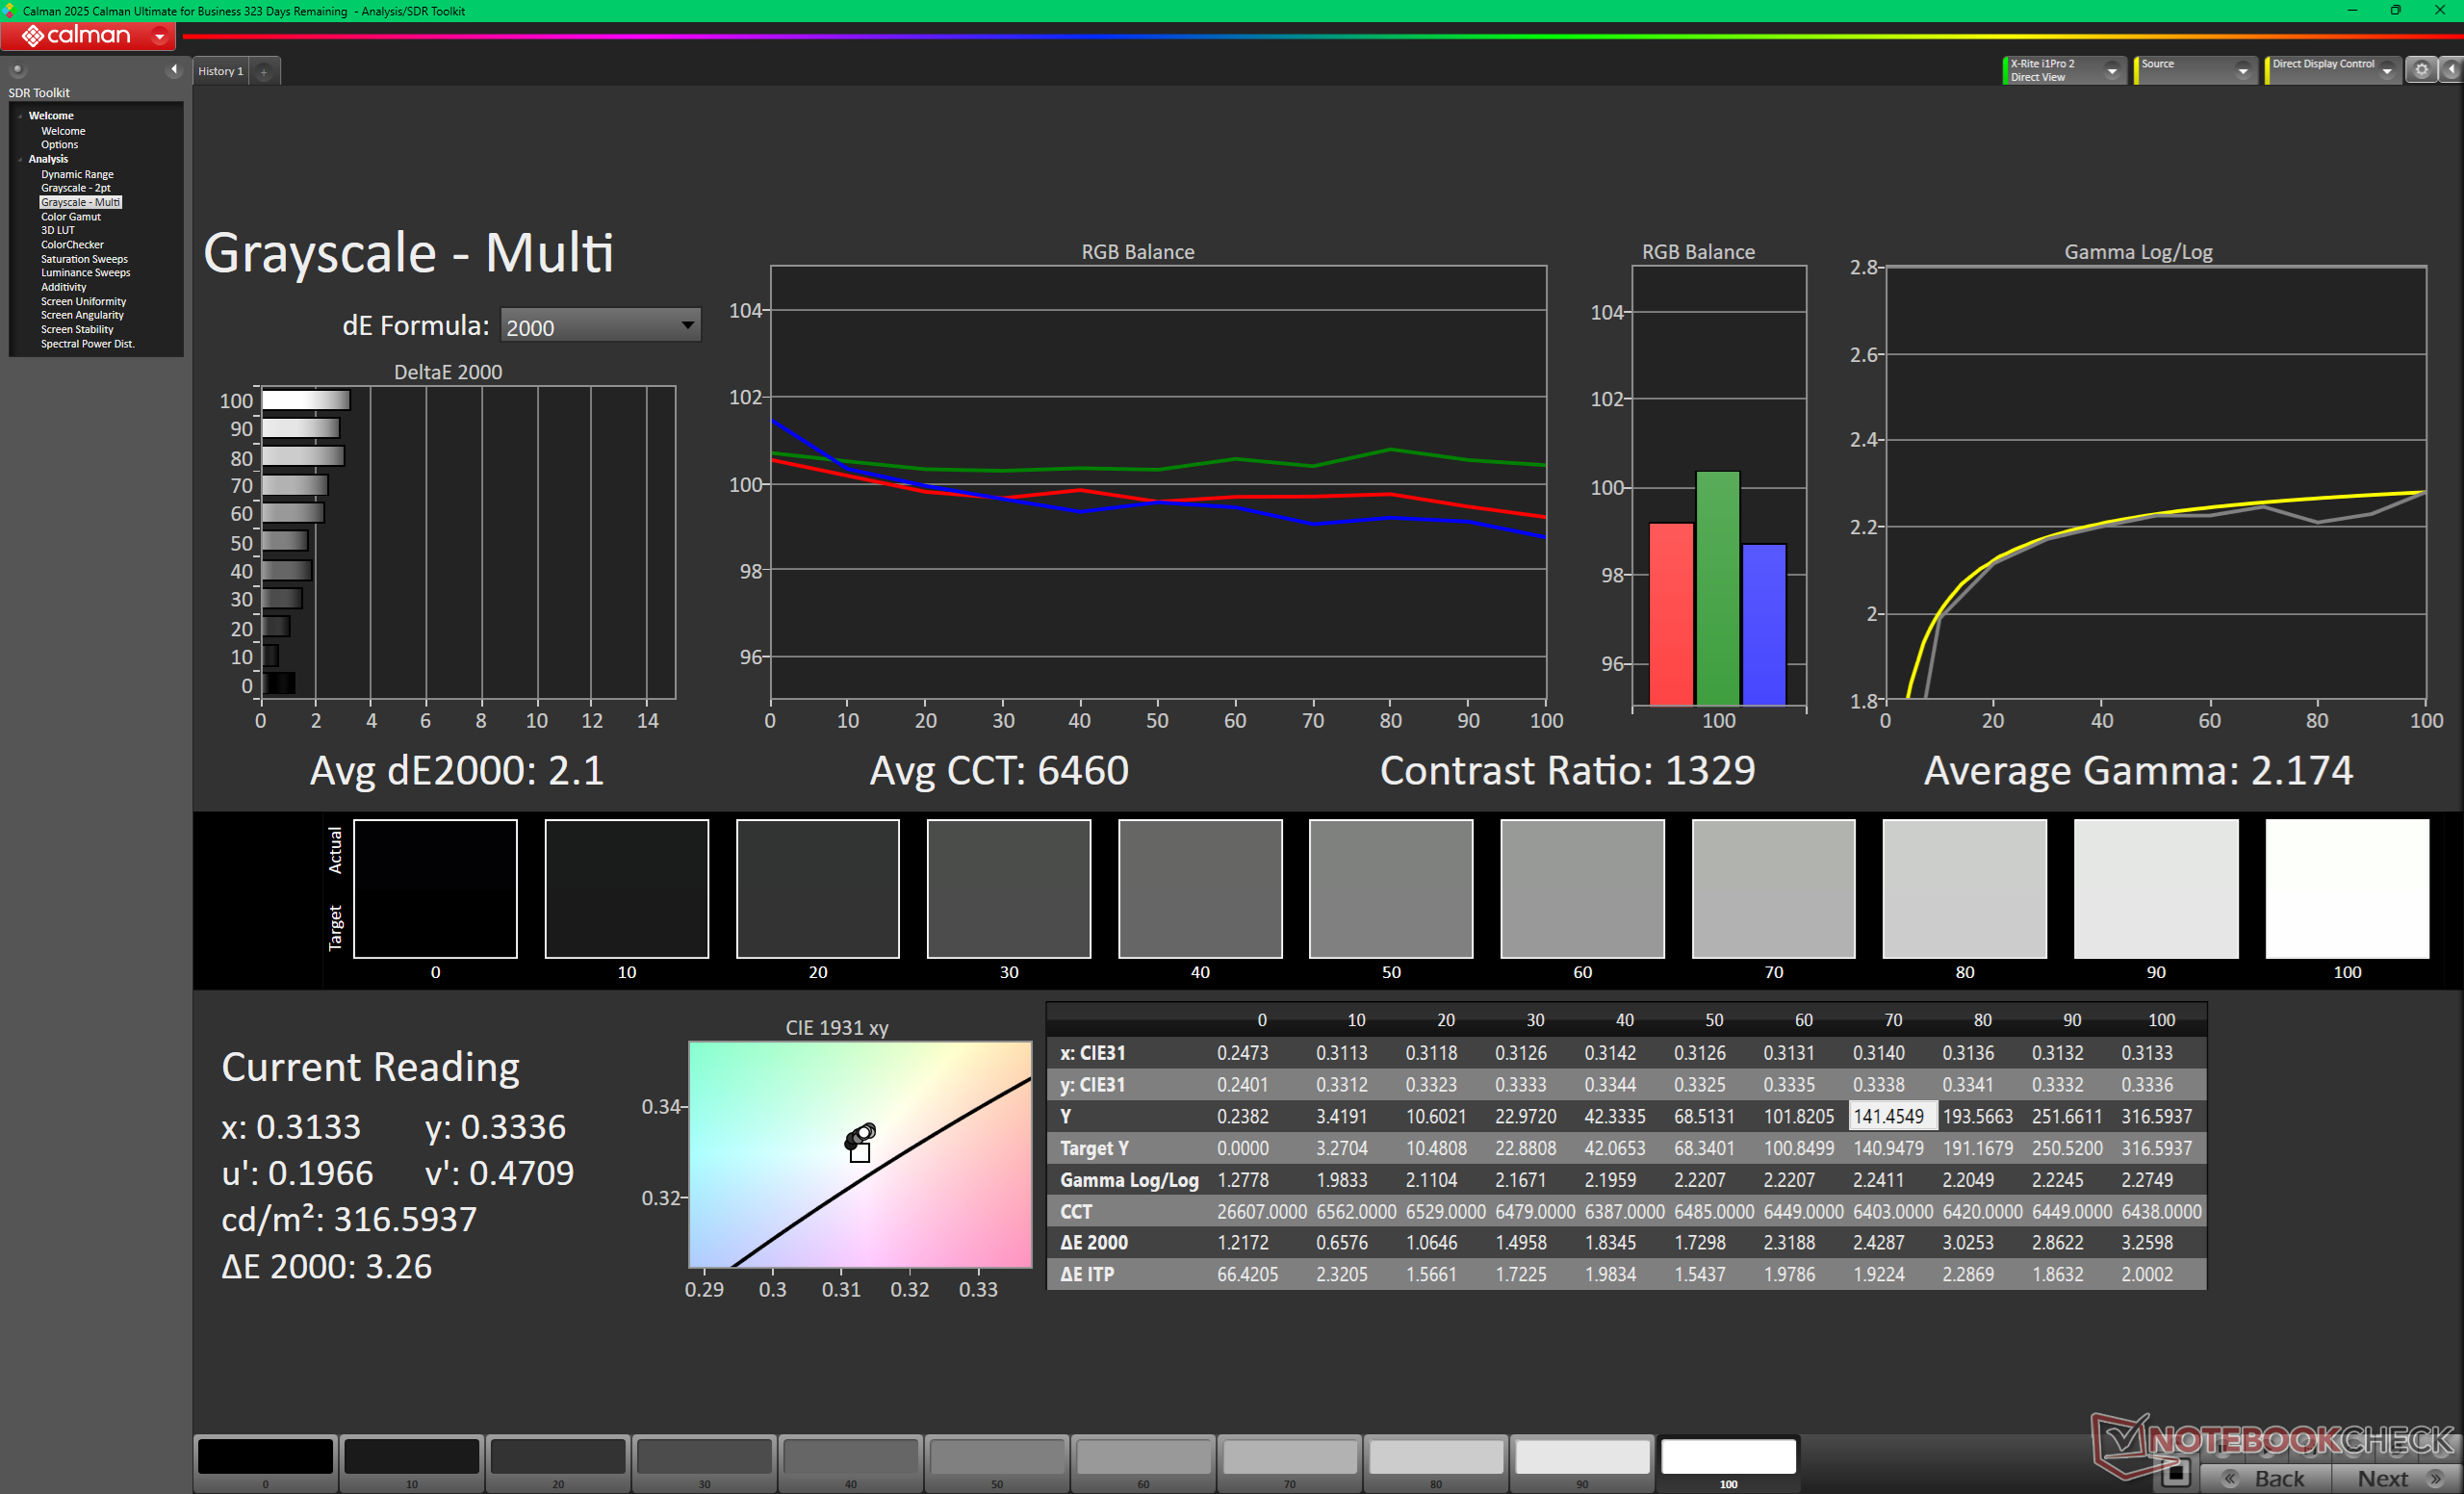
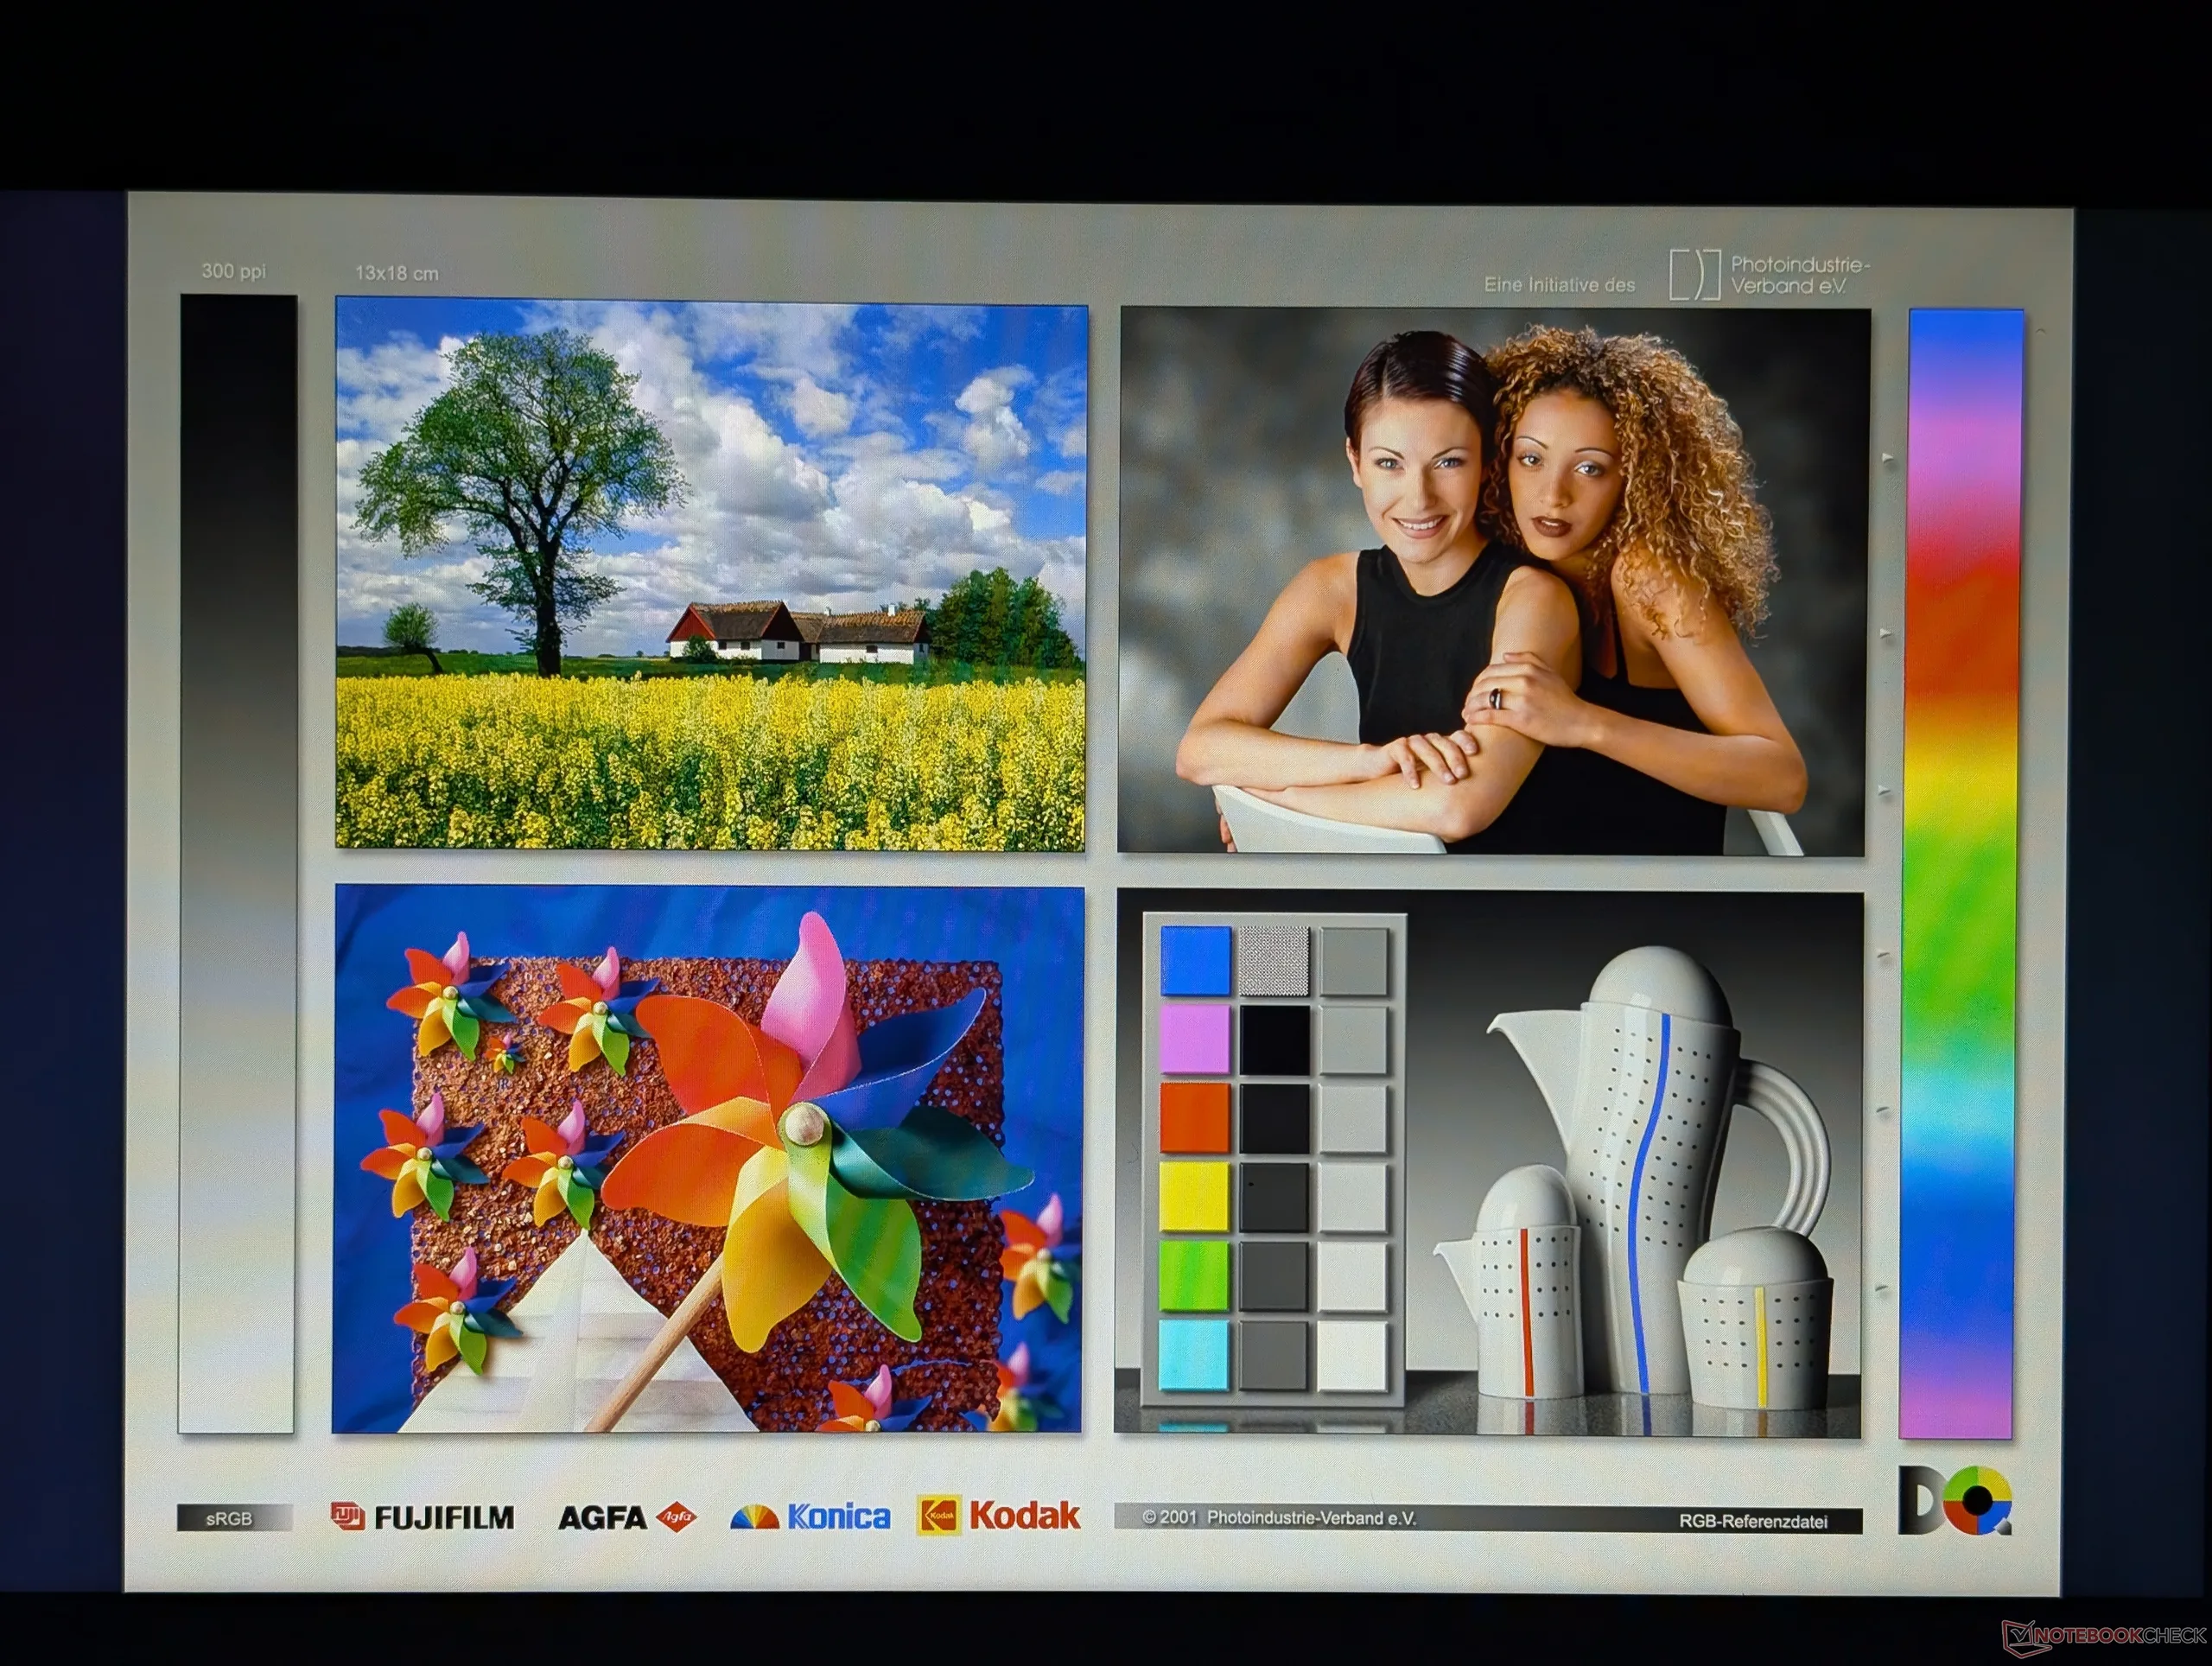
De basisoptie heeft geen sRGB-dekking en is beperkt tot een verversingssnelheid van 60 Hz, in tegenstelling tot de veel betere OLED-optie. Het contrast is verder vrij goed voor een IPS-paneel met meer dan 1500:1.

| |||||||||||||||||||||||||
Helderheidsverdeling: 91 %
Helderheid in Batterij-modus: 321.7 cd/m²
Contrast: 1787:1 (Zwart: 0.18 cd/m²)
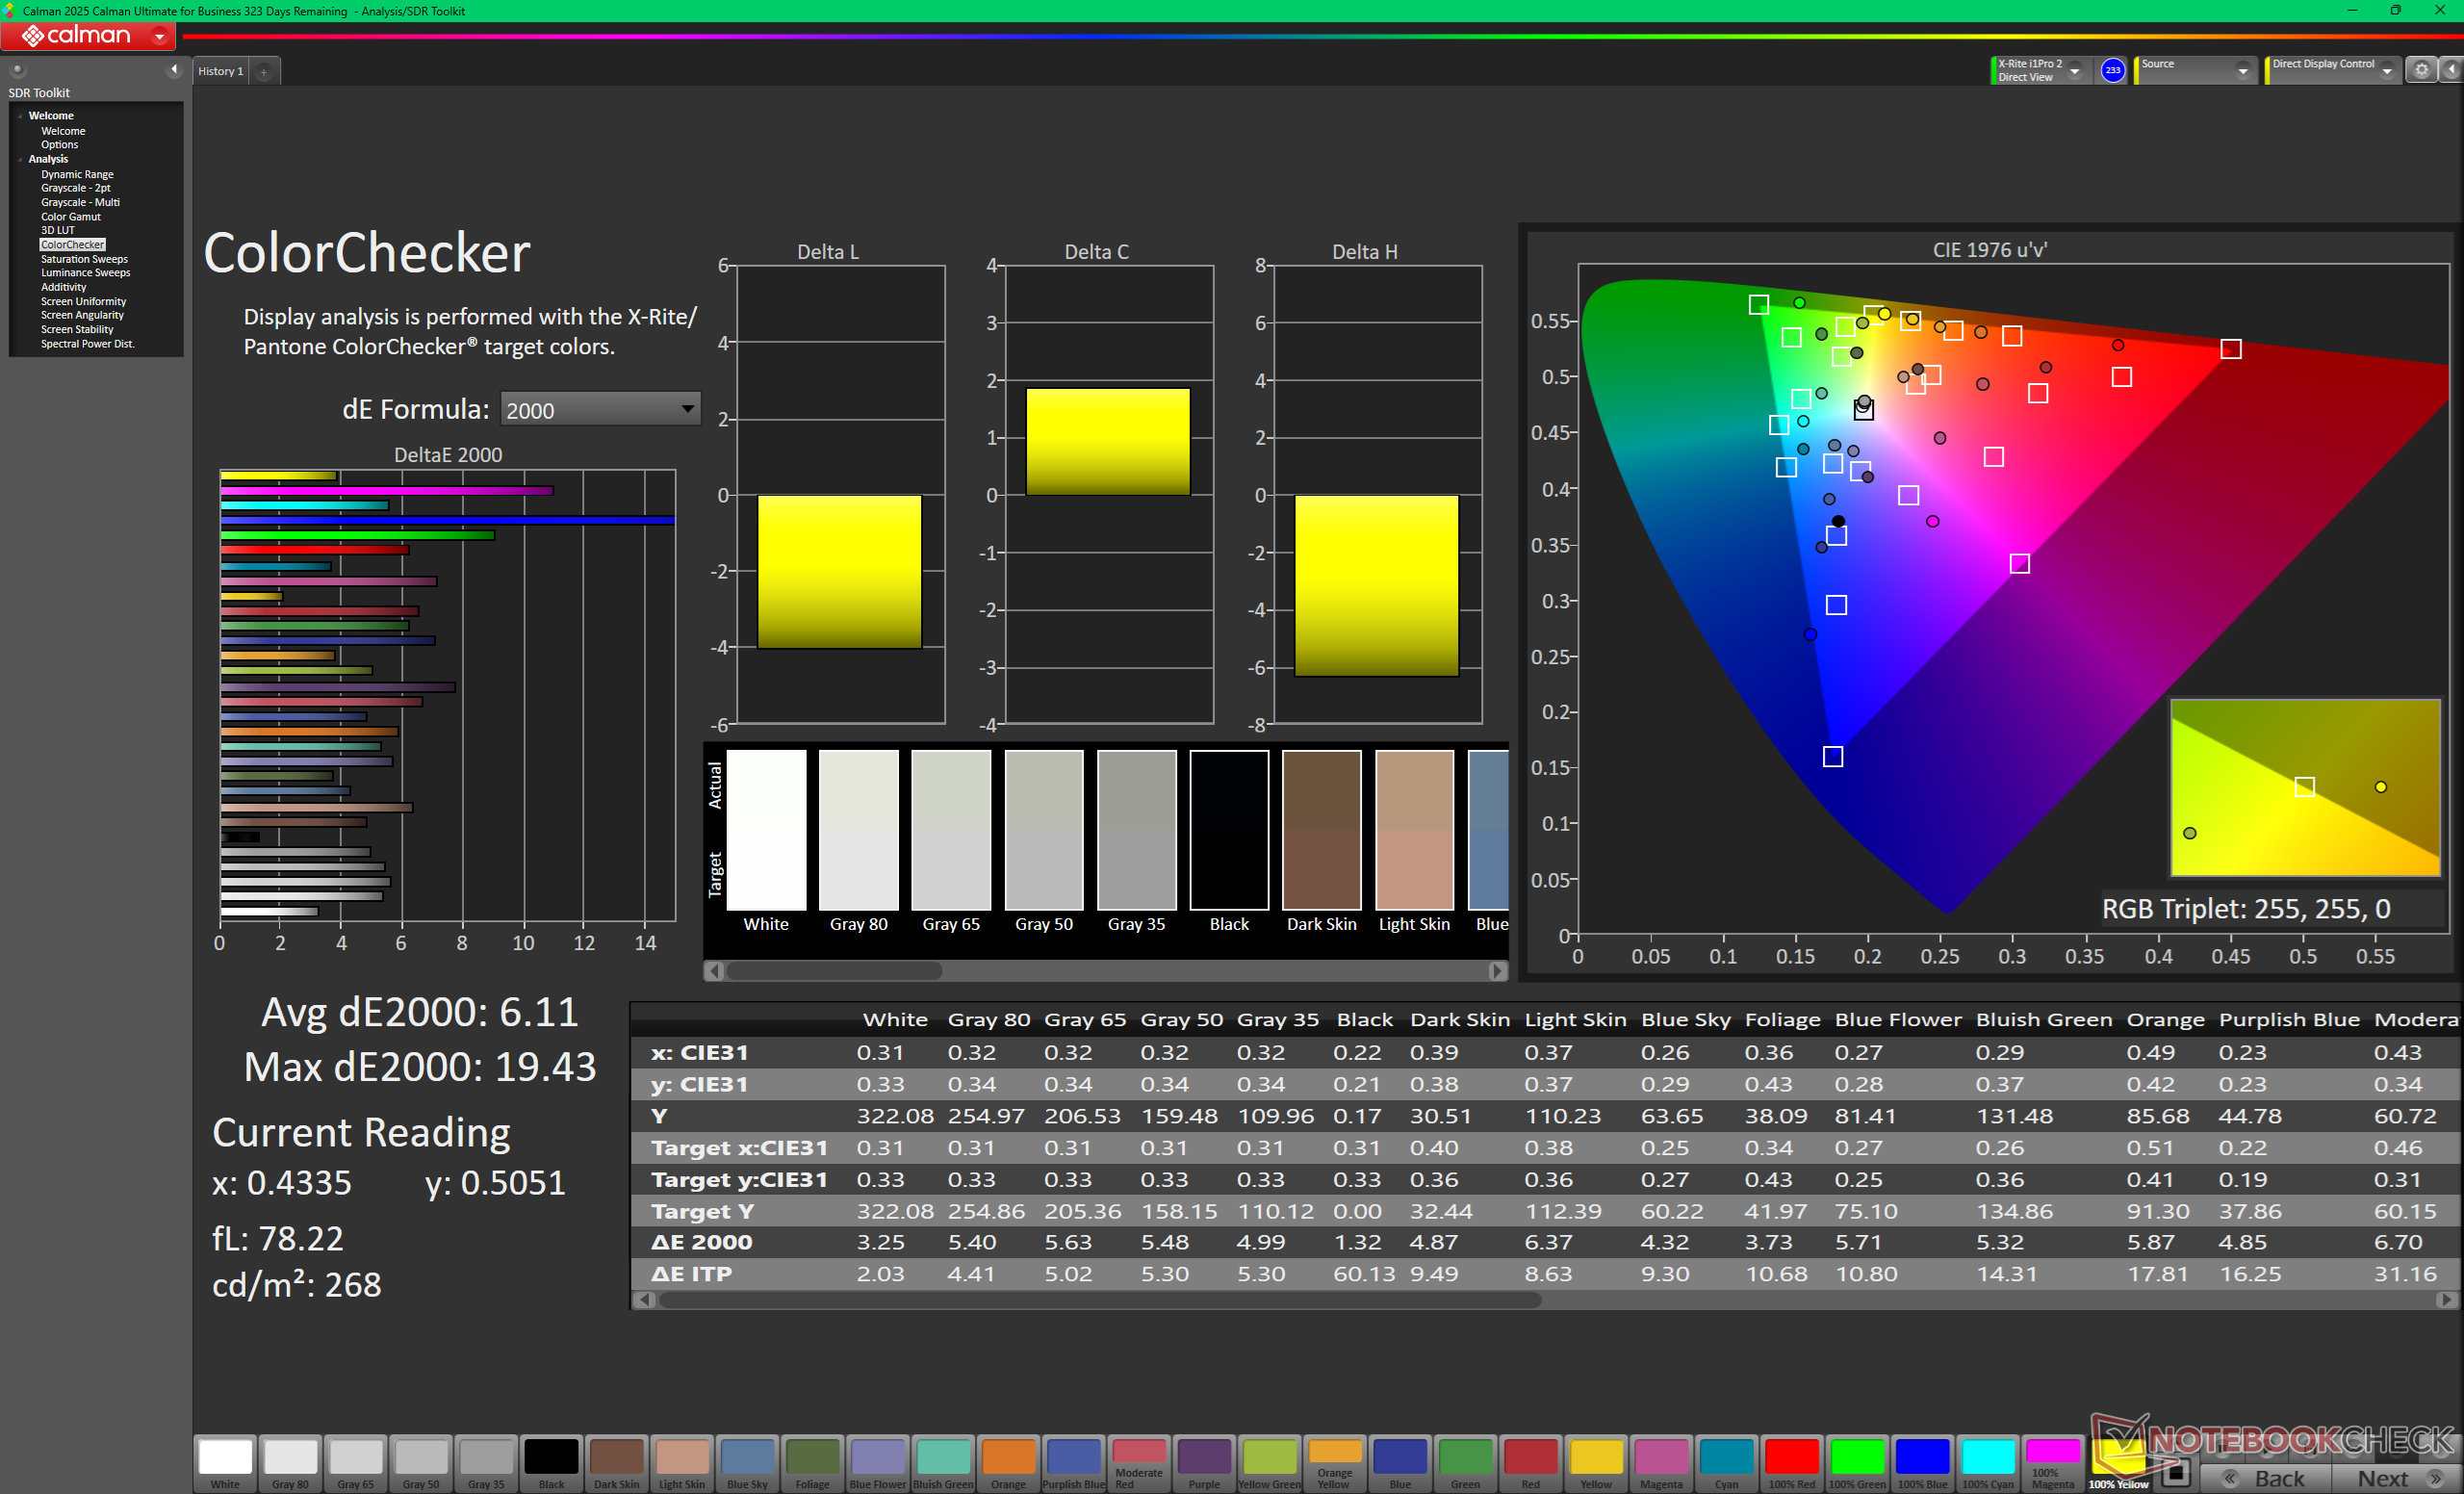
ΔE ColorChecker Calman: 6.11 | ∀{0.5-29.43 Ø4.72}
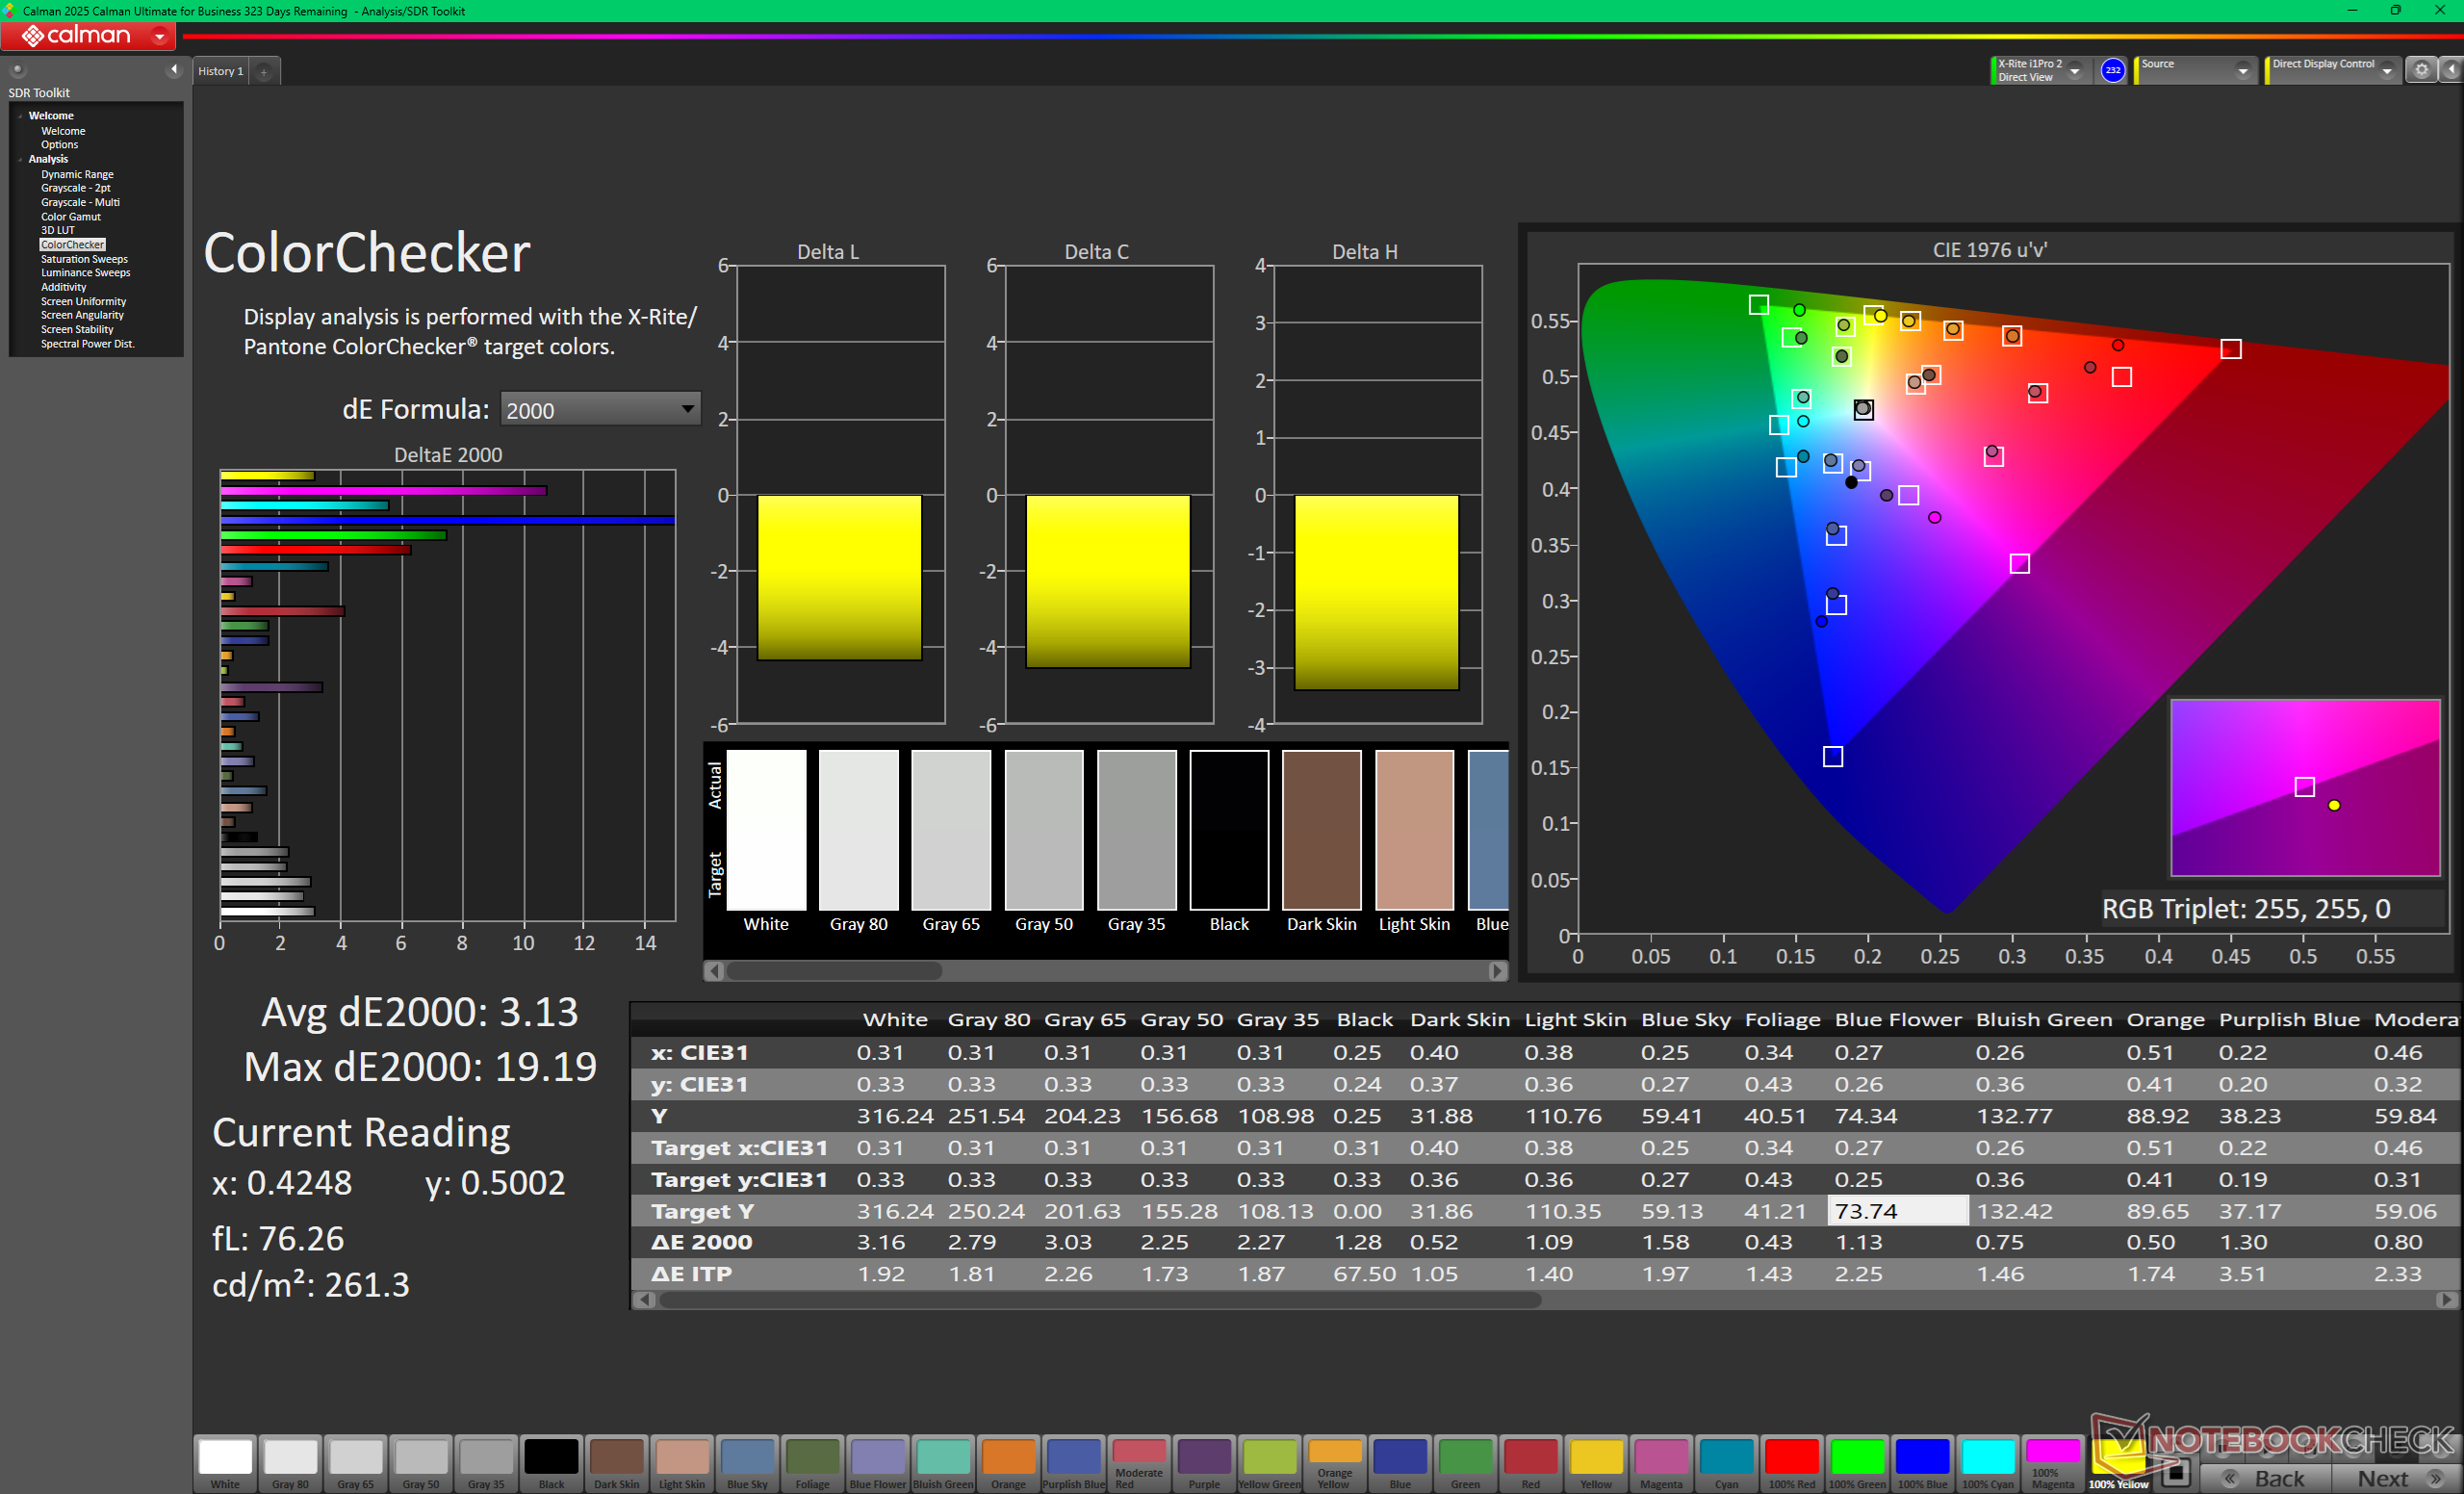
calibrated: 3.13
ΔE Greyscale Calman: 3.9 | ∀{0.09-98 Ø4.97}
40.7% AdobeRGB 1998 (Argyll 3D)
57.4% sRGB (Argyll 3D)
39.4% Display P3 (Argyll 3D)
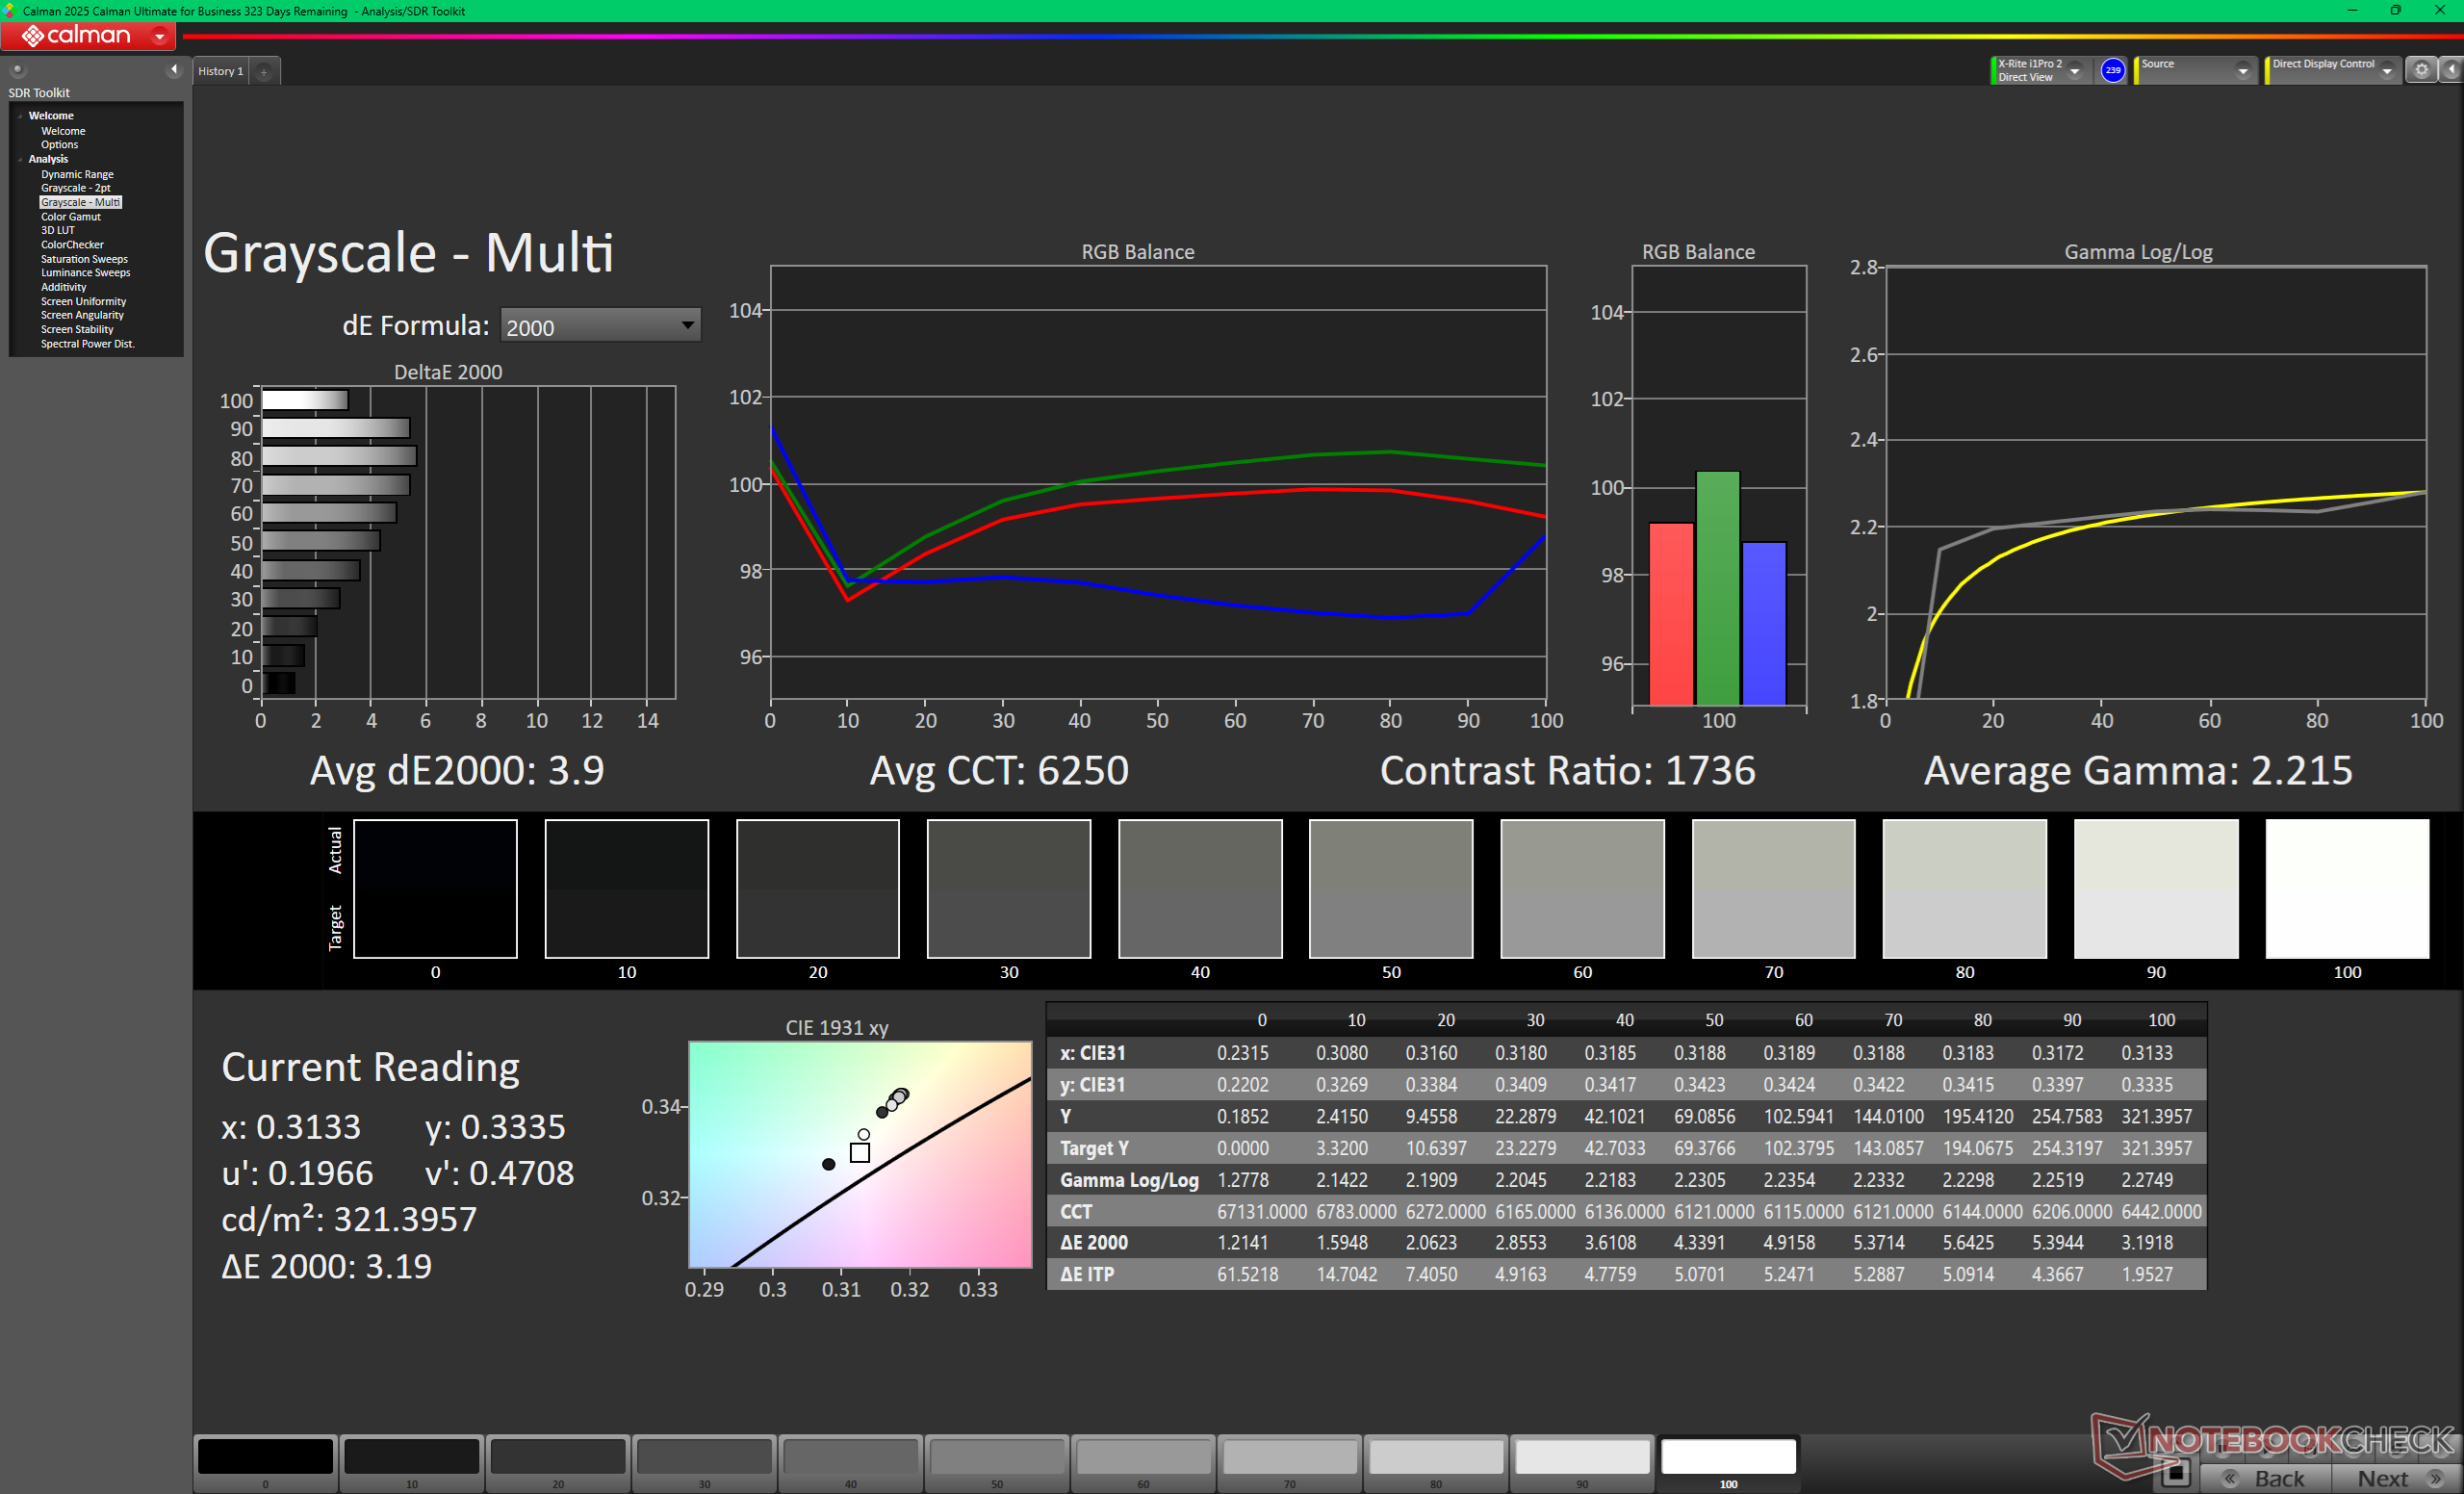
Gamma: 2.22
CCT: 6250 K
| MSI Venture 16 AI A2HMTG BOE0D3E, IPS, 1920x1200, 16", 60 Hz | MSI Prestige 16 B1MG-001US AU Optronics B160QAN03.R, IPS, 2560x1600, 16", 60 Hz | Dell 16 Plus 2-in-1 AU Optronics B160QAT, Mini-LED, 2560x1600, 16", 90 Hz | Asus V16 V3607V MNG007QX2-2, IPS, 1920x1200, 16", 144 Hz | HP Pavilion 16-ag0057ng CMN1640, IPS, 1920x1200, 16", 60 Hz | Lenovo IdeaPad Slim 5 16AKP10 Lenovo LEN160WUM, IPS, 1920x1200, 16", 60 Hz | |
|---|---|---|---|---|---|---|
| Display | 109% | 119% | 4% | 7% | -1% | |
| Display P3 Coverage (%) | 39.4 | 96.7 145% | 99.5 153% | 40.9 4% | 41.6 6% | 39.1 -1% |
| sRGB Coverage (%) | 57.4 | 99.8 74% | 100 74% | 59.7 4% | 62.4 9% | 57.6 0% |
| AdobeRGB 1998 Coverage (%) | 40.7 | 84.6 108% | 94.2 131% | 42.2 4% | 43 6% | 40.4 -1% |
| Response Times | -85% | -148% | 13% | -14% | -16% | |
| Response Time Grey 50% / Grey 80% * (ms) | 26.7 ? | 49.4 ? -85% | 48.8 ? -83% | 22.9 ? 14% | 30.7 ? -15% | 31.9 ? -19% |
| Response Time Black / White * (ms) | 18.4 ? | 33.9 ? -84% | 57.6 ? -213% | 16.1 ? 12% | 20.8 ? -13% | 20.6 ? -12% |
| PWM Frequency (Hz) | 2807 ? | |||||
| PWM Amplitude * (%) | 50 | |||||
| Screen | 18% | 49% | -27% | 0% | -13% | |
| Brightness middle (cd/m²) | 321.7 | 473.6 47% | 432.1 34% | 313.3 -3% | 324 1% | 349 8% |
| Brightness (cd/m²) | 306 | 456 49% | 426 39% | 298 -3% | 295 -4% | 332 8% |
| Brightness Distribution (%) | 91 | 87 -4% | 97 7% | 88 -3% | 88 -3% | 91 0% |
| Black Level * (cd/m²) | 0.18 | 0.19 -6% | 0.5 -178% | 0.2 -11% | 0.33 -83% | |
| Contrast (:1) | 1787 | 2493 40% | 627 -65% | 1620 -9% | 1058 -41% | |
| Colorchecker dE 2000 * | 6.11 | 5.9 3% | 1.95 68% | 6.09 -0% | 5.13 16% | 5.57 9% |
| Colorchecker dE 2000 max. * | 19.43 | 9.37 52% | 3.87 80% | 19.31 1% | 16.11 17% | 19.96 -3% |
| Colorchecker dE 2000 calibrated * | 3.13 | 0.89 72% | 1.16 63% | 2.63 16% | 2.99 4% | 4.52 -44% |
| Greyscale dE 2000 * | 3.9 | 7.3 -87% | 2 49% | 4.1 -5% | 4.24 -9% | 2.7 31% |
| Gamma | 2.22 99% | 1.9 116% | 2.3 96% | 2.18 101% | 2.3 96% | 2.129 103% |
| CCT | 6250 104% | 7260 90% | 6222 104% | 6031 108% | 7318 89% | 6656 98% |
| Totaal Gemiddelde (Programma / Instellingen) | 14% /
23% | 7% /
34% | -3% /
-14% | -2% /
-0% | -10% /
-11% |
* ... kleiner is beter
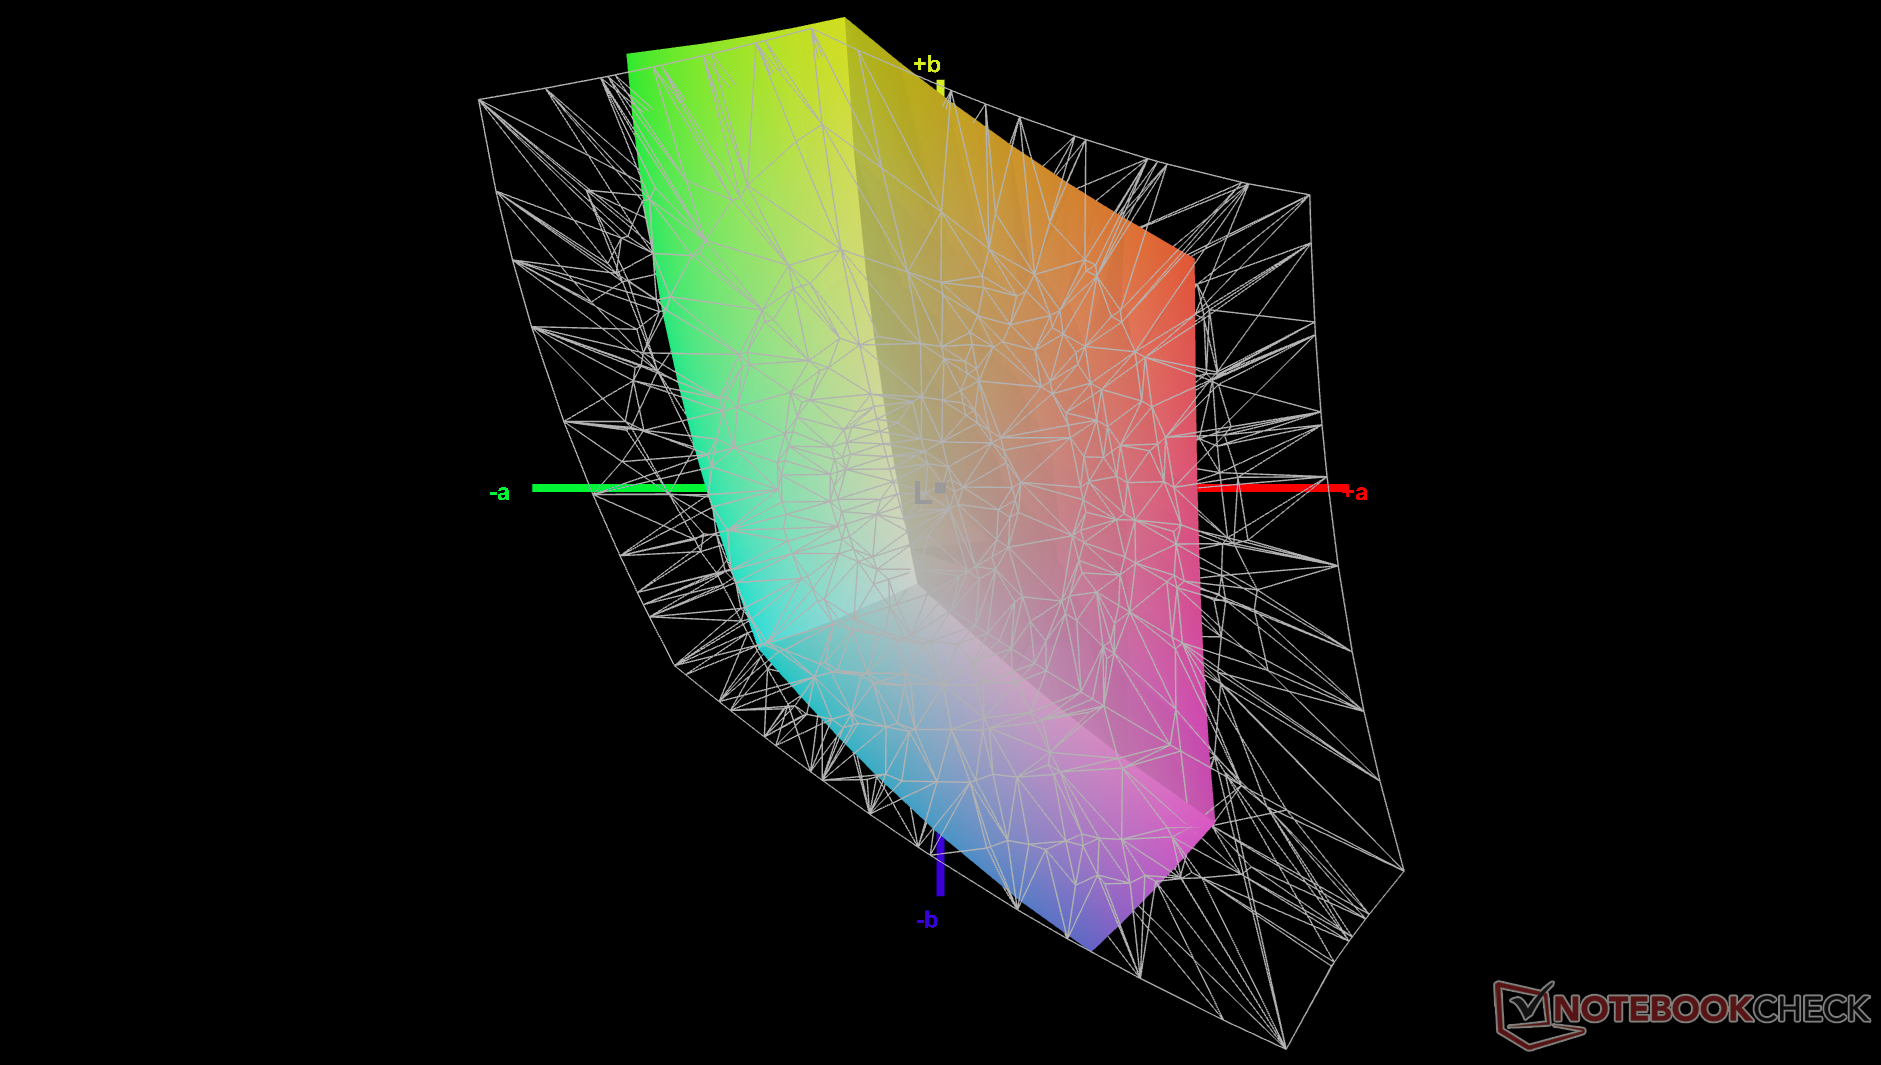
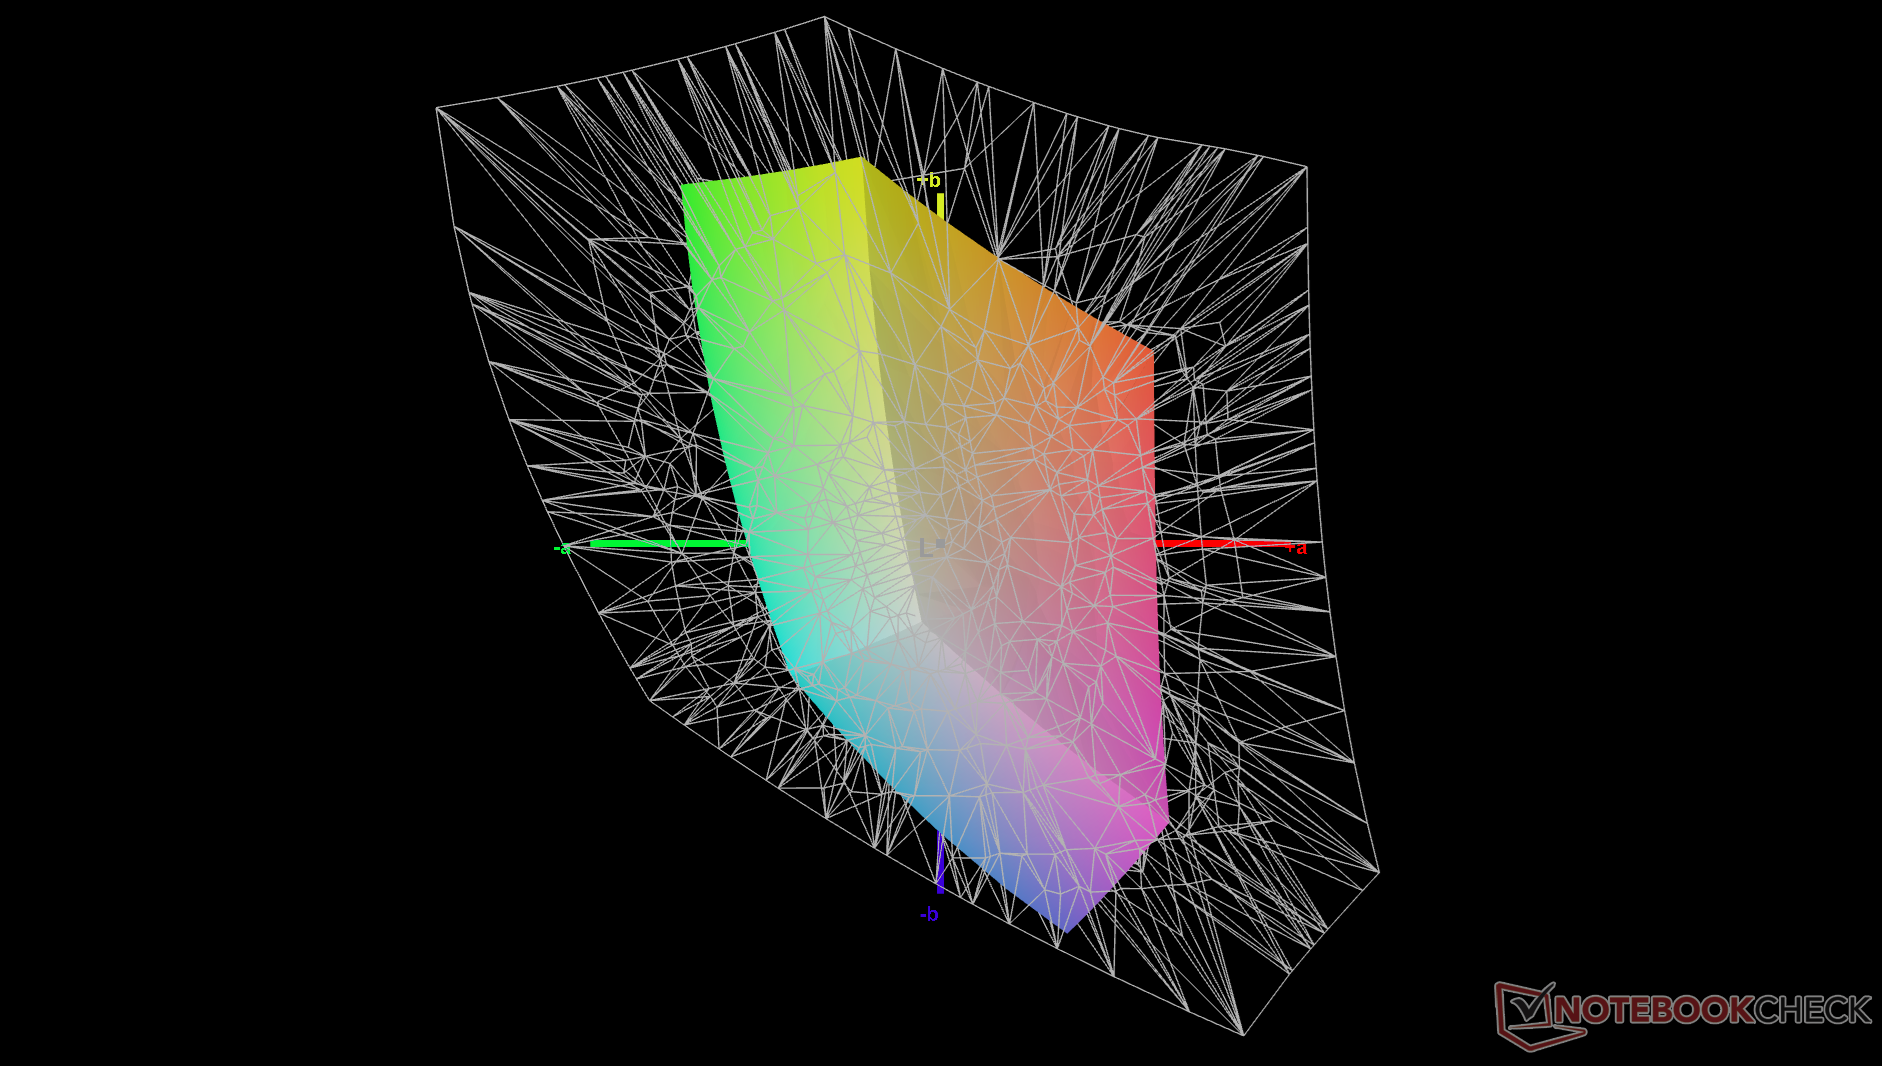
Het scherm is niet gekalibreerd, wat te verwachten is van een budgetmodel. Met name de kleurtemperatuur is met 6250K aan de warme kant, hoewel de gemiddelde deltaE van grijswaarden met slechts 3,9 relatief laag is. Door het paneel zelf te kalibreren worden deze problemen verholpen, zij het niet volledig vanwege de beperkte sRGB-dekking, zoals blijkt uit de CalMAN screenshots hieronder. Ons gekalibreerde ICM-profiel kunt u hierboven gratis downloaden.

Responstijd Scherm
| ↔ Responstijd Zwart naar Wit | ||
|---|---|---|
| 18.4 ms ... stijging ↗ en daling ↘ gecombineerd | ↗ 9.9 ms stijging | 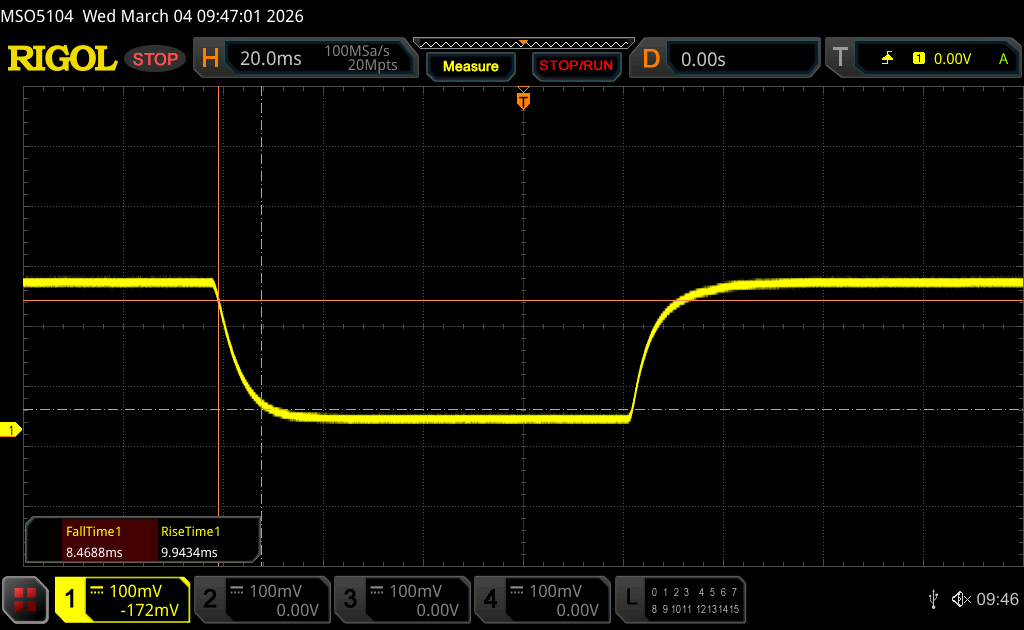 |
| ↘ 8.5 ms daling | ||
| Het scherm vertoonde prima responstijden in onze tests maar is misschien wat te traag voor competitieve games. Ter vergelijking: alle testtoestellen variëren van 0.1 (minimum) tot 240 (maximum) ms. » 41 % van alle toestellen zijn beter. Dit betekent dat de gemeten responstijd vergelijkbaar is met het gemiddelde (19.8 ms) van alle geteste toestellen. | ||
| ↔ Responstijd 50% Grijs naar 80% Grijs | ||
| 26.7 ms ... stijging ↗ en daling ↘ gecombineerd | ↗ 12.9 ms stijging | 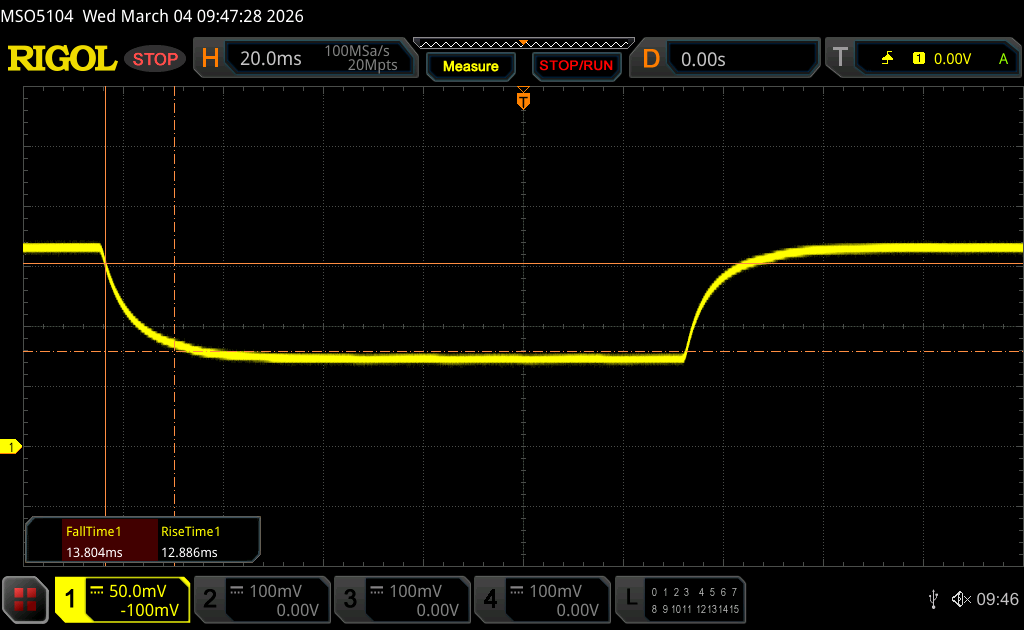 |
| ↘ 13.8 ms daling | ||
| Het scherm vertoonde relatief trage responstijden in onze tests en is misschien te traag voor games. Ter vergelijking: alle testtoestellen variëren van 0.165 (minimum) tot 636 (maximum) ms. » 37 % van alle toestellen zijn beter. Dit betekent dat de gemeten responstijd beter is dan het gemiddelde (31 ms) van alle geteste toestellen. | ||
Screen Flickering / PWM (Pulse-Width Modulation)
| Screen flickering / PWM niet waargenomen | 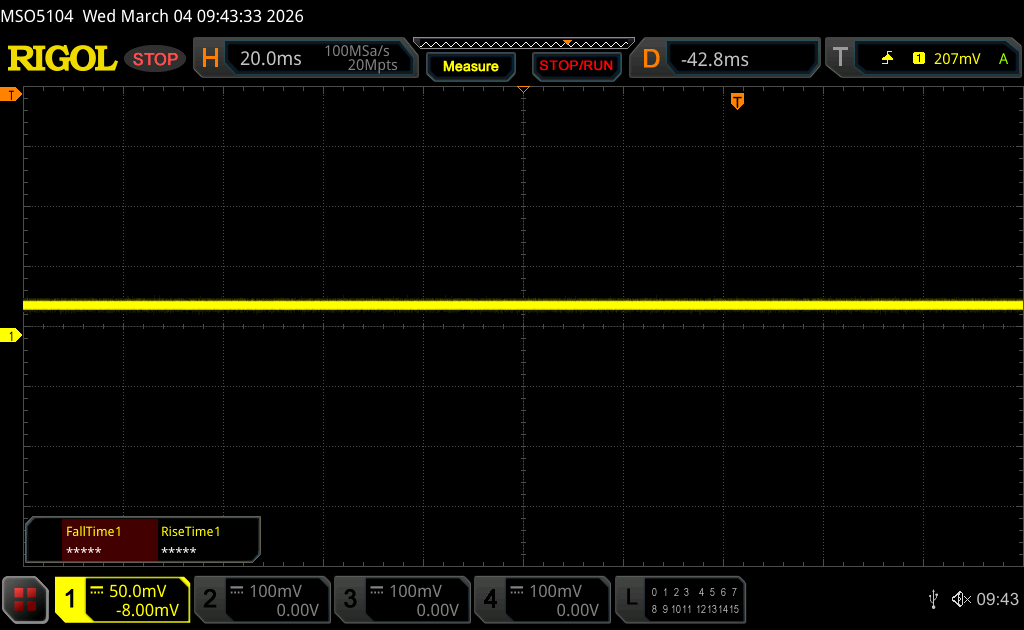 | ||
Ter vergelijking: 52 % van alle geteste toestellen maakten geen gebruik van PWM om de schermhelderheid te verlagen. Als het wel werd gebruikt, werd een gemiddelde van 7747 (minimum: 5 - maximum: 343500) Hz waargenomen. | |||
Prestaties
Testomstandigheden
We hebben zowel Windows als MSI Center ingesteld op de modus Prestaties voordat we de onderstaande benchmarks uitvoerden.
Processor
Ruwe multi-thread prestaties van onze Core Ultra 7 255H is ongeveer 15 tot 20 procent sneller dan de Core Ultra 7 155H in de Prestige 16 om een redelijke jaar-op-jaar boost te vertegenwoordigen. In vergelijking met andere laptops met dezelfde Core Ultra 7 255H-processor komt de MSI echter net iets achter te liggen met slechts een paar procentpunten.
Opwaarderen naar de Core Ultra 9 285H configuratie zal de multi-thread prestaties naar verwachting met 15 tot 25 procent verbeteren, zoals blijkt uit de onderstaande vergelijkingstabel.
Cinebench R15 meervoudige lus
Cinebench R23: Multi Core | Single Core
Cinebench R20: CPU (Multi Core) | CPU (Single Core)
Cinebench R15: CPU Multi 64Bit | CPU Single 64Bit
Blender: v2.79 BMW27 CPU
7-Zip 18.03: 7z b 4 | 7z b 4 -mmt1
Geekbench 6.7: Multi-Core | Single-Core
Geekbench 5.5: Multi-Core | Single-Core
HWBOT x265 Benchmark v2.2: 4k Preset
LibreOffice : 20 Documents To PDF
R Benchmark 2.5: Overall mean
| HWBOT x265 Benchmark v2.2 / 4k Preset | |
| MSI Prestige 16 AI Evo B2HMG | |
| MSI Venture 16 AI A2HMTG | |
| Asus ZenBook S16 UM5606GA | |
| Gemiddeld Intel Core Ultra 7 255H (13.7 - 26.5, n=19) | |
| Acer Swift Go 16 AI SFG16-61-R5Y5 | |
| Asus ExpertBook B5 B5605CCA | |
| MSI Prestige 16 B1MG-001US | |
| Asus V16 V3607V | |
| Dynabook Tecra A60 A65-M | |
| Dell 16 Plus 2-in-1 | |
| HP Pavilion 16-ag0057ng | |
| Lenovo IdeaPad Slim 5 16AKP10 | |
* ... kleiner is beter
AIDA64: FP32 Ray-Trace | FPU Julia | CPU SHA3 | CPU Queen | FPU SinJulia | FPU Mandel | CPU AES | CPU ZLib | FP64 Ray-Trace | CPU PhotoWorxx | CPU CheckMate
| Performance rating | |
| MSI Venture 16 AI A2HMTG -1! | |
| Gemiddeld Intel Core Ultra 7 255H | |
| MSI Prestige 16 B1MG-001US -1! | |
| HP Pavilion 16-ag0057ng -1! | |
| Asus V16 V3607V -1! | |
| Dell 16 Plus 2-in-1 -1! | |
| Lenovo IdeaPad Slim 5 16AKP10 -1! | |
| AIDA64 / FP32 Ray-Trace | |
| Gemiddeld Intel Core Ultra 7 255H (13863 - 24741, n=17) | |
| MSI Venture 16 AI A2HMTG (v8.20.8100) | |
| HP Pavilion 16-ag0057ng (v6.92.6600) | |
| MSI Prestige 16 B1MG-001US (v6.92.6600) | |
| Asus V16 V3607V (v6.92.6600) | |
| Lenovo IdeaPad Slim 5 16AKP10 (v6.92.6600) | |
| Dell 16 Plus 2-in-1 (v6.92.6600) | |
| AIDA64 / FPU Julia | |
| MSI Venture 16 AI A2HMTG (v8.20.8100) | |
| Gemiddeld Intel Core Ultra 7 255H (71030 - 119222, n=17) | |
| MSI Prestige 16 B1MG-001US (v6.92.6600) | |
| HP Pavilion 16-ag0057ng (v6.92.6600) | |
| Asus V16 V3607V (v6.92.6600) | |
| Dell 16 Plus 2-in-1 (v6.92.6600) | |
| Lenovo IdeaPad Slim 5 16AKP10 (v6.92.6600) | |
| AIDA64 / CPU SHA3 | |
| Gemiddeld Intel Core Ultra 7 255H (3408 - 5548, n=17) | |
| MSI Venture 16 AI A2HMTG (v8.20.8100) | |
| MSI Prestige 16 B1MG-001US (v6.92.6600) | |
| HP Pavilion 16-ag0057ng (v6.92.6600) | |
| Asus V16 V3607V (v6.92.6600) | |
| Dell 16 Plus 2-in-1 (v6.92.6600) | |
| Lenovo IdeaPad Slim 5 16AKP10 (v6.92.6600) | |
| AIDA64 / CPU Queen | |
| MSI Prestige 16 B1MG-001US (v6.92.6600) | |
| Asus V16 V3607V (v6.92.6600) | |
| HP Pavilion 16-ag0057ng (v6.92.6600) | |
| Gemiddeld Intel Core Ultra 7 255H (59098 - 68460, n=16) | |
| Dell 16 Plus 2-in-1 (v6.92.6600) | |
| Lenovo IdeaPad Slim 5 16AKP10 (v6.92.6600) | |
| AIDA64 / FPU SinJulia | |
| MSI Prestige 16 B1MG-001US (v6.92.6600) | |
| HP Pavilion 16-ag0057ng (v6.92.6600) | |
| Asus V16 V3607V (v6.92.6600) | |
| MSI Venture 16 AI A2HMTG (v8.20.8100) | |
| Gemiddeld Intel Core Ultra 7 255H (6716 - 9006, n=17) | |
| Lenovo IdeaPad Slim 5 16AKP10 (v6.92.6600) | |
| Dell 16 Plus 2-in-1 (v6.92.6600) | |
| AIDA64 / FPU Mandel | |
| MSI Venture 16 AI A2HMTG (v8.20.8100) | |
| Gemiddeld Intel Core Ultra 7 255H (37031 - 63347, n=17) | |
| MSI Prestige 16 B1MG-001US (v6.92.6600) | |
| HP Pavilion 16-ag0057ng (v6.92.6600) | |
| Asus V16 V3607V (v6.92.6600) | |
| Dell 16 Plus 2-in-1 (v6.92.6600) | |
| Lenovo IdeaPad Slim 5 16AKP10 (v6.92.6600) | |
| AIDA64 / CPU AES | |
| MSI Prestige 16 B1MG-001US (v6.92.6600) | |
| Gemiddeld Intel Core Ultra 7 255H (58402 - 83568, n=17) | |
| MSI Venture 16 AI A2HMTG (v8.20.8100) | |
| Asus V16 V3607V (v6.92.6600) | |
| HP Pavilion 16-ag0057ng (v6.92.6600) | |
| Dell 16 Plus 2-in-1 (v6.92.6600) | |
| Lenovo IdeaPad Slim 5 16AKP10 (v6.92.6600) | |
| AIDA64 / CPU ZLib | |
| Gemiddeld Intel Core Ultra 7 255H (822 - 1316, n=17) | |
| MSI Prestige 16 B1MG-001US (v6.92.6600) | |
| MSI Venture 16 AI A2HMTG (v8.20.8100) | |
| Asus V16 V3607V (v6.92.6600) | |
| HP Pavilion 16-ag0057ng (v6.92.6600) | |
| Dell 16 Plus 2-in-1 (v6.92.6600) | |
| Lenovo IdeaPad Slim 5 16AKP10 (v6.92.6600) | |
| AIDA64 / FP64 Ray-Trace | |
| Gemiddeld Intel Core Ultra 7 255H (7384 - 13231, n=17) | |
| MSI Venture 16 AI A2HMTG (v8.20.8100) | |
| HP Pavilion 16-ag0057ng (v6.92.6600) | |
| MSI Prestige 16 B1MG-001US (v6.92.6600) | |
| Asus V16 V3607V (v6.92.6600) | |
| Lenovo IdeaPad Slim 5 16AKP10 (v6.92.6600) | |
| Dell 16 Plus 2-in-1 (v6.92.6600) | |
| AIDA64 / CPU PhotoWorxx | |
| Gemiddeld Intel Core Ultra 7 255H (23836 - 65787, n=17) | |
| Dell 16 Plus 2-in-1 (v6.92.6600) | |
| MSI Venture 16 AI A2HMTG (v8.20.8100) | |
| MSI Prestige 16 B1MG-001US (v6.92.6600) | |
| Lenovo IdeaPad Slim 5 16AKP10 (v6.92.6600) | |
| HP Pavilion 16-ag0057ng (v6.92.6600) | |
| Asus V16 V3607V (v6.92.6600) | |
| AIDA64 / CPU CheckMate | |
| MSI Venture 16 AI A2HMTG (v8.20.8100) | |
| Gemiddeld Intel Core Ultra 7 255H (n=1) | |
Systeemprestaties
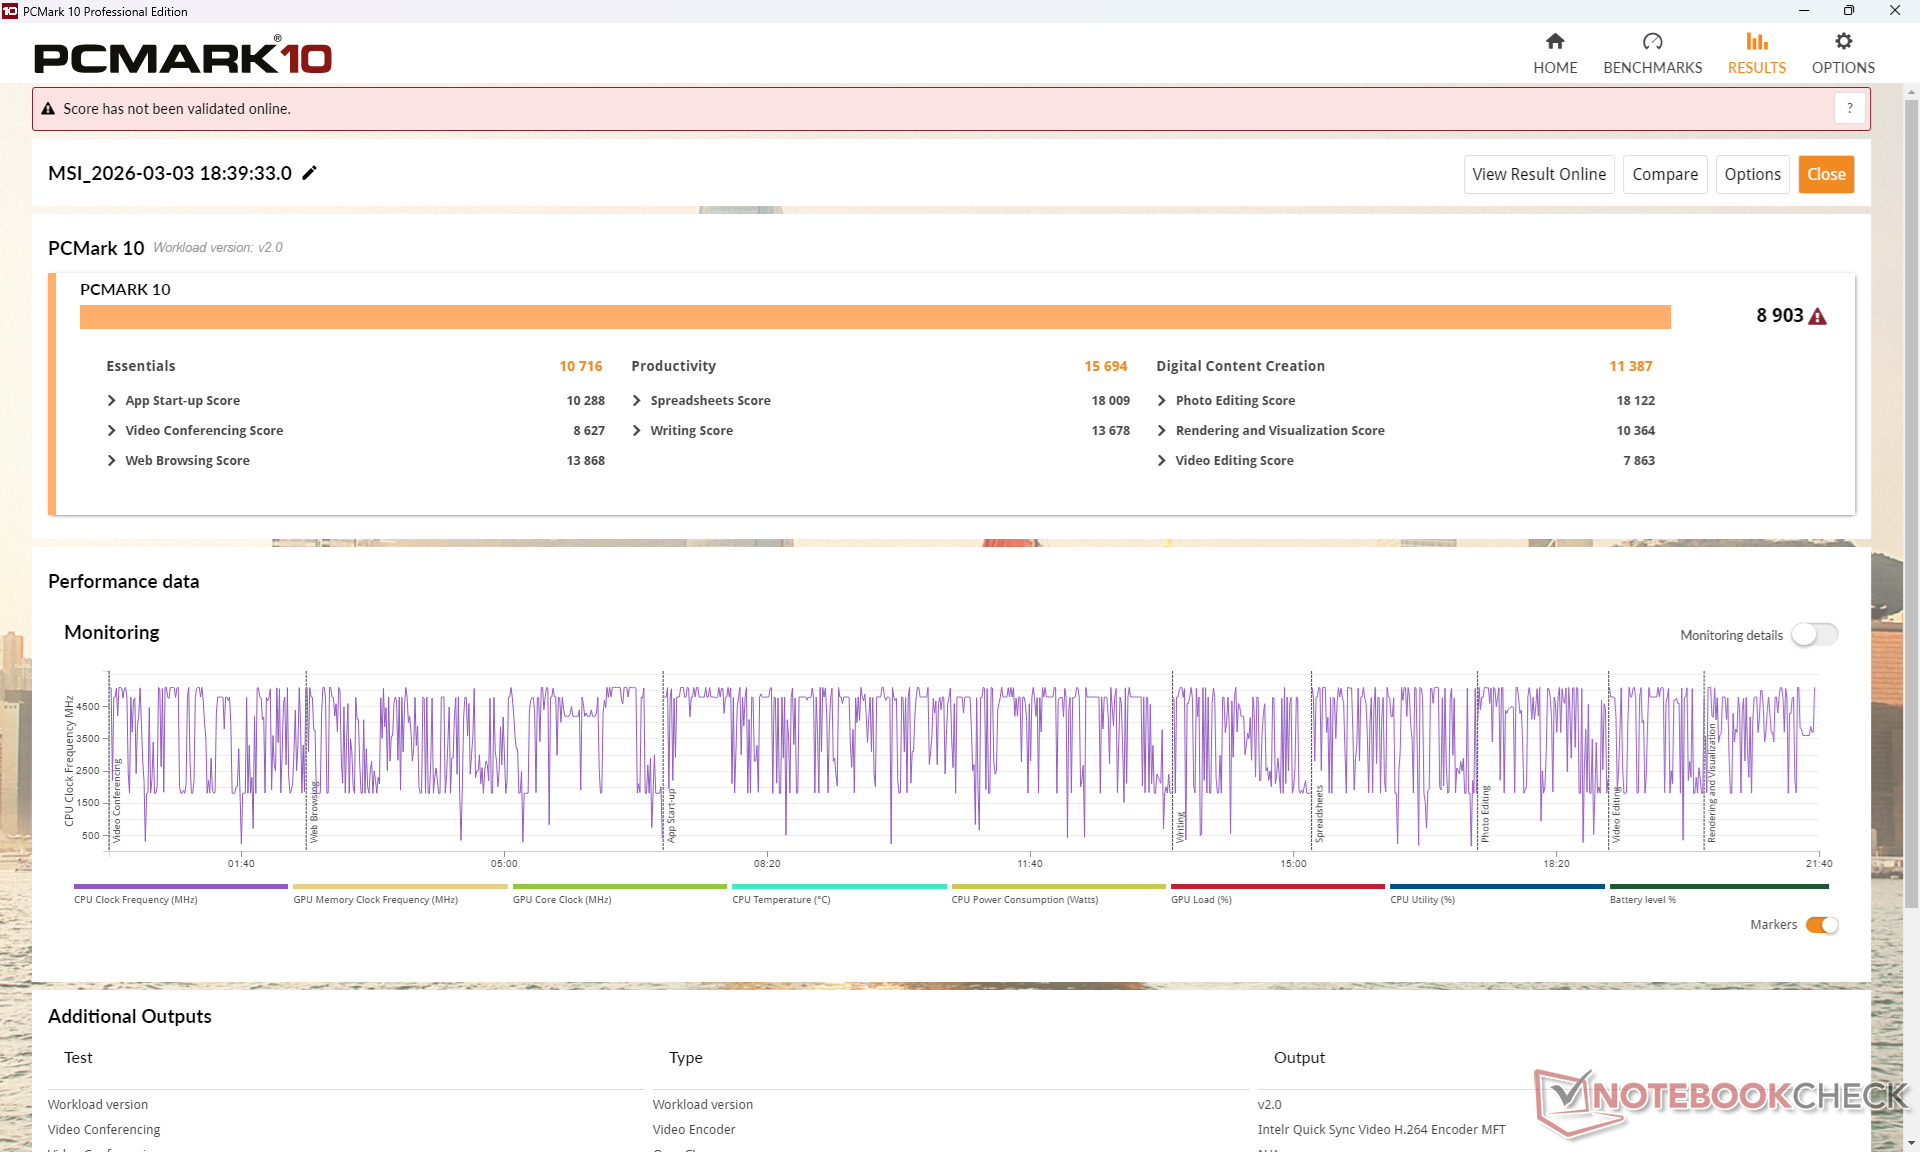
De scores van PCMark 10 liggen ver boven het gemiddelde door een ongewoon hoge productiviteitsscore, zelfs na updates en meerdere hertests. Het resultaat is vrijwel zeker een bug en daarom moeten de onderstaande vergelijkingsscores met een korreltje zout worden genomen.
PCMark 10: Score | Essentials | Productivity | Digital Content Creation
CrossMark: Overall | Productivity | Creativity | Responsiveness
WebXPRT 3: Overall
WebXPRT 4: Overall
Mozilla Kraken 1.1: Total
Geekbench AI: Single Precision GPU 1.7 | Half Precision GPU 1.7 | Quantized GPU 1.7
| Performance rating | |
| MSI Venture 16 AI A2HMTG | |
| Gemiddeld Intel Core Ultra 7 255H, Intel Arc Graphics 140T | |
| Dell 16 Plus 2-in-1 | |
| MSI Prestige 16 B1MG-001US -3! | |
| Asus V16 V3607V -4! | |
| HP Pavilion 16-ag0057ng -7! | |
| Lenovo IdeaPad Slim 5 16AKP10 -4! | |
| PCMark 10 / Score | |
| MSI Venture 16 AI A2HMTG | |
| Gemiddeld Intel Core Ultra 7 255H, Intel Arc Graphics 140T (6878 - 9156, n=13) | |
| MSI Prestige 16 B1MG-001US | |
| Dell 16 Plus 2-in-1 | |
| Asus V16 V3607V | |
| HP Pavilion 16-ag0057ng | |
| Lenovo IdeaPad Slim 5 16AKP10 | |
| PCMark 10 / Essentials | |
| MSI Prestige 16 B1MG-001US | |
| Gemiddeld Intel Core Ultra 7 255H, Intel Arc Graphics 140T (10637 - 11556, n=13) | |
| MSI Venture 16 AI A2HMTG | |
| Dell 16 Plus 2-in-1 | |
| HP Pavilion 16-ag0057ng | |
| Asus V16 V3607V | |
| Lenovo IdeaPad Slim 5 16AKP10 | |
| PCMark 10 / Productivity | |
| MSI Venture 16 AI A2HMTG | |
| Gemiddeld Intel Core Ultra 7 255H, Intel Arc Graphics 140T (7598 - 15694, n=13) | |
| Asus V16 V3607V | |
| Lenovo IdeaPad Slim 5 16AKP10 | |
| HP Pavilion 16-ag0057ng | |
| MSI Prestige 16 B1MG-001US | |
| Dell 16 Plus 2-in-1 | |
| PCMark 10 / Digital Content Creation | |
| Gemiddeld Intel Core Ultra 7 255H, Intel Arc Graphics 140T (10461 - 12552, n=13) | |
| MSI Venture 16 AI A2HMTG | |
| MSI Prestige 16 B1MG-001US | |
| Dell 16 Plus 2-in-1 | |
| Asus V16 V3607V | |
| HP Pavilion 16-ag0057ng | |
| Lenovo IdeaPad Slim 5 16AKP10 | |
| CrossMark / Overall | |
| MSI Venture 16 AI A2HMTG | |
| Gemiddeld Intel Core Ultra 7 255H, Intel Arc Graphics 140T (1610 - 2018, n=13) | |
| Asus V16 V3607V | |
| MSI Prestige 16 B1MG-001US | |
| Dell 16 Plus 2-in-1 | |
| Lenovo IdeaPad Slim 5 16AKP10 | |
| CrossMark / Productivity | |
| MSI Venture 16 AI A2HMTG | |
| Gemiddeld Intel Core Ultra 7 255H, Intel Arc Graphics 140T (1566 - 1908, n=13) | |
| Asus V16 V3607V | |
| MSI Prestige 16 B1MG-001US | |
| Dell 16 Plus 2-in-1 | |
| Lenovo IdeaPad Slim 5 16AKP10 | |
| CrossMark / Creativity | |
| MSI Venture 16 AI A2HMTG | |
| Gemiddeld Intel Core Ultra 7 255H, Intel Arc Graphics 140T (1827 - 2396, n=13) | |
| Asus V16 V3607V | |
| MSI Prestige 16 B1MG-001US | |
| Dell 16 Plus 2-in-1 | |
| Lenovo IdeaPad Slim 5 16AKP10 | |
| CrossMark / Responsiveness | |
| MSI Prestige 16 B1MG-001US | |
| Asus V16 V3607V | |
| Gemiddeld Intel Core Ultra 7 255H, Intel Arc Graphics 140T (1194 - 1781, n=13) | |
| MSI Venture 16 AI A2HMTG | |
| Dell 16 Plus 2-in-1 | |
| Lenovo IdeaPad Slim 5 16AKP10 | |
| WebXPRT 3 / Overall | |
| MSI Venture 16 AI A2HMTG | |
| Gemiddeld Intel Core Ultra 7 255H, Intel Arc Graphics 140T (273 - 327, n=13) | |
| MSI Prestige 16 B1MG-001US | |
| Dell 16 Plus 2-in-1 | |
| HP Pavilion 16-ag0057ng | |
| HP Pavilion 16-ag0057ng | |
| Lenovo IdeaPad Slim 5 16AKP10 | |
| WebXPRT 4 / Overall | |
| MSI Venture 16 AI A2HMTG | |
| Gemiddeld Intel Core Ultra 7 255H, Intel Arc Graphics 140T (247 - 317, n=13) | |
| Dell 16 Plus 2-in-1 | |
| Asus V16 V3607V | |
| MSI Prestige 16 B1MG-001US | |
| HP Pavilion 16-ag0057ng | |
| HP Pavilion 16-ag0057ng | |
| Mozilla Kraken 1.1 / Total | |
| Lenovo IdeaPad Slim 5 16AKP10 | |
| HP Pavilion 16-ag0057ng | |
| HP Pavilion 16-ag0057ng | |
| MSI Prestige 16 B1MG-001US | |
| Asus V16 V3607V | |
| Dell 16 Plus 2-in-1 | |
| MSI Venture 16 AI A2HMTG | |
| Gemiddeld Intel Core Ultra 7 255H, Intel Arc Graphics 140T (427 - 510, n=13) | |
| Geekbench AI / Single Precision GPU 1.7 | |
| Dell 16 Plus 2-in-1 | |
| Gemiddeld Intel Core Ultra 7 255H, Intel Arc Graphics 140T (6840 - 8478, n=7) | |
| MSI Venture 16 AI A2HMTG | |
| Geekbench AI / Half Precision GPU 1.7 | |
| Dell 16 Plus 2-in-1 | |
| Gemiddeld Intel Core Ultra 7 255H, Intel Arc Graphics 140T (8108 - 12393, n=7) | |
| MSI Venture 16 AI A2HMTG | |
| Geekbench AI / Quantized GPU 1.7 | |
| Dell 16 Plus 2-in-1 | |
| Gemiddeld Intel Core Ultra 7 255H, Intel Arc Graphics 140T (4705 - 5621, n=7) | |
| MSI Venture 16 AI A2HMTG | |
* ... kleiner is beter
| PCMark 10 Score | 8903 punten | |
Help | ||
| AIDA64 / Memory Copy | |
| Dell 16 Plus 2-in-1 | |
| Gemiddeld Intel Core Ultra 7 255H (39188 - 110930, n=17) | |
| MSI Prestige 16 B1MG-001US | |
| HP Pavilion 16-ag0057ng | |
| MSI Venture 16 AI A2HMTG | |
| Lenovo IdeaPad Slim 5 16AKP10 | |
| Asus V16 V3607V | |
| AIDA64 / Memory Read | |
| Dell 16 Plus 2-in-1 | |
| MSI Venture 16 AI A2HMTG | |
| Gemiddeld Intel Core Ultra 7 255H (43703 - 90552, n=17) | |
| MSI Prestige 16 B1MG-001US | |
| Lenovo IdeaPad Slim 5 16AKP10 | |
| HP Pavilion 16-ag0057ng | |
| Asus V16 V3607V | |
| AIDA64 / Memory Write | |
| Dell 16 Plus 2-in-1 | |
| HP Pavilion 16-ag0057ng | |
| Lenovo IdeaPad Slim 5 16AKP10 | |
| MSI Venture 16 AI A2HMTG | |
| MSI Prestige 16 B1MG-001US | |
| Gemiddeld Intel Core Ultra 7 255H (36438 - 87199, n=17) | |
| Asus V16 V3607V | |
| AIDA64 / Memory Latency | |
| MSI Prestige 16 B1MG-001US | |
| Gemiddeld Intel Core Ultra 7 255H (107.6 - 147.2, n=17) | |
| HP Pavilion 16-ag0057ng | |
| MSI Venture 16 AI A2HMTG | |
| Dell 16 Plus 2-in-1 | |
| Asus V16 V3607V | |
| Lenovo IdeaPad Slim 5 16AKP10 | |
* ... kleiner is beter
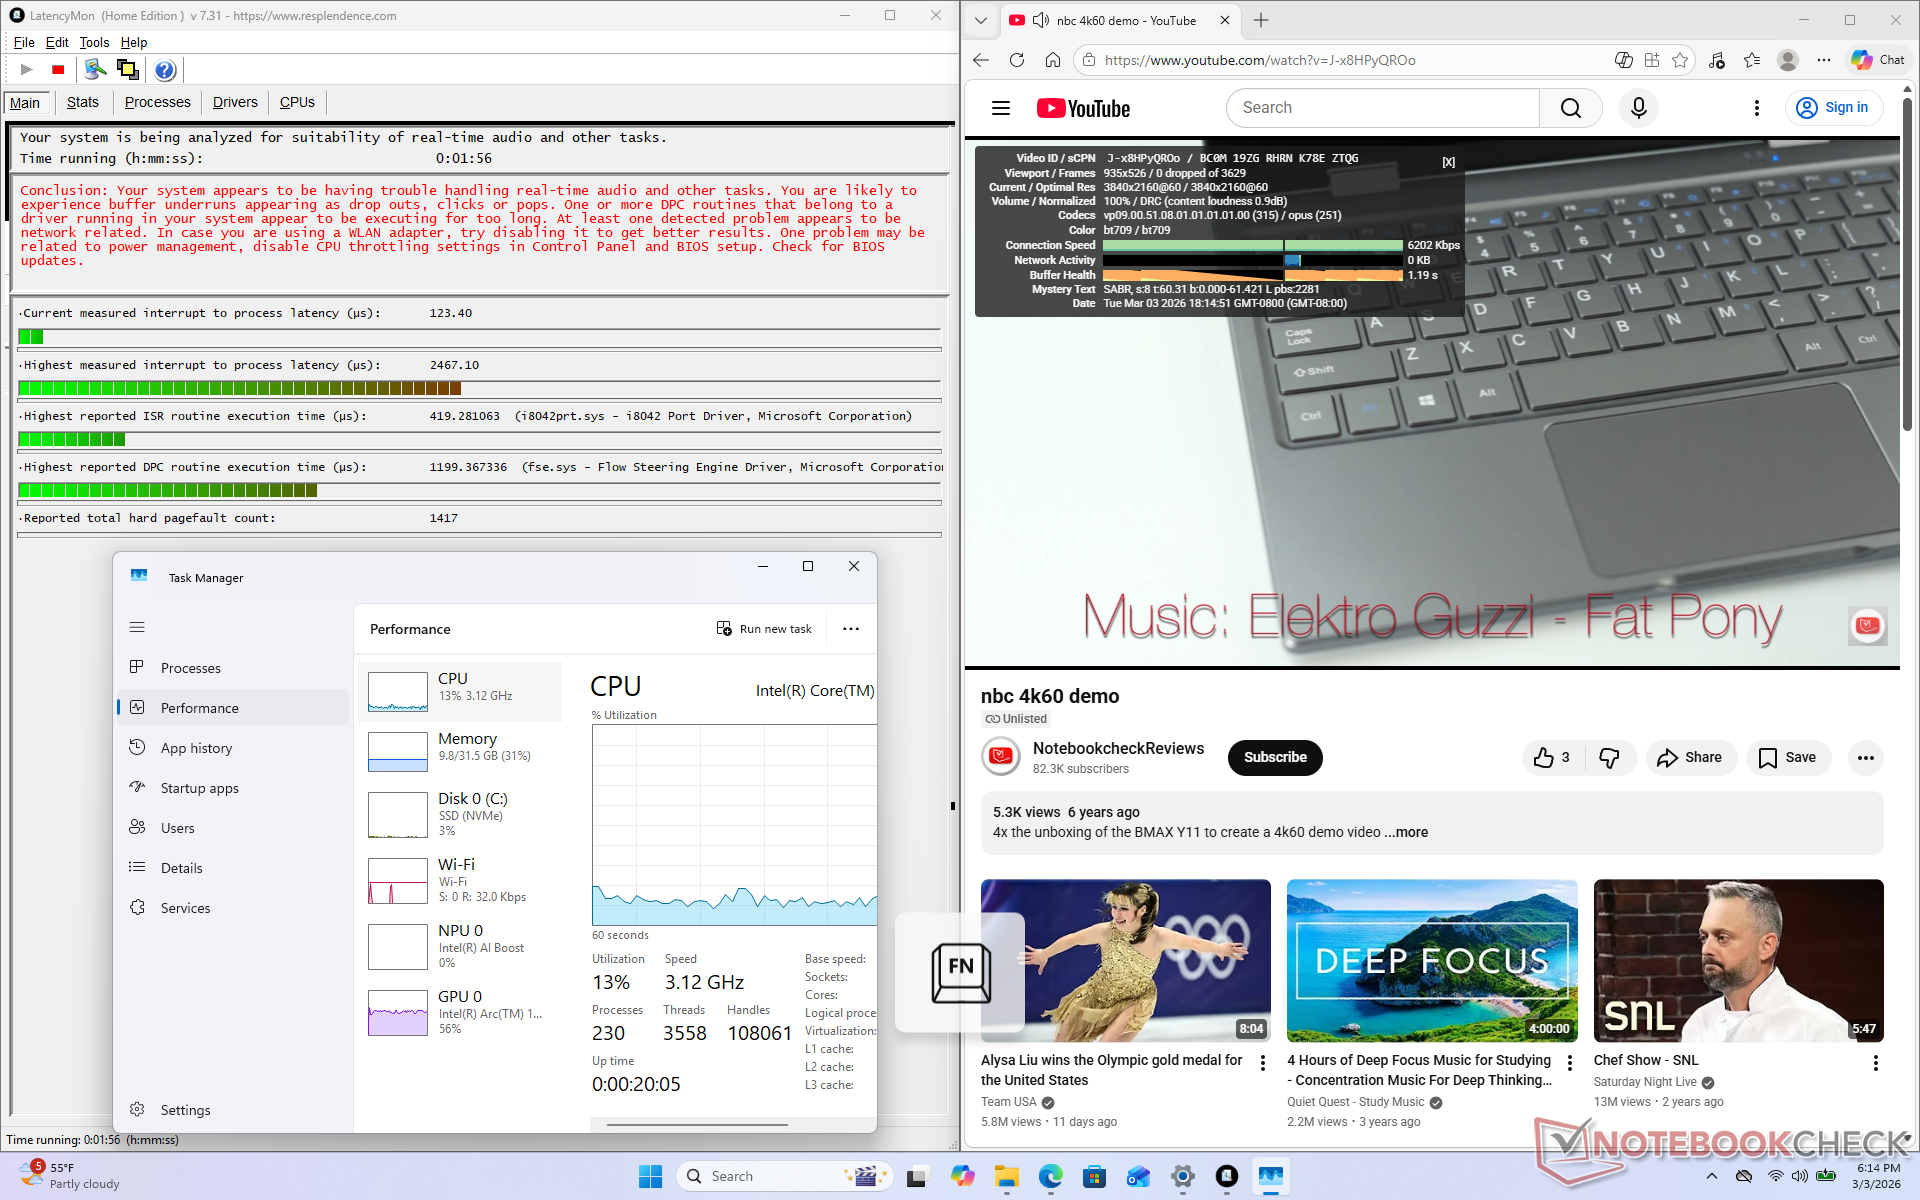
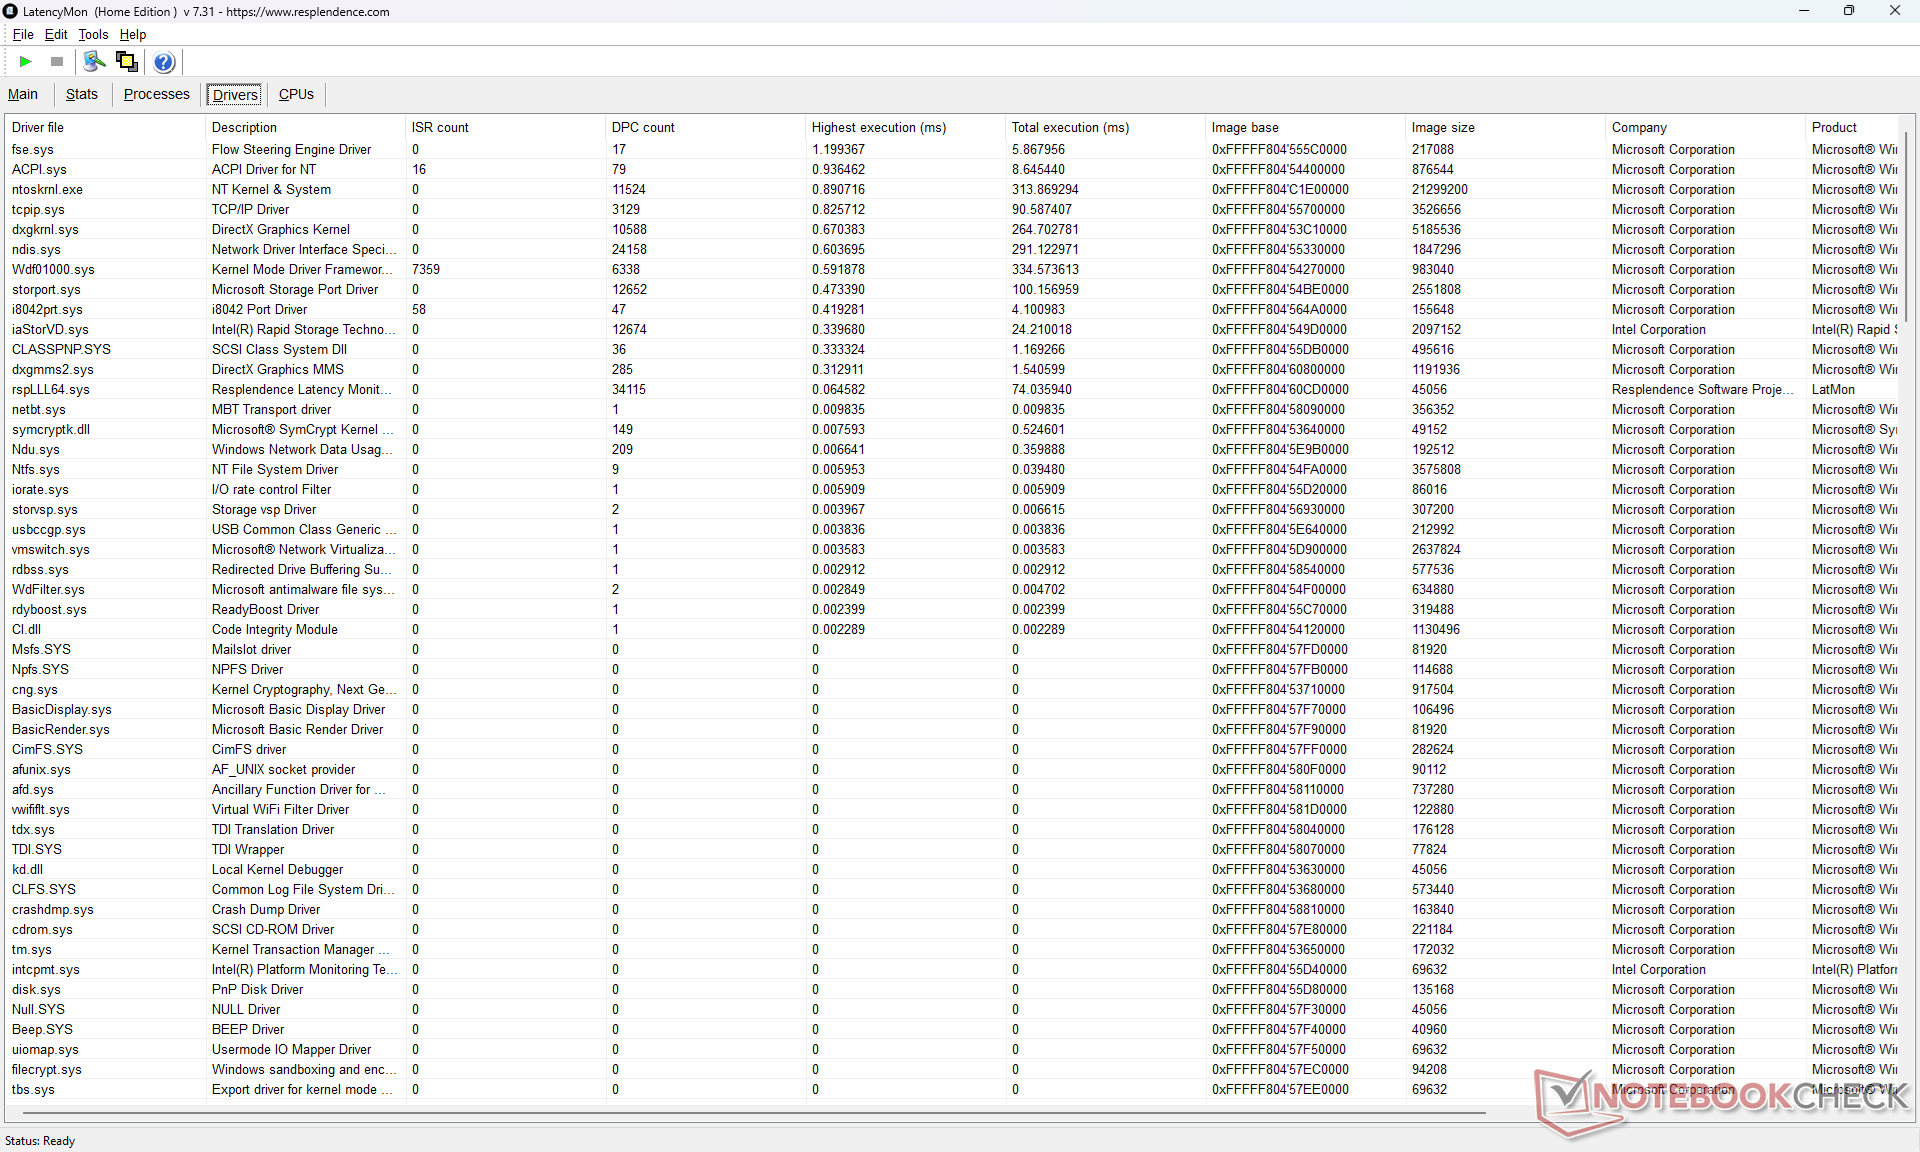
DPC latentie
LatencyMon laat kleine DPC-problemen zien, maar verder geen dropped frames tijdens het afspelen van 4K60-video.
| DPC Latencies / LatencyMon - interrupt to process latency (max), Web, Youtube, Prime95 | |
| Lenovo IdeaPad Slim 5 16AKP10 | |
| Asus V16 V3607V | |
| MSI Venture 16 AI A2HMTG | |
| Dell 16 Plus 2-in-1 | |
| HP Pavilion 16-ag0057ng | |
| MSI Prestige 16 B1MG-001US | |
* ... kleiner is beter
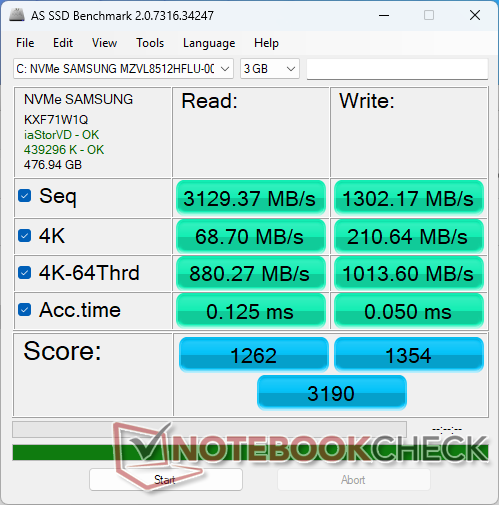
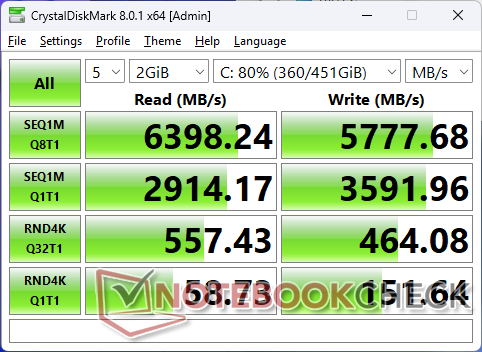
Opslagapparaten
De Samsung MZVL8512HFLU PCIe4 x4 NVMe SSD kan overdrachtsnelheden tot 7000 MB/s aan, zelfs zonder een speciaal koellichaam.

| Drive Performance rating - Percent | |
| MSI Prestige 16 B1MG-001US | |
| Asus V16 V3607V | |
| MSI Venture 16 AI A2HMTG | |
| HP Pavilion 16-ag0057ng | |
| Lenovo IdeaPad Slim 5 16AKP10 | |
| Dell 16 Plus 2-in-1 | |
* ... kleiner is beter
Schijf onderdrukken: DiskSpd Leeslus, wachtrijdiepte 8
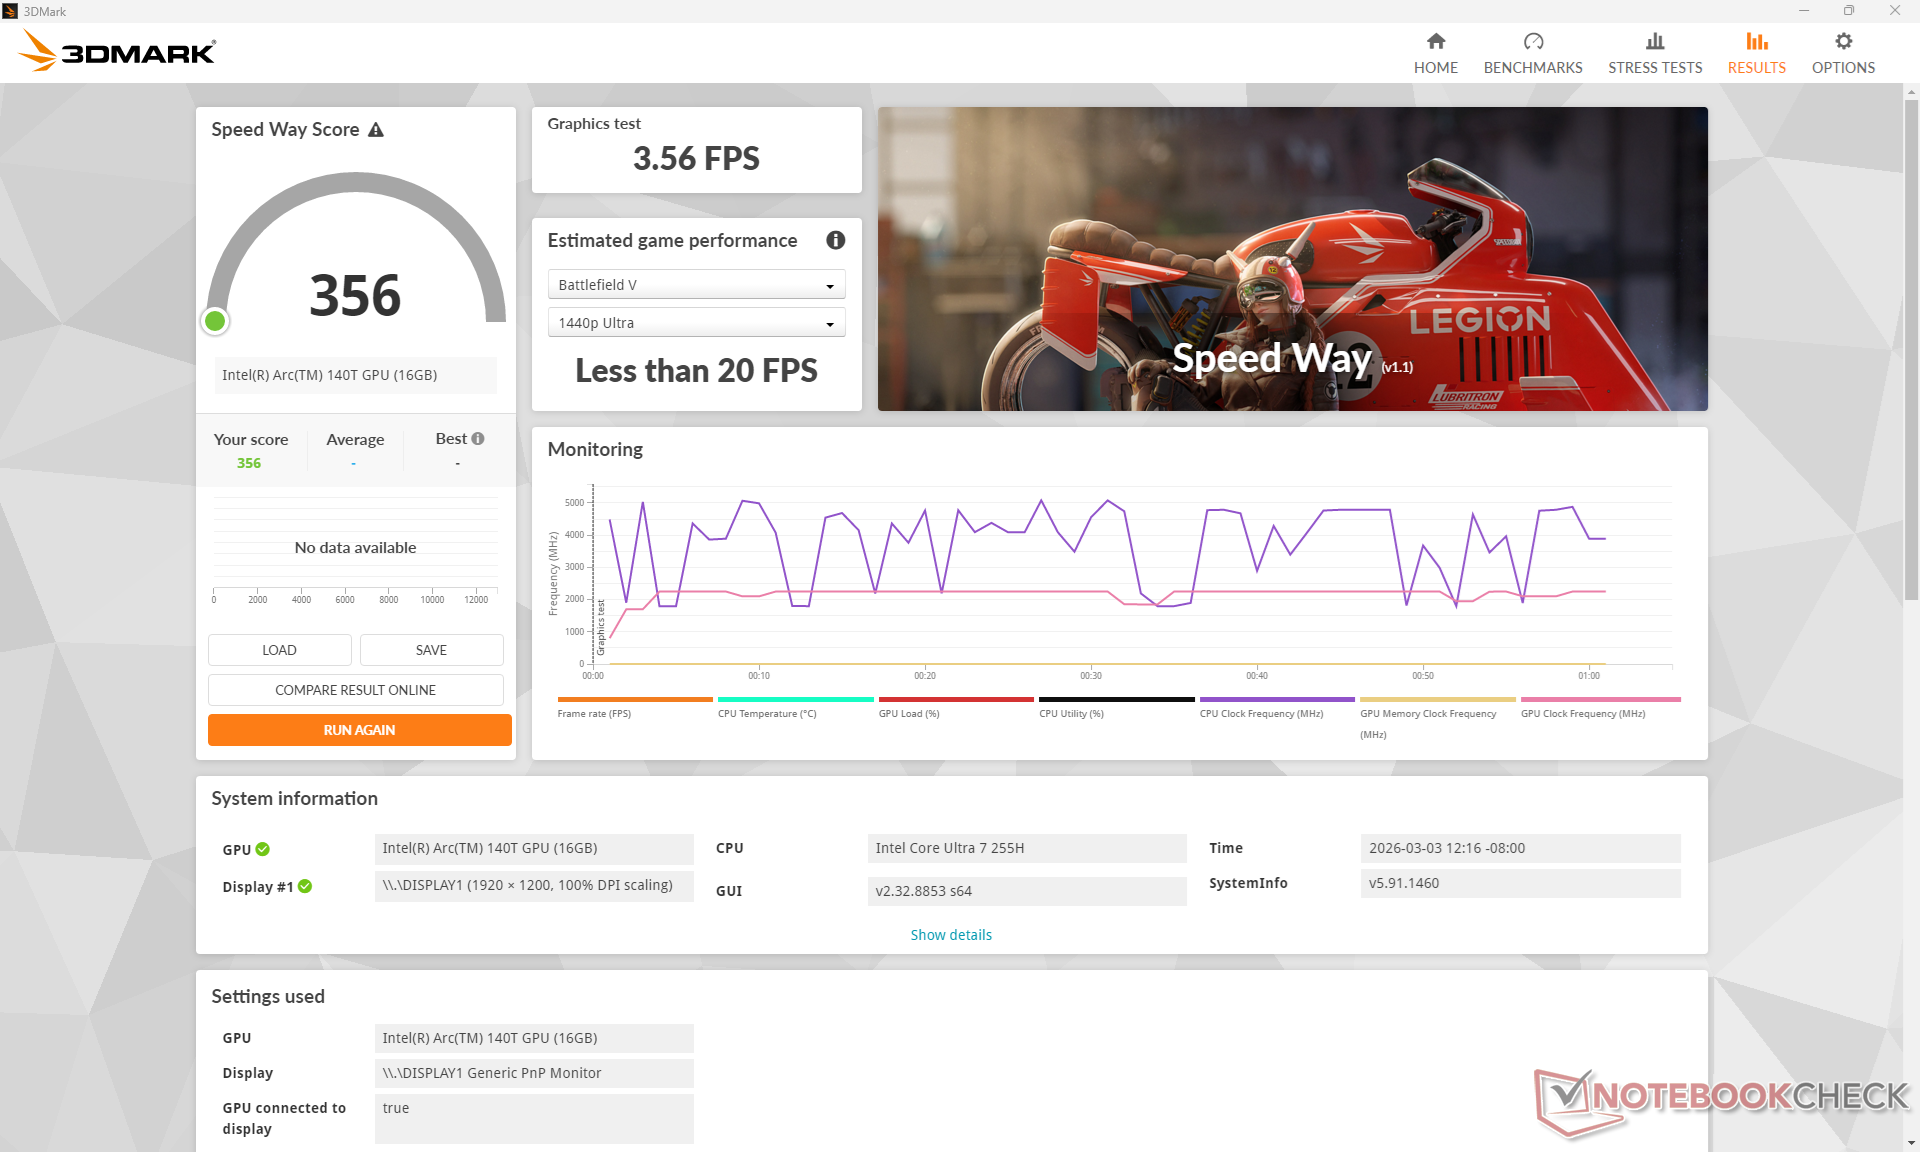
GPU-prestaties
De grafische prestaties, hoewel nog steeds fatsoenlijk voor een iGPU, zijn helaas 10 procent langzamer dan de gemiddelde laptop in onze database met dezelfde Arc 140T. De MSI Prestige 16 van vorig jaar met de oudere Arc 8 is dus vergelijkbaar met onze MSI als het gaat om gaming en GPU-zware taken.
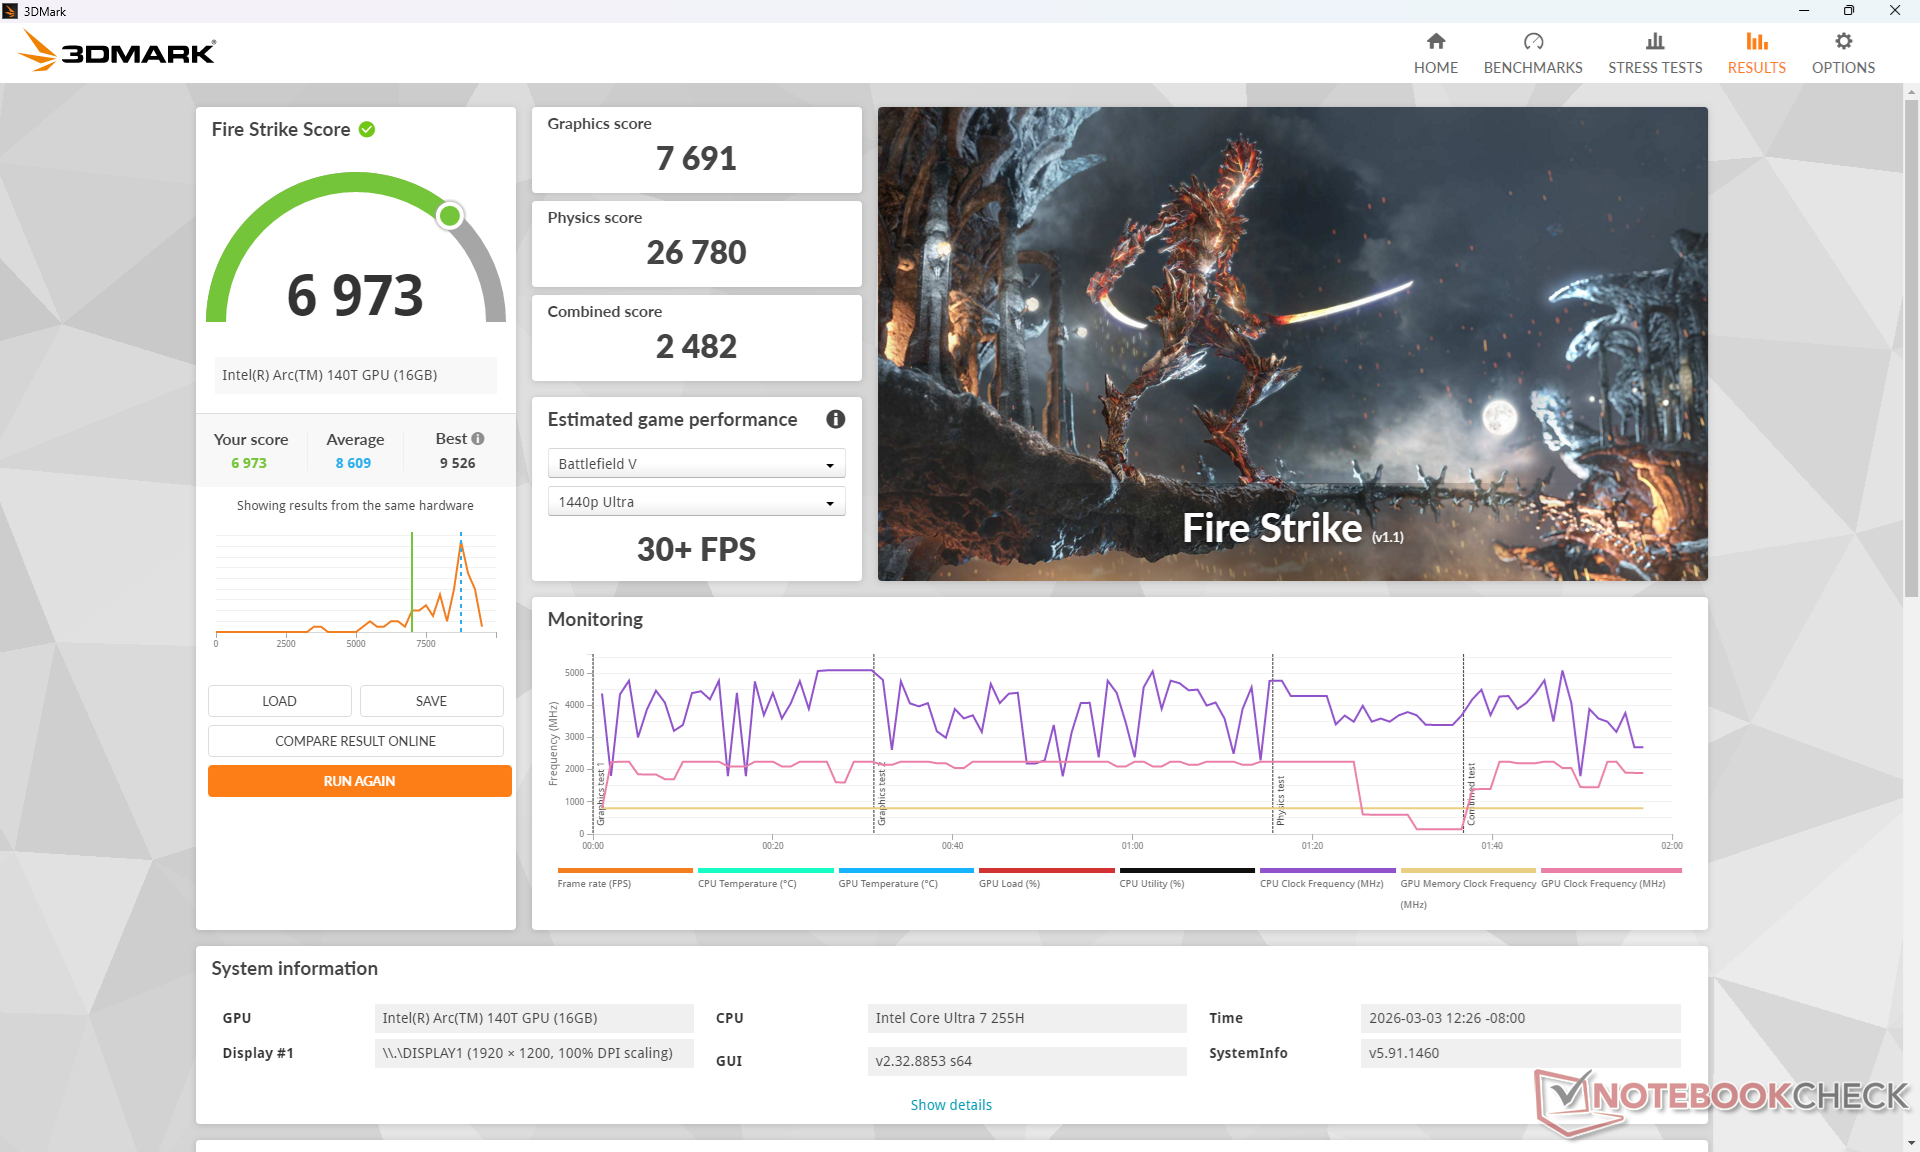
| Vermogen Profiel | Grafische Score | Fysica Score | Gecombineerde Score |
| Prestatiemodus | 7691 | 26780 | 2482 |
| Evenwichtige modus | 7416 (-4%) | 26626 (-1%) | 2521 (-0%) |
| Batterijvermogen | 7319 (-5%) | 25231 (-6%) | 2459 (-0%) |
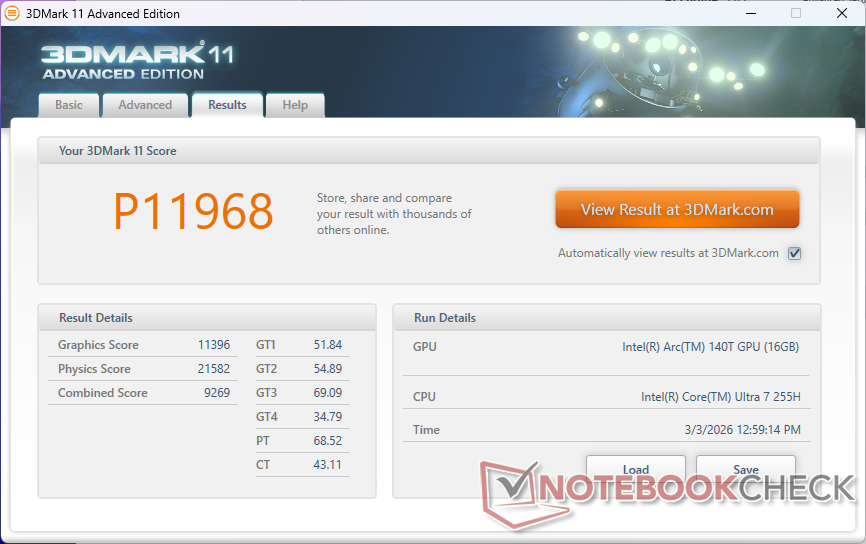
| 3DMark 11 Performance | 11968 punten | |
| 3DMark Cloud Gate Standard Score | 35142 punten | |
| 3DMark Fire Strike Score | 6973 punten | |
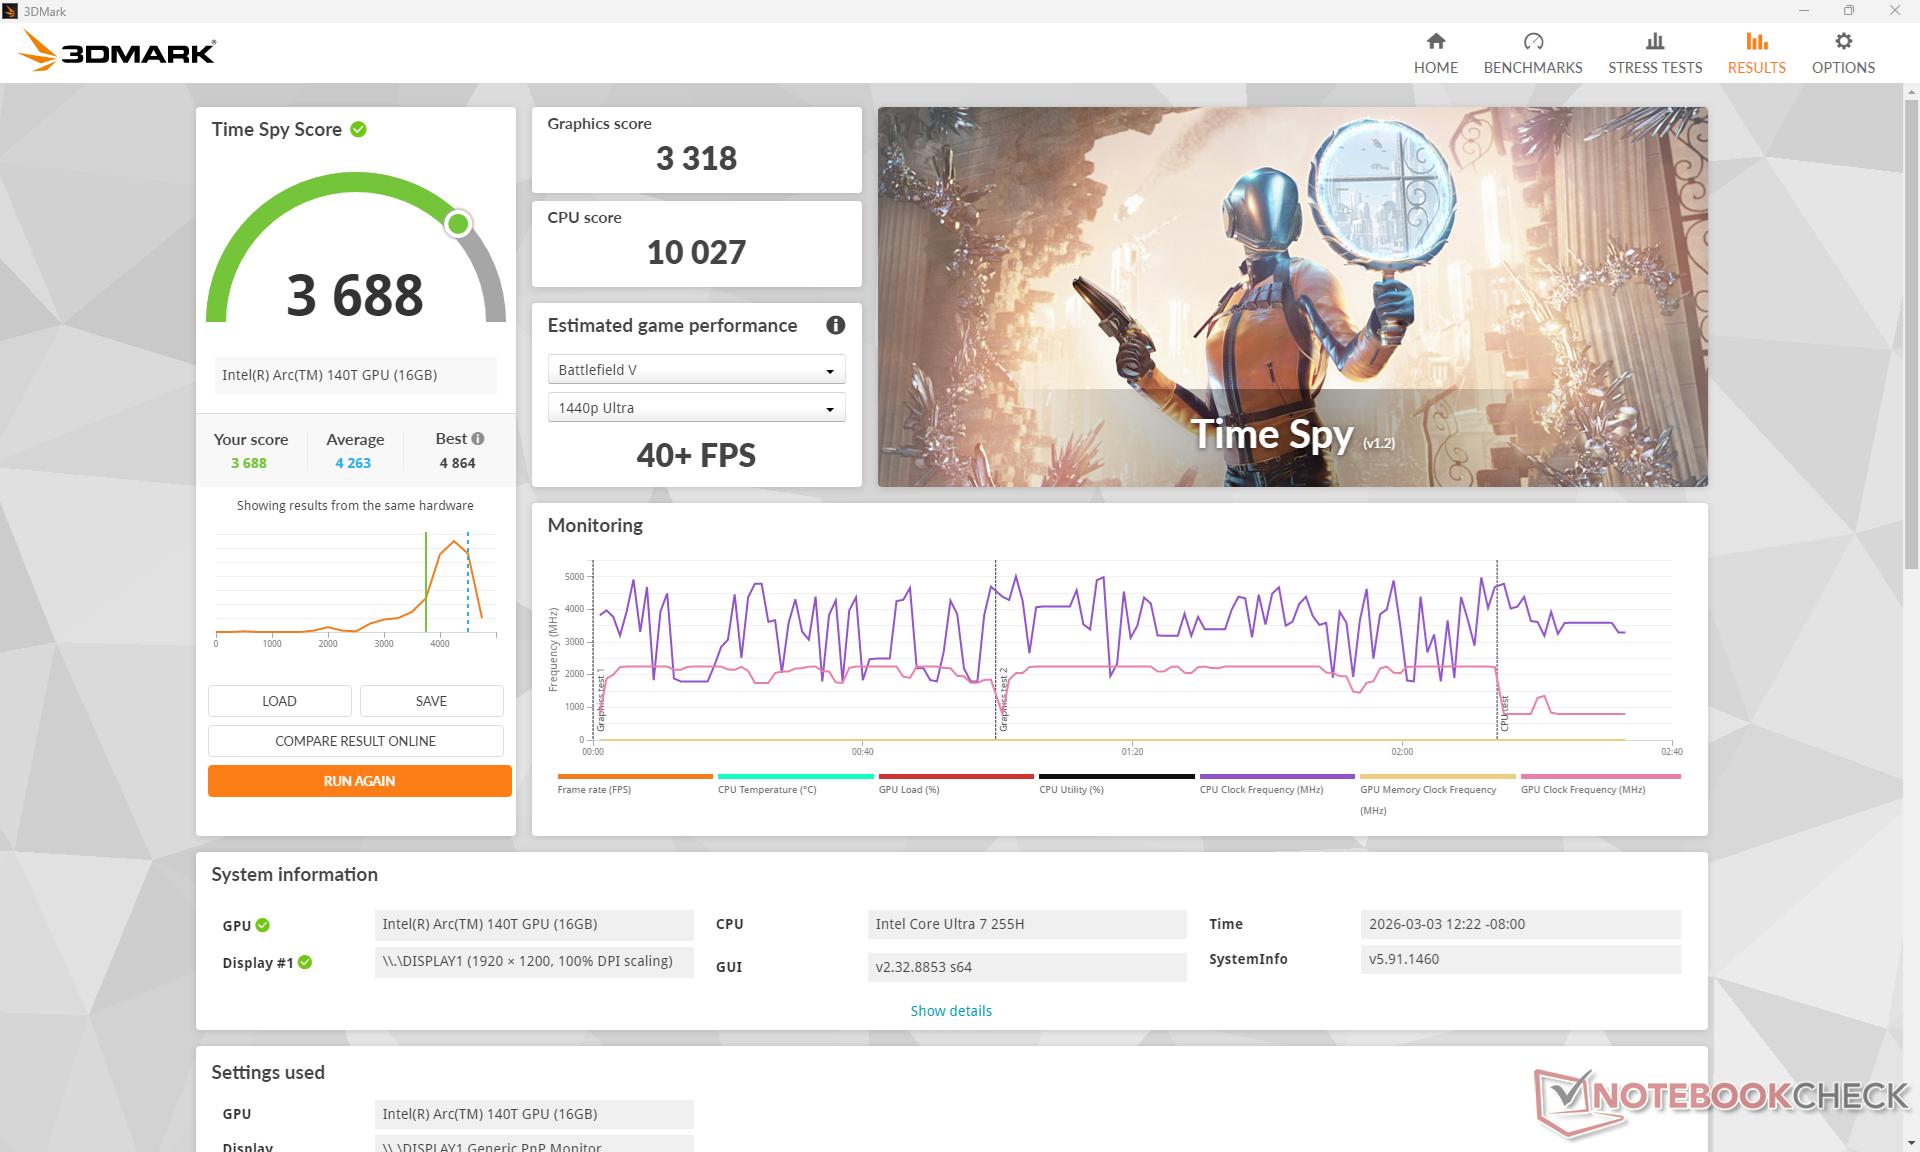
| 3DMark Time Spy Score | 3688 punten | |
Help | ||
| Blender | |
| v3.3 Classroom OPTIX/RTX | |
| Asus V16 V3607V | |
| v3.3 Classroom CUDA | |
| Asus V16 V3607V | |
| v3.3 Classroom CPU | |
| Lenovo IdeaPad Slim 5 16AKP10 | |
| Dell 16 Plus 2-in-1 | |
| HP Pavilion 16-ag0057ng | |
| Dynabook Tecra A60 A65-M | |
| Asus V16 V3607V | |
| MSI Prestige 16 B1MG-001US | |
| Asus ExpertBook B5 B5605CCA | |
| Gemiddeld Intel Arc Graphics 140T (254 - 492, n=20) | |
| Acer Swift Go 16 AI SFG16-61-R5Y5 | |
| Acer Swift Go 16 AI SFG16-61-R5Y5 | |
| MSI Venture 16 AI A2HMTG | |
| Asus ZenBook S16 UM5606GA | |
| v3.3 Classroom oneAPI/Intel | |
| Gemiddeld Intel Arc Graphics 140T (147 - 396, n=6) | |
| Dell 16 Plus 2-in-1 | |
| MSI Venture 16 AI A2HMTG | |
| v4.3 Barbershop CPU | |
| Dell 16 Plus 2-in-1 | |
| Asus V16 V3607V | |
| Dynabook Tecra A60 A65-M | |
| Acer Swift Go 16 AI SFG16-61-R5Y5 | |
| Gemiddeld Intel Arc Graphics 140T (1349 - 1839, n=9) | |
| MSI Venture 16 AI A2HMTG | |
| v4.3 Barbershop oneAPI | |
| Dell 16 Plus 2-in-1 | |
| Gemiddeld Intel Arc Graphics 140T (533 - 1037, n=5) | |
| MSI Venture 16 AI A2HMTG | |
| v4.3 Barbershop HIP | |
| Acer Swift Go 16 AI SFG16-61-R5Y5 | |
| v4.3 Barbershop OPTIX | |
| Asus V16 V3607V | |
* ... kleiner is beter
| Performance rating - Percent | |
| Asus V16 V3607V | |
| Dell 16 Plus 2-in-1 -1! | |
| MSI Prestige 16 B1MG-001US -1! | |
| MSI Venture 16 AI A2HMTG | |
| HP Pavilion 16-ag0057ng | |
| Lenovo IdeaPad Slim 5 16AKP10 | |
| Cyberpunk 2077 - 1920x1080 Ultra Preset (FSR off) | |
| Asus V16 V3607V | |
| Dell 16 Plus 2-in-1 | |
| MSI Venture 16 AI A2HMTG | |
| MSI Prestige 16 B1MG-001US | |
| HP Pavilion 16-ag0057ng | |
| Lenovo IdeaPad Slim 5 16AKP10 | |
| Baldur's Gate 3 - 1920x1080 Ultra Preset AA:T | |
| Asus V16 V3607V | |
| Dell 16 Plus 2-in-1 | |
| MSI Venture 16 AI A2HMTG | |
| MSI Prestige 16 B1MG-001US | |
| HP Pavilion 16-ag0057ng | |
| Lenovo IdeaPad Slim 5 16AKP10 | |
| GTA V - 1920x1080 Highest AA:4xMSAA + FX AF:16x | |
| Asus V16 V3607V | |
| MSI Venture 16 AI A2HMTG | |
| HP Pavilion 16-ag0057ng | |
| Lenovo IdeaPad Slim 5 16AKP10 | |
| Final Fantasy XV Benchmark - 1920x1080 High Quality | |
| Asus V16 V3607V | |
| Dell 16 Plus 2-in-1 | |
| MSI Venture 16 AI A2HMTG | |
| MSI Prestige 16 B1MG-001US | |
| HP Pavilion 16-ag0057ng | |
| Lenovo IdeaPad Slim 5 16AKP10 | |
| Strange Brigade - 1920x1080 ultra AA:ultra AF:16 | |
| Asus V16 V3607V | |
| Dell 16 Plus 2-in-1 | |
| MSI Venture 16 AI A2HMTG | |
| MSI Prestige 16 B1MG-001US | |
| HP Pavilion 16-ag0057ng | |
| Lenovo IdeaPad Slim 5 16AKP10 | |
| Dota 2 Reborn - 1920x1080 ultra (3/3) best looking | |
| Asus V16 V3607V | |
| Dell 16 Plus 2-in-1 | |
| MSI Venture 16 AI A2HMTG | |
| MSI Prestige 16 B1MG-001US | |
| HP Pavilion 16-ag0057ng | |
| Lenovo IdeaPad Slim 5 16AKP10 | |
| X-Plane 11.11 - 1920x1080 high (fps_test=3) | |
| Asus V16 V3607V | |
| MSI Venture 16 AI A2HMTG | |
| MSI Prestige 16 B1MG-001US | |
| Dell 16 Plus 2-in-1 | |
| Lenovo IdeaPad Slim 5 16AKP10 | |
| HP Pavilion 16-ag0057ng | |
| F1 24 | |
| 1920x1080 Low Preset AA:T AF:16x | |
| Dell 16 Plus 2-in-1 | |
| Asus ZenBook S16 UM5606GA | |
| Gemiddeld Intel Arc Graphics 140T (53.5 - 93.4, n=15) | |
| MSI Venture 16 AI A2HMTG | |
| Asus ExpertBook B5 B5605CCA | |
| Dynabook Tecra A60 A65-M | |
| 1920x1080 Medium Preset AA:T AF:16x | |
| Dell 16 Plus 2-in-1 | |
| Asus ZenBook S16 UM5606GA | |
| Gemiddeld Intel Arc Graphics 140T (47.4 - 85.7, n=15) | |
| MSI Venture 16 AI A2HMTG | |
| Asus ExpertBook B5 B5605CCA | |
| Dynabook Tecra A60 A65-M | |
| 1920x1080 High Preset AA:T AF:16x | |
| Dell 16 Plus 2-in-1 | |
| Asus ZenBook S16 UM5606GA | |
| Gemiddeld Intel Arc Graphics 140T (37.5 - 64.9, n=14) | |
| MSI Venture 16 AI A2HMTG | |
| Asus ExpertBook B5 B5605CCA | |
| 1920x1080 Ultra High Preset AA:T AF:16x | |
| Dell 16 Plus 2-in-1 | |
| Gemiddeld Intel Arc Graphics 140T (15.7 - 20.8, n=12) | |
| MSI Venture 16 AI A2HMTG | |
| Asus ZenBook S16 UM5606GA | |
Cyberpunk 2077 ultra FPS Grafiek
| lage | gem. | hoge | ultra | |
|---|---|---|---|---|
| GTA V (2015) | 167.9 | 155 | 41.1 | 16.7 |
| Dota 2 Reborn (2015) | 103.6 | 86.5 | 79.4 | 75.8 |
| Final Fantasy XV Benchmark (2018) | 68 | 39.2 | 26 | |
| X-Plane 11.11 (2018) | 55.8 | 44.6 | 39.7 | |
| Strange Brigade (2018) | 167.5 | 70.6 | 60.2 | 50.1 |
| Baldur's Gate 3 (2023) | 36.7 | 31 | 26.5 | 26.1 |
| Cyberpunk 2077 (2023) | 36.2 | 29.6 | 25.5 | 23 |
| F1 24 (2024) | 76.1 | 69.9 | 48 | 15.7 |
Uitstoot
Systeemgeluid
Het geluid van de ventilator schommelt rond de 27 dB(A) bij alledaagse belastingen zoals browsen, maar hogere belastingen zoals games kunnen een geluidsniveau van 45 dB(A) veroorzaken. De ventilator heeft helaas hoge tonen, dus pulserende geluiden kunnen goed merkbaar zijn.
Geluidsniveau
| Onbelast |
| 23.1 / 23.1 / 24.1 dB (A) |
| Belasting |
| 45.2 / 44.7 dB (A) |
 | ||
30 dB stil 40 dB(A) hoorbaar 50 dB(A) luid |
||
min: | ||
| MSI Venture 16 AI A2HMTG Ultra 7 255H, Arc 140T | MSI Prestige 16 B1MG-001US Ultra 7 155H, Arc 8-Core | Dell 16 Plus 2-in-1 Core Ultra 7 258V, Arc 140V | Asus V16 V3607V Core 7 240H, GeForce RTX 3050 6GB Laptop GPU | HP Pavilion 16-ag0057ng R5 8540U, Radeon 740M | Lenovo IdeaPad Slim 5 16AKP10 Ryzen AI 5 330, Radeon 820M | |
|---|---|---|---|---|---|---|
| Noise | -6% | 2% | -4% | 1% | -3% | |
| uit / omgeving * (dB) | 22.9 | 24.5 -7% | 23.2 -1% | 23.3 -2% | 24 -5% | 24 -5% |
| Idle Minimum * (dB) | 23.1 | 24.5 -6% | 23 -0% | 23.5 -2% | 24 -4% | 24 -4% |
| Idle Average * (dB) | 23.1 | 26.3 -14% | 23 -0% | 23.7 -3% | 25 -8% | 25 -8% |
| Idle Maximum * (dB) | 24.1 | 26.3 -9% | 24.7 -2% | 23.7 2% | 26 -8% | 26 -8% |
| Load Average * (dB) | 45.2 | 36.5 19% | 32.5 28% | 48 -6% | 38 16% | 43 5% |
| Cyberpunk 2077 ultra * (dB) | 39.4 | 42.6 -8% | 40.5 -3% | 37 6% | 42 -7% | |
| Load Maximum * (dB) | 44.7 | 52.9 -18% | 45.6 -2% | 51 -14% | 39 13% | 43 4% |
| Witcher 3 ultra * (dB) | 46.3 |
* ... kleiner is beter
Temperatuur
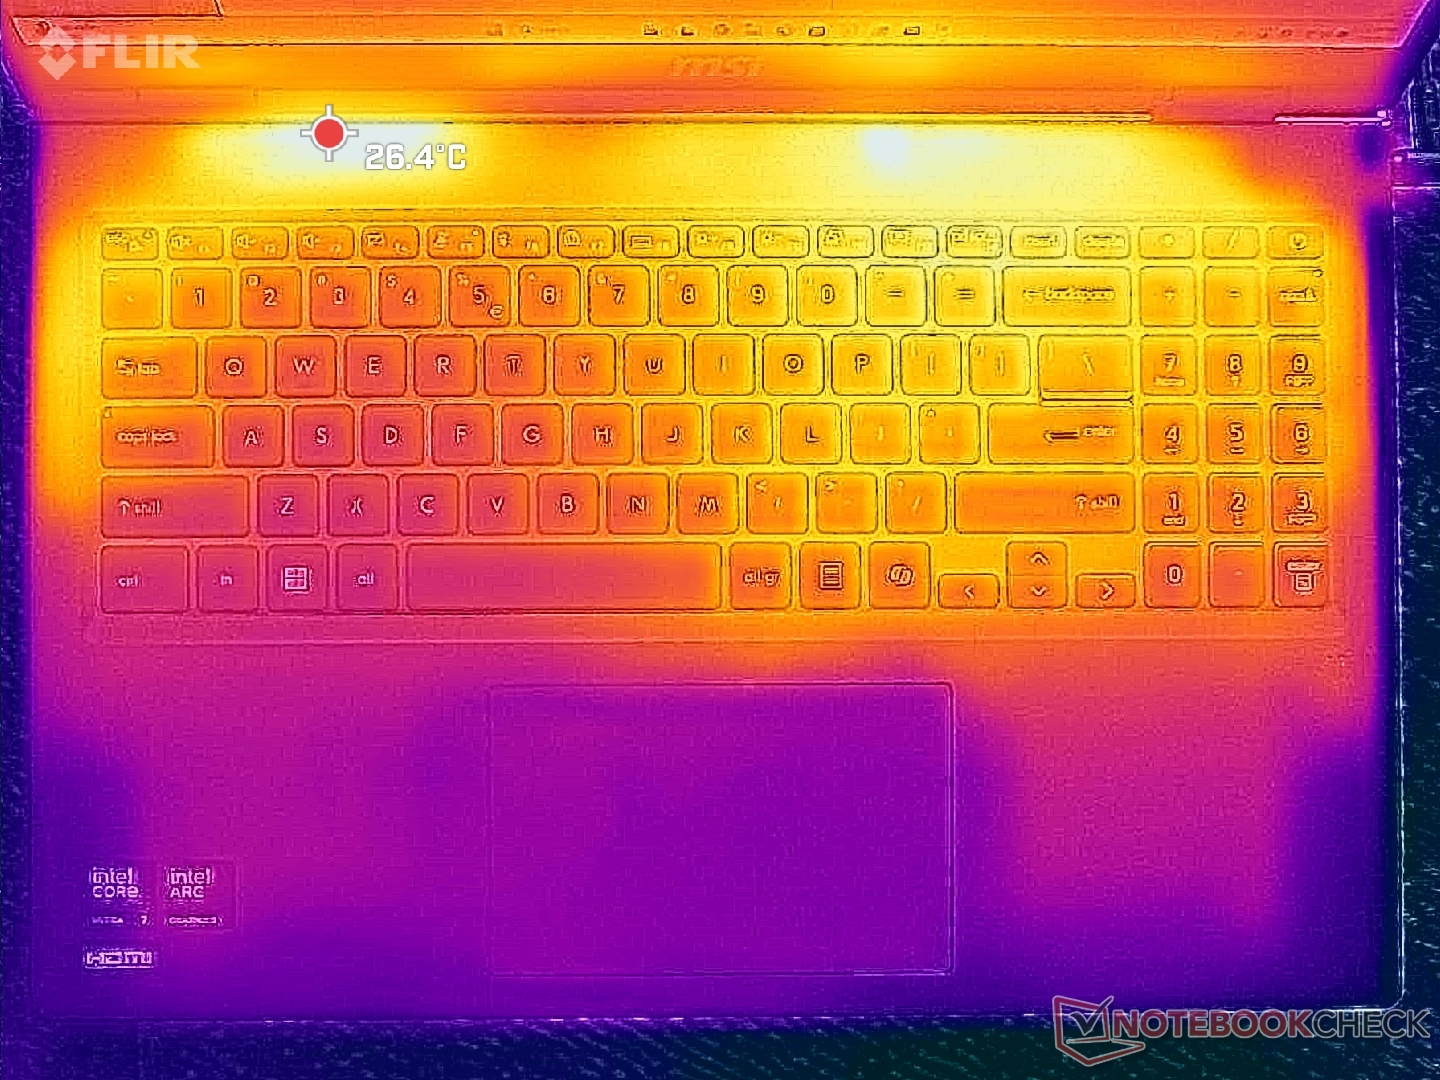
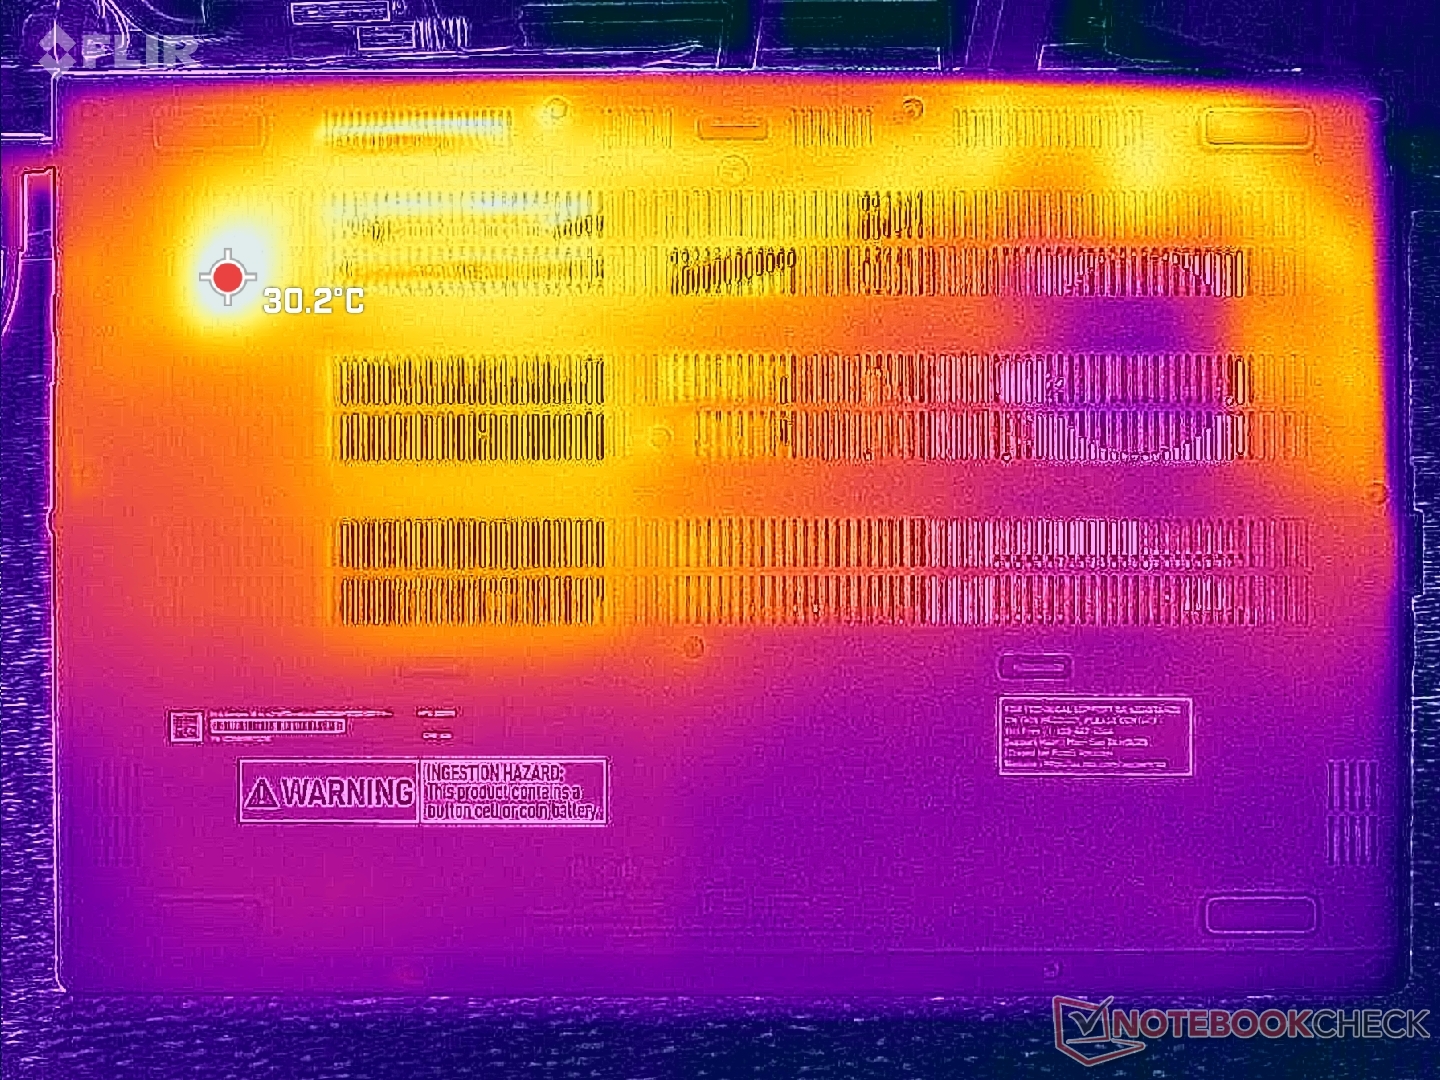
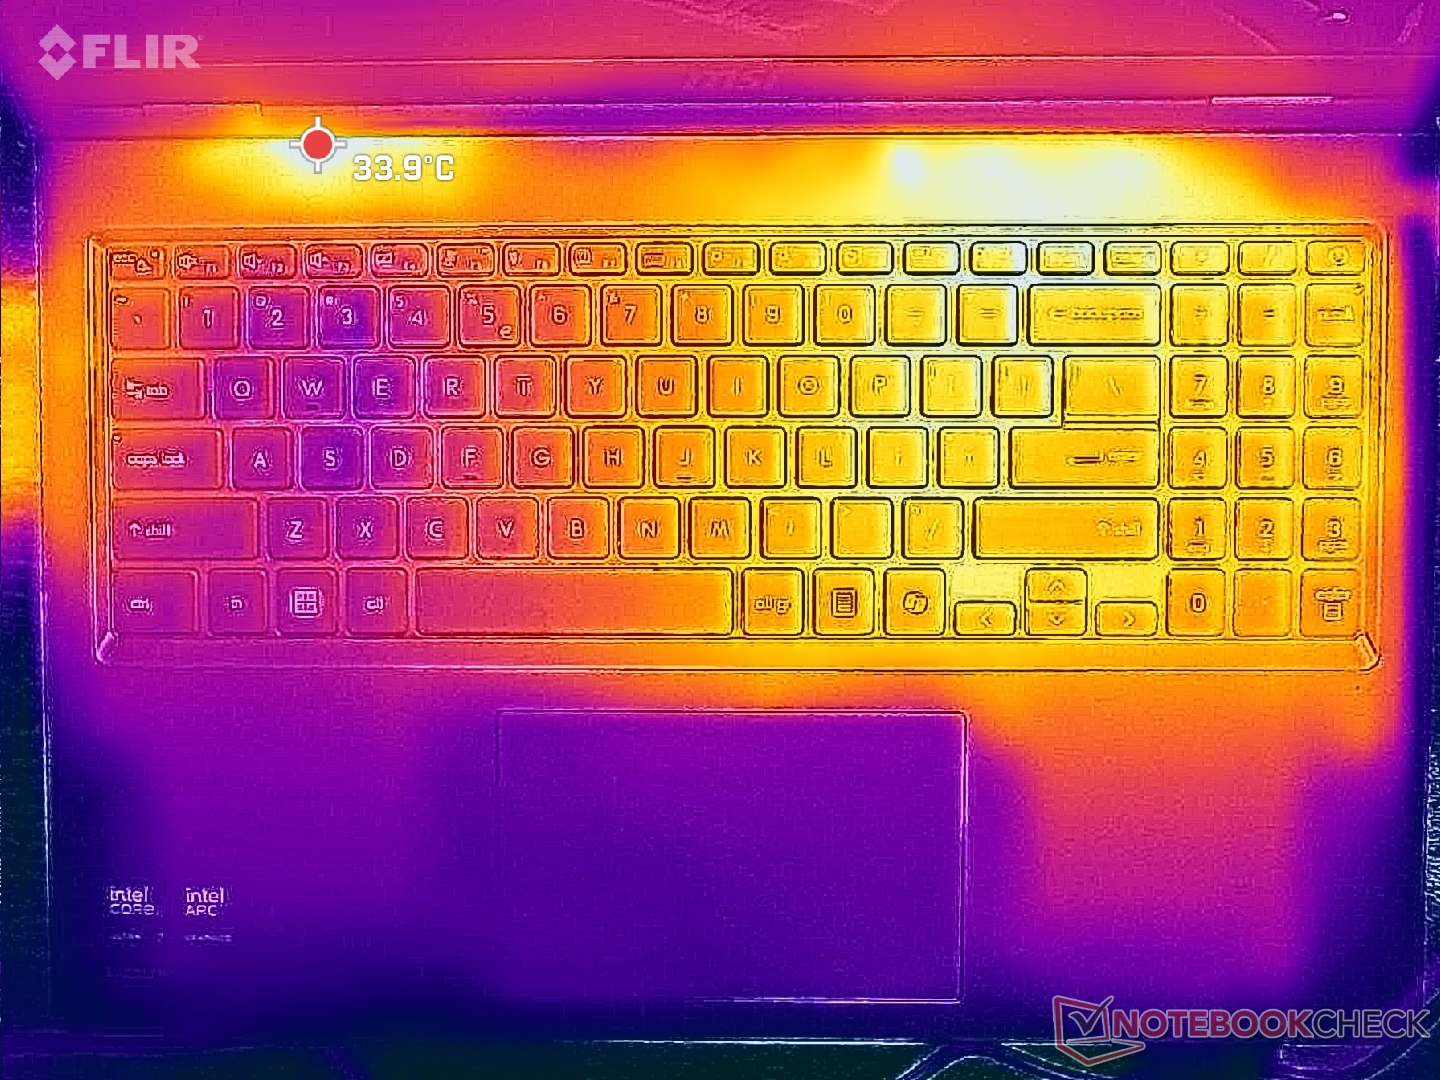
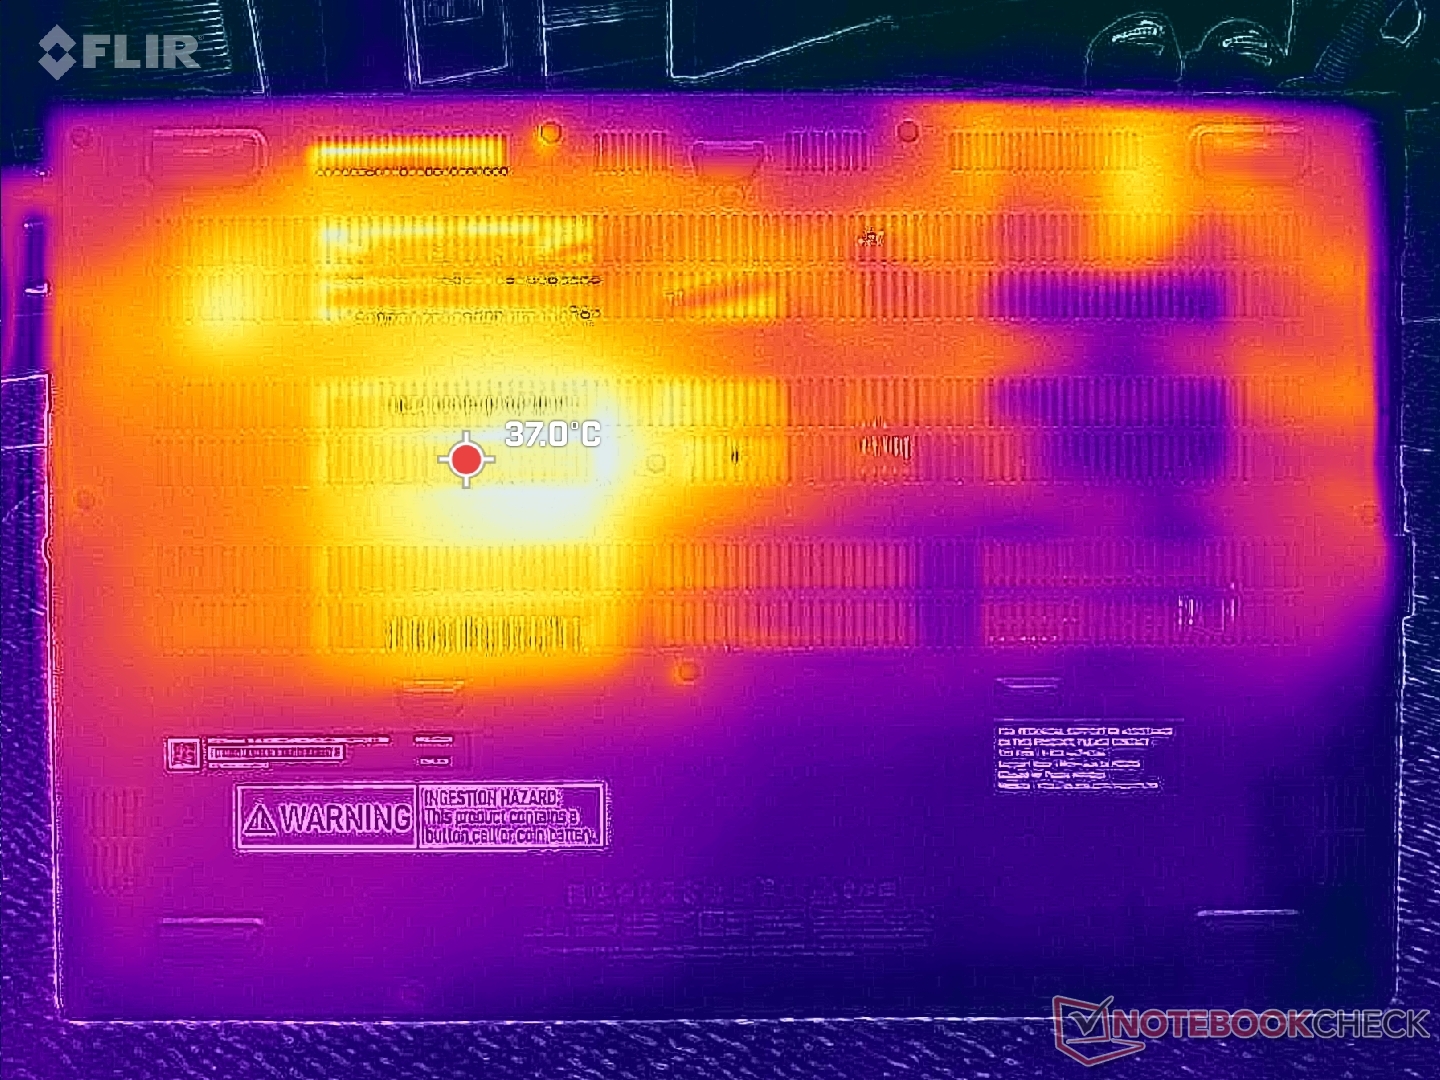
De oppervlaktetemperatuur is op de rechterhelft van het systeem warmer dan op de linkerhelft. Toch bereiken de hete plekken slechts 35 C tot 37 C, deels door het relatief dikke profiel.
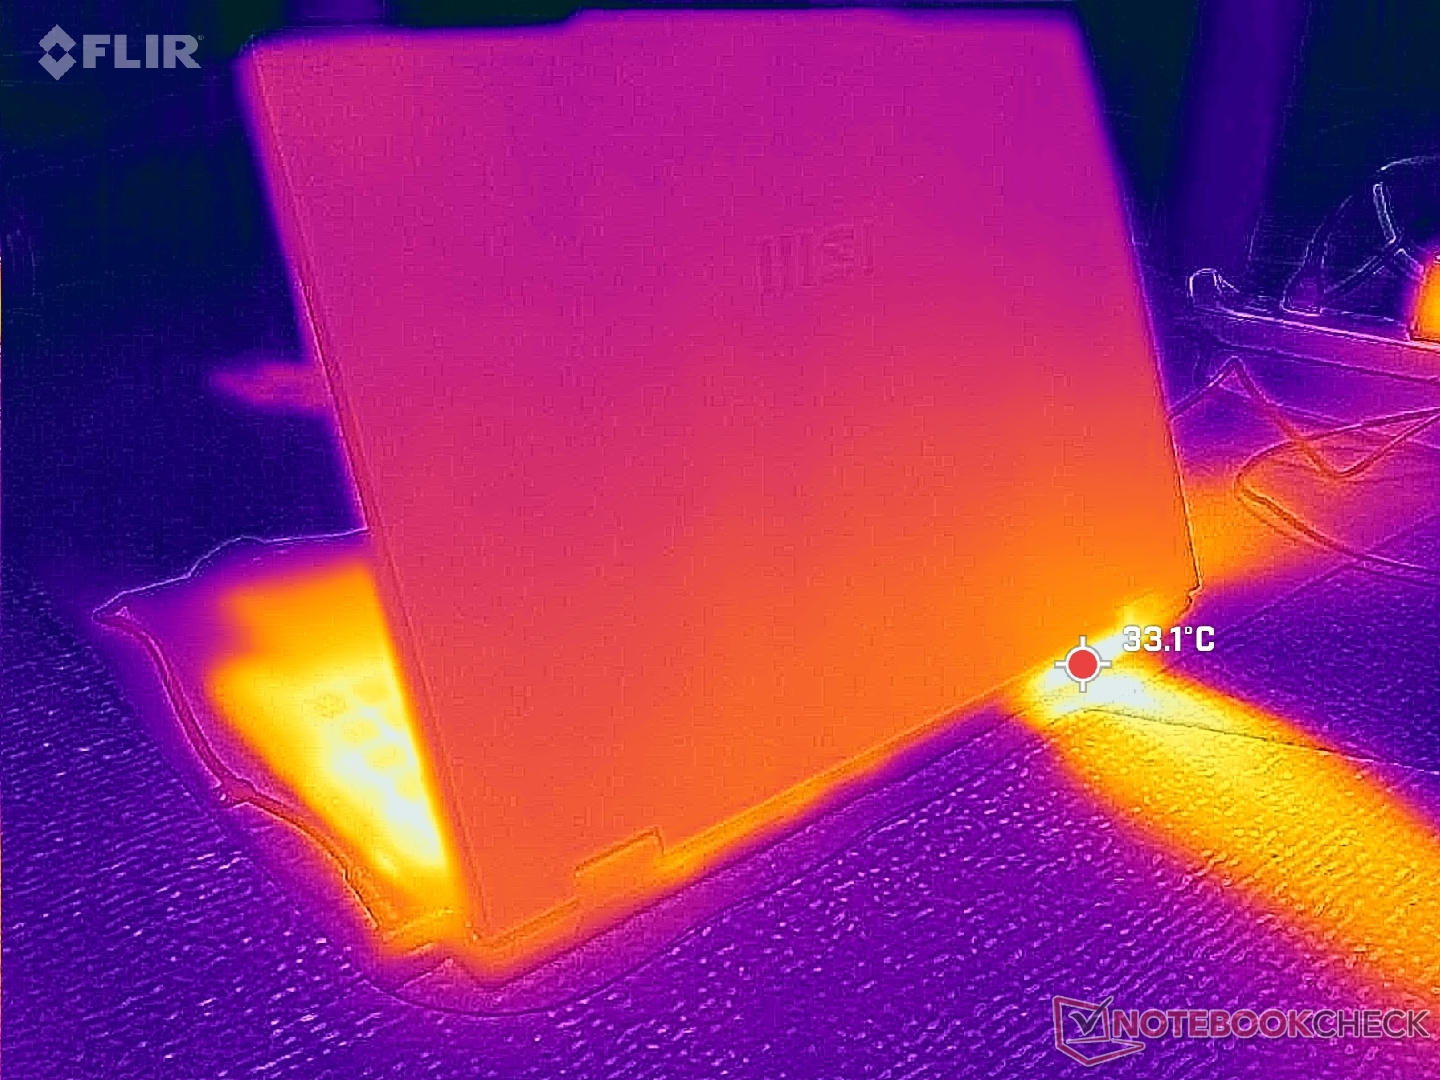
(+) De maximumtemperatuur aan de bovenzijde bedraagt 35 °C / 95 F, vergeleken met het gemiddelde van 34.3 °C / 94 F, variërend van 21.2 tot 62.5 °C voor de klasse Office.
(+) De bodem warmt op tot een maximum van 37.4 °C / 99 F, vergeleken met een gemiddelde van 36.8 °C / 98 F
(+) Bij onbelast gebruik bedraagt de gemiddelde temperatuur voor de bovenzijde 26.8 °C / 80 F, vergeleken met het apparaatgemiddelde van 29.5 °C / 85 F.
(+) De palmsteunen en het touchpad zijn met een maximum van ###max## °C / 87.1 F koeler dan de huidtemperatuur en voelen daarom koel aan.
(-) De gemiddelde temperatuur van de handpalmsteun van soortgelijke toestellen bedroeg 27.5 °C / 81.5 F (-3.1 °C / -5.6 F).
| MSI Venture 16 AI A2HMTG Ultra 7 255H, Arc 140T | MSI Prestige 16 B1MG-001US Ultra 7 155H, Arc 8-Core | Dell 16 Plus 2-in-1 Core Ultra 7 258V, Arc 140V | Asus V16 V3607V Core 7 240H, GeForce RTX 3050 6GB Laptop GPU | HP Pavilion 16-ag0057ng R5 8540U, Radeon 740M | Lenovo IdeaPad Slim 5 16AKP10 Ryzen AI 5 330, Radeon 820M | |
|---|---|---|---|---|---|---|
| Heat | -5% | -10% | 2% | -2% | 8% | |
| Maximum Upper Side * (°C) | 35 | 48.8 -39% | 44 -26% | 41.2 -18% | 42 -20% | 35 -0% |
| Maximum Bottom * (°C) | 37.4 | 47.6 -27% | 39.4 -5% | 34.4 8% | 44 -18% | 37 1% |
| Idle Upper Side * (°C) | 30.2 | 24.2 20% | 31.8 -5% | 28.8 5% | 26 14% | 26 14% |
| Idle Bottom * (°C) | 33 | 23.6 28% | 34.2 -4% | 29 12% | 28 15% | 27 18% |
* ... kleiner is beter
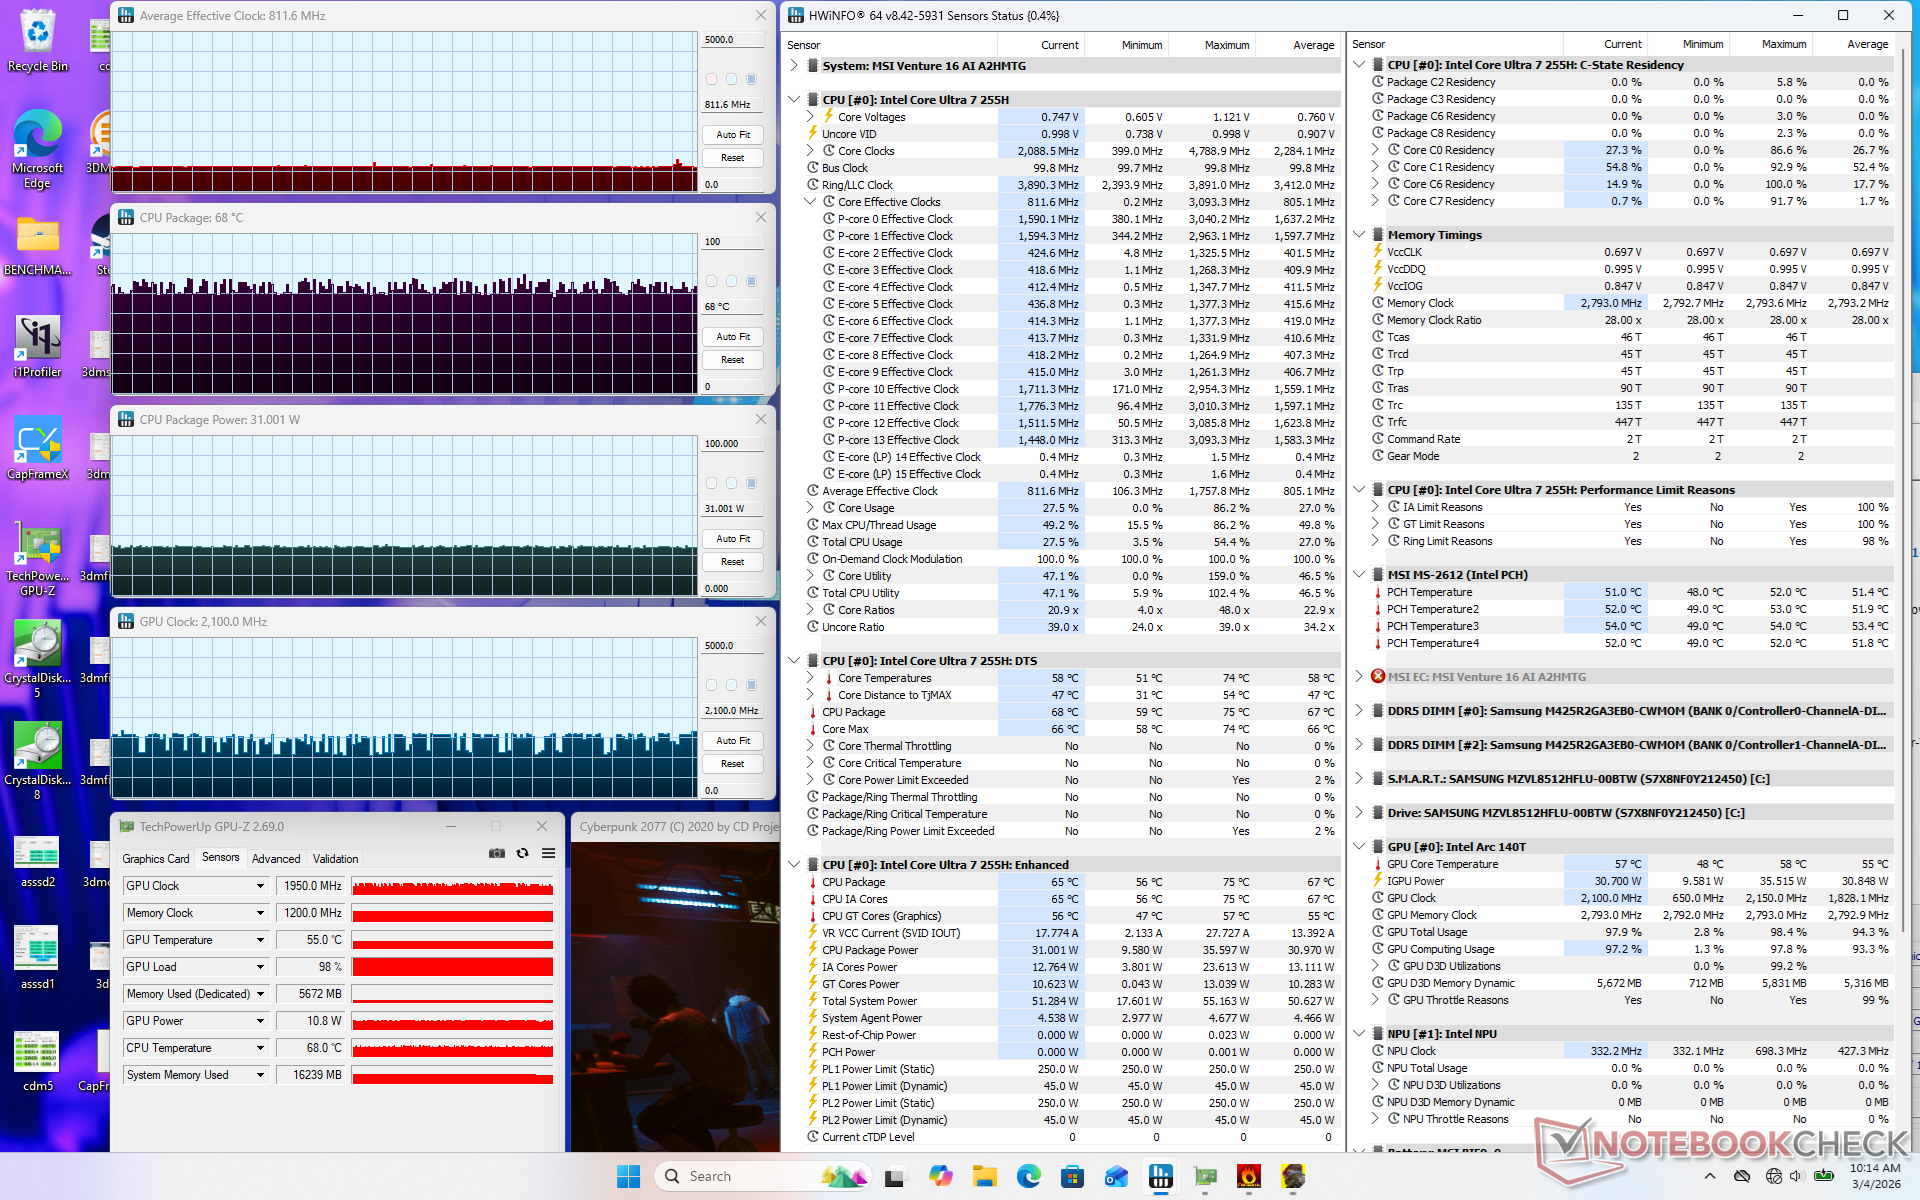
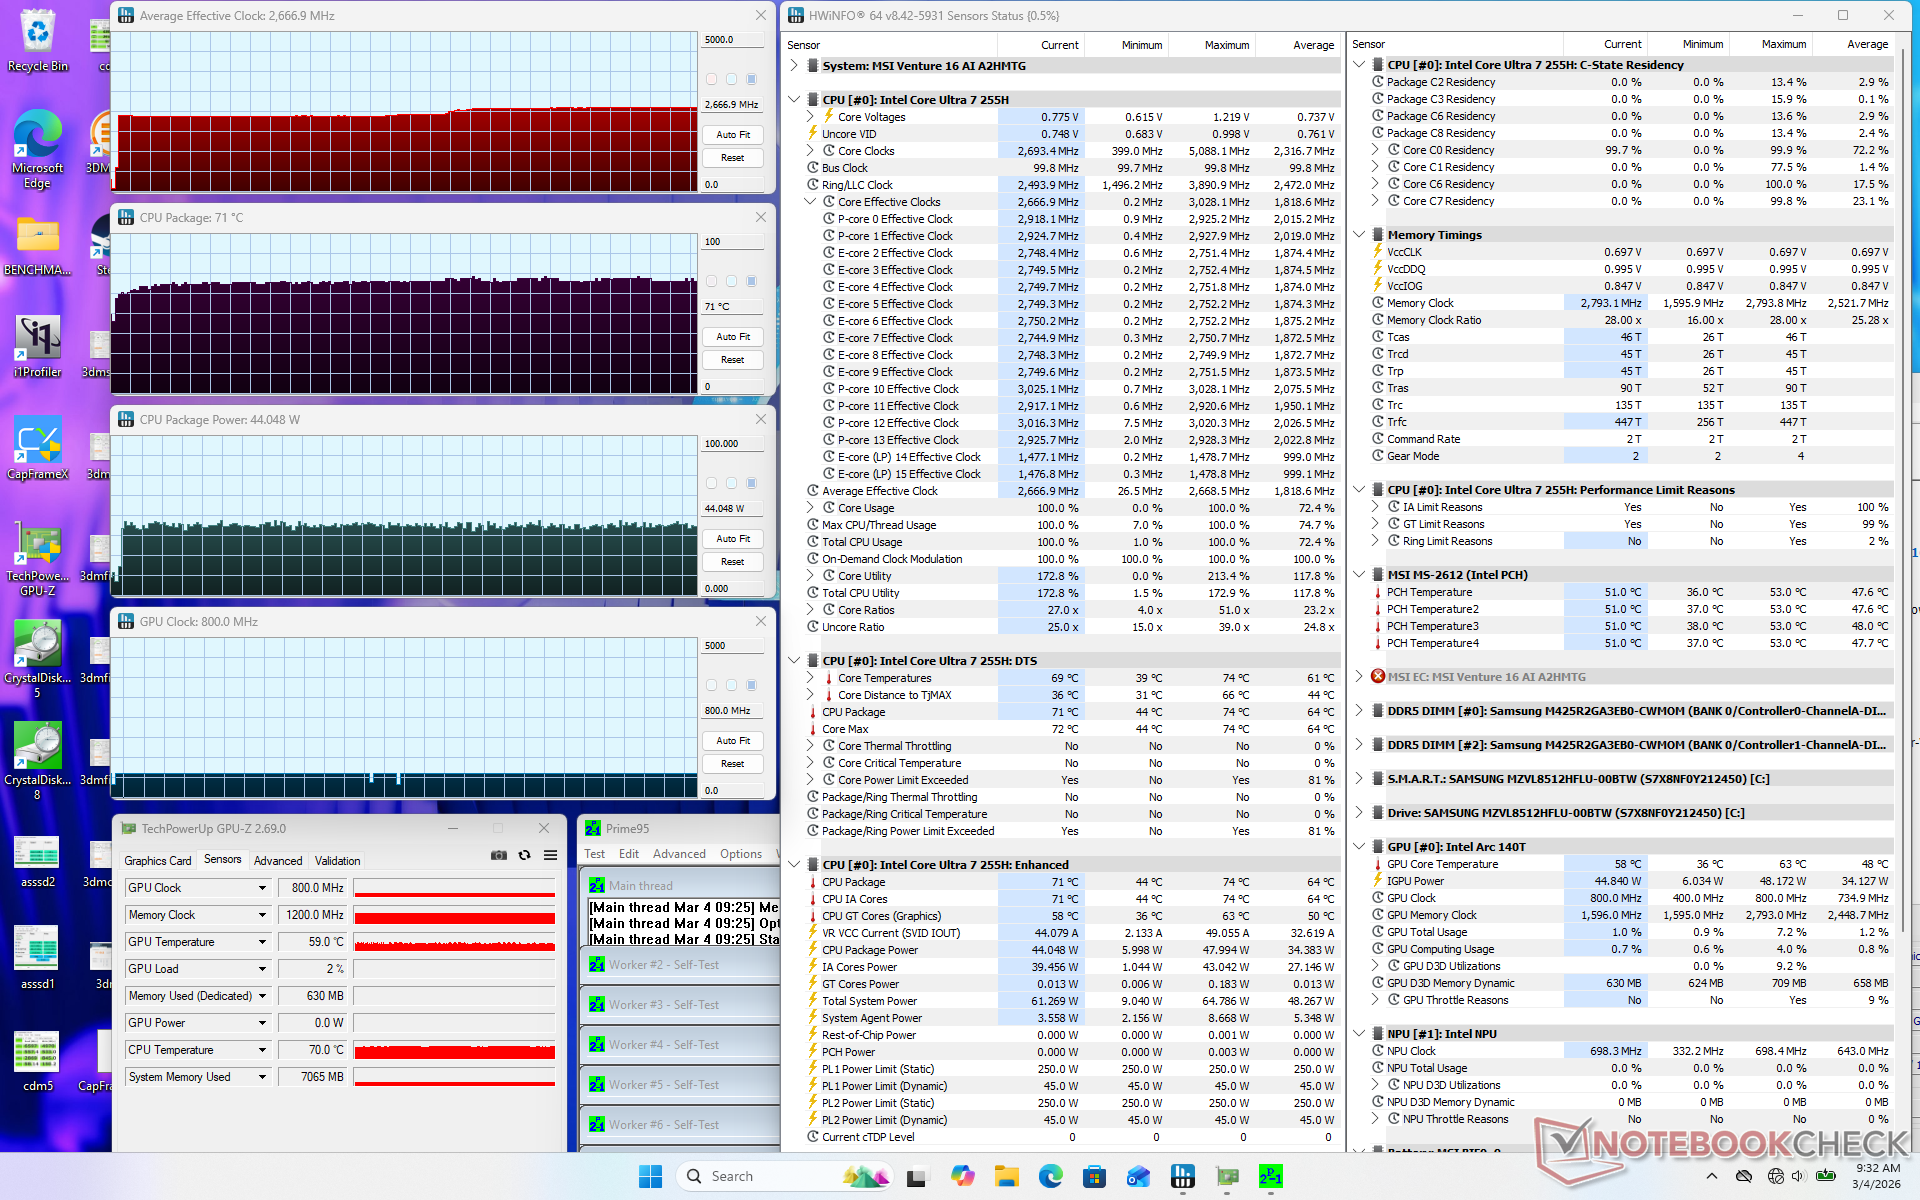
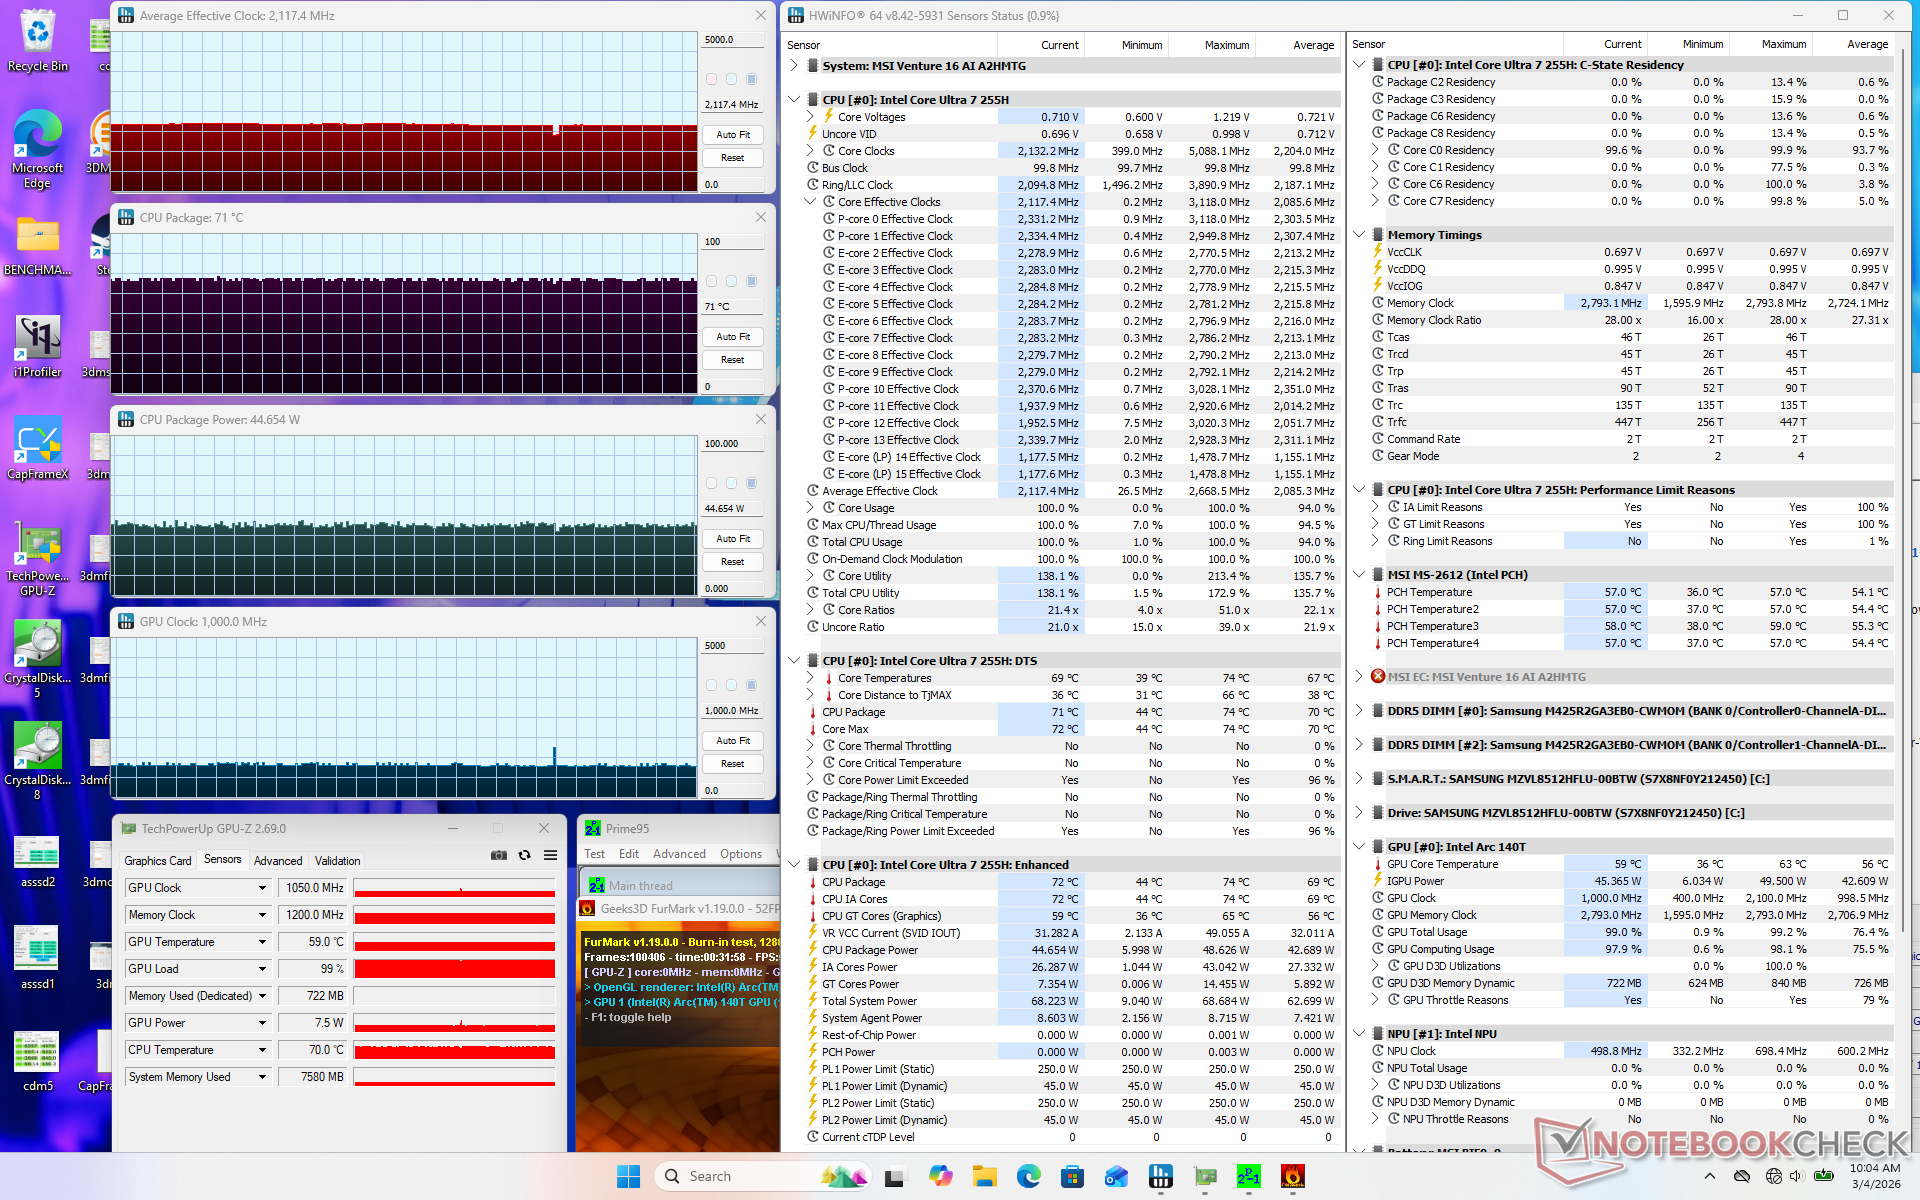
Stresstest
De CPU stabiliseerde zich op 2,7 GHz, 71 C en 44 W bij het starten van Prime95 belasting. De kerntemperatuur bleef in het lage 70 C-bereik, zelfs onder belasting, vergeleken met het midden van 80 C-bereik op de Prestige 16 met een vergelijkbare Core H-serie CPU.
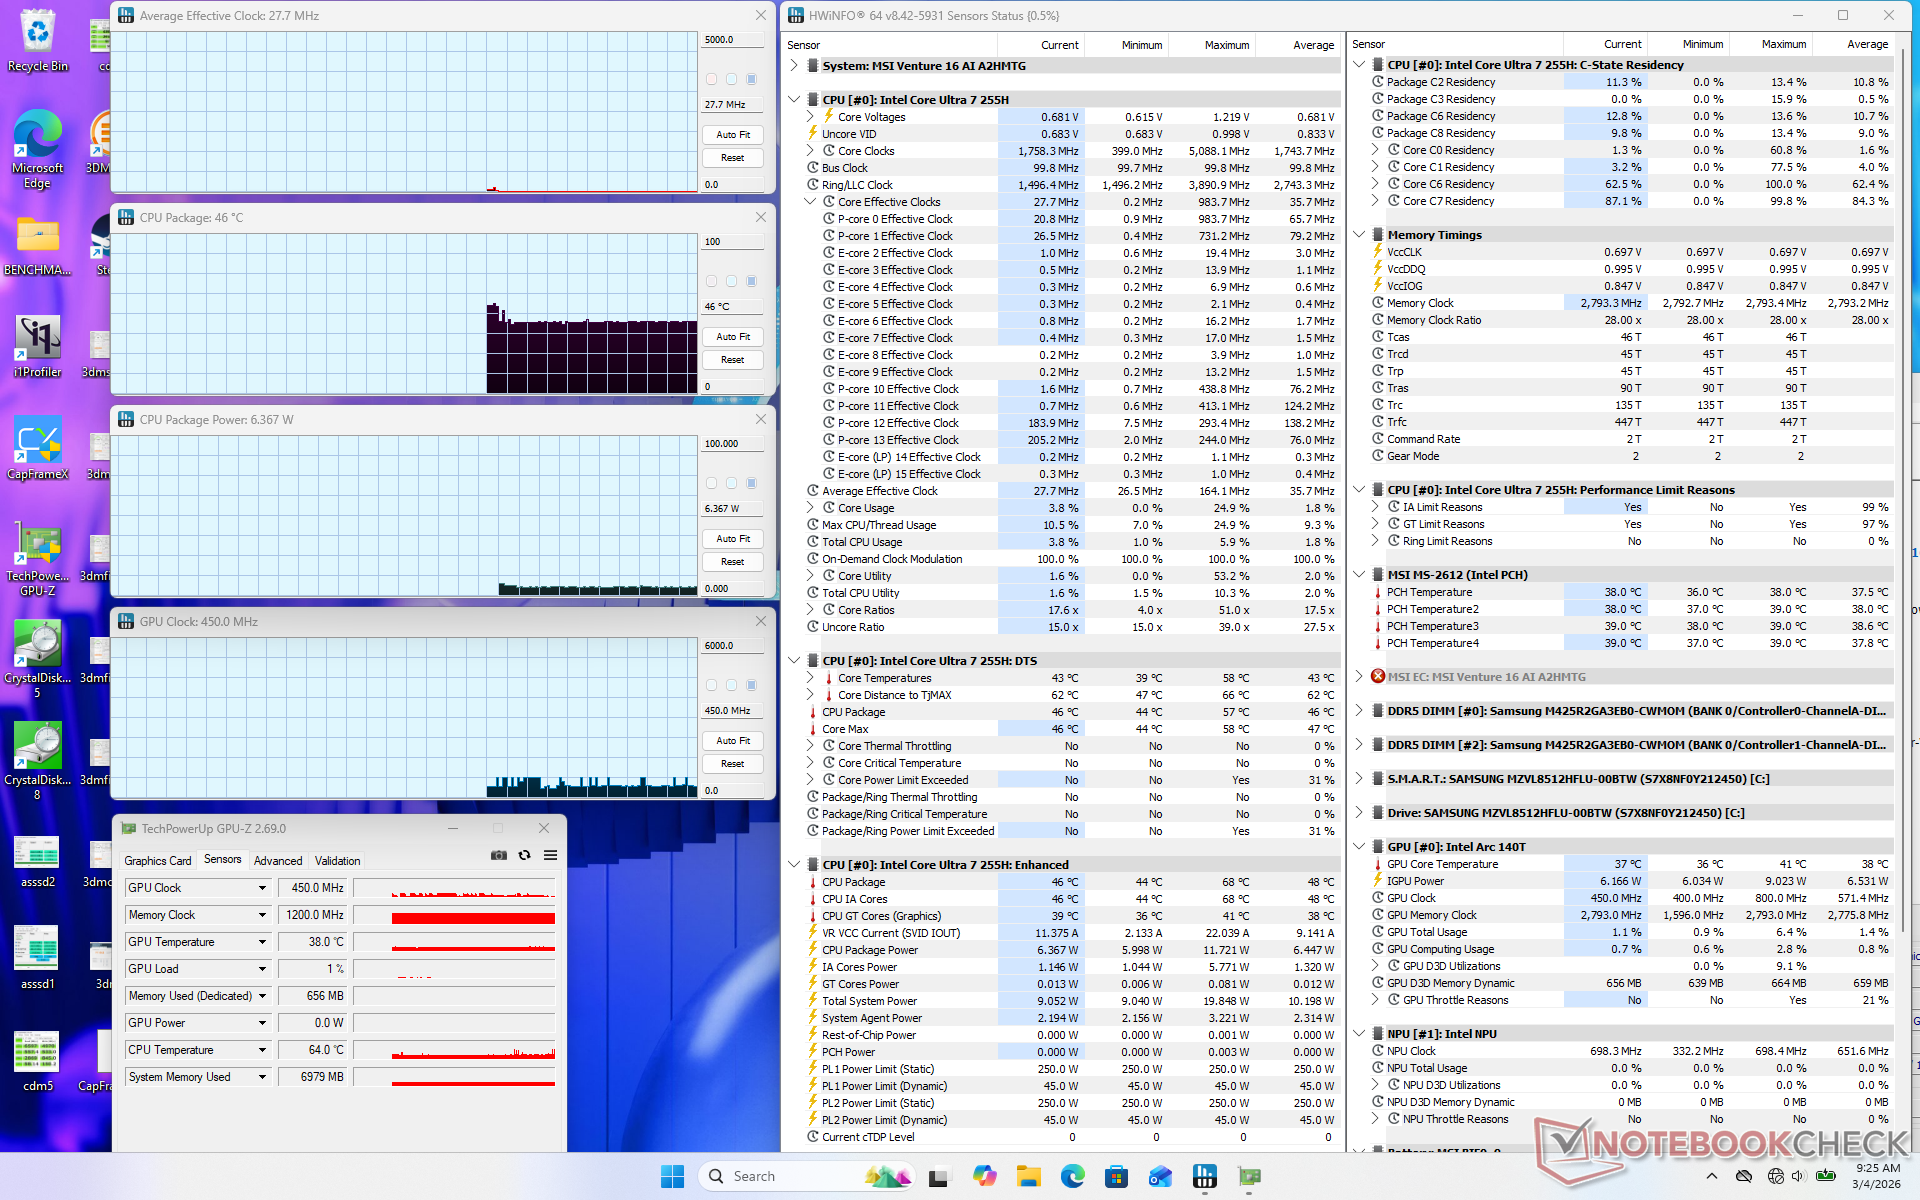
| Gemiddelde CPU-klok (GHz) | GPU-klok (MHz) | Gemiddelde CPU-temperatuur (°C) | |
| Inactief systeem | -- | -- | 46 |
| Prime95-stress | 2.7 | -- | 71 |
| Prime95 + FurMark Stress | 2.1 | 1000 | 71 |
| Cyberpunk 2077 Stress | 0.8 | 1400 - 2100 | 68 |
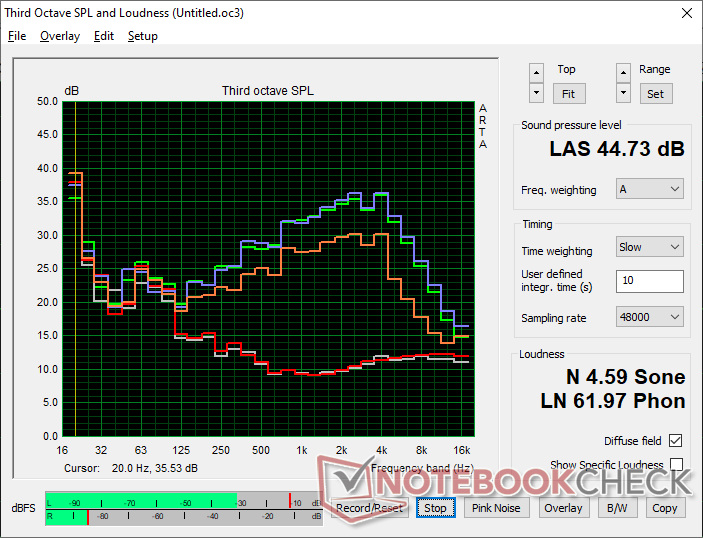
Luidsprekers
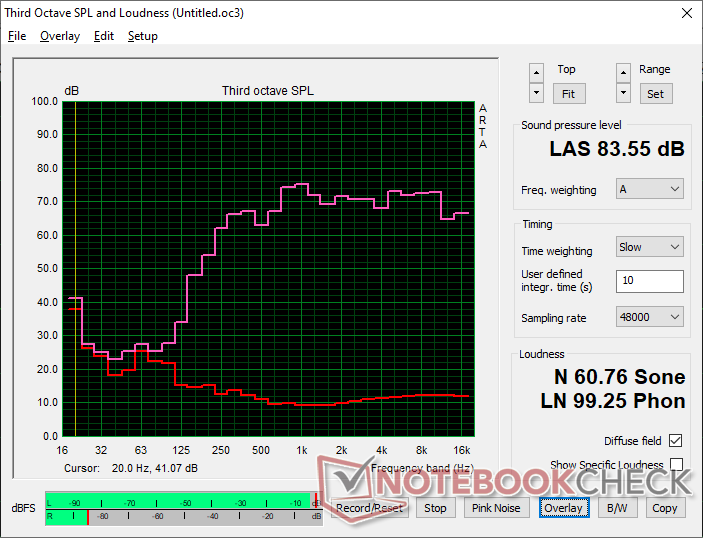
MSI Venture 16 AI A2HMTG audioanalyse
(+) | luidsprekers kunnen relatief luid spelen (83.6 dB)
Bas 100 - 315 Hz
(-) | bijna geen lage tonen - gemiddeld 19.3% lager dan de mediaan
(±) | lineariteit van de lage tonen is gemiddeld (12.2% delta ten opzichte van de vorige frequentie)
Midden 400 - 2000 Hz
(+) | evenwichtige middens - slechts 3.6% verwijderd van de mediaan
(+) | de middentonen zijn lineair (5.8% delta ten opzichte van de vorige frequentie)
Hoog 2 - 16 kHz
(+) | evenwichtige hoogtepunten - slechts 3.5% verwijderd van de mediaan
(+) | de hoge tonen zijn lineair (2.8% delta naar de vorige frequentie)
Algemeen 100 - 16.000 Hz
(+) | het totale geluid is lineair (14% verschil met de mediaan)
Vergeleken met dezelfde klasse
» 9% van alle geteste apparaten in deze klasse waren beter, 4% vergelijkbaar, 87% slechter
» De beste had een delta van 7%, het gemiddelde was 21%, de slechtste was 53%
Vergeleken met alle geteste toestellen
» 16% van alle geteste apparaten waren beter, 4% gelijk, 80% slechter
» De beste had een delta van 4%, het gemiddelde was 23%, de slechtste was 134%
Apple MacBook Pro 16 2021 M1 Pro audioanalyse
(+) | luidsprekers kunnen relatief luid spelen (84.7 dB)
Bas 100 - 315 Hz
(+) | goede baars - slechts 3.8% verwijderd van de mediaan
(+) | de lage tonen zijn lineair (5.2% delta naar de vorige frequentie)
Midden 400 - 2000 Hz
(+) | evenwichtige middens - slechts 1.3% verwijderd van de mediaan
(+) | de middentonen zijn lineair (2.1% delta ten opzichte van de vorige frequentie)
Hoog 2 - 16 kHz
(+) | evenwichtige hoogtepunten - slechts 1.9% verwijderd van de mediaan
(+) | de hoge tonen zijn lineair (2.7% delta naar de vorige frequentie)
Algemeen 100 - 16.000 Hz
(+) | het totale geluid is lineair (4.6% verschil met de mediaan)
Vergeleken met dezelfde klasse
» 0% van alle geteste apparaten in deze klasse waren beter, 0% vergelijkbaar, 100% slechter
» De beste had een delta van 5%, het gemiddelde was 17%, de slechtste was 45%
Vergeleken met alle geteste toestellen
» 0% van alle geteste apparaten waren beter, 0% gelijk, 100% slechter
» De beste had een delta van 4%, het gemiddelde was 23%, de slechtste was 134%
Energiebeheer
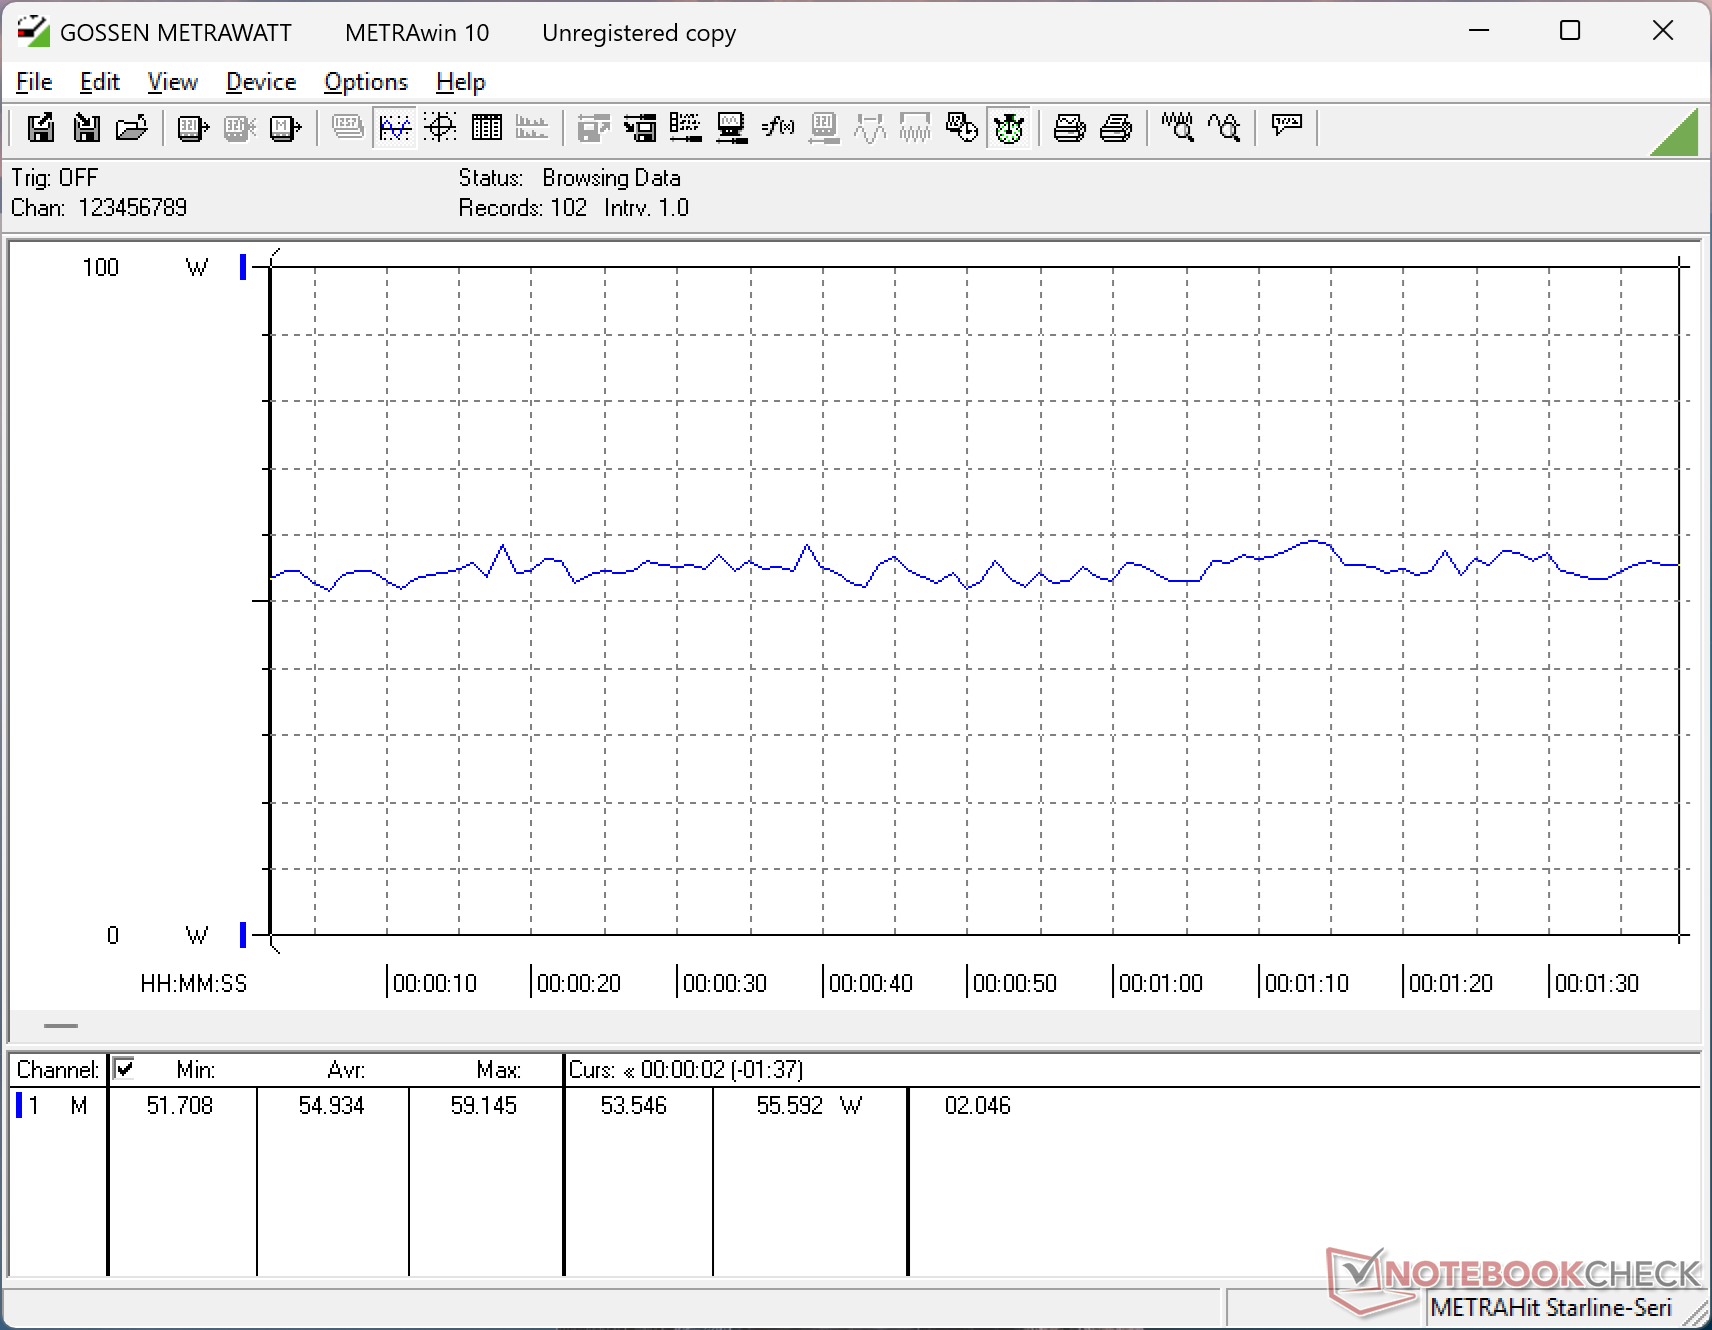
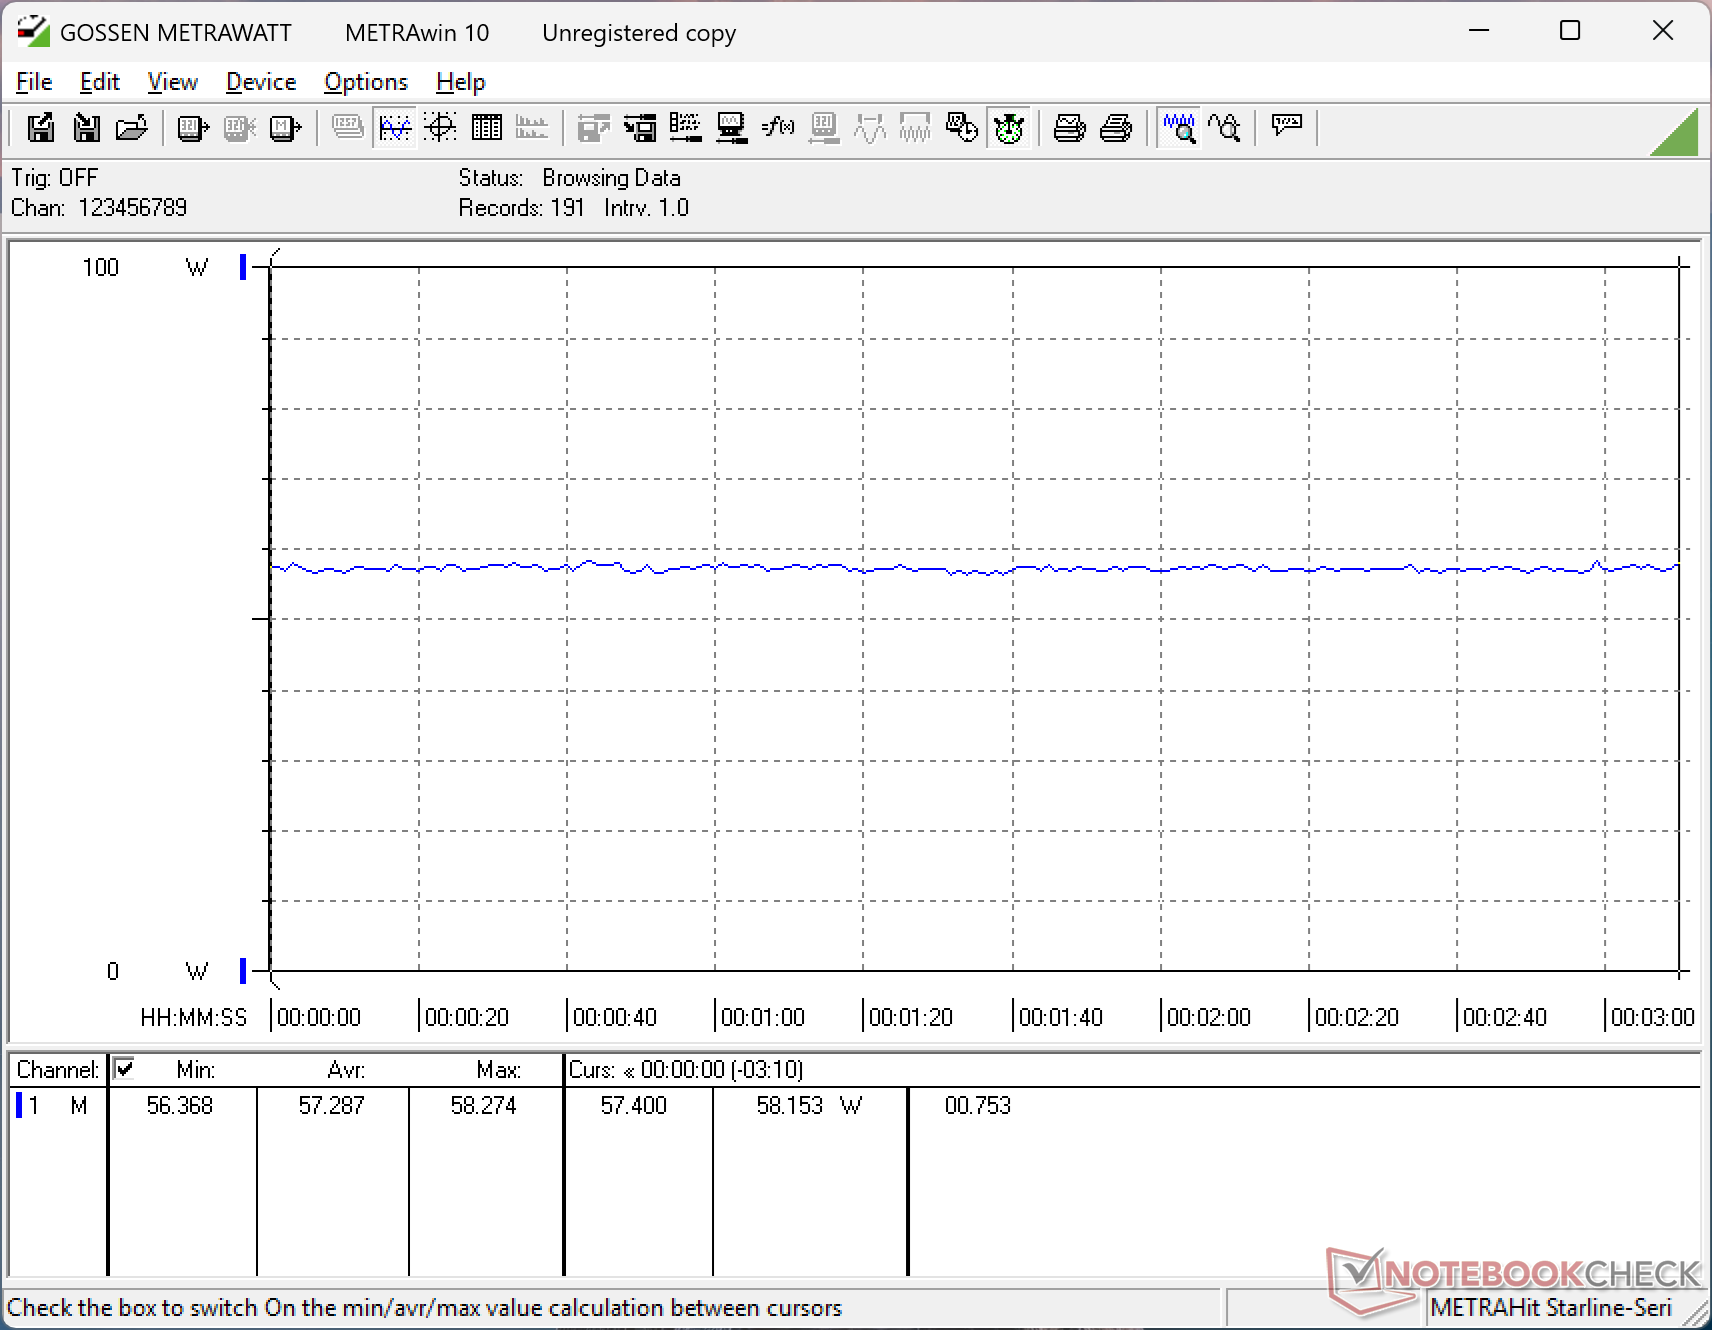
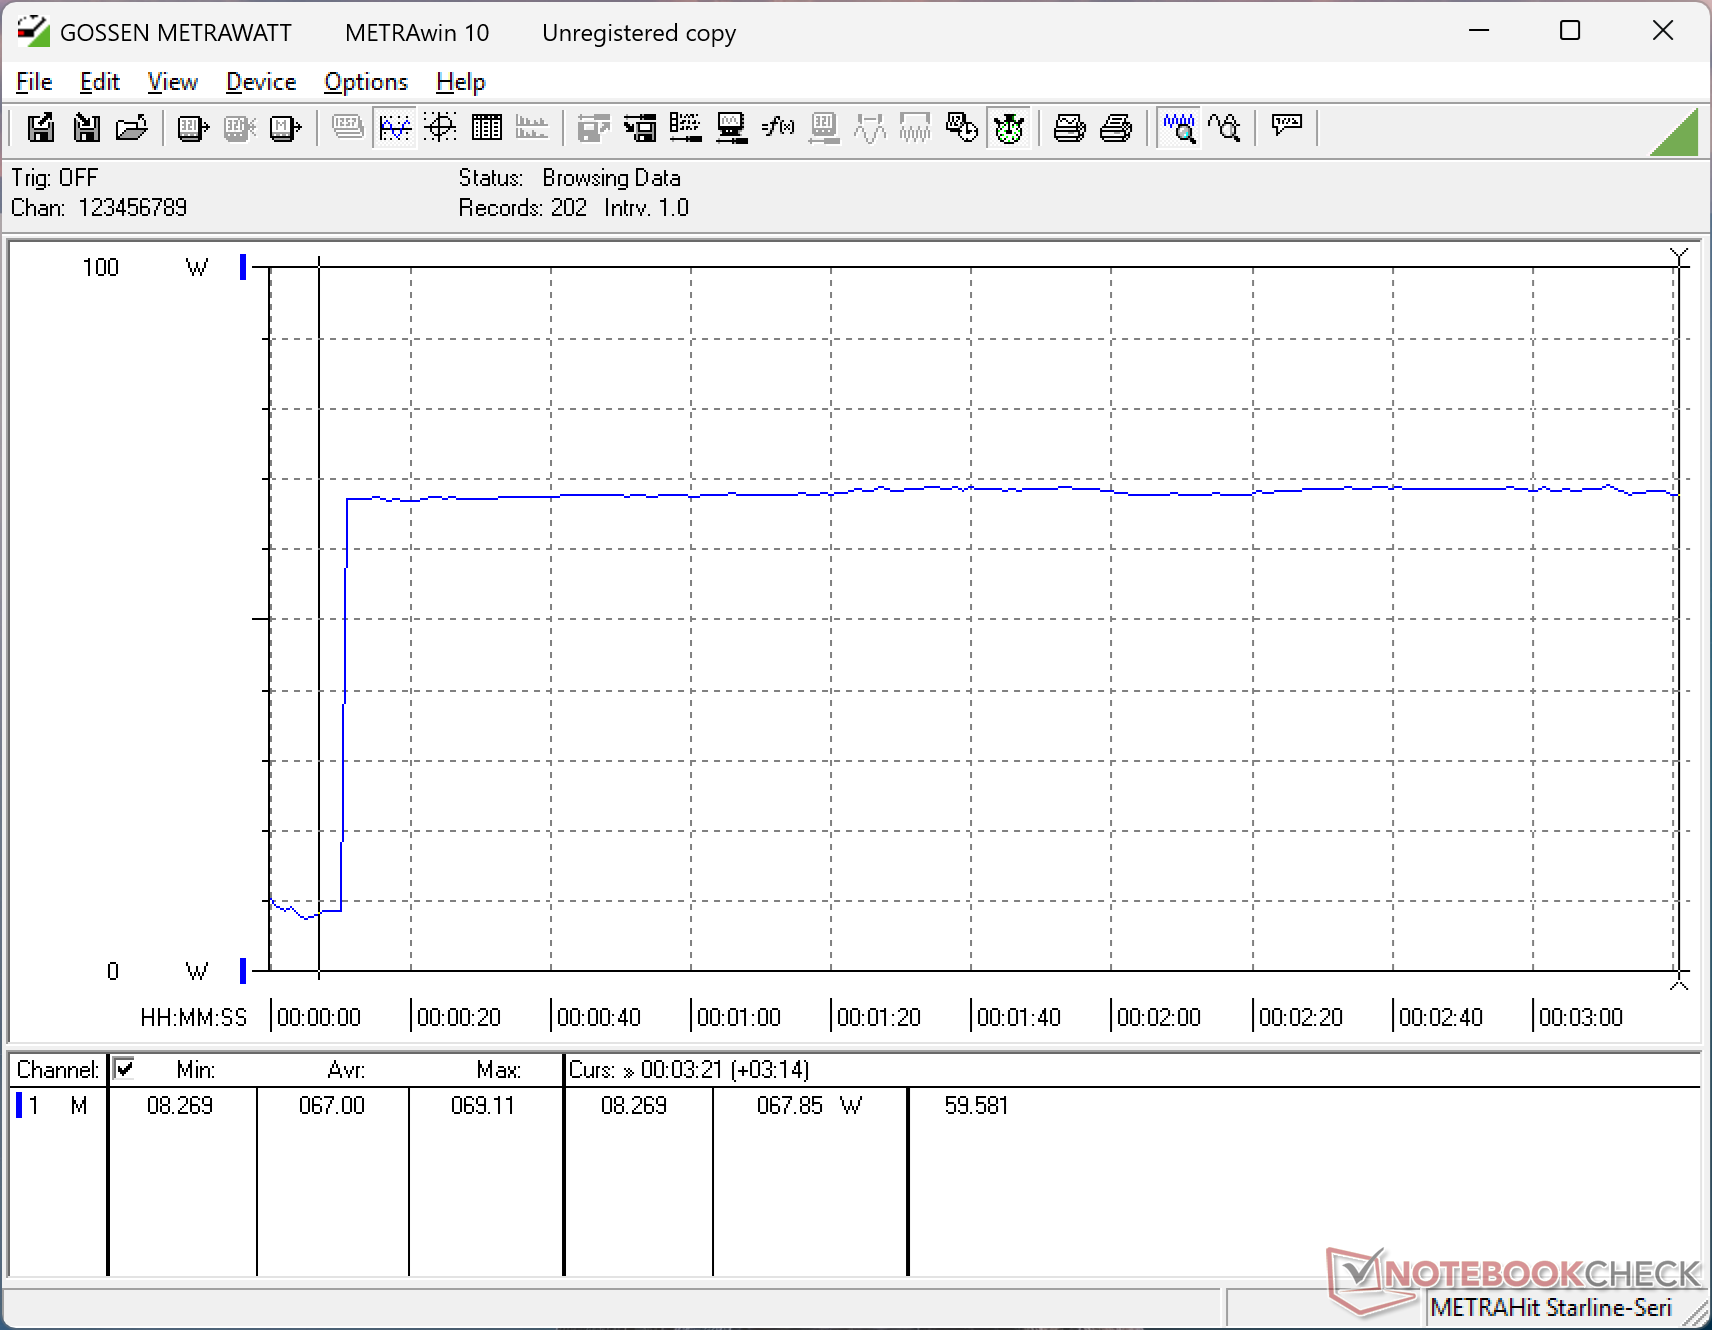
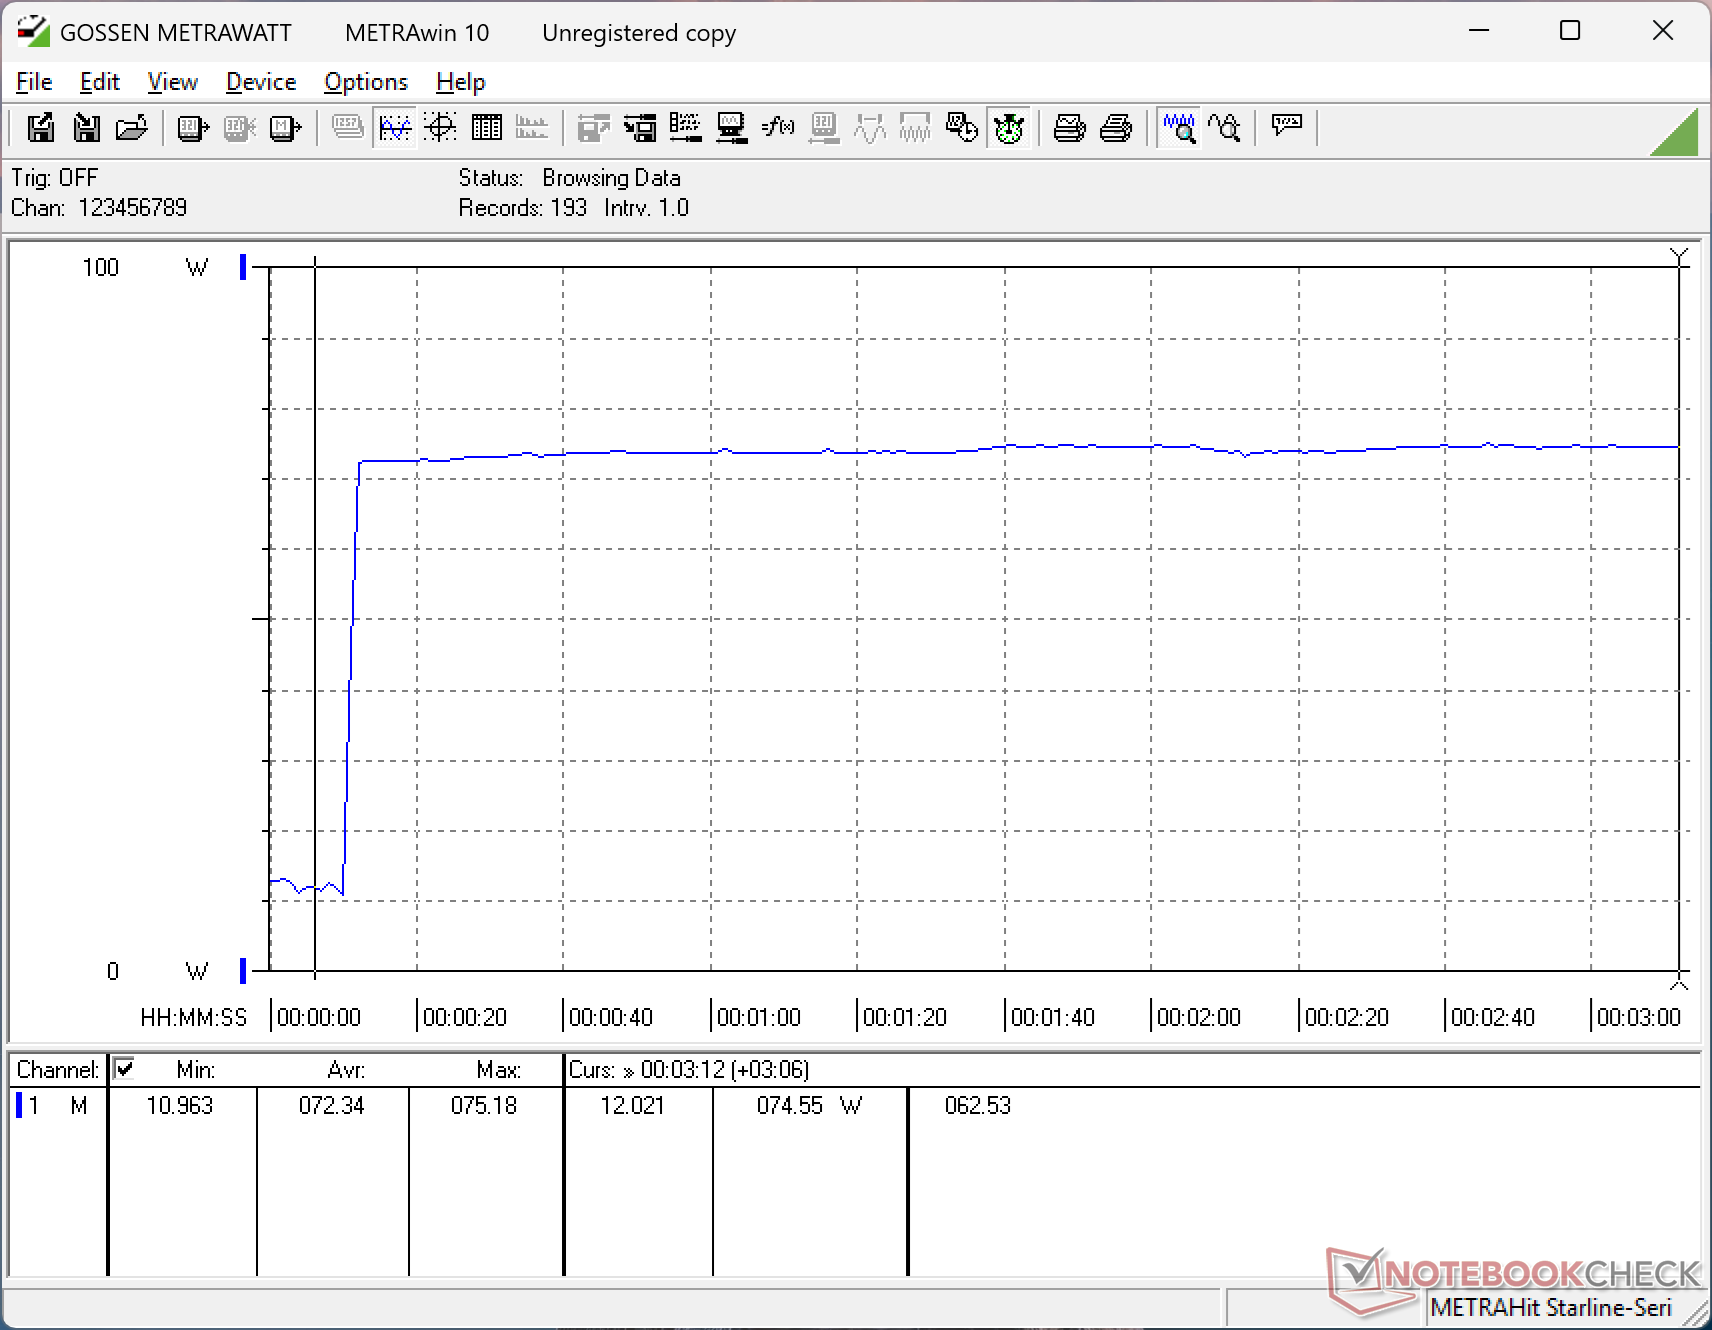
Stroomverbruik
Het totale verbruik is over het algemeen hoger dan dat van veel andere budgetgerichte 16-inch laptops, grotendeels dankzij de snellere Core-H serie CPU. Het uitvoeren van Prime95 zou bijvoorbeeld bijna 70 W vergen, vergeleken met slechts 40 W op de Lunar Lake-V-aangedreven Dell 16 Plus.
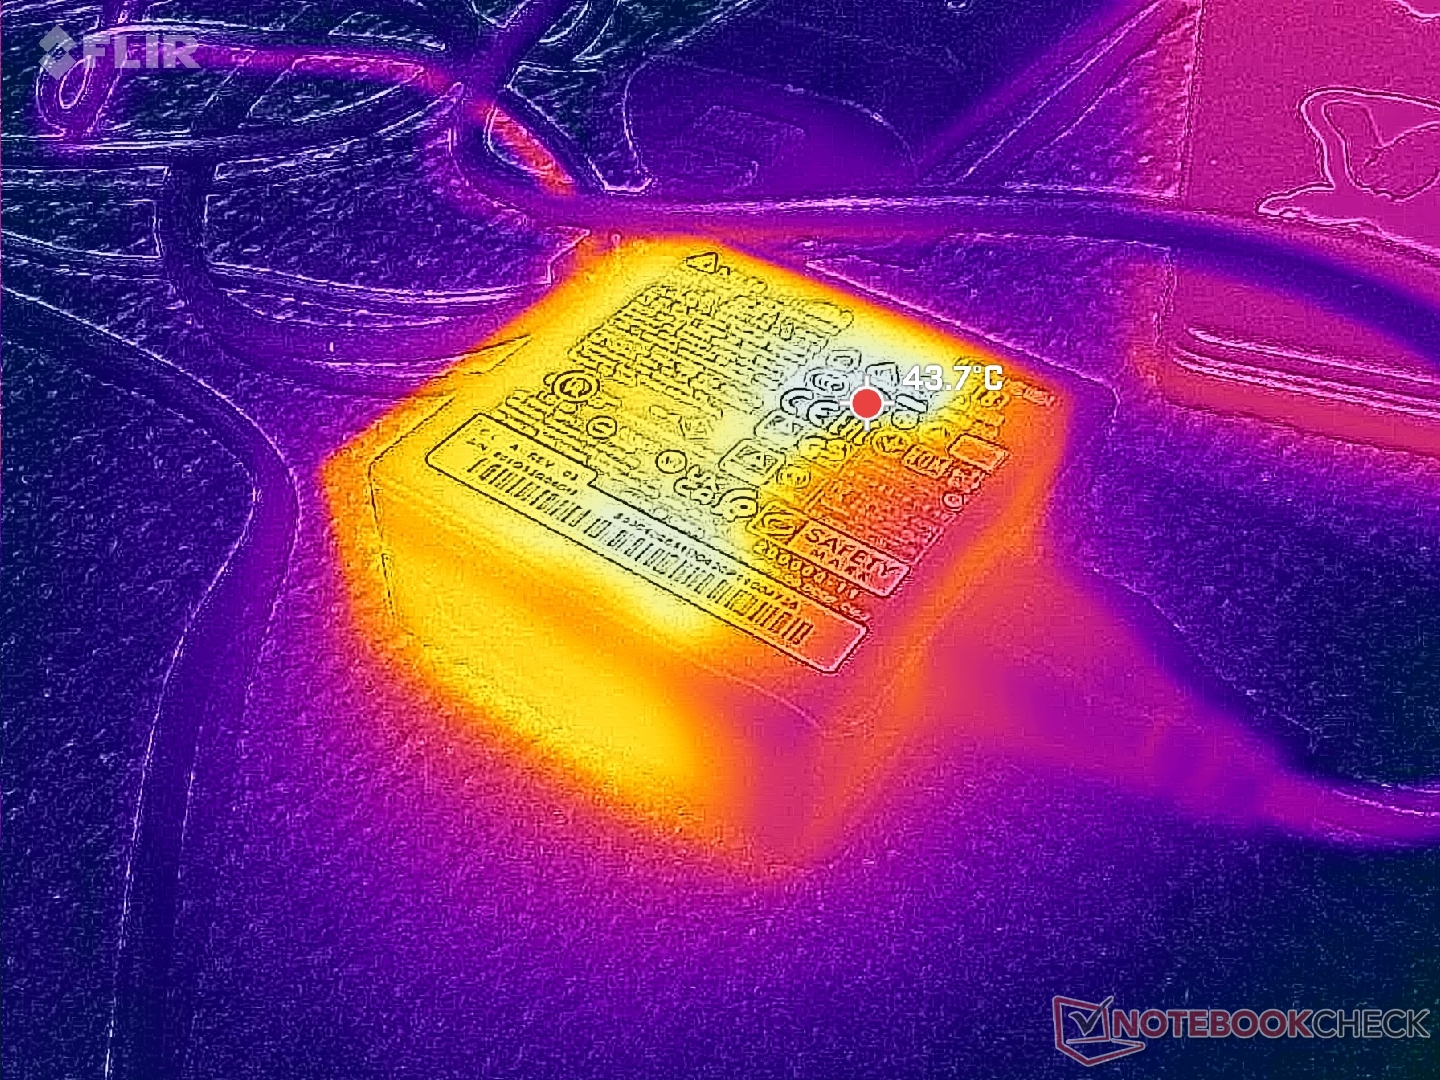
De 90 W AC-adapter is met slechts ~7,5 x 7,5 x 2,8 cm vrij compact. Het is echter wel teleurstellend dat het model vertrouwt op een AC-lader in plaats van universele USB-C.
| Uit / Standby | |
| Inactief | |
| Belasting |
|
Key:
min: | |
| MSI Venture 16 AI A2HMTG Ultra 7 255H, Arc 140T, , IPS, 1920x1200, 16" | MSI Prestige 16 B1MG-001US Ultra 7 155H, Arc 8-Core, Samsung PM9A1 MZVL22T0HBLB, IPS, 2560x1600, 16" | Dell 16 Plus 2-in-1 Core Ultra 7 258V, Arc 140V, Samsung BM9C1 1024GB, Mini-LED, 2560x1600, 16" | Asus V16 V3607V Core 7 240H, GeForce RTX 3050 6GB Laptop GPU, Samsung PM9C1 MZVL8512HELU, IPS, 1920x1200, 16" | HP Pavilion 16-ag0057ng R5 8540U, Radeon 740M, SK hynix BC901 HFS001TEJ4X164N, IPS, 1920x1200, 16" | Lenovo IdeaPad Slim 5 16AKP10 Ryzen AI 5 330, Radeon 820M, Western Digital PC SN5000S SDEPMSJ-512G, IPS, 1920x1200, 16" | |
|---|---|---|---|---|---|---|
| Power Consumption | -10% | -4% | -32% | 33% | 22% | |
| Idle Minimum * (Watt) | 5.9 | 3 49% | 7 -19% | 2.1 64% | 4 32% | 5.2 12% |
| Idle Average * (Watt) | 9 | 9.5 -6% | 13.2 -47% | 7.2 20% | 5 44% | 6 33% |
| Idle Maximum * (Watt) | 9.7 | 12 -24% | 13.4 -38% | 10.7 -10% | 6 38% | 7.7 21% |
| Load Average * (Watt) | 54.9 | 68.3 -24% | 43.9 20% | 99.4 -81% | 40 27% | 44 20% |
| Cyberpunk 2077 ultra * (Watt) | 57.3 | 44.9 22% | 92.1 -61% | 43 25% | 43 25% | |
| Cyberpunk 2077 ultra external monitor * (Watt) | 54.2 | 40.7 25% | 88.7 -64% | 39.1 28% | 40.4 25% | |
| Load Maximum * (Watt) | 72.3 | 104.8 -45% | 67.8 6% | 137.8 -91% | 46 36% | 58 20% |
| Witcher 3 ultra * (Watt) | 59.8 |
* ... kleiner is beter
Stroomverbruik Cyberpunk / Stresstest
Stroomverbruik externe monitor
Levensduur batterij
De WLAN-gebruiksduur is met ongeveer 7 uur uit de relatief kleine batterijcapaciteit van 55 Wh behoorlijk.
| MSI Venture 16 AI A2HMTG Ultra 7 255H, Arc 140T, 55.2 Wh | MSI Prestige 16 B1MG-001US Ultra 7 155H, Arc 8-Core, 99.9 Wh | Dell 16 Plus 2-in-1 Core Ultra 7 258V, Arc 140V, 64 Wh | Asus V16 V3607V Core 7 240H, GeForce RTX 3050 6GB Laptop GPU, 63 Wh | HP Pavilion 16-ag0057ng R5 8540U, Radeon 740M, 59 Wh | Lenovo IdeaPad Slim 5 16AKP10 Ryzen AI 5 330, Radeon 820M, 60 Wh | |
|---|---|---|---|---|---|---|
| Batterijduur | 161% | 27% | 29% | 63% | 50% | |
| WiFi v1.3 (h) | 7 | 18.3 161% | 8.9 27% | 9 29% | 11.4 63% | 10.5 50% |
| Reader / Idle (h) | 25.1 | |||||
| Load (h) | 2.8 |
Notebookcheck Beoordeling
De Venture 16 AI is een van de basismodellen van MSI met een goede bruikbaarheid, maar verder beperkte mogelijkheden, vooral in de basisconfiguratie.
MSI Venture 16 AI A2HMTG
- 06-03-2026 v8
Allen Ngo
 Total Sustainability Score:
 Potentiële concurrenten in vergelijking
Afbeelding | Model / recensie | prijs | Gewicht | Hoogte | Scherm |
|---|---|---|---|---|---|
1. 80.7%  | MSI Venture 16 AI A2HMTG Intel Core Ultra 7 255H ⎘ Intel Arc Graphics 140T ⎘ 32 GB Geheugen | Amazon: Catalogusprijs: 1000 USD | 2.1 kg | 23.15 mm | 16.00" 1920x1200 142 PPI IPS |
2. 88.1% v7 (old)  | MSI Prestige 16 B1MG-001US Intel Core Ultra 7 155H ⎘ Intel Arc 8-Core iGPU ⎘ 32 GB Geheugen, 2048 GB SSD | Amazon: 1. $43.99 AC Adapter Charger Compatibl... 2. $130.00 16.0 inch WQXGA 2560(RGB)*16... 3. $140.00 Replacement Screen 16.0 inch... Catalogusprijs: 1300 USD | 1.6 kg | 19.1 mm | 16.00" 2560x1600 189 PPI IPS |
3. 83.5%  | Dell 16 Plus 2-in-1 Intel Core Ultra 7 258V ⎘ Intel Arc Graphics 140V ⎘ 32 GB Geheugen, 1024 GB SSD | Amazon: $1,149.99 Catalogusprijs: 1500 USD | 2 kg | 16.99 mm | 16.00" 2560x1600 189 PPI Mini-LED |
4. 78.5%  | Asus V16 V3607V Intel Core 7 240H ⎘ NVIDIA GeForce RTX 3050 6GB Laptop GPU ⎘ 16 GB Geheugen, 512 GB SSD | Amazon: 1. $49.99 180W 150W 20V 9A Charger for... 2. $125.98 KrystalPix Replacement LCD f... 3. $125.98 KrystalPix Replacement LCD f... Catalogusprijs: 900 USD | 2 kg | 22 mm | 16.00" 1920x1200 142 PPI IPS |
5. 77.3%  | HP Pavilion 16-ag0057ng AMD Ryzen 5 8540U ⎘ AMD Radeon 740M ⎘ 16 GB Geheugen, 1024 GB SSD | Amazon: Catalogusprijs: 730 EUR | 1.7 kg | 18.6 mm | 16.00" 1920x1200 142 PPI IPS |
6. 80.8%  | Lenovo IdeaPad Slim 5 16AKP10 AMD Ryzen AI 5 330 ⎘ AMD Radeon 820M ⎘ 16 GB Geheugen, 512 GB SSD | Amazon: Catalogusprijs: 700 EUR | 1.9 kg | 18.4 mm | 16.00" 1920x1200 142 PPI IPS |
Transparantie
De selectie van te beoordelen apparaten wordt gemaakt door onze redactie. Het testexemplaar werd ten behoeve van deze beoordeling door de fabrikant of detailhandelaar in bruikleen aan de auteur verstrekt. De kredietverstrekker had geen invloed op deze recensie, noch ontving de fabrikant vóór publicatie een exemplaar van deze recensie. Er bestond geen verplichting om deze recensie te publiceren. Als onafhankelijk mediabedrijf is Notebookcheck niet onderworpen aan het gezag van fabrikanten, detailhandelaren of uitgevers.
[transparency_disclaimer]Dit is hoe Notebookcheck test
Elk jaar beoordeelt Notebookcheck onafhankelijk honderden laptops en smartphones met behulp van gestandaardiseerde procedures om ervoor te zorgen dat alle resultaten vergelijkbaar zijn. We hebben onze testmethoden al zo'n 20 jaar voortdurend ontwikkeld en daarbij de industriestandaard bepaald. In onze testlaboratoria wordt gebruik gemaakt van hoogwaardige meetapparatuur door ervaren technici en redacteuren. Deze tests omvatten een validatieproces in meerdere fasen. Ons complexe beoordelingssysteem is gebaseerd op honderden goed onderbouwde metingen en benchmarks, waardoor de objectiviteit behouden blijft. Meer informatie over onze testmethoden kunt u hier vinden.

