MSI Prestige 16 B1MG laptop test: Van Core i7 Xe naar Core Ultra 7 Arc

De 16-inch MSI Prestige 16 AI B1MG is een van de eerste laptops op de markt met 14e generatie Core Ultra Meteor Lake CPU-opties. Het is de opvolger van de oudere 15,6-inch Prestige 15 met zowel vernieuwde internals als externals voor een gloednieuwe gebruikerservaring. De MSI Prestige-familie bestaat uit laptops uit het hogere middensegment tussen de goedkopere Modern-serie en de duurdere Summit-serie.
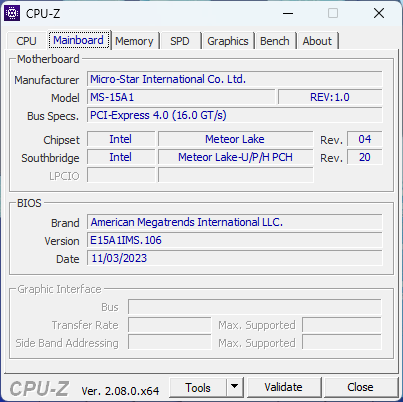
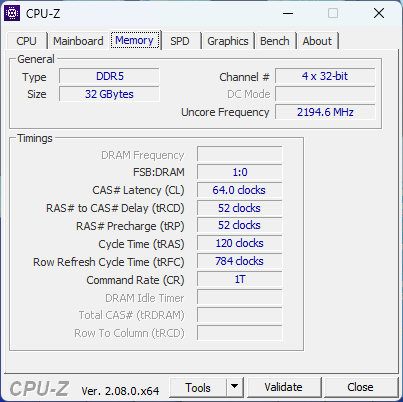
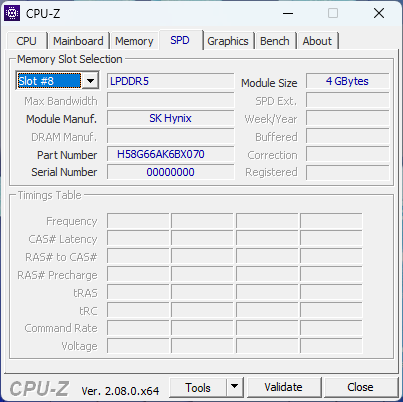
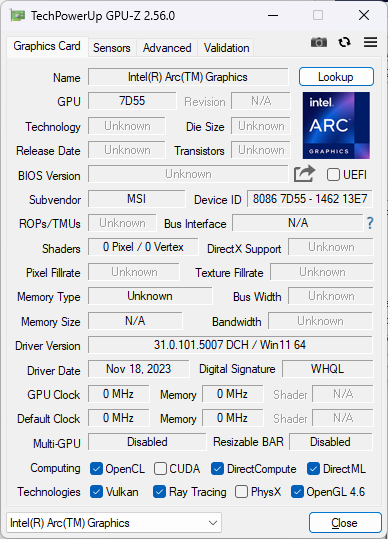
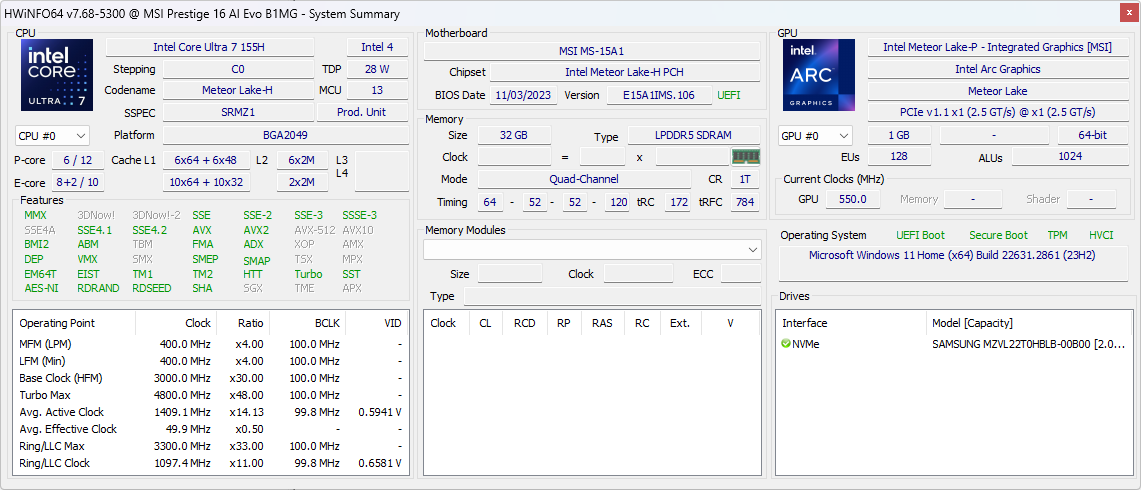
Onze configuratie die we hier bespreken is een verkoopeenheid voor $1400 USD met de Core Ultra 7 155H CPU, geïntegreerde Arc 8 grafische processor, 1600p IPS-beeldscherm, 32 GB LPDDR5-6400 MHz RAM en 2 TB NVMe SSD. Er zijn ook duurdere SKU's verkrijgbaar met de Core Ultra 9 185H, GeForce RTX 4060 of 4070 graphics, Arc 370M graphics en 4K (2400p) OLED.
Concurrenten voor de Prestige 16 zijn andere dunne en lichte laptops voor multimedia of content creators zoals de Dell XPS-serie, Asus VivoBook Pro 16,LG Gram 16 2-in-1of de Lenovo Yoga Pro 9i 16.
Meer MSI beoordelingen:
Potentiële concurrenten in vergelijking
Evaluatie | Datum | Model | Gewicht | Hoogte | Formaat | Resolutie | Beste prijs |
|---|---|---|---|---|---|---|---|
| 88.1 % v7 (old) | 12-2023 | MSI Prestige 16 B1MG-001US Ultra 7 155H, Arc 8-Core | 1.6 kg | 19.1 mm | 16.00" | 2560x1600 | |
| 85.4 % v7 (old) | 12-2022 | MSI Prestige 15 A12UD-093 i7-1280P, GeForce RTX 3050 Ti Laptop GPU | 1.8 kg | 20.1 mm | 15.60" | 3840x2160 | |
| 85.8 % v7 (old) | 11-2023 | LG Gram 2in1 16 16T90R - G.AA78G i7-1360P, Iris Xe G7 96EUs | 1.5 kg | 17.2 mm | 16.00" | 2560x1600 | |
| 85.7 % v7 (old) | 11-2023 | Lenovo ThinkBook 16 G6 ABP R5 7530U, Vega 7 | 1.8 kg | 17.5 mm | 16.00" | 1920x1200 | |
| 87.6 % v7 (old) | 11-2023 | Asus VivoBook Pro 16 K6602VU i9-13900H, GeForce RTX 4050 Laptop GPU | 1.9 kg | 19 mm | 16.00" | 3200x2000 | |
| 87.1 % v7 (old) | 08-2023 | Dell Inspiron 16 Plus 7630 i7-13700H, GeForce RTX 4060 Laptop GPU | 2.2 kg | 19.95 mm | 16.00" | 2560x1600 |
Geval - Dun uiterlijk, dunne materialen
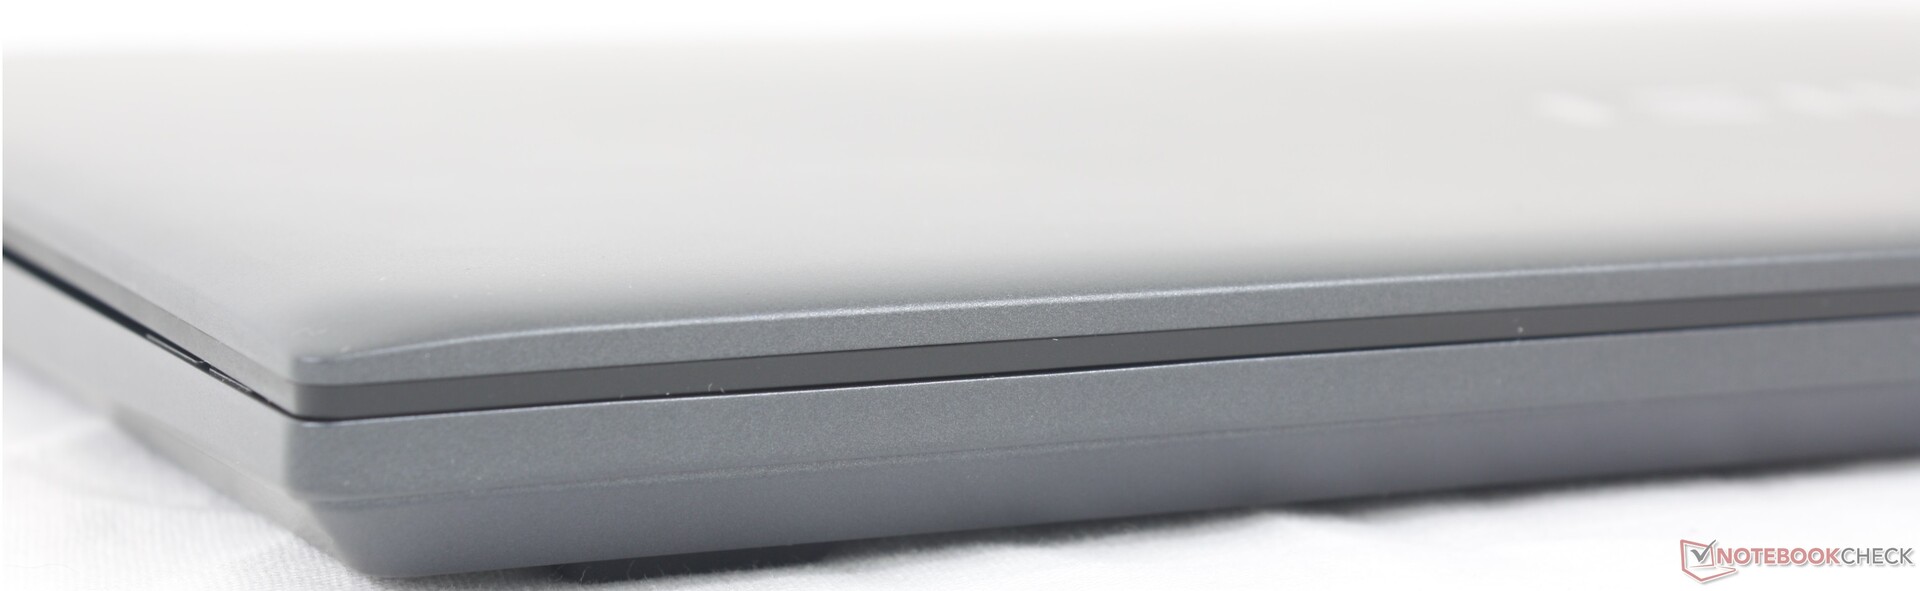
Het metalen chassis is steviger en robuuster dan dat van een goedkopere MSI Modern of Asus VivoBook serie. Als u bijvoorbeeld druk uitoefent op het midden van het toetsenbord, trekt het oppervlak nauwelijks krom. Het deksel is relatief gevoeliger voor verdraaiing en schade, vooral omdat het Gorilla Glass versterking mist. Druk uitoefenen op het midden van de buitenklep zou het oppervlak meer vervormen dan we zouden willen. In dit geval zijn alternatieven zoals de HP Spectre of Razer Blade veel sterker, ook al zijn ze zwaarder.
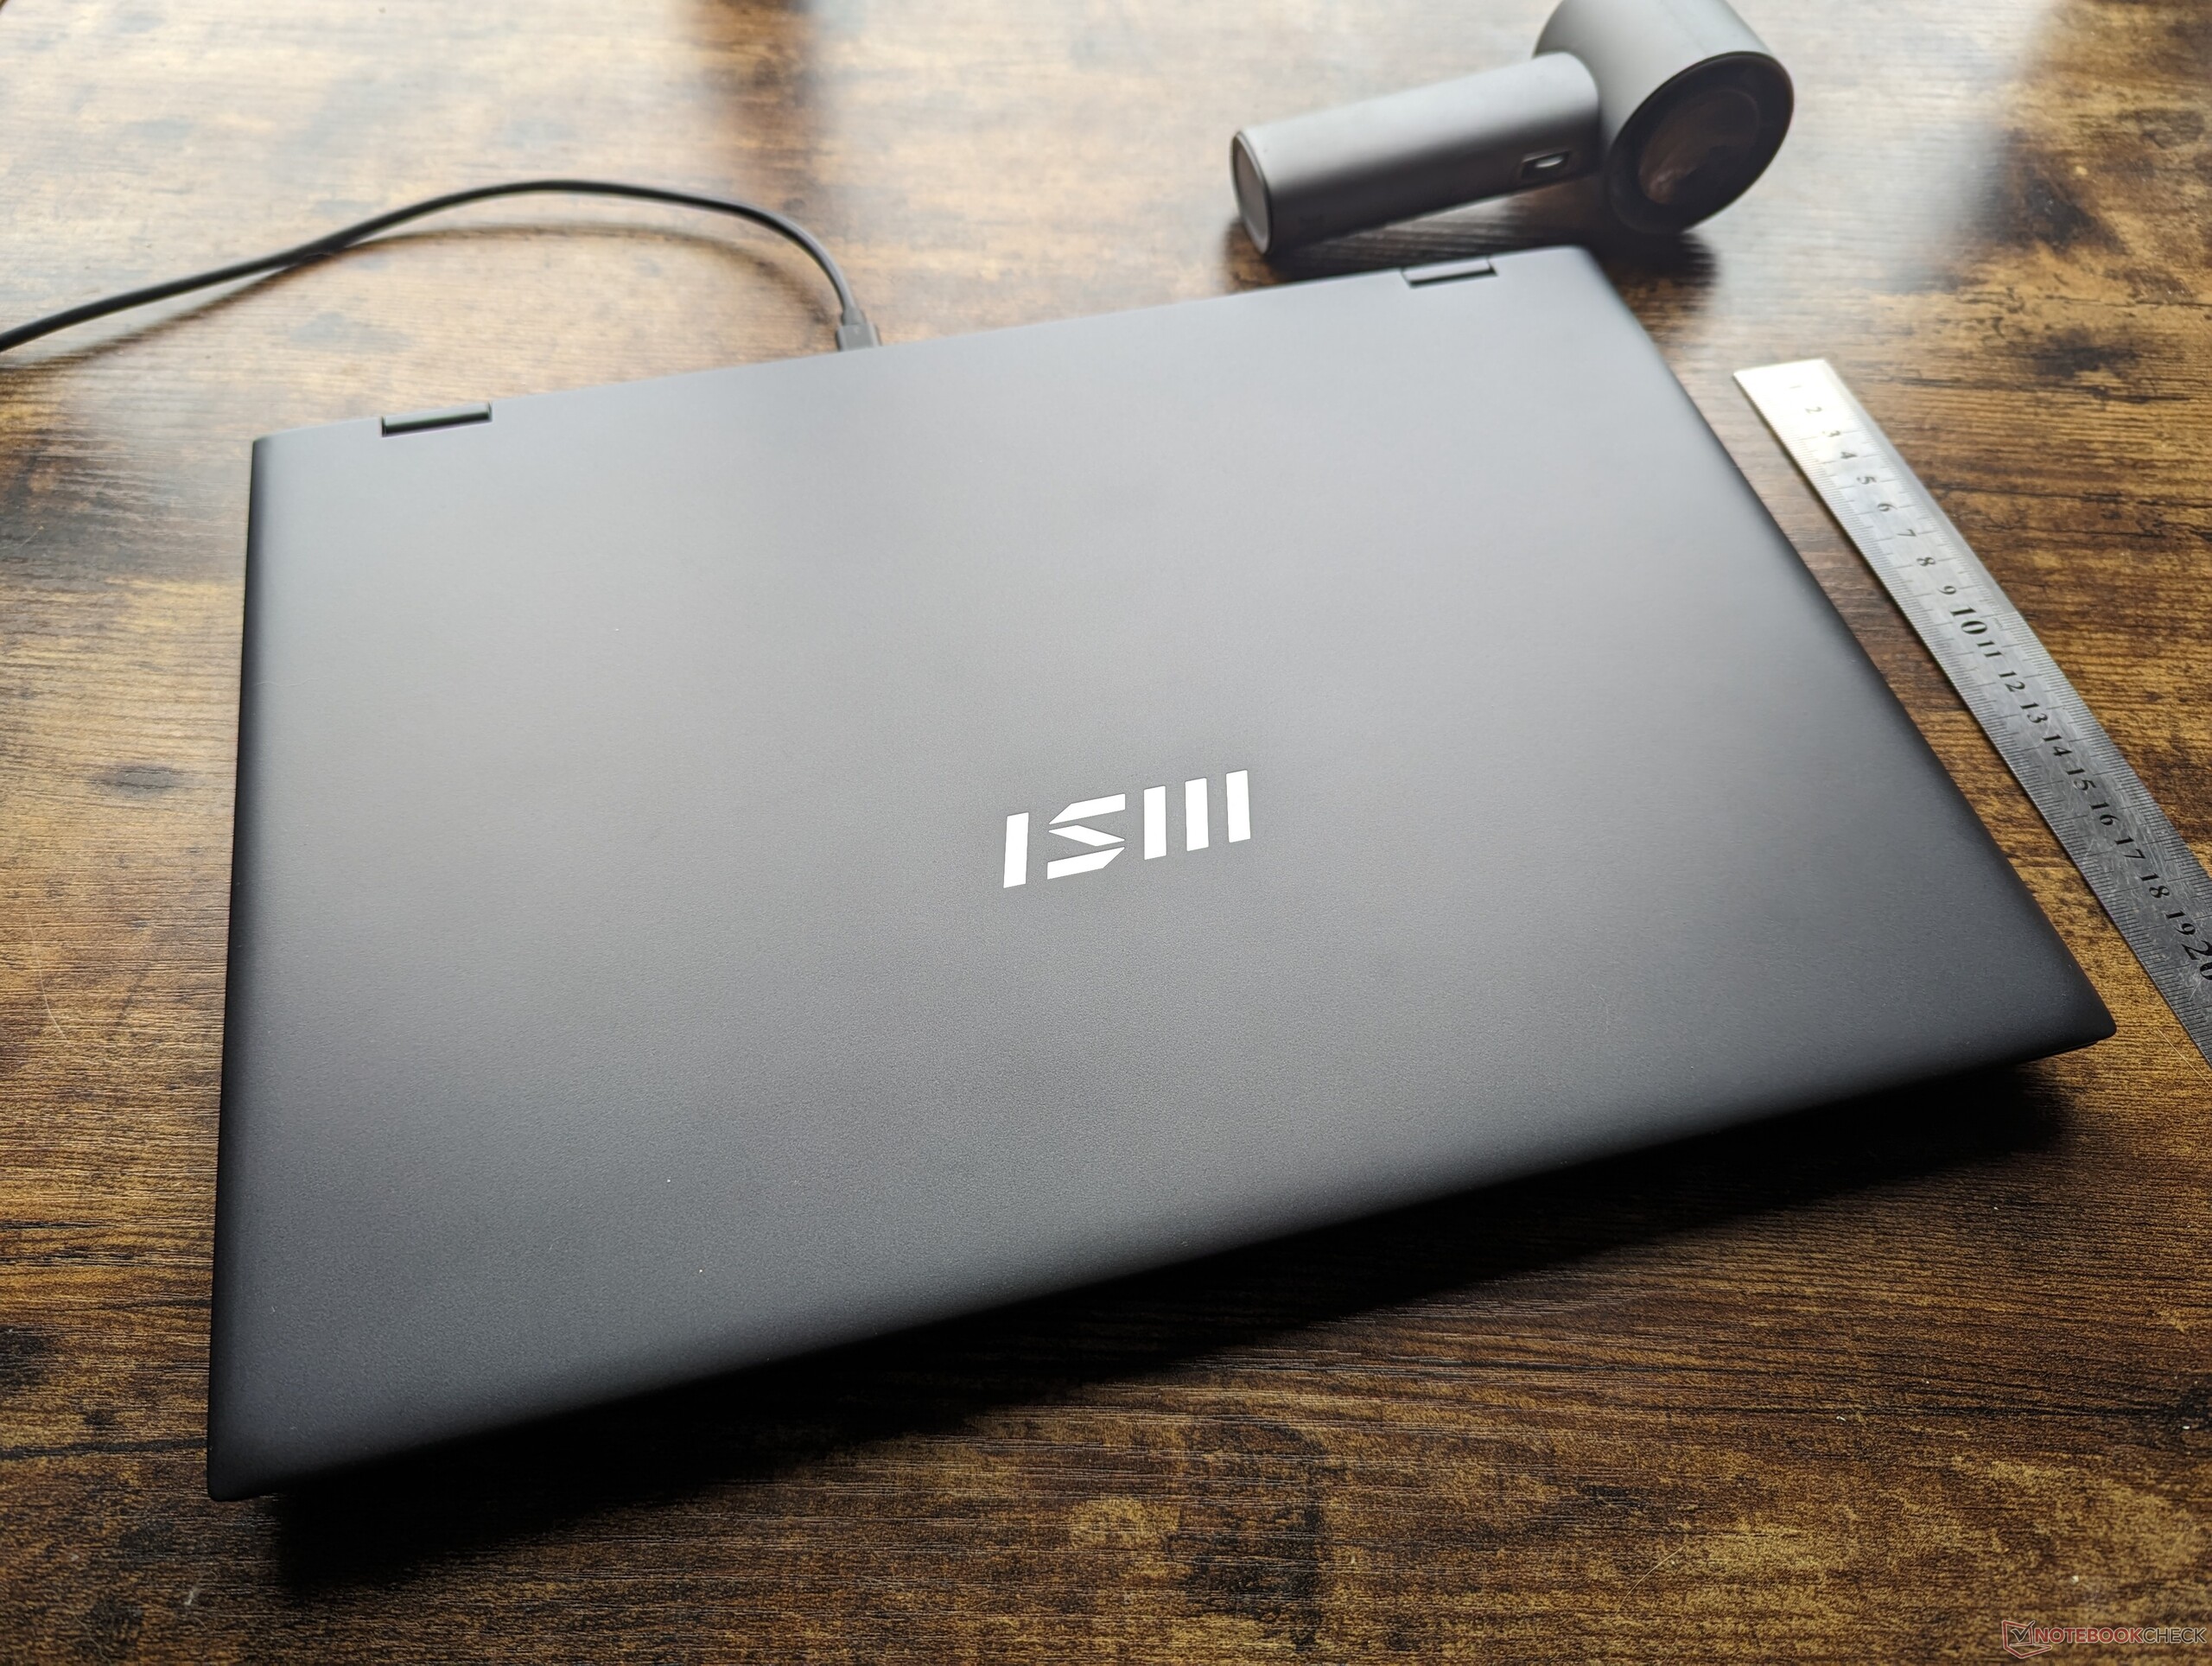
Door de vierkantere beeldverhouding van 16:10 neemt de Prestige 16 meer ruimte in beslag dan de Prestige 15. Het verschil wordt echter goedgemaakt door een dunner profiel en een lichter gewicht. Het verschil wordt echter goedgemaakt met zowel een dunner profiel als een lichter gewicht. In feite is de Prestige 16 een van de lichtste 16-inch multimedia laptops die kan wedijveren met de LG Gram 16 2-in-1. We verwachten echter dat SKU's met discrete graphics iets zwaarder zullen zijn.
Connectiviteit - Klaar voor Wi-Fi 7
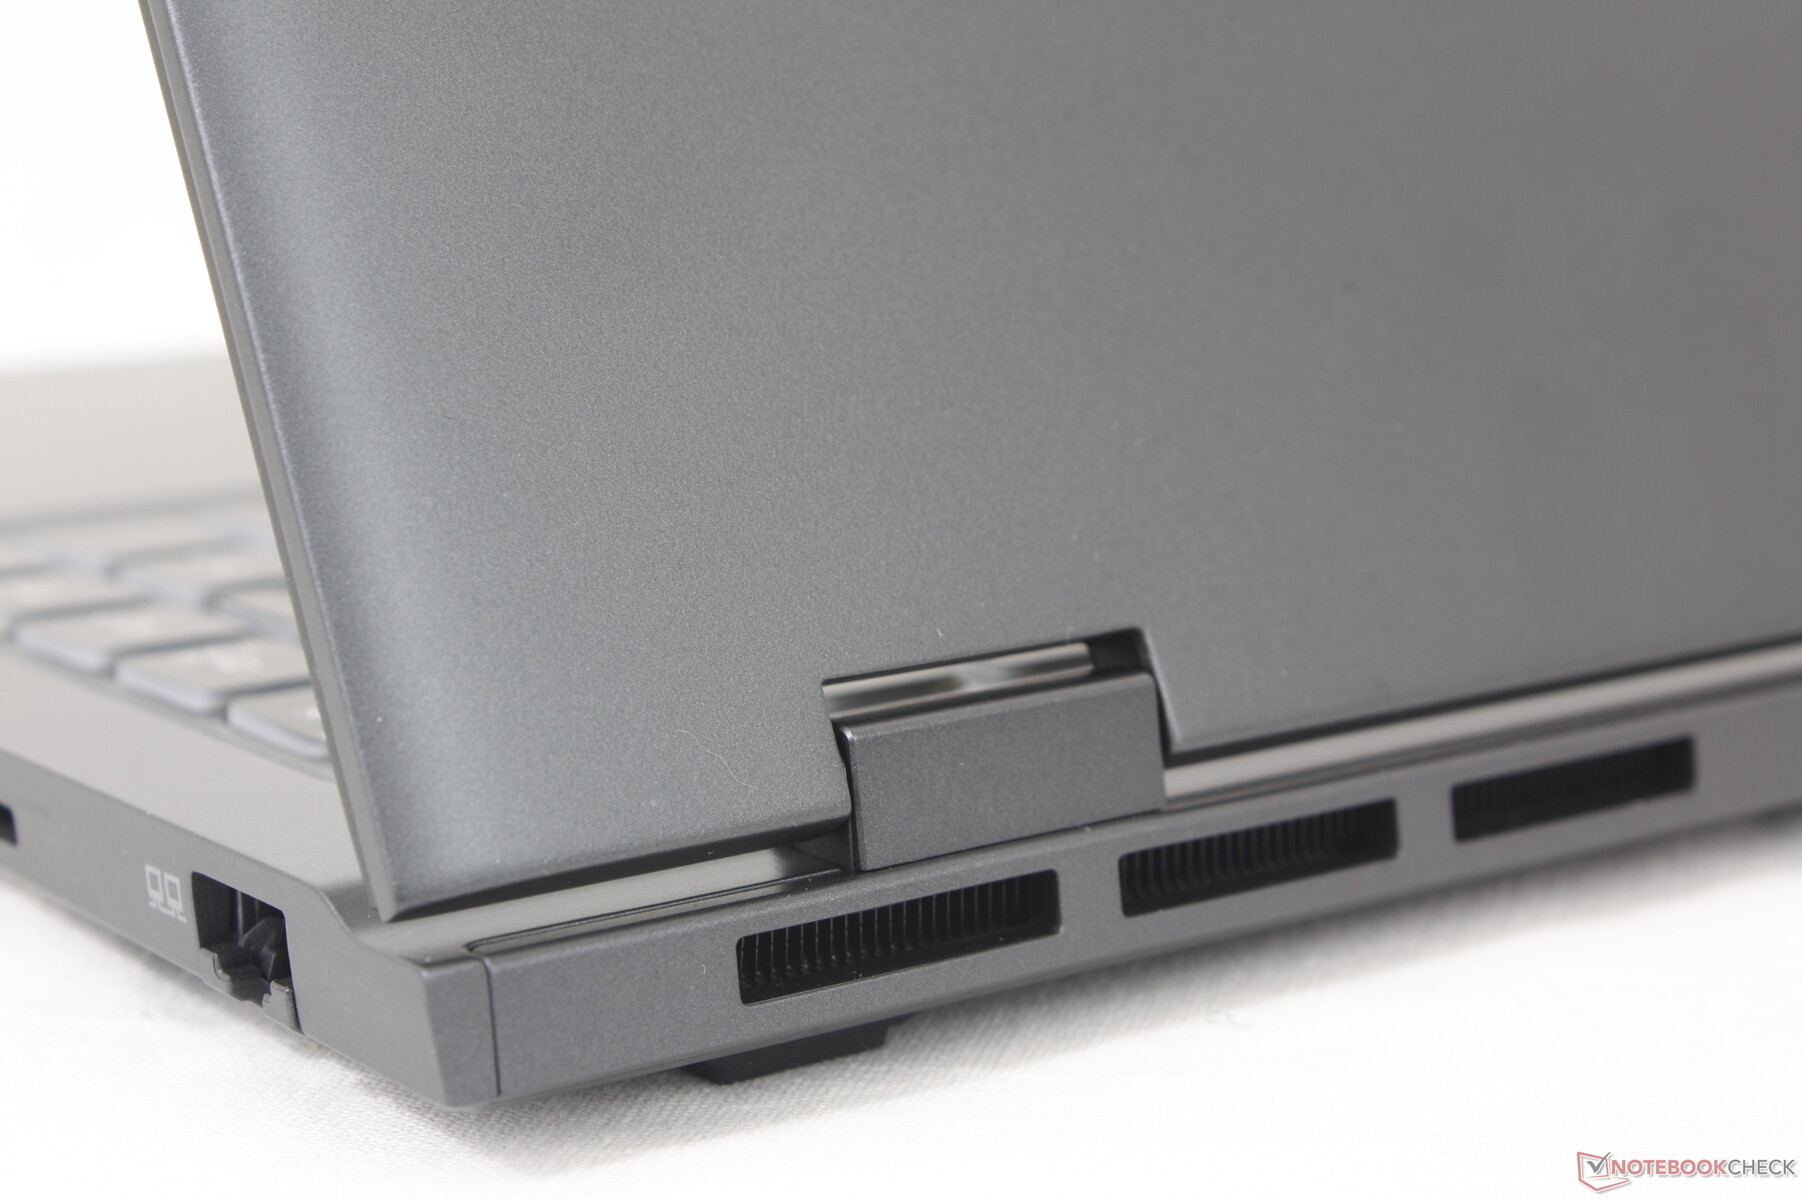
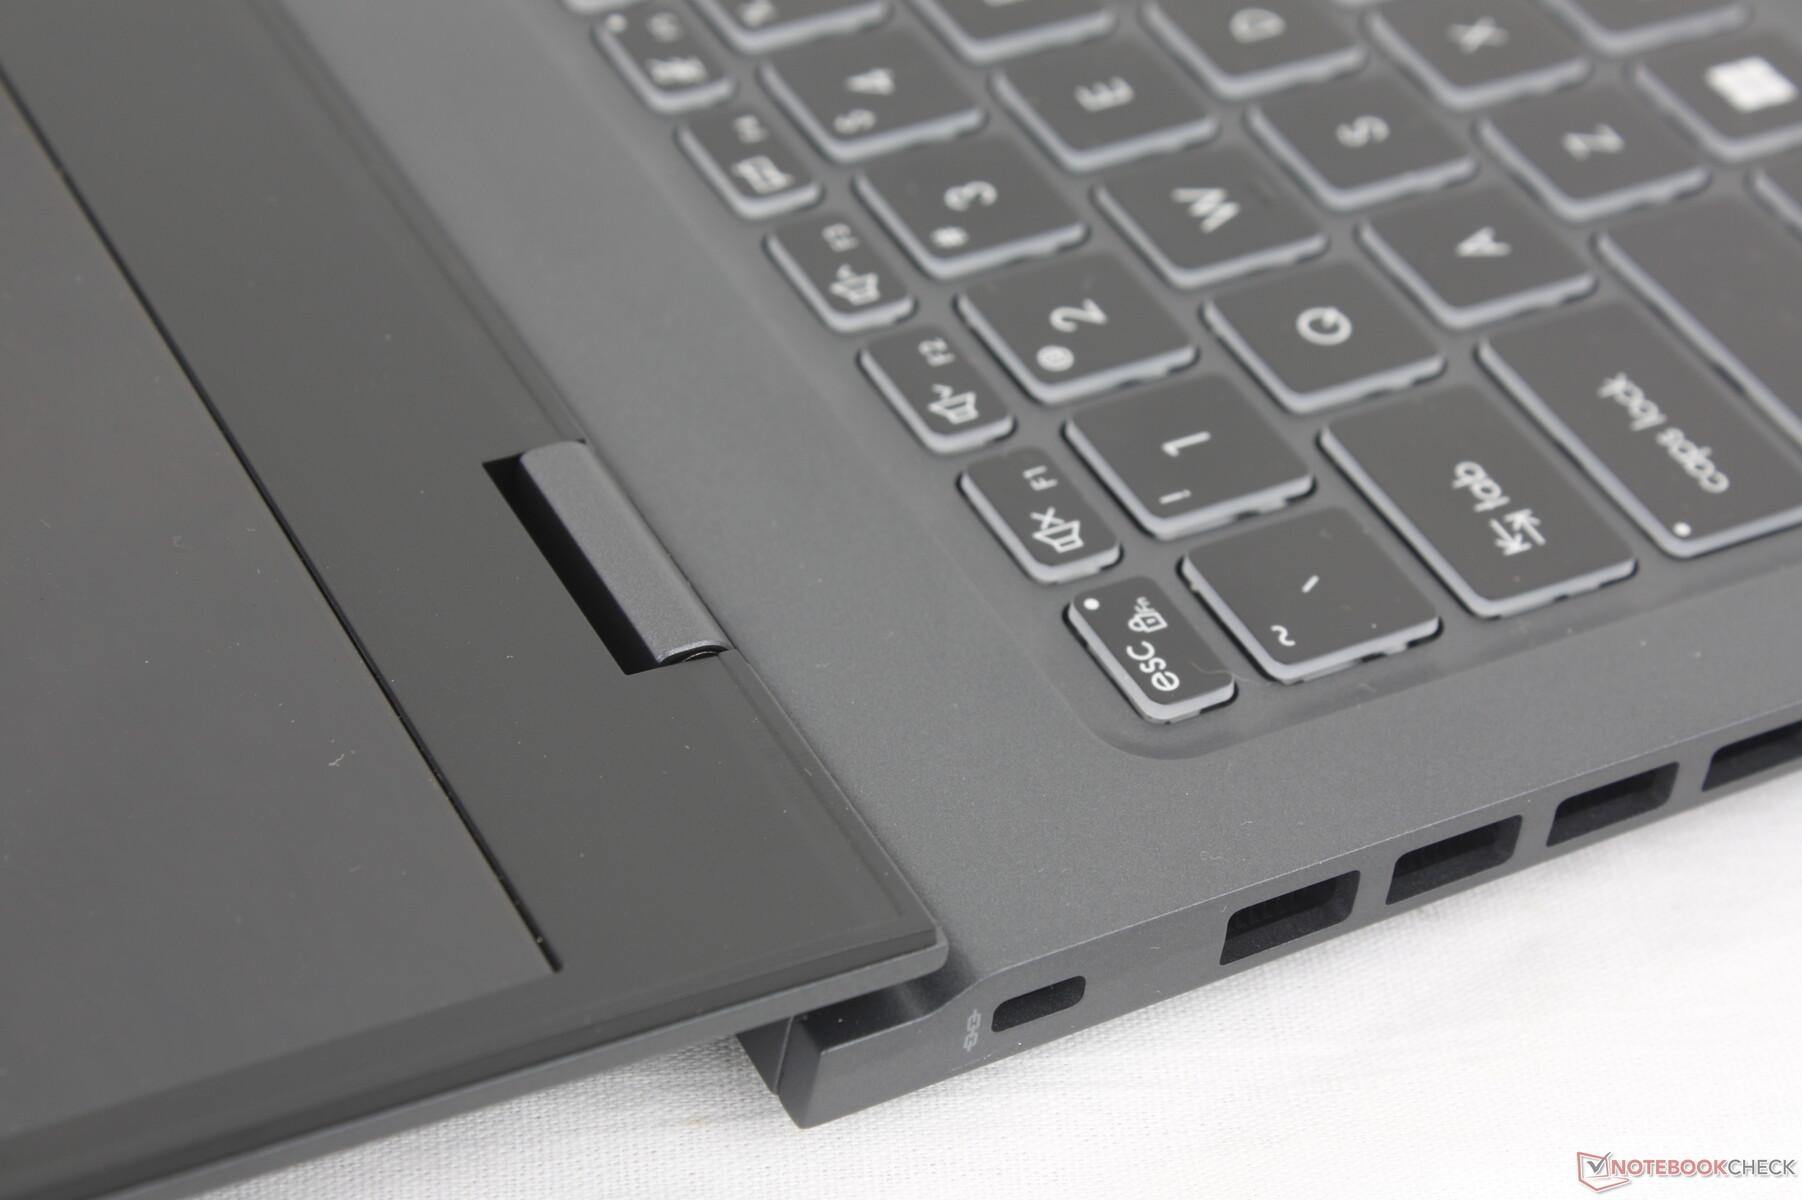
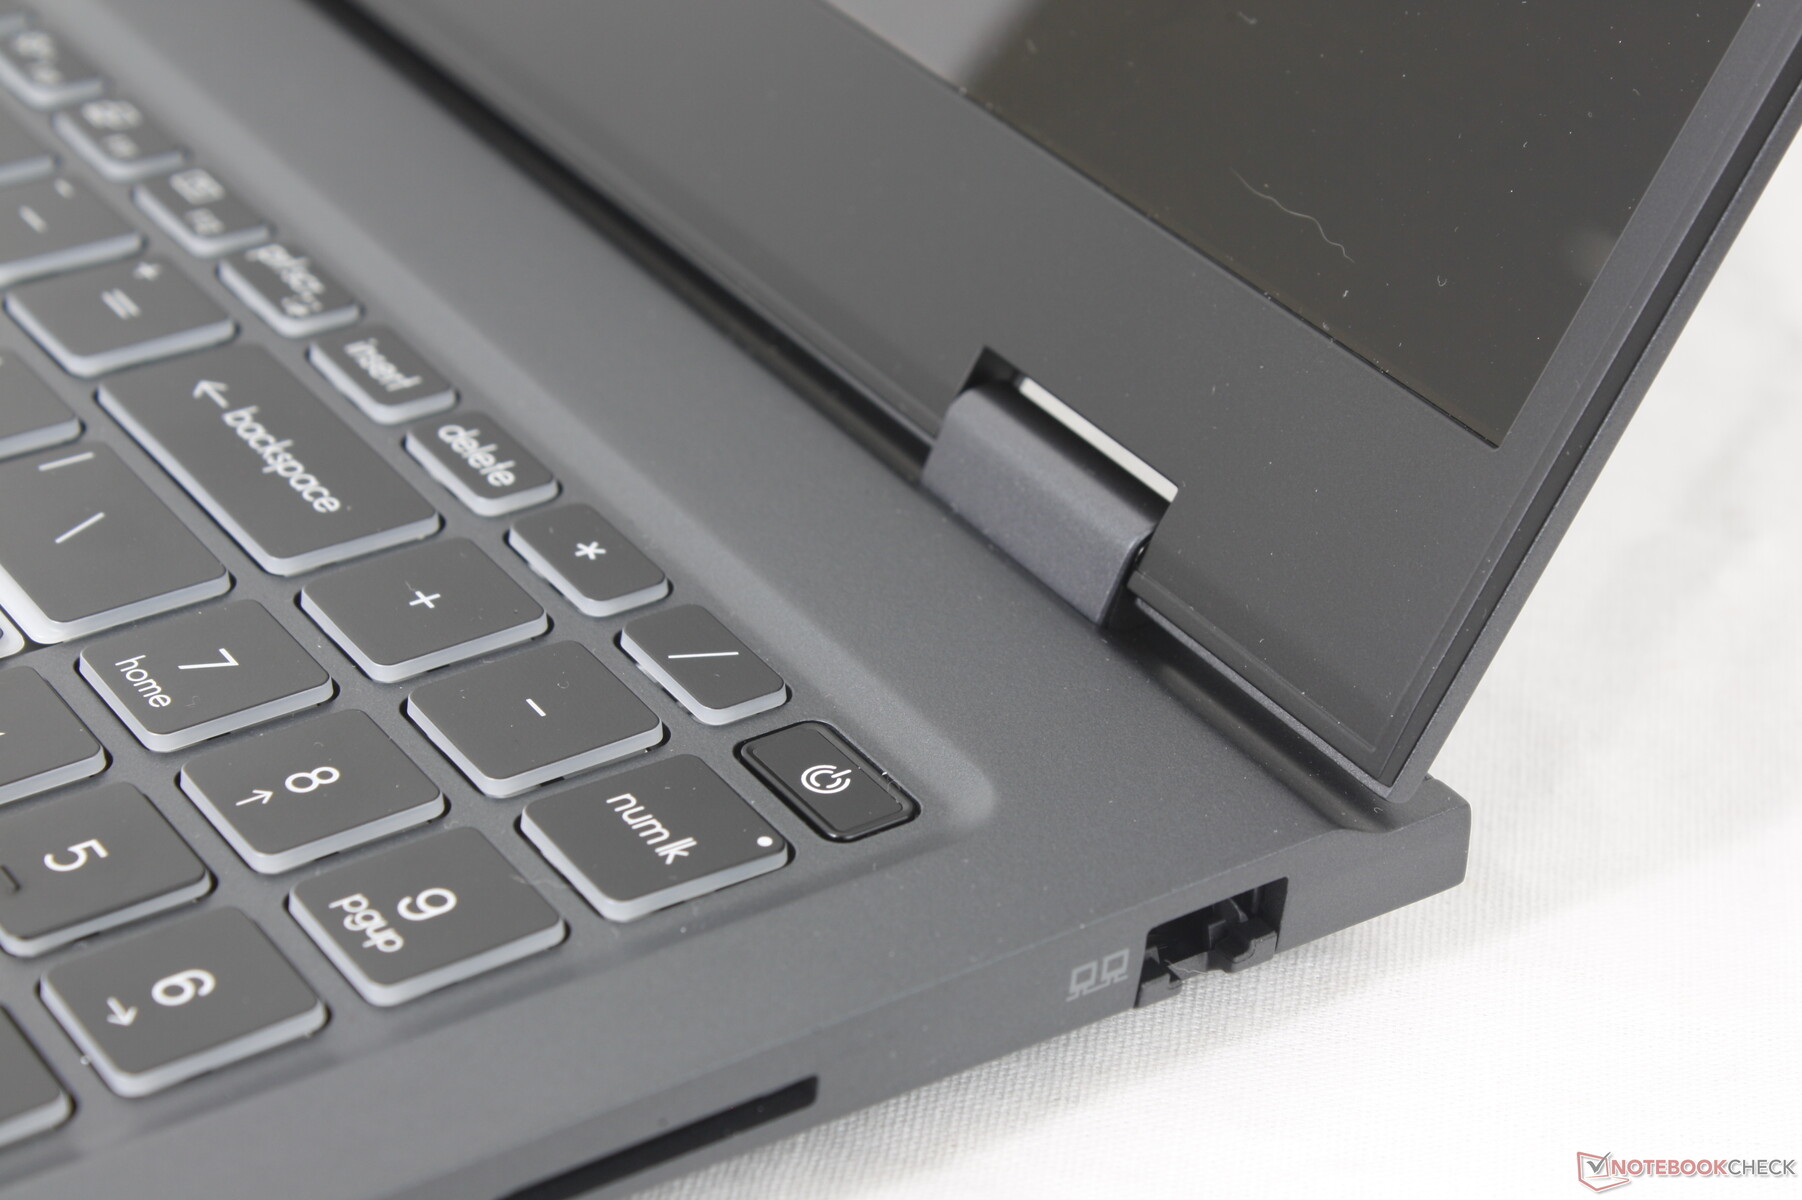
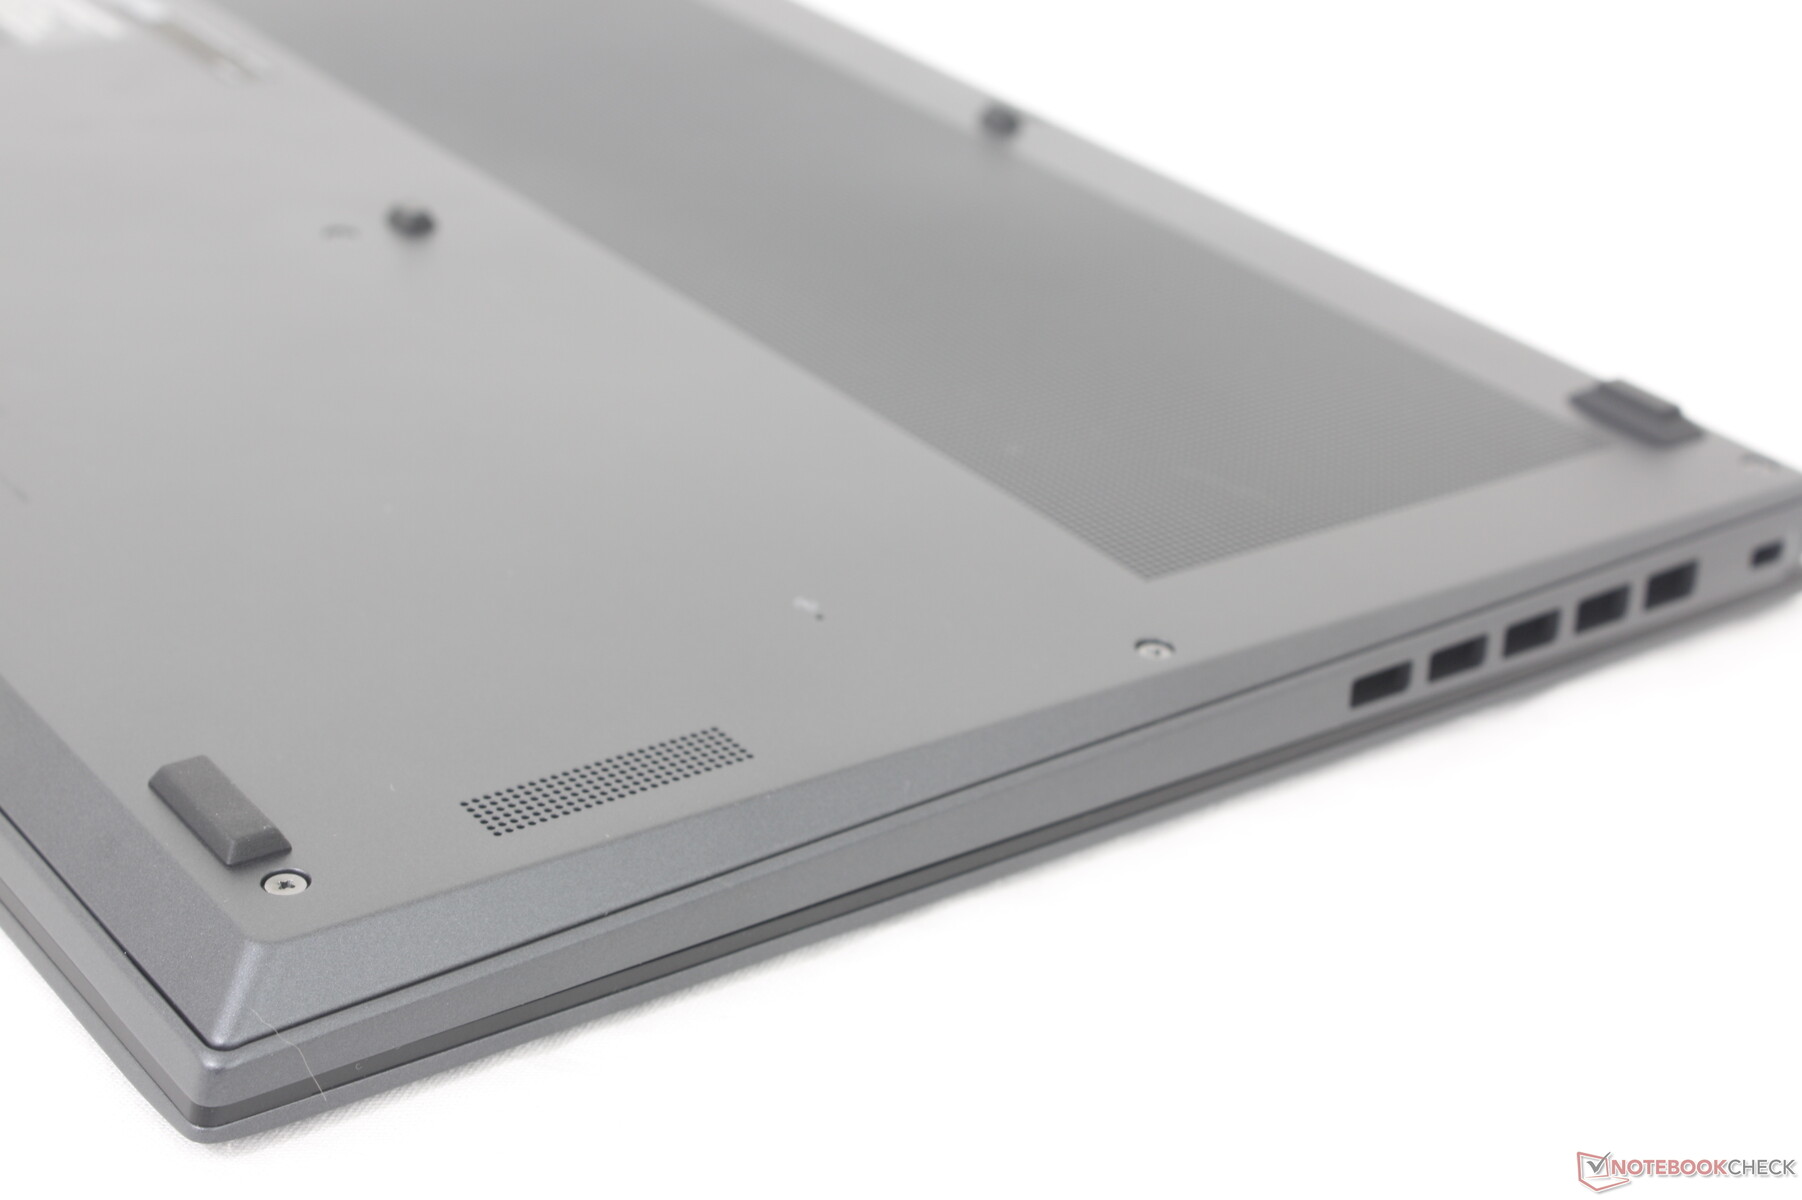
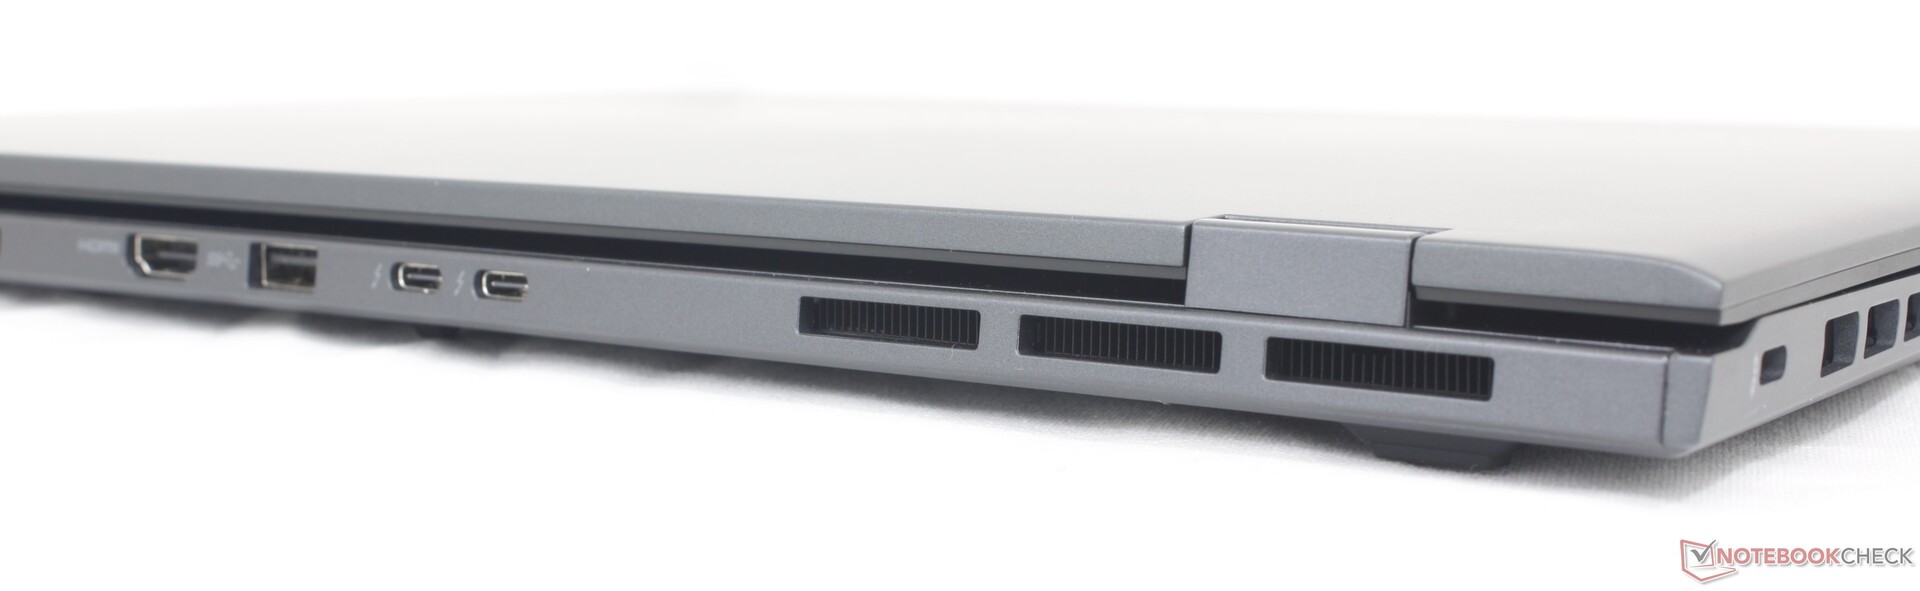
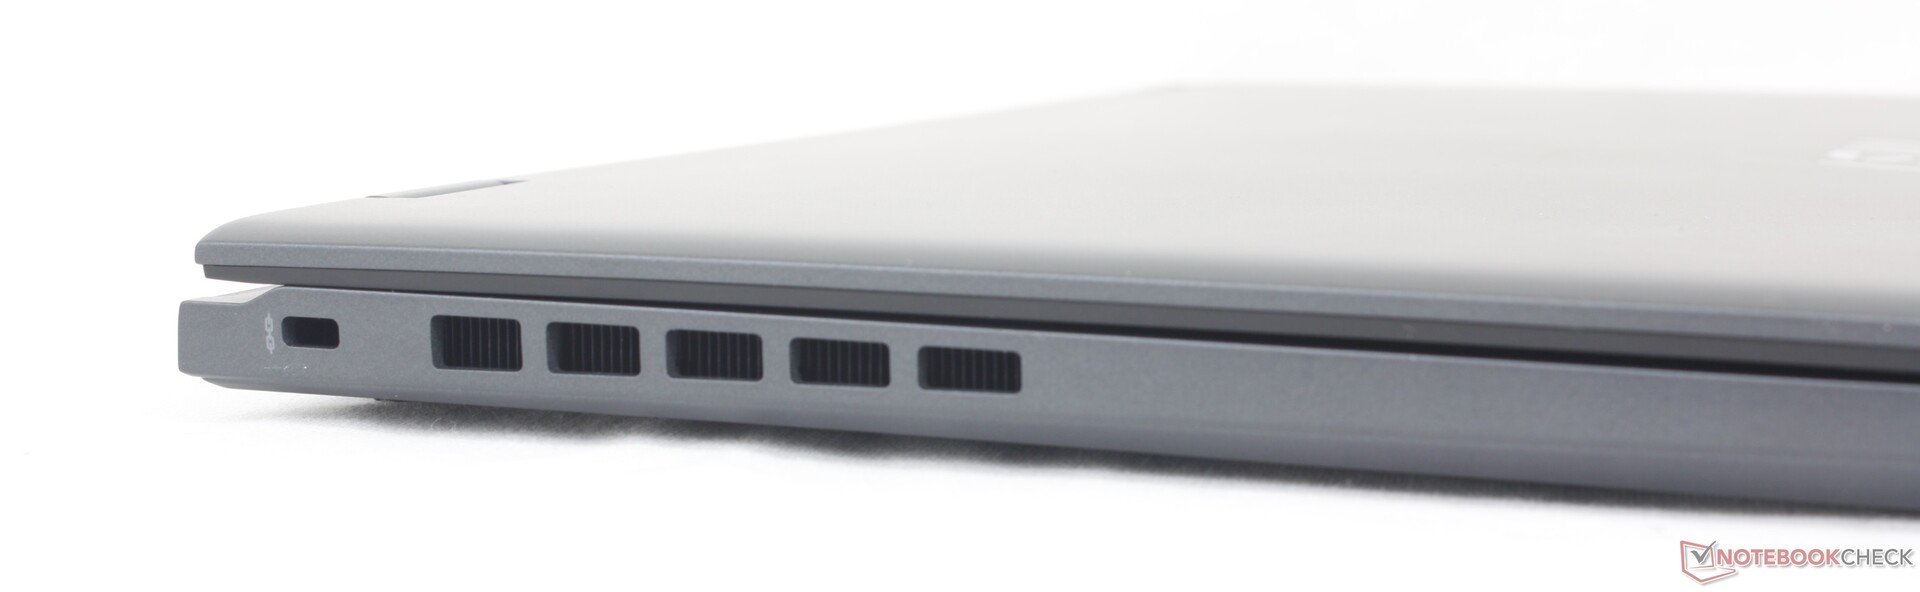
In tegenstelling tot de meeste andere Ultrabooks, zijn de poorten op de Prestige 16 aan de achterkant geconcentreerd in plaats van aan de zijkanten. Dit ontwerp zorgt voor een betere ventilatie langs de zijkanten, maar gaat wel ten koste van de toegankelijkheid van de poorten. Veelgebruikte poorten zoals HDMI, USB-C en zelfs USB-A bevinden zich allemaal aan de achterkant, wat voor de meeste gebruikers misschien niet ideaal is.
In vergelijking met de Prestige 15 heeft de Prestige 16 één USB-A poort vervangen door een RJ-45 poort. De twee Thunderbolt 4 poorten blijven intact voor SKU's met alleen geïntegreerde graphics. Als de Prestige geconfigureerd is met discrete graphics, is slechts één van de twee USB-C poorten compatibel met Thunderbolt.
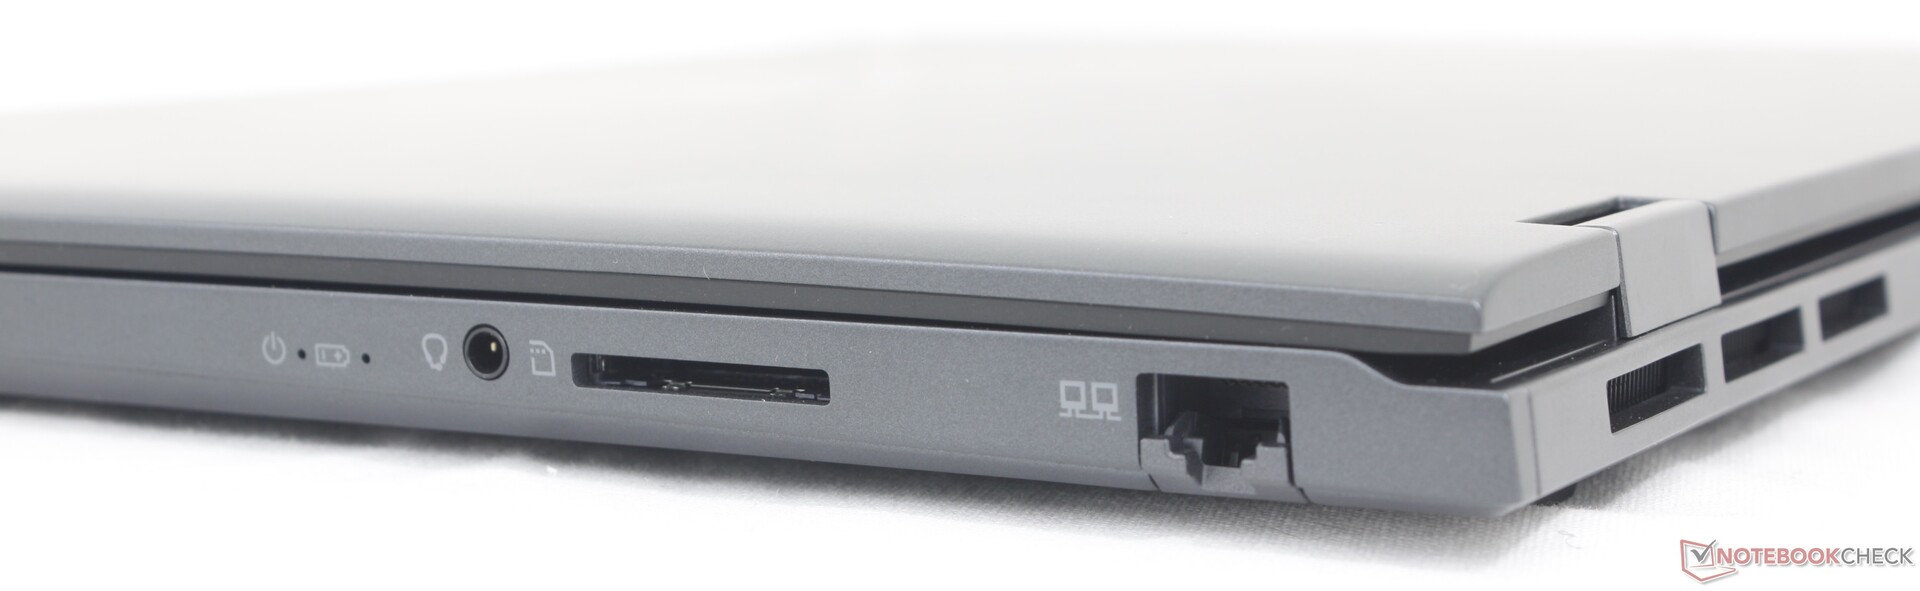
SD-kaartlezer
De geïntegreerde SD-kaartlezer is geüpgraded voor veel hogere snelheden. Het overzetten van 1 GB aan foto's van onze UHS-II testkaart naar het bureaublad duurde iets minder dan 6 seconden, vergeleken met 12+ seconden op de Prestige 15.
| SD Card Reader | |
| average JPG Copy Test (av. of 3 runs) | |
| MSI Prestige 16 B1MG-001US (Toshiba Exceria Pro SDXC 64 GB UHS-II) | |
| Asus VivoBook Pro 16 K6602VU (Angelbird AV Pro V60) | |
| Lenovo ThinkBook 16 G6 ABP (Angelbird AV Pro V60) | |
| MSI Prestige 15 A12UD-093 (AV Pro SD microSD 128 GB V60) | |
| LG Gram 2in1 16 16T90R - G.AA78G | |
| Dell Inspiron 16 Plus 7630 (AV Pro SD microSD 128 GB V60) | |
| maximum AS SSD Seq Read Test (1GB) | |
| Asus VivoBook Pro 16 K6602VU (Angelbird AV Pro V60) | |
| MSI Prestige 16 B1MG-001US (Toshiba Exceria Pro SDXC 64 GB UHS-II) | |
| Lenovo ThinkBook 16 G6 ABP (Angelbird AV Pro V60) | |
| MSI Prestige 15 A12UD-093 (AV Pro SD microSD 128 GB V60) | |
| Dell Inspiron 16 Plus 7630 (AV Pro SD microSD 128 GB V60) | |
| LG Gram 2in1 16 16T90R - G.AA78G | |
Communicatie
De Prestige 16 is een van de eerste laptops die wordt geleverd met de Killer BE1750W WLAN-module voor Wi-Fi 7-compatibiliteit. Wi-Fi 7 routers zijn echter nog niet op grote schaal beschikbaar en daarom is de toevoeging van Wi-Fi 7 op dit moment meer een toekomstbestendigheid dan directe voordelen. Desalniettemin hebben we geen verbindingsproblemen ondervonden bij het koppelen met onze Wi-Fi 6E testrouter.
Webcam
Een 2 MP webcam met IR en fysieke privacy shutter worden standaard meegeleverd. Alternatieven zoals de HP Spectre worden al geleverd met 5 MP sensoren met een hogere resolutie.


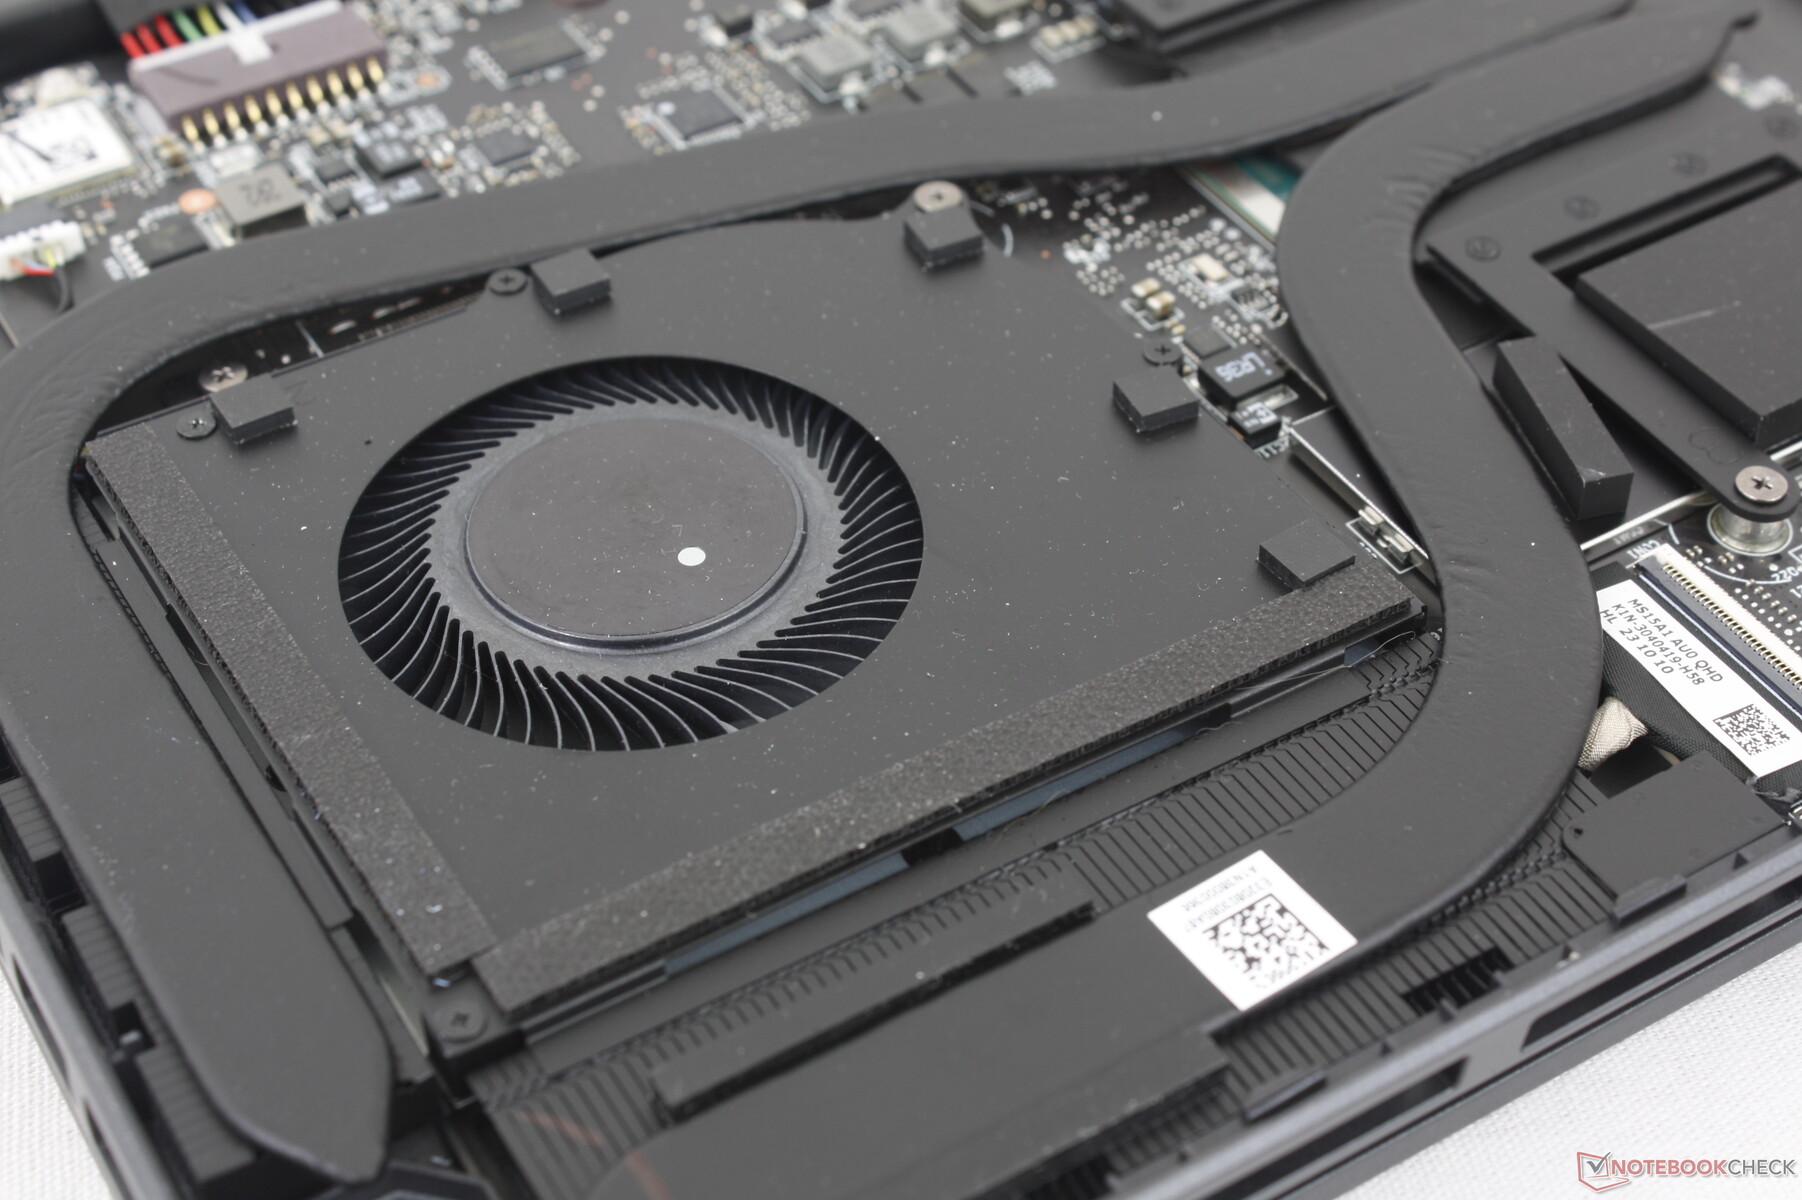
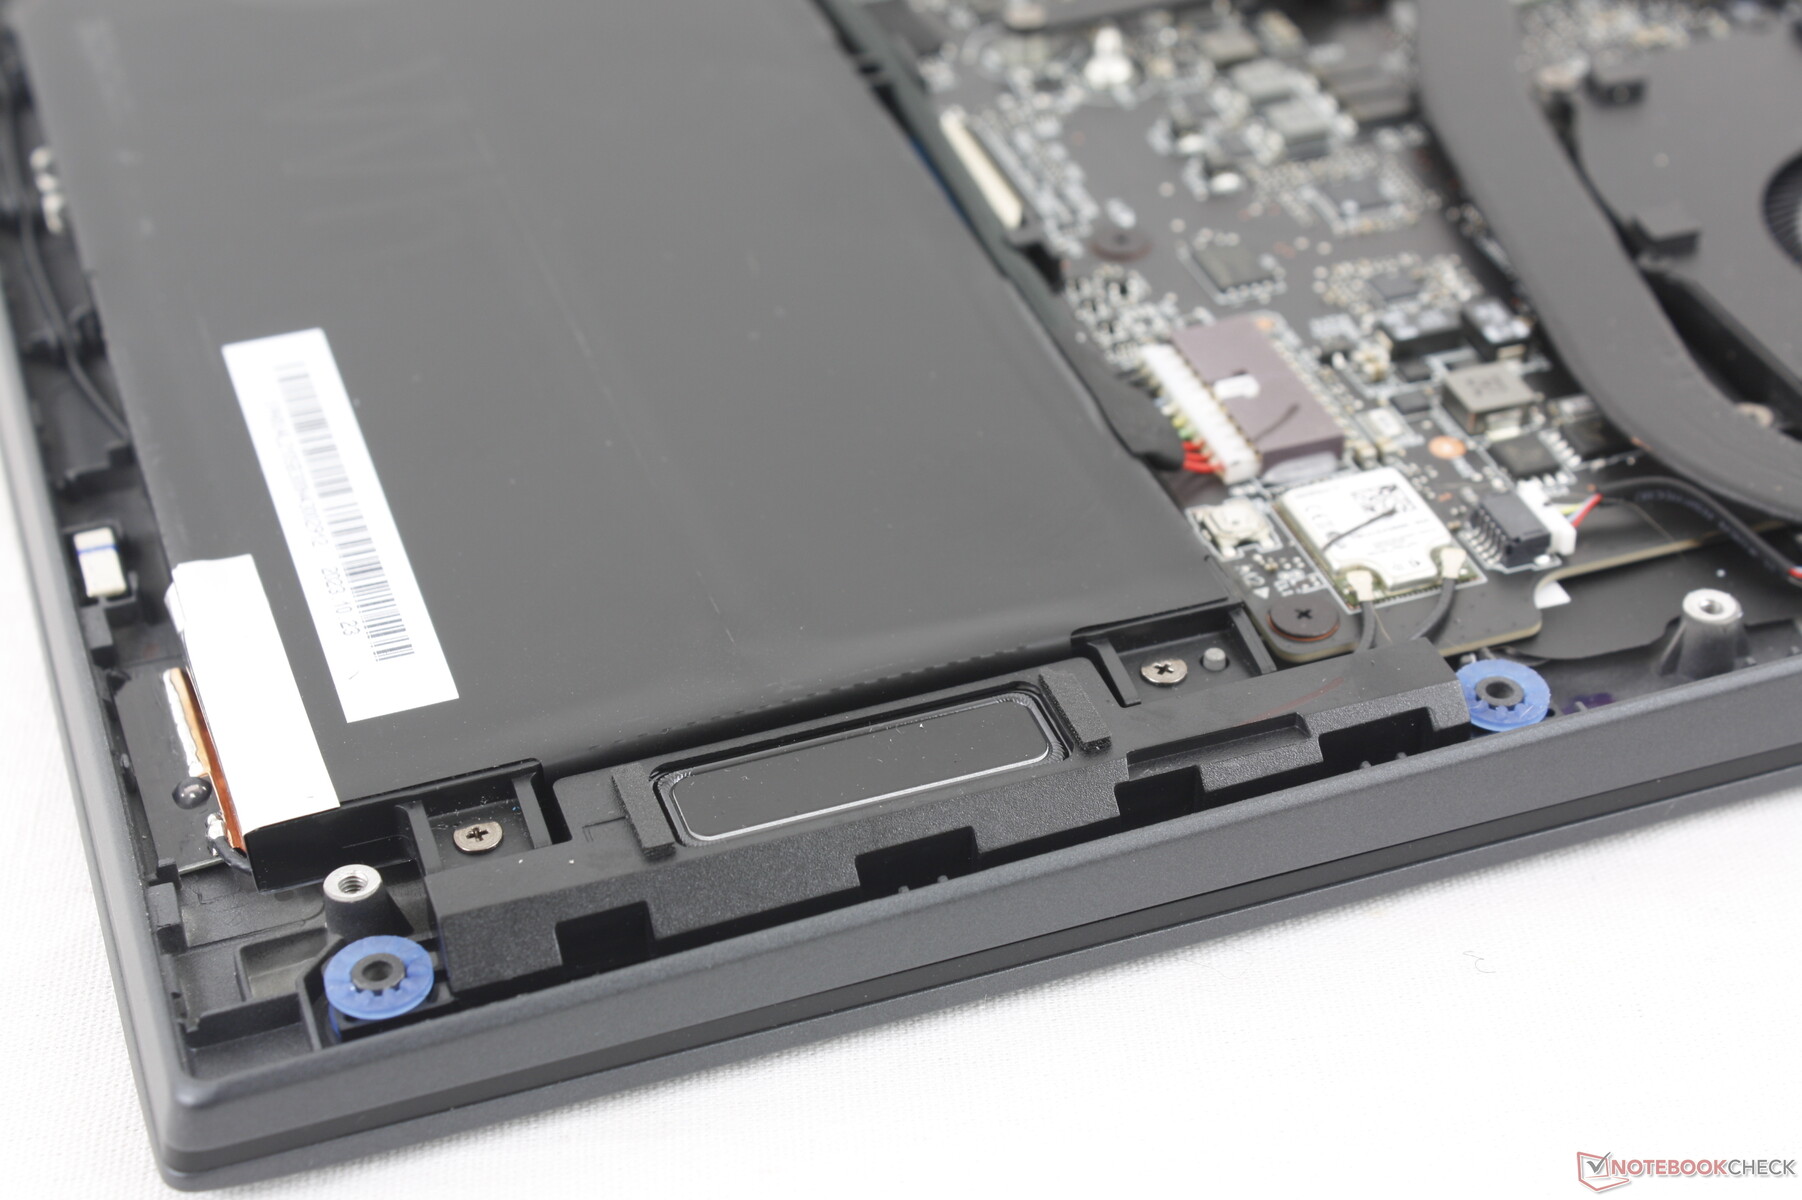
Onderhoud
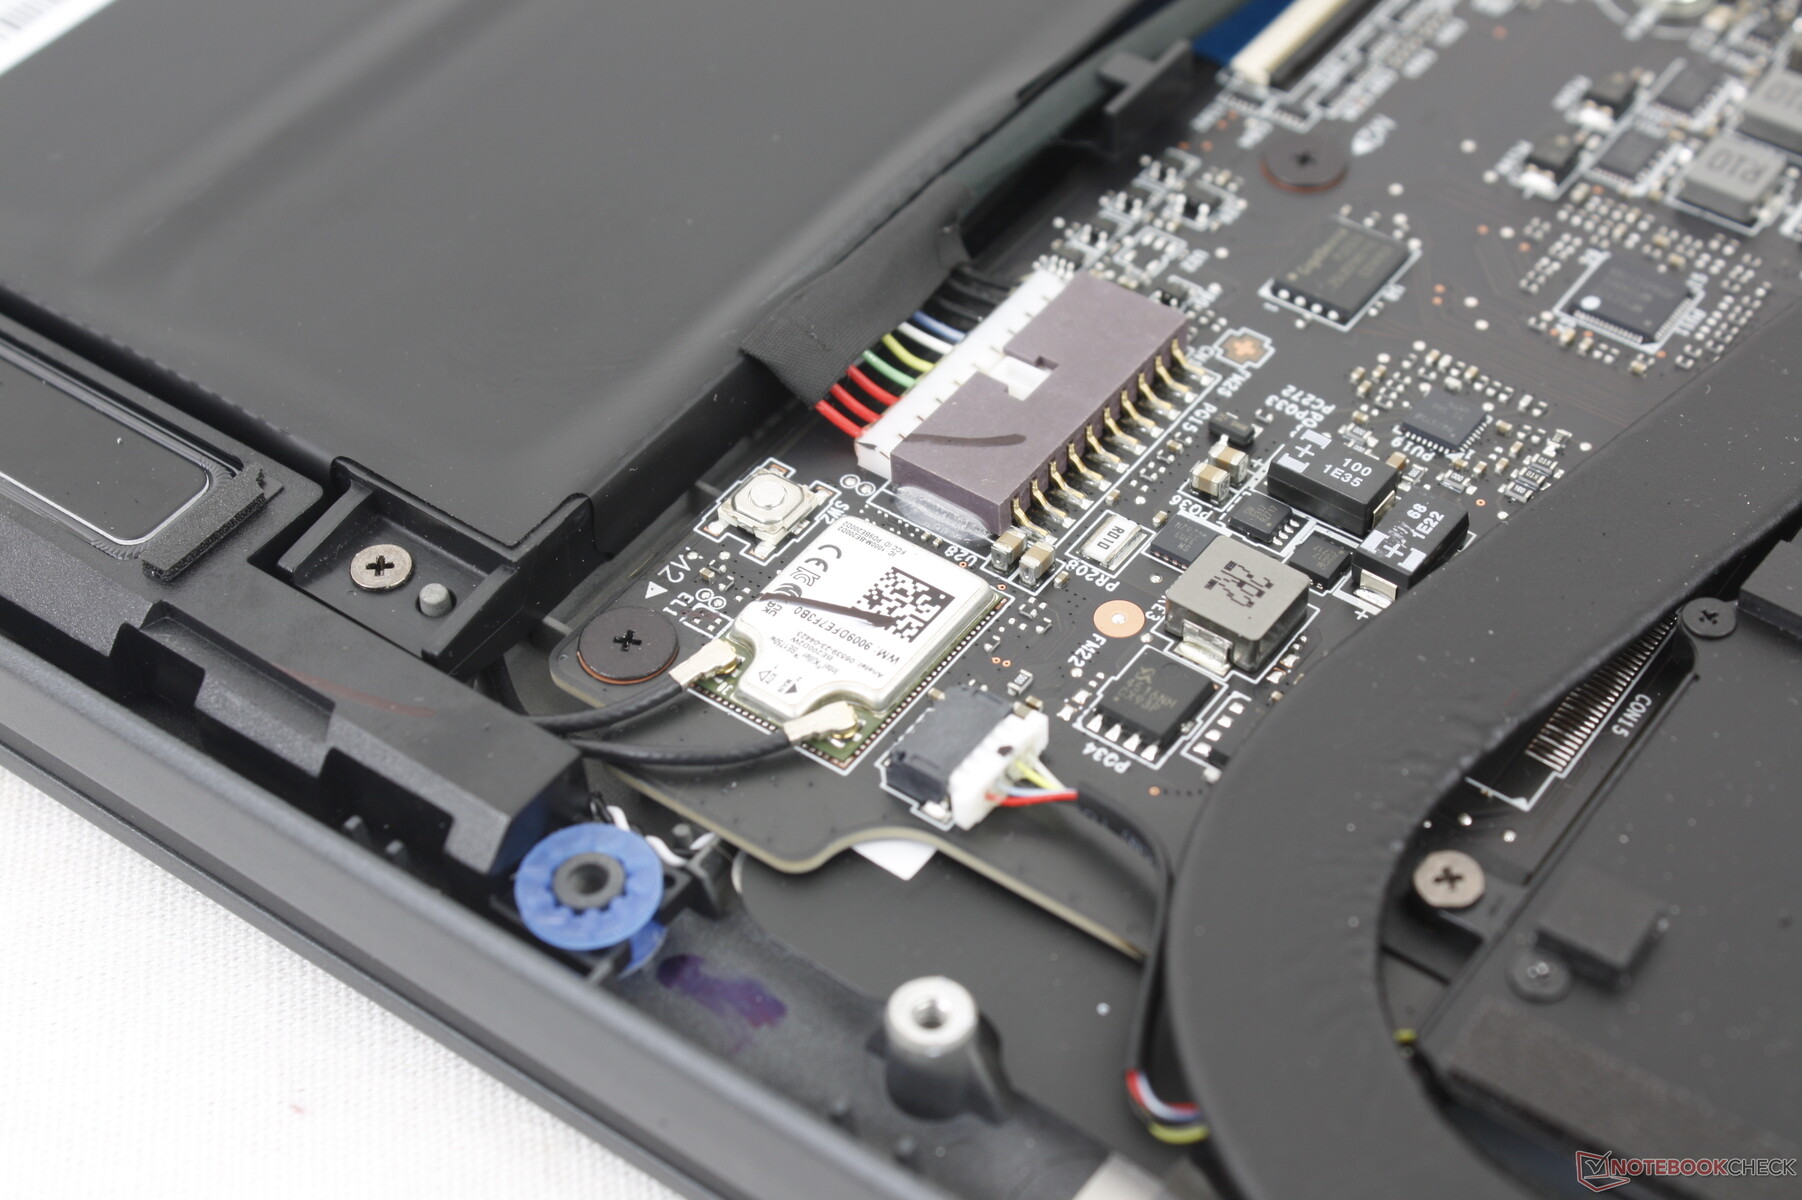
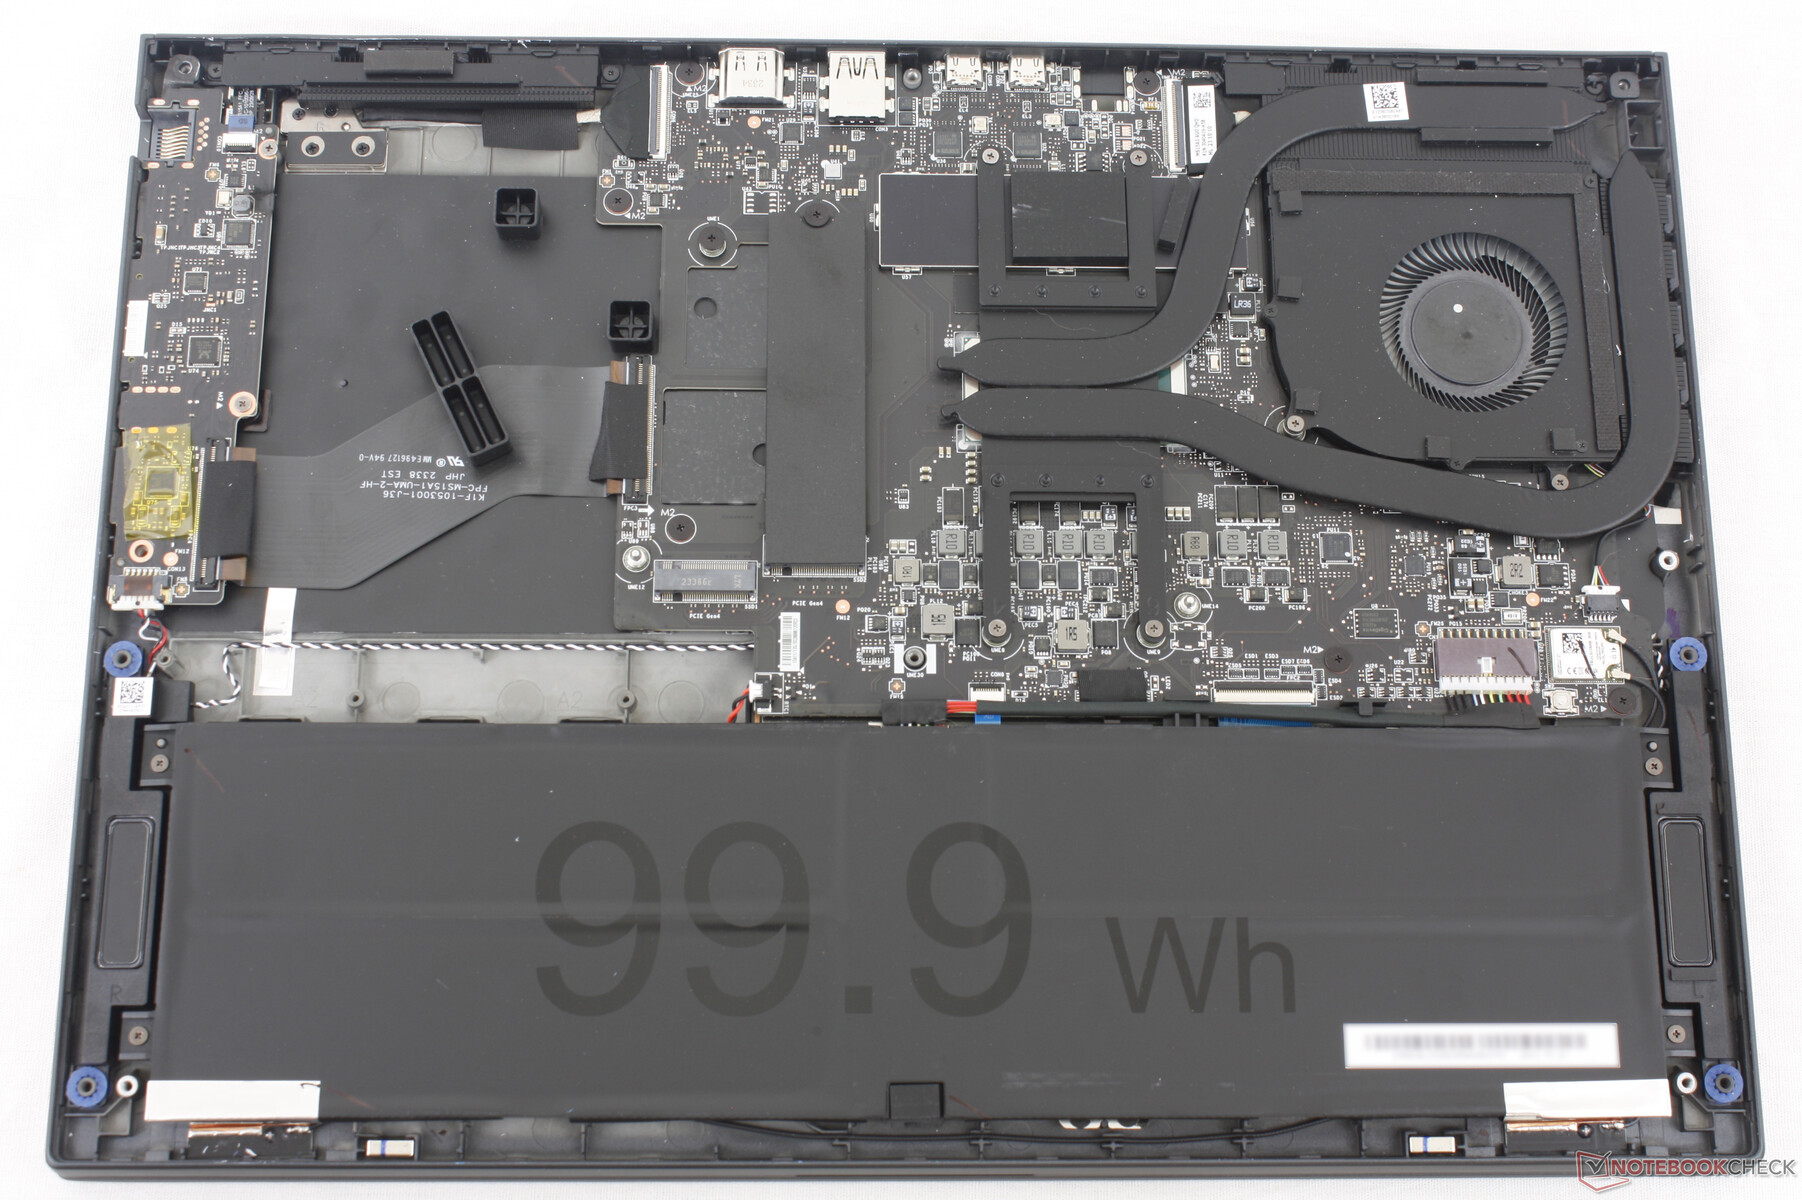
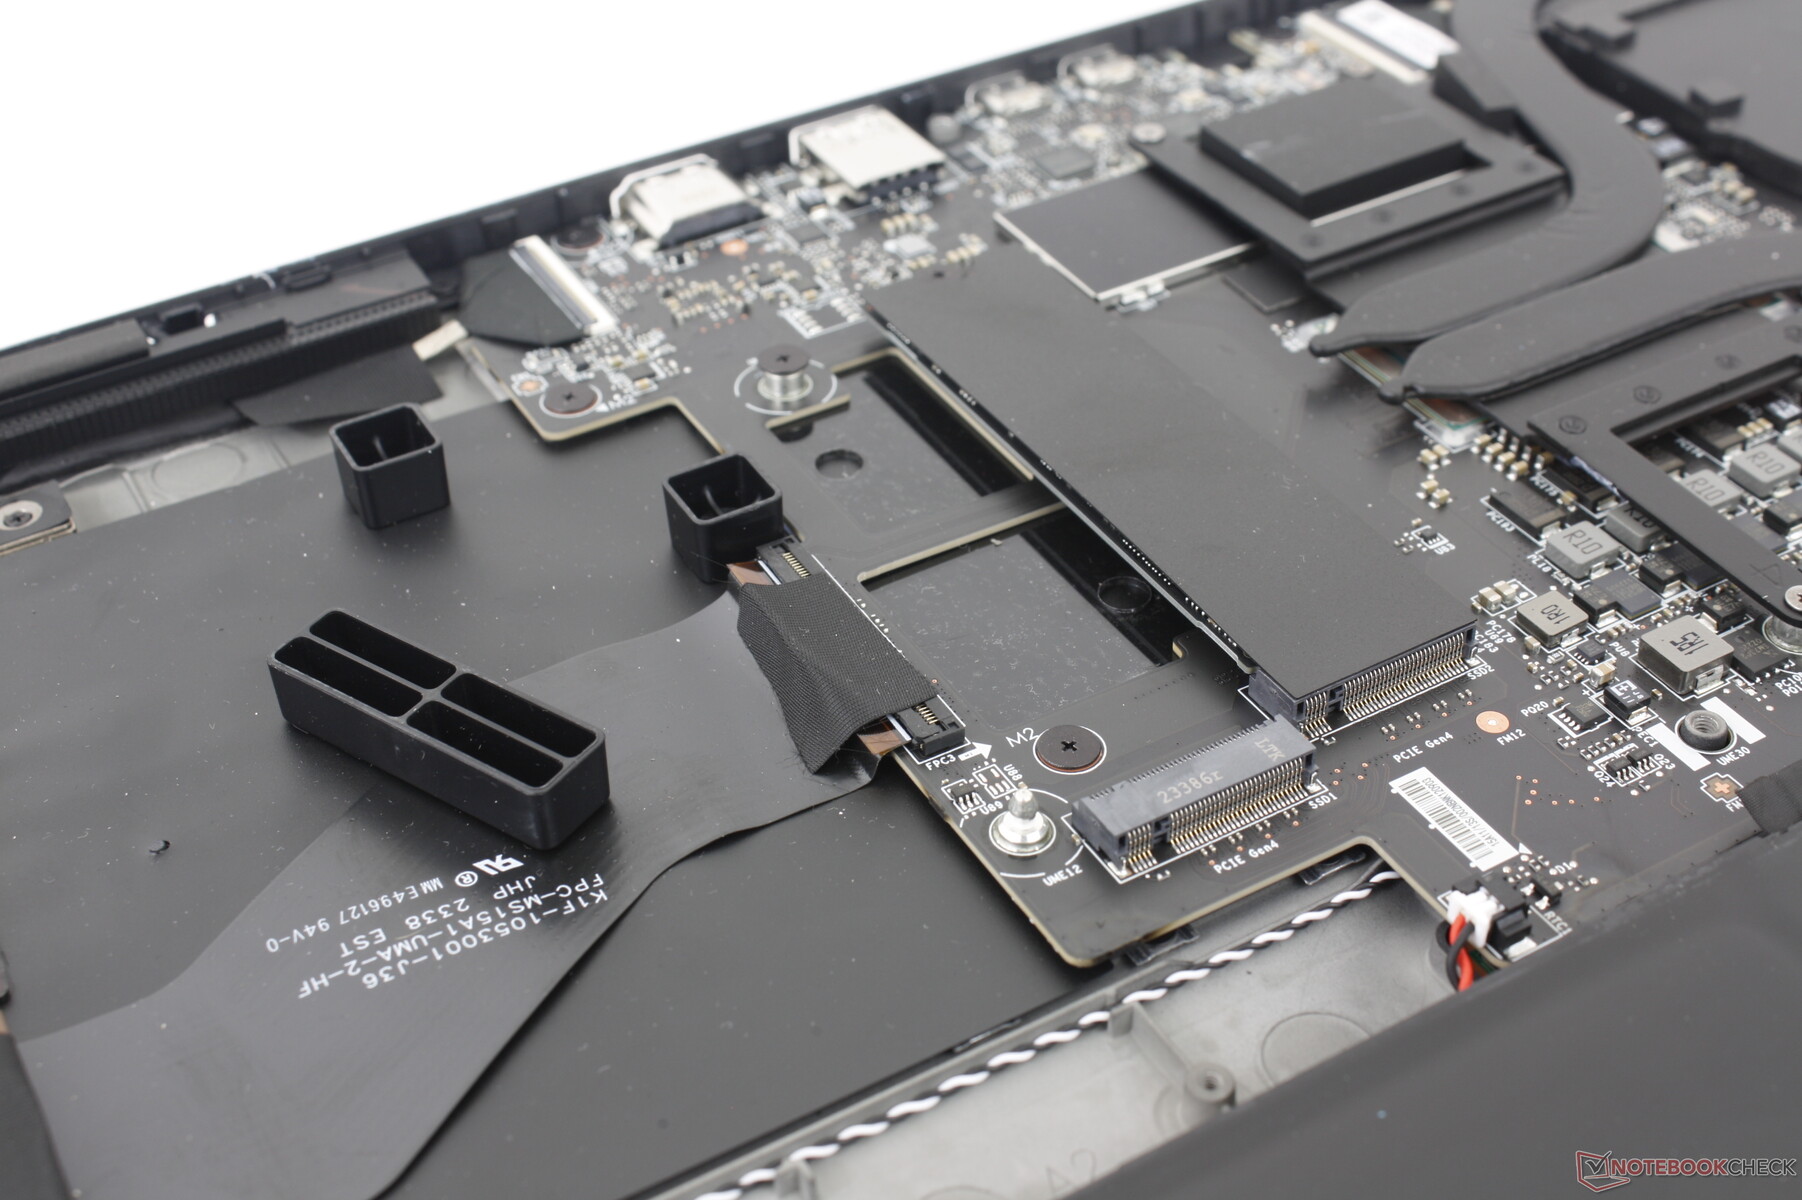
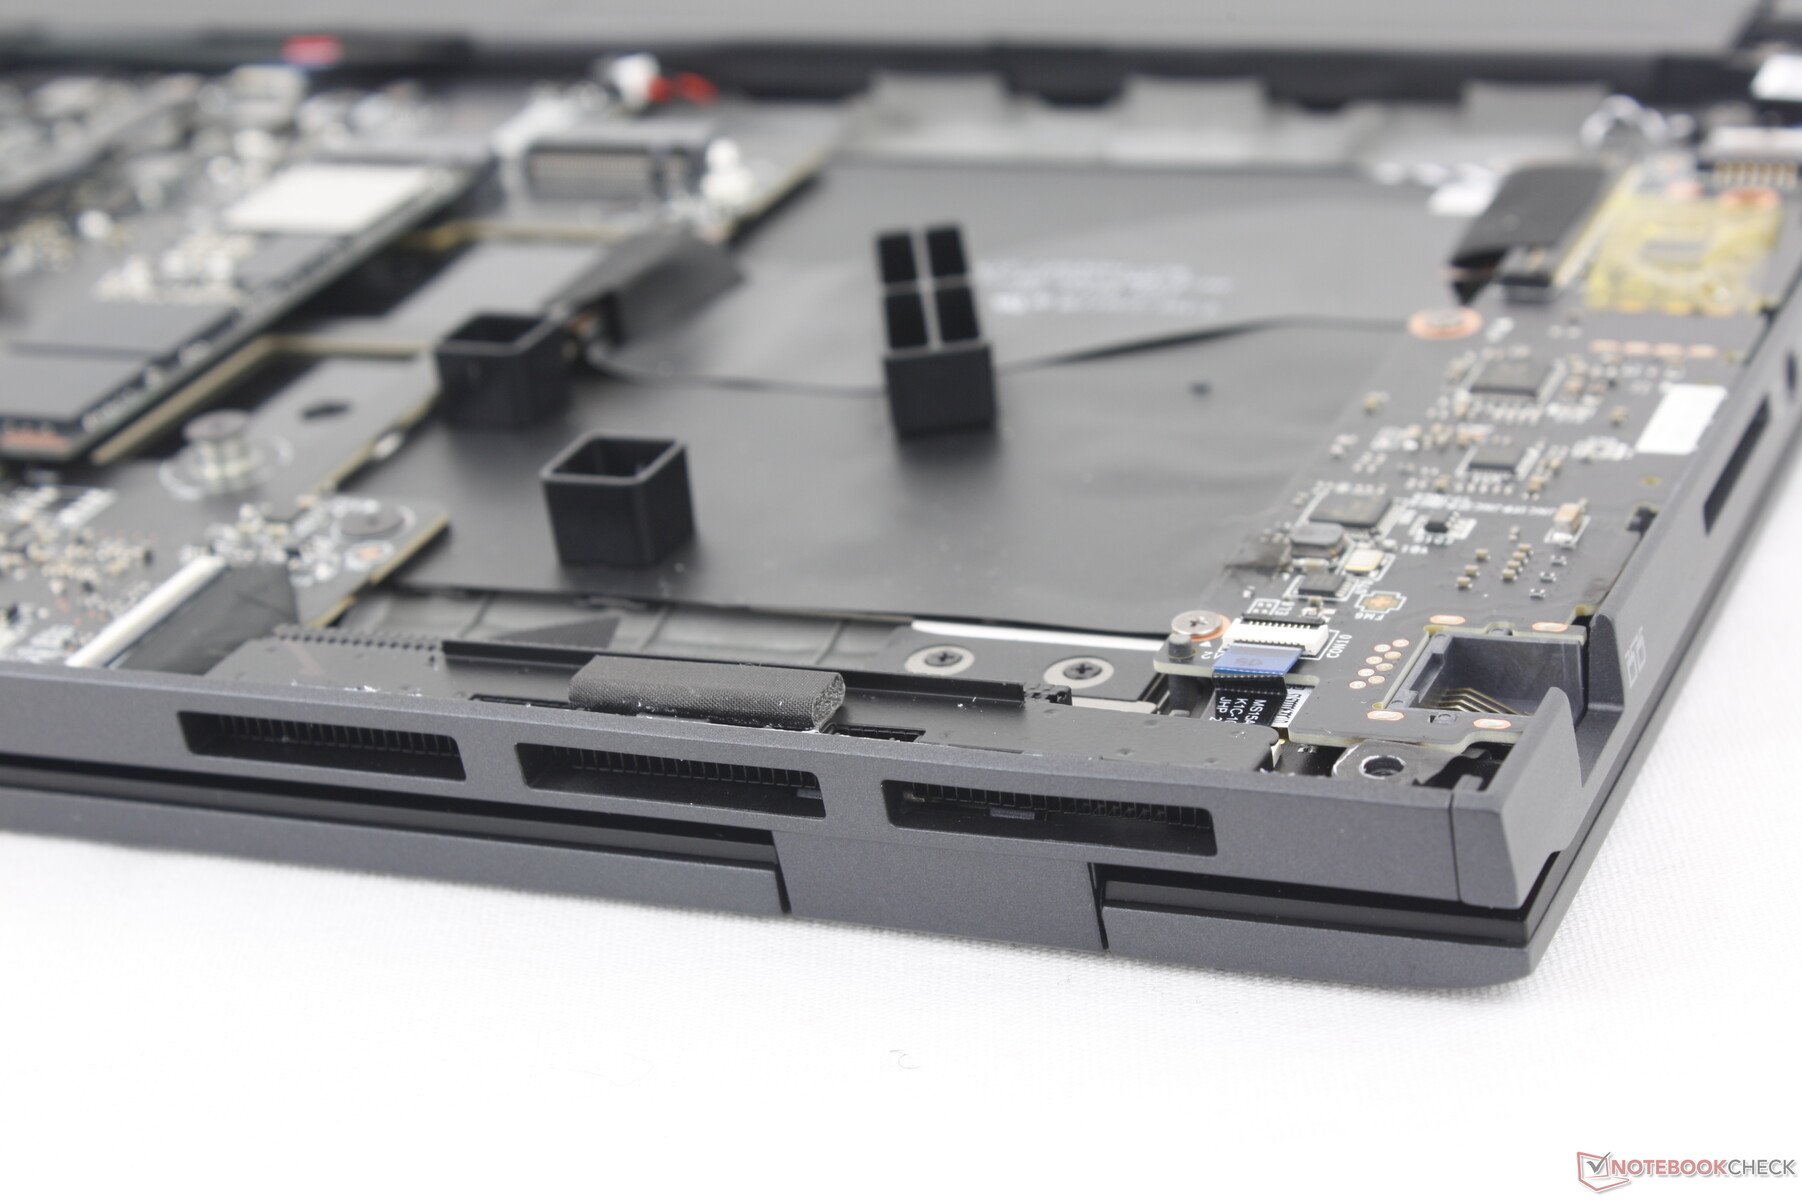
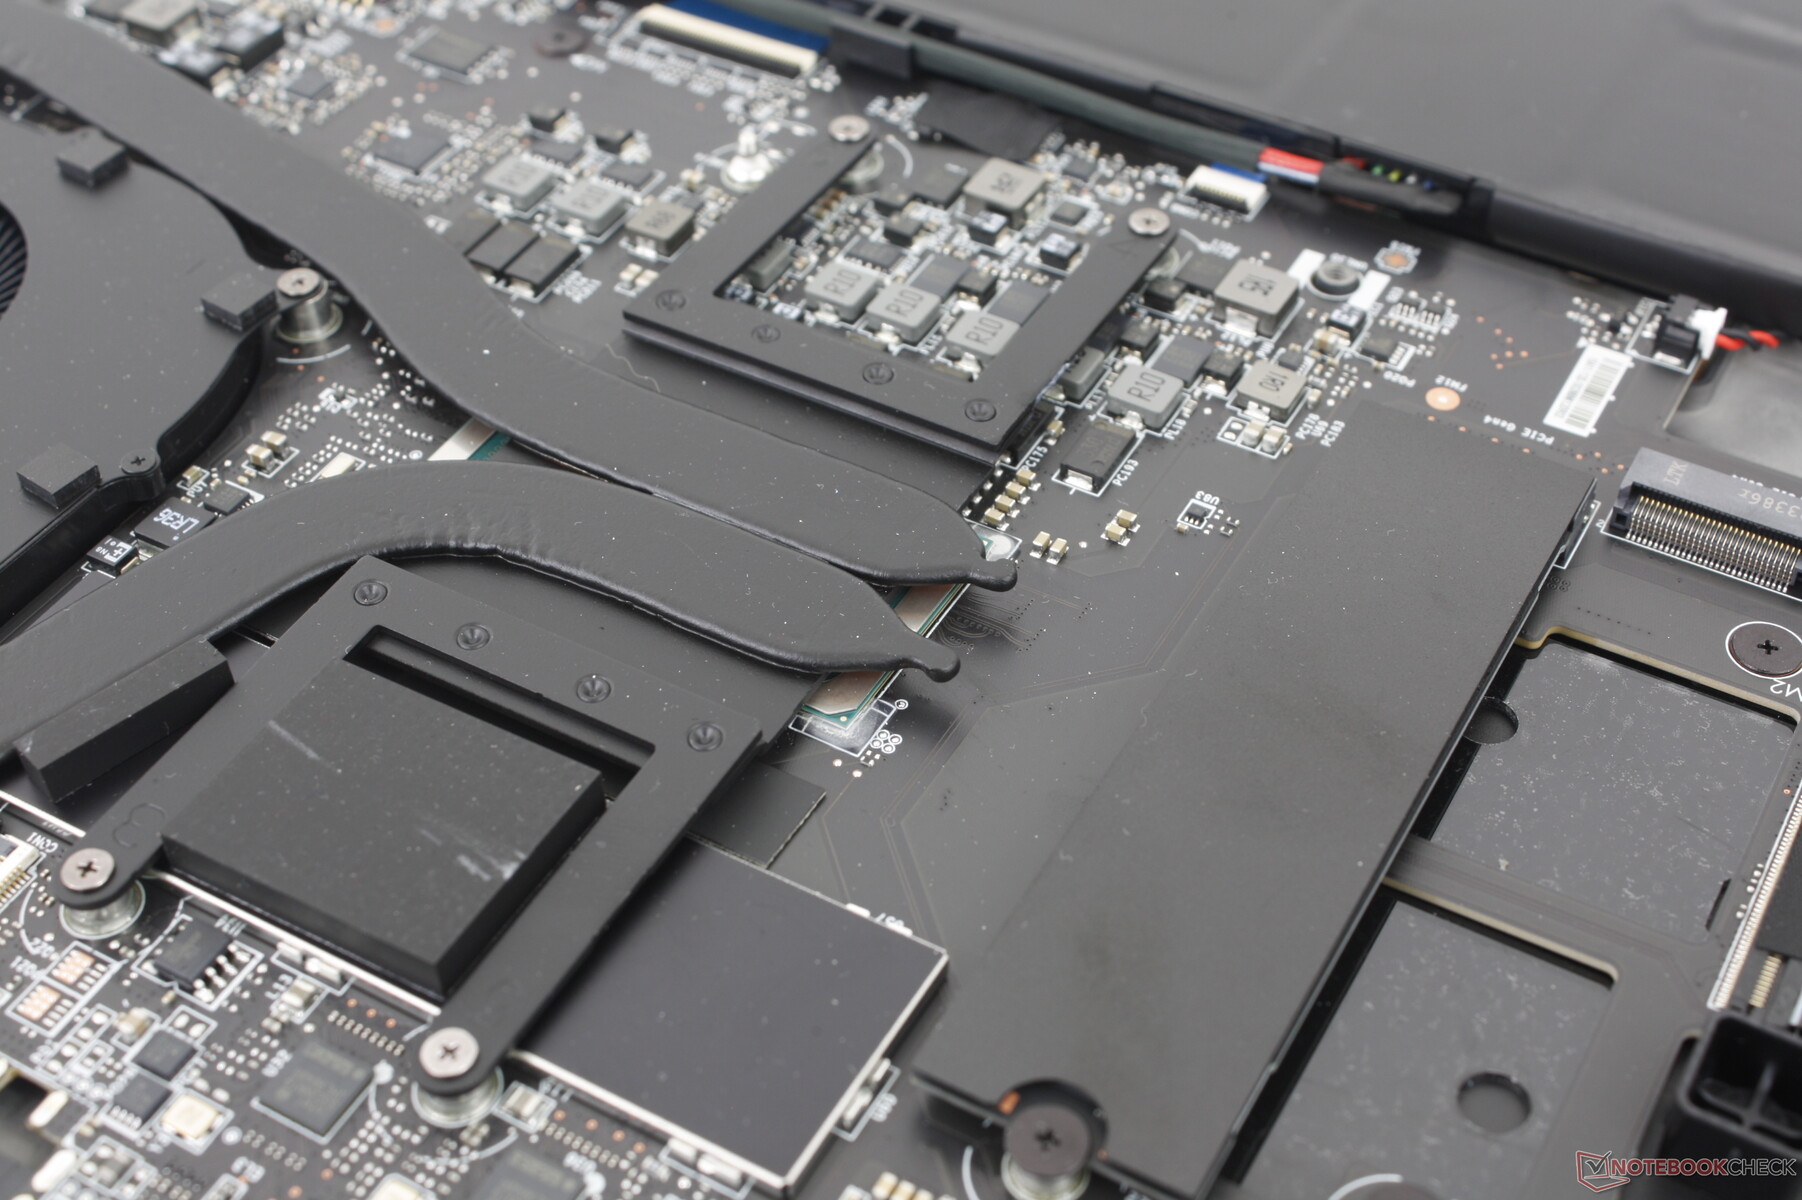
Het onderste paneel springt er vrij gemakkelijk af na het verwijderen van de acht kruiskopschroeven. Houd er rekening mee dat een fabriekszegelsticker verbroken moet worden om bij de interne onderdelen te komen.
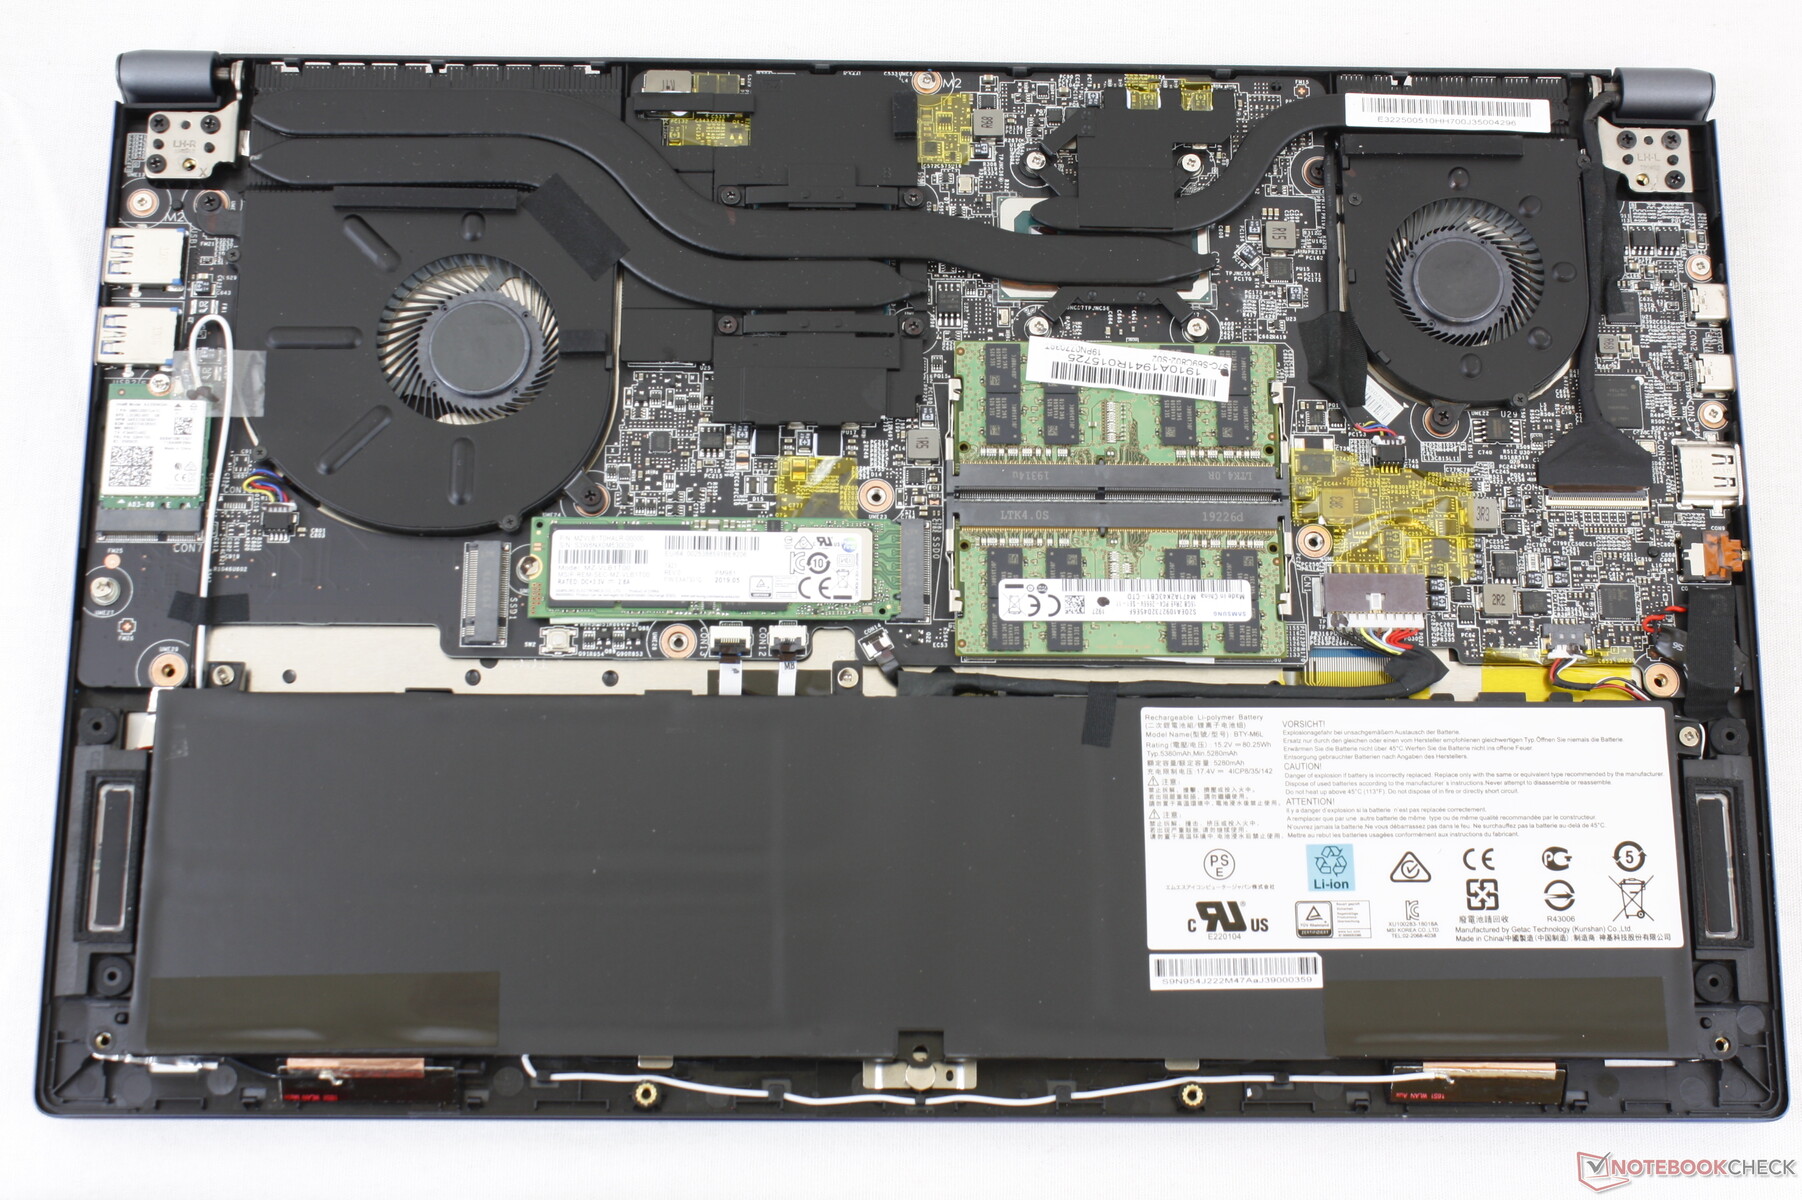
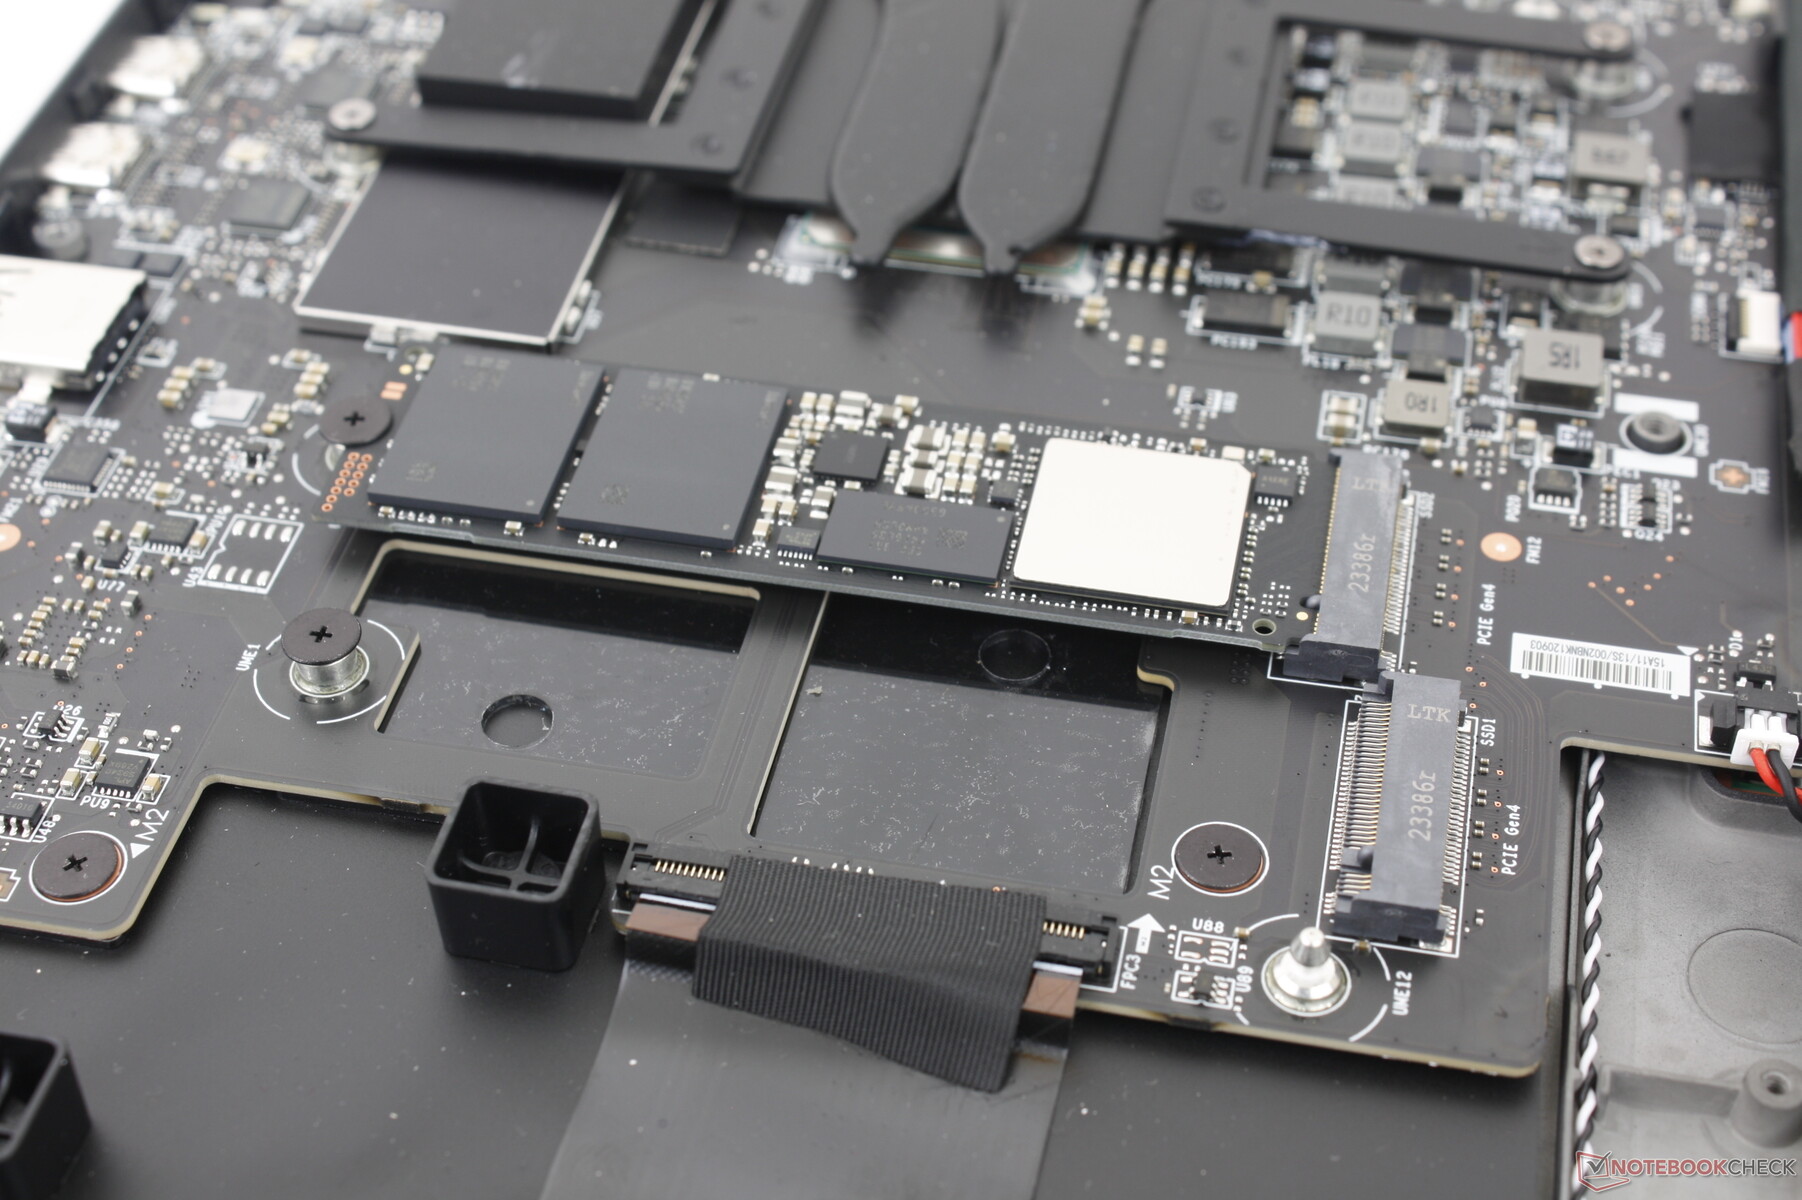
Eenmaal binnenin hebben eigenaren toegang tot twee M.2 2280 PCIe4 x4 NVMe SSD-sleuven, terwijl de RAM- en WLAN-modules allemaal gesoldeerd zijn. Ter vergelijking: al deze modules zijn verwijderbaar op het oudere Prestige 15 ontwerp.
Let op de grote lege ruimte die is gereserveerd voor SKU's met discrete graphics. Het model is uitgerust met meer heat pipes, een extra ventilator en herschikte M.2 SSD's indien geconfigureerd met een dedicated GPU.
Accessoires en garantie
Er zitten geen extra's in de doos behalve de AC-adapter en papierwerk. Bij aankoop in de VS geldt de gebruikelijke beperkte garantie van één jaar.
Invoerapparaten - Groter dan ooit tevoren
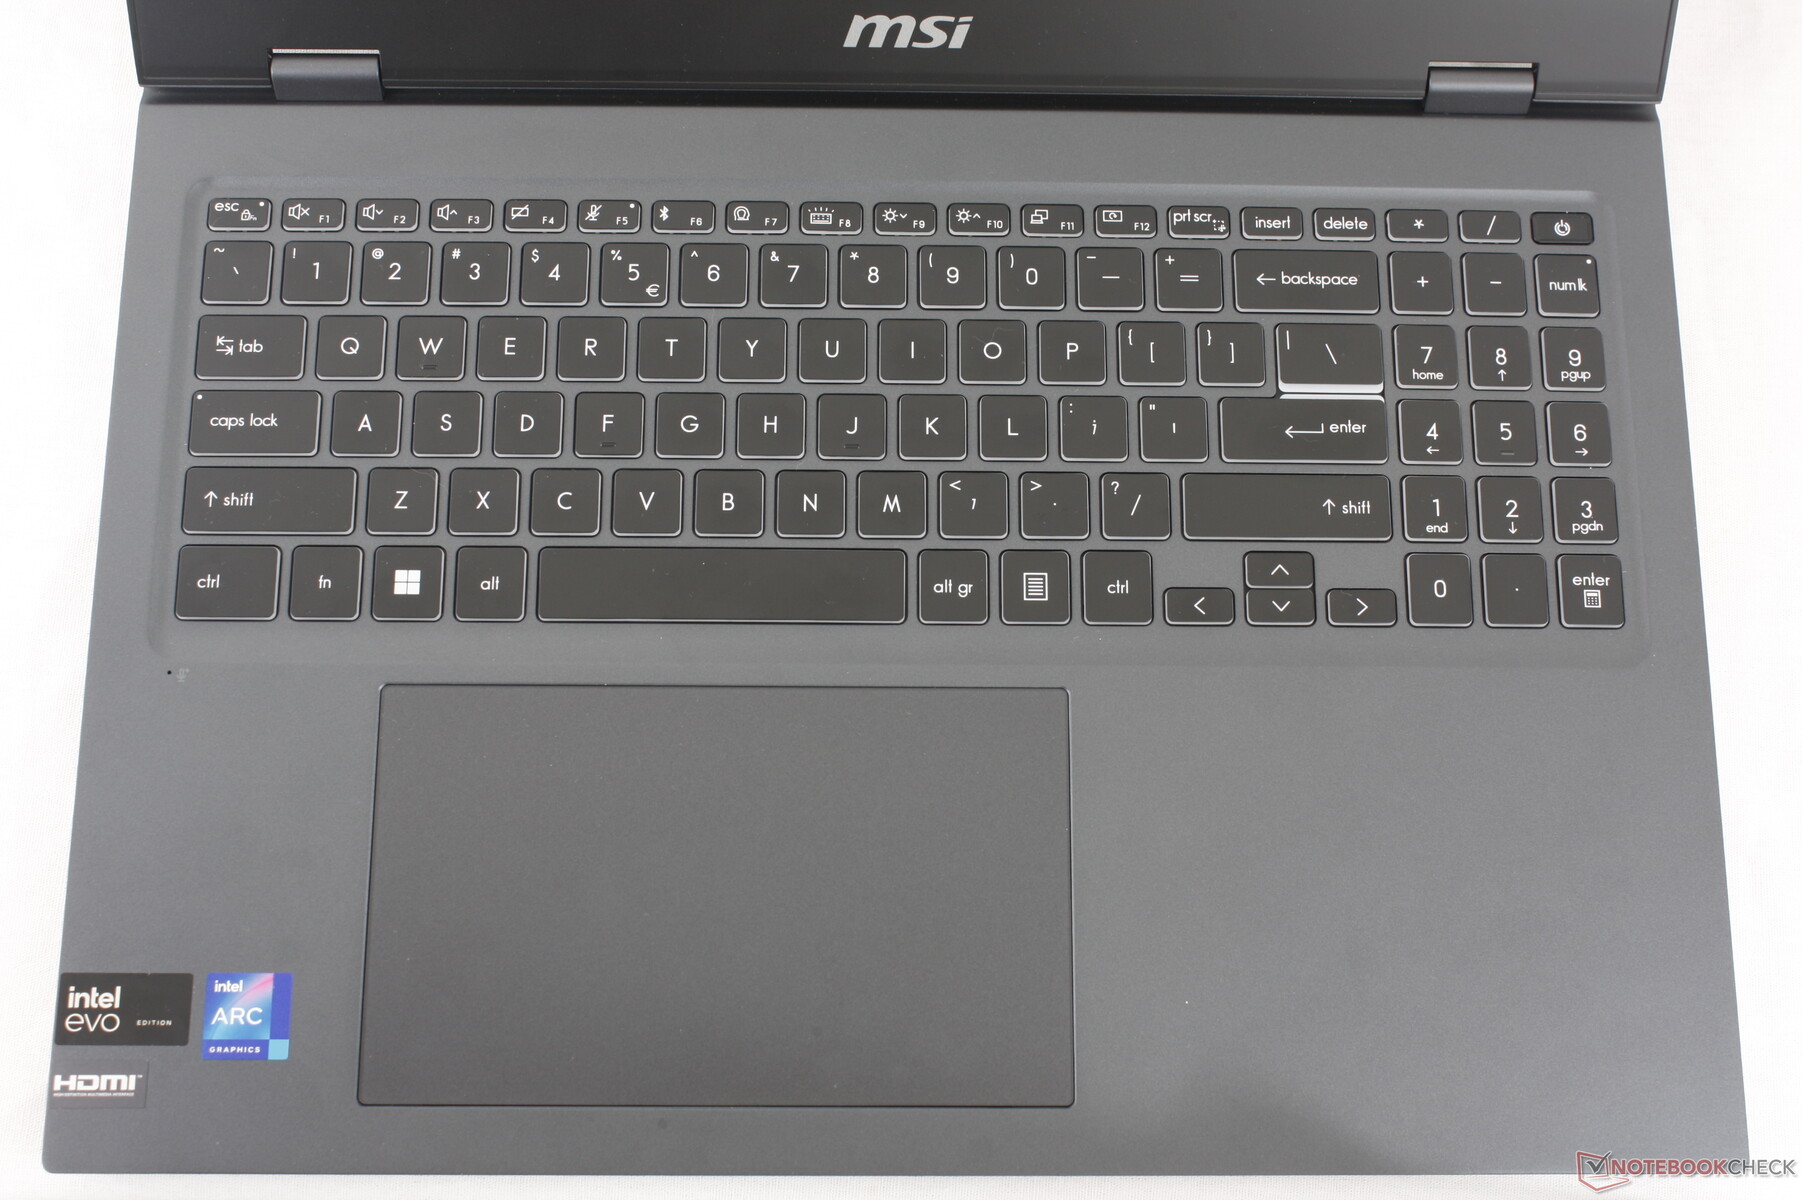
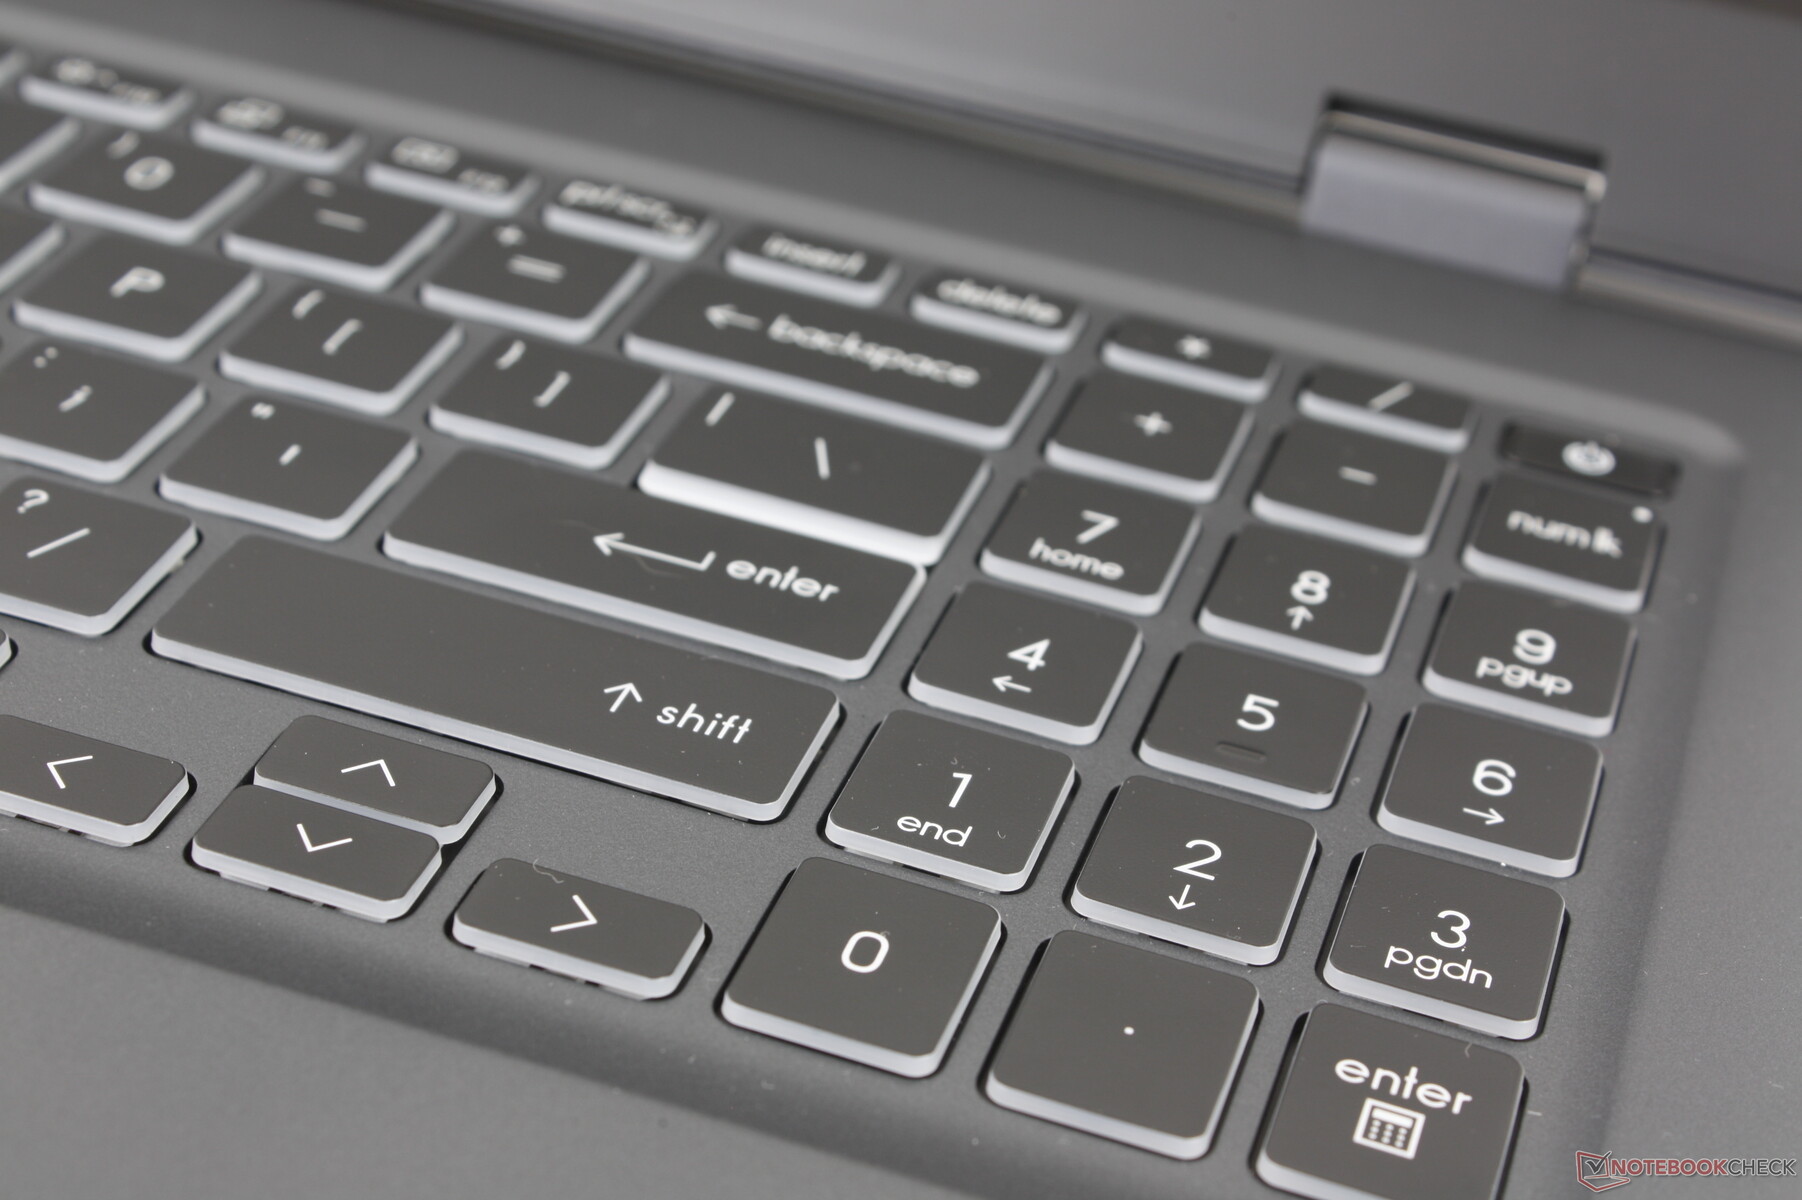
Toetsenbord
Het toetsenbord is vernieuwd en heeft nu een geïntegreerd numpad. Voor de rest voelt de toetsfeedback hetzelfde aan als op de Prestige 15, voor een vergelijkbare type-ervaring ondanks de veranderingen in de lay-out. We vinden nog steeds dat de toetsafstand merkbaar ondieper is dan de toetsen op MSI gaming laptops of de concurrerende HP Spectre serie. Ze zijn niet overdreven zacht of oncomfortabel, maar een stevigere of scherpere feedback bij elke druk op de toets zou ook geen kwaad kunnen.
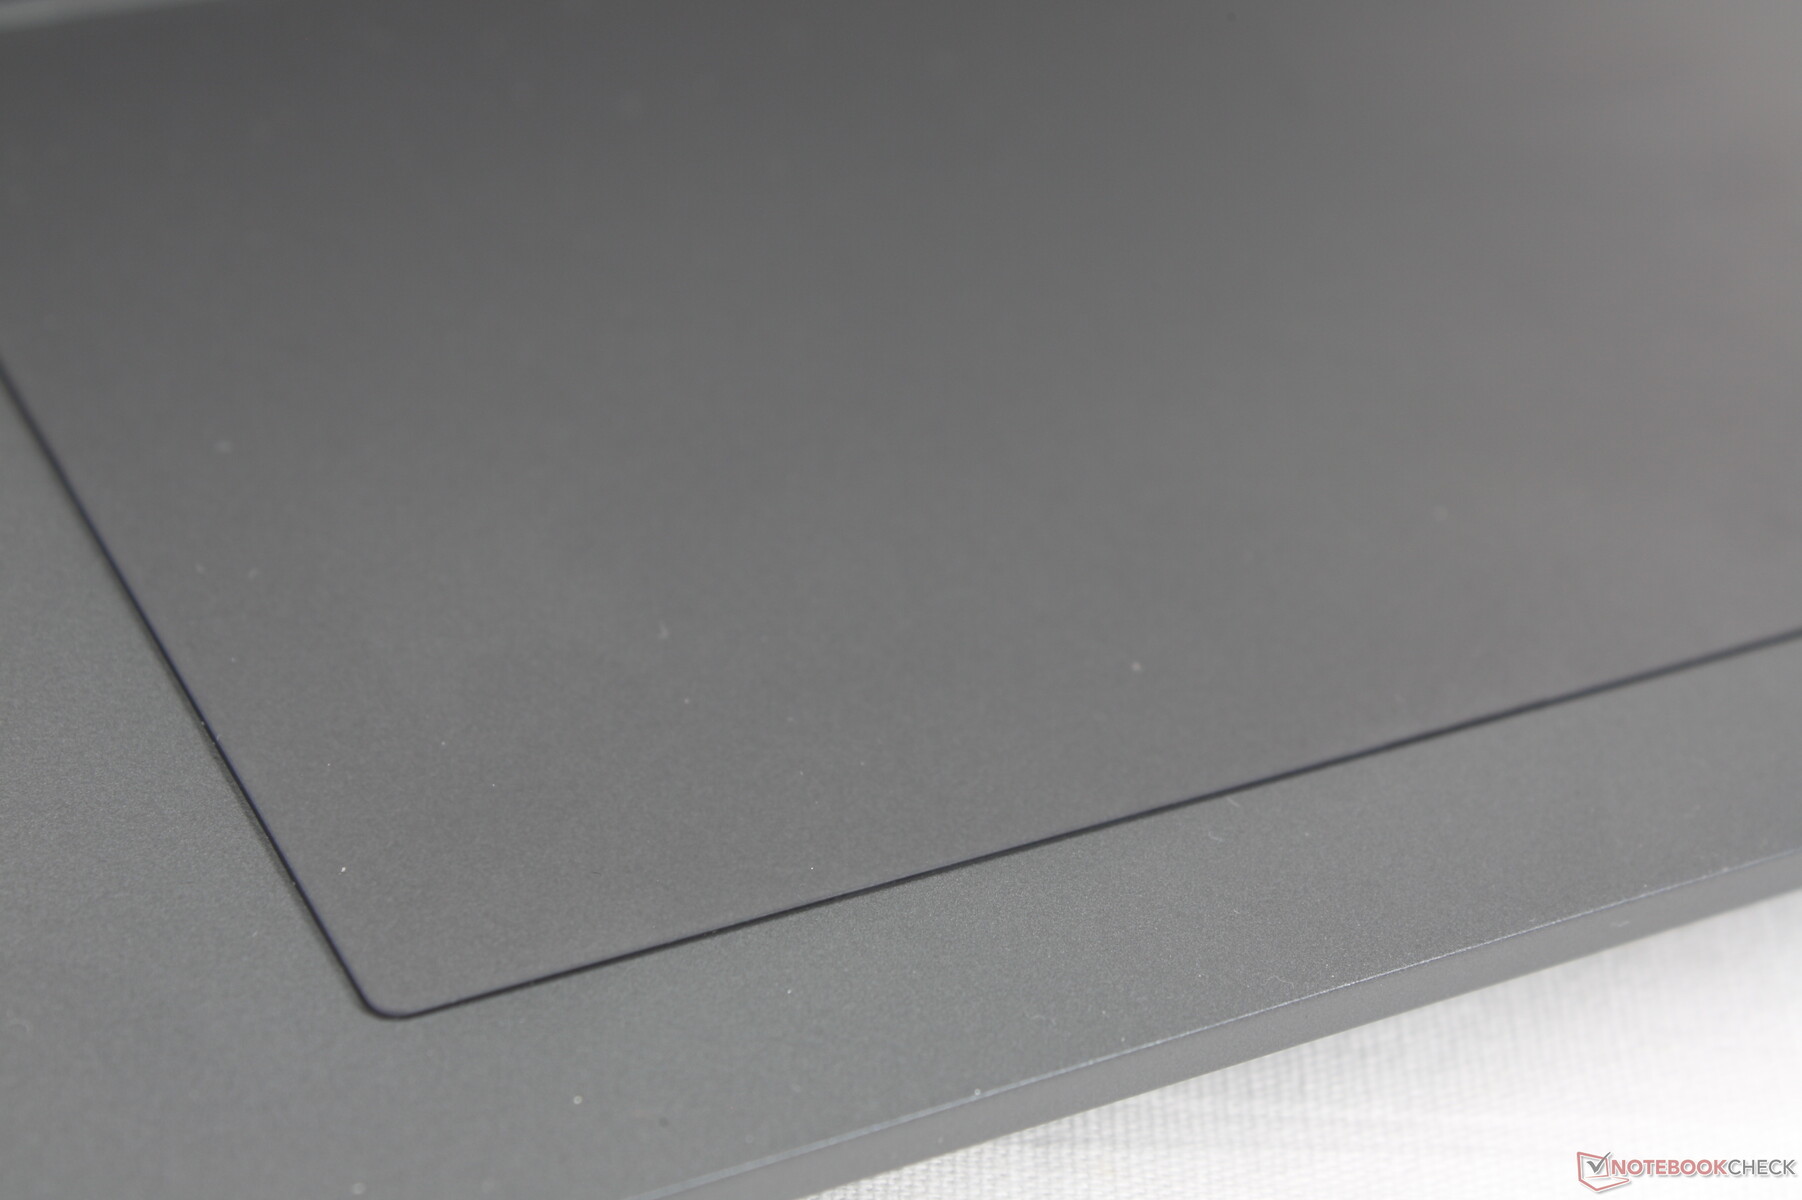
Touchpad
Het clickpad is nu veel groter (15 x 9 cm) om iets te doen aan de onhandig smalle afmetingen van het clickpad op de oudere Prestige 15 ontwerp. De tractie is soepel en betrouwbaar, zonder haperen, zelfs bij lagere snelheden.
De feedback bij het klikken is gemiddeld, zo niet een beetje aan de sponzige kant. Drukken vereist veel kracht van de vinger en dus kunnen acties vermoeiend worden zonder externe muis.

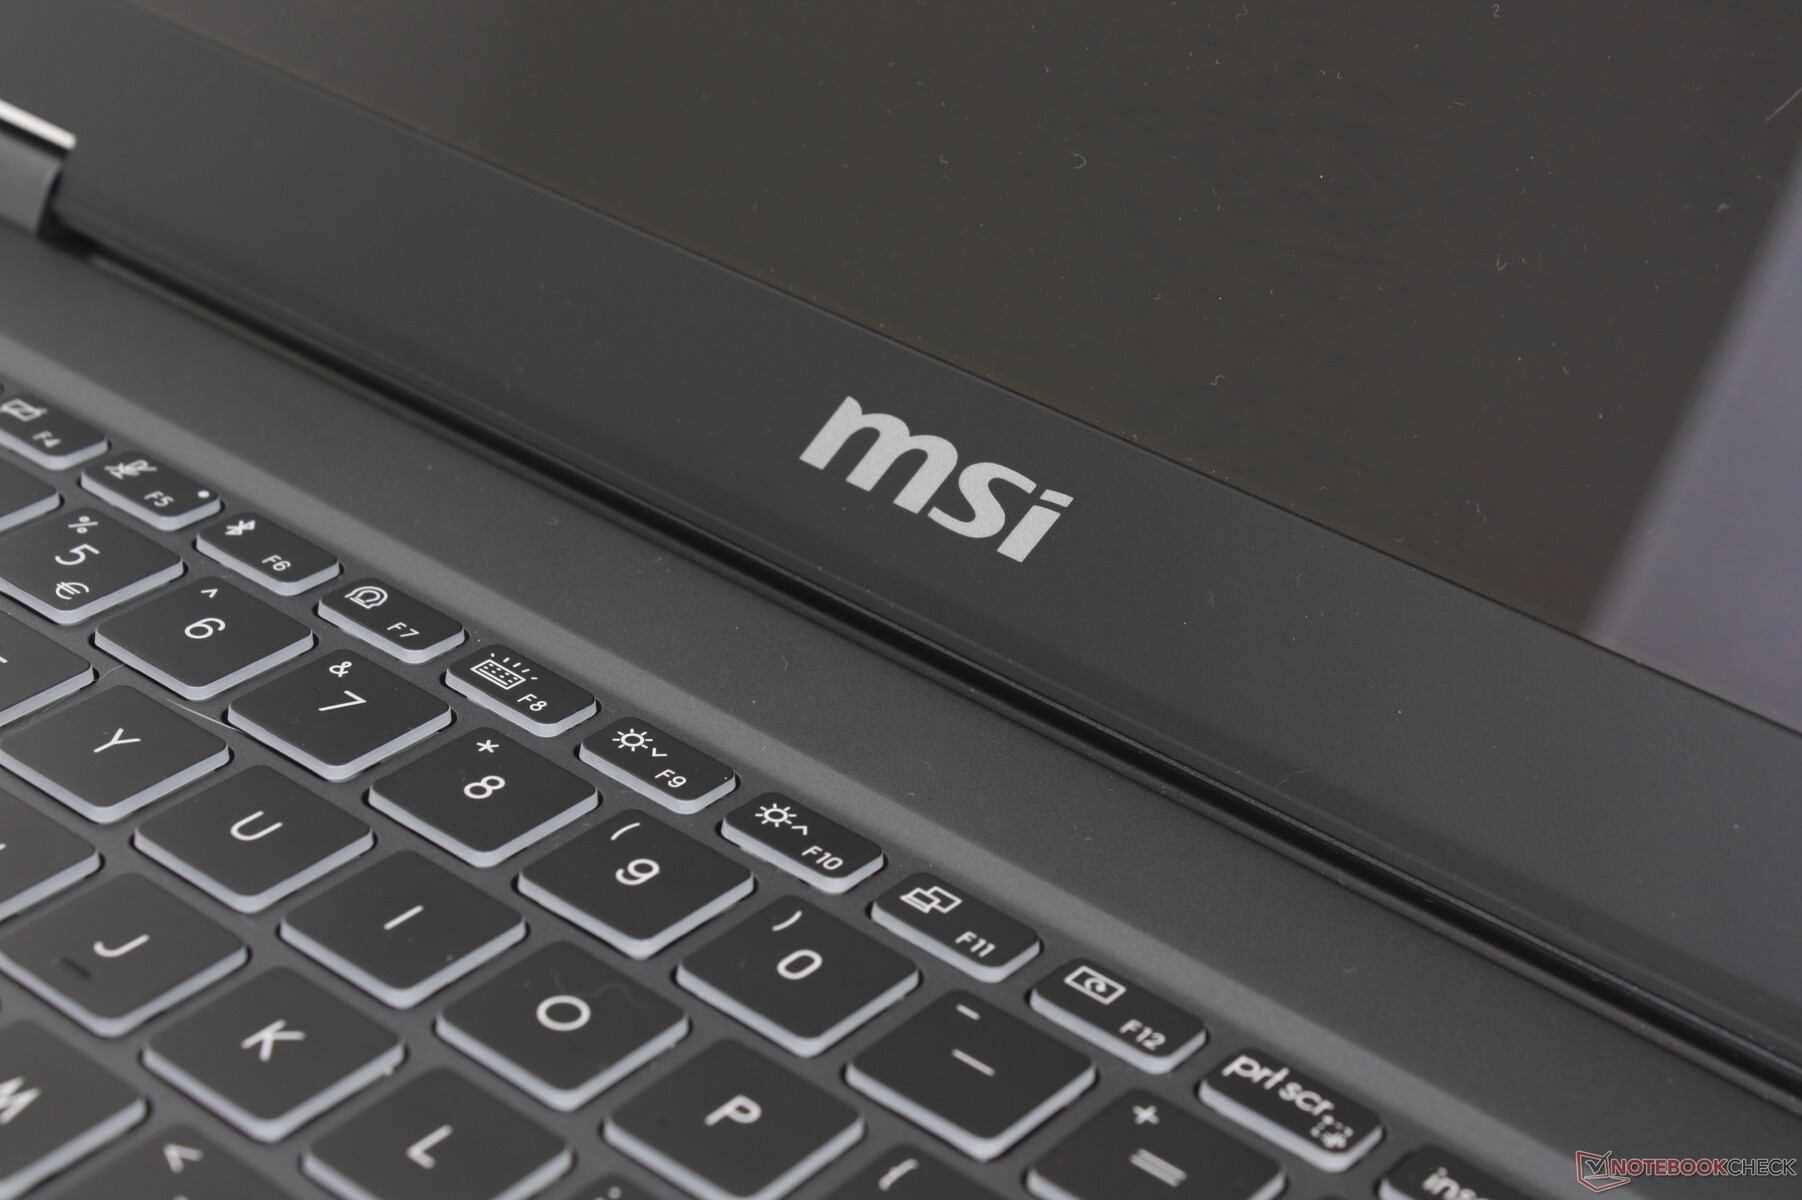
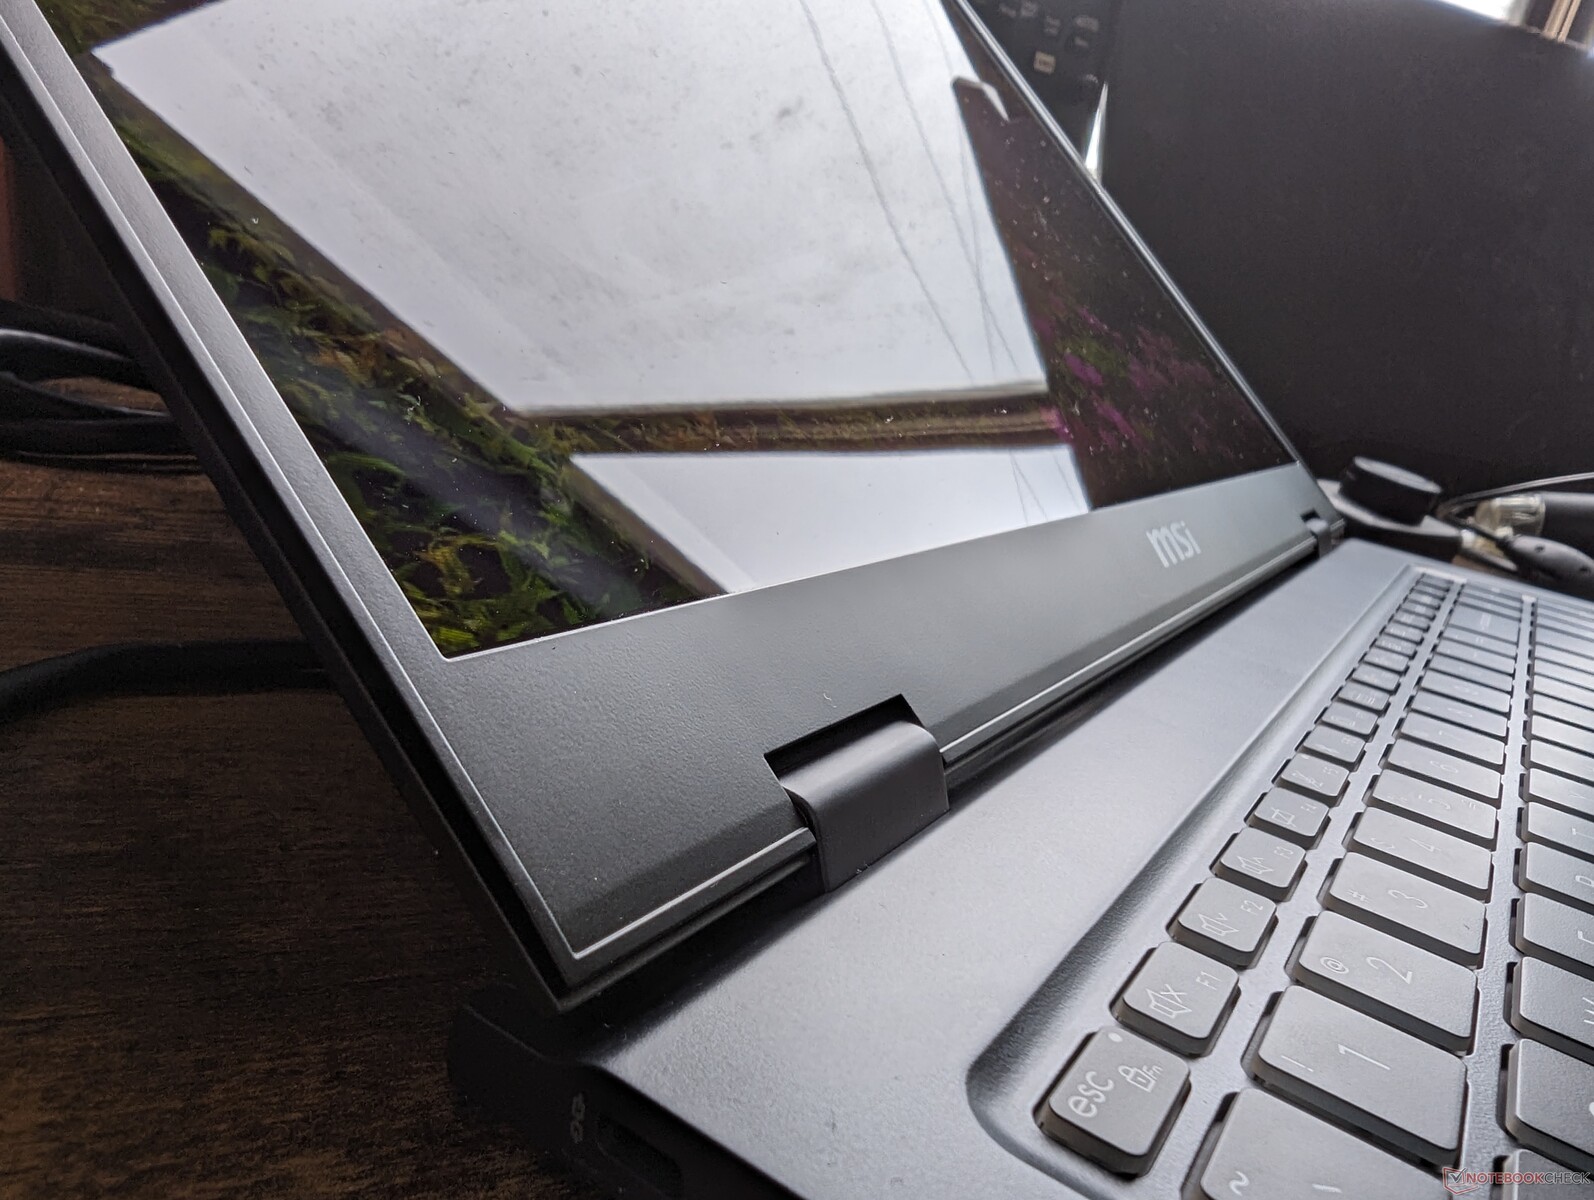
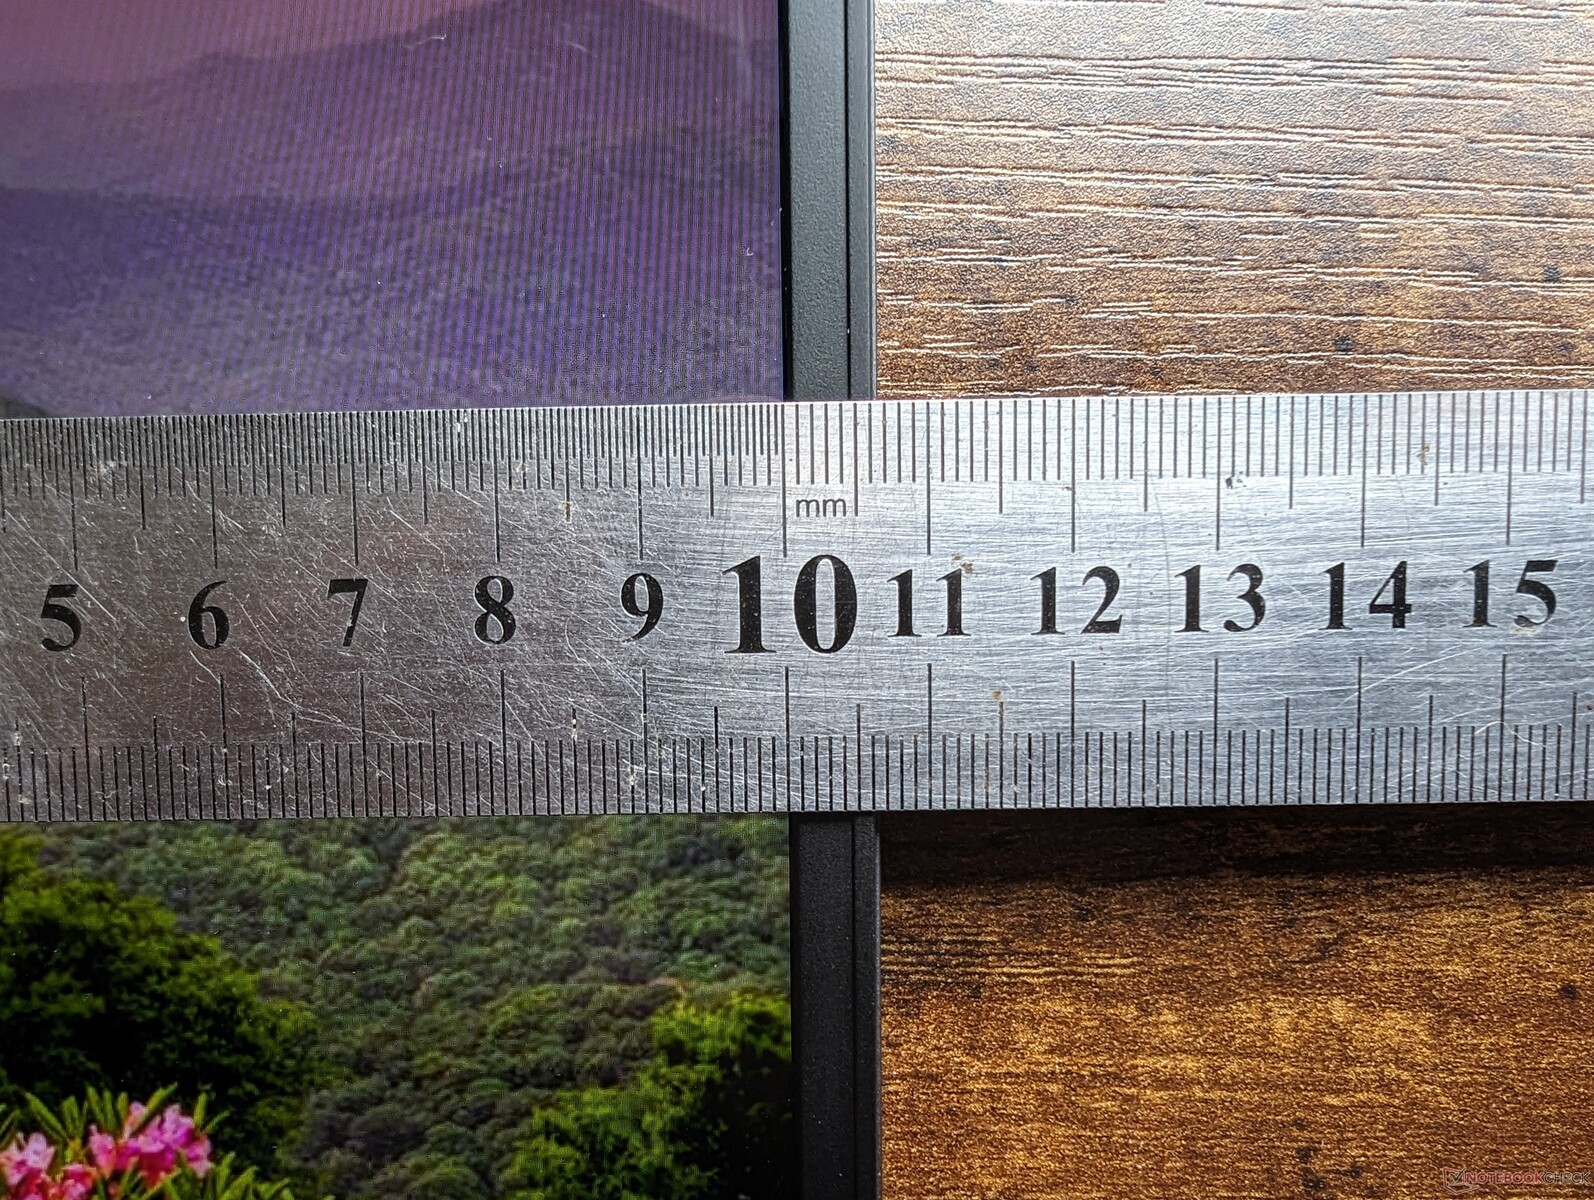
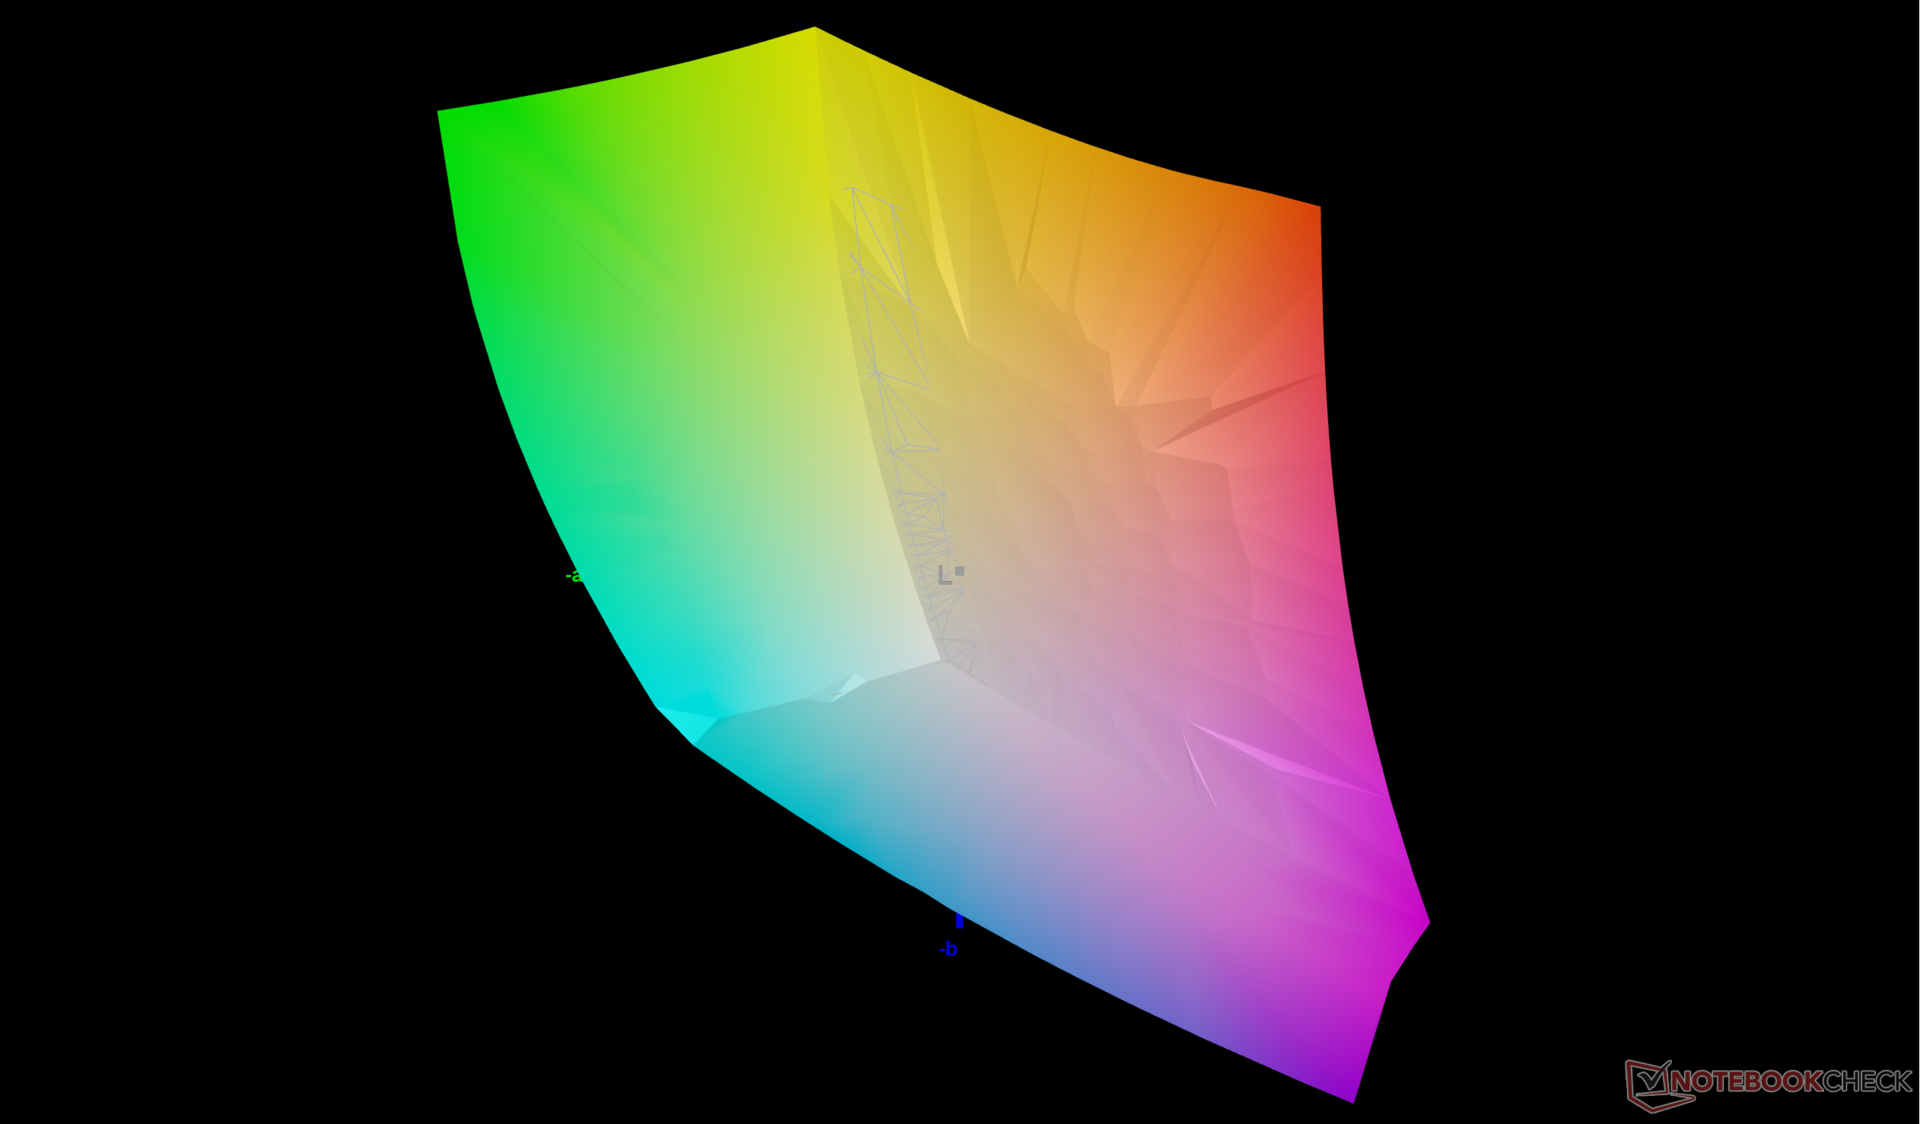
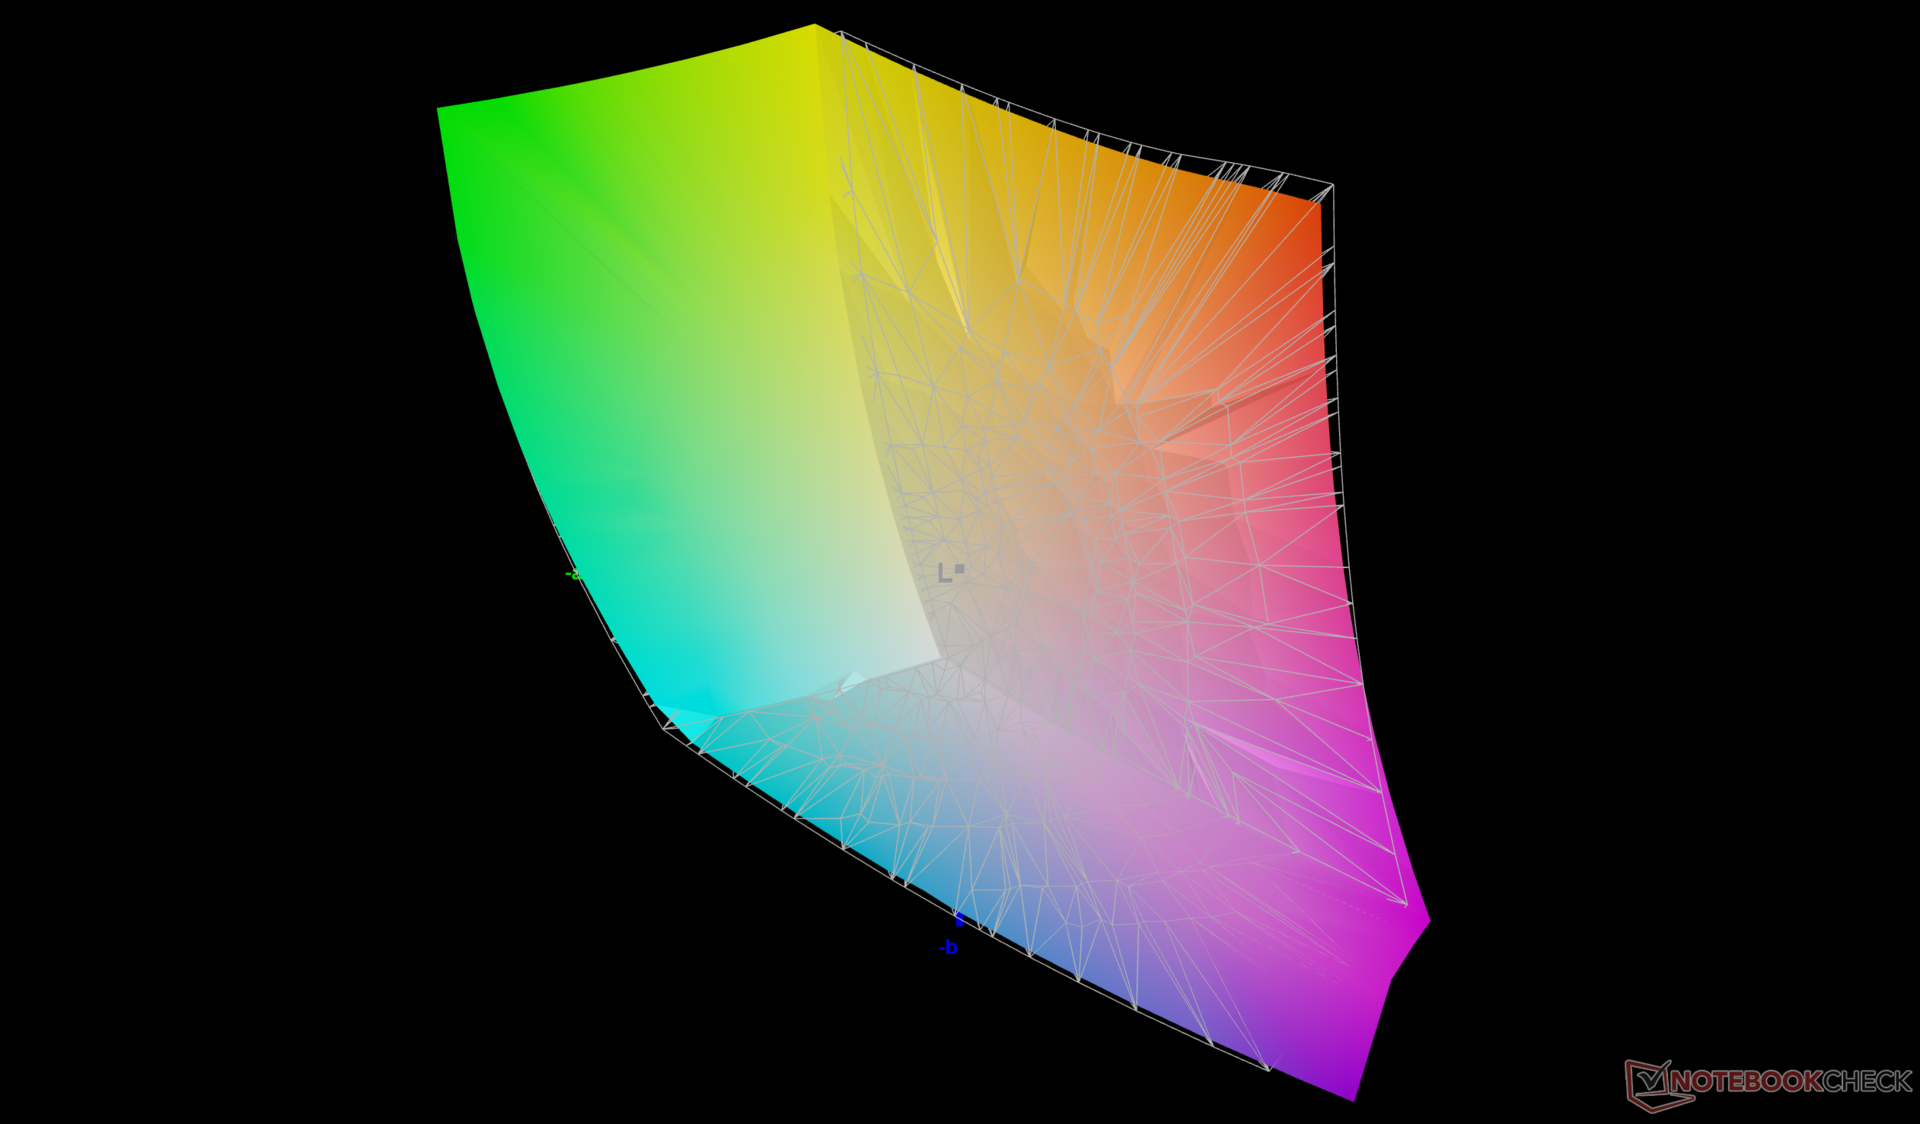
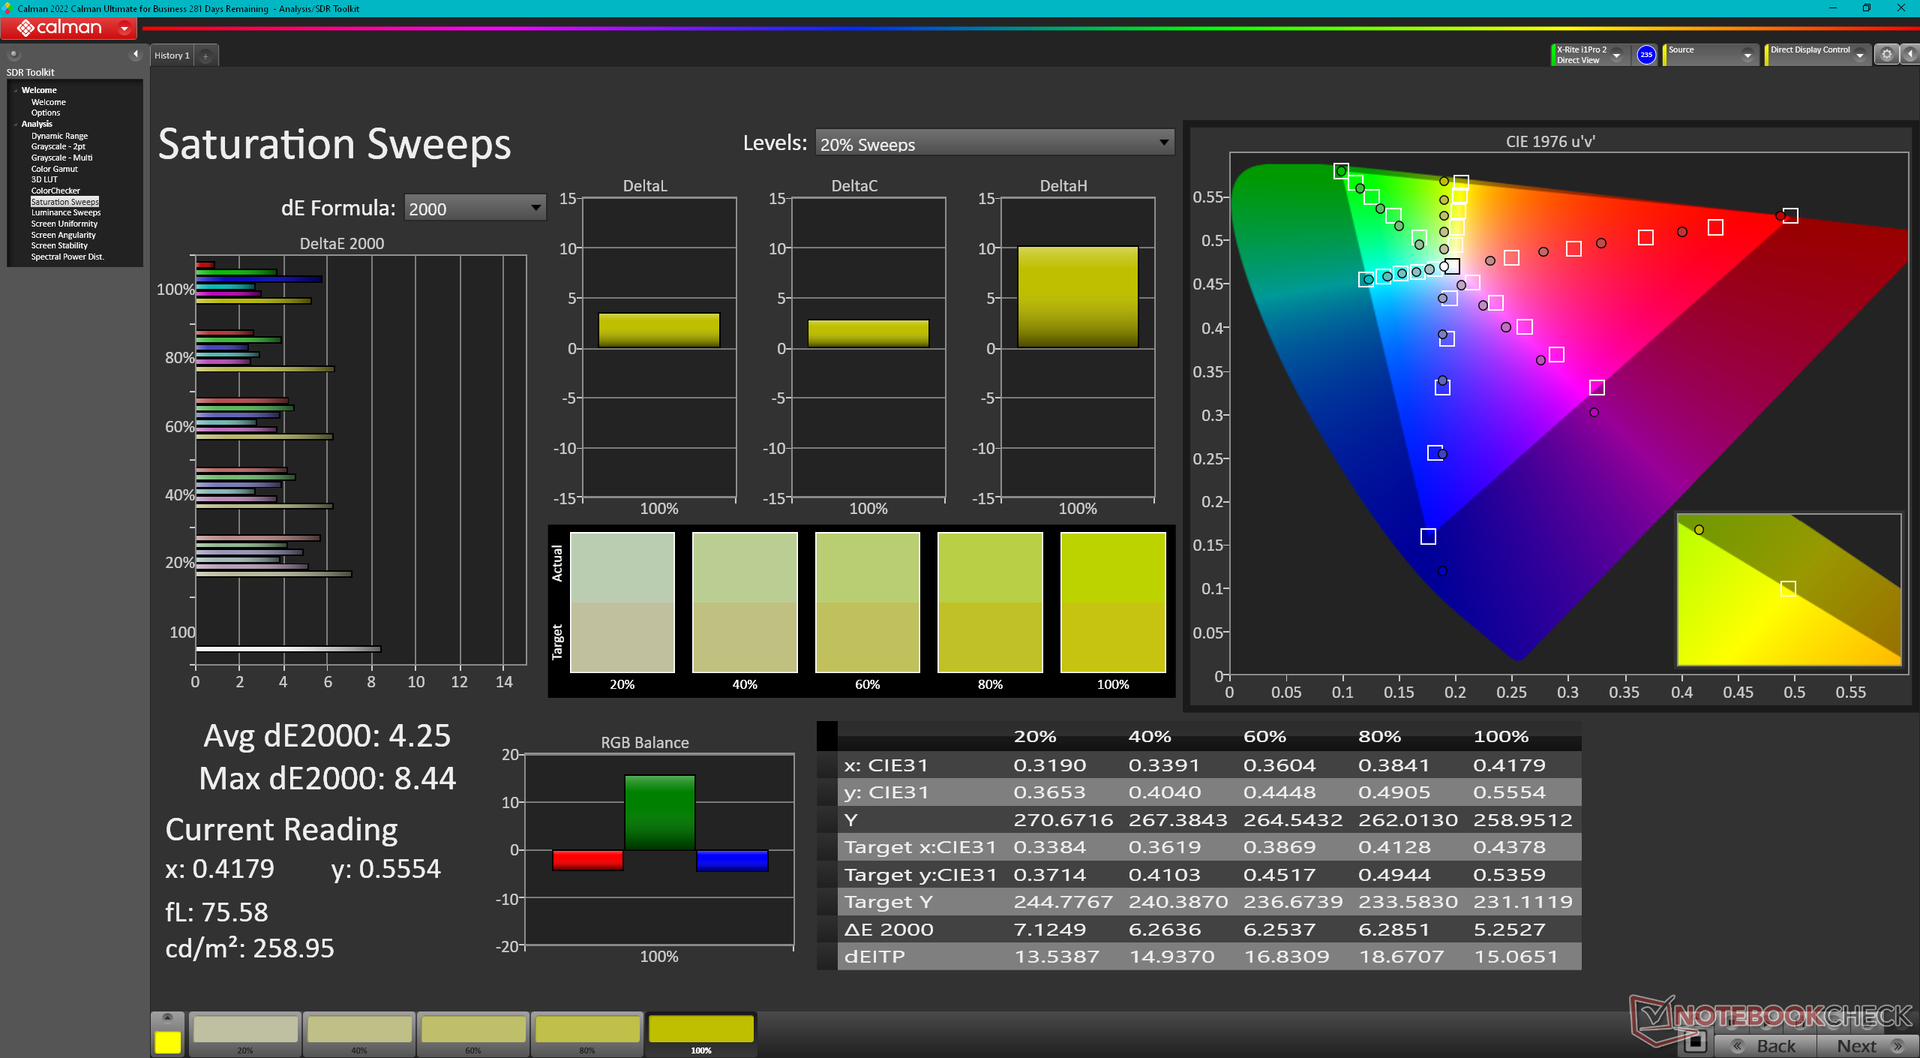
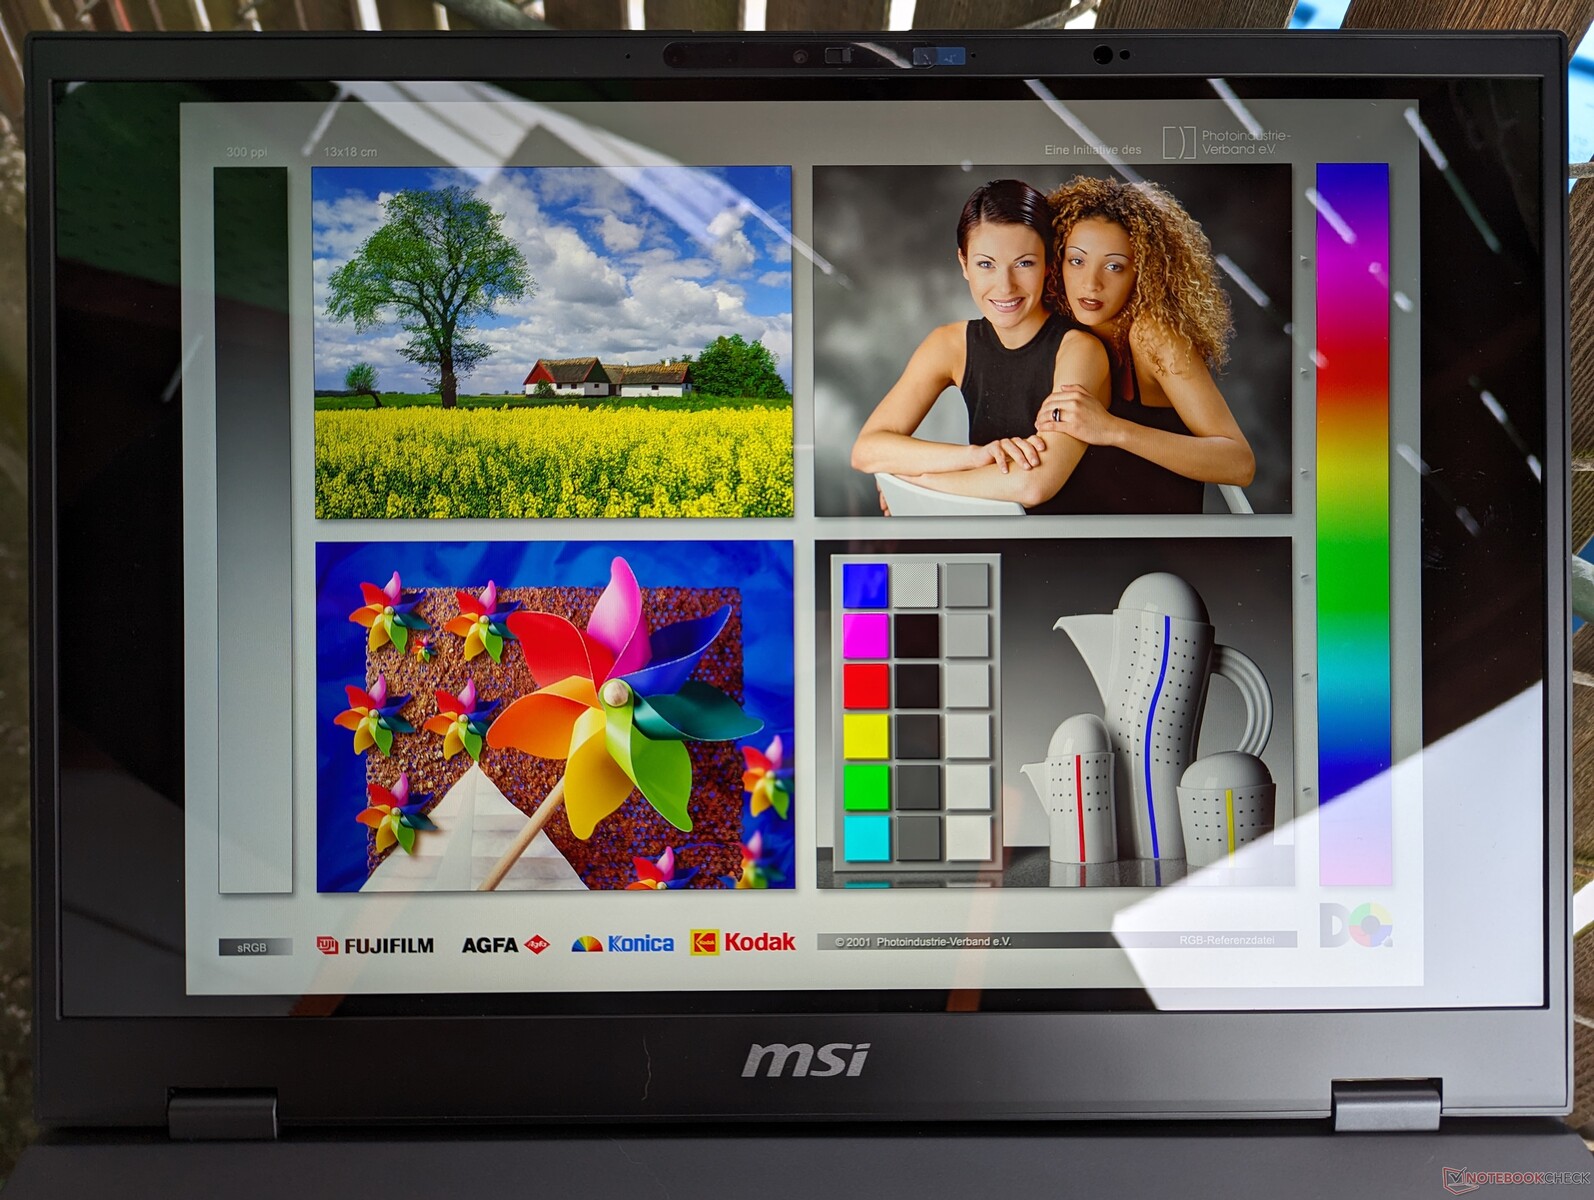
Beeldscherm - Volledig DCI-P3 op alle SKU's
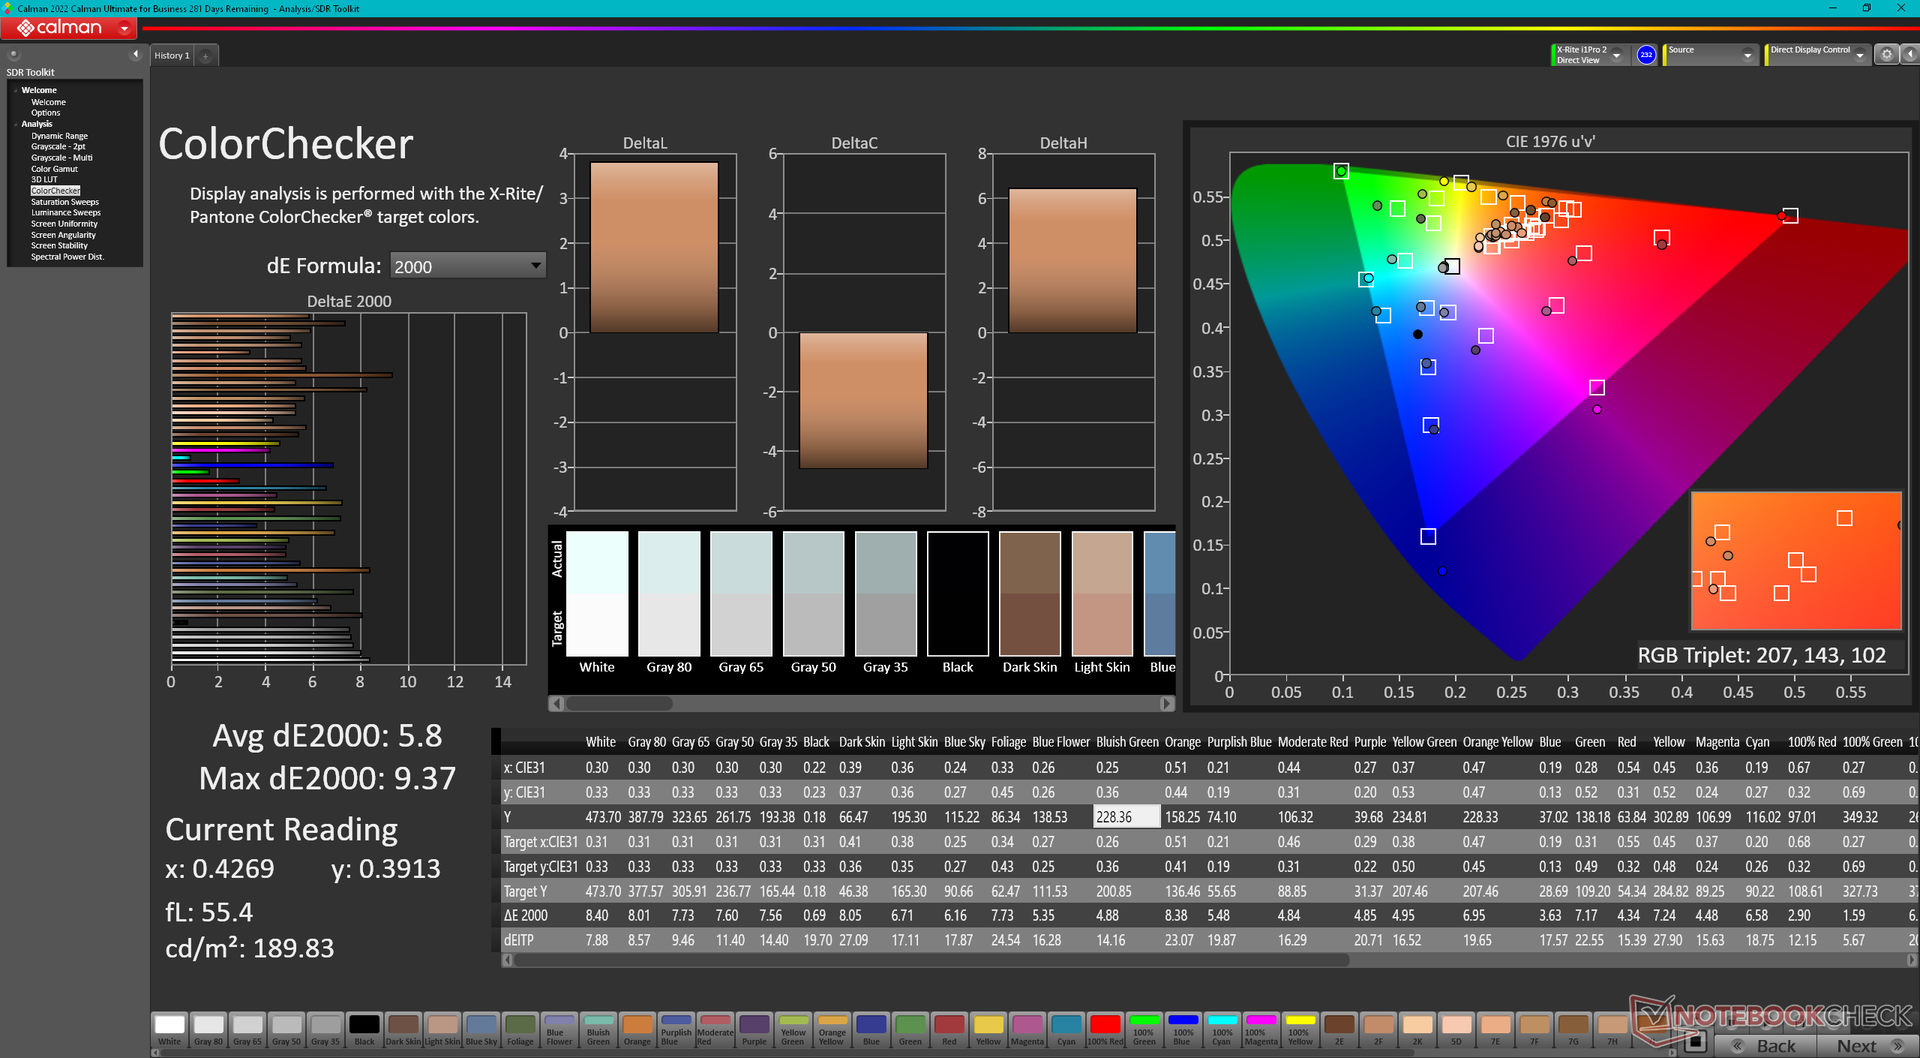
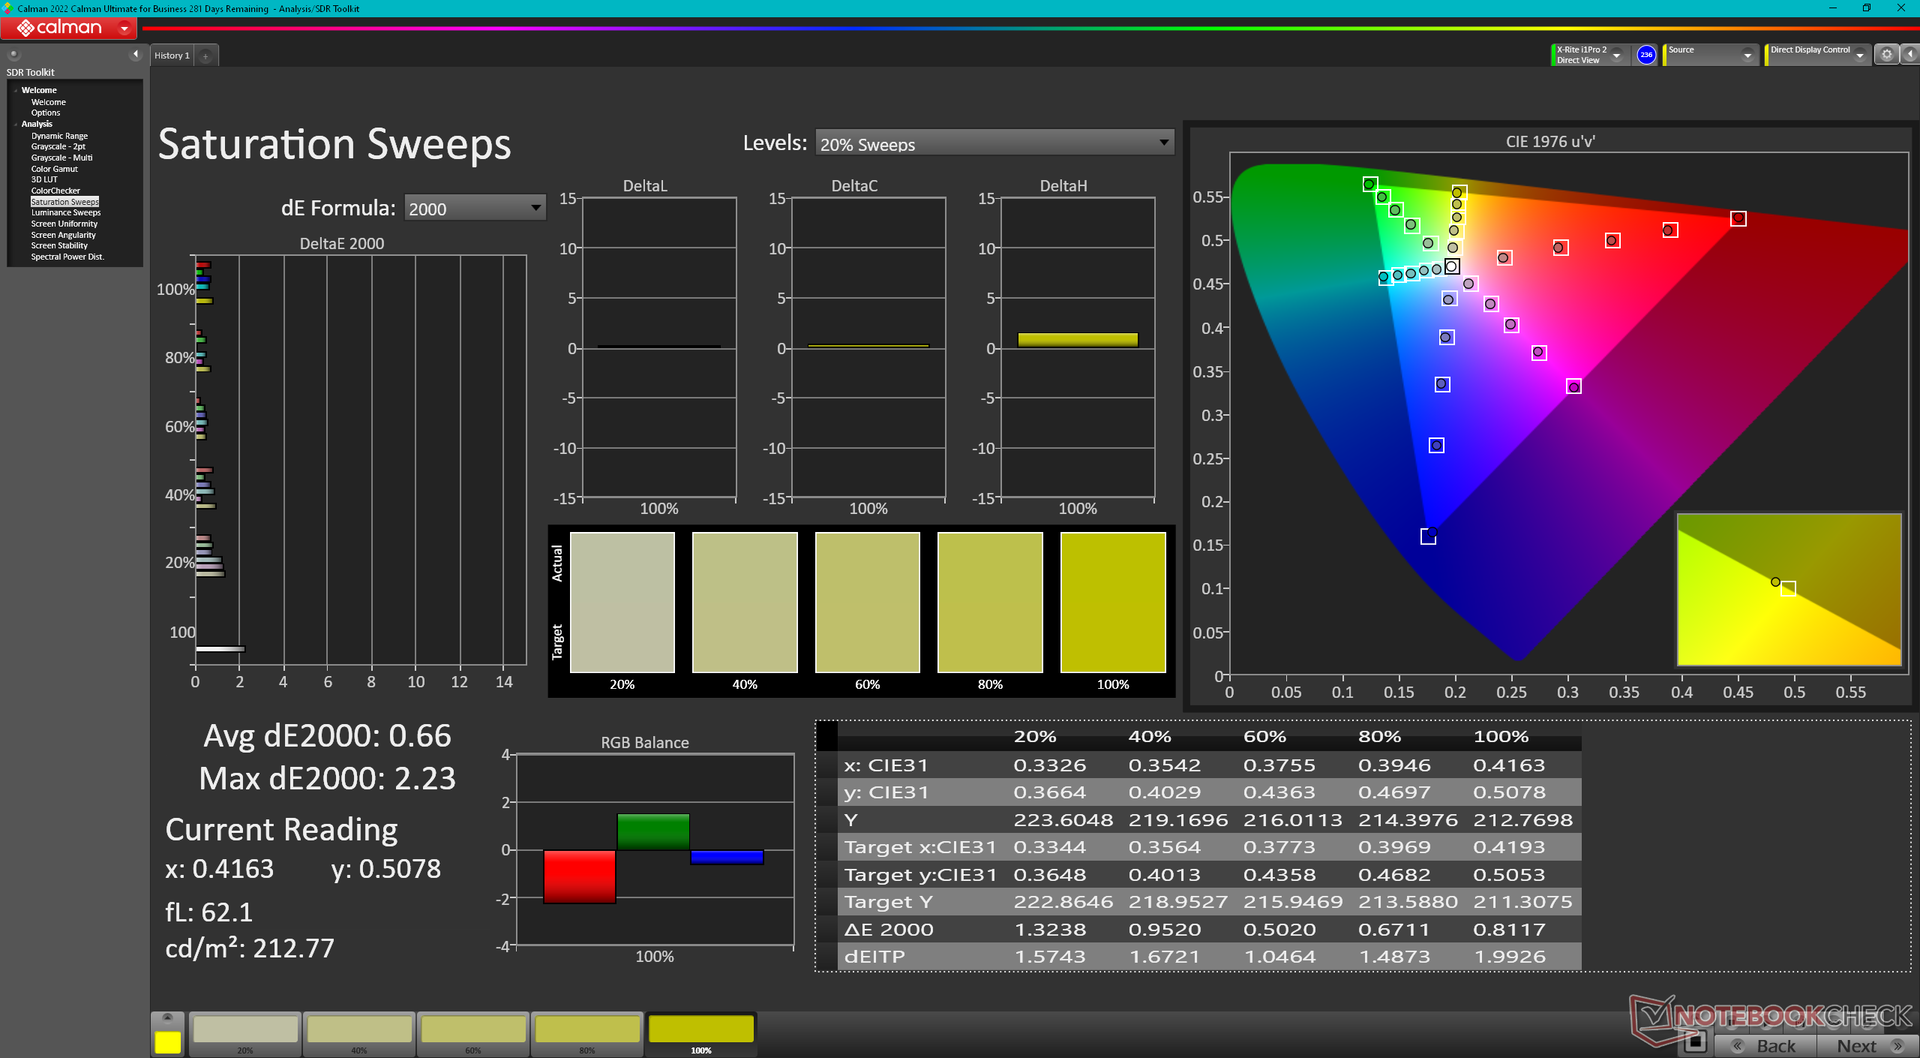
De Prestige 16 is de eerste in onze database met de AU Optronics B160QAN03.R. Dit heldere en glanzende IPS-paneel is van zeer hoge kwaliteit met volledige DCI-P3-kleuren en geen enkel probleem met korreligheid. De trage zwart-wit reactietijden, het gebrek aan adaptieve synchronisatie en de bescheiden verversingssnelheid van 60 Hz maken het echter meer geschikt voor grafische bewerking dan voor gaming.
Er is een tweede schermoptie beschikbaar met OLED en een hogere native resolutie. Geen van beide schermen ondersteunt touchscreen-functionaliteit.


| |||||||||||||||||||||||||
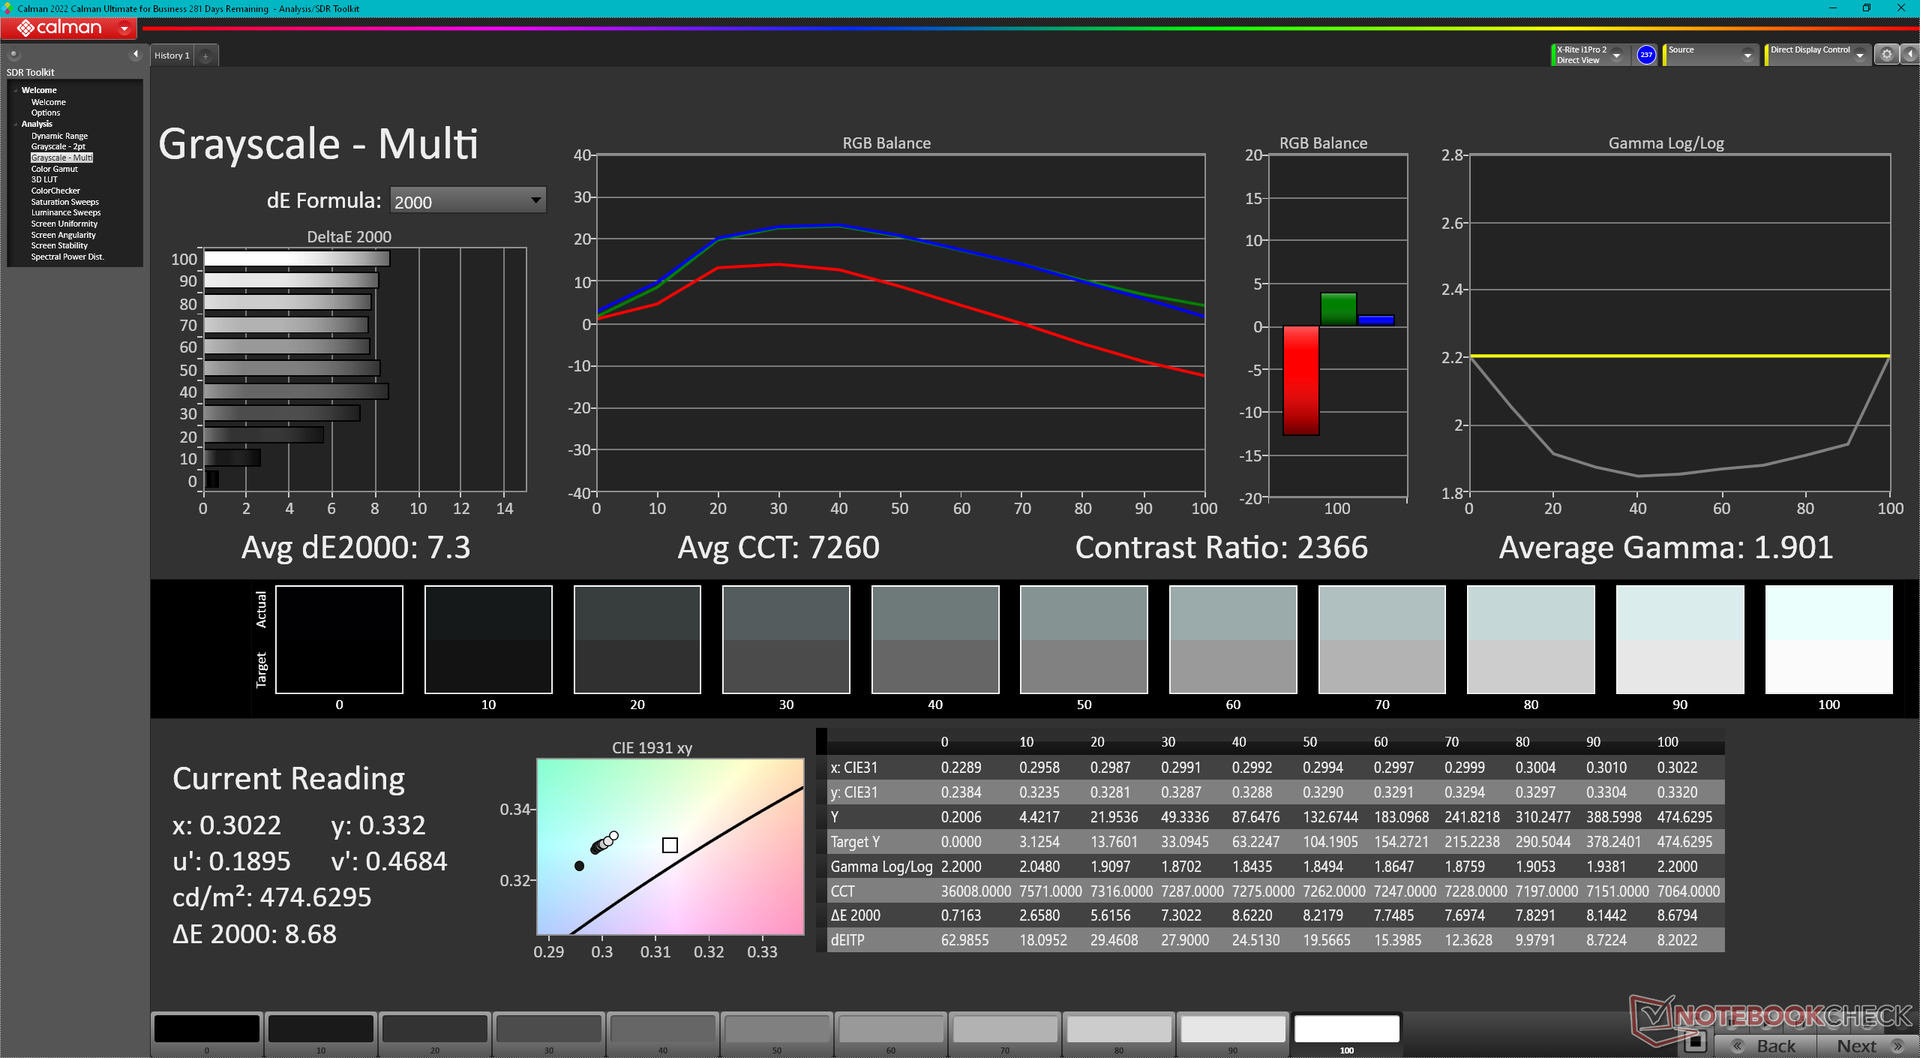
Helderheidsverdeling: 87 %
Helderheid in Batterij-modus: 473.6 cd/m²
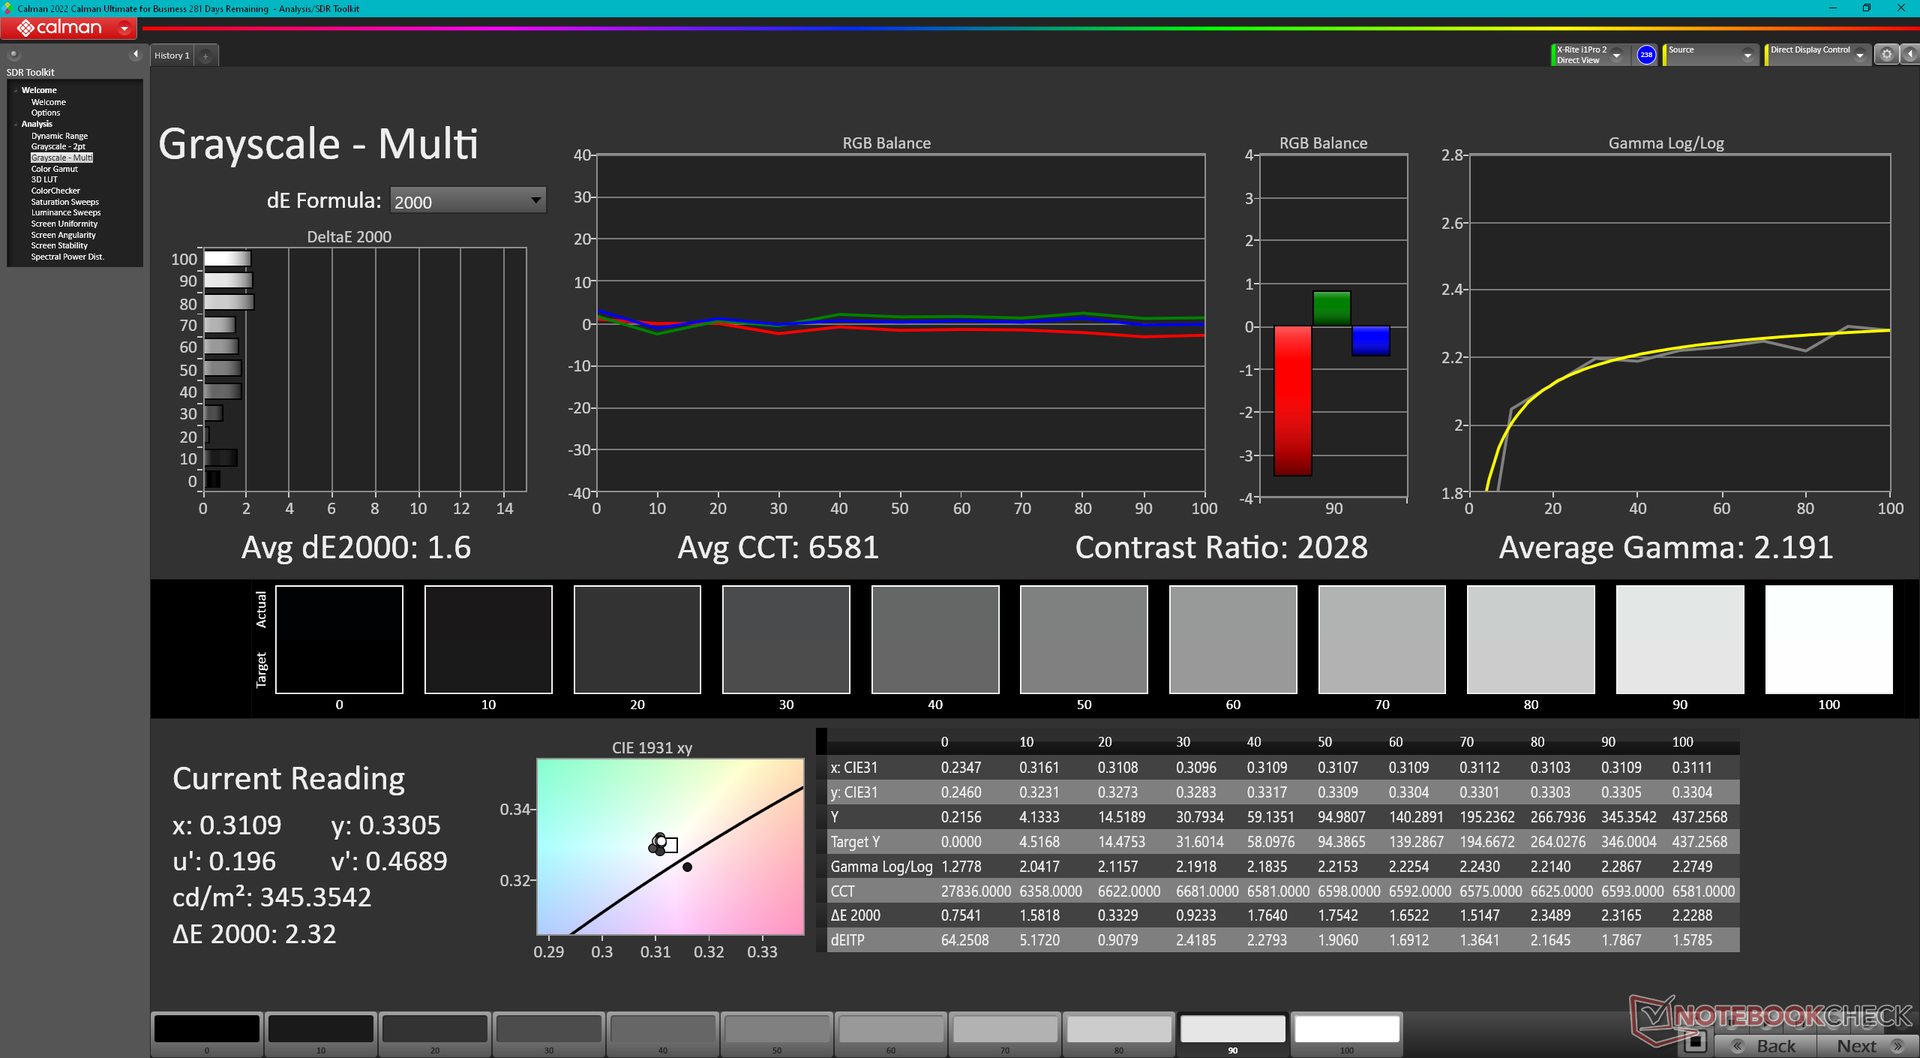
Contrast: 2493:1 (Zwart: 0.19 cd/m²)
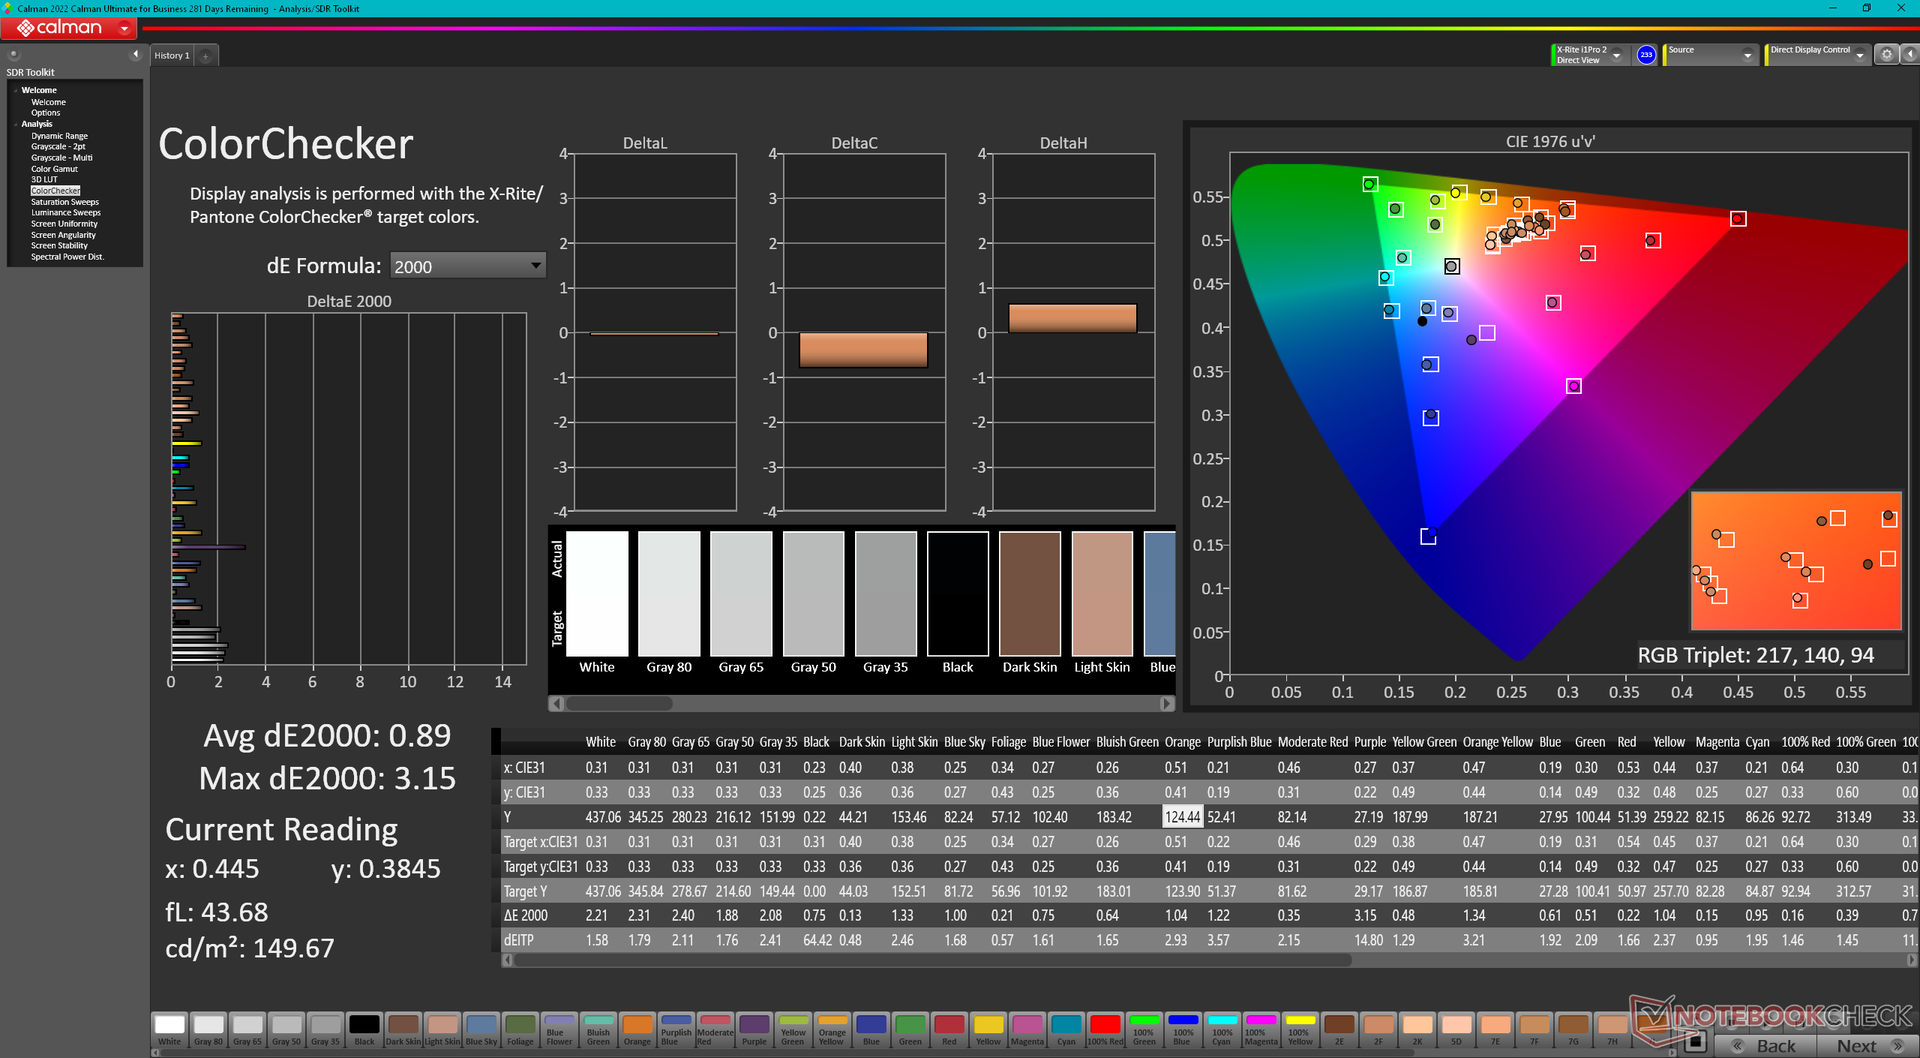
ΔE ColorChecker Calman: 5.9 | ∀{0.5-29.43 Ø4.71}
calibrated: 0.89
ΔE Greyscale Calman: 7.3 | ∀{0.09-98 Ø4.96}
84.6% AdobeRGB 1998 (Argyll 3D)
99.8% sRGB (Argyll 3D)
96.7% Display P3 (Argyll 3D)
Gamma: 1.9
CCT: 7260 K
| MSI Prestige 16 B1MG-001US AU Optronics B160QAN03.R, IPS, 2560x1600, 16" | MSI Prestige 15 A12UD-093 Sharp LQ156D1JW42, IPS, 3840x2160, 15.6" | LG Gram 2in1 16 16T90R - G.AA78G LP160WQ1-SPB2, IPS, 2560x1600, 16" | Lenovo ThinkBook 16 G6 ABP LEN160WUXGA, IPS, 1920x1200, 16" | Asus VivoBook Pro 16 K6602VU Samsung ATNA60BX01-1, OLED, 3200x2000, 16" | Dell Inspiron 16 Plus 7630 LG Philips 160WQ2, IPS, 2560x1600, 16" | |
|---|---|---|---|---|---|---|
| Display | -3% | 0% | -49% | 5% | -14% | |
| Display P3 Coverage (%) | 96.7 | 80.48 -17% | 96.5 0% | 40.4 -58% | 98.7 2% | 70.1 -28% |
| sRGB Coverage (%) | 99.8 | 96.95 -3% | 99.9 0% | 59.8 -40% | 99.7 0% | 99.6 0% |
| AdobeRGB 1998 Coverage (%) | 84.6 | 94.02 11% | 84.6 0% | 42 -50% | 96.5 14% | 72.3 -15% |
| Response Times | 10% | 30% | 32% | 80% | 29% | |
| Response Time Grey 50% / Grey 80% * (ms) | 49.4 ? | 51 ? -3% | 38.4 ? 22% | 32.8 ? 34% | 0.68 ? 99% | 35 ? 29% |
| Response Time Black / White * (ms) | 33.9 ? | 26 ? 23% | 21.4 ? 37% | 23.9 ? 29% | 13.2 ? 61% | 24.2 ? 29% |
| PWM Frequency (Hz) | 240 ? | |||||
| Screen | 27% | -19% | -83% | -13% | 0% | |
| Brightness middle (cd/m²) | 473.6 | 441 -7% | 329 -31% | 310 -35% | 353 -25% | 299.4 -37% |
| Brightness (cd/m²) | 456 | 416 -9% | 310 -32% | 290 -36% | 354 -22% | 290 -36% |
| Brightness Distribution (%) | 87 | 85 -2% | 88 1% | 86 -1% | 98 13% | 92 6% |
| Black Level * (cd/m²) | 0.19 | 0.155 18% | 0.39 -105% | 0.22 -16% | 0.21 -11% | |
| Contrast (:1) | 2493 | 2845 14% | 844 -66% | 1409 -43% | 1426 -43% | |
| Colorchecker dE 2000 * | 5.9 | 1.51 74% | 3.52 40% | 6.2 -5% | 4.23 28% | 4.25 28% |
| Colorchecker dE 2000 max. * | 9.37 | 3.56 62% | 6.96 26% | 24.7 -164% | 7.13 24% | 6.71 28% |
| Colorchecker dE 2000 calibrated * | 0.89 | 1.15 -29% | 5.3 -496% | 2.42 -172% | 0.52 42% | |
| Greyscale dE 2000 * | 7.3 | 2.49 66% | 5.75 21% | 3.8 48% | 2.5 66% | 5.5 25% |
| Gamma | 1.9 116% | 2.17 101% | 2.137 103% | 2.22 99% | 2.4 92% | 2.35 94% |
| CCT | 7260 90% | 6292 103% | 7584 86% | 6011 108% | 6642 98% | 6368 102% |
| Totaal Gemiddelde (Programma / Instellingen) | 11% /
17% | 4% /
-8% | -33% /
-60% | 24% /
7% | 5% /
1% |
* ... kleiner is beter
Het beeldscherm wordt niet voorgekalibreerd geleverd, wat jammer is aangezien alle SKU's DCI-P3 kleuren ondersteunen. De kleurtemperatuur is te koel voor relatief hoge gemiddelde grijswaarden en DeltaE-waarden voor kleuren van respectievelijk 7,3 en 5,8. Door het scherm zelf te kalibreren, zouden deze gemiddelde waarden dalen tot <2 elk. Door het paneel zelf te kalibreren, zouden deze gemiddelde waarden dalen tot <2 elk. Ons gekalibreerde ICM-profiel kunt u hierboven gratis downloaden.
Responstijd Scherm
| ↔ Responstijd Zwart naar Wit | ||
|---|---|---|
| 33.9 ms ... stijging ↗ en daling ↘ gecombineerd | ↗ 15.6 ms stijging | 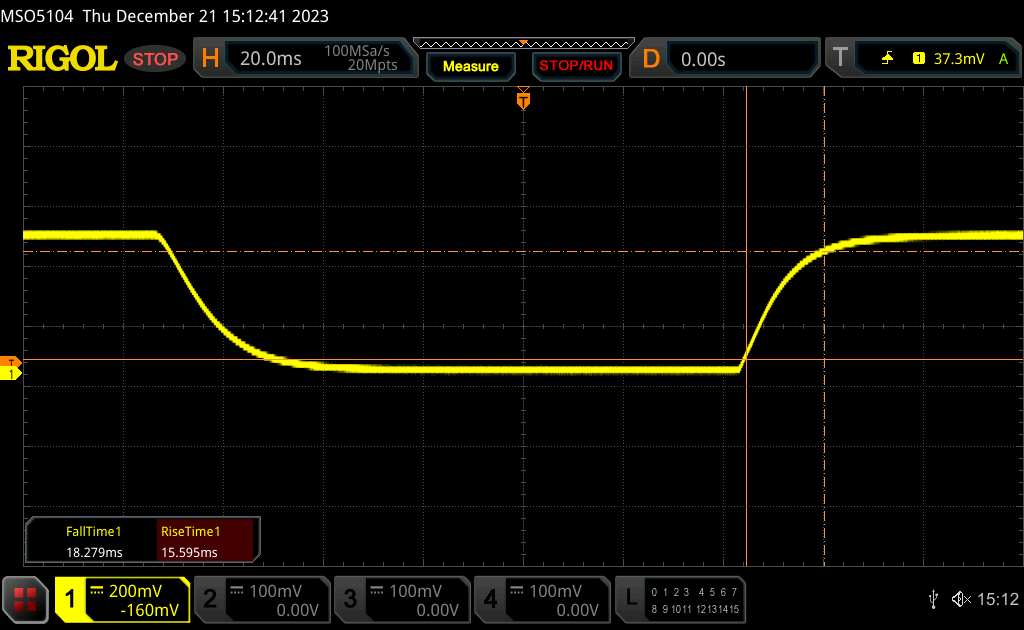 |
| ↘ 18.3 ms daling | ||
| Het scherm vertoonde trage responstijden in onze tests en is misschien te traag voor games. Ter vergelijking: alle testtoestellen variëren van 0.1 (minimum) tot 240 (maximum) ms. » 91 % van alle toestellen zijn beter. Dit betekent dat de gemeten responstijd slechter is dan het gemiddelde (19.8 ms) van alle geteste toestellen. | ||
| ↔ Responstijd 50% Grijs naar 80% Grijs | ||
| 49.4 ms ... stijging ↗ en daling ↘ gecombineerd | ↗ 22.6 ms stijging | 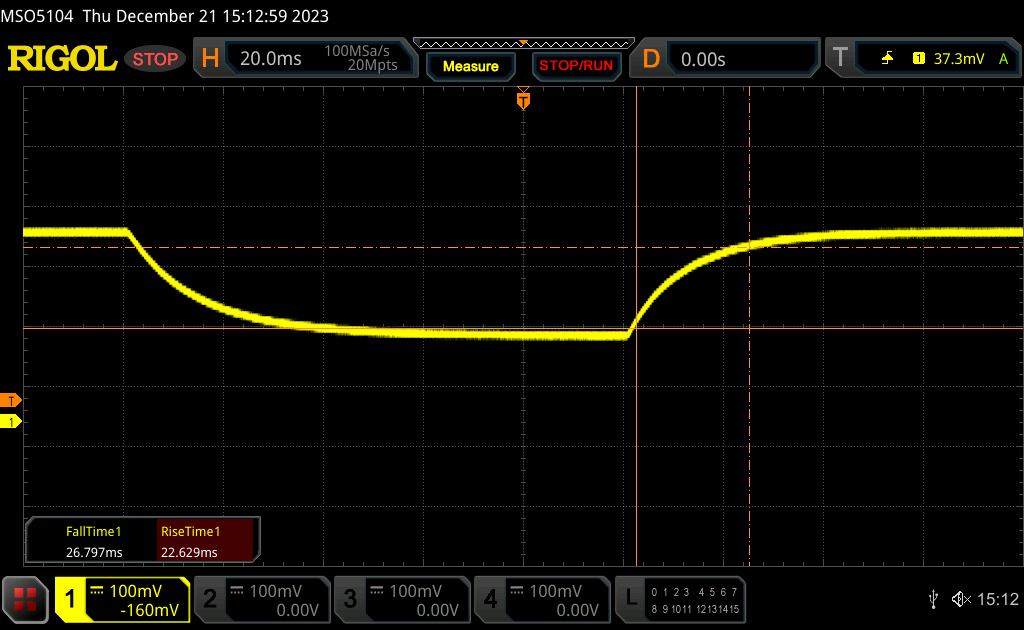 |
| ↘ 26.8 ms daling | ||
| Het scherm vertoonde trage responstijden in onze tests en is misschien te traag voor games. Ter vergelijking: alle testtoestellen variëren van 0.165 (minimum) tot 636 (maximum) ms. » 85 % van alle toestellen zijn beter. Dit betekent dat de gemeten responstijd slechter is dan het gemiddelde (30.9 ms) van alle geteste toestellen. | ||
Screen Flickering / PWM (Pulse-Width Modulation)
| Screen flickering / PWM niet waargenomen | 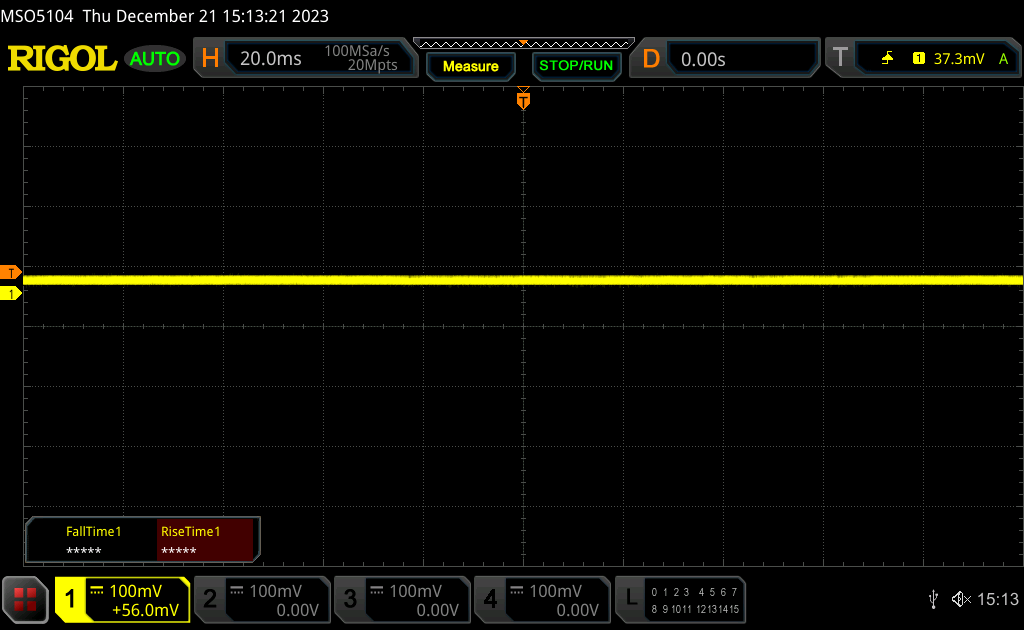 | ||
Ter vergelijking: 52 % van alle geteste toestellen maakten geen gebruik van PWM om de schermhelderheid te verlagen. Als het wel werd gebruikt, werd een gemiddelde van 7741 (minimum: 5 - maximum: 343500) Hz waargenomen. | |||
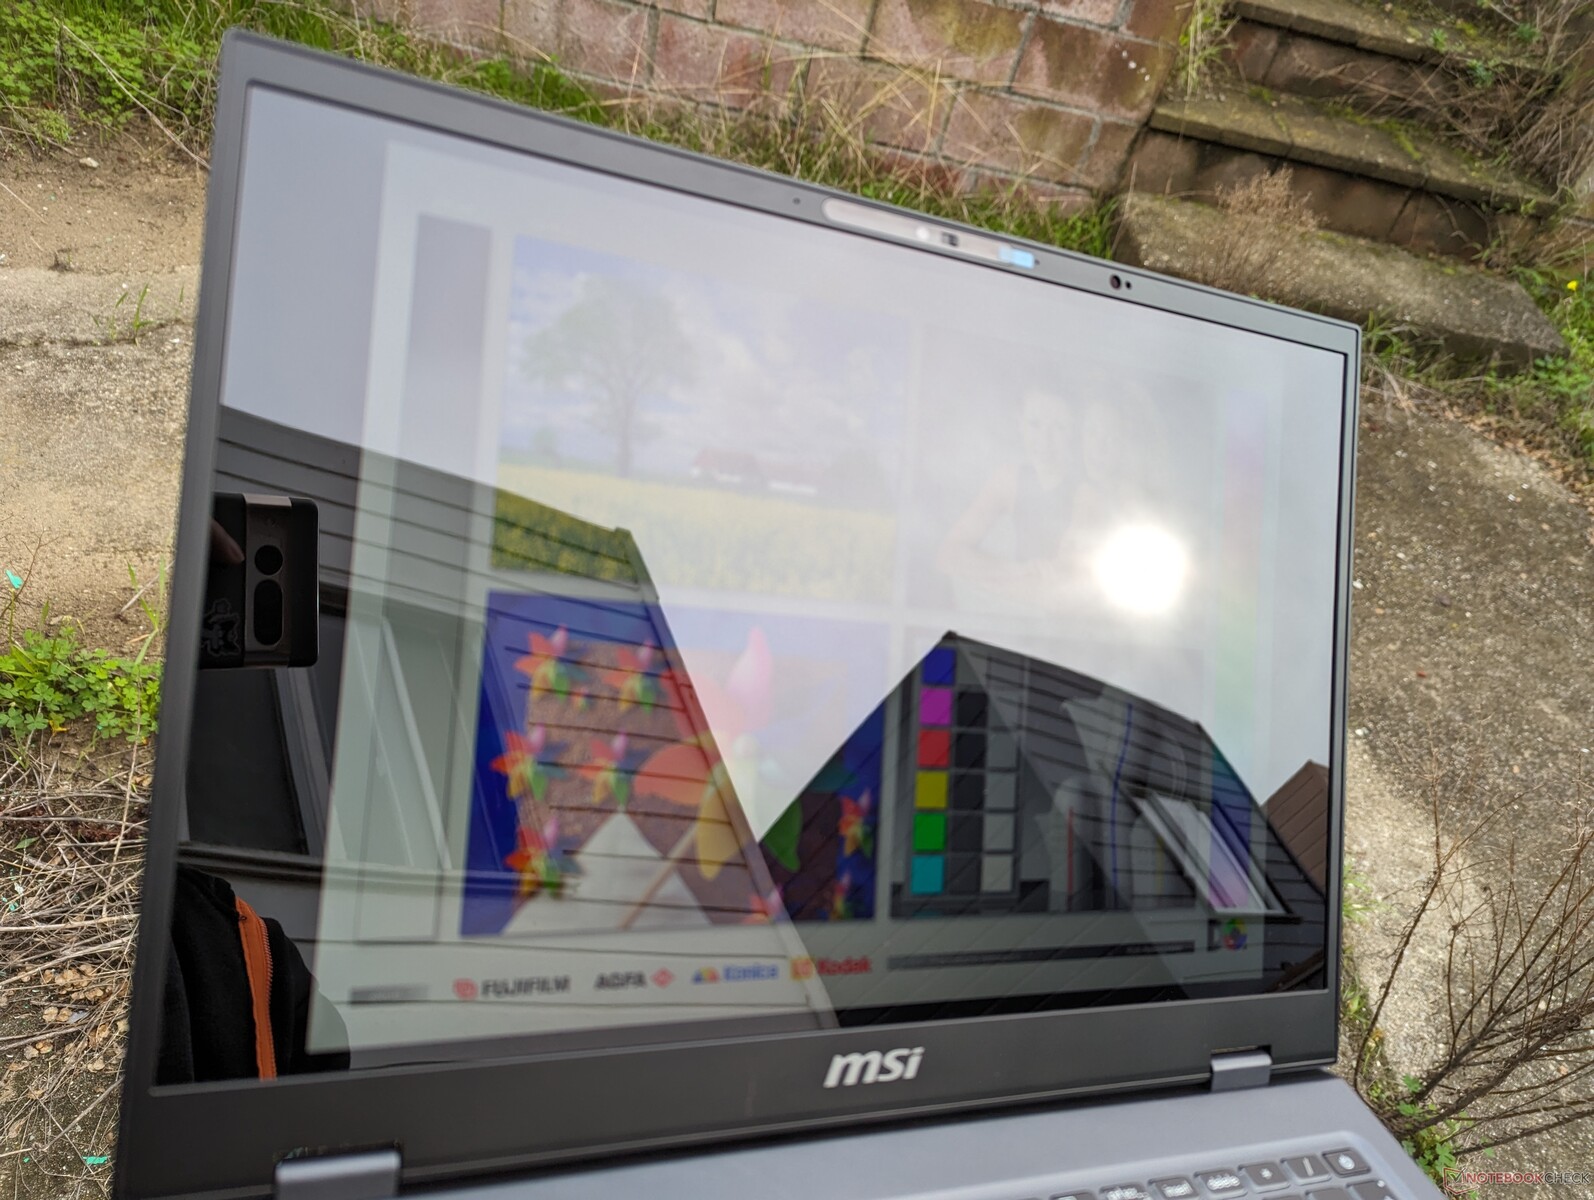
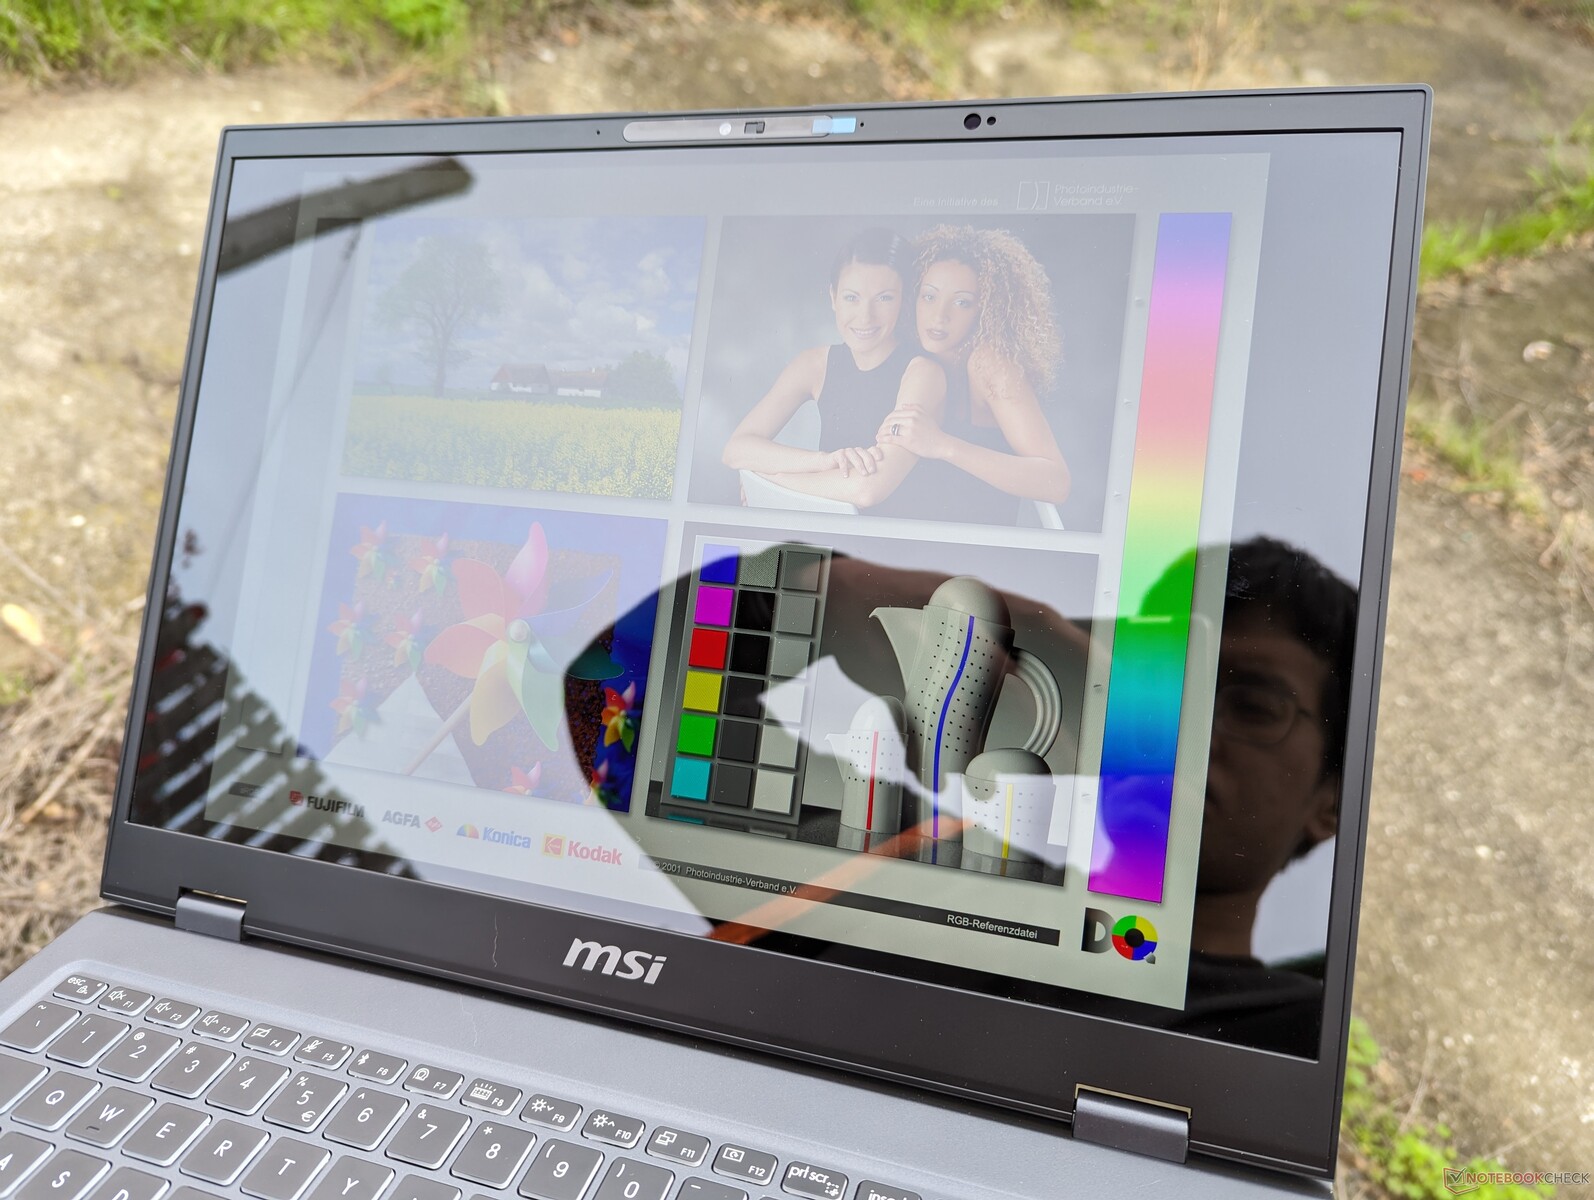
Het superglanzende scherm kan bijdragen aan een scherper beeld, maar het draagt ook bij aan overmatige schittering in de meeste gebruiksscenario's, vooral buitenshuis. Het Mini-LED scherm van de MacBook Pro 16 is ongeveer 30 procent helderder dan onze MSI voor een over het algemeen betere zichtbaarheid bij helder omgevingslicht.
Prestaties - Een razendsnelle opkomst
Testomstandigheden
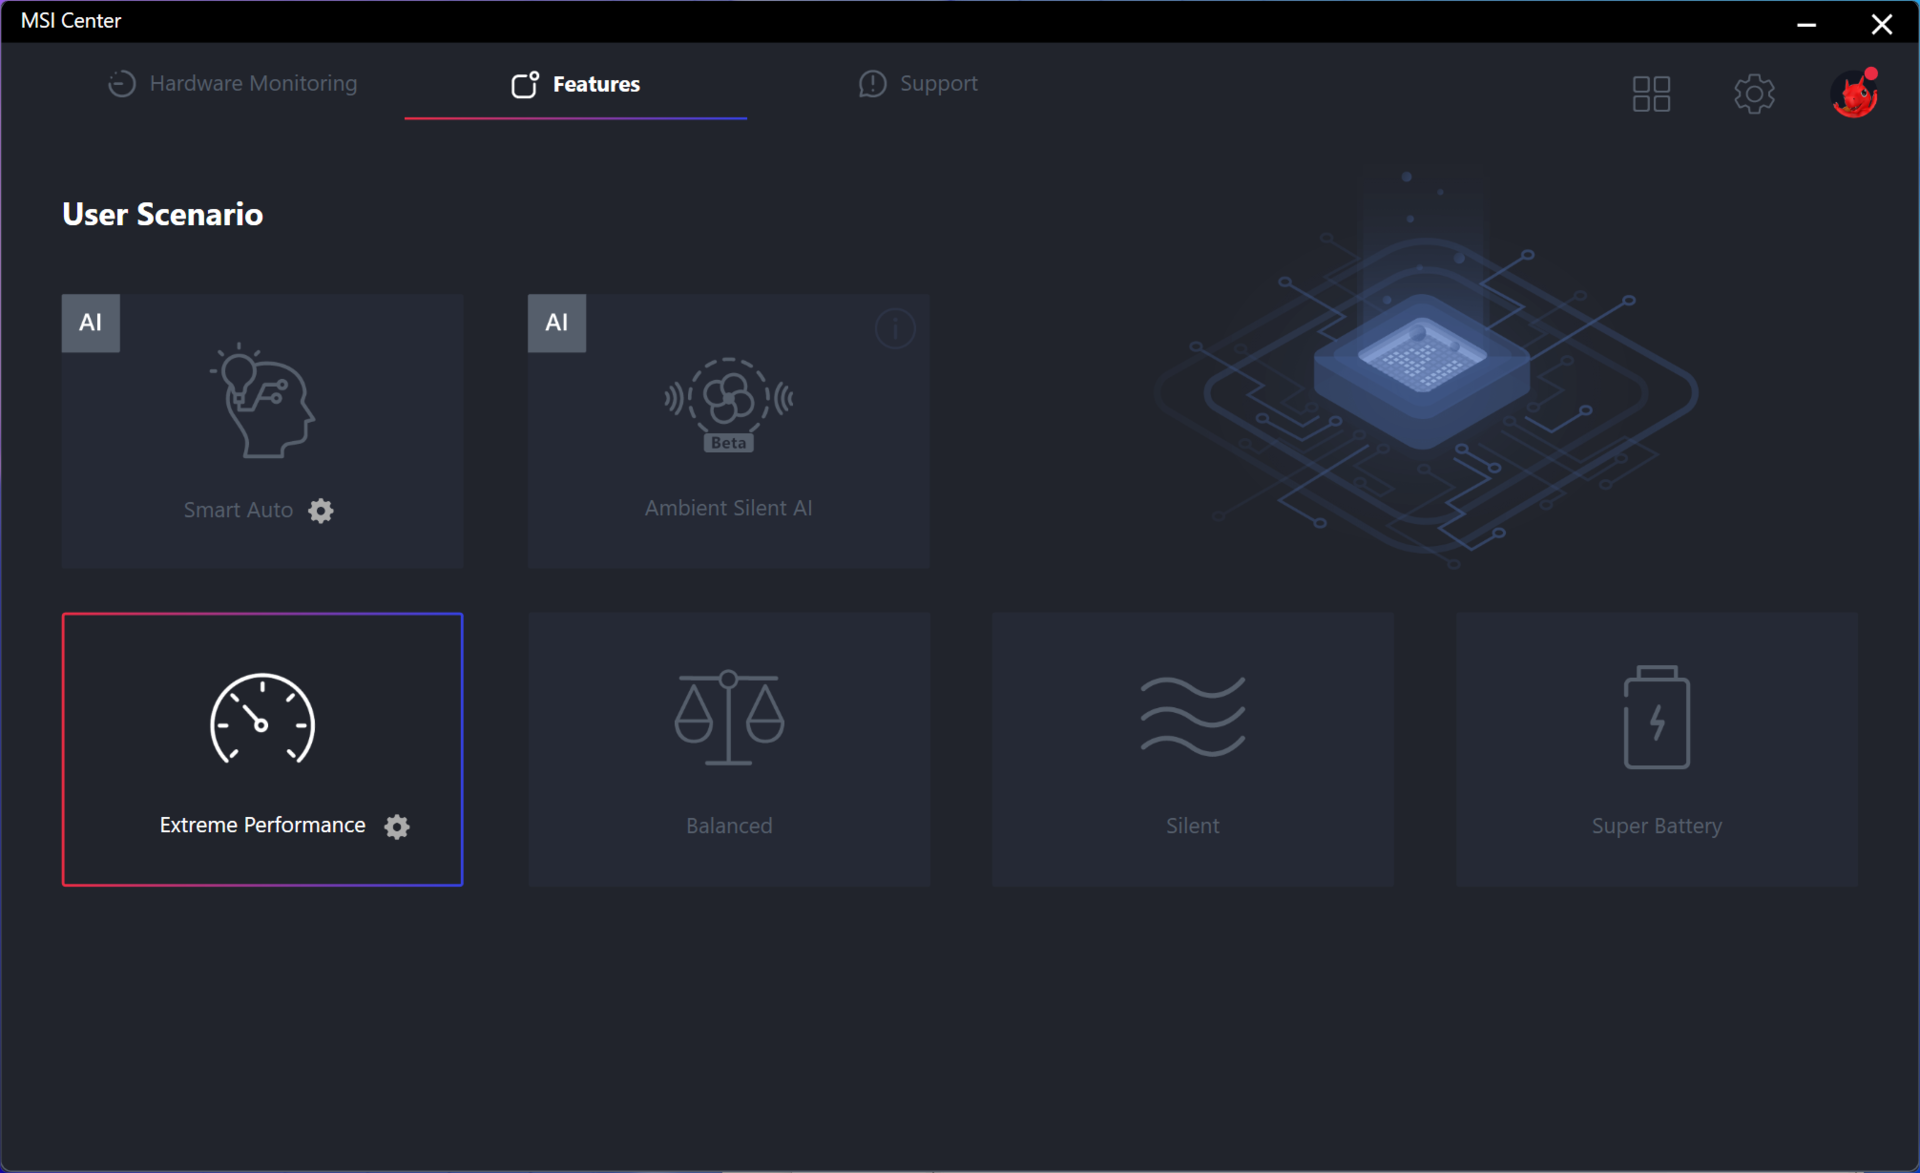
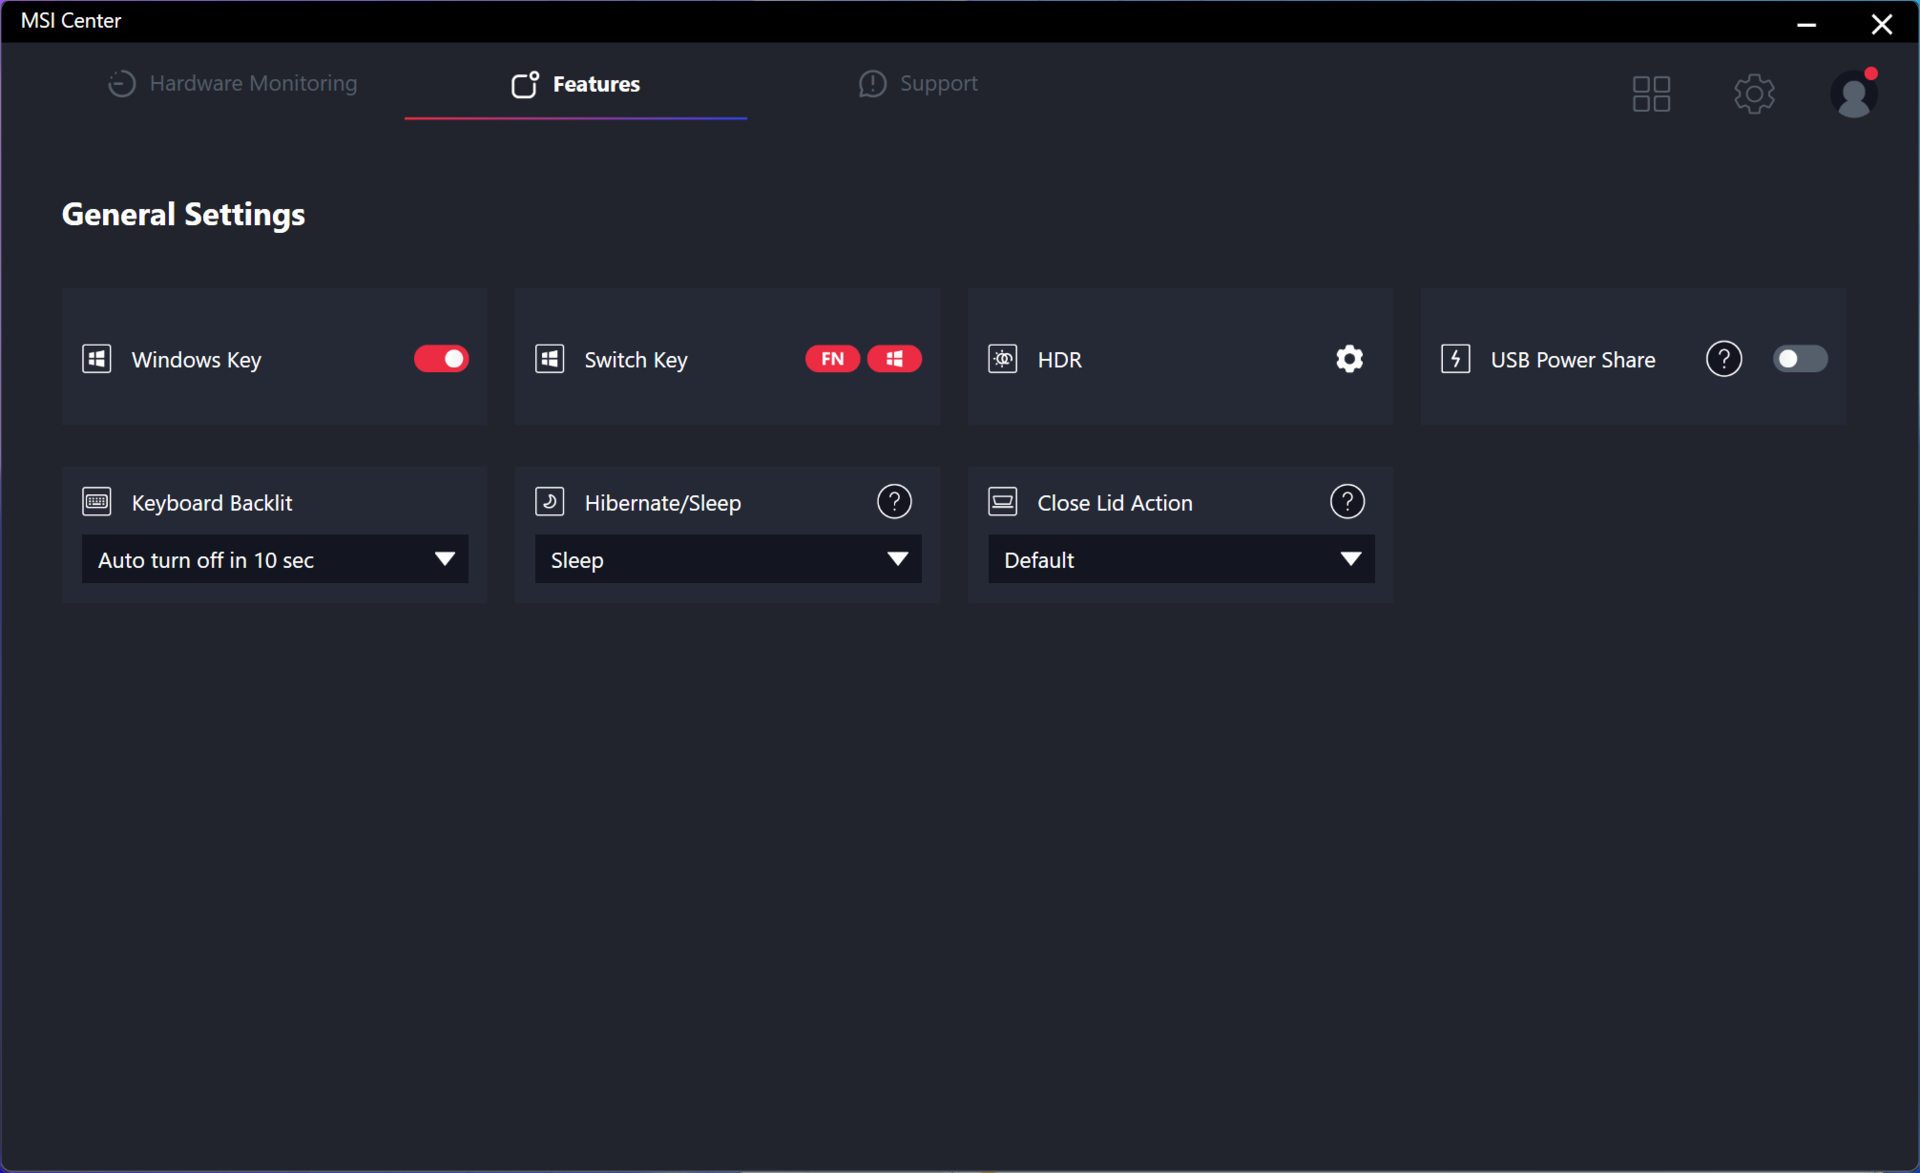
We hebben Windows ingesteld op de modus Prestaties en MSI Center op de modus Extreme prestaties voordat we de onderstaande benchmarks uitvoerden. Eigenaars moeten bekend raken met MSI Center, omdat dit de hub is voor MSI-specifieke updates en functies.
Processor
De CPU-prestaties zijn een enorme sprong voorwaarts ten opzichte van de vorige generatie Core U- en Core P-opties. Onze Core Ultra 7 155H heeft een comfortabele voorsprong van 20 tot 25 procent op de Core i7-1360P en AMD's snelste Zen 4 U-serie optie de Ryzen 7 7840U.
Gebruikers die merkbare verbeteringen ten opzichte van de 13e generatie Core H-opties verwachten, kunnen nog steeds teleurgesteld worden. De ruwe single- en multi-thread prestaties blijven bijvoorbeeld een beetje achter bij de Core i7-13700H. Het grootste verschil tussen de 13e en 14e generatie Core H heeft in plaats daarvan te maken met de verbeterde iGPU en AI-versnelling van de nieuwere opties.
Een duurdere Core Ultra 9 185H SKU is ook beschikbaar voor de Prestige 16, maar we verwachten niet dat deze veel sneller zal presteren dan onze Core Ultra 7 155H configuratie, aangezien beide CPU's exact hetzelfde aantal cores hebben met slechts kleine verschillen in kloksnelheid.
Cinebench R15 Multi Loop
Cinebench R23: Multi Core | Single Core
Cinebench R20: CPU (Multi Core) | CPU (Single Core)
Cinebench R15: CPU Multi 64Bit | CPU Single 64Bit
Blender: v2.79 BMW27 CPU
7-Zip 18.03: 7z b 4 | 7z b 4 -mmt1
Geekbench 5.5: Multi-Core | Single-Core
HWBOT x265 Benchmark v2.2: 4k Preset
LibreOffice : 20 Documents To PDF
R Benchmark 2.5: Overall mean
* ... kleiner is beter
AIDA64: FP32 Ray-Trace | FPU Julia | CPU SHA3 | CPU Queen | FPU SinJulia | FPU Mandel | CPU AES | CPU ZLib | FP64 Ray-Trace | CPU PhotoWorxx
| Performance rating | |
| MSI Prestige 16 B1MG-001US | |
| Asus VivoBook Pro 16 K6602VU | |
| Gemiddeld Intel Core Ultra 7 155H | |
| Dell Inspiron 16 Plus 7630 | |
| MSI Prestige 15 A12UD-093 | |
| LG Gram 2in1 16 16T90R - G.AA78G | |
| Lenovo ThinkBook 16 G6 ABP | |
| AIDA64 / FP32 Ray-Trace | |
| MSI Prestige 16 B1MG-001US | |
| Dell Inspiron 16 Plus 7630 | |
| Asus VivoBook Pro 16 K6602VU | |
| Gemiddeld Intel Core Ultra 7 155H (6670 - 18470, n=50) | |
| Lenovo ThinkBook 16 G6 ABP | |
| MSI Prestige 15 A12UD-093 | |
| LG Gram 2in1 16 16T90R - G.AA78G | |
| LG Gram 2in1 16 16T90R - G.AA78G | |
| AIDA64 / FPU Julia | |
| MSI Prestige 16 B1MG-001US | |
| Asus VivoBook Pro 16 K6602VU | |
| Gemiddeld Intel Core Ultra 7 155H (40905 - 93181, n=50) | |
| Lenovo ThinkBook 16 G6 ABP | |
| Dell Inspiron 16 Plus 7630 | |
| MSI Prestige 15 A12UD-093 | |
| LG Gram 2in1 16 16T90R - G.AA78G | |
| AIDA64 / CPU SHA3 | |
| MSI Prestige 16 B1MG-001US | |
| Asus VivoBook Pro 16 K6602VU | |
| Gemiddeld Intel Core Ultra 7 155H (1940 - 4436, n=50) | |
| Dell Inspiron 16 Plus 7630 | |
| MSI Prestige 15 A12UD-093 | |
| LG Gram 2in1 16 16T90R - G.AA78G | |
| Lenovo ThinkBook 16 G6 ABP | |
| AIDA64 / CPU Queen | |
| Dell Inspiron 16 Plus 7630 | |
| Asus VivoBook Pro 16 K6602VU | |
| MSI Prestige 16 B1MG-001US | |
| Gemiddeld Intel Core Ultra 7 155H (64698 - 94181, n=50) | |
| LG Gram 2in1 16 16T90R - G.AA78G | |
| MSI Prestige 15 A12UD-093 | |
| Lenovo ThinkBook 16 G6 ABP | |
| AIDA64 / FPU SinJulia | |
| MSI Prestige 16 B1MG-001US | |
| Lenovo ThinkBook 16 G6 ABP | |
| Gemiddeld Intel Core Ultra 7 155H (5639 - 10647, n=50) | |
| Dell Inspiron 16 Plus 7630 | |
| Asus VivoBook Pro 16 K6602VU | |
| MSI Prestige 15 A12UD-093 | |
| LG Gram 2in1 16 16T90R - G.AA78G | |
| AIDA64 / FPU Mandel | |
| MSI Prestige 16 B1MG-001US | |
| Lenovo ThinkBook 16 G6 ABP | |
| Gemiddeld Intel Core Ultra 7 155H (18236 - 47685, n=50) | |
| Asus VivoBook Pro 16 K6602VU | |
| Dell Inspiron 16 Plus 7630 | |
| MSI Prestige 15 A12UD-093 | |
| LG Gram 2in1 16 16T90R - G.AA78G | |
| AIDA64 / CPU AES | |
| Asus VivoBook Pro 16 K6602VU | |
| MSI Prestige 15 A12UD-093 | |
| LG Gram 2in1 16 16T90R - G.AA78G | |
| Gemiddeld Intel Core Ultra 7 155H (45713 - 152179, n=50) | |
| MSI Prestige 16 B1MG-001US | |
| Dell Inspiron 16 Plus 7630 | |
| Lenovo ThinkBook 16 G6 ABP | |
| AIDA64 / CPU ZLib | |
| MSI Prestige 16 B1MG-001US | |
| Asus VivoBook Pro 16 K6602VU | |
| Gemiddeld Intel Core Ultra 7 155H (557 - 1250, n=50) | |
| Dell Inspiron 16 Plus 7630 | |
| LG Gram 2in1 16 16T90R - G.AA78G | |
| MSI Prestige 15 A12UD-093 | |
| Lenovo ThinkBook 16 G6 ABP | |
| AIDA64 / FP64 Ray-Trace | |
| MSI Prestige 16 B1MG-001US | |
| Asus VivoBook Pro 16 K6602VU | |
| Dell Inspiron 16 Plus 7630 | |
| Gemiddeld Intel Core Ultra 7 155H (3569 - 9802, n=50) | |
| Lenovo ThinkBook 16 G6 ABP | |
| MSI Prestige 15 A12UD-093 | |
| LG Gram 2in1 16 16T90R - G.AA78G | |
| AIDA64 / CPU PhotoWorxx | |
| Gemiddeld Intel Core Ultra 7 155H (32719 - 54223, n=50) | |
| MSI Prestige 16 B1MG-001US | |
| MSI Prestige 15 A12UD-093 | |
| LG Gram 2in1 16 16T90R - G.AA78G | |
| Asus VivoBook Pro 16 K6602VU | |
| Dell Inspiron 16 Plus 7630 | |
| Lenovo ThinkBook 16 G6 ABP | |
Systeemprestaties
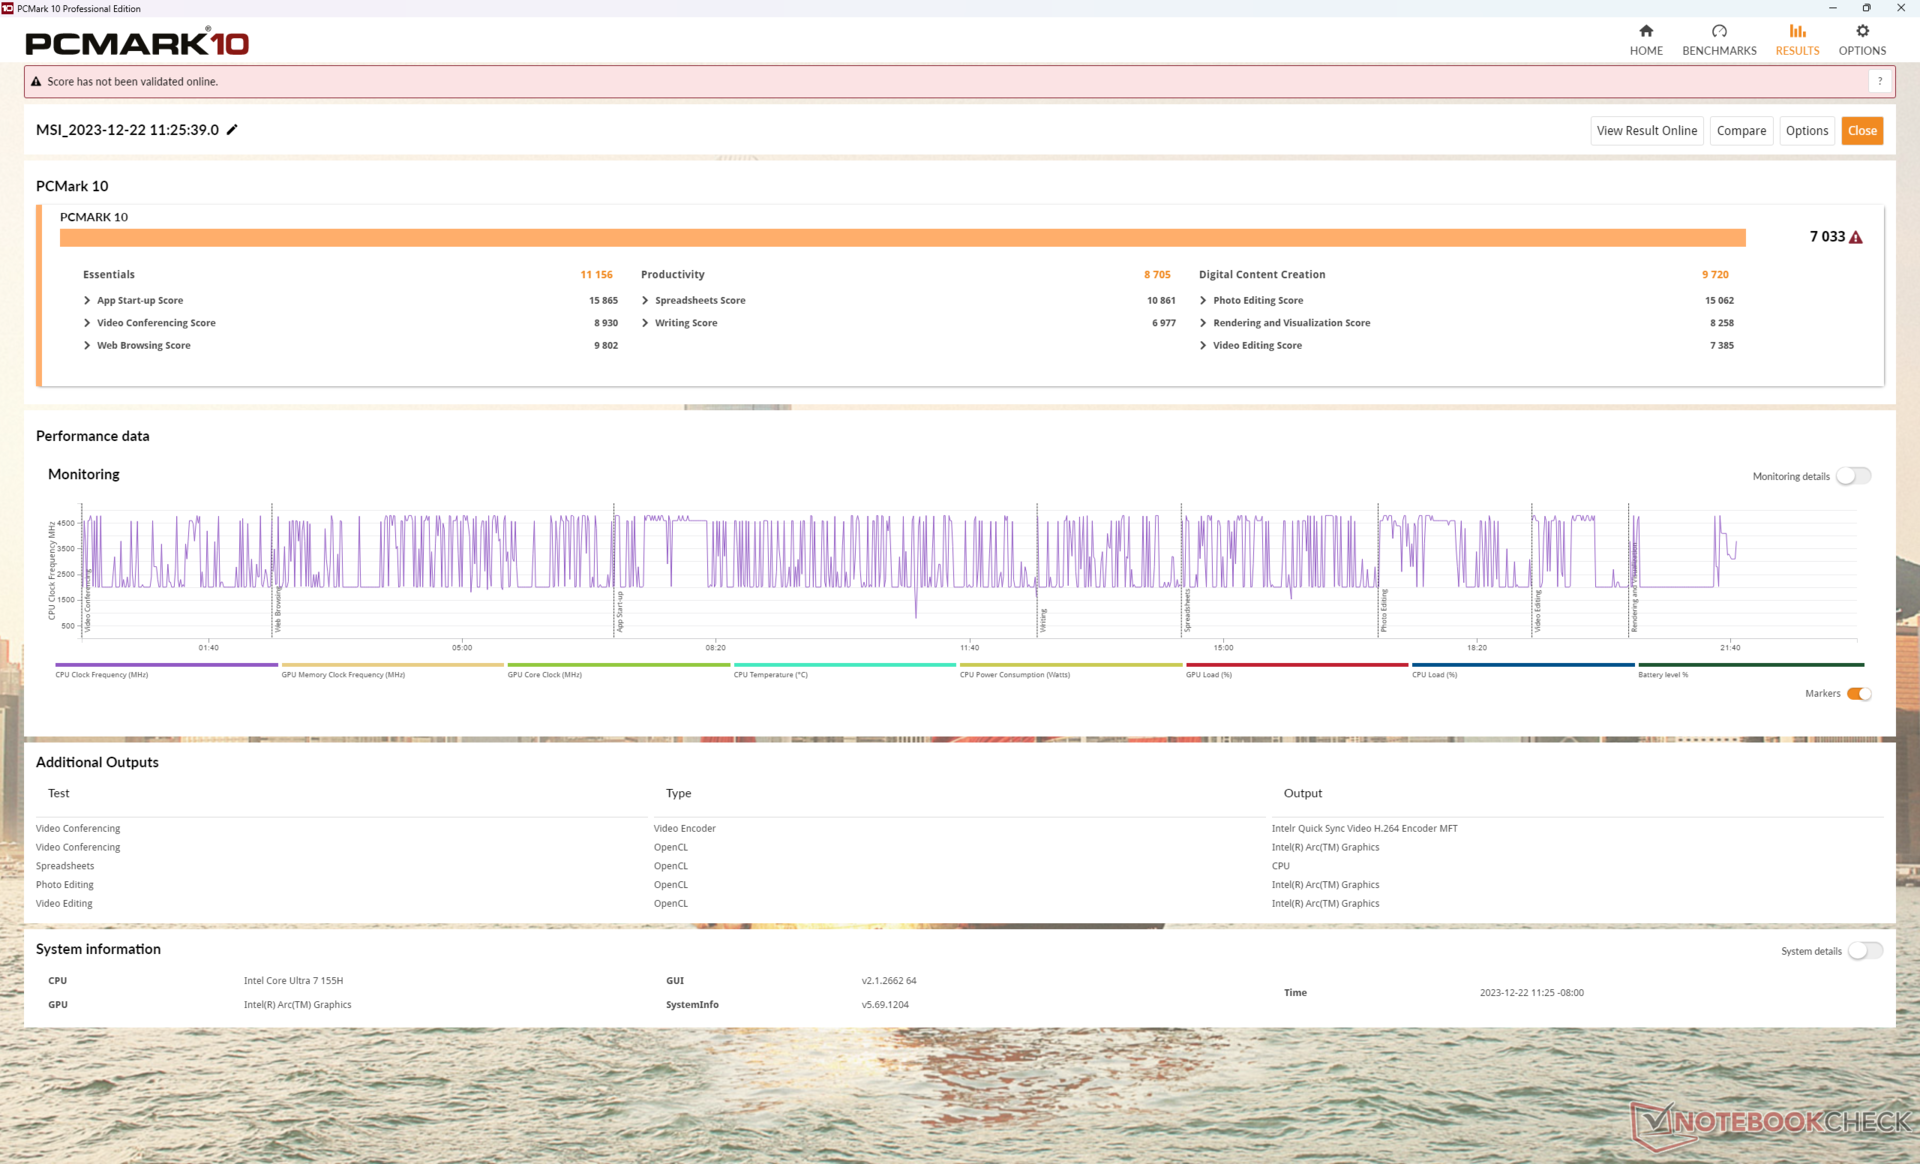
De resultaten van PCMark zijn vergelijkbaar met multimedia-laptops met discrete graphics uit het middensegment, zoals de Asus VivoBook Pro 16. De betekenis van de scores is echter twijfelachtig, omdat de cijfers moeilijk direct te vergelijken zijn tussen laptops met iGPU's en dGPU's.
Het snelle 6400 MHz systeem RAM is het vermelden waard, vooral omdat iGPU-prestaties nauw verbonden zijn met RAM-prestaties.
CrossMark: Overall | Productivity | Creativity | Responsiveness
WebXPRT 3: Overall
WebXPRT 4: Overall
Mozilla Kraken 1.1: Total
| PCMark 10 / Score | |
| Dell Inspiron 16 Plus 7630 | |
| Asus VivoBook Pro 16 K6602VU | |
| MSI Prestige 16 B1MG-001US | |
| Gemiddeld Intel Core Ultra 7 155H, Intel Arc 8-Core iGPU (4809 - 7529, n=34) | |
| MSI Prestige 15 A12UD-093 | |
| Lenovo ThinkBook 16 G6 ABP | |
| LG Gram 2in1 16 16T90R - G.AA78G | |
| PCMark 10 / Essentials | |
| LG Gram 2in1 16 16T90R - G.AA78G | |
| Dell Inspiron 16 Plus 7630 | |
| MSI Prestige 16 B1MG-001US | |
| Lenovo ThinkBook 16 G6 ABP | |
| Gemiddeld Intel Core Ultra 7 155H, Intel Arc 8-Core iGPU (7605 - 11289, n=34) | |
| Asus VivoBook Pro 16 K6602VU | |
| MSI Prestige 15 A12UD-093 | |
| PCMark 10 / Productivity | |
| Dell Inspiron 16 Plus 7630 | |
| Lenovo ThinkBook 16 G6 ABP | |
| MSI Prestige 15 A12UD-093 | |
| MSI Prestige 16 B1MG-001US | |
| Asus VivoBook Pro 16 K6602VU | |
| Gemiddeld Intel Core Ultra 7 155H, Intel Arc 8-Core iGPU (6042 - 10591, n=34) | |
| LG Gram 2in1 16 16T90R - G.AA78G | |
| PCMark 10 / Digital Content Creation | |
| Dell Inspiron 16 Plus 7630 | |
| Asus VivoBook Pro 16 K6602VU | |
| MSI Prestige 16 B1MG-001US | |
| Gemiddeld Intel Core Ultra 7 155H, Intel Arc 8-Core iGPU (4985 - 10709, n=34) | |
| MSI Prestige 15 A12UD-093 | |
| LG Gram 2in1 16 16T90R - G.AA78G | |
| Lenovo ThinkBook 16 G6 ABP | |
| CrossMark / Overall | |
| Dell Inspiron 16 Plus 7630 | |
| MSI Prestige 16 B1MG-001US | |
| Asus VivoBook Pro 16 K6602VU | |
| MSI Prestige 15 A12UD-093 | |
| Gemiddeld Intel Core Ultra 7 155H, Intel Arc 8-Core iGPU (1366 - 1903, n=34) | |
| LG Gram 2in1 16 16T90R - G.AA78G | |
| Lenovo ThinkBook 16 G6 ABP | |
| CrossMark / Productivity | |
| Dell Inspiron 16 Plus 7630 | |
| MSI Prestige 16 B1MG-001US | |
| Asus VivoBook Pro 16 K6602VU | |
| MSI Prestige 15 A12UD-093 | |
| Gemiddeld Intel Core Ultra 7 155H, Intel Arc 8-Core iGPU (1291 - 1798, n=33) | |
| LG Gram 2in1 16 16T90R - G.AA78G | |
| Lenovo ThinkBook 16 G6 ABP | |
| CrossMark / Creativity | |
| Dell Inspiron 16 Plus 7630 | |
| MSI Prestige 16 B1MG-001US | |
| Asus VivoBook Pro 16 K6602VU | |
| Gemiddeld Intel Core Ultra 7 155H, Intel Arc 8-Core iGPU (1519 - 1929, n=33) | |
| MSI Prestige 15 A12UD-093 | |
| LG Gram 2in1 16 16T90R - G.AA78G | |
| Lenovo ThinkBook 16 G6 ABP | |
| CrossMark / Responsiveness | |
| MSI Prestige 15 A12UD-093 | |
| Dell Inspiron 16 Plus 7630 | |
| MSI Prestige 16 B1MG-001US | |
| Asus VivoBook Pro 16 K6602VU | |
| LG Gram 2in1 16 16T90R - G.AA78G | |
| Gemiddeld Intel Core Ultra 7 155H, Intel Arc 8-Core iGPU (939 - 1802, n=33) | |
| Lenovo ThinkBook 16 G6 ABP | |
| WebXPRT 3 / Overall | |
| Dell Inspiron 16 Plus 7630 | |
| MSI Prestige 16 B1MG-001US | |
| Gemiddeld Intel Core Ultra 7 155H, Intel Arc 8-Core iGPU (252 - 299, n=34) | |
| Lenovo ThinkBook 16 G6 ABP | |
| LG Gram 2in1 16 16T90R - G.AA78G | |
| MSI Prestige 15 A12UD-093 | |
| WebXPRT 4 / Overall | |
| Dell Inspiron 16 Plus 7630 | |
| MSI Prestige 16 B1MG-001US | |
| Gemiddeld Intel Core Ultra 7 155H, Intel Arc 8-Core iGPU (166.4 - 309, n=29) | |
| Asus VivoBook Pro 16 K6602VU | |
| Lenovo ThinkBook 16 G6 ABP | |
| Mozilla Kraken 1.1 / Total | |
| MSI Prestige 15 A12UD-093 | |
| LG Gram 2in1 16 16T90R - G.AA78G | |
| Lenovo ThinkBook 16 G6 ABP | |
| Asus VivoBook Pro 16 K6602VU | |
| Gemiddeld Intel Core Ultra 7 155H, Intel Arc 8-Core iGPU (517 - 614, n=35) | |
| MSI Prestige 16 B1MG-001US | |
| Dell Inspiron 16 Plus 7630 | |
* ... kleiner is beter
| PCMark 10 Score | 7033 punten | |
Help | ||
| AIDA64 / Memory Copy | |
| Gemiddeld Intel Core Ultra 7 155H (62397 - 96791, n=50) | |
| MSI Prestige 16 B1MG-001US | |
| MSI Prestige 15 A12UD-093 | |
| LG Gram 2in1 16 16T90R - G.AA78G | |
| Dell Inspiron 16 Plus 7630 | |
| Asus VivoBook Pro 16 K6602VU | |
| Lenovo ThinkBook 16 G6 ABP | |
| AIDA64 / Memory Read | |
| Gemiddeld Intel Core Ultra 7 155H (60544 - 90647, n=50) | |
| MSI Prestige 16 B1MG-001US | |
| Dell Inspiron 16 Plus 7630 | |
| Asus VivoBook Pro 16 K6602VU | |
| MSI Prestige 15 A12UD-093 | |
| LG Gram 2in1 16 16T90R - G.AA78G | |
| Lenovo ThinkBook 16 G6 ABP | |
| AIDA64 / Memory Write | |
| LG Gram 2in1 16 16T90R - G.AA78G | |
| MSI Prestige 16 B1MG-001US | |
| Gemiddeld Intel Core Ultra 7 155H (58692 - 93451, n=50) | |
| MSI Prestige 15 A12UD-093 | |
| Asus VivoBook Pro 16 K6602VU | |
| Dell Inspiron 16 Plus 7630 | |
| Lenovo ThinkBook 16 G6 ABP | |
| AIDA64 / Memory Latency | |
| Gemiddeld Intel Core Ultra 7 155H (116.2 - 233, n=50) | |
| MSI Prestige 16 B1MG-001US | |
| LG Gram 2in1 16 16T90R - G.AA78G | |
| MSI Prestige 15 A12UD-093 | |
| Lenovo ThinkBook 16 G6 ABP | |
| Dell Inspiron 16 Plus 7630 | |
| Asus VivoBook Pro 16 K6602VU | |
* ... kleiner is beter
DPC latentie
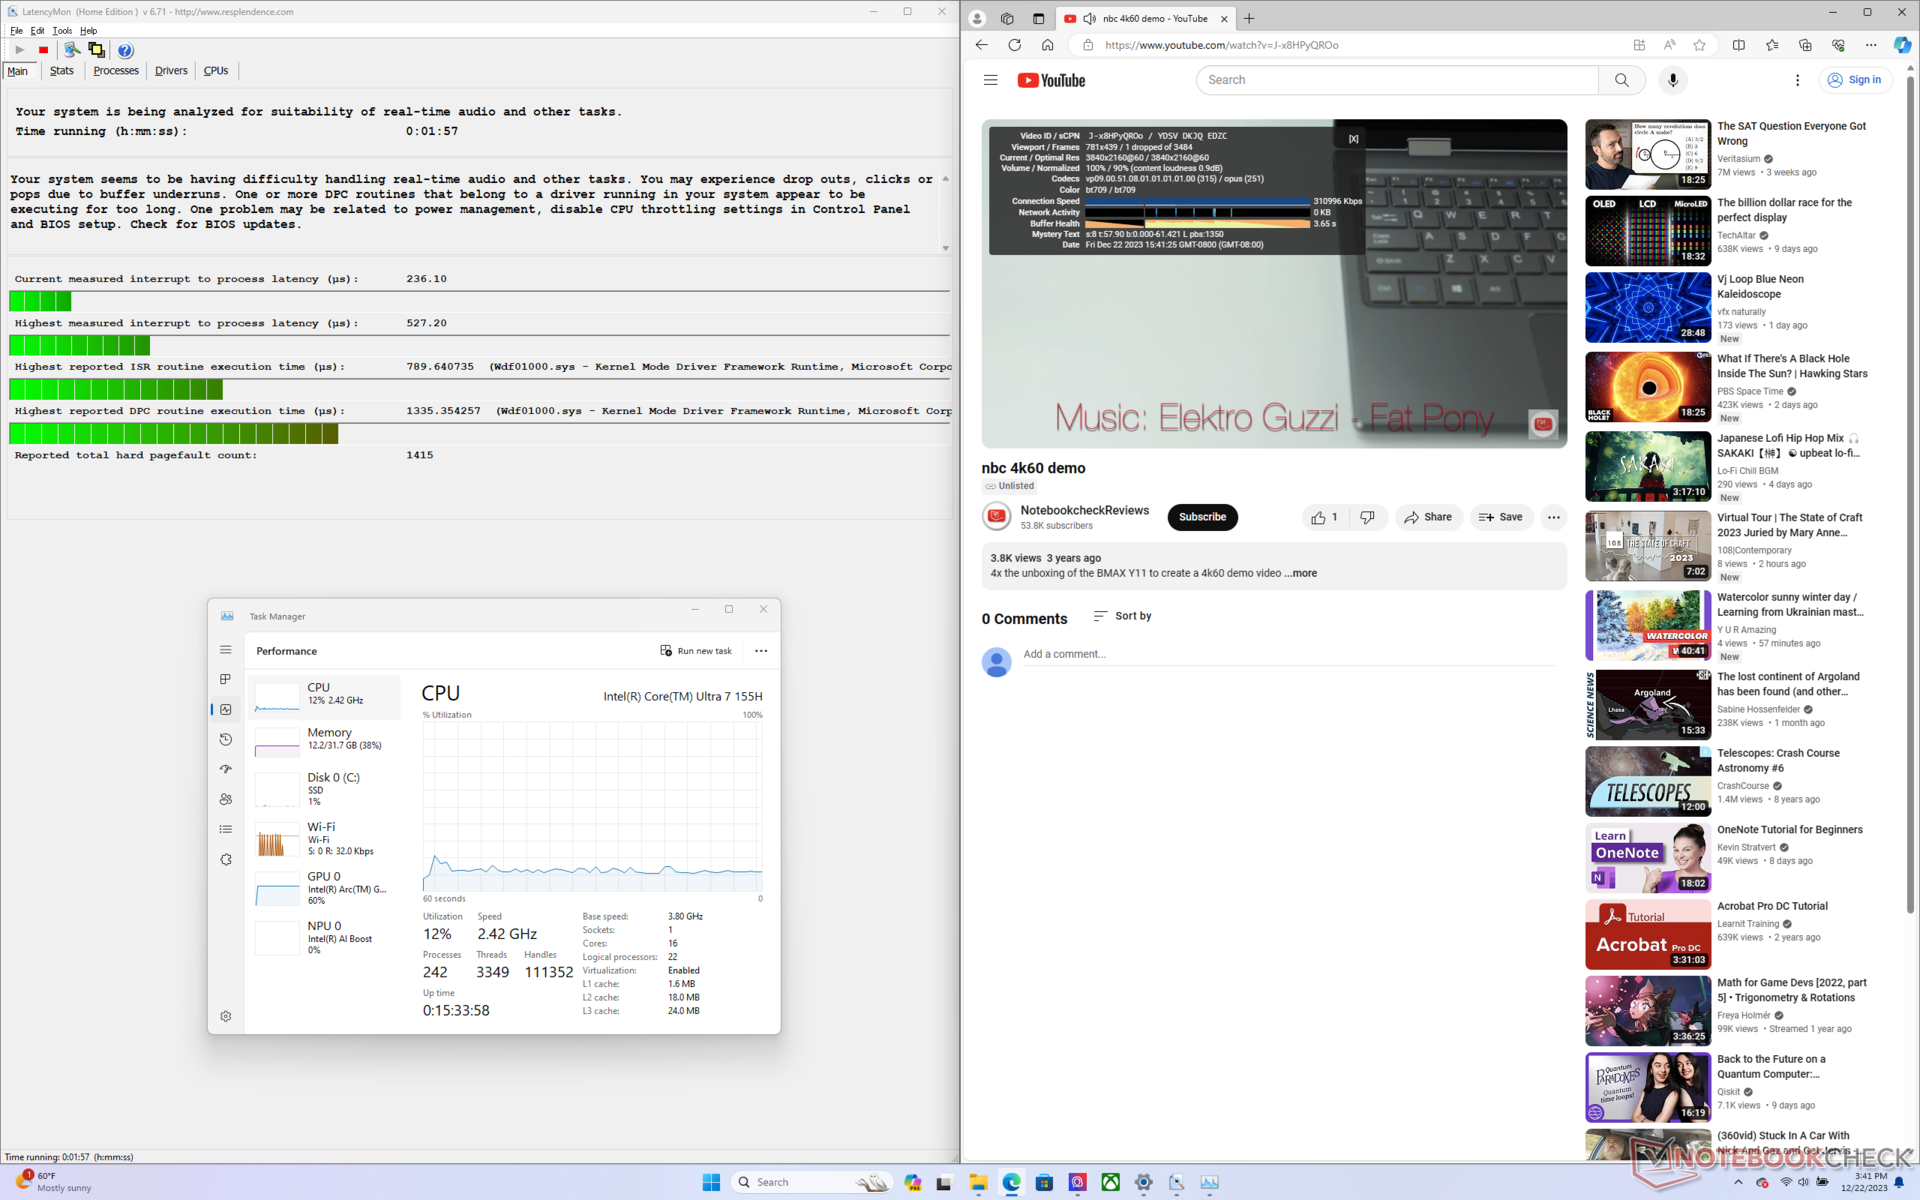
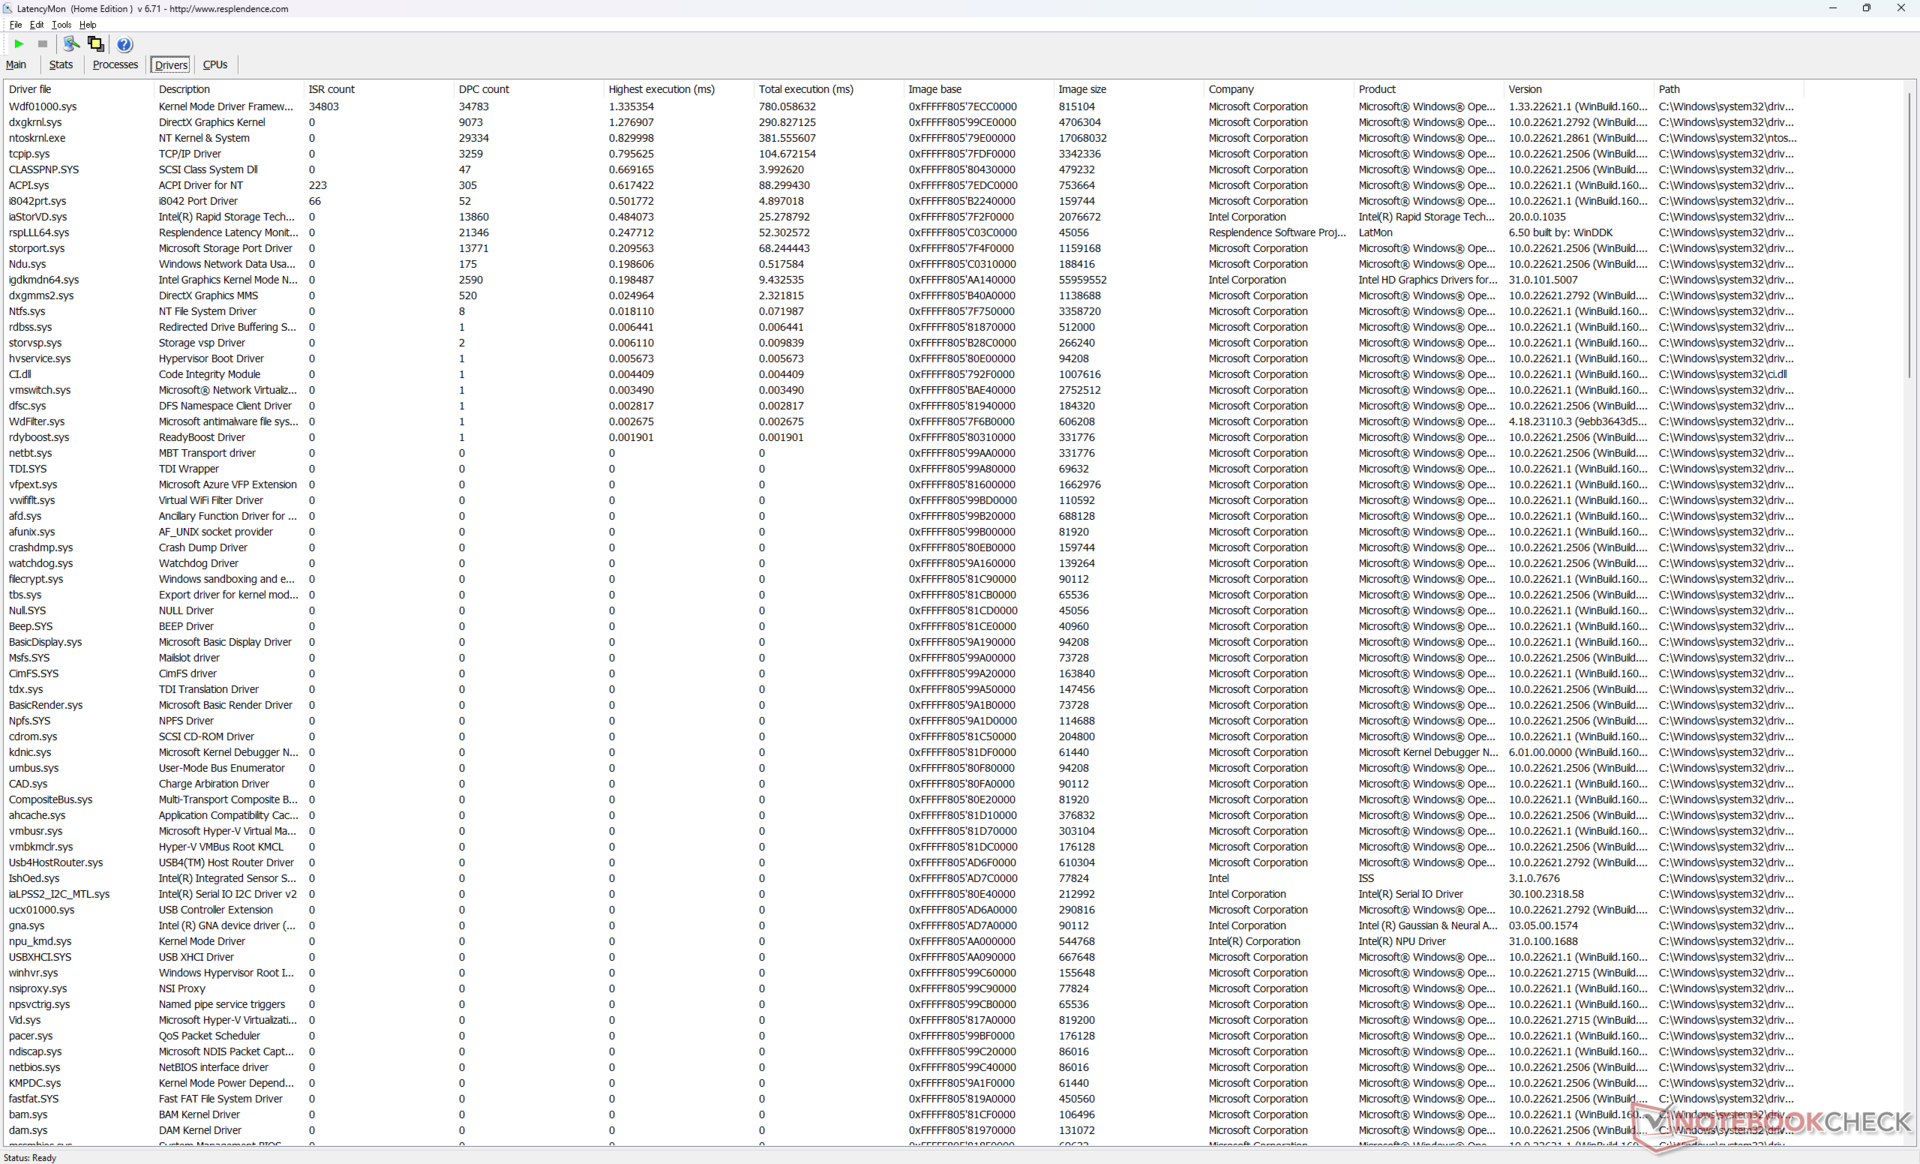
LatencyMon laat slechts kleine DPC-problemen zien bij het openen van meerdere browsertabbladen van onze startpagina. het afspelen van 4K-video's met 60 FPS is bijna perfect, met slechts één dropped frame tijdens een testvideo van 60 seconden.
| DPC Latencies / LatencyMon - interrupt to process latency (max), Web, Youtube, Prime95 | |
| LG Gram 2in1 16 16T90R - G.AA78G | |
| Asus VivoBook Pro 16 K6602VU | |
| MSI Prestige 15 A12UD-093 | |
| Lenovo ThinkBook 16 G6 ABP | |
| Dell Inspiron 16 Plus 7630 | |
| MSI Prestige 16 B1MG-001US | |
* ... kleiner is beter
Opslagapparaten
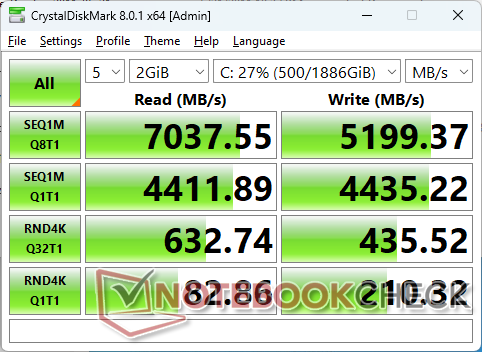
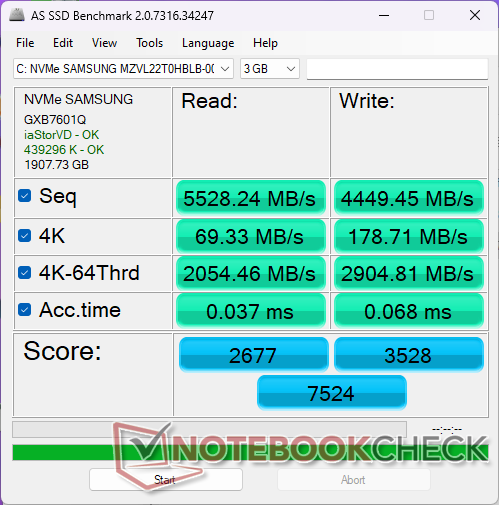
Ons apparaat is uitgerust met een 2 TB Samsung PM9A1 dit is een van de snelste consumenten PCIe4 x4 NVMe SSD's die verkrijgbaar zijn en een upgrade van de Micron 3400 op onze oudere Prestige 15. De schijf is in staat om snelheden van ~7100 MB/s te handhaven, zelfs als deze onder druk staat, wat indrukwekkend is gezien de dunne behuizing.

| Drive Performance rating - Percent | |
| MSI Prestige 16 B1MG-001US | |
| LG Gram 2in1 16 16T90R - G.AA78G | |
| MSI Prestige 15 A12UD-093 | |
| Dell Inspiron 16 Plus 7630 | |
| Lenovo ThinkBook 16 G6 ABP | |
| Asus VivoBook Pro 16 K6602VU | |
* ... kleiner is beter
Disk Throttling: DiskSpd Read Loop, Queue Depth 8
GPU-prestaties - De geïntegreerde grafische kroon heroveren
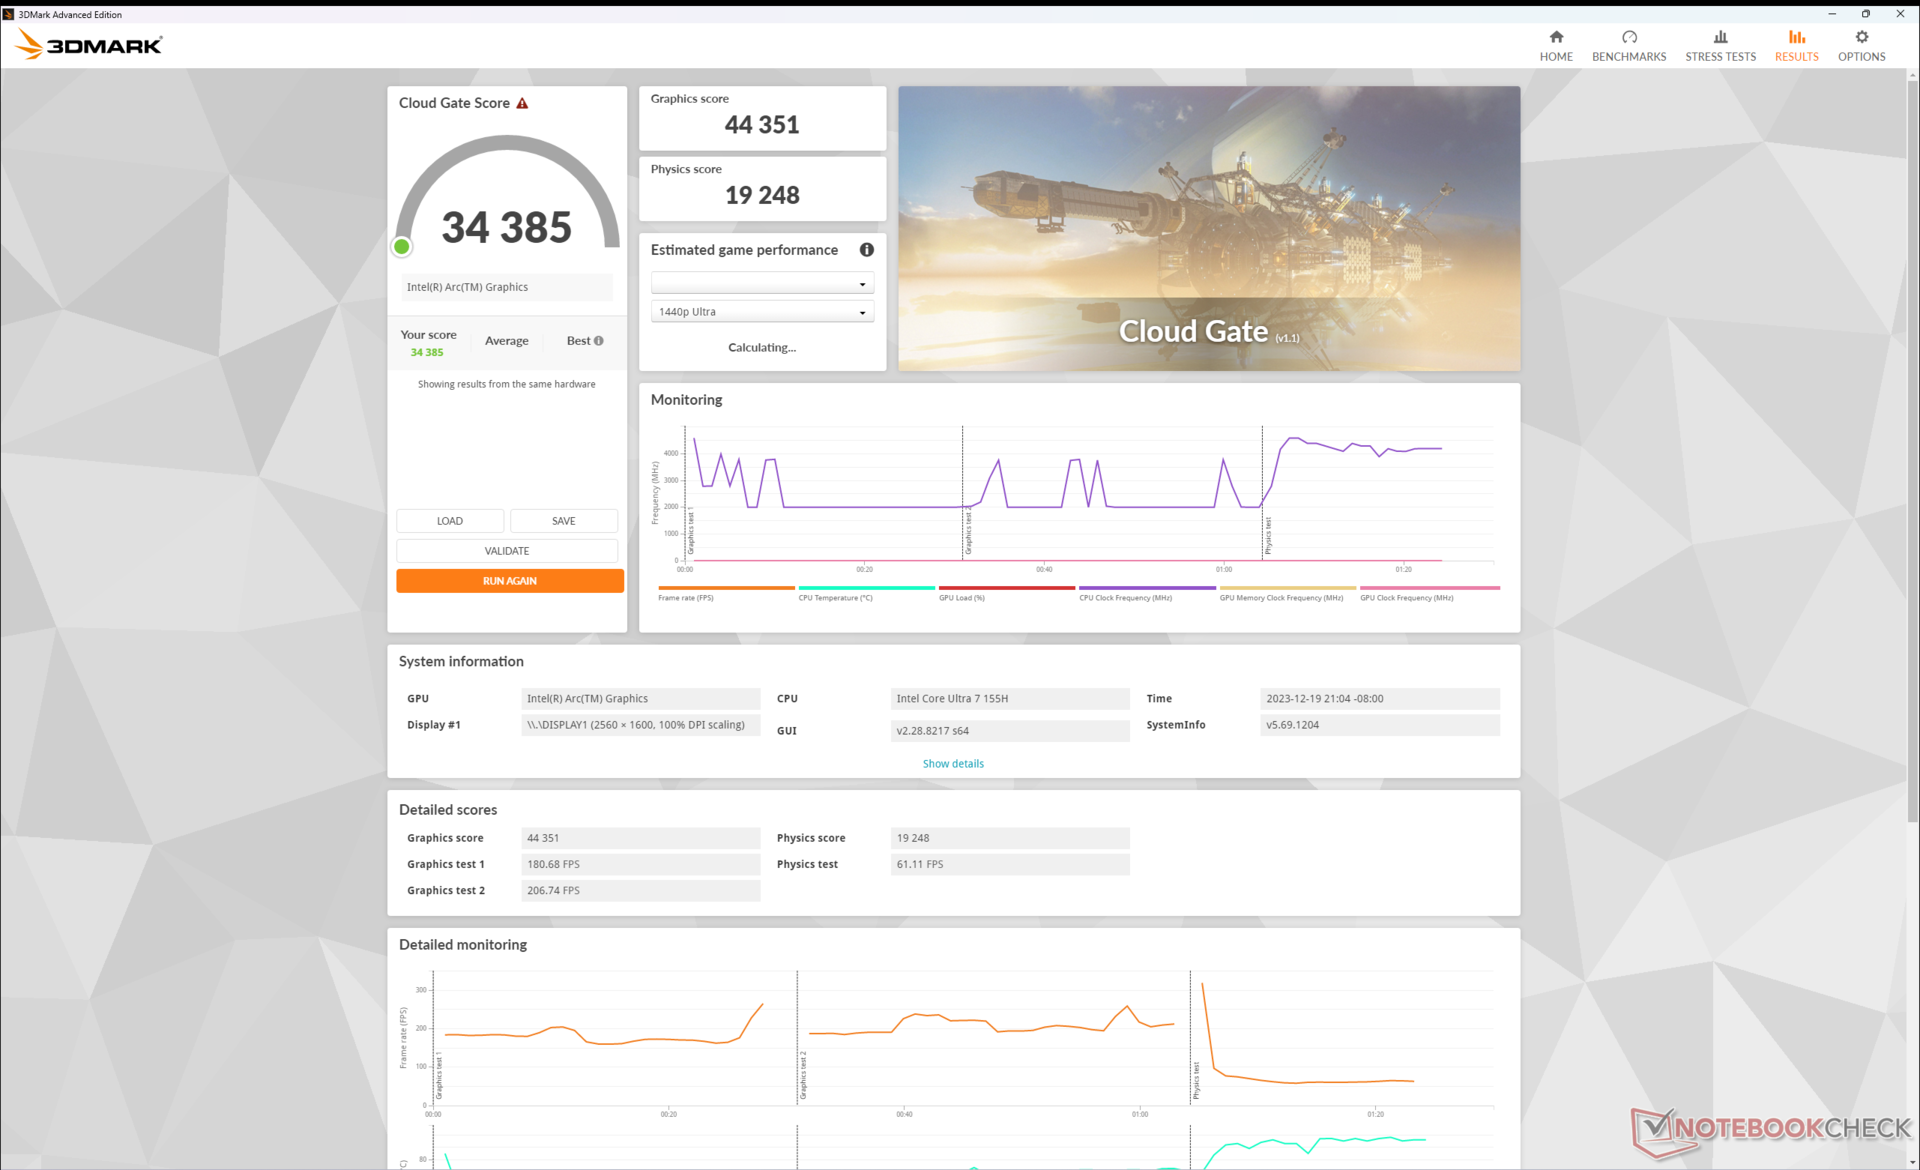
Na een stagnerende afgelopen paar jaar heeft Intel eindelijk zijn geïntegreerde GPU vernieuwd om beter te kunnen concurreren met de concurrerende Radeon 680M en 780M series. de 3DMark resultaten laten onze Arc 8 ongeveer 20 procent voor op de Radeon 780M of zelfs tot 50 procent op DX12 ondersteunde titels. Gebruikers die upgraden van de gewone Iris Xe 96 EU's kunnen een ruwe prestatieboost verwachten van ongeveer 1,5x tot 2x. Het is niet helemaal op het niveau van een GeForce RTX 3050 Ti, maar de scores komen zeker dichter in de buurt van een GeForce RTX 2050.
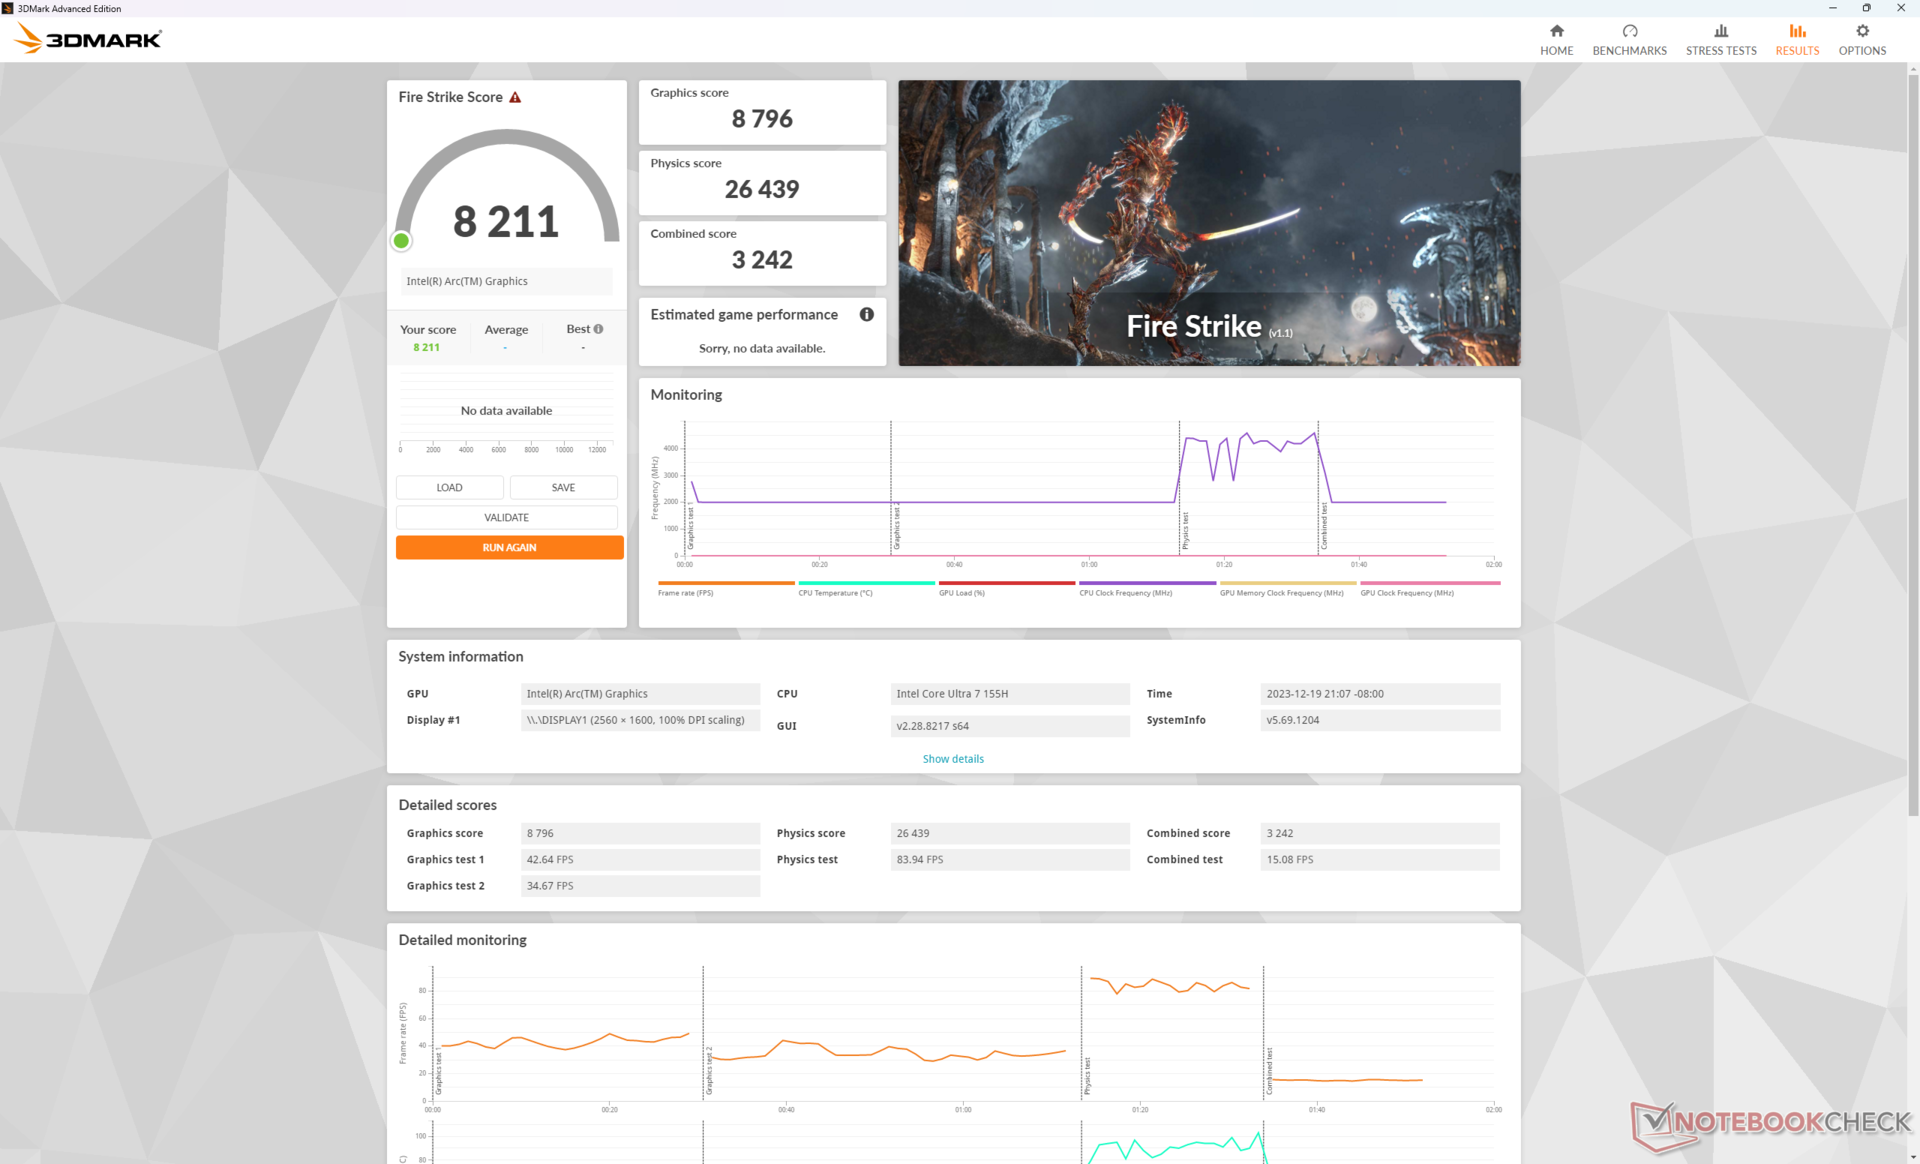
| Vermogen Profiel | Fysische Score | Grafische Score | Gecombineerde Score |
| Extreme prestaties (Cooler Boost aan) | 26439 | 8796 | 3242 |
| Extreme prestaties (koeler Boost uit) | 26460 (-0%) | 8614 (-2%) | 3187 (-2%) |
| Gebalanceerde modus | 25110 (-5%) | 8814 (-0%) | 3306 (-0%) |
| Batterijmodus | 21717 (-18%) | 7425 (-16%) | 2761 (-15%) |
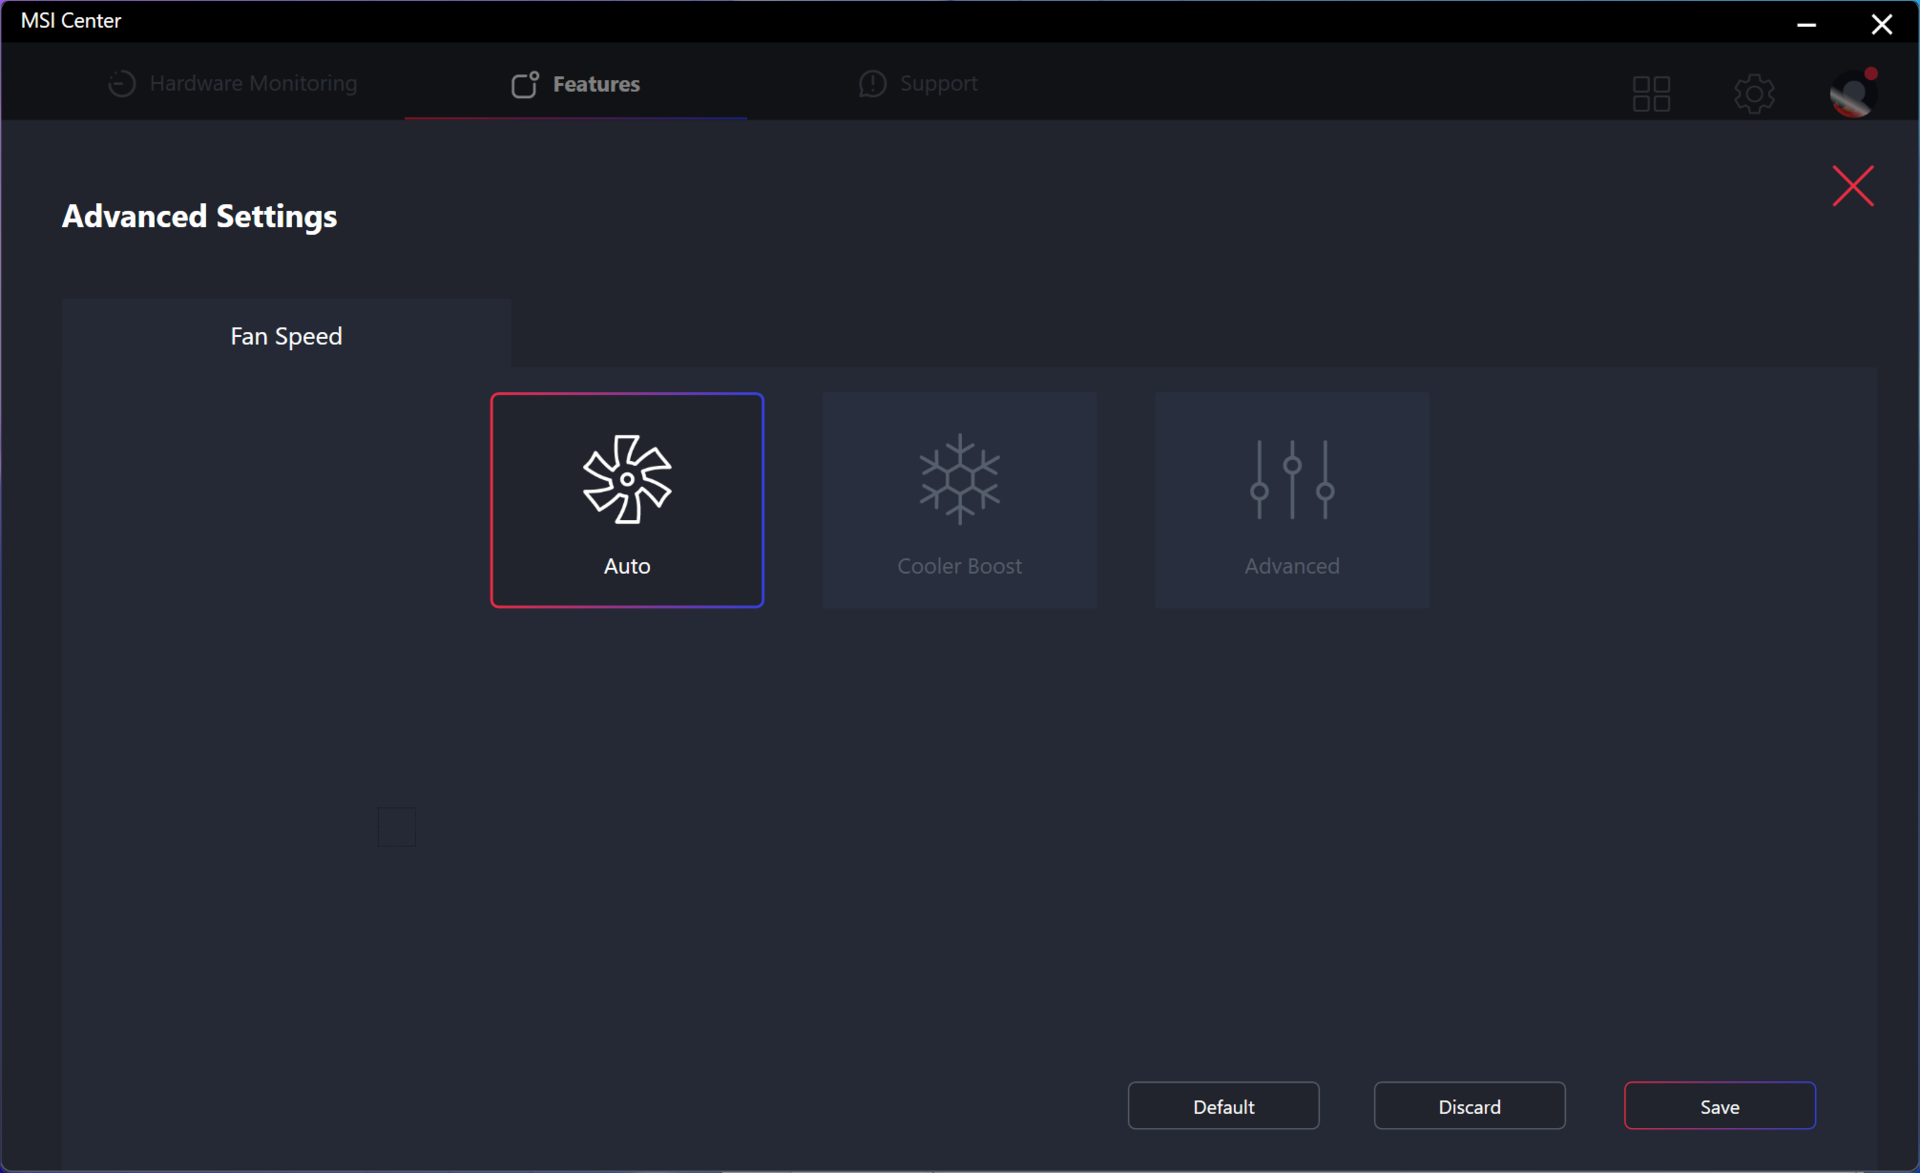
Het inschakelen van Cooler Boost lijkt de prestaties niet significant te beïnvloeden volgens onze bovenstaande tabel met Fire Strike resultaten. Het draaien in de Gebalanceerde modus zou de CPU-prestaties slechts licht beïnvloeden, terwijl de Batterij-modus de prestaties aanzienlijker zou verminderen met ongeveer 15 procent.
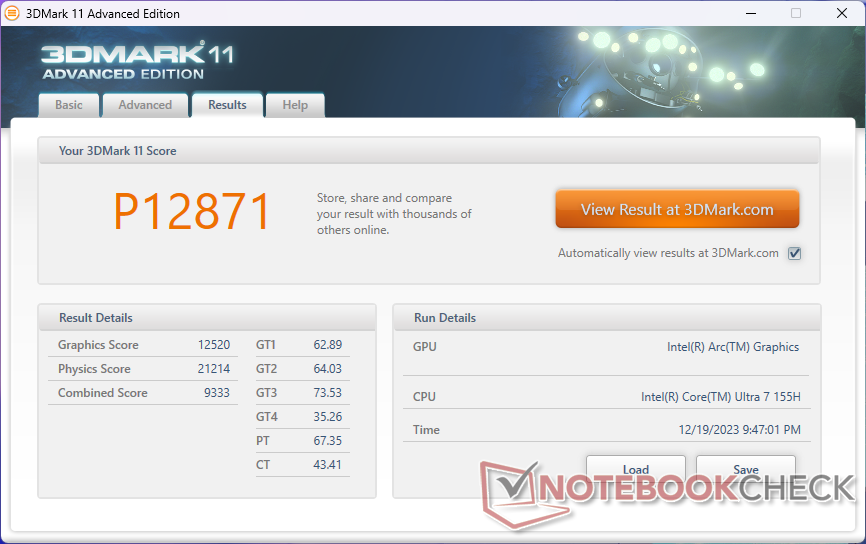
| 3DMark 11 Performance | 12871 punten | |
| 3DMark Cloud Gate Standard Score | 34385 punten | |
| 3DMark Fire Strike Score | 8211 punten | |
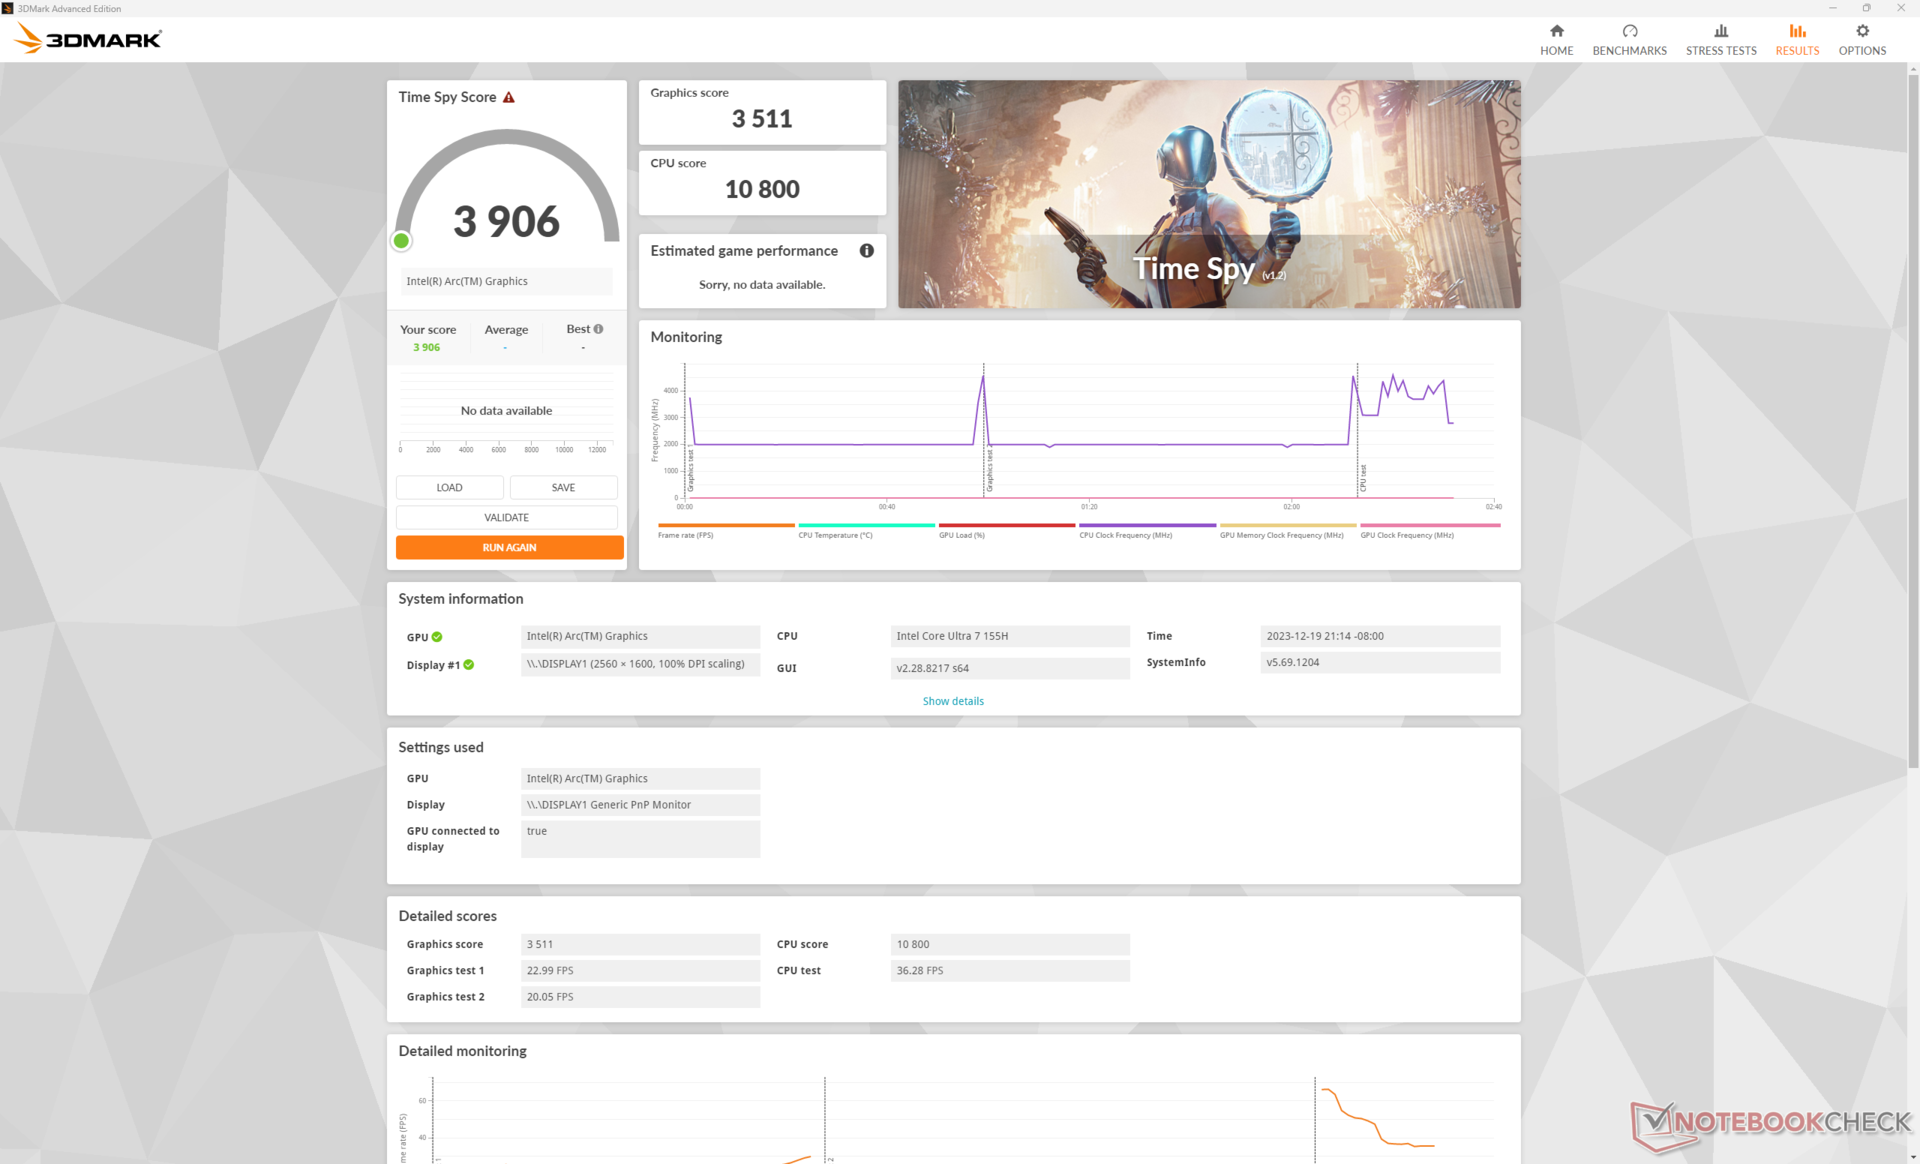
| 3DMark Time Spy Score | 3906 punten | |
Help | ||
* ... kleiner is beter
Gaming prestaties
Real-world prestaties bij het draaien van games zijn uitstekend met resultaten die wedijveren met de GeForce 3050 Ti in de Prestige 15 van vorig jaar, zoals blijkt uit de synthetische benchmarkresultaten hierboven. Far Cry 5 en F1 22 presteren bijvoorbeeld binnen slechts 5 tot 15 procent van de Prestige 15. Houd in gedachten dat de GeForce GPU in de Prestige 15 opmerkelijke throttling-problemen vertoonde die de prestaties sterk beïnvloedden; de overgrote meerderheid van andere GeForce RTX 3050 Ti laptops, zoals de Asus Vivobook Pro 16Xzou games nog steeds aanzienlijk sneller uitvoeren dan onze geïntegreerde Arc 8.
De algehele prestaties zijn niettemin consistent beter dan die van de Radeon 780M in alle geteste games, met ongeveer 5 tot 20 procent. Een paar DX12 games, zoals Tiny Tina's Wonderlands en F1 22, zouden zelfs 50 tot 60 procent beter draaien op de nieuwe Intel GPU.
| The Witcher 3 - 1920x1080 Ultra Graphics & Postprocessing (HBAO+) | |
| Dell Inspiron 16 Plus 7630 | |
| Asus VivoBook Pro 16 K6602VU | |
| MSI Prestige 16 B1MG-001US | |
| MSI Prestige 15 A12UD-093 | |
| LG Gram 2in1 16 16T90R - G.AA78G | |
| Lenovo ThinkBook 16 G6 ABP | |
| GTA V - 1920x1080 Highest AA:4xMSAA + FX AF:16x | |
| Asus VivoBook Pro 16 K6602VU | |
| MSI Prestige 15 A12UD-093 | |
| Lenovo ThinkBook 16 G6 ABP | |
| LG Gram 2in1 16 16T90R - G.AA78G | |
| Final Fantasy XV Benchmark - 1920x1080 High Quality | |
| Dell Inspiron 16 Plus 7630 | |
| Asus VivoBook Pro 16 K6602VU | |
| MSI Prestige 16 B1MG-001US | |
| MSI Prestige 15 A12UD-093 | |
| LG Gram 2in1 16 16T90R - G.AA78G | |
| Lenovo ThinkBook 16 G6 ABP | |
| Strange Brigade - 1920x1080 ultra AA:ultra AF:16 | |
| Dell Inspiron 16 Plus 7630 | |
| Asus VivoBook Pro 16 K6602VU | |
| MSI Prestige 16 B1MG-001US | |
| MSI Prestige 15 A12UD-093 | |
| LG Gram 2in1 16 16T90R - G.AA78G | |
| Lenovo ThinkBook 16 G6 ABP | |
| Dota 2 Reborn - 1920x1080 ultra (3/3) best looking | |
| Dell Inspiron 16 Plus 7630 | |
| Asus VivoBook Pro 16 K6602VU | |
| MSI Prestige 16 B1MG-001US | |
| MSI Prestige 15 A12UD-093 | |
| LG Gram 2in1 16 16T90R - G.AA78G | |
| Lenovo ThinkBook 16 G6 ABP | |
| X-Plane 11.11 - 1920x1080 high (fps_test=3) | |
| Dell Inspiron 16 Plus 7630 | |
| Asus VivoBook Pro 16 K6602VU | |
| MSI Prestige 15 A12UD-093 | |
| LG Gram 2in1 16 16T90R - G.AA78G | |
| MSI Prestige 16 B1MG-001US | |
| Lenovo ThinkBook 16 G6 ABP | |
| Baldur's Gate 3 | |
| 1280x720 Low Preset AA:SM | |
| MSI Prestige 16 B1MG-001US | |
| Gemiddeld Intel Arc 8-Core iGPU (31.8 - 57.6, n=15) | |
| 1920x1080 Low Preset AA:SM | |
| MSI Prestige 16 B1MG-001US | |
| Gemiddeld Intel Arc 8-Core iGPU (21 - 40.3, n=27) | |
| 1920x1080 Medium Preset AA:T | |
| MSI Prestige 16 B1MG-001US | |
| Gemiddeld Intel Arc 8-Core iGPU (16.3 - 31.1, n=28) | |
| 1920x1080 High Preset AA:T | |
| MSI Prestige 16 B1MG-001US | |
| Gemiddeld Intel Arc 8-Core iGPU (15.4 - 27.7, n=27) | |
| 1920x1080 Ultra Preset AA:T | |
| MSI Prestige 16 B1MG-001US | |
| Gemiddeld Intel Arc 8-Core iGPU (14.2 - 26.2, n=26) | |
| Cyberpunk 2077 | |
| 1280x720 Low Preset (FSR off) | |
| MSI Prestige 16 B1MG-001US | |
| Gemiddeld Intel Arc 8-Core iGPU (34.5 - 58, n=20) | |
| LG Gram 2in1 16 16T90R - G.AA78G | |
| 1920x1080 Low Preset (FSR off) | |
| MSI Prestige 16 B1MG-001US | |
| Gemiddeld Intel Arc 8-Core iGPU (11.3 - 38, n=38) | |
| LG Gram 2in1 16 16T90R - G.AA78G | |
| 1920x1080 Medium Preset (FSR off) | |
| MSI Prestige 16 B1MG-001US | |
| Gemiddeld Intel Arc 8-Core iGPU (9.42 - 31.4, n=36) | |
| LG Gram 2in1 16 16T90R - G.AA78G | |
| 1920x1080 High Preset (FSR off) | |
| MSI Prestige 16 B1MG-001US | |
| Gemiddeld Intel Arc 8-Core iGPU (7.3 - 27.6, n=36) | |
| LG Gram 2in1 16 16T90R - G.AA78G | |
| 1920x1080 Ultra Preset (FSR off) | |
| MSI Prestige 16 B1MG-001US | |
| Gemiddeld Intel Arc 8-Core iGPU (13 - 24.7, n=28) | |
| LG Gram 2in1 16 16T90R - G.AA78G | |
Witcher 3 FPS Chart
| lage | gem. | hoge | ultra | |
|---|---|---|---|---|
| The Witcher 3 (2015) | 135.6 | 88.2 | 54.1 | 25.2 |
| Dota 2 Reborn (2015) | 101.7 | 92.8 | 79.1 | 75.6 |
| Final Fantasy XV Benchmark (2018) | 61 | 37.3 | 24.6 | |
| X-Plane 11.11 (2018) | 52.2 | 46.7 | 37.8 | |
| Far Cry 5 (2018) | 63 | 39 | 36 | 34 |
| Strange Brigade (2018) | 179.5 | 71 | 57.8 | 46.1 |
| Tiny Tina's Wonderlands (2022) | 53.3 | 41.2 | 30.1 | 25.1 |
| F1 22 (2022) | 77.7 | 71.6 | 53.3 | 15.3 |
| Baldur's Gate 3 (2023) | 31.9 | 28.2 | 24.1 | 23.4 |
| Cyberpunk 2077 (2023) | 35.7 | 29.5 | 25.2 | 22.1 |
Uitstoot - Luid voor een laptop met geïntegreerde grafische afbeeldingen
Systeemgeluid
Het geluid van de ventilator is stiller dan dat van de Prestige 15 bij lagere belastingen, terwijl het tegenovergestelde waar is bij hogere belastingen. Bij browsen of video streamen bijvoorbeeld, varieert het geluid van de ventilator tussen 26 en 37 dB(A) vergeleken met 31 tot 42 dB(A) op het oudere model. Bij veeleisende belastingen zoals Witcher 3 zou het ventilatorgeluid toenemen tot 46 dB(A) of zelfs tot 53 dB(A) als Cooler Boost actief is. De gemiddelde waarde van 40 dB(A) is nogal luid voor een laptop die alleen op geïntegreerde graphics draait.
We verwachten dat het ventilatorgeluid op SKU's met discrete graphics zich anders zal gedragen dan wat we op onze iGPU-testunit hebben ervaren.
Geluidsniveau
| Onbelast |
| 24.5 / 26.3 / 26.3 dB (A) |
| Belasting |
| 36.5 / 52.9 dB (A) |
 | ||
30 dB stil 40 dB(A) hoorbaar 50 dB(A) luid |
||
min: | ||
| MSI Prestige 16 B1MG-001US Arc 8-Core, Ultra 7 155H, Samsung PM9A1 MZVL22T0HBLB | MSI Prestige 15 A12UD-093 GeForce RTX 3050 Ti Laptop GPU, i7-1280P, Micron 3400 1TB MTFDKBA1T0TFH | LG Gram 2in1 16 16T90R - G.AA78G Iris Xe G7 96EUs, i7-1360P, Samsung PM9A1 MZVL21T0HCLR | Lenovo ThinkBook 16 G6 ABP Vega 7, R5 7530U, SK hynix HFS512GEJ9X125N | Asus VivoBook Pro 16 K6602VU GeForce RTX 4050 Laptop GPU, i9-13900H, Micron 2400 MTFDKBA1T0QFM | Dell Inspiron 16 Plus 7630 GeForce RTX 4060 Laptop GPU, i7-13700H, WD PC SN740 SDDPTQD-1T00 | |
|---|---|---|---|---|---|---|
| Noise | -6% | 8% | 13% | -4% | 4% | |
| uit / omgeving * (dB) | 24.5 | 26 -6% | 25.1 -2% | 24.3 1% | 20.96 14% | 23.2 5% |
| Idle Minimum * (dB) | 24.5 | 26 -6% | 25.1 -2% | 24.3 1% | 25.28 -3% | 23.2 5% |
| Idle Average * (dB) | 26.3 | 30.7 -17% | 25.1 5% | 24.3 8% | 25.28 4% | 23.2 12% |
| Idle Maximum * (dB) | 26.3 | 30.7 -17% | 26.1 1% | 24.3 8% | 25.28 4% | 23.2 12% |
| Load Average * (dB) | 36.5 | 41.9 -15% | 31.4 14% | 29.7 19% | 51.88 -42% | 35.1 4% |
| Witcher 3 ultra * (dB) | 46.3 | 41.1 11% | 32.1 31% | 49 -6% | 52.5 -13% | |
| Load Maximum * (dB) | 52.9 | 40.7 23% | 36.6 31% | 41.4 22% | 51.8 2% | 52.5 1% |
* ... kleiner is beter
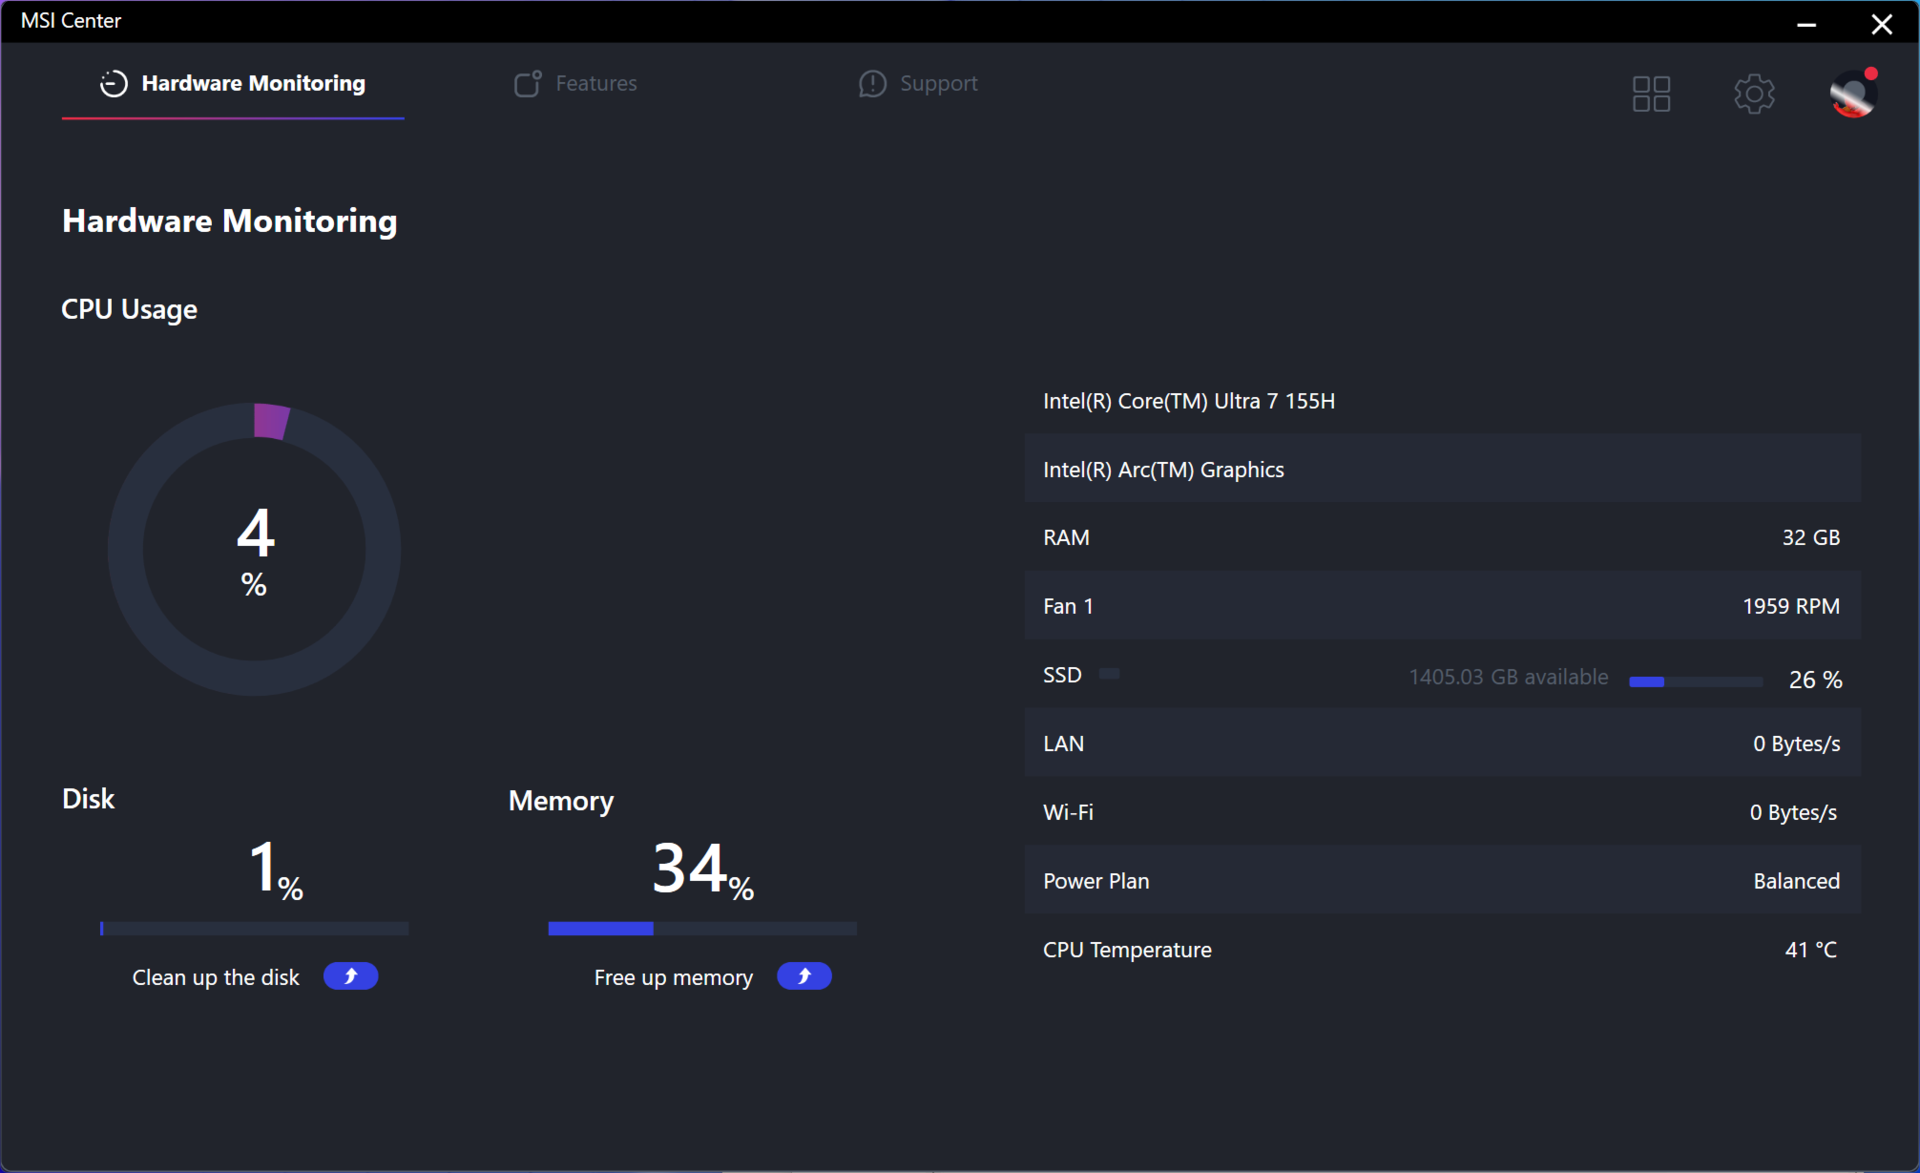
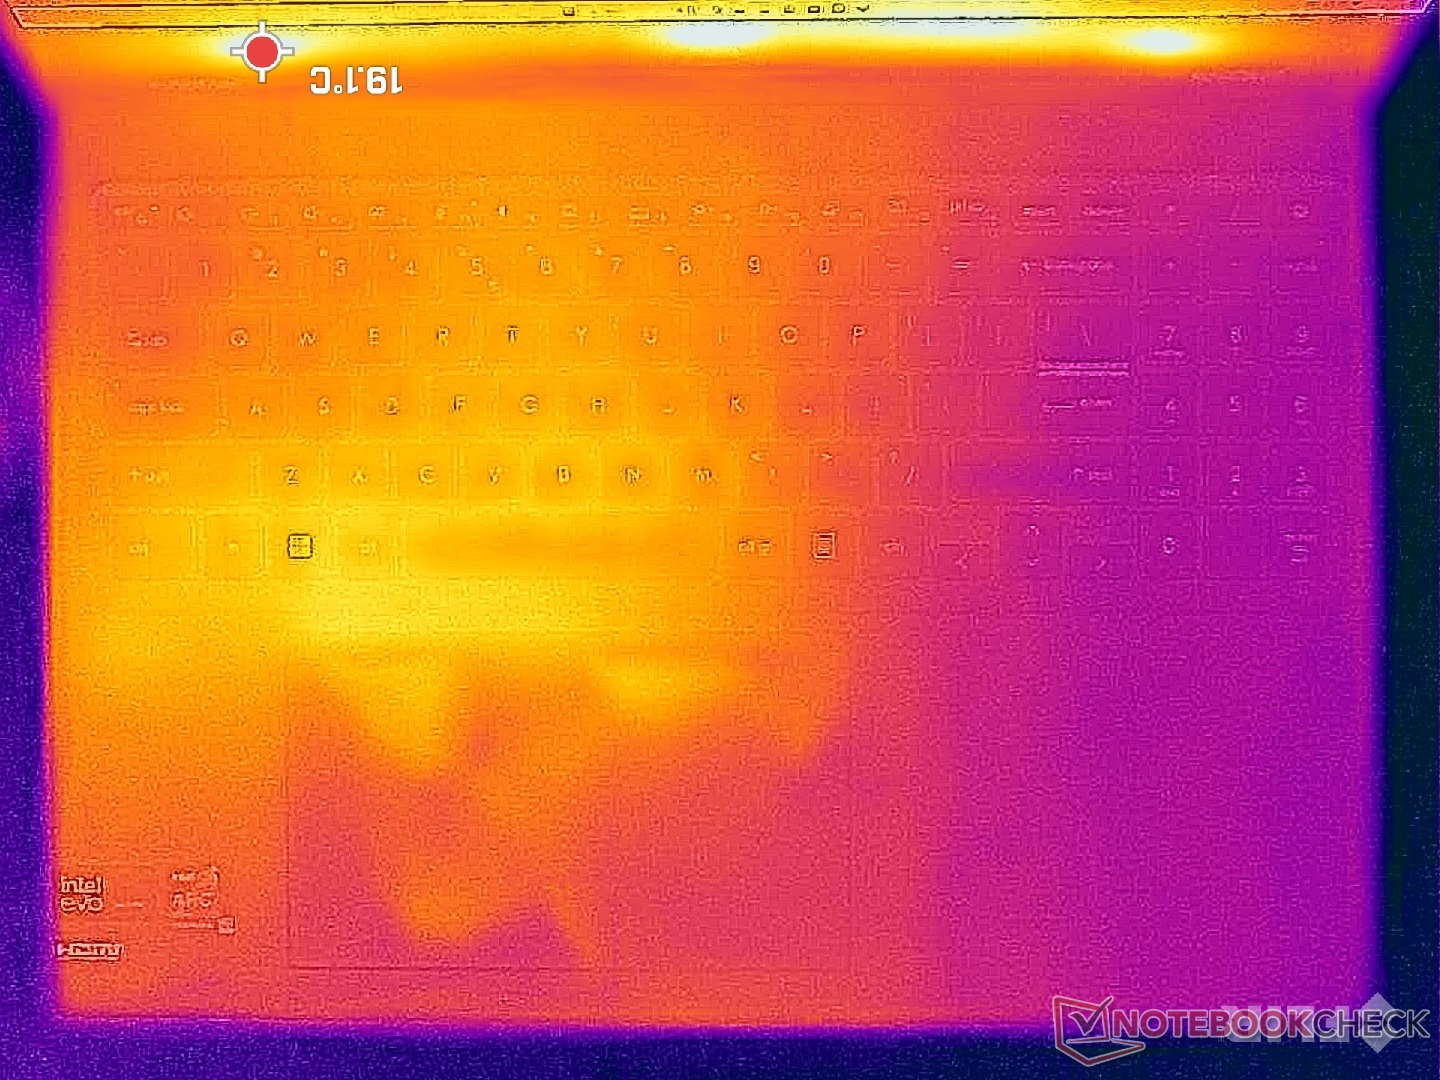
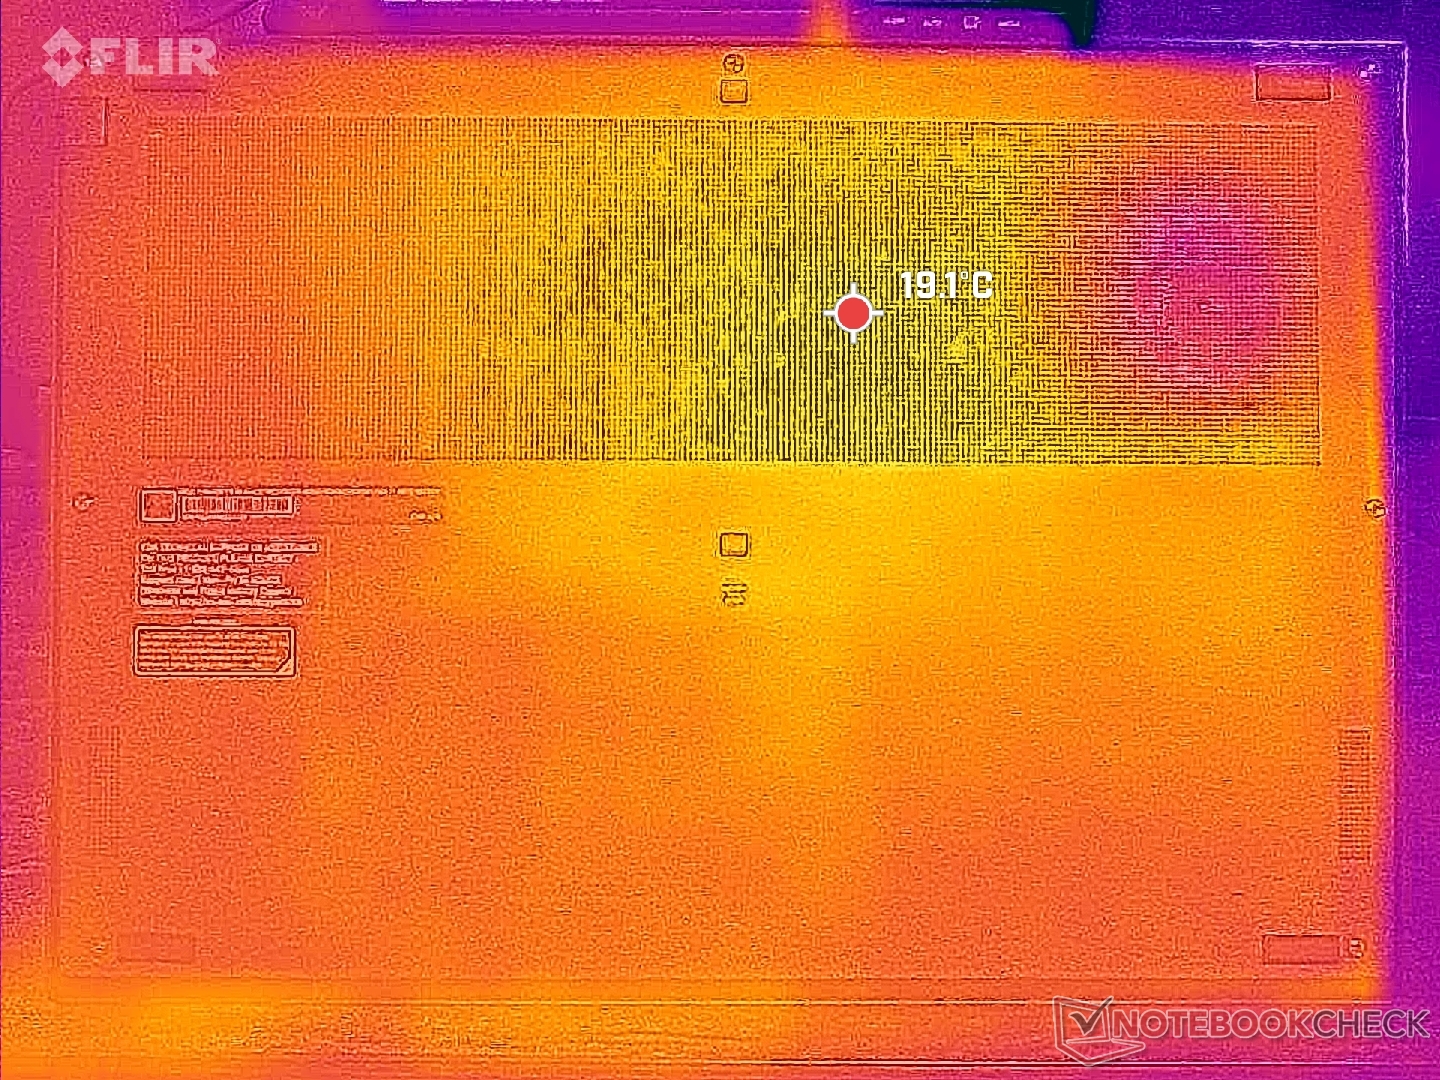
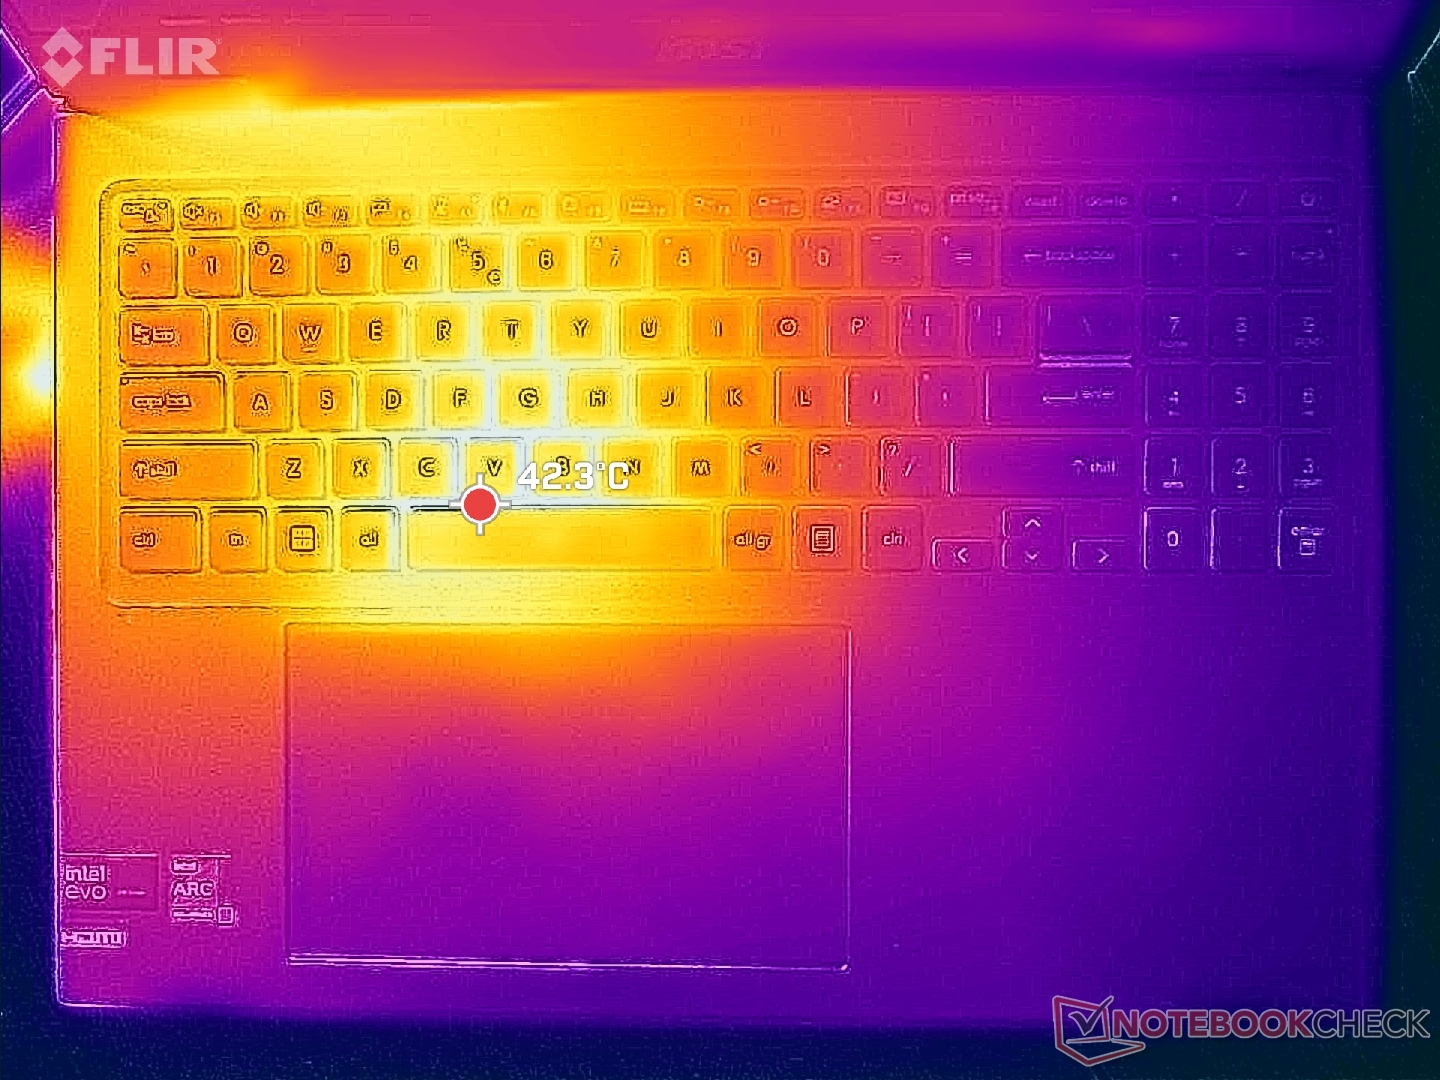
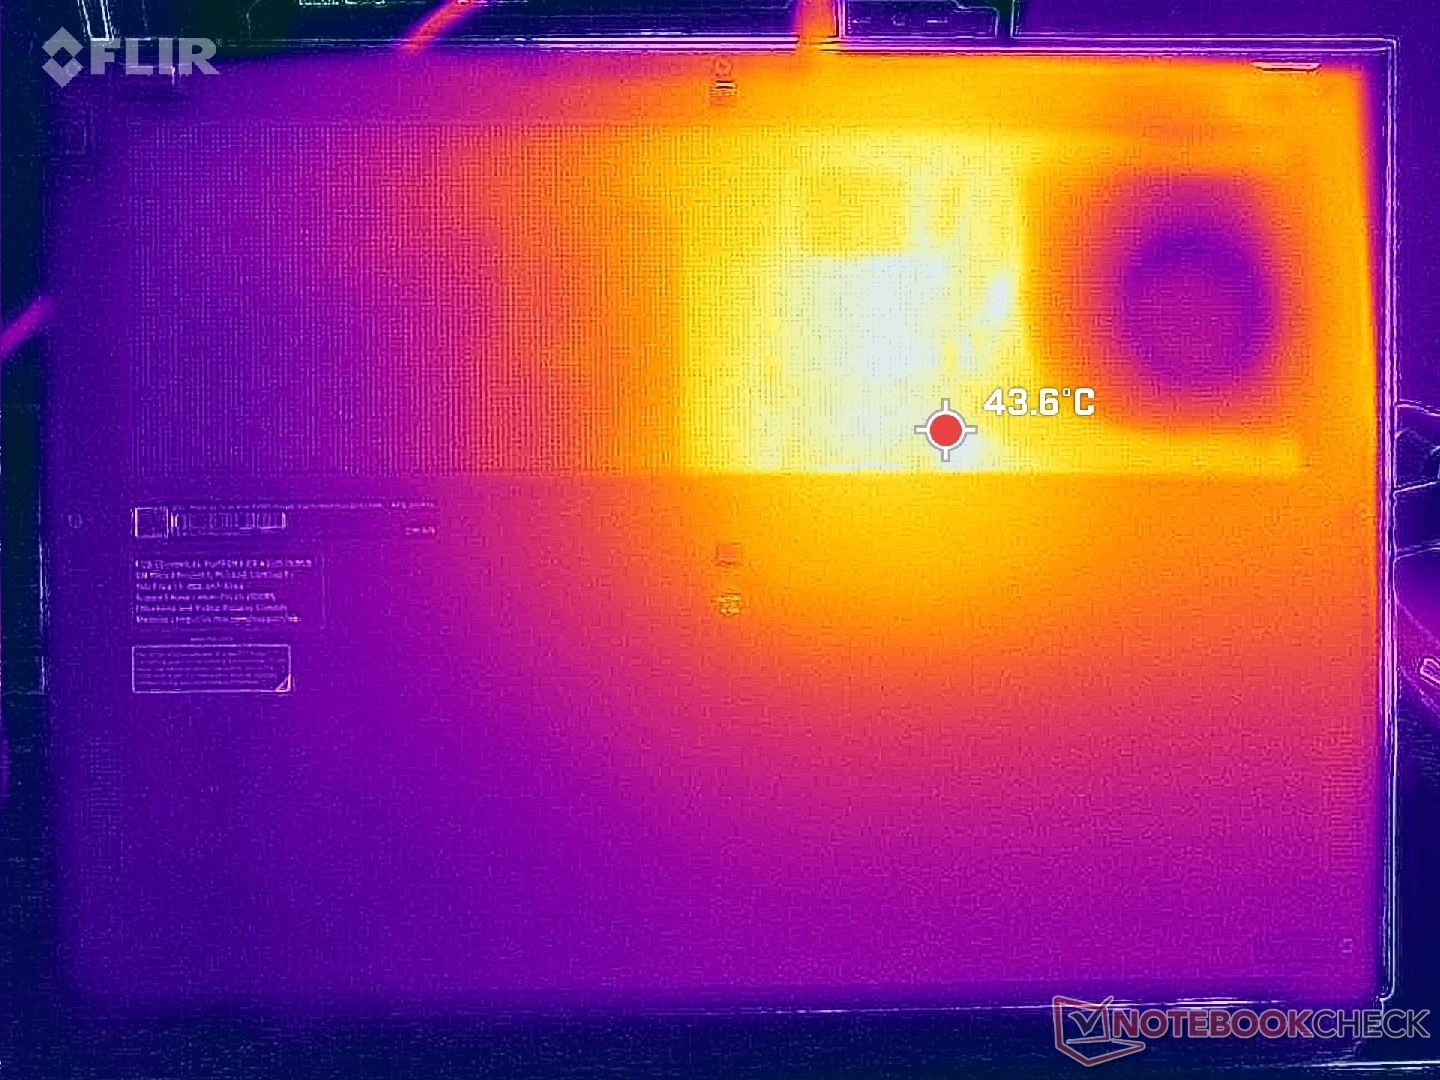
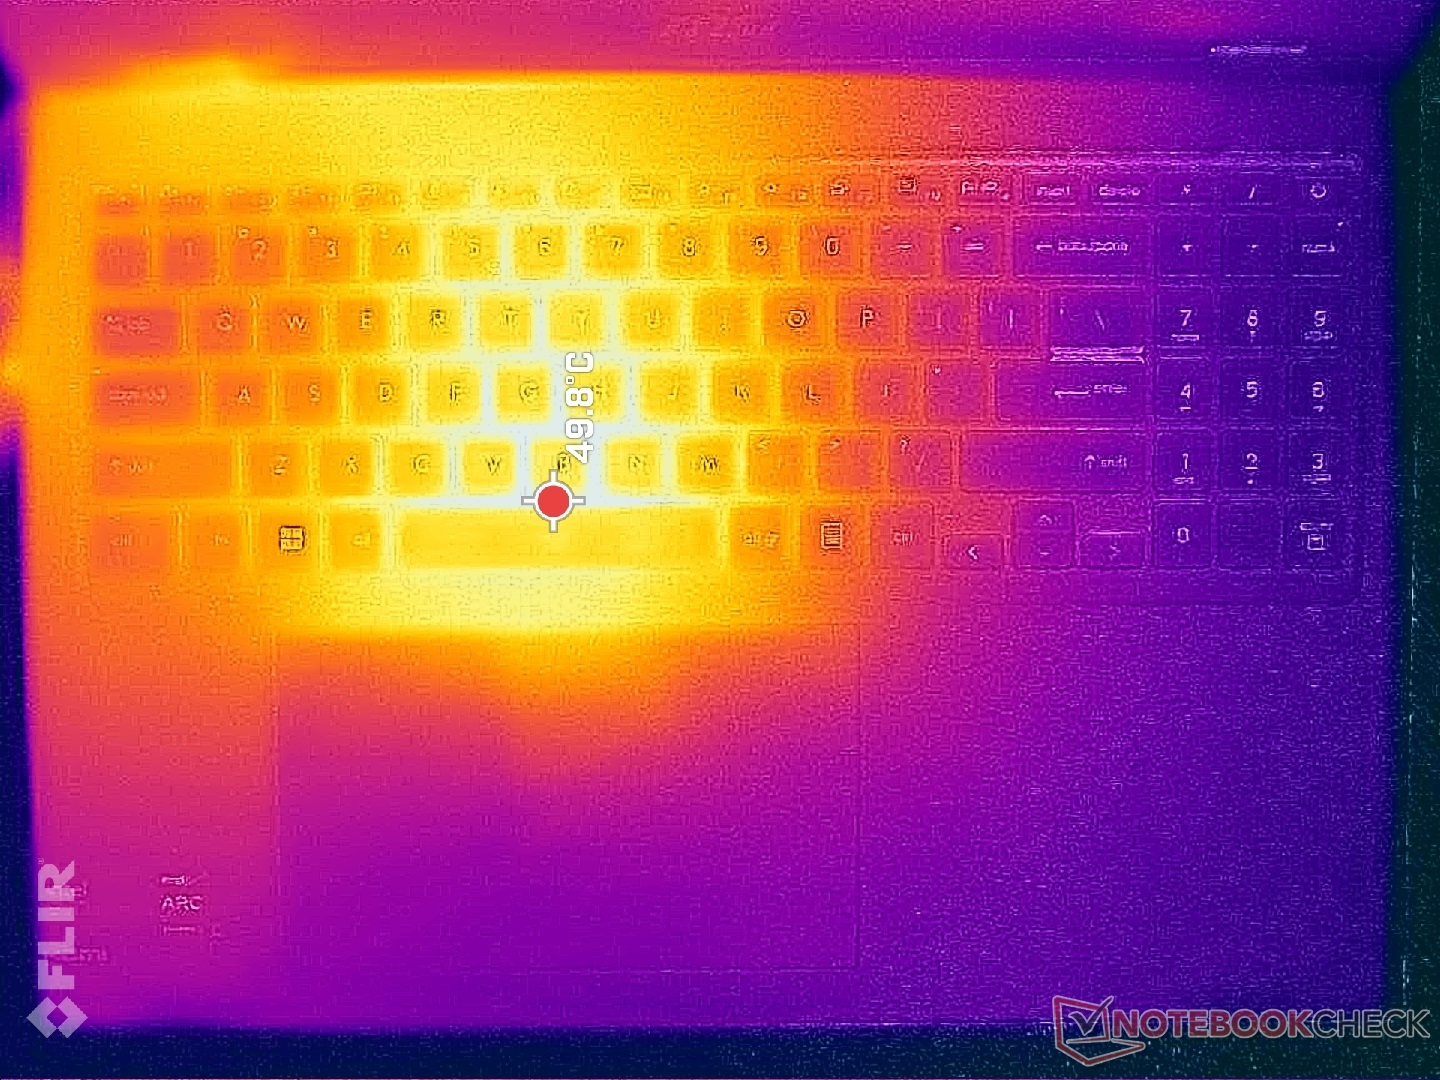
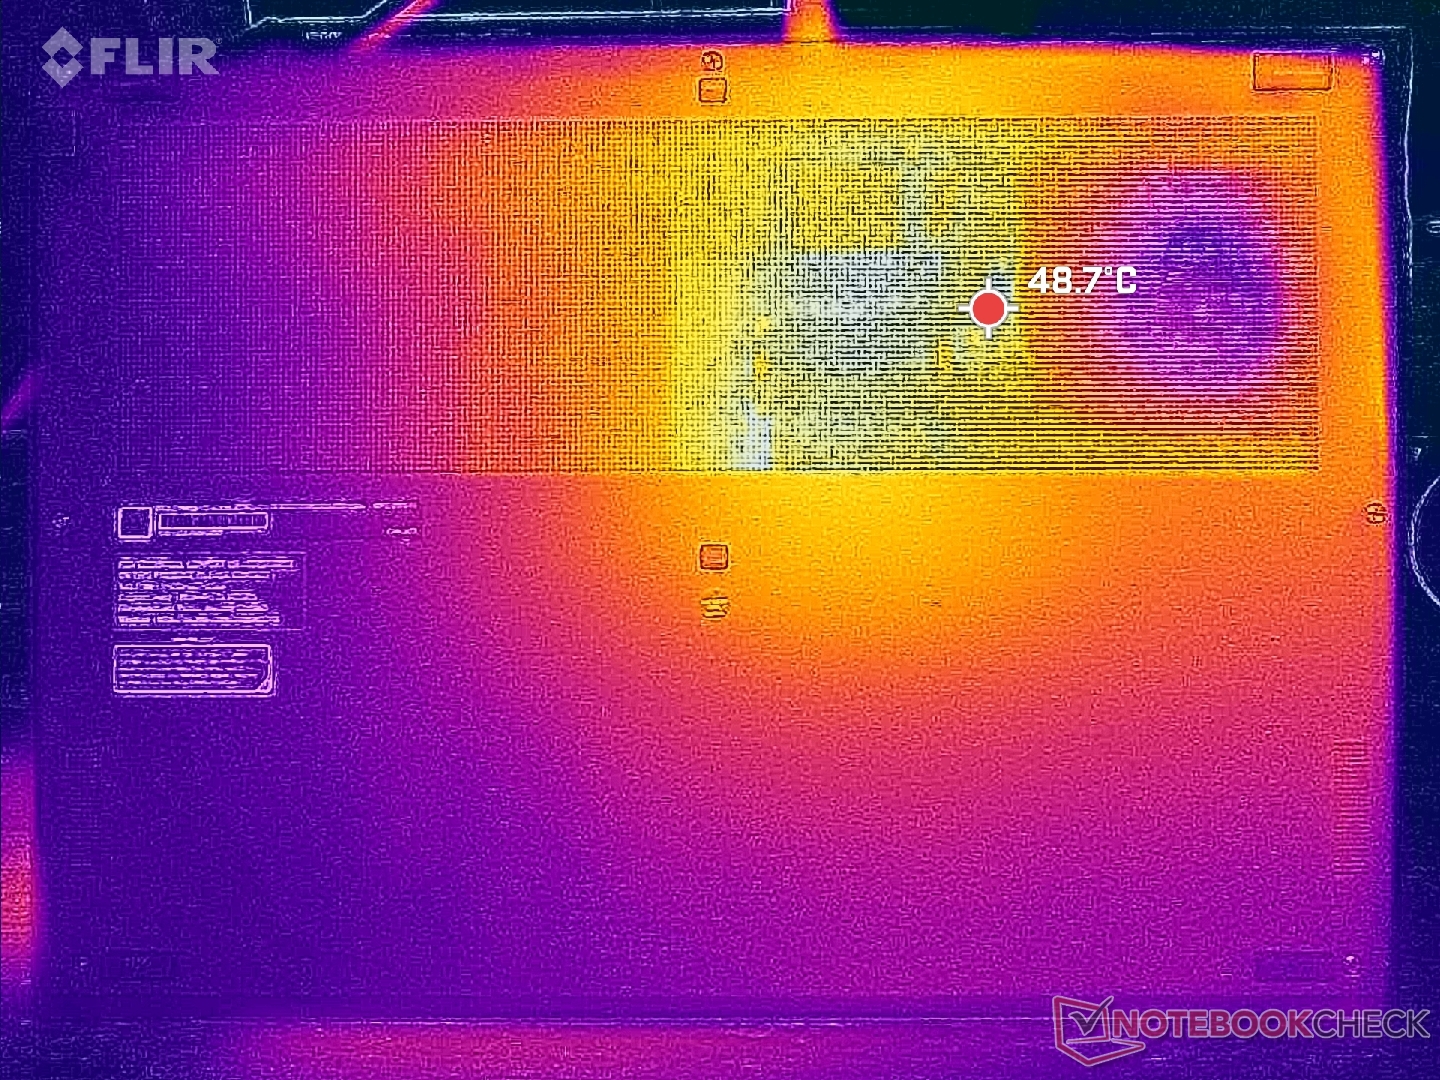
Temperatuur
De oppervlaktetemperaturen zijn warmer op de linkerhelft van de laptop dan op de rechterhelft door de plaatsing van de CPU en de koeloplossing binnenin. De hot spot in de buurt van de spatietoets kan oplopen tot 50 C bij zware belasting, wat vergelijkbaar is met de hot spot op de Prestige 15 van vorig jaar met de speciale GeForce RTX GPU. De WASD-toetsen kunnen daardoor behoorlijk warm aanvoelen tijdens het gamen, maar de palmsteunen en pijltjestoetsen blijven veel koeler. Prestige laptops zijn over het algemeen warmer dan de gemiddelde Ultrabook onder belasting vanwege hun compacte ontwerpen en de Prestige 16 is daarop geen uitzondering.
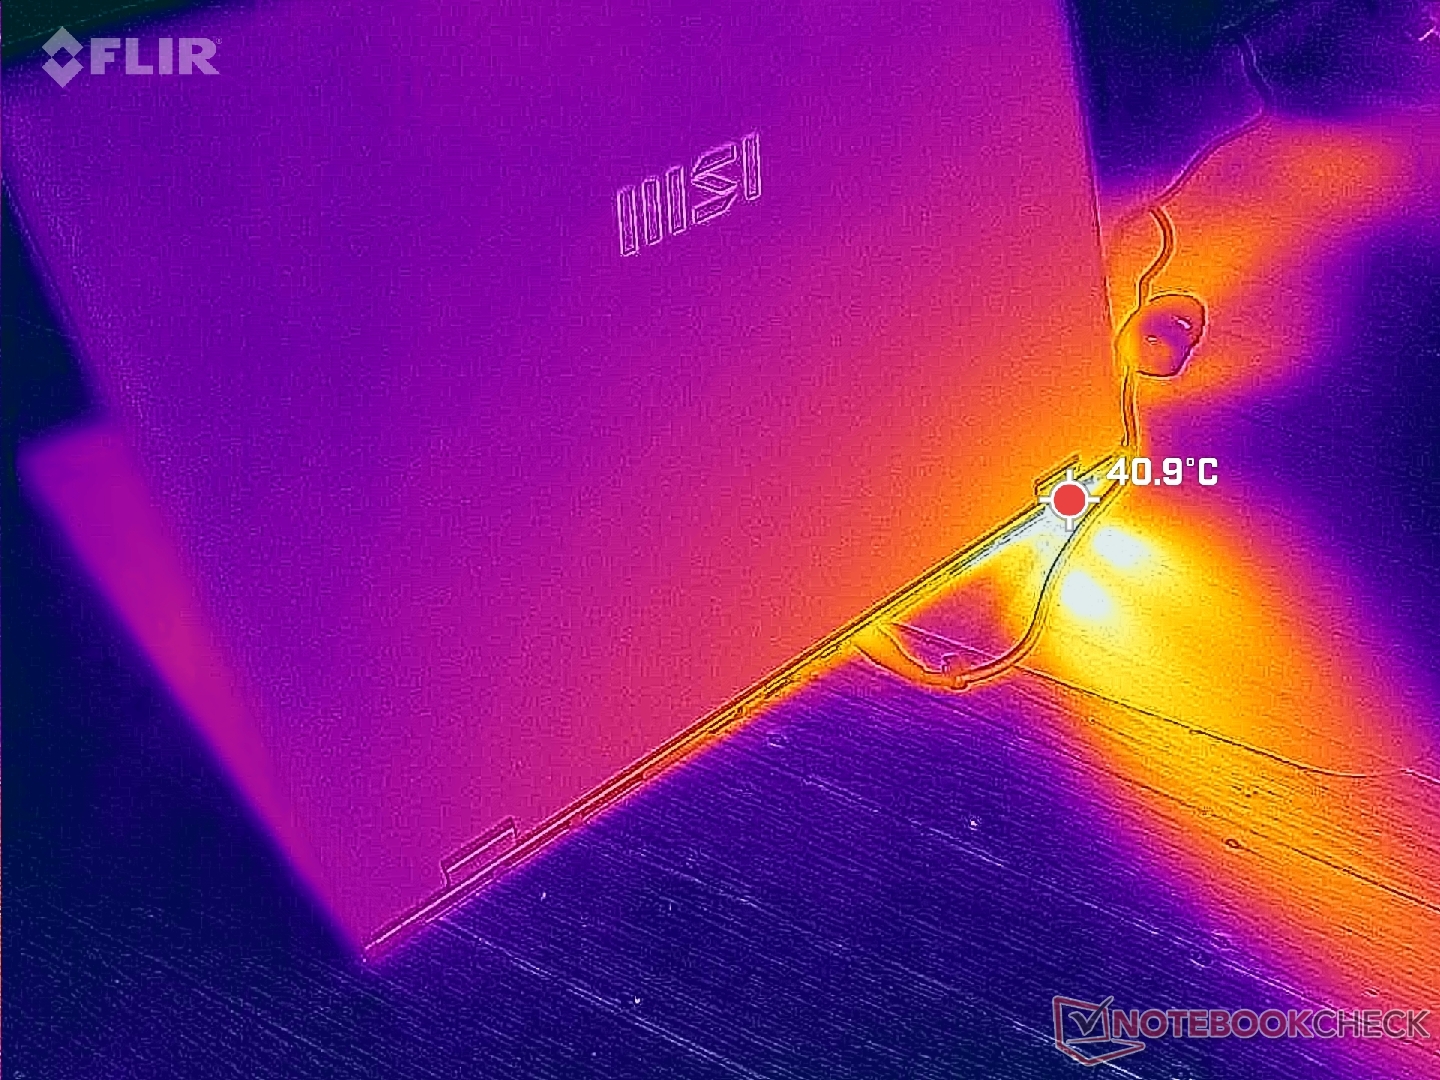
(-) De maximumtemperatuur aan de bovenzijde bedraagt 48.8 °C / 120 F, vergeleken met het gemiddelde van 36.8 °C / 98 F, variërend van 21 tot 71 °C voor de klasse Multimedia.
(-) De bodem warmt op tot een maximum van 47.6 °C / 118 F, vergeleken met een gemiddelde van 39.1 °C / 102 F
(+) Bij onbelast gebruik bedraagt de gemiddelde temperatuur voor de bovenzijde 23 °C / 73 F, vergeleken met het apparaatgemiddelde van 31.3 °C / 88 F.
(±) Bij het spelen van The Witcher 3 is de gemiddelde temperatuur voor de bovenzijde 33.3 °C / 92 F, vergeleken met het apparaatgemiddelde van 31.3 °C / 88 F.
(+) De palmsteunen en het touchpad zijn met een maximum van ###max## °C / 86 F koeler dan de huidtemperatuur en voelen daarom koel aan.
(±) De gemiddelde temperatuur van de handpalmsteun van soortgelijke toestellen bedroeg 28.7 °C / 83.7 F (-1.3 °C / -2.3 F).
| MSI Prestige 16 B1MG-001US Intel Core Ultra 7 155H, Intel Arc 8-Core iGPU | MSI Prestige 15 A12UD-093 Intel Core i7-1280P, NVIDIA GeForce RTX 3050 Ti Laptop GPU | LG Gram 2in1 16 16T90R - G.AA78G Intel Core i7-1360P, Intel Iris Xe Graphics G7 96EUs | Lenovo ThinkBook 16 G6 ABP AMD Ryzen 5 7530U, AMD Radeon RX Vega 7 | Asus VivoBook Pro 16 K6602VU Intel Core i9-13900H, NVIDIA GeForce RTX 4050 Laptop GPU | Dell Inspiron 16 Plus 7630 Intel Core i7-13700H, NVIDIA GeForce RTX 4060 Laptop GPU | |
|---|---|---|---|---|---|---|
| Heat | -16% | -25% | -15% | -30% | -20% | |
| Maximum Upper Side * (°C) | 48.8 | 49 -0% | 55 -13% | 40.8 16% | 42.6 13% | 47.8 2% |
| Maximum Bottom * (°C) | 47.6 | 52.6 -11% | 55.4 -16% | 50.5 -6% | 48.4 -2% | 42.2 11% |
| Idle Upper Side * (°C) | 24.2 | 29.7 -23% | 34.9 -44% | 29.3 -21% | 39.4 -63% | 35.2 -45% |
| Idle Bottom * (°C) | 23.6 | 30.7 -30% | 30 -27% | 35.2 -49% | 39.8 -69% | 35 -48% |
* ... kleiner is beter
Stresstest
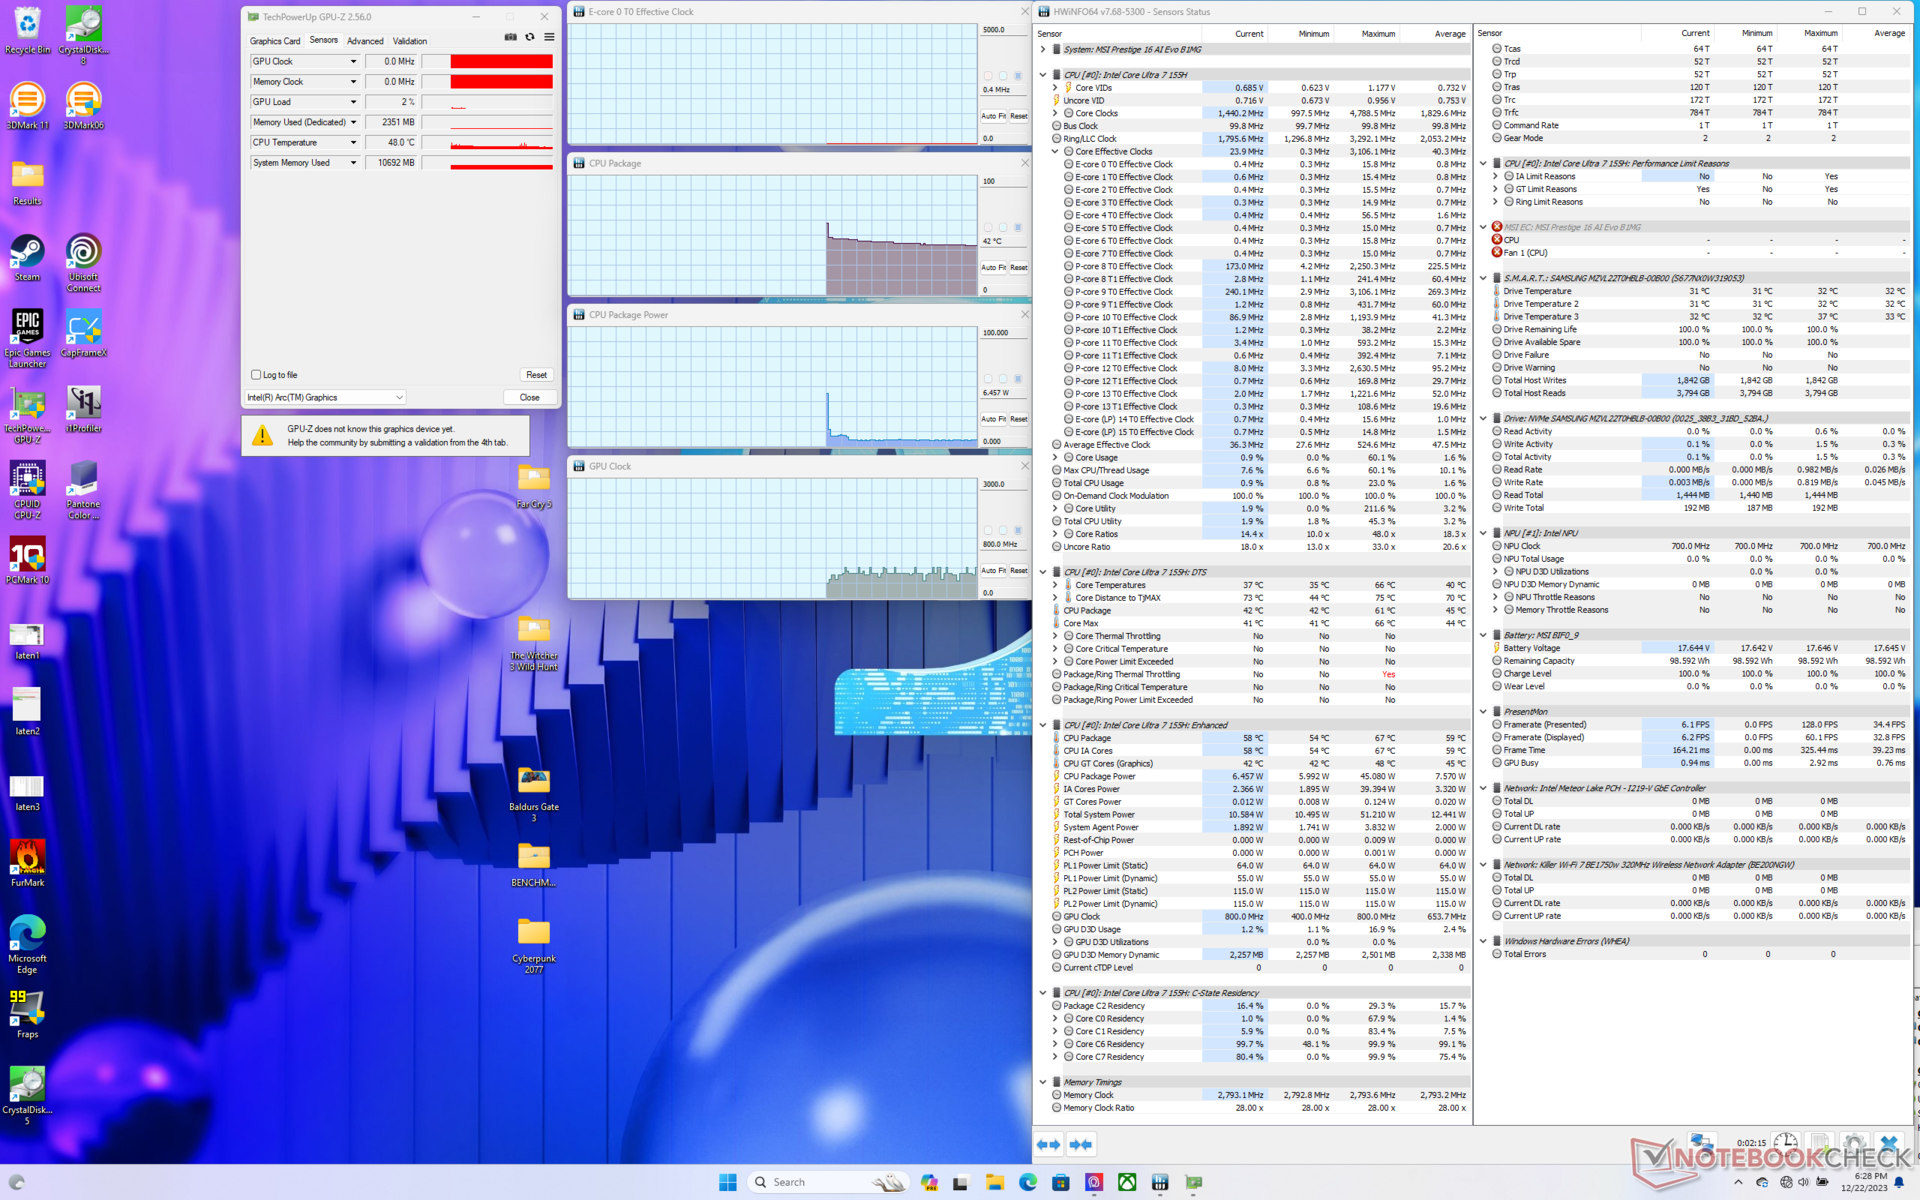
Het vermogen van het CPU-pakket steeg tot 110 W, 2,8 GHz en 96 C voor slechts een paar seconden bij het starten van Prime95 stress, voordat het snel daalde en zich stabiliseerde op 2,2 GHz, 44 W en 83 C. Dit bereik is warmer dan gemiddeld voor een Ultrabook, maar het is verder typisch voor een Prestige model. De Acer Swift Edge SFE16 met de Ryzen 7 7840U zou zich bijvoorbeeld stabiliseren op een koelere 64 C, terwijl de Core H-aangedreven Lenovo Slim Pro 9i 16IRP8 zou stabiliseren op 77 C onder vergelijkbare omstandigheden.
Het draaien met Cooler Boost actief lijkt de prestaties niet te beïnvloeden. De CPU zou zich bijvoorbeeld stabiliseren op 85 C wanneer deze wordt uitgevoerd Witcher 3 met Cooler Boost uit versus 77 C met Cooler Boost aan, terwijl de GPU-kloksnelheden ongewijzigd blijven. Tenzij de kerntemperaturen een probleem vormen, is de Cooler Boost-modus over het algemeen niet nodig voor maximale prestaties. Deze observatie komt overeen met onze ervaringen op veel andere MSI laptops met Cooler Boost.
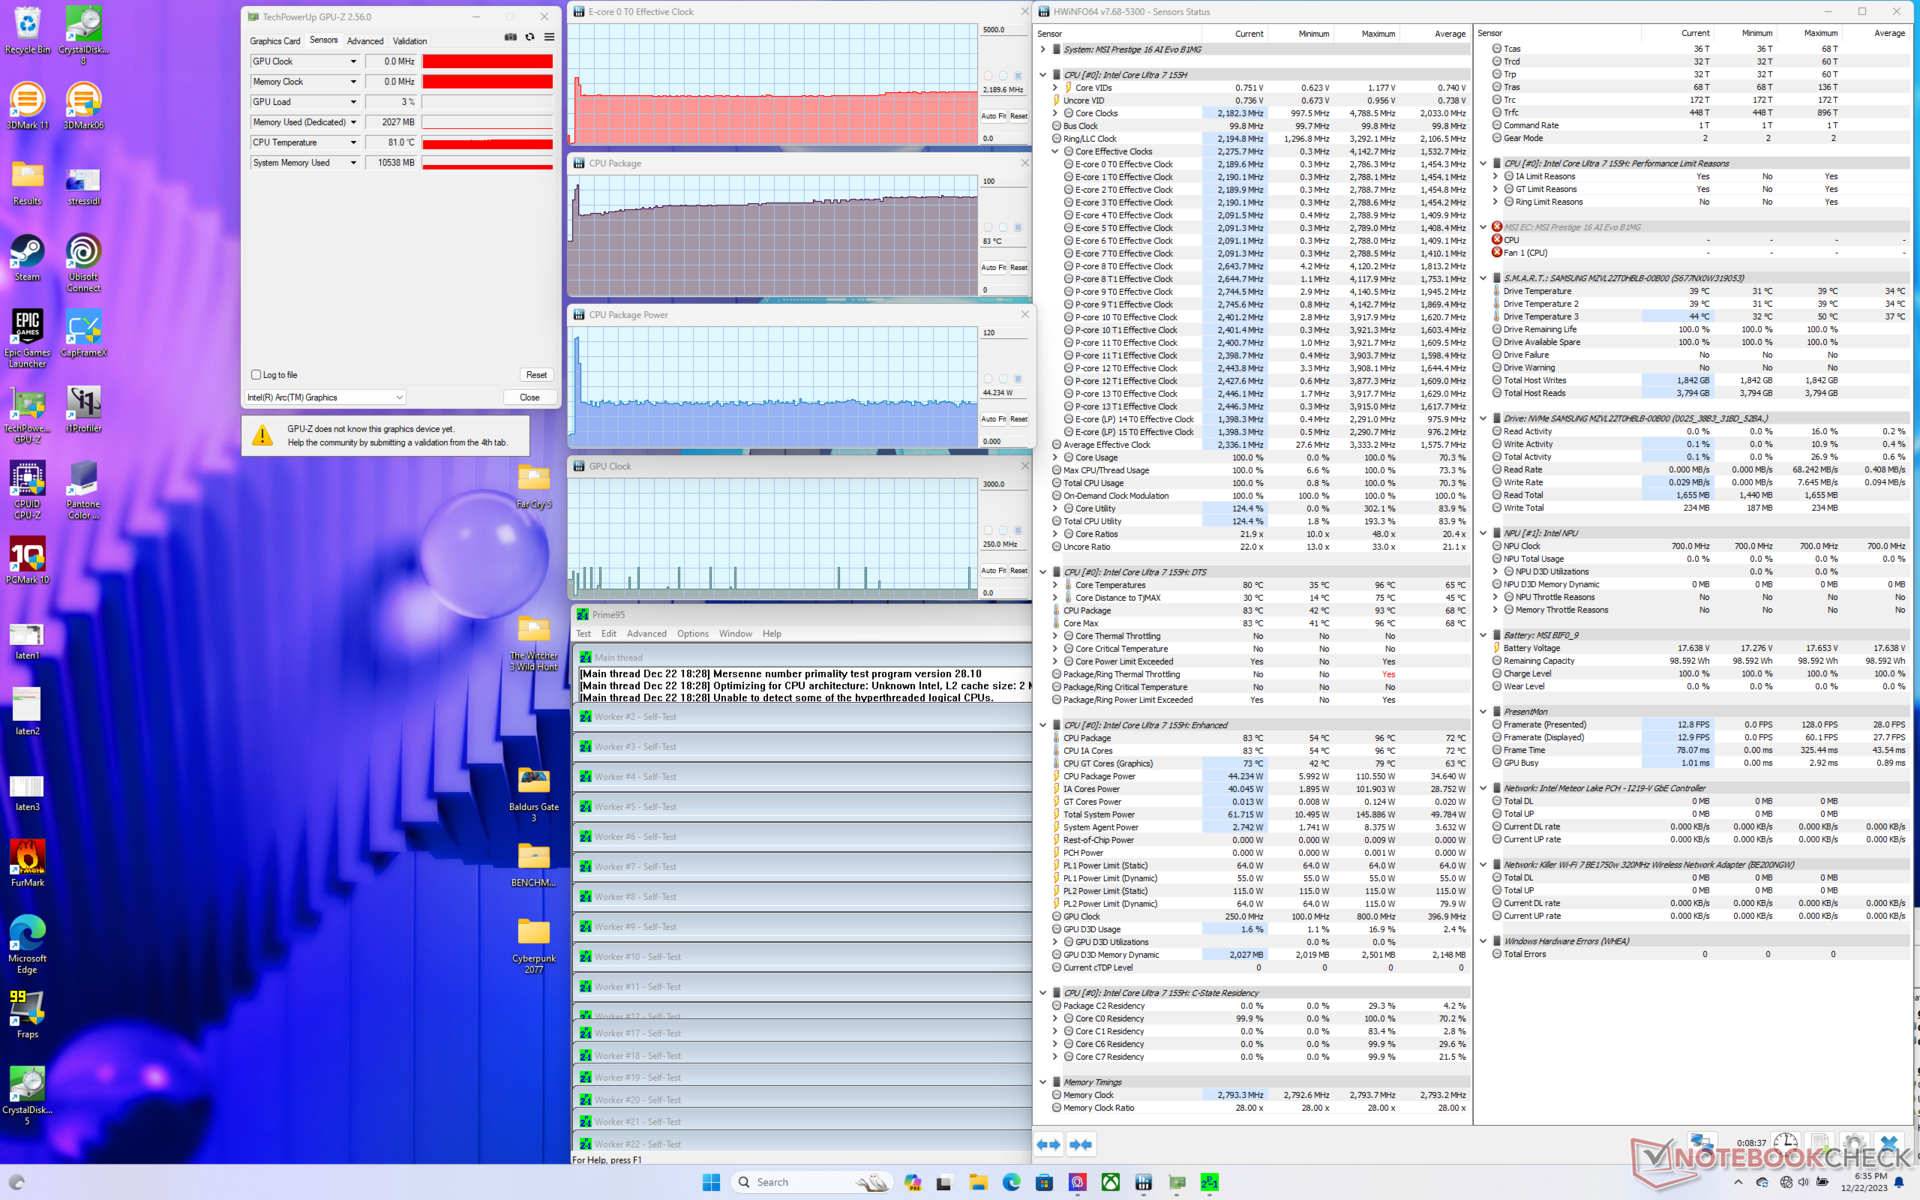
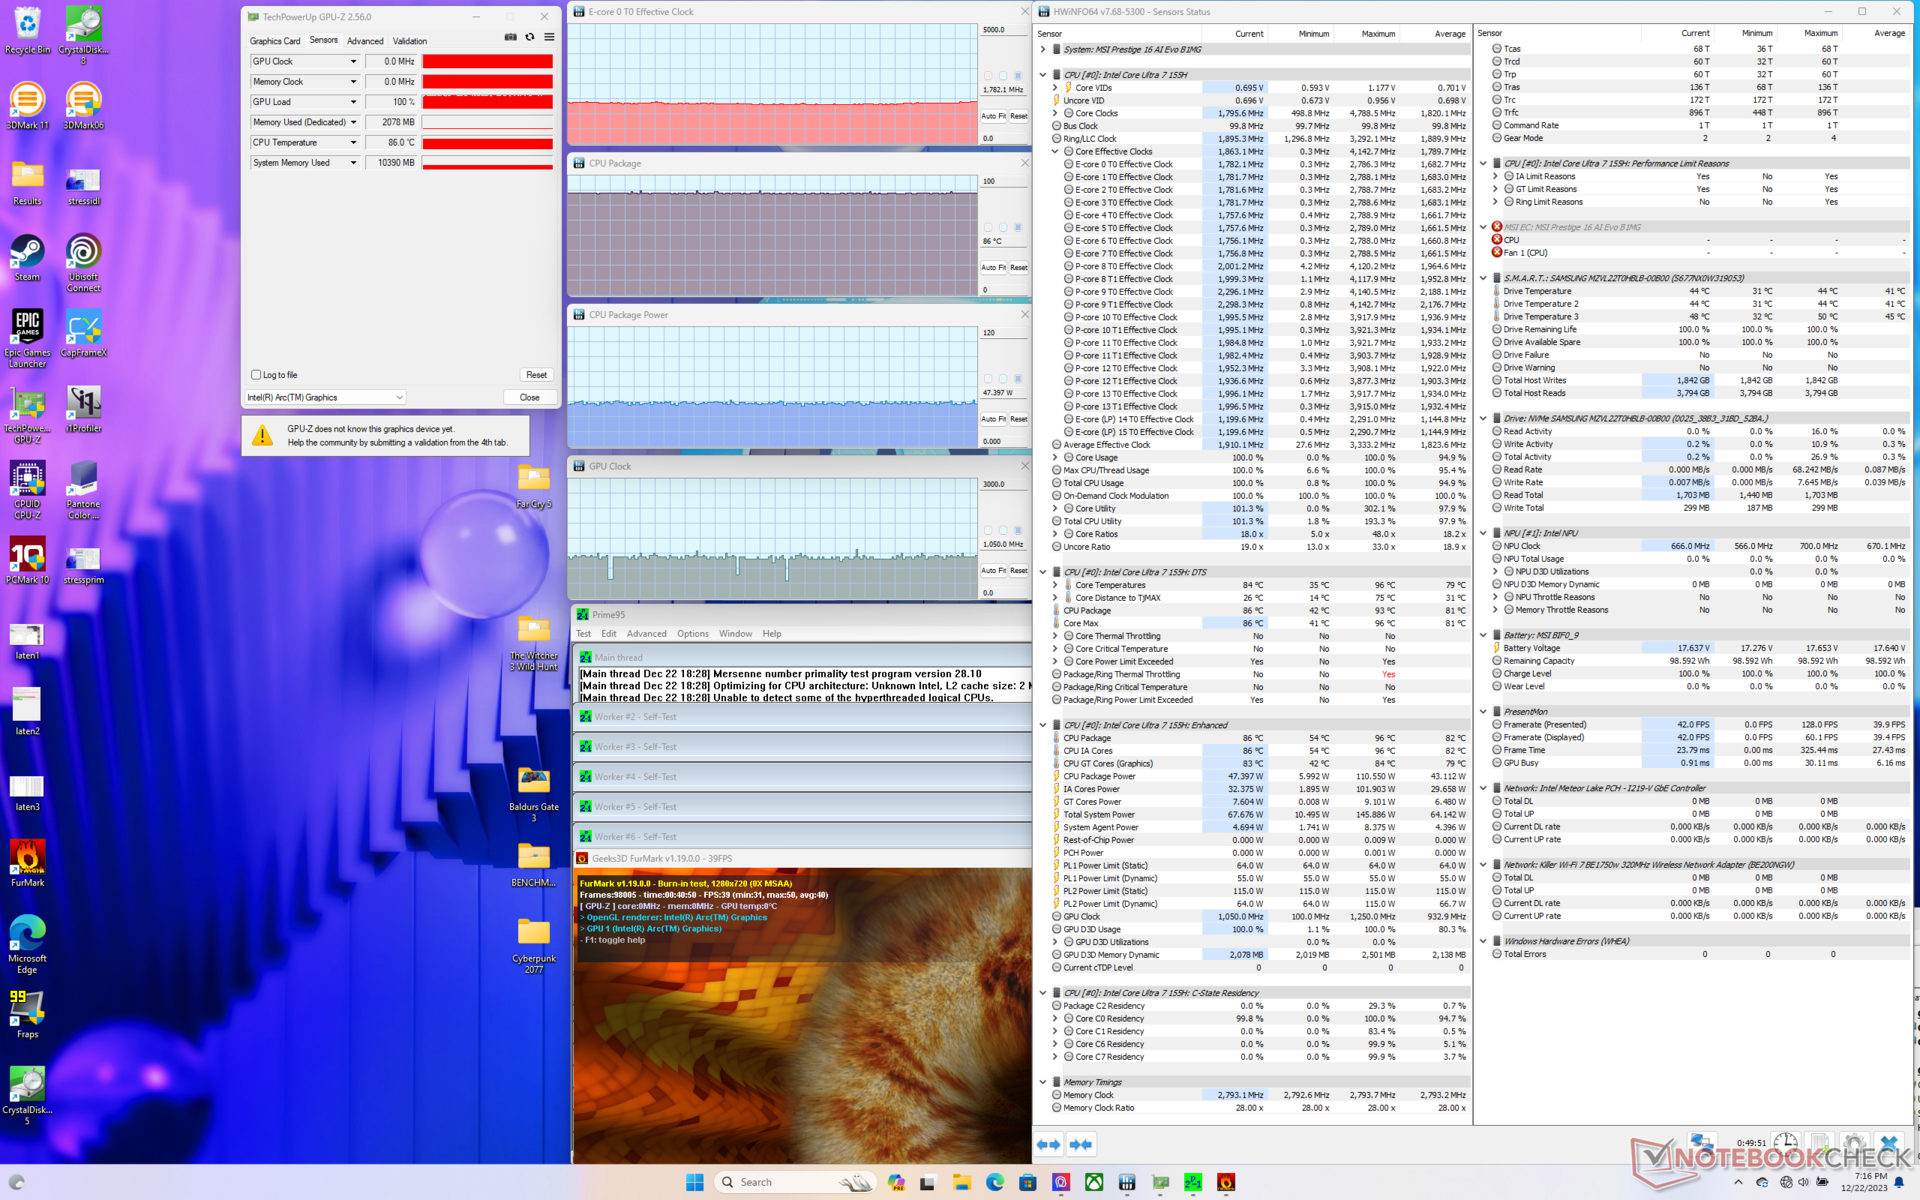

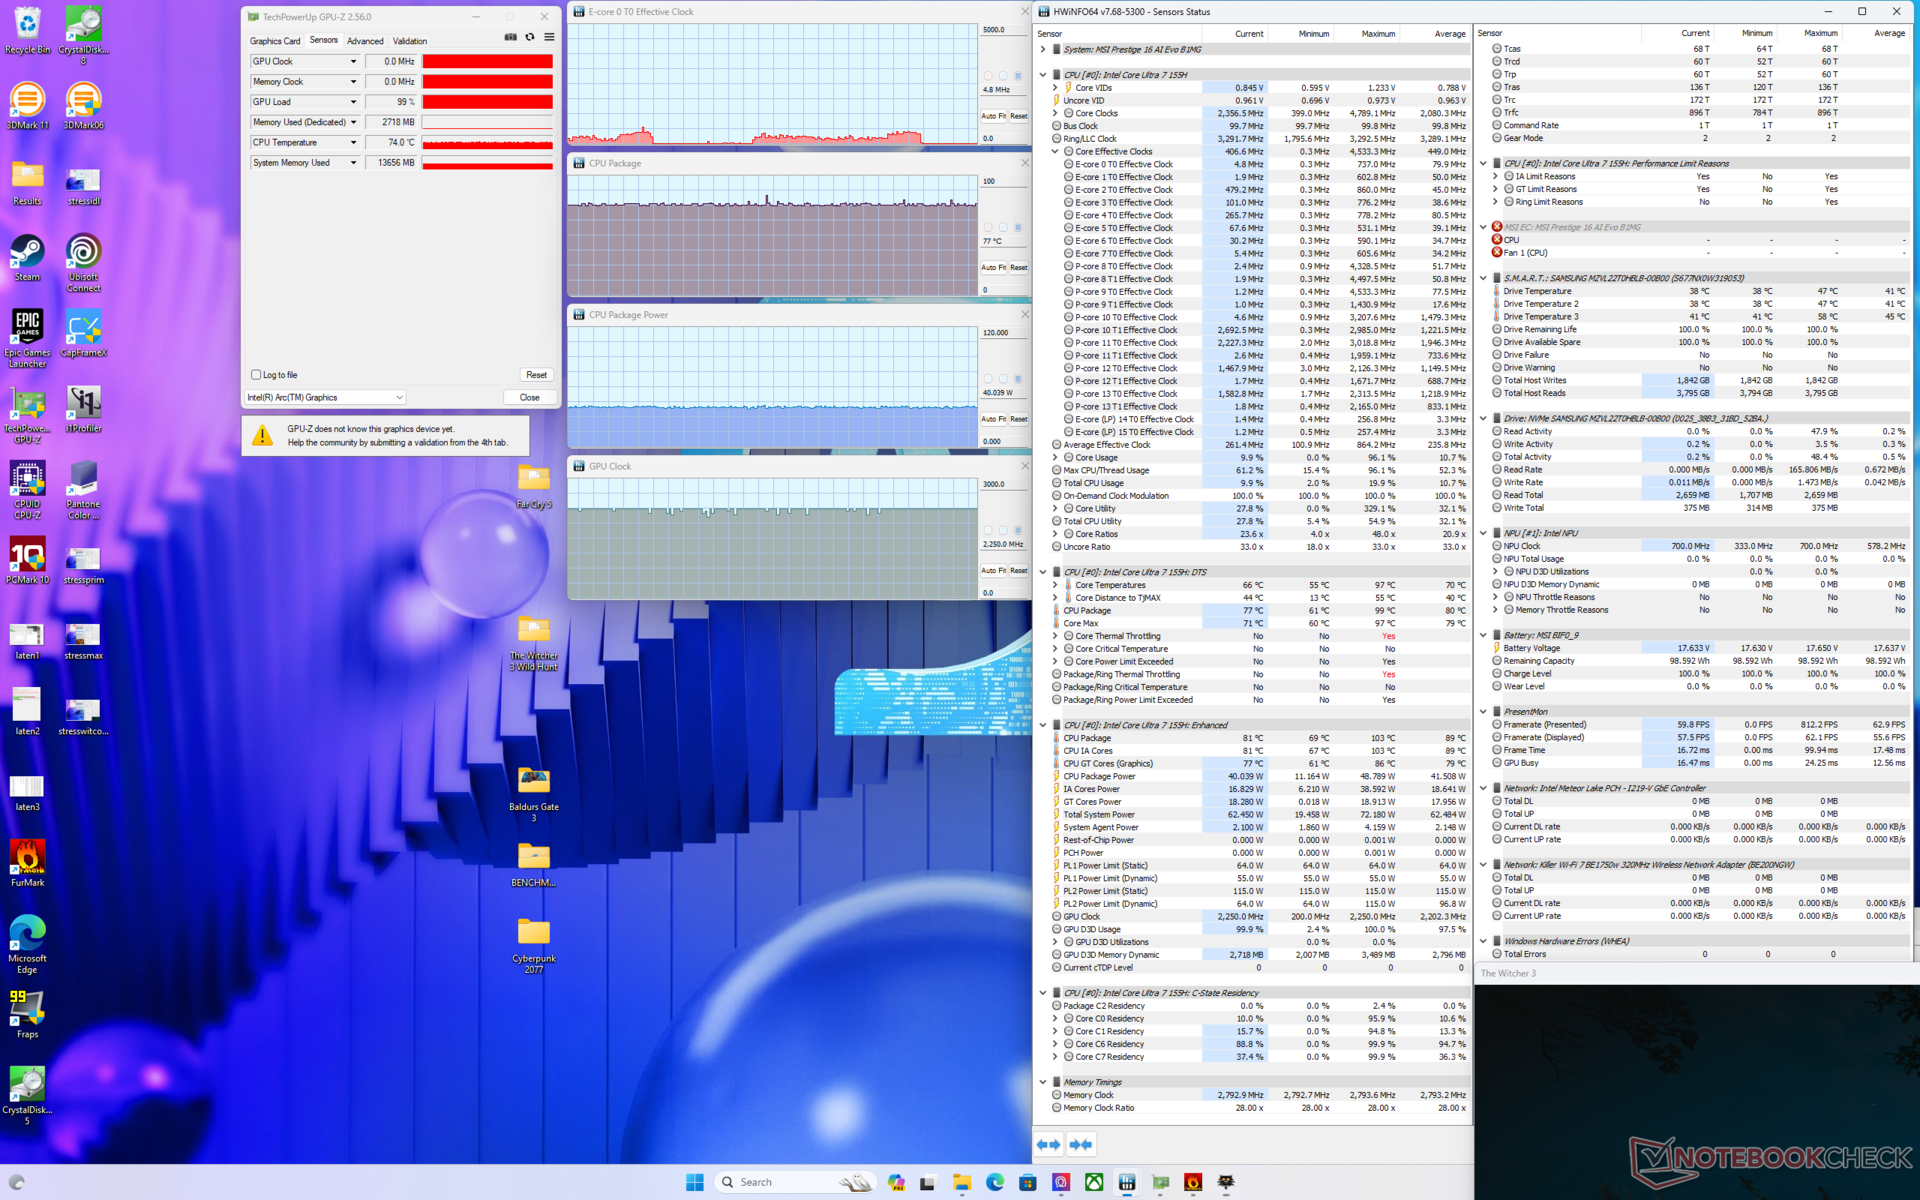
| CPU-klok (GHz) | GPU-klok (MHz) | Gemiddelde CPU-temperatuur (°C) | |
| Inactief systeem | -- | -- | 42 |
| Prime95-stress | 2.2 | -- | 83 |
| Prime95 + FurMark Stress | 1.8 | 1050 | 86 |
| Witcher 3 Stress (Extreme prestaties met Cooler Boost uitgeschakeld) | 0,5 | 2250 | 85 |
| Witcher 3 Stress (Extreme prestaties met koeler Boost aan) | 0,5 | 2250 | 77 |
Luidsprekers
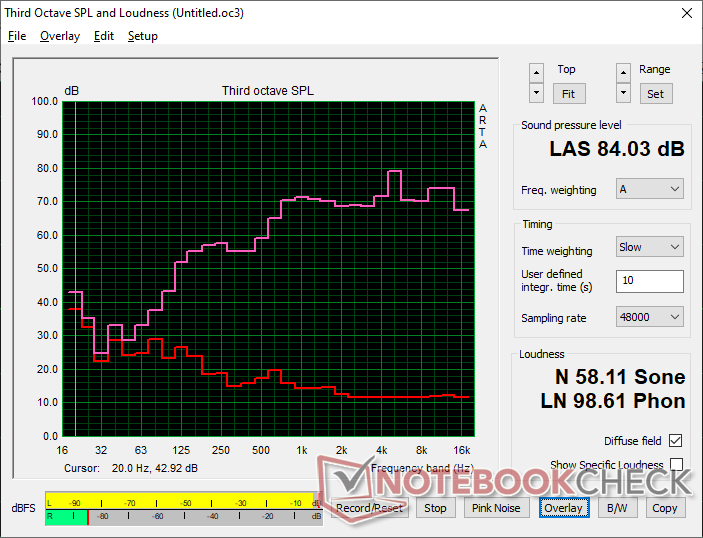
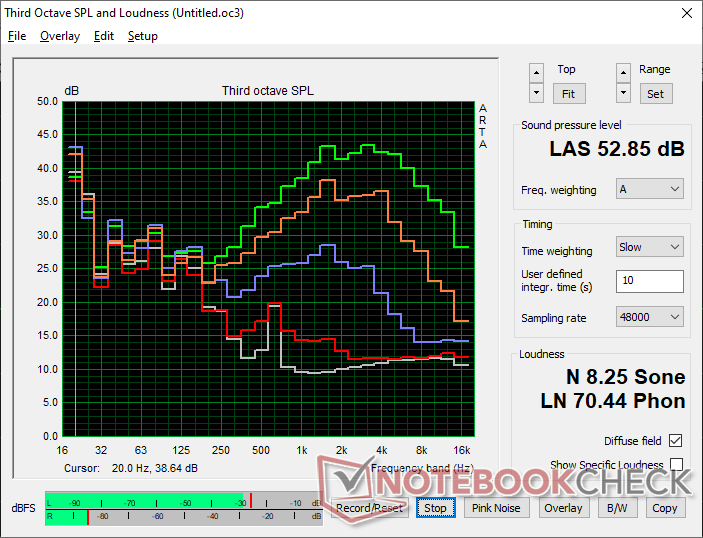
MSI Prestige 16 B1MG-001US audioanalyse
(+) | luidsprekers kunnen relatief luid spelen (84 dB)
Bas 100 - 315 Hz
(-) | bijna geen lage tonen - gemiddeld 15.3% lager dan de mediaan
(±) | lineariteit van de lage tonen is gemiddeld (7% delta ten opzichte van de vorige frequentie)
Midden 400 - 2000 Hz
(+) | evenwichtige middens - slechts 4.3% verwijderd van de mediaan
(+) | de middentonen zijn lineair (4.3% delta ten opzichte van de vorige frequentie)
Hoog 2 - 16 kHz
(+) | evenwichtige hoogtepunten - slechts 3.2% verwijderd van de mediaan
(+) | de hoge tonen zijn lineair (6.5% delta naar de vorige frequentie)
Algemeen 100 - 16.000 Hz
(+) | het totale geluid is lineair (13.3% verschil met de mediaan)
Vergeleken met dezelfde klasse
» 28% van alle geteste apparaten in deze klasse waren beter, 4% vergelijkbaar, 68% slechter
» De beste had een delta van 5%, het gemiddelde was 17%, de slechtste was 45%
Vergeleken met alle geteste toestellen
» 14% van alle geteste apparaten waren beter, 3% gelijk, 83% slechter
» De beste had een delta van 4%, het gemiddelde was 23%, de slechtste was 134%
Apple MacBook Pro 16 2021 M1 Pro audioanalyse
(+) | luidsprekers kunnen relatief luid spelen (84.7 dB)
Bas 100 - 315 Hz
(+) | goede baars - slechts 3.8% verwijderd van de mediaan
(+) | de lage tonen zijn lineair (5.2% delta naar de vorige frequentie)
Midden 400 - 2000 Hz
(+) | evenwichtige middens - slechts 1.3% verwijderd van de mediaan
(+) | de middentonen zijn lineair (2.1% delta ten opzichte van de vorige frequentie)
Hoog 2 - 16 kHz
(+) | evenwichtige hoogtepunten - slechts 1.9% verwijderd van de mediaan
(+) | de hoge tonen zijn lineair (2.7% delta naar de vorige frequentie)
Algemeen 100 - 16.000 Hz
(+) | het totale geluid is lineair (4.6% verschil met de mediaan)
Vergeleken met dezelfde klasse
» 0% van alle geteste apparaten in deze klasse waren beter, 0% vergelijkbaar, 100% slechter
» De beste had een delta van 5%, het gemiddelde was 17%, de slechtste was 45%
Vergeleken met alle geteste toestellen
» 0% van alle geteste apparaten waren beter, 0% gelijk, 100% slechter
» De beste had een delta van 4%, het gemiddelde was 23%, de slechtste was 134%
Energiebeheer - Lagere dalen met hogere pieken
Stroomverbruik
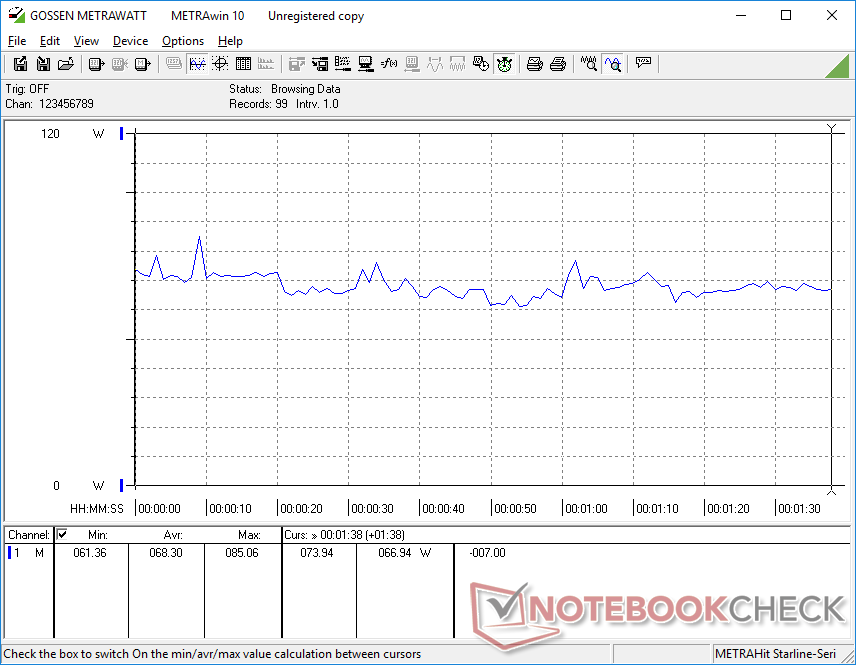
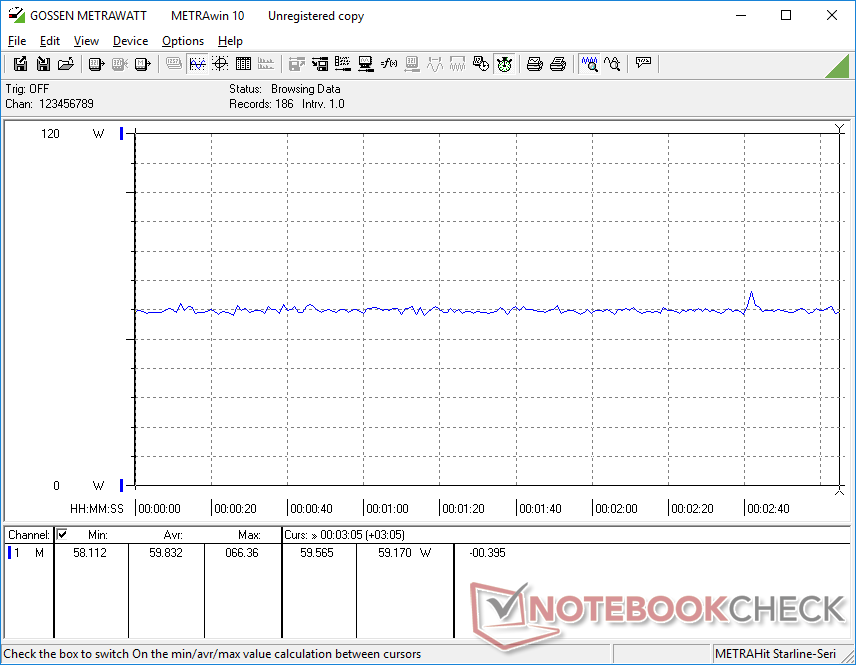
Het stroomverbruik kan zo laag zijn als 3 W bij stationair draaien, wat een van de laagste is van alle 16-inch Intel-laptops die we getest hebben. De zeer lage ondergrens is waarschijnlijk verantwoordelijk voor de extra lange batterijlevensduur in het volgende gedeelte hieronder.
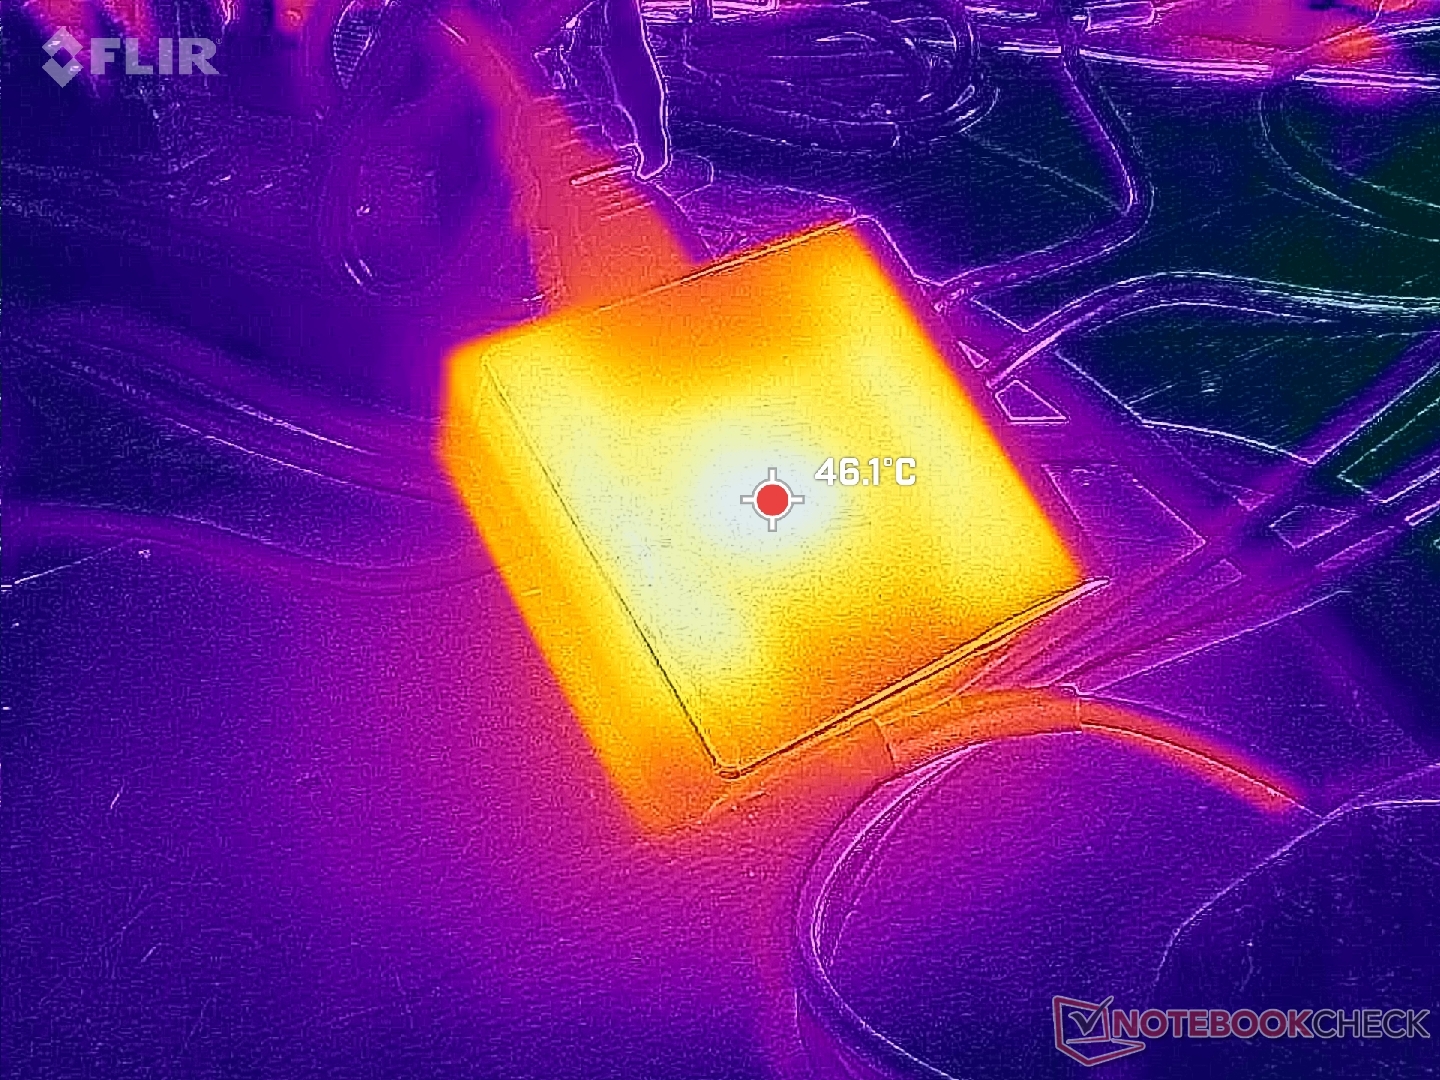
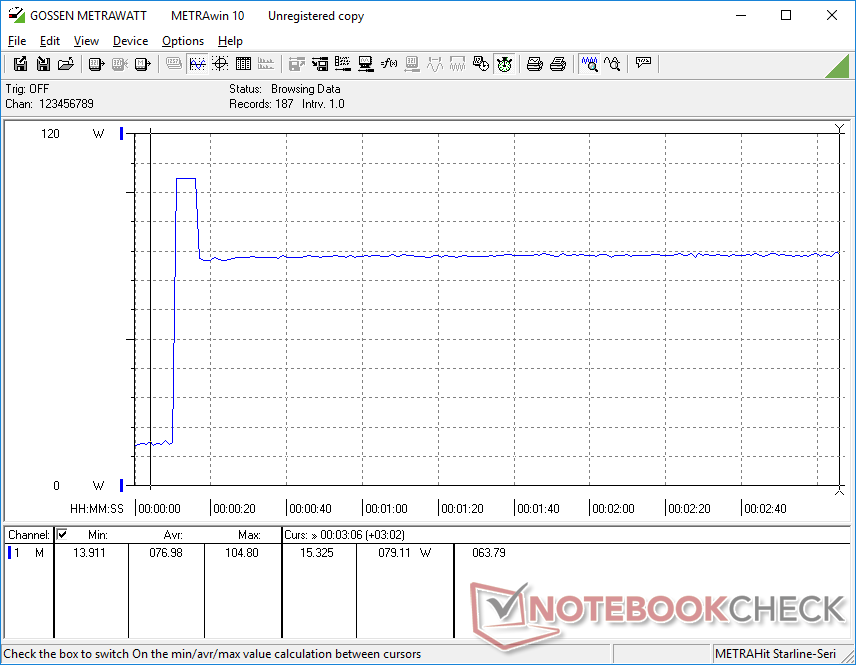
Aan de andere kant lijkt het verbruik hoger te zijn dan bij de meeste andere laptops uit de U-serie wanneer er zwaardere belastingen worden uitgevoerd. Het uitvoeren van 3DMark 06 of games zou bijvoorbeeld tussen de 60 W en 70 W verbruiken, vergeleken met 40 W tot 55 W op de MSI Prestige 15, LG Gram 16 2-in-1, Acer Swift Edge SFE16, of de Core H-aangedreven Schenker Vision 14 onder vergelijkbare omstandigheden. Dit geldt ook wanneer de CPU volledig wordt belast met Prime95. Desalniettemin zijn de prestaties per watt nog steeds in het voordeel van de nieuwere 14e generatie CPU, dus het hogere stroomverbruik is niet per se een nadeel.
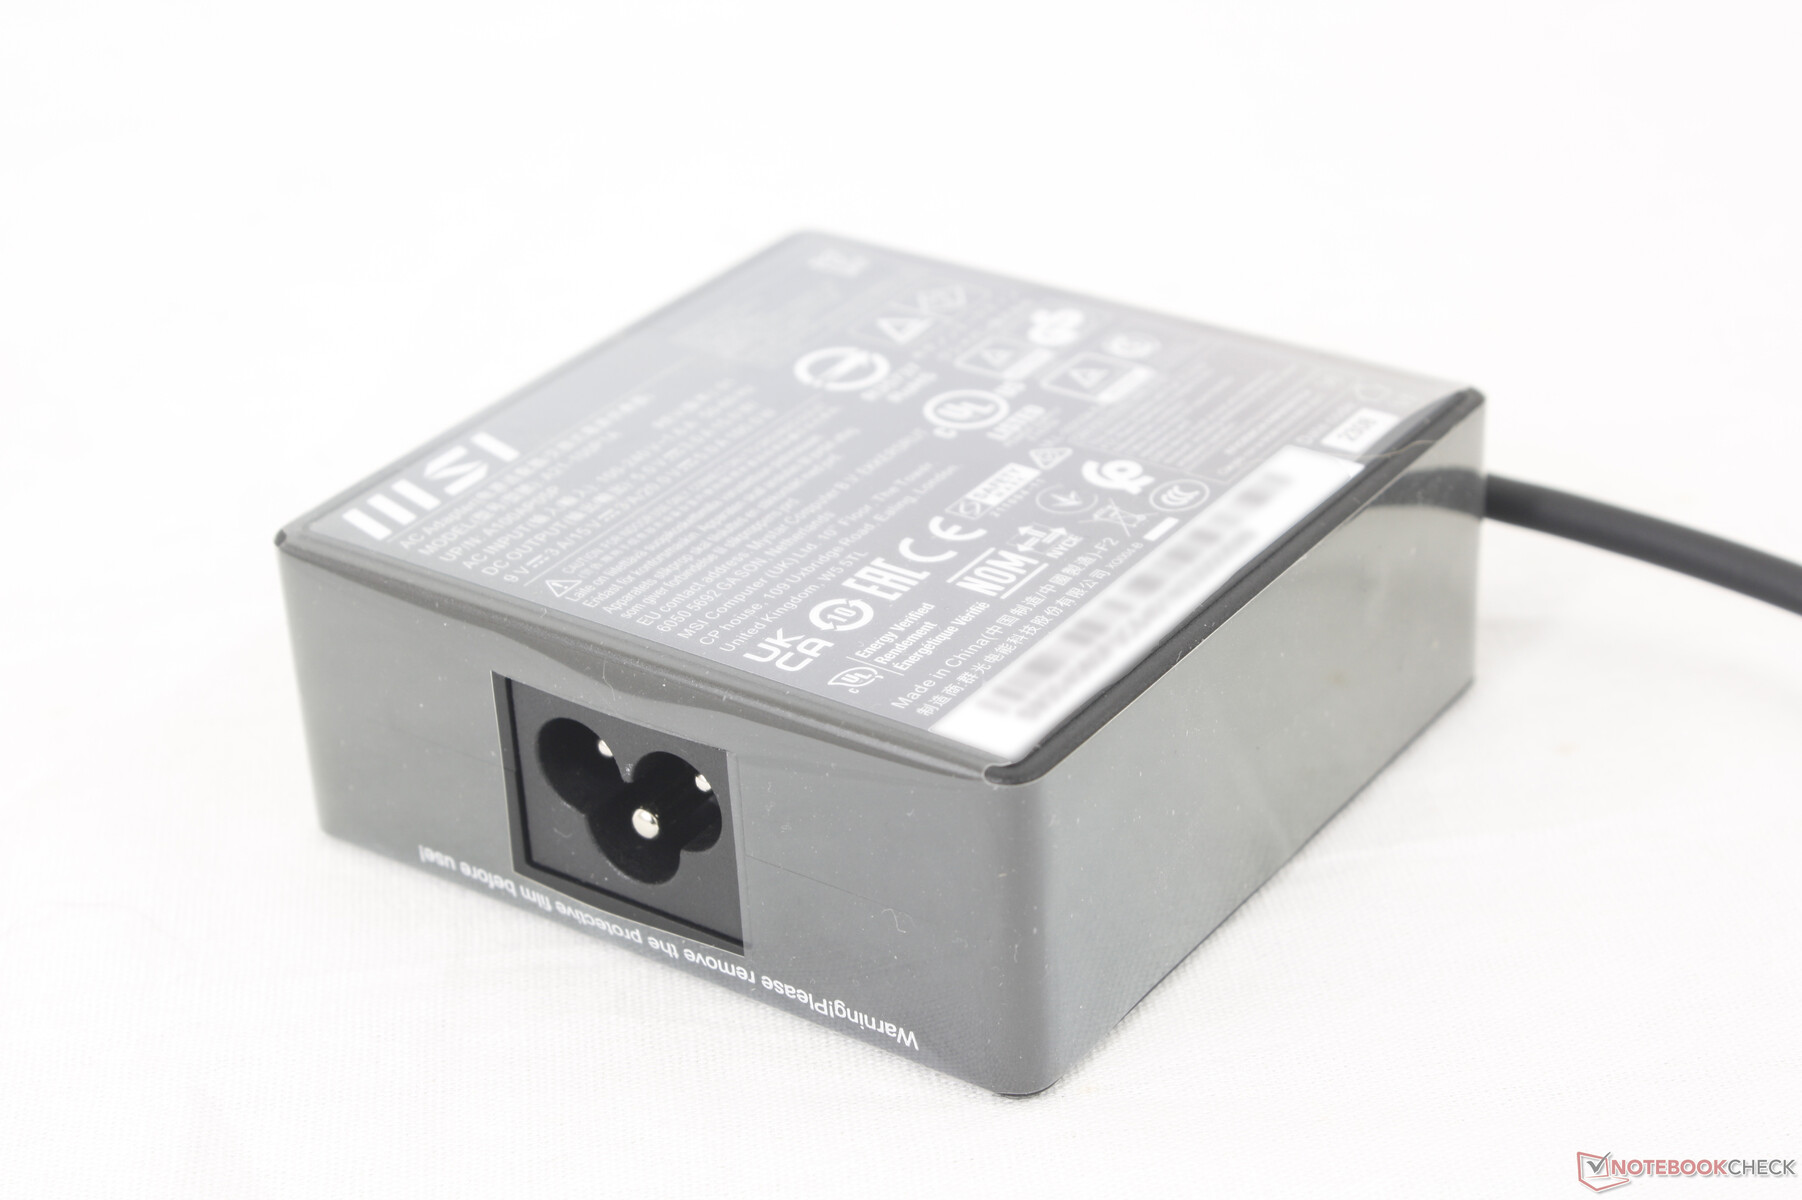
We zijn in staat om een maximaal stroomverbruik van 105 W te registreren van de kleine (~7,5 x 7,5 x 3 cm) 100 W USB-C AC-adapter wanneer de CPU voor 100% wordt gebruikt. Dit is slechts tijdelijk vanwege het beperkte Turbo Boost-potentieel en stabiliseert zich dus meestal rond de 70 W bij zware belasting. Merk op dat SKU's met een discrete RTX 4060 of 4070 grafische processor geleverd worden met een grotere 140 W USB-C wisselstroomadapter.

| Uit / Standby | |
| Inactief | |
| Belasting |
|
Key:
min: | |
| MSI Prestige 16 B1MG-001US Ultra 7 155H, Arc 8-Core, Samsung PM9A1 MZVL22T0HBLB, IPS, 2560x1600, 16" | MSI Prestige 15 A12UD-093 i7-1280P, GeForce RTX 3050 Ti Laptop GPU, Micron 3400 1TB MTFDKBA1T0TFH, IPS, 3840x2160, 15.6" | LG Gram 2in1 16 16T90R - G.AA78G i7-1360P, Iris Xe G7 96EUs, Samsung PM9A1 MZVL21T0HCLR, IPS, 2560x1600, 16" | Lenovo ThinkBook 16 G6 ABP R5 7530U, Vega 7, SK hynix HFS512GEJ9X125N, IPS, 1920x1200, 16" | Asus VivoBook Pro 16 K6602VU i9-13900H, GeForce RTX 4050 Laptop GPU, Micron 2400 MTFDKBA1T0QFM, OLED, 3200x2000, 16" | Dell Inspiron 16 Plus 7630 i7-13700H, GeForce RTX 4060 Laptop GPU, WD PC SN740 SDDPTQD-1T00, IPS, 2560x1600, 16" | |
|---|---|---|---|---|---|---|
| Power Consumption | -2% | 2% | 24% | -161% | -124% | |
| Idle Minimum * (Watt) | 3 | 5.4 -80% | 5.5 -83% | 3.7 -23% | 21.06 -602% | 15.6 -420% |
| Idle Average * (Watt) | 9.5 | 11.8 -24% | 7.2 24% | 7.1 25% | 24.27 -155% | 17.7 -86% |
| Idle Maximum * (Watt) | 12 | 12.7 -6% | 12.9 -8% | 7.7 36% | 25.12 -109% | 20.6 -72% |
| Load Average * (Watt) | 68.3 | 45.9 33% | 55 19% | 43.9 36% | 52.4 23% | 87.4 -28% |
| Witcher 3 ultra * (Watt) | 59.8 | 45.7 24% | 47 21% | 40.8 32% | 110.2 -84% | 121.7 -104% |
| Load Maximum * (Watt) | 104.8 | 63 40% | 63.6 39% | 66.6 36% | 146 -39% | 138 -32% |
* ... kleiner is beter
Power Consumption Witcher 3 / Stresstest
Power Consumption external Monitor
Levensduur batterij
De batterijcapaciteit is toegenomen van 80 Wh op de Prestige 15 tot 99 Wh op onze Prestige 16. Combineer dit met de efficiëntie van de nieuwe 14e generatie Intel CPU en u krijgt extreem lange runtimes van bijna 18,5 uur WLAN browsen in de praktijk. Dit is een van de langst meegaande Windows-laptops die we hebben getest, met resultaten die kunnen wedijveren met de MacBook-serie.
Opladen van leeg naar vol duurt ongeveer 90 minuten.
| MSI Prestige 16 B1MG-001US Ultra 7 155H, Arc 8-Core, 99.9 Wh | MSI Prestige 15 A12UD-093 i7-1280P, GeForce RTX 3050 Ti Laptop GPU, 80 Wh | LG Gram 2in1 16 16T90R - G.AA78G i7-1360P, Iris Xe G7 96EUs, 80 Wh | Lenovo ThinkBook 16 G6 ABP R5 7530U, Vega 7, 45 Wh | Asus VivoBook Pro 16 K6602VU i9-13900H, GeForce RTX 4050 Laptop GPU, 96 Wh | Dell Inspiron 16 Plus 7630 i7-13700H, GeForce RTX 4060 Laptop GPU, 86 Wh | |
|---|---|---|---|---|---|---|
| Batterijduur | -51% | -32% | -45% | -45% | -43% | |
| Reader / Idle (h) | 25.1 | 17.6 -30% | ||||
| WiFi v1.3 (h) | 18.3 | 8.9 -51% | 11.9 -35% | 10.1 -45% | 10.1 -45% | 9.4 -49% |
| Load (h) | 2.8 | 1.4 -50% | 2 -29% | 1.4 -50% | ||
| H.264 (h) | 7.1 | 11.6 | 9.8 |
Pro
Contra
Verdict - Prestige-serie op zijn best
de 14e generatie Intel zou een enorme zegen moeten blijken te zijn voor Ultrabooks zoals de MSI Prestige 16. Hoewel de ruwe CPU-prestaties niet veel beter zijn dan die van de vorige generatie, zijn de verbeteringen op het gebied van geïntegreerde grafische prestaties en accuduur aantoonbaar net zo belangrijk voor de Ultrabook-categorie. De Intel Arc 8 heeft met succes de AMD Radeon 780M met aanzienlijke marges verdrongen, zodat de meeste casual gamers en fotobewerkers tevreden zouden moeten zijn over de prestaties.
Een paar aspecten van het model kunnen verbeterd worden. Ten eerste betekent het ontbreken van een hoge verversingssnelheid of touchscreen opties dat alternatieven zoals de HP Spectre of Asus Vivobook nog steeds enkele voordelen hebben. Ten tweede is ghosting erg merkbaar op de IPS-configuratie, zodat zelfs casual gamers er last van kunnen hebben. De OLED SKU kan daarom de moeite waard zijn, ondanks de onvermijdelijke aanslag op de levensduur van de batterij. En tot slot gaan de hogere iGPU-prestaties ten koste van een hoger energieverbruik en een luider ventilatorgeluid dan bij de meeste andere Ultrabooks uit de U-serie wanneer er GPU-intensieve taken worden uitgevoerd.
Vooral studenten zullen de lange batterijlevensduur, het scherpe DCI-P3-scherm en het brede scala aan grafische opties van de Prestige 16 een waardig alternatief vinden voor de MacBook Pro.
Het draagbare ontwerp, het kleurrijke scherm, de lange batterijlevensduur, de snelle geïntegreerde grafische processor en de snelle SD-kaartlezer zijn de belangrijkste pluspunten van de Prestige 16. Gebruikers zullen deze sterke punten willen benutten om het maximale uit het MSI-model te halen.
Prijs en beschikbaarheid
De MSI Prestige 16 met 14e generatie CPU is nu overal verkrijgbaar op Amazon met OLED voor $1650 USD of Best Buy met discrete Arc A370M graphics voor $1400.
MSI Prestige 16 B1MG-001US
- 28-12-2023 v7 (old)
Allen Ngo
Transparantie
De selectie van te beoordelen apparaten wordt gemaakt door onze redactie. Het proefexemplaar werd door de auteur op eigen kosten vrijelijk aangekocht. De kredietverstrekker had geen invloed op deze recensie, noch ontving de fabrikant vóór publicatie een exemplaar van deze recensie. Er bestond geen verplichting om deze recensie te publiceren. Als onafhankelijk mediabedrijf is Notebookcheck niet onderworpen aan het gezag van fabrikanten, detailhandelaren of uitgevers.
[transparency_disclaimer]Dit is hoe Notebookcheck test
Elk jaar beoordeelt Notebookcheck onafhankelijk honderden laptops en smartphones met behulp van gestandaardiseerde procedures om ervoor te zorgen dat alle resultaten vergelijkbaar zijn. We hebben onze testmethoden al zo'n 20 jaar voortdurend ontwikkeld en daarbij de industriestandaard bepaald. In onze testlaboratoria wordt gebruik gemaakt van hoogwaardige meetapparatuur door ervaren technici en redacteuren. Deze tests omvatten een validatieproces in meerdere fasen. Ons complexe beoordelingssysteem is gebaseerd op honderden goed onderbouwde metingen en benchmarks, waardoor de objectiviteit behouden blijft. Meer informatie over onze testmethoden kunt u hier vinden.
Price comparison

