Alienware m16 R2 laptop test: Grote en riskante veranderingen

De Alienware m16 R2 is de opvolger van de m16 R1maar niet op de manier die u zou verwachten. Het nieuwe model is een compleet herontwerp en heroverweging van de m16-serie in een poging om zowel gamers als algemene gebruikers aan te trekken, terwijl andere Alienware-producten gericht zijn op hardcore gamers. Dit alleen al maakt de m16 R2 een van de meest interessante Alienware-laptops in jaren, omdat het een aantal high-end CPU- en GPU-opties opoffert die anders beschikbaar waren op de m16 R1, ten gunste van een kleiner ontwerp.
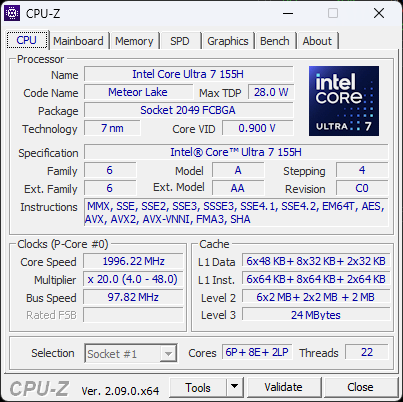
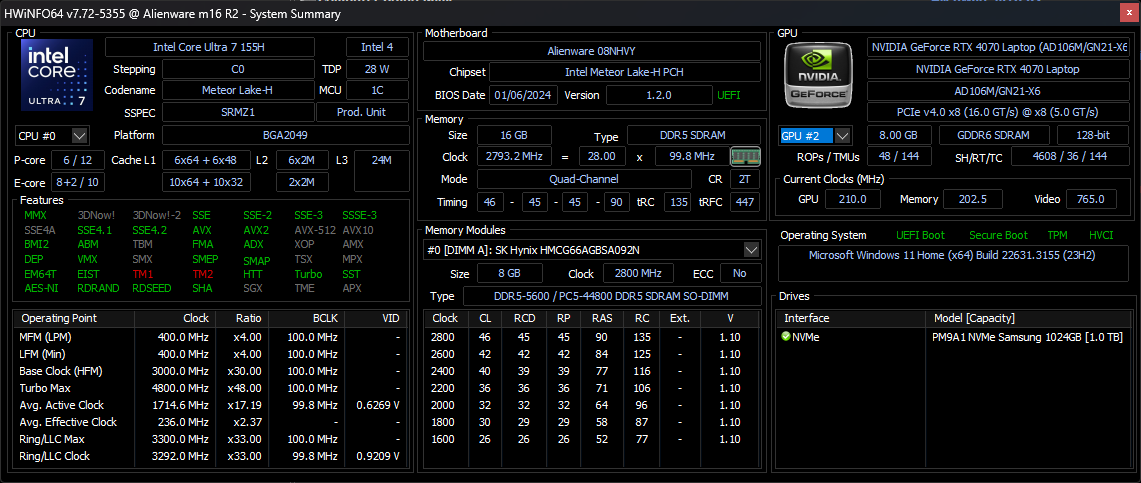
Onze reviewunit is een high-end configuratie met de Meteor Lake-H Core Ultra 7 155H CPU, GeForce RTX 4070 GPU en 1600p 240 Hz IPS-scherm voor ongeveer $1850 USD. De goedkopere SKU's kunnen worden geconfigureerd met de RTX 4050 of 4060 en de duurdere SKU's bevatten de Core Ultra 9, maar alle configuraties zijn verder beperkt tot hetzelfde 1600p240 IPS-beeldscherm en alleen de RTX 4070.
Alternatieven voor de Alienware m16 R2 zijn andere krachtige 16-inch laptops zoals de Razer Blade 16, HP Omen Transcend 16, Asus ROG Zephyrus G16of Lenovo Legion Slim 7 16.
Meer Alienware beoordelingen:
Potentiële concurrenten in vergelijking
Evaluatie | Datum | Model | Gewicht | Hoogte | Formaat | Resolutie | Beste prijs |
|---|---|---|---|---|---|---|---|
| 90.2 % v7 (old) | 03-2024 | Alienware m16 R2 Ultra 7 155H, GeForce RTX 4070 Laptop GPU | 2.5 kg | 23.5 mm | 16.00" | 2560x1600 | |
| 88.3 % v7 (old) | 09-2023 | Alienware m16 R1 Intel i7-13700HX, GeForce RTX 4060 Laptop GPU | 3 kg | 25.4 mm | 16.00" | 2560x1600 | |
| 88.4 % v7 (old) | 06-2023 | Alienware x16 R1 i9-13900HK, GeForce RTX 4080 Laptop GPU | 2.6 kg | 18.57 mm | 16.00" | 2560x1600 | |
| 88.4 % v7 (old) | 02-2024 | HP Omen Transcend 16-u1095ng i9-14900HX, GeForce RTX 4070 Laptop GPU | 2.3 kg | 20 mm | 16.00" | 2560x1600 | |
| 92.3 % v7 (old) | 02-2024 | Asus ROG Zephyrus G16 2024 GU605M Ultra 7 155H, GeForce RTX 4070 Laptop GPU | 1.8 kg | 16.4 mm | 16.00" | 2560x1600 | |
| 90.4 % v7 (old) | 11-2023 | Lenovo Legion Slim 7 16APH8 R7 7840HS, GeForce RTX 4060 Laptop GPU | 2.1 kg | 20 mm | 16.00" | 2560x1600 |
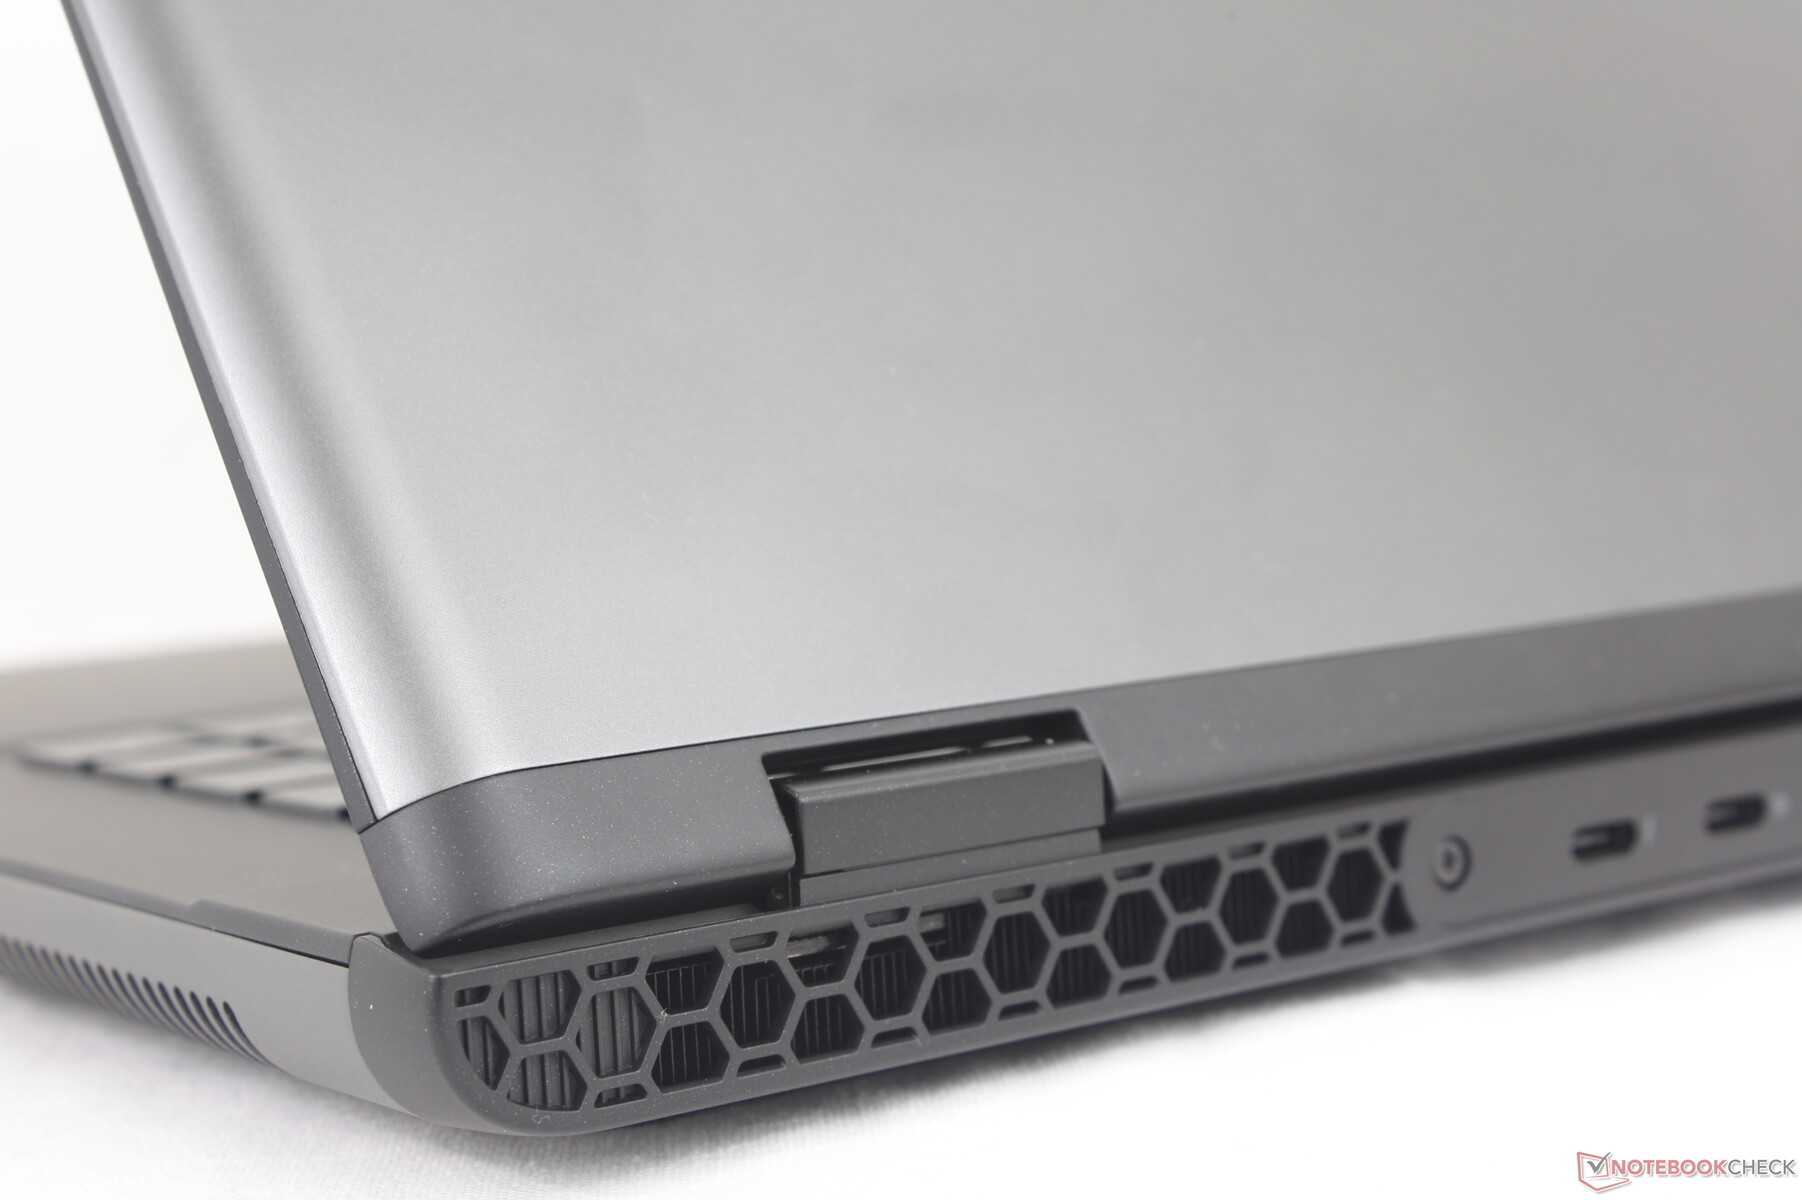
Zaak - Legende 3.0 opnieuw gedefinieerd
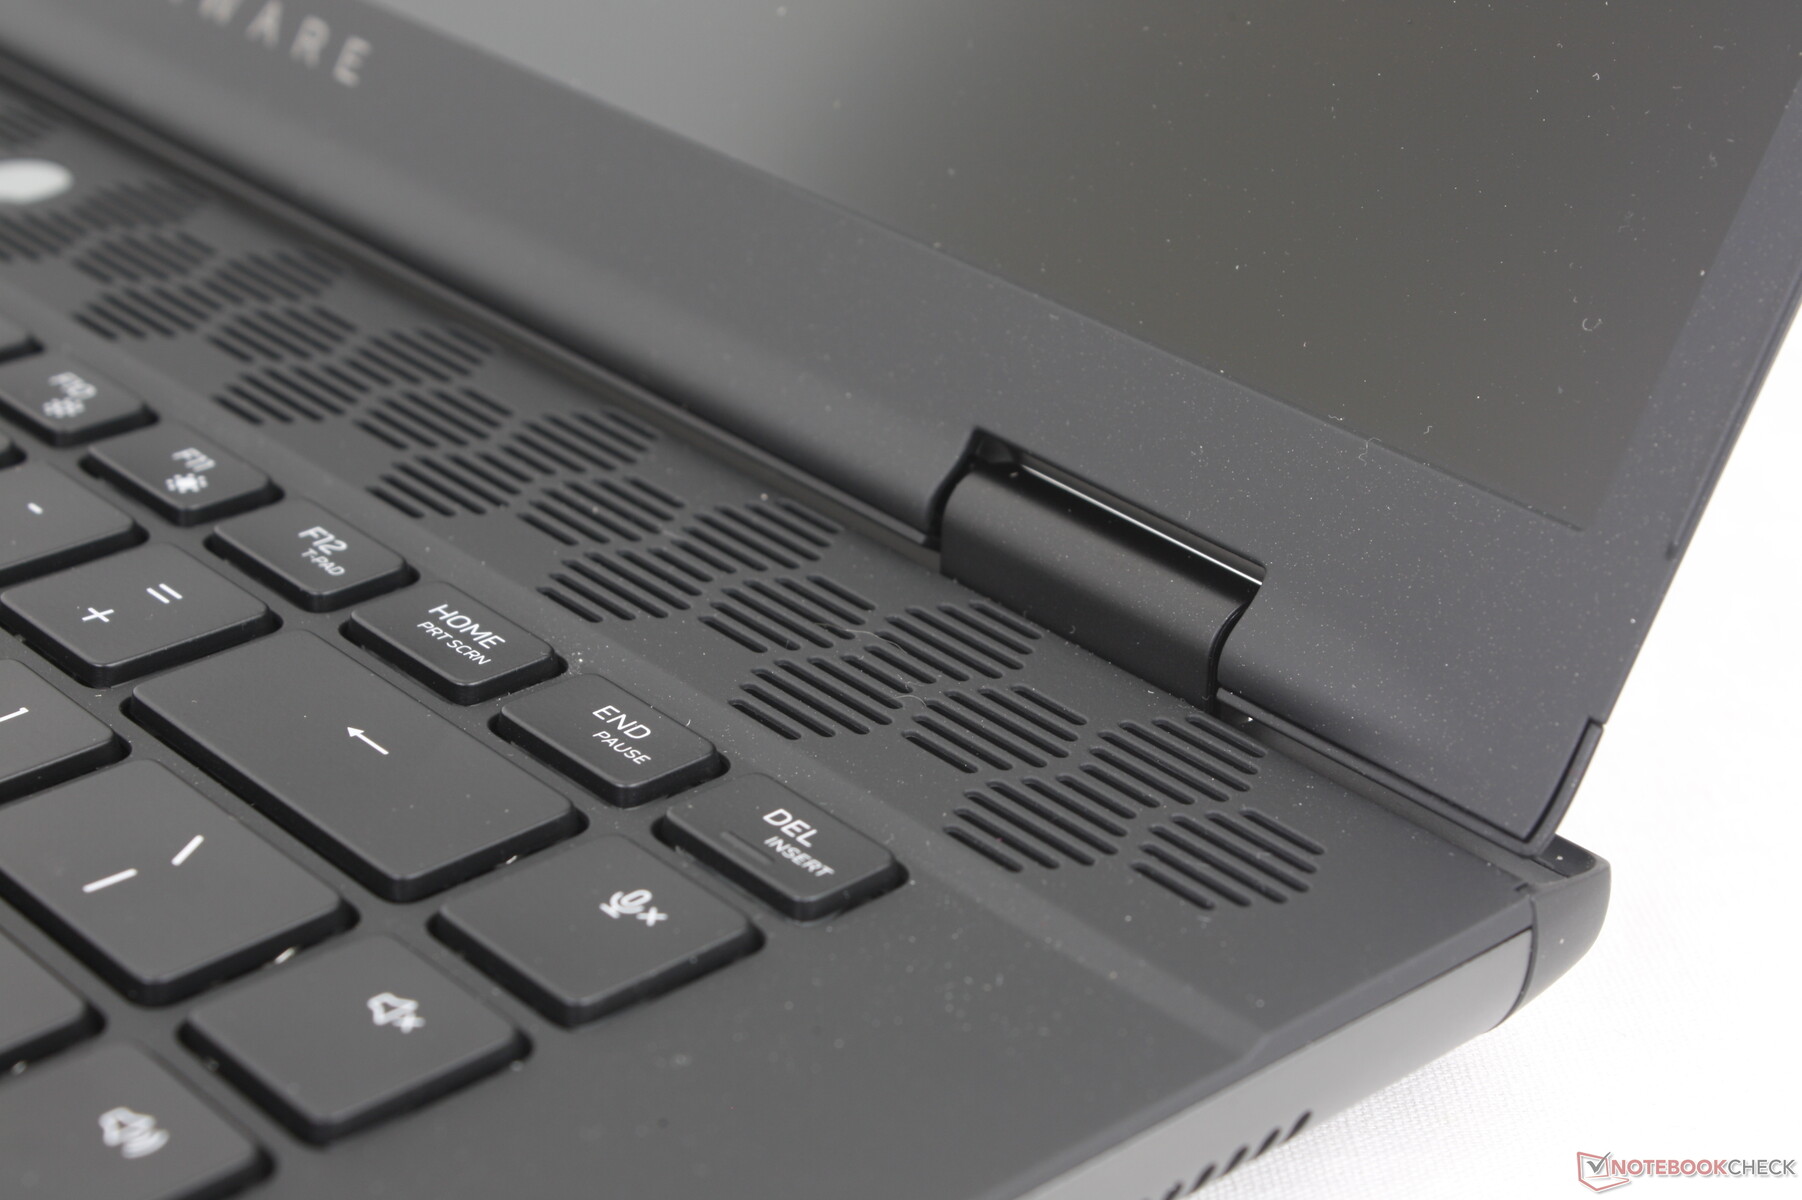
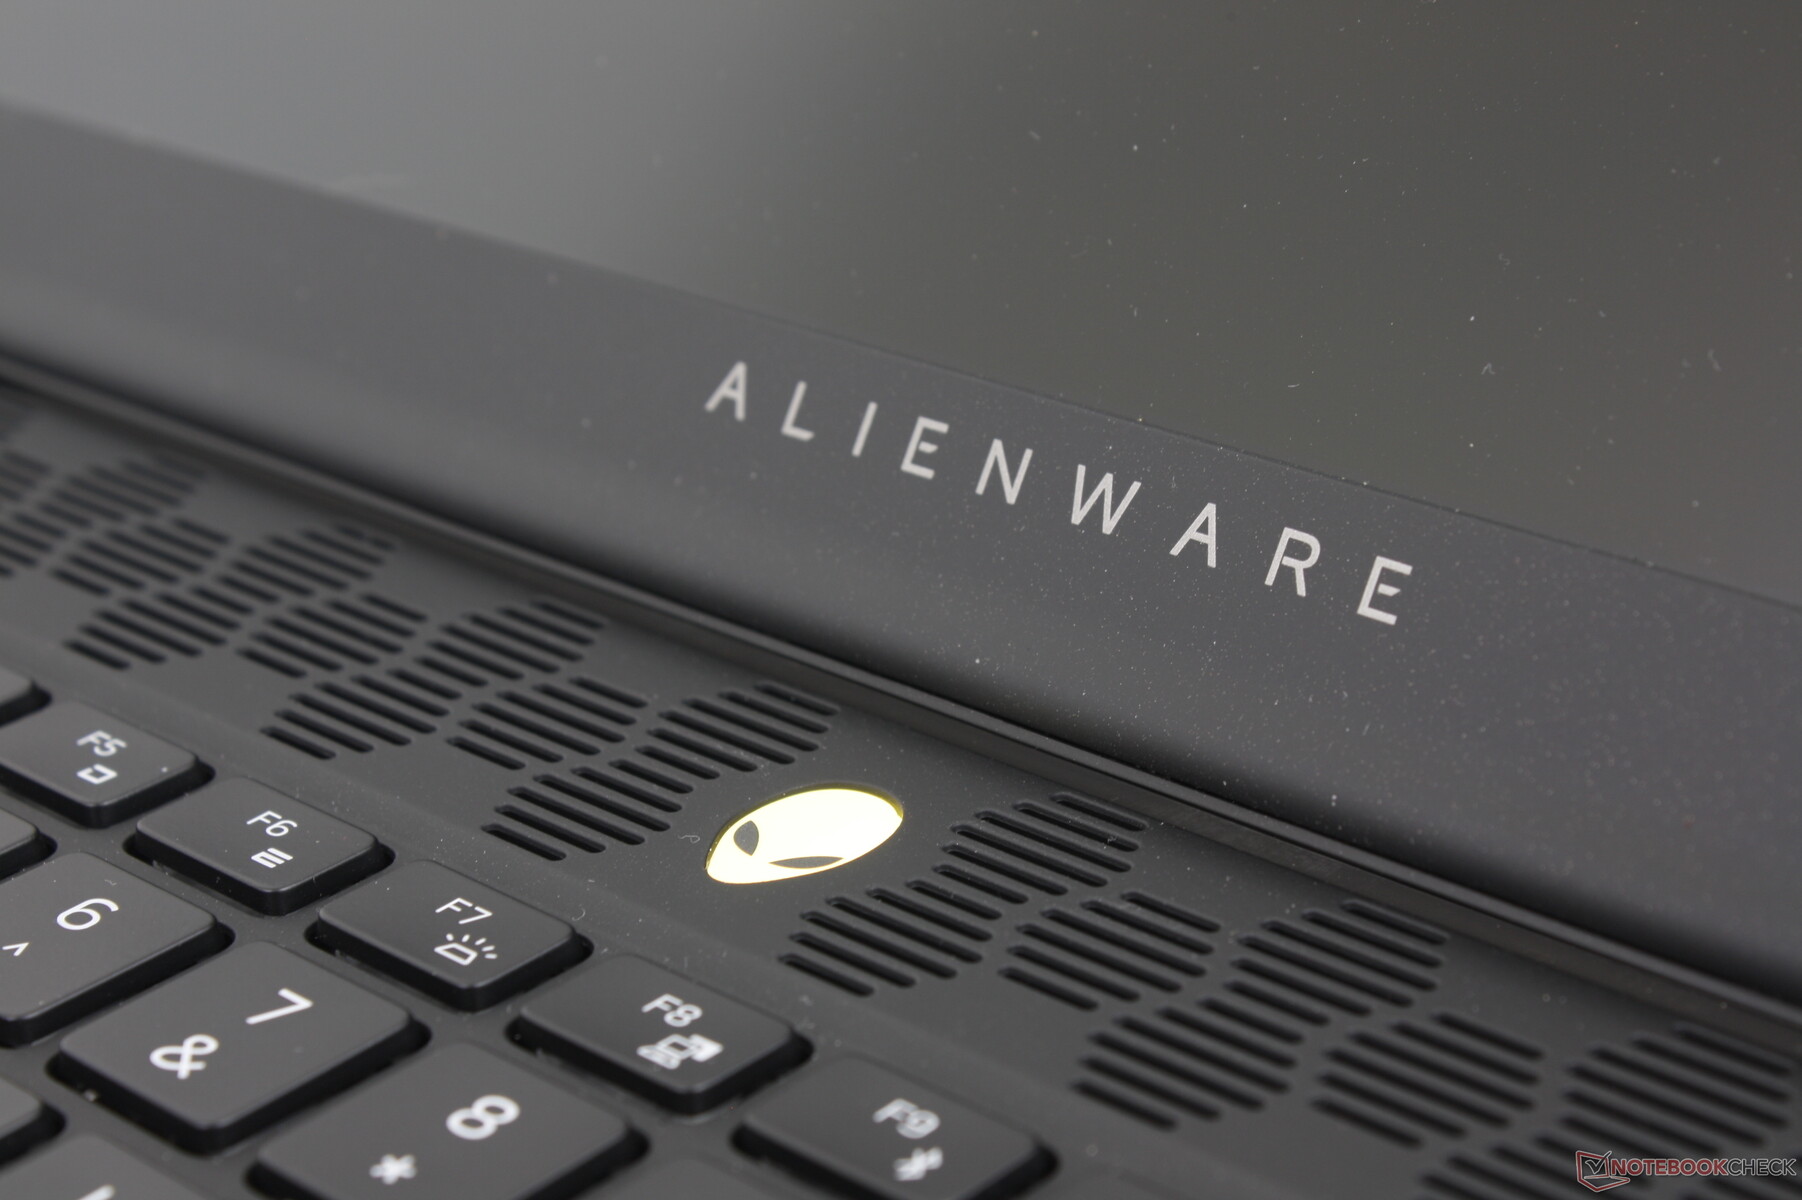
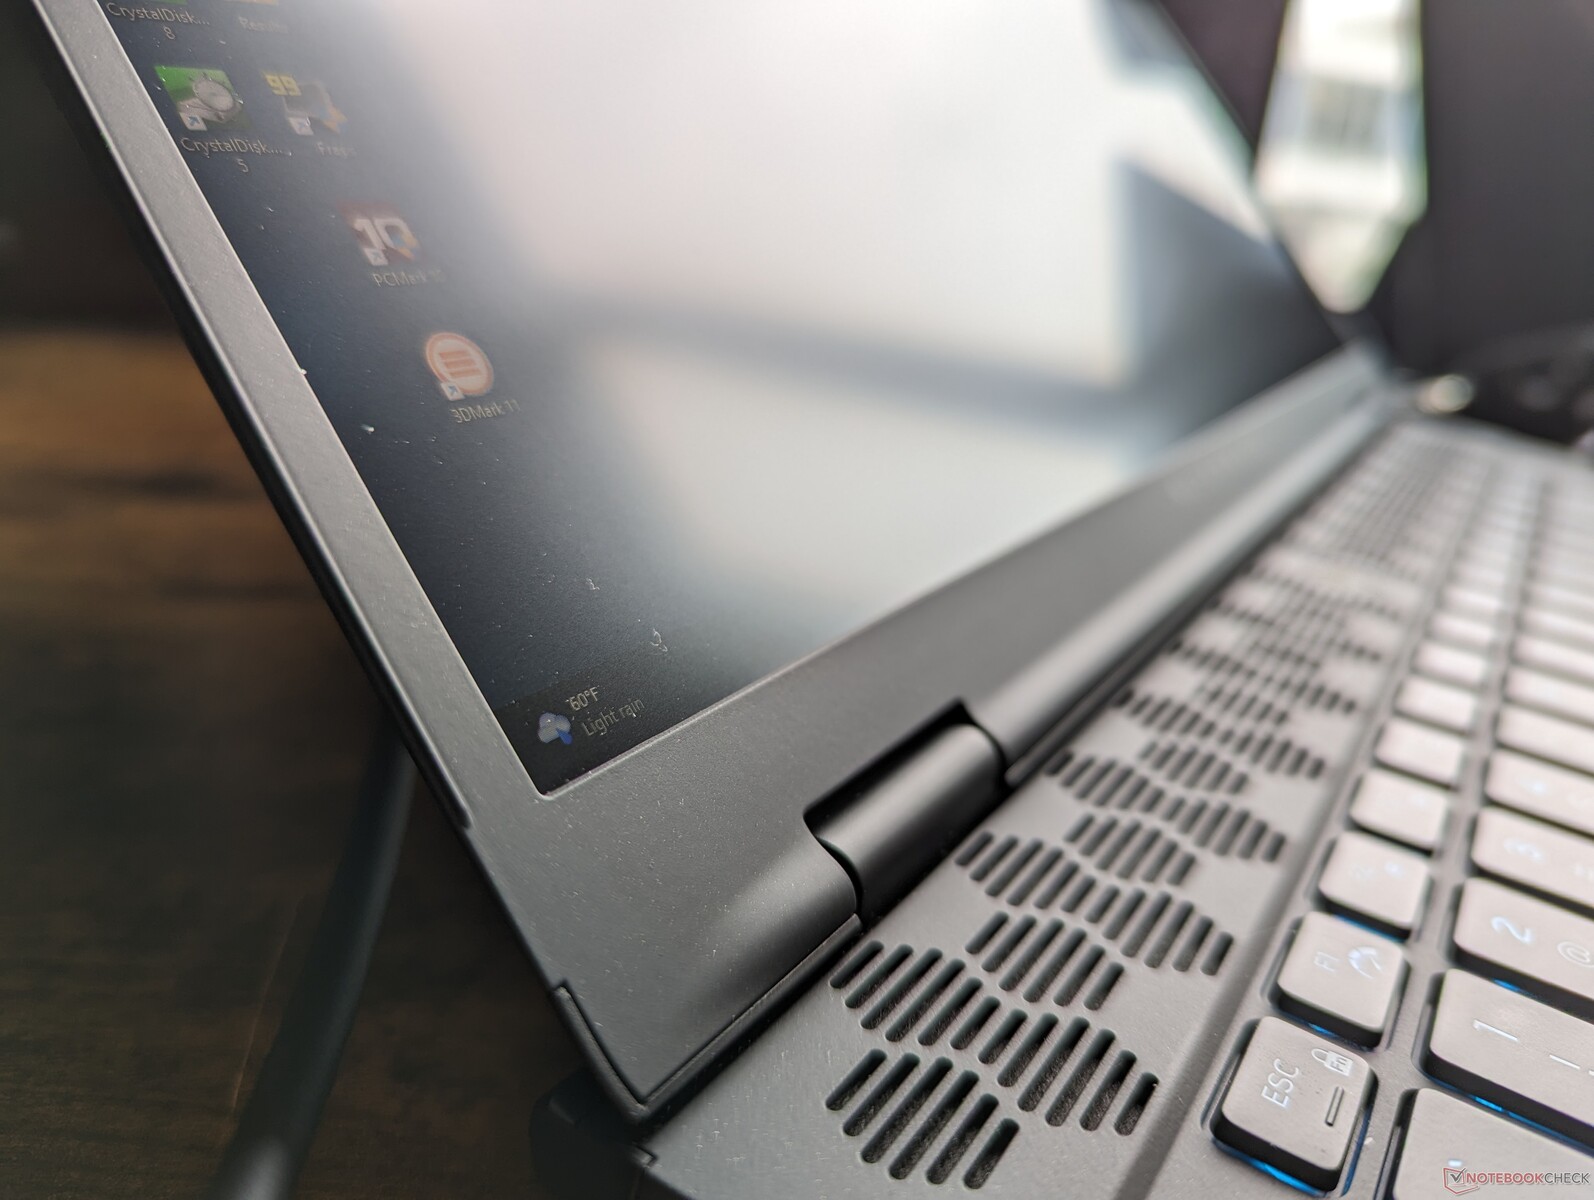
De Alienware m16 R1 is nog geen jaar oud en Dell introduceert nu al een herzien chassisontwerp met de m16 R2. De meest in het oog springende verandering is de verwijdering van het uitstekende thermische dek aan de achterkant voor een veel kleinere footprint dan voorheen. De RGB LED-ring aan de achterkant is nu verdwenen en het toetsenbord is omhoog geduwd om ruimte te maken voor zowel grotere palmsteunen als een groter clickpad.
De materialen van het chassis zijn verder hetzelfde gebleven voor vergelijkbare texturen en indrukken. De stijfheid is niet noemenswaardig veranderd, dus het apparaat voelt van boven tot onder nog steeds behoorlijk sterk aan, zonder grote kraken of duidelijke zwakke punten.
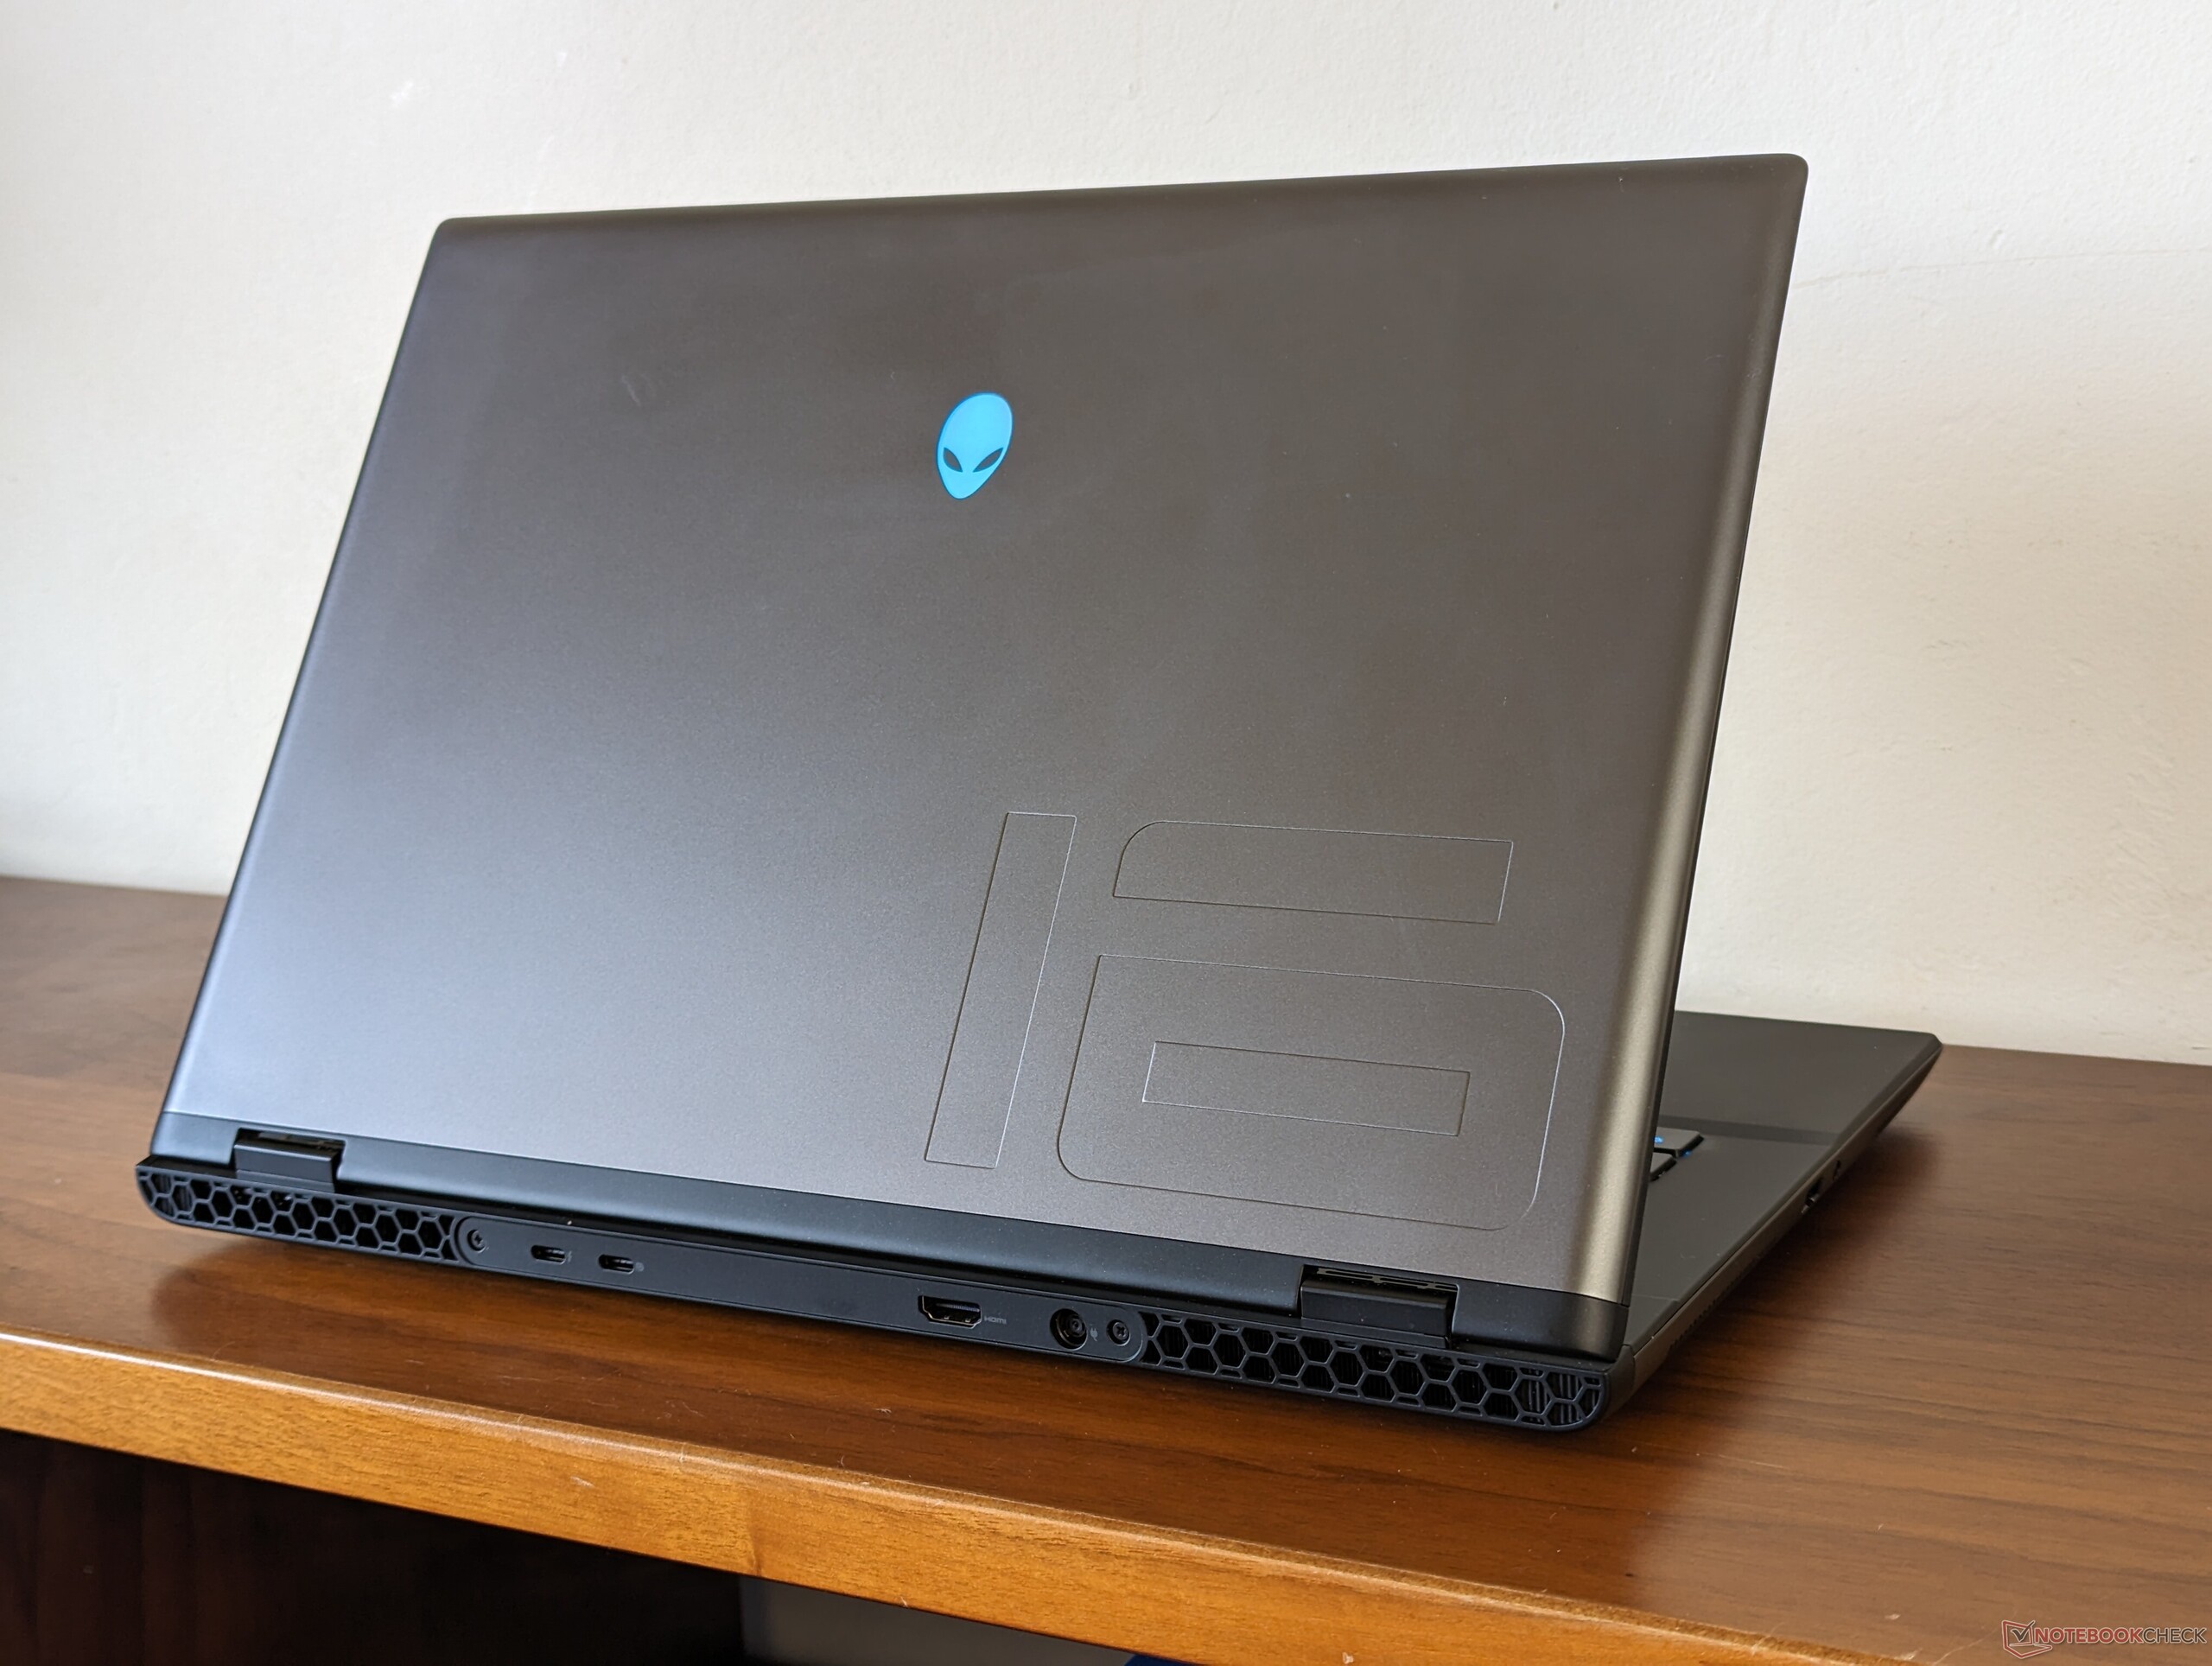
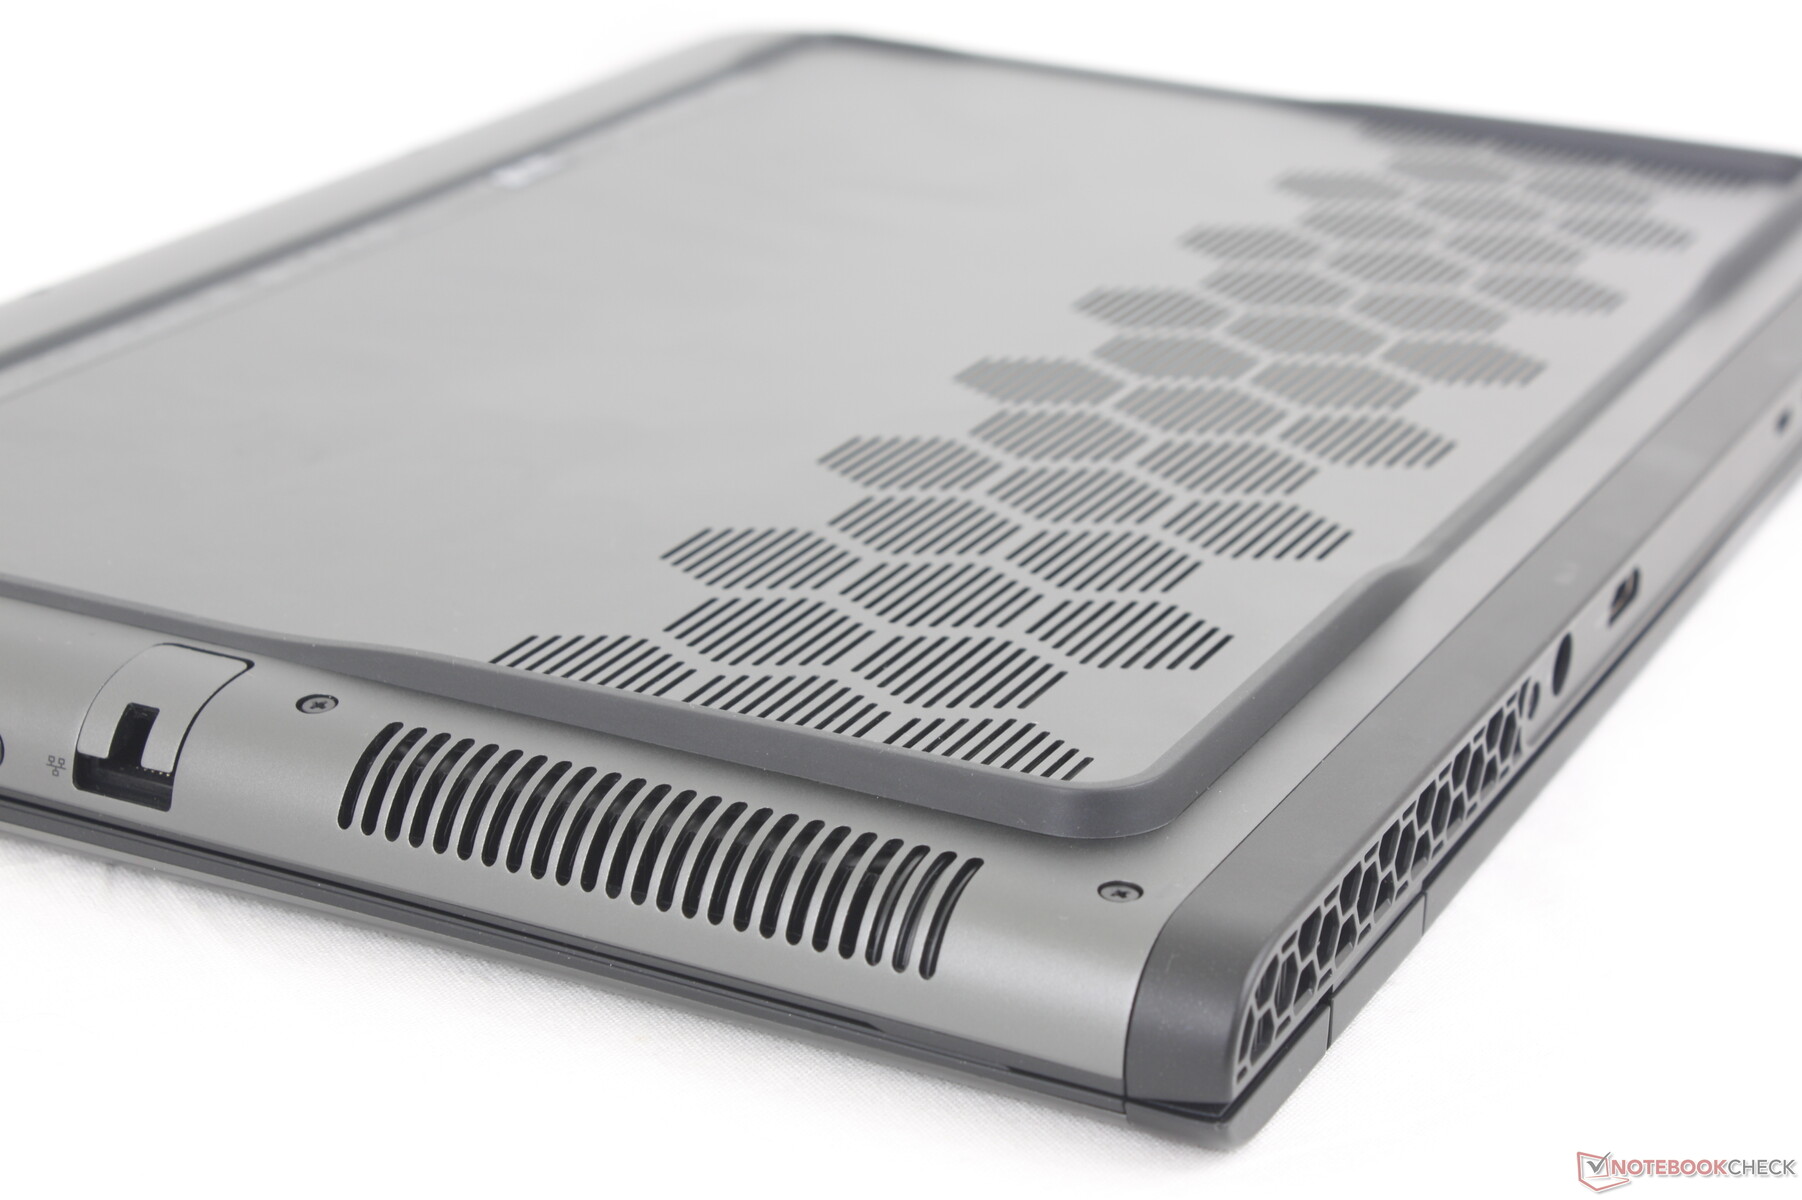
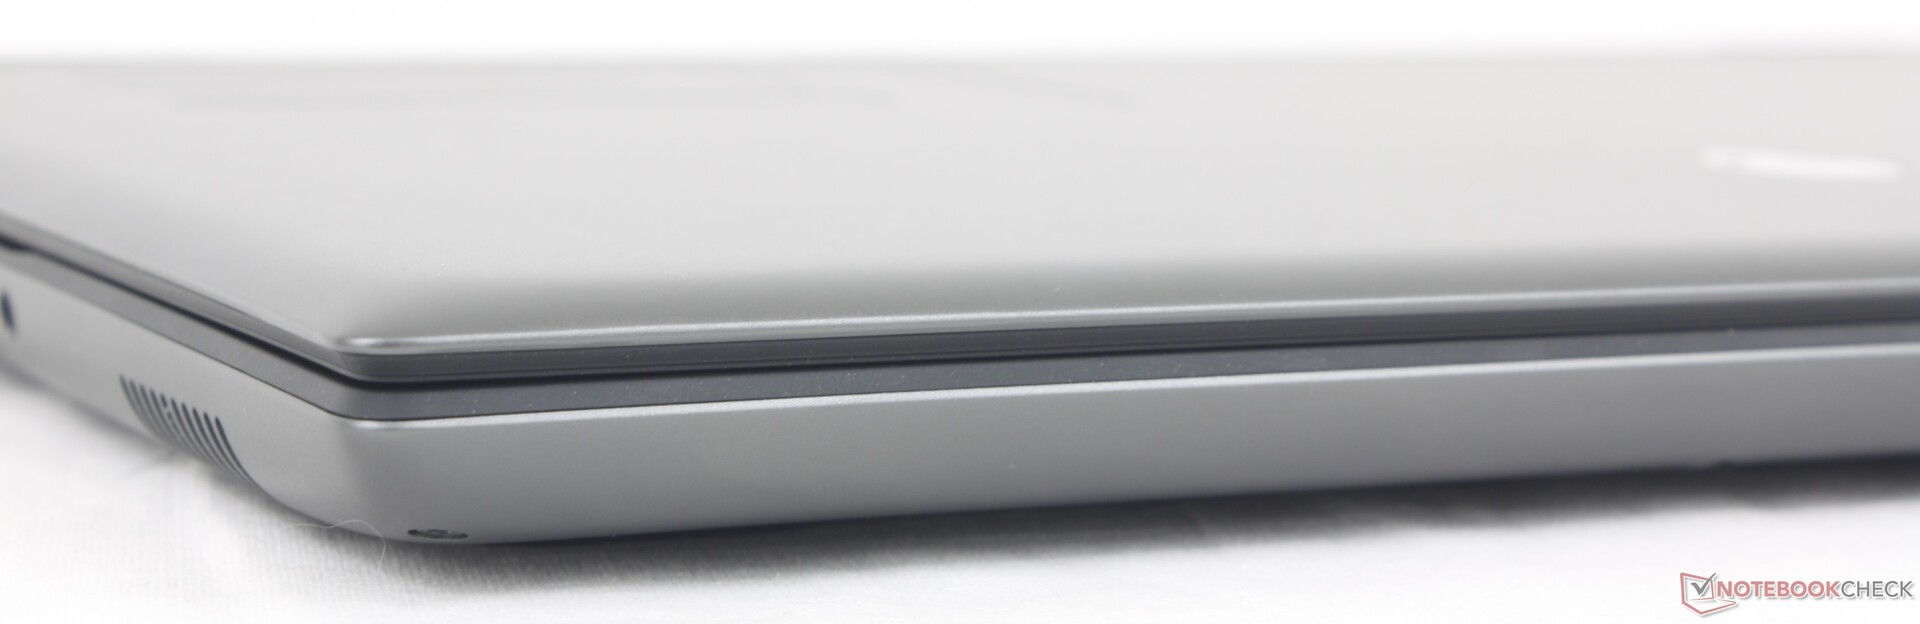
De aanzienlijke veranderingen aan het chassis hebben geleid tot aanzienlijke besparingen in zowel gewicht als afmetingen. De m16 R2 is ongeveer 17 procent lichter en 22 procent kleiner dan de m16 R1 voor een betere draagbaarheid. Het kleinere oppervlak zorgt er ook voor dat het systeem in kleinere rugzakken past, aangezien de bredere afmetingen van de oorspronkelijke m16 R1 grotere tassen zouden vereisen.
De kleinere afmetingen zijn niet genoeg om de m16 R2 de kleinste in zijn categorie te maken, want zowel de Razer Blade 16 en Asus Zephyrus G16 nog steeds lichter en kleiner zijn.
Connectiviteit - Alle basisbeginselen zijn hier
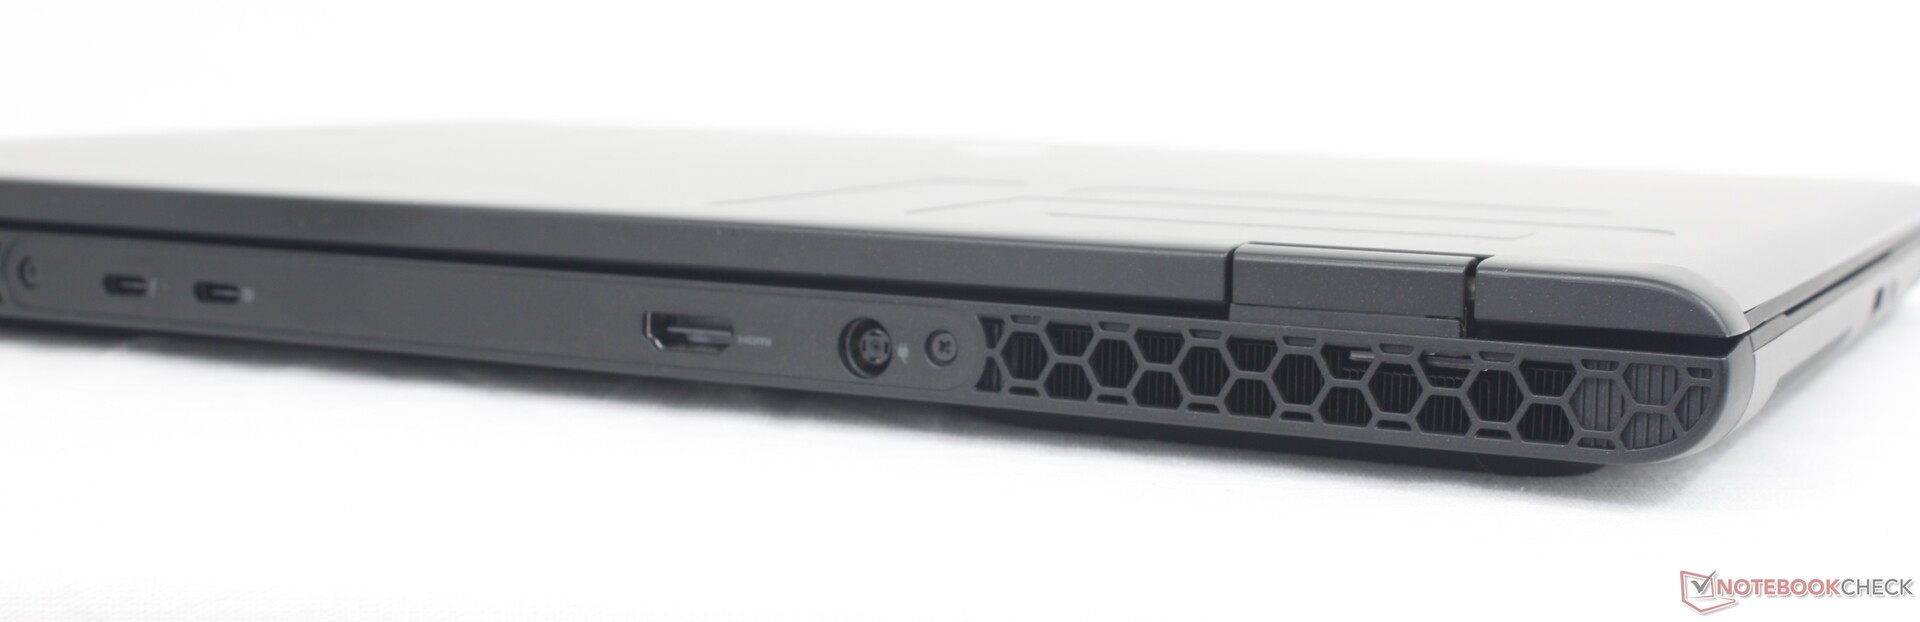
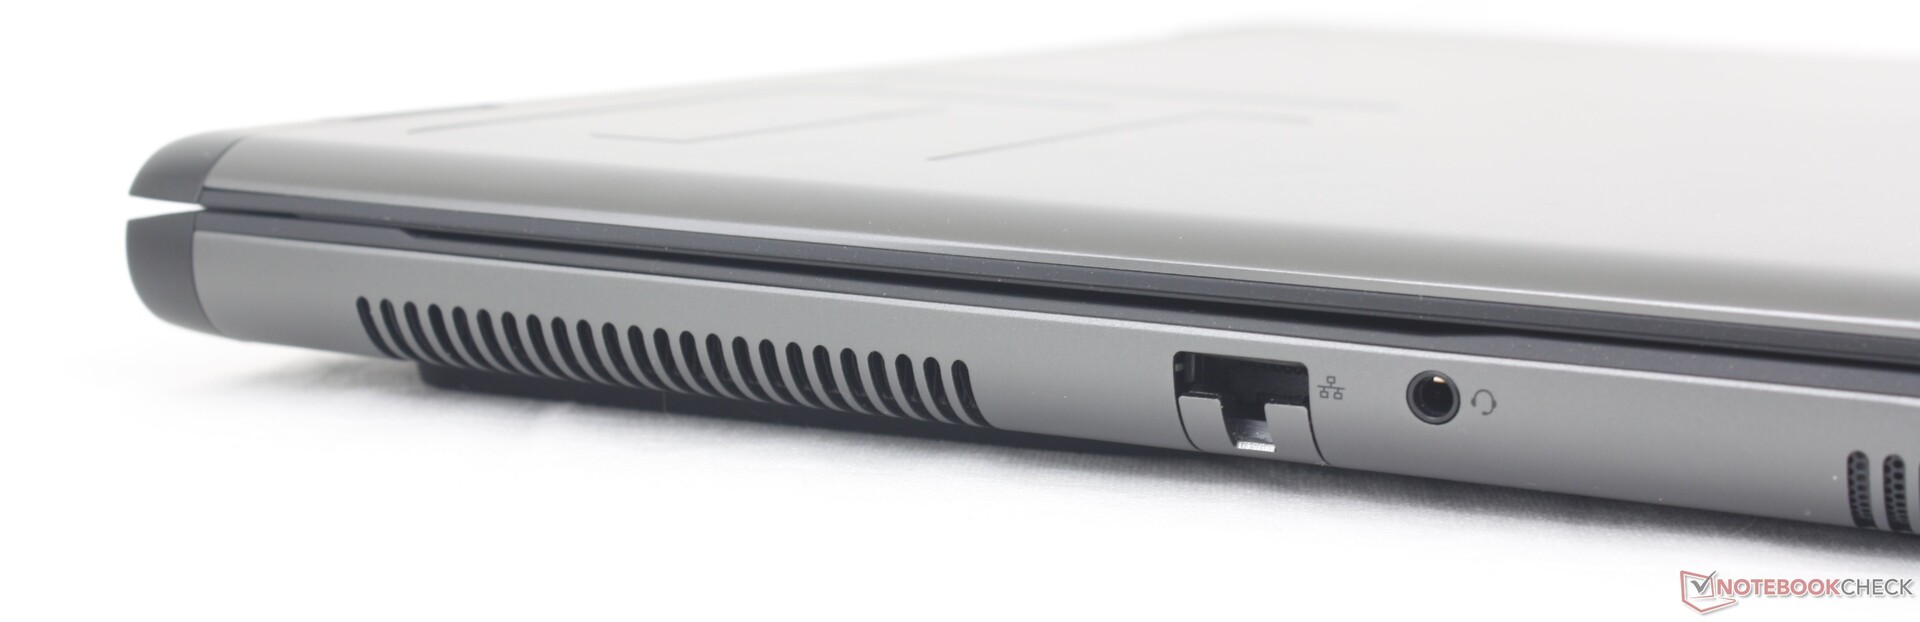
Alle poorten van de m16 R1 van vorig jaar zijn terug, behalve de mini-DisplayPort. De plaatsing van de poorten is veranderd: RJ-45 en de audio-aansluiting zijn naar de linkerrand verplaatst, terwijl de meeste poorten op de m16 R1 onhandig langs de achterkant zaten.
Houd er rekening mee dat slechts één van de twee USB-C poorten Power Delivery ondersteunt. Beide zijn verder compatibel met externe beeldschermen.
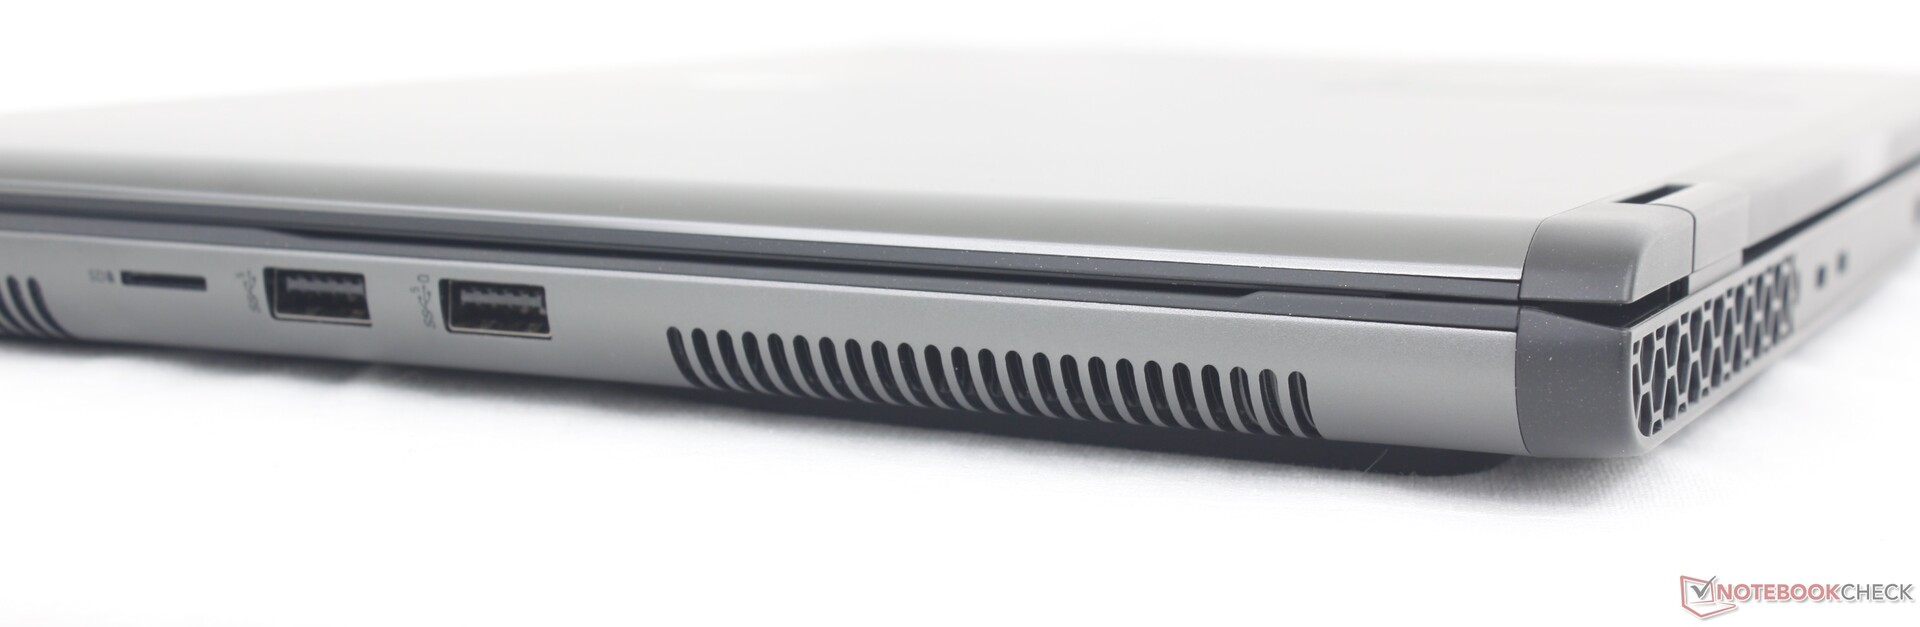
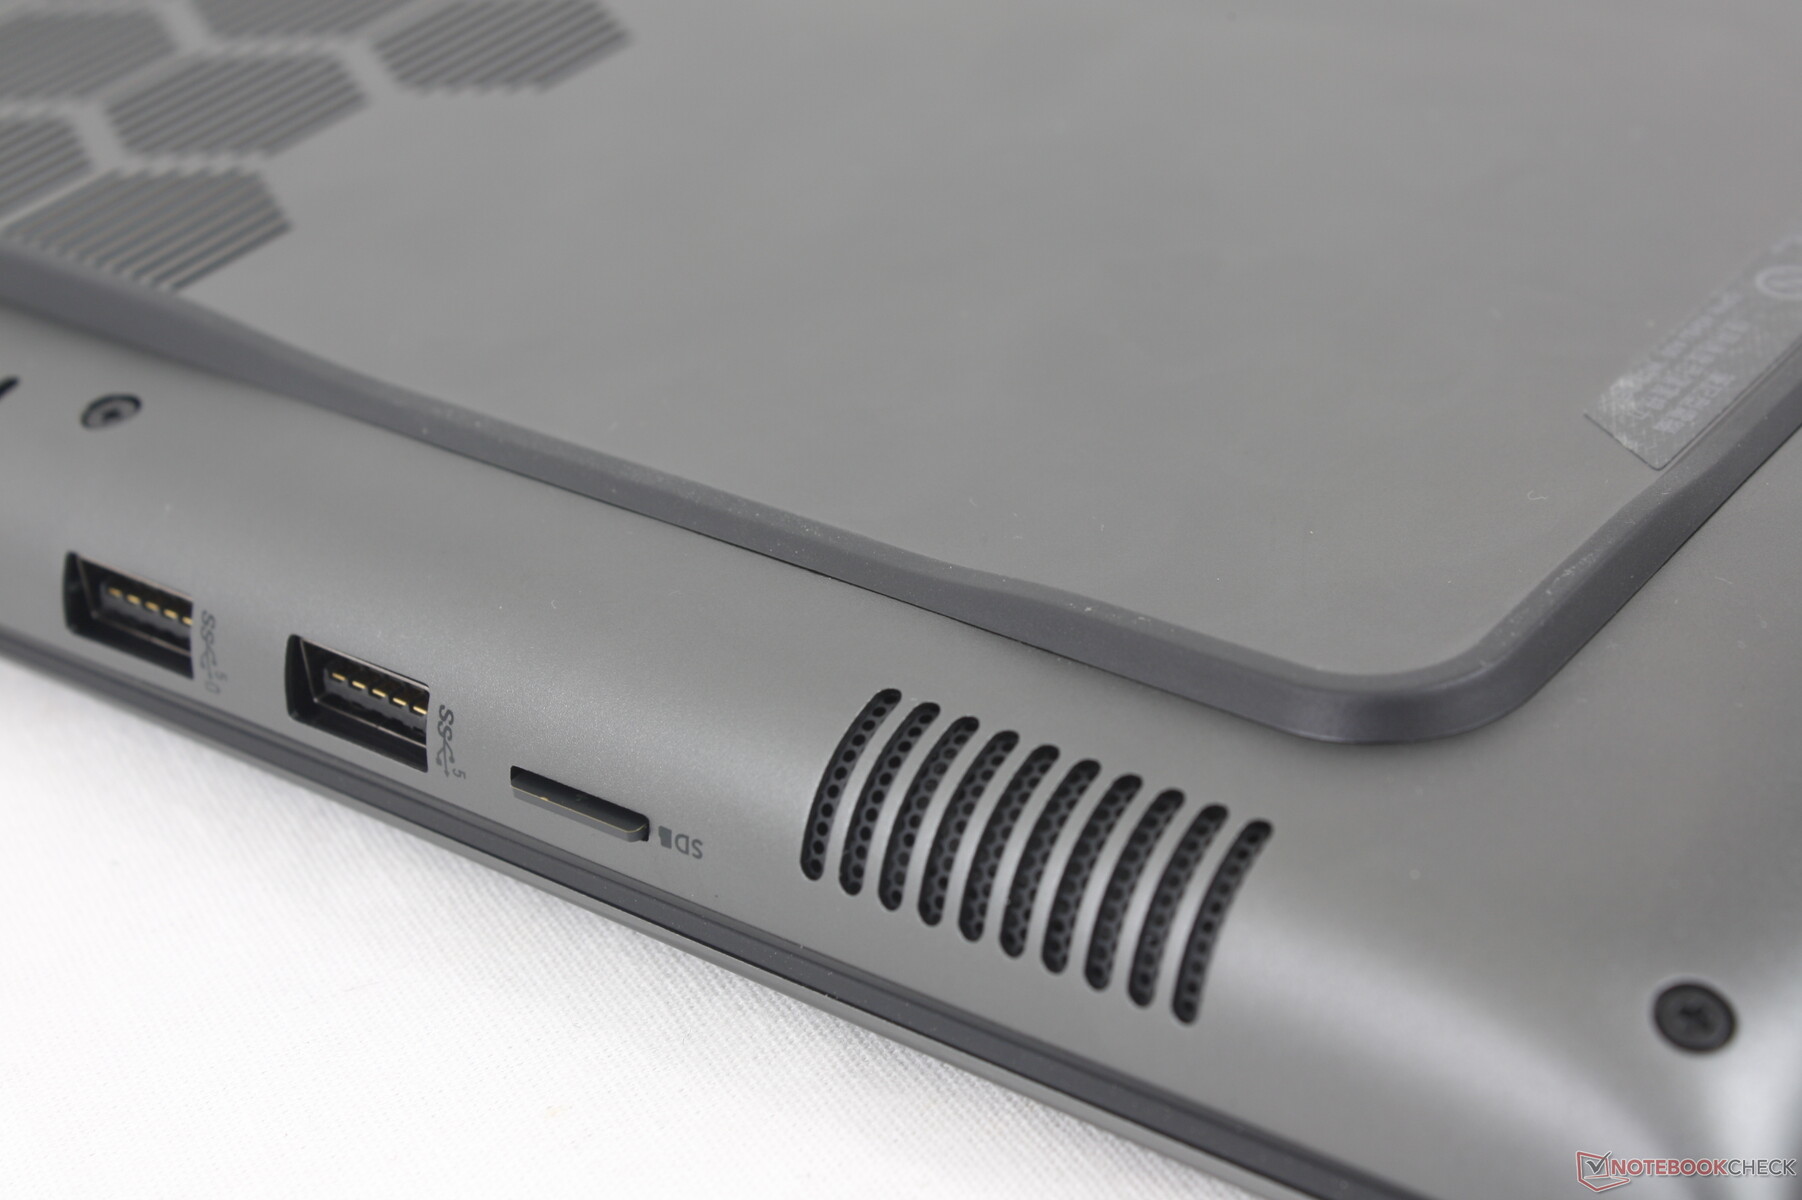
SD-kaartlezer
Terwijl de m16 R1 een full-size SD-lezer had, heeft de m16 R2 zich helaas teruggetrokken tot een MicroSD-lezer, wat sommige contentmakers kan irriteren. Ondanks de overstap naar MicroSD zijn de overdrachtsnelheden ongeveer gelijk aan die van de m16 R1.
| SD Card Reader | |
| average JPG Copy Test (av. of 3 runs) | |
| Alienware m16 R1 Intel (AV PRO microSD 128 GB V60) | |
| Lenovo Legion Slim 7 16APH8 (AV PRO microSD 128 GB V60) | |
| Asus ROG Zephyrus G16 2024 GU605M | |
| Alienware m16 R2 (AV PRO microSD 128 GB V60) | |
| Alienware x16 R1 (AV PRO microSD 128 GB V60) | |
| maximum AS SSD Seq Read Test (1GB) | |
| Alienware x16 R1 (AV PRO microSD 128 GB V60) | |
| Alienware m16 R2 (AV PRO microSD 128 GB V60) | |
| Alienware m16 R1 Intel (AV PRO microSD 128 GB V60) | |
| Asus ROG Zephyrus G16 2024 GU605M | |
| Lenovo Legion Slim 7 16APH8 (AV PRO microSD 128 GB V60) | |
Communicatie
De Intel Killer AX1675 wordt standaard geleverd voor Wi-Fi 6E-connectiviteit met een optie om te upgraden naar de BE202 voor Wi-Fi 7-compatibiliteit. We hebben geen problemen ondervonden bij het koppelen met onze Asus AXE11000 testrouter.
| Networking | |
| iperf3 transmit AXE11000 | |
| Asus ROG Zephyrus G16 2024 GU605M | |
| HP Omen Transcend 16-u1095ng | |
| Alienware m16 R1 Intel | |
| Alienware m16 R2 | |
| Alienware x16 R1 | |
| Lenovo Legion Slim 7 16APH8 | |
| iperf3 receive AXE11000 | |
| Lenovo Legion Slim 7 16APH8 | |
| HP Omen Transcend 16-u1095ng | |
| Alienware m16 R1 Intel | |
| Asus ROG Zephyrus G16 2024 GU605M | |
| Alienware x16 R1 | |
| Alienware m16 R2 | |
| iperf3 transmit AXE11000 6GHz | |
| Alienware m16 R2 | |
| Alienware x16 R1 | |
| iperf3 receive AXE11000 6GHz | |
| Alienware m16 R2 | |
| Alienware x16 R1 | |
Webcam
Een 2 MP webcam wordt standaard geleverd met IR voor Windows Hello ondersteuning. Er is geen geïntegreerde privacy shutter.


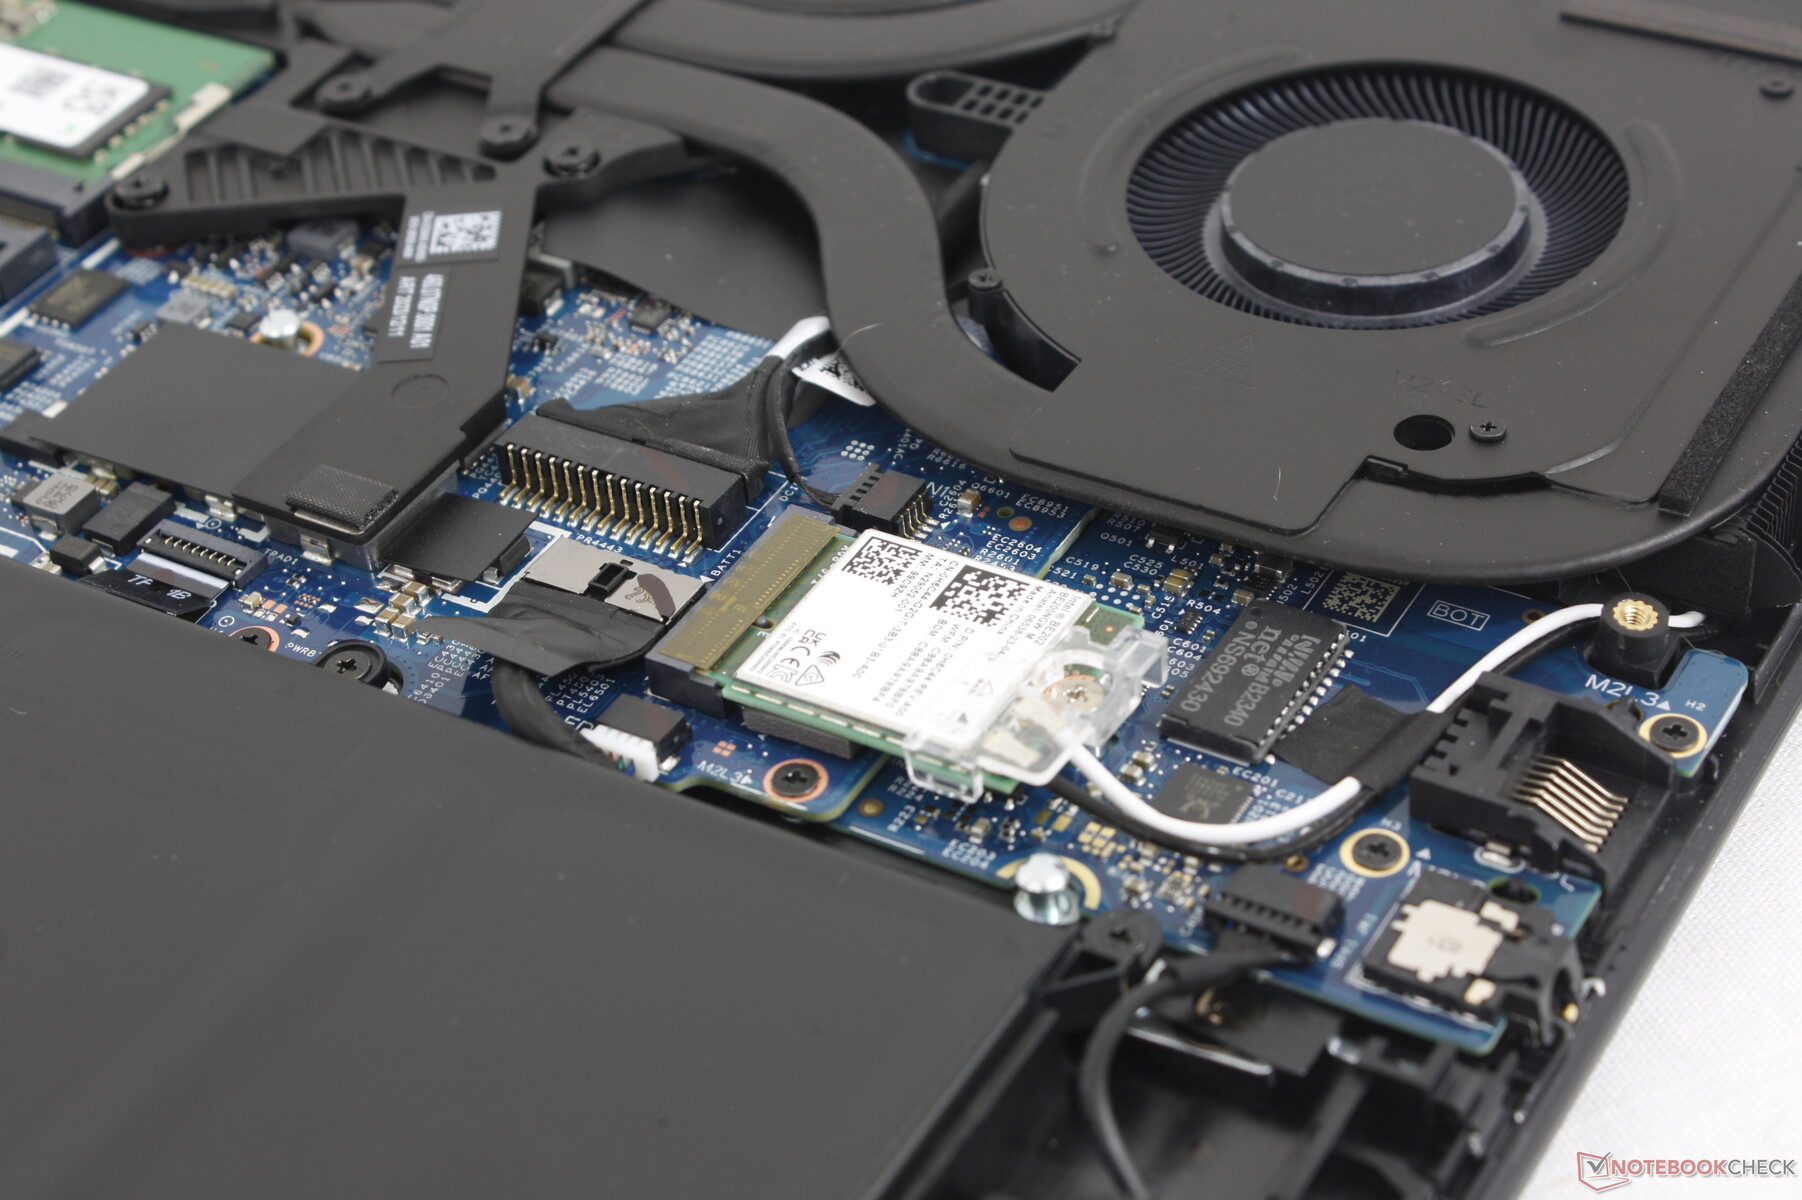
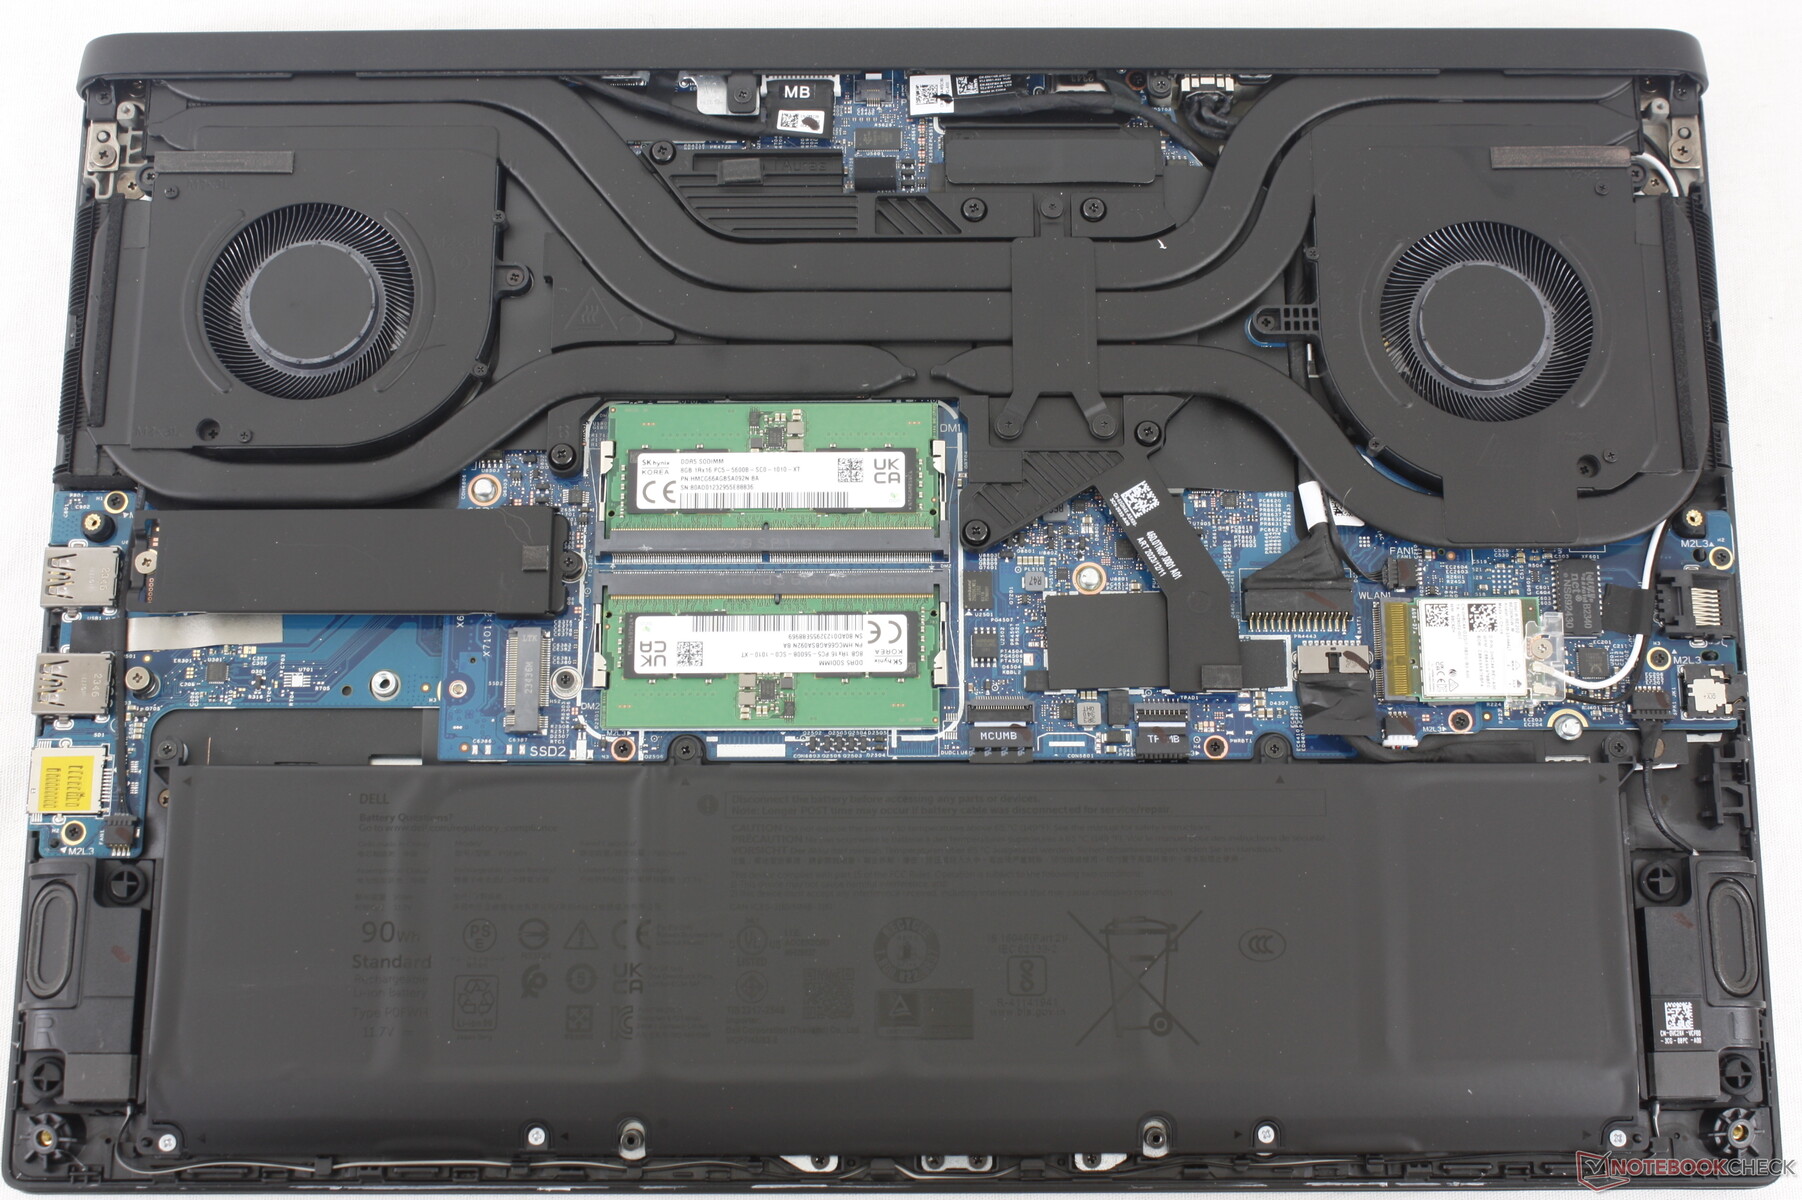
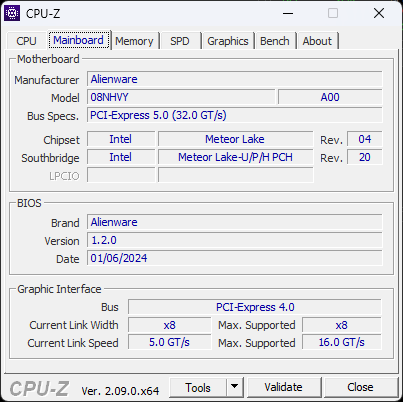
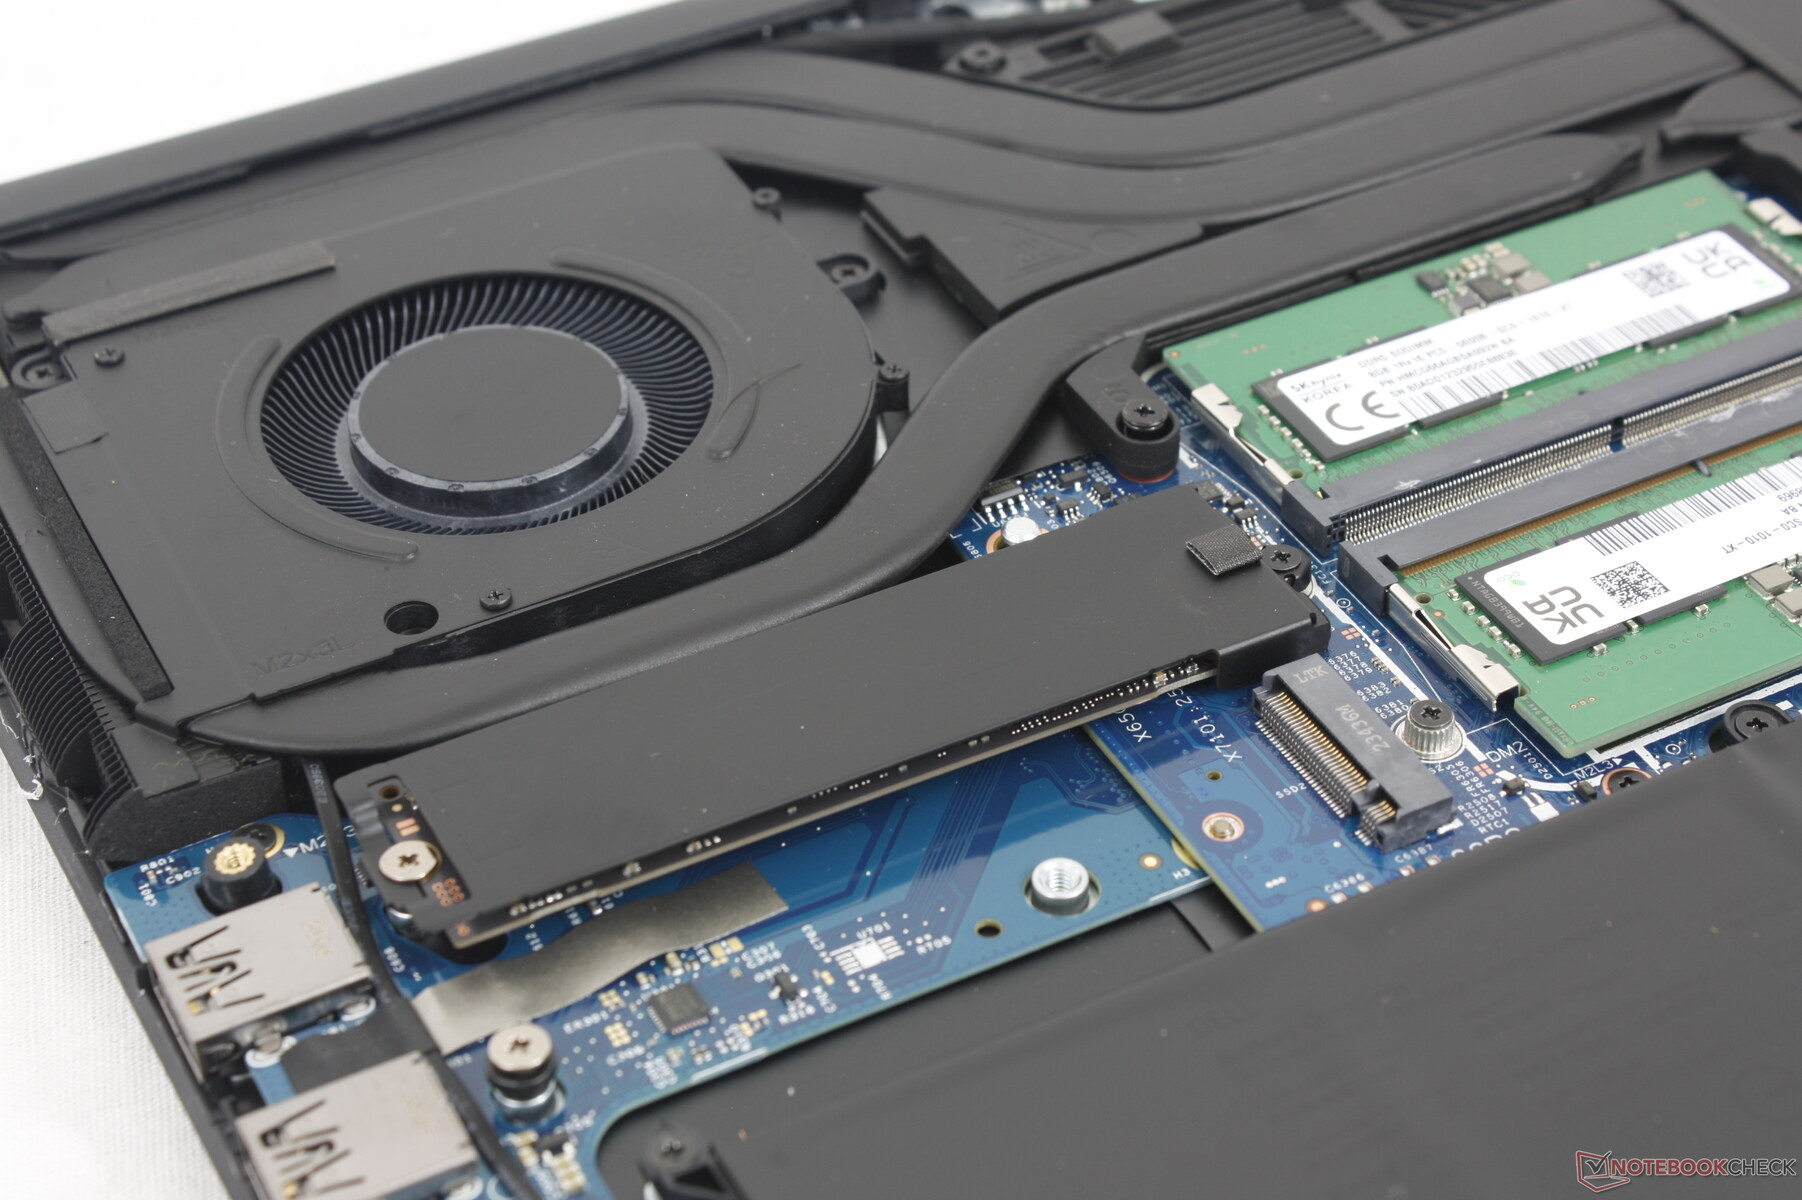
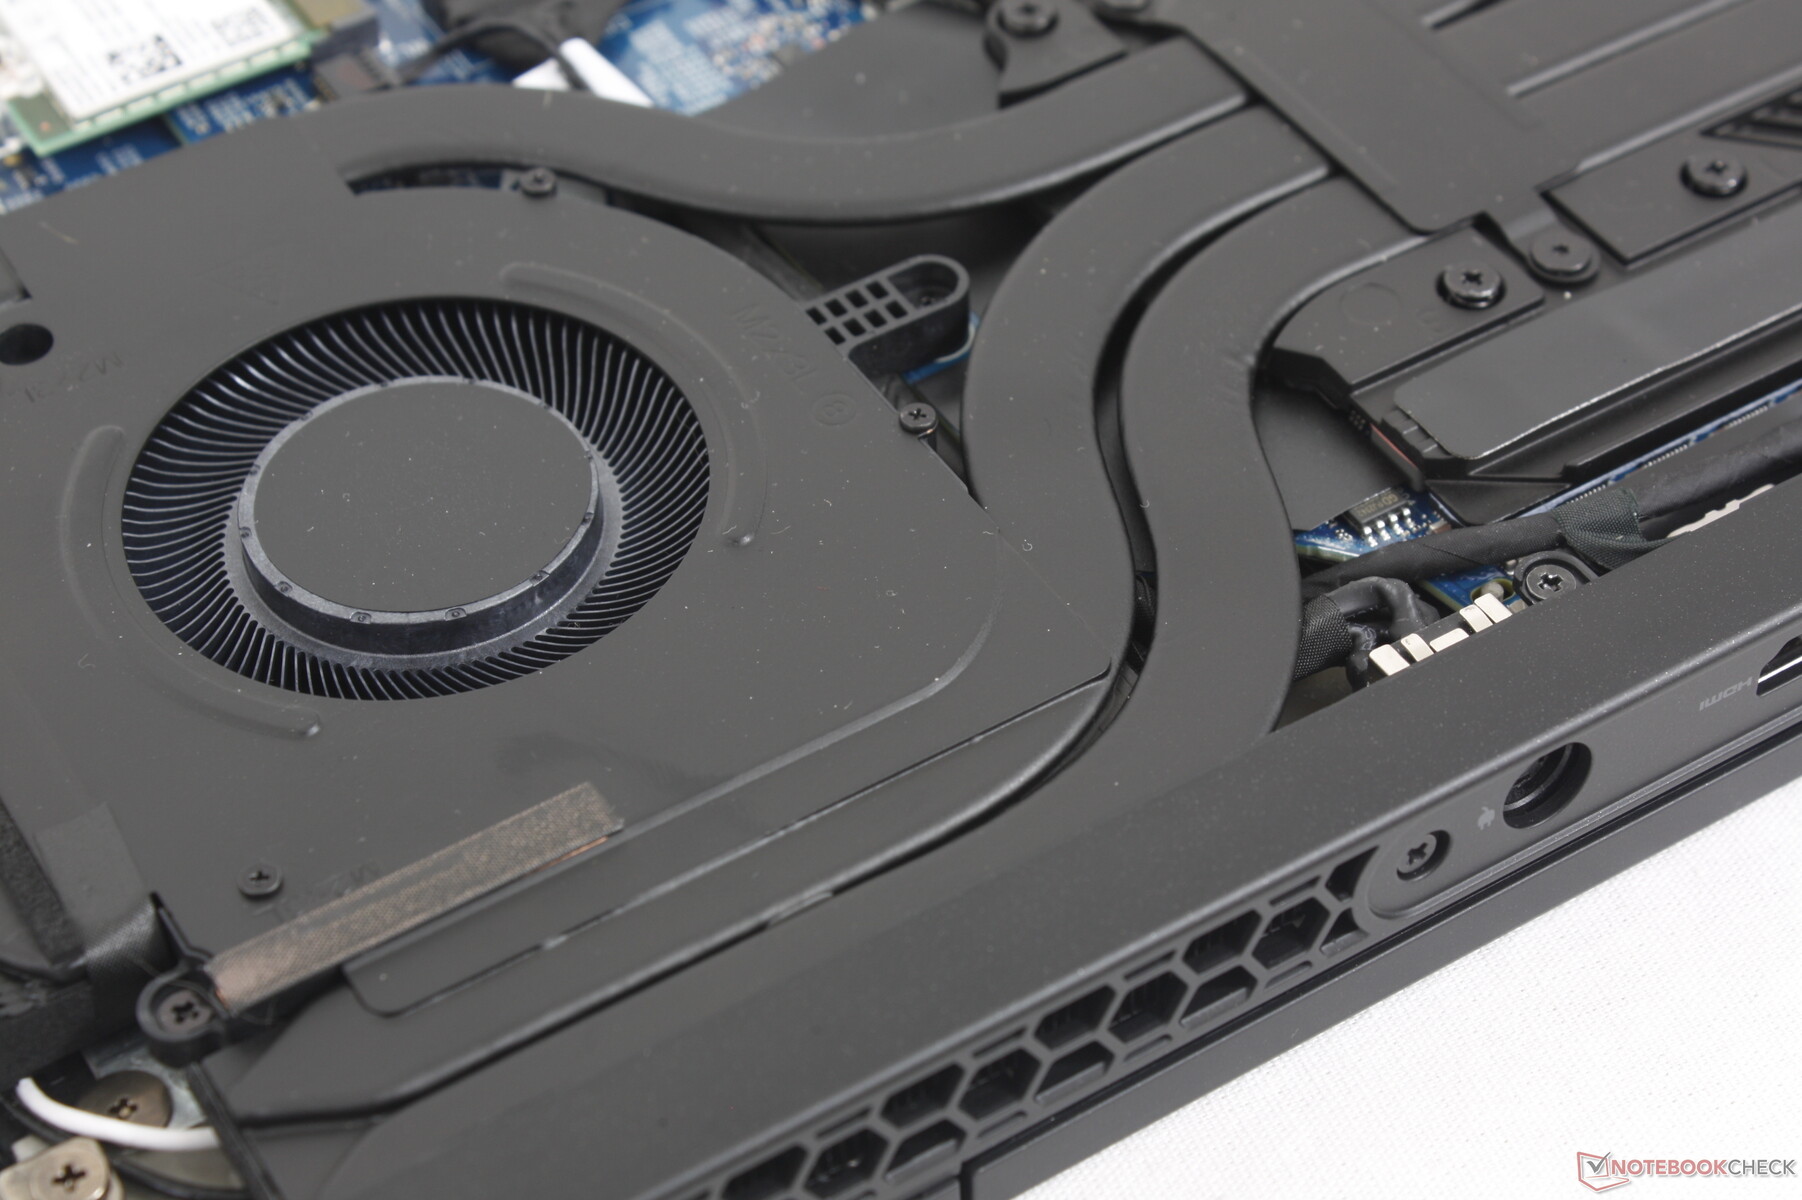
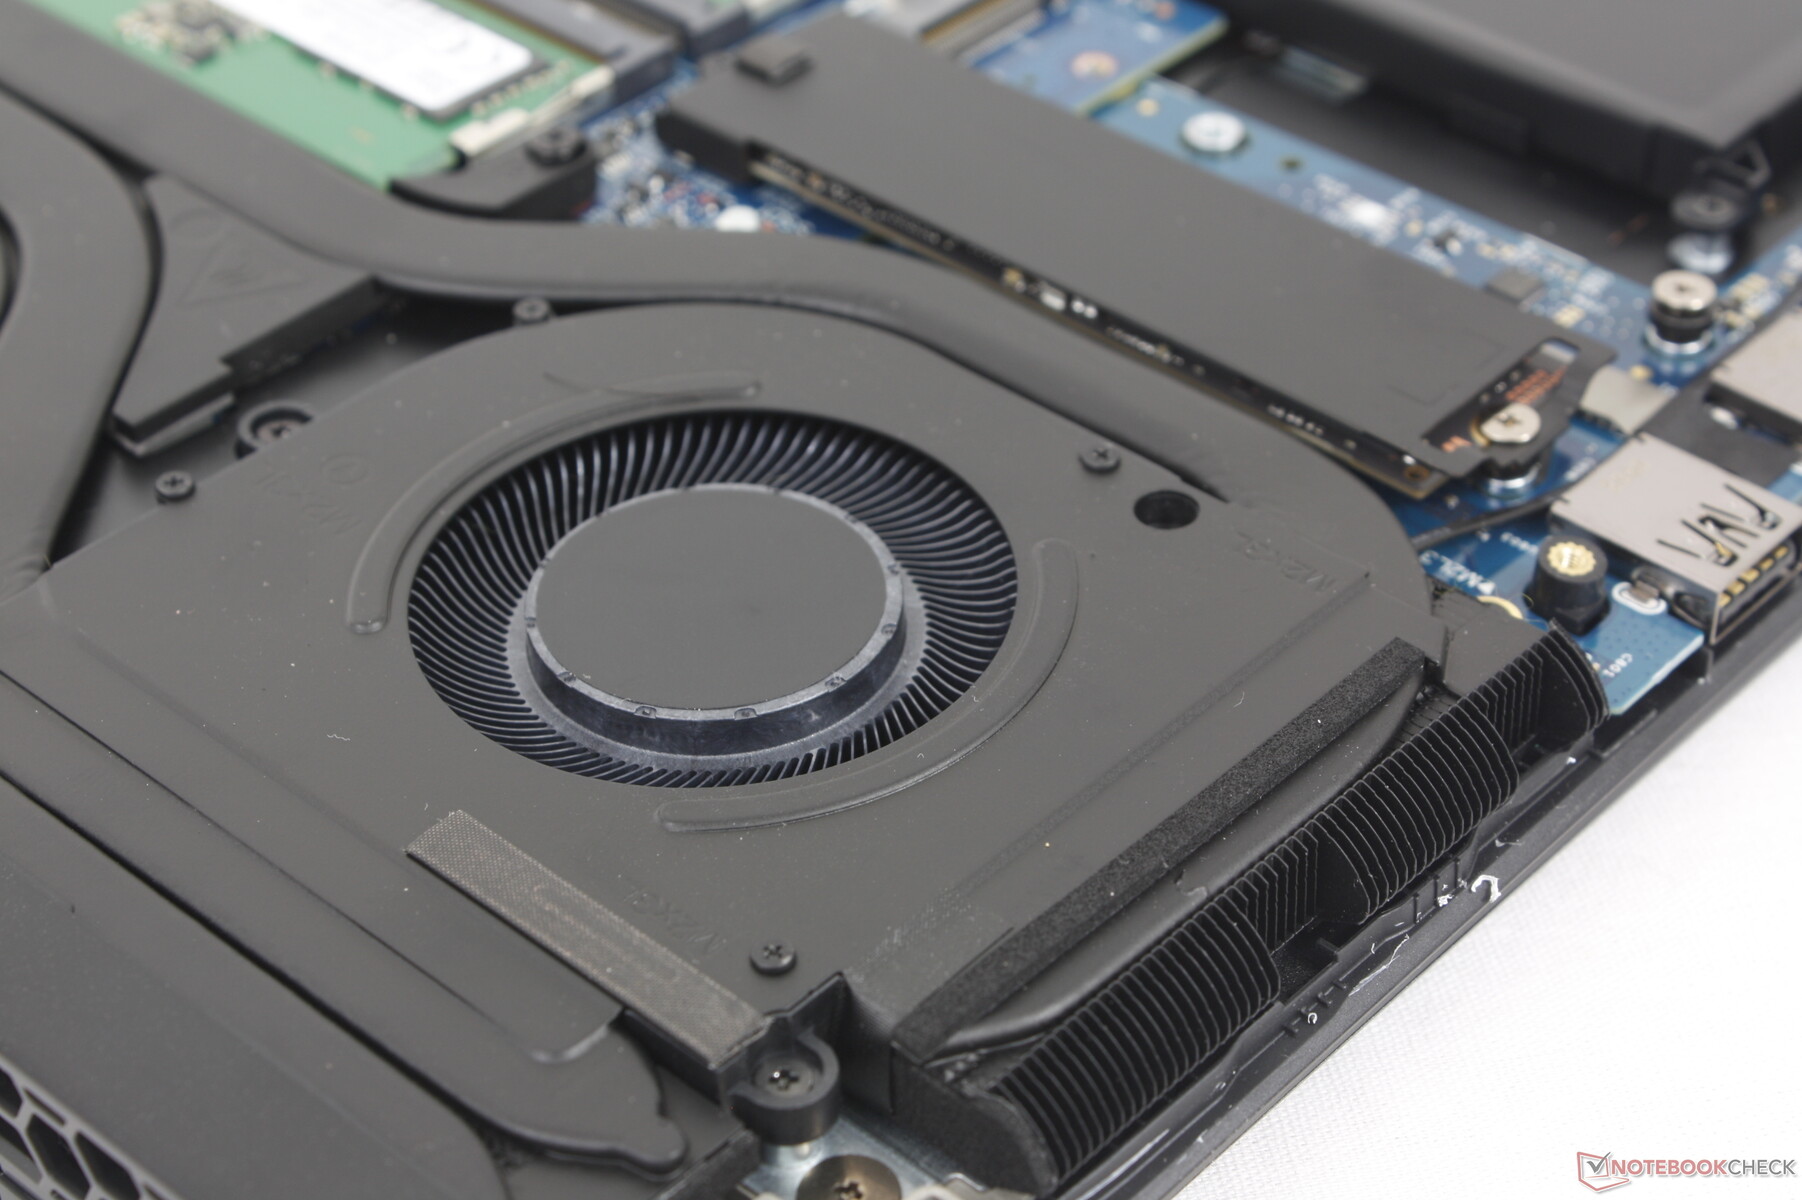
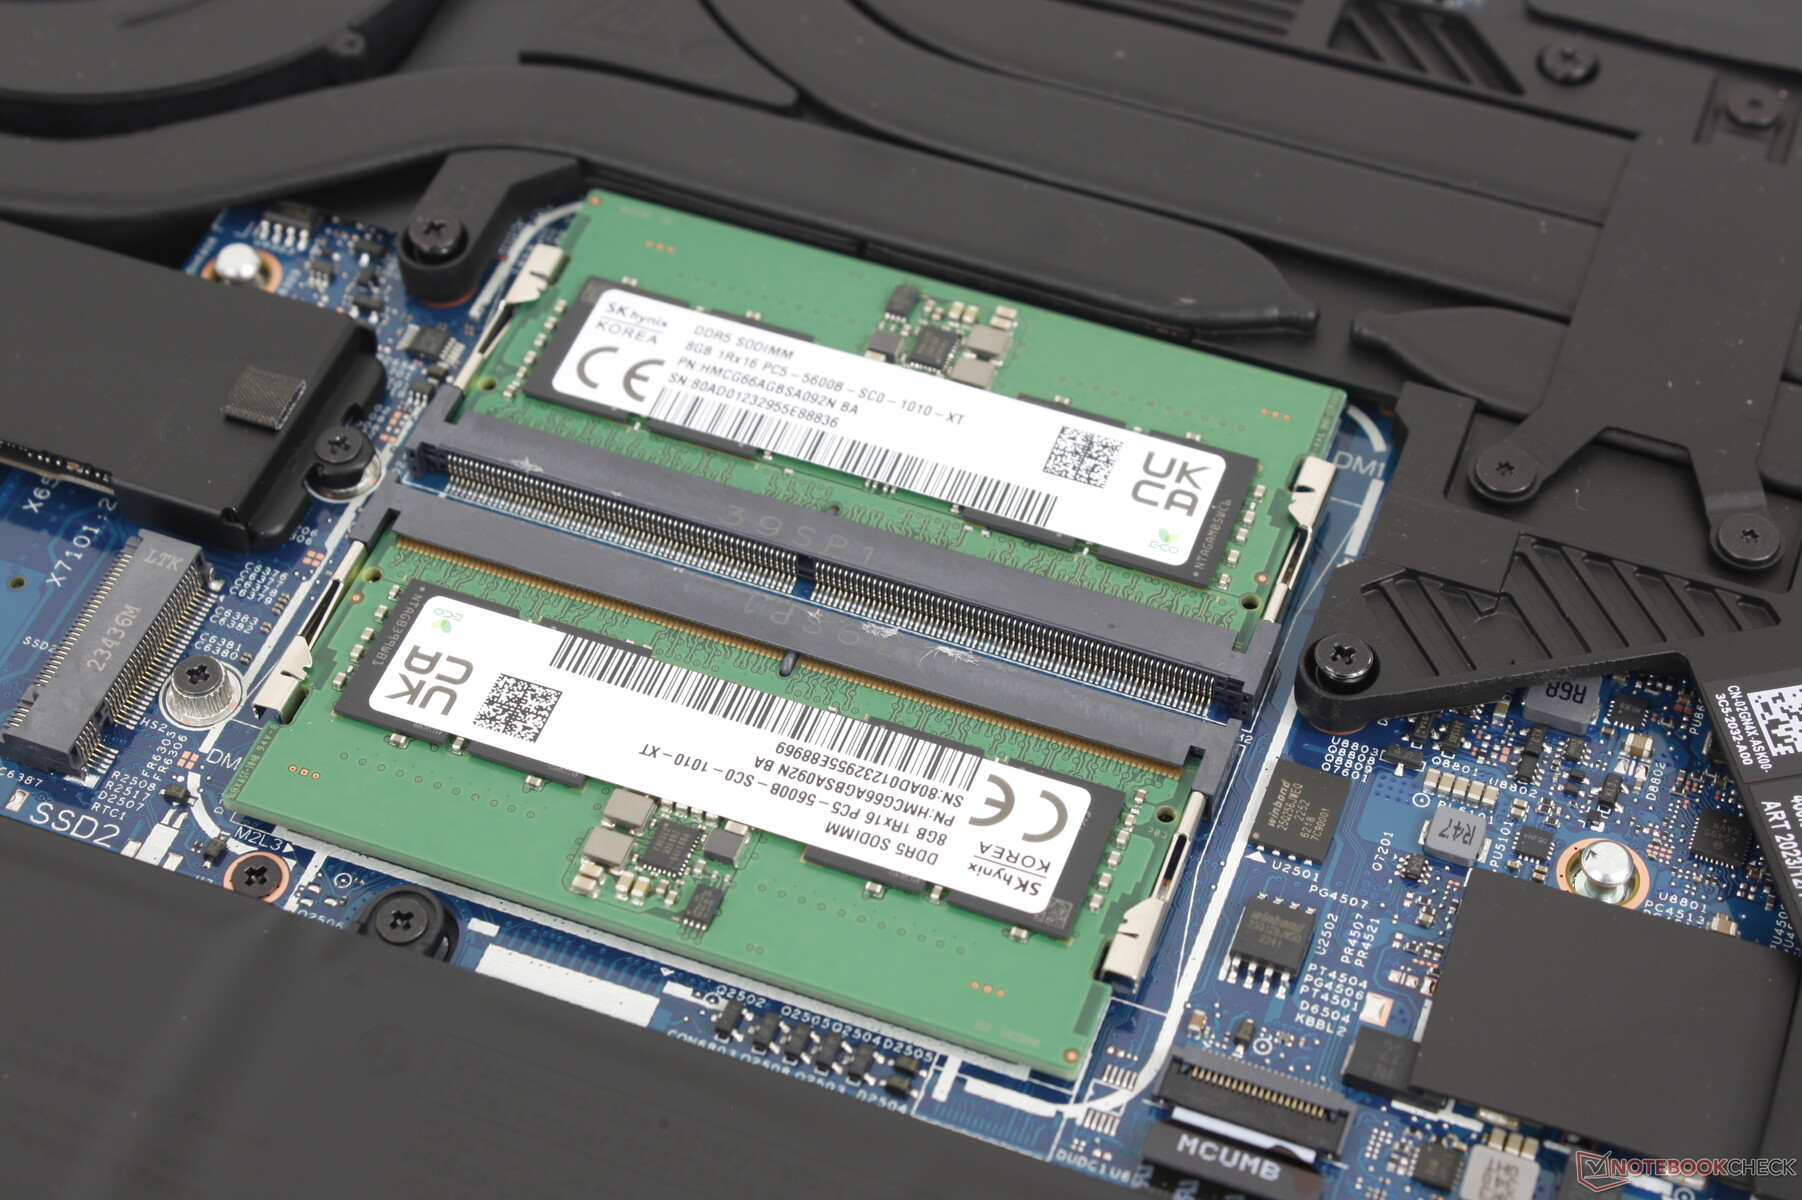
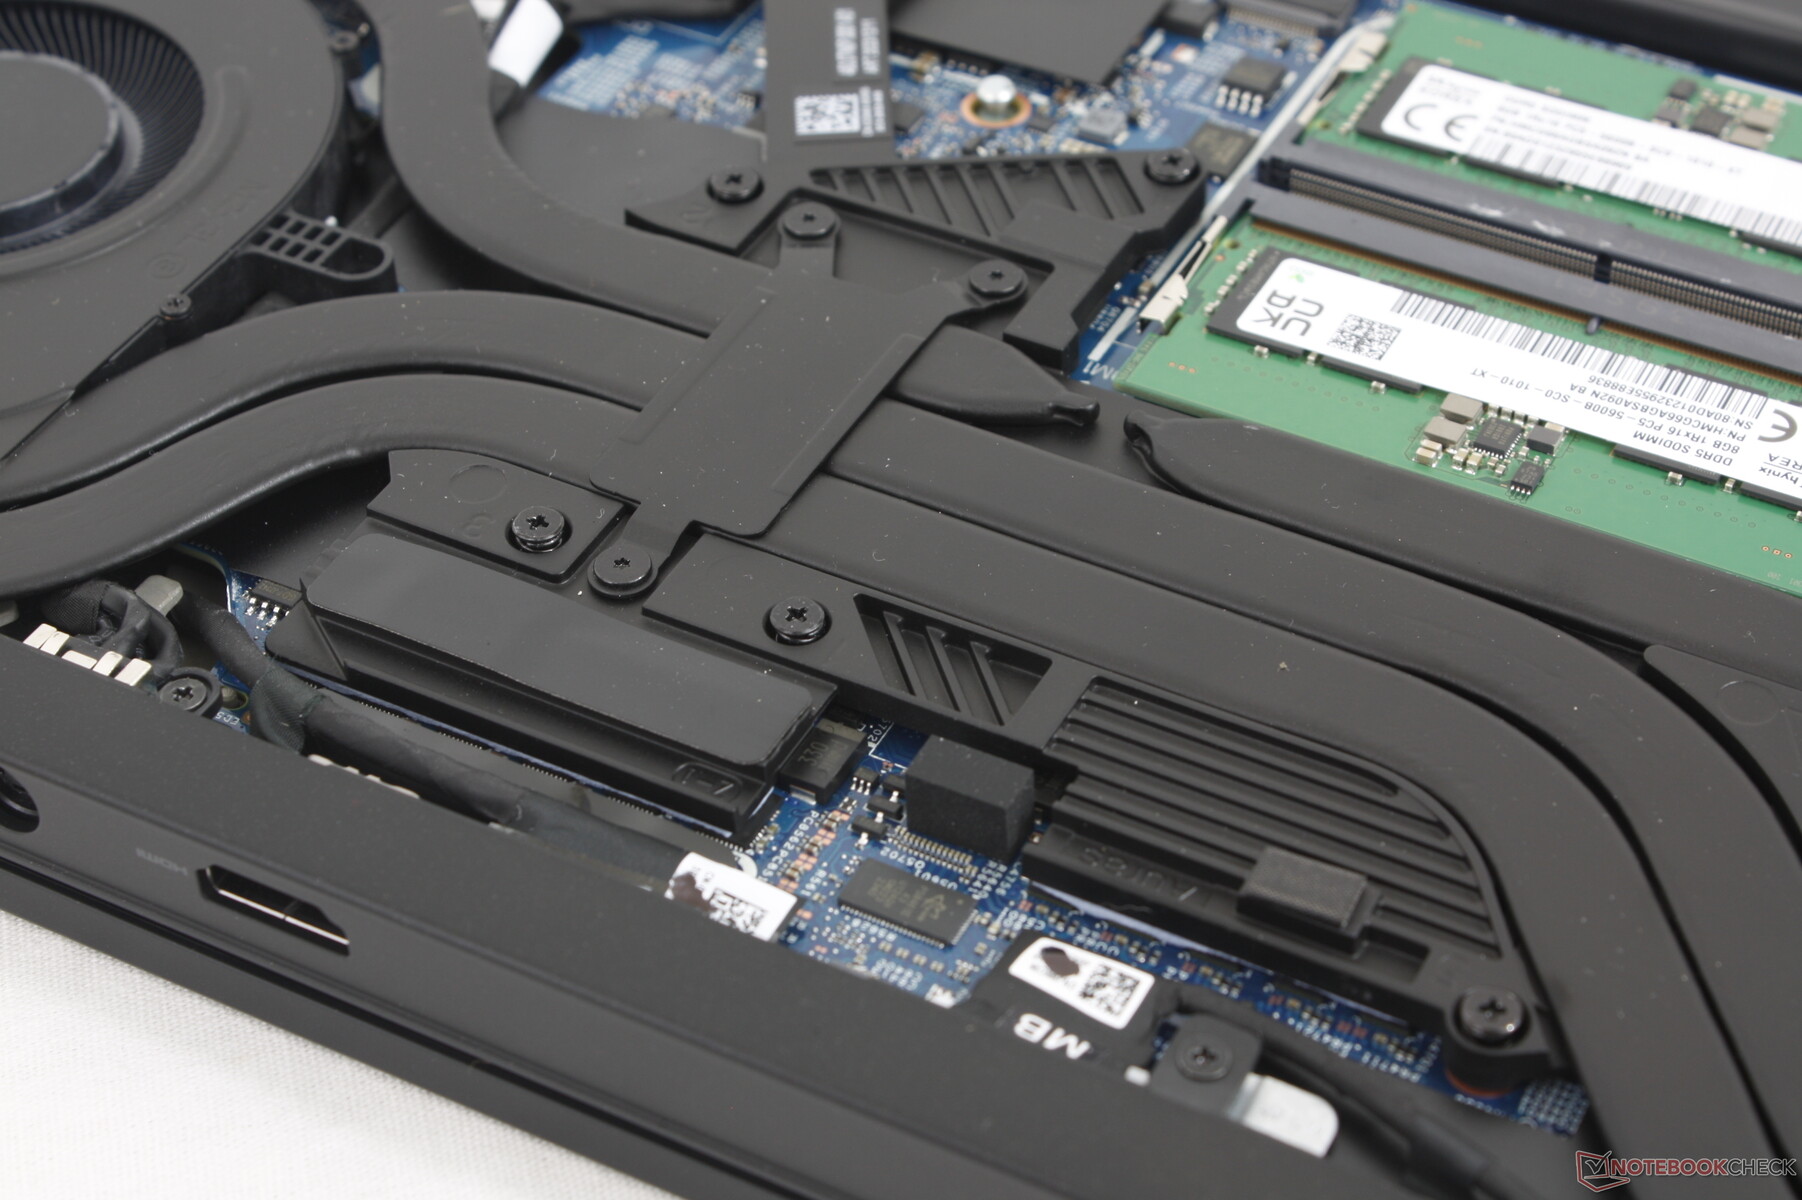
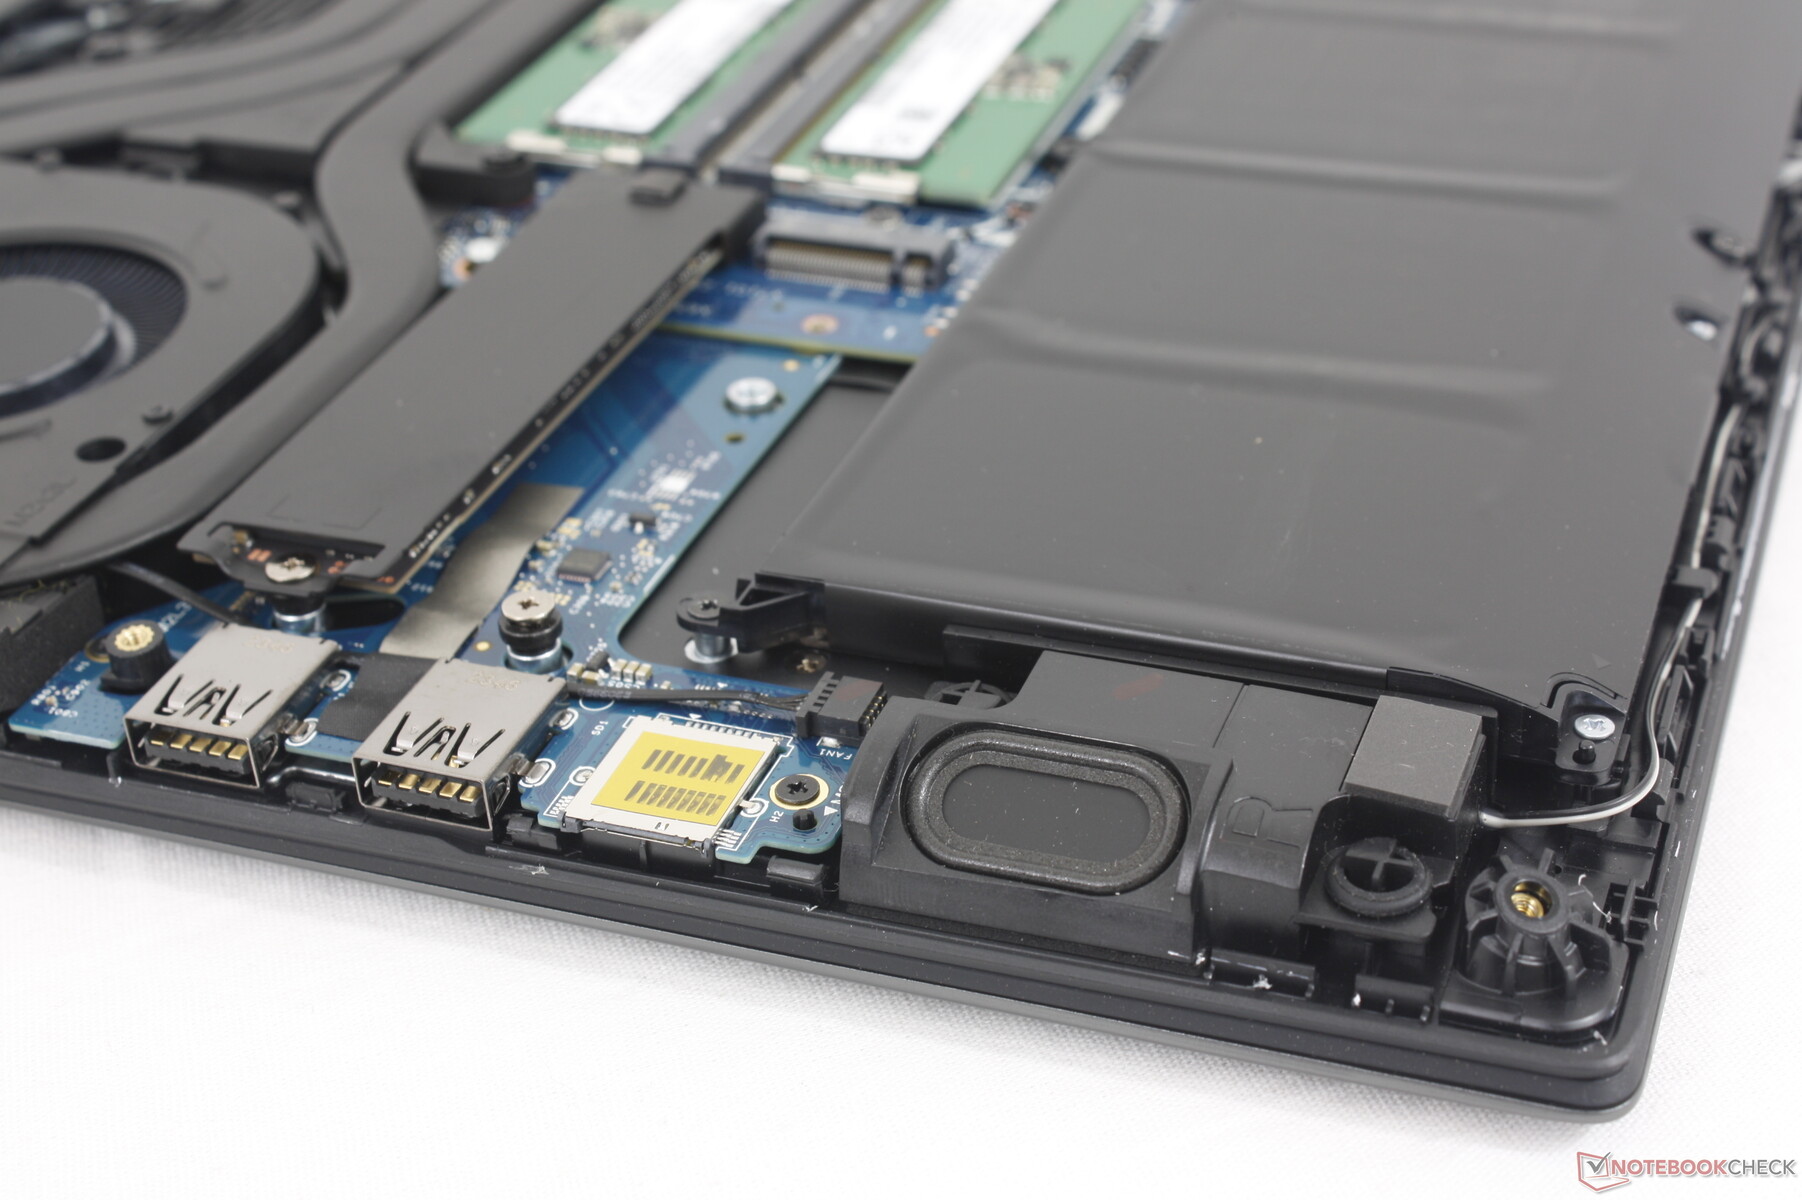
Onderhoud
Het onderpaneel wordt vastgezet met 8 kruiskopschroeven voor eenvoudig onderhoud. RAM en WLAN zijn nog steeds verwijderbaar, maar de opslagconfiguratie is veranderd; het systeem ondersteunt nu twee M.2 2280 SSD's in plaats van één M.2 2280 en twee M.2 2230 SSD's in het ontwerp van vorig jaar.
Accessoires en garantie
De verkoopverpakking bevat een paar Alienware-logostickers naast de gebruikelijke AC-adapter en papierwerk. Een standaard beperkte fabrieksgarantie van een jaar is standaard bij aankoop in de VS.
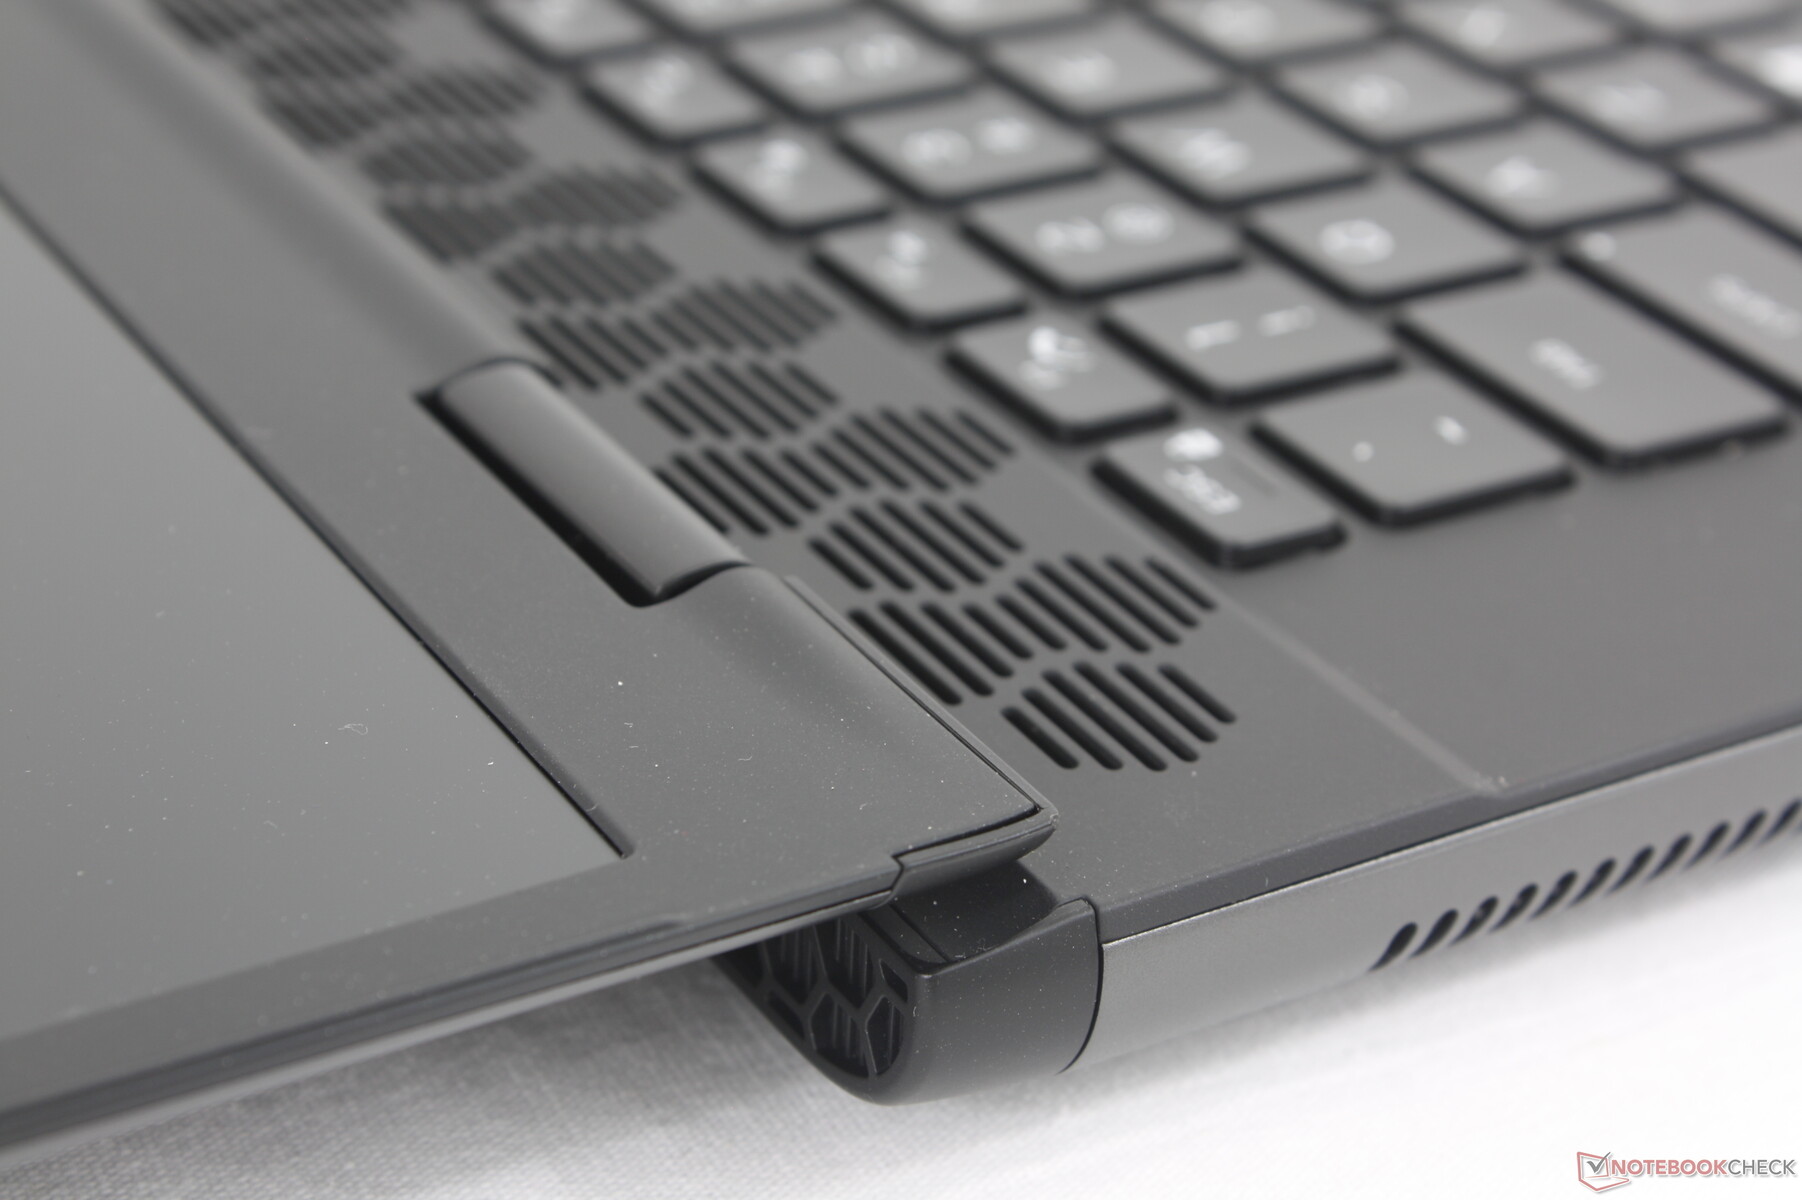
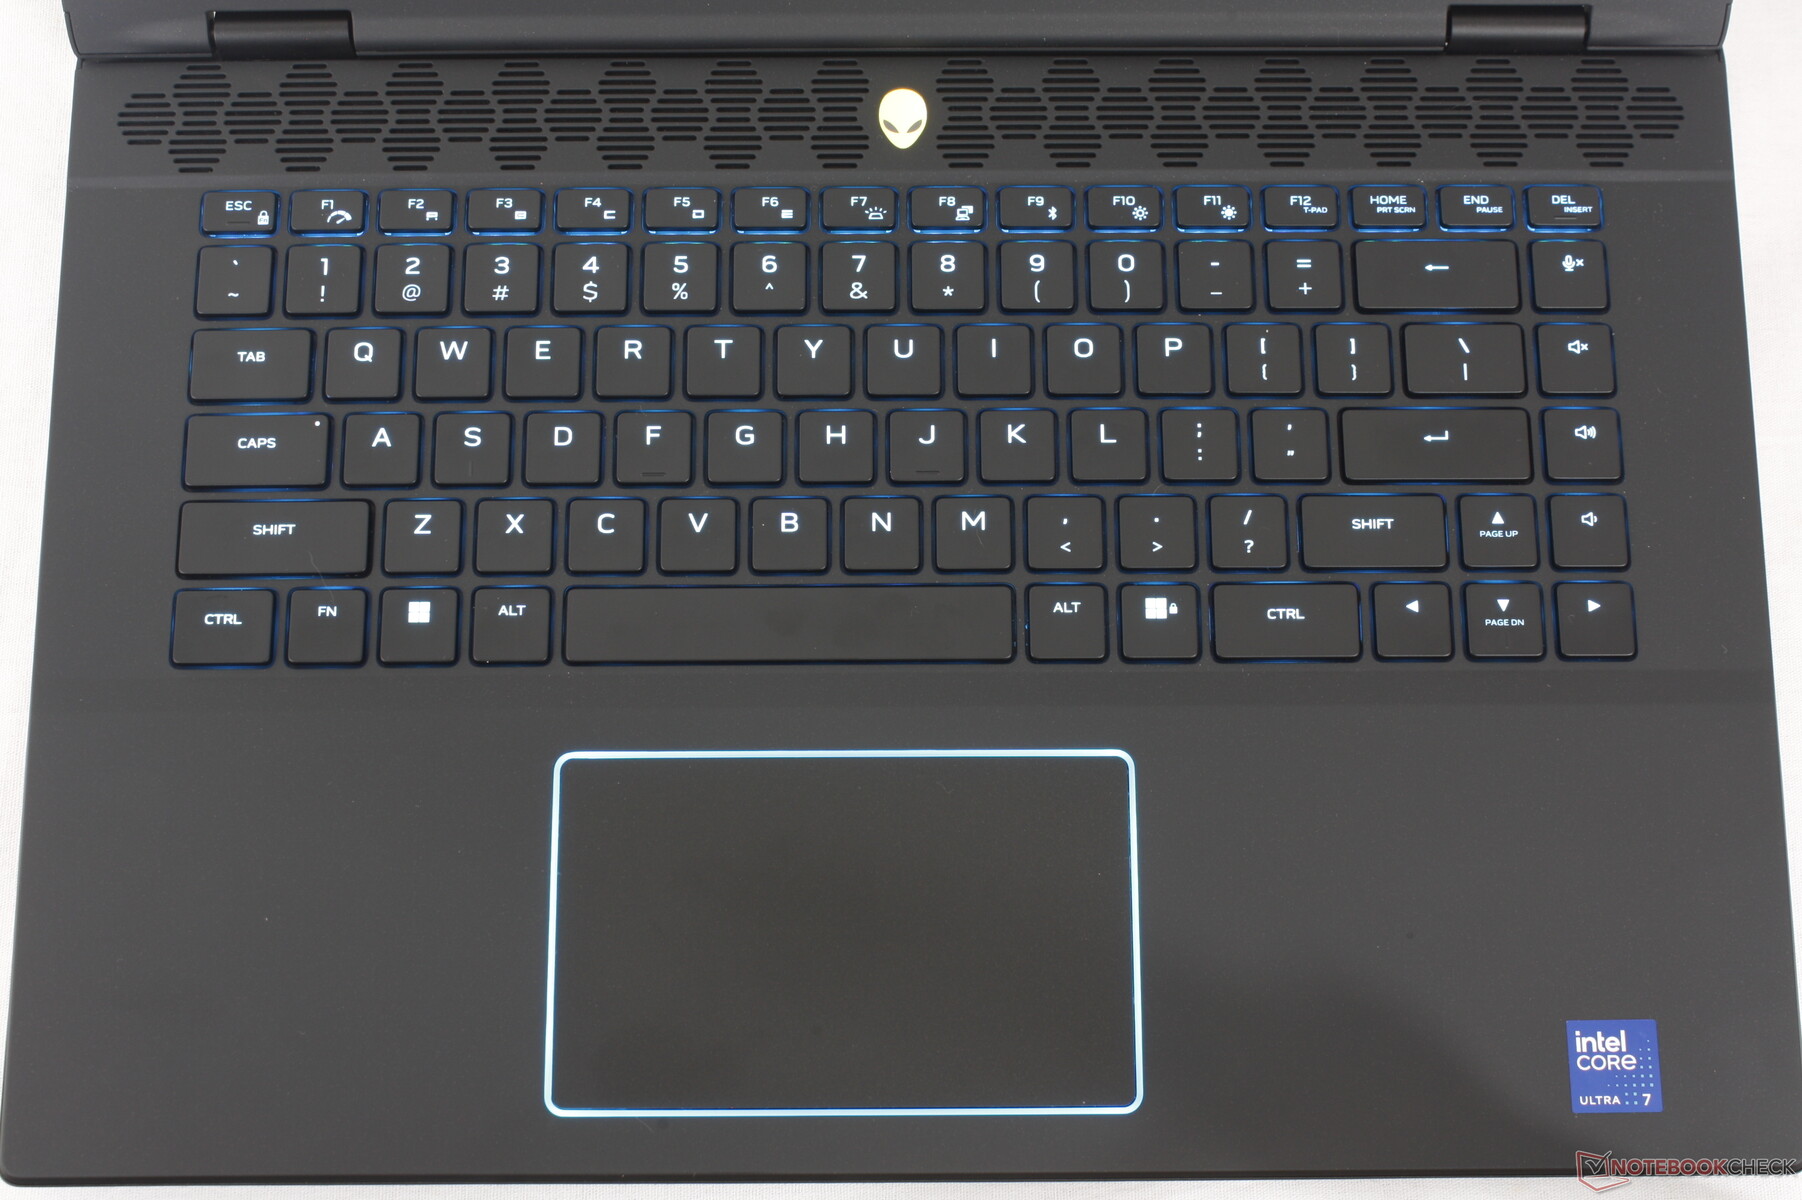
Invoerapparaten - mechanisch is niet nodig
Toetsenbord
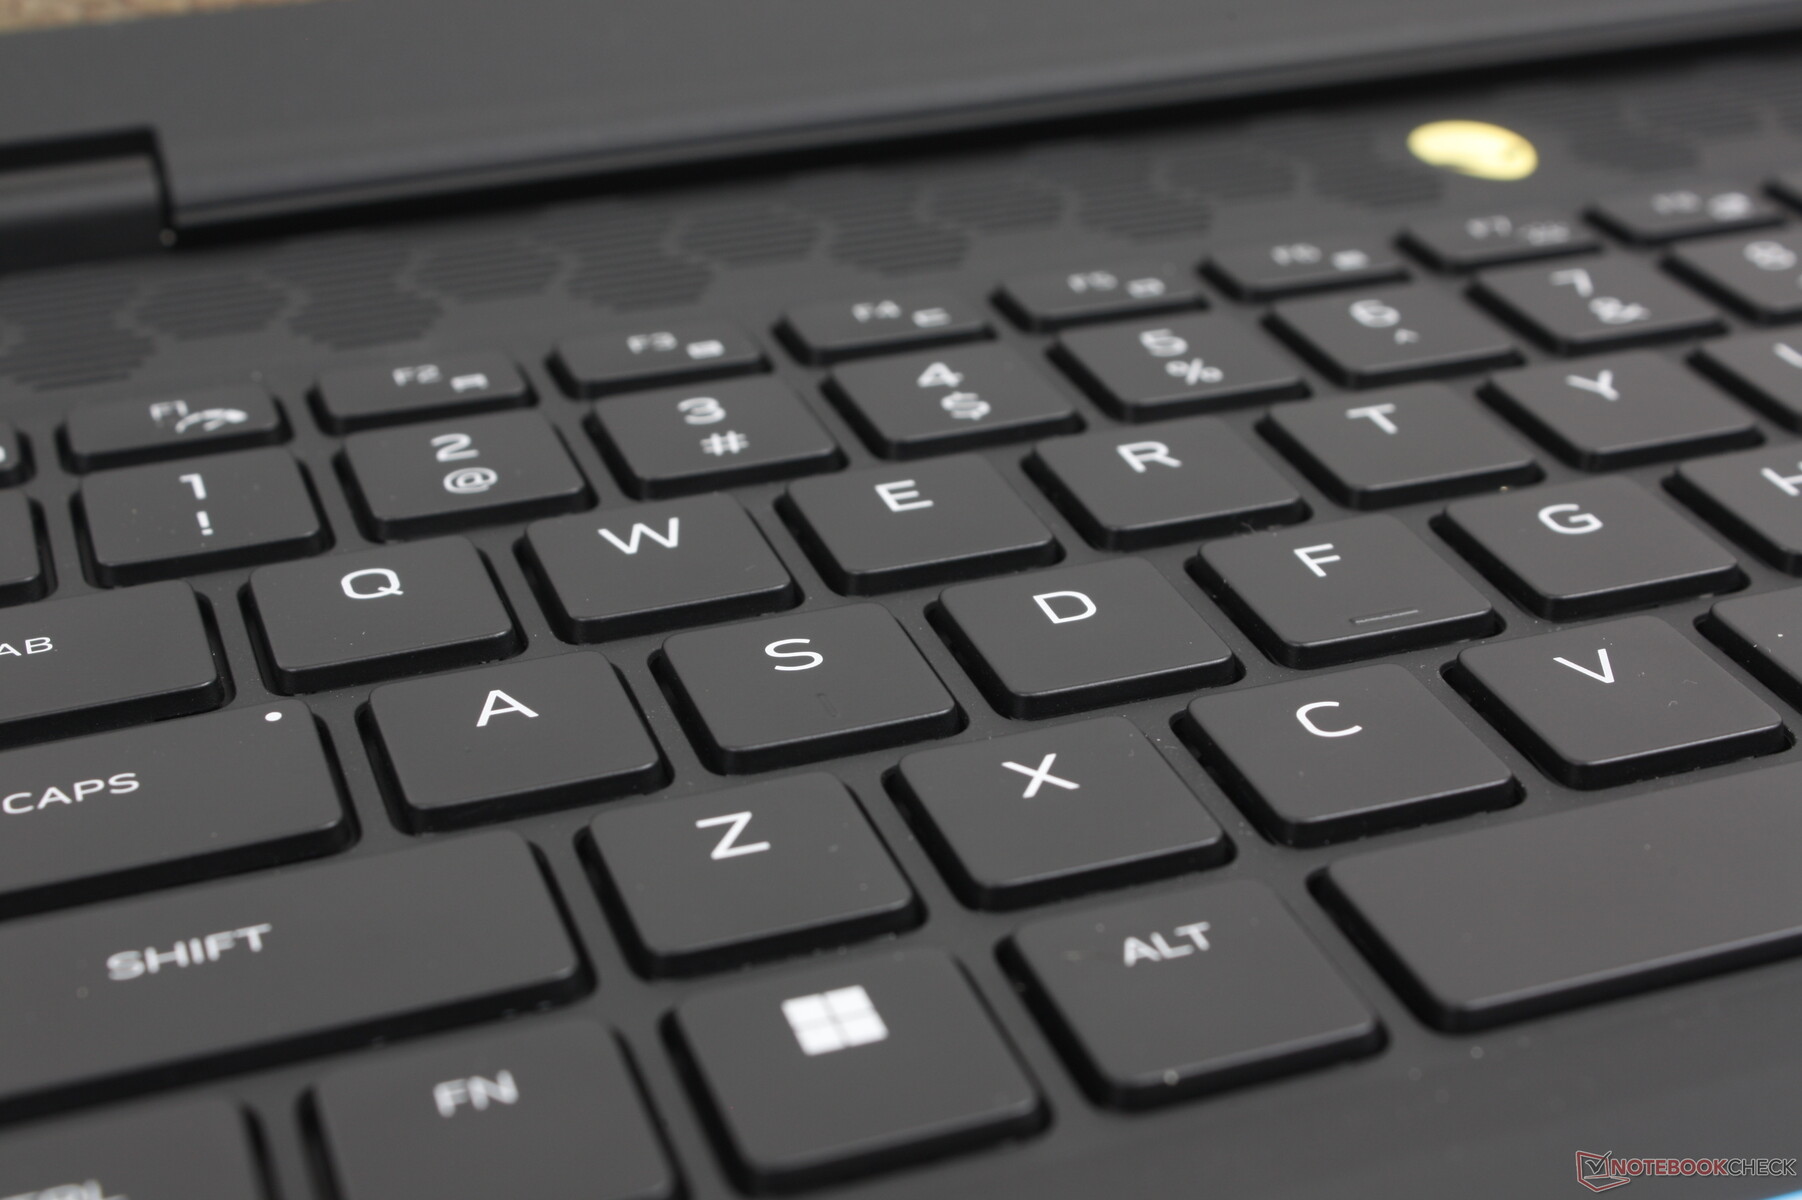
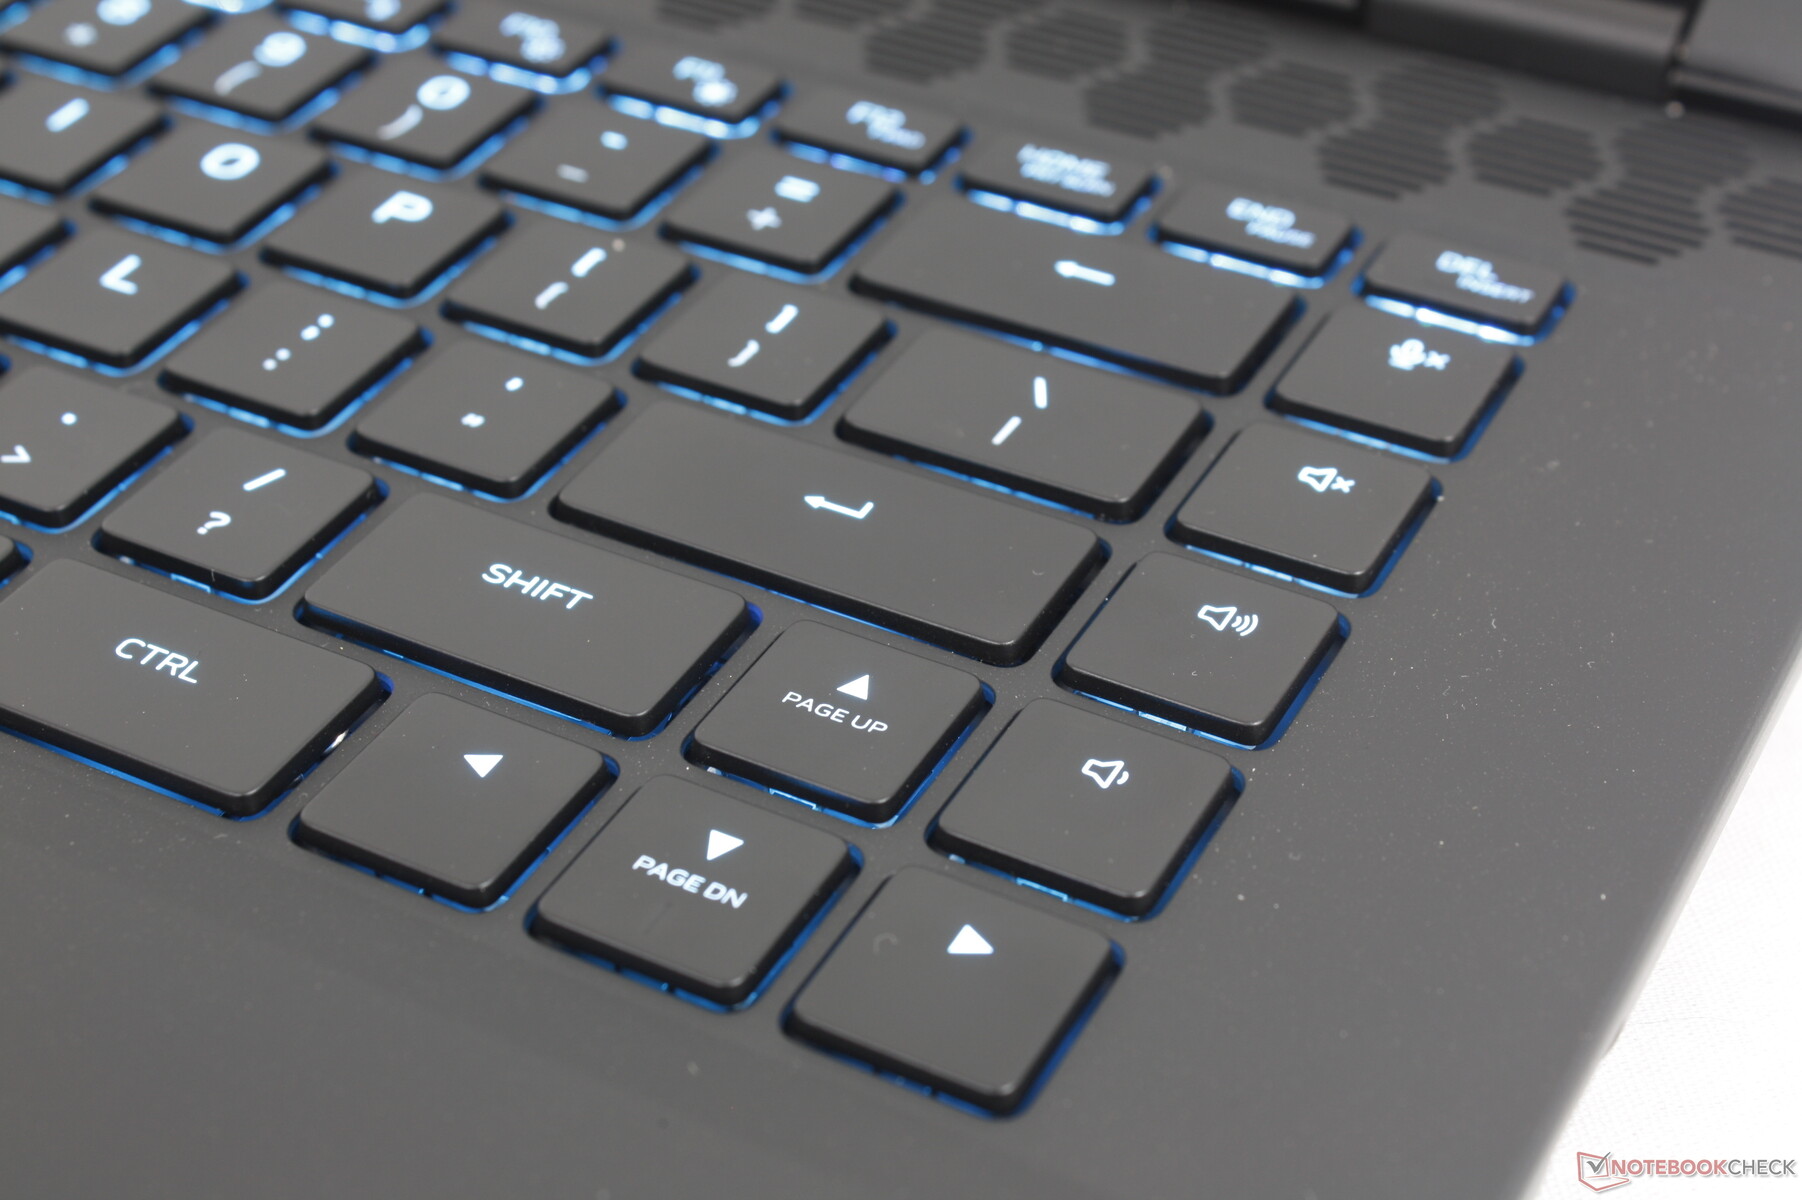
Het systeem maakt gebruik van membraantoetsen met een veerweg van 1,8 mm en geen mechanische optie meer om het gewicht laag te houden en een breder publiek dan alleen gamers aan te spreken. Ze zijn niettemin comfortabel en klikken beter dan verwacht in vergelijking met de toetsenborden op de meeste andere gaming laptops, waaronder de MSI Raider GE68 of HP Omen Transcend 16. Vooral de spatiebalk en Enter-toetsen zijn bij het indrukken veel luider en scherper dan de belangrijkste QWERTY-toetsen.
Nieuw aan het toetsenbord dit jaar is een handige "Stealth mode" functie gekoppeld aan de F2 toets die het systeem in de stille modus zet zonder dat u eerst Alienware Command Center hoeft te starten. Voor de rest blijft de toetsenbordindeling hetzelfde als op de originele m16 R1.
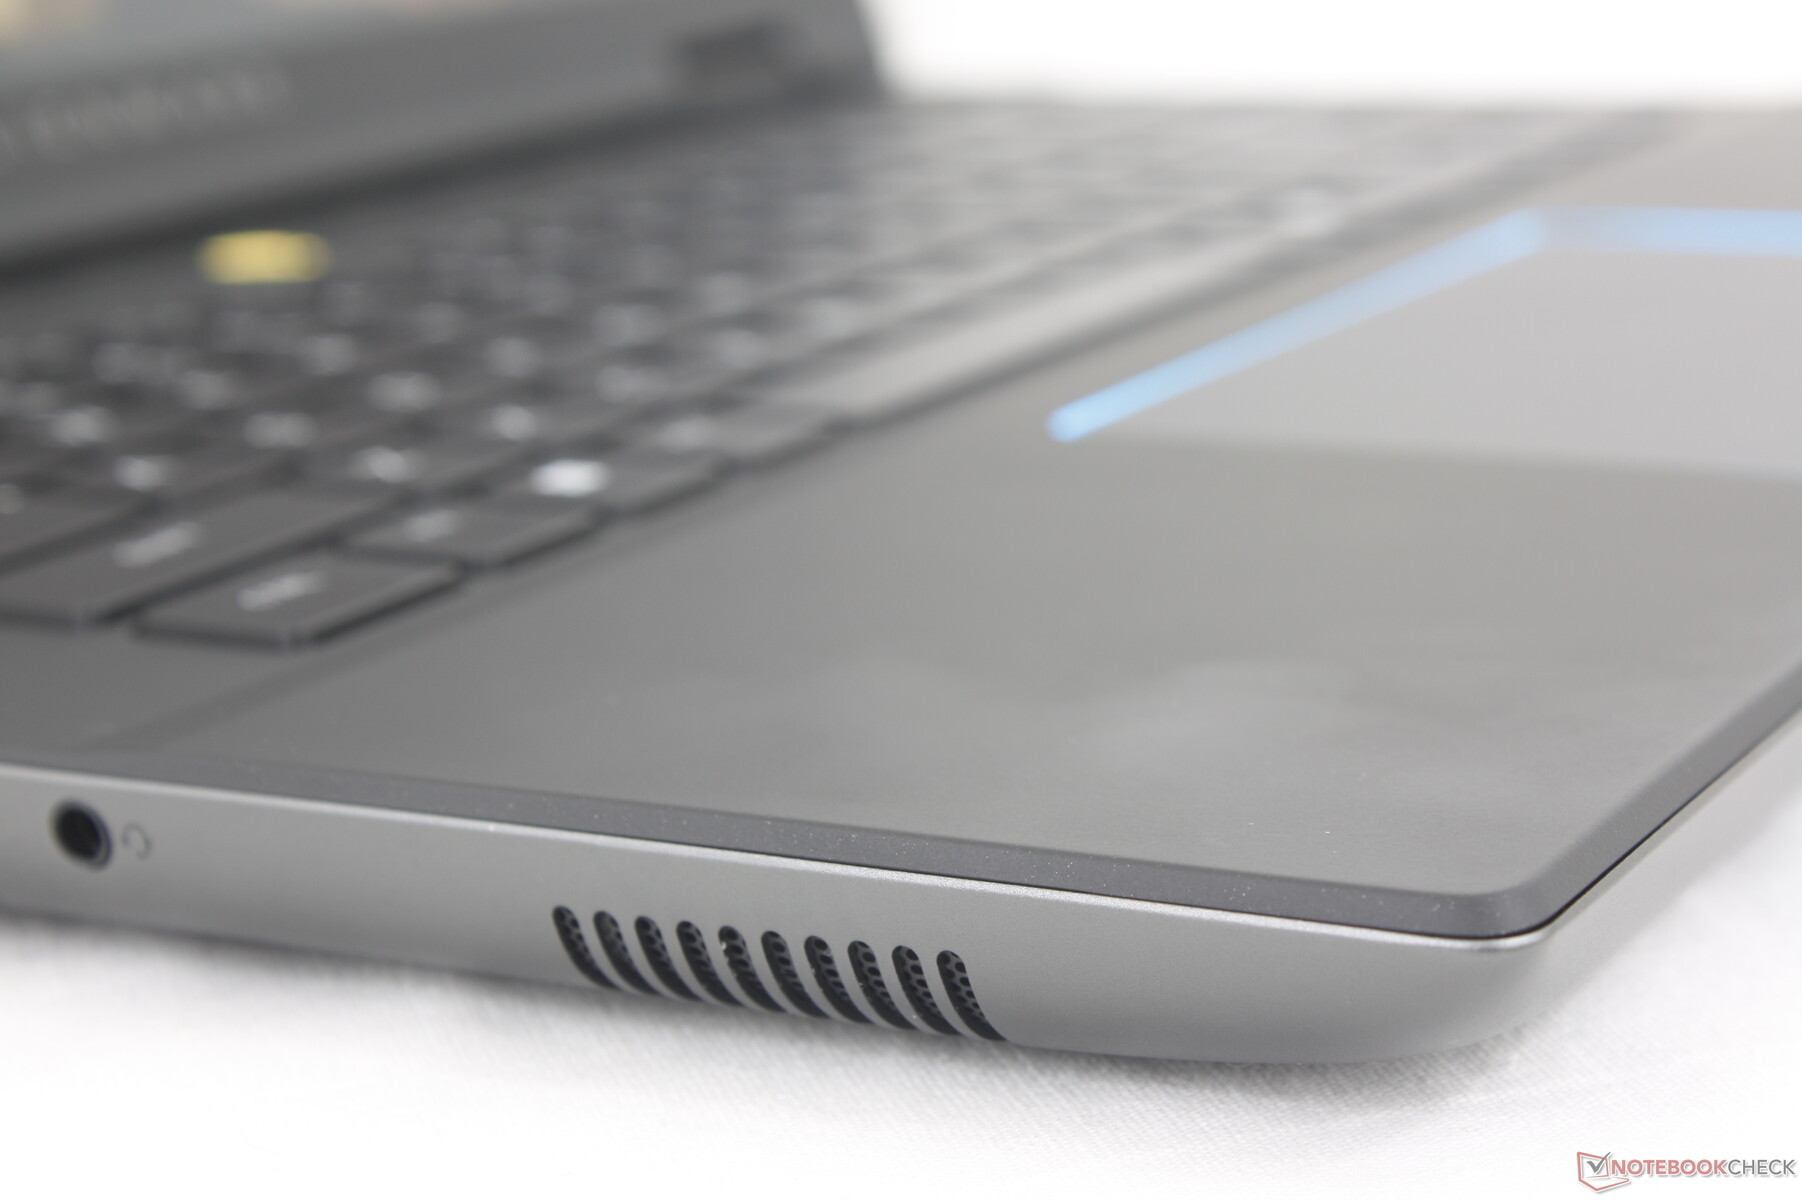
Touchpad
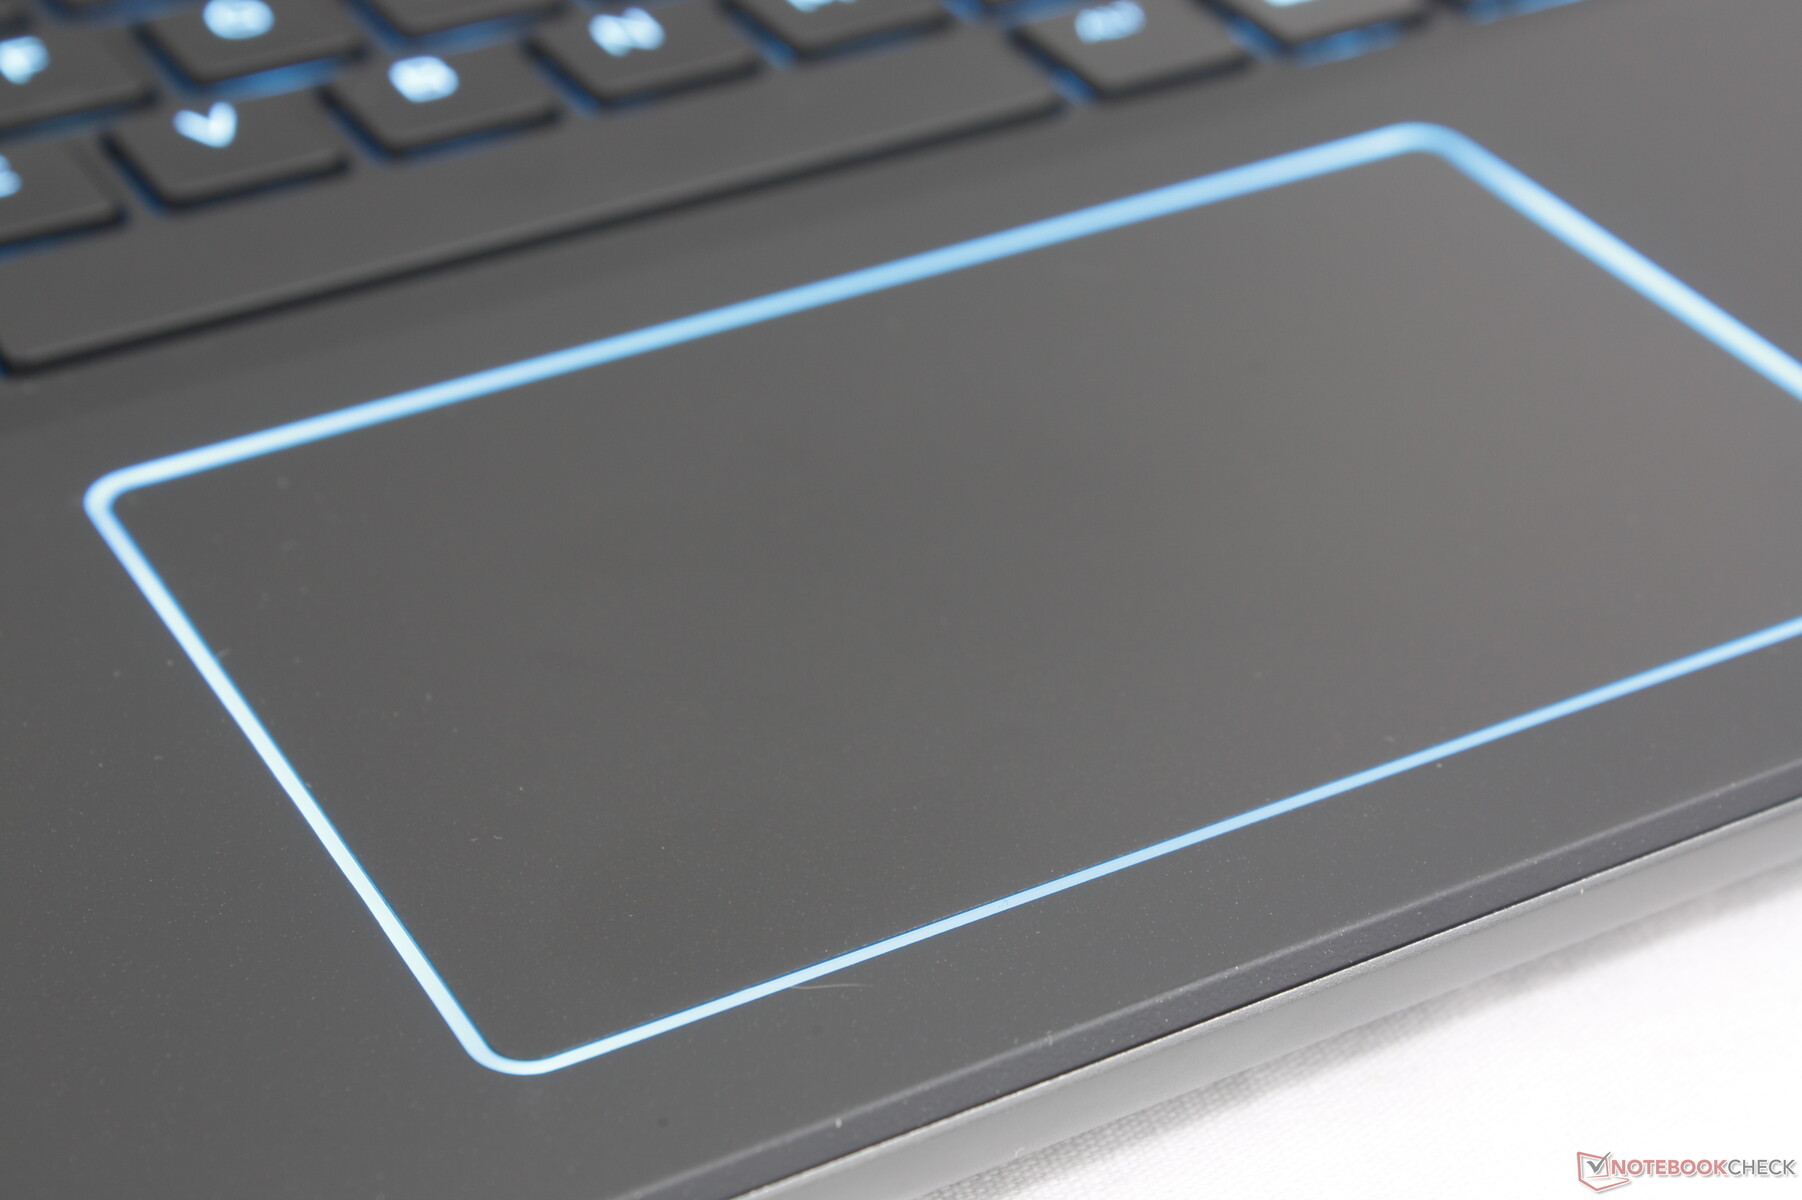
Het clickpad is iets groter dan op het model van vorig jaar (11,5 x 7 cm vs. 11,3 x 6,6 cm) en het bevat nieuwe RGB-verlichting rondom. De feedback bij het klikken is echter nog steeds sponzig en erg oppervlakkig, wat een onbevredigend gevoel geeft. Het werkt betrouwbaar genoeg voor basis aanwijzen en klikken, maar een muis is nog steeds aan te raden voor strakkere acties zoals slepen en neerzetten.
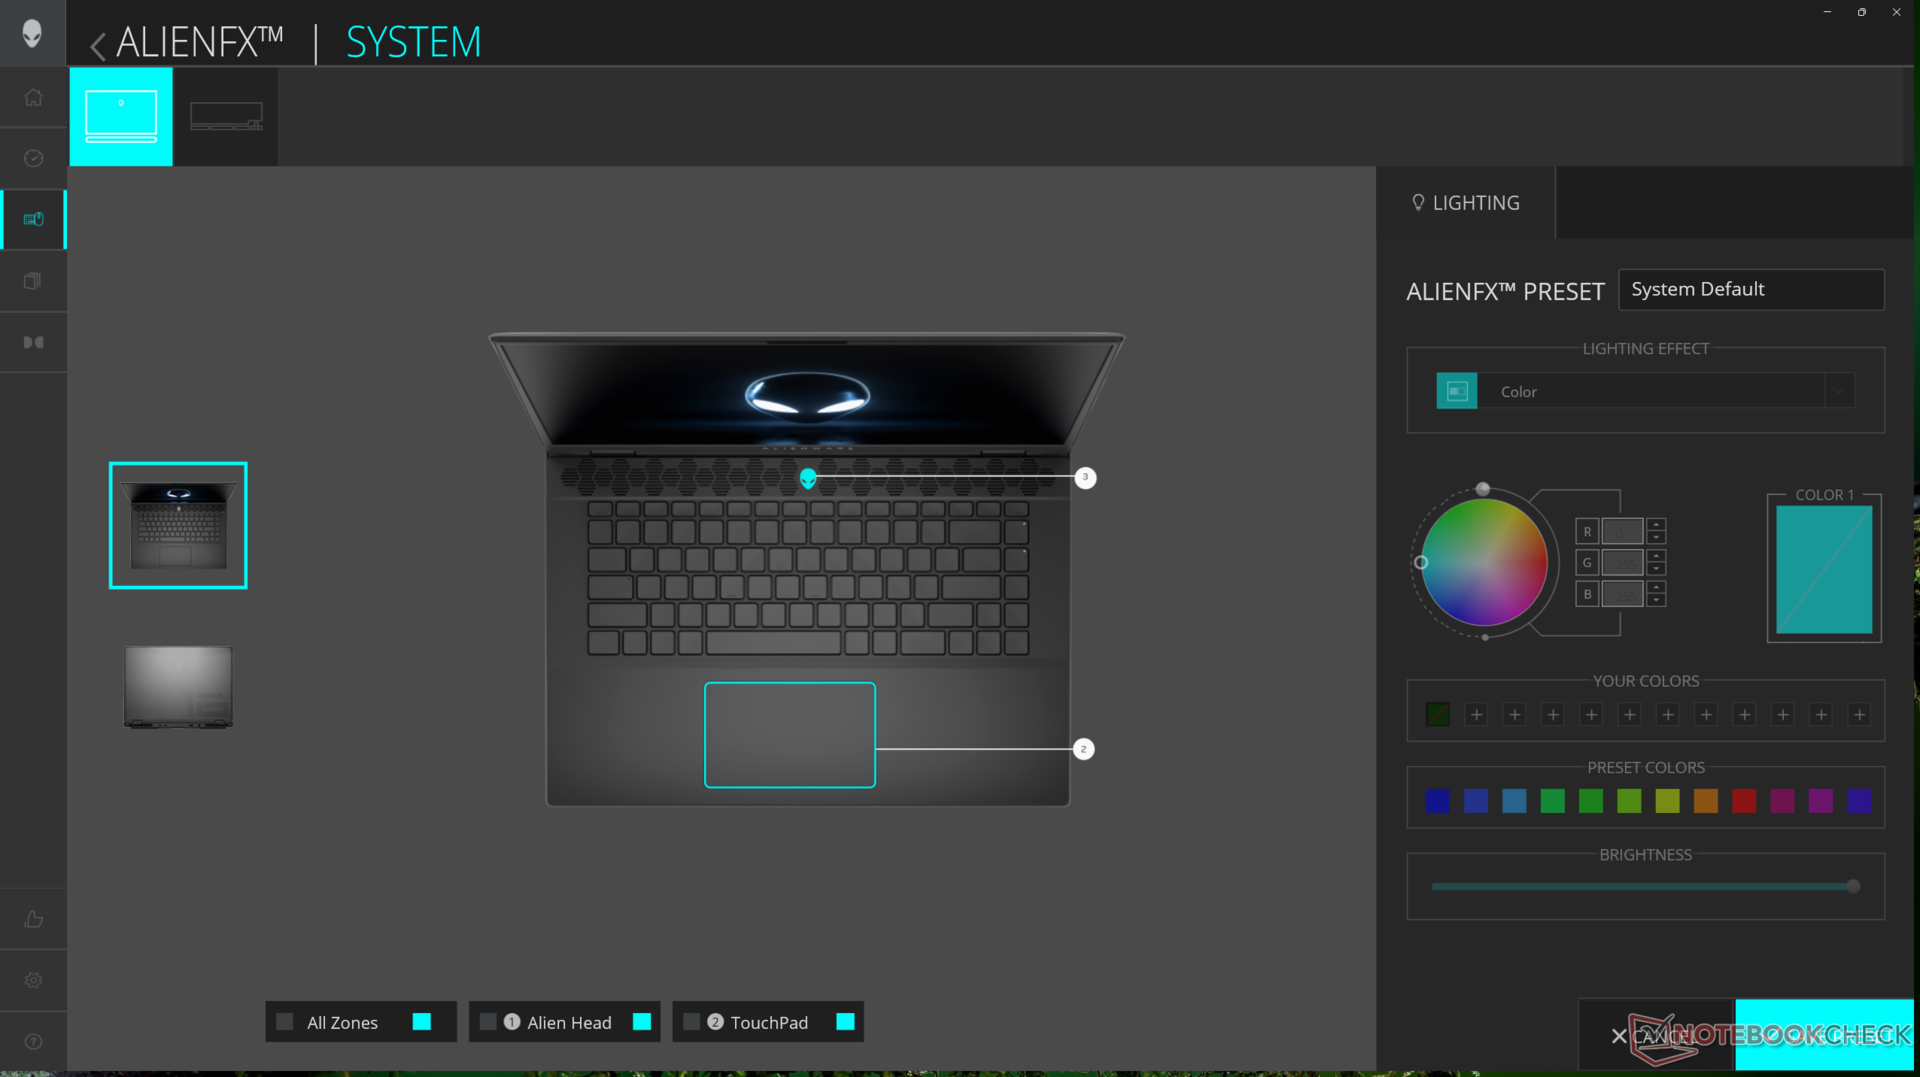
Vervelend genoeg kan de RGB-verlichting alleen worden in- of uitgeschakeld via Alienware Commandocentrum, omdat er geen sneltoets is om deze in te schakelen. Het aanpassen van de helderheid van de RGB-toetsen heeft geen invloed op de verlichting rond het clickpad.
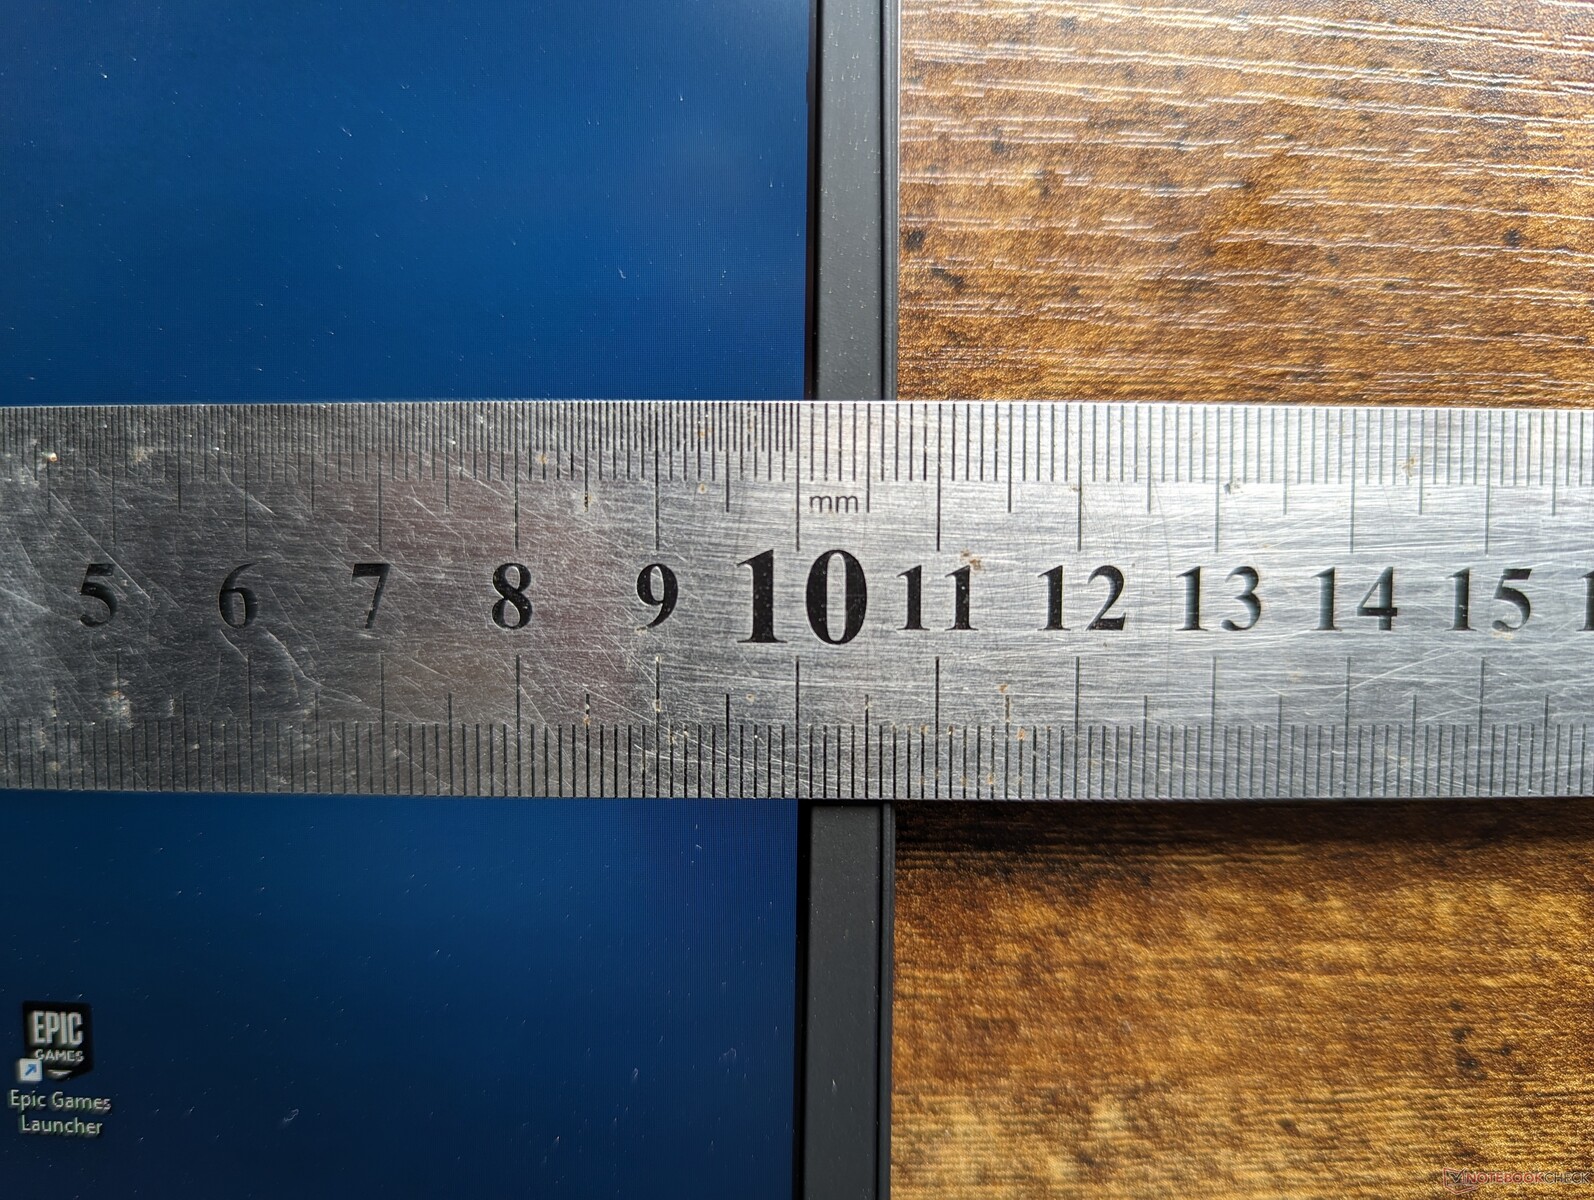
Beeldscherm - 240 Hz en volledig sRGB nu standaard
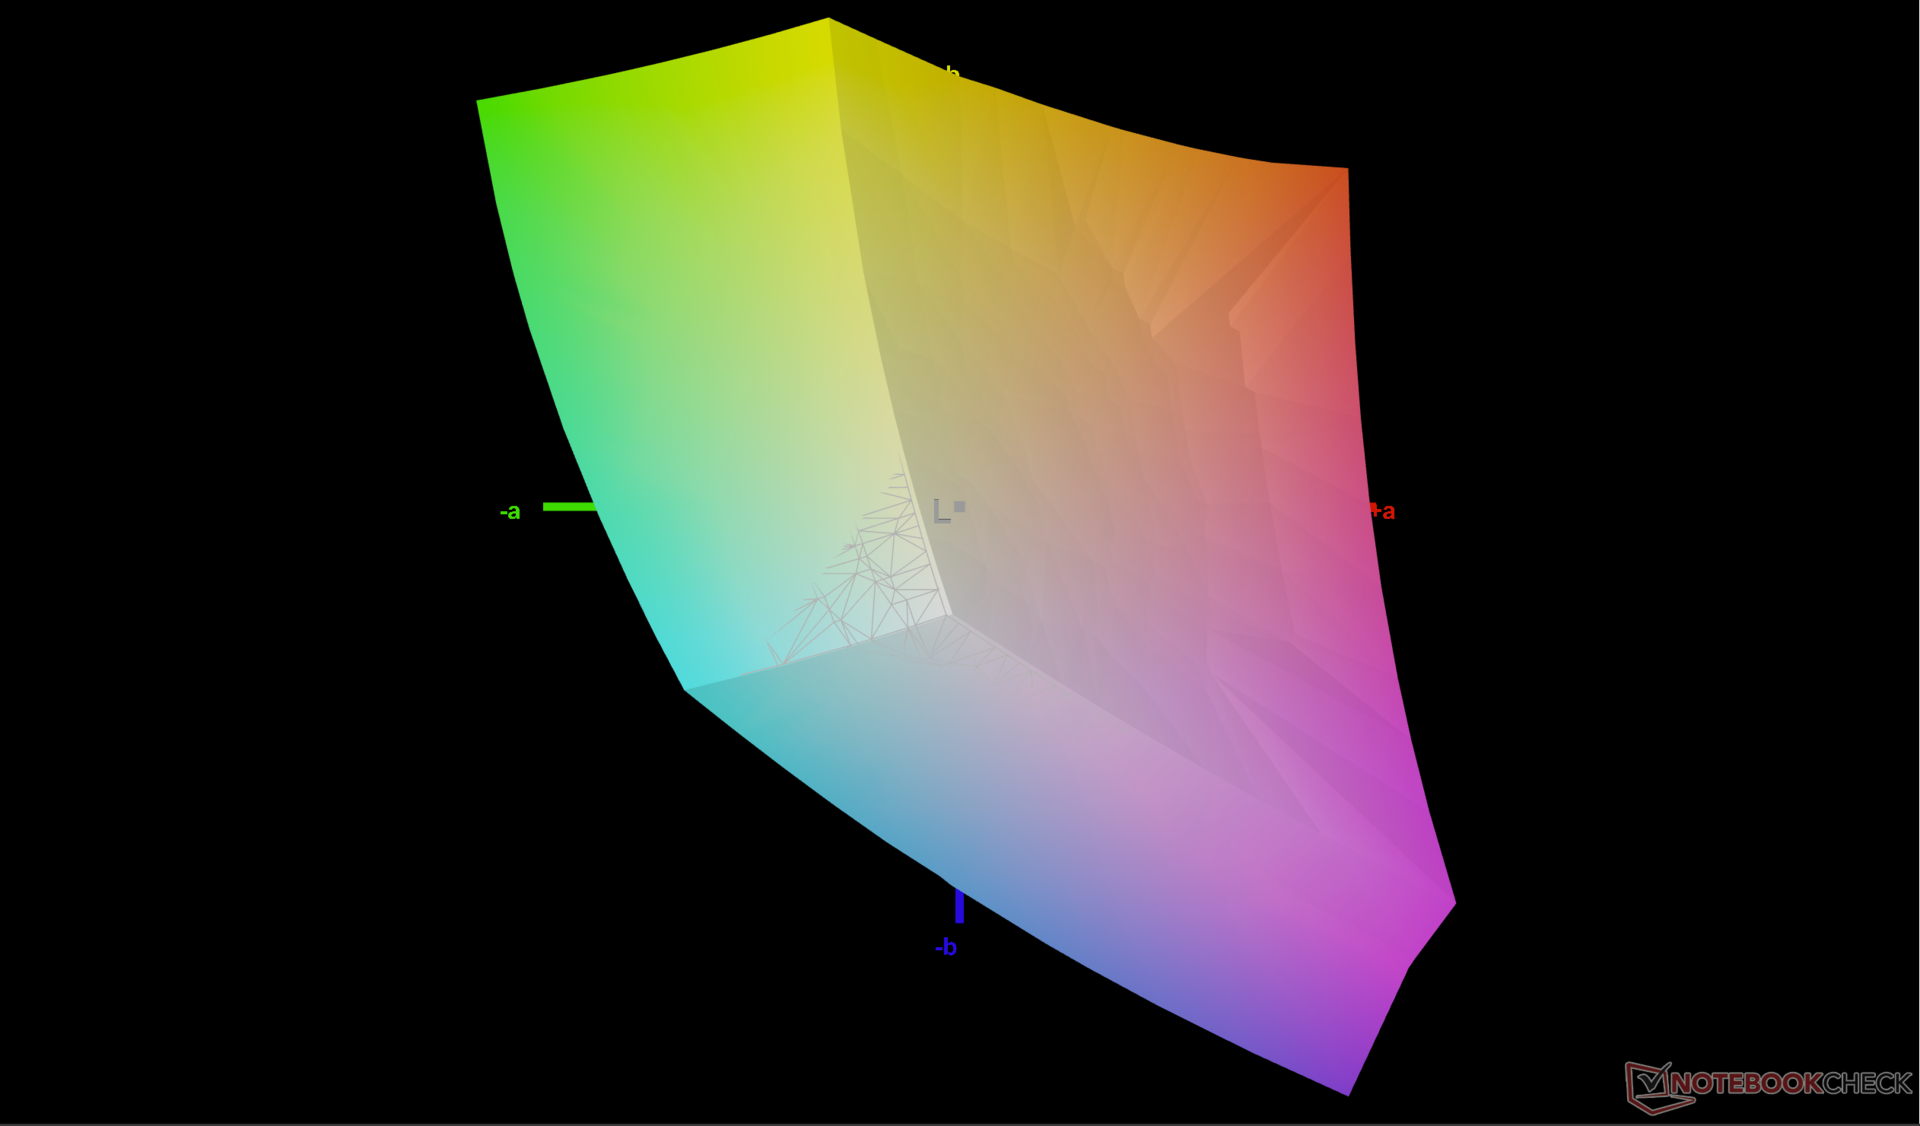
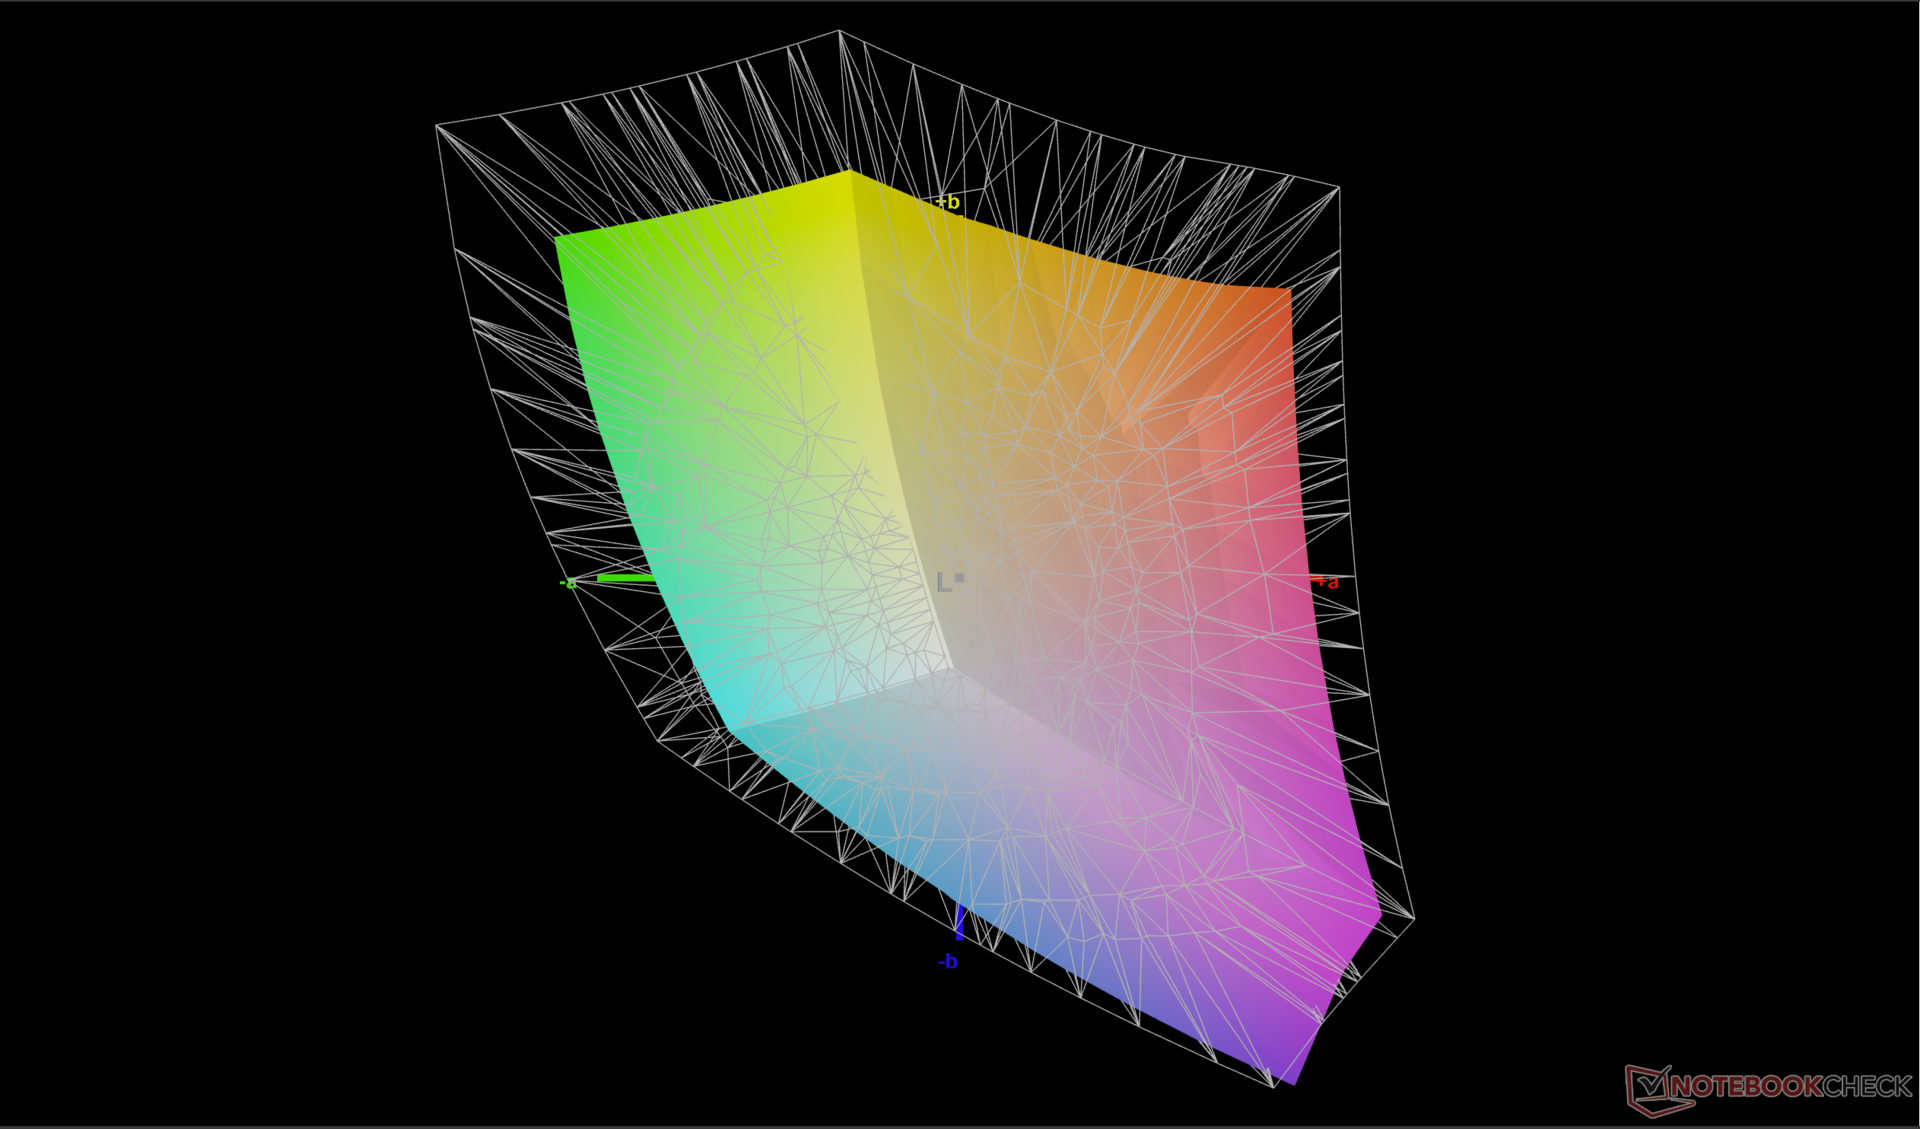
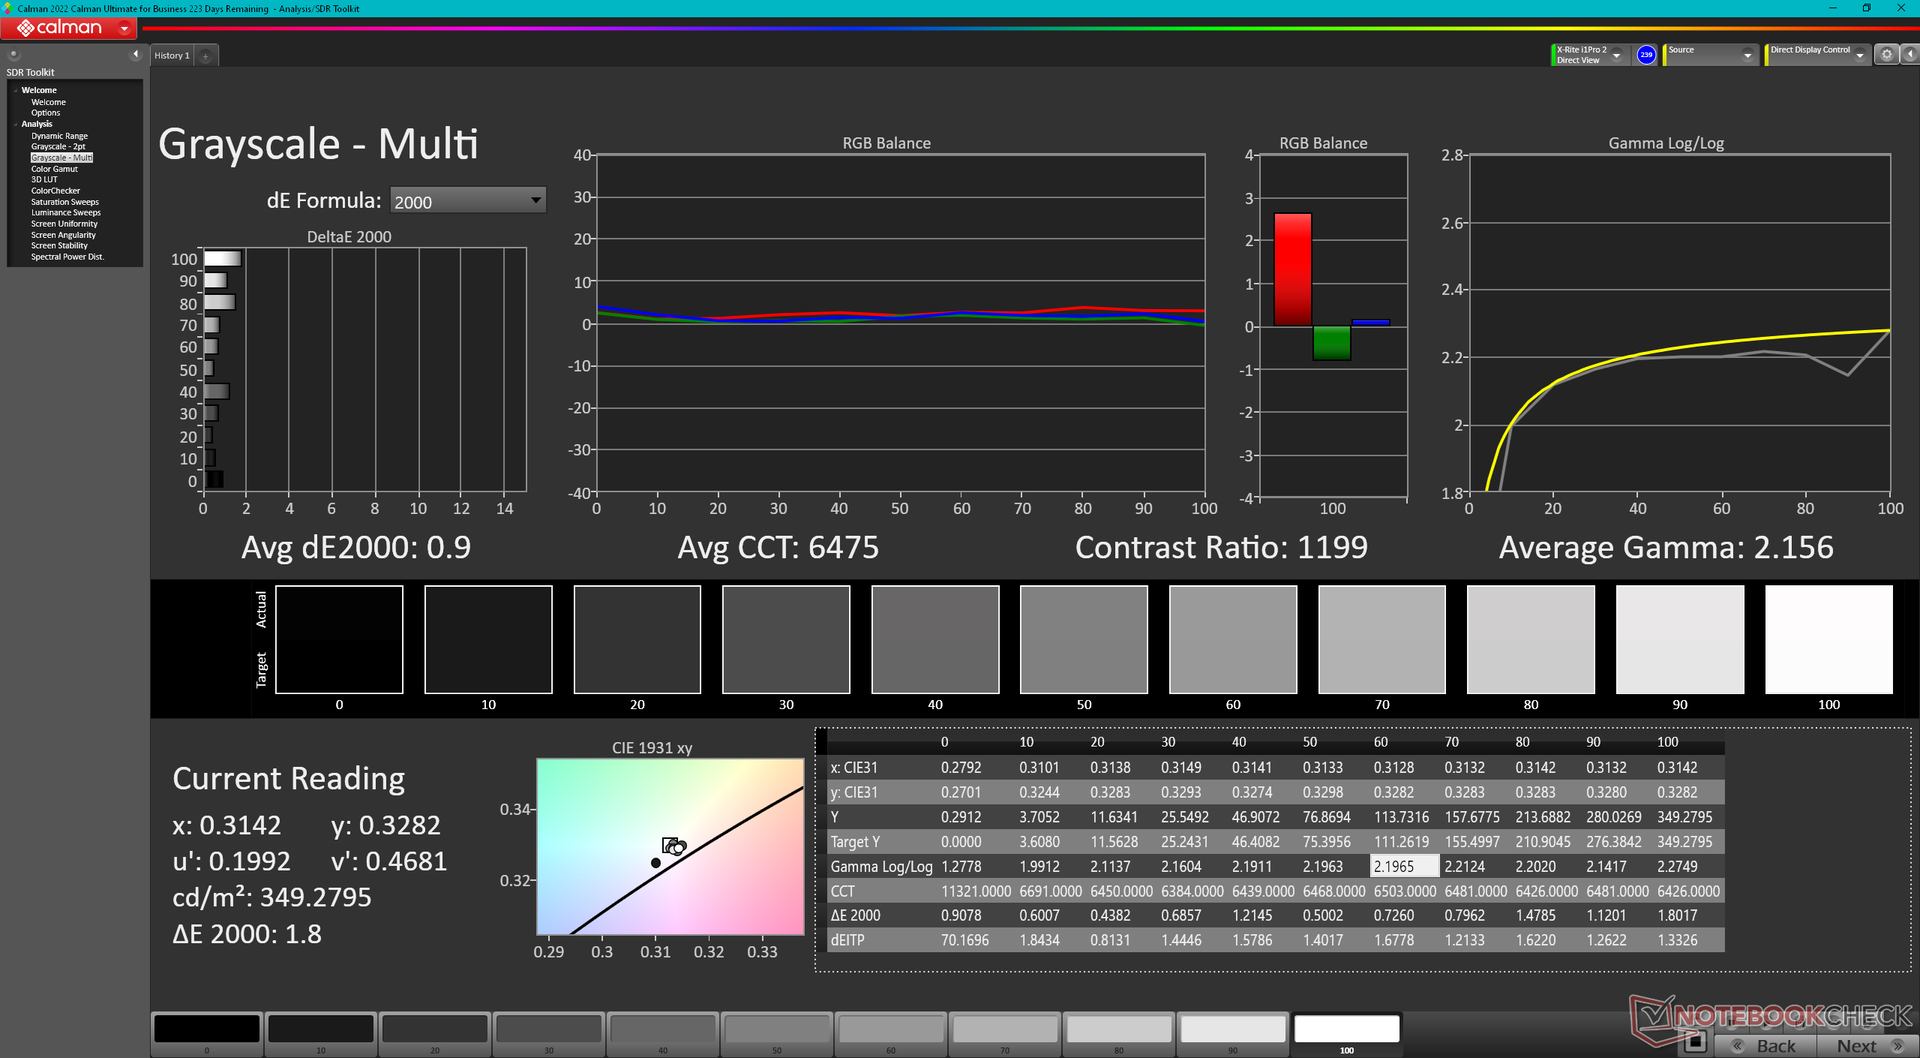
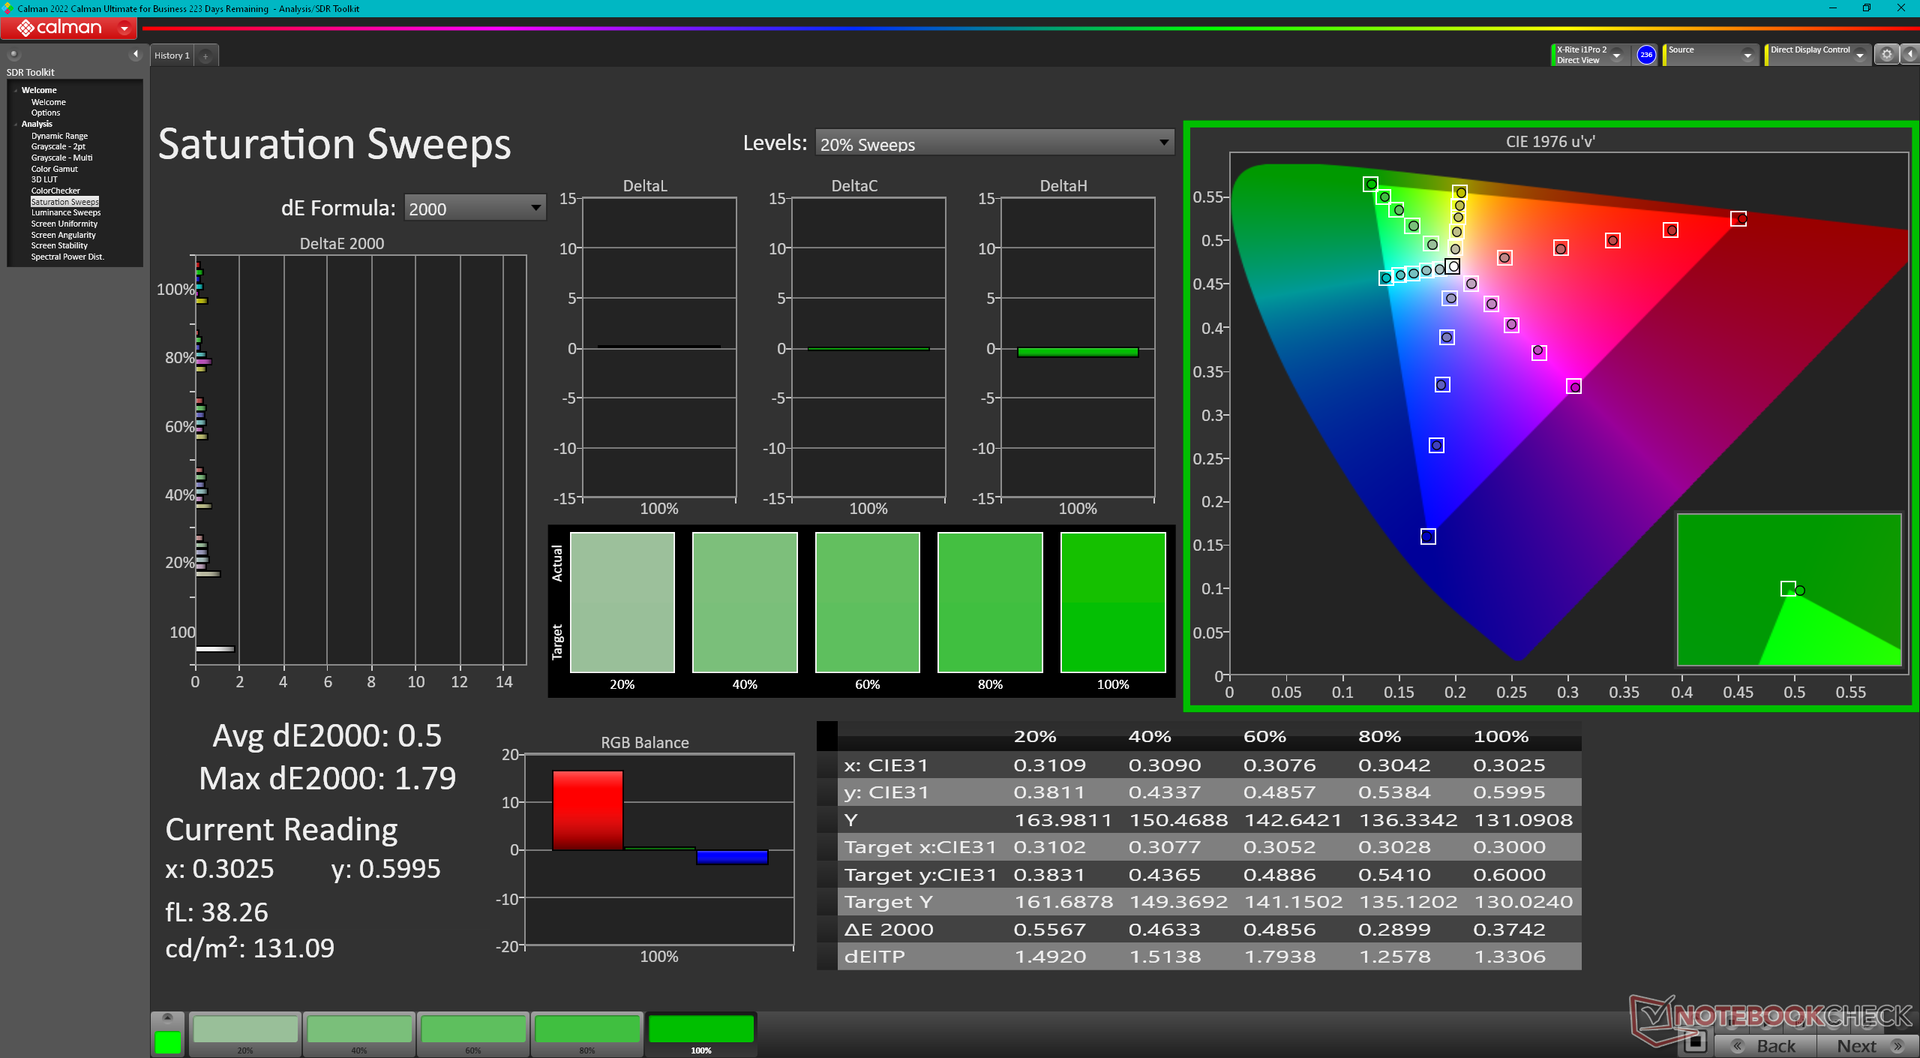
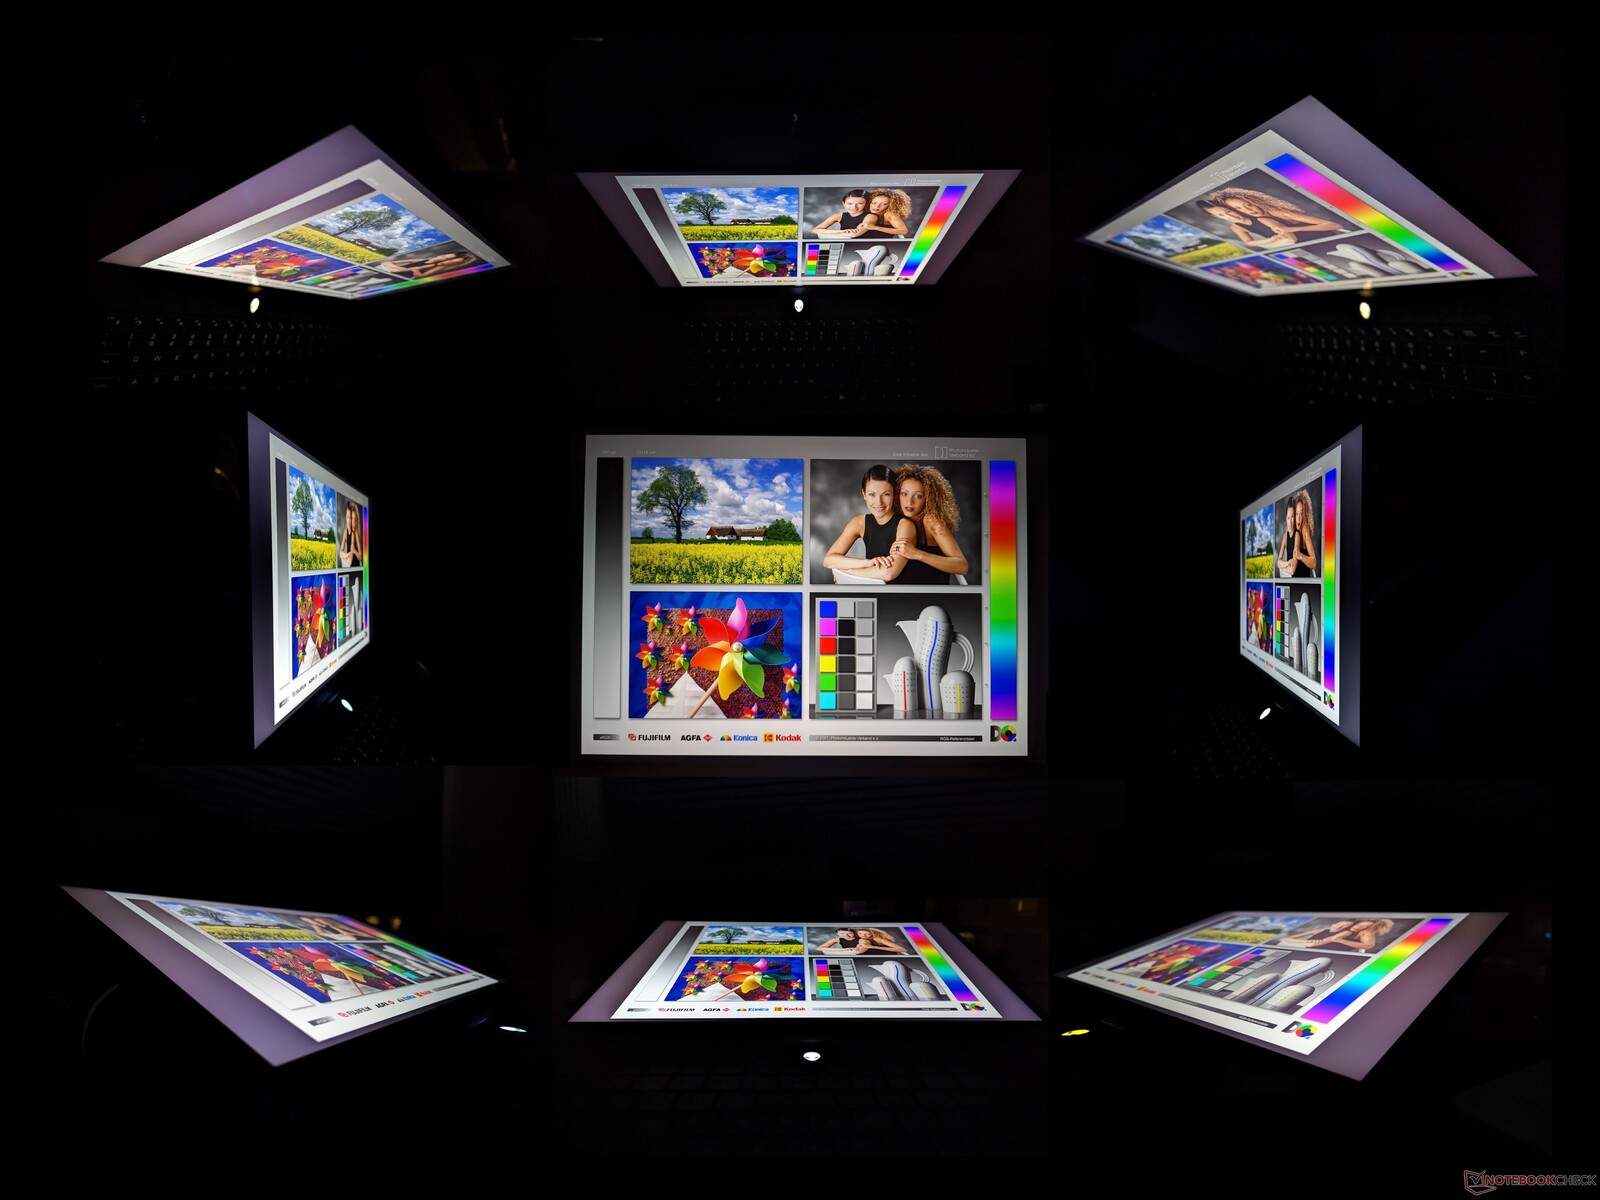
Het model maakt gebruik van een BOE NE16NYH paneel in tegenstelling tot de BOE NE16NYB op de m16 R1 van vorig jaar. Het nieuwere paneel heeft een snellere eigen vernieuwingsfrequentie (240 Hz vs. 165 Hz) terwijl alle andere kenmerken in essentie hetzelfde blijven, inclusief de snelle zwart-wit reactietijden, ~1000:1 contrastverhouding, volledige sRGB dekking en 300 tot 350 nit maximale helderheid. Het beeldscherm is geschikt voor zowel gaming als amateurbewerking.
Hoe soepel het nieuwe paneel ook is, het mist nog steeds DCI-P3-kleuren en Windows variabele vernieuwingsfrequentie. Het eerste zou professionelere grafische bewerkers hebben aangesproken, terwijl het tweede de levensduur van de batterij zou hebben verbeterd. Volledige DCI-P3 kleuren zijn beschikbaar op de x16 R1, HP Omen Transcend 16, en Asus ROG Zephyrus G16. HDR wordt ook niet ondersteund omdat het scherm niet helder genoeg is om aan de HDR400+ voorwaarden te voldoen.
| |||||||||||||||||||||||||
Helderheidsverdeling: 87 %
Helderheid in Batterij-modus: 345.8 cd/m²
Contrast: 1153:1 (Zwart: 0.3 cd/m²)
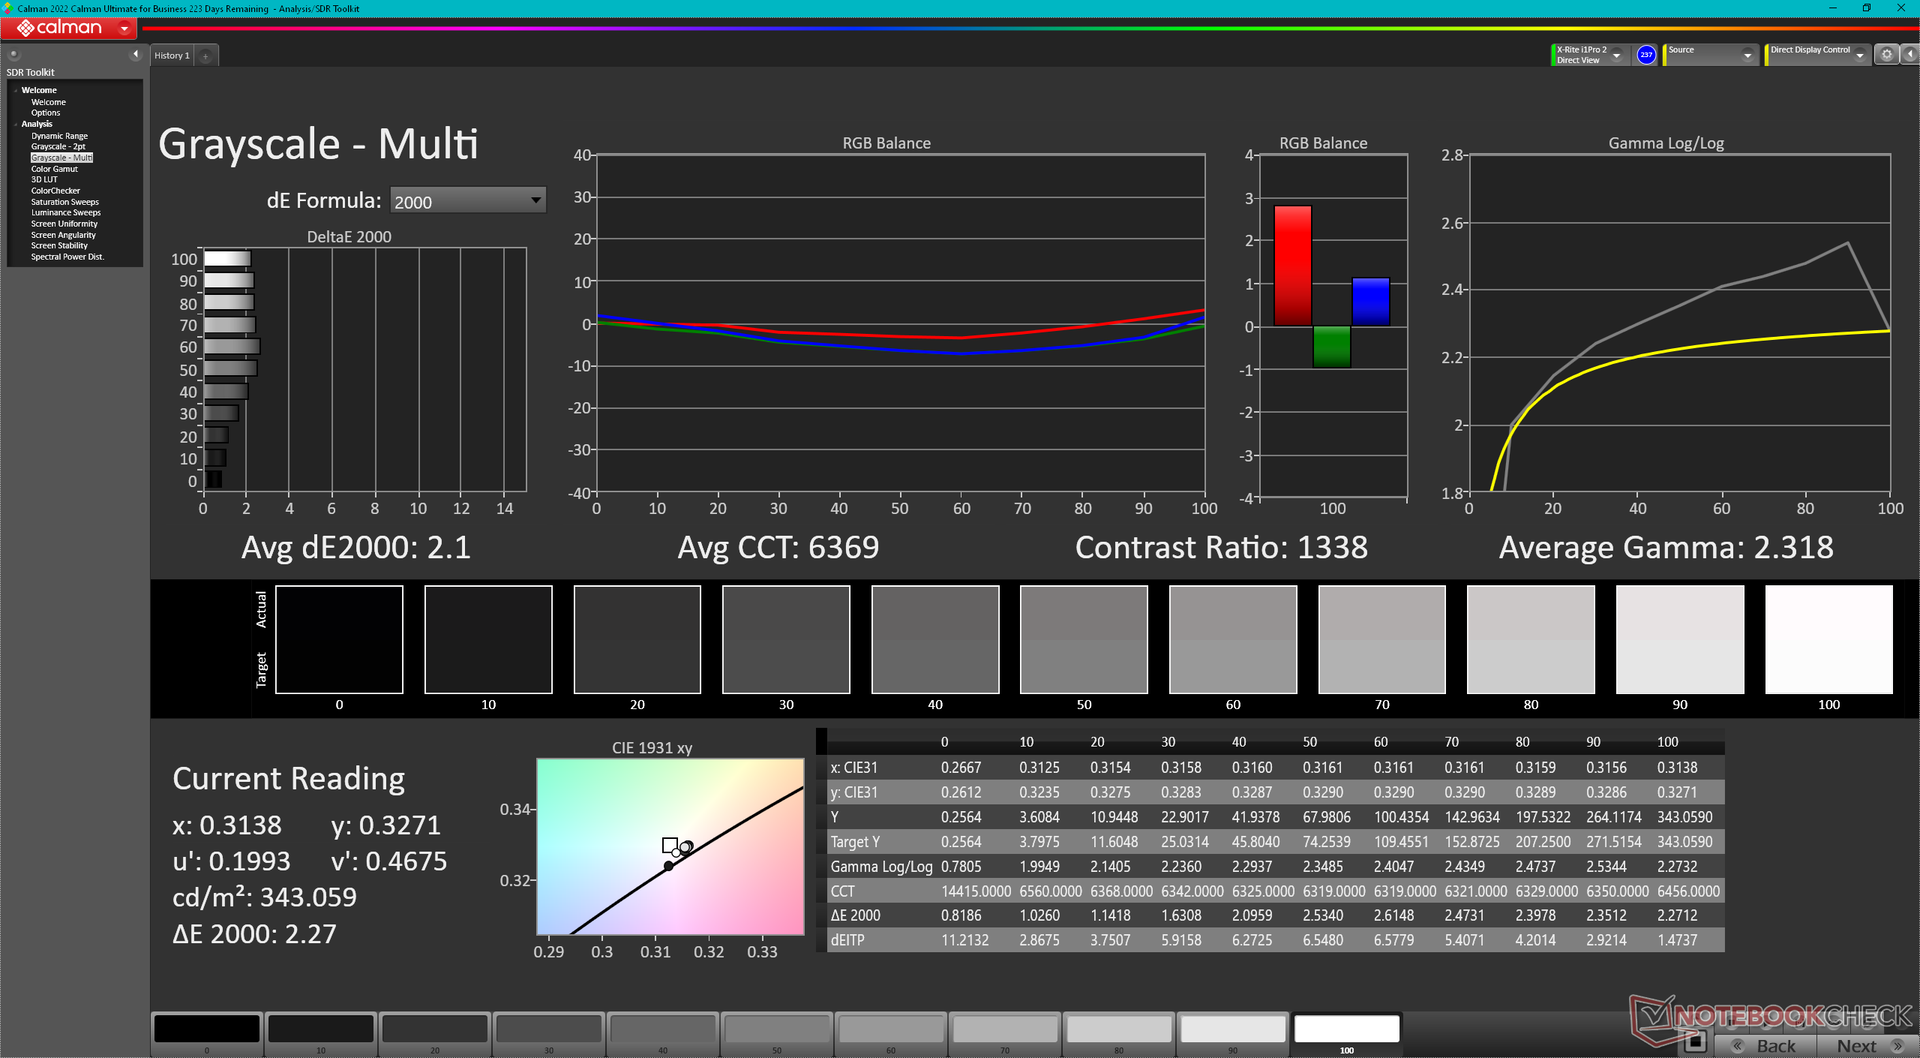
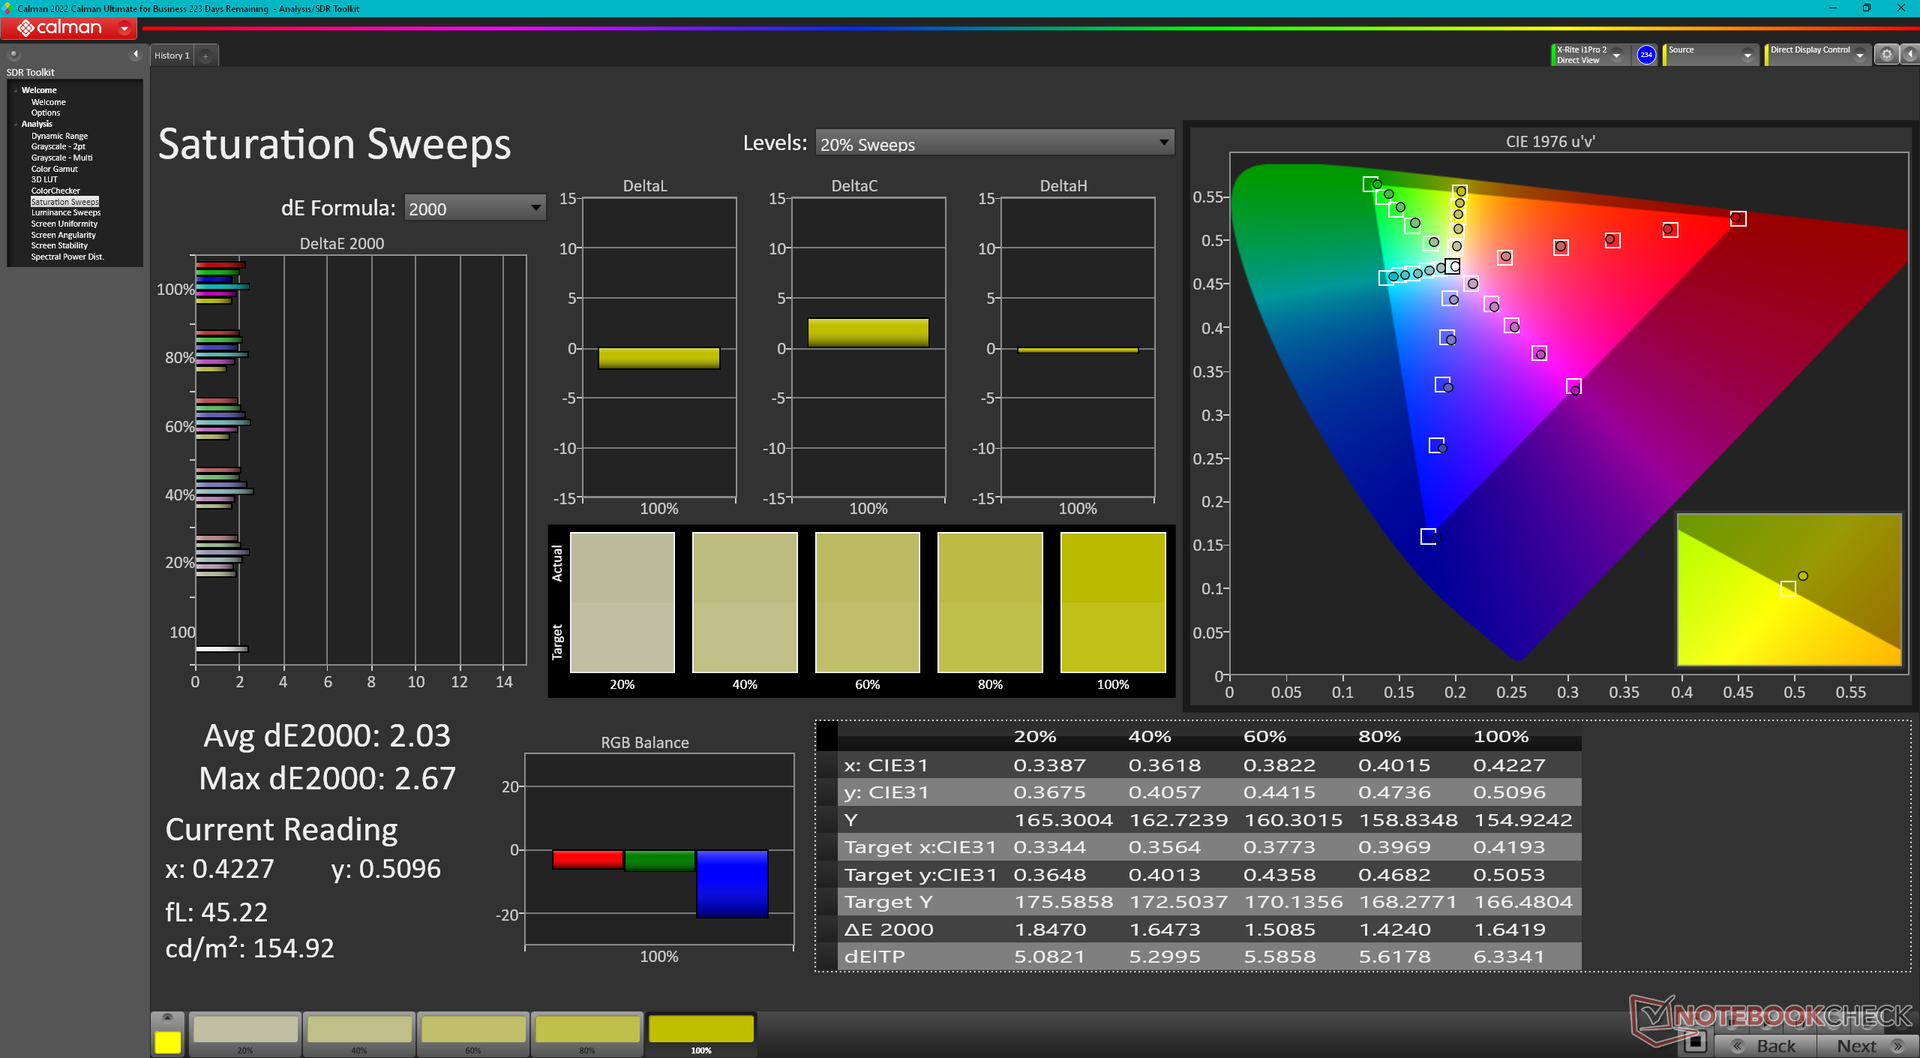
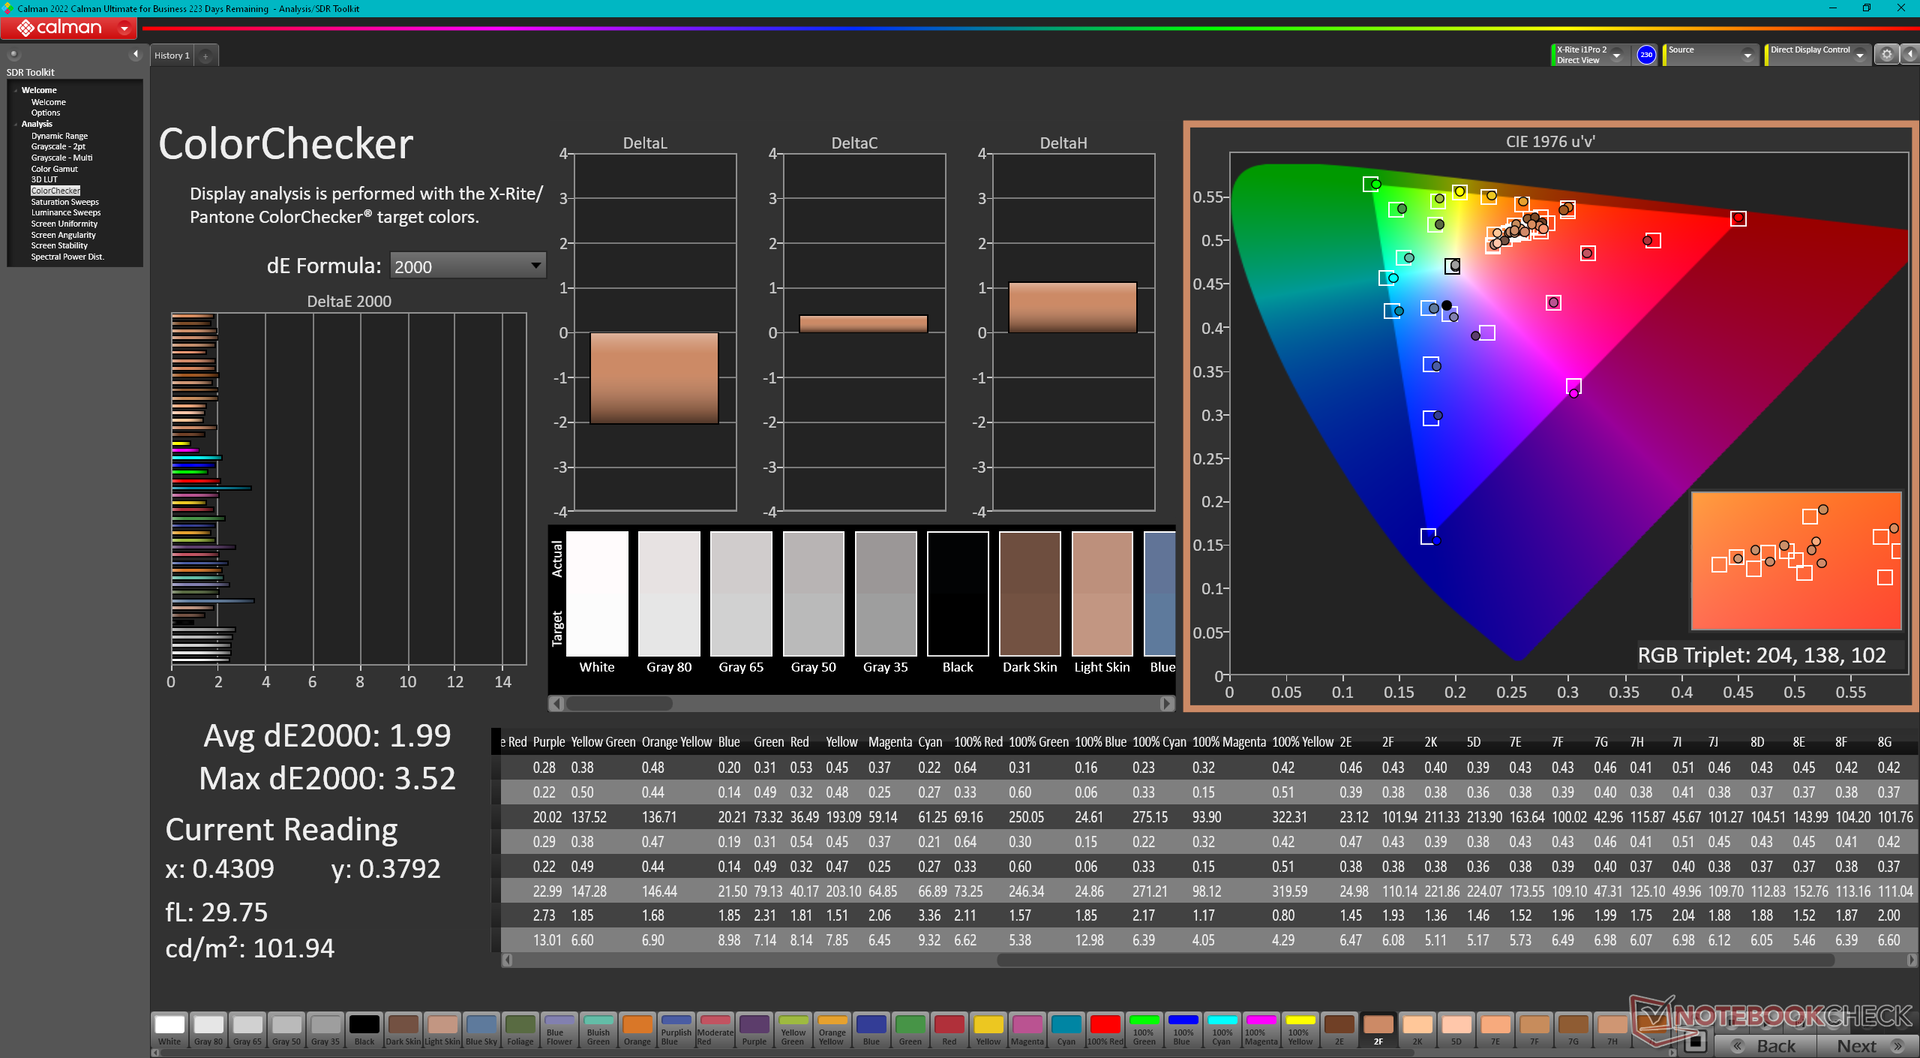
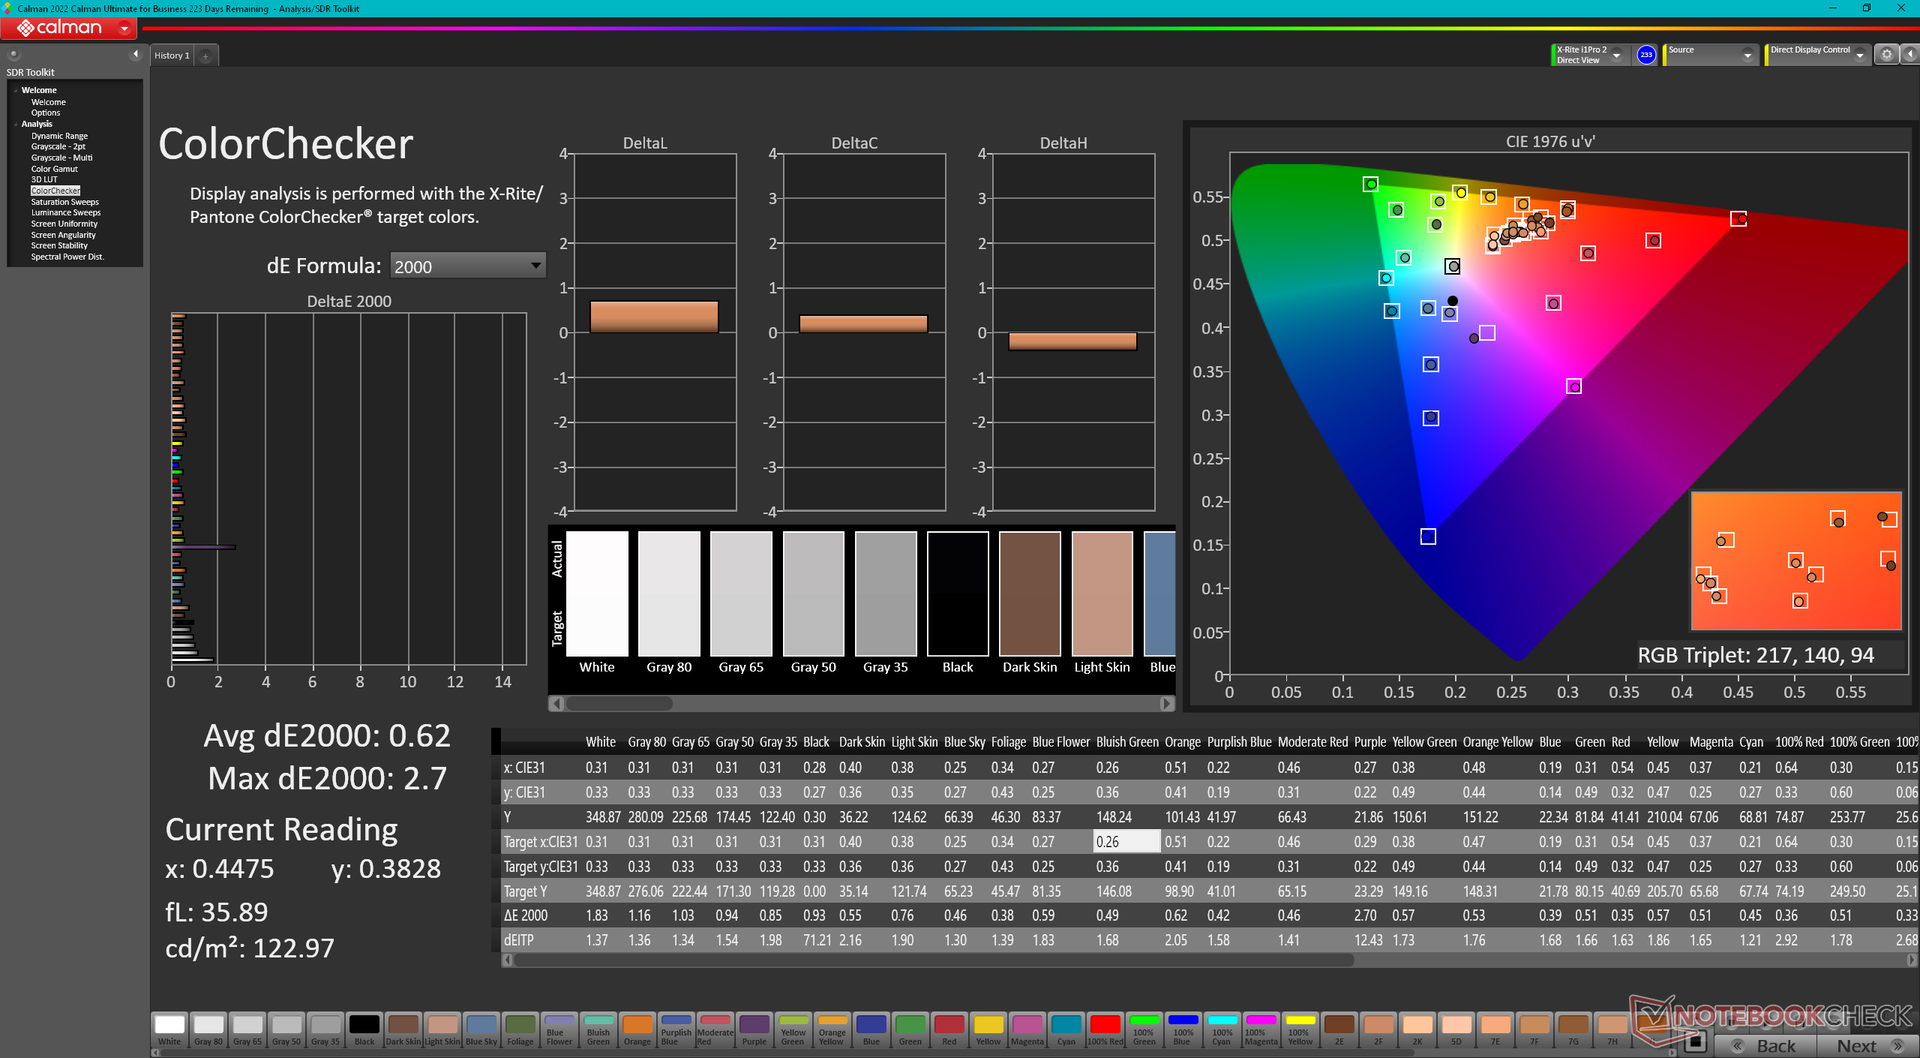
ΔE ColorChecker Calman: 1.99 | ∀{0.5-29.43 Ø4.71}
calibrated: 0.62
ΔE Greyscale Calman: 2.1 | ∀{0.09-98 Ø4.96}
71.4% AdobeRGB 1998 (Argyll 3D)
100% sRGB (Argyll 3D)
71% Display P3 (Argyll 3D)
Gamma: 2.32
CCT: 6369 K
| Alienware m16 R2 BOE NE16NYH, IPS, 2560x1600, 16" | Alienware m16 R1 Intel BOE NE16NYB, IPS, 2560x1600, 16" | Alienware x16 R1 BOE NE16NZ4, IPS, 2560x1600, 16" | HP Omen Transcend 16-u1095ng ATNA60DL02-0 (SDC41A4), OLED, 2560x1600, 16" | Asus ROG Zephyrus G16 2024 GU605M ATNA60DL01-0, OLED, 2560x1600, 16" | Lenovo Legion Slim 7 16APH8 BOE NE160QDM-NZ3, IPS, 2560x1600, 16" | |
|---|---|---|---|---|---|---|
| Display | -3% | 21% | 26% | 26% | 0% | |
| Display P3 Coverage (%) | 71 | 67.7 -5% | 99.2 40% | 99.8 41% | 99.9 41% | 70.3 -1% |
| sRGB Coverage (%) | 100 | 97.2 -3% | 100 0% | 100 0% | 100 0% | 99.6 0% |
| AdobeRGB 1998 Coverage (%) | 71.4 | 70 -2% | 88.6 24% | 97 36% | 96.9 36% | 72.4 1% |
| Response Times | 23% | -4% | 97% | 97% | -45% | |
| Response Time Grey 50% / Grey 80% * (ms) | 5.7 ? | 4 ? 30% | 5.1 ? 11% | 0.2 ? 96% | 0.22 ? 96% | 12.6 ? -121% |
| Response Time Black / White * (ms) | 8.7 ? | 7.3 ? 16% | 10.3 ? -18% | 0.2 ? 98% | 0.25 ? 97% | 5.9 ? 32% |
| PWM Frequency (Hz) | 120 ? | 960 ? | ||||
| Screen | -20% | -13% | 129% | 14% | 5% | |
| Brightness middle (cd/m²) | 345.8 | 306 -12% | 302.2 -13% | 390 13% | 416 20% | 545 58% |
| Brightness (cd/m²) | 337 | 302 -10% | 285 -15% | 392 16% | 418 24% | 502 49% |
| Brightness Distribution (%) | 87 | 89 2% | 89 2% | 98 13% | 96 10% | 82 -6% |
| Black Level * (cd/m²) | 0.3 | 0.3 -0% | 0.26 13% | 0.02 93% | 0.48 -60% | |
| Contrast (:1) | 1153 | 1020 -12% | 1162 1% | 19500 1591% | 1135 -2% | |
| Colorchecker dE 2000 * | 1.99 | 2.57 -29% | 1.63 18% | 1.94 3% | 1.6 20% | 1.36 32% |
| Colorchecker dE 2000 max. * | 3.52 | 4.26 -21% | 4.13 -17% | 4.26 -21% | 2.1 40% | 3.11 12% |
| Colorchecker dE 2000 calibrated * | 0.62 | 0.85 -37% | 1.17 -89% | 4.21 -579% | 1.04 -68% | |
| Greyscale dE 2000 * | 2.1 | 3.3 -57% | 2.5 -19% | 1.5 29% | 2.7 -29% | 1.4 33% |
| Gamma | 2.32 95% | 1.997 110% | 2.23 99% | 2.221 99% | 2.16 102% | 2.253 98% |
| CCT | 6369 102% | 6895 94% | 6590 99% | 6395 102% | 6331 103% | 6631 98% |
| Totaal Gemiddelde (Programma / Instellingen) | 0% /
-10% | 1% /
-4% | 84% /
102% | 46% /
32% | -13% /
-3% |
* ... kleiner is beter
Het beeldscherm komt goed gekalibreerd uit de doos met gemiddelde grijswaarden en kleur deltaE waarden van respectievelijk slechts 2,1 en 1,99. De resultaten zouden nog verder verbeteren tot <1 wanneer ze verder gekalibreerd zouden worden met onze X-Rite colorimeter, maar dit zou voor de meeste gebruikers niet nodig moeten zijn. Ons gekalibreerde ICM-profiel kunt u hierboven gratis downloaden.
Responstijd Scherm
| ↔ Responstijd Zwart naar Wit | ||
|---|---|---|
| 8.7 ms ... stijging ↗ en daling ↘ gecombineerd | ↗ 4.6 ms stijging | 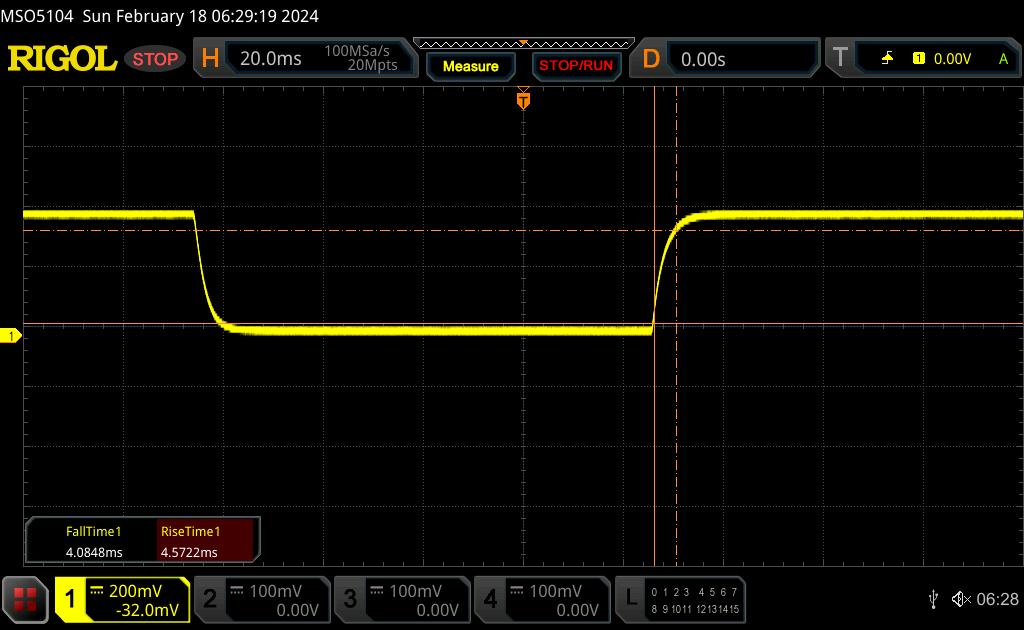 |
| ↘ 4.1 ms daling | ||
| Het scherm vertoonde snelle responstijden in onze tests en zou geschikt moeten zijn voor games. Ter vergelijking: alle testtoestellen variëren van 0.1 (minimum) tot 240 (maximum) ms. » 24 % van alle toestellen zijn beter. Dit betekent dat de gemeten responstijd beter is dan het gemiddelde (19.8 ms) van alle geteste toestellen. | ||
| ↔ Responstijd 50% Grijs naar 80% Grijs | ||
| 5.7 ms ... stijging ↗ en daling ↘ gecombineerd | ↗ 2.6 ms stijging | 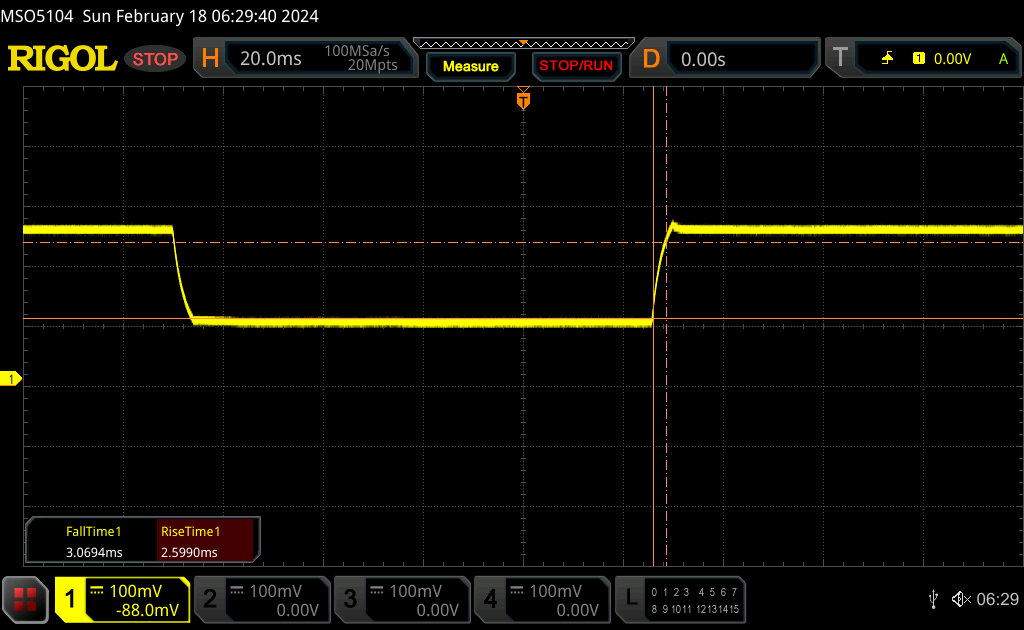 |
| ↘ 3.1 ms daling | ||
| Het scherm vertoonde erg snelle responstijden in onze tests en zou zeer geschikt moeten zijn voor snelle games. Ter vergelijking: alle testtoestellen variëren van 0.165 (minimum) tot 636 (maximum) ms. » 18 % van alle toestellen zijn beter. Dit betekent dat de gemeten responstijd beter is dan het gemiddelde (31 ms) van alle geteste toestellen. | ||
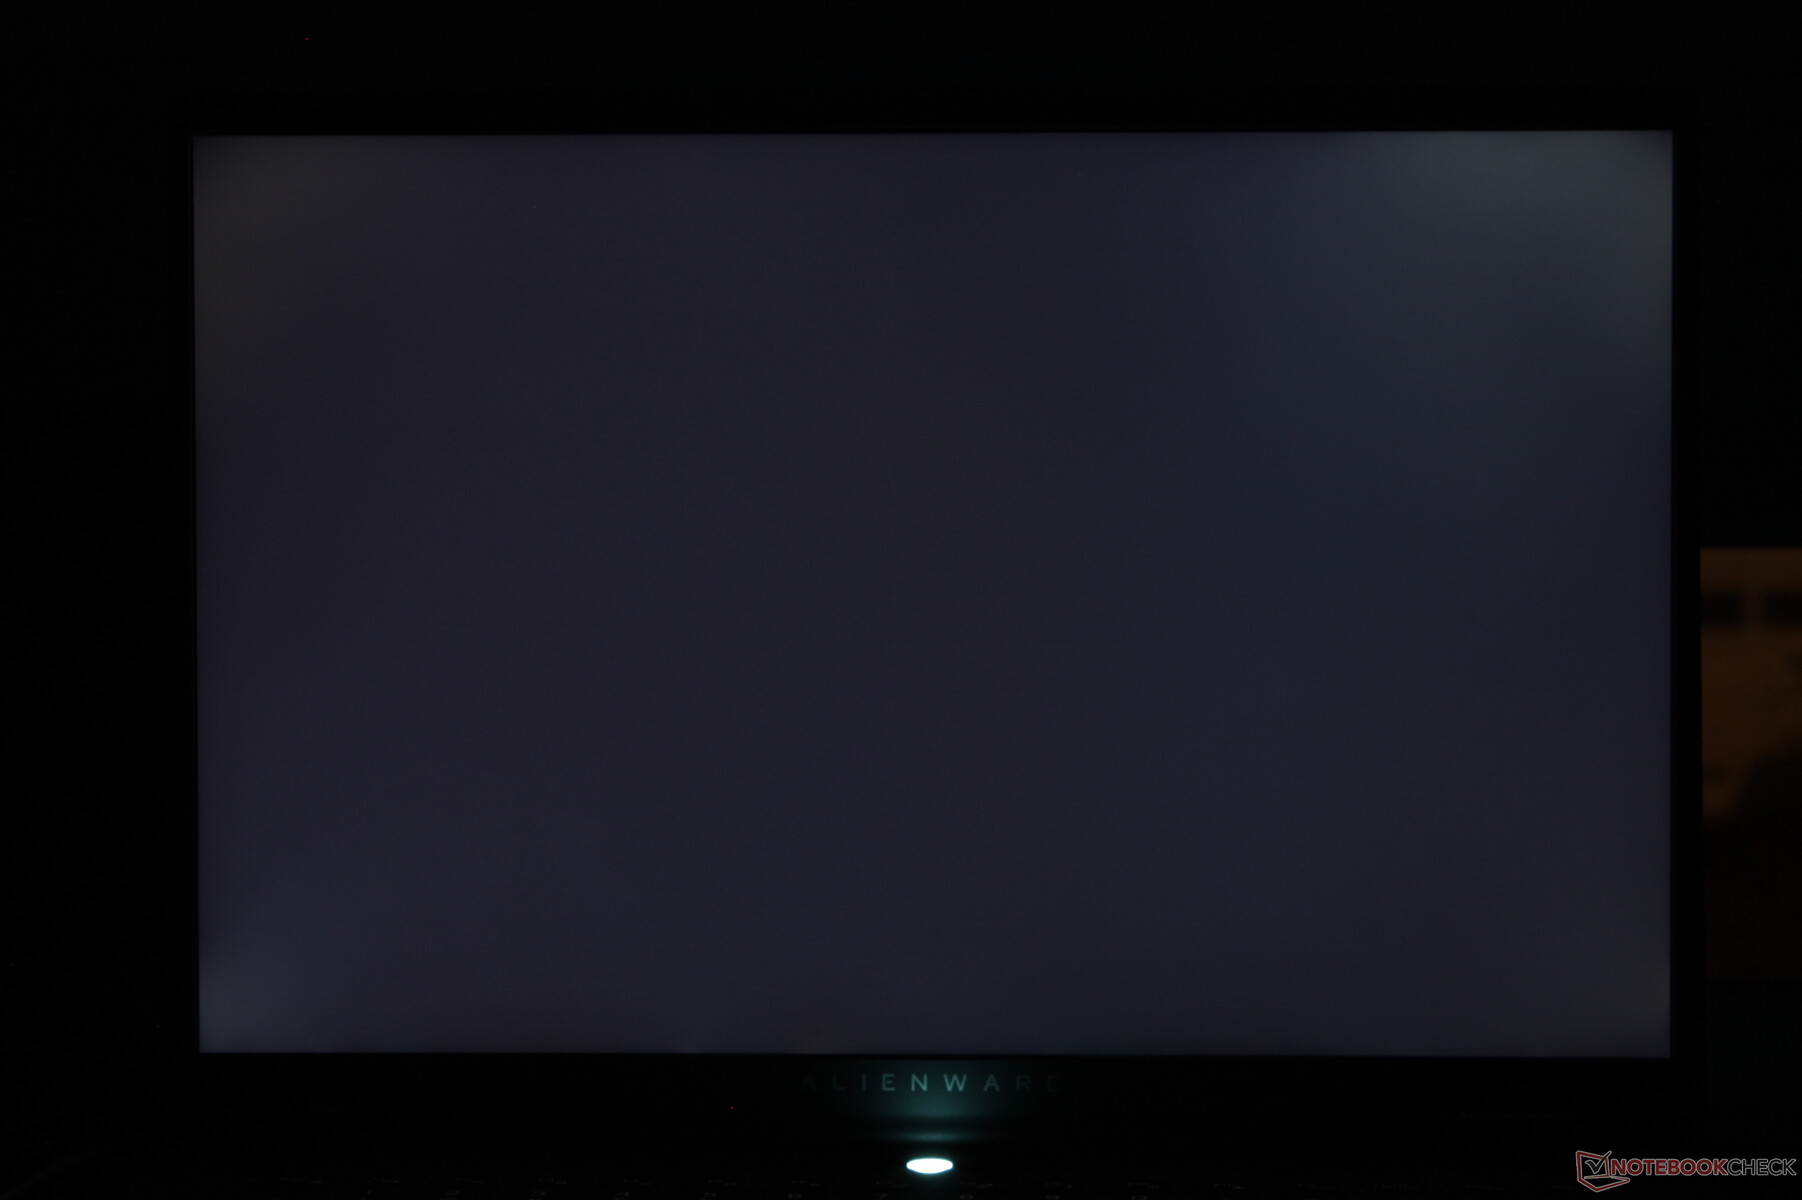
Screen Flickering / PWM (Pulse-Width Modulation)
| Screen flickering / PWM niet waargenomen | 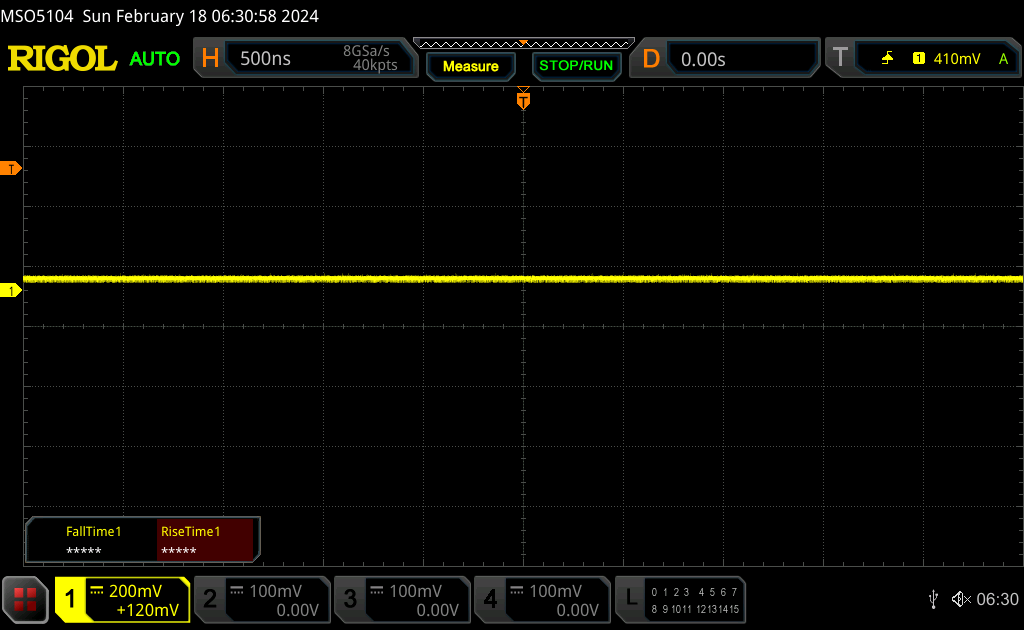 | ||
Ter vergelijking: 52 % van alle geteste toestellen maakten geen gebruik van PWM om de schermhelderheid te verlagen. Als het wel werd gebruikt, werd een gemiddelde van 7757 (minimum: 5 - maximum: 343500) Hz waargenomen. | |||
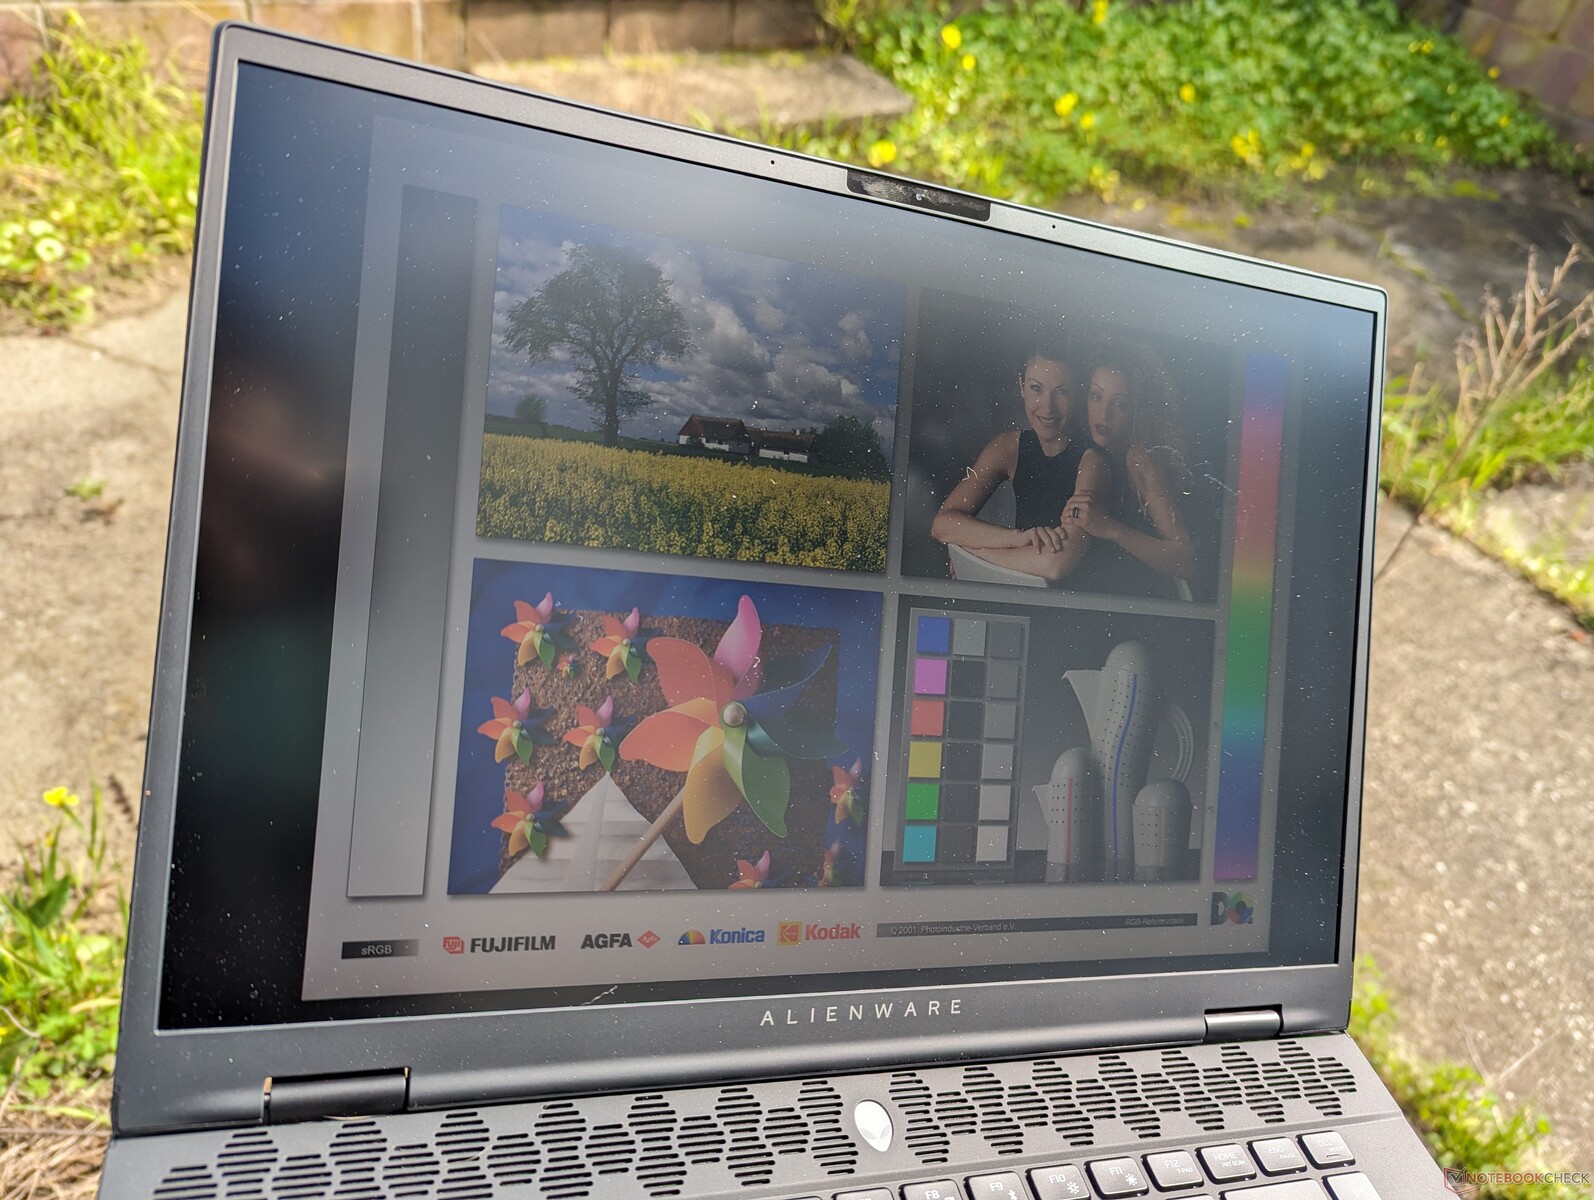
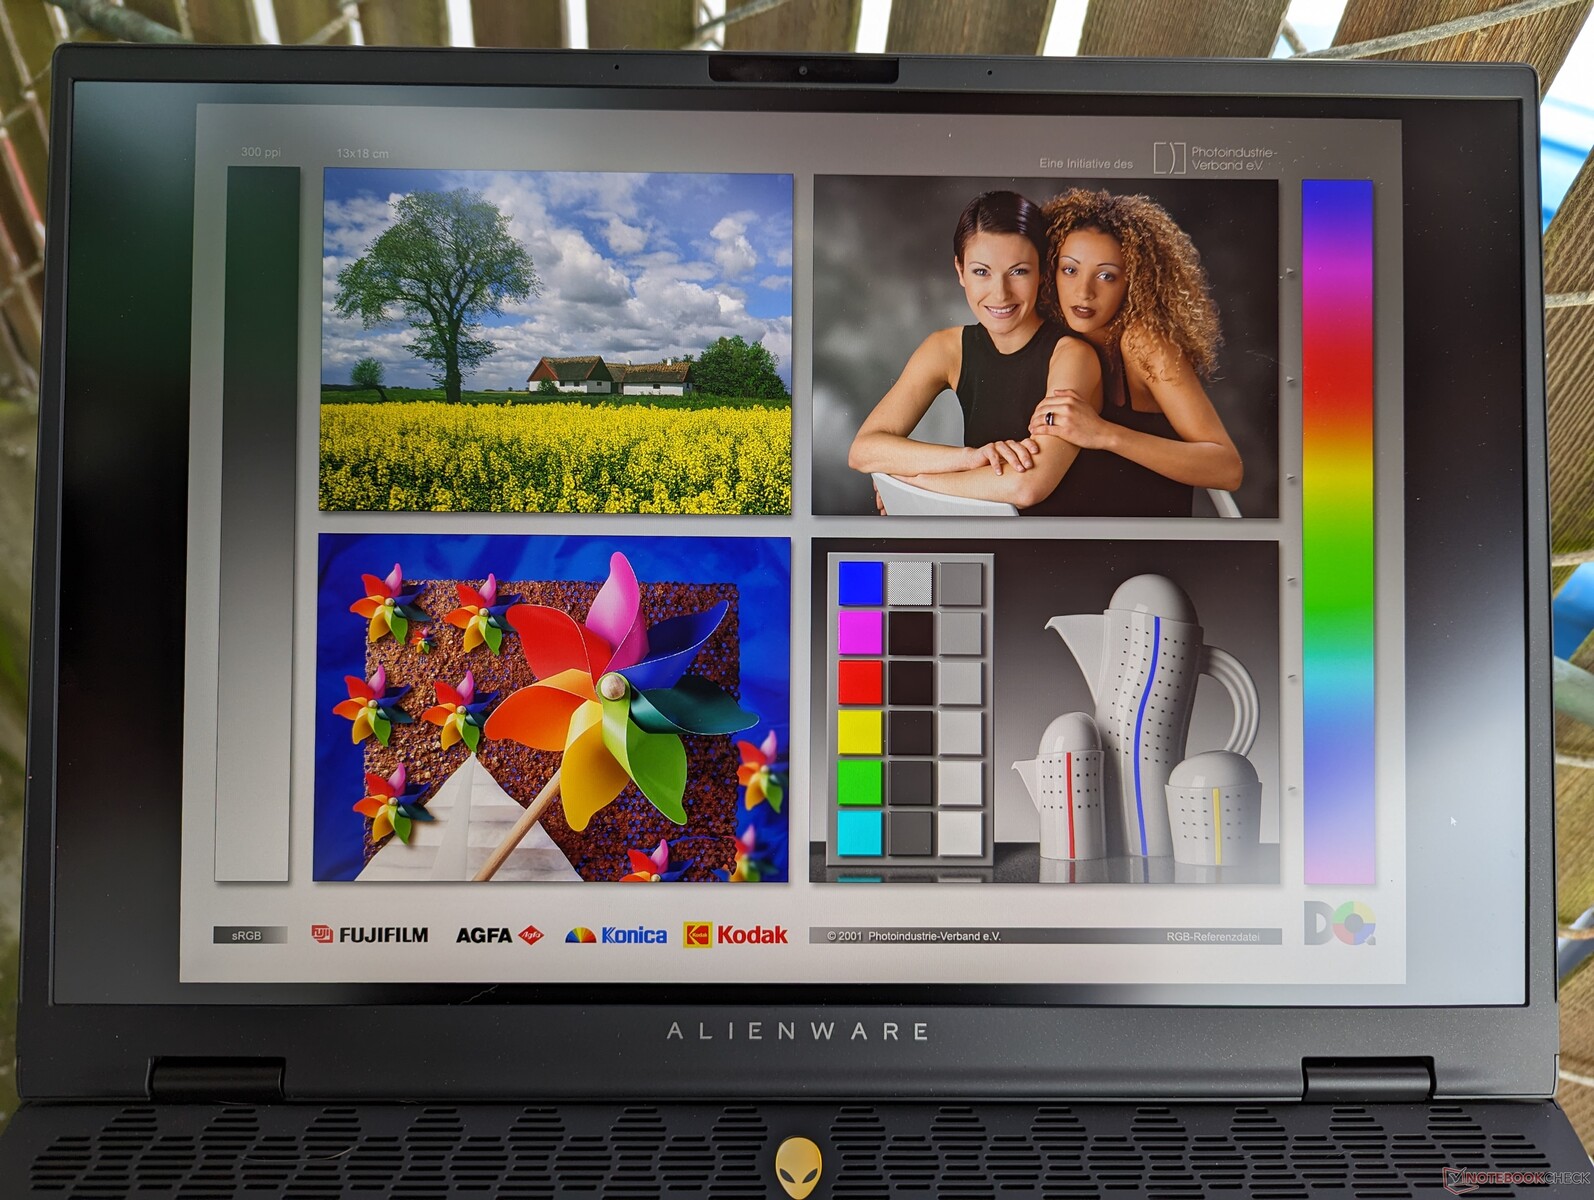
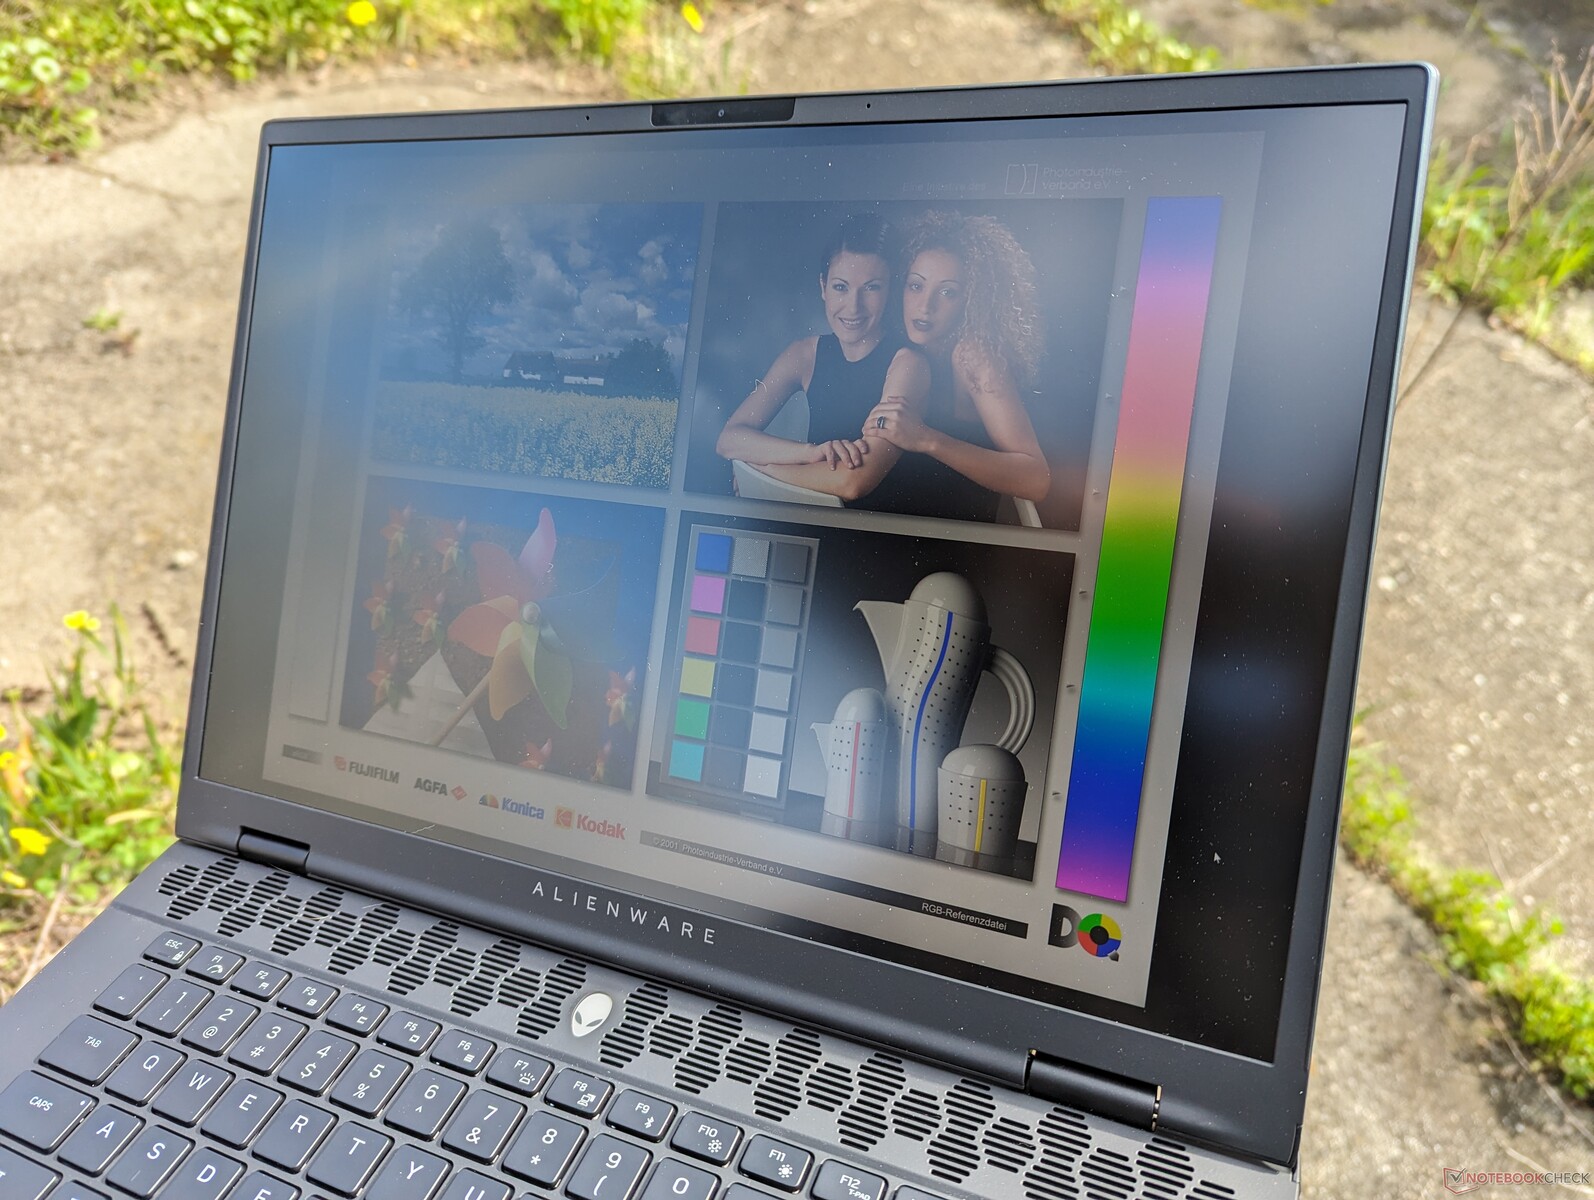
De zichtbaarheid buiten blijft ongeveer hetzelfde als voorheen, dus het is aan te raden om waar mogelijk in de schaduw te blijven om schittering te verminderen en kleuren te behouden. Het lichtere gewicht en het kleinere formaat maken het systeem wel gemakkelijker te hanteren.
Prestaties - Van Raptor Lake-HX tot Meteor Lake-H
Testomstandigheden
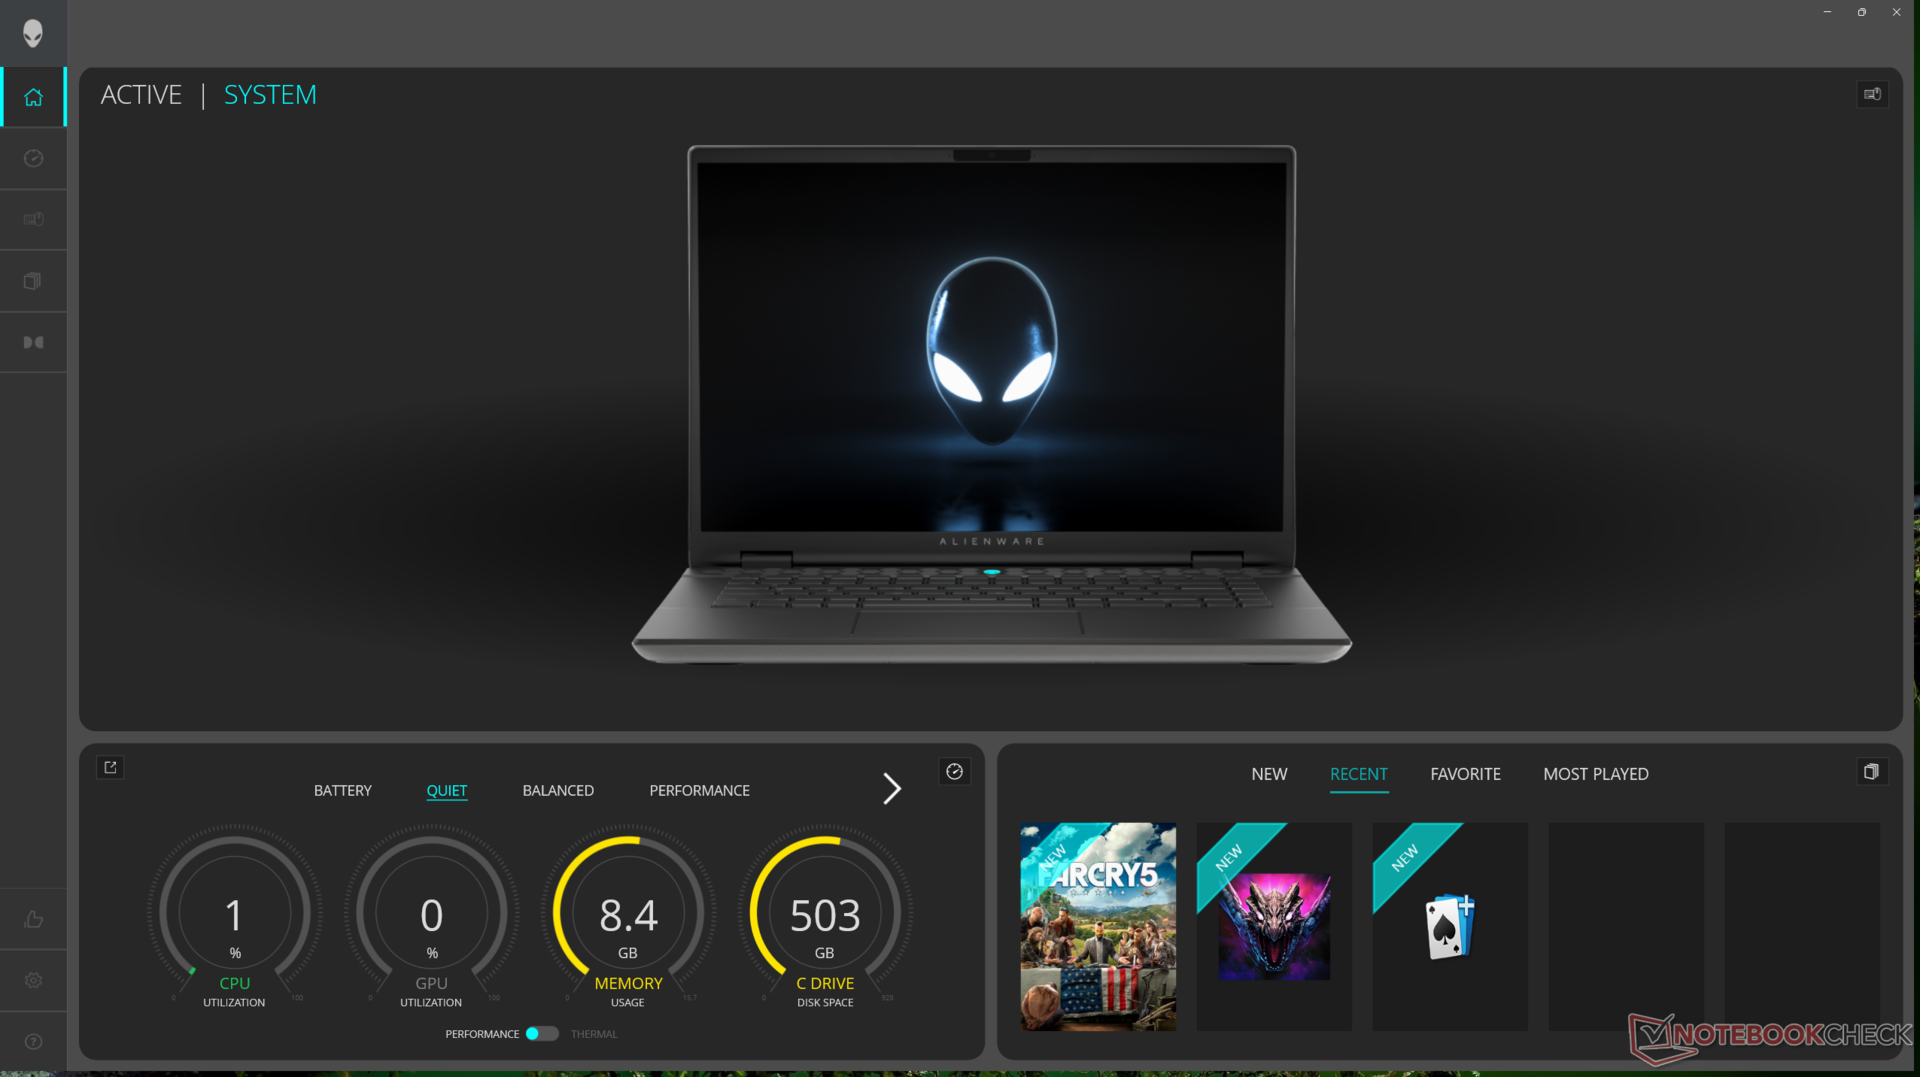
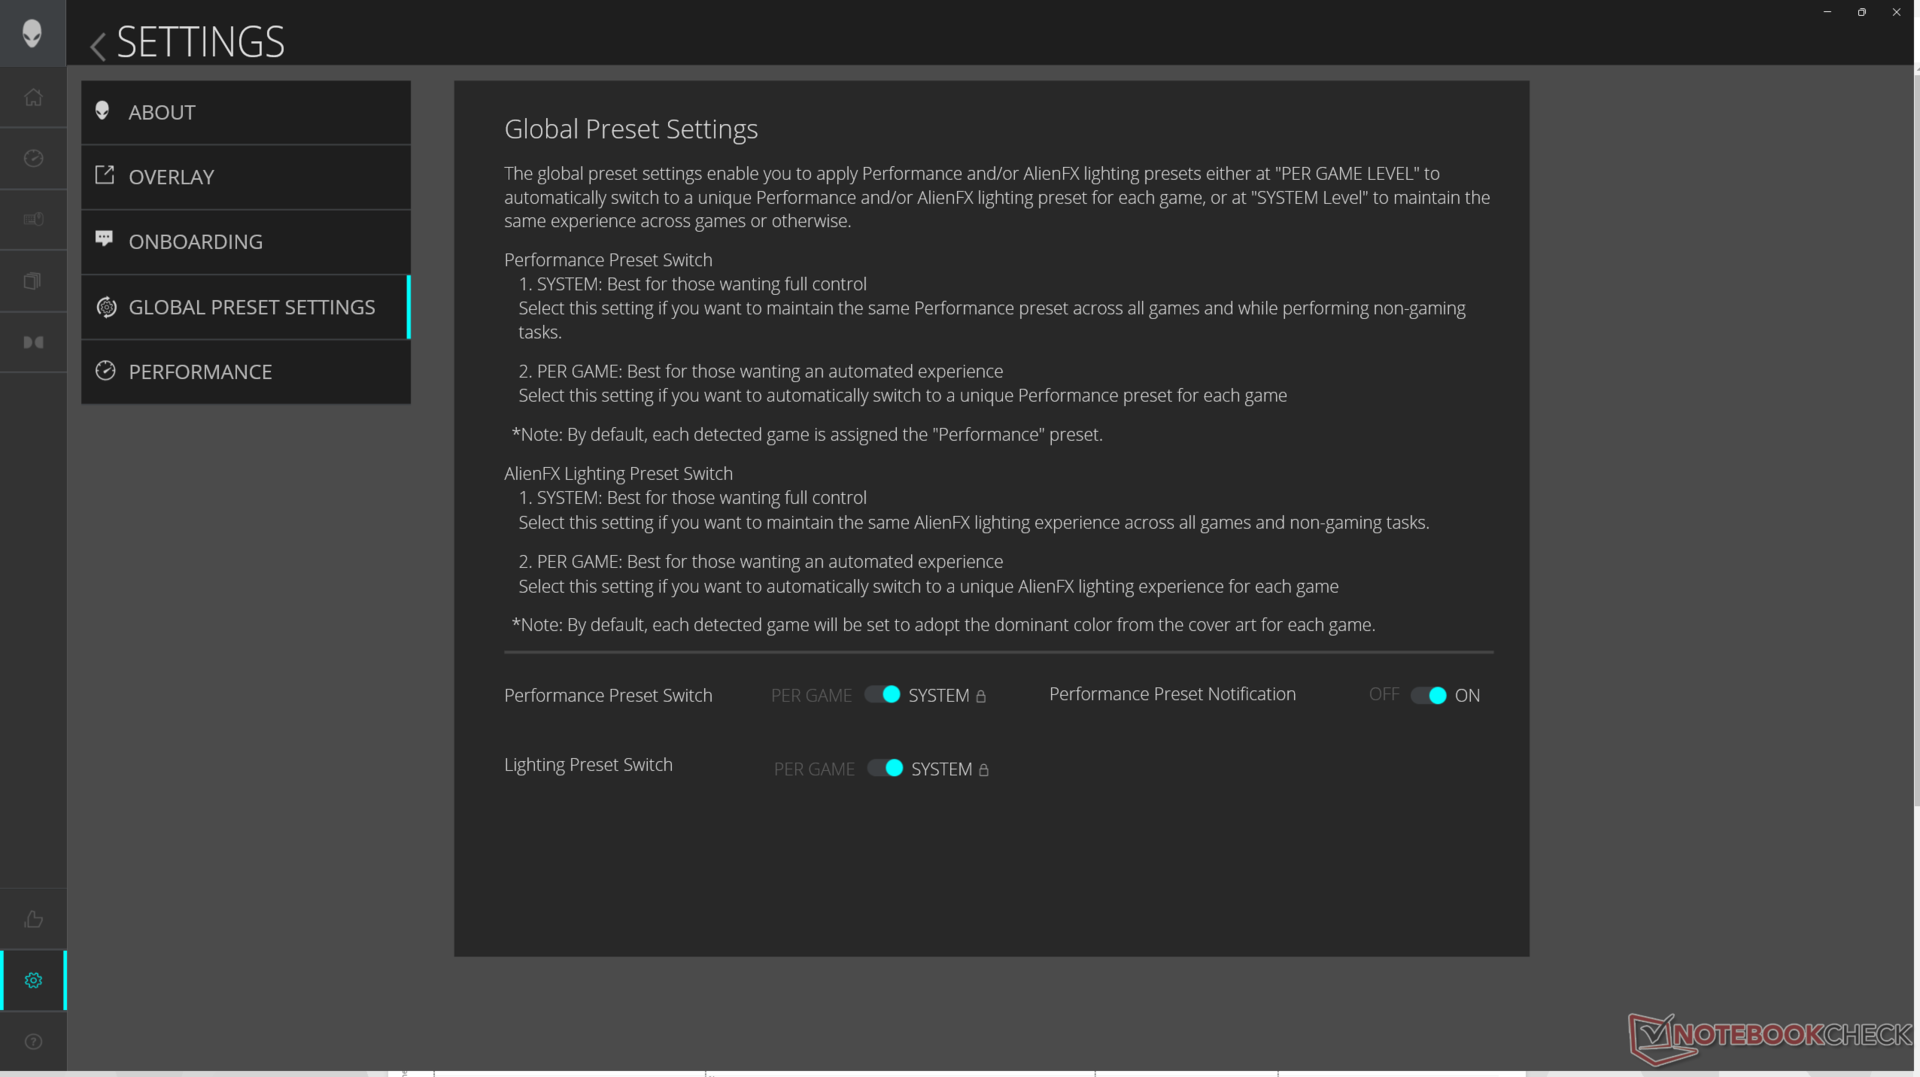
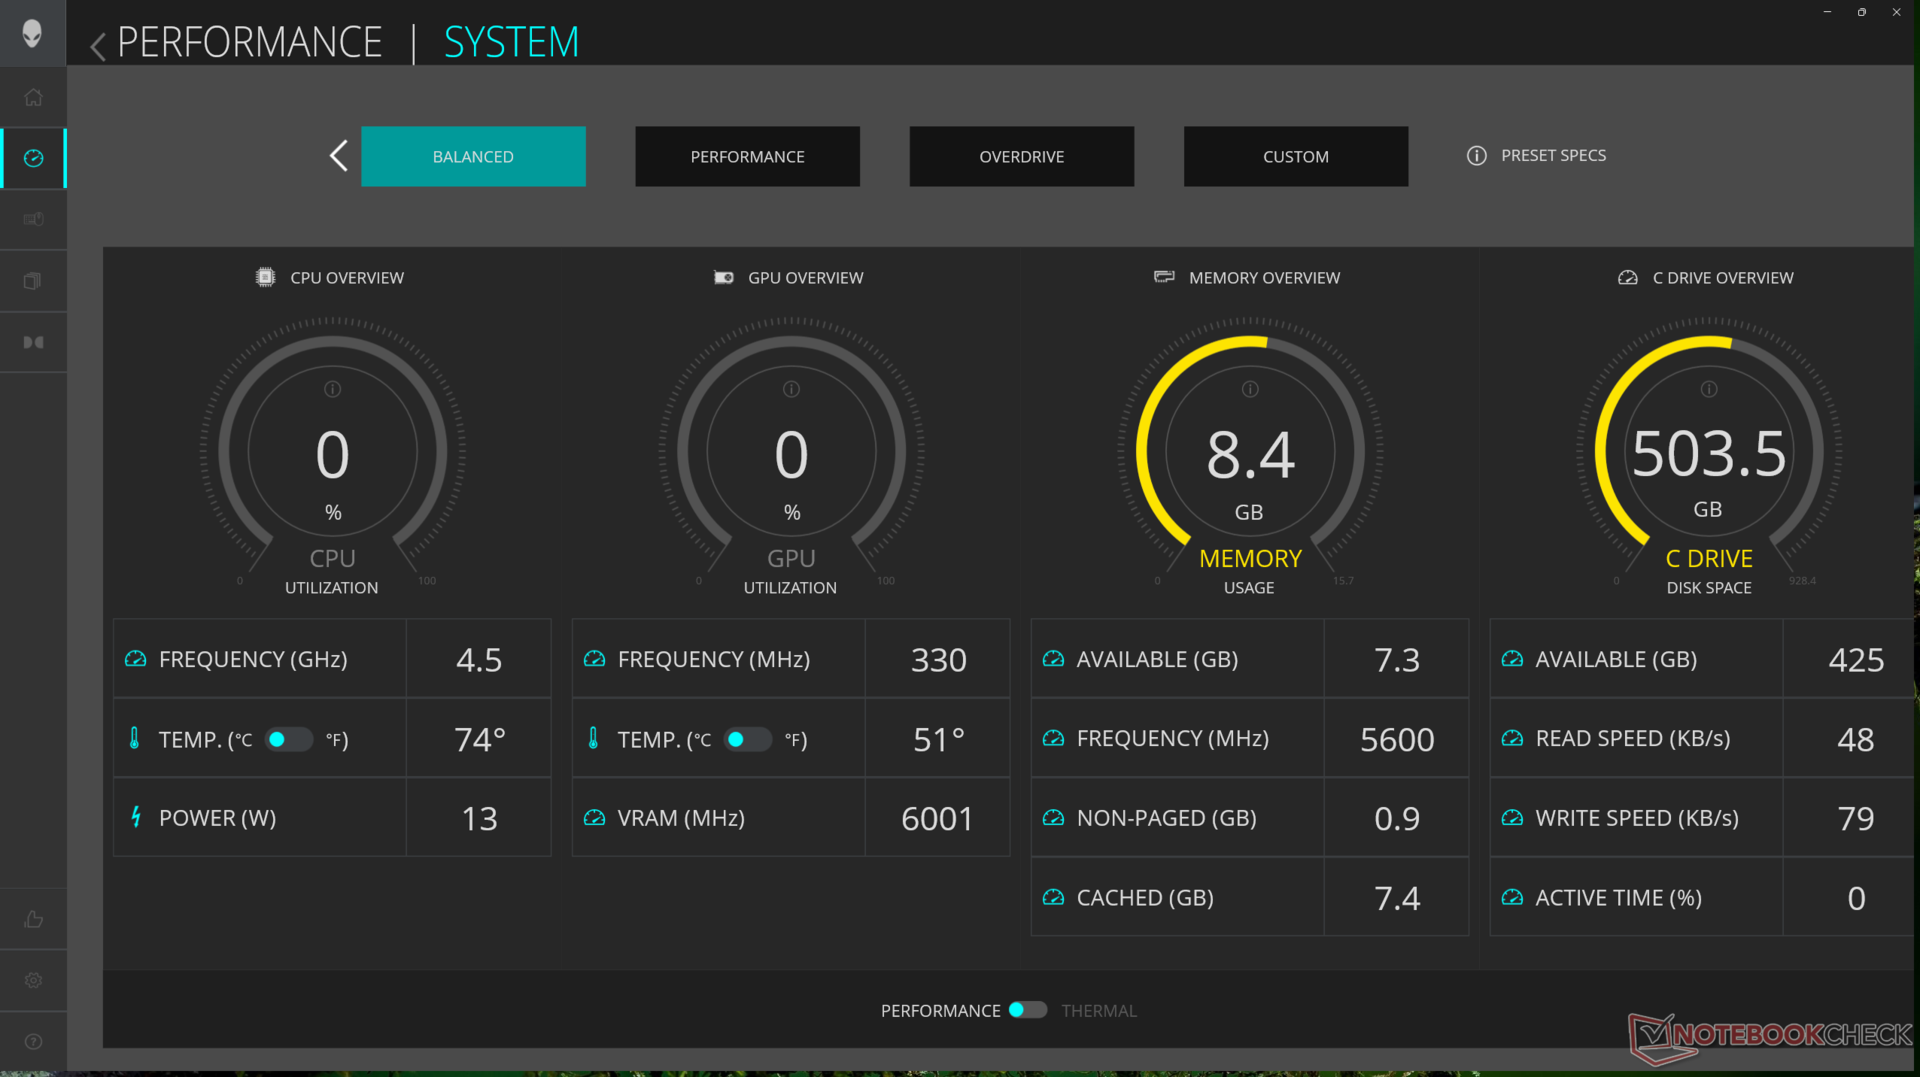
We hebben Alienware Command Center (ACC) ingesteld op Overdrive-modus en Nvidia Control Panel op dGPU-modus voordat we de onderstaande benchmarks uitvoerden. ACC is bijgewerkt en werkt nu veel soepeler en zonder veel van de problemen die we op de m16 R1 ondervonden. Het start nu bijvoorbeeld vrijwel direct op bij het opstarten, terwijl de ventilatorprofielmodi en AlienFX RGB-verlichting niet langer automatisch veranderen zonder de gebruiker eerst te waarschuwen.
Desondanks ondervonden we nog steeds een bug waarbij het systeem soms niet correct in slaapstand ging als het deksel gesloten werd, zelfs nadat we de energie-instellingen van Windows dubbel gecontroleerd hadden. Dit leidde al na een paar uur tot een zeer warme laptop en een volledig lege batterij.
Zowel Advanced Optimus als G-Sync worden ondersteund, wat betekent dat gebruikers kunnen schakelen tussen iGPU- en dGPU-modi zonder soft reboot. Merk op dat het systeem in de dGPU-modus moet staan om G-Sync te laten werken.
Processor
Onze Core Ultra 7 155H is ongeveer 10 tot 15 procent langzamer dan de Core i7-13700HX op de m16 R1 van vorig jaar in zowel single- als multi-threaded bewerkingen. Hij komt in wezen overeen met de recente Ryzen 9 8945HS. Net als bij andere Meteor Lake CPU's is er in de Core Ultra 7 155H een NPU geïntegreerd om AI-taken zoals Microsoft Co-Pilot te versnellen. De meeste AI-toepassingen zijn op dit moment echter cloud-gebaseerd en hebben geen opties om lokaal te draaien, dus de geïntegreerde AI-mogelijkheden van de nieuwe CPU zijn op dit moment erg beperkt.
Ondanks het prestatietekort ten opzichte van de Core i7-13700HX, is de m16 R2 in staat om de Core Ultra 7 155H merkbaar sneller te draaien dan andere laptops met dezelfde processor. De Core Ultra 7 155H in de recente MSI Prestige 16 bijna 20 procent langzamer.
Dell zegt van plan te zijn om in de nabije toekomst een Ultra 9 185H SKU aan te bieden, die zou moeten helpen om de prestatiekloof met de Core i7-13700HX te verkleinen. De meer veeleisende Core i7-14700HX of Core i9-14900HX worden niet aangeboden vanwege thermische beperkingen; Dell heeft prioriteit gegeven aan het maximaliseren van GPU TGP in plaats van CPU TDP.
Cinebench R15 Multi Loop
Cinebench R23: Multi Core | Single Core
Cinebench R20: CPU (Multi Core) | CPU (Single Core)
Cinebench R15: CPU Multi 64Bit | CPU Single 64Bit
Blender: v2.79 BMW27 CPU
7-Zip 18.03: 7z b 4 | 7z b 4 -mmt1
Geekbench 6.7: Multi-Core | Single-Core
Geekbench 5.5: Multi-Core | Single-Core
HWBOT x265 Benchmark v2.2: 4k Preset
LibreOffice : 20 Documents To PDF
R Benchmark 2.5: Overall mean
| CPU Performance rating | |
| Lenovo Legion 9 16IRX8 | |
| Lenovo Legion Pro 7 16IRX8H -2! | |
| Alienware m16 R1 AMD | |
| HP Omen Transcend 16-u1095ng | |
| Alienware m16 R1 Intel | |
| Alienware x16 R1 -3! | |
| Lenovo Legion Slim 7i 16 Gen 8 -3! | |
| Razer Blade 14 RZ09-0508 | |
| Framework Laptop 16 | |
| Alienware m16 R2 -1! | |
| Asus ROG Zephyrus G16 2024 GU605M | |
| Lenovo Legion Slim 7 16APH8 | |
| Gemiddeld Intel Core Ultra 7 155H | |
| Lenovo Legion S7 16ARHA7 -2! | |
| Asus ROG Zephyrus M16 GU603H -4! | |
| Geekbench 6.7 / Multi-Core | |
| Lenovo Legion 9 16IRX8 | |
| HP Omen Transcend 16-u1095ng | |
| Alienware m16 R1 Intel | |
| Razer Blade 14 RZ09-0508 | |
| Asus ROG Zephyrus G16 2024 GU605M | |
| Framework Laptop 16 | |
| Lenovo Legion Slim 7 16APH8 | |
| Alienware m16 R2 | |
| Alienware m16 R1 AMD | |
| Gemiddeld Intel Core Ultra 7 155H (7732 - 13656, n=55) | |
| Geekbench 6.7 / Single-Core | |
| Lenovo Legion 9 16IRX8 | |
| HP Omen Transcend 16-u1095ng | |
| Alienware m16 R1 AMD | |
| Razer Blade 14 RZ09-0508 | |
| Alienware m16 R1 Intel | |
| Framework Laptop 16 | |
| Lenovo Legion Slim 7 16APH8 | |
| Asus ROG Zephyrus G16 2024 GU605M | |
| Alienware m16 R2 | |
| Gemiddeld Intel Core Ultra 7 155H (1901 - 2473, n=52) | |
Cinebench R23: Multi Core | Single Core
Cinebench R20: CPU (Multi Core) | CPU (Single Core)
Cinebench R15: CPU Multi 64Bit | CPU Single 64Bit
Blender: v2.79 BMW27 CPU
7-Zip 18.03: 7z b 4 | 7z b 4 -mmt1
Geekbench 6.7: Multi-Core | Single-Core
Geekbench 5.5: Multi-Core | Single-Core
HWBOT x265 Benchmark v2.2: 4k Preset
LibreOffice : 20 Documents To PDF
R Benchmark 2.5: Overall mean
* ... kleiner is beter
AIDA64: FP32 Ray-Trace | FPU Julia | CPU SHA3 | CPU Queen | FPU SinJulia | FPU Mandel | CPU AES | CPU ZLib | FP64 Ray-Trace | CPU PhotoWorxx
| Performance rating | |
| Lenovo Legion Slim 7 16APH8 | |
| Alienware m16 R1 Intel | |
| Alienware x16 R1 | |
| HP Omen Transcend 16-u1095ng | |
| Alienware m16 R2 | |
| Asus ROG Zephyrus G16 2024 GU605M | |
| Gemiddeld Intel Core Ultra 7 155H | |
| AIDA64 / FP32 Ray-Trace | |
| Lenovo Legion Slim 7 16APH8 | |
| Alienware m16 R1 Intel | |
| Alienware m16 R2 | |
| Alienware x16 R1 | |
| HP Omen Transcend 16-u1095ng | |
| Asus ROG Zephyrus G16 2024 GU605M | |
| Gemiddeld Intel Core Ultra 7 155H (6670 - 18470, n=50) | |
| AIDA64 / FPU Julia | |
| Lenovo Legion Slim 7 16APH8 | |
| Alienware m16 R1 Intel | |
| Alienware m16 R2 | |
| Alienware x16 R1 | |
| HP Omen Transcend 16-u1095ng | |
| Asus ROG Zephyrus G16 2024 GU605M | |
| Gemiddeld Intel Core Ultra 7 155H (40905 - 93181, n=50) | |
| AIDA64 / CPU SHA3 | |
| Alienware m16 R1 Intel | |
| Lenovo Legion Slim 7 16APH8 | |
| HP Omen Transcend 16-u1095ng | |
| Alienware m16 R2 | |
| Alienware x16 R1 | |
| Asus ROG Zephyrus G16 2024 GU605M | |
| Gemiddeld Intel Core Ultra 7 155H (1940 - 4436, n=50) | |
| AIDA64 / CPU Queen | |
| HP Omen Transcend 16-u1095ng | |
| Alienware x16 R1 | |
| Lenovo Legion Slim 7 16APH8 | |
| Alienware m16 R1 Intel | |
| Asus ROG Zephyrus G16 2024 GU605M | |
| Alienware m16 R2 | |
| Gemiddeld Intel Core Ultra 7 155H (64698 - 94181, n=50) | |
| AIDA64 / FPU SinJulia | |
| Lenovo Legion Slim 7 16APH8 | |
| Alienware m16 R1 Intel | |
| HP Omen Transcend 16-u1095ng | |
| Alienware x16 R1 | |
| Asus ROG Zephyrus G16 2024 GU605M | |
| Alienware m16 R2 | |
| Gemiddeld Intel Core Ultra 7 155H (5639 - 10647, n=50) | |
| AIDA64 / FPU Mandel | |
| Lenovo Legion Slim 7 16APH8 | |
| Alienware m16 R1 Intel | |
| Alienware m16 R2 | |
| Alienware x16 R1 | |
| HP Omen Transcend 16-u1095ng | |
| Asus ROG Zephyrus G16 2024 GU605M | |
| Gemiddeld Intel Core Ultra 7 155H (18236 - 47685, n=50) | |
| AIDA64 / CPU AES | |
| Alienware m16 R1 Intel | |
| HP Omen Transcend 16-u1095ng | |
| Alienware m16 R2 | |
| Alienware x16 R1 | |
| Asus ROG Zephyrus G16 2024 GU605M | |
| Gemiddeld Intel Core Ultra 7 155H (45713 - 152179, n=50) | |
| Lenovo Legion Slim 7 16APH8 | |
| AIDA64 / CPU ZLib | |
| Alienware m16 R1 Intel | |
| HP Omen Transcend 16-u1095ng | |
| Alienware x16 R1 | |
| Alienware m16 R2 | |
| Asus ROG Zephyrus G16 2024 GU605M | |
| Lenovo Legion Slim 7 16APH8 | |
| Gemiddeld Intel Core Ultra 7 155H (557 - 1250, n=50) | |
| AIDA64 / FP64 Ray-Trace | |
| Lenovo Legion Slim 7 16APH8 | |
| Alienware m16 R1 Intel | |
| Alienware x16 R1 | |
| Alienware m16 R2 | |
| HP Omen Transcend 16-u1095ng | |
| Asus ROG Zephyrus G16 2024 GU605M | |
| Gemiddeld Intel Core Ultra 7 155H (3569 - 9802, n=50) | |
| AIDA64 / CPU PhotoWorxx | |
| Alienware x16 R1 | |
| HP Omen Transcend 16-u1095ng | |
| Asus ROG Zephyrus G16 2024 GU605M | |
| Gemiddeld Intel Core Ultra 7 155H (32719 - 54223, n=50) | |
| Lenovo Legion Slim 7 16APH8 | |
| Alienware m16 R2 | |
| Alienware m16 R1 Intel | |
Stresstest
Bij het uitvoeren van Prime95 stress in de Overdrive-modus, steeg de CPU gedurende enkele seconden naar 4,6 GHz en 115 W, voordat hij gestaag daalde en zich uiteindelijk stabiliseerde op 3,4 GHz en 102 W. De kerntemperatuur werd echter extreem warm met 100 C, wat suggereert dat de CPU de koeloplossing al tot het uiterste drijft.
Interessant is dat er bijna geen veranderingen zijn in de kloksnelheden van GPU's of het stroomverbruik van de kaart wanneer deze wordt uitgevoerd Witcher 3 in de modi Balanced, Performance of Overdrive, wat overeenkomt met onze bevindingen hieronder in het gedeelte over GPU-prestaties. In plaats daarvan daalt de GPU-temperatuur in de modi Prestaties of Overdrive vanwege de luidere ventilatorplafonds in deze modi. Met andere woorden, kloksnelheden en real-time TGP blijven constant, terwijl het ventilatorgeluid verandert. Er kunnen wat kleine veranderingen zijn in de CPU-prestaties tussen de modi, maar de meeste games zijn toch niet CPU-gebonden.
Het is de moeite waard om op te merken dat de GPU volgens het Nvidia Control Panel een TGP van 140 W kan gebruiken, maar dat deze zich tijdens het gamen op 106 W stabiliseert. We zijn in staat om een tijdelijk maximum van 121 W te bereiken.
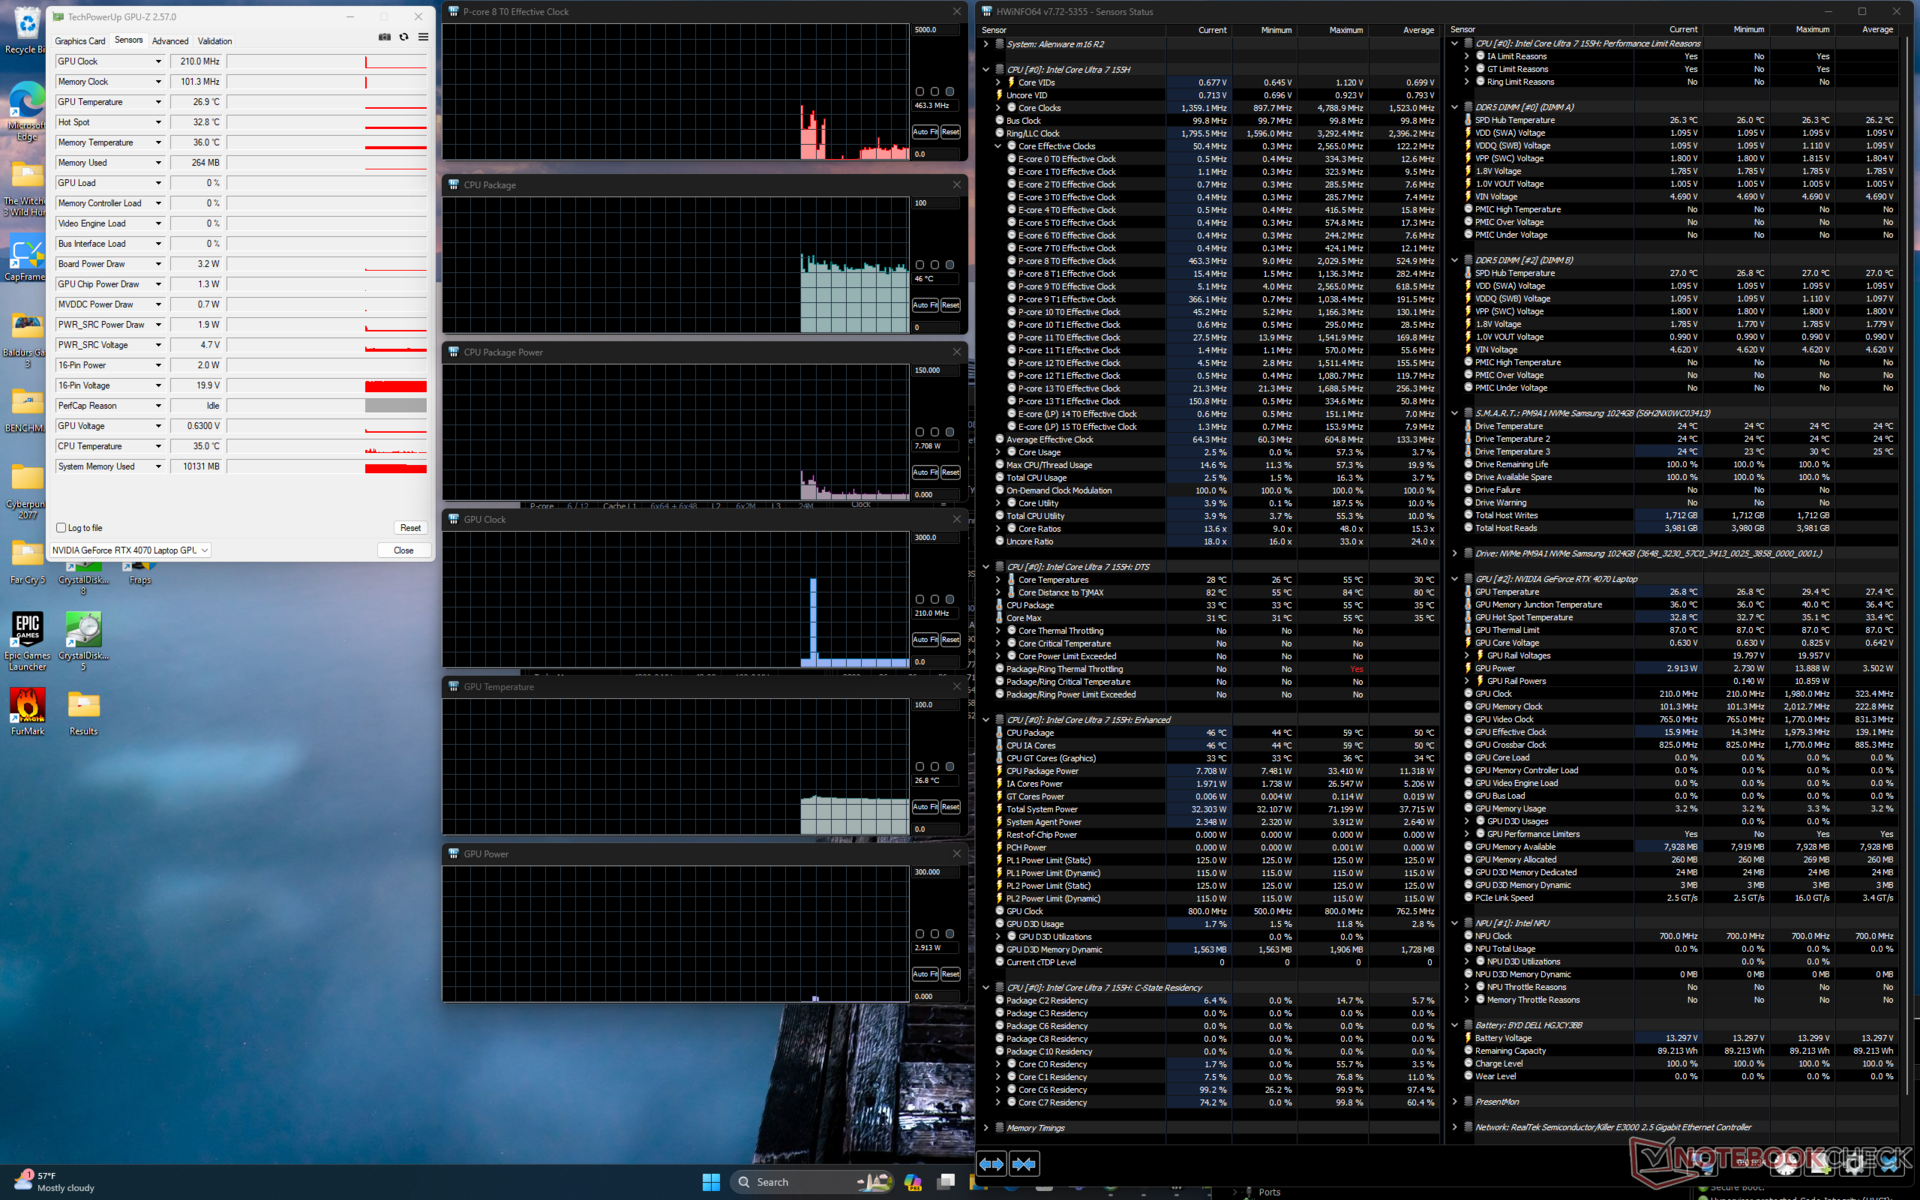
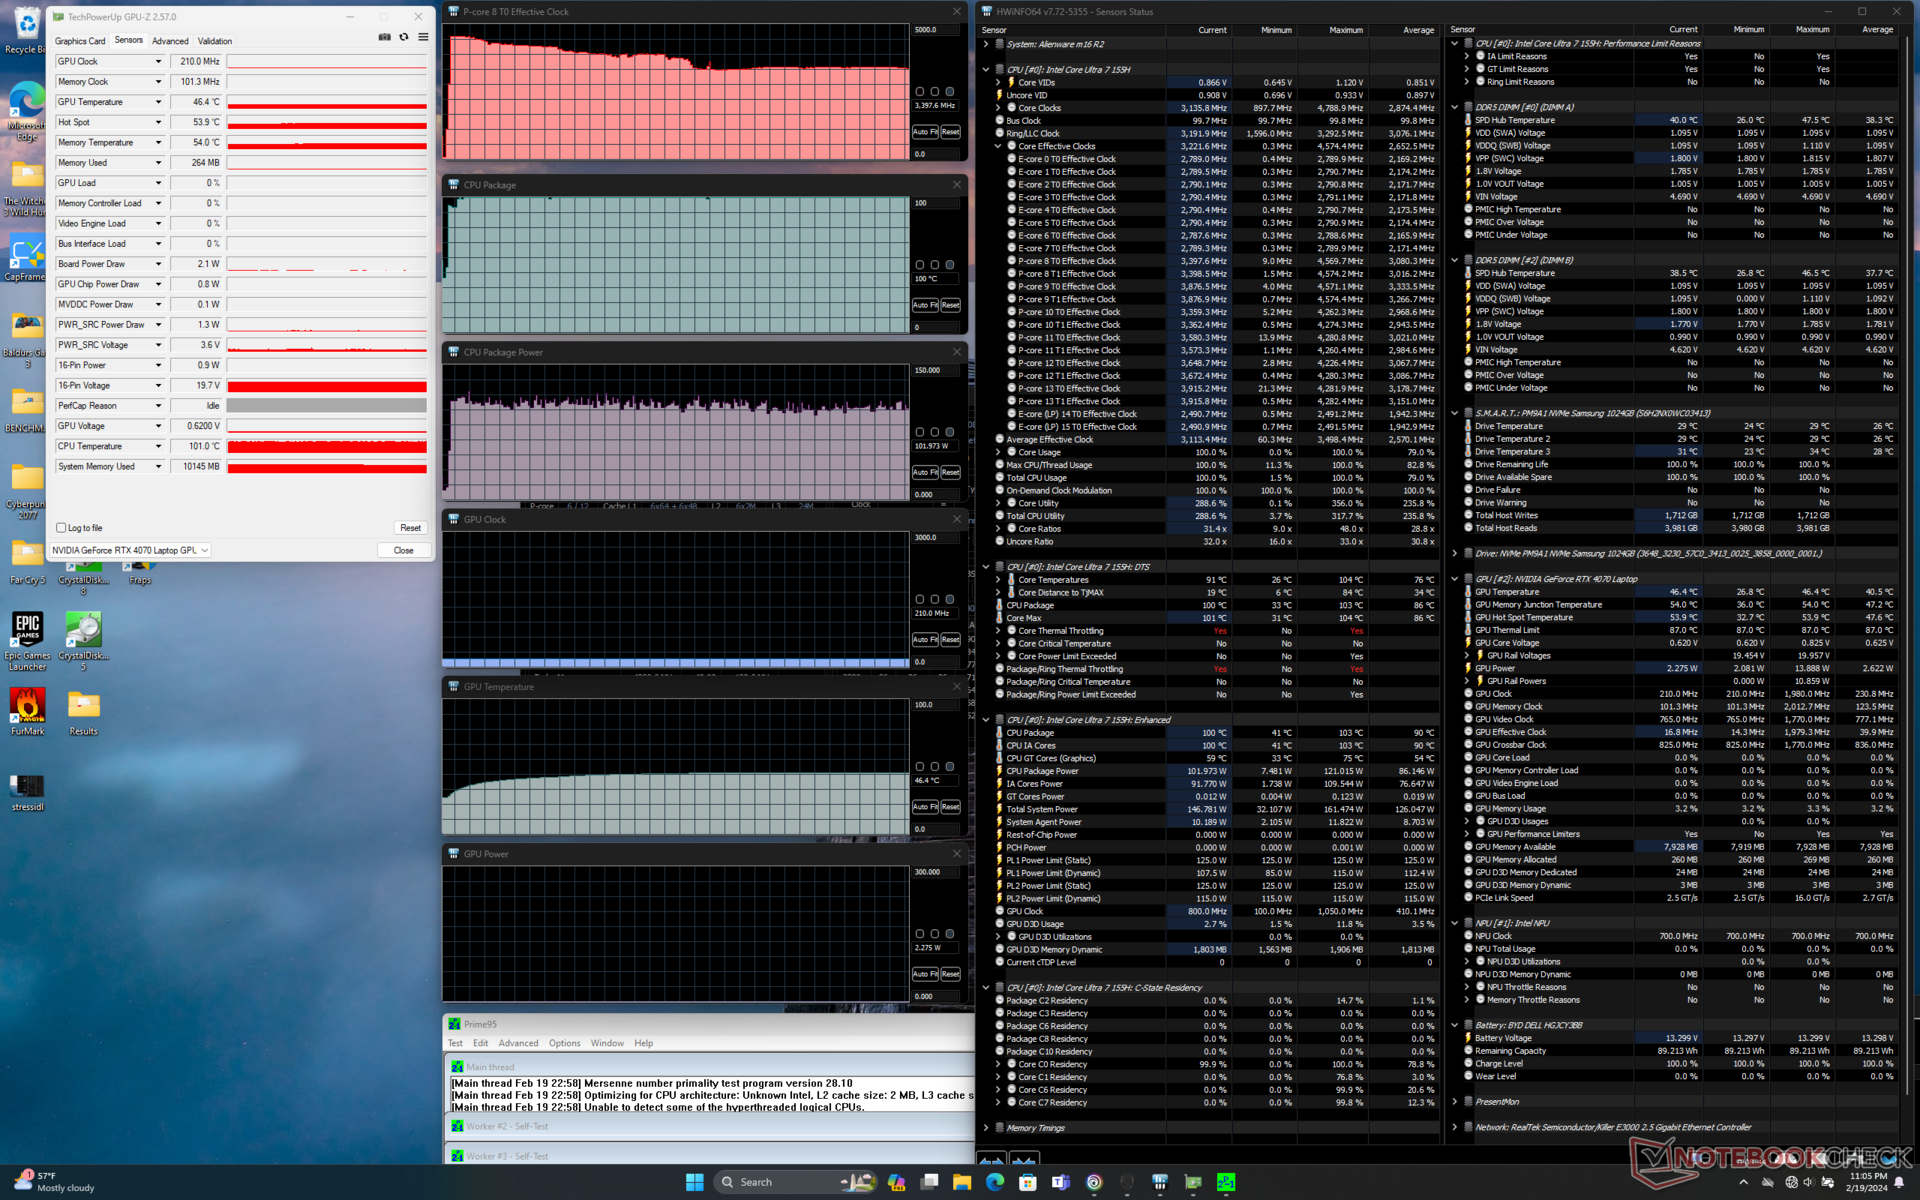
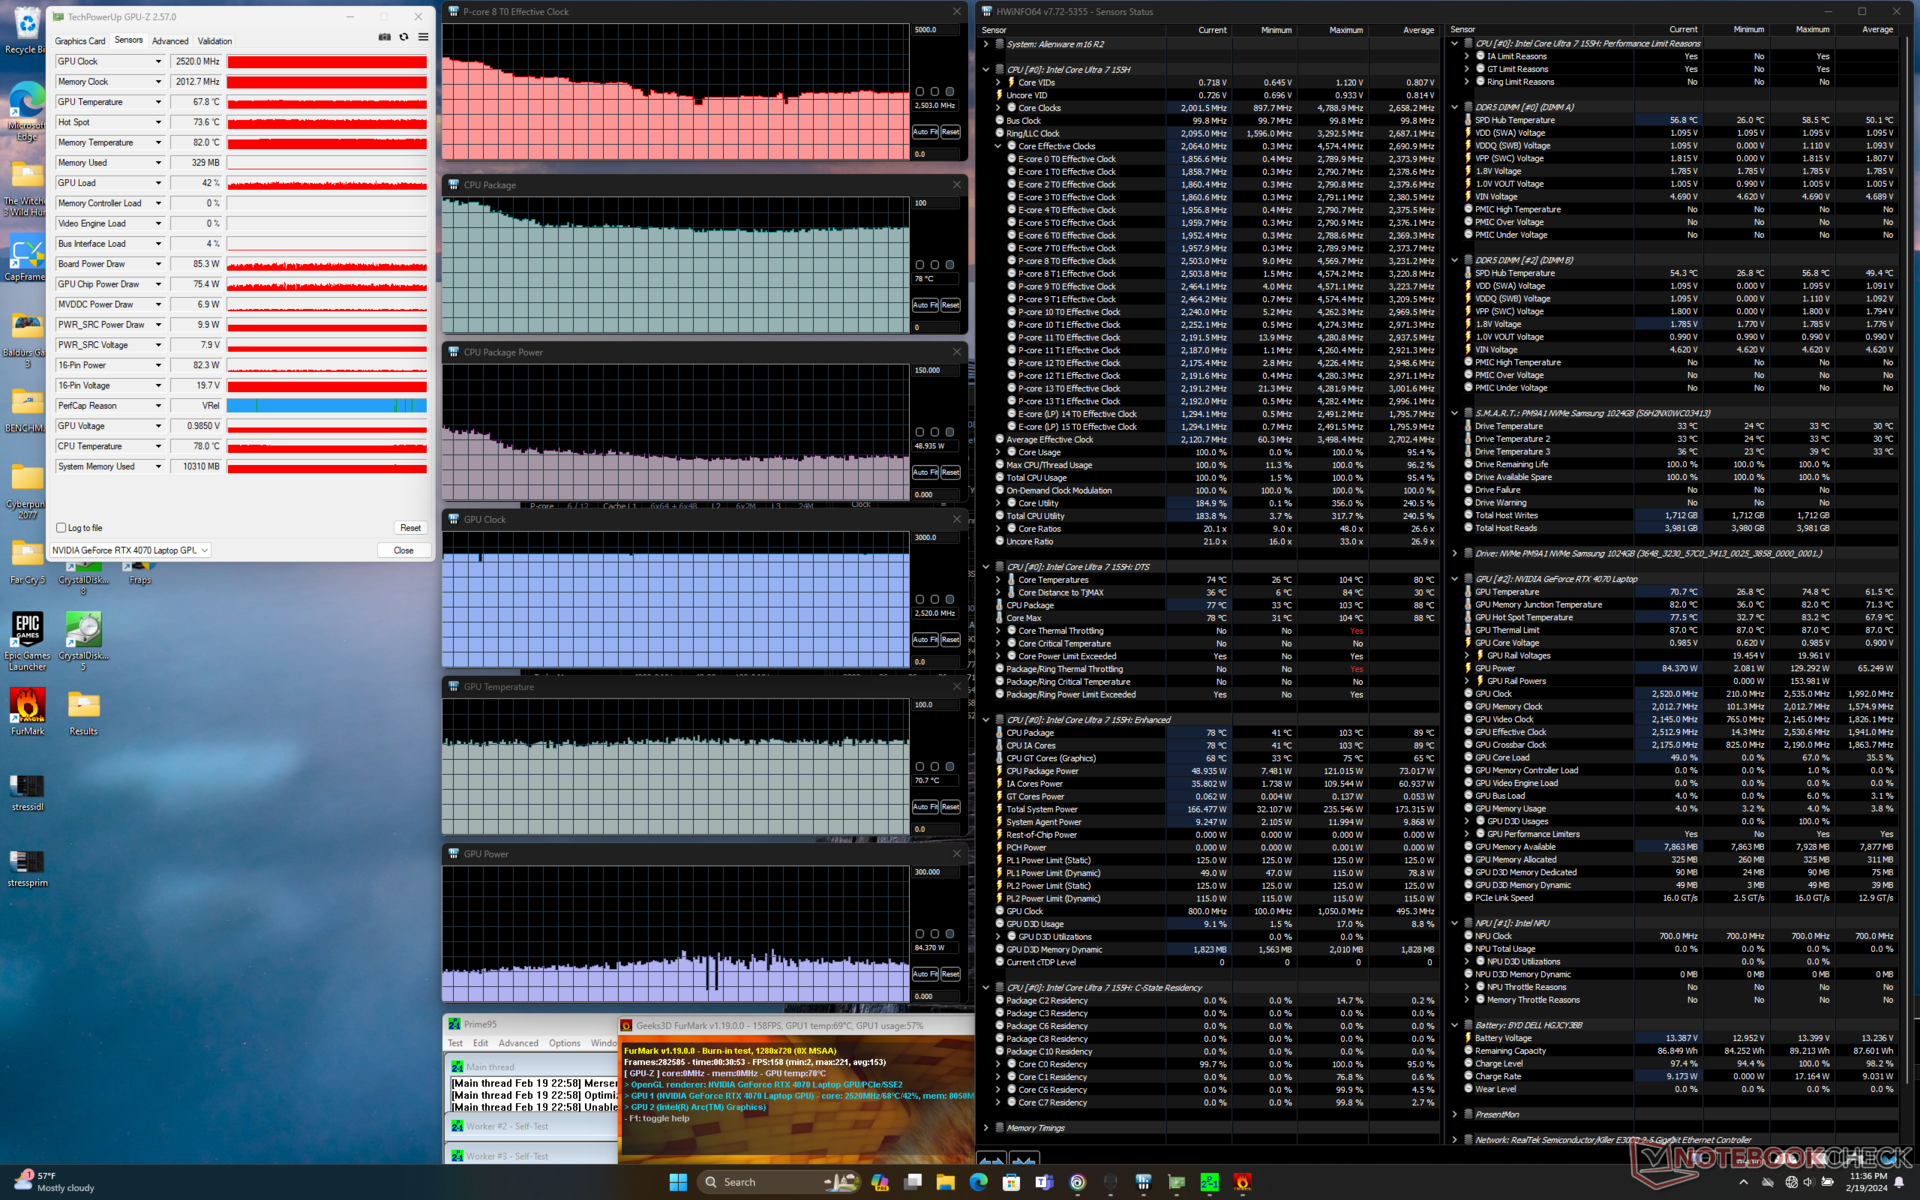

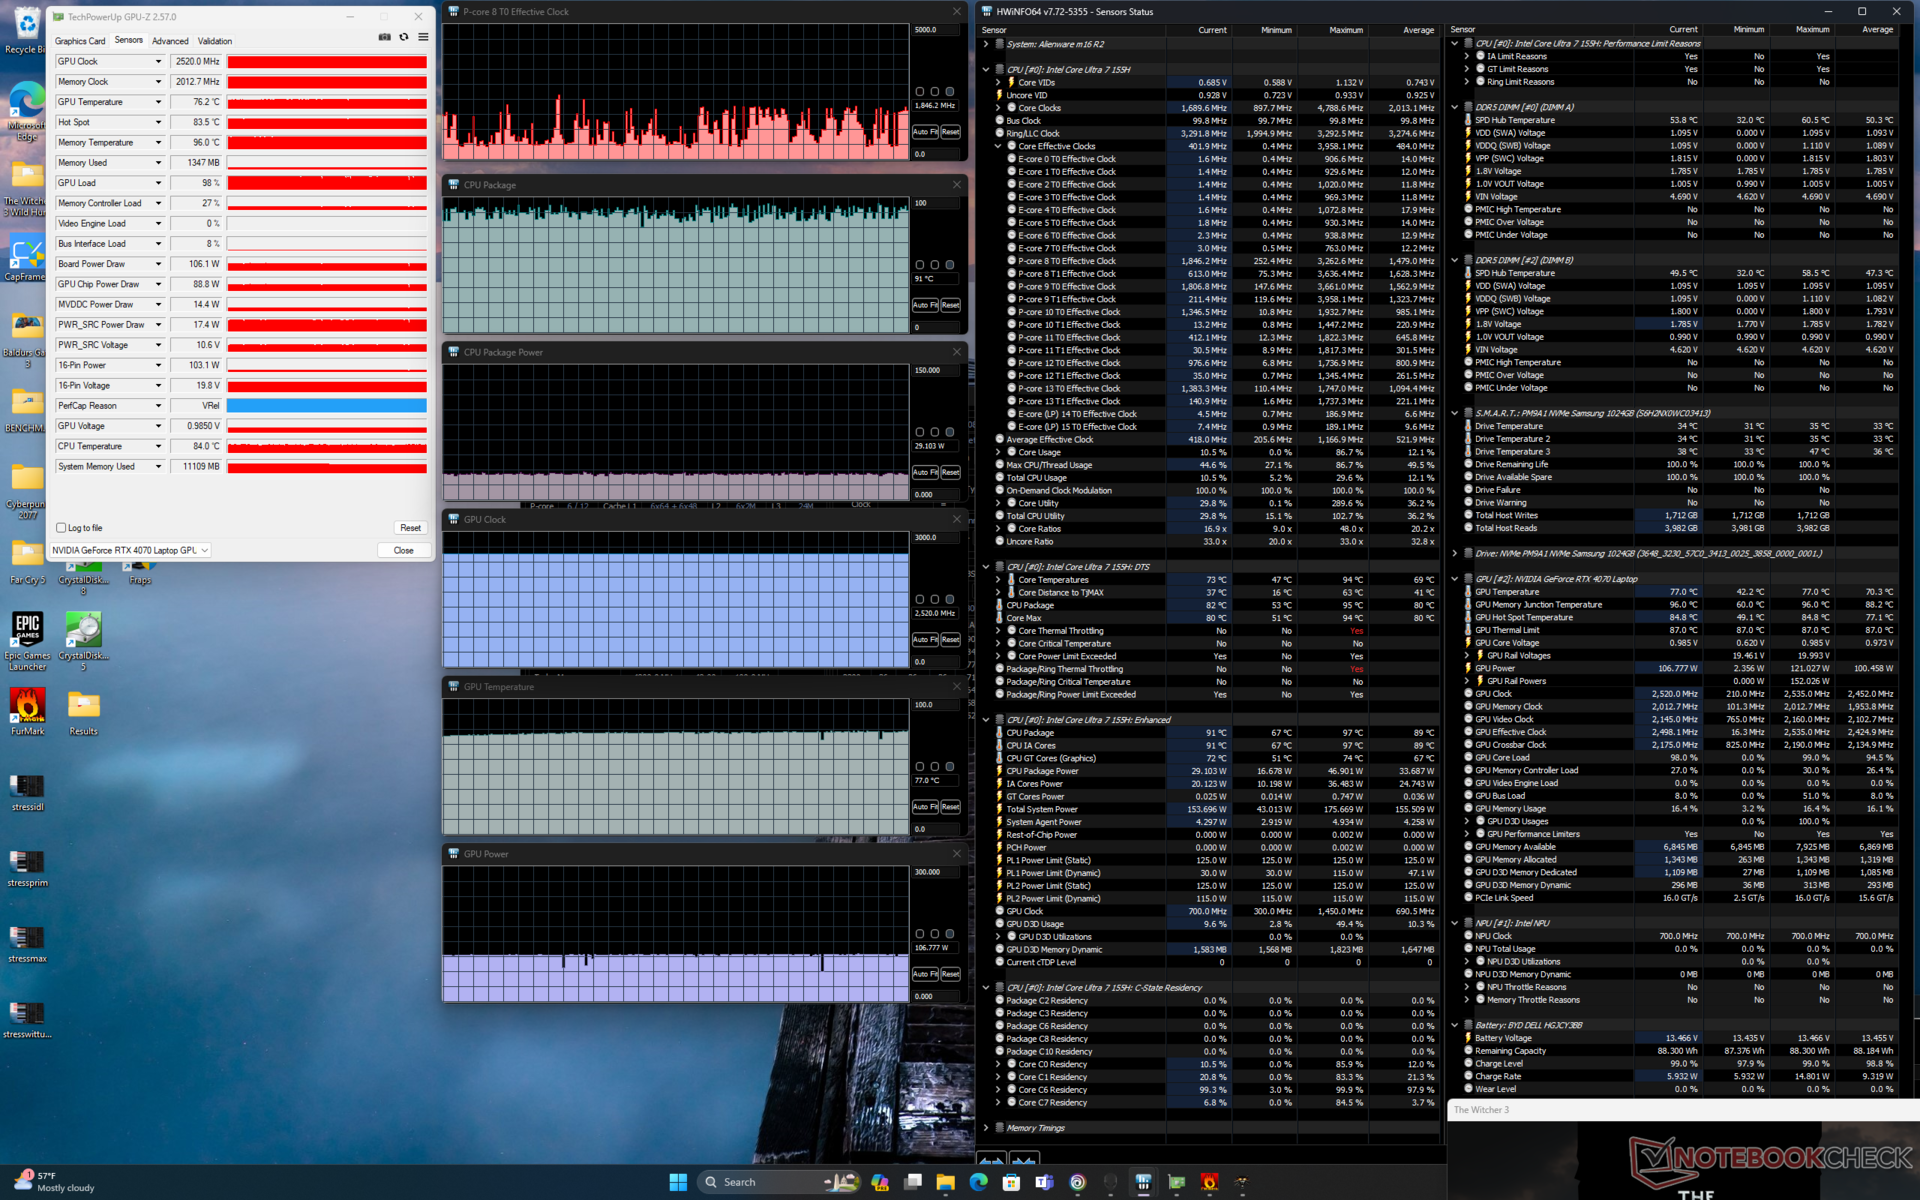
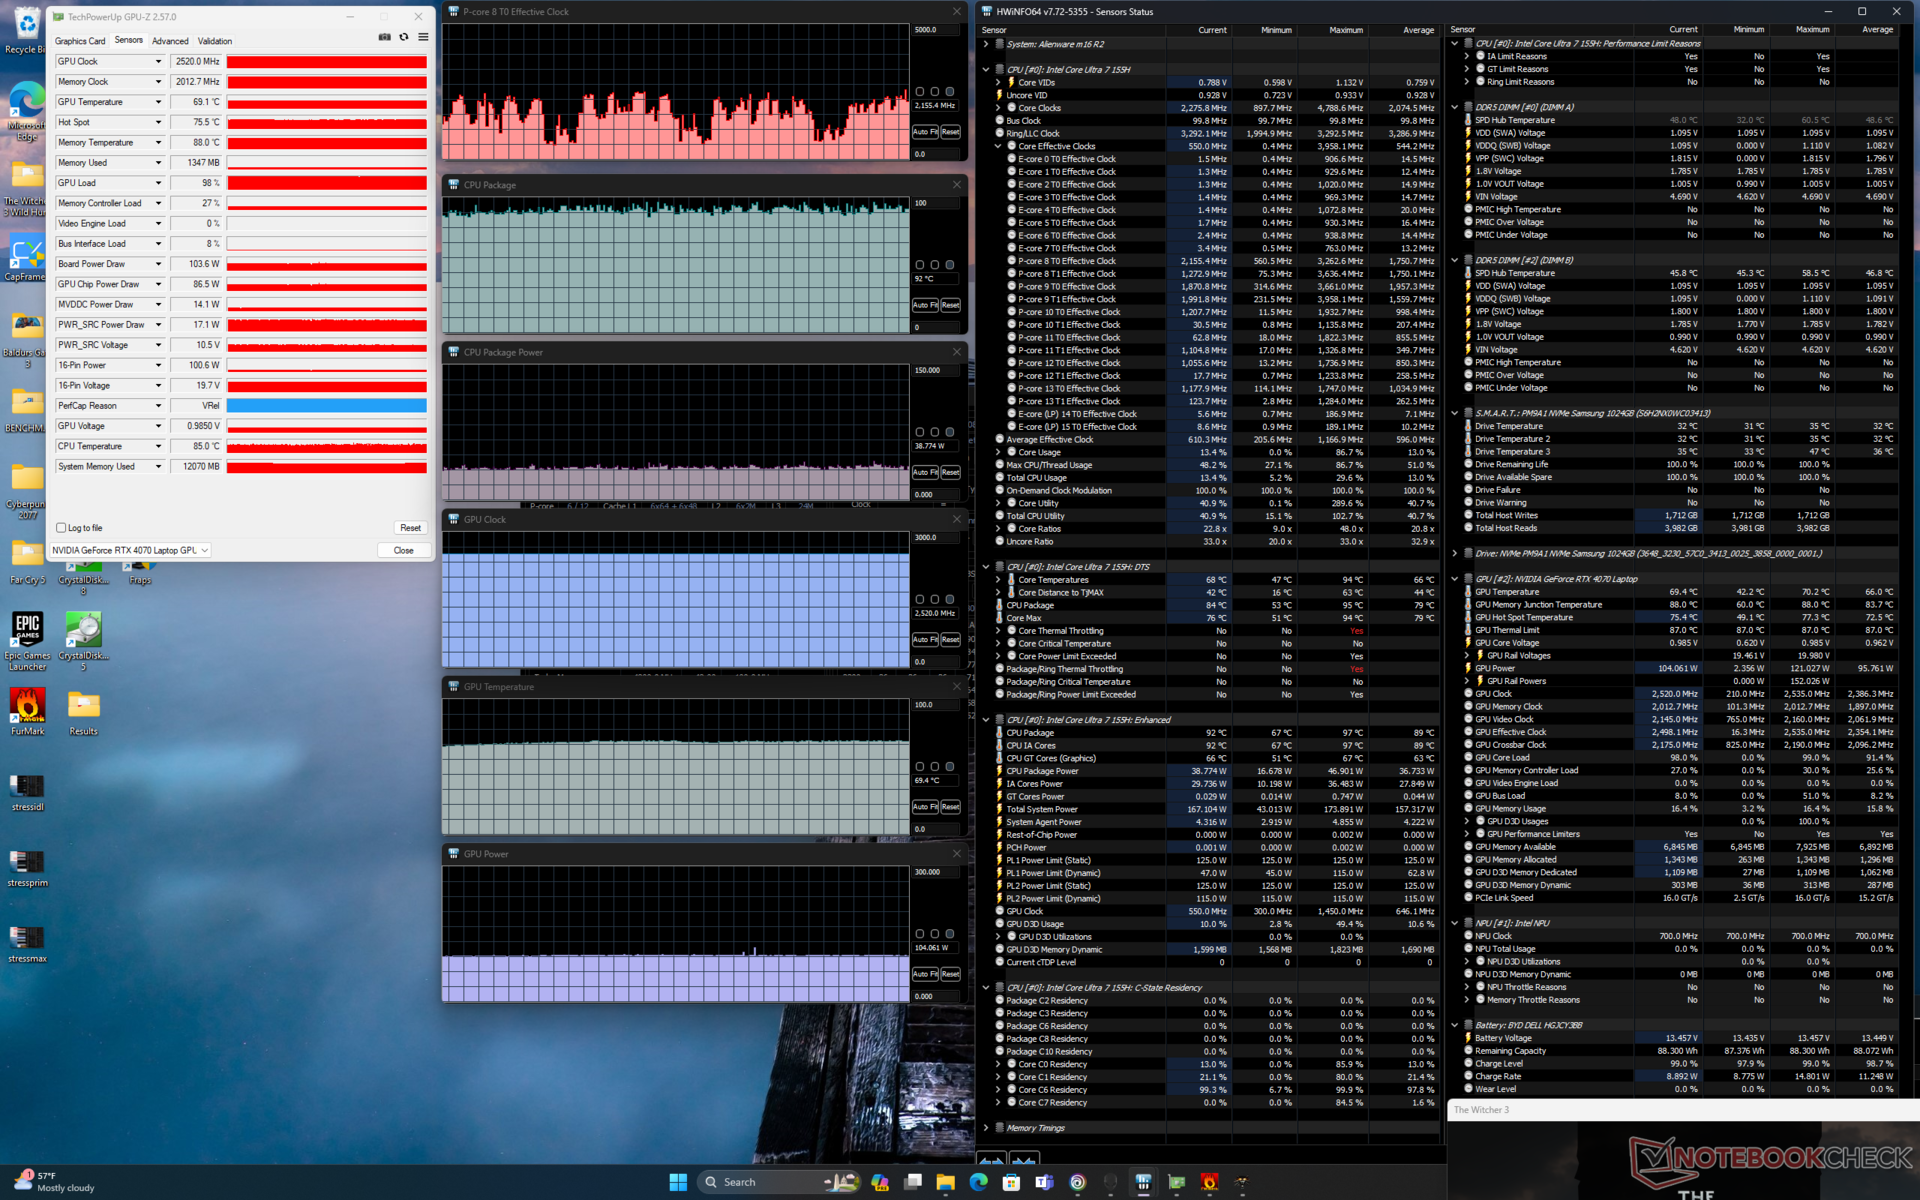
| CPU-klok (GHz) | GPU-klok (MHz) | Gemiddelde CPU-temperatuur (°C) | Gemiddelde GPU-temperatuur (°C) | |
| Systeem inactief | -- | -- | 46 | 27 |
| Prime95 Stress | 3.4 | -- | 100 | 47 |
| Prime95 + FurMark-stress | 2.5 | 2520 | 78 | 71 |
| Witcher 3 Stress (evenwichtige modus) | ~1.8 | 2502 | 93 | 80 |
| Witcher 3 Belasting(prestatiemodus) | ~1.8 | 2520 | 91 | 77 |
| Witcher 3 Belasting (Overdrive-modus) | ~2.0 | 2520 | 92 | 69 |
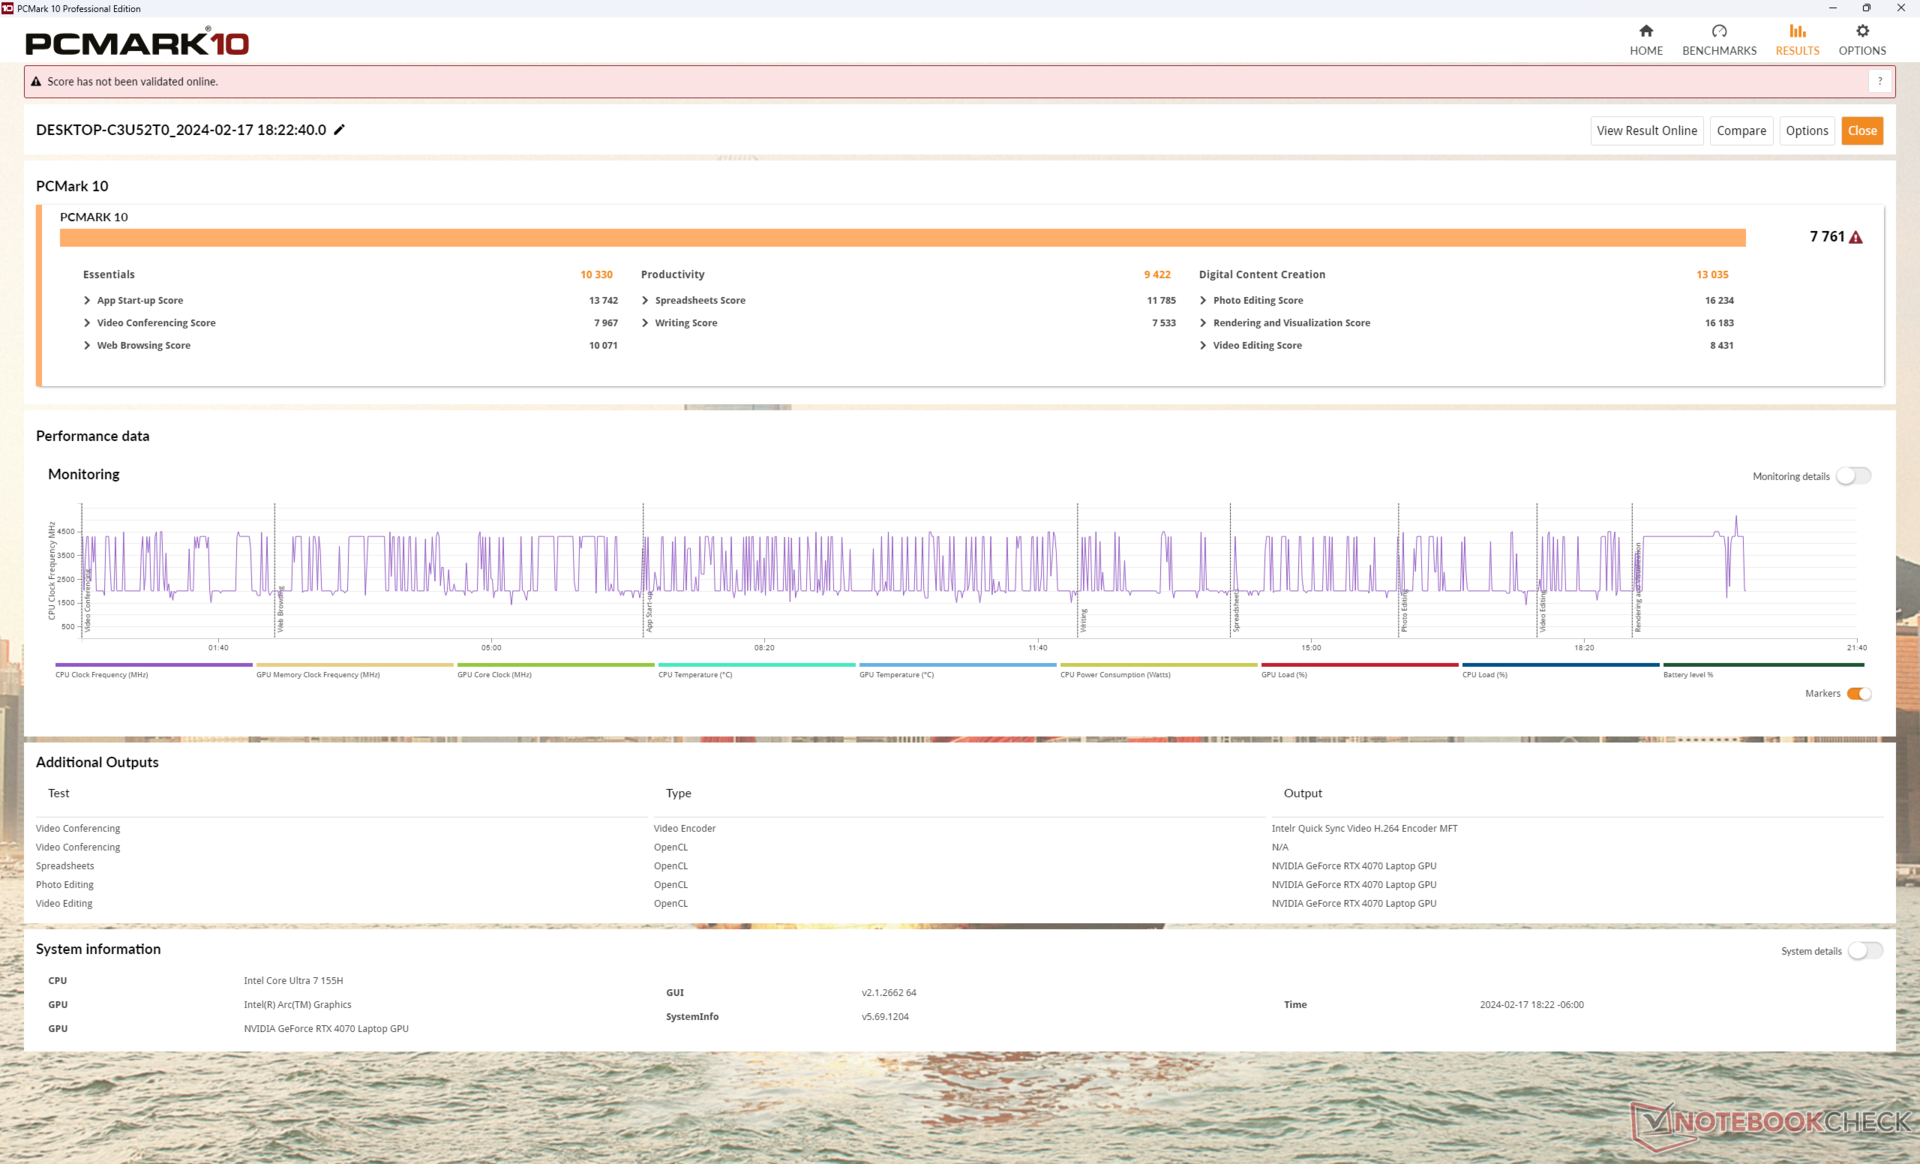
Systeemprestaties
De resultaten van PCMark 10 zijn vergelijkbaar met die van de m16 R1, met uitzondering van onze lagere score voor de subtest Digital Content Creation, omdat de m16 R2 is uitgerust met de langzamere RTX 4070. De systeemprestaties zijn verder zeer vergelijkbaar en laten geen significante verbeteringen zien in de meeste dagelijkse belastingen, ondanks de nieuwere generatie CPU.
CrossMark: Overall | Productivity | Creativity | Responsiveness
WebXPRT 3: Overall
WebXPRT 4: Overall
Mozilla Kraken 1.1: Total
| PCMark 10 / Score | |
| Alienware x16 R1 | |
| HP Omen Transcend 16-u1095ng | |
| Alienware m16 R2 | |
| Lenovo Legion Slim 7 16APH8 | |
| Gemiddeld Intel Core Ultra 7 155H, NVIDIA GeForce RTX 4070 Laptop GPU (7084 - 7761, n=4) | |
| Alienware m16 R1 Intel | |
| Asus ROG Zephyrus G16 2024 GU605M | |
| PCMark 10 / Essentials | |
| Alienware x16 R1 | |
| Alienware m16 R1 Intel | |
| HP Omen Transcend 16-u1095ng | |
| Lenovo Legion Slim 7 16APH8 | |
| Alienware m16 R2 | |
| Gemiddeld Intel Core Ultra 7 155H, NVIDIA GeForce RTX 4070 Laptop GPU (10038 - 10393, n=4) | |
| Asus ROG Zephyrus G16 2024 GU605M | |
| PCMark 10 / Productivity | |
| HP Omen Transcend 16-u1095ng | |
| Alienware x16 R1 | |
| Lenovo Legion Slim 7 16APH8 | |
| Alienware m16 R1 Intel | |
| Alienware m16 R2 | |
| Gemiddeld Intel Core Ultra 7 155H, NVIDIA GeForce RTX 4070 Laptop GPU (9192 - 9518, n=4) | |
| Asus ROG Zephyrus G16 2024 GU605M | |
| PCMark 10 / Digital Content Creation | |
| Alienware x16 R1 | |
| Alienware m16 R2 | |
| HP Omen Transcend 16-u1095ng | |
| Gemiddeld Intel Core Ultra 7 155H, NVIDIA GeForce RTX 4070 Laptop GPU (10100 - 13035, n=4) | |
| Lenovo Legion Slim 7 16APH8 | |
| Asus ROG Zephyrus G16 2024 GU605M | |
| Alienware m16 R1 Intel | |
| CrossMark / Overall | |
| Alienware m16 R1 Intel | |
| Alienware x16 R1 | |
| Alienware m16 R2 | |
| Gemiddeld Intel Core Ultra 7 155H, NVIDIA GeForce RTX 4070 Laptop GPU (1687 - 1848, n=4) | |
| Asus ROG Zephyrus G16 2024 GU605M | |
| CrossMark / Productivity | |
| Alienware m16 R1 Intel | |
| Alienware x16 R1 | |
| Alienware m16 R2 | |
| Gemiddeld Intel Core Ultra 7 155H, NVIDIA GeForce RTX 4070 Laptop GPU (1589 - 1750, n=4) | |
| Asus ROG Zephyrus G16 2024 GU605M | |
| CrossMark / Creativity | |
| Alienware m16 R1 Intel | |
| Alienware x16 R1 | |
| Asus ROG Zephyrus G16 2024 GU605M | |
| Gemiddeld Intel Core Ultra 7 155H, NVIDIA GeForce RTX 4070 Laptop GPU (1860 - 2014, n=4) | |
| Alienware m16 R2 | |
| CrossMark / Responsiveness | |
| Alienware x16 R1 | |
| Alienware m16 R1 Intel | |
| Alienware m16 R2 | |
| Gemiddeld Intel Core Ultra 7 155H, NVIDIA GeForce RTX 4070 Laptop GPU (1424 - 1683, n=4) | |
| Asus ROG Zephyrus G16 2024 GU605M | |
| WebXPRT 3 / Overall | |
| HP Omen Transcend 16-u1095ng | |
| Alienware m16 R1 Intel | |
| Alienware x16 R1 | |
| Alienware m16 R2 | |
| Asus ROG Zephyrus G16 2024 GU605M | |
| Gemiddeld Intel Core Ultra 7 155H, NVIDIA GeForce RTX 4070 Laptop GPU (264 - 294, n=4) | |
| WebXPRT 4 / Overall | |
| Alienware m16 R1 Intel | |
| Alienware x16 R1 | |
| Alienware m16 R2 | |
| Asus ROG Zephyrus G16 2024 GU605M | |
| Gemiddeld Intel Core Ultra 7 155H, NVIDIA GeForce RTX 4070 Laptop GPU (247 - 257, n=4) | |
| Mozilla Kraken 1.1 / Total | |
| Gemiddeld Intel Core Ultra 7 155H, NVIDIA GeForce RTX 4070 Laptop GPU (546 - 568, n=3) | |
| Asus ROG Zephyrus G16 2024 GU605M | |
| Alienware m16 R2 | |
| Alienware m16 R1 Intel | |
| Alienware x16 R1 | |
| HP Omen Transcend 16-u1095ng | |
* ... kleiner is beter
| PCMark 10 Score | 7761 punten | |
Help | ||
| AIDA64 / Memory Copy | |
| Asus ROG Zephyrus G16 2024 GU605M | |
| Gemiddeld Intel Core Ultra 7 155H (62397 - 96791, n=50) | |
| HP Omen Transcend 16-u1095ng | |
| Alienware x16 R1 | |
| Lenovo Legion Slim 7 16APH8 | |
| Alienware m16 R2 | |
| Alienware m16 R1 Intel | |
| AIDA64 / Memory Read | |
| Asus ROG Zephyrus G16 2024 GU605M | |
| HP Omen Transcend 16-u1095ng | |
| Gemiddeld Intel Core Ultra 7 155H (60544 - 90647, n=50) | |
| Alienware m16 R2 | |
| Alienware x16 R1 | |
| Alienware m16 R1 Intel | |
| Lenovo Legion Slim 7 16APH8 | |
| AIDA64 / Memory Write | |
| Lenovo Legion Slim 7 16APH8 | |
| Alienware x16 R1 | |
| HP Omen Transcend 16-u1095ng | |
| Asus ROG Zephyrus G16 2024 GU605M | |
| Gemiddeld Intel Core Ultra 7 155H (58692 - 93451, n=50) | |
| Alienware m16 R2 | |
| Alienware m16 R1 Intel | |
| AIDA64 / Memory Latency | |
| Gemiddeld Intel Core Ultra 7 155H (116.2 - 233, n=50) | |
| Asus ROG Zephyrus G16 2024 GU605M | |
| Alienware m16 R2 | |
| Alienware x16 R1 | |
| Lenovo Legion Slim 7 16APH8 | |
| Alienware m16 R1 Intel | |
| HP Omen Transcend 16-u1095ng | |
* ... kleiner is beter
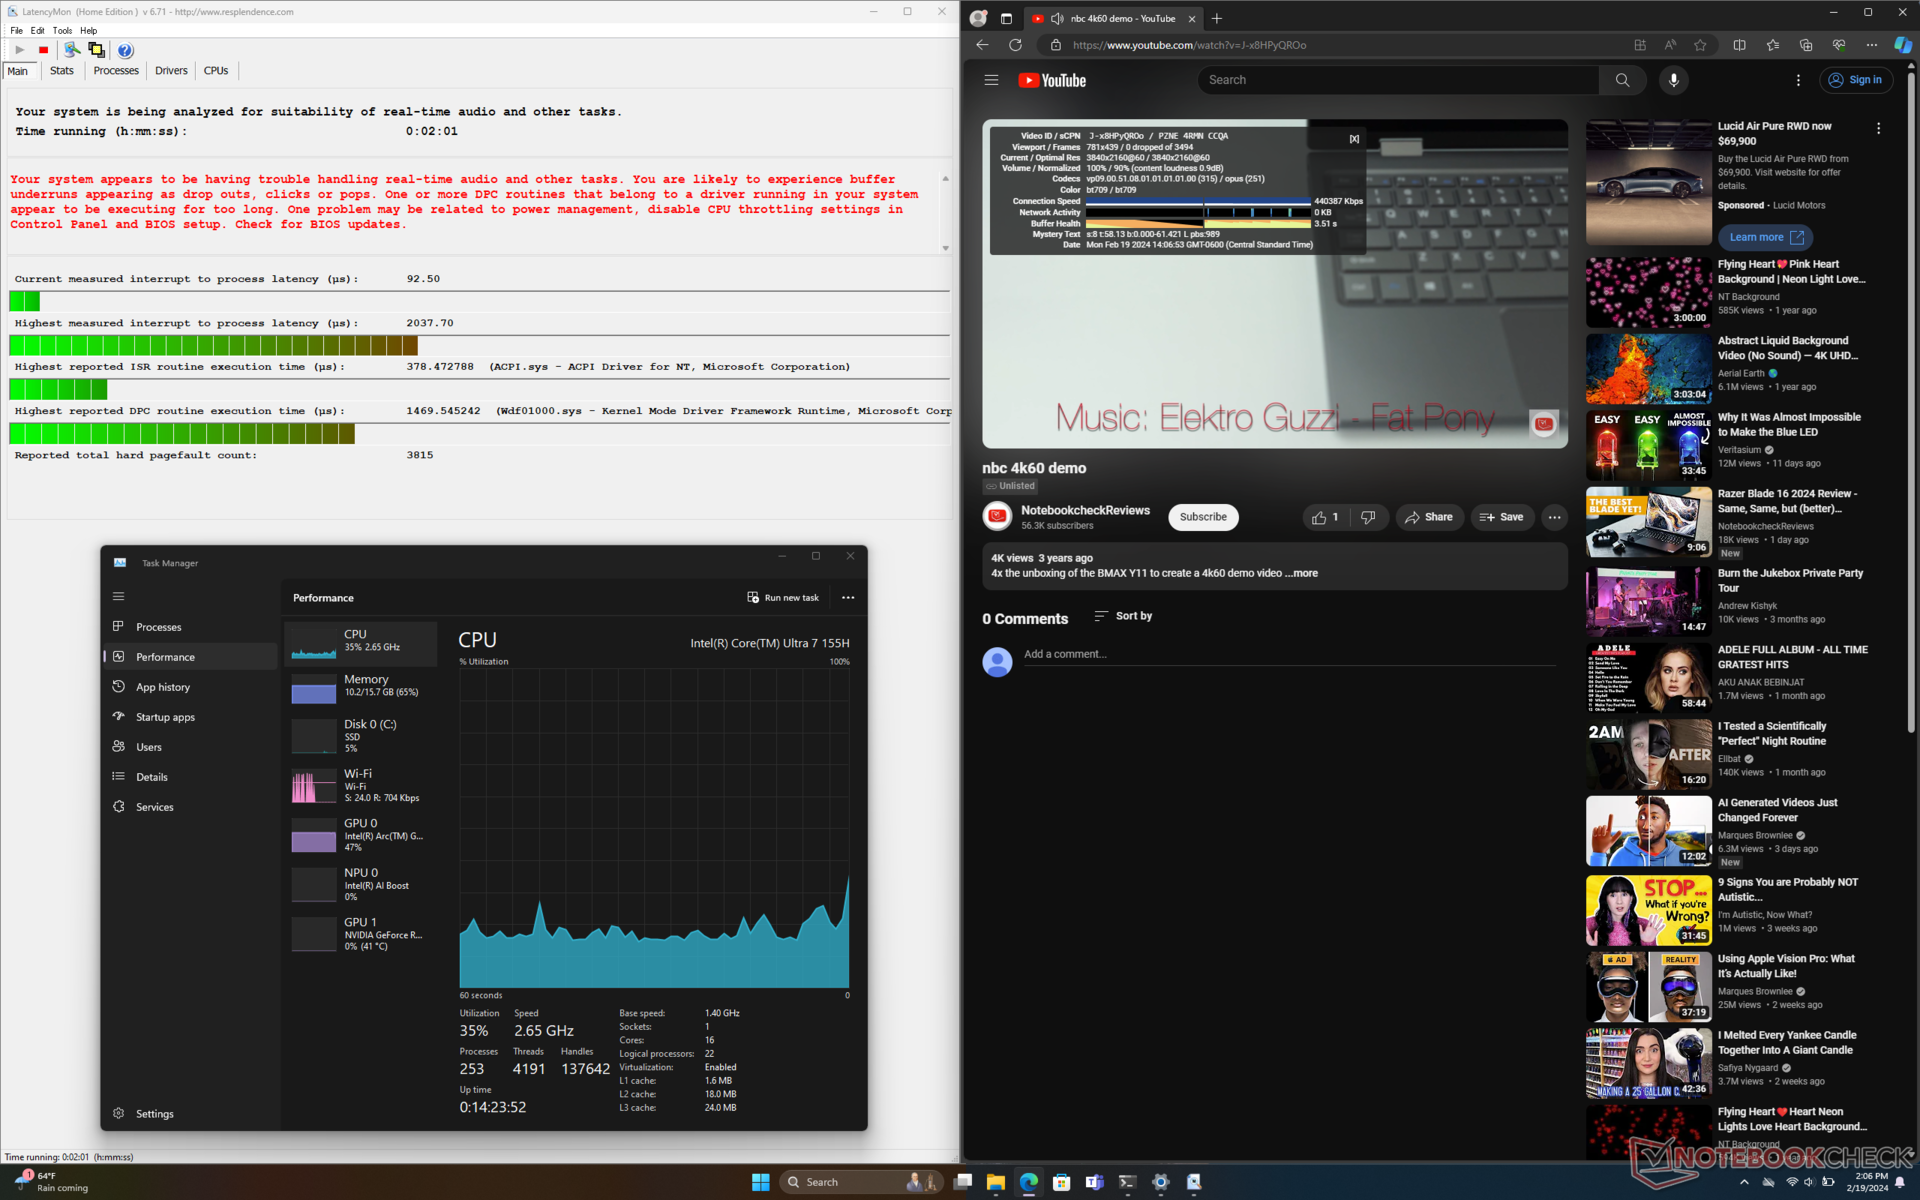
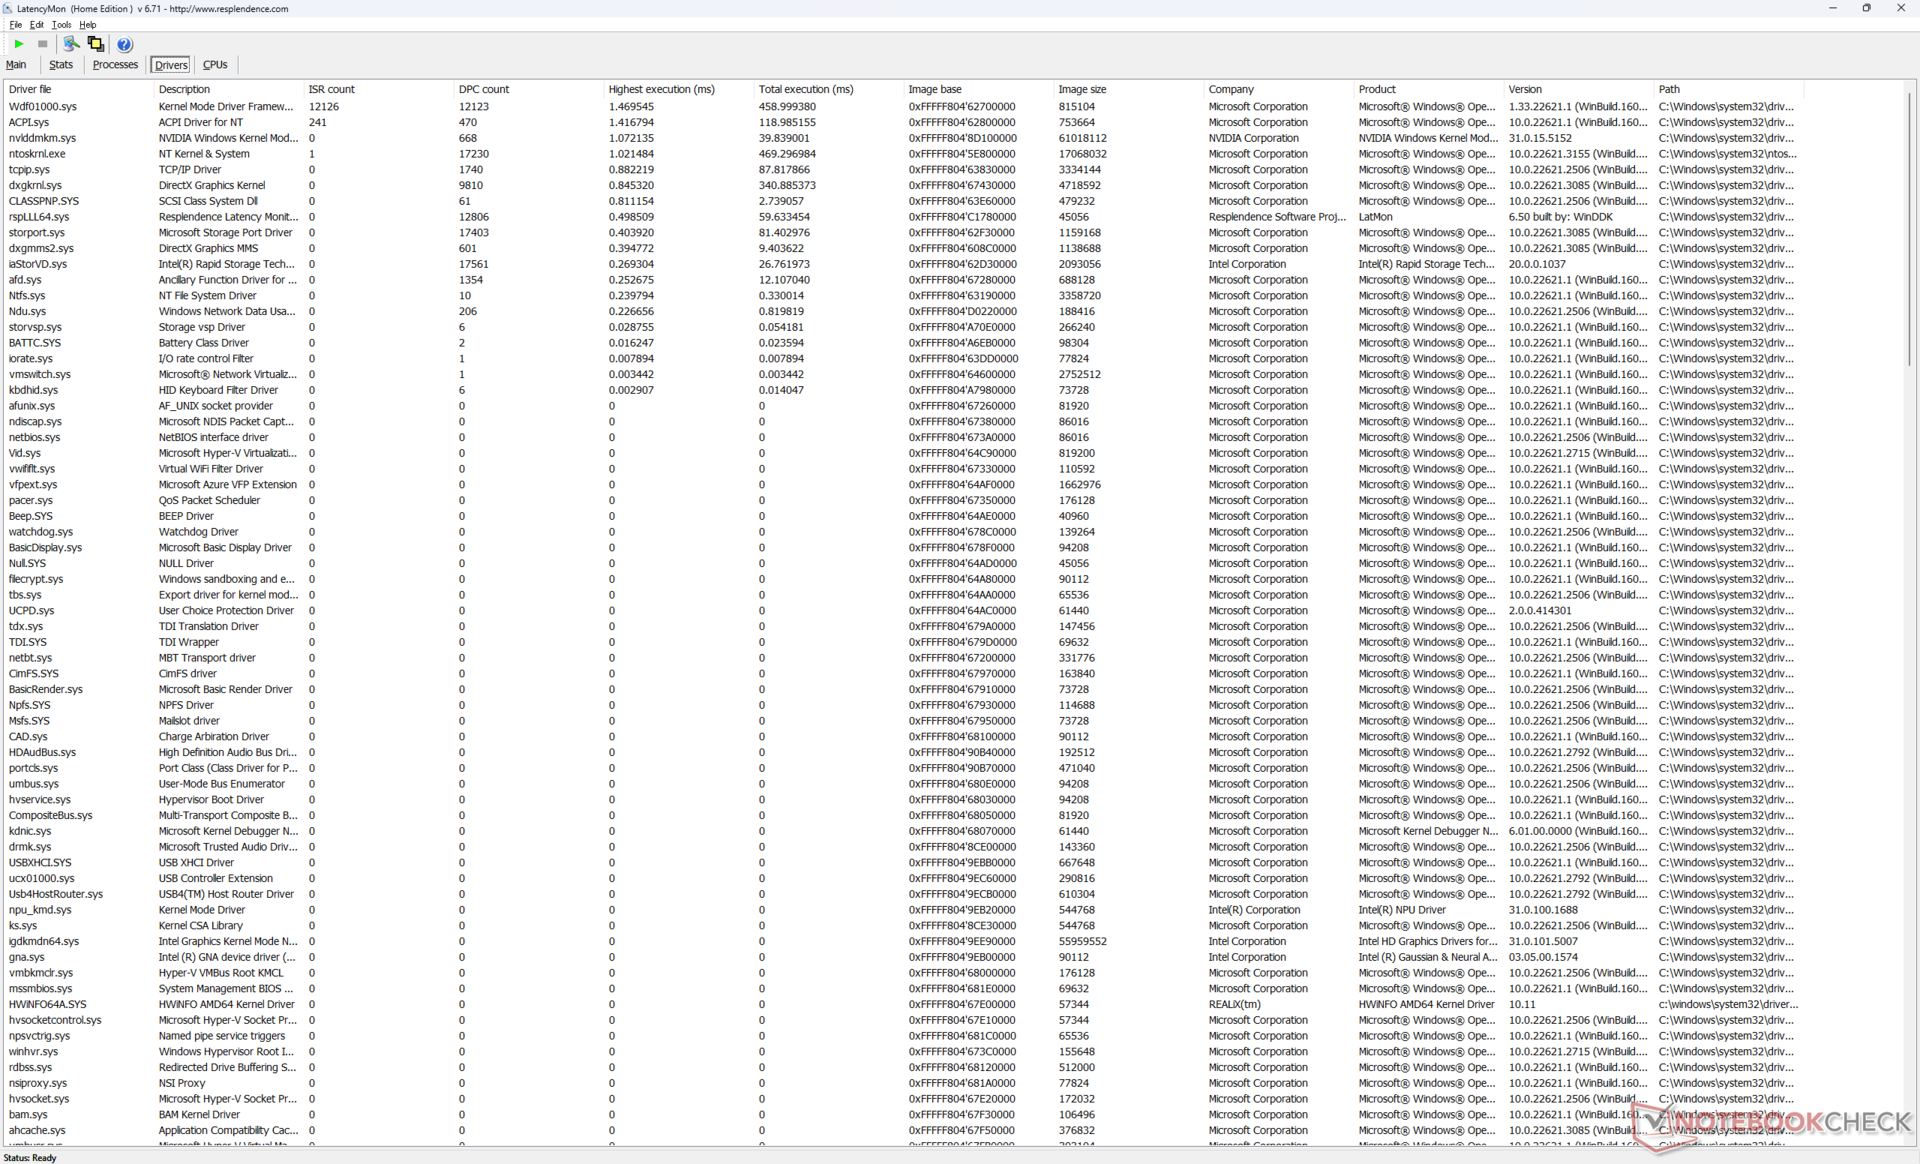
DPC latentie
LatencyMon onthult DPC-problemen bij het openen van meerdere tabbladen van onze startpagina. het afspelen van 4K-video's met 60 FPS verloopt verder perfect, zonder dropped frames.
| DPC Latencies / LatencyMon - interrupt to process latency (max), Web, Youtube, Prime95 | |
| Alienware m16 R1 Intel | |
| Asus ROG Zephyrus G16 2024 GU605M | |
| Alienware m16 R2 | |
| HP Omen Transcend 16-u1095ng | |
| Alienware x16 R1 | |
| Lenovo Legion Slim 7 16APH8 | |
* ... kleiner is beter
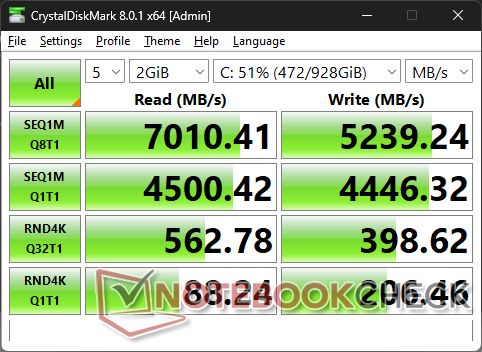
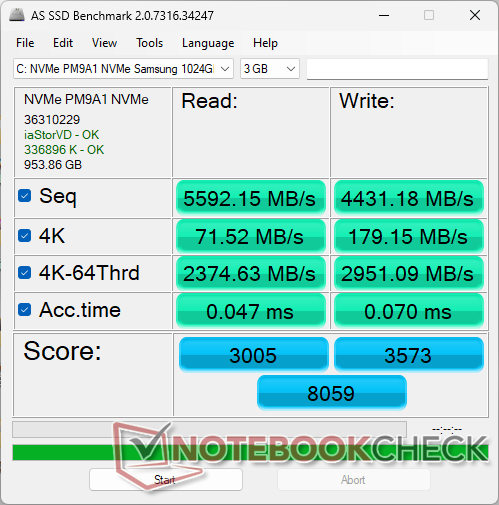
Opslagapparaten
Ons apparaat wordt geleverd met de Samsung PM9A1 PCIe4 x4 NVMe SSD in plaats van de Kioxia op de m16 R1 van vorig jaar. De schijf heeft geen problemen om zijn maximale overdrachtsnelheid van 7000 MB/s gedurende langere perioden te handhaven. Voor elk van de twee M.2 2280 slots is een hitteverspreider meegeleverd.

| Drive Performance rating - Percent | |
| Alienware x16 R1 | |
| Alienware m16 R2 | |
| Alienware m16 R1 Intel | |
| Lenovo Legion Slim 7 16APH8 | |
| HP Omen Transcend 16-u1095ng | |
| Asus ROG Zephyrus G16 2024 GU605M | |
* ... kleiner is beter
Disk Throttling: DiskSpd Read Loop, Queue Depth 8
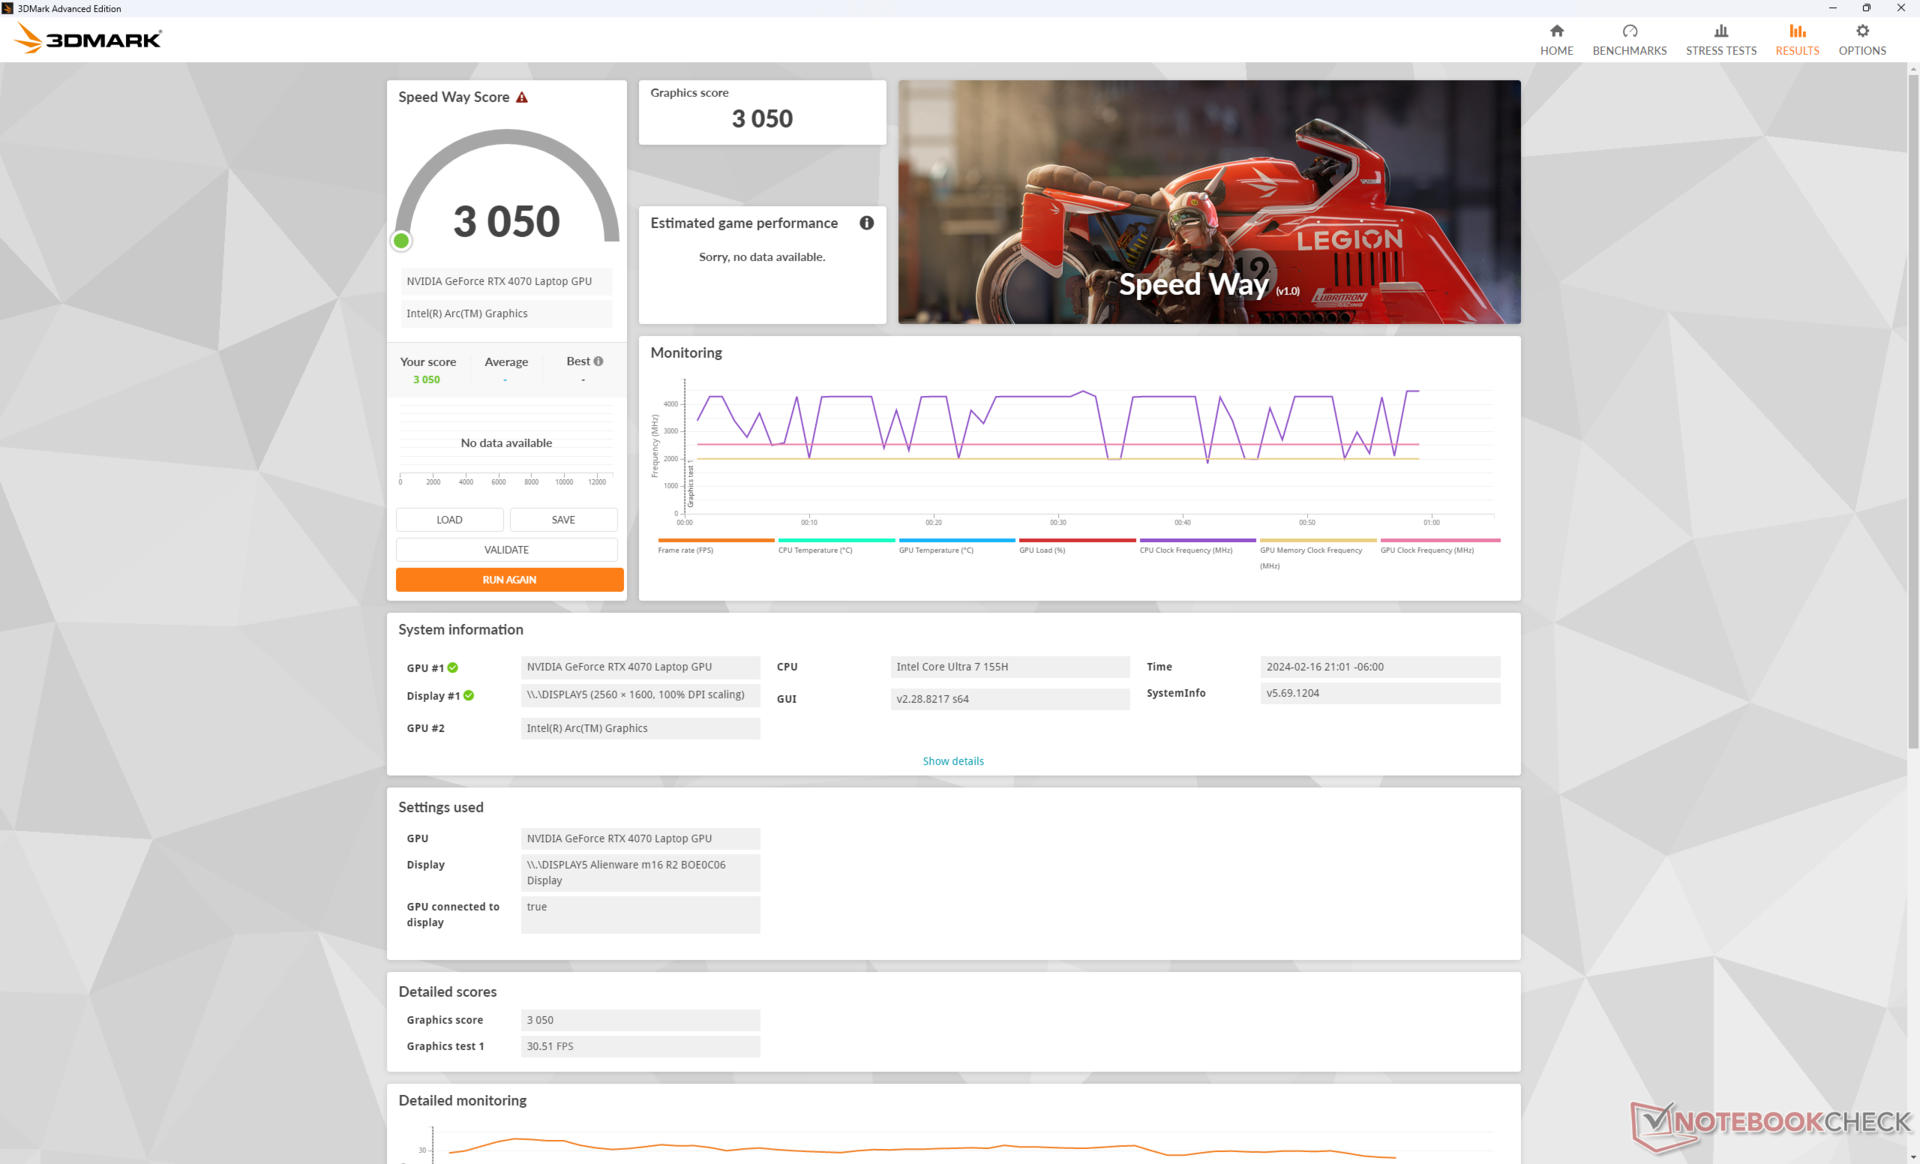
GPU-prestaties
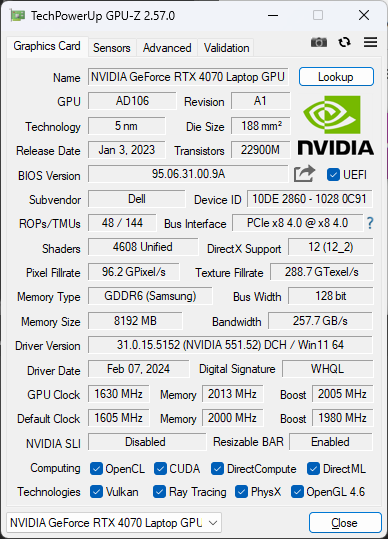
De grafische prestaties van onze 140 W GeForce RTX 4070 zijn ongeveer 10 procent sneller dan de gemiddelde laptop in onze database die met dezelfde GPU is uitgerust. Hoewel dit een downgrade is van de m16 R1 met wel 30 tot 45 procent door het ontbreken van RTX 4080 of 4090 opties, is het in ieder geval goed om te zien dat de RTX 4070 hier beter presteert dan verwacht. Gebruikers die de RTX 4080 of 4090 willen, zullen in plaats daarvan de oudere m16 R1 of de duurdere Alienware x16-serie moeten overwegen.
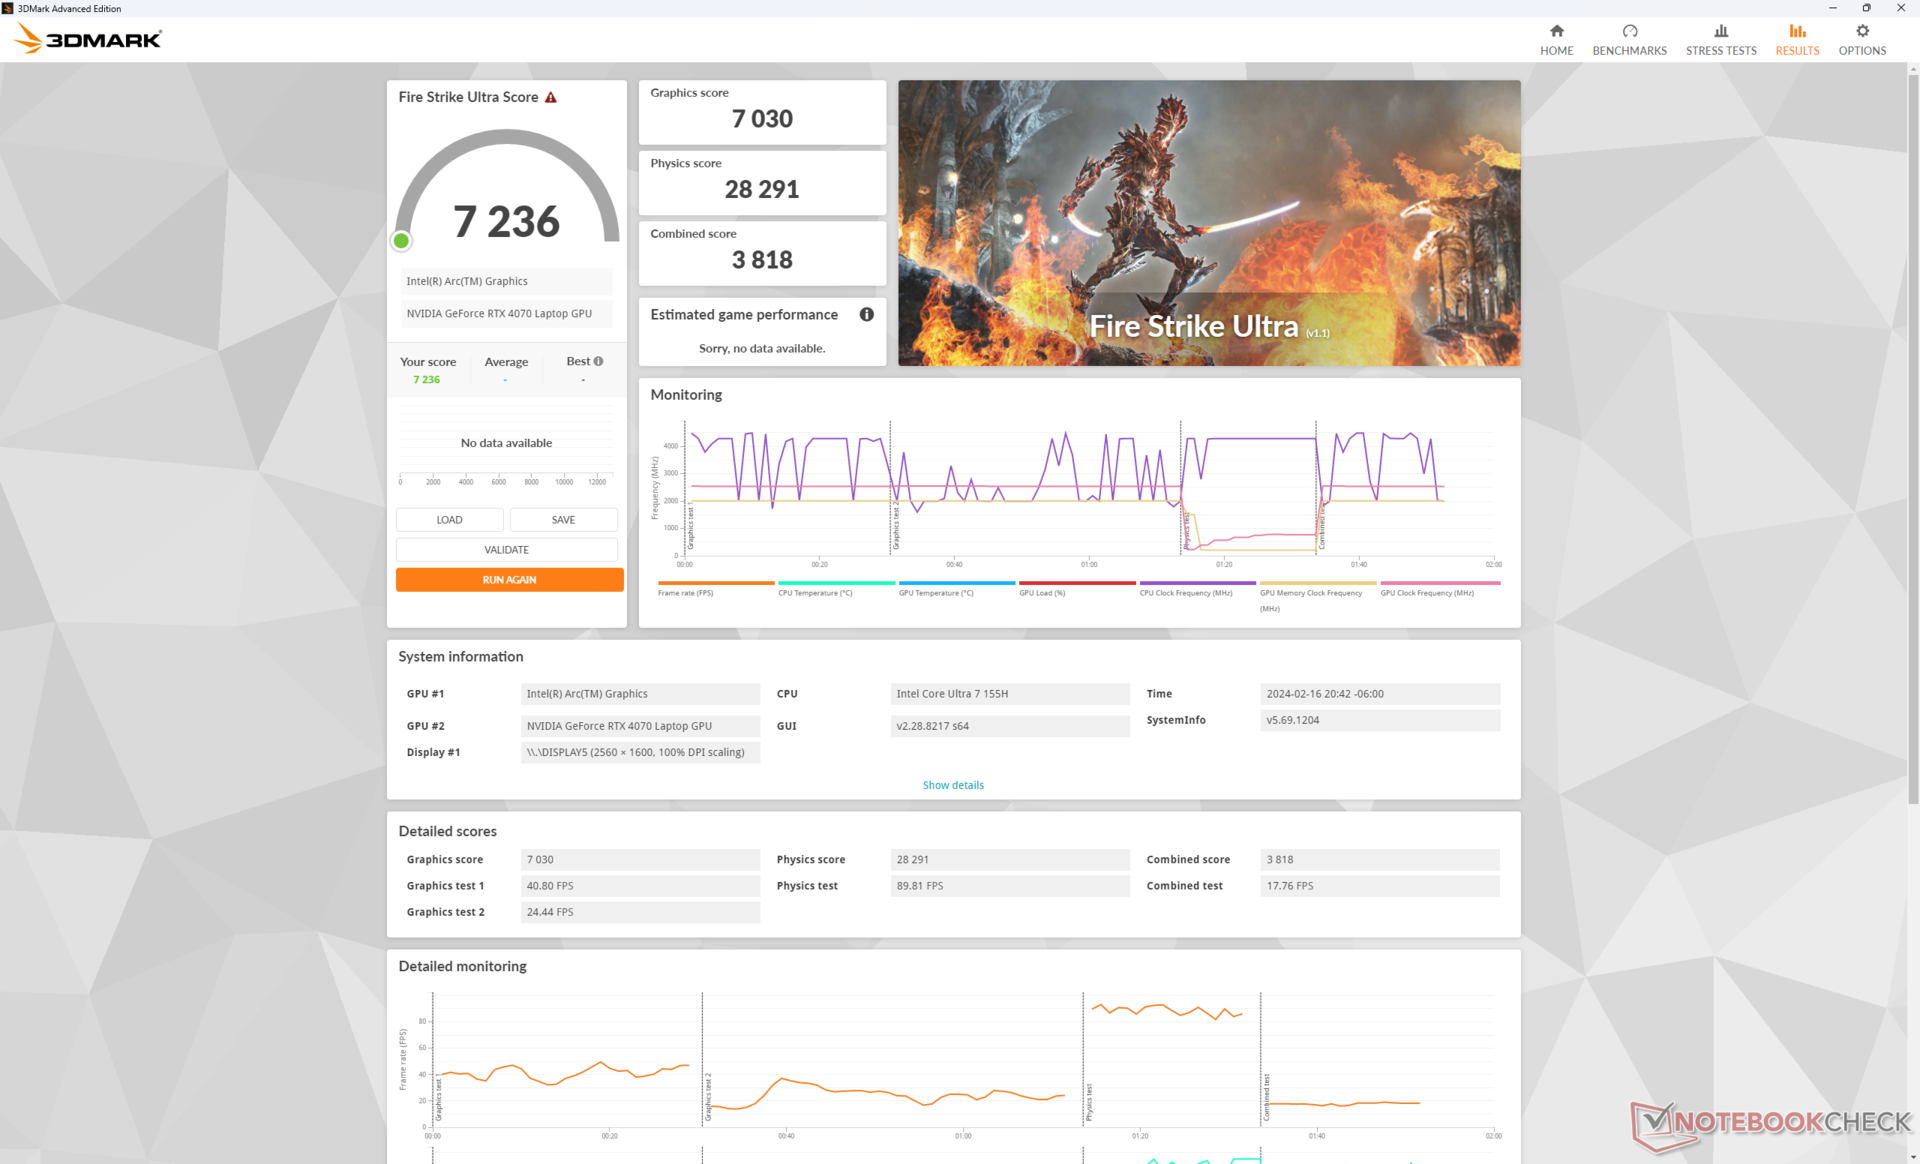
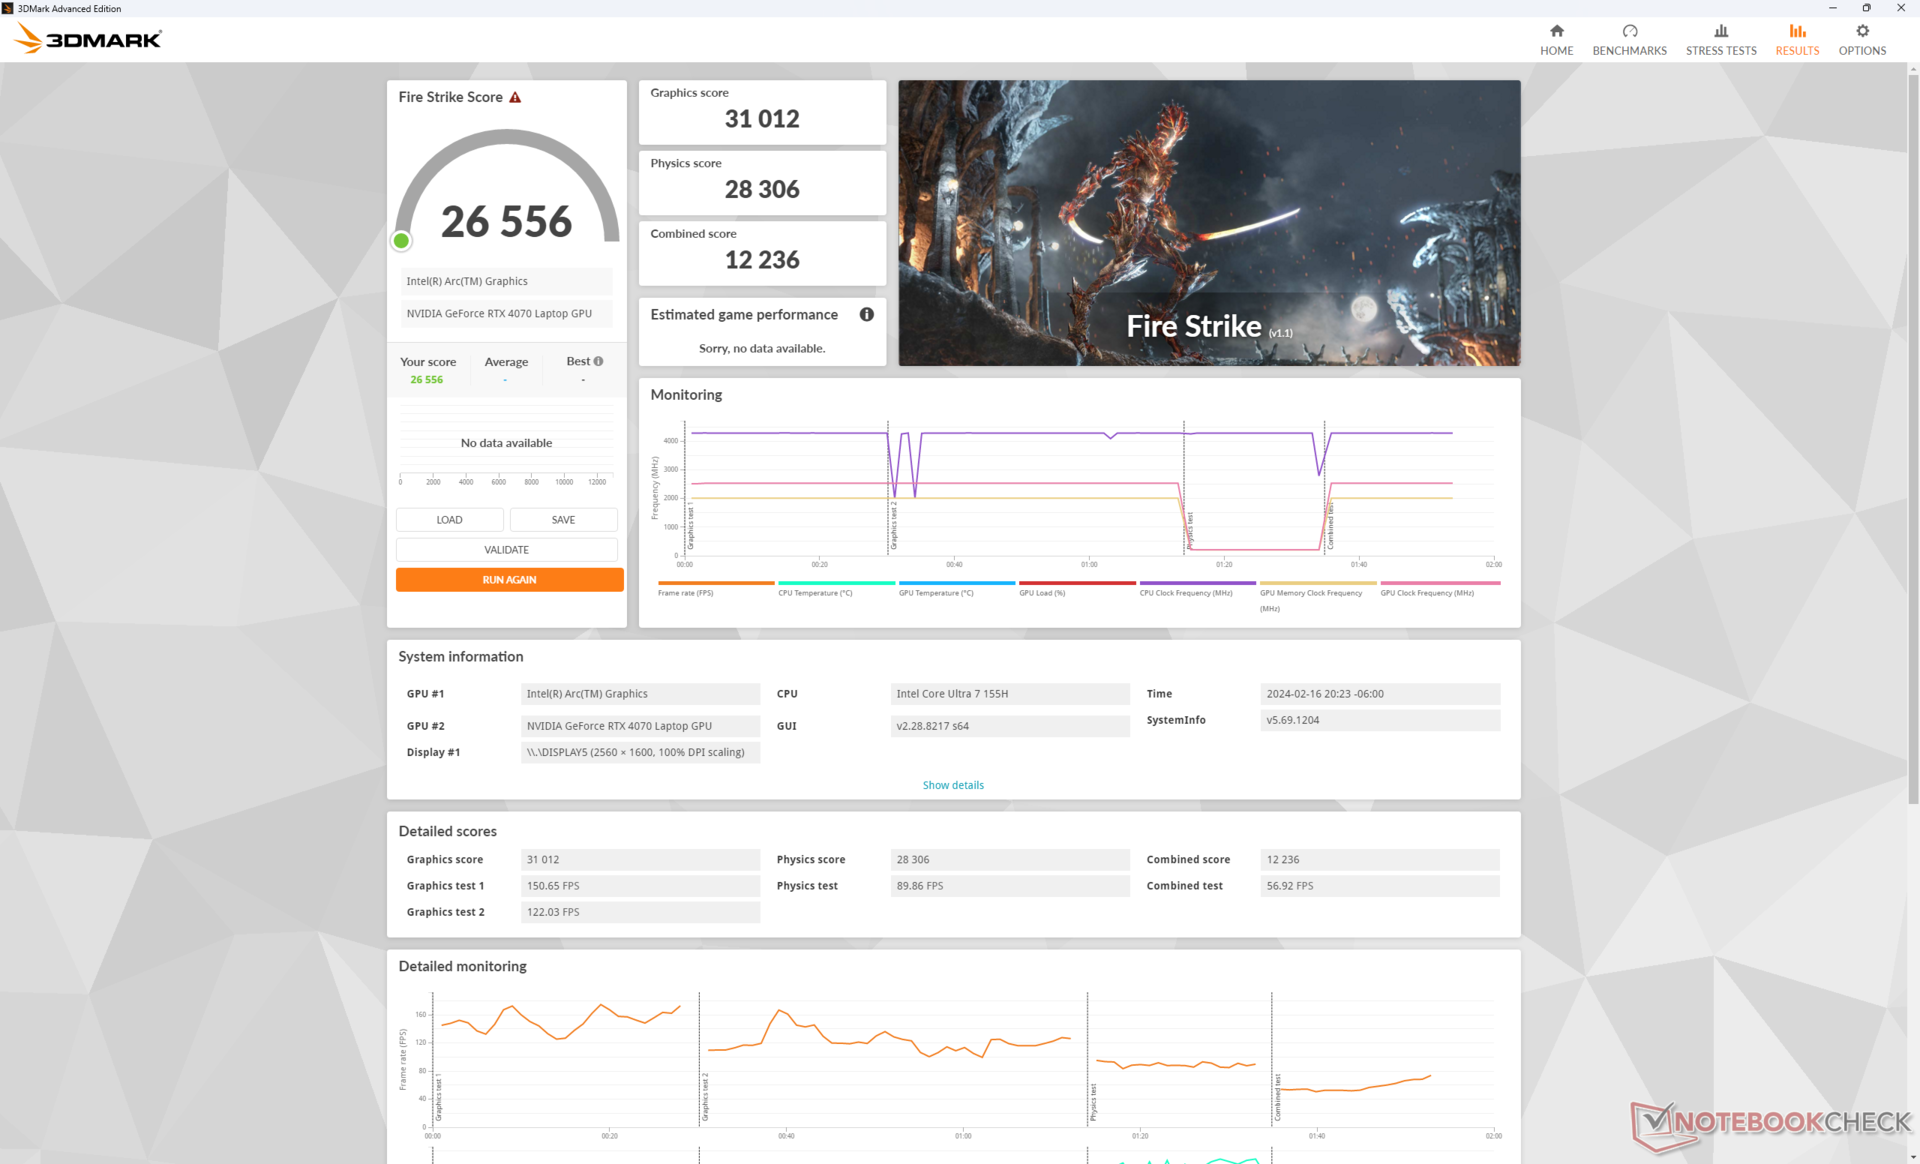
Interessant genoeg zijn de prestatieverschillen tussen de modi Overdrive, Performance en Balanced op zijn best klein. Dit is verrassend omdat het overschakelen naar de Gebalanceerde modus normaal gesproken een prestatieverlies van 10 tot 30 procent met zich meebrengt op de meeste andere gaming laptops, maar Fire Strike scores blijven bijna constant op onze Alienware m16 R2. Dell heeft tijdens de ontwikkeling van dit model zeker de geluidsprofielen van de ventilatoren en het daaruit voortvloeiende prestatiegedrag aangepast.
| Stroomprofiel | Grafische Score | Fysica Score | Gecombineerde Score |
| Overdrive modus | 30932 | 27306 | 12414 |
| Prestatiemodus | 31012 (-0%) | 28306 (-0%) | 12236 (-0%) |
| Gebalanceerde modus | 30603 (-0%) | 28281 (-0%) | 12448 (-0%) |
| Batterijvermogen | 24398 (-21%) | 24684 (-10%) | 10088 (-19%) |
Downgraden naar de RTX 4060 configuratie zal de prestaties naar verwachting met 10 tot 15 procent beïnvloeden.
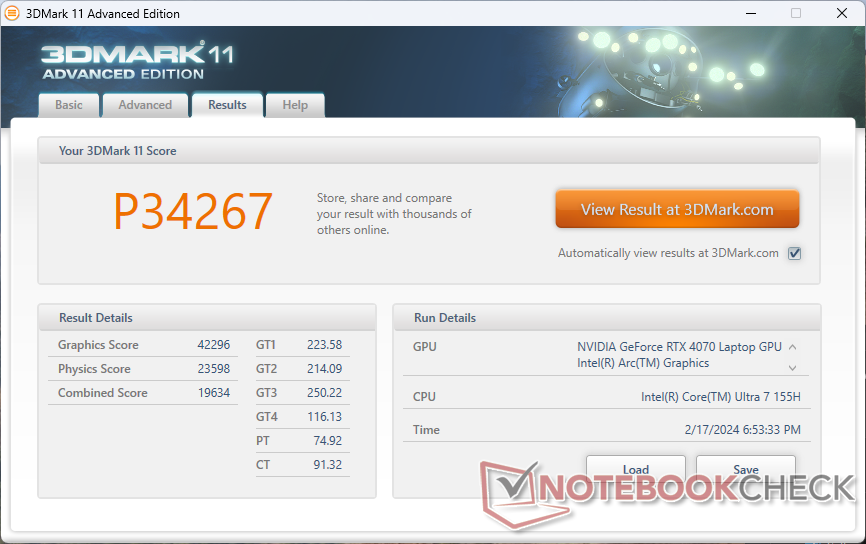
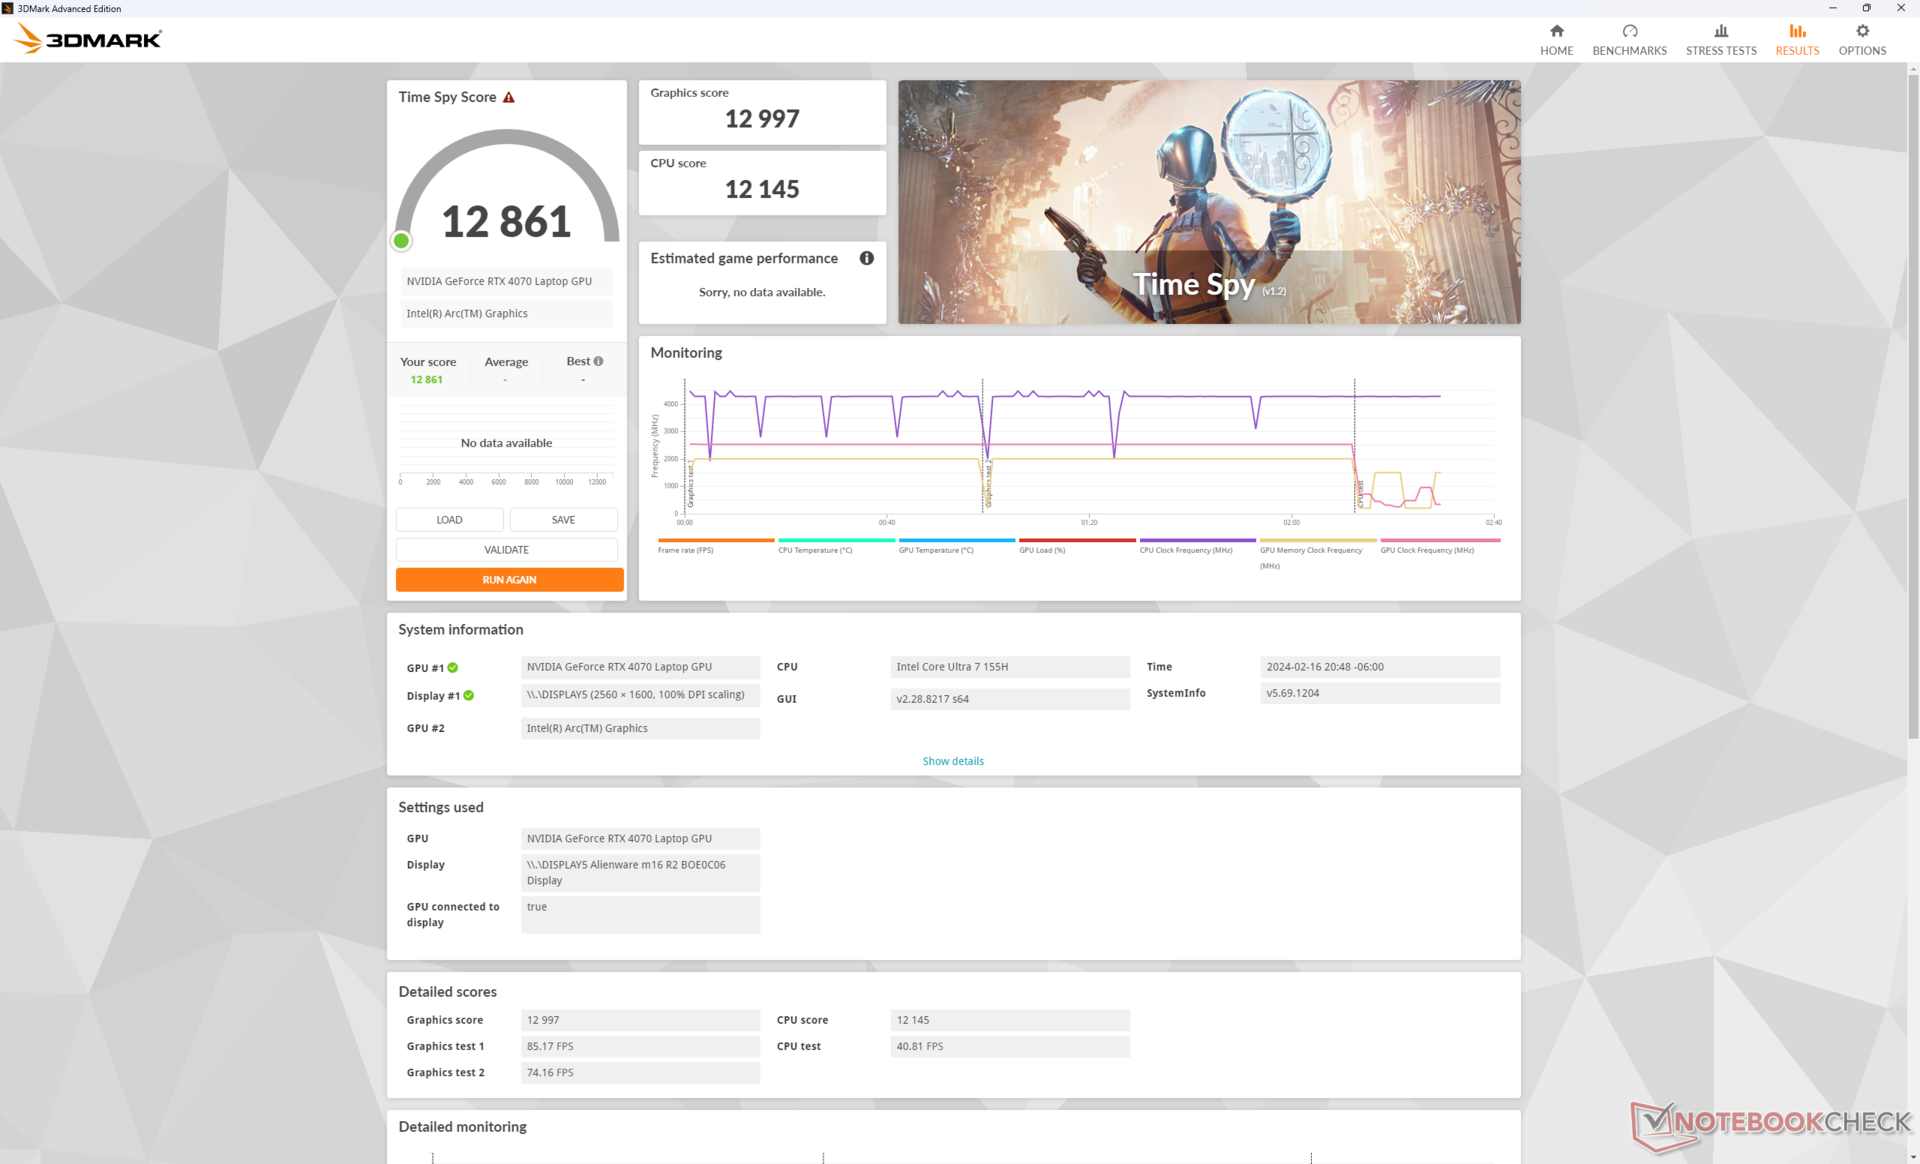
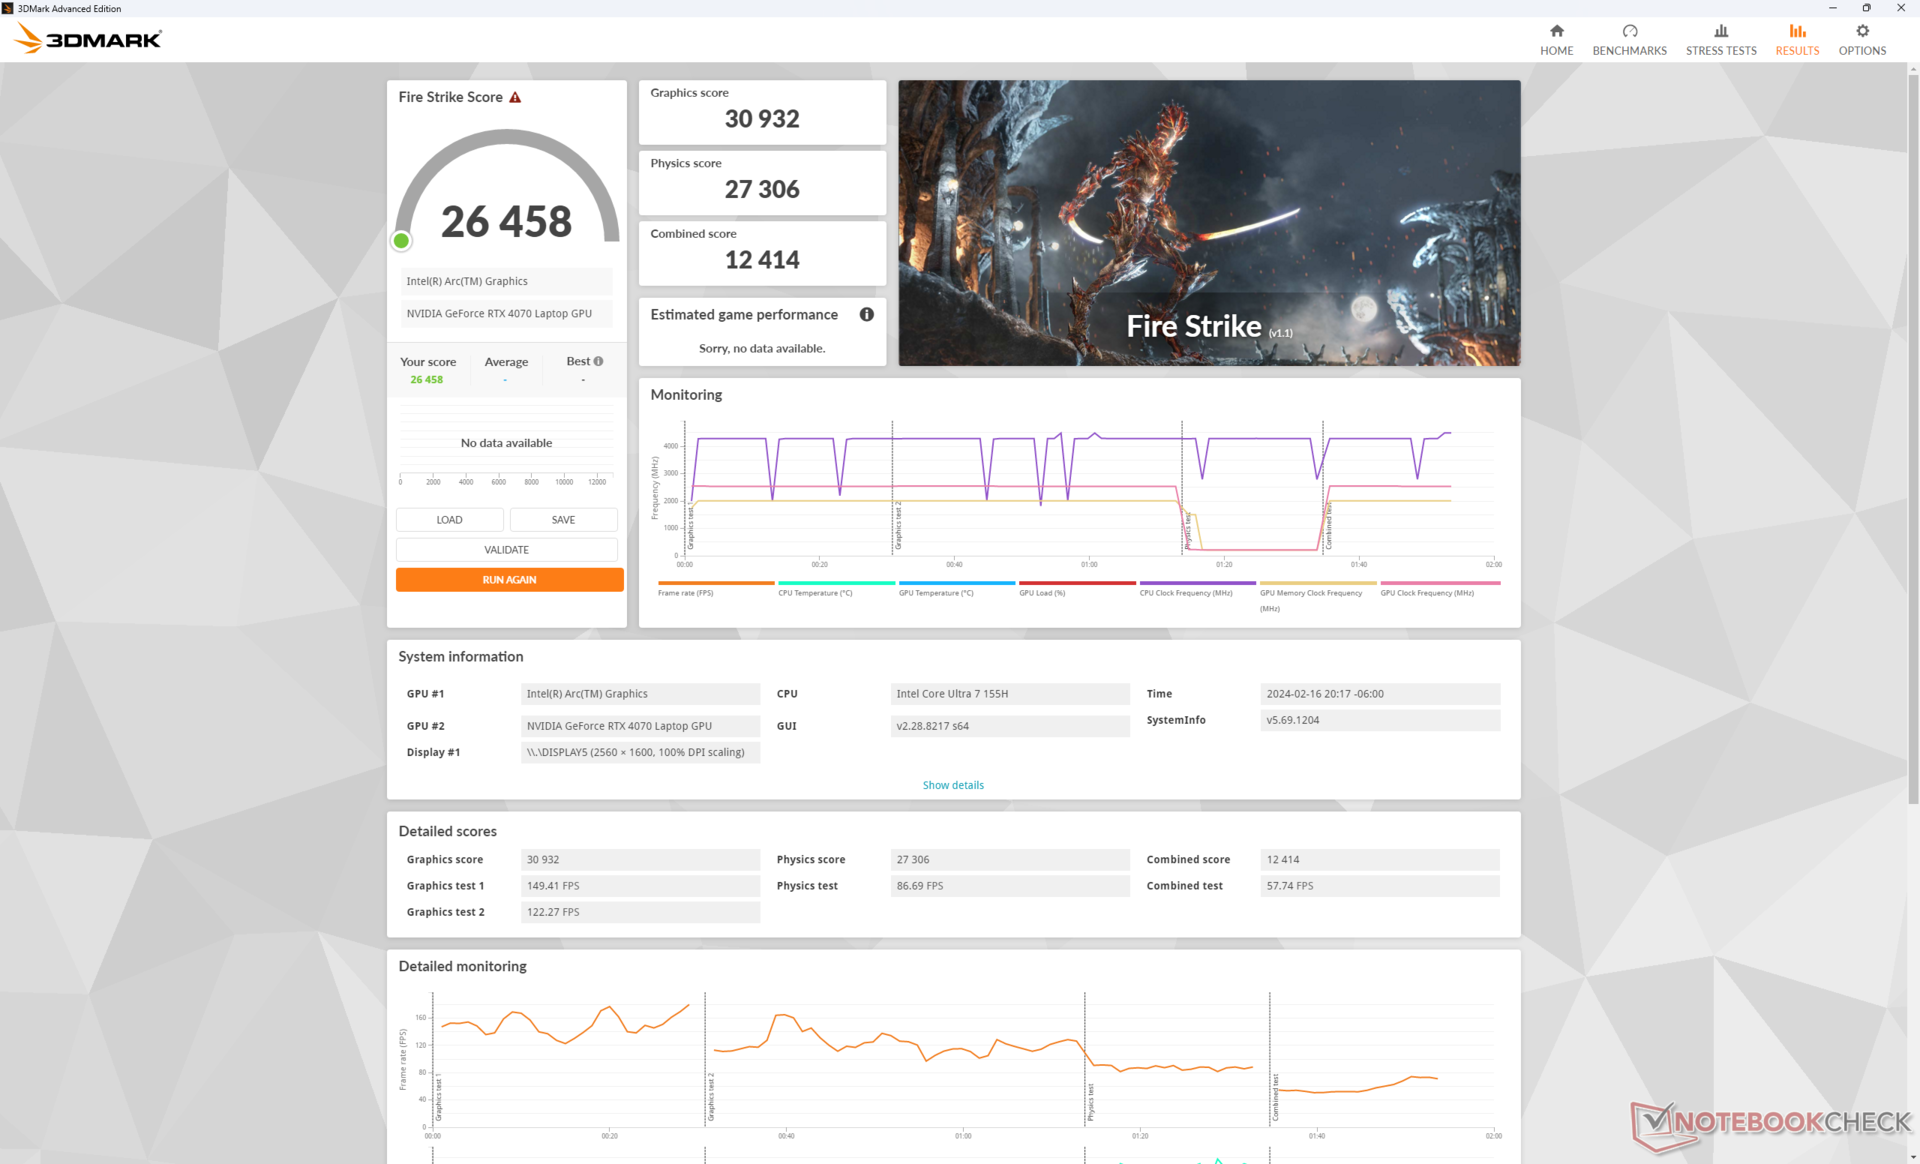
| 3DMark 11 Performance | 34267 punten | |
| 3DMark Fire Strike Score | 26458 punten | |
| 3DMark Time Spy Score | 12861 punten | |
Help | ||
* ... kleiner is beter
| F1 22 | |
| 1920x1080 Ultra High Preset AA:T AF:16x | |
| Lenovo Legion 9 16IRX8 | |
| Alienware m16 R1 AMD | |
| Alienware m16 R2 | |
| Gemiddeld NVIDIA GeForce RTX 4070 Laptop GPU (39.2 - 88.7, n=32) | |
| Lenovo Legion 5 16IRX G9 | |
| HP Victus 16-r0076TX | |
| Framework Laptop 16 | |
| 2560x1440 Ultra High Preset AA:T AF:16x | |
| Lenovo Legion 9 16IRX8 | |
| Alienware m16 R1 AMD | |
| Alienware m16 R2 | |
| Gemiddeld NVIDIA GeForce RTX 4070 Laptop GPU (10.6 - 58.8, n=30) | |
| Lenovo Legion 5 16IRX G9 | |
| Framework Laptop 16 | |
| 3840x2160 Ultra High Preset AA:T AF:16x | |
| Alienware m16 R1 AMD | |
| Alienware m16 R2 | |
| Gemiddeld NVIDIA GeForce RTX 4070 Laptop GPU (4.7 - 27.6, n=15) | |
| Framework Laptop 16 | |
| The Witcher 3 | |
| 1920x1080 Ultra Graphics & Postprocessing (HBAO+) | |
| Lenovo Legion 9 16IRX8 | |
| Alienware m16 R1 AMD | |
| Alienware m16 R2 | |
| Lenovo Legion 7 16IAX7-82TD004SGE | |
| HP Omen Transcend 16-u1095ng | |
| Gemiddeld NVIDIA GeForce RTX 4070 Laptop GPU (69.8 - 133.7, n=57) | |
| Asus ROG Zephyrus M16 GU603Z | |
| Lenovo Legion 5 16IRX G9 | |
| HP Victus 16-r0076TX | |
| Lenovo Legion S7 16ARHA7 | |
| Asus ROG Zephyrus M16 GU603H | |
| Dell G16 7620 | |
| Framework Laptop 16 | |
| 3840x2160 High Graphics & Postprocessing (Nvidia HairWorks Off) | |
| Alienware m16 R1 AMD | |
| Alienware m16 R2 | |
| Gemiddeld NVIDIA GeForce RTX 4070 Laptop GPU (26.5 - 83.5, n=16) | |
| Framework Laptop 16 | |
| Tiny Tina's Wonderlands | |
| 1920x1080 Badass Preset (DX12) | |
| Lenovo Legion 9 16IRX8 | |
| Alienware m16 R1 AMD | |
| Alienware m16 R2 | |
| Gemiddeld NVIDIA GeForce RTX 4070 Laptop GPU (58.6 - 115.9, n=18) | |
| Framework Laptop 16 | |
| 2560x1440 Badass Preset (DX12) | |
| Lenovo Legion 9 16IRX8 | |
| Alienware m16 R1 AMD | |
| Alienware m16 R2 | |
| Gemiddeld NVIDIA GeForce RTX 4070 Laptop GPU (49.8 - 79.5, n=17) | |
| Framework Laptop 16 | |
| 3840x2160 Badass Preset (DX12) | |
| Alienware m16 R1 AMD | |
| Gemiddeld NVIDIA GeForce RTX 4070 Laptop GPU (28.3 - 39.7, n=13) | |
| Alienware m16 R2 | |
| Framework Laptop 16 | |
| Baldur's Gate 3 | |
| 1920x1080 Ultra Preset AA:T | |
| Alienware m16 R2 | |
| Gemiddeld NVIDIA GeForce RTX 4070 Laptop GPU (66.7 - 128.5, n=30) | |
| Framework Laptop 16 | |
| 2560x1440 Ultra Preset AA:T | |
| Alienware m16 R2 | |
| Gemiddeld NVIDIA GeForce RTX 4070 Laptop GPU (54.4 - 89.6, n=25) | |
| Framework Laptop 16 | |
| 3840x2160 Ultra Preset AA:T | |
| Alienware m16 R2 | |
| Gemiddeld NVIDIA GeForce RTX 4070 Laptop GPU (33.4 - 45.2, n=12) | |
| Framework Laptop 16 | |
| Cyberpunk 2077 | |
| 1920x1080 Ultra Preset (FSR off) | |
| Lenovo Legion 9 16IRX8 | |
| Alienware m16 R2 | |
| Lenovo Legion 5 16IRX G9 | |
| Gemiddeld NVIDIA GeForce RTX 4070 Laptop GPU (30.7 - 90.7, n=40) | |
| Framework Laptop 16 | |
| 2560x1440 Ultra Preset (FSR off) | |
| Lenovo Legion 9 16IRX8 | |
| Alienware m16 R2 | |
| Lenovo Legion 5 16IRX G9 | |
| Gemiddeld NVIDIA GeForce RTX 4070 Laptop GPU (24.8 - 57.1, n=37) | |
| Framework Laptop 16 | |
| 3840x2160 Ultra Preset (FSR off) | |
| Gemiddeld NVIDIA GeForce RTX 4070 Laptop GPU (20.2 - 24, n=13) | |
| Alienware m16 R2 | |
| Framework Laptop 16 | |
Witcher 3 FPS Chart
| lage | gem. | hoge | ultra | QHD | 4K | |
|---|---|---|---|---|---|---|
| The Witcher 3 (2015) | 399.6 | 344.6 | 240.5 | 121.3 | 72 | |
| Dota 2 Reborn (2015) | 166.8 | 149 | 149.5 | 139.7 | 130.6 | |
| Final Fantasy XV Benchmark (2018) | 184.6 | 165.1 | 119.3 | 85.2 | 48.5 | |
| X-Plane 11.11 (2018) | 132.3 | 116 | 90.8 | 78.2 | ||
| Far Cry 5 (2018) | 146 | 134 | 123 | 115 | 61 | |
| Strange Brigade (2018) | 427 | 308 | 255 | 219 | 141.7 | 73.8 |
| Tiny Tina's Wonderlands (2022) | 244 | 202.8 | 138.3 | 107.6 | 74.6 | 34.8 |
| F1 22 (2022) | 235 | 225 | 217 | 83.6 | 52.9 | 26.6 |
| Baldur's Gate 3 (2023) | 168.7 | 148.9 | 129.3 | 128.5 | 88.3 | 44.3 |
| Cyberpunk 2077 (2023) | 125.7 | 114.1 | 95.6 | 83.1 | 52.7 | 21 |
Uitstoot
Systeemgeluid
Het geluidsgedrag van de ventilator is aanzienlijk verbeterd ten opzichte van de m16 R1. Bij het uitvoeren van 3DMark 06 in de gebalanceerde modus blijft de m16 R2 bijvoorbeeld langer stil met 32 dB(A), terwijl de m16 R1 gedurende de eerste benchmarkscène onnodig hard is met 52 dB(A). Dit maakt de m16 R2 beter vergelijkbaar met concurrenten zoals de Lenovo Legion Slim 7 onder vergelijkbare omstandigheden.
Het ventilatorgeluid tijdens het gamen hangt nauw samen met het geselecteerde energieprofiel. Het ventilatorgeluid bedraagt bijvoorbeeld 52 dB(A), 54 dB(A) en 62 dB(A) bij gebruik in de Witcher 3 in respectievelijk de modus Gebalanceerd, de modus Prestaties en de modus Overdrive. Aangezien de prestatieverschillen tussen deze drie modi zeer klein zijn, zoals hierboven vermeld, raden wij aan om in de meeste scenario's in de modus Prestaties te spelen en de modus Overdrive te vermijden. Het maximum van 62 dB(A) is veel luider dan wat we vaststelden op zelfs de krachtigere Alienware x16 R1, maar deze modus is vooral bedoeld voor overklokken door eindgebruikers; de modus Prestaties is voldoende voor standaardinstellingen.
Geluidsniveau
| Onbelast |
| 25.3 / 25.3 / 25.3 dB (A) |
| Belasting |
| 31.7 / 62 dB (A) |
 | ||
30 dB stil 40 dB(A) hoorbaar 50 dB(A) luid |
||
min: | ||
| Alienware m16 R2 GeForce RTX 4070 Laptop GPU, Ultra 7 155H, Samsung PM9A1 MZVL21T0HCLR | Alienware m16 R1 Intel GeForce RTX 4060 Laptop GPU, i7-13700HX, Kioxia KXG70ZNV512G | Alienware x16 R1 GeForce RTX 4080 Laptop GPU, i9-13900HK, SK hynix PC801 HFS001TEJ9X101N | HP Omen Transcend 16-u1095ng GeForce RTX 4070 Laptop GPU, i9-14900HX, Kioxia XG8 KXG80ZNV1T02 | Asus ROG Zephyrus G16 2024 GU605M GeForce RTX 4070 Laptop GPU, Ultra 7 155H, WD PC SN560 SDDPNQE-1T00 | Lenovo Legion Slim 7 16APH8 GeForce RTX 4060 Laptop GPU, R7 7840HS, WDC PC SN810 1TB | |
|---|---|---|---|---|---|---|
| Noise | -8% | 1% | -8% | 2% | 0% | |
| uit / omgeving * (dB) | 24.7 | 25 -1% | 22.7 8% | 24 3% | 23.9 3% | 24 3% |
| Idle Minimum * (dB) | 25.3 | 25 1% | 23.1 9% | 29 -15% | 23.9 6% | 25 1% |
| Idle Average * (dB) | 25.3 | 26 -3% | 25.8 -2% | 30 -19% | 27.8 -10% | 28 -11% |
| Idle Maximum * (dB) | 25.3 | 27 -7% | 25.8 -2% | 31 -23% | 30.1 -19% | 31 -23% |
| Load Average * (dB) | 31.7 | 52 -64% | 39.3 -24% | 45 -42% | 34.2 -8% | 33 -4% |
| Witcher 3 ultra * (dB) | 53.8 | 51 5% | 49.9 7% | 44 18% | 46.4 14% | 47 13% |
| Load Maximum * (dB) | 62 | 53 15% | 54.8 12% | 47 24% | 46.4 25% | 49 21% |
* ... kleiner is beter
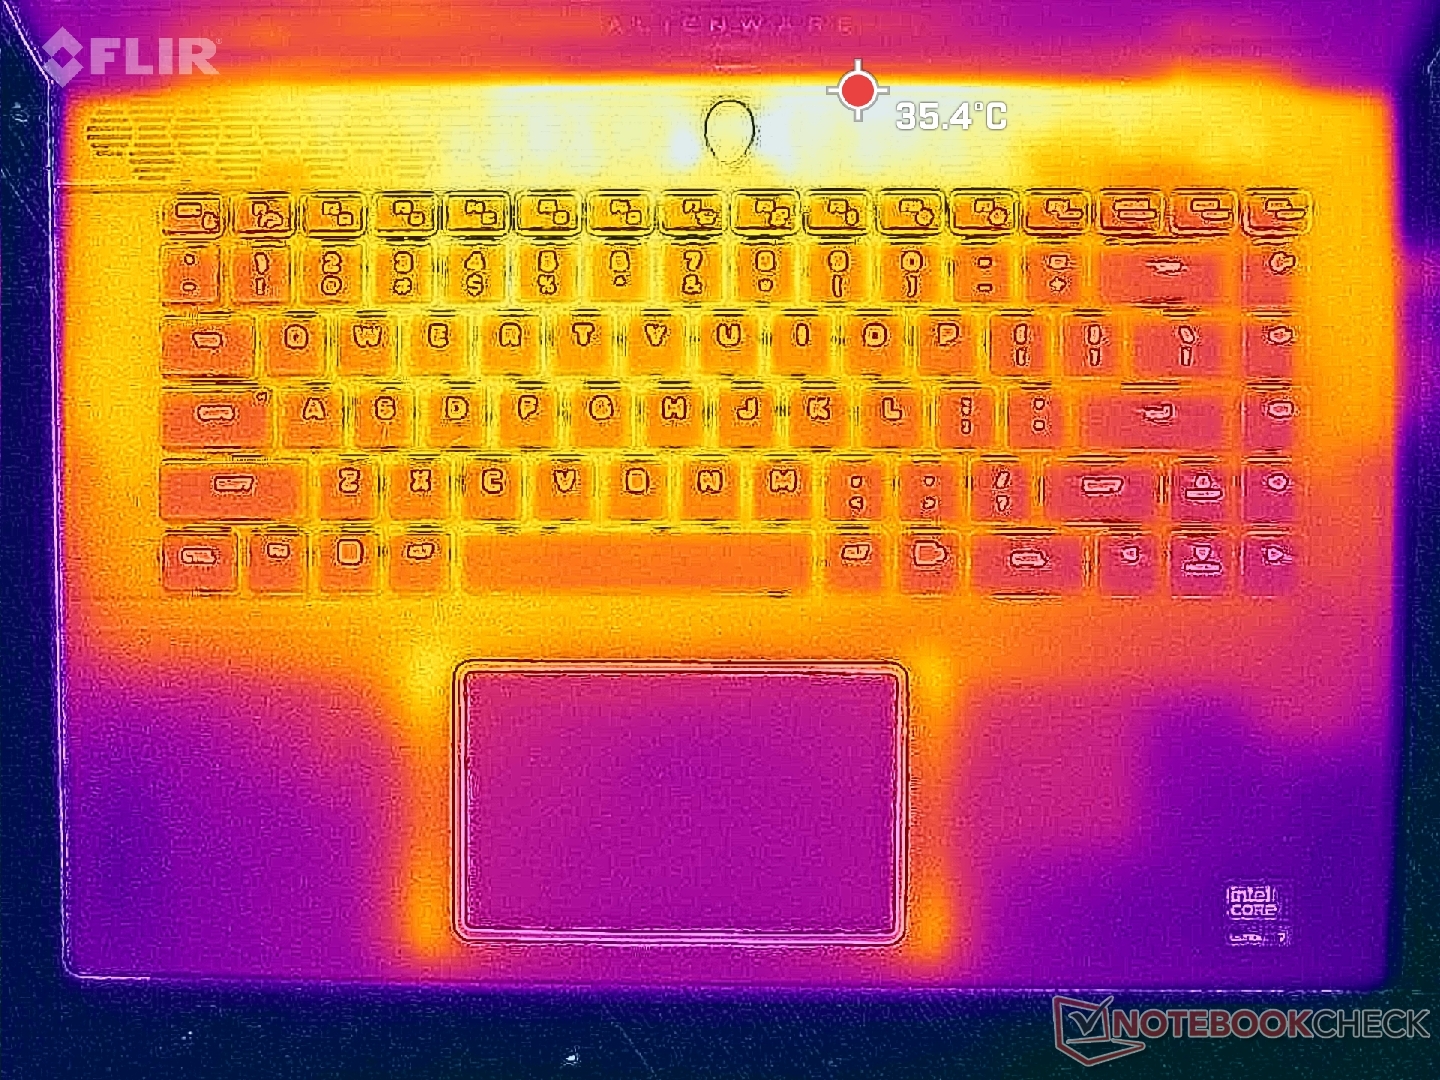
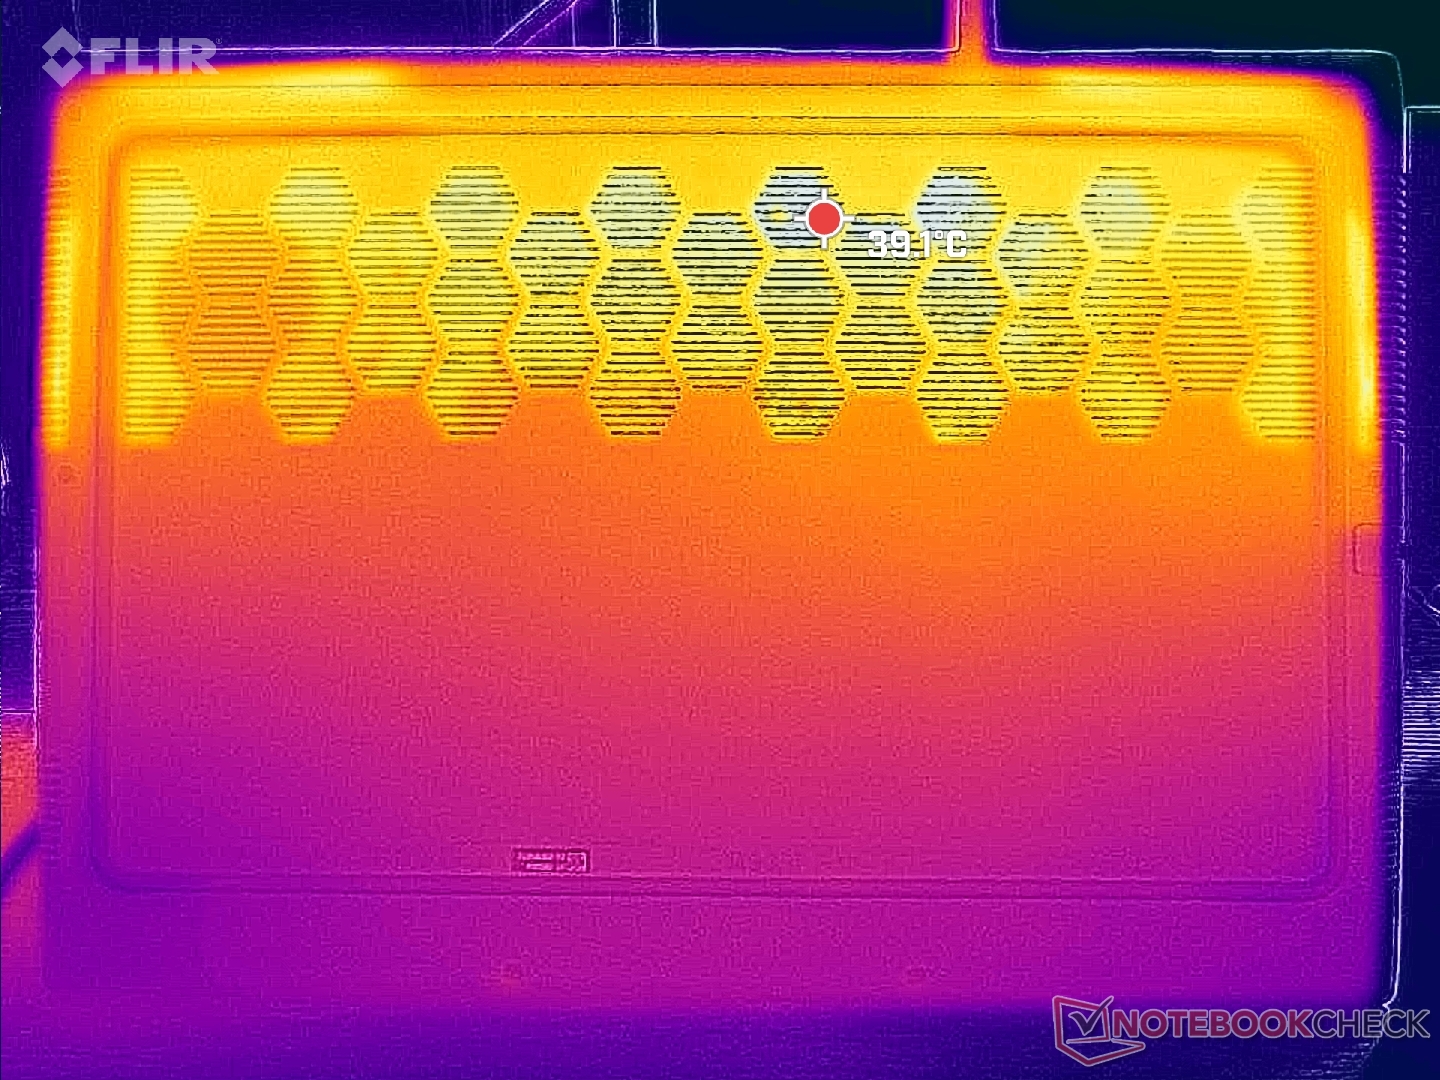
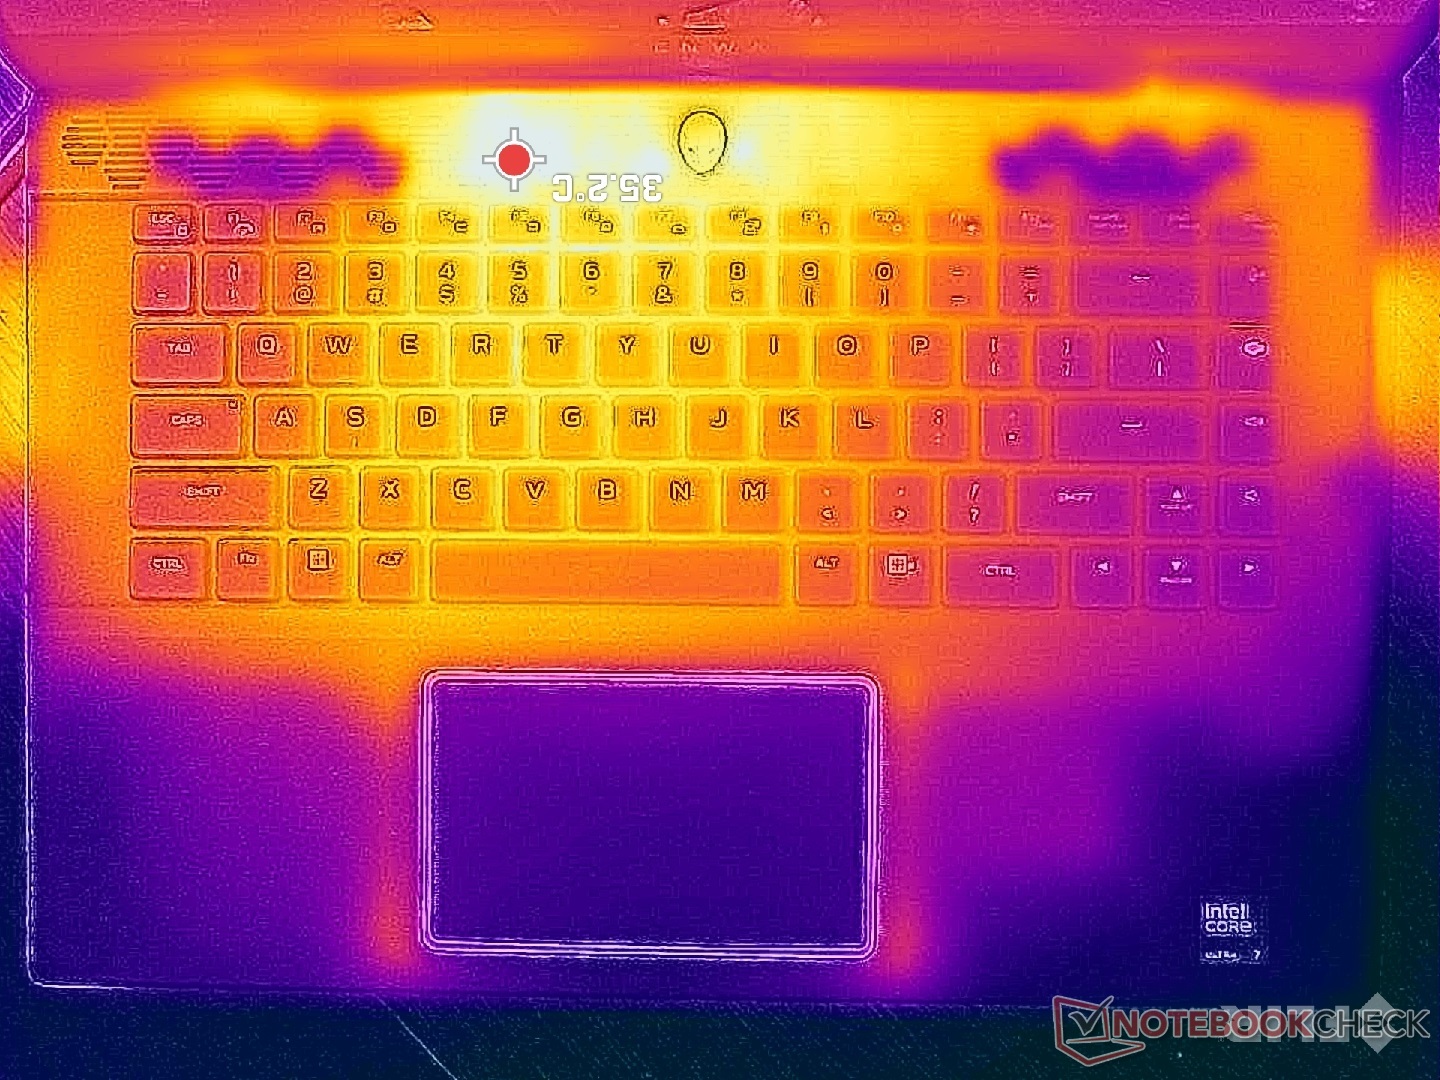
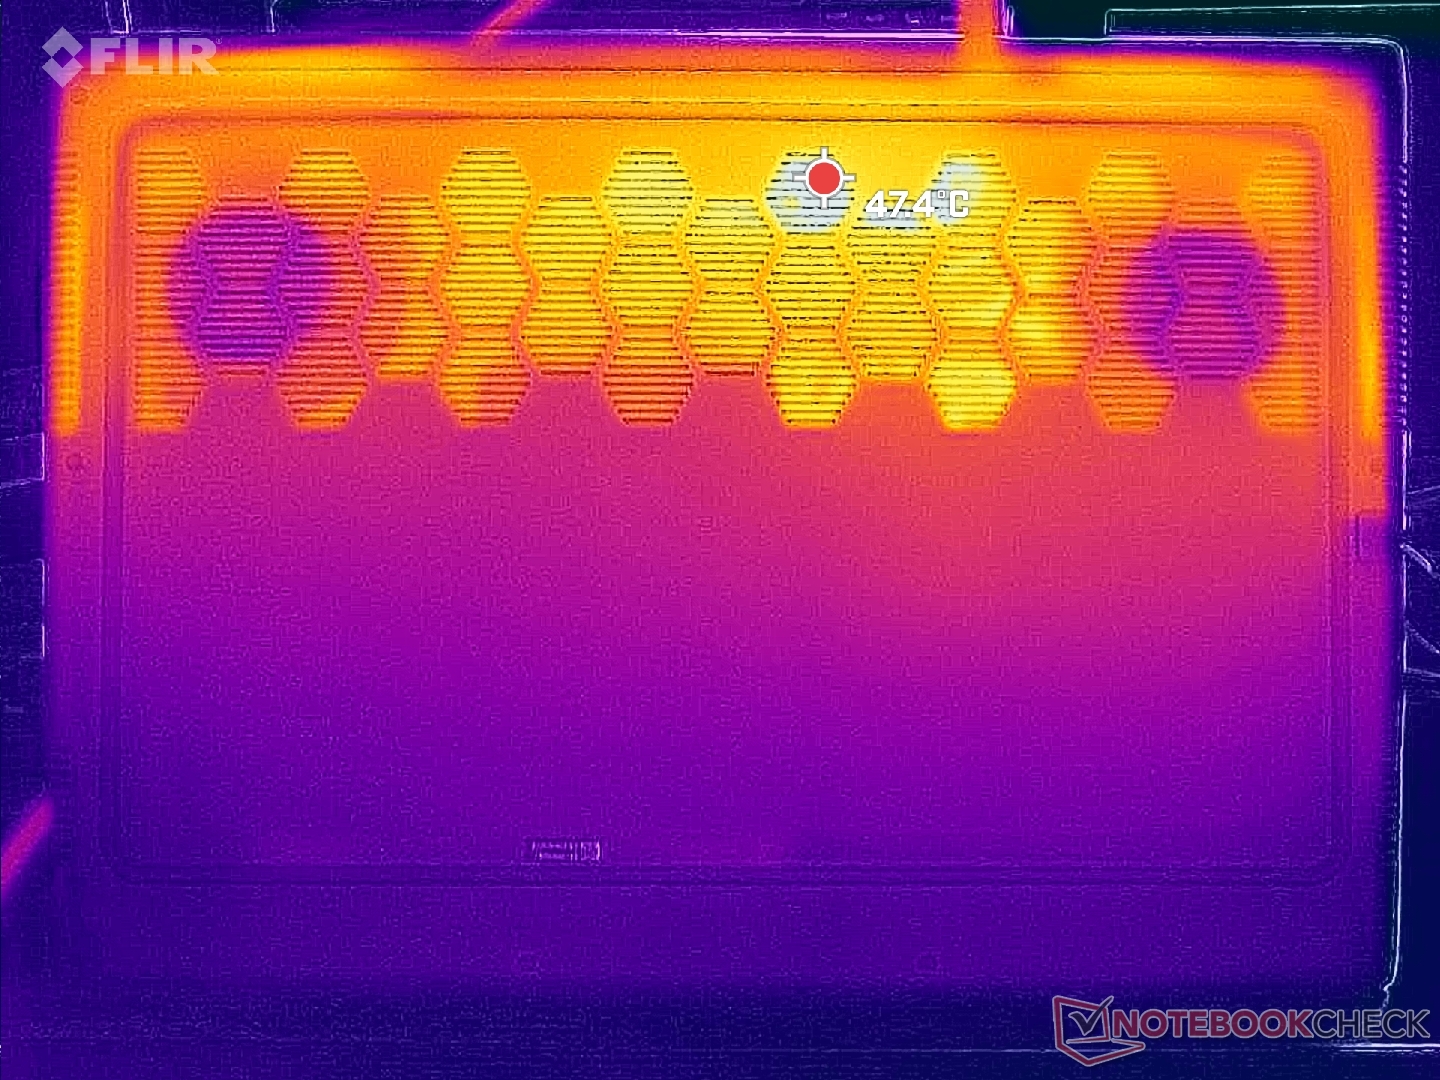
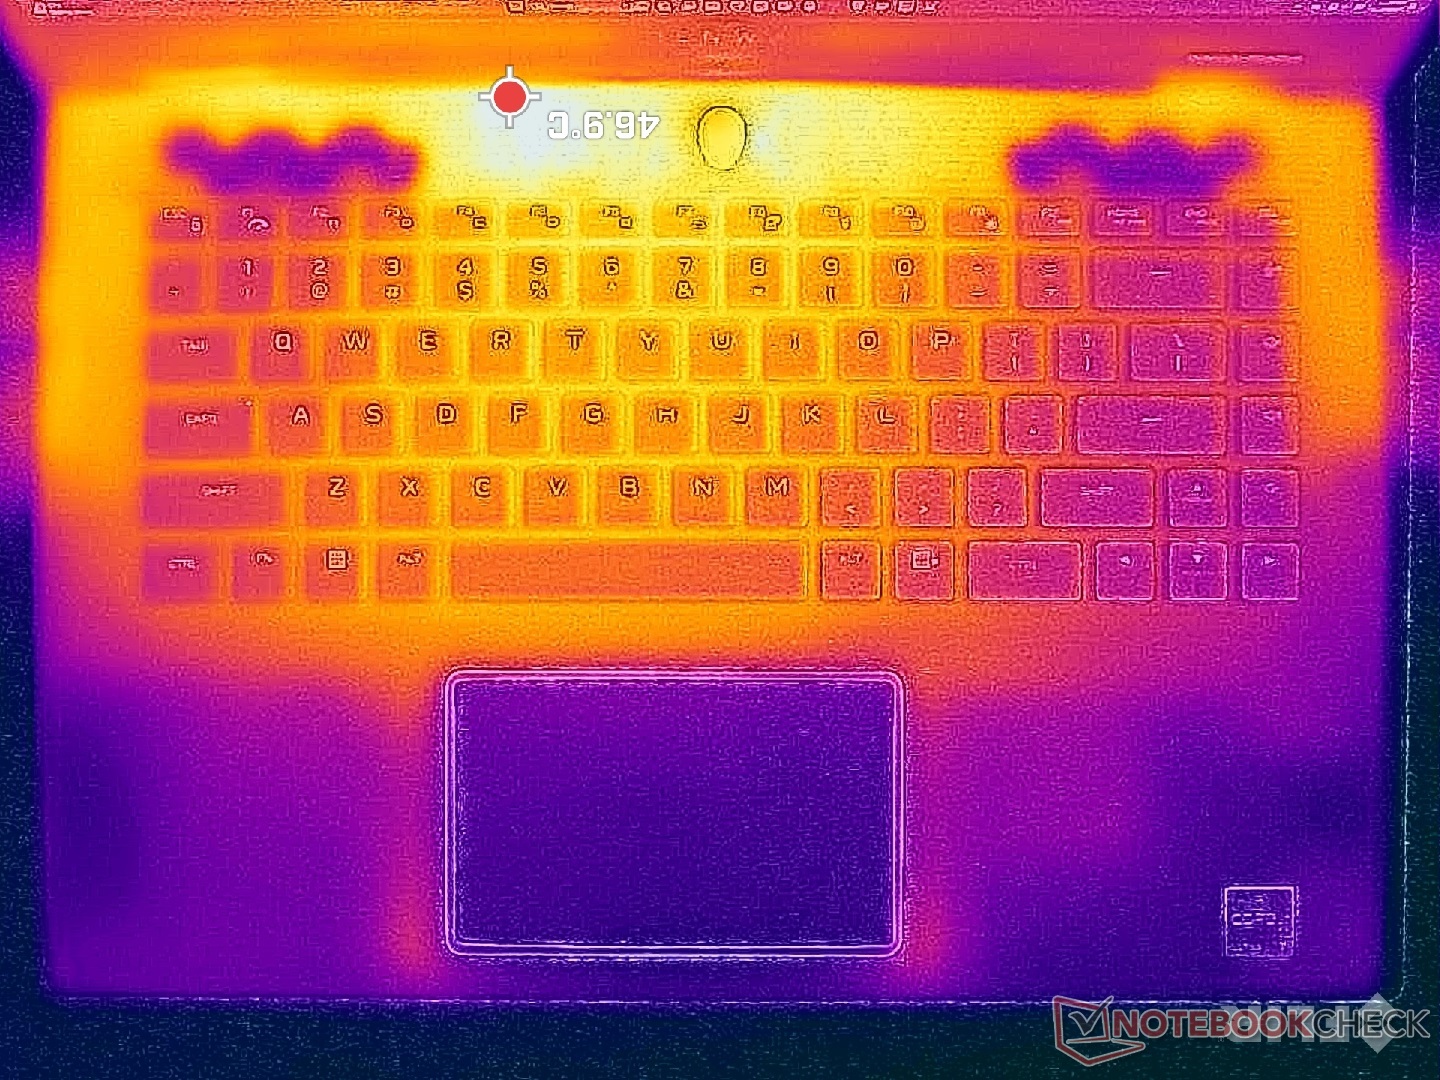
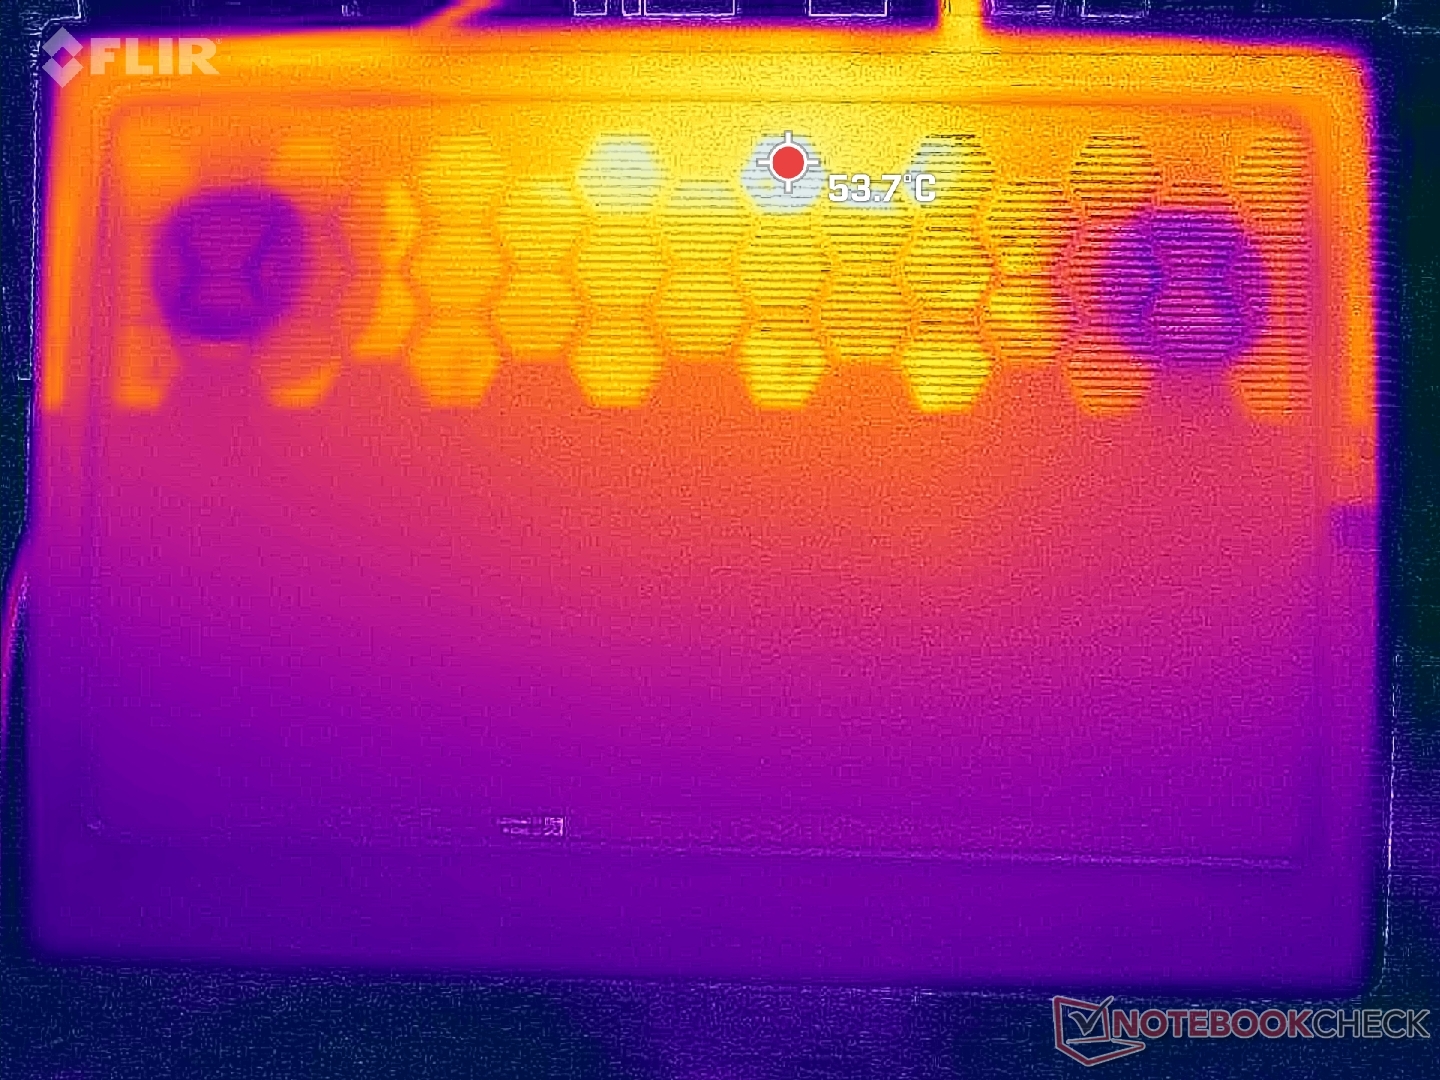
Temperatuur
Hete plekken bij veeleisende belastingen zoals games zijn geconcentreerd aan de achterkant van de behuizing, waar handen elkaar waarschijnlijk niet aanraken. De palmsteunen en het toetsenbord blijven respectievelijk redelijk koel in het middenbereik van 20 C en 30 C, terwijl de achterkant in de buurt kan komen van 50 C. De gemiddelde oppervlaktetemperaturen zijn warmer dan wat we registreerden op de Blade 16 maar nog steeds koeler dan op de HP Omen Transcend 16 waar bepaalde gebieden meer dan 60 C kunnen bereiken.
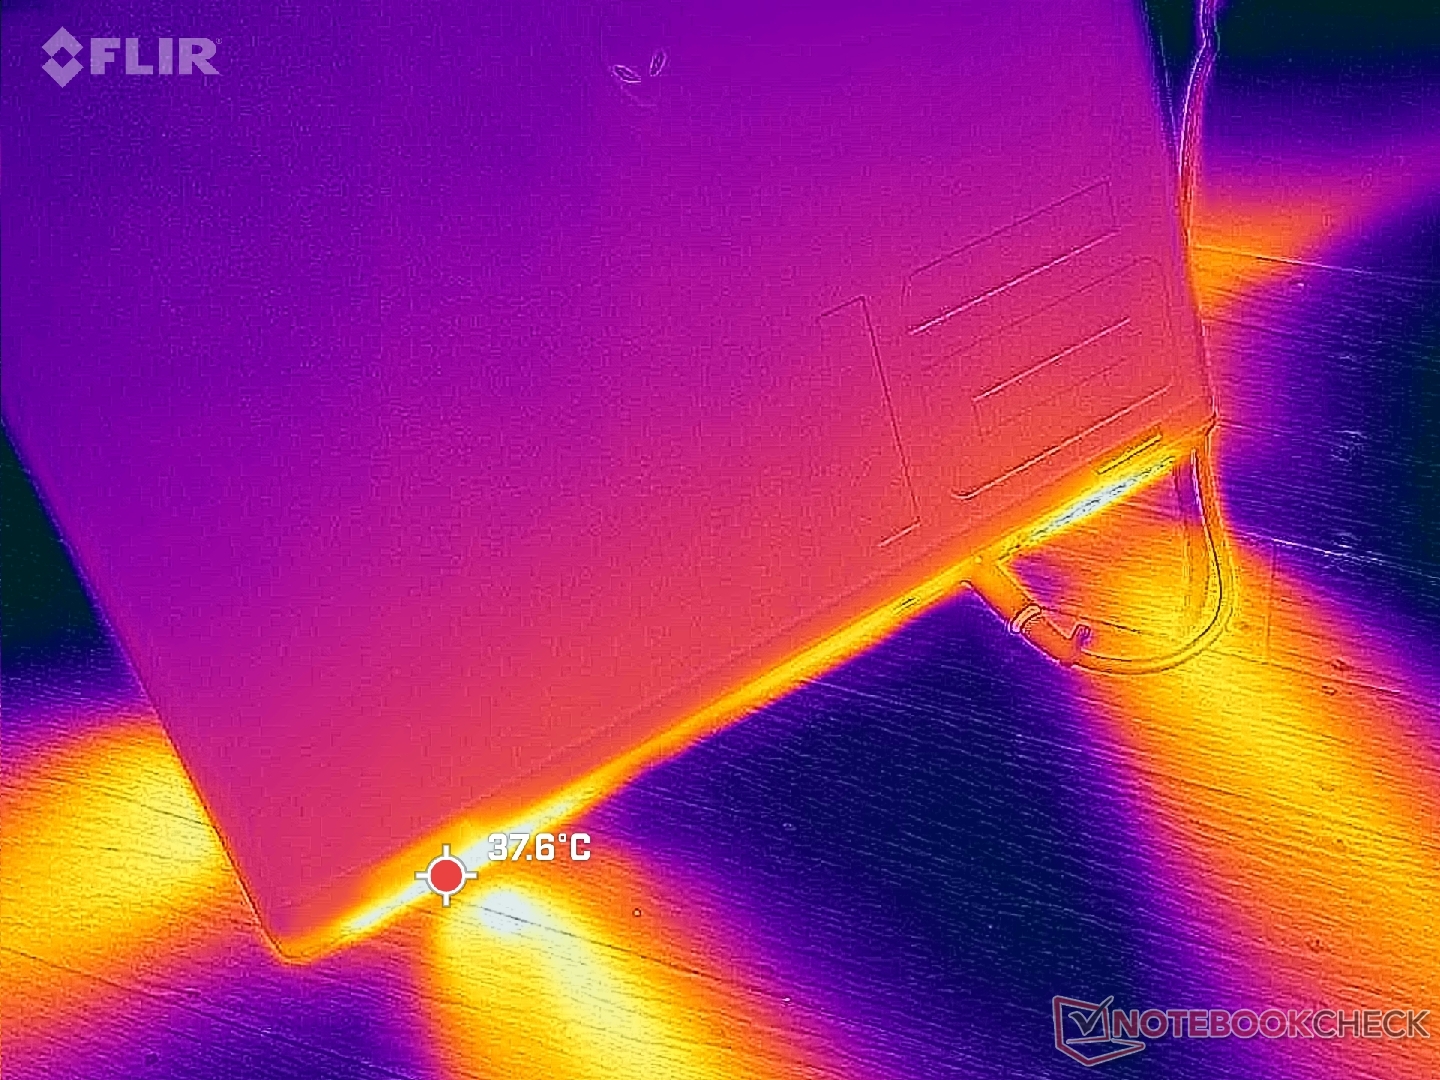
(±) De maximumtemperatuur aan de bovenzijde bedraagt 44.8 °C / 113 F, vergeleken met het gemiddelde van 40.4 °C / 105 F, variërend van 21.2 tot 68.8 °C voor de klasse Gaming.
(-) De bodem warmt op tot een maximum van 48 °C / 118 F, vergeleken met een gemiddelde van 43.2 °C / 110 F
(+) Bij onbelast gebruik bedraagt de gemiddelde temperatuur voor de bovenzijde 30.9 °C / 88 F, vergeleken met het apparaatgemiddelde van 33.9 °C / 93 F.
(+) Bij het spelen van The Witcher 3 is de gemiddelde temperatuur voor de bovenzijde 28.7 °C / 84 F, vergeleken met het apparaatgemiddelde van 33.9 °C / 93 F.
(+) De palmsteunen en het touchpad zijn met een maximum van ###max## °C / 81 F koeler dan de huidtemperatuur en voelen daarom koel aan.
(±) De gemiddelde temperatuur van de handpalmsteun van soortgelijke toestellen bedroeg 28.8 °C / 83.8 F (+1.6 °C / 2.8 F).
| Alienware m16 R2 Intel Core Ultra 7 155H, NVIDIA GeForce RTX 4070 Laptop GPU | Alienware m16 R1 Intel Intel Core i7-13700HX, NVIDIA GeForce RTX 4060 Laptop GPU | Alienware x16 R1 Intel Core i9-13900HK, NVIDIA GeForce RTX 4080 Laptop GPU | HP Omen Transcend 16-u1095ng Intel Core i9-14900HX, NVIDIA GeForce RTX 4070 Laptop GPU | Asus ROG Zephyrus G16 2024 GU605M Intel Core Ultra 7 155H, NVIDIA GeForce RTX 4070 Laptop GPU | Lenovo Legion Slim 7 16APH8 AMD Ryzen 7 7840HS, NVIDIA GeForce RTX 4060 Laptop GPU | |
|---|---|---|---|---|---|---|
| Heat | -3% | 3% | 3% | 10% | 8% | |
| Maximum Upper Side * (°C) | 44.8 | 49 -9% | 47.2 -5% | 49 -9% | 50.3 -12% | 46 -3% |
| Maximum Bottom * (°C) | 48 | 48 -0% | 47.8 -0% | 63 -31% | 48 -0% | 46 4% |
| Idle Upper Side * (°C) | 37.2 | 40 -8% | 36.8 1% | 30 19% | 28.8 23% | 33 11% |
| Idle Bottom * (°C) | 42 | 39 7% | 35.8 15% | 29 31% | 29.8 29% | 34 19% |
* ... kleiner is beter
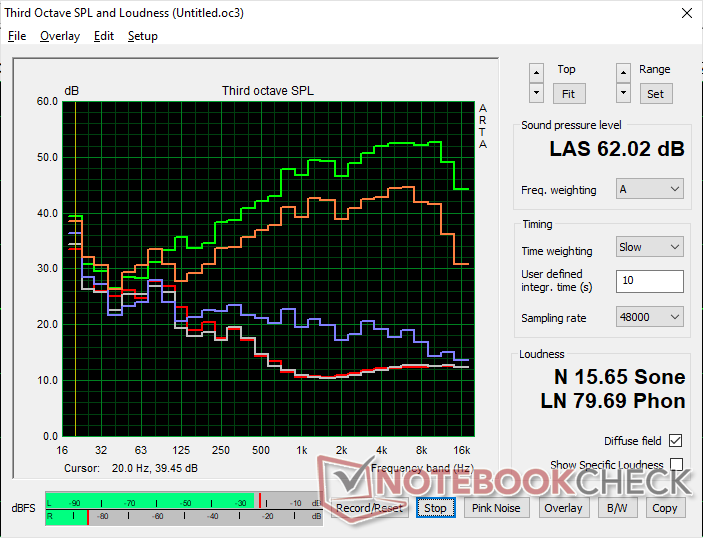
Luidsprekers
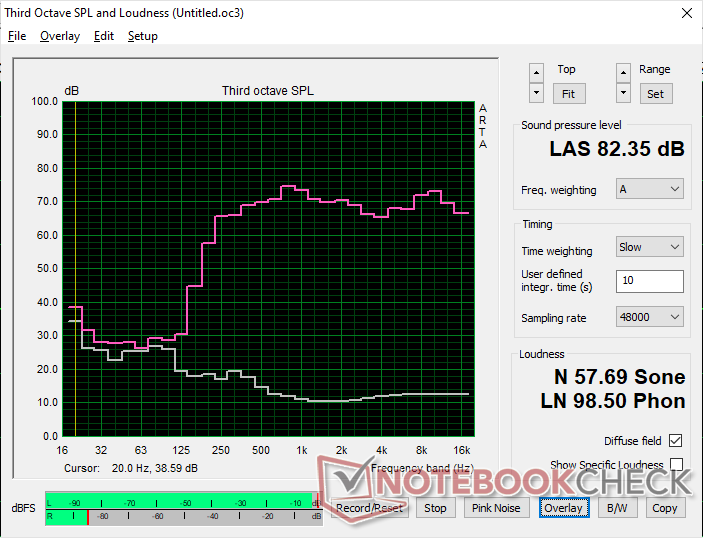
Alienware m16 R2 audioanalyse
(+) | luidsprekers kunnen relatief luid spelen (82.4 dB)
Bas 100 - 315 Hz
(-) | bijna geen lage tonen - gemiddeld 20.1% lager dan de mediaan
(±) | lineariteit van de lage tonen is gemiddeld (11.1% delta ten opzichte van de vorige frequentie)
Midden 400 - 2000 Hz
(+) | evenwichtige middens - slechts 2.2% verwijderd van de mediaan
(+) | de middentonen zijn lineair (3.1% delta ten opzichte van de vorige frequentie)
Hoog 2 - 16 kHz
(+) | evenwichtige hoogtepunten - slechts 2.2% verwijderd van de mediaan
(+) | de hoge tonen zijn lineair (3.5% delta naar de vorige frequentie)
Algemeen 100 - 16.000 Hz
(+) | het totale geluid is lineair (12.9% verschil met de mediaan)
Vergeleken met dezelfde klasse
» 17% van alle geteste apparaten in deze klasse waren beter, 4% vergelijkbaar, 79% slechter
» De beste had een delta van 6%, het gemiddelde was 18%, de slechtste was 132%
Vergeleken met alle geteste toestellen
» 12% van alle geteste apparaten waren beter, 3% gelijk, 85% slechter
» De beste had een delta van 4%, het gemiddelde was 23%, de slechtste was 134%
Apple MacBook Pro 16 2021 M1 Pro audioanalyse
(+) | luidsprekers kunnen relatief luid spelen (84.7 dB)
Bas 100 - 315 Hz
(+) | goede baars - slechts 3.8% verwijderd van de mediaan
(+) | de lage tonen zijn lineair (5.2% delta naar de vorige frequentie)
Midden 400 - 2000 Hz
(+) | evenwichtige middens - slechts 1.3% verwijderd van de mediaan
(+) | de middentonen zijn lineair (2.1% delta ten opzichte van de vorige frequentie)
Hoog 2 - 16 kHz
(+) | evenwichtige hoogtepunten - slechts 1.9% verwijderd van de mediaan
(+) | de hoge tonen zijn lineair (2.7% delta naar de vorige frequentie)
Algemeen 100 - 16.000 Hz
(+) | het totale geluid is lineair (4.6% verschil met de mediaan)
Vergeleken met dezelfde klasse
» 0% van alle geteste apparaten in deze klasse waren beter, 0% vergelijkbaar, 100% slechter
» De beste had een delta van 5%, het gemiddelde was 17%, de slechtste was 45%
Vergeleken met alle geteste toestellen
» 0% van alle geteste apparaten waren beter, 0% gelijk, 100% slechter
» De beste had een delta van 4%, het gemiddelde was 23%, de slechtste was 134%
Energiebeheer - Slanker en minder energieverslindend
Stroomverbruik
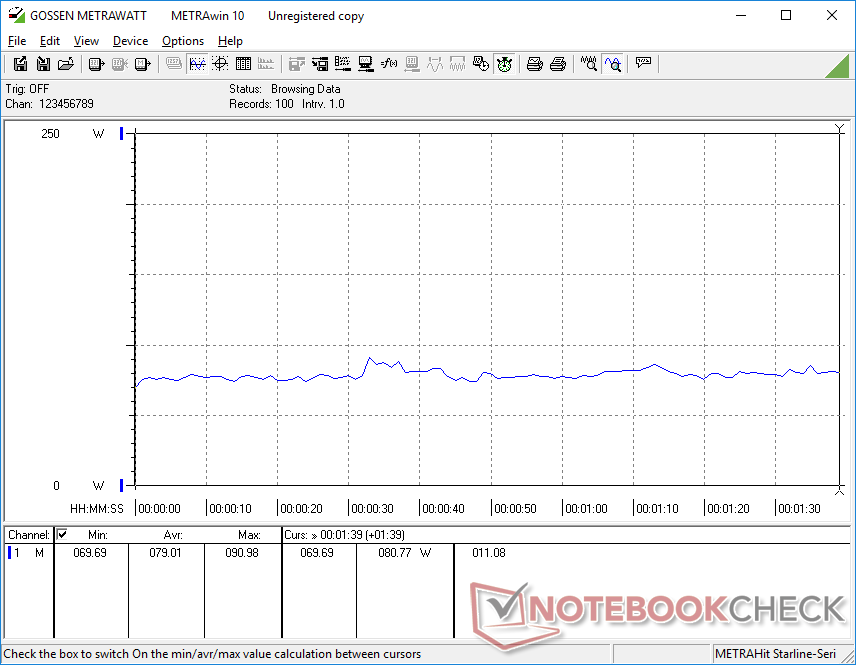
Het inactiviteitsniveau op de desktop kan zo laag zijn als 8 W wanneer deze is ingesteld op minimale helderheid in de Stille modus en iGPU-modus, of tot 40 W wanneer deze is ingesteld op maximale helderheid in de Overdrive-modus en dGPU-modus. U zult de Gebalanceerde modus en iGPU-modus willen gebruiken wanneer de extra paardenkracht niet nodig is om de levensduur van de batterij te verlengen, zoals in de volgende sectie wordt weergegeven.
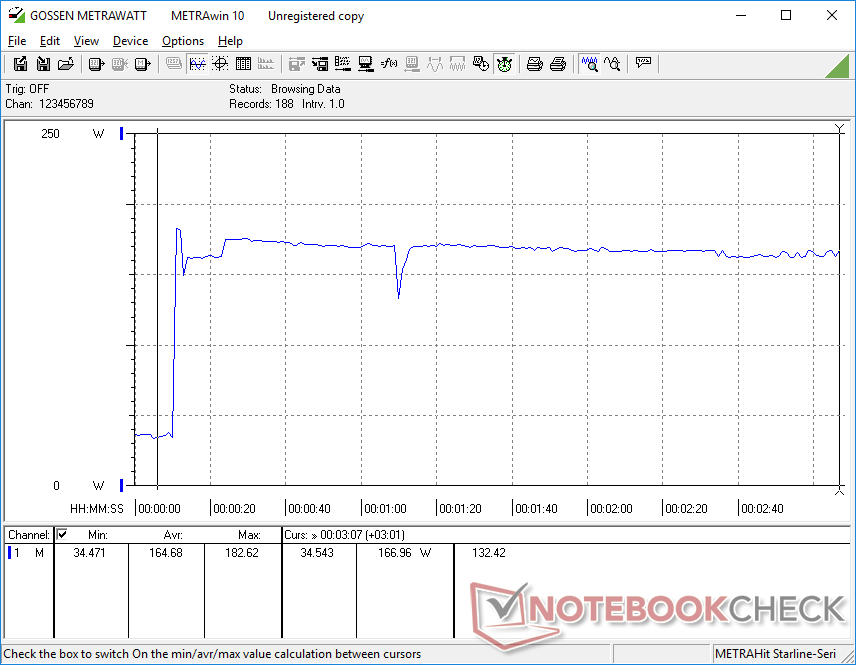
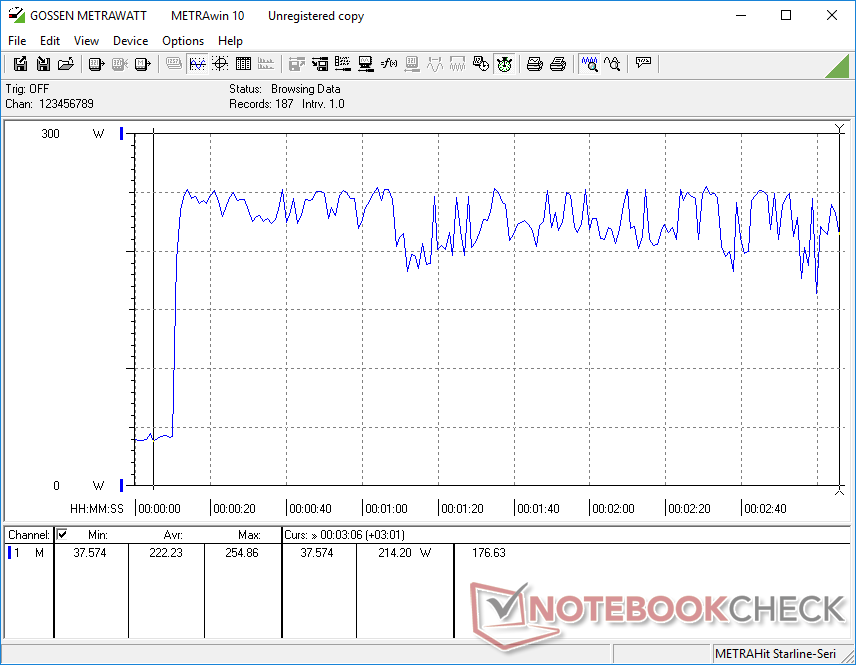
Bij gamen of zware CPU-belastingen is het totale verbruik ongeveer hetzelfde als wat we registreerden op de RTX 4060-aangedreven m16 R1 voor iets hogere prestaties per watt.
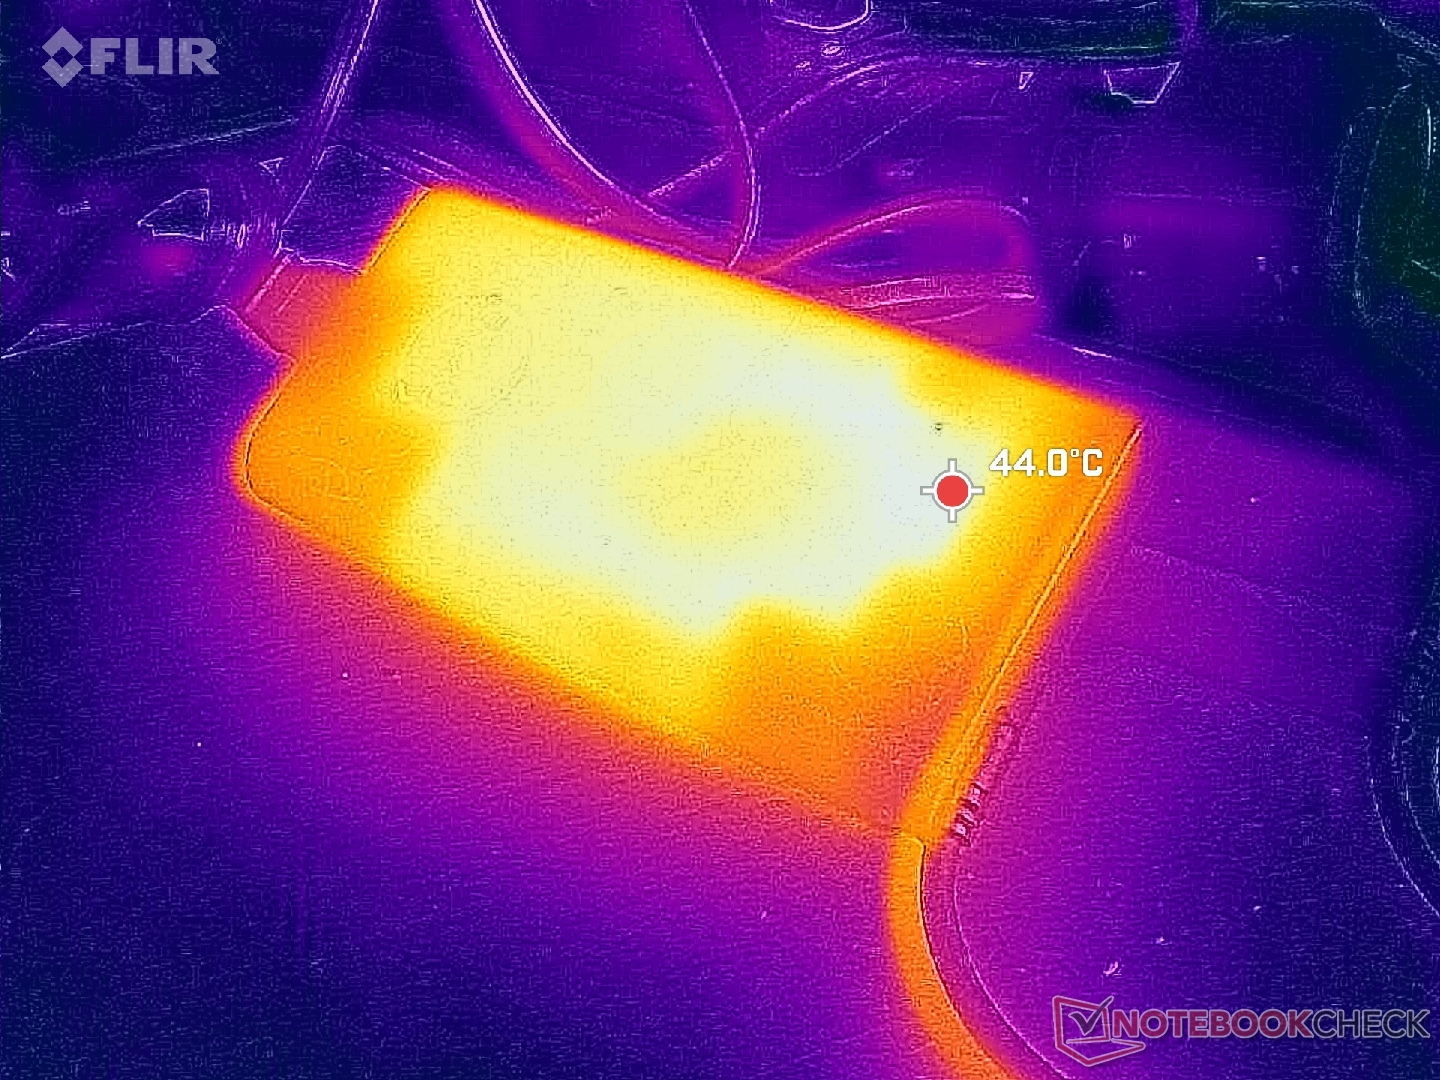
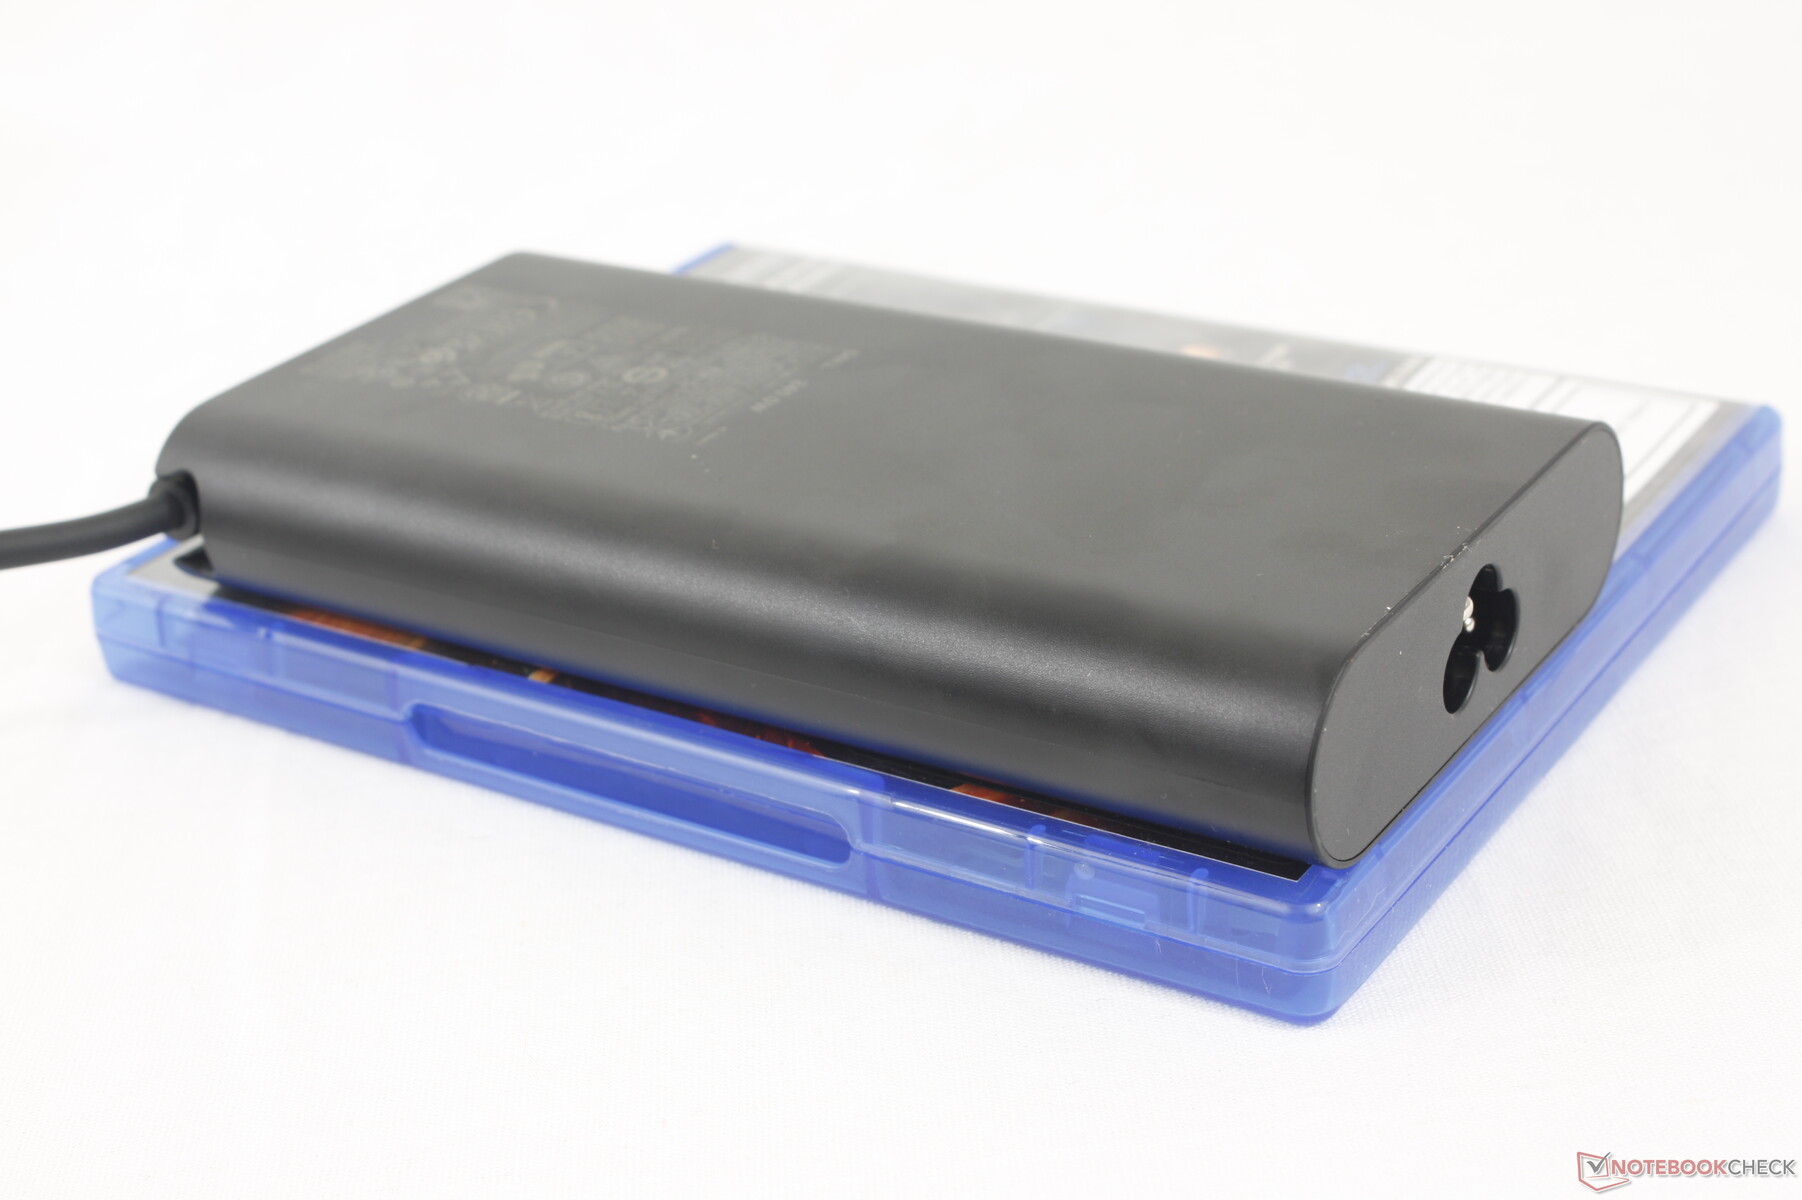
De m16 R2 kan zo worden geconfigureerd dat deze wordt geleverd met een kleine (~15,2 x 7,7 x 2,3 cm) 240 W GaN wisselstroomadapter, terwijl de m16 R1 wordt geleverd met een grotere (~20 x 10 x 4,5 cm) 330 W adapter die geschikt is voor de RTX 4080 en 4090 configuraties. Sommige SKU's, zoals de onze, worden geleverd met een 280 W wisselstroomadapter.

| Uit / Standby | |
| Inactief | |
| Belasting |
|
Key:
min: | |
| Alienware m16 R2 Ultra 7 155H, GeForce RTX 4070 Laptop GPU, Samsung PM9A1 MZVL21T0HCLR, IPS, 2560x1600, 16" | Alienware m16 R1 Intel i7-13700HX, GeForce RTX 4060 Laptop GPU, Kioxia KXG70ZNV512G, IPS, 2560x1600, 16" | Alienware x16 R1 i9-13900HK, GeForce RTX 4080 Laptop GPU, SK hynix PC801 HFS001TEJ9X101N, IPS, 2560x1600, 16" | HP Omen Transcend 16-u1095ng i9-14900HX, GeForce RTX 4070 Laptop GPU, Kioxia XG8 KXG80ZNV1T02, OLED, 2560x1600, 16" | Asus ROG Zephyrus G16 2024 GU605M Ultra 7 155H, GeForce RTX 4070 Laptop GPU, WD PC SN560 SDDPNQE-1T00, OLED, 2560x1600, 16" | Lenovo Legion Slim 7 16APH8 R7 7840HS, GeForce RTX 4060 Laptop GPU, WDC PC SN810 1TB, IPS, 2560x1600, 16" | |
|---|---|---|---|---|---|---|
| Power Consumption | -10% | -77% | -13% | 24% | -67% | |
| Idle Minimum * (Watt) | 8.1 | 10 -23% | 25.2 -211% | 10 -23% | 8.3 -2% | 33 -307% |
| Idle Average * (Watt) | 13 | 14 -8% | 29.9 -130% | 18 -38% | 12.5 4% | 35 -169% |
| Idle Maximum * (Watt) | 40.3 | 21 48% | 49.8 -24% | 32 21% | 12.8 68% | 45 -12% |
| Load Average * (Watt) | 79 | 119 -51% | 105.4 -33% | 128 -62% | 71.3 10% | 59 25% |
| Witcher 3 ultra * (Watt) | 188.1 | 186.7 1% | 263 -40% | 148.4 21% | 127.5 32% | 131 30% |
| Load Maximum * (Watt) | 254.9 | 323 -27% | 313.8 -23% | 242 5% | 169.1 34% | 177 31% |
* ... kleiner is beter
Power Consumption Witcher 3 / Stresstest
Power Consumption external Monitor
Levensduur batterij
De batterijcapaciteit is dit jaar zelfs iets groter, namelijk 90 Wh, ondanks het kleinere chassisontwerp. Het lijkt er ook op dat Dell de problemen met de batterijlevensduur heeft opgelost die we op veel oudere Alienware-laptops hebben ervaren; surfen op het web in de Balanced- en Optimus-modus duurde maar liefst 8 uur, vergeleken met bijna de helft daarvan op de Alienware m16 R1. Het systeem gaat zelfs langer mee dan de nieuwste Asus ROG Zephyrus G16 GU605M met bijna een uur.
Opladen van leeg naar volledig vermogen duurt ongeveer 90 minuten. Als alternatief duurt het opladen tot 85% iets minder dan 40 minuten. Het model kan ook worden opgeladen via generieke USB-C adapters, zij het veel langzamer.
| Alienware m16 R2 Ultra 7 155H, GeForce RTX 4070 Laptop GPU, 90 Wh | Alienware m16 R1 Intel i7-13700HX, GeForce RTX 4060 Laptop GPU, 86 Wh | Alienware x16 R1 i9-13900HK, GeForce RTX 4080 Laptop GPU, 90 Wh | HP Omen Transcend 16-u1095ng i9-14900HX, GeForce RTX 4070 Laptop GPU, 97 Wh | Asus ROG Zephyrus G16 2024 GU605M Ultra 7 155H, GeForce RTX 4070 Laptop GPU, 90 Wh | Lenovo Legion Slim 7 16APH8 R7 7840HS, GeForce RTX 4060 Laptop GPU, 99.9 Wh | |
|---|---|---|---|---|---|---|
| Batterijduur | -30% | -47% | -40% | 5% | -12% | |
| Reader / Idle (h) | 12.6 | 6.4 -49% | 7.3 -42% | |||
| WiFi v1.3 (h) | 8.1 | 4.8 -41% | 2.5 -69% | 4.9 -40% | 7.3 -10% | 7.1 -12% |
| Load (h) | 1 | 1 0% | 0.7 -30% | 1.2 20% | ||
| H.264 (h) | 5.6 | 11.2 |
Pro
Contra
Verdict - Een nieuw evenwicht vinden tussen gamen en hybride werk
De Alienware m16 R2 is gemaakt met één duidelijk doel voor ogen: kleiner zijn dan de Alienware m16 R1 zelfs als dat ten koste gaat van de prestaties. Het model is zeker veel draagbaarder dan voorheen, maar gebruikers verliezen hierdoor wel de GeForce RTX 4080/4090 grafische weergave, Core HX CPU's en mechanische toetsen. Dell hoopt dat de slankere m16 R2, door het verwijderen van deze functies voor enthousiaste gebruikers ten gunste van een kleiner ontwerp, een groter publiek van hybride werknemers, studenten en mainstream gamers kan aantrekken die de meer "hardcore" en minder reisvriendelijke m16 R1 of x16 R1 hebben overgeslagen x16 R1.
Het eindresultaat is een systeem dat alle fronten uitstekend in balans houdt, van prestaties tot levensduur van de batterij en draagbaarheid, terwijl de m16 R1 zich bijna volledig richtte op prestaties ten koste van gewicht en looptijden. Zelfs de geluidsniveaus en het gedrag van de ventilator zijn verbeterd zodat ze beter passen in klaslokalen of kantoren waar de extra paardenkracht niet nodig is. Dit is absoluut de meest veelzijdige Alienware-laptop die we getest hebben dankzij alle hardware- en softwareveranderingen.
Als u genoegen neemt met GeForce RTX 4060 of 4070 graphics, dan is de Alienware m16 R2 met gemak de beste alleskunner uit de serie. Als u meer vermogen nodig hebt en draagbaarheid wilt behouden, dan is de duurdere Blade 16 nog steeds de beste keuze.
Hoewel de m16 R2 indrukwekkend en vaak verrassend is, heeft hij nog steeds te maken met zware concurrentie in de 16-inch categorie. De Razer Blade 16is bijvoorbeeld nog steeds lichter, kleiner en sneller dan de m16 R2 en heeft diepere DCI-P3-kleuren. De Asus ROG Zephyrus G16 is ook lichter en heeft meer schermopties, maar de GPU-prestaties blijven iets achter. In dit scenario heeft Dell de Alienware m16 R2 goedkoper geprijsd dan zowel de Razer als de Asus systemen.
Prijs en beschikbaarheid
Dell levert de Alienware m16 R2 nu vanaf $1650 voor de RTX 4060 of tot $1850+ voor de RTX 4070-configuratie. De instapconfiguratie RTX 4050 is ook verkrijgbaar voor $1500.
Alienware m16 R2
- 24-02-2024 v7 (old)
Allen Ngo
Transparantie
De selectie van te beoordelen apparaten wordt gemaakt door onze redactie. Het testexemplaar werd ten behoeve van deze beoordeling door de fabrikant of detailhandelaar in bruikleen aan de auteur verstrekt. De kredietverstrekker had geen invloed op deze recensie, noch ontving de fabrikant vóór publicatie een exemplaar van deze recensie. Er bestond geen verplichting om deze recensie te publiceren. Als onafhankelijk mediabedrijf is Notebookcheck niet onderworpen aan het gezag van fabrikanten, detailhandelaren of uitgevers.
[transparency_disclaimer]Dit is hoe Notebookcheck test
Elk jaar beoordeelt Notebookcheck onafhankelijk honderden laptops en smartphones met behulp van gestandaardiseerde procedures om ervoor te zorgen dat alle resultaten vergelijkbaar zijn. We hebben onze testmethoden al zo'n 20 jaar voortdurend ontwikkeld en daarbij de industriestandaard bepaald. In onze testlaboratoria wordt gebruik gemaakt van hoogwaardige meetapparatuur door ervaren technici en redacteuren. Deze tests omvatten een validatieproces in meerdere fasen. Ons complexe beoordelingssysteem is gebaseerd op honderden goed onderbouwde metingen en benchmarks, waardoor de objectiviteit behouden blijft. Meer informatie over onze testmethoden kunt u hier vinden.
Price comparison

