Verdict - Prestaties van een 18-inch gaminglaptop in een 16-inch schermformaat
De Raider 16 Max HX mag dan kleiner zijn dan de enorme Raider 18 of Titan 18maar hij geeft nog steeds voorrang aan prestaties. De Arrow Lake-HX CPU en 175 W GPU behoren tot de snelste opties die beschikbaar zijn, ongeacht de grootte van de laptop, waardoor de Raider 16 Max HX een van de snelste oplossingen voor gaming op de markt is. Het glanzende OLED-scherm is net zo indrukwekkend als u de onvermijdelijke schittering kunt beperken, terwijl het subpaneel een praktische functie is die we graag op alle MSI gaming laptops zouden willen zien.
Aan de extreme prestaties zijn kosten verbonden. Het meest opvallend is dat de Raider 16 Max HX logger en zwaarder is dan veel andere 16-inch gaming laptops, waaronder de al grote Alienware 16X Aurora. Het plastic chassis voelt niet zo luxueus aan als de Alienware 16 Area-51 ondanks dat ze ongeveer hetzelfde kosten, terwijl het ontbreken van G-Sync en Advanced Optimus moeilijk te vergeven is in deze prijsklasse. Gebruikers die graag reizen en onderweg gamen, vinden misschien meer heil in lichtere en draagbare 16-inch oplossingen zoals de MSI Stealth 16 of Razer Blade 16 die worden geleverd met vergelijkbare RTX 5090 grafische kaarten en iets langzamere prestatieniveaus hebben.
Pro
Contra
Prijs en beschikbaarheid
De MSI Raider 16 Max HX wordt nu geleverd op Amazon voor maximaal 4300 USD indien geconfigureerd met de GeForce RTX 5090 GPU.
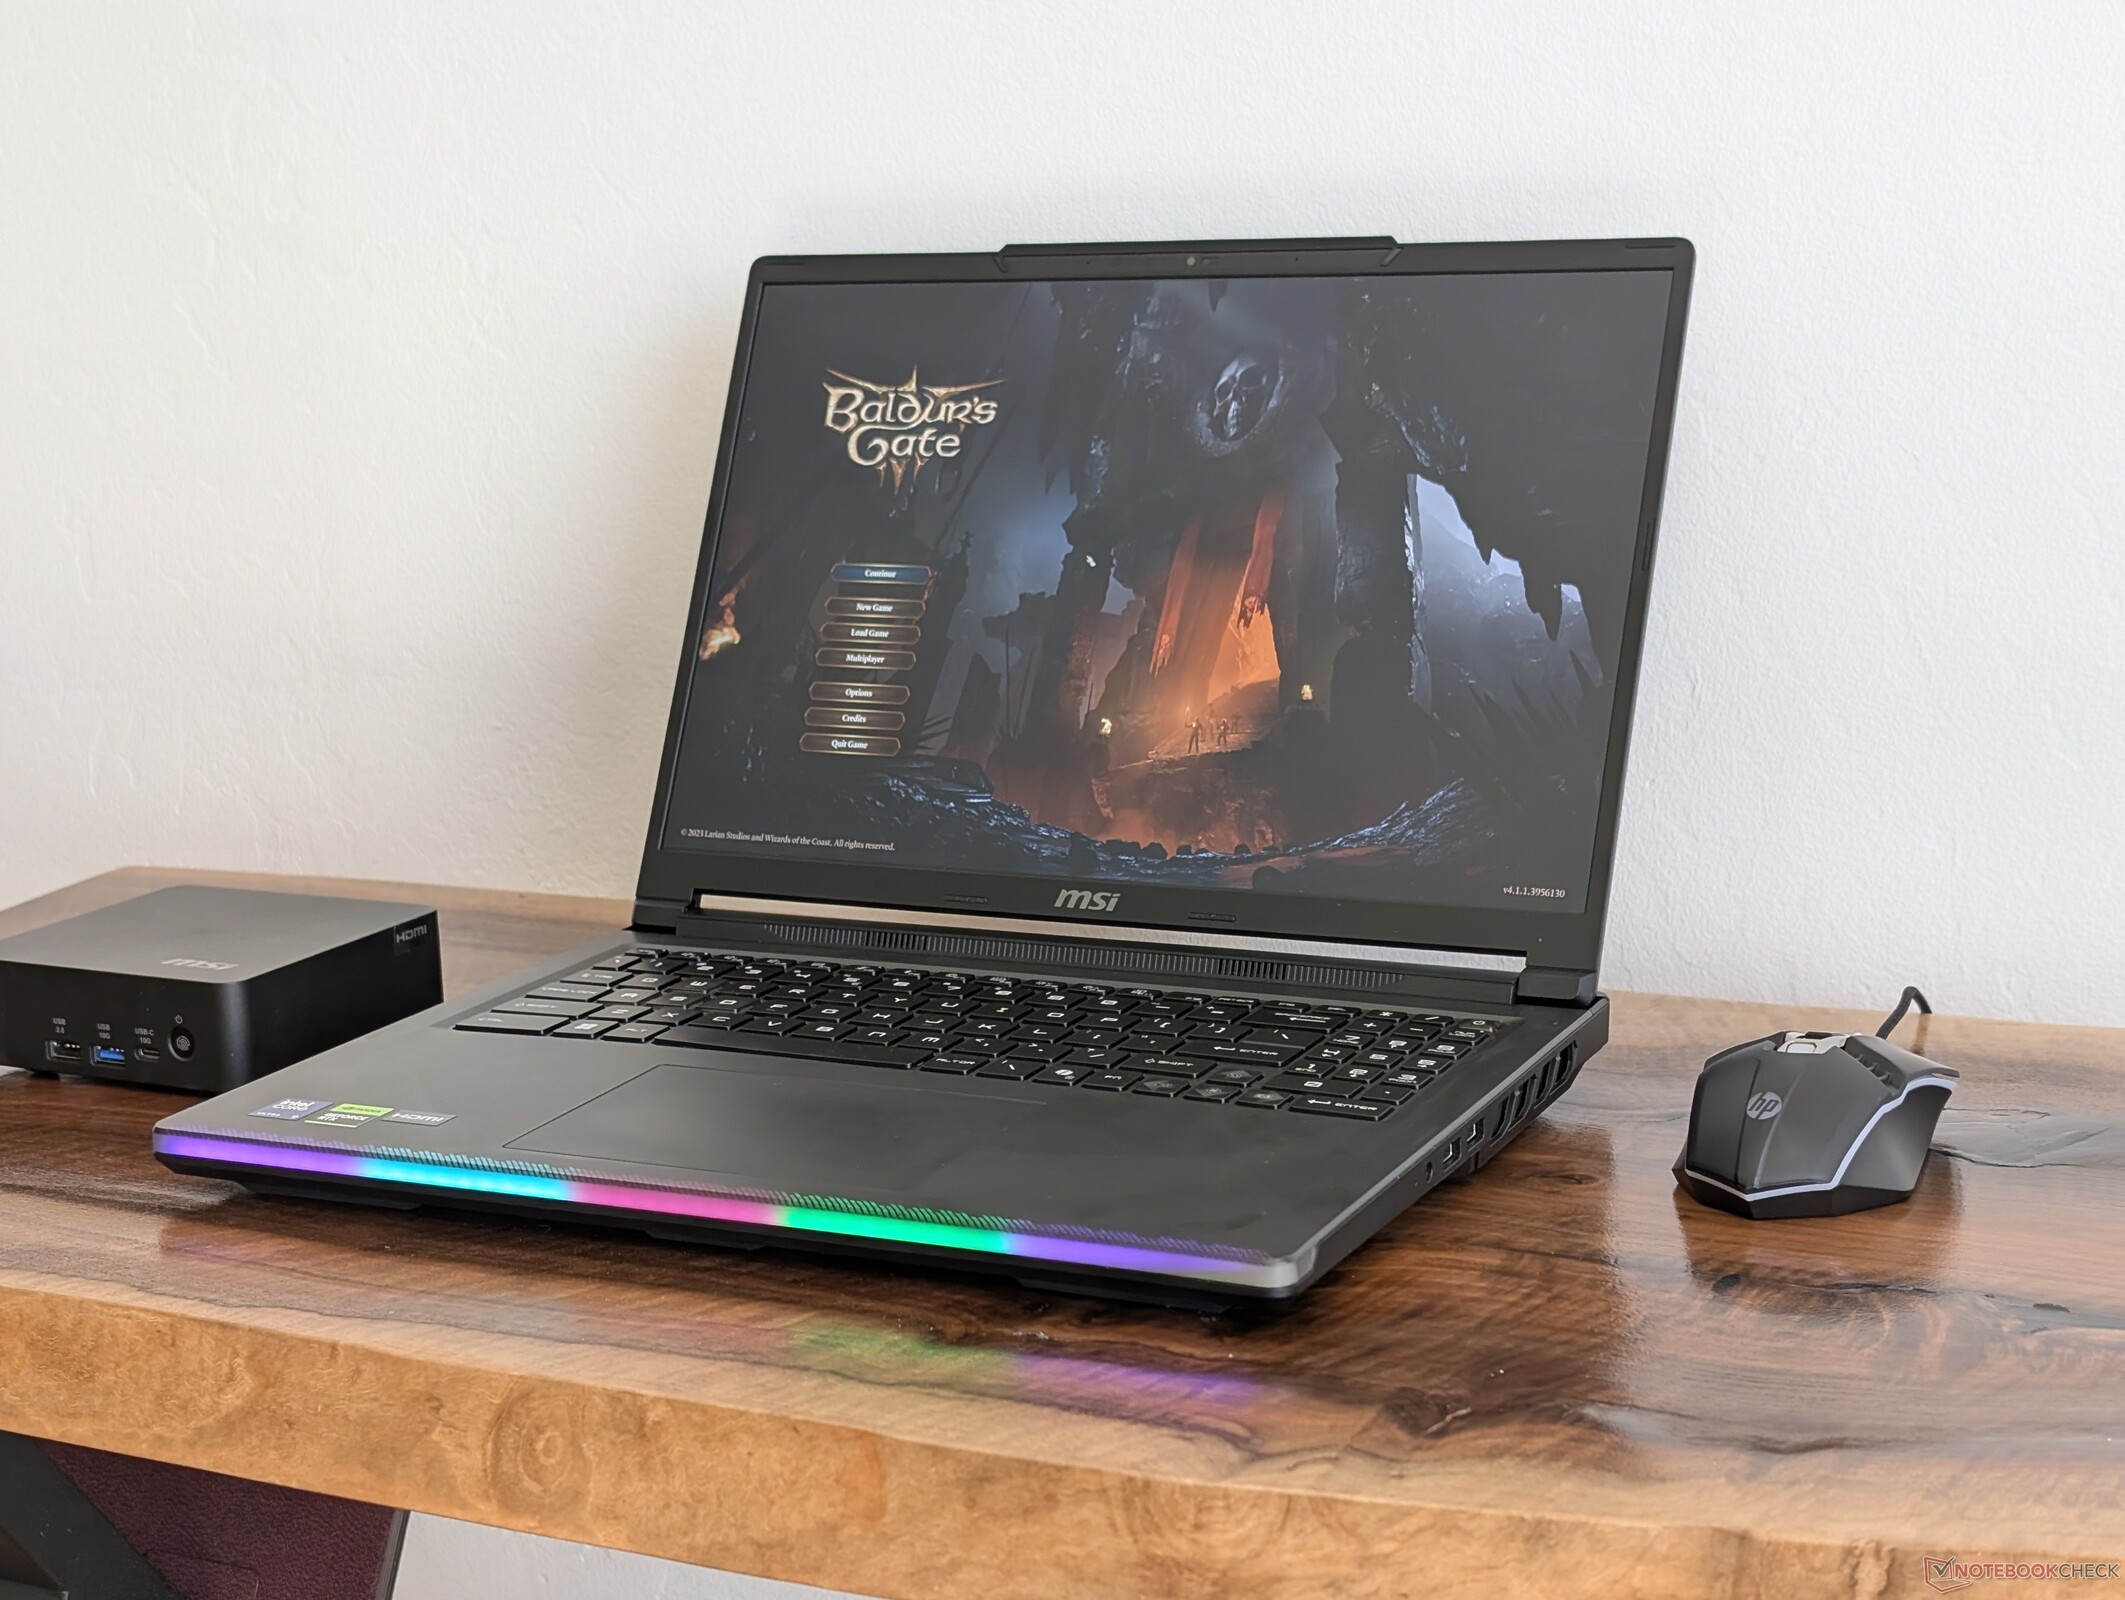
De MSI Raider 16 Max HX werd onthuld op CES 2026 als de eerste 16-inch laptop in de Raider-serie. Het is toevallig ook een van de eerste MSI gaming laptops met een OLED beeldscherm in plaats van de gebruikelijke IPS of Mini-LED. Net als bij de Raider 18-serie is de Raider 16 Max HX een van de snelste laptops die MSI te bieden heeft.
Onze testunit is de snelste configuratie met de Arrow Lake Core Ultra 9 290HX Plus CPU en 175 W GeForce RTX 5090 GPU voor ongeveer $4400 USD. Alle SKU's worden op dit moment geleverd met dezelfde CPU en QHD+ 240 Hz OLED glanzend beeldscherm, maar het is mogelijk dat u begint met de GeForce RTX 5070 Ti.
Concurrenten zijn andere high-end of vlaggenschip 16-inch gaming laptops zoals de Dell Alienware 16 Area-51, Asus Zephyrus Duoof Razer Blade 16.
Meer MSI beoordelingen:
Specificaties
Zaak
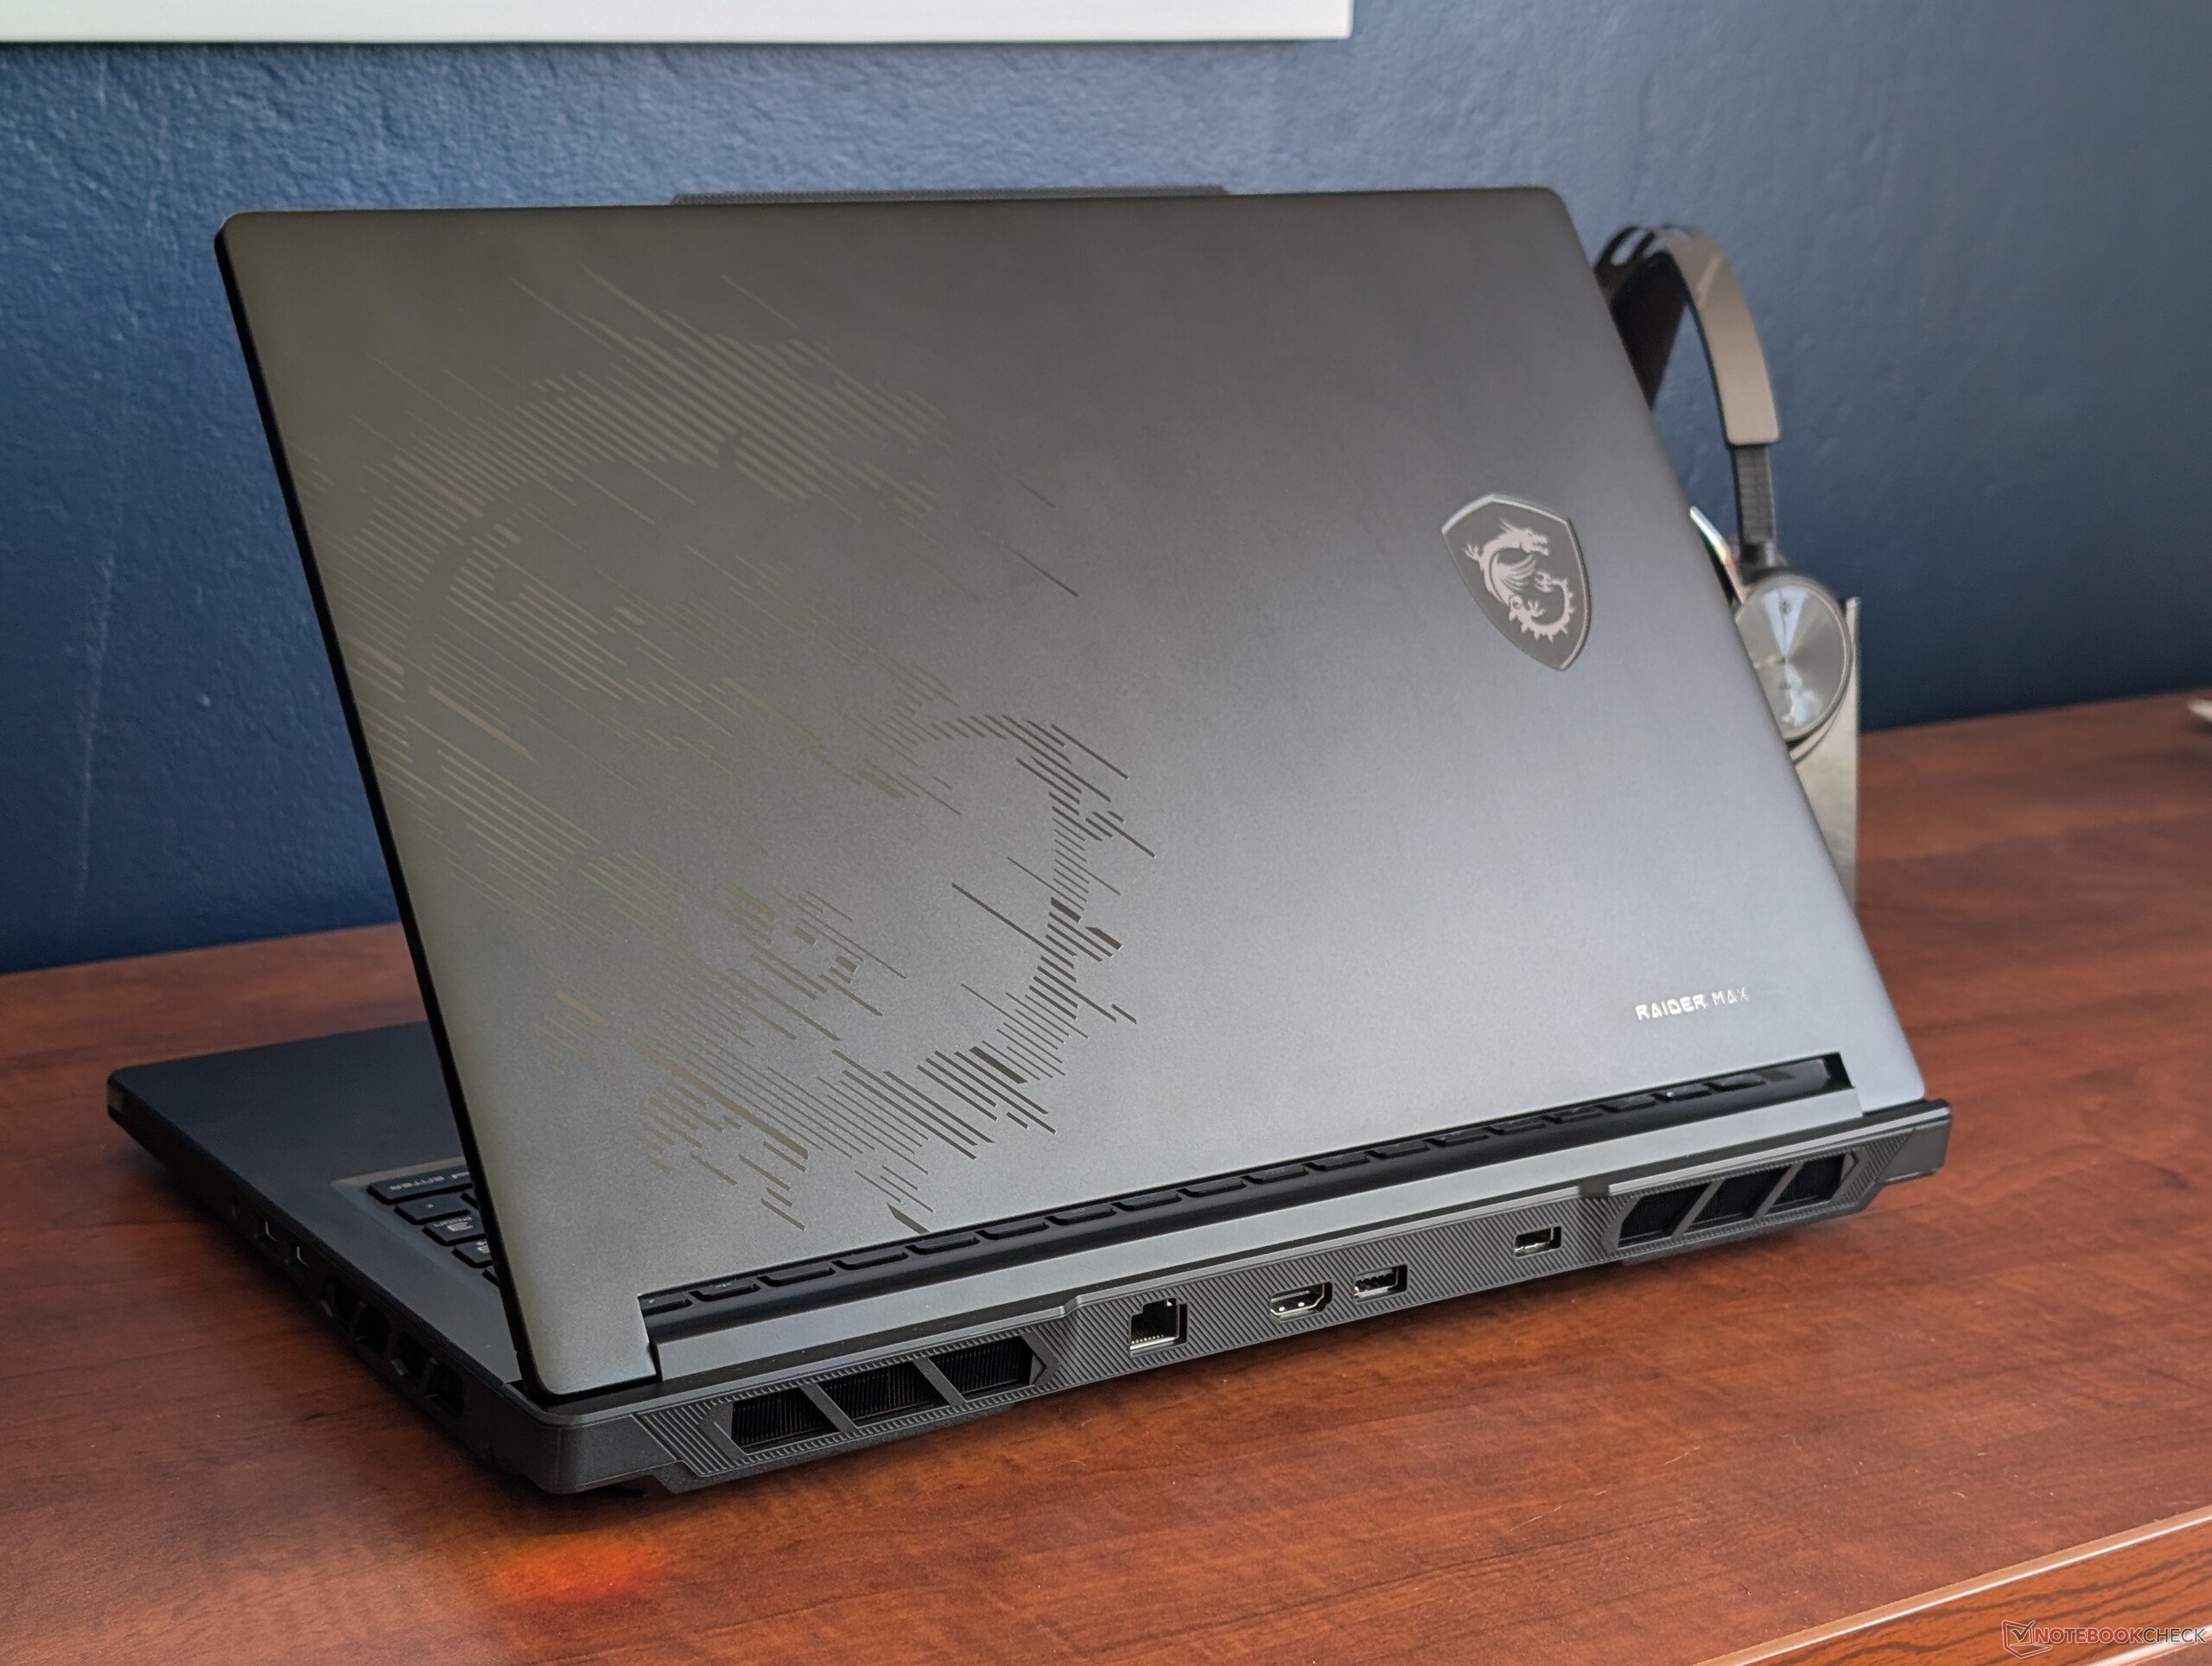
Het buitenste deksel is van glad, mat metaal, terwijl de basis grotendeels van plastic is. Hoewel het zeker niet verschrikkelijk is, buigen de oppervlakken en voelen ze niet zo stijf aan als concurrerende modellen zoals de Alienware 16 Area-51 of Razer Blade 16. Gezien de hoge vraagprijs hadden we een sterker of meer eersteklas chassisontwerp verwacht.
Connectiviteit
De poortopties zijn identiek aan die van de Raider 18 HX, zij het anders ingedeeld.


SD-kaartlezer
| SD Card Reader | |
| average JPG Copy Test (av. of 3 runs) | |
| MSI Raider 16 Max HX B2WJ (Toshiba Exceria Pro SDXC 64 GB UHS-II) | |
| Razer Blade 16 Core Ultra 9 386H (Toshiba Exceria Pro SDXC 64 GB UHS-II) | |
| Lenovo Legion 7 16IAX10 (Toshiba Exceria Pro SDXC 64 GB UHS-II) | |
| maximum AS SSD Seq Read Test (1GB) | |
| Lenovo Legion 7 16IAX10 (Toshiba Exceria Pro SDXC 64 GB UHS-II) | |
| Razer Blade 16 Core Ultra 9 386H (Toshiba Exceria Pro SDXC 64 GB UHS-II) | |
| MSI Raider 16 Max HX B2WJ (Toshiba Exceria Pro SDXC 64 GB UHS-II) | |
Communicatie
Webcam
2 MP webcam met IR en fysieke sluiter zijn standaard.


Onderhoud
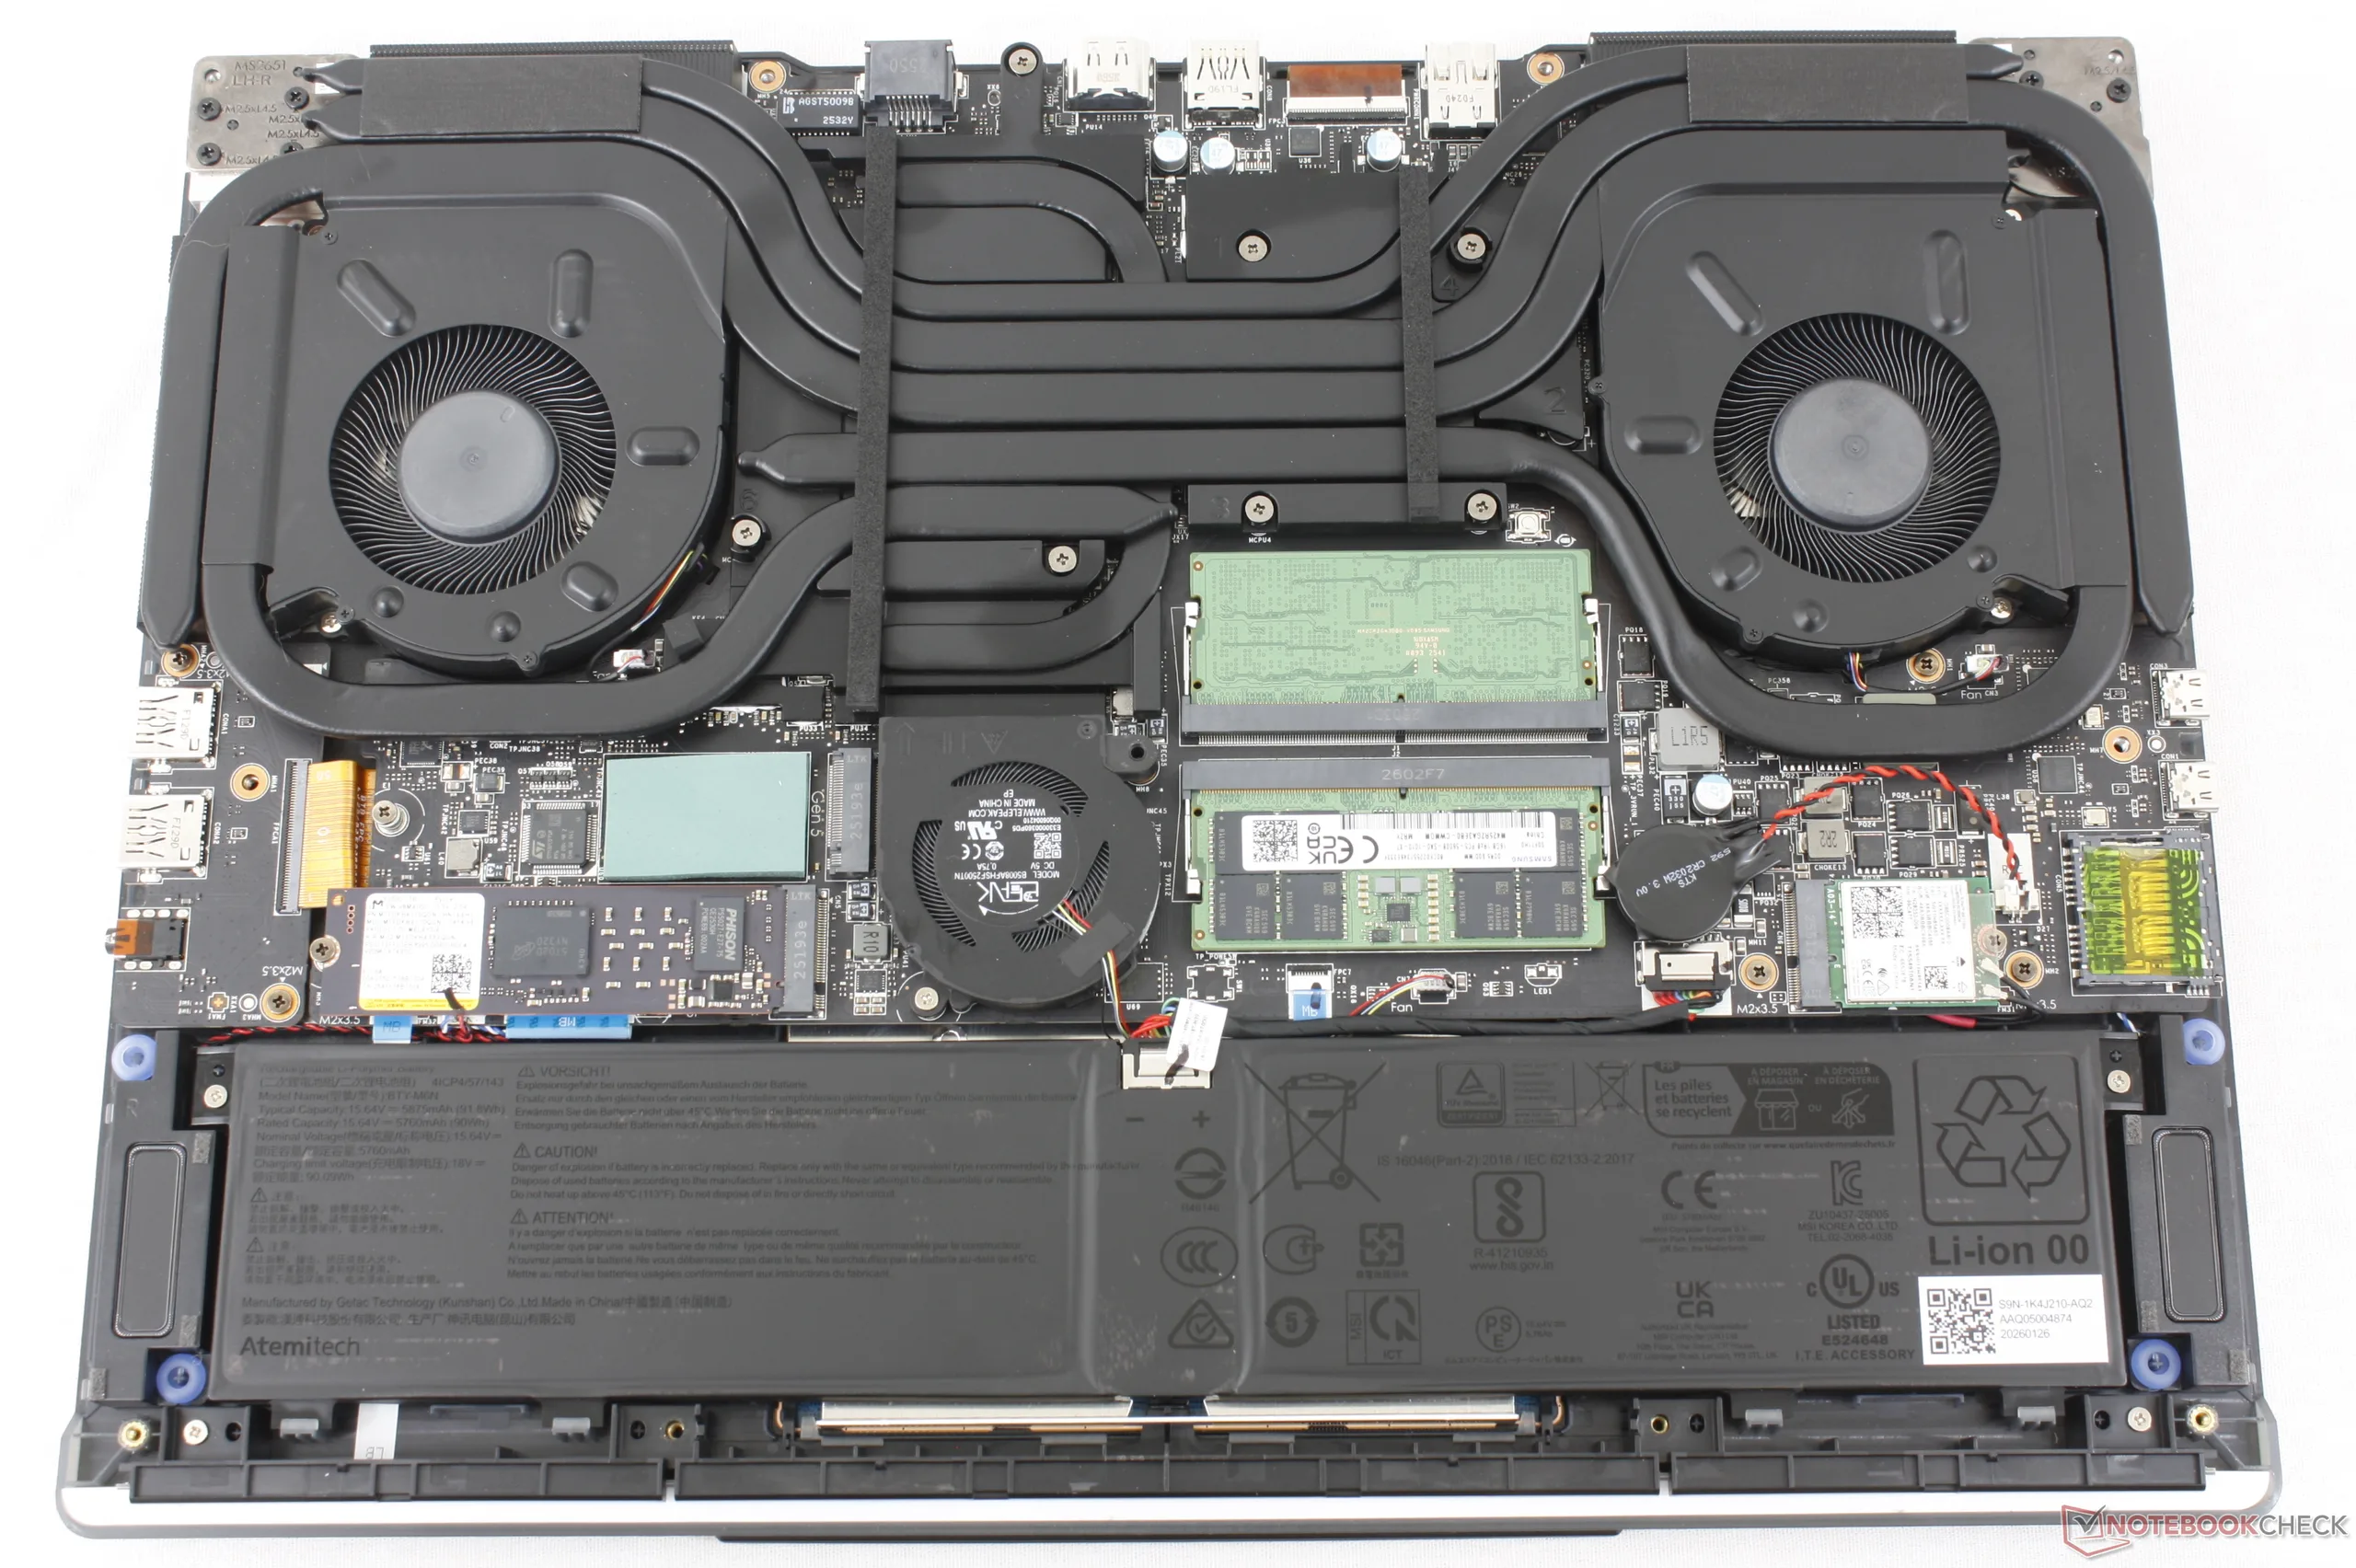
Het onderpaneel bevat een subpaneel voor gemakkelijkere toegang tot de twee M.2 2280 SSD-slots (één PCIe5 plus één PCIe4) en twee DDR5 SODIMM-slots. Voor de rest is het hele onderpaneel nog steeds relatief eenvoudig te verwijderen met een standaard kruiskopschroevendraaier.
Duurzaamheid
MSI maakt geen melding van gerecycled materiaal dat gebruikt is tijdens de productie van de Raider 16 Max HX. De verpakking is plastic-vrij.
Accessoires en garantie
Er zitten geen extra's in de doos behalve de AC-adapter en papierwerk. Bij aankoop in de VS geldt de gebruikelijke beperkte fabrieksgarantie van één jaar.
Invoerapparaten
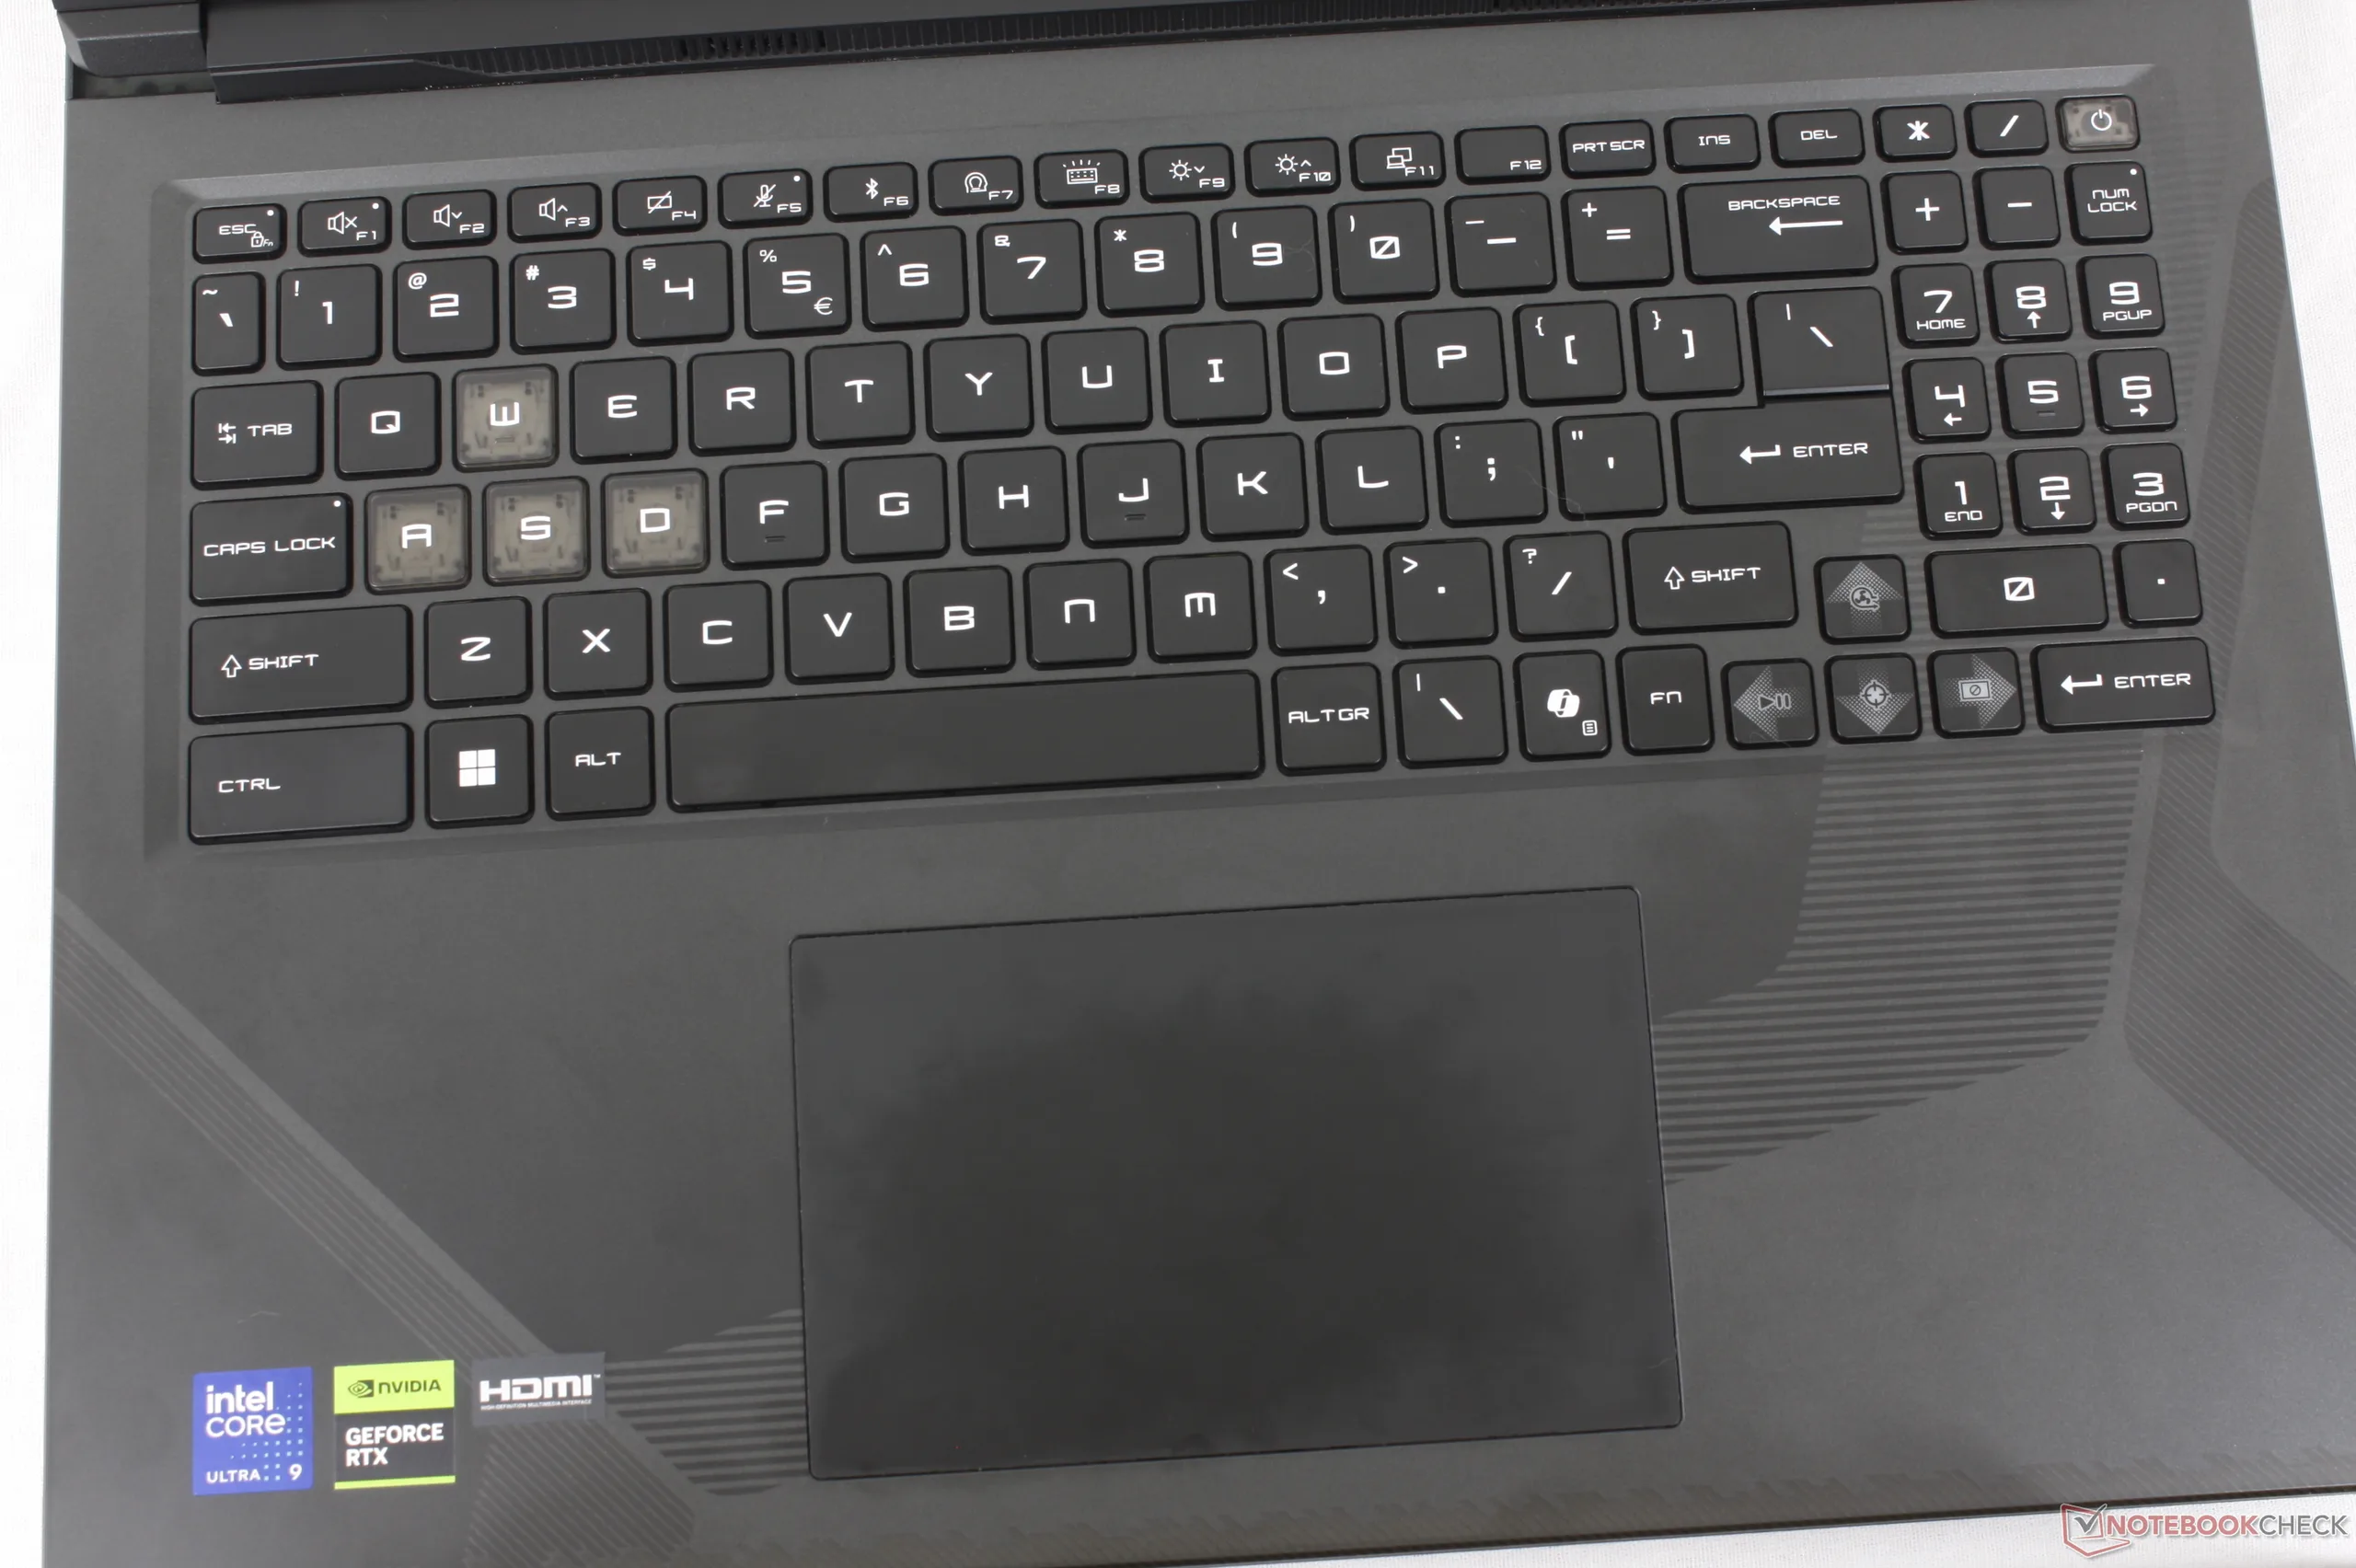
Het toetsenbord en clickpad van de Raider 16 Max HX zijn identiek aan die van de Crosshair 16 HX, ook al is de Crosshair 16 HX een gamingmodel van MSI in een lagere klasse. Op de Raider hebben de toetsen echter RGB-verlichting per toets voor meer aanpassingsmogelijkheden aan de gebruiker, terwijl de Crosshair meer beperkte RGB-zones heeft.
Weergave
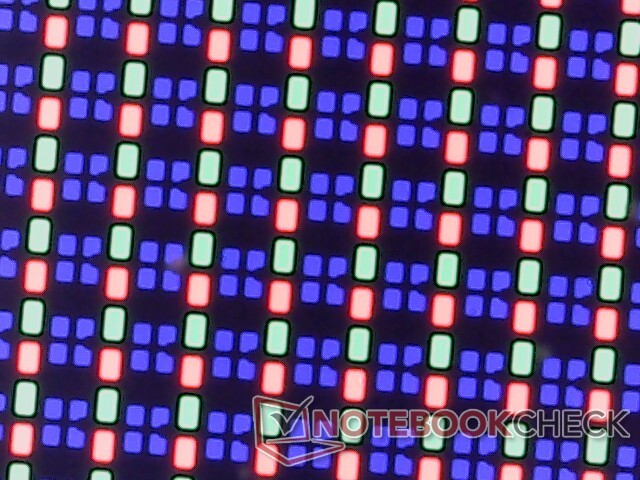
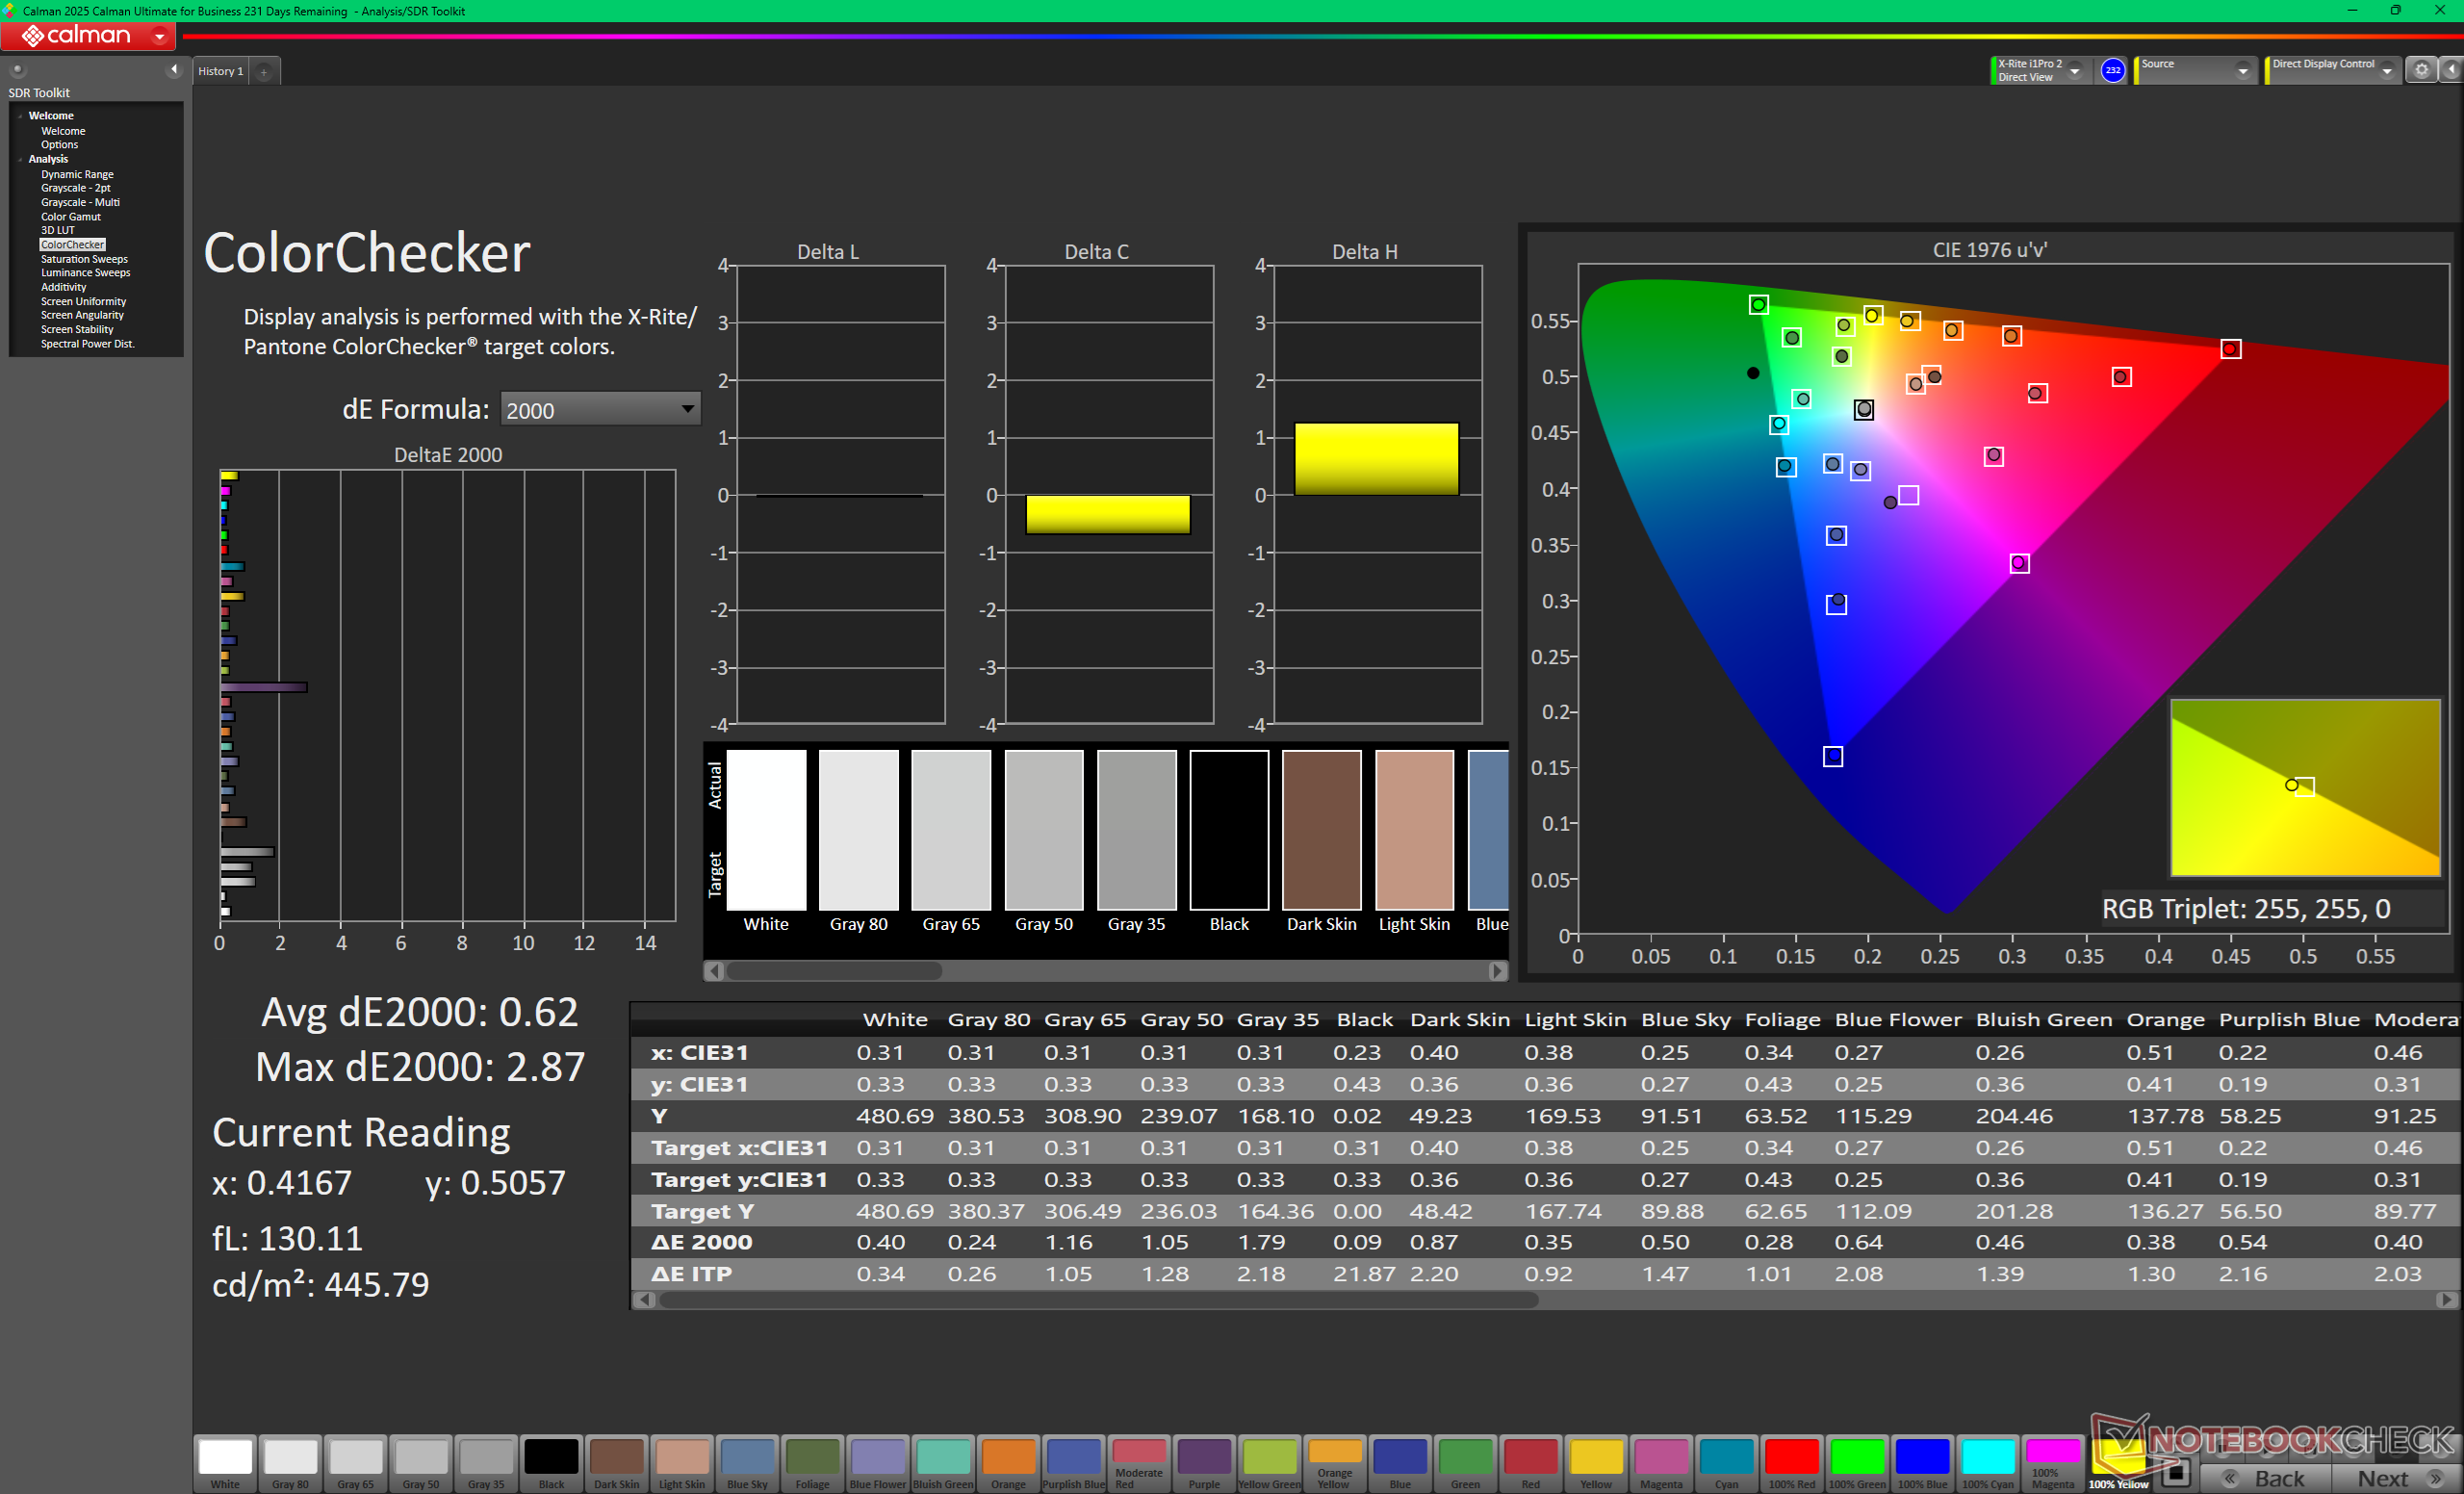
MSI begint steeds meer te kiezen voor OLED in plaats van IPS of Mini-LED voor veel van zijn gaming laptops. Voor de Raider 16 Max HX is het 240 Hz QHD+ OLED-paneel helder met perfecte zwartniveaus, nauwkeurige P3-kleuren, DisplayHDR1000-ondersteuning en geen "halo"-effect dat vaak wordt aangetroffen op concurrerende mini-LED-opties.
De twee meest opvallende nadelen aan het scherm zijn de zeer glanzende overlay en het ontbreken van G-Sync ondersteuning in tegenstelling tot de meeste oudere MSI gaming laptops waar matte panelen standaard waren. Wees voorbereid om te vechten tegen schittering tijdens het gamen in lichte omstandigheden binnenshuis.
| |||||||||||||||||||||||||
Helderheidsverdeling: 98 %
Helderheid in Batterij-modus: 478.6 cd/m²
Contrast: ∞:1 (Zwart: 0 cd/m²)
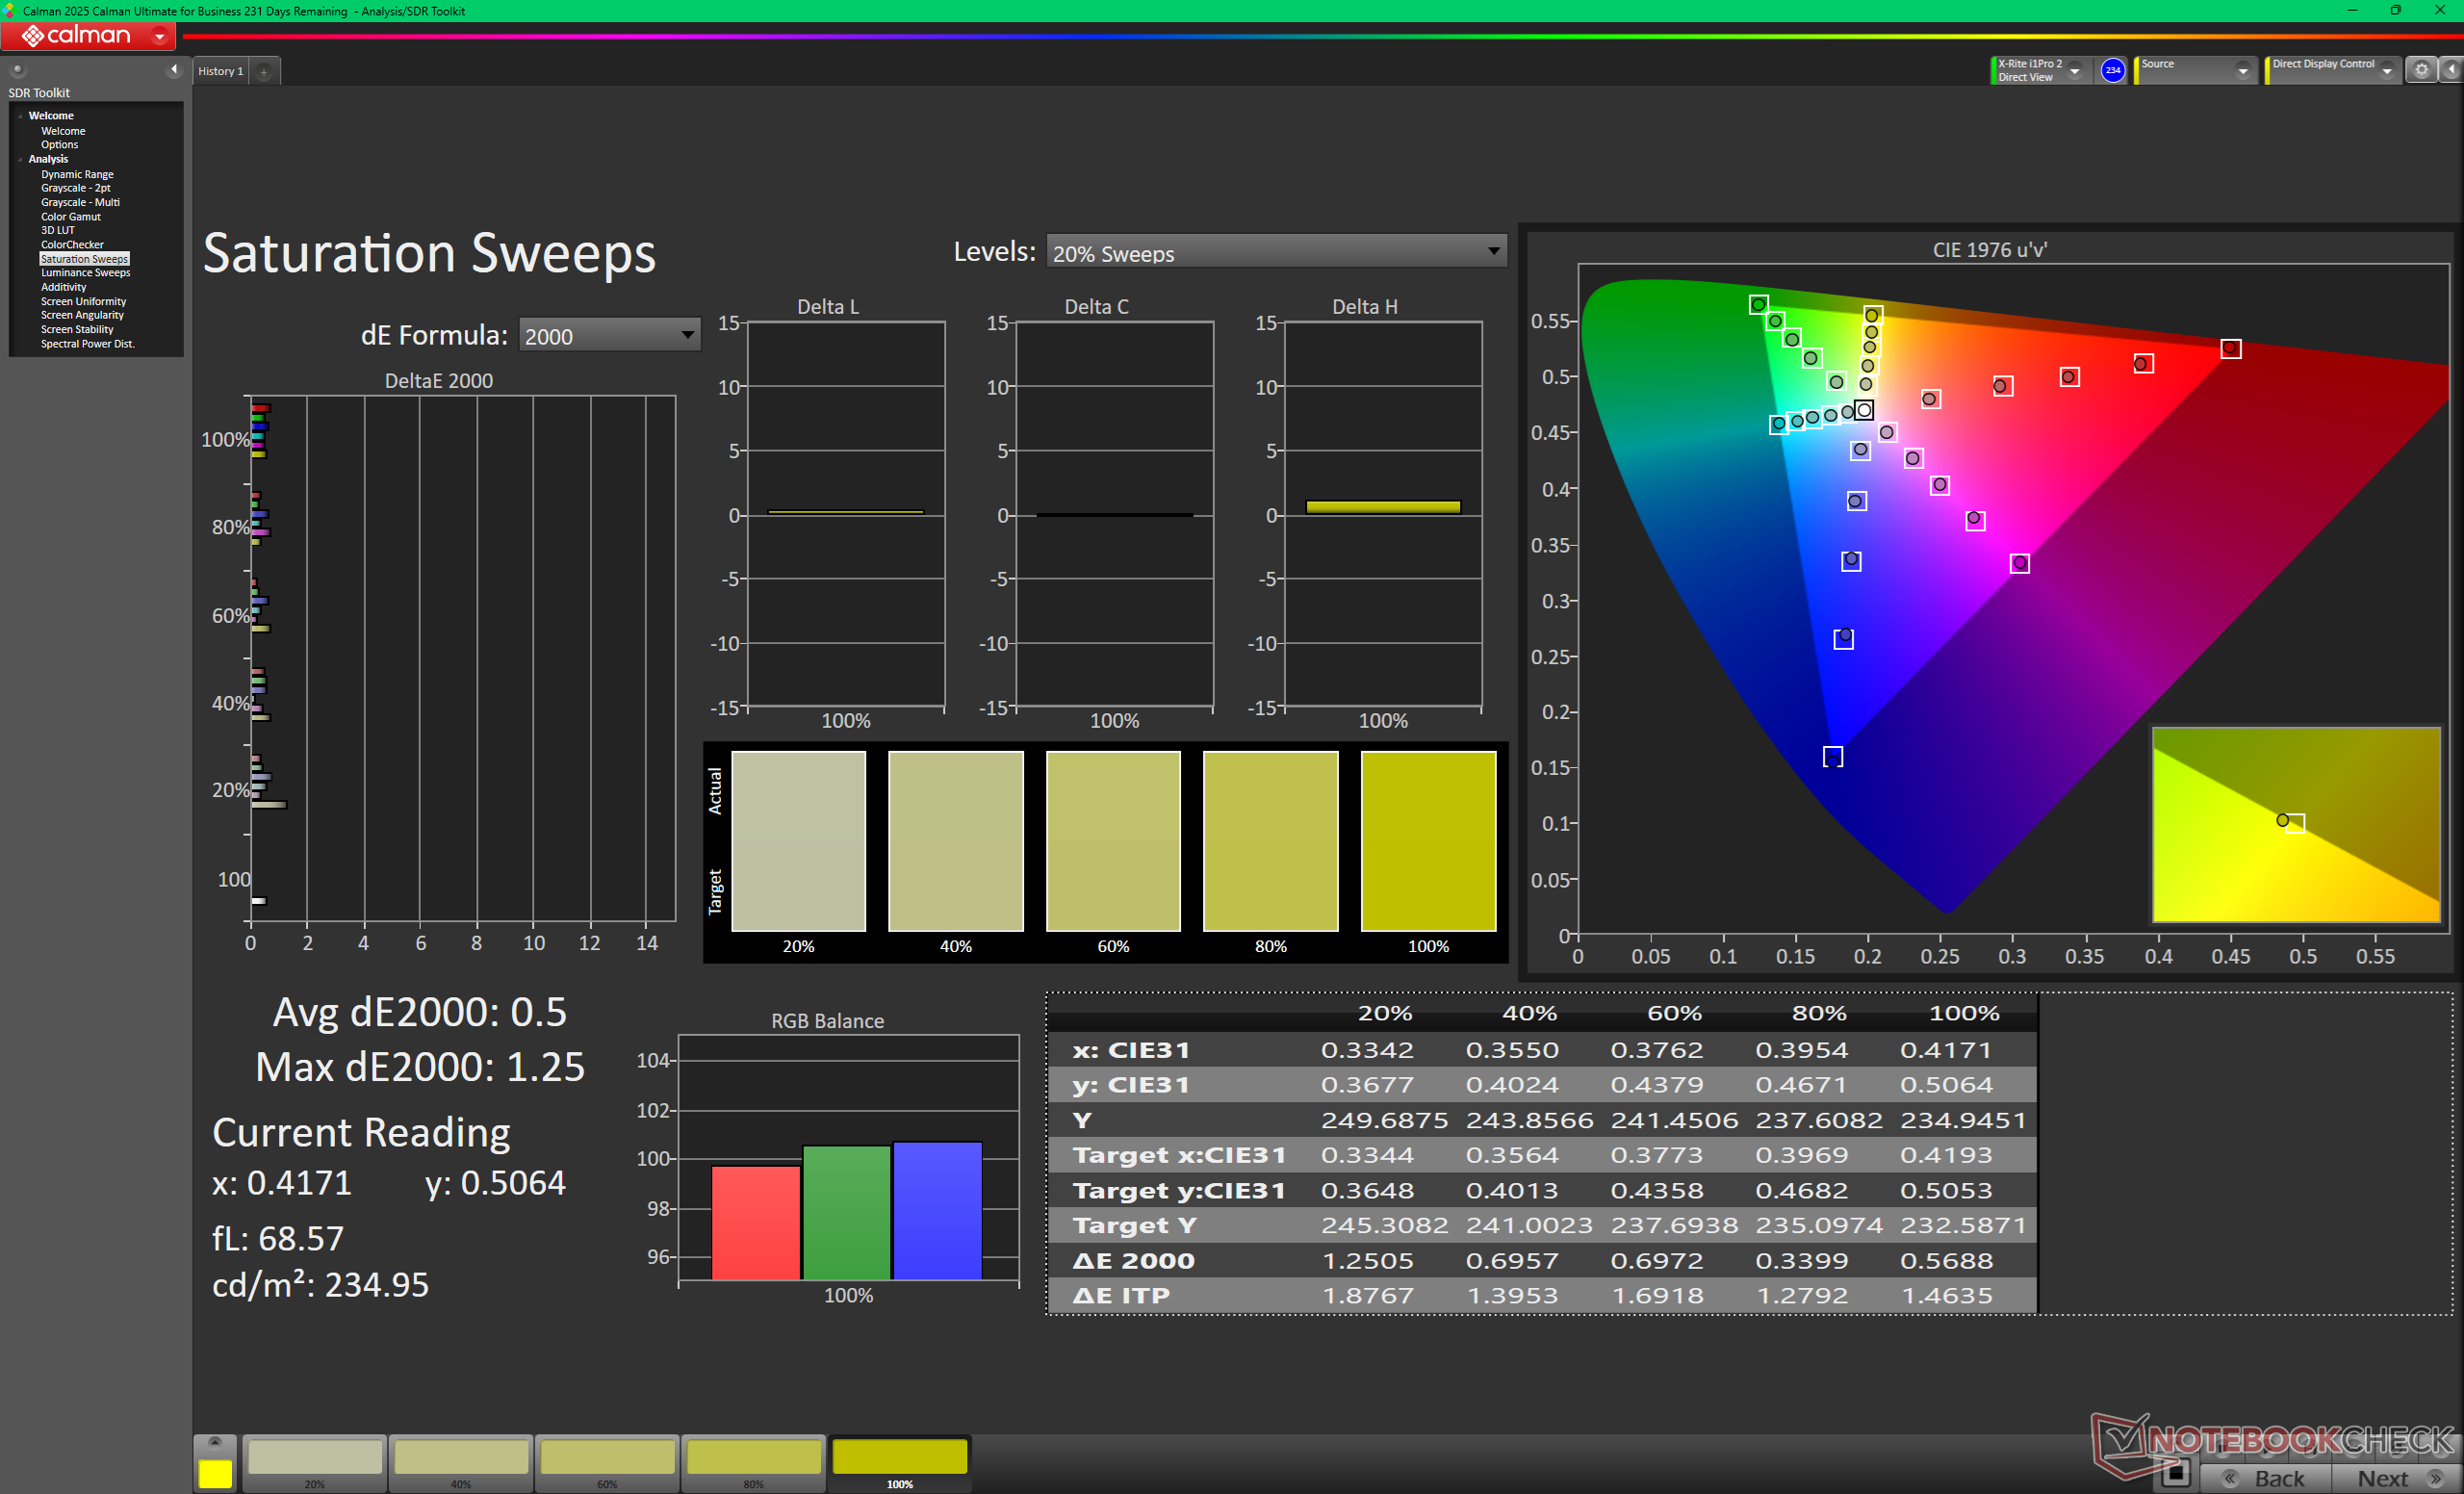
ΔE ColorChecker Calman: 0.62 | ∀{0.5-29.43 Ø4.71}
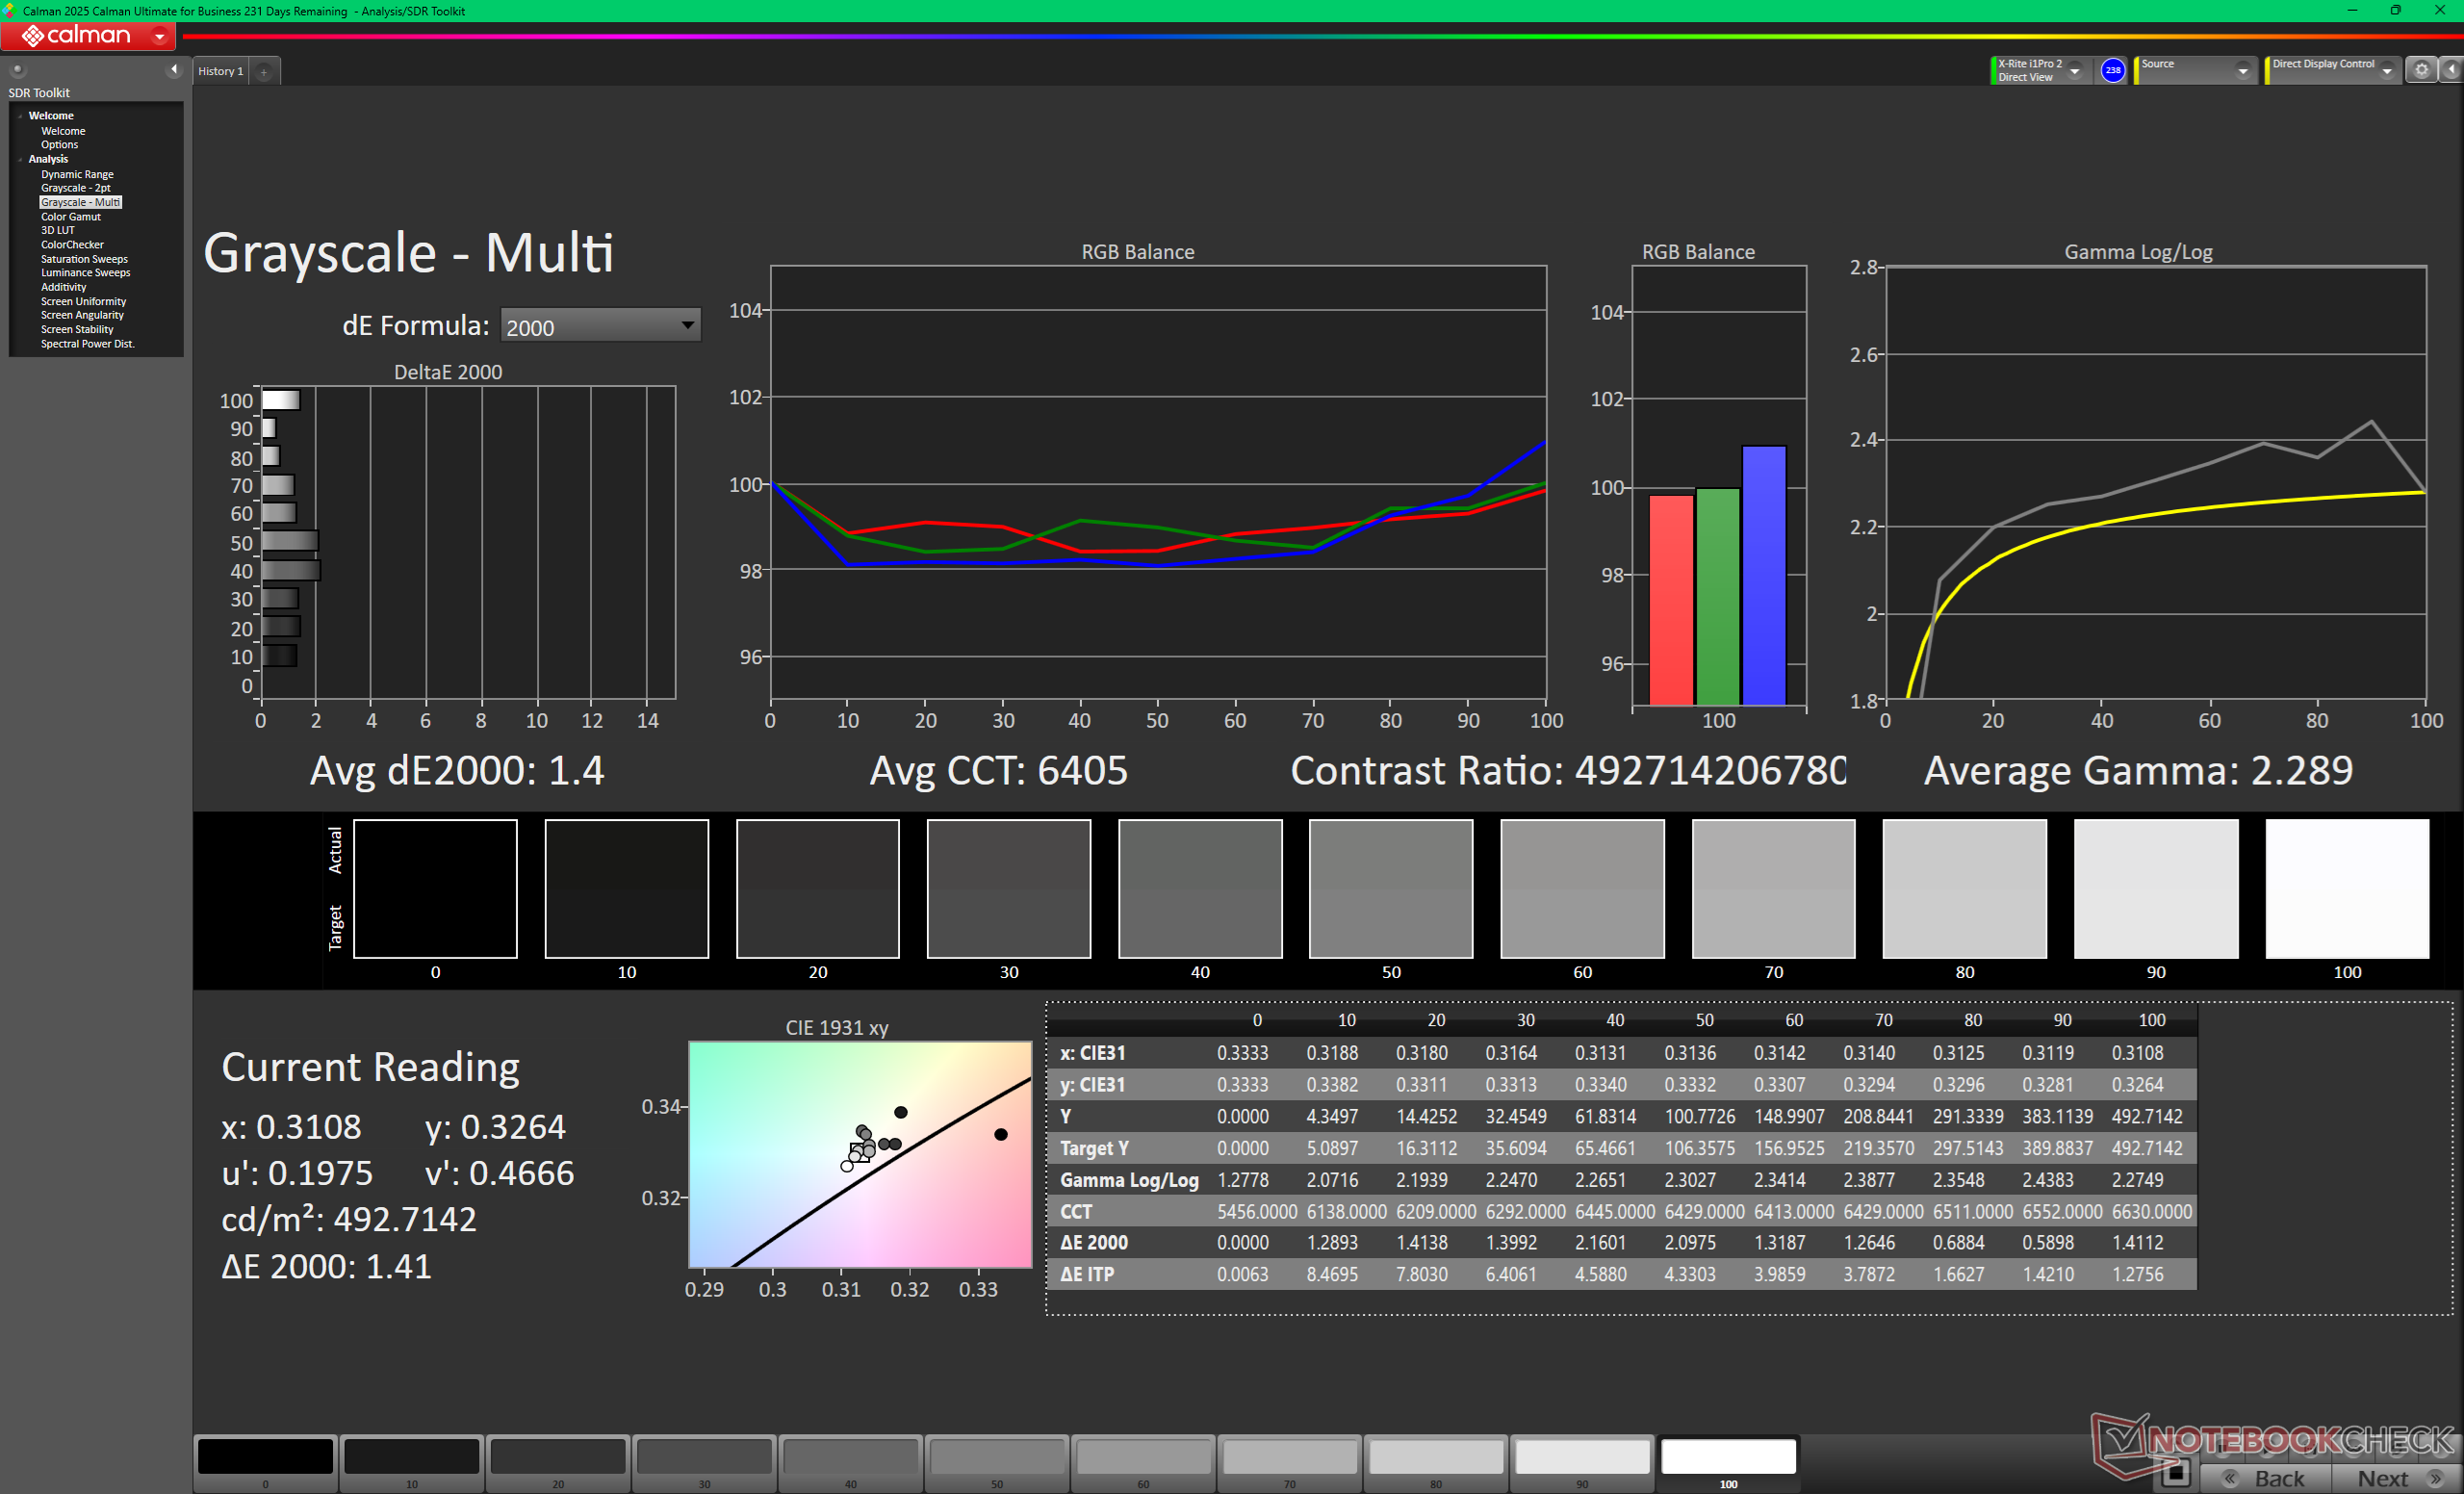
ΔE Greyscale Calman: 0.7 | ∀{0.09-98 Ø4.96}
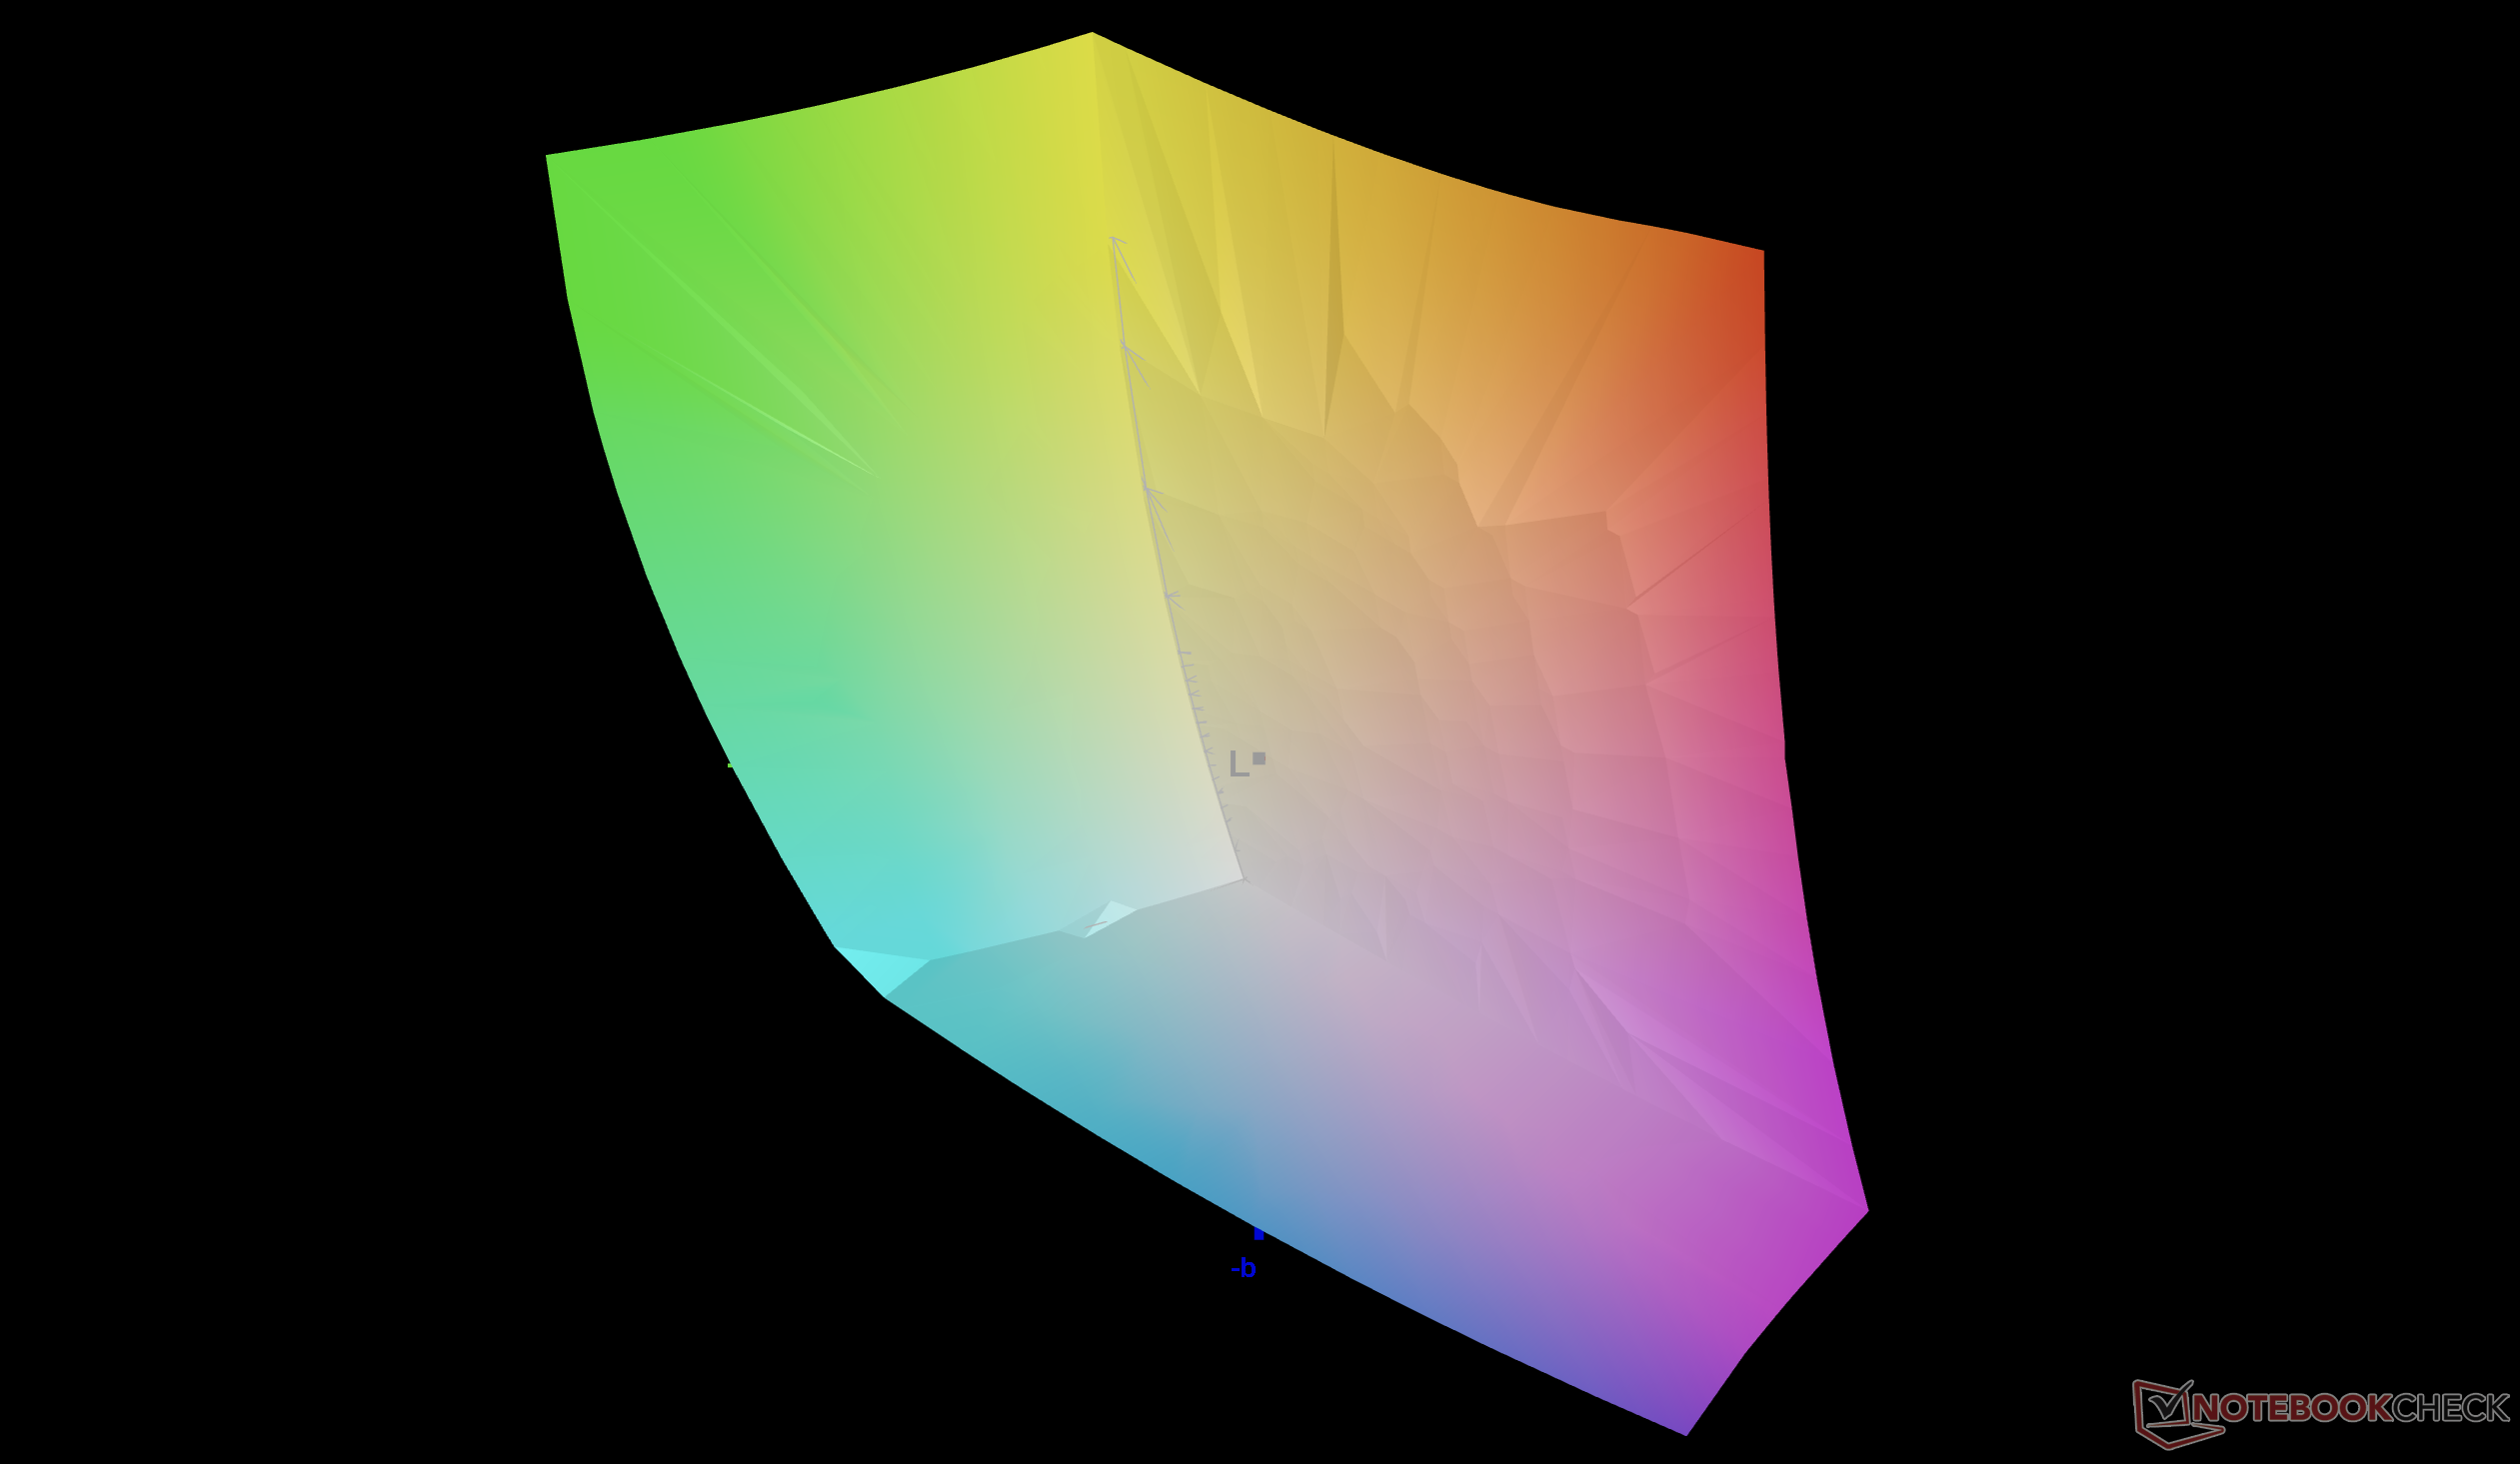
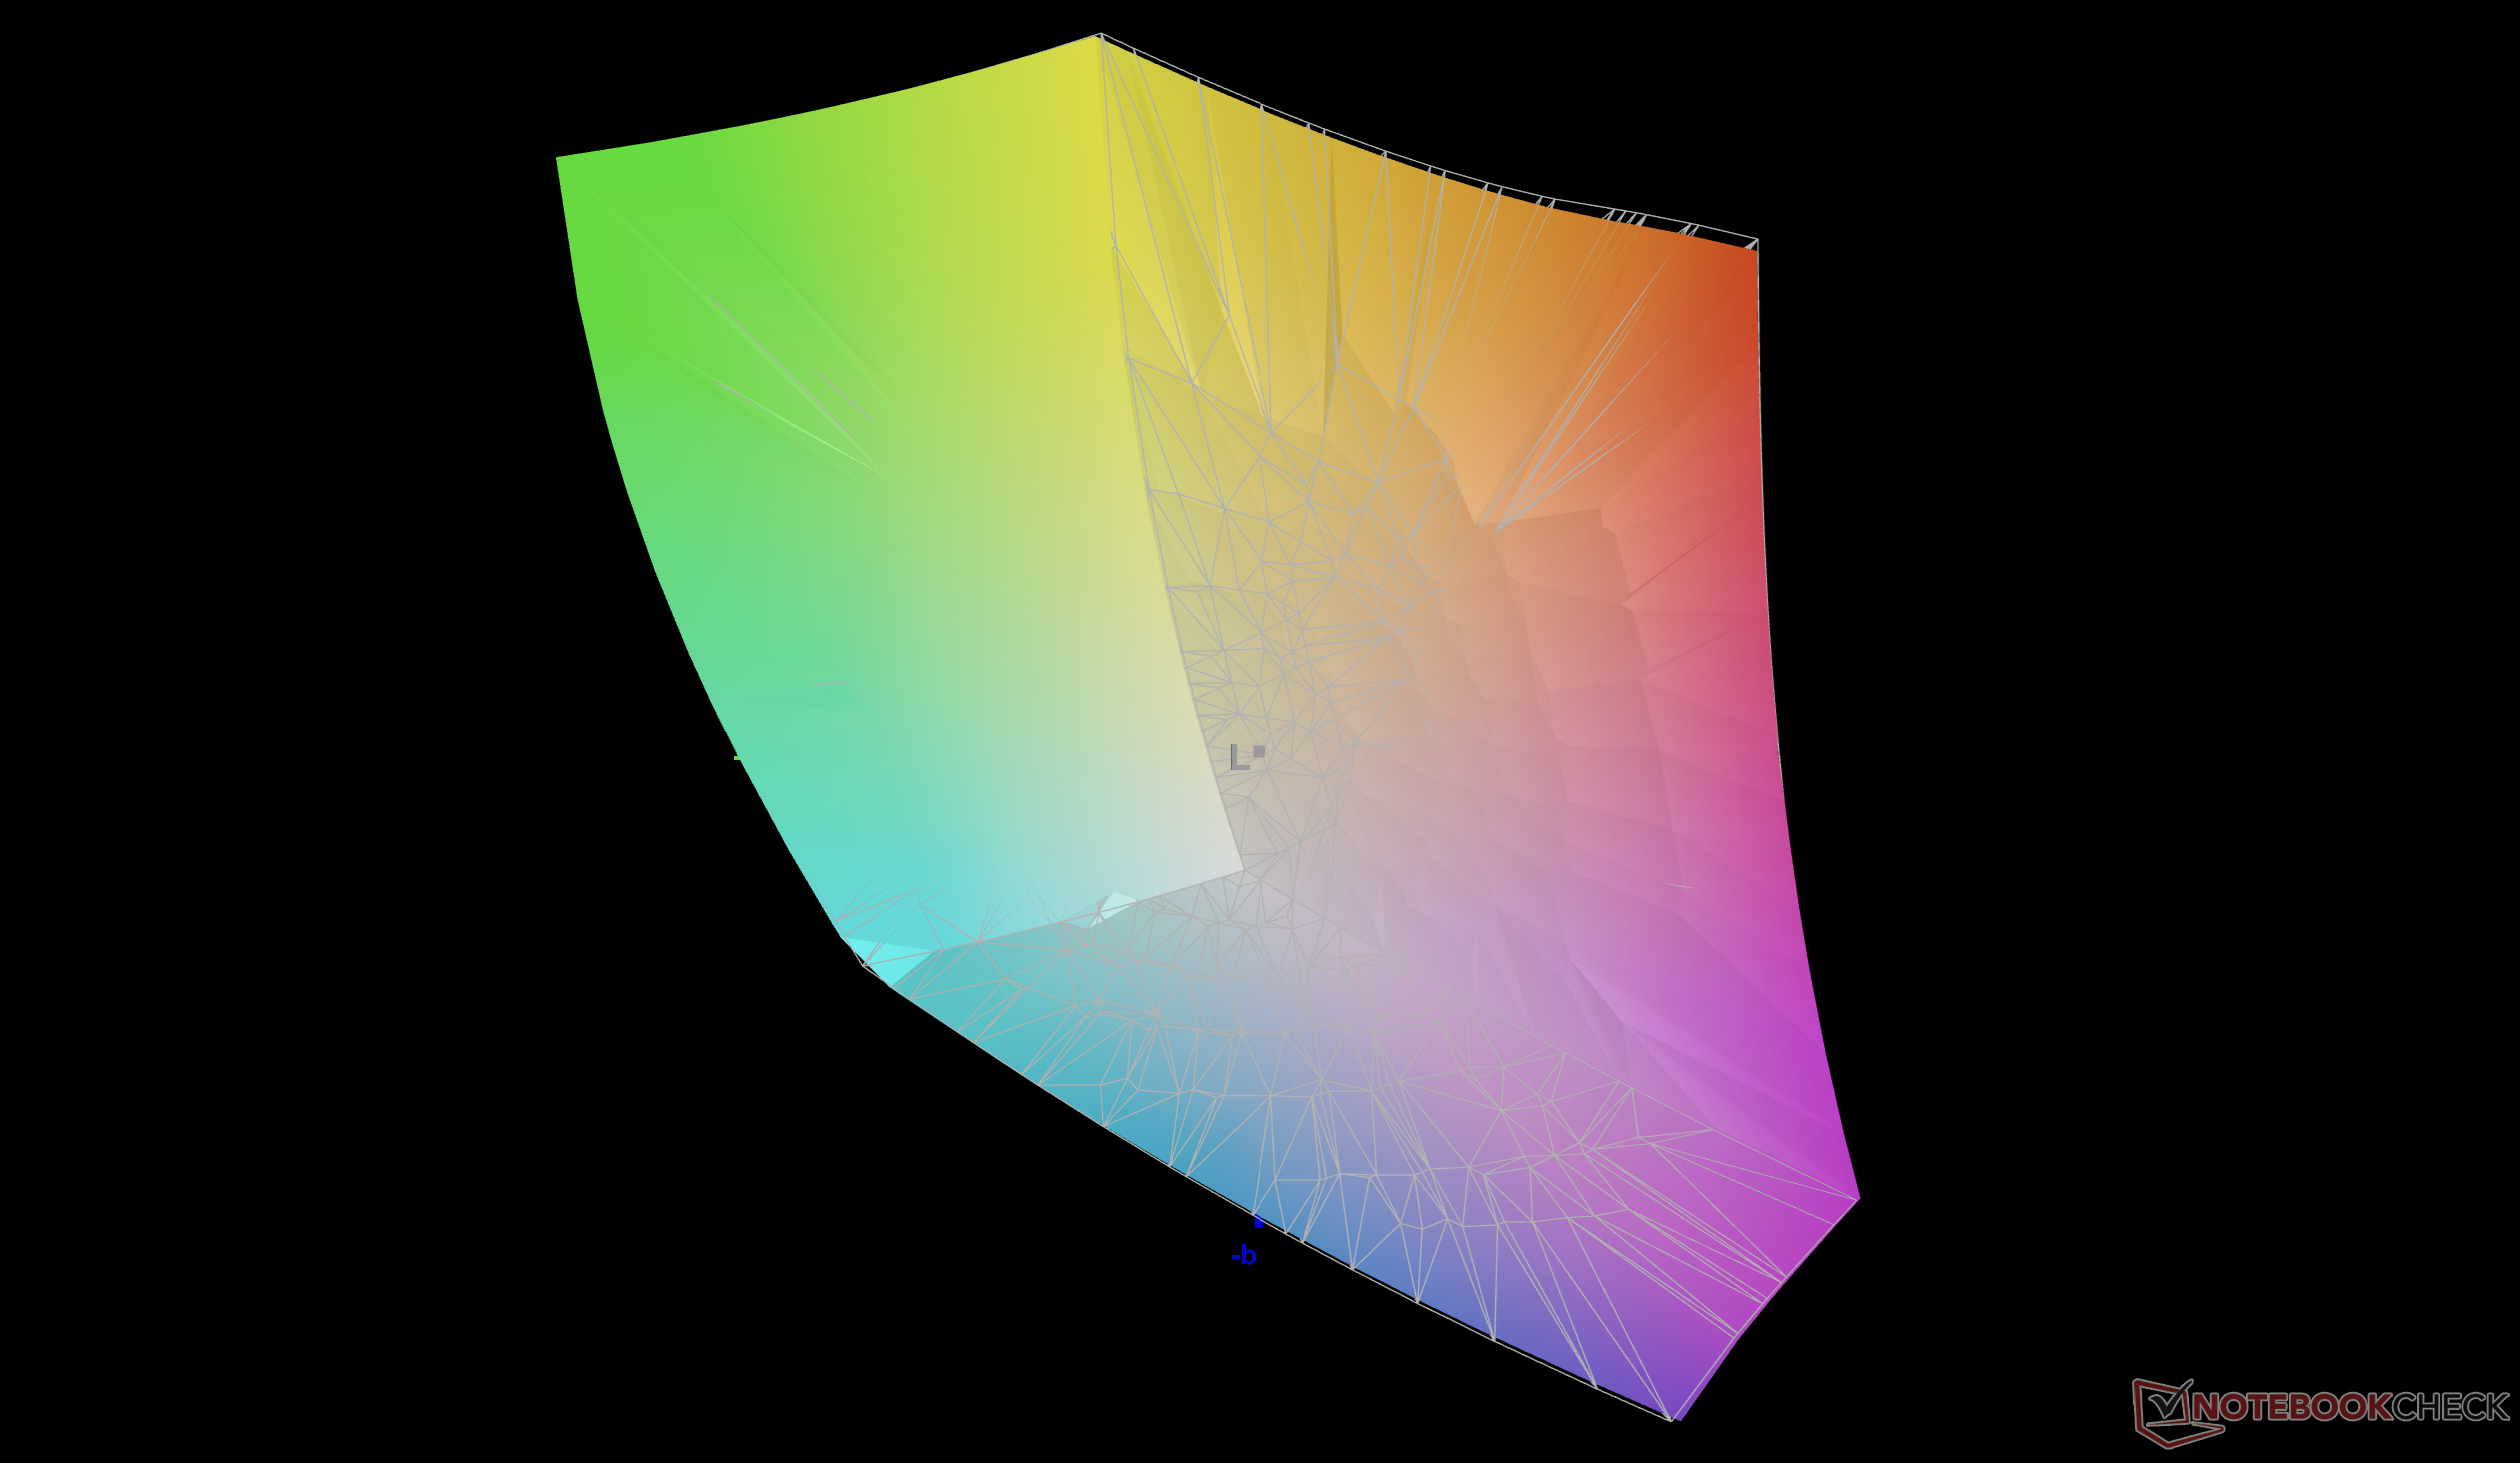
87.5% AdobeRGB 1998 (Argyll 3D)
99.9% sRGB (Argyll 3D)
99.3% Display P3 (Argyll 3D)
Gamma: 2.16
CCT: 6535 K
| MSI Raider 16 Max HX B2WJ Samsung ATNA60HU01-0, OLED, 2560x1600, 16", 240 Hz | MSI Crosshair 16 HX AI D2XWGKG AUO B160QAN02.3, IPS, 2560x1600, 16", 240 Hz | Razer Blade 16 Core Ultra 9 386H Samsung ATNA60HU06-0, OLED, 2560x1600, 16", 240 Hz | Alienware 16X Aurora Core Ultra 9 290HX Plus Samsung 160HU05, OLED, 2560x1600, 16", 240 Hz | Asus TUF Gaming A16 FA608UP MNG007DA5-3, IPS, 2560x1600, 16", 165 Hz | Lenovo Legion 7 16IAX10 Samsung ATNA60HS01-0, OLED, 2560x1600, 16", 165 Hz | |
|---|---|---|---|---|---|---|
| Display | -3% | 2% | 2% | -17% | 2% | |
| Display P3 Coverage (%) | 99.3 | 95.5 -4% | 99.7 0% | 99.6 0% | 69.4 -30% | 99.6 0% |
| sRGB Coverage (%) | 99.9 | 99.7 0% | 100 0% | 100 0% | 97.2 -3% | 100 0% |
| AdobeRGB 1998 Coverage (%) | 87.5 | 83.9 -4% | 93.5 7% | 93.9 7% | 71.9 -18% | 93.5 7% |
| Response Times | -1450% | 2% | -1% | -1641% | -62% | |
| Response Time Grey 50% / Grey 80% * (ms) | 0.28 ? | 3.59 ? -1182% | 0.28 ? -0% | 0.29 ? -4% | 6.3 ? -2150% | 0.6 ? -114% |
| Response Time Black / White * (ms) | 0.39 ? | 7.09 ? -1718% | 0.4 ? -3% | 0.45 ? -15% | 4.8 ? -1131% | 0.8 ? -105% |
| PWM Frequency (Hz) | 1440 ? | 1441 | 1439.8 ? | 1317 ? | ||
| PWM Amplitude * (%) | 35 | 32 9% | 29 17% | 23 34% | ||
| Screen | -326% | -81% | -105% | -33% | -91% | |
| Brightness middle (cd/m²) | 478.6 | 472 -1% | 462.2 -3% | 380.5 -20% | 480 0% | 477.6 0% |
| Brightness (cd/m²) | 481 | 438 -9% | 465 -3% | 384 -20% | 456 -5% | 483 0% |
| Brightness Distribution (%) | 98 | 88 -10% | 97 -1% | 98 0% | 91 -7% | 95 -3% |
| Black Level * (cd/m²) | 0.4 | 0.32 | ||||
| Colorchecker dE 2000 * | 0.62 | 6.07 -879% | 3.03 -389% | 3.27 -427% | 1.4 -126% | 3.11 -402% |
| Colorchecker dE 2000 max. * | 2.87 | 9.76 -240% | 5.84 -103% | 6.31 -120% | 2.5 13% | 5.99 -109% |
| Greyscale dE 2000 * | 0.7 | 6.4 -814% | 0.6 14% | 1 -43% | 1.2 -71% | 0.9 -29% |
| Gamma | 2.16 102% | 2.52 87% | 2.2 100% | 2.23 99% | 2.16 102% | 2.18 101% |
| CCT | 6535 99% | 7987 81% | 6452 101% | 6410 101% | 6620 98% | 6405 101% |
| Contrast (:1) | 1180 | 1500 | ||||
| Colorchecker dE 2000 calibrated * | 2.25 | 0.6 | 1.1 | 1.3 | 0.79 | |
| Totaal Gemiddelde (Programma / Instellingen) | -593% /
-442% | -26% /
-39% | -35% /
-52% | -564% /
-321% | -50% /
-60% |
* ... kleiner is beter

Responstijd Scherm
| ↔ Responstijd Zwart naar Wit | ||
|---|---|---|
| 0.39 ms ... stijging ↗ en daling ↘ gecombineerd | ↗ 0.21 ms stijging | 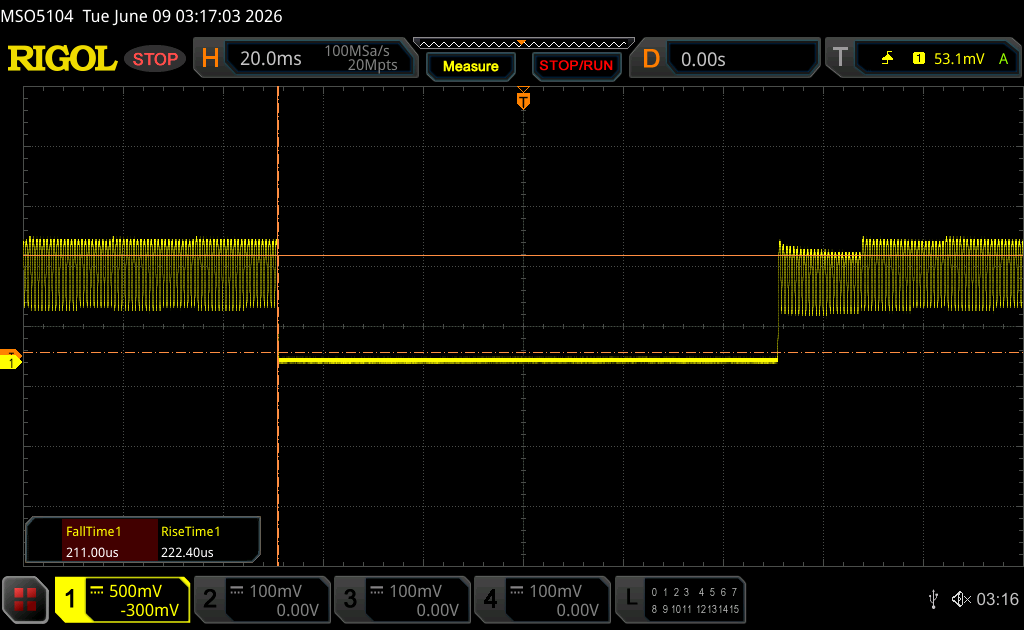 |
| ↘ 0.18 ms daling | ||
| Het scherm vertoonde erg snelle responstijden in onze tests en zou zeer geschikt moeten zijn voor snelle games. Ter vergelijking: alle testtoestellen variëren van 0.1 (minimum) tot 240 (maximum) ms. » 0 % van alle toestellen zijn beter. Dit betekent dat de gemeten responstijd beter is dan het gemiddelde (19.8 ms) van alle geteste toestellen. | ||
| ↔ Responstijd 50% Grijs naar 80% Grijs | ||
| 0.28 ms ... stijging ↗ en daling ↘ gecombineerd | ↗ 0.14 ms stijging | 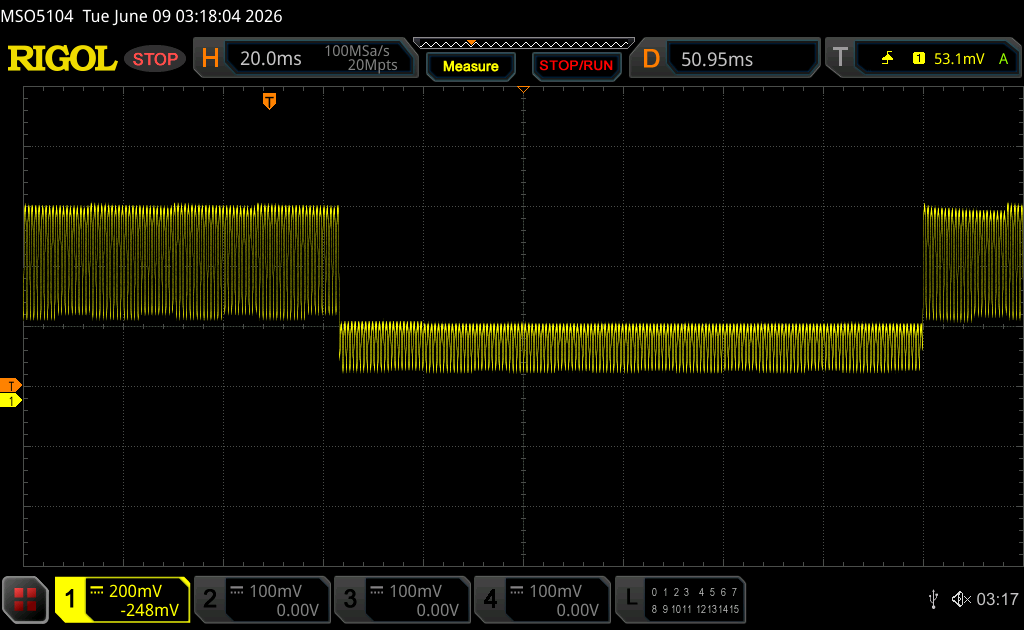 |
| ↘ 0.14 ms daling | ||
| Het scherm vertoonde erg snelle responstijden in onze tests en zou zeer geschikt moeten zijn voor snelle games. Ter vergelijking: alle testtoestellen variëren van 0.165 (minimum) tot 636 (maximum) ms. » 0 % van alle toestellen zijn beter. Dit betekent dat de gemeten responstijd beter is dan het gemiddelde (31 ms) van alle geteste toestellen. | ||
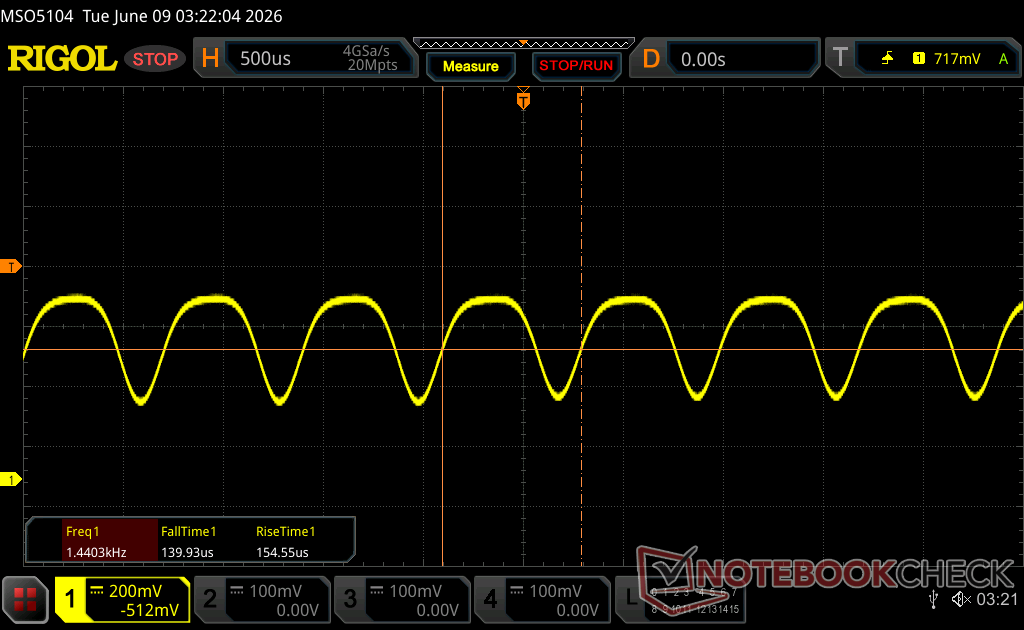
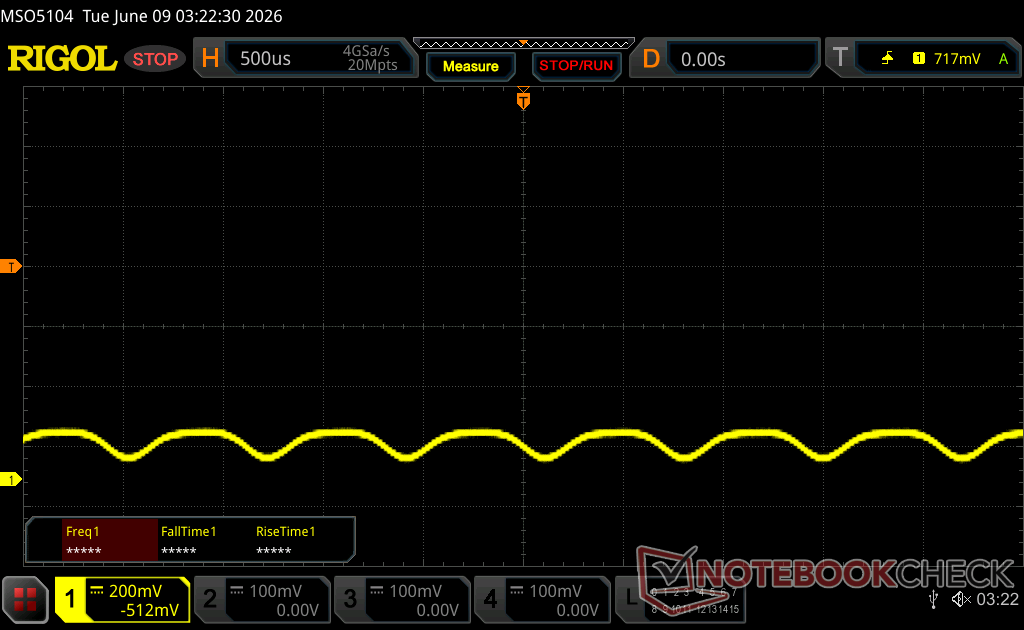
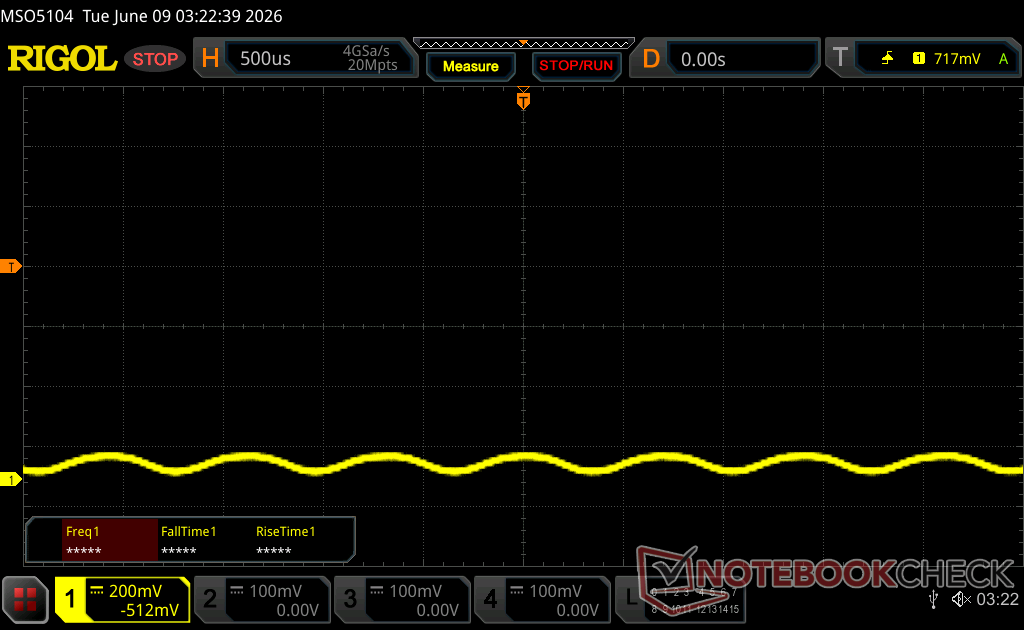
Screen Flickering / PWM (Pulse-Width Modulation)
| Screen flickering / PWM waargenomen | 1440 Hz Amplitude: 35 % | ≤ 100 % helderheid instelling | 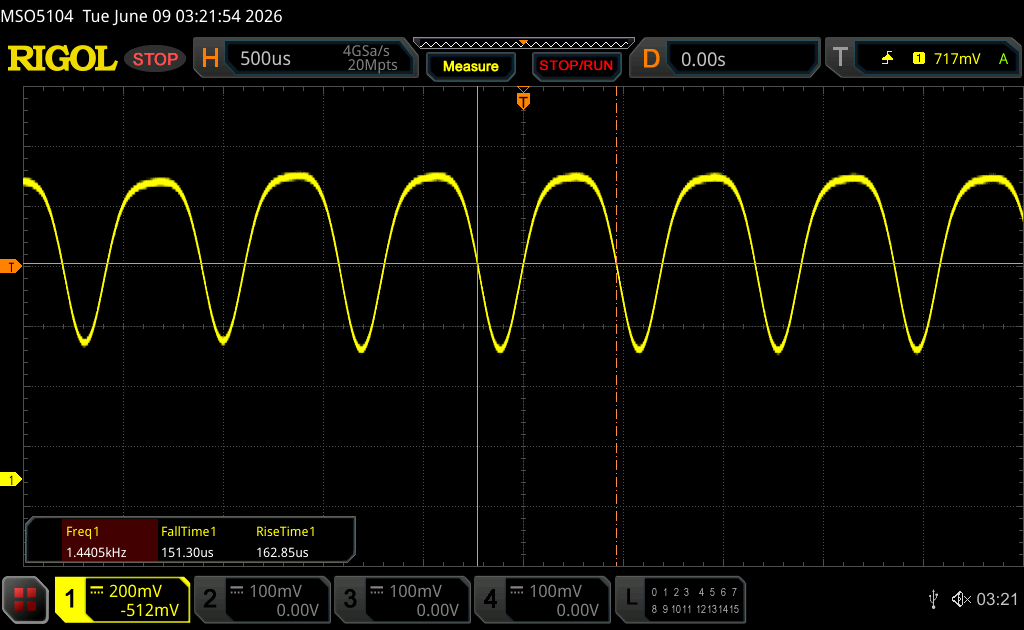 |
De achtergrondverlichting van het scherm flikkert op 1440 Hz (in het slechtste geval, bijvoorbeeld bij gebruik van PWM) aan een helderheid van 100 % en lager. Boven deze helderheid zou er geen flickering / PWM mogen optreden. De frequentie van 1440 Hz is redelijk hoog en de meeste mensen die gevoelig zijn aan flickering zouden dit dus niet mogen waarnemen of geïrriteerde ogen krijgen. Ter vergelijking: 52 % van alle geteste toestellen maakten geen gebruik van PWM om de schermhelderheid te verlagen. Als het wel werd gebruikt, werd een gemiddelde van 7757 (minimum: 5 - maximum: 343500) Hz waargenomen. | |||


Prestaties
Testomstandigheden
We hebben MSI Center ingesteld op Extreme Performance-modus en discrete grafische modus voordat we de onderstaande benchmarks uitvoerden.
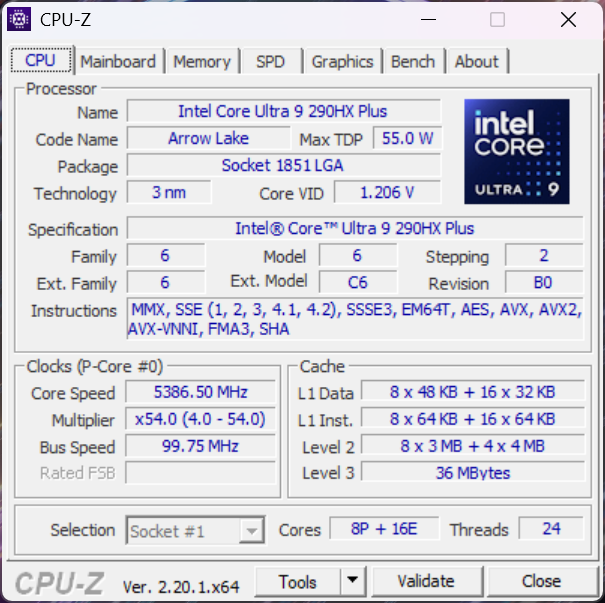
Processor
De Core Ultra 9 290HX Plus is in wezen een overgeklokte Core Ultra 9 275HX met exact dezelfde cachegroottes en hetzelfde aantal cores. Gebruikers kunnen ruwweg 15 procent snellere CPU-prestaties verwachten in vergelijking met de MSI Crosshair 16 HX. Interessanter is dat onze MSI tot 10 procent sneller zou zijn dan de Dell Alienware 16X Aurora met exact dezelfde Core Ultra 9 290HX Plus processor, zoals blijkt uit de onderstaande vergelijkingstabellen.
Cinebench R15 meervoudige lus
Cinebench R23: Multi Core | Single Core
Cinebench R20: CPU (Multi Core) | CPU (Single Core)
Cinebench R15: CPU Multi 64Bit | CPU Single 64Bit
Blender: v2.79 BMW27 CPU
7-Zip 18.03: 7z b 4 | 7z b 4 -mmt1
Geekbench 6.7: Multi-Core | Single-Core
Geekbench 5.5: Multi-Core | Single-Core
HWBOT x265 Benchmark v2.2: 4k Preset
LibreOffice : 20 Documents To PDF
R Benchmark 2.5: Overall mean
* ... kleiner is beter
AIDA64: FP32 Ray-Trace | FPU Julia | CPU SHA3 | CPU Queen | FPU SinJulia | FPU Mandel | CPU AES | CPU ZLib | FP64 Ray-Trace | CPU PhotoWorxx | CPU CheckMate
| Performance rating | |
| Gemiddeld Intel Core Ultra 9 290HX Plus | |
| MSI Raider 16 Max HX B2WJ -1! | |
| Alienware 16X Aurora Core Ultra 9 290HX Plus -1! | |
| MSI Crosshair 16 HX AI D2XWGKG -1! | |
| Lenovo Legion 7 16IAX10 -1! | |
| Asus TUF Gaming A16 FA608UP -1! | |
| Razer Blade 16 Core Ultra 9 386H -1! | |
| AIDA64 / FP32 Ray-Trace | |
| MSI Raider 16 Max HX B2WJ (v8.20.8100) | |
| Gemiddeld Intel Core Ultra 9 290HX Plus (34761 - 43239, n=6) | |
| MSI Crosshair 16 HX AI D2XWGKG (v6.92.6600) | |
| Alienware 16X Aurora Core Ultra 9 290HX Plus (v8.20.8100) | |
| Lenovo Legion 7 16IAX10 (v6.92.6600) | |
| Asus TUF Gaming A16 FA608UP (v6.92.6600) | |
| Razer Blade 16 Core Ultra 9 386H (v8.20.8100) | |
| AIDA64 / FPU Julia | |
| MSI Raider 16 Max HX B2WJ (v8.20.8100) | |
| Gemiddeld Intel Core Ultra 9 290HX Plus (174665 - 218895, n=6) | |
| MSI Crosshair 16 HX AI D2XWGKG (v6.92.6600) | |
| Alienware 16X Aurora Core Ultra 9 290HX Plus (v8.20.8100) | |
| Lenovo Legion 7 16IAX10 (v6.92.6600) | |
| Asus TUF Gaming A16 FA608UP (v6.92.6600) | |
| Razer Blade 16 Core Ultra 9 386H (v8.20.8100) | |
| AIDA64 / CPU SHA3 | |
| MSI Raider 16 Max HX B2WJ (v8.20.8100) | |
| Gemiddeld Intel Core Ultra 9 290HX Plus (8352 - 10115, n=6) | |
| MSI Crosshair 16 HX AI D2XWGKG (v6.92.6600) | |
| Alienware 16X Aurora Core Ultra 9 290HX Plus (v8.20.8100) | |
| Lenovo Legion 7 16IAX10 (v6.92.6600) | |
| Razer Blade 16 Core Ultra 9 386H (v8.20.8100) | |
| Asus TUF Gaming A16 FA608UP (v6.92.6600) | |
| AIDA64 / CPU Queen | |
| Gemiddeld Intel Core Ultra 9 290HX Plus (n=1) | |
| Lenovo Legion 7 16IAX10 (v6.92.6600) | |
| MSI Crosshair 16 HX AI D2XWGKG (v6.92.6600) | |
| Asus TUF Gaming A16 FA608UP (v6.92.6600) | |
| AIDA64 / FPU SinJulia | |
| Asus TUF Gaming A16 FA608UP (v6.92.6600) | |
| MSI Raider 16 Max HX B2WJ (v8.20.8100) | |
| Gemiddeld Intel Core Ultra 9 290HX Plus (13612 - 14874, n=6) | |
| Alienware 16X Aurora Core Ultra 9 290HX Plus (v8.20.8100) | |
| MSI Crosshair 16 HX AI D2XWGKG (v6.92.6600) | |
| Lenovo Legion 7 16IAX10 (v6.92.6600) | |
| Razer Blade 16 Core Ultra 9 386H (v8.20.8100) | |
| AIDA64 / FPU Mandel | |
| MSI Raider 16 Max HX B2WJ (v8.20.8100) | |
| Gemiddeld Intel Core Ultra 9 290HX Plus (91215 - 115371, n=6) | |
| MSI Crosshair 16 HX AI D2XWGKG (v6.92.6600) | |
| Alienware 16X Aurora Core Ultra 9 290HX Plus (v8.20.8100) | |
| Lenovo Legion 7 16IAX10 (v6.92.6600) | |
| Asus TUF Gaming A16 FA608UP (v6.92.6600) | |
| Razer Blade 16 Core Ultra 9 386H (v8.20.8100) | |
| AIDA64 / CPU AES | |
| MSI Raider 16 Max HX B2WJ (v8.20.8100) | |
| Gemiddeld Intel Core Ultra 9 290HX Plus (127585 - 143205, n=6) | |
| Alienware 16X Aurora Core Ultra 9 290HX Plus (v8.20.8100) | |
| MSI Crosshair 16 HX AI D2XWGKG (v6.92.6600) | |
| Lenovo Legion 7 16IAX10 (v6.92.6600) | |
| Asus TUF Gaming A16 FA608UP (v6.92.6600) | |
| Razer Blade 16 Core Ultra 9 386H (v8.20.8100) | |
| AIDA64 / CPU ZLib | |
| MSI Raider 16 Max HX B2WJ (v8.20.8100) | |
| Gemiddeld Intel Core Ultra 9 290HX Plus (1967 - 2340, n=6) | |
| MSI Crosshair 16 HX AI D2XWGKG (v6.92.6600) | |
| Alienware 16X Aurora Core Ultra 9 290HX Plus (v8.20.8100) | |
| Lenovo Legion 7 16IAX10 (v6.92.6600) | |
| Razer Blade 16 Core Ultra 9 386H (v8.20.8100) | |
| Asus TUF Gaming A16 FA608UP (v6.92.6600) | |
| AIDA64 / FP64 Ray-Trace | |
| MSI Raider 16 Max HX B2WJ (v8.20.8100) | |
| Gemiddeld Intel Core Ultra 9 290HX Plus (18611 - 23843, n=6) | |
| MSI Crosshair 16 HX AI D2XWGKG (v6.92.6600) | |
| Alienware 16X Aurora Core Ultra 9 290HX Plus (v8.20.8100) | |
| Lenovo Legion 7 16IAX10 (v6.92.6600) | |
| Asus TUF Gaming A16 FA608UP (v6.92.6600) | |
| Razer Blade 16 Core Ultra 9 386H (v8.20.8100) | |
| AIDA64 / CPU PhotoWorxx | |
| Razer Blade 16 Core Ultra 9 386H (v8.20.8100) | |
| Gemiddeld Intel Core Ultra 9 290HX Plus (51134 - 65272, n=6) | |
| Alienware 16X Aurora Core Ultra 9 290HX Plus (v8.20.8100) | |
| MSI Raider 16 Max HX B2WJ (v8.20.8100) | |
| Lenovo Legion 7 16IAX10 (v6.92.6600) | |
| Asus TUF Gaming A16 FA608UP (v6.92.6600) | |
| MSI Crosshair 16 HX AI D2XWGKG (v6.92.6600) | |
| AIDA64 / CPU CheckMate | |
| MSI Raider 16 Max HX B2WJ (v8.20.8100) | |
| Gemiddeld Intel Core Ultra 9 290HX Plus (7624 - 8765, n=5) | |
| Alienware 16X Aurora Core Ultra 9 290HX Plus (v8.20.8100) | |
| Razer Blade 16 Core Ultra 9 386H (v8.20.8100) | |
Systeemprestaties
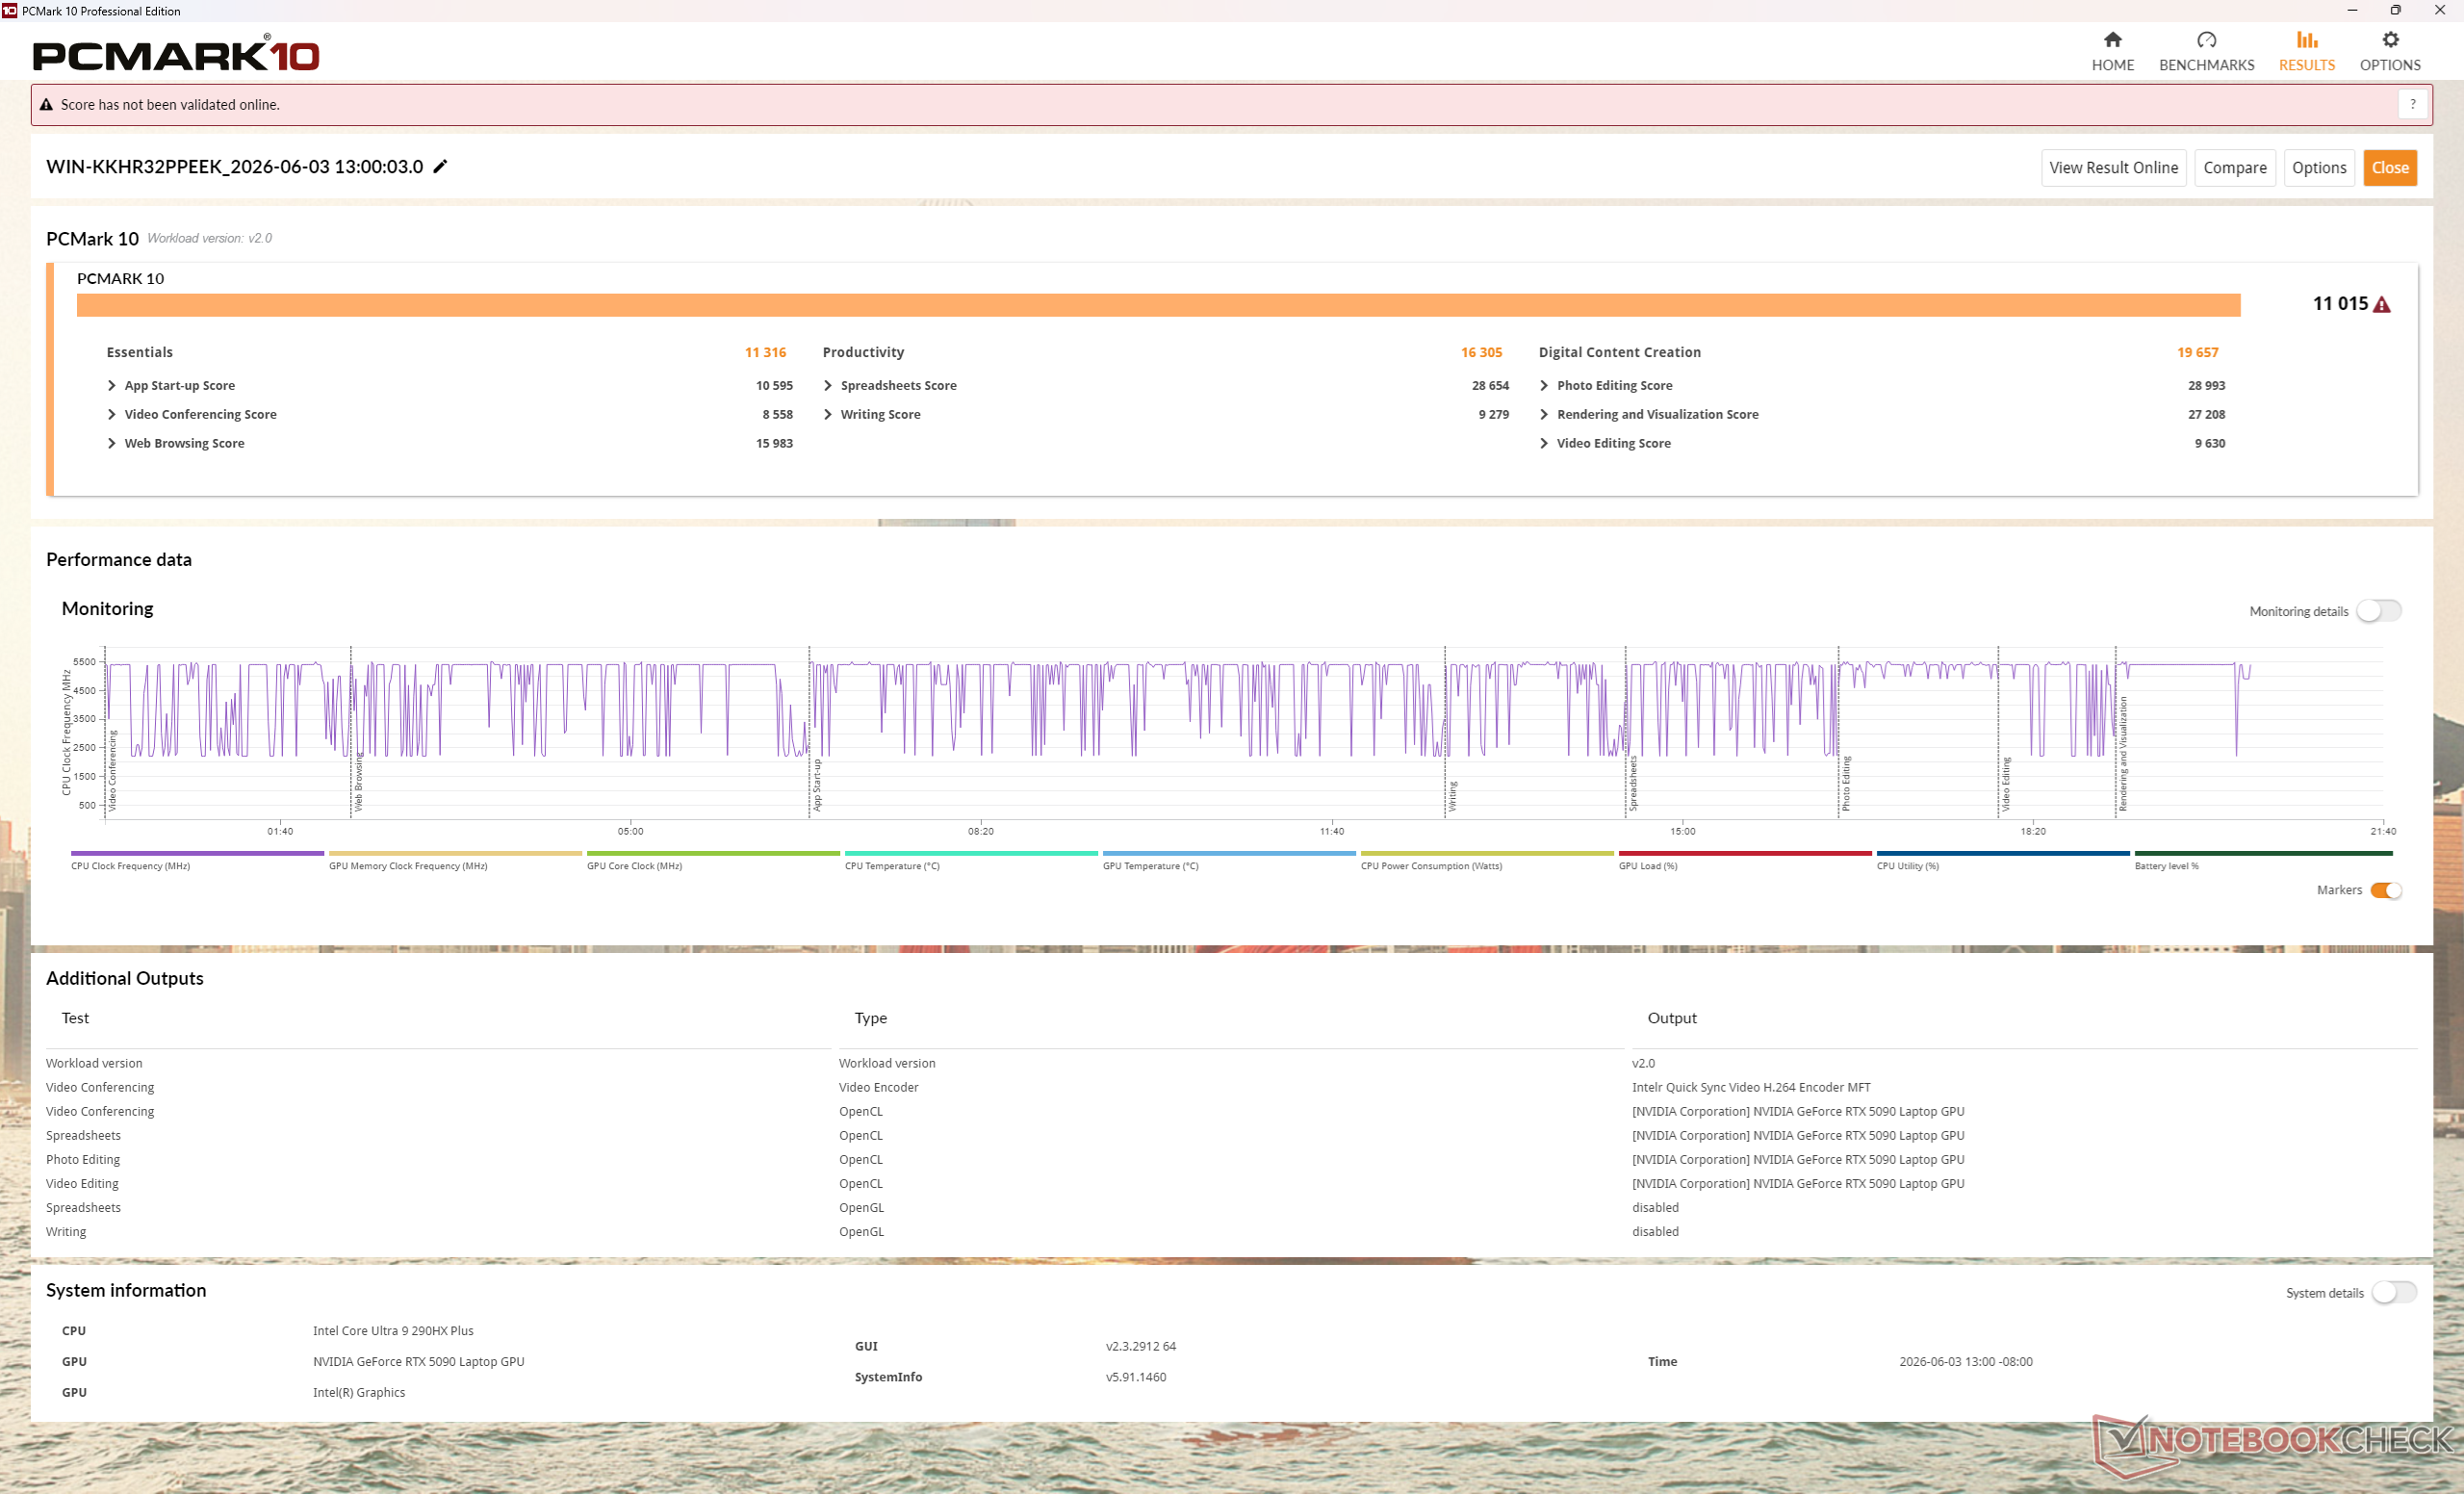
PCMark 10: Score | Essentials | Productivity | Digital Content Creation
CrossMark: Overall | Productivity | Creativity | Responsiveness
WebXPRT 3: Overall
WebXPRT 4: Overall
Mozilla Kraken 1.1: Total
Geekbench AI: Quantized GPU 1.7 | Half Precision GPU 1.7 | Single Precision GPU 1.7
| Performance rating | |
| Gemiddeld Intel Core Ultra 9 290HX Plus, NVIDIA GeForce RTX 5090 Laptop | |
| MSI Raider 16 Max HX B2WJ | |
| Alienware 16X Aurora Core Ultra 9 290HX Plus | |
| Razer Blade 16 Core Ultra 9 386H | |
| MSI Crosshair 16 HX AI D2XWGKG | |
| Lenovo Legion 7 16IAX10 | |
| Asus TUF Gaming A16 FA608UP -4! | |
| PCMark 10 / Score | |
| Gemiddeld Intel Core Ultra 9 290HX Plus, NVIDIA GeForce RTX 5090 Laptop (11015 - 12414, n=3) | |
| MSI Raider 16 Max HX B2WJ | |
| Alienware 16X Aurora Core Ultra 9 290HX Plus | |
| Razer Blade 16 Core Ultra 9 386H | |
| MSI Crosshair 16 HX AI D2XWGKG | |
| Lenovo Legion 7 16IAX10 | |
| PCMark 10 / Essentials | |
| Alienware 16X Aurora Core Ultra 9 290HX Plus | |
| Lenovo Legion 7 16IAX10 | |
| Gemiddeld Intel Core Ultra 9 290HX Plus, NVIDIA GeForce RTX 5090 Laptop (11316 - 11604, n=3) | |
| MSI Raider 16 Max HX B2WJ | |
| Razer Blade 16 Core Ultra 9 386H | |
| MSI Crosshair 16 HX AI D2XWGKG | |
| PCMark 10 / Productivity | |
| Gemiddeld Intel Core Ultra 9 290HX Plus, NVIDIA GeForce RTX 5090 Laptop (16305 - 25323, n=3) | |
| Alienware 16X Aurora Core Ultra 9 290HX Plus | |
| MSI Raider 16 Max HX B2WJ | |
| Razer Blade 16 Core Ultra 9 386H | |
| Lenovo Legion 7 16IAX10 | |
| MSI Crosshair 16 HX AI D2XWGKG | |
| PCMark 10 / Digital Content Creation | |
| MSI Raider 16 Max HX B2WJ | |
| Gemiddeld Intel Core Ultra 9 290HX Plus, NVIDIA GeForce RTX 5090 Laptop (17665 - 19954, n=3) | |
| Alienware 16X Aurora Core Ultra 9 290HX Plus | |
| MSI Crosshair 16 HX AI D2XWGKG | |
| Razer Blade 16 Core Ultra 9 386H | |
| Lenovo Legion 7 16IAX10 | |
| CrossMark / Overall | |
| MSI Raider 16 Max HX B2WJ | |
| Alienware 16X Aurora Core Ultra 9 290HX Plus | |
| Gemiddeld Intel Core Ultra 9 290HX Plus, NVIDIA GeForce RTX 5090 Laptop (2177 - 2401, n=3) | |
| Razer Blade 16 Core Ultra 9 386H | |
| MSI Crosshair 16 HX AI D2XWGKG | |
| Lenovo Legion 7 16IAX10 | |
| Asus TUF Gaming A16 FA608UP | |
| CrossMark / Productivity | |
| Alienware 16X Aurora Core Ultra 9 290HX Plus | |
| MSI Raider 16 Max HX B2WJ | |
| Gemiddeld Intel Core Ultra 9 290HX Plus, NVIDIA GeForce RTX 5090 Laptop (1994 - 2213, n=3) | |
| Razer Blade 16 Core Ultra 9 386H | |
| MSI Crosshair 16 HX AI D2XWGKG | |
| Lenovo Legion 7 16IAX10 | |
| Asus TUF Gaming A16 FA608UP | |
| CrossMark / Creativity | |
| Gemiddeld Intel Core Ultra 9 290HX Plus, NVIDIA GeForce RTX 5090 Laptop (2548 - 2786, n=3) | |
| MSI Raider 16 Max HX B2WJ | |
| Alienware 16X Aurora Core Ultra 9 290HX Plus | |
| Razer Blade 16 Core Ultra 9 386H | |
| MSI Crosshair 16 HX AI D2XWGKG | |
| Lenovo Legion 7 16IAX10 | |
| Asus TUF Gaming A16 FA608UP | |
| CrossMark / Responsiveness | |
| Alienware 16X Aurora Core Ultra 9 290HX Plus | |
| MSI Raider 16 Max HX B2WJ | |
| Gemiddeld Intel Core Ultra 9 290HX Plus, NVIDIA GeForce RTX 5090 Laptop (1766 - 2249, n=3) | |
| Razer Blade 16 Core Ultra 9 386H | |
| MSI Crosshair 16 HX AI D2XWGKG | |
| Lenovo Legion 7 16IAX10 | |
| Asus TUF Gaming A16 FA608UP | |
| WebXPRT 3 / Overall | |
| Alienware 16X Aurora Core Ultra 9 290HX Plus | |
| MSI Raider 16 Max HX B2WJ | |
| Gemiddeld Intel Core Ultra 9 290HX Plus, NVIDIA GeForce RTX 5090 Laptop (354 - 369, n=3) | |
| Lenovo Legion 7 16IAX10 | |
| MSI Crosshair 16 HX AI D2XWGKG | |
| Razer Blade 16 Core Ultra 9 386H | |
| Asus TUF Gaming A16 FA608UP | |
| WebXPRT 4 / Overall | |
| Alienware 16X Aurora Core Ultra 9 290HX Plus | |
| MSI Raider 16 Max HX B2WJ | |
| Gemiddeld Intel Core Ultra 9 290HX Plus, NVIDIA GeForce RTX 5090 Laptop (310 - 336, n=3) | |
| Lenovo Legion 7 16IAX10 | |
| MSI Crosshair 16 HX AI D2XWGKG | |
| Razer Blade 16 Core Ultra 9 386H | |
| Asus TUF Gaming A16 FA608UP | |
| Mozilla Kraken 1.1 / Total | |
| Asus TUF Gaming A16 FA608UP | |
| Razer Blade 16 Core Ultra 9 386H | |
| Lenovo Legion 7 16IAX10 | |
| MSI Crosshair 16 HX AI D2XWGKG | |
| MSI Raider 16 Max HX B2WJ | |
| Gemiddeld Intel Core Ultra 9 290HX Plus, NVIDIA GeForce RTX 5090 Laptop (393 - 399, n=3) | |
| Alienware 16X Aurora Core Ultra 9 290HX Plus | |
| Geekbench AI / Quantized GPU 1.7 | |
| Gemiddeld Intel Core Ultra 9 290HX Plus, NVIDIA GeForce RTX 5090 Laptop (25151 - 25211, n=2) | |
| MSI Raider 16 Max HX B2WJ | |
| Razer Blade 16 Core Ultra 9 386H | |
| Alienware 16X Aurora Core Ultra 9 290HX Plus | |
| MSI Crosshair 16 HX AI D2XWGKG | |
| Asus TUF Gaming A16 FA608UP | |
| Lenovo Legion 7 16IAX10 | |
| Geekbench AI / Half Precision GPU 1.7 | |
| Gemiddeld Intel Core Ultra 9 290HX Plus, NVIDIA GeForce RTX 5090 Laptop (55223 - 56393, n=2) | |
| MSI Raider 16 Max HX B2WJ | |
| Alienware 16X Aurora Core Ultra 9 290HX Plus | |
| Razer Blade 16 Core Ultra 9 386H | |
| MSI Crosshair 16 HX AI D2XWGKG | |
| Asus TUF Gaming A16 FA608UP | |
| Lenovo Legion 7 16IAX10 | |
| Geekbench AI / Single Precision GPU 1.7 | |
| Gemiddeld Intel Core Ultra 9 290HX Plus, NVIDIA GeForce RTX 5090 Laptop (31828 - 32576, n=2) | |
| MSI Raider 16 Max HX B2WJ | |
| Razer Blade 16 Core Ultra 9 386H | |
| Alienware 16X Aurora Core Ultra 9 290HX Plus | |
| MSI Crosshair 16 HX AI D2XWGKG | |
| Asus TUF Gaming A16 FA608UP | |
| Lenovo Legion 7 16IAX10 | |
* ... kleiner is beter
| PCMark 10 Score | 11015 punten | |
Help | ||
| AIDA64 / Memory Copy | |
| Razer Blade 16 Core Ultra 9 386H | |
| Lenovo Legion 7 16IAX10 | |
| Gemiddeld Intel Core Ultra 9 290HX Plus (76912 - 93930, n=6) | |
| MSI Raider 16 Max HX B2WJ | |
| Alienware 16X Aurora Core Ultra 9 290HX Plus | |
| MSI Crosshair 16 HX AI D2XWGKG | |
| Asus TUF Gaming A16 FA608UP | |
| AIDA64 / Memory Read | |
| Razer Blade 16 Core Ultra 9 386H | |
| Gemiddeld Intel Core Ultra 9 290HX Plus (84638 - 98574, n=6) | |
| MSI Raider 16 Max HX B2WJ | |
| Lenovo Legion 7 16IAX10 | |
| Alienware 16X Aurora Core Ultra 9 290HX Plus | |
| MSI Crosshair 16 HX AI D2XWGKG | |
| Asus TUF Gaming A16 FA608UP | |
| AIDA64 / Memory Write | |
| Razer Blade 16 Core Ultra 9 386H | |
| Asus TUF Gaming A16 FA608UP | |
| Gemiddeld Intel Core Ultra 9 290HX Plus (76094 - 100988, n=6) | |
| MSI Raider 16 Max HX B2WJ | |
| Lenovo Legion 7 16IAX10 | |
| Alienware 16X Aurora Core Ultra 9 290HX Plus | |
| MSI Crosshair 16 HX AI D2XWGKG | |
| AIDA64 / Memory Latency | |
| MSI Crosshair 16 HX AI D2XWGKG | |
| Alienware 16X Aurora Core Ultra 9 290HX Plus | |
| Lenovo Legion 7 16IAX10 | |
| MSI Raider 16 Max HX B2WJ | |
| Gemiddeld Intel Core Ultra 9 290HX Plus (100.7 - 108.4, n=6) | |
| Asus TUF Gaming A16 FA608UP | |
| Razer Blade 16 Core Ultra 9 386H | |
* ... kleiner is beter
DPC latentie
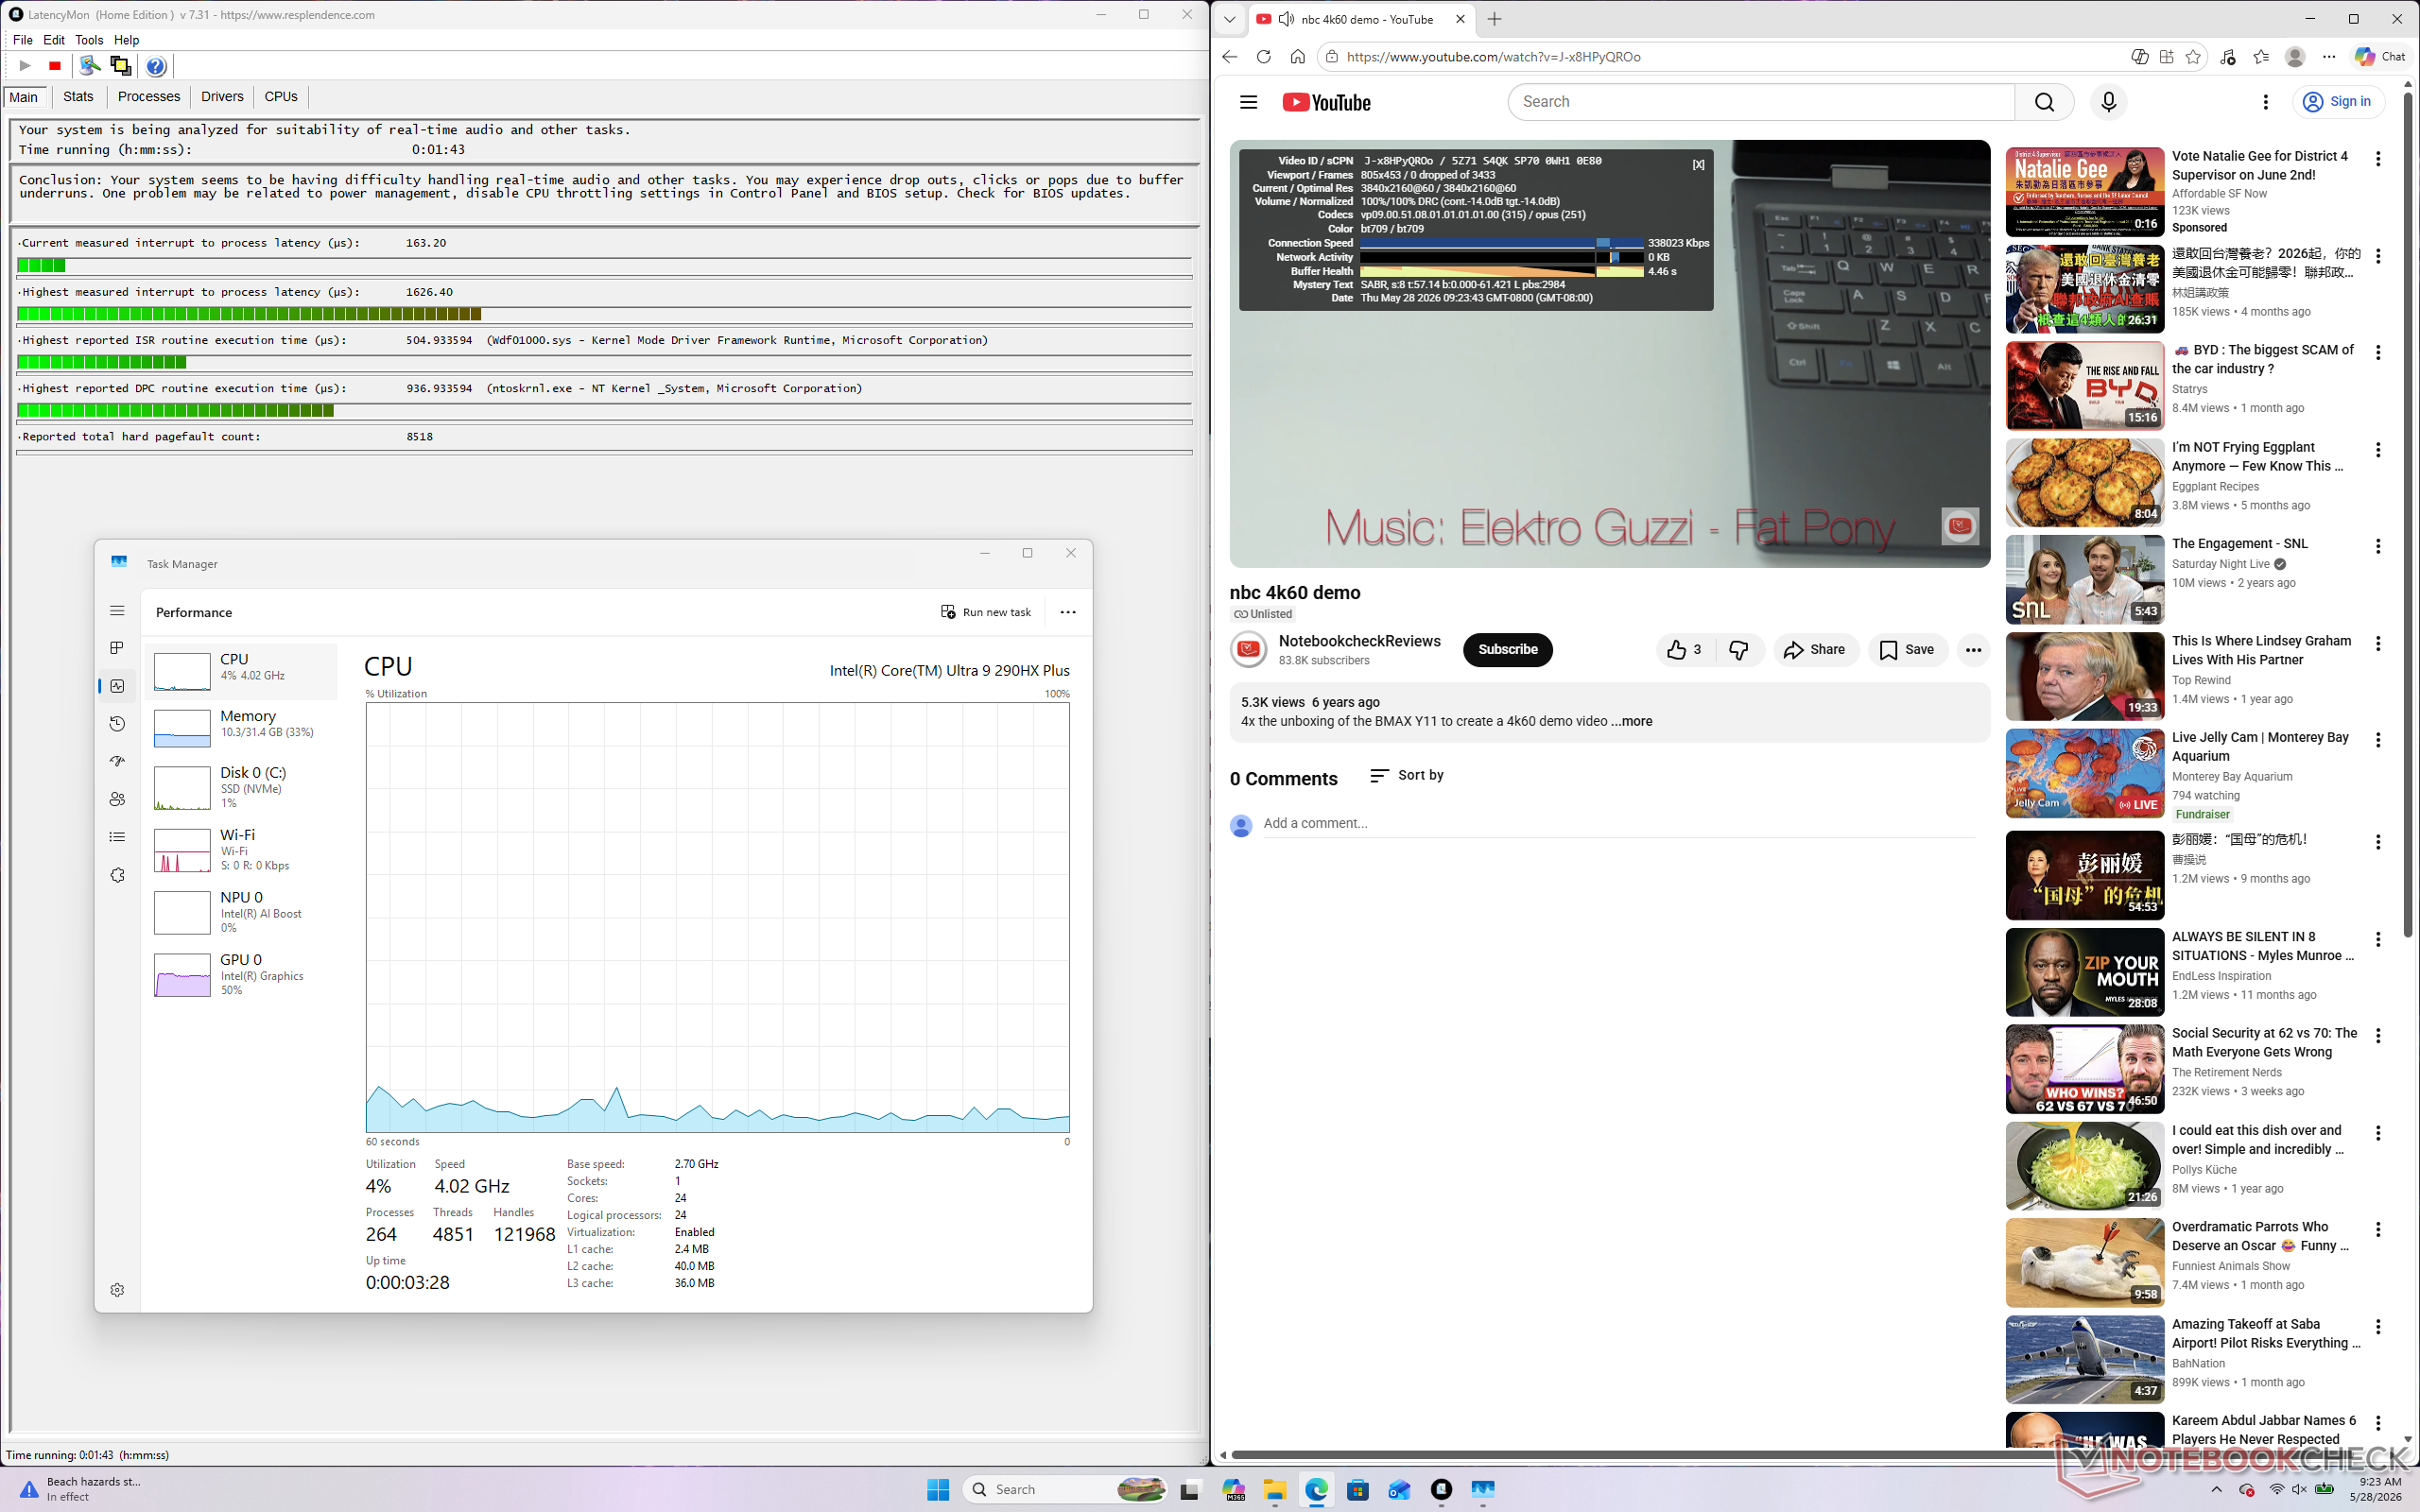
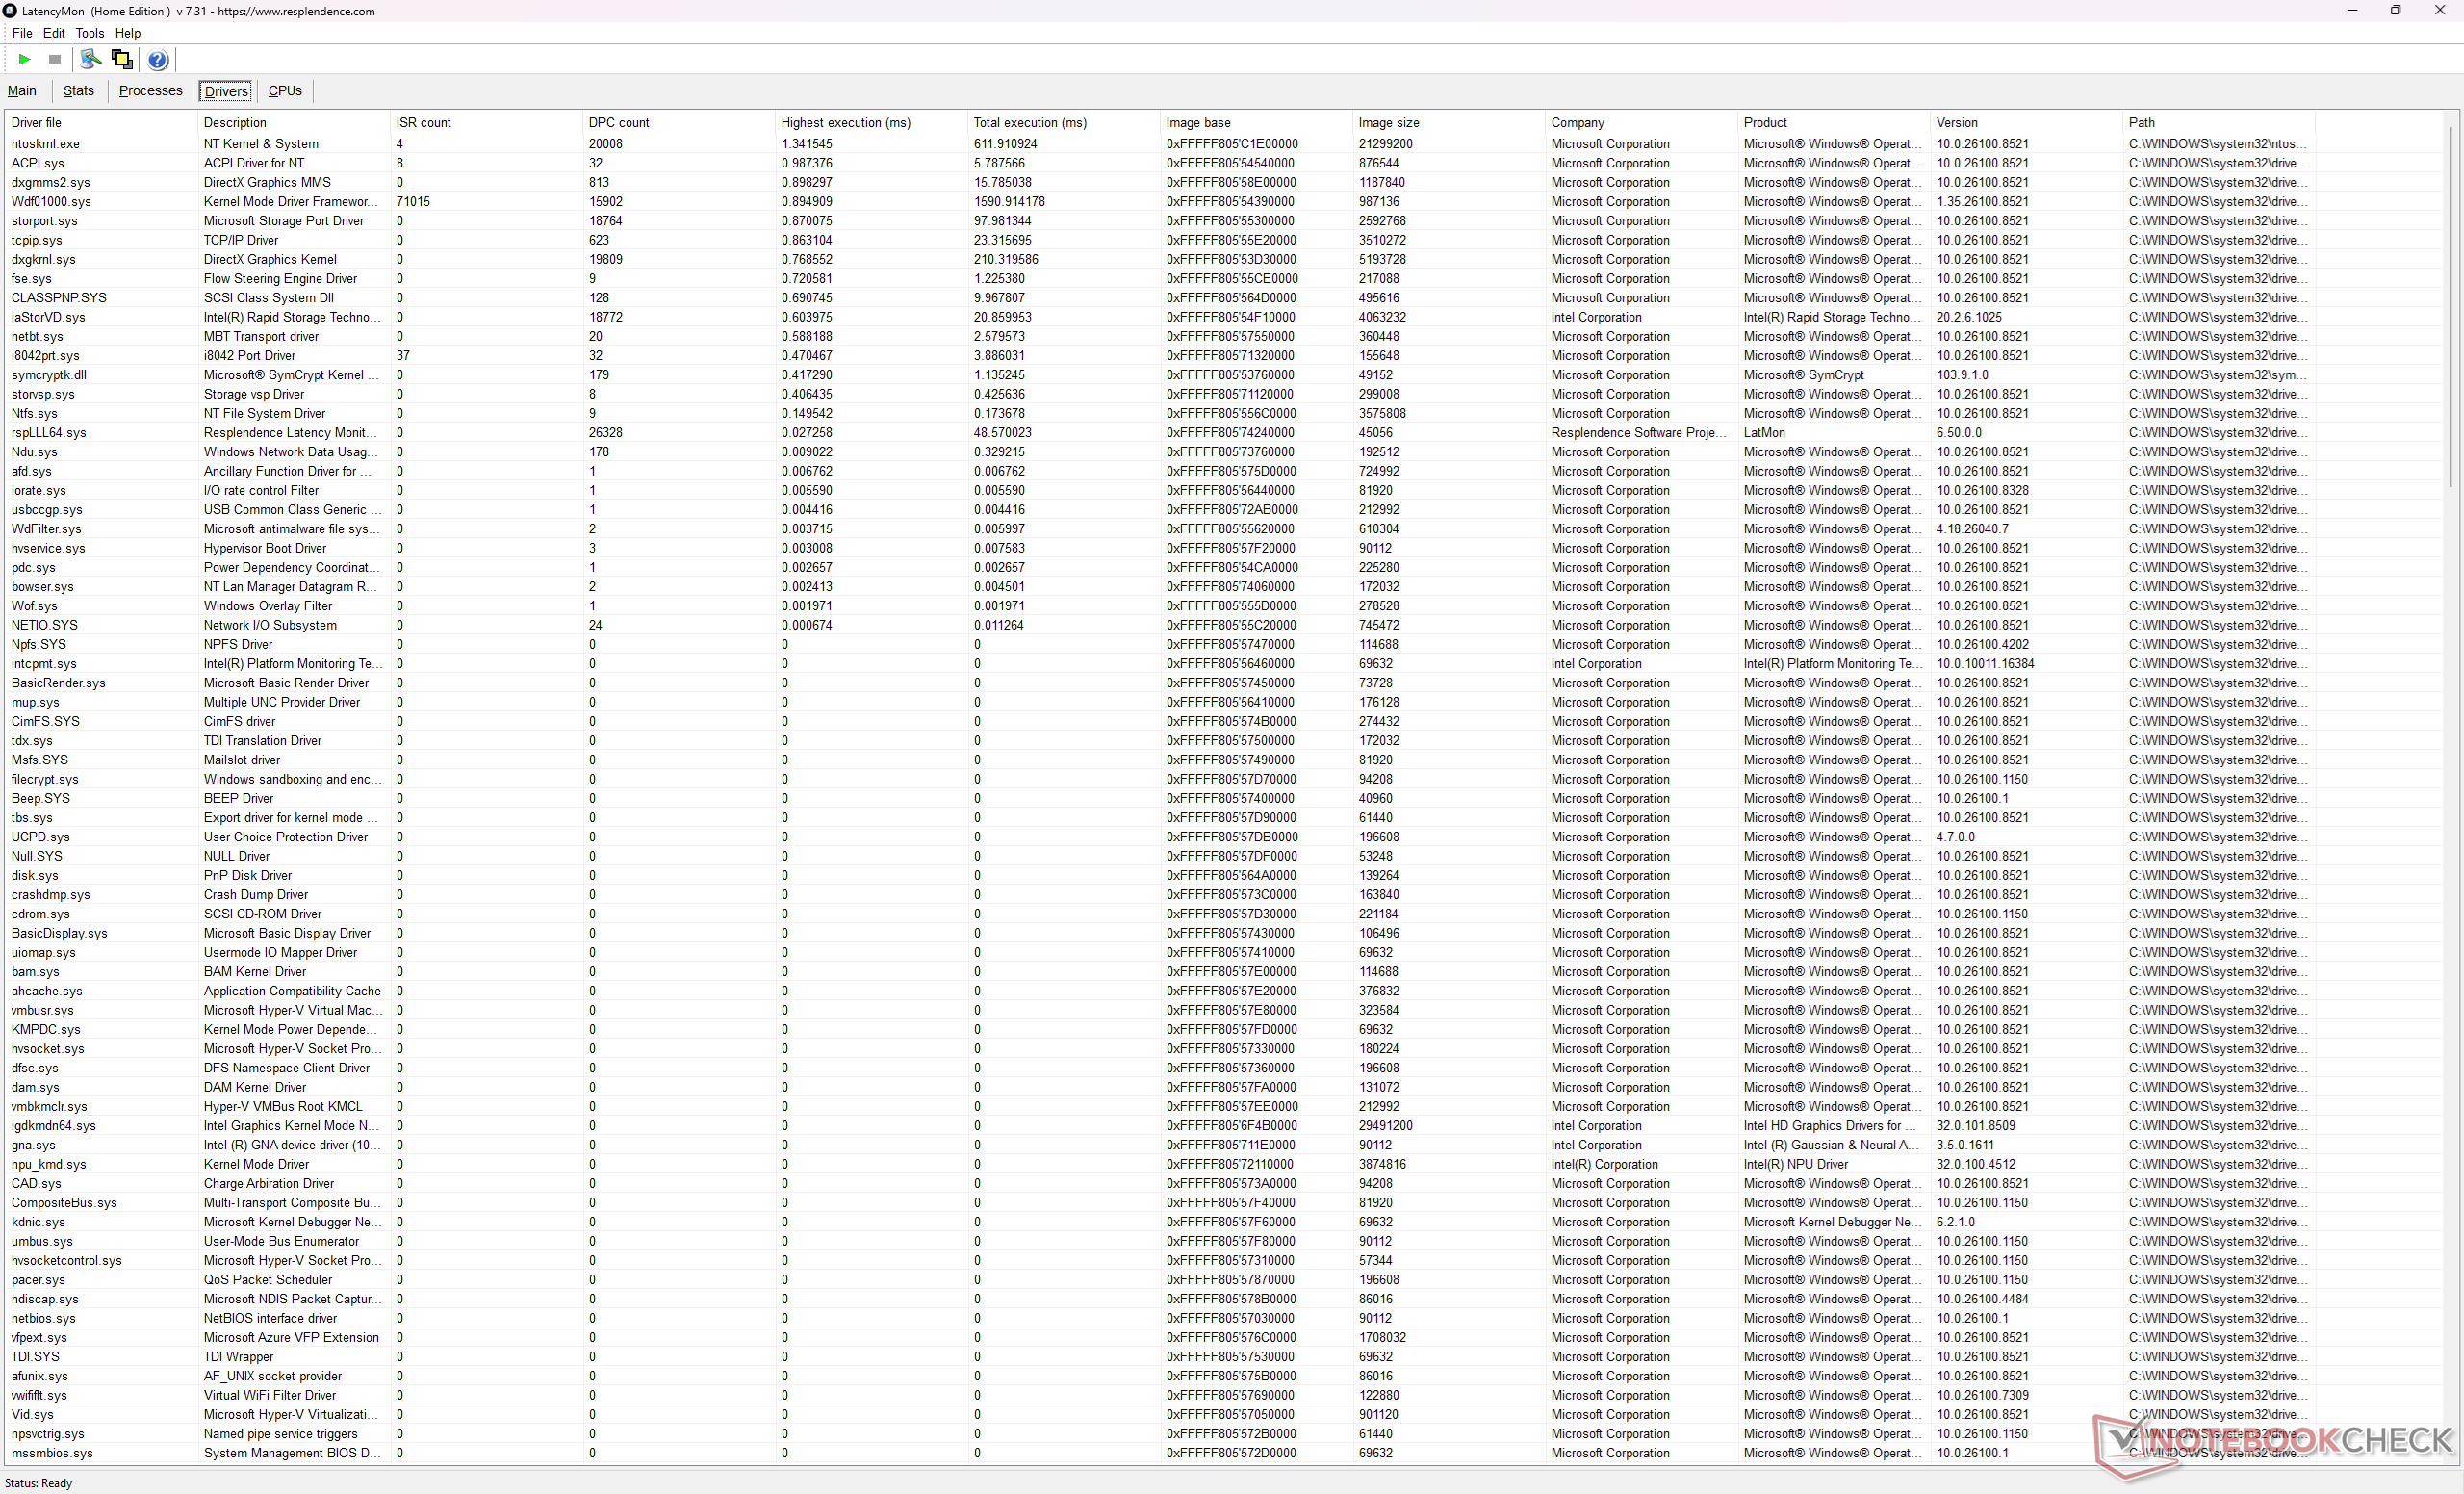
| DPC Latencies / LatencyMon - interrupt to process latency (max), Web, Youtube, Prime95 | |
| Alienware 16X Aurora Core Ultra 9 290HX Plus | |
| Razer Blade 16 Core Ultra 9 386H | |
| MSI Raider 16 Max HX B2WJ | |
| MSI Crosshair 16 HX AI D2XWGKG | |
| Lenovo Legion 7 16IAX10 | |
| Asus TUF Gaming A16 FA608UP | |
* ... kleiner is beter
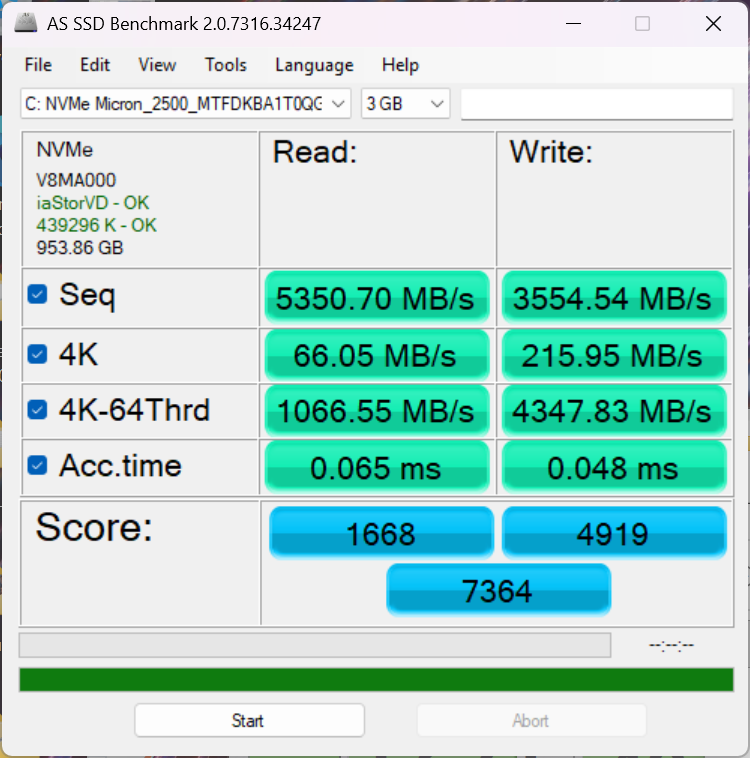
Opslagapparaten
Onze testunit wordt geleverd met dezelfde Micron 2500 PCIe4 x4 NVMe SSD die ook in de Crosshair 16 HX zit.
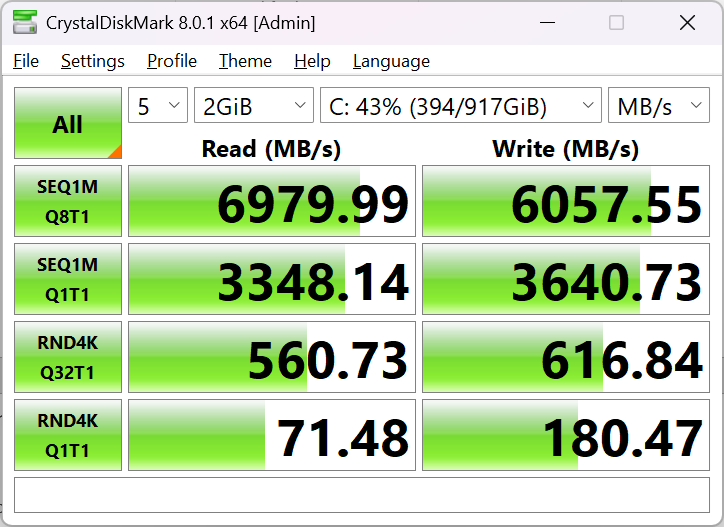

* ... kleiner is beter
Schijf onderdrukken: DiskSpd Leeslus, wachtrijdiepte 8
GPU-prestaties
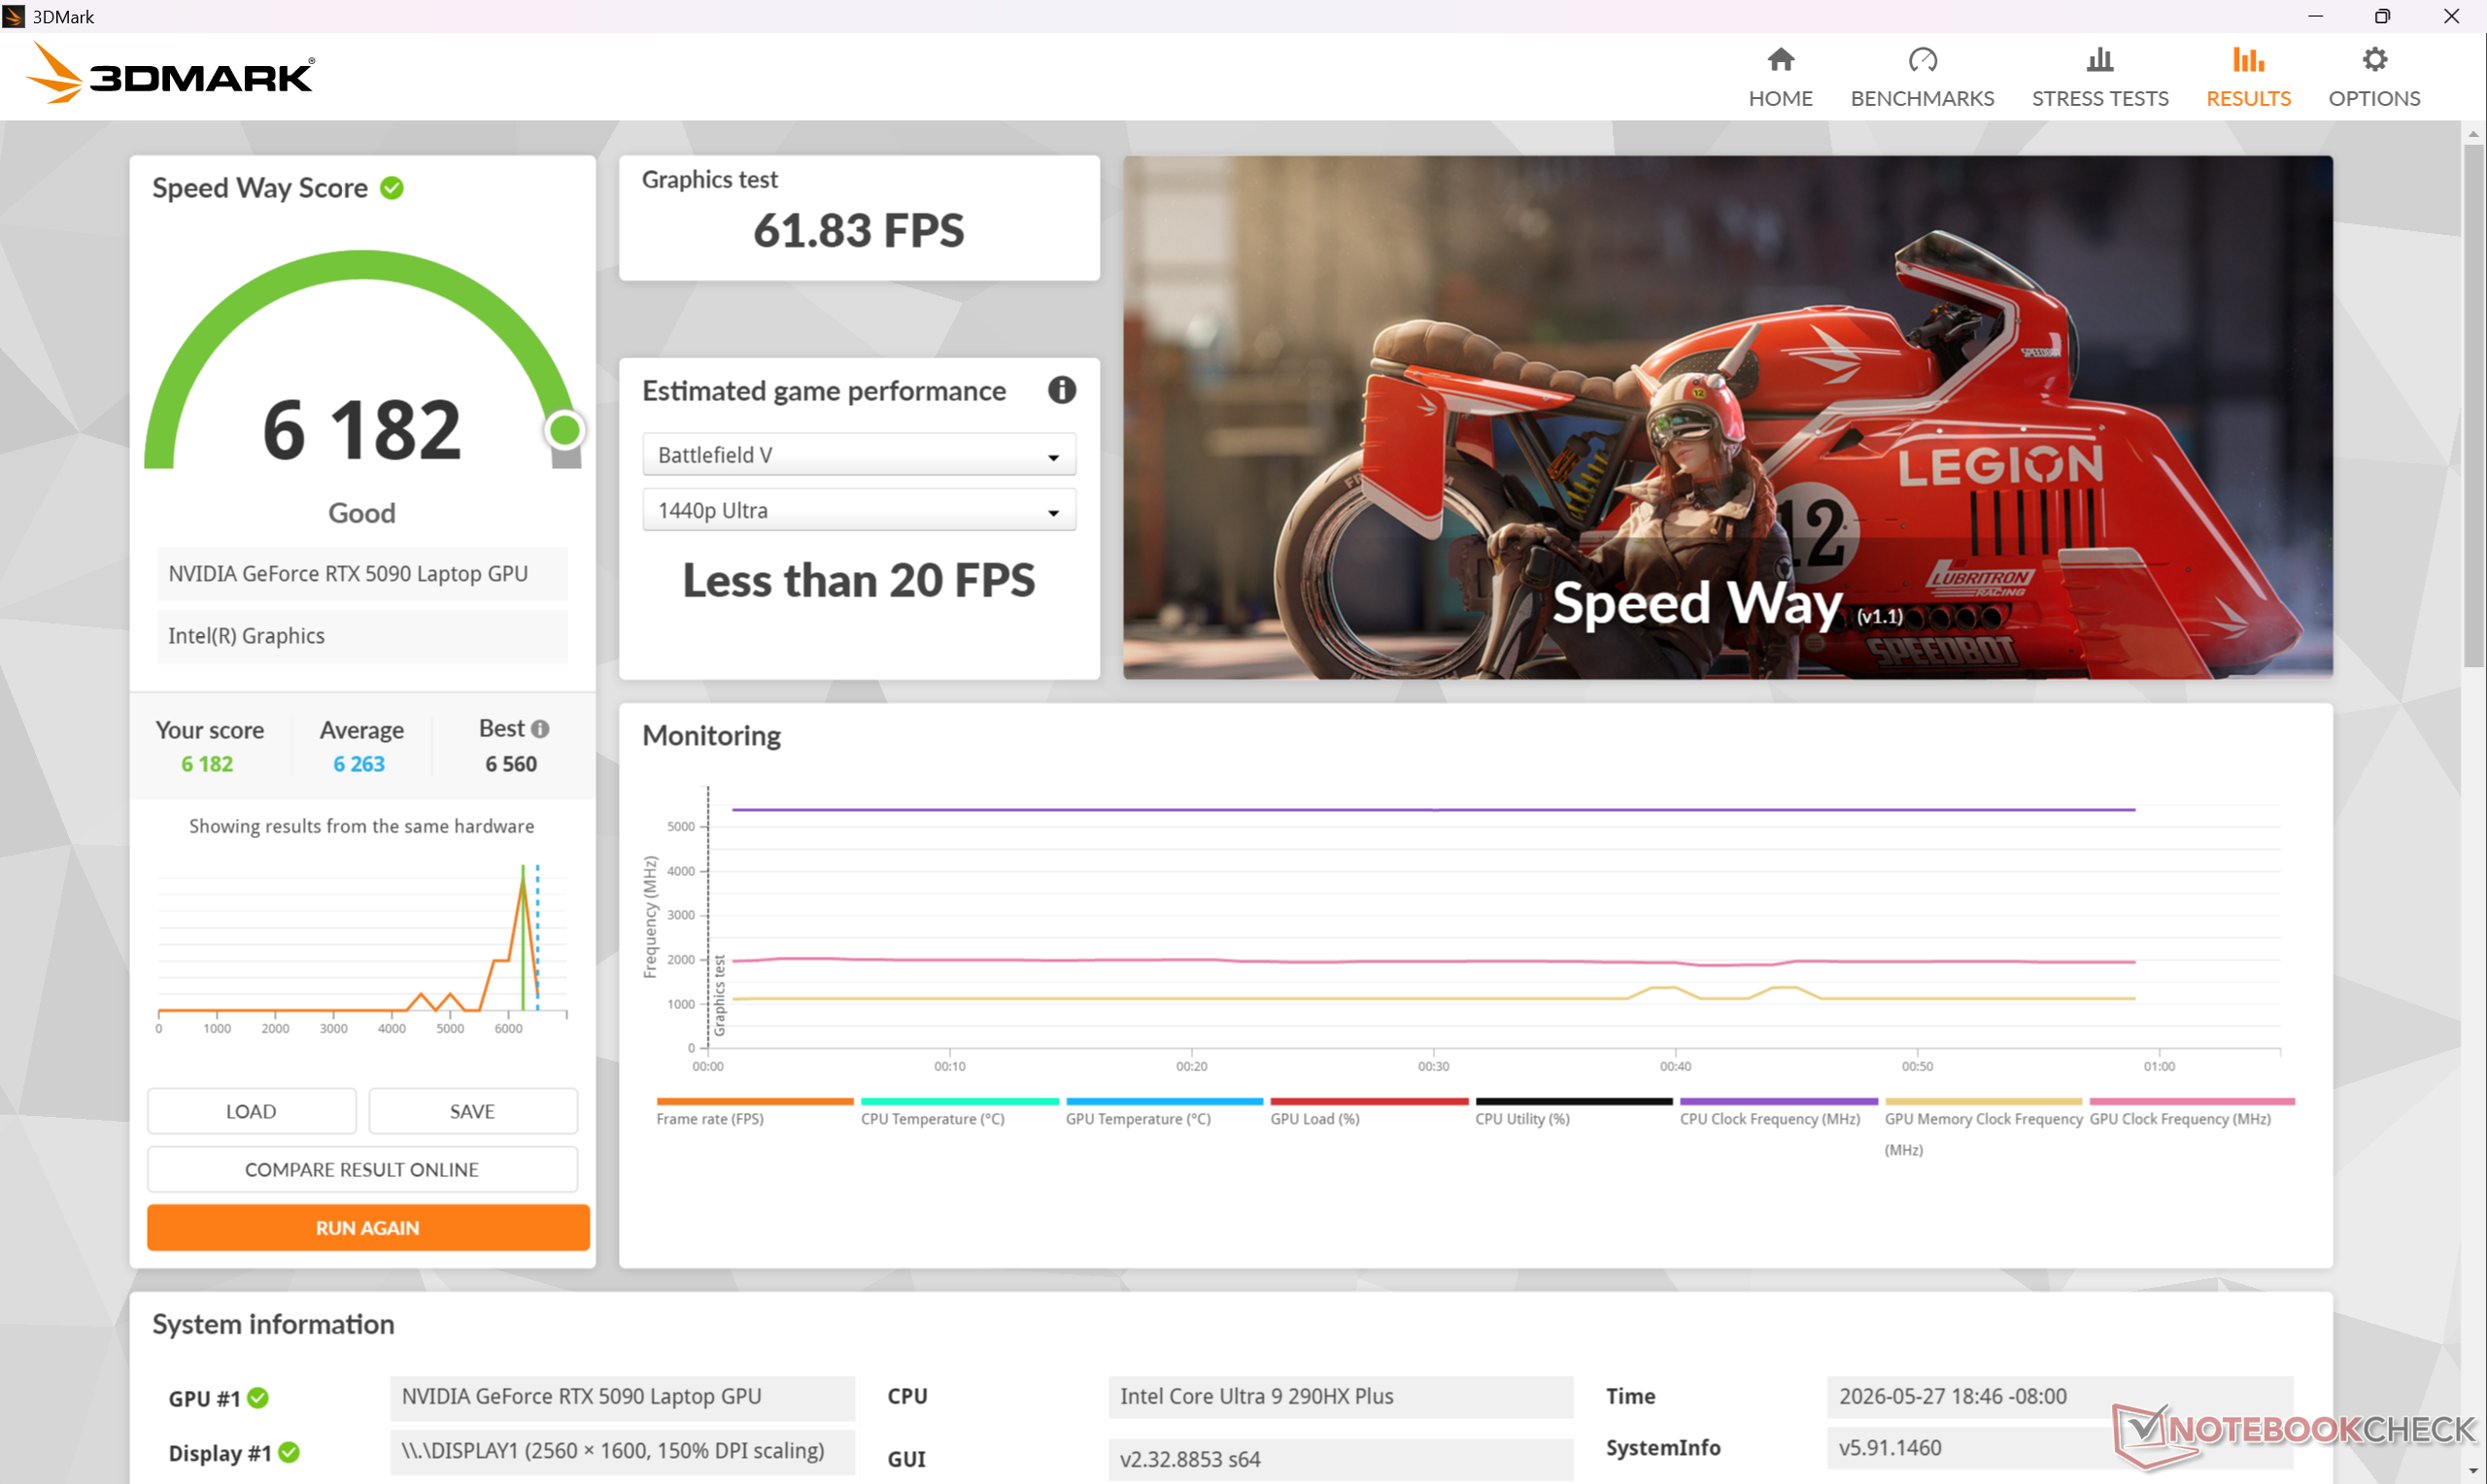
Het systeem in de Apex-modus of Cooler Boost-modus (d.w.z. modus met maximaal ventilatorgeluid) laten draaien is de enige manier om de meeste verwerkingskracht uit zowel de CPU als de GeForce RTX 5090 GPU, zoals blijkt uit onze onderstaande tabel met Time Spy resultaten. Als u naar de stillere Balanced-modus gaat, nemen de algehele prestaties met ongeveer 10 procent af.
| Vermogen Profiel | Grafische Score | Fysica Score | Gecombineerde score |
| Koeler Boost-modus | 26009 | 16635 | 23981 |
| Apex-modus | 25594 (-2%) | 16938 (-2%) | 23771 (-1%) |
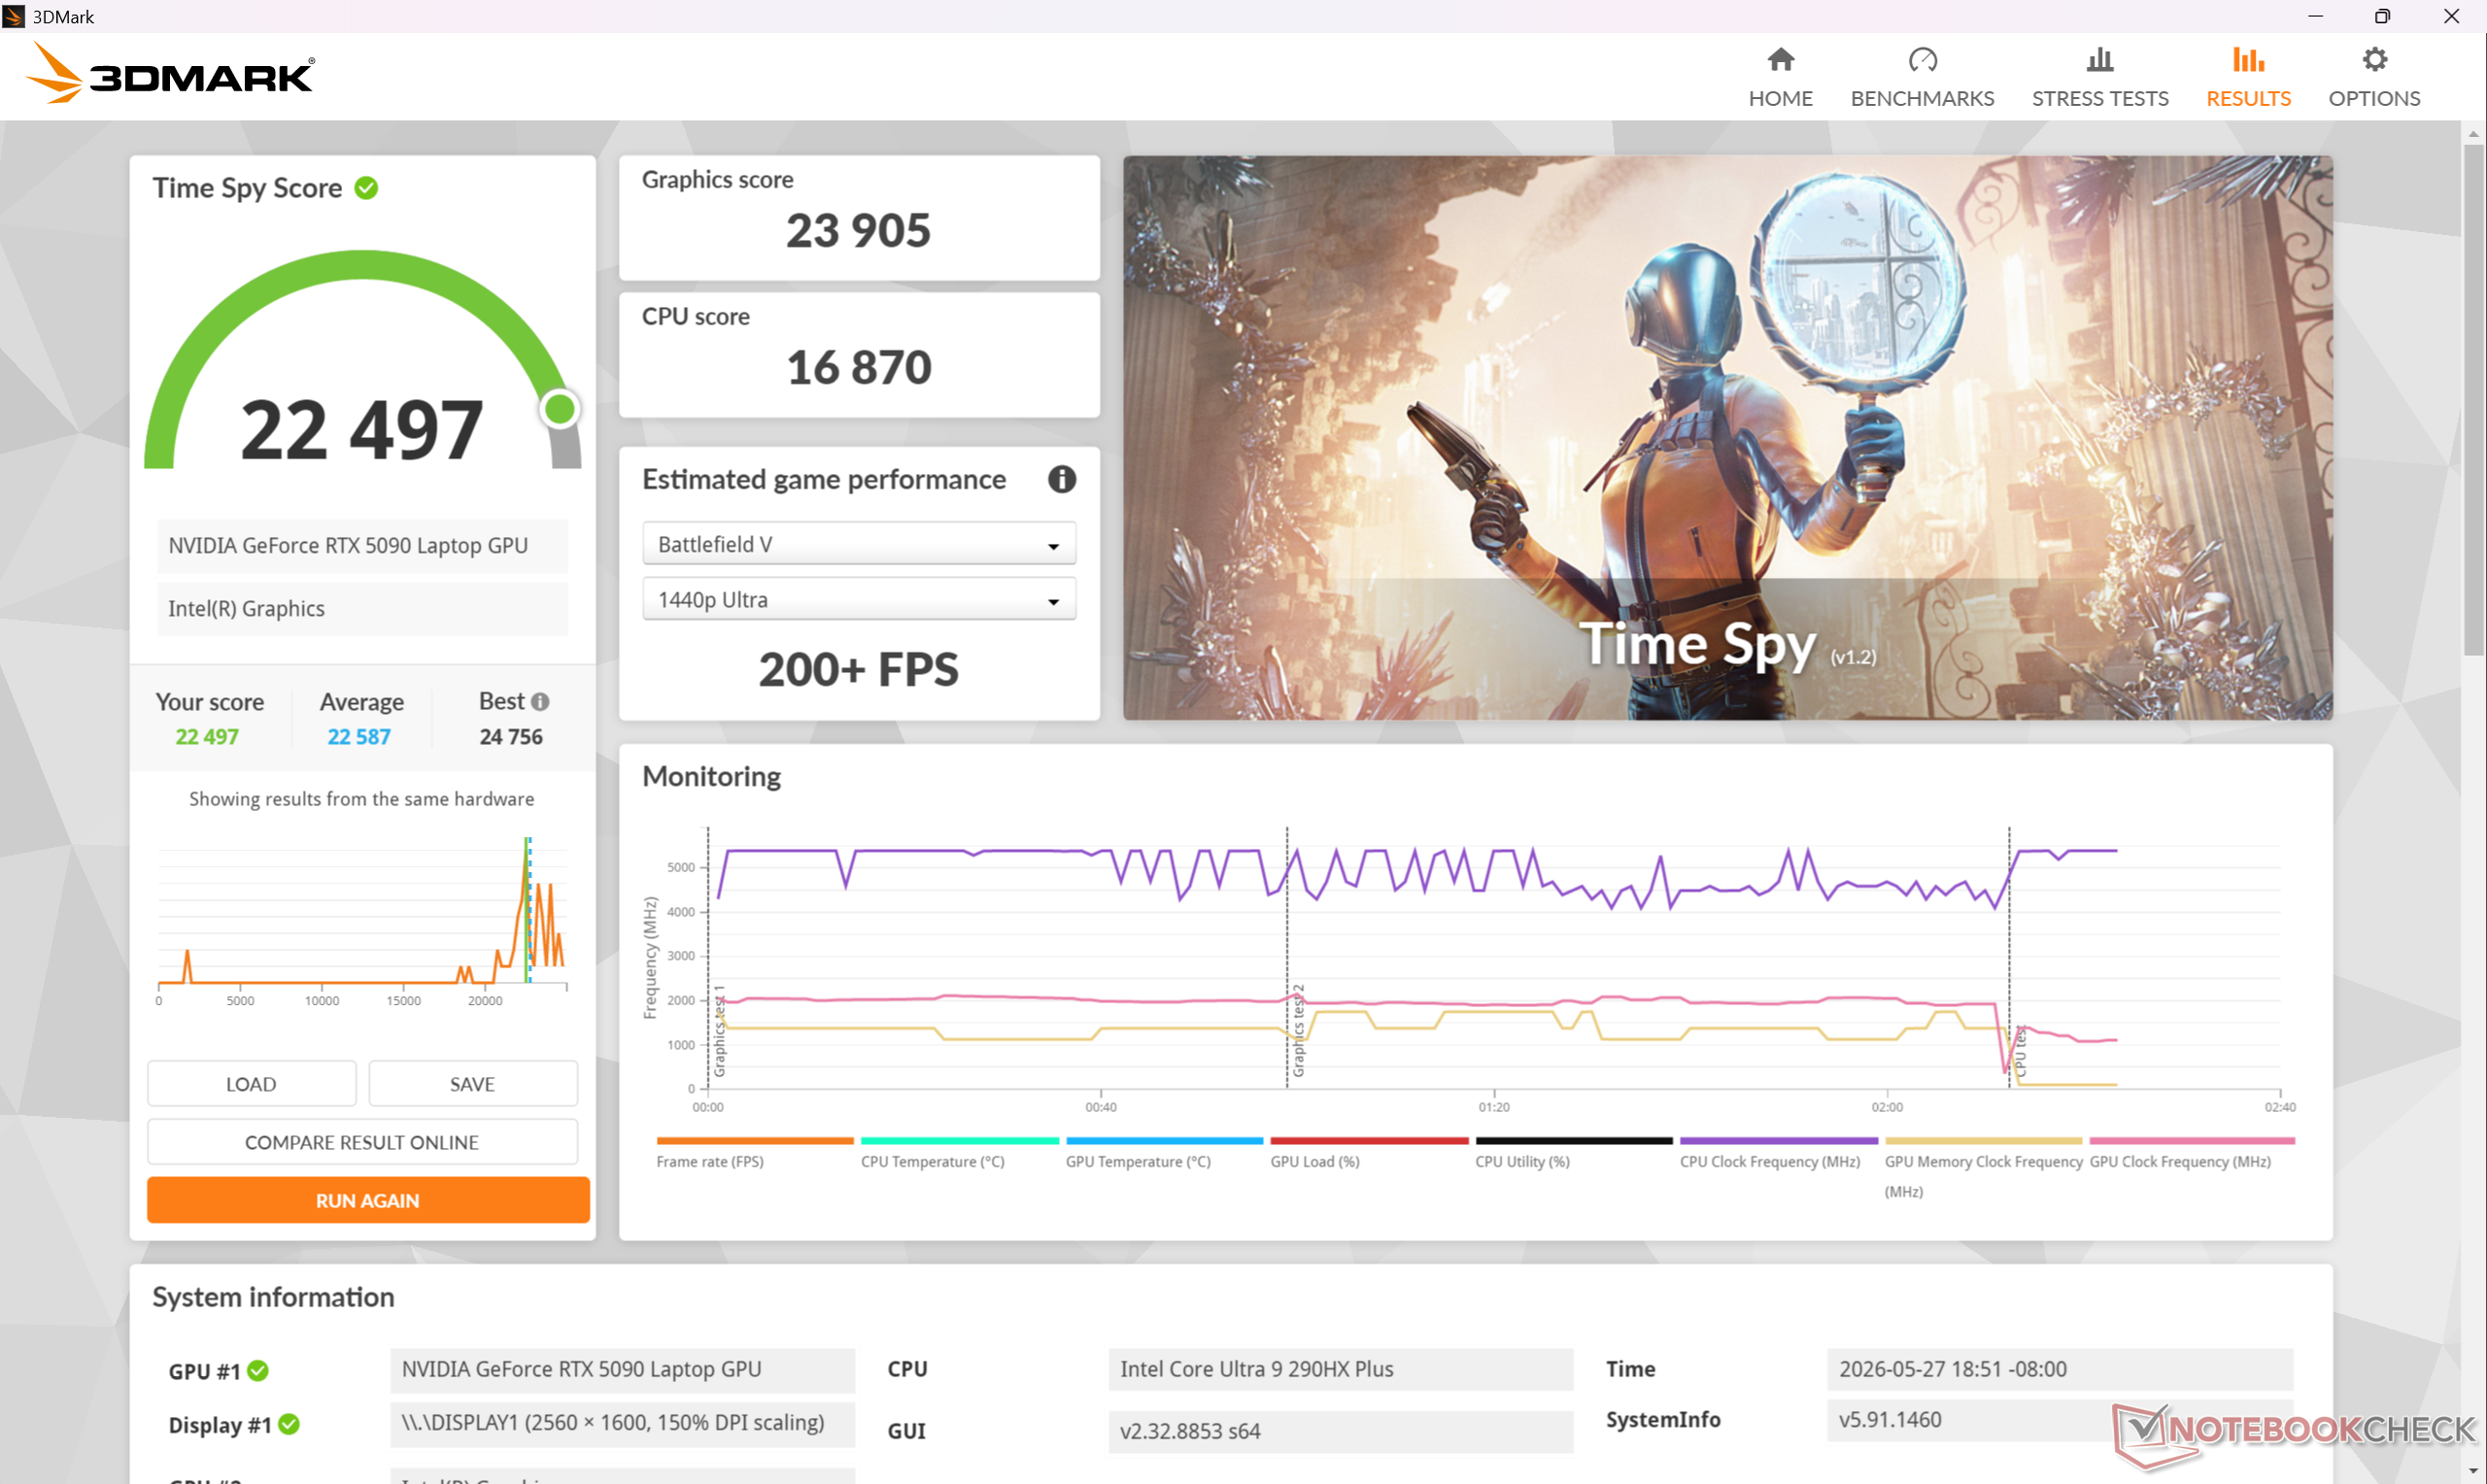
| Modus Extreme prestaties | 23905 (-8%) | 16870 (-1%) | 22497 (-6%) |
| Gebalanceerde modus | 23572 (-9%) | 14462 (-13%) | 21536 (-10%) |
| Energiebesparing | 18192 (-30%) | 13786 (-17%) | 17912 (-25%) |
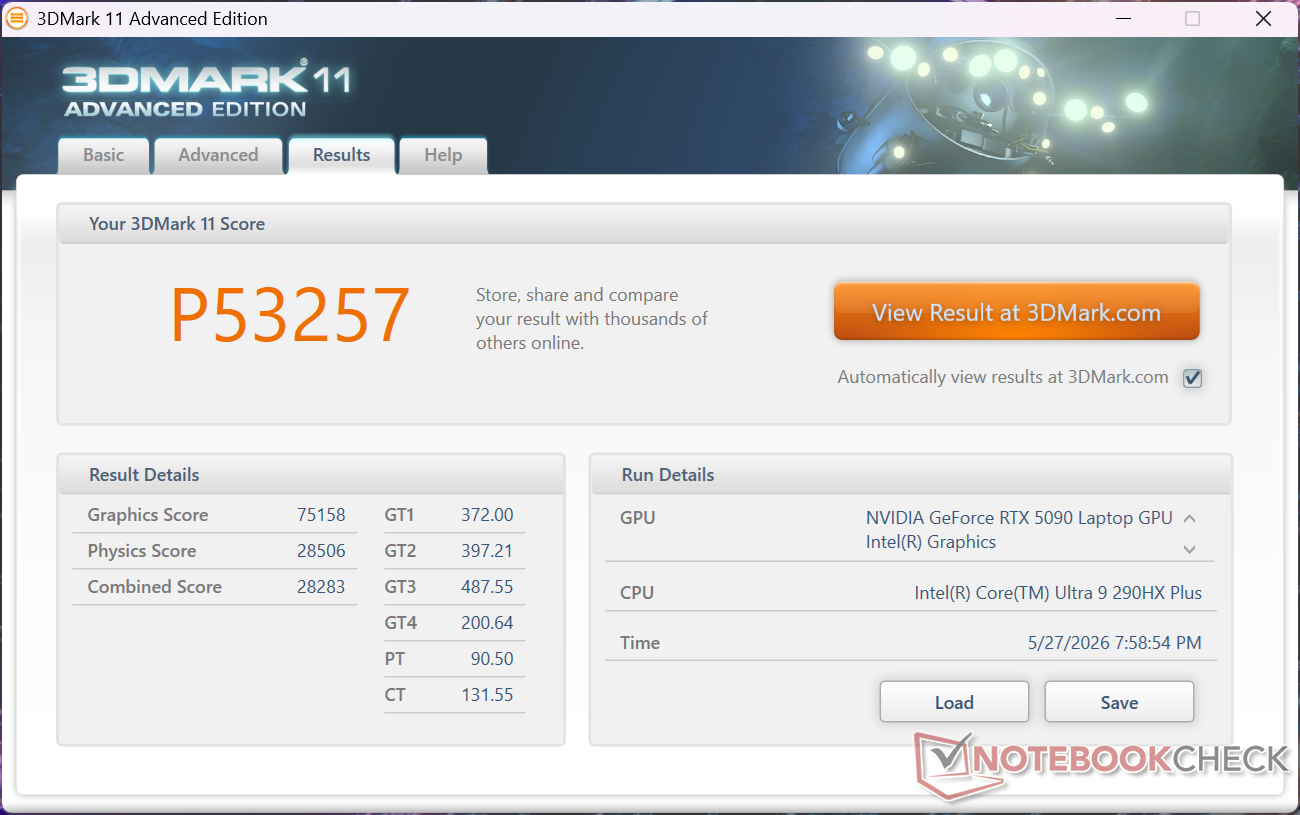
| 3DMark 11 Performance | 53257 punten | |
| 3DMark Cloud Gate Standard Score | 77700 punten | |
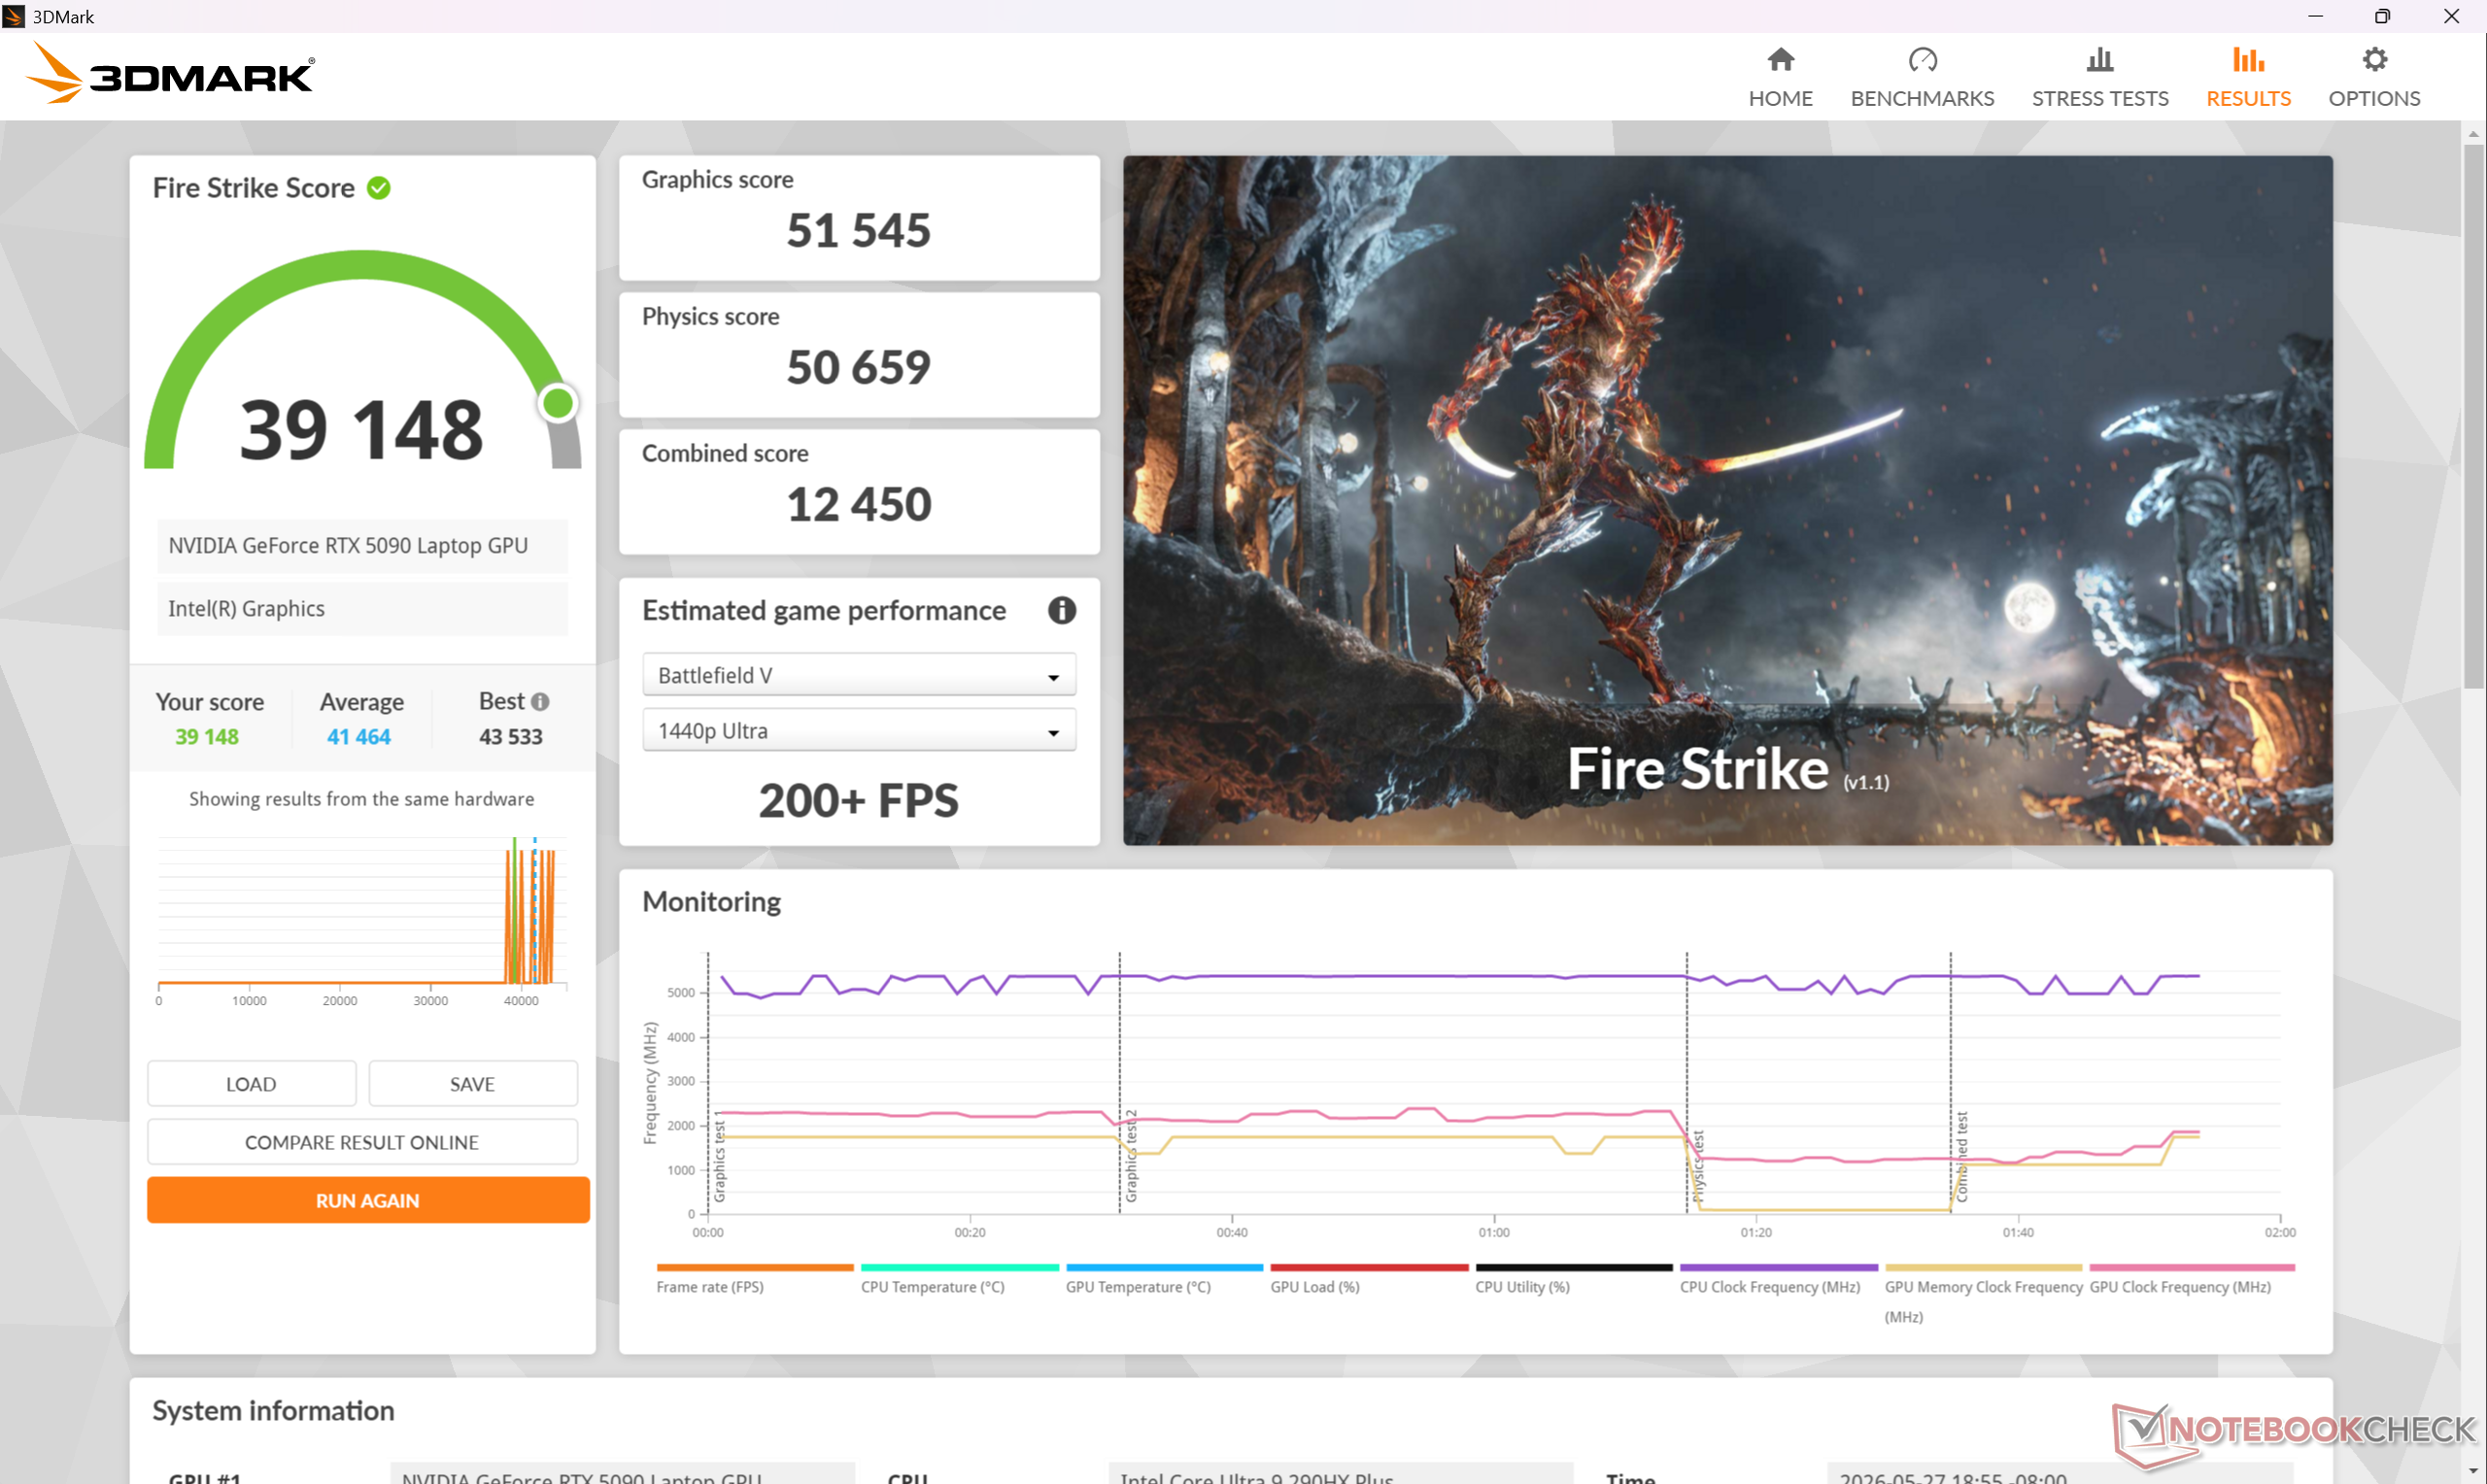
| 3DMark Fire Strike Score | 39148 punten | |
| 3DMark Time Spy Score | 22497 punten | |
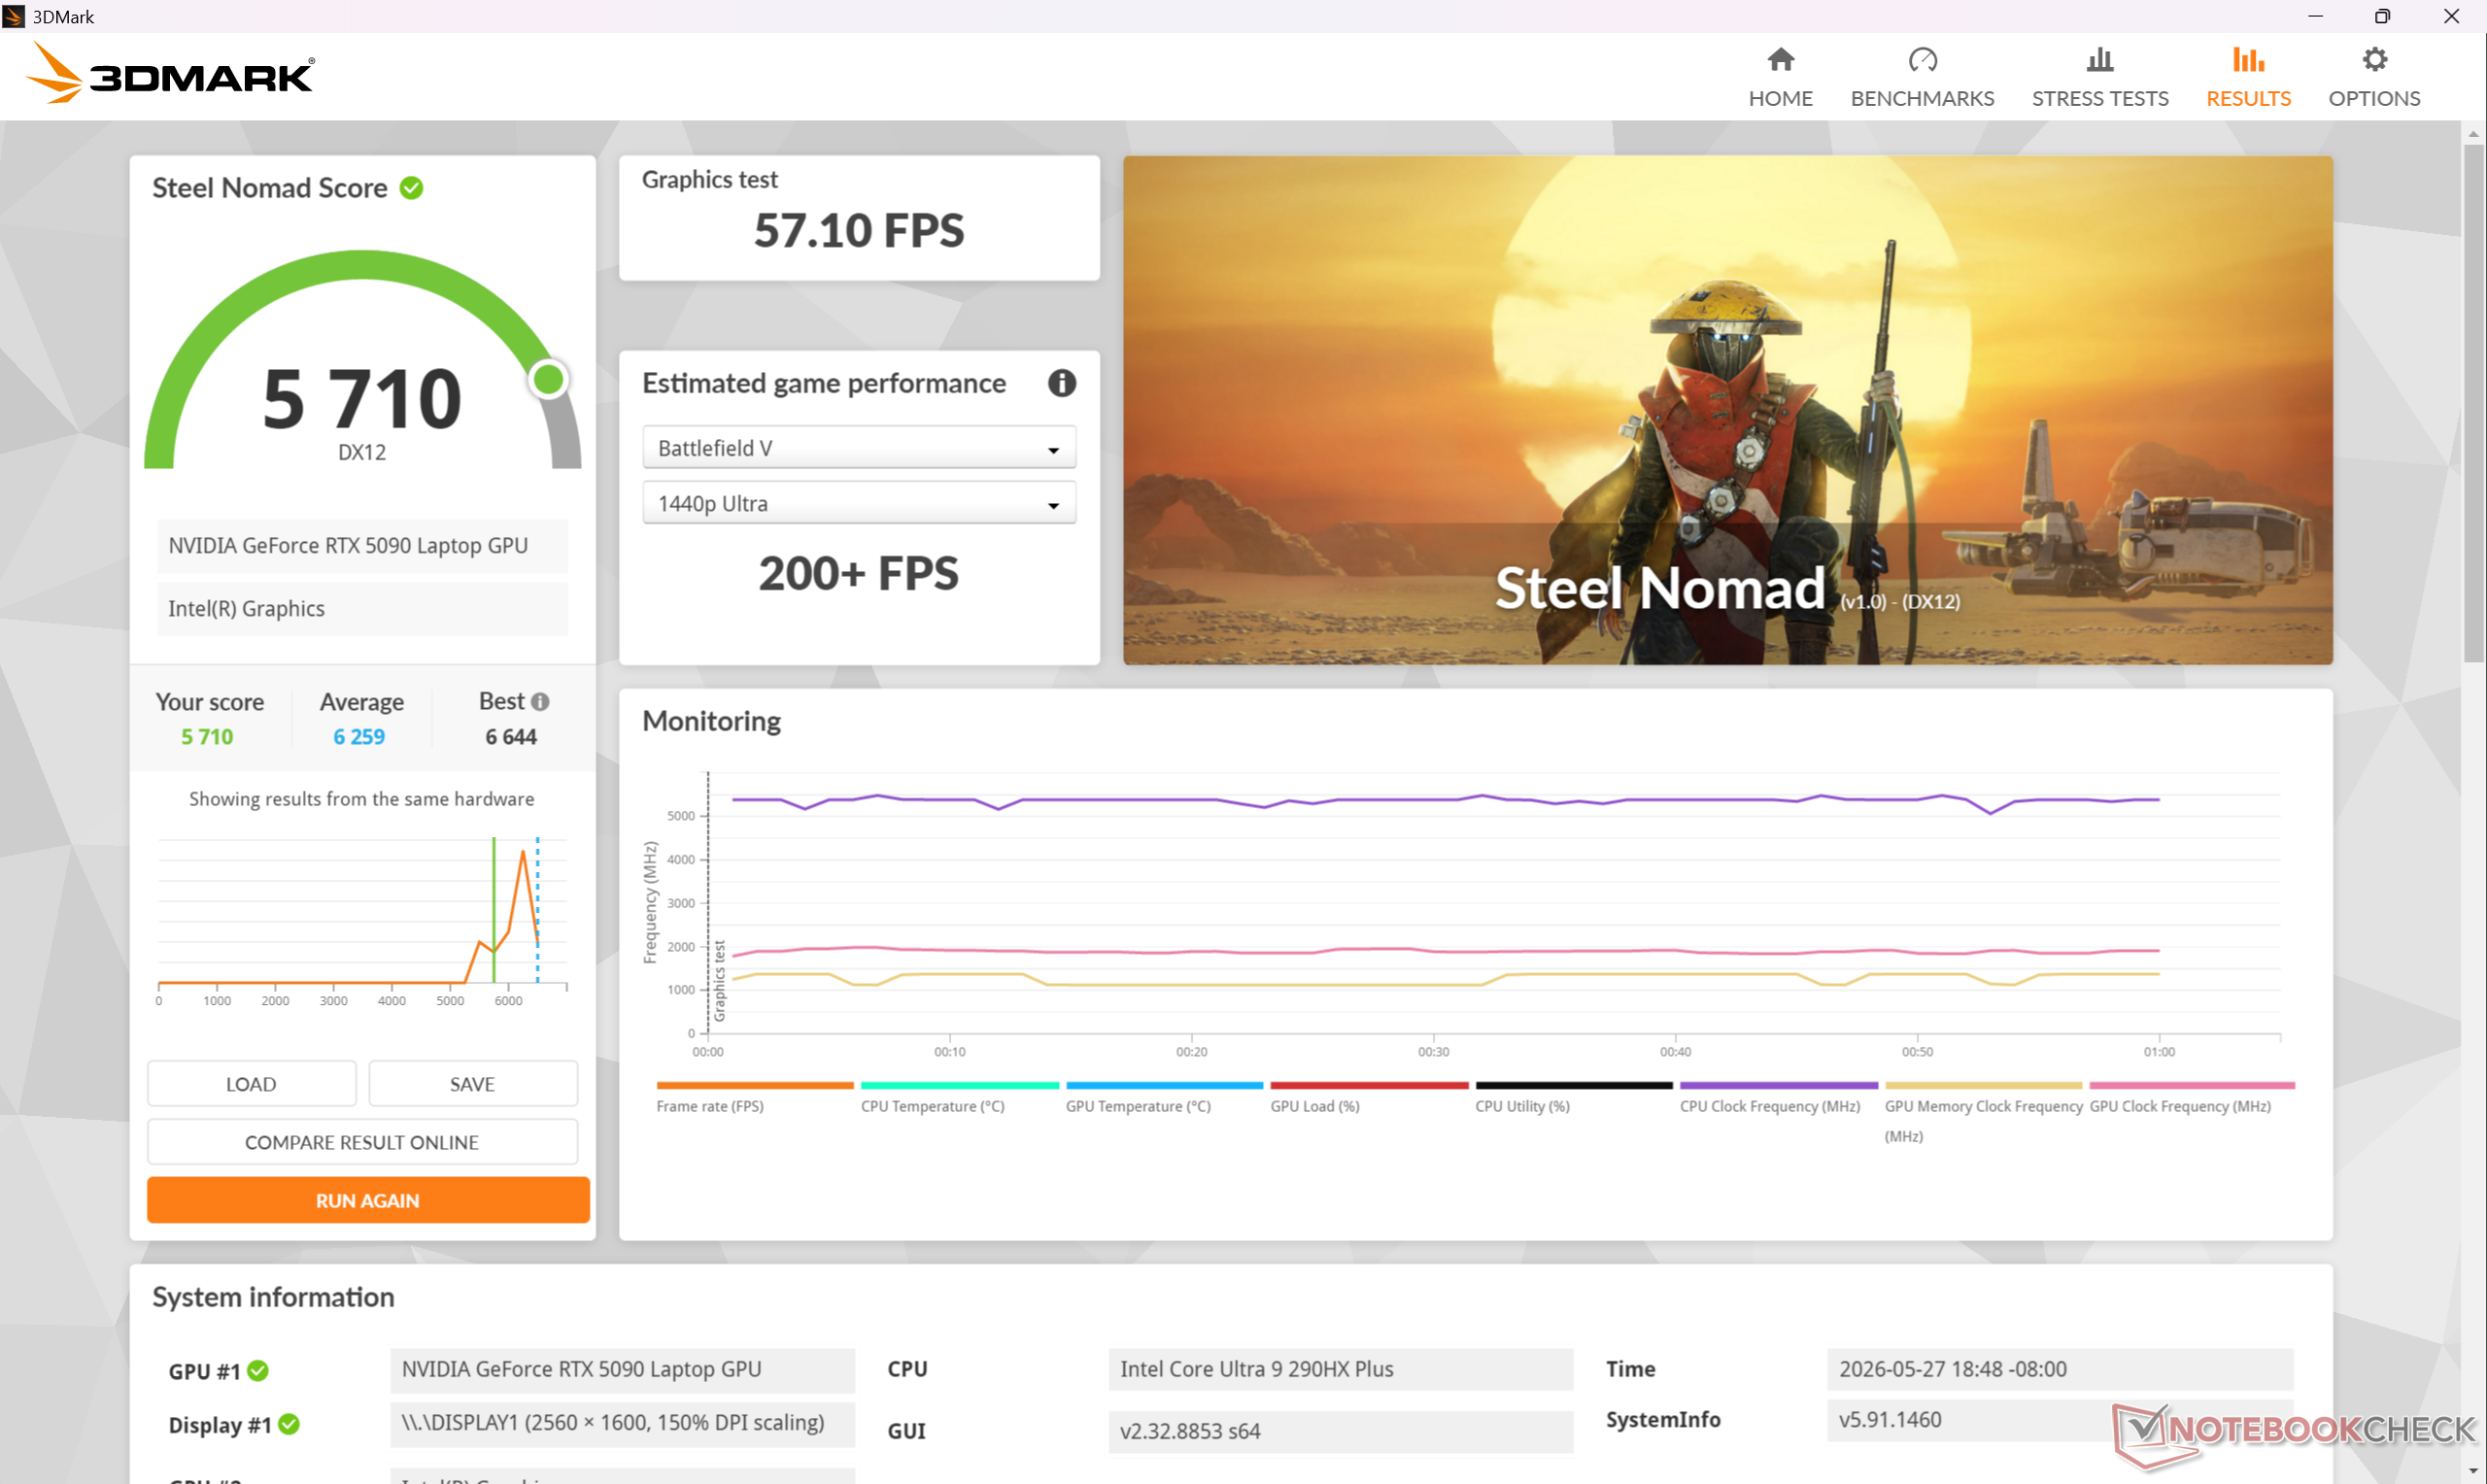
| 3DMark Steel Nomad Score | 5710 punten | |
Help | ||
* ... kleiner is beter
Gaming prestaties
De mobiele GeForce RTX 5090 is waarschijnlijk beter te combineren met een native 1600p beeldscherm in plaats van 4K als u bedenkt dat de desktopversie twee keer krachtiger kan zijn. Houd er rekening mee dat het systeem moet worden ingesteld op de Apex-modus of Cooler Boost-modus om de geadverteerde 175 W TGP volledig te benutten.
| Cyberpunk 2077 - 1920x1080 Ultra Preset (FSR off) | |
| MSI Raider 16 Max HX B2WJ | |
| Razer Blade 16 Core Ultra 9 386H | |
| Alienware 16X Aurora Core Ultra 9 290HX Plus | |
| Asus TUF Gaming A16 FA608UP | |
| MSI Crosshair 16 HX AI D2XWGKG | |
| Lenovo Legion 7 16IAX10 | |
| Baldur's Gate 3 - 1920x1080 Ultra Preset AA:T | |
| MSI Raider 16 Max HX B2WJ | |
| Razer Blade 16 Core Ultra 9 386H | |
| Alienware 16X Aurora Core Ultra 9 290HX Plus | |
| MSI Crosshair 16 HX AI D2XWGKG | |
| Asus TUF Gaming A16 FA608UP | |
| Lenovo Legion 7 16IAX10 | |
| GTA V - 1920x1080 Highest AA:4xMSAA + FX AF:16x | |
| MSI Raider 16 Max HX B2WJ | |
| Alienware 16X Aurora Core Ultra 9 290HX Plus | |
| Lenovo Legion 7 16IAX10 | |
| MSI Crosshair 16 HX AI D2XWGKG | |
| Asus TUF Gaming A16 FA608UP | |
| Razer Blade 16 Core Ultra 9 386H | |
| Final Fantasy XV Benchmark - 1920x1080 High Quality | |
| MSI Raider 16 Max HX B2WJ | |
| Razer Blade 16 Core Ultra 9 386H | |
| Alienware 16X Aurora Core Ultra 9 290HX Plus | |
| Asus TUF Gaming A16 FA608UP | |
| MSI Crosshair 16 HX AI D2XWGKG | |
| Lenovo Legion 7 16IAX10 | |
| Strange Brigade - 1920x1080 ultra AA:ultra AF:16 | |
| MSI Raider 16 Max HX B2WJ | |
| Razer Blade 16 Core Ultra 9 386H | |
| Alienware 16X Aurora Core Ultra 9 290HX Plus | |
| MSI Crosshair 16 HX AI D2XWGKG | |
| Lenovo Legion 7 16IAX10 | |
| Asus TUF Gaming A16 FA608UP | |
| Dota 2 Reborn - 1920x1080 ultra (3/3) best looking | |
| Alienware 16X Aurora Core Ultra 9 290HX Plus | |
| MSI Raider 16 Max HX B2WJ | |
| MSI Crosshair 16 HX AI D2XWGKG | |
| Lenovo Legion 7 16IAX10 | |
| Razer Blade 16 Core Ultra 9 386H | |
| Asus TUF Gaming A16 FA608UP | |
Cyberpunk 2077 ultra FPS Grafiek
| lage | gem. | hoge | ultra | QHD DLSS | QHD | 4K DLSS | 4K | |
|---|---|---|---|---|---|---|---|---|
| GTA V (2015) | 191.4 | 190.9 | 187.5 | 165.2 | 162.3 | 181.5 | ||
| Dota 2 Reborn (2015) | 225 | 206 | 189.6 | 176.1 | 160 | |||
| Final Fantasy XV Benchmark (2018) | 234 | 236 | 205 | 171.3 | 96.3 | |||
| X-Plane 11.11 (2018) | 154.8 | 138 | 112.6 | 93.8 | ||||
| Strange Brigade (2018) | 639 | 503 | 471 | 433 | 329 | 179.6 | ||
| Baldur's Gate 3 (2023) | 287 | 242 | 211 | 207 | 202 | 147.7 | 125.9 | 83.1 |
| Cyberpunk 2077 (2023) | 199.4 | 196.6 | 177.3 | 161.7 | 122.7 | 111.2 | 61 | 50.4 |
| F1 24 (2024) | 353 | 379 | 364 | 153.8 | 154.1 | 99.8 | 85.3 | 50.5 |
| Black Myth: Wukong (2024) | 122 | 97 | 58 | 65 | 45 | 46 | 27 | |
| Assassin's Creed Shadows (2025) | 102 | 89 | 69 | 70 | 59 | 56 | 43 |
Uitstoot
Systeemgeluid
Het ventilatorgeluid is nauw verbonden met de vijf energieprofielinstellingen in volgorde van laagste tot hoogste prestatie: Eco, Balanced, Extreme Performance, Apex en Cooler Boost. Als Cyberpunk 2077 op deze profielen wordt uitgevoerd, stabiliseert het ventilatorgeluid zich op respectievelijk 36,2 dB(A), 47,5 dB(A), 51,1 dB(A), 57 dB(A) en 60,2 dB(A). Pulserend gedrag is over het algemeen minimaal wanneer het is ingesteld op Gebalanceerde modus of lager. Toch is 51,1 dB(A) bij gamen in de modus Extreme prestaties iets stiller dan concurrerende modellen zoals de Lenovo Legion 7 16IAX10 of Razer Blade 16.
Geluidsniveau
| Onbelast |
| 26.6 / 26.7 / 26.9 dB (A) |
| Belasting |
| 36 / 60.2 dB (A) |
 | ||
30 dB stil 40 dB(A) hoorbaar 50 dB(A) luid |
||
min: | ||
| MSI Raider 16 Max HX B2WJ Ultra 9 290HX Plus, GeForce RTX 5090 Laptop | MSI Crosshair 16 HX AI D2XWGKG Ultra 9 275HX, GeForce RTX 5070 Laptop | Razer Blade 16 Core Ultra 9 386H Ultra 9 386H, GeForce RTX 5090 Laptop | Alienware 16X Aurora Core Ultra 9 290HX Plus Ultra 9 290HX Plus, GeForce RTX 5070 Ti Laptop | Asus TUF Gaming A16 FA608UP R7 260, GeForce RTX 5070 Laptop | Lenovo Legion 7 16IAX10 Ultra 7 255HX, GeForce RTX 5060 Laptop | |
|---|---|---|---|---|---|---|
| Noise | -11% | -1% | -4% | -11% | 1% | |
| uit / omgeving * (dB) | 23.1 | 25.56 -11% | 23.1 -0% | 23.4 -1% | 25.1 -9% | 23.9 -3% |
| Idle Minimum * (dB) | 26.6 | 28.3 -6% | 23.4 12% | 23.8 11% | 32.2 -21% | 24 10% |
| Idle Average * (dB) | 26.7 | 28.3 -6% | 25.4 5% | 23.8 11% | 32.2 -21% | 26 3% |
| Idle Maximum * (dB) | 26.9 | 28.3 -5% | 29.3 -9% | 31.4 -17% | 32.2 -20% | 29.4 -9% |
| Load Average * (dB) | 36 | 50.26 -40% | 42.6 -18% | 48.7 -35% | 38.1 -6% | 35.4 2% |
| Cyberpunk 2077 ultra * (dB) | 51.1 | 57.8 -13% | 53.6 -5% | 51.5 -1% | 53.9 -5% | 54.6 -7% |
| Load Maximum * (dB) | 60.2 | 57.95 4% | 53.7 11% | 59.8 1% | 57.1 5% | 54.7 9% |
* ... kleiner is beter
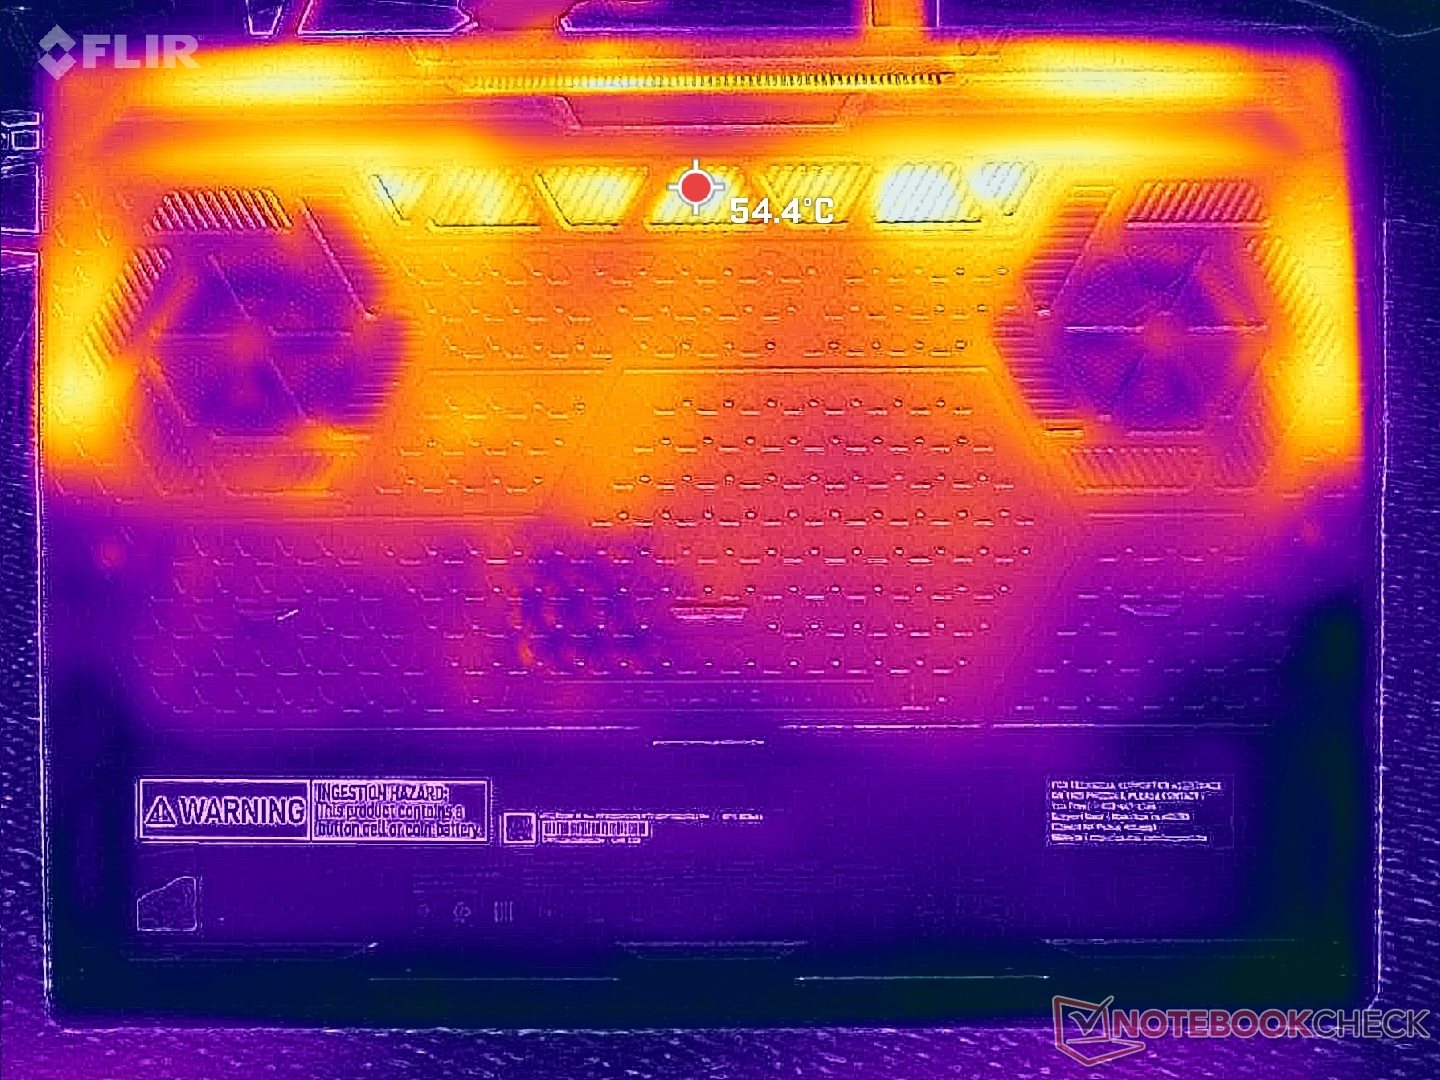
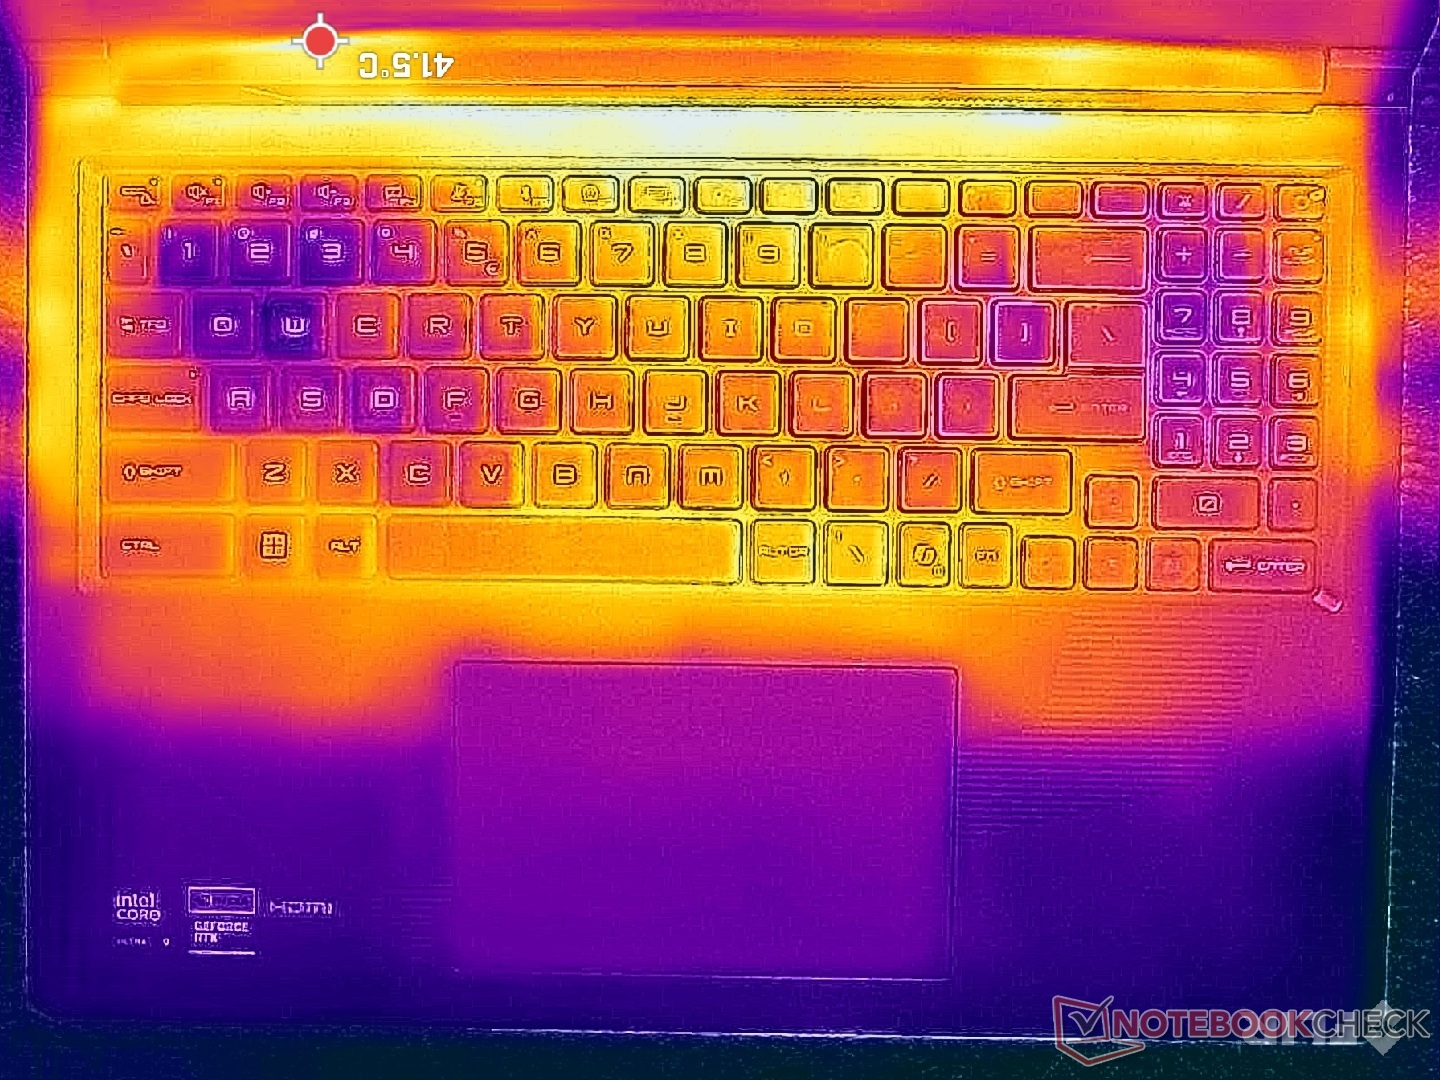
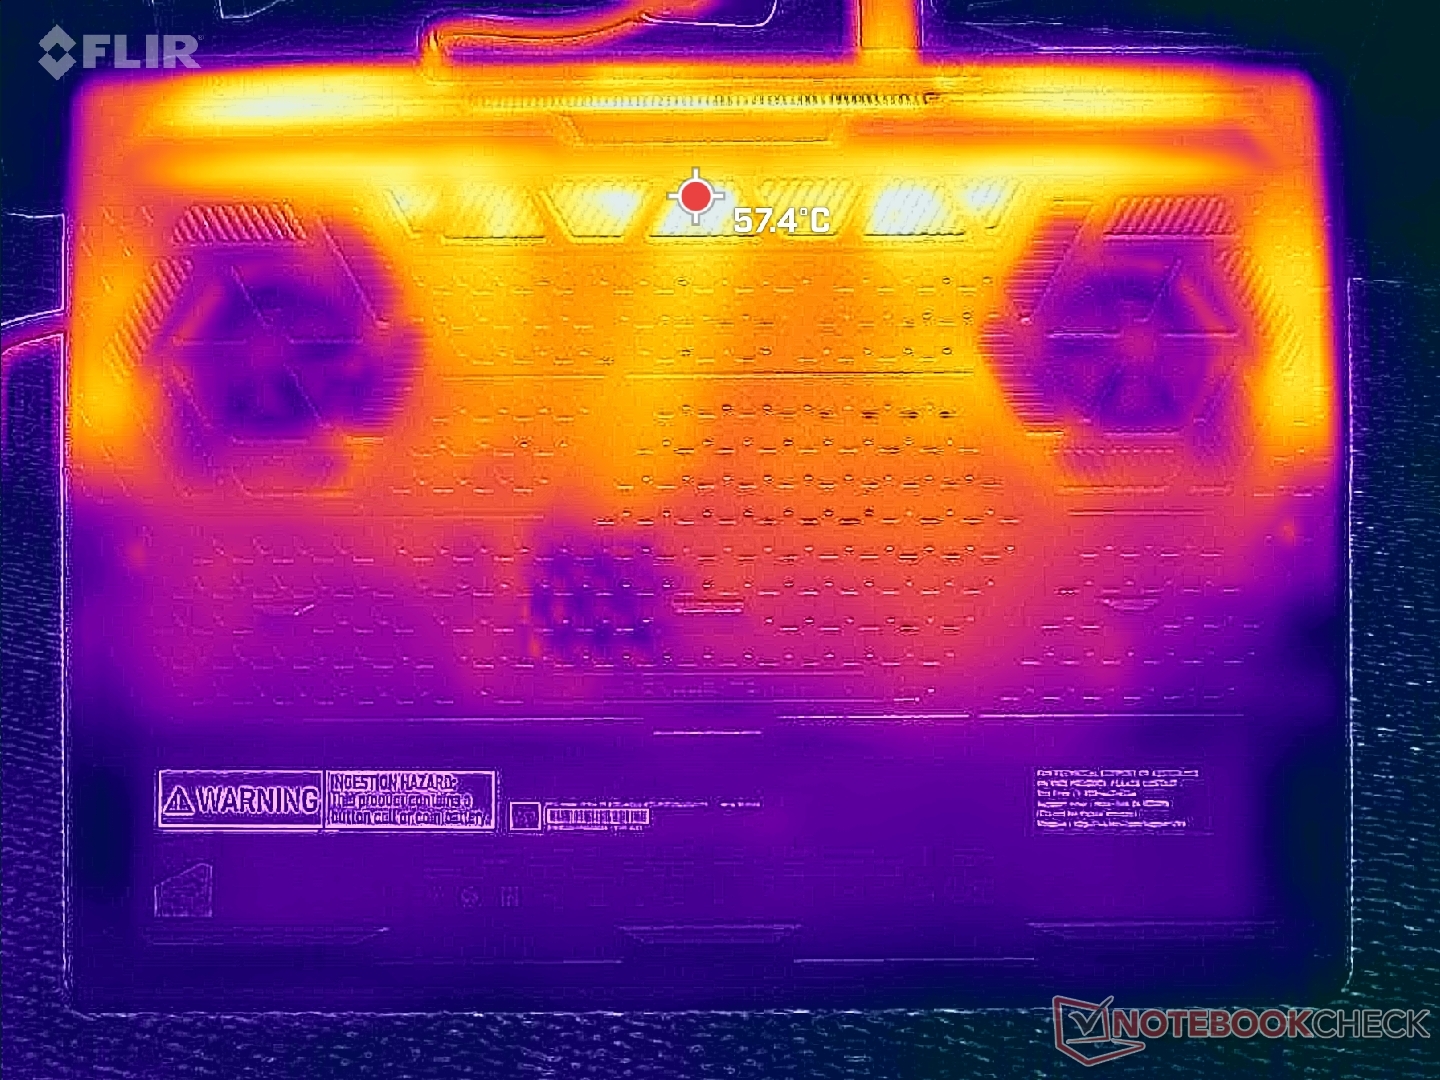
Temperatuur
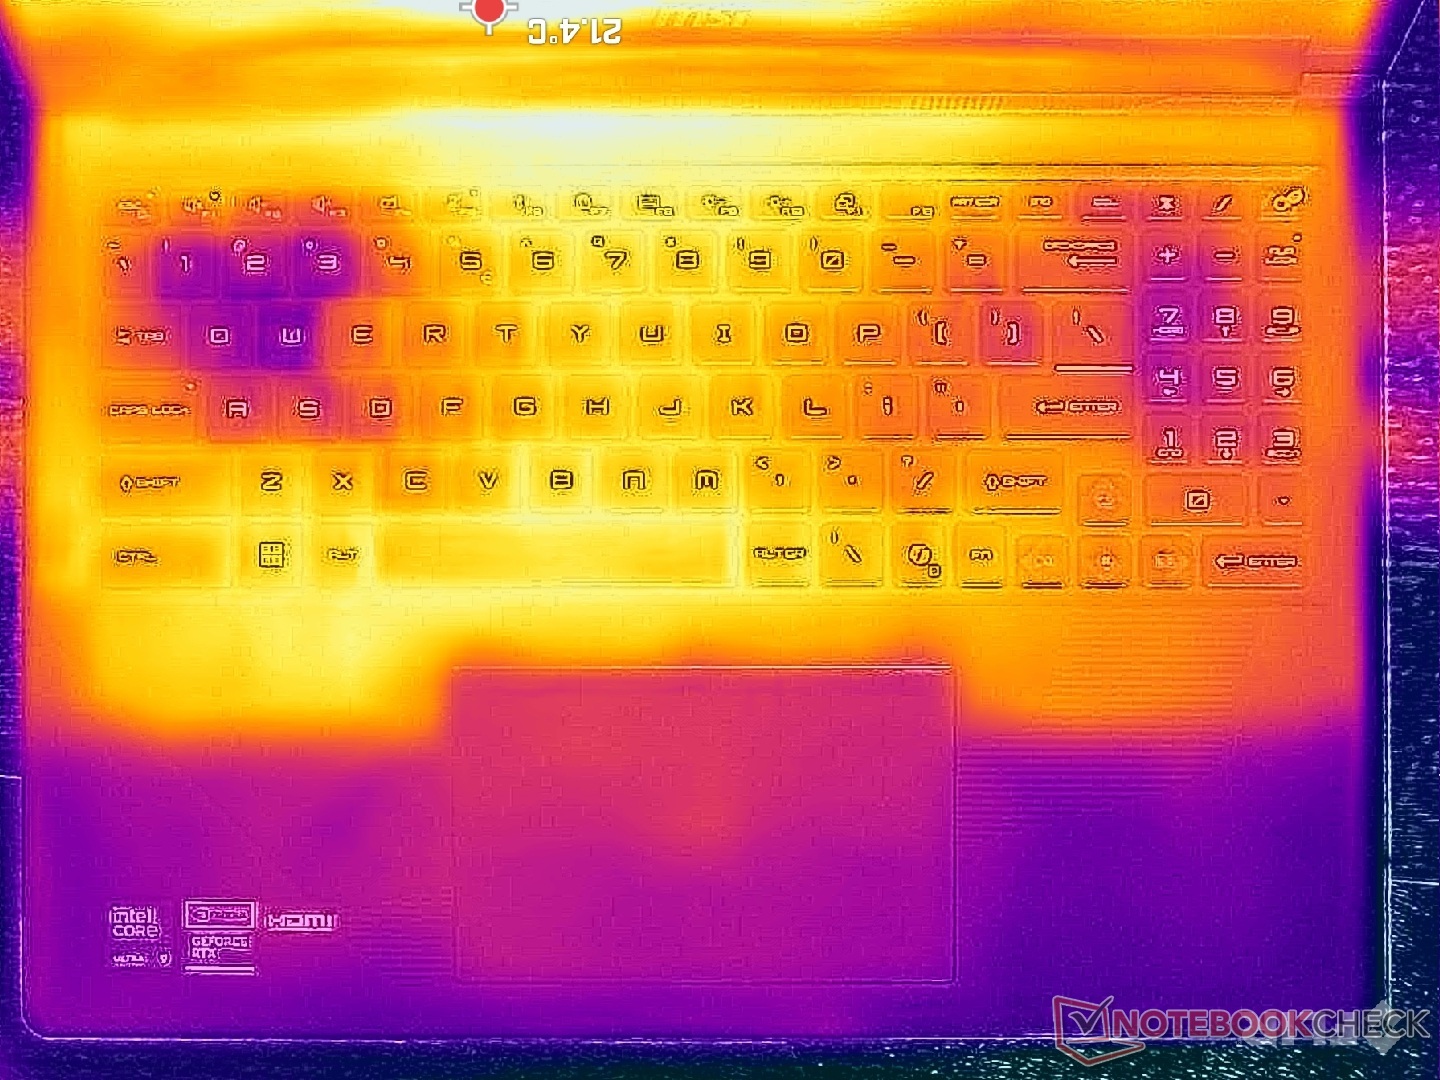
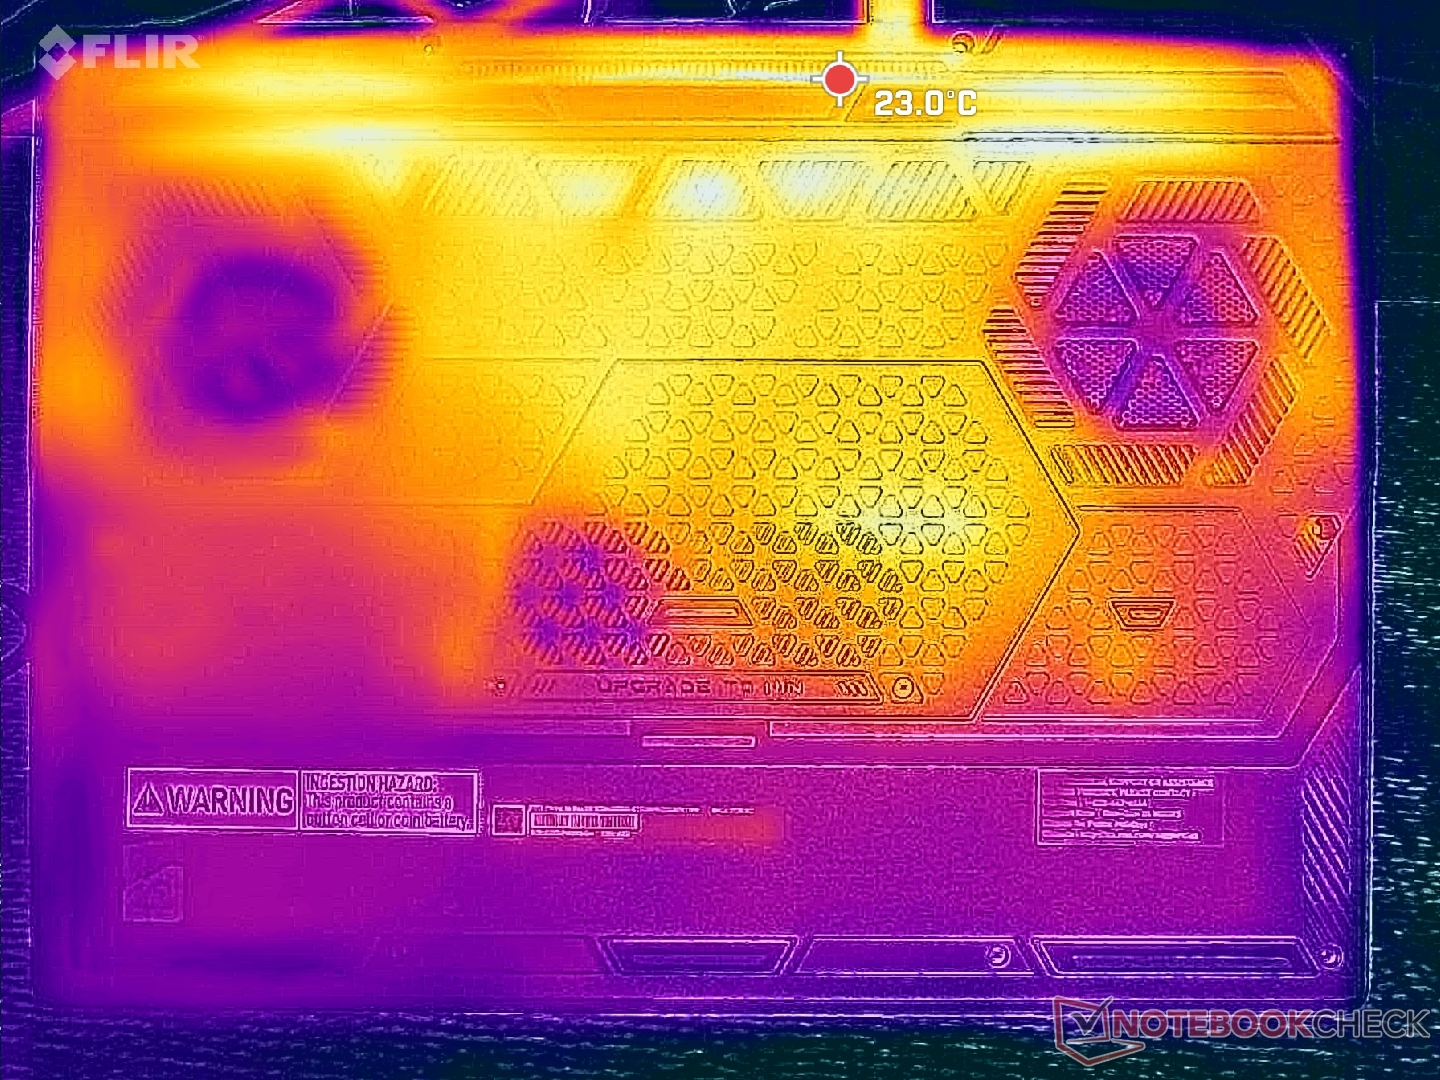
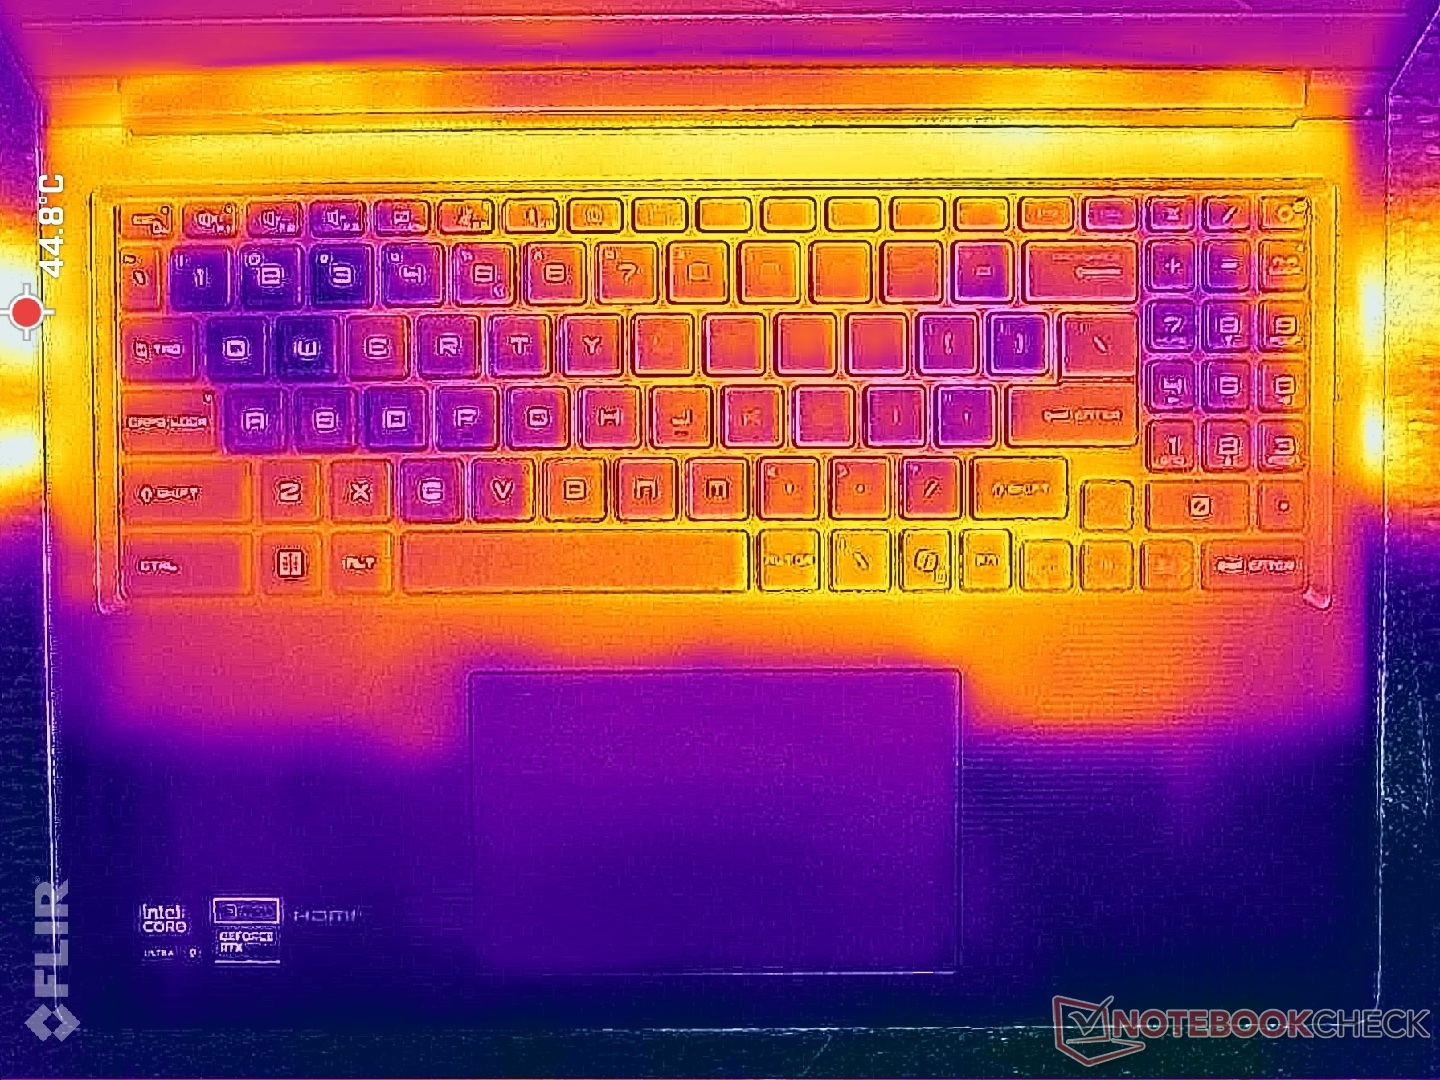
De hotspots van de oppervlaktetemperatuur bereiken respectievelijk 44 C en 46 C op het toetsenbord en de onderklep, wat een paar graden koeler is dan wat we op de dunnere Razer Blade 16 hebben waargenomen.
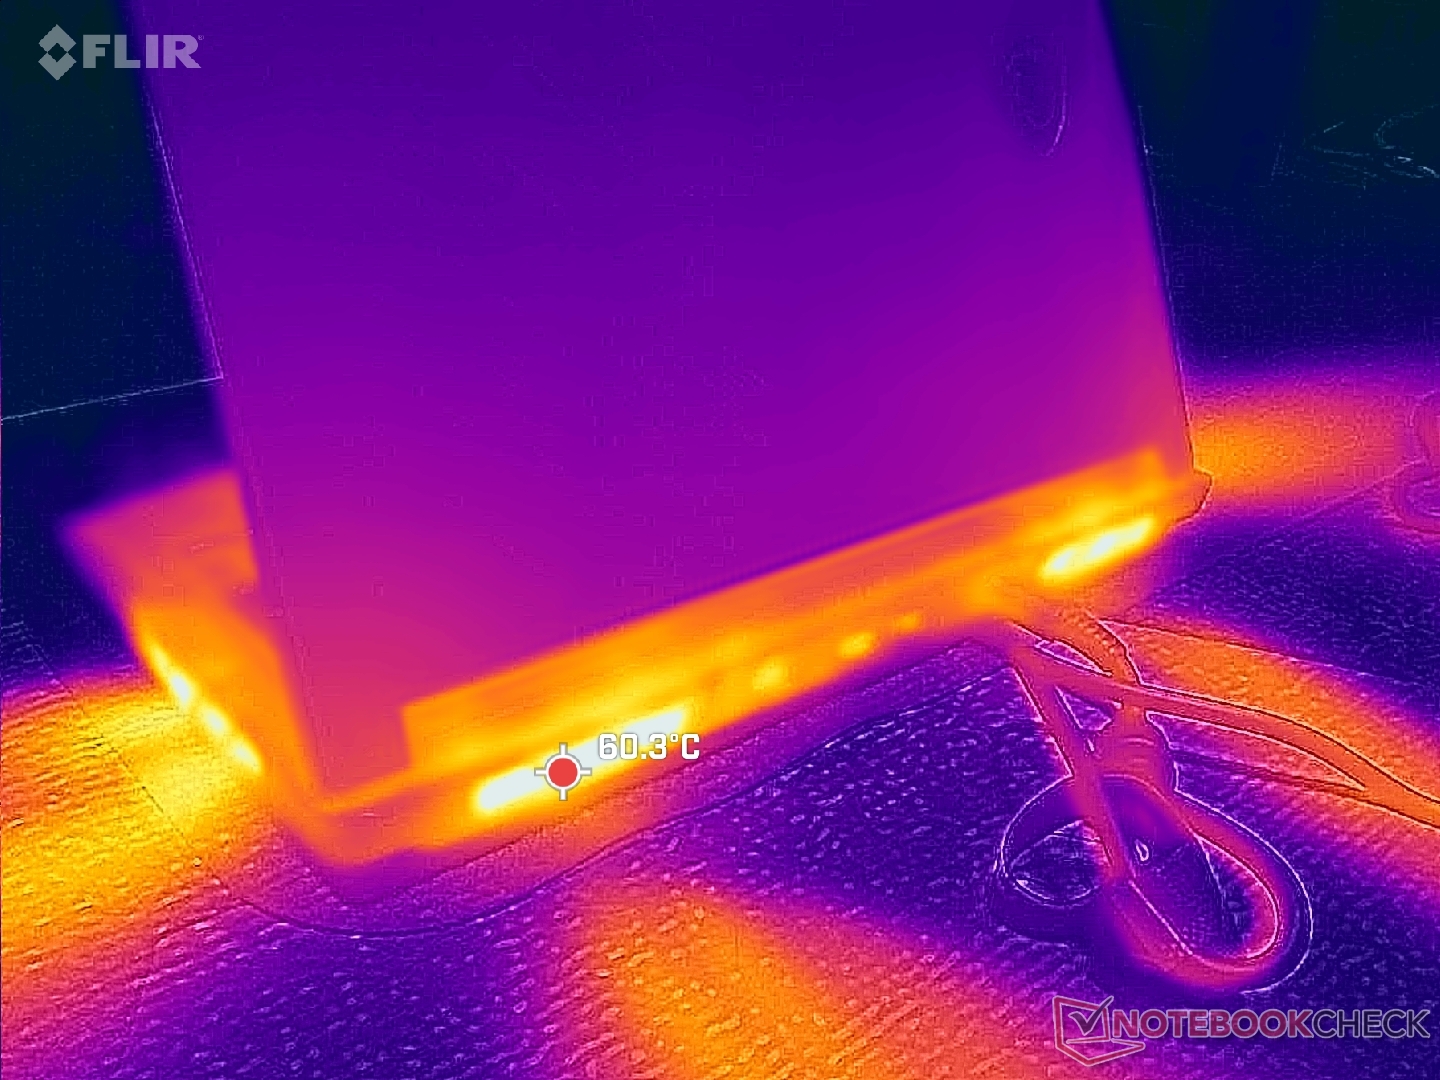
(±) De maximumtemperatuur aan de bovenzijde bedraagt 43.2 °C / 110 F, vergeleken met het gemiddelde van 40.4 °C / 105 F, variërend van 21.2 tot 68.8 °C voor de klasse Gaming.
(-) De bodem warmt op tot een maximum van 45.6 °C / 114 F, vergeleken met een gemiddelde van 43.2 °C / 110 F
(+) Bij onbelast gebruik bedraagt de gemiddelde temperatuur voor de bovenzijde 26.1 °C / 79 F, vergeleken met het apparaatgemiddelde van 33.9 °C / 93 F.
(±) 3: The average temperature for the upper side is 34.1 °C / 93 F, compared to the average of 33.9 °C / 93 F for the class Gaming.
(+) De handpalmsteunen en het touchpad bereiken maximaal de huidtemperatuur (33.6 °C / 92.5 F) en zijn dus niet heet.
(-) De gemiddelde temperatuur van de handpalmsteun van soortgelijke toestellen bedroeg 28.8 °C / 83.8 F (-4.8 °C / -8.7 F).
| MSI Raider 16 Max HX B2WJ Ultra 9 290HX Plus, GeForce RTX 5090 Laptop | MSI Crosshair 16 HX AI D2XWGKG Ultra 9 275HX, GeForce RTX 5070 Laptop | Razer Blade 16 Core Ultra 9 386H Ultra 9 386H, GeForce RTX 5090 Laptop | Alienware 16X Aurora Core Ultra 9 290HX Plus Ultra 9 290HX Plus, GeForce RTX 5070 Ti Laptop | Asus TUF Gaming A16 FA608UP R7 260, GeForce RTX 5070 Laptop | Lenovo Legion 7 16IAX10 Ultra 7 255HX, GeForce RTX 5060 Laptop | |
|---|---|---|---|---|---|---|
| Heat | -3% | -17% | 2% | 8% | -14% | |
| Maximum Upper Side * (°C) | 43.2 | 44.8 -4% | 45.6 -6% | 48.2 -12% | 39.5 9% | 47 -9% |
| Maximum Bottom * (°C) | 45.6 | 43.4 5% | 47 -3% | 41 10% | 45.1 1% | 44 4% |
| Idle Upper Side * (°C) | 27.8 | 31.2 -12% | 35.2 -27% | 28.2 -1% | 25.7 8% | 35.6 -28% |
| Idle Bottom * (°C) | 29 | 28.8 1% | 37.6 -30% | 26.2 10% | 25.5 12% | 35.2 -21% |
* ... kleiner is beter
Stresstest
De CPU steeg naar 4,5 GHz, 215 W en 105 C gedurende ongeveer een minuut na het starten van Prime95 stress. Daarna daalde hij naar 3,9 GHz en ~152 W om een beter beheersbare kerntemperatuur van 96 C te handhaven Alienware 16 Area-51die geleverd wordt met exact dezelfde CPU als onze MSI, stabiliseerde zich ook in het hoge bereik van 90 C onder vergelijkbare omstandigheden, wat suggereert dat de Core Ultra 9 290HX Plus een van de warmst lopende mobiele CPU's op de markt is.
Let op de gestaag stijgende gemiddelde GPU-kloksnelheden wanneer u overschakelt naar snellere stroomprofielen, zoals blijkt uit de onderstaande schermafbeeldingen en tabel.
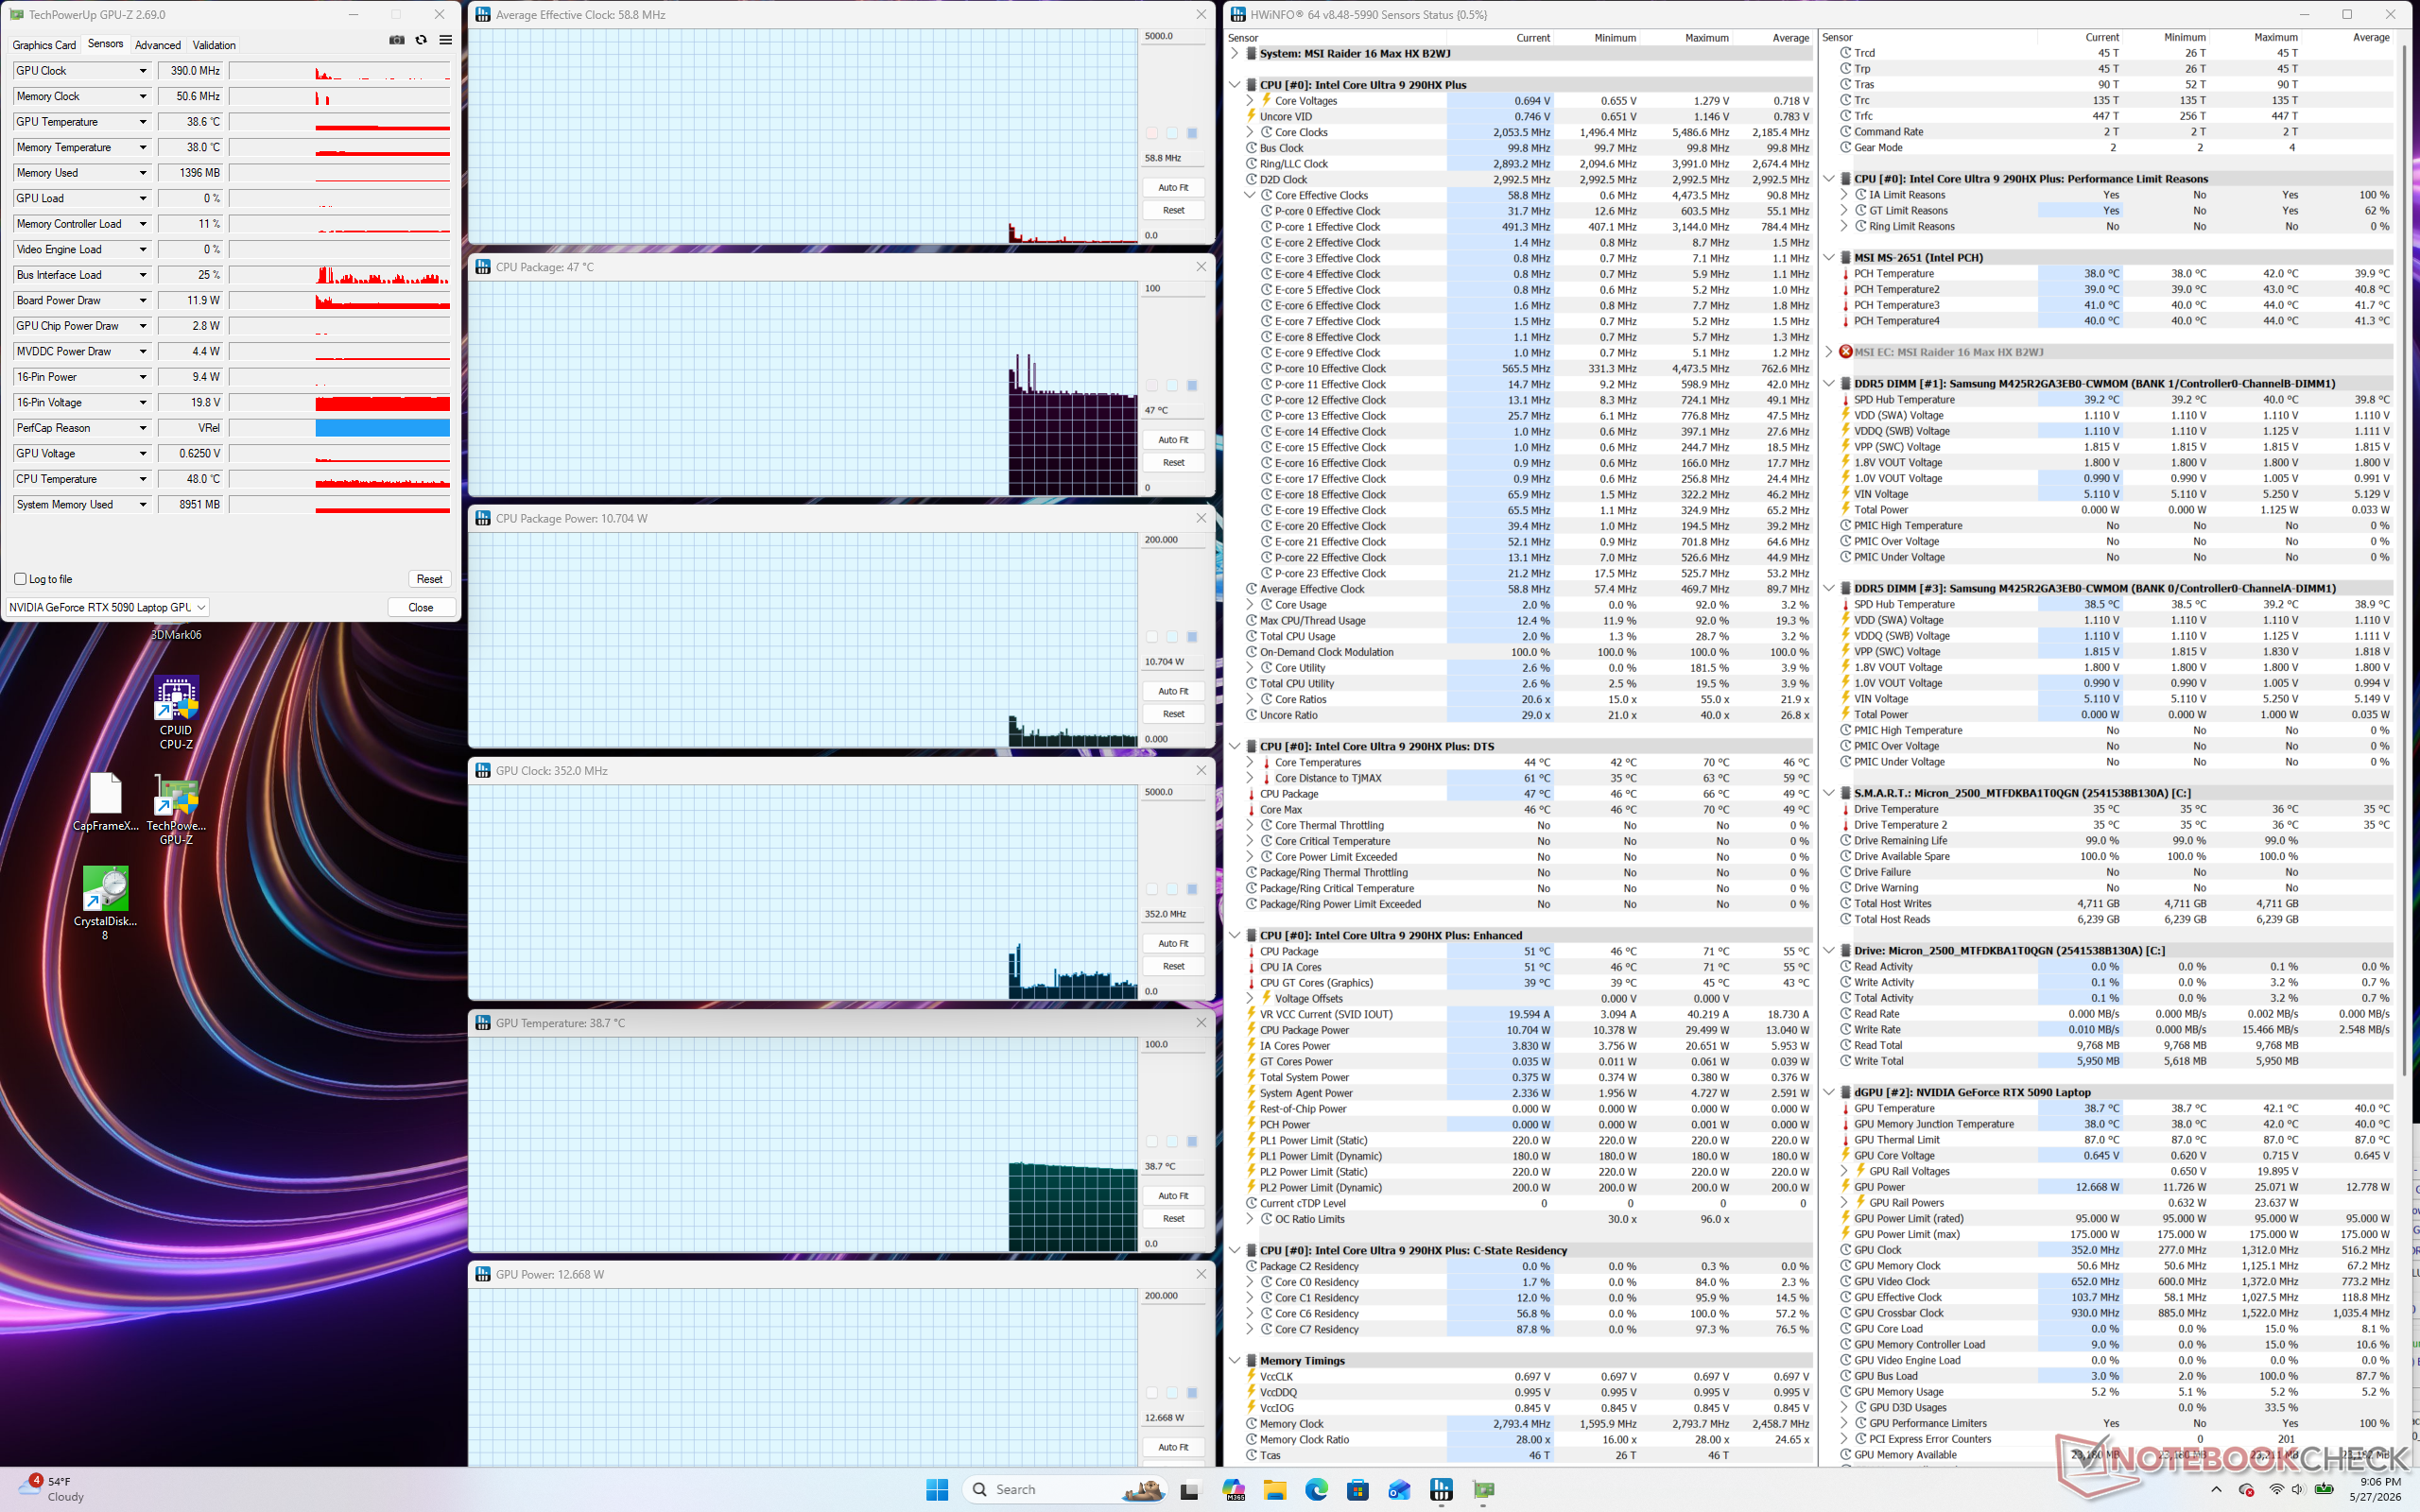
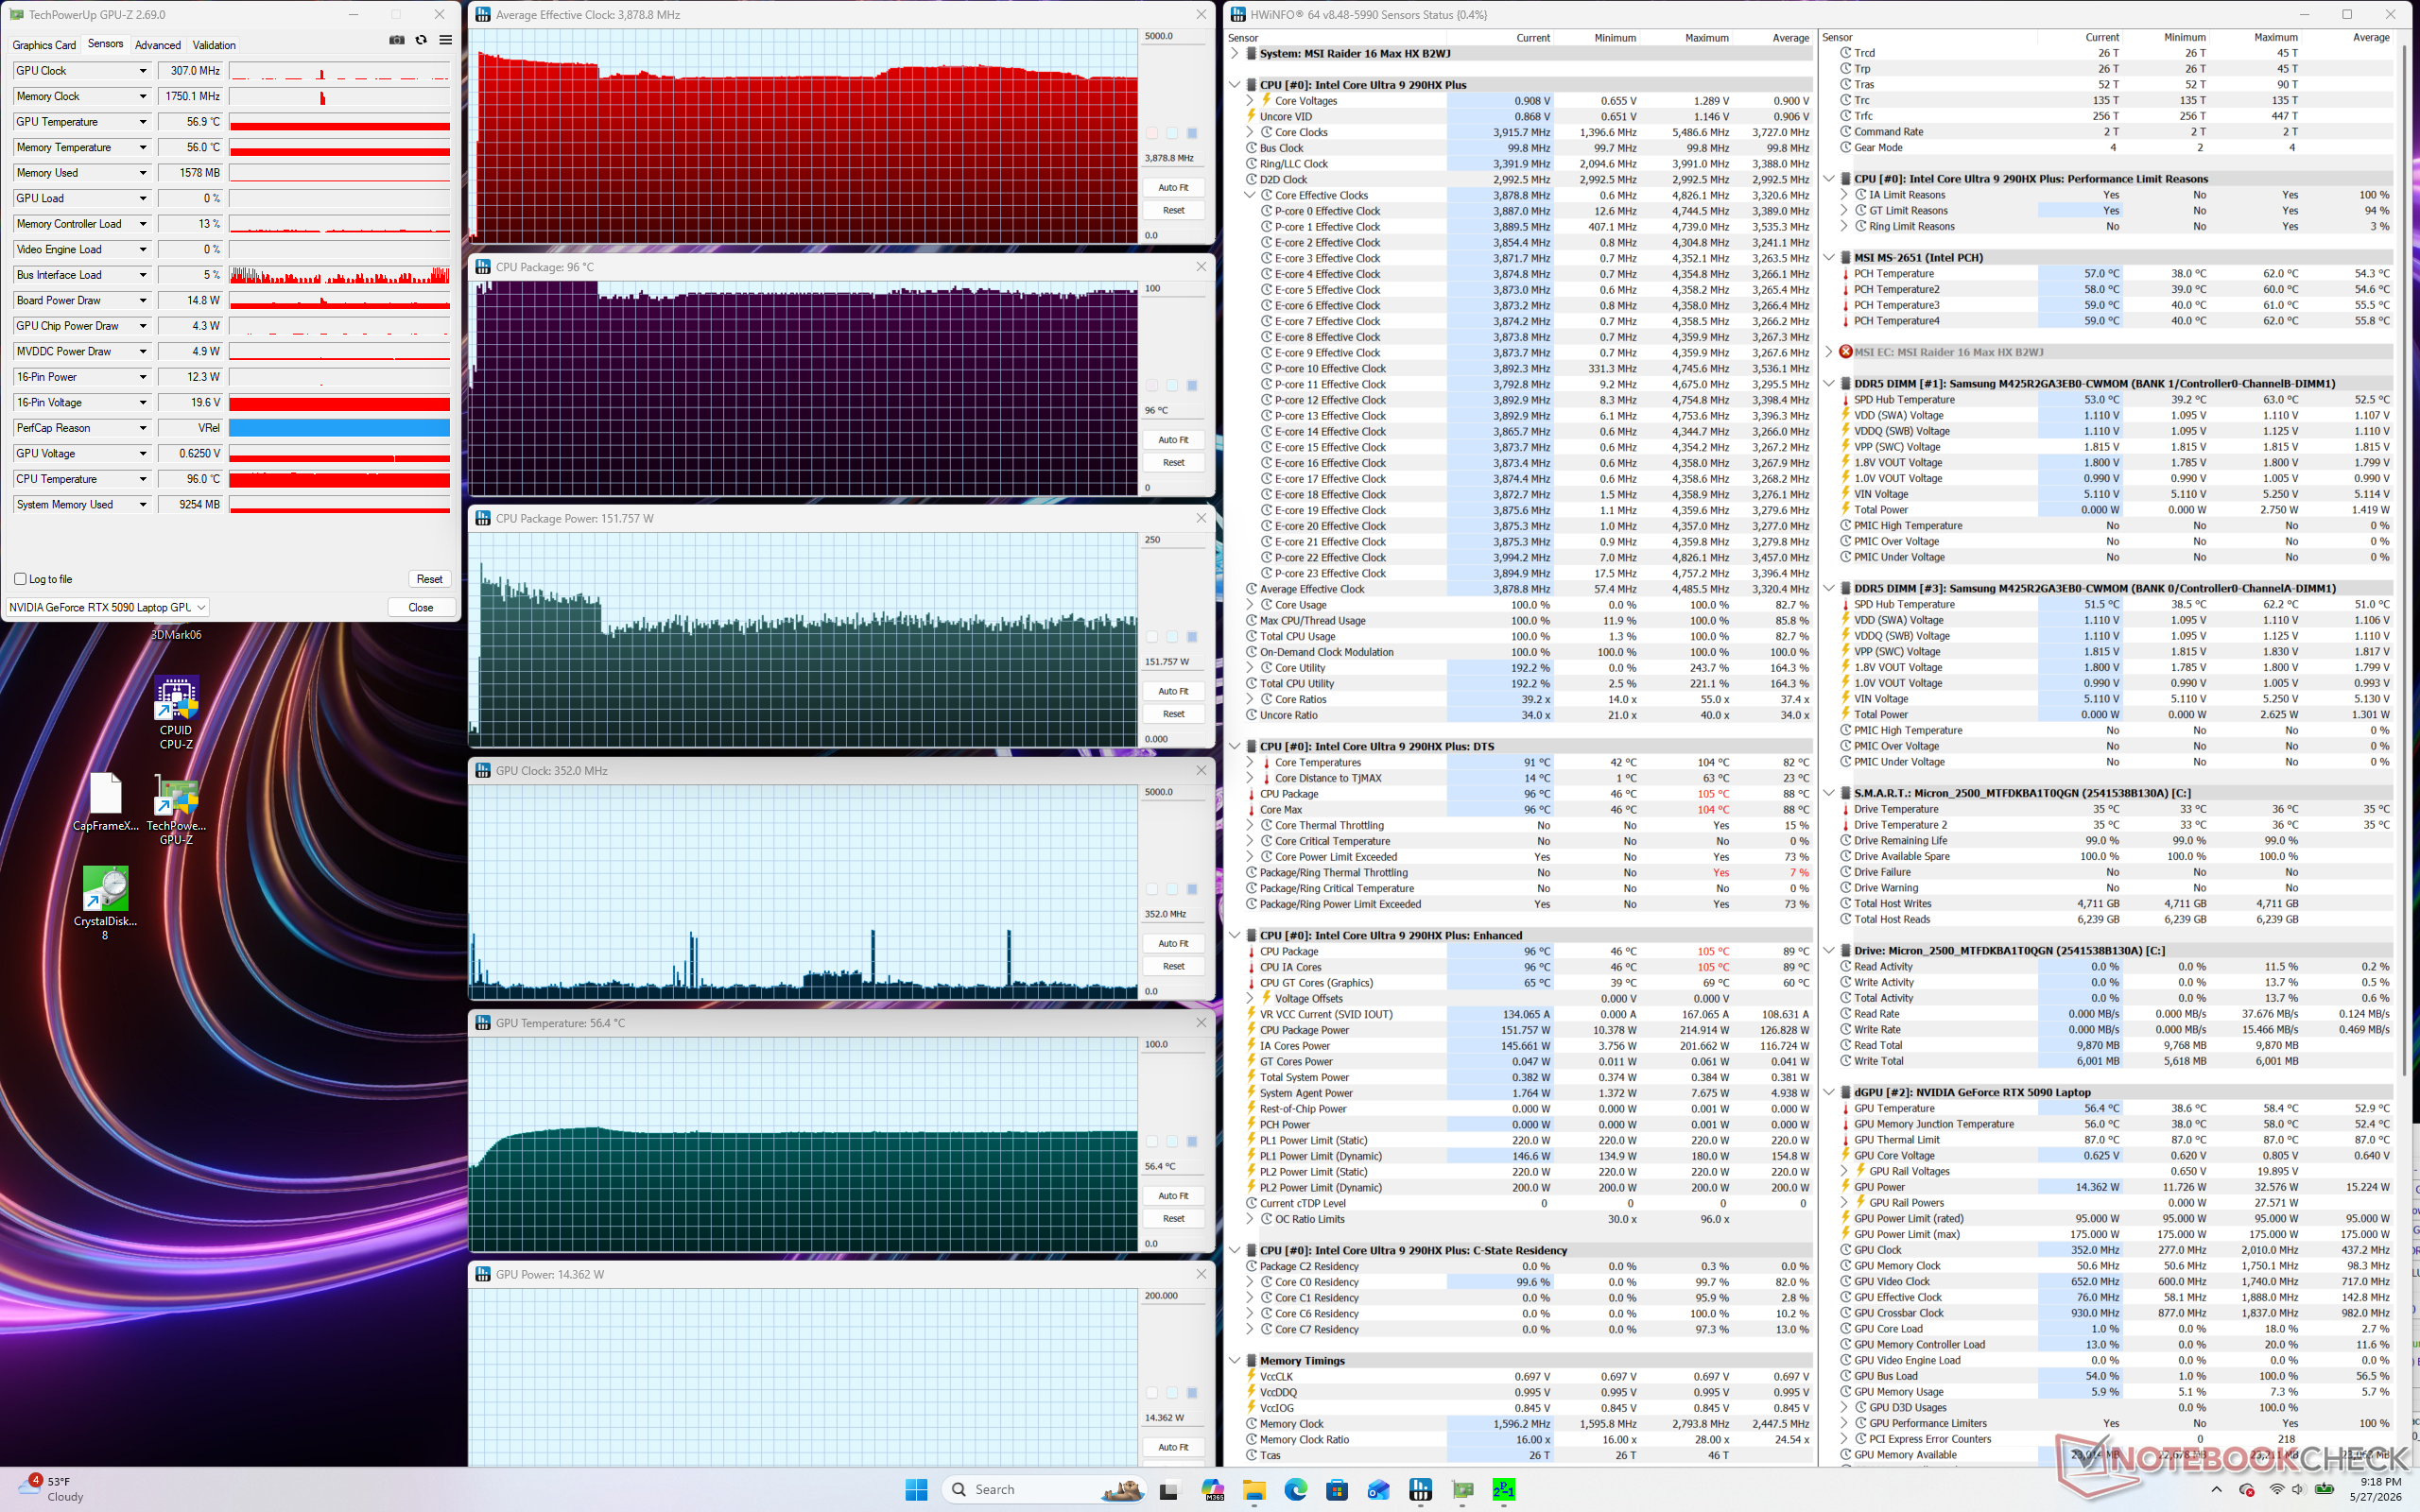
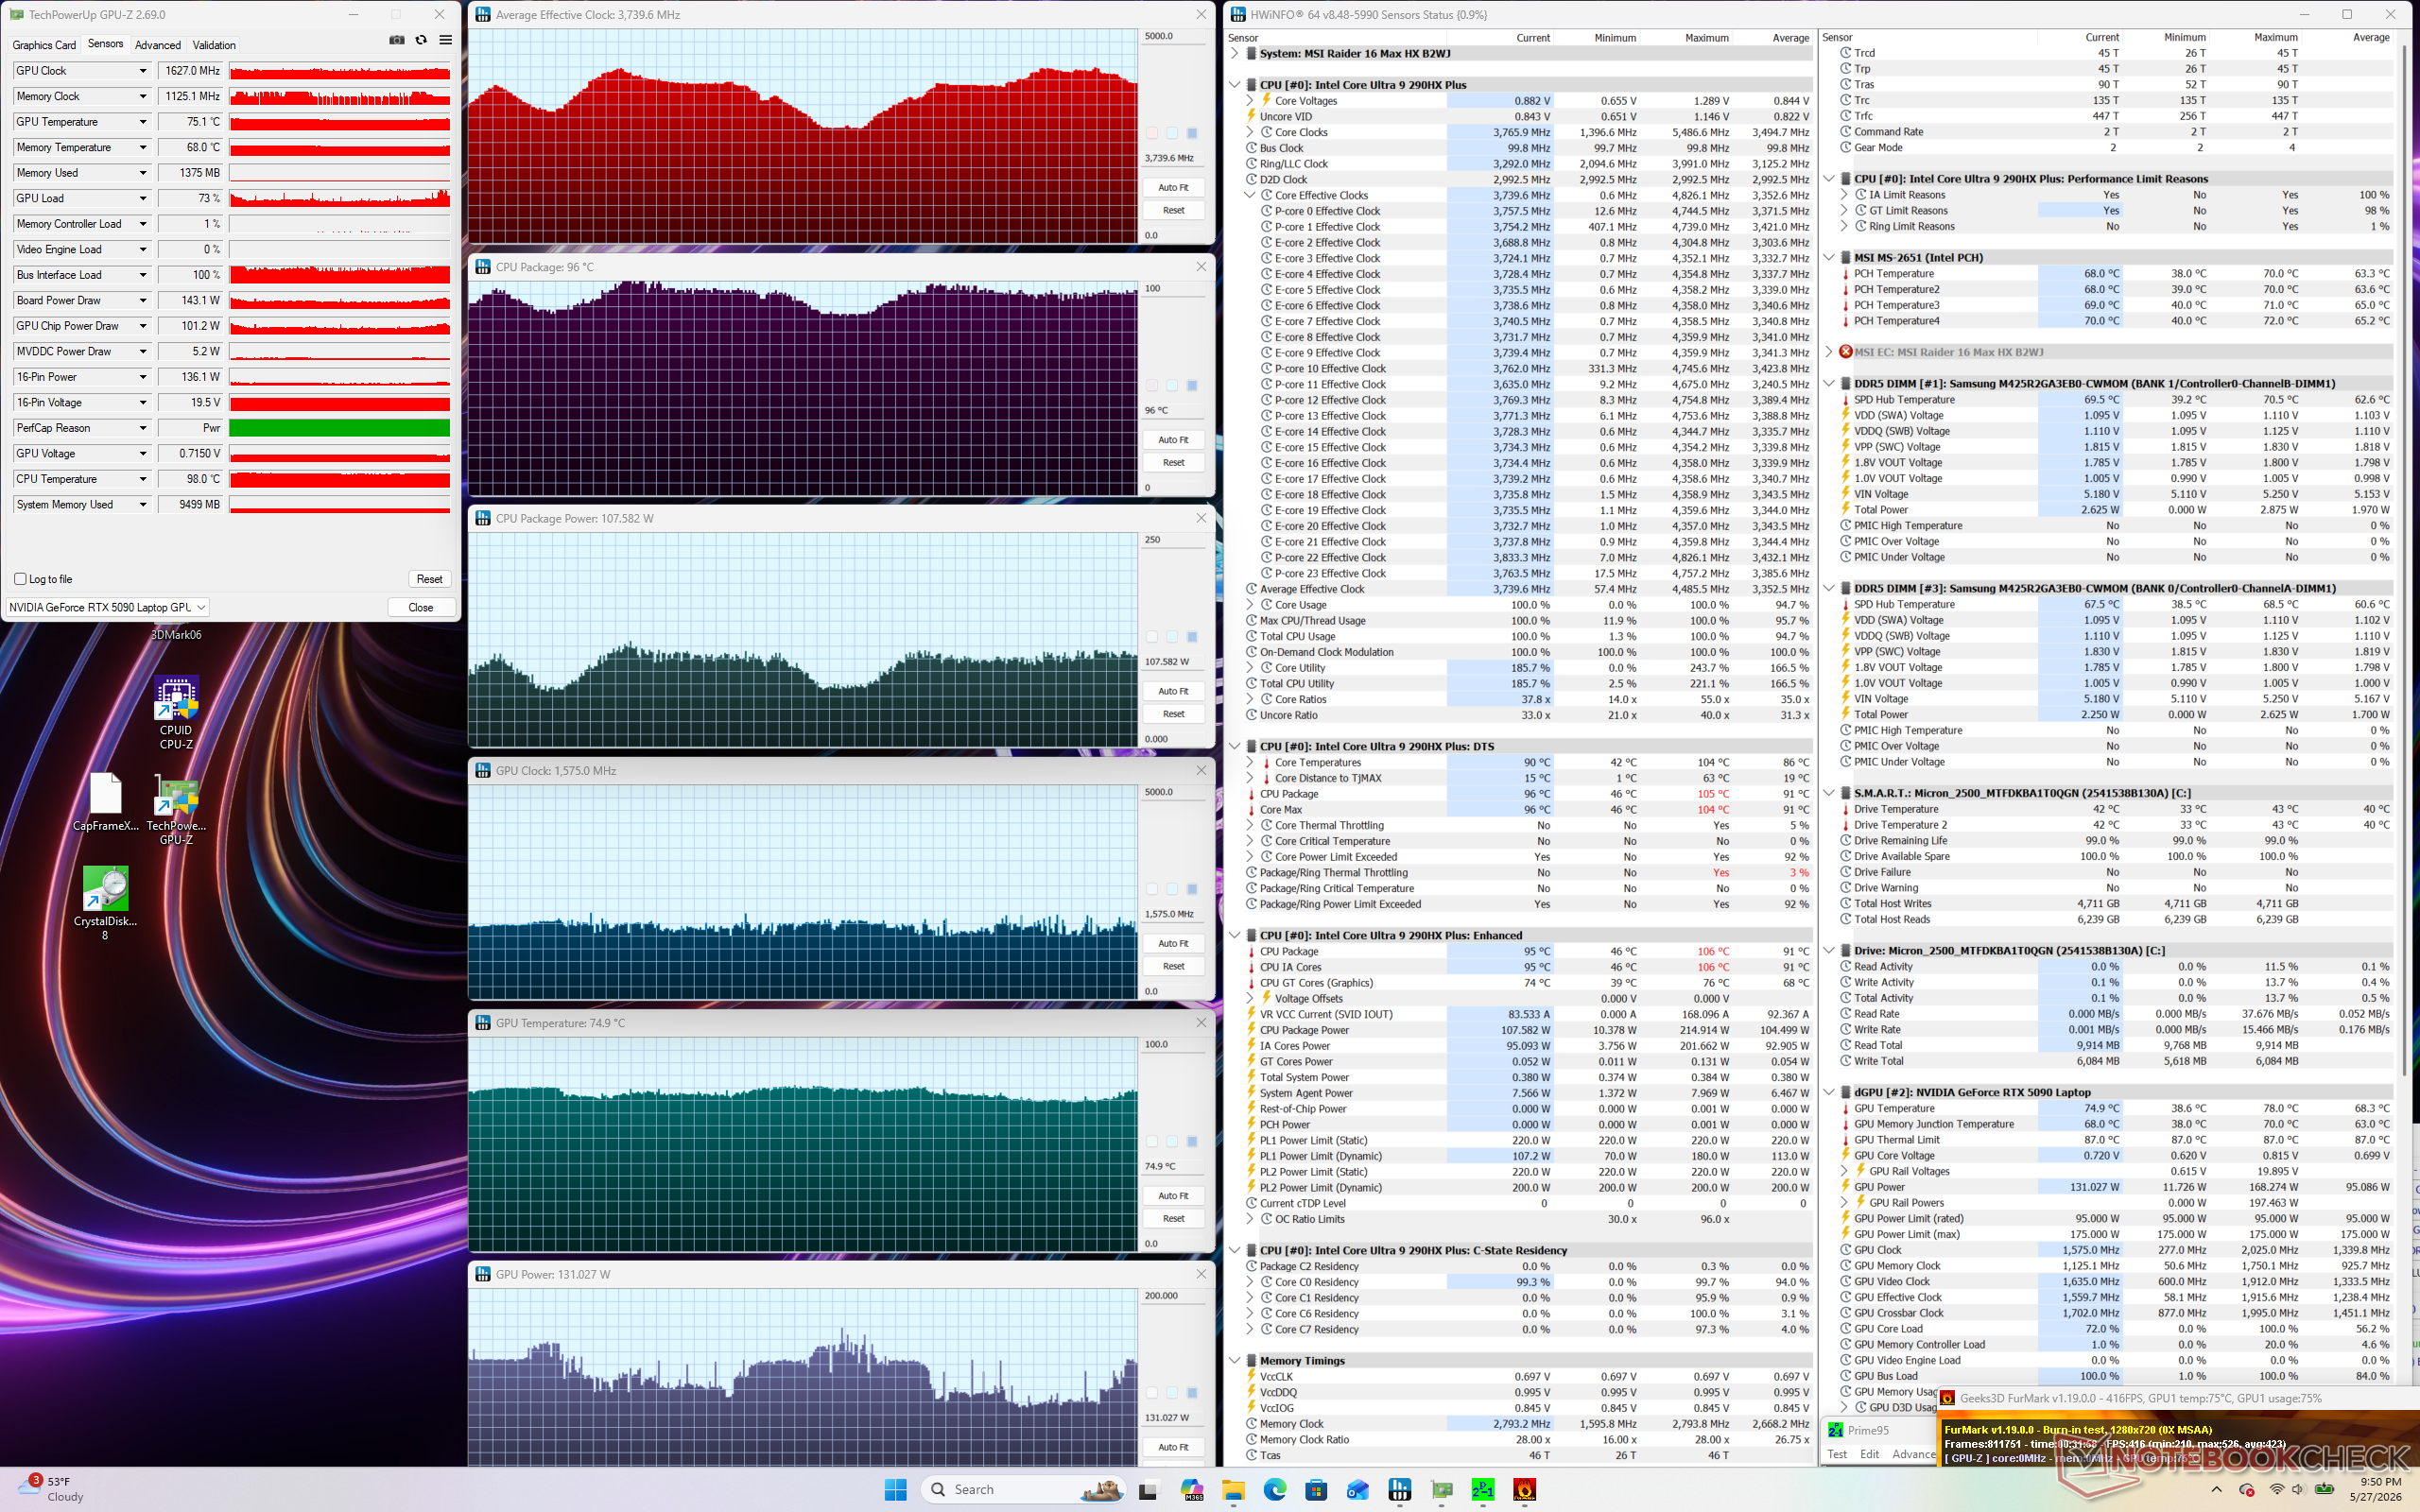
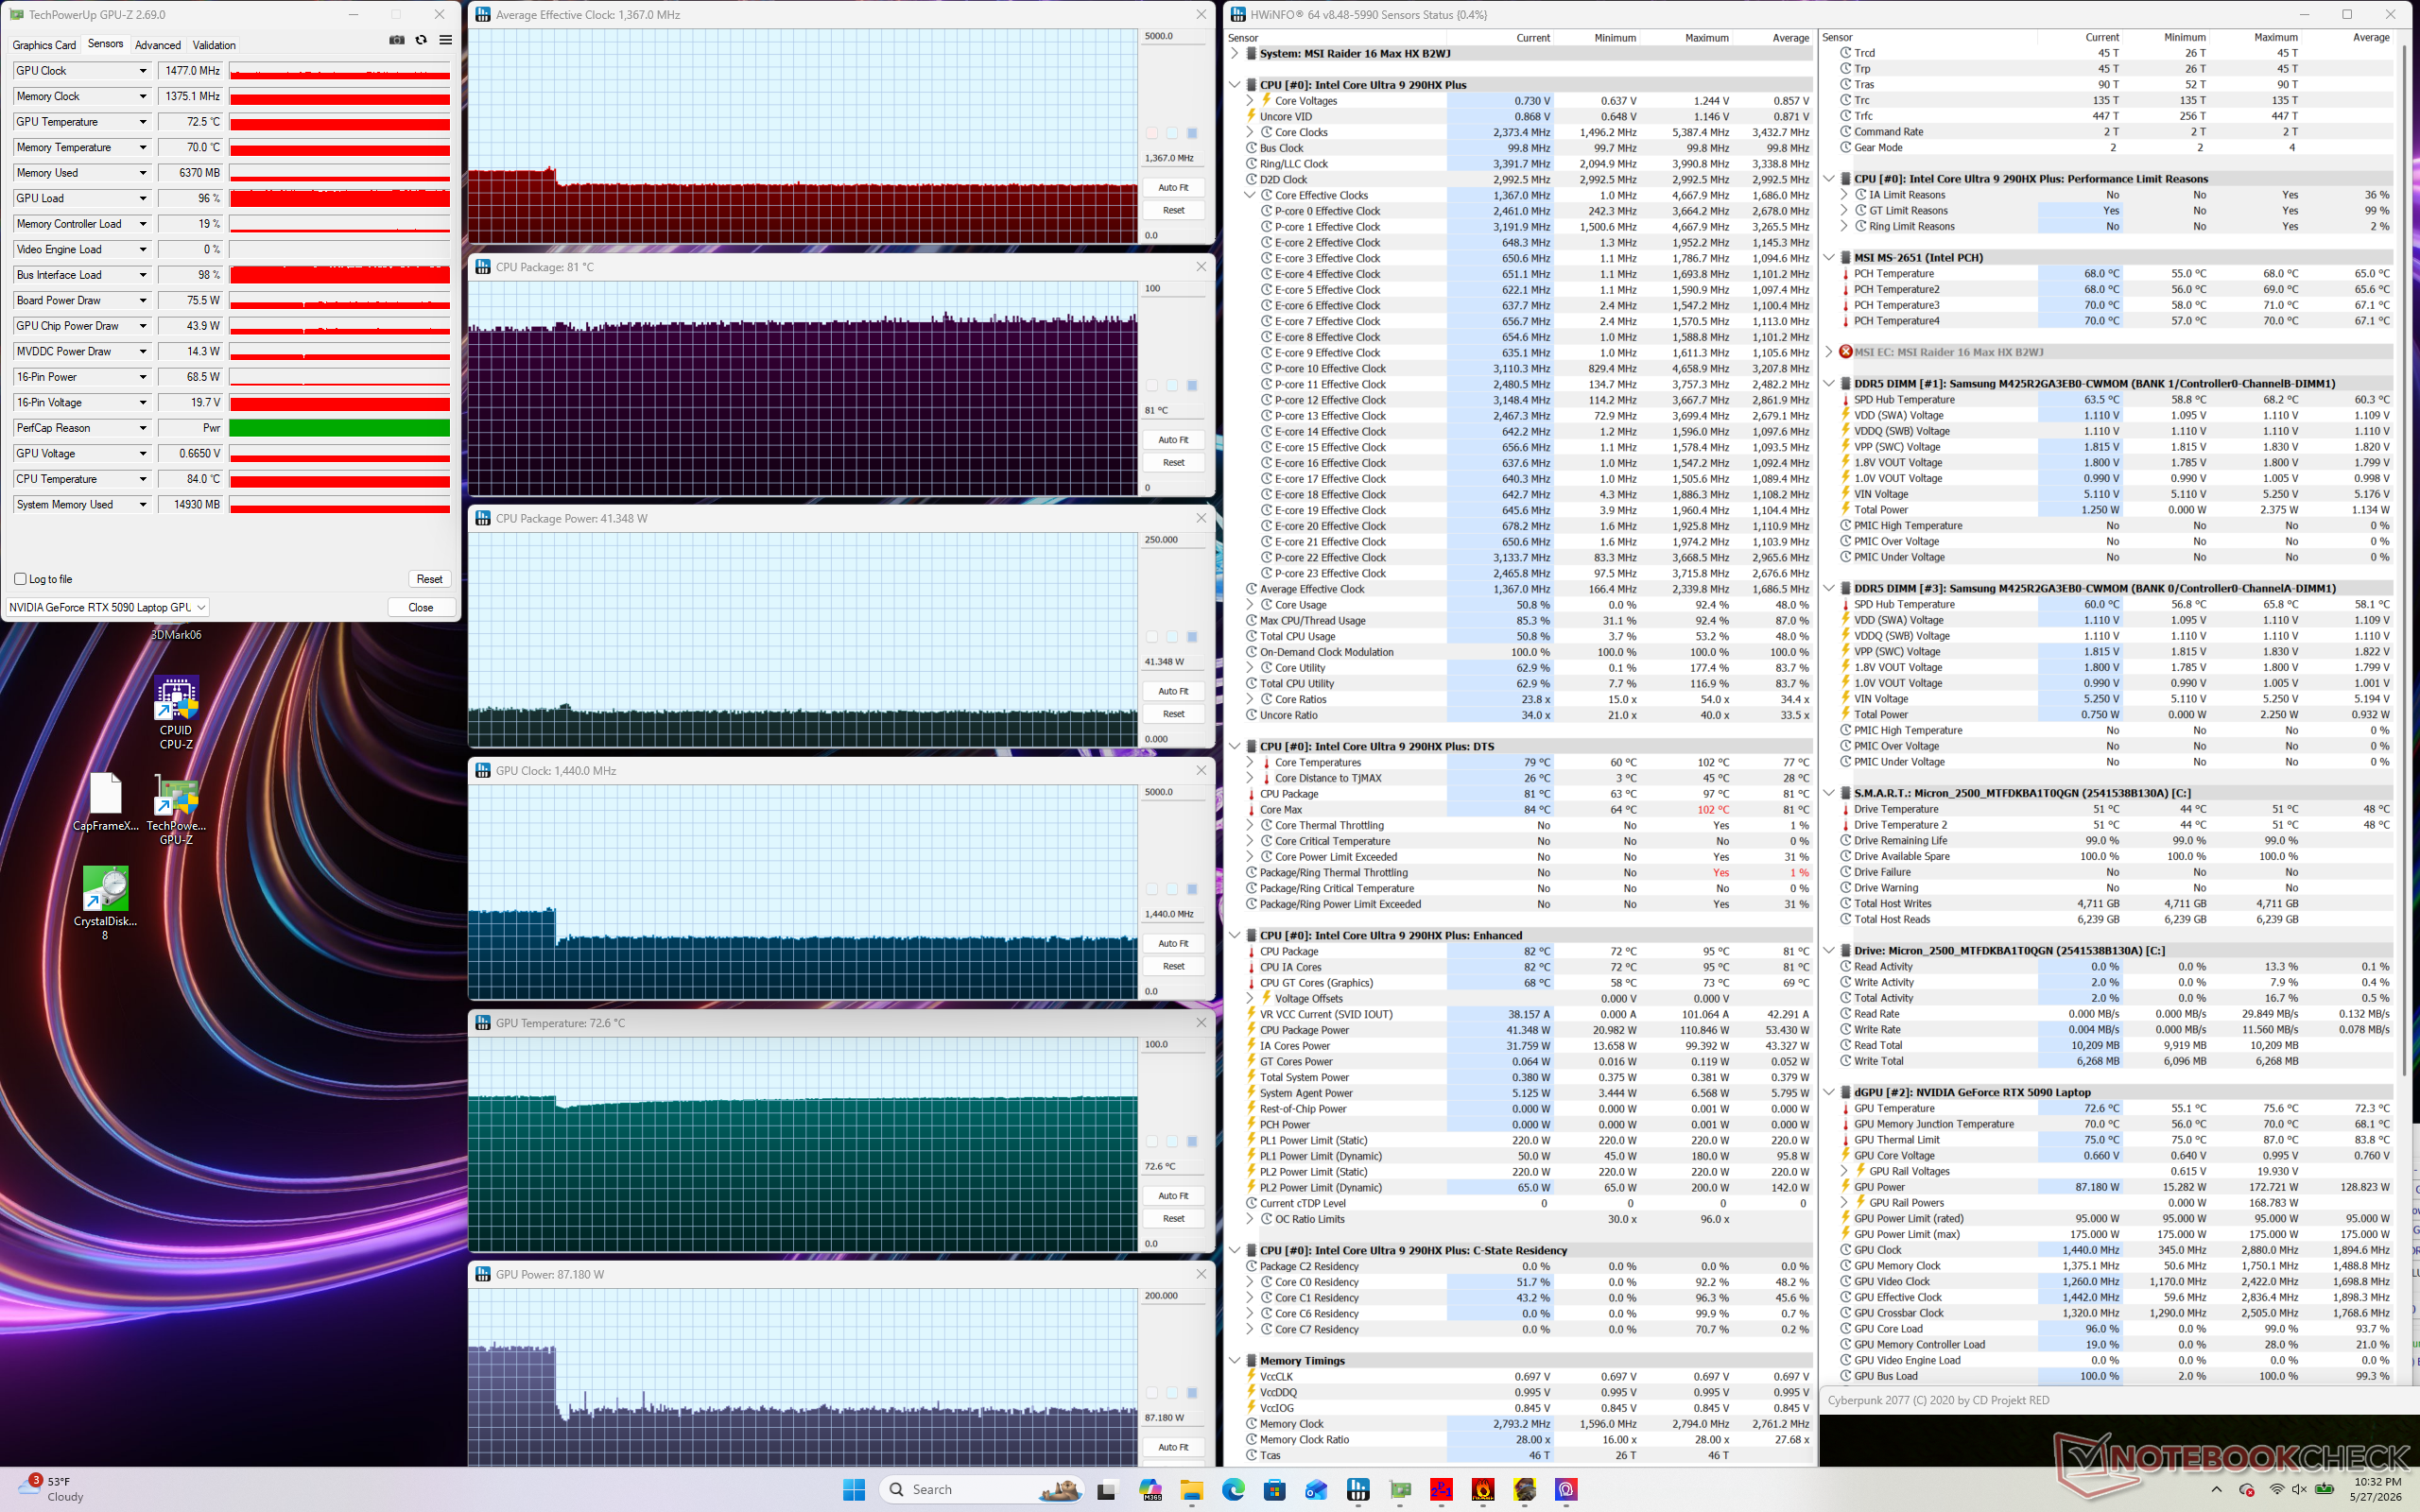
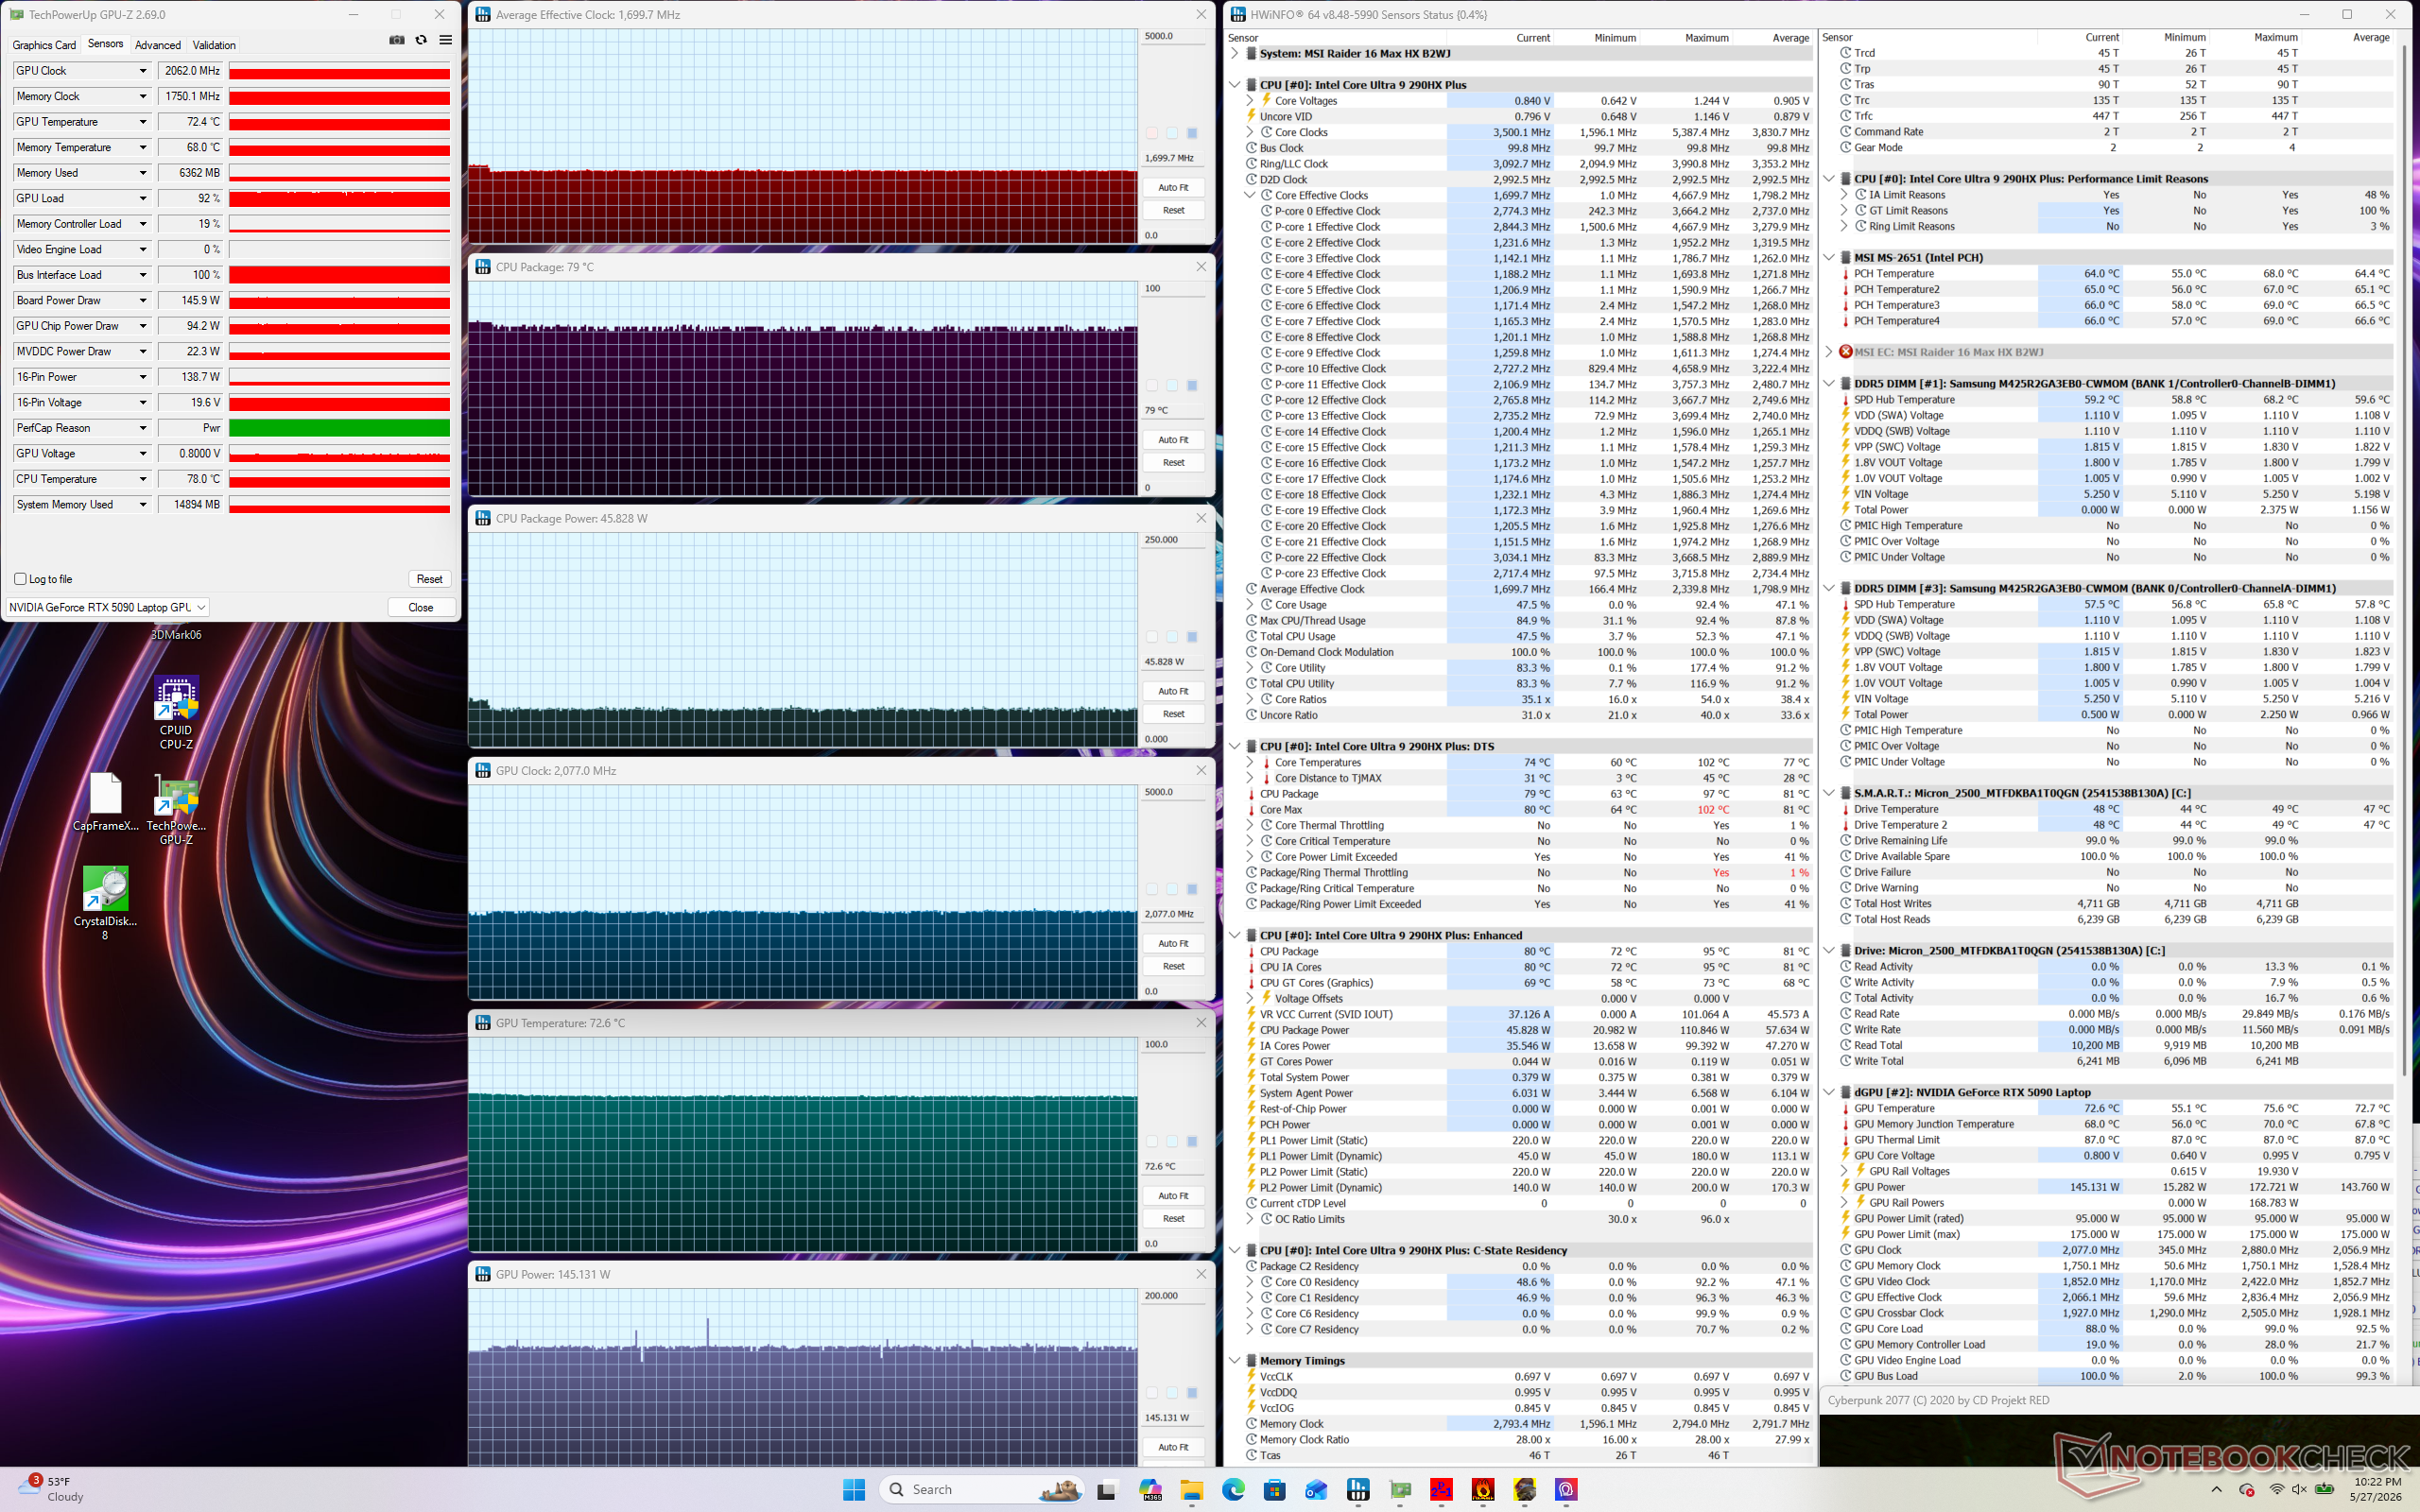
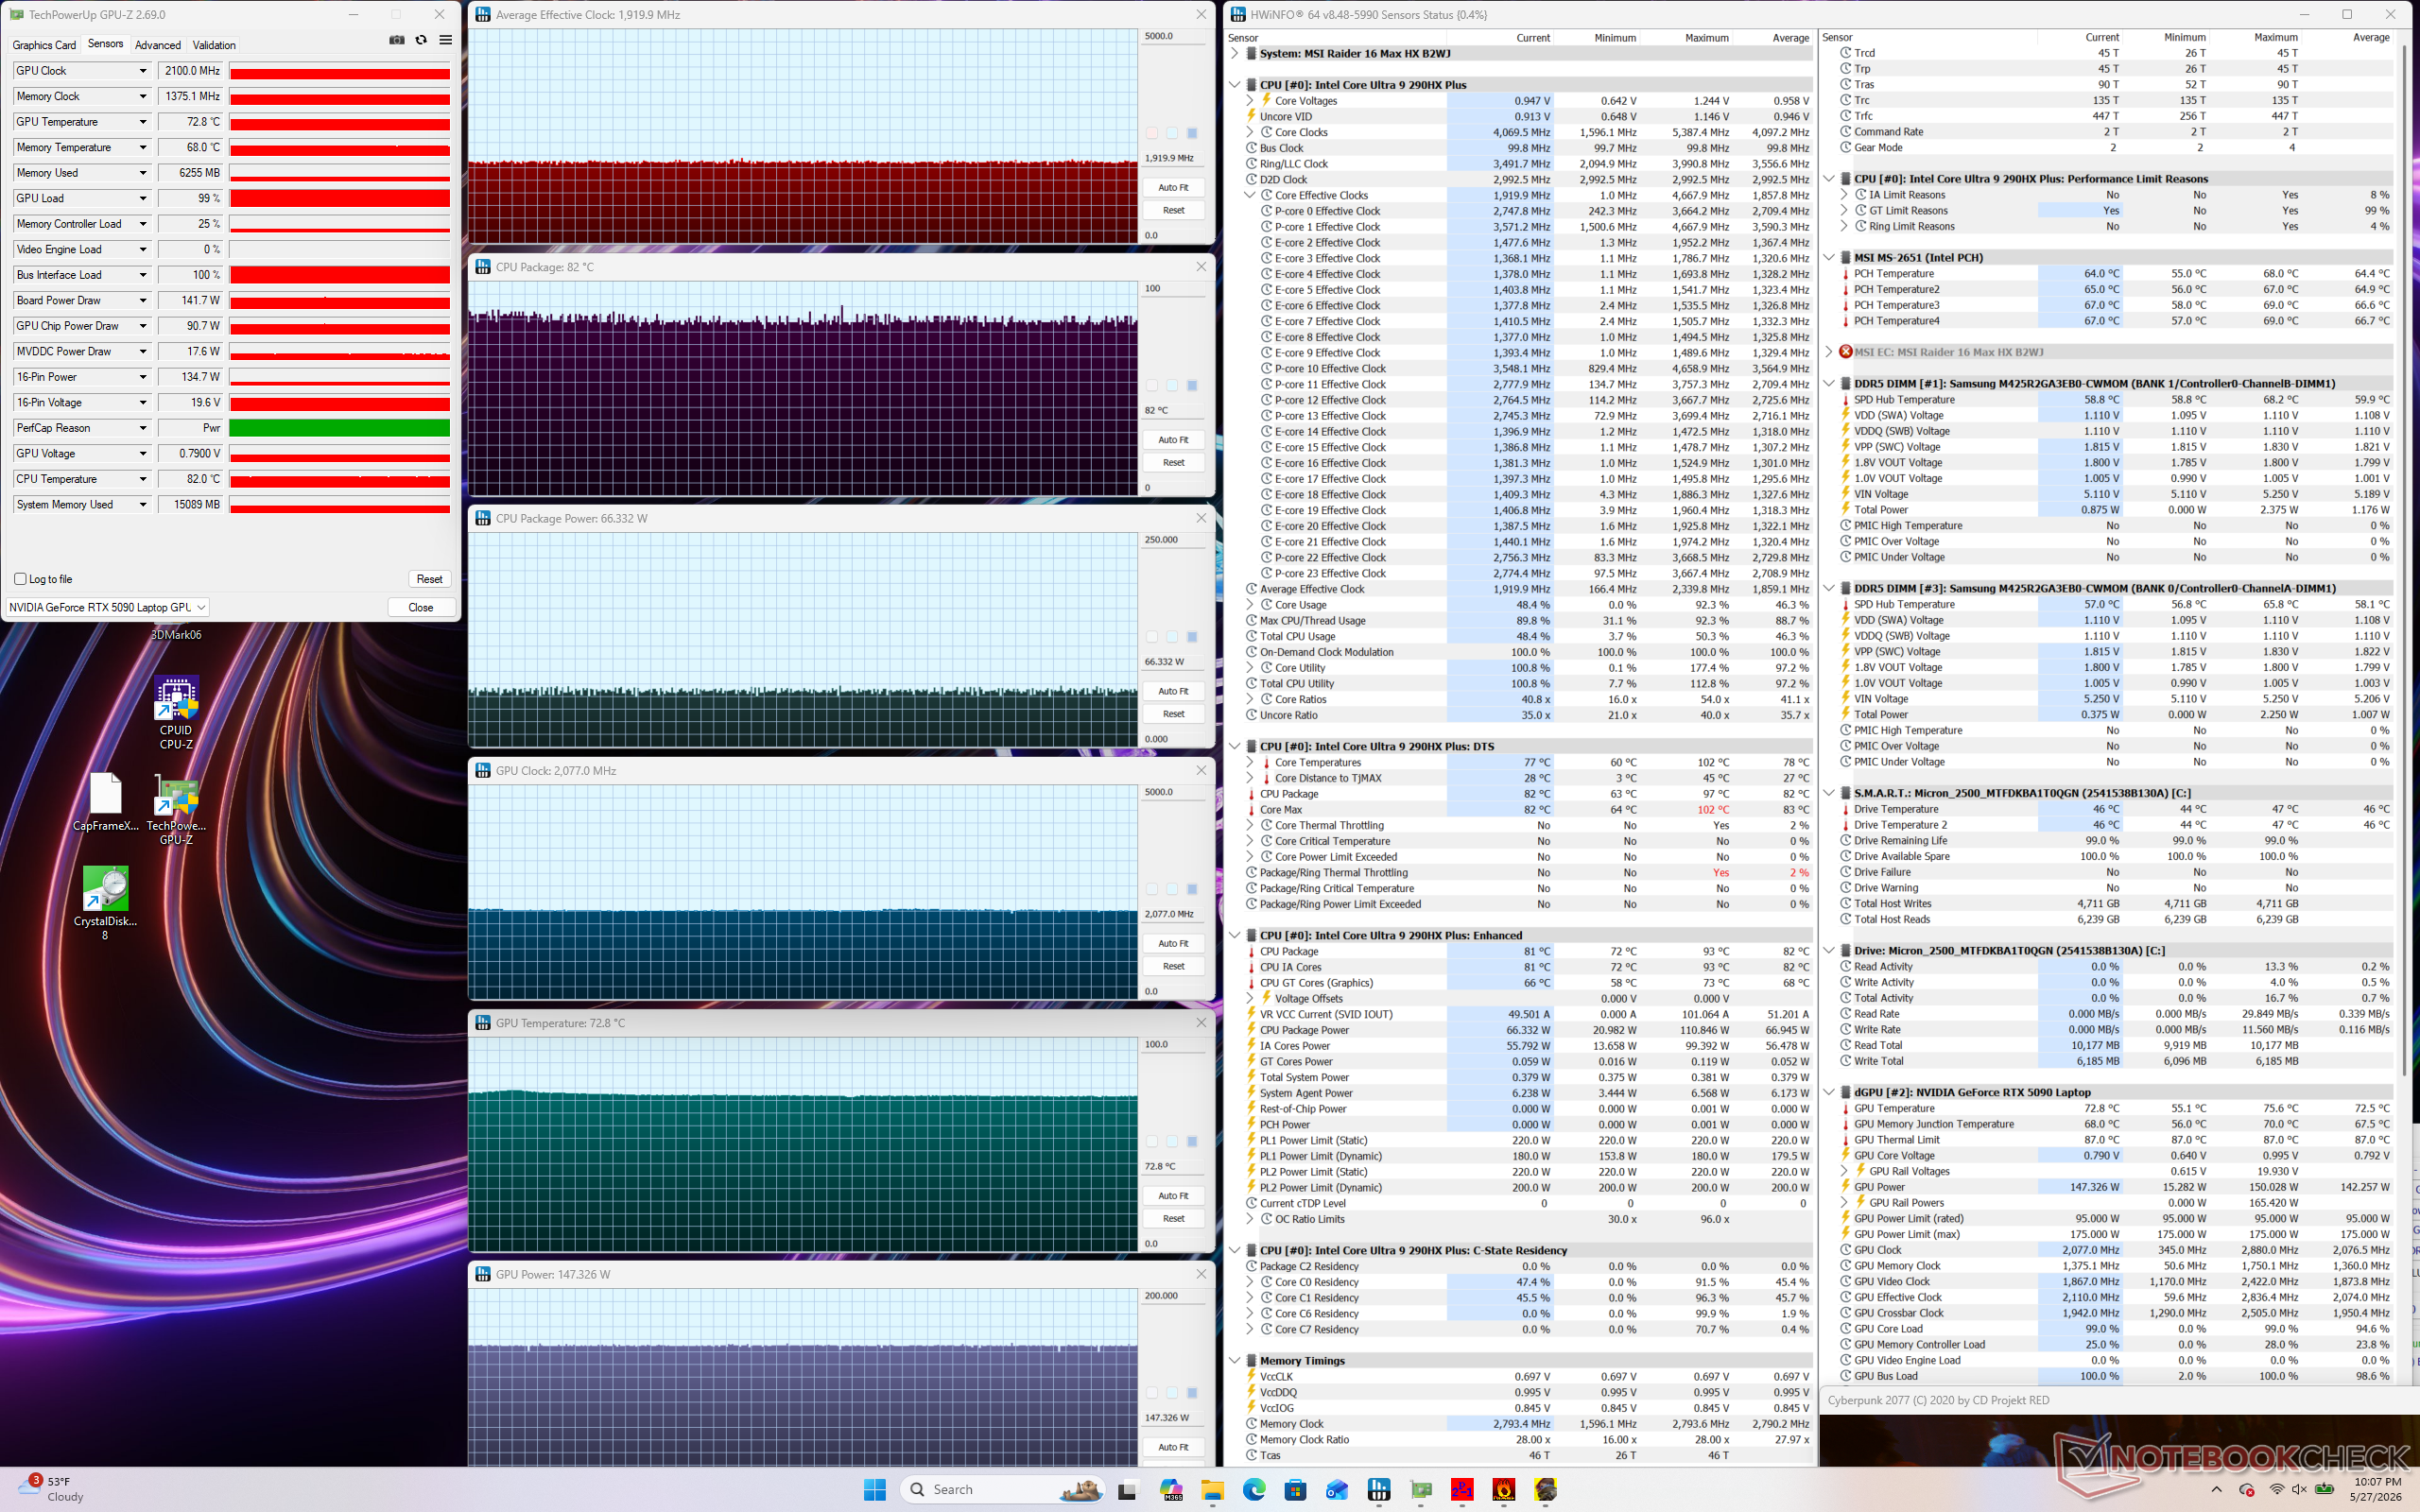
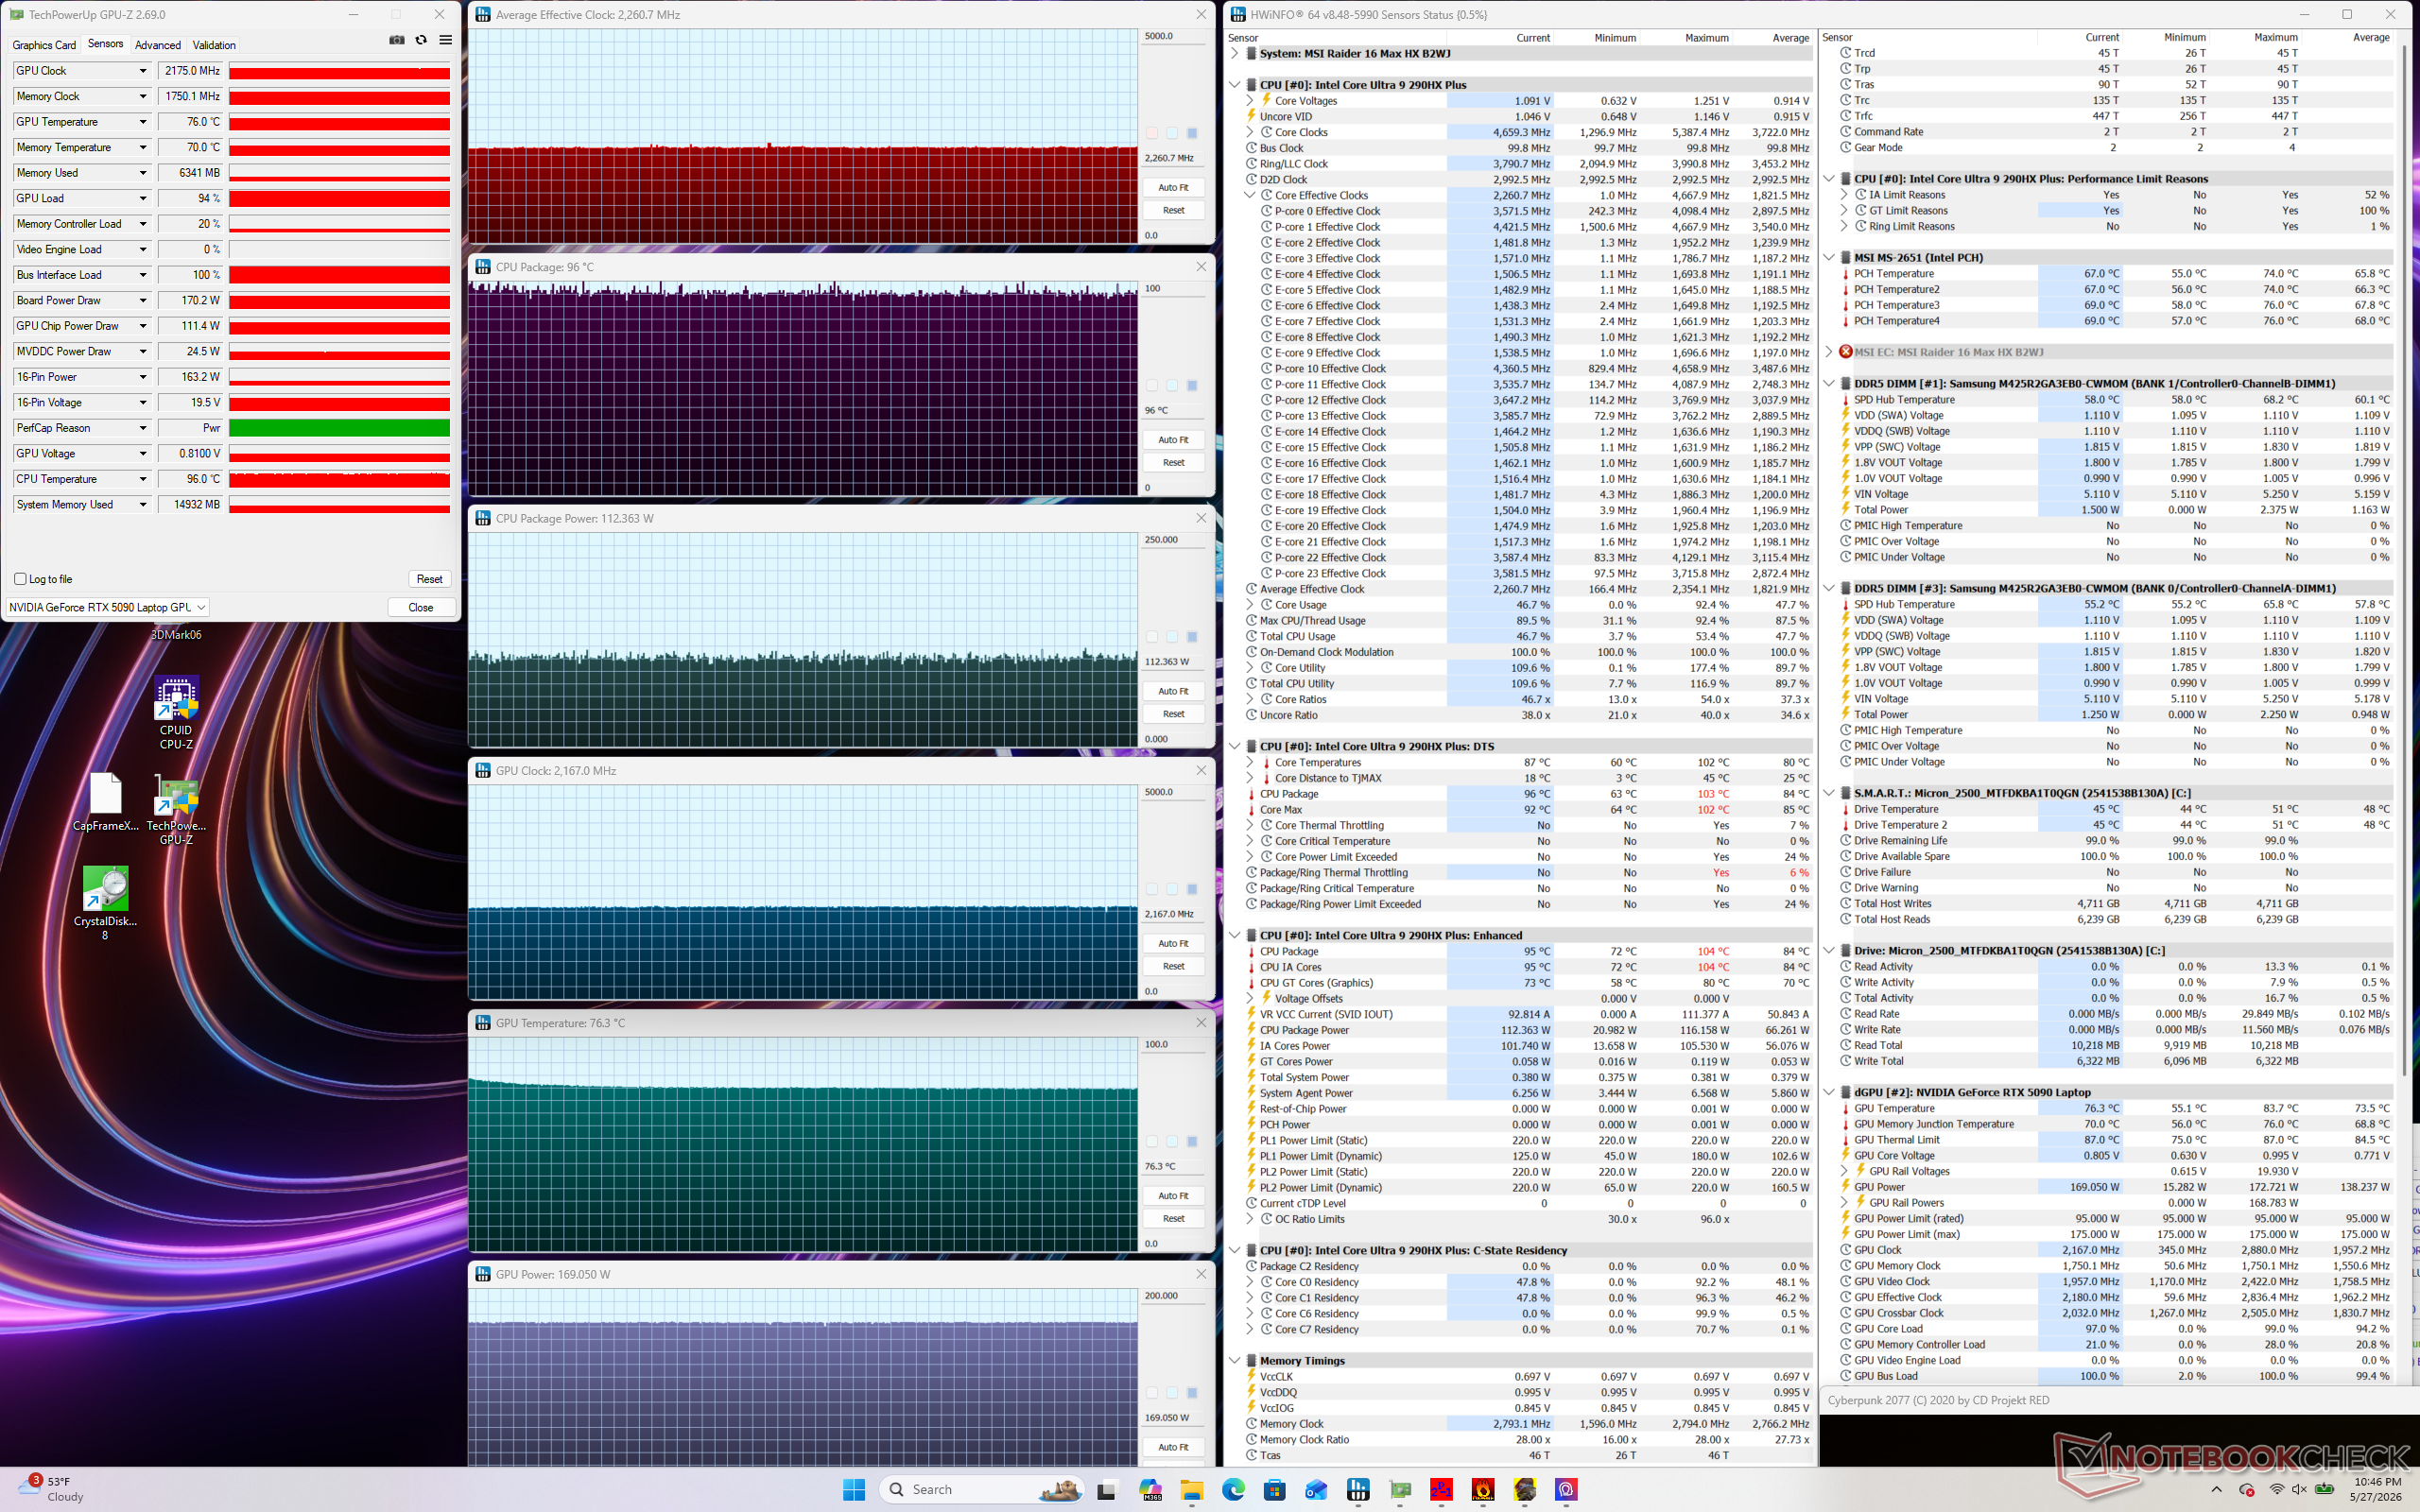

| Gemiddelde CPU-klok (GHz) | GPU-klok (MHz) | Gemiddelde CPU-temperatuur (°C) | Gemiddelde GPU-temperatuur (°C) | |
| Systeem inactief | -- | -- | 47 | 39 |
| Prime95 Stress | 3.9 | -- | 96 | 56 |
| Prime95 + FurMark Stress | 2.7 - 3.9 | ~1600 | 96 | 75 |
| Cyberpunk 2077 Stress (Rustige modus) | 1.4 | 1440 | 81 | 73 |
| Cyberpunk 2077 Stress (evenwichtige modus) | 1.7 | 2062 | 79 | 73 |
| Cyberpunk 2077 Stress (Extreme prestatiemodus) | 1.9 | 2100 | 82 | 73 |
| Cyberpunk 2077 Stress (Apex-modus) | 2.3 | 2175 | 96 | 76 |
| Cyberpunk 2077 Stress (Koelere Boostmodus) | 2.2 | 2295 | 87 | 72 |
Luidsprekers
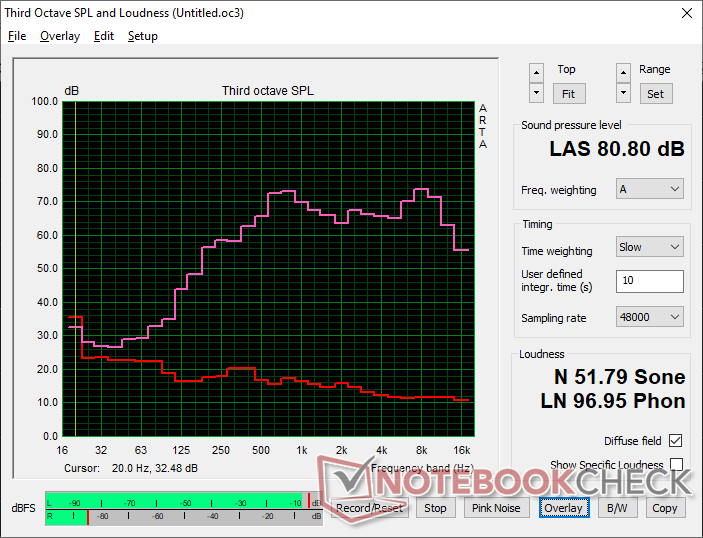
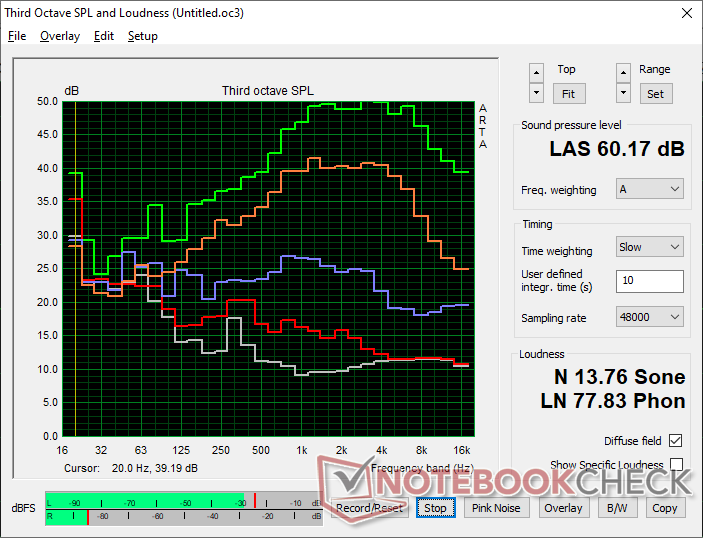
MSI Raider 16 Max HX B2WJ audioanalyse
(±) | luidspreker luidheid is gemiddeld maar goed (80.8 dB)
Bas 100 - 315 Hz
(-) | bijna geen lage tonen - gemiddeld 15.7% lager dan de mediaan
(±) | lineariteit van de lage tonen is gemiddeld (8.6% delta ten opzichte van de vorige frequentie)
Midden 400 - 2000 Hz
(+) | evenwichtige middens - slechts 3.2% verwijderd van de mediaan
(+) | de middentonen zijn lineair (6.1% delta ten opzichte van de vorige frequentie)
Hoog 2 - 16 kHz
(+) | evenwichtige hoogtepunten - slechts 2.9% verwijderd van de mediaan
(+) | de hoge tonen zijn lineair (4.9% delta naar de vorige frequentie)
Algemeen 100 - 16.000 Hz
(+) | het totale geluid is lineair (14.5% verschil met de mediaan)
Vergeleken met dezelfde klasse
» 27% van alle geteste apparaten in deze klasse waren beter, 7% vergelijkbaar, 66% slechter
» De beste had een delta van 6%, het gemiddelde was 18%, de slechtste was 132%
Vergeleken met alle geteste toestellen
» 18% van alle geteste apparaten waren beter, 4% gelijk, 77% slechter
» De beste had een delta van 4%, het gemiddelde was 23%, de slechtste was 134%
Apple MacBook Pro 16 2021 M1 Pro audioanalyse
(+) | luidsprekers kunnen relatief luid spelen (84.7 dB)
Bas 100 - 315 Hz
(+) | goede baars - slechts 3.8% verwijderd van de mediaan
(+) | de lage tonen zijn lineair (5.2% delta naar de vorige frequentie)
Midden 400 - 2000 Hz
(+) | evenwichtige middens - slechts 1.3% verwijderd van de mediaan
(+) | de middentonen zijn lineair (2.1% delta ten opzichte van de vorige frequentie)
Hoog 2 - 16 kHz
(+) | evenwichtige hoogtepunten - slechts 1.9% verwijderd van de mediaan
(+) | de hoge tonen zijn lineair (2.7% delta naar de vorige frequentie)
Algemeen 100 - 16.000 Hz
(+) | het totale geluid is lineair (4.6% verschil met de mediaan)
Vergeleken met dezelfde klasse
» 0% van alle geteste apparaten in deze klasse waren beter, 0% vergelijkbaar, 100% slechter
» De beste had een delta van 5%, het gemiddelde was 17%, de slechtste was 45%
Vergeleken met alle geteste toestellen
» 0% van alle geteste apparaten waren beter, 0% gelijk, 100% slechter
» De beste had een delta van 4%, het gemiddelde was 23%, de slechtste was 134%
Energiebeheer
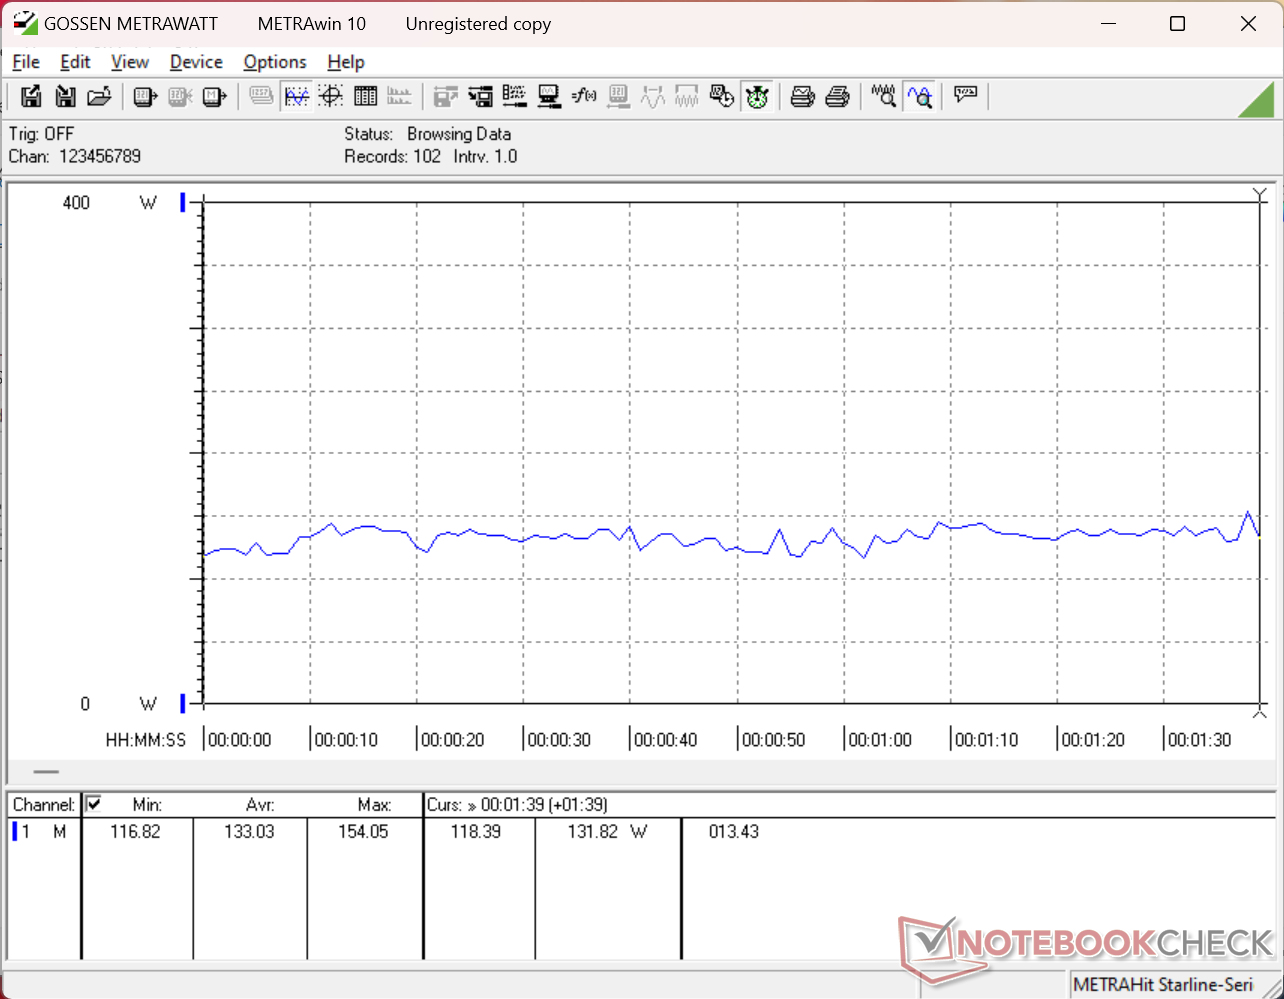
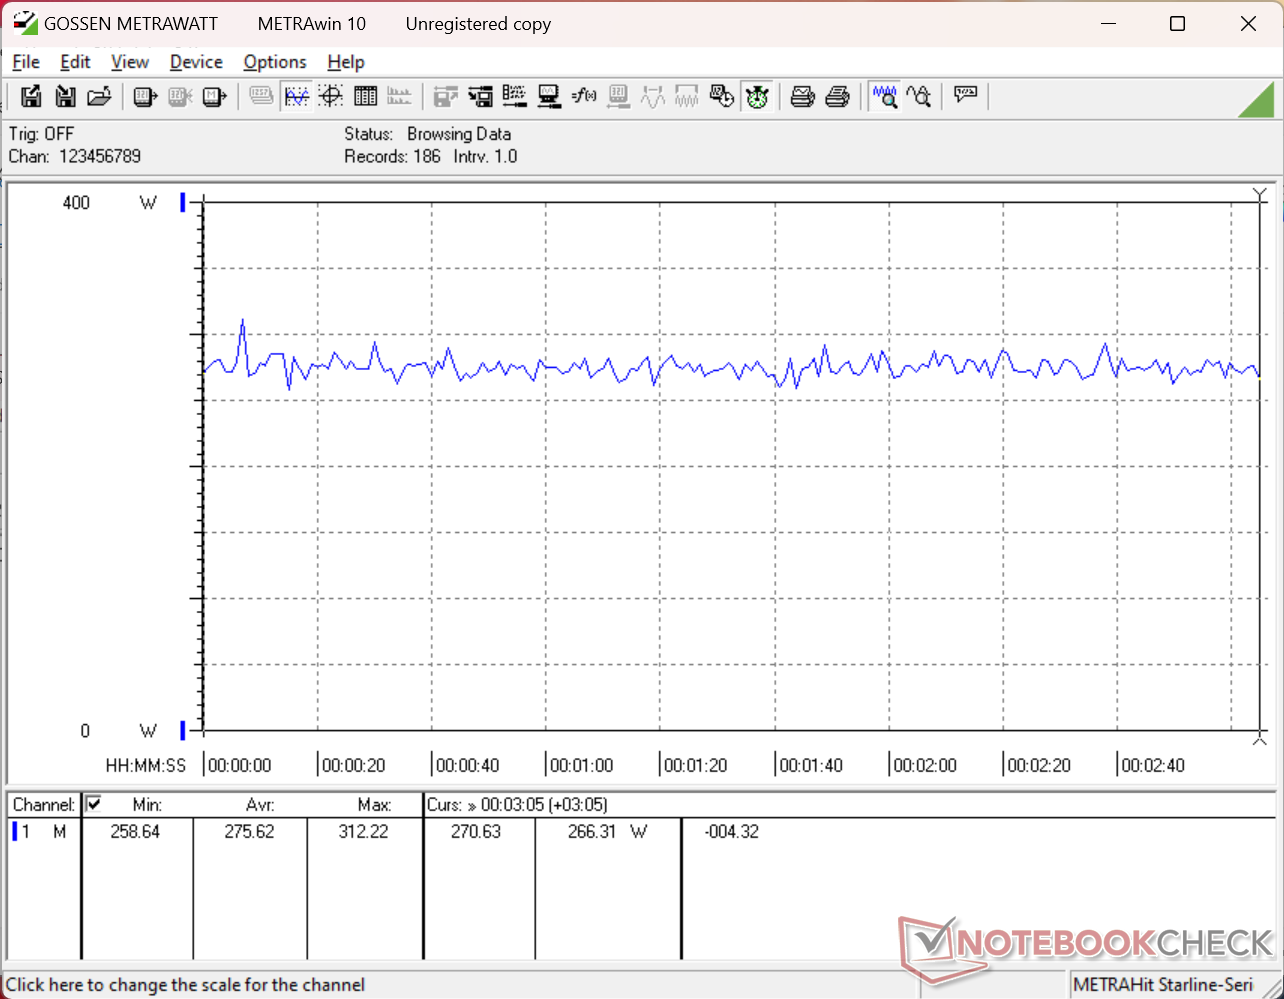
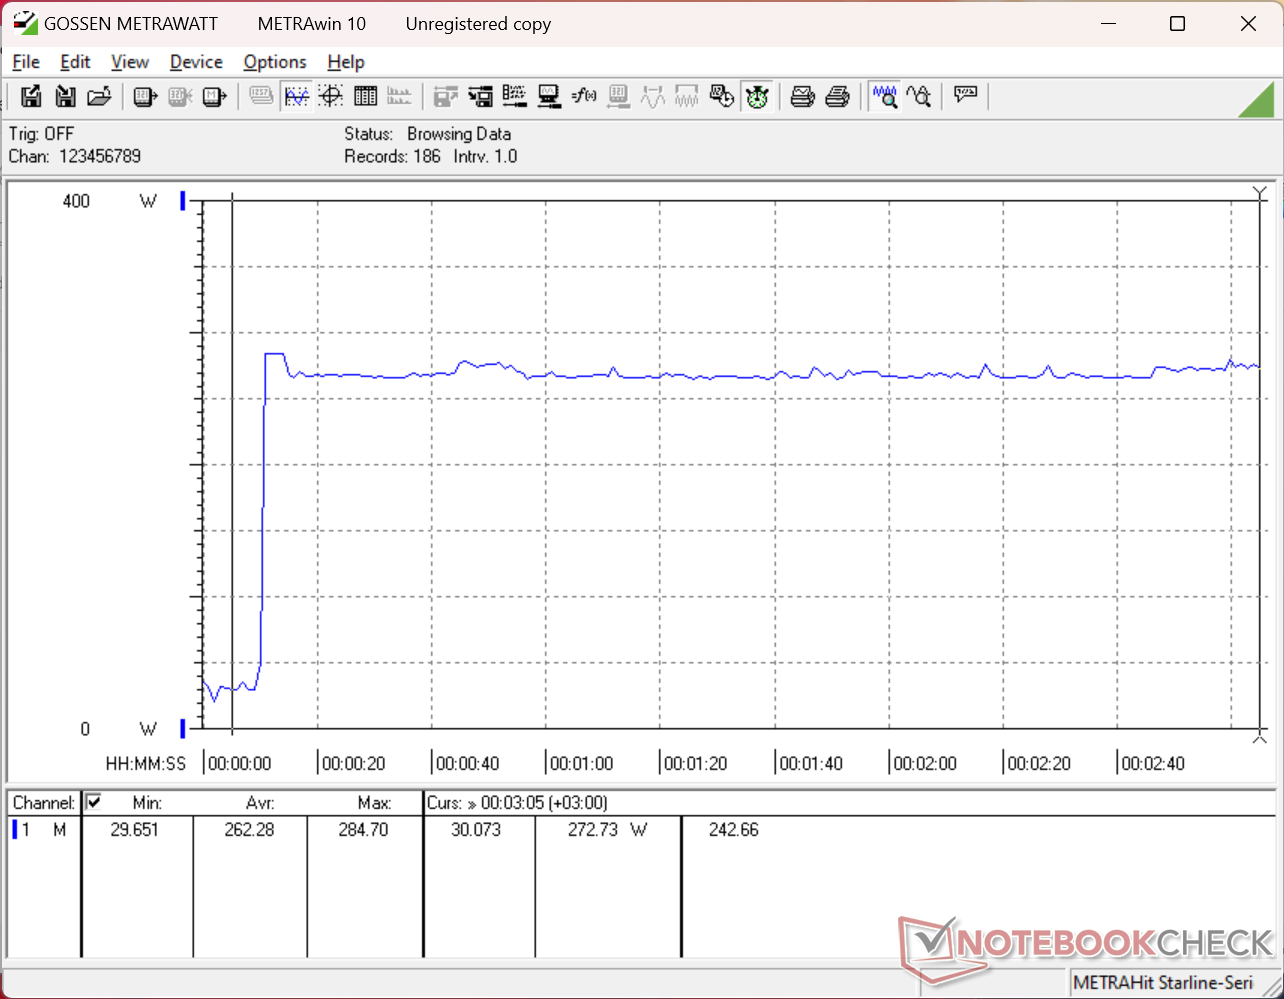
Stroomverbruik
Het stroomverbruik is voorspelbaar erg hoog gezien de hardware die erbij betrokken is. Het uitvoeren van Cyberpunk 2077 in de modus Extreme prestaties is ruwweg 28 procent veeleisender dan de Razer Blade 16 ook al heeft deze dezelfde RTX 5090 GPU. Het grote verschil kan worden toegeschreven aan de Arrow Lake-HX CPU in vergelijking met de langzamere maar veel efficiëntere Panther Lake-H serie.
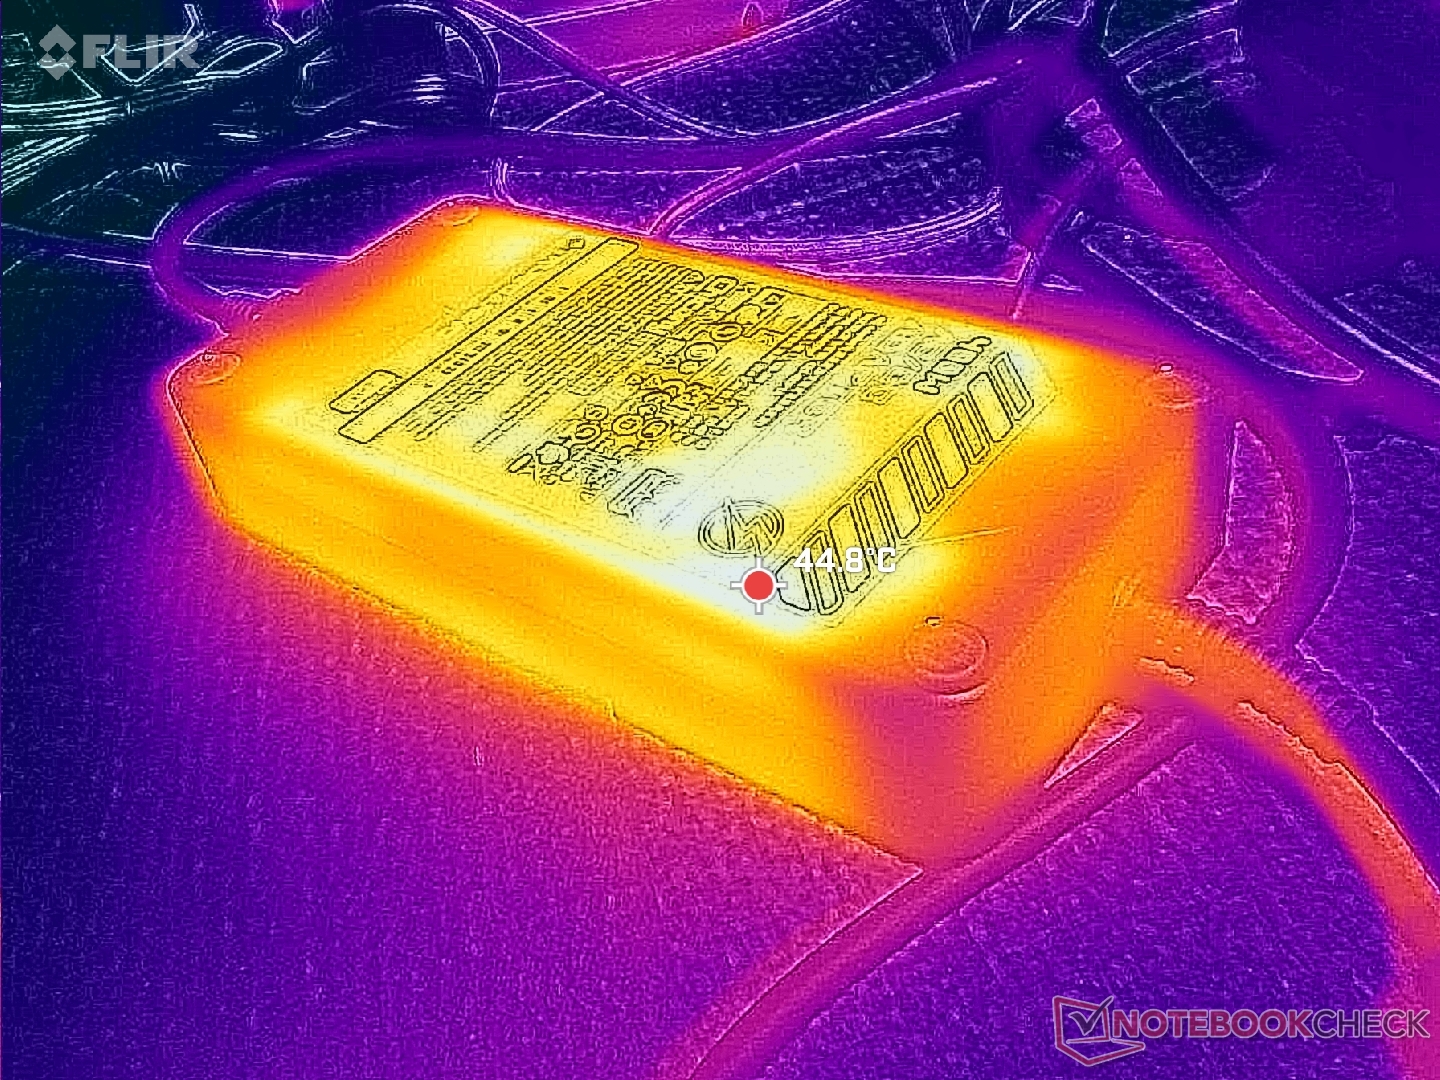
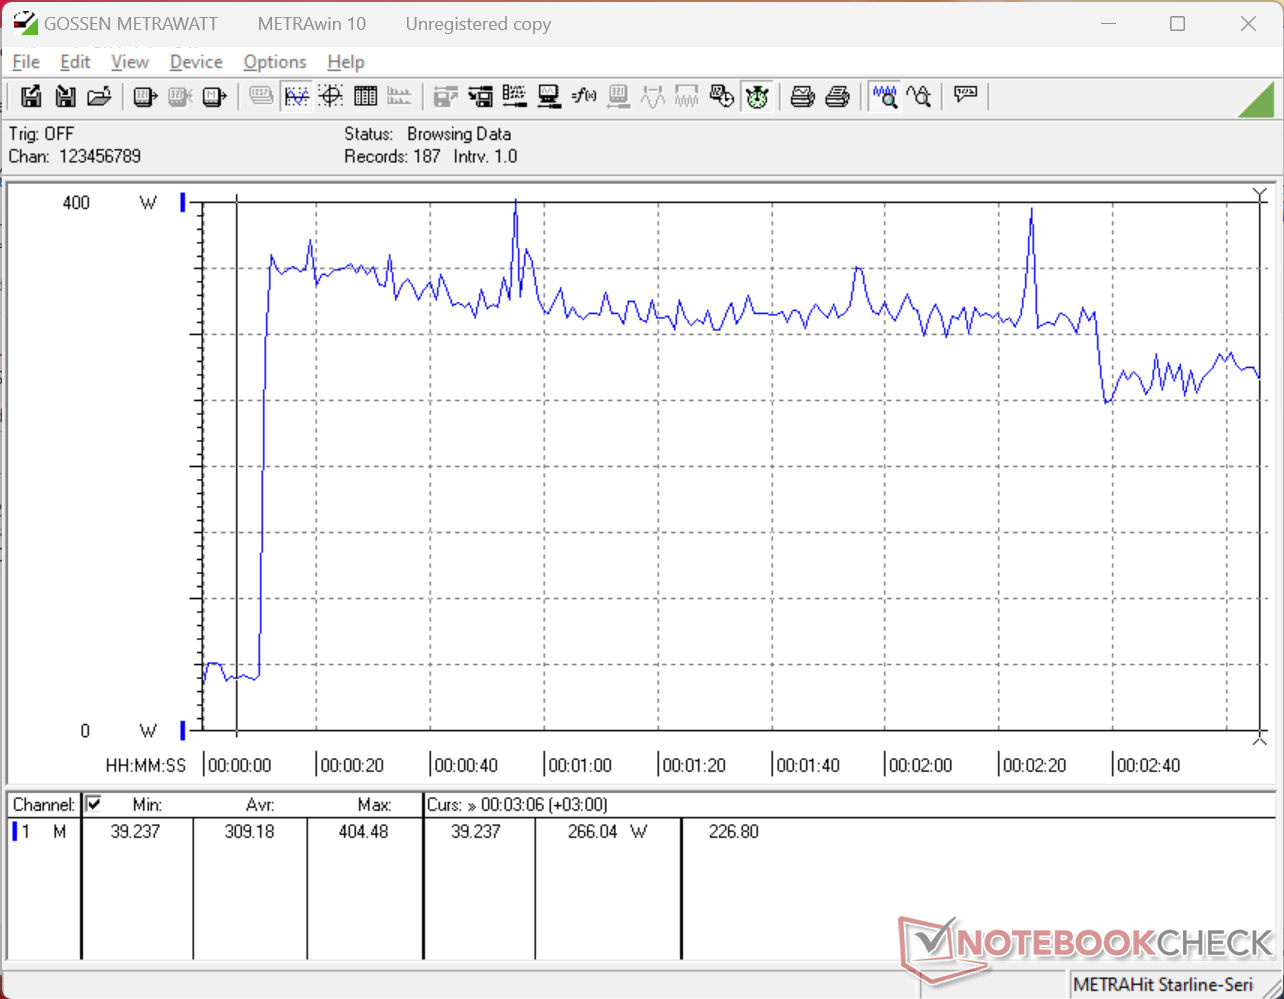
We zijn in staat om een tijdelijke maximale stroomafname van 405 W vast te leggen met een grote (~18,8 x 8,8 x 3,4 cm) 400 W wisselstroomadapter.
| Uit / Standby | |
| Inactief | |
| Belasting |
|
Key:
min: | |
| MSI Raider 16 Max HX B2WJ Ultra 9 290HX Plus, GeForce RTX 5090 Laptop, Micron 2500 1TB MTFDKBA1T0QGN, OLED, 2560x1600, 16" | MSI Crosshair 16 HX AI D2XWGKG Ultra 9 275HX, GeForce RTX 5070 Laptop, Micron 2500 1TB MTFDKBA1T0QGN, IPS, 2560x1600, 16" | Razer Blade 16 Core Ultra 9 386H Ultra 9 386H, GeForce RTX 5090 Laptop, Lexar NM790 2TB, OLED, 2560x1600, 16" | Alienware 16X Aurora Core Ultra 9 290HX Plus Ultra 9 290HX Plus, GeForce RTX 5070 Ti Laptop, , OLED, 2560x1600, 16" | Asus TUF Gaming A16 FA608UP R7 260, GeForce RTX 5070 Laptop, Western Digital PC SN5000S SDEQNSJ-1T00, IPS, 2560x1600, 16" | Lenovo Legion 7 16IAX10 Ultra 7 255HX, GeForce RTX 5060 Laptop, WD PC SN7100S SDFPMSL-1T00-1101, OLED, 2560x1600, 16" | |
|---|---|---|---|---|---|---|
| Power Consumption | -53% | 8% | 19% | 38% | 13% | |
| Idle Minimum * (Watt) | 7.2 | 26.2 -264% | 4.4 39% | 6.9 4% | 4.6 36% | 9.4 -31% |
| Idle Average * (Watt) | 12 | 33.8 -182% | 22.3 -86% | 8.1 32% | 9.8 18% | 10.6 12% |
| Idle Maximum * (Watt) | 32.8 | 34 -4% | 30.4 7% | 31 5% | 10.2 69% | 36.4 -11% |
| Load Average * (Watt) | 133 | 112 16% | 110.7 17% | 131.6 1% | 76.1 43% | 107.7 19% |
| Cyberpunk 2077 ultra external monitor * (Watt) | 275 | 220 20% | 216 21% | 172.1 37% | 198.1 28% | 187.5 32% |
| Cyberpunk 2077 ultra * (Watt) | 276 | 224 19% | 216 22% | 198.3 28% | 198.9 28% | 188 32% |
| Load Maximum * (Watt) | 404.5 | 315 22% | 251.3 38% | 300.1 26% | 235.2 42% | 247 39% |
* ... kleiner is beter
Stroomverbruik Cyberpunk / Stresstest
Stroomverbruik externe monitor
Levensduur batterij
De looptijden zijn redelijk, maar korter dan bij veel modellen van de vorige generatie, deels door de overstap van IPS naar OLED.
| MSI Raider 16 Max HX B2WJ Ultra 9 290HX Plus, GeForce RTX 5090 Laptop, 91.8 Wh | MSI Crosshair 16 HX AI D2XWGKG Ultra 9 275HX, GeForce RTX 5070 Laptop, 90 Wh | Razer Blade 16 Core Ultra 9 386H Ultra 9 386H, GeForce RTX 5090 Laptop, 90 Wh | Alienware 16X Aurora Core Ultra 9 290HX Plus Ultra 9 290HX Plus, GeForce RTX 5070 Ti Laptop, 96 Wh | Asus TUF Gaming A16 FA608UP R7 260, GeForce RTX 5070 Laptop, 90 Wh | Lenovo Legion 7 16IAX10 Ultra 7 255HX, GeForce RTX 5060 Laptop, 84 Wh | |
|---|---|---|---|---|---|---|
| Batterijduur | 41% | 48% | -6% | 65% | -41% | |
| WiFi v1.3 (h) | 7.9 | 11.1 41% | 11.7 48% | 7.4 -6% | 13 65% | 4.7 -41% |
| H.264 (h) | 14.2 |
Notebookcheck Beoordeling
De Raider 16 Max HX is zwaarder en groter dan veel andere 16-inch gaming laptops, maar kan daardoor meer prestaties uit de CPU en GPU persen.
MSI Raider 16 Max HX B2WJ
- 09-06-2026 v8
Allen Ngo
 Total Sustainability Score:
 Potentiële concurrenten in vergelijking
Afbeelding | Model / recensie | prijs | Gewicht | Hoogte | Scherm |
|---|---|---|---|---|---|
1. 87.7%  | MSI Raider 16 Max HX B2WJ Intel Core Ultra 9 290HX Plus ⎘ NVIDIA GeForce RTX 5090 Laptop ⎘ 32 GB Geheugen, 1024 GB SSD | Amazon: Catalogusprijs: 4200 USD | 2.7 kg | 28.9 mm | 16.00" 2560x1600 189 PPI OLED |
2. 81.9%  | MSI Crosshair 16 HX AI D2XWGKG Intel Core Ultra 9 275HX ⎘ NVIDIA GeForce RTX 5070 Laptop ⎘ 16 GB Geheugen, 1024 GB SSD | Amazon: Catalogusprijs: 2500 EUR | 2.5 kg | 27.9 mm | 16.00" 2560x1600 189 PPI IPS |
3. 87.7%  | Razer Blade 16 Core Ultra 9 386H Intel Core Ultra 9 386H ⎘ NVIDIA GeForce RTX 5090 Laptop ⎘ 32 GB Geheugen, 2048 GB SSD | Amazon: 1. $3,499.99 Razer Blade 16 (2026) Gaming... 2. $4,899.99 Razer Blade 16 (2026) Gaming... 3. $4,699.99 Razer Blade 16 (2026) Gaming... Catalogusprijs: 4900 USD | 2.1 kg | 17.4 mm | 16.00" 2560x1600 189 PPI OLED |
4. 85.9%  | Alienware 16X Aurora Core Ultra 9 290HX Plus Intel Core Ultra 9 290HX Plus ⎘ NVIDIA GeForce RTX 5070 Ti Laptop ⎘ 32 GB Geheugen | Amazon: Catalogusprijs: 3000 USD | 2.6 kg | 23.4 mm | 16.00" 2560x1600 189 PPI OLED |
5. 83.8%  | Asus TUF Gaming A16 FA608UP AMD Ryzen 7 260 ⎘ NVIDIA GeForce RTX 5070 Laptop ⎘ 32 GB Geheugen, 1024 GB SSD | Amazon: Catalogusprijs: 2199€ | 2.2 kg | 25.7 mm | 16.00" 2560x1600 189 PPI IPS |
6. 86.6%  | Lenovo Legion 7 16IAX10 Intel Core Ultra 7 255HX ⎘ NVIDIA GeForce RTX 5060 Laptop ⎘ 32 GB Geheugen, 1024 GB SSD | Amazon: Catalogusprijs: 1650 USD | 2 kg | 17.9 mm | 16.00" 2560x1600 189 PPI OLED |
Transparantie
De selectie van te beoordelen apparaten wordt gemaakt door onze redactie. Het testexemplaar werd ten behoeve van deze beoordeling door de fabrikant of detailhandelaar in bruikleen aan de auteur verstrekt. De kredietverstrekker had geen invloed op deze recensie, noch ontving de fabrikant vóór publicatie een exemplaar van deze recensie. Er bestond geen verplichting om deze recensie te publiceren. Als onafhankelijk mediabedrijf is Notebookcheck niet onderworpen aan het gezag van fabrikanten, detailhandelaren of uitgevers.
[transparency_disclaimer]Dit is hoe Notebookcheck test
Elk jaar beoordeelt Notebookcheck onafhankelijk honderden laptops en smartphones met behulp van gestandaardiseerde procedures om ervoor te zorgen dat alle resultaten vergelijkbaar zijn. We hebben onze testmethoden al zo'n 20 jaar voortdurend ontwikkeld en daarbij de industriestandaard bepaald. In onze testlaboratoria wordt gebruik gemaakt van hoogwaardige meetapparatuur door ervaren technici en redacteuren. Deze tests omvatten een validatieproces in meerdere fasen. Ons complexe beoordelingssysteem is gebaseerd op honderden goed onderbouwde metingen en benchmarks, waardoor de objectiviteit behouden blijft. Meer informatie over onze testmethoden kunt u hier vinden.

