2022 Beelink GTR5 mini PC review: Een Intel NUC met AMD Ryzen 9

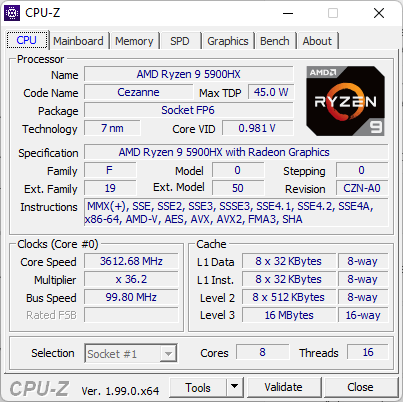
In de begindagen van NUC-formaat mini PC's, werden dergelijke producten meestal gezien als ultra low-power alternatieven voor de typische desktop of laptop. Tegenwoordig zijn mini PC's geëvolueerd naar gaming-level specificaties en andere krachtige functies. De Beelink GTR5 is de nieuwste high-performance mini PC van de fabrikant, uitgerust met een AMD Zen 3 Ryzen 9 5900HX processor die meestal gereserveerd is voor krachtige gaming laptops zoals de Asus ROG Zephyrus Duo 15 SE, Lenovo Legion 7 16, of de Gigabyte A7 X1. Het zien van een dergelijke optie voor een 0,8 L vormfactor PC zou de GTR5 automatisch een van de snelste in zijn categorie moeten maken, als alles loopt zoals geadverteerd.
De GTR5 is momenteel op Indiegogo variërend van $620 USD voor een barebones kit tot $950 indien volledig geconfigureerd. Alle SKU's worden geleverd met dezelfde Ryzen 9 5900HX processor. De GTR5 moet niet verward worden met de GTR7, wat eigenlijk een ouder Beelink model is dat draait op de veel tragere Ryzen 7 3750H.
Meer Beelink reviews:
Potential Competitors in Comparison
Evaluatie | Datum | Model | Gewicht | Hoogte | Formaat | Resolutie | Beste prijs |
|---|---|---|---|---|---|---|---|
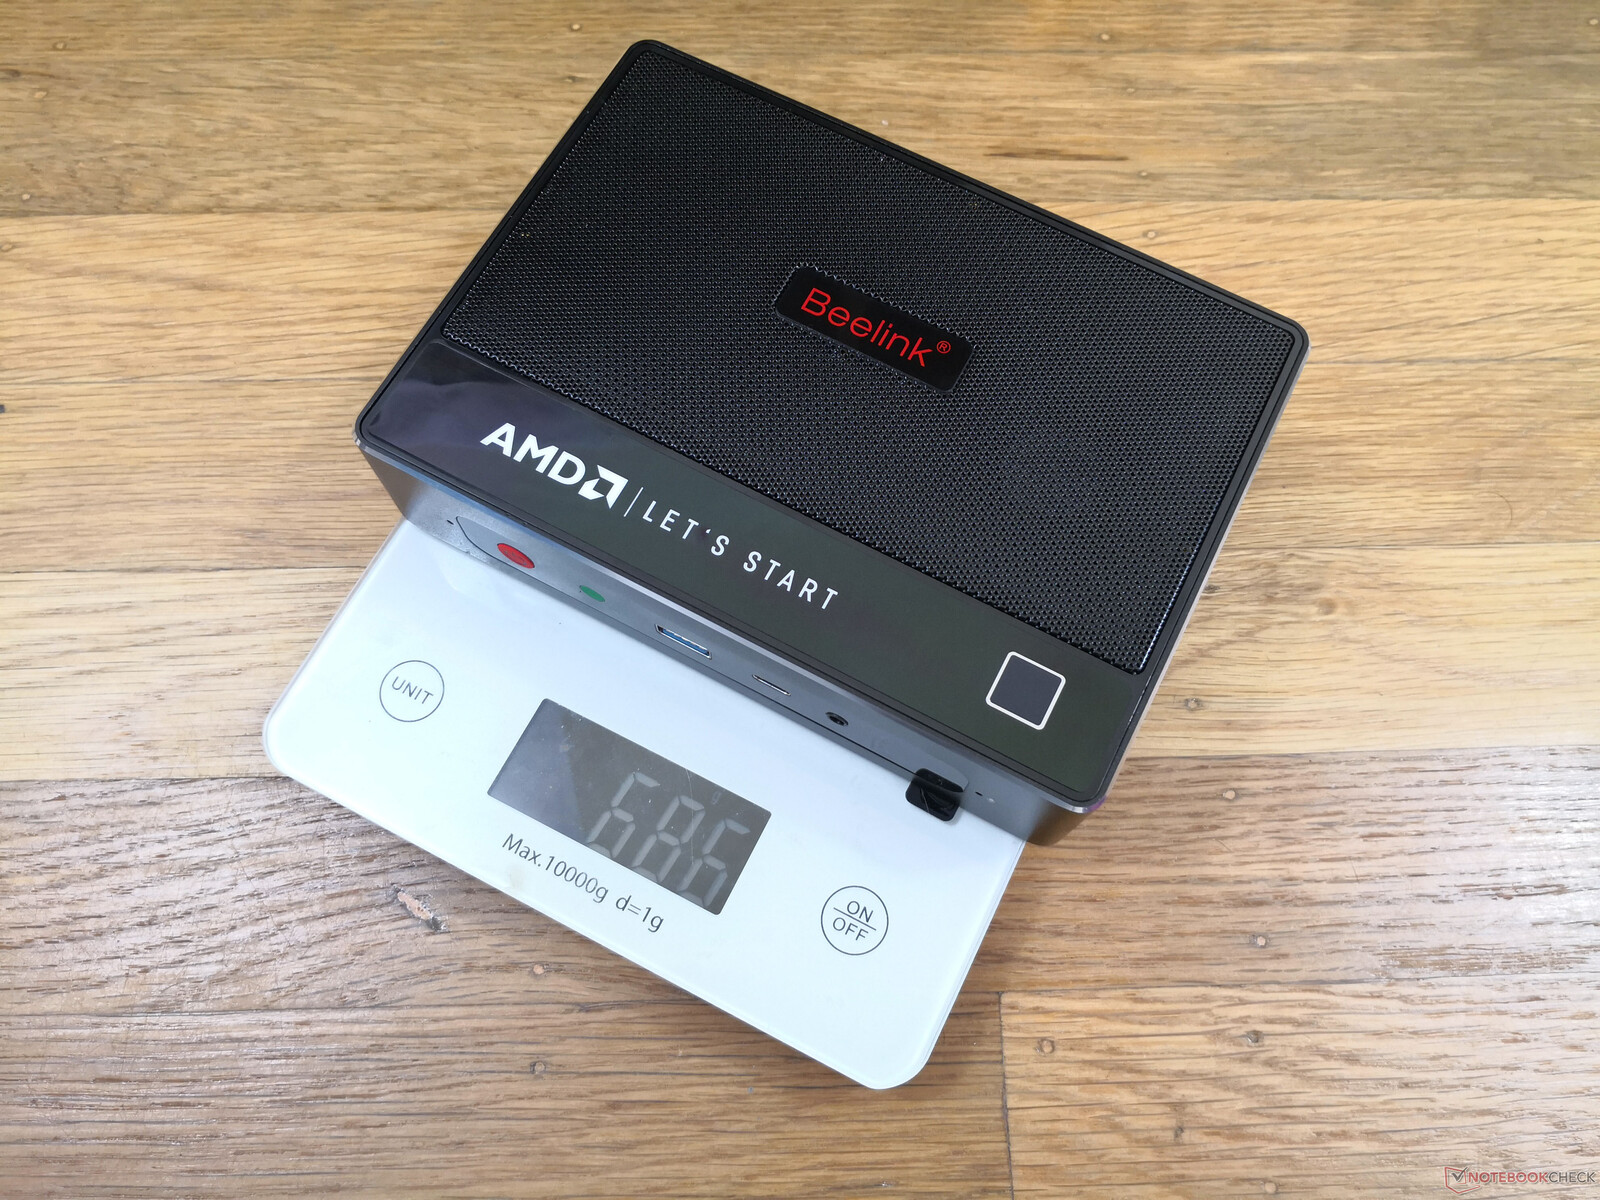
v (old) | 01-2022 | Beelink GTR5 R9 5900HX, Vega 8 | 686 g | 39 mm | x | ||
v (old) | 12-2021 | Beelink GTI 11 i5-1135G7, Iris Xe G7 80EUs | 638 g | 39 mm | x | ||
v (old) | 03-2021 | GMK NucBox 2 i5-8259U, Iris Plus Graphics 655 | 430 g | 50 mm | x | ||
v (old) | 04-2021 | Intel NUC11PHKi7C i7-1165G7, GeForce RTX 2060 Mobile | 1.4 kg | 42 mm | x | ||
v (old) | 02-2021 | Intel NUC11PAQi7 i7-1165G7, Iris Xe G7 96EUs | 647 g | 56 mm | x | ||
v (old) | 05-2021 | Beelink GK Mini Celeron J4125, UHD Graphics 600 | 269 g | 43 mm | x |
Zaak
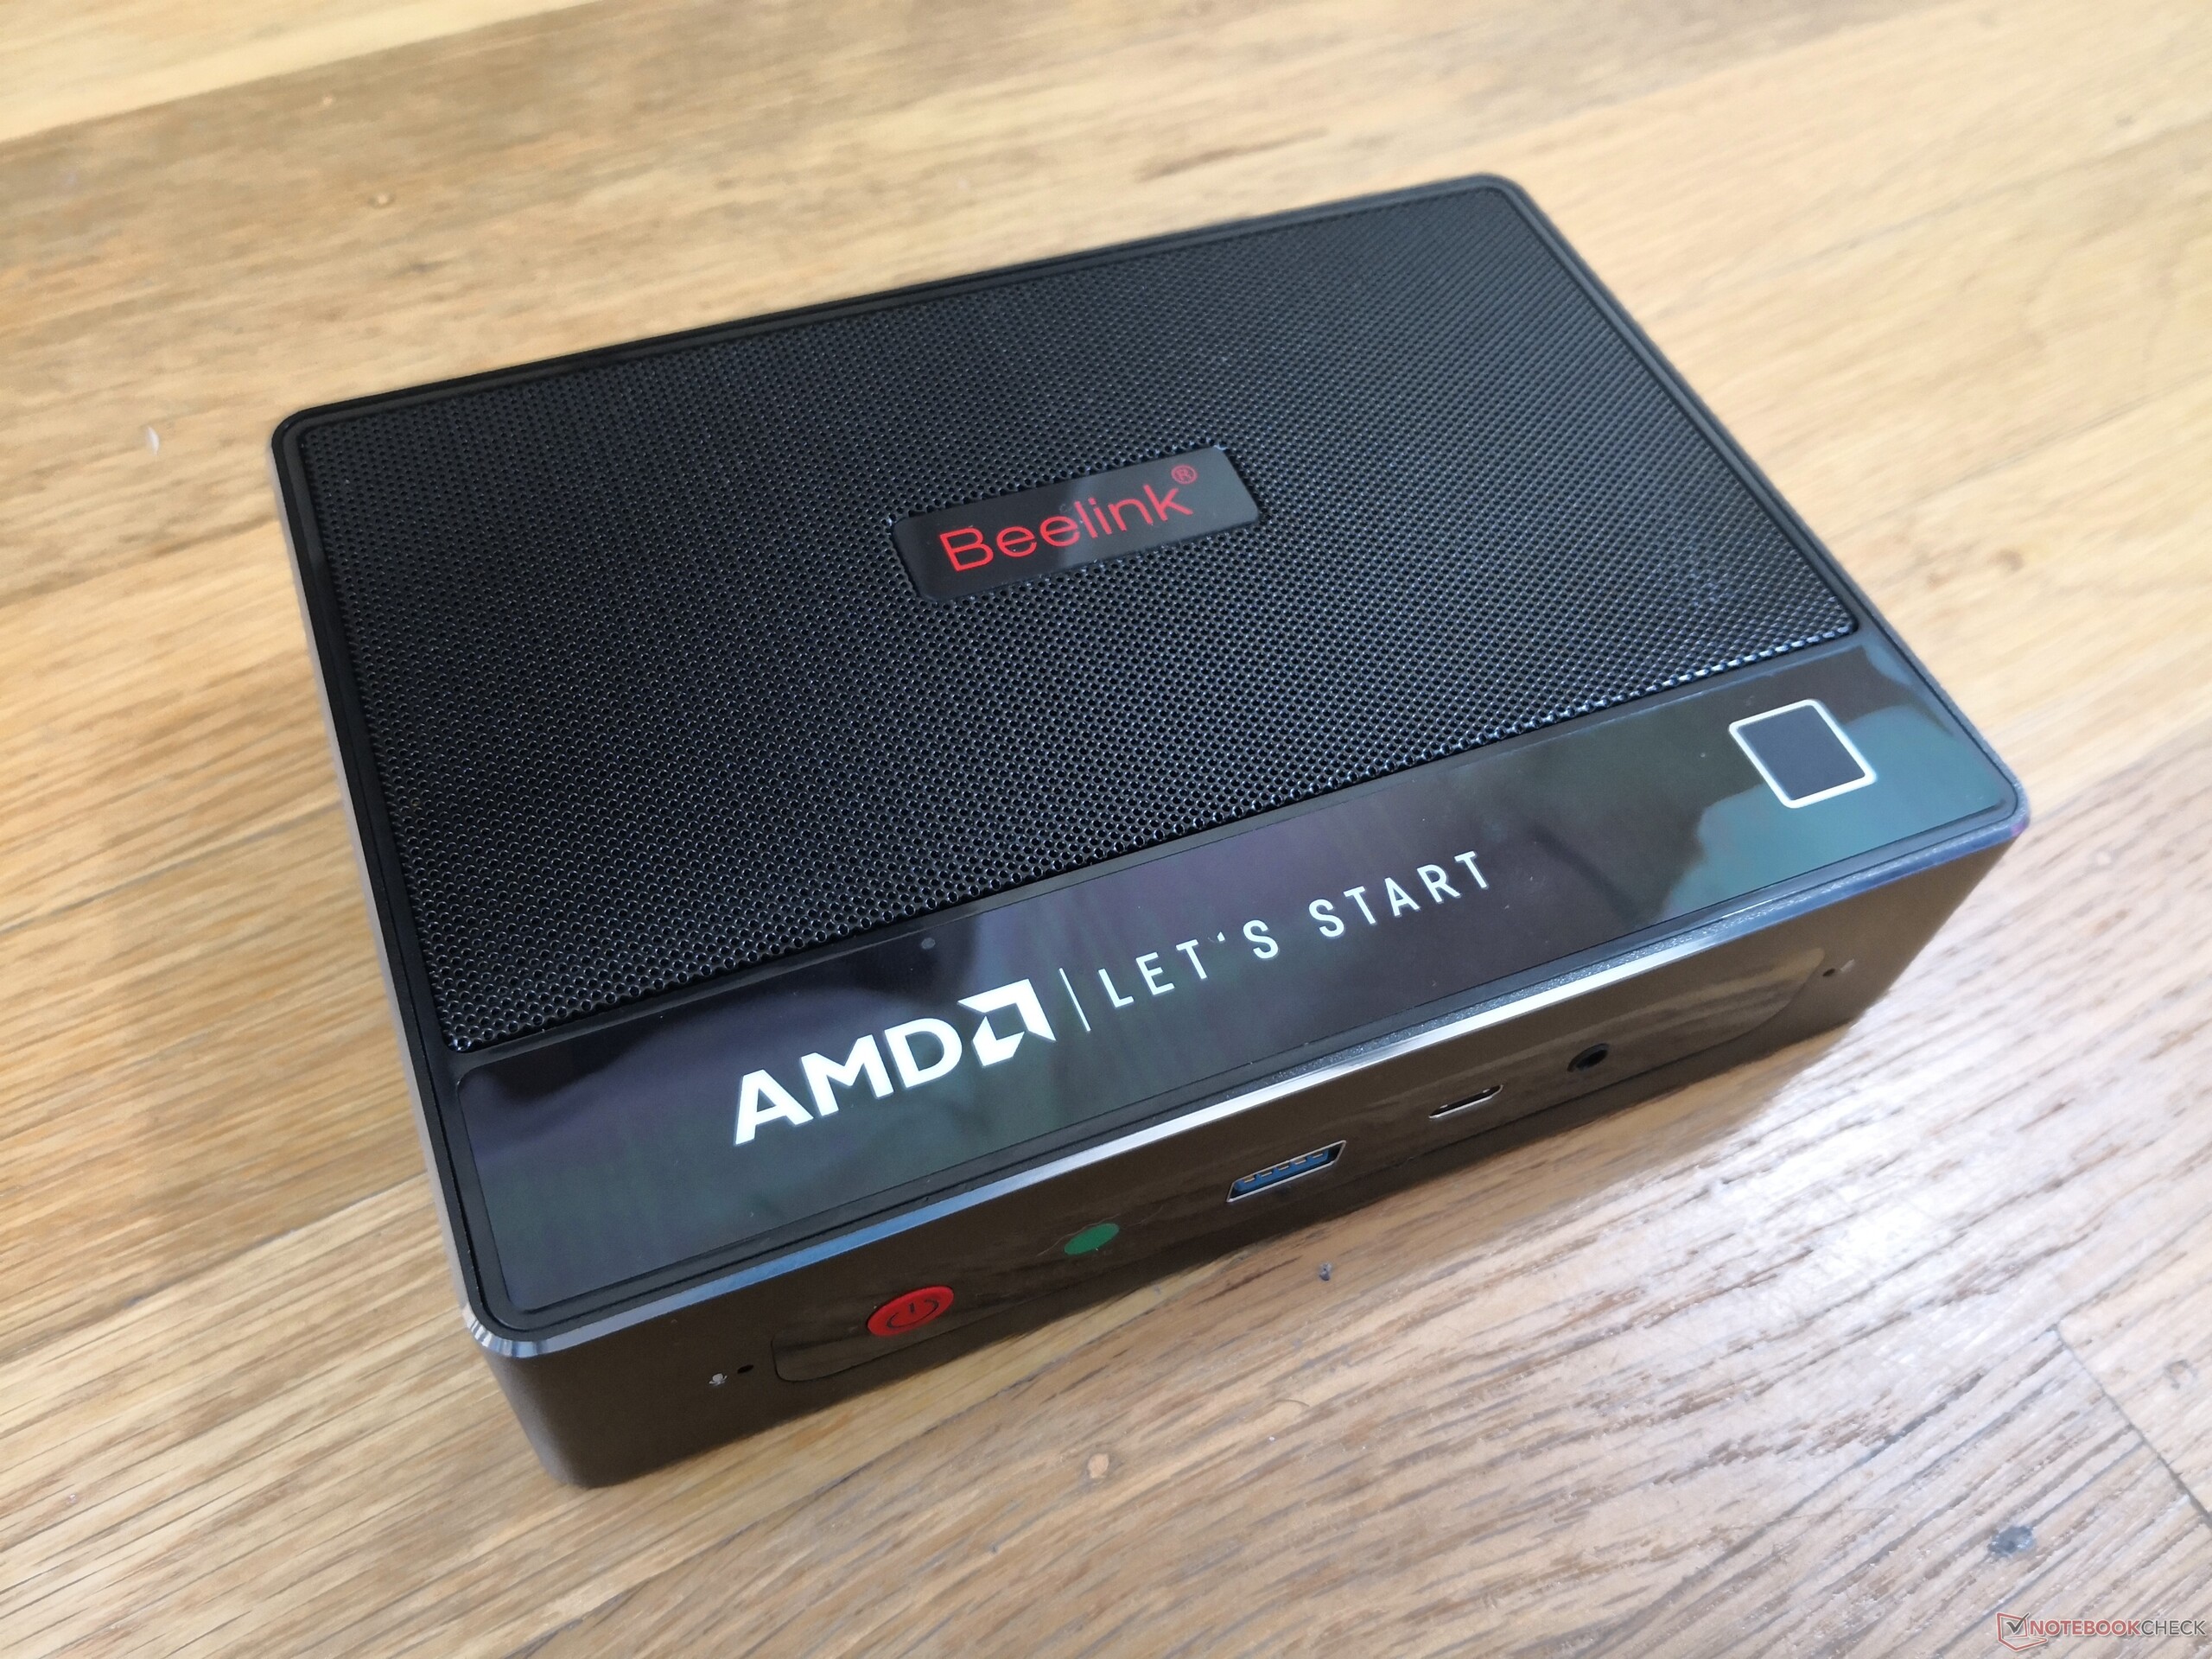
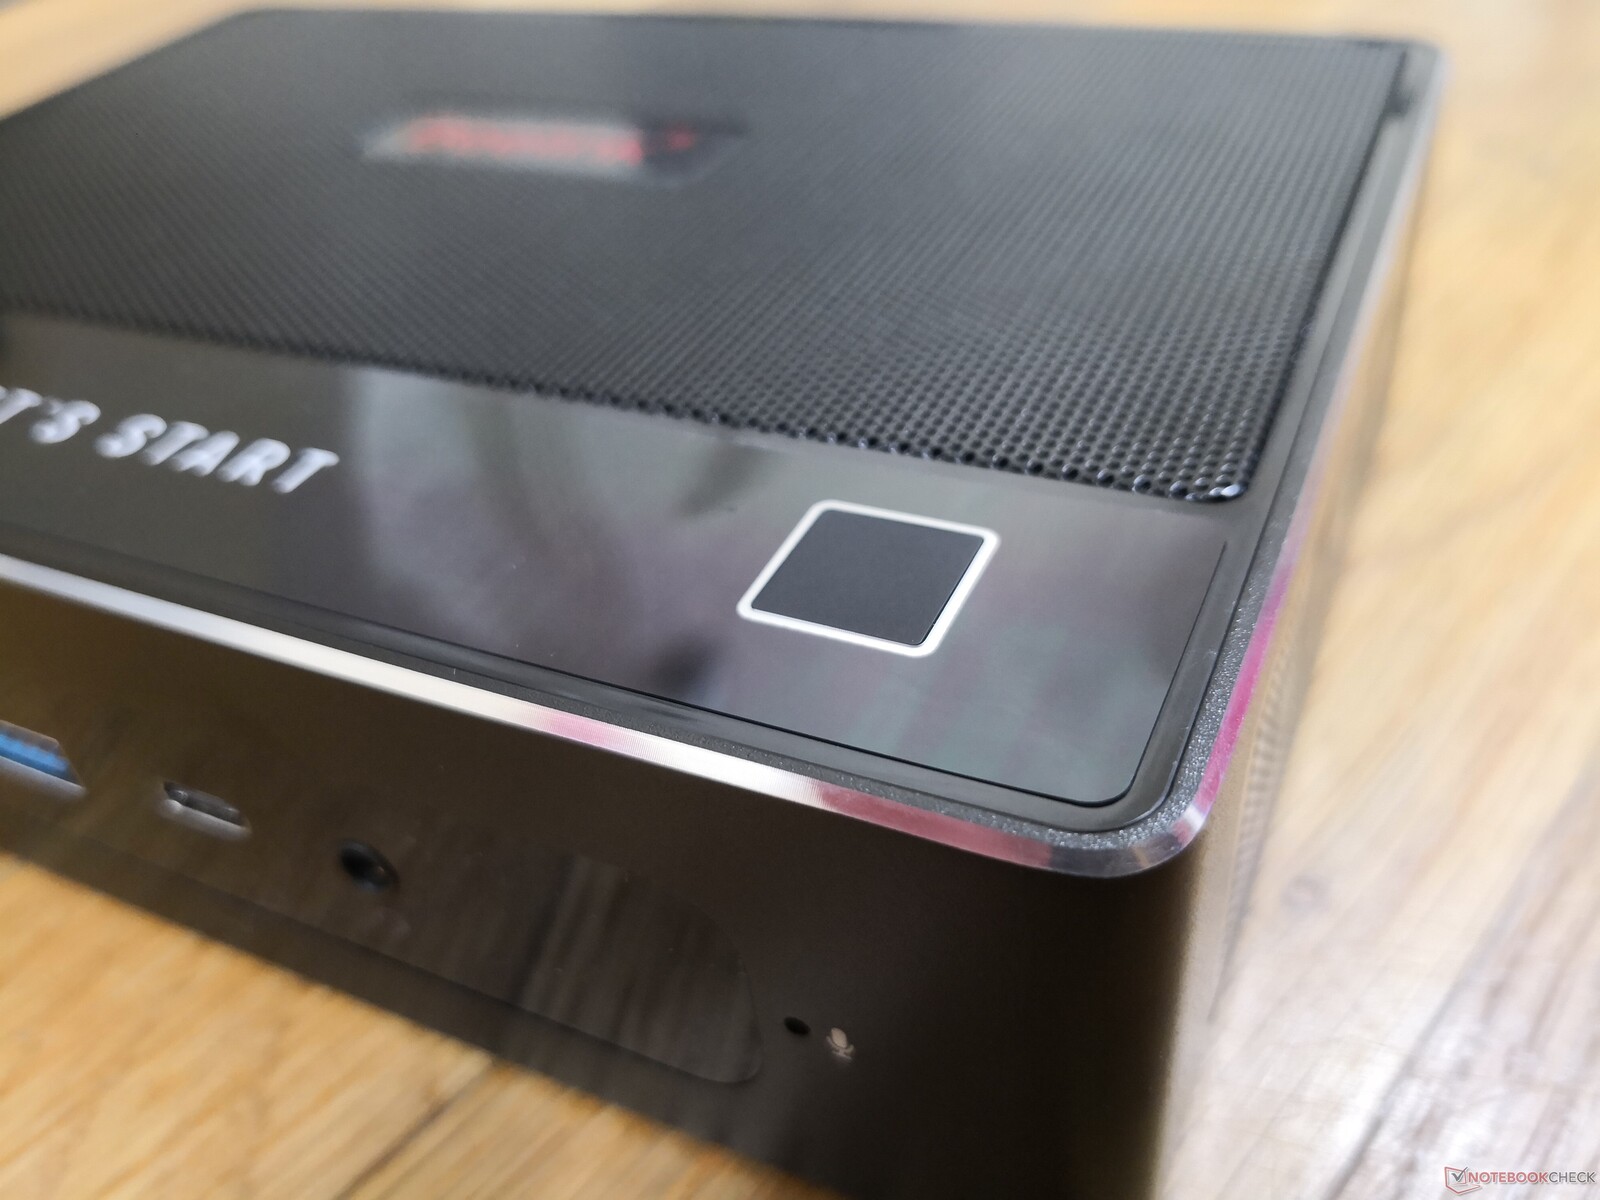
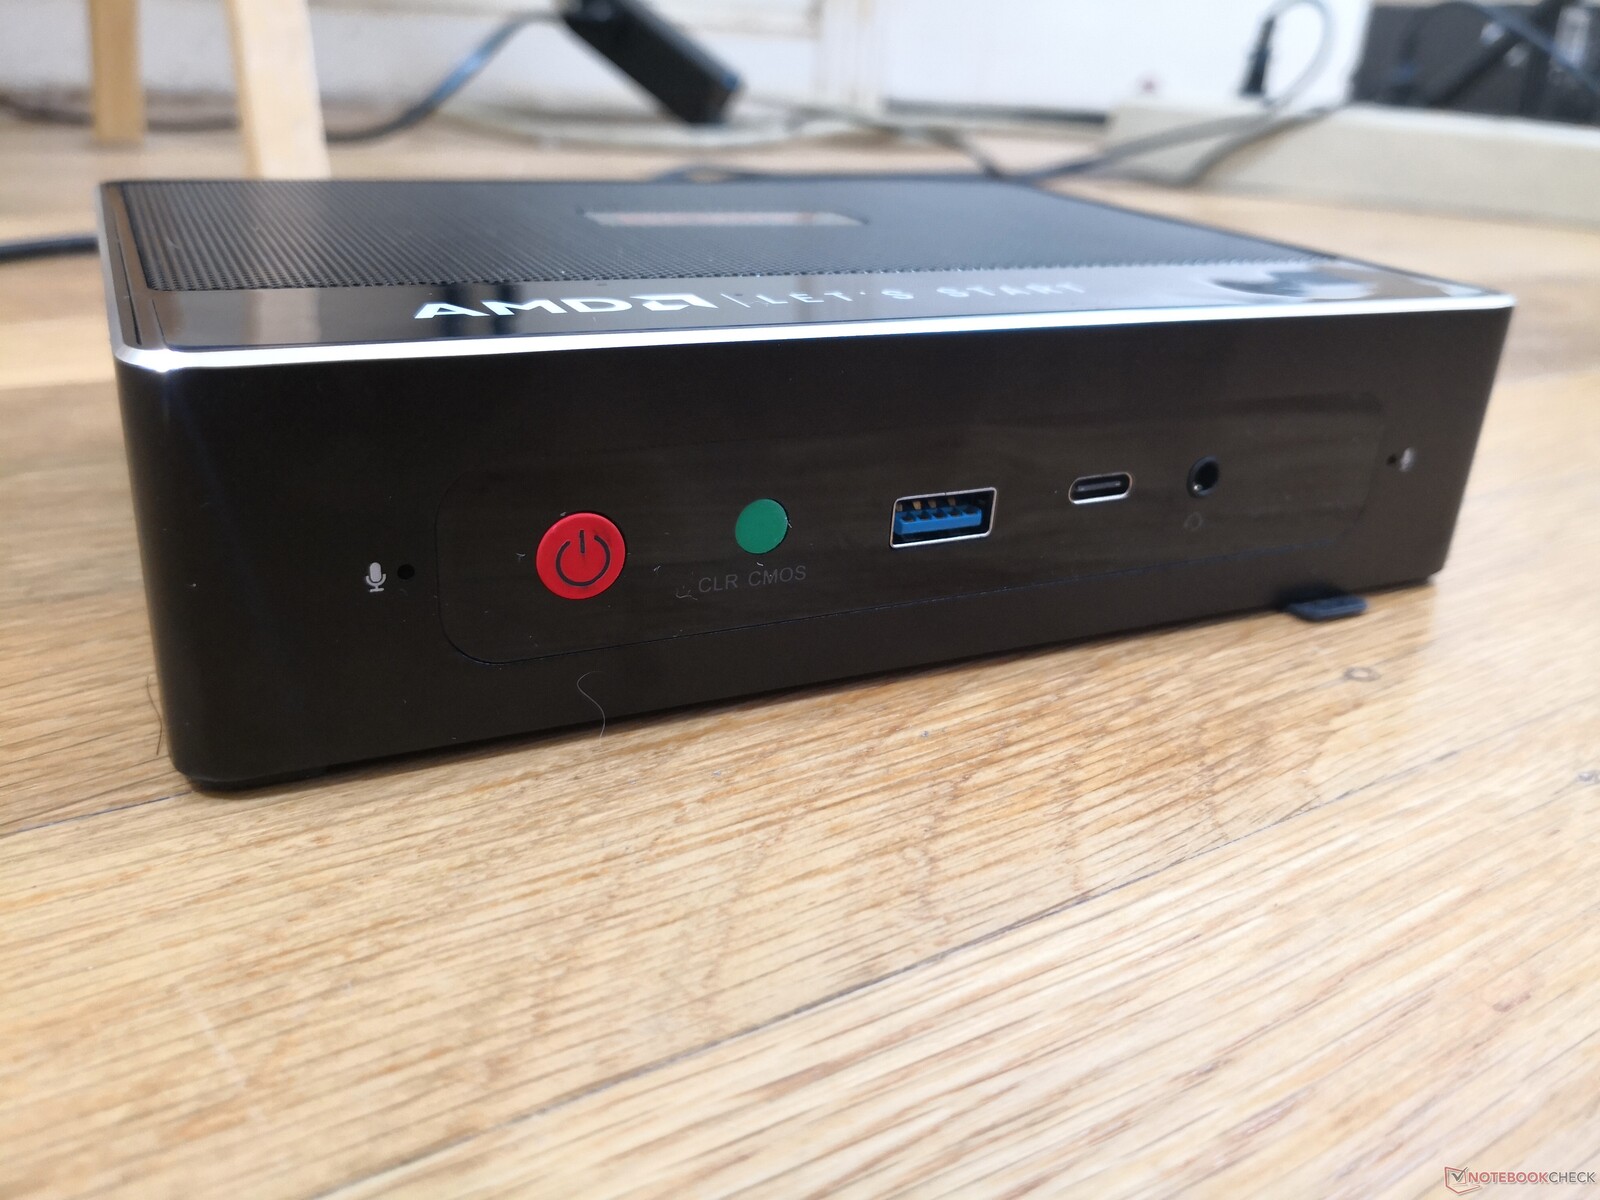
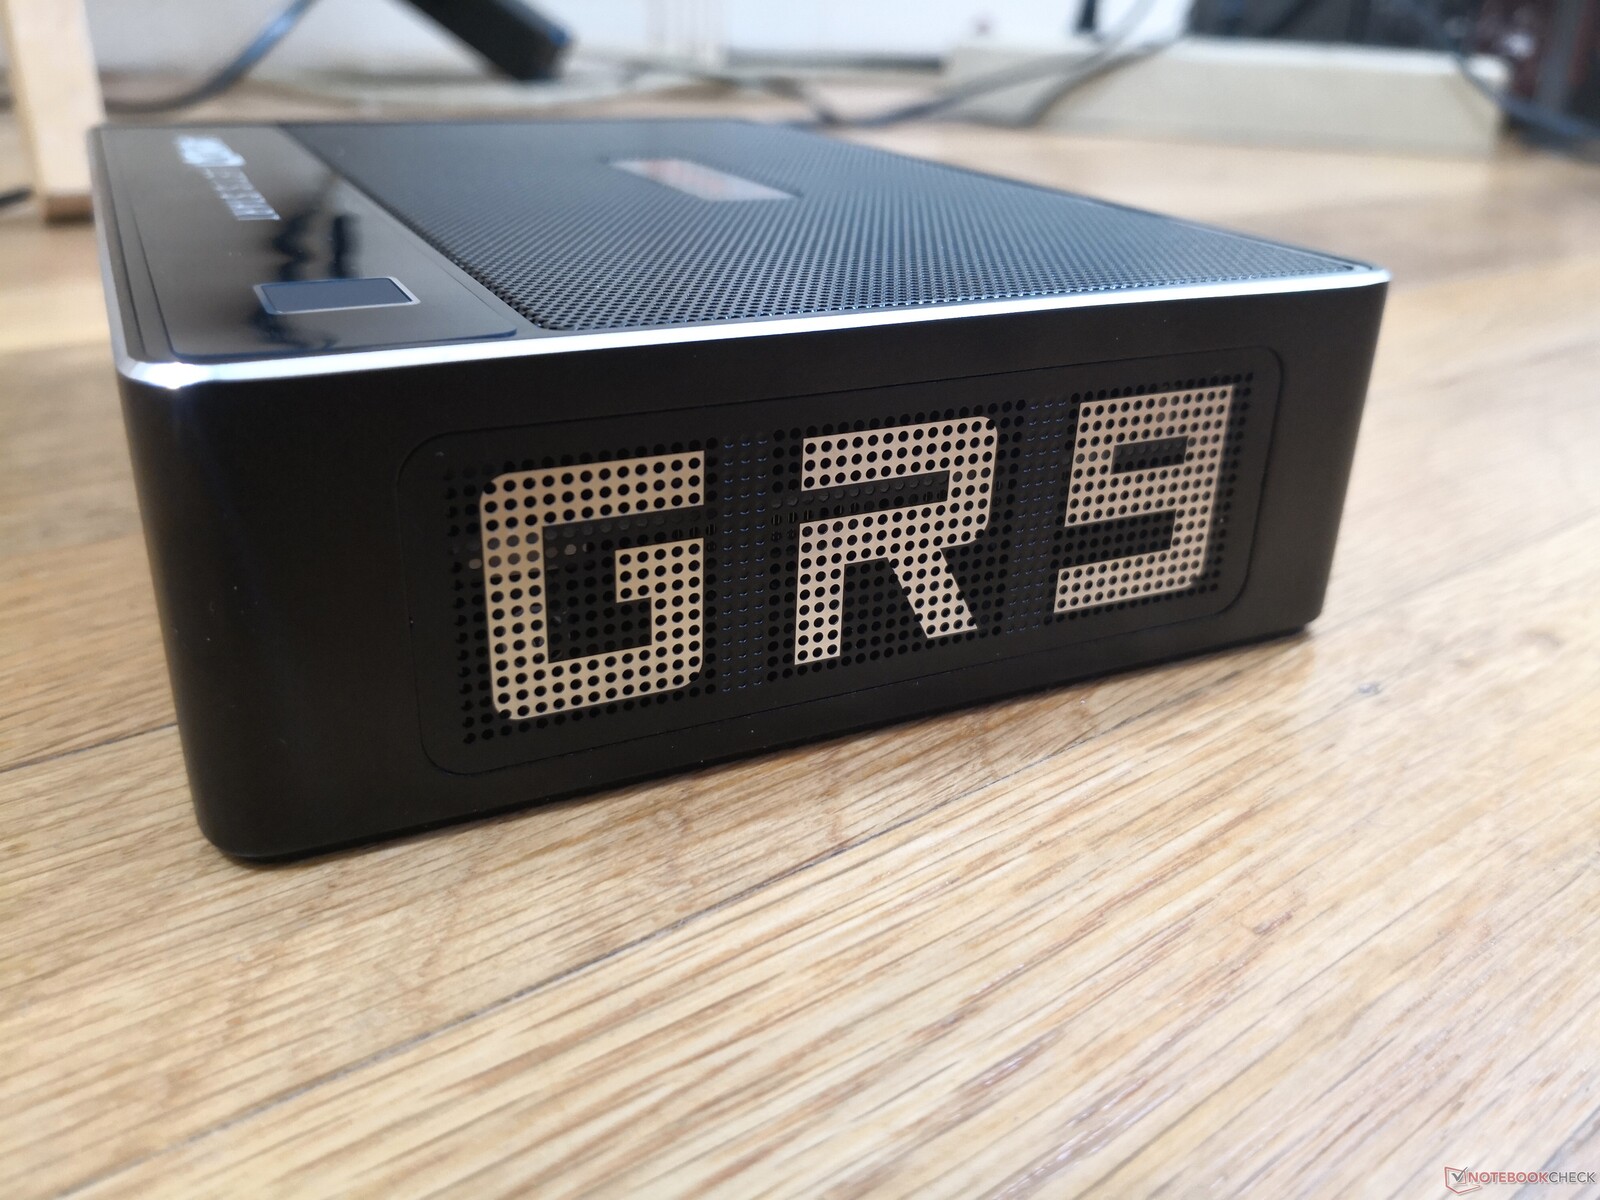
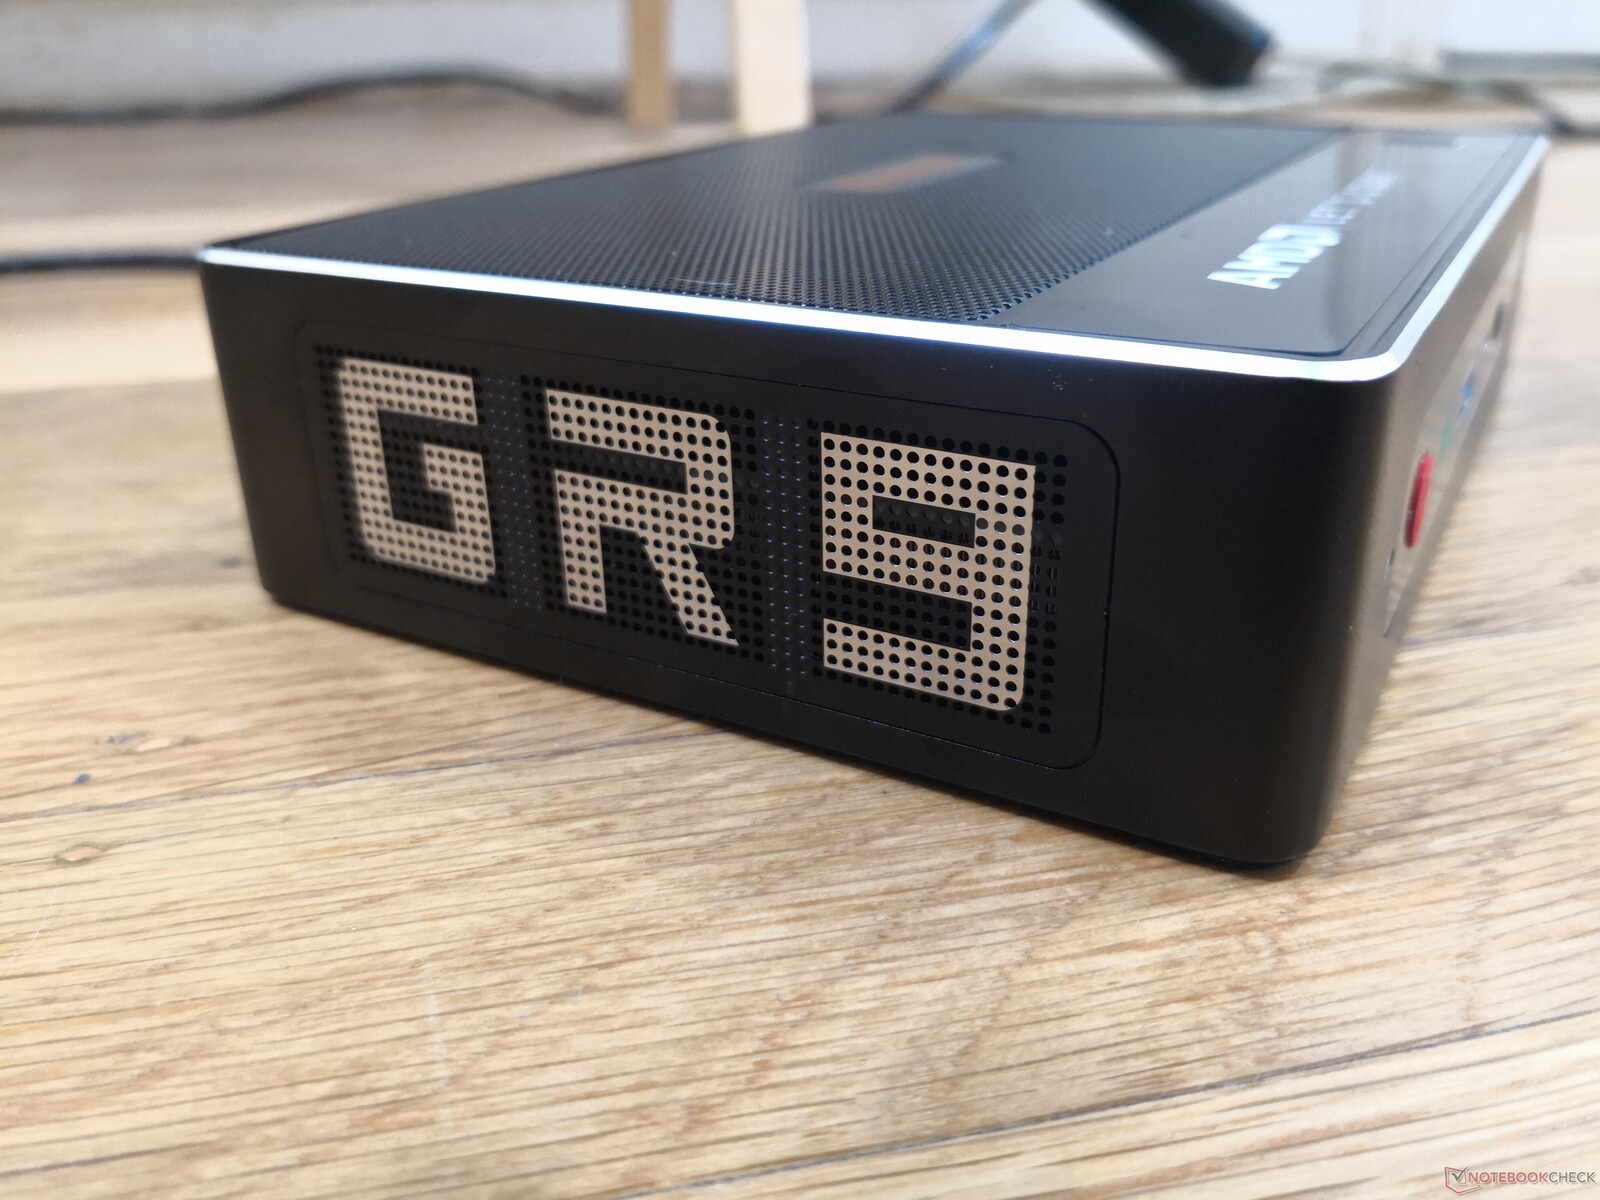
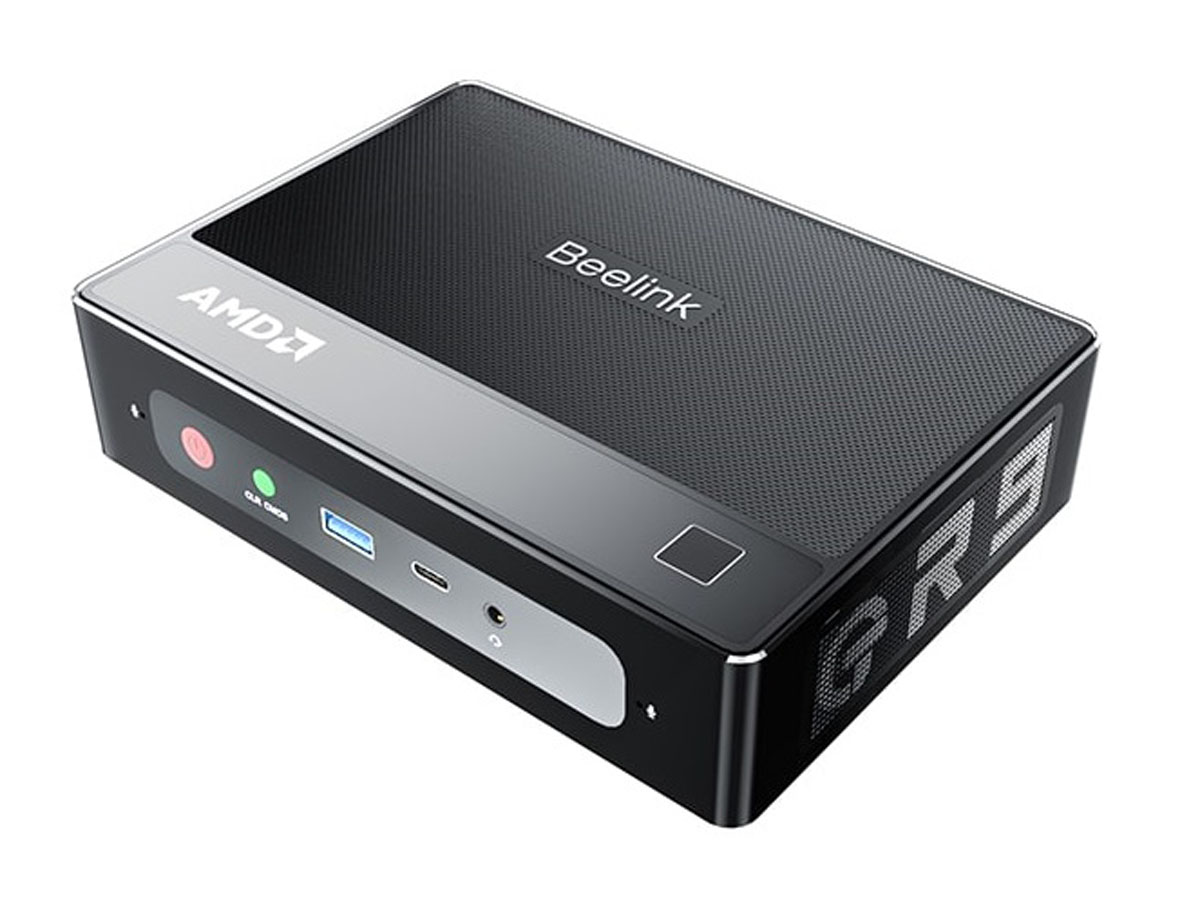
Beelink heeft zijn Intel GTI11 chassis hergebruikt voor de AMD GTR5. De afmetingen en de algemene opbouw van de GTR5 zijn in essentie identiek aan zijn Intel tegenhanger. De meest opvallende verandering is de bovenkant van het toestel om beter plaats te bieden aan de meer veeleisende H-serie AMD processor. Dit oppervlak is nu geperforeerd in plaats van glad glanzend plastic voor een betere luchtstroom.

Connectiviteit
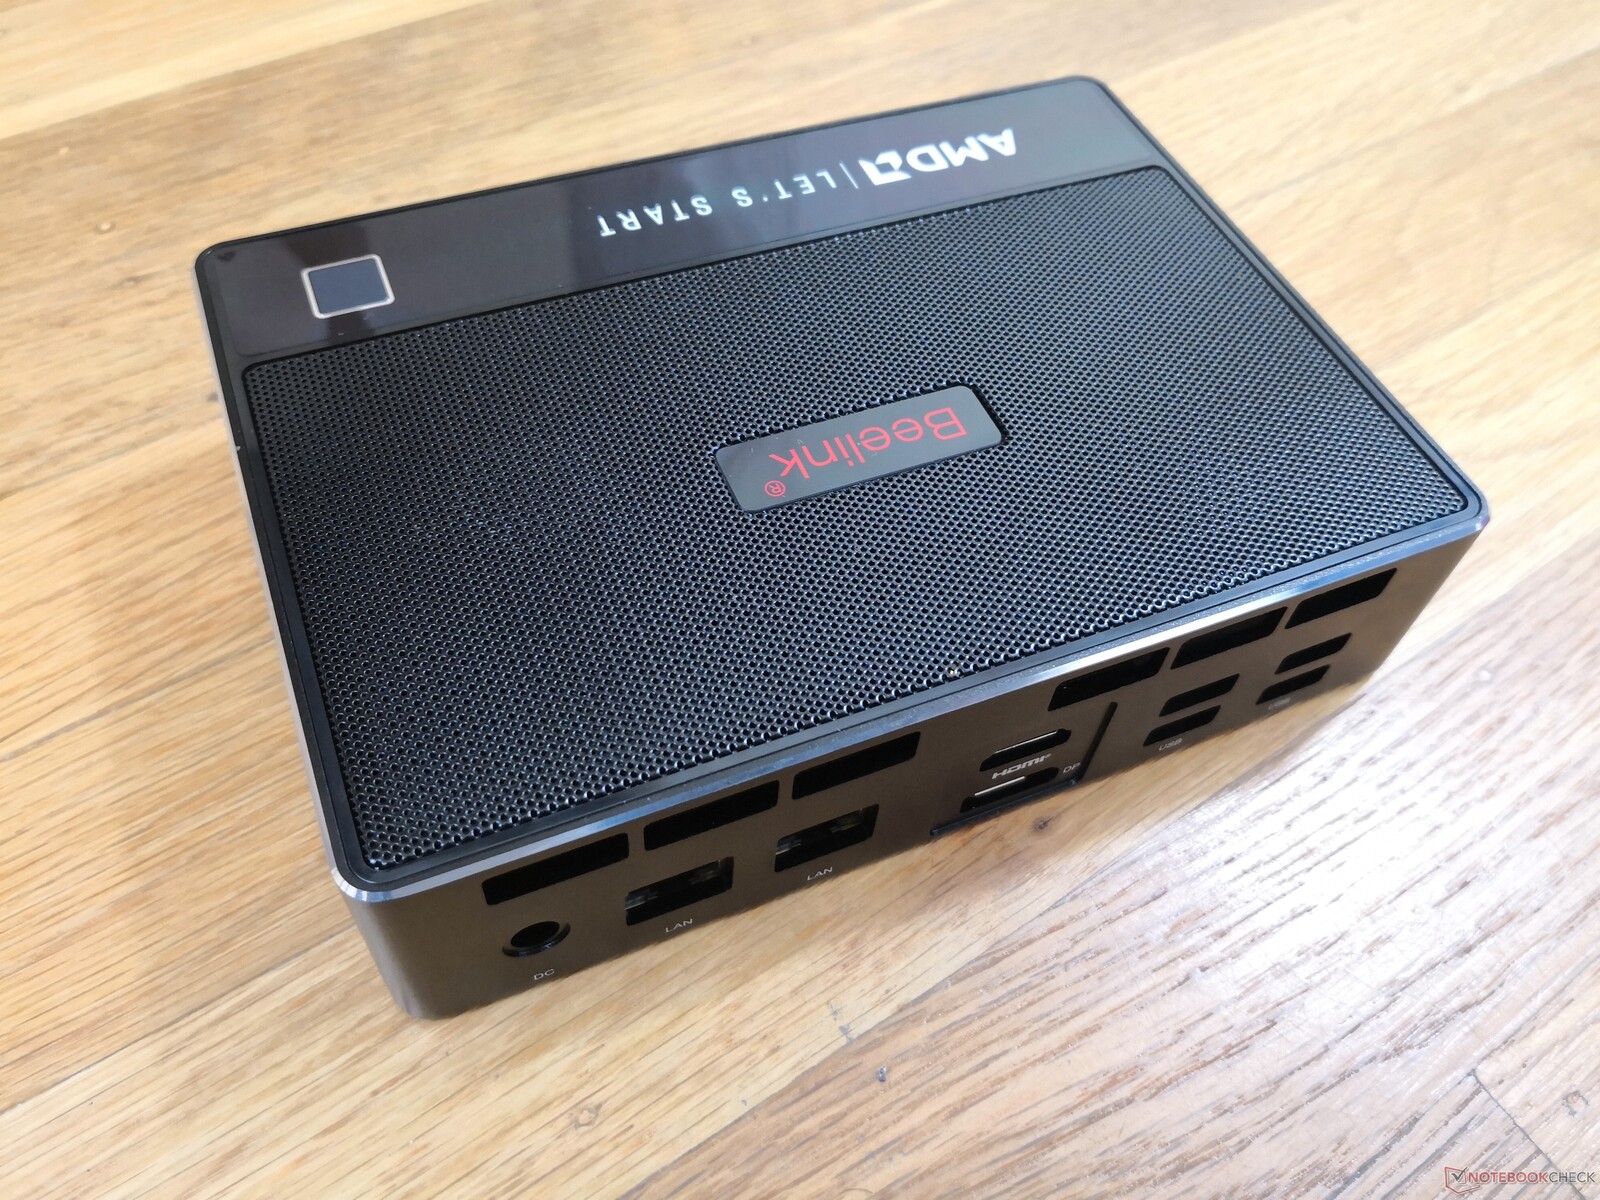
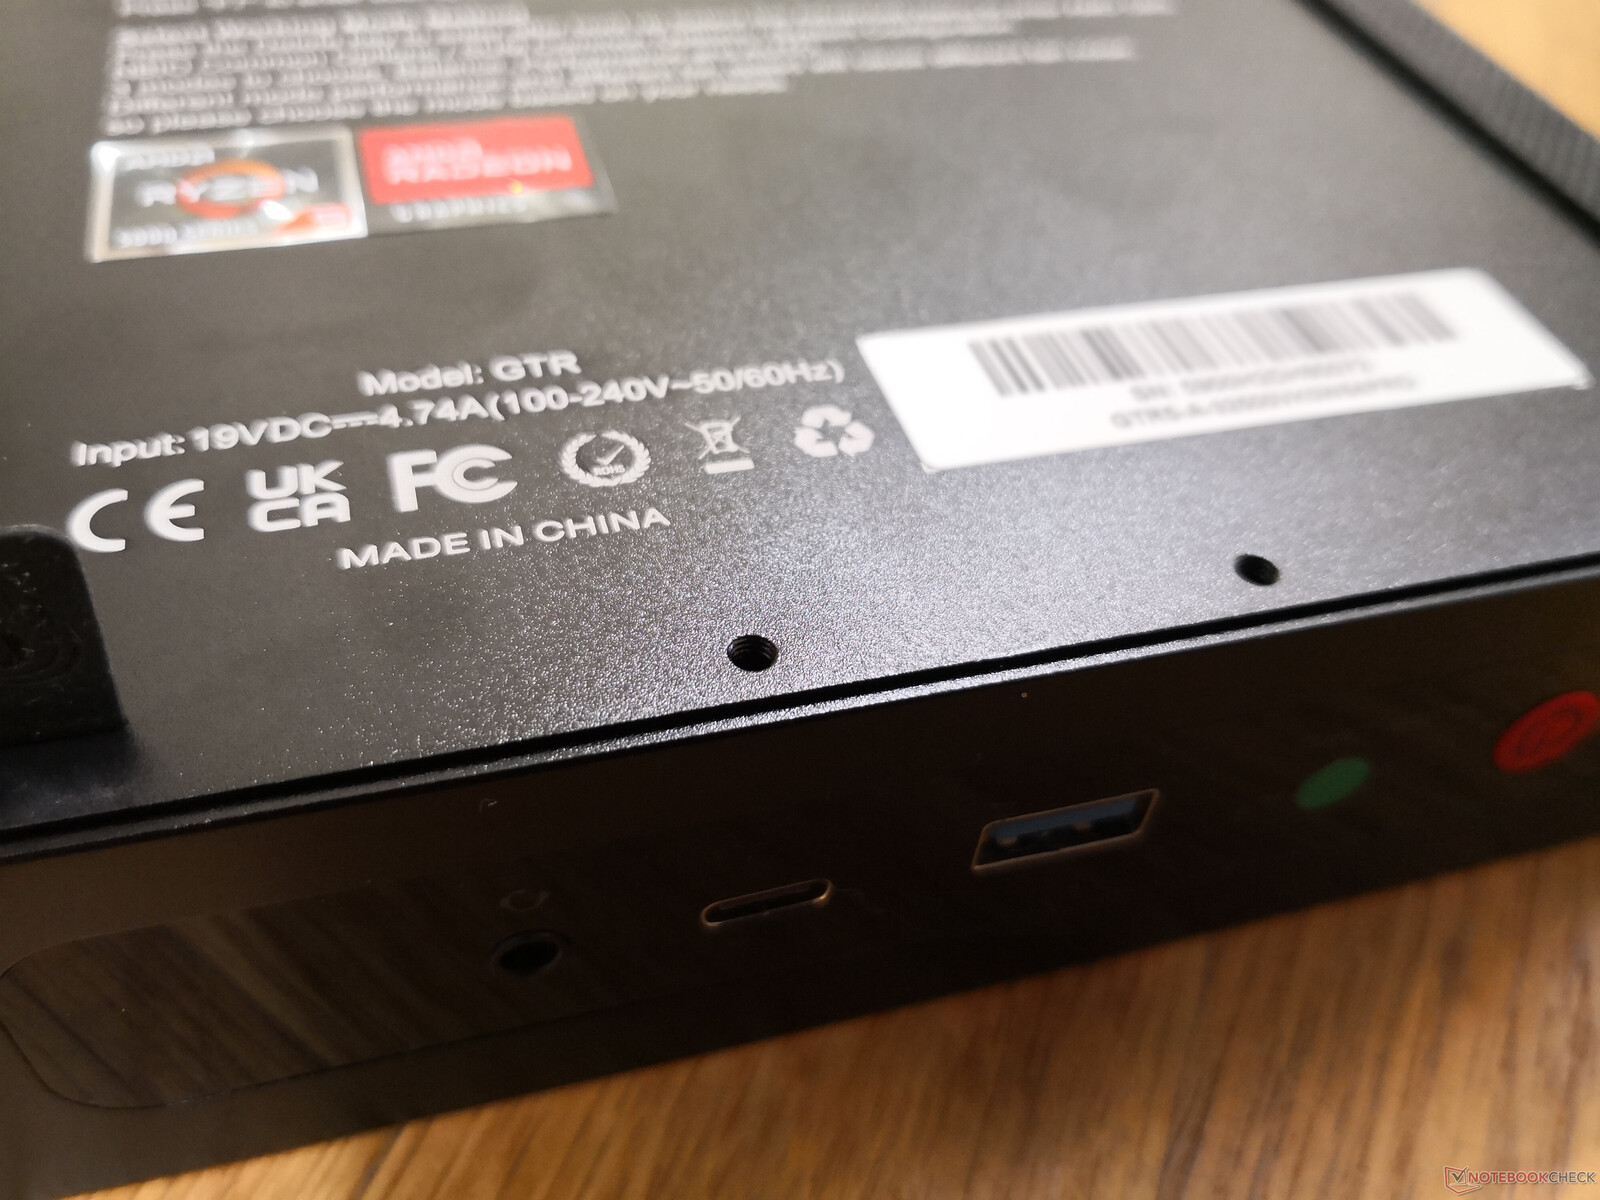
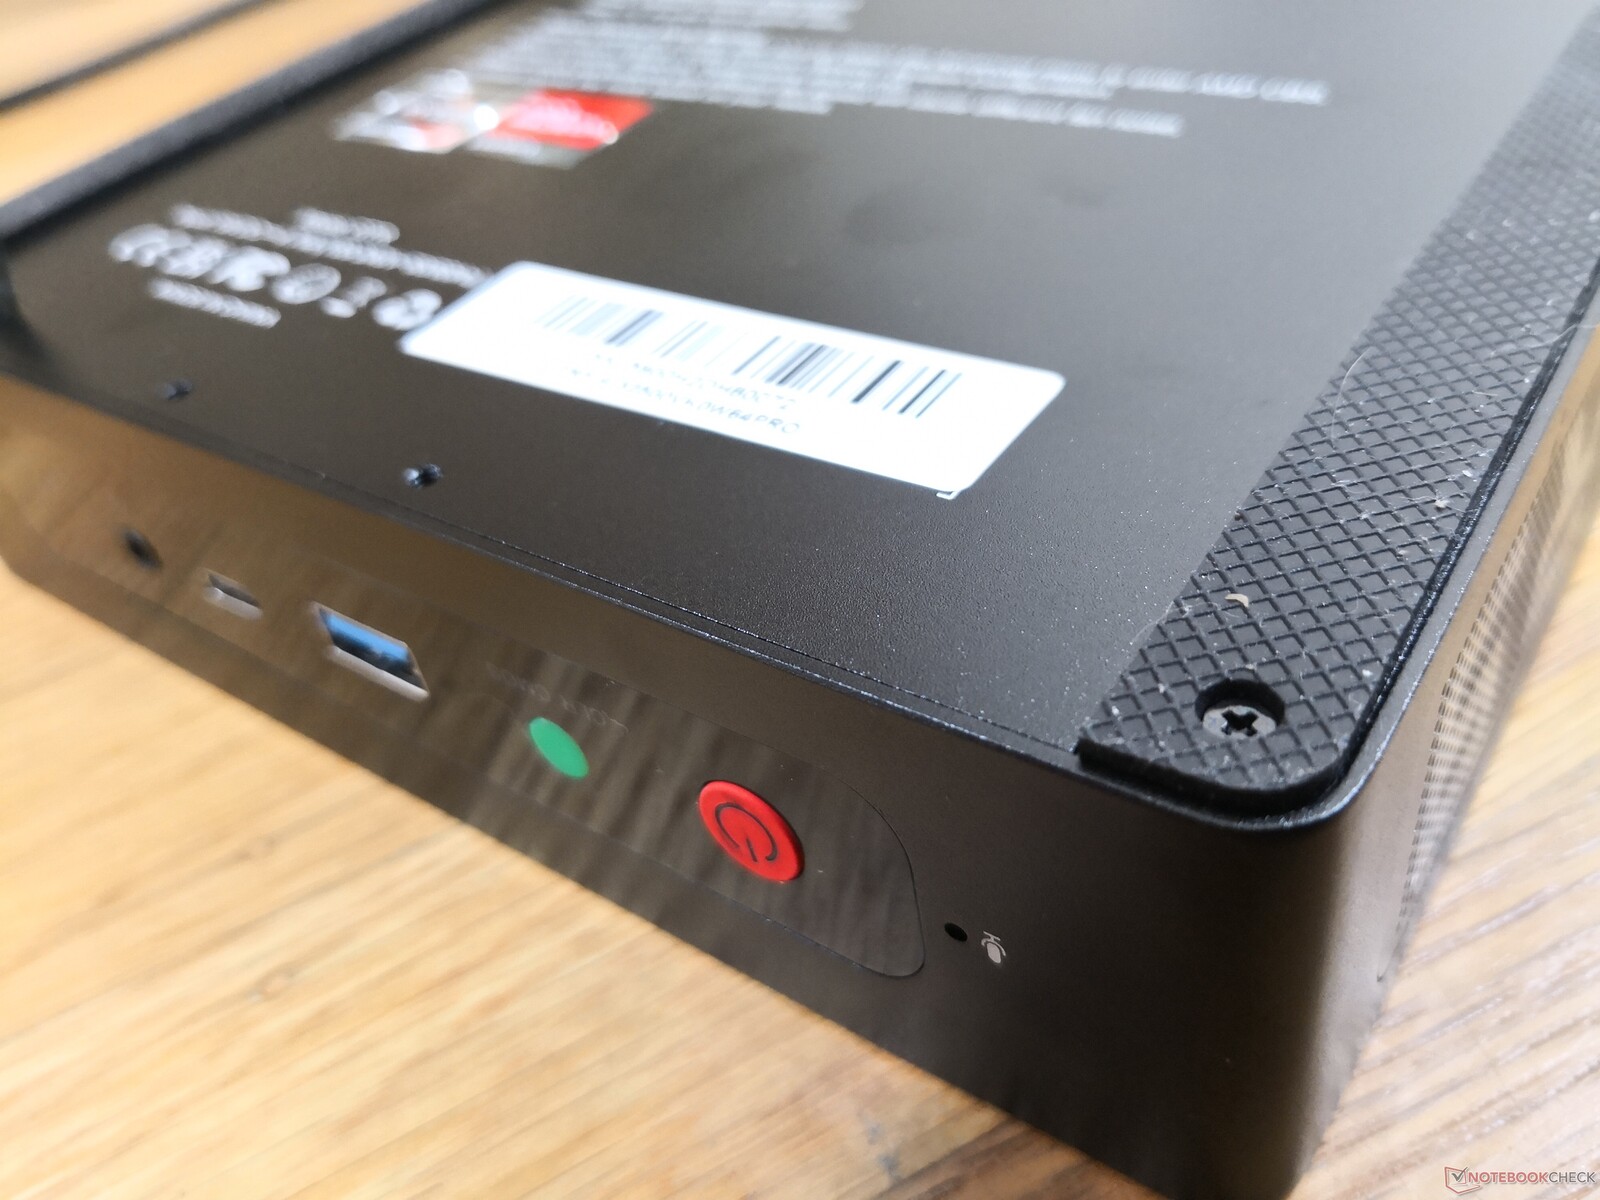
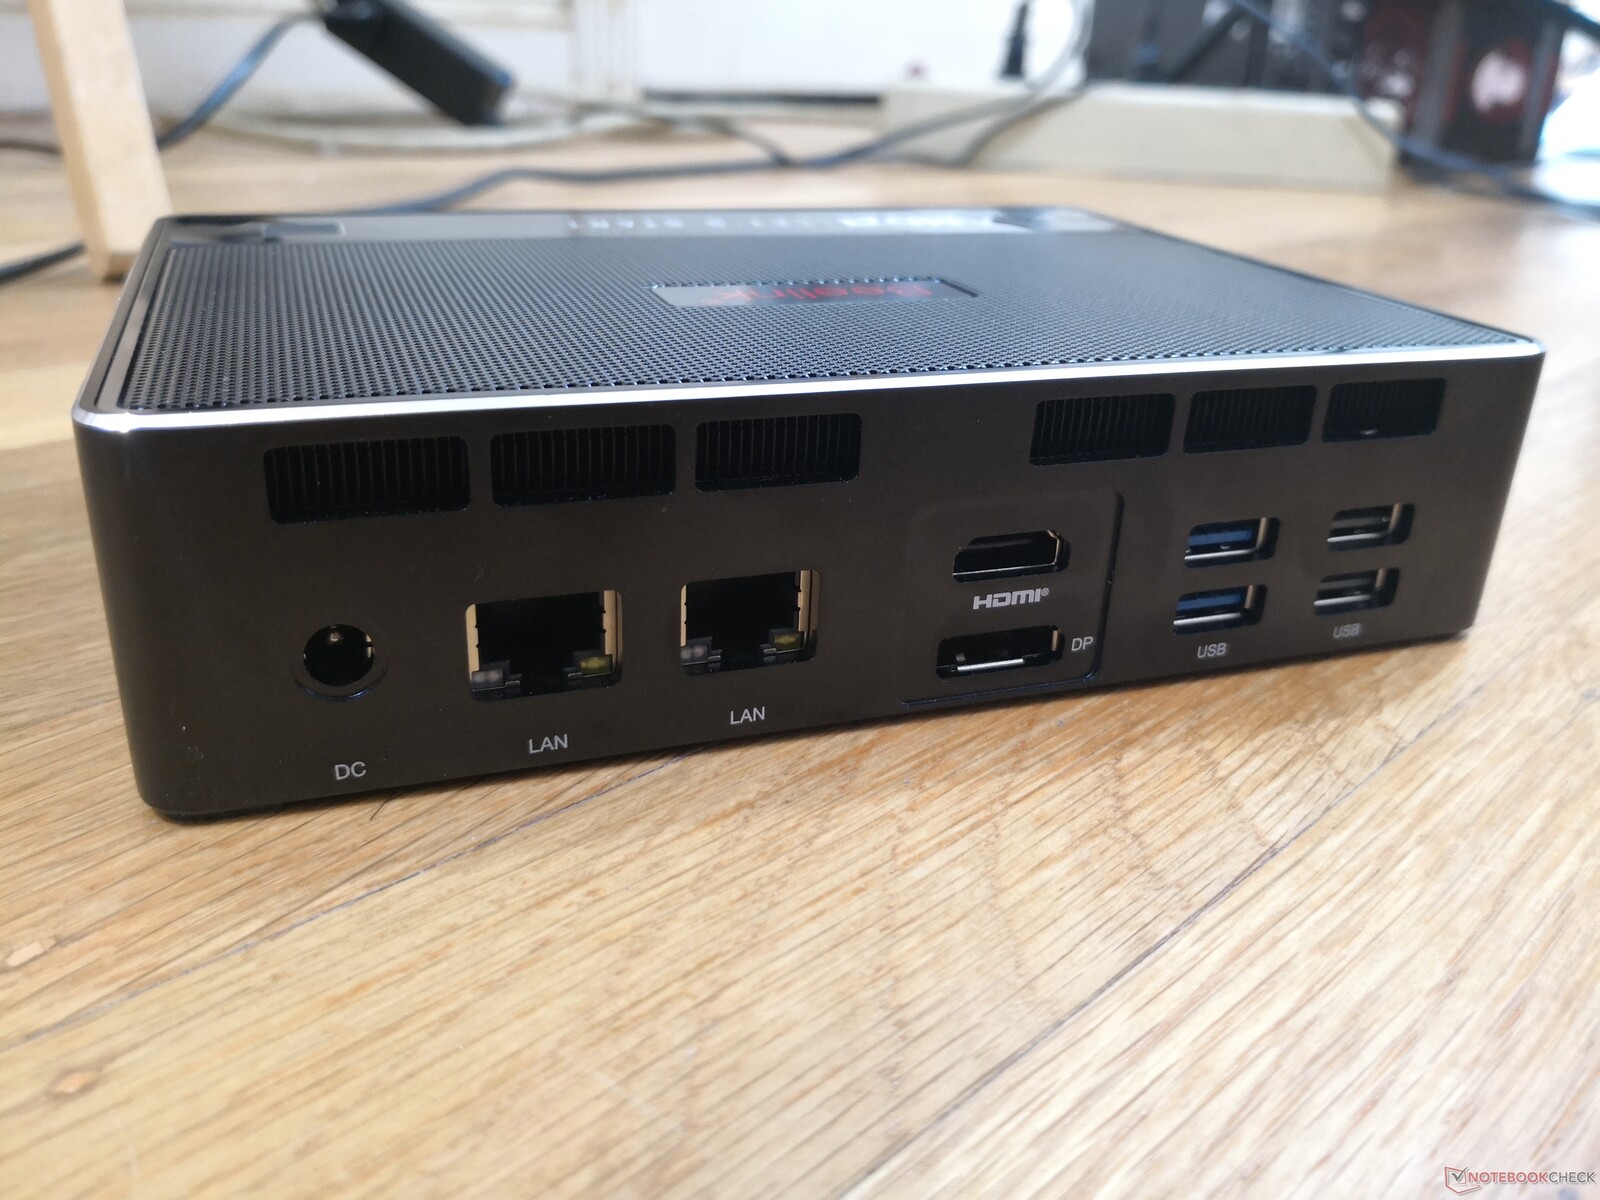
De poort opties zijn identiek aan de Beelink GTI 11, op twee belangrijke verschillen na: onze AMD-aangedreven GTR5 mist Thunderbolt ondersteuning en een extra USB-A poort. We hadden liever meer USB-C poorten gezien, zoals op de Intel Phantom Canyon NUC11PHKi7C of op zijn minst een geïntegreerde SD-kaartlezer
Interessant is dat het systeem kan worden gevoed door USB-C, mocht je ooit de eigen 90 W AC adapter verliezen. We sloten onze Dell XPS 15 9575 130 W USB-C adapter aan op de GTR5 en hij startte zonder problemen op. Desalniettemin raden we aan om waar mogelijk de eigen 90 W AC-adapter te gebruiken, aangezien de meeste USB-C adapters van andere fabrikanten veel minder vermogen leveren.
Communicatie
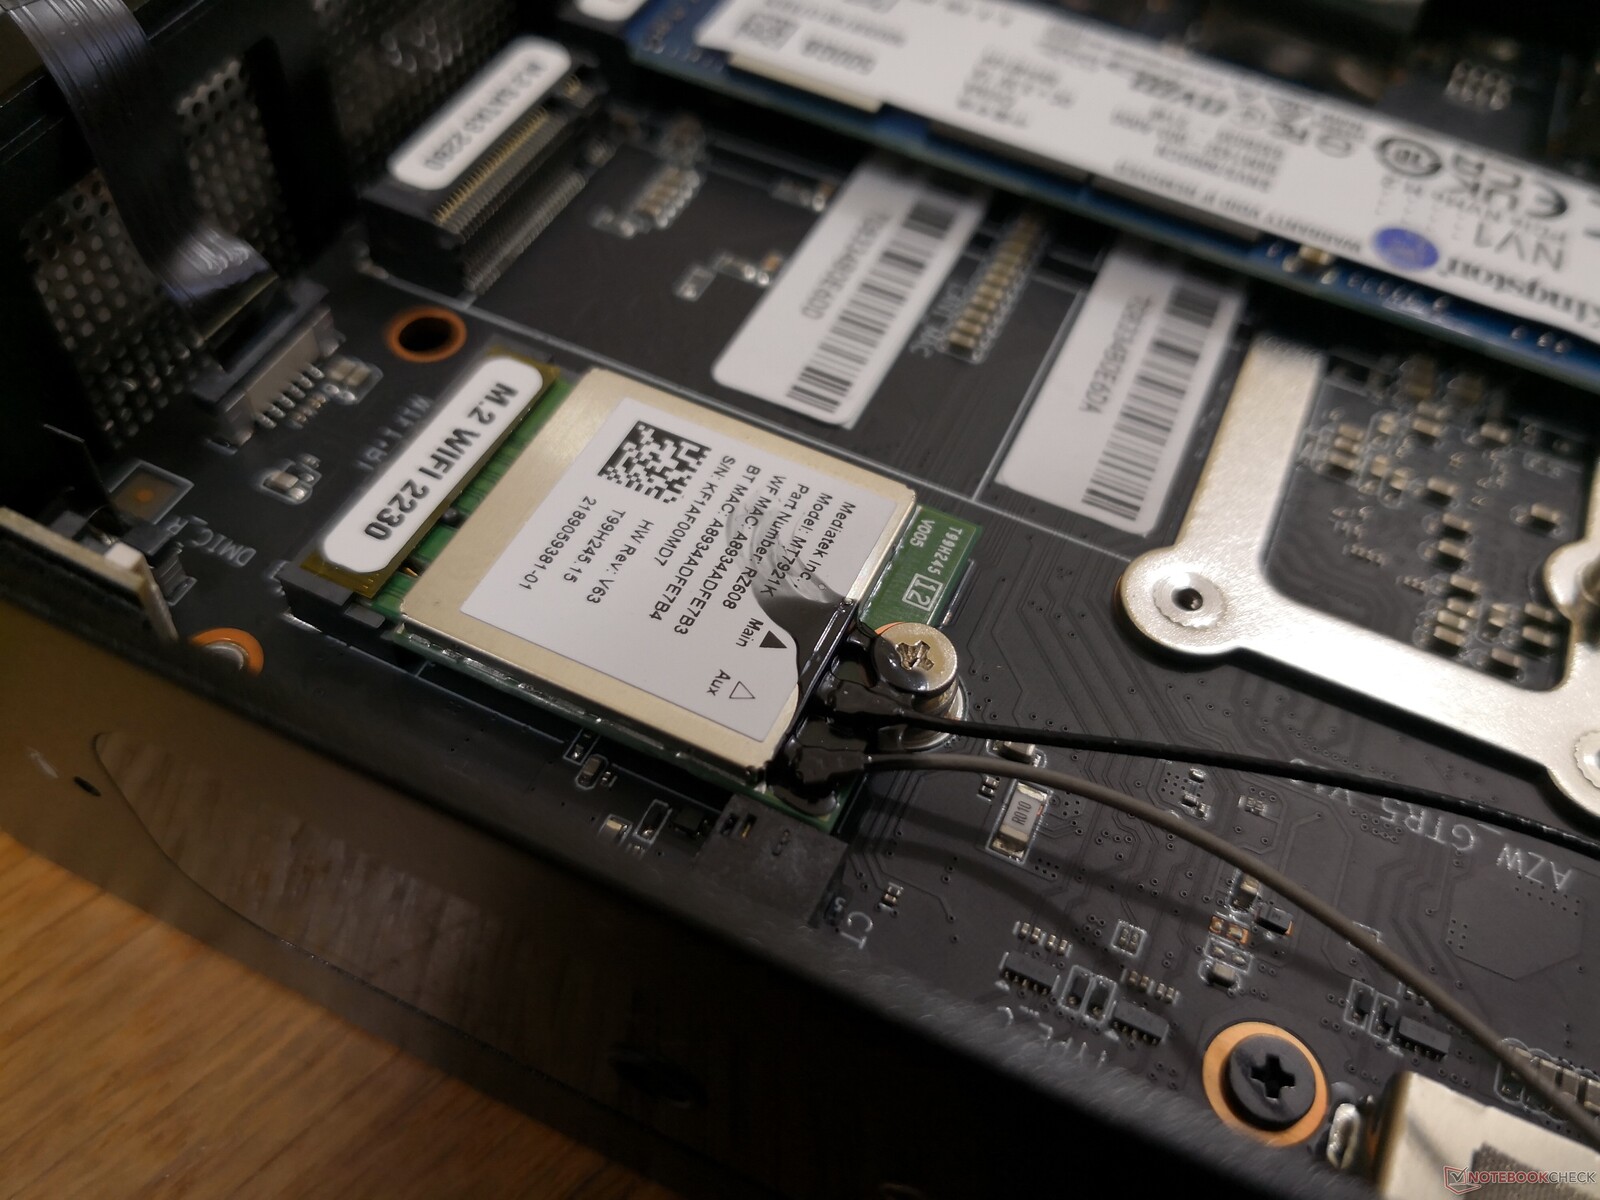
De GTR5 is een van de eerste mini PC's die gebruik maakt van de MediaTek RZ608 in plaats van de meer typische Intel AX200 serie of Qualcomm Atheros. De module is geschikt voor Wi-Fi 6E snelheden, maar we zijn voorlopig beperkt tot onze Wi-Fi 6 Netgear RAX200. De overdrachtssnelheden zijn desondanks betrouwbaar.
| Networking | |
| iperf3 transmit AX12 | |
| Beelink GTI 11 | |
| Intel NUC11PHKi7C | |
| Beelink GTR5 | |
| Intel NUC11PAQi7 | |
| GMK NucBox 2 | |
| Beelink GK Mini | |
| iperf3 receive AX12 | |
| Beelink GTI 11 | |
| Intel NUC11PHKi7C | |
| Intel NUC11PAQi7 | |
| Beelink GTR5 | |
| GMK NucBox 2 | |
| Beelink GK Mini | |
Onderhoud
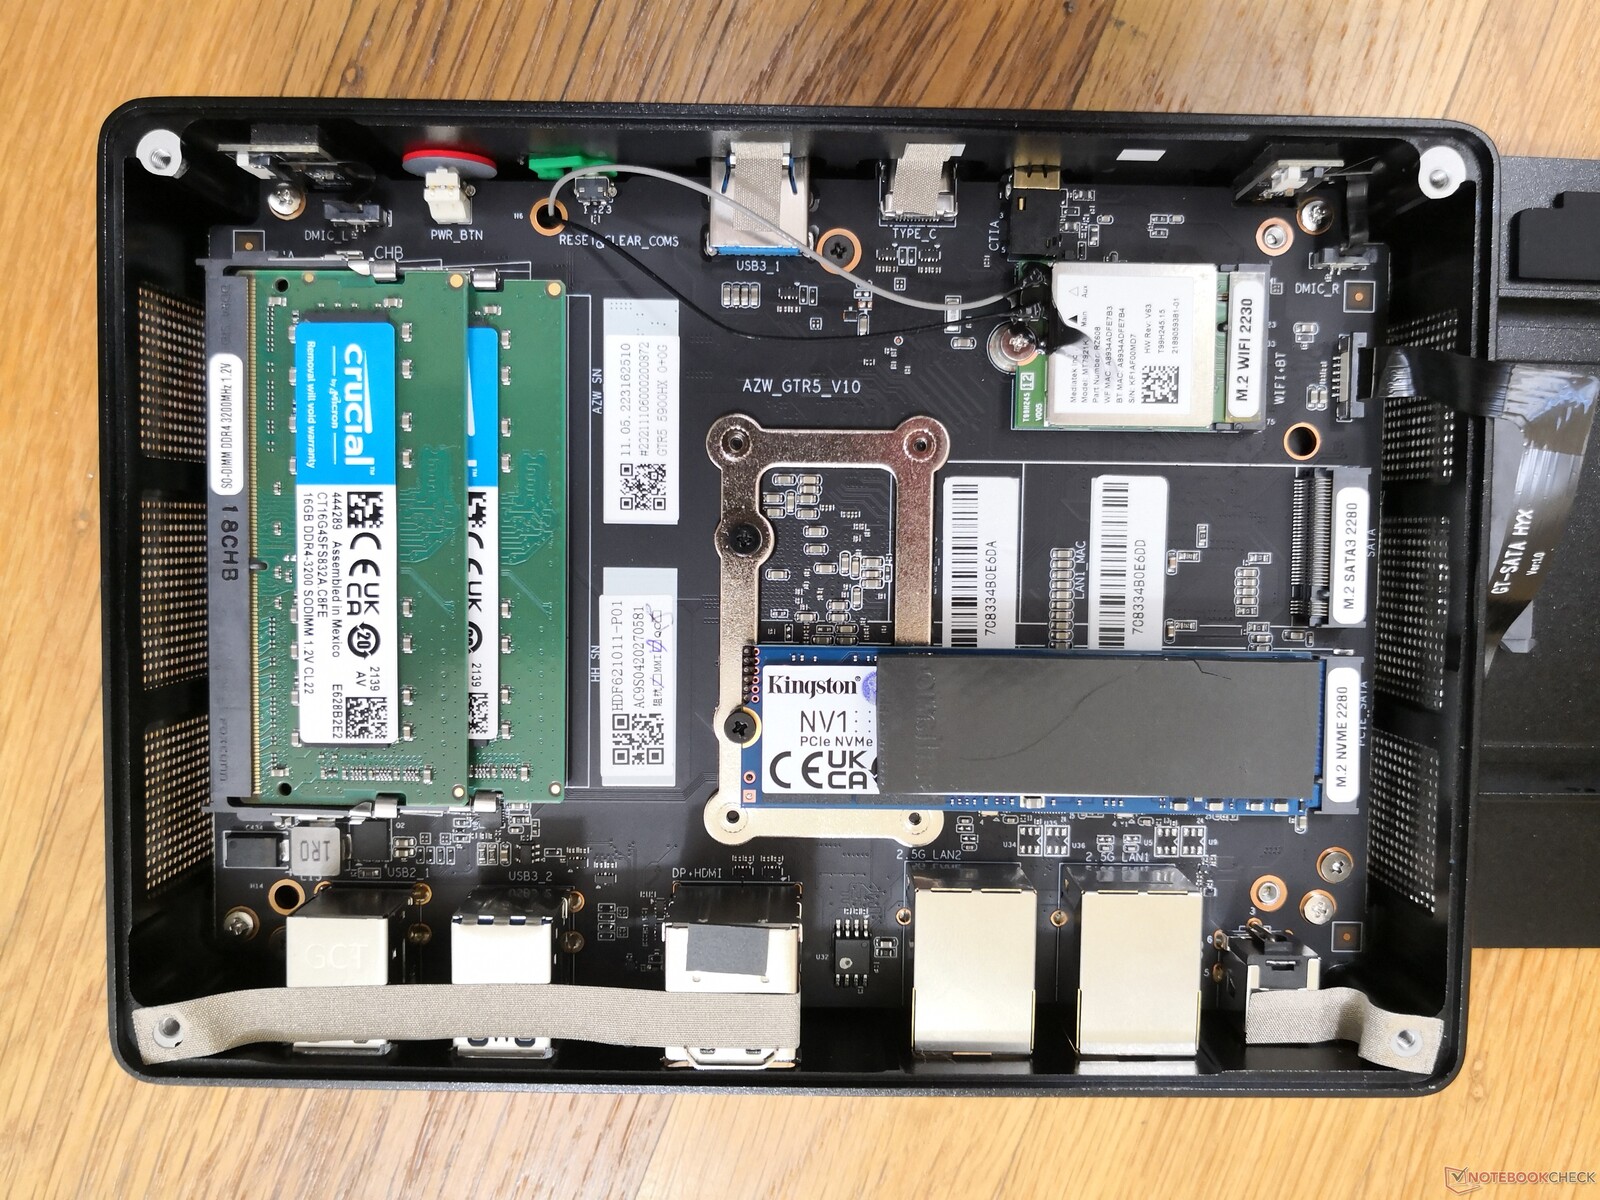
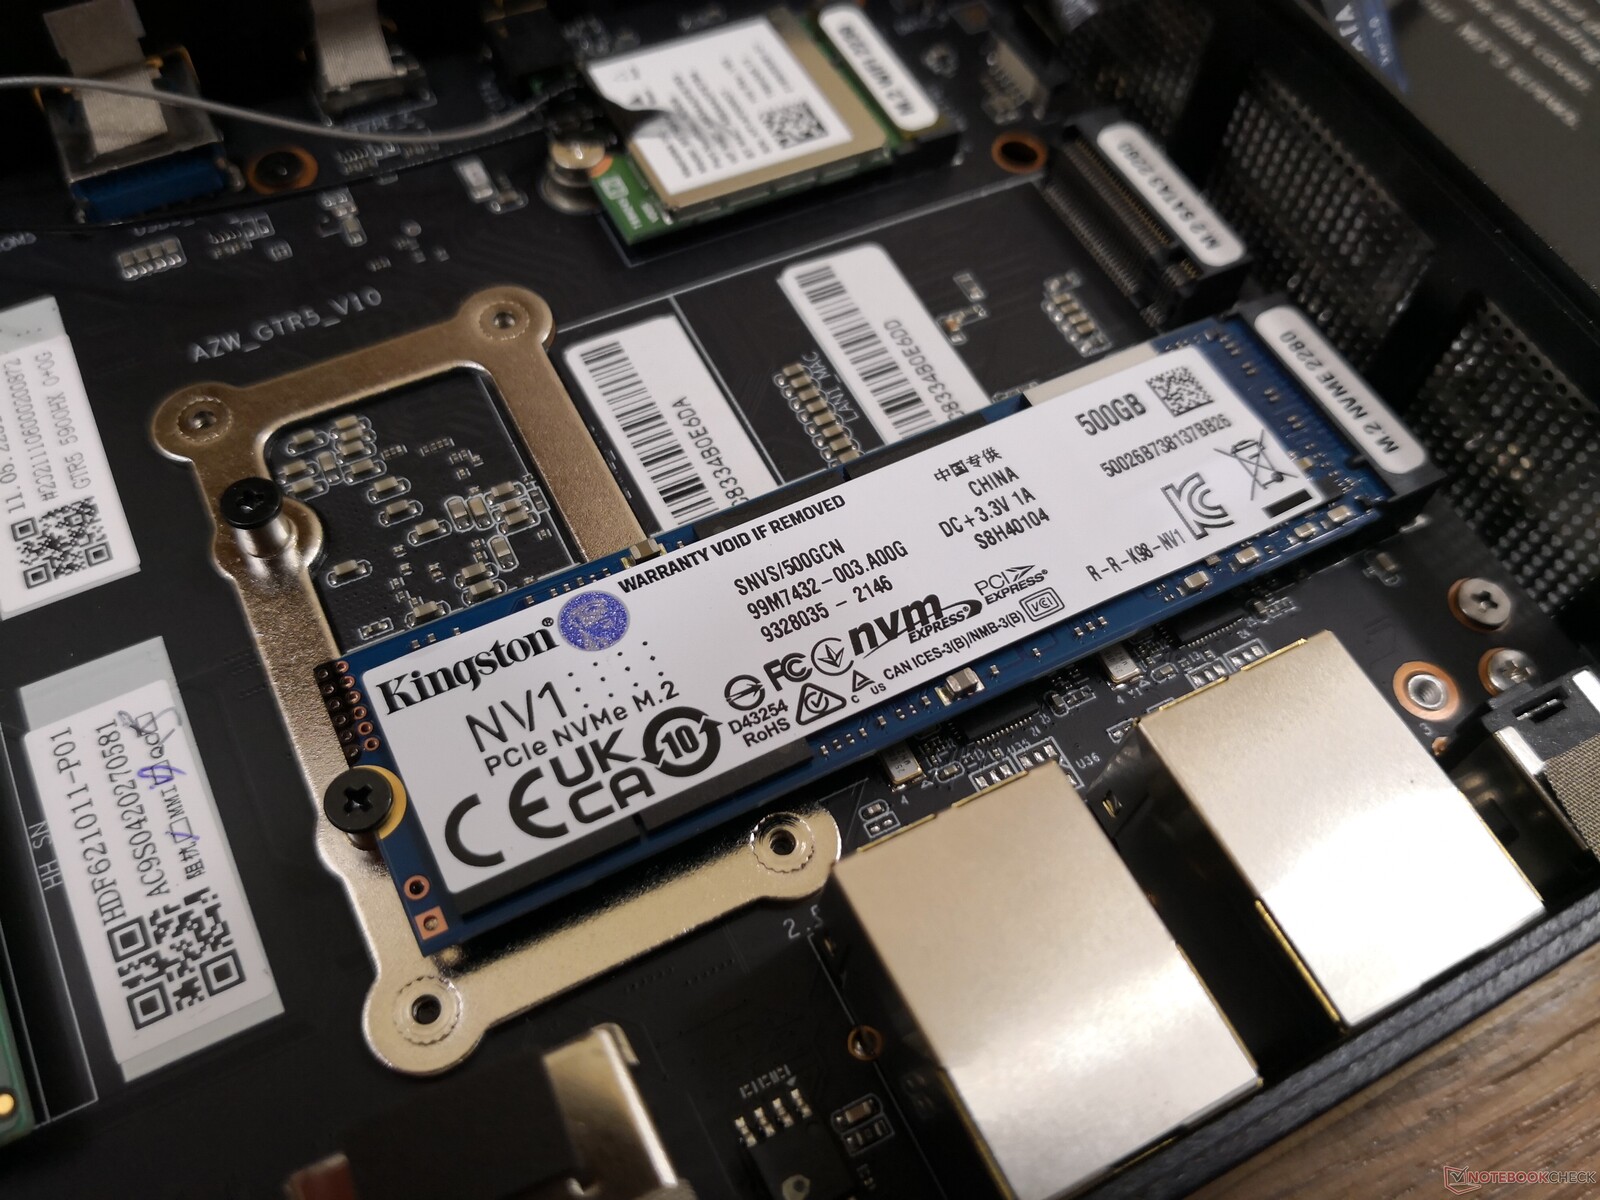
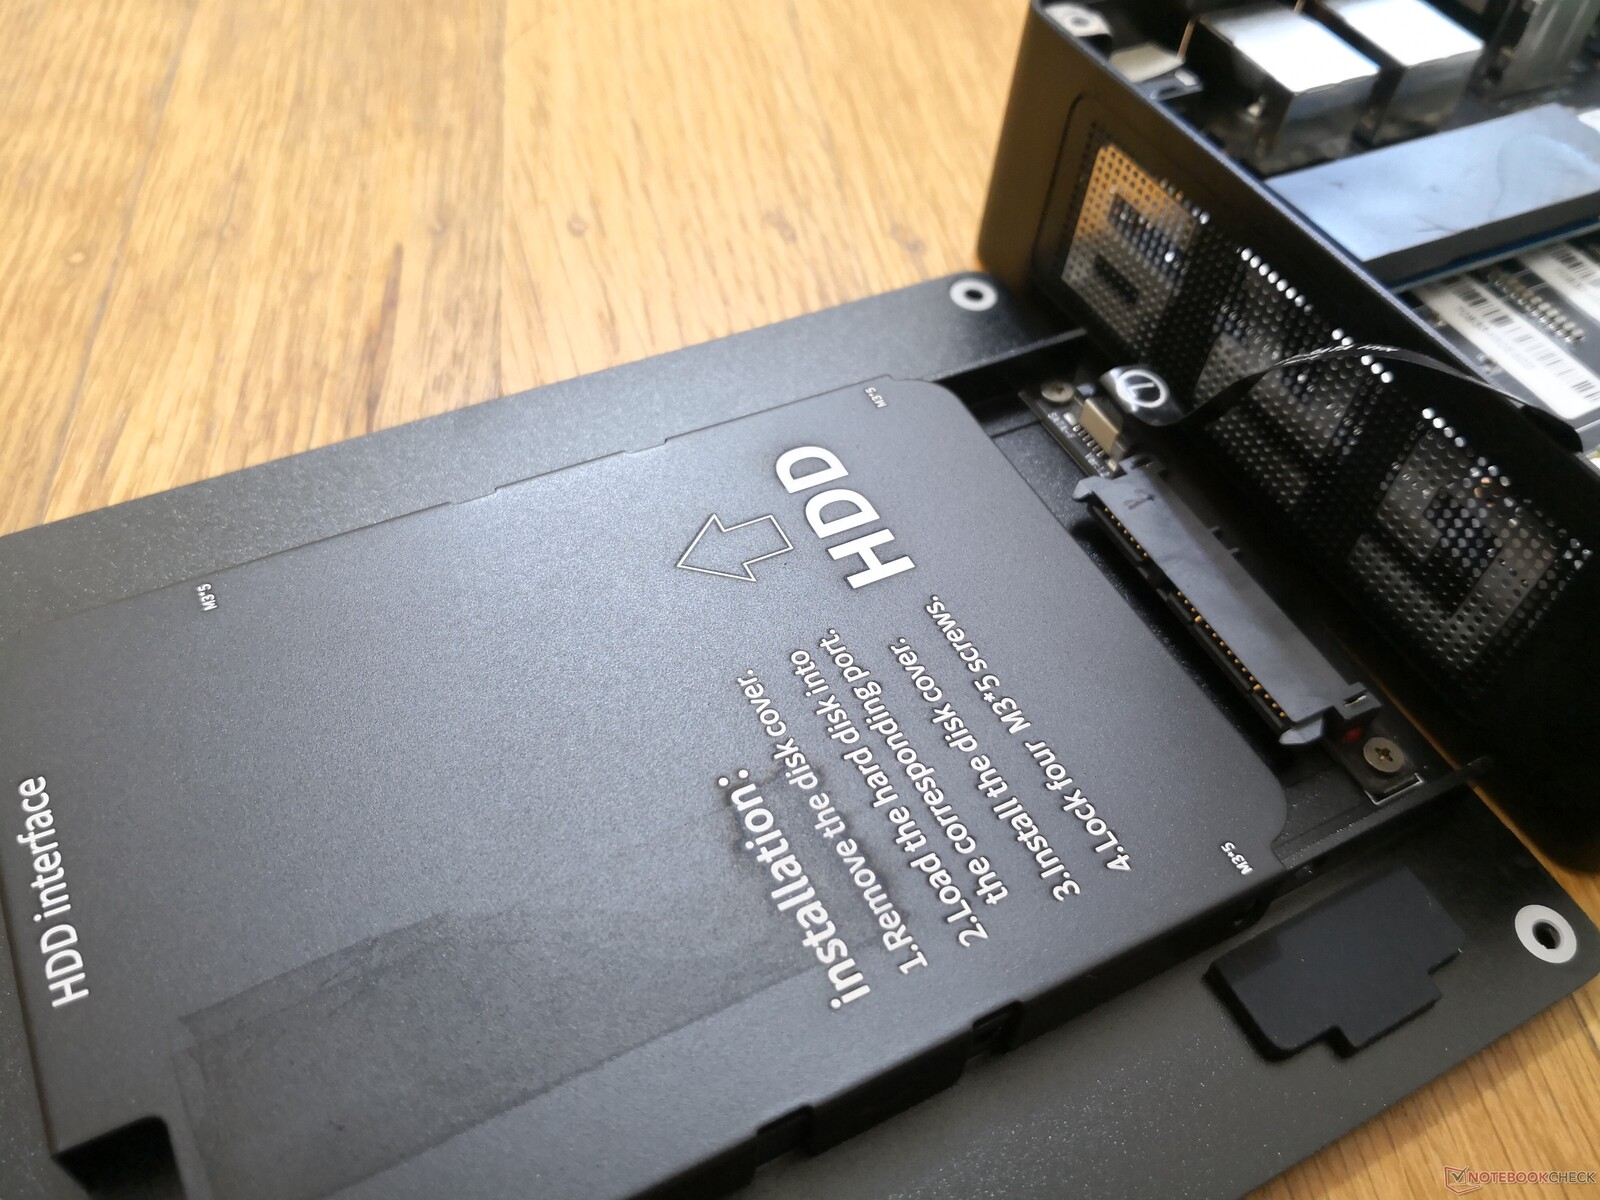
Het bodempaneel wordt vastgezet met slechts vier Philips-schroeven voor eenvoudig onderhoud. In tegenstelling tot de duimschroeven op een Intel NUC, zijn de schroeven hier echter veel kleiner en zal een schroevendraaier nodig zijn om ze te verwijderen. Eenmaal binnen hebben gebruikers direct toegang tot 2x SODIMM, 3x opslag bays, en vervolgens de WLAN module. Extra demontage is helaas vereist als u de dubbele ventilatoren wilt schoonmaken die zich aan de andere kant van het moederbord bevinden.
Accessoires en garantie
De doos bevat de netstroomadapter, papierwerk, een HDMI-kabel en een VESA-montagebeugel met schroeven. De standaard beperkte fabrieksgarantie van één jaar is van toepassing
Prestaties
Testomstandigheden
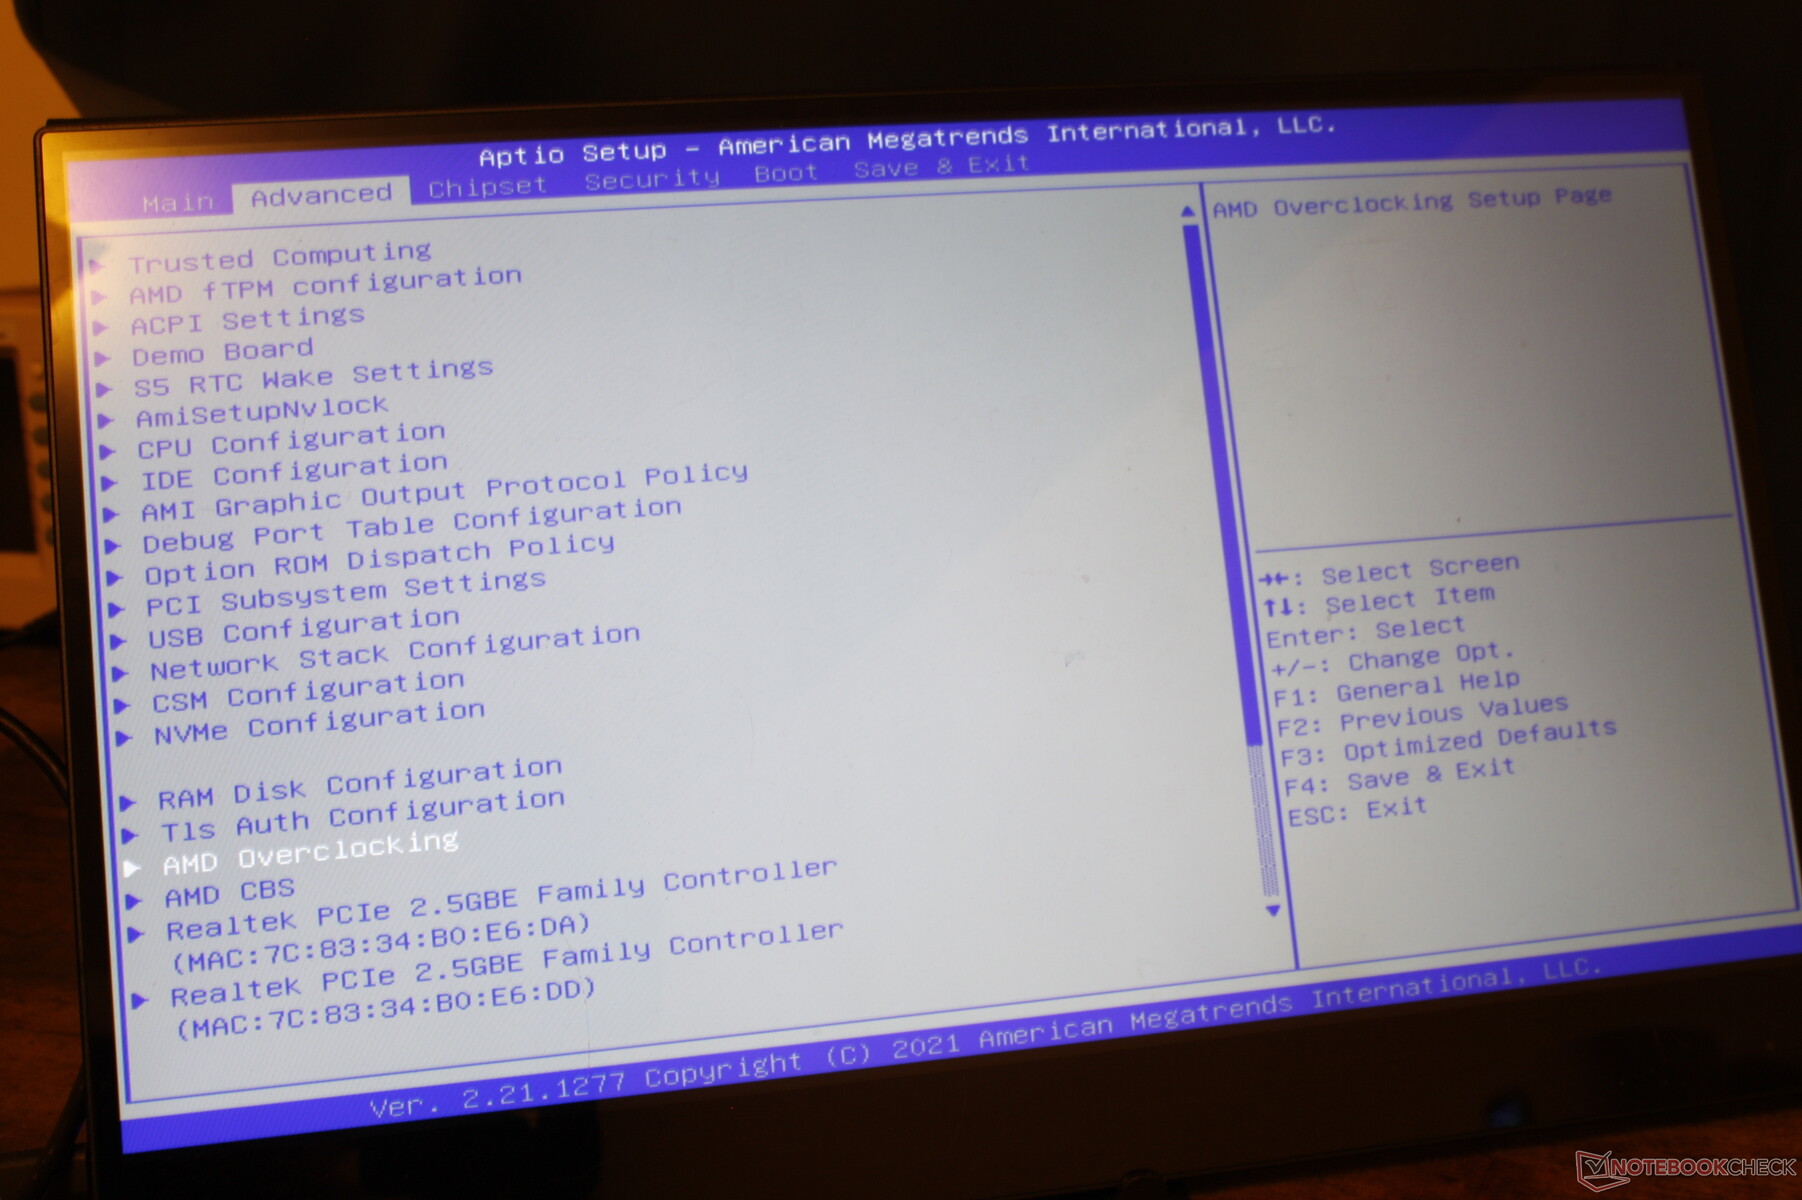
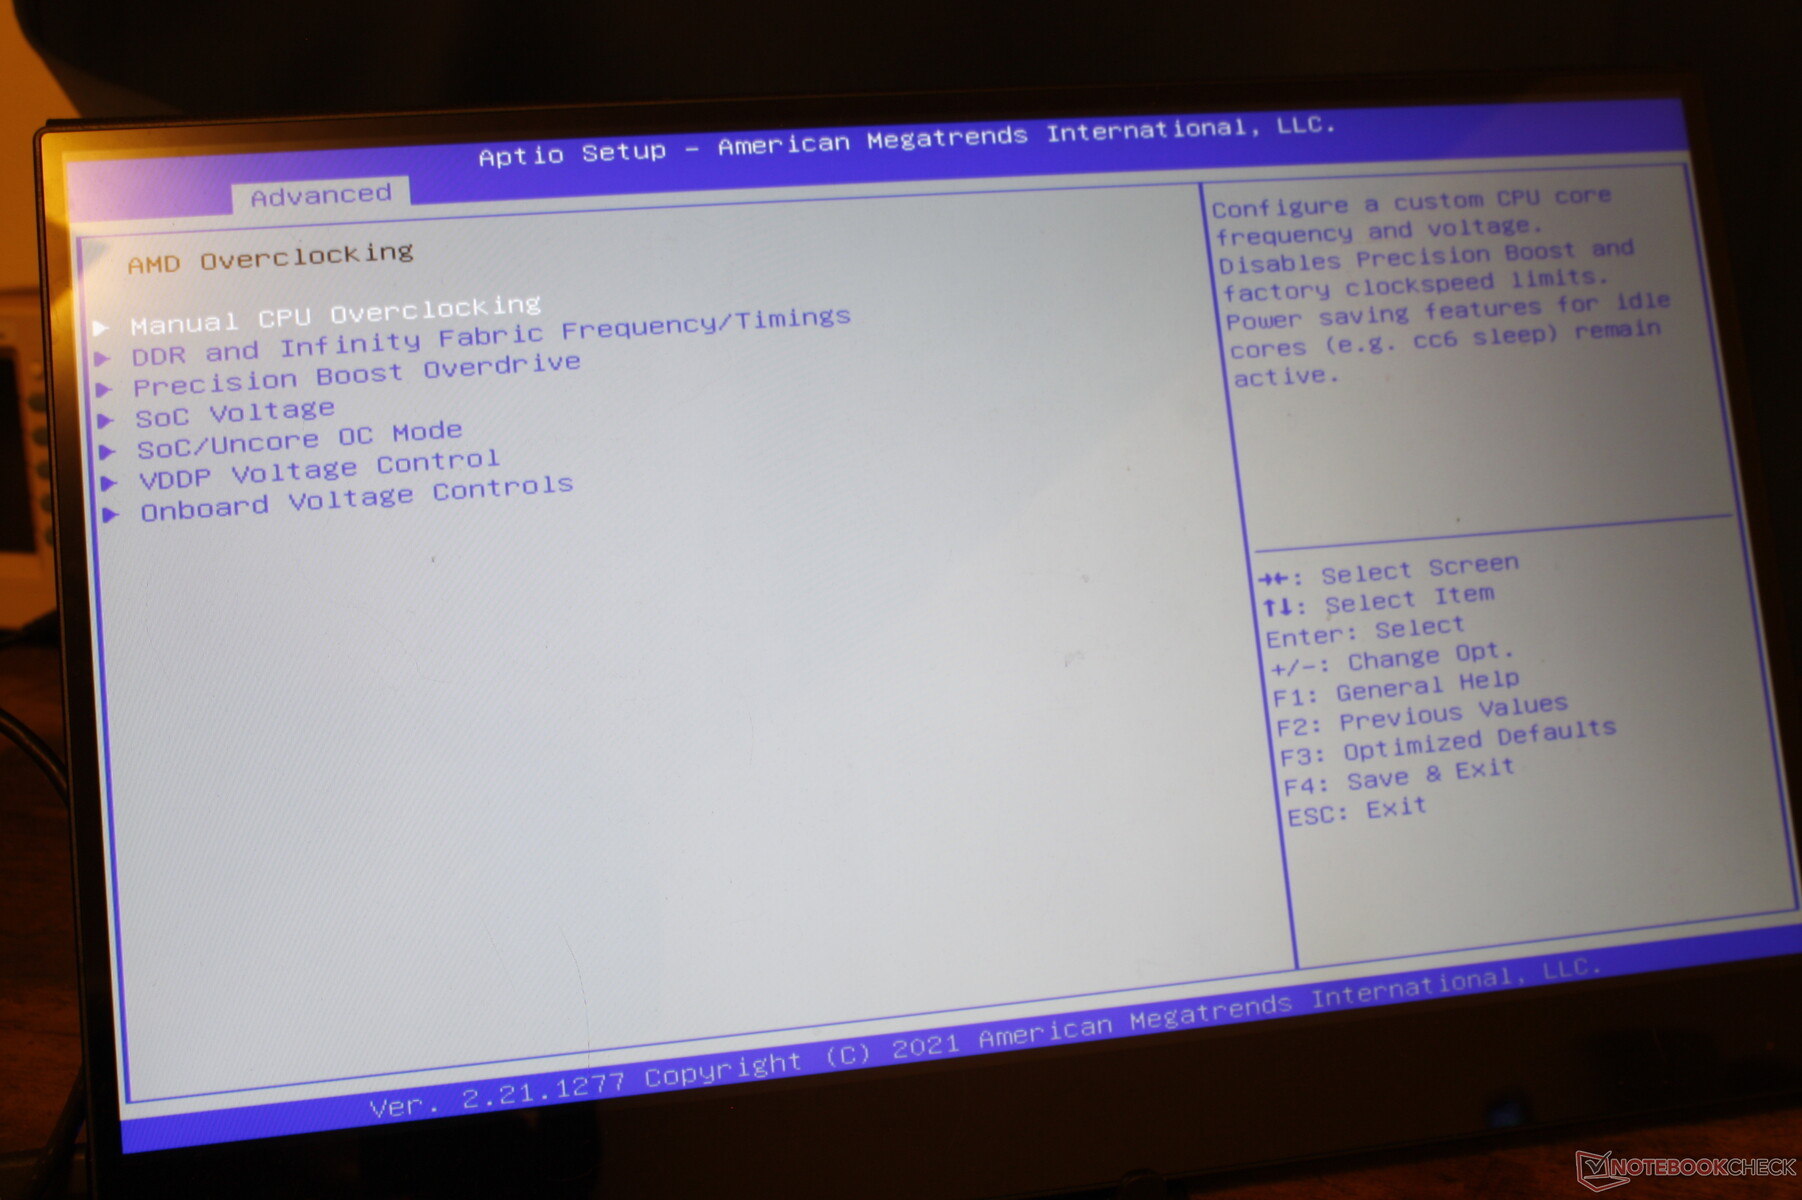
We gebruikten standaard BIOS instellingen en het Windows Performance energieprofiel voor het uitvoeren van onze benchmarks hieronder. Gebruikers kunnen desgewenst de CPU via het BIOS overklokken om meer prestaties te verkrijgen.
Processor
De ruwe multi-thread CPU-prestaties zijn sneller dan op de meeste gaminglaptops die op 11e generatie Core i7 CPU's draaien, terwijl ze vergelijkbaar zijn met die op 11e generatie Core i9 CPU's. In vergelijking met andere laptops met dezelfde Ryzen 9 5900HXkomt onze Beelink echter ongeveer 5 procent tekort. Prestaties zijn niettemin zeer dicht bij de Ryzen 9 5900X zoals gevonden op de Eurocom Nightsky ARX15 zelfs zonder overklokken.
Cinebench R15 Multi Loop
Cinebench R20: CPU (Multi Core) | CPU (Single Core)
Cinebench R15: CPU Multi 64Bit | CPU Single 64Bit
Blender: v2.79 BMW27 CPU
7-Zip 18.03: 7z b 4 | 7z b 4 -mmt1
Geekbench 5.5: Multi-Core | Single-Core
HWBOT x265 Benchmark v2.2: 4k Preset
LibreOffice : 20 Documents To PDF
R Benchmark 2.5: Overall mean
| Cinebench R23 / Multi Core | |
| MSI GE76 Raider | |
| Intel Core i9-10900K | |
| MSI GS76 Stealth 11UH | |
| Gemiddeld AMD Ryzen 9 5900HX (6622 - 14363, n=30) | |
| Minisforum HM90 | |
| Beelink GTR5 | |
| Huawei MateBook 16 R7 5800H | |
| Lenovo Legion C7 15IMH05 82EH0030GE | |
| Acer Aspire 5 A515-45-R4R1 | |
| Intel NUC11PAQi7 | |
| Asus Vivobook 15 K513EQ | |
| Beelink GTI 11 | |
| Lenovo IdeaPad 3 15ALC6 | |
| Beelink SER3 | |
| GMK NucBox 2 | |
| Beelink GK Mini | |
| Cinebench R23 / Single Core | |
| MSI GE76 Raider | |
| MSI GS76 Stealth 11UH | |
| Beelink GTR5 | |
| Asus Vivobook 15 K513EQ | |
| Gemiddeld AMD Ryzen 9 5900HX (1218 - 1499, n=29) | |
| Intel Core i9-10900K | |
| Beelink GTI 11 | |
| Huawei MateBook 16 R7 5800H | |
| Minisforum HM90 | |
| Acer Aspire 5 A515-45-R4R1 | |
| Lenovo Legion C7 15IMH05 82EH0030GE | |
| Lenovo IdeaPad 3 15ALC6 | |
| GMK NucBox 2 | |
| Beelink SER3 | |
| Beelink GK Mini | |
| Cinebench R20 / CPU (Multi Core) | |
| MSI GE76 Raider | |
| Intel Core i9-10900K | |
| MSI GS76 Stealth 11UH | |
| Gemiddeld AMD Ryzen 9 5900HX (2242 - 5476, n=30) | |
| Beelink GTR5 | |
| Minisforum HM90 | |
| Huawei MateBook 16 R7 5800H | |
| Lenovo Legion C7 15IMH05 82EH0030GE | |
| Acer Aspire 5 A515-45-R4R1 | |
| Intel NUC11PAQi7 | |
| Asus Vivobook 15 K513EQ | |
| Beelink GTI 11 | |
| Lenovo IdeaPad 3 15ALC6 | |
| Intel Hades Canyon NUC8i7HVK | |
| Beelink SER3 | |
| GMK NucBox 2 | |
| Beelink GK Mini | |
| Cinebench R20 / CPU (Single Core) | |
| MSI GE76 Raider | |
| MSI GS76 Stealth 11UH | |
| Intel NUC11PAQi7 | |
| Beelink GTR5 | |
| Gemiddeld AMD Ryzen 9 5900HX (471 - 584, n=29) | |
| Asus Vivobook 15 K513EQ | |
| Intel Core i9-10900K | |
| Beelink GTI 11 | |
| Huawei MateBook 16 R7 5800H | |
| Minisforum HM90 | |
| Acer Aspire 5 A515-45-R4R1 | |
| Lenovo Legion C7 15IMH05 82EH0030GE | |
| Lenovo IdeaPad 3 15ALC6 | |
| Intel Hades Canyon NUC8i7HVK | |
| GMK NucBox 2 | |
| Beelink SER3 | |
| Beelink GK Mini | |
| Cinebench R15 / CPU Multi 64Bit | |
| MSI GE76 Raider | |
| Intel Core i9-10900K | |
| MSI GS76 Stealth 11UH | |
| Gemiddeld AMD Ryzen 9 5900HX (1076 - 2267, n=29) | |
| Huawei MateBook 16 R7 5800H | |
| Minisforum HM90 | |
| Beelink GTR5 | |
| Lenovo Legion C7 15IMH05 82EH0030GE | |
| Acer Aspire 5 A515-45-R4R1 | |
| Intel NUC11PAQi7 | |
| Beelink GTI 11 | |
| Lenovo IdeaPad 3 15ALC6 | |
| Asus Vivobook 15 K513EQ | |
| Intel Hades Canyon NUC8i7HVK | |
| Beelink SER3 | |
| GMK NucBox 2 | |
| Beelink GK Mini | |
| Cinebench R15 / CPU Single 64Bit | |
| MSI GE76 Raider | |
| Beelink GTR5 | |
| MSI GS76 Stealth 11UH | |
| Gemiddeld AMD Ryzen 9 5900HX (197 - 243, n=25) | |
| Huawei MateBook 16 R7 5800H | |
| Intel NUC11PAQi7 | |
| Asus Vivobook 15 K513EQ | |
| Intel Core i9-10900K | |
| Lenovo Legion C7 15IMH05 82EH0030GE | |
| Beelink GTI 11 | |
| Minisforum HM90 | |
| Acer Aspire 5 A515-45-R4R1 | |
| Intel Hades Canyon NUC8i7HVK | |
| Lenovo IdeaPad 3 15ALC6 | |
| GMK NucBox 2 | |
| Beelink SER3 | |
| Beelink GK Mini | |
| 7-Zip 18.03 / 7z b 4 -mmt1 | |
| MSI GE76 Raider | |
| Intel Core i9-10900K | |
| Beelink GTR5 | |
| Gemiddeld AMD Ryzen 9 5900HX (4791 - 5905, n=29) | |
| MSI GS76 Stealth 11UH | |
| Huawei MateBook 16 R7 5800H | |
| Lenovo Legion C7 15IMH05 82EH0030GE | |
| Intel NUC11PAQi7 | |
| Asus Vivobook 15 K513EQ | |
| Beelink GTI 11 | |
| Minisforum HM90 | |
| Acer Aspire 5 A515-45-R4R1 | |
| Lenovo IdeaPad 3 15ALC6 | |
| Intel Hades Canyon NUC8i7HVK | |
| GMK NucBox 2 | |
| Beelink SER3 | |
| Beelink GK Mini | |
| Geekbench 5.5 / Multi-Core | |
| MSI GE76 Raider | |
| Intel Core i9-10900K | |
| MSI GS76 Stealth 11UH | |
| Gemiddeld AMD Ryzen 9 5900HX (5057 - 9294, n=27) | |
| Lenovo Legion C7 15IMH05 82EH0030GE | |
| Beelink GTR5 | |
| Huawei MateBook 16 R7 5800H | |
| Minisforum HM90 | |
| Beelink GTI 11 | |
| Acer Aspire 5 A515-45-R4R1 | |
| Intel NUC11PAQi7 | |
| Lenovo IdeaPad 3 15ALC6 | |
| GMK NucBox 2 | |
| Beelink GK Mini | |
| Geekbench 5.5 / Single-Core | |
| MSI GE76 Raider | |
| MSI GS76 Stealth 11UH | |
| Beelink GTR5 | |
| Intel NUC11PAQi7 | |
| Gemiddeld AMD Ryzen 9 5900HX (1271 - 1574, n=27) | |
| Huawei MateBook 16 R7 5800H | |
| Intel Core i9-10900K | |
| Beelink GTI 11 | |
| Lenovo Legion C7 15IMH05 82EH0030GE | |
| Minisforum HM90 | |
| Acer Aspire 5 A515-45-R4R1 | |
| Lenovo IdeaPad 3 15ALC6 | |
| GMK NucBox 2 | |
| Beelink GK Mini | |
| HWBOT x265 Benchmark v2.2 / 4k Preset | |
| Intel Core i9-10900K | |
| MSI GE76 Raider | |
| Gemiddeld AMD Ryzen 9 5900HX (8.26 - 17.1, n=29) | |
| MSI GS76 Stealth 11UH | |
| Beelink GTR5 | |
| Huawei MateBook 16 R7 5800H | |
| Minisforum HM90 | |
| Lenovo Legion C7 15IMH05 82EH0030GE | |
| Acer Aspire 5 A515-45-R4R1 | |
| Intel NUC11PAQi7 | |
| Asus Vivobook 15 K513EQ | |
| Intel Hades Canyon NUC8i7HVK | |
| Beelink GTI 11 | |
| Lenovo IdeaPad 3 15ALC6 | |
| GMK NucBox 2 | |
| Beelink SER3 | |
| Beelink GK Mini | |
| LibreOffice / 20 Documents To PDF | |
| Beelink GK Mini | |
| Beelink SER3 | |
| Intel Core i9-10900K | |
| Minisforum HM90 | |
| GMK NucBox 2 | |
| Lenovo IdeaPad 3 15ALC6 | |
| Acer Aspire 5 A515-45-R4R1 | |
| Lenovo Legion C7 15IMH05 82EH0030GE | |
| Beelink GTI 11 | |
| Gemiddeld AMD Ryzen 9 5900HX (44.1 - 87.4, n=29) | |
| Beelink GTR5 | |
| Huawei MateBook 16 R7 5800H | |
| MSI GS76 Stealth 11UH | |
| Asus Vivobook 15 K513EQ | |
| Intel NUC11PAQi7 | |
| MSI GE76 Raider | |
| R Benchmark 2.5 / Overall mean | |
| Beelink GK Mini | |
| GMK NucBox 2 | |
| Beelink SER3 | |
| Lenovo IdeaPad 3 15ALC6 | |
| Beelink GTI 11 | |
| Acer Aspire 5 A515-45-R4R1 | |
| Lenovo Legion C7 15IMH05 82EH0030GE | |
| Minisforum HM90 | |
| Asus Vivobook 15 K513EQ | |
| Intel NUC11PAQi7 | |
| MSI GS76 Stealth 11UH | |
| Intel Core i9-10900K | |
| Huawei MateBook 16 R7 5800H | |
| Gemiddeld AMD Ryzen 9 5900HX (0.48 - 0.599, n=29) | |
| Beelink GTR5 | |
| MSI GE76 Raider | |
Cinebench R20: CPU (Multi Core) | CPU (Single Core)
Cinebench R15: CPU Multi 64Bit | CPU Single 64Bit
Blender: v2.79 BMW27 CPU
7-Zip 18.03: 7z b 4 | 7z b 4 -mmt1
Geekbench 5.5: Multi-Core | Single-Core
HWBOT x265 Benchmark v2.2: 4k Preset
LibreOffice : 20 Documents To PDF
R Benchmark 2.5: Overall mean
* ... kleiner is beter
AIDA64: FP32 Ray-Trace | FPU Julia | CPU SHA3 | CPU Queen | FPU SinJulia | FPU Mandel | CPU AES | CPU ZLib | FP64 Ray-Trace | CPU PhotoWorxx
| Performance rating | |
| Gemiddeld AMD Ryzen 9 5900HX | |
| Beelink GTR5 | |
| Beelink GTI 11 | |
| Intel NUC11PHKi7C | |
| GMK NucBox 2 | |
| Beelink GK Mini | |
| AIDA64 / FP32 Ray-Trace | |
| Gemiddeld AMD Ryzen 9 5900HX (12470 - 16014, n=26) | |
| Beelink GTR5 | |
| Beelink GTI 11 | |
| Intel NUC11PHKi7C | |
| GMK NucBox 2 | |
| Beelink GK Mini | |
| AIDA64 / FPU Julia | |
| Gemiddeld AMD Ryzen 9 5900HX (79554 - 101008, n=26) | |
| Beelink GTR5 | |
| Beelink GTI 11 | |
| Intel NUC11PHKi7C | |
| GMK NucBox 2 | |
| Beelink GK Mini | |
| AIDA64 / CPU SHA3 | |
| Gemiddeld AMD Ryzen 9 5900HX (2754 - 3444, n=26) | |
| Beelink GTR5 | |
| Beelink GTI 11 | |
| Intel NUC11PHKi7C | |
| GMK NucBox 2 | |
| Beelink GK Mini | |
| AIDA64 / CPU Queen | |
| Gemiddeld AMD Ryzen 9 5900HX (87865 - 105123, n=26) | |
| Beelink GTR5 | |
| Intel NUC11PHKi7C | |
| Beelink GTI 11 | |
| GMK NucBox 2 | |
| Beelink GK Mini | |
| AIDA64 / FPU SinJulia | |
| Beelink GTR5 | |
| Gemiddeld AMD Ryzen 9 5900HX (10899 - 12806, n=26) | |
| Intel NUC11PHKi7C | |
| Beelink GTI 11 | |
| GMK NucBox 2 | |
| Beelink GK Mini | |
| AIDA64 / FPU Mandel | |
| Gemiddeld AMD Ryzen 9 5900HX (43685 - 55702, n=26) | |
| Beelink GTR5 | |
| Intel NUC11PHKi7C | |
| Beelink GTI 11 | |
| GMK NucBox 2 | |
| Beelink GK Mini | |
| AIDA64 / CPU AES | |
| Gemiddeld AMD Ryzen 9 5900HX (109927 - 137901, n=26) | |
| Beelink GTR5 | |
| Intel NUC11PHKi7C | |
| Beelink GTI 11 | |
| GMK NucBox 2 | |
| Beelink GK Mini | |
| AIDA64 / CPU ZLib | |
| Gemiddeld AMD Ryzen 9 5900HX (706 - 878, n=26) | |
| Beelink GTR5 | |
| Intel NUC11PHKi7C | |
| Beelink GTI 11 | |
| GMK NucBox 2 | |
| Beelink GK Mini | |
| AIDA64 / FP64 Ray-Trace | |
| Gemiddeld AMD Ryzen 9 5900HX (6664 - 8644, n=26) | |
| Beelink GTR5 | |
| Beelink GTI 11 | |
| Intel NUC11PHKi7C | |
| GMK NucBox 2 | |
| Beelink GK Mini | |
| AIDA64 / CPU PhotoWorxx | |
| Beelink GTI 11 | |
| Intel NUC11PHKi7C | |
| Beelink GTR5 | |
| Gemiddeld AMD Ryzen 9 5900HX (14344 - 25533, n=26) | |
| GMK NucBox 2 | |
| Beelink GK Mini | |
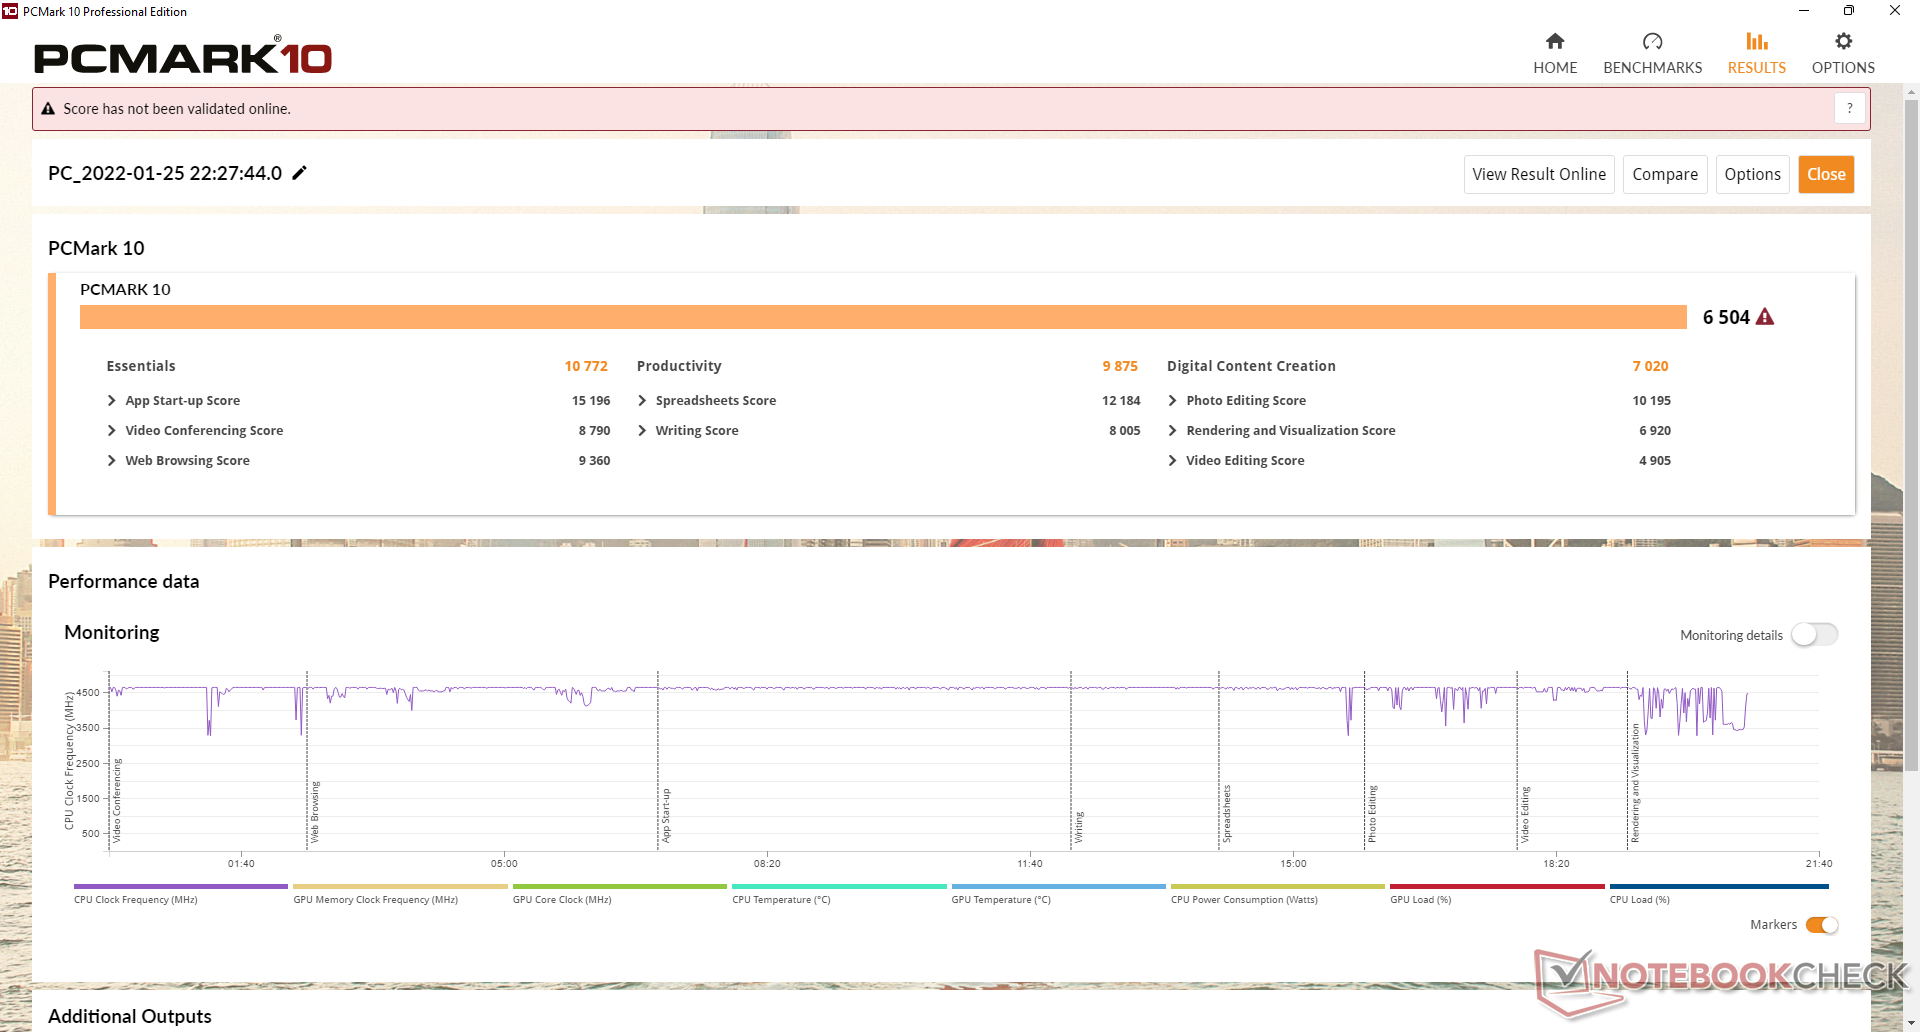
Systeemprestaties
PCMark resultaten zijn uitstekend en ver boven de meeste andere mini PC's en NUC's. We zijn echter twee crashes tegengekomen tijdens onze tests, waarbij het apparaat automatisch uitschakelde zonder dat daar een reden voor leek te zijn. We waren niet in staat om de crashes betrouwbaar te herhalen, in voor- en tegenspoed.
CrossMark: Overall | Productivity | Creativity | Responsiveness
| PCMark 10 / Score | |
| Beelink GTR5 | |
| Gemiddeld AMD Ryzen 9 5900HX, AMD Radeon RX Vega 8 (Ryzen 4000/5000) (6290 - 6507, n=5) | |
| Intel NUC11PHKi7C | |
| Intel NUC11PAQi7 | |
| Beelink GTI 11 | |
| GMK NucBox 2 | |
| Beelink GK Mini | |
| PCMark 10 / Essentials | |
| Beelink GTR5 | |
| Gemiddeld AMD Ryzen 9 5900HX, AMD Radeon RX Vega 8 (Ryzen 4000/5000) (10087 - 10836, n=5) | |
| Intel NUC11PAQi7 | |
| Beelink GTI 11 | |
| Intel NUC11PHKi7C | |
| GMK NucBox 2 | |
| Beelink GK Mini | |
| PCMark 10 / Productivity | |
| Gemiddeld AMD Ryzen 9 5900HX, AMD Radeon RX Vega 8 (Ryzen 4000/5000) (9852 - 10196, n=5) | |
| Beelink GTR5 | |
| Intel NUC11PHKi7C | |
| Intel NUC11PAQi7 | |
| Beelink GTI 11 | |
| GMK NucBox 2 | |
| Beelink GK Mini | |
| PCMark 10 / Digital Content Creation | |
| Beelink GTR5 | |
| Intel NUC11PHKi7C | |
| Gemiddeld AMD Ryzen 9 5900HX, AMD Radeon RX Vega 8 (Ryzen 4000/5000) (6660 - 7105, n=5) | |
| Beelink GTI 11 | |
| Intel NUC11PAQi7 | |
| GMK NucBox 2 | |
| Beelink GK Mini | |
| CrossMark / Overall | |
| Beelink GTR5 | |
| Gemiddeld AMD Ryzen 9 5900HX, AMD Radeon RX Vega 8 (Ryzen 4000/5000) (1402 - 1501, n=2) | |
| CrossMark / Productivity | |
| Beelink GTR5 | |
| Gemiddeld AMD Ryzen 9 5900HX, AMD Radeon RX Vega 8 (Ryzen 4000/5000) (1387 - 1495, n=2) | |
| CrossMark / Creativity | |
| Beelink GTR5 | |
| Gemiddeld AMD Ryzen 9 5900HX, AMD Radeon RX Vega 8 (Ryzen 4000/5000) (1553 - 1589, n=2) | |
| CrossMark / Responsiveness | |
| Beelink GTR5 | |
| Gemiddeld AMD Ryzen 9 5900HX, AMD Radeon RX Vega 8 (Ryzen 4000/5000) (1068 - 1281, n=2) | |
| PCMark 10 Score | 6504 punten | |
Help | ||
| AIDA64 / Memory Copy | |
| GMK NucBox 2 | |
| Beelink GTR5 | |
| Beelink GTI 11 | |
| Gemiddeld AMD Ryzen 9 5900HX (36725 - 43318, n=26) | |
| Intel NUC11PHKi7C | |
| Beelink GK Mini | |
| AIDA64 / Memory Read | |
| Beelink GTR5 | |
| Beelink GTI 11 | |
| Gemiddeld AMD Ryzen 9 5900HX (41378 - 47593, n=26) | |
| Intel NUC11PHKi7C | |
| GMK NucBox 2 | |
| Beelink GK Mini | |
| AIDA64 / Memory Write | |
| GMK NucBox 2 | |
| Beelink GTI 11 | |
| Beelink GTR5 | |
| Gemiddeld AMD Ryzen 9 5900HX (32536 - 46718, n=26) | |
| Intel NUC11PHKi7C | |
| Beelink GK Mini | |
| AIDA64 / Memory Latency | |
| Intel NUC11PHKi7C | |
| Beelink GTR5 | |
| Gemiddeld AMD Ryzen 9 5900HX (73.5 - 97.1, n=26) | |
| Beelink GK Mini | |
| Beelink GTI 11 | |
| GMK NucBox 2 | |
* ... kleiner is beter
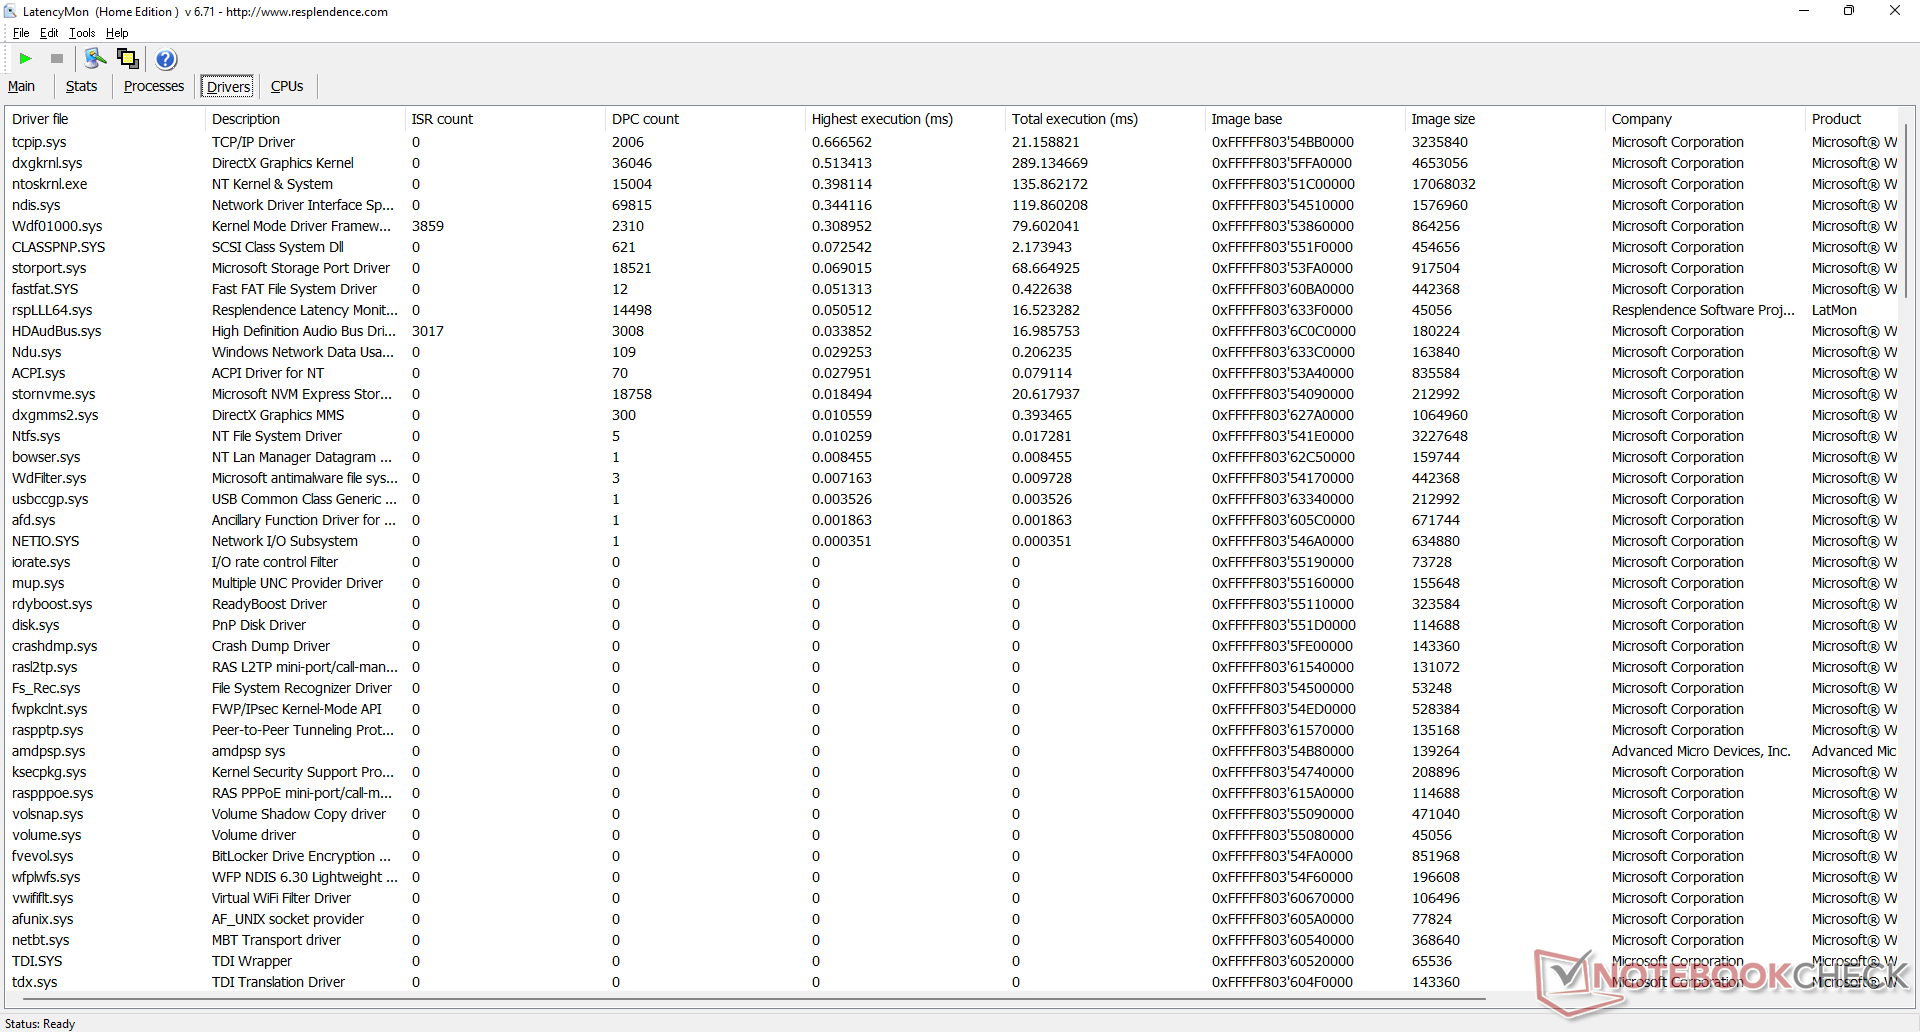
DPC latentie
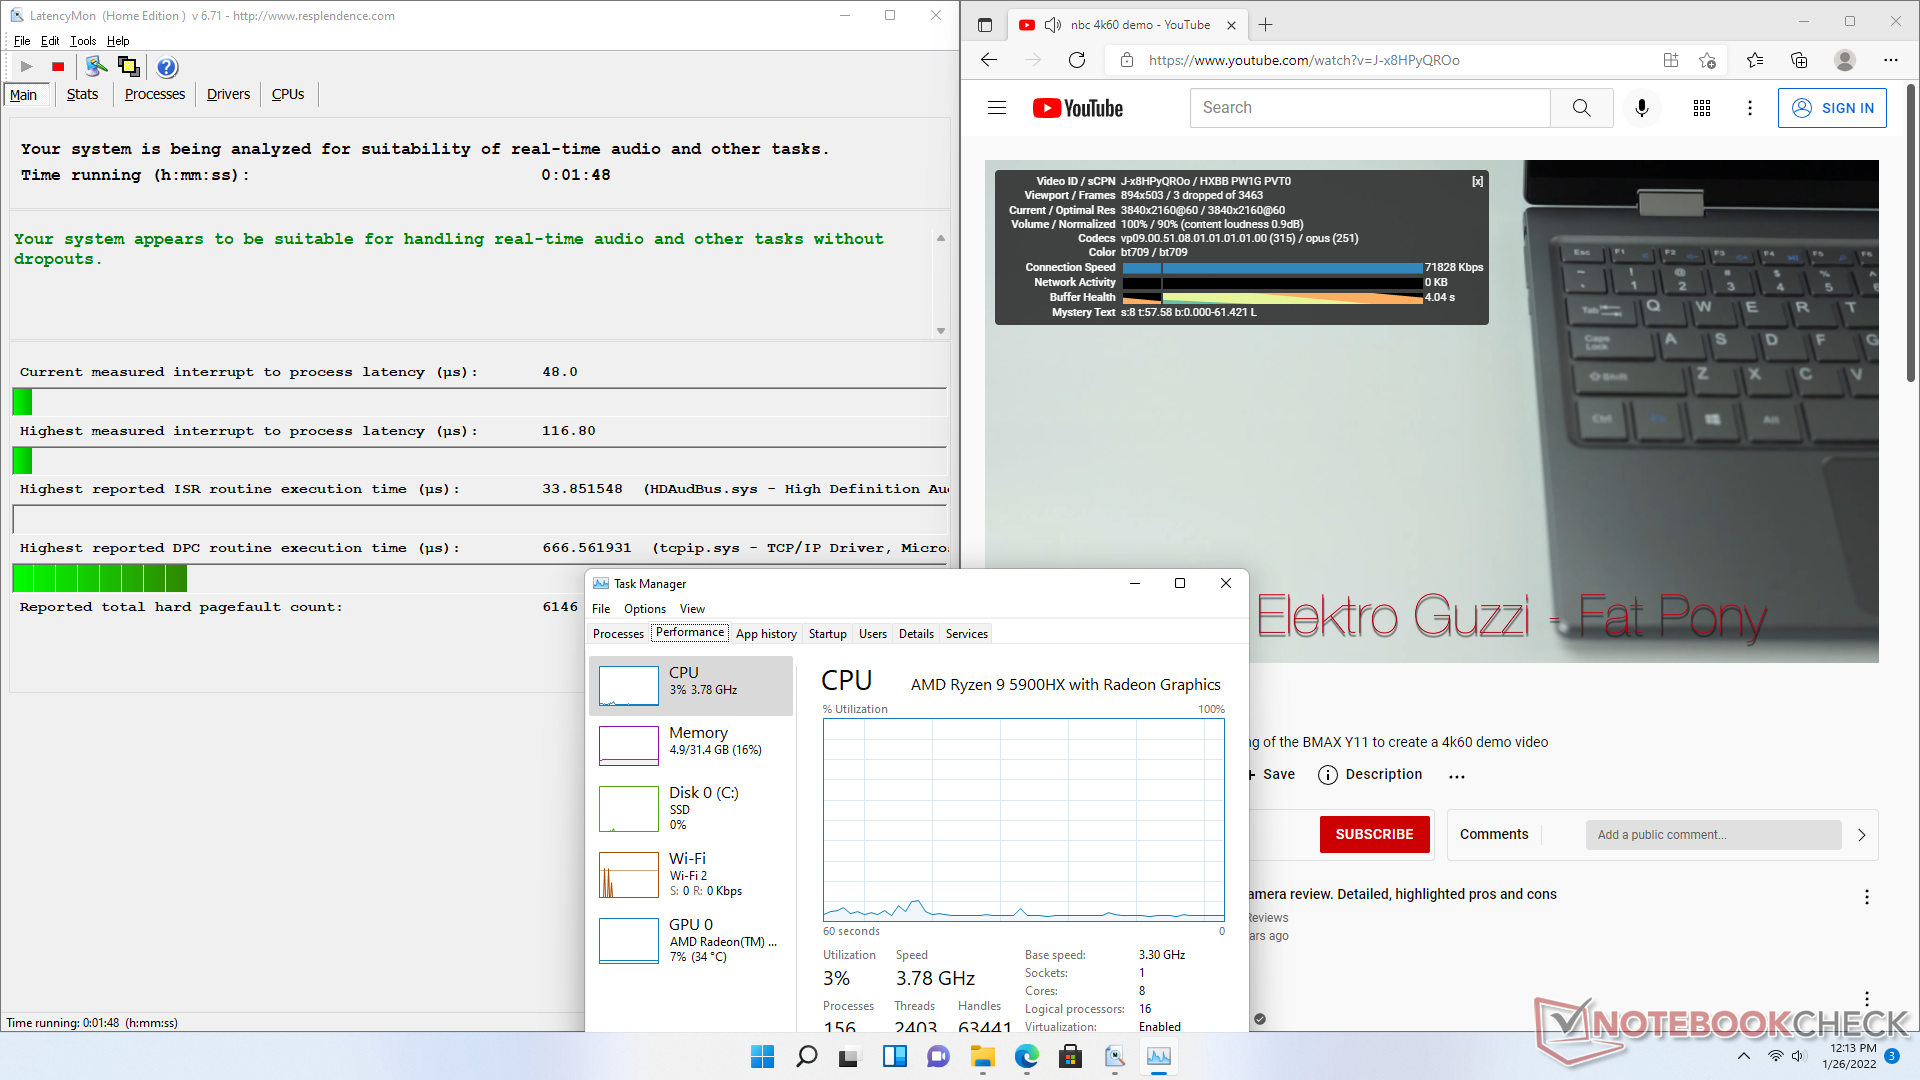
LatencyMon toont geen DPC-problemen bij het openen van meerdere browsertabbladen op onze startpagina. het afspelen van 4K-video's met 60 FPS verloopt vloeiend, met slechts 3 dropped frames tijdens onze YouTube-test die een minuut duurde.
| DPC Latencies / LatencyMon - interrupt to process latency (max), Web, Youtube, Prime95 | |
| Beelink GK Mini | |
| Intel NUC11PHKi7C | |
| GMK NucBox 2 | |
| Intel NUC11PAQi7 | |
| Beelink GTI 11 | |
| Beelink GTR5 | |
* ... kleiner is beter
Opslagapparaten
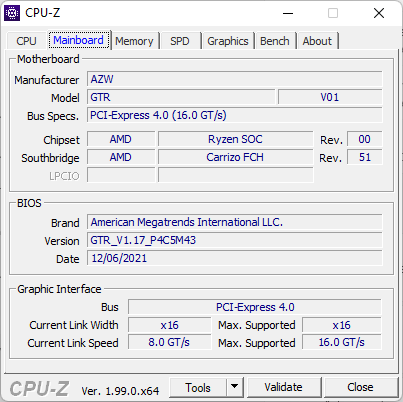
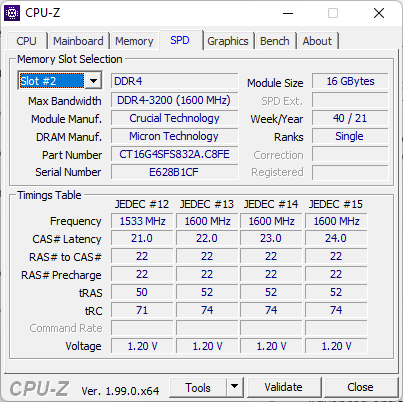
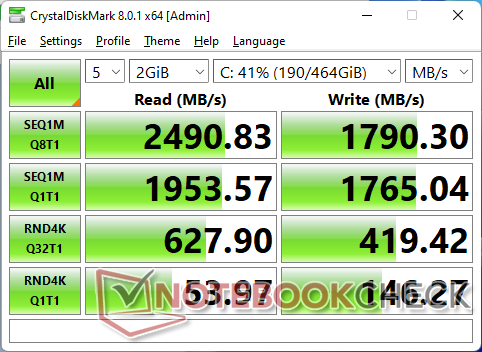
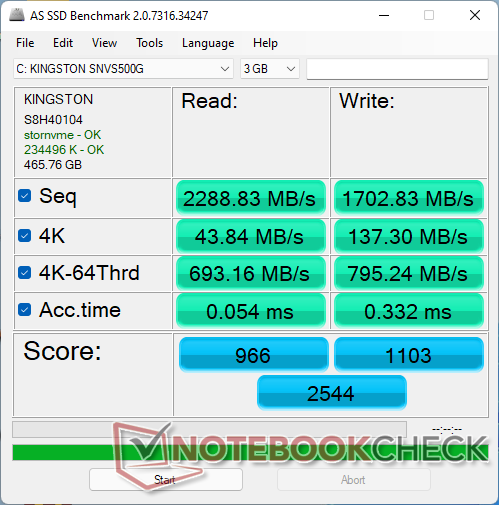
Onze testeenheid wordt geleverd met een midrange 500 GB Kingston NV1 PCIe3 x4 SSD. PCIe4 snelheden worden niet ondersteund, in tegenstelling tot de nieuwste Intel NUC's die draaien op 11e generatie Core CPU's. De Kingston schijf vertoont verder geen problemen om zijn maximale overdrachtssnelheid van ~2300 MB/s gedurende langere perioden te behouden.

| Drive Performance rating - Percent | |
| Intel NUC11PAQi7 | |
| Beelink GTI 11 | |
| Intel NUC11PHKi7C | |
| Beelink GTR5 | |
| GMK NucBox 2 | |
| Beelink GK Mini | |
* ... kleiner is beter
Disk Throttling: DiskSpd Read Loop, Queue Depth 8
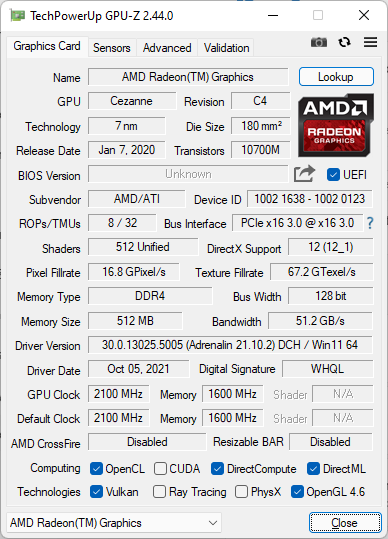
GPU prestatie
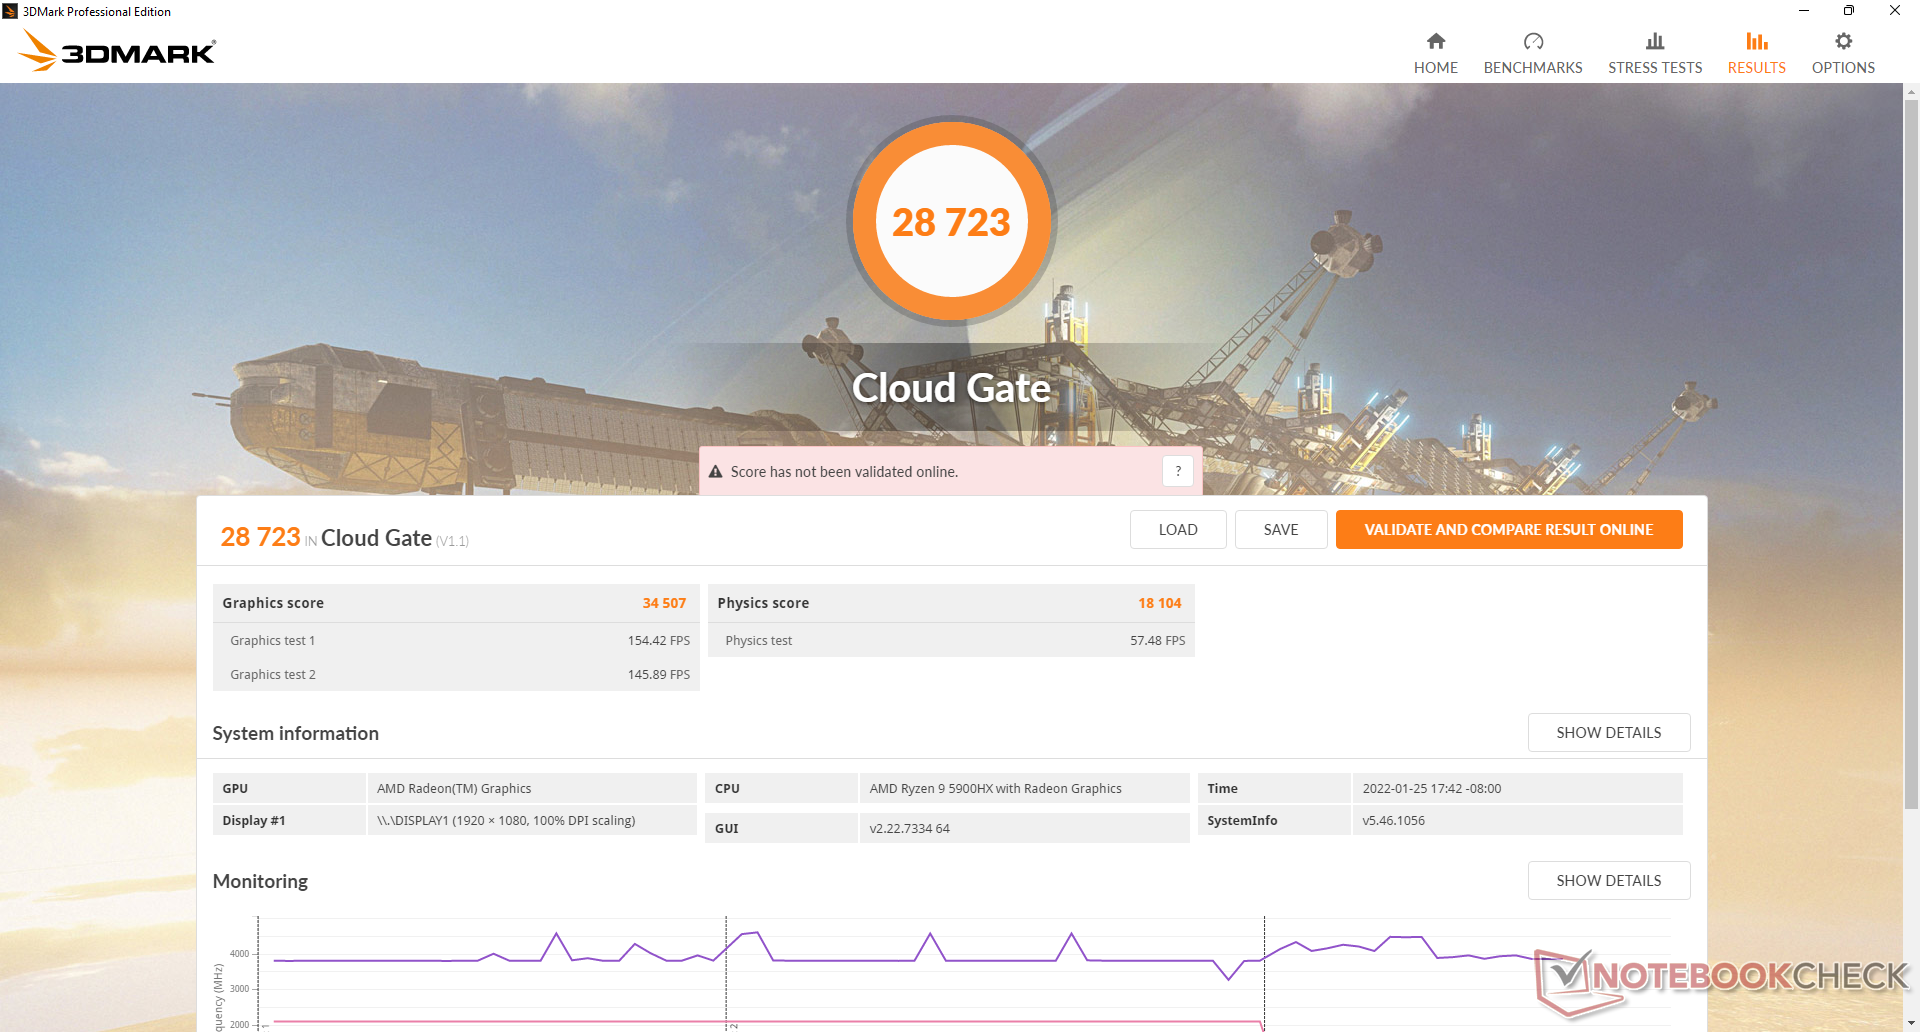
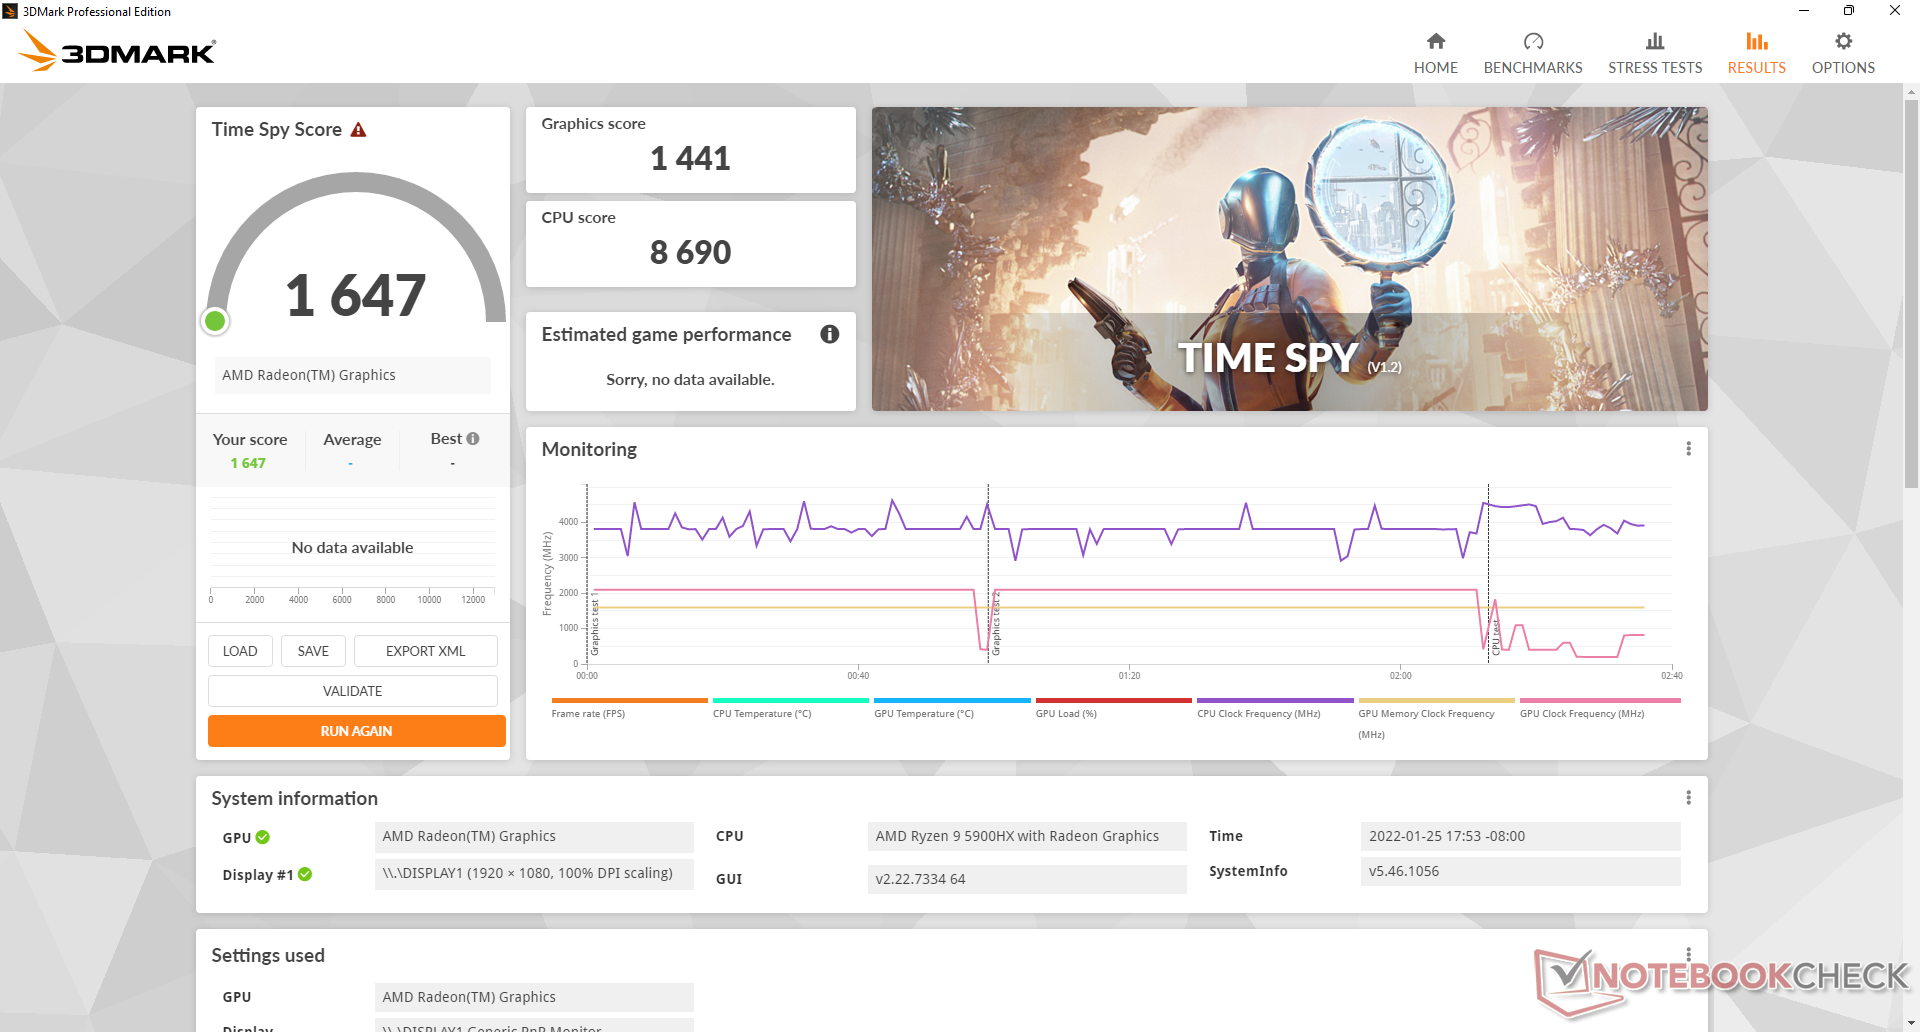
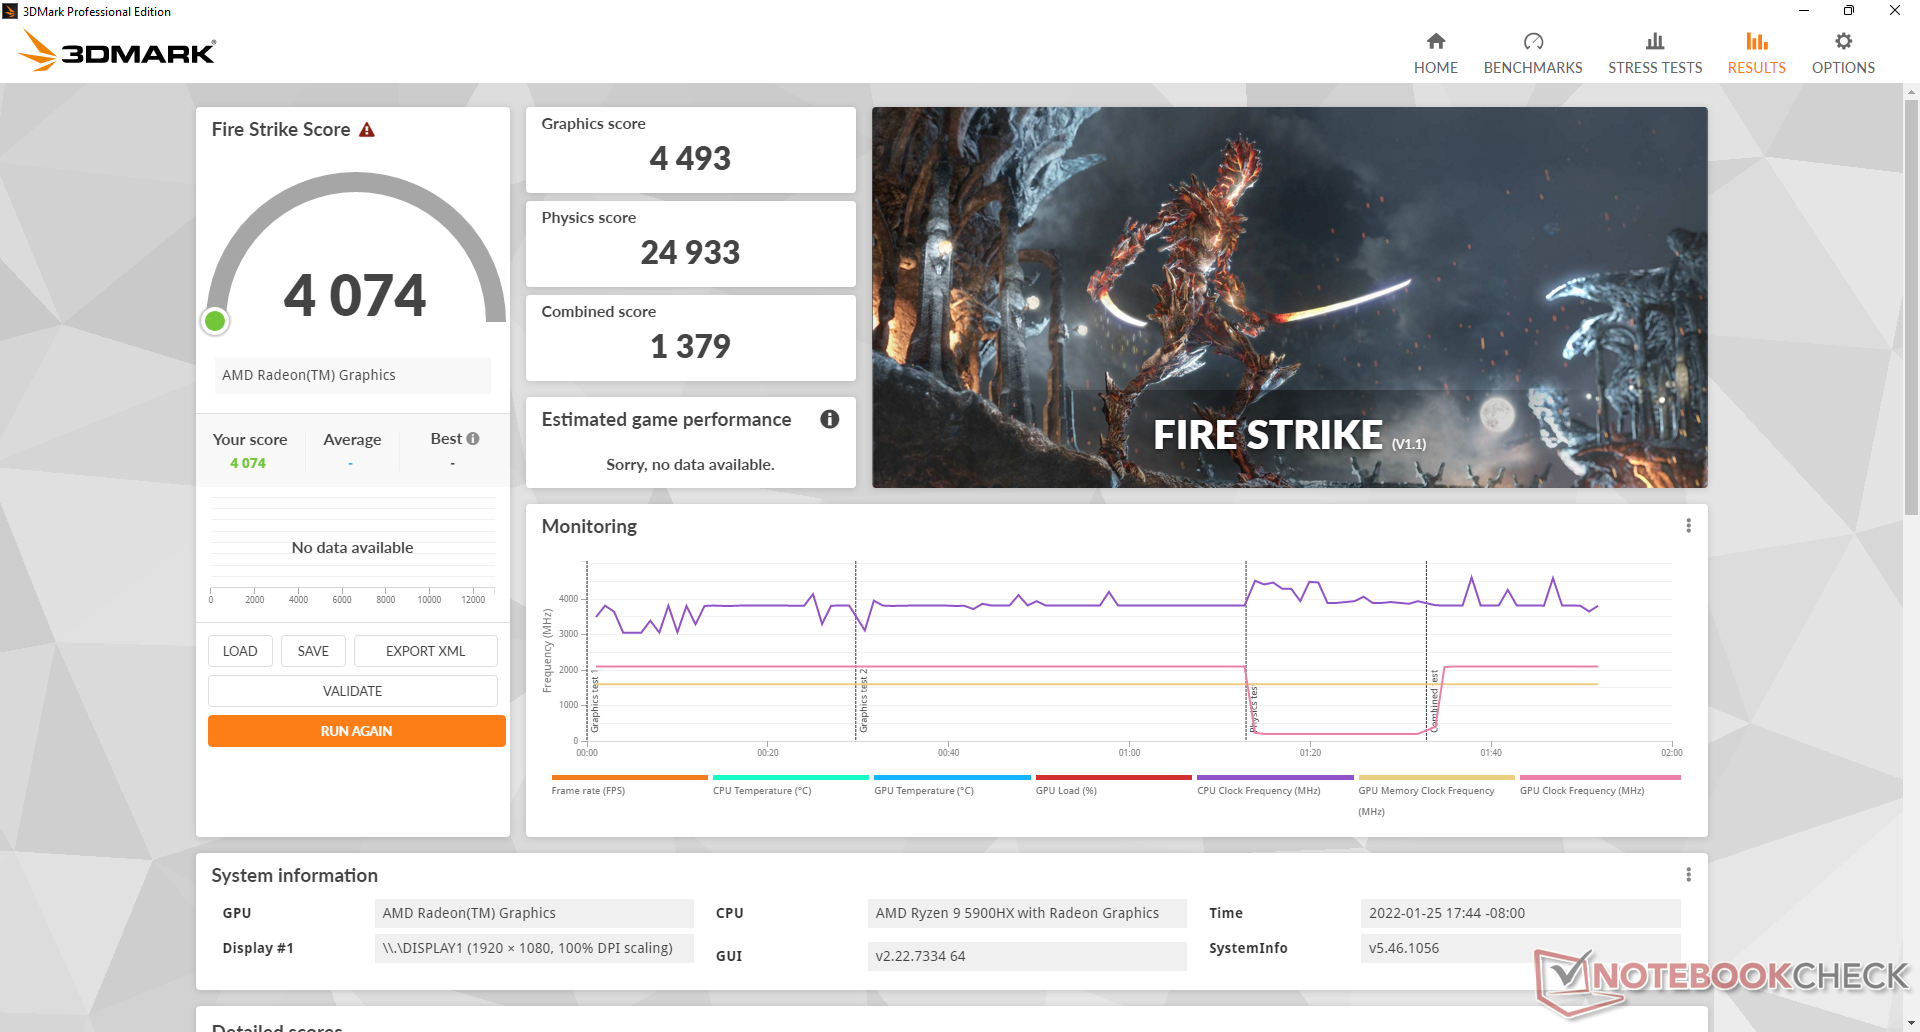
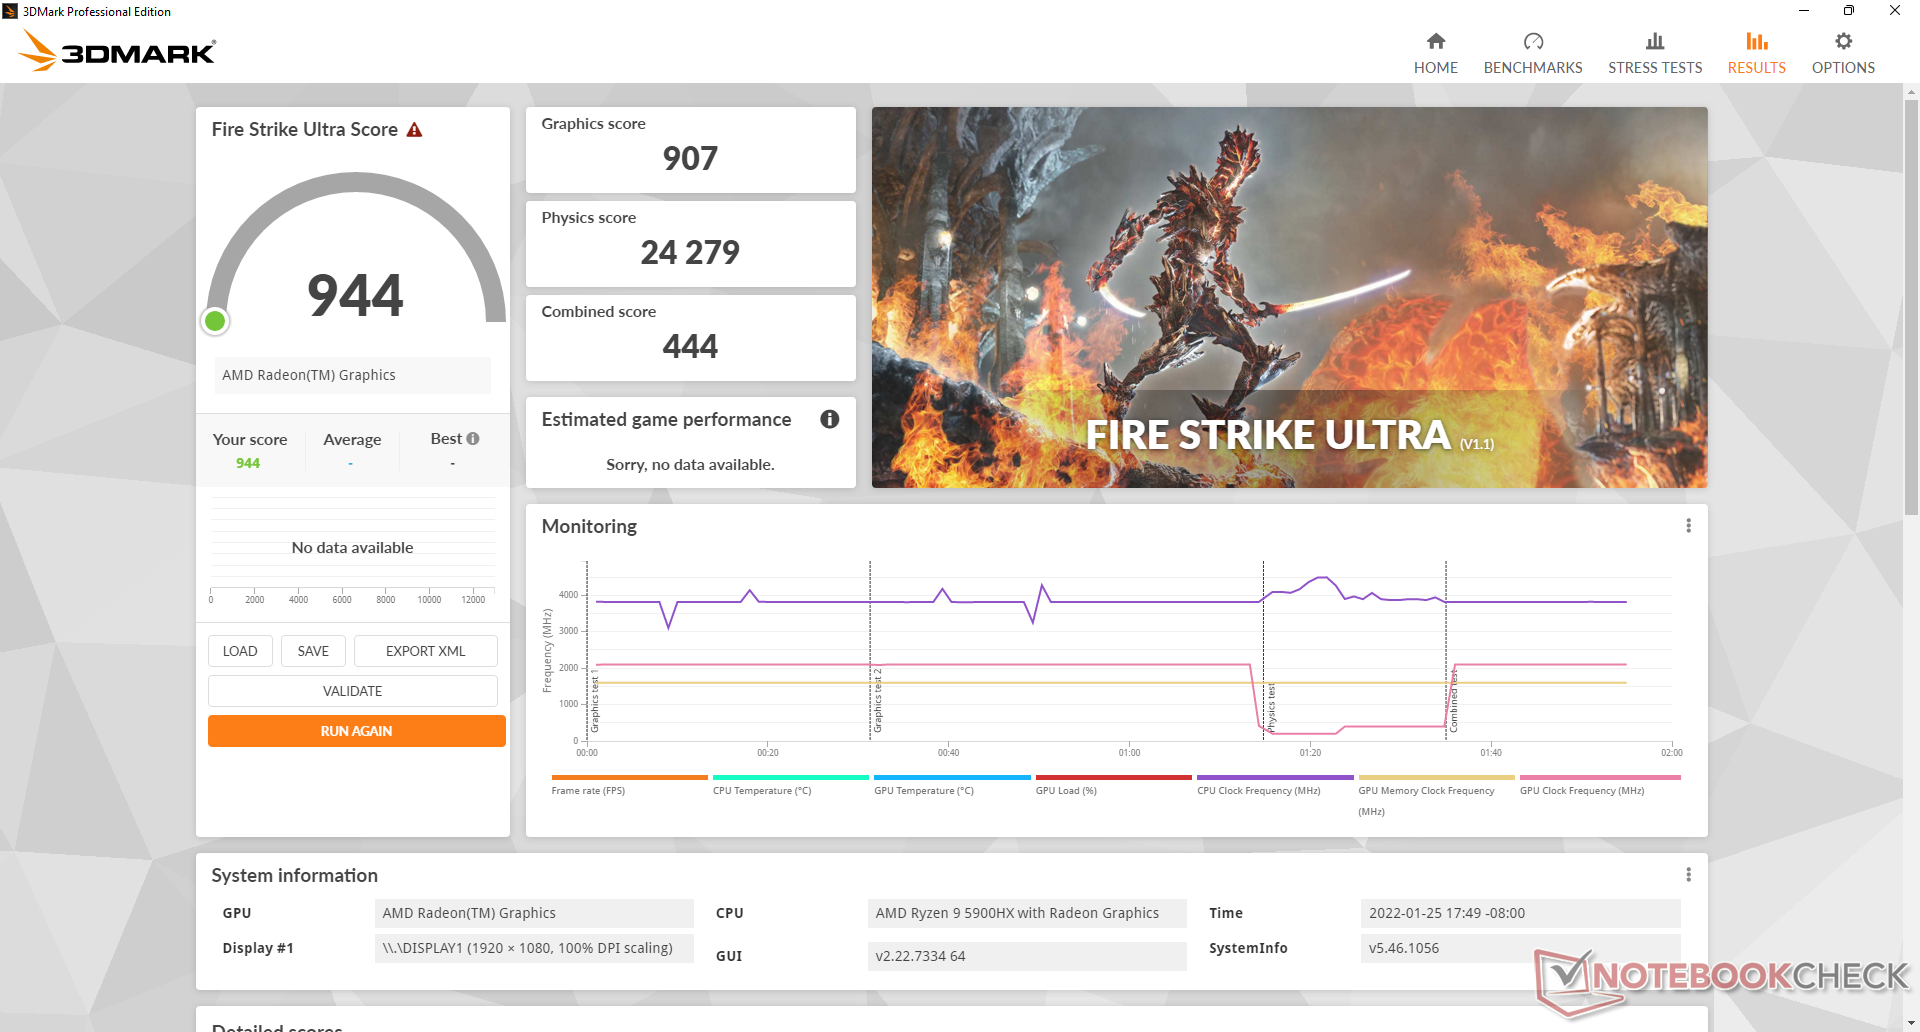
De geïntegreerdeRadeon RX Vega 8 is hier ongeveer 20 procent sneller dan de gemiddelde laptop in onze database die is uitgerust met dezelfde geïntegreerde GPU. Intel's Iris Xe 96 EUs oplossing zoals te vinden op de meeste 11e gen Core i7 laptops nog steeds onze AMD oplossing in de meeste titels, maar de delta tussen hen is veel kleiner deze keer rond. De meeste moderne en veeleisende titels draaien redelijk goed op lage instellingen van 1080p.
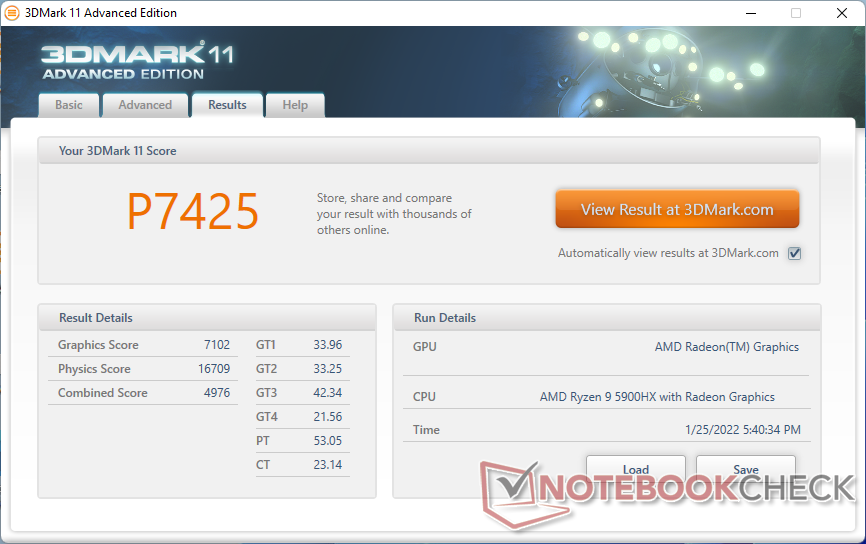
| 3DMark 11 Performance | 7425 punten | |
| 3DMark Cloud Gate Standard Score | 28723 punten | |
| 3DMark Fire Strike Score | 4074 punten | |
| 3DMark Time Spy Score | 1647 punten | |
Help | ||
Witcher 3 FPS Chart
| lage | gem. | hoge | ultra | |
|---|---|---|---|---|
| GTA V (2015) | 140 | 124 | 33.4 | 15.1 |
| The Witcher 3 (2015) | 86.9 | 55.2 | 26.8 | 17.1 |
| Dota 2 Reborn (2015) | 135 | 107 | 63.8 | 59.9 |
| Final Fantasy XV Benchmark (2018) | 44.8 | 22.3 | 15.7 | |
| X-Plane 11.11 (2018) | 58.2 | 45.7 | 40.5 | |
| Far Cry 5 (2018) | 62 | 29 | 27 | 25 |
| Strange Brigade (2018) | 99.1 | 37.8 | 31.9 | 27.5 |
Emissies
Systeemgeluid
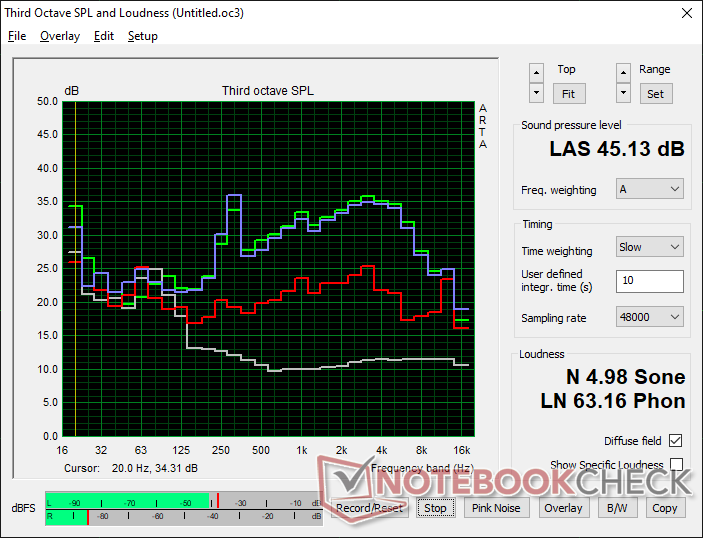
De GTR5 is een van de luidere mini PC's die we getest hebben, omdat de twee interne ventilatoren in principe altijd actief zijn. Als we bijvoorbeeld gewoon op het Windows bureaubladscherm zitten, kunnen we al een ventilatorgeluid van 34,2 dB(A) noteren, vergeleken met ~25 dB(A) op de GMK NucBox 2 of Intel NUC11PAQi7, elk met minder krachtige CPU's.
Het draaien van hogere belastingen zoals games kan een ventilatorgeluid van 41 tot 45 dB(A) veroorzaken, wat nog luider is dan bij de Intel NUC11PHKi7C die is uitgerust met de aanzienlijk snellere GeForce RTX 2060. Hoe je het ook wendt of keert, de GTR5 zal onder de meeste omstandigheden luidruchtig zijn. Het goede nieuws is dat de ventilatoren niet erg vaak pulseren of cyclussen uitvoeren, wat het geluid nog irritanter zou hebben gemaakt.
Geluidsniveau
| Onbelast |
| 34.2 / 34.2 / 34.2 dB (A) |
| Belasting |
| 44.6 / 45.1 dB (A) |
 | ||
30 dB stil 40 dB(A) hoorbaar 50 dB(A) luid |
||
min: | ||
| Beelink GTR5 Vega 8, R9 5900HX, Kingston NV1 SNVS/500GCN | Beelink GTI 11 Iris Xe G7 80EUs, i5-1135G7, Kingston SA2000M8500G | GMK NucBox 2 Iris Plus Graphics 655, i5-8259U, Netac S930E8/256GPN | Intel NUC11PHKi7C GeForce RTX 2060 Mobile, i7-1165G7, Samsung SSD 980 Pro 500GB MZ-V8P500BW | Intel NUC11PAQi7 Iris Xe G7 96EUs, i7-1165G7, Samsung SSD 980 Pro 500GB MZ-V8P500BW | Beelink GK Mini UHD Graphics 600, Celeron J4125, Silicon Motion SM2258XT 256GB | |
|---|---|---|---|---|---|---|
| Noise | -4% | 18% | 13% | 12% | 1% | |
| uit / omgeving * (dB) | 23.1 | 25.7 -11% | 25.6 -11% | 24.5 -6% | 25.6 -11% | 24.6 -6% |
| Idle Minimum * (dB) | 34.2 | 28.4 17% | 25.7 25% | 25.3 26% | 25.6 25% | 36.9 -8% |
| Idle Average * (dB) | 34.2 | 32 6% | 25.7 25% | 25.3 26% | 25.6 25% | 36.9 -8% |
| Idle Maximum * (dB) | 34.2 | 37.7 -10% | 25.7 25% | 25.3 26% | 25.6 25% | 36.9 -8% |
| Load Average * (dB) | 44.6 | 44.2 1% | 35.3 21% | 36.4 18% | 33.6 25% | 37 17% |
| Witcher 3 ultra * (dB) | 41.4 | 44.5 -7% | 39.7 4% | 33.6 19% | ||
| Load Maximum * (dB) | 45.1 | 56 -24% | 35.1 22% | 47.9 -6% | 54.5 -21% | 37 18% |
* ... kleiner is beter
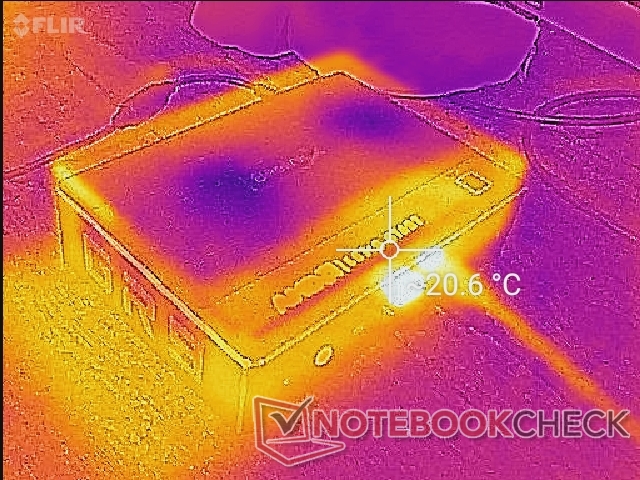
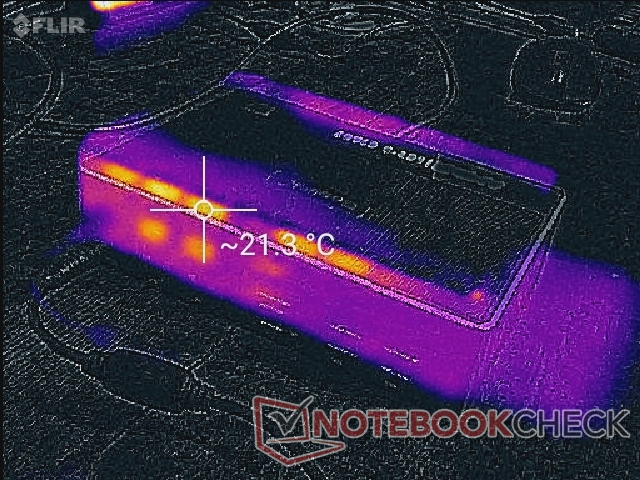
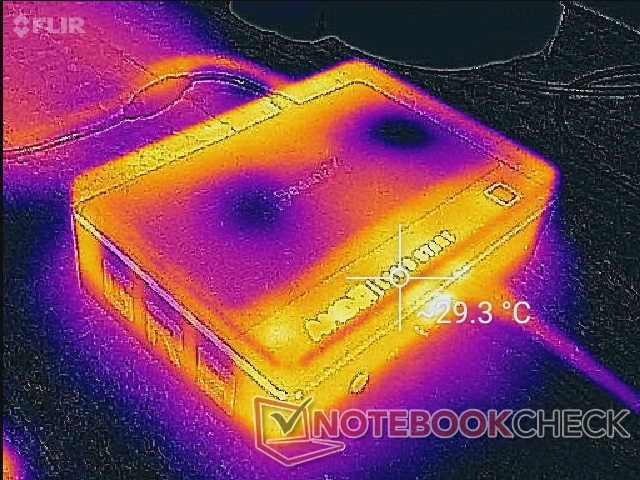
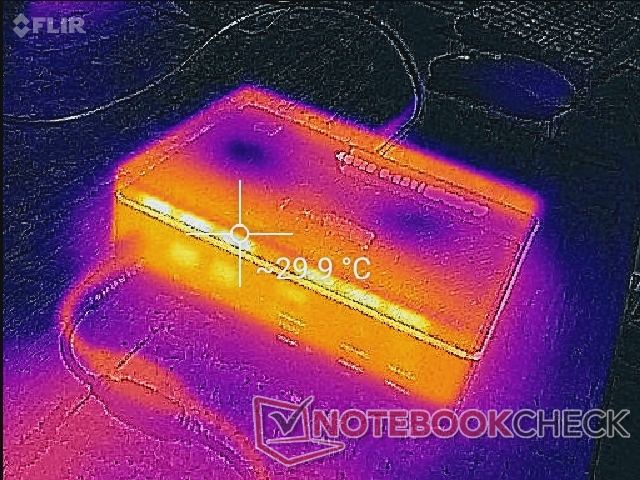
Temperatuur
Oppervlaktetemperaturen zijn geen probleem, vooral omdat de gehele bovenkant van het apparaat een ventilatieopening is voor luchtinlaat. Het is daarom niet aan te raden om papieren of boeken bovenop de mini PC te plaatsen. Als u de mini PC verticaal plaatst, zorg er dan voor dat u de bovenkant van de mini PC niet tegen muren of planken drukt om de luchtstroom te behouden.
Stresstest
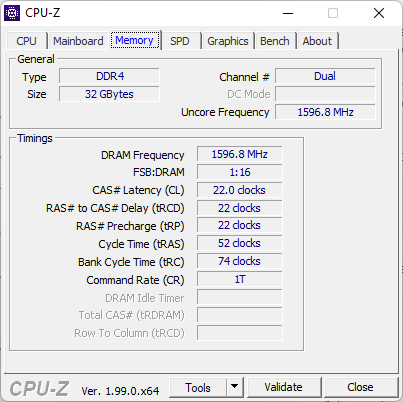
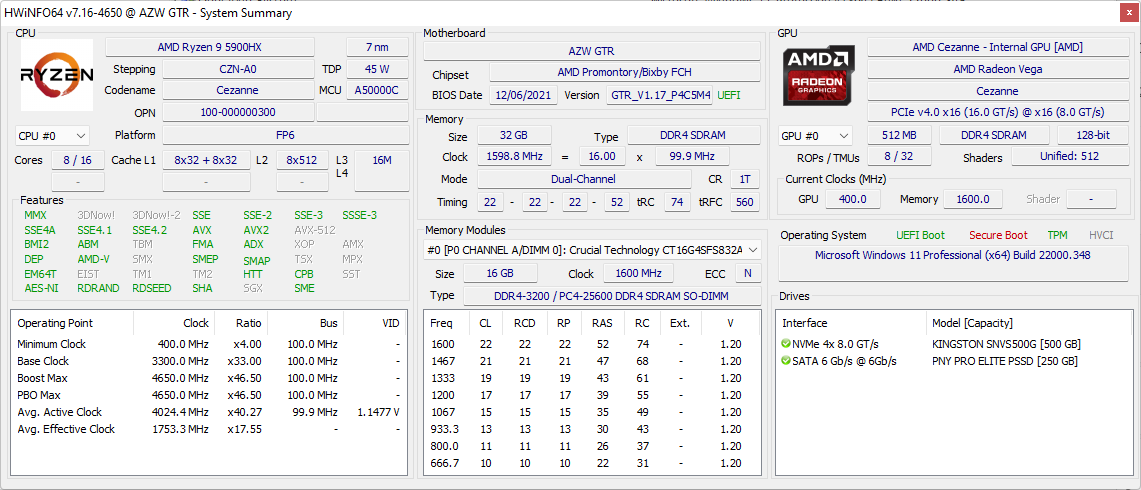
Bij het draaien van Prime95 om de CPU te belasten op standaard BIOS instellingen, steeg de kloksnelheid gedurende de eerste paar seconden tot 3,9 GHz, voordat hij iets daalde tot een stabielere 3,8 GHz. De kerntemperatuur (Tctl/Tdie) stabiliseerde op 74 C om genoeg ruimte over te laten voor overklokken. CPU TDP lijkt een top te bereiken van 55 W tijdens het begin van de test, om daarna te stabiliseren op 45 W volgens HWiNFO.
Bij het uitvoeren Witcher 3 om gaming stress weer te geven, zou de geïntegreerde GPU stabiliseren op 2100 MHz en bij een CPU (Tctl/Tdie) kerntemperatuur van 65 C. Het uitvoeren van deze zelfde test op de Beelink GTI11 uitgerust met de minder veeleisende Core i5-1135G7 zou vergelijkbare temperatuurresultaten opleveren.
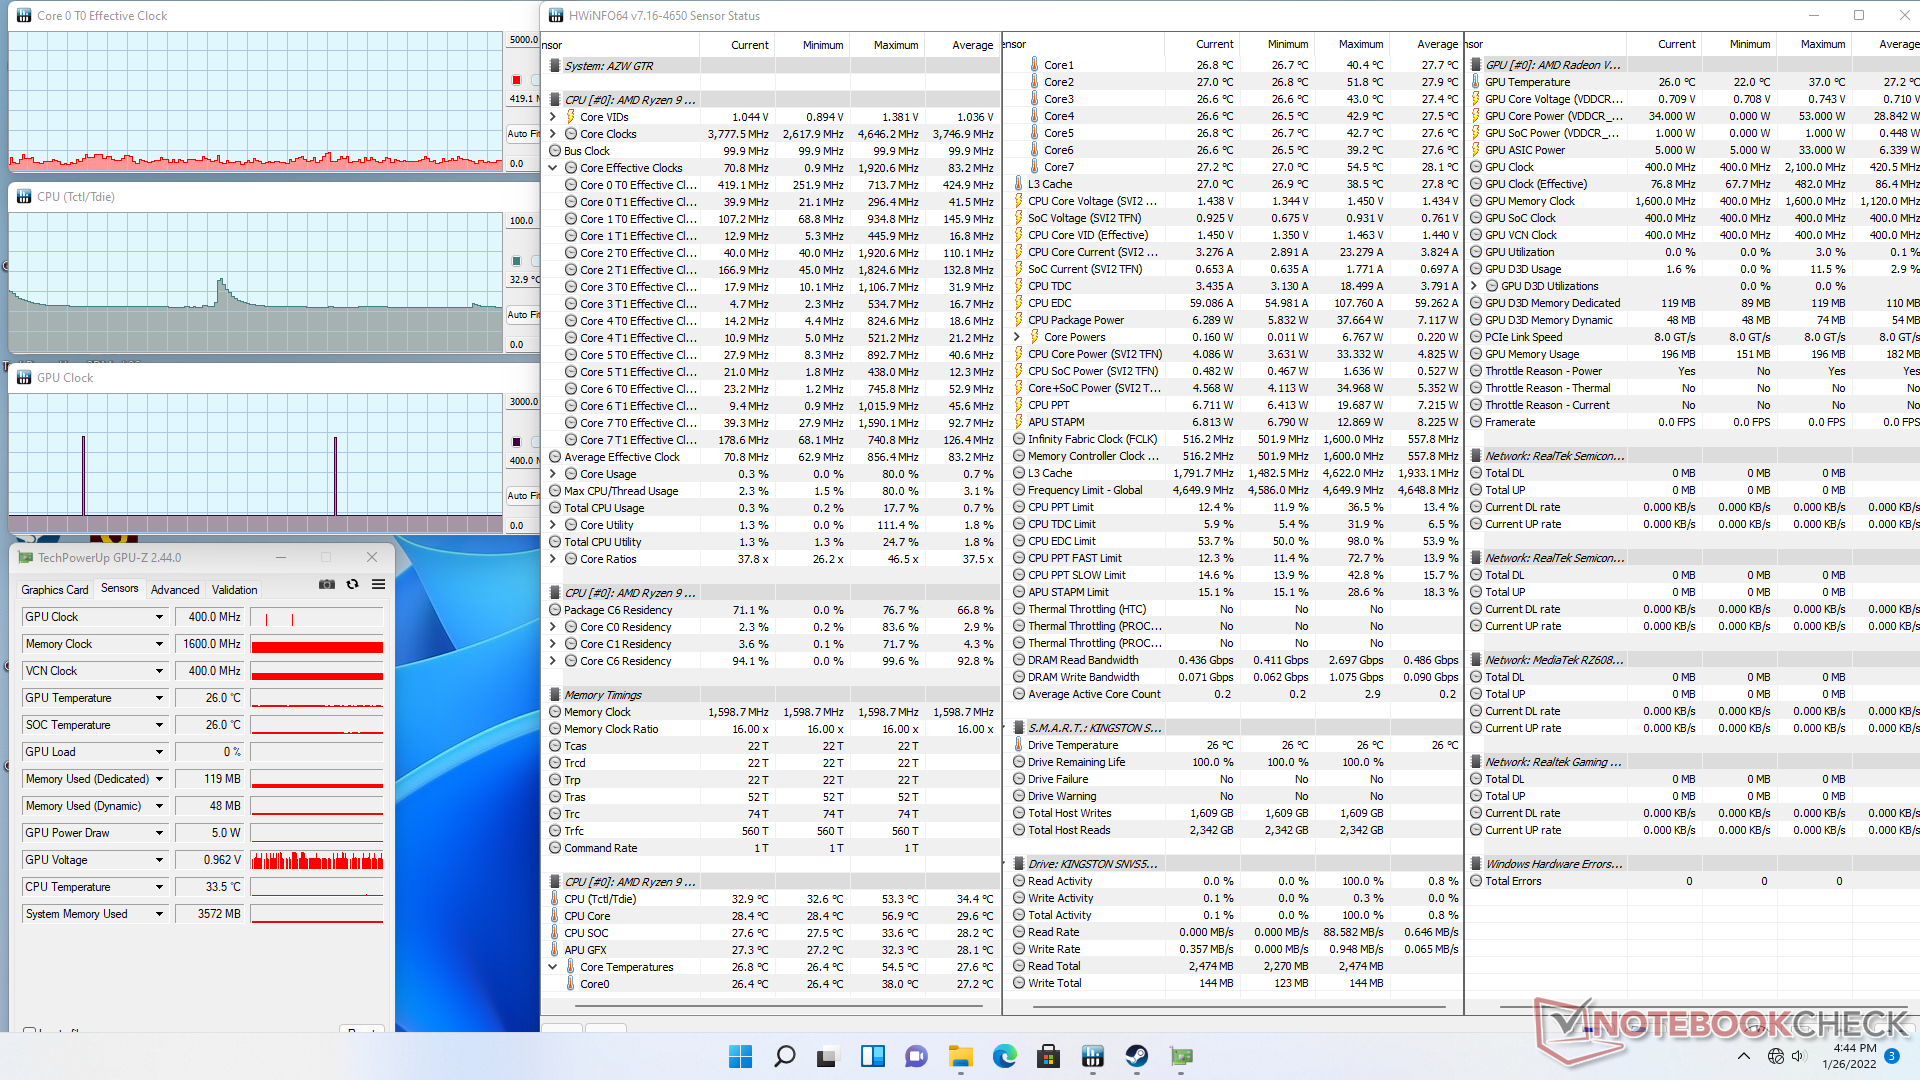
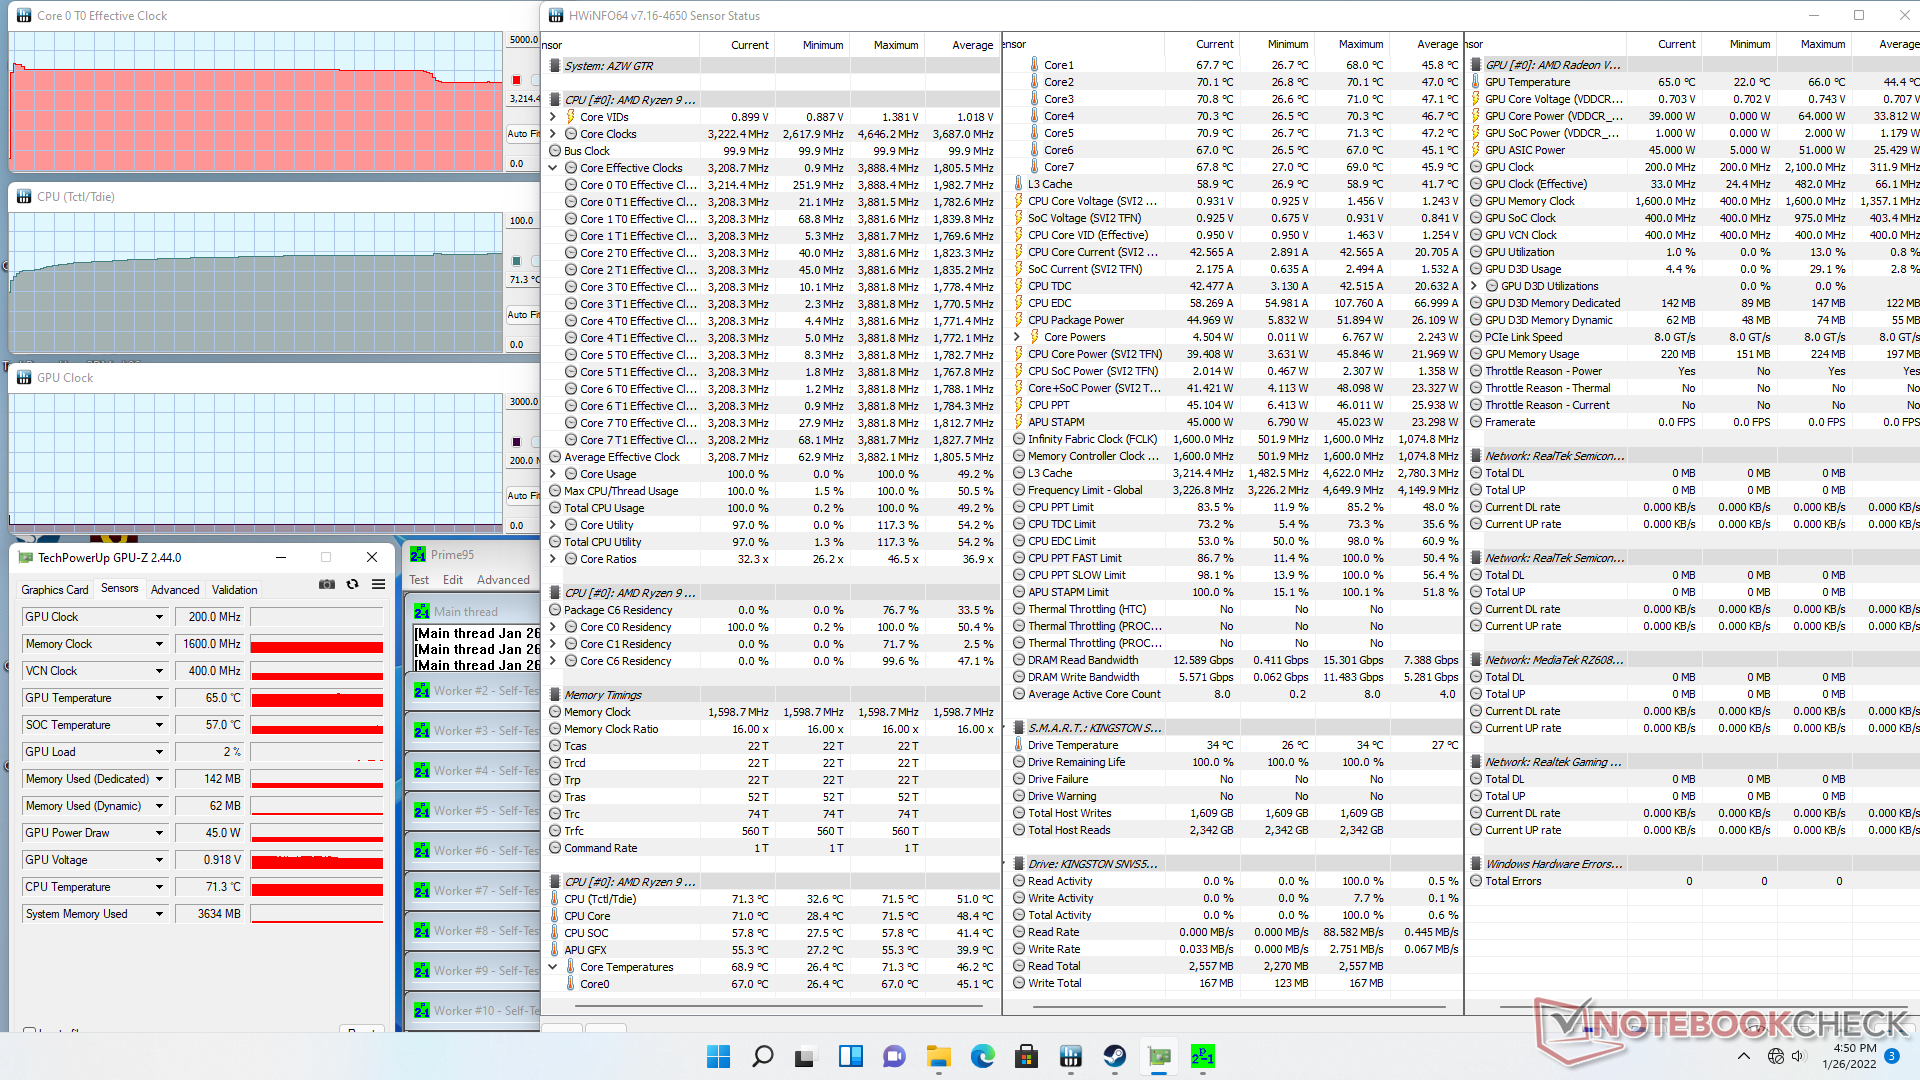
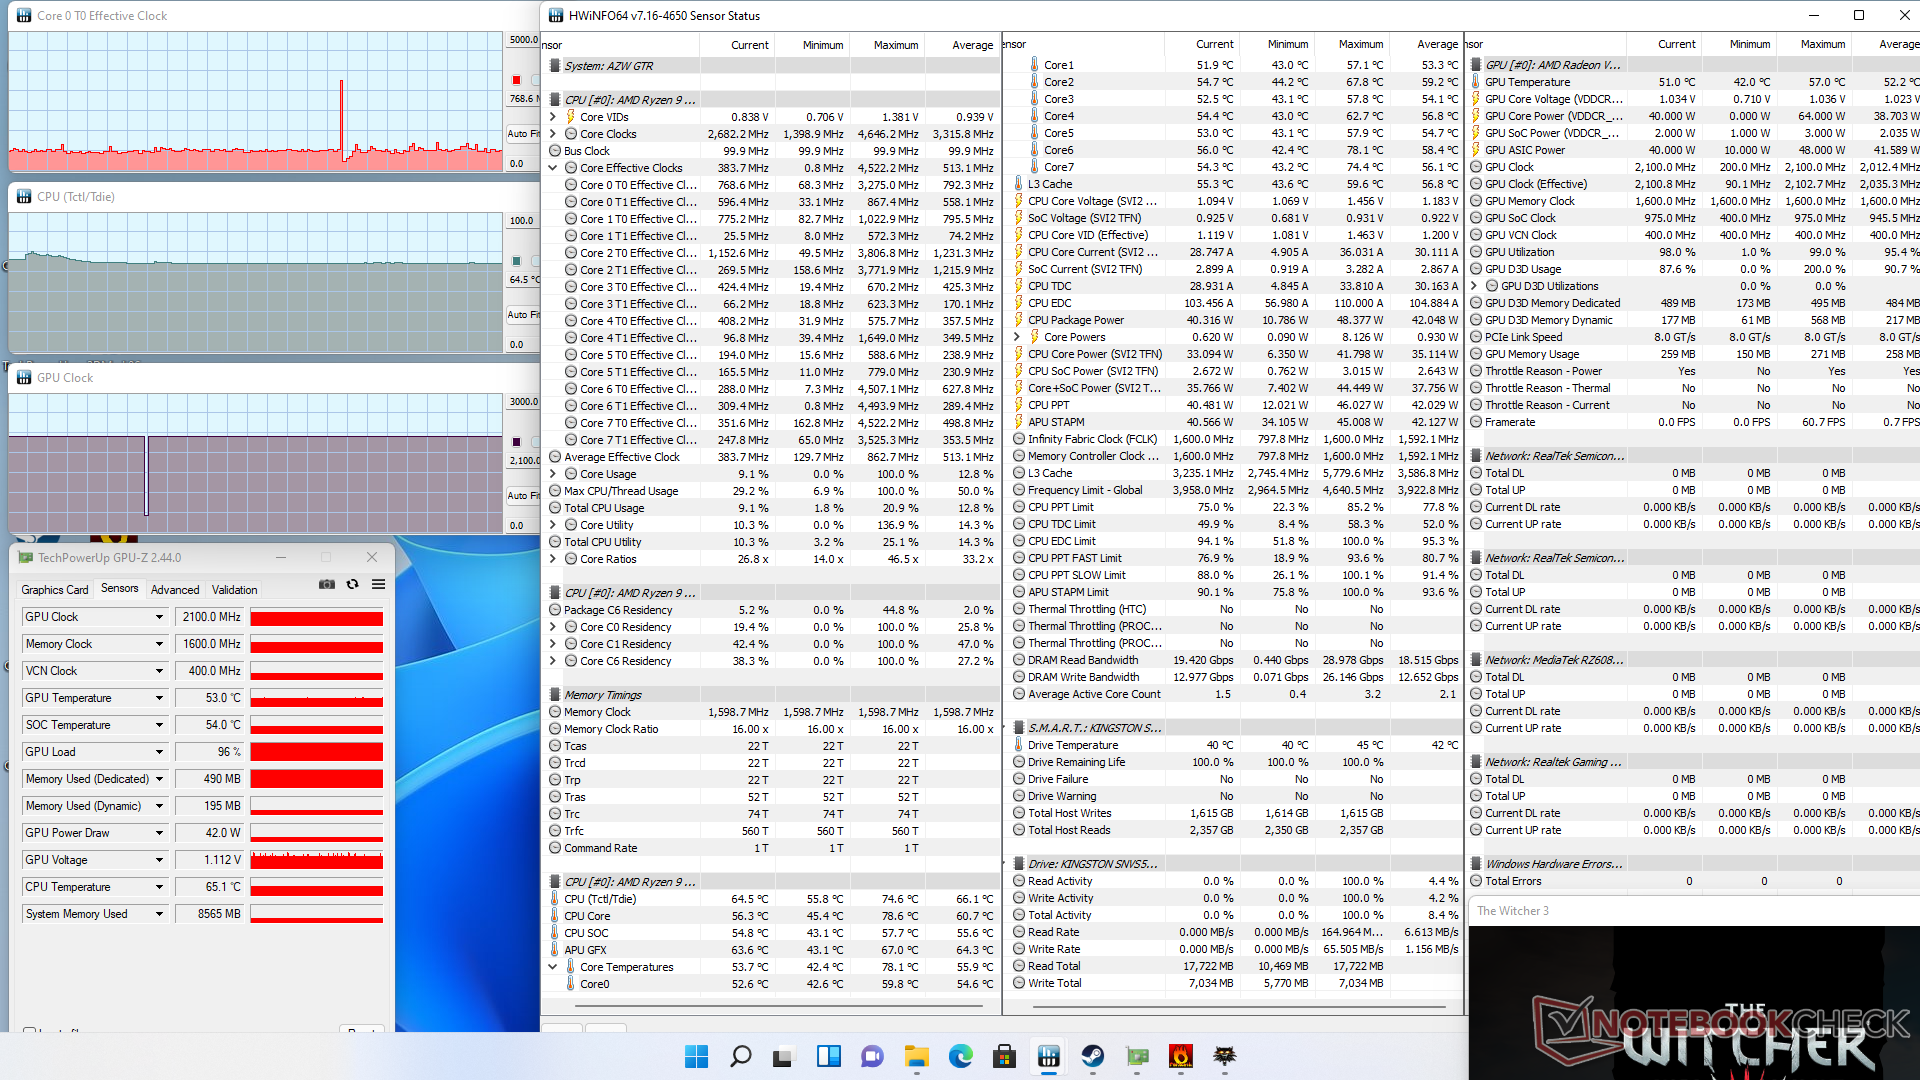
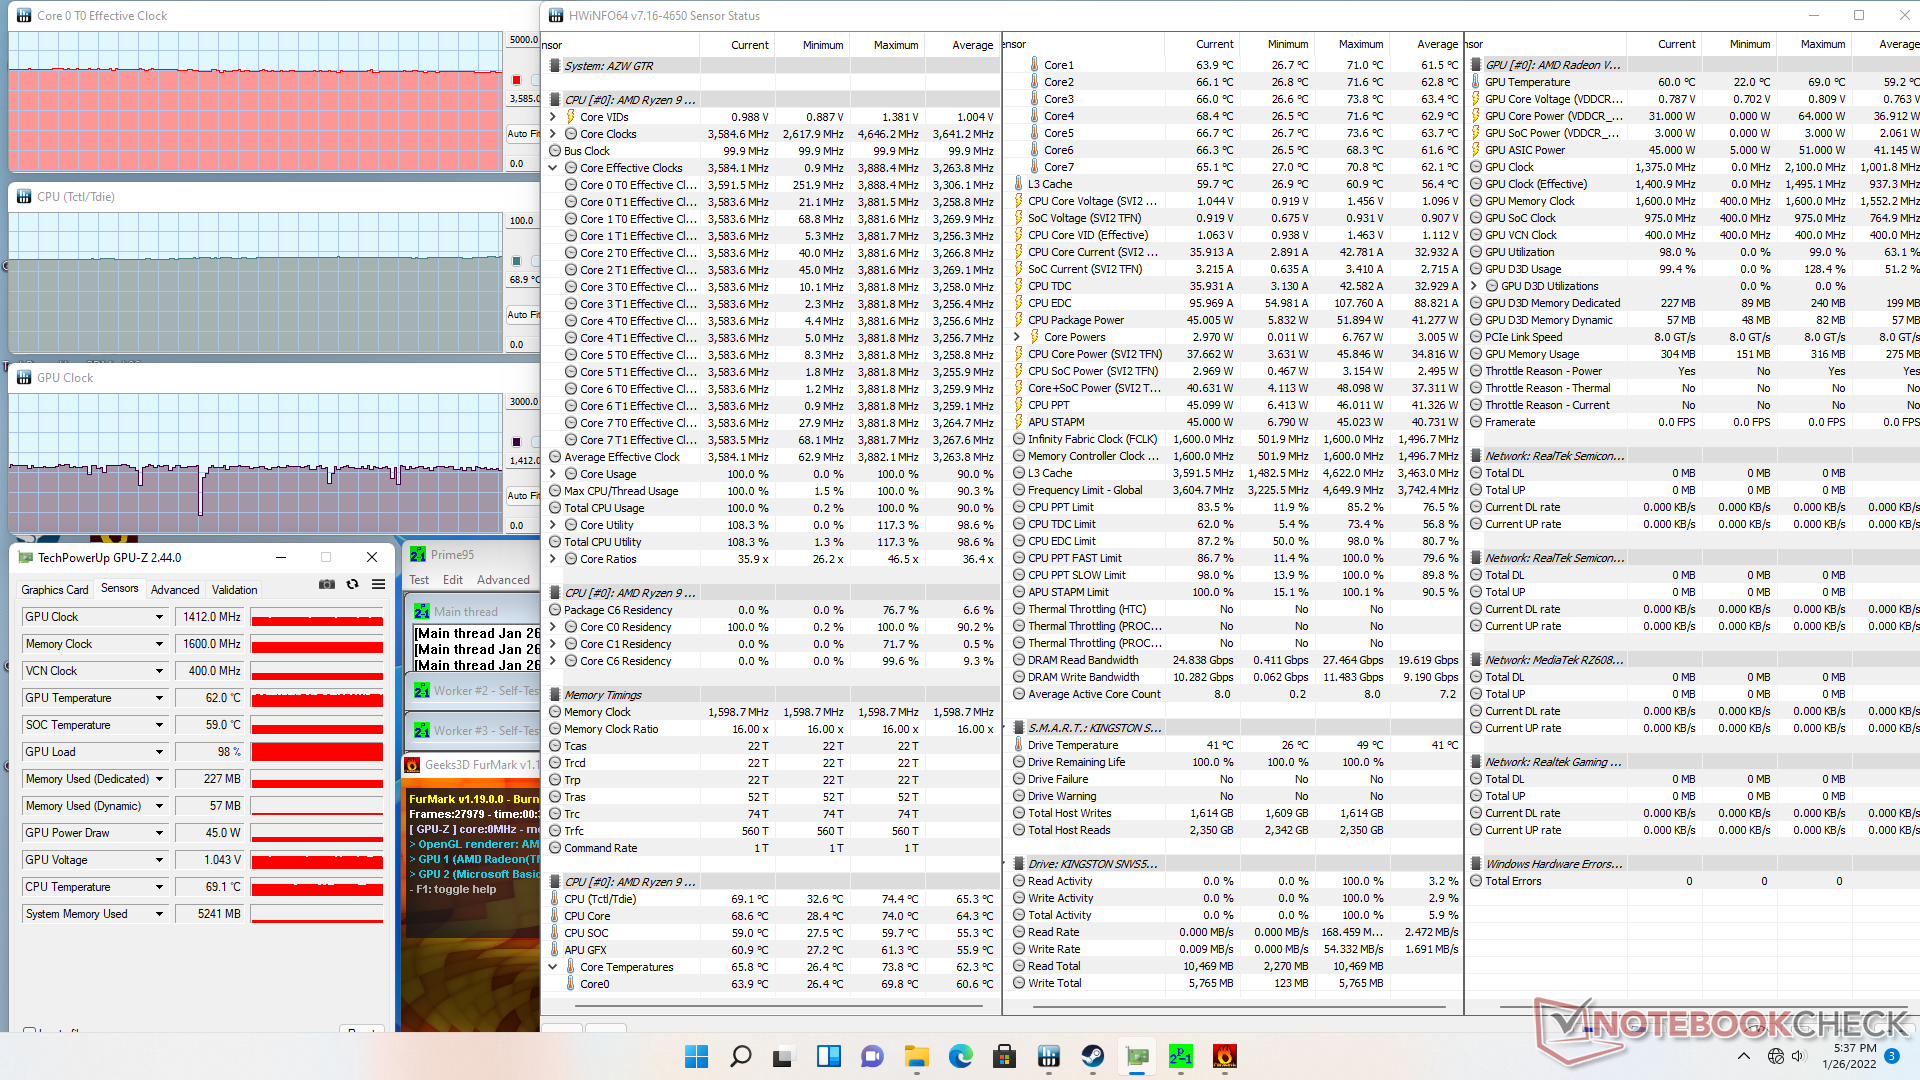
| CPU Klok (GHz) | GPU Klok (MHz) | Gemiddelde CPU Temperatuur Tctl/Tdie (°C) | |
| Systeem in rusttoestand | -- | -- | 33 |
| Prime95 Stress | 3.8 | -- | 74 |
| Prime95 + FurMark Stress | 3.6 | 1412 | 69 |
| Witcher 3 Stress | ~0.8 | 2100 | 65 |
Energiebeheer
Stroomverbruik
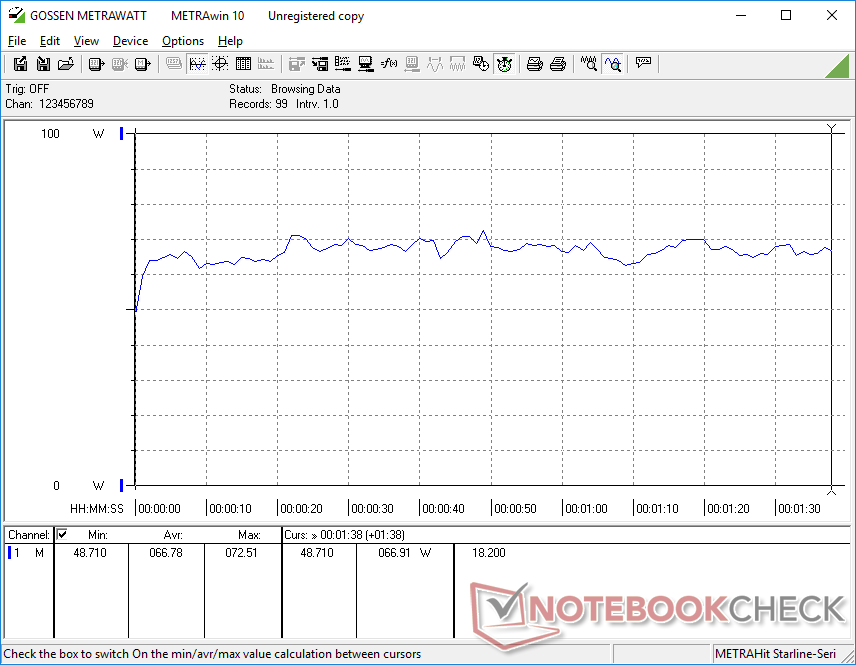
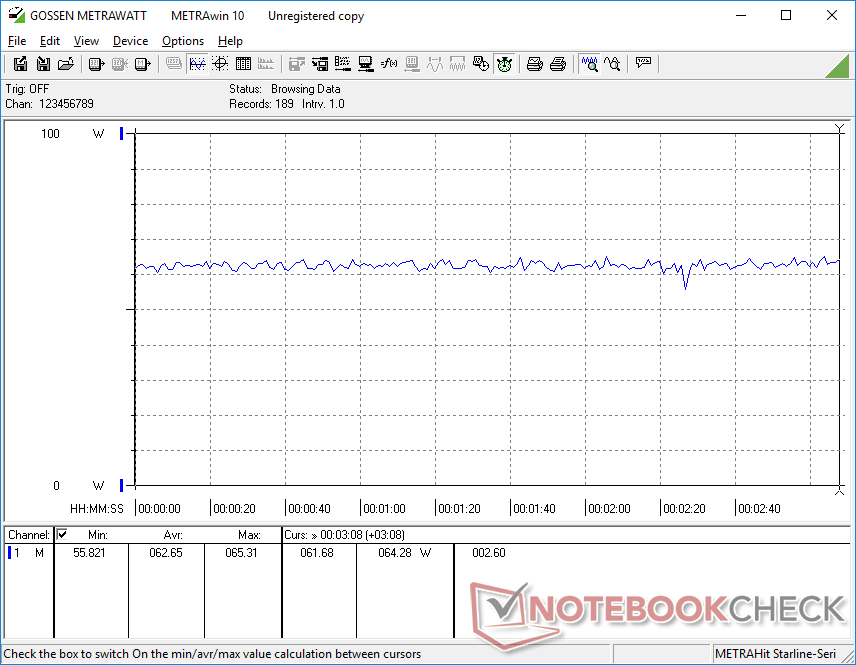
Het draaien van hogere belastingen zoals games zal ongeveer 2x meer stroom verbruiken dan de Core i7-aangedreven Intel NUC11PAQi7 ondanks de iets lagere grafische prestaties van onze Radeon RX Vega 8. GTR5 bezitters zouden echter nog steeds ongeveer 70 procent snellere multi-thread CPU prestaties krijgen, wat het relatief hogere stroomverbruik kan compenseren
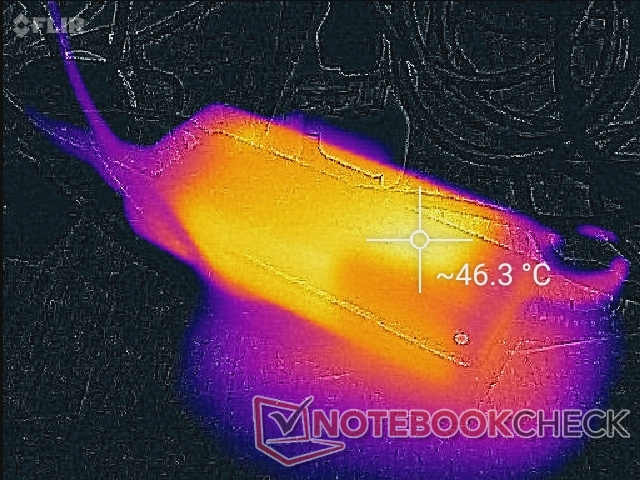
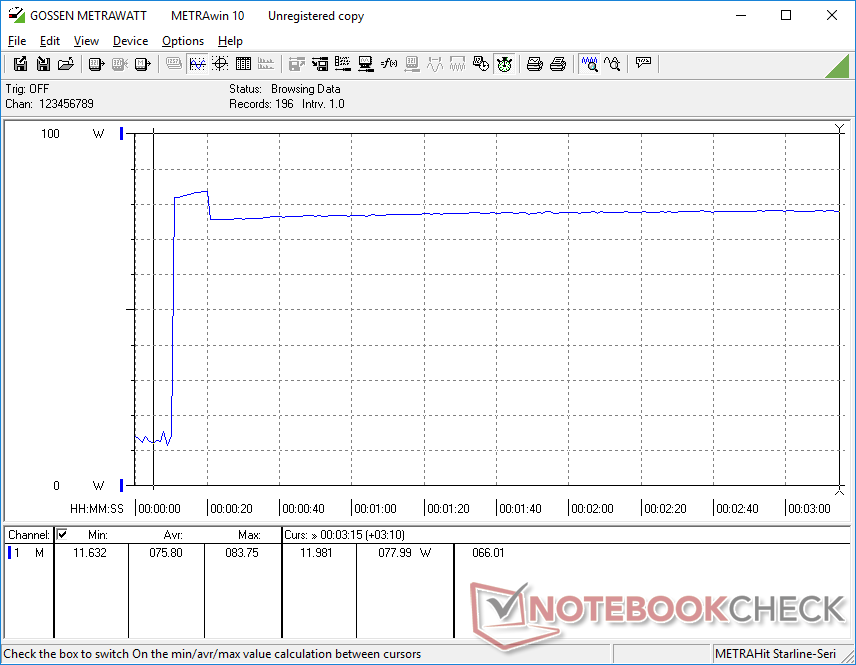
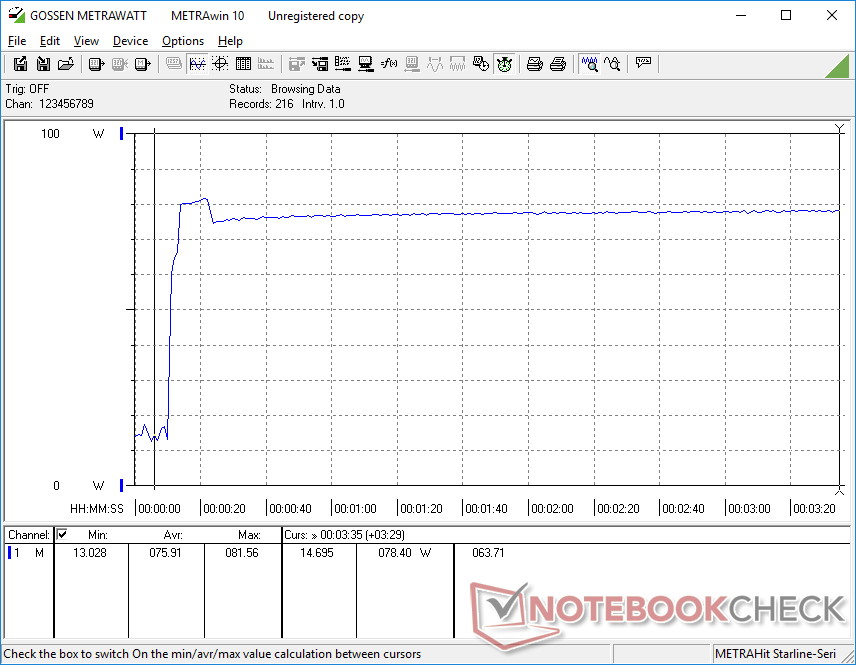
We halen maximaal 82 W uit de kleine (12,5 x 5 x 3 cm) 90 W AC adapter wanneer we extreme Prime95 en FurMark belastingen draaien.
| Uit / Standby | |
| Inactief | |
| Belasting |
|
Key:
min: | |
| Beelink GTR5 R9 5900HX, Vega 8, Kingston NV1 SNVS/500GCN, , x, | Beelink GTI 11 i5-1135G7, Iris Xe G7 80EUs, Kingston SA2000M8500G, , x, | GMK NucBox 2 i5-8259U, Iris Plus Graphics 655, Netac S930E8/256GPN, , x, | Intel NUC11PHKi7C i7-1165G7, GeForce RTX 2060 Mobile, Samsung SSD 980 Pro 500GB MZ-V8P500BW, , x, | Intel NUC11PAQi7 i7-1165G7, Iris Xe G7 96EUs, Samsung SSD 980 Pro 500GB MZ-V8P500BW, , x, | Beelink GK Mini Celeron J4125, UHD Graphics 600, Silicon Motion SM2258XT 256GB, , x, | |
|---|---|---|---|---|---|---|
| Power Consumption | -48% | 23% | -85% | 29% | 66% | |
| Idle Minimum * (Watt) | 6.2 | 15.2 -145% | 6.1 2% | 5.8 6% | 5.6 10% | 3.2 48% |
| Idle Average * (Watt) | 8.9 | 16 -80% | 6.8 24% | 5.9 34% | 5.6 37% | 3.3 63% |
| Idle Maximum * (Watt) | 9 | 16 -78% | 7.3 19% | 20.7 -130% | 6 33% | 3.7 59% |
| Load Average * (Watt) | 66.8 | 48.6 27% | 46.3 31% | 130.8 -96% | 31.4 53% | 13.6 80% |
| Witcher 3 ultra * (Watt) | 62.6 | 53.8 14% | 154.4 -147% | 39 38% | ||
| Load Maximum * (Watt) | 81.6 | 104.3 -28% | 50.7 38% | 225.2 -176% | 80.5 1% | 17.8 78% |
* ... kleiner is beter
Power Consumption Witcher 3 / Stresstest
Power Consumption external Monitor
Pro
Contra
Verdict - Alles over die processor
Elke PC met de Ryzen 9 5900HX zal waanzinnig snel zijn voor zijn prijs en de Beelink GTR5 is geen uitzondering. De AMD processor evenaart elke mobiele 11e generatie Intel oplossing in ruwe CPU prestaties, inclusief de duurdere Core i9-11900H. Als u de processorprestaties wilt maximaliseren en toch het systeem zo klein mogelijk wilt houden, dan is de GTR5 uw beste keuze
Voor maximale CPU prestaties tegen minimale kosten en afmetingen, kijk niet verder dan de Beelink GTR5.
Er zijn twee belangrijke nadelen om in het achterhoofd te houden. Ten eerste worden de graphics beperkt door de geïntegreerde Radeon Vega 8 GPU, terwijl de meeste laptops met dezelfde CPU doorgaans snellere discrete graphics hebben. Gebruikers zullen vrijwel zeker GPU-gebonden zijn bij het uitvoeren van intensievere toepassingen zoals grafische bewerking of gaming. Het is jammer dat Thunderbolt niet wordt ondersteund, wat deze beperking via eGPU's zou hebben ondervangen. Ten tweede is het ventilatorgeluid luider dan bij de meeste andere mini-PC's, wat een direct gevolg is van het stoppen van zo'n snelle processor in zo'n klein chassisformaat. Daarom is de GTR5 wellicht niet de beste keuze voor HTPC of vergaderzaal setups waar omgevingsgeluid tot een minimum beperkt moet worden. Misschien dat een overstap naar dampkamerkoeling in de toekomst het totale ventilatorgeluid kan verminderen. CPU prestatiejagers met een kleiner budget zullen niettemin onder de indruk zijn van wat de GTR5 te bieden heeft.
Prijs en beschikbaarheid
De Beelink GTR5 is nog niet overal verkrijgbaar. De Indiegogo pagina kan hier gevonden worden.
Price comparison

