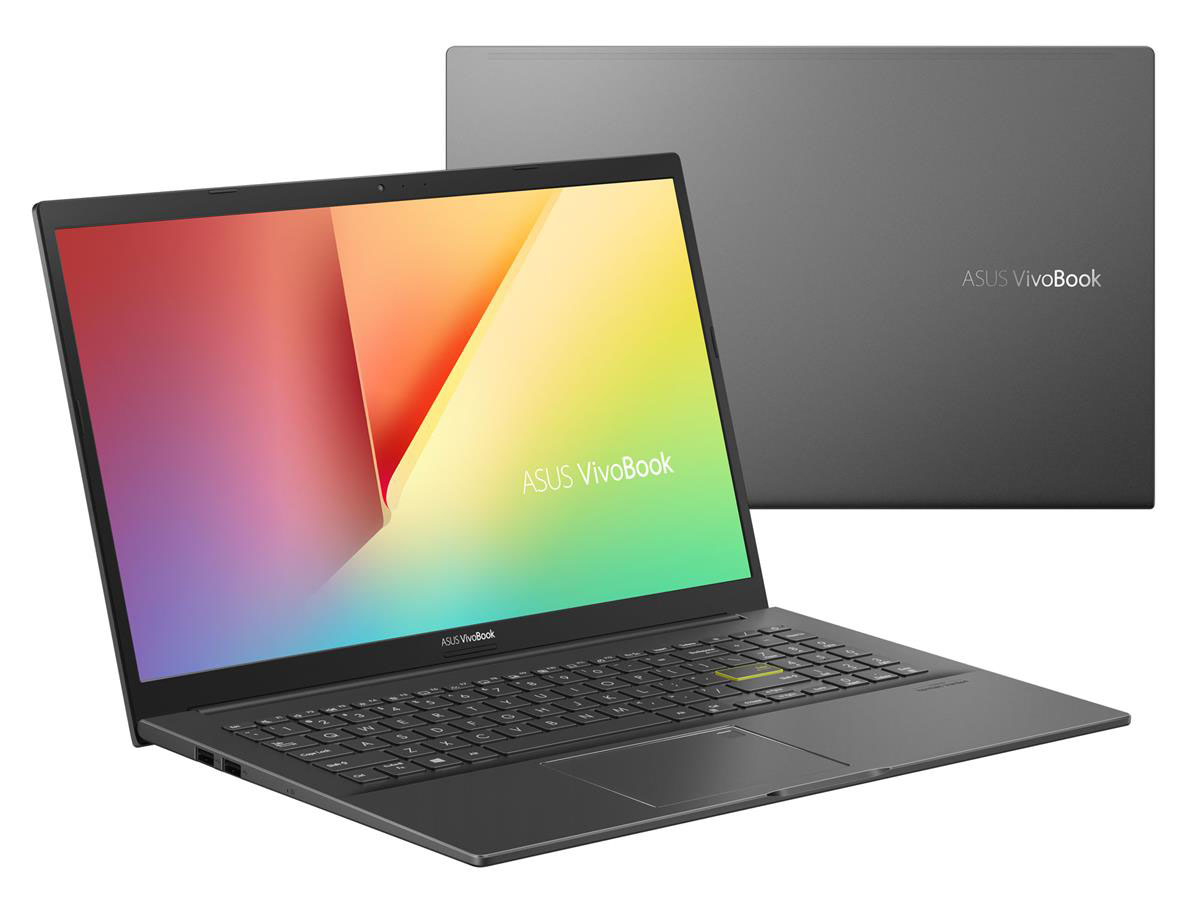
Asus Vivobook 15 K513EQ OLED laptop review: Het Lenovo IdeaPad-alternatief
Neem een stap lager dan de high-end Asus ZenBook serie en je staat tot aan je knieën in de budget-georiënteerde Asus VivoBook serie. De familie is snel uitgegroeid tot een verwarrend grote line-up van modellen bestaande uit zowel Intel als AMD CPU's met geïntegreerde of discrete graphics en zelfs OLED opties. Het is zeker moeilijk geweest om bij te blijven en de nieuwste VivoBook 15 K513 maakt het er niet bepaald makkelijker op.
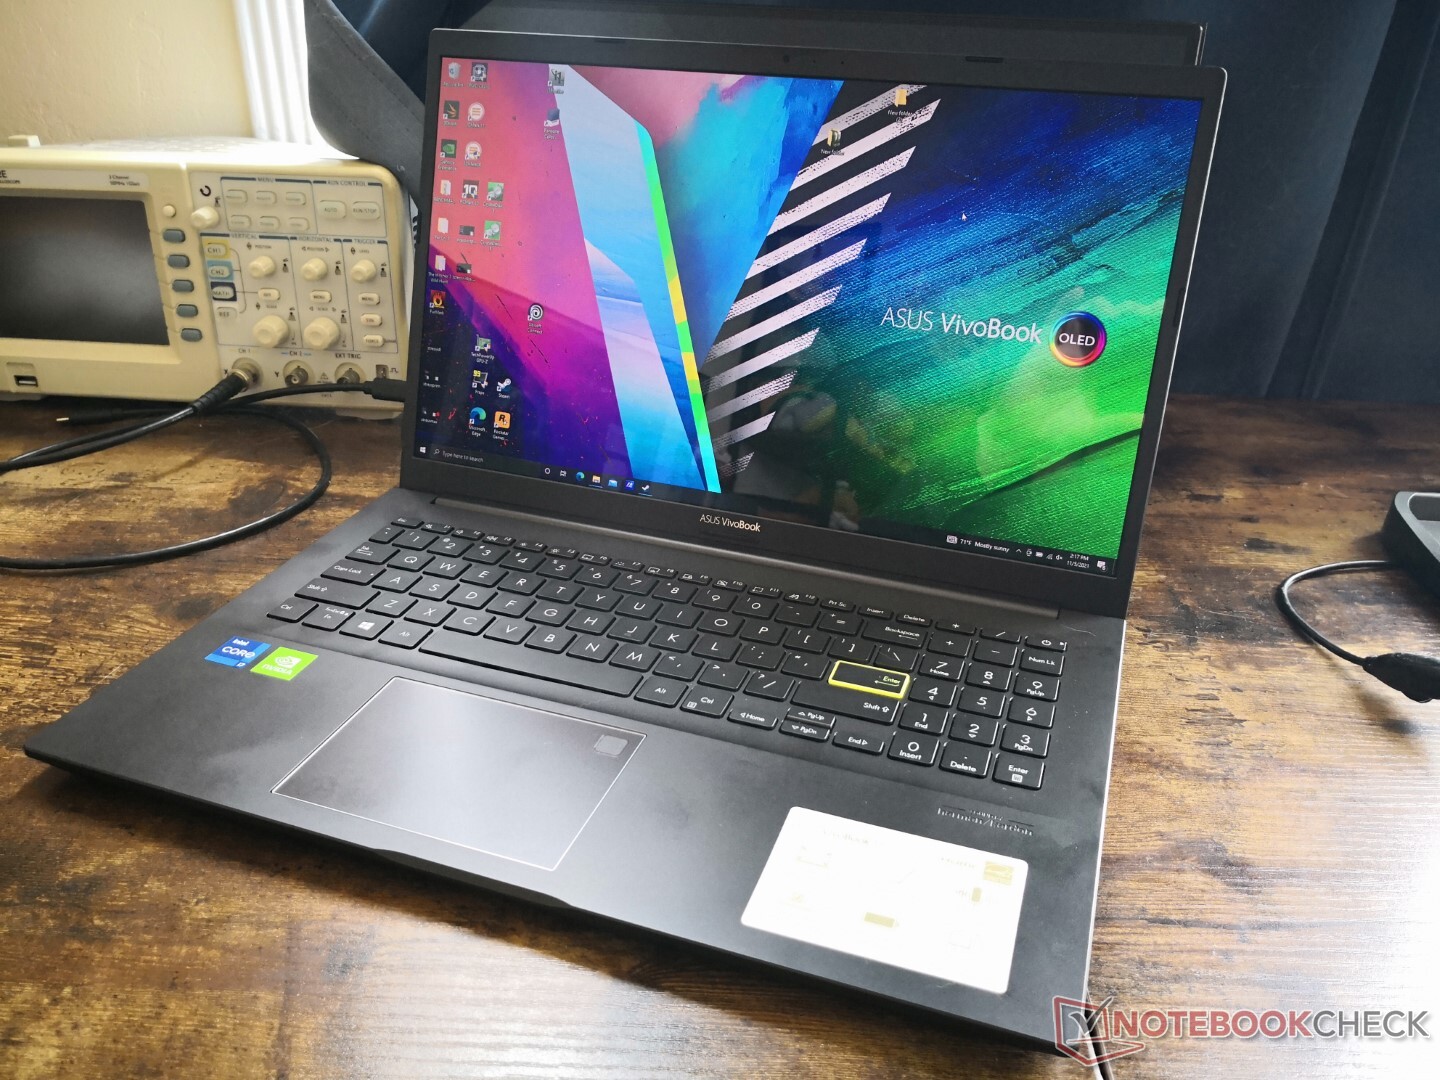
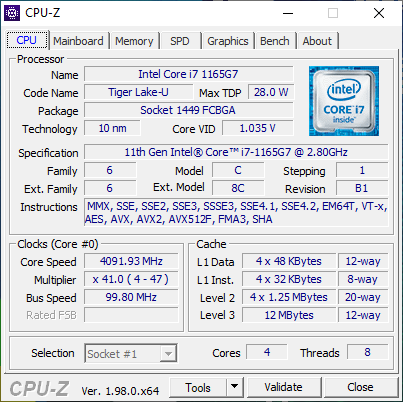
Afgezien van de naamgeving is onze VivoBook 15 K513 testunit zeker anders dan de meeste andere budget of mid-range multimedia laptops die er zijn, met zijn ongewone Intel 11e gen Core i7-1165G7 en GeForce MX350 koppeling. Bovendien is het een van de eerste 15,6-inch laptops met een non-touch 1080p OLED-scherm in vergelijking met alle 4K OLED-panelen die er zijn. We nemen de prestaties, het beeldscherm en de fysieke kenmerken van de VivoBook 15 K513 onder de loep om erachter te komen wat hem nu precies zo anders maakt dan alle andere VivoBook 15 modellen op de markt
Concurrenten op dit gebied zijn onder andere mid-range multimedia laptops zoals de Lenovo IdeaPad 5 15, Dell Inspiron 15, HP Pavilion 15, of de MSI top B15/E15serie. Onze specifieke testeenheid kan online worden gevonden voor ongeveer $900 tot $1000 USD.
Meer Asus VivoBook reviews:
Potential Competitors in Comparison
Evaluatie | Datum | Model | Gewicht | Hoogte | Formaat | Resolutie | Beste prijs |
|---|---|---|---|---|---|---|---|
| 80.6 % v7 (old) | 11-2021 | Asus Vivobook 15 K513EQ i7-1165G7, GeForce MX350 | 1.6 kg | 17.9 mm | 15.60" | 1920x1080 | |
| 85.9 % v7 (old) | 11-2021 | Asus VivoBook 15 Pro M3500QC-L1062 R5 5600H, GeForce RTX 3050 4GB Laptop GPU | 1.7 kg | 19.9 mm | 15.60" | 1920x1080 | |
| 83.4 % v7 (old) | 12-2020 | Asus VivoBook S15 S533EQ-BQ002T i7-1165G7, GeForce MX350 | 1.8 kg | 16.1 mm | 15.60" | 1920x1080 | |
| 83.5 % v7 (old) | 08-2021 | Lenovo IdeaPad 5 15ALC05 R5 5500U, Vega 7 | 1.7 kg | 19.1 mm | 15.60" | 1920x1080 | |
| 80.5 % v7 (old) | 10-2021 | Dell Inspiron 15 3501 i7-1165G7, Iris Xe G7 96EUs | 2 kg | 19.9 mm | 15.60" | 1920x1080 | |
| 81.2 % v7 (old) | 06-2021 | HP Pavilion 15-eg i7-1165G7, GeForce MX450 | 1.7 kg | 17.9 mm | 15.60" | 1920x1080 |
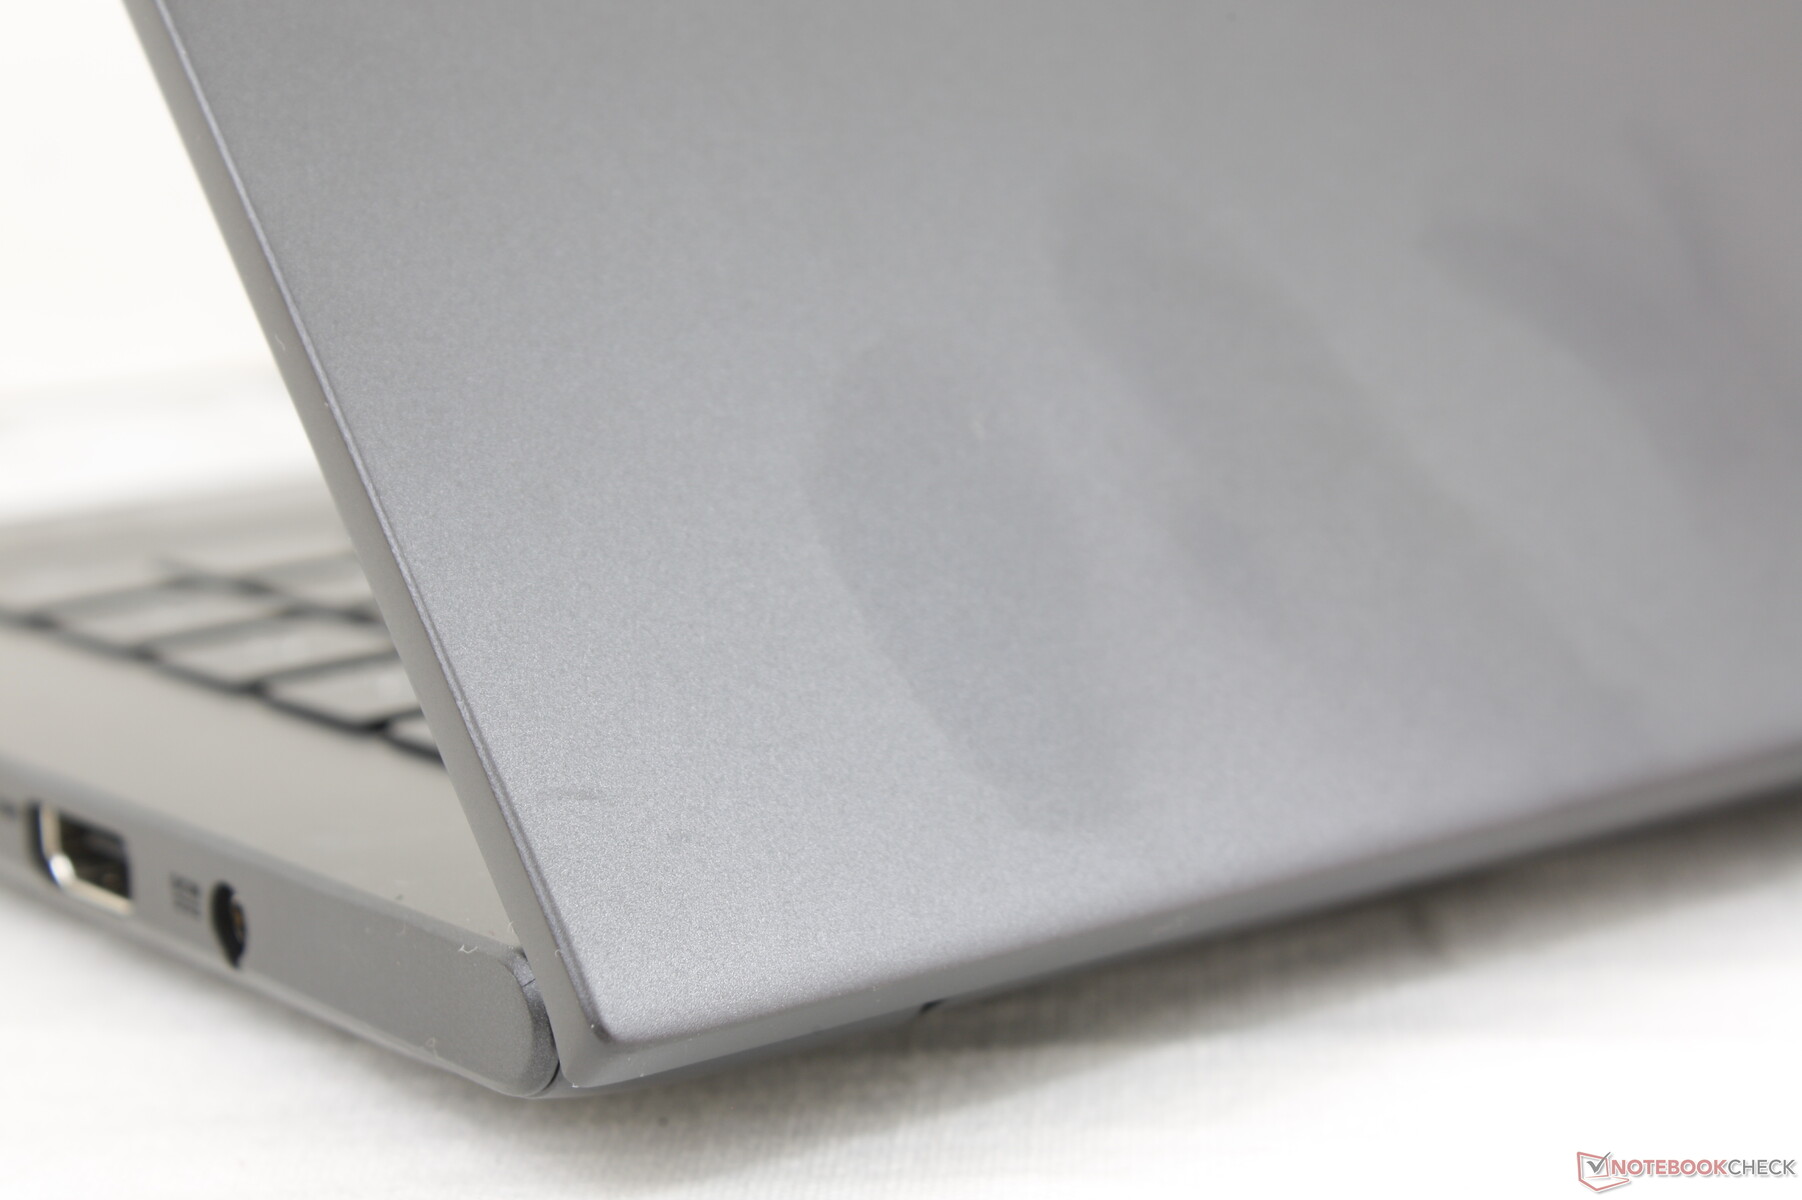
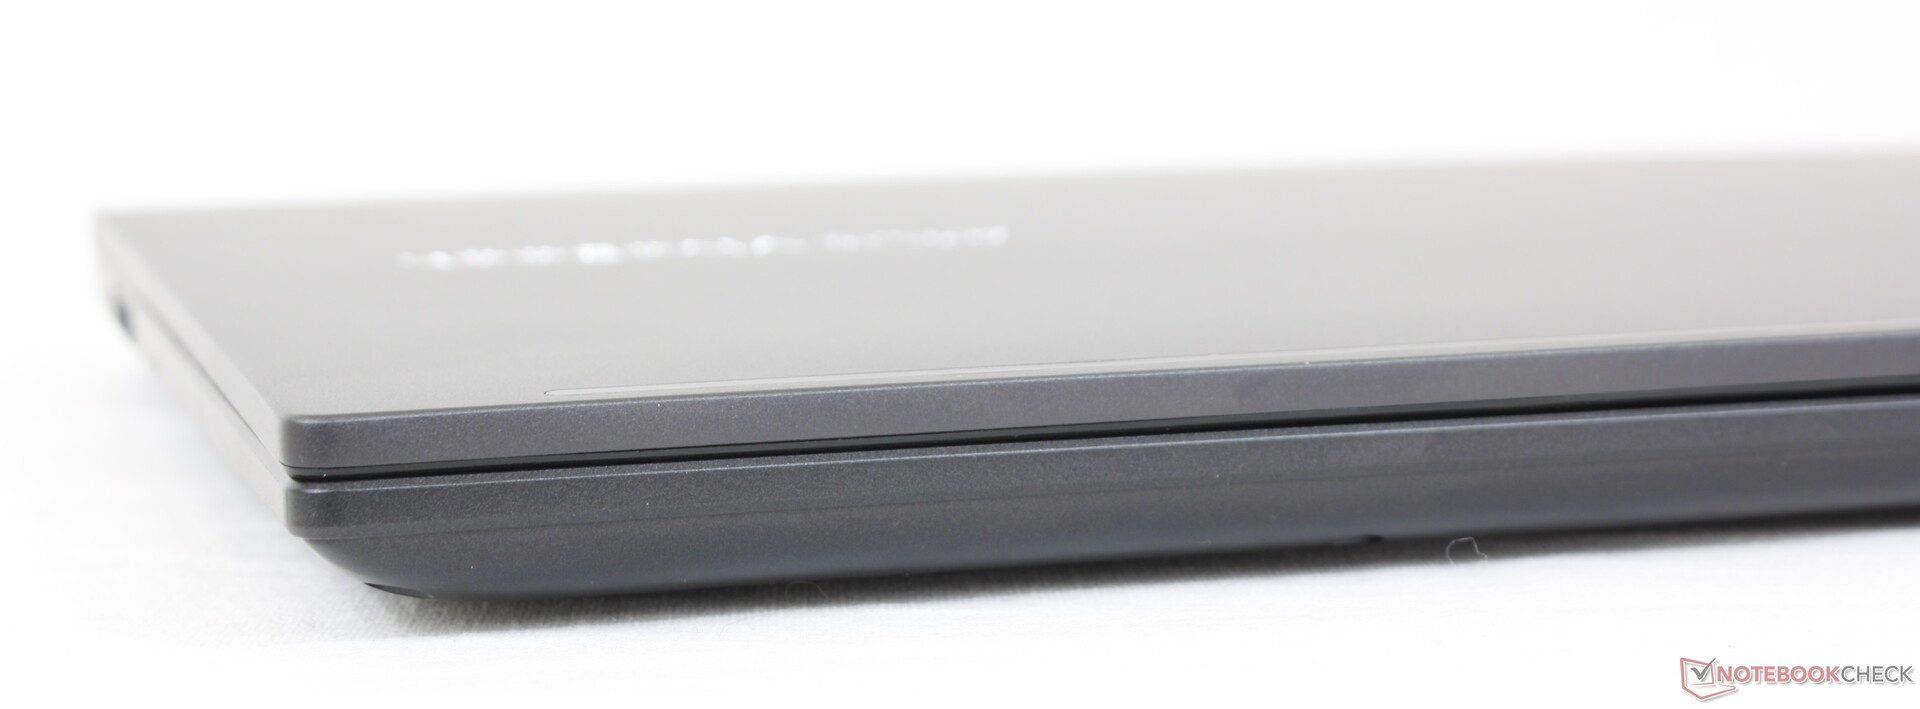
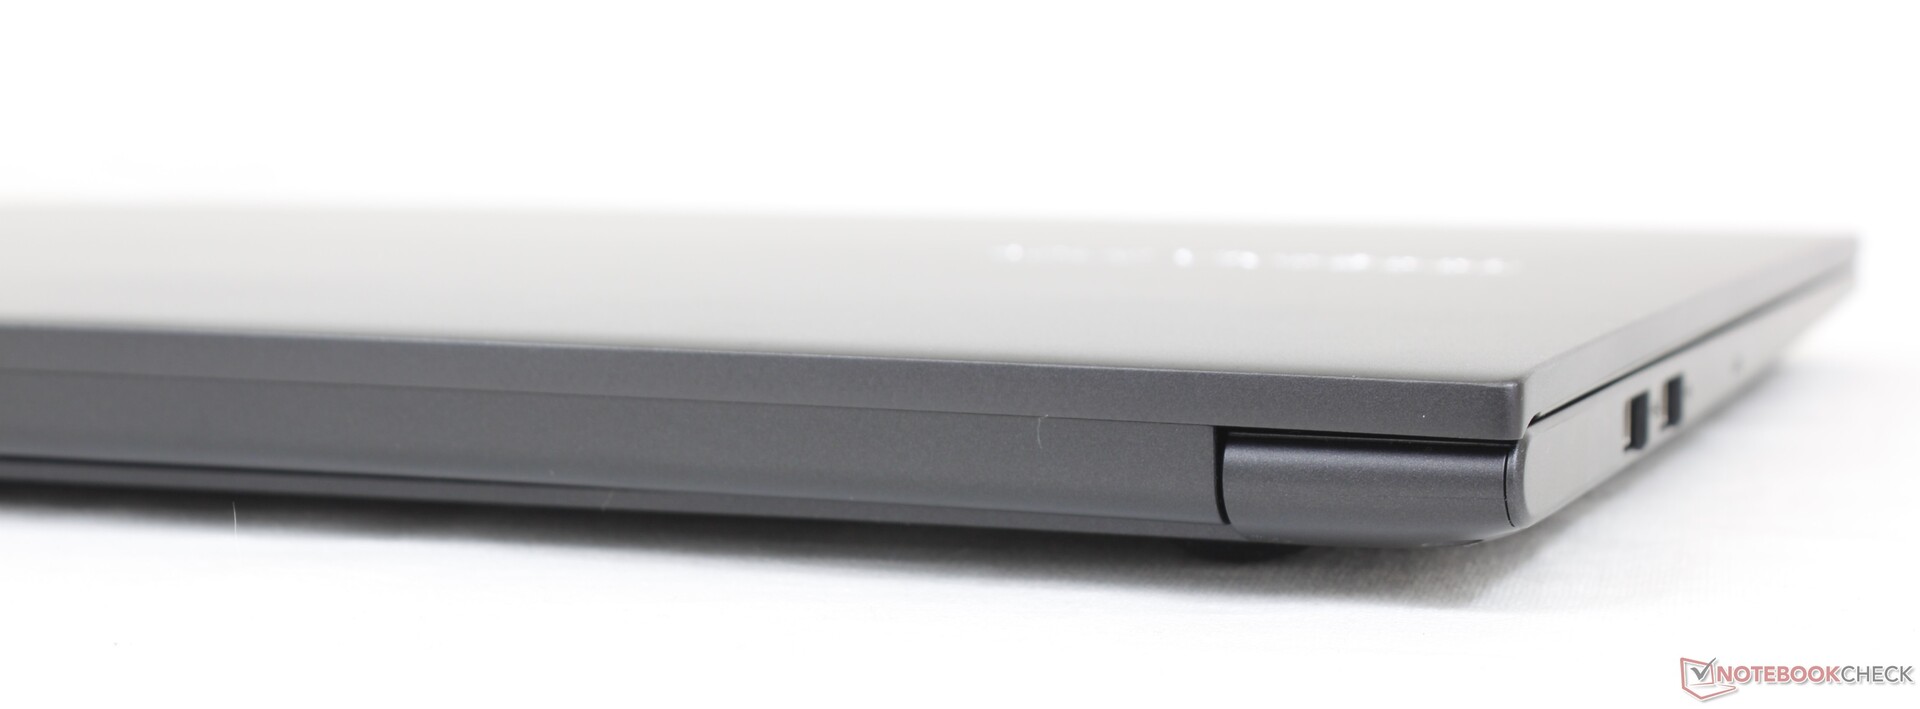
Case - Hope You Like Plastic
Er zijn gematigde verschillen, zowel van binnen als van buiten, tussen alle verschillende 15.6-inch VivoBook 15 modellen. In ons geval lijkt de VivoBook 15 K513 het meest op de VivoBook 15 F512 wat betreft de plaatsing van de poorten en de indeling van het moederbord. Vooral de plastic basis is lang niet zo stevig of luxueus als een typische ZenBook 15, HP Spectre, of Dell XPS 15 wat te verwachten is. De stijfheid van het chassis is in plaats daarvan meer in lijn met de Lenovo IdeaPad 5 15 of Dell Inspiron 3501, terwijl het een beetje zwakker is dan de nieuwste HP Pavilion 15. Het midden van het toetsenbord, bijvoorbeeld, buigt gemakkelijker dan we zouden willen.
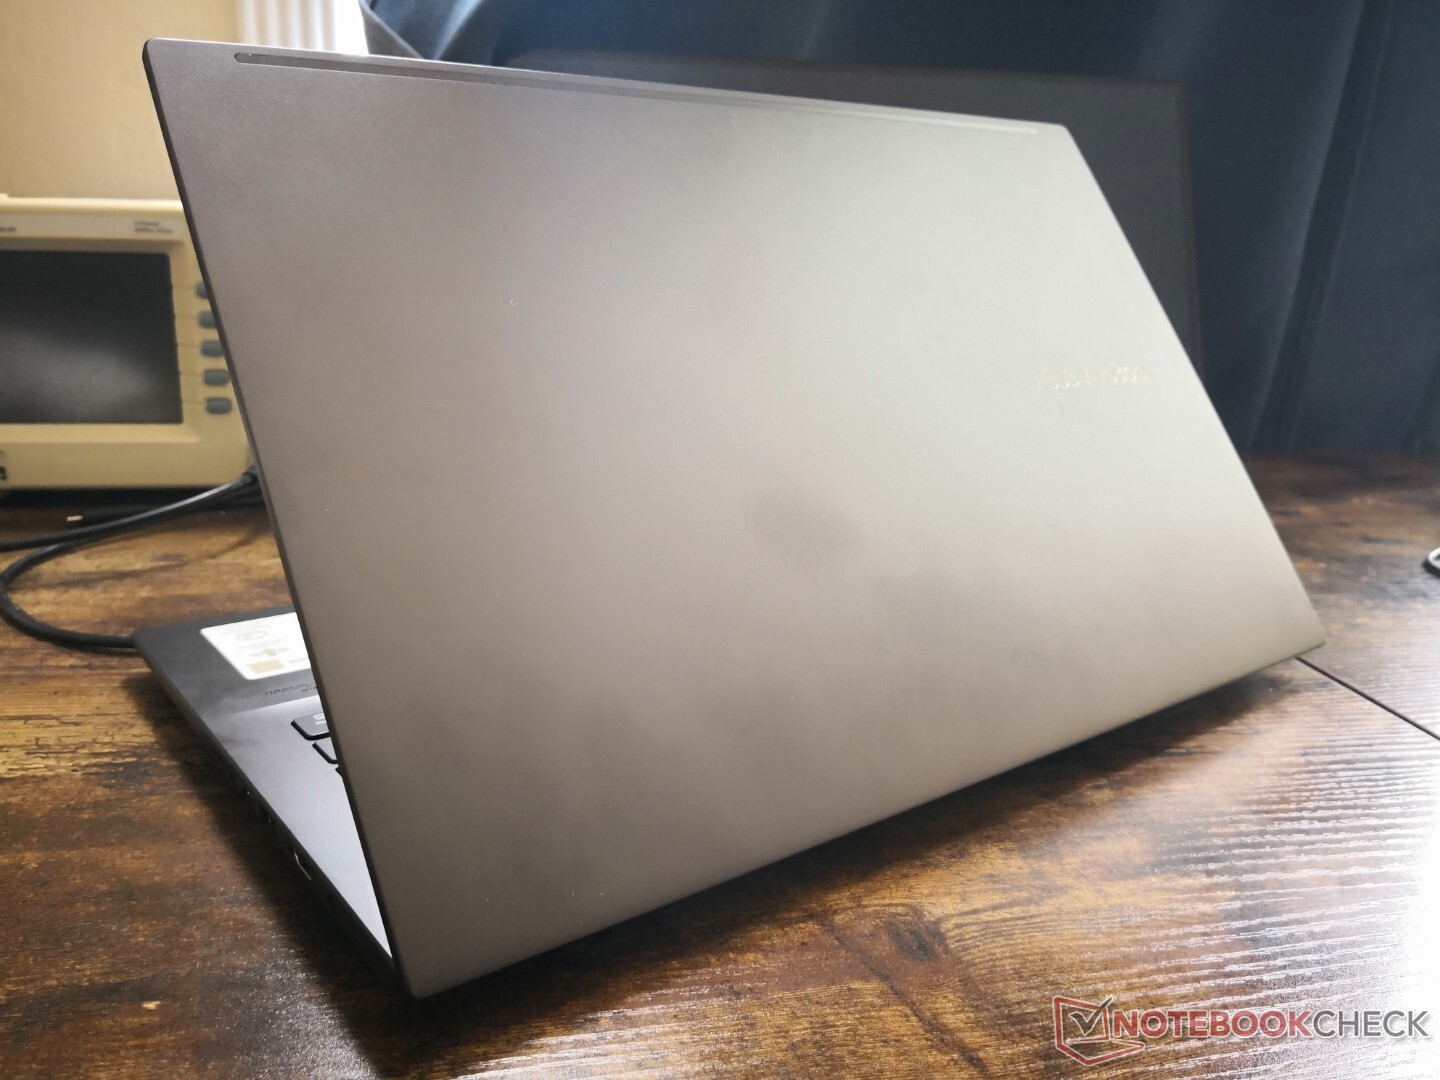
Het systeem is lichter dan veel van zijn concurrenten met ongeveer 100 g tot 200 g, ondanks de discrete GPU en het OLED paneel. De totale afmetingen lijken het meest op die van de nieuwste HP Pavilion 15, terwijl hij dunner en dikker is dan respectievelijk de VivoBook 15 Pro en VivoBook S15.
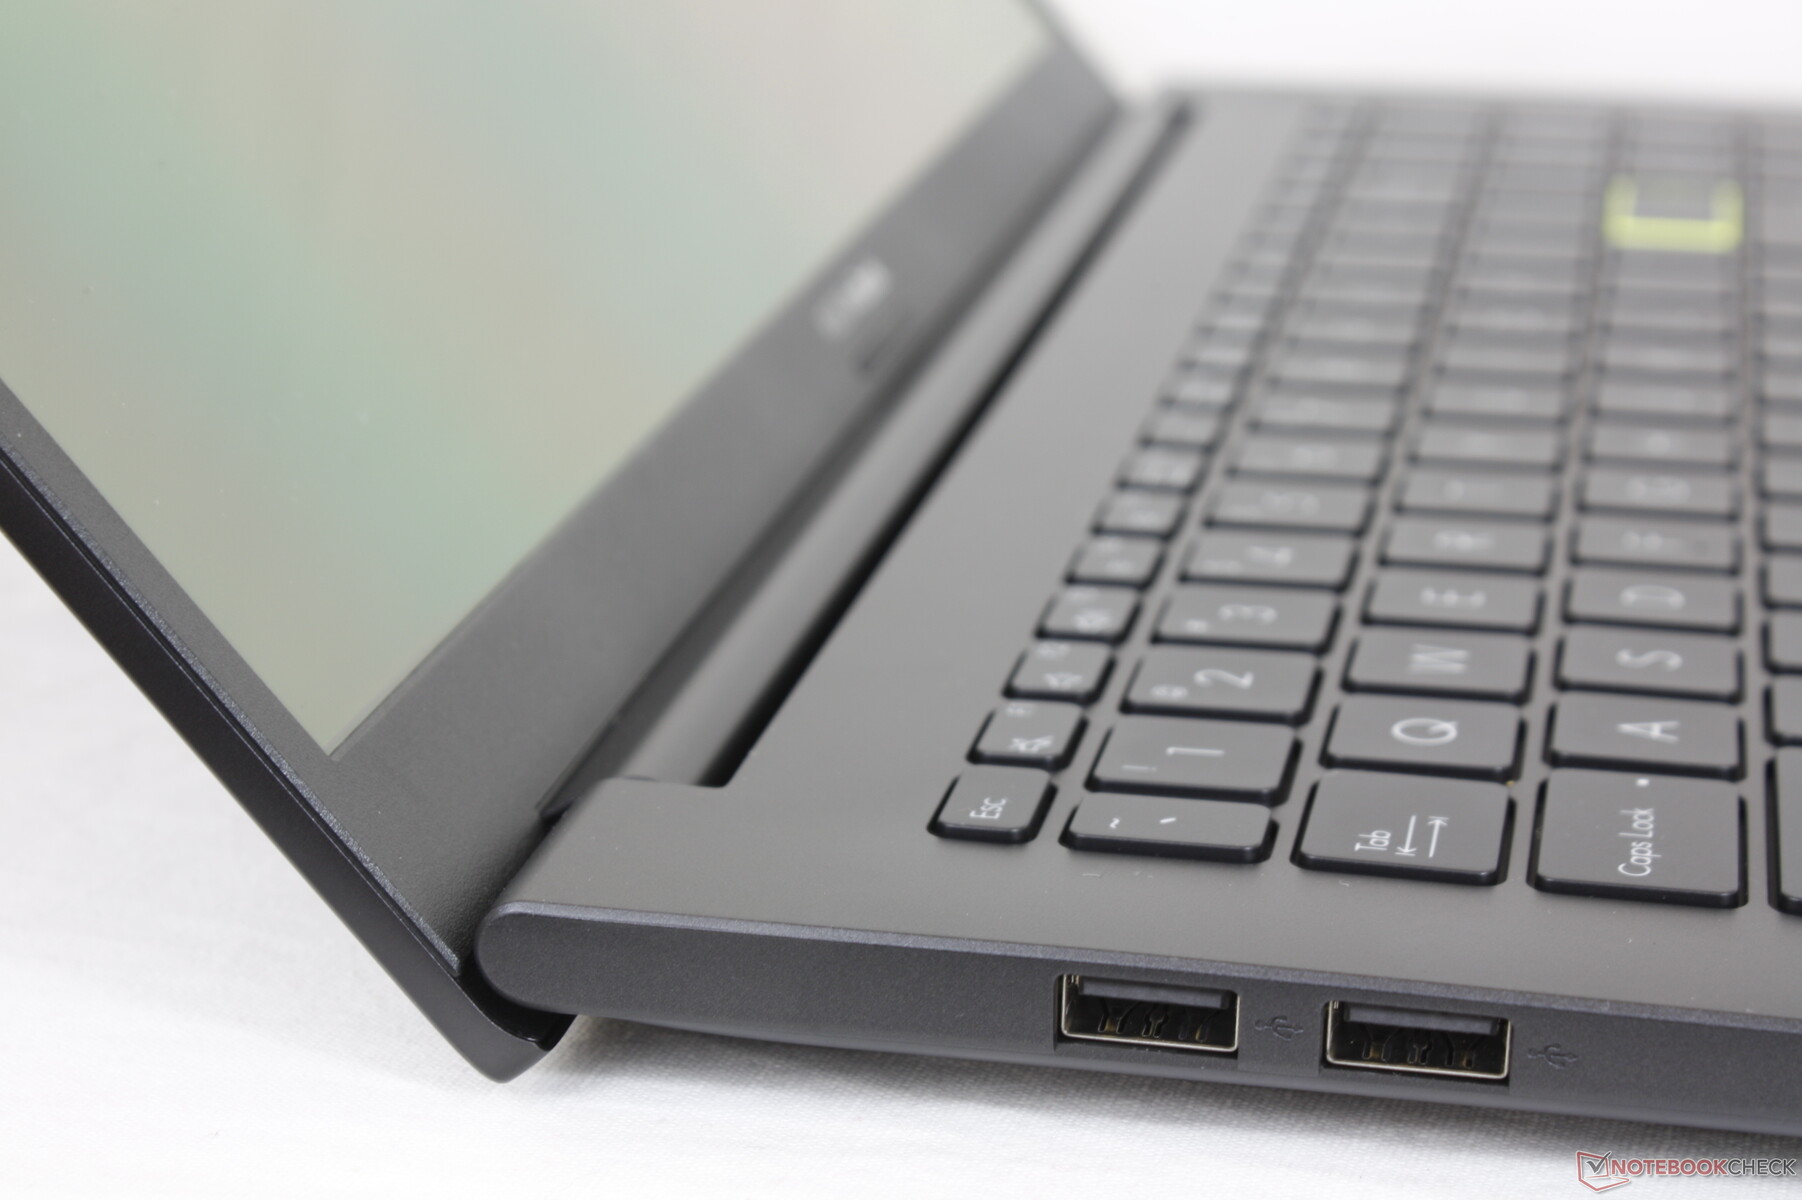
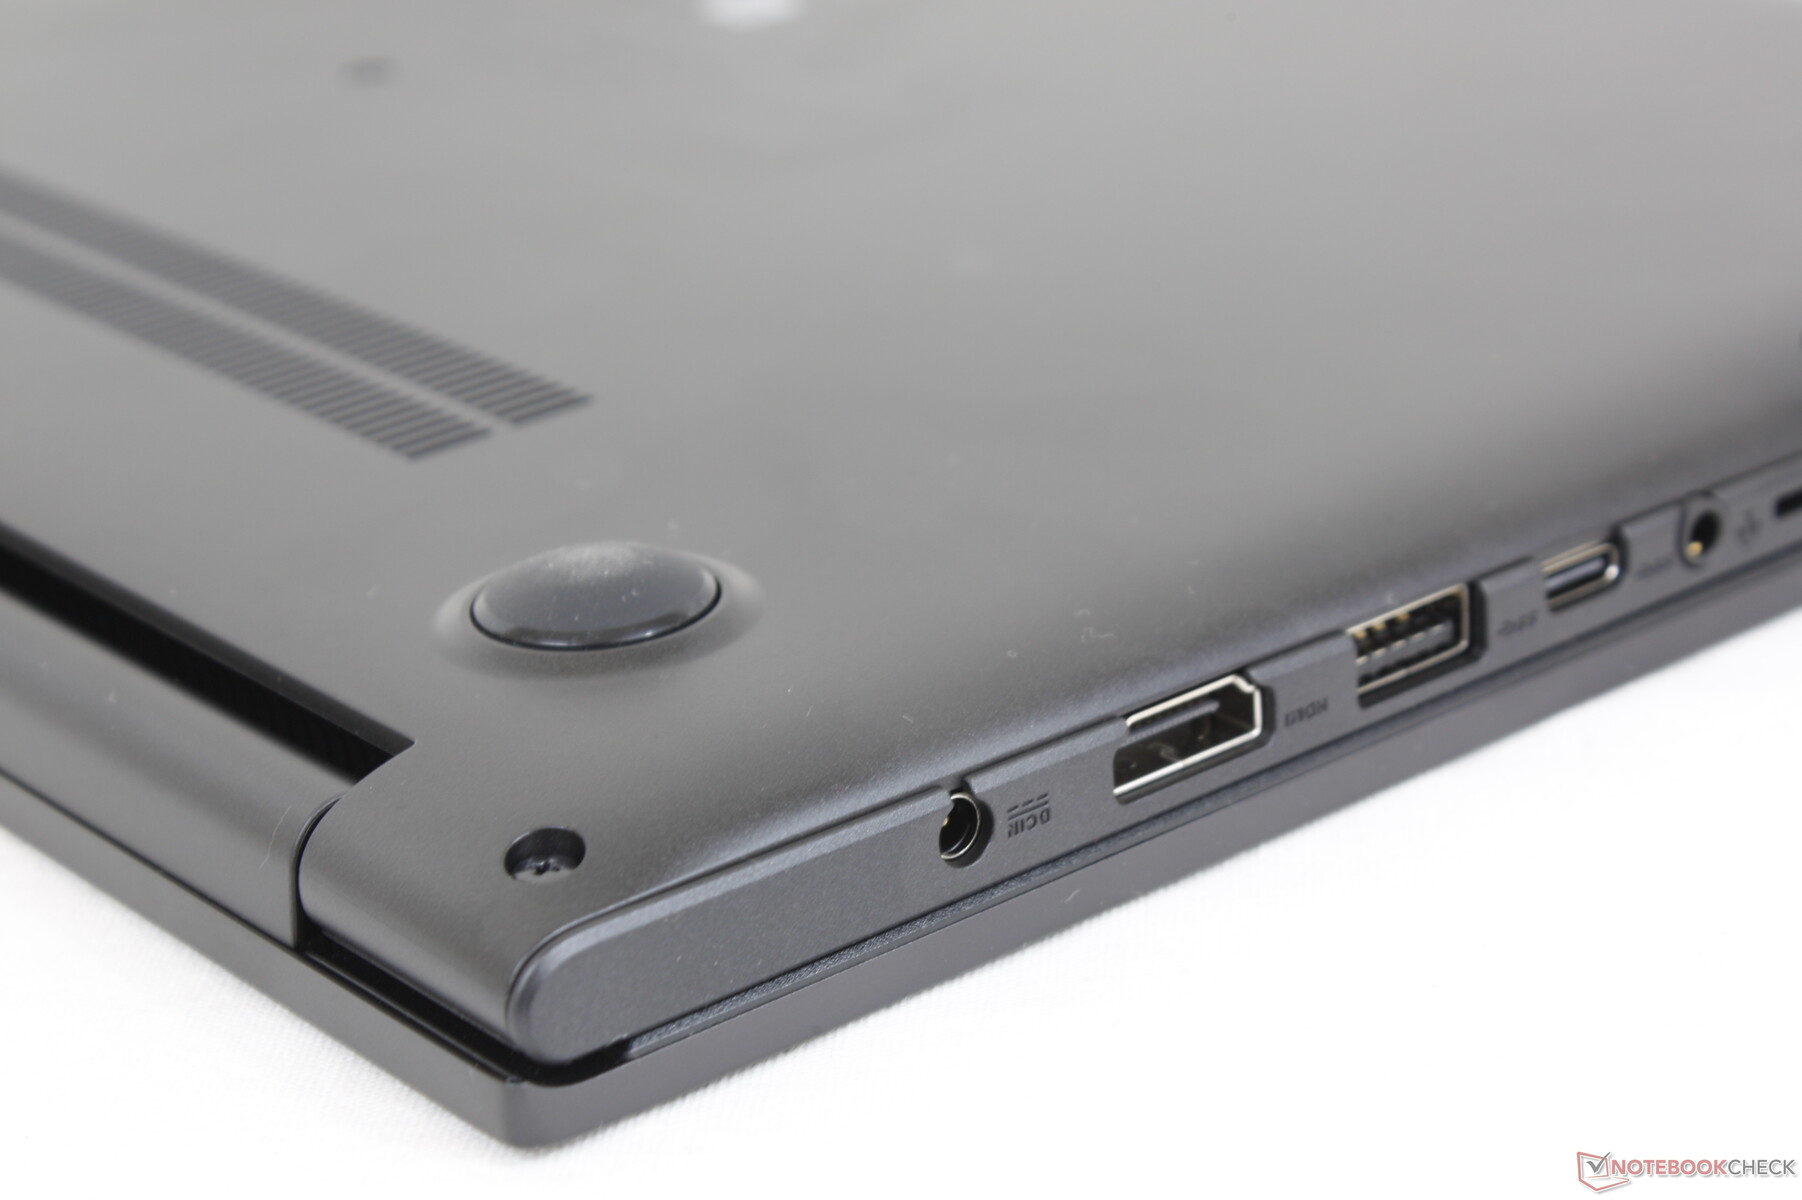
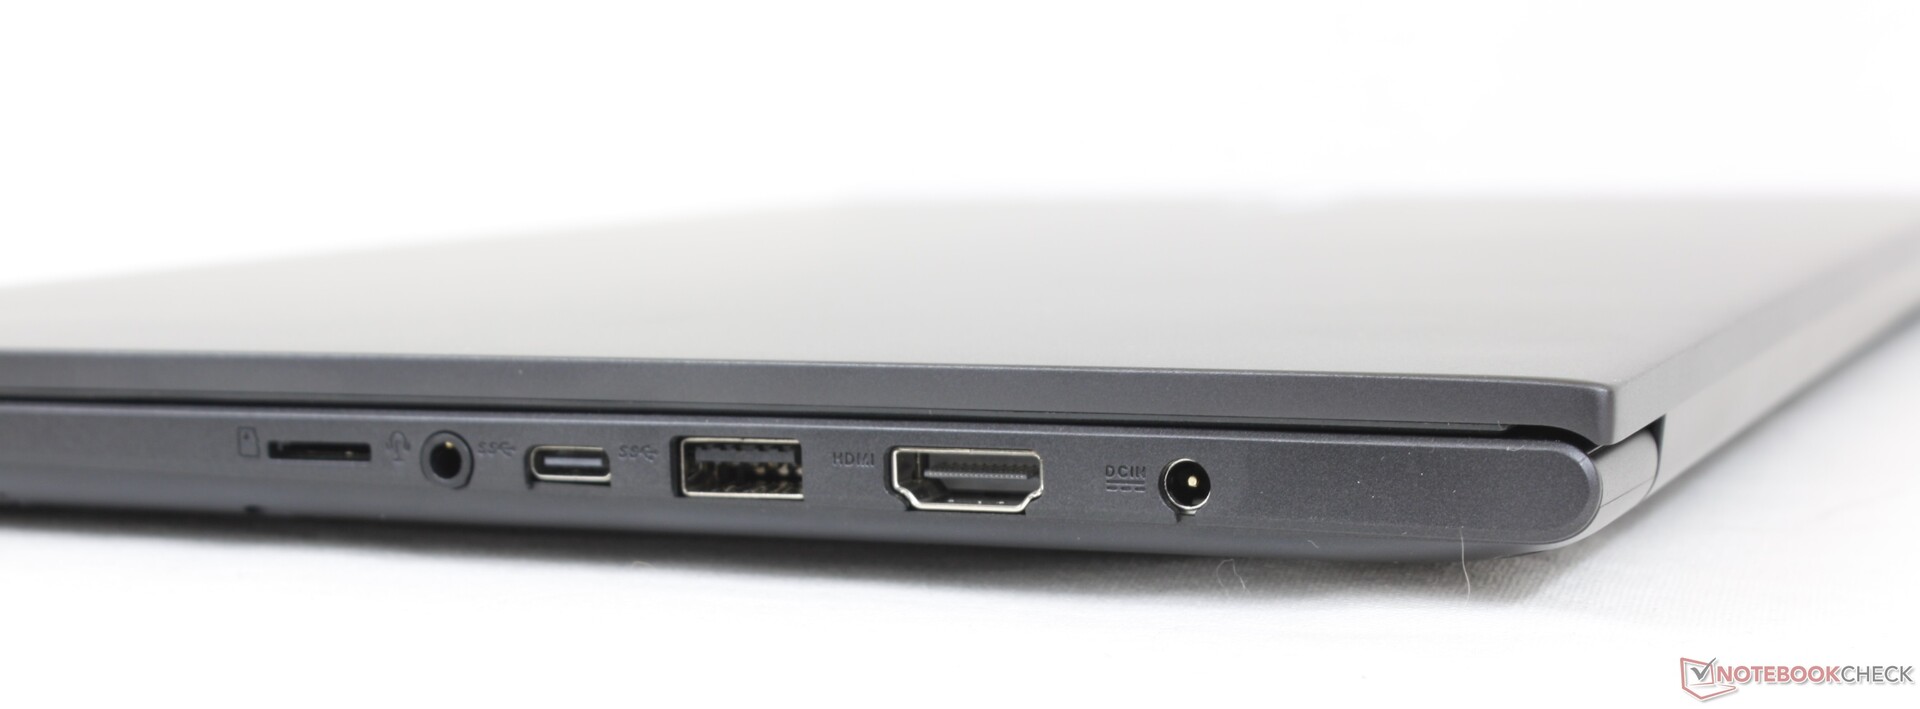
Connectiviteit - geen Thunderbolt of USB-C opladen
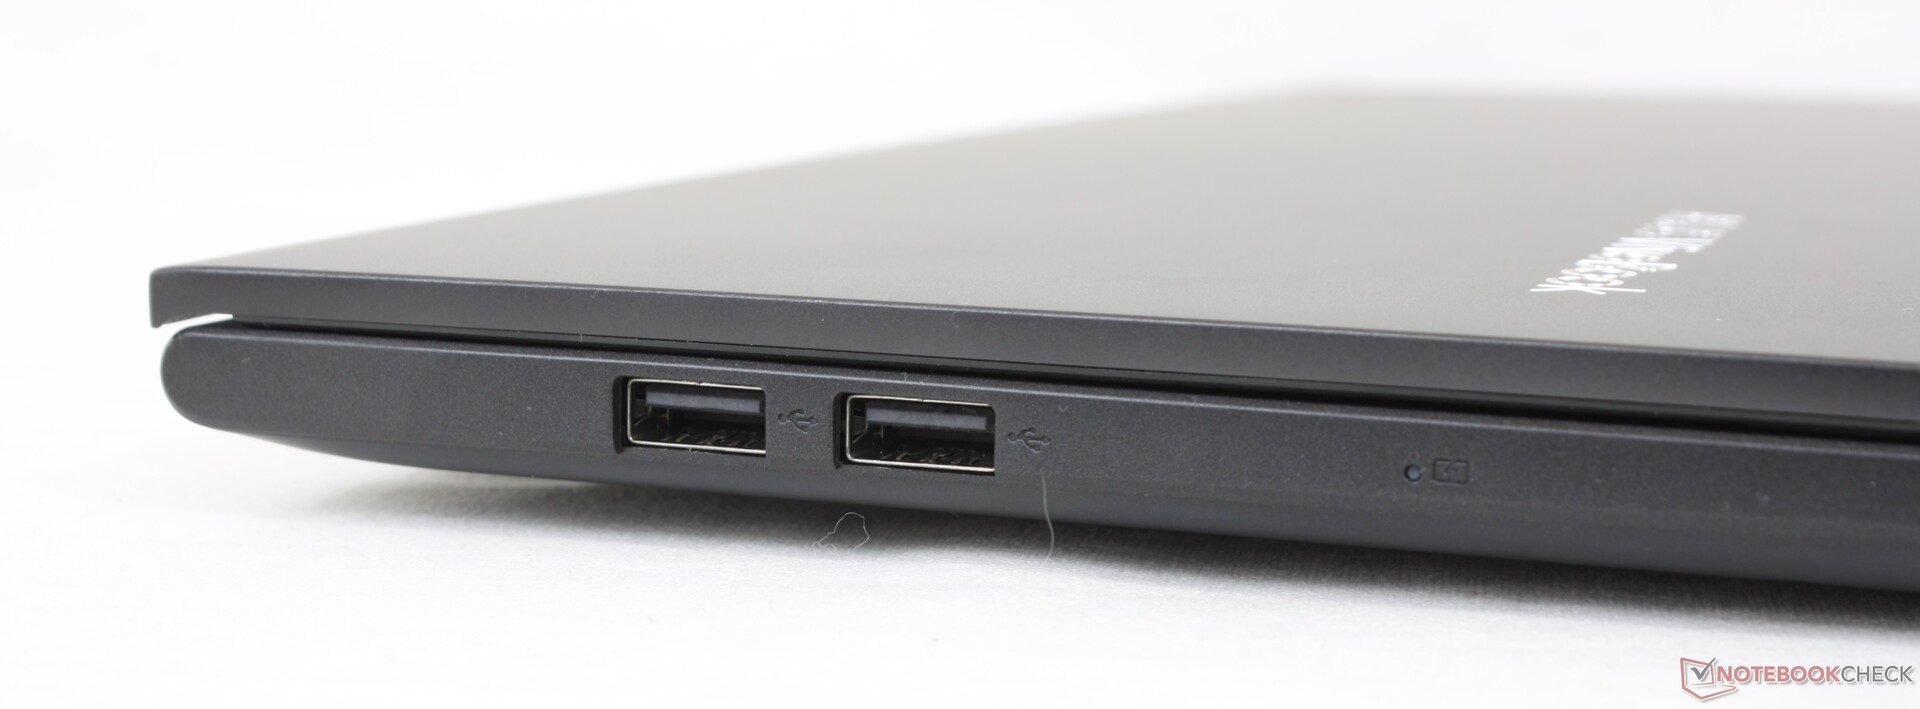
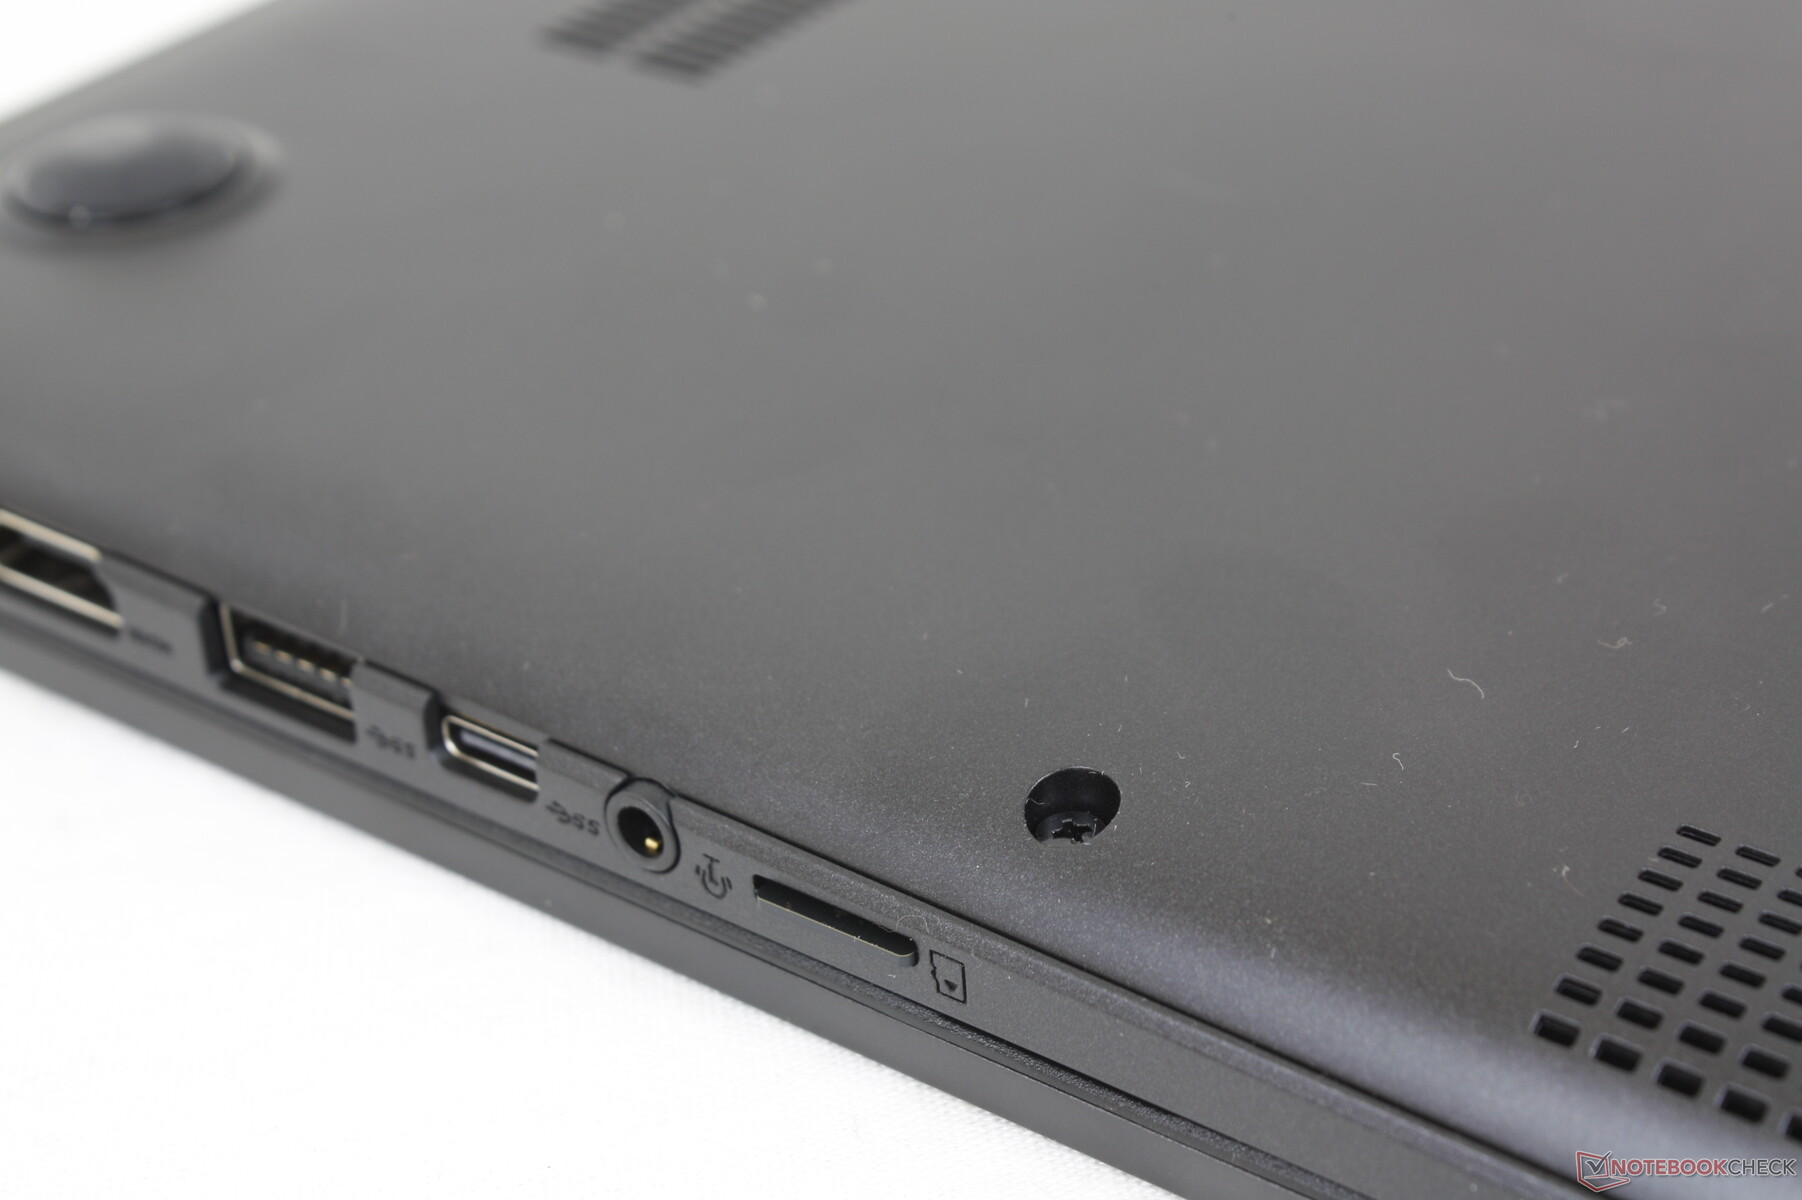
De poortopties zijn behoorlijk, maar met teleurstellende kanttekeningen. Ten eerste biedt de USB-C-poort geen ondersteuning voor DisplayPort of Power Delivery, wat betekent dat je geen externe monitoren kunt aansluiten of het systeem kunt opladen via deze poort, in tegenstelling tot de meeste andere laptops. Ten tweede is de HDMI-poort slechts versie 1.4, wat betekent dat er geen ondersteuning is voor 4K externe monitoren bij 60 FPS. Het model maakt zelfs gebruik van langzamere USB-A 2.0 poorten dan USB-A 3.0.
SD-kaartlezer
De veerbelaste MicroSD kaartlezer blijft traag, wat past bij de budget Vivobook serie. Het verplaatsen van 1 GB aan foto's van onze UHS-II testkaart naar de desktop duurt ongeveer 30 seconden, vergeleken met slechts 14 seconden op de ZenBook 15.
| SD Card Reader | |
| average JPG Copy Test (av. of 3 runs) | |
| HP Pavilion 15-eg (AV PRO microSD 128 GB V60) | |
| Asus VivoBook 15 Pro M3500QC-L1062 (AV Pro V60) | |
| Asus Vivobook 15 K513EQ (AV Pro V60) | |
| Lenovo IdeaPad 5 15ALC05 (Toshiba Exceria Pro SDXC 64 GB UHS-II) | |
| Asus VivoBook S15 S533EQ-BQ002T (Toshiba Exceria Pro M501 microSDXC 64GB) | |
| Dell Inspiron 15 3501 (AV Pro SD 128 GB V60) | |
| maximum AS SSD Seq Read Test (1GB) | |
| HP Pavilion 15-eg (AV PRO microSD 128 GB V60) | |
| Asus VivoBook 15 Pro M3500QC-L1062 (AV Pro V60) | |
| Asus Vivobook 15 K513EQ (AV Pro V60) | |
| Lenovo IdeaPad 5 15ALC05 (Toshiba Exceria Pro SDXC 64 GB UHS-II) | |
| Dell Inspiron 15 3501 (AV Pro SD microSD 128 GB V60) | |
| Asus VivoBook S15 S533EQ-BQ002T (Toshiba Exceria Pro M501 microSDXC 64GB) | |
Communicatie
Ons testexemplaar wordt geleverd met Wi-Fi 6, terwijl mindere SKU's worden geleverd met Wi-Fi 5. We zijn in staat om uitstekende real-world gemiddelde ontvangstsnelheden van meer dan 1,2 Gbps te bereiken op onze Netgear RAX200 testrouter, terwijl de overdrachtssnelheden teleurstellender zijn met slechts ~600 Mbps.
Webcam
De camerakwaliteit blijft slecht en is al jaren grotendeels ongewijzigd. Windows Hello wordt evenmin ondersteund aangezien er geen geïntegreerde IR-sensor of zelfs maar een fysieke privacy sluiter is.


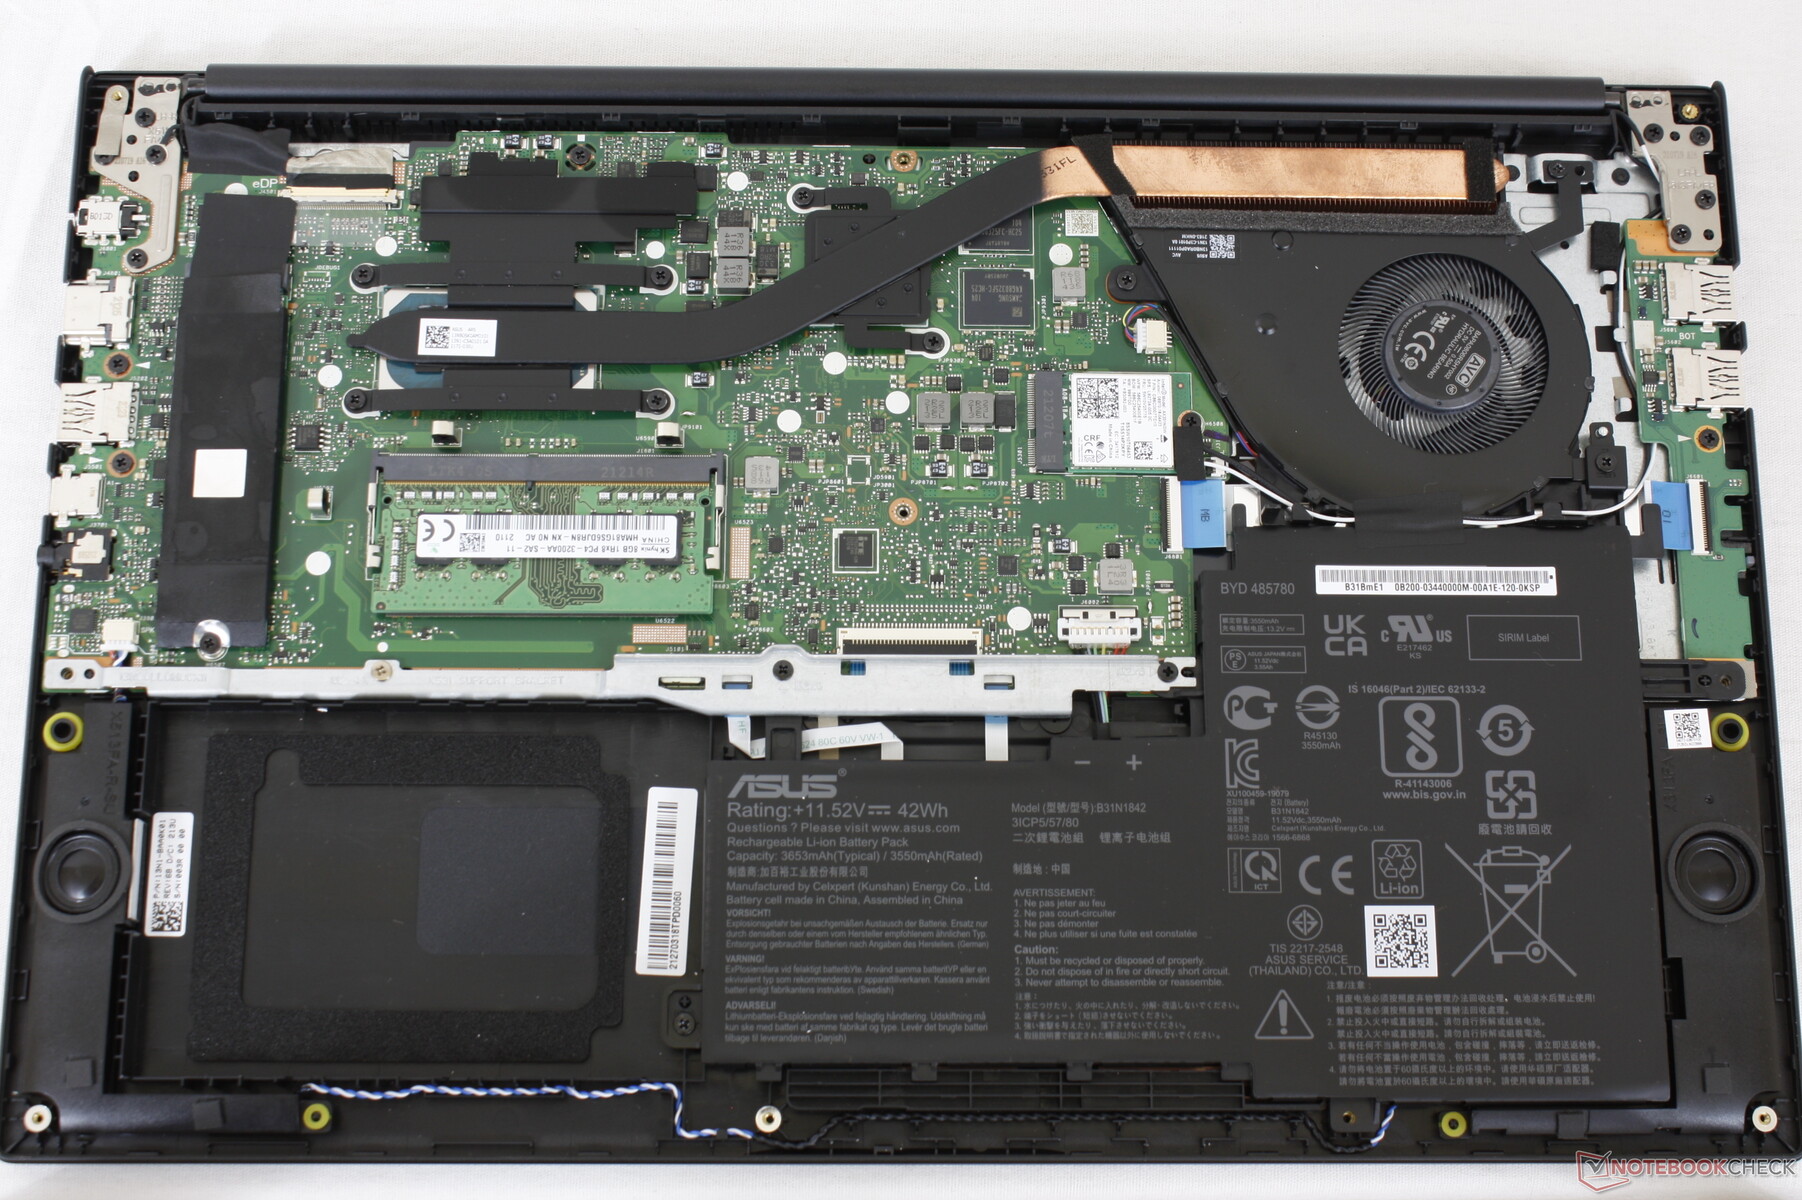
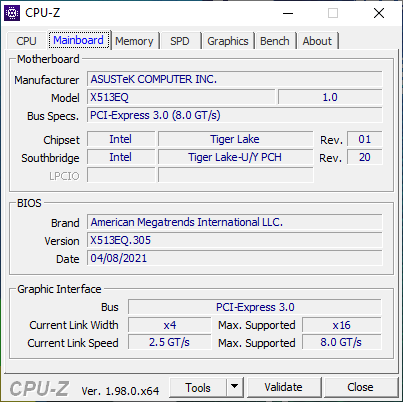
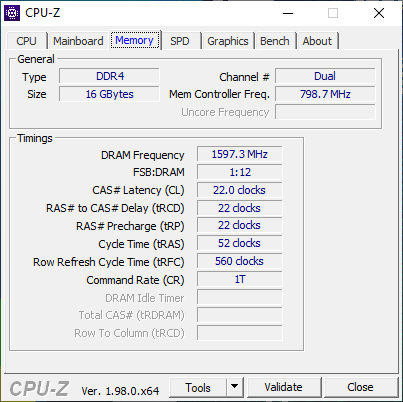
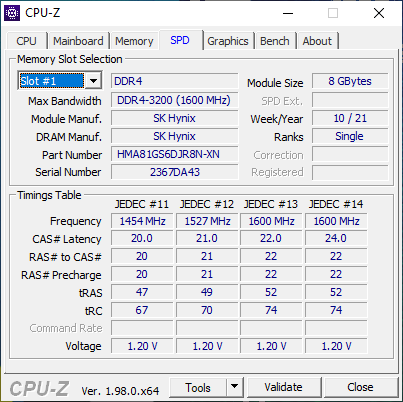
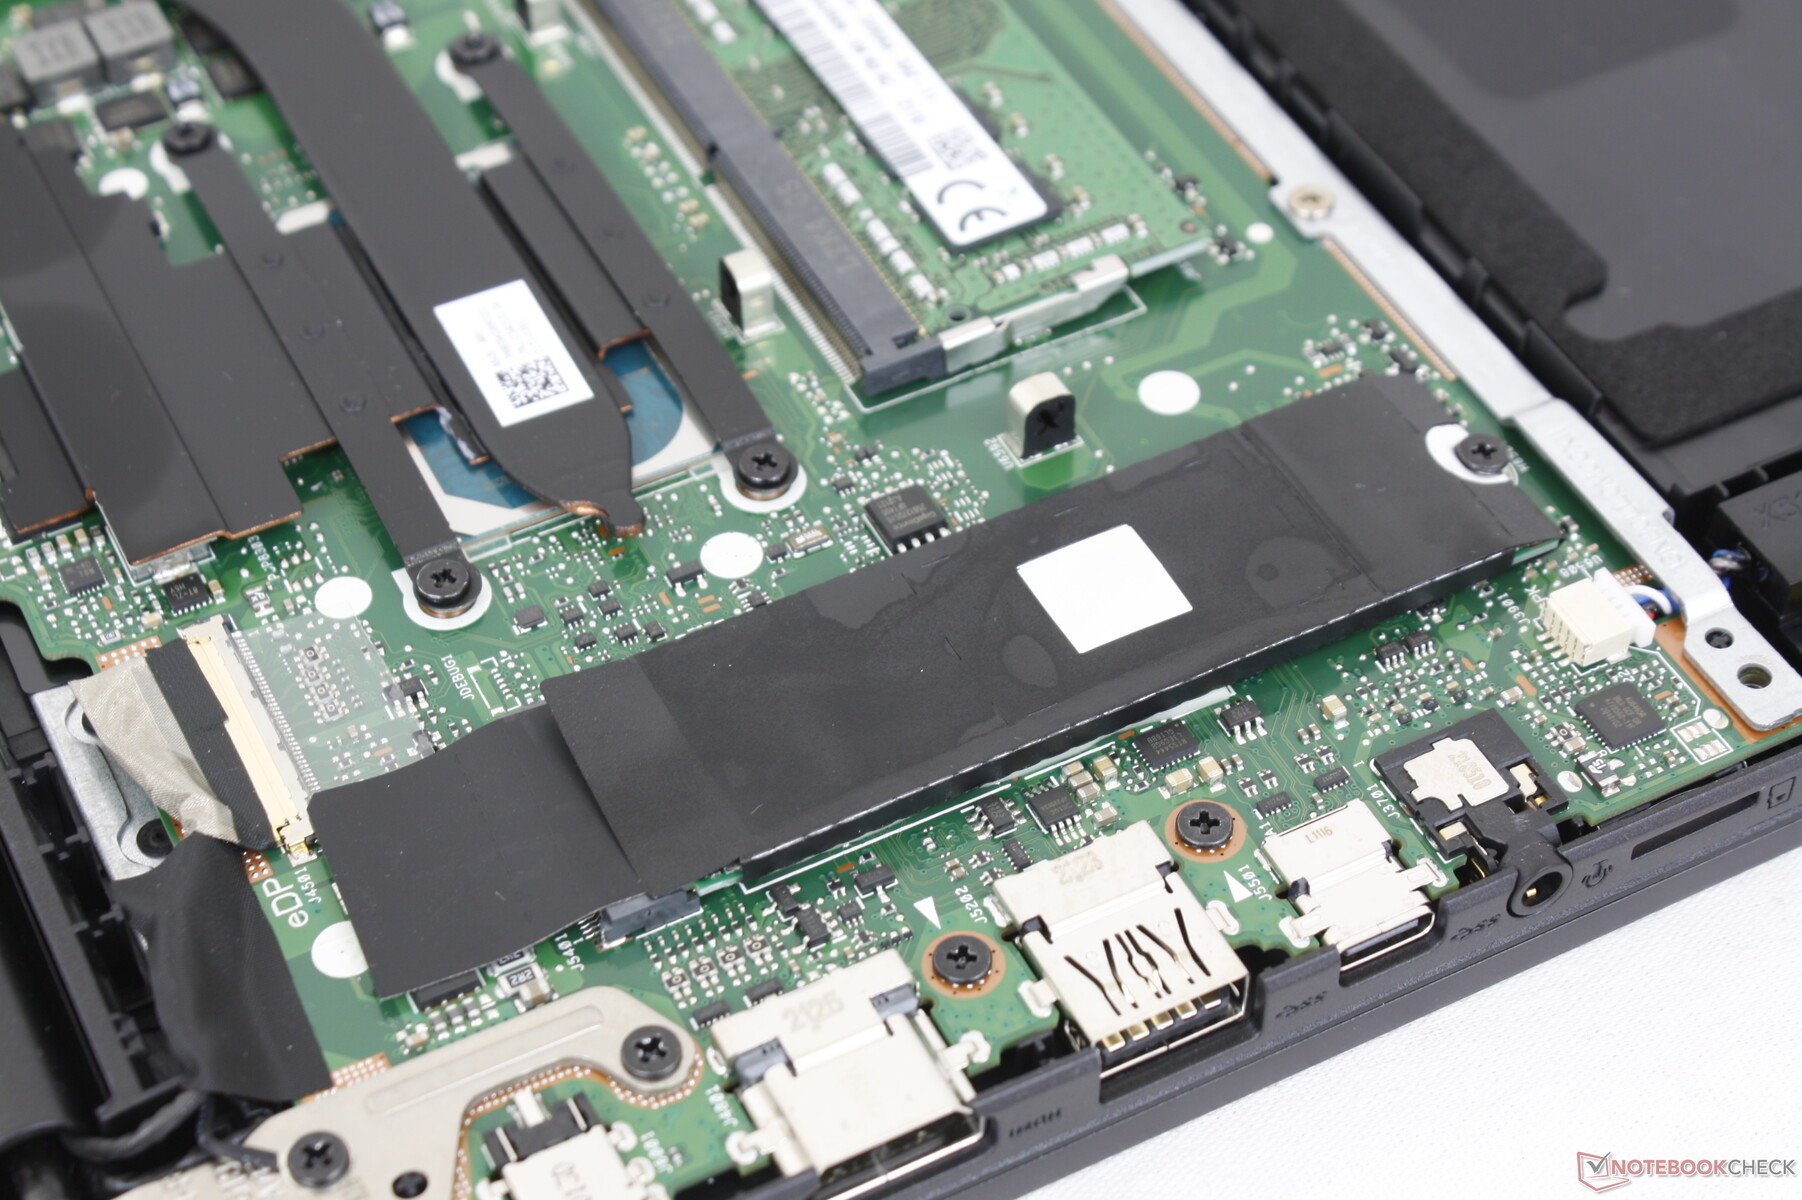
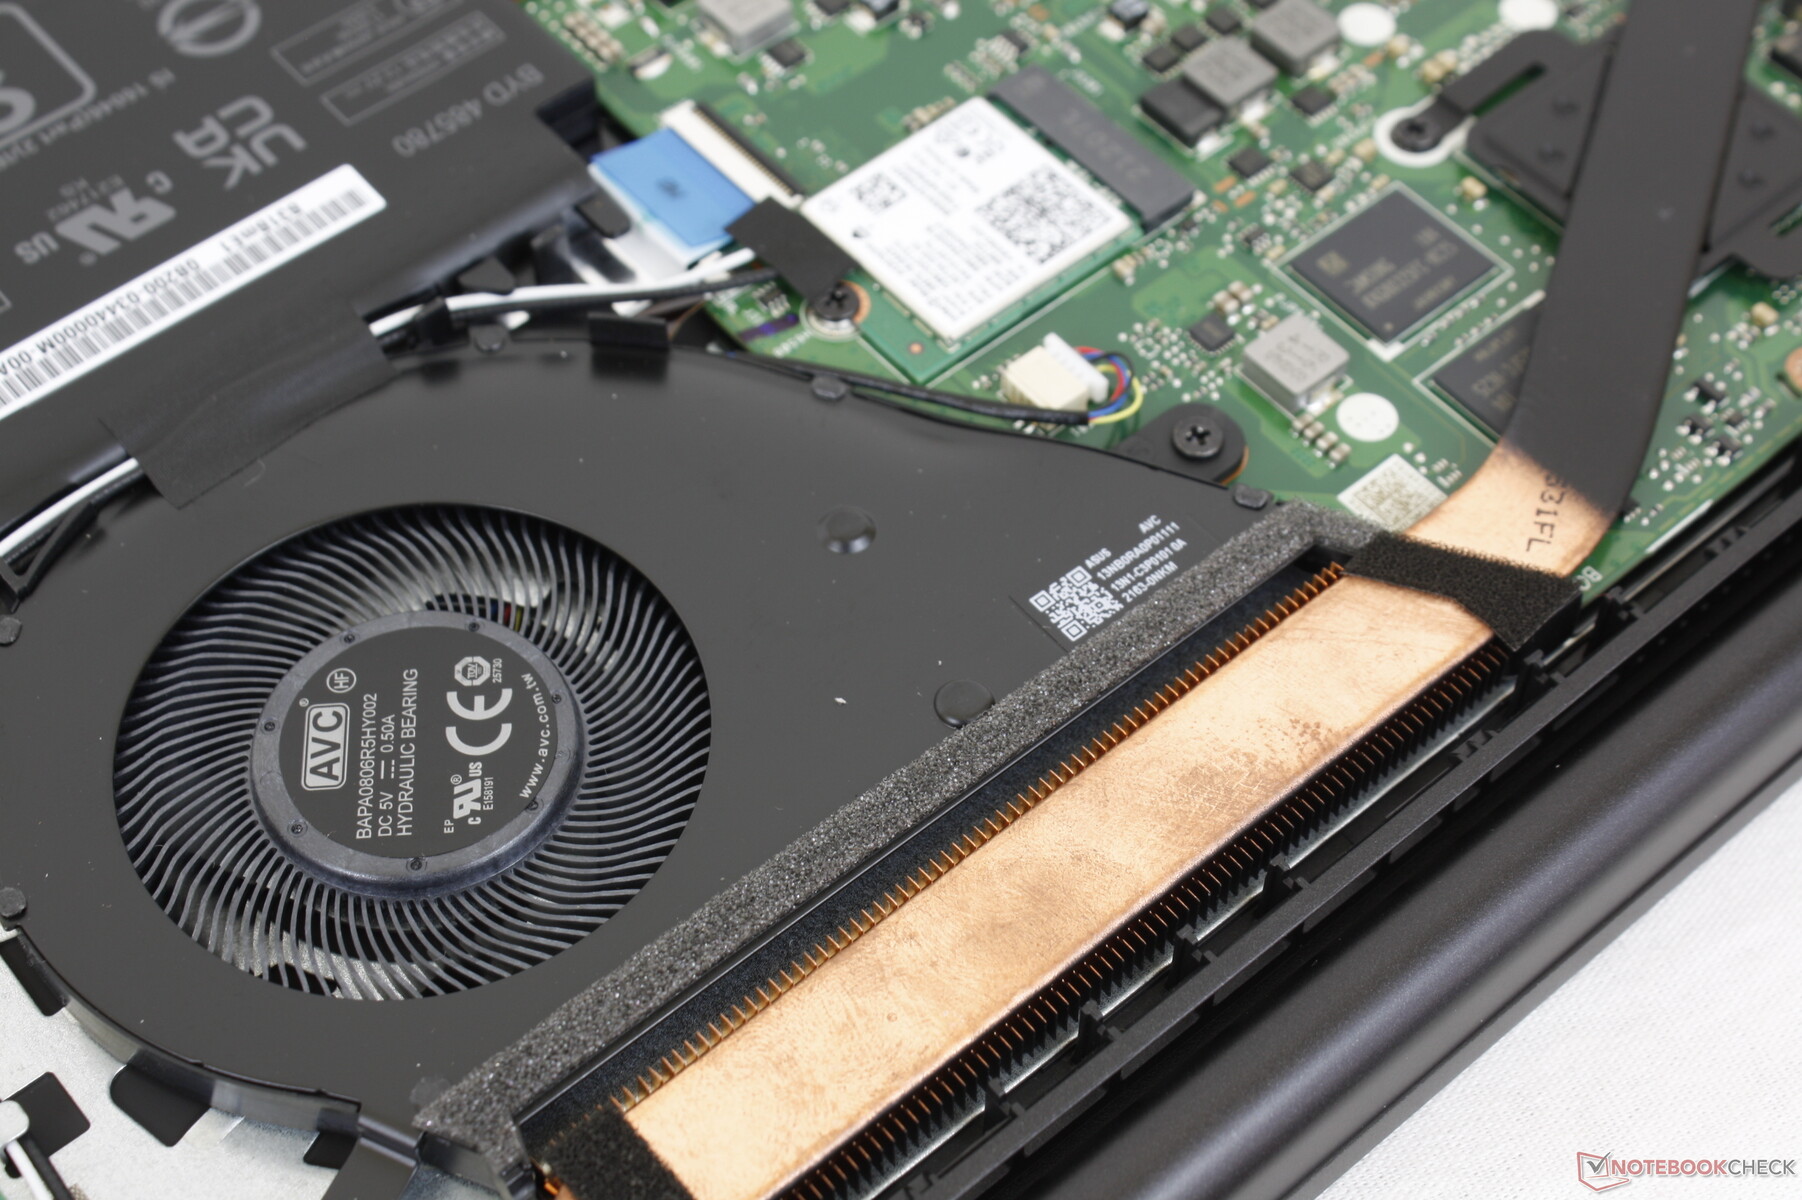
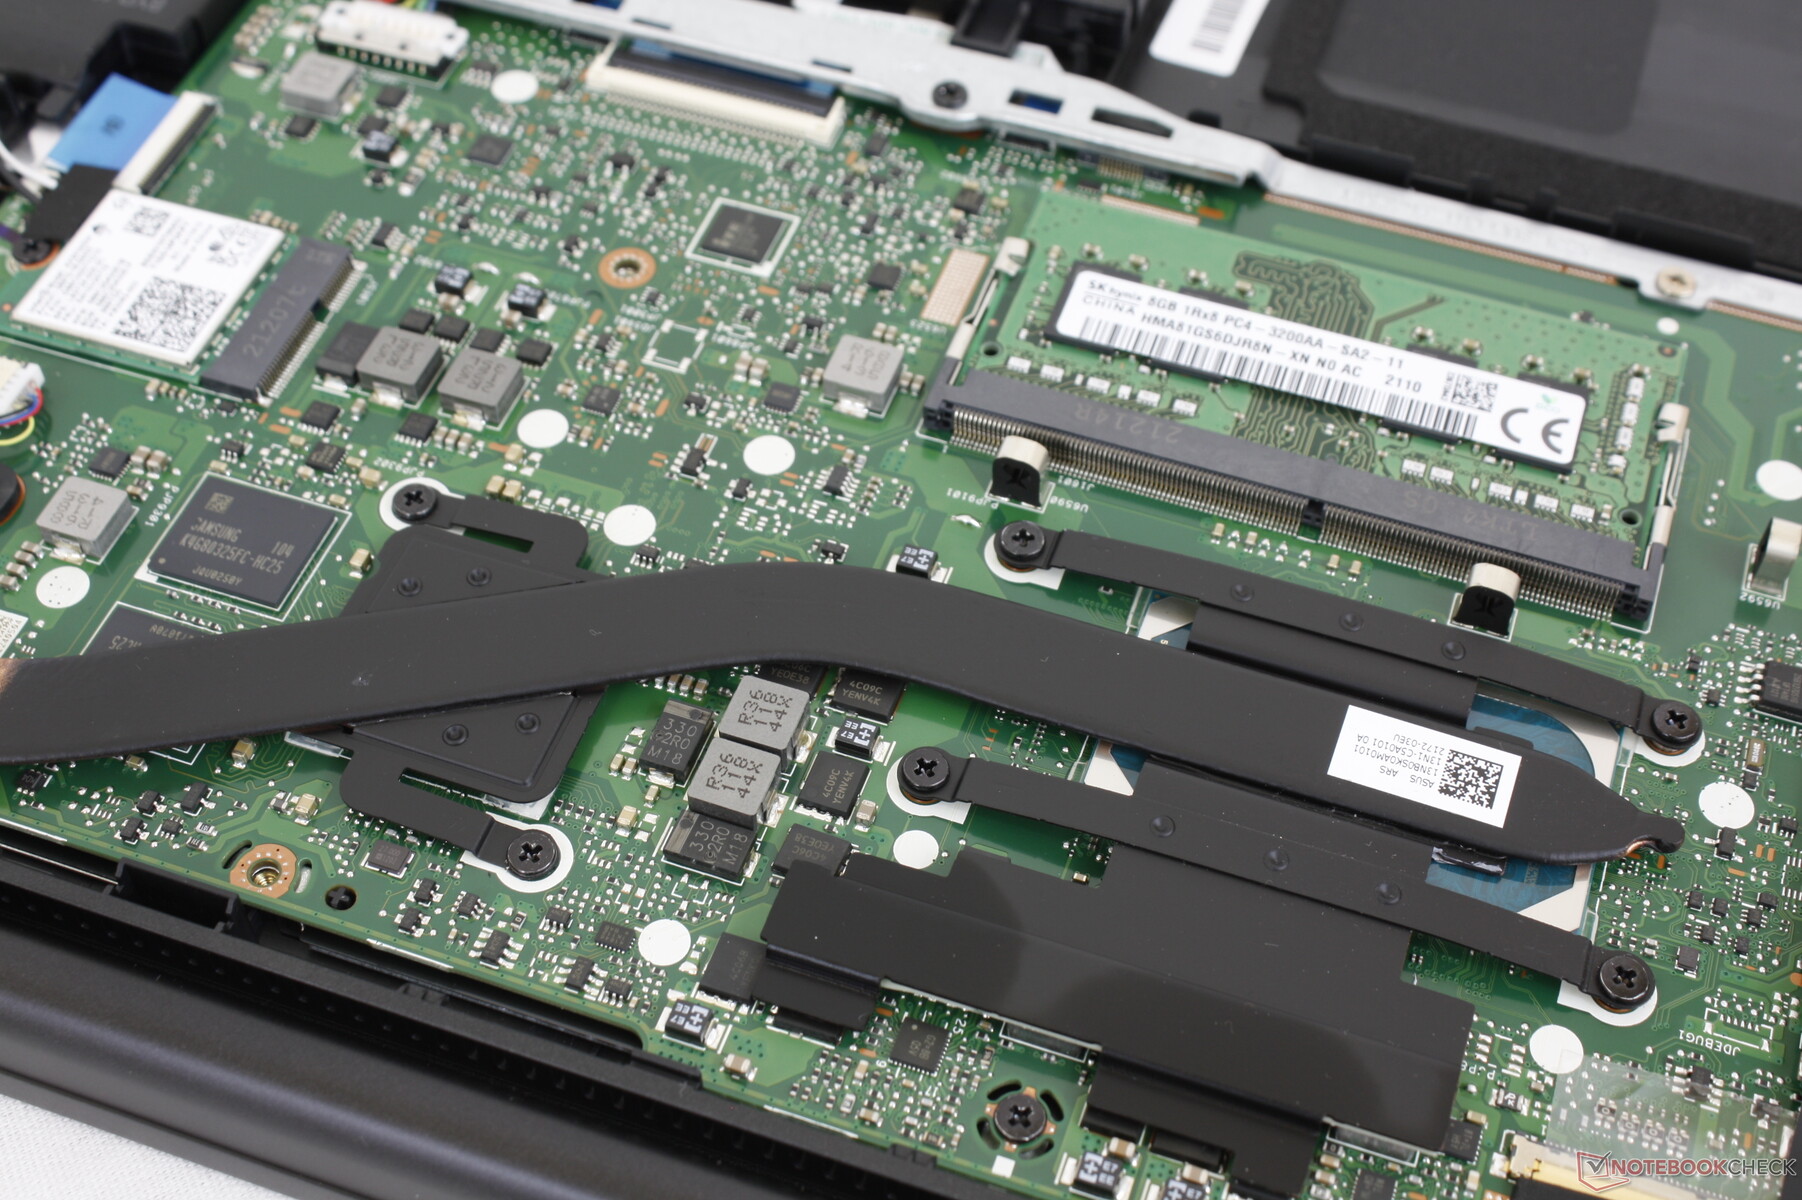
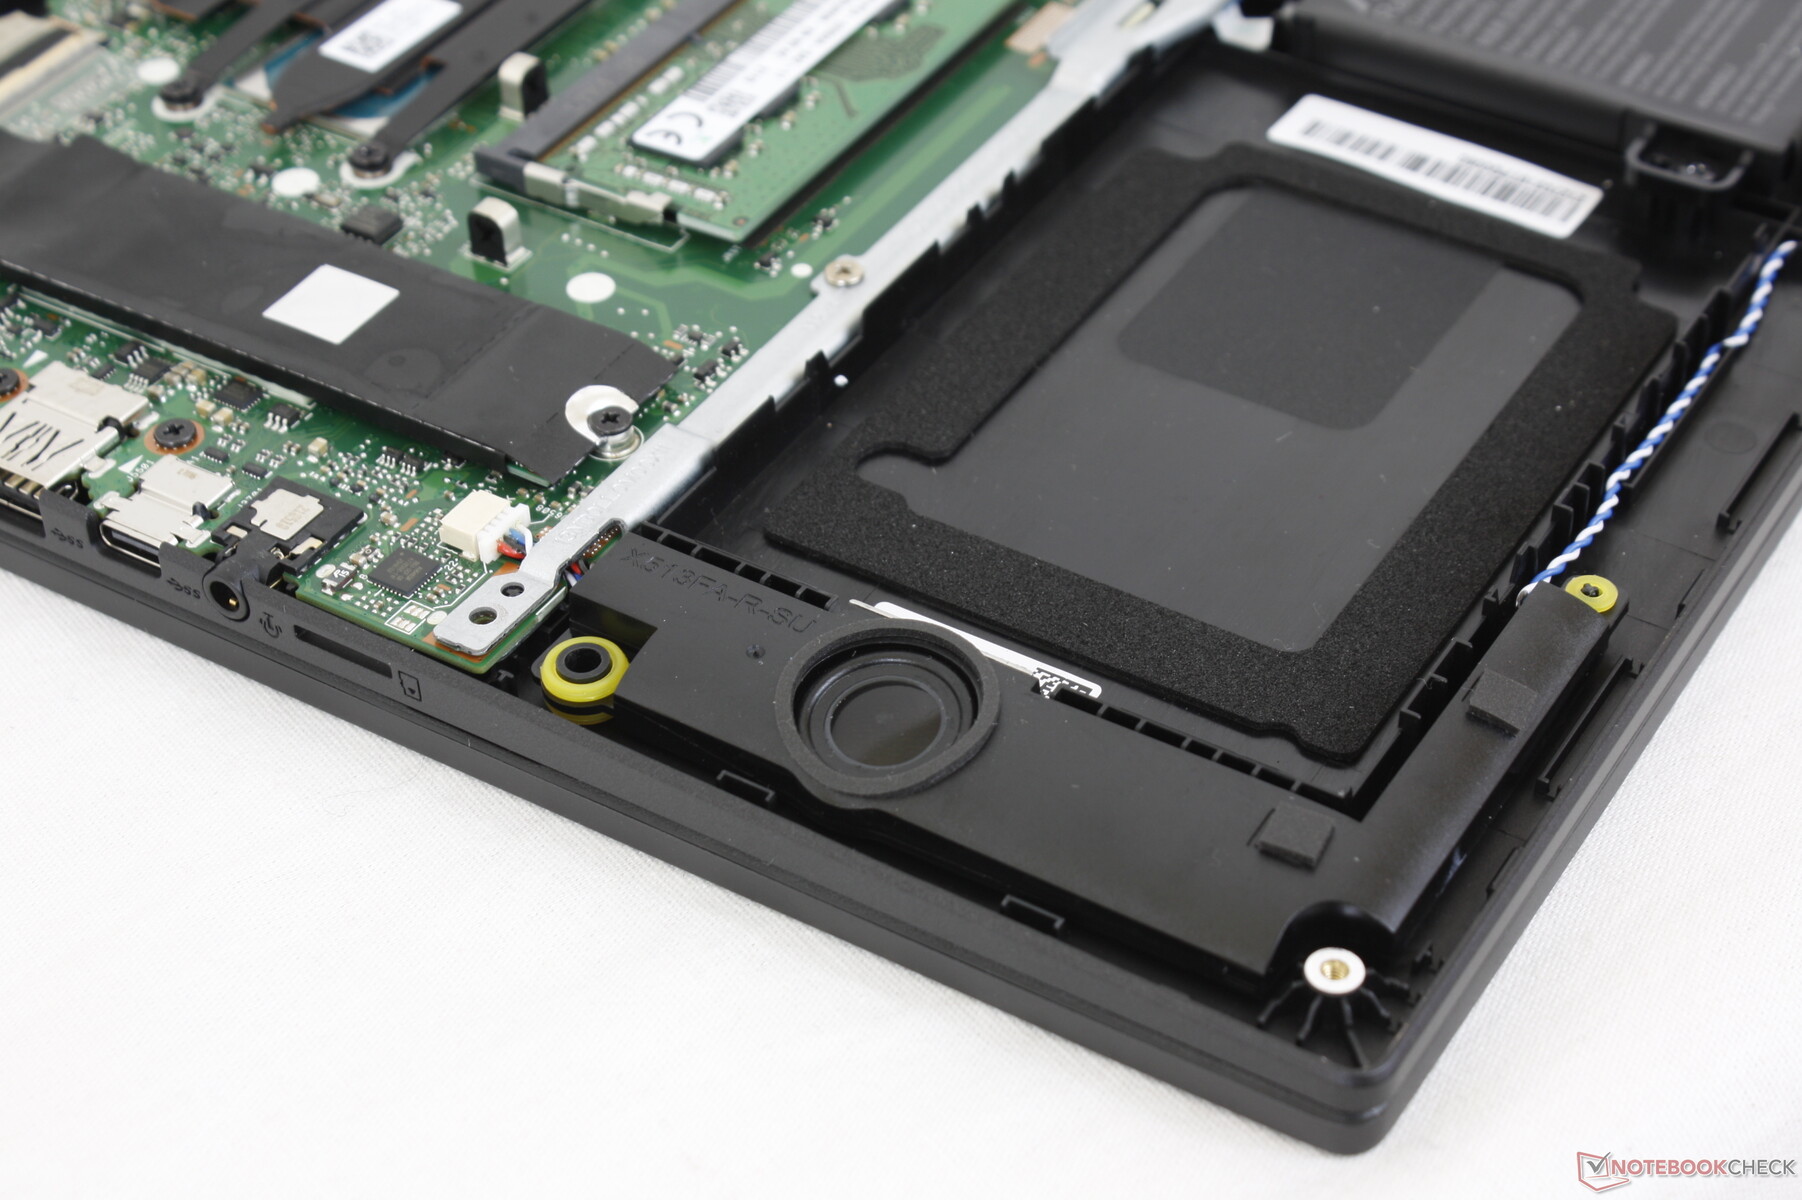
Onderhoud - Gemakkelijk te openen
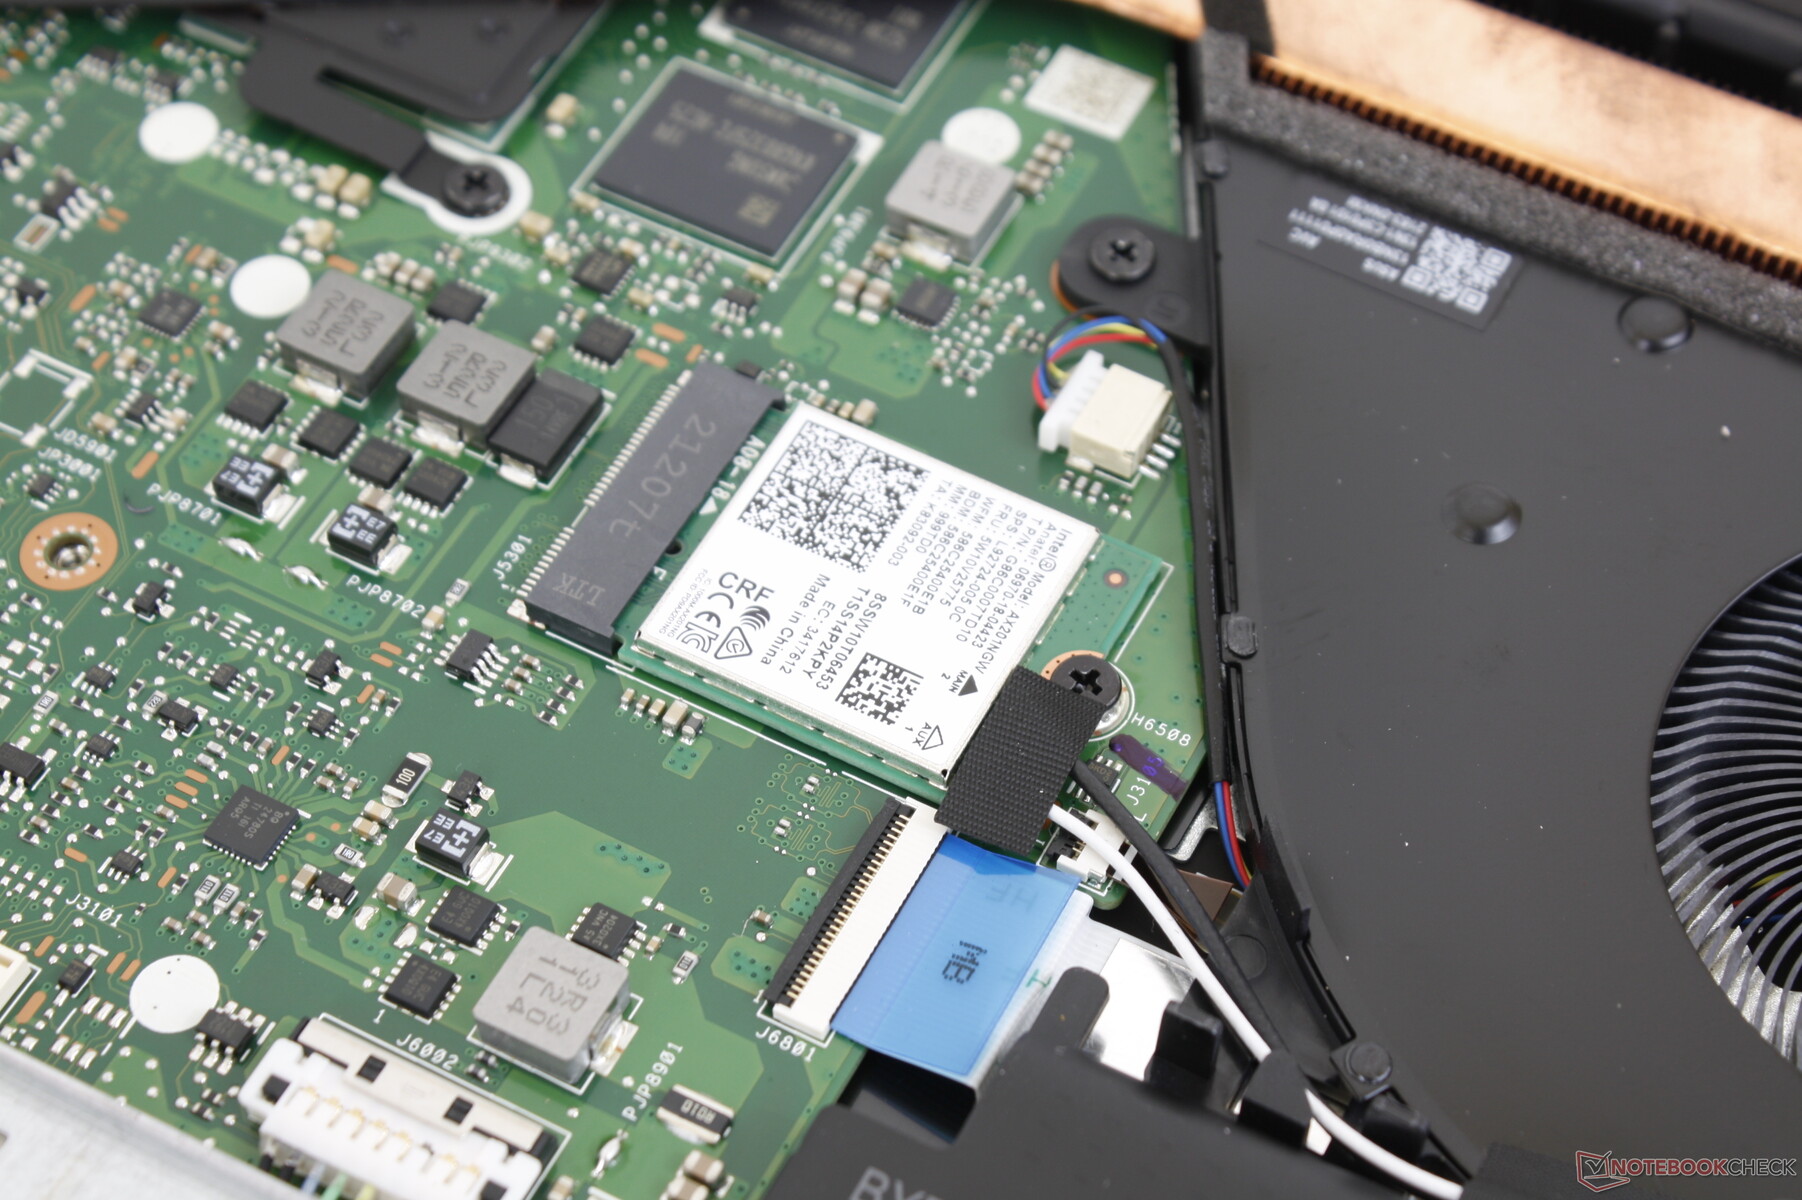
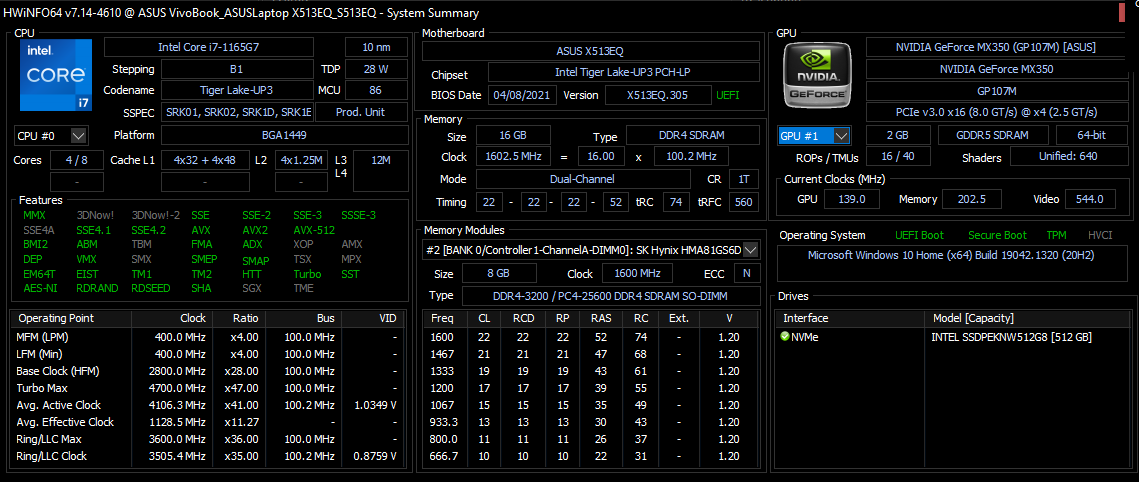
Het bodempaneel kan eenvoudig worden verwijderd met een Philips schroevendraaier en scherpe rand om de enkele SODIMM sleuf, WLAN module en M.2 2280 PCIe3 x4 sleuf te onthullen. Een basis van 8 GB enkelkanaals RAM wordt gesoldeerd geleverd, die kan worden gekoppeld aan een 8 GB verwijderbare module voor maximaal 16 GB totaal.
Accessoires en garantie
De doos bevat geen andere extra's dan de papieren en de wisselstroomadapter. De standaard beperkte fabrieksgarantie van één jaar is van toepassing
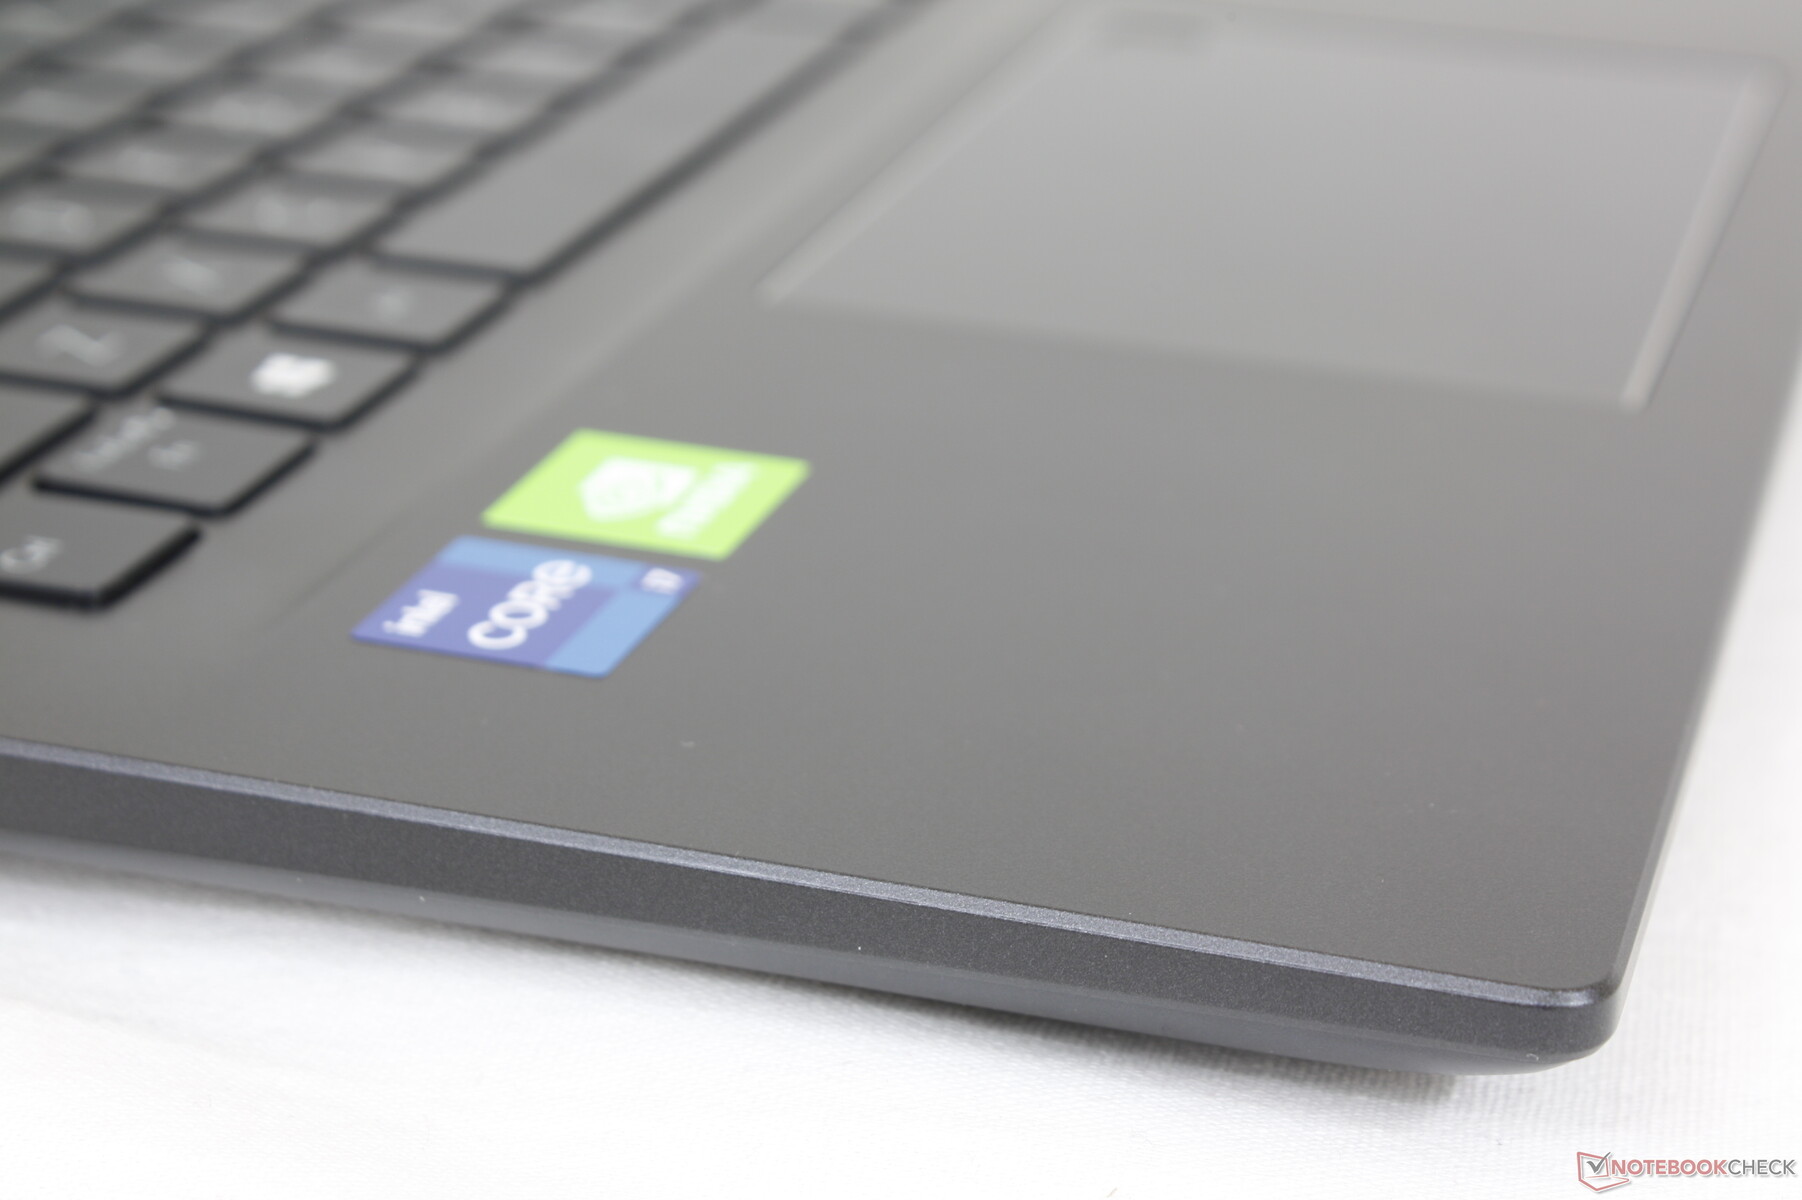
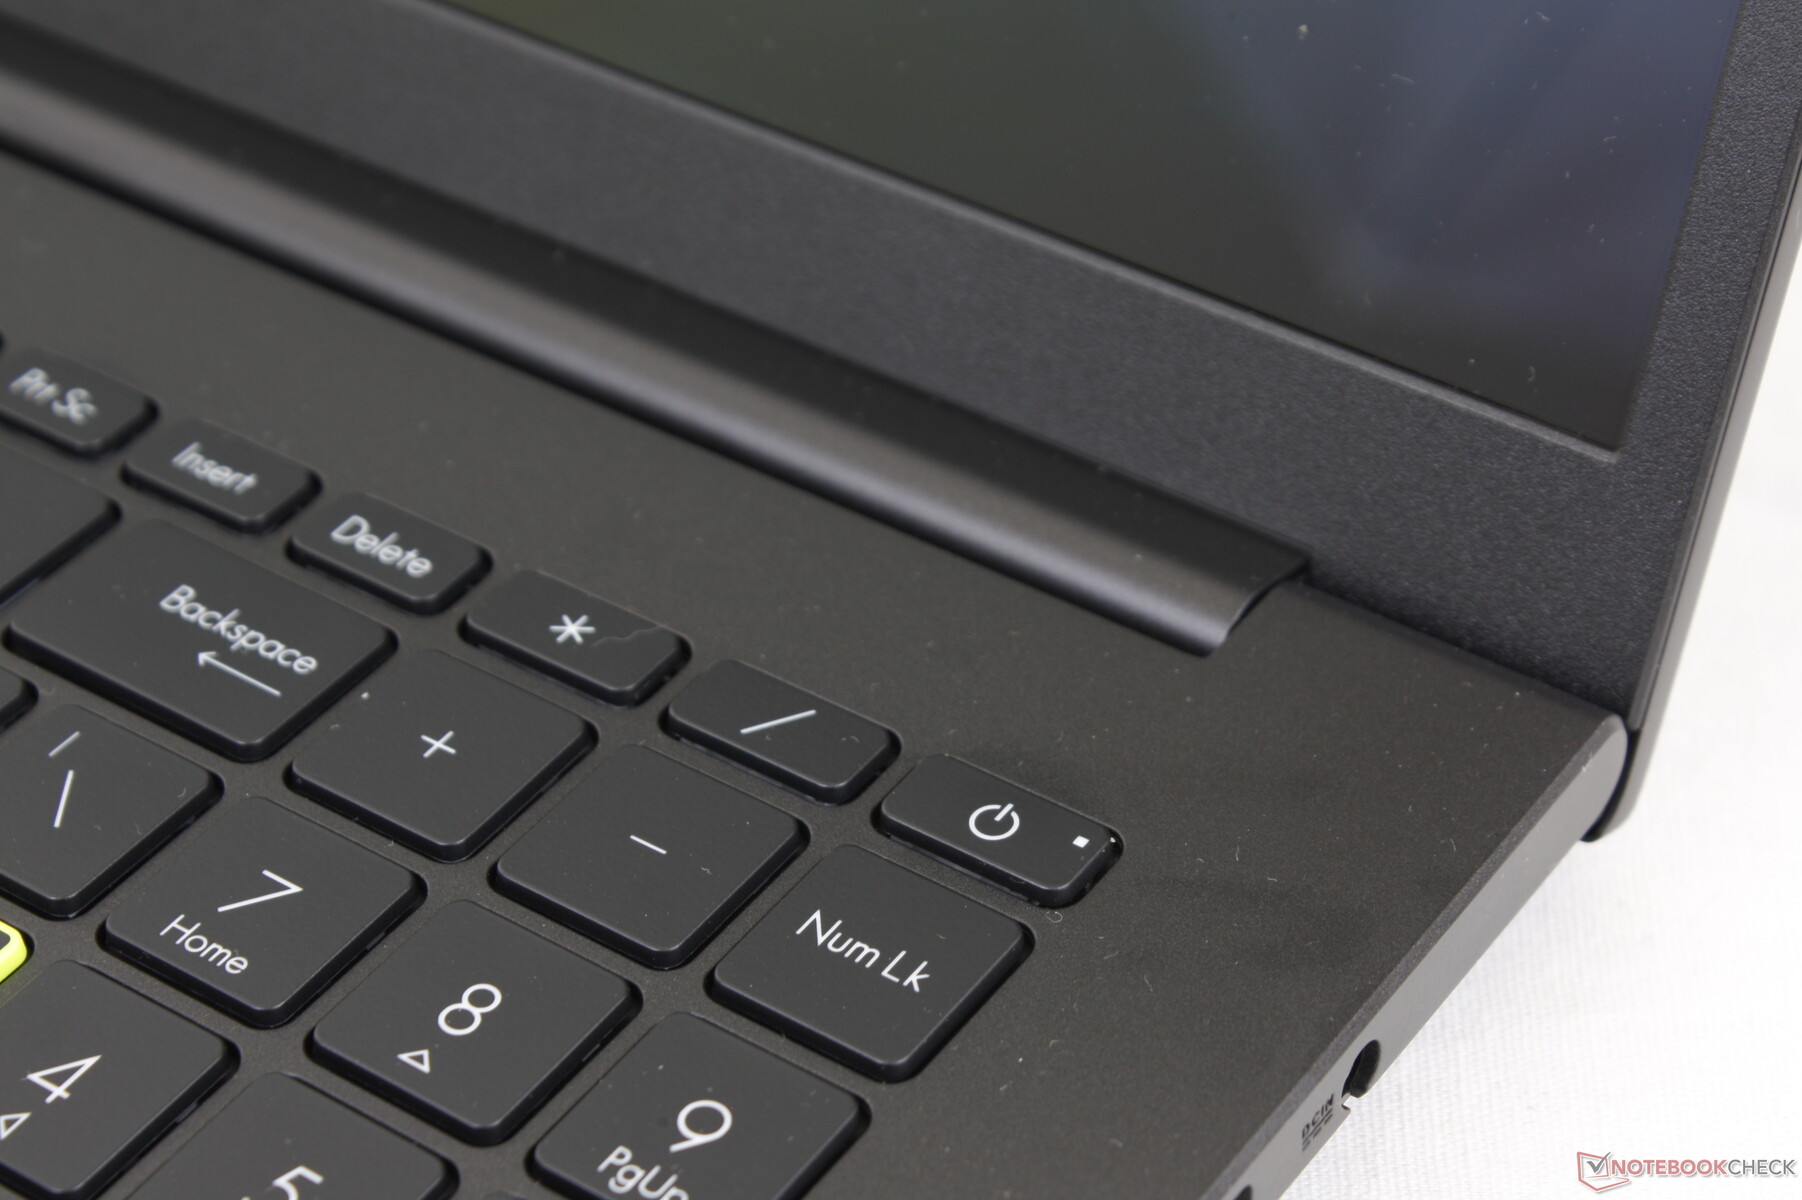
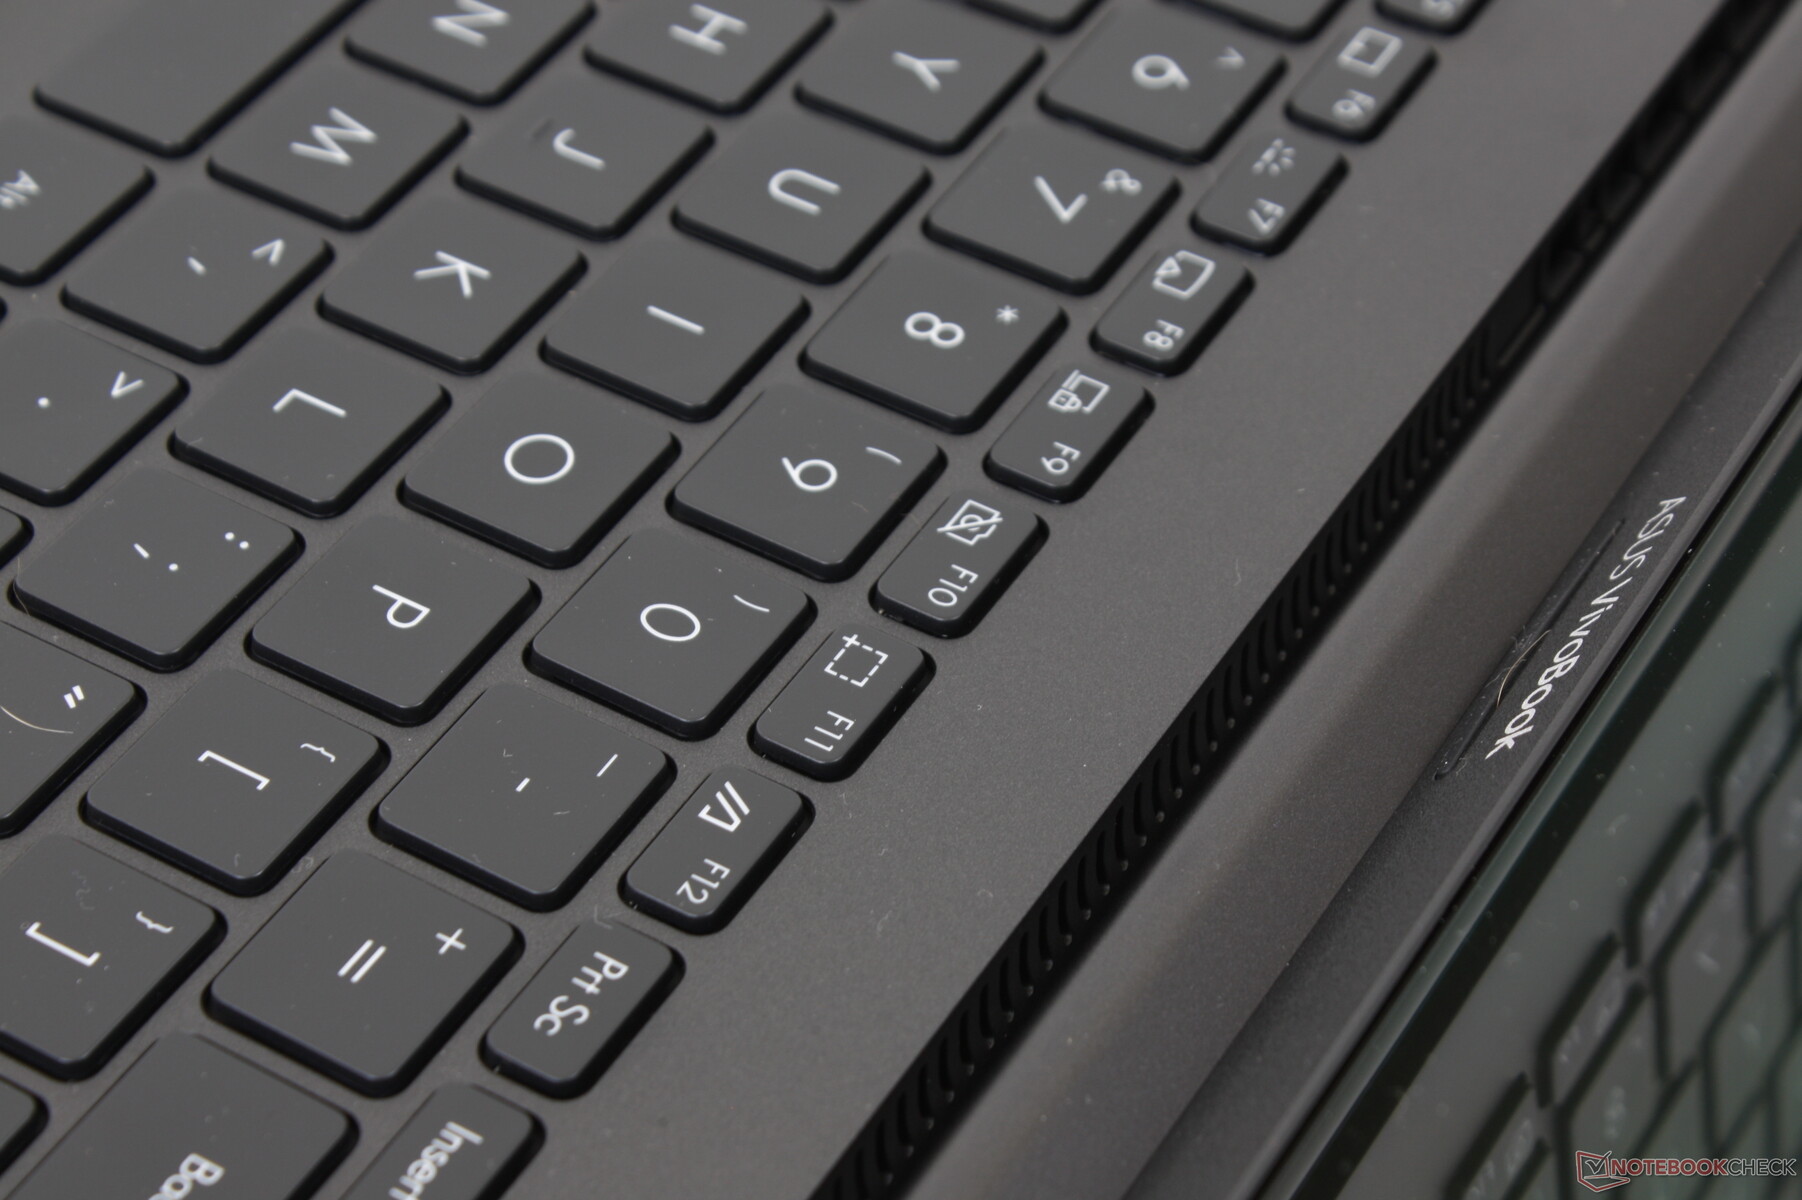
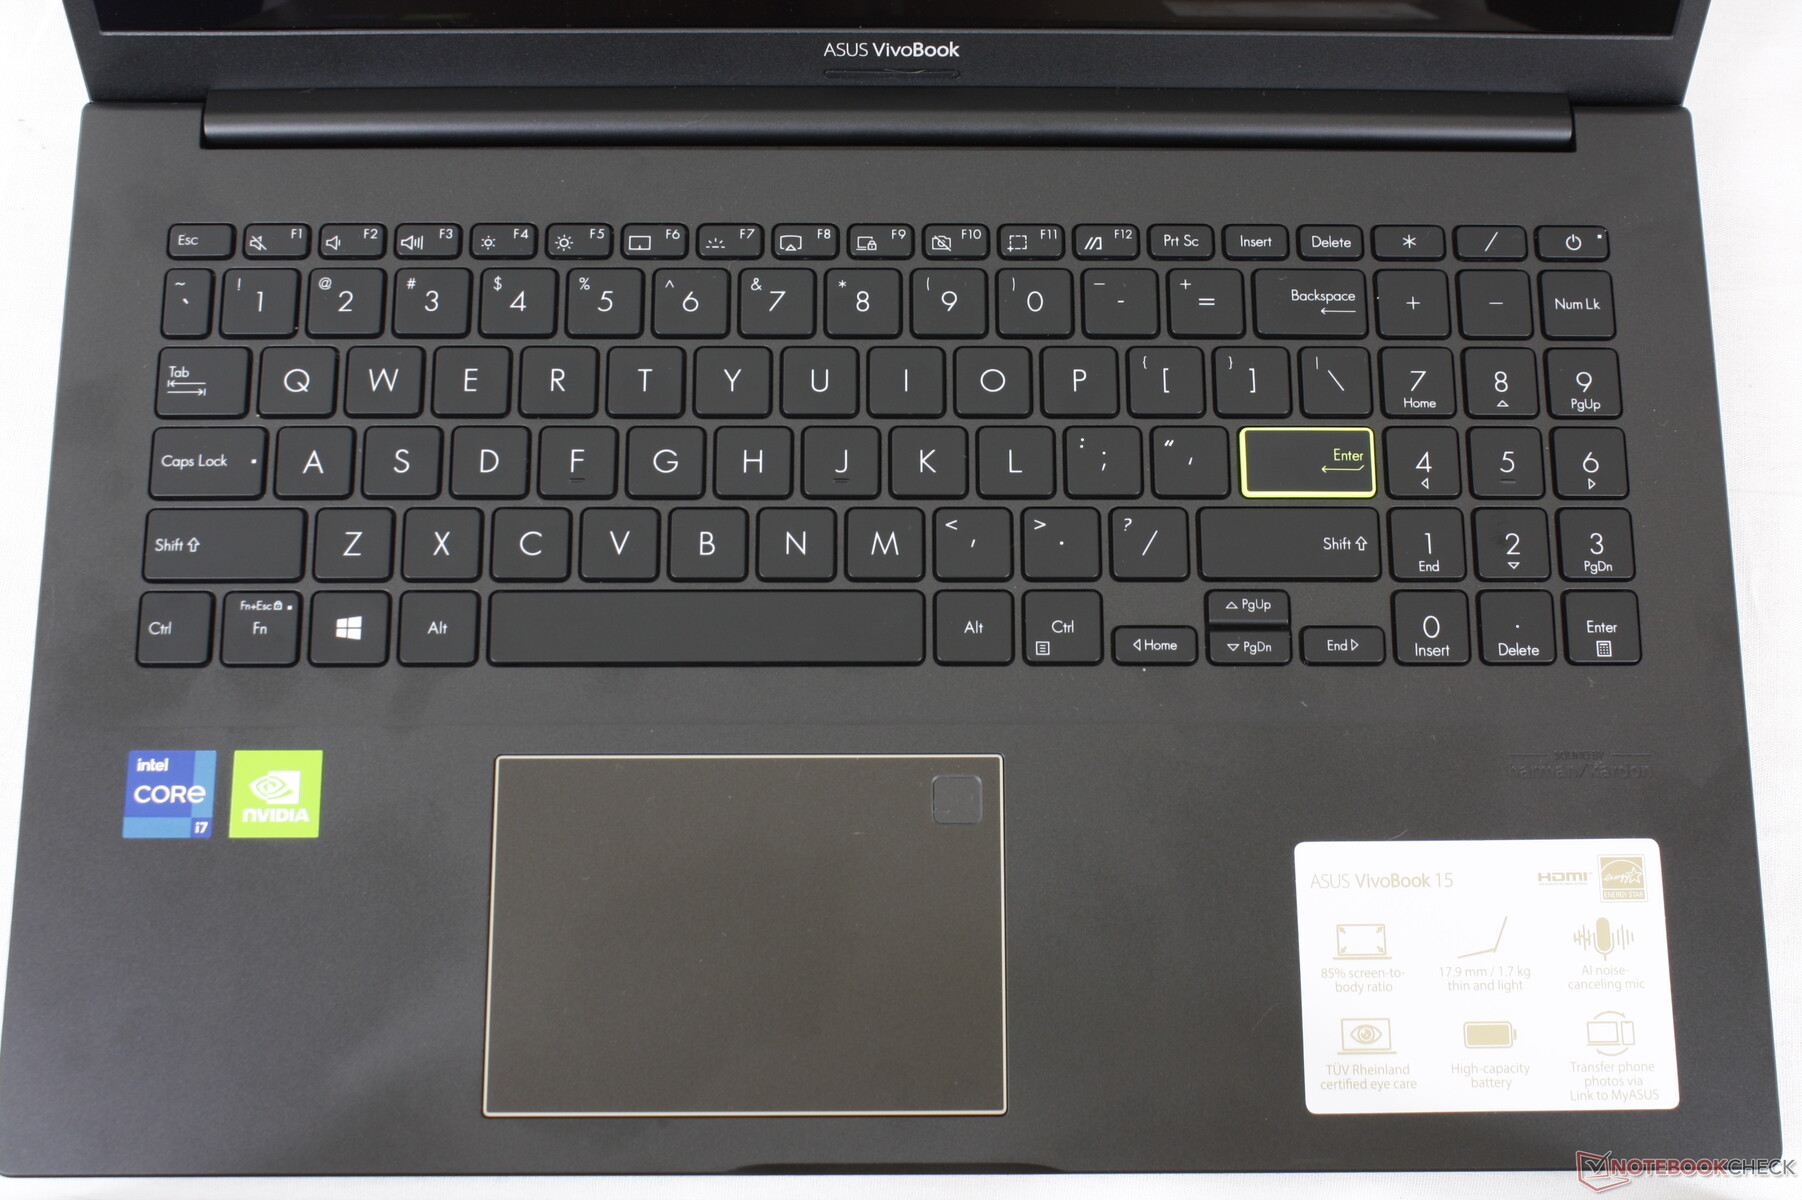
Invoerapparaten - Sponsachtig Clickpad
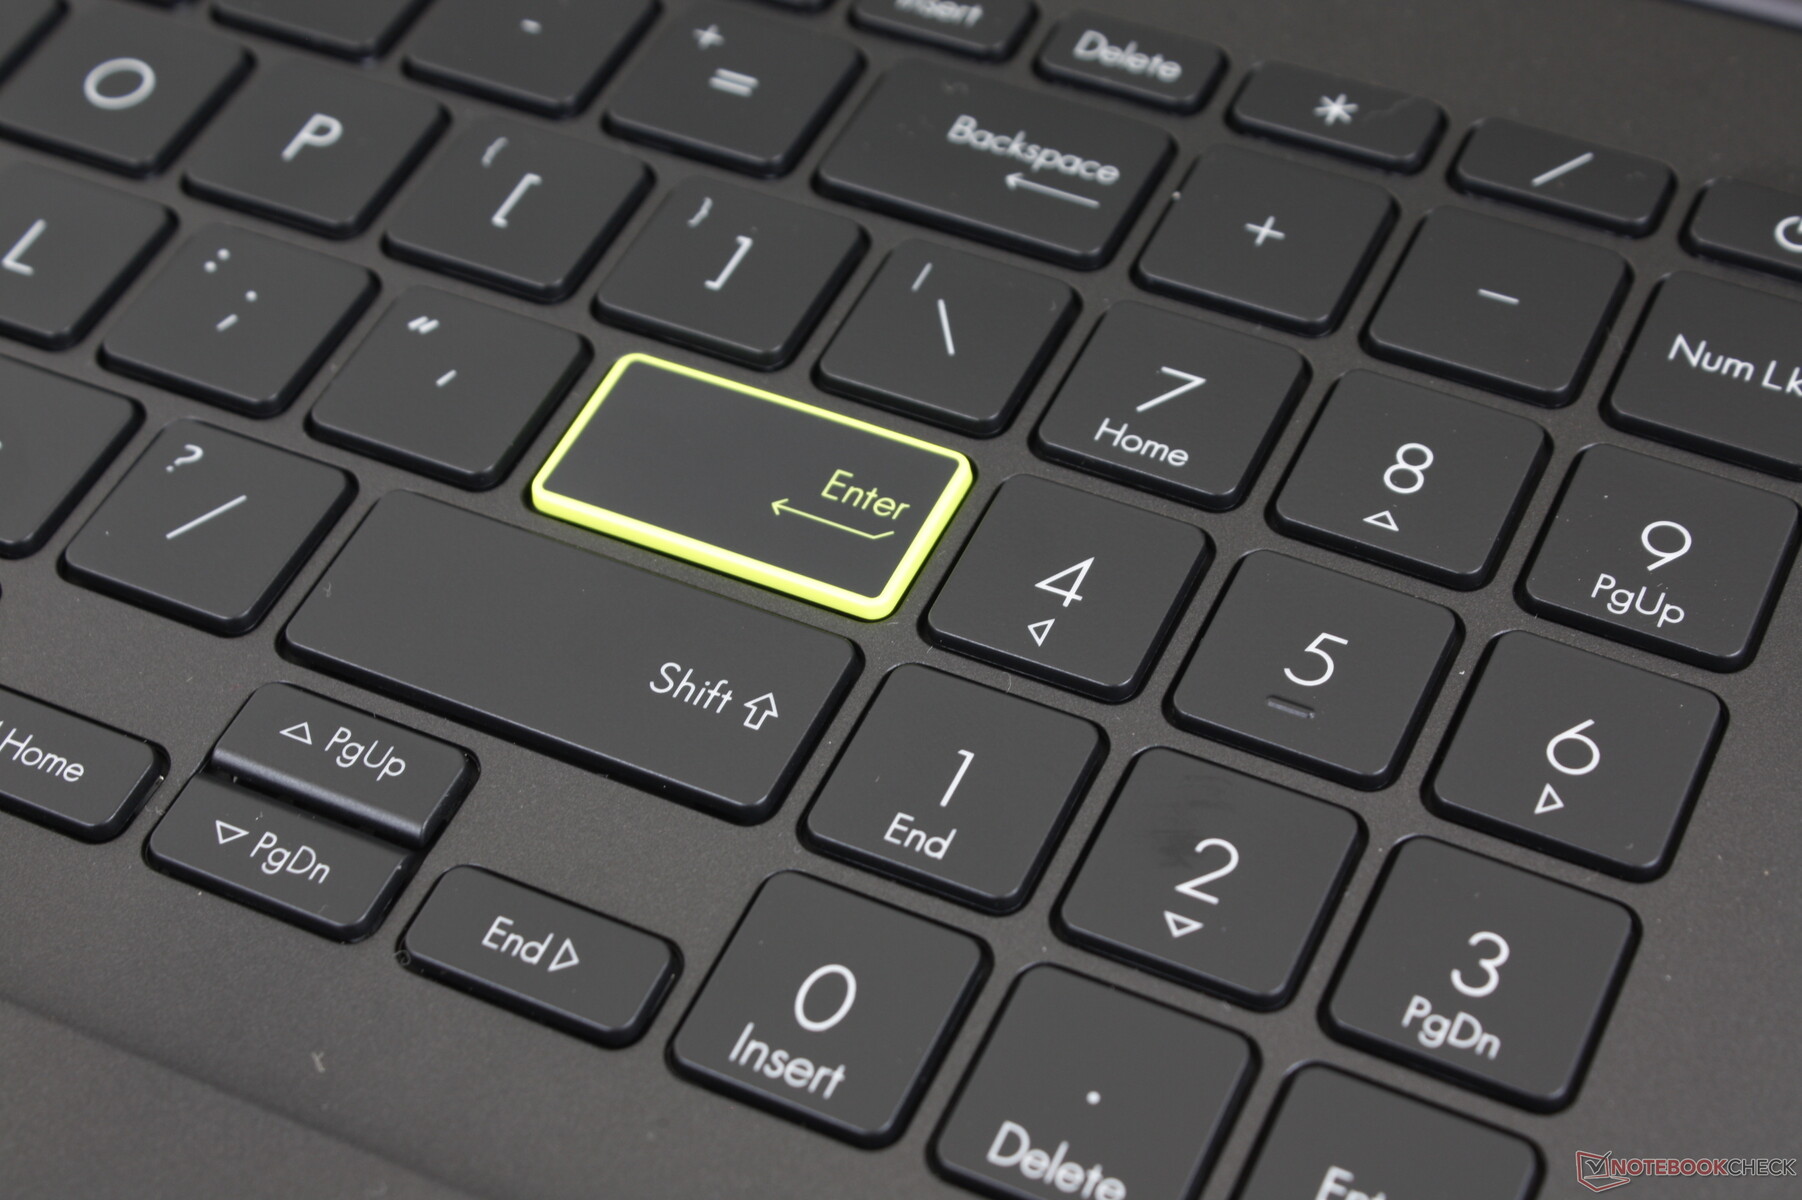
Toetsenbord
Als u al eens op een VivoBook laptop hebt getypt, dan weet u precies wat u kunt verwachten van de VivoBook 15 K513, want er is weinig variatie tussen de modellen wat betreft de feedback op het toetsenbord. Zowel travel als tactiliteit blijven respectievelijk ondiep en zacht, vergeleken met de stevigere toetsen van de business-centric Lenovo ThinkPad of HP EliteBook. De toetsen van de Lenovo IdeaPad 5 15voelen vergelijkbaar aan met wat we hier hebben op de Asus, maar het gekletter van de toetsen is gematigd luider op de Asus.
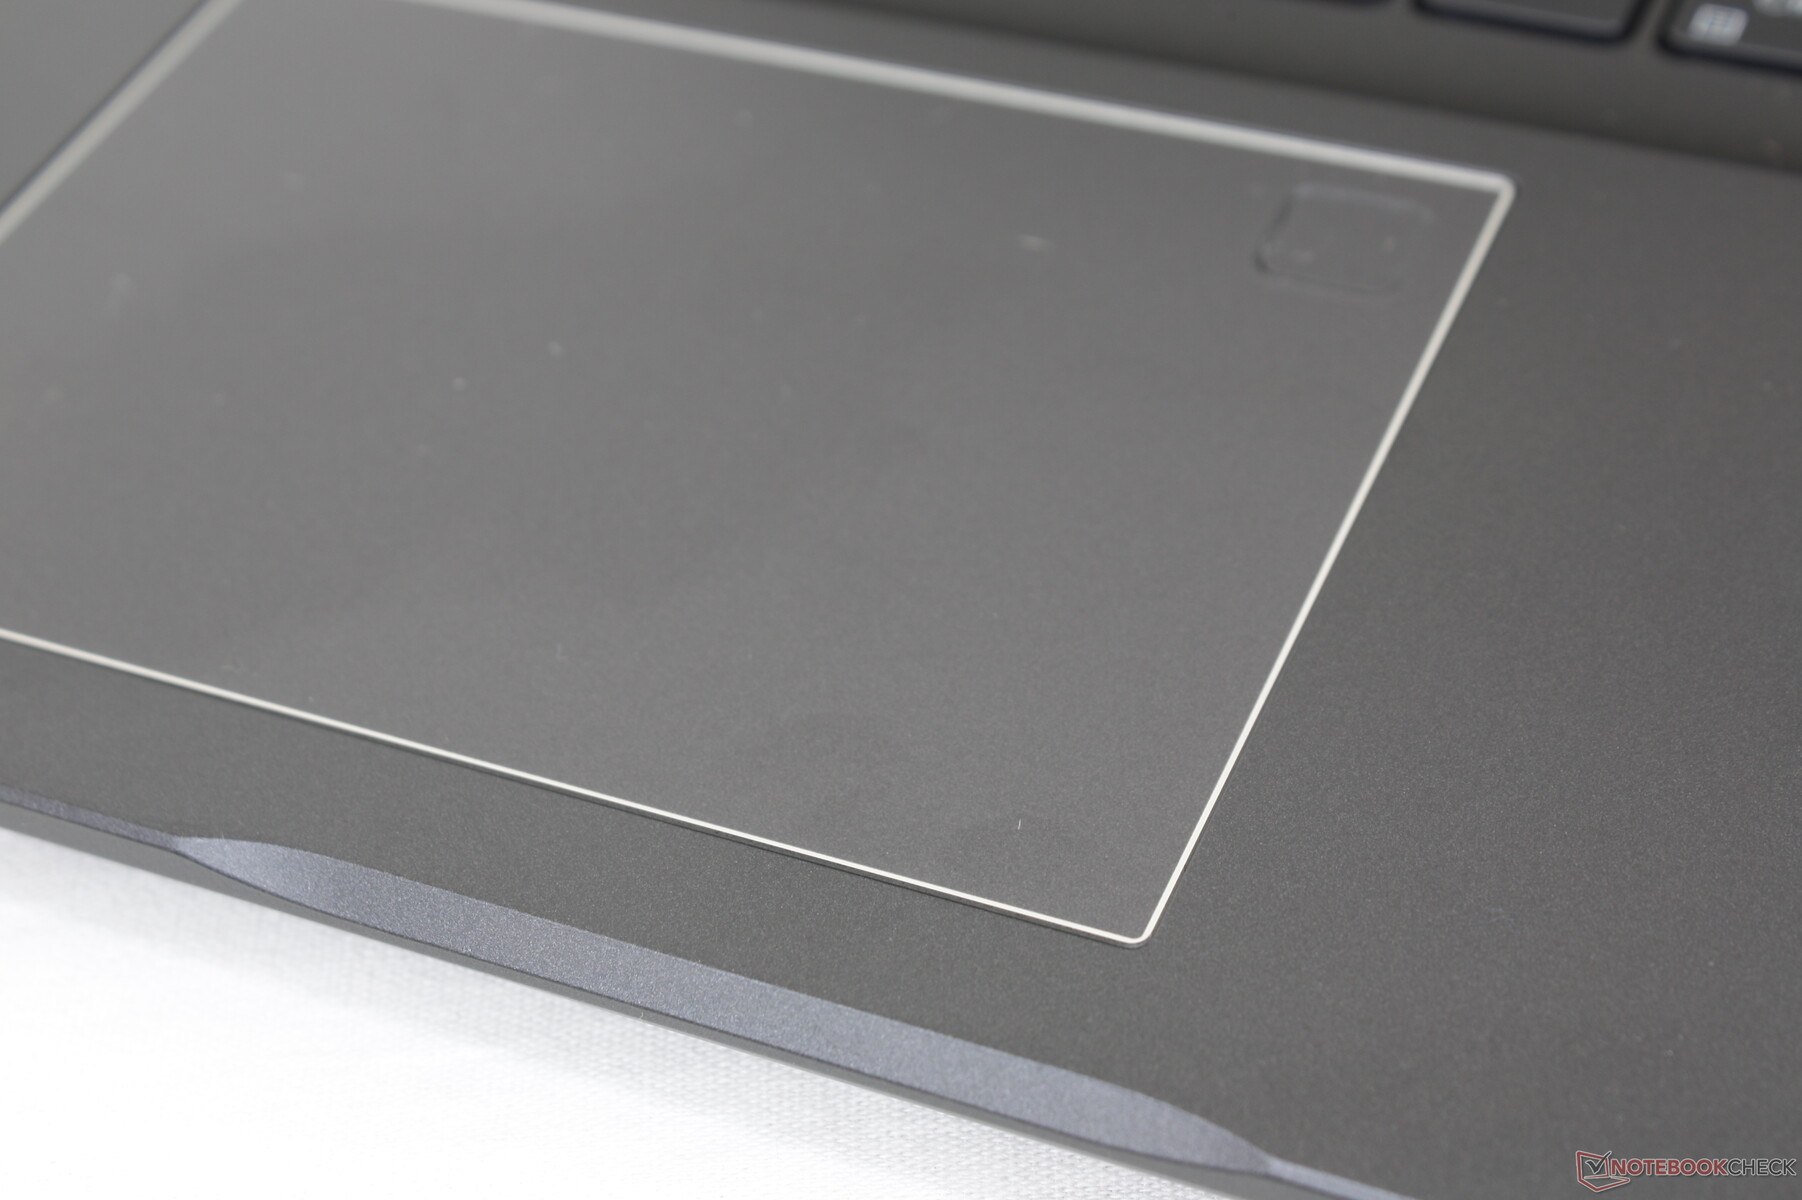
Touchpad
Het clickpad (~10,5 x 7,3 cm) is slecht en ondergemiddeld, zelfs naar budget maatstaven. Terwijl gewone cursorbewegingen soepel en zonder plotselinge sprongen verlopen, zijn de geïntegreerde muistoetsen veel te sponzig en ondiep. Klikken voelt daardoor onbevredigend aan, vooral als je klikt en sleept of andere multi-touch acties uitvoert.

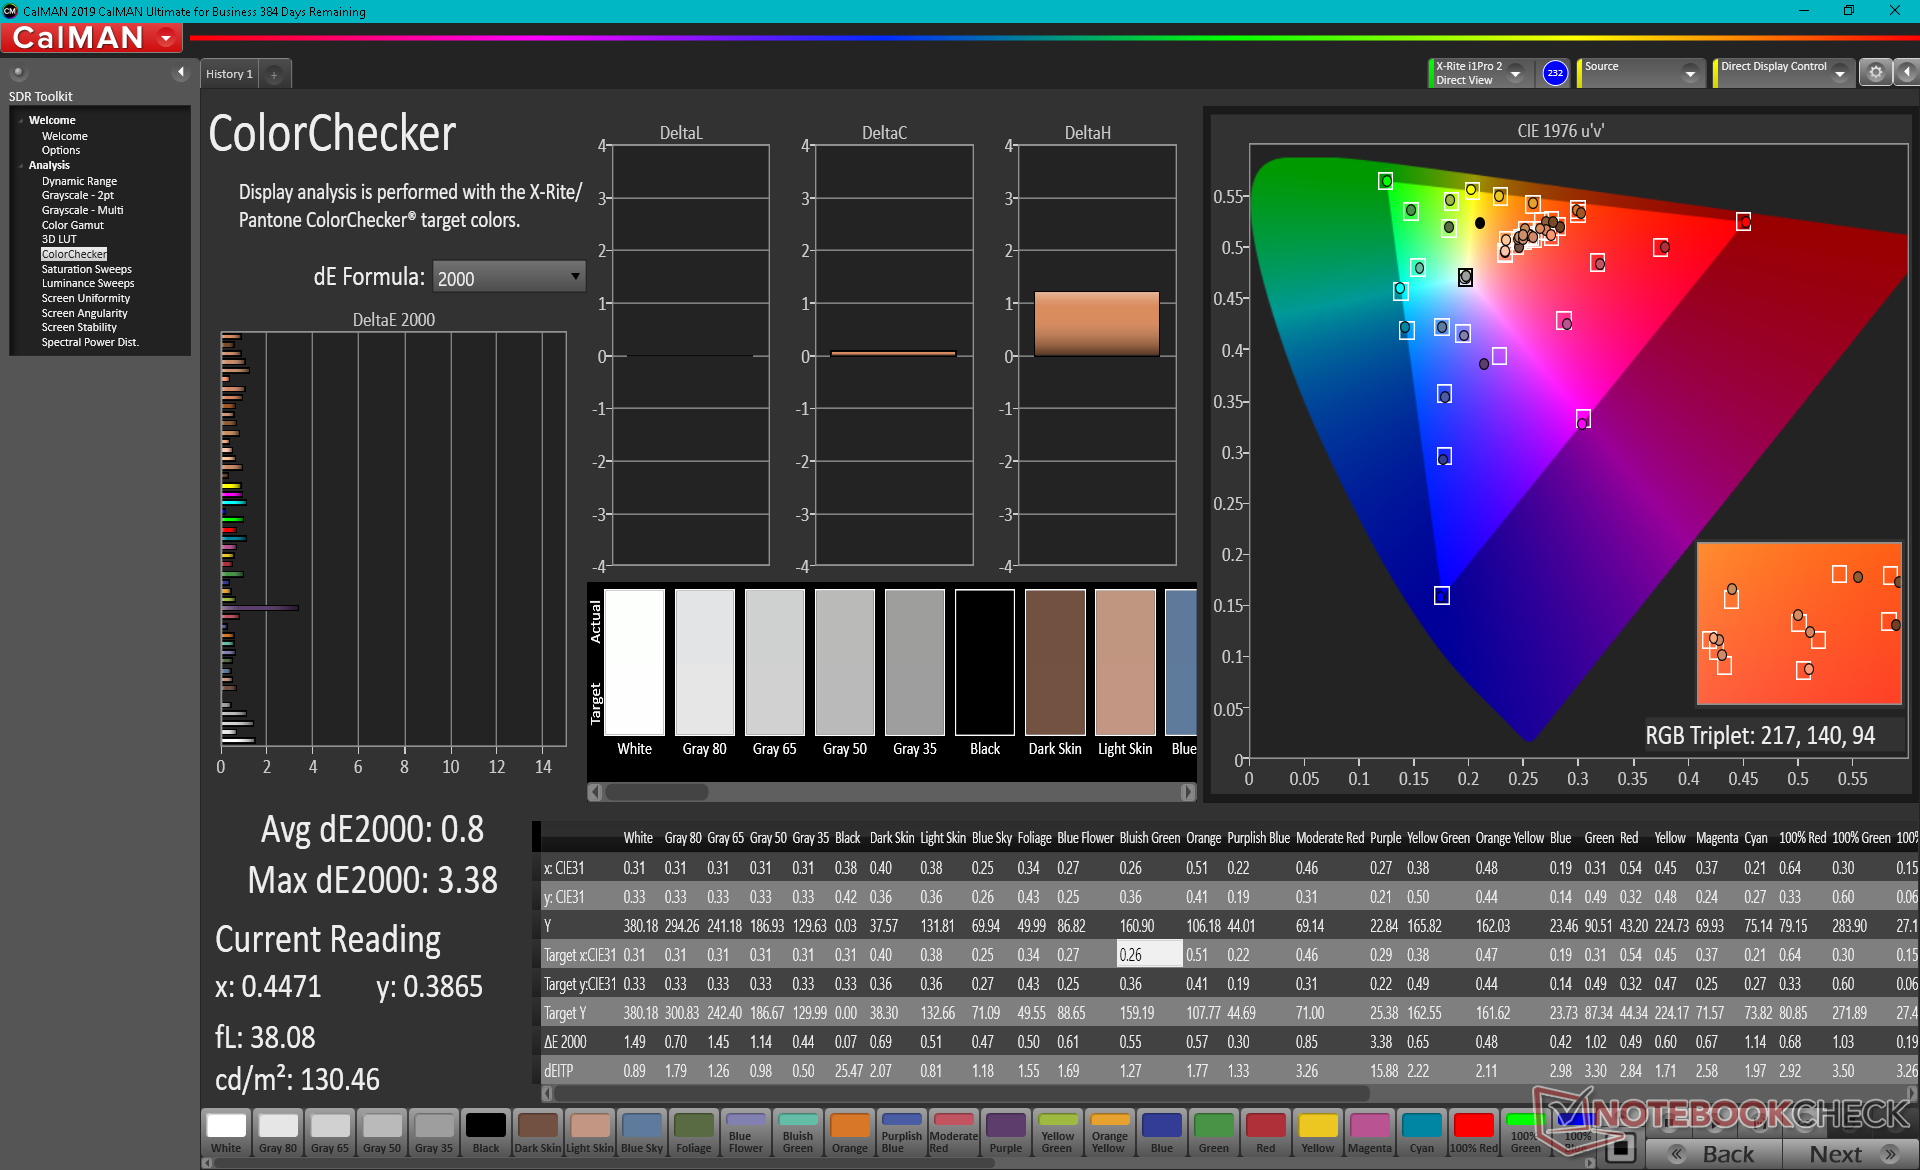
Beeldscherm - meestal beter dan IPS
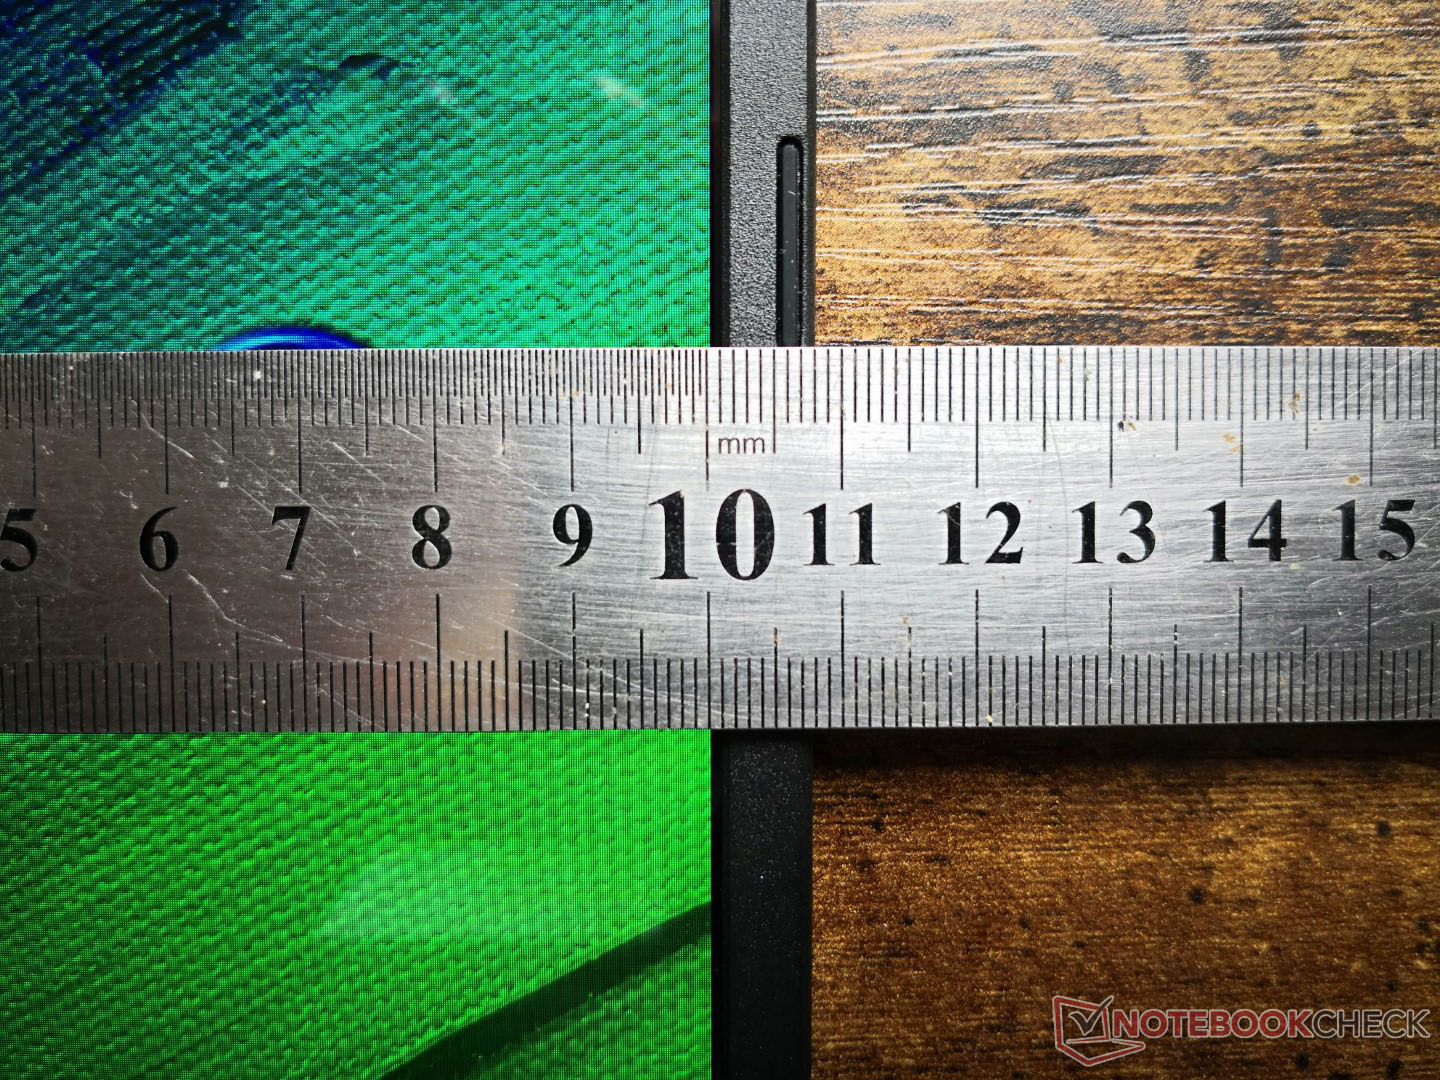
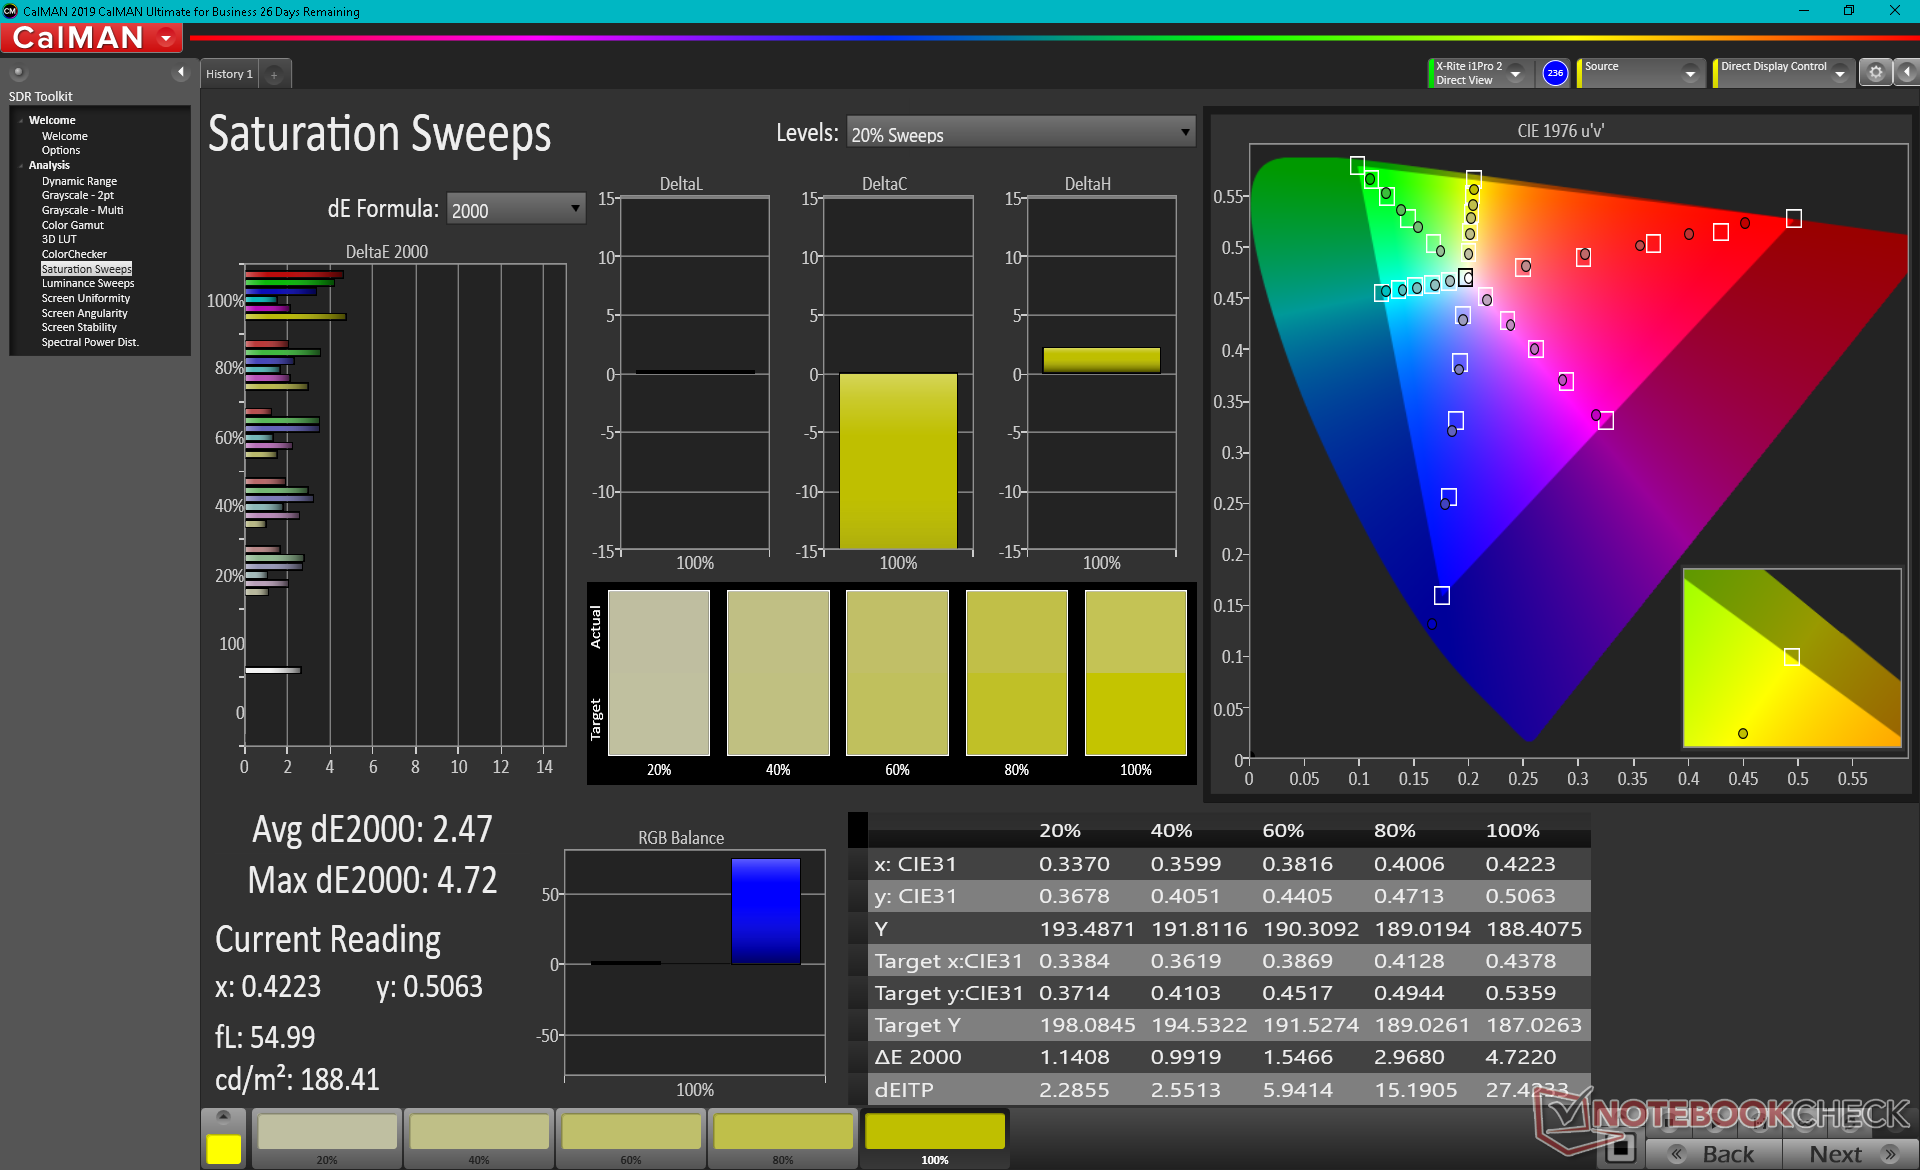
Asus maakt gebruik van hetzelfde 1080p Samsung ATNA56YX03-0 OLED paneel voor zowel de VivoBook 15 K513 als de VivoBook 15 Pro series. Het paneel valt op door de volledige DCI-P3 dekking die de meeste IPS panelen niet kunnen bereiken, zeker niet in deze <$1000 USD prijsklasse. De extra snelle responstijden, relatief heldere achtergrondverlichting en extreme contrast ratio maken onze VivoBook beter dan verwacht voor grafische bewerking
Houd in gedachten dat pulse-width modulation aanwezig is op alle helderheidsniveaus, in tegenstelling tot op de meeste andere laptops. We kunnen een frequentie van 59 Hz registreren als de helderheid is ingesteld op 50 procent of hoger en 434 Hz als de helderheid is ingesteld op 49 procent of lager.


| |||||||||||||||||||||||||
Helderheidsverdeling: 98 %
Helderheid in Batterij-modus: 384.5 cd/m²
Contrast: ∞:1 (Zwart: 0 cd/m²)
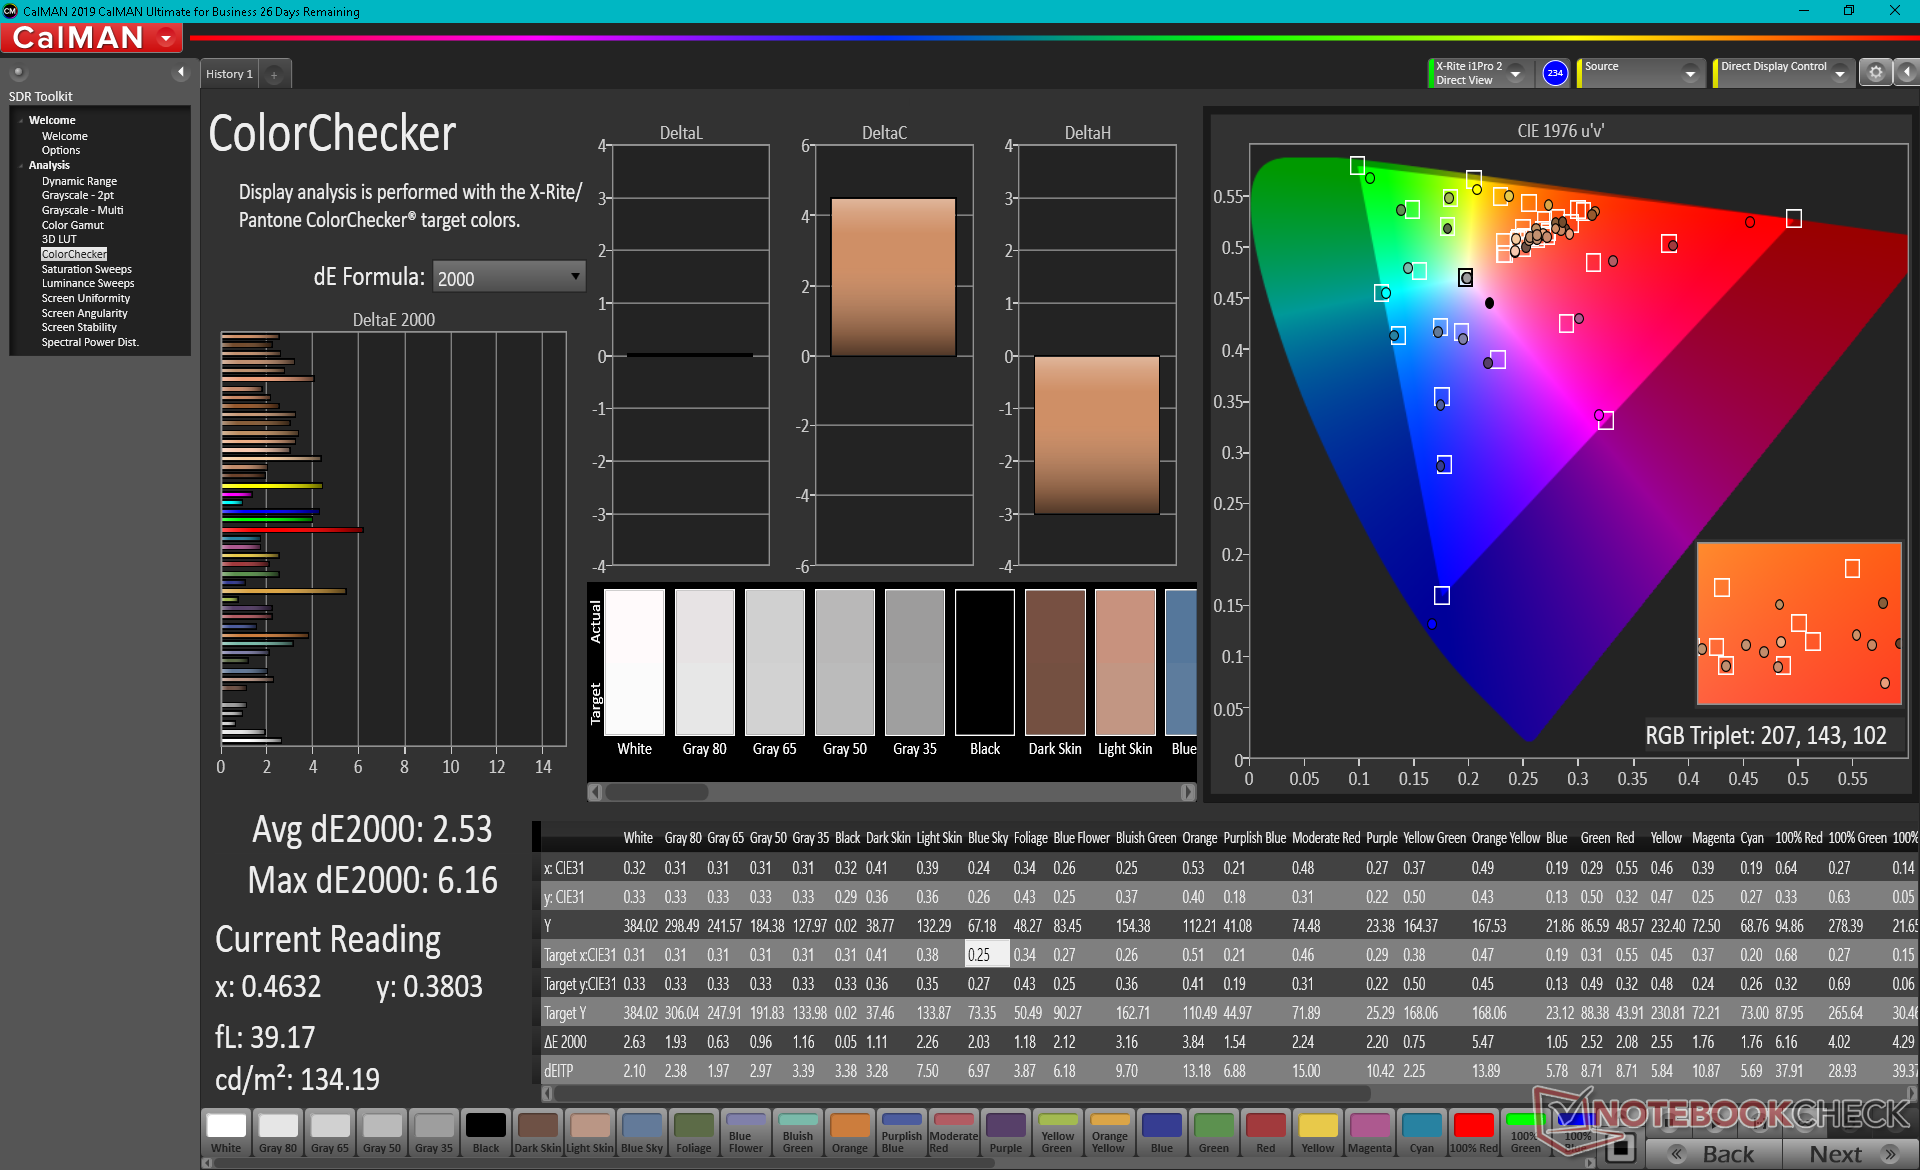
ΔE ColorChecker Calman: 2.53 | ∀{0.5-29.43 Ø4.72}
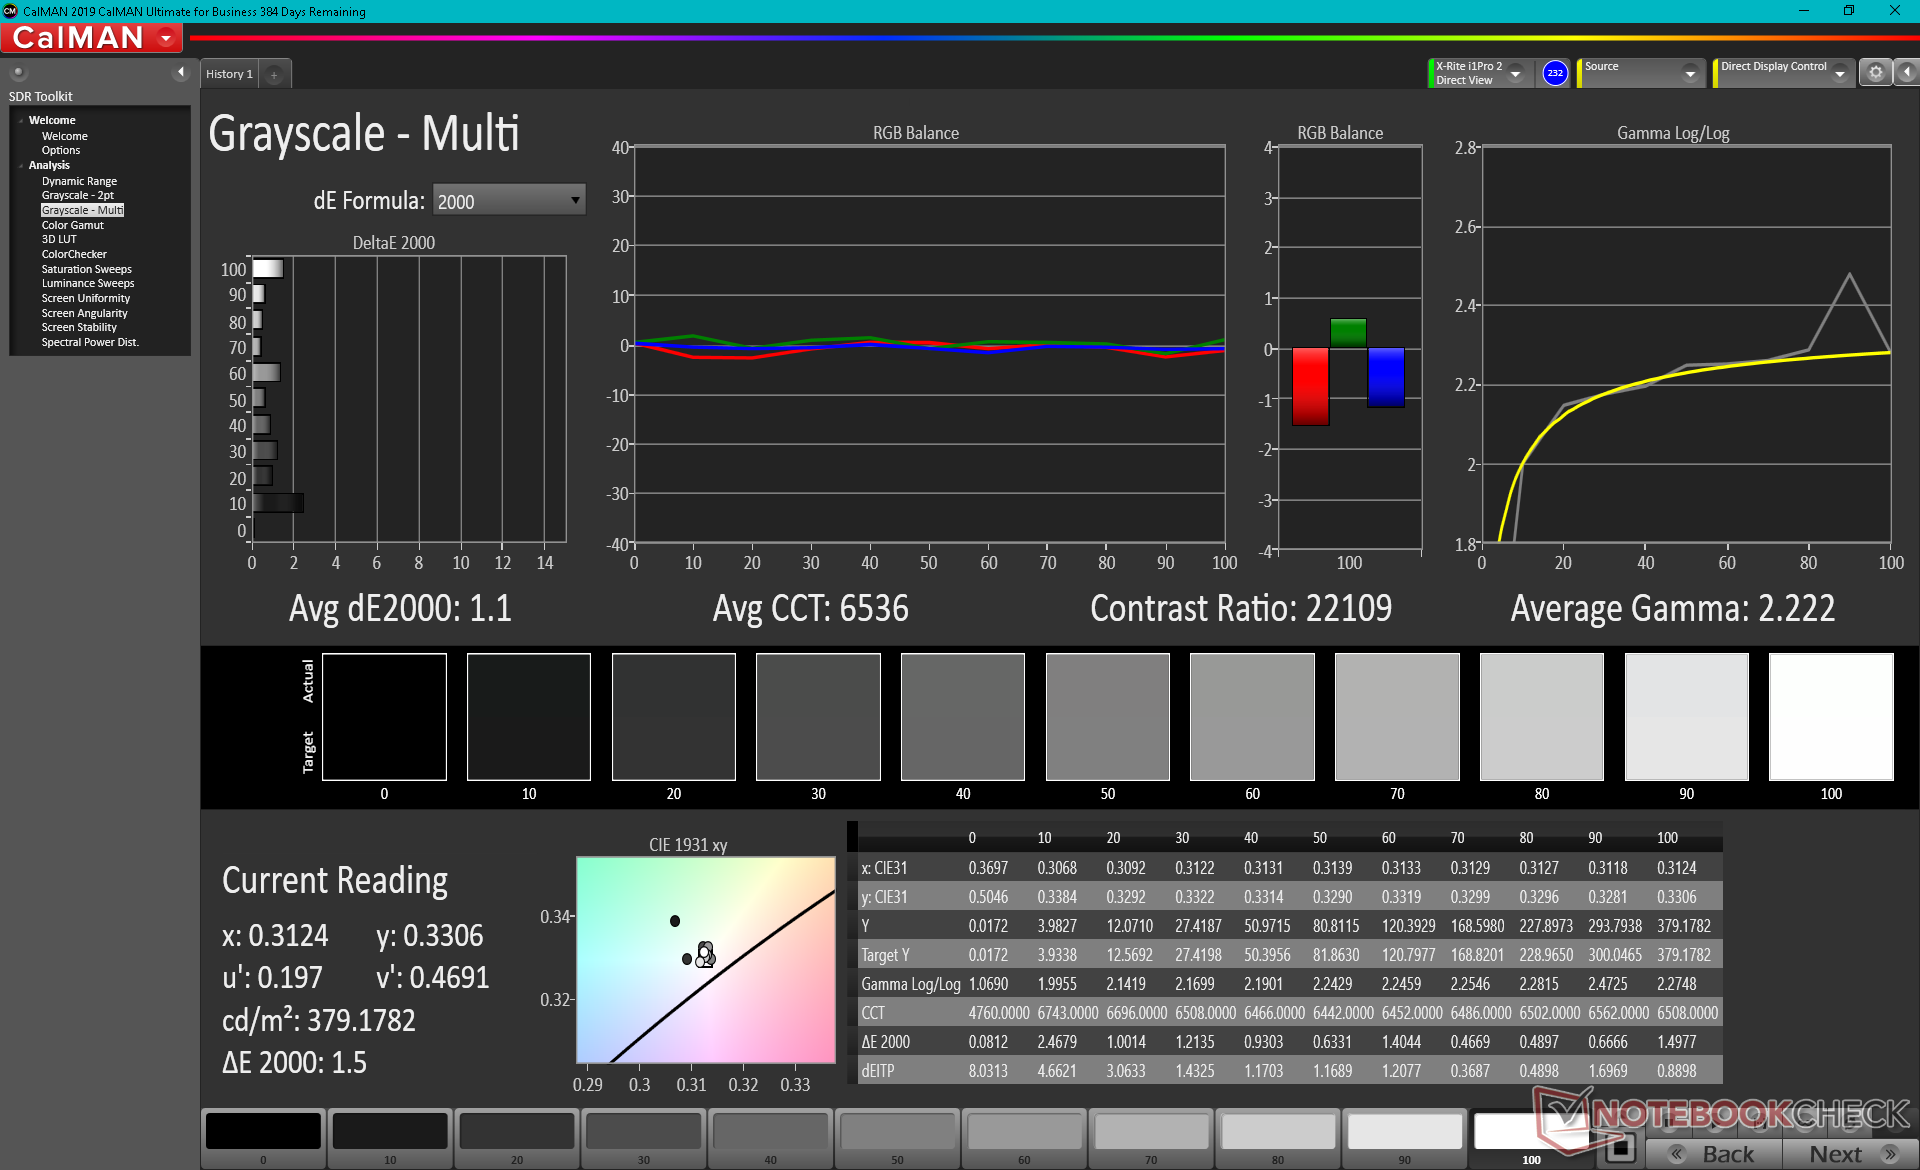
ΔE Greyscale Calman: 1.6 | ∀{0.09-98 Ø4.97}
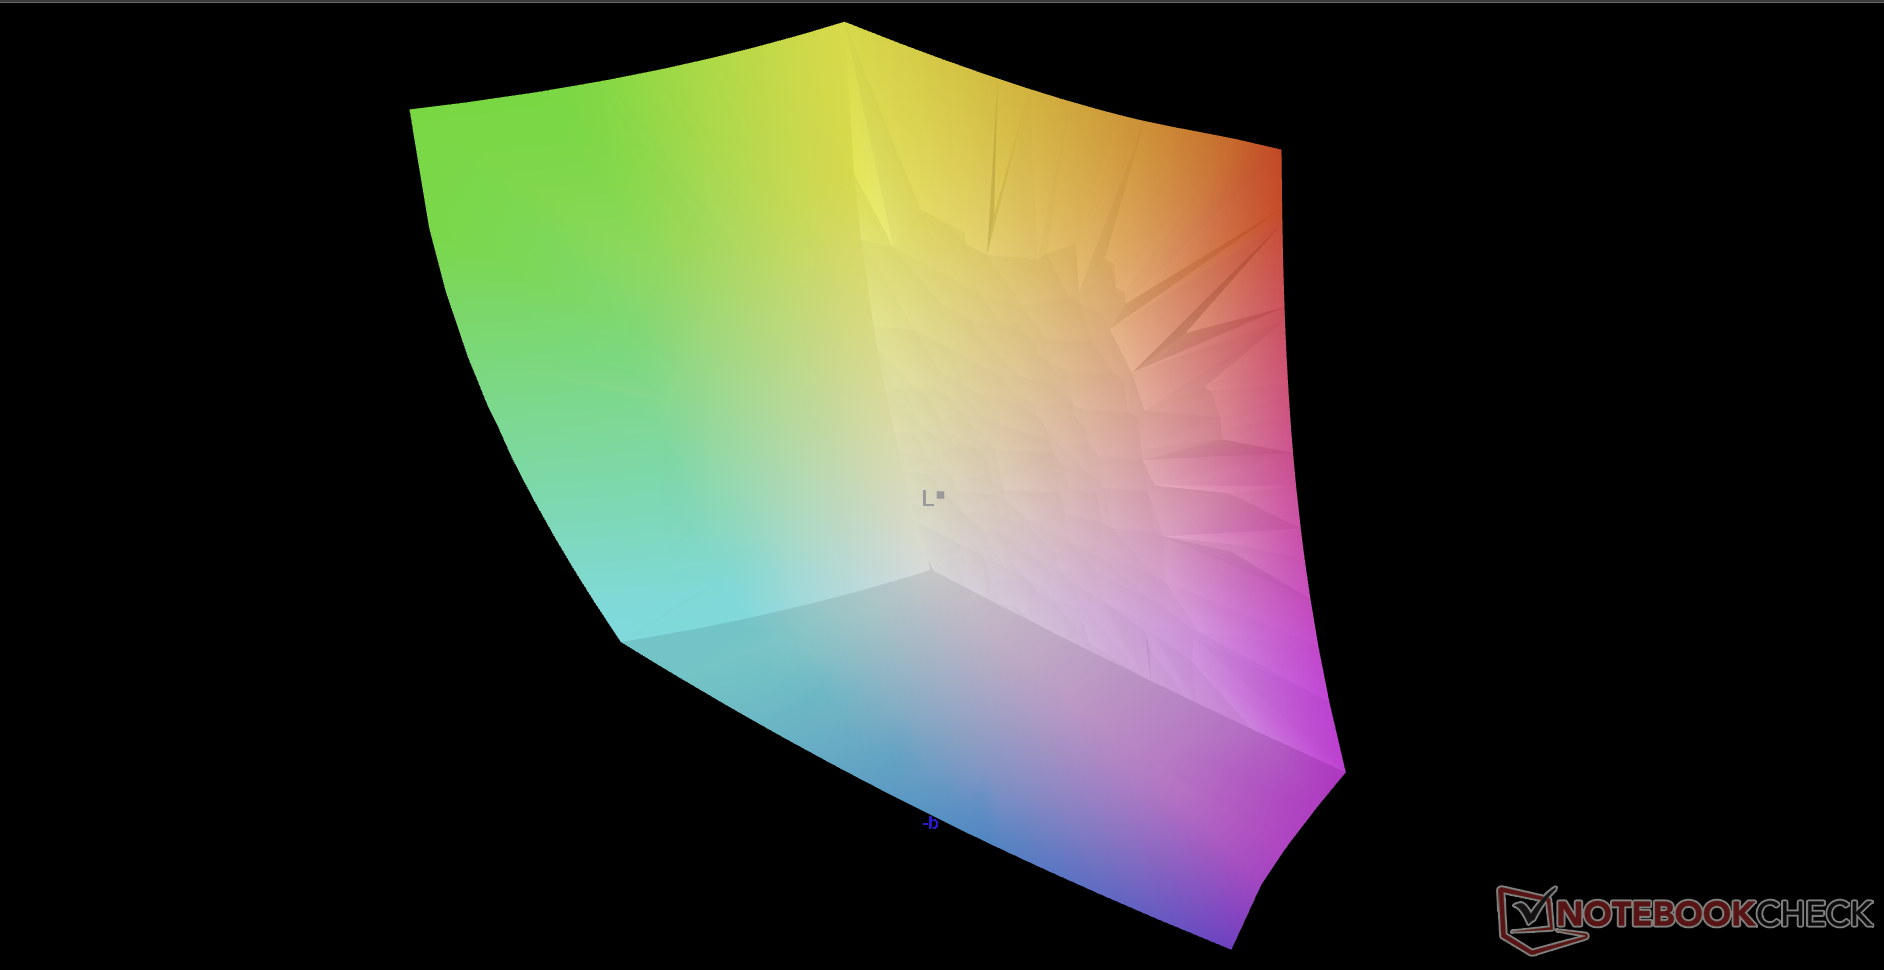
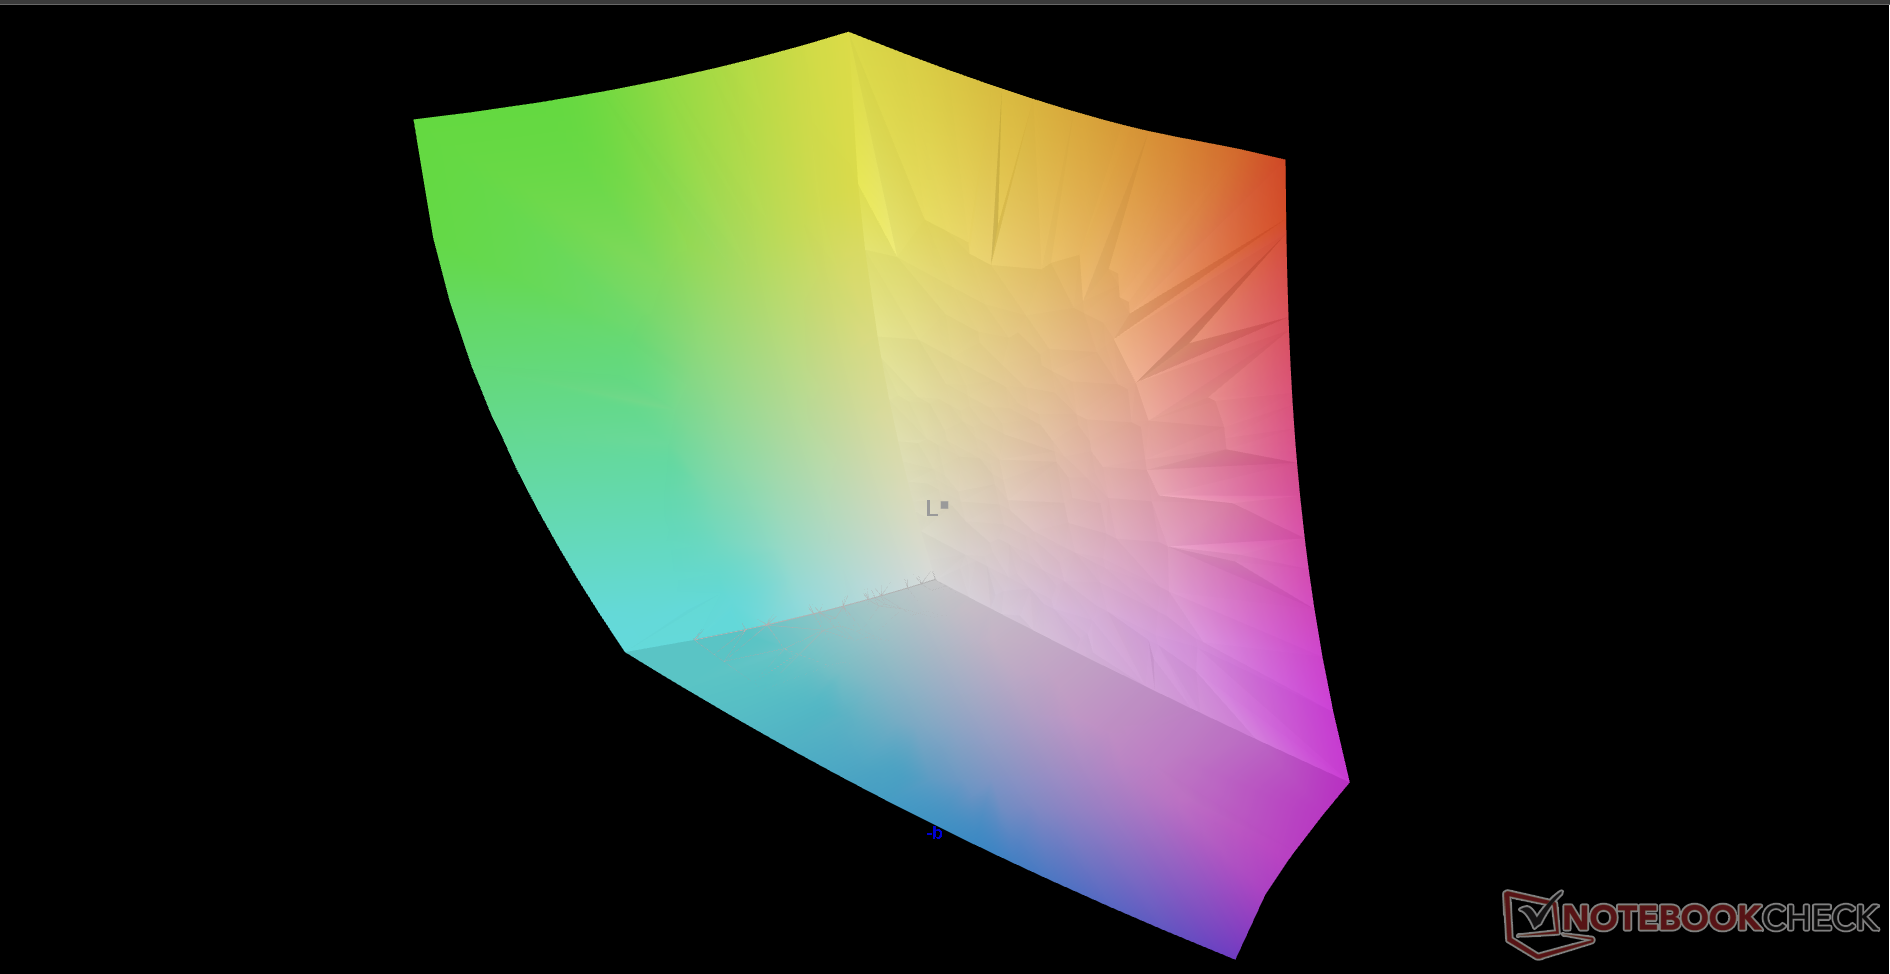
99.9% AdobeRGB 1998 (Argyll 3D)
100% sRGB (Argyll 3D)
99.9% Display P3 (Argyll 3D)
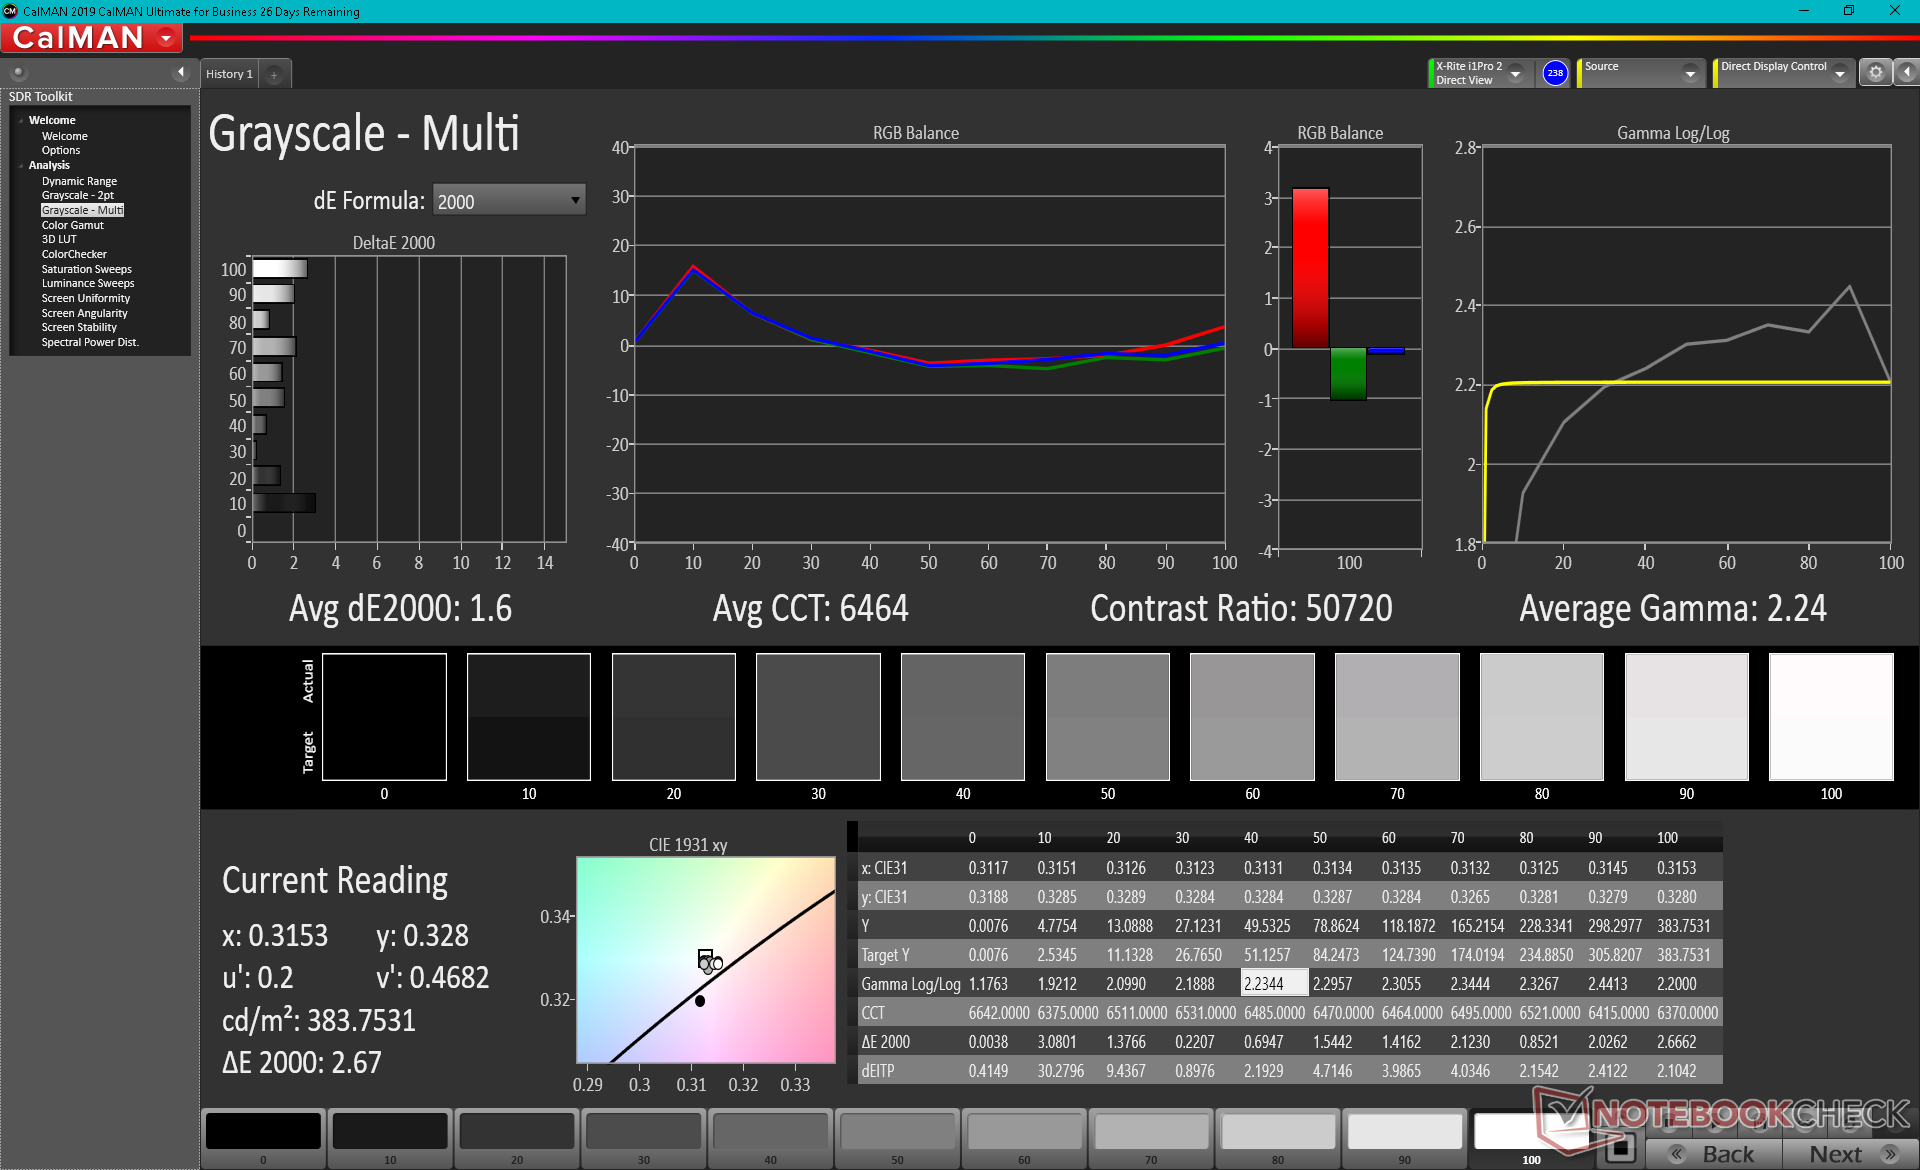
Gamma: 2.24
CCT: 6464 K
| Asus Vivobook 15 K513EQ Samsung ATNA56YX03-0, OLED, 1920x1080, 15.6" | Asus VivoBook 15 Pro M3500QC-L1062 ATNA56YX03-0, AMOLED, 1920x1080, 15.6" | Asus VivoBook S15 S533EQ-BQ002T Panda LM156LF-5L04, IPS, 1920x1080, 15.6" | Lenovo IdeaPad 5 15ALC05 Lenovo LEN156FHD, IPS, 1920x1080, 15.6" | Dell Inspiron 15 3501 BOE NV15N3D (Dell P/N: N39X1), IPS, 1920x1080, 15.6" | HP Pavilion 15-eg Chi Mei CMN1523, IPS, 1920x1080, 15.6" | |
|---|---|---|---|---|---|---|
| Display | -1% | -54% | -52% | -54% | -50% | |
| Display P3 Coverage (%) | 99.9 | 99.9 0% | 39.01 -61% | 39.4 -61% | 42.9 -57% | |
| sRGB Coverage (%) | 100 | 99.9 0% | 58.5 -41% | 59 -41% | 58.7 -41% | 64 -36% |
| AdobeRGB 1998 Coverage (%) | 99.9 | 95.8 -4% | 40.33 -60% | 38 -62% | 40.7 -59% | 44.4 -56% |
| Response Times | -28% | -1229% | -870% | -1429% | -825% | |
| Response Time Grey 50% / Grey 80% * (ms) | 2.2 ? | 3.2 ? -45% | 38 ? -1627% | 29 ? -1218% | 43 ? -1855% | 22.8 ? -936% |
| Response Time Black / White * (ms) | 2.9 ? | 3.2 ? -10% | 27 ? -831% | 18 ? -521% | 32 ? -1003% | 23.6 ? -714% |
| PWM Frequency (Hz) | 59.5 ? | 60.2 ? | 1000 ? | 26320 ? | ||
| Screen | 14% | -65% | -101% | -47% | -74% | |
| Brightness middle (cd/m²) | 384.5 | 396 3% | 287 -25% | 376 -2% | 271 -30% | 294.3 -23% |
| Brightness (cd/m²) | 388 | 397 2% | 261 -33% | 341 -12% | 263 -32% | 251 -35% |
| Brightness Distribution (%) | 98 | 99 1% | 84 -14% | 78 -20% | 92 -6% | 76 -22% |
| Black Level * (cd/m²) | 0.51 | 0.66 | 0.15 | 0.26 | ||
| Colorchecker dE 2000 * | 2.53 | 2 21% | 4.72 -87% | 6.4 -153% | 4.83 -91% | 4.08 -61% |
| Colorchecker dE 2000 max. * | 6.16 | 4.8 22% | 17.94 -191% | 20.45 -232% | 7 -14% | 19.49 -216% |
| Greyscale dE 2000 * | 1.6 | 1 37% | 2.2 -38% | 4.59 -187% | 3.36 -110% | 3 -88% |
| Gamma | 2.24 98% | 2.17 101% | 2.51 88% | 2.26 97% | 2.56 86% | 2.21 100% |
| CCT | 6464 101% | 6608 98% | 6758 96% | 6819 95% | 6764 96% | 6616 98% |
| Colorchecker dE 2000 calibrated * | 1.8 | 3.74 | 3.7 | |||
| Contrast (:1) | 563 | 570 | 1807 | 1132 | ||
| Color Space (Percent of AdobeRGB 1998) (%) | 37 | 38 | ||||
| Color Space (Percent of sRGB) (%) | 58 | 59 | ||||
| Totaal Gemiddelde (Programma / Instellingen) | -5% /
2% | -449% /
-273% | -341% /
-245% | -510% /
-300% | -316% /
-204% |
* ... kleiner is beter
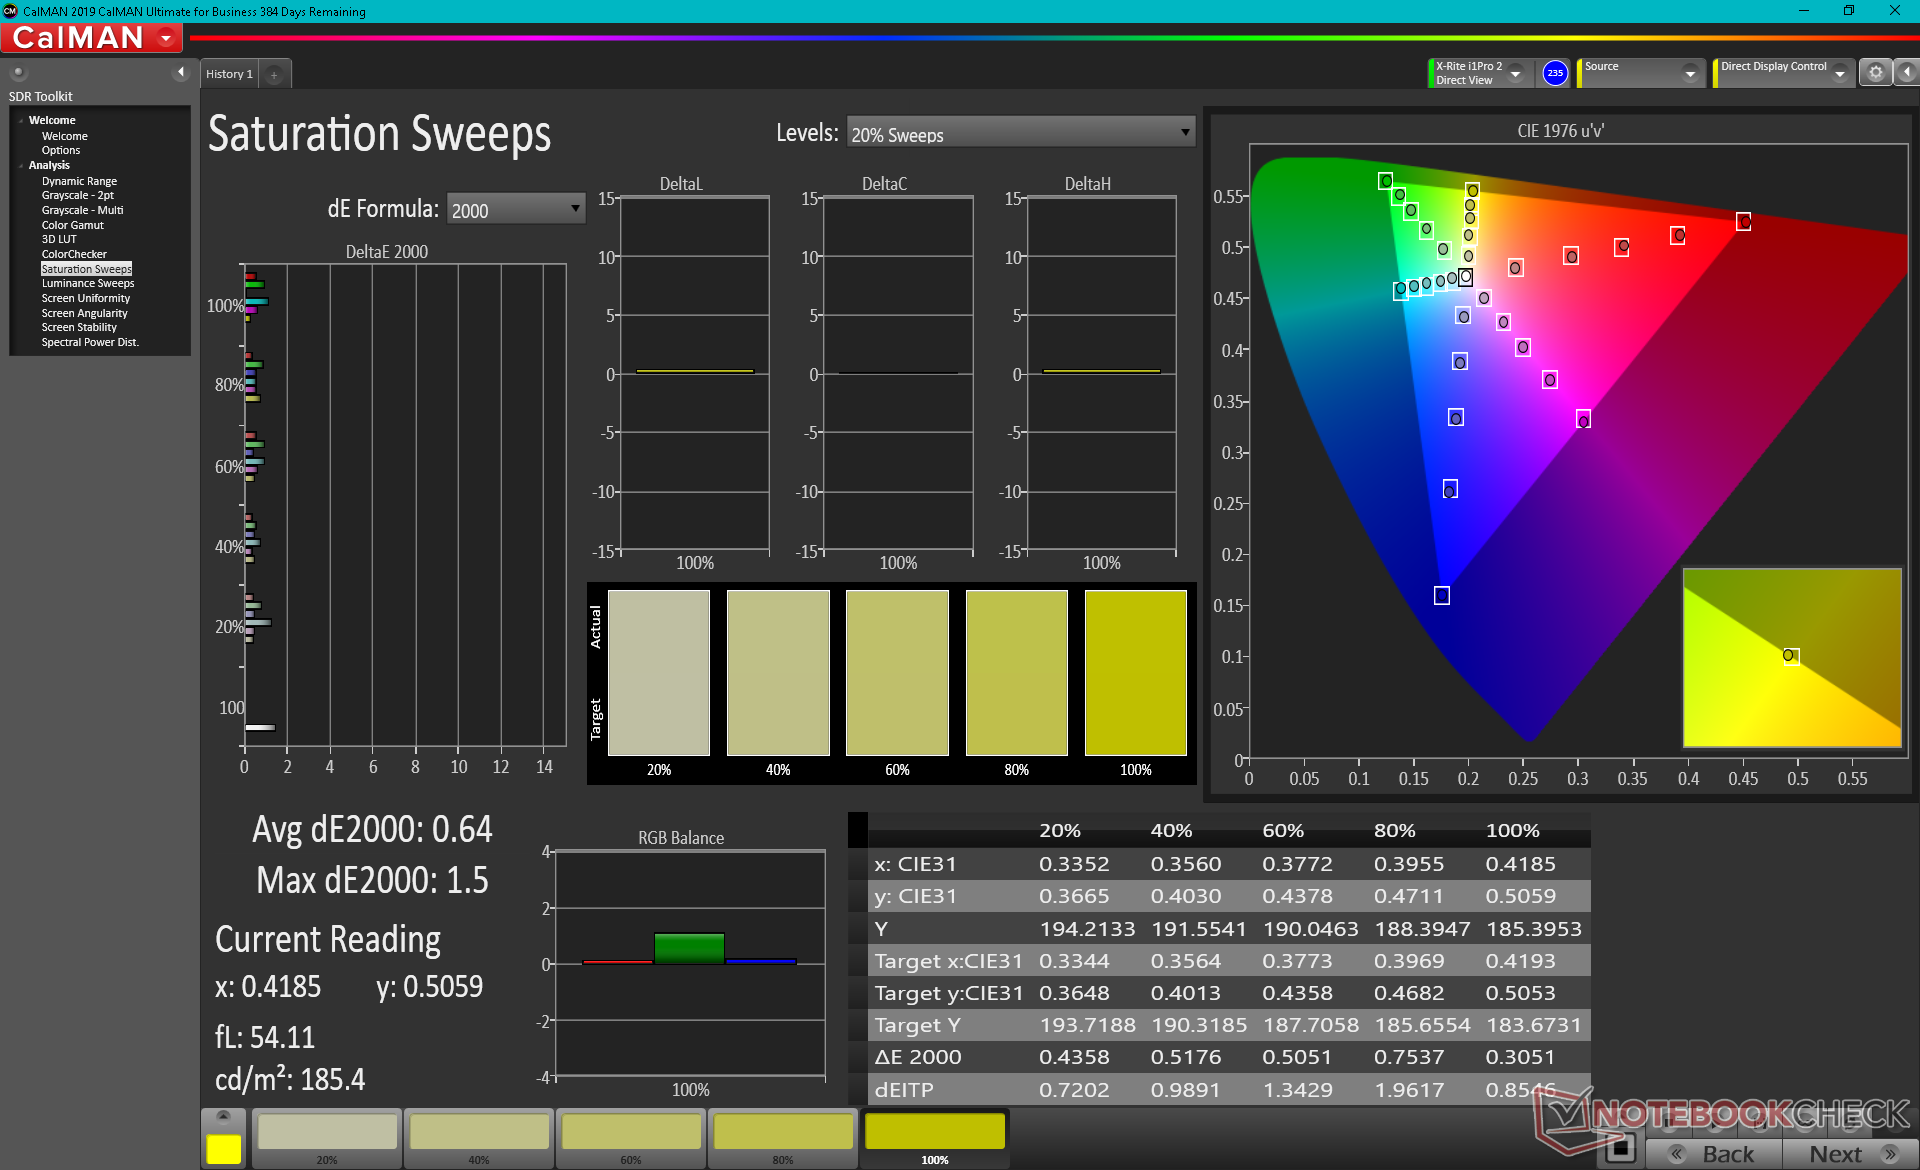
Het scherm is uit de doos behoorlijk gekalibreerd met gemiddelde grijswaarden en kleur deltaE waarden van slechts 1,6 en 2,53, respectievelijk, wanneer vergeleken met de P3 standaard. De kleuren rood en geel lijken de meest onnauwkeurige te zijn in vergelijking met andere primaire en secundaire kleuren
Responstijd Scherm
| ↔ Responstijd Zwart naar Wit | ||
|---|---|---|
| 2.9 ms ... stijging ↗ en daling ↘ gecombineerd | ↗ 1.1 ms stijging | 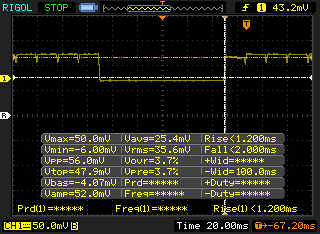 |
| ↘ 1.8 ms daling | ||
| Het scherm vertoonde erg snelle responstijden in onze tests en zou zeer geschikt moeten zijn voor snelle games. Ter vergelijking: alle testtoestellen variëren van 0.1 (minimum) tot 240 (maximum) ms. » 14 % van alle toestellen zijn beter. Dit betekent dat de gemeten responstijd beter is dan het gemiddelde (19.8 ms) van alle geteste toestellen. | ||
| ↔ Responstijd 50% Grijs naar 80% Grijs | ||
| 2.2 ms ... stijging ↗ en daling ↘ gecombineerd | ↗ 1.1 ms stijging | 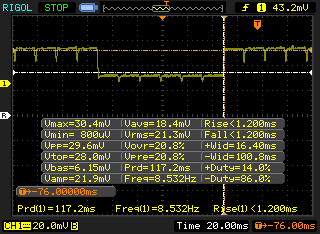 |
| ↘ 1.1 ms daling | ||
| Het scherm vertoonde erg snelle responstijden in onze tests en zou zeer geschikt moeten zijn voor snelle games. Ter vergelijking: alle testtoestellen variëren van 0.165 (minimum) tot 636 (maximum) ms. » 11 % van alle toestellen zijn beter. Dit betekent dat de gemeten responstijd beter is dan het gemiddelde (31 ms) van alle geteste toestellen. | ||
Screen Flickering / PWM (Pulse-Width Modulation)
| Screen flickering / PWM waargenomen | 59.5 Hz | ≤ 100 % helderheid instelling | 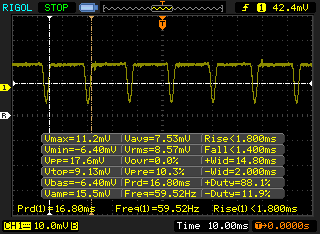 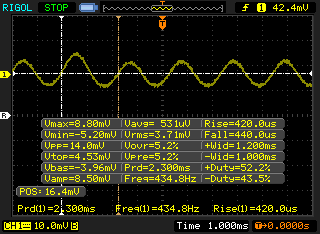 |
De achtergrondverlichting van het scherm flikkert op 59.5 Hz (in het slechtste geval, bijvoorbeeld bij gebruik van PWM) aan een helderheid van 100 % en lager. Boven deze helderheid zou er geen flickering / PWM mogen optreden. De frequentie van 59.5 Hz is erg laag en kan dus aanleiding geven tot geïrriteerde ogen en hoofdpijn bij langer gebruik. Ter vergelijking: 52 % van alle geteste toestellen maakten geen gebruik van PWM om de schermhelderheid te verlagen. Als het wel werd gebruikt, werd een gemiddelde van 7763 (minimum: 5 - maximum: 343500) Hz waargenomen. | |||
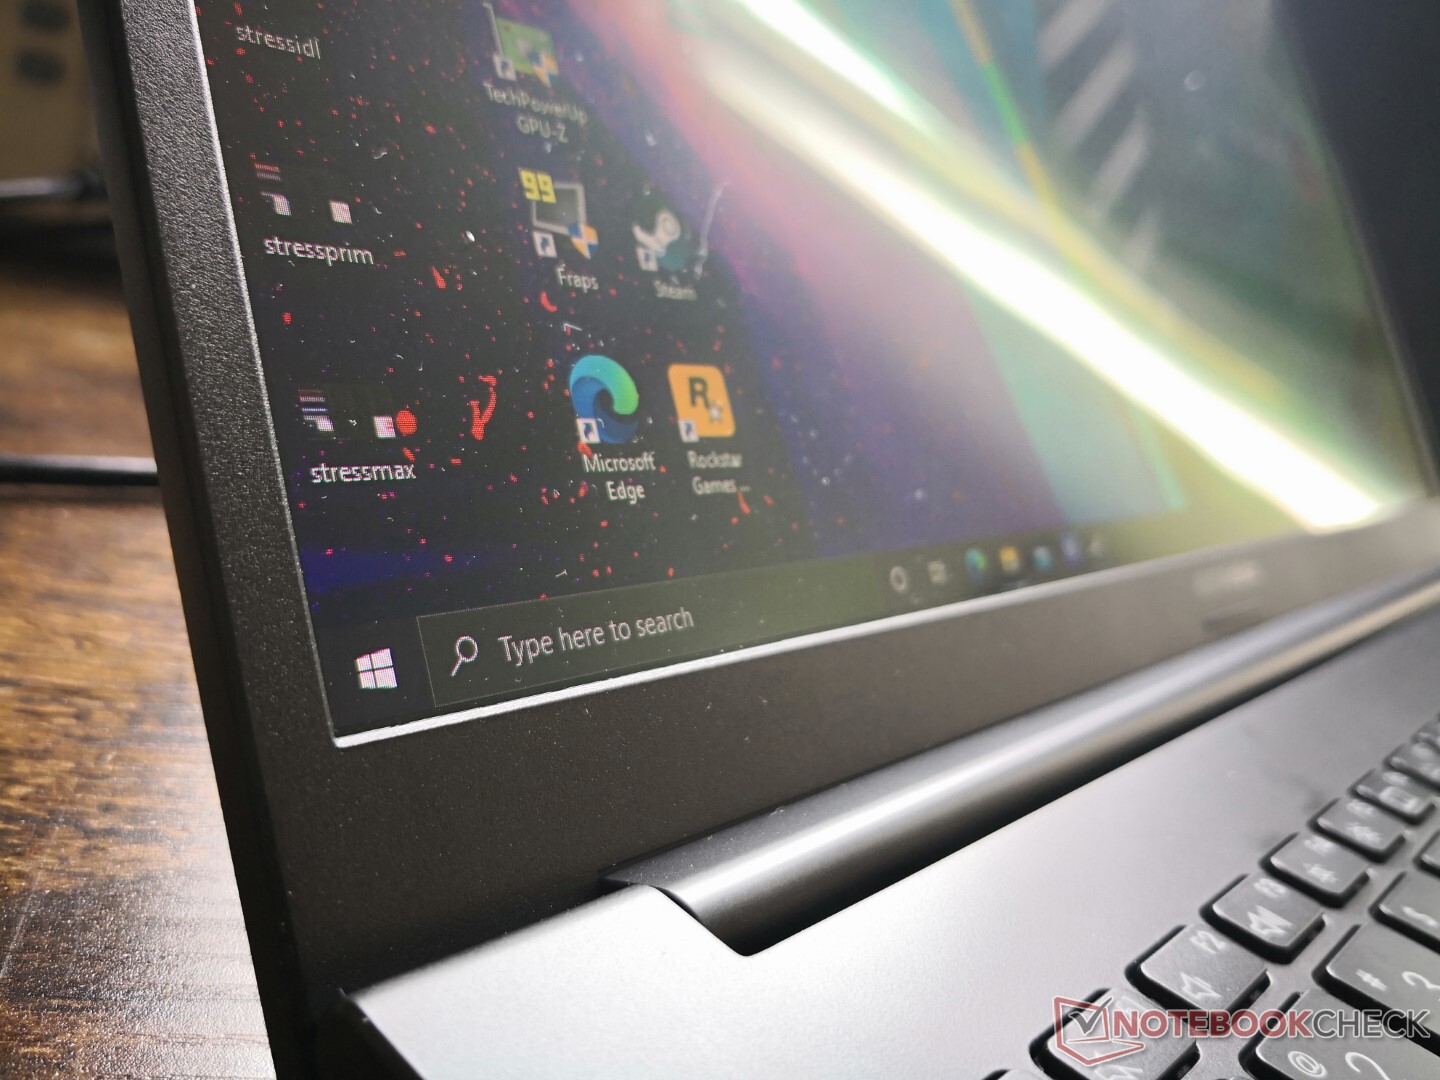
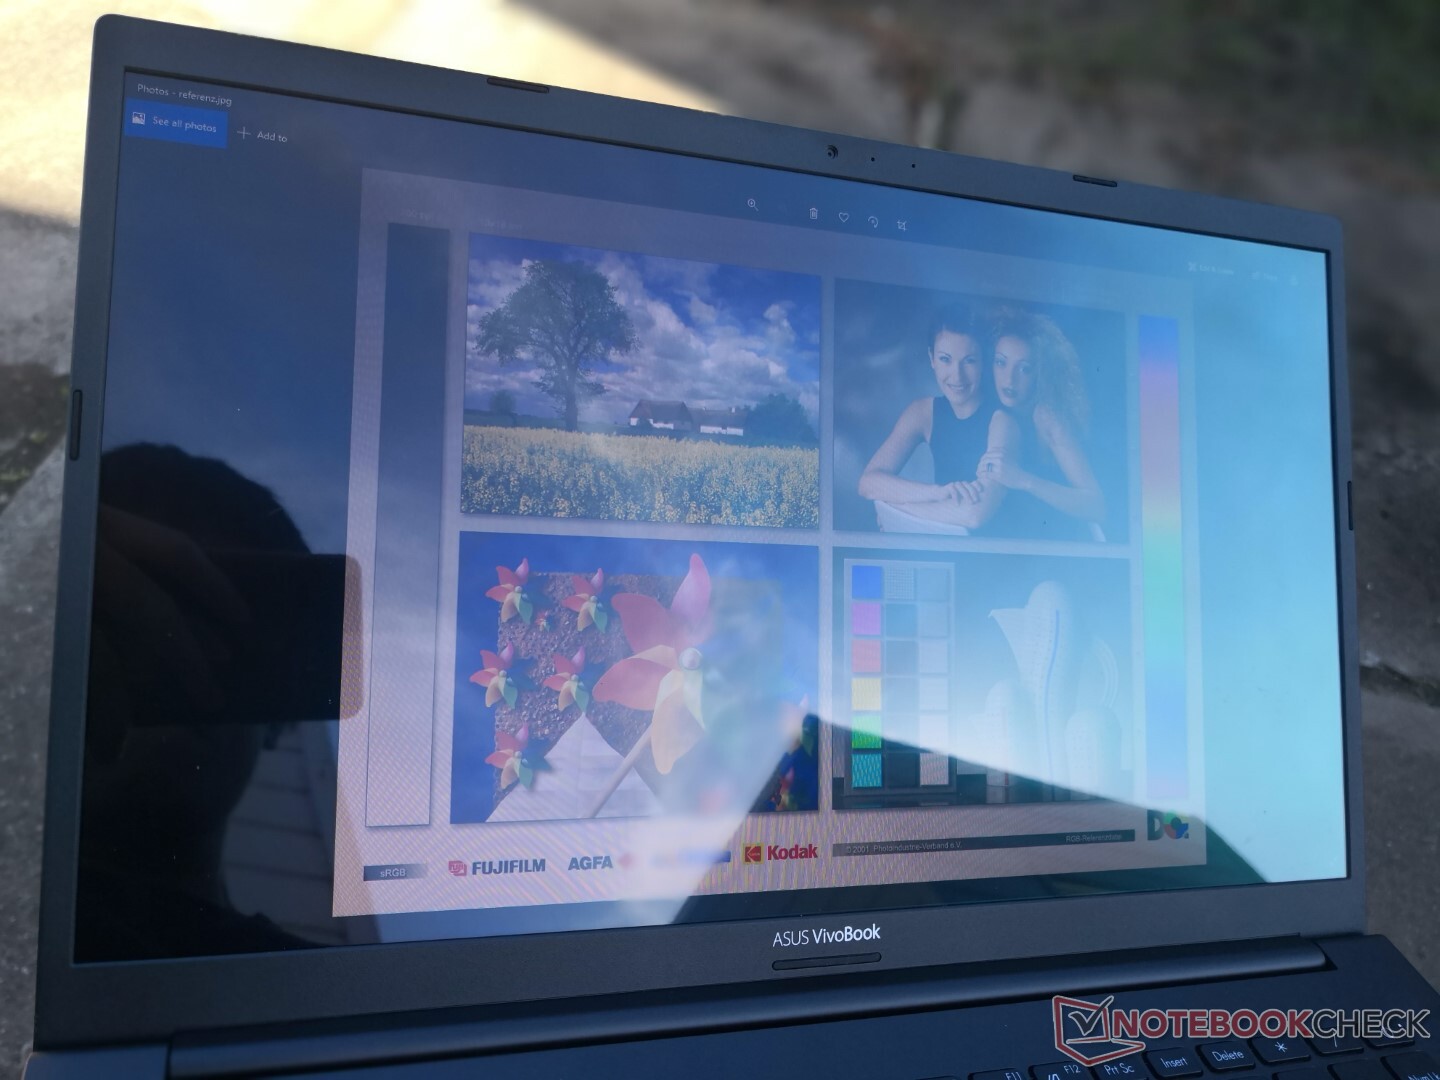
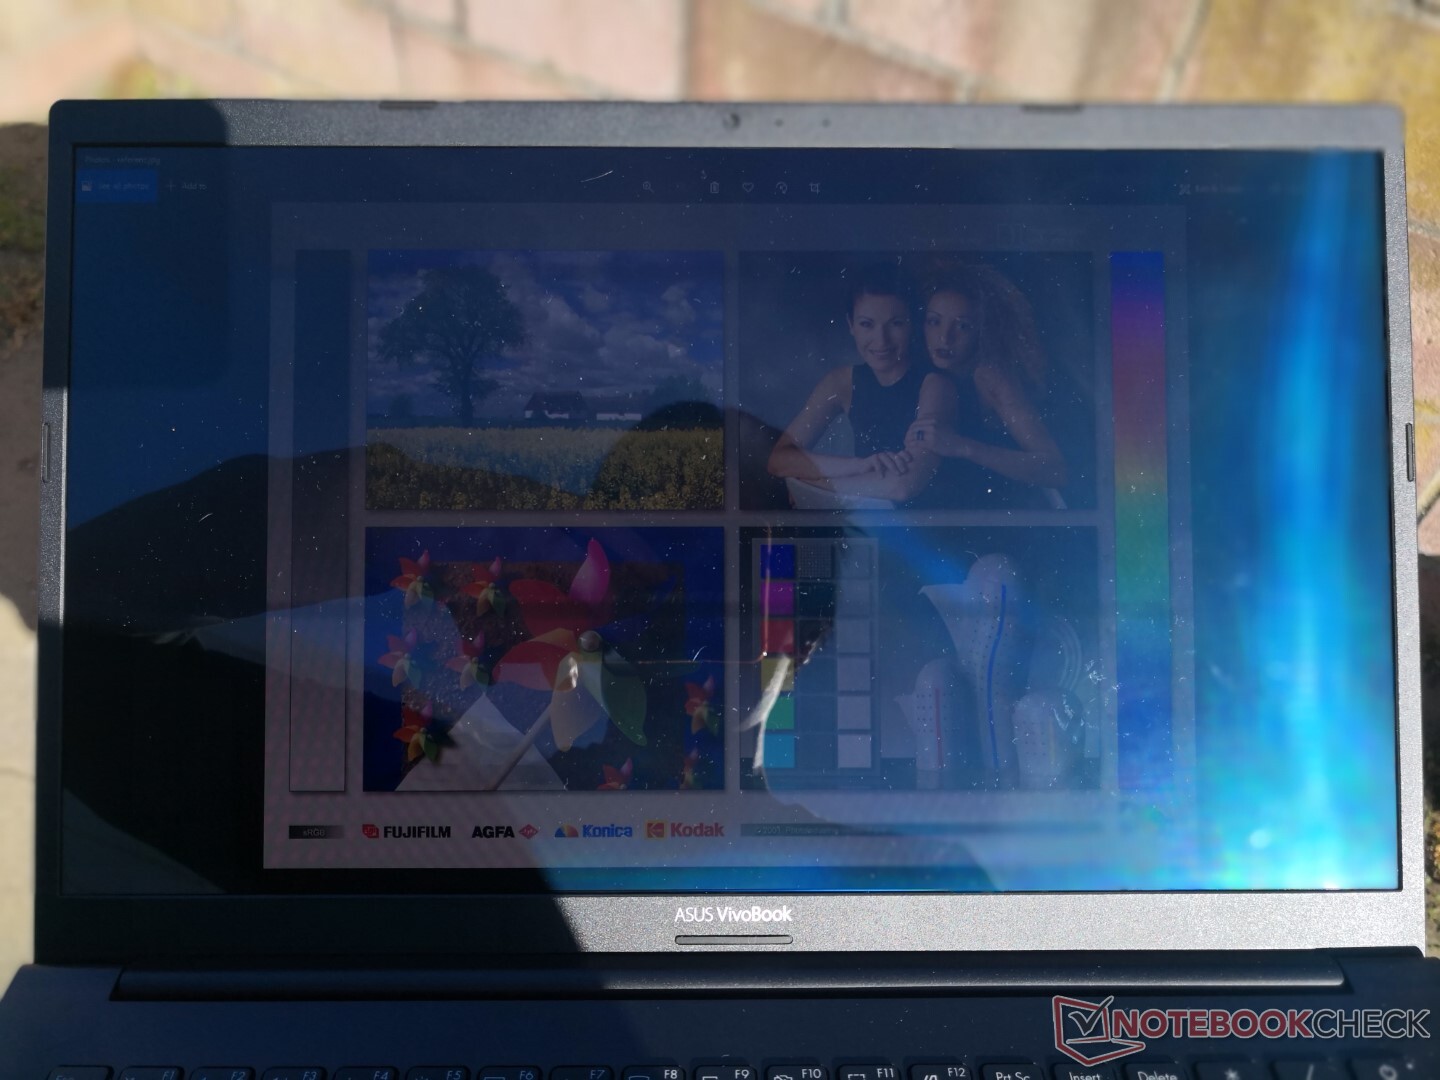
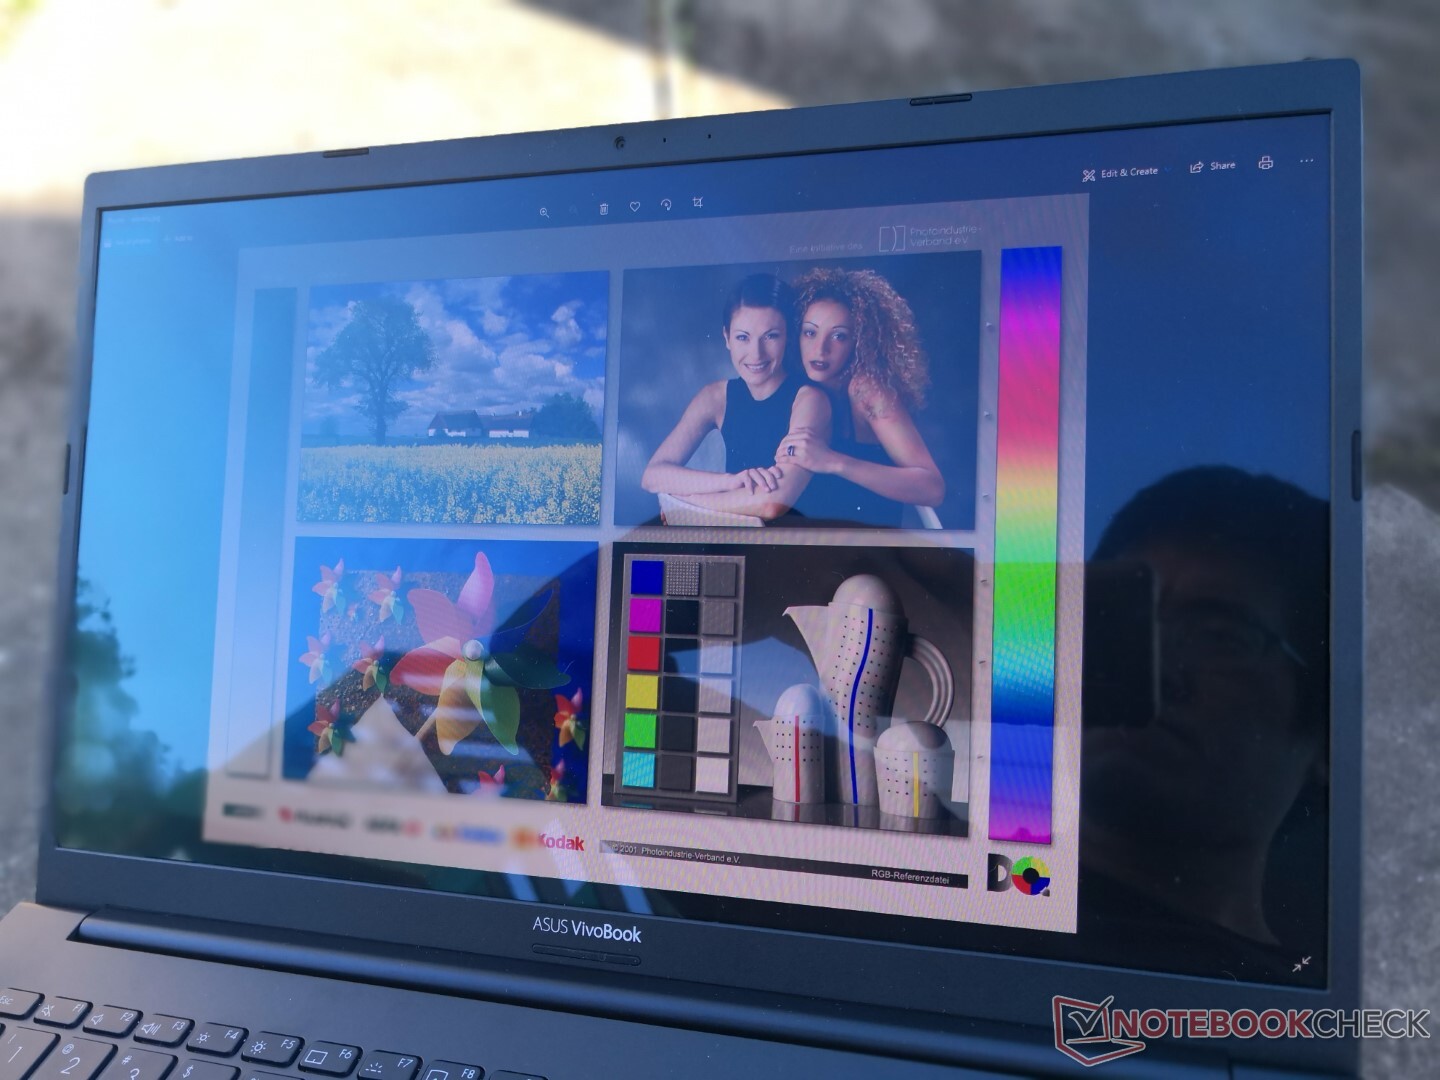
De zichtbaarheid buitenshuis is gemiddeld, mits in de schaduw, en iets beter dan IPS bij dezelfde helderheid, dankzij de veel diepere zwartniveaus van OLED. Het scherm valt daardoor minder snel uit, maar schittering is desondanks nog steeds moeilijk te vermijden.

Prestaties - 11e Gen Tiger Lake-U
De huidige SKU's zijn uitgerust met de U-serie Core i3-1115G4 CPU tot en met de Core i7-1165G7 plus optionele GeForce MX330 of MX350 graphics op Optimus 1.0. De eerder genoemde Core i3 SKU wordt alleen geleverd met geïntegreerde UHD Graphics om aanzienlijk langzamer te zijn dan Iris Xe of de discrete Nvidia GPU. Gebruikers zullen moeten kijken naar de high-end VivoBook 15 Pro serie als ze snellere Core H-serie CPU's en GeForce RTX graphics willen
Testomstandigheden
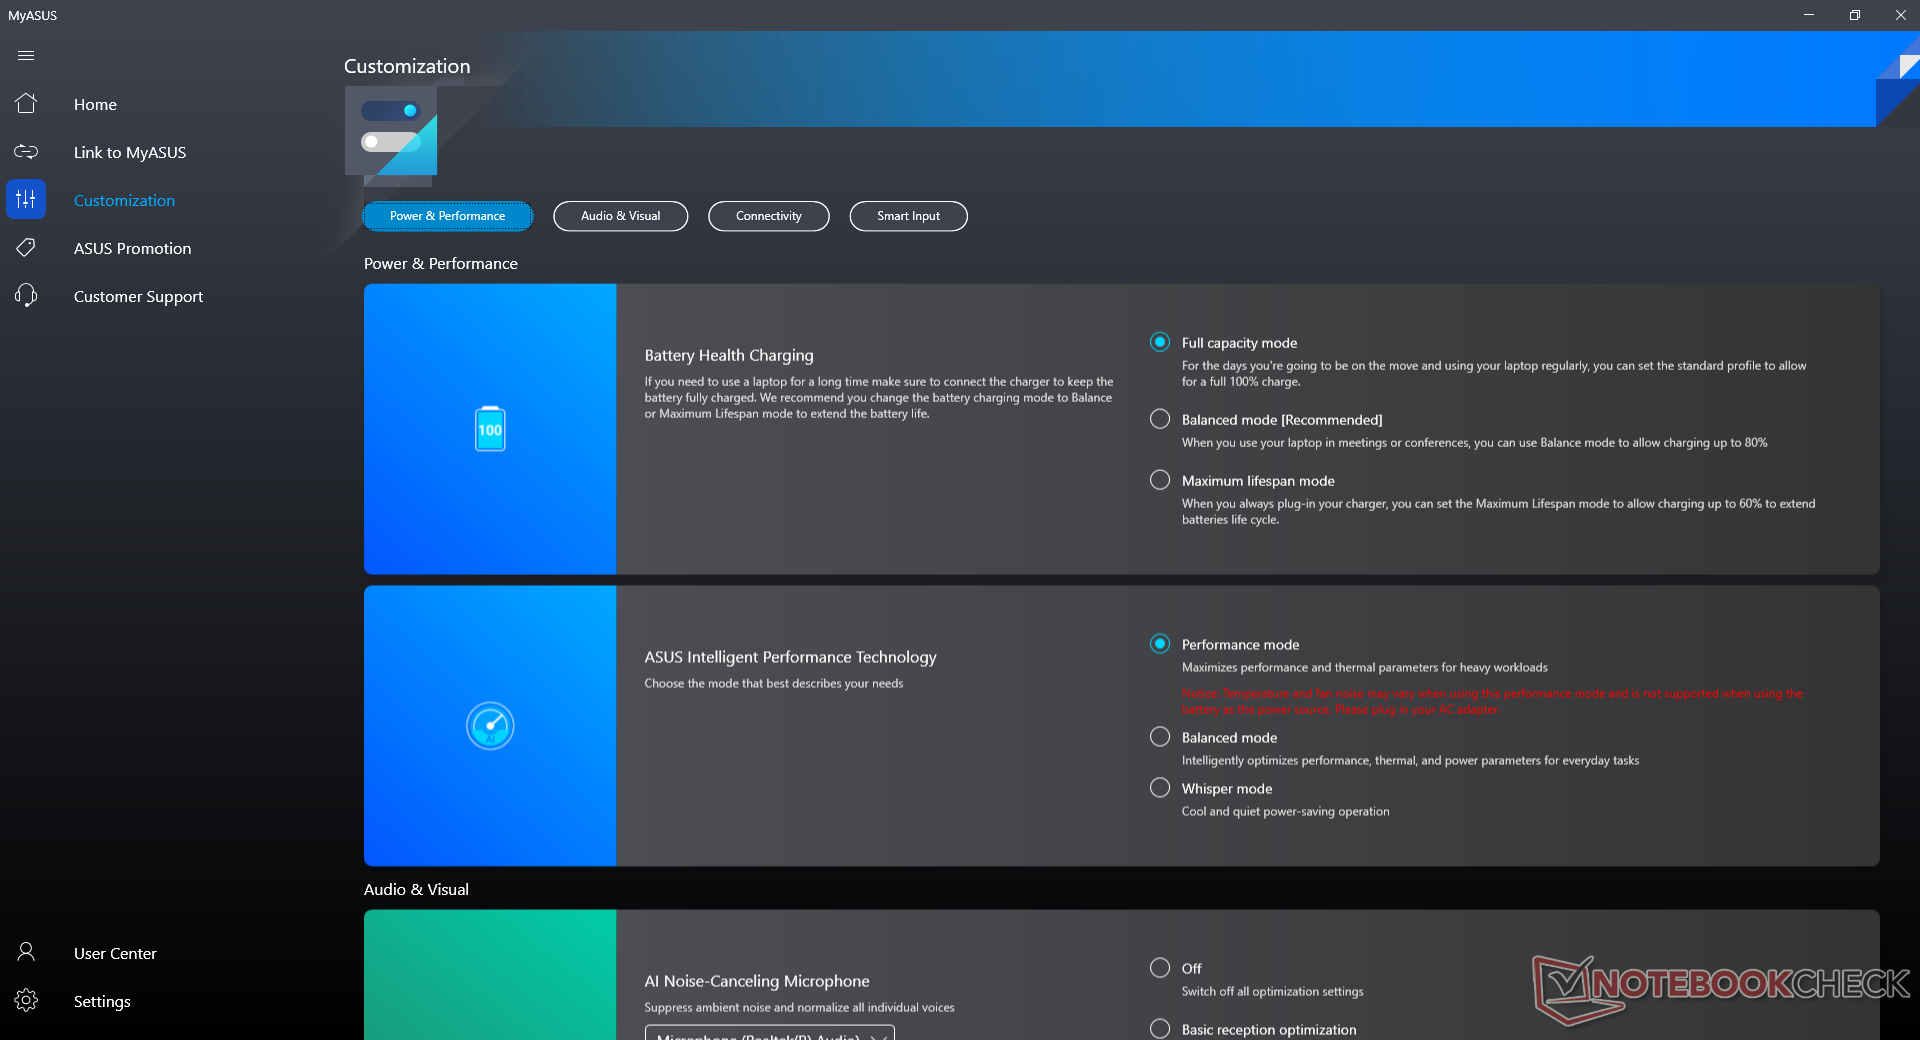
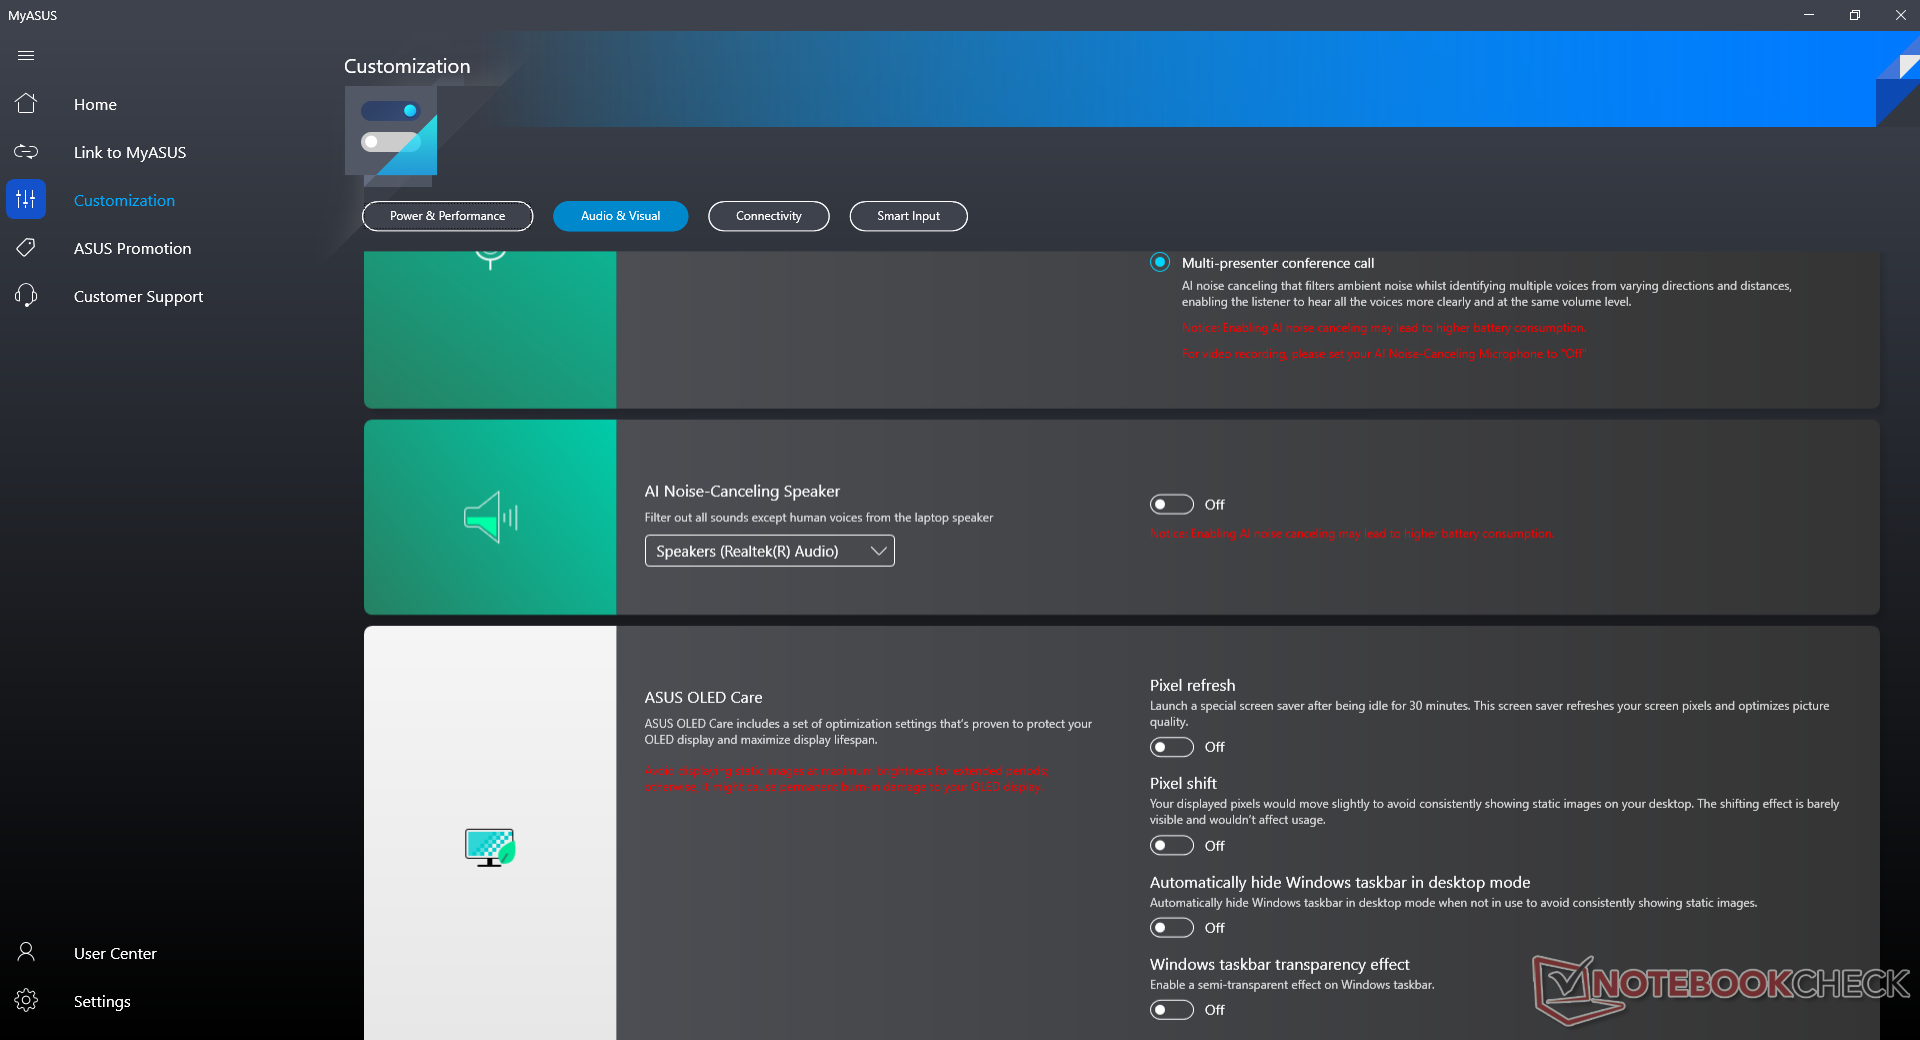
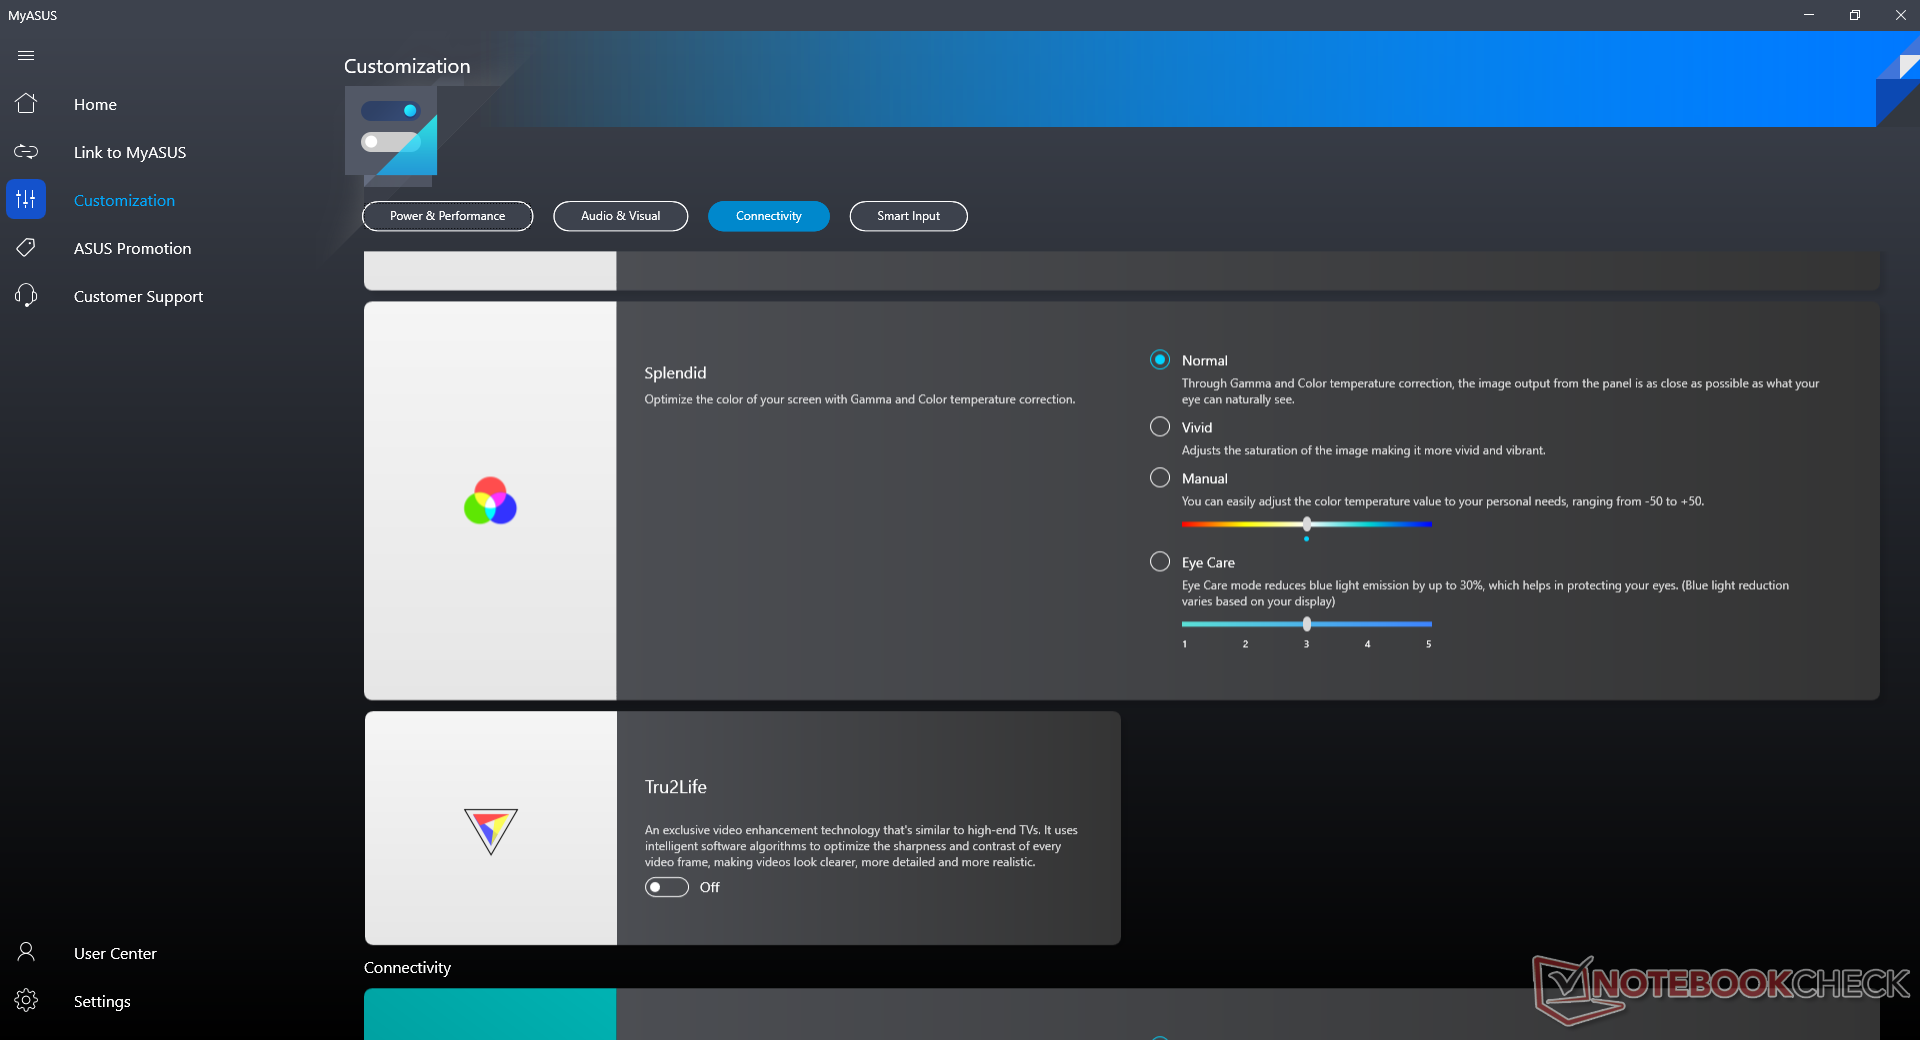
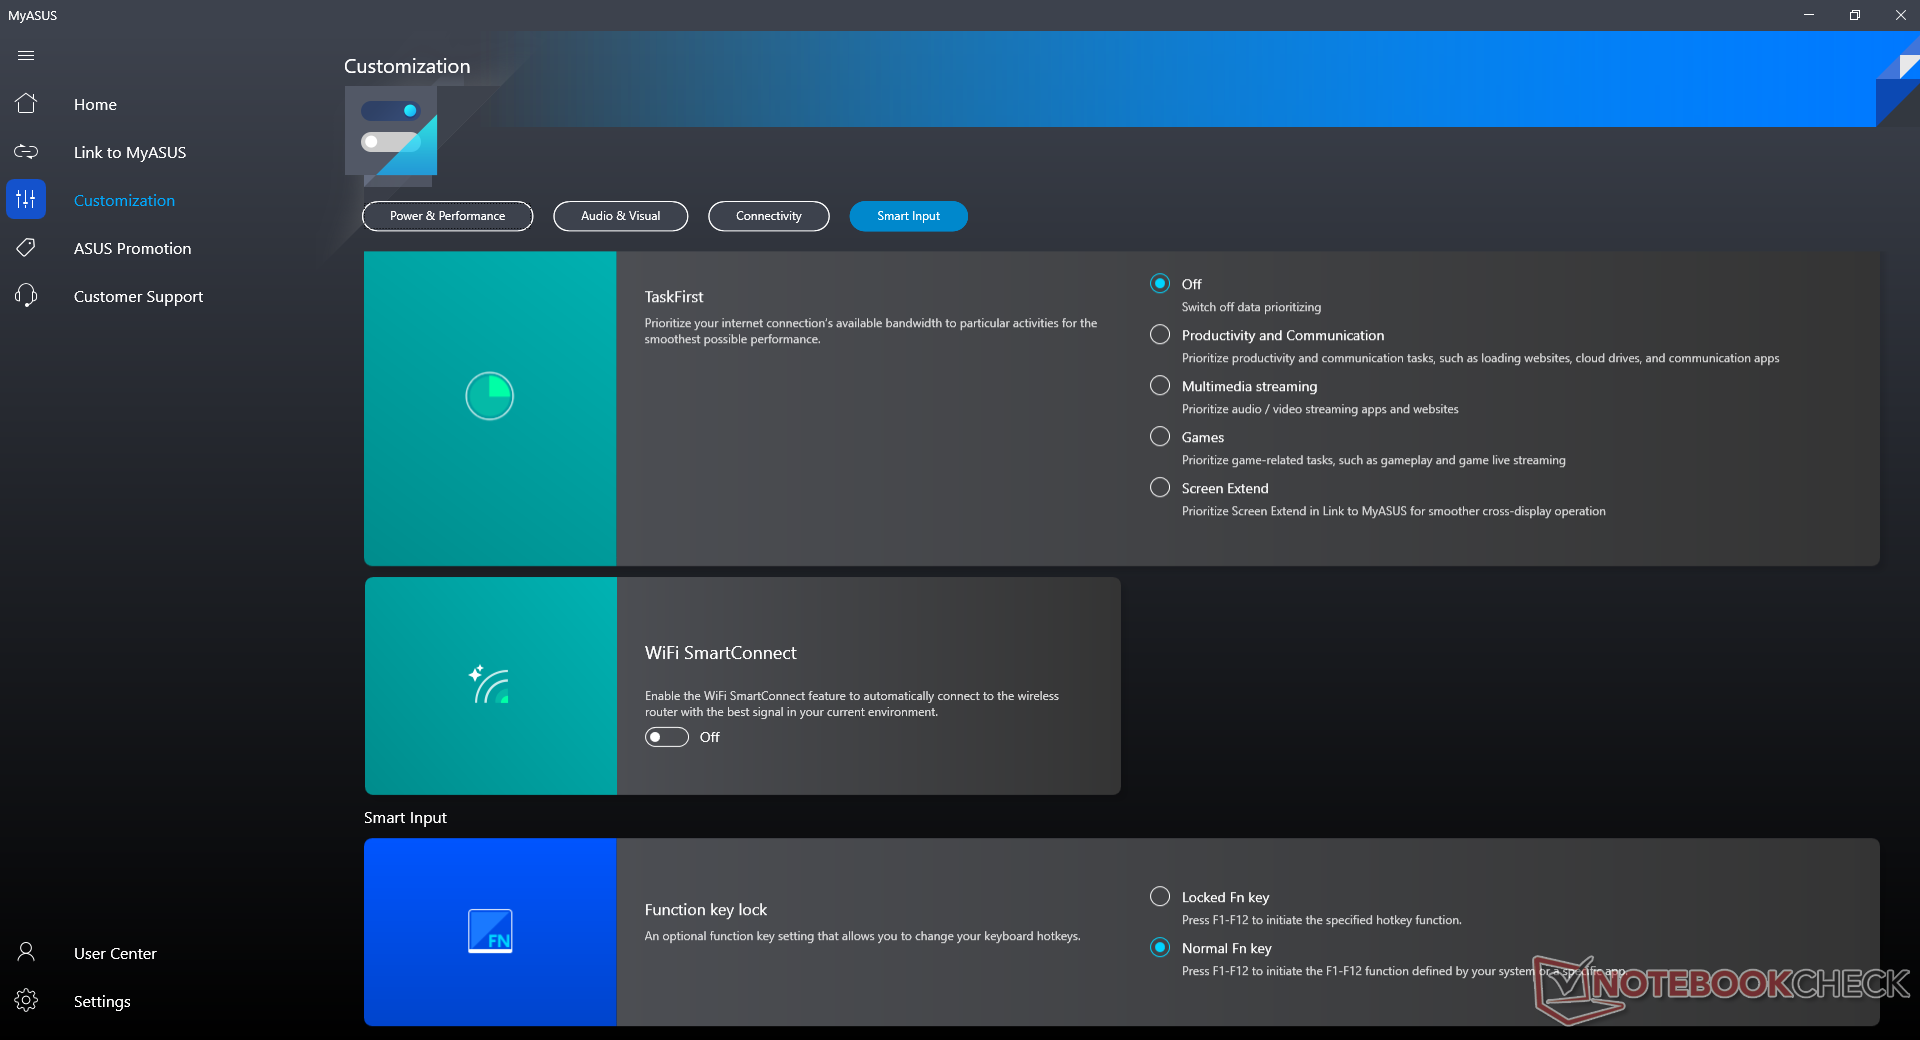
Ons toestel werd via de MyAsus software ingesteld op Prestatiemodus voor de best mogelijke benchmark scores. We raden eigenaars aan om vertrouwd te raken met deze software, omdat belangrijke functies met betrekking tot OLED, microfoon, batterij gezondheid, Asus updates en meer hier allemaal toegankelijk zijn.
Processor
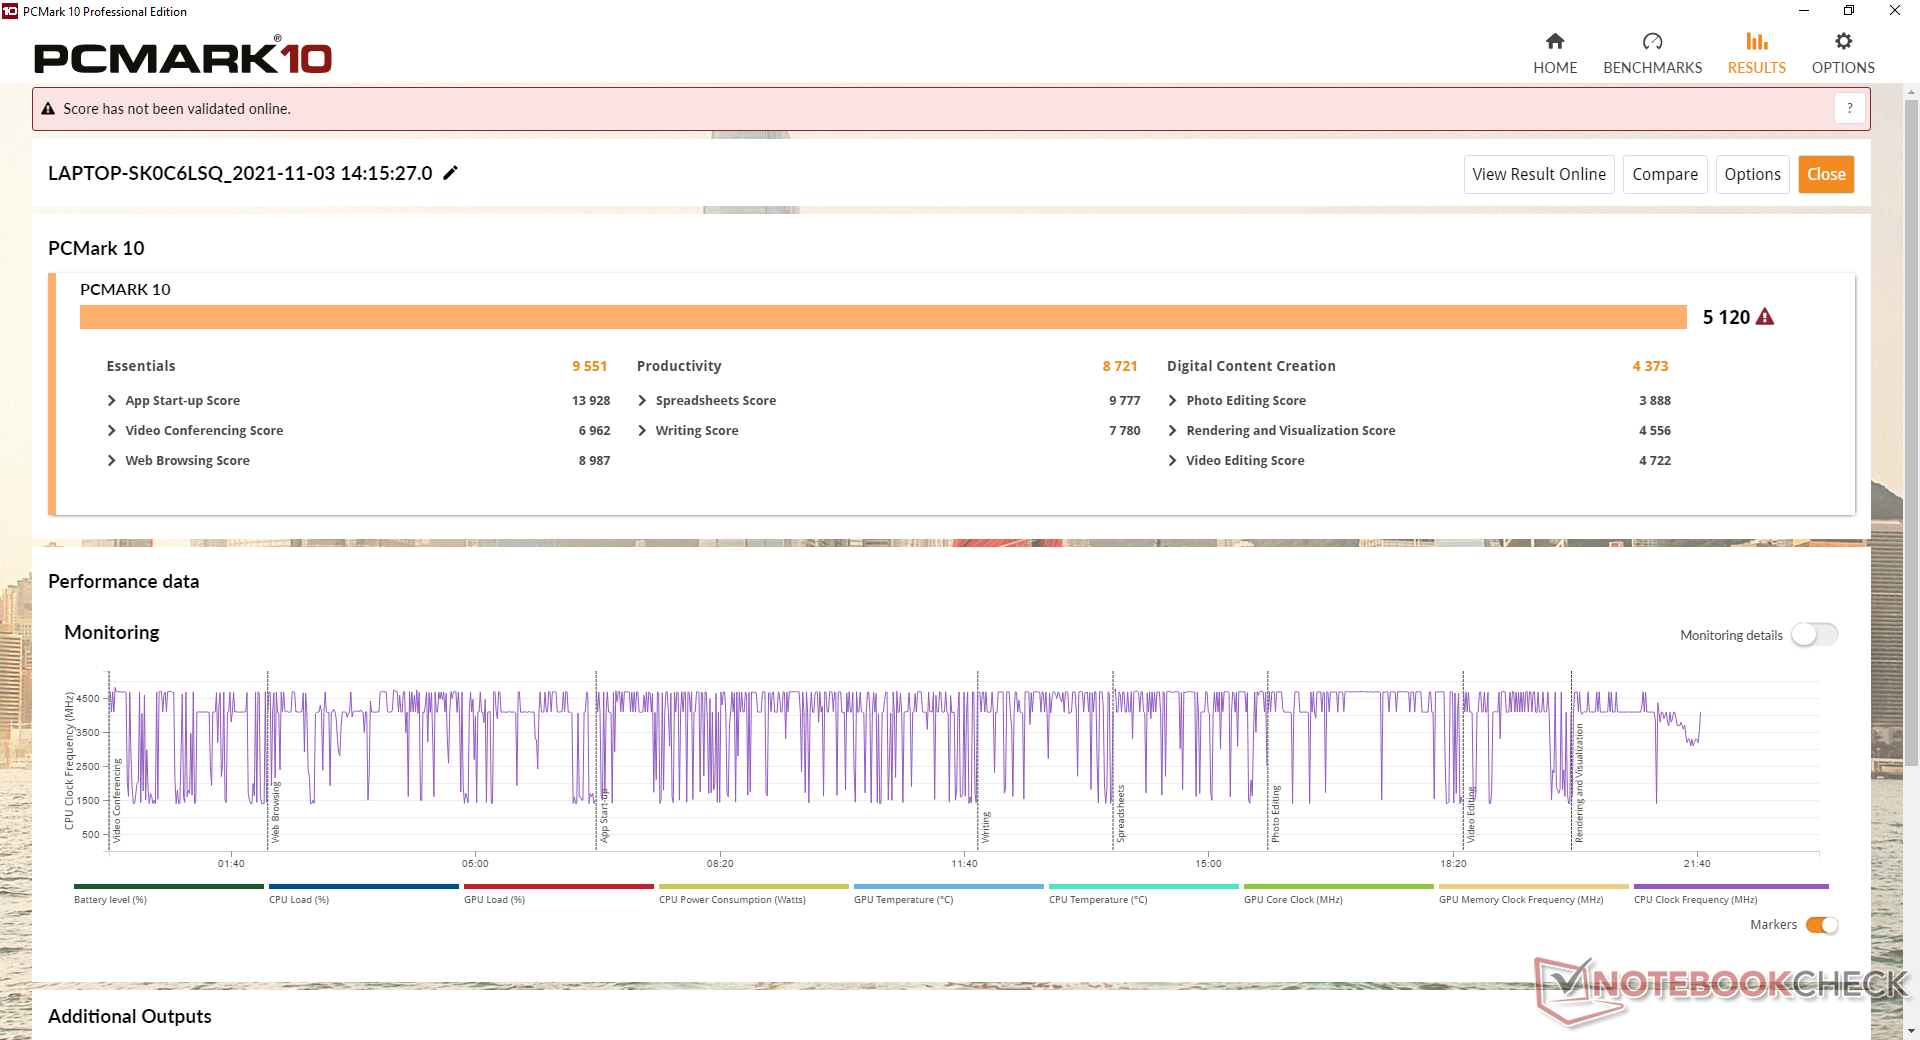
CPU-prestaties zijn uitstekend met multi-thread resultaten die ongeveer 10 procent sneller zijn dan de gemiddelde laptop in onze database met dezelfde Core i7-1165G7 processor. Kiezen voor de mindere Core i5-1135G7 optie zal een prestatiedaling van slechts ongeveer 10 tot 15 procent met zich meebrengen.
Cinebench R15 Multi Loop
Cinebench R23: Multi Core | Single Core
Cinebench R20: CPU (Multi Core) | CPU (Single Core)
Cinebench R15: CPU Multi 64Bit | CPU Single 64Bit
Blender: v2.79 BMW27 CPU
7-Zip 18.03: 7z b 4 | 7z b 4 -mmt1
Geekbench 5.5: Multi-Core | Single-Core
HWBOT x265 Benchmark v2.2: 4k Preset
LibreOffice : 20 Documents To PDF
R Benchmark 2.5: Overall mean
| CPU Performance rating | |
| HP Pavilion Aero 13 be0097nr -2! | |
| Lenovo ThinkPad E15 G3-20YG003UGE | |
| Microsoft Surface Laptop 4 15 AMD TFF_00028 | |
| MSI Prestige 15 A10SC -10! | |
| VAIO SX14 VJS144X0111K -2! | |
| Asus Vivobook 15 K513EQ -2! | |
| Gemiddeld Intel Core i7-1165G7 | |
| Microsoft Surface Laptop 3 15 i7-1065G7 -10! | |
| HP Pavilion x360 15-er0155ng | |
| Asus ZenBook 15 UX534FT-DB77 -10! | |
| Lenovo ThinkPad P15s Gen1-20T4000JGE -2! | |
| HP 250 G7-15S40ES -2! | |
| Dell Inspiron 15 5000 5502 -2! | |
| Cinebench R23 / Multi Core | |
| Microsoft Surface Laptop 4 15 AMD TFF_00028 | |
| Lenovo ThinkPad E15 G3-20YG003UGE | |
| HP Pavilion Aero 13 be0097nr | |
| VAIO SX14 VJS144X0111K | |
| Asus Vivobook 15 K513EQ | |
| Gemiddeld Intel Core i7-1165G7 (2525 - 6862, n=64) | |
| HP Pavilion x360 15-er0155ng | |
| Cinebench R23 / Single Core | |
| VAIO SX14 VJS144X0111K | |
| Asus Vivobook 15 K513EQ | |
| Gemiddeld Intel Core i7-1165G7 (1110 - 1539, n=59) | |
| HP Pavilion Aero 13 be0097nr | |
| HP Pavilion x360 15-er0155ng | |
| Microsoft Surface Laptop 4 15 AMD TFF_00028 | |
| Lenovo ThinkPad E15 G3-20YG003UGE | |
| Geekbench 5.5 / Multi-Core | |
| Microsoft Surface Laptop 4 15 AMD TFF_00028 | |
| Lenovo ThinkPad E15 G3-20YG003UGE | |
| Gemiddeld Intel Core i7-1165G7 (3078 - 5926, n=77) | |
| HP Pavilion x360 15-er0155ng | |
| Lenovo ThinkPad P15s Gen1-20T4000JGE | |
| HP 250 G7-15S40ES | |
| Dell Inspiron 15 5000 5502 | |
| Geekbench 5.5 / Single-Core | |
| Gemiddeld Intel Core i7-1165G7 (1302 - 1595, n=77) | |
| HP Pavilion x360 15-er0155ng | |
| Dell Inspiron 15 5000 5502 | |
| Lenovo ThinkPad P15s Gen1-20T4000JGE | |
| Lenovo ThinkPad E15 G3-20YG003UGE | |
| HP 250 G7-15S40ES | |
| Microsoft Surface Laptop 4 15 AMD TFF_00028 | |
| HWBOT x265 Benchmark v2.2 / 4k Preset | |
| HP Pavilion Aero 13 be0097nr | |
| Lenovo ThinkPad E15 G3-20YG003UGE | |
| Microsoft Surface Laptop 4 15 AMD TFF_00028 | |
| VAIO SX14 VJS144X0111K | |
| Asus Vivobook 15 K513EQ | |
| Gemiddeld Intel Core i7-1165G7 (1.39 - 8.47, n=80) | |
| HP Pavilion x360 15-er0155ng | |
| Lenovo ThinkPad P15s Gen1-20T4000JGE | |
| HP 250 G7-15S40ES | |
| Dell Inspiron 15 5000 5502 | |
Cinebench R23: Multi Core | Single Core
Cinebench R20: CPU (Multi Core) | CPU (Single Core)
Cinebench R15: CPU Multi 64Bit | CPU Single 64Bit
Blender: v2.79 BMW27 CPU
7-Zip 18.03: 7z b 4 | 7z b 4 -mmt1
Geekbench 5.5: Multi-Core | Single-Core
HWBOT x265 Benchmark v2.2: 4k Preset
LibreOffice : 20 Documents To PDF
R Benchmark 2.5: Overall mean
* ... kleiner is beter
AIDA64: FP32 Ray-Trace | FPU Julia | CPU SHA3 | CPU Queen | FPU SinJulia | FPU Mandel | CPU AES | CPU ZLib | FP64 Ray-Trace | CPU PhotoWorxx
| Performance rating | |
| Asus VivoBook 15 Pro M3500QC-L1062 | |
| Lenovo IdeaPad 5 15ALC05 | |
| Asus Vivobook 15 K513EQ | |
| HP Pavilion 15-eg | |
| Asus VivoBook S15 S533EQ-BQ002T | |
| Gemiddeld Intel Core i7-1165G7 | |
| Dell Inspiron 15 3501 | |
| AIDA64 / FP32 Ray-Trace | |
| Asus VivoBook 15 Pro M3500QC-L1062 | |
| Lenovo IdeaPad 5 15ALC05 | |
| Asus Vivobook 15 K513EQ | |
| Asus VivoBook S15 S533EQ-BQ002T | |
| Gemiddeld Intel Core i7-1165G7 (3933 - 8184, n=58) | |
| HP Pavilion 15-eg | |
| Dell Inspiron 15 3501 | |
| AIDA64 / FPU Julia | |
| Asus VivoBook 15 Pro M3500QC-L1062 | |
| Lenovo IdeaPad 5 15ALC05 | |
| Asus Vivobook 15 K513EQ | |
| Asus VivoBook S15 S533EQ-BQ002T | |
| Gemiddeld Intel Core i7-1165G7 (17720 - 34369, n=58) | |
| HP Pavilion 15-eg | |
| Dell Inspiron 15 3501 | |
| AIDA64 / CPU SHA3 | |
| Asus VivoBook 15 Pro M3500QC-L1062 | |
| Asus Vivobook 15 K513EQ | |
| Asus VivoBook S15 S533EQ-BQ002T | |
| Gemiddeld Intel Core i7-1165G7 (958 - 2338, n=58) | |
| HP Pavilion 15-eg | |
| Dell Inspiron 15 3501 | |
| Lenovo IdeaPad 5 15ALC05 | |
| AIDA64 / CPU Queen | |
| Asus VivoBook 15 Pro M3500QC-L1062 | |
| Lenovo IdeaPad 5 15ALC05 | |
| HP Pavilion 15-eg | |
| Asus VivoBook S15 S533EQ-BQ002T | |
| Asus Vivobook 15 K513EQ | |
| Dell Inspiron 15 3501 | |
| Gemiddeld Intel Core i7-1165G7 (44161 - 50624, n=58) | |
| AIDA64 / FPU SinJulia | |
| Lenovo IdeaPad 5 15ALC05 | |
| Asus VivoBook 15 Pro M3500QC-L1062 | |
| Asus Vivobook 15 K513EQ | |
| Asus VivoBook S15 S533EQ-BQ002T | |
| Gemiddeld Intel Core i7-1165G7 (3183 - 4796, n=58) | |
| HP Pavilion 15-eg | |
| Dell Inspiron 15 3501 | |
| AIDA64 / FPU Mandel | |
| Asus VivoBook 15 Pro M3500QC-L1062 | |
| Lenovo IdeaPad 5 15ALC05 | |
| Asus Vivobook 15 K513EQ | |
| Asus VivoBook S15 S533EQ-BQ002T | |
| Gemiddeld Intel Core i7-1165G7 (11876 - 20468, n=58) | |
| HP Pavilion 15-eg | |
| Dell Inspiron 15 3501 | |
| AIDA64 / CPU AES | |
| Asus VivoBook 15 Pro M3500QC-L1062 | |
| Asus Vivobook 15 K513EQ | |
| Asus VivoBook S15 S533EQ-BQ002T | |
| HP Pavilion 15-eg | |
| Dell Inspiron 15 3501 | |
| Gemiddeld Intel Core i7-1165G7 (29506 - 73387, n=58) | |
| Lenovo IdeaPad 5 15ALC05 | |
| AIDA64 / CPU ZLib | |
| Asus VivoBook 15 Pro M3500QC-L1062 | |
| Lenovo IdeaPad 5 15ALC05 | |
| Asus Vivobook 15 K513EQ | |
| Asus VivoBook S15 S533EQ-BQ002T | |
| Dell Inspiron 15 3501 | |
| HP Pavilion 15-eg | |
| Gemiddeld Intel Core i7-1165G7 (169 - 402, n=65) | |
| AIDA64 / FP64 Ray-Trace | |
| Asus VivoBook 15 Pro M3500QC-L1062 | |
| Lenovo IdeaPad 5 15ALC05 | |
| Asus Vivobook 15 K513EQ | |
| Asus VivoBook S15 S533EQ-BQ002T | |
| Dell Inspiron 15 3501 | |
| Gemiddeld Intel Core i7-1165G7 (2033 - 4461, n=58) | |
| HP Pavilion 15-eg | |
| AIDA64 / CPU PhotoWorxx | |
| HP Pavilion 15-eg | |
| Gemiddeld Intel Core i7-1165G7 (12392 - 45694, n=58) | |
| Asus VivoBook S15 S533EQ-BQ002T | |
| Asus Vivobook 15 K513EQ | |
| Dell Inspiron 15 3501 | |
| Lenovo IdeaPad 5 15ALC05 | |
| Asus VivoBook 15 Pro M3500QC-L1062 | |
Systeemprestaties
| PCMark 10 / Score | |
| Asus VivoBook 15 Pro M3500QC-L1062 | |
| HP Pavilion 15-eg | |
| Asus VivoBook S15 S533EQ-BQ002T | |
| Lenovo IdeaPad 5 15ALC05 | |
| Asus Vivobook 15 K513EQ | |
| Gemiddeld Intel Core i7-1165G7, NVIDIA GeForce MX350 (4855 - 5306, n=5) | |
| Dell Inspiron 15 3501 | |
| PCMark 10 / Essentials | |
| Asus VivoBook 15 Pro M3500QC-L1062 | |
| HP Pavilion 15-eg | |
| Dell Inspiron 15 3501 | |
| Asus Vivobook 15 K513EQ | |
| Lenovo IdeaPad 5 15ALC05 | |
| Asus VivoBook S15 S533EQ-BQ002T | |
| Gemiddeld Intel Core i7-1165G7, NVIDIA GeForce MX350 (8026 - 9551, n=5) | |
| PCMark 10 / Productivity | |
| HP Pavilion 15-eg | |
| Asus Vivobook 15 K513EQ | |
| Gemiddeld Intel Core i7-1165G7, NVIDIA GeForce MX350 (8343 - 9071, n=5) | |
| Asus VivoBook 15 Pro M3500QC-L1062 | |
| Asus VivoBook S15 S533EQ-BQ002T | |
| Lenovo IdeaPad 5 15ALC05 | |
| Dell Inspiron 15 3501 | |
| PCMark 10 / Digital Content Creation | |
| Asus VivoBook 15 Pro M3500QC-L1062 | |
| HP Pavilion 15-eg | |
| Asus VivoBook S15 S533EQ-BQ002T | |
| Lenovo IdeaPad 5 15ALC05 | |
| Dell Inspiron 15 3501 | |
| Gemiddeld Intel Core i7-1165G7, NVIDIA GeForce MX350 (4373 - 5330, n=5) | |
| Asus Vivobook 15 K513EQ | |
| PCMark 10 Score | 5120 punten | |
Help | ||
| AIDA64 / Memory Copy | |
| Gemiddeld Intel Core i7-1165G7 (20032 - 65446, n=58) | |
| HP Pavilion 15-eg | |
| Asus VivoBook 15 Pro M3500QC-L1062 | |
| Asus VivoBook S15 S533EQ-BQ002T | |
| Asus Vivobook 15 K513EQ | |
| Lenovo IdeaPad 5 15ALC05 | |
| Dell Inspiron 15 3501 | |
| AIDA64 / Memory Read | |
| Gemiddeld Intel Core i7-1165G7 (23033 - 64524, n=58) | |
| HP Pavilion 15-eg | |
| Asus VivoBook 15 Pro M3500QC-L1062 | |
| Asus Vivobook 15 K513EQ | |
| Asus VivoBook S15 S533EQ-BQ002T | |
| Lenovo IdeaPad 5 15ALC05 | |
| Dell Inspiron 15 3501 | |
| AIDA64 / Memory Write | |
| Gemiddeld Intel Core i7-1165G7 (21736 - 66791, n=58) | |
| HP Pavilion 15-eg | |
| Asus Vivobook 15 K513EQ | |
| Asus VivoBook S15 S533EQ-BQ002T | |
| Asus VivoBook 15 Pro M3500QC-L1062 | |
| Dell Inspiron 15 3501 | |
| Lenovo IdeaPad 5 15ALC05 | |
| AIDA64 / Memory Latency | |
| Lenovo IdeaPad 5 15ALC05 | |
| Dell Inspiron 15 3501 | |
| Asus Vivobook 15 K513EQ | |
| Asus VivoBook S15 S533EQ-BQ002T | |
| Gemiddeld Intel Core i7-1165G7 (69 - 110, n=65) | |
| Asus VivoBook 15 Pro M3500QC-L1062 | |
| HP Pavilion 15-eg | |
* ... kleiner is beter
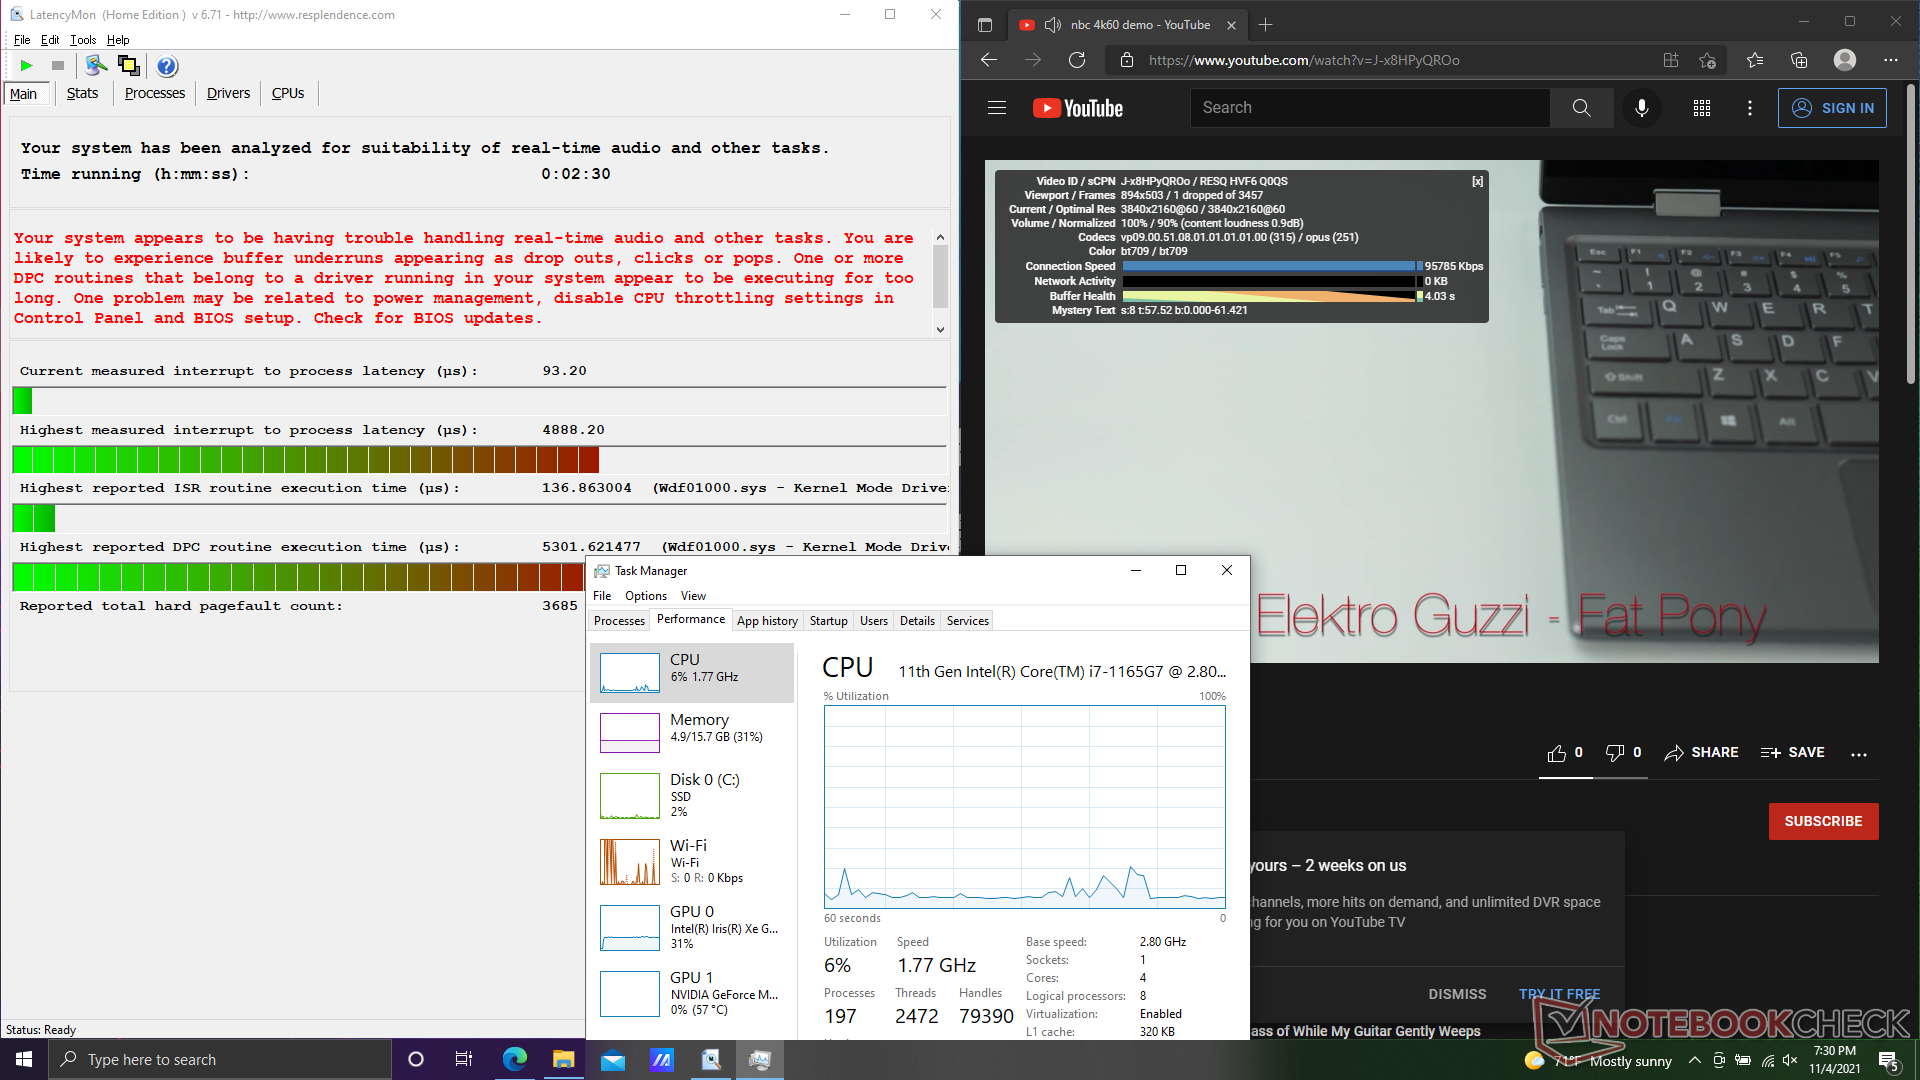
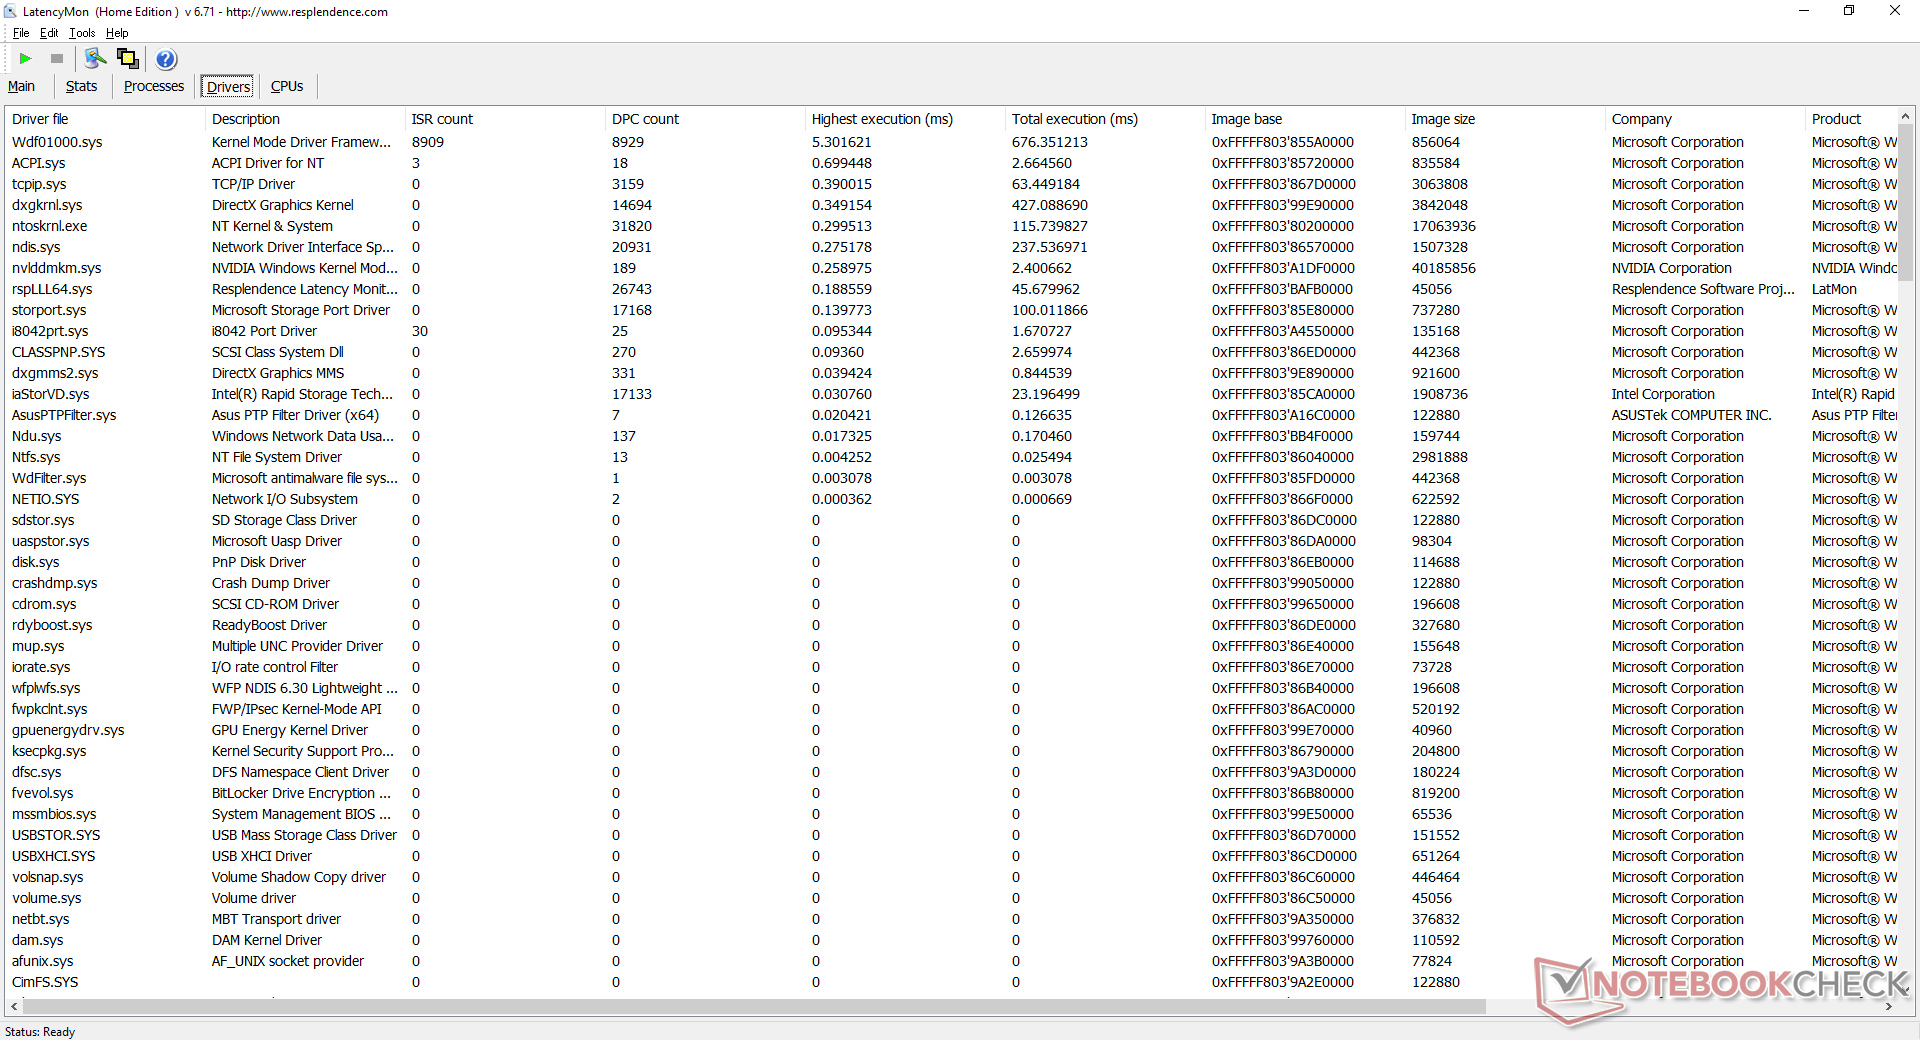
DPC latentie
LatencyMon toont DPC-problemen bij het openen van meerdere browsertabbladen op onze homepage. Het afspelen van native 4K-video's met 60 FPS verloopt verder soepel en zonder problemen.
| DPC Latencies / LatencyMon - interrupt to process latency (max), Web, Youtube, Prime95 | |
| Asus Vivobook 15 K513EQ | |
| HP Pavilion 15-eg | |
| Dell Inspiron 15 3501 | |
| Lenovo IdeaPad 5 15ALC05 | |
| Asus VivoBook S15 S533EQ-BQ002T | |
| Asus VivoBook 15 Pro M3500QC-L1062 | |
* ... kleiner is beter
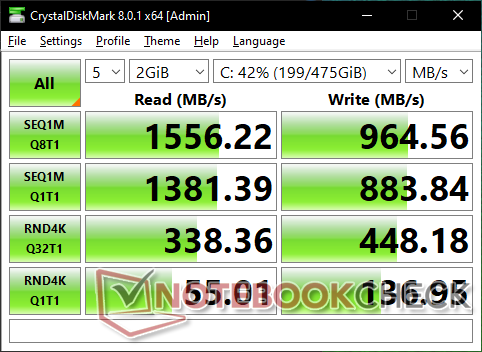
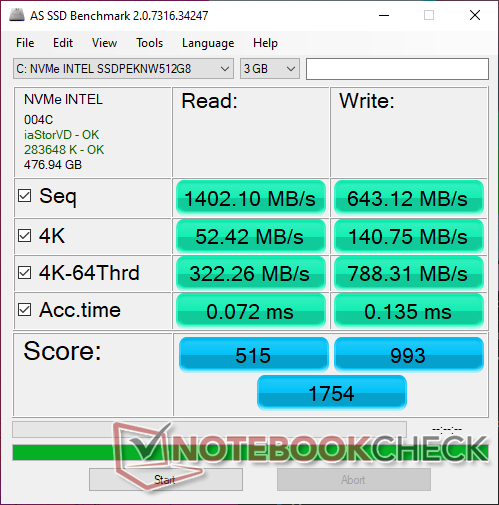
Opslagapparatuur -Alleen ruimte voor één schijf
Onze unit is geconfigureerd met een 512 GB Intel 660p SSDPEKNW512G8 PCIe3 NVMe SSD voor theoretische maximale lees- en schrijfsnelheden van slechts 1500 MB/s en 1000 MB/s, respectievelijk, wat ruwweg 2x langzamer is dan de duurdere Samsung PM981a serie. De prestaties zullen waarschijnlijk voldoende zijn voor het doelpubliek, vooral gezien de ULV U-serie CPU en GeForce MX graphics waarmee de schijf is gekoppeld. Een warmtespreider is niet zo noodzakelijk voor het behoud van prestaties onder stress, aangezien de Intel 660p slechts een budget tot mid-range NVMe oplossing is.

| Drive Performance rating - Percent | |
| Asus VivoBook 15 Pro M3500QC-L1062 | |
| Dell Inspiron 15 3501 | |
| Lenovo IdeaPad 5 15ALC05 | |
| Asus VivoBook S15 S533EQ-BQ002T | |
| HP Pavilion 15-eg | |
| Asus Vivobook 15 K513EQ | |
* ... kleiner is beter
Disk Throttling: DiskSpd Read Loop, Queue Depth 8
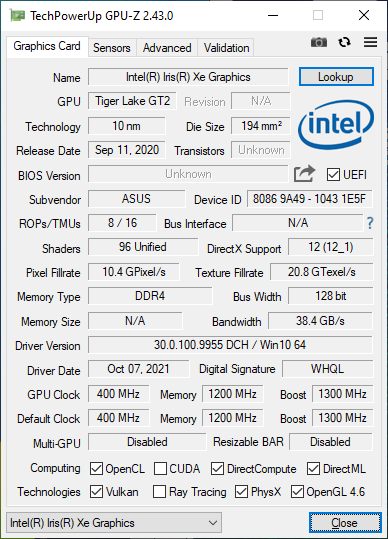
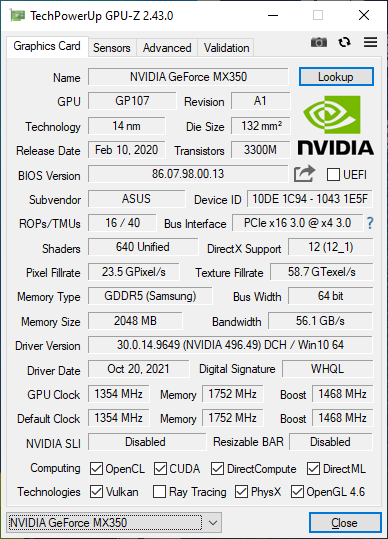
GPU-prestaties - Iris Xe vs. GeForce MX350
De grafische prestaties zijn waar we ze verwachten in vergelijking met andere laptops die zijn uitgerust met dezelfde GeForce MX350 GPU. Intel's concurrerende geïntegreerde Iris Xe platform van Intel is in de loop der tijd gestaag verbeterd op het gebied van stuurprogramma's en gamingondersteuning, tot het punt waarop het nu in de meeste gevallen nek-aan-nek staat met de Nvidia GPU. GTA V en DOTA 2 Reborn zijn twee opmerkelijke uitzonderingen waar onze GeForce-aangedreven Vivobook nog steeds een aanzienlijk prestatievoordeel zou hebben ten opzichte van de Iris Xe.
Upgraden van de MX330 naar de MX350 zal de prestaties met ongeveer 15 tot 20 procent verbeteren.
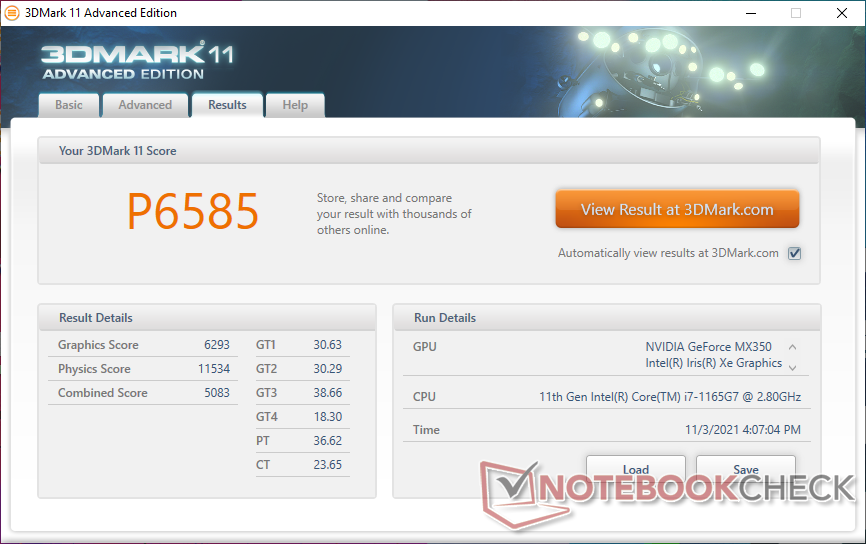
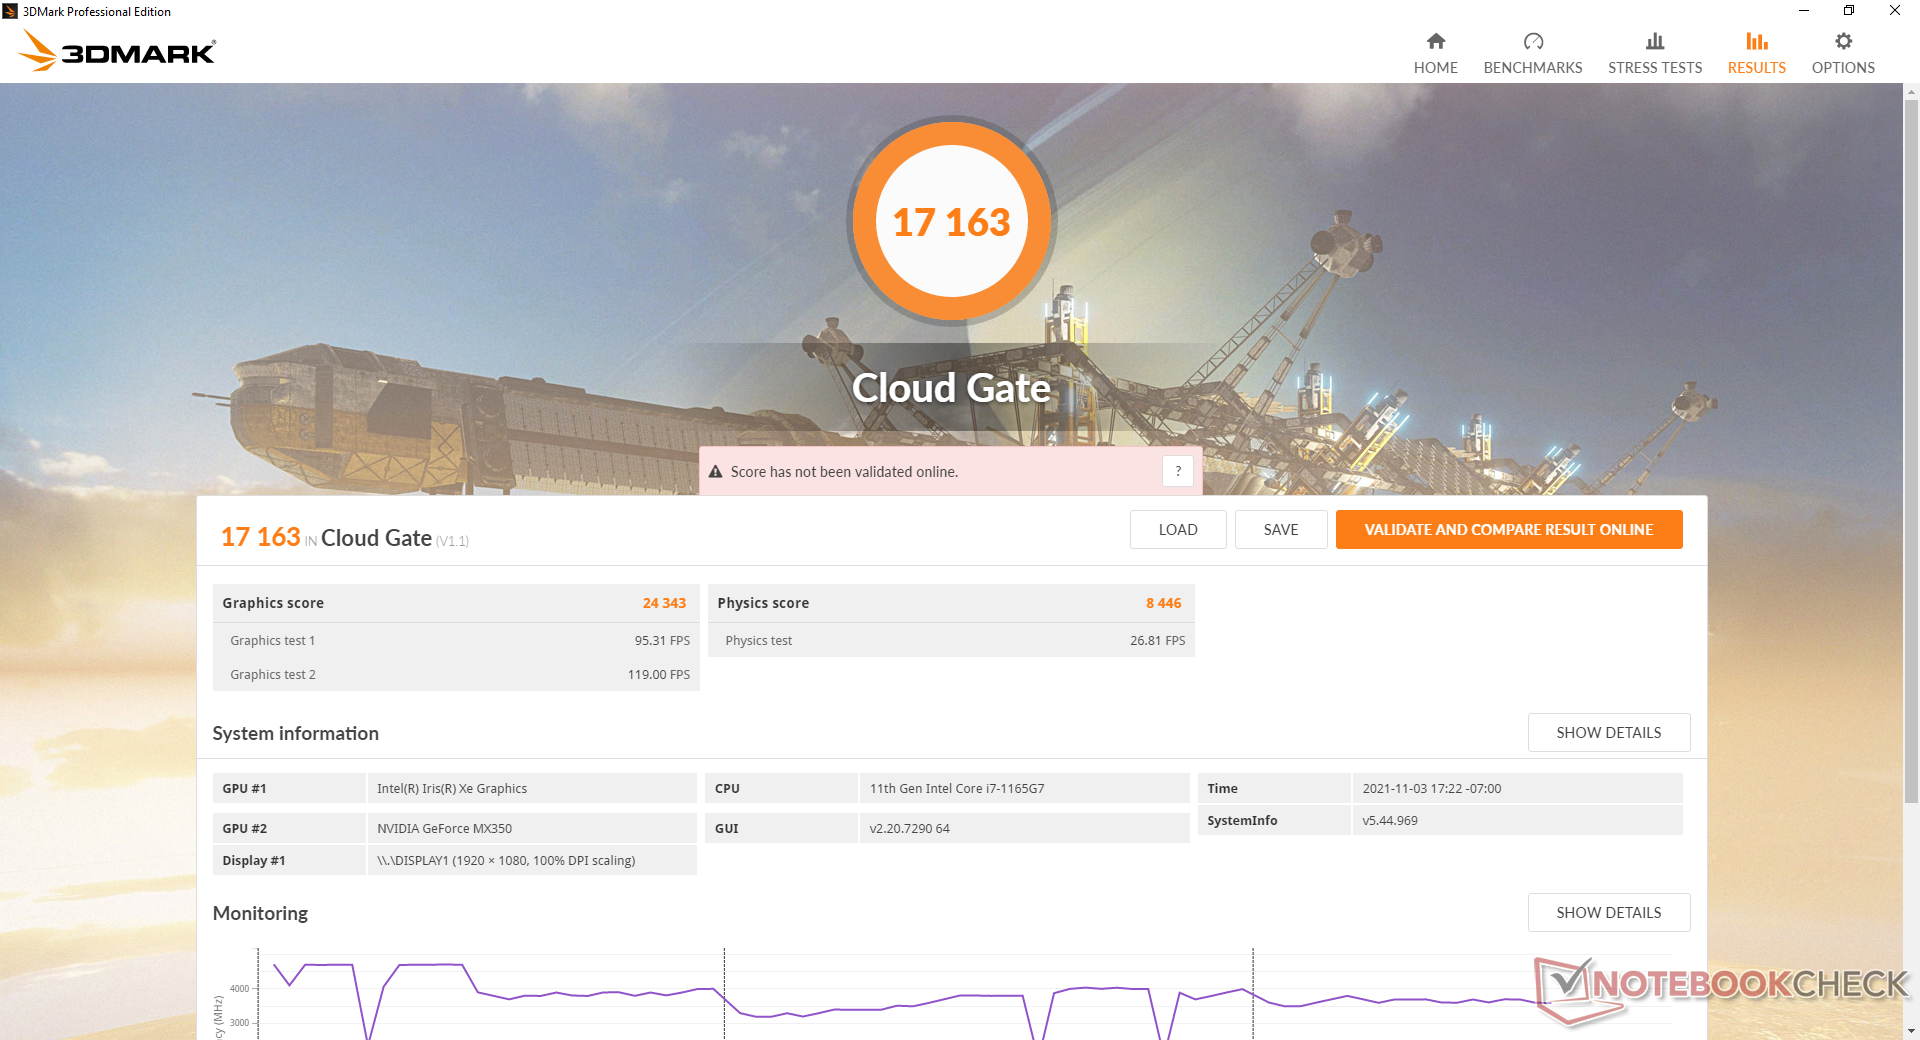
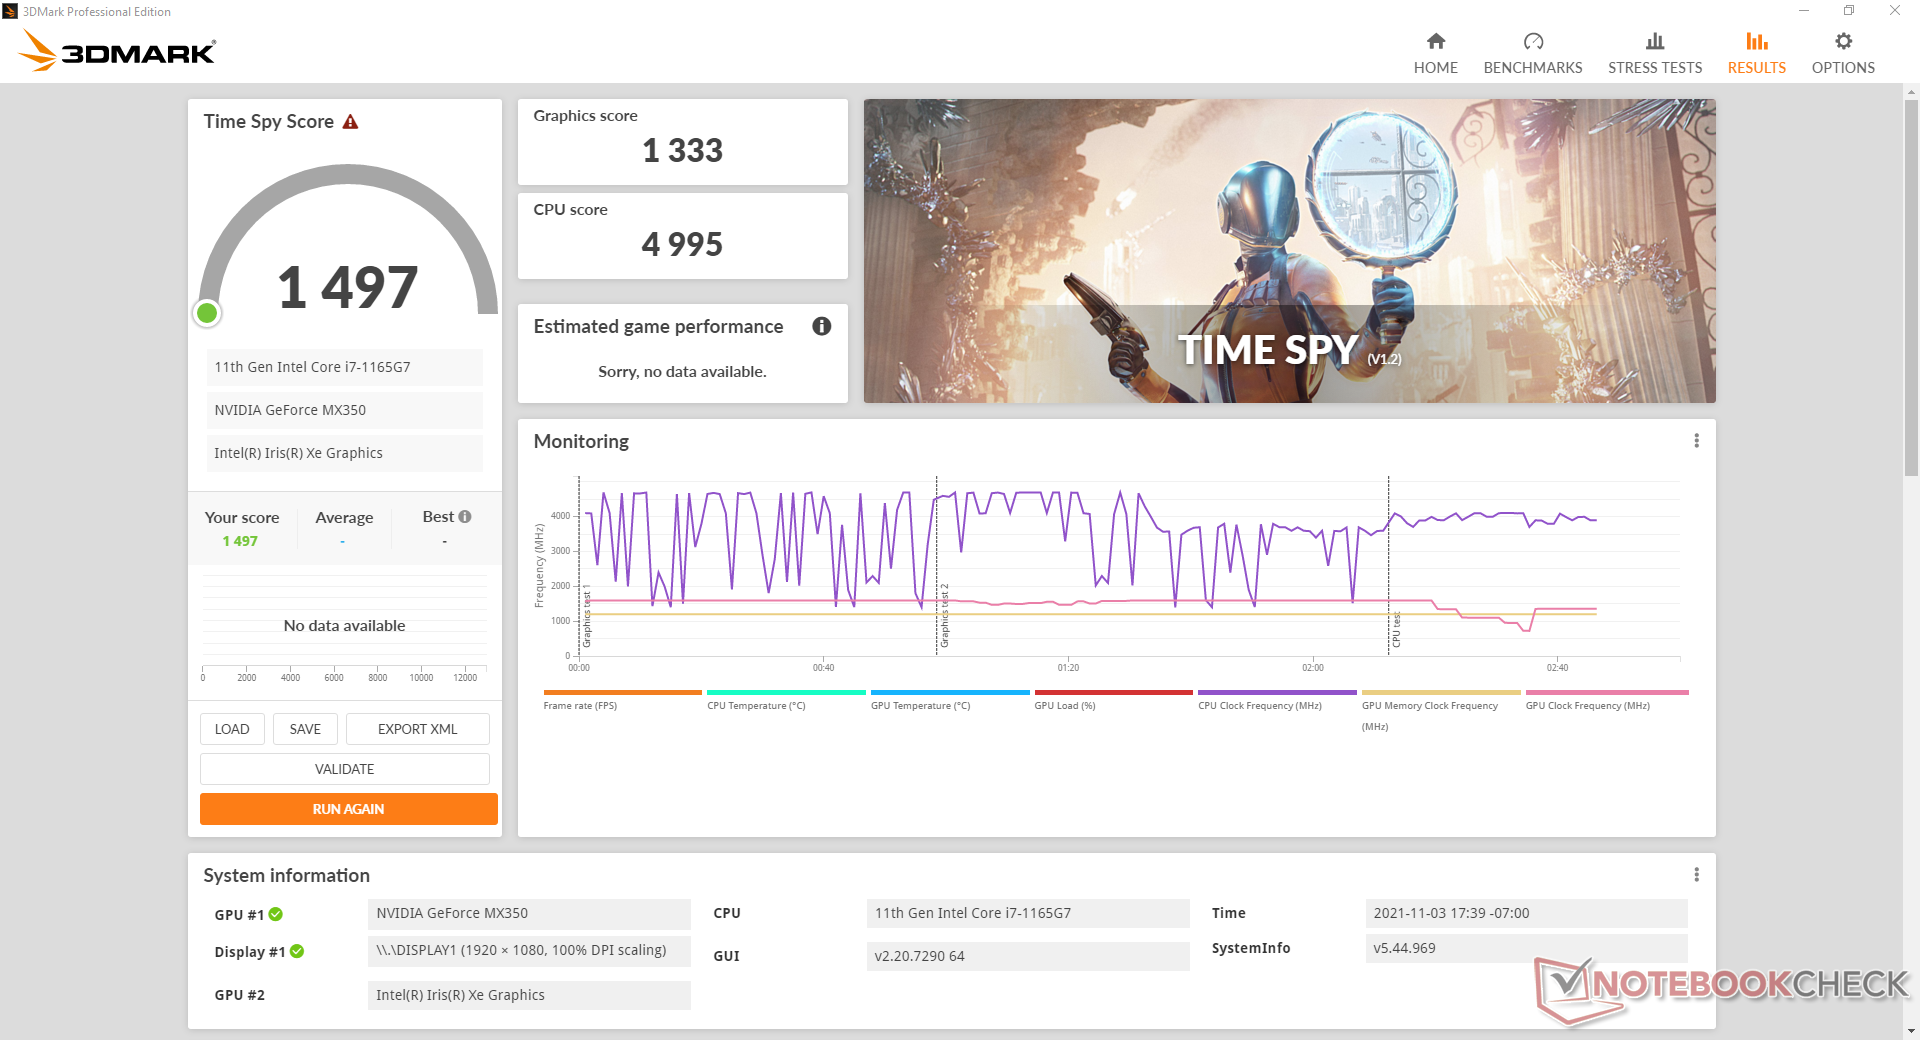
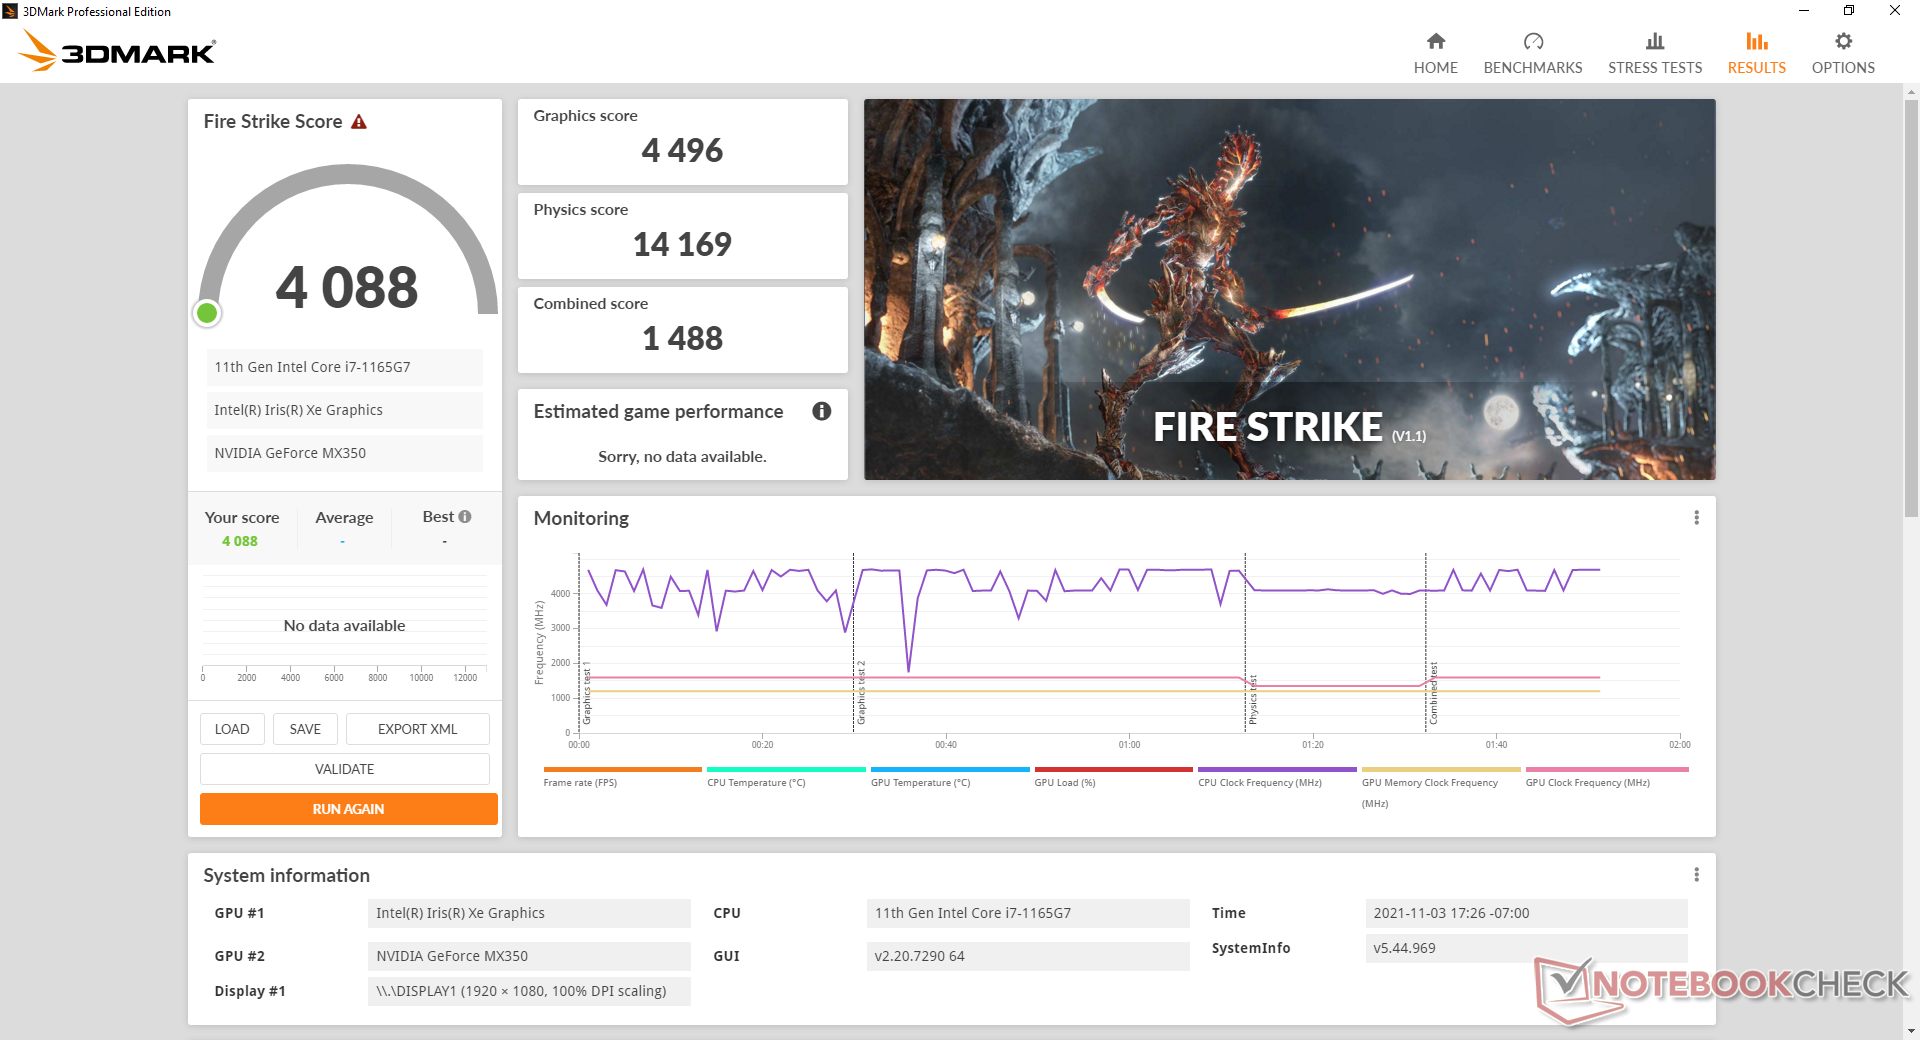
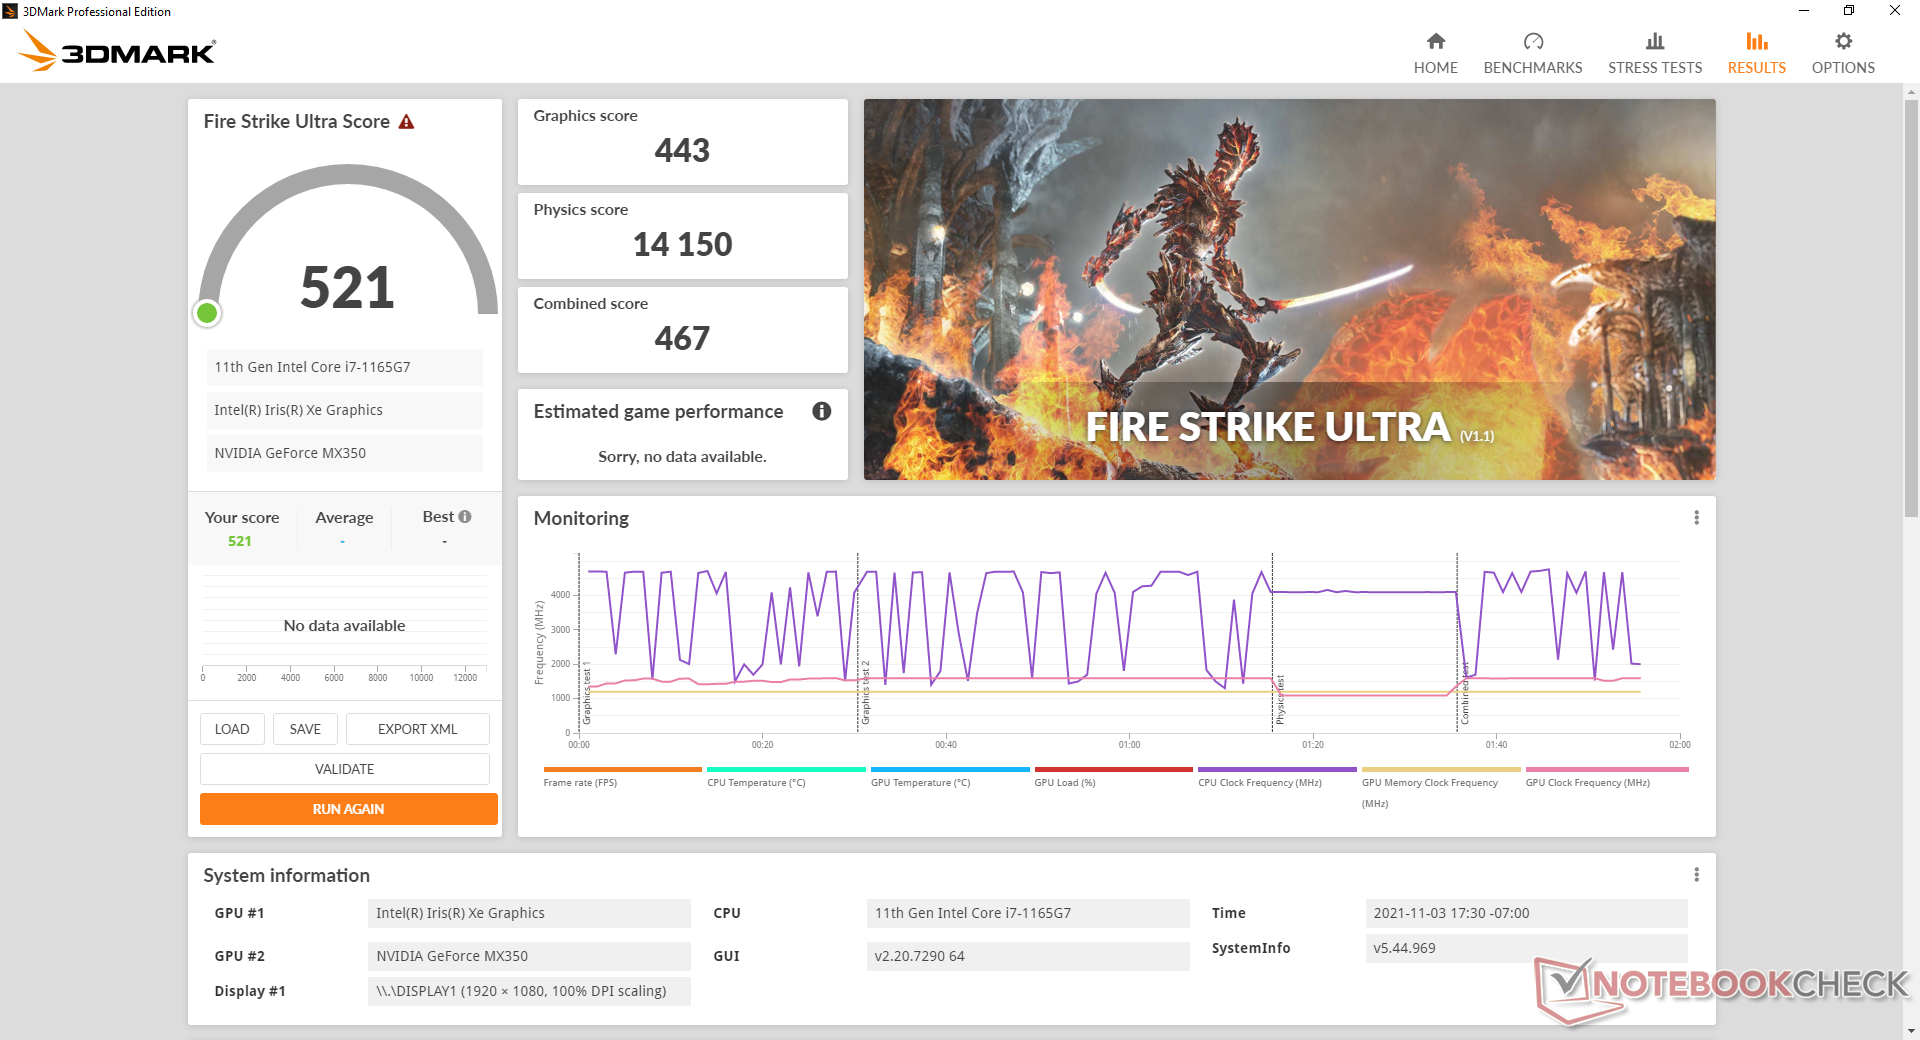
| 3DMark 11 Performance | 6585 punten | |
| 3DMark Cloud Gate Standard Score | 17163 punten | |
| 3DMark Fire Strike Score | 4088 punten | |
| 3DMark Time Spy Score | 1497 punten | |
Help | ||
Witcher 3 FPS Chart
| lage | gem. | hoge | ultra | |
|---|---|---|---|---|
| GTA V (2015) | 141 | 115 | 45.8 | 23.7 |
| The Witcher 3 (2015) | 86 | 48.6 | 29.9 | 16.7 |
| Dota 2 Reborn (2015) | 126 | 119 | 80.4 | 73.4 |
| Final Fantasy XV Benchmark (2018) | 48.6 | 23 | 14.5 | |
| X-Plane 11.11 (2018) | 66.7 | 62.7 | 53.9 | |
| Far Cry 5 (2018) | 59 | 26 | 23 | 22 |
| Strange Brigade (2018) | 92.7 | 32.3 | 25 | 18.8 |
Emissies - Stil voor het grootste deel
Systeemgeluid
De interne ventilator doet zijn uiterste best om zo stil mogelijk te blijven en met minimaal pulserend gedrag bij lage verwerkingsbelastingen. Het ventilatorgeluid ligt over het algemeen op 27 dB(A) of lager tijdens het surfen op het web of het streamen van video tegen een stille achtergrond van 23,4 dB(A). Een lichte elektronische ruis of spoelgejank op onze testeenheid verhindert dat hij absoluut geruisloos is
Het ventilatorgeluid is gekoppeld aan de drie prestatie-instellingen (Fluister, Gebalanceerd en Prestaties) in de MyAsus software. Als u Witcher 3 op Balanced of Performance mode resulteert in een constant ventilatorgeluid van respectievelijk 40,7 dB(A) of 42,9 dB(A), wat iets luider is dan veel Ultrabooks die alleen worden aangedreven door geïntegreerde graphics. Extreme verwerkingsbelastingen zoals Prime95 en FurMark leiden tot een nog luider maximaal ventilatorgeluid van 47 dB(A).
Geluidsniveau
| Onbelast |
| 23.6 / 23.6 / 23.6 dB (A) |
| Belasting |
| 41 / 47 dB (A) |
 | ||
30 dB stil 40 dB(A) hoorbaar 50 dB(A) luid |
||
min: | ||
| Asus Vivobook 15 K513EQ GeForce MX350, i7-1165G7, Intel SSD 660p SSDPEKNW512G8 | Asus VivoBook 15 Pro M3500QC-L1062 GeForce RTX 3050 4GB Laptop GPU, R5 5600H, SK Hynix HFM512GD3JX013N | Asus VivoBook S15 S533EQ-BQ002T GeForce MX350, i7-1165G7, Intel SSD 660p 1TB SSDPEKNW010T8 | Lenovo IdeaPad 5 15ALC05 Vega 7, R5 5500U | Dell Inspiron 15 3501 Iris Xe G7 96EUs, i7-1165G7, Samsung PM991a MZ9LQ512HBLU-00BD1 | HP Pavilion 15-eg GeForce MX450, i7-1165G7, Samsung PM991 MZVLQ1T0HALB | |
|---|---|---|---|---|---|---|
| Noise | -3% | -0% | -4% | -1% | -1% | |
| uit / omgeving * (dB) | 23.4 | 24.8 -6% | 25 -7% | 26 -11% | 26 -11% | 25.4 -9% |
| Idle Minimum * (dB) | 23.6 | 24.8 -5% | 25 -6% | 26 -10% | 26 -10% | 25.6 -8% |
| Idle Average * (dB) | 23.6 | 24.8 -5% | 25 -6% | 26 -10% | 26 -10% | 25.6 -8% |
| Idle Maximum * (dB) | 23.6 | 26.4 -12% | 25 -6% | 26 -10% | 26 -10% | 25.6 -8% |
| Load Average * (dB) | 41 | 42.8 -4% | 39.5 4% | 42.6 -4% | 35.9 12% | 39.2 4% |
| Witcher 3 ultra * (dB) | 42.9 | 42.8 -0% | 39.3 8% | 39.1 9% | ||
| Load Maximum * (dB) | 47 | 42.8 9% | 41.6 11% | 37.4 20% | 35.8 24% | 41.5 12% |
* ... kleiner is beter
Temperatuur
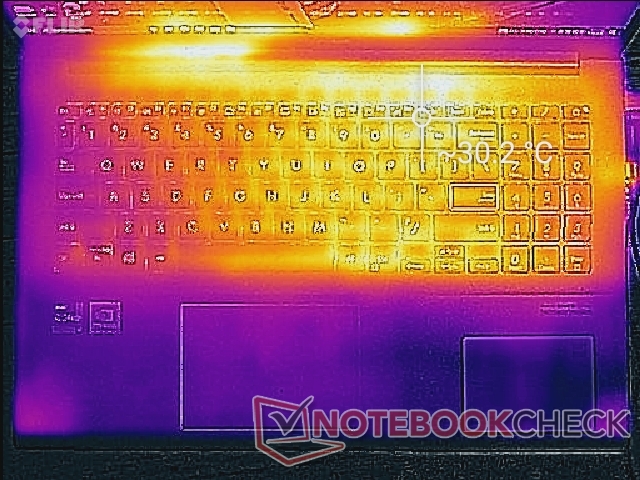
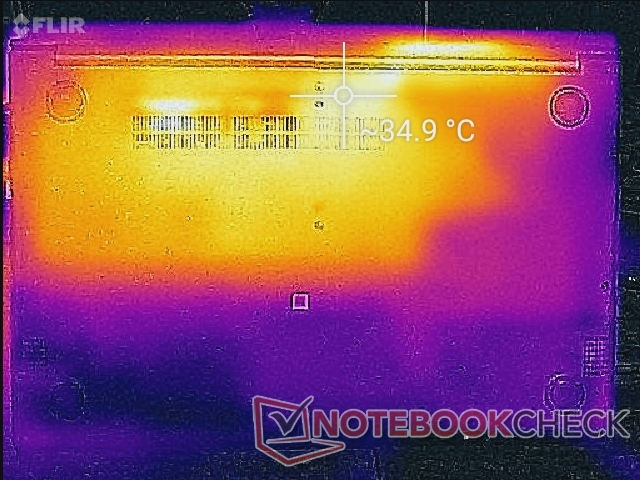
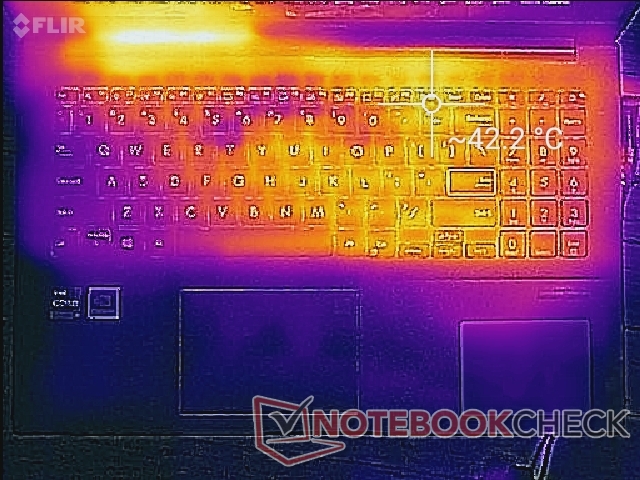
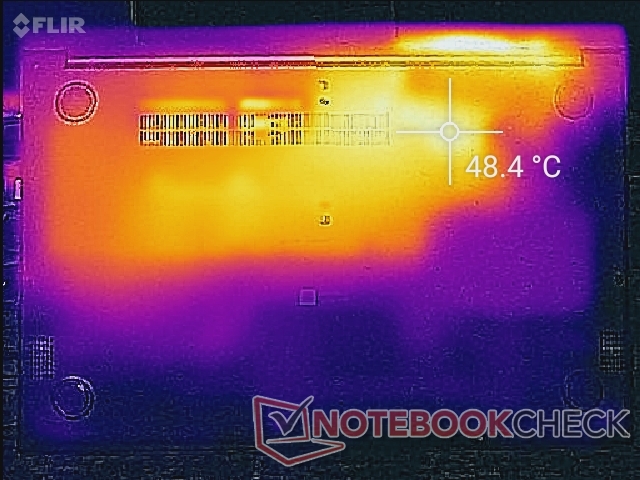
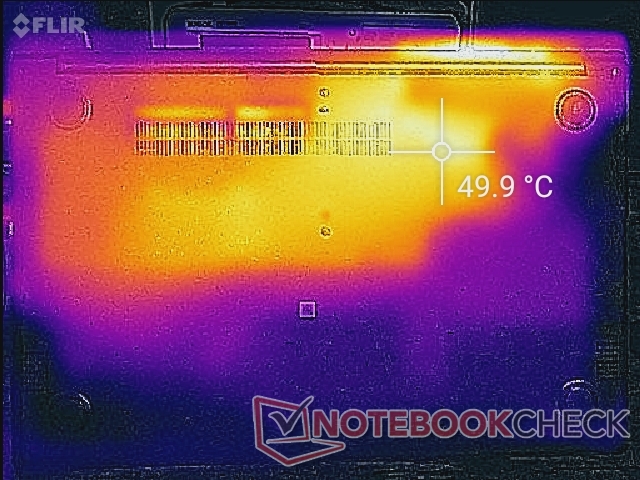
De rechterhelft van de laptop zal altijd warmer zijn dan de linkerhelft, vanwege het ontwerp van de koeloplossing binnenin. Hete plekken op het toetsenbord kunnen oplopen tot 42 C tijdens het gamen, wat vergelijkbaar is met de HP Pavilion 15 uitgerust met geïntegreerde Iris Xe graphics. De onderkant kan echter nog warmer worden met bijna 50 C dicht bij de achterkant.
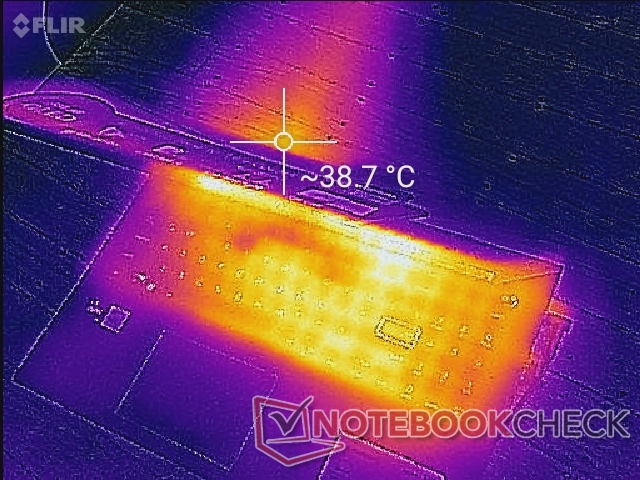
(-) De maximumtemperatuur aan de bovenzijde bedraagt 48.8 °C / 120 F, vergeleken met het gemiddelde van 36.8 °C / 98 F, variërend van 21 tot 71 °C voor de klasse Multimedia.
(±) De bodem warmt op tot een maximum van 42 °C / 108 F, vergeleken met een gemiddelde van 39.1 °C / 102 F
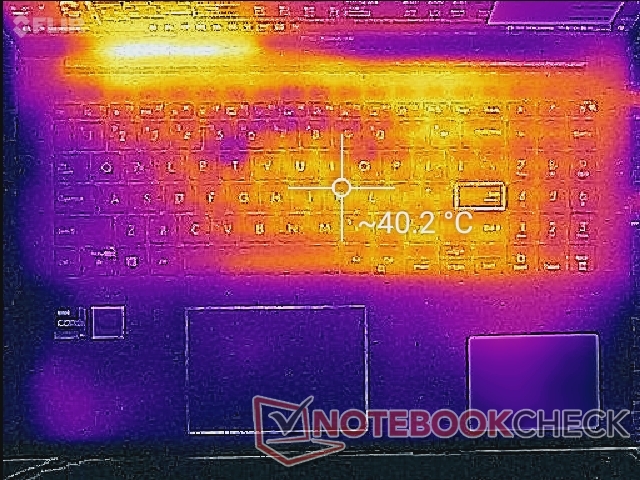
(+) Bij onbelast gebruik bedraagt de gemiddelde temperatuur voor de bovenzijde 25.6 °C / 78 F, vergeleken met het apparaatgemiddelde van 31.3 °C / 88 F.
(±) Bij het spelen van The Witcher 3 is de gemiddelde temperatuur voor de bovenzijde 33.9 °C / 93 F, vergeleken met het apparaatgemiddelde van 31.3 °C / 88 F.
(+) De palmsteunen en het touchpad zijn met een maximum van ###max## °C / 82.8 F koeler dan de huidtemperatuur en voelen daarom koel aan.
(±) De gemiddelde temperatuur van de handpalmsteun van soortgelijke toestellen bedroeg 28.7 °C / 83.7 F (+0.5 °C / 0.9 F).
| Asus Vivobook 15 K513EQ Intel Core i7-1165G7, NVIDIA GeForce MX350 | Asus VivoBook 15 Pro M3500QC-L1062 AMD Ryzen 5 5600H, NVIDIA GeForce RTX 3050 4GB Laptop GPU | Asus VivoBook S15 S533EQ-BQ002T Intel Core i7-1165G7, NVIDIA GeForce MX350 | Lenovo IdeaPad 5 15ALC05 AMD Ryzen 5 5500U, AMD Radeon RX Vega 7 | Dell Inspiron 15 3501 Intel Core i7-1165G7, Intel Iris Xe Graphics G7 96EUs | HP Pavilion 15-eg Intel Core i7-1165G7, NVIDIA GeForce MX450 | |
|---|---|---|---|---|---|---|
| Heat | 14% | 16% | 12% | 8% | 3% | |
| Maximum Upper Side * (°C) | 48.8 | 37.8 23% | 38.1 22% | 40.5 17% | 45.6 7% | 44 10% |
| Maximum Bottom * (°C) | 42 | 48.4 -15% | 41.3 2% | 42 -0% | 41 2% | 53.4 -27% |
| Idle Upper Side * (°C) | 30 | 24 20% | 24.5 18% | 26.5 12% | 28.2 6% | 27.4 9% |
| Idle Bottom * (°C) | 35 | 25.1 28% | 26.8 23% | 29 17% | 29.1 17% | 28.8 18% |
* ... kleiner is beter
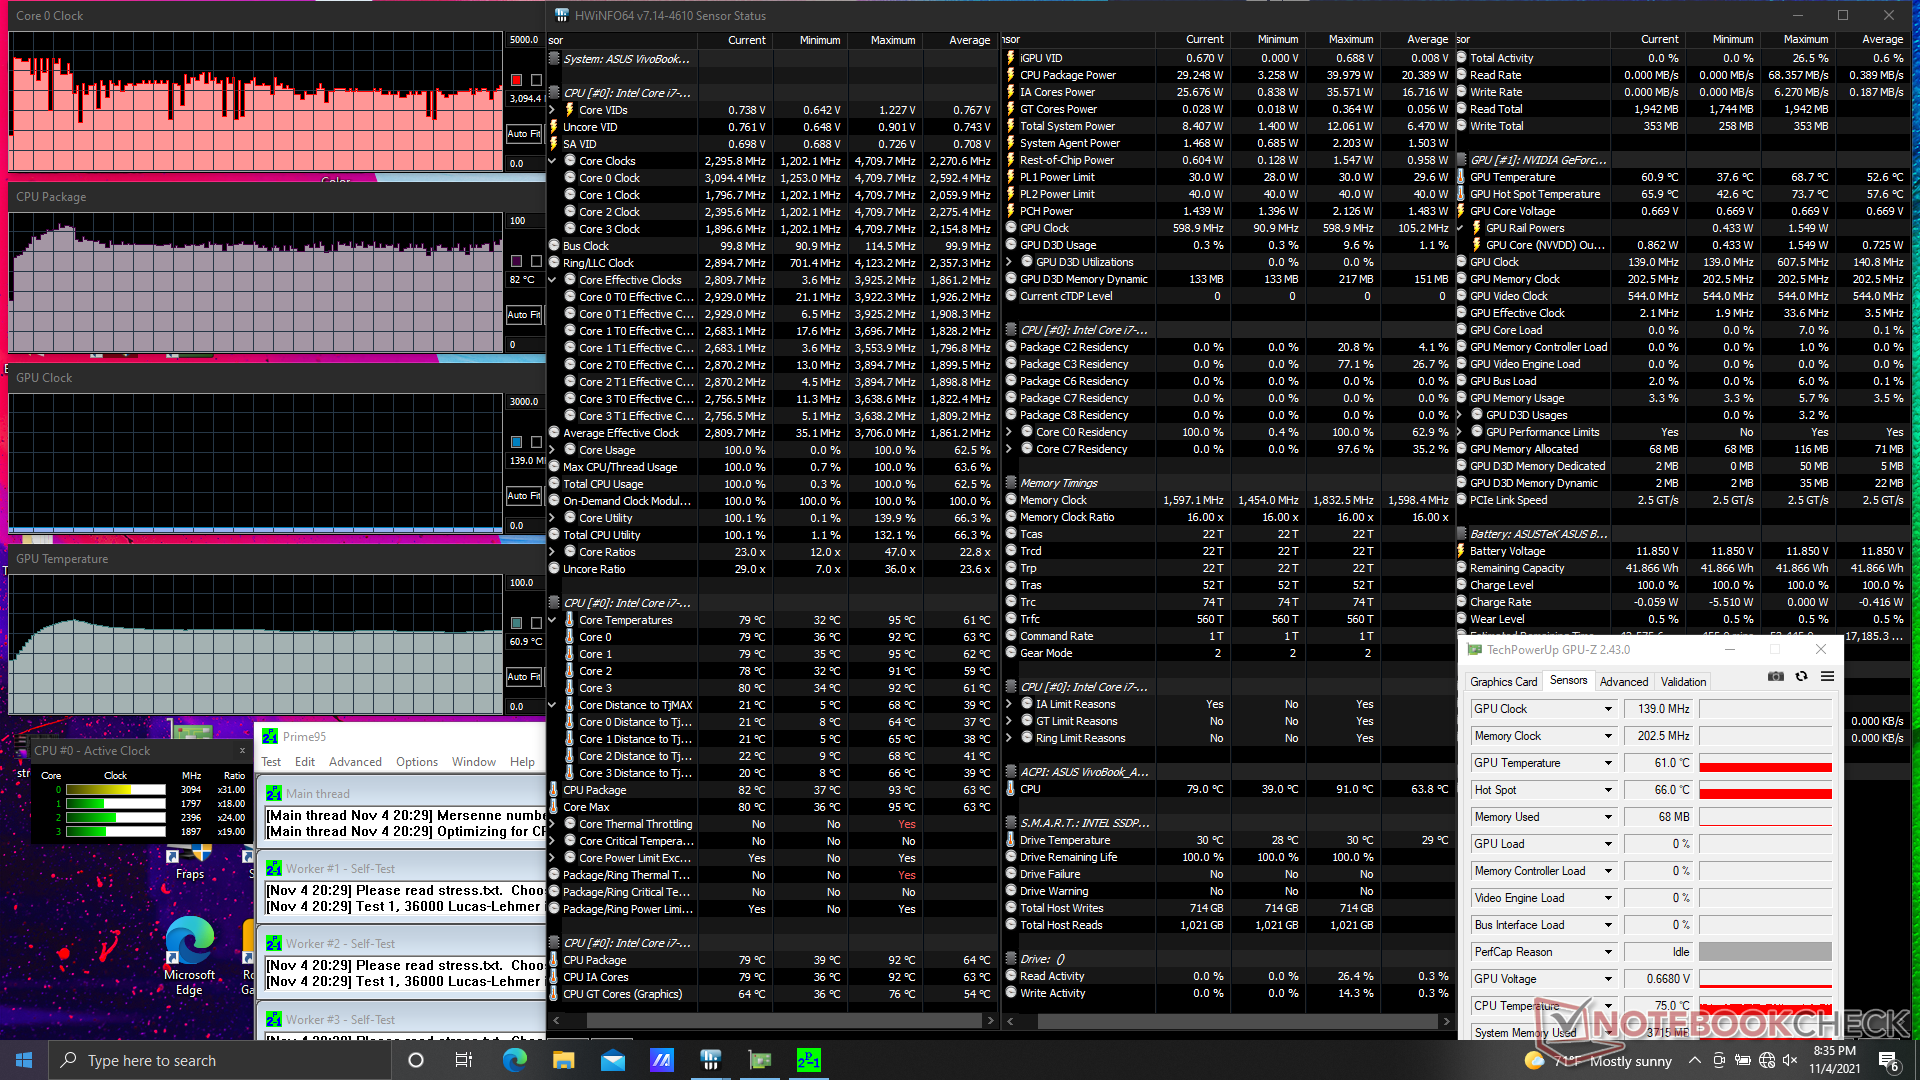
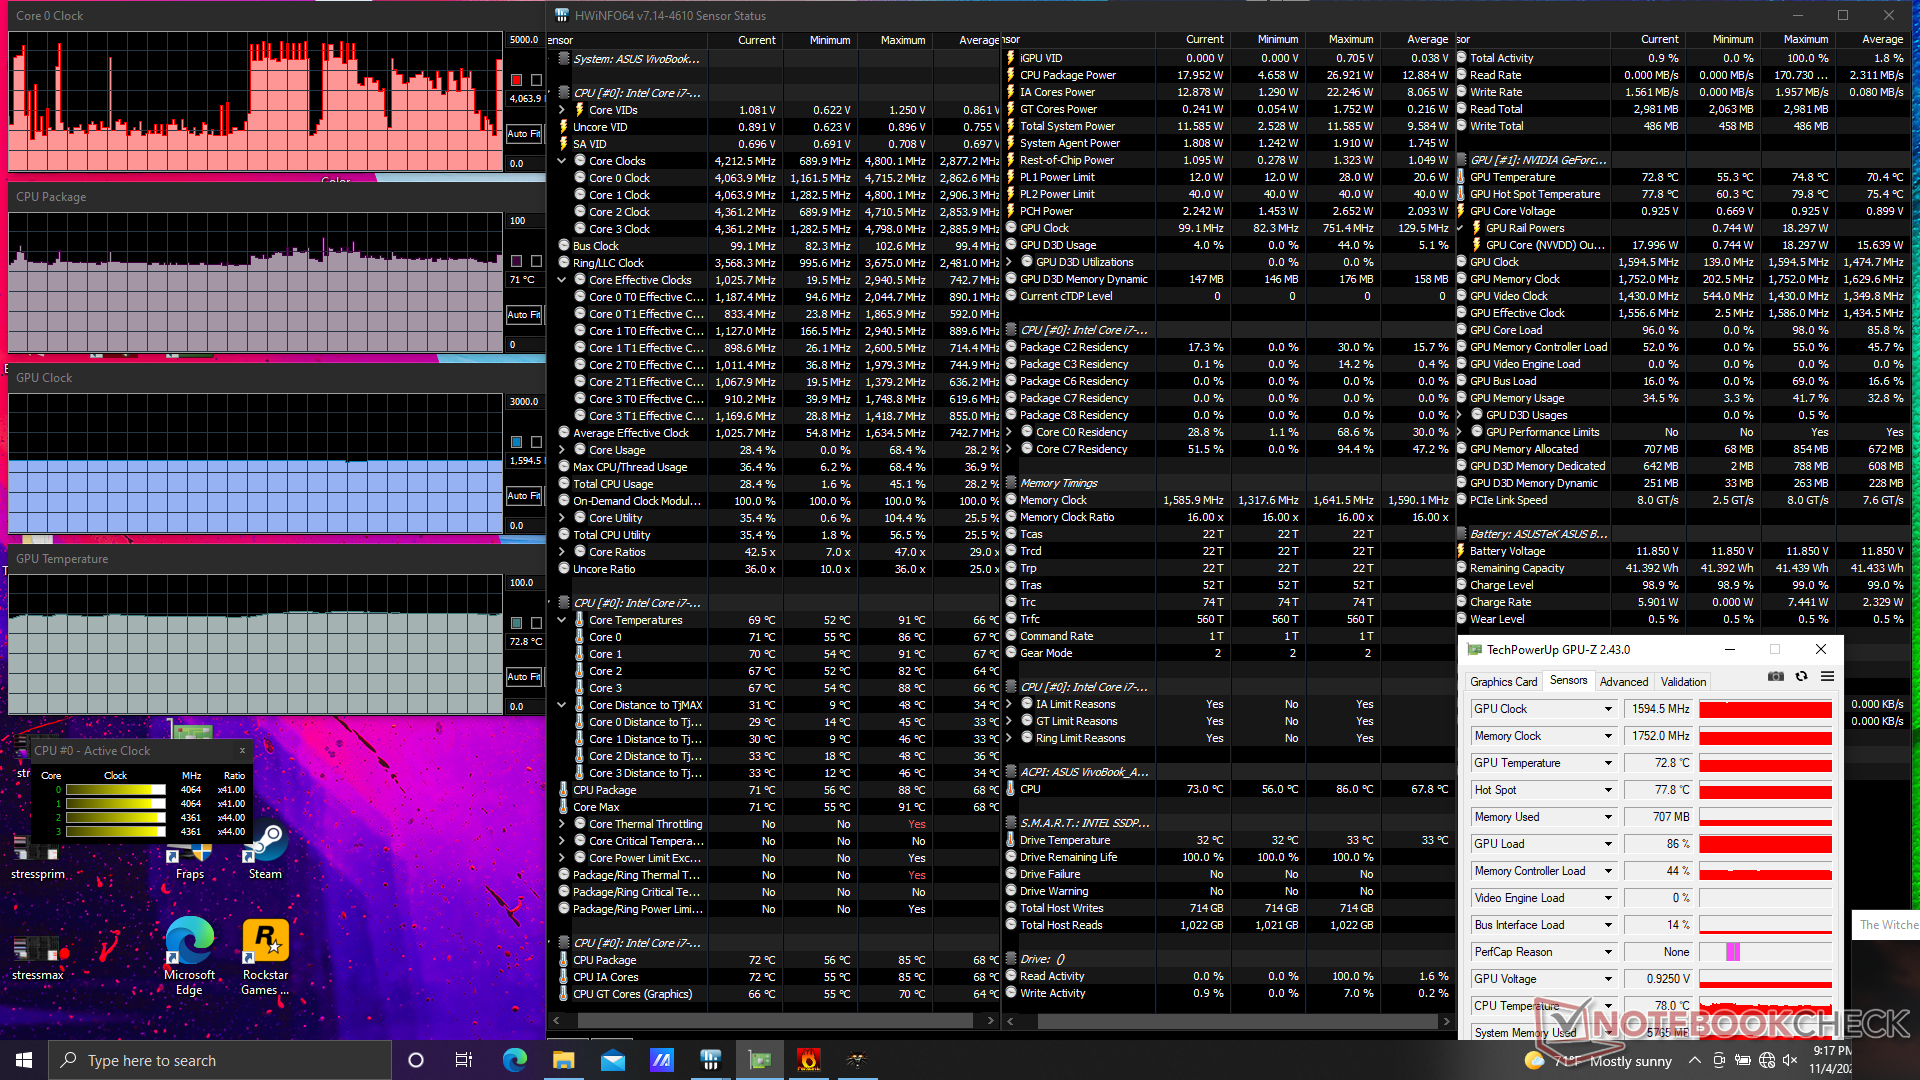
Stresstest
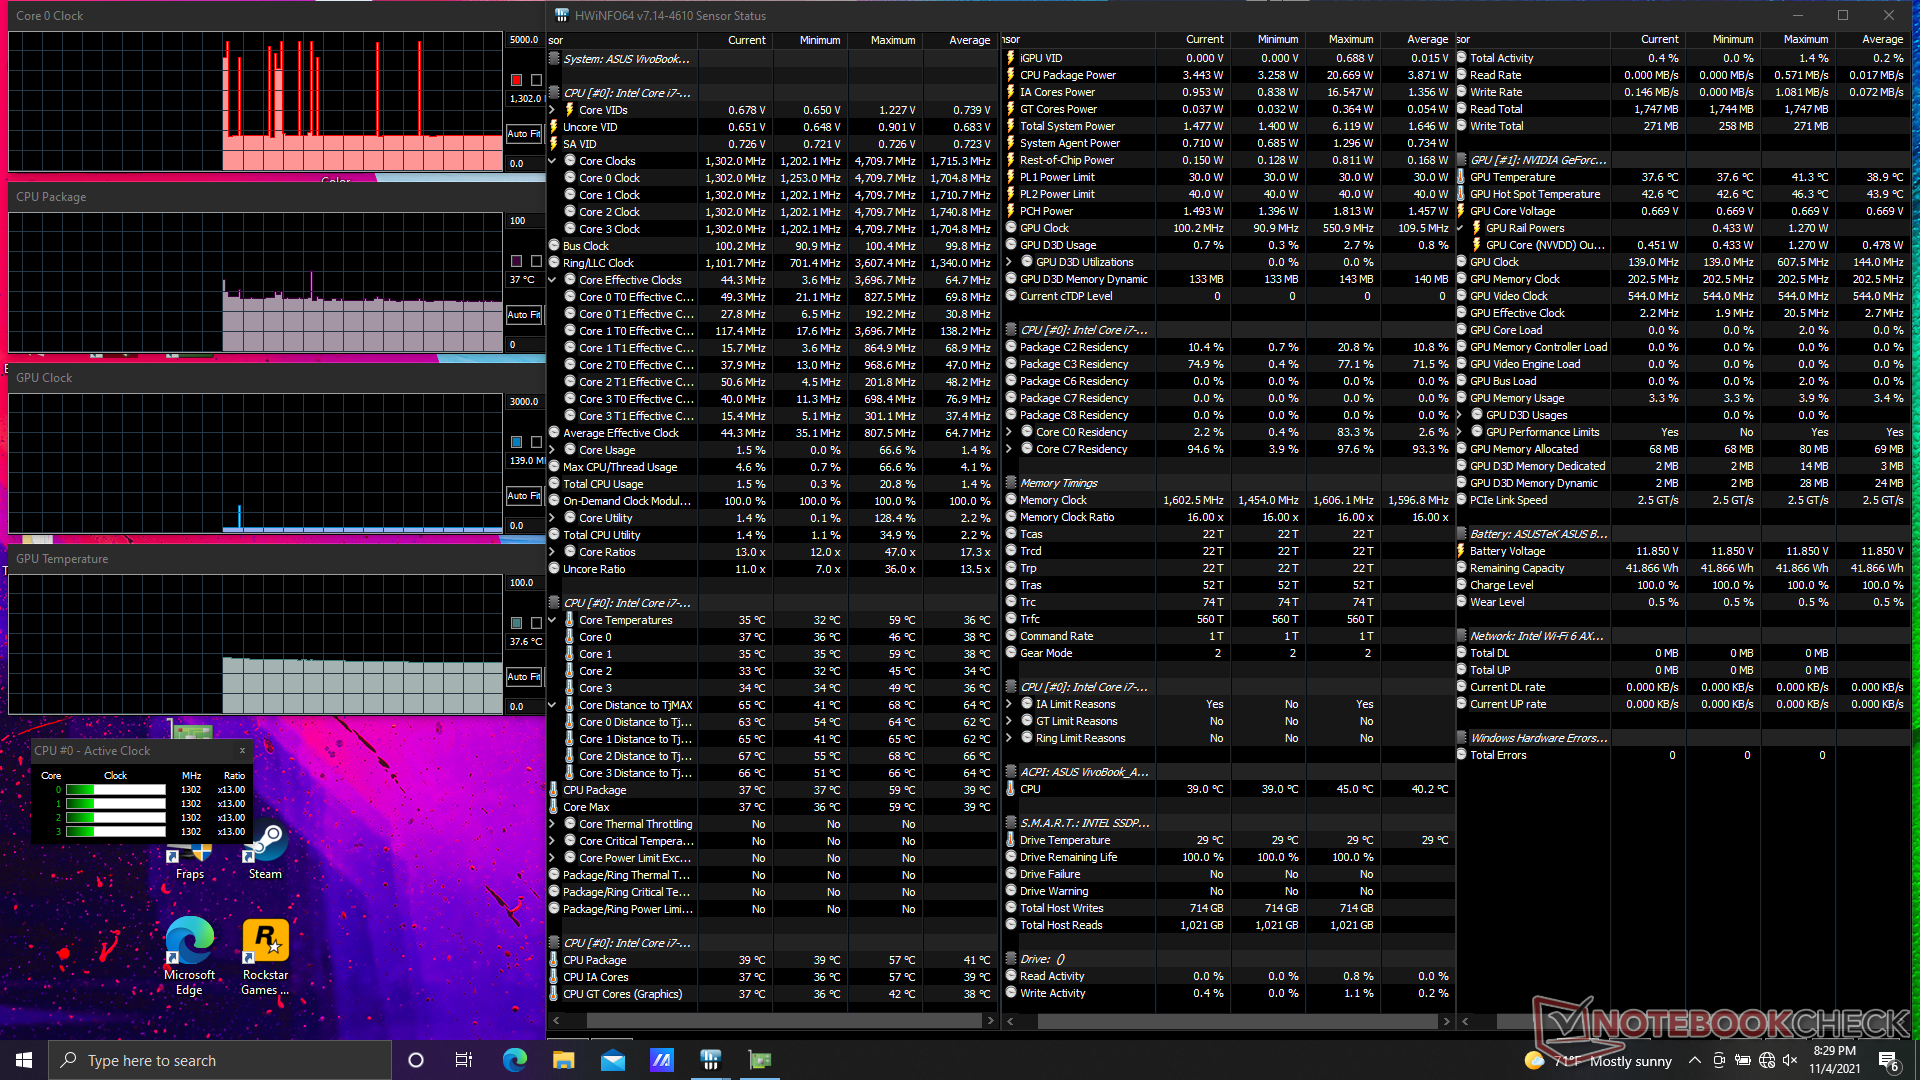
Wanneer de CPU onder Prime95 werd gestrest, steeg hij de eerste 30 seconden tot 4,1 GHz totdat hij een kerntemperatuur van 91 C bereikte. Daarna daalde de kloksnelheid tot minder dan 3,1 GHz om een koelere kerntemperatuur van 78 C te behouden Framework Laptop, die gebruik maakt van dezelfde Core i7-1165G7 CPU, zou stabiliseren op een iets hogere temperatuur van 82 C wanneer onderworpen aan soortgelijke belastingen.
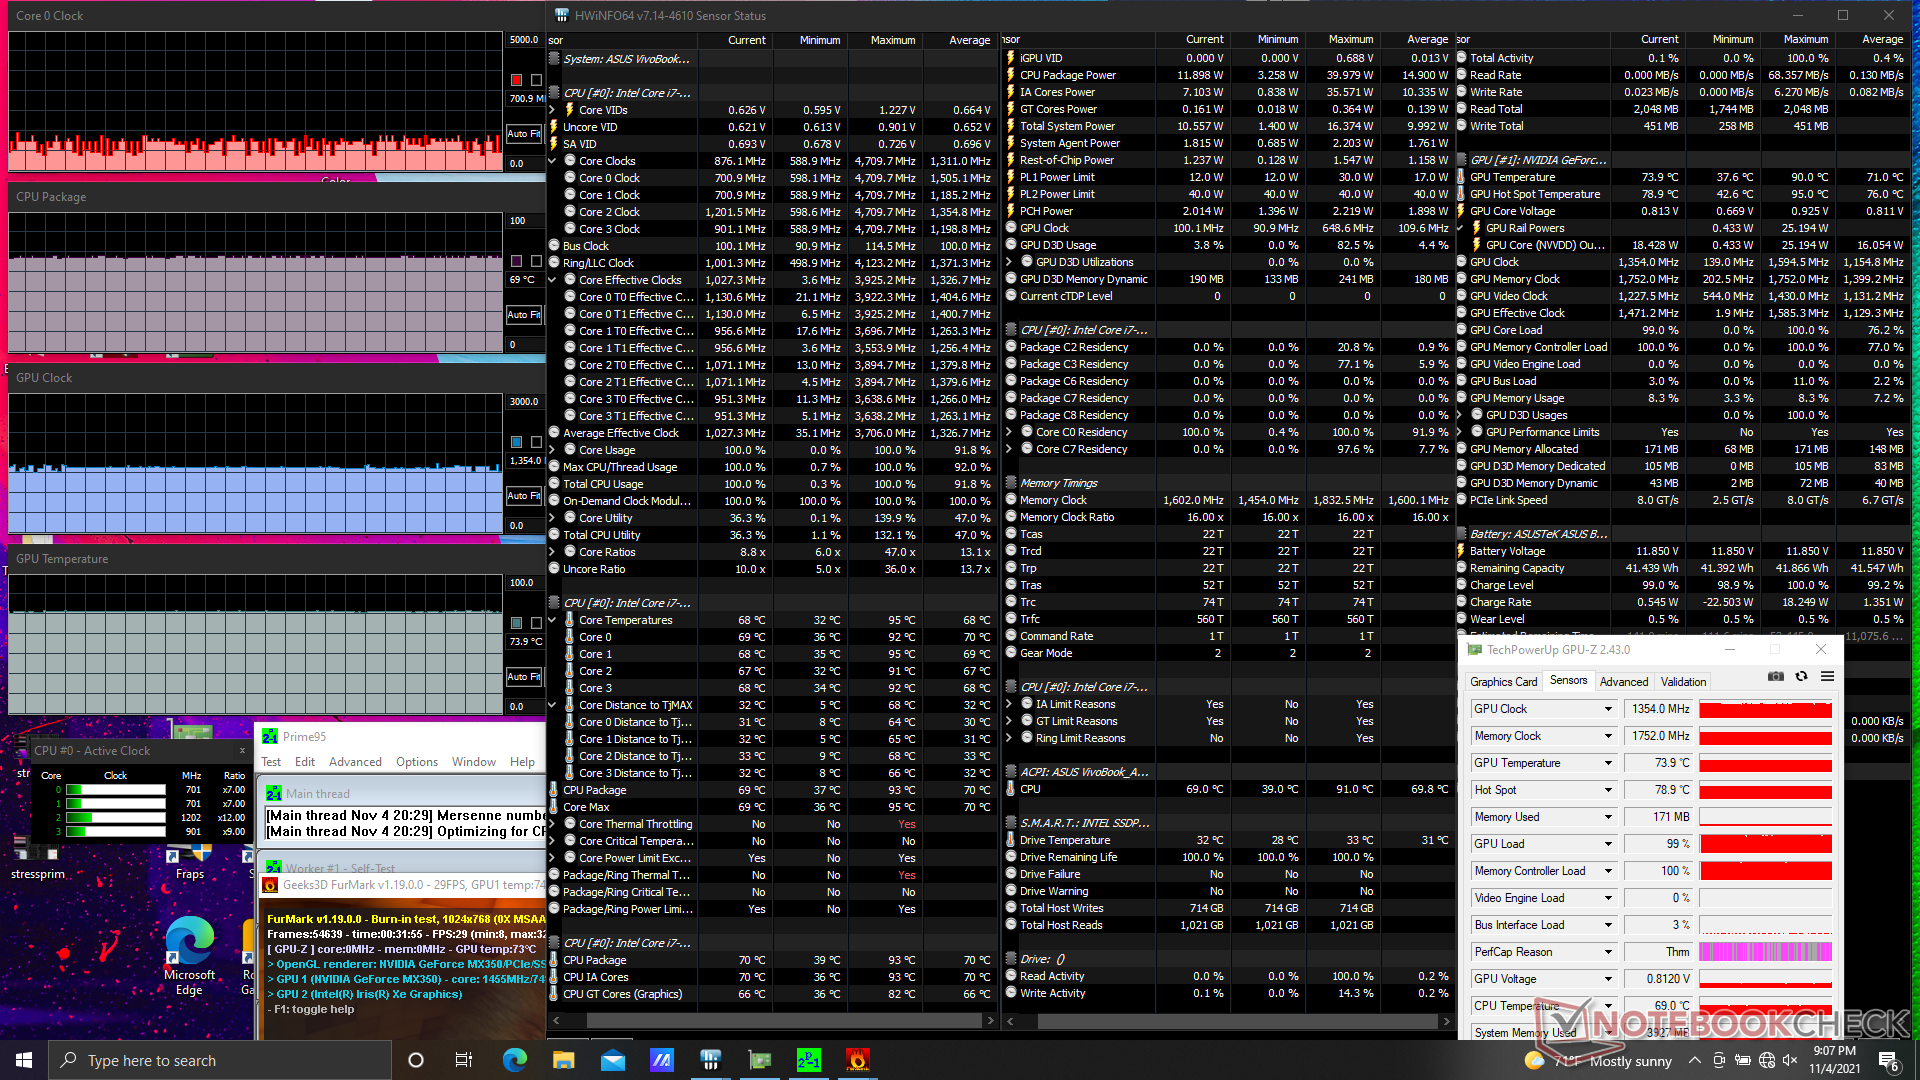
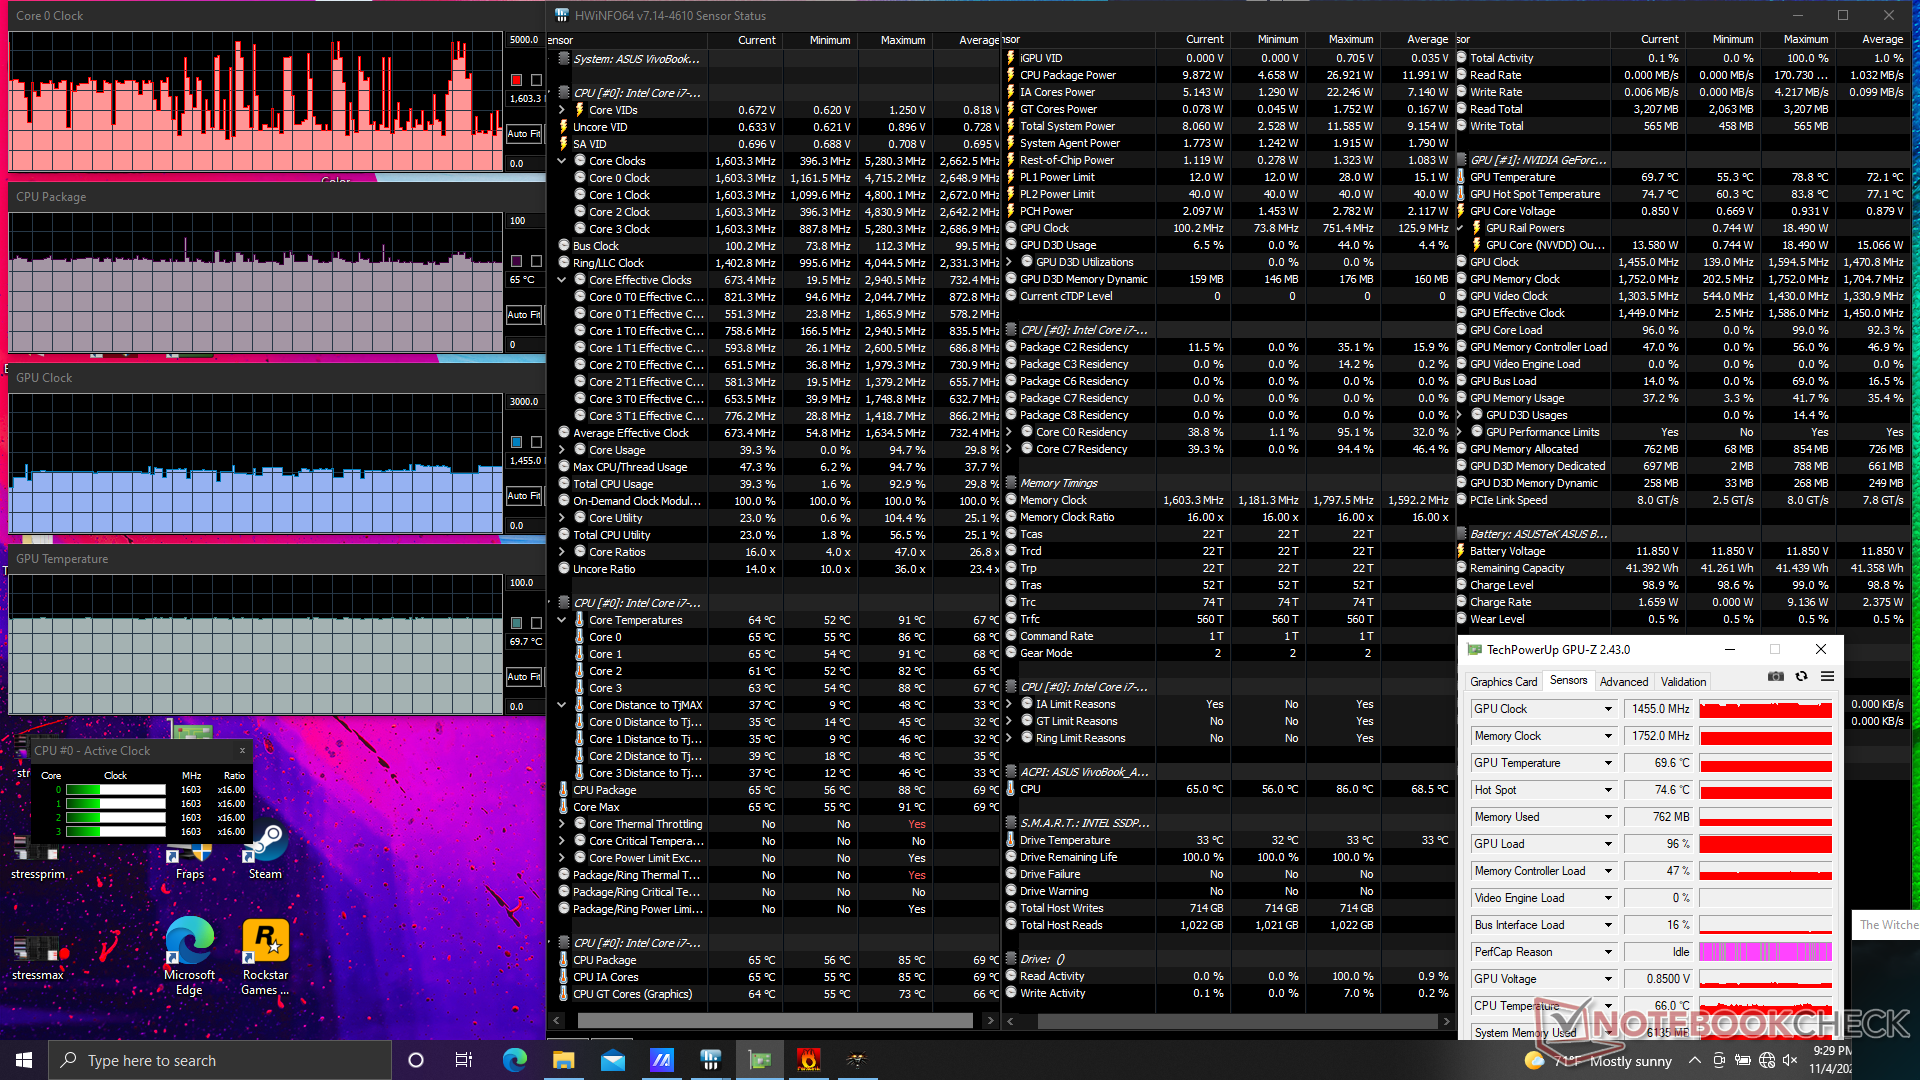
Draaien in de prestatiemodus zorgt voor iets snellere grafische prestaties. De GPU kloksnelheid zou tussen 1100 en 1455 MHz liggen bij Witcher 3 in de gebalanceerde modus, vergeleken met een constante 1595 MHz wanneer hetzelfde spel in de prestatiemodus wordt uitgevoerd. Gebruikers moeten dus rekening houden met het hardere ventilatorgeluid dat gepaard gaat met de prestatiemodus als ze de laptop optimaal willen benutten.
Het draaien op batterijen heeft invloed op de prestaties. Een 3DMark 11 test op batterijen zou een Physics en Graphics score opleveren van respectievelijk 8064 en 6075 punten, vergeleken met 11534 en 6293 punten op netstroom.
| CPUklok (GHz) GPUklok (MHz) GemiddeldeCPU temperatuur (°C) GemiddeldeGPU temperatuur (°C) |
| Systeem Idle |
| Prime95 Stress |
| Prime95 + FurMark Stress 0.7 - 1.1 1354 69 74 |
| Witcher 3 Stress (Uitgebalanceerde modus) |
| Witcher 3 Stress (Prestatiemodus) |
Sprekers
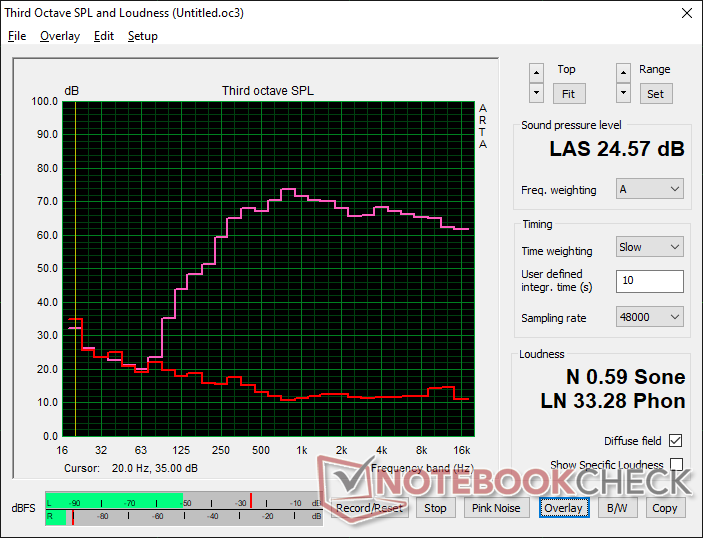
Asus Vivobook 15 K513EQ audioanalyse
(±) | luidspreker luidheid is gemiddeld maar goed (80.8 dB)
Bas 100 - 315 Hz
(-) | bijna geen lage tonen - gemiddeld 15.3% lager dan de mediaan
(±) | lineariteit van de lage tonen is gemiddeld (13% delta ten opzichte van de vorige frequentie)
Midden 400 - 2000 Hz
(+) | evenwichtige middens - slechts 4.2% verwijderd van de mediaan
(+) | de middentonen zijn lineair (3.8% delta ten opzichte van de vorige frequentie)
Hoog 2 - 16 kHz
(+) | evenwichtige hoogtepunten - slechts 0.8% verwijderd van de mediaan
(+) | de hoge tonen zijn lineair (2.3% delta naar de vorige frequentie)
Algemeen 100 - 16.000 Hz
(+) | het totale geluid is lineair (12.5% verschil met de mediaan)
Vergeleken met dezelfde klasse
» 24% van alle geteste apparaten in deze klasse waren beter, 3% vergelijkbaar, 73% slechter
» De beste had een delta van 5%, het gemiddelde was 17%, de slechtste was 45%
Vergeleken met alle geteste toestellen
» 11% van alle geteste apparaten waren beter, 2% gelijk, 87% slechter
» De beste had een delta van 4%, het gemiddelde was 24%, de slechtste was 134%
Apple MacBook 12 (Early 2016) 1.1 GHz audioanalyse
(+) | luidsprekers kunnen relatief luid spelen (83.6 dB)
Bas 100 - 315 Hz
(±) | verminderde zeebaars - gemiddeld 11.3% lager dan de mediaan
(±) | lineariteit van de lage tonen is gemiddeld (14.2% delta ten opzichte van de vorige frequentie)
Midden 400 - 2000 Hz
(+) | evenwichtige middens - slechts 2.4% verwijderd van de mediaan
(+) | de middentonen zijn lineair (5.5% delta ten opzichte van de vorige frequentie)
Hoog 2 - 16 kHz
(+) | evenwichtige hoogtepunten - slechts 2% verwijderd van de mediaan
(+) | de hoge tonen zijn lineair (4.5% delta naar de vorige frequentie)
Algemeen 100 - 16.000 Hz
(+) | het totale geluid is lineair (10.2% verschil met de mediaan)
Vergeleken met dezelfde klasse
» 7% van alle geteste apparaten in deze klasse waren beter, 2% vergelijkbaar, 91% slechter
» De beste had een delta van 5%, het gemiddelde was 18%, de slechtste was 53%
Vergeleken met alle geteste toestellen
» 5% van alle geteste apparaten waren beter, 1% gelijk, 94% slechter
» De beste had een delta van 4%, het gemiddelde was 24%, de slechtste was 134%
Energiebeheer
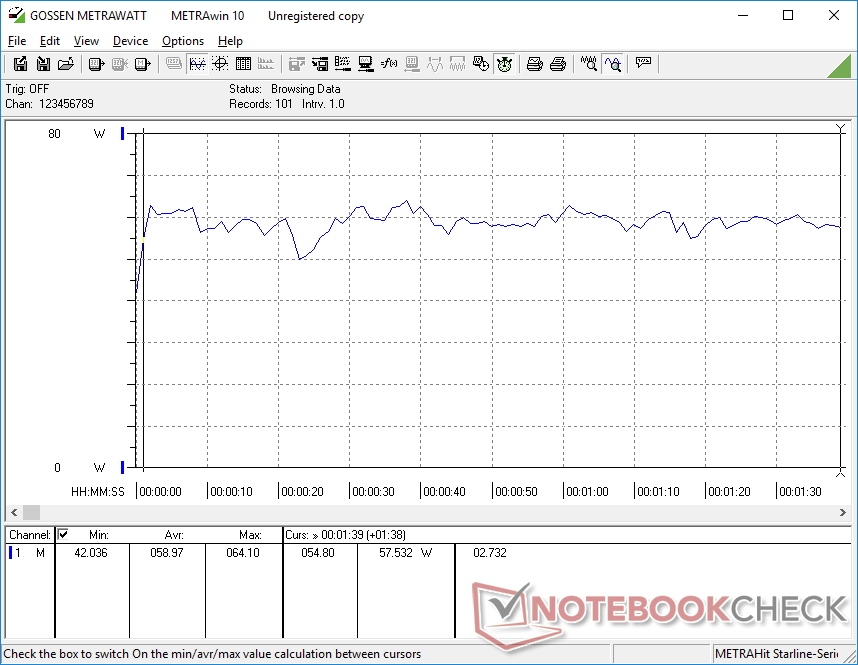
Energieverbruik - hogere eisen vanwege Nvidia GPU
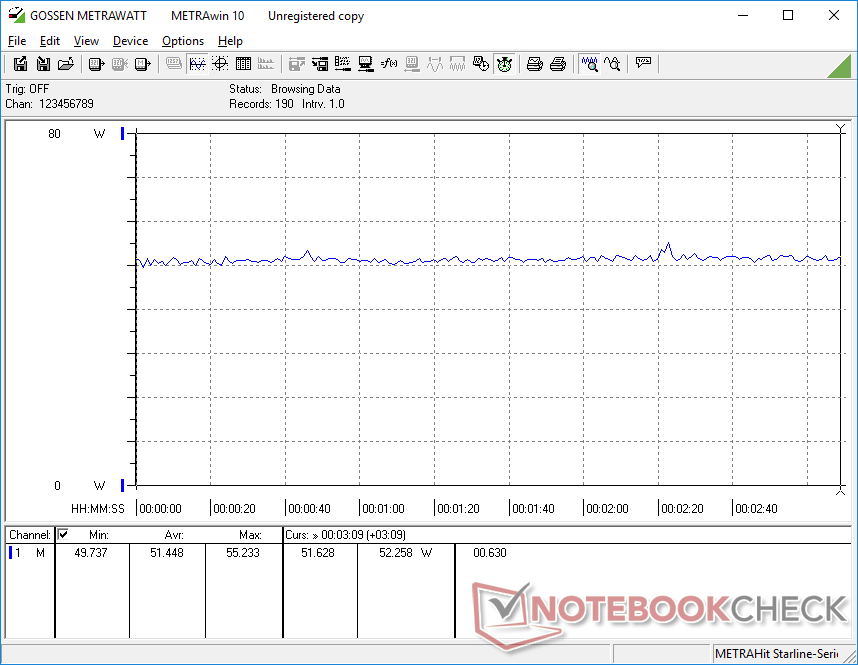
In de ruststand op het bureaublad wordt tussen 3 W en 9 W verbruikt, afhankelijk van de helderheidsinstelling en het stroomprofiel. Het stroomverbruik hangt ook af van de kleuren die worden weergegeven, aangezien ons toestel een OLED paneel gebruikt, zoals beschreven in onze bevindingen hier.
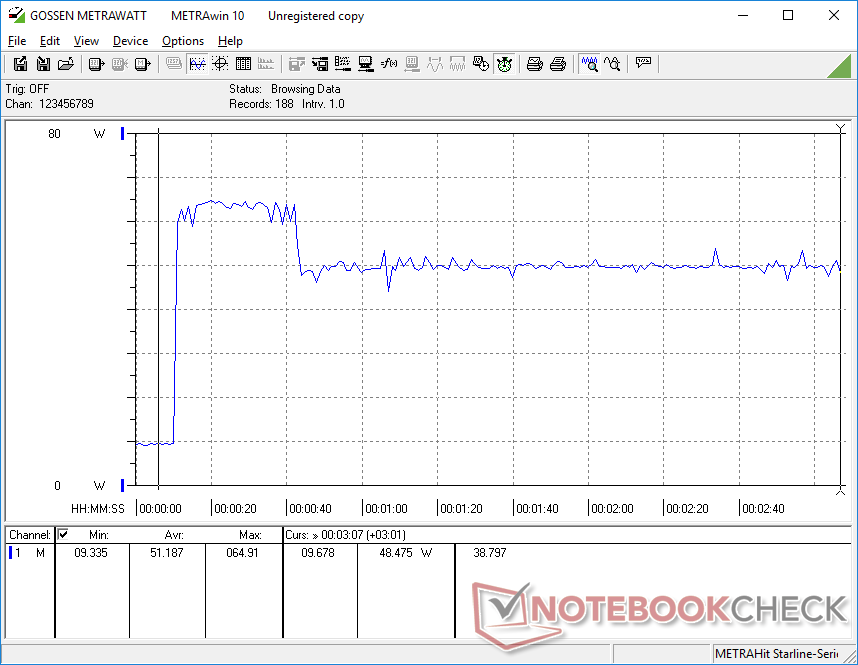
Het draaien van hogere belastingen zoals games verbruikt tussen 51 W en 59 W, vergeleken met ongeveer 40 W elk op de AMD-aangedreven Lenovo IdeaPad 5 15ALC05 of Iris Xe-aangedrevenDell Inspiron 15 3501. De discrete Nvidia GPU is het meest verantwoordelijk voor de opmerkelijke 48 procent meer stroomverbruik dan andere Ultrabooks die alleen worden aangedreven door geïntegreerde graphics. Natuurlijk zullen eigenaars ook profiteren van de betrouwbaardere en over het algemeen snellere prestaties van de GeForce MX350.
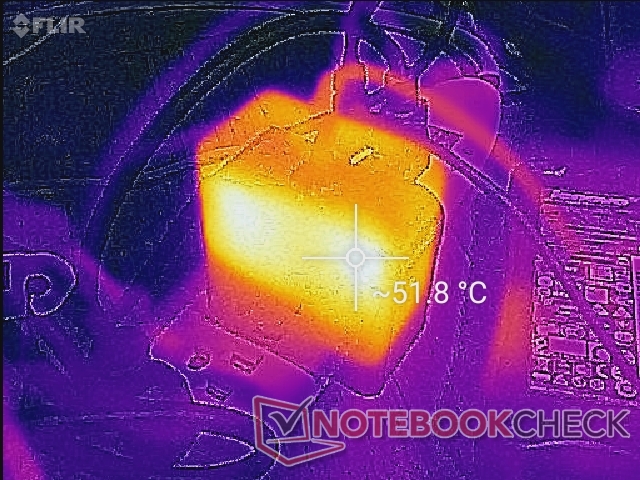
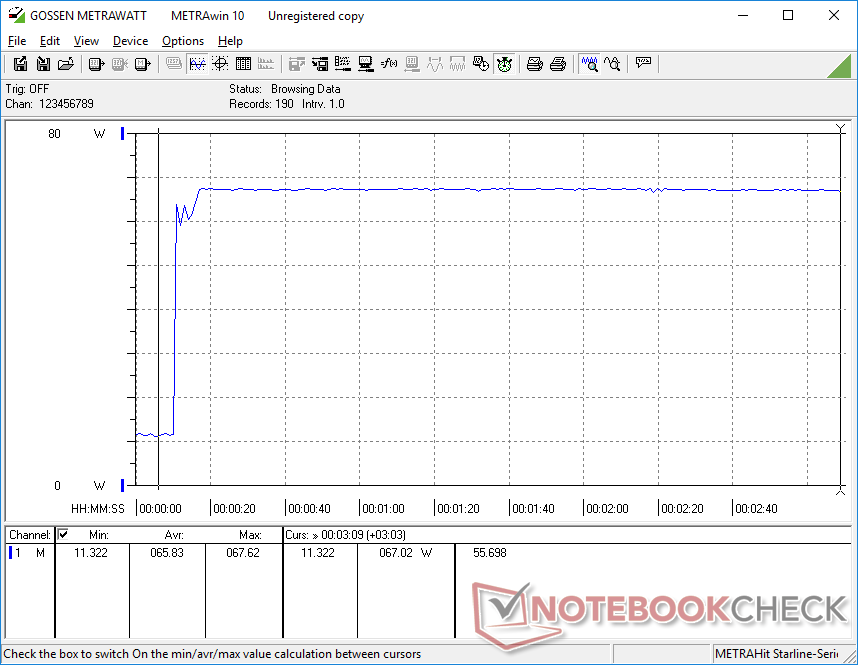
We zijn in staat om een maximum van 67,6 W te registreren bij het draaien van extreme Prime95 en FurMark belastingen. De kleine adapter (~6,4 x 6,4 x 3 cm) is slechts geschikt voor 65 W, wat betekent dat de batterijlaadsnelheid zal vertragen bij het draaien van zulke hoge belastingen. Het systeem had mogelijk baat gehad bij een grotere en meer capabele AC adapter.
| Uit / Standby | |
| Inactief | |
| Belasting |
|
Key:
min: | |
| Asus Vivobook 15 K513EQ i7-1165G7, GeForce MX350, Intel SSD 660p SSDPEKNW512G8, OLED, 1920x1080, 15.6" | Asus VivoBook 15 Pro M3500QC-L1062 R5 5600H, GeForce RTX 3050 4GB Laptop GPU, SK Hynix HFM512GD3JX013N, AMOLED, 1920x1080, 15.6" | Asus VivoBook S15 S533EQ-BQ002T i7-1165G7, GeForce MX350, Intel SSD 660p 1TB SSDPEKNW010T8, IPS, 1920x1080, 15.6" | Lenovo IdeaPad 5 15ALC05 R5 5500U, Vega 7, , IPS, 1920x1080, 15.6" | Dell Inspiron 15 3501 i7-1165G7, Iris Xe G7 96EUs, Samsung PM991a MZ9LQ512HBLU-00BD1, IPS, 1920x1080, 15.6" | HP Pavilion 15-eg i7-1165G7, GeForce MX450, Samsung PM991 MZVLQ1T0HALB, IPS, 1920x1080, 15.6" | |
|---|---|---|---|---|---|---|
| Power Consumption | -33% | 7% | 9% | 20% | -20% | |
| Idle Minimum * (Watt) | 3.7 | 4.7 -27% | 3 19% | 3.7 -0% | 3.6 3% | 4.9 -32% |
| Idle Average * (Watt) | 6.3 | 9.4 -49% | 6.4 -2% | 7.9 -25% | 6.4 -2% | 7.9 -25% |
| Idle Maximum * (Watt) | 9.7 | 10 -3% | 7.9 19% | 9.3 4% | 7.9 19% | 14.2 -46% |
| Load Average * (Watt) | 59 | 74.3 -26% | 59 -0% | 41 31% | 39 34% | 64.3 -9% |
| Witcher 3 ultra * (Watt) | 51.4 | 67.7 -32% | 48 7% | 41 20% | 37.6 27% | 55.6 -8% |
| Load Maximum * (Watt) | 67.7 | 106.9 -58% | 68 -0% | 52.2 23% | 41.8 38% | 65.4 3% |
* ... kleiner is beter
Power Consumption Witcher 3 / Stresstest
Batterijlevensduur - Kleine capaciteit betekent kortere runtijden
De batterijcapaciteit is klein met slechts 41 Wh, vergeleken met 71 Wh op de duurdere ZenBook 15. Runtimes zijn slechts gemiddeld met ongeveer 6 uur van real-world WLAN gebruik, terwijl de eerder genoemde ZenBook meer dan 12 uur kan bereiken bij vergelijkbare belasting. Als budget systeem is 6 uur echter vergelijkbaar met modellen als de HP Pavilion 15 of Dell Inspiron 15.
Opladen van leeg naar vol duurt iets minder dan 90 minuten.
| Asus Vivobook 15 K513EQ i7-1165G7, GeForce MX350, 42 Wh | Asus VivoBook 15 Pro M3500QC-L1062 R5 5600H, GeForce RTX 3050 4GB Laptop GPU, 63 Wh | Asus VivoBook S15 S533EQ-BQ002T i7-1165G7, GeForce MX350, 50 Wh | Lenovo IdeaPad 5 15ALC05 R5 5500U, Vega 7, 70 Wh | Dell Inspiron 15 3501 i7-1165G7, Iris Xe G7 96EUs, 42 Wh | HP Pavilion 15-eg i7-1165G7, GeForce MX450, 41 Wh | |
|---|---|---|---|---|---|---|
| Batterijduur | 19% | 40% | 101% | 13% | 5% | |
| Reader / Idle (h) | 13.3 | 15 13% | ||||
| WiFi v1.3 (h) | 6 | 8.3 38% | 8.4 40% | 14 133% | 6.8 13% | 6.6 10% |
| Load (h) | 1.3 | 1.3 0% | 2.2 69% | 1.2 -8% | ||
| H.264 (h) | 12.1 | 15.4 | ||||
| Witcher 3 ultra (h) | 1.2 | 1.8 |
Pro
Contra
Verdict - Betaalbare OLED
Het woord "OLED" roept meestal een gevoel van luxe of hogere prijzen op. Asus brengt daar verandering in door nieuwe 1080p OLED-panelen te introduceren voor haar budgetvriendelijke VivoBook-serie in plaats van de duurdere 4K OLED-panelen die doorgaans te vinden zijn op laptops in het hogere segment. Gebruikers kunnen nu een systeem bezitten dat is uitgerust met de nieuwste Intel Core i7 U-serie CPU, discrete GeForce MX graphics en een helder OLED-scherm dat DCI-P3 kleuren kan reproduceren, en dat alles voor iets meer dan $900 USD. Gebruikers die niet tevreden zijn met "slechts" ~95 procent sRGB-dekking op de meeste Ultrabooks uit het middensegment, zoals de Lenovo IdeaPad, MSI Modern, of Dell Inspiron zullen de nieuwe OLED VivoBook om deze reden zeer aantrekkelijk vinden.
De VivoBook 15 OLED zet een nieuwe standaard voor budget tot mid-range Ultrabooks in termen van beeldkwaliteit en kleurprofiel. De prestaties zijn ook uitstekend, terwijl het overwegend plastic chassis wel wat upgrades kan gebruiken.
De rest van de laptop is vrij standaard in goede en slechte tijden. Het is zeker vreemd om zo'n scherp en kleurrijk OLED scherm te zien op een verder goedkope laptop met een plastic basis, sponsachtig clickpad, en een kleine interne batterij. Je zult een paar honderd dollar meer moeten uitgeven aan een slankere ZenBook voor de volledige vlaggenschip-ervaring. Wat laptops in het middensegment betreft, is de VivoBook 15 K513 echter voorzien van een van de beste beeldschermen die je in deze prijsklasse kunt krijgen.
Prijs en beschikbaarheid
Asus Vivobook 15 K513EQ
- 30-08-2022 v7 (old)
Allen Ngo
Price comparison

