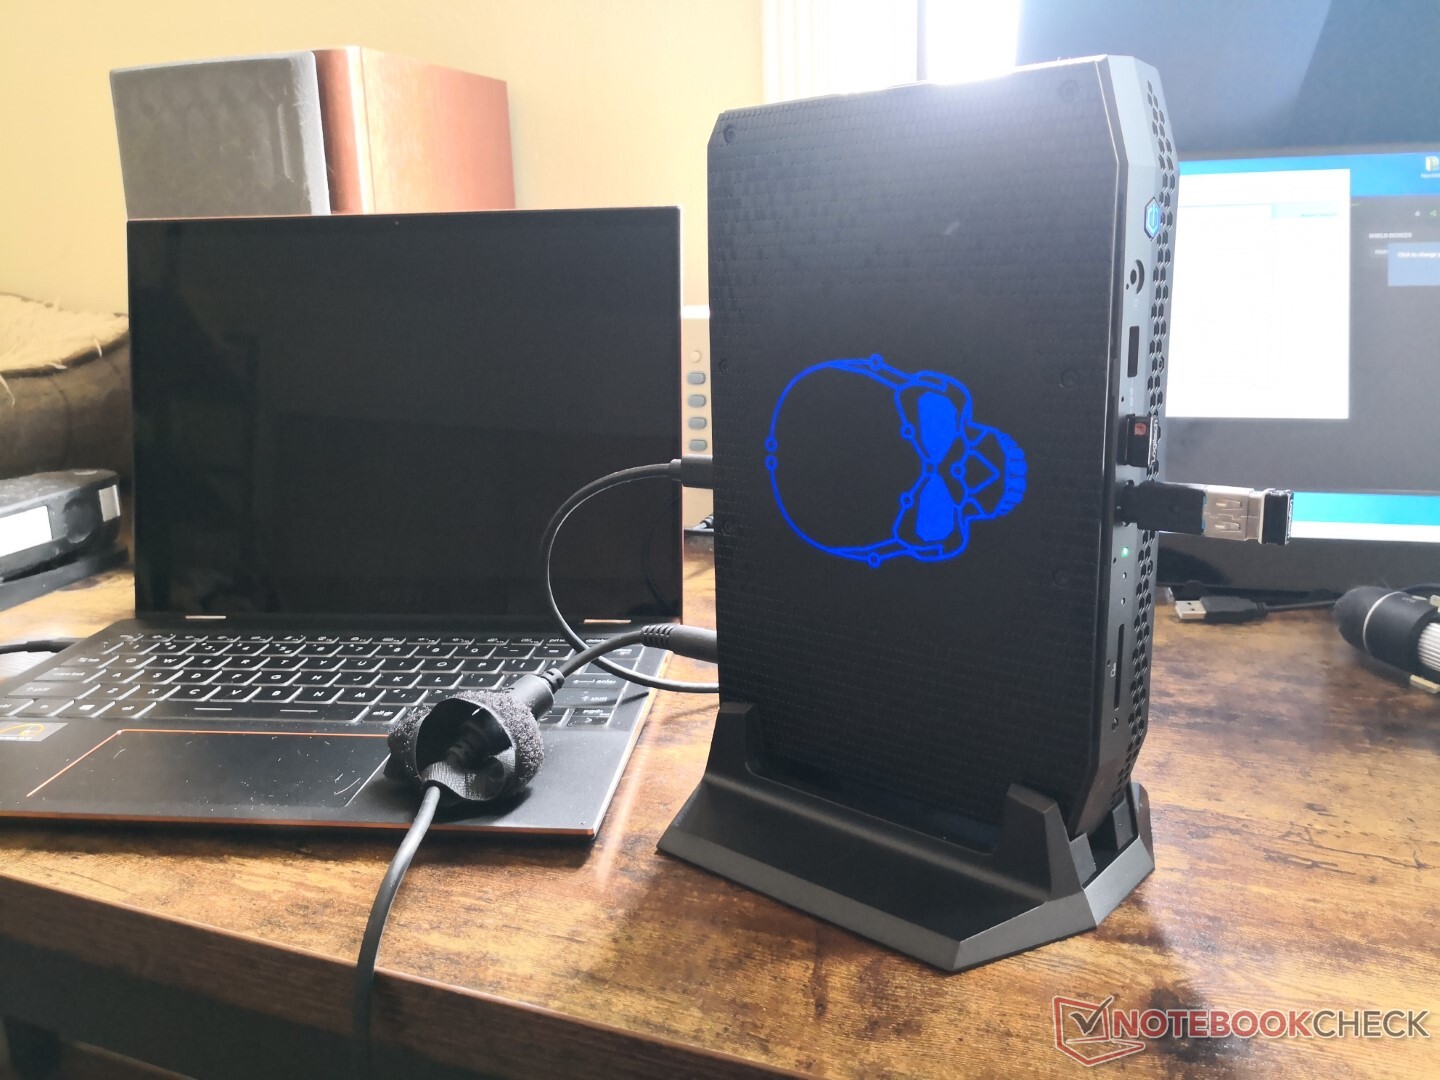
Kaby Lake-G is geschiedenis: Intel Phantom Canyon NUC11PHKi7C Review
 vs. 2018 Intel Hades Canyon (rechts)")
(26 april 2021 update: We zijn met Intel aan het bevestigen of de NUC11PHK al dan niet G-Sync ondersteunt en of de blauwe LED-verlichte schedel in verschillende kleuren kan worden veranderd. De pagina zal worden bijgewerkt zodra we de informatie hebben)
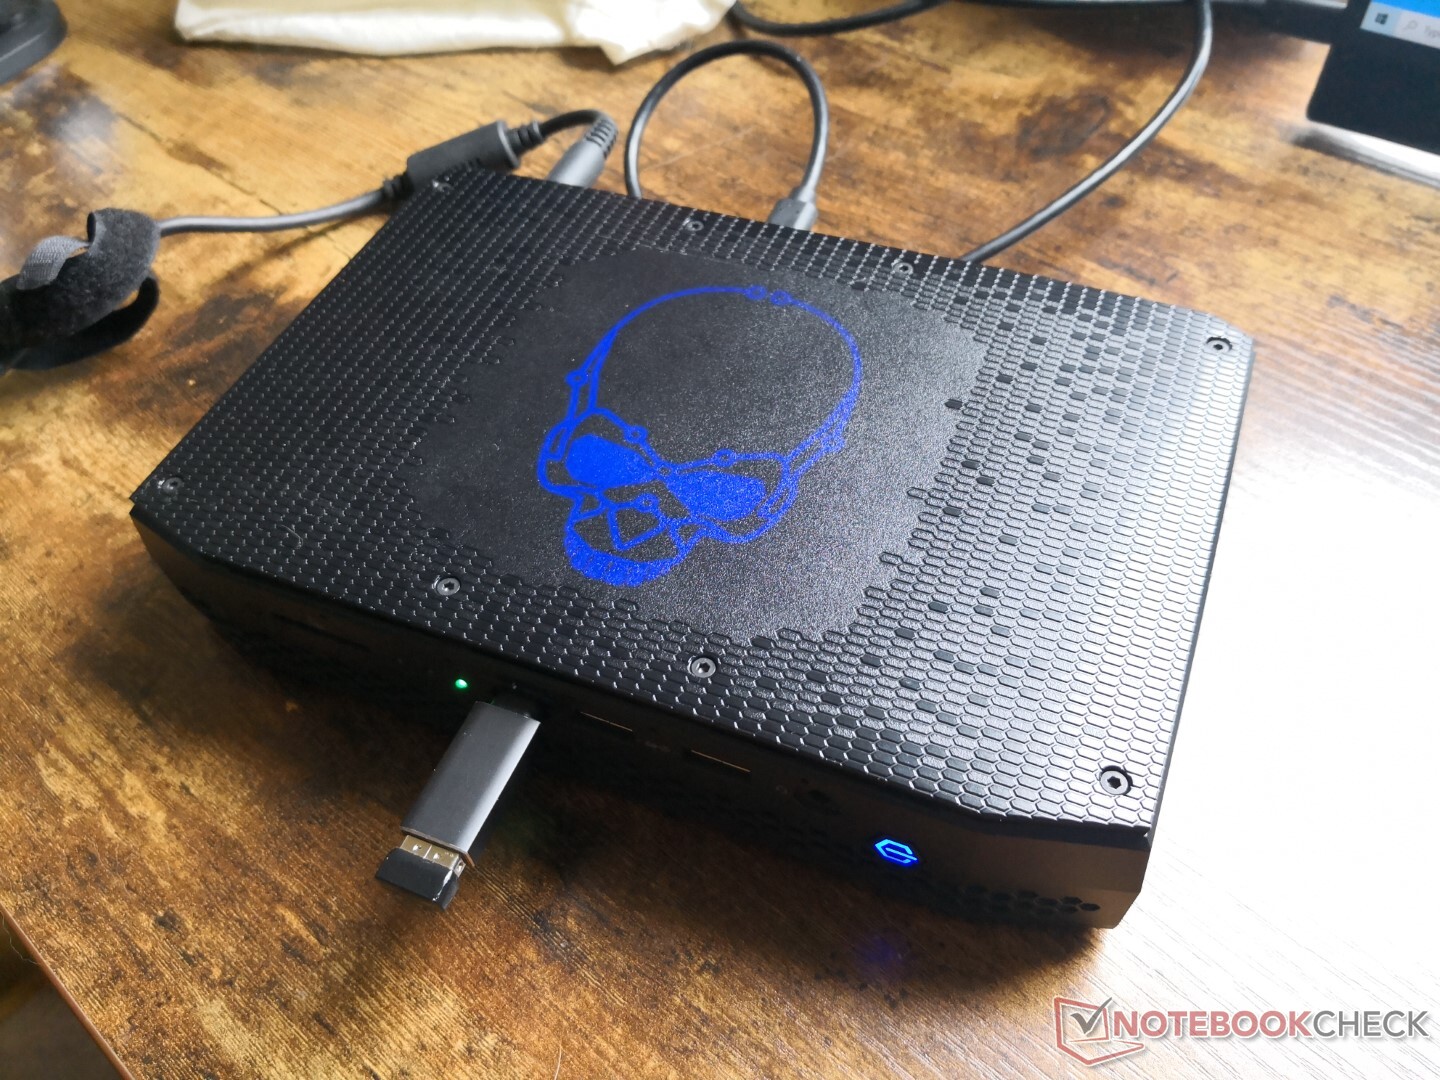
In tegenstelling tot de langzamere en minder dure NUC11TNK of NUC11PAQwordt de NUC11PHK Phantom Canyon standaard geleverd met een discrete GeForce RTX 2060 GPU voor aanzienlijk snellere grafische prestaties en gamingmogelijkheden. Het is de directe opvolger van de NUC8 Hades Canyon en niet de NUC9 Extreme aangezien het chassis meer lijkt op de eerste en niet op de laatste.
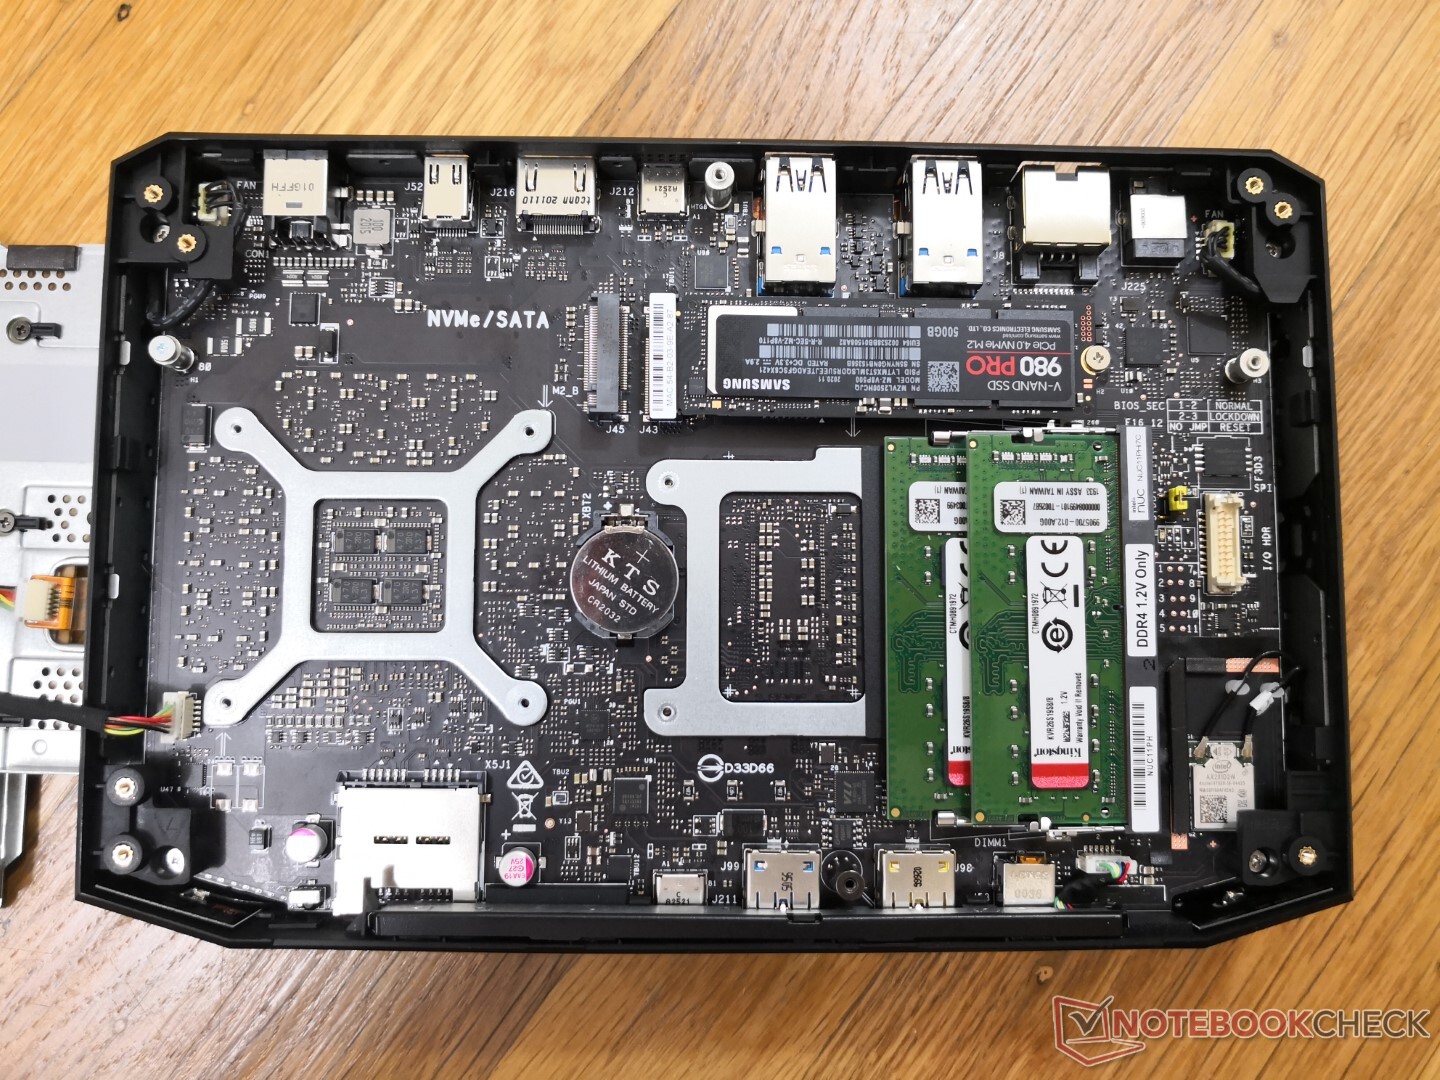
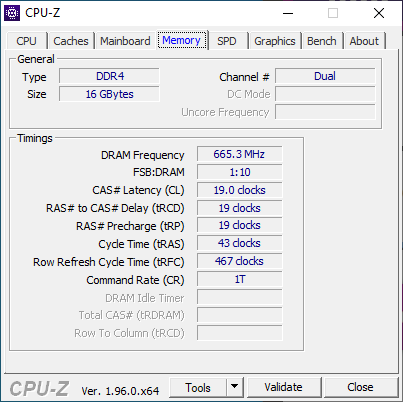
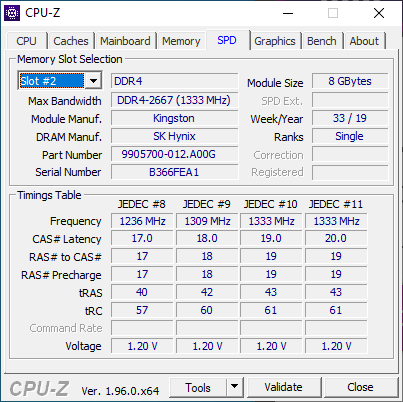
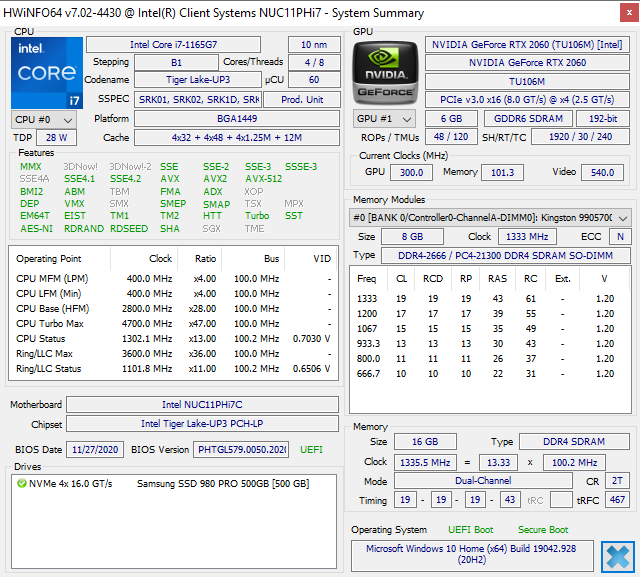
Phantom Canyon wordt geleverd als een barebones kit en dus kozen we ervoor om een Samsung 980 Pro NVMe SSD te installeren met 16 GB DDR4-2666 dual-channel RAM voor onze review doeleinden. De NUC zelf kan snellere RAM ondersteunen tot 3200 MHz.
Meer Intel NUC reviews:
potential competitors in comparison
Evaluatie | Datum | Model | Gewicht | Hoogte | Formaat | Resolutie | Beste prijs |
|---|---|---|---|---|---|---|---|
v (old) | 04-2021 | Intel NUC11PHKi7C i7-1165G7, GeForce RTX 2060 Mobile | 1.4 kg | 42 mm | x | ||
v (old) | 04-2018 | Intel Hades Canyon NUC8i7HVK i7-8809G, Vega M GH | 1.3 kg | 39 mm | x | ||
v (old) | 02-2021 | Intel NUC11PAQi7 i7-1165G7, Iris Xe G7 96EUs | 647 g | 56 mm | x | ||
v (old) | 03-2021 | GMK NucBox 2 i5-8259U, Iris Plus Graphics 655 | 430 g | 50 mm | x | ||
v (old) | 03-2018 | Zotac ZBOX Magnus EK71080 i7-7700HQ, GeForce GTX 1080 (Desktop) | 3.3 kg | 128 mm | 0.00" | x | |
v (old) | 02-2021 | Aorus Gaming Box GeForce RTX 2080 Ti i7-1165G7 | 3.8 kg | 140 mm | x | ||
v (old) | Beelink GTR35 II-G-16512D00W64PRO-1T R5 3550H, Vega 8 | 843 g | 39 mm | x |
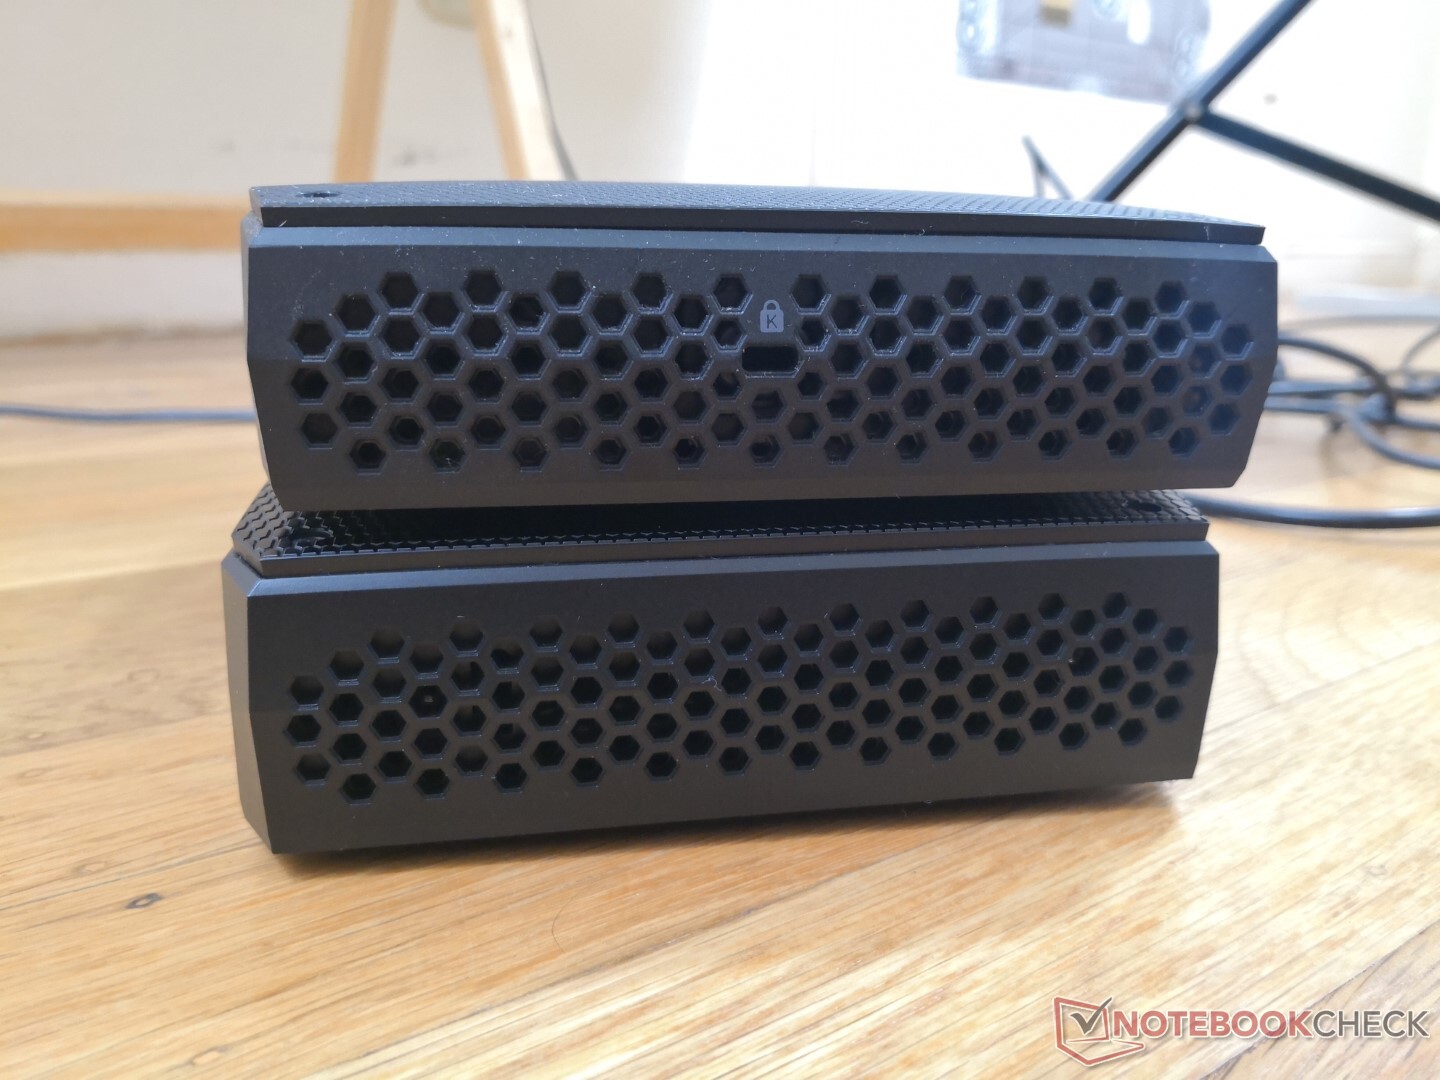
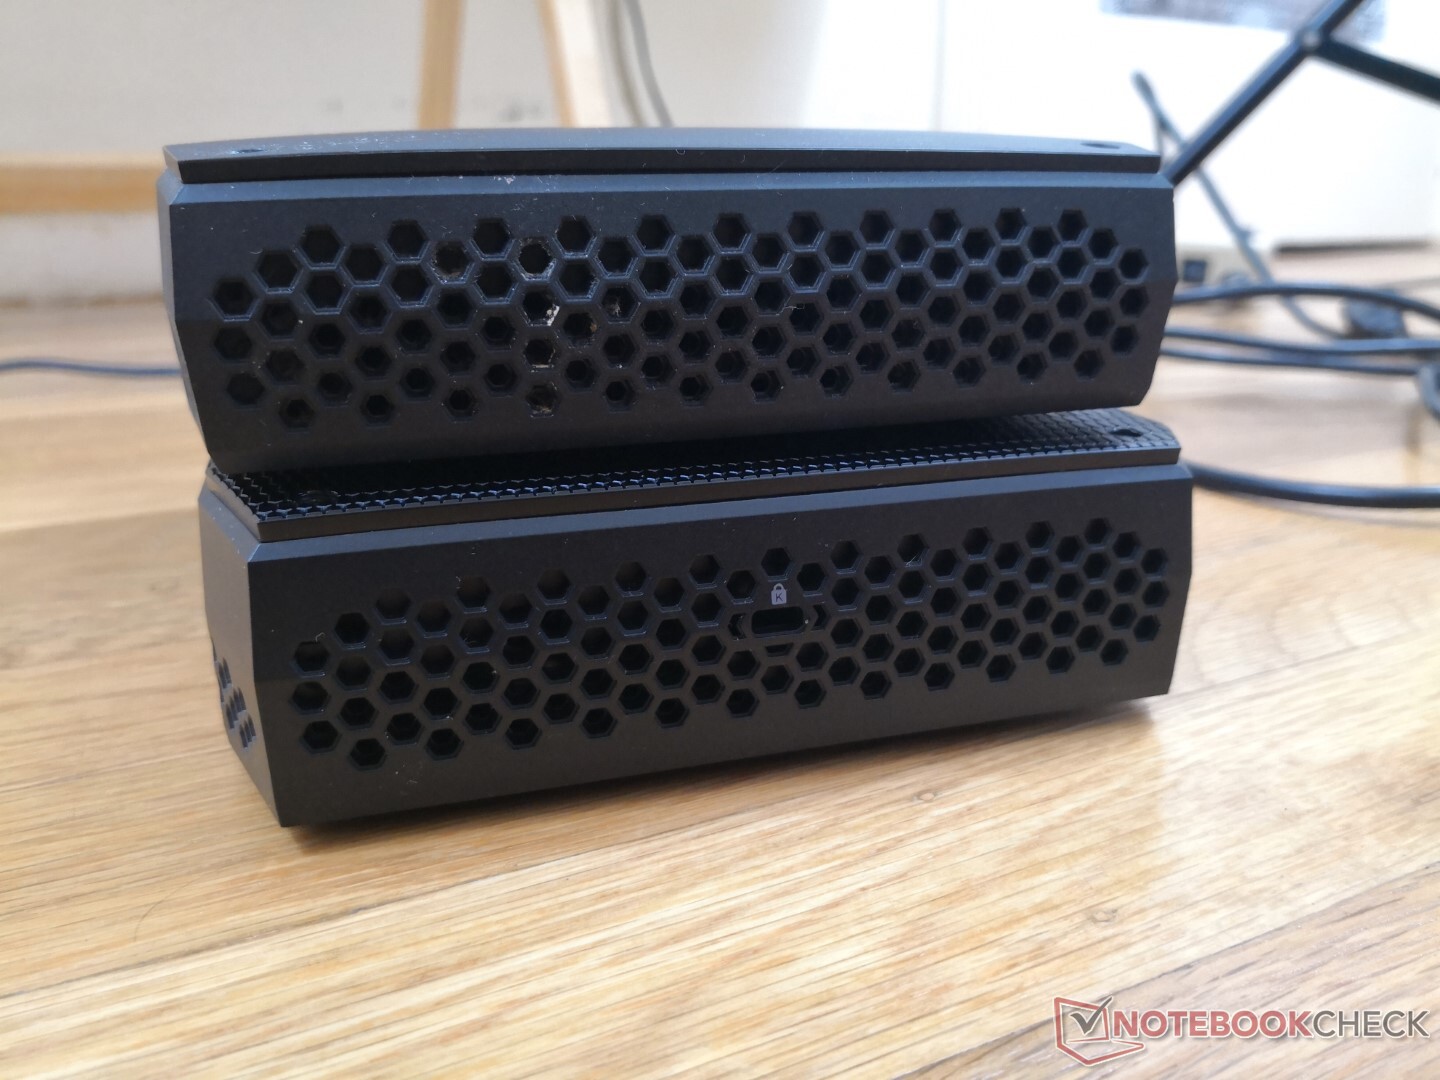
Zaak
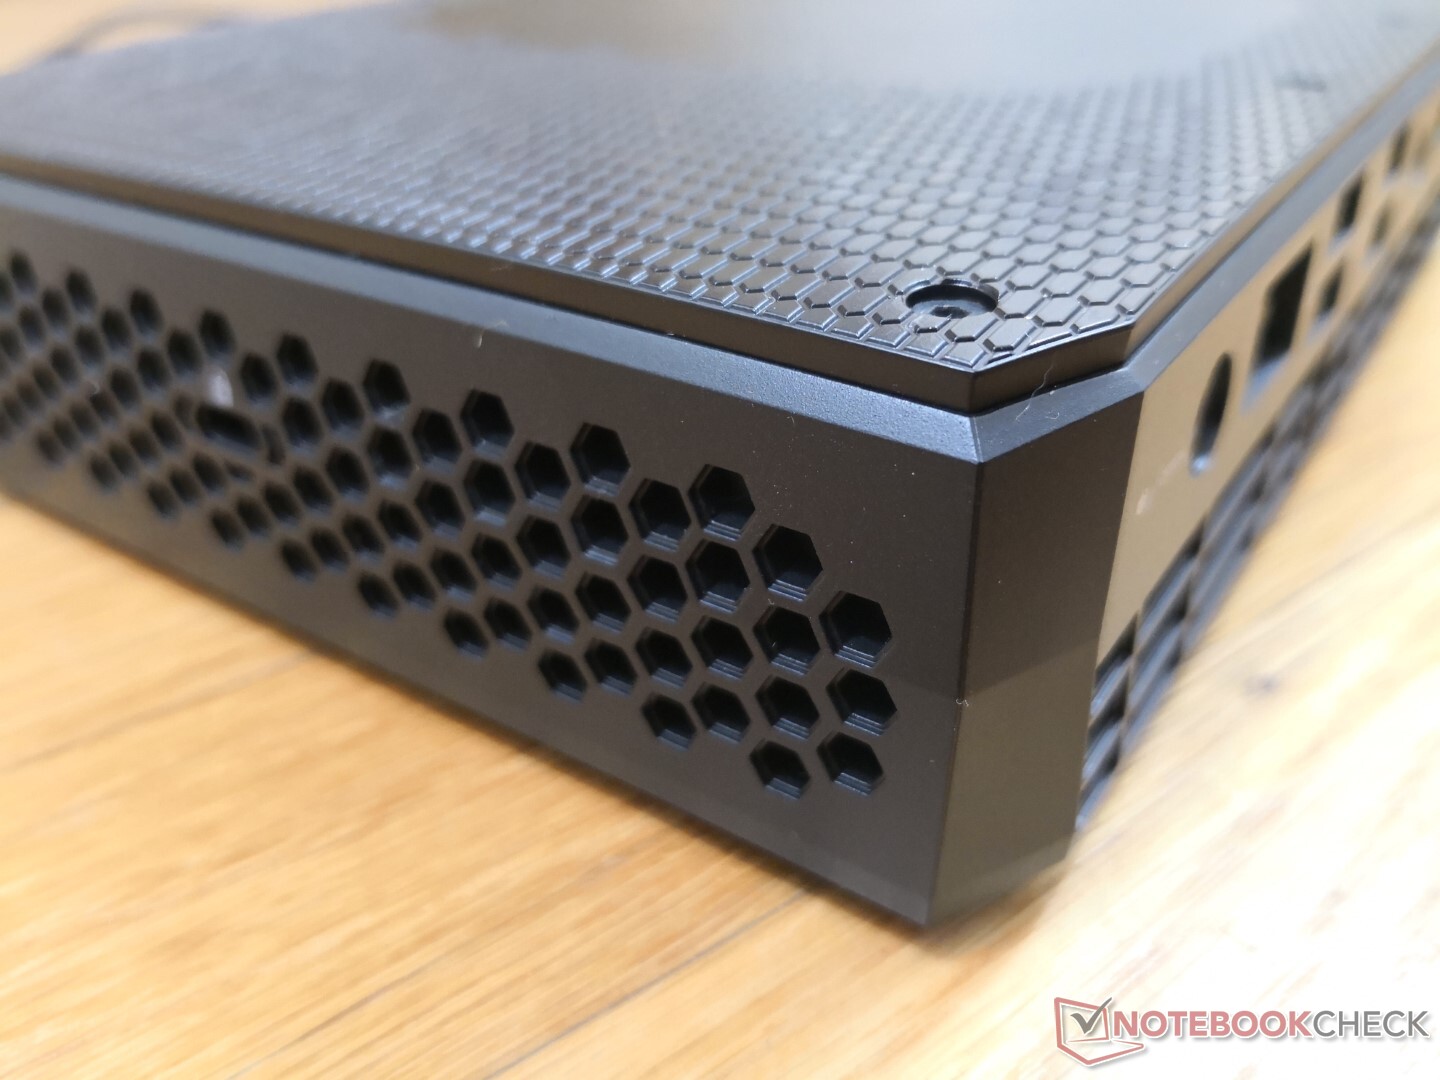
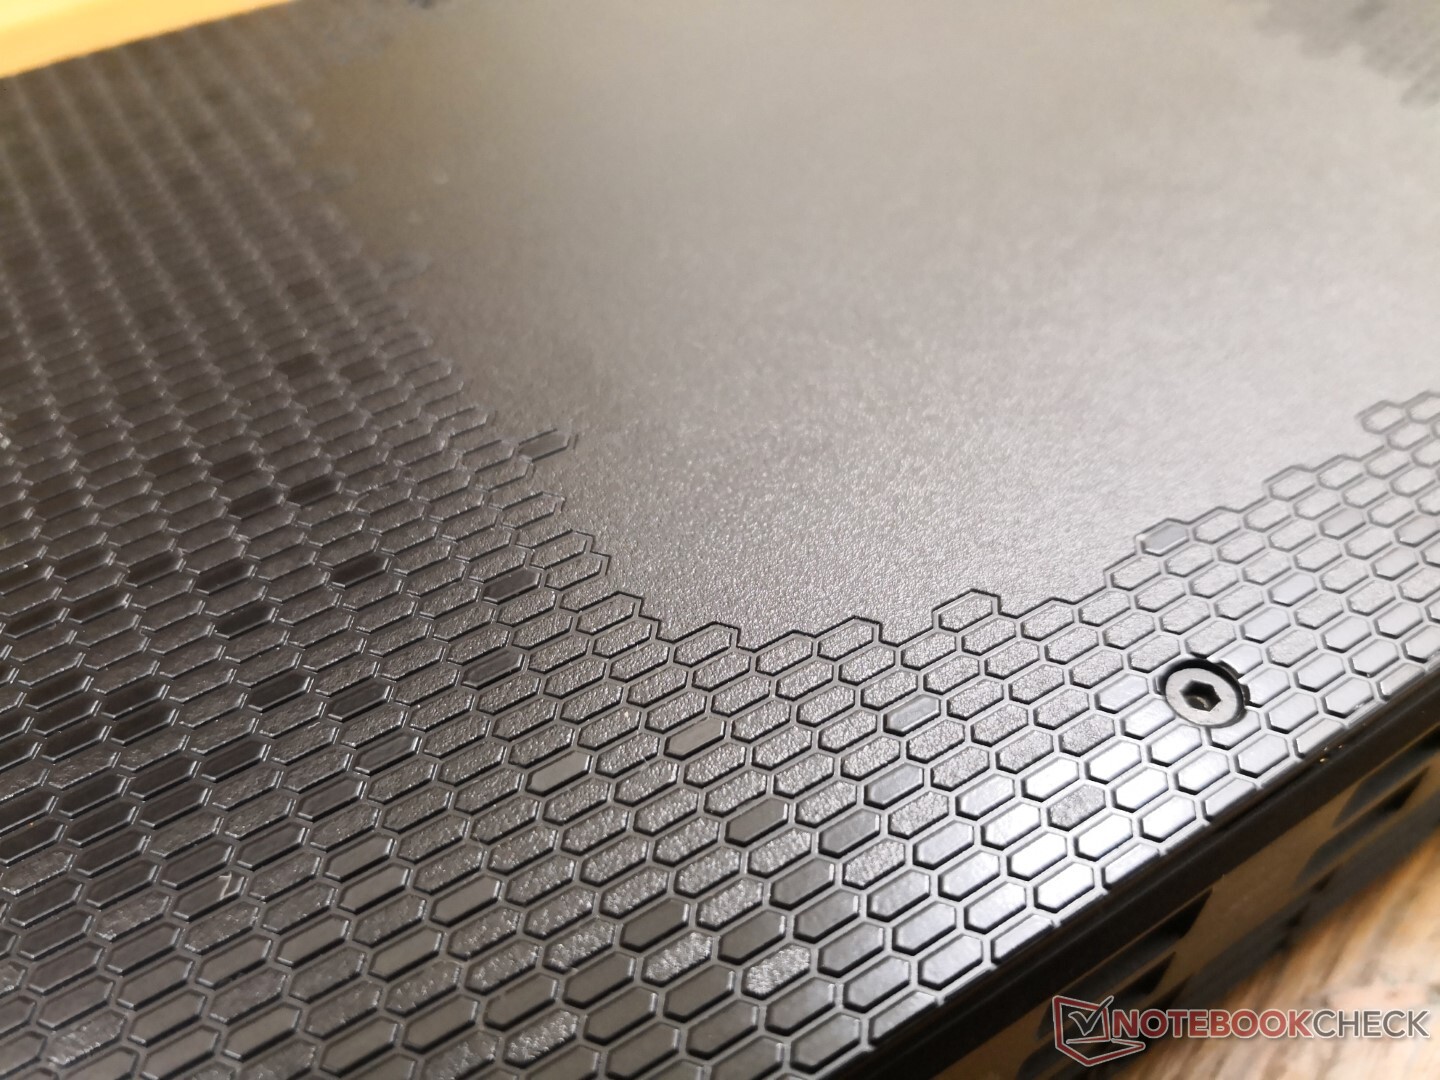
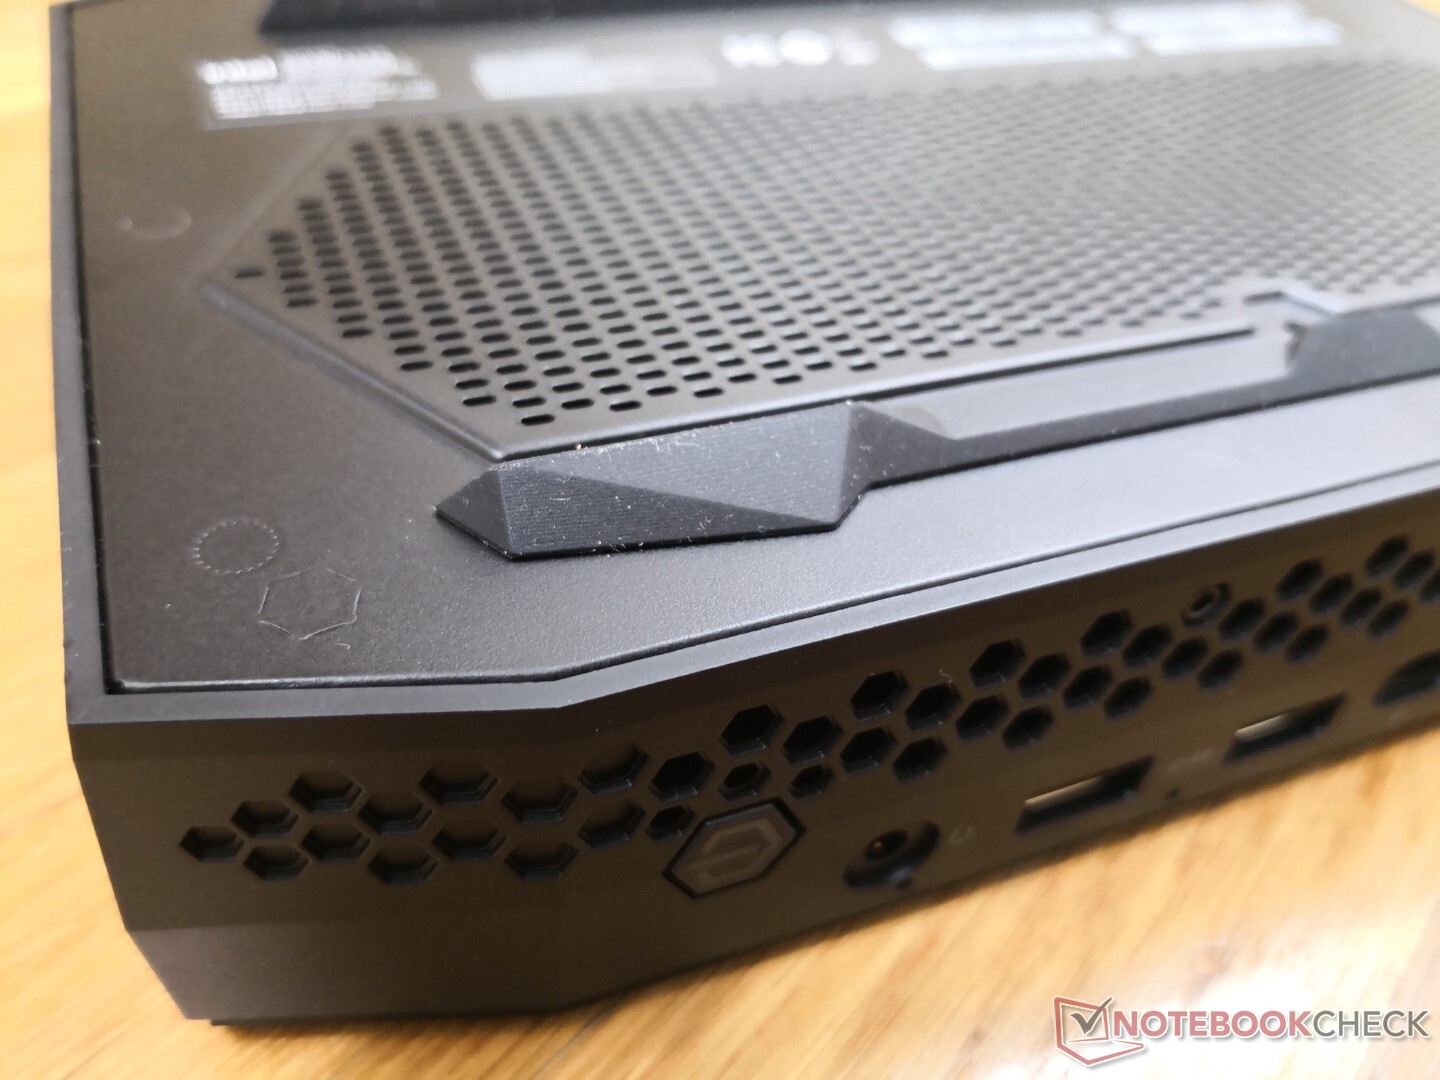
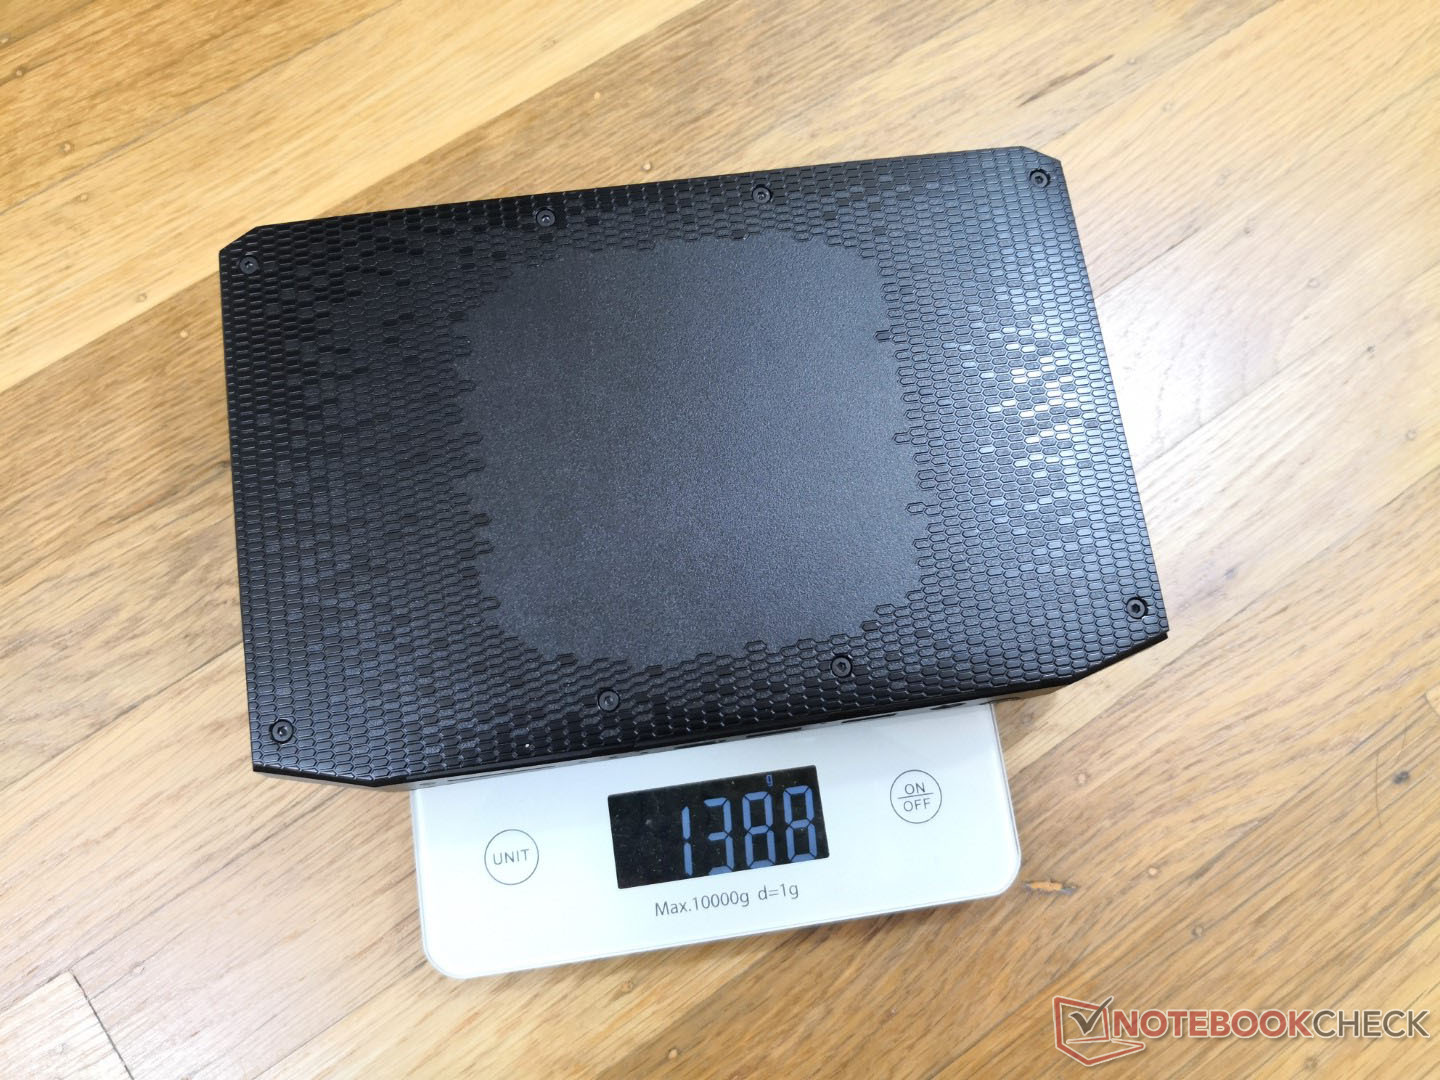
De materialen en afmetingen van het chassis zijn in essentie gelijk aan die van de Hades Canyon NUC, met slechts kleine cosmetische wijzigingen aan texturen en ventilatieroosters. De Phantom Canyon is echter iets dikker (42 mm vs. 39 mm) en zwaarder (1,4 kg vs. 1,3 kg) dan zijn onmiddellijke voorganger, om beter plaats te bieden aan de processoren die meer energie vragen en voor de nieuwe verwijderbare LED-verlichte frontplaat.
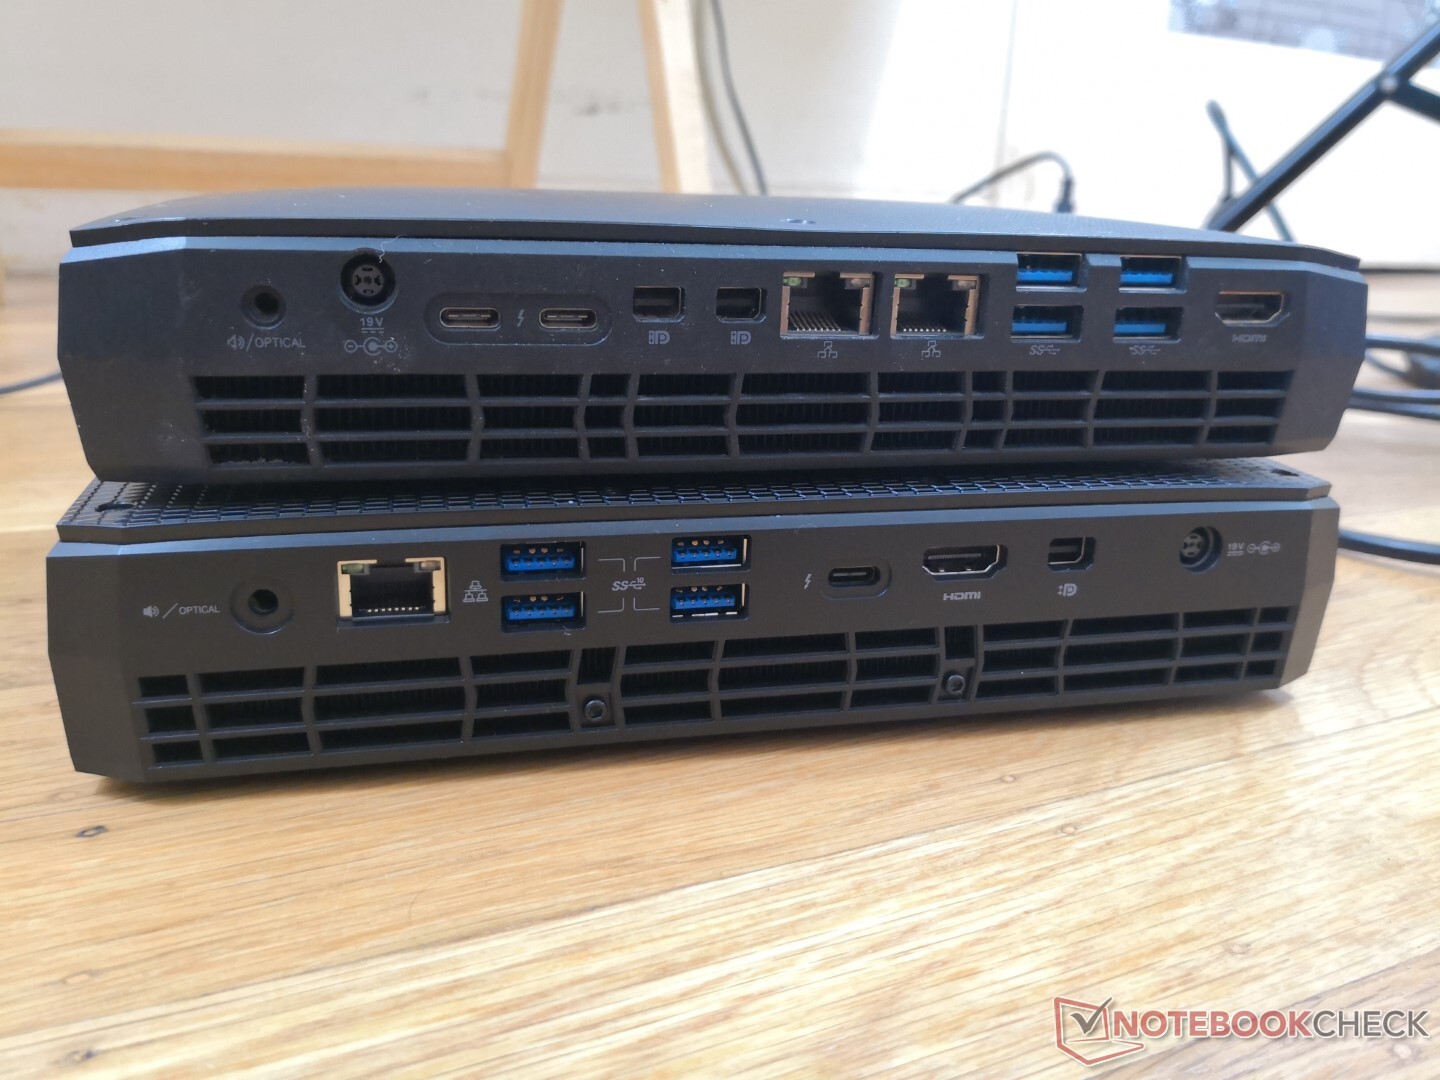
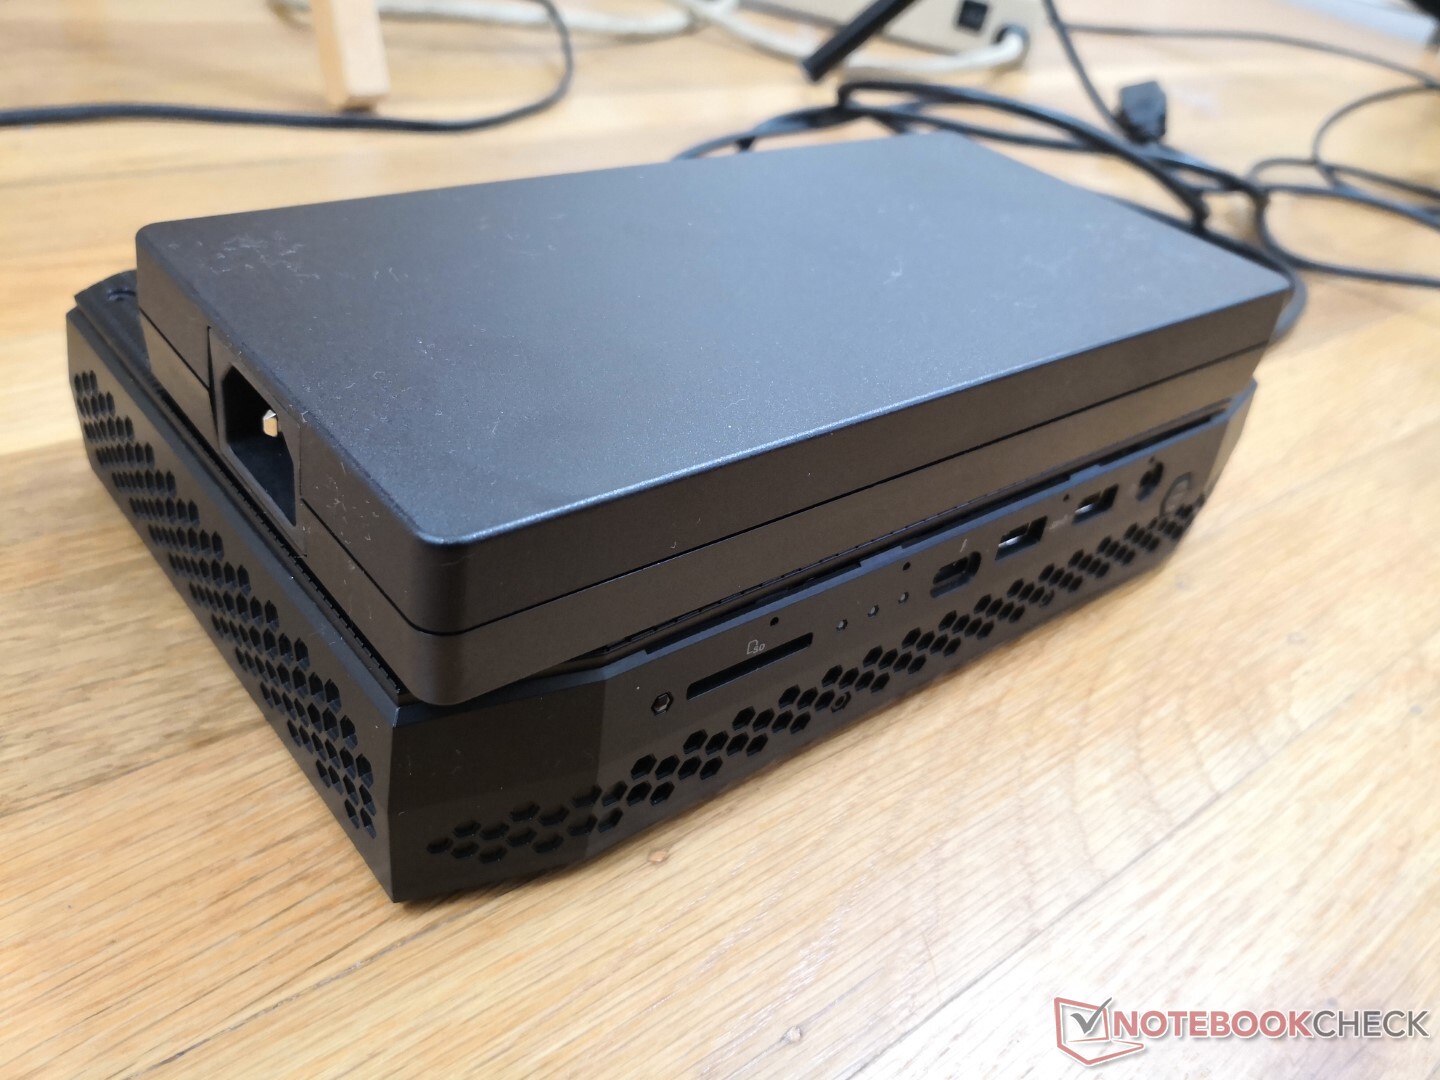
Connectiviteit
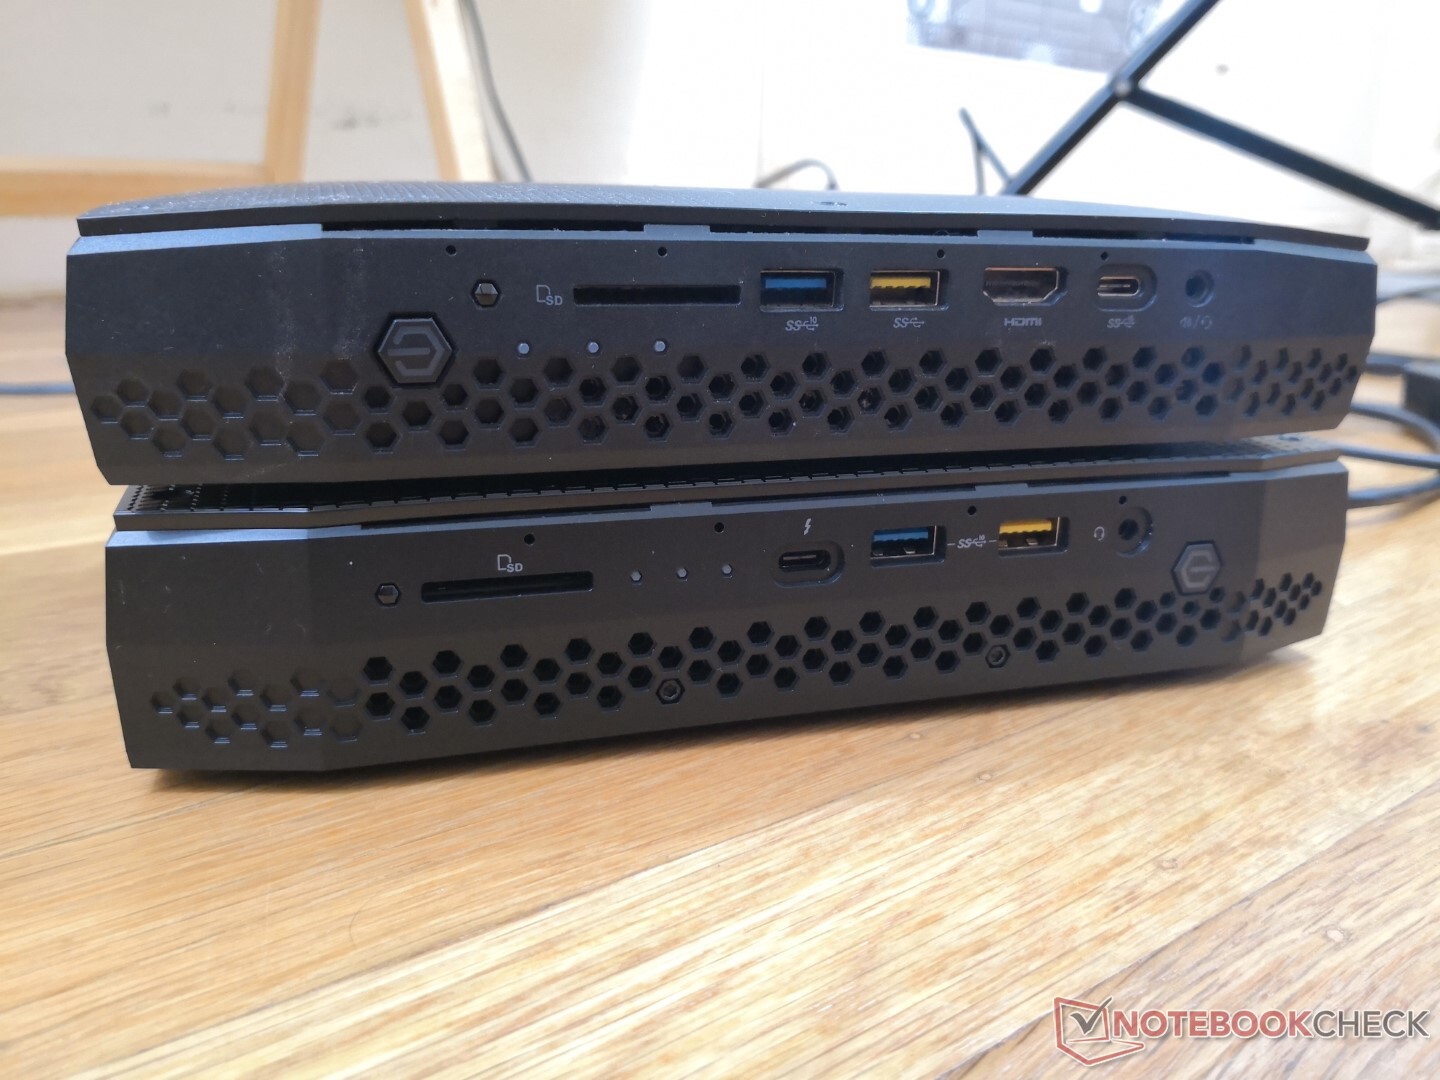
De poortopties zijn veranderd ten opzichte van de 2018 Hades Canyon. Er is nu slechts één RJ-45-poort, één HDMI-poort, één mini-DisplayPort, en twee USB-C met Thunderbolt 4 in plaats van twee RJ-45, twee HDMI, twee mini-DisplayPort, en drie USB-C op het vorige model. Alle zes USB-A-poorten blijven behouden.
De NUC kan niet worden gevoed via USB-C en zelfs als dat zou kunnen, zou het meer sap vergen om te draaien dan de USB-C limiet van 100 W.
De afbeeldingen hieronder vergelijken de NUC8 Hades Canyon (boven) met de NUC11 Phantom Canyon (onder).
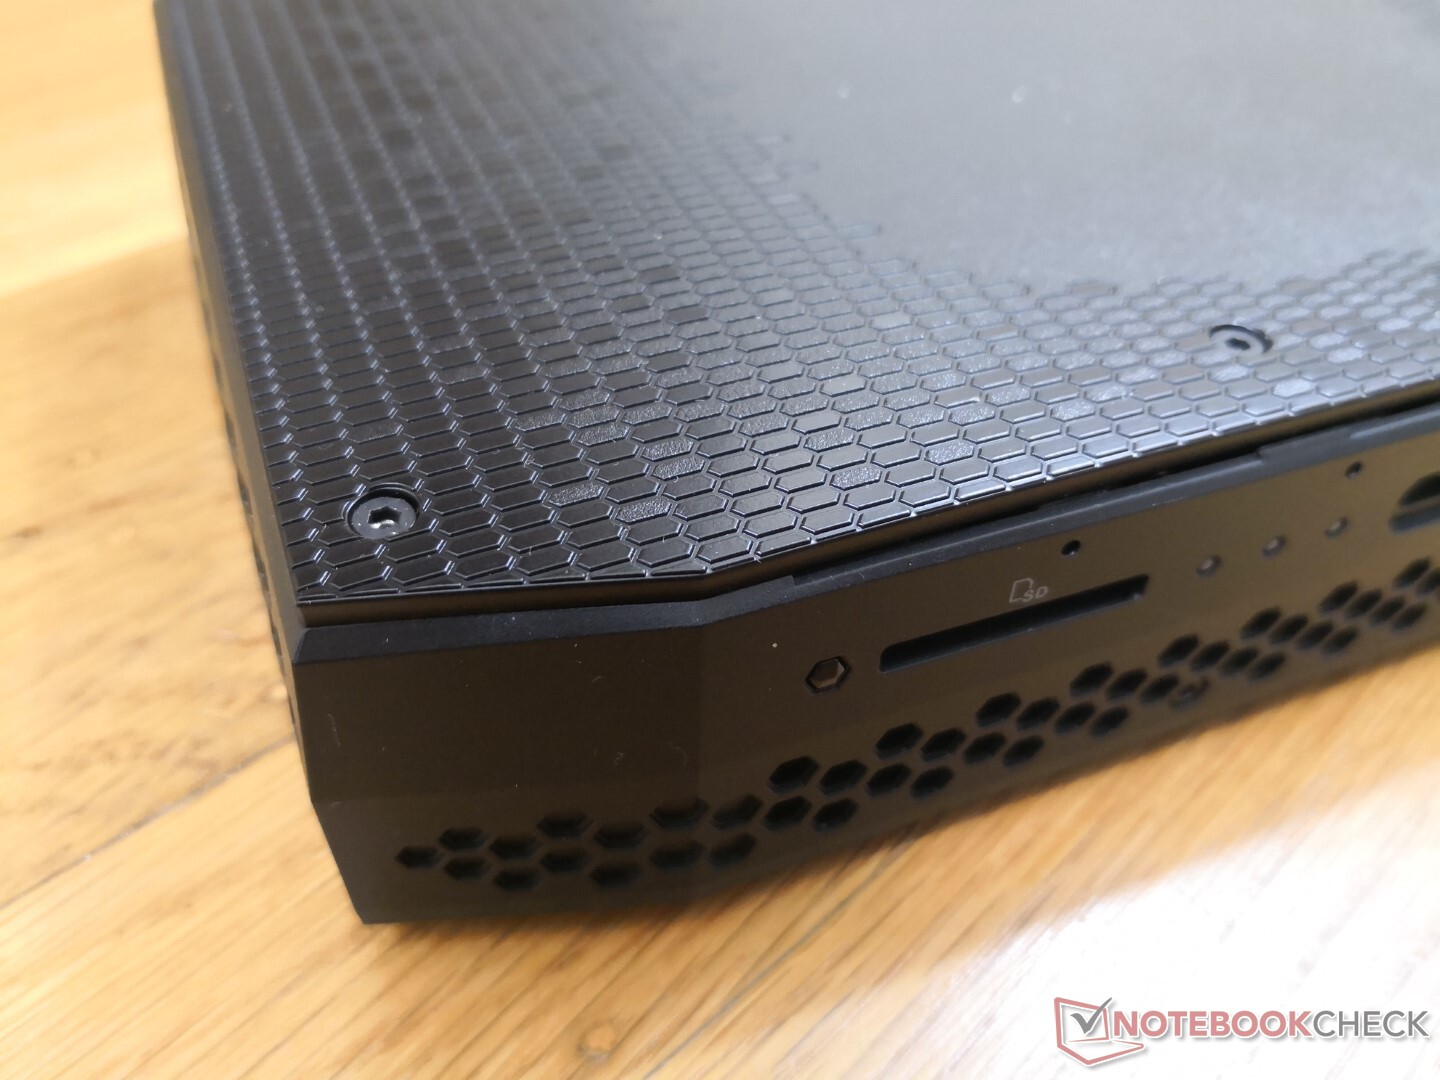
SD-kaartlezer
De geïntegreerde SD-lezer biedt snellere overdrachtssnelheden dan de kaartlezer op Hades Canyon. Hij is niet voorzien van een veer, zoals bij de meeste laptops.
| SD Card Reader | |
| average JPG Copy Test (av. of 3 runs) | |
| Intel NUC11PAQi7 (Toshiba Exceria Pro SDXC 64 GB UHS-II) | |
| Intel NUC11PHKi7C (Toshiba Exceria Pro SDXC 64 GB UHS-II) | |
| Intel Hades Canyon NUC8i7HVK (Toshiba Exceria Pro SDXC 64 GB UHS-II) | |
| Zotac ZBOX Magnus EK71080 (Toshiba Exceria Pro SDXC 64 GB UHS-II) | |
| GMK NucBox 2 (Toshiba Exceria Pro M501 UHS-II) | |
| maximum AS SSD Seq Read Test (1GB) | |
| Intel NUC11PHKi7C (Toshiba Exceria Pro SDXC 64 GB UHS-II) | |
| Intel NUC11PAQi7 (Toshiba Exceria Pro SDXC 64 GB UHS-II) | |
| Intel Hades Canyon NUC8i7HVK (Toshiba Exceria Pro SDXC 64 GB UHS-II) | |
| Zotac ZBOX Magnus EK71080 (Toshiba Exceria Pro SDXC 64 GB UHS-II) | |
| GMK NucBox 2 (Toshiba Exceria Pro M501 UHS-II) | |
Communicatie
| Networking | |
| iperf3 transmit AX12 | |
| Intel NUC11PHKi7C | |
| Intel NUC11PAQi7 | |
| GMK NucBox 2 | |
| Intel Hades Canyon NUC8i7HVK | |
| Zotac ZBOX Magnus EK71080 | |
| iperf3 receive AX12 | |
| Intel NUC11PHKi7C | |
| Intel NUC11PAQi7 | |
| GMK NucBox 2 | |
| Intel Hades Canyon NUC8i7HVK | |
| Zotac ZBOX Magnus EK71080 | |
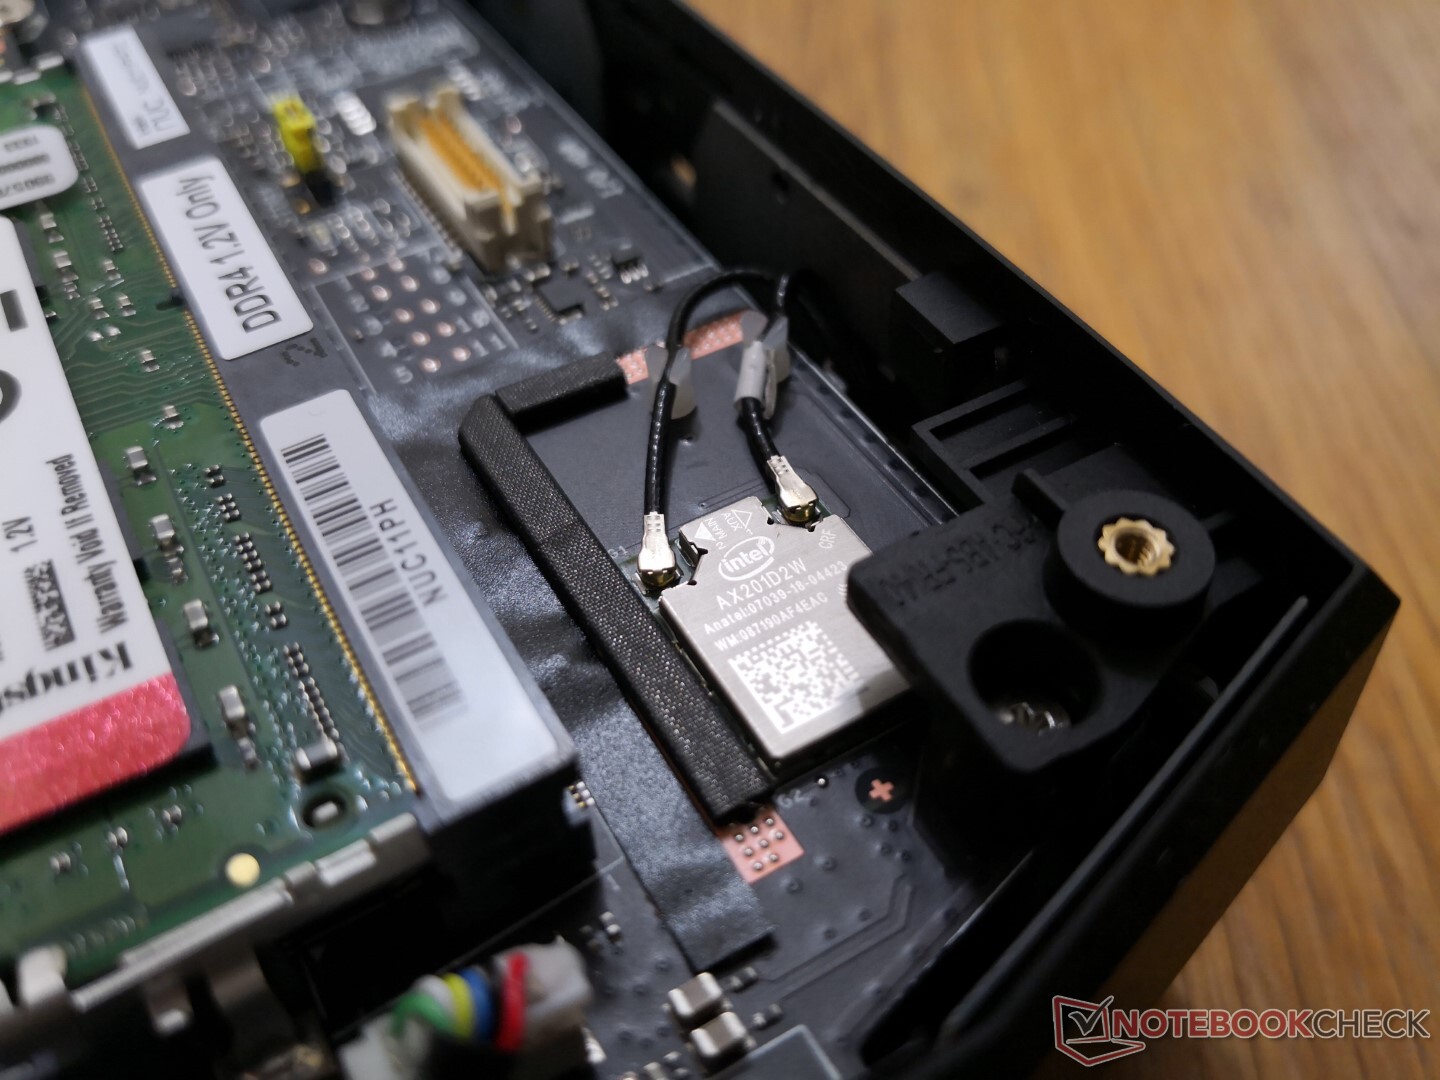
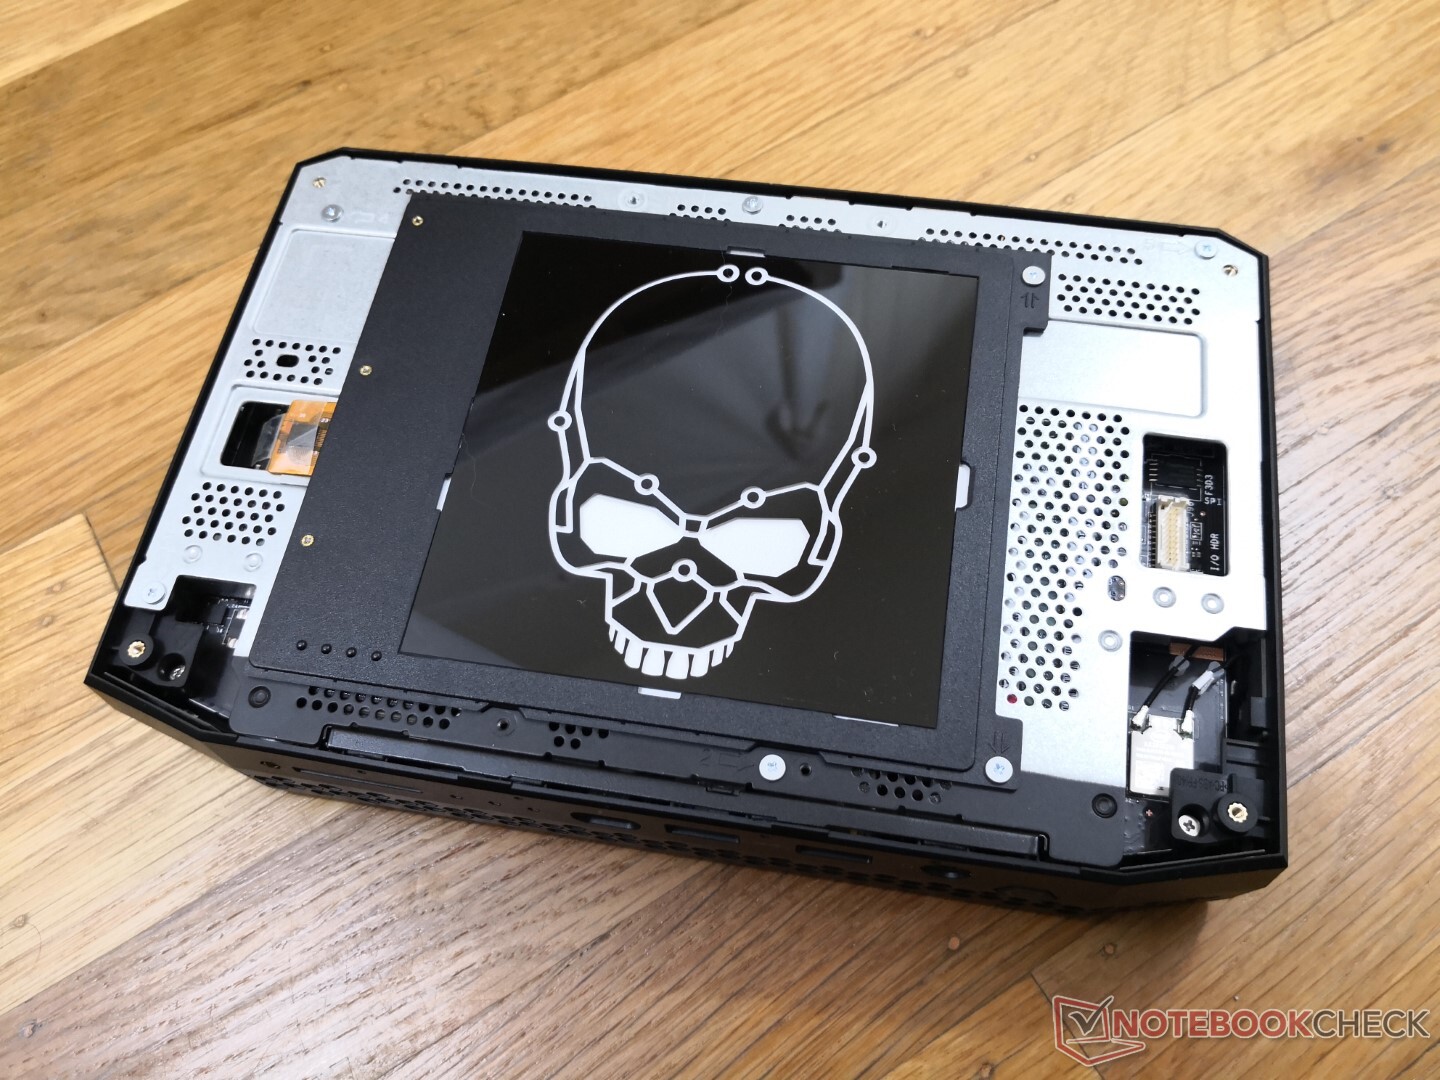
Onderhoud
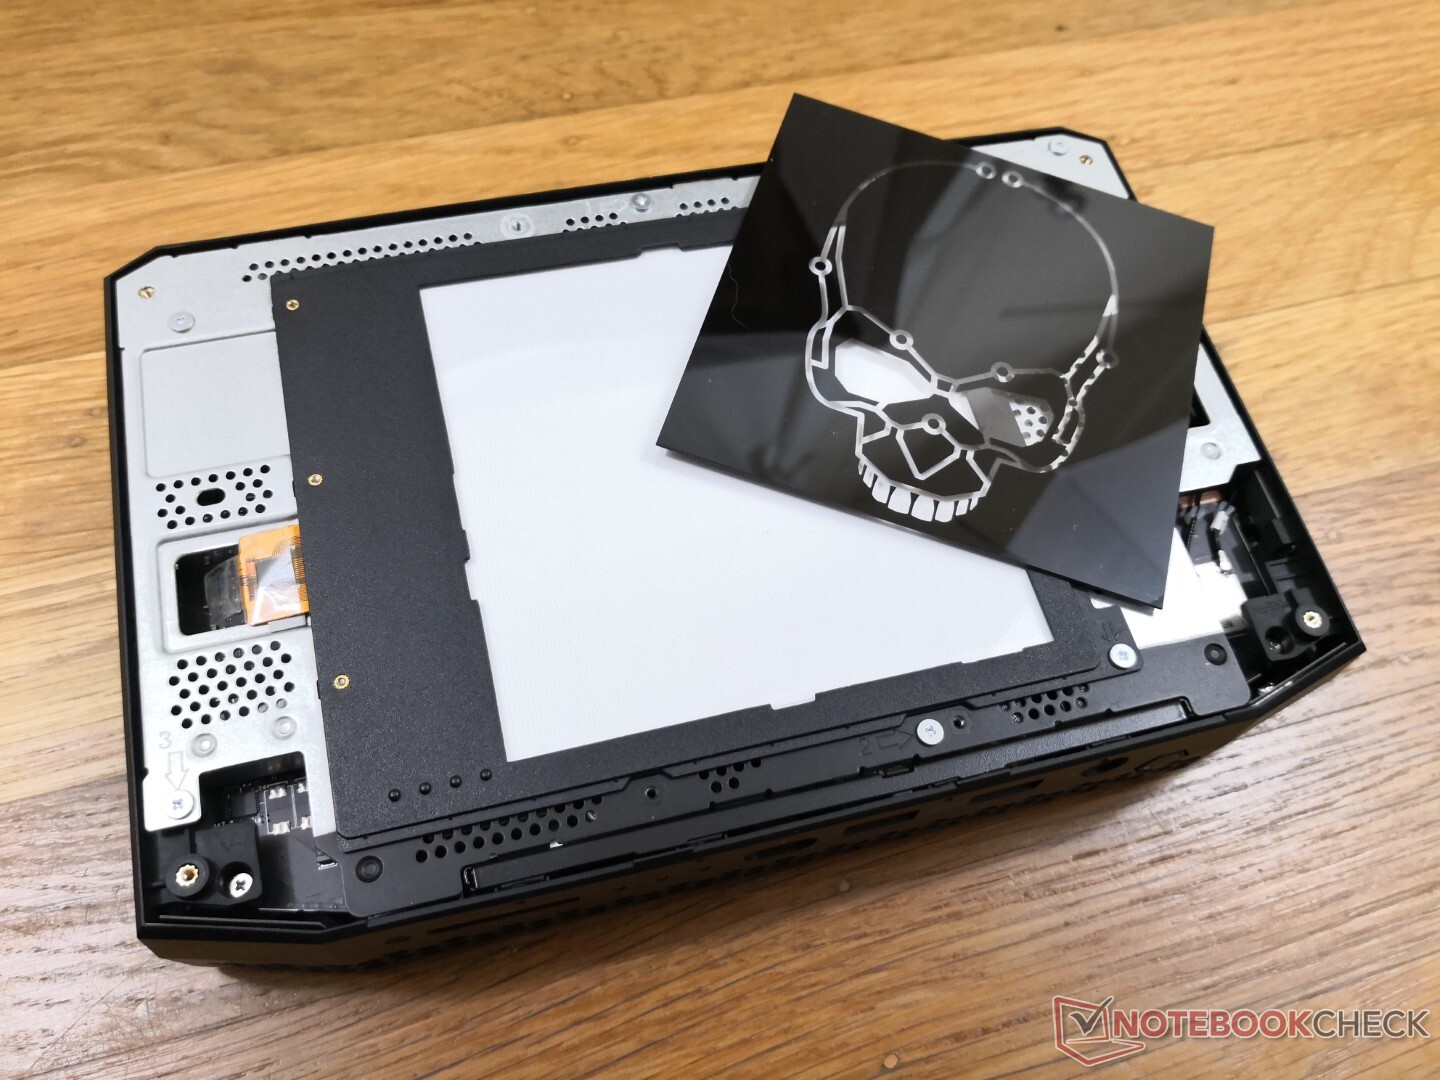
Het bovenpaneel wordt vastgezet met 8 zeskantschroeven die de aanpasbare LED frontplaat en metalen kooi beschermen. Het verwijderen van de metalen kooi om toegang te krijgen tot de RAM en opslagsleuven vereist een standaard Philips schroevendraaier. Toegang tot de koeloplossing eronder is helaas moeilijker en minder gebruiksvriendelijk.
Accessoires en garantie
Extra's in de doos zijn een verwijderbare VESA beugel, extra schroeven, plastic verticale standaard, en vijf doorzichtige plastic frontplaten als de eigenaar de LED-verlichte schedel wil verwisselen voor een ander patroon. De standaard is gelukkig stevig en er is geen echt risico dat hij omvalt. Kussens houden de NUC op zijn plaats met een beetje ruimte aan de onderkant voor de luchtstroom
Een beperkte garantie van drie jaar is standaard, in tegenstelling tot de meeste andere mini-PC's.
Prestaties
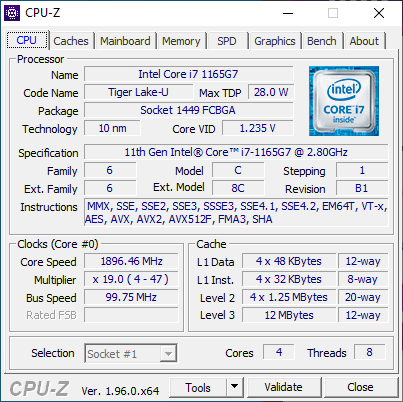
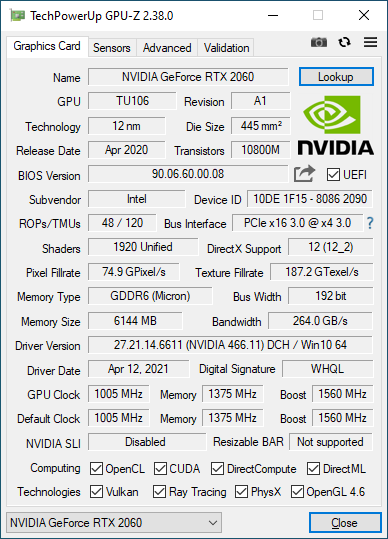
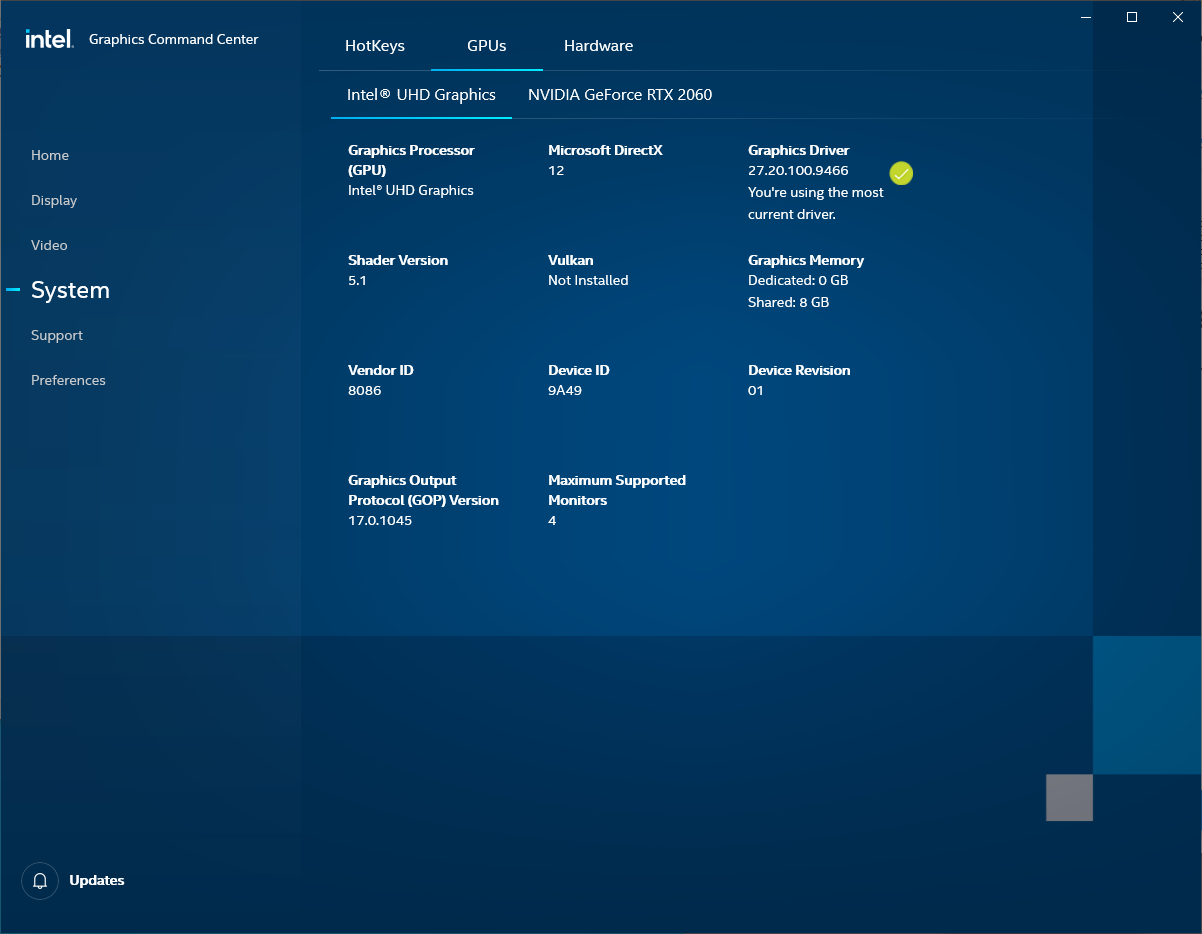
Alle NUC11 Enthusiast SKU's worden vanaf dit schrijven geleverd met de 11e generatie Core i7-1165G7 CPU en GeForce RTX 2060 GPU. Houd in gedachten dat de Nvidia GPU hier de mobiele Max-P versie en niet de desktop versie.
Optimus wordt ondersteund voor automatische grafische schakeling. Er is geen ondersteuning voor G-Sync.
Onze unit werd via BIOS in de "Performance" modus gezet voordat de onderstaande prestatiebenchmarks werden uitgevoerd om de hoogst mogelijke scores te halen.
Processor
De CPU prestaties zijn uitstekend met resultaten die binnen 5 procent van die van de NUC11PHKi7C liggen. De Huawei MateBook X Pro uitgerust met dezelfde Core i7-1165G7 CPU zou ongeveer 32 procent langzamer draaien dan onze Phantom Canyon NUC.
Indien via het BIOS de Balanced-modus wordt ingesteld in plaats van de Performance-modus, dan zouden de multi-thread prestaties volgens CineBench met ongeveer 10 tot 15 procent afnemen.
In vergelijking met de oudere Core i7-8809Gpresteert onze Core i7-1165G7 beter in zowel single-thread als multi-thread benchmarks, met respectievelijk ongeveer 30 procent en 15 procent. Interessant is dat onze CineBench R20 xT score lager is dan verwacht, zelfs na twee keer opnieuw proberen.
Cinebench R15: CPU Multi 64Bit | CPU Single 64Bit
Blender: v2.79 BMW27 CPU
7-Zip 18.03: 7z b 4 -mmt1 | 7z b 4
Geekbench 5.5: Single-Core | Multi-Core
HWBOT x265 Benchmark v2.2: 4k Preset
LibreOffice : 20 Documents To PDF
R Benchmark 2.5: Overall mean
| Cinebench R20 / CPU (Multi Core) | |
| Lenovo Legion C7 15IMH05 82EH0030GE | |
| Asus ZenBook 13 UM325S | |
| Zotac ZBOX Magnus EN72070V | |
| Lenovo ThinkBook 15p Gen1 4K | |
| Intel Hades Canyon NUC8i7HVK | |
| Intel NUC11TNKi5 | |
| Gemiddeld Intel Core i7-1165G7 (1060 - 2657, n=81) | |
| Intel NUC11PHKi7C | |
| Beelink GTR35 II-G-16512D00W64PRO-1T | |
| Asus VivoBook S13 S333JA-DS51 | |
| Asus Zenbook S UX393JA | |
| Beelink SEi10 | |
| Cinebench R20 / CPU (Single Core) | |
| Intel NUC11PHKi7C | |
| Asus ZenBook 13 UM325S | |
| Gemiddeld Intel Core i7-1165G7 (442 - 589, n=81) | |
| Intel NUC11TNKi5 | |
| Zotac ZBOX Magnus EN72070V | |
| Lenovo Legion C7 15IMH05 82EH0030GE | |
| Lenovo ThinkBook 15p Gen1 4K | |
| Asus Zenbook S UX393JA | |
| Intel Hades Canyon NUC8i7HVK | |
| Beelink SEi10 | |
| Asus VivoBook S13 S333JA-DS51 | |
| Beelink GTR35 II-G-16512D00W64PRO-1T | |
| Cinebench R15 / CPU Multi 64Bit | |
| Lenovo Legion C7 15IMH05 82EH0030GE | |
| Asus ZenBook 13 UM325S | |
| Lenovo ThinkBook 15p Gen1 4K | |
| Zotac ZBOX Magnus EN72070V | |
| Intel NUC11PHKi7C | |
| Intel Hades Canyon NUC8i7HVK | |
| Gemiddeld Intel Core i7-1165G7 (553 - 1027, n=86) | |
| Intel NUC11TNKi5 | |
| Beelink GTR35 II-G-16512D00W64PRO-1T | |
| Asus VivoBook S13 S333JA-DS51 | |
| Asus Zenbook S UX393JA | |
| Beelink SEi10 | |
| Cinebench R15 / CPU Single 64Bit | |
| Intel NUC11PHKi7C | |
| Asus ZenBook 13 UM325S | |
| Gemiddeld Intel Core i7-1165G7 (115 - 230, n=78) | |
| Lenovo Legion C7 15IMH05 82EH0030GE | |
| Intel NUC11TNKi5 | |
| Lenovo ThinkBook 15p Gen1 4K | |
| Zotac ZBOX Magnus EN72070V | |
| Asus Zenbook S UX393JA | |
| Intel Hades Canyon NUC8i7HVK | |
| Beelink SEi10 | |
| Beelink GTR35 II-G-16512D00W64PRO-1T | |
| Asus VivoBook S13 S333JA-DS51 | |
| Blender / v2.79 BMW27 CPU | |
| Beelink SEi10 | |
| Asus Zenbook S UX393JA | |
| Asus VivoBook S13 S333JA-DS51 | |
| Beelink GTR35 II-G-16512D00W64PRO-1T | |
| Gemiddeld Intel Core i7-1165G7 (468 - 1138, n=80) | |
| Intel NUC11TNKi5 | |
| Intel NUC11PHKi7C | |
| Intel Hades Canyon NUC8i7HVK | |
| Lenovo ThinkBook 15p Gen1 4K | |
| Zotac ZBOX Magnus EN72070V | |
| Asus ZenBook 13 UM325S | |
| Lenovo Legion C7 15IMH05 82EH0030GE | |
| 7-Zip 18.03 / 7z b 4 -mmt1 | |
| Lenovo Legion C7 15IMH05 82EH0030GE | |
| Asus ZenBook 13 UM325S | |
| Intel NUC11PHKi7C | |
| Gemiddeld Intel Core i7-1165G7 (4478 - 5507, n=80) | |
| Lenovo ThinkBook 15p Gen1 4K | |
| Zotac ZBOX Magnus EN72070V | |
| Intel NUC11TNKi5 | |
| Asus Zenbook S UX393JA | |
| Intel Hades Canyon NUC8i7HVK | |
| Beelink SEi10 | |
| Asus VivoBook S13 S333JA-DS51 | |
| Beelink GTR35 II-G-16512D00W64PRO-1T | |
| 7-Zip 18.03 / 7z b 4 | |
| Lenovo Legion C7 15IMH05 82EH0030GE | |
| Asus ZenBook 13 UM325S | |
| Zotac ZBOX Magnus EN72070V | |
| Lenovo ThinkBook 15p Gen1 4K | |
| Intel NUC11PHKi7C | |
| Intel NUC11TNKi5 | |
| Gemiddeld Intel Core i7-1165G7 (15347 - 27405, n=80) | |
| Intel Hades Canyon NUC8i7HVK | |
| Asus Zenbook S UX393JA | |
| Asus VivoBook S13 S333JA-DS51 | |
| Beelink GTR35 II-G-16512D00W64PRO-1T | |
| Beelink SEi10 | |
| Geekbench 5.5 / Single-Core | |
| Intel NUC11PHKi7C | |
| Gemiddeld Intel Core i7-1165G7 (1302 - 1595, n=77) | |
| Asus ZenBook 13 UM325S | |
| Intel NUC11TNKi5 | |
| Asus Zenbook S UX393JA | |
| Lenovo Legion C7 15IMH05 82EH0030GE | |
| Lenovo ThinkBook 15p Gen1 4K | |
| Zotac ZBOX Magnus EN72070V | |
| Asus VivoBook S13 S333JA-DS51 | |
| Beelink SEi10 | |
| Beelink GTR35 II-G-16512D00W64PRO-1T | |
| Geekbench 5.5 / Multi-Core | |
| Lenovo Legion C7 15IMH05 82EH0030GE | |
| Asus ZenBook 13 UM325S | |
| Lenovo ThinkBook 15p Gen1 4K | |
| Zotac ZBOX Magnus EN72070V | |
| Intel NUC11PHKi7C | |
| Gemiddeld Intel Core i7-1165G7 (3078 - 5926, n=77) | |
| Asus Zenbook S UX393JA | |
| Intel NUC11TNKi5 | |
| Asus VivoBook S13 S333JA-DS51 | |
| Beelink GTR35 II-G-16512D00W64PRO-1T | |
| Beelink SEi10 | |
| HWBOT x265 Benchmark v2.2 / 4k Preset | |
| Lenovo Legion C7 15IMH05 82EH0030GE | |
| Asus ZenBook 13 UM325S | |
| Zotac ZBOX Magnus EN72070V | |
| Lenovo ThinkBook 15p Gen1 4K | |
| Intel NUC11PHKi7C | |
| Intel Hades Canyon NUC8i7HVK | |
| Intel NUC11TNKi5 | |
| Gemiddeld Intel Core i7-1165G7 (1.39 - 8.47, n=80) | |
| Asus VivoBook S13 S333JA-DS51 | |
| Asus Zenbook S UX393JA | |
| Beelink GTR35 II-G-16512D00W64PRO-1T | |
| Beelink SEi10 | |
| LibreOffice / 20 Documents To PDF | |
| Beelink GTR35 II-G-16512D00W64PRO-1T | |
| Asus VivoBook S13 S333JA-DS51 | |
| Zotac ZBOX Magnus EN72070V | |
| Lenovo ThinkBook 15p Gen1 4K | |
| Lenovo Legion C7 15IMH05 82EH0030GE | |
| Beelink SEi10 | |
| Asus ZenBook 13 UM325S | |
| Intel NUC11TNKi5 | |
| Gemiddeld Intel Core i7-1165G7 (21.5 - 88.1, n=78) | |
| Asus Zenbook S UX393JA | |
| Intel NUC11PHKi7C | |
| R Benchmark 2.5 / Overall mean | |
| Asus VivoBook S13 S333JA-DS51 | |
| Beelink SEi10 | |
| Beelink GTR35 II-G-16512D00W64PRO-1T | |
| Asus Zenbook S UX393JA | |
| Intel NUC11TNKi5 | |
| Lenovo ThinkBook 15p Gen1 4K | |
| Zotac ZBOX Magnus EN72070V | |
| Gemiddeld Intel Core i7-1165G7 (0.552 - 1.002, n=80) | |
| Lenovo Legion C7 15IMH05 82EH0030GE | |
| Intel NUC11PHKi7C | |
| Asus ZenBook 13 UM325S | |
* ... kleiner is beter
Systeemprestaties
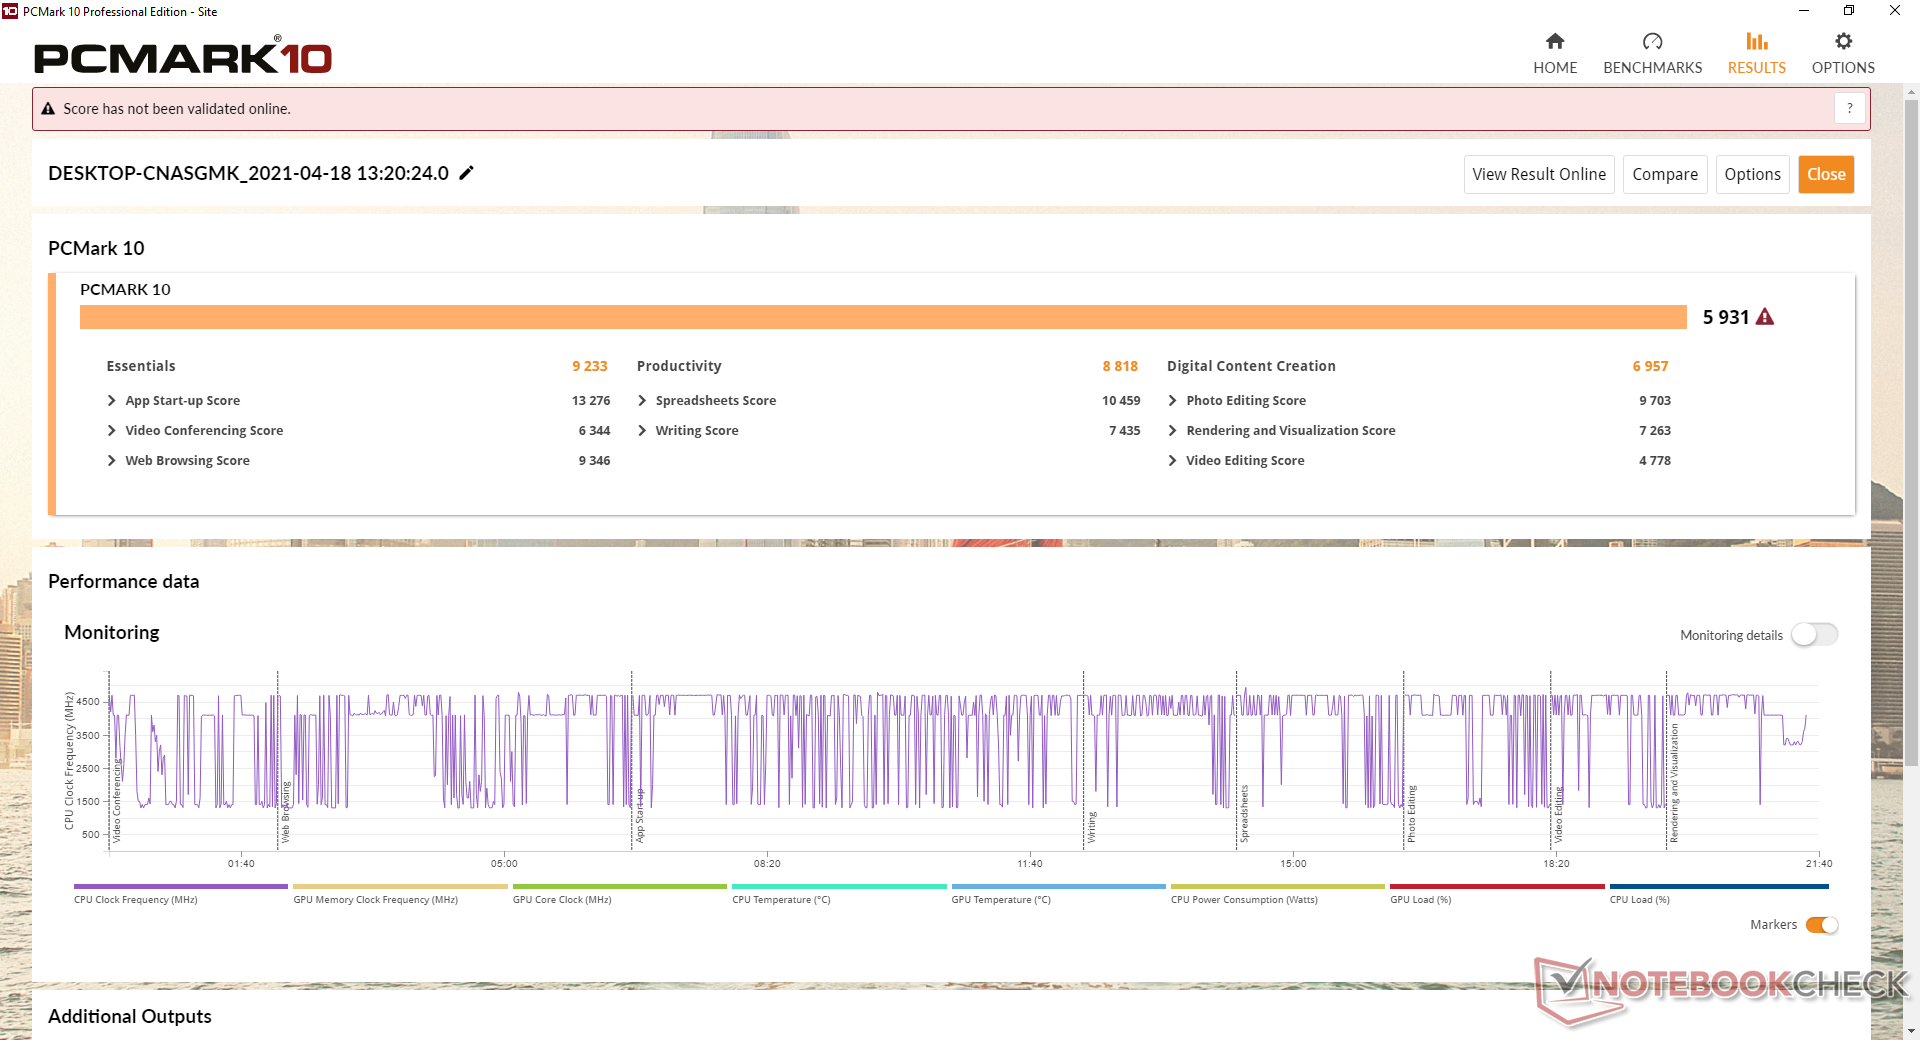
| PCMark 10 Score | 5931 punten | |
Help | ||
DPC latentie
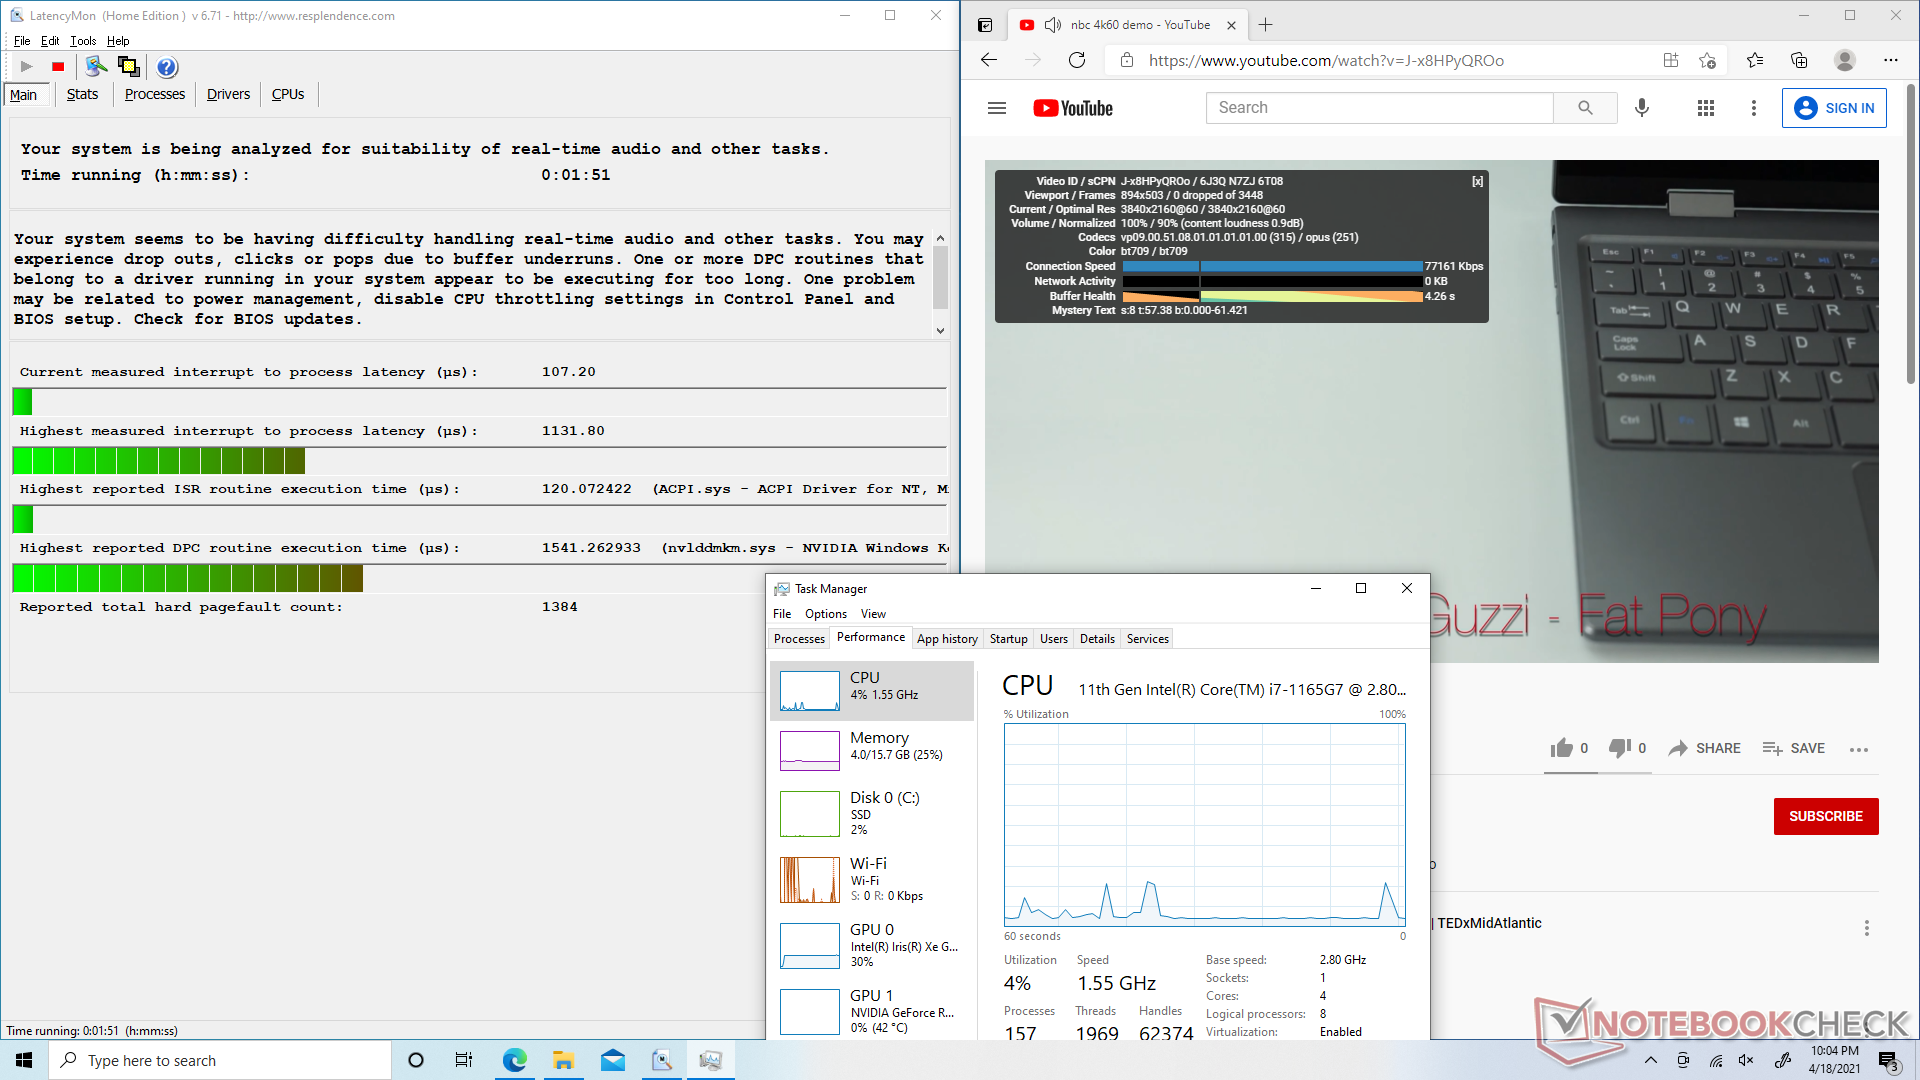
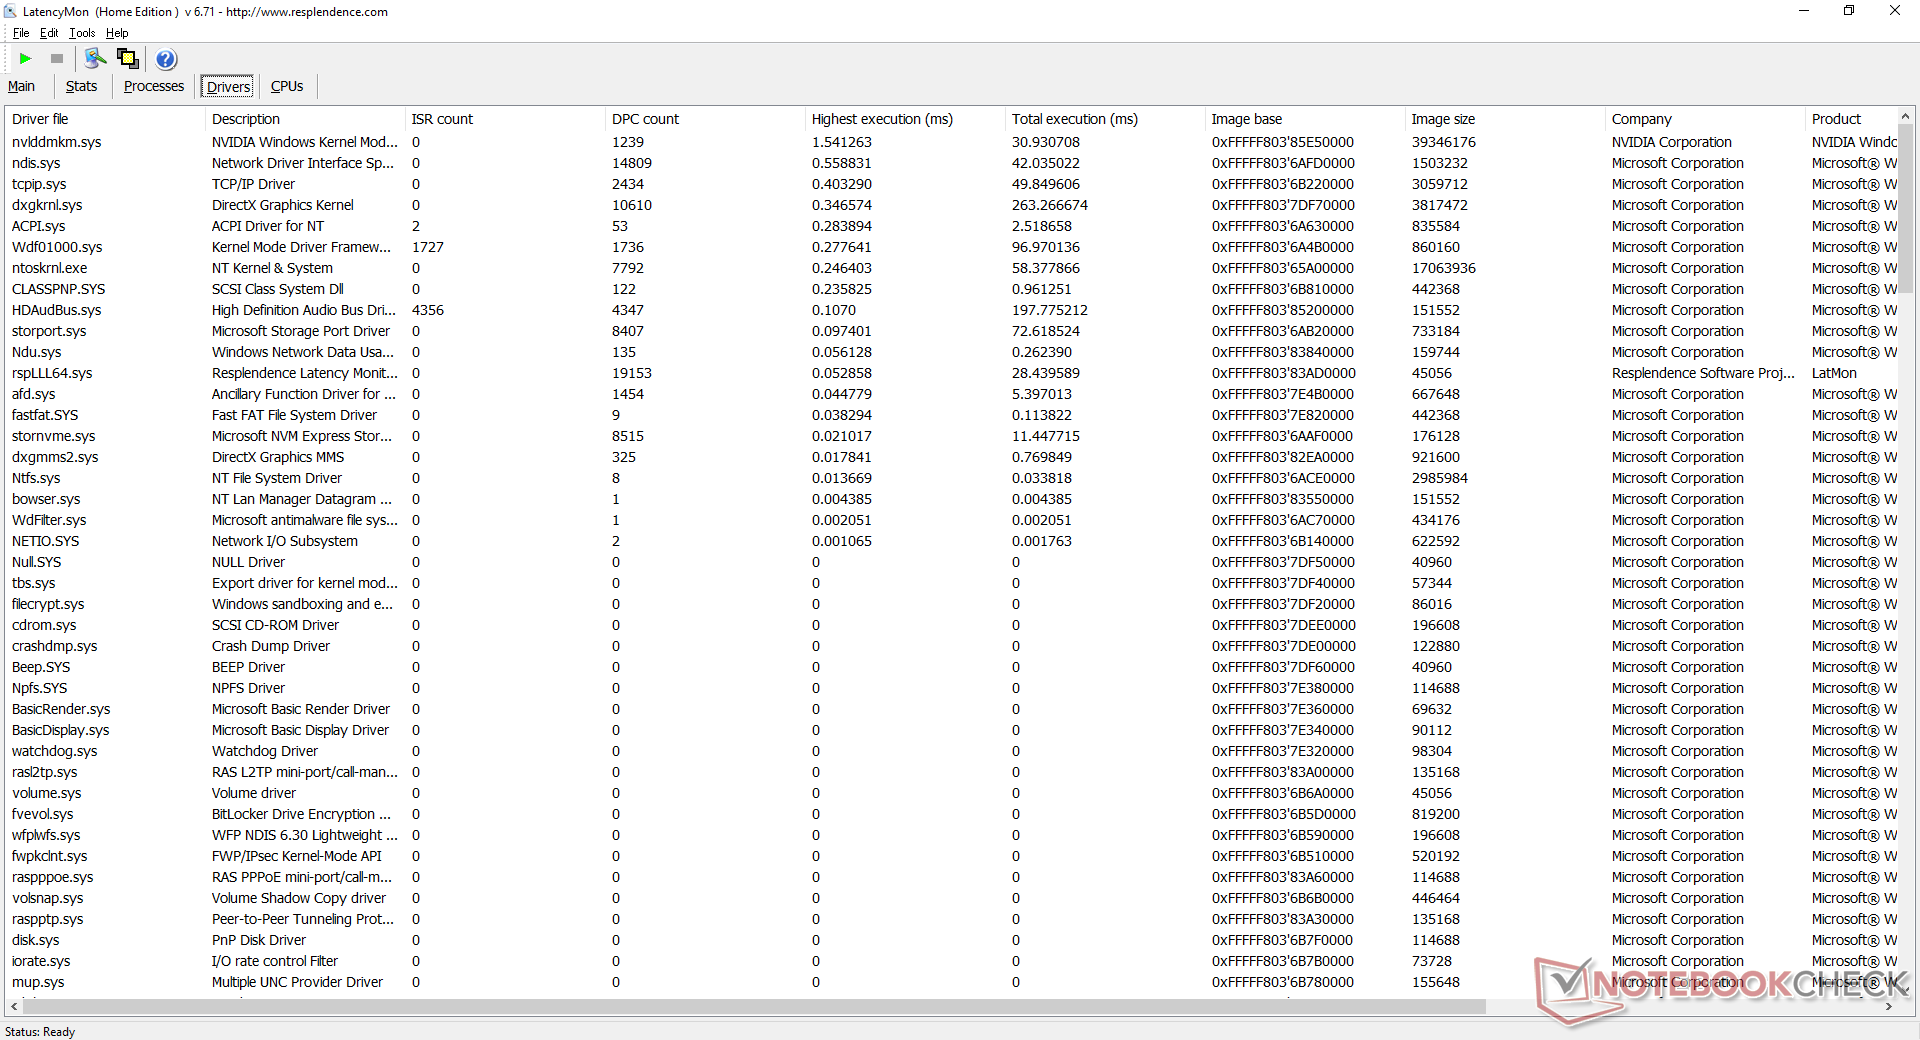
| DPC Latencies / LatencyMon - interrupt to process latency (max), Web, Youtube, Prime95 | |
| Intel NUC11PHKi7C | |
| GMK NucBox 2 | |
| Intel NUC11PAQi7 | |
* ... kleiner is beter
Opslagapparaten
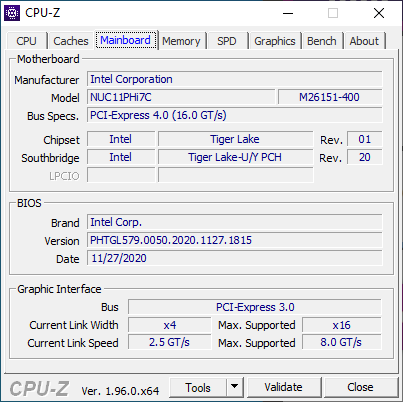
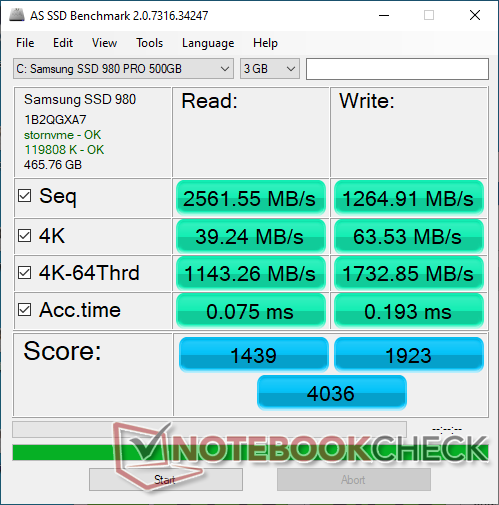
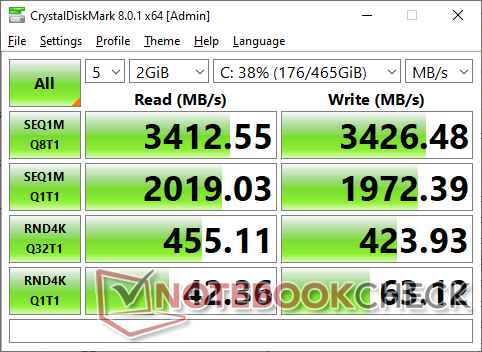
Terwijl deNUC11PAQi7 pCIe 4.0 x4 NVMe SSD snelheden ondersteunt, doet de NUC11PHKi7C dit niet, aangezien de twee M.2 slots beperkt zijn tot slechts PCIe 3.0 x4 en SATA III snelheden, respectievelijk. Dit is enigszins teleurstellend wanneer men bedenkt dat de NUC11PHKi7C wordt verondersteld een "enthousiast" product te zijn dat zich richt op gebruikers met hoge prestaties. We installeerden dezelfde Samsung SSD 980 van de NUC11PAQi7 op onze NUC11PHKi7C en, zeker genoeg, onze overdrachtssnelheden waren slechts ongeveer de helft van die op de NUC11PAQi7.
Het is vermeldenswaard dat het systeem langere M.2 22110 SSD's ondersteunt, terwijl de meeste andere systemen beperkt zijn tot 2280.
| Intel NUC11PHKi7C Samsung SSD 980 Pro 500GB MZ-V8P500BW | Intel Hades Canyon NUC8i7HVK Intel Optane 120 GB SSDPEK1W120GA | Intel NUC11PAQi7 Samsung SSD 980 Pro 500GB MZ-V8P500BW | GMK NucBox 2 Netac S930E8/256GPN | Zotac ZBOX Magnus EK71080 Samsung PM961 MZVLW256HEHP | |
|---|---|---|---|---|---|
| AS SSD | 3% | 47% | -33% | -8% | |
| Seq Read (MB/s) | 2562 | 1379 -46% | 3257 27% | 2069 -19% | 2119 -17% |
| Seq Write (MB/s) | 1265 | 553 -56% | 3937 211% | 1203 -5% | 1205 -5% |
| 4K Read (MB/s) | 39.24 | 127.9 226% | 51.3 31% | 41.66 6% | 46.69 19% |
| 4K Write (MB/s) | 63.5 | 103.5 63% | 75.7 19% | 136.9 116% | 105.2 66% |
| 4K-64 Read (MB/s) | 1143 | 1258 10% | 2283 100% | 366.3 -68% | 1170 2% |
| 4K-64 Write (MB/s) | 1733 | 556 -68% | 2206 27% | 340.5 -80% | 443.8 -74% |
| Access Time Read * (ms) | 0.075 | 0.025 67% | 0.056 25% | 0.064 15% | 0.06 20% |
| Access Time Write * (ms) | 0.193 | 0.033 83% | 0.154 20% | 0.347 -80% | 0.04 79% |
| Score Read (Points) | 1439 | 1524 6% | 2660 85% | 615 -57% | 1429 -1% |
| Score Write (Points) | 1923 | 714 -63% | 2676 39% | 598 -69% | 669 -65% |
| Score Total (Points) | 4036 | 3023 -25% | 6725 67% | 1497 -63% | 2791 -31% |
| Copy ISO MB/s (MB/s) | 1675 | 1125 -33% | 2030 21% | 1186 -29% | 1649 -2% |
| Copy Program MB/s (MB/s) | 1030 | 342.4 -67% | 883 -14% | 428.6 -58% | 468 -55% |
| Copy Game MB/s (MB/s) | 1810 | 768 -58% | 1817 0% | 435.7 -76% | 1010 -44% |
| CrystalDiskMark 5.2 / 6 | 21% | 111% | 6% | -2% | |
| Write 4K (MB/s) | 67.3 | 133.7 99% | 244.6 263% | 178.4 165% | 132.7 97% |
| Read 4K (MB/s) | 38.32 | 178.6 366% | 80.4 110% | 61 59% | 44.48 16% |
| Write Seq (MB/s) | 1985 | 608 -69% | 4094 106% | 1040 -48% | 1193 -40% |
| Read Seq (MB/s) | 2049 | 1428 -30% | 4099 100% | 1919 -6% | 1371 -33% |
| Write 4K Q32T1 (MB/s) | 432.3 | 323.6 -25% | 715 65% | 417.7 -3% | 398.5 -8% |
| Read 4K Q32T1 (MB/s) | 452.4 | 282.3 -38% | 783 73% | 325.6 -28% | 483.5 7% |
| Write Seq Q32T1 (MB/s) | 3423 | 627 -82% | 5065 48% | 1144 -67% | 1202 -65% |
| Read Seq Q32T1 (MB/s) | 3123 | 1521 -51% | 6884 120% | 2379 -24% | 3388 8% |
| Totaal Gemiddelde (Programma / Instellingen) | 12% /
10% | 79% /
70% | -14% /
-19% | -5% /
-6% |
* ... kleiner is beter

Disk Throttling: DiskSpd Read Loop, Queue Depth 8
GPU prestatie
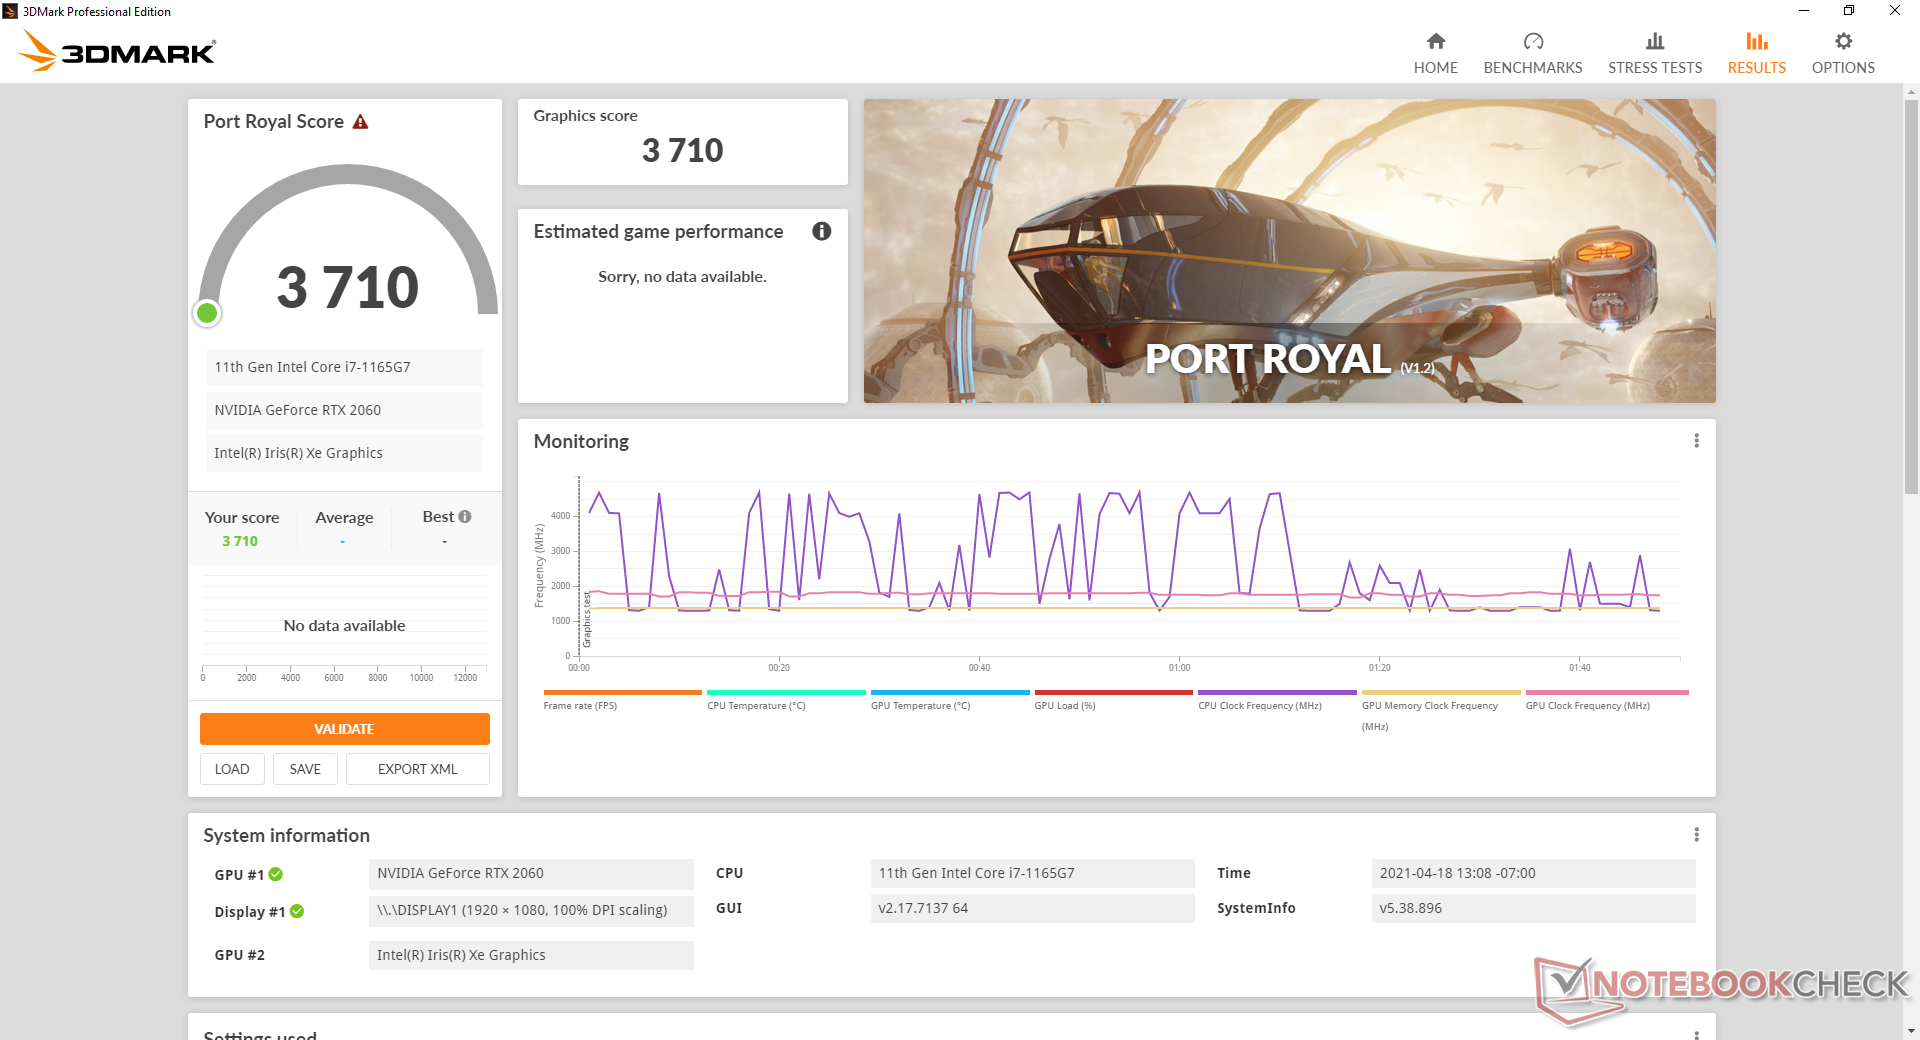
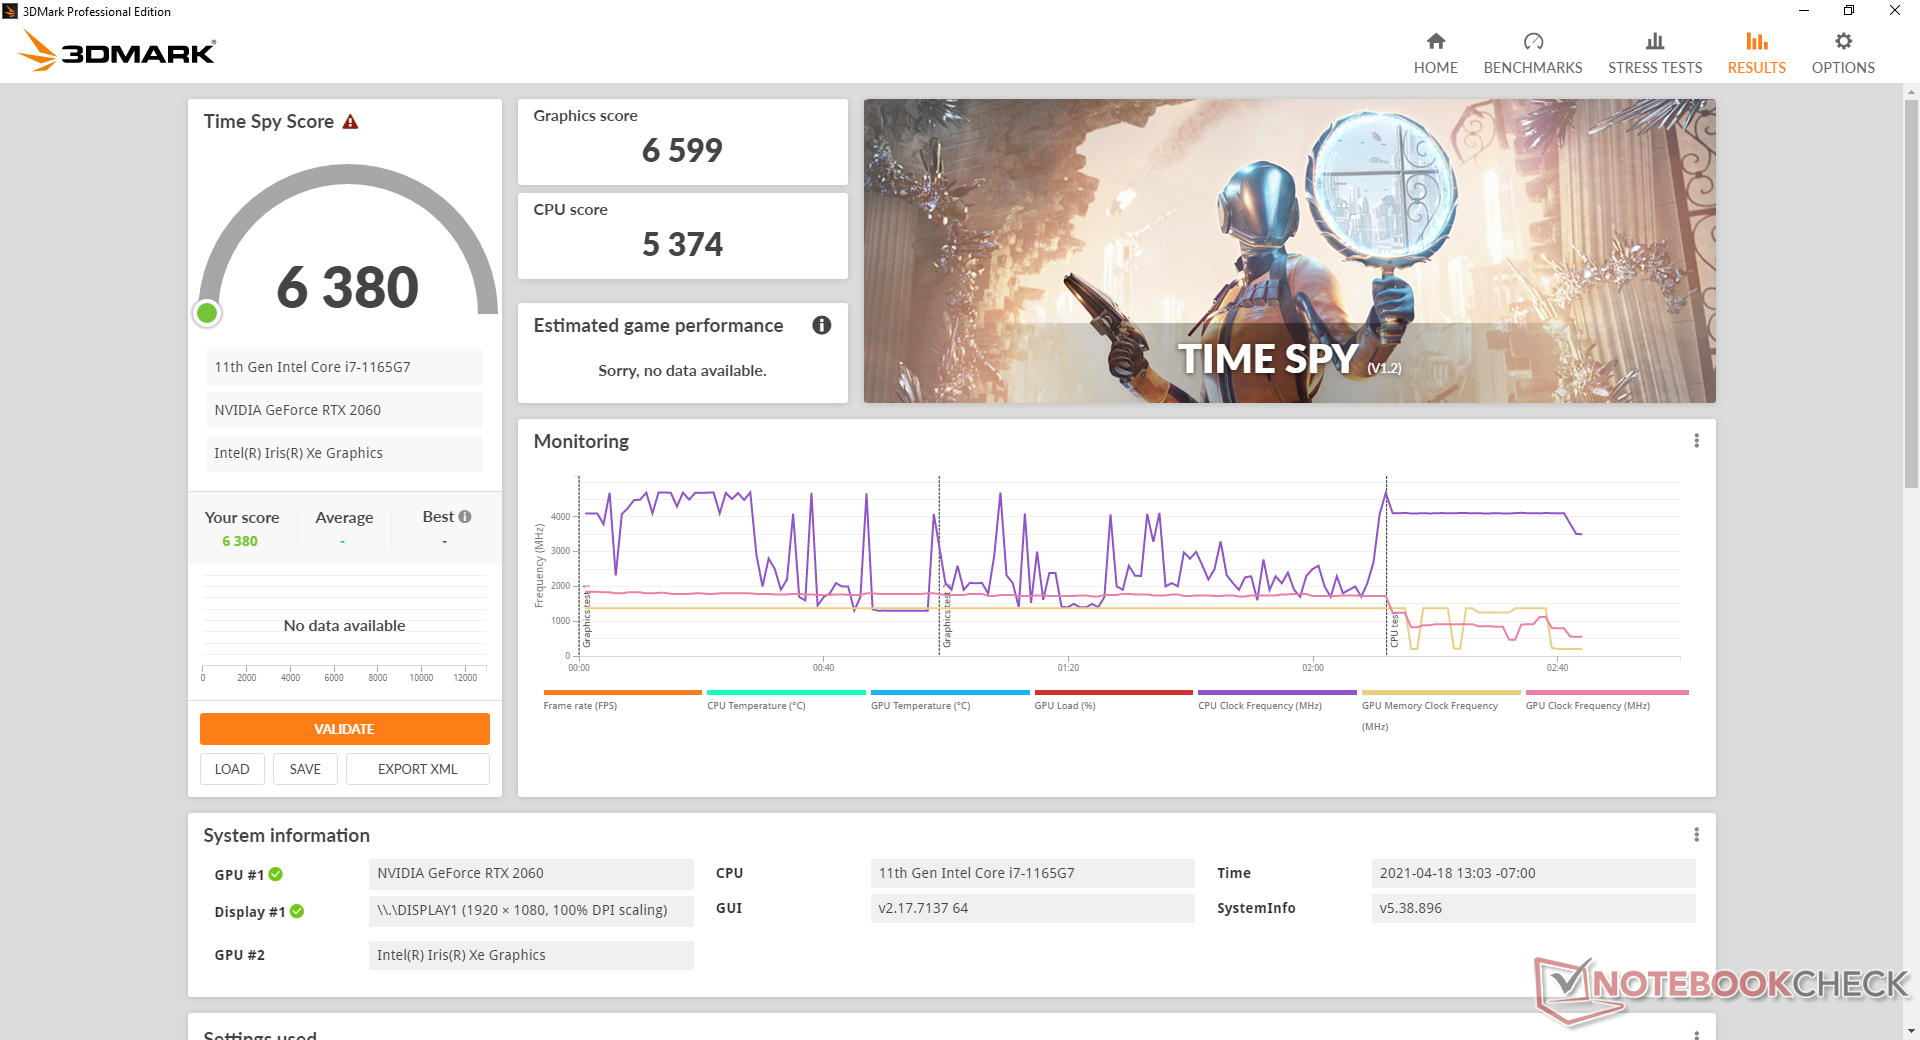
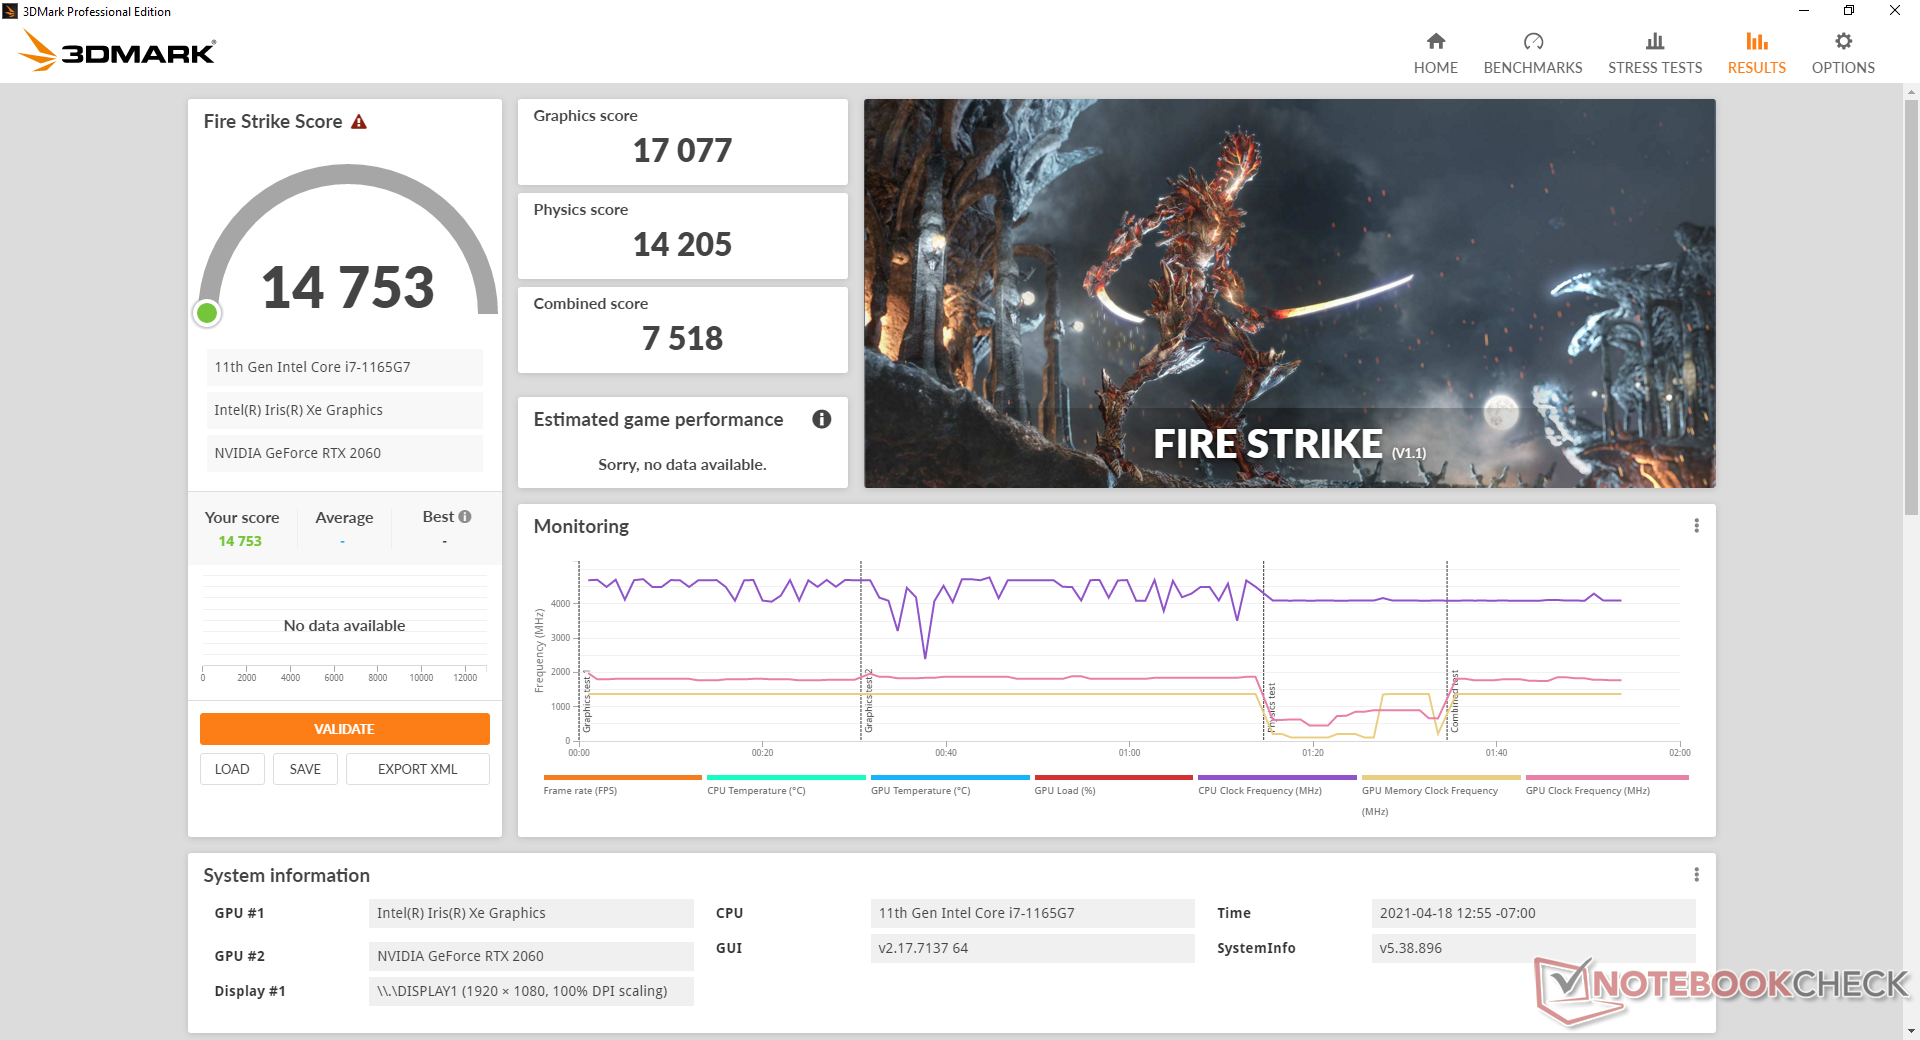
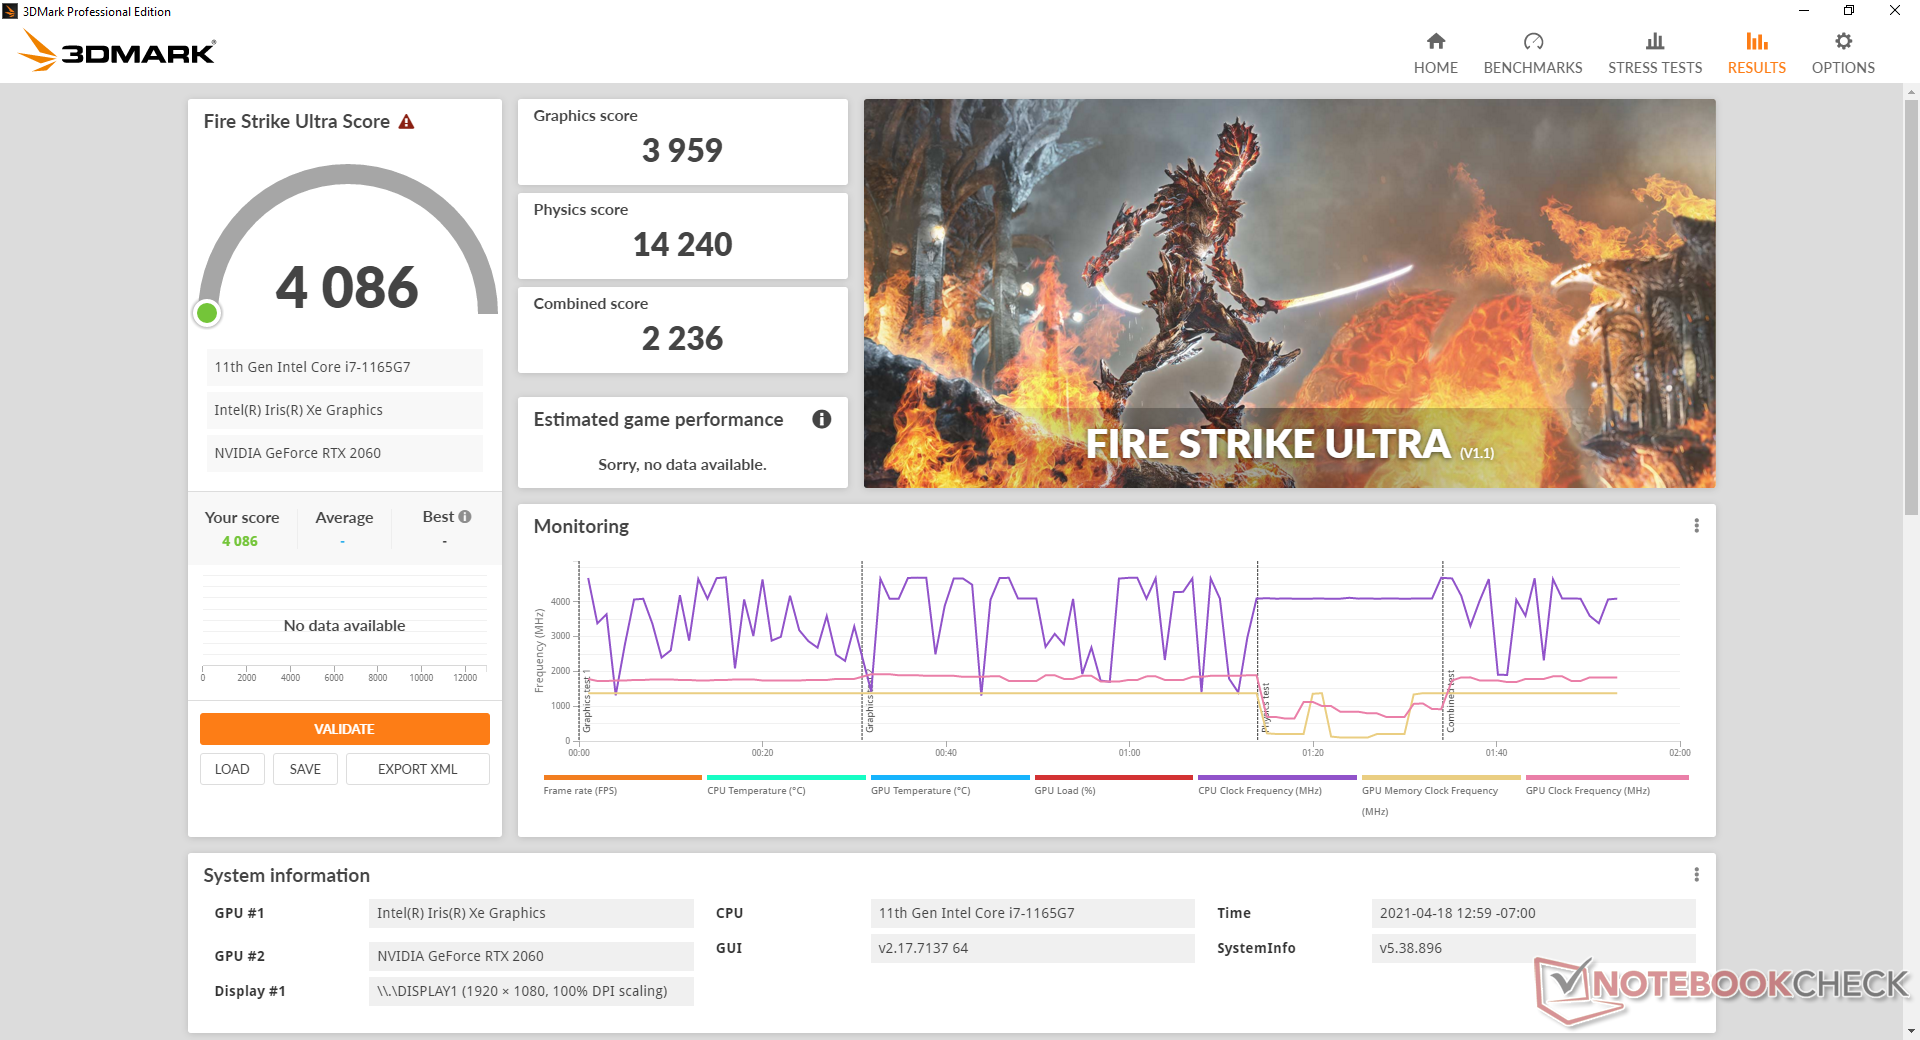
De grafische prestaties zijn waar we ze verwachten te zijn ten opzichte van de gemiddelde laptop uitgerust met dezelfde GeForce RTX 2060 GPU. De prestaties zijn met name bijna 70 procent sneller dan de Radeon RX Vega M GH op de oudere Hades Canyon volgens 3DMark Fire Strike terwijl Time Spy een nog grotere prestatie boost laat zien van iets meer dan 2x. Dit suggereert dat games die op DX12 draaien de grootste prestatievoordelen gen-op-gen zullen zien.
Een desktop PC met een "echte" GeForce RTX 2060 zal nog steeds beter presteren dan de mobiele RTX 2060 in onze NUC met ongeveer 15 tot 20 procent
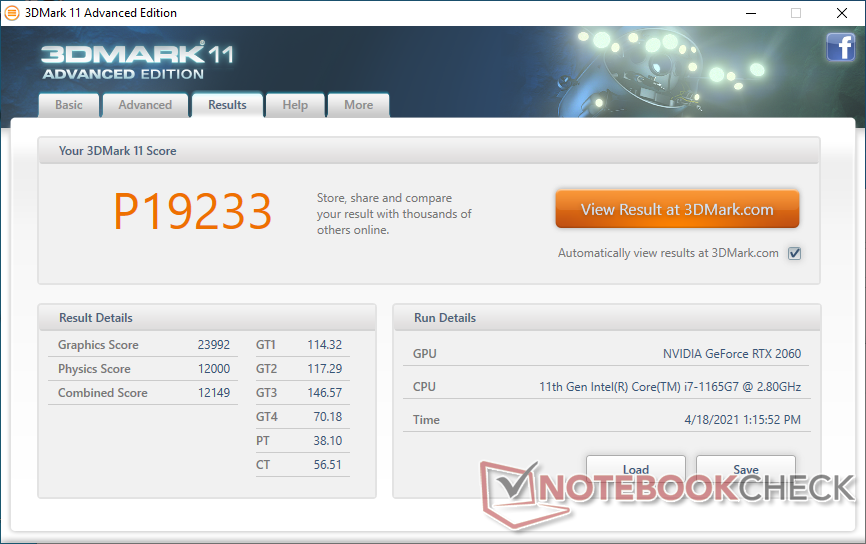

| 3DMark 11 Performance | 19233 punten | |
| 3DMark Cloud Gate Standard Score | 30679 punten | |
| 3DMark Fire Strike Score | 14753 punten | |
| 3DMark Time Spy Score | 6380 punten | |
Help | ||
| lage | gem. | hoge | ultra | |
|---|---|---|---|---|
| GTA V (2015) | 168 | 158 | 119 | 69.6 |
| The Witcher 3 (2015) | 220.7 | 152.2 | 101.5 | 61.4 |
| Dota 2 Reborn (2015) | 139 | 123 | 116 | 112 |
| Final Fantasy XV Benchmark (2018) | 130 | 89.2 | 67.5 | |
| X-Plane 11.11 (2018) | 94.8 | 81.3 | 69.8 | |
| Strange Brigade (2018) | 287 | 148 | 124 | 109 |
Emissions
Systeemgeluid
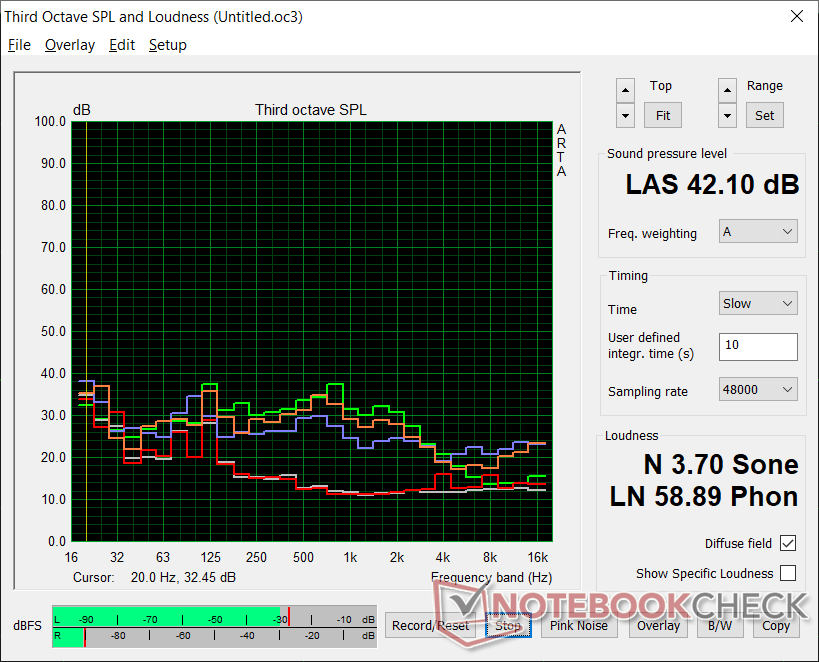
We zijn in staat om een spoelgejank op te nemen van 25,3 dB(A) wanneer het stationair draait op desktop tegen een stille achtergrond van 24,5 dB(A). Het ventilatorgeluid ligt verder dicht bij wat we registreerden op de Hades Canyon NUC. Tijdens het draaien Witcher 3bijvoorbeeld, neemt het ventilatorgeluid langzaam toe tot het een constante 39,7 dB(A) bereikt. Tijdens het draaien van meer extreme belastingen, zoals Prime95 of FurMark, steeg het geluid van de ventilator tijdelijk tot 47,9 dB(A), voordat het daalde en stabiliseerde op 42,1 dB(A).
| Intel NUC11PHKi7C GeForce RTX 2060 Mobile, i7-1165G7, Samsung SSD 980 Pro 500GB MZ-V8P500BW | Intel Hades Canyon NUC8i7HVK Vega M GH, i7-8809G, Intel Optane 120 GB SSDPEK1W120GA | Intel NUC11PAQi7 Iris Xe G7 96EUs, i7-1165G7, Samsung SSD 980 Pro 500GB MZ-V8P500BW | GMK NucBox 2 Iris Plus Graphics 655, i5-8259U, Netac S930E8/256GPN | Zotac ZBOX Magnus EK71080 GeForce GTX 1080 (Desktop), i7-7700HQ, Samsung PM961 MZVLW256HEHP | Aorus Gaming Box GeForce RTX 2080 Ti , i7-1165G7 | |
|---|---|---|---|---|---|---|
| Noise | -10% | 0% | 3% | -28% | -25% | |
| uit / omgeving * (dB) | 24.5 | 28.7 -17% | 25.6 -4% | 25.6 -4% | 29.9 -22% | 26.5 -8% |
| Idle Minimum * (dB) | 25.3 | 29 -15% | 25.6 -1% | 25.7 -2% | 38.6 -53% | 34.7 -37% |
| Idle Average * (dB) | 25.3 | 29 -15% | 25.6 -1% | 25.7 -2% | 38.6 -53% | 39.1 -55% |
| Idle Maximum * (dB) | 25.3 | 29 -15% | 25.6 -1% | 25.7 -2% | 39 -54% | 39.1 -55% |
| Load Average * (dB) | 36.4 | 36 1% | 33.6 8% | 35.3 3% | 40.6 -12% | 39.5 -9% |
| Witcher 3 ultra * (dB) | 39.7 | 42 -6% | 33.6 15% | 41.7 -5% | 43.7 -10% | |
| Load Maximum * (dB) | 47.9 | 49.4 -3% | 54.5 -14% | 35.1 27% | 47 2% | 48 -0% |
* ... kleiner is beter
Geluidsniveau
| Onbelast |
| 25.3 / 25.3 / 25.3 dB (A) |
| Belasting |
| 36.4 / 47.9 dB (A) |
 | ||
30 dB stil 40 dB(A) hoorbaar 50 dB(A) luid |
||
min: | ||
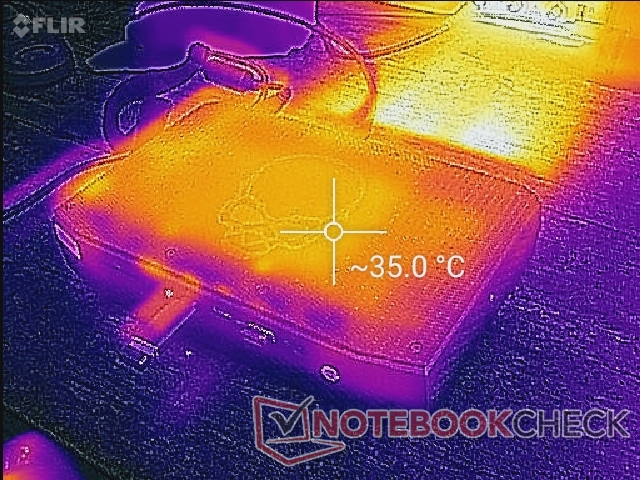
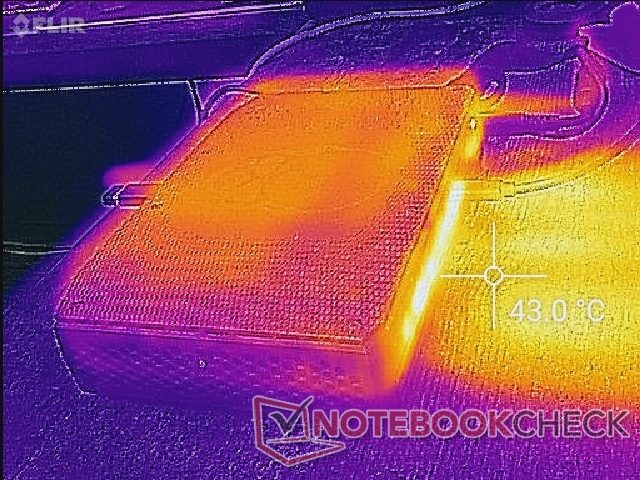
Temperatuur
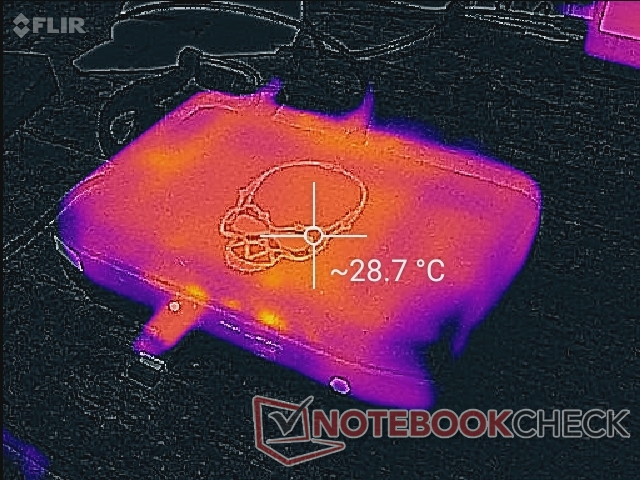
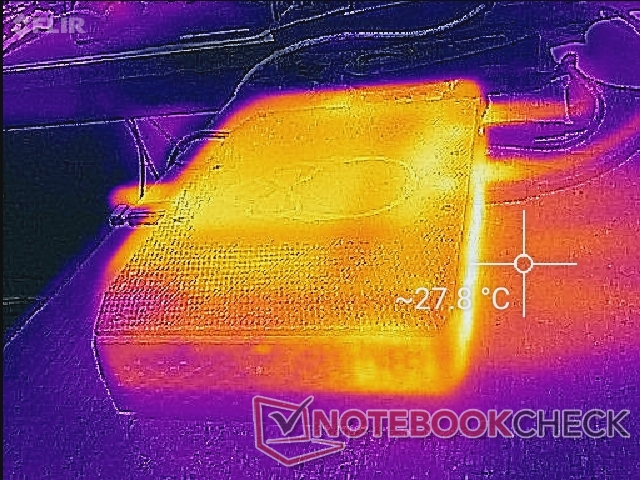
Oppervlaktetemperaturen zijn geen probleem, aangezien het hete punt aan de bovenkant slechts ongeveer 35 C is tijdens het gamen. Alle uitlaatgassen komen echter van de achterkant, dus er moet voldoende ruimte worden gereserveerd achter het apparaat voor voldoende ventilatie.
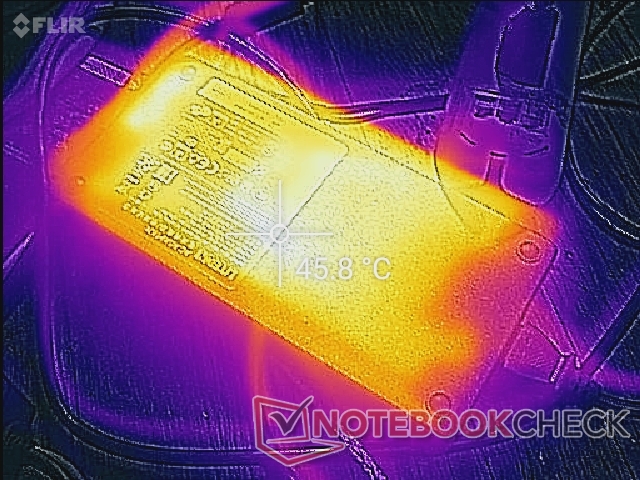
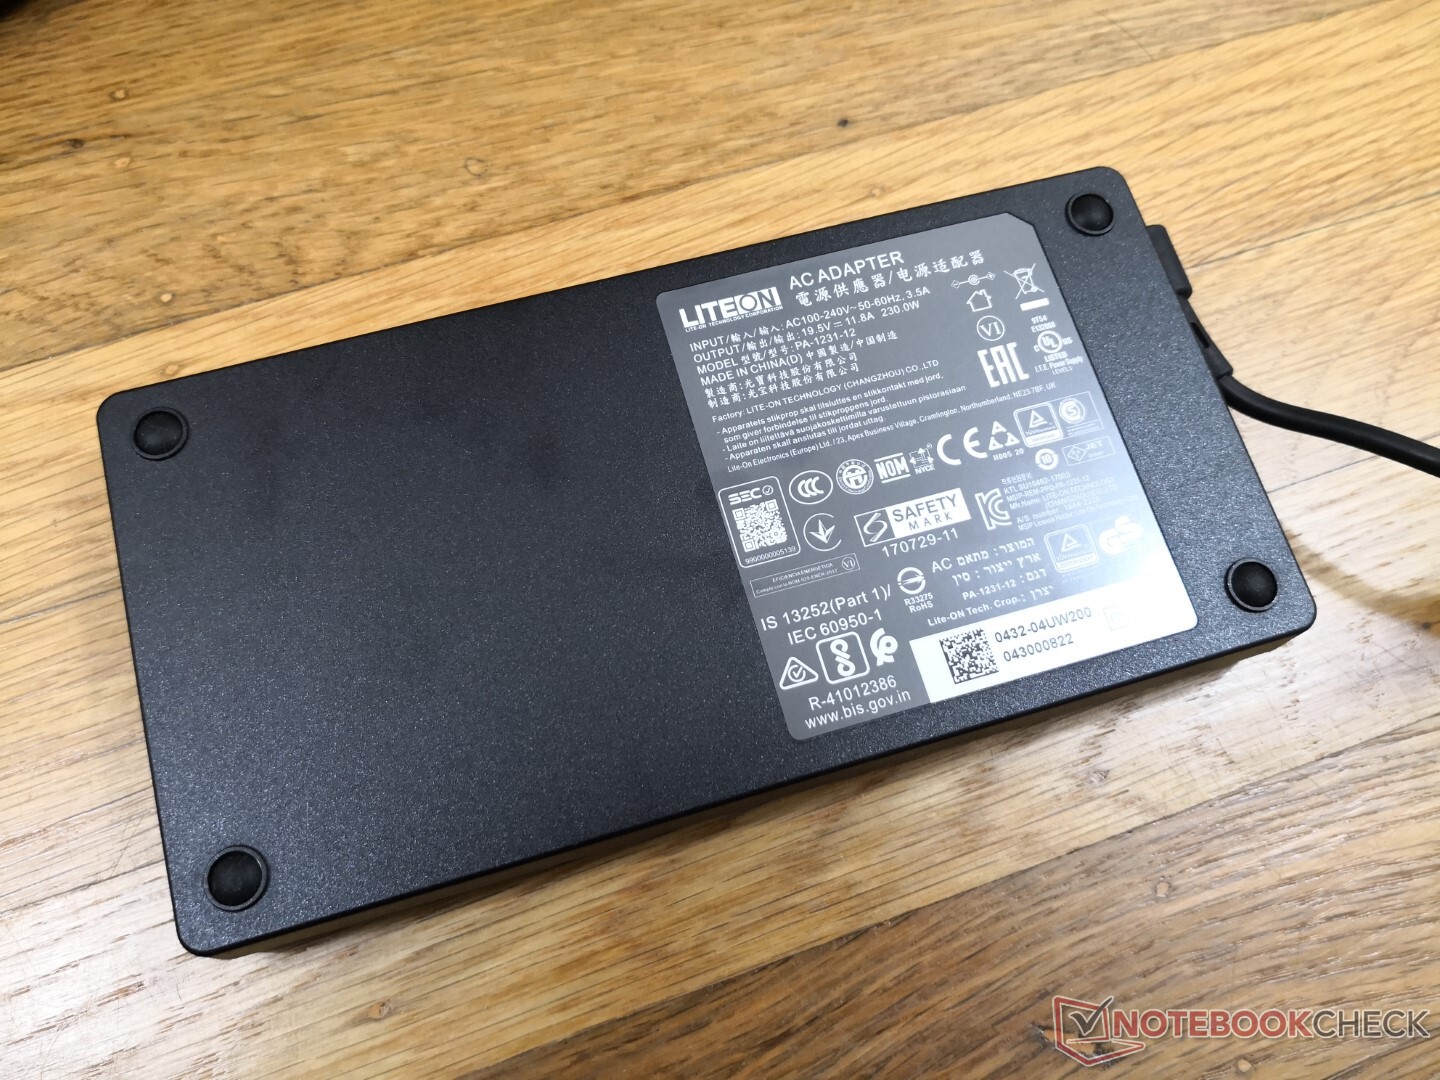
De AC-adapter kan warmer worden dan de NUC zelf met 43 C tijdens het gamen. Intel had waarschijnlijk een kleinere en dichtere AC adapter kunnen ontwerpen, maar dan zou het waarschijnlijk nog warmer zijn geworden, zoals we hebben waargenomen bij de Razer Blade serie.
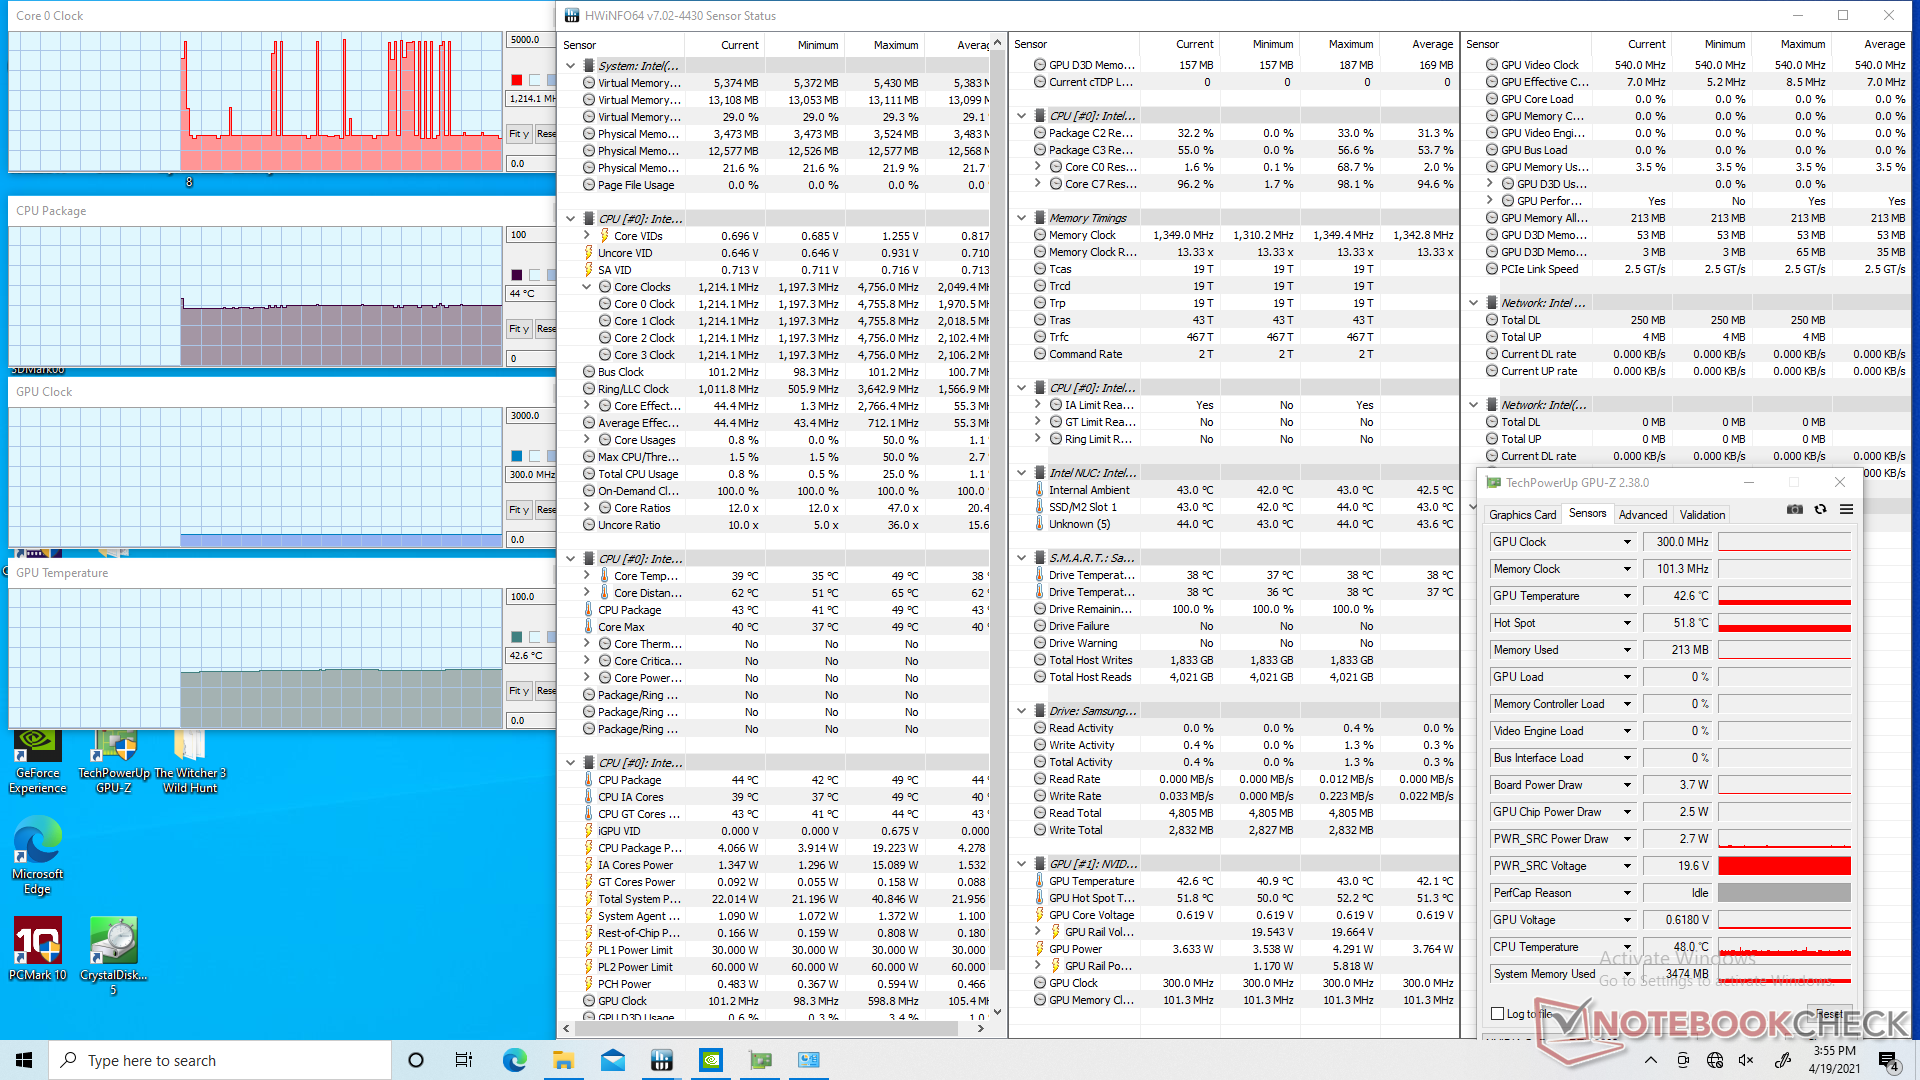
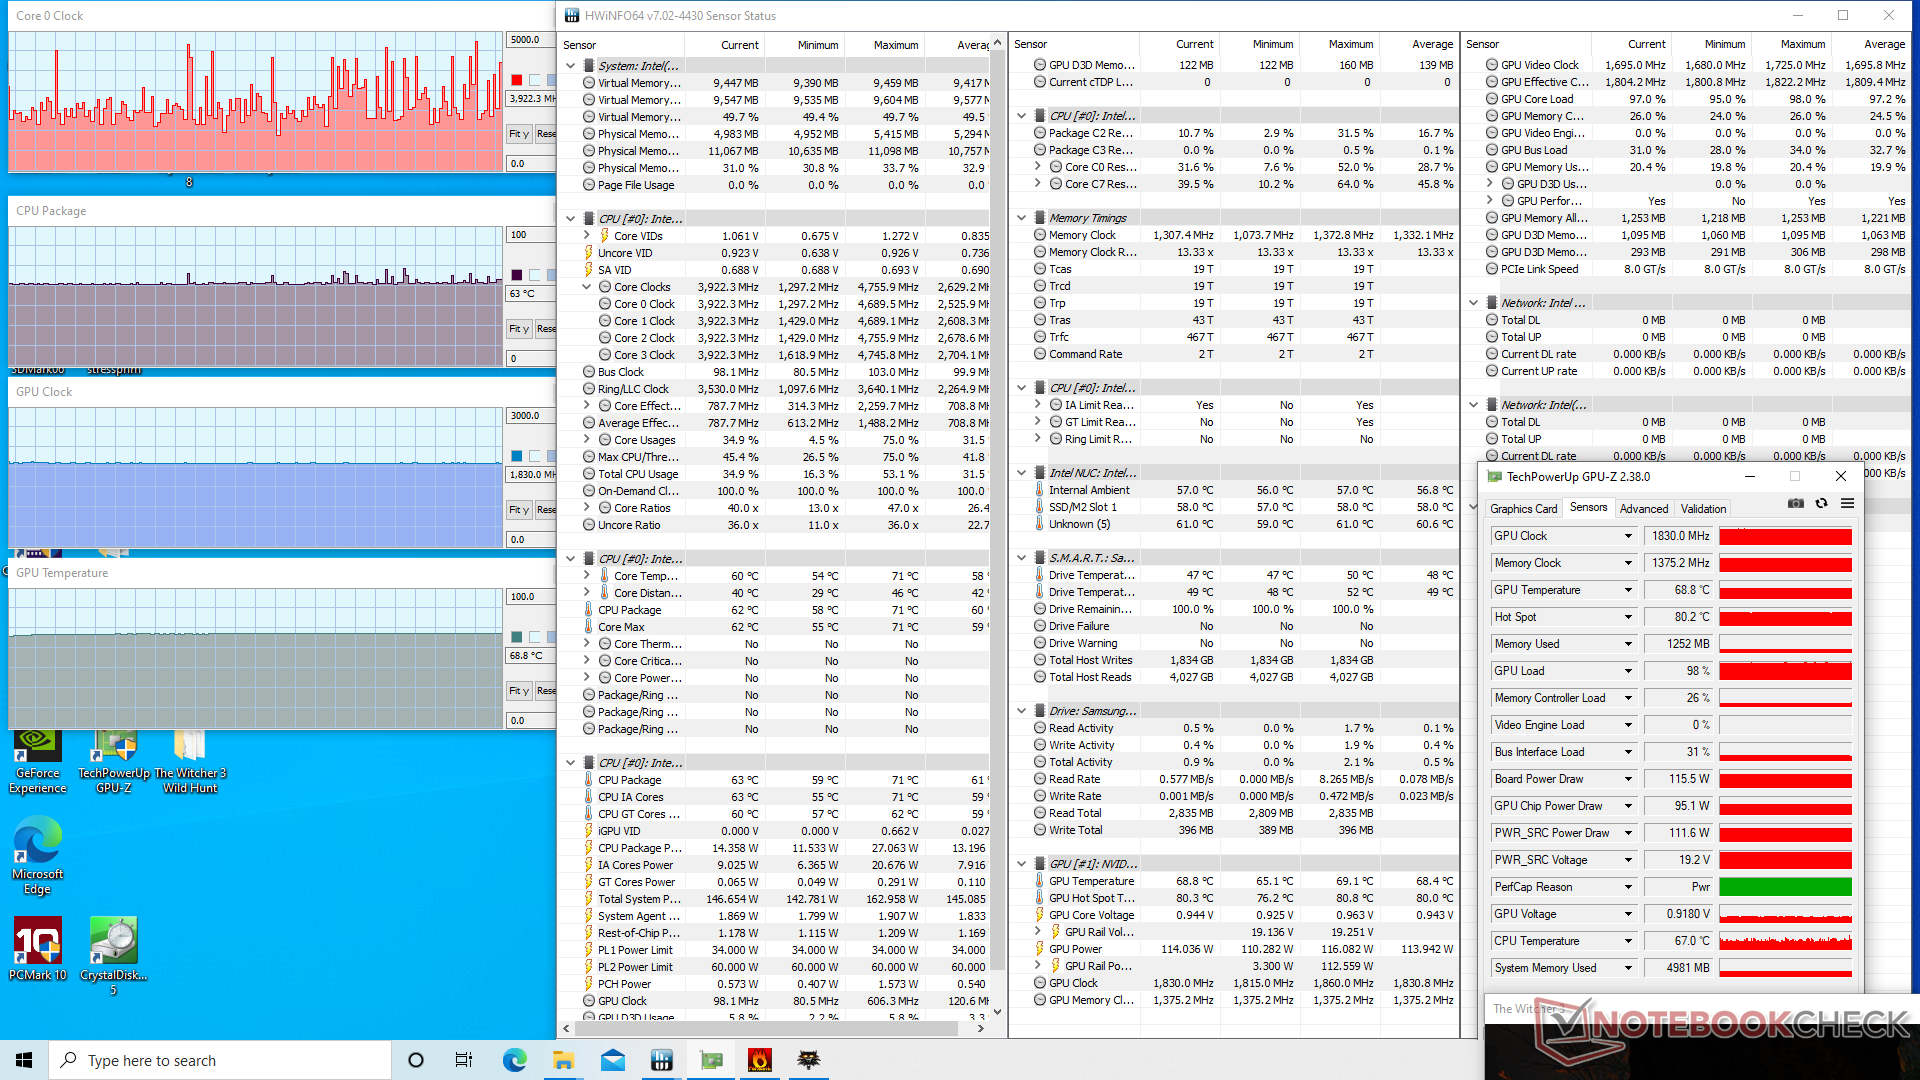
Stresstest
Wanneer Prime95 wordt uitgevoerd om de CPU te belasten, worden de kloksnelheden gedurende ongeveer 20 seconden opgevoerd tot 4,1 GHz, totdat een kerntemperatuur van 89 C wordt bereikt. Daarna dalen de kloksnelheden gestaag totdat ze stabiliseren op 3,0 tot 3,2 GHz en een kerntemperatuur van 67 C. Als de NUC is ingesteld op de gebalanceerde modus, dalen de kloksnelheden verder tot 2,8 GHz voor een koelere kerntemperatuur van 57 C.
Bij het uitvoeren Witcher 3 om echte gamingbelastingen weer te geven, zouden CPU- en GPU-temperaturen stabiliseren op respectievelijk 63 C en 69 C, met een constante GPU-board stroomopname van ongeveer 116 W. De Kaby Lake-G CPU in de Hades Canyon NUC zou stabiliseren op een vergelijkbaar temperatuurbereik wanneer hetzelfde spel wordt uitgevoerd.
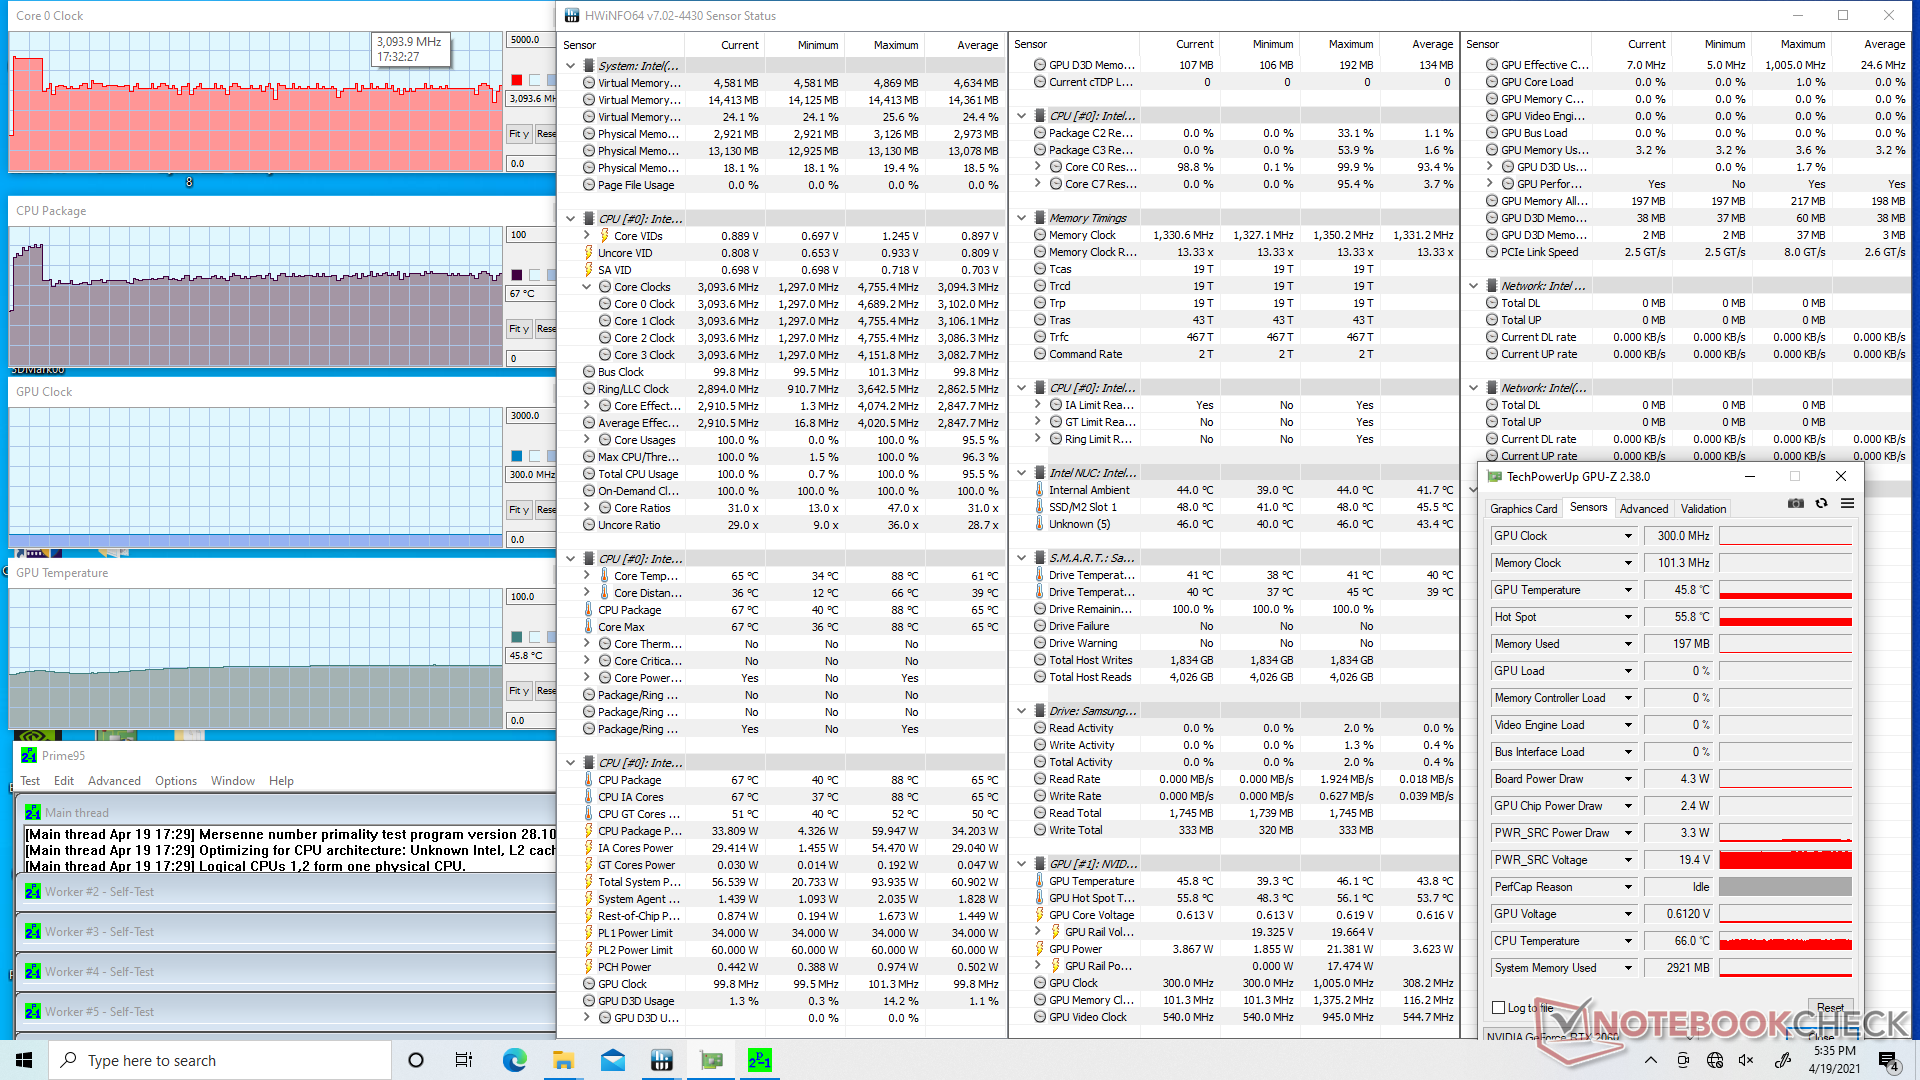
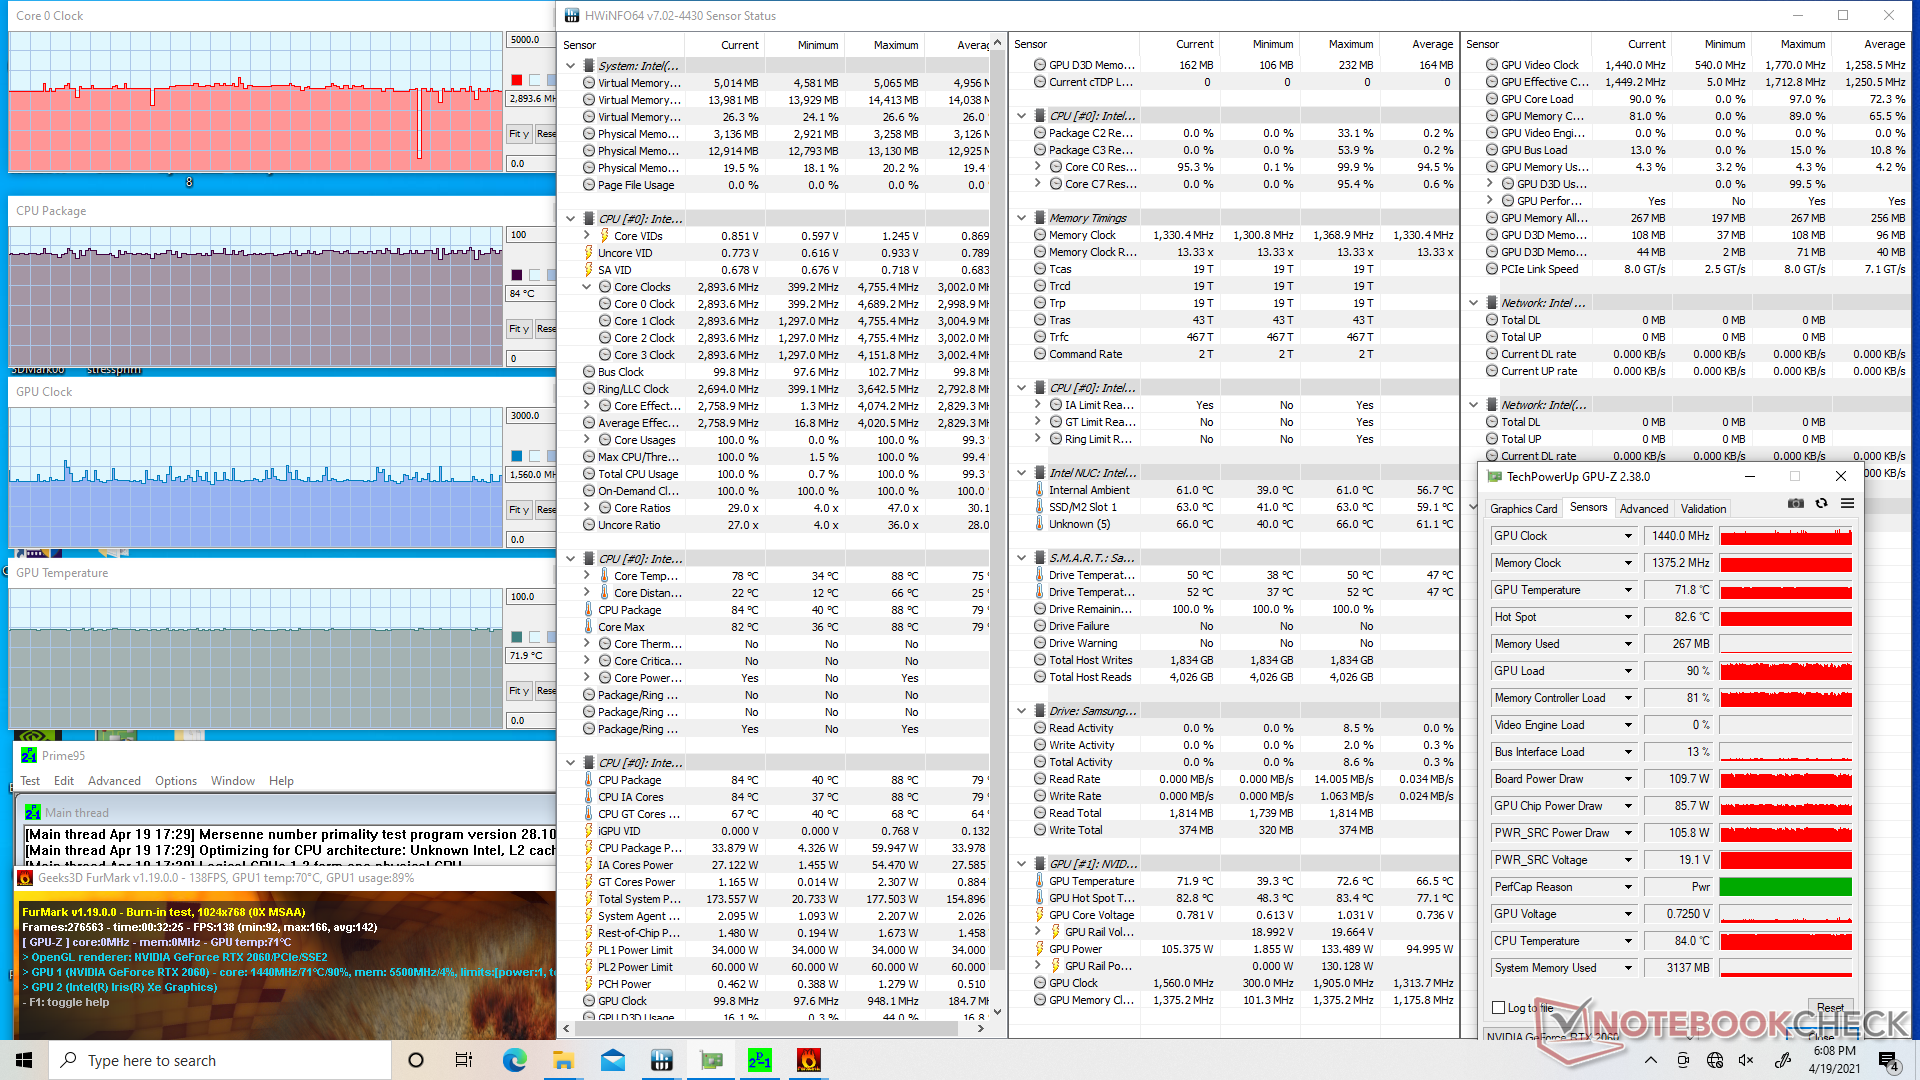
| CPUklok (GHz) GPUklok (MHz) GemiddeldeCPU temperatuur (°C) GemiddeldeGPU temperatuur (°C) |
| Systeem in ruststand |
| Prime95 Stress |
| Prime95 + FurMark Stress 2.9 1440 84 72 |
| Witcher 3 Stress |
Energy Management
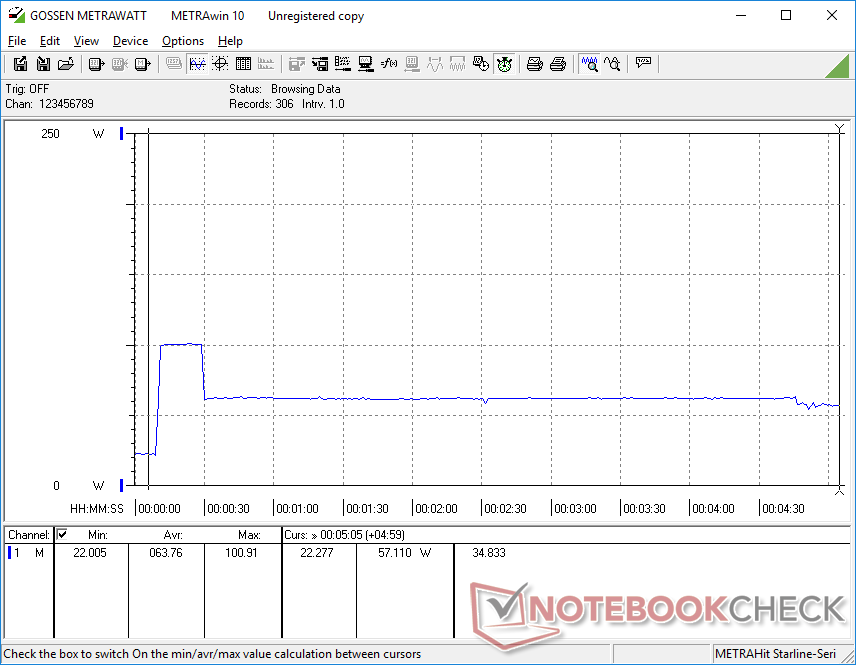
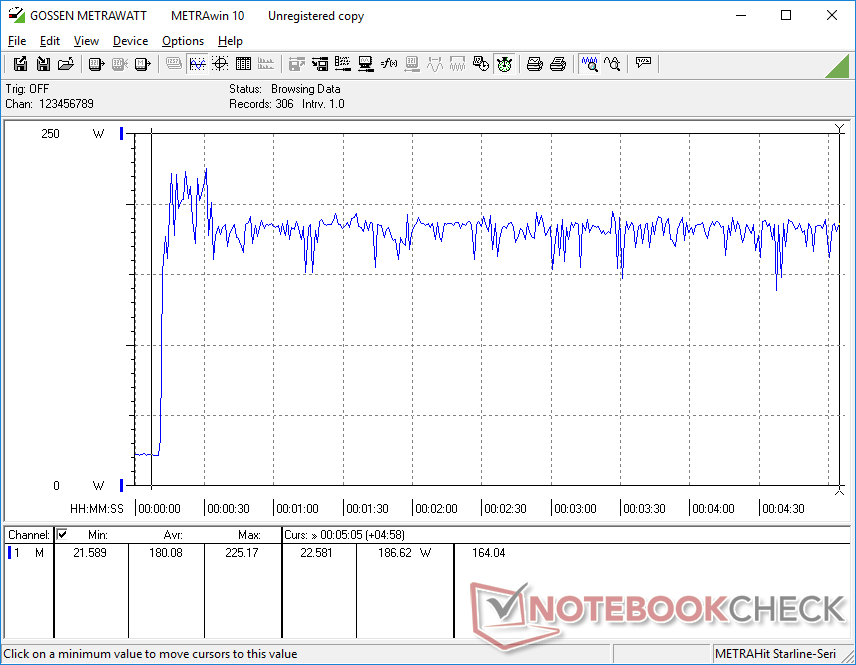
Stroomverbruik
Stationair draaien op een desktop verbruikt zo'n 5 tot 6 W wanneer er geen schermen of USB-apparaten zijn aangesloten, tot 21 W wanneer toetsenborden, muizen en schermen zijn aangesloten en de discrete GPU actief is. Het stroomverbruik tijdens gamen kan ongeveer 30 tot 60 procent hoger zijn dan de Hades Canyon NUC, wat redelijk is gezien de 70 tot 100 procent boost in grafische prestaties.
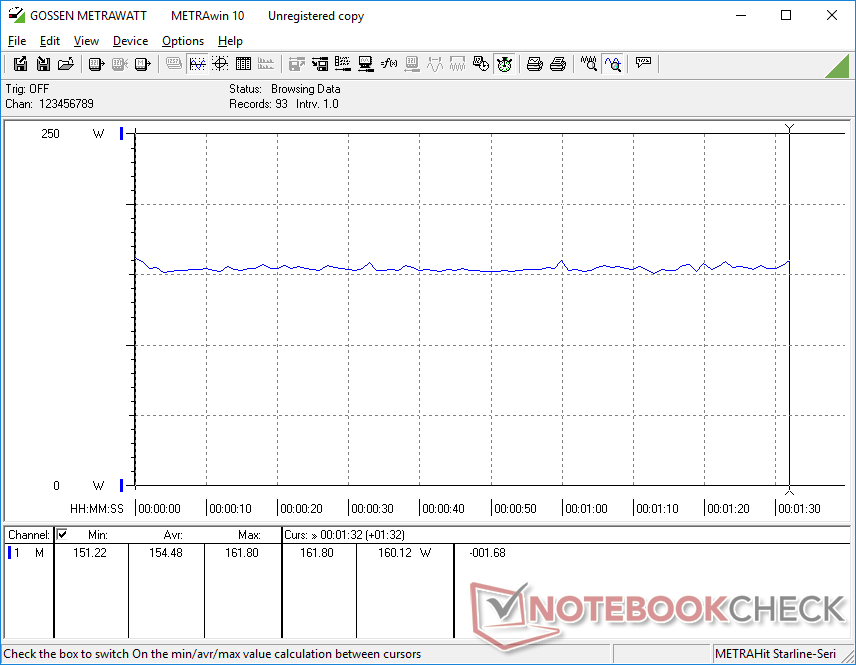
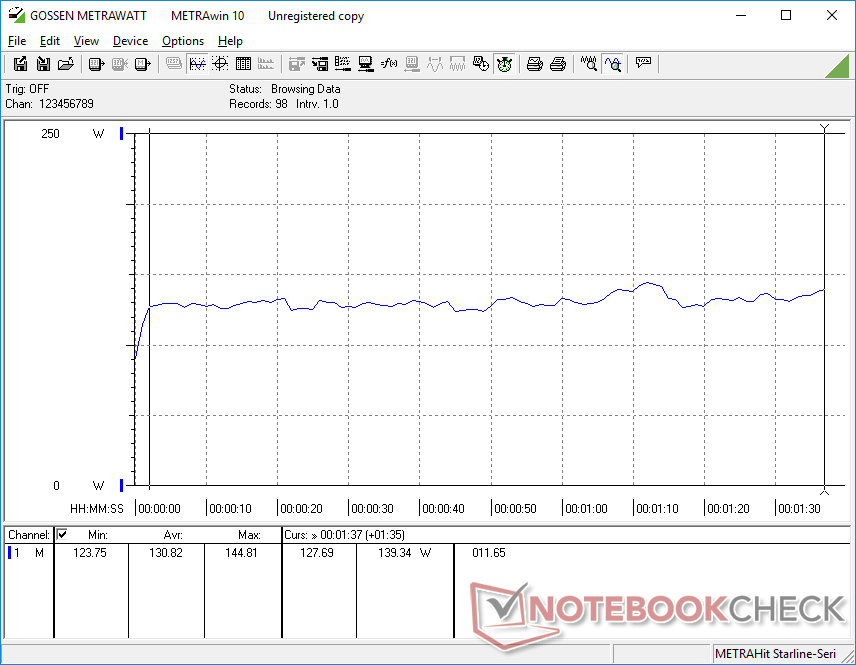
We zijn in staat om een maximaal tijdelijk verbruik van 225 W te registreren van de grote (~20 x 10 x 2 cm) 240 W AC adapter wanneer we tegelijkertijd Prime95 en FurMark draaien. Merk op dat de NUC11 Phantom Canyon dezelfde Lite-On AC adapter gebruikt als de NUC8 Hades Canyon en dat ze dus onderling uitwisselbaar zijn.
| Uit / Standby | |
| Inactief | |
| Belasting |
|
Key:
min: | |
| Intel NUC11PHKi7C i7-1165G7, GeForce RTX 2060 Mobile, Samsung SSD 980 Pro 500GB MZ-V8P500BW, , x, | Intel Hades Canyon NUC8i7HVK i7-8809G, Vega M GH, Intel Optane 120 GB SSDPEK1W120GA, , x, | Intel NUC11PAQi7 i7-1165G7, Iris Xe G7 96EUs, Samsung SSD 980 Pro 500GB MZ-V8P500BW, , x, | Zotac ZBOX Magnus EK71080 i7-7700HQ, GeForce GTX 1080 (Desktop), Samsung PM961 MZVLW256HEHP, , x, 0" | Aorus Gaming Box GeForce RTX 2080 Ti i7-1165G7, , , , x, | |
|---|---|---|---|---|---|
| Power Consumption | -40% | 49% | -131% | -154% | |
| Idle Minimum * (Watt) | 5.8 | 15.5 -167% | 5.6 3% | 27.1 -367% | 29.6 -410% |
| Idle Average * (Watt) | 5.9 | 16.2 -175% | 5.6 5% | 27.4 -364% | 29.6 -402% |
| Idle Maximum * (Watt) | 20.7 | 16.5 20% | 6 71% | 28.8 -39% | 29.6 -43% |
| Load Average * (Watt) | 130.8 | 83.4 36% | 31.4 76% | 100.4 23% | 79.9 39% |
| Witcher 3 ultra * (Watt) | 154.4 | 121.7 21% | 39 75% | 243.1 -57% | 252 -63% |
| Load Maximum * (Watt) | 225.2 | 173.5 23% | 80.5 64% | 186.7 17% | 319.8 -42% |
* ... kleiner is beter
Pro
Contra
Uitspraak
Phantom Canyon is het bewijs dat Intel verder is gegaan na Kaby Lake-G. De nieuwigheid van een Intel-AMD-chipset is verdwenen ten gunste van meer kant-en-klare processoren en VRAM-modules die gebruikelijk zijn voor Ultrabooks en gaminglaptops. Dit betekent uiteindelijk betrouwbaardere driverondersteuning en soepelere compatibiliteit met games dan waar Hades Canyon ooit op kon hopen.
Hades Canyon voelt bijna verouderd tegenover Phantom Canyon. De nieuwste NUC is misschien een beetje groter, maar hij is aanzienlijk sneller zonder dat hij luider of heter hoeft te werken om de toename in grootte van gen tot gen meer dan goed te maken.
De algemene prestaties zijn zoals verwacht sneller dan Hades Canyon, maar het is geweldig om te zien dat dit niet ten koste gaat van merkbaar luidere ventilatoren of warmere kerntemperaturen, waar men altijd bang voor is bij het upgraden naar snellere PC's.
Nadelen zijn het iets dikkere formaat en het hogere stroomverbruik dan Hades Canyon, de lelijke power brick, en de hoge straatprijs van meer dan $1000 USD voor een barebones unit. Gebruikers zullen de vormfactor en kwaliteit van de NUC-naam echt moeten waarderen, aangezien krachtigere gaminglaptops - compleet met RAM en opslag, tussen haakjes - voor ongeveer dezelfde prijs te krijgen zijn.
Prijs en beschikbaarheid
De Intel NUC11PHKi7C Phantom Canyon is op het moment van schrijven nog niet overal verkrijgbaar. Simplynuc.com biedt momenteel pre-orders aan voor het systeem vanaf $1339 USD.
Price comparison

