Intel NUC11TNKi5 Pro Mini Tiger Canyon Review: Kleinste Tiger Lake NUC

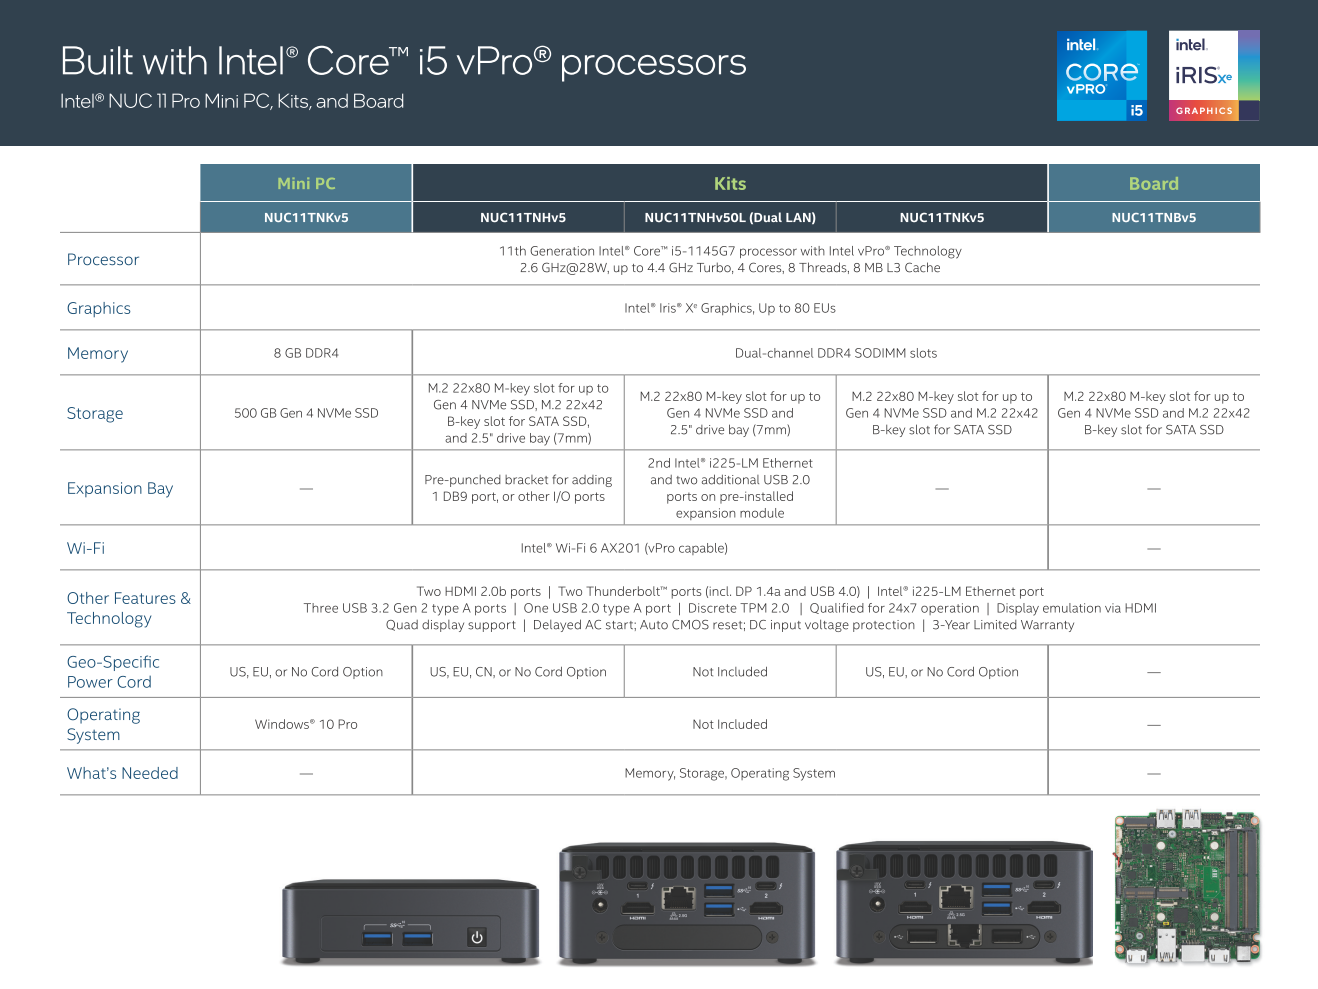
De NUC 11-familie bestaat uit drie brede modellen: de NUC 11 Pro Mini (NUC11TNK), NUC 11 Performance (NUC11PAQ), en de GeForce RTX-aangedreven NUC 11 Enthusiast (NUC11PHK). Elk model is visueel verschillend, waarbij de Pro Mini de kleinste van het stel is.
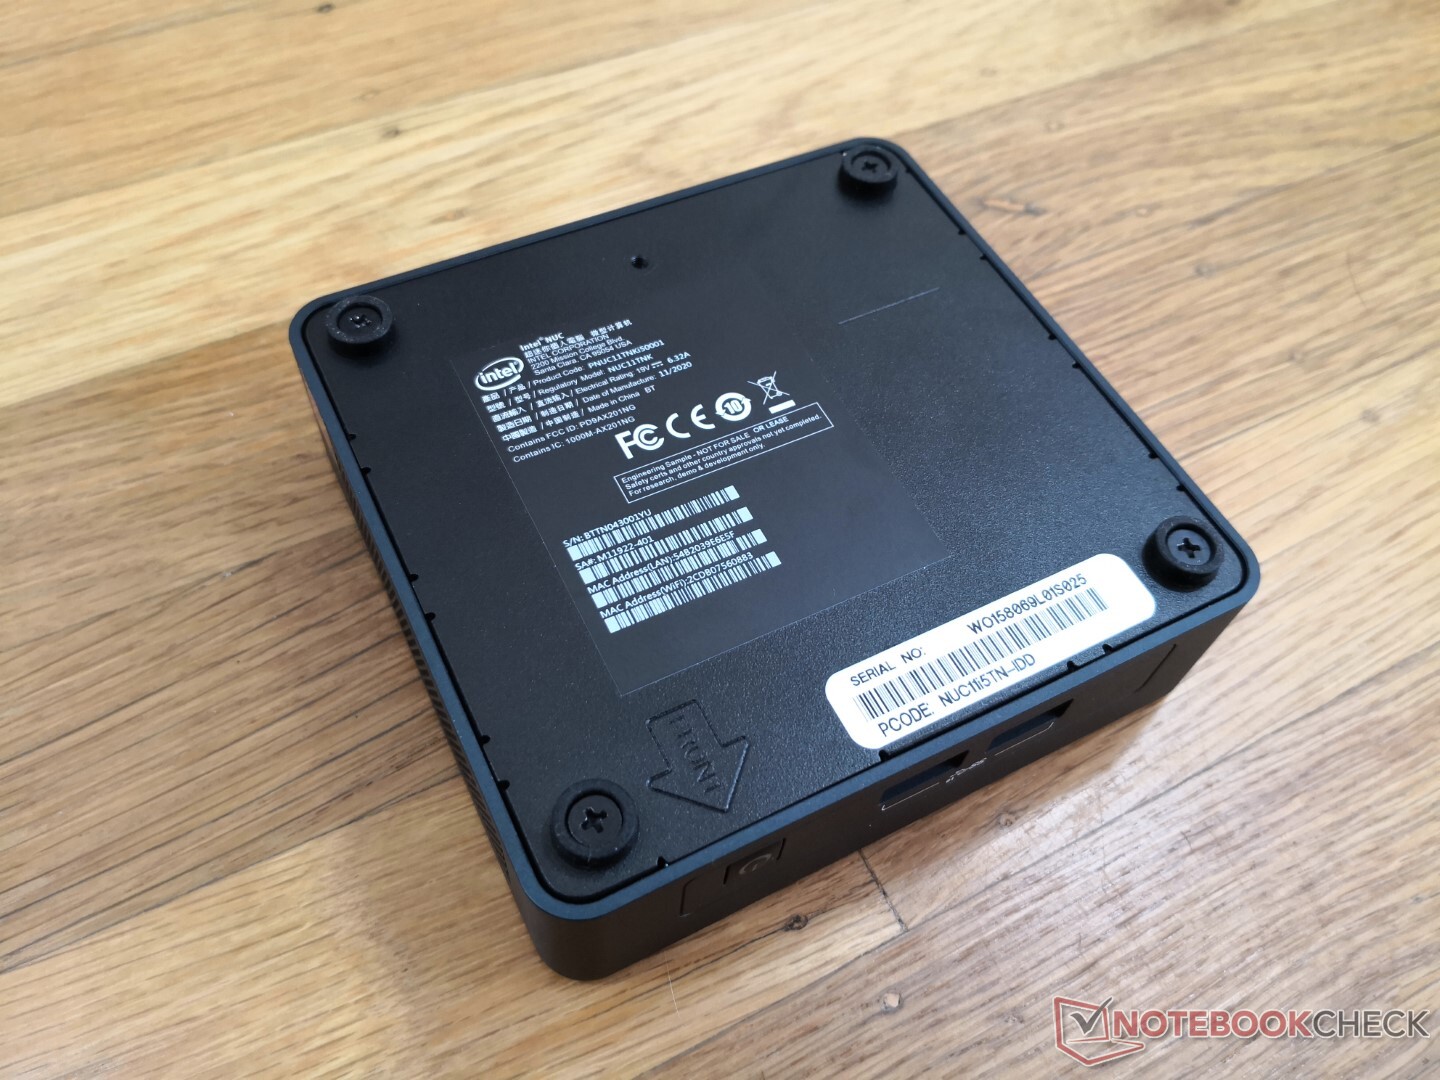
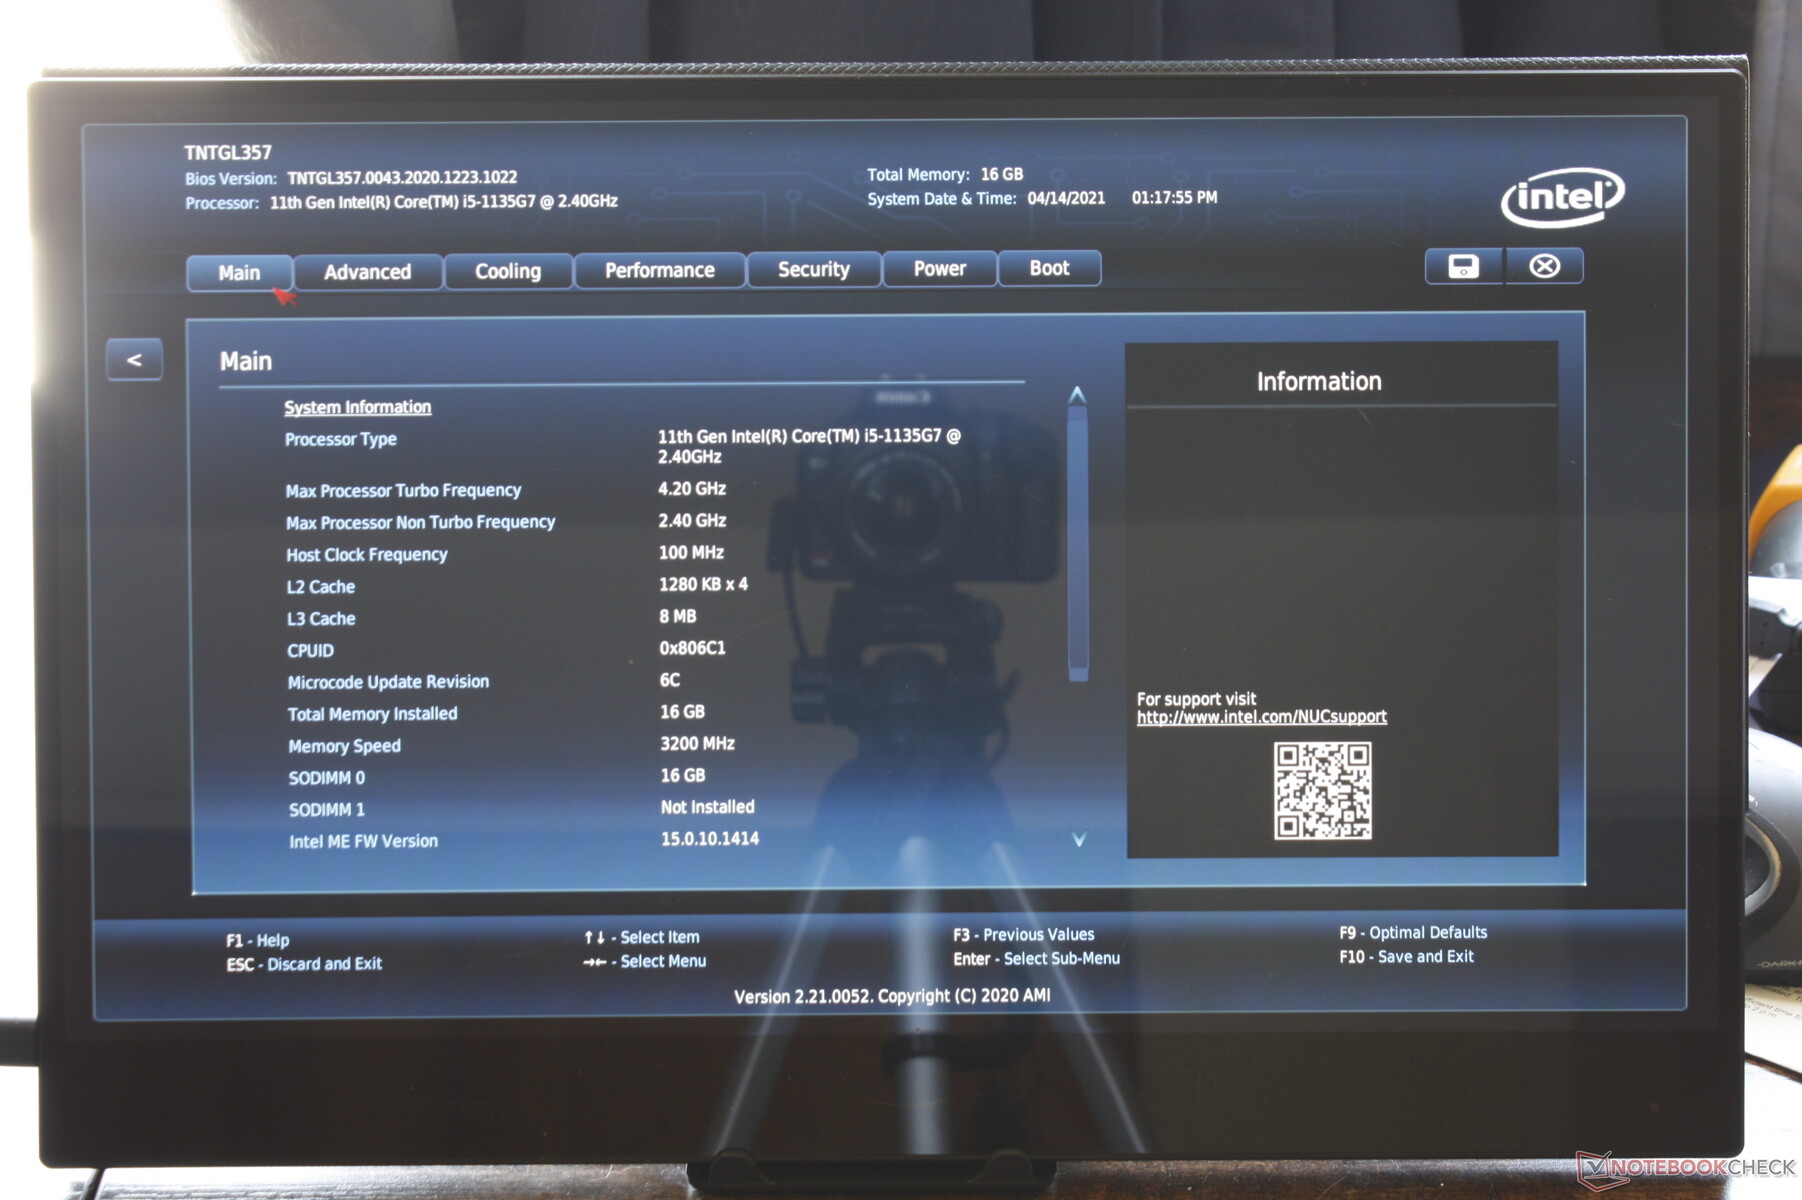
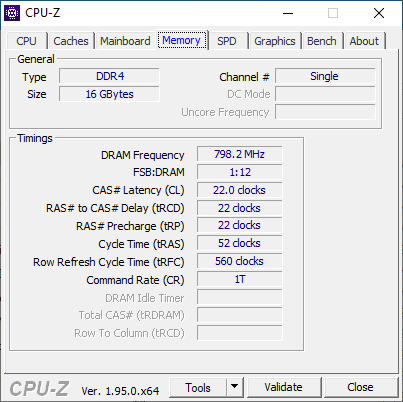
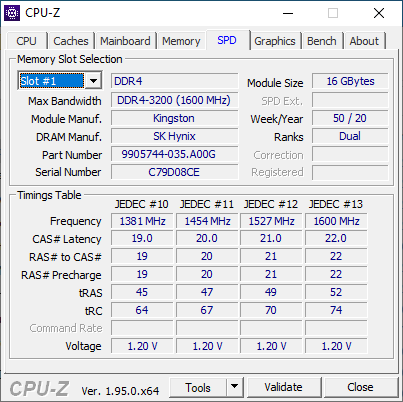
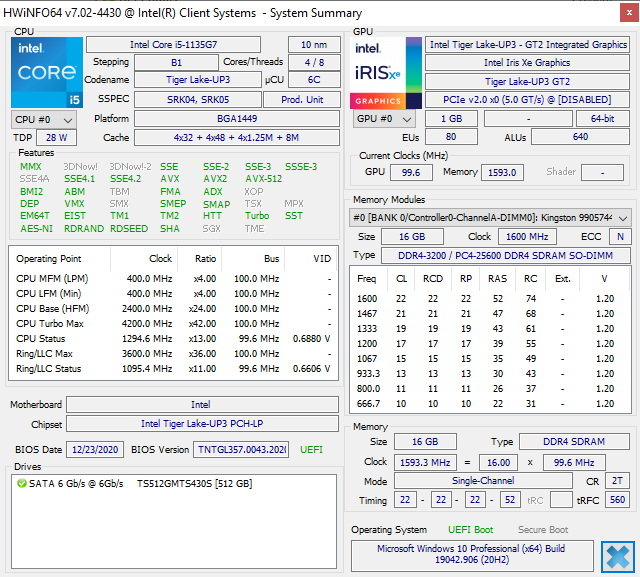
De eenheid die we hier testen is de NUC 11 Pro Mini, onze bespreking van het Enthusiast model volgt in de komende weken. Hoewel Core i3, Core i7, dual-channel RAM, en NVMe SSD's opties beschikbaar zijn, heeft Intel de onze geconfigureerd met de Core i5-1135G7 CPU, 16 GB single-channel RAM, en een 512 GB M.2 SATA III SSD.
Concurrenten voor de Intel NUC-serie zijn in de loop der jaren gestaag gegroeid. Alternatieven zijn onder andere de Zotac ZBox, Beelink SEi10, GMK NucBox 2, en de Lenovo ThinkCentre Nano.
Meer Intel NUC beoordelingen:
potential competitors in comparison
Evaluatie | Datum | Model | Gewicht | Hoogte | Formaat | Resolutie | Beste prijs |
|---|---|---|---|---|---|---|---|
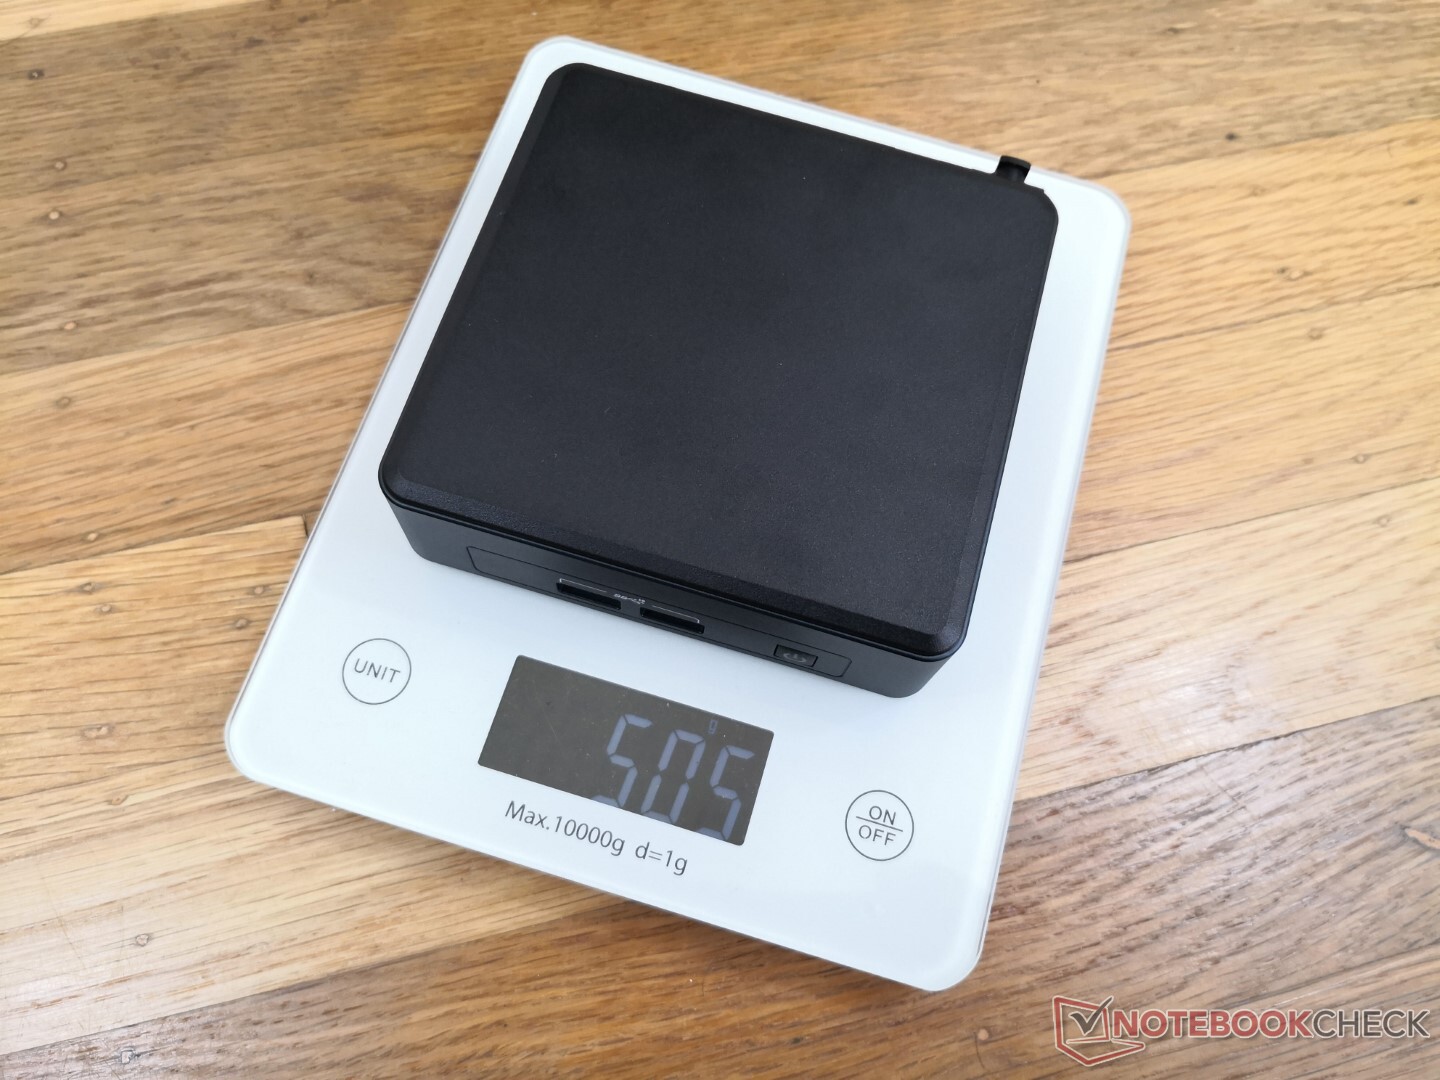
v (old) | 04-2021 | Intel NUC11TNKi5 i5-1135G7, Iris Xe G7 80EUs | 504 g | 37 mm | x | ||
v (old) | 03-2021 | GMK NucBox 2 i5-8259U, Iris Plus Graphics 655 | 430 g | 50 mm | x | ||
v (old) | 02-2021 | Intel NUC11PAQi7 i7-1165G7, Iris Xe G7 96EUs | 647 g | 56 mm | x | ||
v (old) | 02-2020 | Intel NUC10i5FNK i5-10210U, UHD Graphics 620 | 493 g | 36 mm | 0.00" | 0x0 | |
v (old) | Beelink SEi10 i3-1005G1, UHD Graphics G1 (Ice Lake 32 EU) | 350 g | 41 mm | x | |||
v (old) | Zotac ZBOX MI642 Nano i5-10210U, UHD Graphics 620 | 472 g | 51 mm | x |
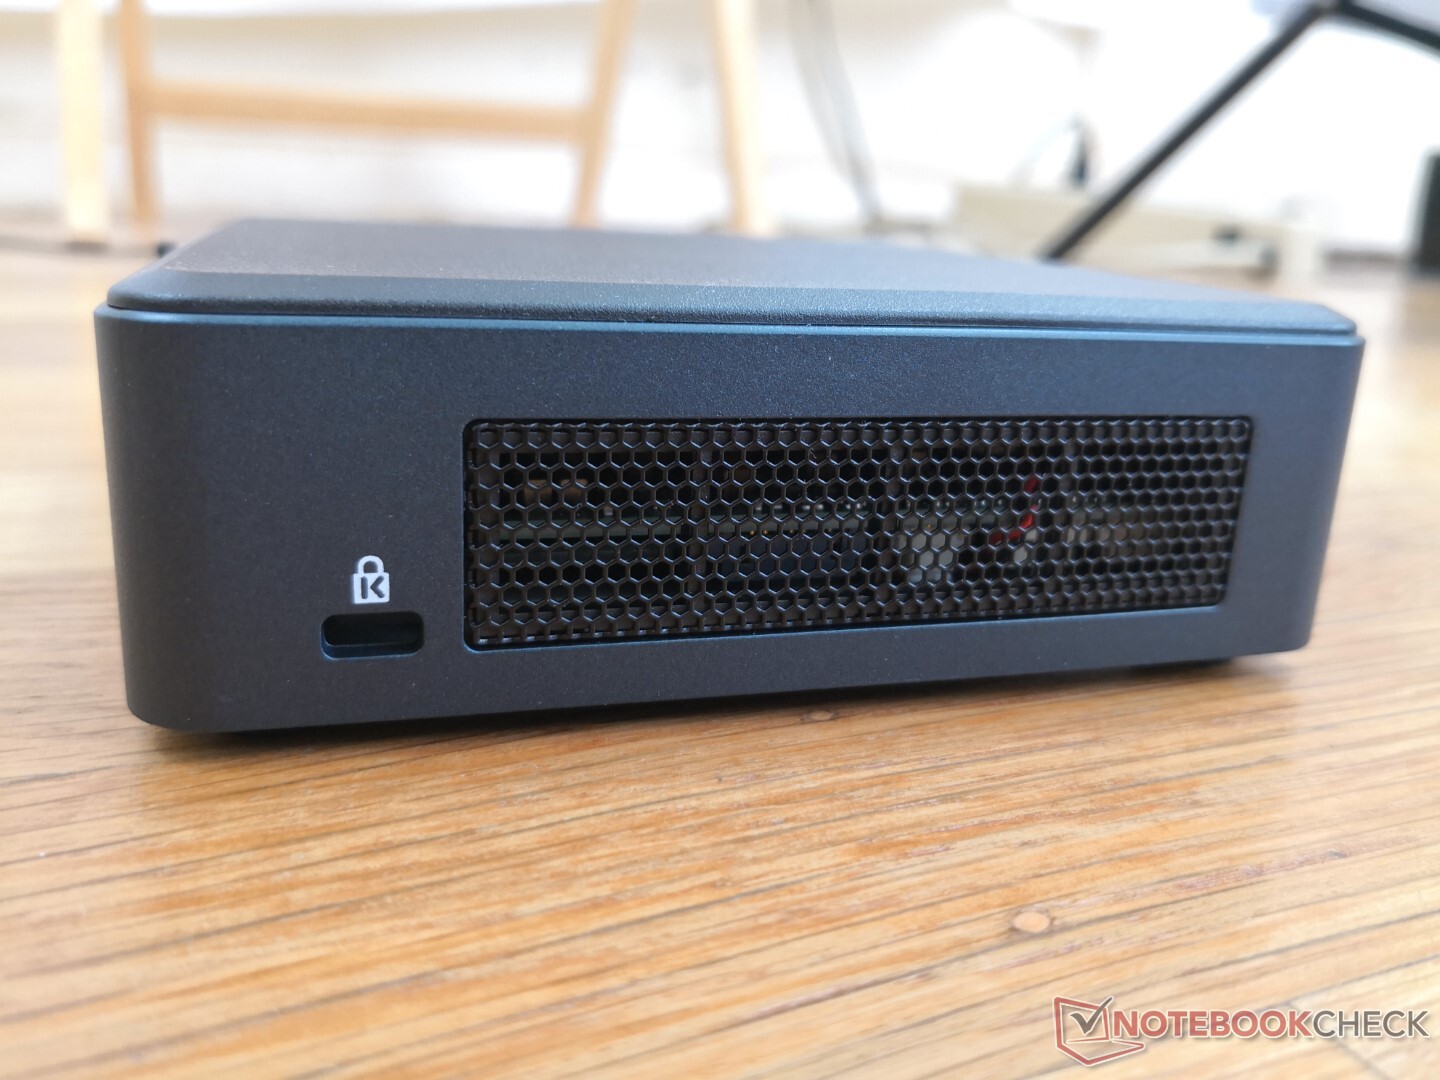
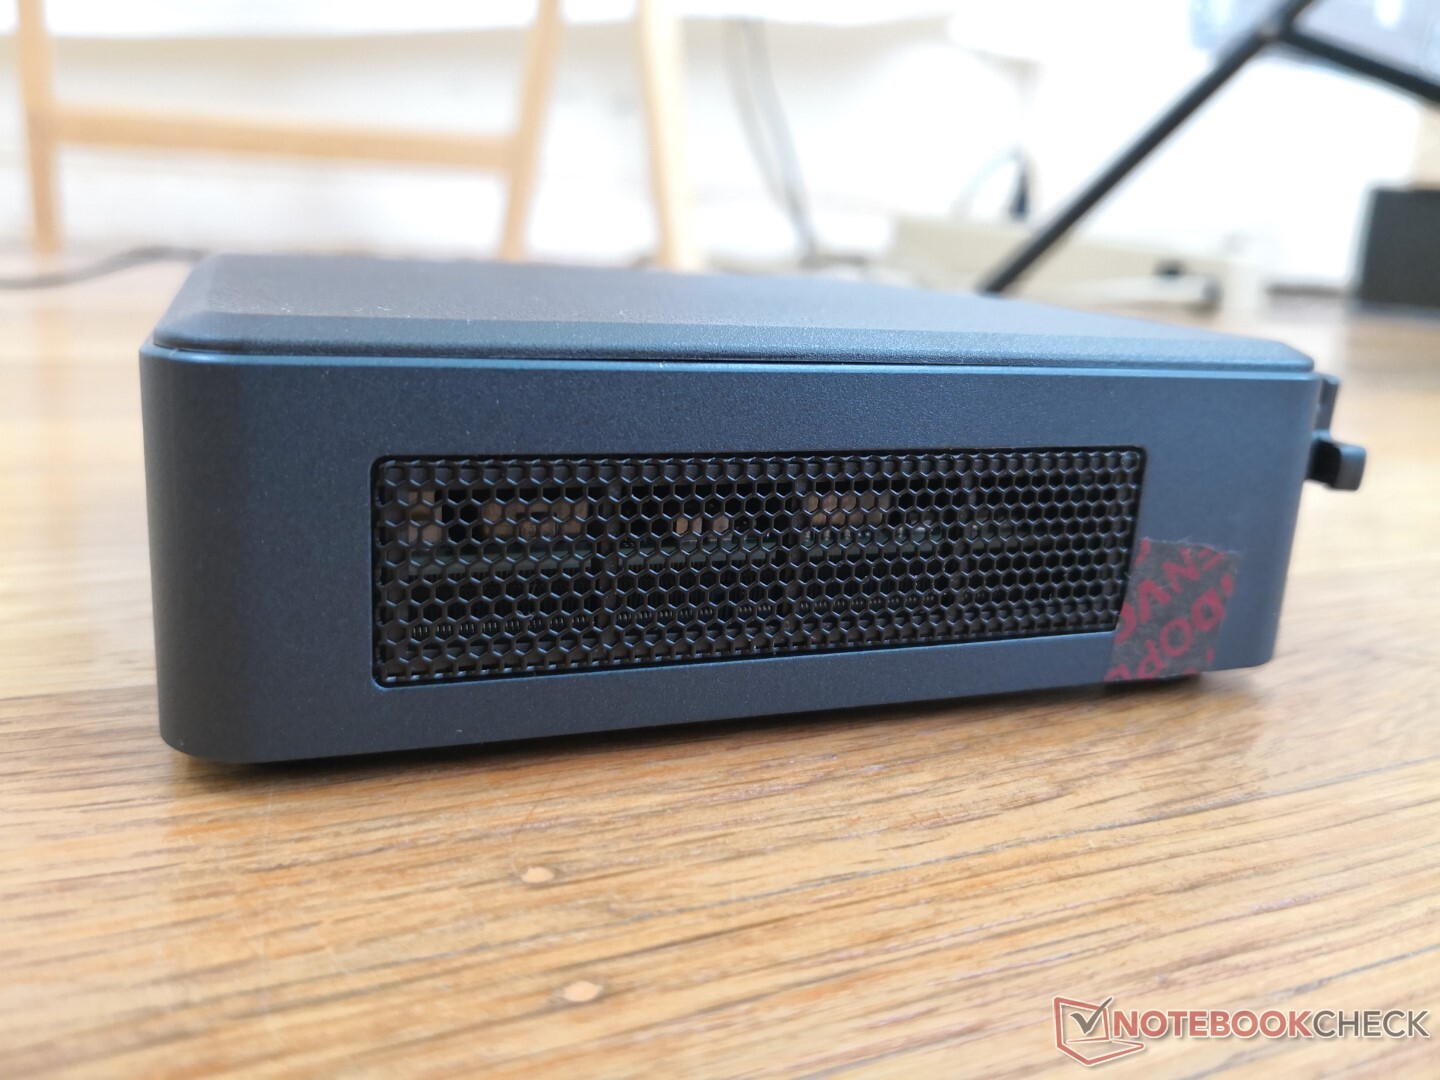
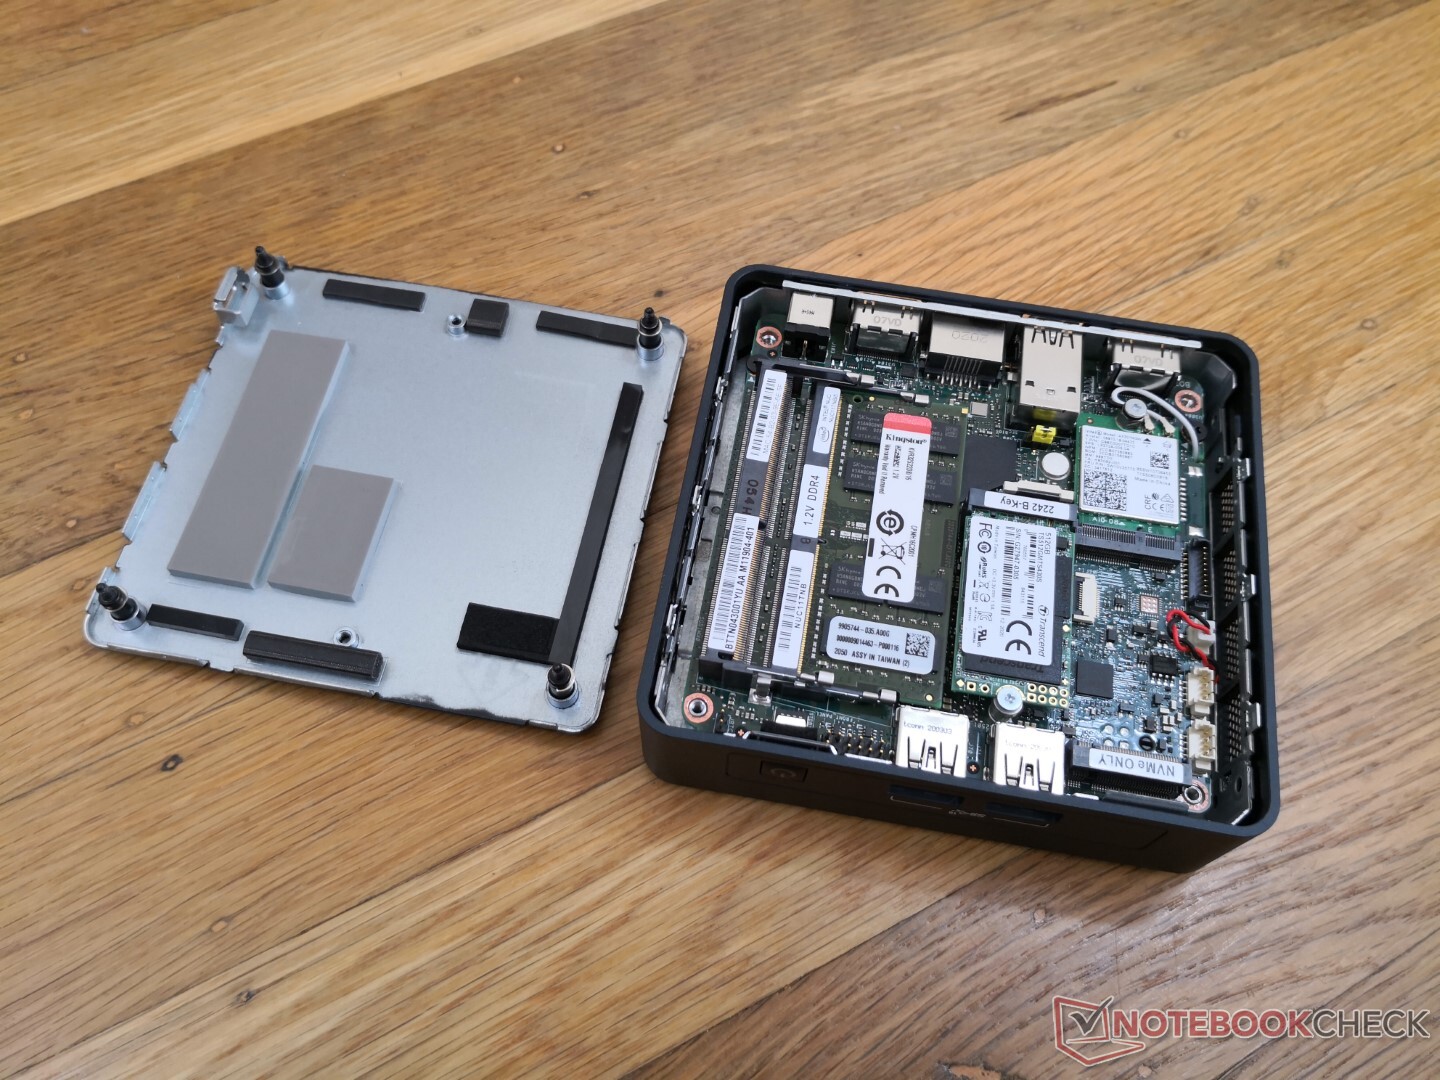
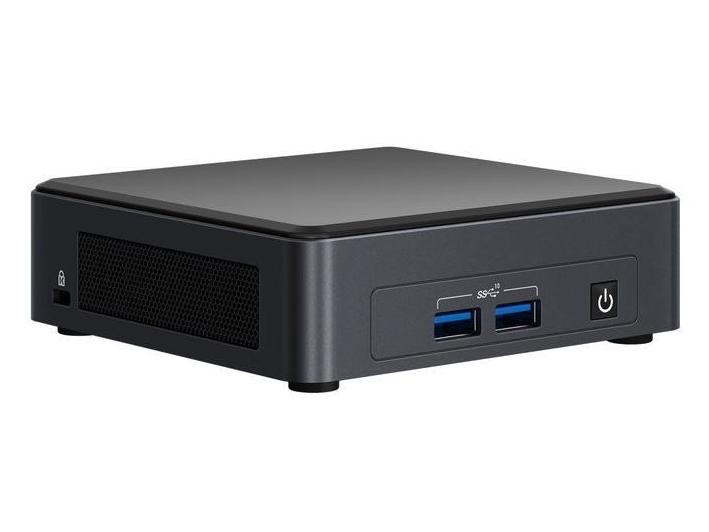
Zaak
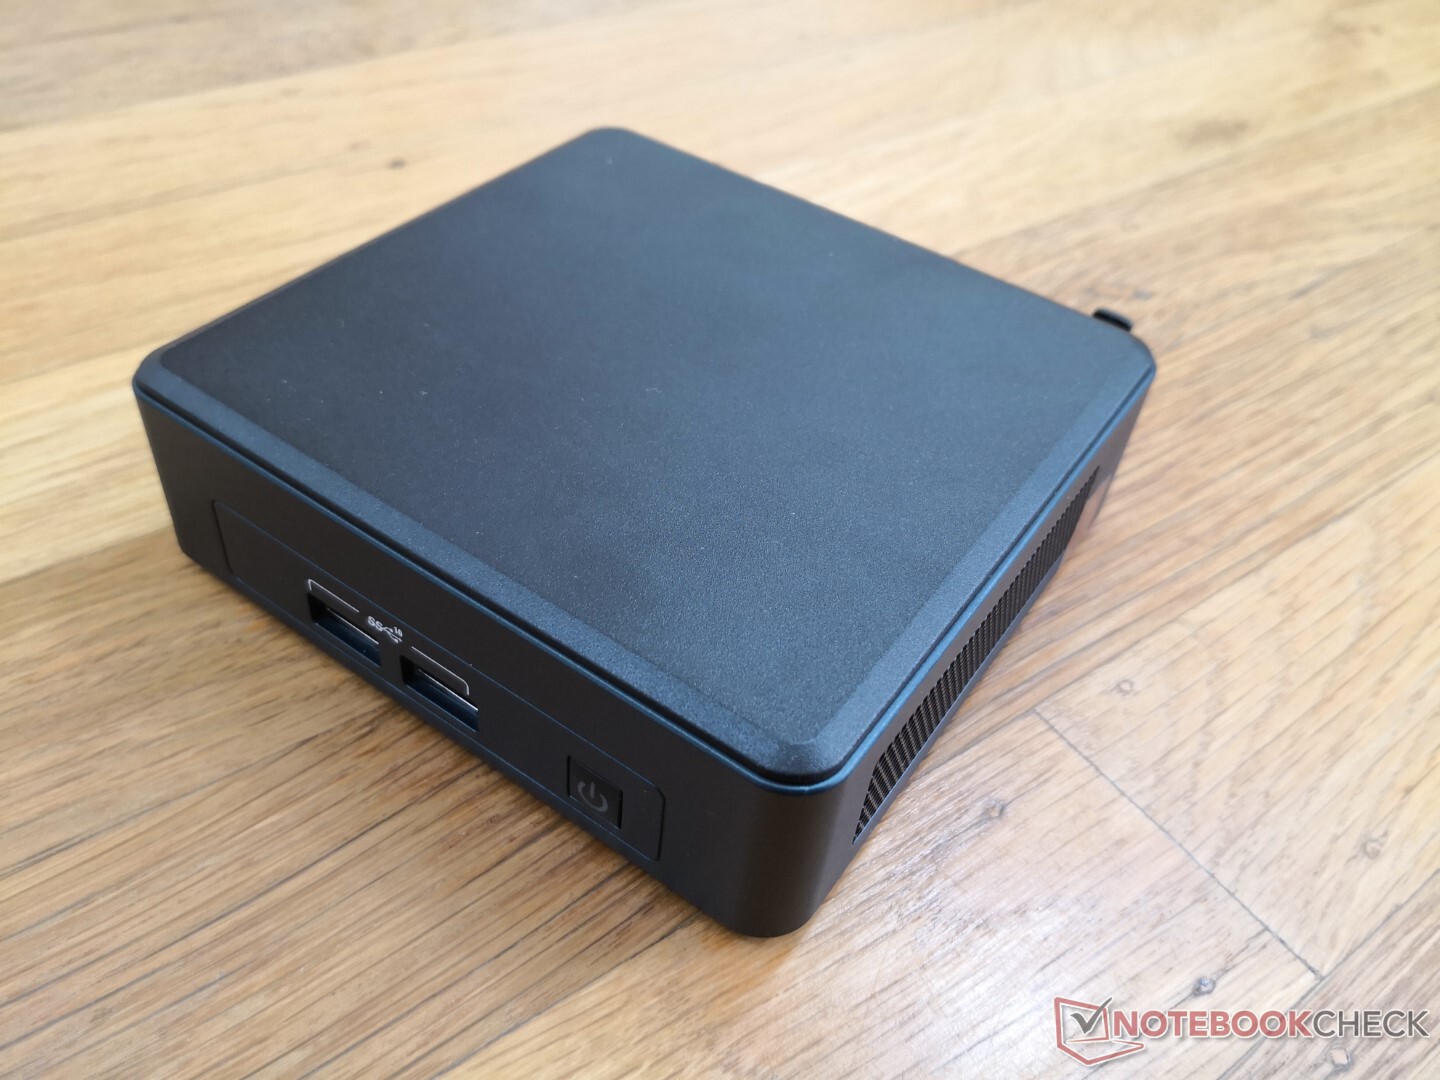
Lengte en breedte zijn identiek aan de NUC 11 Performance, terwijl de hoogte 19 mm korter is. De bovenste plastic plaat is nu mat en lichtjes geruwd in tegenstelling tot de gladde en glanzende platen op oudere NUC's, waarschijnlijk om lelijke vingerafdrukopbouw en krassen te verminderen.
Net als bij andere Intel NUC's is er een binnenste metalen rolkooi aanwezig voor verbeterde stevigheid en kwaliteit ten koste van extra gewicht. Dit blijft een onderscheidend kenmerk van de NUC in vergelijking met de meeste andere mini-PC's.
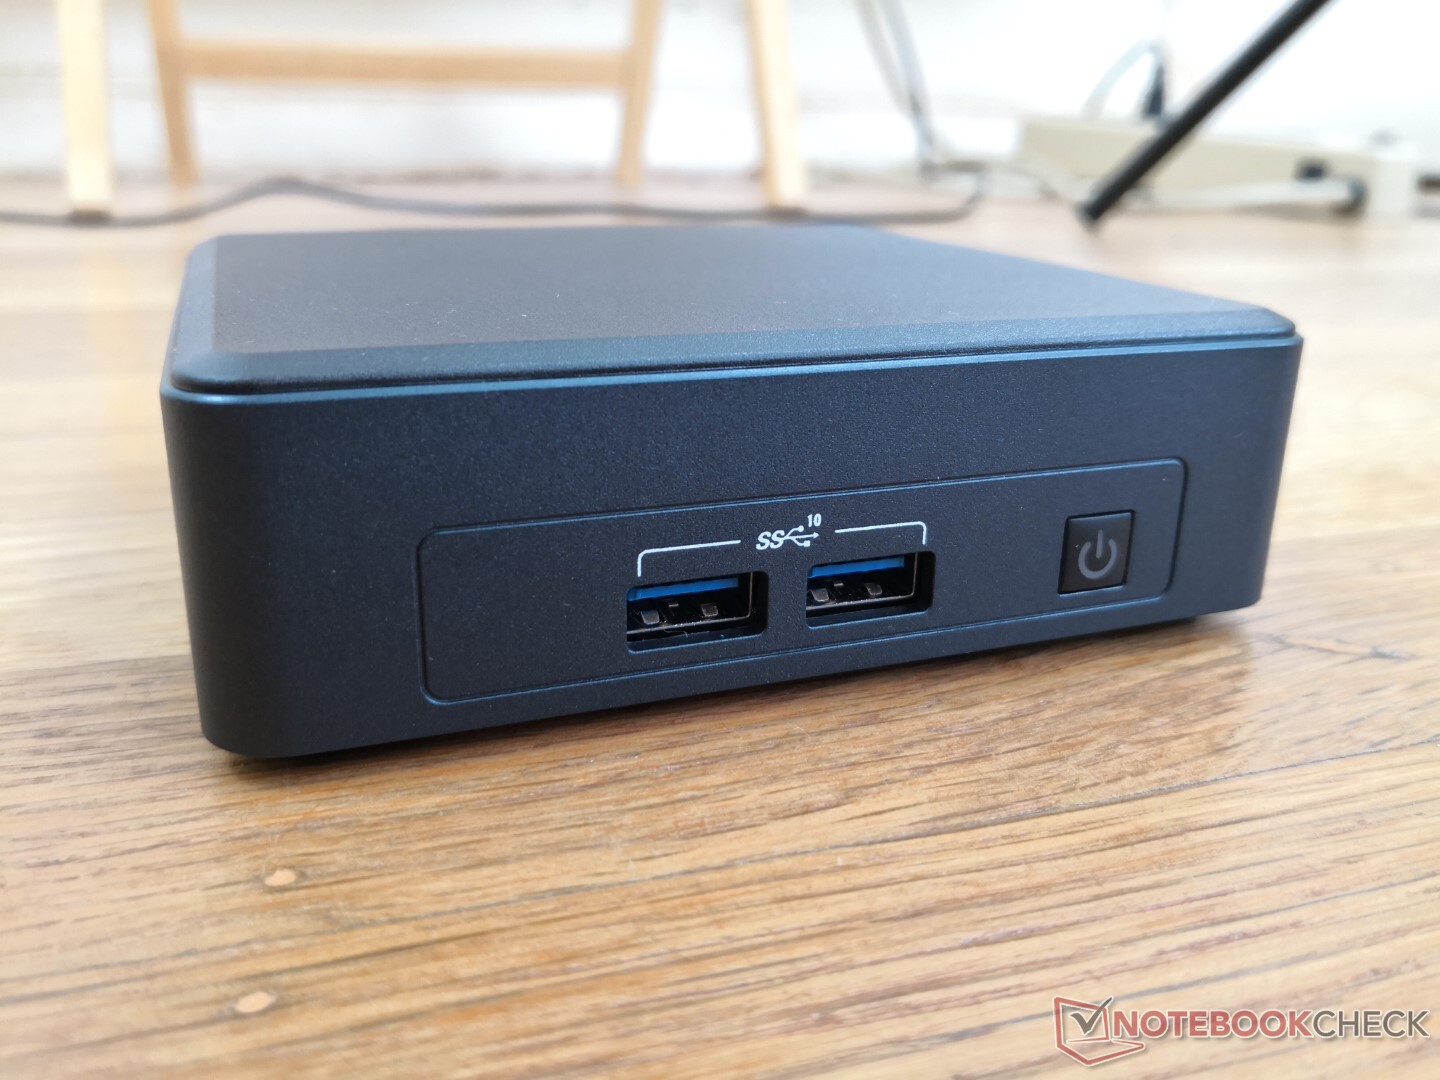
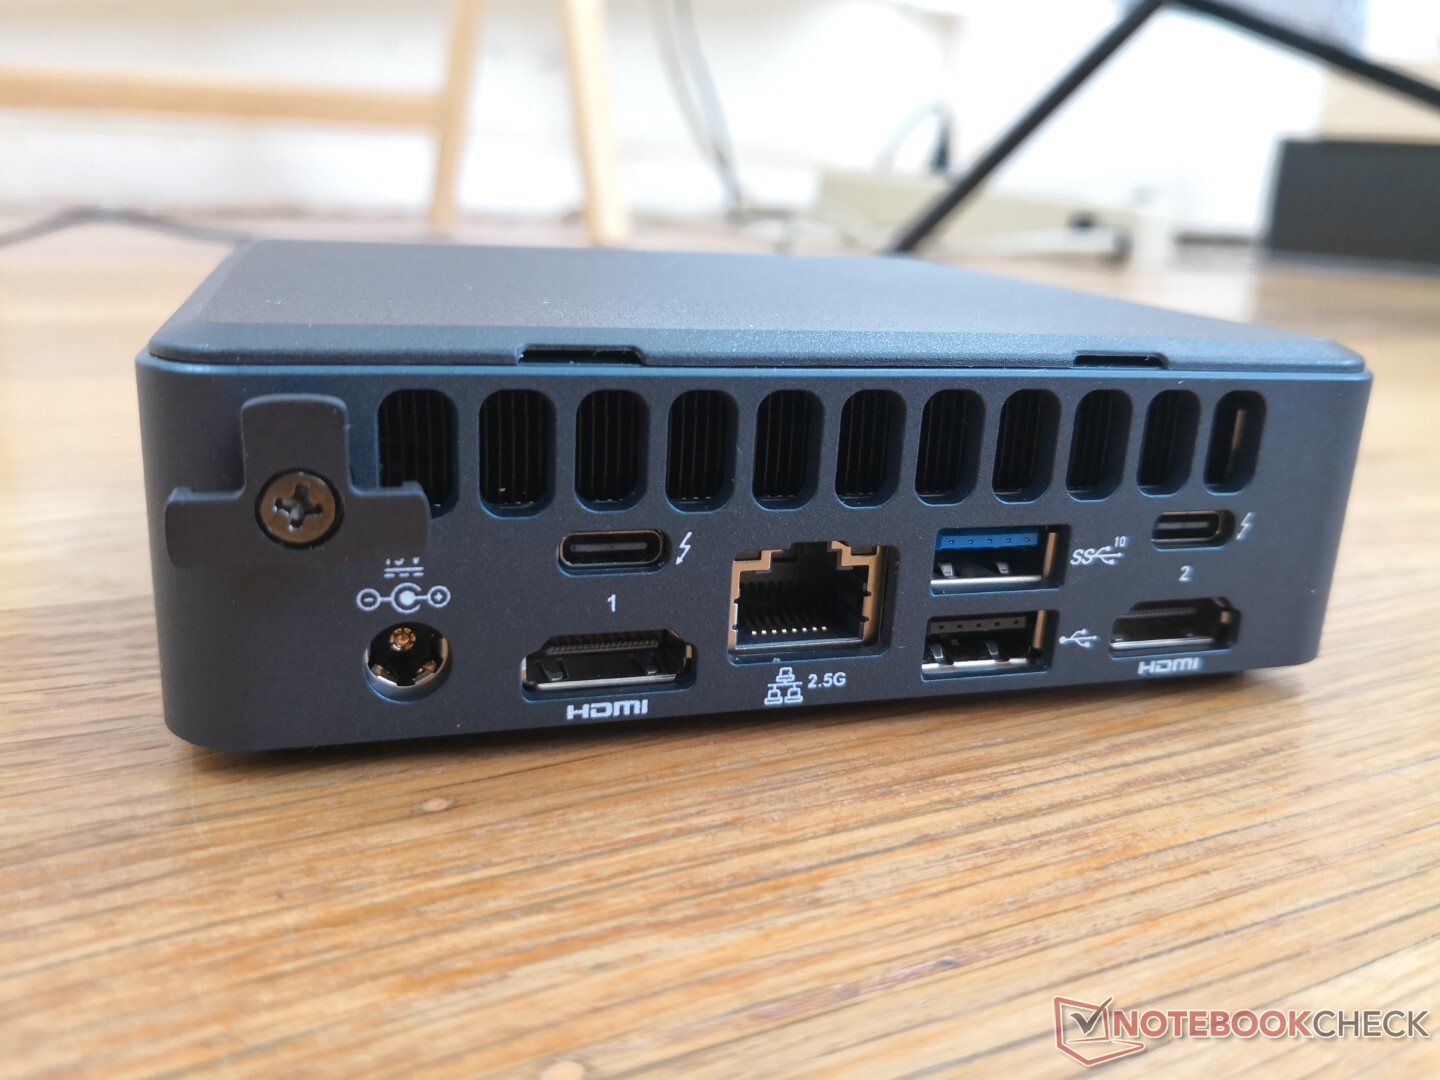
Connectiviteit
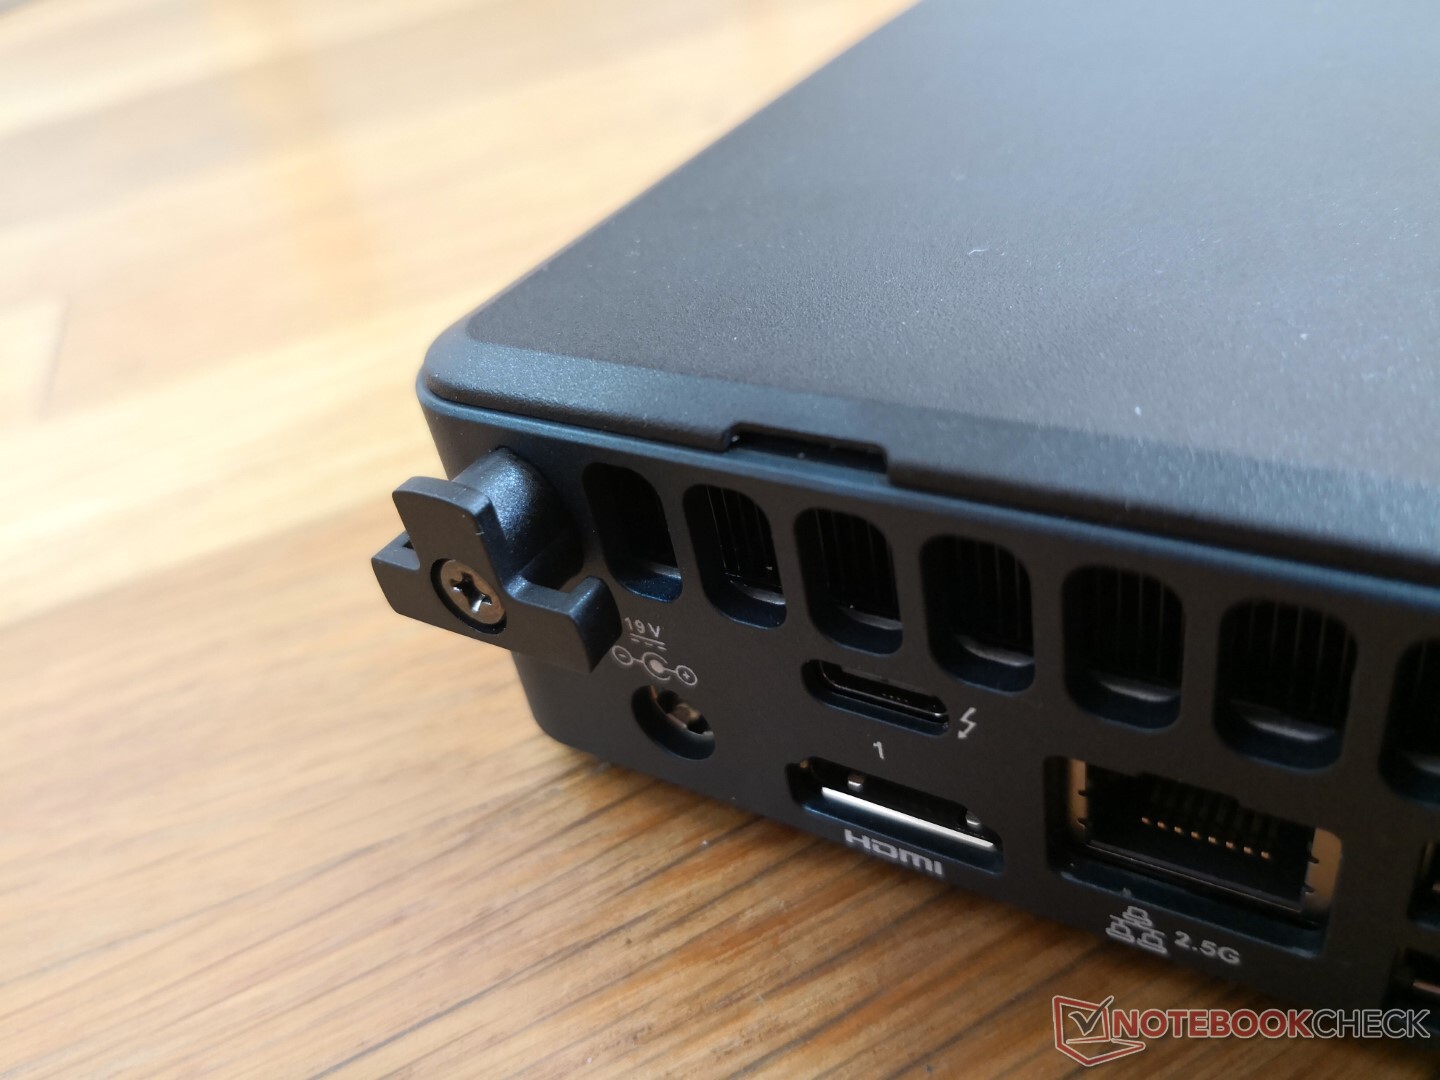
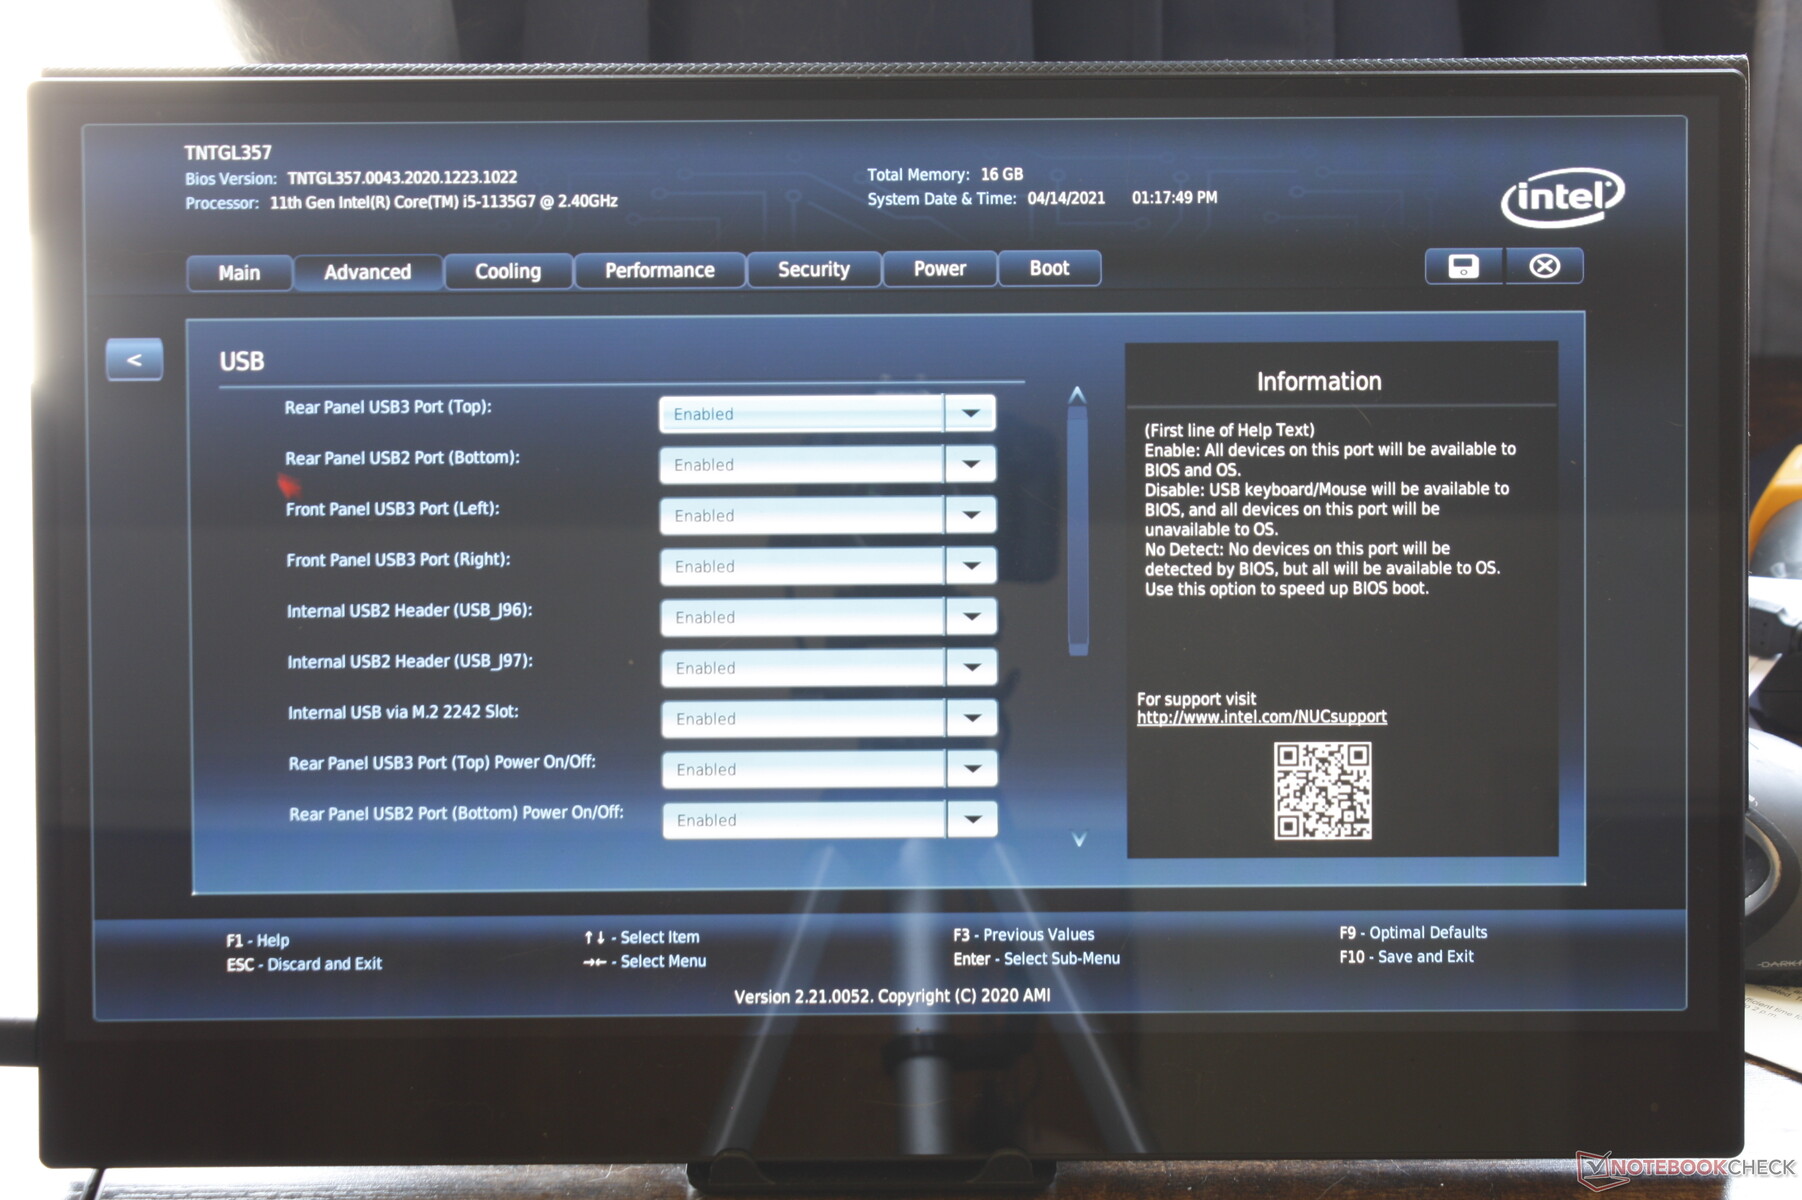
Bijna alle poorten zijn dicht opeengepakt langs de achterkant, inclusief de ene Thunderbolt 3 poort en de andere Thunderbolt 4 poort. Helaas kan de NUC niet worden gevoed door USB-C AC-adapters en dus moeten eigenaars de bijgeleverde eigen AC-vatpoort gebruiken.
Communicatie
| Networking | |
| iperf3 transmit AX12 | |
| Intel NUC11TNKi5 | |
| Beelink SEi10 | |
| Intel NUC11PAQi7 | |
| GMK NucBox 2 | |
| iperf3 receive AX12 | |
| Intel NUC11TNKi5 | |
| Beelink SEi10 | |
| Intel NUC11PAQi7 | |
| GMK NucBox 2 | |
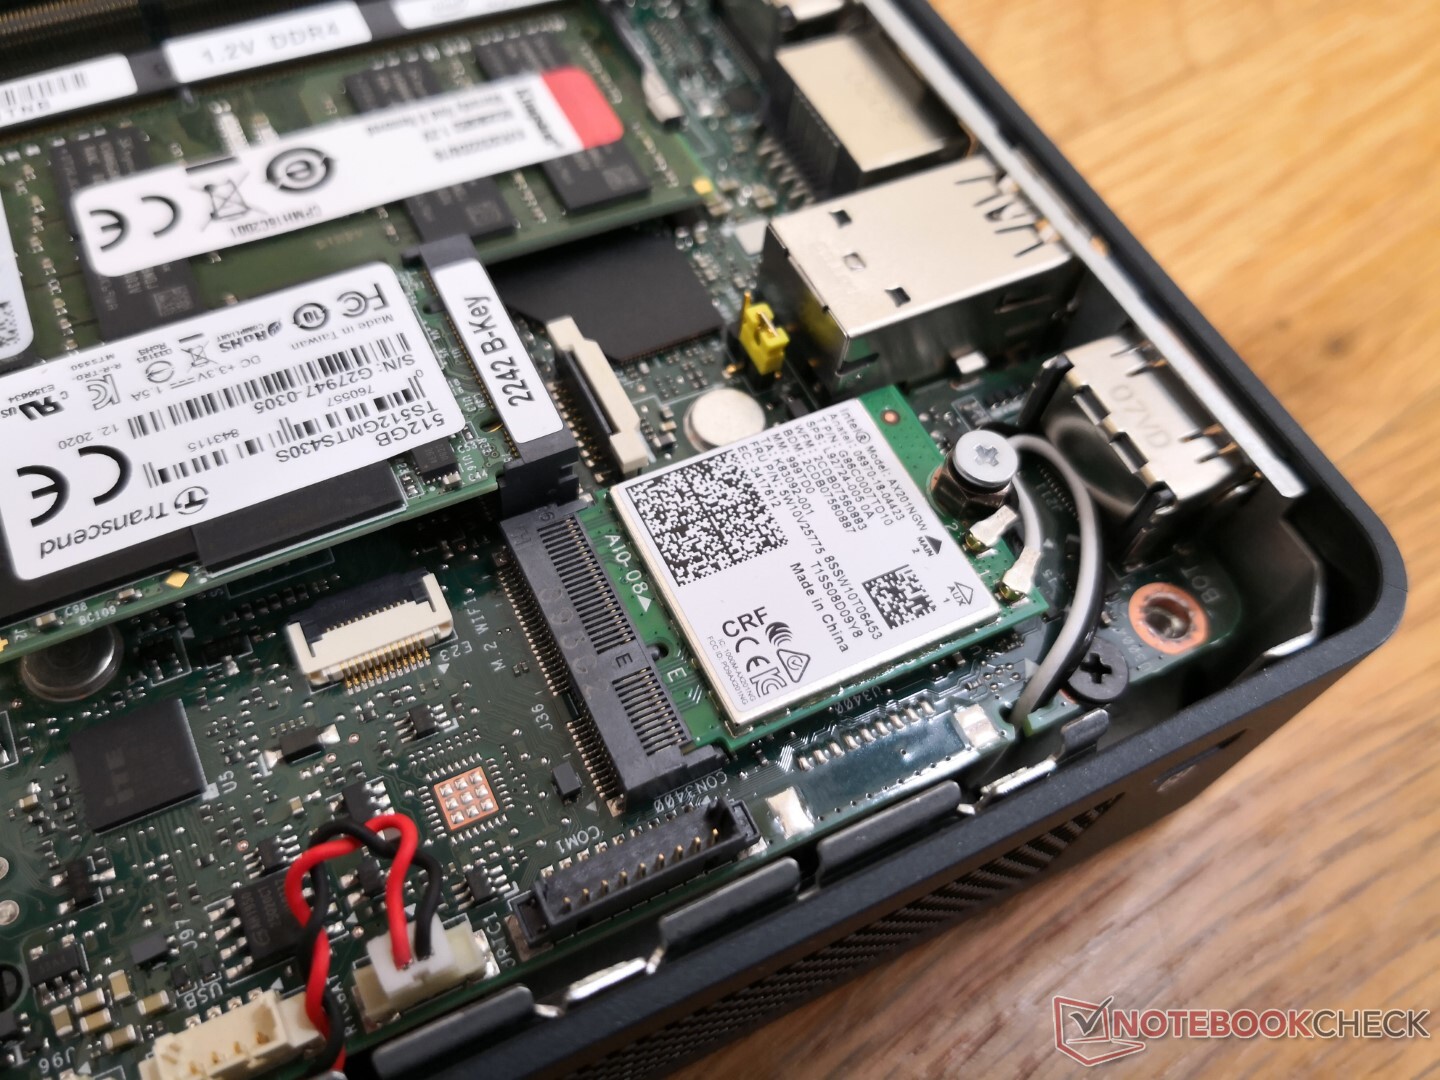
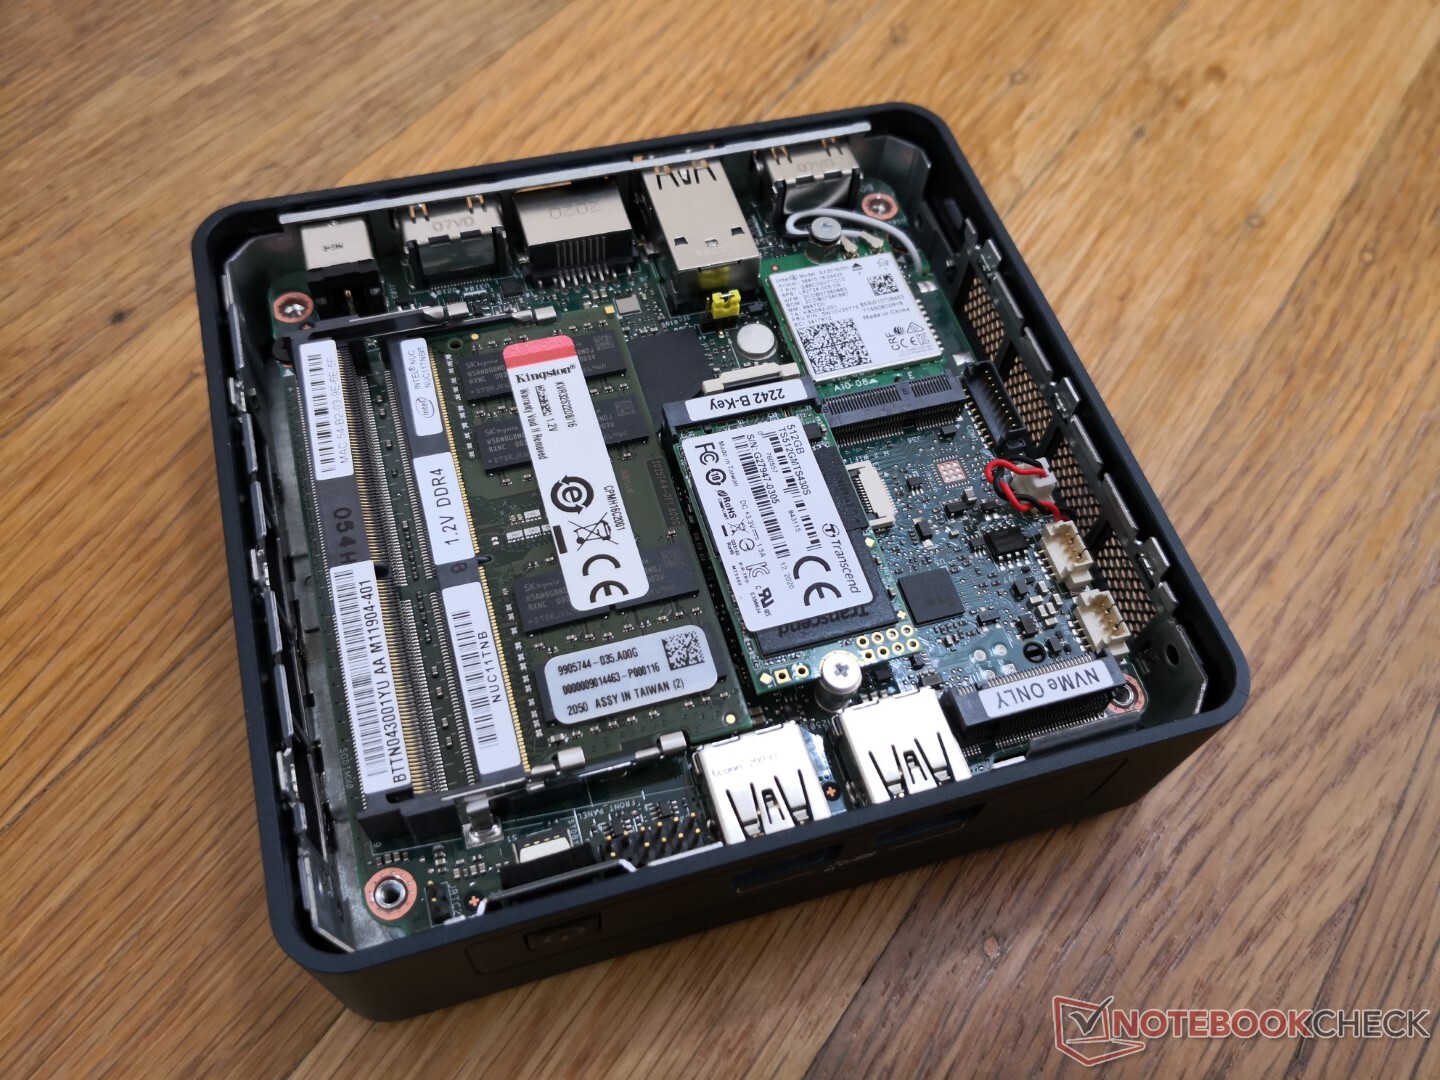
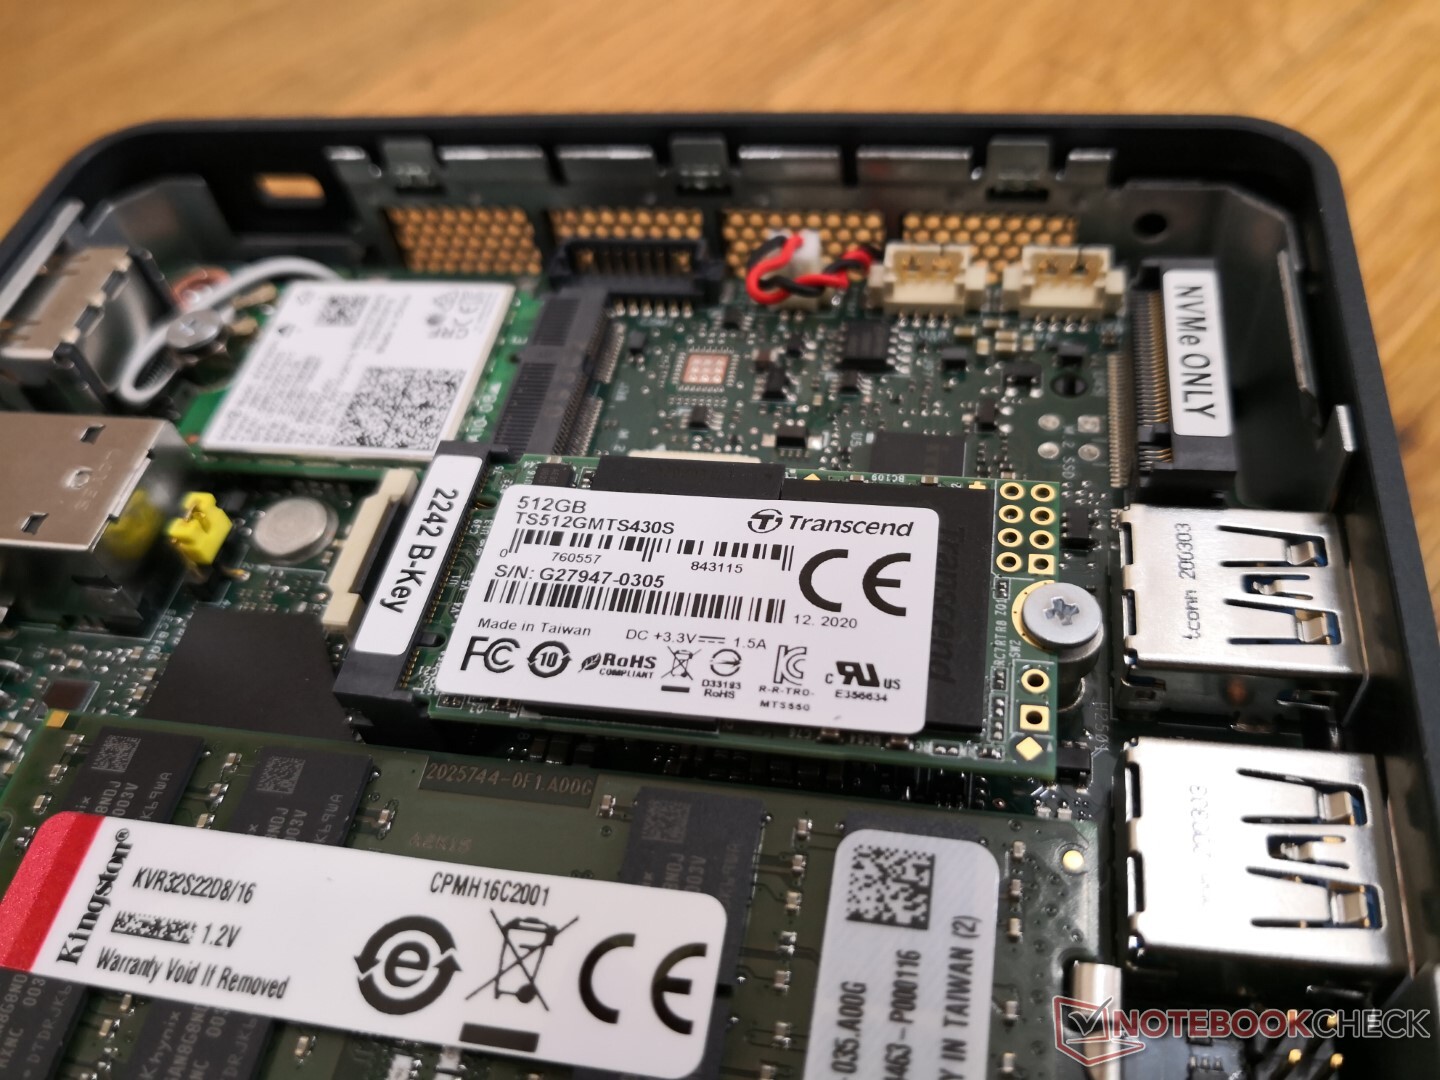
Onderhoud
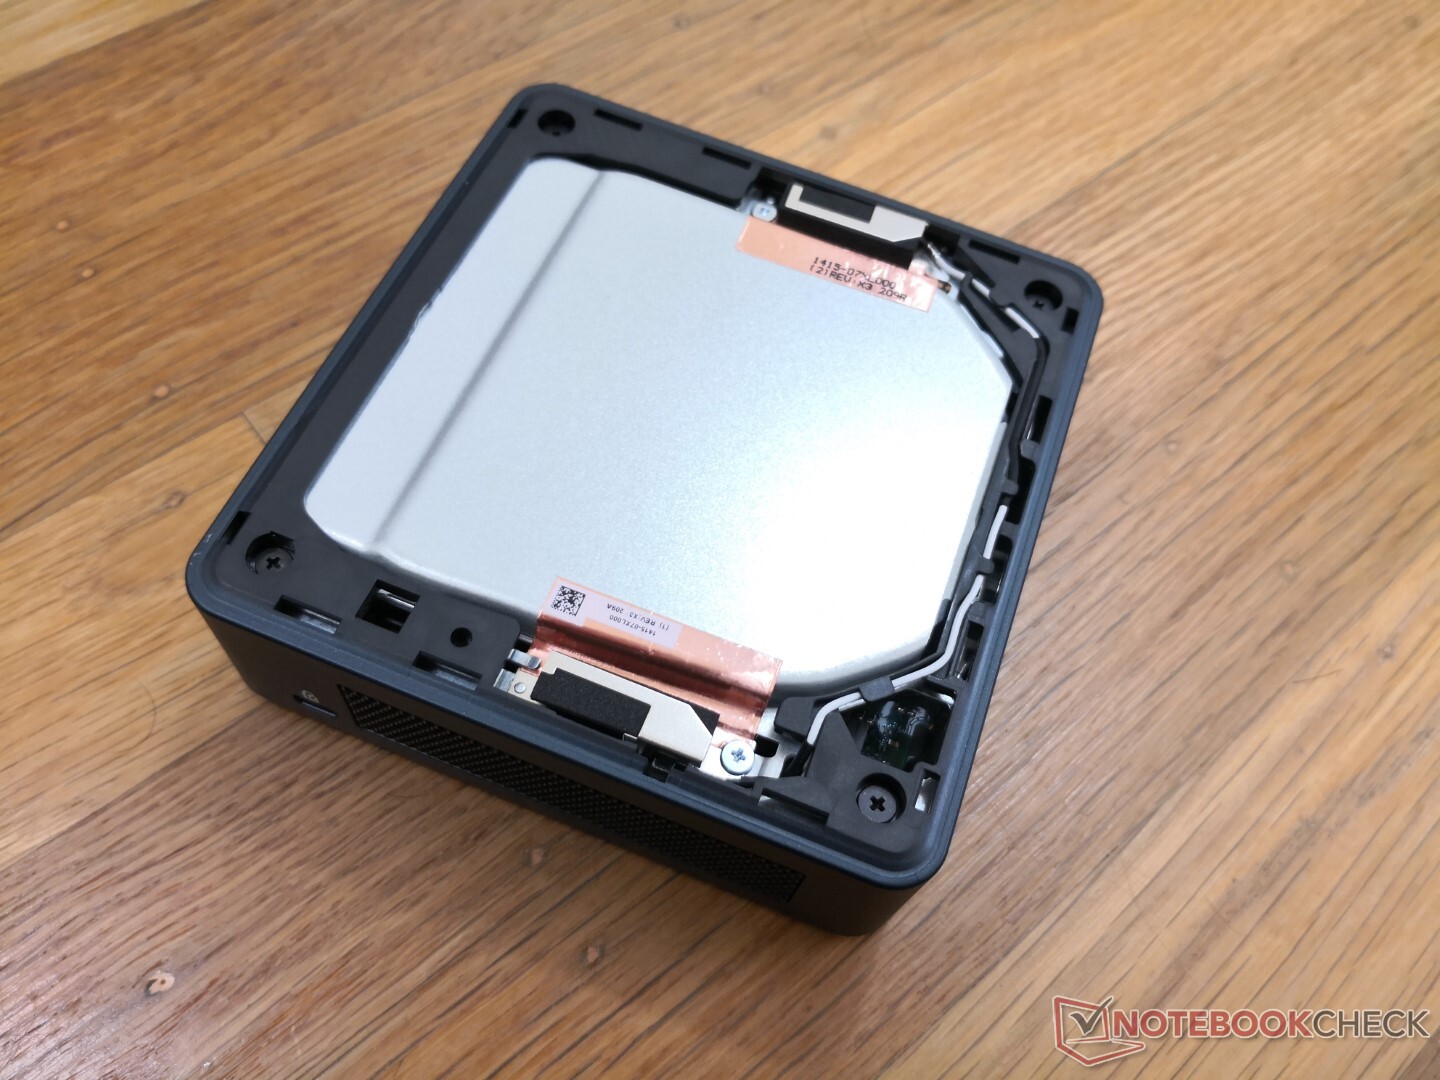
Het bodempaneel kan eenvoudig worden verwijderd om uitbreidbare componenten bloot te leggen: 2x SODIMM, 2x M.2 opslag (M.2 2242 SATA III, M.2 2280 PCIe 4), en de verwijderbare WLAN module. De langere M.2 2280 SSD zou bovenop de WLAN module komen te zitten.
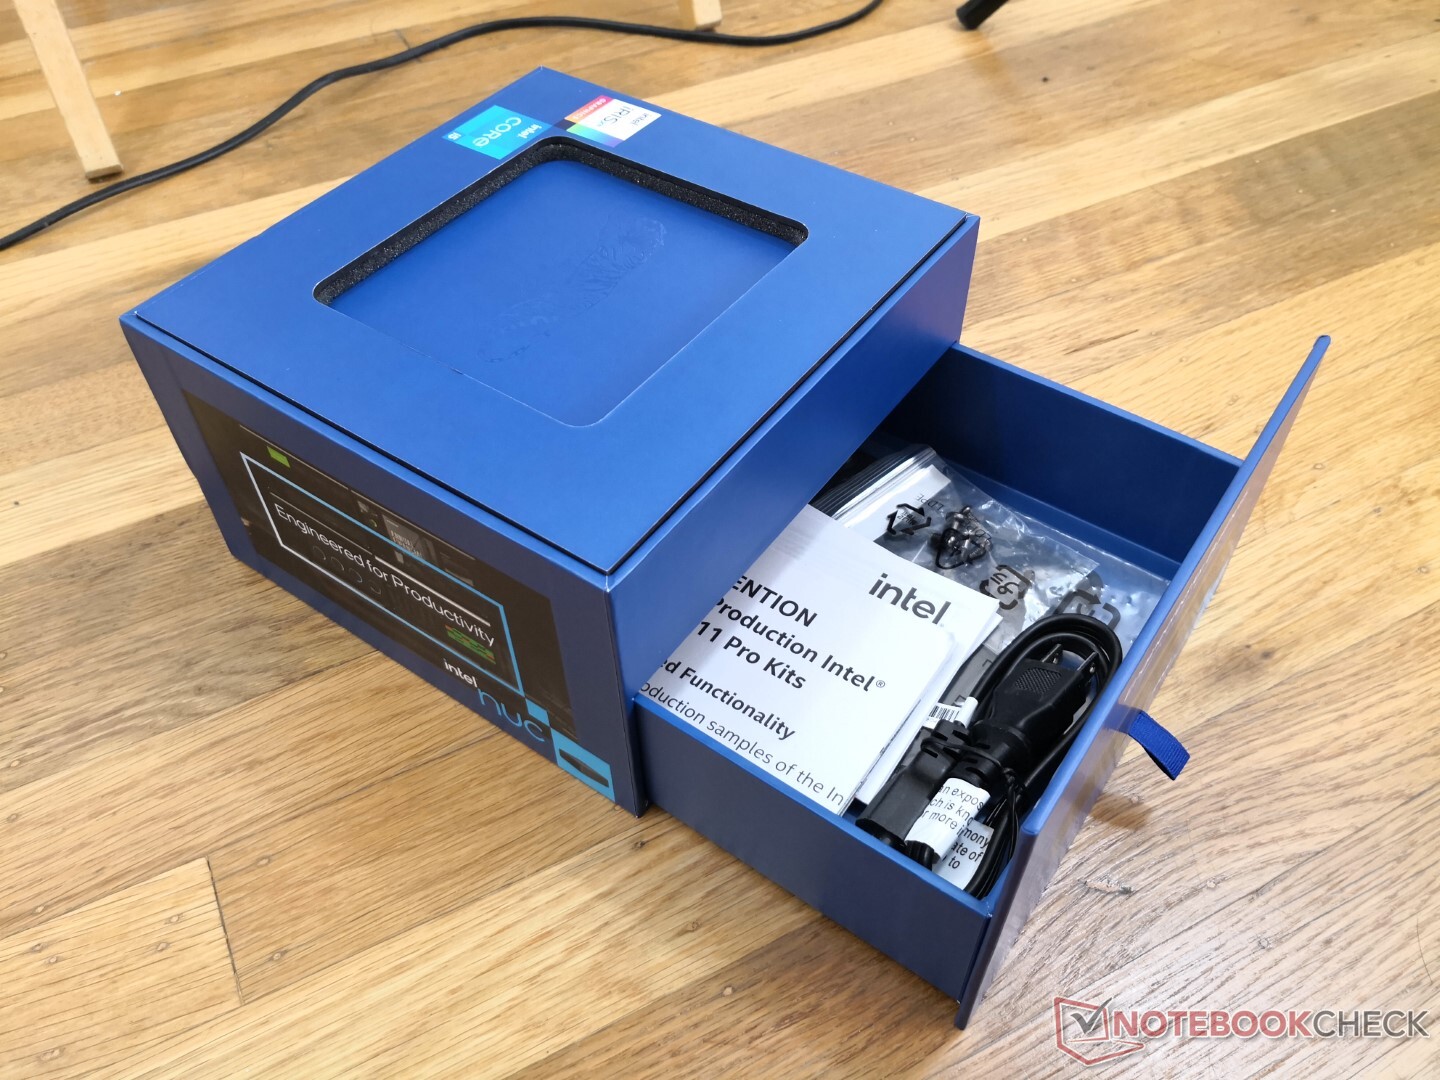
Accessoires en garantie
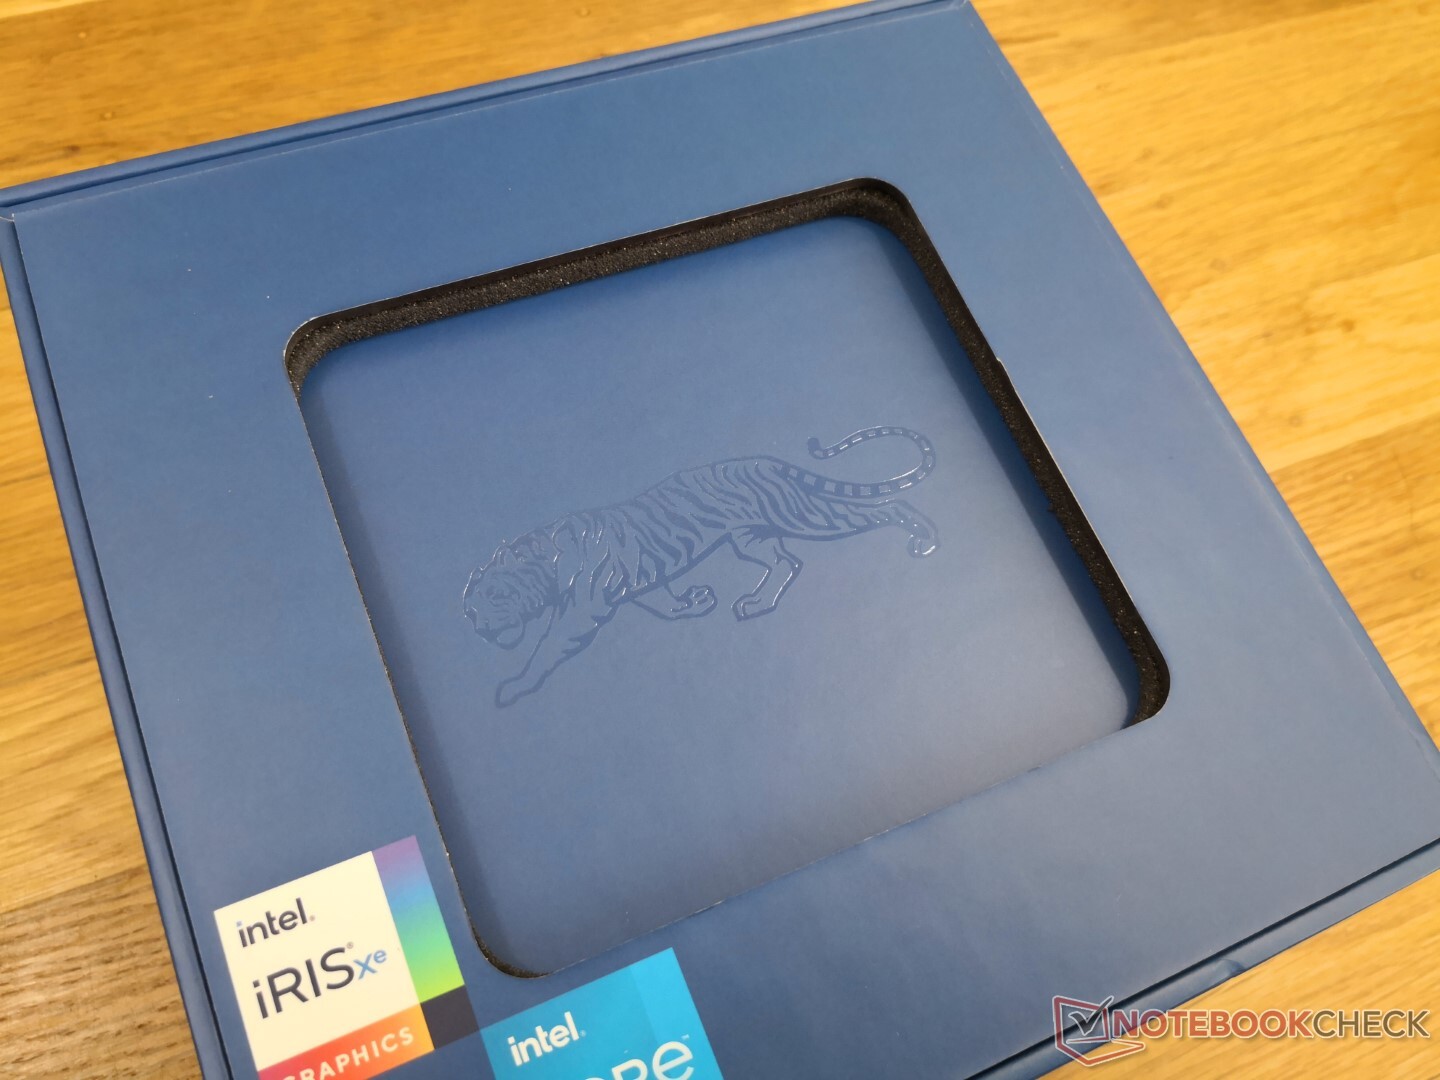
De doos bevat een verwijderbare VESA-montagebeugel en extra schroeven. Standaard wordt een beperkte fabrieksgarantie van drie jaar geleverd, wat twee jaar langer is dan de meeste andere mini-pc's.
Prestaties
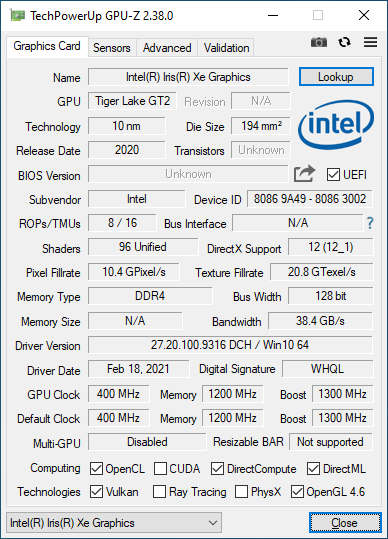
Zoals de naam al doet vermoeden, wordt elke mini-pc in de NUC11-serie aangedreven door een 11e generatie Tiger Lake processor, variërend van de Core i3 uit de U-serie tot de Core i7. Intel vPro is beschikbaar op de Core i5-1145G7 en i7-1185G7 terwijl de niet-vPro opties de gebruikelijke i5-1135G7 en i7-1165G7 zijn. Ze worden allemaal geleverd met Iris Xe grafische voorzieningen, behalve de low-end Core i3-1115G4.
Er zijn geen opties voor discrete graphics. Gebruikers kunnen misschien beter kijken naar de NUC 11 Enthusiast als grafische prestaties een hoge prioriteit hebben.
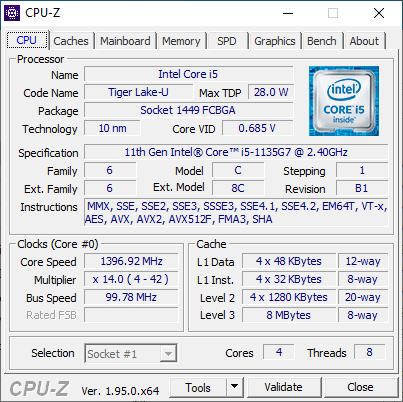
Processor
CPU-prestaties liggen binnen een paar procentpunten van het gemiddelde Core i5-1135G7 CPU in onze database. Upgraden naar de duurdere Core i7-1165G7 kan de multi-thread prestaties met 25 of 35 procent verbeteren, gebaseerd op onze waarnemingen met deNUC11PAQi7. Het is vermeldenswaard dat de Core i5-1135G7 in staat is om beter te presteren dan de eenmalige Core i7-8809G in de oudere Hades Canyon NUC8.
De duurzaamheid van de prestaties is beter dan op de Surface Pro 7 Plus die wordt geleverd met exact dezelfde CPU. Het draaien van CineBench R15 xT in een loop laat zien dat onze NUC11 na verloop van tijd veel hogere scores behaalt in vergelijking met de Microsoft-tablet.
Cinebench R15: CPU Multi 64Bit | CPU Single 64Bit
Blender: v2.79 BMW27 CPU
7-Zip 18.03: 7z b 4 -mmt1 | 7z b 4
Geekbench 5.5: Single-Core | Multi-Core
HWBOT x265 Benchmark v2.2: 4k Preset
LibreOffice : 20 Documents To PDF
R Benchmark 2.5: Overall mean
| Cinebench R20 / CPU (Multi Core) | |
| Lenovo Yoga Slim 7-14ARE | |
| Asus VivoBook Flip 14 TM420IA | |
| Lenovo IdeaPad S540-13ARE-82DL000YGE | |
| Intel NUC11PAQi7 | |
| Intel Hades Canyon NUC8i7HVK | |
| Intel NUC11TNKi5 | |
| Lenovo Yoga 9 14 ITL 4K | |
| Gemiddeld Intel Core i5-1135G7 (979 - 2382, n=62) | |
| Intel NUC10i5FNK | |
| Microsoft Surface Pro 7 Plus | |
| GMK NucBox 2 | |
| HP Envy 13-ba0001ng | |
| Zotac ZBOX MI642 Nano | |
| Beelink SEi10 | |
| Cinebench R20 / CPU (Single Core) | |
| Intel NUC11PAQi7 | |
| Lenovo Yoga 9 14 ITL 4K | |
| Gemiddeld Intel Core i5-1135G7 (375 - 527, n=62) | |
| Intel NUC11TNKi5 | |
| Microsoft Surface Pro 7 Plus | |
| Lenovo Yoga Slim 7-14ARE | |
| Asus VivoBook Flip 14 TM420IA | |
| Lenovo IdeaPad S540-13ARE-82DL000YGE | |
| HP Envy 13-ba0001ng | |
| Intel NUC10i5FNK | |
| Zotac ZBOX MI642 Nano | |
| Intel Hades Canyon NUC8i7HVK | |
| Beelink SEi10 | |
| GMK NucBox 2 | |
| Cinebench R15 / CPU Multi 64Bit | |
| Lenovo Yoga Slim 7-14ARE | |
| Lenovo IdeaPad S540-13ARE-82DL000YGE | |
| Asus VivoBook Flip 14 TM420IA | |
| Intel NUC11PAQi7 | |
| Lenovo Yoga 9 14 ITL 4K | |
| Intel Hades Canyon NUC8i7HVK | |
| Intel NUC11TNKi5 | |
| Gemiddeld Intel Core i5-1135G7 (431 - 941, n=65) | |
| Intel NUC10i5FNK | |
| Microsoft Surface Pro 7 Plus | |
| GMK NucBox 2 | |
| HP Envy 13-ba0001ng | |
| Zotac ZBOX MI642 Nano | |
| Beelink SEi10 | |
| Cinebench R15 / CPU Single 64Bit | |
| Intel NUC11PAQi7 | |
| Lenovo Yoga 9 14 ITL 4K | |
| Intel NUC11TNKi5 | |
| Gemiddeld Intel Core i5-1135G7 (141.4 - 205, n=61) | |
| Microsoft Surface Pro 7 Plus | |
| Lenovo Yoga Slim 7-14ARE | |
| Asus VivoBook Flip 14 TM420IA | |
| Intel Hades Canyon NUC8i7HVK | |
| HP Envy 13-ba0001ng | |
| Lenovo IdeaPad S540-13ARE-82DL000YGE | |
| Intel NUC10i5FNK | |
| Zotac ZBOX MI642 Nano | |
| Beelink SEi10 | |
| GMK NucBox 2 | |
| Blender / v2.79 BMW27 CPU | |
| Beelink SEi10 | |
| Zotac ZBOX MI642 Nano | |
| HP Envy 13-ba0001ng | |
| GMK NucBox 2 | |
| Microsoft Surface Pro 7 Plus | |
| Gemiddeld Intel Core i5-1135G7 (499 - 1044, n=60) | |
| Lenovo Yoga 9 14 ITL 4K | |
| Intel NUC11TNKi5 | |
| Intel NUC10i5FNK | |
| Intel Hades Canyon NUC8i7HVK | |
| Intel NUC11PAQi7 | |
| Asus VivoBook Flip 14 TM420IA | |
| Lenovo IdeaPad S540-13ARE-82DL000YGE | |
| Lenovo Yoga Slim 7-14ARE | |
| 7-Zip 18.03 / 7z b 4 -mmt1 | |
| Intel NUC11PAQi7 | |
| Lenovo Yoga 9 14 ITL 4K | |
| Intel NUC11TNKi5 | |
| HP Envy 13-ba0001ng | |
| Gemiddeld Intel Core i5-1135G7 (3924 - 4921, n=62) | |
| Lenovo Yoga Slim 7-14ARE | |
| Asus VivoBook Flip 14 TM420IA | |
| Microsoft Surface Pro 7 Plus | |
| Zotac ZBOX MI642 Nano | |
| Intel NUC10i5FNK | |
| Lenovo IdeaPad S540-13ARE-82DL000YGE | |
| Intel Hades Canyon NUC8i7HVK | |
| Beelink SEi10 | |
| GMK NucBox 2 | |
| 7-Zip 18.03 / 7z b 4 | |
| Lenovo Yoga Slim 7-14ARE | |
| Lenovo IdeaPad S540-13ARE-82DL000YGE | |
| Asus VivoBook Flip 14 TM420IA | |
| Intel NUC11PAQi7 | |
| Intel NUC11TNKi5 | |
| Microsoft Surface Pro 7 Plus | |
| Lenovo Yoga 9 14 ITL 4K | |
| Intel NUC10i5FNK | |
| Gemiddeld Intel Core i5-1135G7 (14745 - 24873, n=62) | |
| Intel Hades Canyon NUC8i7HVK | |
| GMK NucBox 2 | |
| Zotac ZBOX MI642 Nano | |
| HP Envy 13-ba0001ng | |
| Beelink SEi10 | |
| Geekbench 5.5 / Single-Core | |
| Intel NUC11PAQi7 | |
| Lenovo Yoga 9 14 ITL 4K | |
| Intel NUC11TNKi5 | |
| Gemiddeld Intel Core i5-1135G7 (1147 - 1428, n=58) | |
| Microsoft Surface Pro 7 Plus | |
| HP Envy 13-ba0001ng | |
| Asus VivoBook Flip 14 TM420IA | |
| Lenovo Yoga Slim 7-14ARE | |
| Lenovo Yoga Slim 7-14ARE | |
| Beelink SEi10 | |
| Zotac ZBOX MI642 Nano | |
| Lenovo IdeaPad S540-13ARE-82DL000YGE | |
| Intel NUC10i5FNK | |
| GMK NucBox 2 | |
| Geekbench 5.5 / Multi-Core | |
| Lenovo Yoga Slim 7-14ARE | |
| Lenovo Yoga Slim 7-14ARE | |
| Lenovo IdeaPad S540-13ARE-82DL000YGE | |
| Lenovo Yoga 9 14 ITL 4K | |
| Asus VivoBook Flip 14 TM420IA | |
| Intel NUC11PAQi7 | |
| Microsoft Surface Pro 7 Plus | |
| Gemiddeld Intel Core i5-1135G7 (3475 - 5472, n=58) | |
| Intel NUC11TNKi5 | |
| HP Envy 13-ba0001ng | |
| Intel NUC10i5FNK | |
| Zotac ZBOX MI642 Nano | |
| GMK NucBox 2 | |
| Beelink SEi10 | |
| HWBOT x265 Benchmark v2.2 / 4k Preset | |
| Lenovo Yoga Slim 7-14ARE | |
| Asus VivoBook Flip 14 TM420IA | |
| Lenovo IdeaPad S540-13ARE-82DL000YGE | |
| Intel NUC11PAQi7 | |
| Intel Hades Canyon NUC8i7HVK | |
| Intel NUC11TNKi5 | |
| Intel NUC10i5FNK | |
| Microsoft Surface Pro 7 Plus | |
| Gemiddeld Intel Core i5-1135G7 (3.57 - 7.6, n=57) | |
| Lenovo Yoga 9 14 ITL 4K | |
| GMK NucBox 2 | |
| HP Envy 13-ba0001ng | |
| Zotac ZBOX MI642 Nano | |
| Beelink SEi10 | |
| LibreOffice / 20 Documents To PDF | |
| Lenovo IdeaPad S540-13ARE-82DL000YGE | |
| Zotac ZBOX MI642 Nano | |
| GMK NucBox 2 | |
| Lenovo Yoga Slim 7-14ARE | |
| Microsoft Surface Pro 7 Plus | |
| Asus VivoBook Flip 14 TM420IA | |
| HP Envy 13-ba0001ng | |
| Beelink SEi10 | |
| Gemiddeld Intel Core i5-1135G7 (44.2 - 62.9, n=60) | |
| Lenovo Yoga 9 14 ITL 4K | |
| Intel NUC11TNKi5 | |
| Intel NUC11PAQi7 | |
| R Benchmark 2.5 / Overall mean | |
| GMK NucBox 2 | |
| Beelink SEi10 | |
| Intel NUC10i5FNK | |
| Zotac ZBOX MI642 Nano | |
| Microsoft Surface Pro 7 Plus | |
| HP Envy 13-ba0001ng | |
| Gemiddeld Intel Core i5-1135G7 (0.619 - 0.727, n=59) | |
| Lenovo IdeaPad S540-13ARE-82DL000YGE | |
| Intel NUC11TNKi5 | |
| Lenovo Yoga Slim 7-14ARE | |
| Asus VivoBook Flip 14 TM420IA | |
| Lenovo Yoga 9 14 ITL 4K | |
| Intel NUC11PAQi7 | |
Cinebench R15: CPU Multi 64Bit | CPU Single 64Bit
Blender: v2.79 BMW27 CPU
7-Zip 18.03: 7z b 4 -mmt1 | 7z b 4
Geekbench 5.5: Single-Core | Multi-Core
HWBOT x265 Benchmark v2.2: 4k Preset
LibreOffice : 20 Documents To PDF
R Benchmark 2.5: Overall mean
* ... kleiner is beter
Systeemprestaties
| PCMark 10 | |
| Score | |
| Intel NUC11PAQi7 | |
| Gemiddeld Intel Core i5-1135G7, Intel Iris Xe Graphics G7 80EUs (4026 - 4952, n=53) | |
| Intel NUC11TNKi5 | |
| GMK NucBox 2 | |
| Intel NUC10i5FNK | |
| Zotac ZBOX MI642 Nano | |
| Beelink SEi10 | |
| Essentials | |
| Intel NUC11PAQi7 | |
| Gemiddeld Intel Core i5-1135G7, Intel Iris Xe Graphics G7 80EUs (8149 - 9917, n=53) | |
| Intel NUC11TNKi5 | |
| GMK NucBox 2 | |
| Intel NUC10i5FNK | |
| Zotac ZBOX MI642 Nano | |
| Beelink SEi10 | |
| Productivity | |
| Intel NUC11PAQi7 | |
| Intel NUC10i5FNK | |
| GMK NucBox 2 | |
| Zotac ZBOX MI642 Nano | |
| Gemiddeld Intel Core i5-1135G7, Intel Iris Xe Graphics G7 80EUs (5040 - 6619, n=53) | |
| Intel NUC11TNKi5 | |
| Beelink SEi10 | |
| Digital Content Creation | |
| Intel NUC11PAQi7 | |
| Gemiddeld Intel Core i5-1135G7, Intel Iris Xe Graphics G7 80EUs (3548 - 5255, n=53) | |
| Intel NUC11TNKi5 | |
| GMK NucBox 2 | |
| Intel NUC10i5FNK | |
| Zotac ZBOX MI642 Nano | |
| Beelink SEi10 | |
| PCMark 8 | |
| Home Score Accelerated v2 | |
| Gemiddeld Intel Core i5-1135G7, Intel Iris Xe Graphics G7 80EUs (3472 - 5032, n=11) | |
| Intel NUC11PAQi7 | |
| Intel NUC10i5FNK | |
| Zotac ZBOX MI642 Nano | |
| Beelink SEi10 | |
| Work Score Accelerated v2 | |
| Zotac ZBOX MI642 Nano | |
| Intel NUC10i5FNK | |
| Intel NUC11PAQi7 | |
| Gemiddeld Intel Core i5-1135G7, Intel Iris Xe Graphics G7 80EUs (2473 - 3214, n=11) | |
| Beelink SEi10 | |
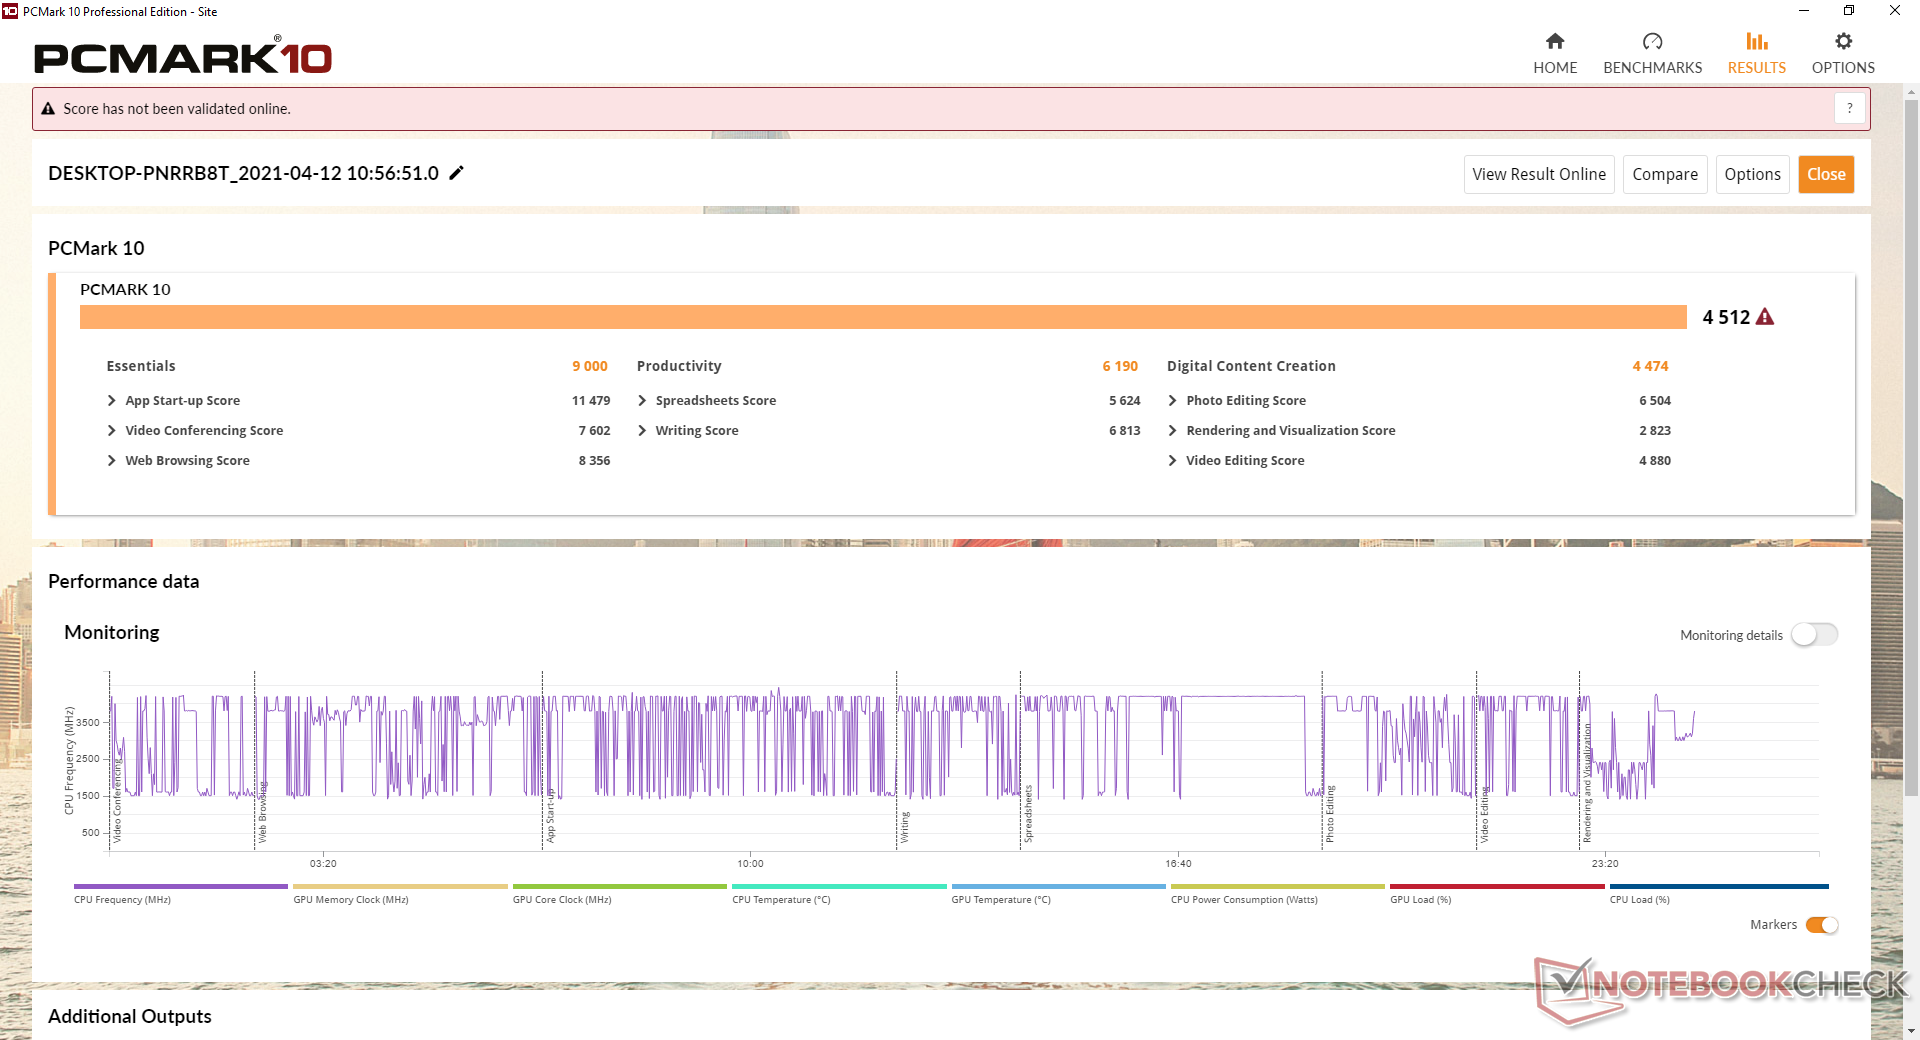
| PCMark 10 Score | 4512 punten | |
Help | ||
DPC latentie
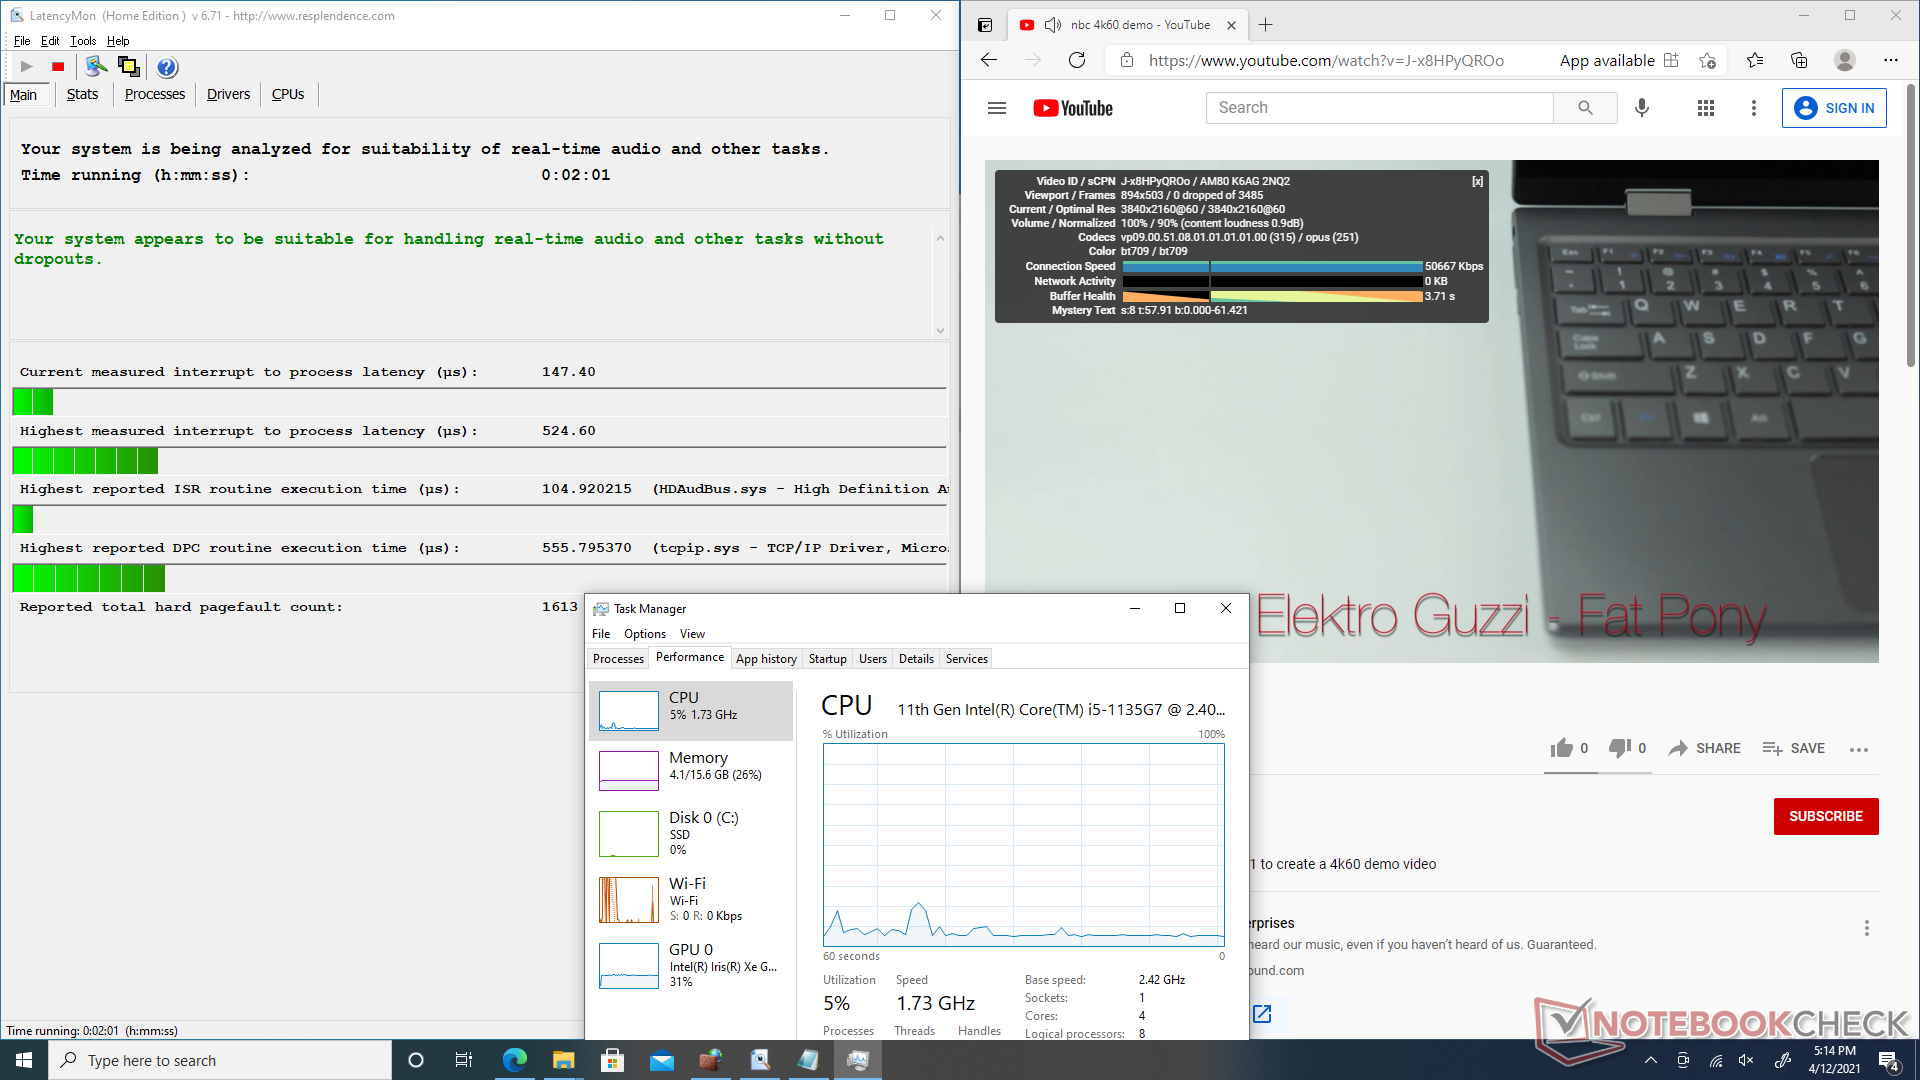
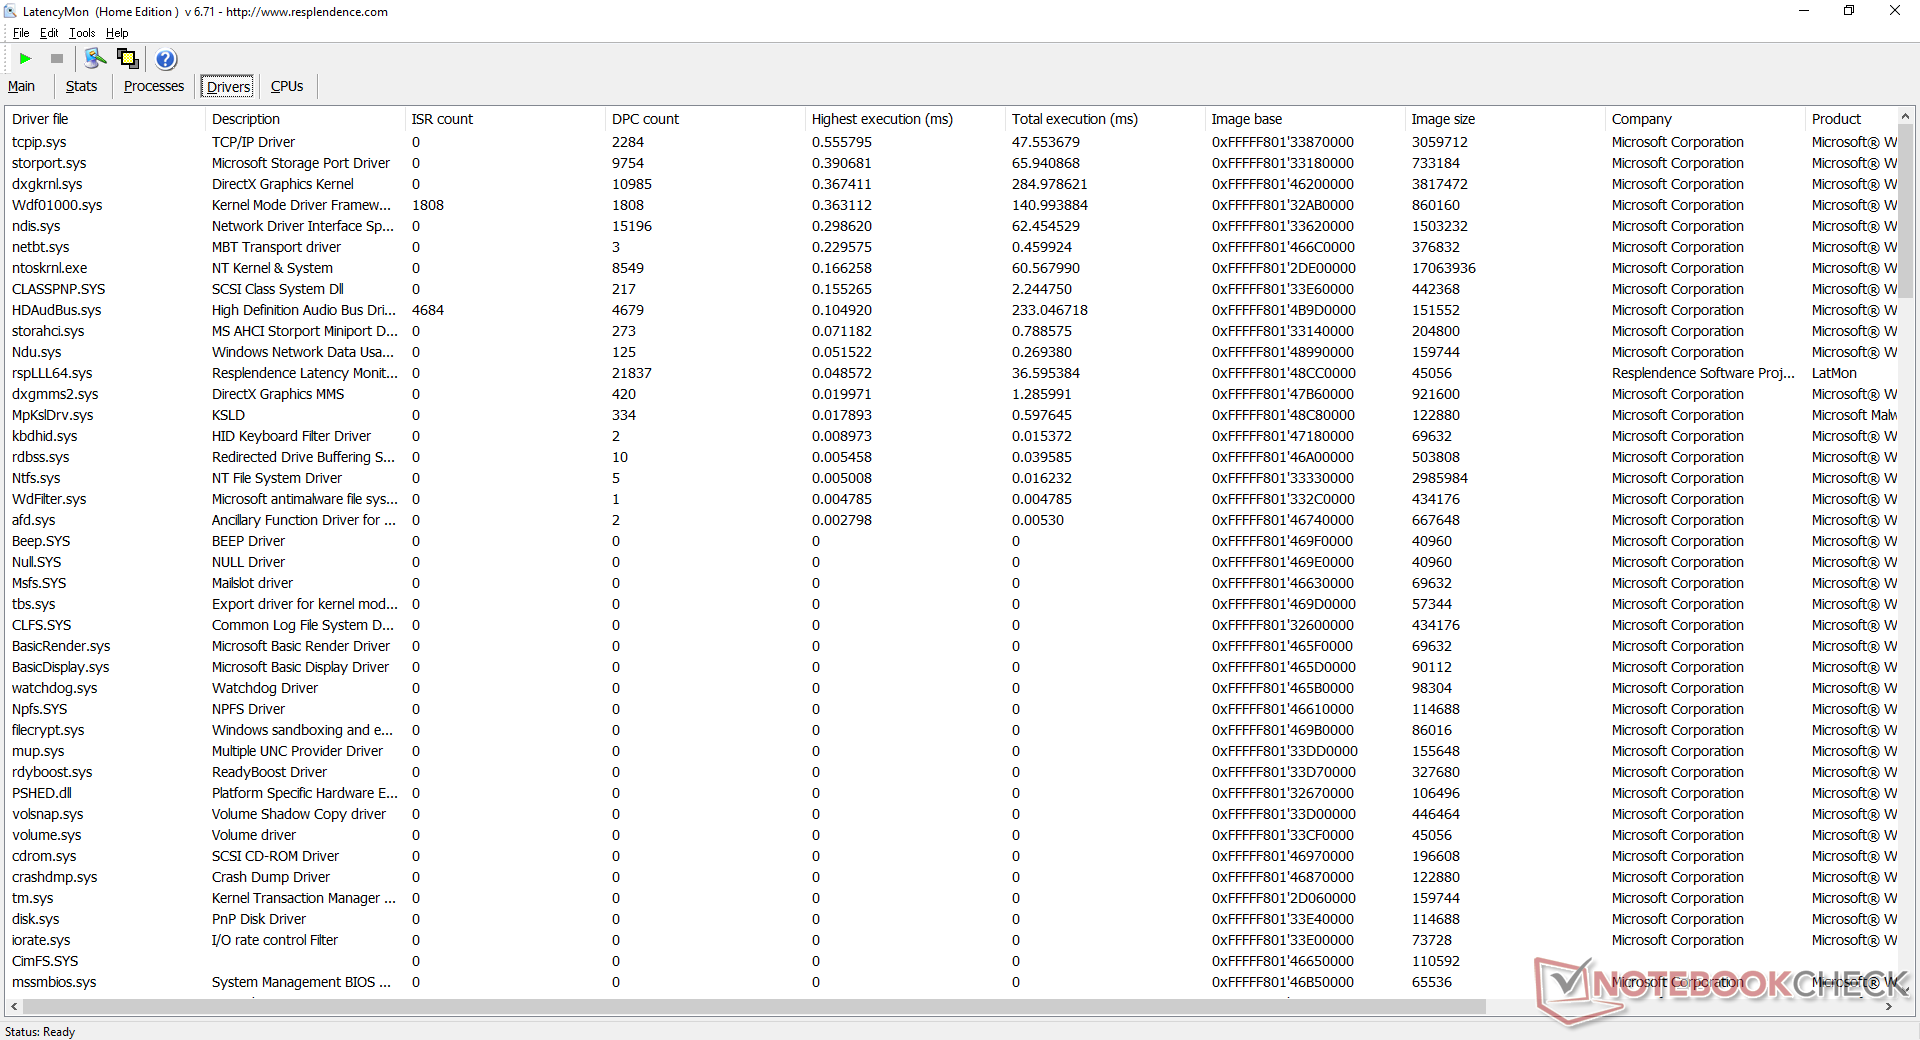
LatencyMon laat geen DPC latency problemen zien bij het openen van meerdere tabbladen op onze homepage. Het afspelen van 4K-video's bij 60 FPS verloopt ook soepel en zonder wegvallende frames tijdens onze tests.
| DPC Latencies / LatencyMon - interrupt to process latency (max), Web, Youtube, Prime95 | |
| Beelink SEi10 | |
| GMK NucBox 2 | |
| Intel NUC11PAQi7 | |
| Intel NUC11TNKi5 | |
* ... kleiner is beter
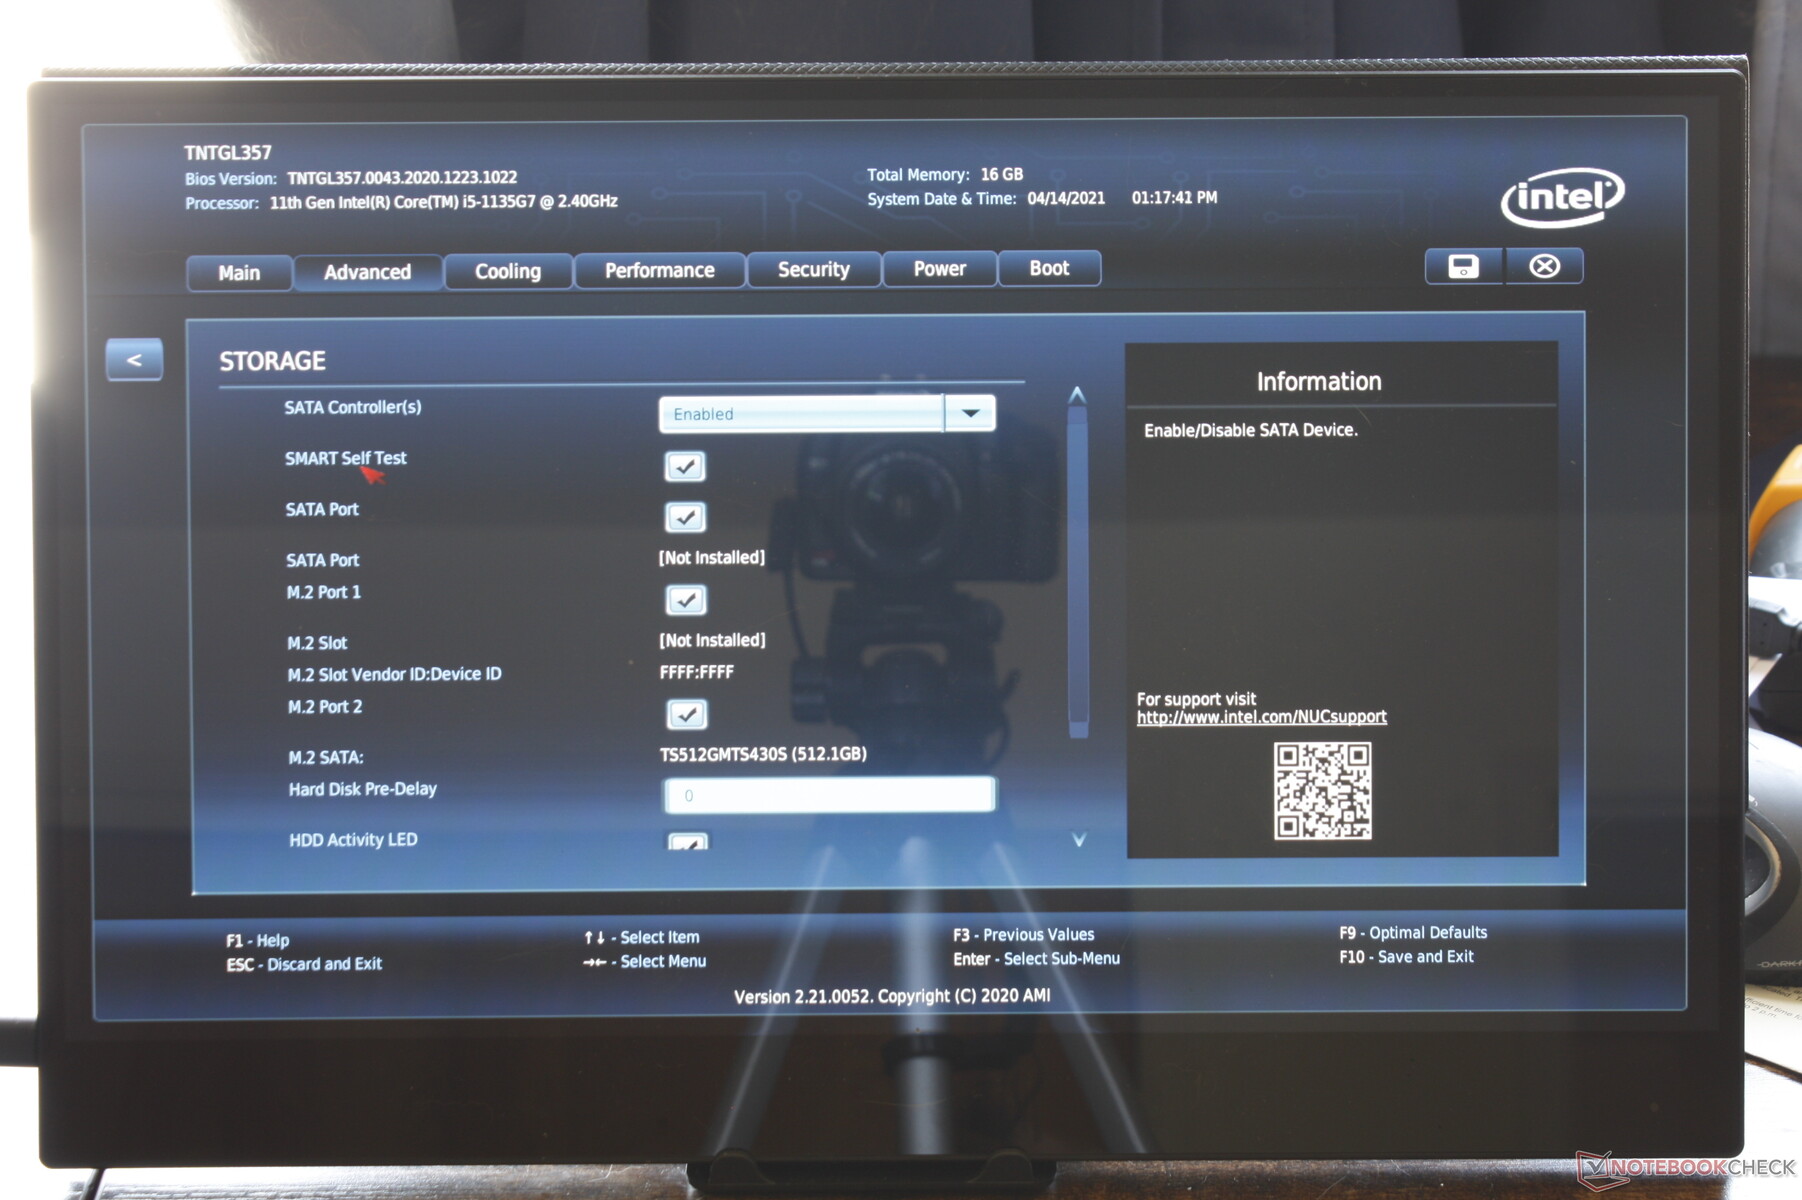
Opslagapparaten
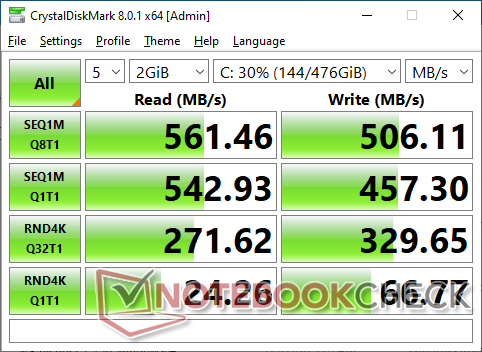
De NUC 11 Pro Mini heeft een unieke opslagopstelling met zijn twee asymmetrische M.2-sleuven. Eén slot ondersteunt alleen 2242 SATA III SSD's, terwijl het tweede slot tot 2280 PCIe 4.0 schijven ondersteunt. De SATA III Transcend SSD in ons apparaat kan niet op tegen NVMe drives, maar eigenaren kunnen gemakkelijk upgraden indien gewenst.
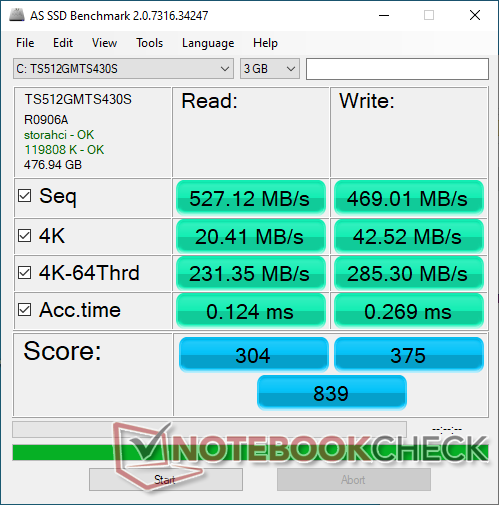
| Intel NUC11TNKi5 Transcend M.2 SSD 430S TS512GMTS430S | GMK NucBox 2 Netac S930E8/256GPN | Intel NUC11PAQi7 Samsung SSD 980 Pro 500GB MZ-V8P500BW | Beelink SEi10 Silicon Motion AZW 256G M.2280 NVMe 4X 200725 D | Zotac ZBOX MI642 Nano Western Digital WD Blue 3D WDBNCE5000PNC | |
|---|---|---|---|---|---|
| AS SSD | 91% | 434% | 17% | 18% | |
| Seq Read (MB/s) | 527 | 2069 293% | 3257 518% | 1111 111% | 507 -4% |
| Seq Write (MB/s) | 469 | 1203 157% | 3937 739% | 323.5 -31% | 413.8 -12% |
| 4K Read (MB/s) | 20.41 | 41.66 104% | 51.3 151% | 33.1 62% | 36.75 80% |
| 4K Write (MB/s) | 42.52 | 136.9 222% | 75.7 78% | 66.2 56% | 88.5 108% |
| 4K-64 Read (MB/s) | 231.4 | 366.3 58% | 2283 887% | 357.3 54% | 369.4 60% |
| 4K-64 Write (MB/s) | 285.3 | 340.5 19% | 2206 673% | 154.8 -46% | 193.7 -32% |
| Access Time Read * (ms) | 0.124 | 0.064 48% | 0.056 55% | 0.066 47% | 0.103 17% |
| Access Time Write * (ms) | 0.269 | 0.347 -29% | 0.154 43% | 0.616 -129% | 0.095 65% |
| Score Read (Points) | 304 | 615 102% | 2660 775% | 501 65% | 457 50% |
| Score Write (Points) | 375 | 598 59% | 2676 614% | 253 -33% | 324 -14% |
| Score Total (Points) | 839 | 1497 78% | 6725 702% | 983 17% | 1023 22% |
| Copy ISO MB/s (MB/s) | 490.9 | 1186 142% | 2030 314% | 1160 136% | 482.5 -2% |
| Copy Program MB/s (MB/s) | 415.9 | 428.6 3% | 883 112% | 121.1 -71% | 191.9 -54% |
| Copy Game MB/s (MB/s) | 352.3 | 435.7 24% | 1817 416% | 364.4 3% | 248.9 -29% |
| CrystalDiskMark 5.2 / 6 | 149% | 533% | 146% | 23% | |
| Write 4K (MB/s) | 65.9 | 178.4 171% | 244.6 271% | 203 208% | 105.9 61% |
| Read 4K (MB/s) | 24.27 | 61 151% | 80.4 231% | 63.2 160% | 39.15 61% |
| Write Seq (MB/s) | 456.4 | 1040 128% | 4094 797% | 1114 144% | |
| Read Seq (MB/s) | 542 | 1919 254% | 4099 656% | 1765 226% | |
| Write 4K Q32T1 (MB/s) | 331.3 | 417.7 26% | 715 116% | 423.9 28% | 320.5 -3% |
| Read 4K Q32T1 (MB/s) | 295 | 325.6 10% | 783 165% | 389.2 32% | 342.1 16% |
| Write Seq Q32T1 (MB/s) | 506 | 1144 126% | 5065 901% | 1104 118% | 514 2% |
| Read Seq Q32T1 (MB/s) | 562 | 2379 323% | 6884 1125% | 1990 254% | 554 -1% |
| Write 4K Q8T8 (MB/s) | 330.8 | ||||
| Read 4K Q8T8 (MB/s) | 391.8 | ||||
| Totaal Gemiddelde (Programma / Instellingen) | 120% /
112% | 484% /
470% | 82% /
64% | 21% /
20% |
* ... kleiner is beter

Disk Throttling: DiskSpd Read Loop, Queue Depth 8
GPU prestatie
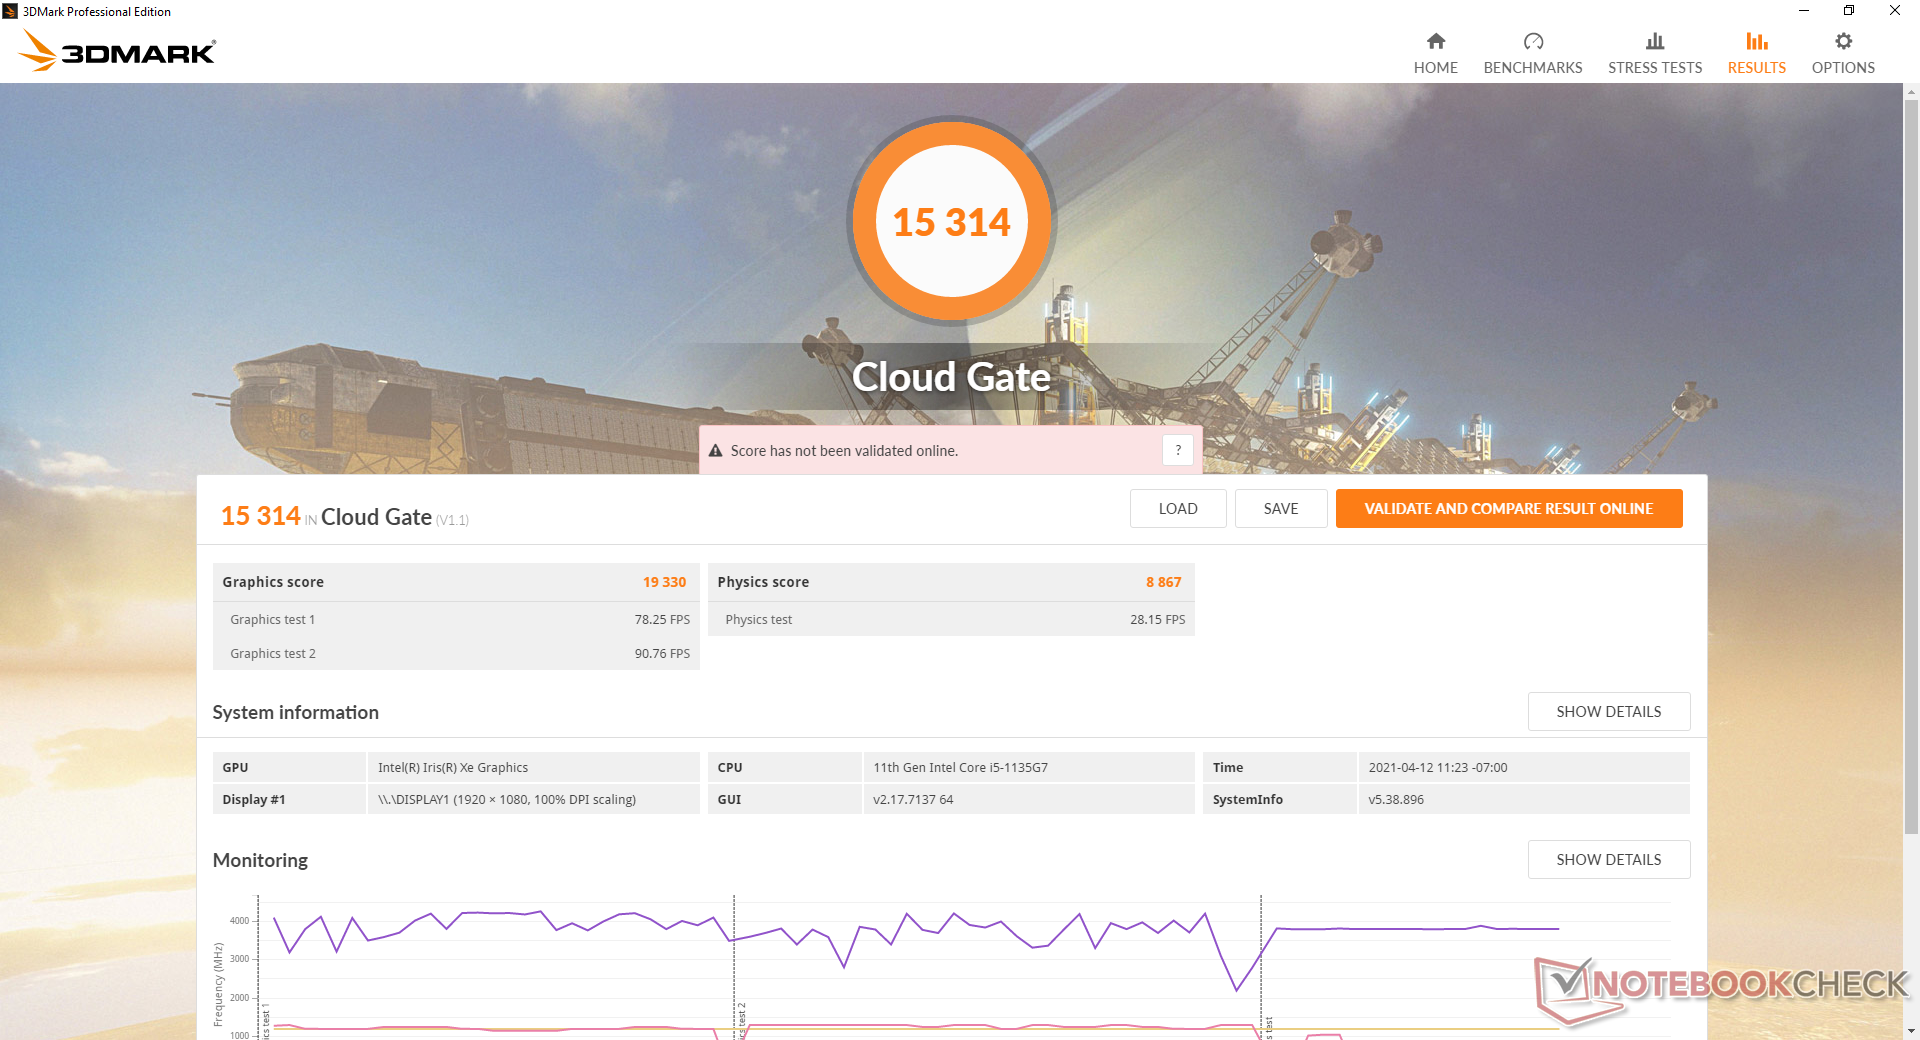
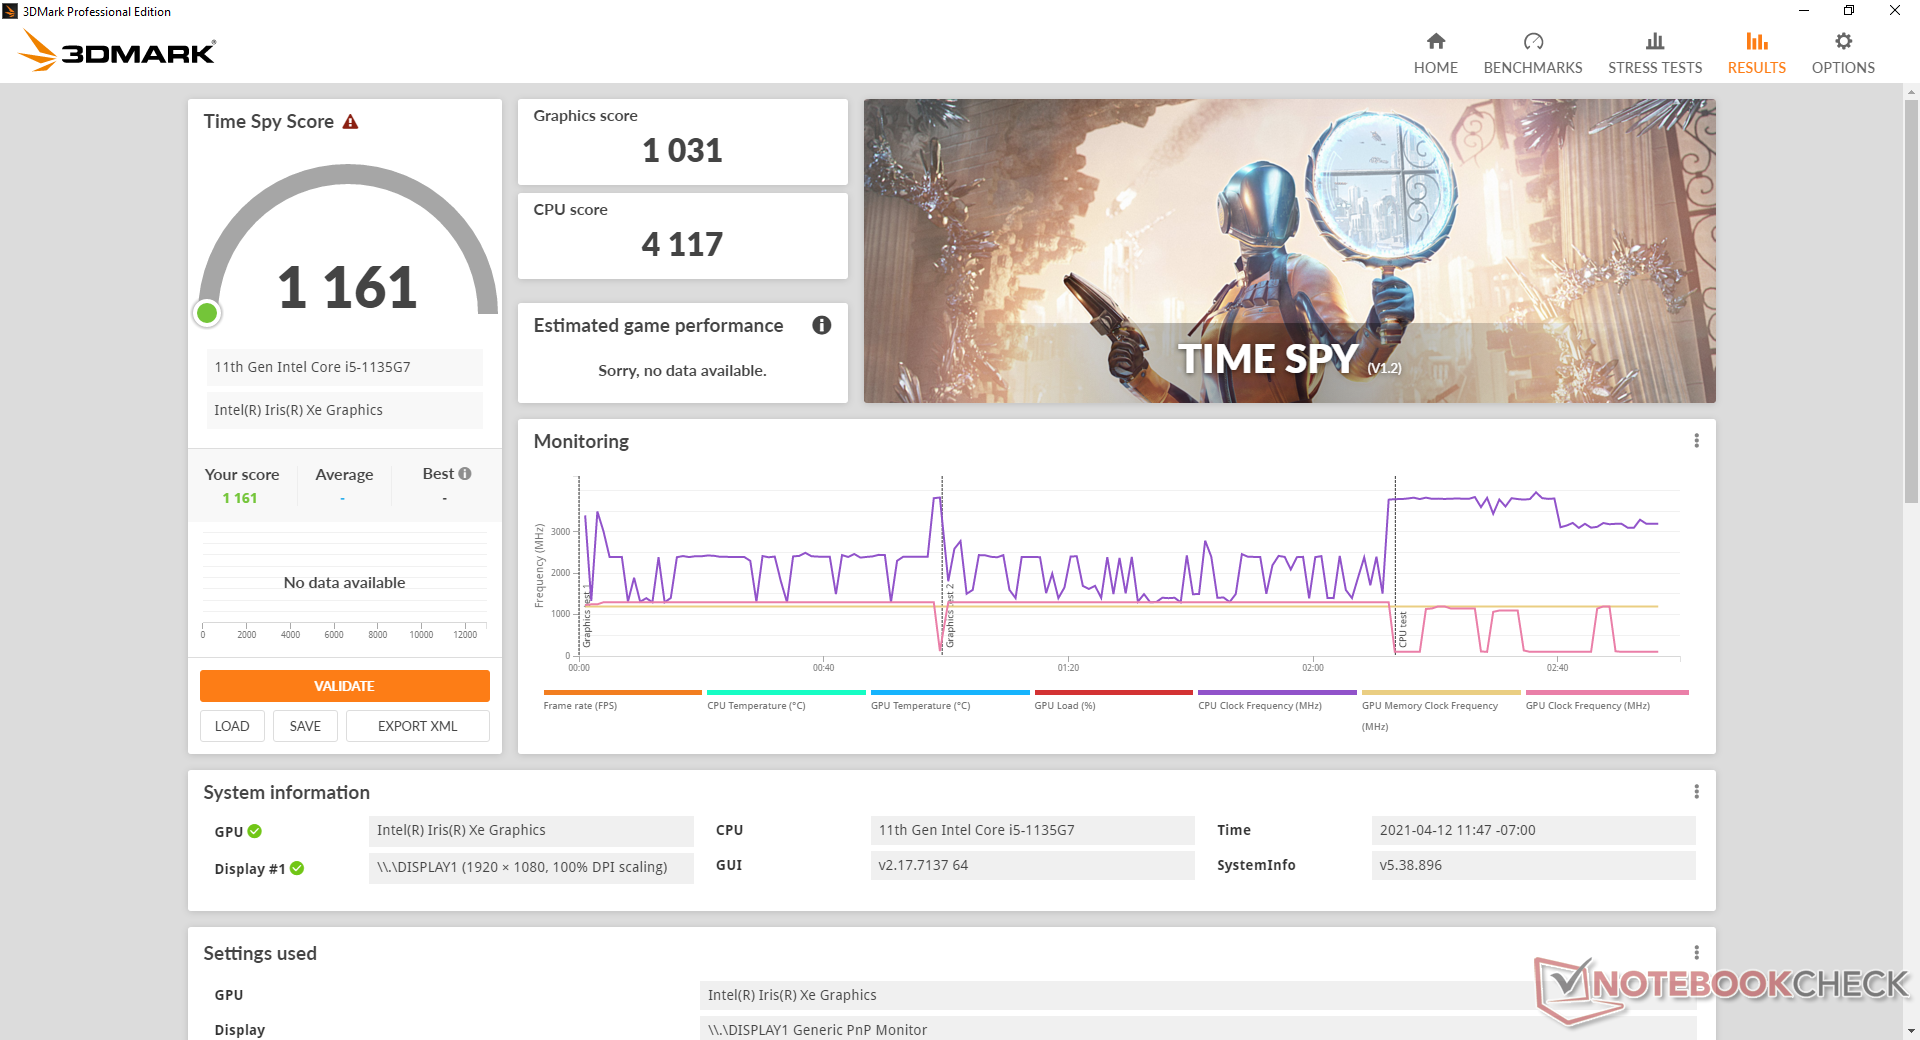
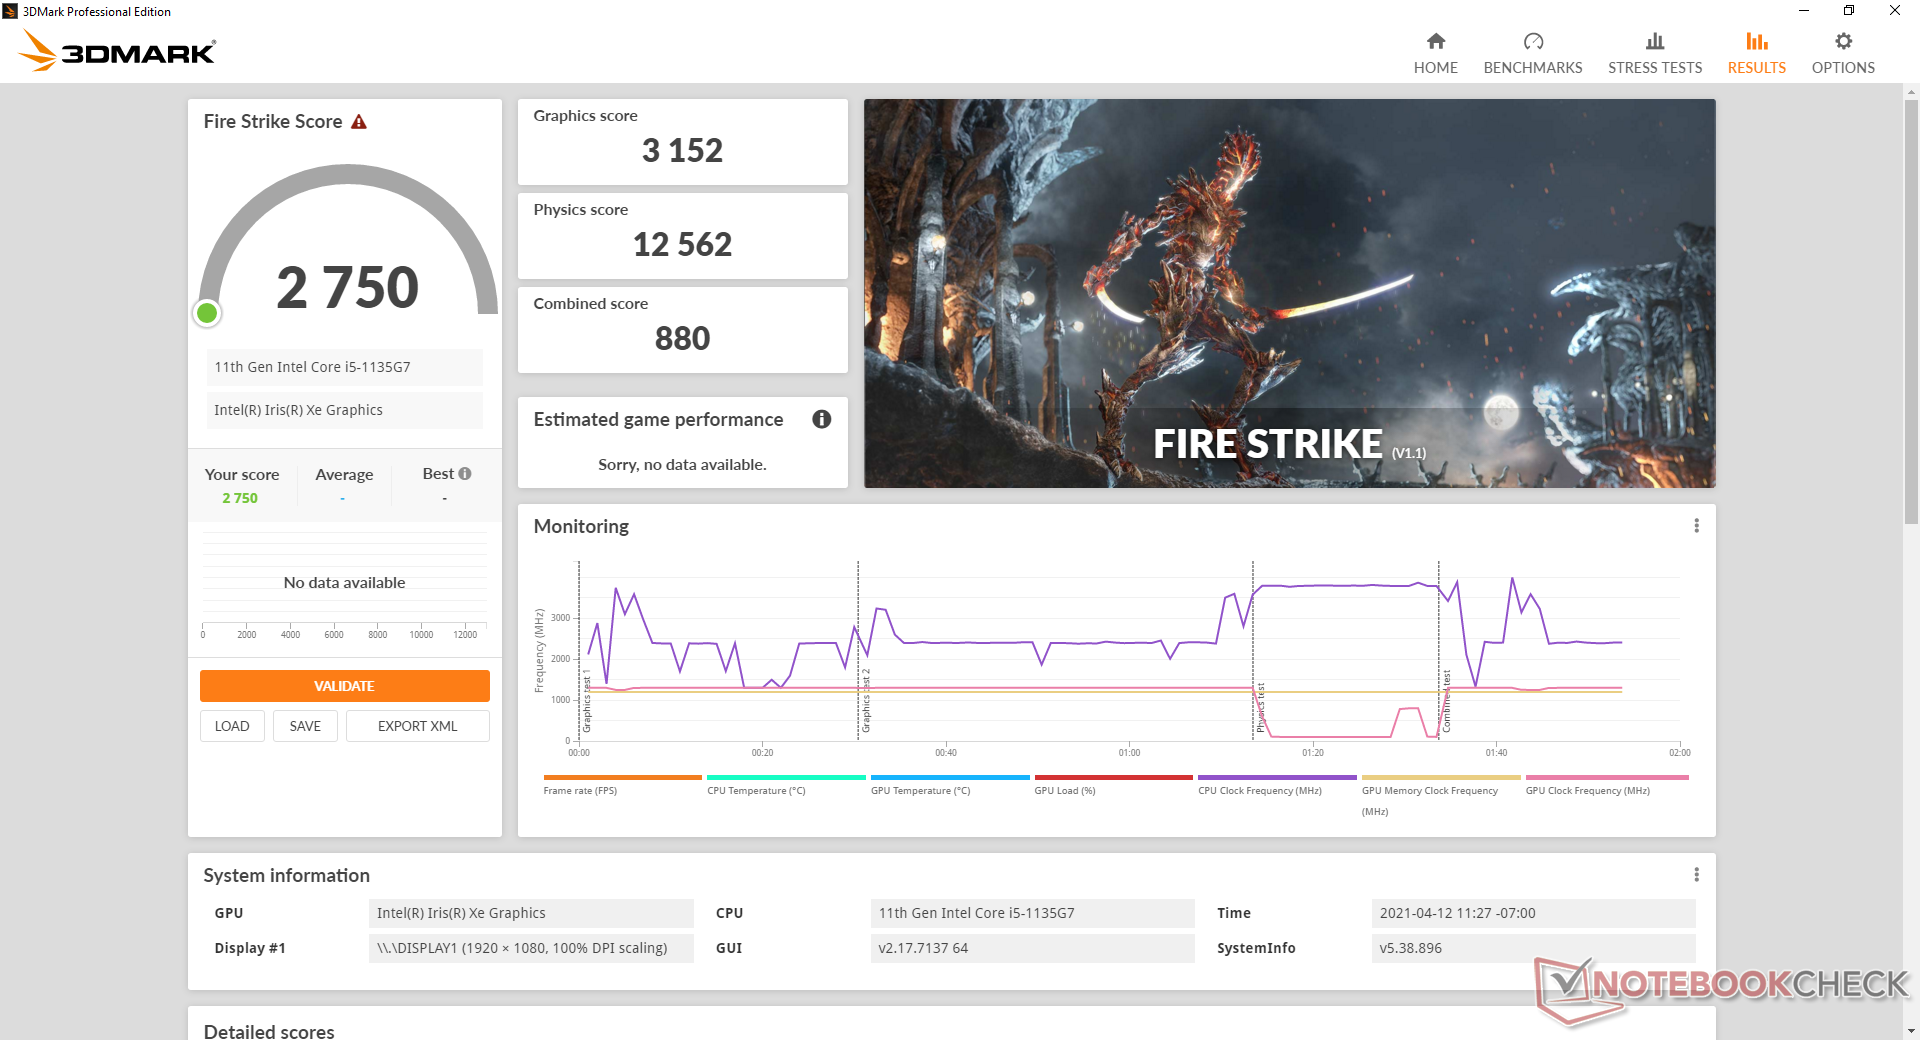
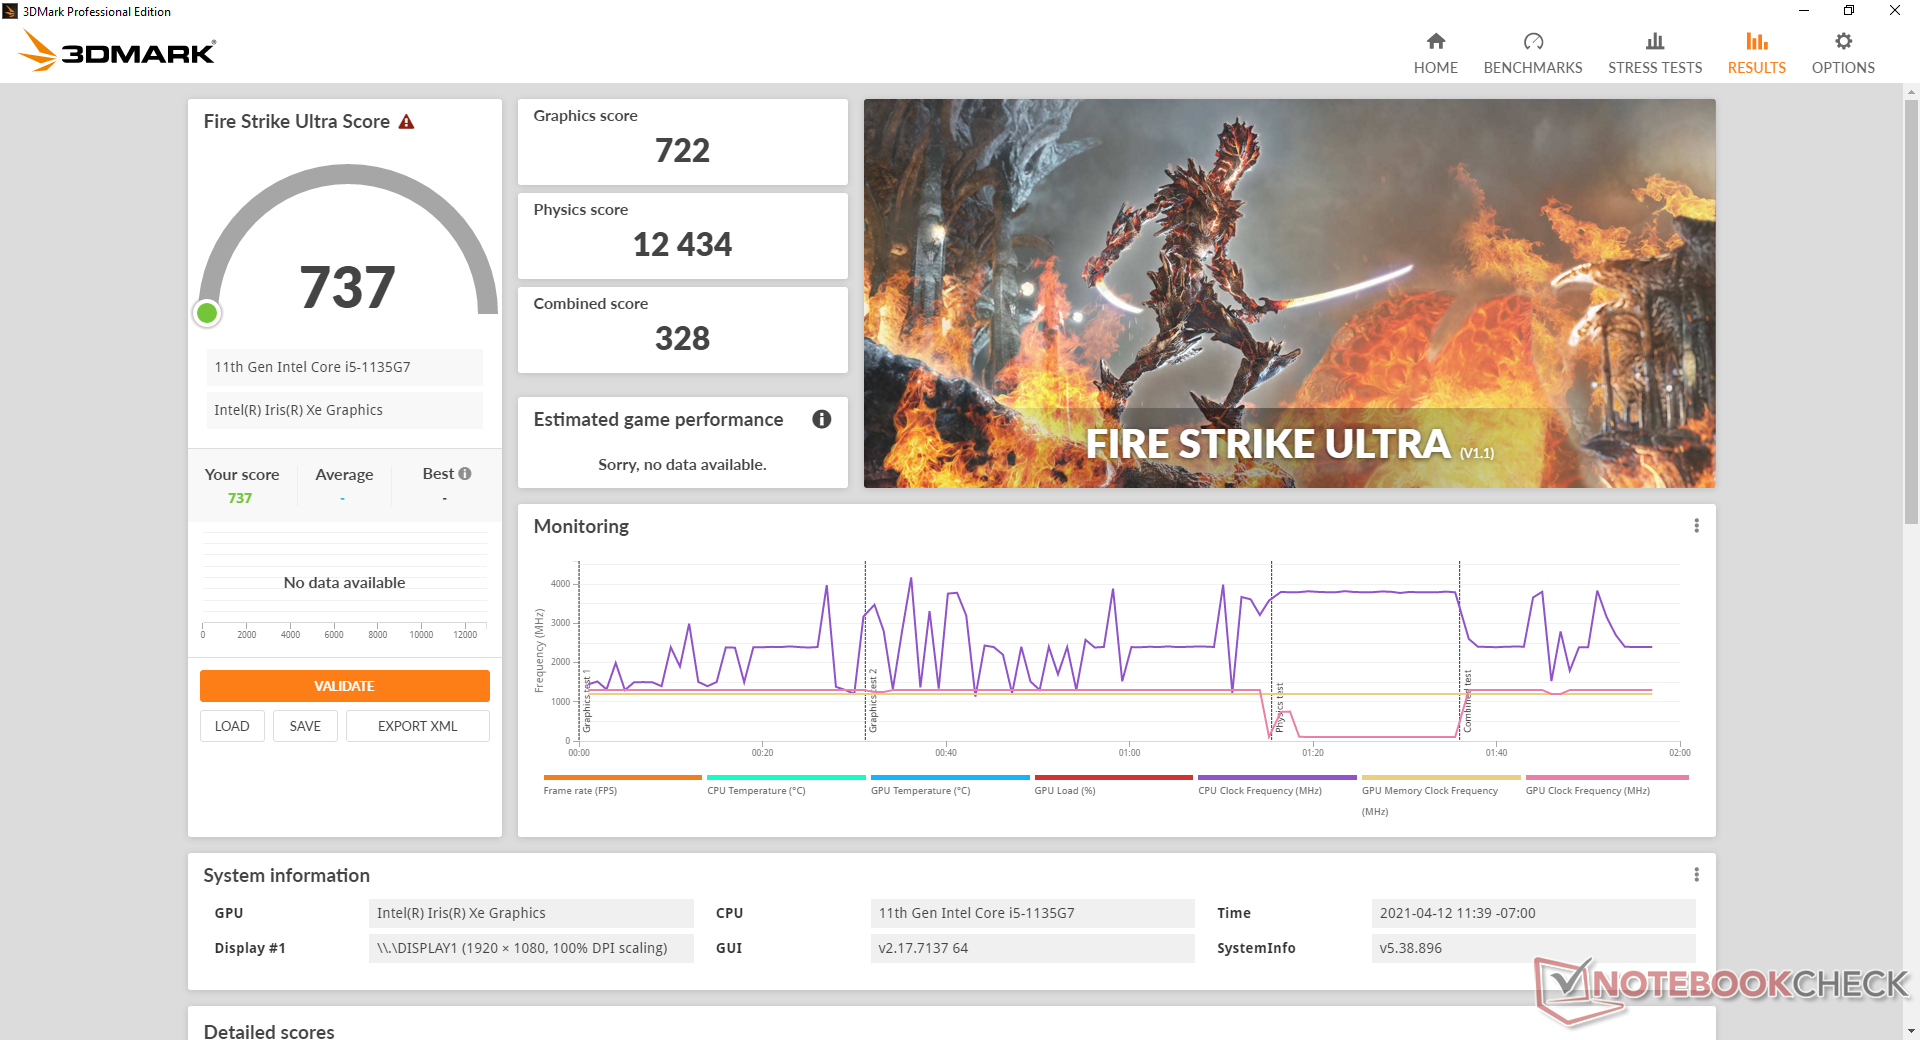
3DMark scoort ongeveer 10 procent langzamer dan de gemiddeldeIris Xe Graphics G7 80EUs in onze database, waarschijnlijk als gevolg van de single-channel RAM setup van onze pre-productie unit. Een upgrade naar de Core i7-1165G7 optie met de snellere Iris Xe 96EUs zal de GPU-prestaties met ten minste 30 procent verbeteren.
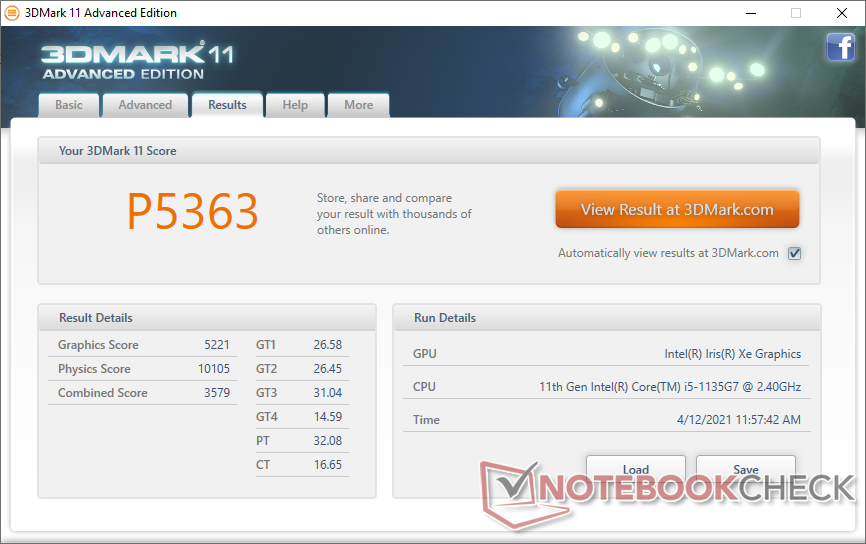
| 3DMark 11 Performance | 5363 punten | |
| 3DMark Cloud Gate Standard Score | 15314 punten | |
| 3DMark Fire Strike Score | 2750 punten | |
| 3DMark Time Spy Score | 1161 punten | |
Help | ||
| lage | gem. | hoge | ultra | |
|---|---|---|---|---|
| The Witcher 3 (2015) | 59.8 | |||
| Dota 2 Reborn (2015) | 73.8 | 56 | 34.2 | 31.4 |
| Final Fantasy XV Benchmark (2018) | 26.8 | 13.7 | 10.5 | |
| X-Plane 11.11 (2018) | 37.1 | 27.3 | 29.1 |
Emissions
Systeemgeluid
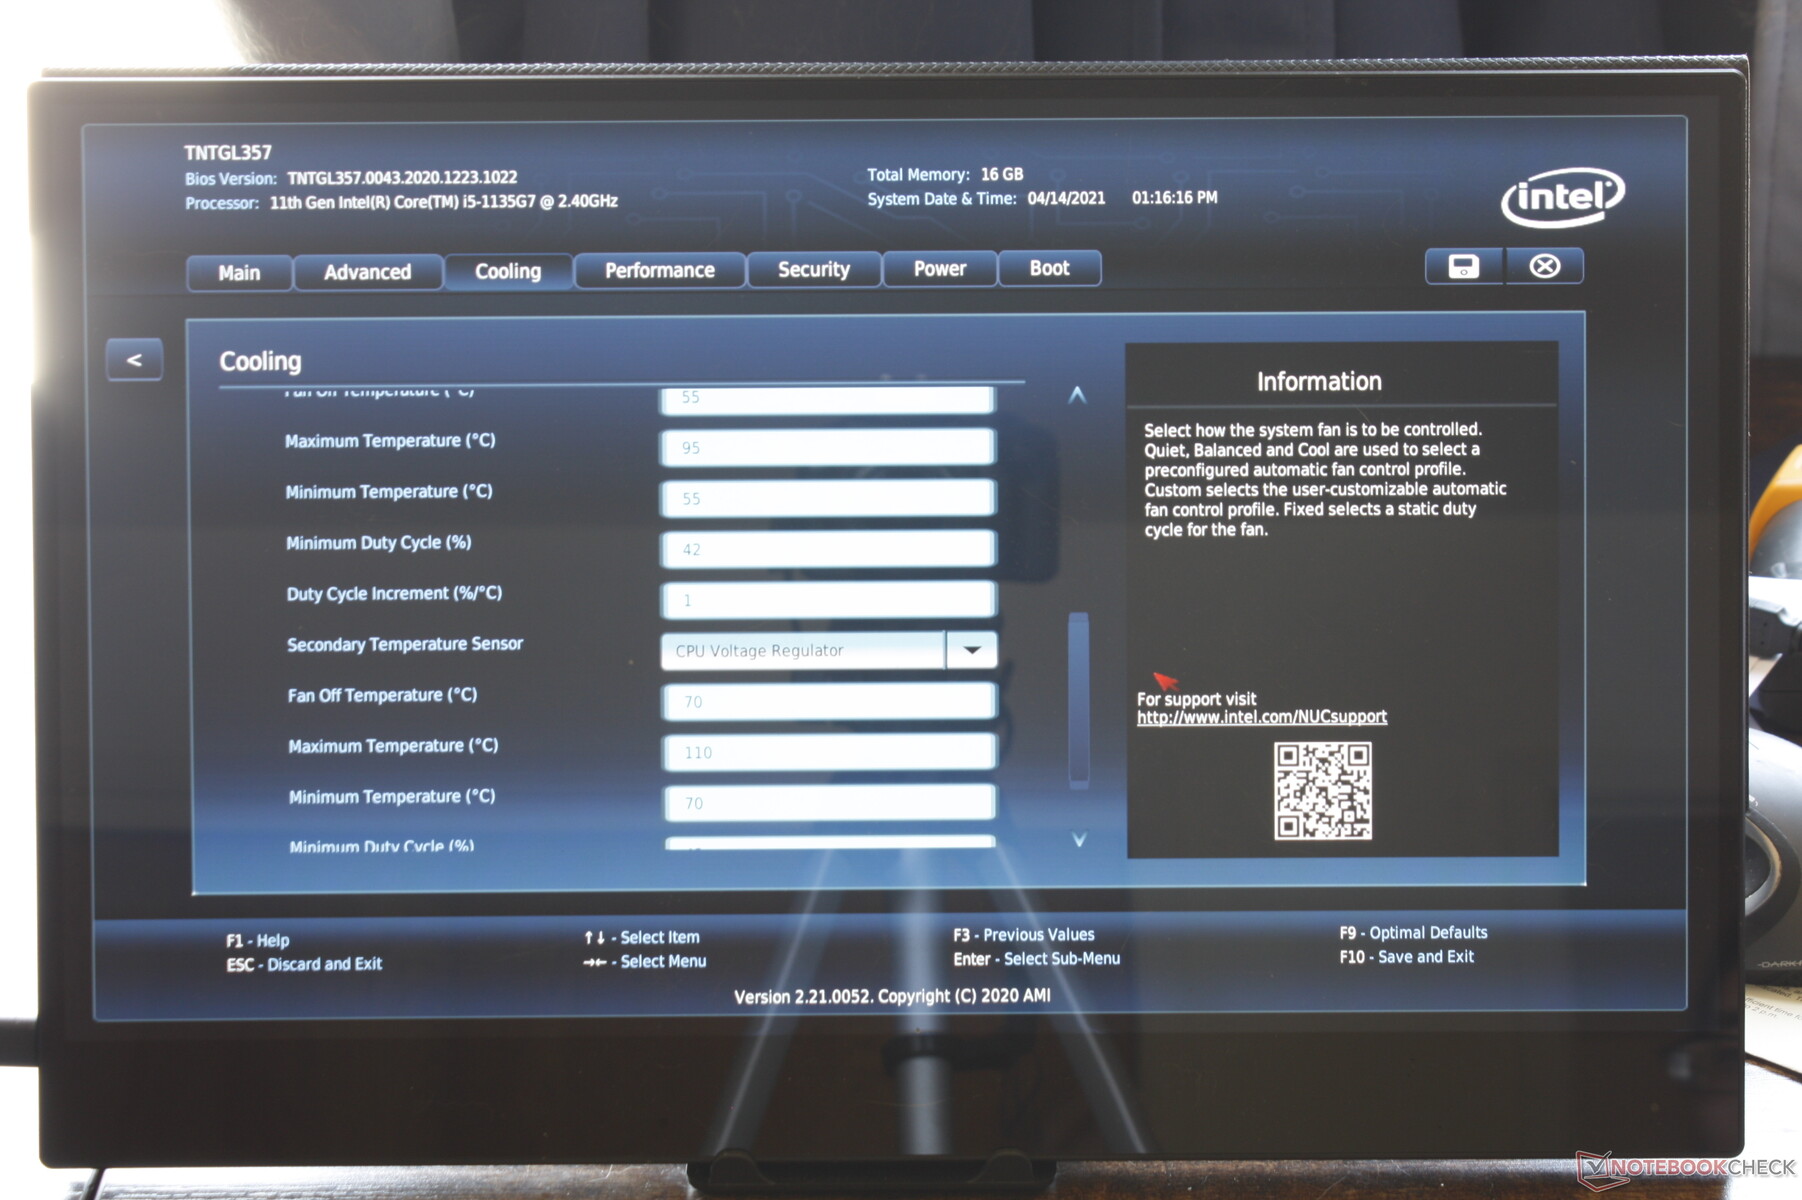
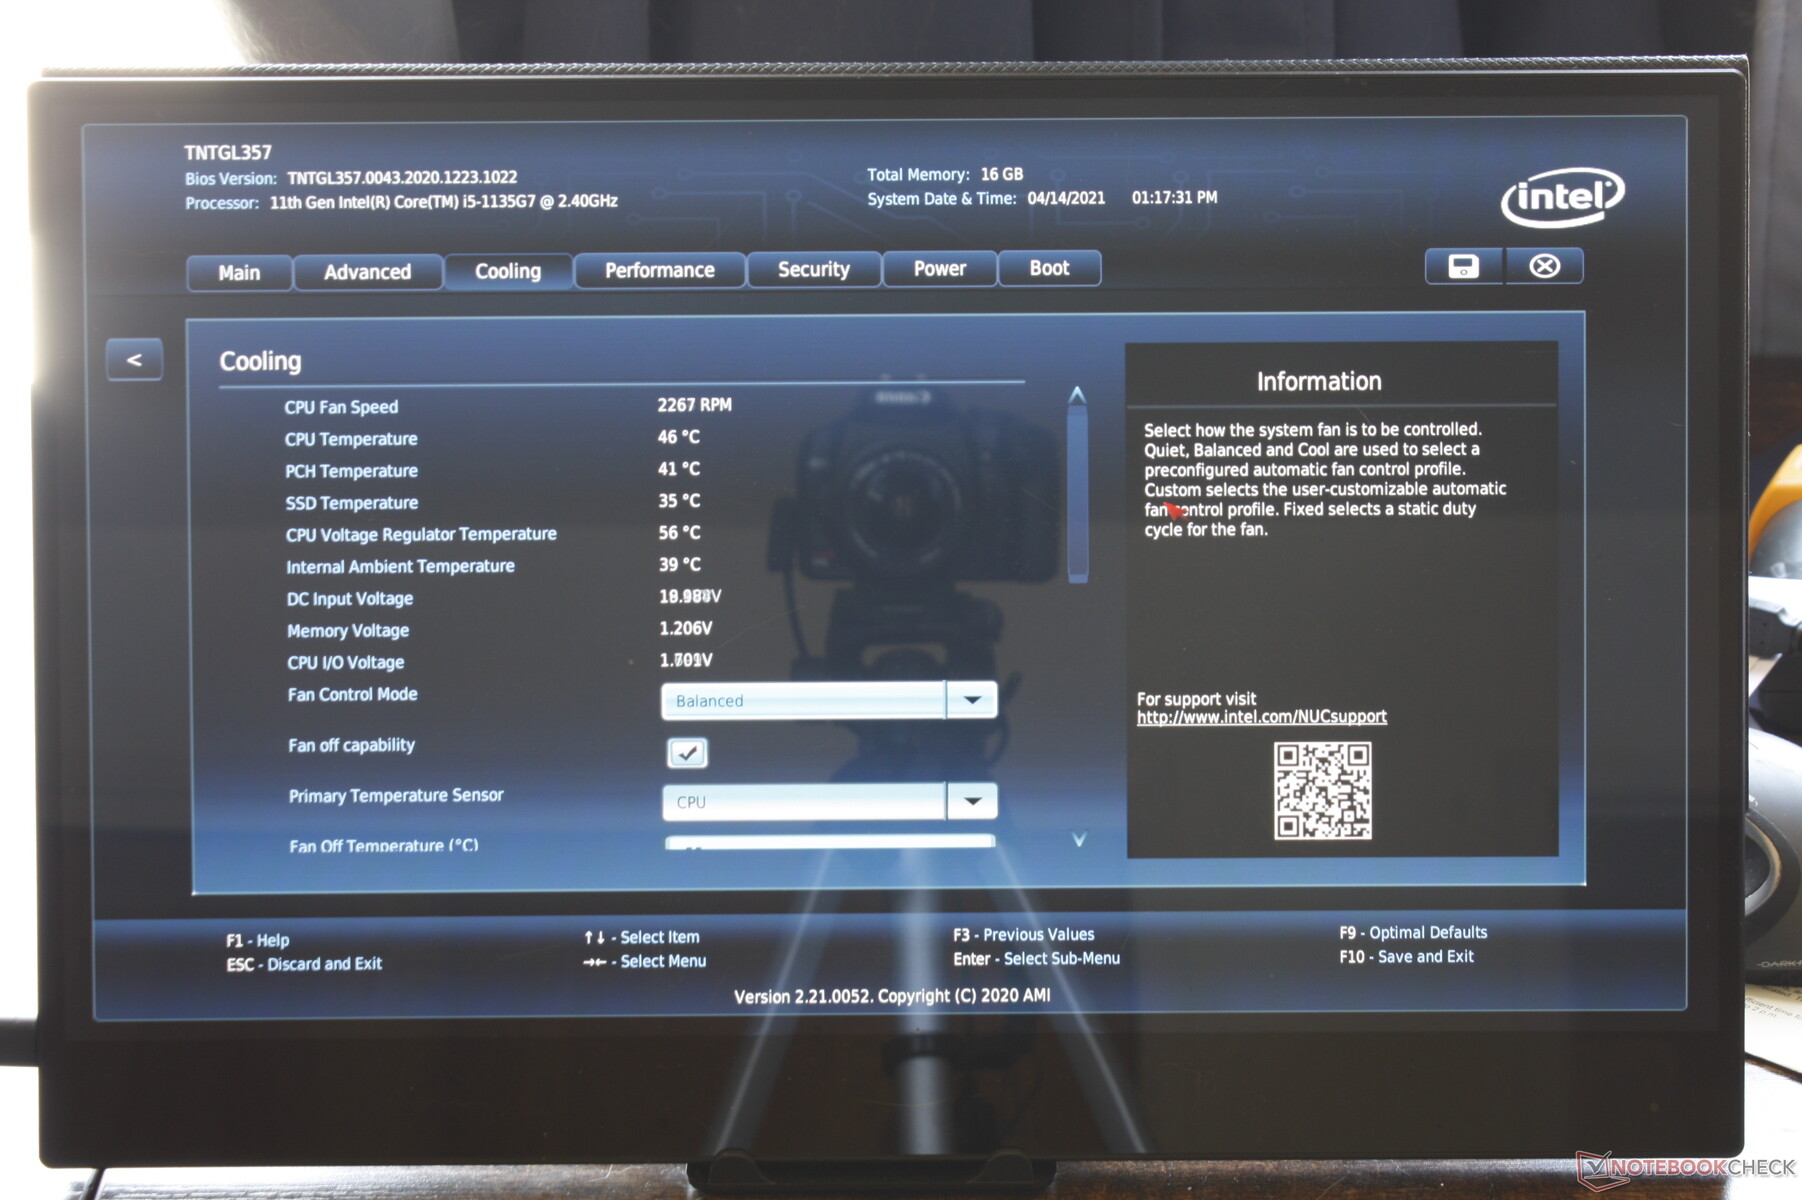
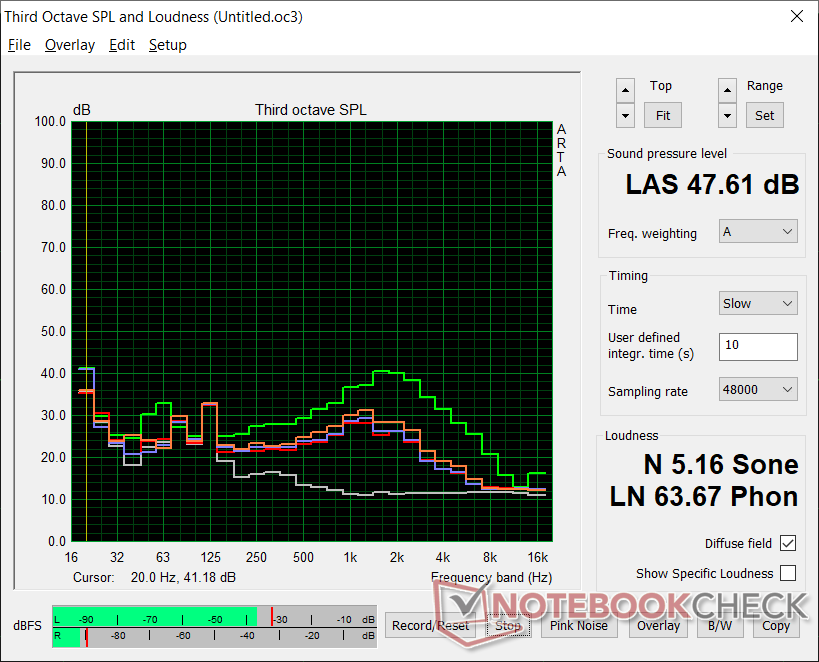
De interne ventilator draait zelden stationair, zelfs niet wanneer het systeem stationair draait op het bureaublad. We registreren een constant ventilatorgeluid van 35,6 dB(A) tegen een stille achtergrond van 24,8 dB(A) tijdens het webbrowsen, om luider te zijn dan de meeste andere mini-PC's onder vergelijkbare omstandigheden. Toerentalveranderingen zijn geleidelijk en er zijn dus geen pulserende problemen, maar gebruikers moeten nog steeds meer dan gemiddeld ventilatorgeluid verwachten wanneer de meeste belastingen worden uitgevoerd. Het BIOS maakt meer specifieke temperatuurdrempels mogelijk voor de controle van het ventilatorgeluid.
| Intel NUC11TNKi5 | GMK NucBox 2 | Intel NUC11PAQi7 | Beelink SEi10 | Zotac ZBOX MI642 Nano | Intel NUC8i7BE | |
|---|---|---|---|---|---|---|
| Noise | 18% | 12% | 0% | 1% | 5% | |
| uit / omgeving * (dB) | 24.8 | 25.6 -3% | 25.6 -3% | 27.5 -11% | 27.8 -12% | 28.7 -16% |
| Idle Minimum * (dB) | 35.6 | 25.7 28% | 25.6 28% | 30.9 13% | 27.8 22% | 28.7 19% |
| Idle Average * (dB) | 35.6 | 25.7 28% | 25.6 28% | 33.5 6% | 33.9 5% | 29.3 18% |
| Idle Maximum * (dB) | 35.6 | 25.7 28% | 25.6 28% | 33.5 6% | 33.9 5% | 31.8 11% |
| Load Average * (dB) | 36.2 | 35.3 2% | 33.6 7% | 38.5 -6% | 43.7 -21% | 39 -8% |
| Witcher 3 ultra * (dB) | 38 | 33.6 12% | 39 -3% | |||
| Load Maximum * (dB) | 47.6 | 35.1 26% | 54.5 -14% | 51.6 -8% | 43.7 8% | 41.4 13% |
* ... kleiner is beter
Geluidsniveau
| Onbelast |
| 35.6 / 35.6 / 35.6 dB (A) |
| Belasting |
| 36.2 / 47.6 dB (A) |
 | ||
30 dB stil 40 dB(A) hoorbaar 50 dB(A) luid |
||
min: | ||
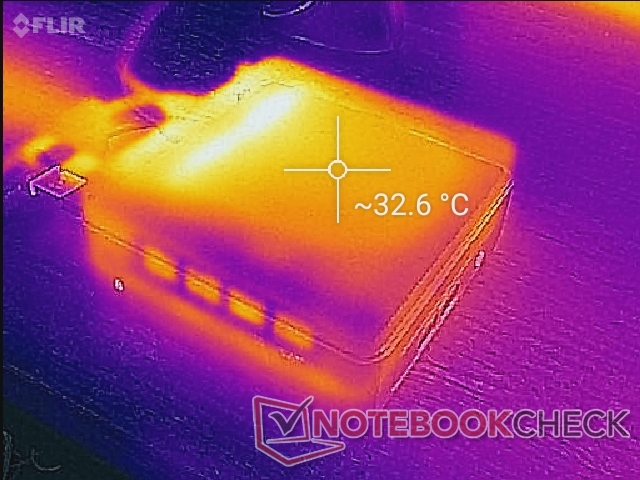
Temperatuur
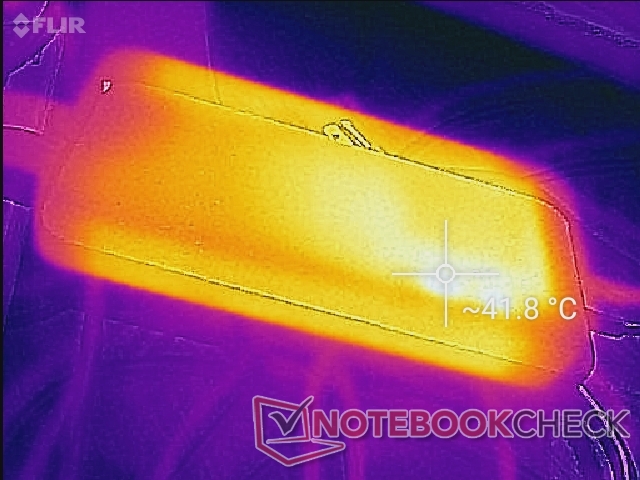
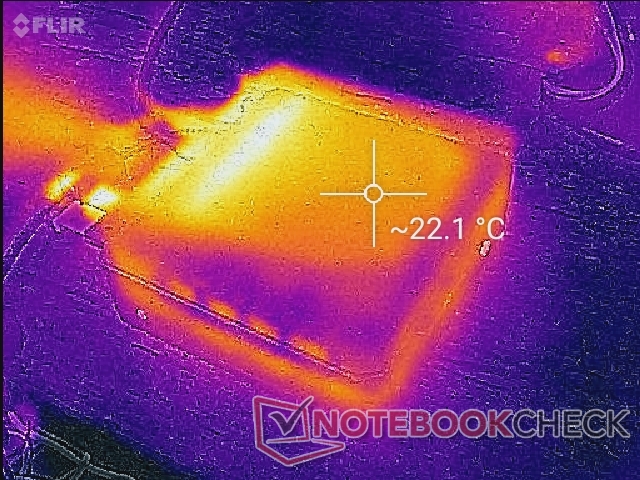
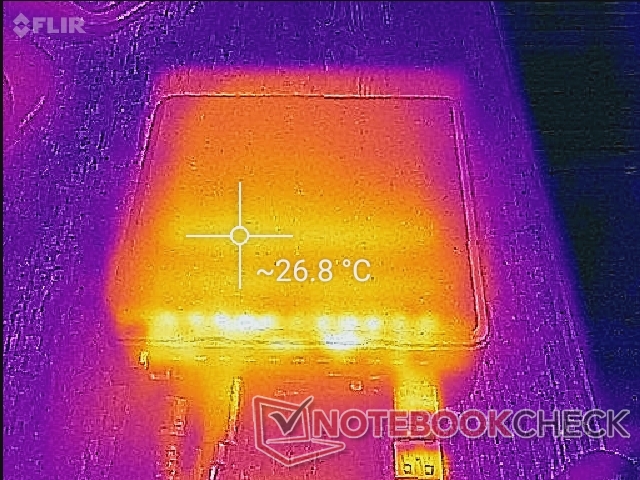
De oppervlaktetemperatuur varieert van 22 C tot 27 C in ruststand tot 43 C bij extreme verwerkingsbelasting. Verse lucht wordt vanaf de zijkanten aangezogen, wat betekent dat de ventilatie gedeeltelijk wordt geblokkeerd als de NUC verticaal wordt geplaatst.
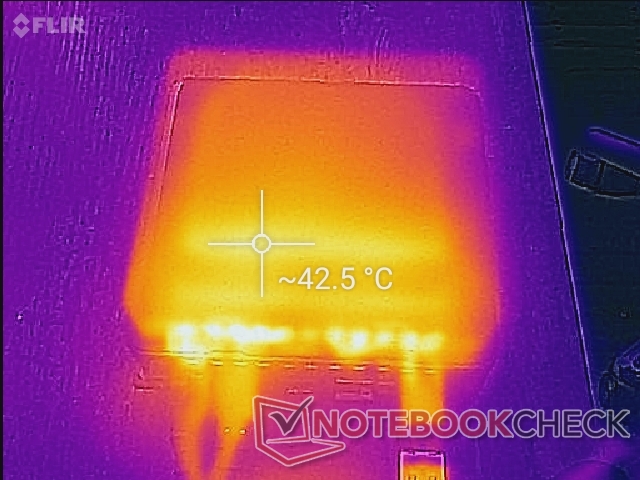
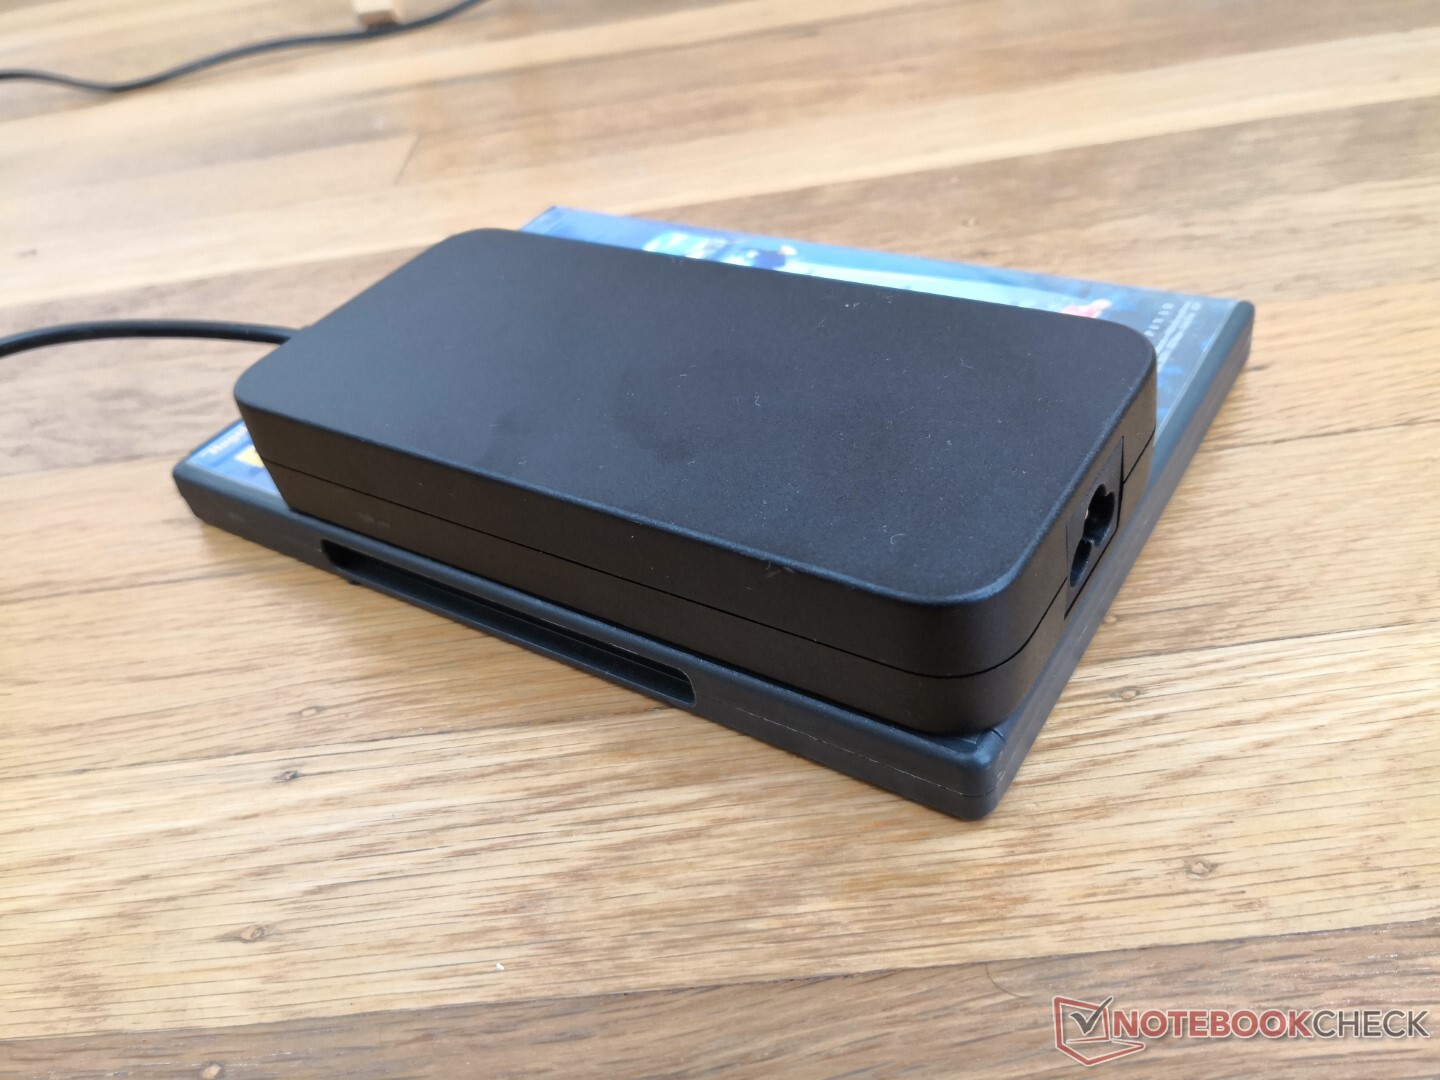
De AC-adapter kan net zo warm worden als de mini PC zelf met 42 C wanneer deze wordt belast.
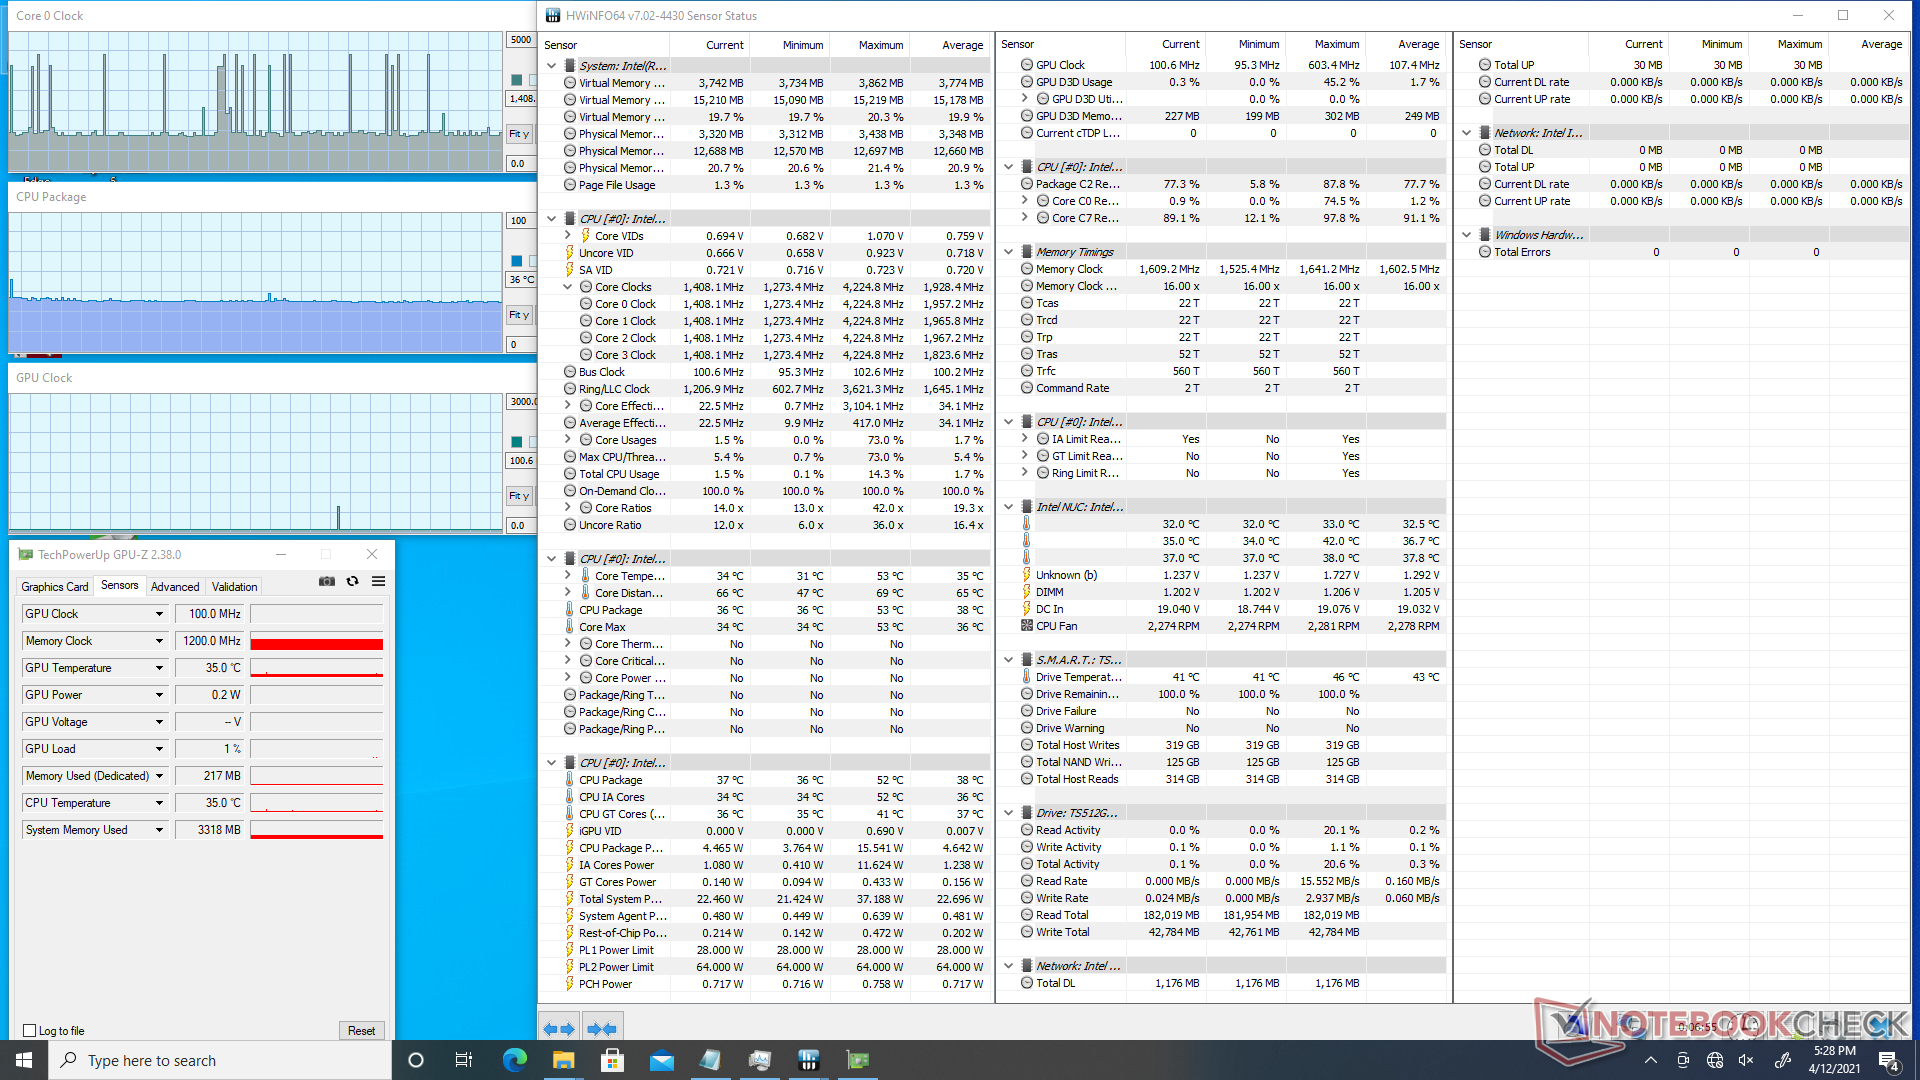
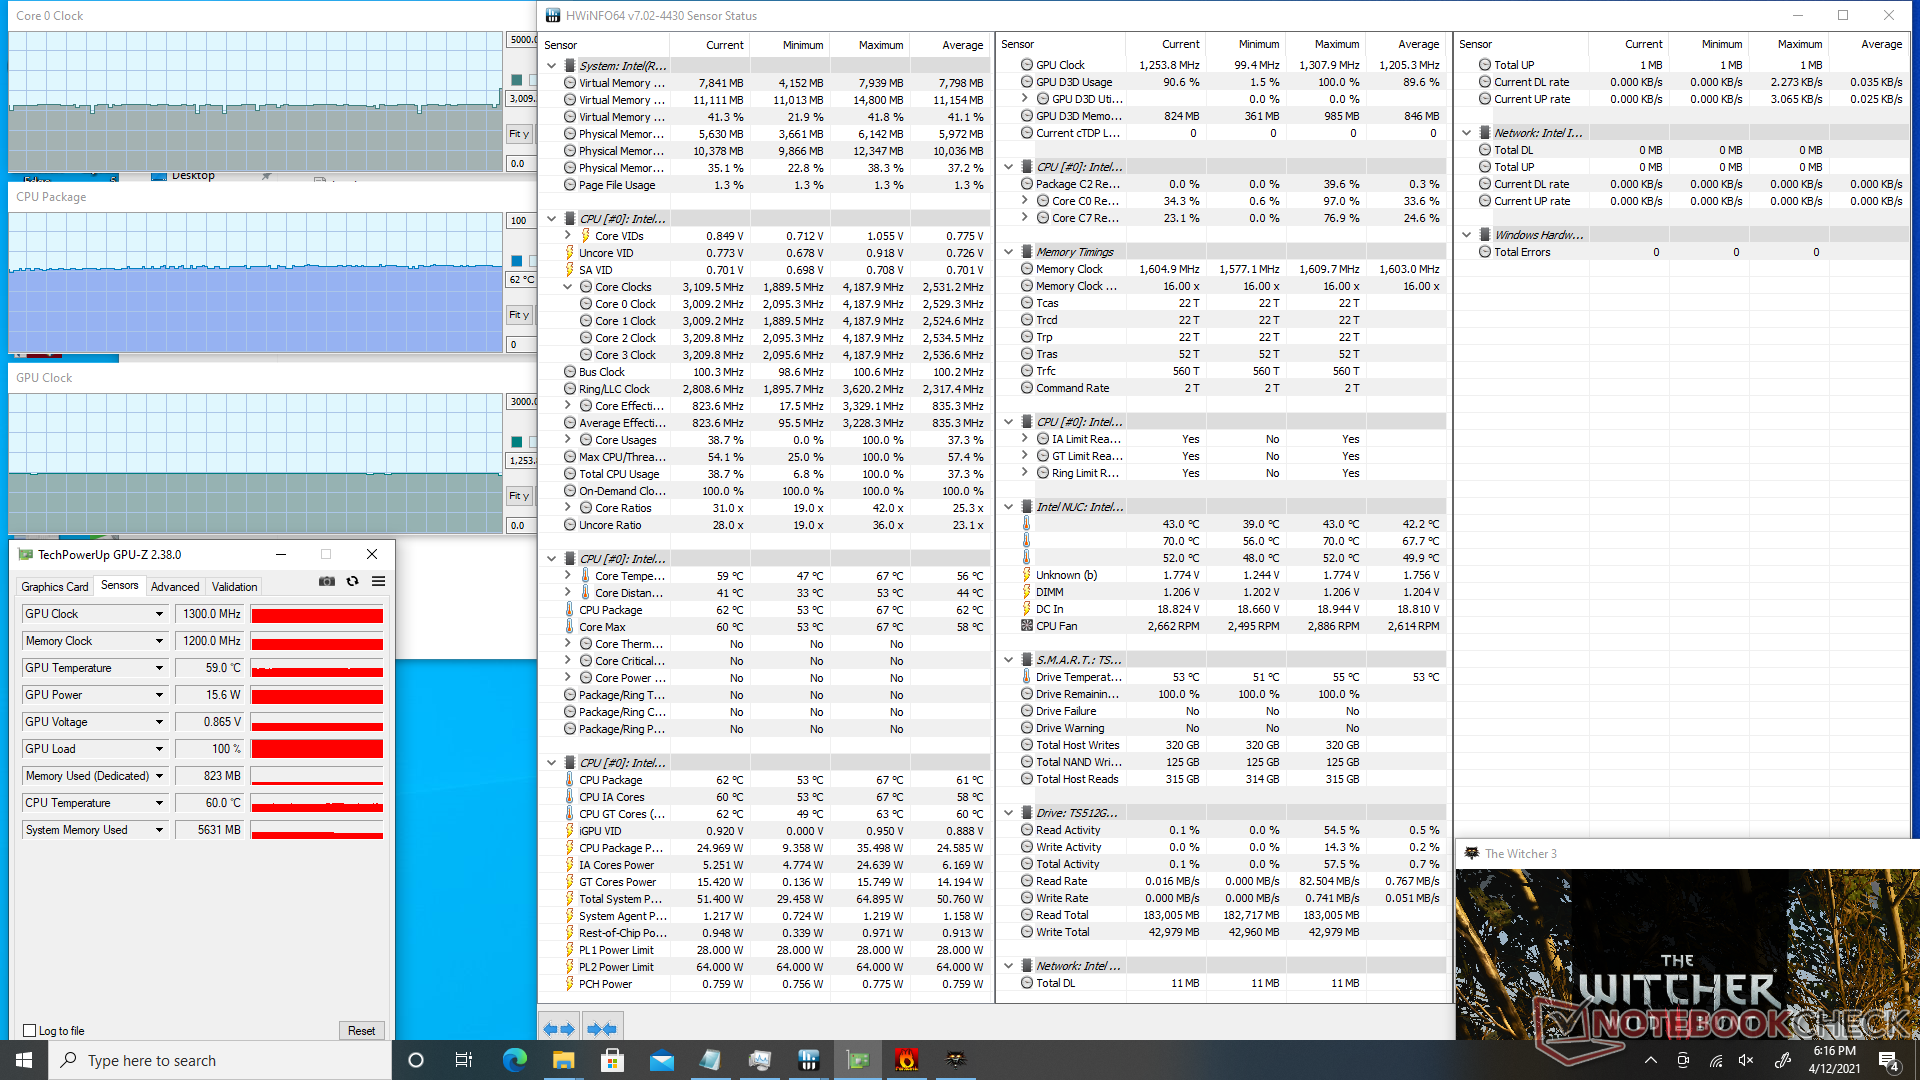
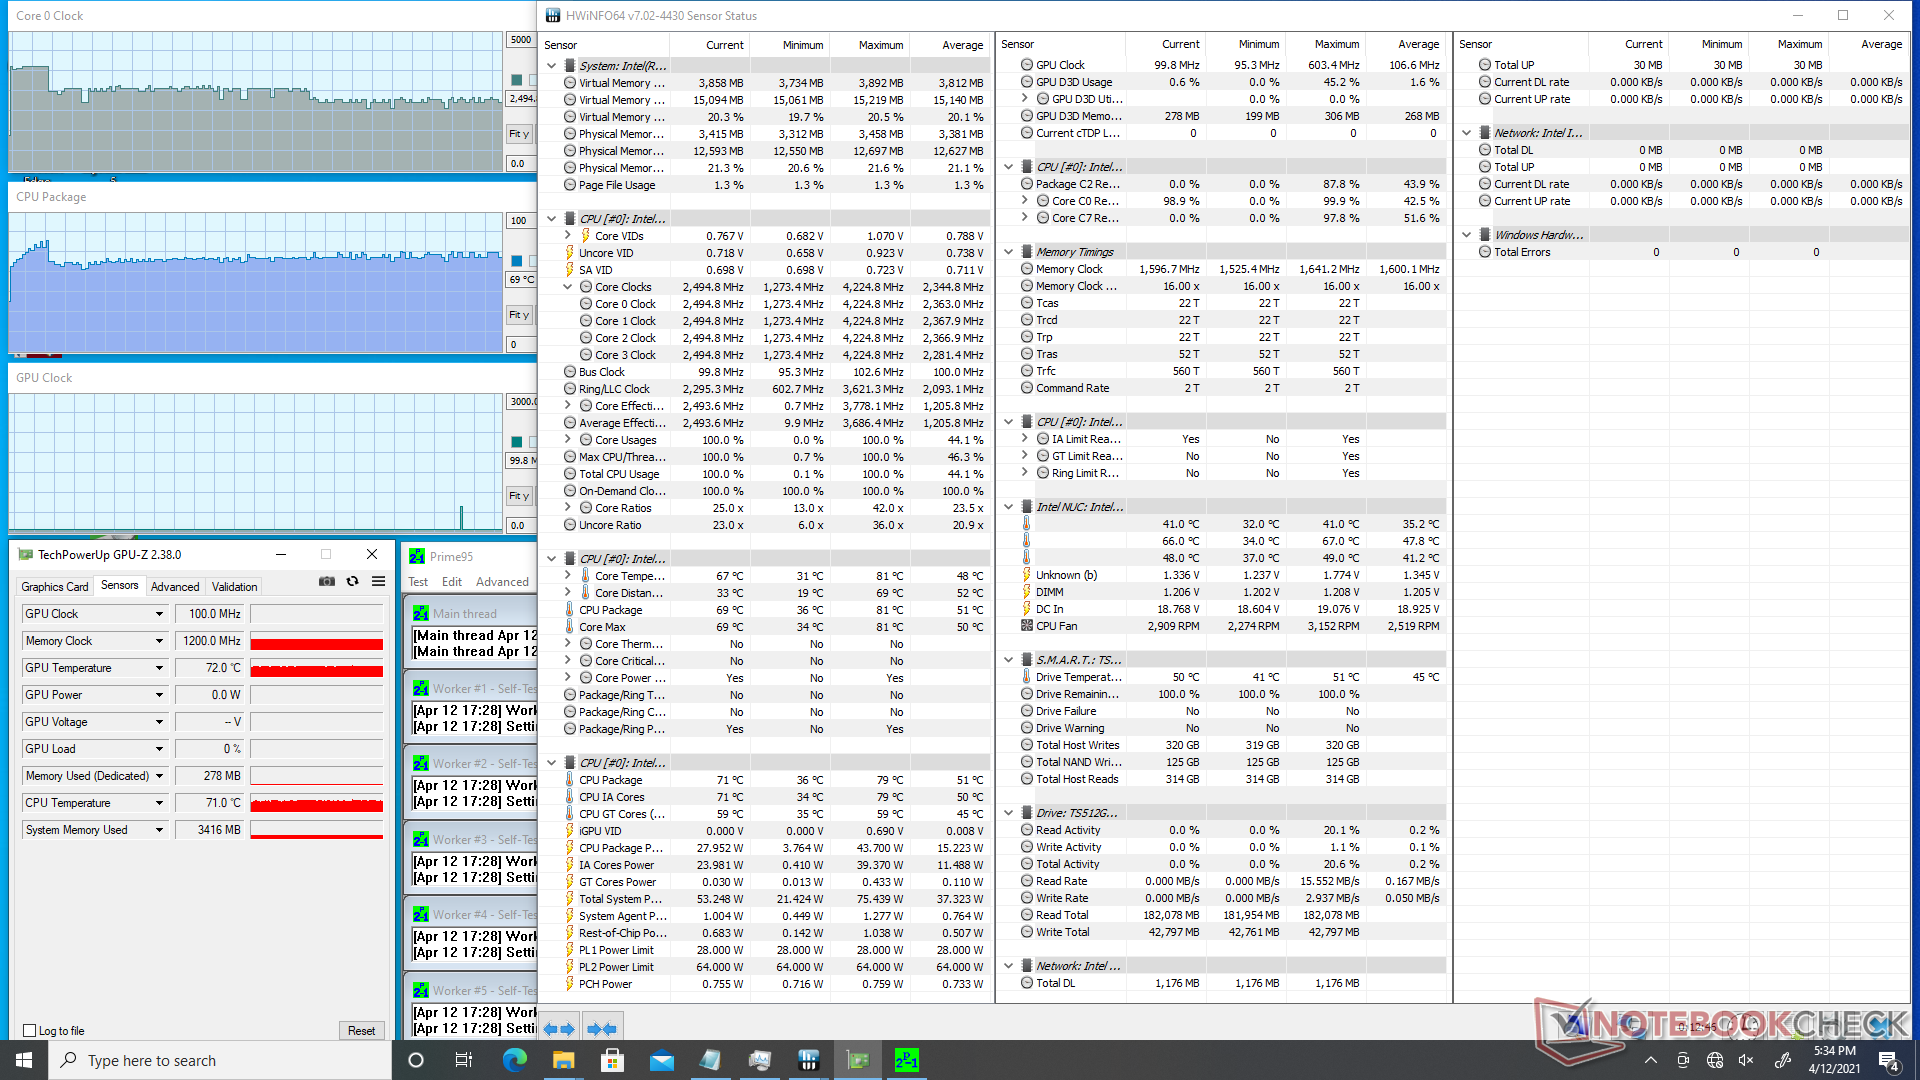
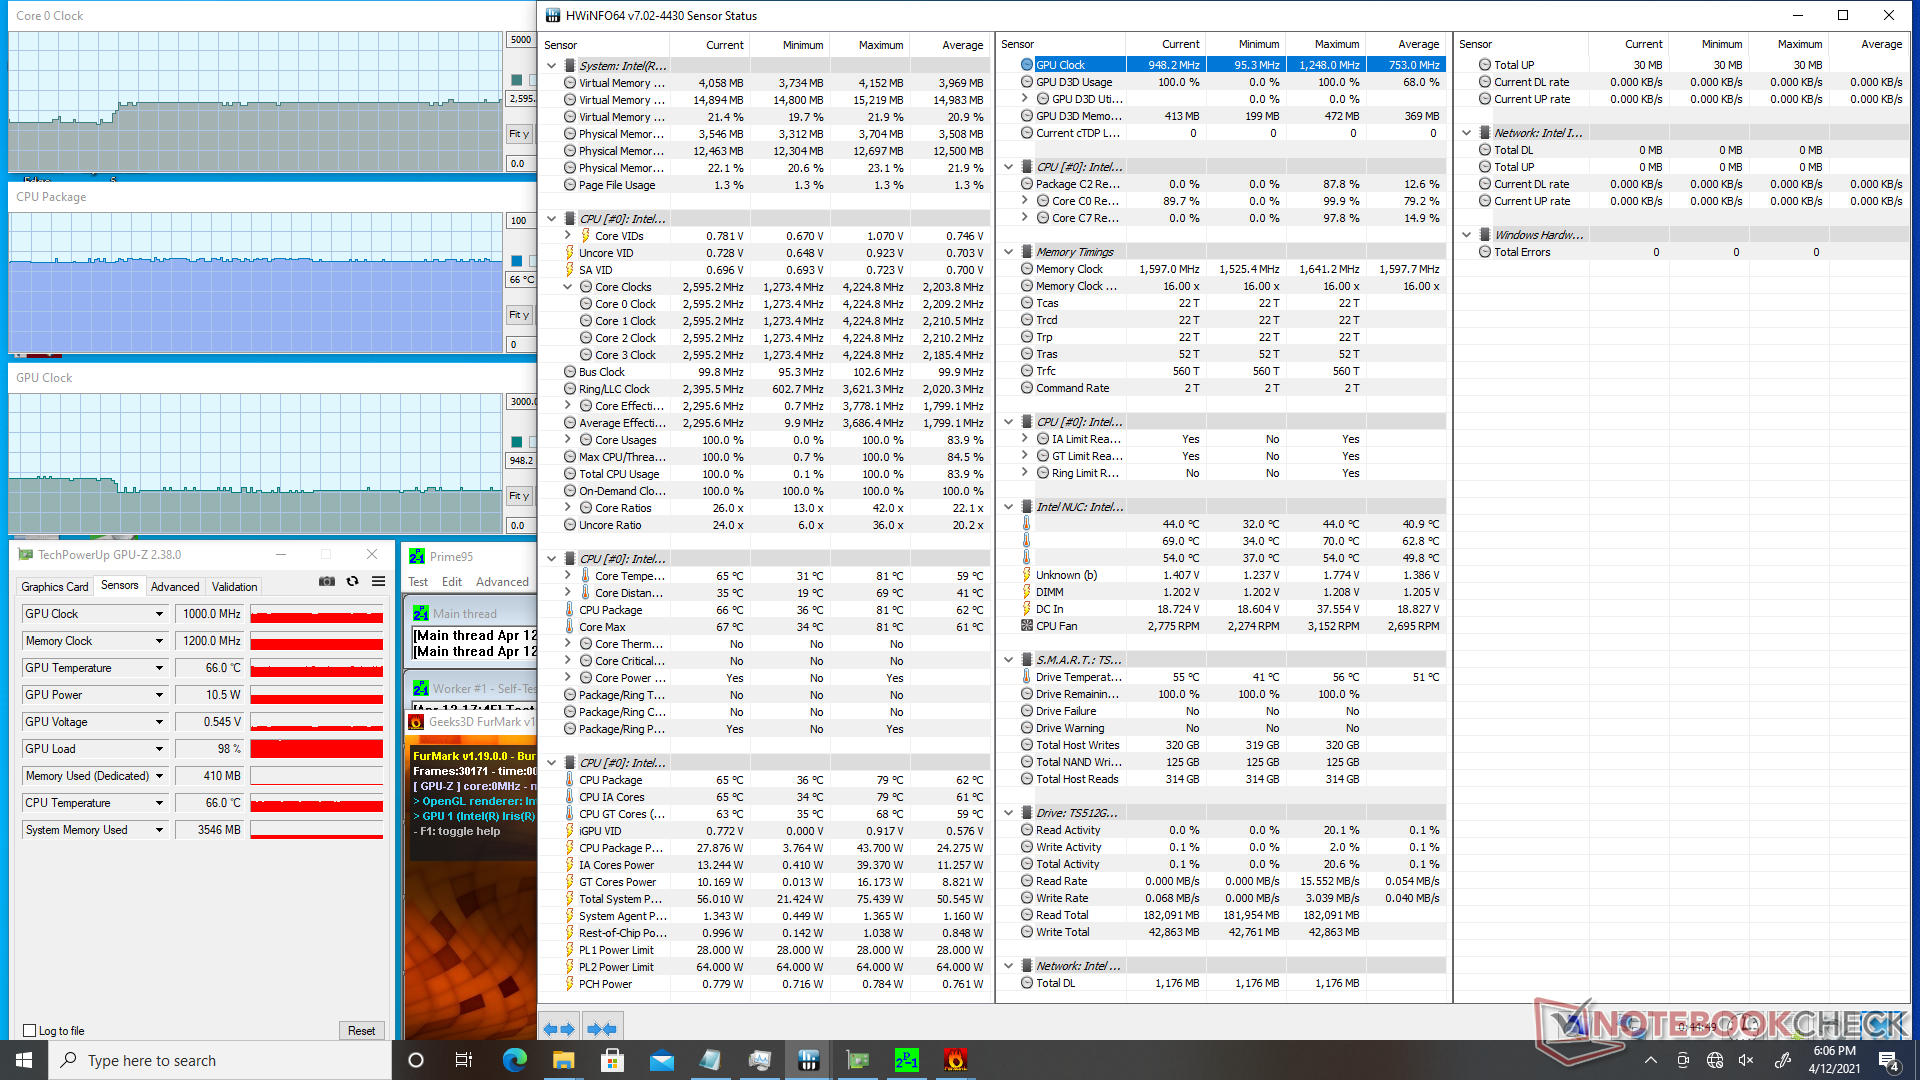
Stresstest
Tijdens het draaien van Prime95, zou de CPU gedurende ongeveer 30 seconden een boost geven tot 3,7 GHz, totdat een kerntemperatuur van 81 C werd bereikt. Daarna zou de kloksnelheid gestaag dalen en stabiliseren in het 2,5 tot 2,7 GHz bereik, om een koelere kerntemperatuur van 70 C te handhaven. De maximale Turbo Boost duurzaamheid is dus niet oneindig, maar het is in ieder geval langer dan veel laptops met dezelfde Core i5-1135G7 CPU. De Lenovo Yoga 7i 14bereikt bijvoorbeeld 3,8 GHz gedurende slechts een paar korte seconden voordat het plateau onder dezelfde Prime95-omstandigheden wordt bereikt
Gebruikers kunnen verwachten dat de kerntemperaturen rond de 60 C tot 70 C schommelen bij het uitvoeren van veeleisende belastingen.
| CPUklok (GHz) GPUklok (MHz) GemiddeldeCPU temperatuur (°C) |
| Systeem Idle |
| Prime95 Stress |
| Prime95 + FurMark Stress |
| Witcher 3 Stress |
Energy Management
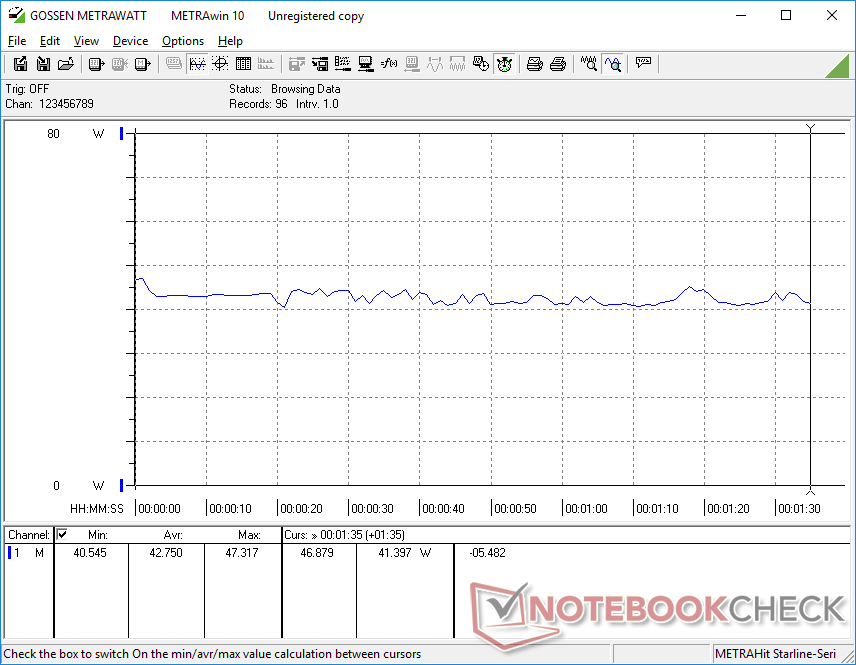
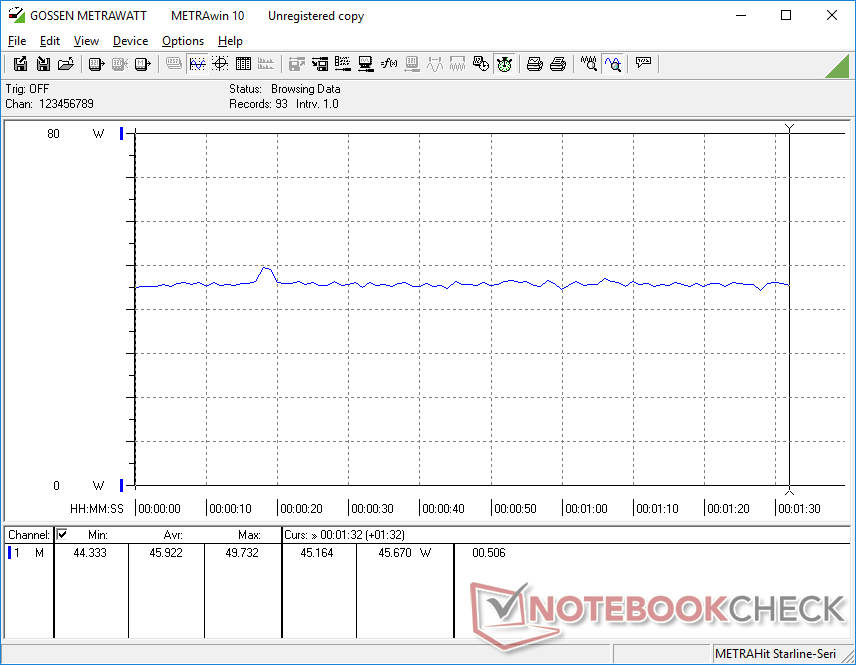
Stroomverbruik
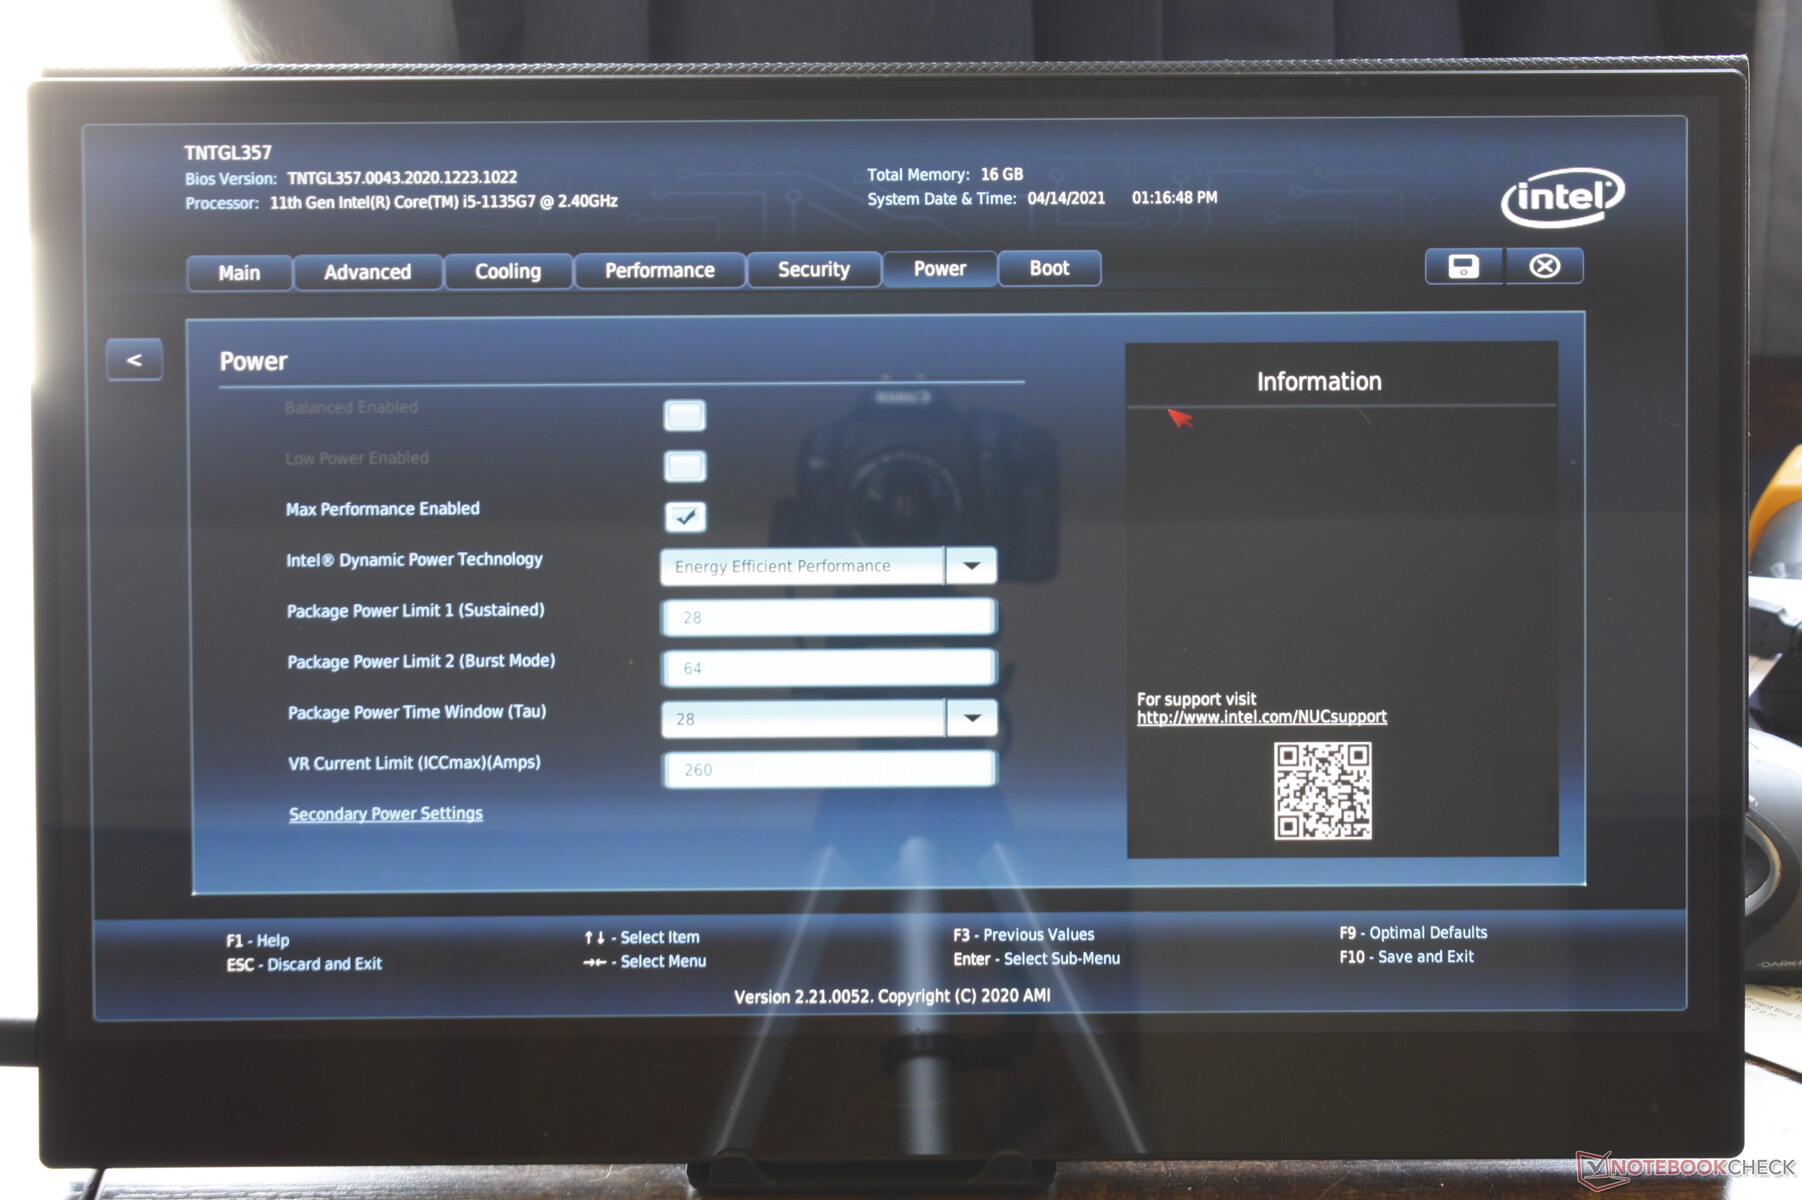
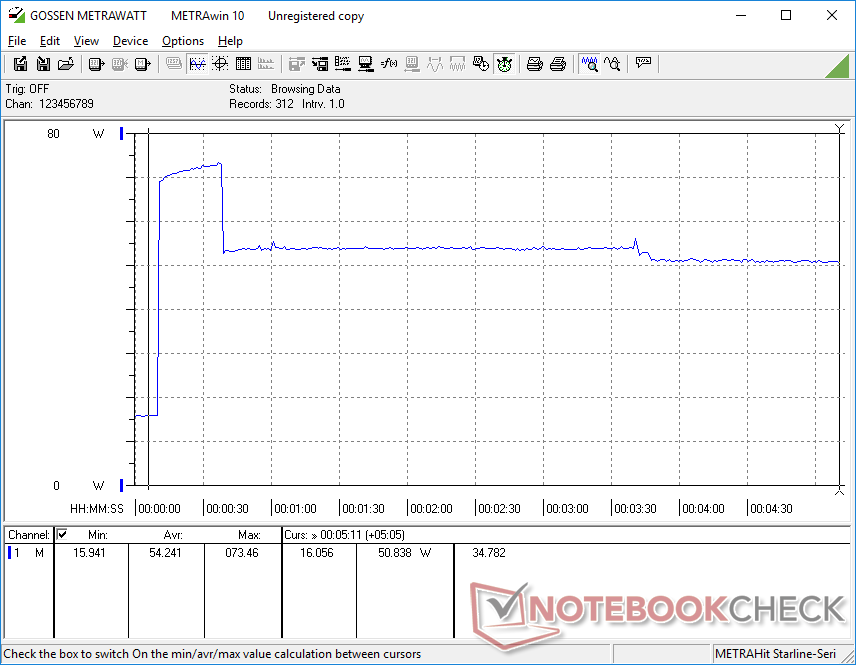
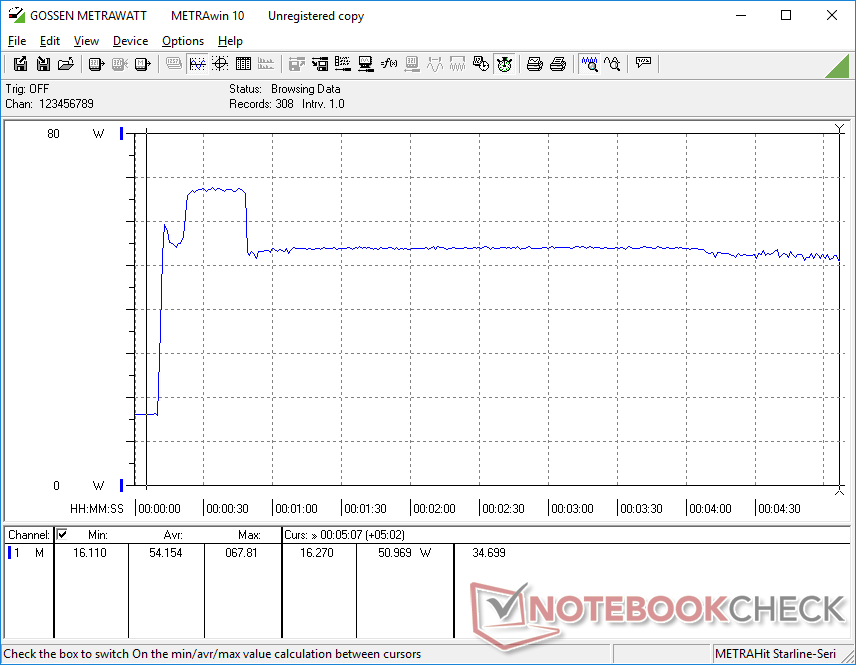
De NUC11TNKi5 verbruikt consequent meer stroom dan de NUC11PAQi7, hoewel de laatste de snellere en grotere NUC is. Gaming-belastingen zouden tussen 40 W en 44 W verbruiken, vergeleken met 31 W tot 39 W op de NUC11PAQi7. Het verbruik kan oplopen tot 74 W bij extreme verwerkingsbelastingen, maar deze belasting is slechts tijdelijk vanwege de beperkte Turbo Boost van het systeem.
| Uit / Standby | |
| Inactief | |
| Belasting |
|
Key:
min: | |
| Intel NUC11TNKi5 | GMK NucBox 2 | Intel NUC11PAQi7 | Intel NUC10i5FNK | Beelink SEi10 | Zotac ZBOX MI642 Nano | |
|---|---|---|---|---|---|---|
| Power Consumption | 30% | 31% | -4% | 42% | 23% | |
| Idle Minimum * (Watt) | 11.5 | 6.1 47% | 5.6 51% | 6.3 45% | 8.9 23% | |
| Idle Average * (Watt) | 12.4 | 6.8 45% | 5.6 55% | 15.7 -27% | 6.6 47% | 9 27% |
| Idle Maximum * (Watt) | 12.9 | 7.3 43% | 6 53% | 6.7 48% | 9.9 23% | |
| Load Average * (Watt) | 40.7 | 46.3 -14% | 31.4 23% | 25.9 36% | 33 19% | |
| Witcher 3 ultra * (Watt) | 43.9 | 39 11% | ||||
| Load Maximum * (Watt) | 73.5 | 50.7 31% | 80.5 -10% | 58.6 20% | 46.7 36% | 58 21% |
* ... kleiner is beter
Pro
Contra
Uitspraak
De prijs is altijd een zware strijd geweest voor de NUC-serie. De NUC11TNKi5 met 4 GB RAM, geen OS, en geen opslag kost $670 USD, vergeleken met $500 USD voor de GMK NucBox 2 met 8 GB RAM, Windows 10 OS, en een 256 GB NVMe SSD. De nog goedkopere Beelink SEi10 kost $ 400 met 8 GB RAM, 256 GB NVMe SSD, en zelfs Thunderbolt 3 ondersteuning. Om de NUC 11 Pro echt de moeite waard te maken, zullen gebruikers gebruik moeten maken van de relatief hoge prestaties van de processor en waarde moeten hechten aan zowel de driejarige fabrieksgarantie als de solide bouwkwaliteit. Anders zullen de eerder genoemde GMK of Beelink net zo goed werken voor low-power HTPC omgevingen of 4K streaming.
Het is niet bepaald goedkoop, maar gebruikers krijgen wel een slanke eersteklas mini-pc met de nieuwste 11e gen CPU en al zijn prestatievoordelen.
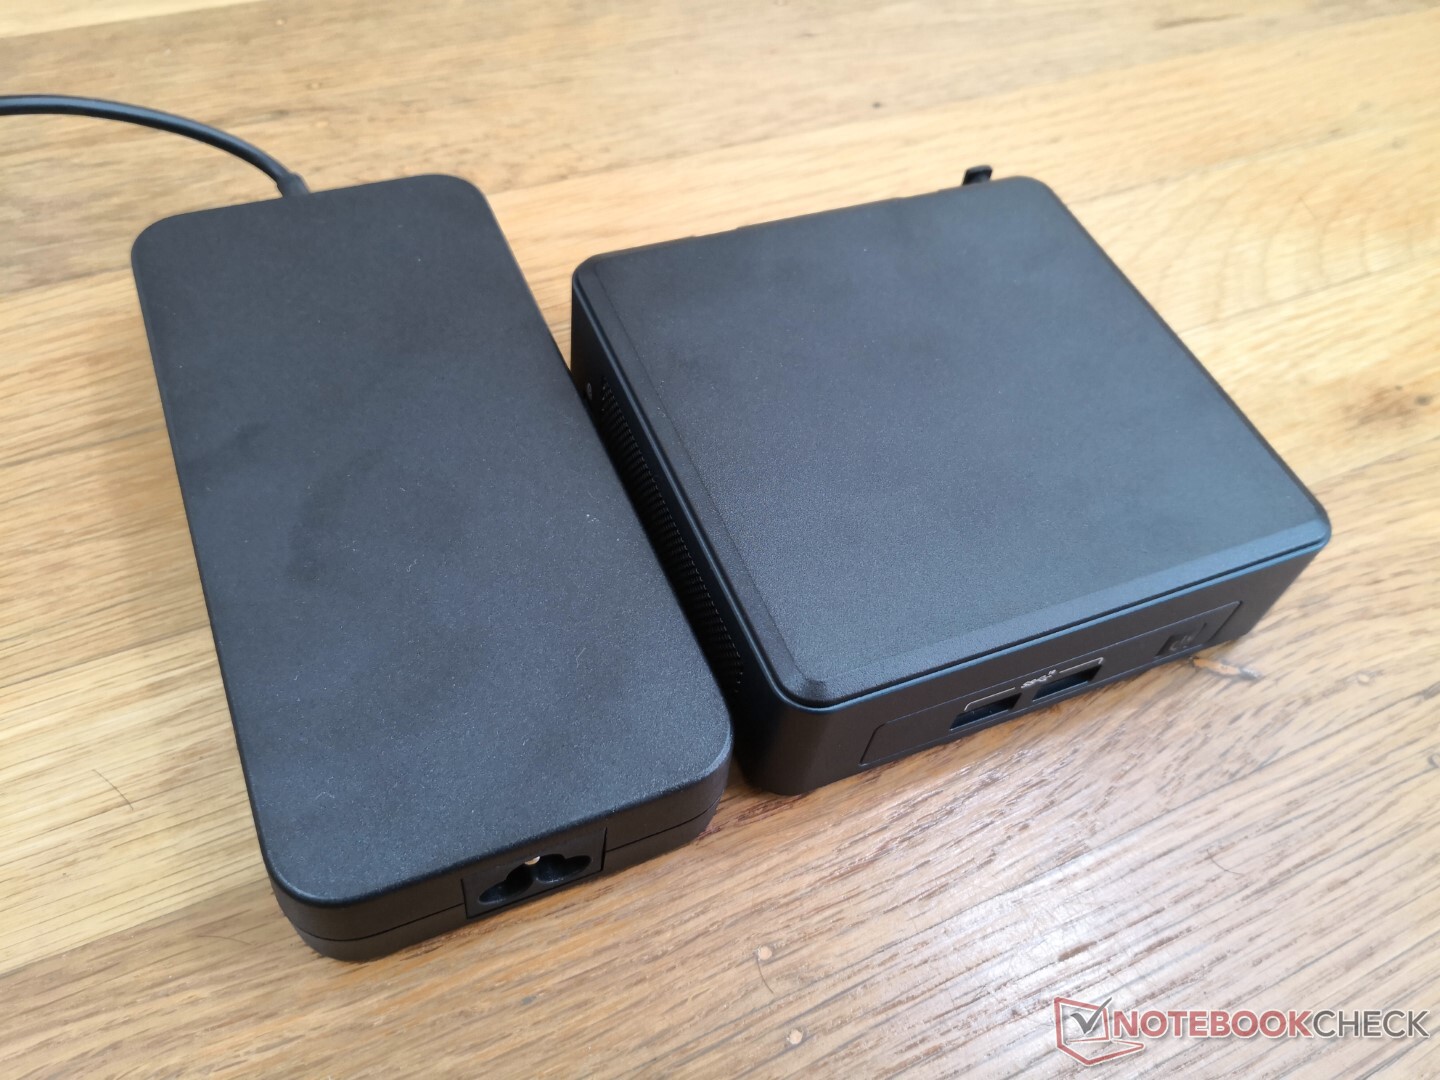
Voor de onvermijdelijke "NUC 12 Pro", zouden we graag USB-C Power Delivery en een kleinere AC-adapter zien. USB-C PD zou USB-C AC-adapters van derden mogelijk maken om de afhankelijkheid van Intels gepatenteerde vatadapters te verminderen. De oversized 120 W Intel adapter hier is net zo groot als de adapter voor de MSI GP66 gaming laptop, wat absurd is voor een Core U-aangedreven mini PC.
Prijs en beschikbaarheid
De Intel NUC 11 Pro zal op grote schaal beschikbaar zijn in de weken na deze recensie. Ten minste één online detailhandelaar levert nu al de Core i7 configuratie van het model
Price comparison

