Intel NUC11PAQi7 Panther Canyon Mini PC Review: Tiger Lake Done Right
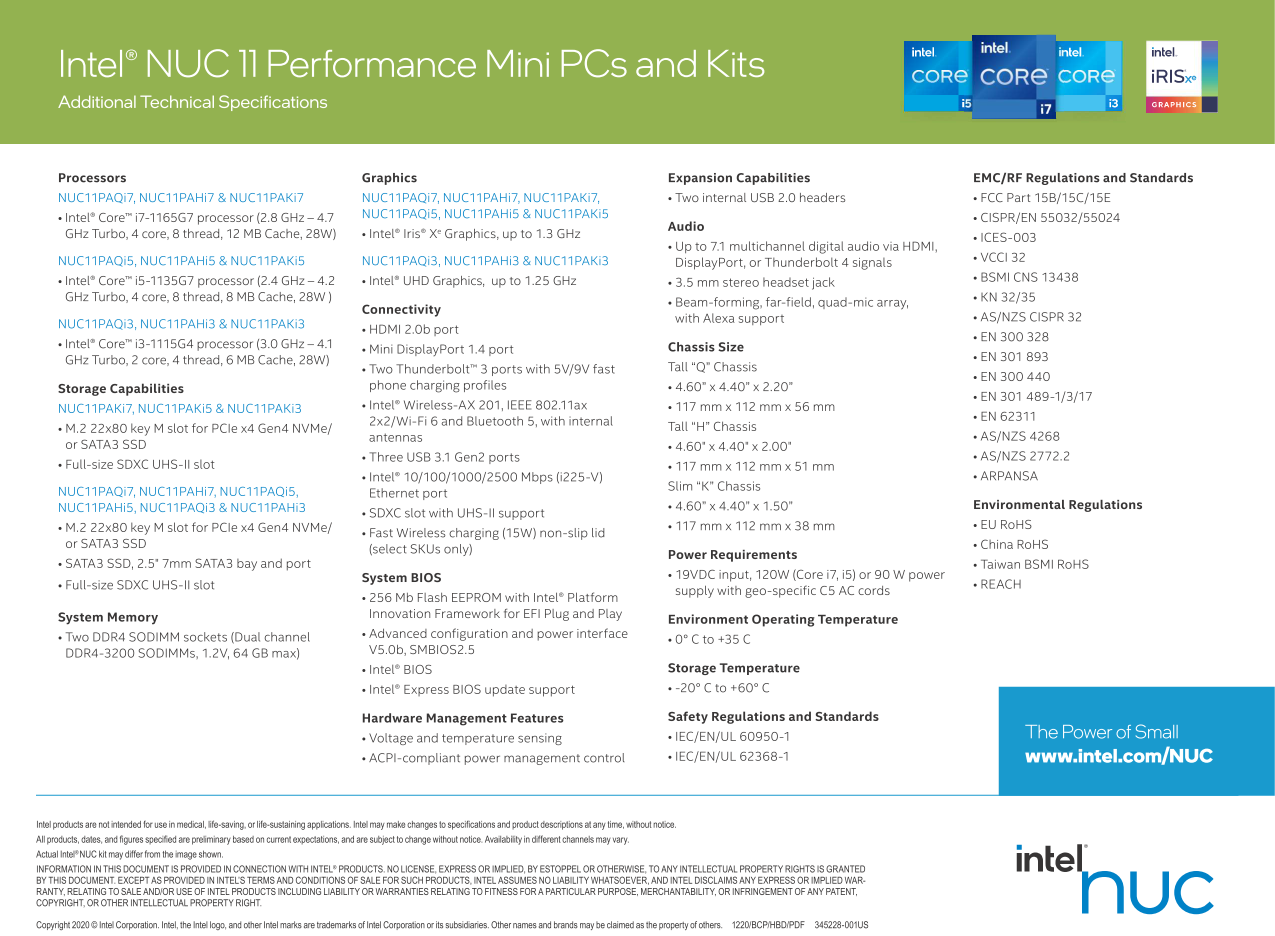
De NUC 11-serie volgt de NUC 10 van vorig jaar op door nieuwe chassisontwerpen te introduceren en de processoropties te updaten naar Tiger Lake-U. Er zijn drie modellen beschikbaar in verschillende formaten: de grote NUC11PAQ, de middelgrote NUC11PAH en de kleine NUC11PAK. De fysieke verschillen en kenmerken worden allemaal gedetailleerd beschreven in Intels officiële productbrochure hieronder.
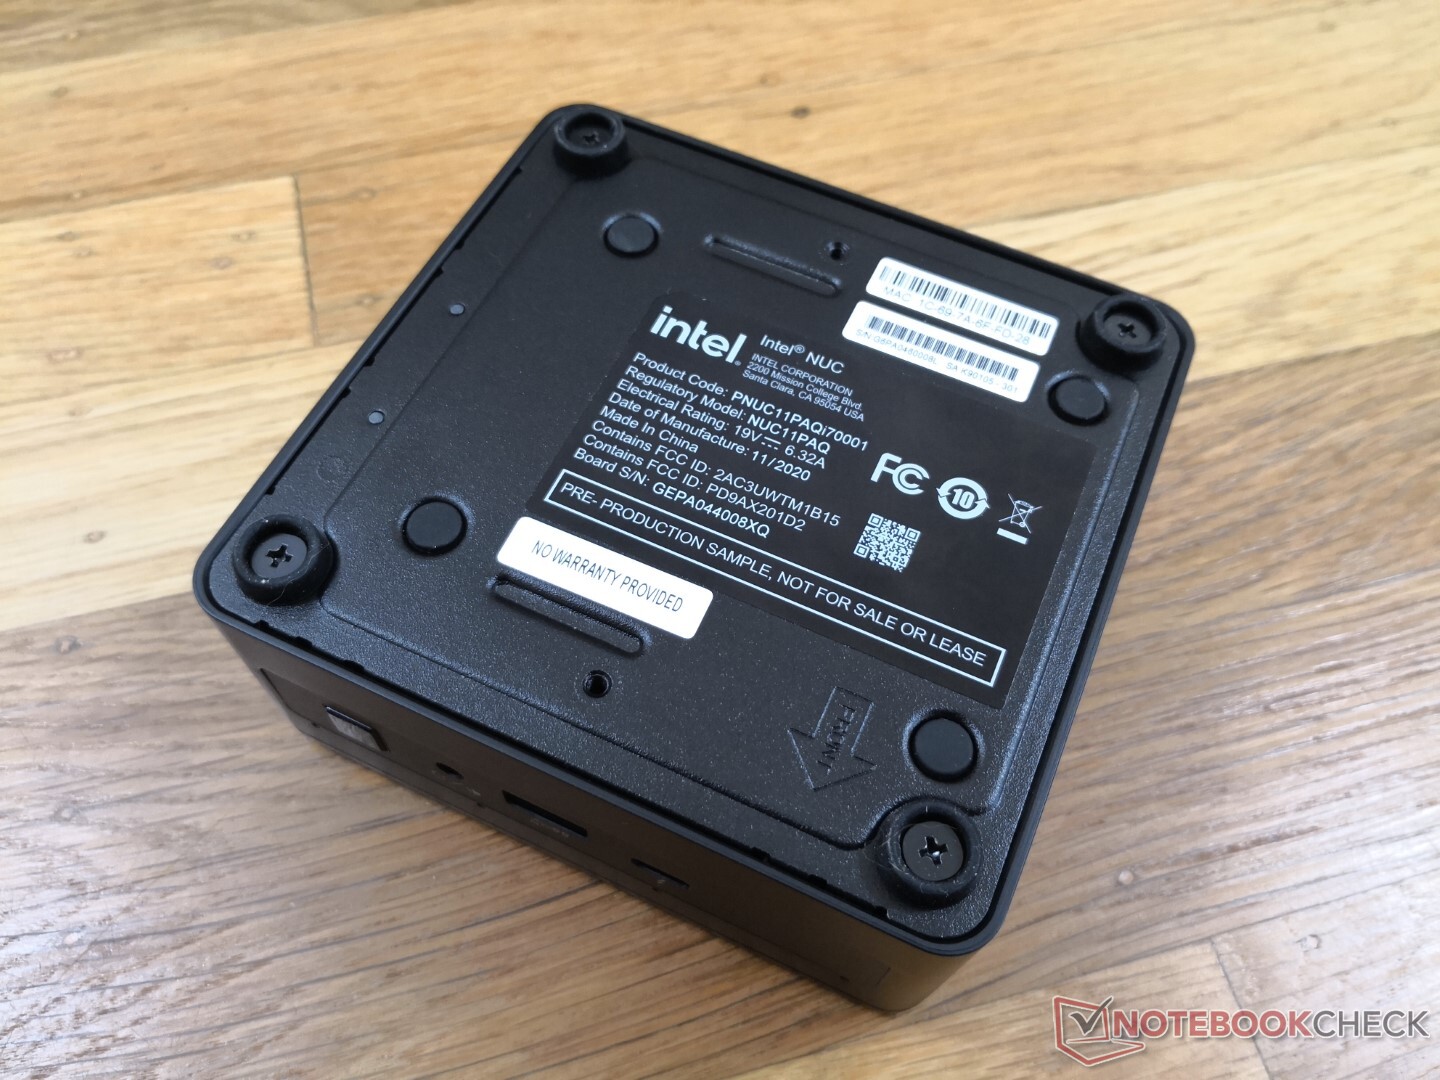
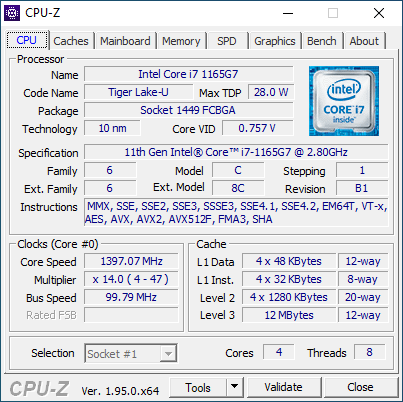
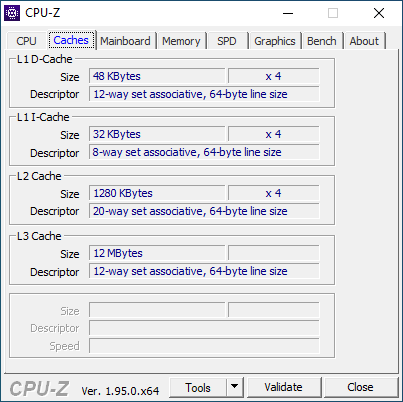
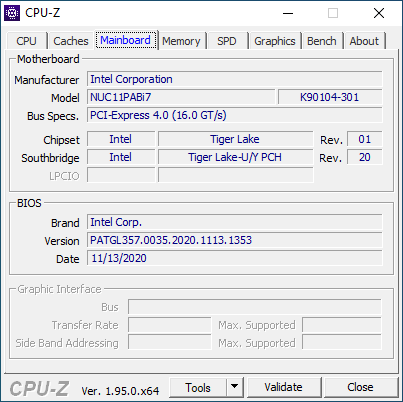
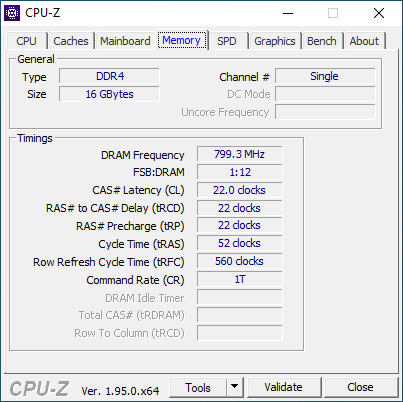
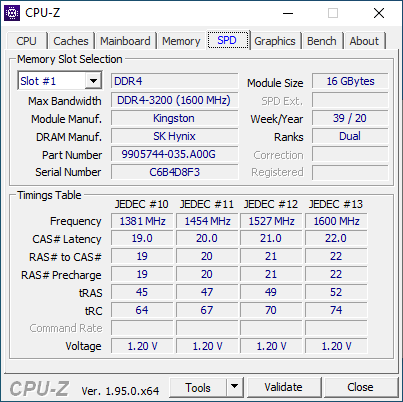
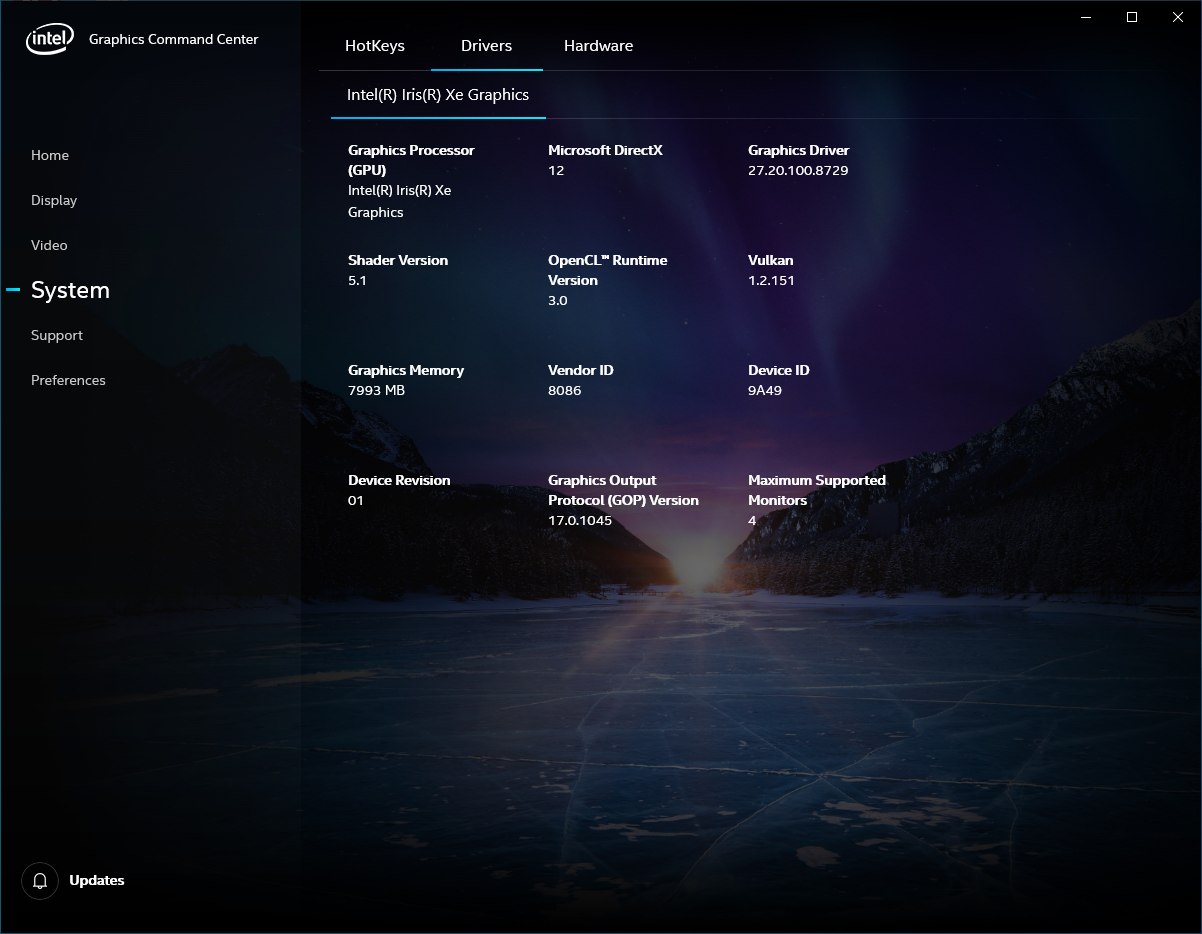
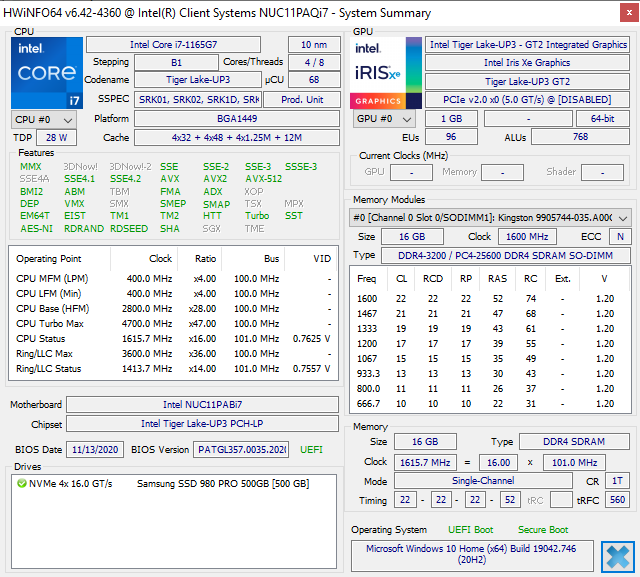
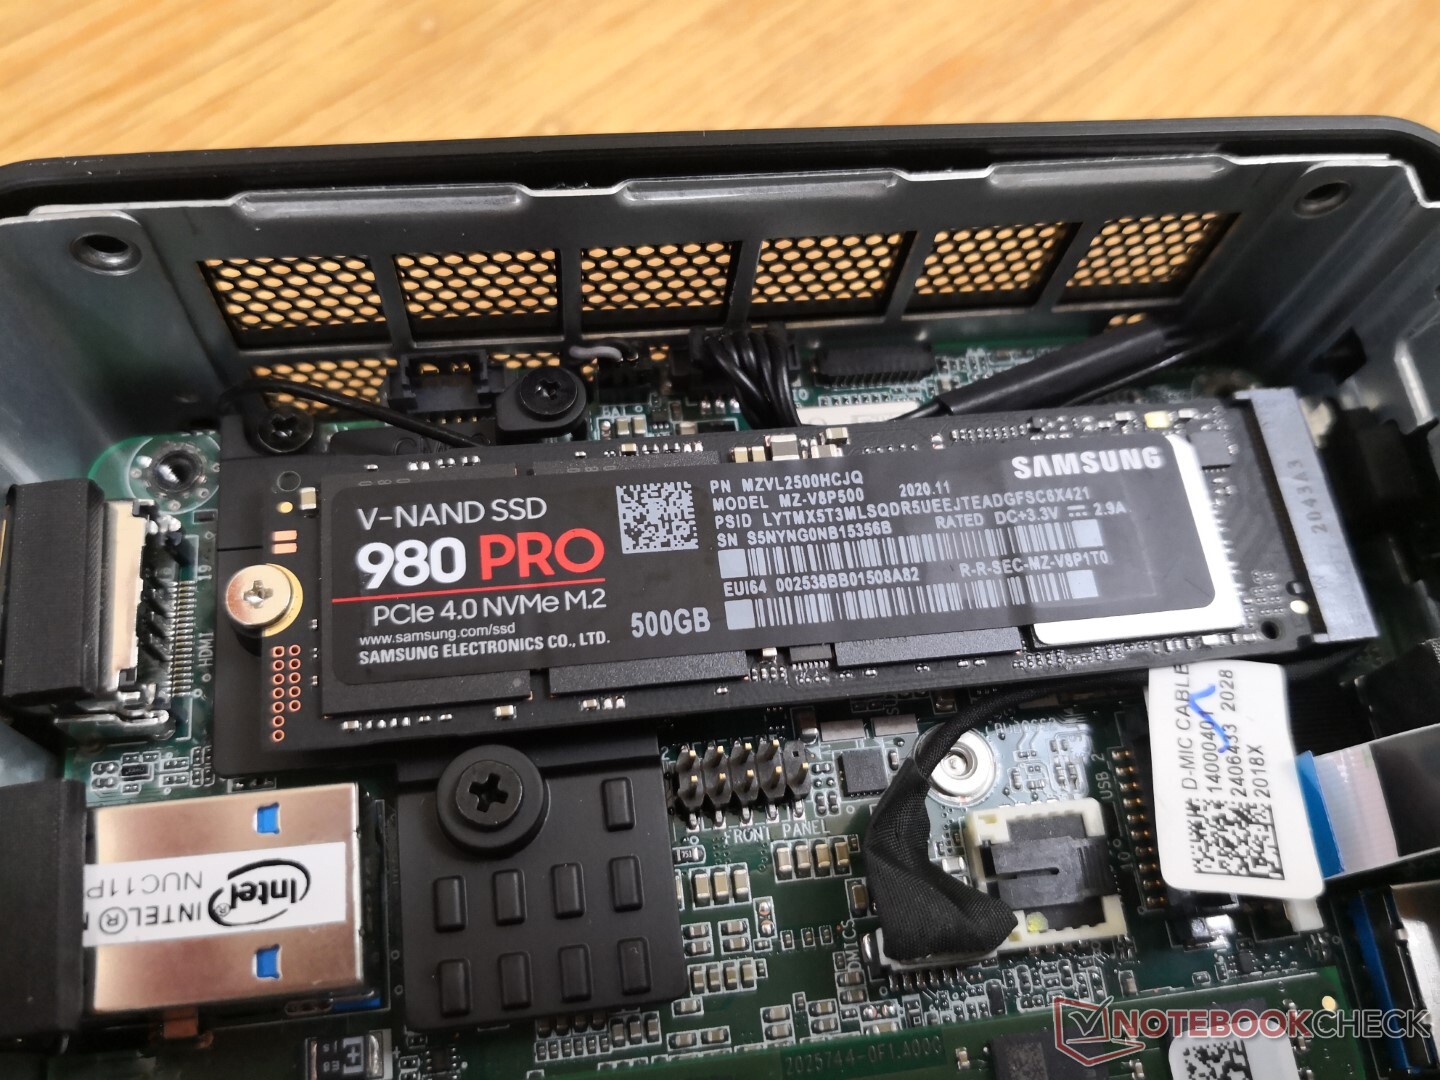
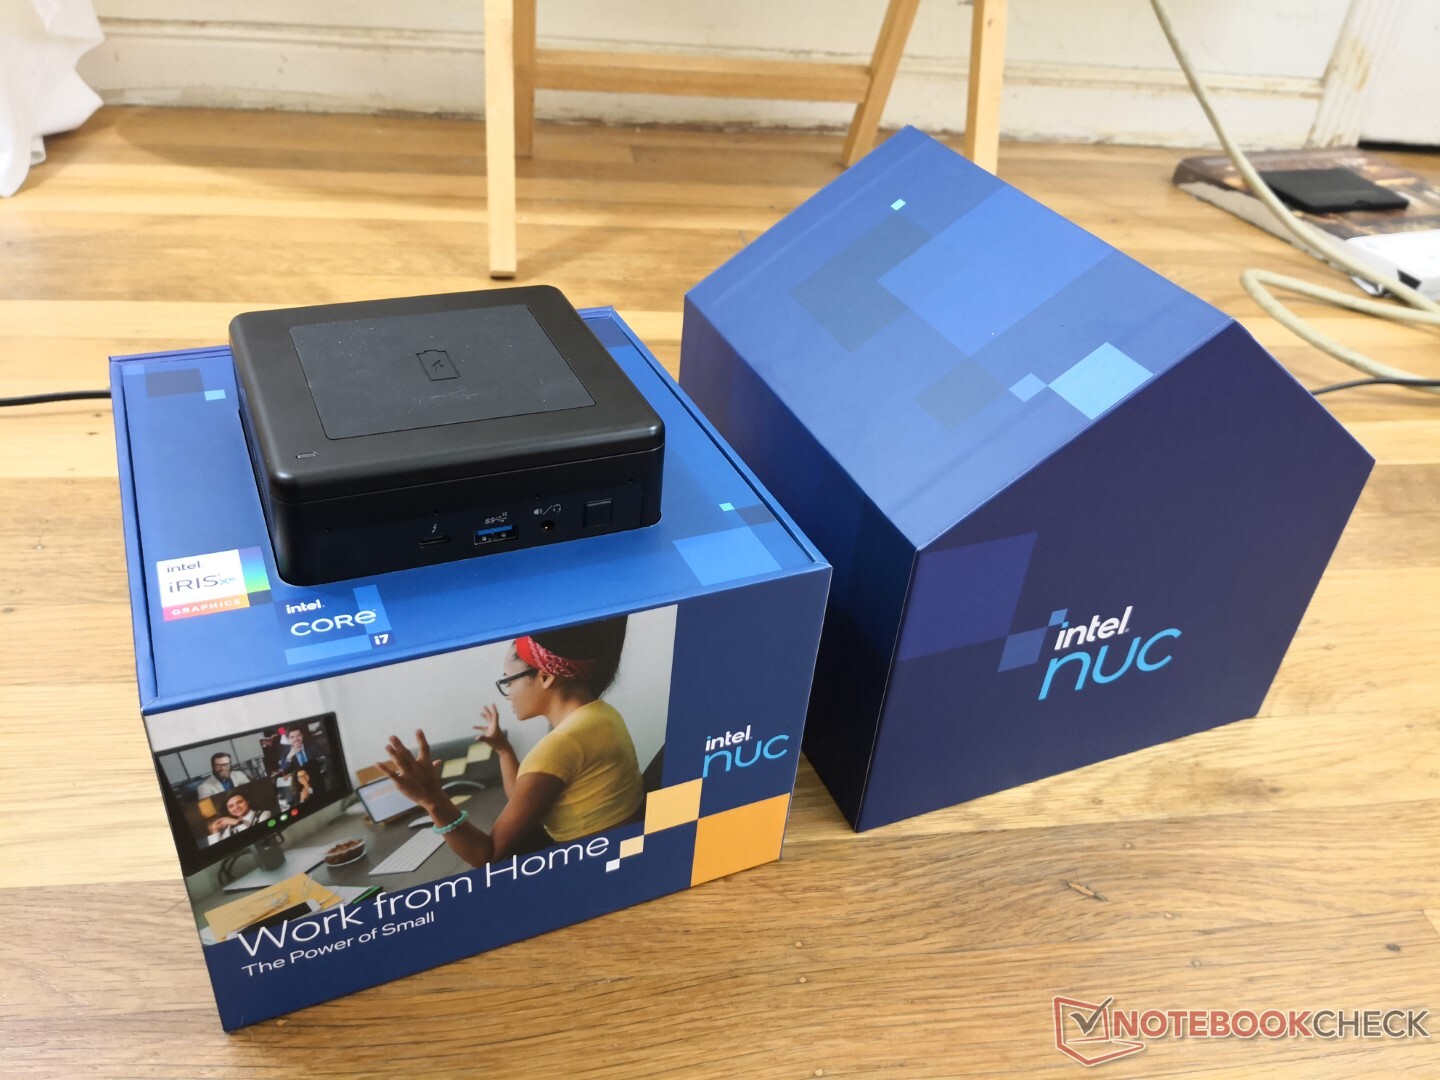
Onze beoordelingseenheid hier is de NUC11PAQ uitgerust met de Core i7-1165G7 CPU, 16 GB enkel-kanaals RAM, en 500 GB PCIe 4.0 Samsung 980 Pro NVMe SSD. Minder Core i5-1135G7 en Core i3-1115G4 SKU's zijn ook beschikbaar, alle met geïntegreerde Iris Xe graphics.
Meer Intel NUC reviews:
potential competitors in comparison
Evaluatie | Datum | Model | Gewicht | Hoogte | Formaat | Resolutie | Beste prijs |
|---|---|---|---|---|---|---|---|
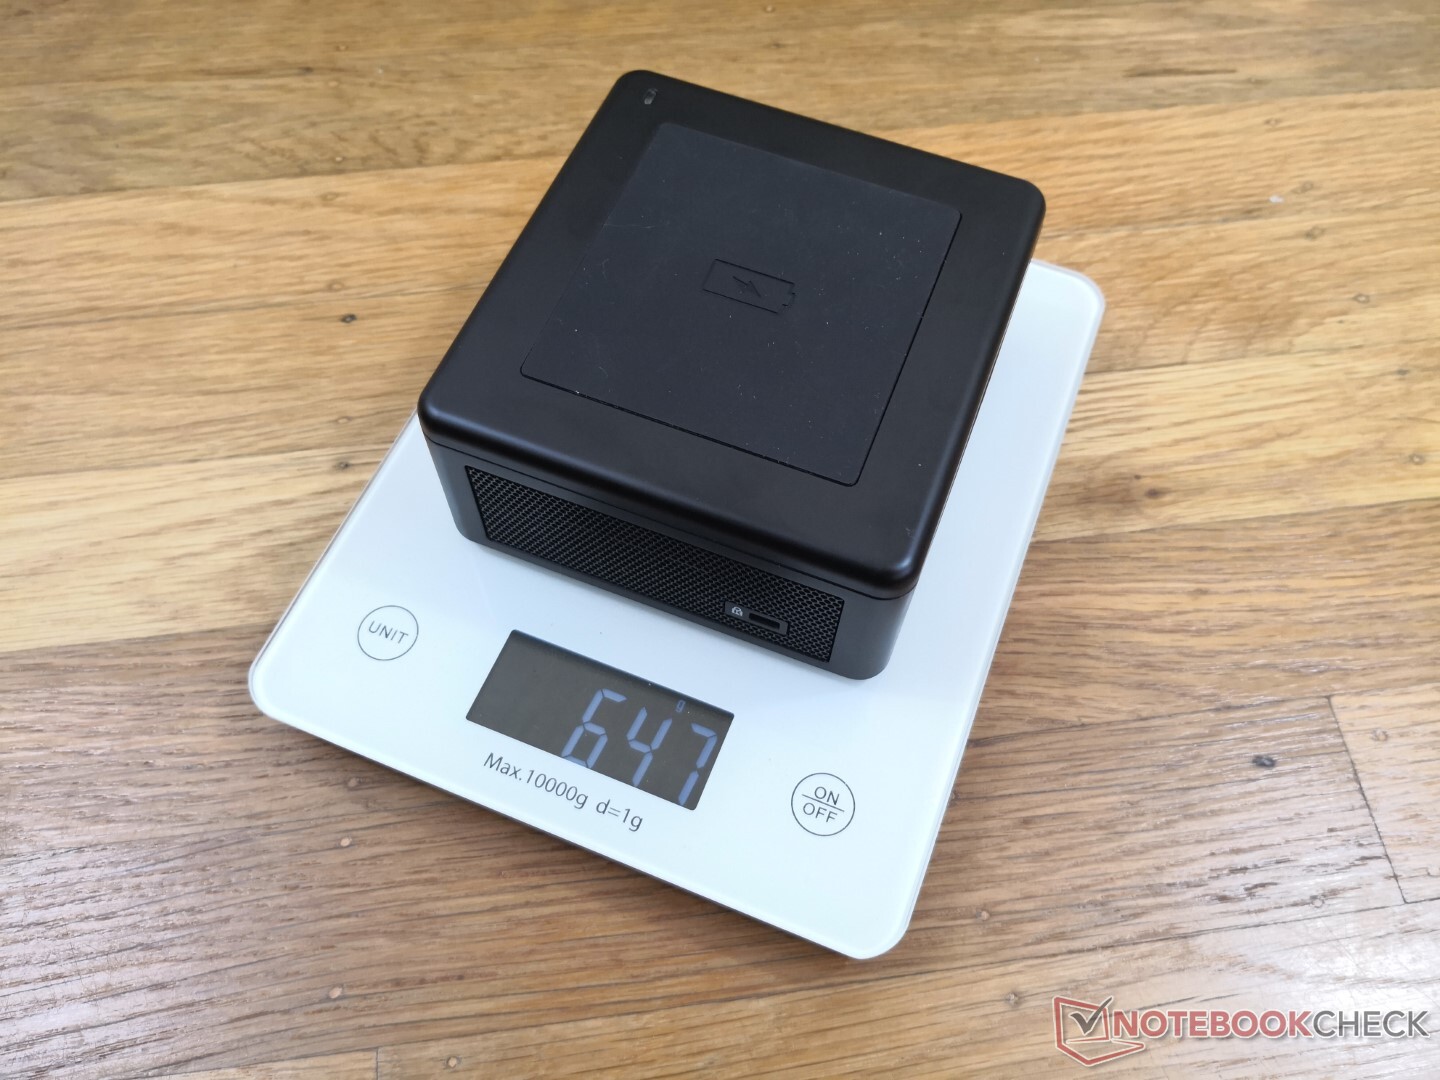
v (old) | 02-2021 | Intel NUC11PAQi7 i7-1165G7, Iris Xe G7 96EUs | 647 g | 56 mm | x | ||
v (old) | Intel NUC10i7FNH i7-10710U, UHD Graphics 620 | 697 g | 51 mm | 0.00" | 0x0 | ||
v (old) | 11-2018 | Intel NUC8i7BE i7-8559U, Iris Plus Graphics 655 | 683 g | 51 mm | x | ||
v (old) | 04-2018 | Intel Hades Canyon NUC8i7HVK i7-8809G, Vega M GH | 1.3 kg | 39 mm | x | ||
v (old) | Beelink SEi10 i3-1005G1, UHD Graphics G1 (Ice Lake 32 EU) | 350 g | 41 mm | x | |||
v (old) | Zotac ZBox MI643 i5-10210U, UHD Graphics 620 | 550 g | 28.5 mm | x |
Zaak
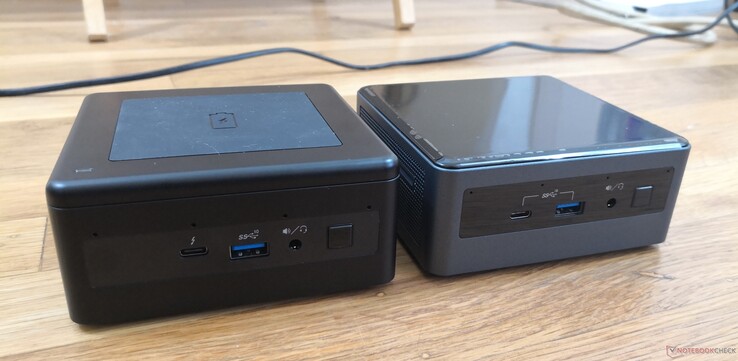
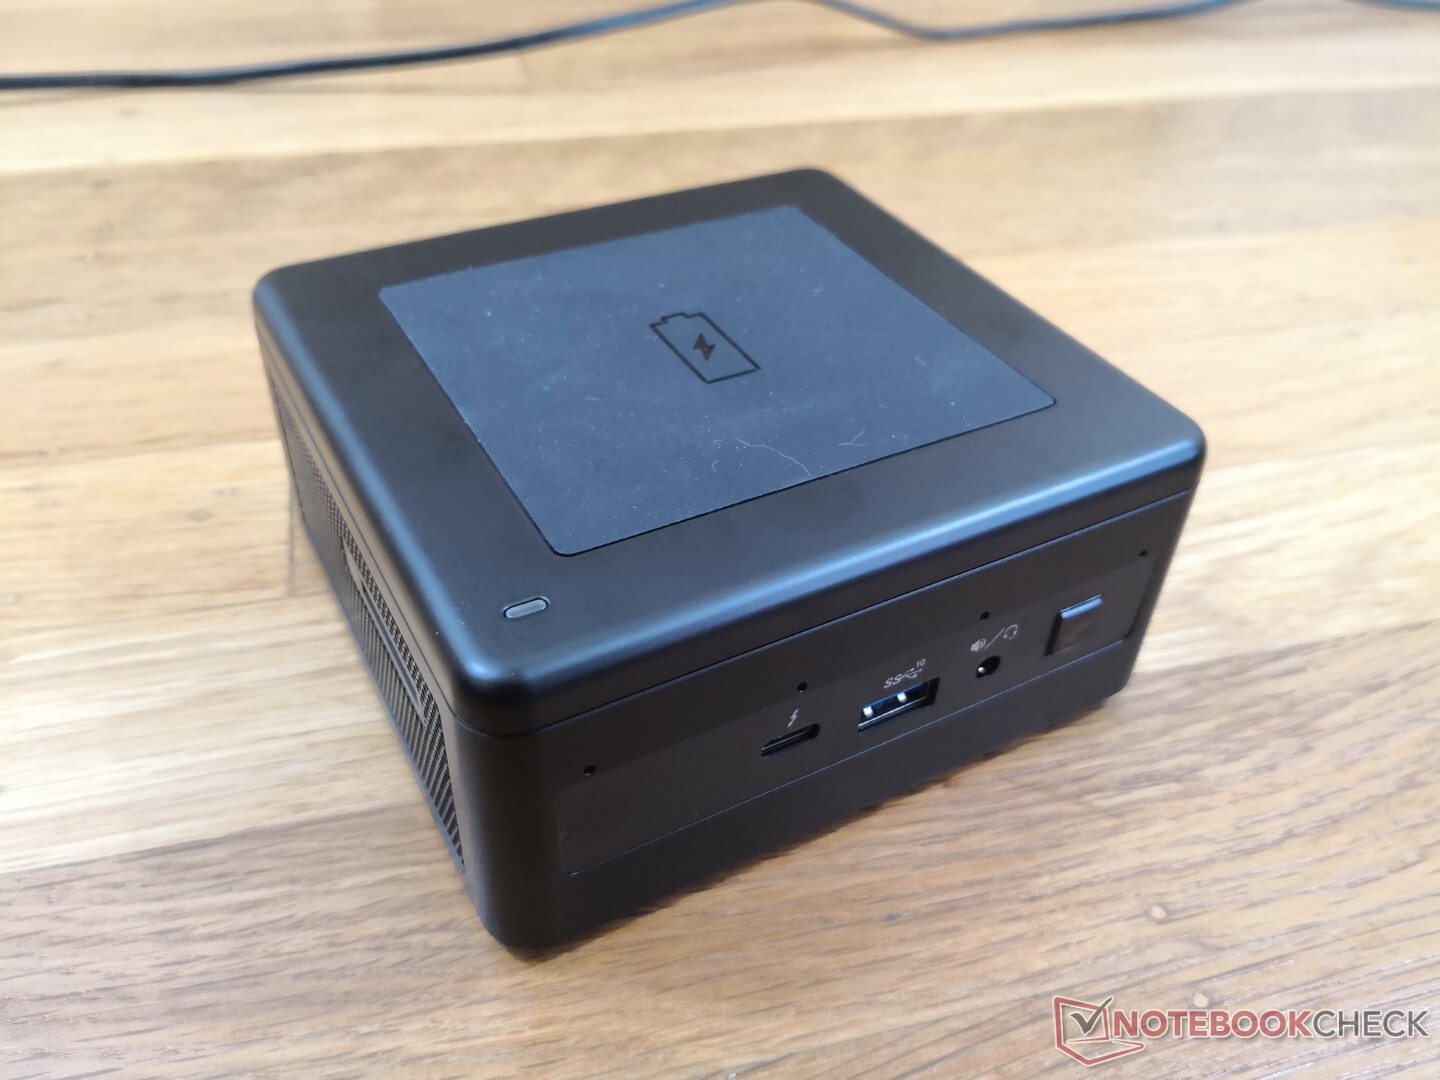
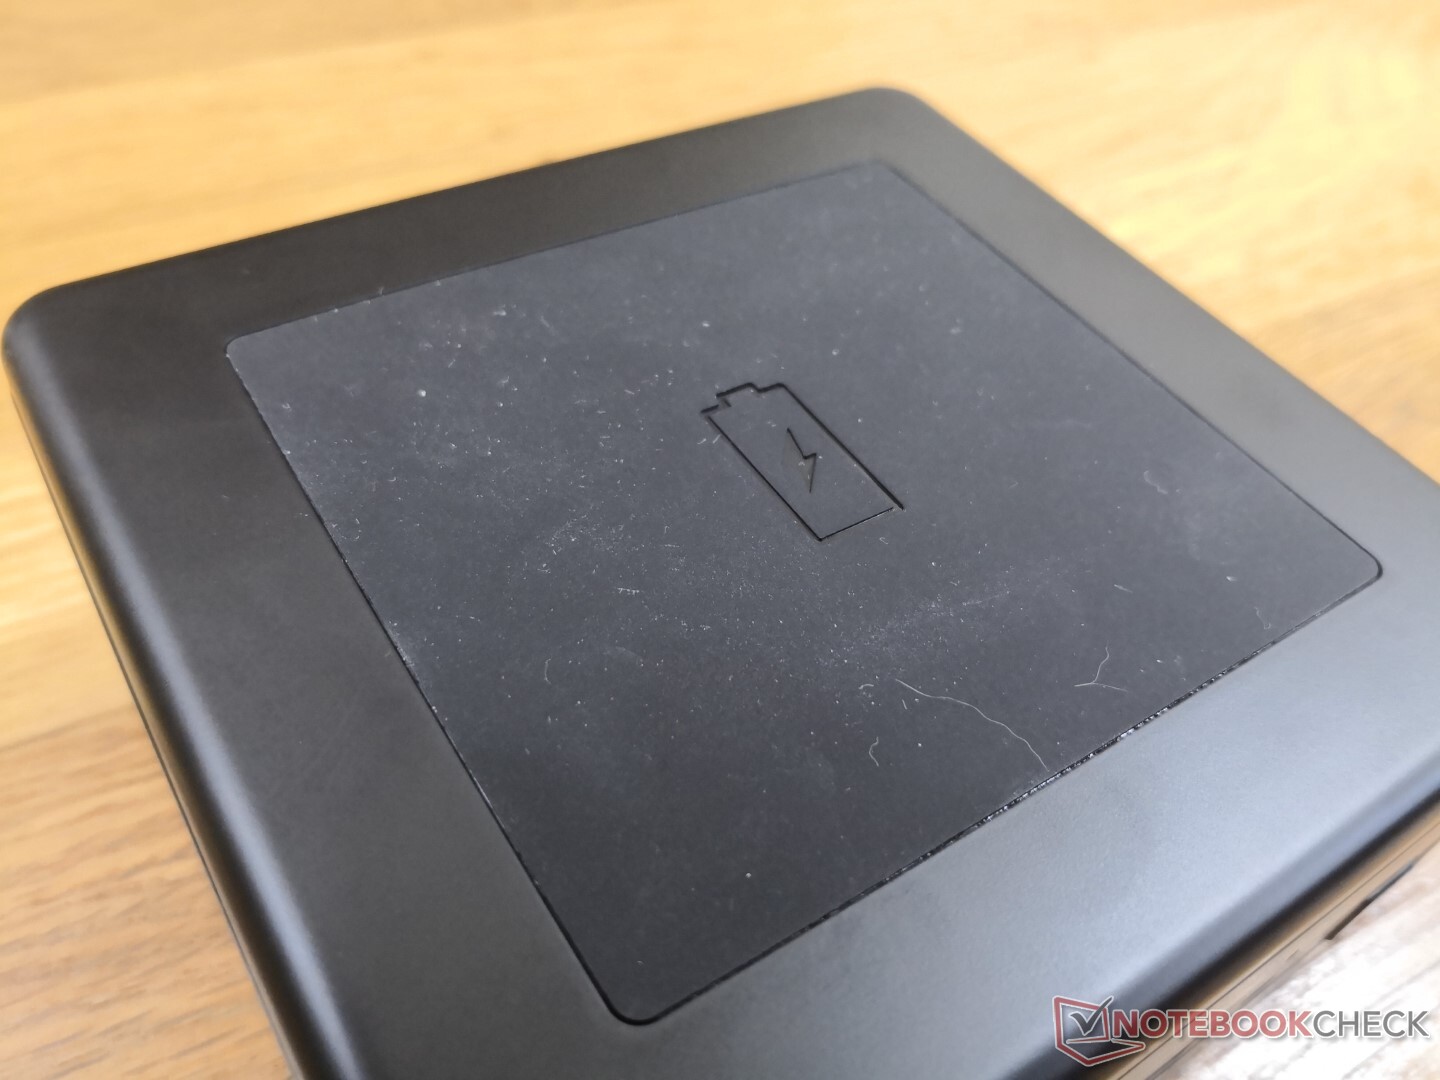
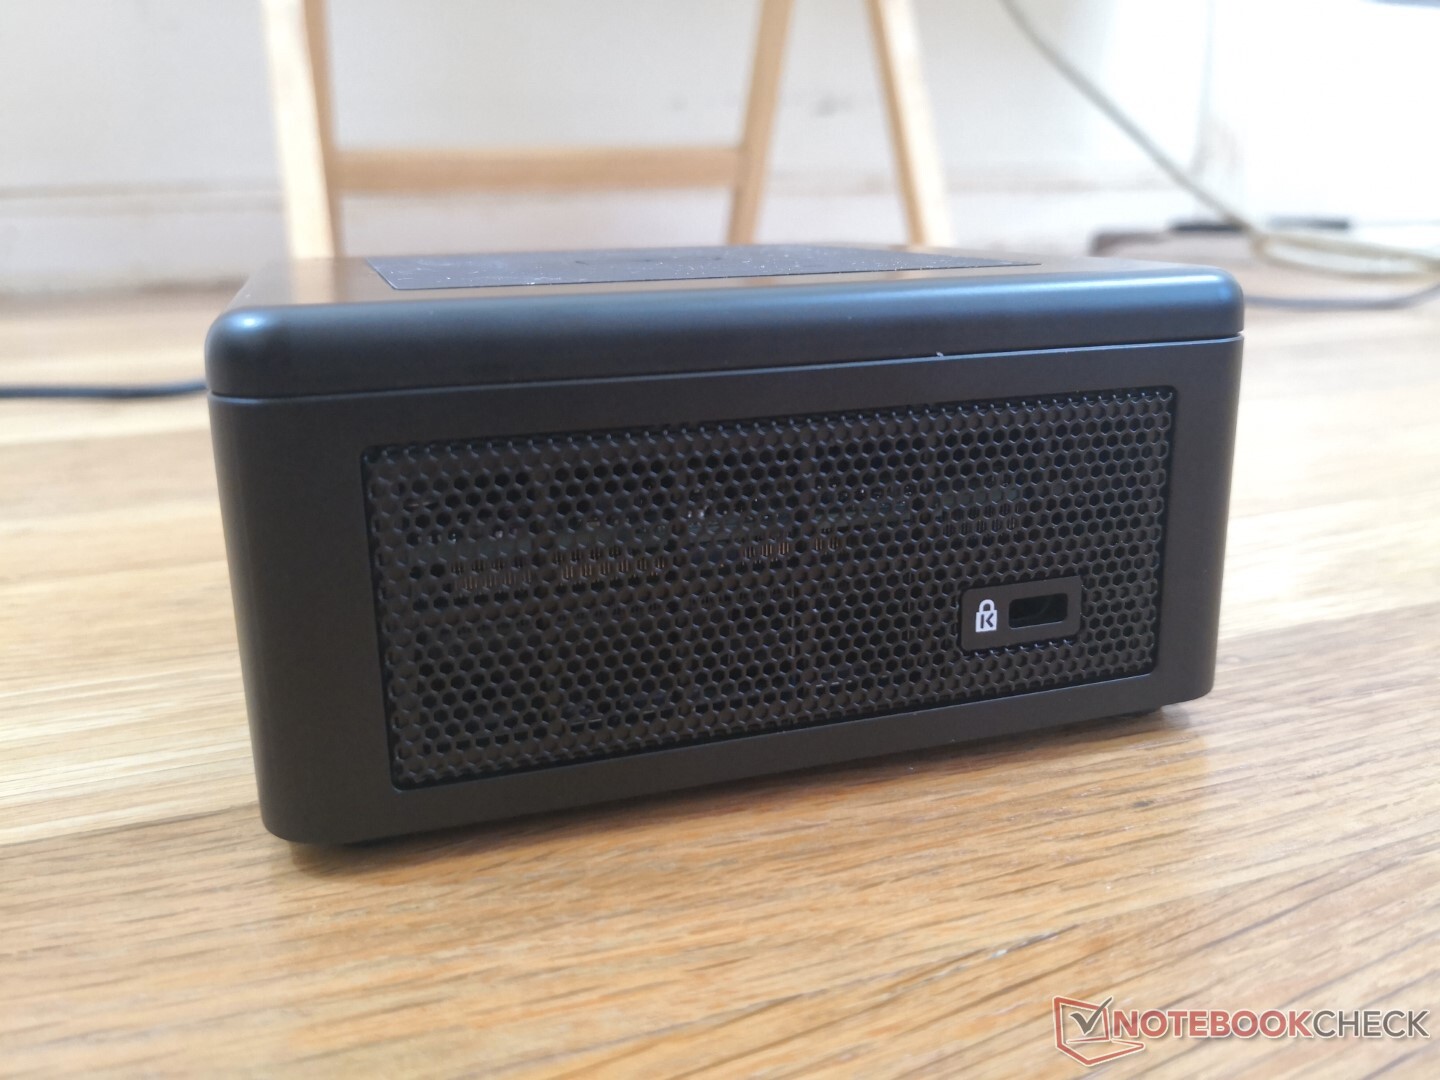
De NUC 11PAQ heeft de vertrouwde vorm en materialen van eerdere NUC-ontwerpen, maar met een nieuwe rubberen Qi-oplaad "mat" bovenop. Het ziet er sjieker uit dan het gladde glanzende plastic op de NUC 10 van vorig jaar, maar het rubberen oppervlak zal stof en vacht aantrekken als geen ander. De nieuwe functie zal ook nutteloos zijn voor eigenaars die van plan zijn hun NUC-eenheden onder tafels te verbergen of ze verticaal achter monitoren te monteren
Connectiviteit
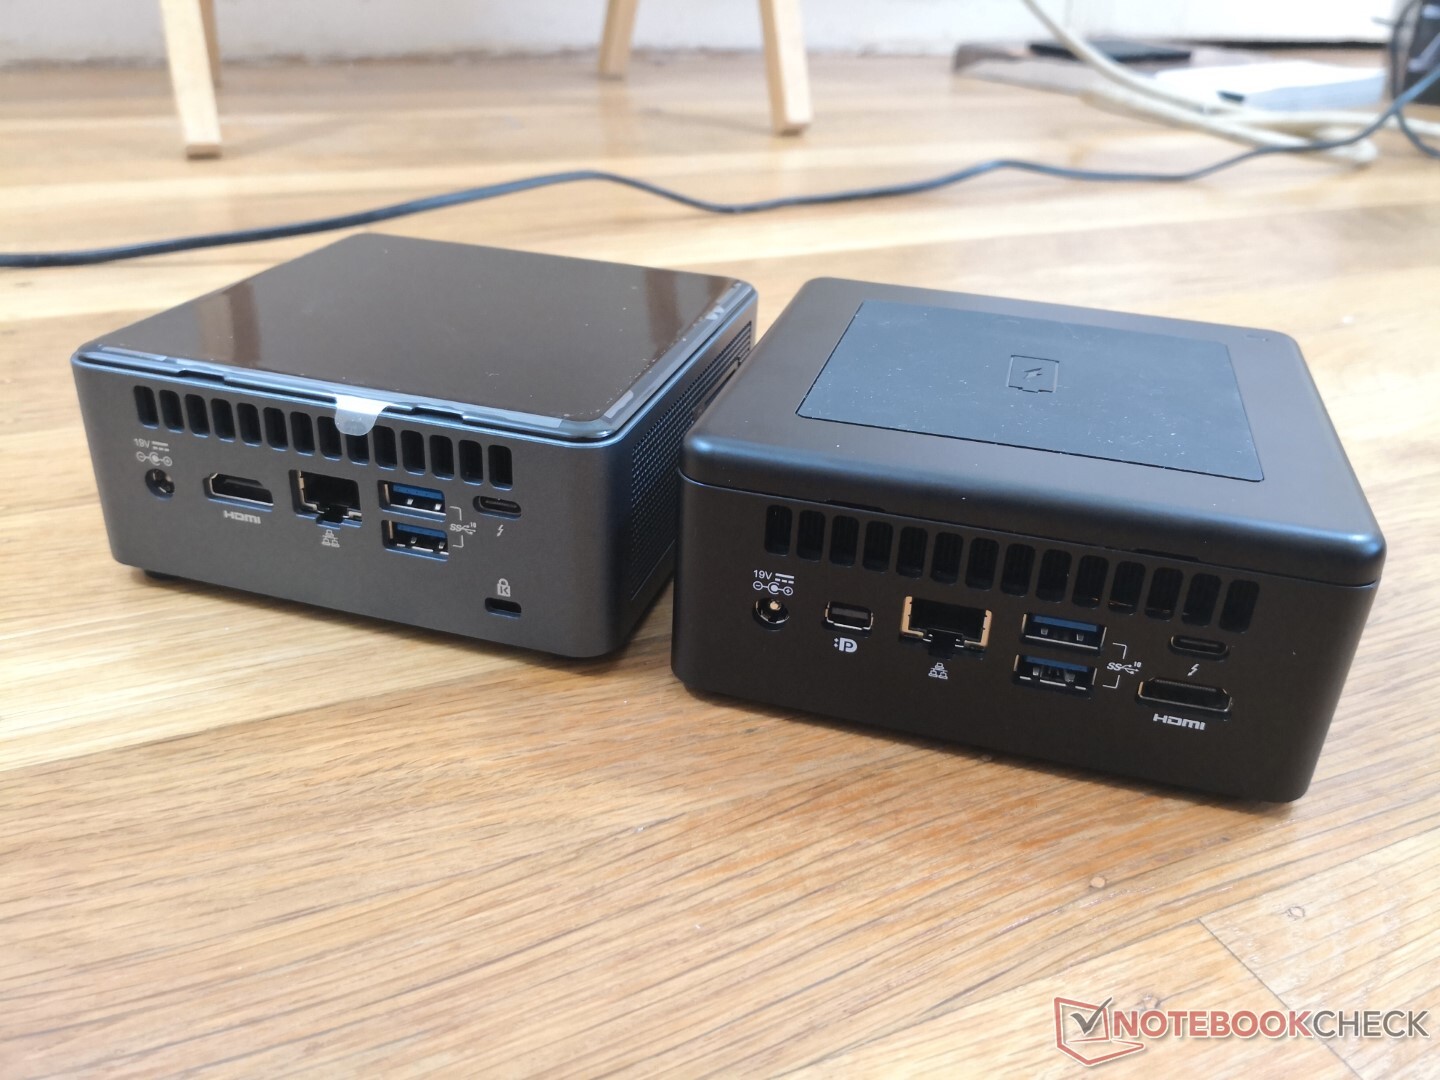
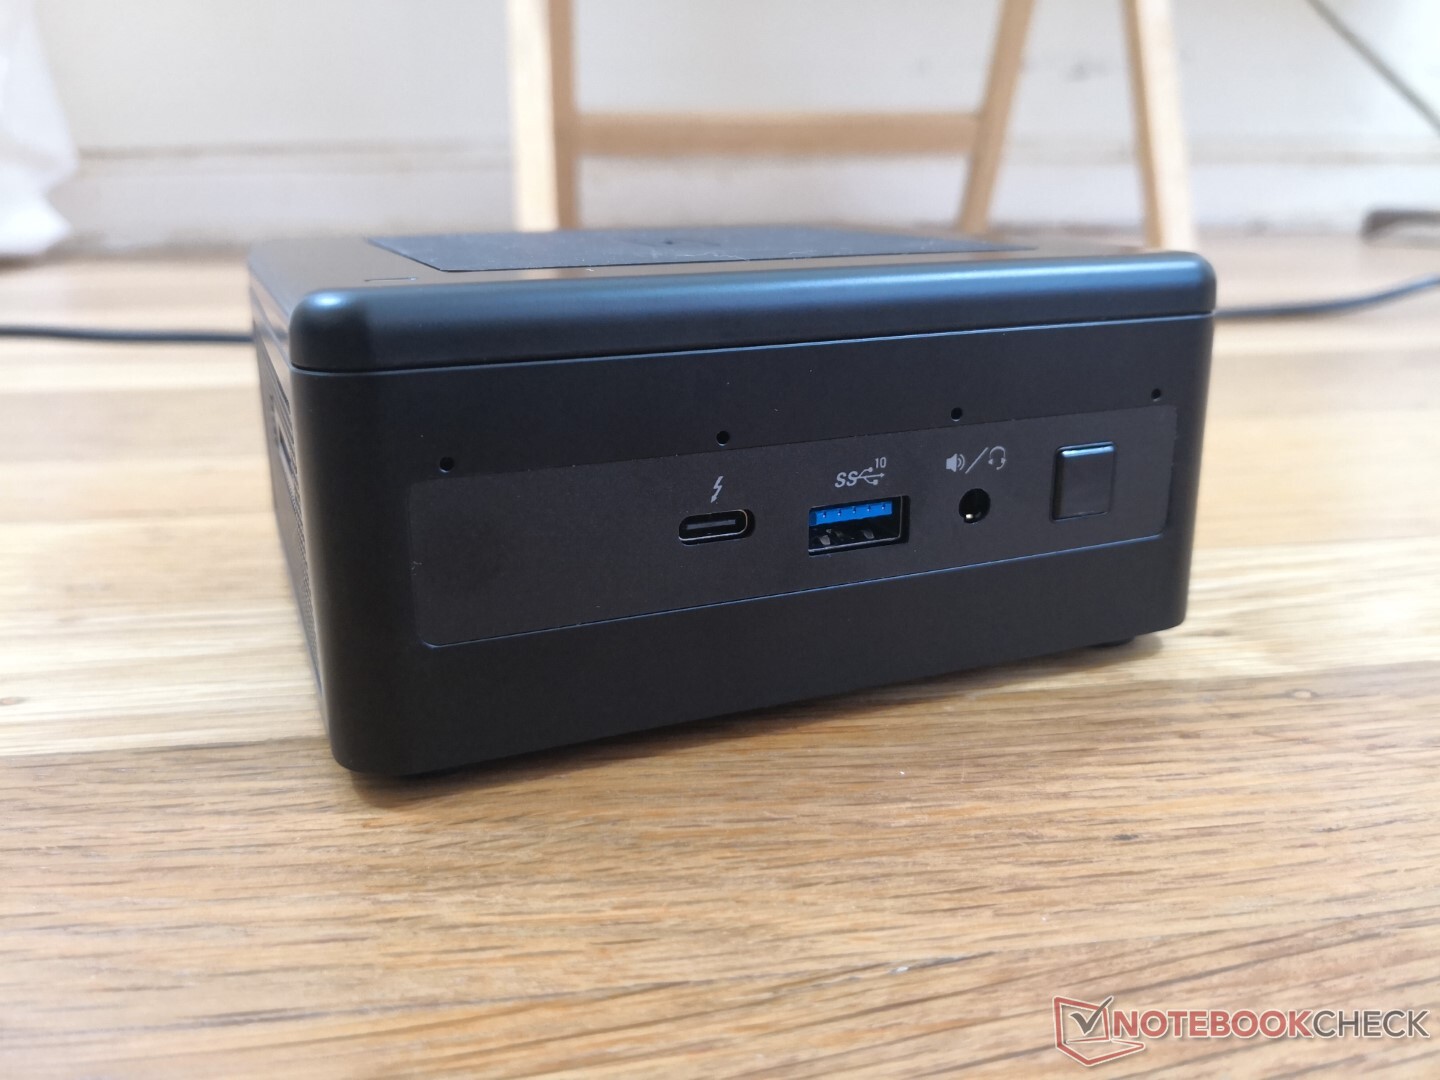
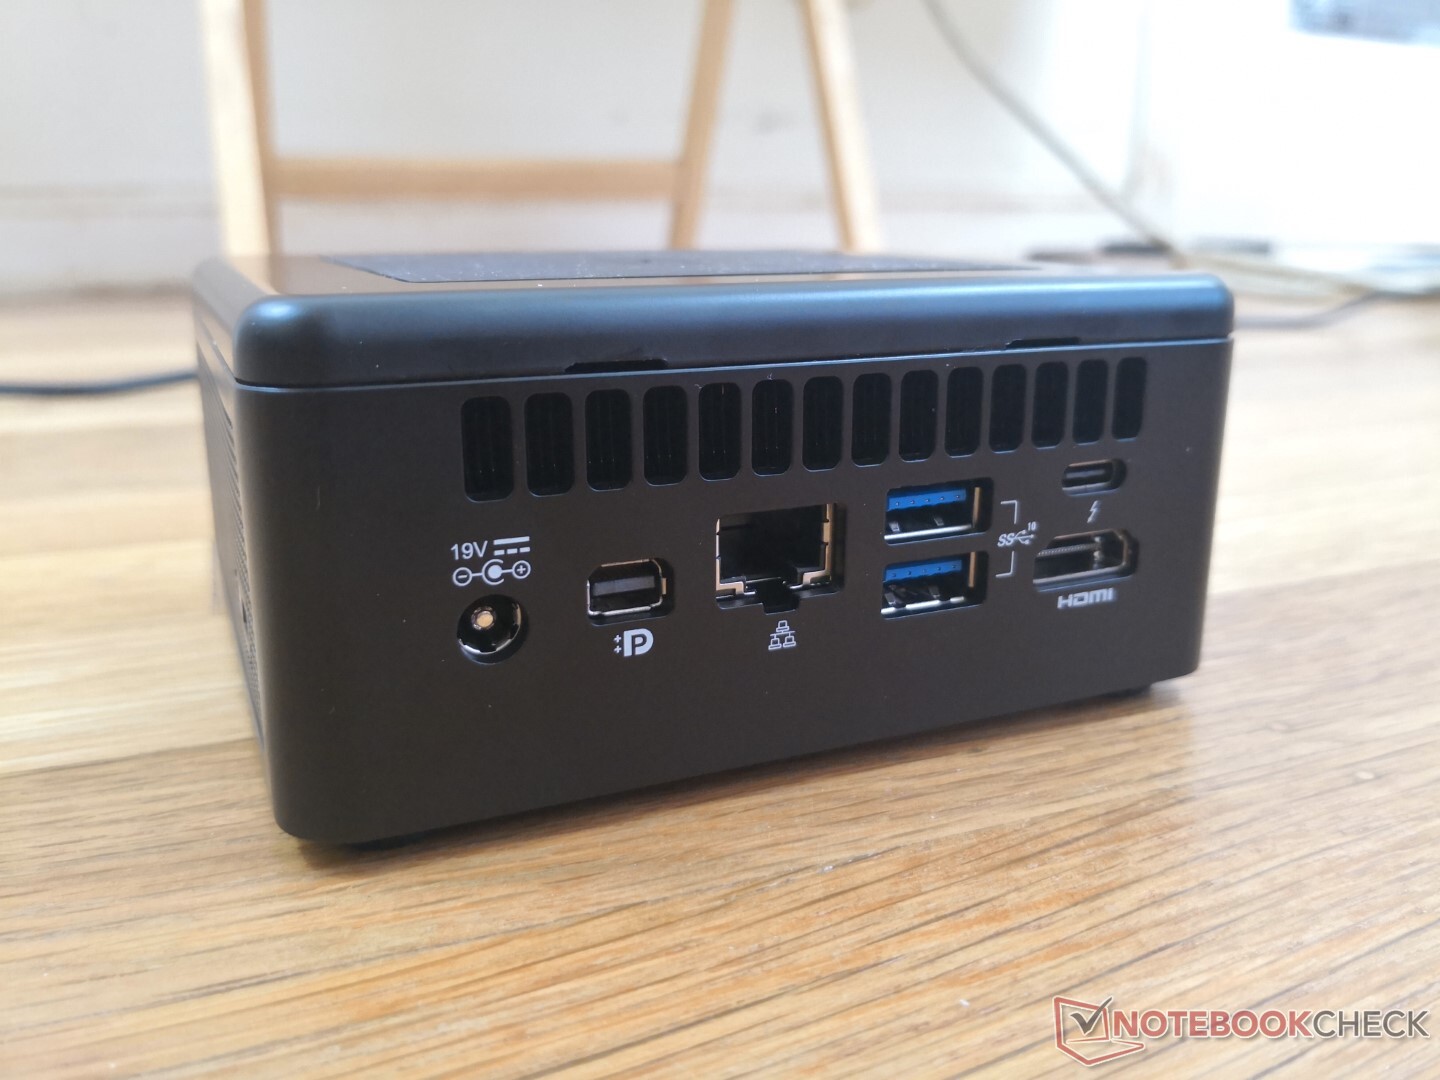
De NUC 11 bevat alle poorten van de NUC 10, zij het in een iets andere volgorde. Een nieuwe toevoeging is mini DisplayPort 1.4 als vierde video-uitvoeroptie naast de bestaande HDMI- en 2x Thunderbolt 3-poorten.
Helaas is de eigen AC-adapter nog steeds vereist om de NUC van stroom te voorzien, aangezien geen van de USB-C poorten power-in ondersteunt.
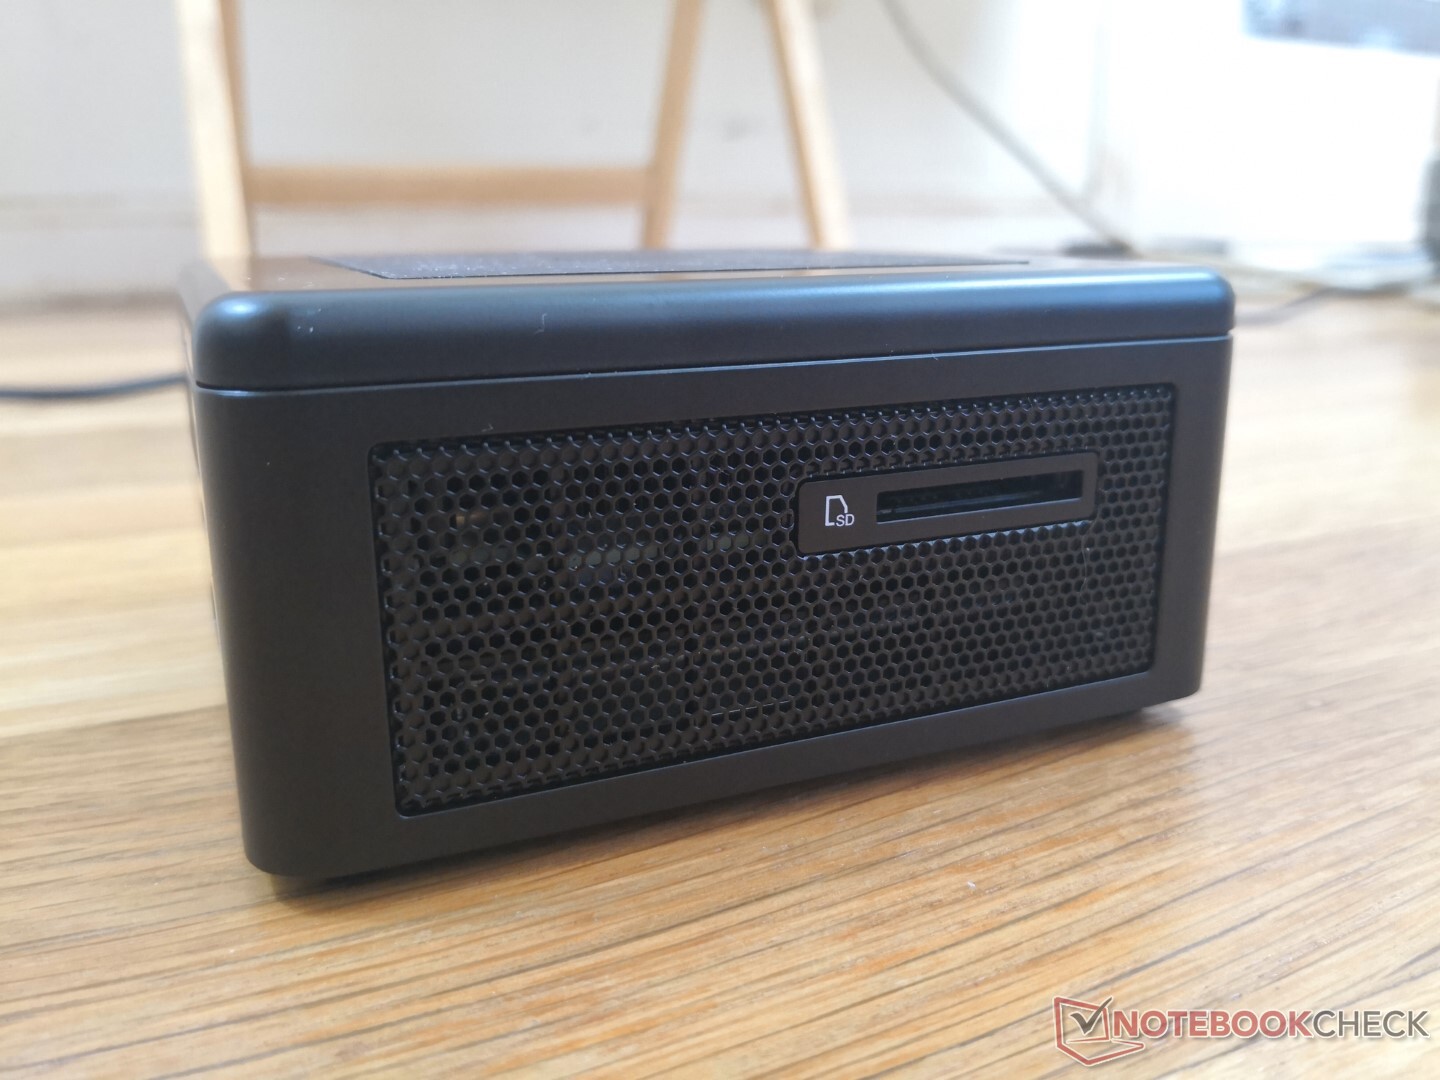
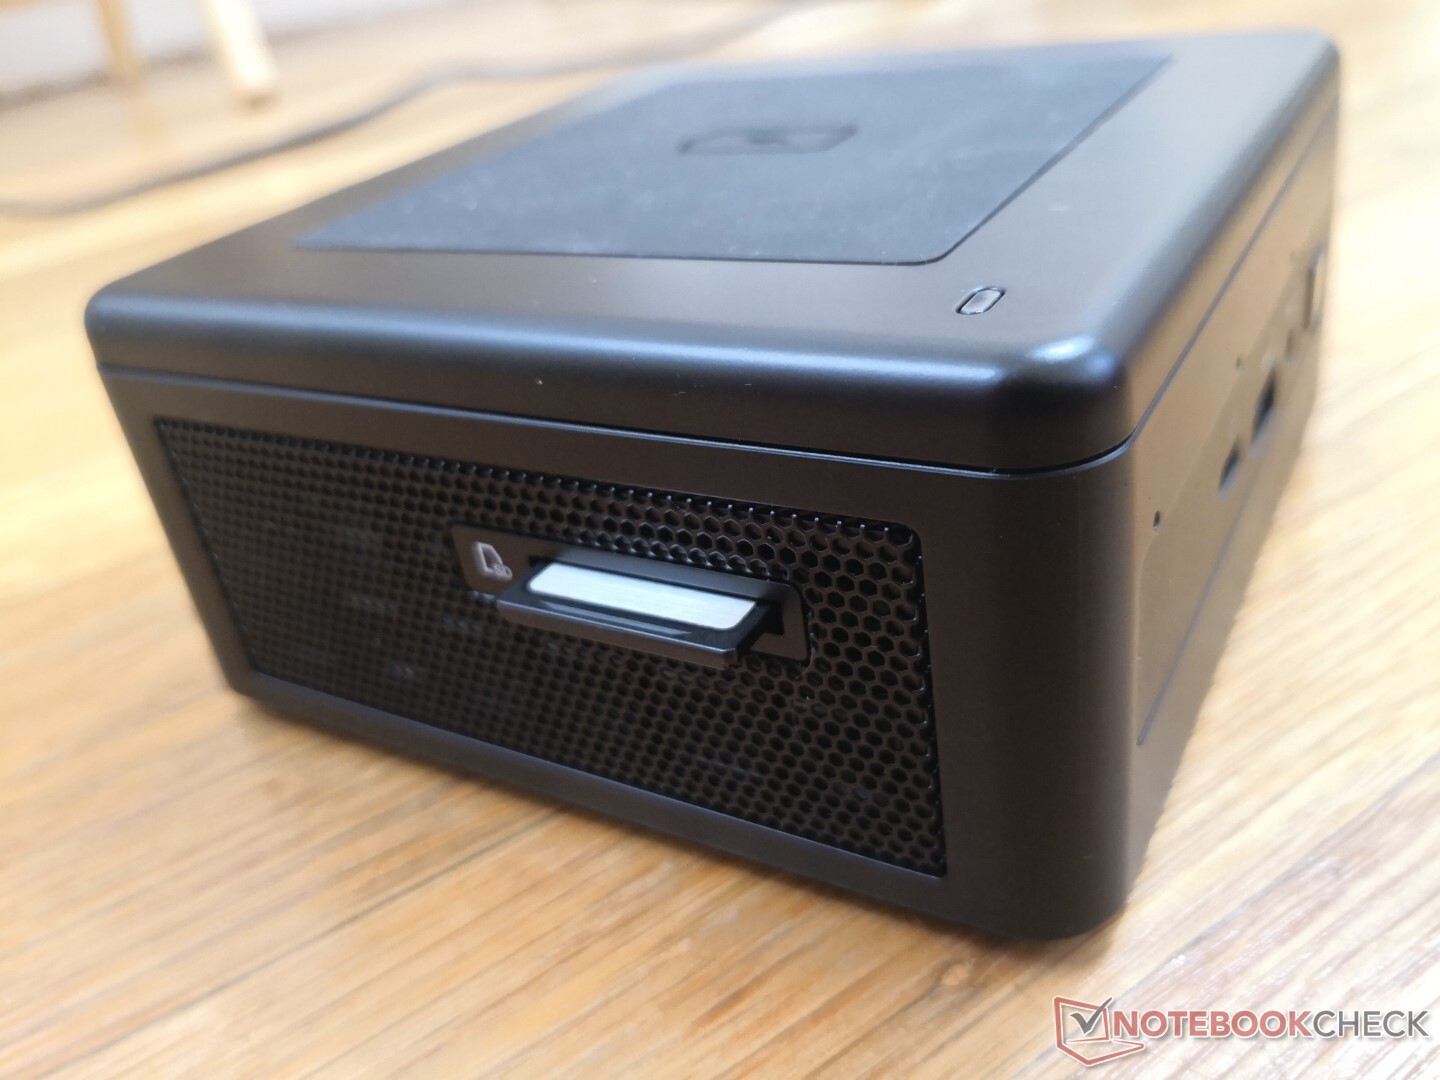
SD-kaartlezer
Overdrachtssnelheden van de geïntegreerde kaartlezer zijn meer dan twee keer zo snel als op de oudere Hades Canyon NUC. Het verplaatsen van 1 GB aan bestanden van onze UHS-II testkaart duurt ongeveer 5 tot 6 seconden, vergeleken met 12 seconden op de Hades Canyon.
| SD Card Reader | |
| average JPG Copy Test (av. of 3 runs) | |
| Intel NUC11PAQi7 (Toshiba Exceria Pro SDXC 64 GB UHS-II) | |
| Intel Hades Canyon NUC8i7HVK (Toshiba Exceria Pro SDXC 64 GB UHS-II) | |
| Intel NUC8i7BE (Toshiba Exceria Pro M501 UHS-II) | |
| Zotac ZBox MI643 (Toshiba Exceria Pro M501 UHS-II) | |
| Beelink SEi10 (Toshiba Exceria Pro M501 UHS-II) | |
| maximum AS SSD Seq Read Test (1GB) | |
| Intel NUC11PAQi7 (Toshiba Exceria Pro SDXC 64 GB UHS-II) | |
| Intel Hades Canyon NUC8i7HVK (Toshiba Exceria Pro SDXC 64 GB UHS-II) | |
| Intel NUC8i7BE (Toshiba Exceria Pro M501 UHS-II) | |
| Zotac ZBox MI643 (Toshiba Exceria Pro M501 UHS-II) | |
| Beelink SEi10 (Toshiba Exceria Pro M501 UHS-II) | |
Communicatie
Wi-Fi 6 en Bluetooth 5.1 zijn standaard aanwezig via de Intel AX201. Hoewel we geen connectiviteitsproblemen hebben ondervonden, zijn de ruwe overdrachtssnelheden ongeveer de helft trager dan verwacht in vergelijking met laptops met dezelfde AX201-module. We vermoeden dat dit te wijten kan zijn aan de zwakkere antenne in de NUC.
| Networking | |
| iperf3 transmit AX12 | |
| Beelink SEi10 | |
| Intel NUC8i7BE | |
| Intel NUC11PAQi7 | |
| Intel Hades Canyon NUC8i7HVK | |
| Zotac ZBox MI643 | |
| iperf3 receive AX12 | |
| Beelink SEi10 | |
| Intel NUC11PAQi7 | |
| Intel NUC8i7BE | |
| Intel Hades Canyon NUC8i7HVK | |
| Zotac ZBox MI643 | |
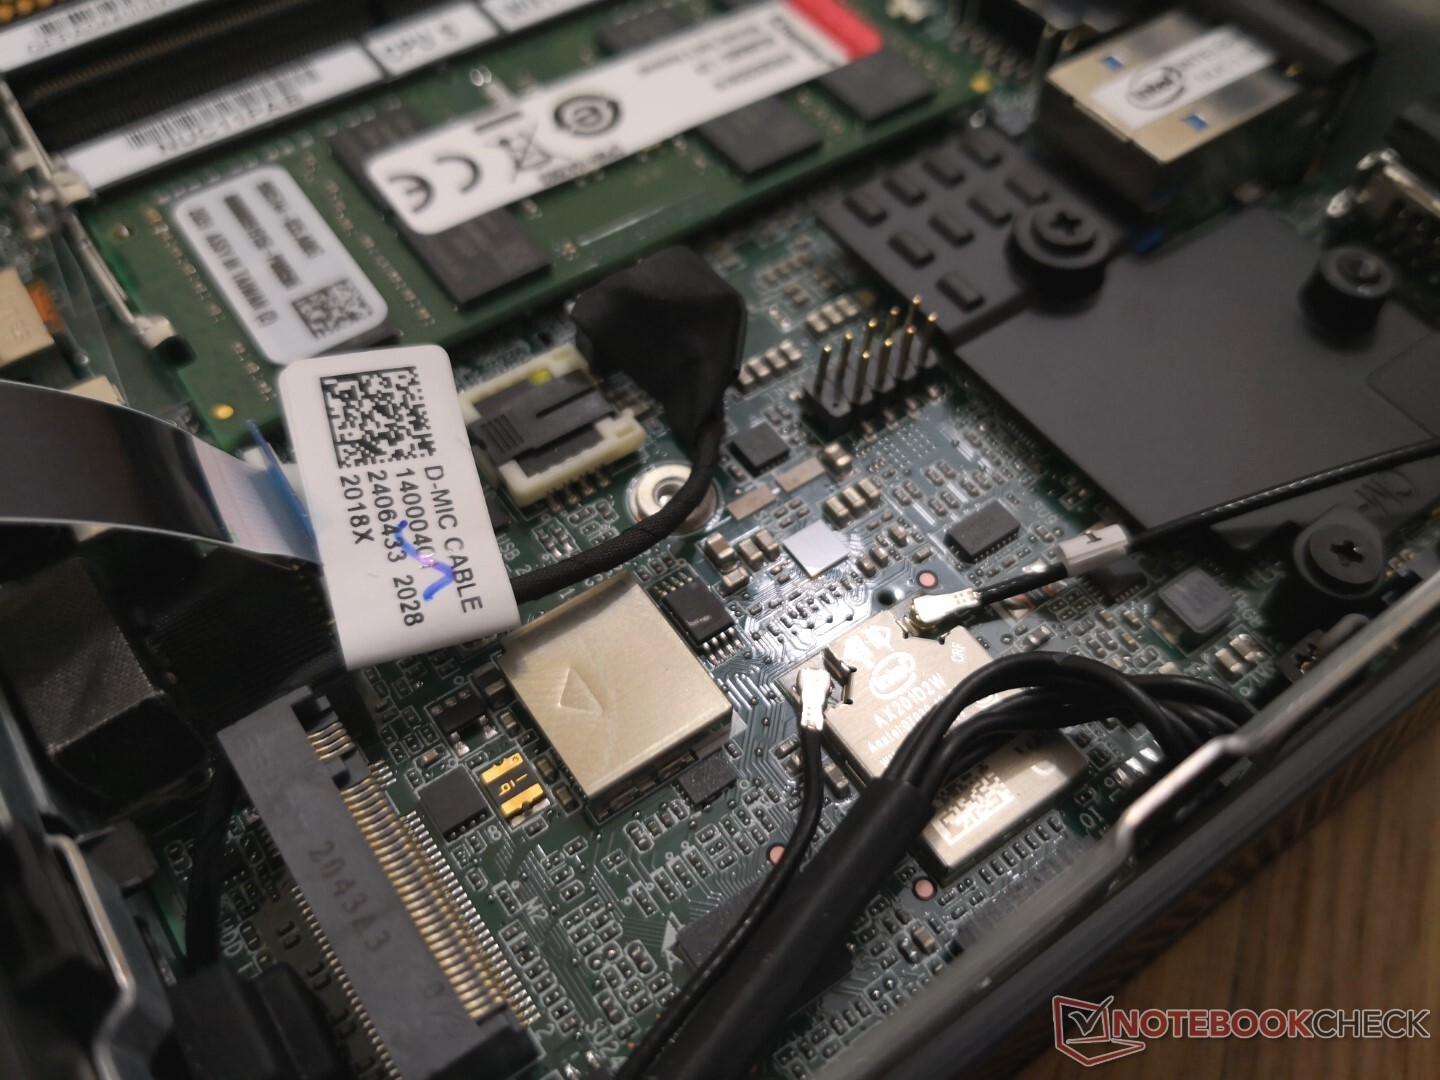
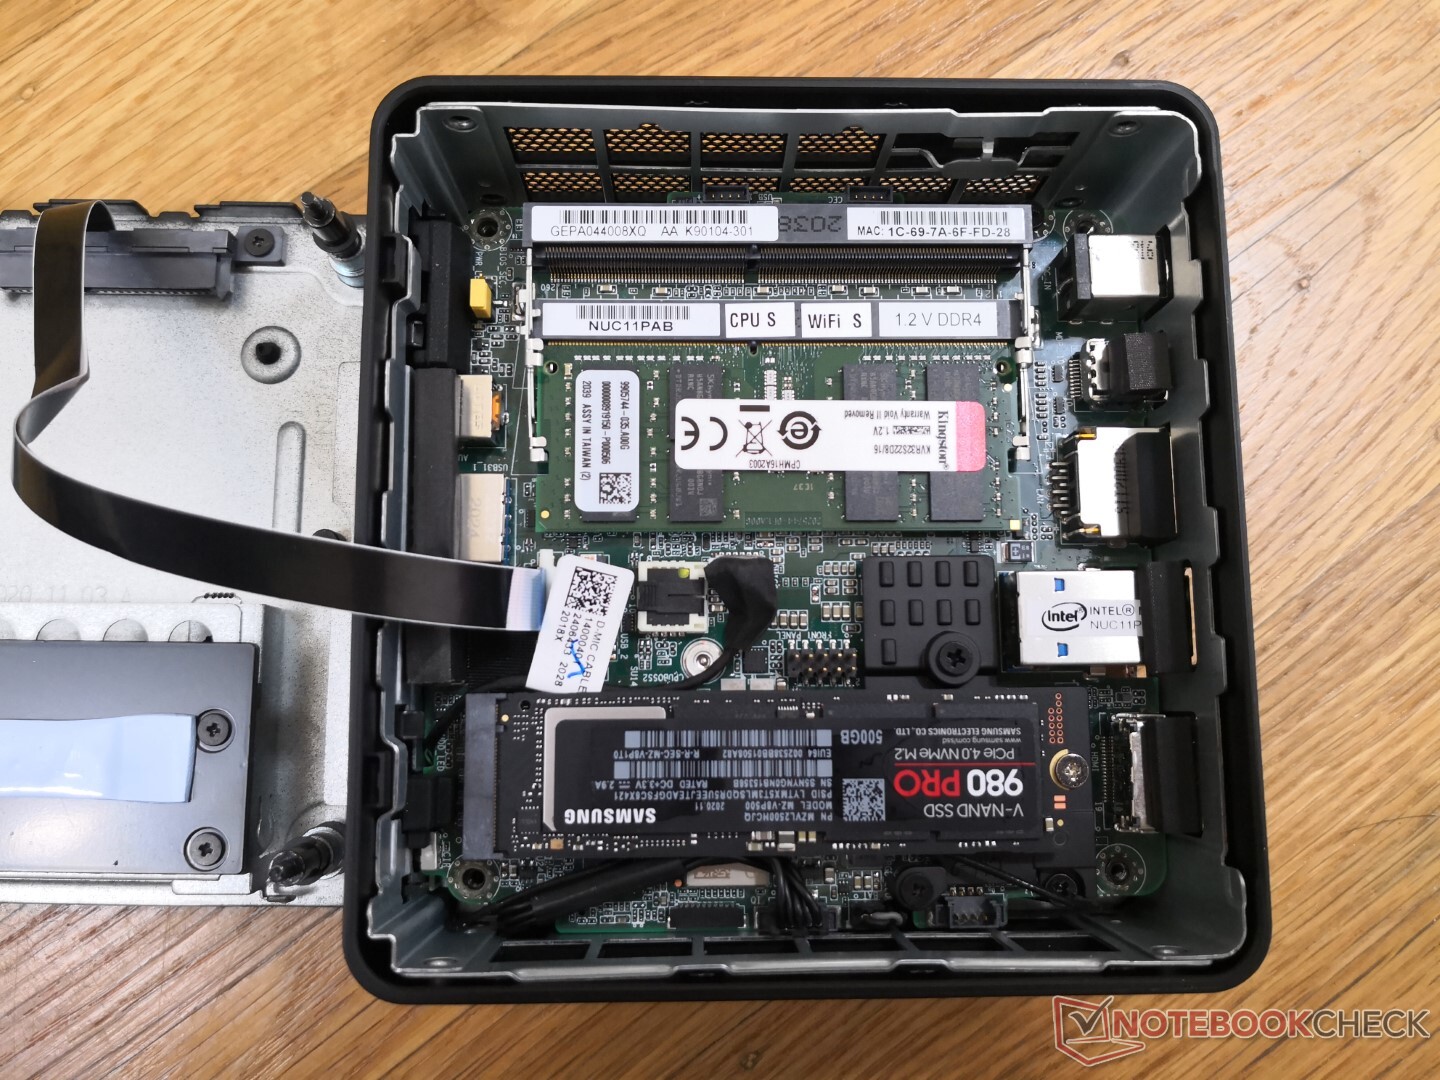
Onderhoud
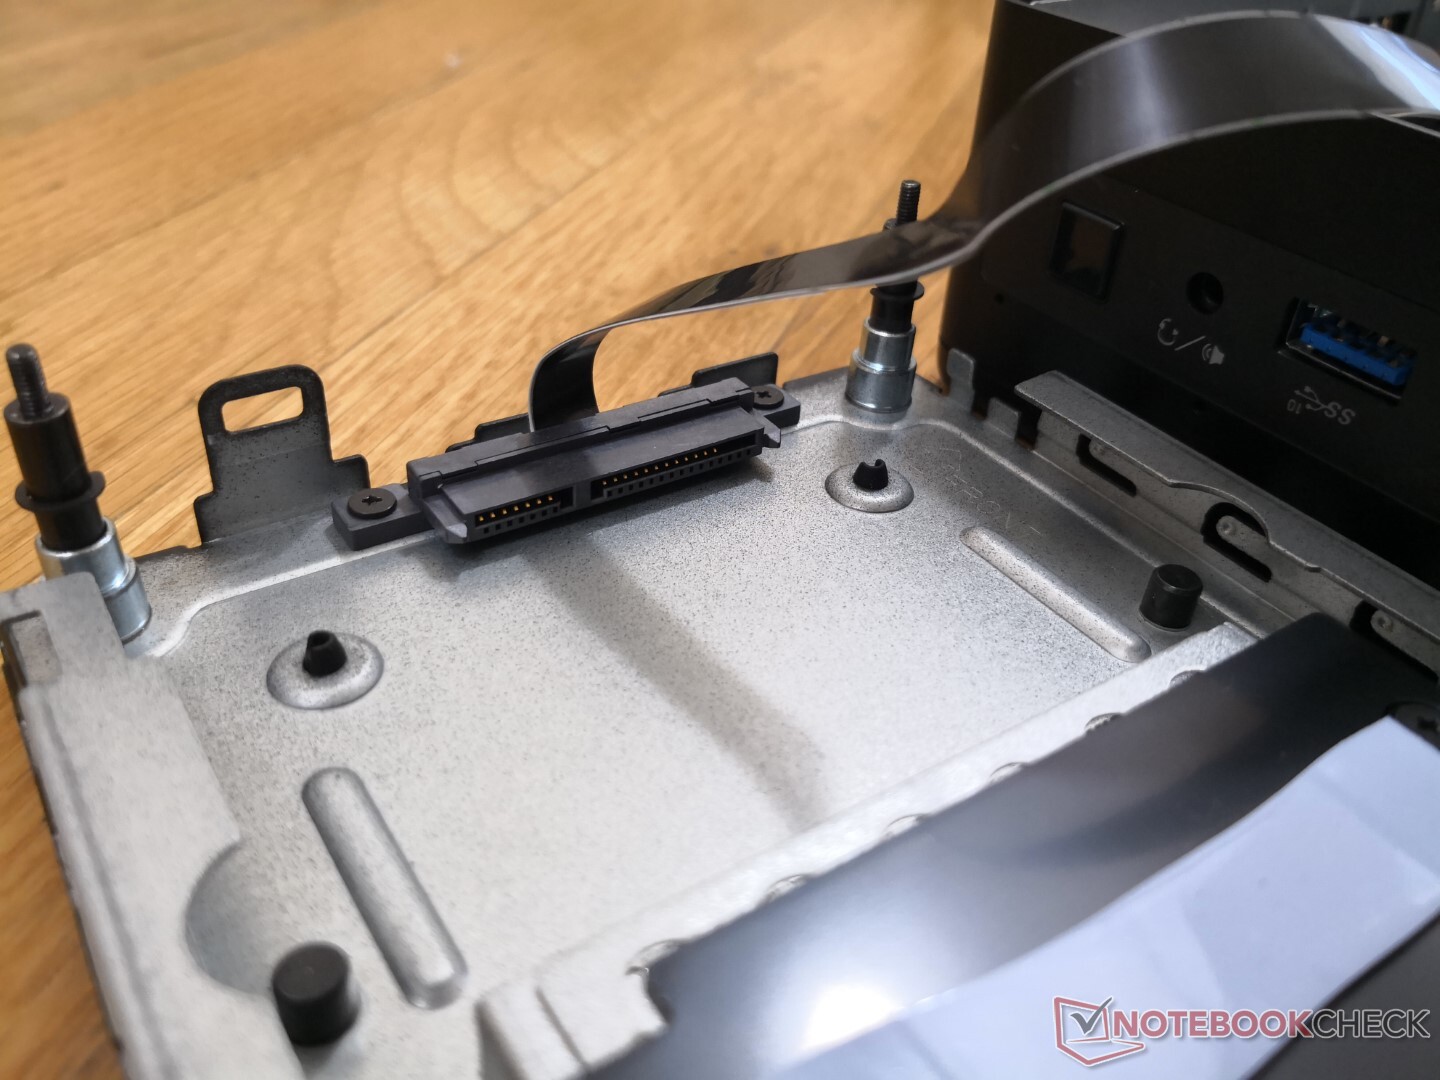
Het bodempaneel biedt directe toegang tot de M.2 2280 slot, 2,5-inch SATA III slot en beide SODIMM slots. Extra demontage is vereist om toegang te krijgen tot de ventilator en het oplaadpad. Intel heeft het 2,5-inch SATA III lint deze keer langer gemaakt voor eenvoudiger onderhoud.
Accessoires en garantie
De doos bevat vier montageschroeven en de gebruikelijke handleidingen. Een montagebeugel is niet inbegrepen.
Drie jaar beperkte garantie wordt standaard geleverd bij alle nieuwe aankopen.
Prestaties
Processor
De CPU prestaties zijn uitstekend met een CineBench R15 xT score die ruim boven de gemiddelde Core i7-1165G7 in onze database ligt met ten minste 15 procent. Deze delta wordt groter bij het vergelijken van CineBench R20 xT resultaten, omdat de Intel NUC beter is in het langer volhouden van hogere kloksnelheden dan de meeste laptops met dezelfde CPU. Minder dure AMD Zen 2 processoren zoals de Ryzen 5 4500U of Ryzen 7 4700U zijn in staat om te wedijveren met onze Intel, zij het met tragere single-thread prestaties.
Kiezen voor de mindere Core i3-1115G4 of Core i5-1135G7 NUC SKU's zal een tekort aan multi-thread prestaties van respectievelijk 30 procent en 65 procent met zich meebrengen.
Cinebench R15: CPU Multi 64Bit | CPU Single 64Bit
Blender: v2.79 BMW27 CPU
7-Zip 18.03: 7z b 4 -mmt1 | 7z b 4
Geekbench 5.5: Single-Core | Multi-Core
HWBOT x265 Benchmark v2.2: 4k Preset
LibreOffice : 20 Documents To PDF
R Benchmark 2.5: Overall mean
| Cinebench R20 / CPU (Multi Core) | |
| Lenovo Yoga Slim 7-14ARE | |
| Lenovo Yoga Slim 7 14ARE05 82A20008GE | |
| Intel NUC11PAQi7 | |
| Honor MagicBook 15 4500U | |
| Intel NUC10i7FNH | |
| Intel Hades Canyon NUC8i7HVK | |
| Gemiddeld Intel Core i7-1165G7 (1060 - 2657, n=81) | |
| Dell XPS 13 9310 Core i7 4K | |
| GPD Win 3 | |
| Intel NUC8i7BE | |
| Lenovo ThinkPad P14s Gen1 20S40009GE | |
| Lenovo IdeaPad Slim 9i 14ITL5 | |
| Beelink GTR35 II-G-16512D00W64PRO-1T | |
| Acer Swift 3 SF314-42-R27B | |
| Asus ZenBook 14 UX434FL-DB77 | |
| Zotac ZBox MI643 | |
| Microsoft Surface Laptop Go Core i5 | |
| Dell Inspiron 15 5000 5502 | |
| Beelink SEi10 | |
| Cinebench R20 / CPU (Single Core) | |
| Intel NUC11PAQi7 | |
| Dell XPS 13 9310 Core i7 4K | |
| Gemiddeld Intel Core i7-1165G7 (442 - 589, n=81) | |
| GPD Win 3 | |
| Lenovo IdeaPad Slim 9i 14ITL5 | |
| Dell Inspiron 15 5000 5502 | |
| Intel NUC10i7FNH | |
| Lenovo Yoga Slim 7-14ARE | |
| Lenovo Yoga Slim 7 14ARE05 82A20008GE | |
| Intel NUC8i7BE | |
| Lenovo ThinkPad P14s Gen1 20S40009GE | |
| Asus ZenBook 14 UX434FL-DB77 | |
| Honor MagicBook 15 4500U | |
| Acer Swift 3 SF314-42-R27B | |
| Zotac ZBox MI643 | |
| Microsoft Surface Laptop Go Core i5 | |
| Intel Hades Canyon NUC8i7HVK | |
| Beelink SEi10 | |
| Beelink GTR35 II-G-16512D00W64PRO-1T | |
| Cinebench R15 / CPU Multi 64Bit | |
| Lenovo Yoga Slim 7-14ARE | |
| Lenovo Yoga Slim 7 14ARE05 82A20008GE | |
| Intel NUC10i7FNH | |
| Intel NUC11PAQi7 | |
| Honor MagicBook 15 4500U | |
| Dell XPS 13 9310 Core i7 4K | |
| Intel Hades Canyon NUC8i7HVK | |
| Gemiddeld Intel Core i7-1165G7 (553 - 1027, n=86) | |
| Intel NUC8i7BE | |
| Lenovo IdeaPad Slim 9i 14ITL5 | |
| GPD Win 3 | |
| Lenovo ThinkPad P14s Gen1 20S40009GE | |
| Asus ZenBook 14 UX434FL-DB77 | |
| Beelink GTR35 II-G-16512D00W64PRO-1T | |
| Acer Swift 3 SF314-42-R27B | |
| Microsoft Surface Laptop Go Core i5 | |
| Zotac ZBox MI643 | |
| Beelink SEi10 | |
| Dell Inspiron 15 5000 5502 | |
| Cinebench R15 / CPU Single 64Bit | |
| Intel NUC11PAQi7 | |
| Dell XPS 13 9310 Core i7 4K | |
| Gemiddeld Intel Core i7-1165G7 (115 - 230, n=78) | |
| Lenovo IdeaPad Slim 9i 14ITL5 | |
| GPD Win 3 | |
| Intel NUC10i7FNH | |
| Dell Inspiron 15 5000 5502 | |
| Intel NUC8i7BE | |
| Lenovo ThinkPad P14s Gen1 20S40009GE | |
| Lenovo Yoga Slim 7-14ARE | |
| Intel Hades Canyon NUC8i7HVK | |
| Asus ZenBook 14 UX434FL-DB77 | |
| Lenovo Yoga Slim 7 14ARE05 82A20008GE | |
| Zotac ZBox MI643 | |
| Honor MagicBook 15 4500U | |
| Acer Swift 3 SF314-42-R27B | |
| Microsoft Surface Laptop Go Core i5 | |
| Beelink SEi10 | |
| Beelink GTR35 II-G-16512D00W64PRO-1T | |
| Blender / v2.79 BMW27 CPU | |
| Dell Inspiron 15 5000 5502 | |
| Beelink SEi10 | |
| Microsoft Surface Laptop Go Core i5 | |
| Acer Swift 3 SF314-42-R27B | |
| Zotac ZBox MI643 | |
| Asus ZenBook 14 UX434FL-DB77 | |
| Intel NUC8i7BE | |
| Intel NUC8i7BE | |
| Beelink GTR35 II-G-16512D00W64PRO-1T | |
| Dell XPS 13 9310 Core i7 4K | |
| Lenovo ThinkPad P14s Gen1 20S40009GE | |
| GPD Win 3 | |
| Gemiddeld Intel Core i7-1165G7 (468 - 1138, n=80) | |
| Lenovo IdeaPad Slim 9i 14ITL5 | |
| Honor MagicBook 15 4500U | |
| Intel Hades Canyon NUC8i7HVK | |
| Lenovo Yoga Slim 7 14ARE05 82A20008GE | |
| Intel NUC10i7FNH | |
| Intel NUC11PAQi7 | |
| Lenovo Yoga Slim 7-14ARE | |
| 7-Zip 18.03 / 7z b 4 -mmt1 | |
| Intel NUC8i7BE | |
| Intel NUC8i7BE | |
| Intel NUC11PAQi7 | |
| Lenovo IdeaPad Slim 9i 14ITL5 | |
| Gemiddeld Intel Core i7-1165G7 (4478 - 5507, n=80) | |
| Dell XPS 13 9310 Core i7 4K | |
| Lenovo ThinkPad P14s Gen1 20S40009GE | |
| GPD Win 3 | |
| Intel NUC10i7FNH | |
| Dell Inspiron 15 5000 5502 | |
| Zotac ZBox MI643 | |
| Lenovo Yoga Slim 7-14ARE | |
| Lenovo Yoga Slim 7 14ARE05 82A20008GE | |
| Honor MagicBook 15 4500U | |
| Intel Hades Canyon NUC8i7HVK | |
| Beelink SEi10 | |
| Acer Swift 3 SF314-42-R27B | |
| Microsoft Surface Laptop Go Core i5 | |
| Asus ZenBook 14 UX434FL-DB77 | |
| Beelink GTR35 II-G-16512D00W64PRO-1T | |
| 7-Zip 18.03 / 7z b 4 | |
| Lenovo Yoga Slim 7-14ARE | |
| Lenovo Yoga Slim 7 14ARE05 82A20008GE | |
| Intel NUC8i7BE | |
| Intel NUC8i7BE | |
| Intel NUC10i7FNH | |
| Intel NUC11PAQi7 | |
| Honor MagicBook 15 4500U | |
| Lenovo IdeaPad Slim 9i 14ITL5 | |
| Gemiddeld Intel Core i7-1165G7 (15347 - 27405, n=80) | |
| GPD Win 3 | |
| Dell XPS 13 9310 Core i7 4K | |
| Intel Hades Canyon NUC8i7HVK | |
| Lenovo ThinkPad P14s Gen1 20S40009GE | |
| Zotac ZBox MI643 | |
| Asus ZenBook 14 UX434FL-DB77 | |
| Beelink GTR35 II-G-16512D00W64PRO-1T | |
| Acer Swift 3 SF314-42-R27B | |
| Microsoft Surface Laptop Go Core i5 | |
| Dell Inspiron 15 5000 5502 | |
| Beelink SEi10 | |
| Geekbench 5.5 / Single-Core | |
| Lenovo IdeaPad Slim 9i 14ITL5 | |
| Intel NUC11PAQi7 | |
| Dell XPS 13 9310 Core i7 4K | |
| Gemiddeld Intel Core i7-1165G7 (1302 - 1595, n=77) | |
| GPD Win 3 | |
| Dell Inspiron 15 5000 5502 | |
| Intel NUC10i7FNH | |
| Lenovo ThinkPad P14s Gen1 20S40009GE | |
| Honor MagicBook 15 4500U | |
| Asus ZenBook 14 UX434FL-DB77 | |
| Lenovo Yoga Slim 7-14ARE | |
| Lenovo Yoga Slim 7-14ARE | |
| Microsoft Surface Laptop Go Core i5 | |
| Zotac ZBox MI643 | |
| Lenovo Yoga Slim 7 14ARE05 82A20008GE | |
| Beelink SEi10 | |
| Acer Swift 3 SF314-42-R27B | |
| Beelink GTR35 II-G-16512D00W64PRO-1T | |
| Intel NUC8i7BE | |
| Geekbench 5.5 / Multi-Core | |
| Lenovo Yoga Slim 7-14ARE | |
| Lenovo Yoga Slim 7-14ARE | |
| Lenovo Yoga Slim 7 14ARE05 82A20008GE | |
| Honor MagicBook 15 4500U | |
| Intel NUC10i7FNH | |
| Dell XPS 13 9310 Core i7 4K | |
| Lenovo IdeaPad Slim 9i 14ITL5 | |
| Gemiddeld Intel Core i7-1165G7 (3078 - 5926, n=77) | |
| Intel NUC11PAQi7 | |
| GPD Win 3 | |
| Zotac ZBox MI643 | |
| Lenovo ThinkPad P14s Gen1 20S40009GE | |
| Intel NUC8i7BE | |
| Microsoft Surface Laptop Go Core i5 | |
| Acer Swift 3 SF314-42-R27B | |
| Beelink GTR35 II-G-16512D00W64PRO-1T | |
| Asus ZenBook 14 UX434FL-DB77 | |
| Dell Inspiron 15 5000 5502 | |
| Beelink SEi10 | |
| HWBOT x265 Benchmark v2.2 / 4k Preset | |
| Lenovo Yoga Slim 7-14ARE | |
| Lenovo Yoga Slim 7 14ARE05 82A20008GE | |
| Intel NUC11PAQi7 | |
| Intel NUC10i7FNH | |
| Honor MagicBook 15 4500U | |
| Intel Hades Canyon NUC8i7HVK | |
| Lenovo IdeaPad Slim 9i 14ITL5 | |
| Gemiddeld Intel Core i7-1165G7 (1.39 - 8.47, n=80) | |
| GPD Win 3 | |
| Intel NUC8i7BE | |
| Intel NUC8i7BE | |
| Dell XPS 13 9310 Core i7 4K | |
| Lenovo ThinkPad P14s Gen1 20S40009GE | |
| Asus ZenBook 14 UX434FL-DB77 | |
| Acer Swift 3 SF314-42-R27B | |
| Zotac ZBox MI643 | |
| Beelink GTR35 II-G-16512D00W64PRO-1T | |
| Microsoft Surface Laptop Go Core i5 | |
| Beelink SEi10 | |
| Dell Inspiron 15 5000 5502 | |
| LibreOffice / 20 Documents To PDF | |
| Beelink GTR35 II-G-16512D00W64PRO-1T | |
| Asus ZenBook 14 UX434FL-DB77 | |
| Lenovo Yoga Slim 7 14ARE05 82A20008GE | |
| Honor MagicBook 15 4500U | |
| Microsoft Surface Laptop Go Core i5 | |
| Dell Inspiron 15 5000 5502 | |
| Acer Swift 3 SF314-42-R27B | |
| Lenovo Yoga Slim 7-14ARE | |
| Zotac ZBox MI643 | |
| Lenovo ThinkPad P14s Gen1 20S40009GE | |
| Beelink SEi10 | |
| Lenovo IdeaPad Slim 9i 14ITL5 | |
| Gemiddeld Intel Core i7-1165G7 (21.5 - 88.1, n=78) | |
| GPD Win 3 | |
| Dell XPS 13 9310 Core i7 4K | |
| Intel NUC11PAQi7 | |
| R Benchmark 2.5 / Overall mean | |
| Asus ZenBook 14 UX434FL-DB77 | |
| Beelink SEi10 | |
| Microsoft Surface Laptop Go Core i5 | |
| Beelink GTR35 II-G-16512D00W64PRO-1T | |
| Acer Swift 3 SF314-42-R27B | |
| Lenovo ThinkPad P14s Gen1 20S40009GE | |
| Zotac ZBox MI643 | |
| Dell Inspiron 15 5000 5502 | |
| Intel NUC10i7FNH | |
| GPD Win 3 | |
| Intel NUC8i7BE | |
| Honor MagicBook 15 4500U | |
| Lenovo Yoga Slim 7 14ARE05 82A20008GE | |
| Lenovo Yoga Slim 7-14ARE | |
| Dell XPS 13 9310 Core i7 4K | |
| Gemiddeld Intel Core i7-1165G7 (0.552 - 1.002, n=80) | |
| Lenovo IdeaPad Slim 9i 14ITL5 | |
| Intel NUC11PAQi7 | |
Cinebench R15: CPU Multi 64Bit | CPU Single 64Bit
Blender: v2.79 BMW27 CPU
7-Zip 18.03: 7z b 4 -mmt1 | 7z b 4
Geekbench 5.5: Single-Core | Multi-Core
HWBOT x265 Benchmark v2.2: 4k Preset
LibreOffice : 20 Documents To PDF
R Benchmark 2.5: Overall mean
* ... kleiner is beter
Systeemprestaties
| PCMark 10 | |
| Score | |
| Intel Hades Canyon NUC8i7HVK | |
| Intel NUC11PAQi7 | |
| Gemiddeld Intel Core i7-1165G7, Intel Iris Xe Graphics G7 96EUs (4531 - 5454, n=50) | |
| Intel NUC8i7BE | |
| Intel NUC10i7FNH | |
| Beelink GTR35 II-G-16512D00W64PRO-1T | |
| Zotac ZBox MI643 | |
| Beelink SEi10 | |
| Essentials | |
| Intel NUC11PAQi7 | |
| Gemiddeld Intel Core i7-1165G7, Intel Iris Xe Graphics G7 96EUs (8997 - 11505, n=50) | |
| Zotac ZBox MI643 | |
| Intel Hades Canyon NUC8i7HVK | |
| Intel NUC10i7FNH | |
| Intel NUC8i7BE | |
| Beelink GTR35 II-G-16512D00W64PRO-1T | |
| Beelink SEi10 | |
| Productivity | |
| Intel Hades Canyon NUC8i7HVK | |
| Intel NUC8i7BE | |
| Intel NUC11PAQi7 | |
| Zotac ZBox MI643 | |
| Intel NUC10i7FNH | |
| Gemiddeld Intel Core i7-1165G7, Intel Iris Xe Graphics G7 96EUs (5570 - 7136, n=50) | |
| Beelink GTR35 II-G-16512D00W64PRO-1T | |
| Beelink SEi10 | |
| Digital Content Creation | |
| Intel Hades Canyon NUC8i7HVK | |
| Intel NUC11PAQi7 | |
| Gemiddeld Intel Core i7-1165G7, Intel Iris Xe Graphics G7 96EUs (4083 - 5550, n=50) | |
| Intel NUC8i7BE | |
| Beelink GTR35 II-G-16512D00W64PRO-1T | |
| Intel NUC10i7FNH | |
| Zotac ZBox MI643 | |
| Beelink SEi10 | |
| PCMark 8 | |
| Home Score Accelerated v2 | |
| Intel Hades Canyon NUC8i7HVK | |
| Intel NUC8i7BE | |
| Gemiddeld Intel Core i7-1165G7, Intel Iris Xe Graphics G7 96EUs (3769 - 5686, n=17) | |
| Intel NUC11PAQi7 | |
| Intel NUC10i7FNH | |
| Beelink GTR35 II-G-16512D00W64PRO-1T | |
| Zotac ZBox MI643 | |
| Beelink SEi10 | |
| Work Score Accelerated v2 | |
| Intel Hades Canyon NUC8i7HVK | |
| Beelink GTR35 II-G-16512D00W64PRO-1T | |
| Zotac ZBox MI643 | |
| Intel NUC10i7FNH | |
| Intel NUC11PAQi7 | |
| Gemiddeld Intel Core i7-1165G7, Intel Iris Xe Graphics G7 96EUs (2431 - 3221, n=15) | |
| Beelink SEi10 | |
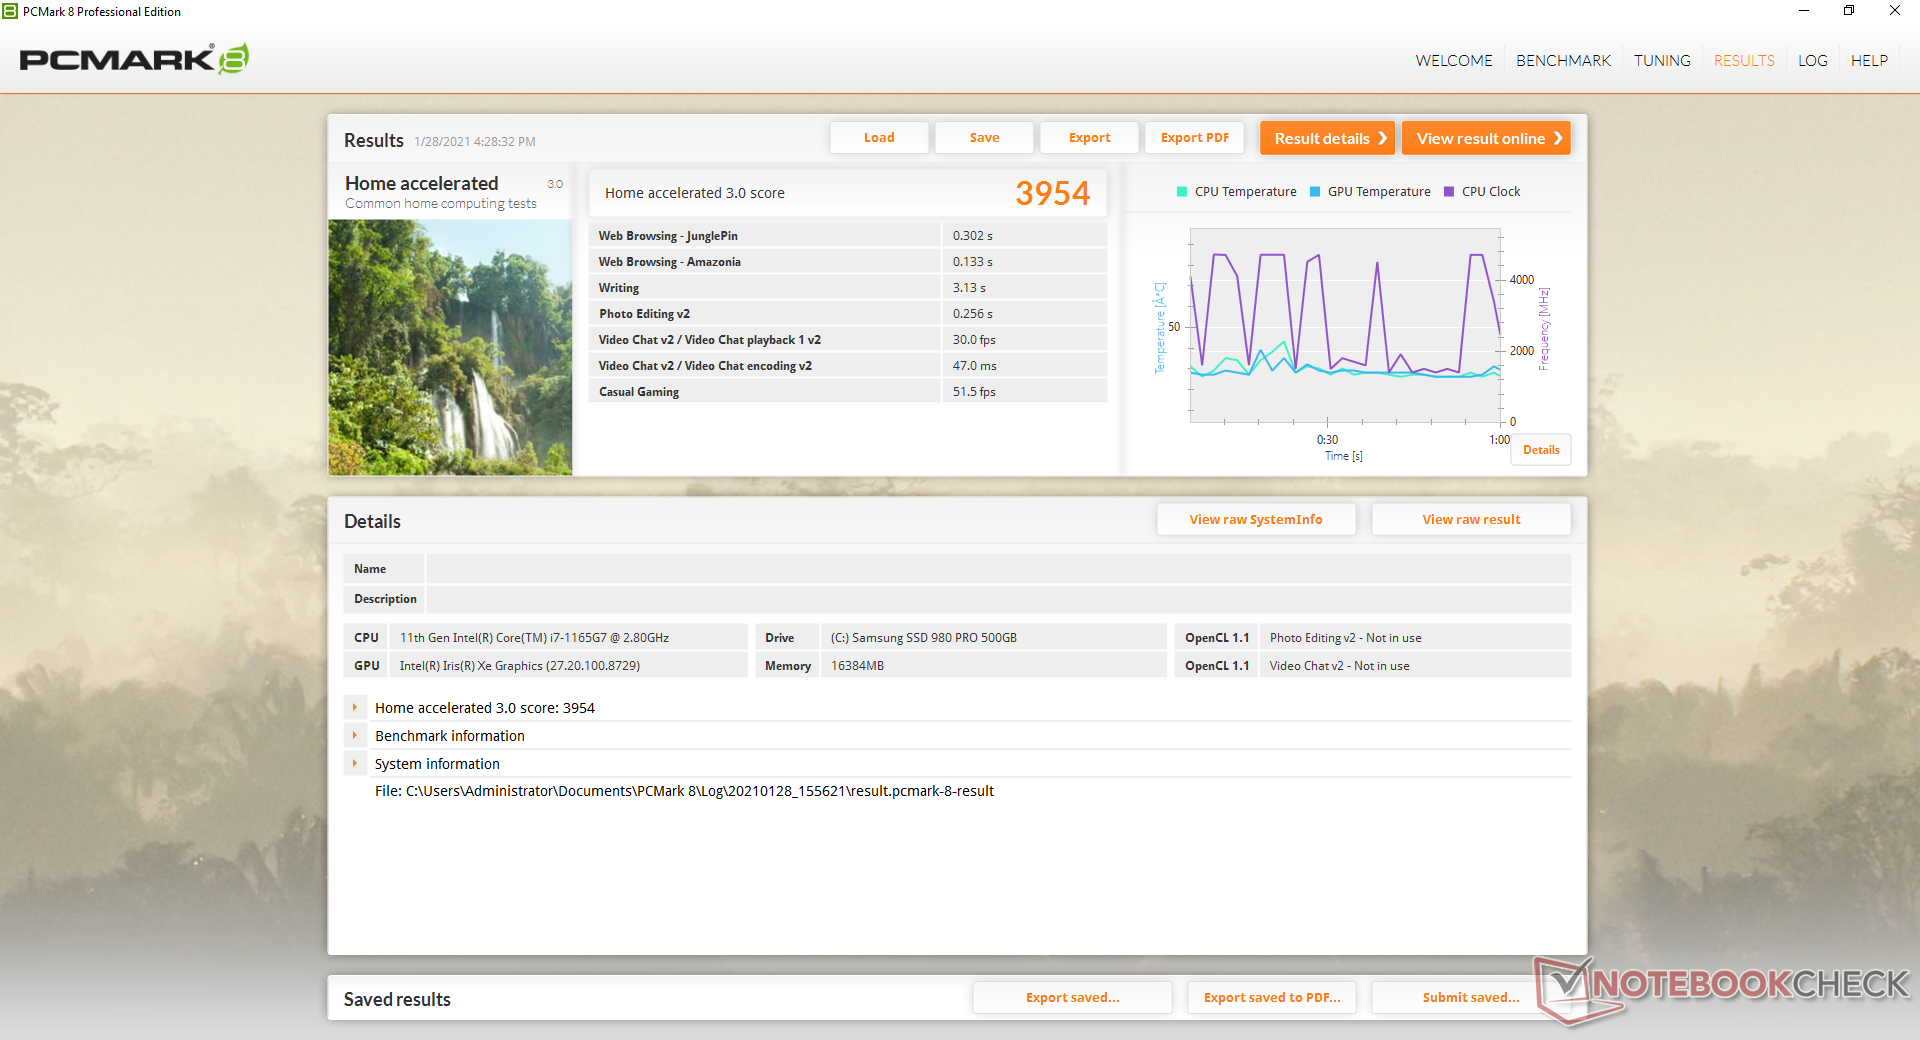
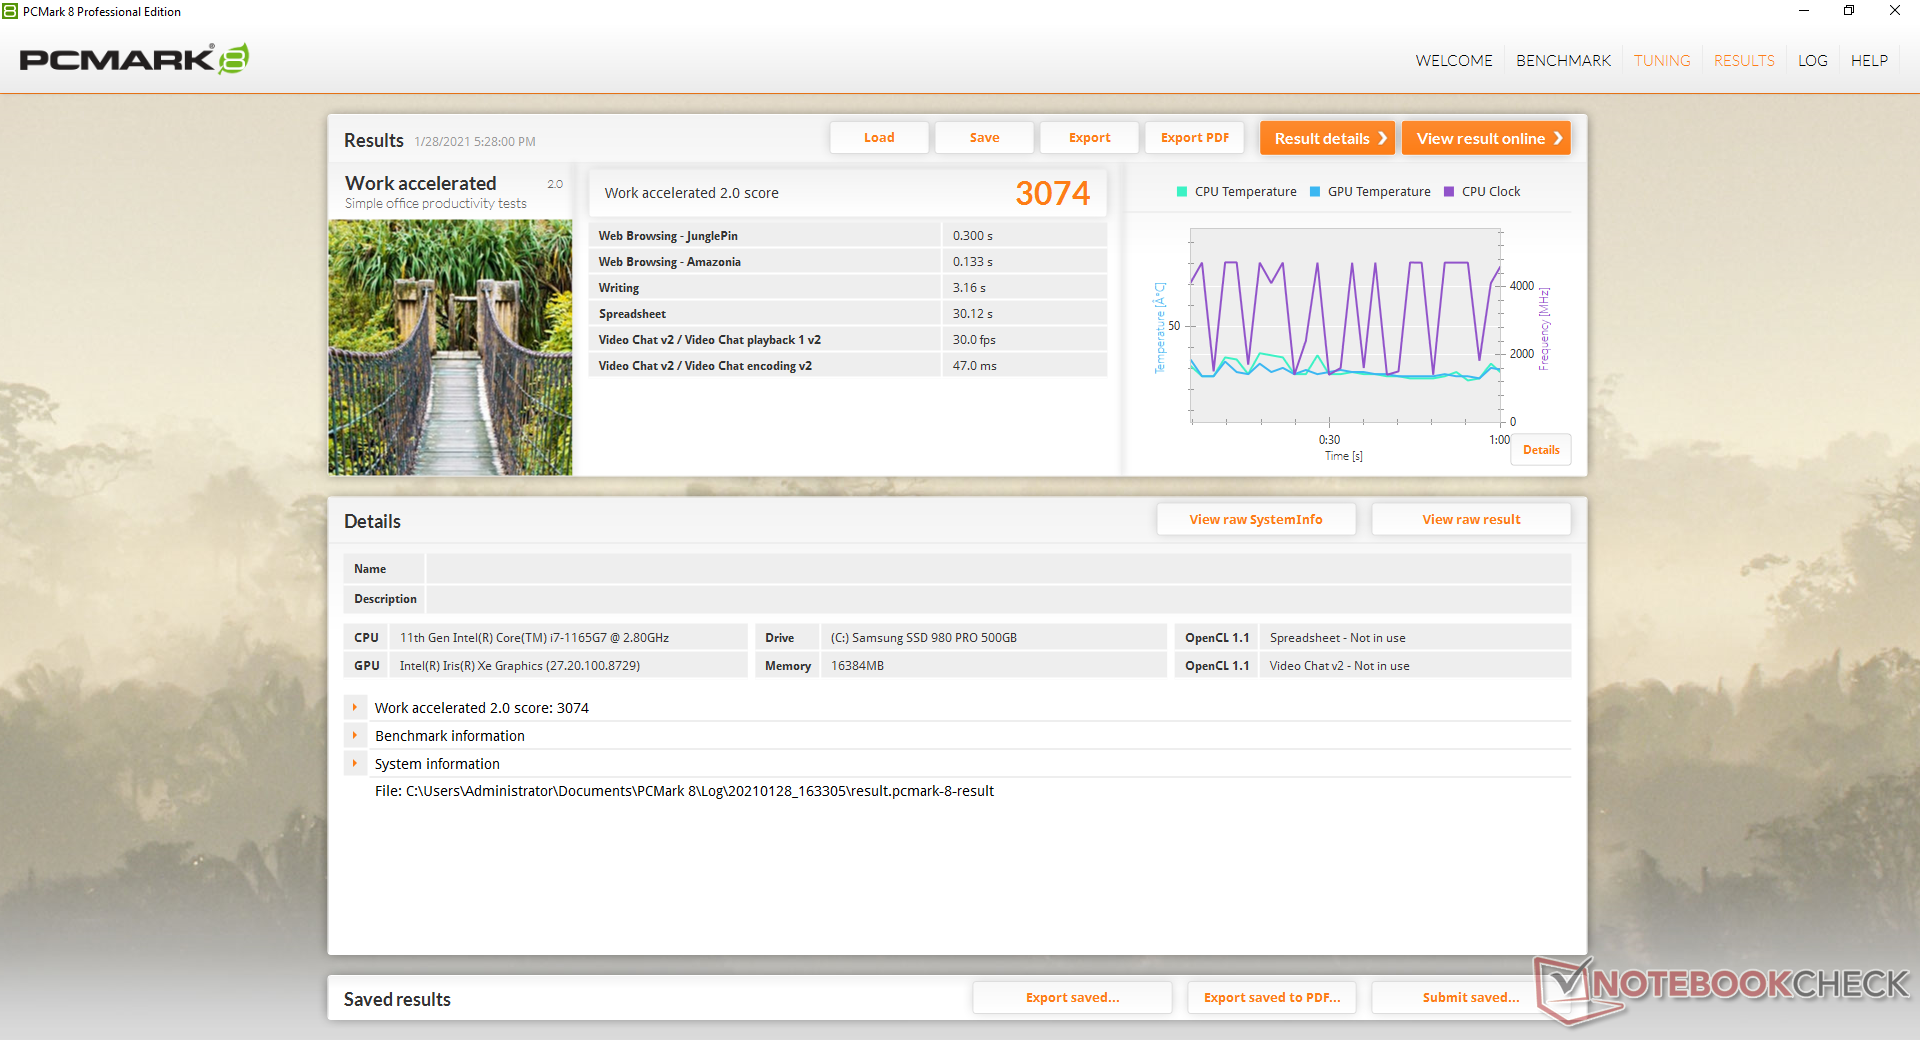
| PCMark 8 Home Score Accelerated v2 | 3954 punten | |
| PCMark 8 Work Score Accelerated v2 | 3074 punten | |
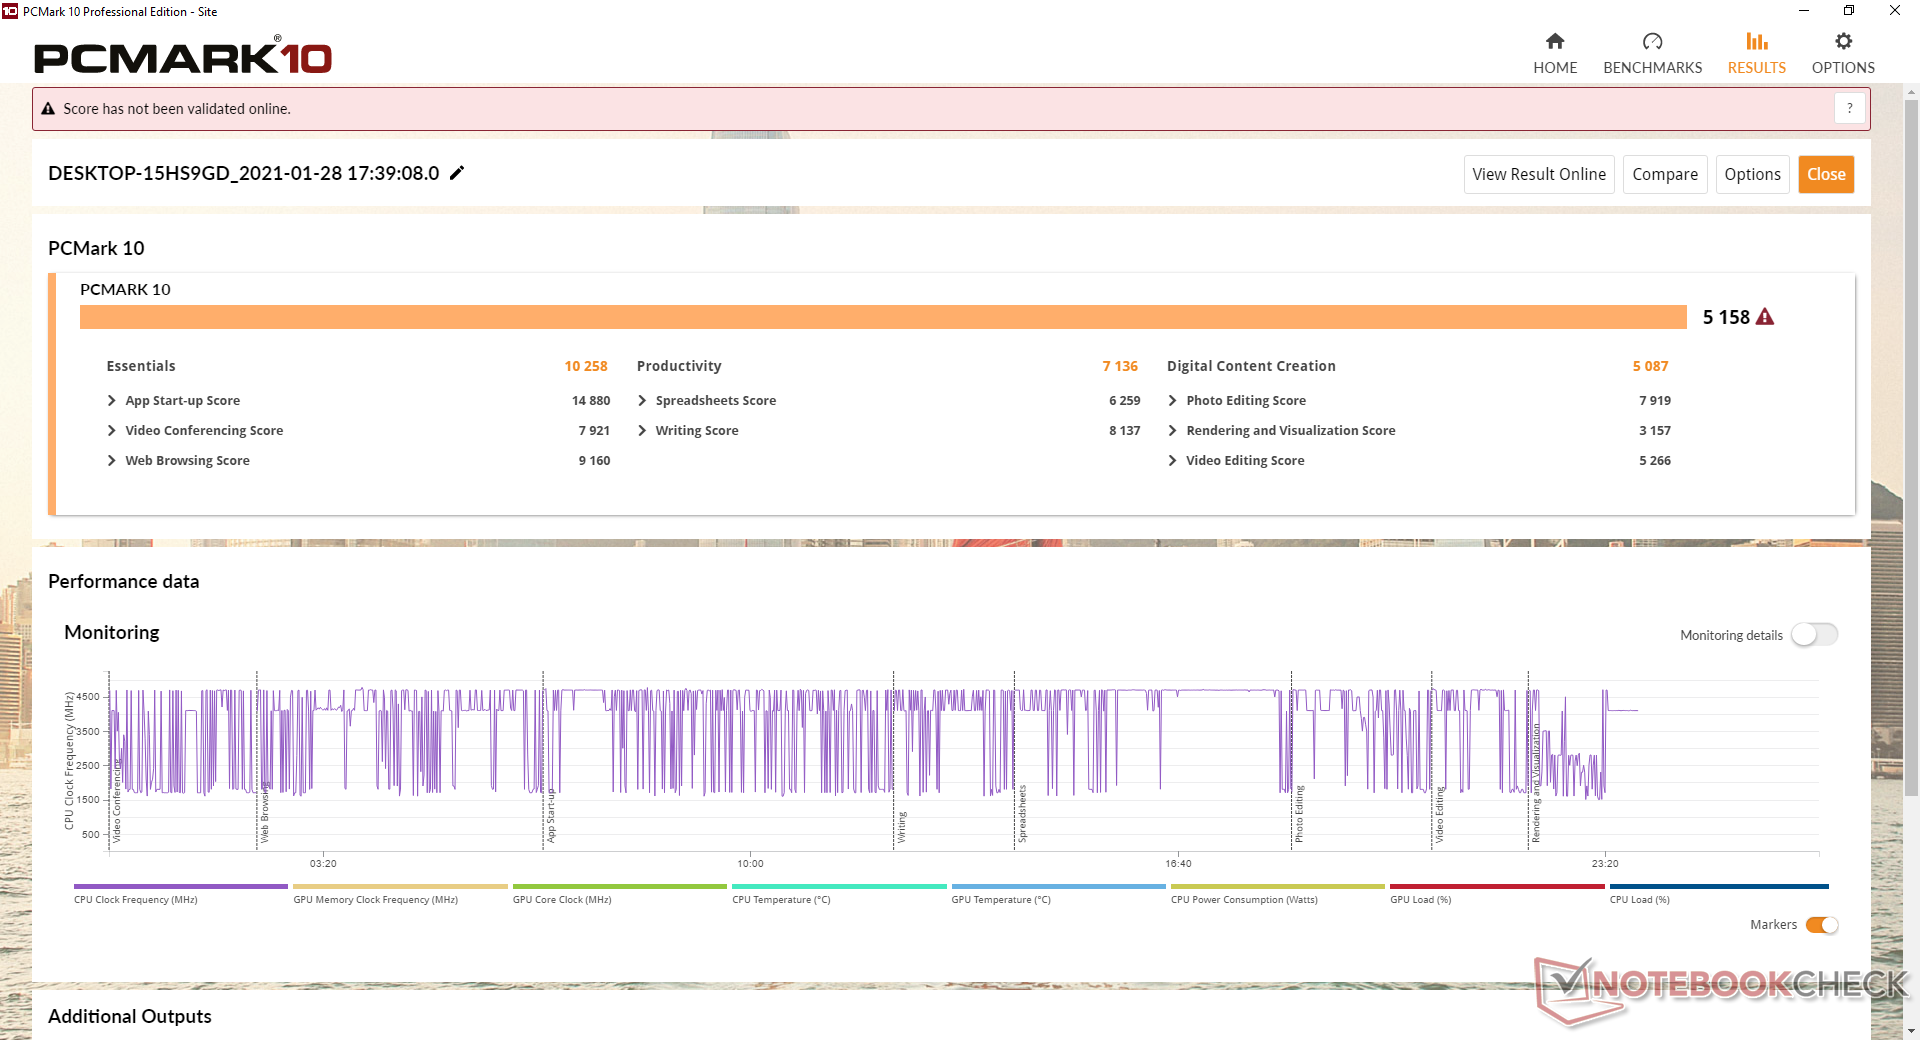
| PCMark 10 Score | 5158 punten | |
Help | ||
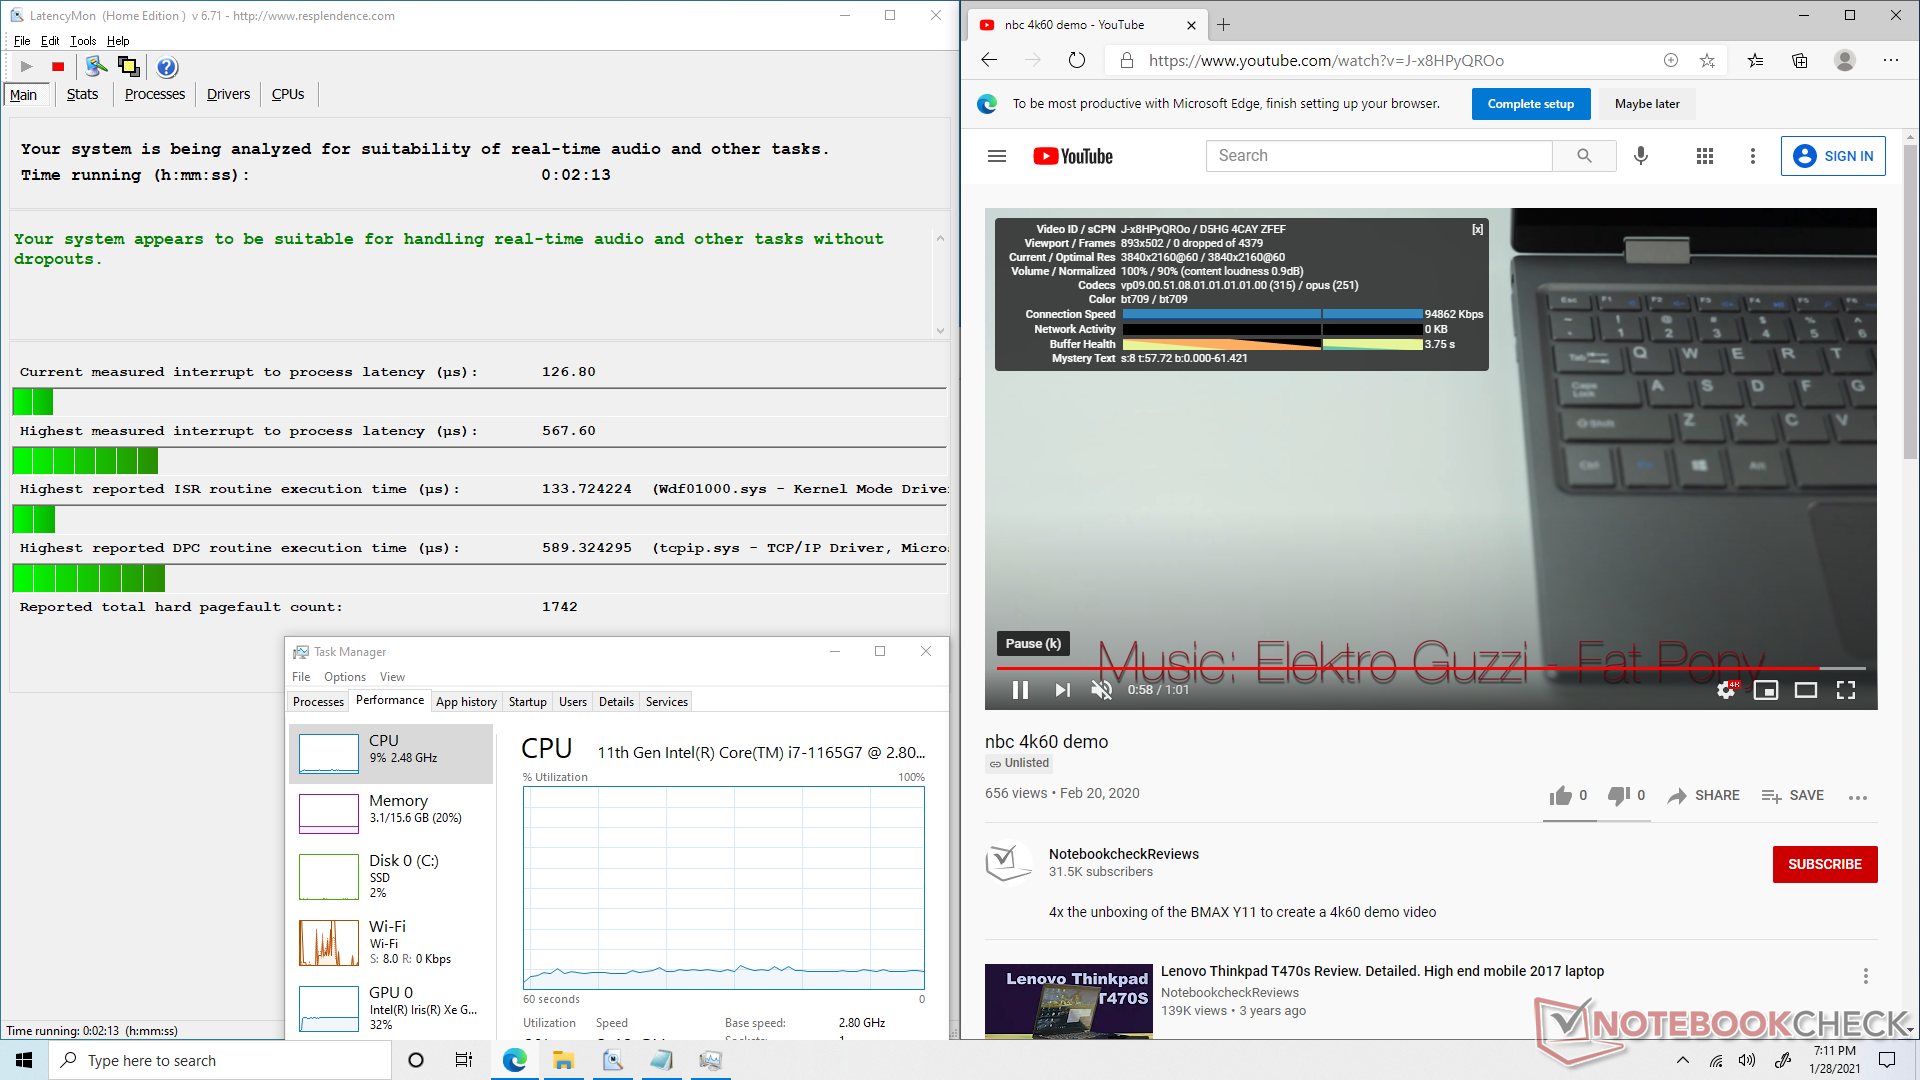
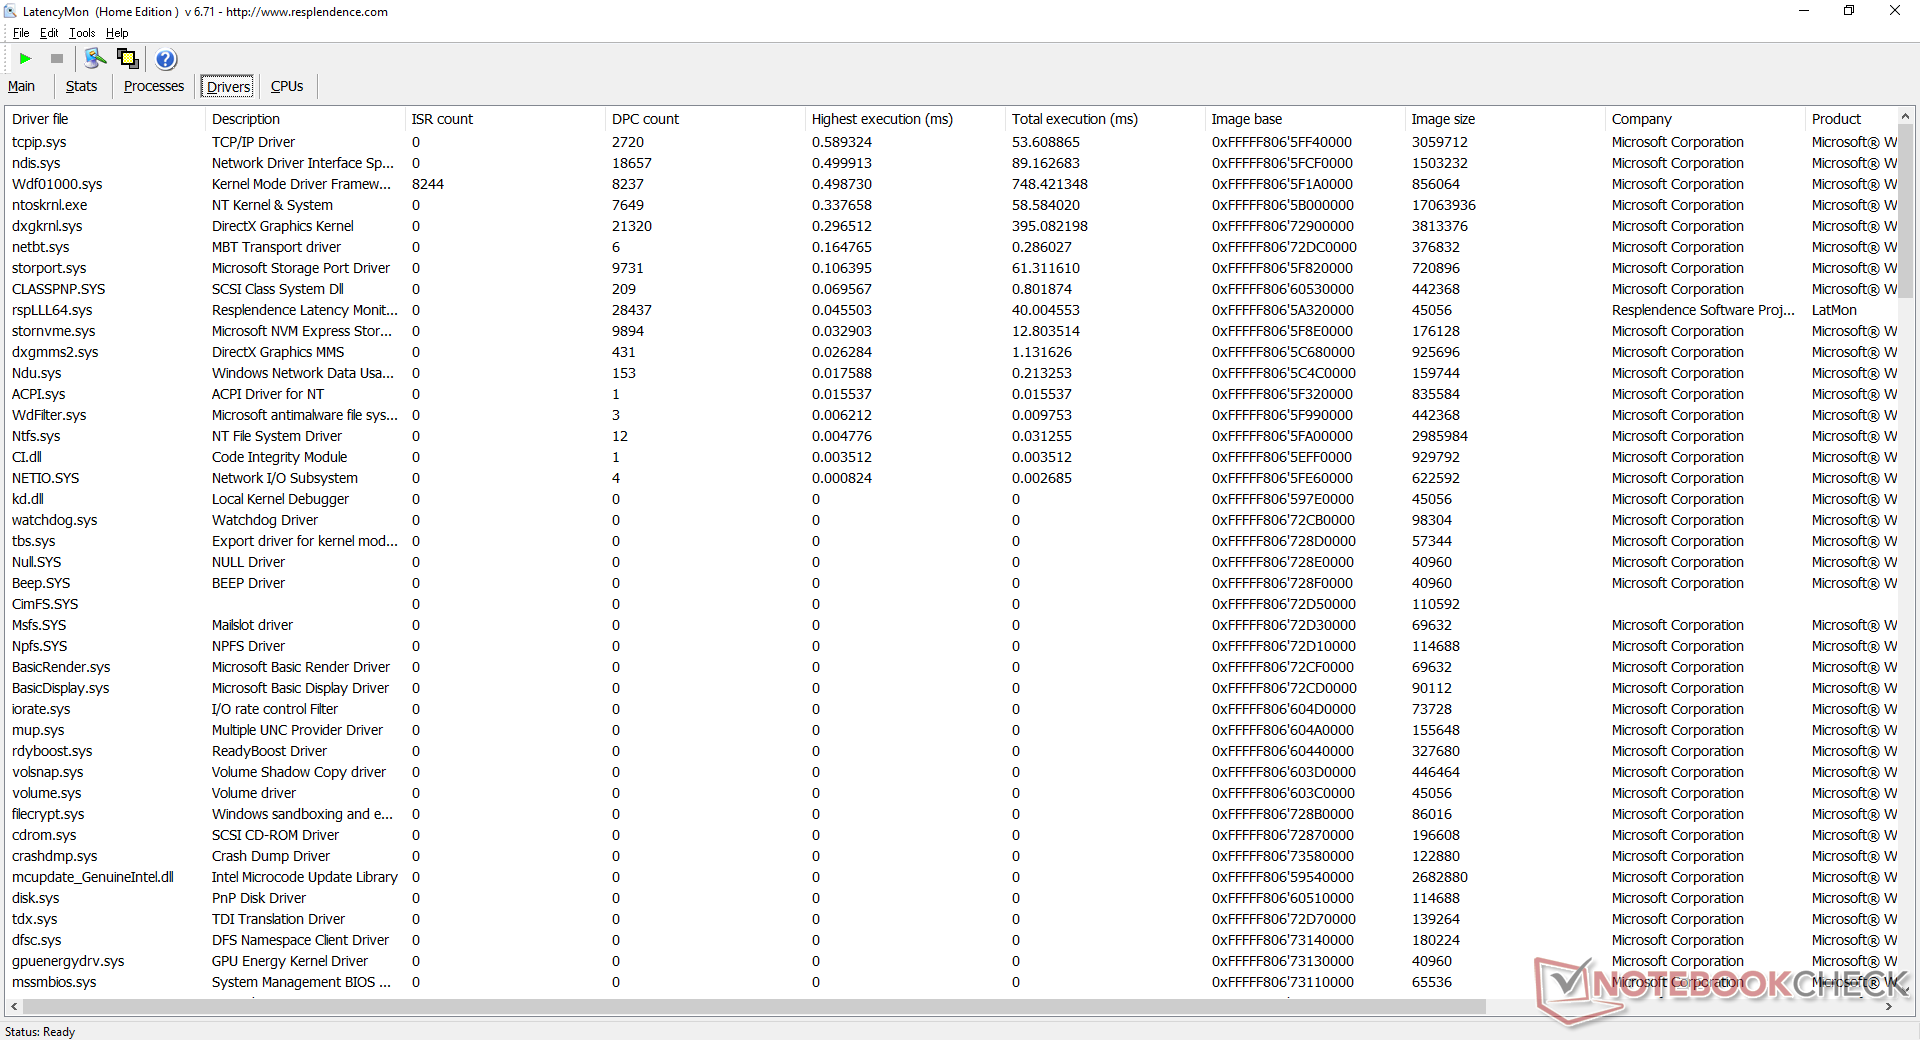
DPC latentie
LatencyMon laat geen DPC latency problemen zien. Het afspelen van 4K video's bij 60 FPS verloopt ook vloeiend en zonder wegvallende frames. De Iris Xe GPU is stabiel bij 32 procent bezetting, vergeleken met ~50 procent op de oudere Iris Plus G7.
| DPC Latencies / LatencyMon - interrupt to process latency (max), Web, Youtube, Prime95 | |
| Beelink SEi10 | |
| Zotac ZBox MI643 | |
| Intel NUC11PAQi7 | |
* ... kleiner is beter
Opslagapparaten
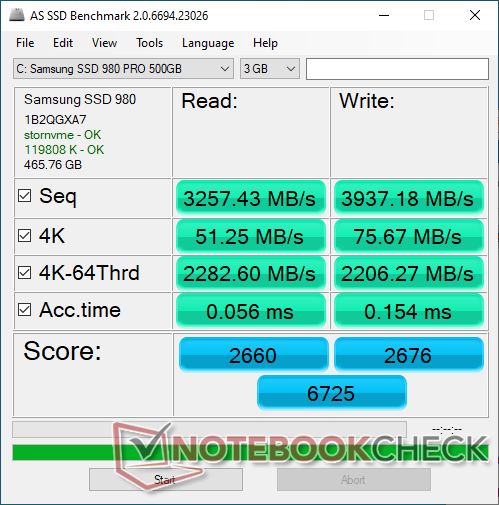
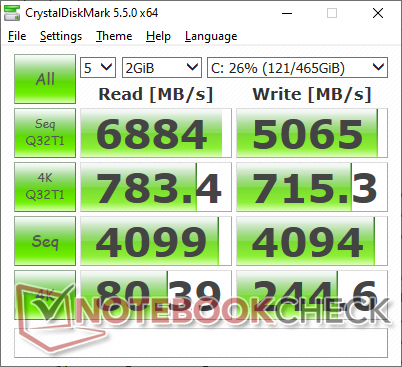
Ons apparaat wordt geleverd met een 500 GB Samsung SSD 980 Pro voor theoretische lees- en schrijfsnelheden tot 6900 MB/s en 5000 MB/s, respectievelijk. We kunnen deze geadverteerde cijfers bevestigen door DiskSpd in een lus te draaien, zoals blijkt uit de onderstaande grafiek. Merk op dat thermische padding en een dunne hitteverspreider zijn meegeleverd.
| Intel NUC11PAQi7 Samsung SSD 980 Pro 500GB MZ-V8P500BW | Intel NUC10i7FNH Kingston RBUSNS8154P3256GJ1 | Intel Hades Canyon NUC8i7HVK Intel Optane 120 GB SSDPEK1W120GA | Beelink SEi10 Silicon Motion AZW 256G M.2280 NVMe 4X 200725 D | Zotac ZBox MI643 Lexar NM610 1TB | |
|---|---|---|---|---|---|
| AS SSD | -58% | -20% | -83% | -40% | |
| Seq Read (MB/s) | 3257 | 1306 -60% | 1379 -58% | 1111 -66% | 1511 -54% |
| Seq Write (MB/s) | 3937 | 611 -84% | 553 -86% | 323.5 -92% | 1558 -60% |
| 4K Read (MB/s) | 51.3 | 21.53 -58% | 127.9 149% | 33.1 -35% | 43.77 -15% |
| 4K Write (MB/s) | 75.7 | 53.5 -29% | 103.5 37% | 66.2 -13% | 119.5 58% |
| 4K-64 Read (MB/s) | 2283 | 652 -71% | 1258 -45% | 357.3 -84% | 839 -63% |
| 4K-64 Write (MB/s) | 2206 | 648 -71% | 556 -75% | 154.8 -93% | 909 -59% |
| Access Time Read * (ms) | 0.056 | 0.114 -104% | 0.025 55% | 0.066 -18% | 0.032 43% |
| Access Time Write * (ms) | 0.154 | 0.07 55% | 0.033 79% | 0.616 -300% | 0.242 -57% |
| Score Read (Points) | 2660 | 804 -70% | 1524 -43% | 501 -81% | 1034 -61% |
| Score Write (Points) | 2676 | 762 -72% | 714 -73% | 253 -91% | 1185 -56% |
| Score Total (Points) | 6725 | 1944 -71% | 3023 -55% | 983 -85% | 2760 -59% |
| Copy ISO MB/s (MB/s) | 2030 | 976 -52% | 1125 -45% | 1160 -43% | 1373 -32% |
| Copy Program MB/s (MB/s) | 883 | 346 -61% | 342.4 -61% | 121.1 -86% | 280.4 -68% |
| Copy Game MB/s (MB/s) | 1817 | 735 -60% | 768 -58% | 364.4 -80% | 531 -71% |
| CrystalDiskMark 5.2 / 6 | 6% | -45% | -51% | -48% | |
| Write 4K (MB/s) | 244.6 | 442.4 81% | 133.7 -45% | 203 -17% | 214.1 -12% |
| Read 4K (MB/s) | 80.4 | 371.1 362% | 178.6 122% | 63.2 -21% | 62.1 -23% |
| Write Seq (MB/s) | 4094 | 900 -78% | 608 -85% | 1114 -73% | 1664 -59% |
| Read Seq (MB/s) | 4099 | 1582 -61% | 1428 -65% | 1765 -57% | 1797 -56% |
| Write 4K Q32T1 (MB/s) | 715 | 373.8 -48% | 323.6 -55% | 423.9 -41% | 421.8 -41% |
| Read 4K Q32T1 (MB/s) | 783 | 374.9 -52% | 282.3 -64% | 389.2 -50% | 512 -35% |
| Write Seq Q32T1 (MB/s) | 5065 | 893 -82% | 627 -88% | 1104 -78% | 564 -89% |
| Read Seq Q32T1 (MB/s) | 6884 | 1582 -77% | 1521 -78% | 1990 -71% | 2073 -70% |
| Write 4K Q8T8 (MB/s) | 399.1 | ||||
| Read 4K Q8T8 (MB/s) | 688 | ||||
| Totaal Gemiddelde (Programma / Instellingen) | -26% /
-35% | -33% /
-29% | -67% /
-72% | -44% /
-43% |
* ... kleiner is beter

Disk Throttling: DiskSpd Read Loop, Queue Depth 8
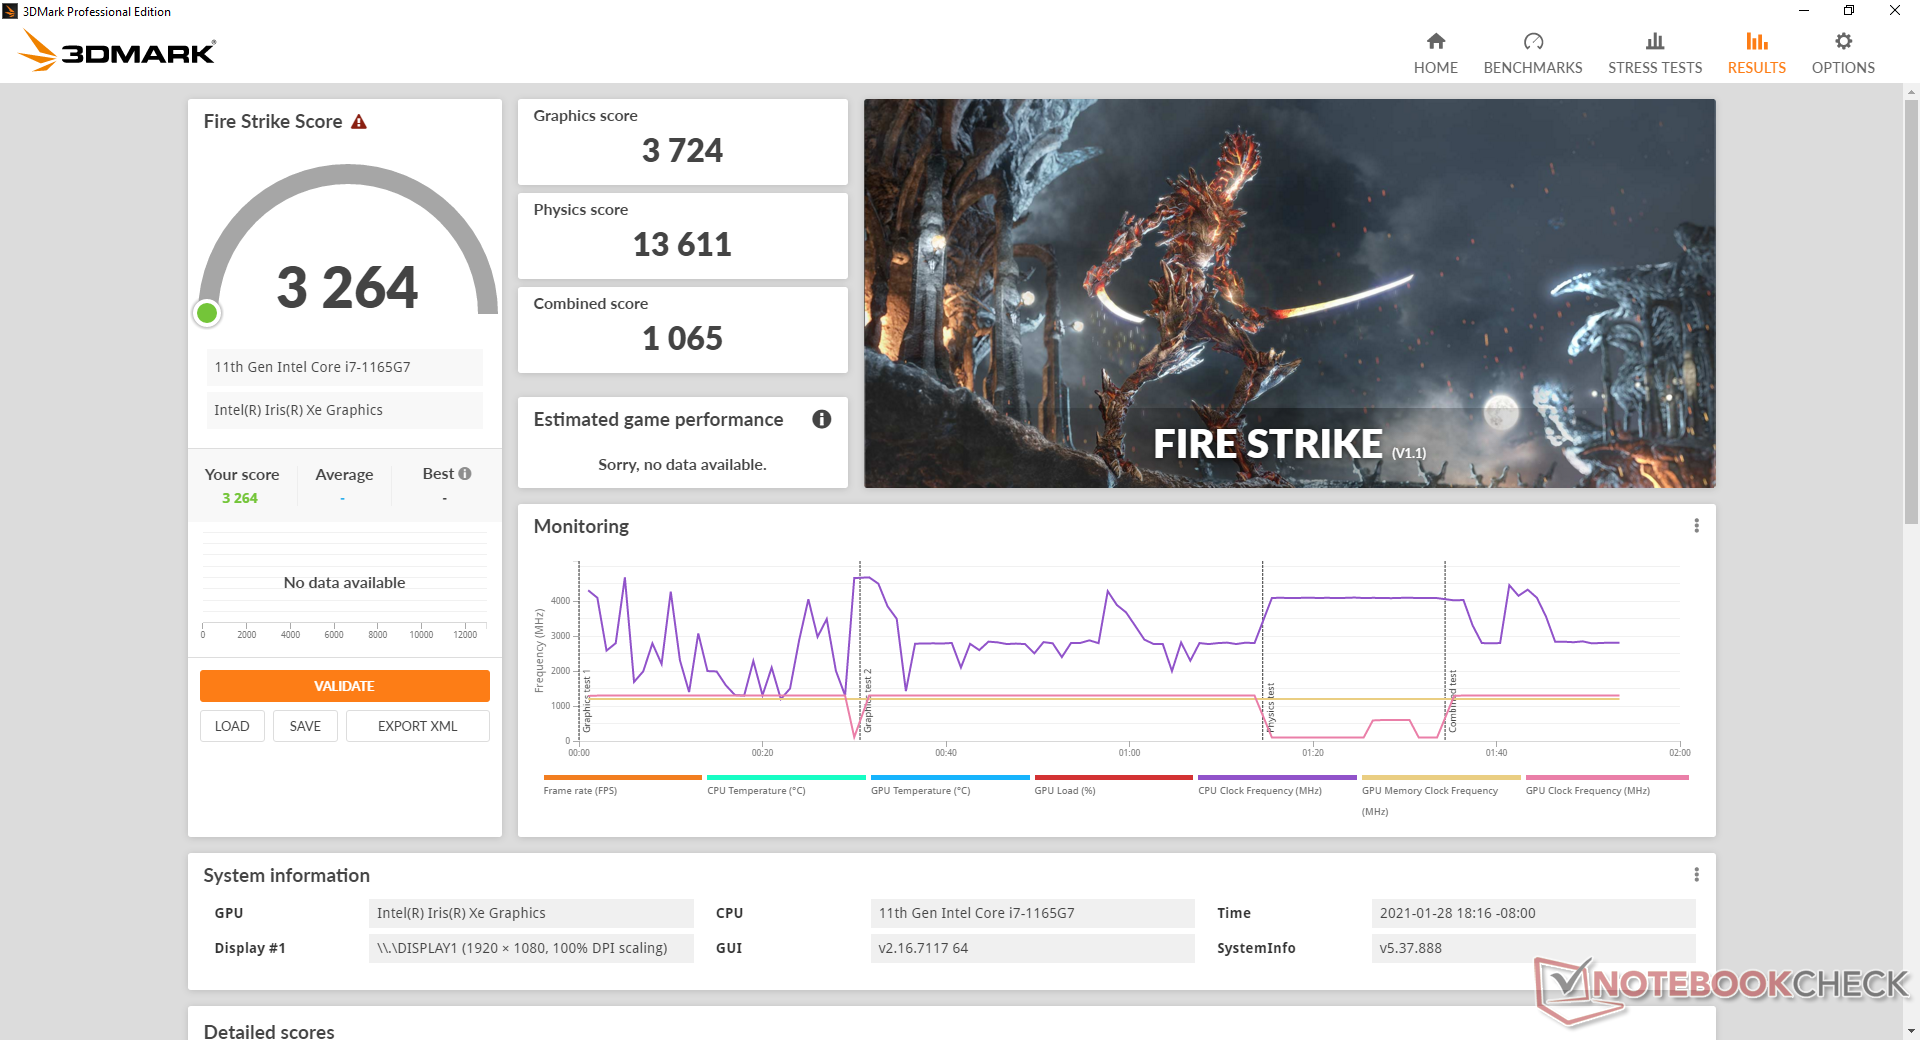
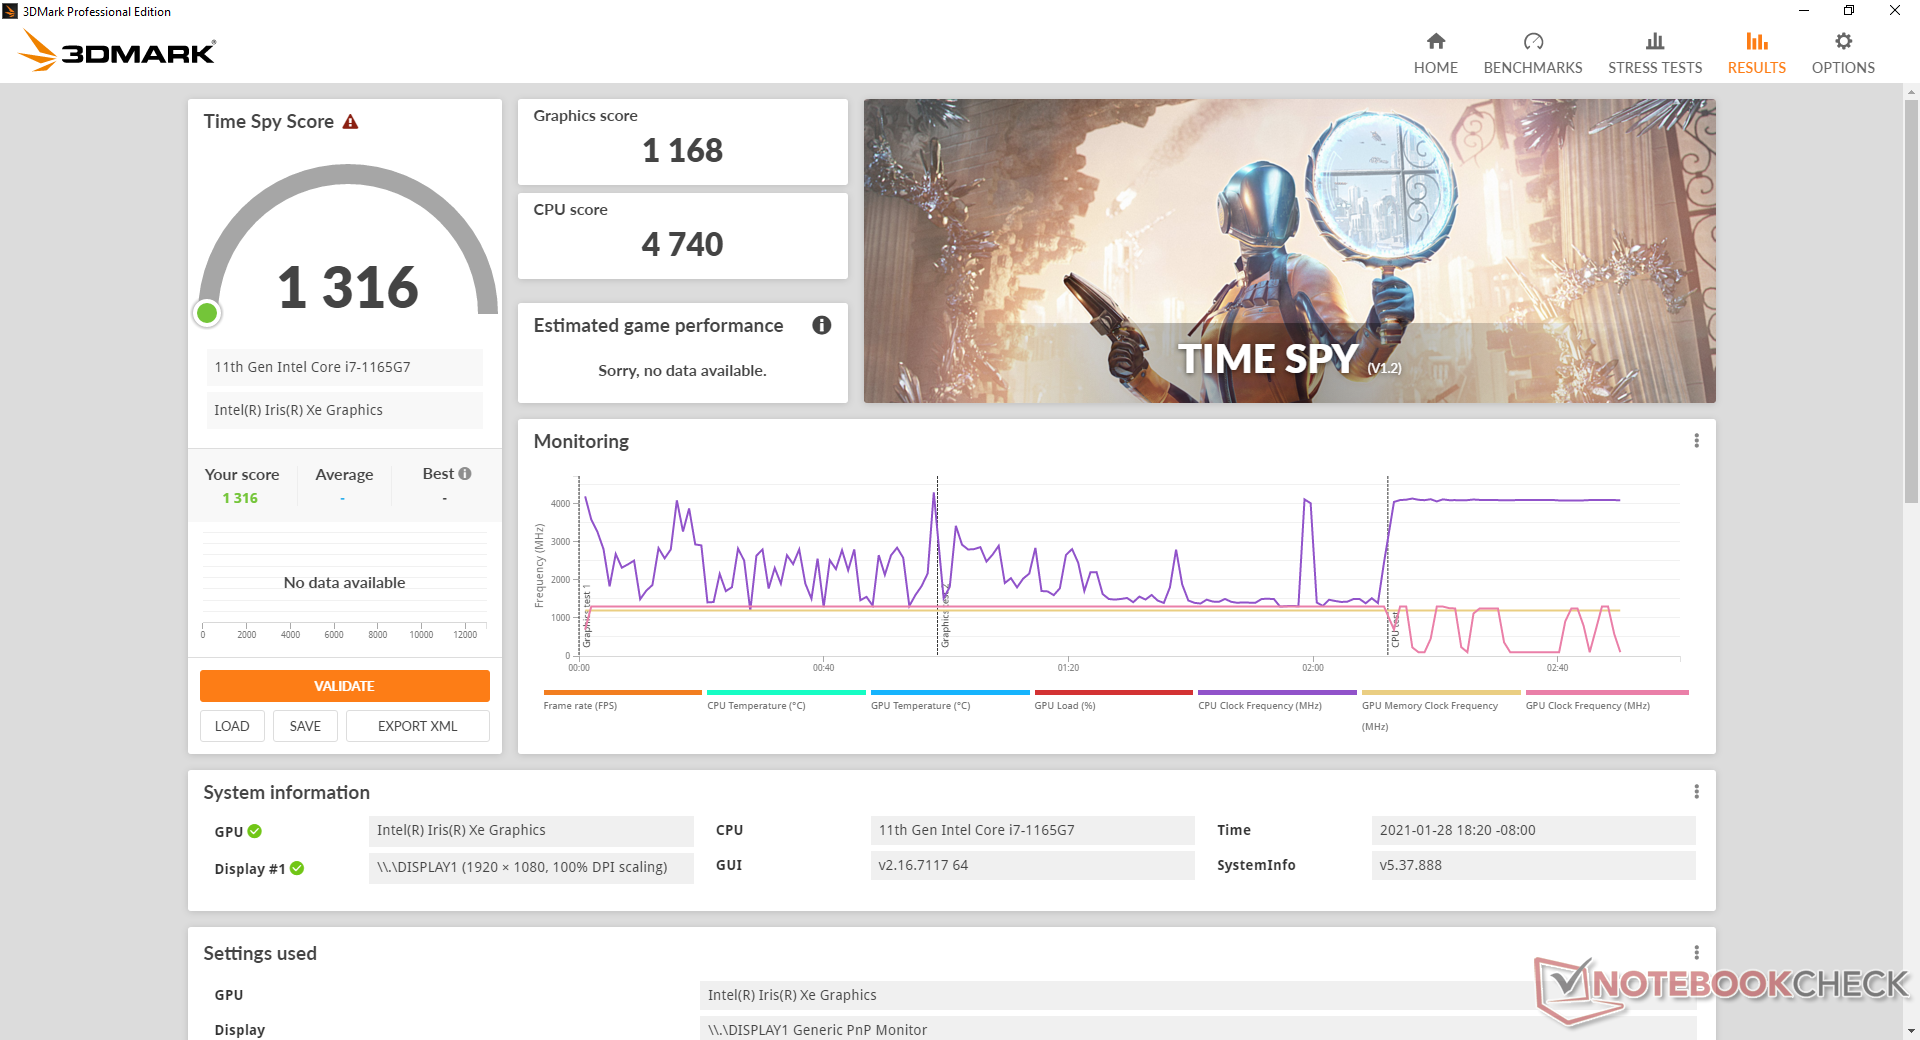
GPU prestatie
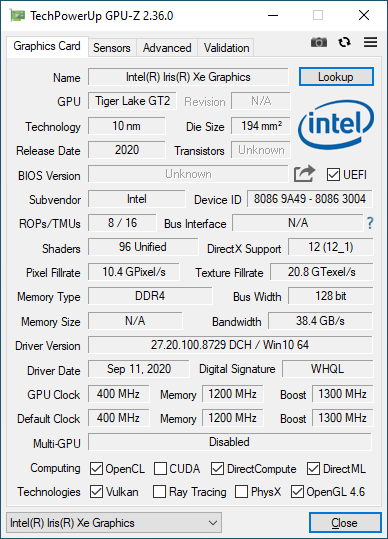
De 3DMark scores zijn ongeveer 15 procent langzamer dan de gemiddelde Iris Xe 96 EU's in onze database, ondanks de sneller dan gemiddelde CPU prestaties die hierboven zijn genoteerd. Het verschil wordt waarschijnlijk toegeschreven aan het enkel-kanaals RAM in onze review unit. Als het dual-channel was geweest, dan zouden de resultaten waarschijnlijk 30 procent of meer hoger zijn geweest, net als wat we zagen op de Lenovo IdeaPad Slim 9i.
Meer benchmarks en technische informatie over de Iris Xe 96 EUs kunt u hier vinden. Kiezen voor de mindere Core i5 Iris Xe 80 EU's betekent niet noodzakelijk slechtere grafische prestaties, afhankelijk van de RAM opstelling. Verwacht echter dat de Core i3 UHD Graphics 620 (of Iris Xe 48 EUs) optie aanzienlijk langzamer zal zijn.
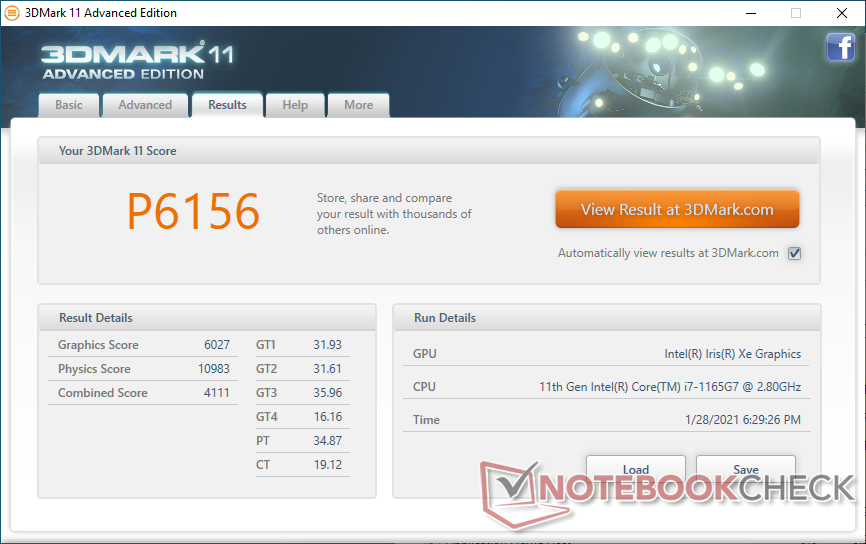

| 3DMark 11 Performance | 6156 punten | |
| 3DMark Cloud Gate Standard Score | 17226 punten | |
| 3DMark Fire Strike Score | 3264 punten | |
| 3DMark Time Spy Score | 1316 punten | |
Help | ||
| lage | gem. | hoge | ultra | |
|---|---|---|---|---|
| GTA V (2015) | 67.6 | 52.5 | 12.6 | 5.72 |
| The Witcher 3 (2015) | 70.3 | 43.7 | 20.7 | 10.3 |
| Dota 2 Reborn (2015) | 78.8 | 61.8 | 37.7 | 35 |
| Final Fantasy XV Benchmark (2018) | 30.3 | 15.6 | 12.7 | |
| X-Plane 11.11 (2018) | 42.3 | 32.7 | 28.8 | |
| Strange Brigade (2018) | 66.2 | 23.8 | 20.1 | 16.9 |
Emissions
Systeemgeluid
De interne ventilator pulseert tussen stationair en 33.6 dB(A), zelfs wanneer u gewoon aan het surfen bent of op uw bureaublad zit. Hoewel niet luid genoeg om hinderlijk te zijn of te veel op te vallen, zou een gelijkmatigere aanpak beter zijn geweest. Ventilatorgeluid tijdens gebruik Witcher 3 is stabiel op 33,6 dB(A) om stiller te zijn dan aanvankelijk verwacht. Het draaien van andere games op lagere instellingen voor hogere framerates zal het ventilatorgeluid iets doen verspringen.
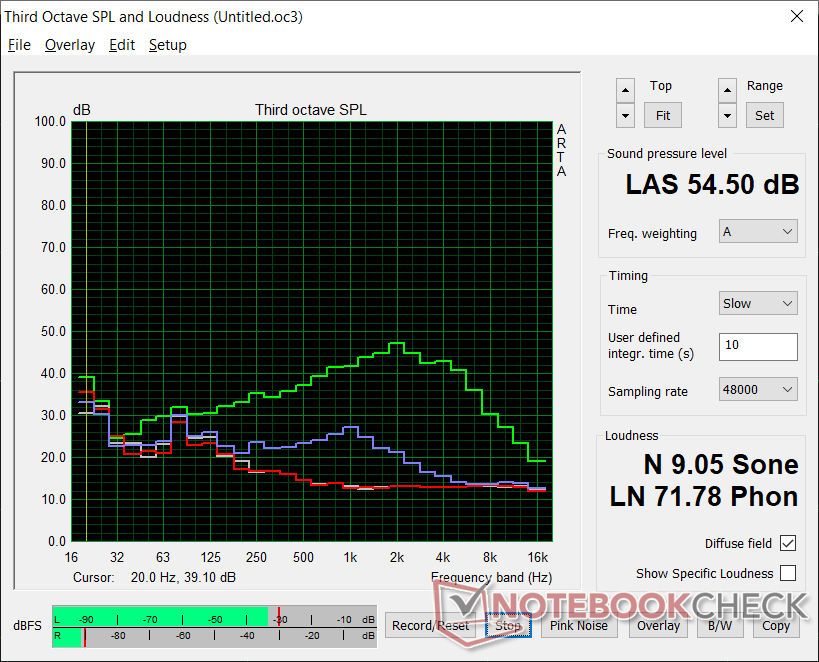
Extreme belastingen zoals Prime95 doen het ventilatorgeluid oplopen tot 49,2 dB(A) en zelfs 54,5 dB(A) en zijn daarmee veel luider dan de meeste andere mini-PC's wanneer ze onder vergelijkbare omstandigheden werken. De CPU mag dan snel zijn, maar de ventilator zal hard moeten werken om die indrukwekkende prestatieniveaus te handhaven.
We kunnen een kleine winding whine of elektronische ruis waarnemen van onze test unit.
| Intel NUC11PAQi7 Iris Xe G7 96EUs, i7-1165G7, Samsung SSD 980 Pro 500GB MZ-V8P500BW | Intel NUC8i7BE Iris Plus Graphics 655, i7-8559U | Intel Hades Canyon NUC8i7HVK Vega M GH, i7-8809G, Intel Optane 120 GB SSDPEK1W120GA | Beelink SEi10 UHD Graphics G1 (Ice Lake 32 EU), i3-1005G1, Silicon Motion AZW 256G M.2280 NVMe 4X 200725 D | Zotac ZBox MI643 UHD Graphics 620, i5-10210U, Lexar NM610 1TB | GMK NucBox K1 UHD Graphics 600, Celeron J4125, HIKVision C100 NGFF SSD 128GB | |
|---|---|---|---|---|---|---|
| Noise | -10% | -11% | -17% | 2% | -10% | |
| uit / omgeving * (dB) | 25.6 | 28.7 -12% | 28.7 -12% | 27.5 -7% | 26.1 -2% | 27.8 -9% |
| Idle Minimum * (dB) | 25.6 | 28.7 -12% | 29 -13% | 30.9 -21% | 27.5 -7% | 27.8 -9% |
| Idle Average * (dB) | 25.6 | 29.3 -14% | 29 -13% | 33.5 -31% | 27.5 -7% | 27.8 -9% |
| Idle Maximum * (dB) | 25.6 | 31.8 -24% | 29 -13% | 33.5 -31% | 27.5 -7% | 27.8 -9% |
| Load Average * (dB) | 33.6 | 39 -16% | 36 -7% | 38.5 -15% | 28.9 14% | 46.8 -39% |
| Witcher 3 ultra * (dB) | 33.6 | 39 -16% | 42 -25% | |||
| Load Maximum * (dB) | 54.5 | 41.4 24% | 49.4 9% | 51.6 5% | 42 23% | 46.8 14% |
* ... kleiner is beter
Geluidsniveau
| Onbelast |
| 25.6 / 25.6 / 25.6 dB (A) |
| Belasting |
| 33.6 / 54.5 dB (A) |
 | ||
30 dB stil 40 dB(A) hoorbaar 50 dB(A) luid |
||
min: | ||
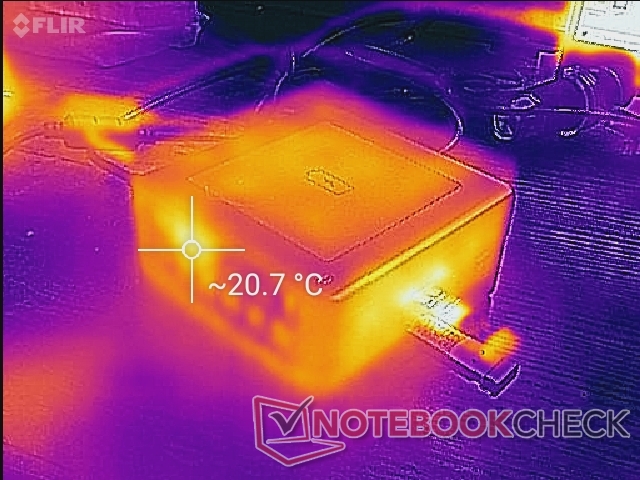
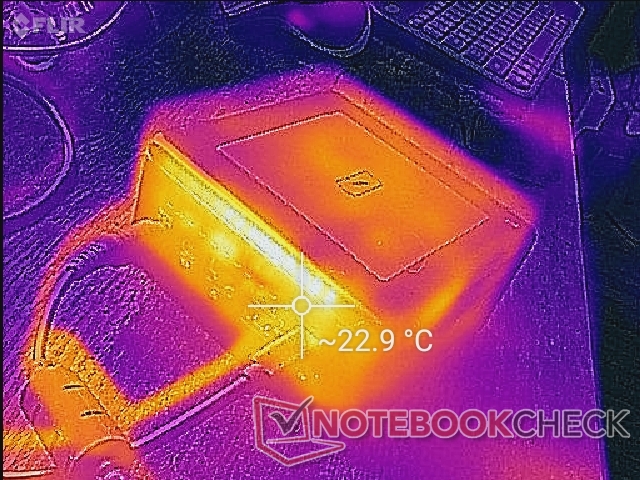
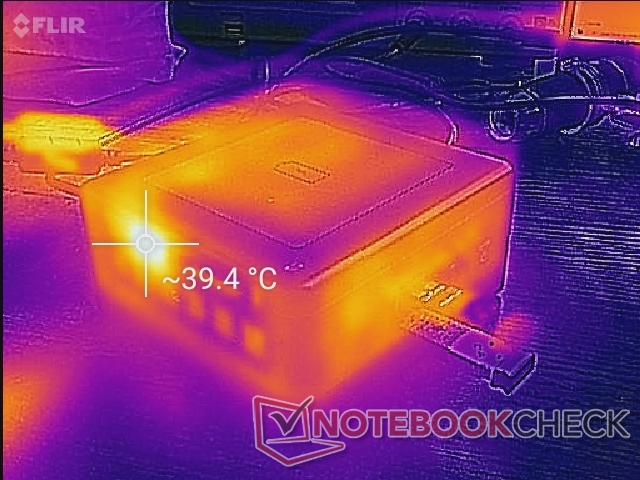
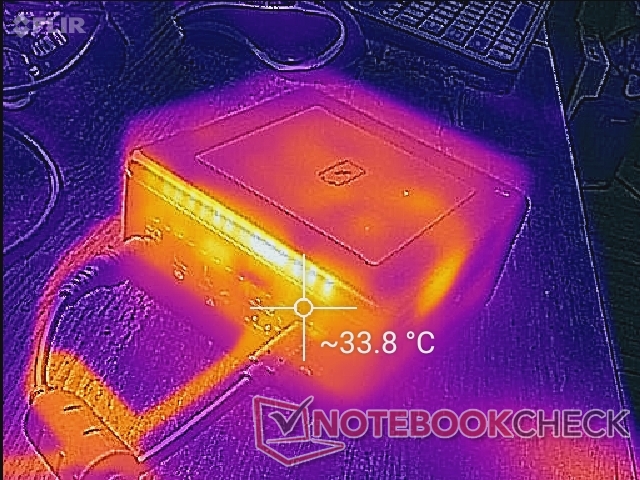
Temperatuur
Oppervlaktetemperaturen zijn geen probleem, zelfs niet onder belasting. Het apparaat werkt prima als het op zijn kant wordt gelegd, maar dit wordt niet aanbevolen omdat de ventilatieroosters dan geblokkeerd zijn.
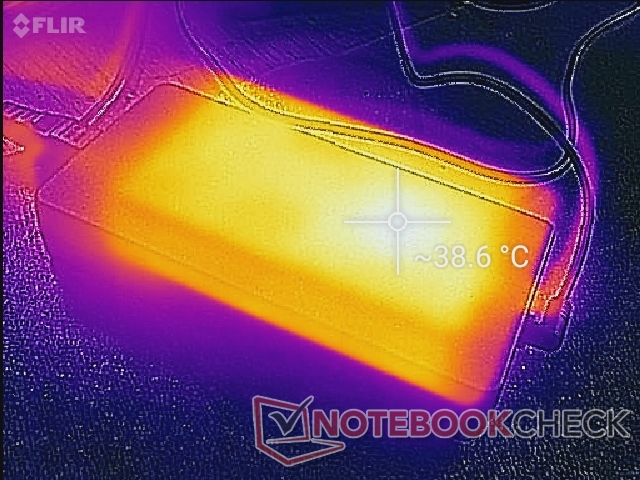
De AC-adapter kan merkbaar warmer worden dan de mini PC zelf met ongeveer 40 C tijdens het gamen.
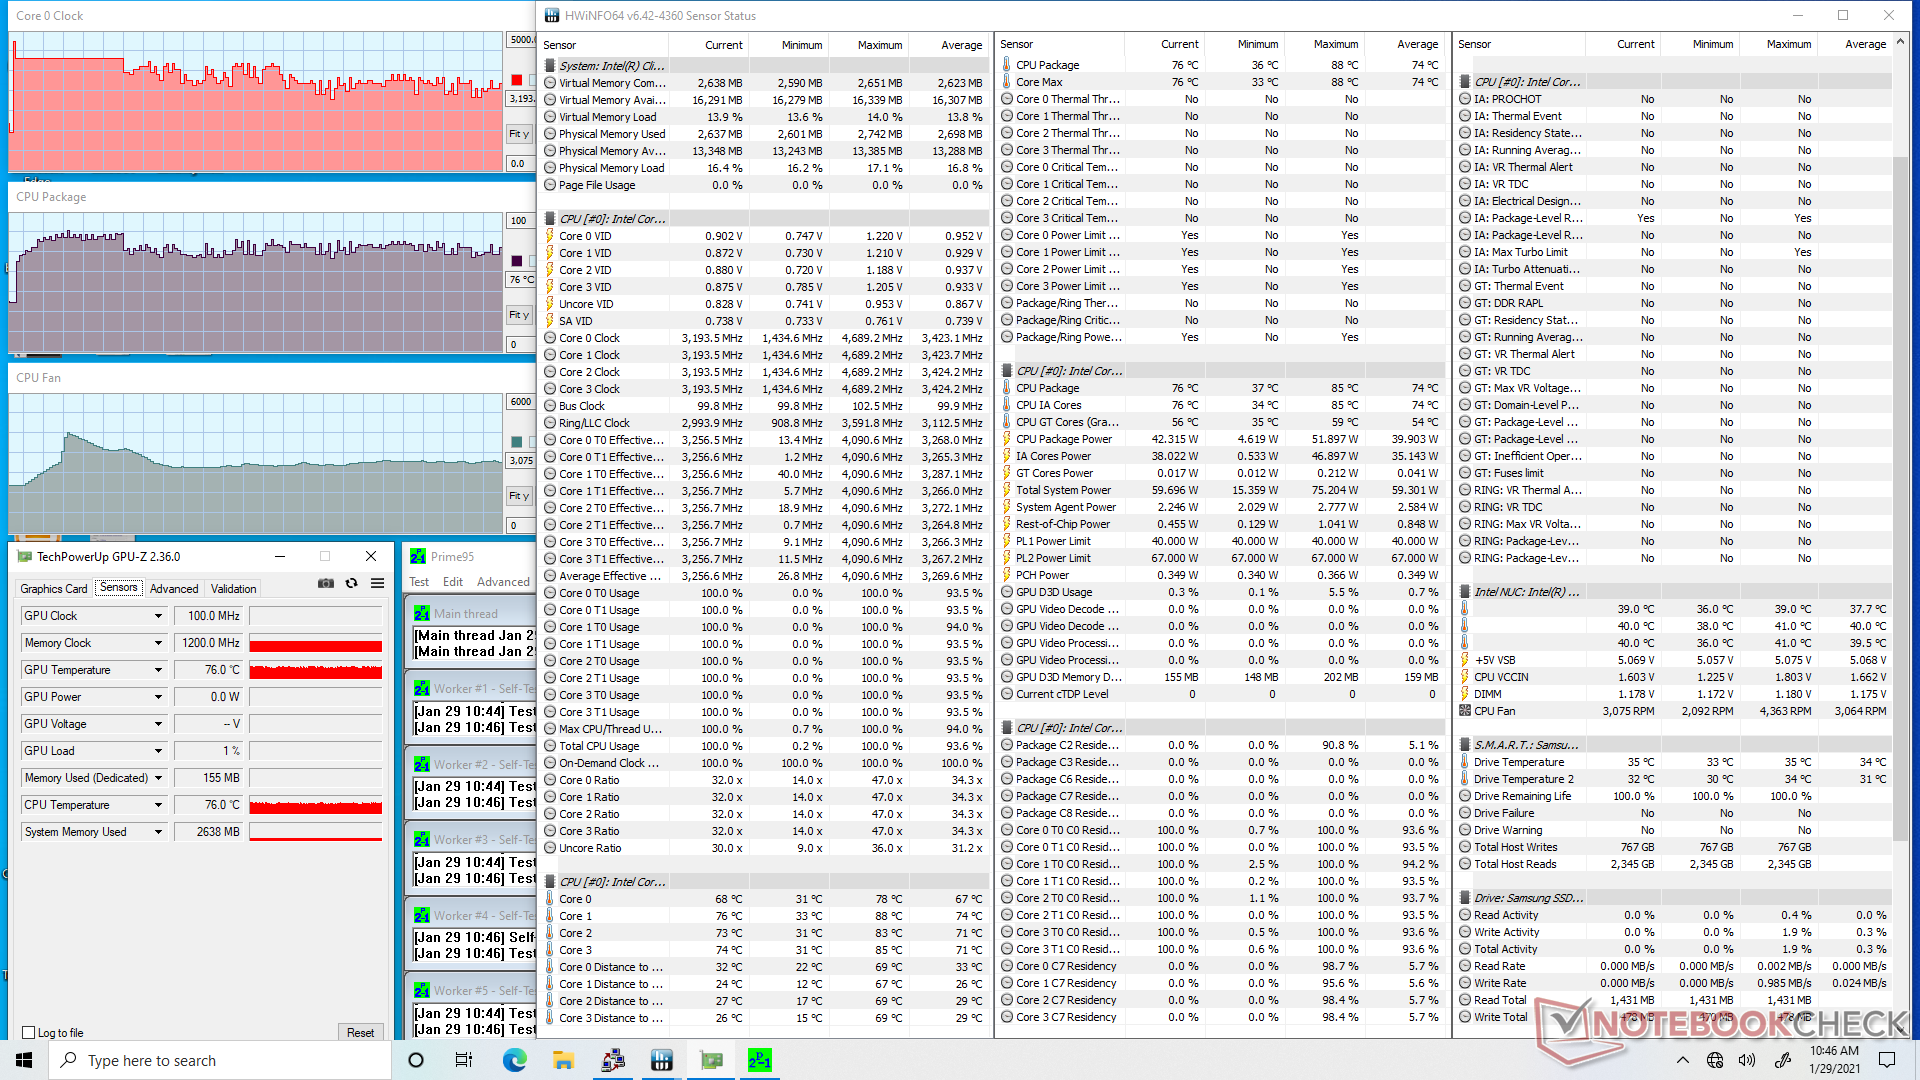
Stresstest
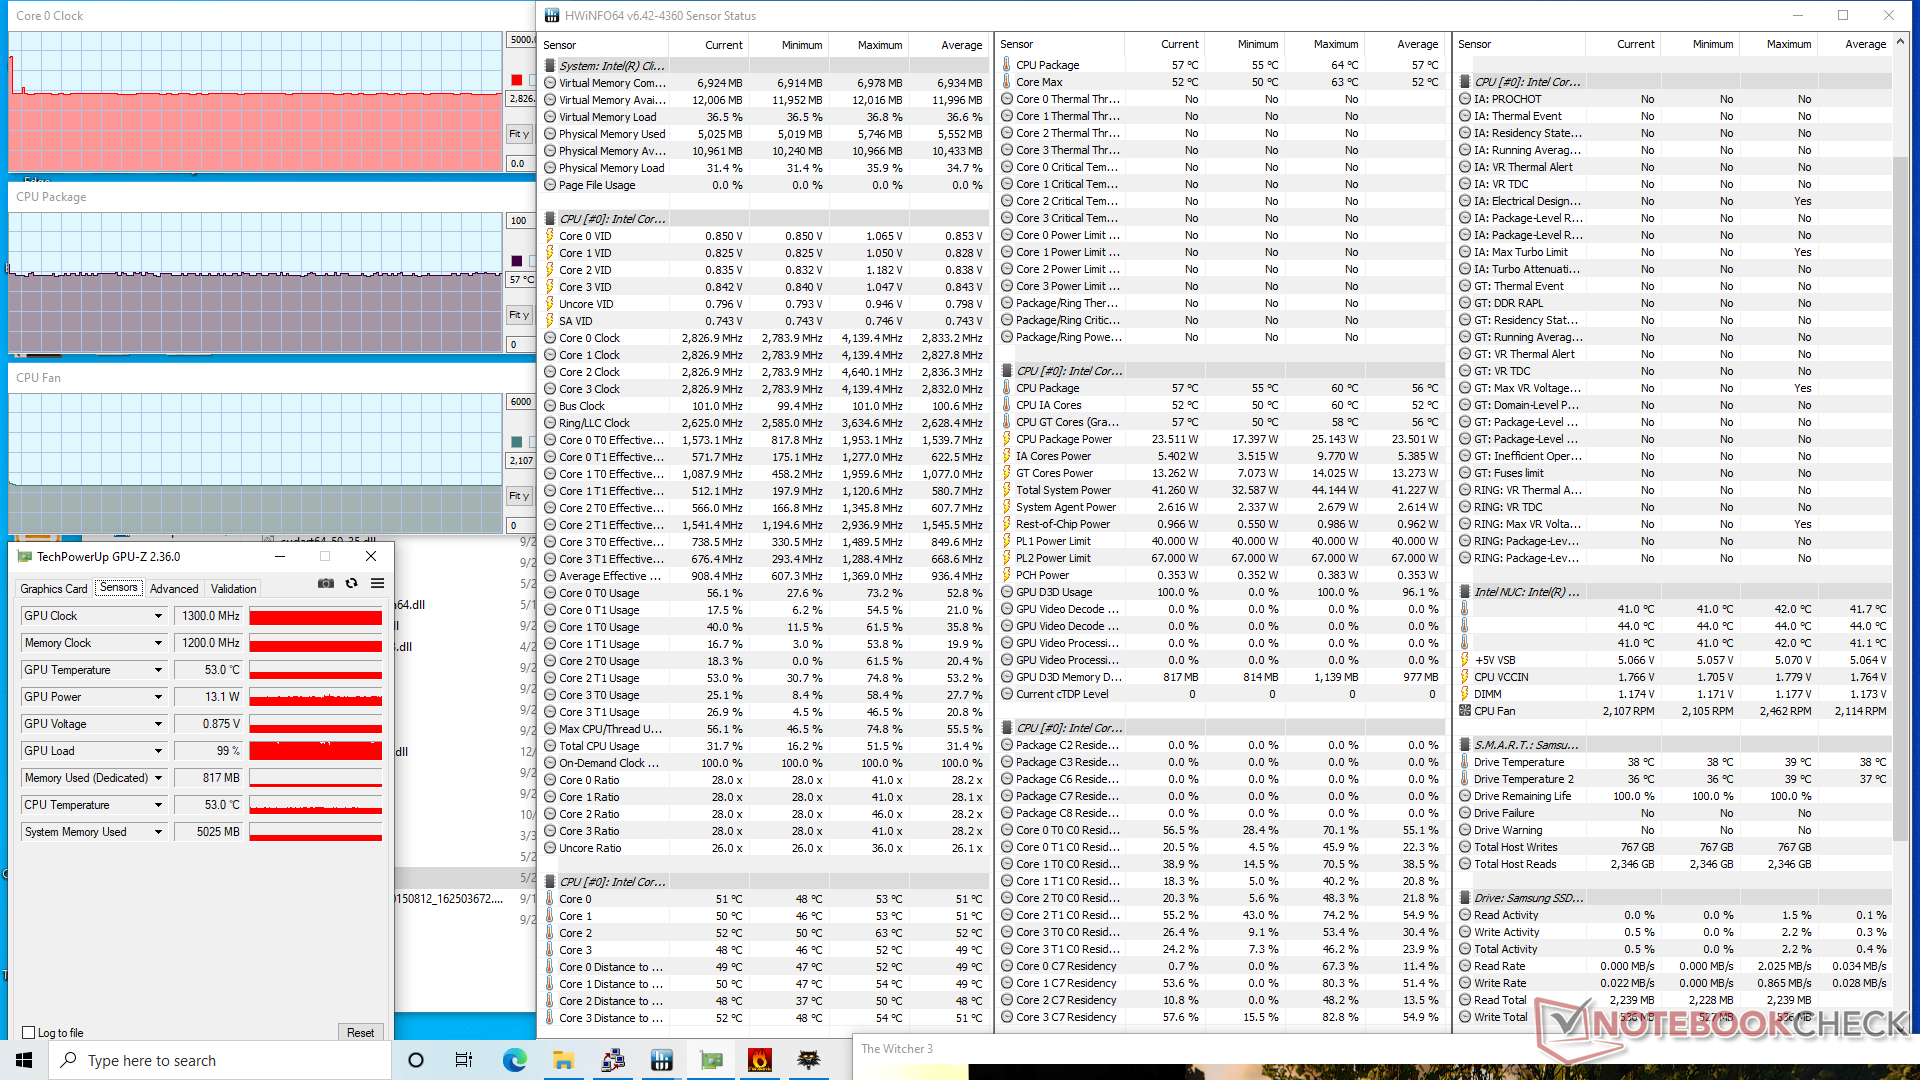
We belasten de NUC om mogelijke throttling problemen op te sporen. Tijdens het draaien van Prime95, zou de kloksnelheid stijgen naar 4.1 GHz gedurende de eerste paar minuten en bij een stabiele kerntemperatuur van 86 C. Uiteindelijk dalen zowel de kloksnelheid als de temperatuur echter automatisch en schommelen tussen respectievelijk 2.7 tot 3.4 GHz en 71 C tot 79 C. Een optie om onbeperkt op 4,1 GHz en 86 C te draaien voor maximale aanhoudende prestaties zou geweldig zijn geweest voor power-gebruikers. Bij het uitvoeren Witcher 3 om echte gamingbelastingen weer te geven, zijn de kloksnelheden en de temperatuur veel lager met slechts 57 C.
Merk op dat het toerental van de ventilator schommelt tussen 0 en 2000, zelfs wanneer het systeem stationair draait, zoals te zien is in de schermafbeelding hieronder.
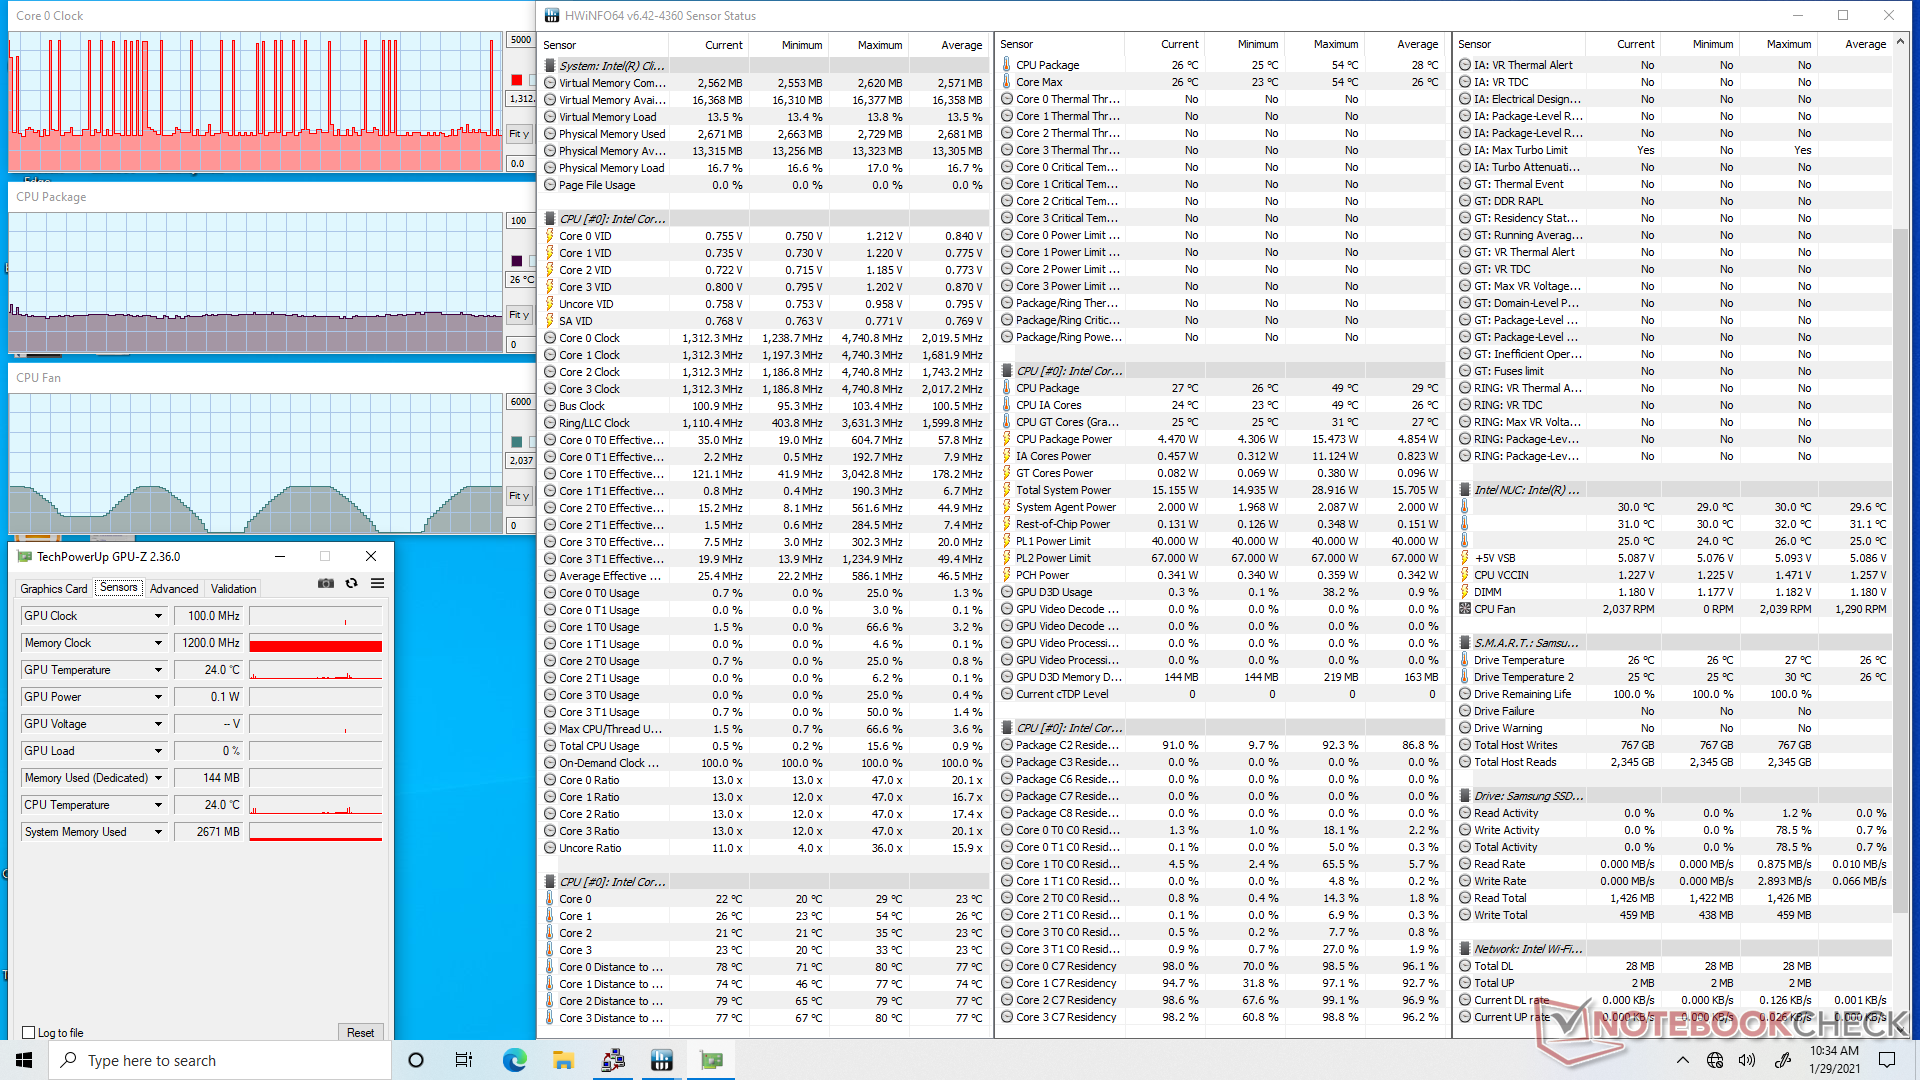
| CPUklok (GHz) GPUklok (MHz) GemiddeldeCPU temperatuur (°C) |
| Systeem Idle |
| Prime95 Stress |
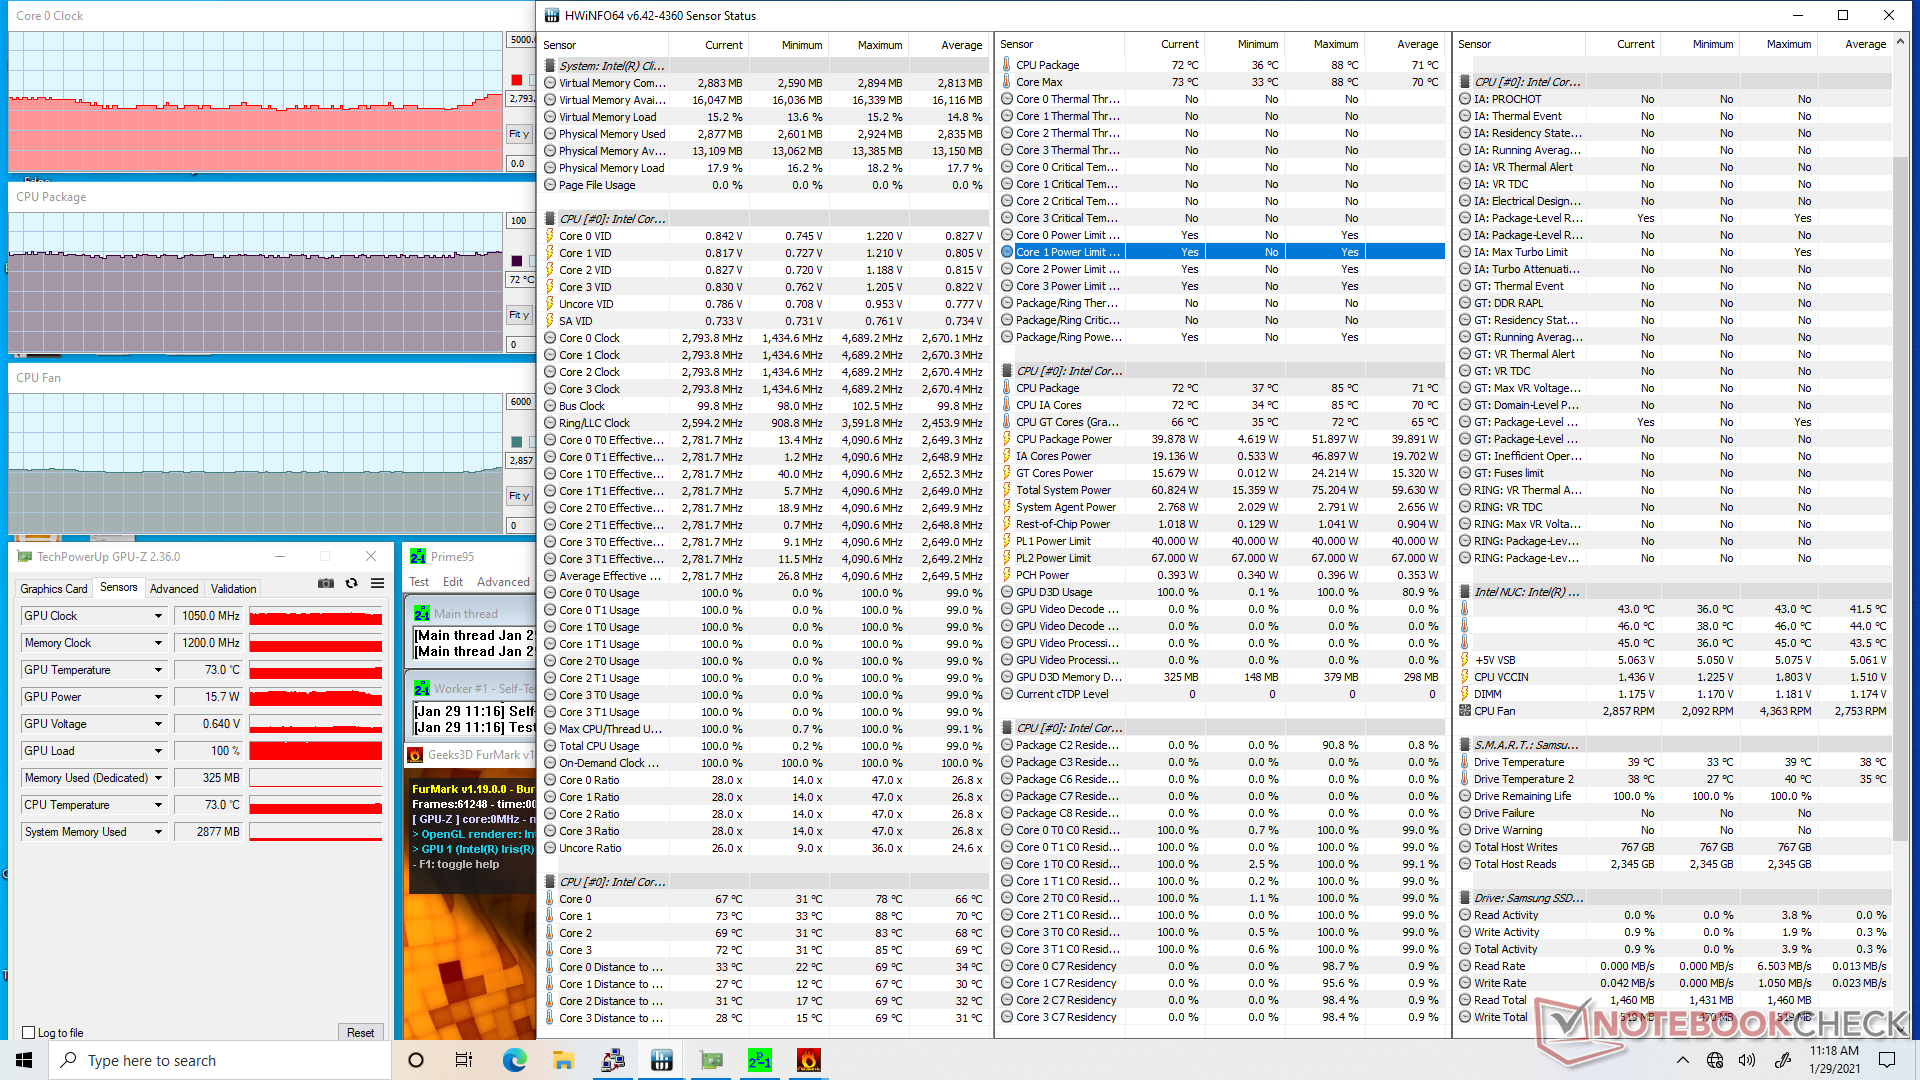
| Prime95 + FurMark Stress |
| Witcher 3 Stress |
Energy Management
Stroomverbruik
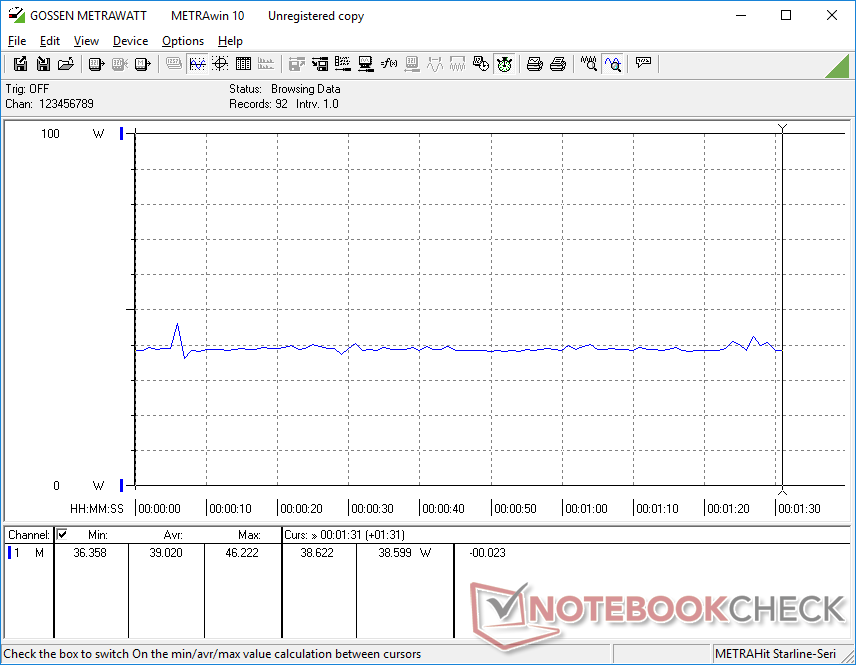
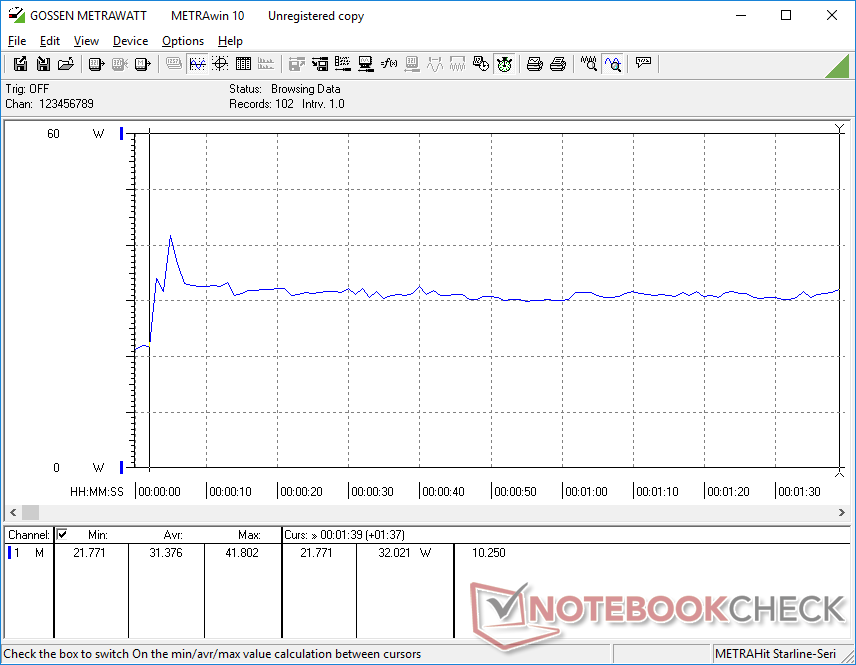
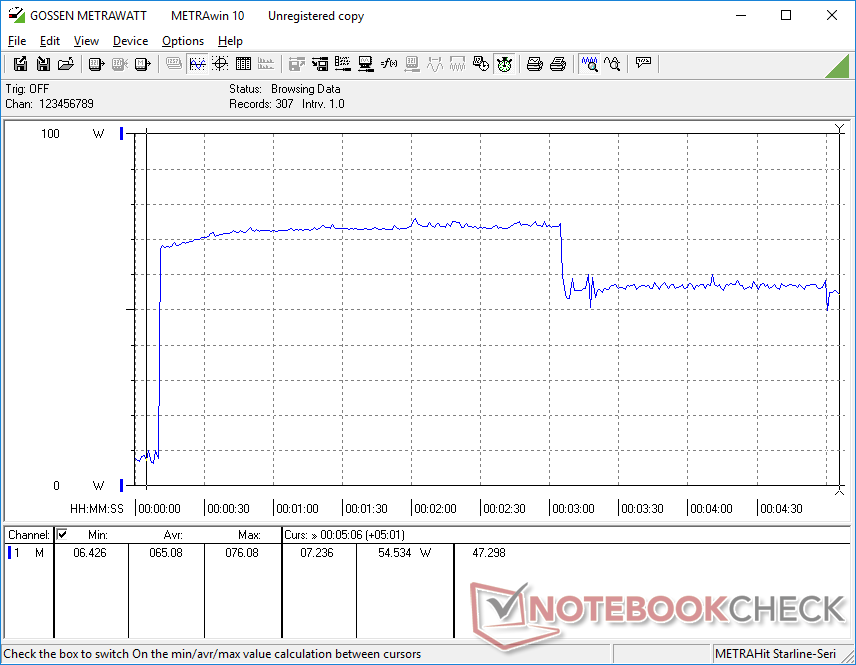
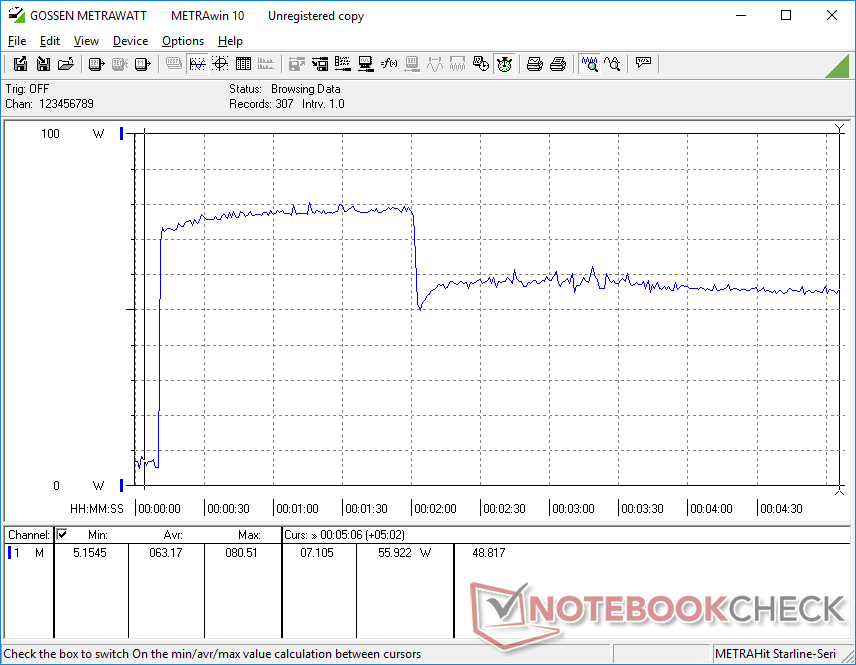
NUC-modellen zijn altijd zeer energie-efficiënt geweest en de NUC 11 zet deze trend voort. Het systeem verbruikt slechts 31 W tot 39 W tijdens het gamen, vergeleken met 63 W en 50 W op respectievelijk de Skull Canyon NUC en de concurrerende Beelink GT-R35, dit alles terwijl het aanzienlijk snellere CPU en GPU prestaties levert dan beiden. Hades Canyon is nog steeds ruim twee keer krachtiger als het aankomt op grafische prestaties, maar verbruikt daarbij ook 3 keer meer stroom.
We kunnen een maximaal verbruik van 80,5 W meten bij extreme belasting, zoals blijkt uit de onderstaande grafieken. Dit verbruik is slechts tijdelijk en komt overeen met onze kloksnelheid waarnemingen tijdens het draaien van Prime95 in de Stress Test sectie hierboven.
Het is vermeldenswaard dat de externe 120 W AC adapter relatief groot is (~15 x 7,5 x 2,5 cm) en meer dan tweederde weegt van de NUC unit (448 g vs. 647 g).
| Uit / Standby | |
| Inactief | |
| Belasting |
|
Key:
min: | |
| Intel NUC11PAQi7 i7-1165G7, Iris Xe G7 96EUs, Samsung SSD 980 Pro 500GB MZ-V8P500BW, , x, | Intel NUC8i7BE i7-8559U, Iris Plus Graphics 655, , , x, | Intel Hades Canyon NUC8i7HVK i7-8809G, Vega M GH, Intel Optane 120 GB SSDPEK1W120GA, , x, | Zotac ZBox MI643 i5-10210U, UHD Graphics 620, Lexar NM610 1TB, , x, | Beelink GTR35 II-G-16512D00W64PRO-1T R5 3550H, Vega 8, Silicon Motion AZW 512G NV428, , x, | |
|---|---|---|---|---|---|
| Power Consumption | -3% | -173% | -29% | -44% | |
| Idle Minimum * (Watt) | 5.6 | 2.7 52% | 15.5 -177% | 7.5 -34% | 8.8 -57% |
| Idle Average * (Watt) | 5.6 | 3.1 45% | 16.2 -189% | 9.2 -64% | 9.1 -63% |
| Idle Maximum * (Watt) | 6 | 6.3 -5% | 16.5 -175% | 9.6 -60% | 9.6 -60% |
| Load Average * (Watt) | 31.4 | 59.7 -90% | 83.4 -166% | 34.4 -10% | 55.3 -76% |
| Witcher 3 ultra * (Watt) | 39 | 47.2 -21% | 121.7 -212% | 50.3 -29% | |
| Load Maximum * (Watt) | 80.5 | 78 3% | 173.5 -116% | 60.6 25% | 65.6 19% |
* ... kleiner is beter
Pro
Contra
Uitspraak
In termen van prestaties is onze Tiger Lake Core i7 ruwweg gelijk aan de Comet Lake NUC 10 in multi-threaded belastingen, terwijl hij ongeveer 20 procent sneller is in single-threaded belastingen. Het grootste voordeel ligt echter op het gebied van grafische prestaties, waar de Iris Xe meer dan 3x sneller kan zijn dan de UHD Graphics 620 zonder zelfs maar veel meer stroom te hoeven verbruiken. Als GPU kracht en efficiëntie het belangrijkst zijn, dan is de NUC 11 de betere investering. Anders zouden gebruikers die vooral HTPC belastingen willen draaien, zoals 4K streaming of video browsing, prima uit de voeten kunnen met een oudere NUC 10, terwijl de Hades Canyon NUC nog steeds de betere optie zal zijn voor ruwe gaming.
De NUC zet Tiger Lake in een beter daglicht dan wat de meeste laptops hebben weten te doen met dezelfde processorserie. Hij zal je meer kosten dan de meeste andere Core U-serie mini PC's, maar de kwaliteit en 3 jaar garantie maken het een veiligere investering.
Het wordt ten zeerste aanbevolen om de NUC 11 te configureren met dual-channel geheugen om de grafische prestaties te verbeteren. Onze enkel-kanaals kit geleverd door Intel leverde langzamer dan verwachte 3DMark scores en frame rates die de Iris Xe geen recht doen.
Op toekomstige NUC's zouden we graag een geïntegreerde vingerafdruklezer en ondersteuning voor USB-C AC-adapters zien. De concurrerende Beelink GT-R mini PC bevat een vingerafdruklezer, terwijl een externe USB-C stroombron een meer universele oplossing zou zijn.
Prijs en beschikbaarheid
De NUC 11-serie wordt naar verwachting pas in maart 2021 geleverd en is op het moment van schrijven dus nog niet overal verkrijgbaar
Price comparison

