GMK NucBox 2 Mini PC Review: Redelijk geprijsd en goed te upgraden
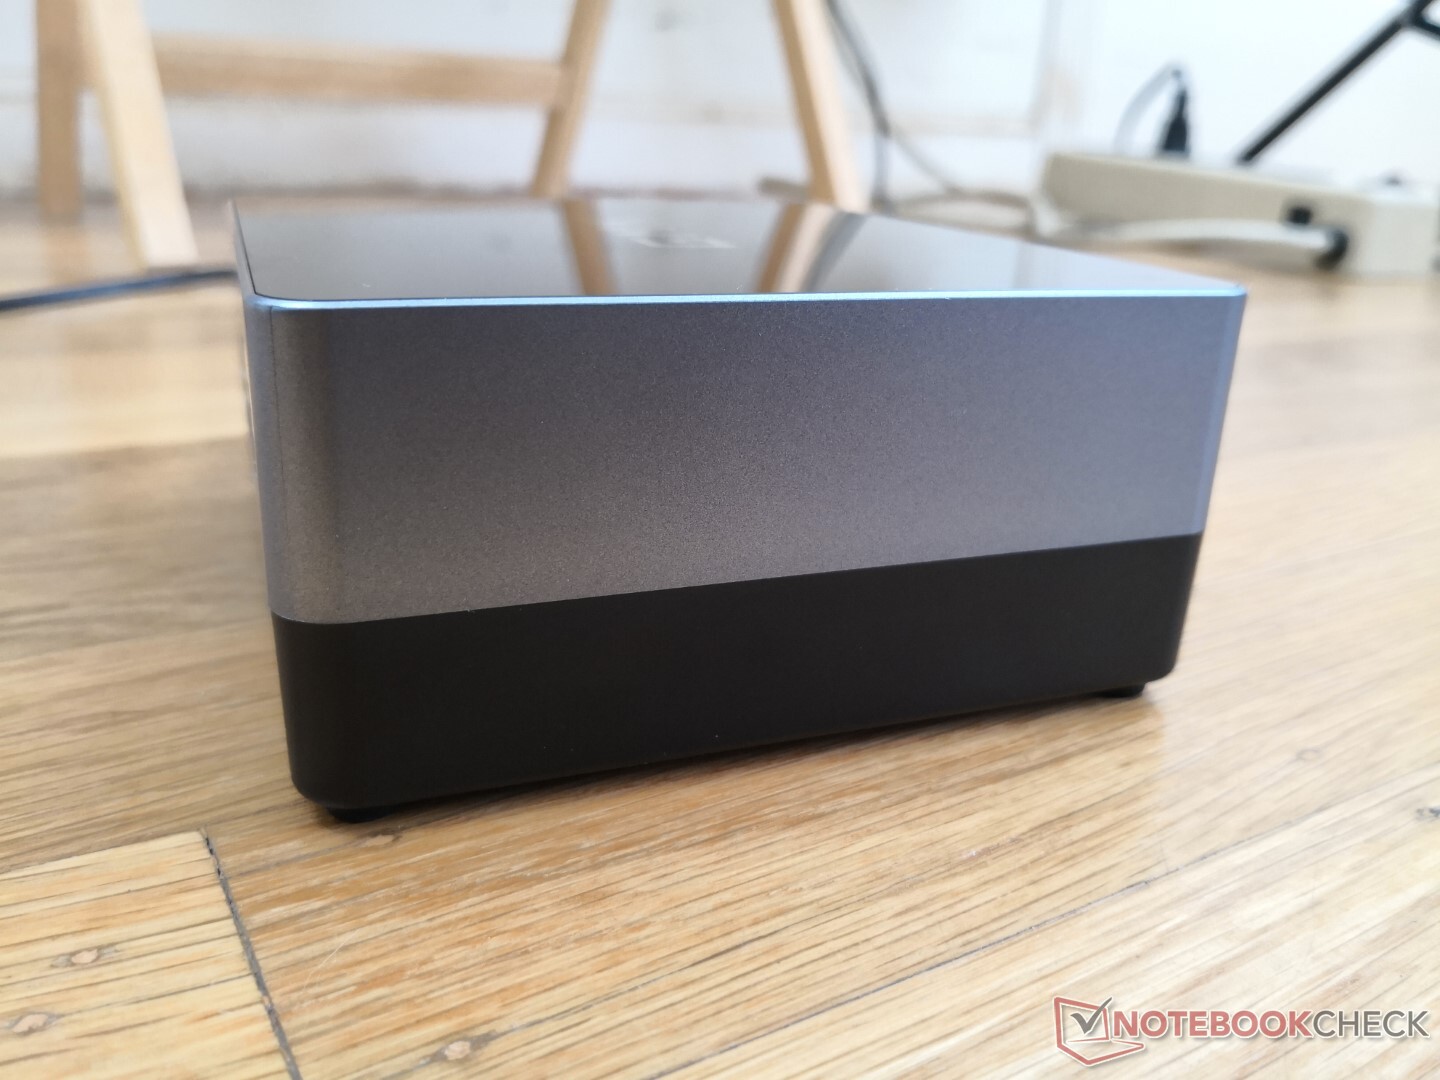
 vs. NucBox K1 (rechts)")
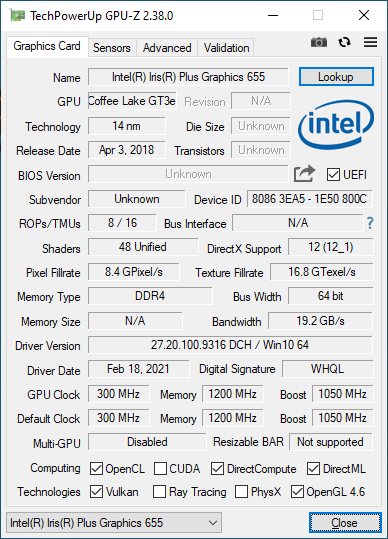
In tegenstelling tot de superkleine GMK NucBox K1 vorig jaar, is de NucBox 2 een meer traditionele mini-pc in dezelfde trant als de Intel NUC. De huidige configuratie wordt geleverd met een Intel Coffee Lake-U Core i5 CPU, Iris Plus Graphics 655 GPU, 8 GB enkel-kanaals RAM, en 256 GB NVMe SSD voor ongeveer $ 500 USD (of $ 440 wanneer in de aanbieding).
Concurrenten in deze ruimte worden steeds gewoner met alternatieven zoals de expansieve Zotac ZBox-serie, Beelink SEi10, Chuwi GBox, Lenovo ThinkCentre, of de populaire Intel NUC-serie.
Gebruikers kunnen meer te weten komen over de NucBox 2 via zijn officiële productpagina hier.
potential competitors in comparison
Evaluatie | Datum | Model | Gewicht | Hoogte | Formaat | Resolutie | Beste prijs |
|---|---|---|---|---|---|---|---|
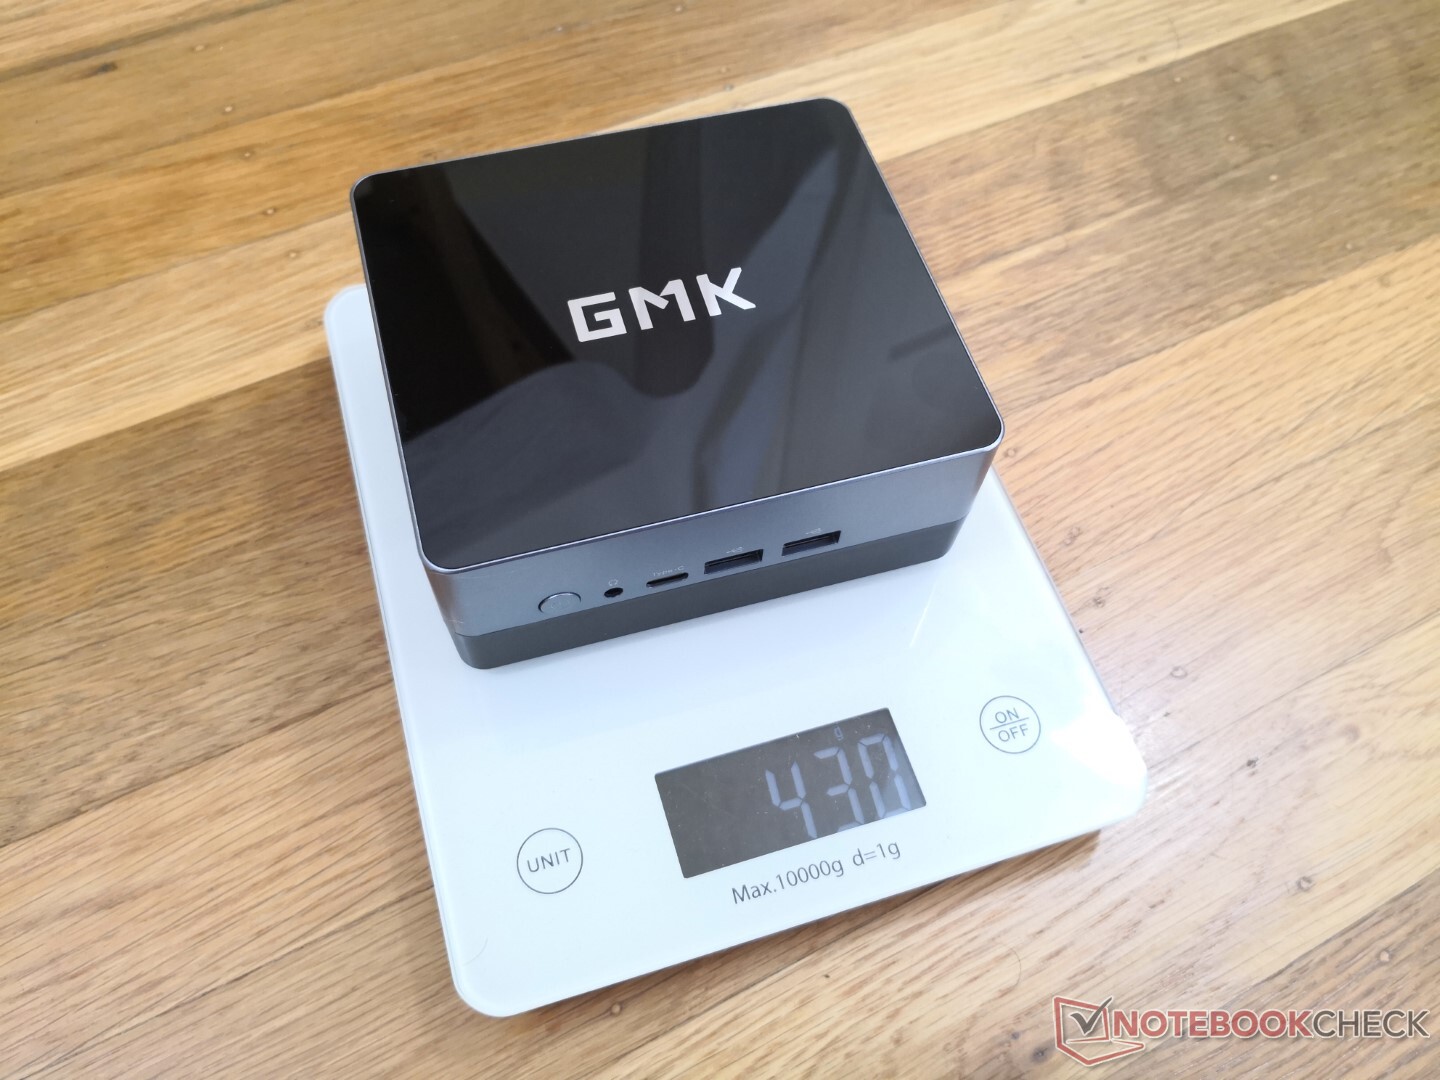
v (old) | 03-2021 | GMK NucBox 2 i5-8259U, Iris Plus Graphics 655 | 430 g | 50 mm | x | ||
v (old) | 02-2021 | Intel NUC11PAQi7 i7-1165G7, Iris Xe G7 96EUs | 647 g | 56 mm | x | ||
v (old) | 11-2018 | Intel NUC8i7BE i7-8559U, Iris Plus Graphics 655 | 683 g | 51 mm | x | ||
v (old) | GMK NucBox K1 Celeron J4125, UHD Graphics 600 | 130 g | 42 mm | x | |||
v (old) | Beelink SEi10 i3-1005G1, UHD Graphics G1 (Ice Lake 32 EU) | 350 g | 41 mm | x | |||
v (old) | Zotac ZBox MI643 i5-10210U, UHD Graphics 620 | 550 g | 28.5 mm | x |
Zaak
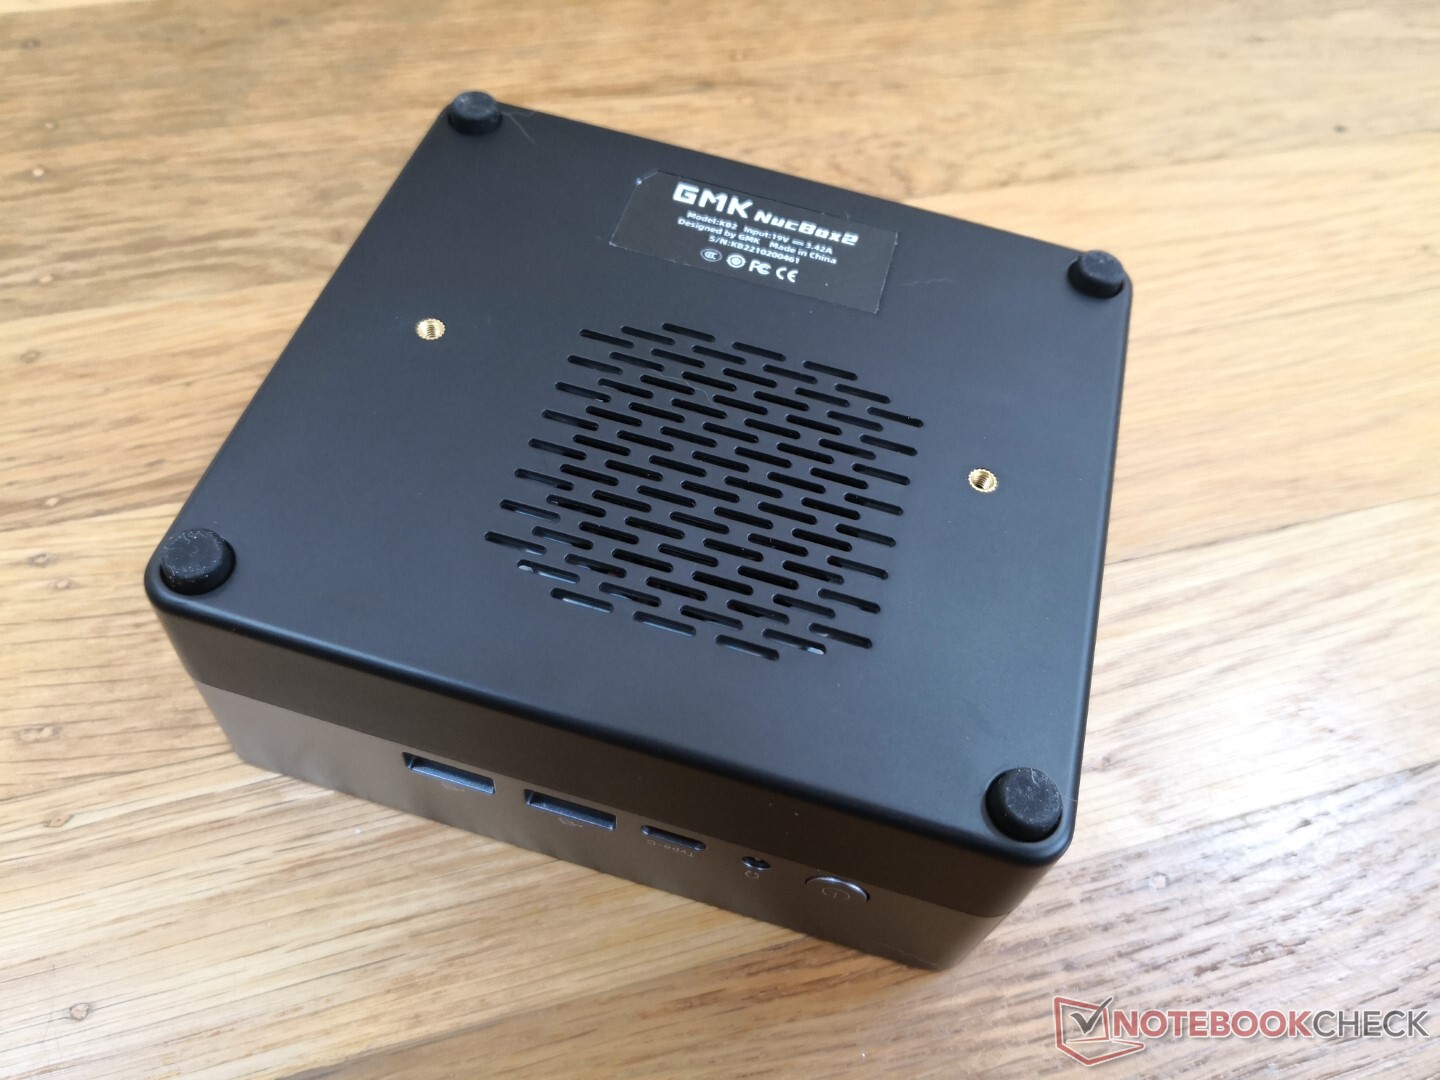
De totale afmetingen lijken het meest op die van de oudere Intel NUC 8, maar zijn bijna 40 procent lichter. De bouwkwaliteit is rondom uitstekend met geen kromtrekking op een van de zes vlakken. Verwacht dat het glanzende plastic oppervlak aan de bovenkant sneller vuil wordt dan de rest van het matte metalen chassis.
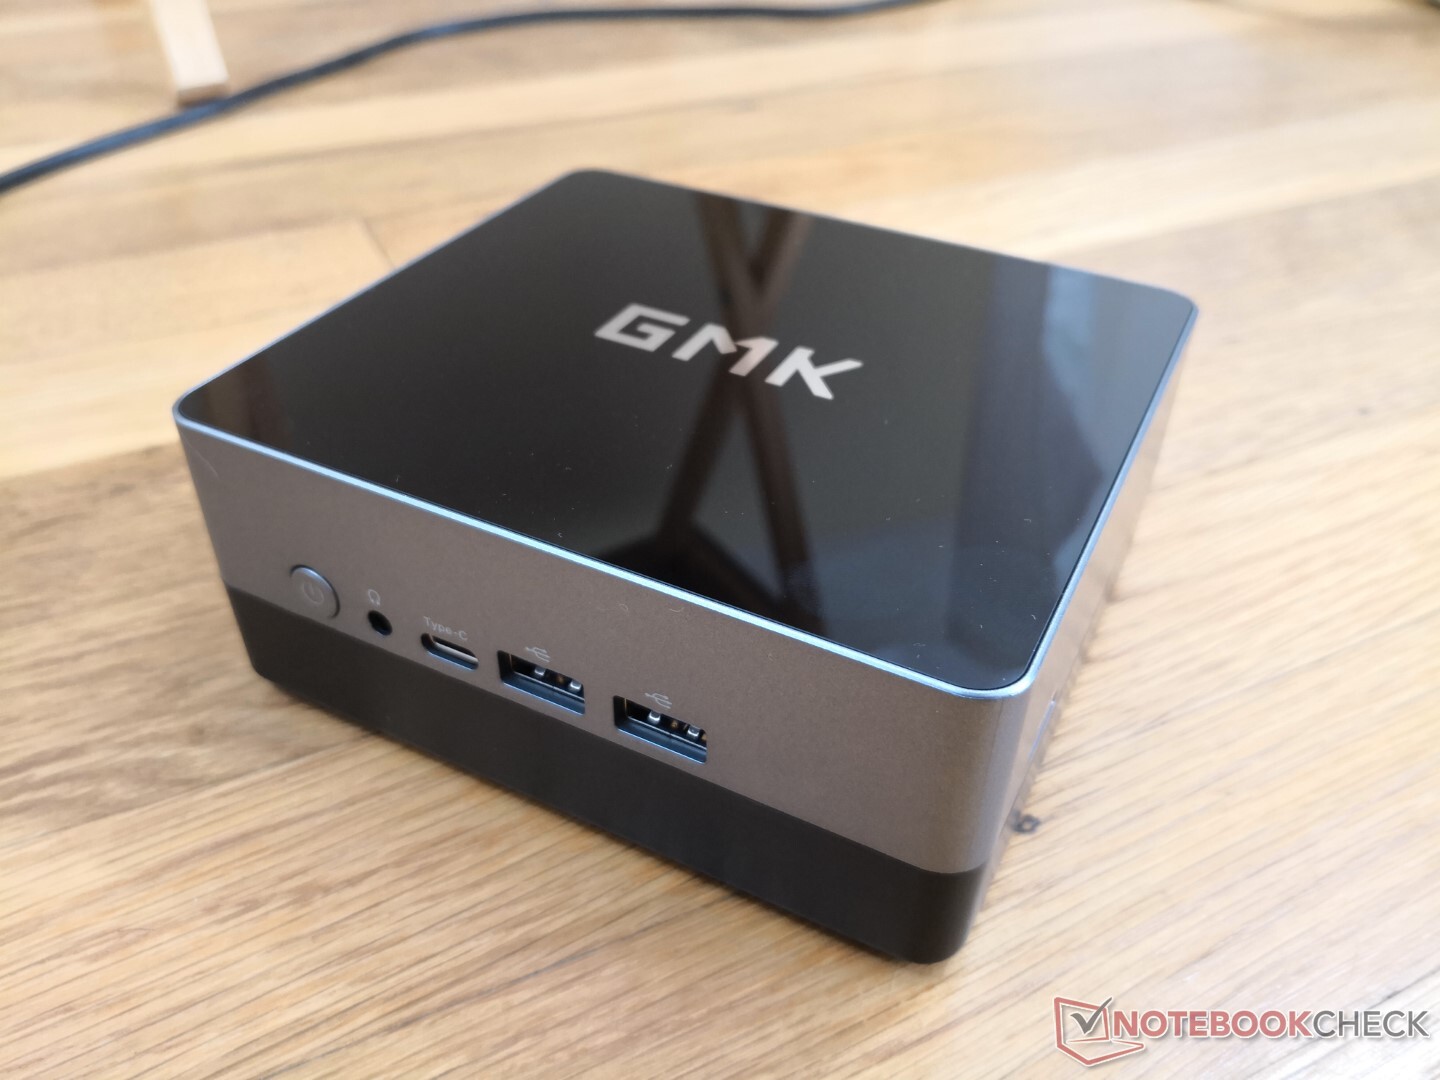
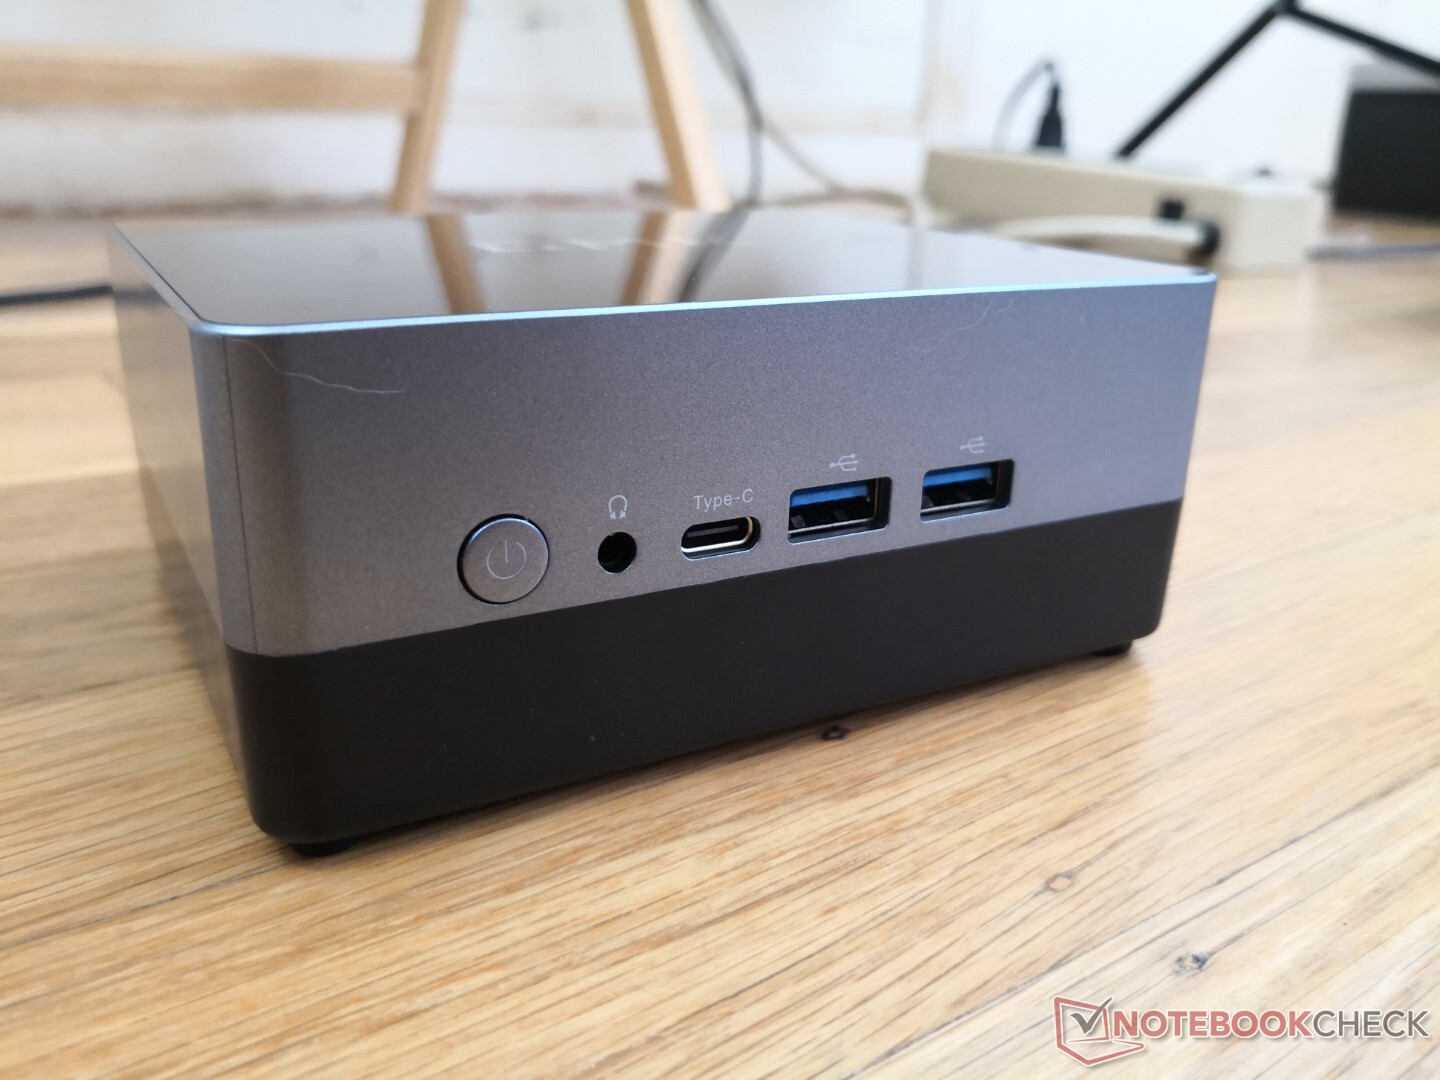
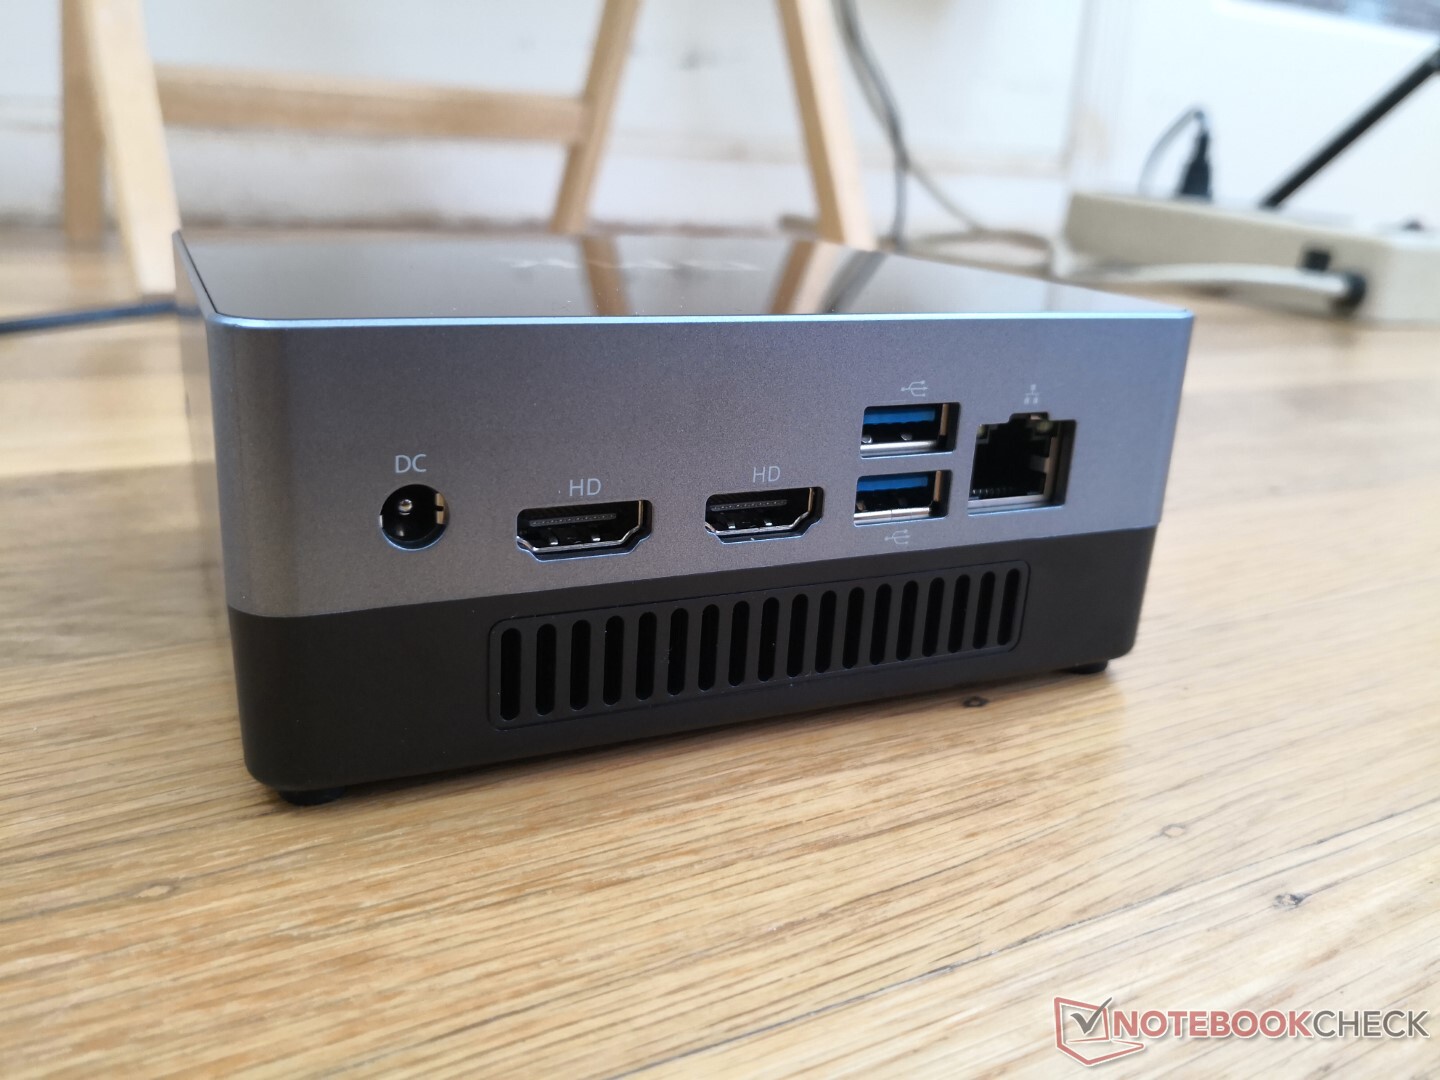
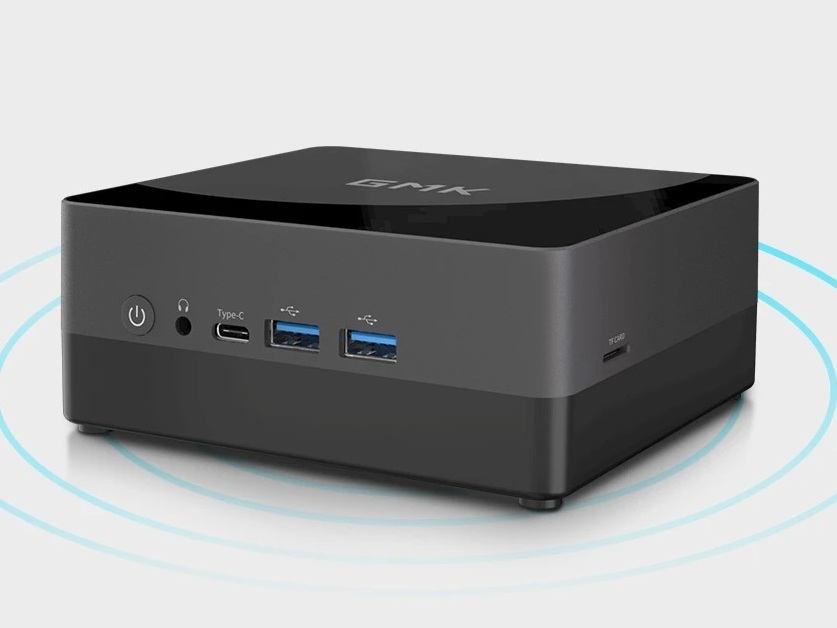
Connectiviteit
De poortopties zijn goed, maar ze hadden beter gekund. Er is met name slechts één USB-C poort en deze ondersteunt geen DisplayPort, Thunderbolt of Power Delivery, in tegenstelling tot de USB-C poort op de concurrerende Beelink SEi10. Er is ook geen IR-ontvanger.
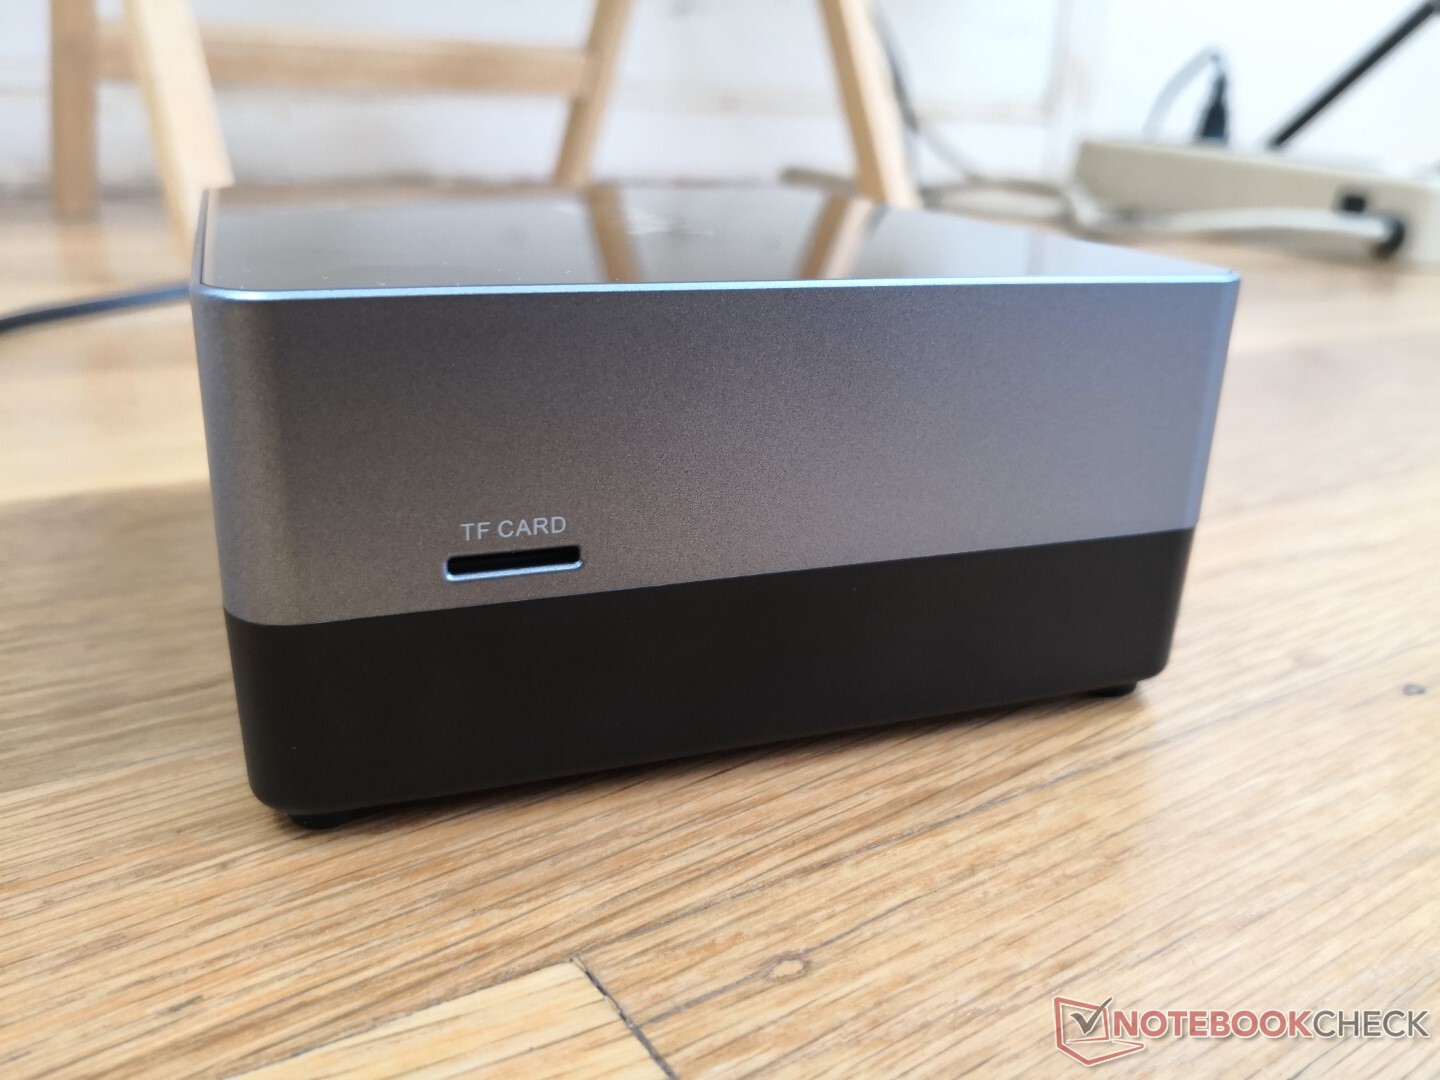
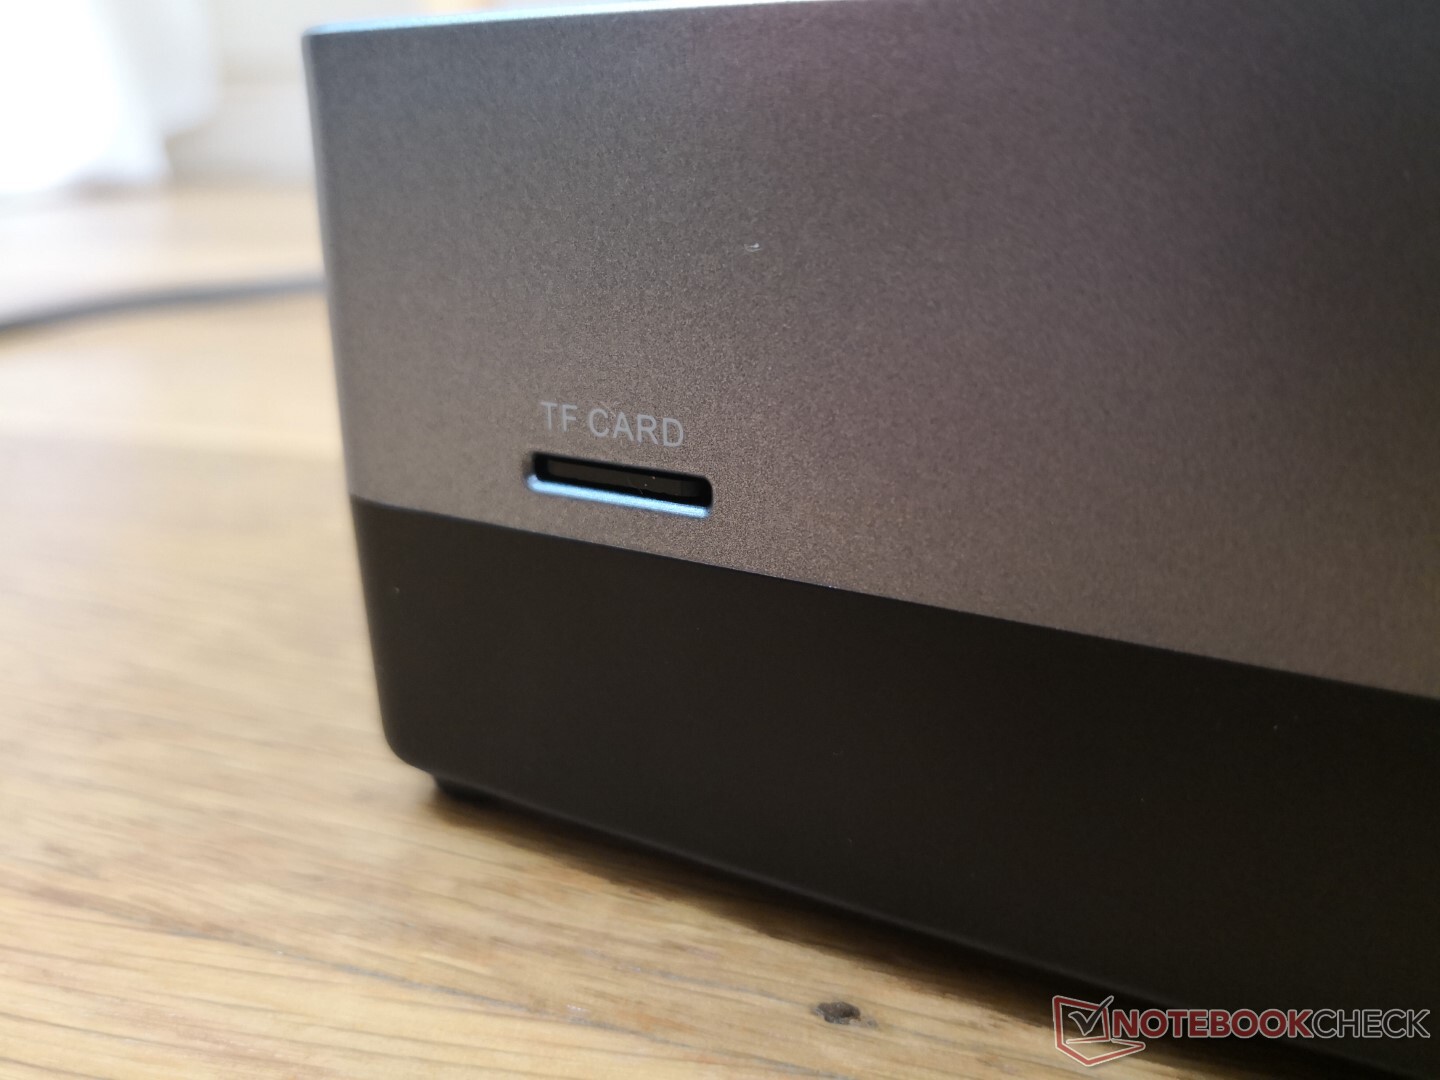
SD-kaartlezer
| SD Card Reader | |
| average JPG Copy Test (av. of 3 runs) | |
| Intel NUC11PAQi7 (Toshiba Exceria Pro SDXC 64 GB UHS-II) | |
| Intel NUC8i7BE (Toshiba Exceria Pro M501 UHS-II) | |
| GMK NucBox K1 (Toshiba Exceria Pro M501 UHS-) | |
| Zotac ZBox MI643 (Toshiba Exceria Pro M501 UHS-II) | |
| GMK NucBox 2 (Toshiba Exceria Pro M501 UHS-II) | |
| Beelink SEi10 (Toshiba Exceria Pro M501 UHS-II) | |
| maximum AS SSD Seq Read Test (1GB) | |
| Intel NUC11PAQi7 (Toshiba Exceria Pro SDXC 64 GB UHS-II) | |
| Intel NUC8i7BE (Toshiba Exceria Pro M501 UHS-II) | |
| GMK NucBox K1 (Toshiba Exceria Pro M501 UHS-) | |
| Zotac ZBox MI643 (Toshiba Exceria Pro M501 UHS-II) | |
| Beelink SEi10 (Toshiba Exceria Pro M501 UHS-II) | |
| GMK NucBox 2 (Toshiba Exceria Pro M501 UHS-II) | |
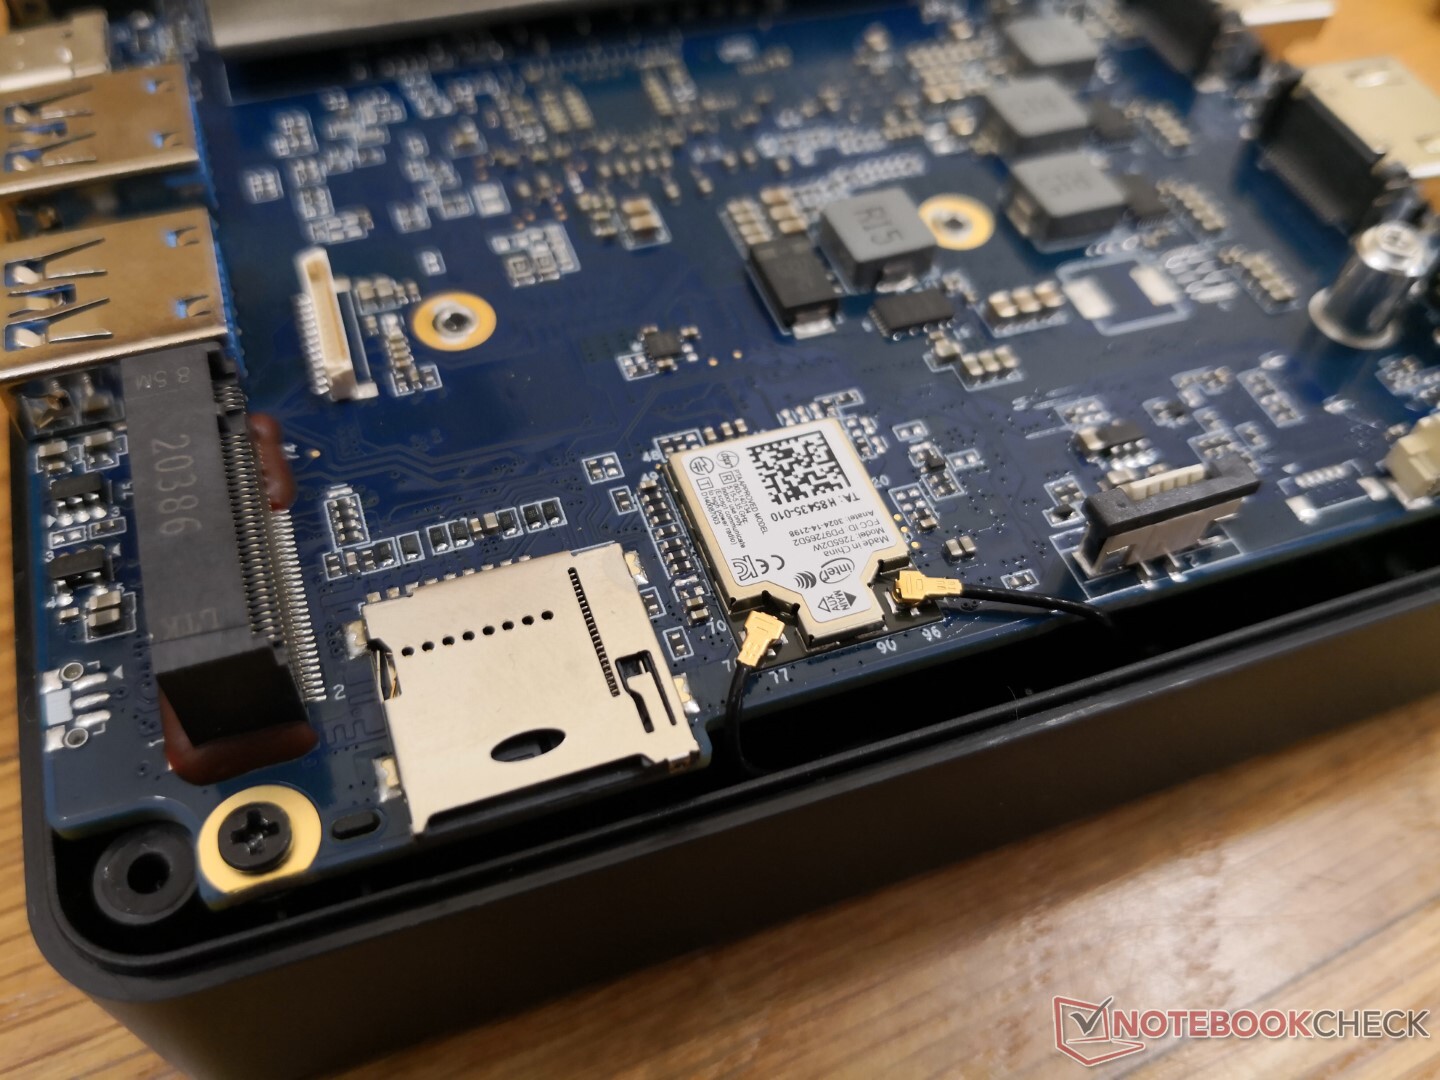
Communicatie
Een Intel 7265 komt gesoldeerd voor Wi-Fi 5 connectiviteit. Wi-Fi 6 is waarschijnlijk niet beschikbaar om kosten te besparen. Hoewel de ontvangstsnelheden uitstekend zijn, zijn de overdrachtsnelheden in de praktijk trager dan verwacht: bijna de helft bij verbinding met onze Netgear RAX200 testrouter.
| Networking | |
| iperf3 transmit AX12 | |
| Beelink SEi10 | |
| Intel NUC8i7BE | |
| Intel NUC11PAQi7 | |
| GMK NucBox 2 | |
| Zotac ZBox MI643 | |
| GMK NucBox K1 | |
| iperf3 receive AX12 | |
| Beelink SEi10 | |
| Intel NUC11PAQi7 | |
| GMK NucBox 2 | |
| Intel NUC8i7BE | |
| GMK NucBox K1 | |
| Zotac ZBox MI643 | |
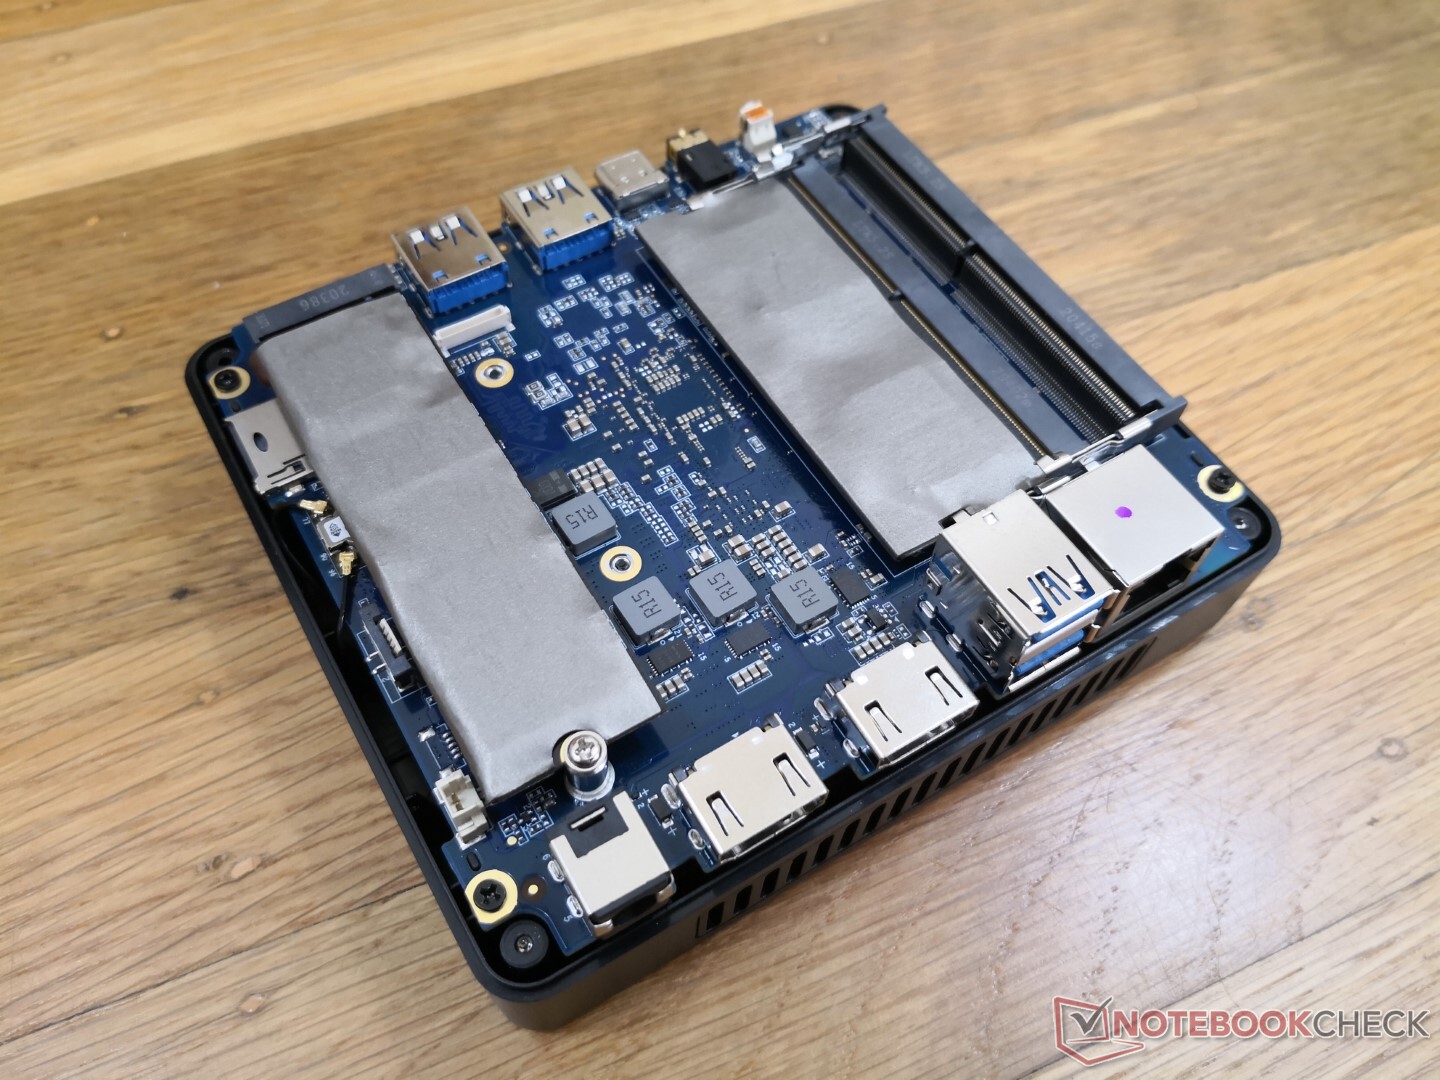
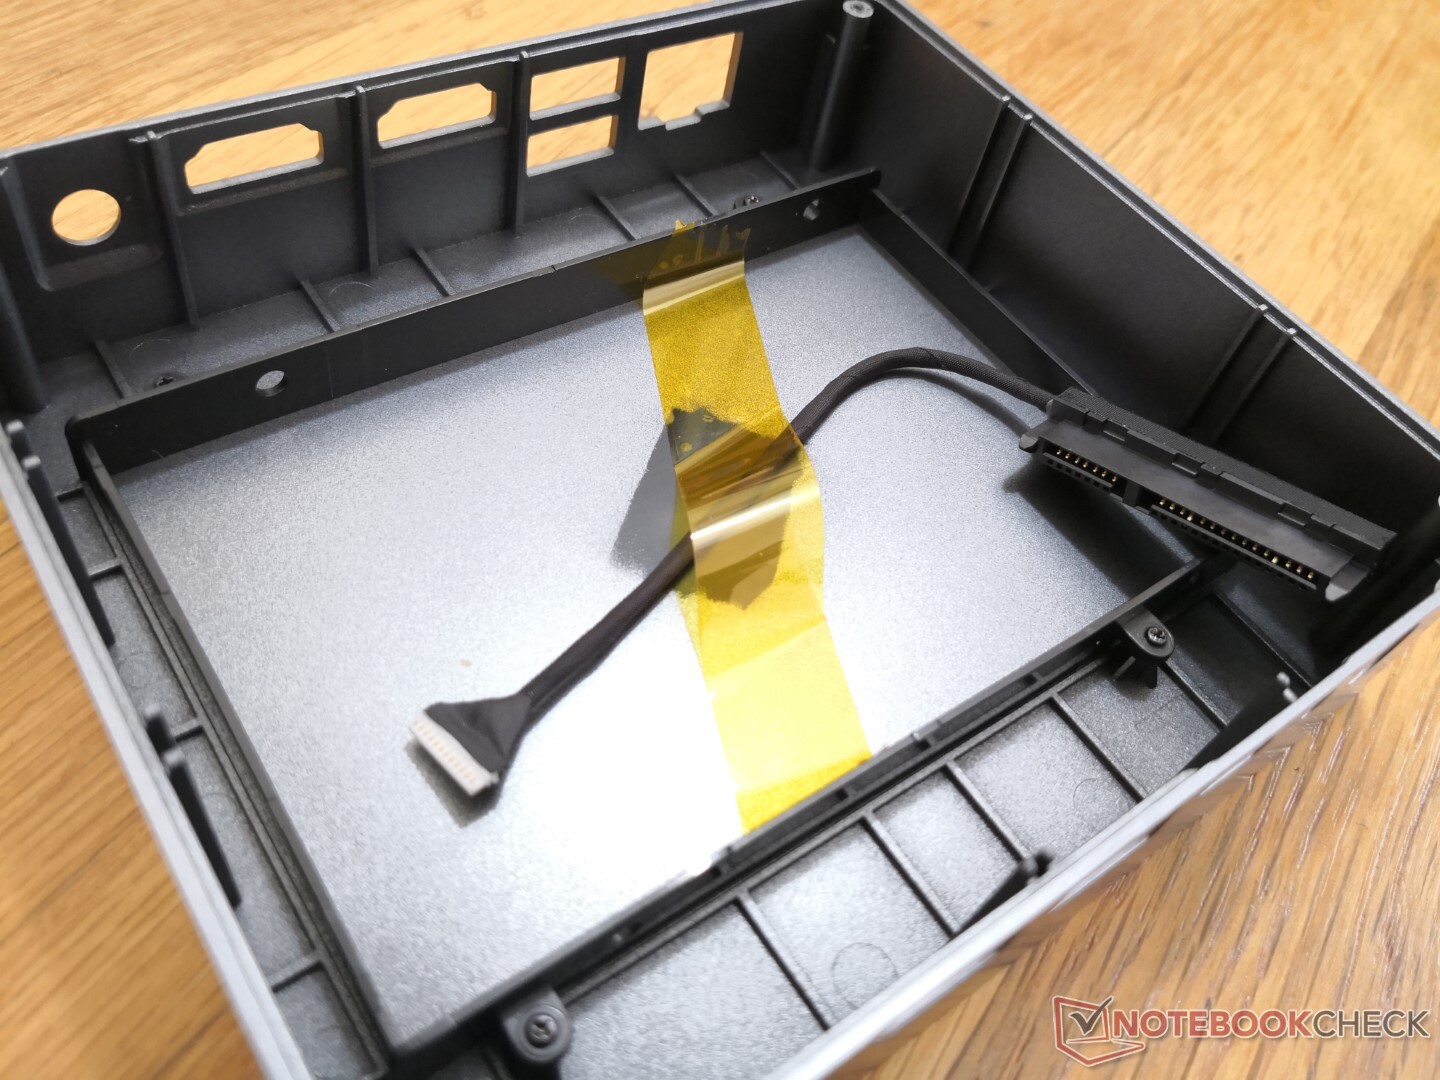
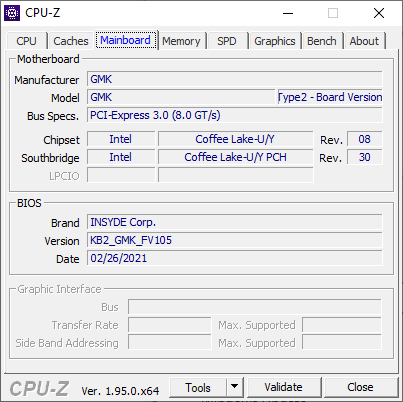
Onderhoud
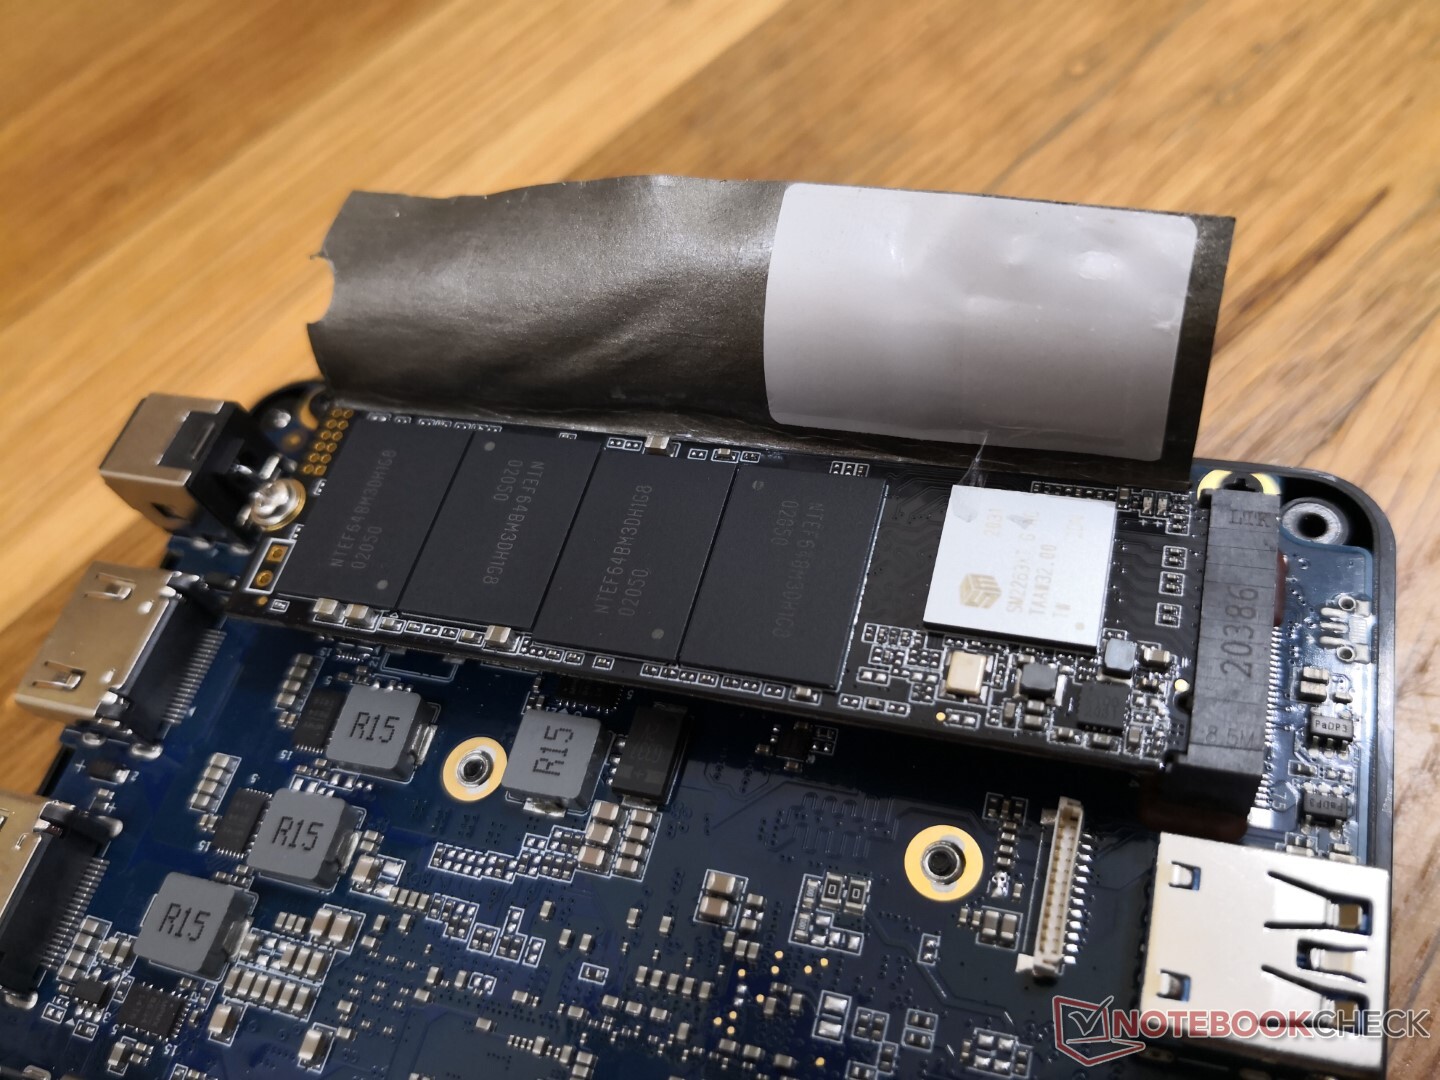
Vier Philips schroeven zijn verborgen onder de rubberen voetjes voor relatief eenvoudig onderhoud. Eenmaal binnenin zien gebruikers 1x M.2 2280, 1x 2,5-inch SATA III bay, en 2x DDR4 SODIMM slots. De kabel voor de 2,5 inch SATA III schijf is standaard losgekoppeld.
Accessoires en garantie
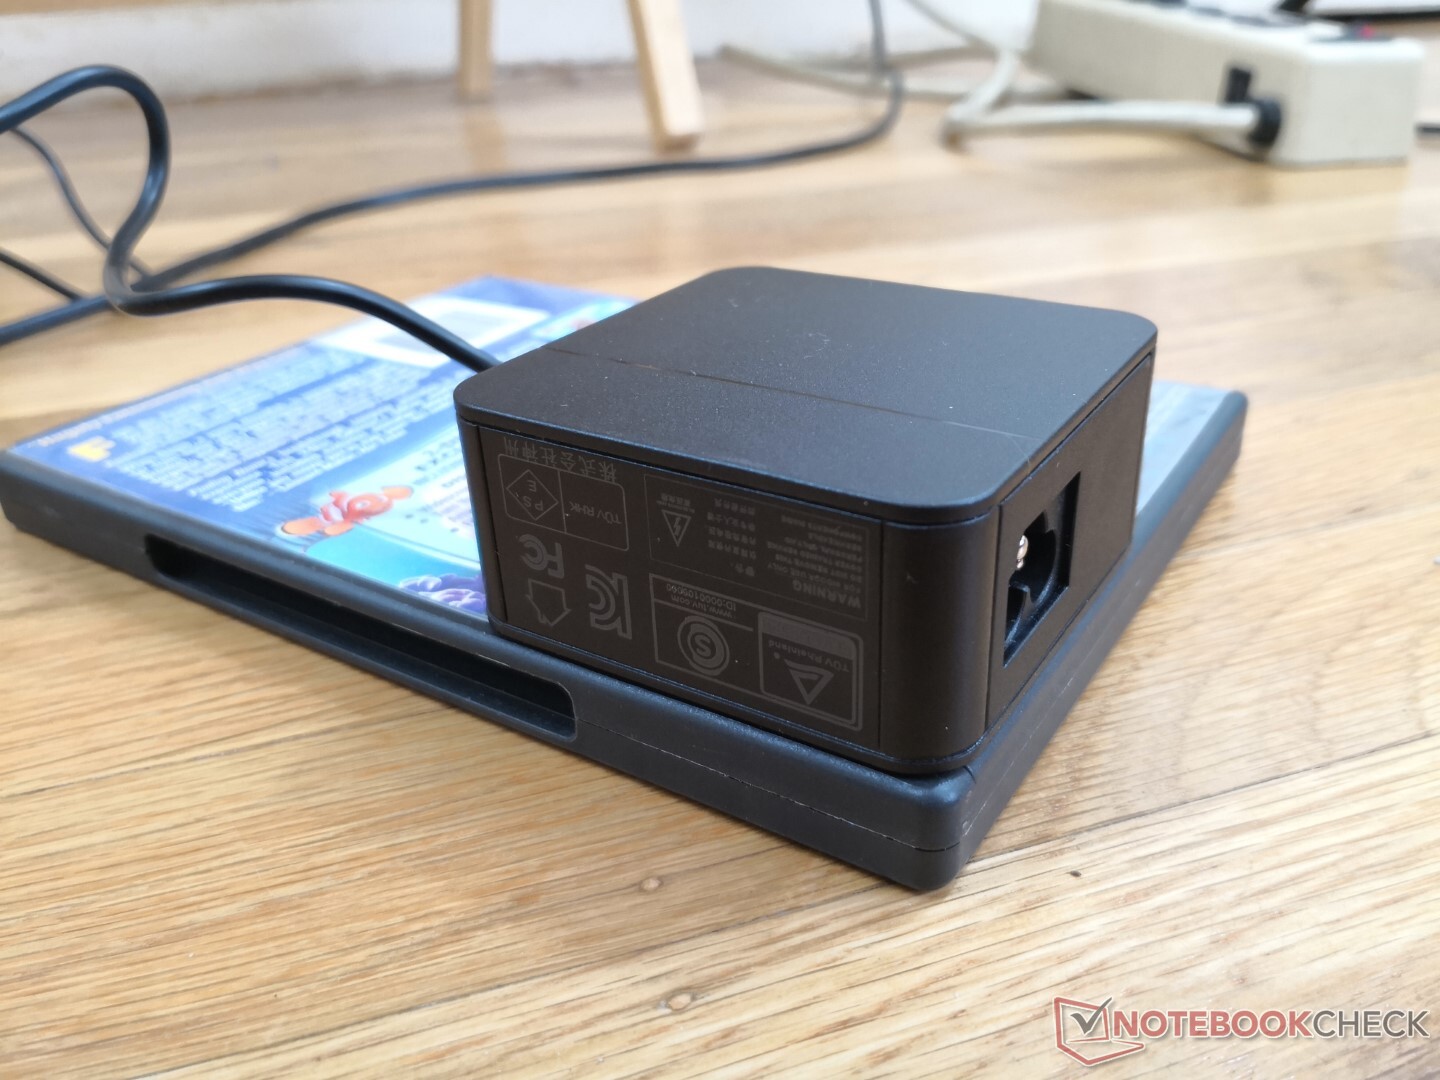
Er zijn geen extra's in de doos buiten de AC-adapter en het papierwerk, wat betekent dat gebruikers hun eigen VESA-schroeven zullen moeten leveren als ze de PC willen monteren. Gebruikers moeten mogelijk betalen voor overzeese verzending en afhandeling als ze aanspraak maken op garantie.
Prestaties
Goedkope mini PC's zoals de Chuwi GBox worden meestal geleverd met Celeron CPU's die veel langzamer zijn dan de meeste Core serie opties. Ondertussen worden duurdere mini PC's zoals de Intel NUC geleverd met de nieuwste top-of-the-line Core i5/i7 CPU's. De NucBox 2 kiest een middenweg door gebruik te maken van de 8e generatie Coffee Lake-U CPU's in plaats van de nieuwere 11e generatie Tiger Lake-U processoren.
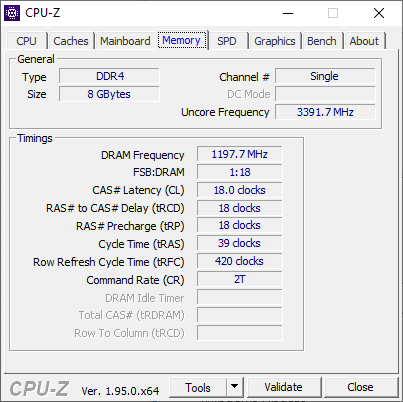
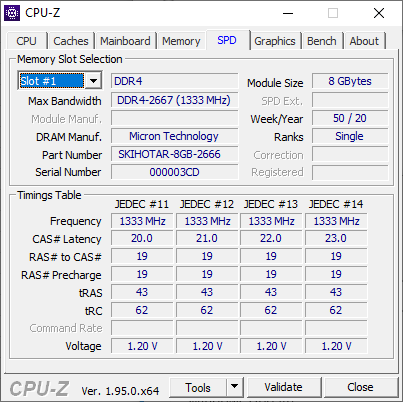
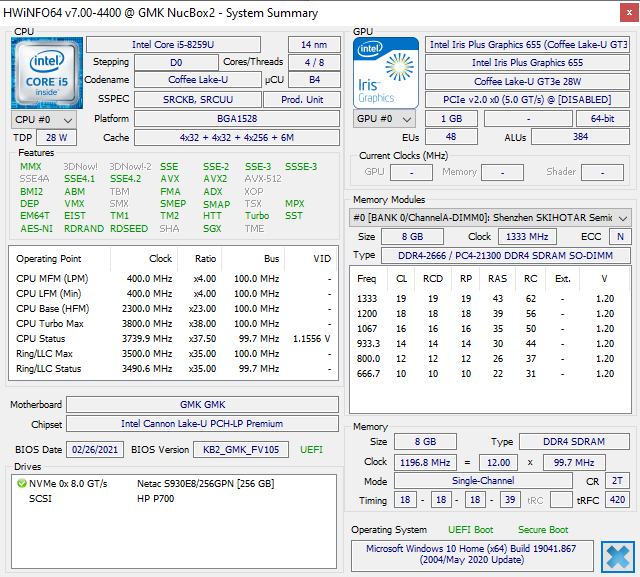
Onze unit wordt geleverd met een verwijderbare 8 GB DDR4 2666 MHz RAM-module. Gebruikers kunnen upgraden tot 32 GB over beide SODIMM-sleuven.
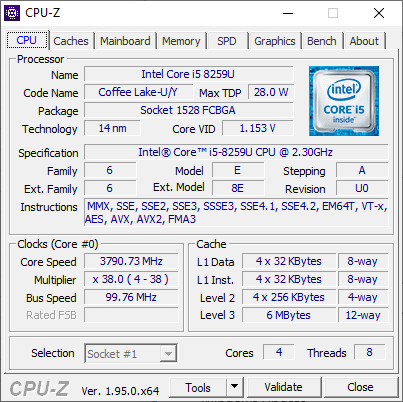
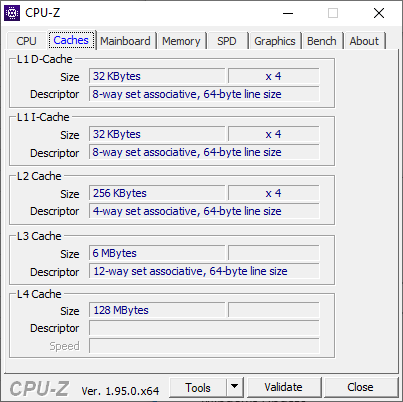
Processor
Ruwe CPU prestaties zijn het meest vergelijkbaar met de Core i5-8250U, terwijl ze ruim boven de Celeron J4125 en Core i3-1005G1 staan, zoals gevonden op respectievelijk de NucBox K1 en Beelink SEi10. Onze Core i5-8259U is een middenklasse processor die ongeveer 15 tot 25 procent trager is dan de Core i7-8559U direct erboven. De prestatiestabiliteit is ook goed, zonder steile dalingen in kloksnelheden na meerdere loops van CineBench R15 xT.
Cinebench R20: CPU (Multi Core) | CPU (Single Core)
Blender: v2.79 BMW27 CPU
7-Zip 18.03: 7z b 4 -mmt1 | 7z b 4
Geekbench 5.5: Single-Core | Multi-Core
HWBOT x265 Benchmark v2.2: 4k Preset
LibreOffice : 20 Documents To PDF
R Benchmark 2.5: Overall mean
| Cinebench R15 / CPU Multi 64Bit | |
| Lenovo Yoga Slim 7 14ARE05 82A20008GE | |
| Intel NUC11PAQi7 | |
| HP Envy x360 15-ee0257ng | |
| Intel NUC8i7BE | |
| GPD Win 3 | |
| Gemiddeld Intel Core i5-8259U (575 - 687, n=7) | |
| GMK NucBox 2 | |
| Lenovo Yoga C930-13IKB | |
| Zotac ZBox MI643 | |
| Beelink SEi10 | |
| GMK NucBox K1 | |
| Chuwi LarkBook CWI509 | |
| Apple MacBook 12 (Early 2016) 1.1 GHz | |
| Cinebench R15 / CPU Single 64Bit | |
| Intel NUC11PAQi7 | |
| GPD Win 3 | |
| Intel NUC8i7BE | |
| Lenovo Yoga Slim 7 14ARE05 82A20008GE | |
| Zotac ZBox MI643 | |
| HP Envy x360 15-ee0257ng | |
| Beelink SEi10 | |
| GMK NucBox 2 | |
| Gemiddeld Intel Core i5-8259U (132 - 154, n=6) | |
| Lenovo Yoga C930-13IKB | |
| Apple MacBook 12 (Early 2016) 1.1 GHz | |
| Apple MacBook 12 (Early 2016) 1.1 GHz | |
| GMK NucBox K1 | |
| Chuwi LarkBook CWI509 | |
| Cinebench R20 / CPU (Multi Core) | |
| Lenovo Yoga Slim 7 14ARE05 82A20008GE | |
| Intel NUC11PAQi7 | |
| HP Envy x360 15-ee0257ng | |
| GPD Win 3 | |
| Intel NUC8i7BE | |
| Gemiddeld Intel Core i5-8259U (1385 - 1567, n=5) | |
| GMK NucBox 2 | |
| Zotac ZBox MI643 | |
| Beelink SEi10 | |
| Chuwi LarkBook CWI509 | |
| GMK NucBox K1 | |
| Cinebench R20 / CPU (Single Core) | |
| Intel NUC11PAQi7 | |
| GPD Win 3 | |
| Lenovo Yoga Slim 7 14ARE05 82A20008GE | |
| Intel NUC8i7BE | |
| HP Envy x360 15-ee0257ng | |
| Zotac ZBox MI643 | |
| Beelink SEi10 | |
| GMK NucBox 2 | |
| Gemiddeld Intel Core i5-8259U (369 - 386, n=5) | |
| Chuwi LarkBook CWI509 | |
| GMK NucBox K1 | |
| Blender / v2.79 BMW27 CPU | |
| GMK NucBox K1 | |
| Beelink SEi10 | |
| Zotac ZBox MI643 | |
| GMK NucBox 2 | |
| HP Envy x360 15-ee0257ng | |
| Gemiddeld Intel Core i5-8259U (688 - 769, n=6) | |
| Intel NUC8i7BE | |
| Intel NUC8i7BE | |
| GPD Win 3 | |
| Lenovo Yoga Slim 7 14ARE05 82A20008GE | |
| Intel NUC11PAQi7 | |
| 7-Zip 18.03 / 7z b 4 -mmt1 | |
| Intel NUC8i7BE | |
| Intel NUC8i7BE | |
| Intel NUC11PAQi7 | |
| GPD Win 3 | |
| Zotac ZBox MI643 | |
| Lenovo Yoga Slim 7 14ARE05 82A20008GE | |
| HP Envy x360 15-ee0257ng | |
| Beelink SEi10 | |
| GMK NucBox 2 | |
| Gemiddeld Intel Core i5-8259U (3753 - 4022, n=6) | |
| GMK NucBox K1 | |
| Chuwi LarkBook CWI509 | |
| 7-Zip 18.03 / 7z b 4 | |
| Lenovo Yoga Slim 7 14ARE05 82A20008GE | |
| Intel NUC8i7BE | |
| Intel NUC8i7BE | |
| Intel NUC11PAQi7 | |
| HP Envy x360 15-ee0257ng | |
| GPD Win 3 | |
| Gemiddeld Intel Core i5-8259U (17799 - 28824, n=6) | |
| GMK NucBox 2 | |
| Zotac ZBox MI643 | |
| Beelink SEi10 | |
| GMK NucBox K1 | |
| Chuwi LarkBook CWI509 | |
| Geekbench 5.5 / Single-Core | |
| Intel NUC11PAQi7 | |
| GPD Win 3 | |
| Zotac ZBox MI643 | |
| Lenovo Yoga Slim 7 14ARE05 82A20008GE | |
| Beelink SEi10 | |
| HP Envy x360 15-ee0257ng | |
| GMK NucBox 2 | |
| Gemiddeld Intel Core i5-8259U (948 - 984, n=3) | |
| Intel NUC8i7BE | |
| Chuwi LarkBook CWI509 | |
| GMK NucBox K1 | |
| Geekbench 5.5 / Multi-Core | |
| Lenovo Yoga Slim 7 14ARE05 82A20008GE | |
| HP Envy x360 15-ee0257ng | |
| Intel NUC11PAQi7 | |
| GPD Win 3 | |
| Zotac ZBox MI643 | |
| Intel NUC8i7BE | |
| Gemiddeld Intel Core i5-8259U (3359 - 3839, n=3) | |
| GMK NucBox 2 | |
| Beelink SEi10 | |
| Chuwi LarkBook CWI509 | |
| GMK NucBox K1 | |
| HWBOT x265 Benchmark v2.2 / 4k Preset | |
| Lenovo Yoga Slim 7 14ARE05 82A20008GE | |
| Intel NUC11PAQi7 | |
| GPD Win 3 | |
| Intel NUC8i7BE | |
| Intel NUC8i7BE | |
| HP Envy x360 15-ee0257ng | |
| GMK NucBox 2 | |
| Gemiddeld Intel Core i5-8259U (4.72 - 5.49, n=6) | |
| Zotac ZBox MI643 | |
| Beelink SEi10 | |
| GMK NucBox K1 | |
| Chuwi LarkBook CWI509 | |
| LibreOffice / 20 Documents To PDF | |
| Chuwi LarkBook CWI509 | |
| GMK NucBox K1 | |
| HP Envy x360 15-ee0257ng | |
| Gemiddeld Intel Core i5-8259U (62.7 - 76, n=5) | |
| Lenovo Yoga Slim 7 14ARE05 82A20008GE | |
| GMK NucBox 2 | |
| Zotac ZBox MI643 | |
| Beelink SEi10 | |
| GPD Win 3 | |
| Intel NUC11PAQi7 | |
| R Benchmark 2.5 / Overall mean | |
| Chuwi LarkBook CWI509 | |
| GMK NucBox K1 | |
| GMK NucBox 2 | |
| Gemiddeld Intel Core i5-8259U (0.738 - 0.818, n=5) | |
| Beelink SEi10 | |
| Zotac ZBox MI643 | |
| GPD Win 3 | |
| Intel NUC8i7BE | |
| Lenovo Yoga Slim 7 14ARE05 82A20008GE | |
| HP Envy x360 15-ee0257ng | |
| Intel NUC11PAQi7 | |
Cinebench R20: CPU (Multi Core) | CPU (Single Core)
Blender: v2.79 BMW27 CPU
7-Zip 18.03: 7z b 4 -mmt1 | 7z b 4
Geekbench 5.5: Single-Core | Multi-Core
HWBOT x265 Benchmark v2.2: 4k Preset
LibreOffice : 20 Documents To PDF
R Benchmark 2.5: Overall mean
* ... kleiner is beter
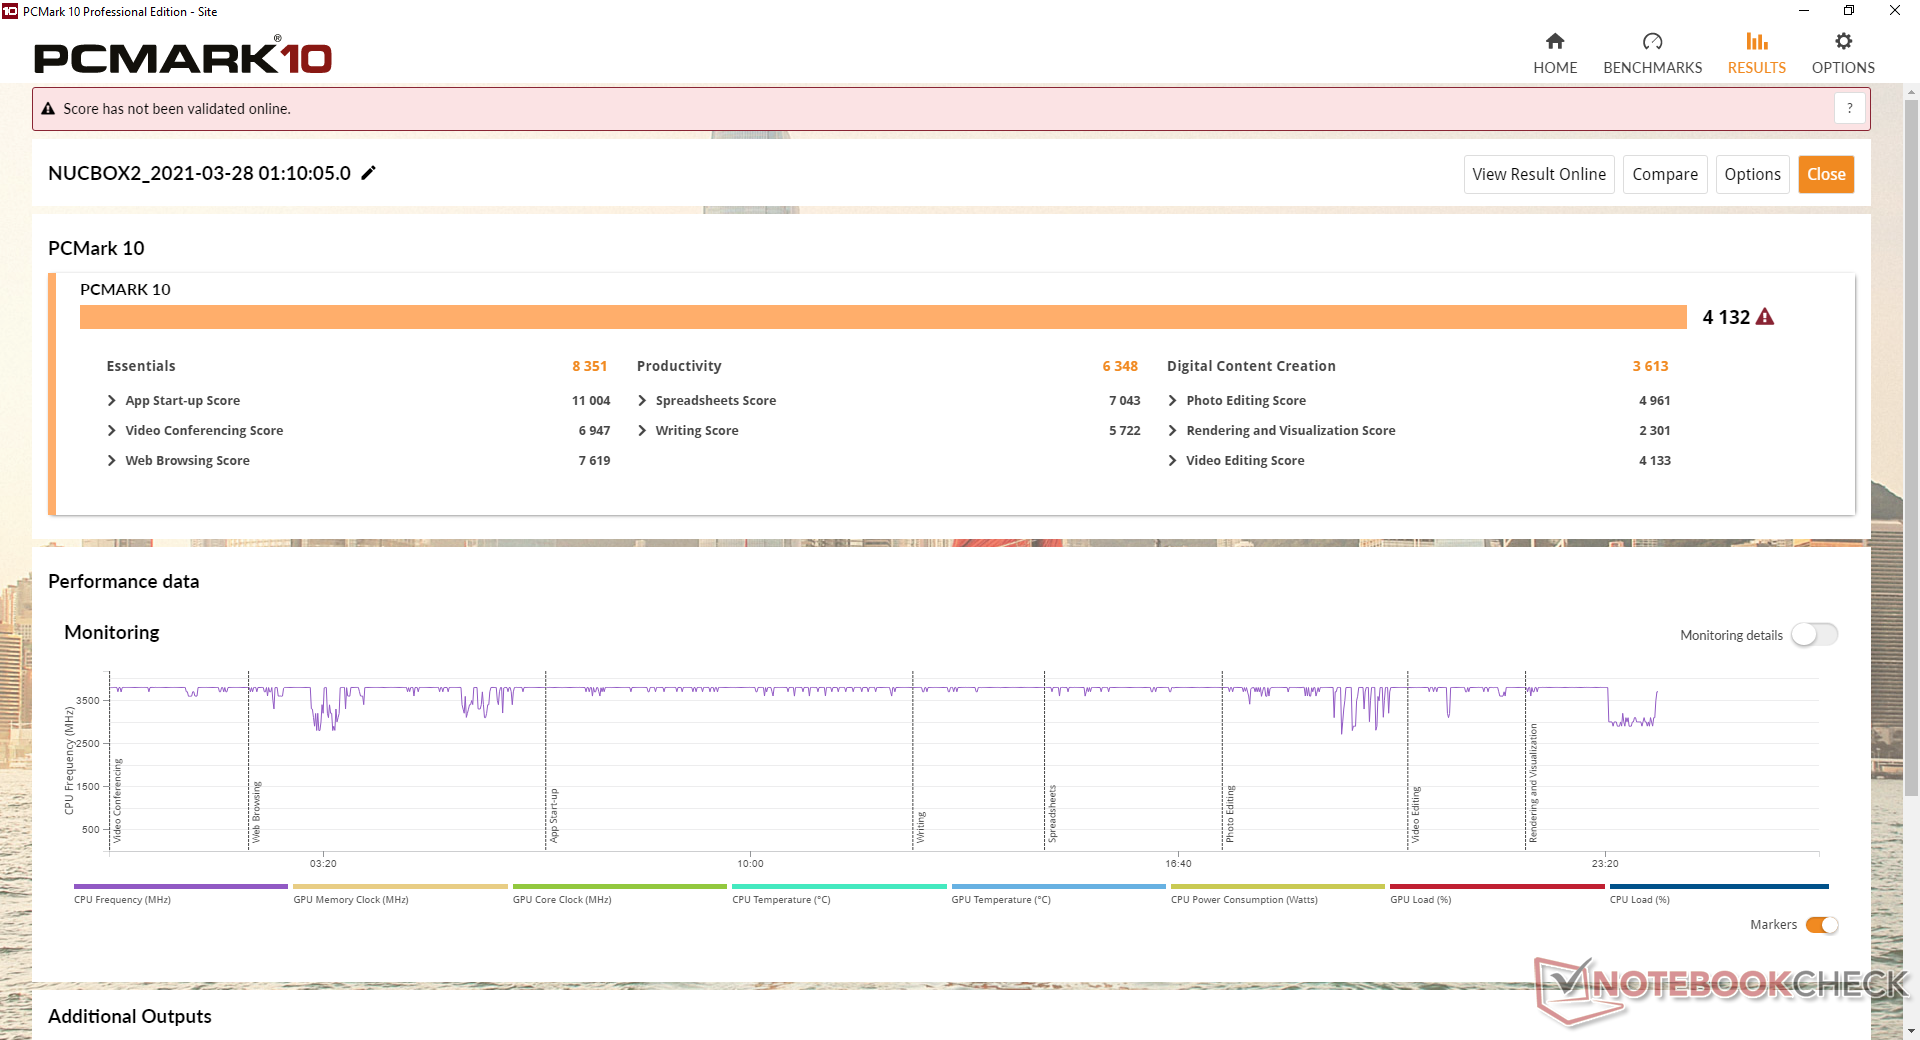
Systeemprestaties
| PCMark 10 | |
| Score | |
| Intel NUC11PAQi7 | |
| Intel NUC8i7BE | |
| Zotac ZBox MI643 | |
| GMK NucBox 2 | |
| Gemiddeld Intel Core i5-8259U, Intel Iris Plus Graphics 655 (3284 - 4132, n=6) | |
| Beelink SEi10 | |
| GMK NucBox K1 | |
| Essentials | |
| Intel NUC11PAQi7 | |
| Zotac ZBox MI643 | |
| Intel NUC8i7BE | |
| GMK NucBox 2 | |
| Gemiddeld Intel Core i5-8259U, Intel Iris Plus Graphics 655 (7364 - 8351, n=6) | |
| Beelink SEi10 | |
| GMK NucBox K1 | |
| Productivity | |
| Intel NUC8i7BE | |
| Intel NUC11PAQi7 | |
| Zotac ZBox MI643 | |
| GMK NucBox 2 | |
| Gemiddeld Intel Core i5-8259U, Intel Iris Plus Graphics 655 (4390 - 6400, n=6) | |
| Beelink SEi10 | |
| GMK NucBox K1 | |
| Digital Content Creation | |
| Intel NUC11PAQi7 | |
| Intel NUC8i7BE | |
| GMK NucBox 2 | |
| Gemiddeld Intel Core i5-8259U, Intel Iris Plus Graphics 655 (2679 - 3902, n=6) | |
| Zotac ZBox MI643 | |
| Beelink SEi10 | |
| GMK NucBox K1 | |
| PCMark 10 Score | 4132 punten | |
Help | ||
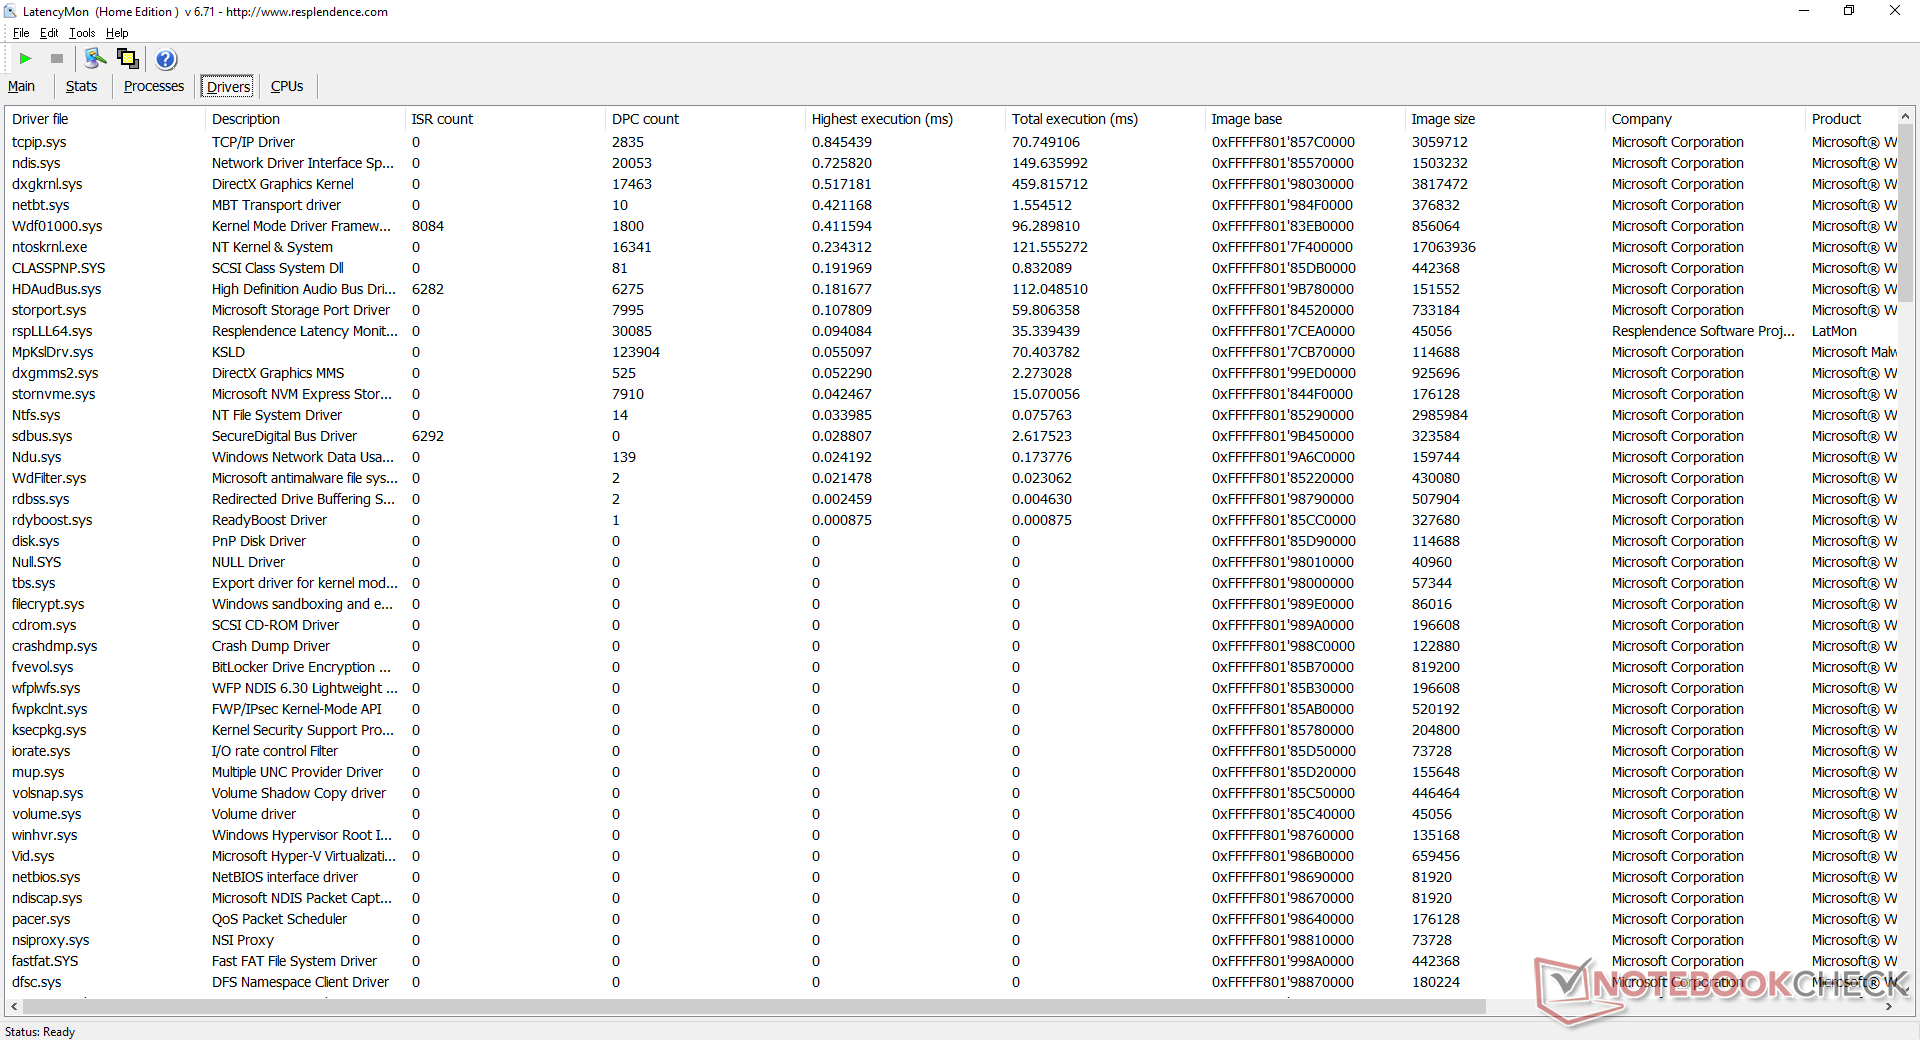
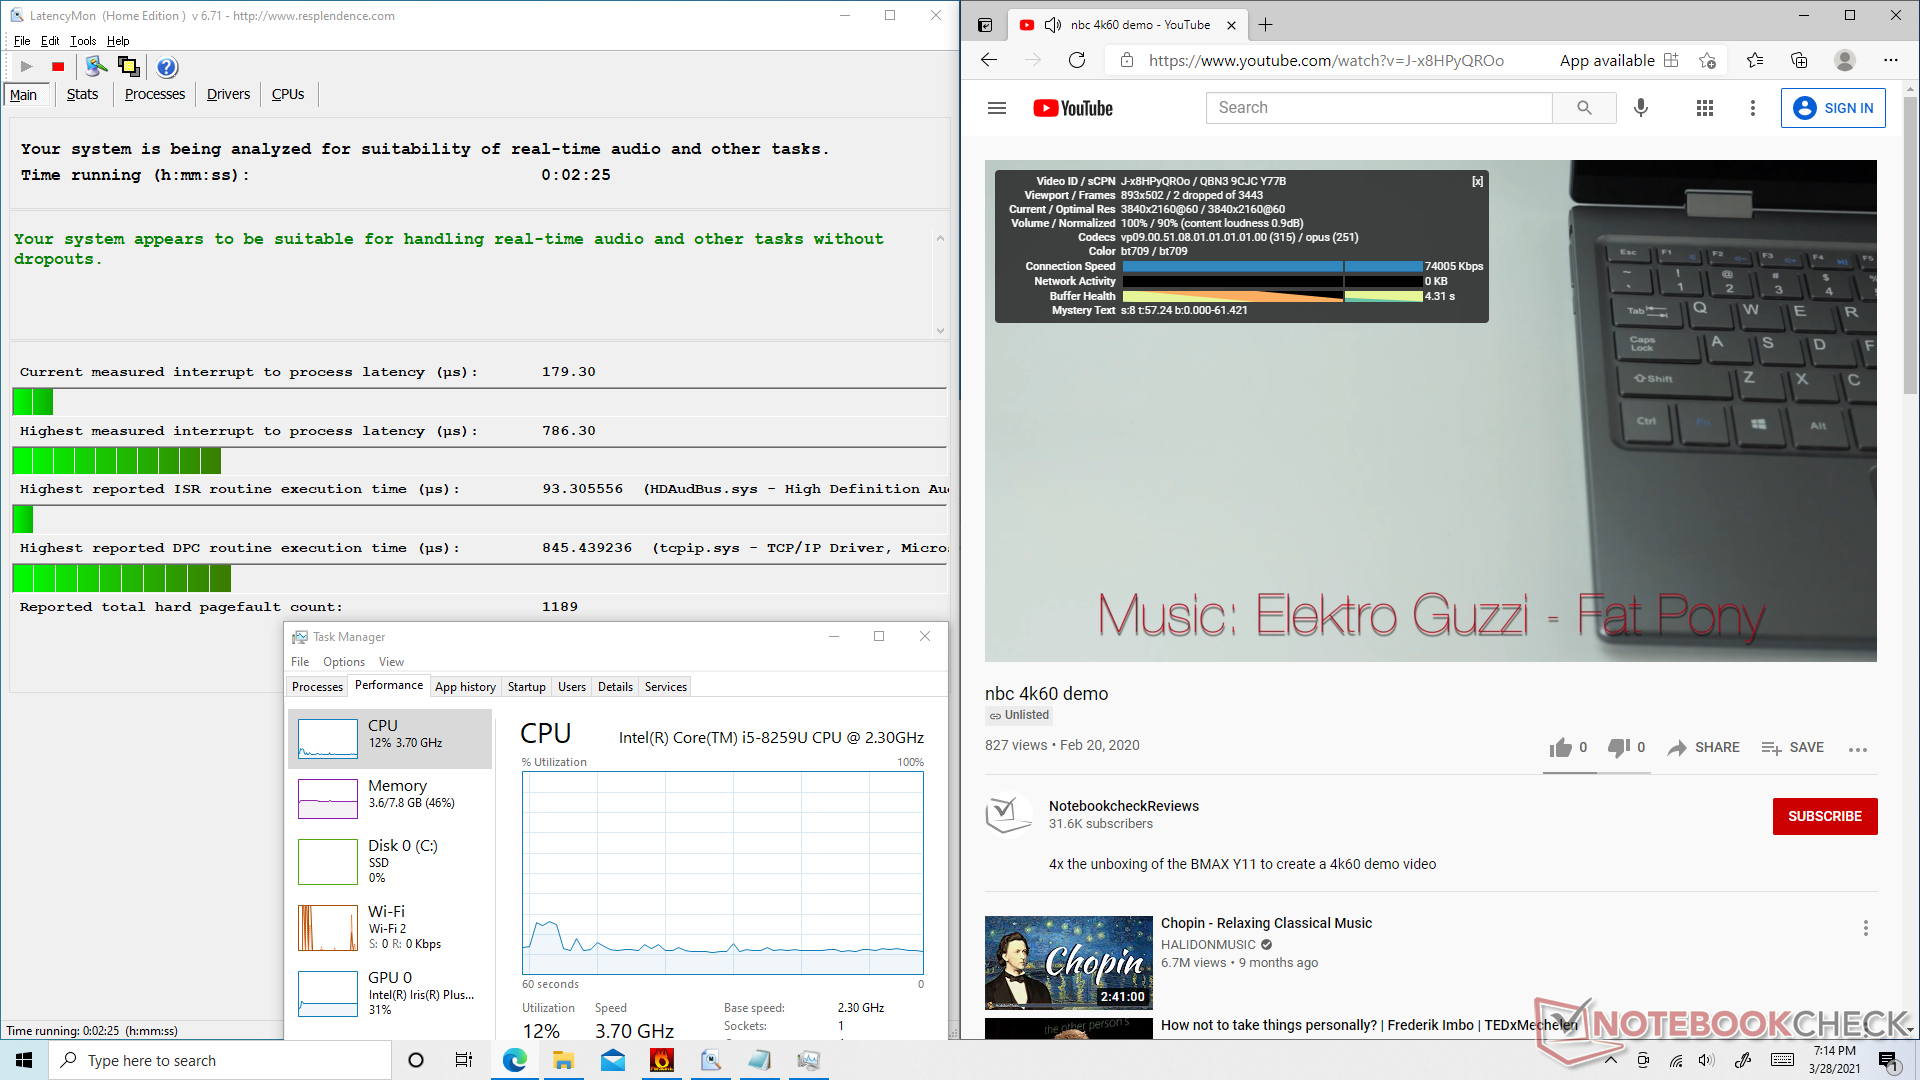
DPC latentie
LatencyMon laat geen grote DPC latency problemen zien bij het openen van meerdere browser tabs op onze homepage. Het afspelen van 4K UHD bij 60 FPS verloopt ook soepel, met slechts twee dropped frames tijdens onze YouTube-test van een minuut.
| DPC Latencies / LatencyMon - interrupt to process latency (max), Web, Youtube, Prime95 | |
| GMK NucBox K1 | |
| Beelink SEi10 | |
| GMK NucBox 2 | |
| Zotac ZBox MI643 | |
| Intel NUC11PAQi7 | |
* ... kleiner is beter
Opslagapparaten
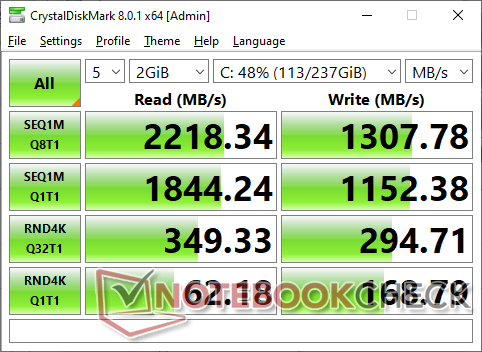
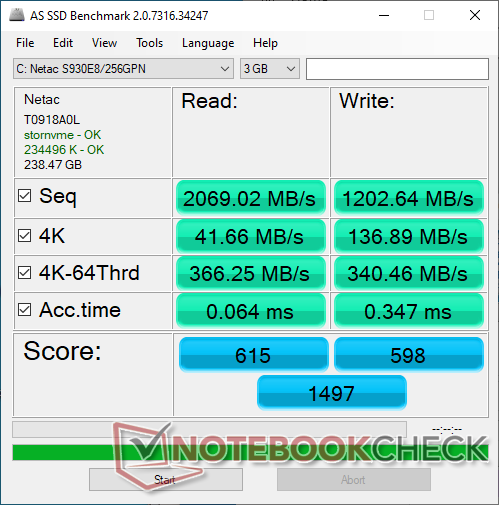
Een 256 GB Netac S930E8 NVMe SSD wordt meegeleverd met de optie om een 2,5 inch SATA III schijf toe te voegen voor extra opslag. Overdrachtssnelheden zijn vrij goed voor een 256 GB NVMe SSD, vooral van deze minder bekende fabrikant, maar onze DiskSpd loop test laat zien dat het moeite kan hebben om maximale prestatieniveaus over langere perioden te handhaven.
| GMK NucBox 2 Netac S930E8/256GPN | Intel NUC11PAQi7 Samsung SSD 980 Pro 500GB MZ-V8P500BW | Zotac ZBox MI643 Lexar NM610 1TB | GPD Win 3 BIWIN NS200 1TB CNF82GS1G02-1TB | |
|---|---|---|---|---|
| AS SSD | 209% | 45% | 99% | |
| Seq Read (MB/s) | 2069 | 3257 57% | 1511 -27% | 1585 -23% |
| Seq Write (MB/s) | 1203 | 3937 227% | 1558 30% | 1776 48% |
| 4K Read (MB/s) | 41.66 | 51.3 23% | 43.77 5% | 61.6 48% |
| 4K Write (MB/s) | 136.9 | 75.7 -45% | 119.5 -13% | 208.9 53% |
| 4K-64 Read (MB/s) | 366.3 | 2283 523% | 839 129% | 1142 212% |
| 4K-64 Write (MB/s) | 340.5 | 2206 548% | 909 167% | 1103 224% |
| Access Time Read * (ms) | 0.064 | 0.056 12% | 0.032 50% | 0.03 53% |
| Access Time Write * (ms) | 0.347 | 0.154 56% | 0.242 30% | 0.074 79% |
| Score Read (Points) | 615 | 2660 333% | 1034 68% | 1362 121% |
| Score Write (Points) | 598 | 2676 347% | 1185 98% | 1489 149% |
| Score Total (Points) | 1497 | 6725 349% | 2760 84% | 3573 139% |
| Copy ISO MB/s (MB/s) | 1186 | 2030 71% | 1373 16% | 1741 47% |
| Copy Program MB/s (MB/s) | 428.6 | 883 106% | 280.4 -35% | 543 27% |
| Copy Game MB/s (MB/s) | 435.7 | 1817 317% | 531 22% | 1318 203% |
| CrystalDiskMark 5.2 / 6 | 153% | 9% | 39% | |
| Write 4K (MB/s) | 178.4 | 244.6 37% | 214.1 20% | 223 25% |
| Read 4K (MB/s) | 61 | 80.4 32% | 62.1 2% | 66.5 9% |
| Write Seq (MB/s) | 1040 | 4094 294% | 1664 60% | 1857 79% |
| Read Seq (MB/s) | 1919 | 4099 114% | 1797 -6% | 1737 -9% |
| Write 4K Q32T1 (MB/s) | 417.7 | 715 71% | 421.8 1% | 611 46% |
| Read 4K Q32T1 (MB/s) | 325.6 | 783 140% | 512 57% | 688 111% |
| Write Seq Q32T1 (MB/s) | 1144 | 5065 343% | 564 -51% | 1948 70% |
| Read Seq Q32T1 (MB/s) | 2379 | 6884 189% | 2073 -13% | 1995 -16% |
| Totaal Gemiddelde (Programma / Instellingen) | 181% /
188% | 27% /
32% | 69% /
77% |
* ... kleiner is beter

Disk Throttling: DiskSpd Read Loop, Queue Depth 8
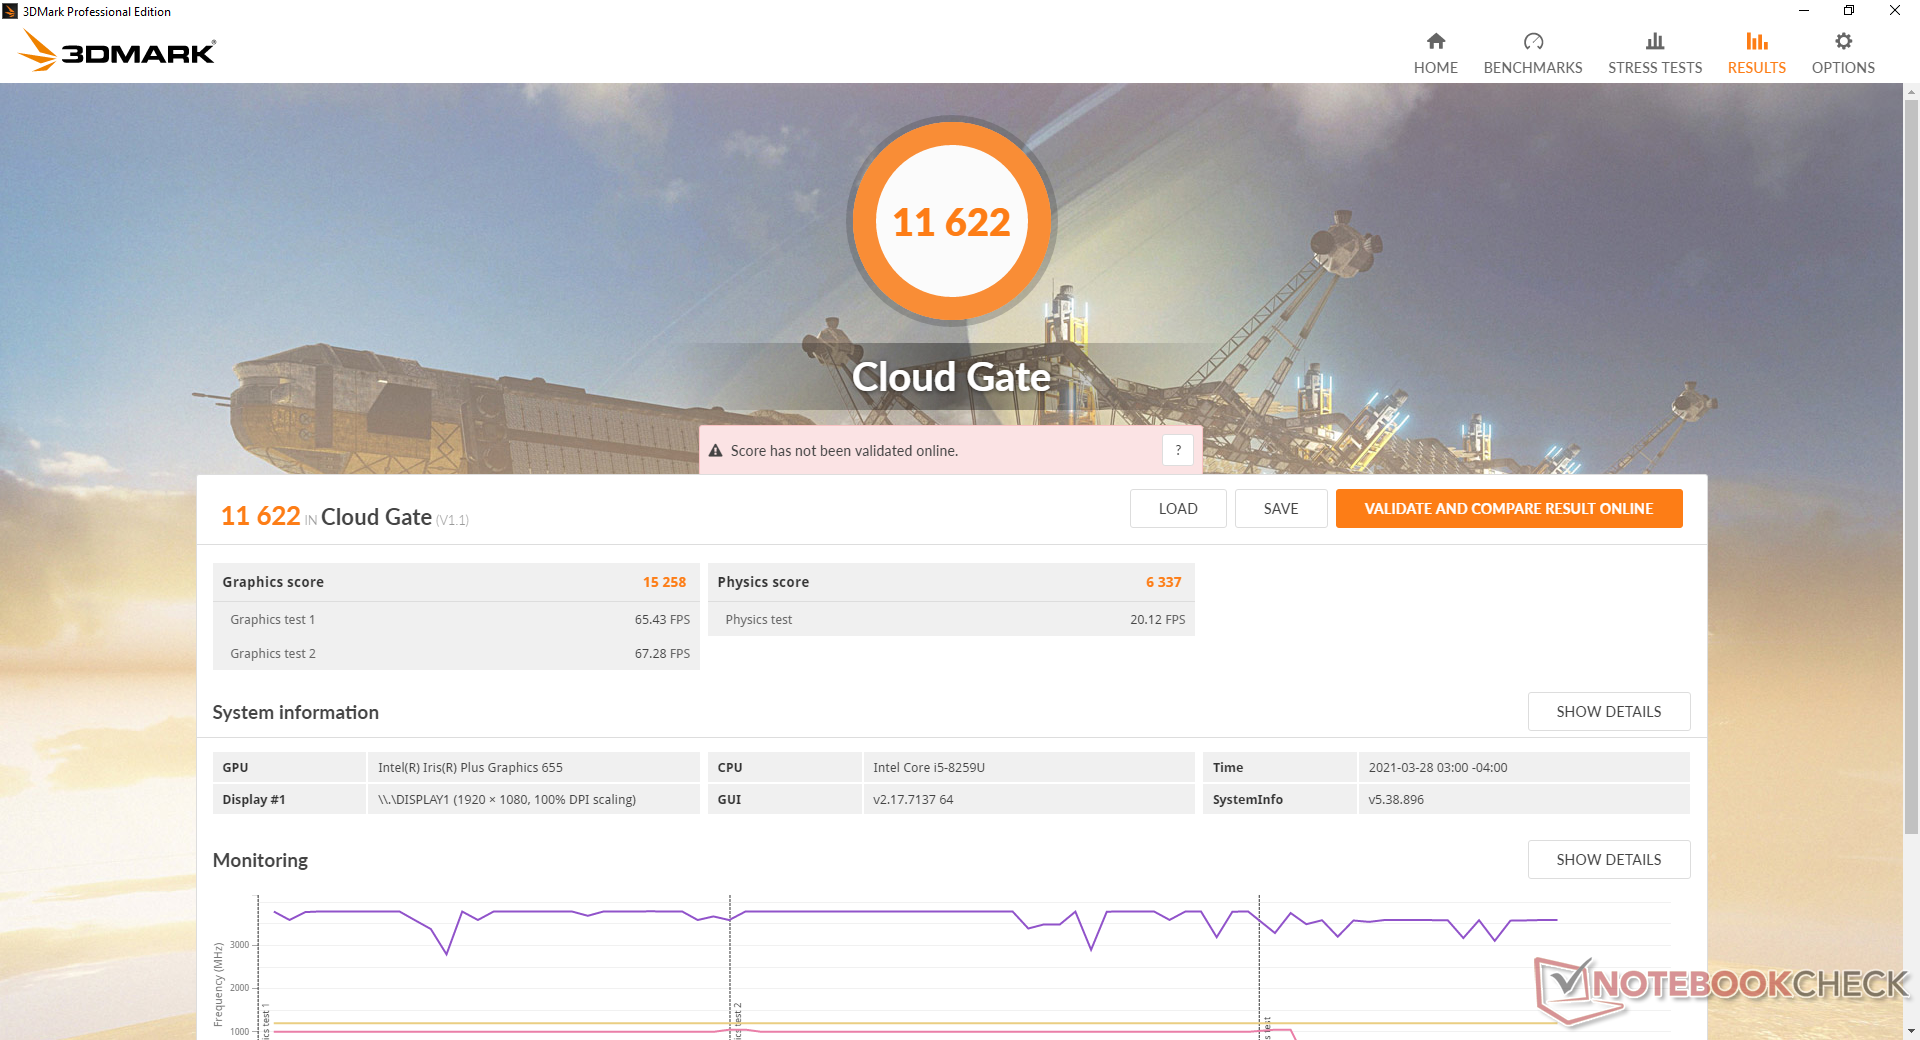
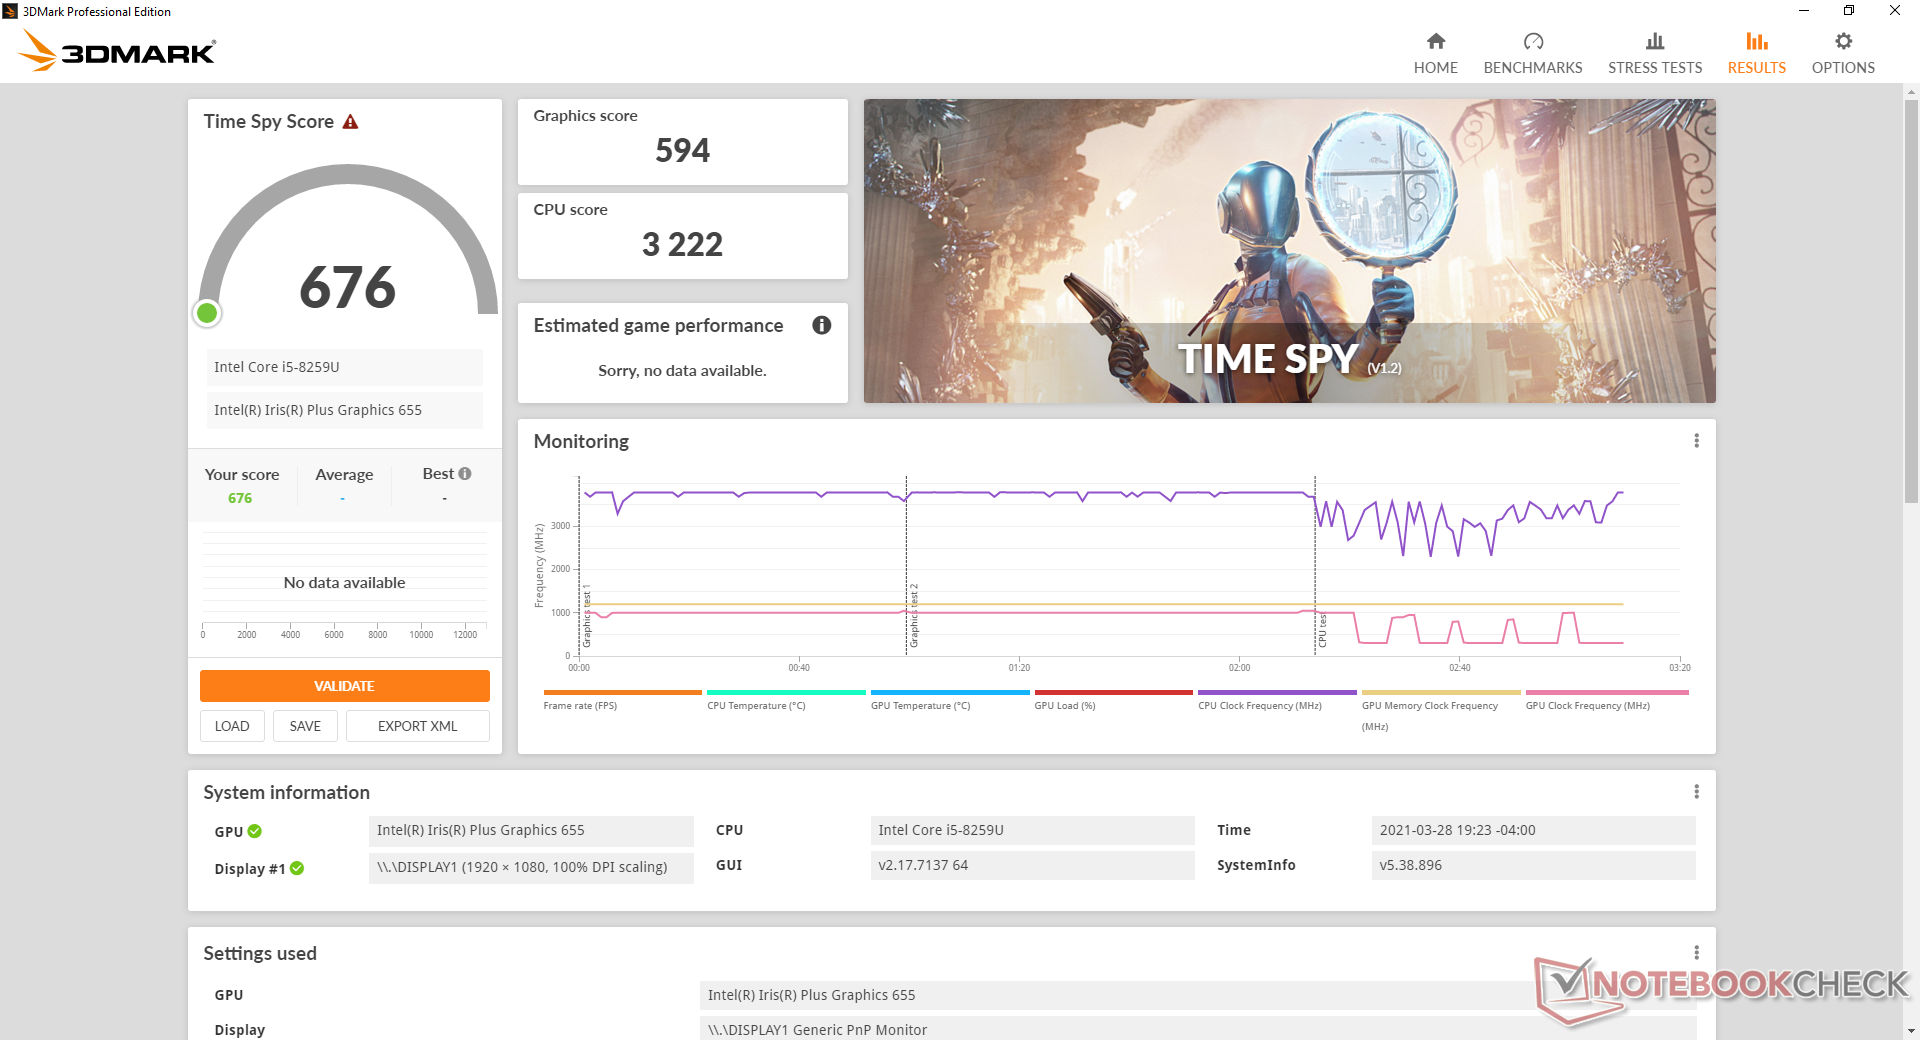
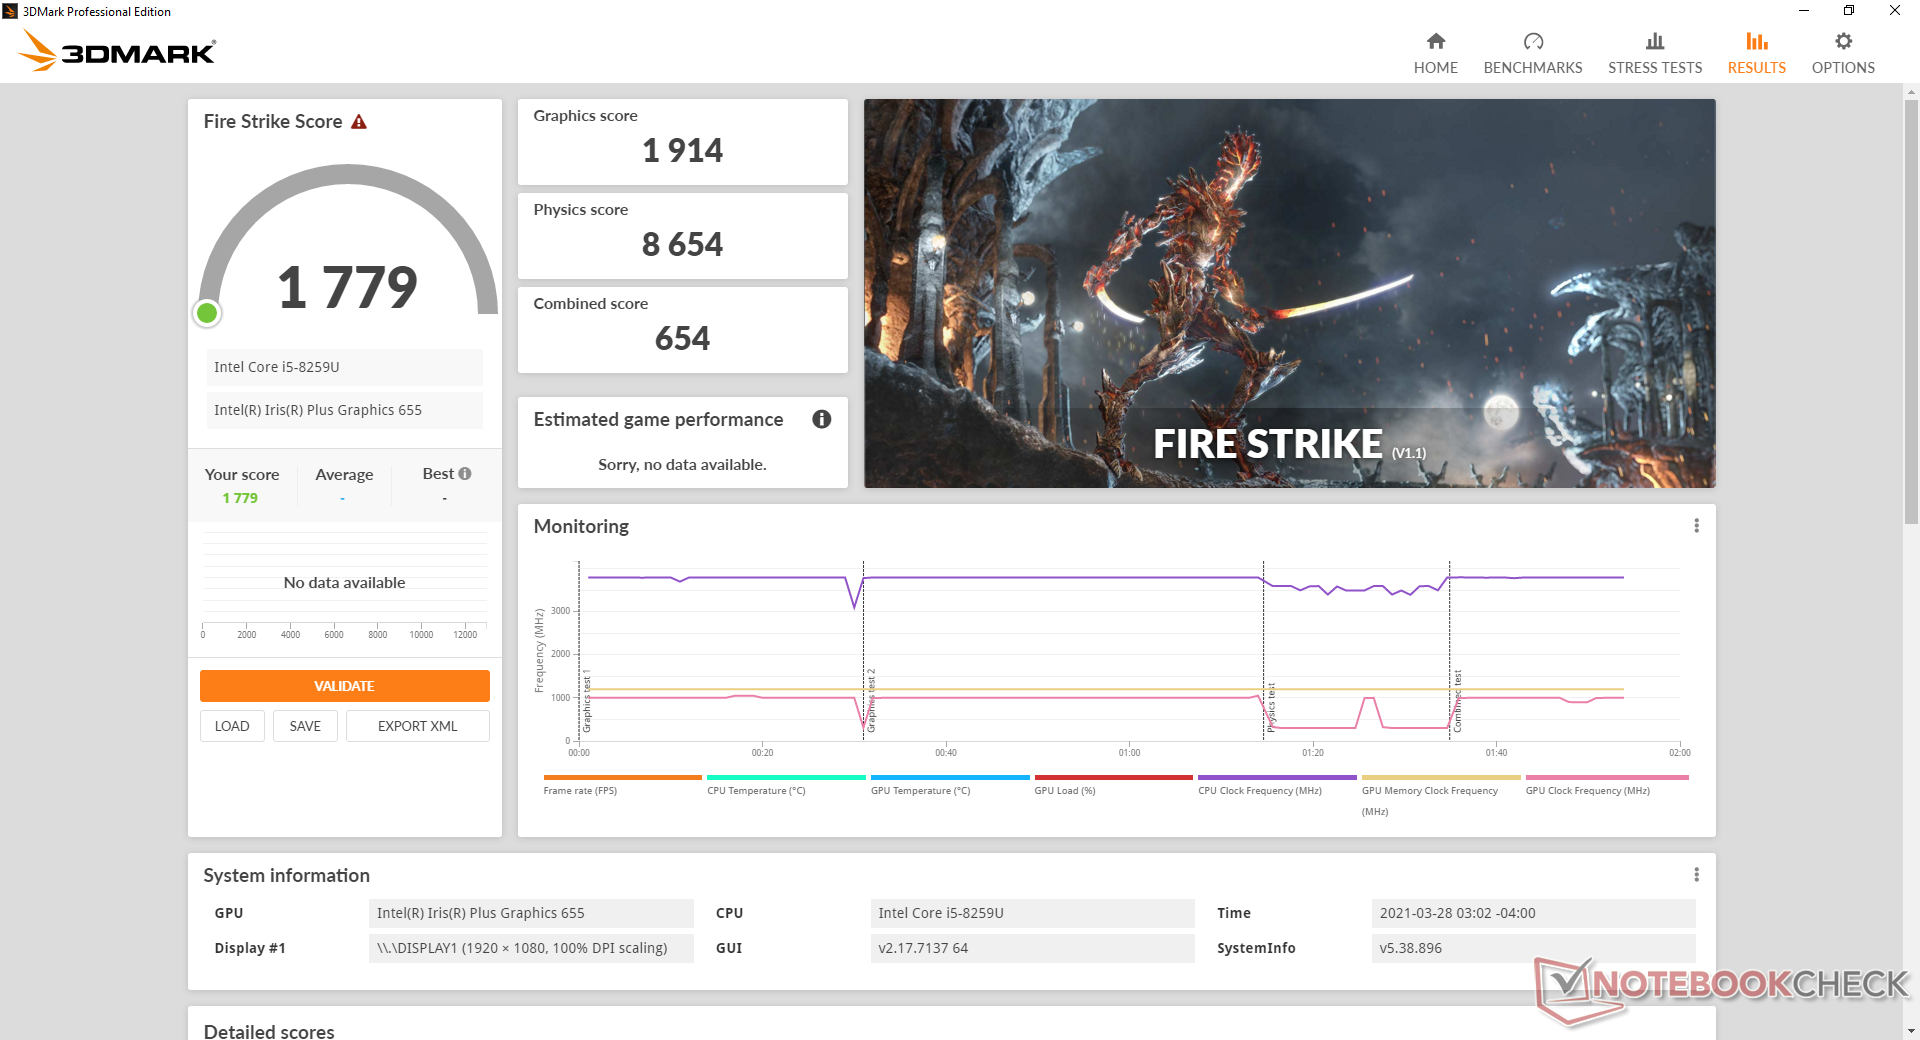
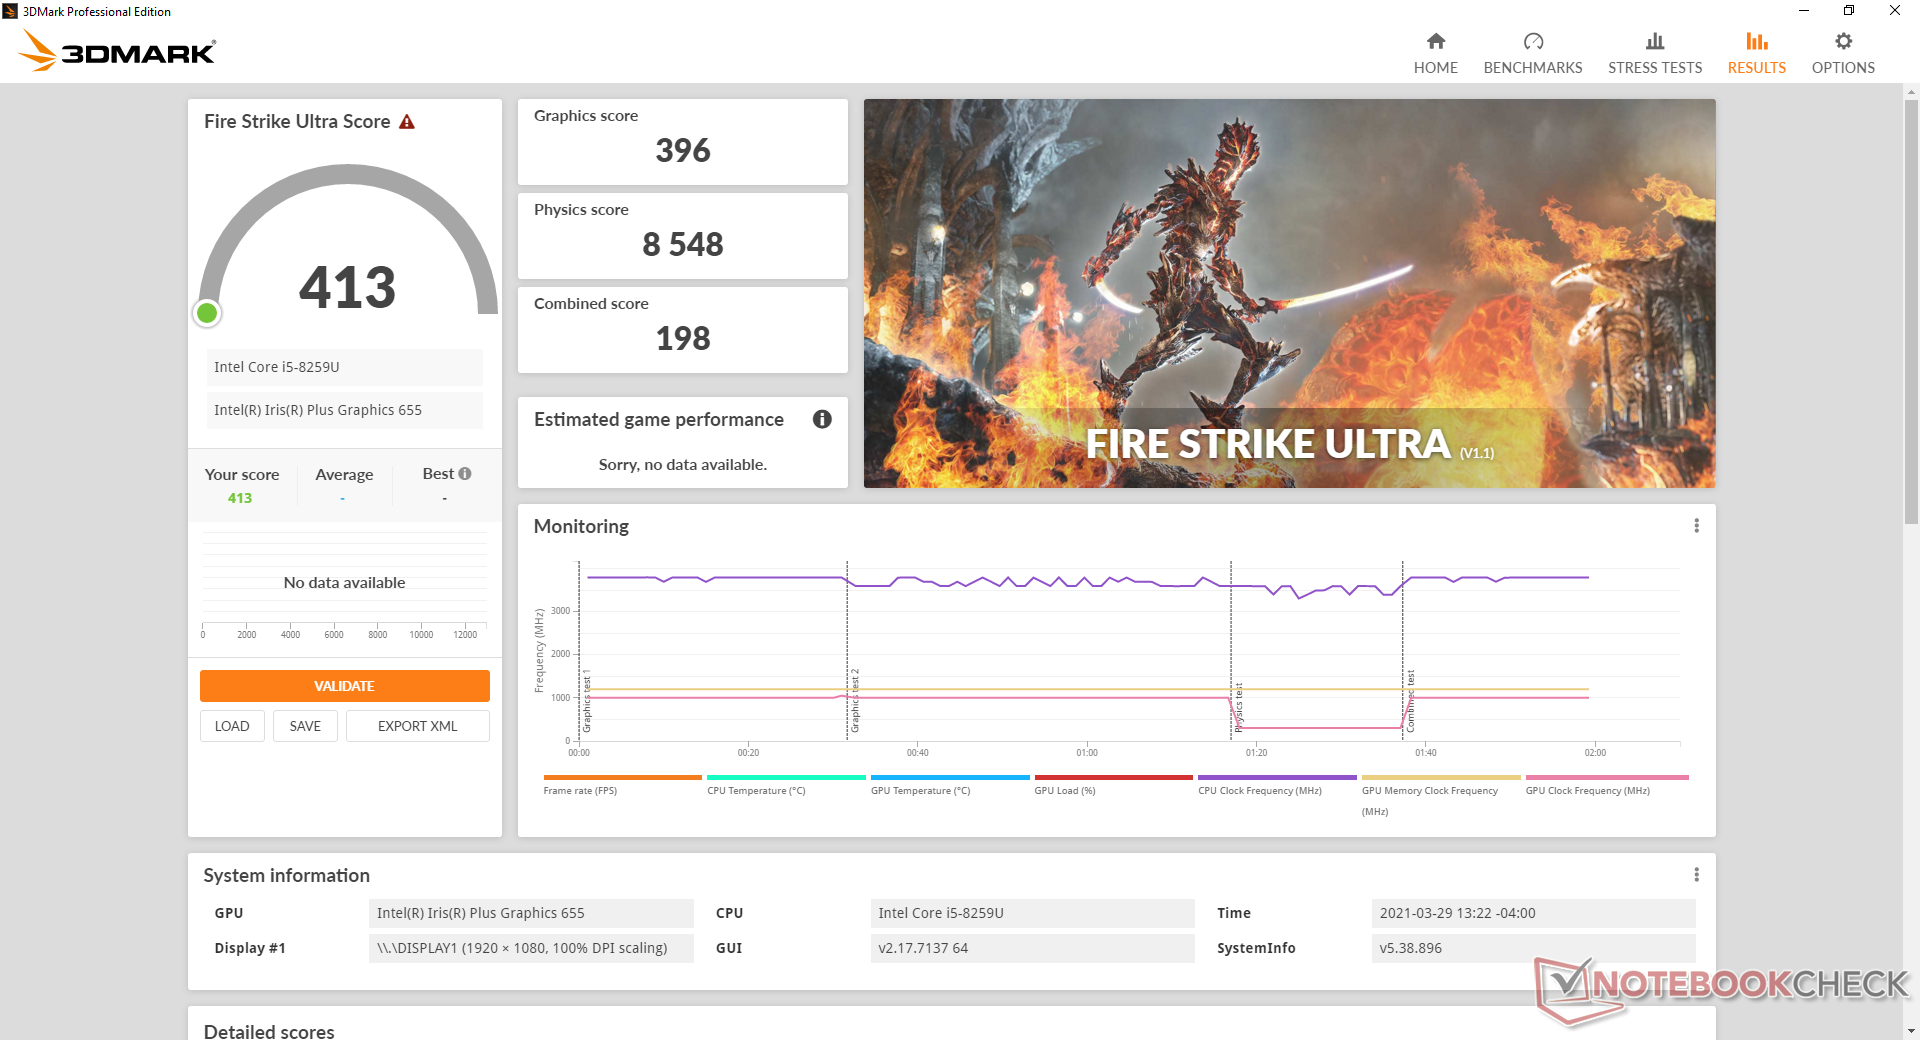
GPU prestatie
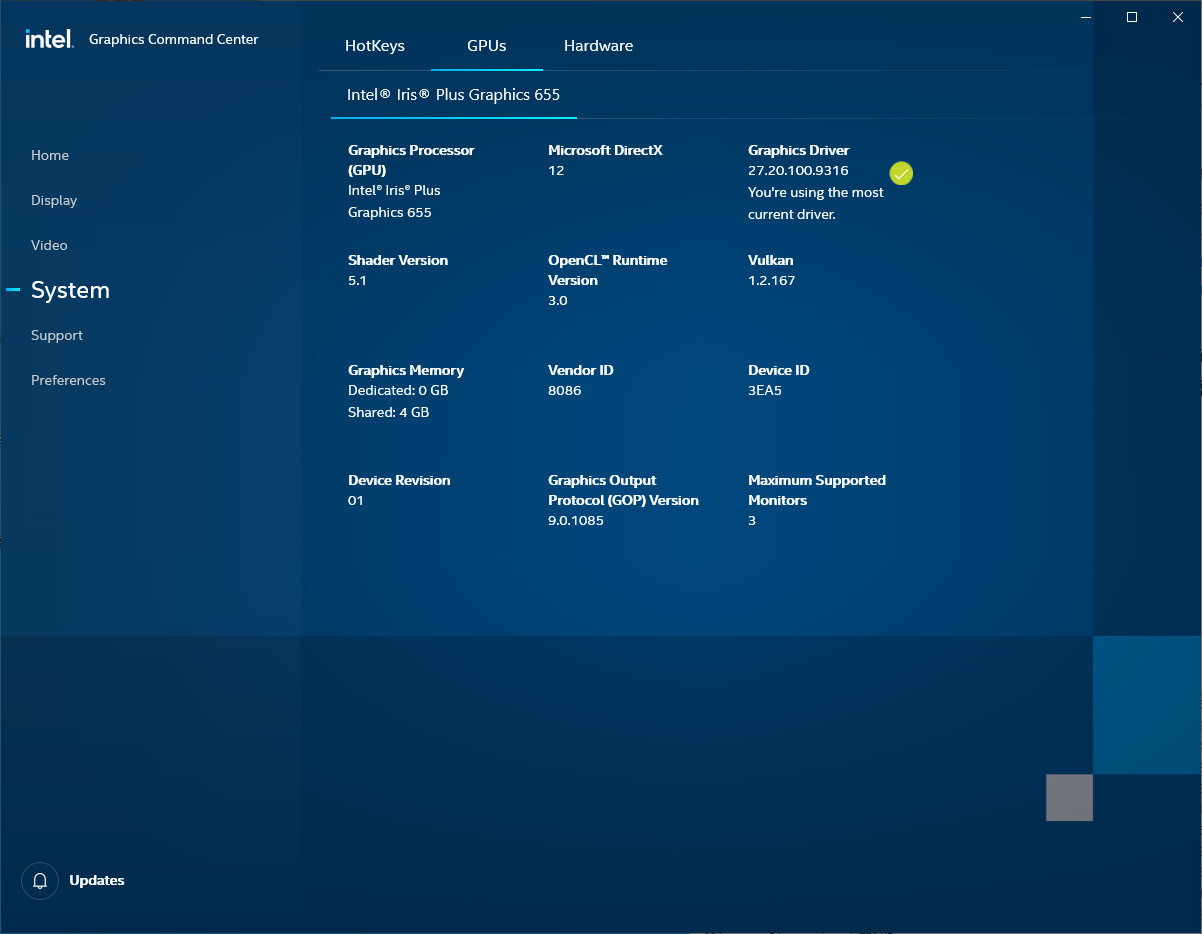
De grafische prestaties liggen tussen die van de oudere UHD Graphics 620 en de nieuwere 10e generatie Ice Lake Iris Plus G7 grafische voorzieningen. De nieuwste 11e gen Tiger Lake Iris Xe oplossing is nog sneller, maar ook veel duurder. De extra paardenkracht ten opzichte van de UHD Graphics 620 is handig voor lichte bewerkingen en 4K-uitvoer, zoals op de 2018 MacBook Pro 13. Houd in gedachten dat de Iris Plus Graphics 655 niet erg oud is geworden in vergelijking met zelfs de Radeon RX Vega-serie
| 3DMark 11 | |
| 1280x720 Performance GPU | |
| Intel NUC11PAQi7 | |
| GPD Win 3 | |
| Lenovo Yoga Slim 7 14ARE05 82A20008GE | |
| HP Envy x360 15-ee0257ng | |
| Asus ZenBook 13 UX325JA | |
| Intel NUC8i7BE | |
| Apple MacBook Pro 13 2018 Touchbar i5 | |
| GMK NucBox 2 | |
| Gemiddeld Intel Iris Plus Graphics 655 (1365 - 3081, n=8) | |
| Zotac ZBox MI643 | |
| Lenovo Yoga C930-13IKB | |
| Beelink SEi10 | |
| Chuwi LarkBook CWI509 | |
| GMK NucBox K1 | |
| 1280x720 Performance Combined | |
| GPD Win 3 | |
| Lenovo Yoga Slim 7 14ARE05 82A20008GE | |
| HP Envy x360 15-ee0257ng | |
| Intel NUC11PAQi7 | |
| Asus ZenBook 13 UX325JA | |
| Apple MacBook Pro 13 2018 Touchbar i5 | |
| Intel NUC8i7BE | |
| GMK NucBox 2 | |
| Gemiddeld Intel Iris Plus Graphics 655 (1245 - 2688, n=8) | |
| Zotac ZBox MI643 | |
| Lenovo Yoga C930-13IKB | |
| Beelink SEi10 | |
| Chuwi LarkBook CWI509 | |
| GMK NucBox K1 | |
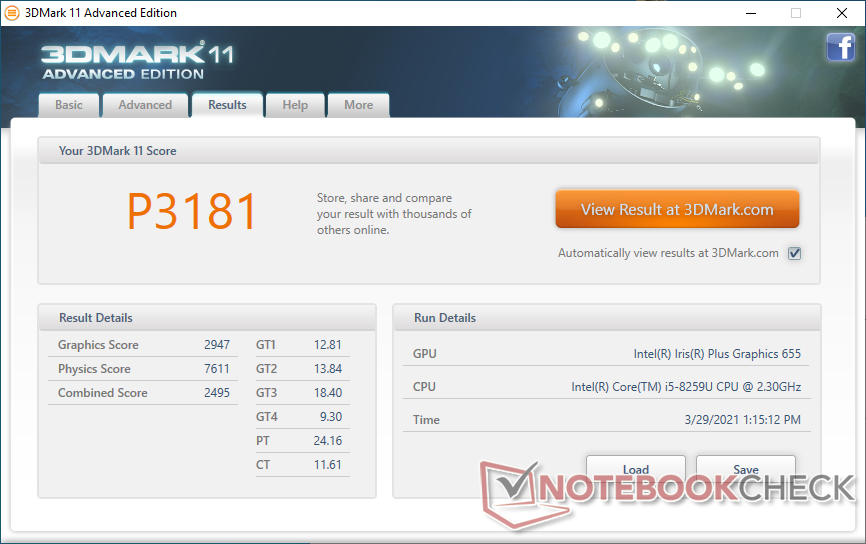
| 3DMark 11 Performance | 3181 punten | |
| 3DMark Cloud Gate Standard Score | 11622 punten | |
| 3DMark Fire Strike Score | 1779 punten | |
| 3DMark Time Spy Score | 676 punten | |
Help | ||
| Dota 2 Reborn | |
| 1280x720 min (0/3) fastest | |
| GMK NucBox 2 | |
| Intel NUC8i7BE | |
| Apple MacBook Pro 13 2018 Touchbar i5 | |
| Gemiddeld Intel Iris Plus Graphics 655 (51.4 - 98, n=8) | |
| GPD Win 3 | |
| Intel NUC11PAQi7 | |
| Zotac ZBox MI643 | |
| Beelink SEi10 | |
| Chuwi LarkBook CWI509 | |
| GMK NucBox K1 | |
| 1366x768 med (1/3) | |
| Intel NUC8i7BE | |
| GMK NucBox 2 | |
| GPD Win 3 | |
| Apple MacBook Pro 13 2018 Touchbar i5 | |
| Intel NUC11PAQi7 | |
| Gemiddeld Intel Iris Plus Graphics 655 (34.6 - 77.9, n=8) | |
| Zotac ZBox MI643 | |
| Beelink SEi10 | |
| GMK NucBox K1 | |
| Chuwi LarkBook CWI509 | |
| 1920x1080 high (2/3) | |
| GPD Win 3 | |
| Intel NUC11PAQi7 | |
| Intel NUC8i7BE | |
| Apple MacBook Pro 13 2018 Touchbar i5 | |
| GMK NucBox 2 | |
| Gemiddeld Intel Iris Plus Graphics 655 (15.8 - 34.7, n=8) | |
| Zotac ZBox MI643 | |
| Beelink SEi10 | |
| Chuwi LarkBook CWI509 | |
| GMK NucBox K1 | |
| 1920x1080 ultra (3/3) best looking | |
| GPD Win 3 | |
| Intel NUC11PAQi7 | |
| Intel NUC8i7BE | |
| Apple MacBook Pro 13 2018 Touchbar i5 | |
| GMK NucBox 2 | |
| Gemiddeld Intel Iris Plus Graphics 655 (13.4 - 30.4, n=8) | |
| Zotac ZBox MI643 | |
| Beelink SEi10 | |
| Chuwi LarkBook CWI509 | |
| GMK NucBox K1 | |
| Final Fantasy XV Benchmark | |
| 1280x720 Lite Quality | |
| GPD Win 3 | |
| Intel NUC11PAQi7 | |
| GMK NucBox 2 | |
| Intel NUC8i7BE | |
| Gemiddeld Intel Iris Plus Graphics 655 (9.11 - 18.1, n=8) | |
| Apple MacBook Pro 13 2018 Touchbar i5 | |
| 1920x1080 Standard Quality | |
| GPD Win 3 | |
| Intel NUC11PAQi7 | |
| GMK NucBox 2 | |
| Gemiddeld Intel Iris Plus Graphics 655 (7.88 - 9.73, n=4) | |
| 1920x1080 High Quality | |
| GPD Win 3 | |
| Intel NUC11PAQi7 | |
| GMK NucBox 2 | |
| Gemiddeld Intel Iris Plus Graphics 655 (5.25 - 6.55, n=4) | |
| X-Plane 11.11 | |
| 1280x720 low (fps_test=1) | |
| Intel NUC11PAQi7 | |
| Intel NUC8i7BE | |
| GPD Win 3 | |
| Gemiddeld Intel Iris Plus Graphics 655 (13.8 - 42.8, n=7) | |
| GMK NucBox 2 | |
| Zotac ZBox MI643 | |
| Chuwi LarkBook CWI509 | |
| GMK NucBox K1 | |
| 1920x1080 med (fps_test=2) | |
| GPD Win 3 | |
| Intel NUC11PAQi7 | |
| Intel NUC8i7BE | |
| Gemiddeld Intel Iris Plus Graphics 655 (9.75 - 29.5, n=7) | |
| GMK NucBox 2 | |
| Zotac ZBox MI643 | |
| GMK NucBox K1 | |
| Chuwi LarkBook CWI509 | |
| 1920x1080 high (fps_test=3) | |
| GPD Win 3 | |
| Intel NUC11PAQi7 | |
| Intel NUC8i7BE | |
| GMK NucBox 2 | |
| Gemiddeld Intel Iris Plus Graphics 655 (8.55 - 25.1, n=7) | |
| Zotac ZBox MI643 | |
| GMK NucBox K1 | |
| Chuwi LarkBook CWI509 | |
| lage | gem. | hoge | ultra | |
|---|---|---|---|---|
| Dota 2 Reborn (2015) | 98 | 66 | 31.9 | 27.7 |
| Final Fantasy XV Benchmark (2018) | 17.3 | 9.07 | 6.04 | |
| X-Plane 11.11 (2018) | 25.3 | 18 | 15.9 |
Emissions
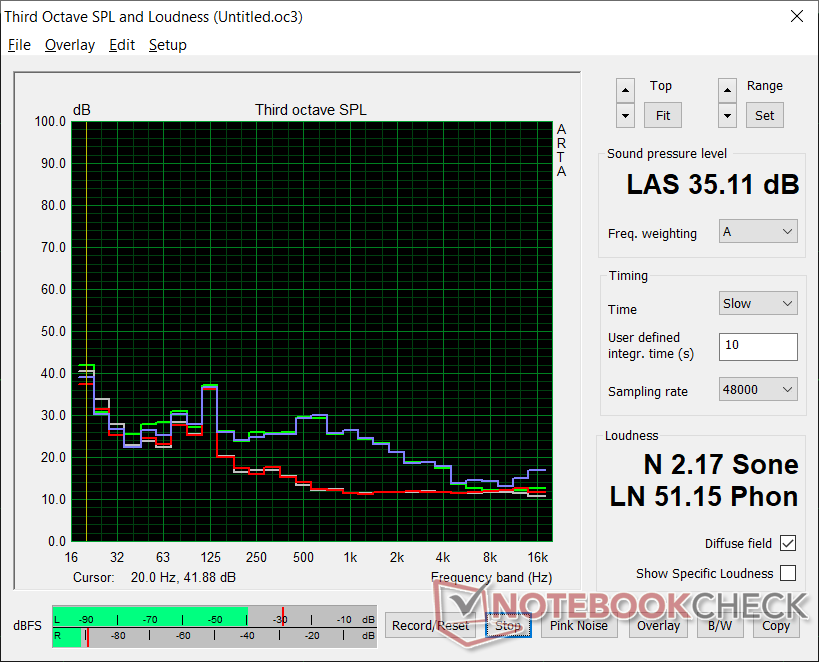
Systeemgeluid
Een enkele ~45 mm ventilator zuigt koele lucht aan de onderkant naar binnen en voert de warme lucht aan de achterkant weer naar buiten. Hij is bijna altijd stil als hij stationair draait op het bureaublad, maar lage belastingen zoals browsen of video streamen zullen al snel een constant ventilatorgeluid van 29.1 dB(A) veroorzaken tegen een stille achtergrond van 25.6 dB(A). Hogere belastingen zoals 3DMark 06 of games zullen een constant ventilatorgeluid van 35 dB(A) veroorzaken, wat nog steeds stiller is dan de meeste andere mini PC's onder vergelijkbare belastingen en condities.
We kunnen een licht spoelgejank waarnemen van onze test unit wanneer deze uitgeschakeld is of in standby mode staat.
| GMK NucBox 2 Iris Plus Graphics 655, i5-8259U, Netac S930E8/256GPN | Intel NUC8i7BE Iris Plus Graphics 655, i7-8559U | Zotac ZBox MI643 UHD Graphics 620, i5-10210U, Lexar NM610 1TB | GMK NucBox K1 UHD Graphics 600, Celeron J4125, HIKVision C100 NGFF SSD 128GB | |
|---|---|---|---|---|
| Noise | -15% | -4% | -17% | |
| uit / omgeving * (dB) | 25.6 | 28.7 -12% | 26.1 -2% | 27.8 -9% |
| Idle Minimum * (dB) | 25.7 | 28.7 -12% | 27.5 -7% | 27.8 -8% |
| Idle Average * (dB) | 25.7 | 29.3 -14% | 27.5 -7% | 27.8 -8% |
| Idle Maximum * (dB) | 25.7 | 31.8 -24% | 27.5 -7% | 27.8 -8% |
| Load Average * (dB) | 35.3 | 39 -10% | 28.9 18% | 46.8 -33% |
| Load Maximum * (dB) | 35.1 | 41.4 -18% | 42 -20% | 46.8 -33% |
| Witcher 3 ultra * (dB) | 39 |
* ... kleiner is beter
Geluidsniveau
| Onbelast |
| 25.7 / 25.7 / 25.7 dB (A) |
| Belasting |
| 35.3 / 35.1 dB (A) |
 | ||
30 dB stil 40 dB(A) hoorbaar 50 dB(A) luid |
||
min: | ||
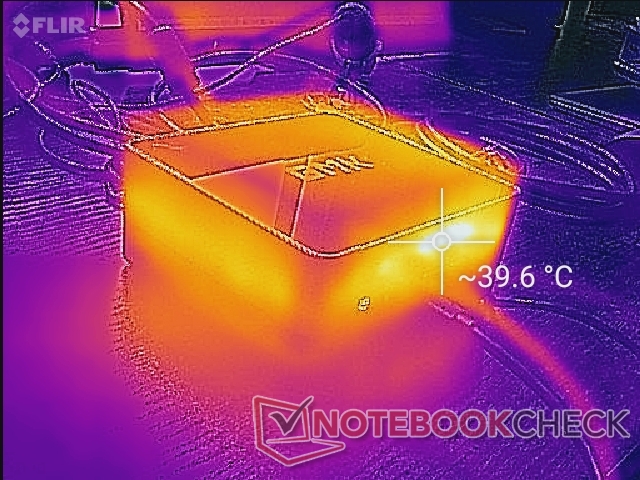
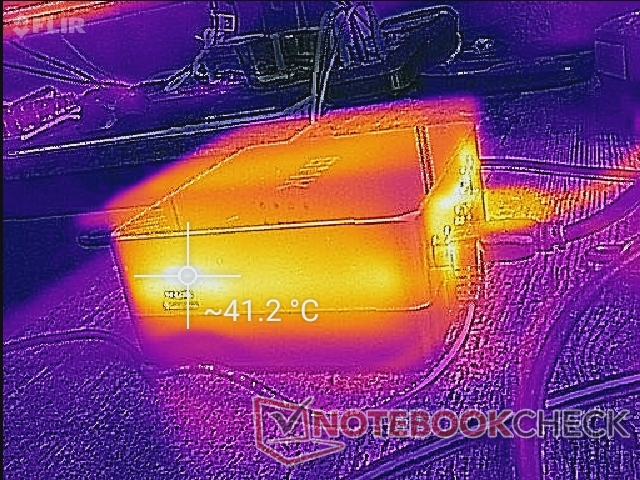
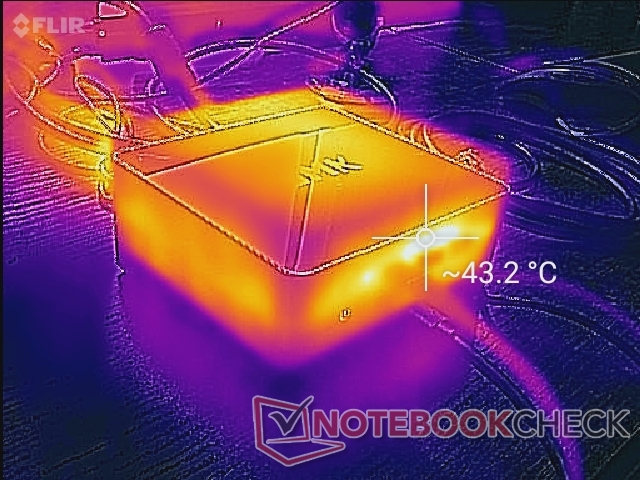
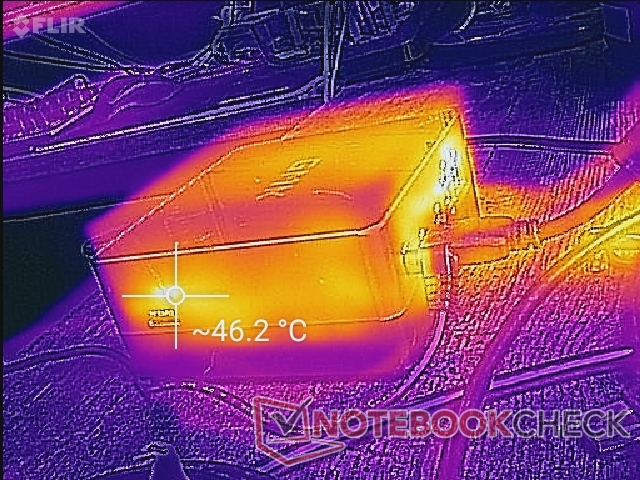
Temperatuur
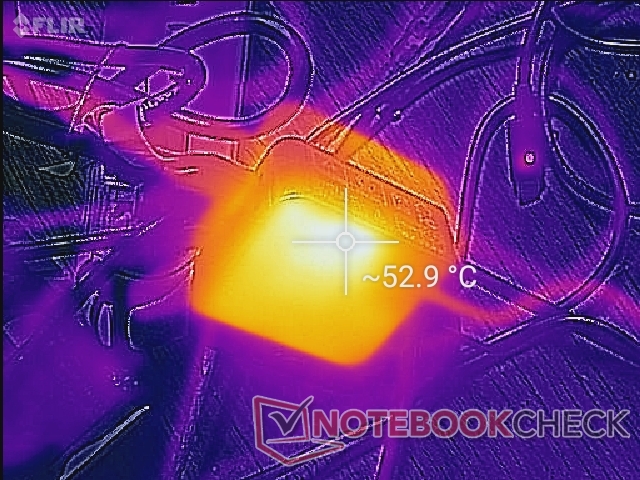
Ventilatieroosters zijn alleen lang de achterste rand van de mini PC, wat betekent dat je de unit veilig verticaal of op zijn kant kunt zetten zonder de koeling te belemmeren. De bovenzijde van het systeemis warm met ongeveer 27 C, zelfs wanneer hetstationair draait op het bureaublad.
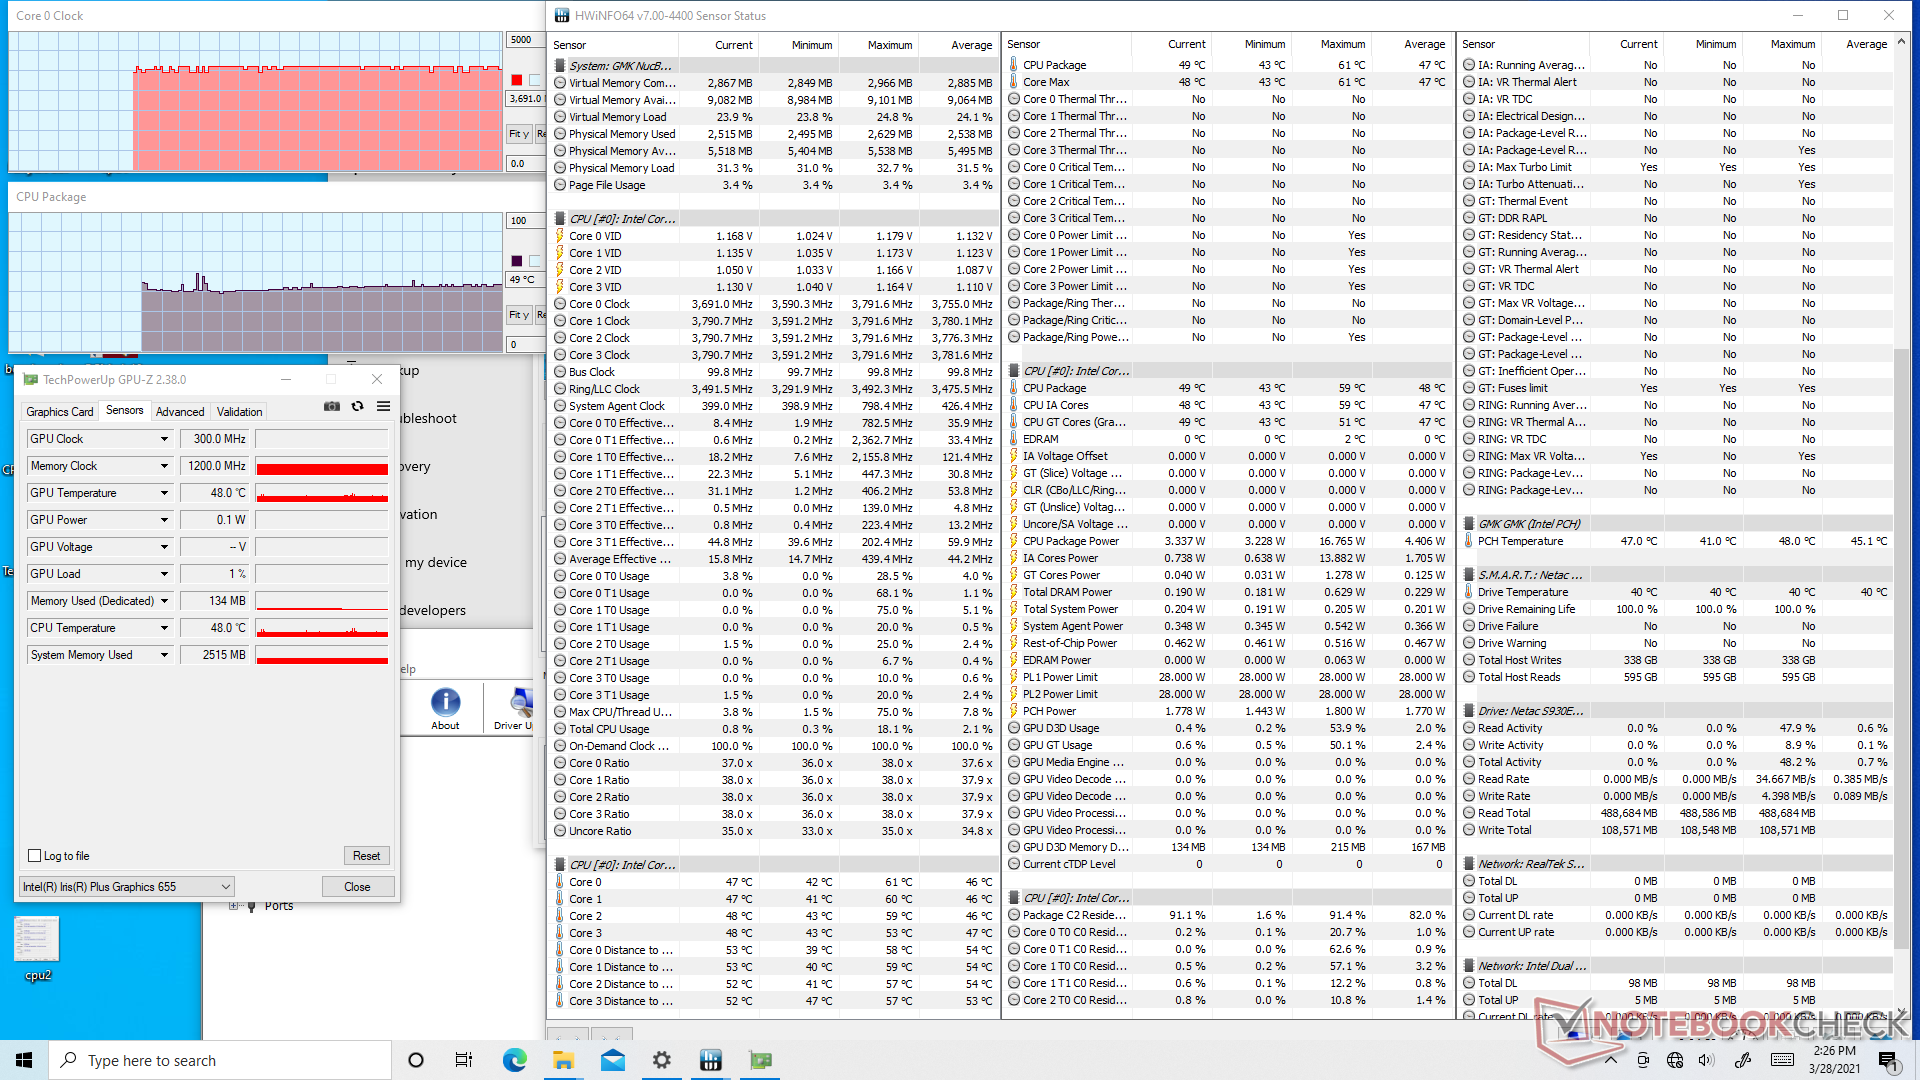
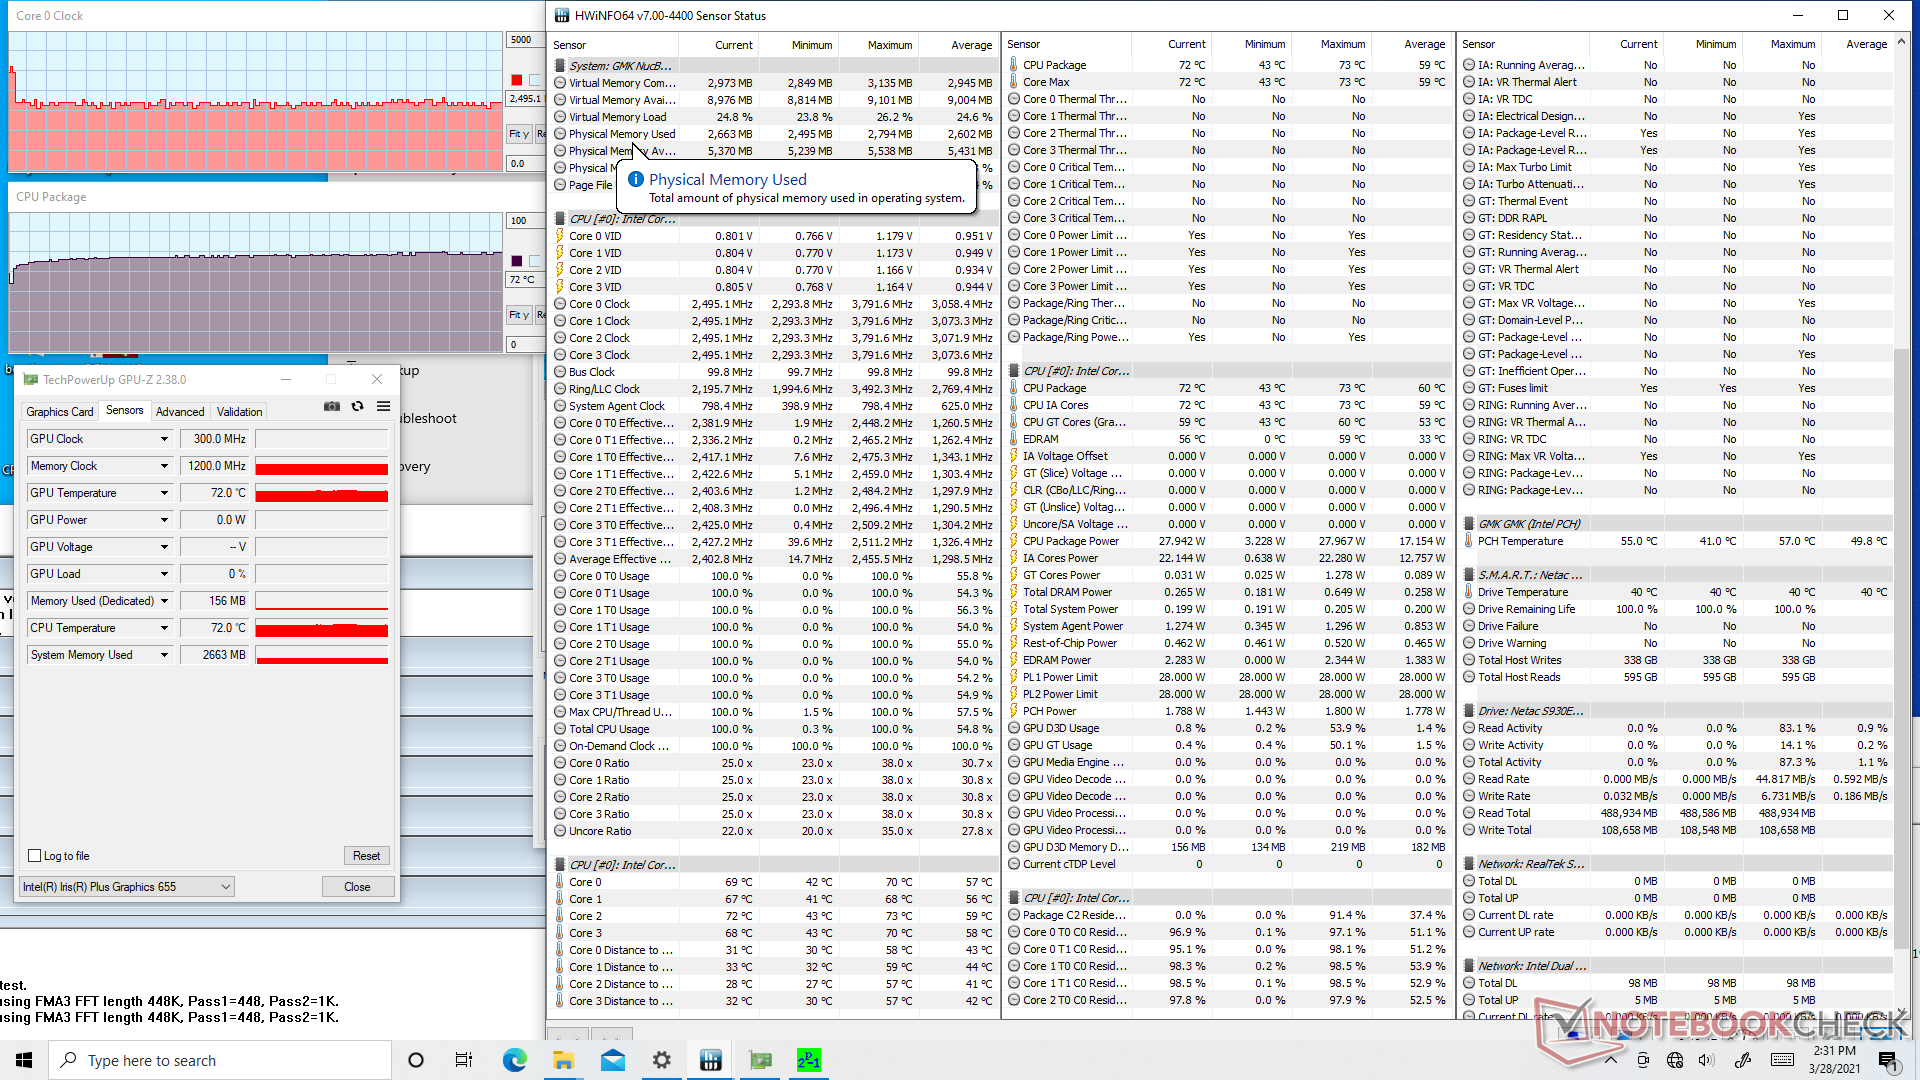
Stresstest
Onder belasting van Prime95 zou de CPU simpelweg stabiliseren op het 2,3 tot 2,5 GHz bereik zonder hoger Turbo Boost potentieel. De CPU is in staat om tot 3,8 GHz te gaan, maar alleen in single-threaded werkbelastingen. De kerntemperatuur blijft steken op een respectabele 73 C bij zeer hoge multi-threaded belastingen. De processor zal niet overgeven tenzij zowel de CPU als de geïntegreerde GPU volledig worden belast.
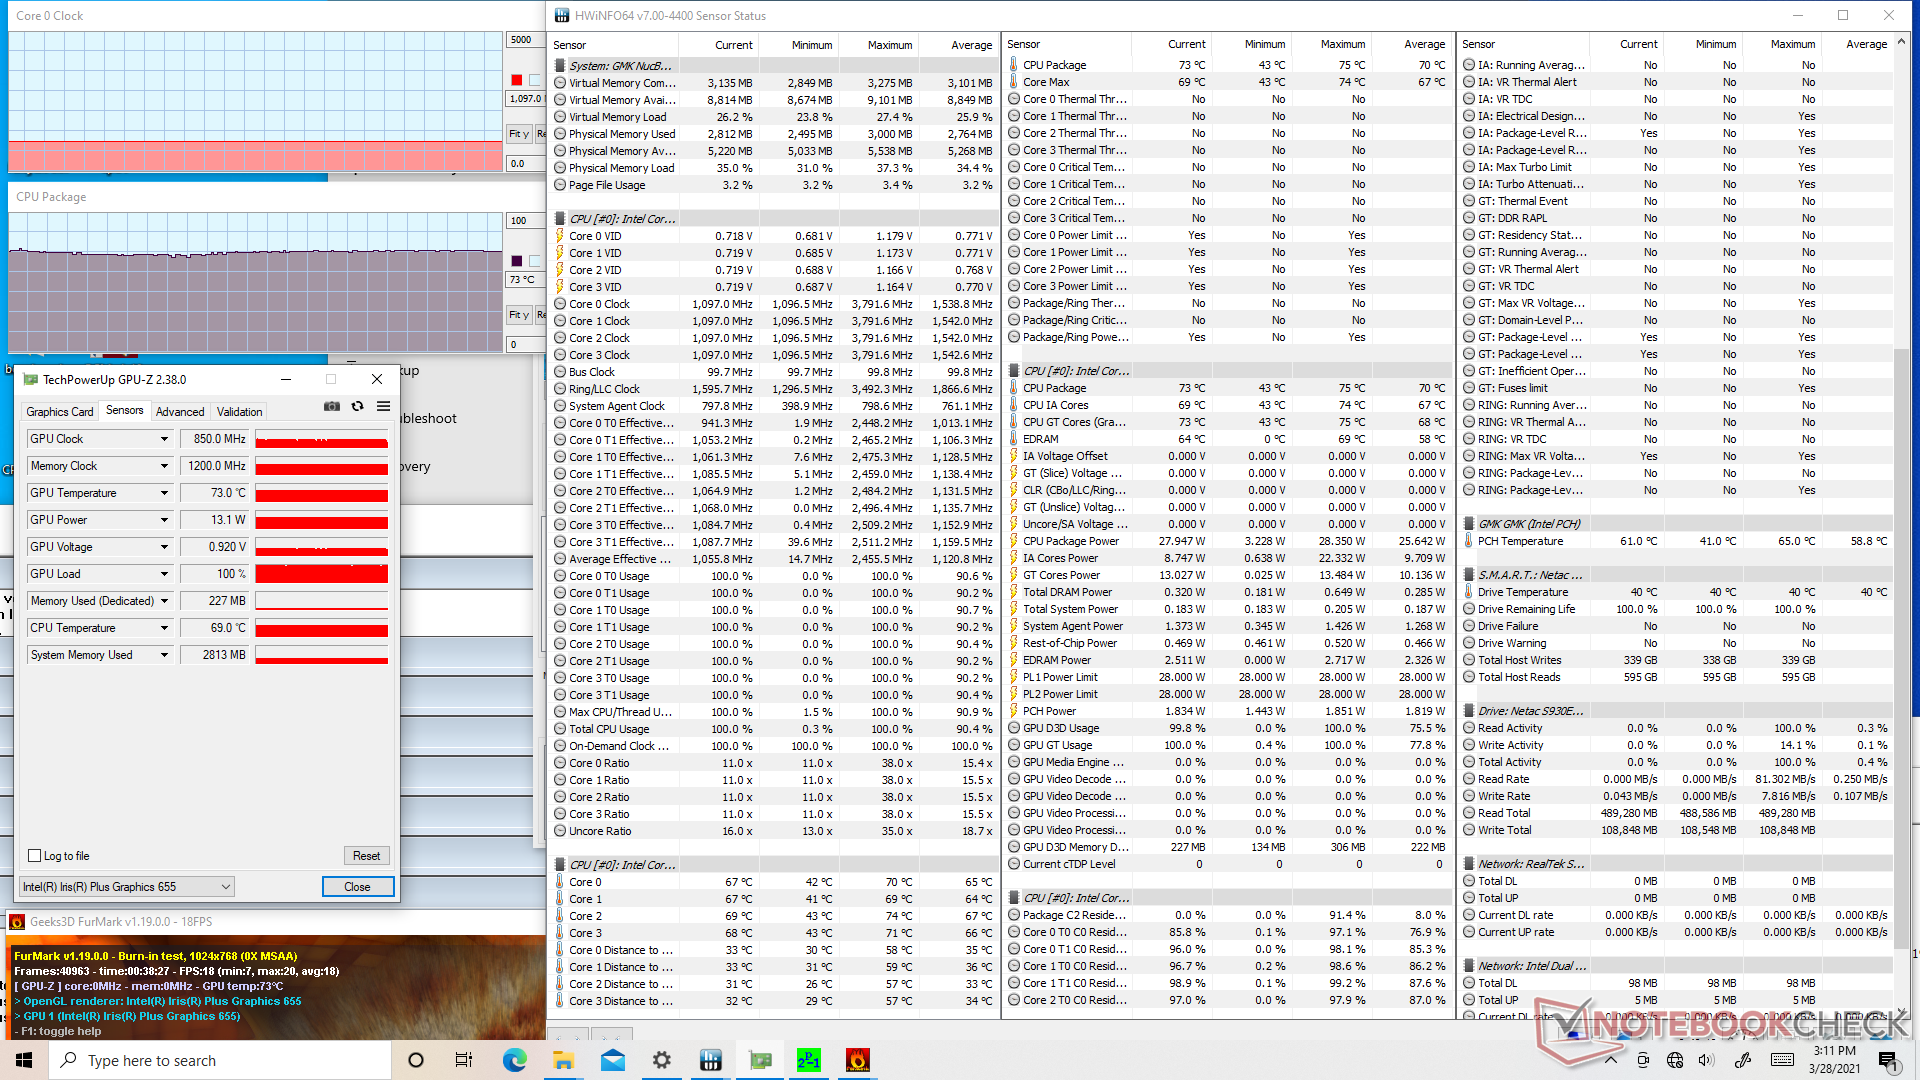
| CPU-klok (GHz)GPU-klok (MHz) GemiddeldeCPU-temperatuur (°C) |
| Systeem Idle |
| Prime95 Stress |
| Prime95 + FurMark Stress |
Energy Management
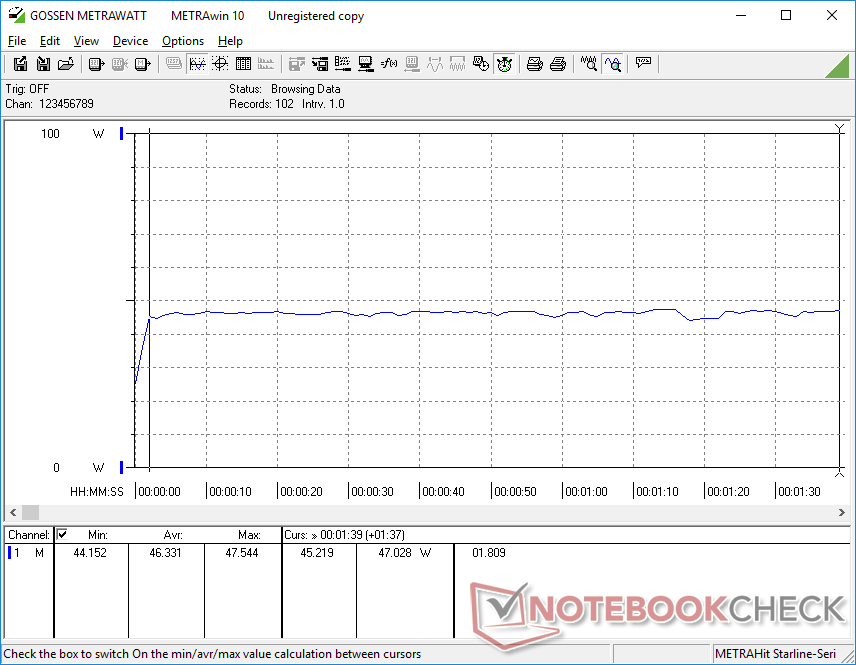
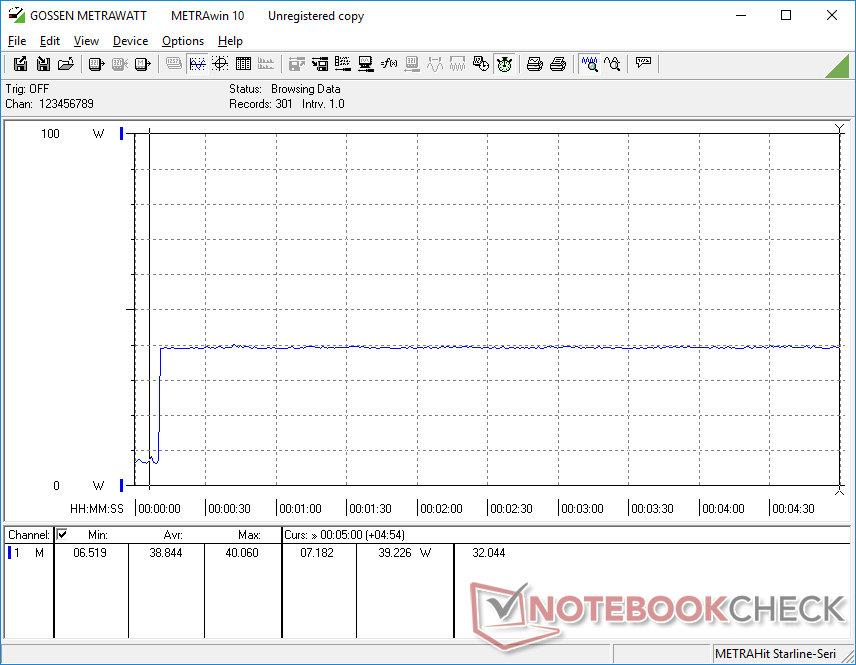
Stroomverbruik
Stationair draaien op een desktop verbruikt slechts 6 tot 8 W, terwijl hogere belastingen zoals games ongeveer 46 W kunnen verbruiken. Merk op dat de Intel NUC 11 met zijn nieuwere generatie Iris Xe grafische kaart slechts 31 tot 39 W verbruikt bij het draaien van games, ondanks het feit dat deze bijna 2x de grafische prestaties van onze Iris Plus 655 biedt.

| Uit / Standby | |
| Inactief | |
| Belasting |
|
Key:
min: | |
| GMK NucBox 2 i5-8259U, Iris Plus Graphics 655, Netac S930E8/256GPN, , x, | Intel NUC11PAQi7 i7-1165G7, Iris Xe G7 96EUs, Samsung SSD 980 Pro 500GB MZ-V8P500BW, , x, | Intel NUC8i7BE i7-8559U, Iris Plus Graphics 655, , , x, | GMK NucBox K1 Celeron J4125, UHD Graphics 600, HIKVision C100 NGFF SSD 128GB, , x, | Beelink SEi10 i3-1005G1, UHD Graphics G1 (Ice Lake 32 EU), Silicon Motion AZW 256G M.2280 NVMe 4X 200725 D, , x, | Zotac ZBox MI643 i5-10210U, UHD Graphics 620, Lexar NM610 1TB, , x, | |
|---|---|---|---|---|---|---|
| Power Consumption | 3% | 8% | 53% | 12% | -17% | |
| Idle Minimum * (Watt) | 6.1 | 5.6 8% | 2.7 56% | 3.4 44% | 6.3 -3% | 7.5 -23% |
| Idle Average * (Watt) | 6.8 | 5.6 18% | 3.1 54% | 3.8 44% | 6.6 3% | 9.2 -35% |
| Idle Maximum * (Watt) | 7.3 | 6 18% | 6.3 14% | 3.9 47% | 6.7 8% | 9.6 -32% |
| Load Average * (Watt) | 46.3 | 31.4 32% | 59.7 -29% | 12.5 73% | 25.9 44% | 34.4 26% |
| Load Maximum * (Watt) | 50.7 | 80.5 -59% | 78 -54% | 22.7 55% | 46.7 8% | 60.6 -20% |
| Witcher 3 ultra * (Watt) | 39 | 47.2 |
* ... kleiner is beter
Pro
Contra
Uitspraak
De NucBox 2 probeert niet de kleinste mini PC of zelfs de snelste te zijn. In plaats daarvan is het een no-frills middenklasse aanbieding met een fatsoenlijke Core i5 CPU, Iris Plus GPU voor dubbele 4K60 ondersteuning, en net genoeg RAM en opslag om uit de voeten te kunnen voor HTPC doeleinden. Het ventilatorgeluid is ook stiller dan dat van de Intel NUC, vooral bij hogere belastingen.
In tegenstelling tot barebone kits die ongeveer hetzelfde kosten, wordt de NucBox 2 geleverd met alles wat je nodig hebt om aan de slag te gaan en met ruimte voor eenvoudige uitbreiding mocht dat ooit nodig zijn.
De afhankelijkheid van een eigen AC-adapterstekker in plaats van een meer standaard USB-C oplossing maakt de NucBox 2 minder universeel. We zouden graag meer USB-C poorten zien op toekomstige modellen of zelfs een geïntegreerde PSU om een externe AC adapter helemaal te vermijden. Een dergelijke stap zou de concurrentie, waar externe adapters soms net zo groot zijn als de mini PC's zelf, echt de loef afsteken.
Prijs en beschikbaarheid
De GMK NucBox 2 is op Amazon verkrijgbaar voor 499 USD. Een huidige verkoop scheert $ 60 voor een eindprijs van $ 439. Als alternatief kunnen gebruikers de NucBox ook rechtstreeks bij GMK kopen voor dezelfde verkoopprijs wanneer ze op het moment van schrijven de couponcode 'Easter60OFF' gebruiken
Price comparison

