Conclusie - Superlicht en ultra-efficiënt
De NucBox K13 is speciaal ontworpen met de voordelen van Intel Lunar Lake in gedachten. Het ultracompacte ontwerp, het zeer lage gewicht en de nog kleinere AC-adapter zouden niet mogelijk zijn geweest met een processor uit de H-serie zoals de Core Ultra 7 255H of Ryzen AI 9. Het systeem is nog kleiner dan de al kleine MSI Cubi NUC AI+ 2MG voor gebruikers die een mini PC in kleinere of onopvallendere ruimtes willen plaatsen.
Het kleine formaat brengt echter een aantal nadelen met zich mee. In tegenstelling tot de eerder genoemde MSI heeft de GMK geen geïntegreerde luidspreker en ook niet zoveel poorten als de krachtigere NucBox K12. De GPU-prestaties zijn iets langzamer dan verwacht, het maximale RAM-geheugen is beperkt tot 16 GB, en ventilatorgeluid is helaas vrij merkbaar wanneer er iets veeleisends wordt uitgevoerd. Desalniettemin waarderen we het dat het model nog steeds tot twee interne M.2 SSD's ondersteunt, ondanks het kleine volume, en dat de prijs niet onredelijk is gezien de uitgebalanceerde specificaties en voetafdruk.
Pro
Contra
Prijs en beschikbaarheid
De NucBox K13 is en wordt nu rechtstreeks vanaf de fabrikant verzonden vanaf $670 voor de basisconfiguratie met 16 GB RAM/512 GB SSD tot $720 voor de configuratie met 16 GB RAM/1 TB SSD.
GMKtec mini PC's bestrijken het hele spectrum van processoren, van 15 W CPU's uit de U-serie zoals de Core Ultra 5 125U tot de kolossale 100 W Ryzen AI Max+ 395. De nieuwe NucBox K13 is een middenweg oplossing die relevanter zou moeten zijn voor de meerderheid van thuis- of kantoorgebruikers die op zoek zijn naar een kleine maar evenwichtige mini PC.
Alternatieven voor de GMK NucBox K13 zijn andere mini PC's met ULV-processors, zoals de MSI Cubi NUC, Ninkear M7of NiPoGi AM06 Pro.
Meer GMK beoordelingen:
Specificaties
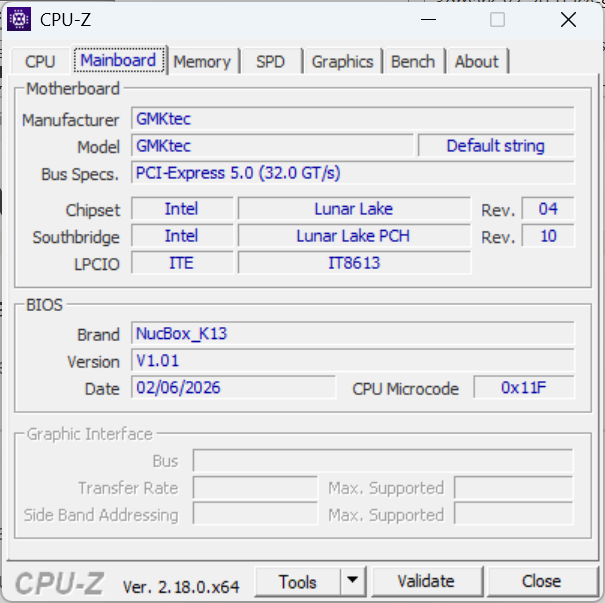
Zaak
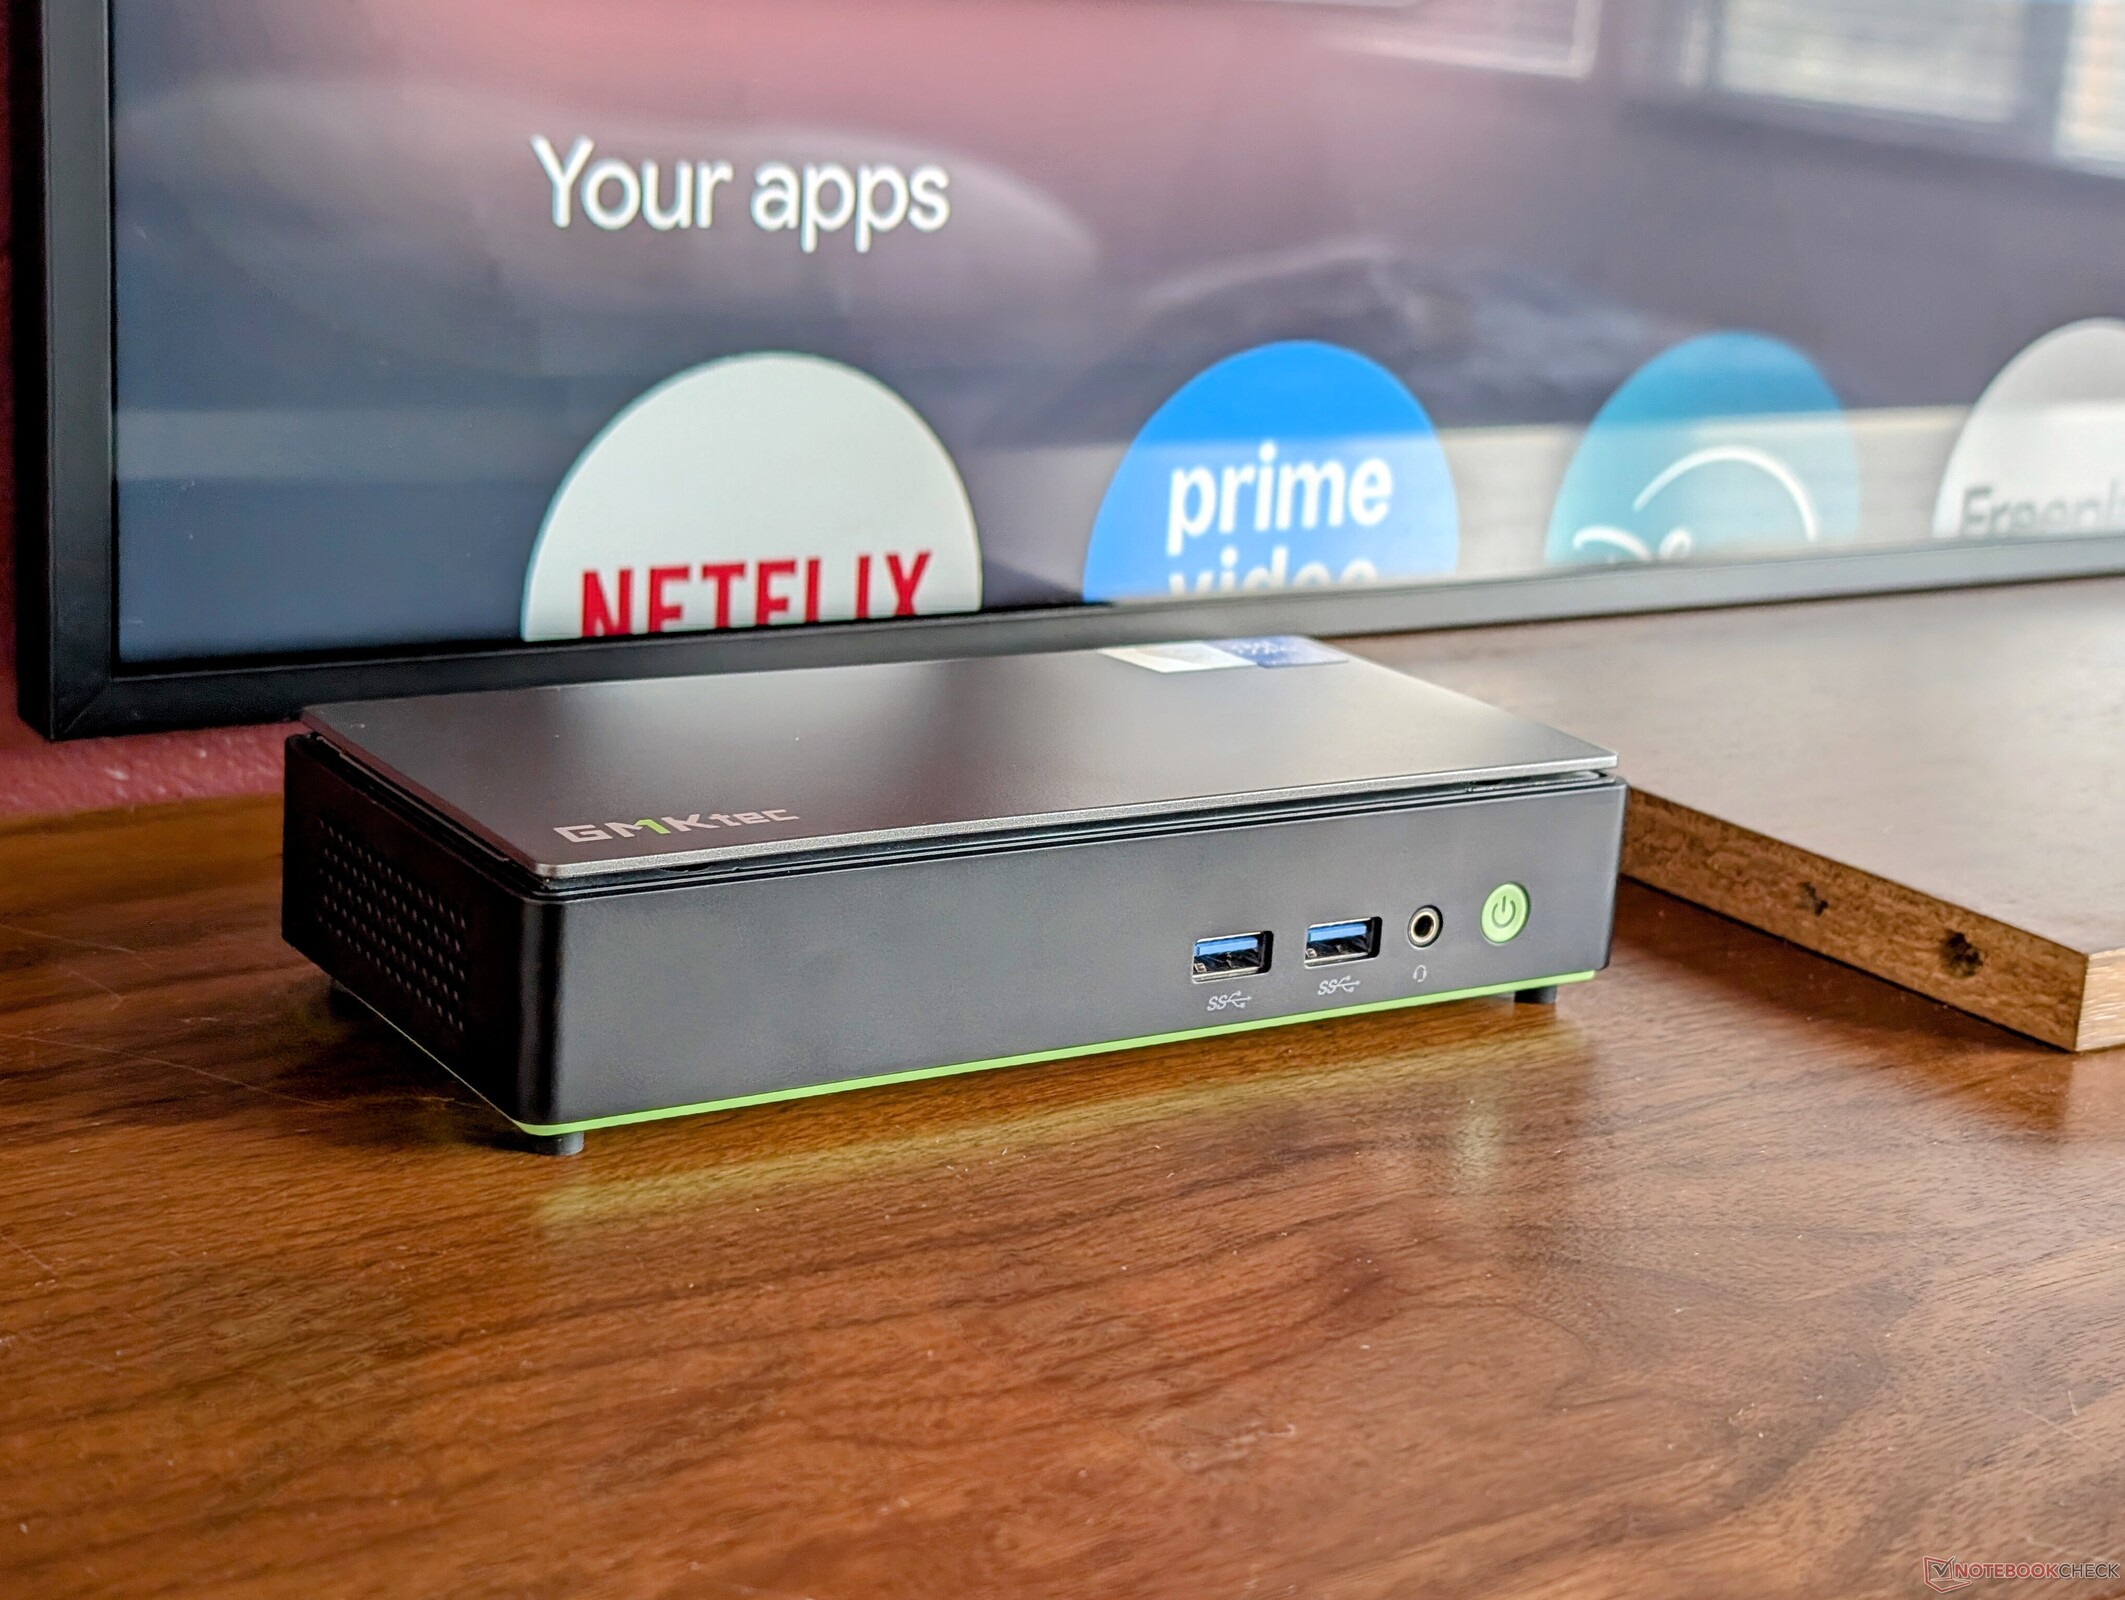
Het stevige chassis bestaat uit donkergrijs metaal, maar met een plastic groene onderkant die overeenkomt met de kleurtint van het GMKtec logo. De meest opvallende eigenschap is waarschijnlijk het kleine formaat en de smalle afmetingen in vergelijking met de vierkantere ontwerpen van de meeste andere mini PC's, inclusief die van dezelfde fabrikant. Het model is ook bijna 25 procent lichter dan de MSI Cubi NUC die vergelijkbare Intel Lunar Lake-V processoropties heeft.
Connectiviteit
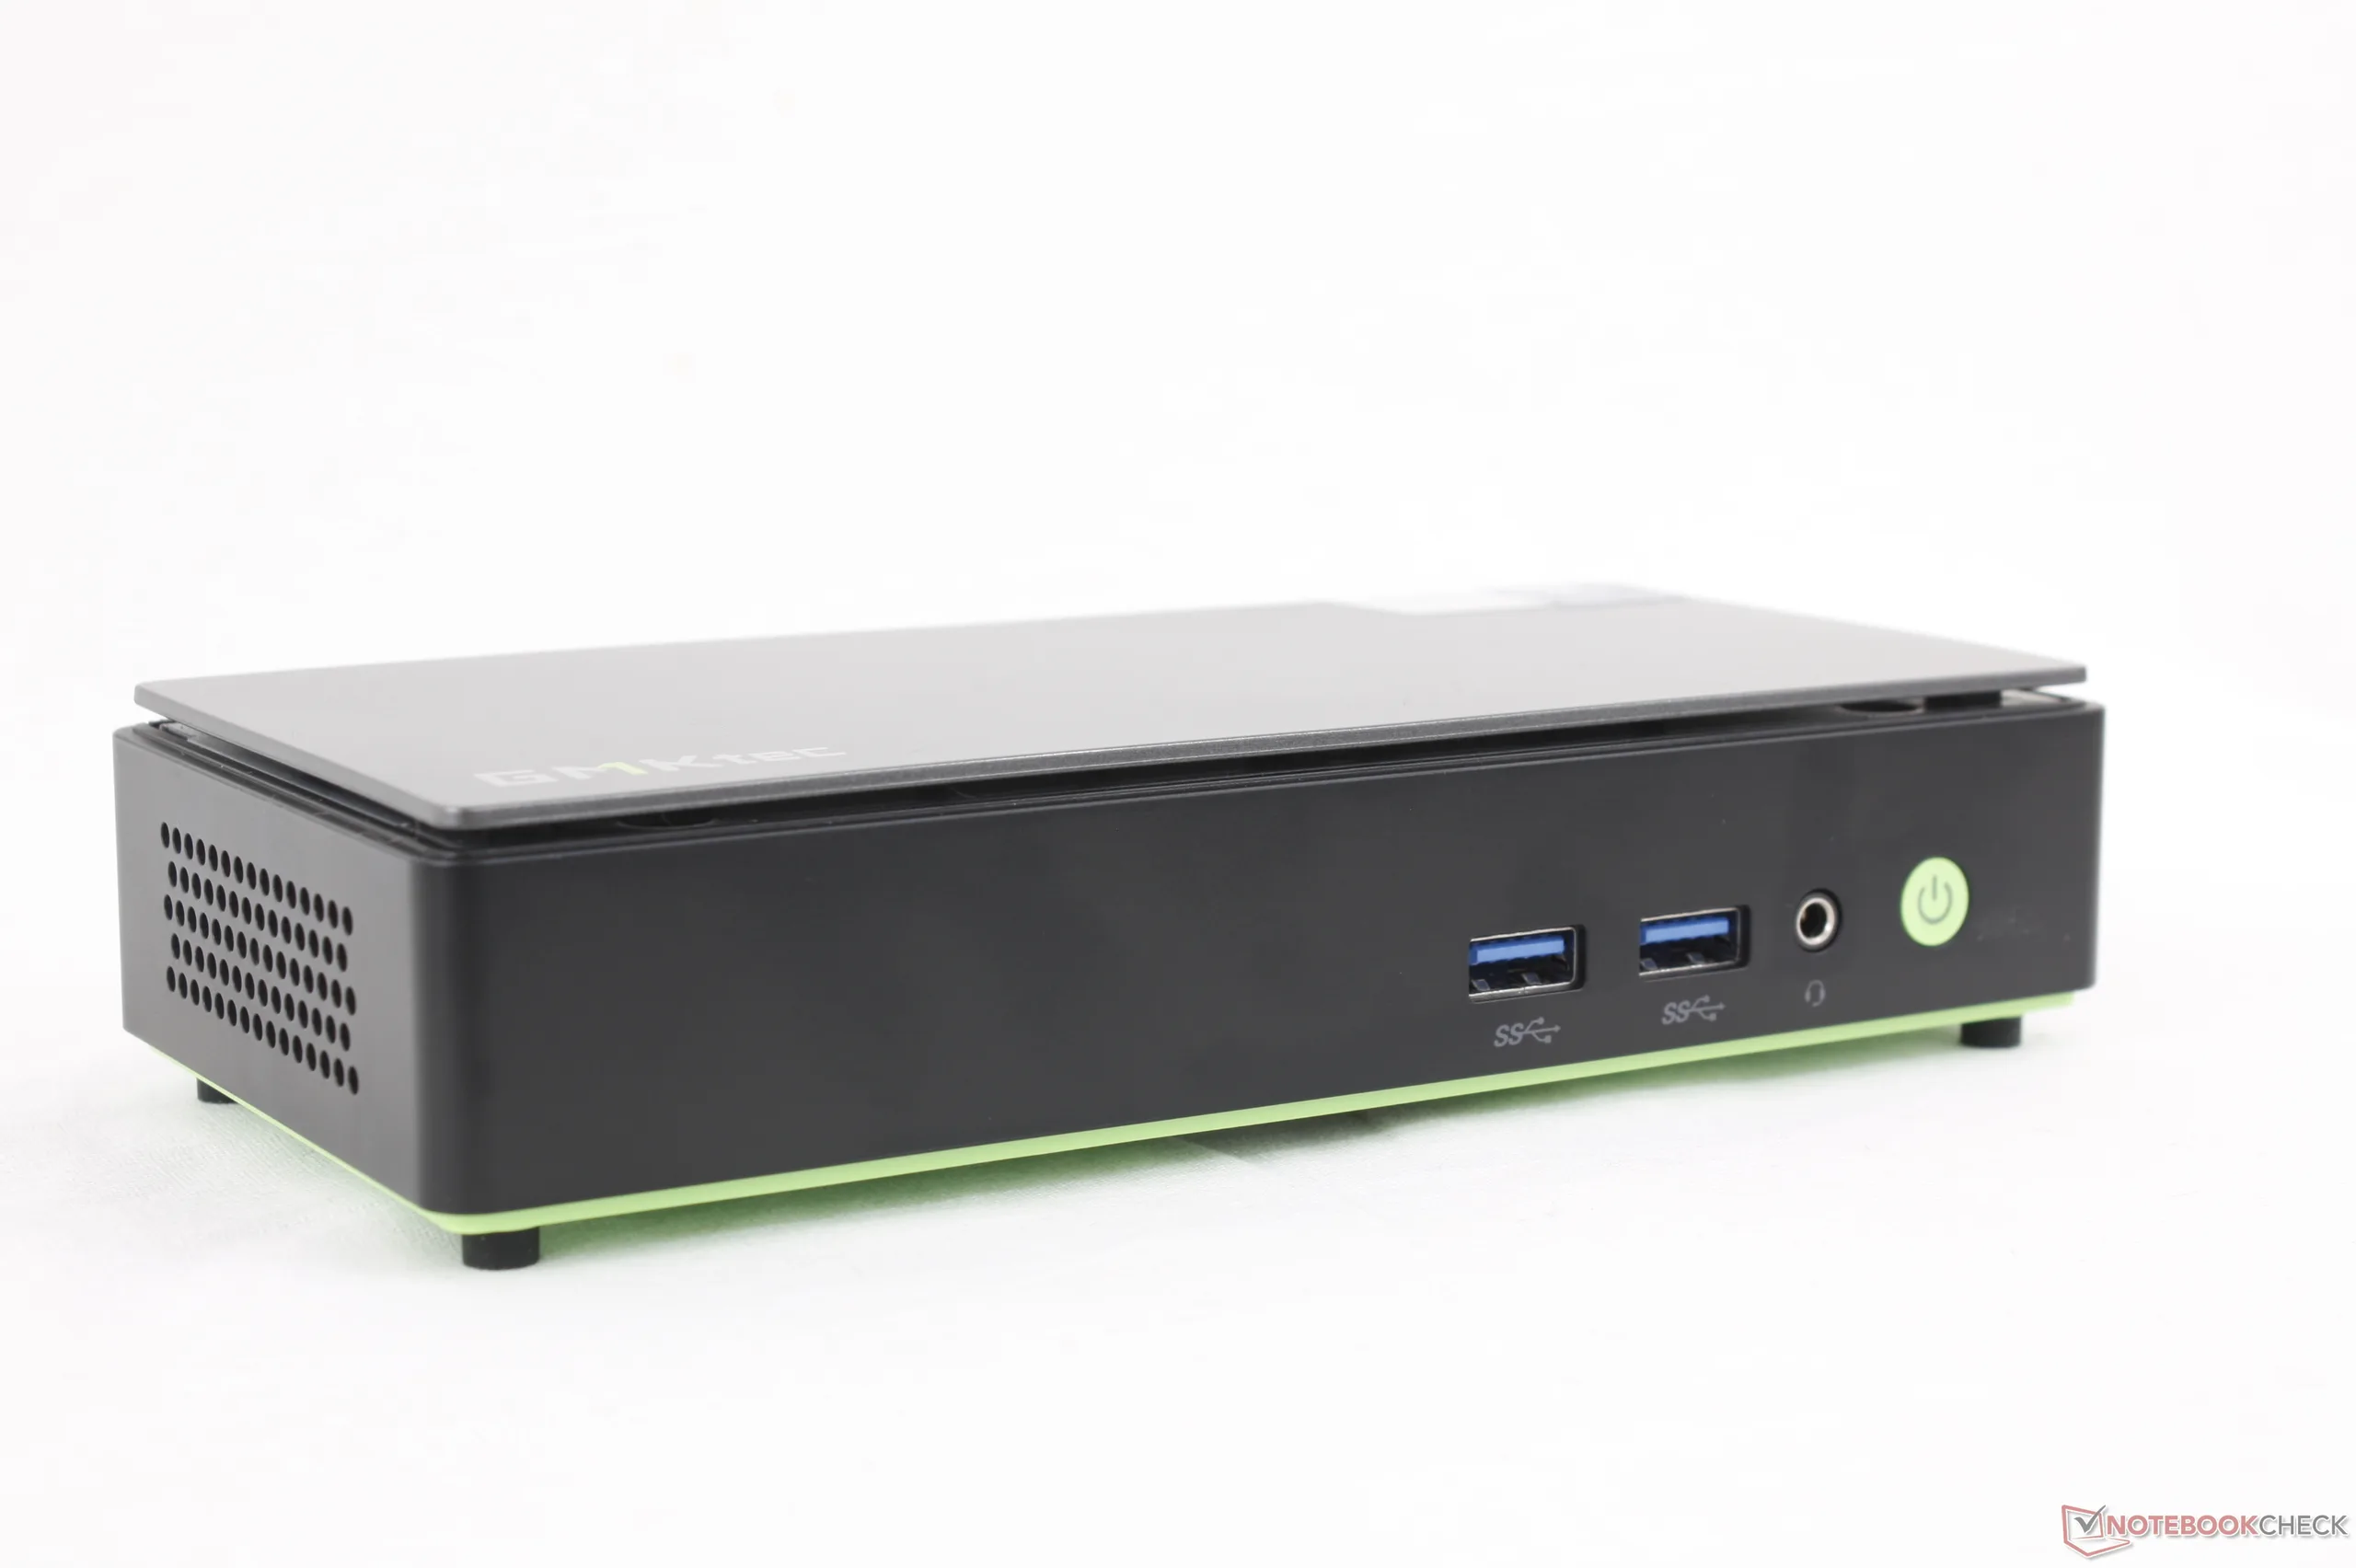
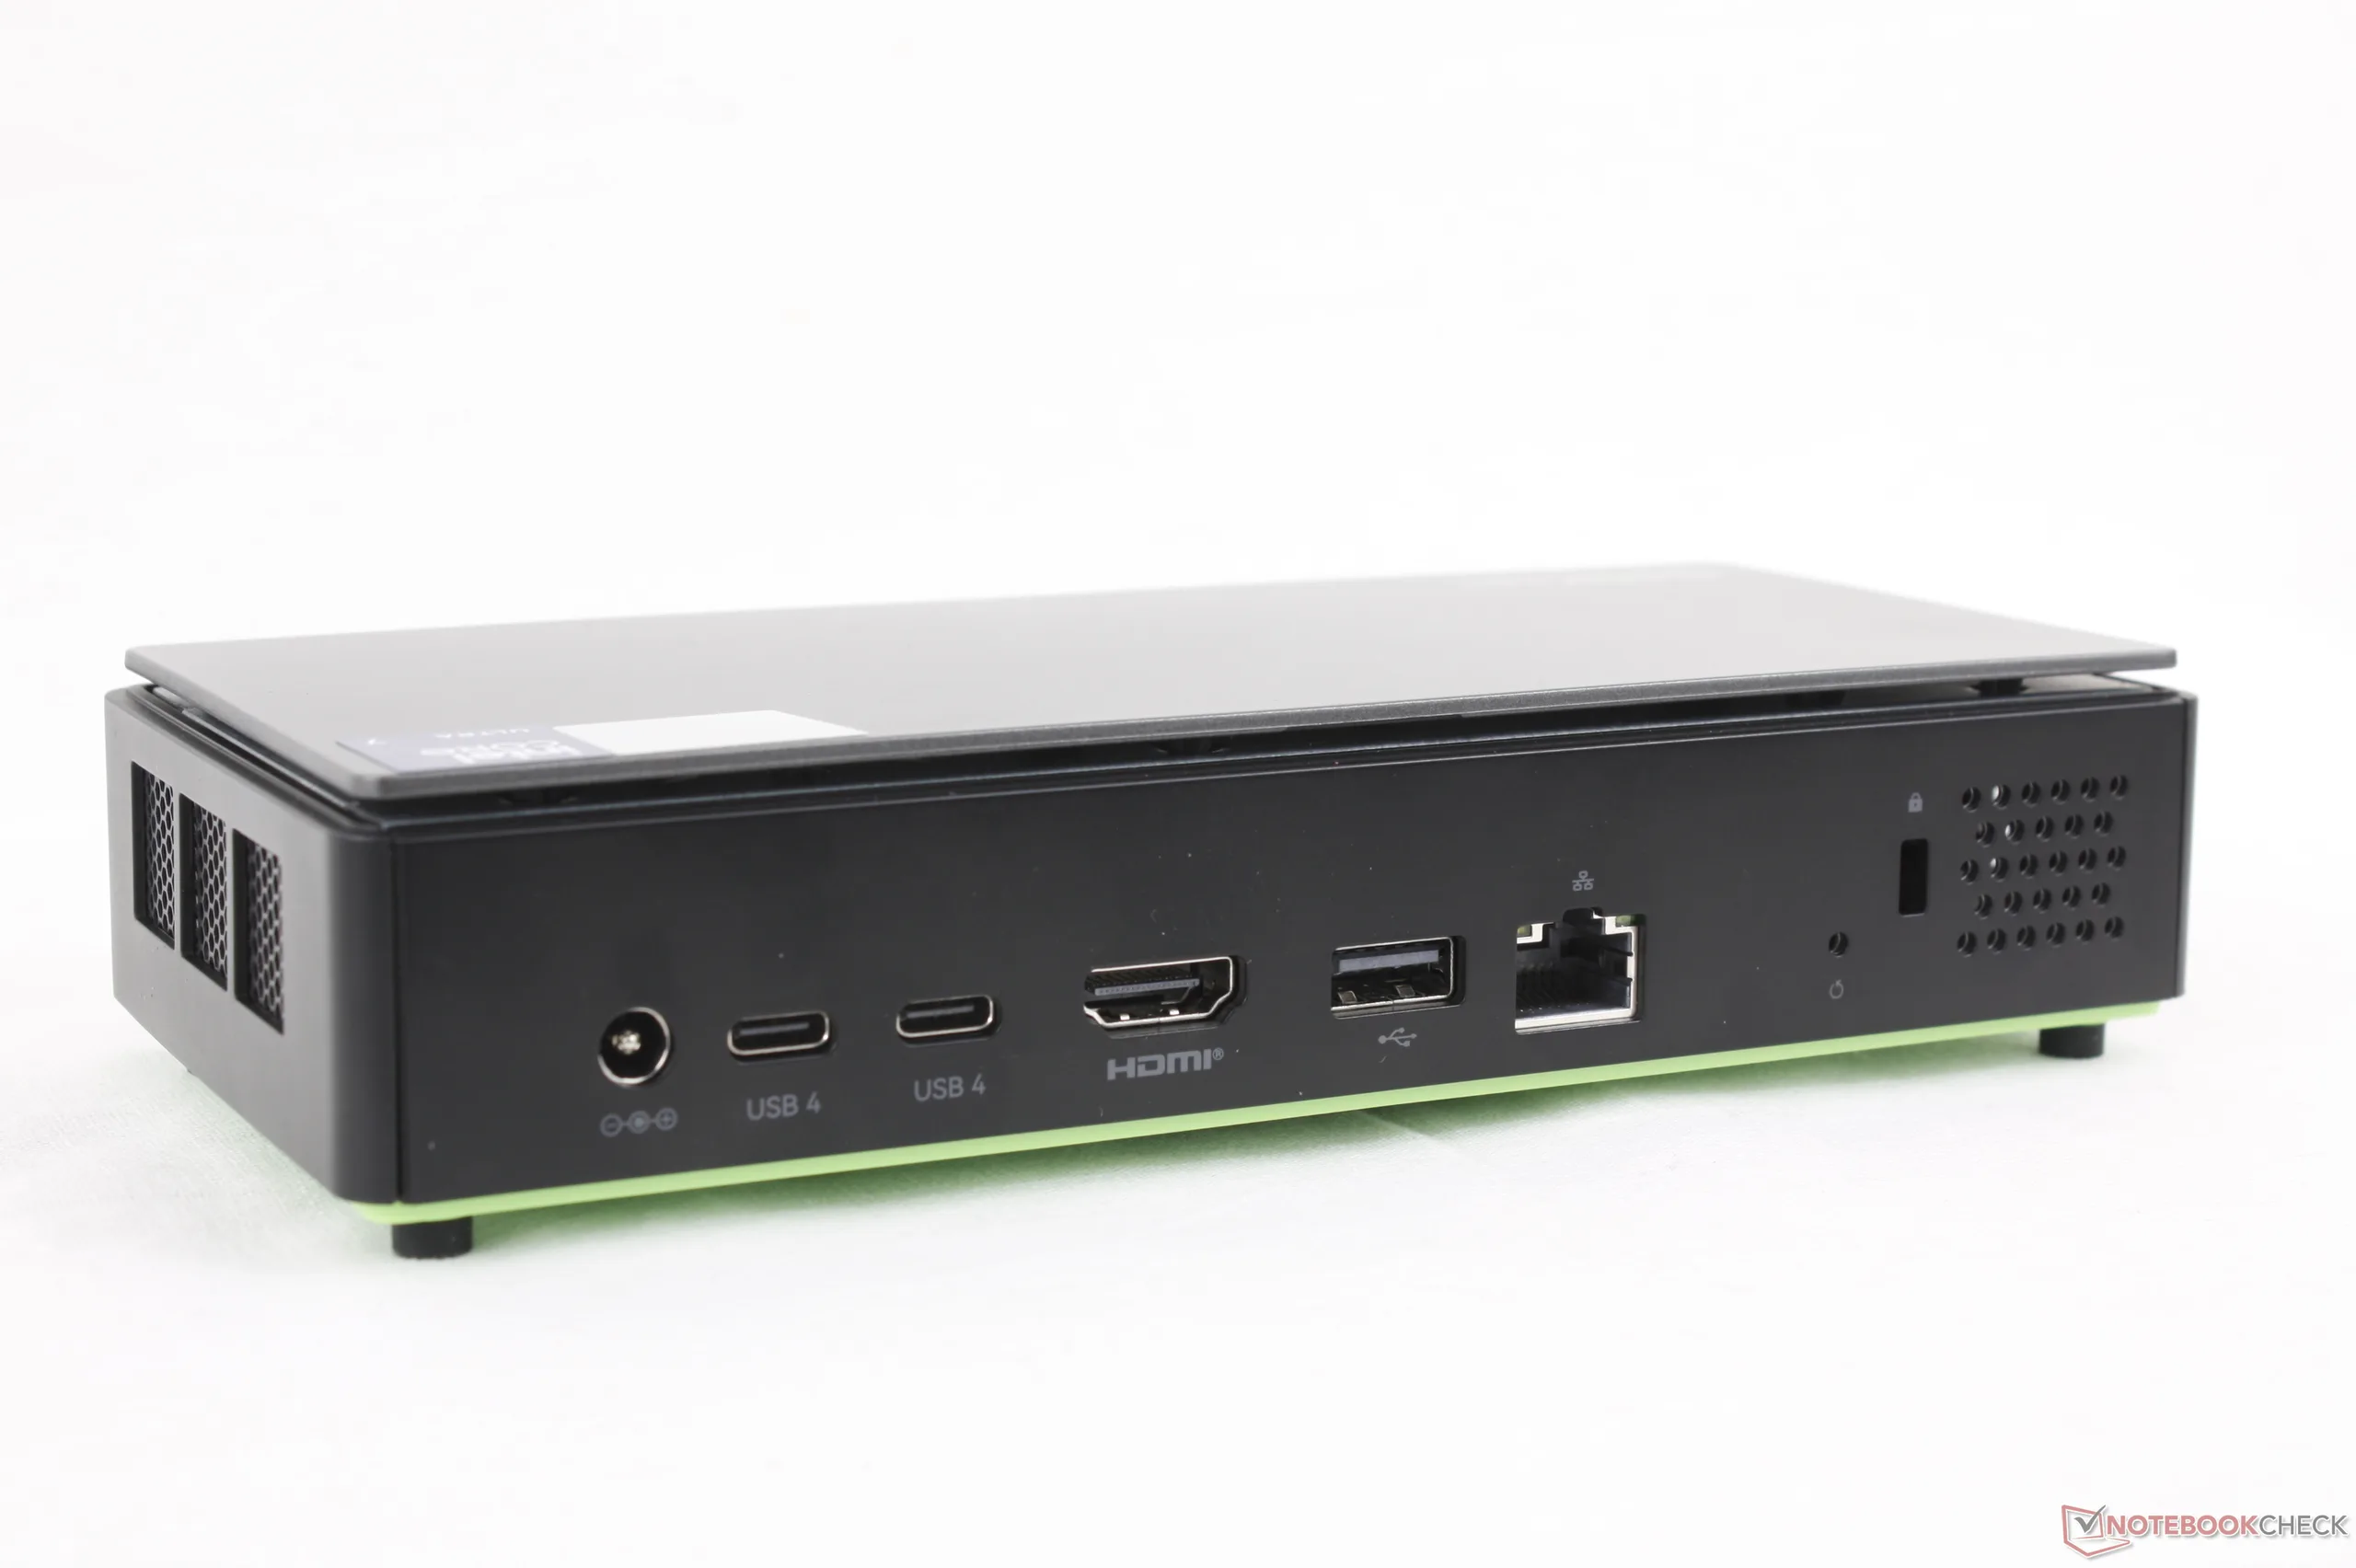
De poortopties zijn iets beperkter in vergelijking met concurrenten. Het model heeft bijvoorbeeld geen OcuLink of full-size DisplayPort, en minder USB-A poorten dan op de NucBox K12.
Hoewel het systeem geleverd wordt met een AC-adapter, kan het in plaats daarvan gevoed worden door de meeste generieke USB-C AC-adapters.
Communicatie
Het systeem wordt niet geleverd met Wi-Fi 7 ondersteuning, waarschijnlijk om kosten te besparen.
| Networking | |
| iperf3 transmit AXE11000 | |
| Asus NUC 15 Pro+ | |
| GMK EVO-T1 | |
| MSI Cubi NUC AI+ 2MG | |
| GMK NucBox K12 | |
| GMK NucBox K13 | |
| Beelink SER9 Pro | |
| iperf3 receive AXE11000 | |
| Asus NUC 15 Pro+ | |
| GMK EVO-T1 | |
| MSI Cubi NUC AI+ 2MG | |
| Beelink SER9 Pro | |
| GMK NucBox K12 | |
| GMK NucBox K13 | |
| iperf3 transmit AXE11000 6GHz | |
| Asus NUC 15 Pro+ | |
| MSI Cubi NUC AI+ 2MG | |
| GMK NucBox K13 | |
| GMK NucBox K12 | |
| iperf3 receive AXE11000 6GHz | |
| GMK NucBox K13 | |
| MSI Cubi NUC AI+ 2MG | |
| Asus NUC 15 Pro+ | |
| GMK NucBox K12 | |
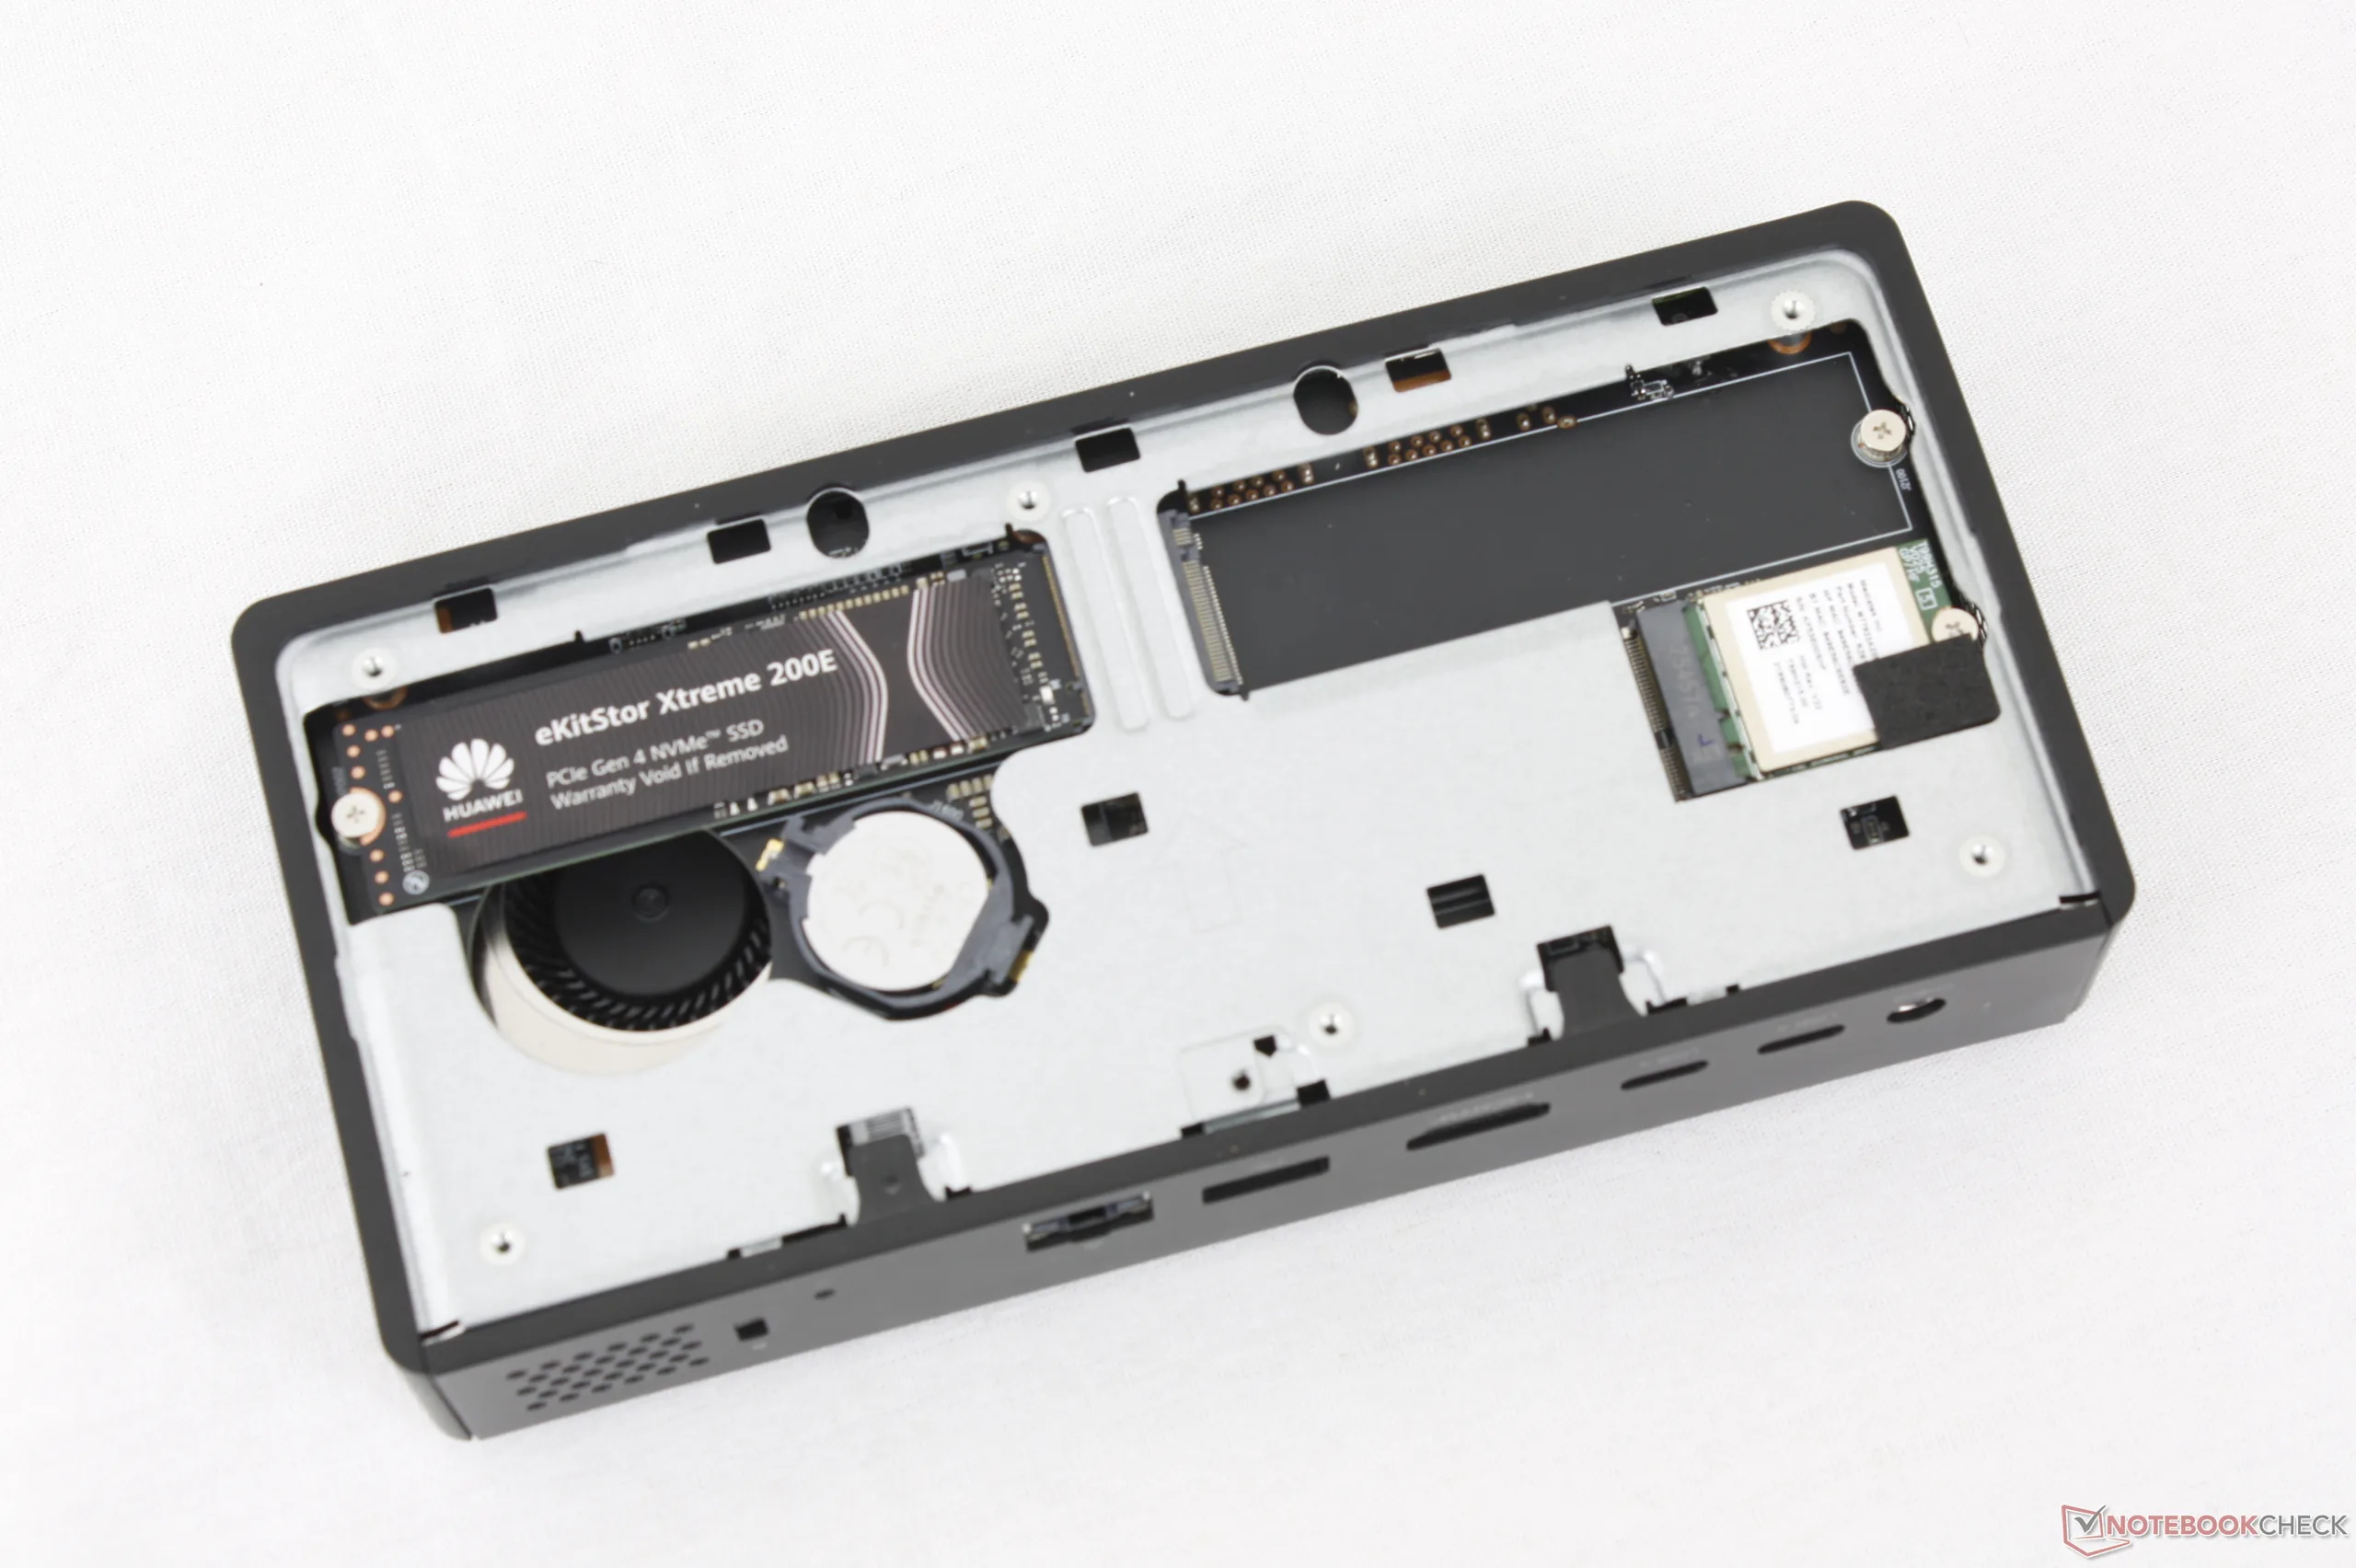
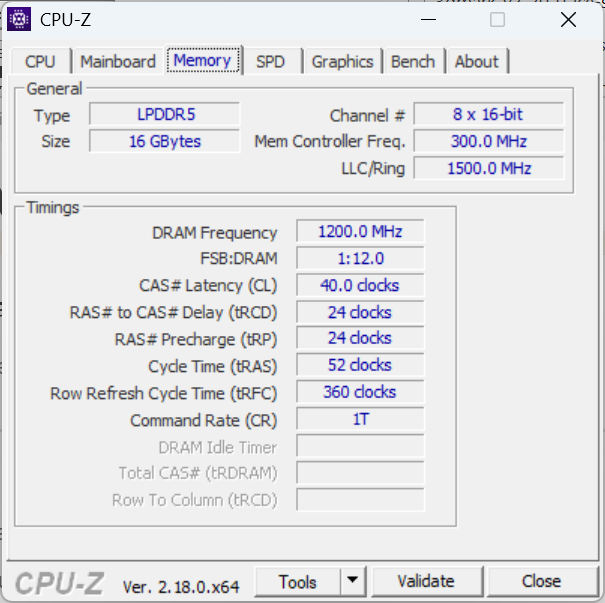
Onderhoud
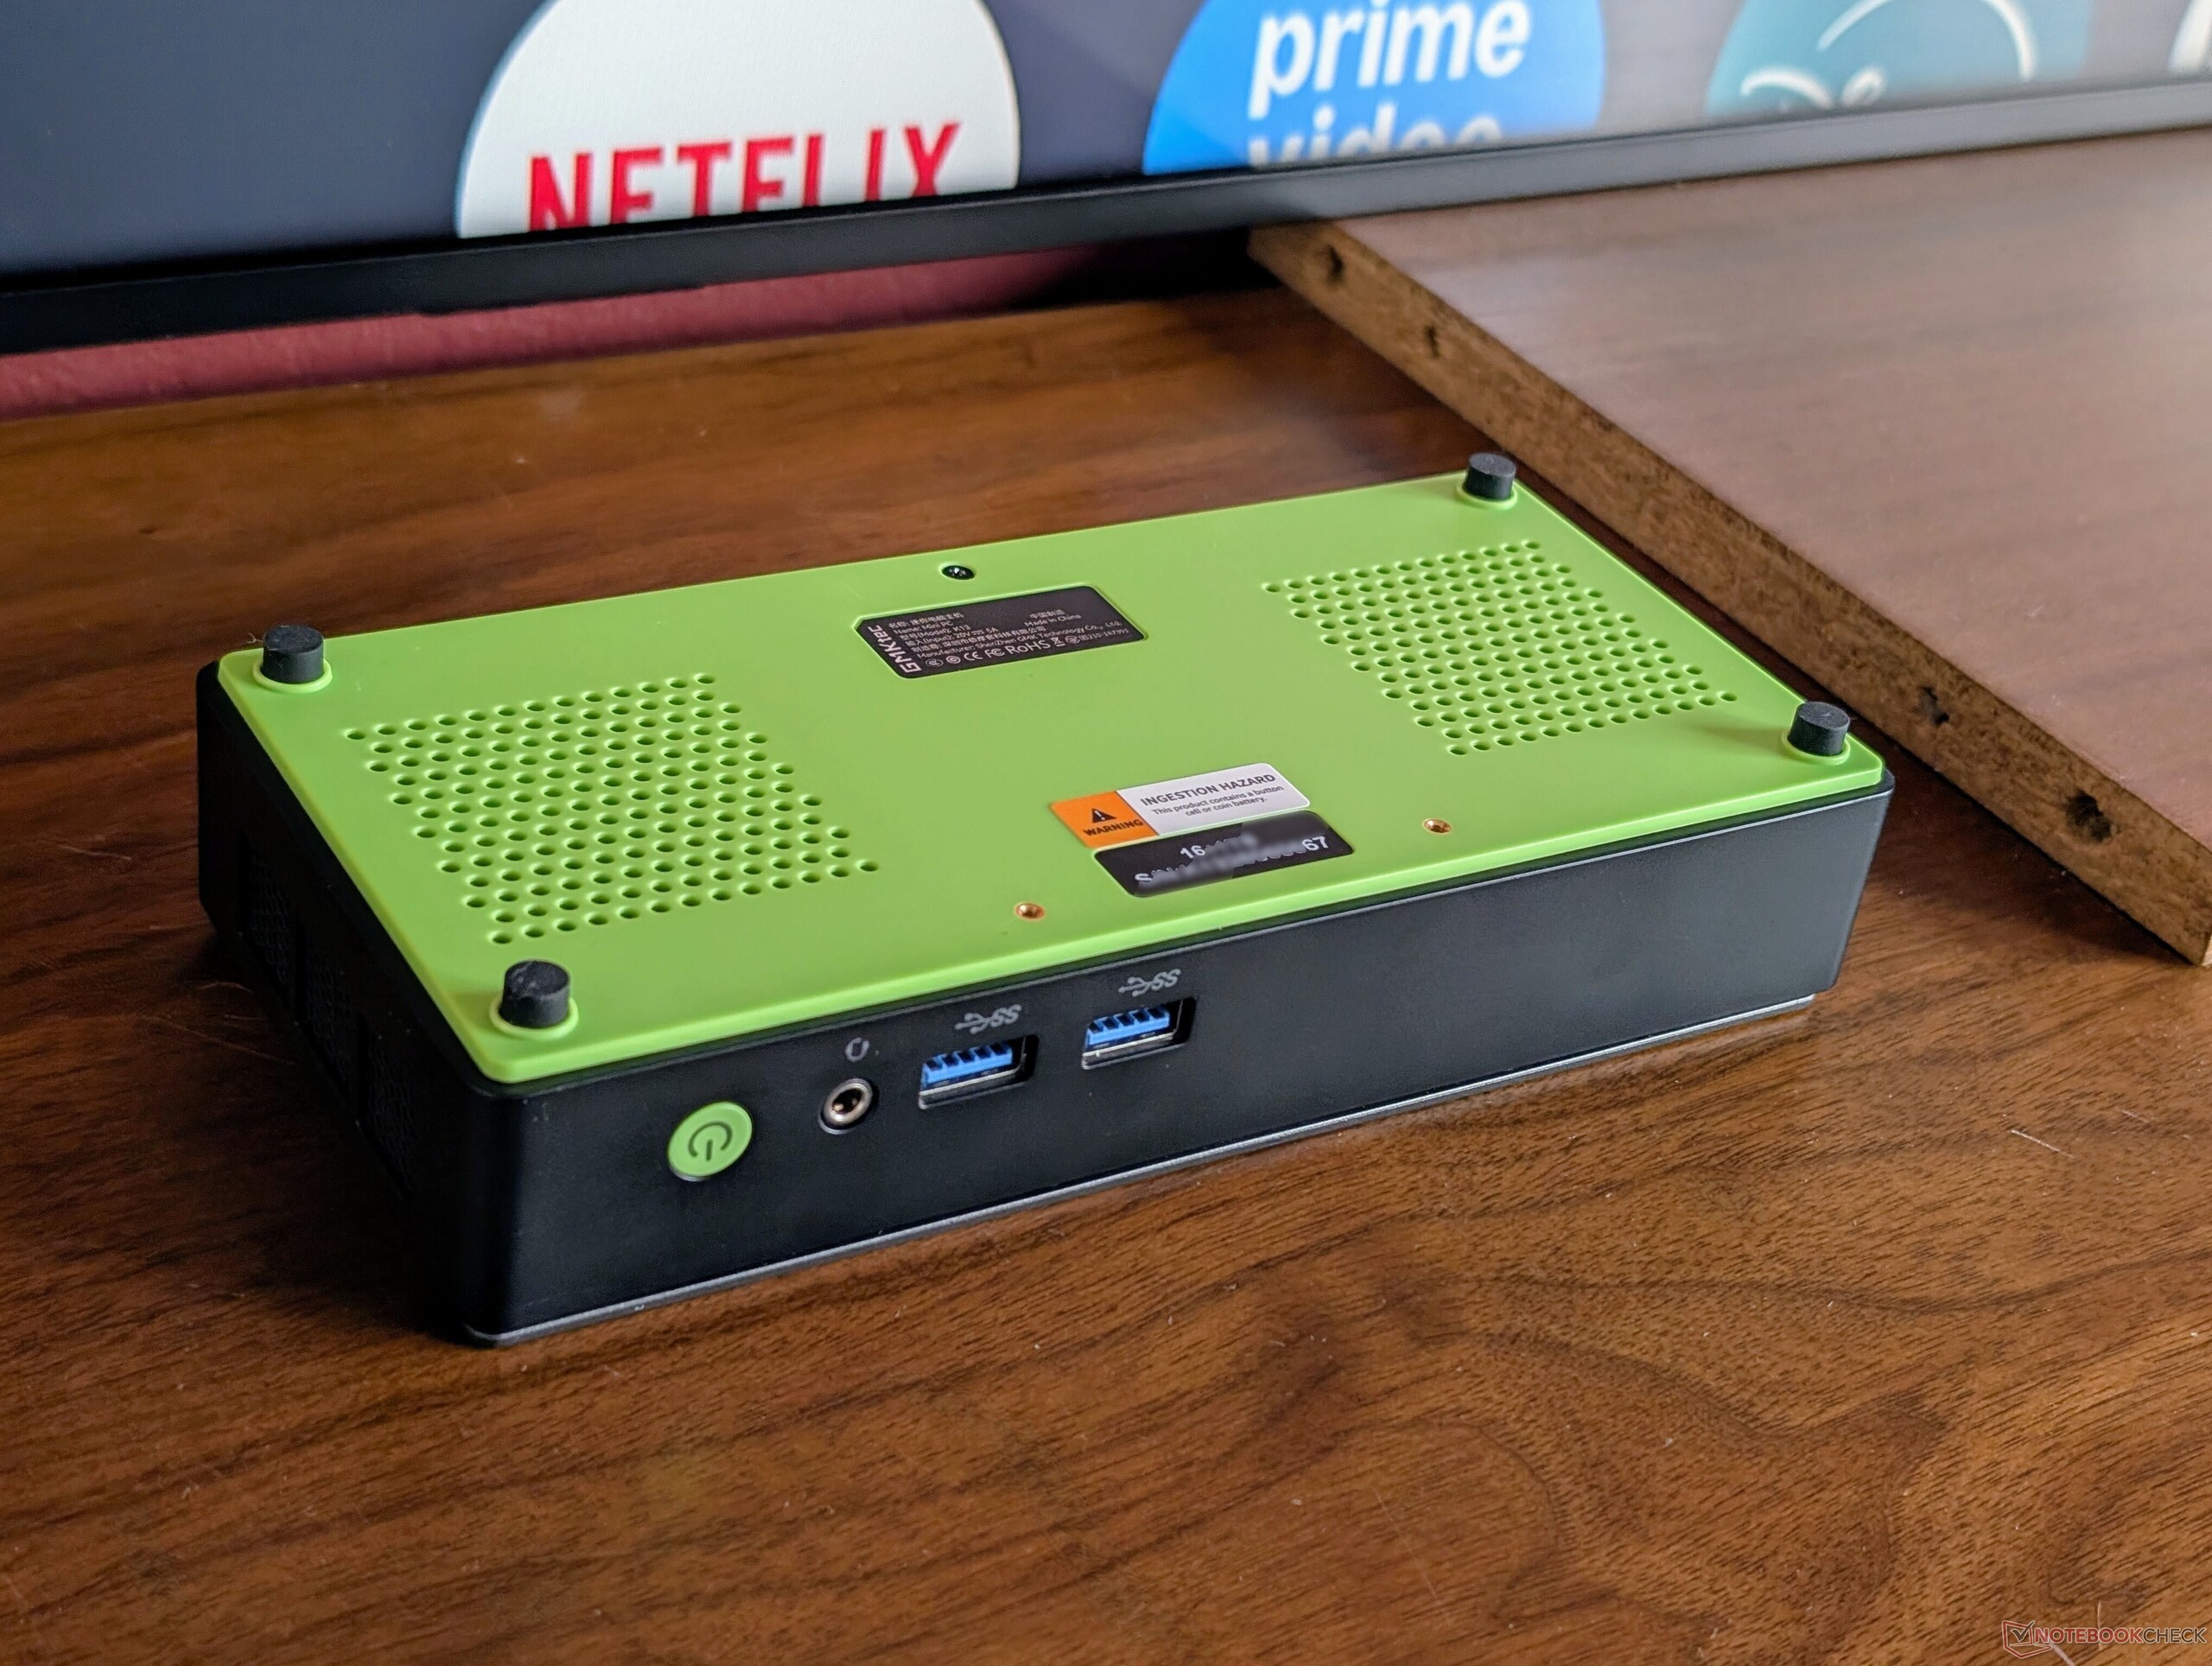
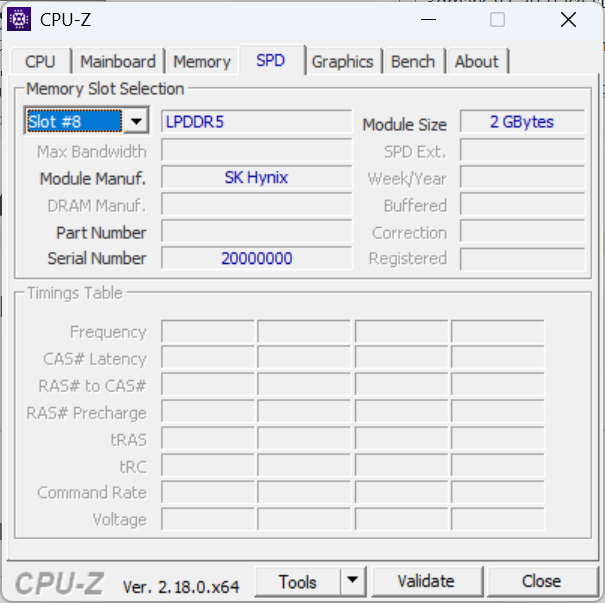
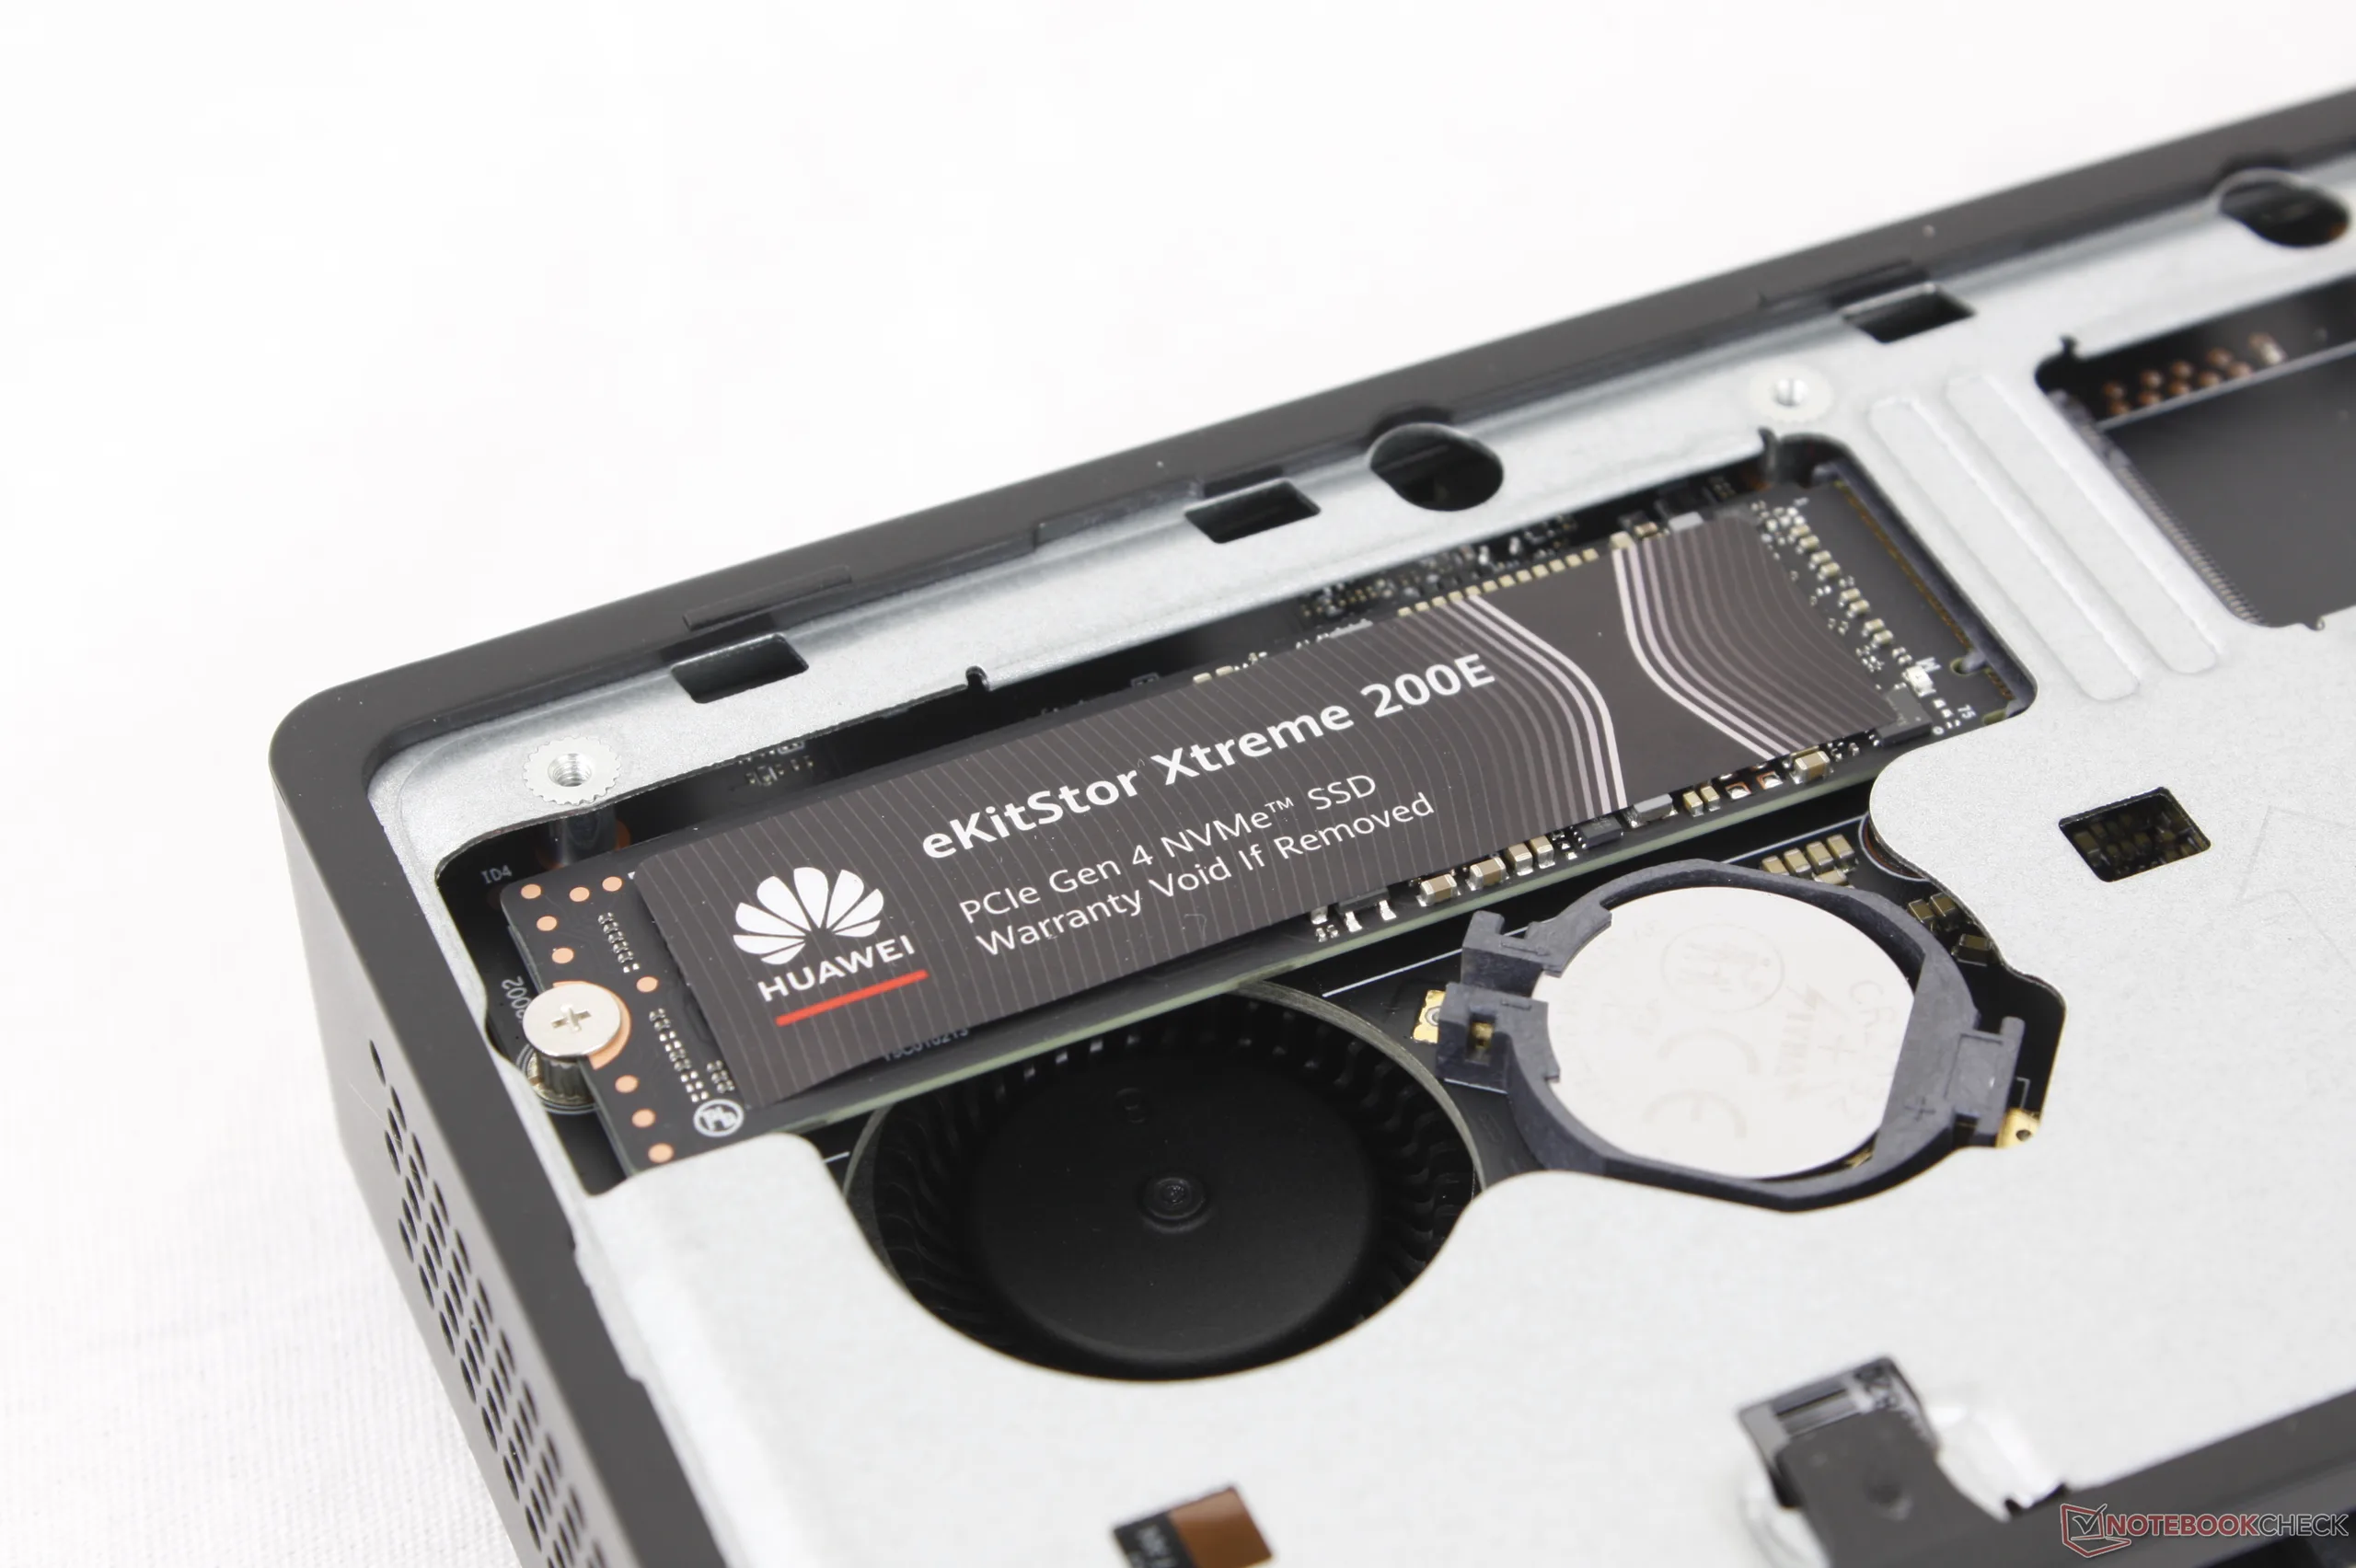
Het onderpaneel kan eenvoudig verwijderd worden met een Philips schroevendraaier om de twee M.2 2280 SSD slots, BIOS batterij en verwijderbare M.2 WLAN module te onthullen. Het RAM is gesoldeerd en kan niet worden geüpgraded.
Duurzaamheid
De fabrikant maakt geen melding van gerecycled materiaal dat tijdens de productie is gebruikt. De verpakking bestaat verder voornamelijk uit papier en karton met een beetje plastic verpakking.
Accessoires en garantie
De verkoopverpakking bevat een HDMI-kabel en een verwijderbare VESA-montagebeugel naast een AC-adapter. Bij aankoop in de VS geldt de gebruikelijke beperkte fabrieksgarantie van één jaar.
Prestaties - Lunar Lake Efficiëntie
Testomstandigheden
We hebben zowel Windows als het BIOS ingesteld op de modus Prestaties voordat we de onderstaande benchmarks uitvoerden. Het is de moeite waard om op te merken dat het BIOS standaard is ingesteld op de modus Gebalanceerd.
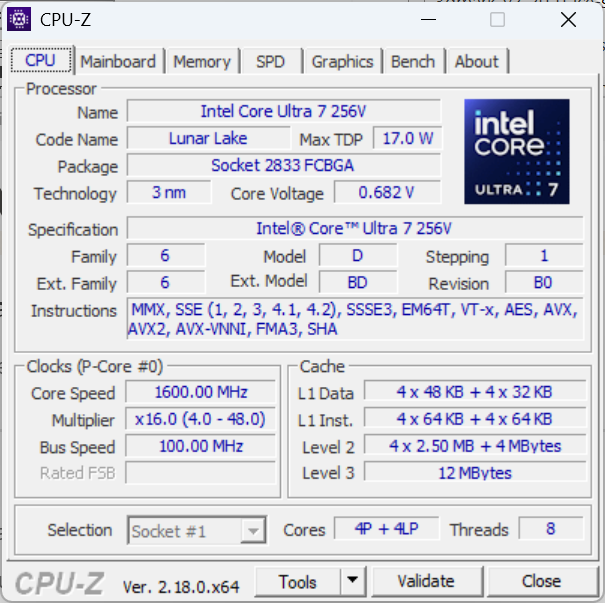
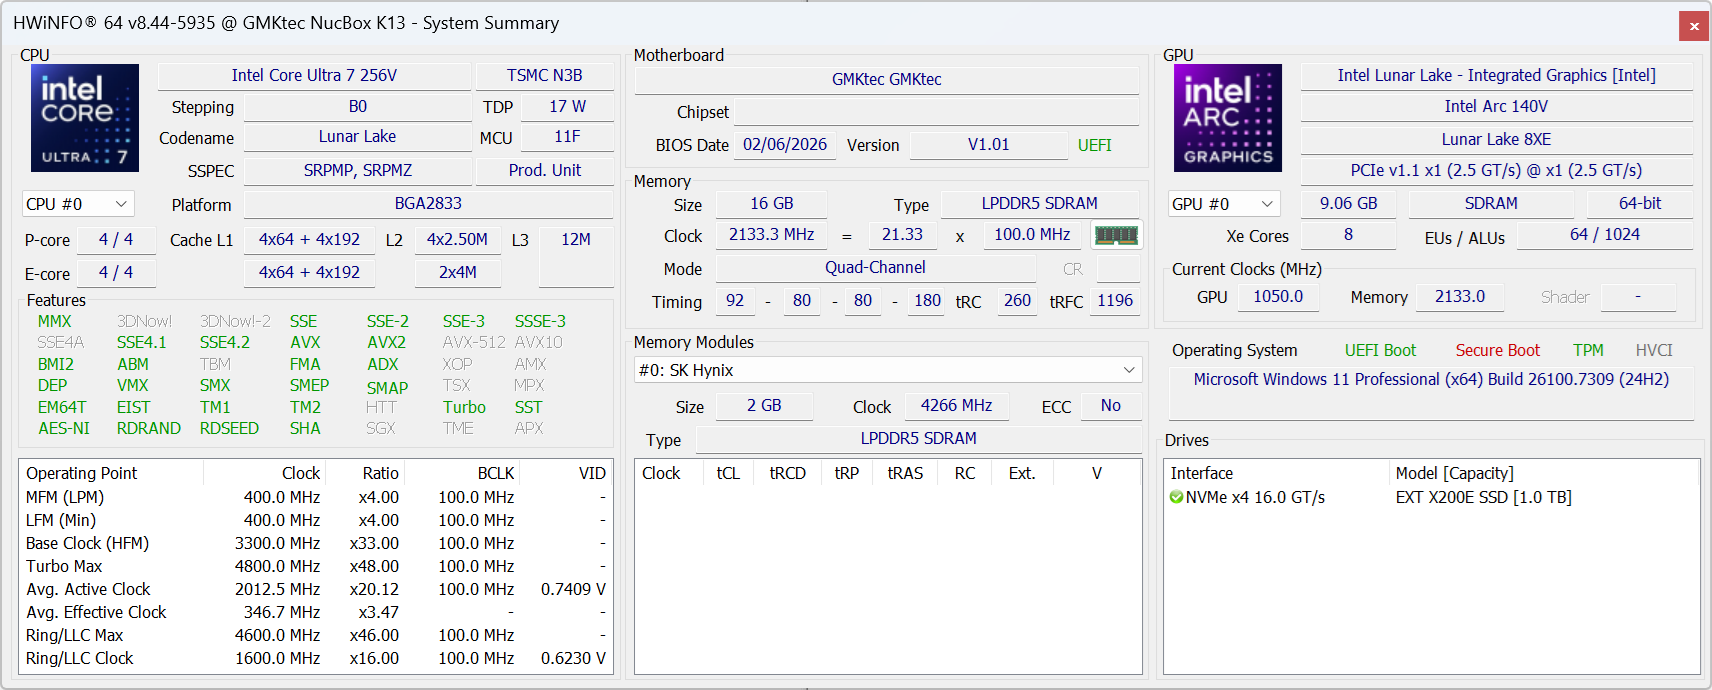
Processor
De CPU-prestaties zijn waar we ze verwachten ten opzichte van andere pc's met dezelfde Core Ultra 7 256V processor. De ruwe prestaties zijn aan de zwakkere kant, waarbij de meeste oudere CPU's uit de H-serie beter presteren dan onze Lunar Lake-V CPU. In plaats daarvan blinkt de CPU uit in prestaties-per-watt en een relatief snelle 47 TOPS NPU voor AI-versnelling.
Cinebench R15 meervoudige lus
Cinebench R23: Multi Core | Single Core
Cinebench R20: CPU (Multi Core) | CPU (Single Core)
Cinebench R15: CPU Multi 64Bit | CPU Single 64Bit
Blender: v2.79 BMW27 CPU
7-Zip 18.03: 7z b 4 | 7z b 4 -mmt1
Geekbench 6.7: Multi-Core | Single-Core
Geekbench 5.5: Multi-Core | Single-Core
HWBOT x265 Benchmark v2.2: 4k Preset
LibreOffice : 20 Documents To PDF
R Benchmark 2.5: Overall mean
| Cinebench R23 / Multi Core | |
| Acemagic M1A Pro+ | |
| Minisforum AI X1 Pro, HX 470 | |
| Asus NUC 15 Pro+ | |
| Beelink SER8 | |
| Geekom A7 Max, R9 7940HS | |
| GMK NucBox K12 | |
| GMK NucBox M7 Ultra | |
| Alliwava H90 Pro | |
| GMK NucBox K13 | |
| MSI Cubi NUC AI+ 2MG | |
| GMK NucBox M6 | |
| GMK NucBox M3 Ultra | |
| Gemiddeld Intel Core Ultra 7 256V (8589 - 10864, n=8) | |
| MSI Cubi NUC 1M | |
| Cinebench R23 / Single Core | |
| Asus NUC 15 Pro+ | |
| Minisforum AI X1 Pro, HX 470 | |
| Acemagic M1A Pro+ | |
| MSI Cubi NUC AI+ 2MG | |
| GMK NucBox K13 | |
| MSI Cubi NUC 1M | |
| Gemiddeld Intel Core Ultra 7 256V (1799 - 1909, n=8) | |
| Geekom A7 Max, R9 7940HS | |
| GMK NucBox M3 Ultra | |
| Beelink SER8 | |
| GMK NucBox K12 | |
| GMK NucBox M7 Ultra | |
| GMK NucBox M6 | |
| Alliwava H90 Pro | |
| Cinebench R20 / CPU (Multi Core) | |
| Acemagic M1A Pro+ | |
| Minisforum AI X1 Pro, HX 470 | |
| Asus NUC 15 Pro+ | |
| Geekom A7 Max, R9 7940HS | |
| Beelink SER8 | |
| GMK NucBox K12 | |
| Alliwava H90 Pro | |
| GMK NucBox M7 Ultra | |
| GMK NucBox K13 | |
| MSI Cubi NUC AI+ 2MG | |
| GMK NucBox M6 | |
| Gemiddeld Intel Core Ultra 7 256V (3822 - 4233, n=7) | |
| GMK NucBox M3 Ultra | |
| MSI Cubi NUC 1M | |
| Cinebench R20 / CPU (Single Core) | |
| Asus NUC 15 Pro+ | |
| Minisforum AI X1 Pro, HX 470 | |
| Acemagic M1A Pro+ | |
| MSI Cubi NUC AI+ 2MG | |
| GMK NucBox K13 | |
| Gemiddeld Intel Core Ultra 7 256V (700 - 733, n=7) | |
| MSI Cubi NUC 1M | |
| Beelink SER8 | |
| GMK NucBox M3 Ultra | |
| Geekom A7 Max, R9 7940HS | |
| GMK NucBox K12 | |
| Alliwava H90 Pro | |
| GMK NucBox M7 Ultra | |
| GMK NucBox M6 | |
| Cinebench R15 / CPU Multi 64Bit | |
| Acemagic M1A Pro+ | |
| Minisforum AI X1 Pro, HX 470 | |
| Asus NUC 15 Pro+ | |
| Beelink SER8 | |
| Geekom A7 Max, R9 7940HS | |
| GMK NucBox K12 | |
| GMK NucBox M7 Ultra | |
| Alliwava H90 Pro | |
| GMK NucBox M6 | |
| GMK NucBox K13 | |
| Gemiddeld Intel Core Ultra 7 256V (1500 - 1627, n=6) | |
| GMK NucBox M3 Ultra | |
| MSI Cubi NUC AI+ 2MG | |
| MSI Cubi NUC 1M | |
| Cinebench R15 / CPU Single 64Bit | |
| Asus NUC 15 Pro+ | |
| Minisforum AI X1 Pro, HX 470 | |
| Acemagic M1A Pro+ | |
| MSI Cubi NUC AI+ 2MG | |
| GMK NucBox K13 | |
| Gemiddeld Intel Core Ultra 7 256V (275 - 290, n=6) | |
| Beelink SER8 | |
| Geekom A7 Max, R9 7940HS | |
| GMK NucBox K12 | |
| MSI Cubi NUC 1M | |
| GMK NucBox M3 Ultra | |
| Alliwava H90 Pro | |
| GMK NucBox M7 Ultra | |
| GMK NucBox M6 | |
| Blender / v2.79 BMW27 CPU | |
| MSI Cubi NUC 1M | |
| Gemiddeld Intel Core Ultra 7 256V (315 - 373, n=7) | |
| MSI Cubi NUC AI+ 2MG | |
| GMK NucBox K13 | |
| GMK NucBox M3 Ultra | |
| GMK NucBox M6 | |
| Alliwava H90 Pro | |
| GMK NucBox M7 Ultra | |
| GMK NucBox K12 | |
| Geekom A7 Max, R9 7940HS | |
| Beelink SER8 | |
| Asus NUC 15 Pro+ | |
| Minisforum AI X1 Pro, HX 470 | |
| Acemagic M1A Pro+ | |
| 7-Zip 18.03 / 7z b 4 -mmt1 | |
| Beelink SER8 | |
| Geekom A7 Max, R9 7940HS | |
| Acemagic M1A Pro+ | |
| Minisforum AI X1 Pro, HX 470 | |
| GMK NucBox K12 | |
| Asus NUC 15 Pro+ | |
| Alliwava H90 Pro | |
| MSI Cubi NUC 1M | |
| GMK NucBox M3 Ultra | |
| MSI Cubi NUC AI+ 2MG | |
| GMK NucBox K13 | |
| GMK NucBox M6 | |
| Gemiddeld Intel Core Ultra 7 256V (5528 - 5763, n=7) | |
| GMK NucBox M7 Ultra | |
| Geekbench 6.7 / Multi-Core | |
| Acemagic M1A Pro+ | |
| Asus NUC 15 Pro+ | |
| Beelink SER8 | |
| GMK NucBox K12 | |
| Minisforum AI X1 Pro, HX 470 | |
| Alliwava H90 Pro | |
| Gemiddeld Intel Core Ultra 7 256V (9852 - 11085, n=8) | |
| GMK NucBox K13 | |
| Geekom A7 Max, R9 7940HS | |
| GMK NucBox M7 Ultra | |
| GMK NucBox M6 | |
| MSI Cubi NUC AI+ 2MG | |
| MSI Cubi NUC 1M | |
| GMK NucBox M3 Ultra | |
| Geekbench 6.7 / Single-Core | |
| Acemagic M1A Pro+ | |
| Minisforum AI X1 Pro, HX 470 | |
| GMK NucBox K13 | |
| MSI Cubi NUC AI+ 2MG | |
| Gemiddeld Intel Core Ultra 7 256V (2680 - 2784, n=8) | |
| Beelink SER8 | |
| Asus NUC 15 Pro+ | |
| MSI Cubi NUC 1M | |
| Geekom A7 Max, R9 7940HS | |
| GMK NucBox K12 | |
| Alliwava H90 Pro | |
| GMK NucBox M3 Ultra | |
| GMK NucBox M7 Ultra | |
| GMK NucBox M6 | |
| Geekbench 5.5 / Multi-Core | |
| Acemagic M1A Pro+ | |
| Asus NUC 15 Pro+ | |
| Minisforum AI X1 Pro, HX 470 | |
| Beelink SER8 | |
| GMK NucBox K12 | |
| Alliwava H90 Pro | |
| Geekom A7 Max, R9 7940HS | |
| Gemiddeld Intel Core Ultra 7 256V (9044 - 9715, n=7) | |
| GMK NucBox M7 Ultra | |
| GMK NucBox K13 | |
| GMK NucBox M3 Ultra | |
| GMK NucBox M6 | |
| MSI Cubi NUC 1M | |
| MSI Cubi NUC AI+ 2MG | |
| Geekbench 5.5 / Single-Core | |
| Acemagic M1A Pro+ | |
| MSI Cubi NUC AI+ 2MG | |
| Beelink SER8 | |
| GMK NucBox K13 | |
| Gemiddeld Intel Core Ultra 7 256V (1972 - 2013, n=7) | |
| Minisforum AI X1 Pro, HX 470 | |
| Geekom A7 Max, R9 7940HS | |
| MSI Cubi NUC 1M | |
| GMK NucBox K12 | |
| Alliwava H90 Pro | |
| GMK NucBox M3 Ultra | |
| Asus NUC 15 Pro+ | |
| GMK NucBox M7 Ultra | |
| GMK NucBox M6 | |
| HWBOT x265 Benchmark v2.2 / 4k Preset | |
| Acemagic M1A Pro+ | |
| Asus NUC 15 Pro+ | |
| Minisforum AI X1 Pro, HX 470 | |
| Beelink SER8 | |
| GMK NucBox K12 | |
| Geekom A7 Max, R9 7940HS | |
| GMK NucBox M7 Ultra | |
| Alliwava H90 Pro | |
| GMK NucBox M6 | |
| GMK NucBox K13 | |
| MSI Cubi NUC AI+ 2MG | |
| Gemiddeld Intel Core Ultra 7 256V (11.9 - 13.9, n=7) | |
| GMK NucBox M3 Ultra | |
| MSI Cubi NUC 1M | |
| LibreOffice / 20 Documents To PDF | |
| GMK NucBox M7 Ultra | |
| GMK NucBox M3 Ultra | |
| Minisforum AI X1 Pro, HX 470 | |
| Asus NUC 15 Pro+ | |
| Geekom A7 Max, R9 7940HS | |
| Acemagic M1A Pro+ | |
| GMK NucBox M6 | |
| Alliwava H90 Pro | |
| GMK NucBox K12 | |
| GMK NucBox K13 | |
| Gemiddeld Intel Core Ultra 7 256V (42.7 - 55.6, n=7) | |
| Beelink SER8 | |
| MSI Cubi NUC AI+ 2MG | |
| MSI Cubi NUC 1M | |
| R Benchmark 2.5 / Overall mean | |
| Alliwava H90 Pro | |
| GMK NucBox M6 | |
| GMK NucBox M7 Ultra | |
| GMK NucBox M3 Ultra | |
| GMK NucBox K12 | |
| Gemiddeld Intel Core Ultra 7 256V (0.439 - 0.4645, n=7) | |
| MSI Cubi NUC AI+ 2MG | |
| GMK NucBox K13 | |
| MSI Cubi NUC 1M | |
| Geekom A7 Max, R9 7940HS | |
| Asus NUC 15 Pro+ | |
| Beelink SER8 | |
| Minisforum AI X1 Pro, HX 470 | |
| Acemagic M1A Pro+ | |
Cinebench R23: Multi Core | Single Core
Cinebench R20: CPU (Multi Core) | CPU (Single Core)
Cinebench R15: CPU Multi 64Bit | CPU Single 64Bit
Blender: v2.79 BMW27 CPU
7-Zip 18.03: 7z b 4 | 7z b 4 -mmt1
Geekbench 6.7: Multi-Core | Single-Core
Geekbench 5.5: Multi-Core | Single-Core
HWBOT x265 Benchmark v2.2: 4k Preset
LibreOffice : 20 Documents To PDF
R Benchmark 2.5: Overall mean
* ... kleiner is beter
AIDA64: FP32 Ray-Trace | FPU Julia | CPU SHA3 | CPU Queen | FPU SinJulia | FPU Mandel | CPU AES | CPU ZLib | FP64 Ray-Trace | CPU PhotoWorxx | CPU CheckMate
| Performance rating | |
| Beelink SER9 Pro -1! | |
| GMK NucBox K12 -1! | |
| Asus NUC 15 Pro+ -1! | |
| GMK EVO-T1 | |
| GMK NucBox K13 -1! | |
| Gemiddeld Intel Core Ultra 7 256V | |
| MSI Cubi NUC AI+ 2MG -1! | |
| AIDA64 / FP32 Ray-Trace | |
| Beelink SER9 Pro (v6.92.6600) | |
| GMK NucBox K12 (v6.92.6600) | |
| Asus NUC 15 Pro+ (v6.92.6600) | |
| GMK EVO-T1 (v6.92.6600) | |
| GMK EVO-T1 (v8.20.8100) | |
| GMK NucBox K13 (v8.20.8100) | |
| Gemiddeld Intel Core Ultra 7 256V (10524 - 12898, n=7) | |
| MSI Cubi NUC AI+ 2MG (v6.92.6600) | |
| AIDA64 / FPU Julia | |
| Asus NUC 15 Pro+ (v6.92.6600) | |
| GMK EVO-T1 (v6.92.6600) | |
| GMK EVO-T1 (v8.20.8100) | |
| Beelink SER9 Pro (v6.92.6600) | |
| GMK NucBox K12 (v6.92.6600) | |
| GMK NucBox K13 (v8.20.8100) | |
| MSI Cubi NUC AI+ 2MG (v6.92.6600) | |
| Gemiddeld Intel Core Ultra 7 256V (52443 - 62522, n=7) | |
| AIDA64 / CPU SHA3 | |
| Asus NUC 15 Pro+ (v6.92.6600) | |
| GMK EVO-T1 (v6.92.6600) | |
| GMK EVO-T1 (v8.20.8100) | |
| Beelink SER9 Pro (v6.92.6600) | |
| GMK NucBox K12 (v6.92.6600) | |
| GMK NucBox K13 (v8.20.8100) | |
| MSI Cubi NUC AI+ 2MG (v6.92.6600) | |
| Gemiddeld Intel Core Ultra 7 256V (2364 - 2915, n=7) | |
| AIDA64 / CPU Queen | |
| Beelink SER9 Pro (v6.92.6600) | |
| GMK NucBox K12 (v6.92.6600) | |
| Asus NUC 15 Pro+ (v6.92.6600) | |
| GMK EVO-T1 (v6.92.6600) | |
| Gemiddeld Intel Core Ultra 7 256V (49622 - 49794, n=6) | |
| MSI Cubi NUC AI+ 2MG (v6.92.6600) | |
| AIDA64 / FPU SinJulia | |
| Beelink SER9 Pro (v6.92.6600) | |
| GMK NucBox K12 (v6.92.6600) | |
| Asus NUC 15 Pro+ (v6.92.6600) | |
| GMK EVO-T1 (v6.92.6600) | |
| GMK EVO-T1 (v8.20.8100) | |
| GMK NucBox K13 (v8.20.8100) | |
| MSI Cubi NUC AI+ 2MG (v6.92.6600) | |
| Gemiddeld Intel Core Ultra 7 256V (4401 - 4434, n=7) | |
| AIDA64 / FPU Mandel | |
| GMK EVO-T1 (v6.92.6600) | |
| GMK EVO-T1 (v8.20.8100) | |
| Asus NUC 15 Pro+ (v6.92.6600) | |
| Beelink SER9 Pro (v6.92.6600) | |
| GMK NucBox K12 (v6.92.6600) | |
| GMK NucBox K13 (v8.20.8100) | |
| MSI Cubi NUC AI+ 2MG (v6.92.6600) | |
| Gemiddeld Intel Core Ultra 7 256V (27382 - 33019, n=7) | |
| AIDA64 / CPU AES | |
| Beelink SER9 Pro (v6.92.6600) | |
| GMK NucBox K12 (v6.92.6600) | |
| Asus NUC 15 Pro+ (v6.92.6600) | |
| GMK NucBox K13 (v8.20.8100) | |
| GMK EVO-T1 (v6.92.6600) | |
| GMK EVO-T1 (v8.20.8100) | |
| Gemiddeld Intel Core Ultra 7 256V (38495 - 75938, n=7) | |
| MSI Cubi NUC AI+ 2MG (v6.92.6600) | |
| AIDA64 / CPU ZLib | |
| Asus NUC 15 Pro+ (v6.92.6600) | |
| GMK EVO-T1 (v6.92.6600) | |
| GMK EVO-T1 (v8.20.8100) | |
| Beelink SER9 Pro (v6.92.6600) | |
| GMK NucBox K12 (v6.92.6600) | |
| GMK NucBox K13 (v8.20.8100) | |
| MSI Cubi NUC AI+ 2MG (v6.92.6600) | |
| Gemiddeld Intel Core Ultra 7 256V (536 - 632, n=7) | |
| AIDA64 / FP64 Ray-Trace | |
| Beelink SER9 Pro (v6.92.6600) | |
| GMK NucBox K12 (v6.92.6600) | |
| Asus NUC 15 Pro+ (v6.92.6600) | |
| GMK EVO-T1 (v6.92.6600) | |
| GMK EVO-T1 (v8.20.8100) | |
| GMK NucBox K13 (v8.20.8100) | |
| MSI Cubi NUC AI+ 2MG (v6.92.6600) | |
| Gemiddeld Intel Core Ultra 7 256V (5655 - 6878, n=7) | |
| AIDA64 / CPU PhotoWorxx | |
| GMK NucBox K13 (v8.20.8100) | |
| GMK EVO-T1 (v8.20.8100) | |
| GMK EVO-T1 (v6.92.6600) | |
| Asus NUC 15 Pro+ (v6.92.6600) | |
| MSI Cubi NUC AI+ 2MG (v6.92.6600) | |
| Gemiddeld Intel Core Ultra 7 256V (49906 - 57060, n=7) | |
| Beelink SER9 Pro (v6.92.6600) | |
| GMK NucBox K12 (v6.92.6600) | |
| AIDA64 / CPU CheckMate | |
| GMK EVO-T1 (v8.20.8100) | |
| GMK NucBox K13 (v8.20.8100) | |
| Gemiddeld Intel Core Ultra 7 256V (n=1) | |
Systeemprestaties
De scores van PCMark zijn iets hoger dan verwacht doordat de subtest Productiviteit wordt overschat, zelfs na het updaten naar de nieuwste versie van de benchmark op het moment van schrijven. Interessant genoeg ondervonden we soortgelijke problemen met de recente MSI Venture 16 AI.
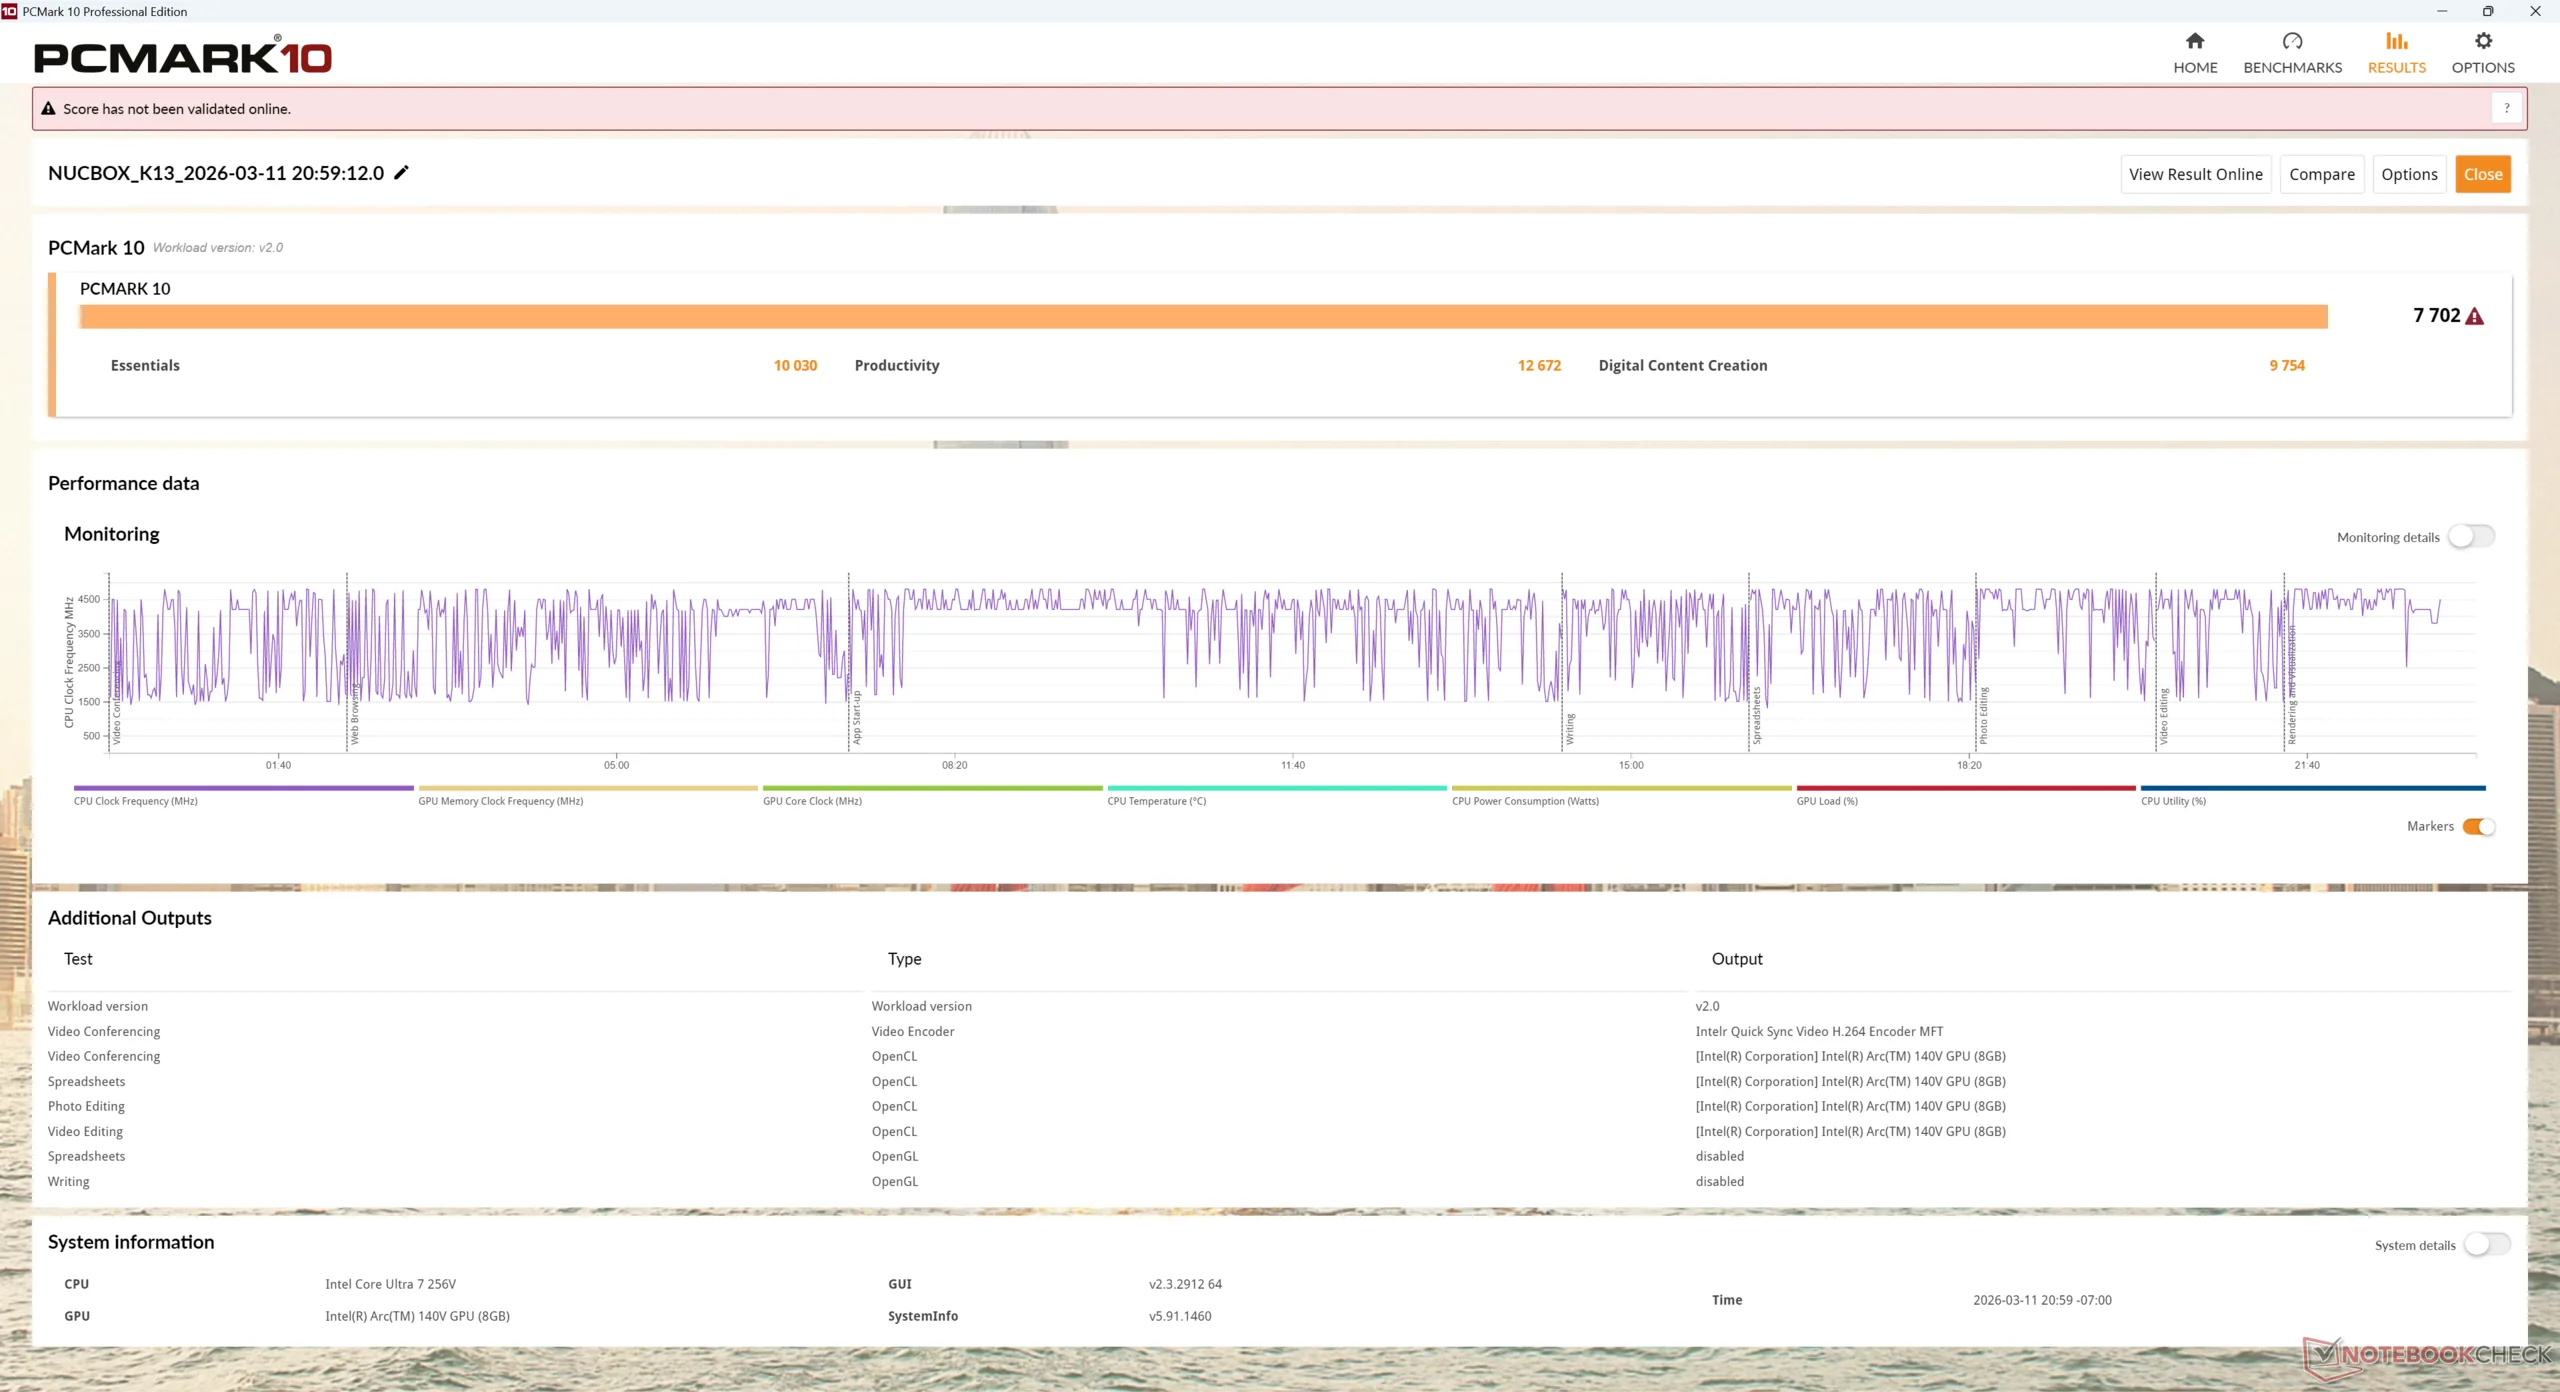
PCMark 10: Score | Essentials | Productivity | Digital Content Creation
CrossMark: Overall | Productivity | Creativity | Responsiveness
WebXPRT 3: Overall
WebXPRT 4: Overall
Mozilla Kraken 1.1: Total
Geekbench AI: Single Precision GPU 1.7 | Half Precision GPU 1.7 | Quantized GPU 1.7
| Performance rating | |
| GMK EVO-T1 | |
| Gemiddeld Intel Core Ultra 7 256V, Intel Arc Graphics 140V | |
| GMK NucBox K13 | |
| Beelink SER9 Pro | |
| MSI Cubi NUC AI+ 2MG | |
| Asus NUC 15 Pro+ | |
| GMK NucBox K12 | |
| PCMark 10 / Score | |
| GMK EVO-T1 | |
| GMK NucBox K13 | |
| Asus NUC 15 Pro+ | |
| Gemiddeld Intel Core Ultra 7 256V, Intel Arc Graphics 140V (6677 - 7702, n=7) | |
| GMK NucBox K12 | |
| Beelink SER9 Pro | |
| MSI Cubi NUC AI+ 2MG | |
| PCMark 10 / Essentials | |
| GMK NucBox K12 | |
| Beelink SER9 Pro | |
| GMK EVO-T1 | |
| Gemiddeld Intel Core Ultra 7 256V, Intel Arc Graphics 140V (9627 - 11365, n=7) | |
| MSI Cubi NUC AI+ 2MG | |
| GMK NucBox K13 | |
| Asus NUC 15 Pro+ | |
| PCMark 10 / Productivity | |
| GMK NucBox K13 | |
| GMK EVO-T1 | |
| Gemiddeld Intel Core Ultra 7 256V, Intel Arc Graphics 140V (8161 - 12672, n=7) | |
| GMK NucBox K12 | |
| Beelink SER9 Pro | |
| MSI Cubi NUC AI+ 2MG | |
| Asus NUC 15 Pro+ | |
| PCMark 10 / Digital Content Creation | |
| GMK EVO-T1 | |
| Asus NUC 15 Pro+ | |
| Gemiddeld Intel Core Ultra 7 256V, Intel Arc Graphics 140V (9481 - 10126, n=7) | |
| GMK NucBox K13 | |
| MSI Cubi NUC AI+ 2MG | |
| Beelink SER9 Pro | |
| GMK NucBox K12 | |
| CrossMark / Overall | |
| GMK EVO-T1 | |
| Beelink SER9 Pro | |
| Asus NUC 15 Pro+ | |
| GMK NucBox K12 | |
| GMK NucBox K13 | |
| Gemiddeld Intel Core Ultra 7 256V, Intel Arc Graphics 140V (1636 - 1736, n=7) | |
| MSI Cubi NUC AI+ 2MG | |
| CrossMark / Productivity | |
| GMK EVO-T1 | |
| Beelink SER9 Pro | |
| GMK NucBox K12 | |
| GMK NucBox K13 | |
| Asus NUC 15 Pro+ | |
| Gemiddeld Intel Core Ultra 7 256V, Intel Arc Graphics 140V (1563 - 1682, n=7) | |
| MSI Cubi NUC AI+ 2MG | |
| CrossMark / Creativity | |
| GMK EVO-T1 | |
| Asus NUC 15 Pro+ | |
| GMK NucBox K13 | |
| Gemiddeld Intel Core Ultra 7 256V, Intel Arc Graphics 140V (1862 - 1962, n=7) | |
| Beelink SER9 Pro | |
| GMK NucBox K12 | |
| MSI Cubi NUC AI+ 2MG | |
| CrossMark / Responsiveness | |
| GMK EVO-T1 | |
| Beelink SER9 Pro | |
| GMK NucBox K12 | |
| GMK NucBox K13 | |
| Asus NUC 15 Pro+ | |
| Gemiddeld Intel Core Ultra 7 256V, Intel Arc Graphics 140V (1215 - 1371, n=7) | |
| MSI Cubi NUC AI+ 2MG | |
| WebXPRT 3 / Overall | |
| GMK EVO-T1 | |
| MSI Cubi NUC AI+ 2MG | |
| Beelink SER9 Pro | |
| GMK NucBox K13 | |
| Gemiddeld Intel Core Ultra 7 256V, Intel Arc Graphics 140V (243 - 310, n=7) | |
| GMK NucBox K12 | |
| Asus NUC 15 Pro+ | |
| WebXPRT 4 / Overall | |
| GMK EVO-T1 | |
| GMK NucBox K13 | |
| Gemiddeld Intel Core Ultra 7 256V, Intel Arc Graphics 140V (282 - 286, n=7) | |
| MSI Cubi NUC AI+ 2MG | |
| Beelink SER9 Pro | |
| GMK NucBox K12 | |
| Asus NUC 15 Pro+ | |
| Mozilla Kraken 1.1 / Total | |
| GMK NucBox K12 | |
| Beelink SER9 Pro | |
| MSI Cubi NUC AI+ 2MG | |
| Asus NUC 15 Pro+ | |
| GMK NucBox K13 | |
| Gemiddeld Intel Core Ultra 7 256V, Intel Arc Graphics 140V (470 - 480, n=7) | |
| GMK EVO-T1 | |
| Geekbench AI / Single Precision GPU 1.7 | |
| MSI Cubi NUC AI+ 2MG | |
| Asus NUC 15 Pro+ | |
| Beelink SER9 Pro | |
| GMK EVO-T1 | |
| Gemiddeld Intel Core Ultra 7 256V, Intel Arc Graphics 140V (6698 - 8212, n=4) | |
| GMK NucBox K12 | |
| GMK NucBox K13 | |
| Geekbench AI / Half Precision GPU 1.7 | |
| MSI Cubi NUC AI+ 2MG | |
| Gemiddeld Intel Core Ultra 7 256V, Intel Arc Graphics 140V (11542 - 16259, n=4) | |
| GMK EVO-T1 | |
| Asus NUC 15 Pro+ | |
| GMK NucBox K13 | |
| Beelink SER9 Pro | |
| GMK NucBox K12 | |
| Geekbench AI / Quantized GPU 1.7 | |
| Beelink SER9 Pro | |
| MSI Cubi NUC AI+ 2MG | |
| GMK NucBox K12 | |
| Asus NUC 15 Pro+ | |
| GMK EVO-T1 | |
| Gemiddeld Intel Core Ultra 7 256V, Intel Arc Graphics 140V (4150 - 5483, n=4) | |
| GMK NucBox K13 | |
* ... kleiner is beter
| PCMark 10 Score | 7702 punten | |
Help | ||
| AIDA64 / Memory Copy | |
| MSI Cubi NUC AI+ 2MG | |
| GMK NucBox K13 | |
| Gemiddeld Intel Core Ultra 7 256V (99227 - 104459, n=7) | |
| Asus NUC 15 Pro+ | |
| GMK EVO-T1 | |
| GMK EVO-T1 | |
| Beelink SER9 Pro | |
| GMK NucBox K12 | |
| AIDA64 / Memory Read | |
| GMK NucBox K13 | |
| Asus NUC 15 Pro+ | |
| Gemiddeld Intel Core Ultra 7 256V (86352 - 89848, n=7) | |
| MSI Cubi NUC AI+ 2MG | |
| GMK EVO-T1 | |
| GMK EVO-T1 | |
| GMK NucBox K12 | |
| Beelink SER9 Pro | |
| AIDA64 / Memory Write | |
| MSI Cubi NUC AI+ 2MG | |
| Gemiddeld Intel Core Ultra 7 256V (108692 - 117933, n=7) | |
| GMK NucBox K13 | |
| Beelink SER9 Pro | |
| GMK NucBox K12 | |
| Asus NUC 15 Pro+ | |
| GMK EVO-T1 | |
| GMK EVO-T1 | |
| AIDA64 / Memory Latency | |
| GMK EVO-T1 | |
| GMK EVO-T1 | |
| Asus NUC 15 Pro+ | |
| Beelink SER9 Pro | |
| GMK NucBox K13 | |
| Gemiddeld Intel Core Ultra 7 256V (96.1 - 99.6, n=7) | |
| MSI Cubi NUC AI+ 2MG | |
| GMK NucBox K12 | |
* ... kleiner is beter
DPC latentie
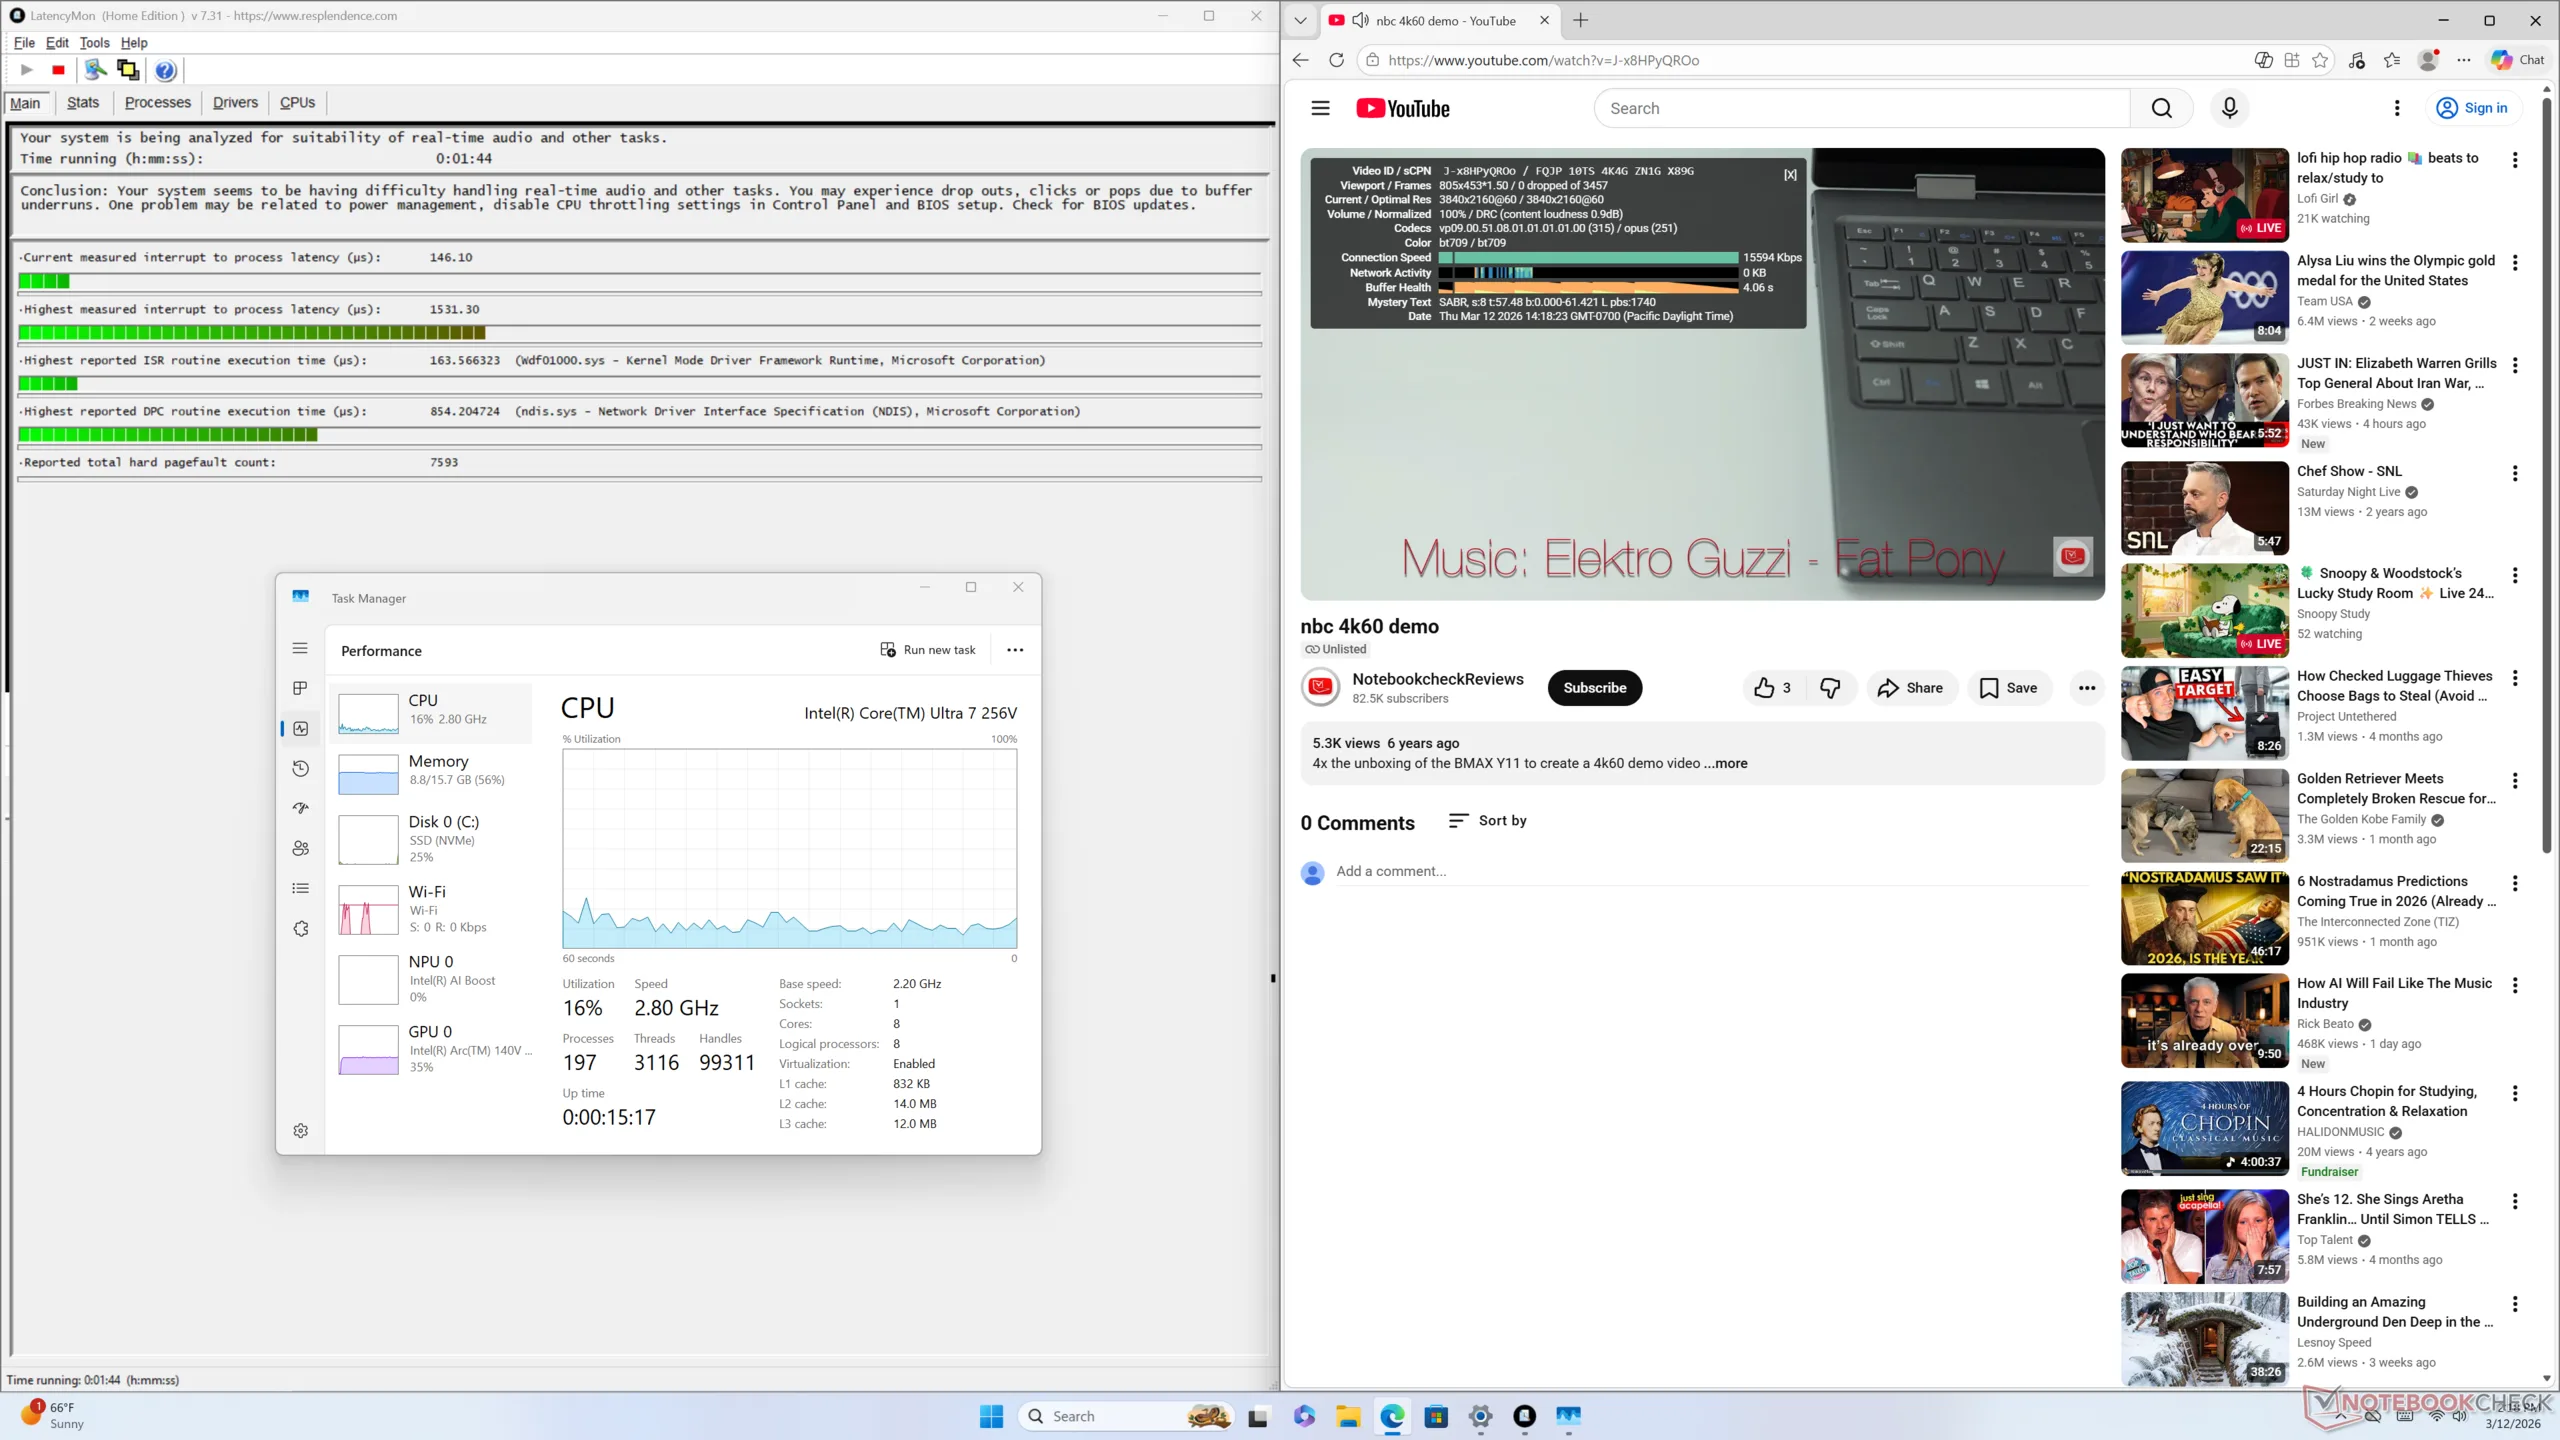
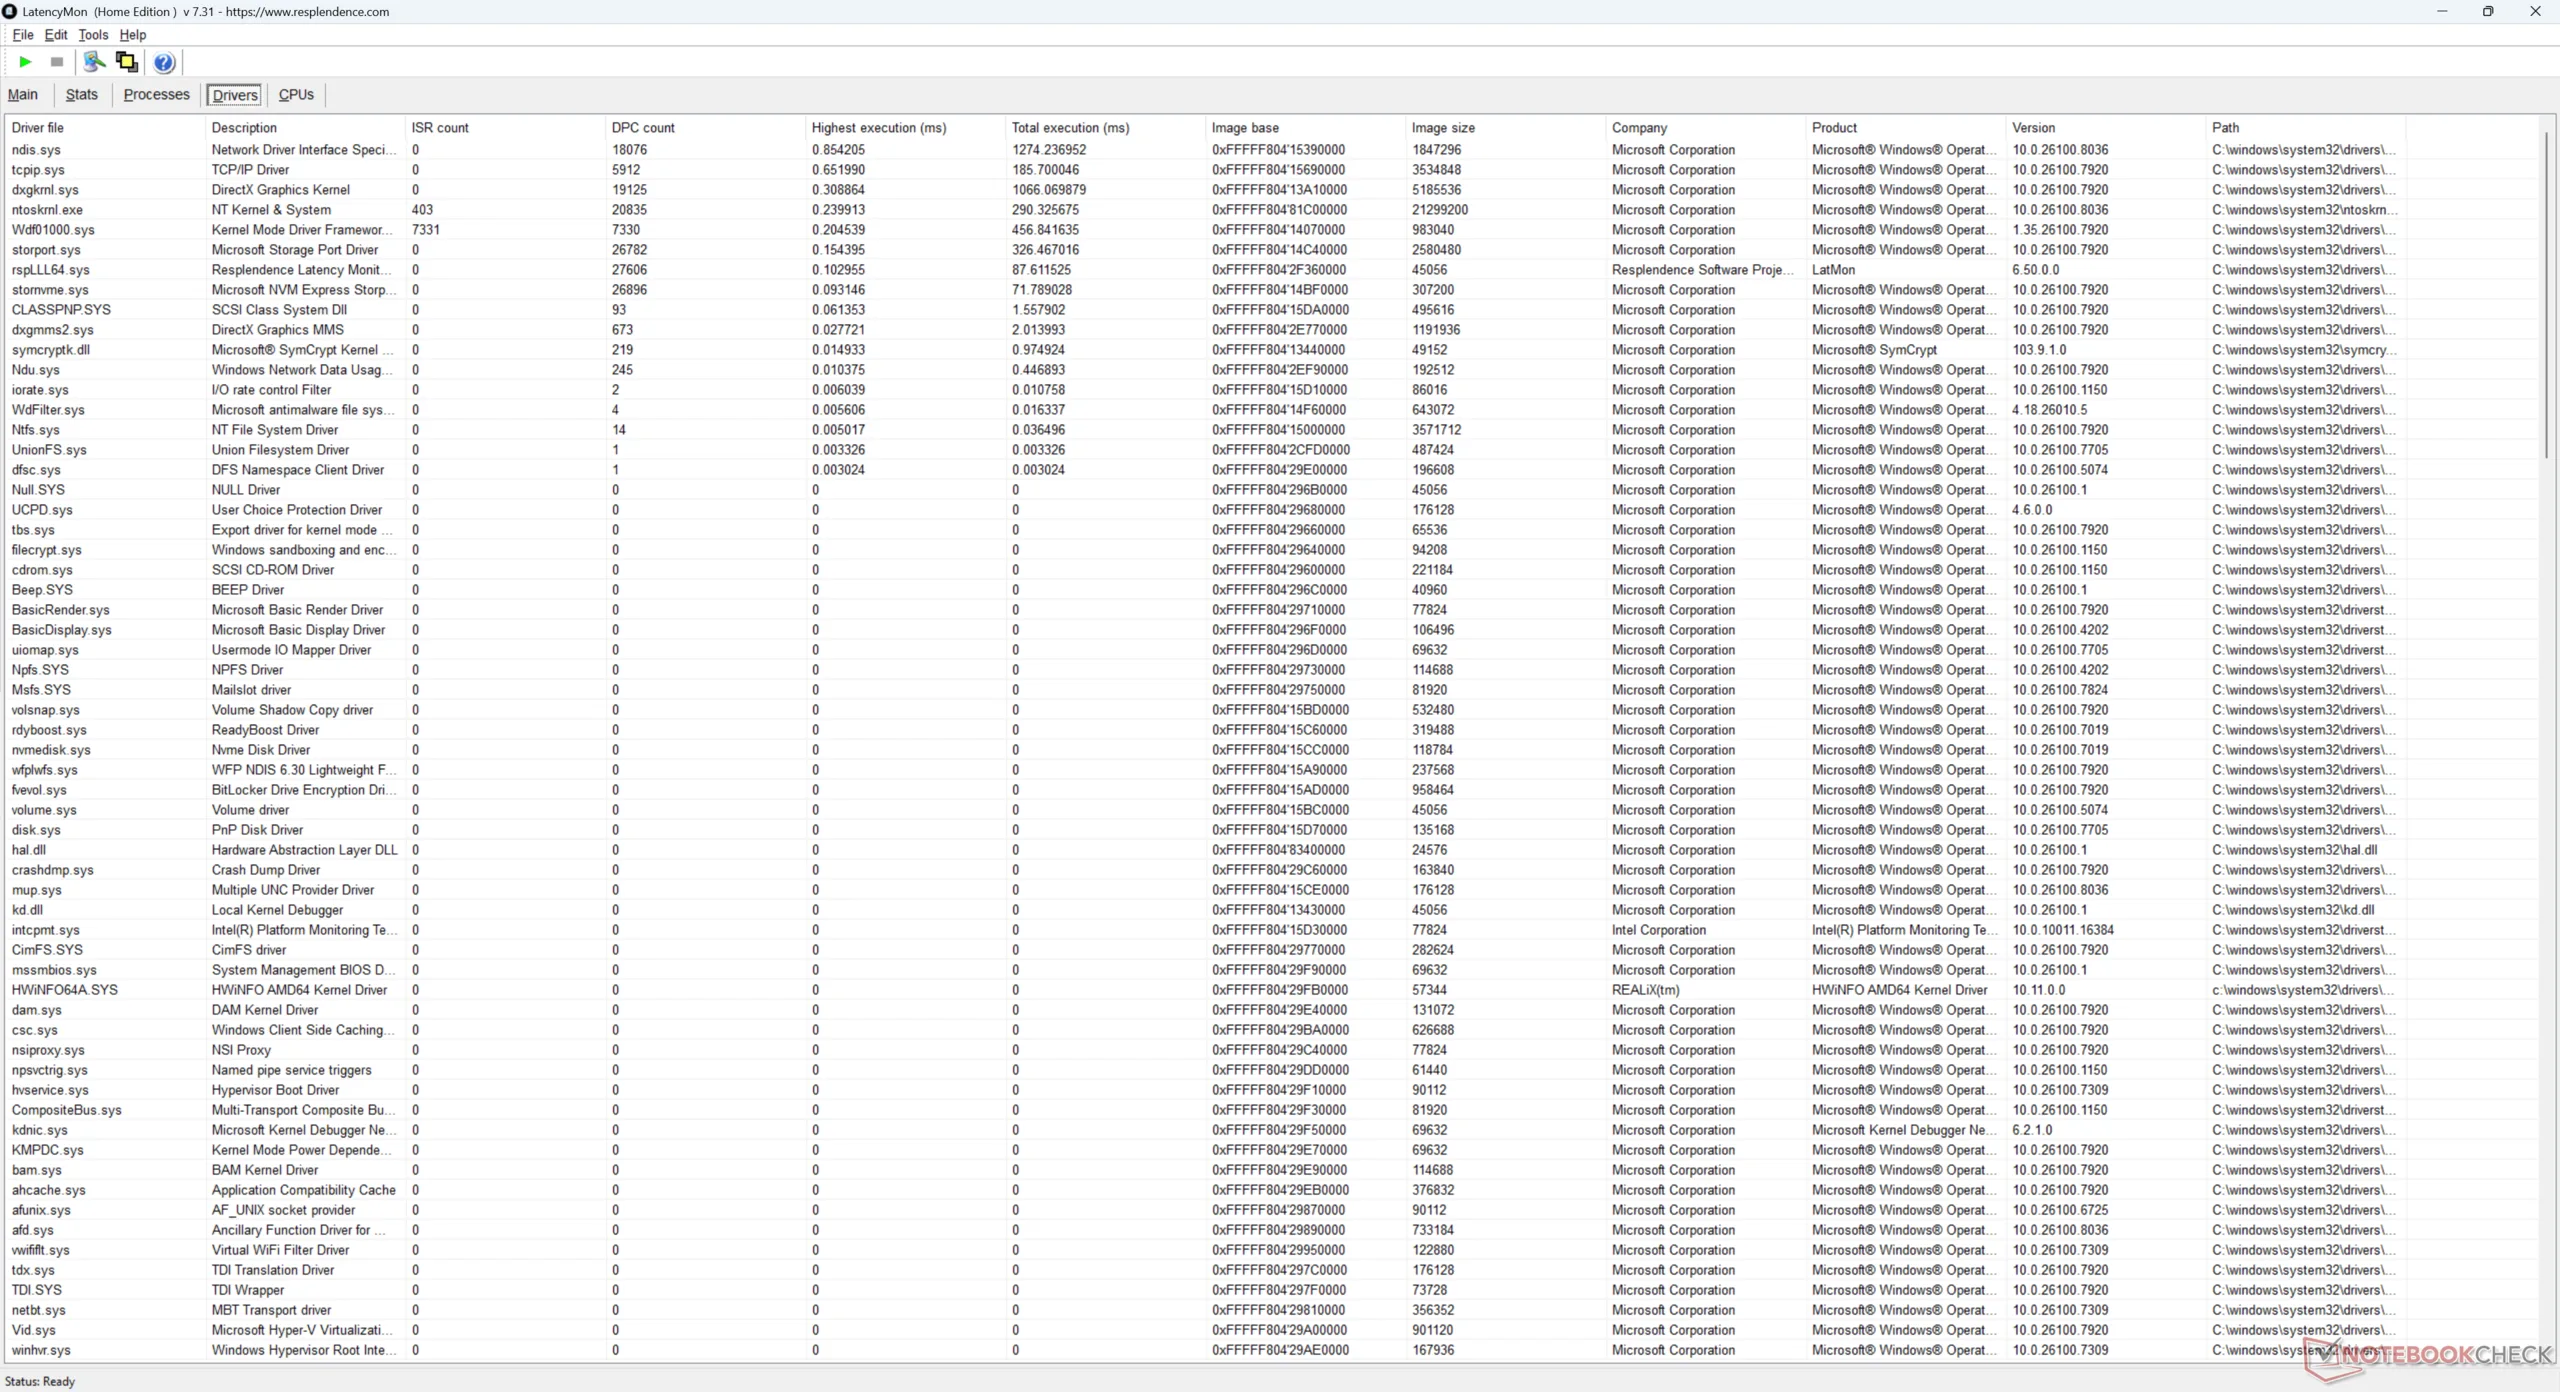
| DPC Latencies / LatencyMon - interrupt to process latency (max), Web, Youtube, Prime95 | |
| GMK NucBox K13 | |
| GMK NucBox K12 | |
| Asus NUC 15 Pro+ | |
| GMK EVO-T1 | |
| MSI Cubi NUC AI+ 2MG | |
| Beelink SER9 Pro | |
* ... kleiner is beter
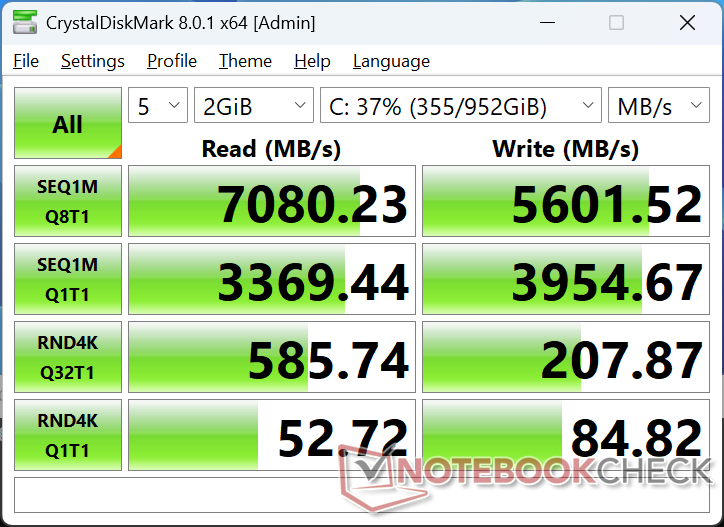
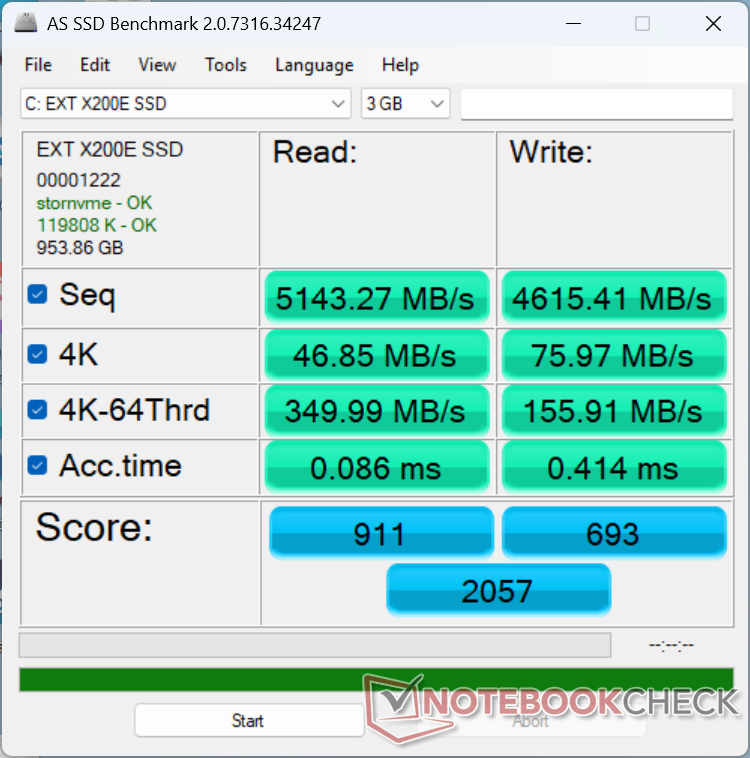
Opslagapparaten
Overdrachtssnelheden met de Huawei eKitStor Xtreme 200E bereiken een top van 6800 MB/s, maar de prestaties zouden snel afnemen tot slechts 3600 MB/s wanneer ze onder druk komen te staan, zoals blijkt uit onze DiskSpd loop testresultaten hieronder.

| Drive Performance rating - Percent | |
| GMK EVO-T1 | |
| Asus NUC 15 Pro+ | |
| Beelink SER9 Pro | |
| GMK NucBox K12 | |
| MSI Cubi NUC AI+ 2MG | |
| GMK NucBox K13 | |
| Gemiddeld Huawei eKitStor Xtreme 200e 1 TB | |
* ... kleiner is beter
Schijf onderdrukken: DiskSpd Leeslus, wachtrijdiepte 8
GPU-prestaties
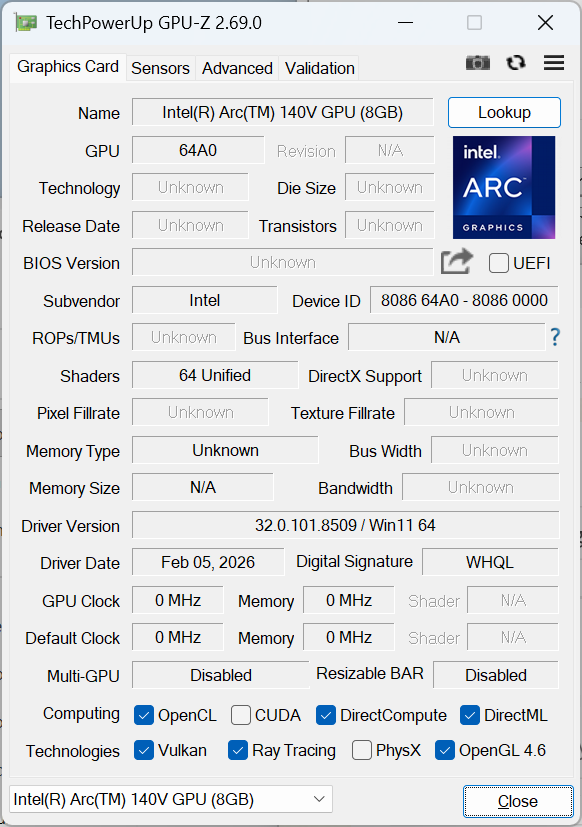
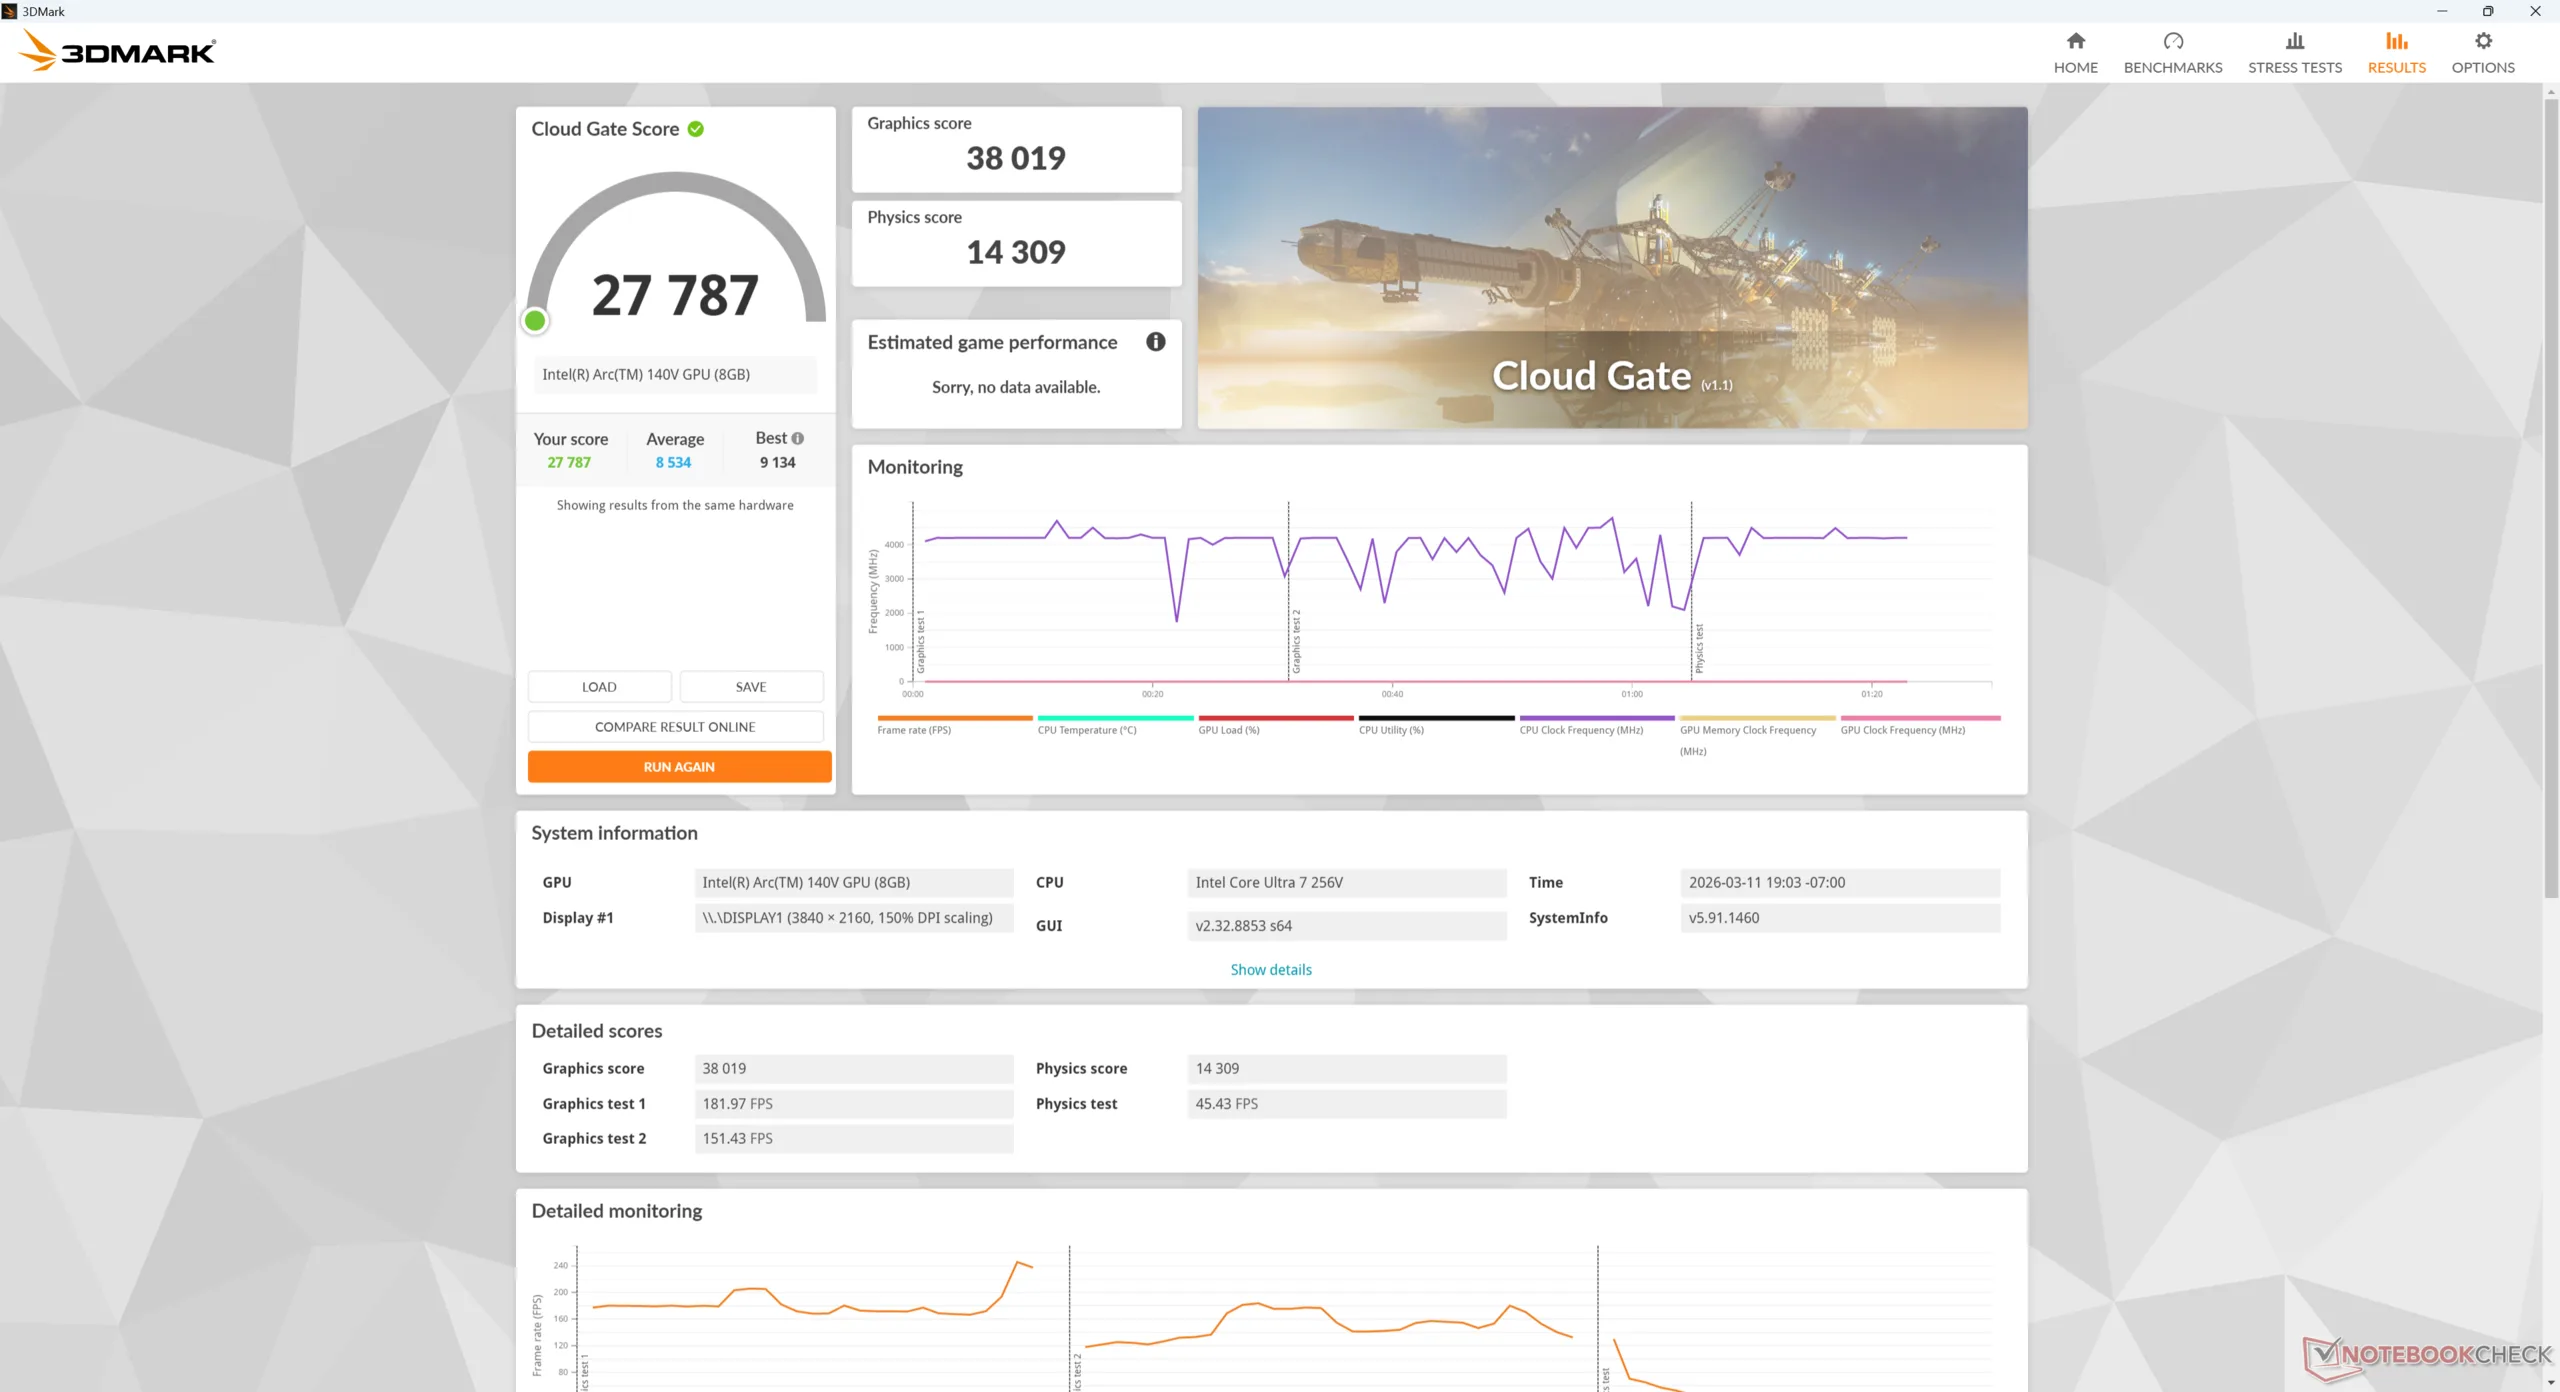
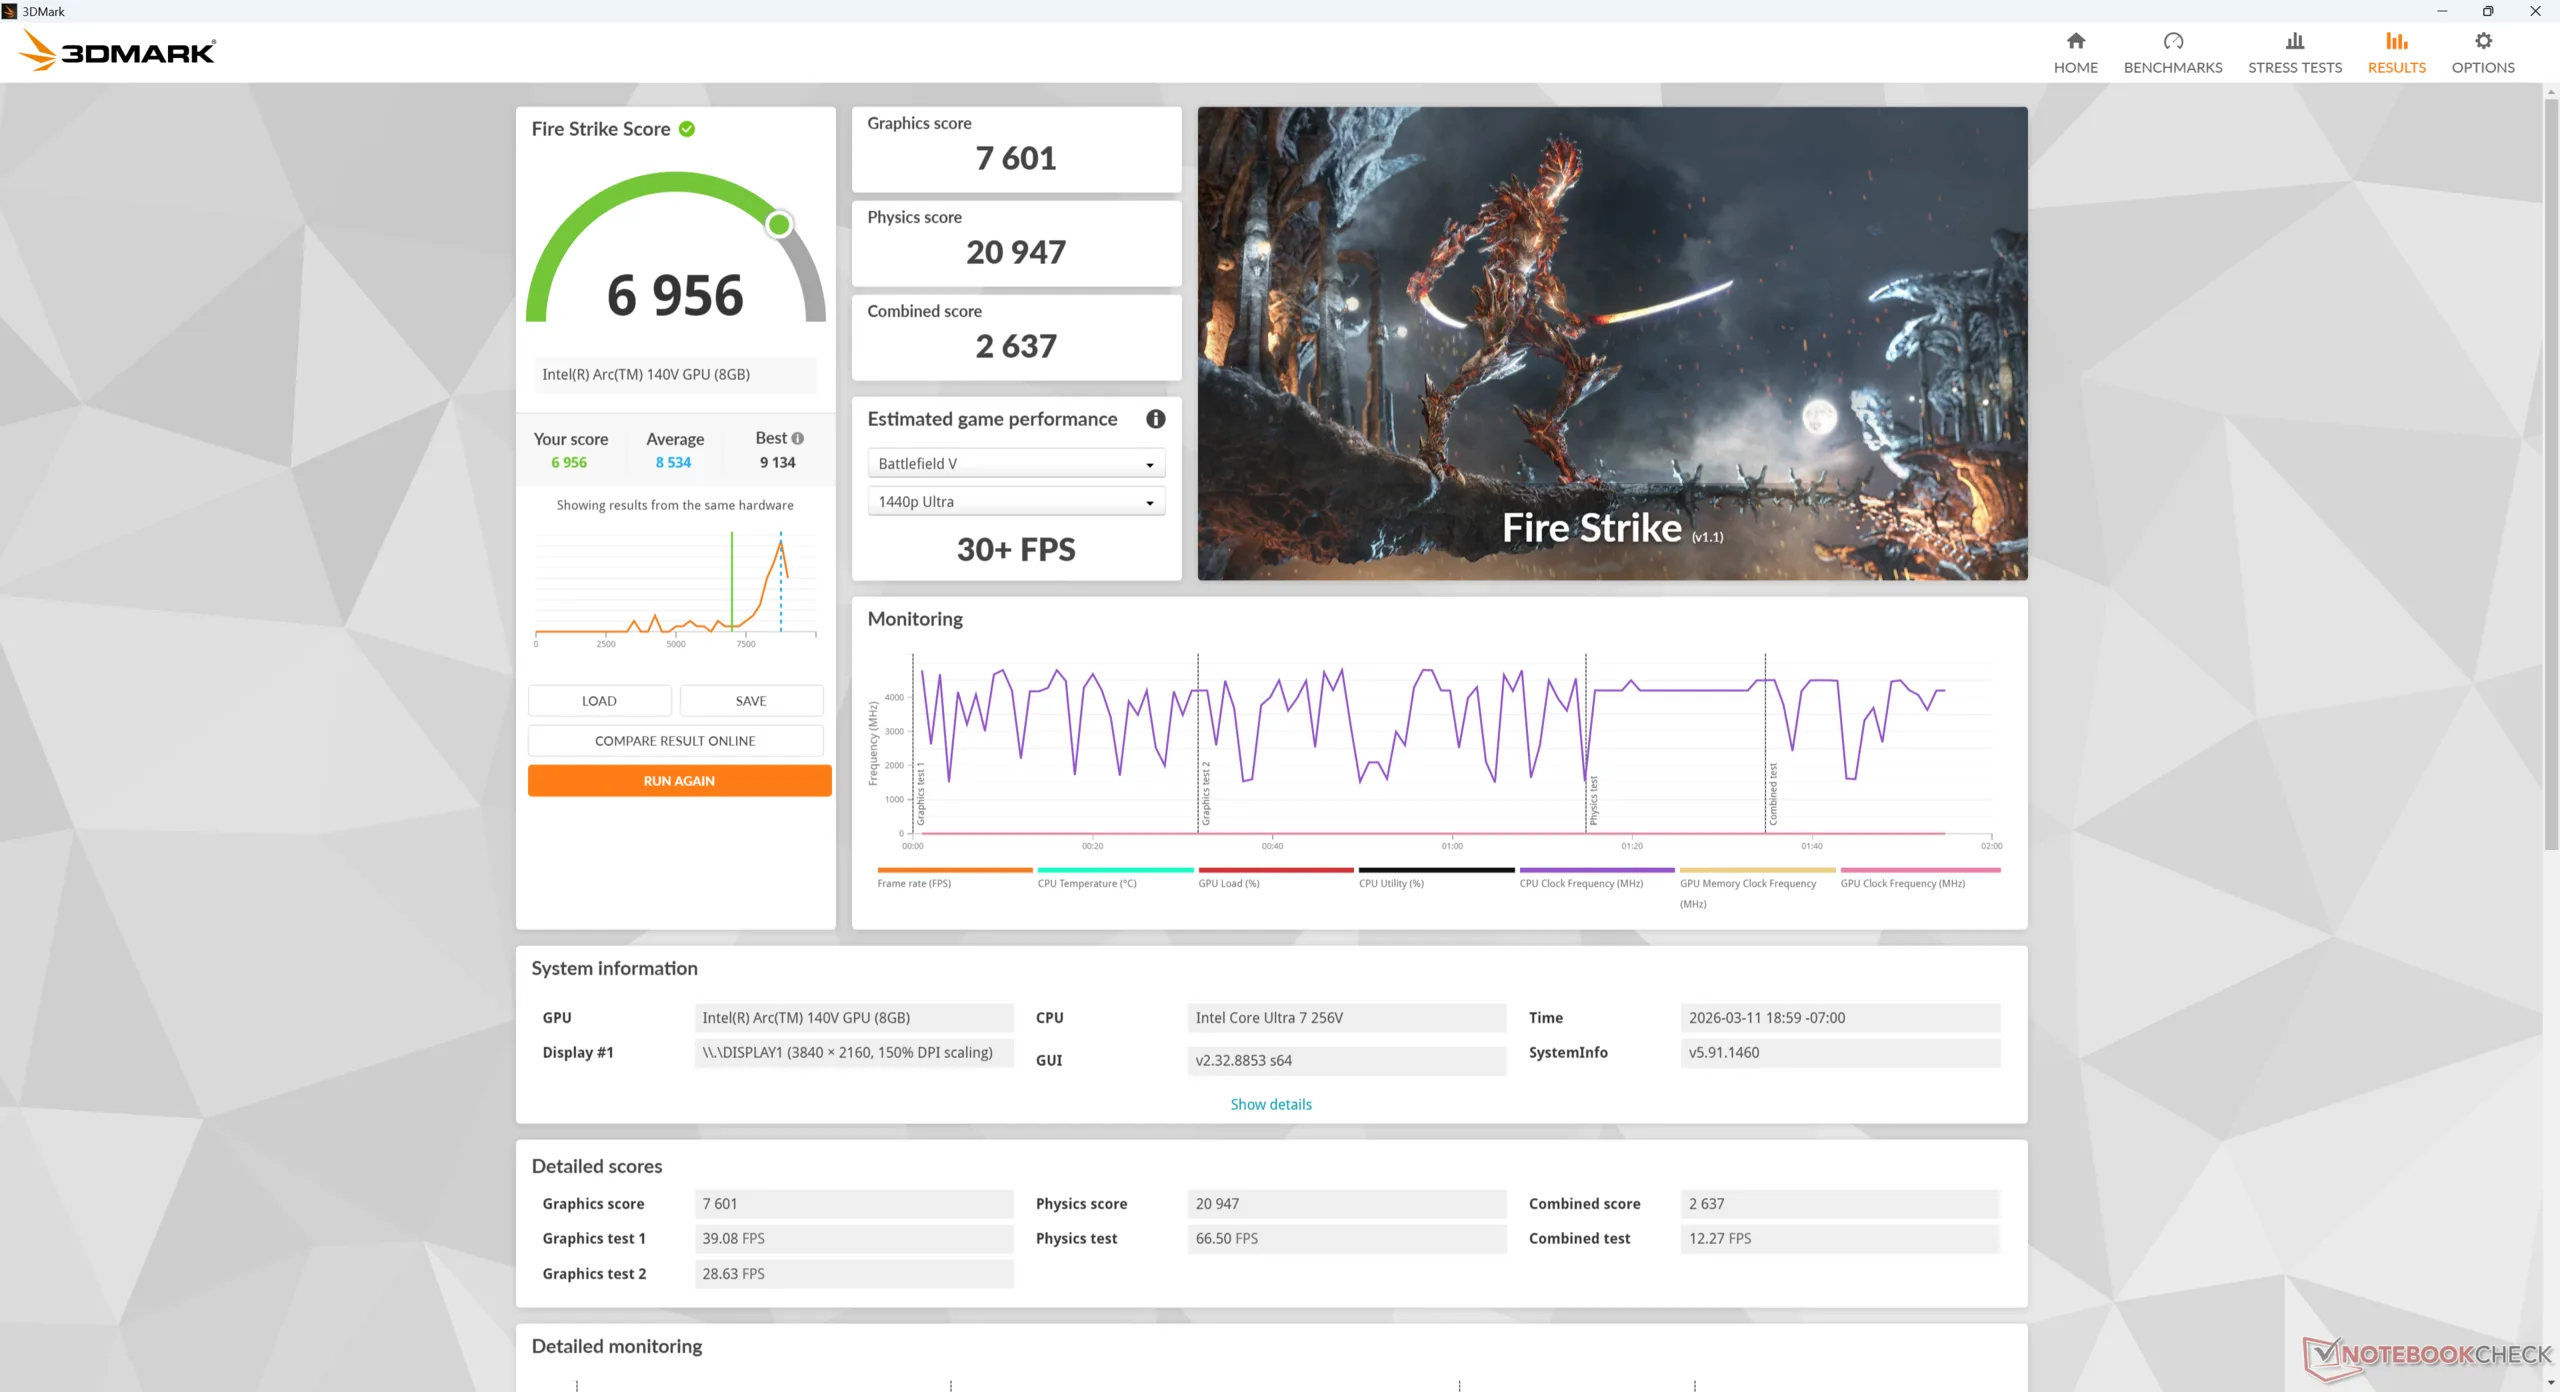
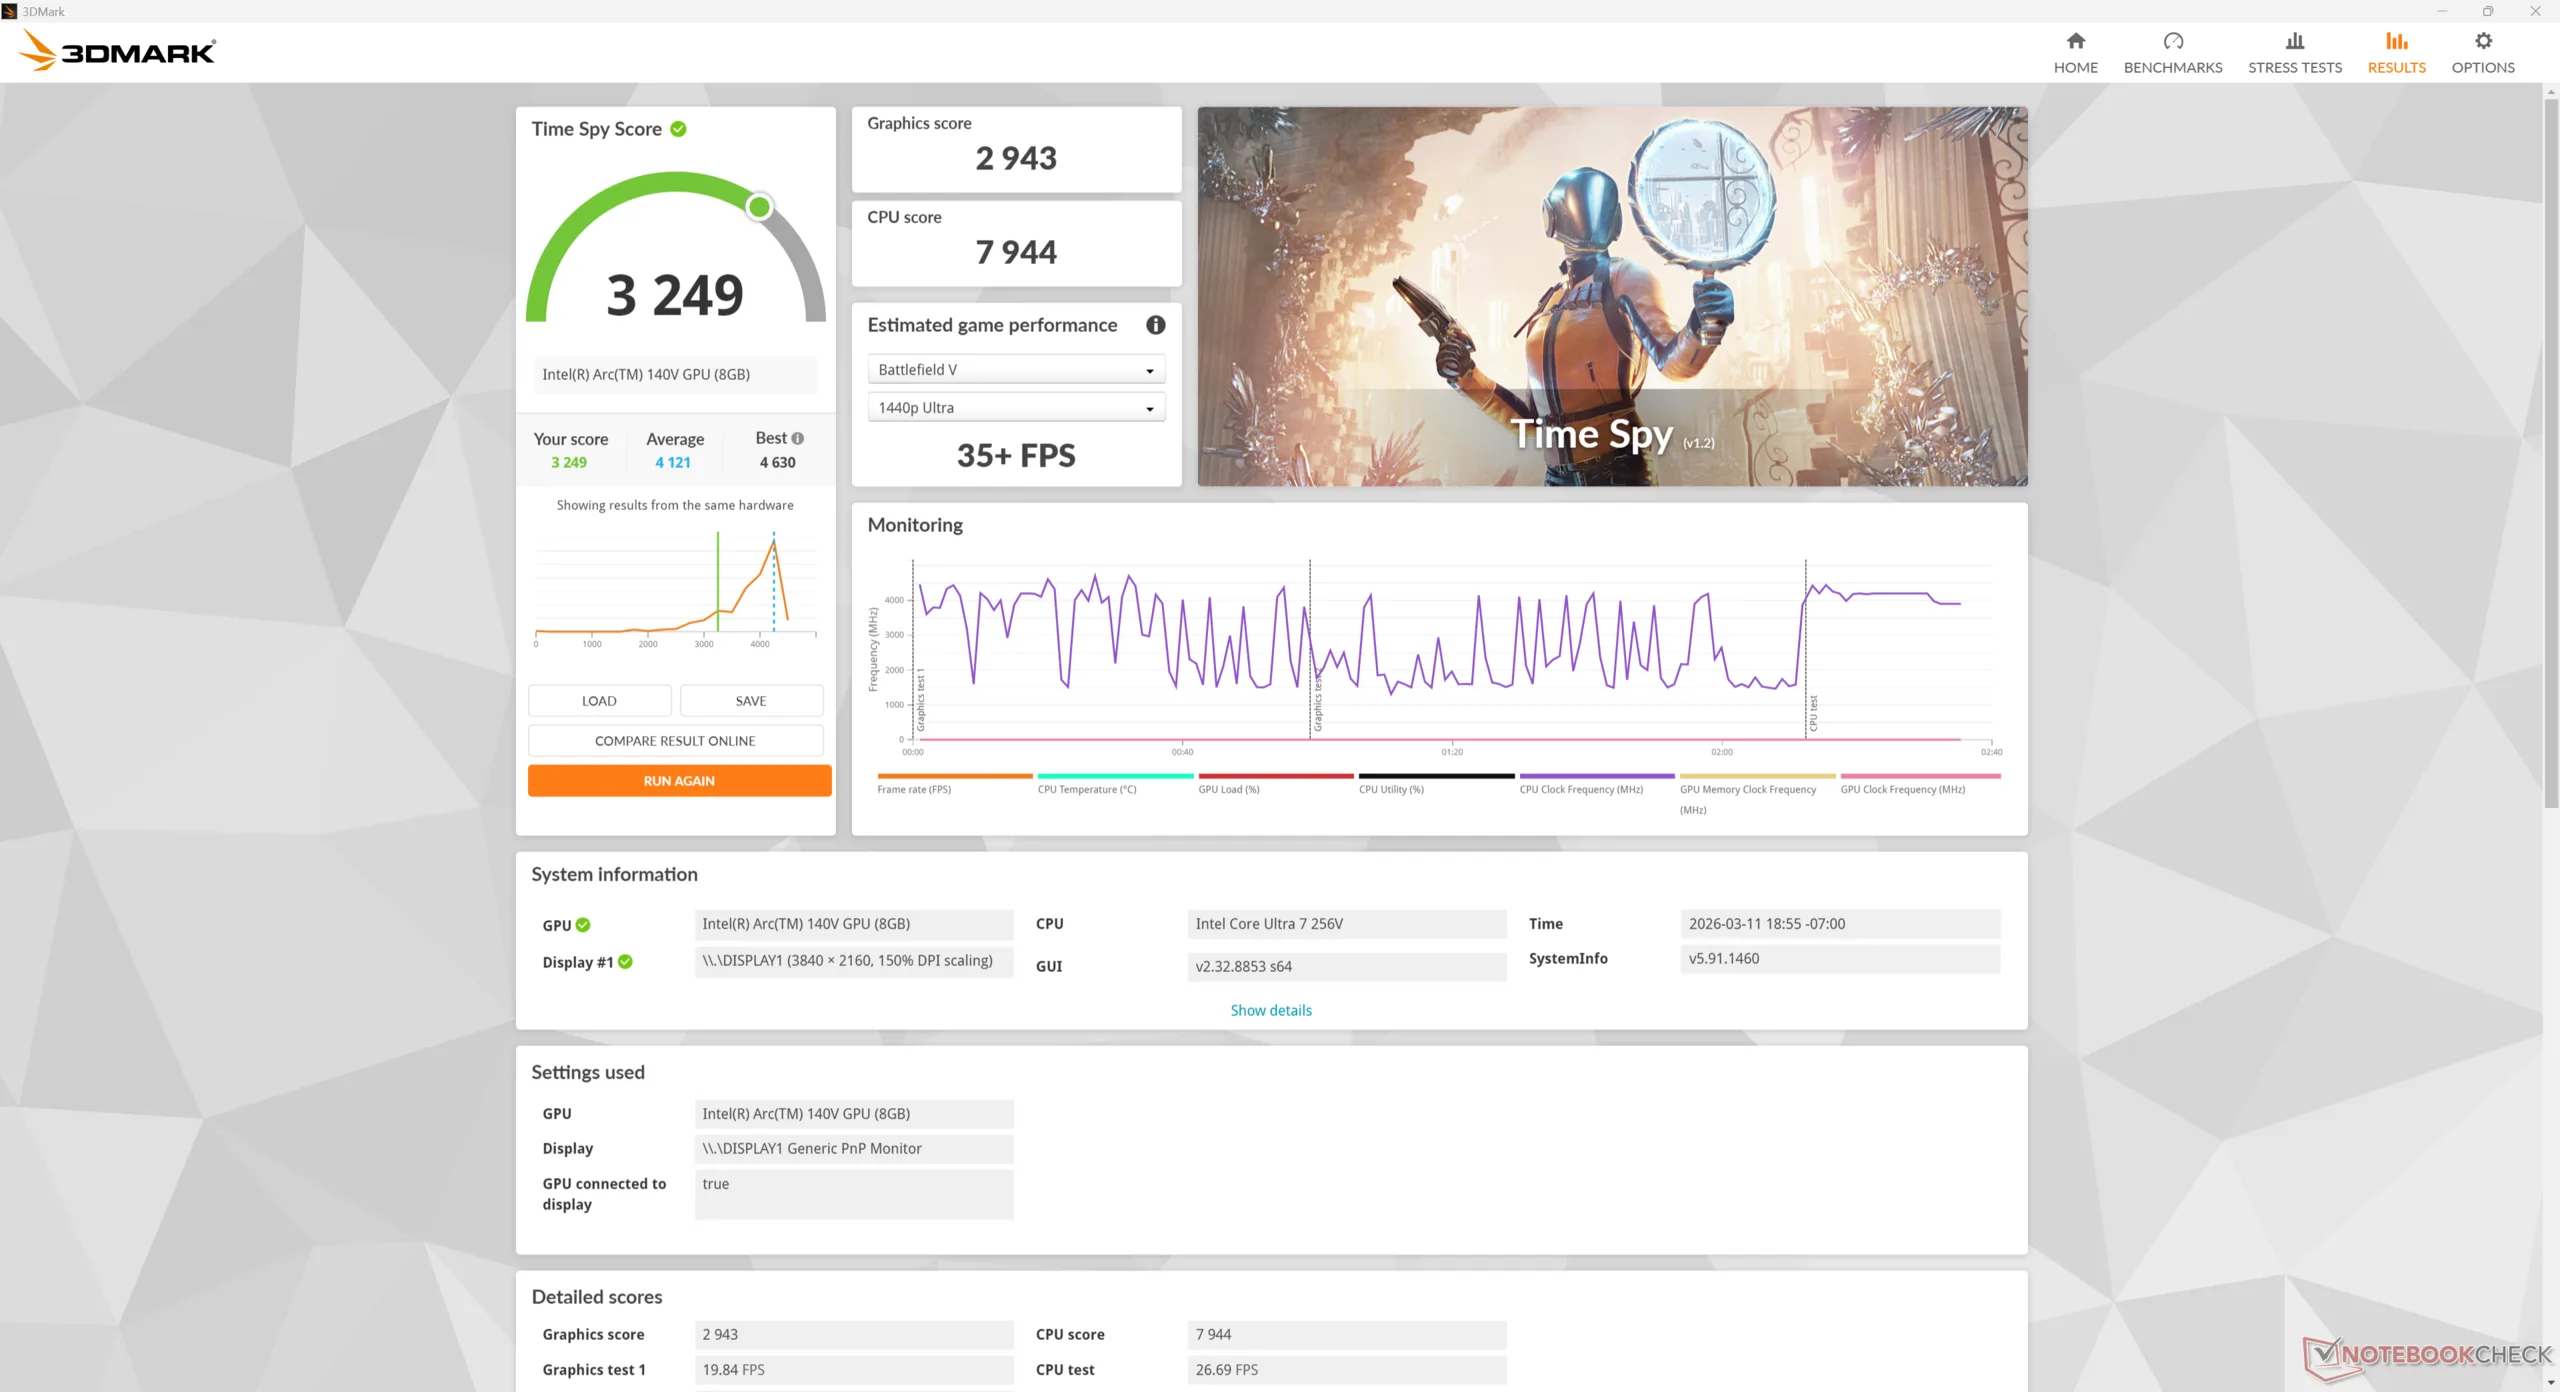
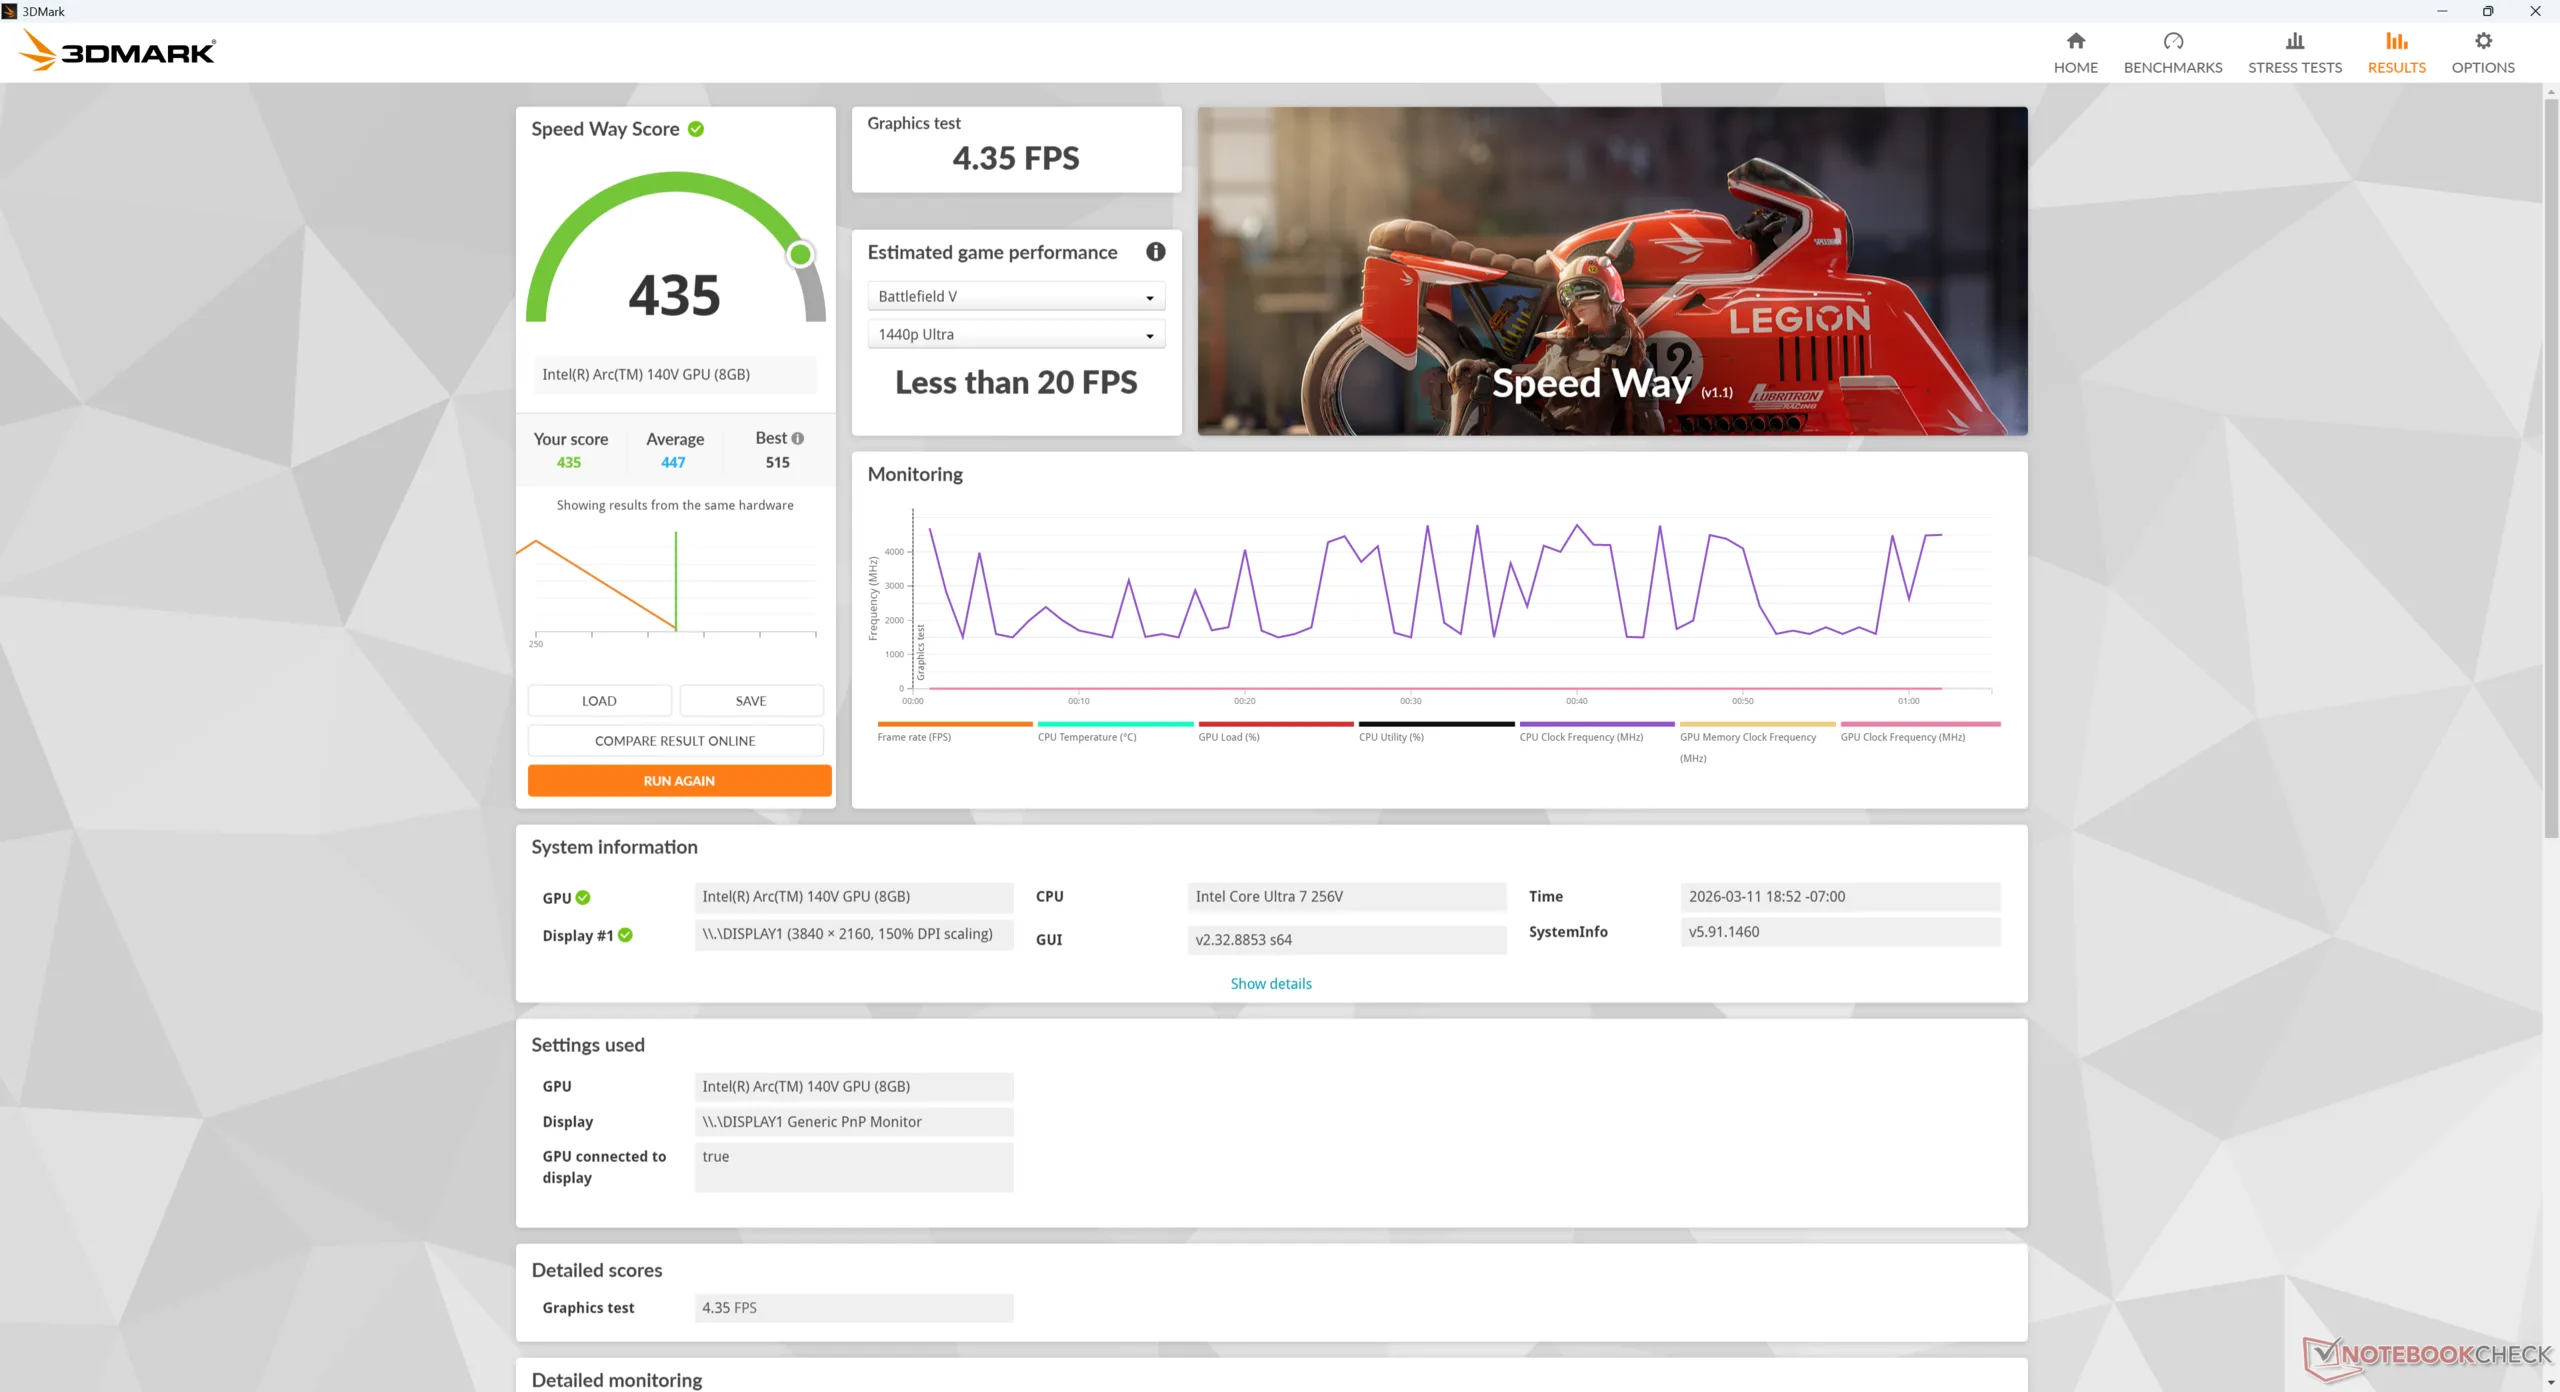
Hoewel nog steeds relatief snel voor een geïntegreerde GPU, is de Arc 140V in onze GMK ongeveer 15 tot 25 procent langzamer dan de gemiddelde PC in onze database met dezelfde iGPU volgens 3DMark benchmarks. Dit is helaas ook het geval bij het uitvoeren van echte games, waarbij onze GMK bijna constant iets langzamer presteert dan verwacht.
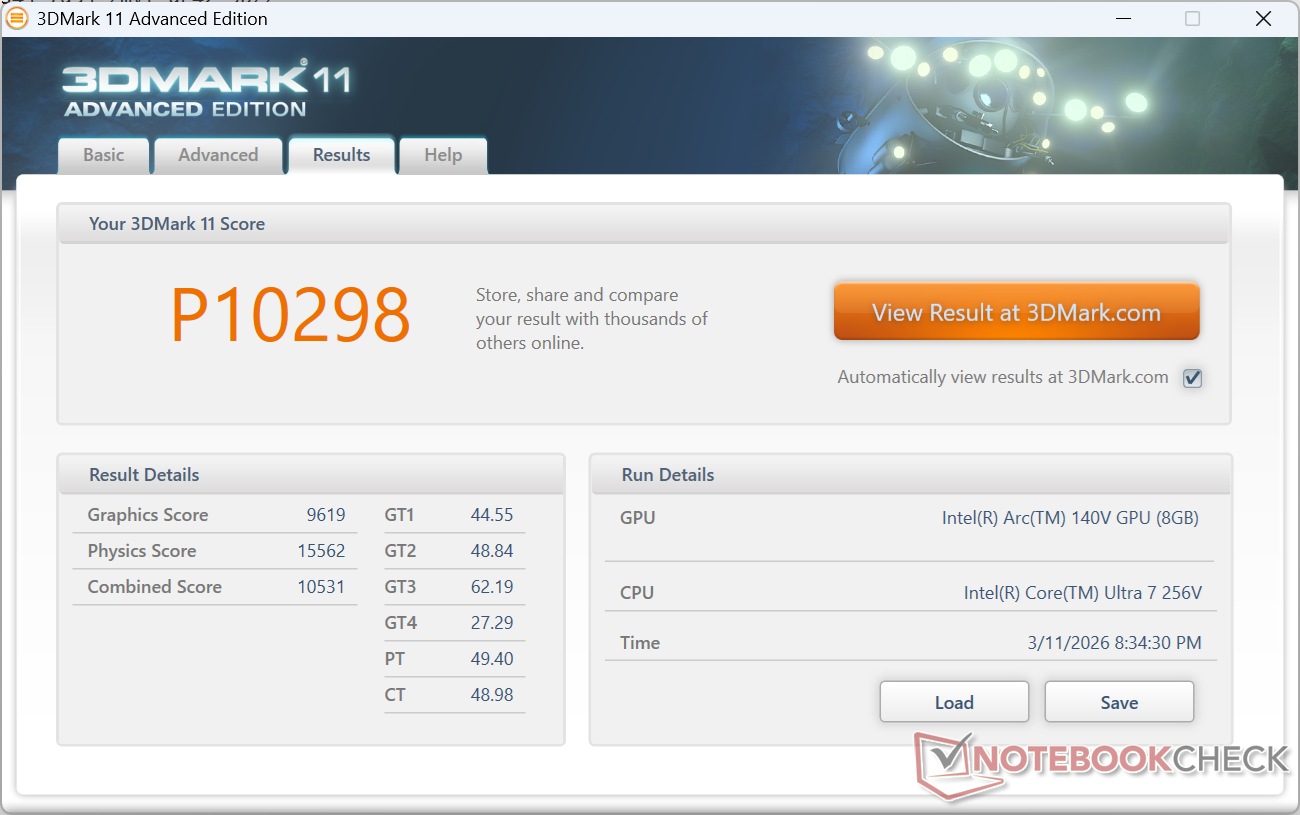
| 3DMark 11 Performance | 10298 punten | |
| 3DMark Cloud Gate Standard Score | 27787 punten | |
| 3DMark Fire Strike Score | 6956 punten | |
| 3DMark Time Spy Score | 3249 punten | |
Help | ||
* ... kleiner is beter
| Performance rating - Percent | |
| Asus NUC 15 Pro+ | |
| Beelink SER9 Pro | |
| GMK NucBox K12 | |
| GMK EVO-T1 -1! | |
| MSI Cubi NUC AI+ 2MG | |
| GMK NucBox K13 | |
| Cyberpunk 2077 - 1920x1080 Ultra Preset (FSR off) | |
| Asus NUC 15 Pro+ | |
| GMK EVO-T1 | |
| GMK NucBox K12 | |
| Beelink SER9 Pro | |
| GMK NucBox K13 | |
| MSI Cubi NUC AI+ 2MG | |
| Baldur's Gate 3 - 1920x1080 Ultra Preset AA:T | |
| Beelink SER9 Pro | |
| GMK NucBox K12 | |
| MSI Cubi NUC AI+ 2MG | |
| Asus NUC 15 Pro+ | |
| GMK NucBox K13 | |
| GMK EVO-T1 | |
| GTA V - 1920x1080 Highest AA:4xMSAA + FX AF:16x | |
| Beelink SER9 Pro | |
| GMK NucBox K12 | |
| MSI Cubi NUC AI+ 2MG | |
| GMK NucBox K13 | |
| Asus NUC 15 Pro+ | |
| GMK EVO-T1 | |
| Final Fantasy XV Benchmark - 1920x1080 High Quality | |
| GMK EVO-T1 | |
| Asus NUC 15 Pro+ | |
| Beelink SER9 Pro | |
| MSI Cubi NUC AI+ 2MG | |
| GMK NucBox K13 | |
| GMK NucBox K12 | |
| Strange Brigade - 1920x1080 ultra AA:ultra AF:16 | |
| MSI Cubi NUC AI+ 2MG | |
| Asus NUC 15 Pro+ | |
| GMK NucBox K13 | |
| Beelink SER9 Pro | |
| GMK NucBox K12 | |
| Dota 2 Reborn - 1920x1080 ultra (3/3) best looking | |
| Asus NUC 15 Pro+ | |
| GMK NucBox K12 | |
| GMK EVO-T1 | |
| GMK NucBox K13 | |
| Beelink SER9 Pro | |
| MSI Cubi NUC AI+ 2MG | |
| X-Plane 11.11 - 1920x1080 high (fps_test=3) | |
| Asus NUC 15 Pro+ | |
| GMK EVO-T1 | |
| GMK NucBox K12 | |
| Beelink SER9 Pro | |
| MSI Cubi NUC AI+ 2MG | |
| GMK NucBox K13 | |
Cyberpunk 2077 ultra FPS Grafiek
| lage | gem. | hoge | ultra | |
|---|---|---|---|---|
| GTA V (2015) | 164.2 | 157.7 | 57.4 | 22.8 |
| Dota 2 Reborn (2015) | 104.5 | 88.7 | 68.9 | 78.5 |
| Final Fantasy XV Benchmark (2018) | 78.7 | 42.8 | 28.5 | |
| X-Plane 11.11 (2018) | 31.5 | 28.4 | 22.2 | |
| Strange Brigade (2018) | 231 | 83.5 | 65.8 | 54.5 |
| Baldur's Gate 3 (2023) | 36.6 | 30.6 | 26.5 | 25.8 |
| Cyberpunk 2077 (2023) | 38.4 | 30.2 | 23.7 | 21.7 |
| F1 24 (2024) | 76.8 | 78.4 | 58.7 | 17.2 |
Uitstoot
Systeemgeluid
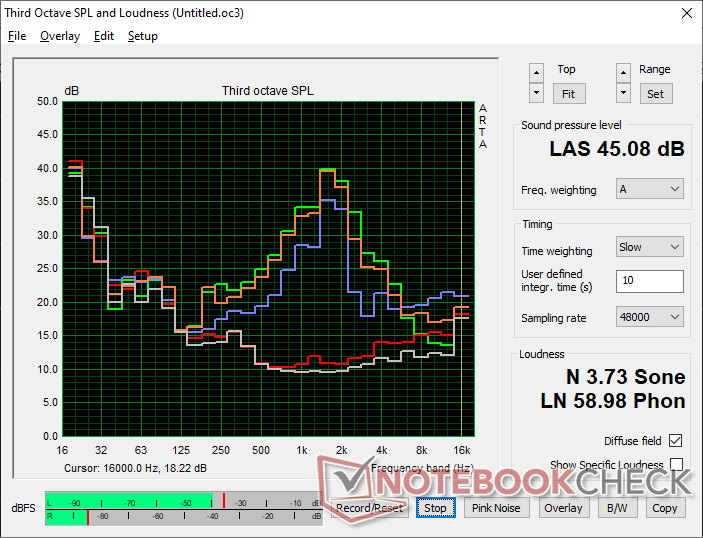
Het ventilatorgeluid is gemengd. Hoewel het systeem over het algemeen stil is wanneer u op het web surft of andere niet veeleisende belastingen uitvoert, neemt het ventilatorgeluid vrij snel toe tot meer dan 40 dB(A) wanneer u intensievere toepassingen uitvoert, zoals games. Bovendien heeft de ventilator hoge tonen, zoals onze scherpe grafiek hieronder laat zien, wat betekent dat elke verandering in toerental beter in het gehoor zal klinken.
Geluidsniveau
| Onbelast |
| 24.5 / 25 / 25.1 dB (A) |
| Belasting |
| 40.1 / 45.1 dB (A) |
 | ||
30 dB stil 40 dB(A) hoorbaar 50 dB(A) luid |
||
min: | ||
| GMK NucBox K13 Core Ultra 7 256V, Arc 140V | GMK NucBox K12 Ryzen 7 H 255, Radeon 780M | GMK EVO-T1 Ultra 9 285H, Arc 140T | Beelink SER9 Pro Ryzen 7 H 255, Radeon 780M | Asus NUC 15 Pro+ Ultra 9 285H, Arc 140T | MSI Cubi NUC AI+ 2MG Core Ultra 7 258V, Arc 140V | |
|---|---|---|---|---|---|---|
| Noise | -19% | -34% | -0% | -14% | -14% | |
| uit / omgeving * (dB) | 23.3 | 23.5 -1% | 24.7 -6% | 23 1% | 25.3 -9% | 24.8 -6% |
| Idle Minimum * (dB) | 24.5 | 35.4 -44% | 38.7 -58% | 29.1 -19% | 25.4 -4% | 28 -14% |
| Idle Average * (dB) | 25 | 35.4 -42% | 38.8 -55% | 30.1 -20% | 25.5 -2% | 36.1 -44% |
| Idle Maximum * (dB) | 25.1 | 39 -55% | 38.9 -55% | 31.7 -26% | 37.3 -49% | 36.1 -44% |
| Load Average * (dB) | 40.1 | 42.4 -6% | 51.6 -29% | 33.7 16% | 44.4 -11% | 38.9 3% |
| Cyberpunk 2077 ultra * (dB) | 44.2 | 40.4 9% | 52 -18% | 33.8 24% | 46.2 -5% | 37 16% |
| Load Maximum * (dB) | 45.1 | 41.4 8% | 51.6 -14% | 35.2 22% | 52.7 -17% | 49.2 -9% |
| Witcher 3 ultra * (dB) | 38.7 | 47.7 |
* ... kleiner is beter
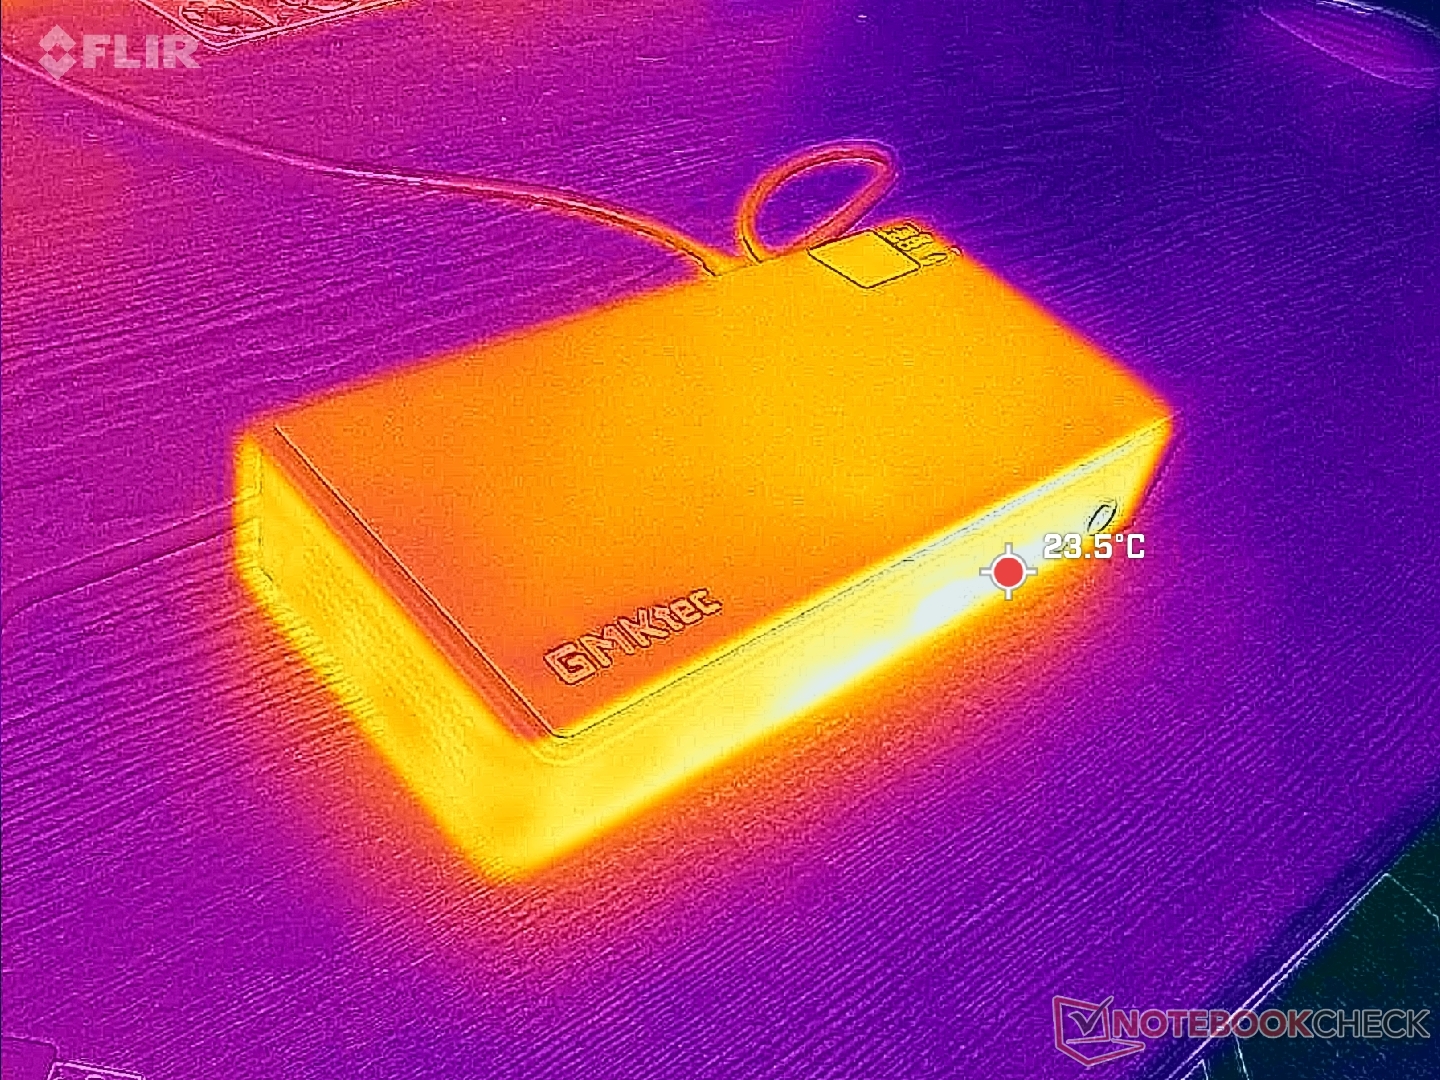
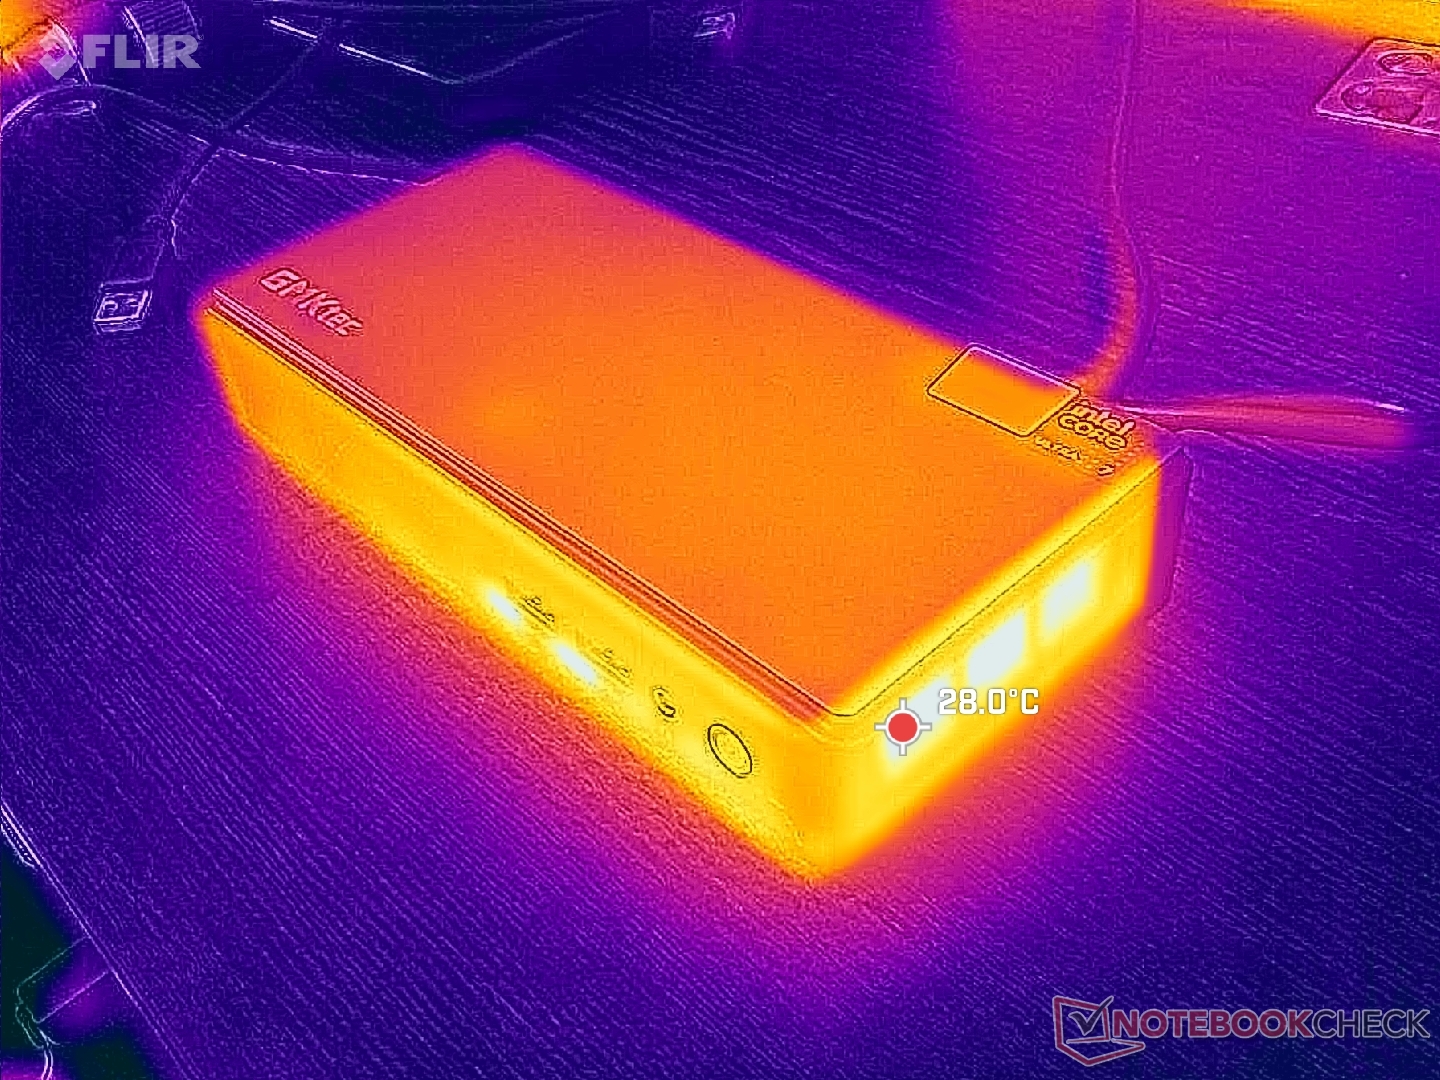
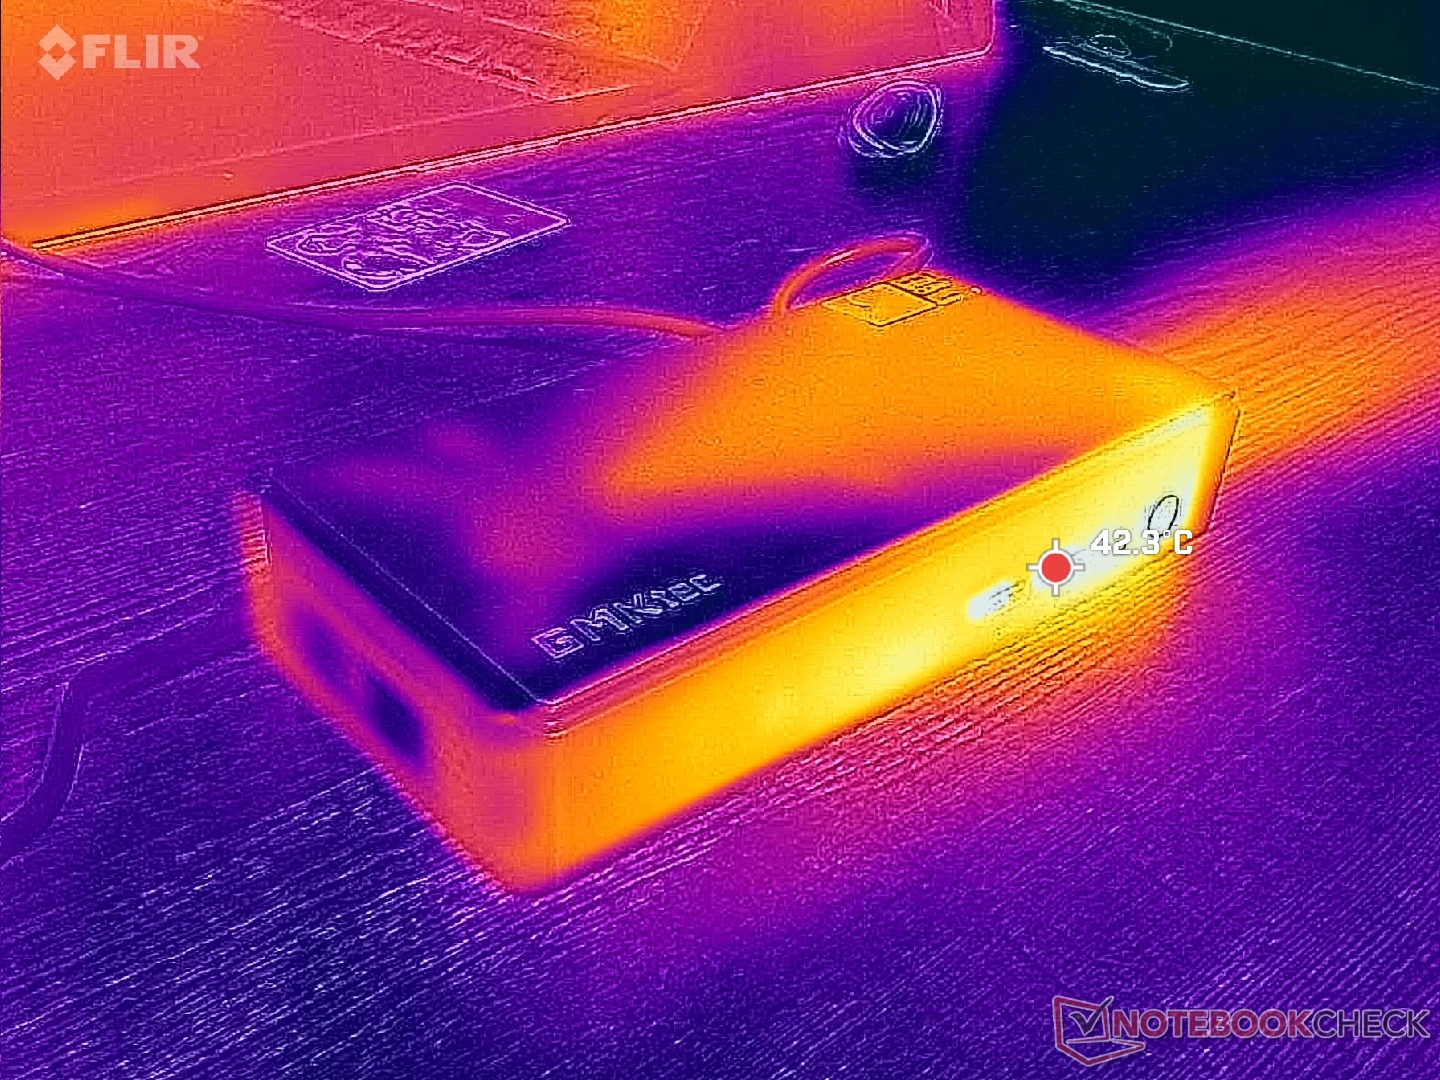
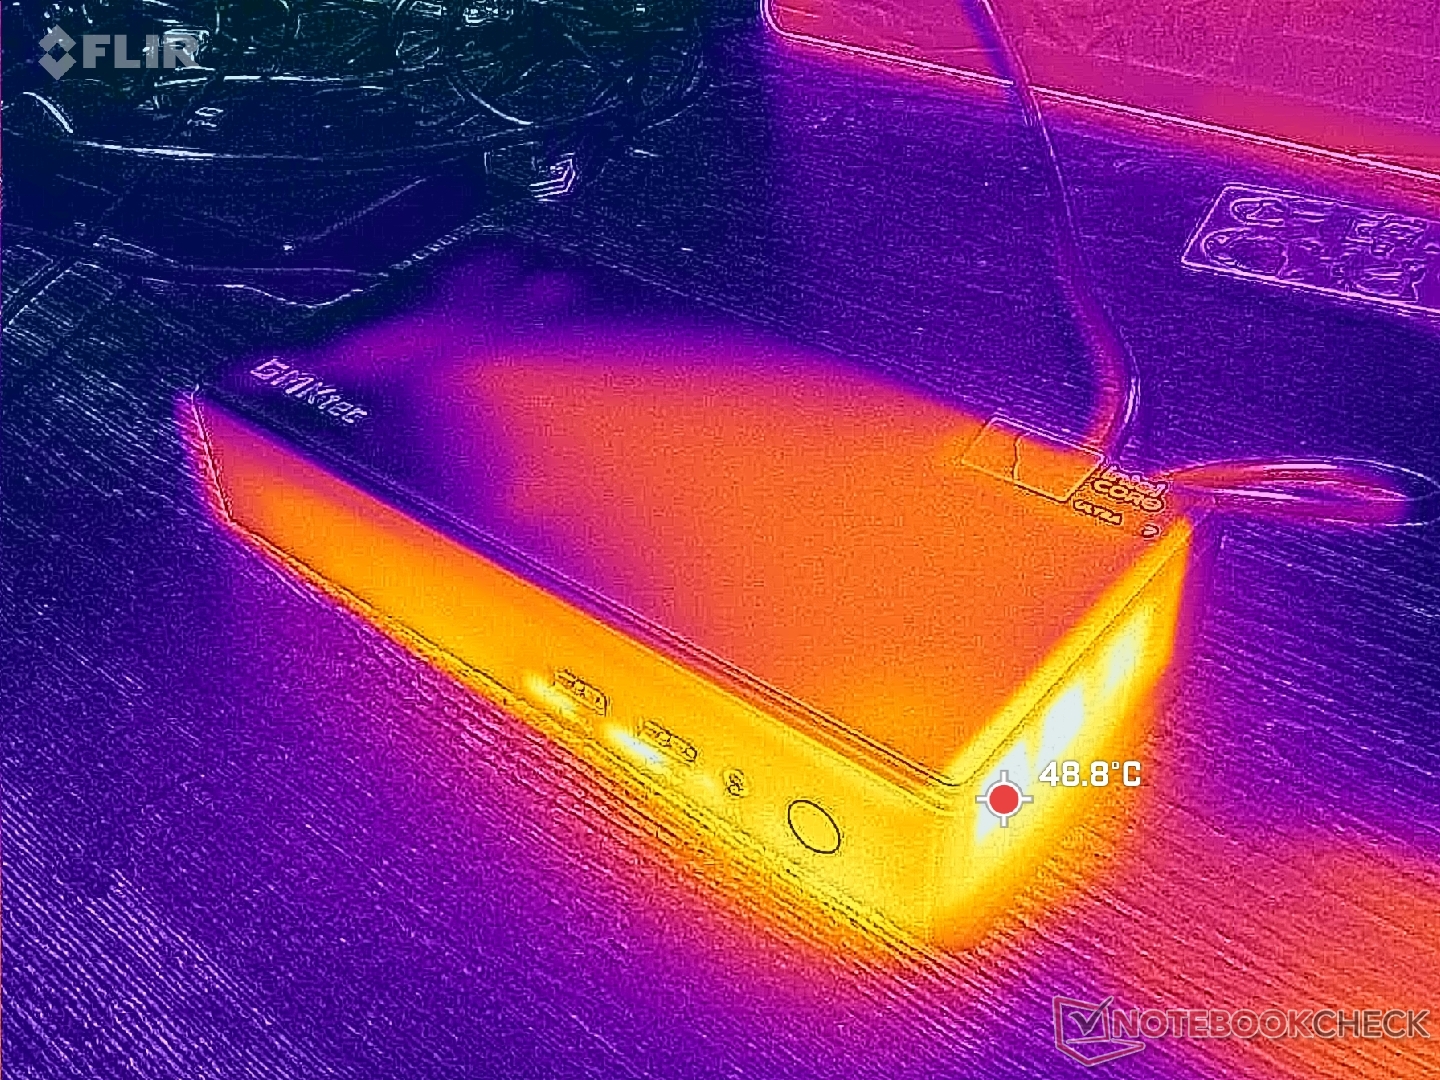
Temperatuur
De rechterhelft van het systeem zal altijd warmer zijn dan de linkerhelft vanwege het ontwerp van de koeloplossing. Afvalwarmte ontsnapt aan de rechterkant, zoals blijkt uit de onderstaande temperatuurkaarten, en daarom is het belangrijk om de unit correct te oriënteren als deze verticaal geplaatst wordt.
(+) De maximumtemperatuur aan de bovenzijde bedraagt 31.6 °C / 89 F, vergeleken met het gemiddelde van 35.4 °C / 96 F, variërend van 20.6 tot 69.5 °C voor de klasse Mini PC.
(-) De bodem warmt op tot een maximum van 50.6 °C / 123 F, vergeleken met een gemiddelde van 36.1 °C / 97 F
(+) Bij onbelast gebruik bedraagt de gemiddelde temperatuur voor de bovenzijde 26.3 °C / 79 F, vergeleken met het apparaatgemiddelde van 32.1 °C / 90 F.
| GMK NucBox K13 Core Ultra 7 256V, Arc 140V | GMK NucBox K12 Ryzen 7 H 255, Radeon 780M | GMK EVO-T1 Ultra 9 285H, Arc 140T | Beelink SER9 Pro Ryzen 7 H 255, Radeon 780M | Asus NUC 15 Pro+ Ultra 9 285H, Arc 140T | MSI Cubi NUC AI+ 2MG Core Ultra 7 258V, Arc 140V | |
|---|---|---|---|---|---|---|
| Heat | 6% | -4% | 9% | -7% | 18% | |
| Maximum Upper Side * (°C) | 31.6 | 31.6 -0% | 36.4 -15% | 26.8 15% | 42.2 -34% | 30.8 3% |
| Maximum Bottom * (°C) | 50.6 | 35.8 29% | 48.5 4% | 31.3 38% | 26.4 48% | |
| Idle Upper Side * (°C) | 27 | 28.2 -4% | 29.6 -10% | 26.2 3% | 34.9 -29% | 26.4 2% |
| Idle Bottom * (°C) | 31.2 | 31.4 -1% | 30 4% | 32.2 -3% | 25.4 19% |
* ... kleiner is beter
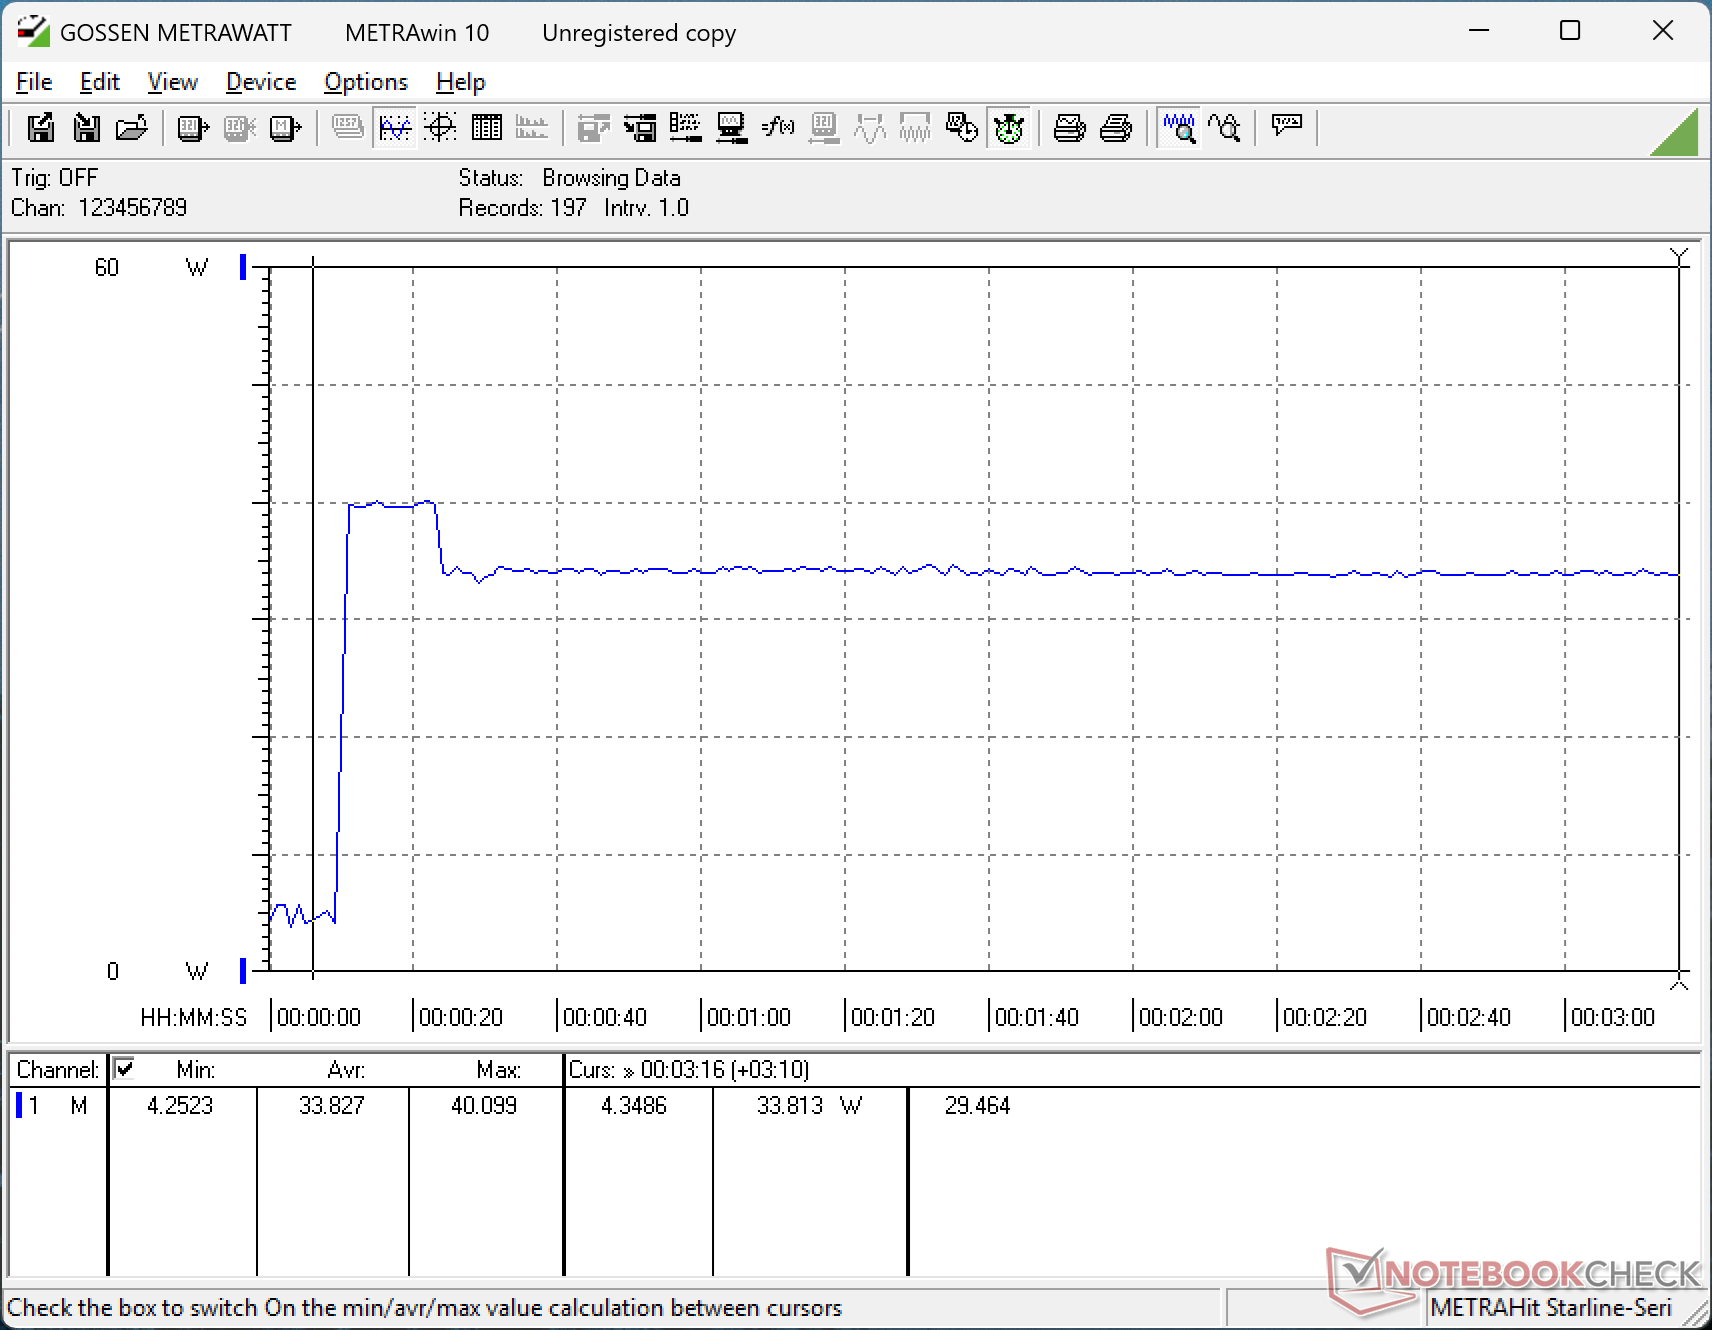
Stresstest
Tijdens het uitvoeren van Prime95 stress, boostte de CPU naar 3,5 GHz en 37 W, voordat hij een paar seconden later snel daalde naar 3,2 GHz en 30 W om de beperkte Turbo Boost duurzaamheid aan te geven. De kerntemperatuur ligt rond de 70 C, wat vergelijkbaar is met wat we zagen op de NucBox K12 ondanks hun verschillen in grootte en prestaties.
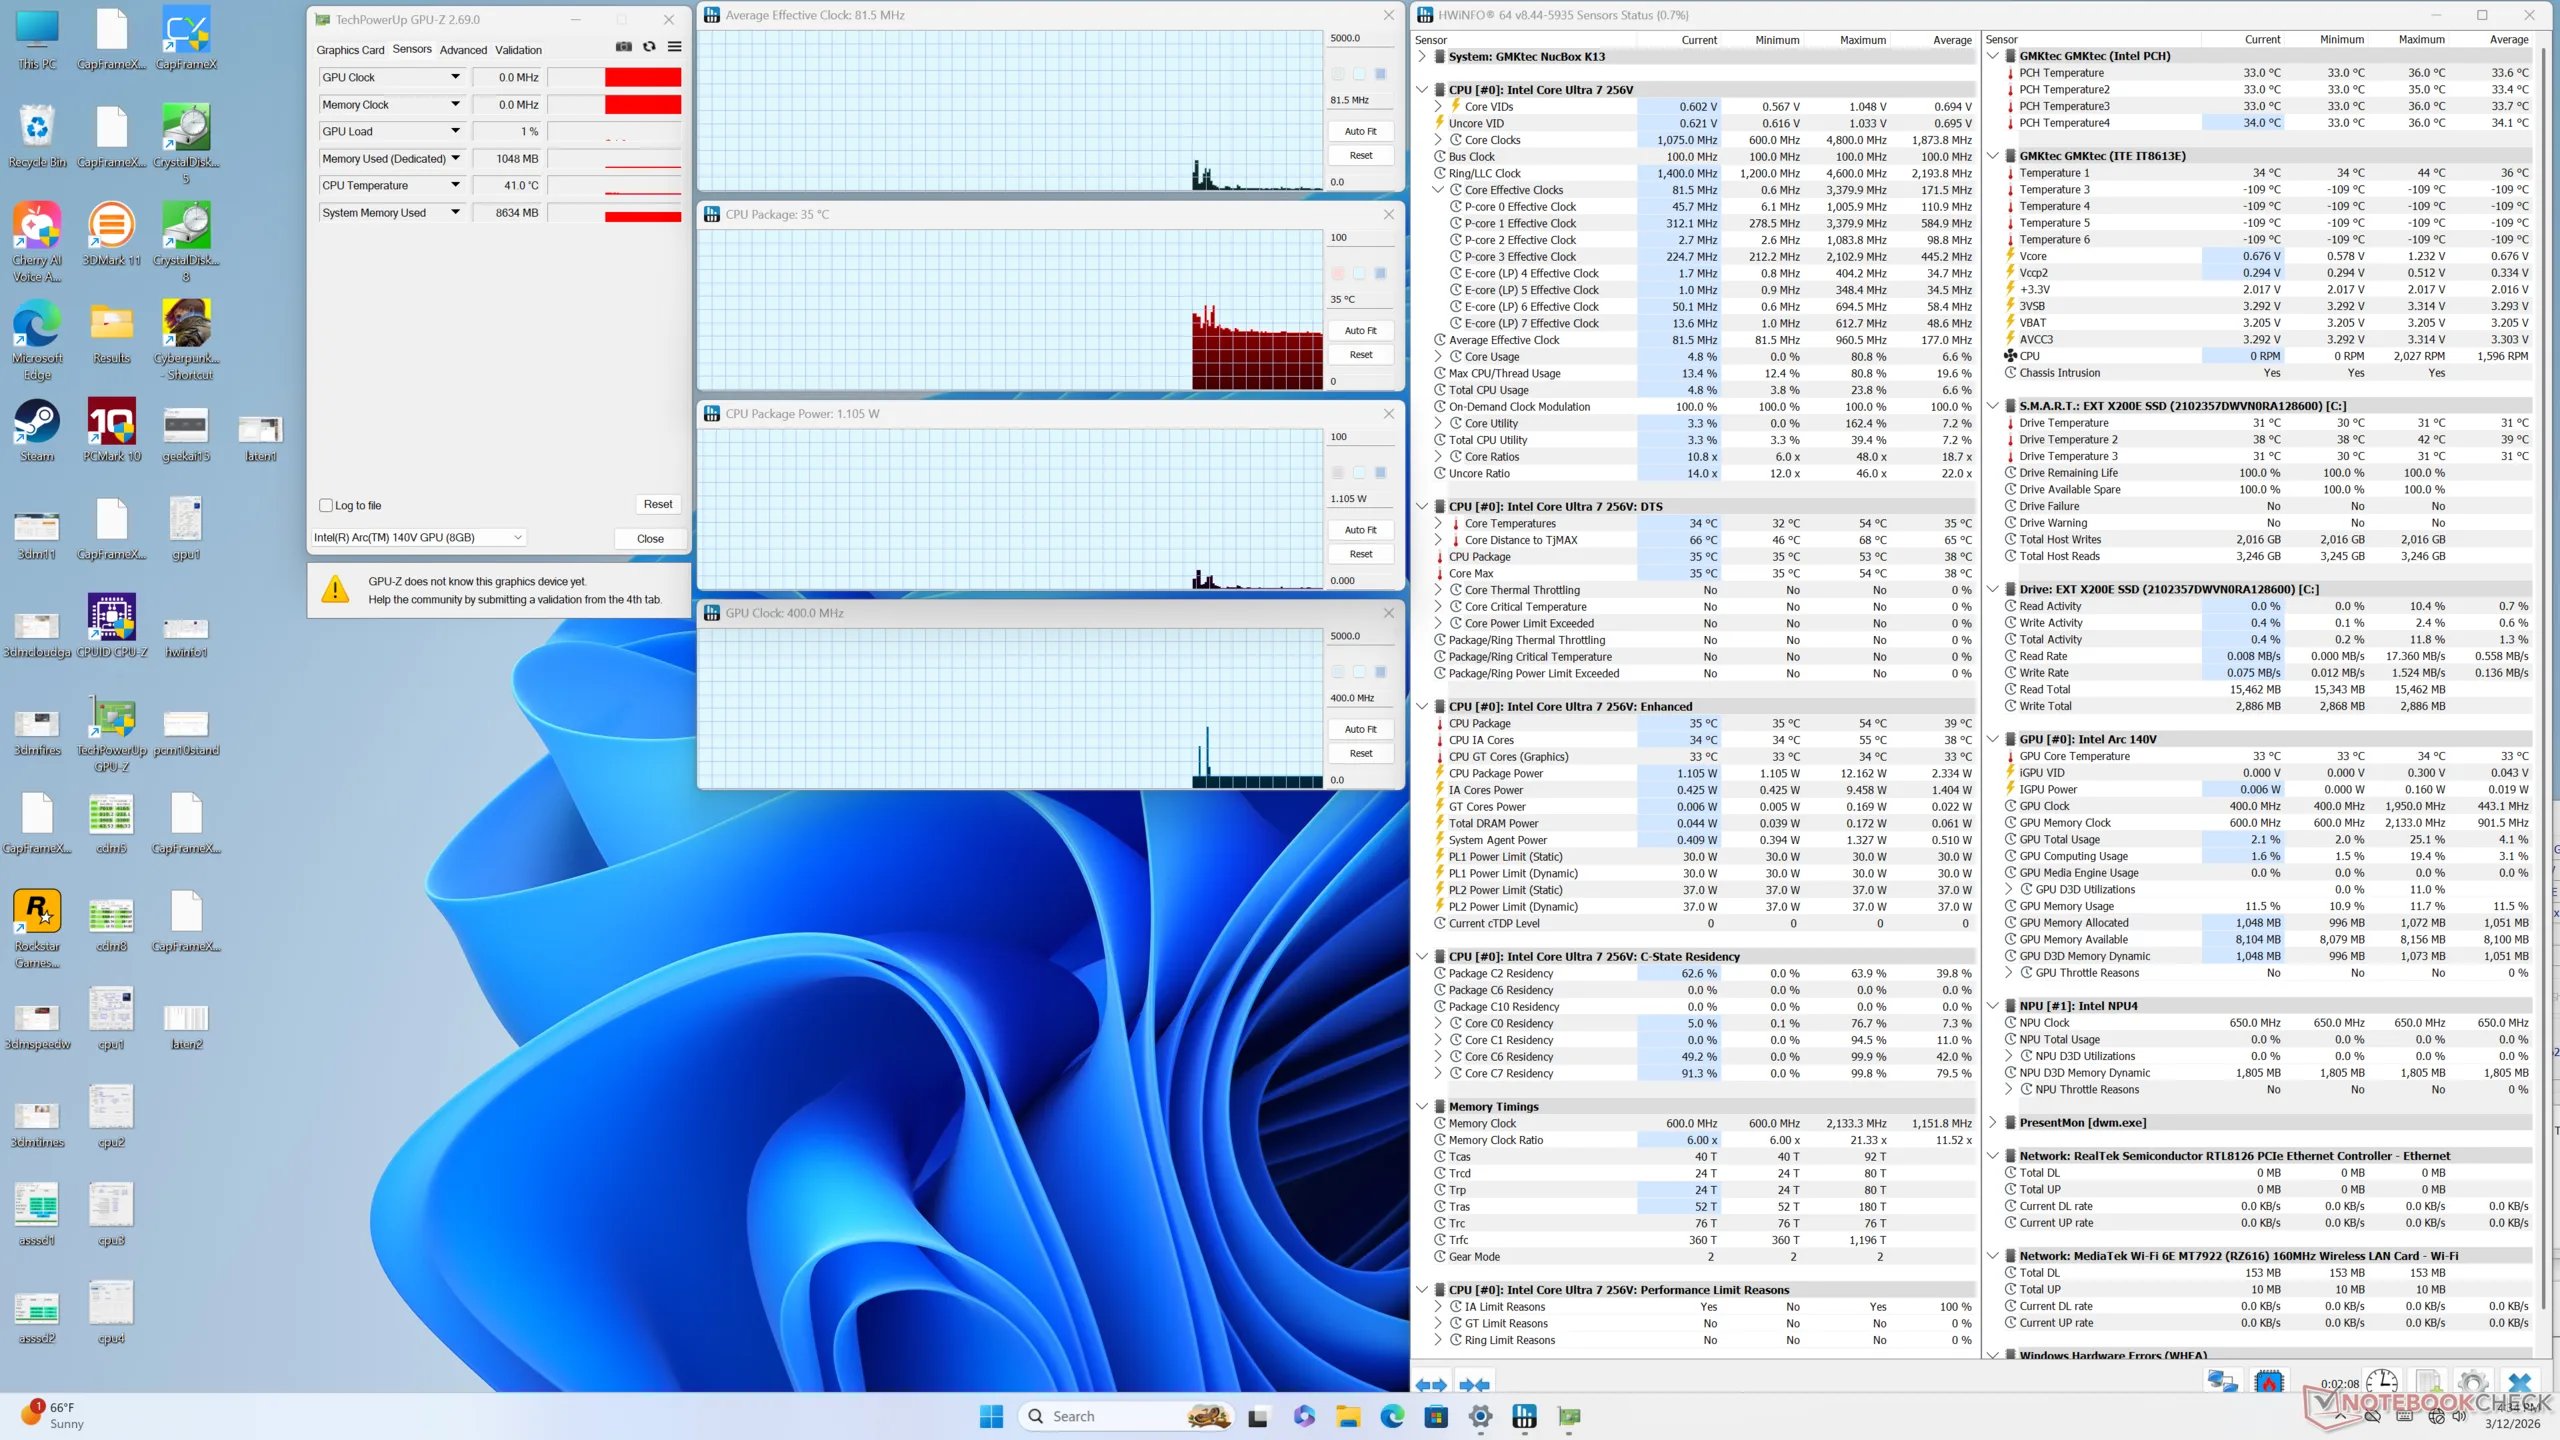
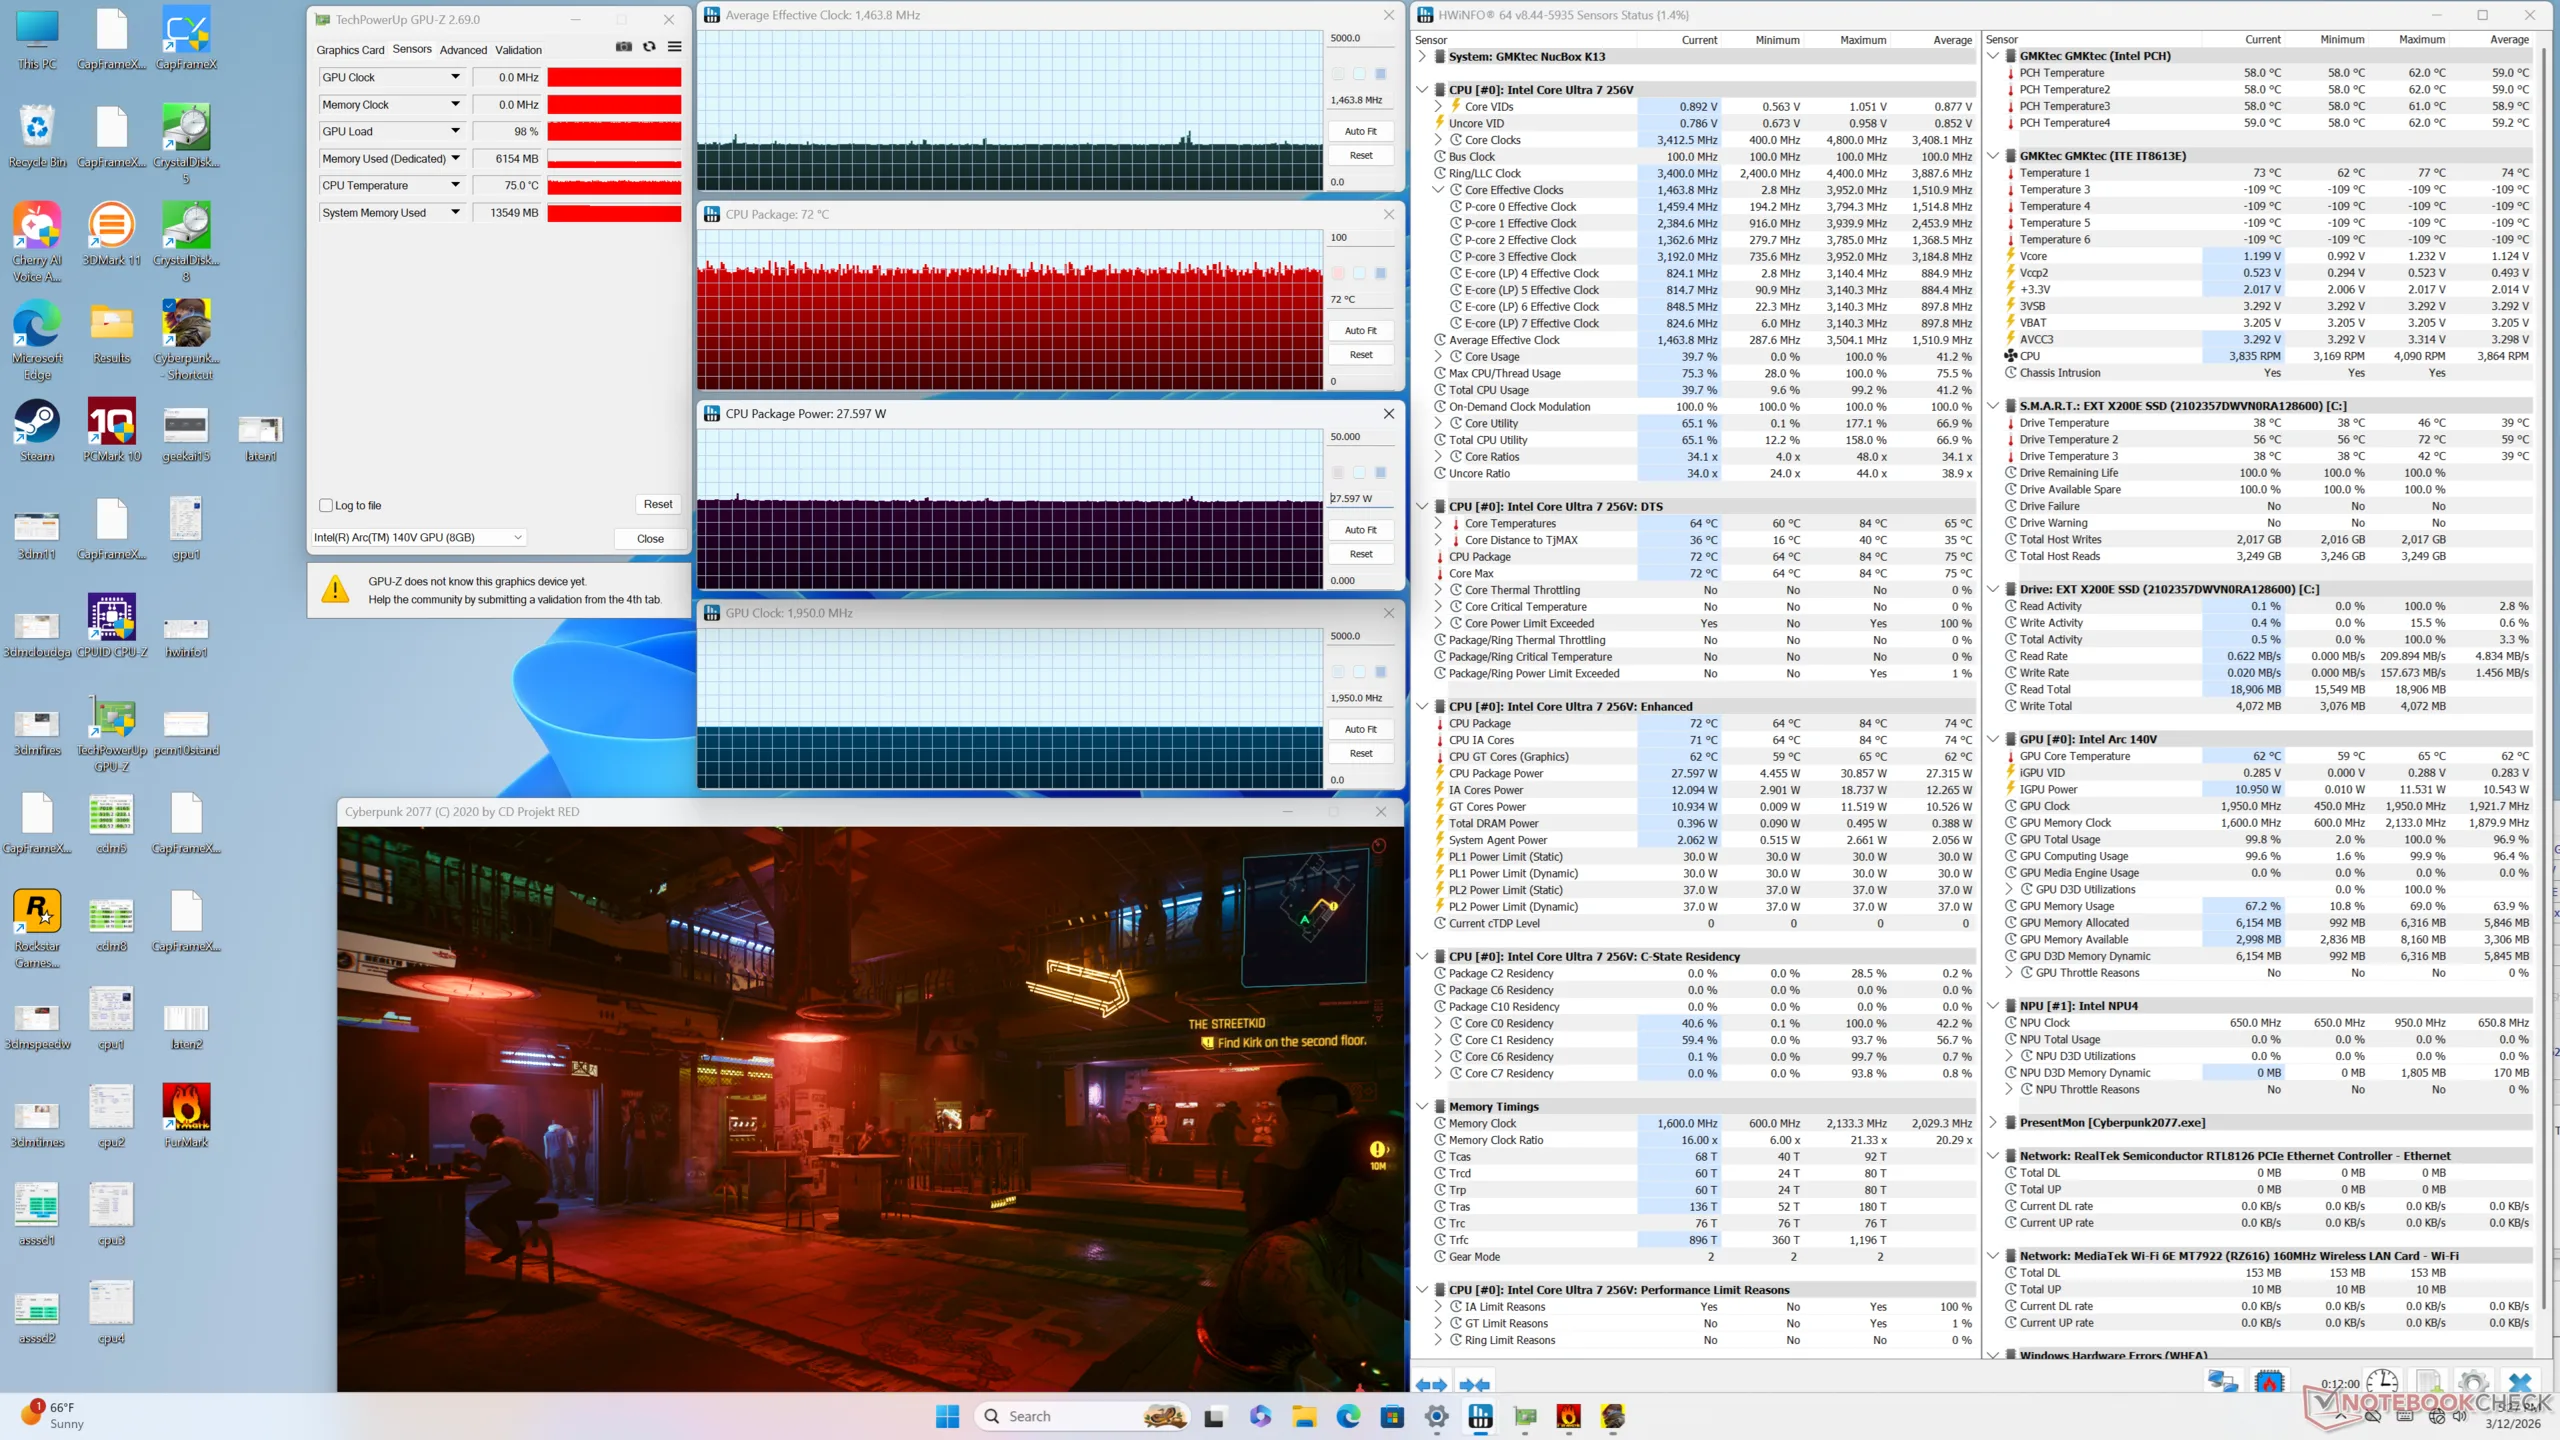
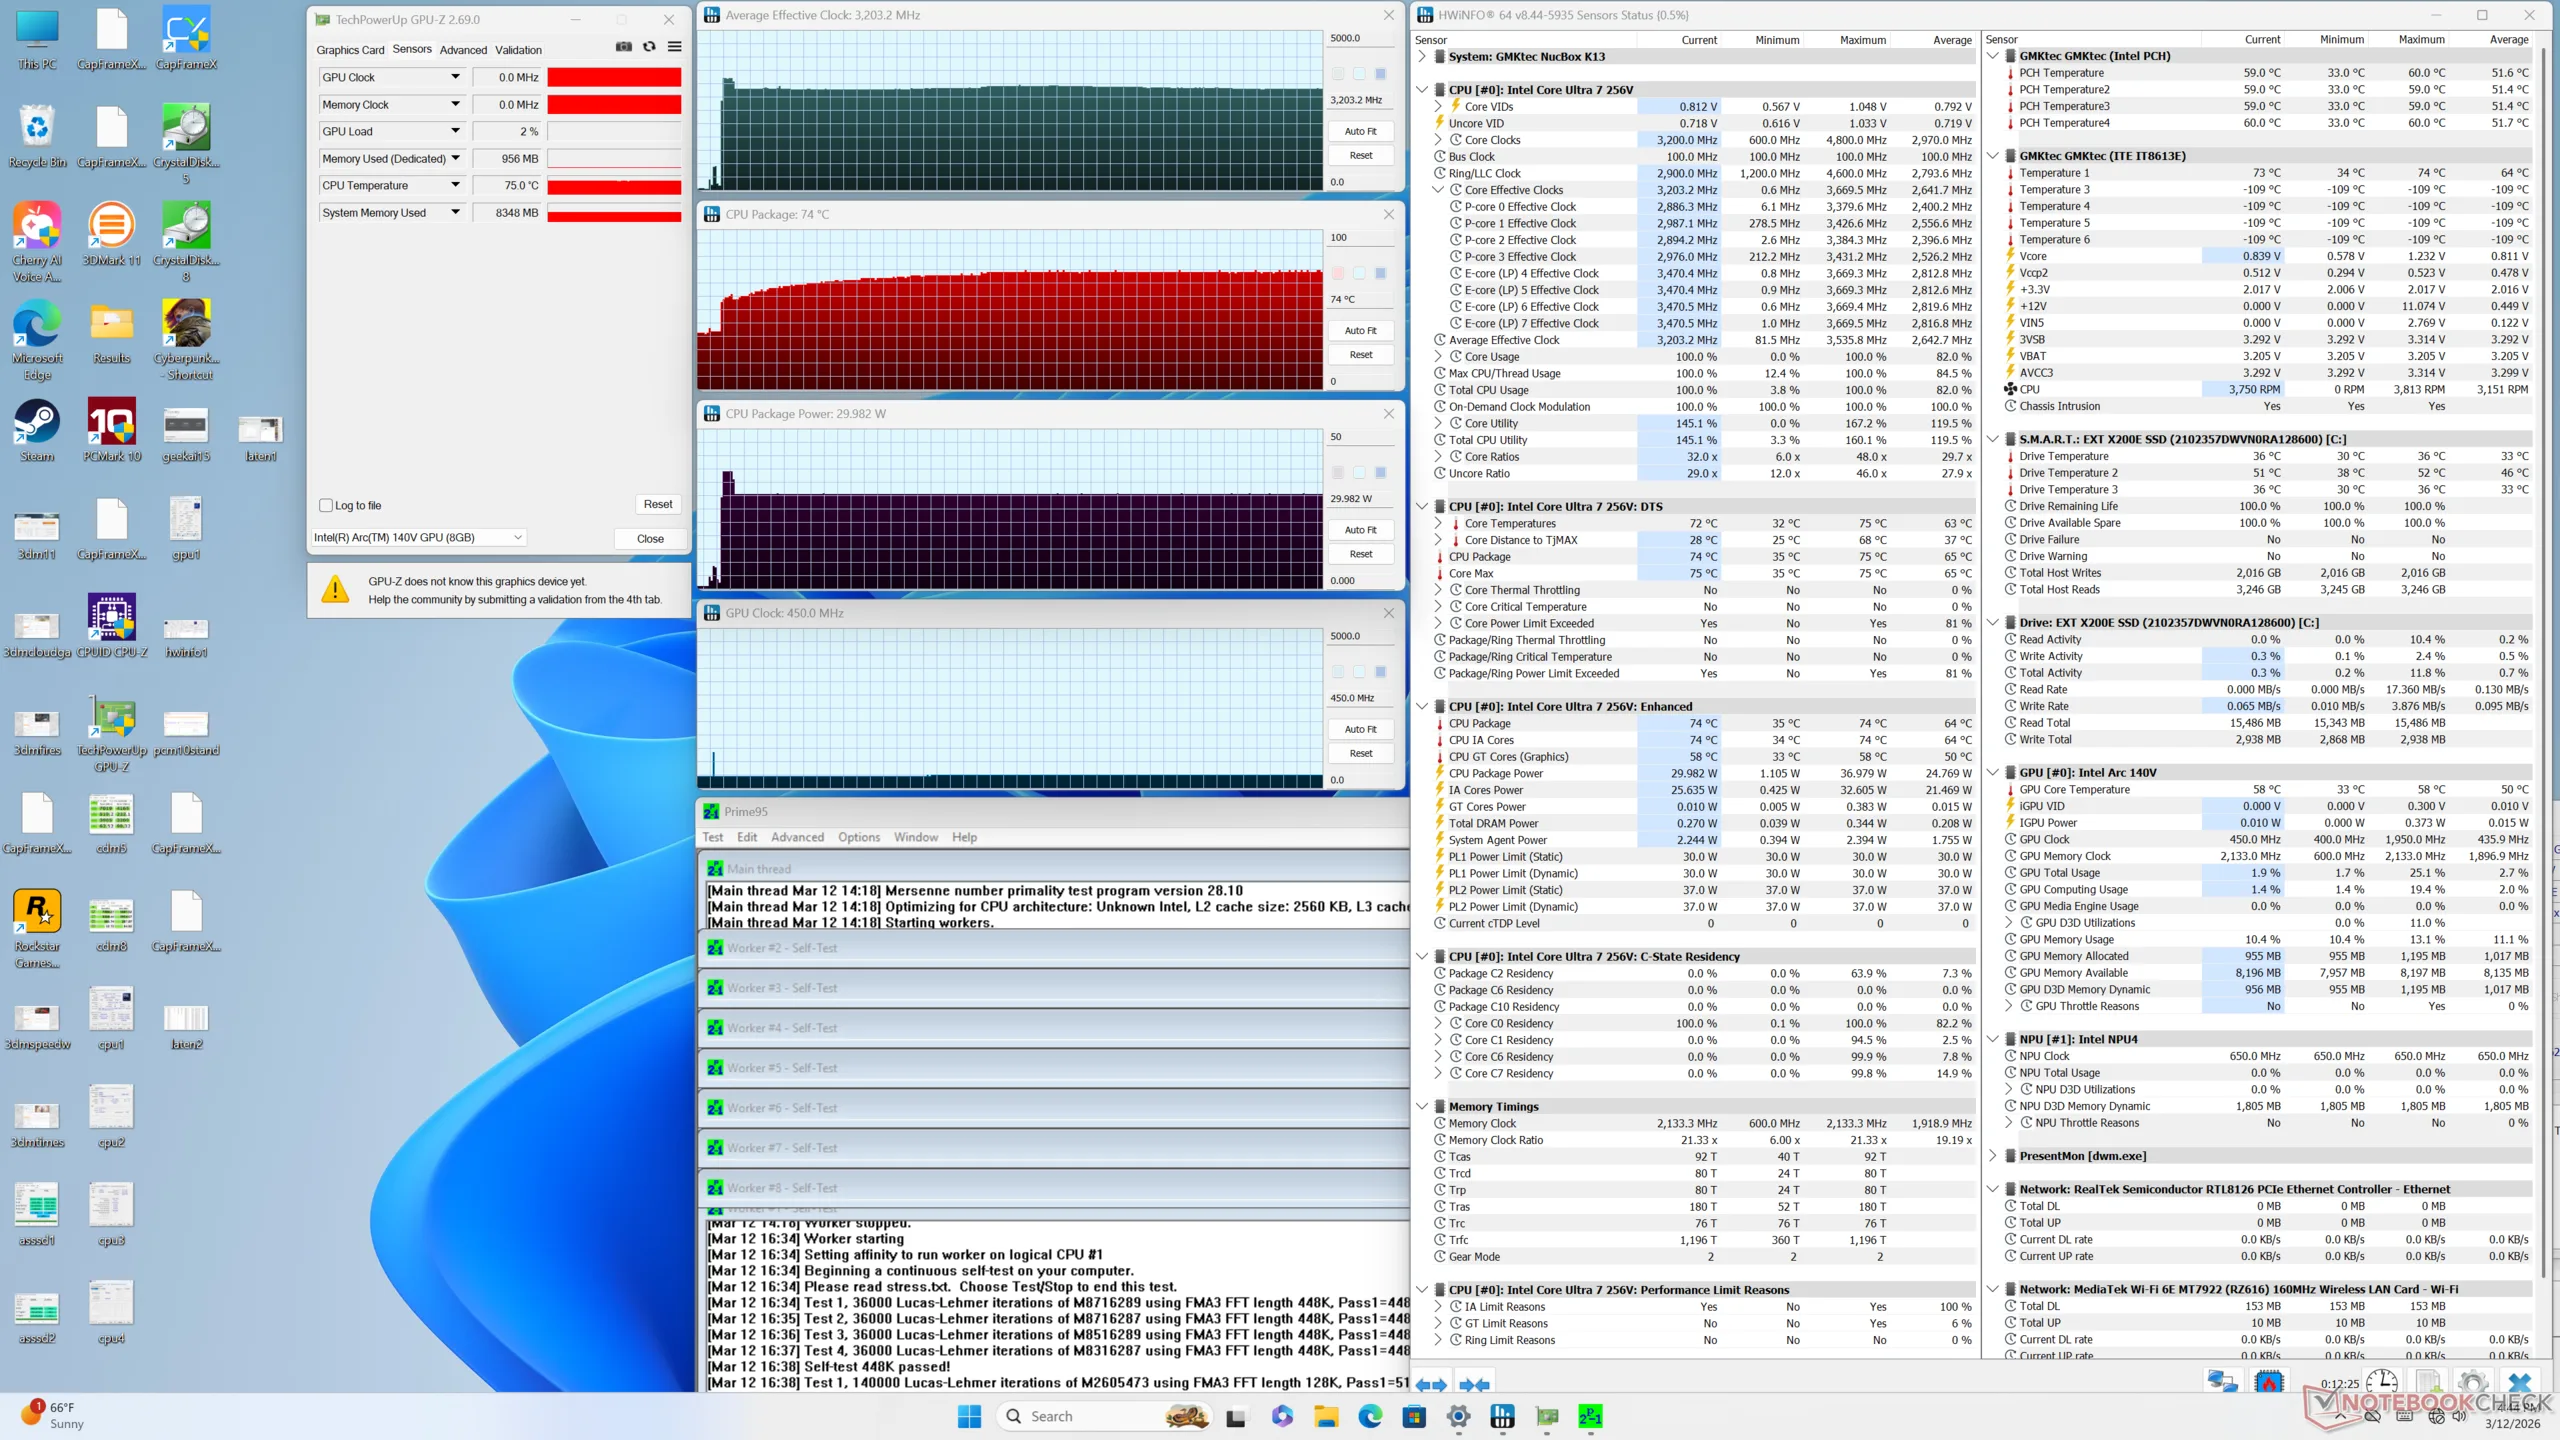
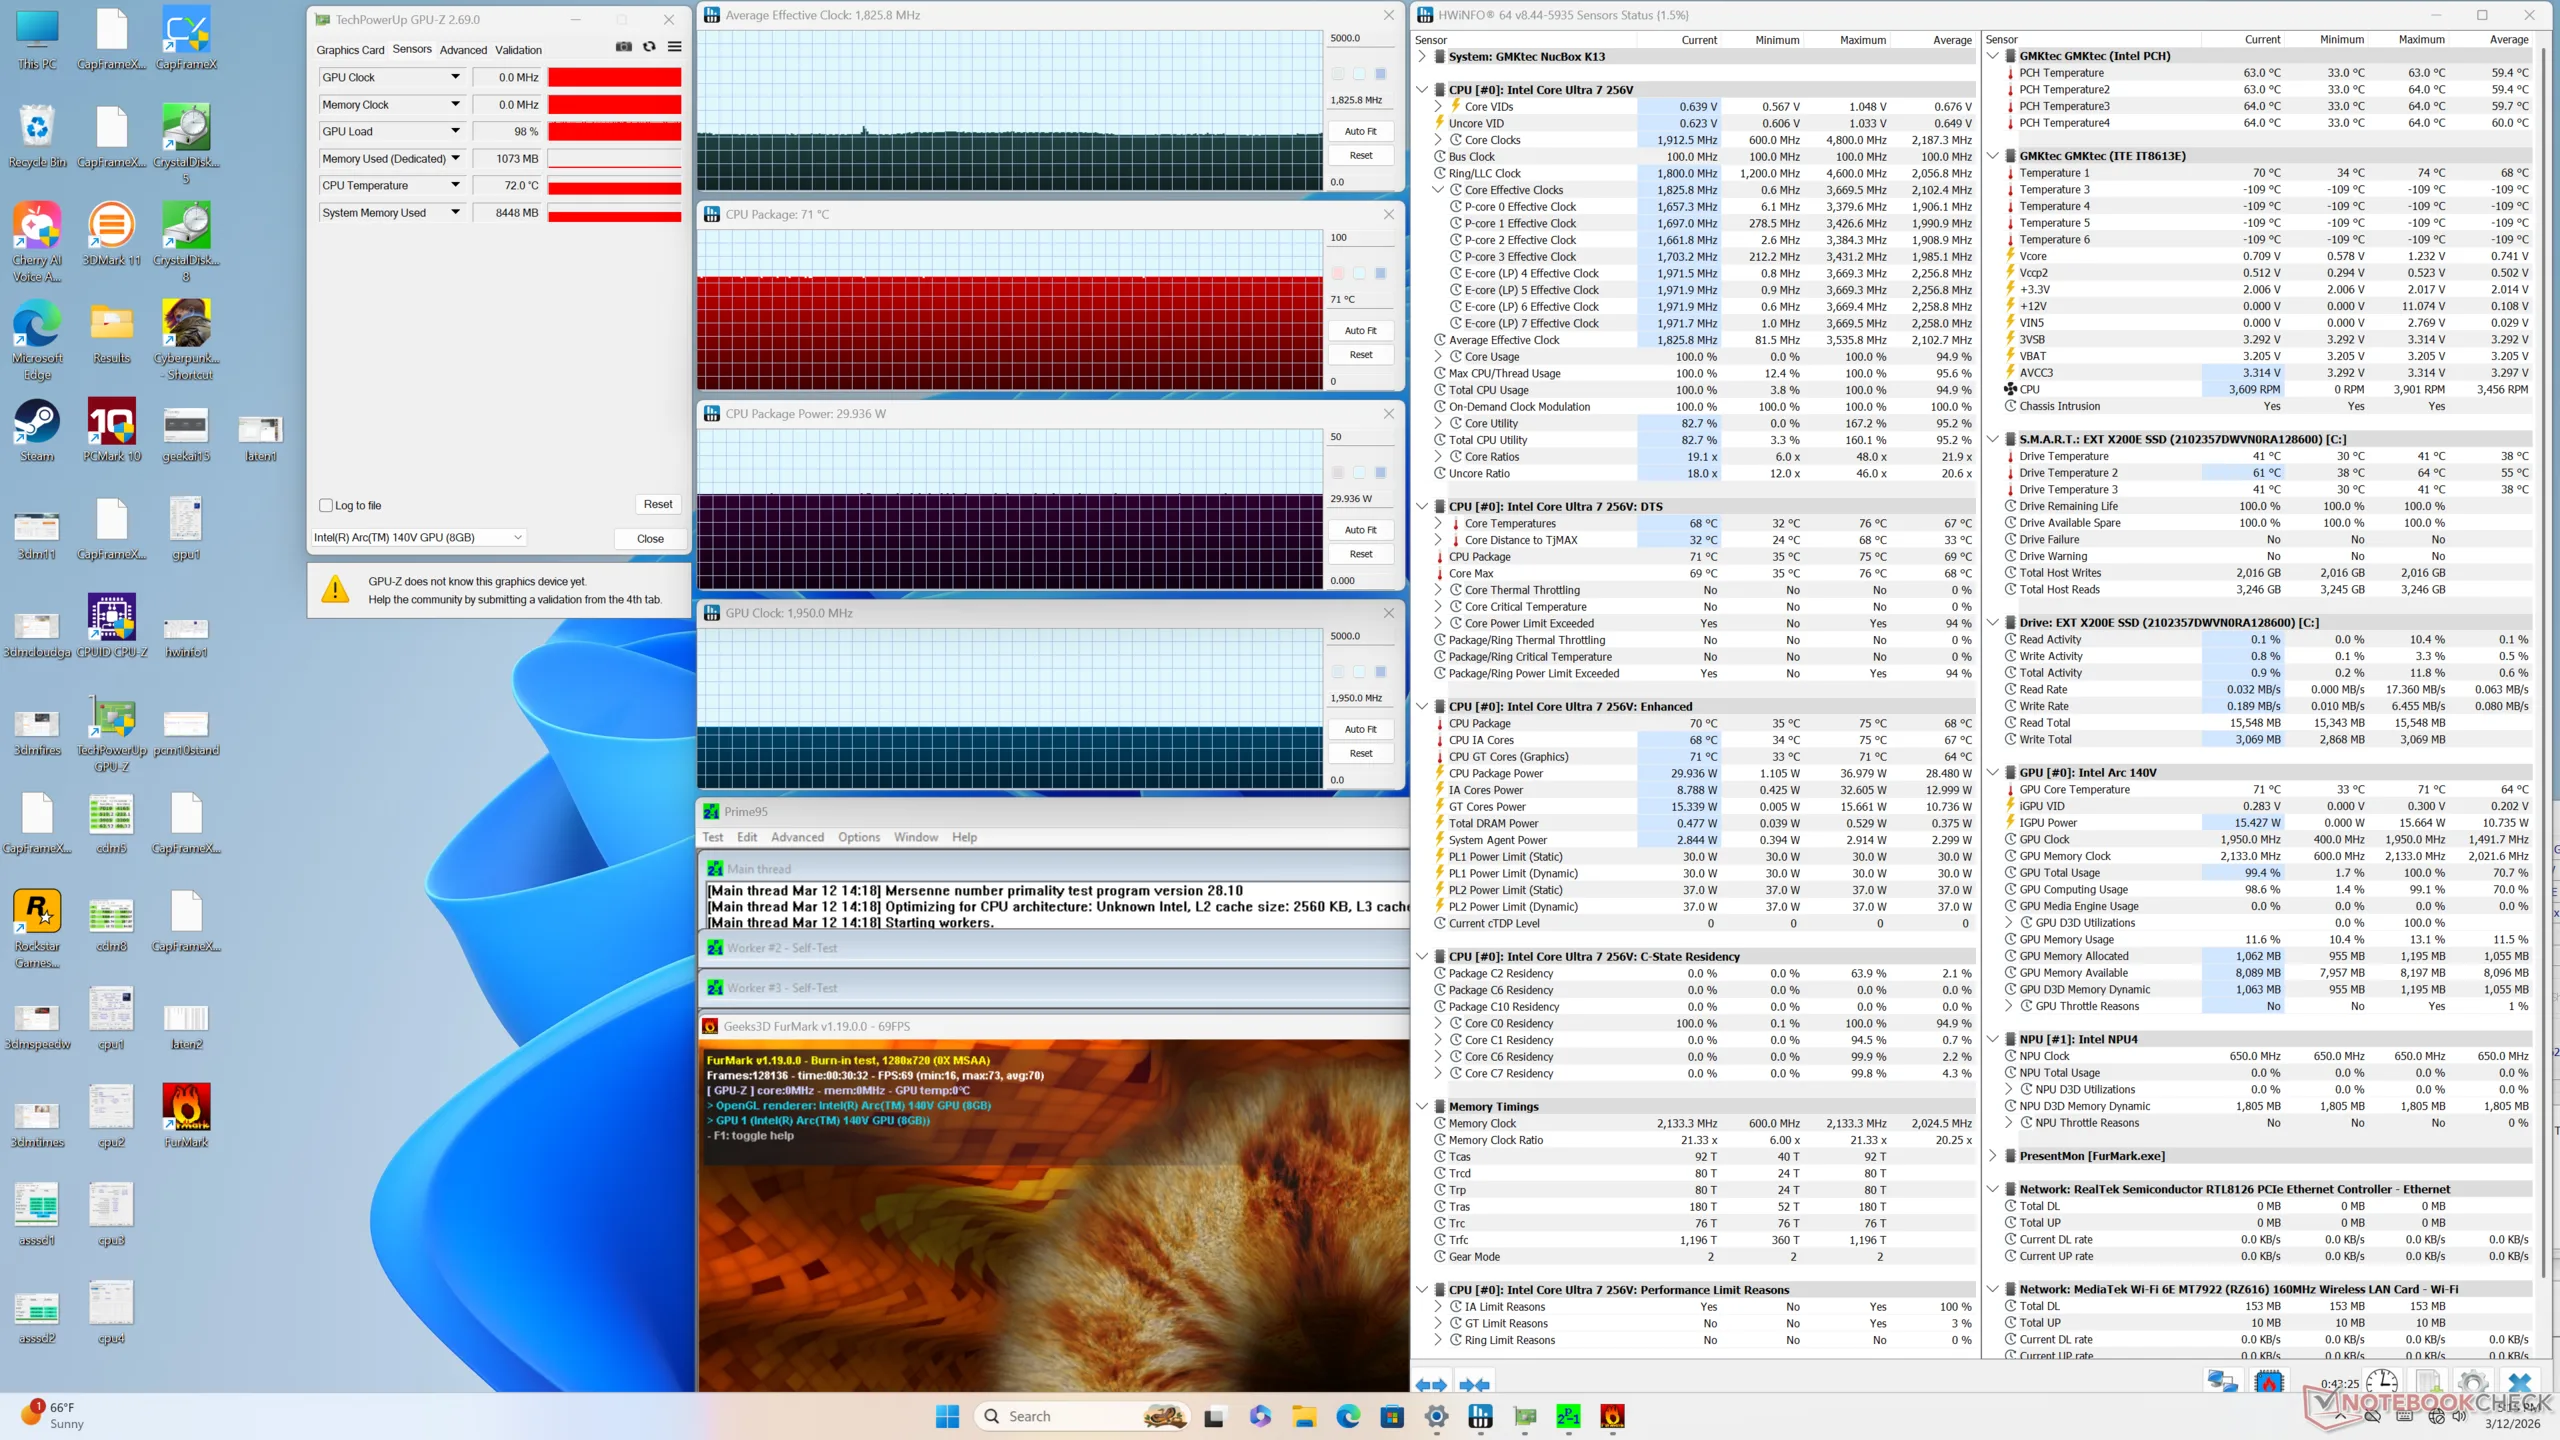
| CPU Klok (GHz) | GPU Klok (MHz) | Gemiddelde CPU Temperatuur (°C) | |
| Inactief systeem | -- | -- | 35 |
| Prime95-stress | 3.2 | -- | 74 |
| Prime95 + FurMark Stress | 1.8 | 1950 | 71 |
| Cyberpunk 2077 Stress | 1.5 | 1950 | 72 |
Energiebeheer
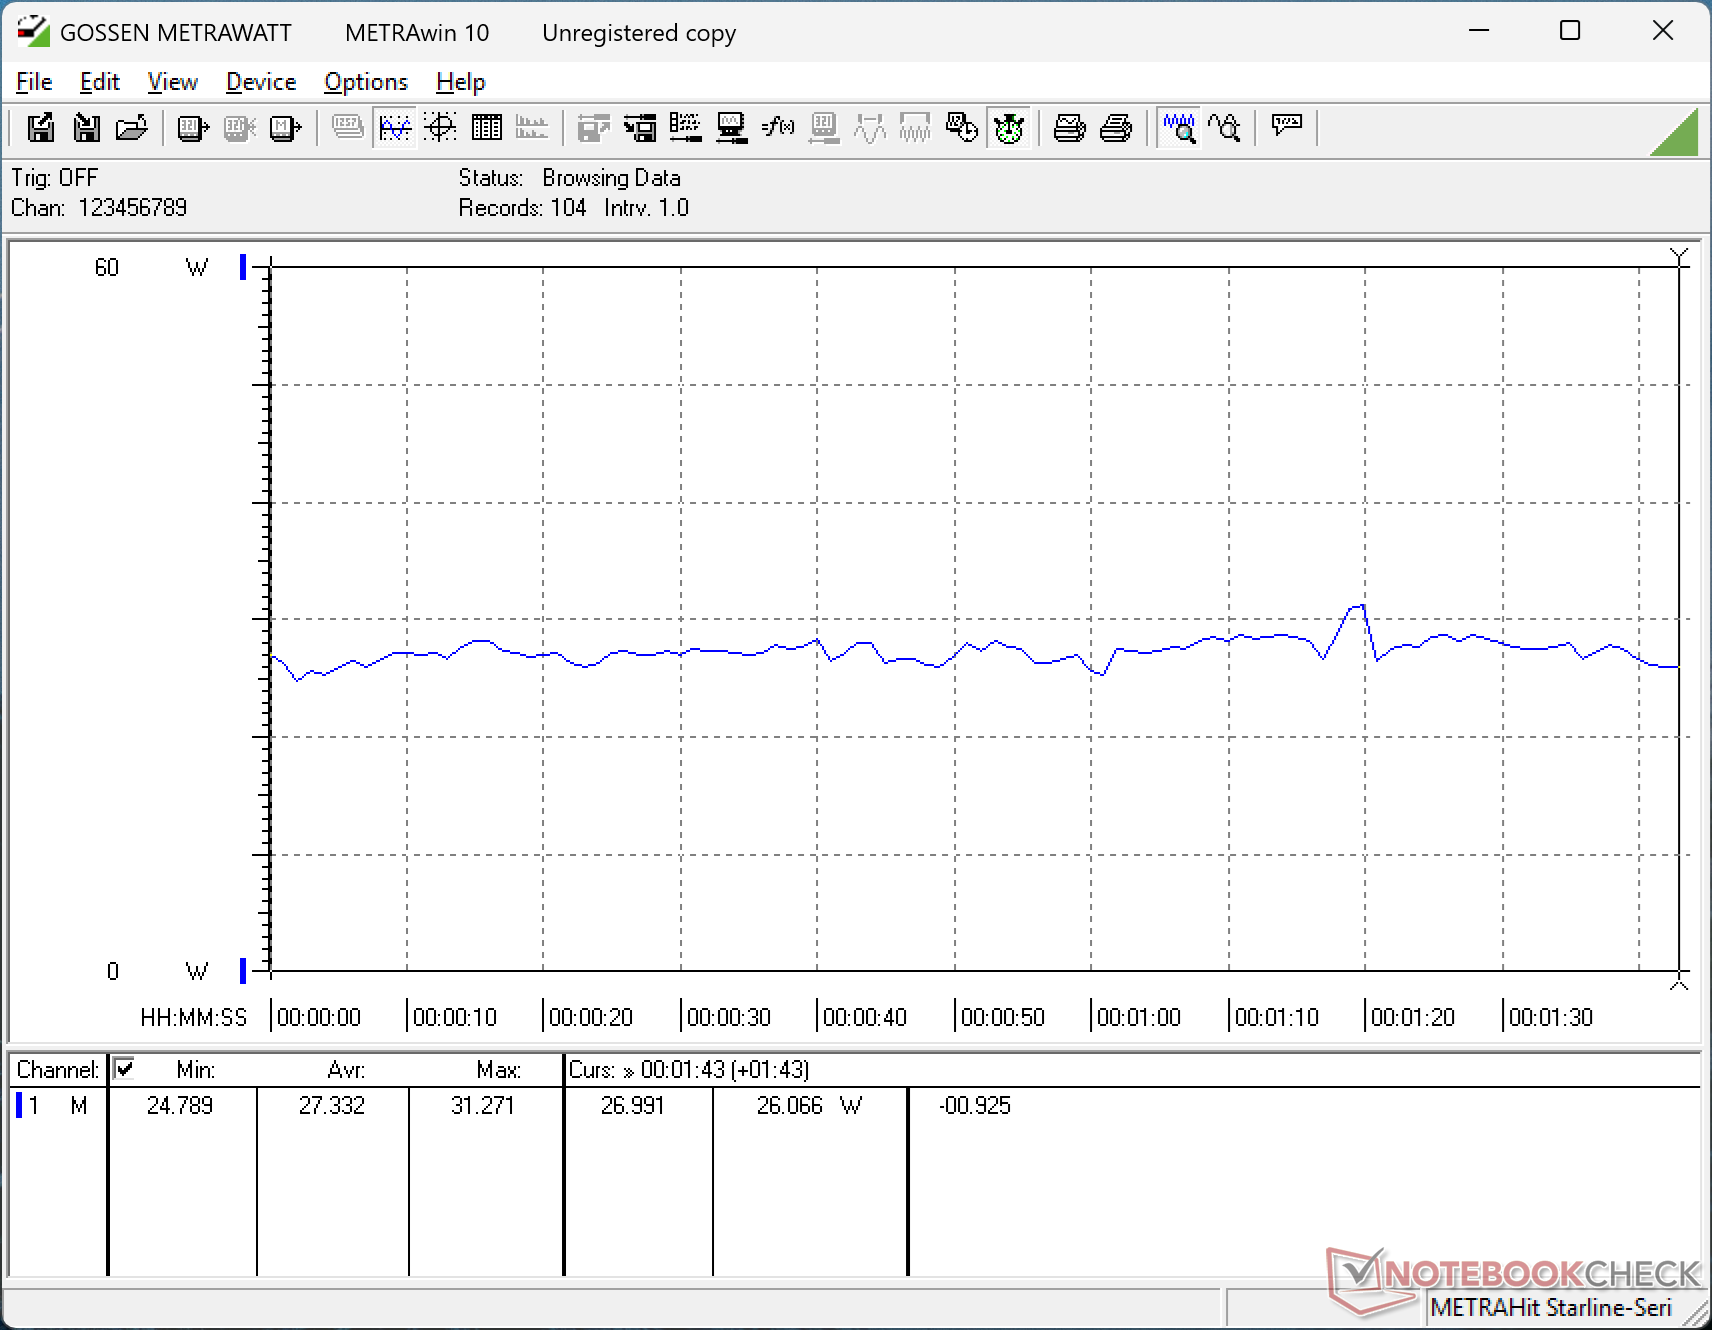
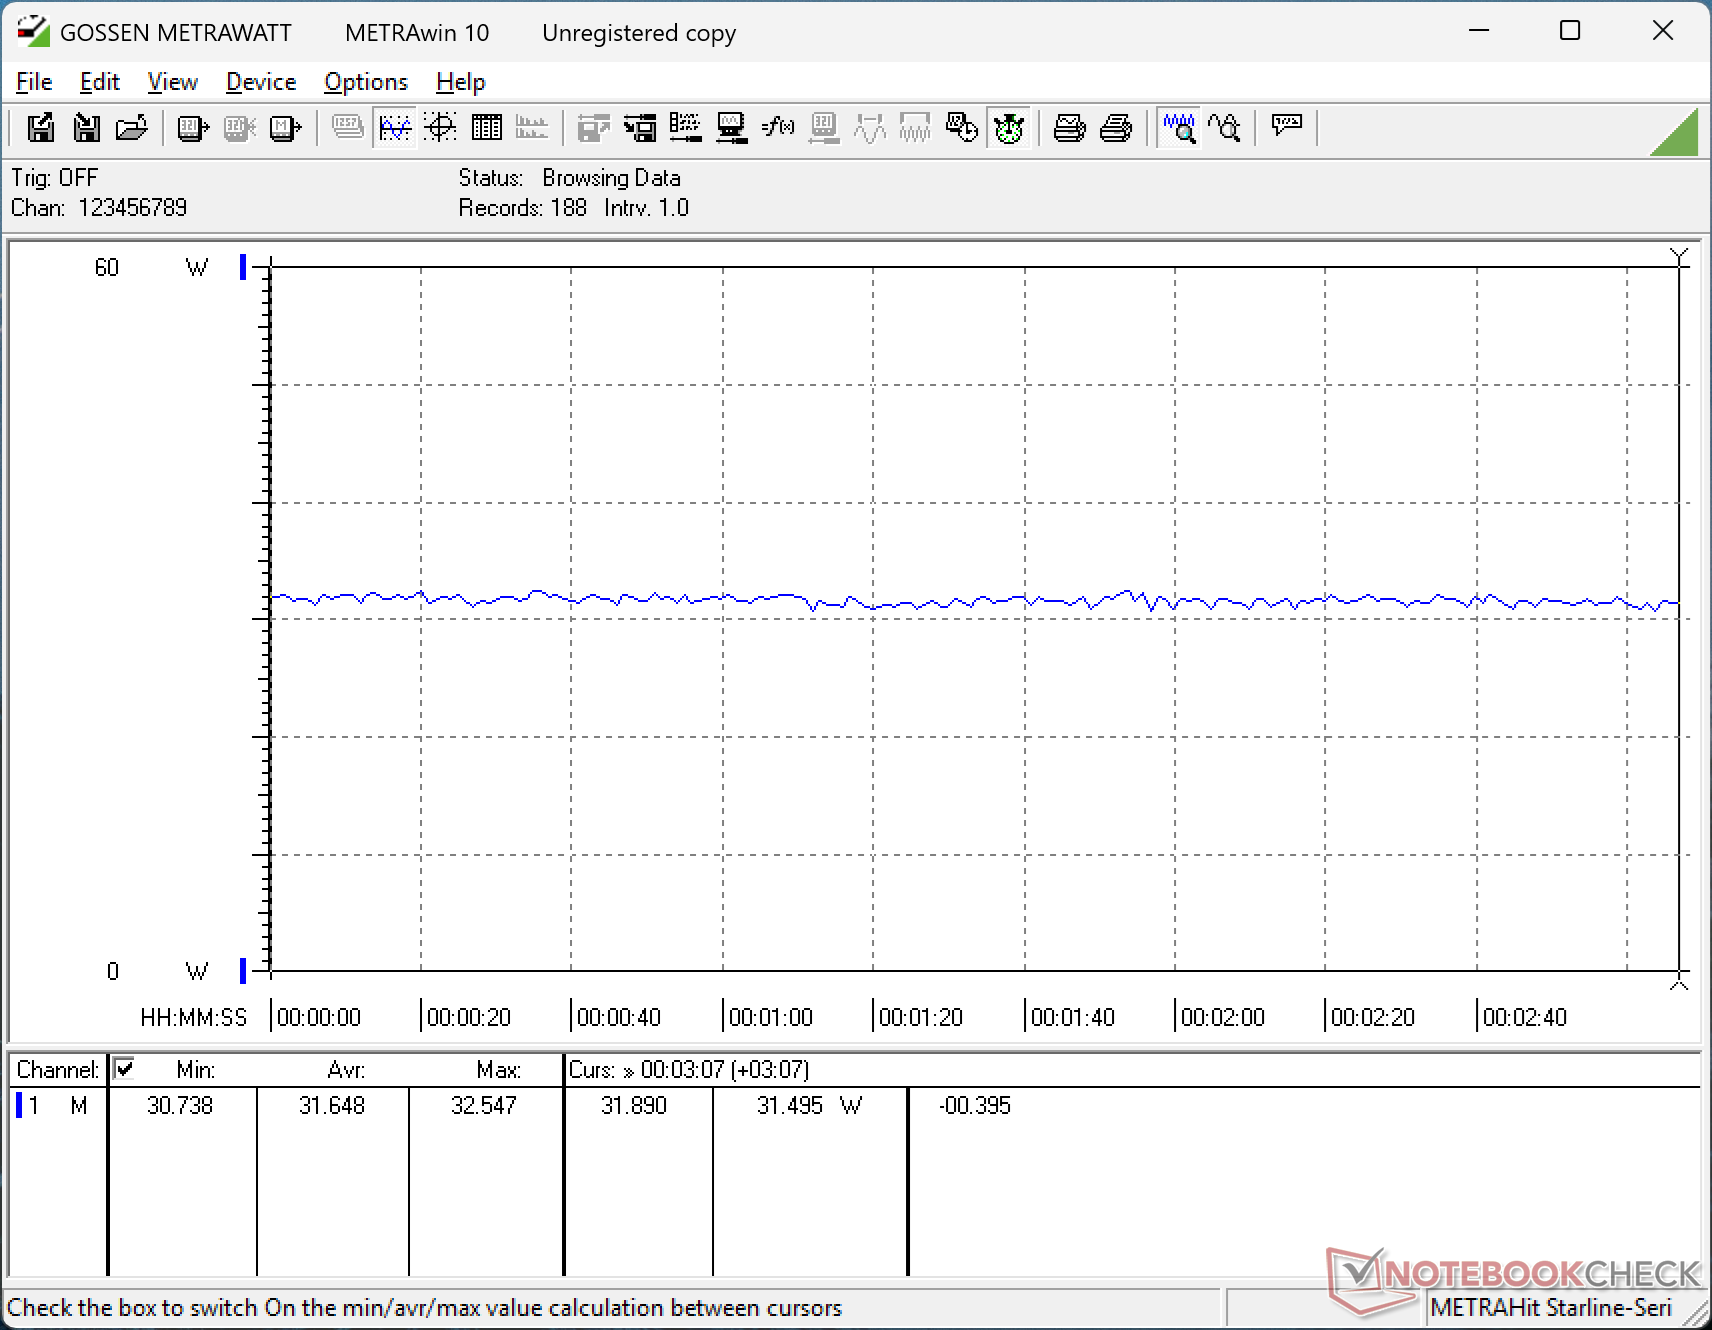
Stroomverbruik
Lunar Lake-V is extreem efficiënt, zoals blijkt uit de onderstaande tabellen. Het systeem verbruikt gemiddeld slechts 32 W wanneer Cyberpunk 2077 wordt uitgevoerd, vergeleken met 86 W op de NucBox K12 die wordt aangedreven door de Radeon 780M. Deze laatste mag dan wel sneller zijn, hij is zeker niet 2x of 3x zo snel als onze Intel-oplossing.
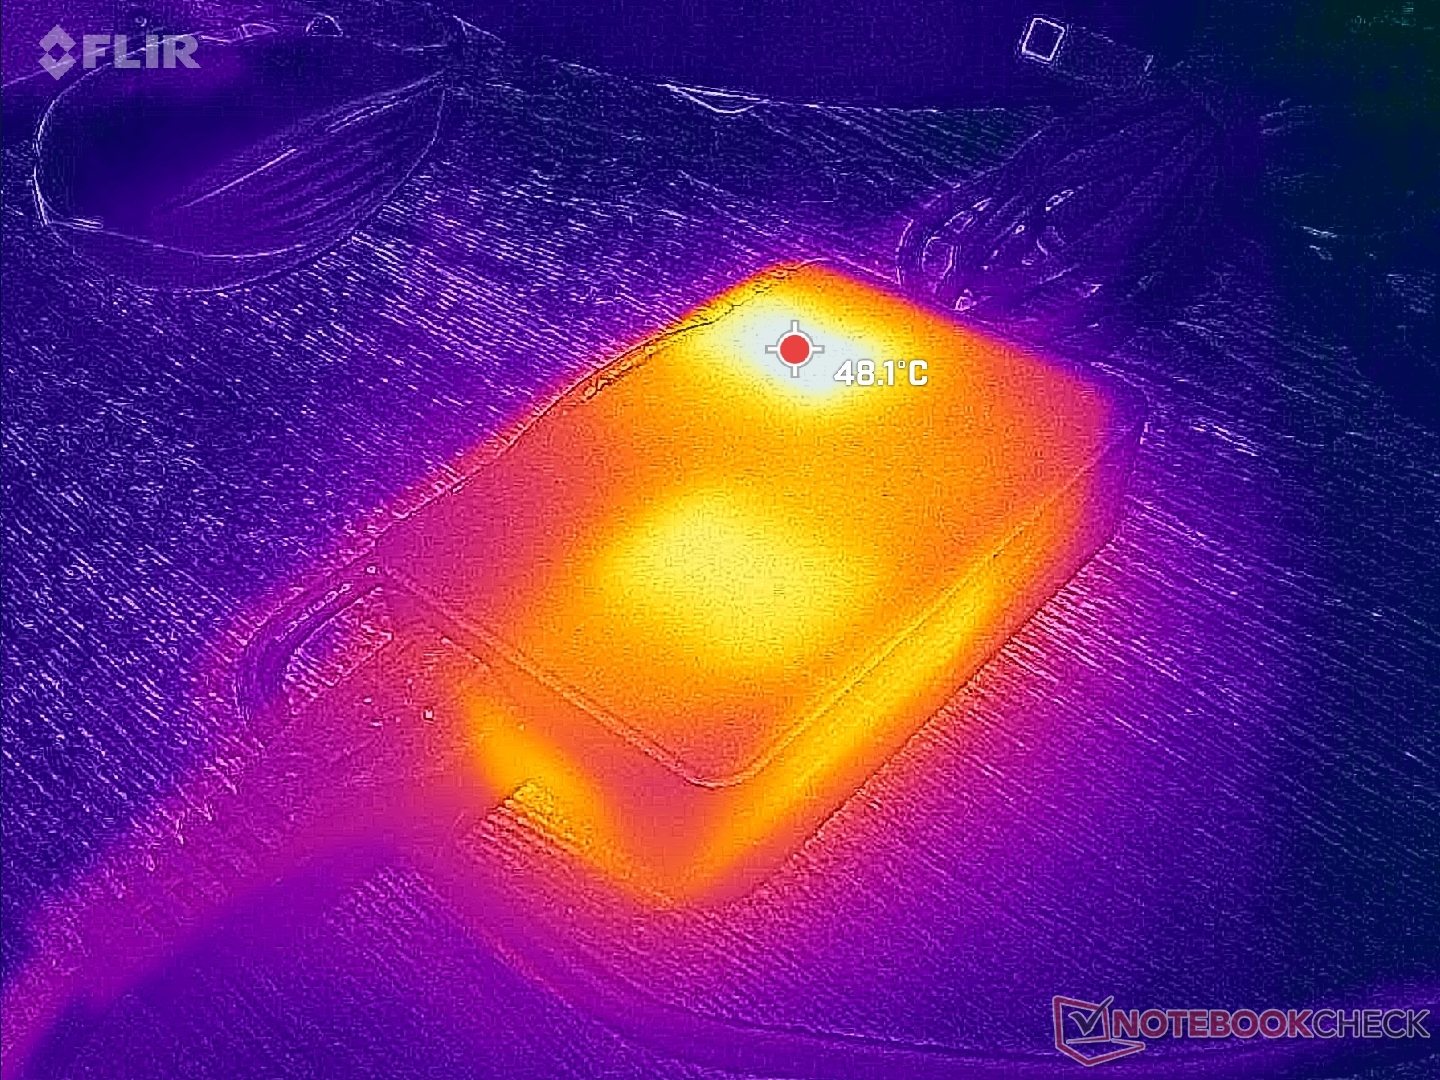
De 100 W voeding is met slechts ~9,9 x 6,3 x 2,3 cm vrij compact.

| Uit / Standby | |
| Inactief | |
| Belasting |
|
Key:
min: | |
| GMK NucBox K13 Core Ultra 7 256V, Arc 140V, Huawei eKitStor Xtreme 200e 1 TB, , x, | GMK NucBox K12 Ryzen 7 H 255, Radeon 780M, Crucial P3 Plus CT1000P3PSSD8, , x, | GMK EVO-T1 Ultra 9 285H, Arc 140T, Crucial P3 Plus CT1000P3PSSD8, , x, | Beelink SER9 Pro Ryzen 7 H 255, Radeon 780M, Crucial P3 Plus CT1000P3PSSD8, , x, | Asus NUC 15 Pro+ Ultra 9 285H, Arc 140T, Micron 3500 1TB MTFDKBA1T0TGD, , x, | MSI Cubi NUC AI+ 2MG Core Ultra 7 258V, Arc 140V, Phison 1 TB ESR01TBTCCZ-27J, , x, | |
|---|---|---|---|---|---|---|
| Power Consumption | -183% | -141% | -120% | -116% | -47% | |
| Idle Minimum * (Watt) | 2.3 | 9.9 -330% | 6.1 -165% | 7 -204% | 3.9 -70% | 2.9 -26% |
| Idle Average * (Watt) | 3.6 | 10.1 -181% | 7.9 -119% | 7.1 -97% | 6.1 -69% | 5.7 -58% |
| Idle Maximum * (Watt) | 5.8 | 13.1 -126% | 13.2 -128% | 7.5 -29% | 8.2 -41% | 10.2 -76% |
| Load Average * (Watt) | 27.3 | 69.8 -156% | 60.7 -122% | 62.3 -128% | 56.1 -105% | 38.7 -42% |
| Cyberpunk 2077 ultra external monitor * (Watt) | 31.6 | 86.3 -173% | 67.4 -113% | 80.1 -153% | 63.9 -102% | 41.1 -30% |
| Load Maximum * (Watt) | 39.6 | 92.8 -134% | 117.1 -196% | 82.9 -109% | 160.6 -306% | 60 -52% |
* ... kleiner is beter
Stroomverbruik Cyberpunk / Stresstest
Stroomverbruik externe monitor
Notebookcheck Beoordeling
De zeer compacte GMK NucBox K13 zorgt voor een goede balans tussen grootte en prestaties, zij het ten koste van een luider ventilatorgeluid en een paar ontbrekende extra functies.
GMK NucBox K13
- 16-03-2026 v8
Allen Ngo
 Total Sustainability Score:
 Potentiële concurrenten in vergelijking
Afbeelding | Model / recensie | prijs | Gewicht | Hoogte | Scherm |
|---|---|---|---|---|---|
1. 77.4% 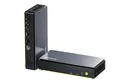 | GMK NucBox K13 Intel Core Ultra 7 256V ⎘ Intel Arc Graphics 140V ⎘ 16 GB Geheugen, 1024 GB SSD | Amazon: Catalogusprijs: 670 USD | 506 g | 36.6 mm | x |
2. 73.7% 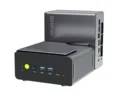 | GMK NucBox K12 AMD Ryzen 7 H 255 ⎘ AMD Radeon 780M ⎘ 32 GB Geheugen, 1024 GB SSD | Amazon: 1. $29.99 19V~20V Charger for GMKtec M... | 938 g | 78 mm | x |
3. 75.4%  | GMK EVO-T1 Intel Core Ultra 9 285H ⎘ Intel Arc Graphics 140T ⎘ 64 GB Geheugen, 1024 GB SSD | Amazon: Catalogusprijs: 999€ | 946 g | 73.6 mm | x |
4. 80.2% 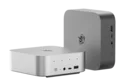 | Beelink SER9 Pro AMD Ryzen 7 H 255 ⎘ AMD Radeon 780M ⎘ 32 GB Geheugen, 1024 GB SSD | Amazon: Catalogusprijs: 520 USD | 812 g | 44.7 mm | x |
5. 77.5% 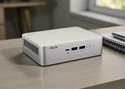 | Asus NUC 15 Pro+ Intel Core Ultra 9 285H ⎘ Intel Arc Graphics 140T ⎘ 32 GB Geheugen, 1024 GB SSD | Amazon: $1,230.00 Catalogusprijs: 991€ | 690 g | 42 mm | x |
6. 75.2% 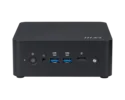 | MSI Cubi NUC AI+ 2MG Intel Core Ultra 7 258V ⎘ Intel Arc Graphics 140V ⎘ 32 GB Geheugen, 1000 GB SSD | Amazon: Catalogusprijs: 900 USD | 669 g | 50.1 mm | x |
Transparantie
De selectie van te beoordelen apparaten wordt gemaakt door onze redactie. Het testexemplaar werd ten behoeve van deze beoordeling door de fabrikant of detailhandelaar in bruikleen aan de auteur verstrekt. De kredietverstrekker had geen invloed op deze recensie, noch ontving de fabrikant vóór publicatie een exemplaar van deze recensie. Er bestond geen verplichting om deze recensie te publiceren. Als onafhankelijk mediabedrijf is Notebookcheck niet onderworpen aan het gezag van fabrikanten, detailhandelaren of uitgevers.
[transparency_disclaimer]Dit is hoe Notebookcheck test
Elk jaar beoordeelt Notebookcheck onafhankelijk honderden laptops en smartphones met behulp van gestandaardiseerde procedures om ervoor te zorgen dat alle resultaten vergelijkbaar zijn. We hebben onze testmethoden al zo'n 20 jaar voortdurend ontwikkeld en daarbij de industriestandaard bepaald. In onze testlaboratoria wordt gebruik gemaakt van hoogwaardige meetapparatuur door ervaren technici en redacteuren. Deze tests omvatten een validatieproces in meerdere fasen. Ons complexe beoordelingssysteem is gebaseerd op honderden goed onderbouwde metingen en benchmarks, waardoor de objectiviteit behouden blijft. Meer informatie over onze testmethoden kunt u hier vinden.

