Onze top Intel NUC 11 alternatief: Beelink GTI 11 mini PC review
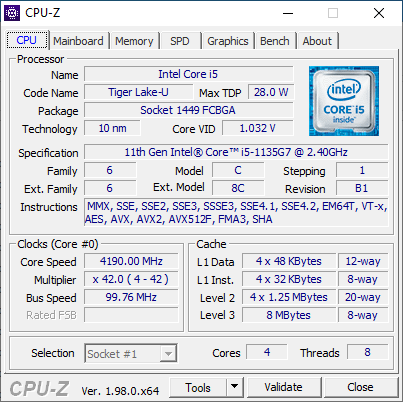
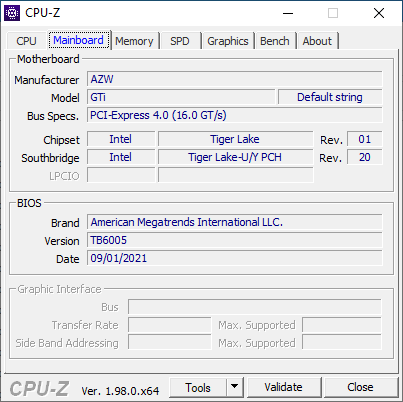
Beelink heeft een hele reeks mini PC's beschikbaar gericht op kopers die geïnteresseerd zijn in de Intel NUC ervaring zonder de hoge Intel NUC prijzen te moeten betalen. Het nieuwste model is de GTI 11 die gebruik maakt van de nieuwste 11e generatie Tiger Lake-U Core i5-1135G7 processor met geïntegreerde Iris Xe 80 EUs grafische processor. Dit detail is opmerkelijk aangezien de meeste andere Beelink mini PC's gebruik maken van oudere of tragere CPU's om de kosten op een betaalbaar niveau te houden. De GTI 11 is dan ook één van de snelste en duurste mini PC's in Beelink's huidige line-up.
Alternatieven voor de GTI 11 zijn andere mini PC's aangedreven door 11de generatie Intel Core U-serie CPU's zoals de Intel NUC11 Phantom Canyon, Beelink GMK NucBoc 2, of Zotac ZBox CI665 Nano
Meer Beelink reviews:
Potential Competitors in Comparison
Evaluatie | Datum | Model | Gewicht | Hoogte | Formaat | Resolutie | Beste prijs |
|---|---|---|---|---|---|---|---|
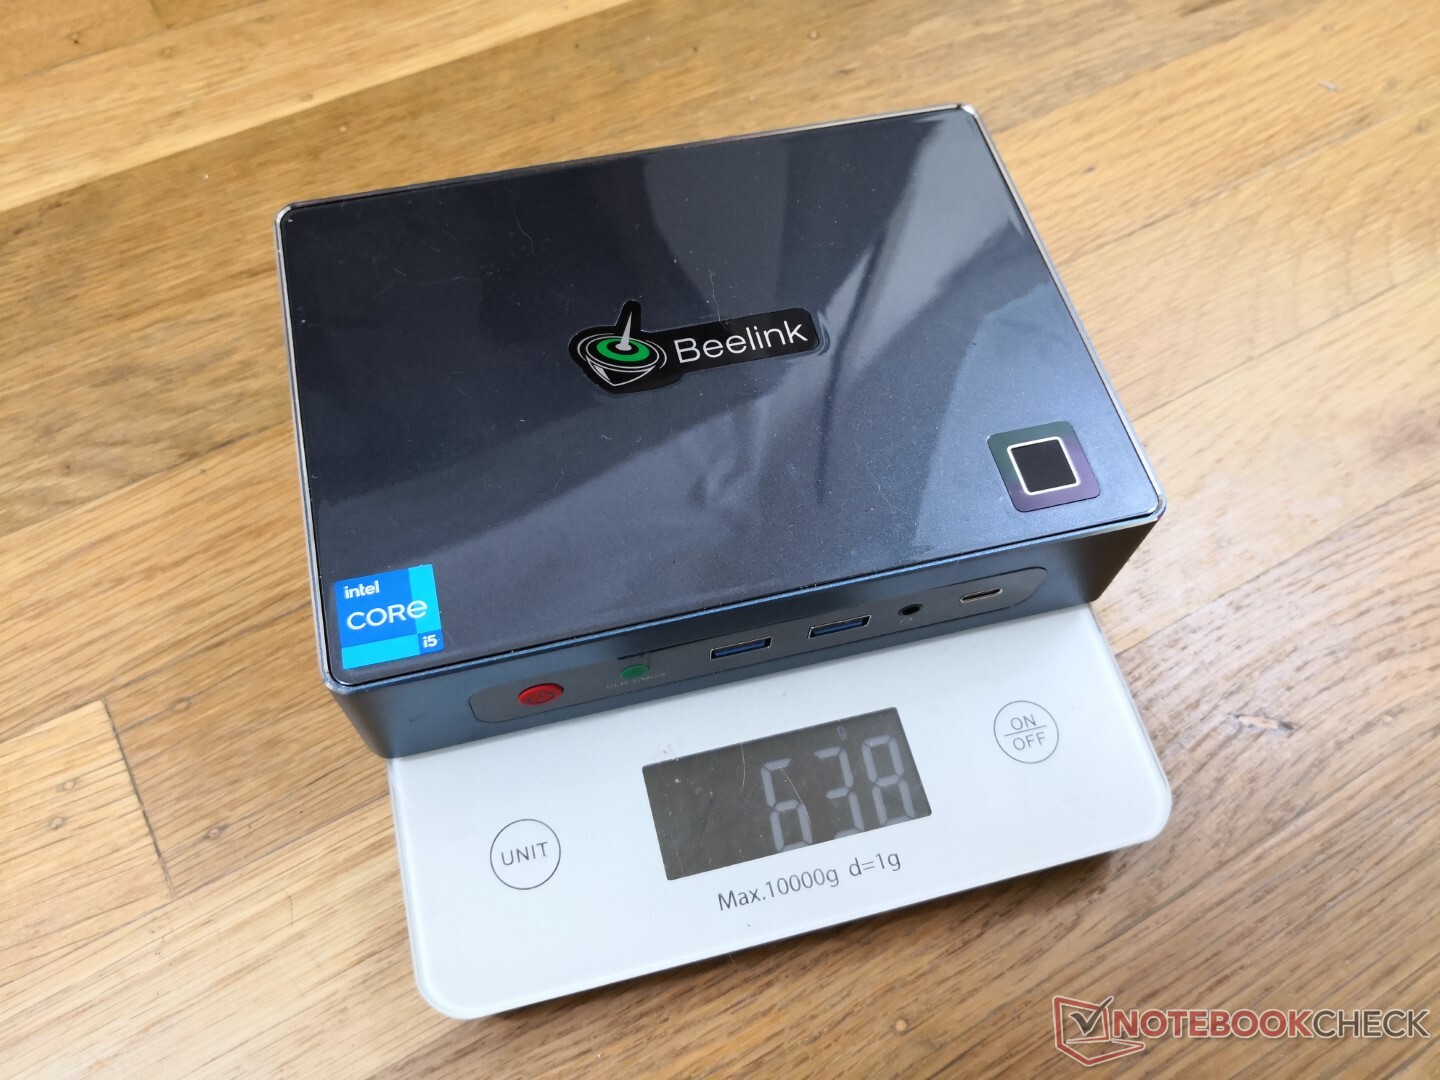
v (old) | 12-2021 | Beelink GTI 11 i5-1135G7, Iris Xe G7 80EUs | 638 g | 39 mm | x | ||
v (old) | 11-2021 | Beelink SER3 R7 3750H, Vega 10 | 492 g | 40 mm | x | ||
v (old) | 04-2021 | Intel NUC11TNKi5 i5-1135G7, Iris Xe G7 80EUs | 504 g | 37 mm | x | ||
v (old) | Intel NUC10i7FNH i7-10710U, UHD Graphics 620 | 697 g | 51 mm | 0.00" | 0x0 | ||
v (old) | 03-2021 | GMK NucBox 2 i5-8259U, Iris Plus Graphics 655 | 430 g | 50 mm | x | ||
v (old) | 04-2018 | Intel Hades Canyon NUC8i7HVK i7-8809G, Vega M GH | 1.3 kg | 39 mm | x |
Zaak
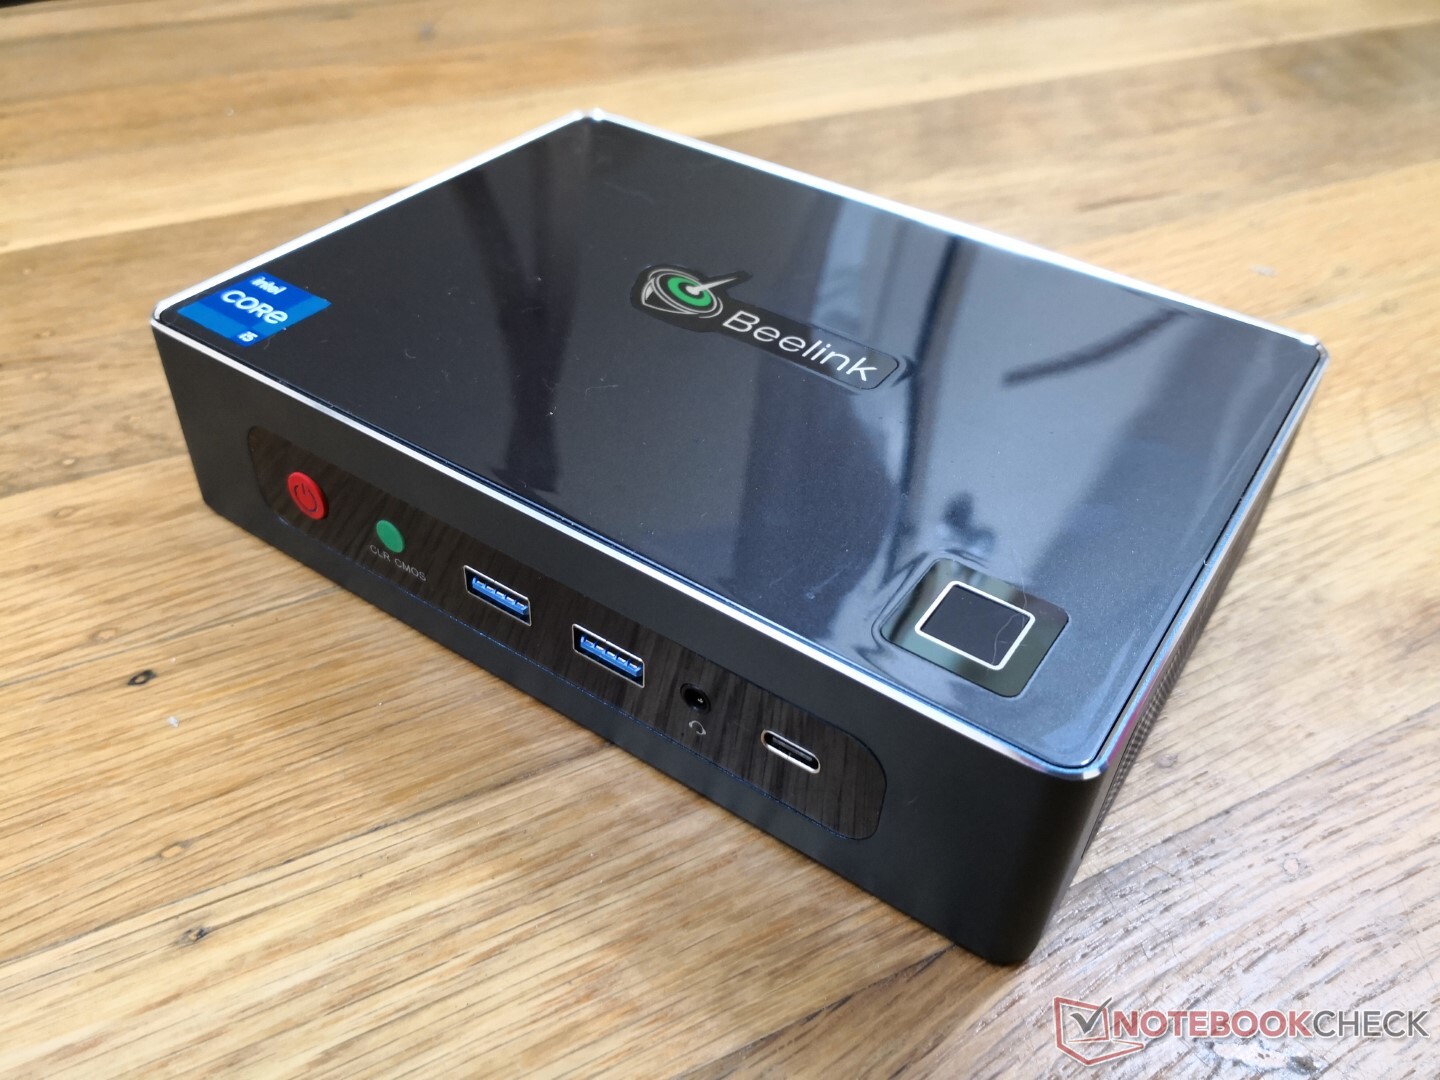
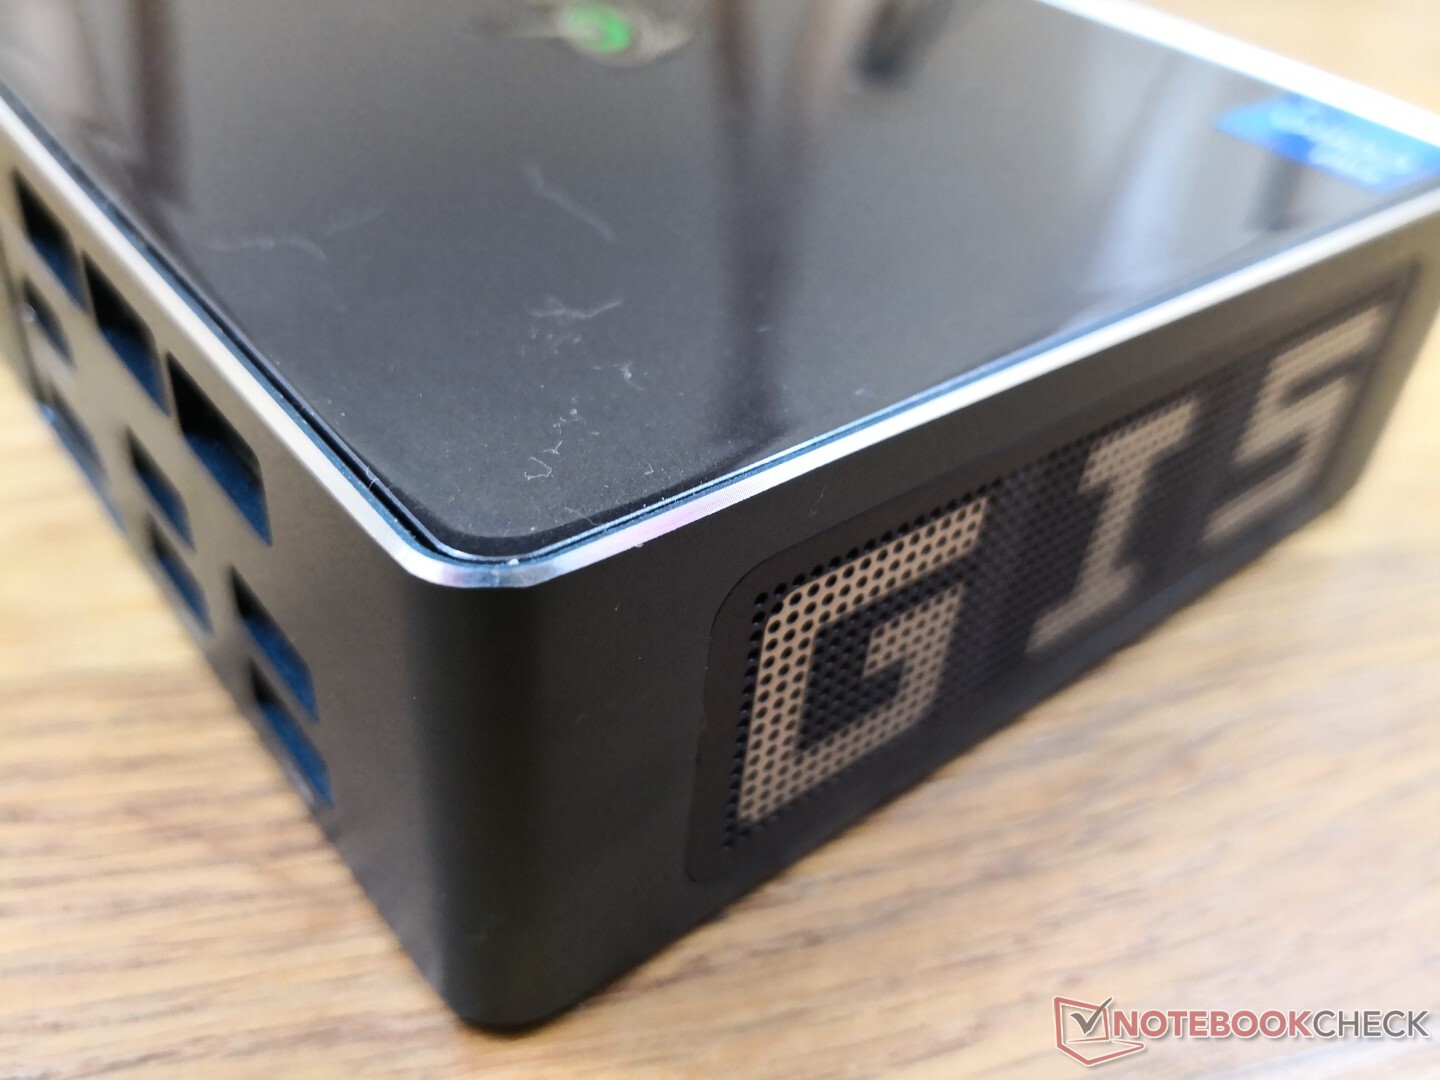
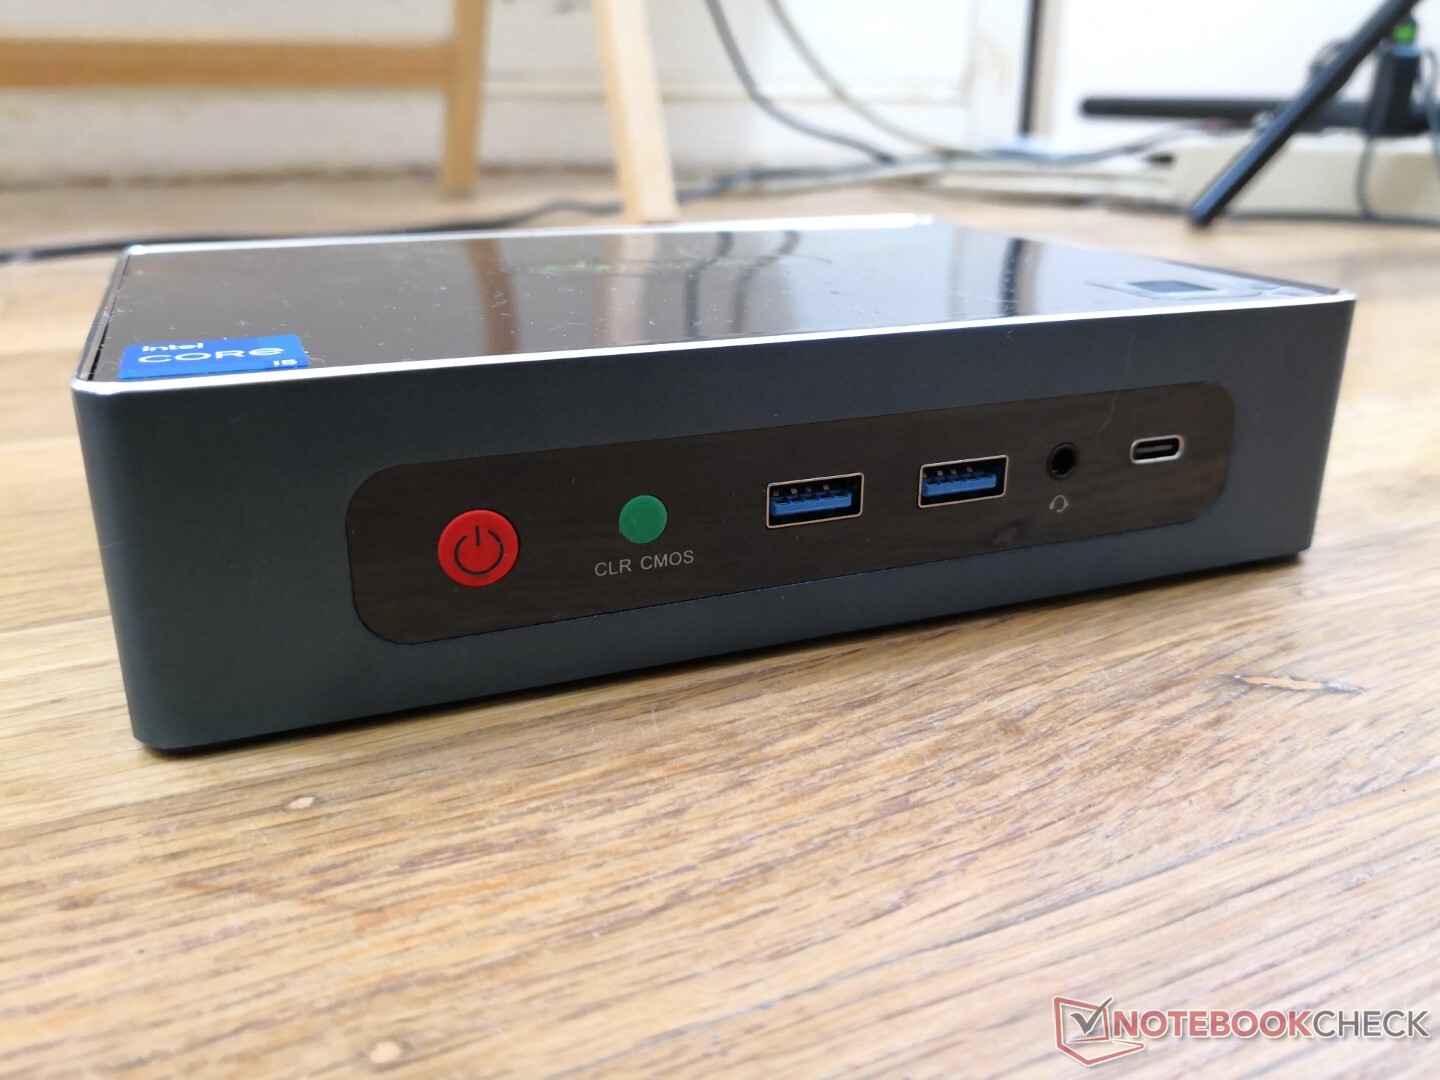
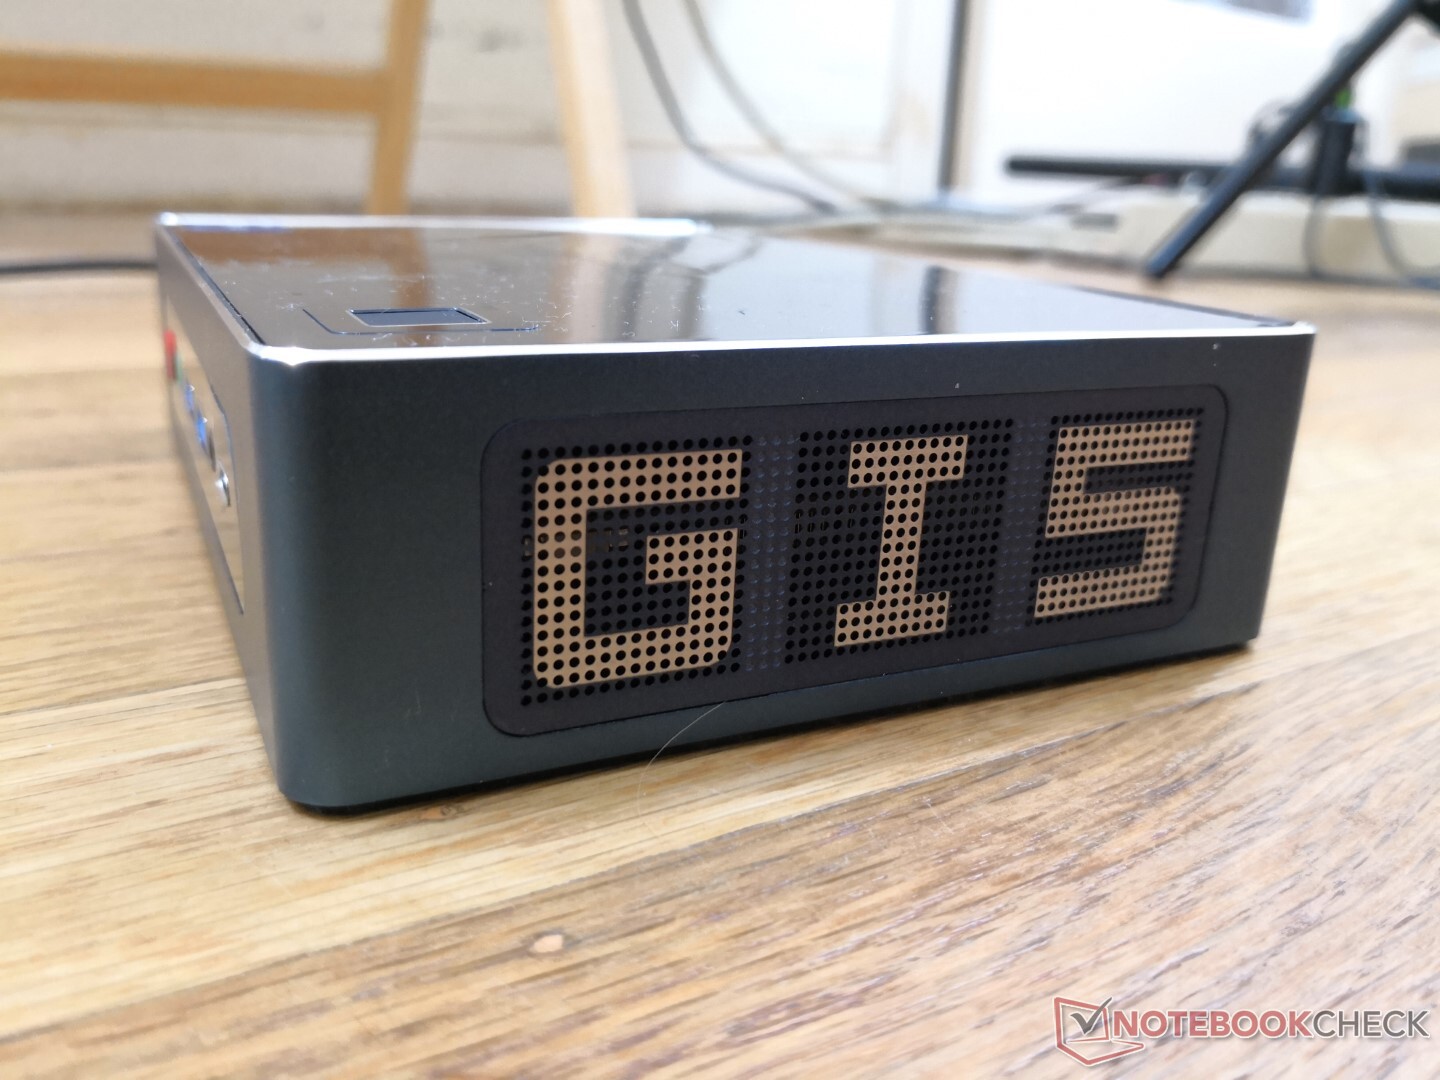
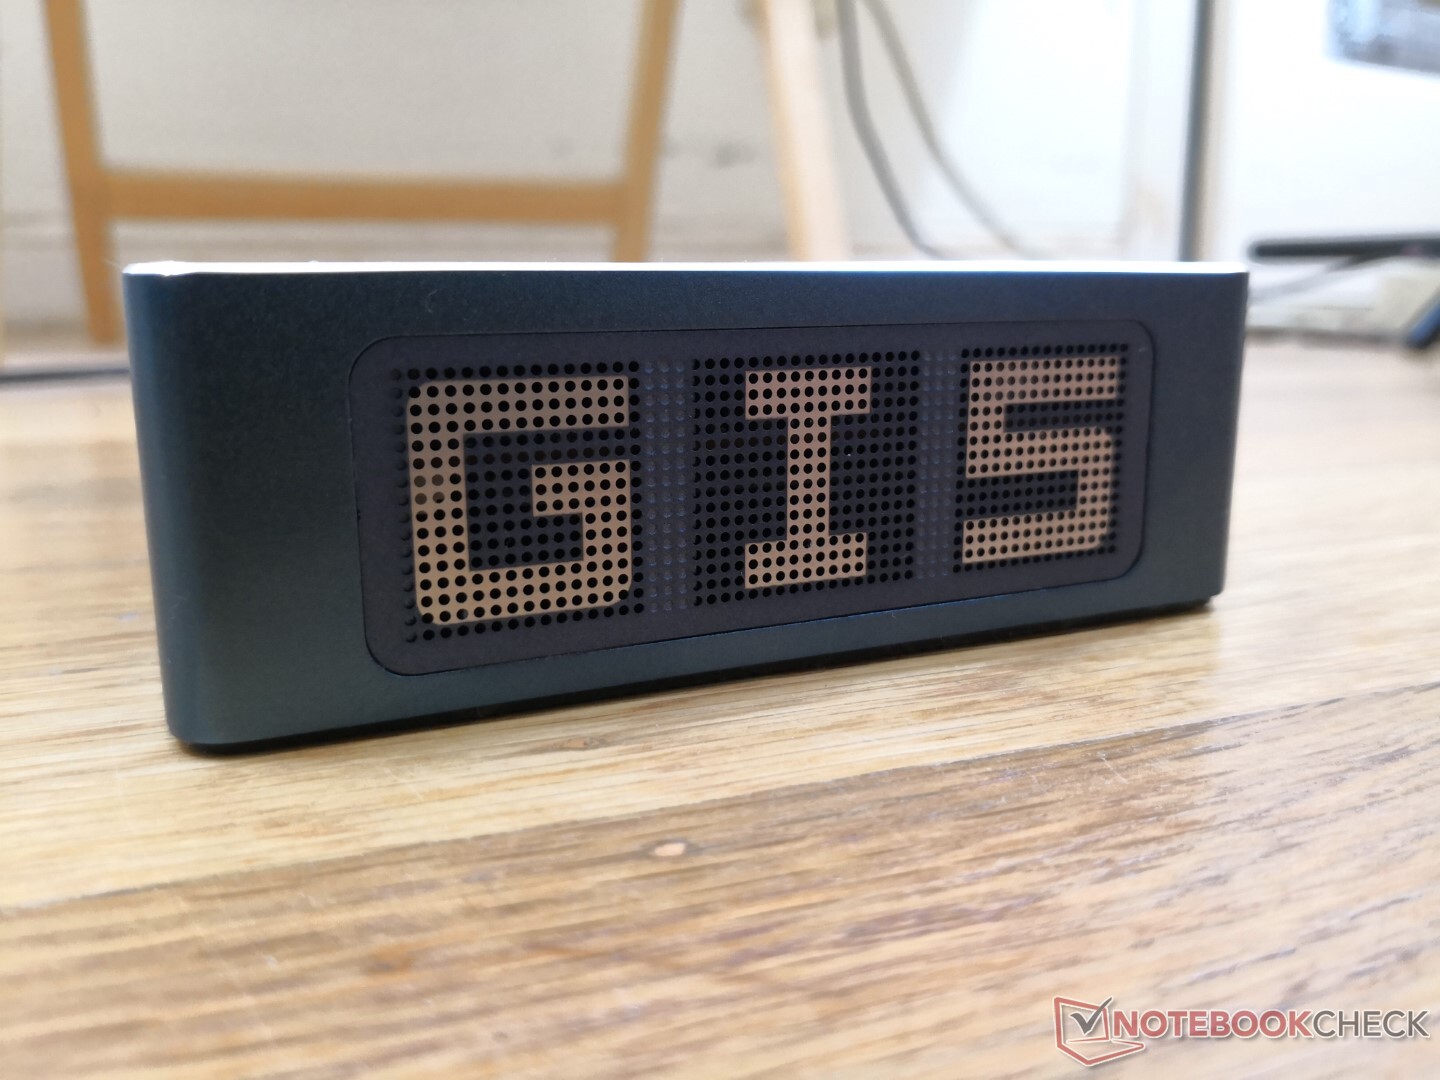
Het skelet is gemaakt van dunnere materialen en minder metaal dan op een Intel NUC, waarschijnlijk om zowel de kosten als het gewicht laag te houden. De bouwkwaliteit is nog steeds uitstekend en er zijn geen buigingen of zichtbare zwakke punten. We houden echter niet zo van de glanzende plastic bovenkant, omdat deze snel zowel vingerafdrukken als krassen aantrekt
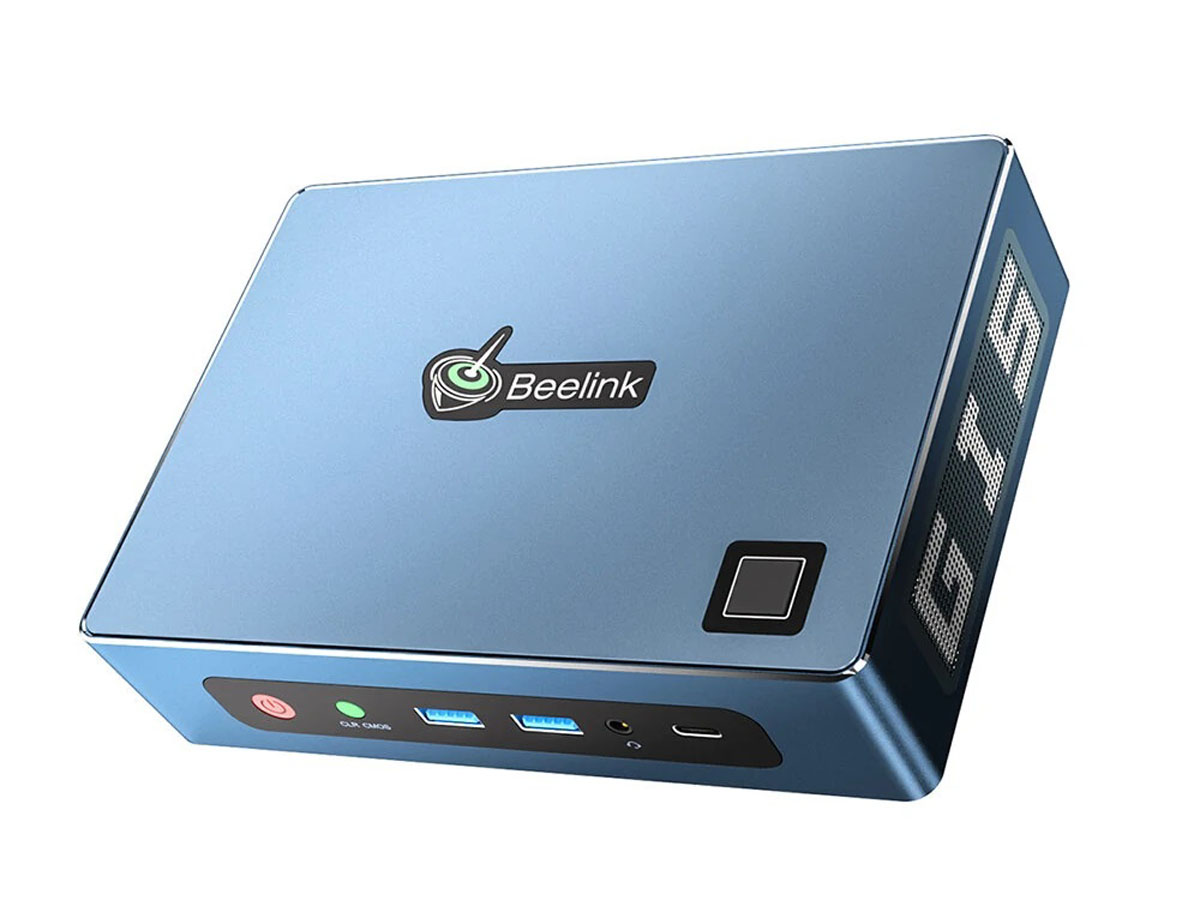
Connectiviteit
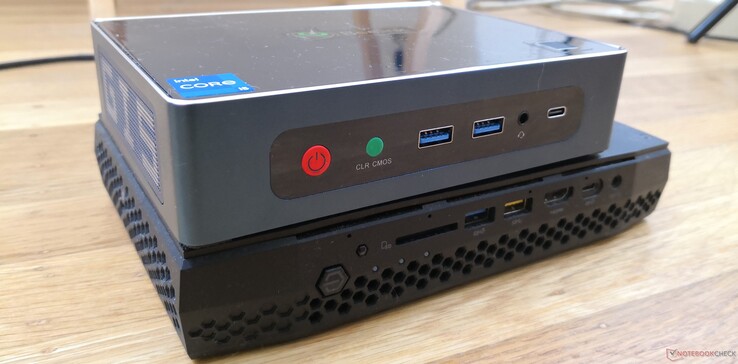
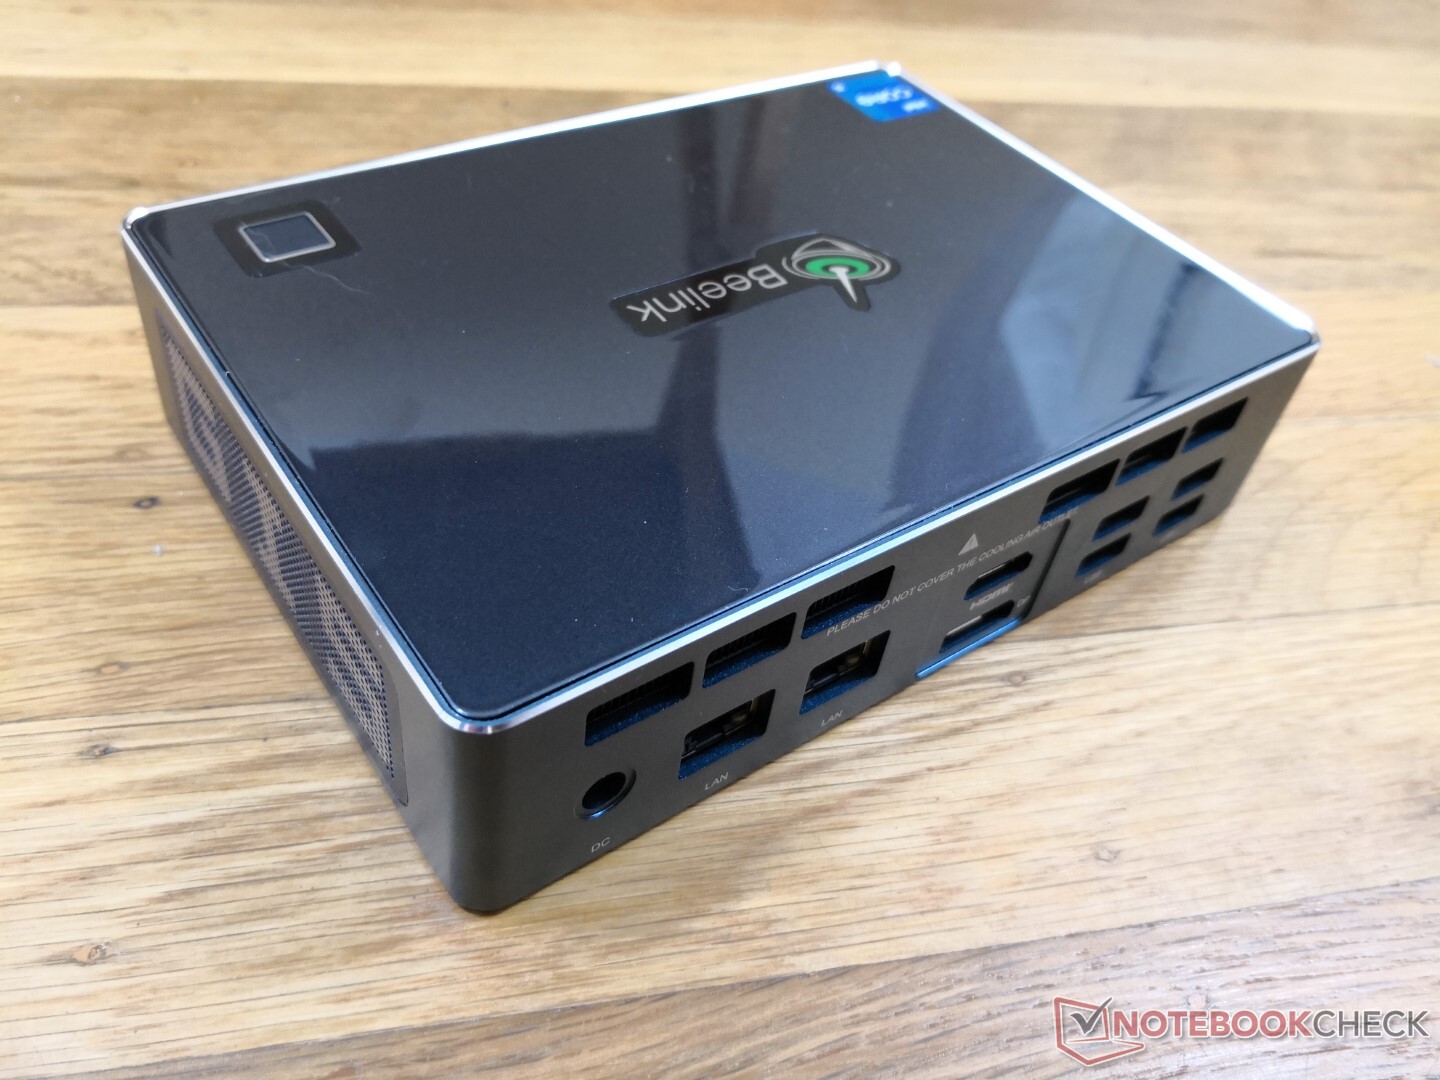
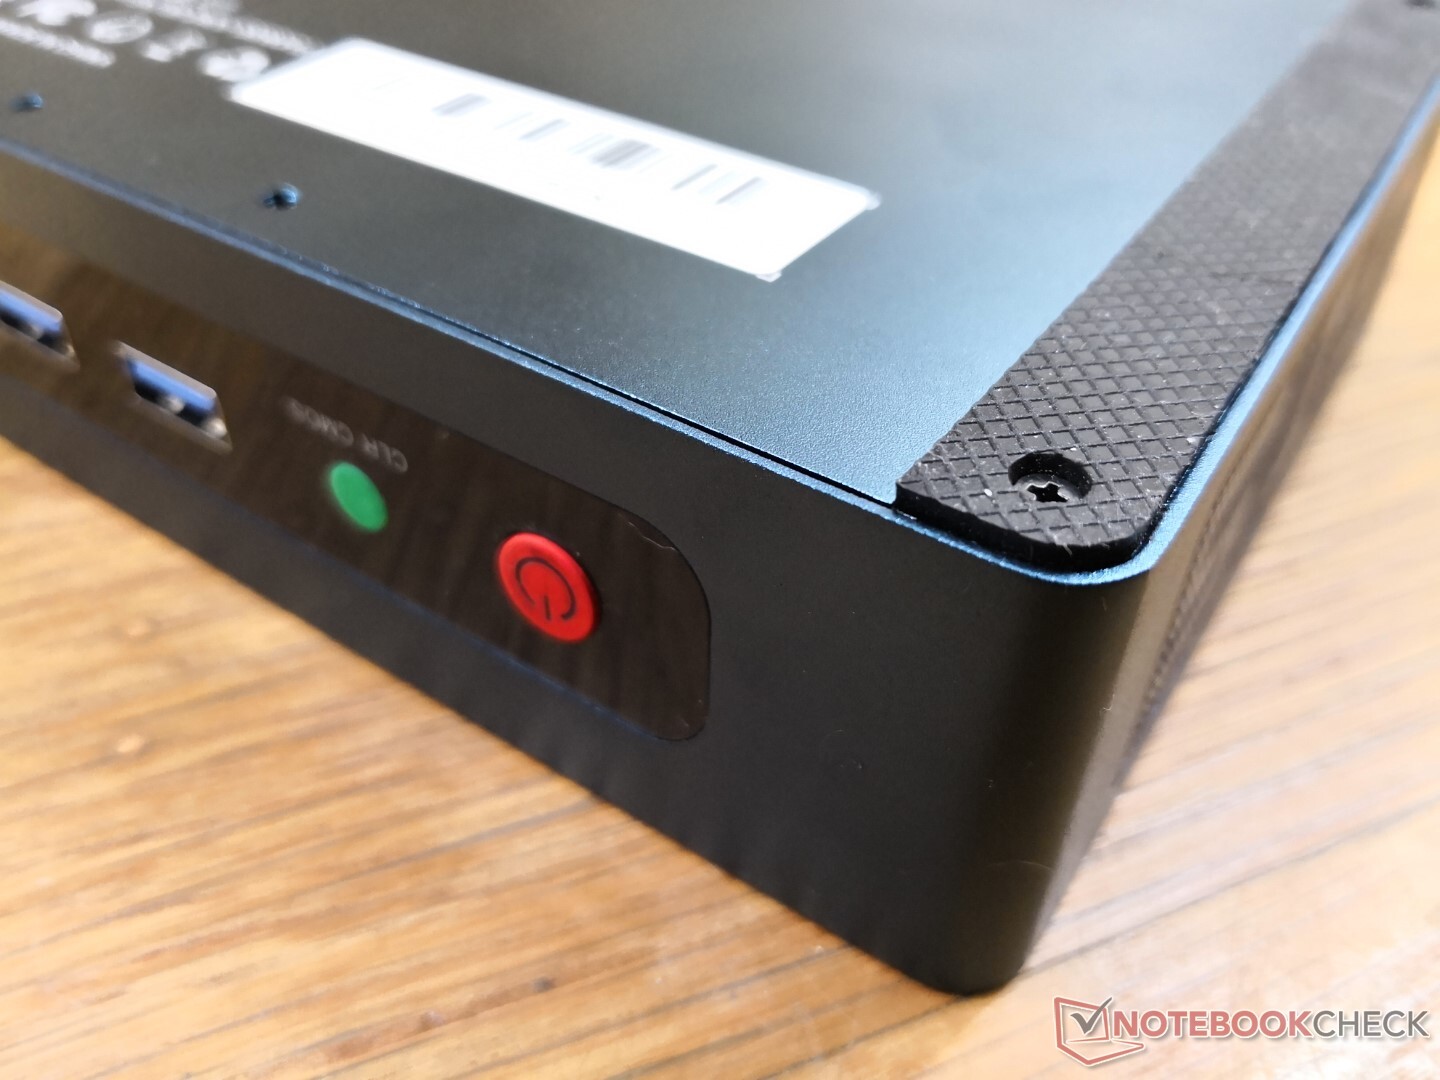
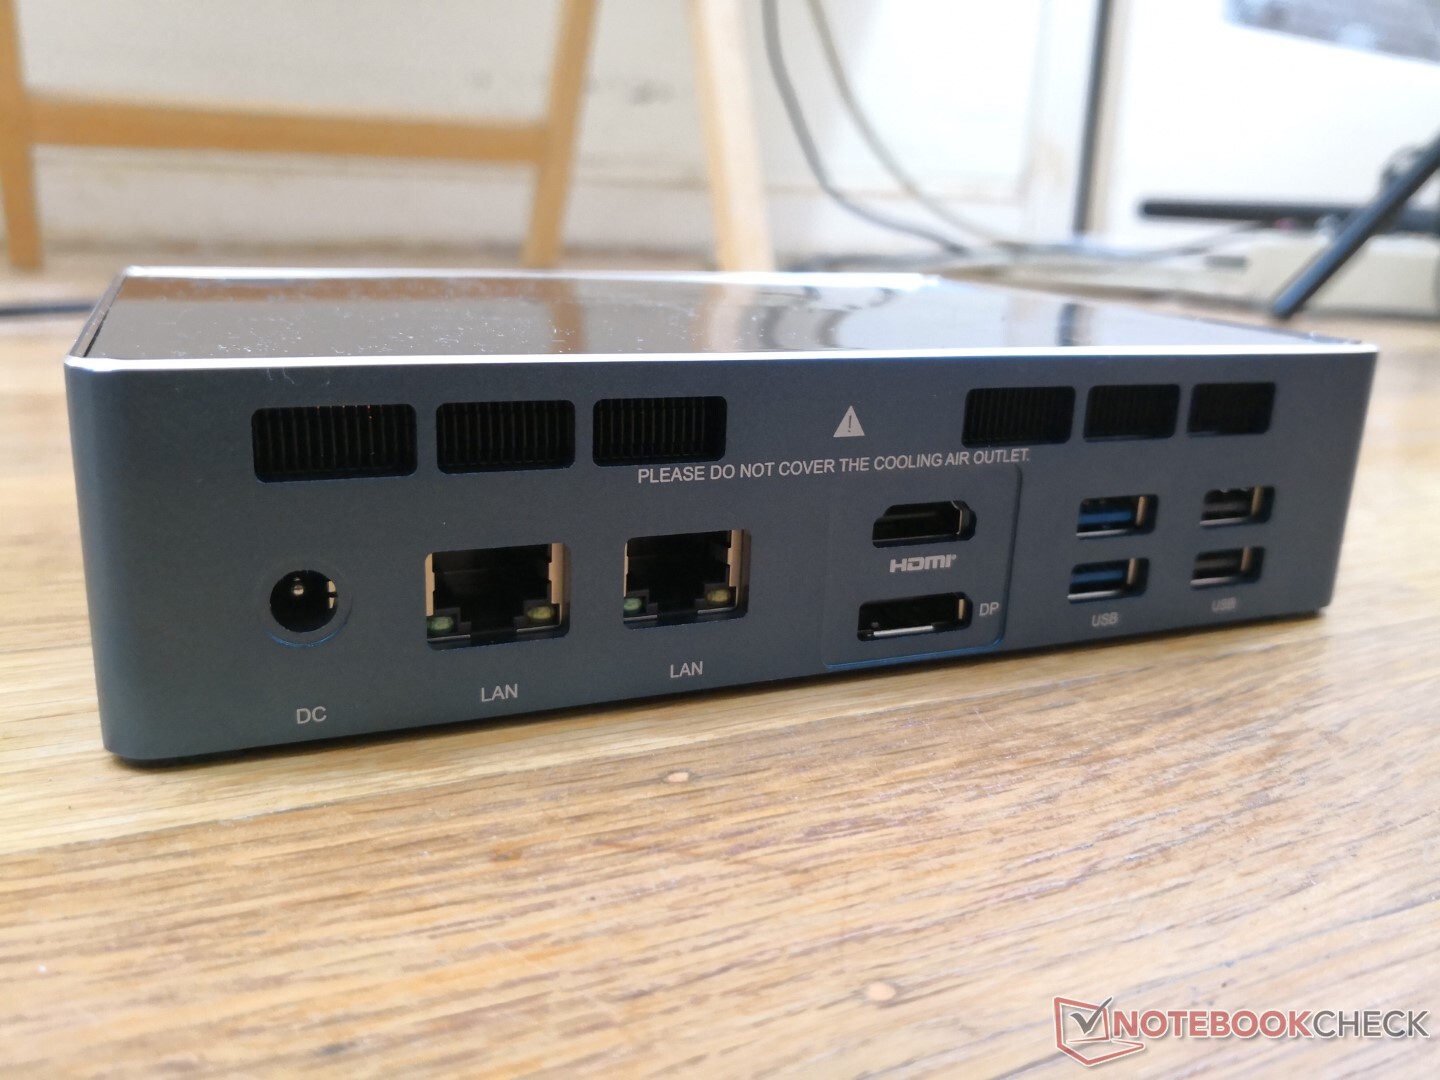
Er zijn voldoende poorten om uit te kiezen, waaronder meerdere RJ-45 poorten, meerdere HDMI poorten en zes USB-A poorten. De USB-C poort ondersteunt ook Thunderbolt 4 apparaten, ook al adverteert de fabrikant hier niet mee. Het Thunderbolt Control Center is voorgeïnstalleerd en het DxDiag-bestand bevestigt dat Thunderbolt ook wordt ondersteund.
De enkele USB-C poort kan beperkend aanvoelen en er is ook geen mini-DisplayPort of Kensington-slot in tegenstelling tot de Intel NUC11TNKi5 Pro.
Van bijzonder belang is dat de Beelink kan worden gevoed door USB-C in plaats van de eigen AC adapter. We hebben dit getest met een 130 W USB-C adapter van een Dell XPS 15 9500 die zonder problemen werkte op onze Beelink eenheid.
Communicatie
Ingebouwde bedrade en draadloze communicatiemodules, vergelijk Netwerktestgegevens met concurrenten, alternatieve oplossingen beschikbaar (5G/LTE)?, Onregelmatigheden (radio-ontvangst)?
| Networking | |
| iperf3 transmit AX12 | |
| Intel NUC11TNKi5 | |
| Beelink GTI 11 | |
| GMK NucBox 2 | |
| Intel Hades Canyon NUC8i7HVK | |
| Beelink SER3 | |
| iperf3 receive AX12 | |
| Intel NUC11TNKi5 | |
| Beelink GTI 11 | |
| Beelink SER3 | |
| GMK NucBox 2 | |
| Intel Hades Canyon NUC8i7HVK | |
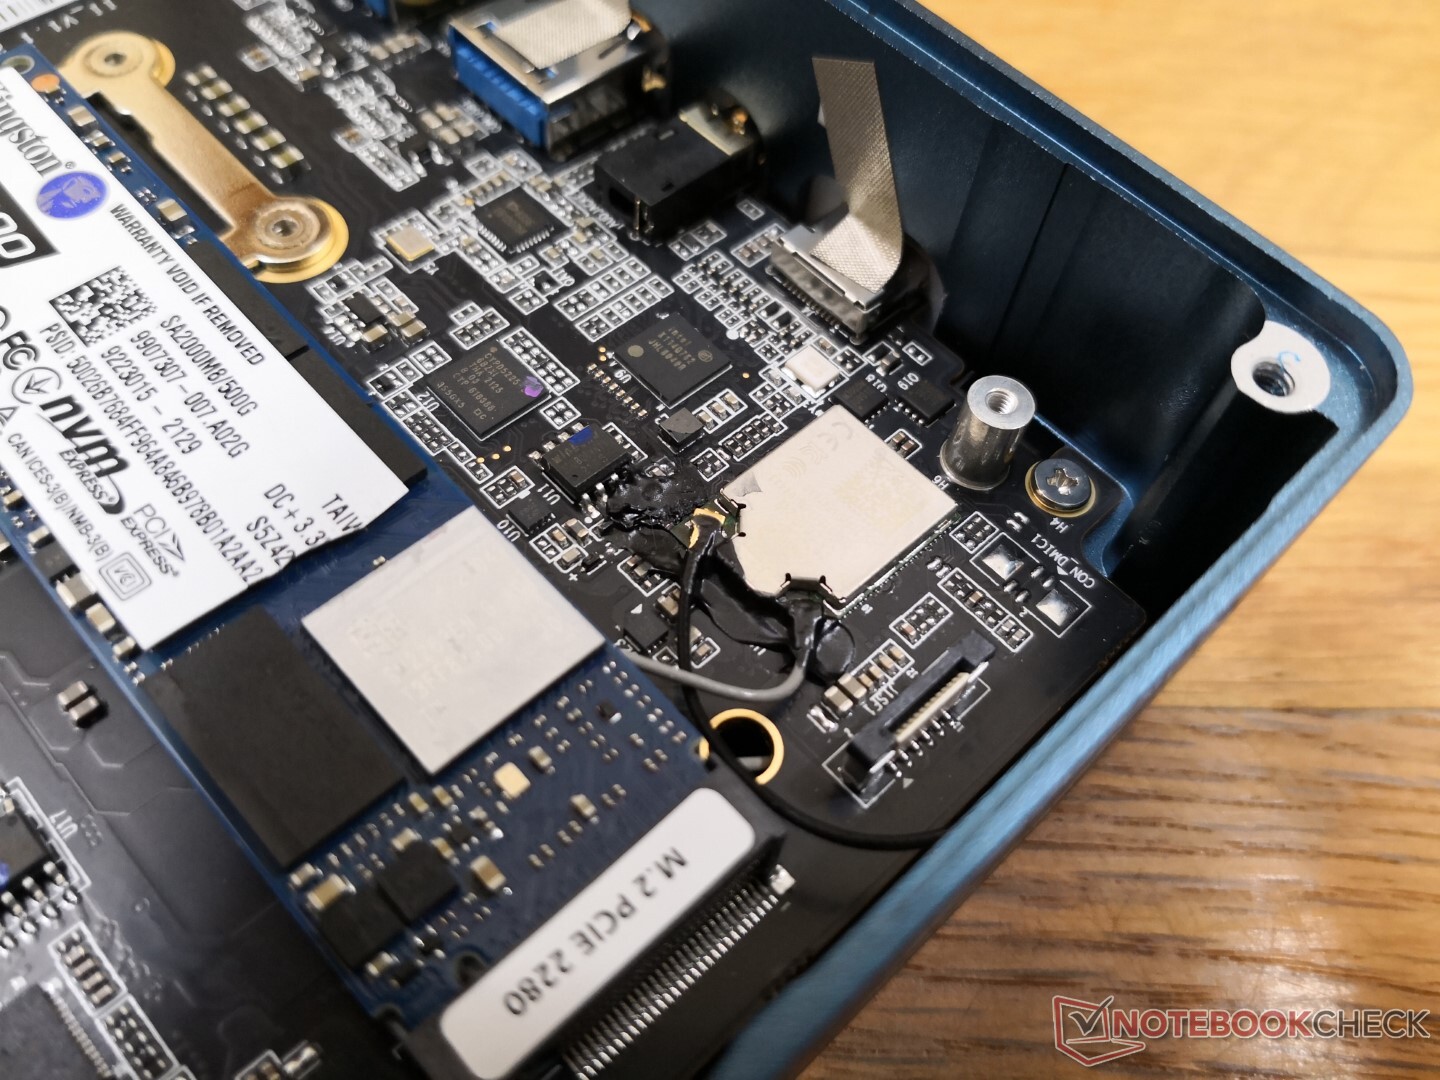
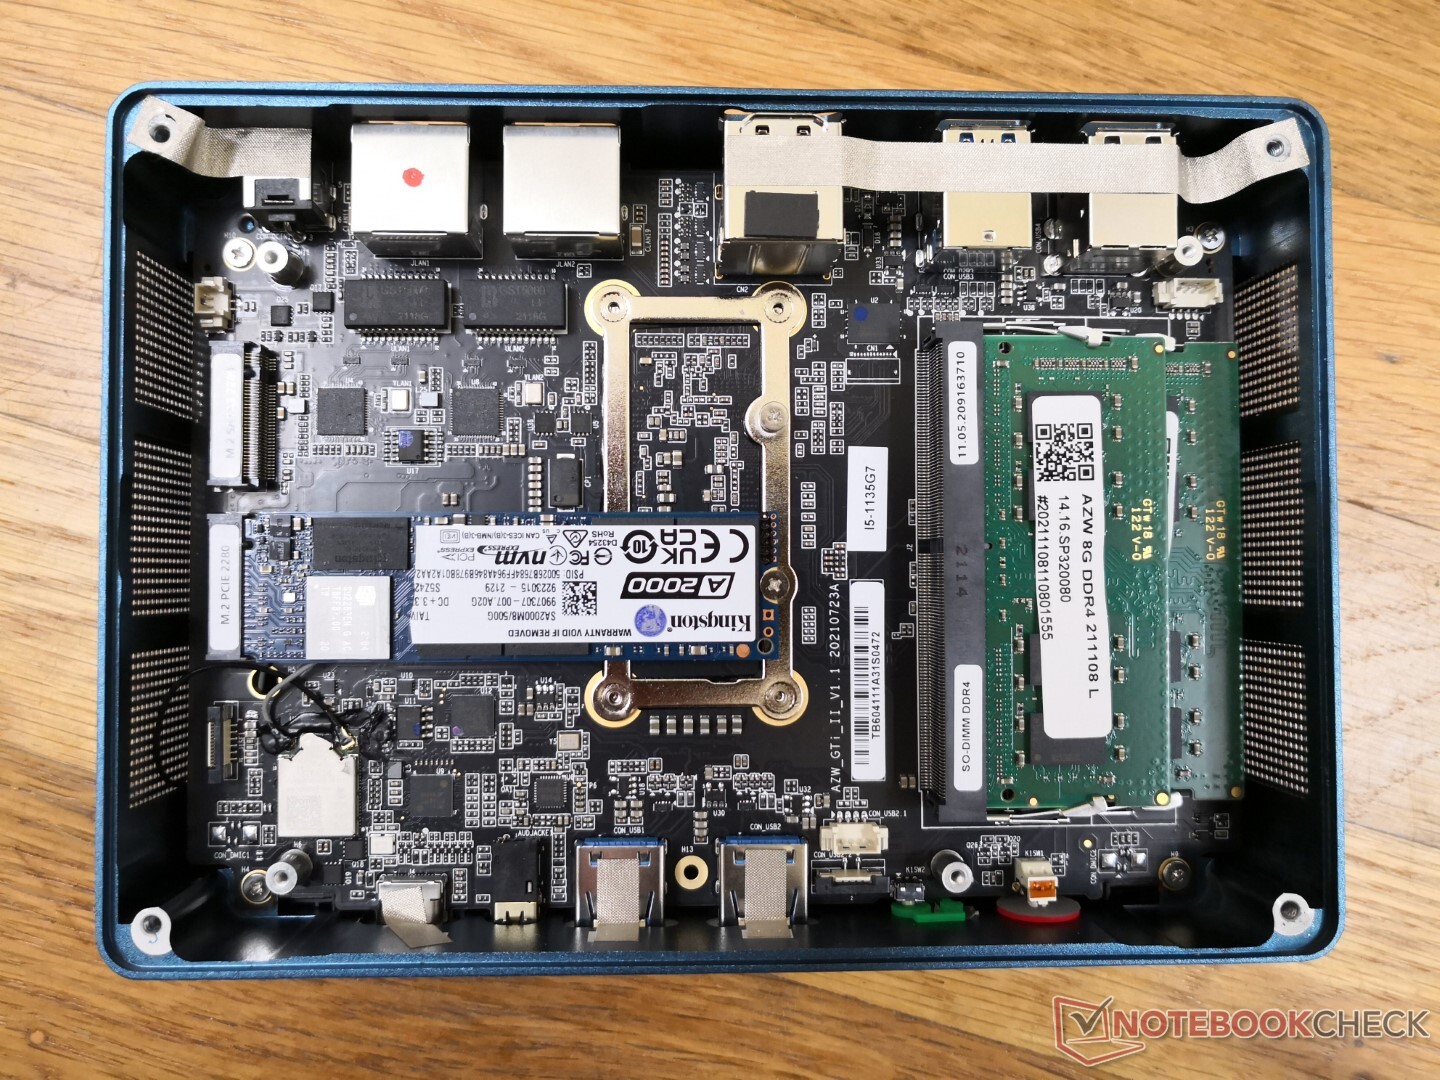
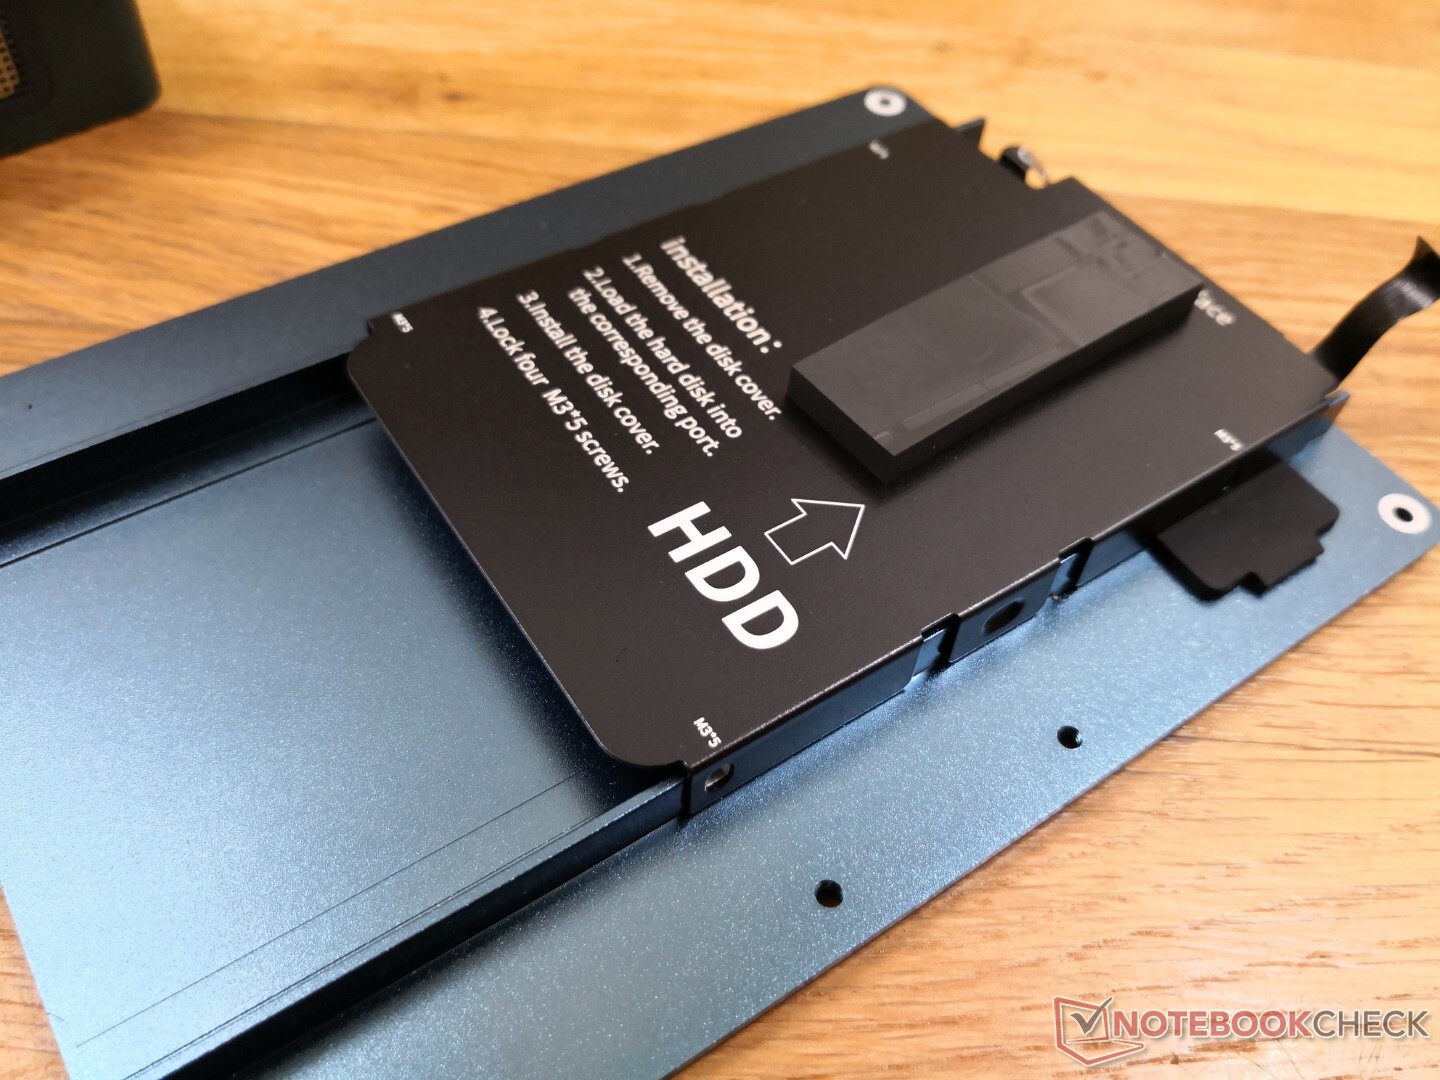
Onderhoud
Het bodempaneel kan worden verwijderd met slechts een Philips schroevendraaier. Gebruikers moeten voorzichtig zijn om ook het lint los te maken dat het bodempaneel met het moederbord verbindt. Er is directe toegang tot beide SODIMM sleuven, beide M.2 2280 sleuven, en de 2,5 inch SATA III bay op het bodempaneel als het eenmaal is verwijderd.
Accessoires en garantie
Tot de extra's behoren twee HDMI-kabels, extra schroeven en een VESA 50/100 mm-telbeugel.
De standaard beperkte garantie van één jaar is van toepassing. Het claimen van garantie kan voor sommige gebruikers lastig zijn, omdat de verzending overzees is.
Prestaties

Processor
De onbewerkte multi-thread CPU-prestaties zijn 15 tot 20 procent sneller dan de gemiddelde pc of laptop met dezelfde Core i5-1135G7 CPU. Zelfs de oudere 100 W Kaby Lake-GCore i7-8809G Hades Canyon mini PC loopt achter op onze 11e generatie Core i7 CPU. De high-endCore i7-1165G7die niet beschikbaar is op de GTI 11, kan gebruikers tot 25 procent betere multi-thread prestaties bieden dan onze Core i5-1135G7
Wanneer CineBench R15 xT in een loop wordt uitgevoerd, daalt de aanvankelijke score van 915 punten snel tot ~840 punten, wat neerkomt op een prestatiedip van 8 procent als gevolg van de beperkte Turbo Boost duurzaamheid, zoals beschreven in onze stresstest sectie hieronder.
Cinebench R15 Multi Loop
Cinebench R23: Multi Core | Single Core
Cinebench R20: CPU (Multi Core) | CPU (Single Core)
Cinebench R15: CPU Multi 64Bit | CPU Single 64Bit
Blender: v2.79 BMW27 CPU
7-Zip 18.03: 7z b 4 | 7z b 4 -mmt1
Geekbench 5.5: Multi-Core | Single-Core
HWBOT x265 Benchmark v2.2: 4k Preset
LibreOffice : 20 Documents To PDF
R Benchmark 2.5: Overall mean
| CPU Performance rating | |
| Intel NUC11PAQi7 -1! | |
| Lenovo Yoga 6 13ALC6 -2! | |
| Intel NUC10i7FNH -3! | |
| Asus Vivobook 15 K513EQ -2! | |
| Beelink GTI 11 | |
| Lenovo Yoga 6 13 82ND0009US -2! | |
| Intel NUC11TNKi5 | |
| Intel Hades Canyon NUC8i7HVK -6! | |
| Gemiddeld Intel Core i5-1135G7 | |
| Infinix INBook X1 Pro -2! | |
| Asus VivoBook S13 S333JA-DS51 | |
| GMK NucBox 2 | |
| Beelink SER3 -2! | |
| Beelink GTR35 II-G-16512D00W64PRO-1T -2! | |
| Cinebench R23 / Multi Core | |
| Lenovo Yoga 6 13ALC6 | |
| Intel NUC11PAQi7 | |
| Lenovo Yoga 6 13 82ND0009US | |
| Asus Vivobook 15 K513EQ | |
| Beelink GTI 11 | |
| Intel NUC11TNKi5 | |
| Gemiddeld Intel Core i5-1135G7 (2786 - 6136, n=55) | |
| Infinix INBook X1 Pro | |
| Asus VivoBook S13 S333JA-DS51 | |
| Beelink SER3 | |
| GMK NucBox 2 | |
| Cinebench R23 / Single Core | |
| Asus Vivobook 15 K513EQ | |
| Intel NUC11TNKi5 | |
| Beelink GTI 11 | |
| Gemiddeld Intel Core i5-1135G7 (1062 - 1373, n=53) | |
| Lenovo Yoga 6 13ALC6 | |
| Infinix INBook X1 Pro | |
| Lenovo Yoga 6 13 82ND0009US | |
| Asus VivoBook S13 S333JA-DS51 | |
| GMK NucBox 2 | |
| Beelink SER3 | |
| Cinebench R20 / CPU (Multi Core) | |
| Lenovo Yoga 6 13ALC6 | |
| Intel NUC11PAQi7 | |
| Lenovo Yoga 6 13 82ND0009US | |
| Intel NUC10i7FNH | |
| Asus Vivobook 15 K513EQ | |
| Beelink GTI 11 | |
| Intel Hades Canyon NUC8i7HVK | |
| Intel NUC11TNKi5 | |
| Gemiddeld Intel Core i5-1135G7 (979 - 2382, n=62) | |
| Infinix INBook X1 Pro | |
| Beelink GTR35 II-G-16512D00W64PRO-1T | |
| Asus VivoBook S13 S333JA-DS51 | |
| Beelink SER3 | |
| GMK NucBox 2 | |
| Cinebench R20 / CPU (Single Core) | |
| Intel NUC11PAQi7 | |
| Asus Vivobook 15 K513EQ | |
| Beelink GTI 11 | |
| Gemiddeld Intel Core i5-1135G7 (375 - 527, n=62) | |
| Intel NUC11TNKi5 | |
| Lenovo Yoga 6 13ALC6 | |
| Intel NUC10i7FNH | |
| Infinix INBook X1 Pro | |
| Lenovo Yoga 6 13 82ND0009US | |
| Intel Hades Canyon NUC8i7HVK | |
| GMK NucBox 2 | |
| Asus VivoBook S13 S333JA-DS51 | |
| Beelink SER3 | |
| Beelink GTR35 II-G-16512D00W64PRO-1T | |
| Cinebench R15 / CPU Multi 64Bit | |
| Lenovo Yoga 6 13ALC6 | |
| Intel NUC10i7FNH | |
| Lenovo Yoga 6 13 82ND0009US | |
| Intel NUC11PAQi7 | |
| Beelink GTI 11 | |
| Asus Vivobook 15 K513EQ | |
| Intel Hades Canyon NUC8i7HVK | |
| Intel NUC11TNKi5 | |
| Gemiddeld Intel Core i5-1135G7 (431 - 941, n=65) | |
| Beelink SER3 | |
| Beelink GTR35 II-G-16512D00W64PRO-1T | |
| Infinix INBook X1 Pro | |
| Asus VivoBook S13 S333JA-DS51 | |
| GMK NucBox 2 | |
| Cinebench R15 / CPU Single 64Bit | |
| Intel NUC11PAQi7 | |
| Asus Vivobook 15 K513EQ | |
| Intel NUC11TNKi5 | |
| Beelink GTI 11 | |
| Gemiddeld Intel Core i5-1135G7 (141.4 - 205, n=61) | |
| Intel NUC10i7FNH | |
| Lenovo Yoga 6 13ALC6 | |
| Infinix INBook X1 Pro | |
| Intel Hades Canyon NUC8i7HVK | |
| Lenovo Yoga 6 13 82ND0009US | |
| GMK NucBox 2 | |
| Beelink GTR35 II-G-16512D00W64PRO-1T | |
| Beelink SER3 | |
| Asus VivoBook S13 S333JA-DS51 | |
| Blender / v2.79 BMW27 CPU | |
| GMK NucBox 2 | |
| Asus VivoBook S13 S333JA-DS51 | |
| Infinix INBook X1 Pro | |
| Beelink SER3 | |
| Beelink GTR35 II-G-16512D00W64PRO-1T | |
| Gemiddeld Intel Core i5-1135G7 (499 - 1044, n=60) | |
| Intel NUC11TNKi5 | |
| Beelink GTI 11 | |
| Asus Vivobook 15 K513EQ | |
| Intel Hades Canyon NUC8i7HVK | |
| Lenovo Yoga 6 13 82ND0009US | |
| Intel NUC10i7FNH | |
| Intel NUC11PAQi7 | |
| Lenovo Yoga 6 13ALC6 | |
| 7-Zip 18.03 / 7z b 4 | |
| Lenovo Yoga 6 13ALC6 | |
| Lenovo Yoga 6 13 82ND0009US | |
| Intel NUC10i7FNH | |
| Intel NUC11PAQi7 | |
| Asus Vivobook 15 K513EQ | |
| Beelink GTI 11 | |
| Intel NUC11TNKi5 | |
| Gemiddeld Intel Core i5-1135G7 (14745 - 24873, n=62) | |
| Infinix INBook X1 Pro | |
| Intel Hades Canyon NUC8i7HVK | |
| GMK NucBox 2 | |
| Asus VivoBook S13 S333JA-DS51 | |
| Beelink SER3 | |
| Beelink GTR35 II-G-16512D00W64PRO-1T | |
| 7-Zip 18.03 / 7z b 4 -mmt1 | |
| Intel NUC11PAQi7 | |
| Asus Vivobook 15 K513EQ | |
| Beelink GTI 11 | |
| Intel NUC11TNKi5 | |
| Intel NUC10i7FNH | |
| Gemiddeld Intel Core i5-1135G7 (3924 - 4921, n=62) | |
| Lenovo Yoga 6 13ALC6 | |
| Infinix INBook X1 Pro | |
| Lenovo Yoga 6 13 82ND0009US | |
| Intel Hades Canyon NUC8i7HVK | |
| GMK NucBox 2 | |
| Beelink SER3 | |
| Asus VivoBook S13 S333JA-DS51 | |
| Beelink GTR35 II-G-16512D00W64PRO-1T | |
| Geekbench 5.5 / Multi-Core | |
| Intel NUC10i7FNH | |
| Beelink GTI 11 | |
| Intel NUC11PAQi7 | |
| Gemiddeld Intel Core i5-1135G7 (3475 - 5472, n=58) | |
| Intel NUC11TNKi5 | |
| Asus VivoBook S13 S333JA-DS51 | |
| GMK NucBox 2 | |
| Beelink GTR35 II-G-16512D00W64PRO-1T | |
| Geekbench 5.5 / Single-Core | |
| Intel NUC11PAQi7 | |
| Beelink GTI 11 | |
| Intel NUC11TNKi5 | |
| Gemiddeld Intel Core i5-1135G7 (1147 - 1428, n=58) | |
| Intel NUC10i7FNH | |
| Asus VivoBook S13 S333JA-DS51 | |
| GMK NucBox 2 | |
| Beelink GTR35 II-G-16512D00W64PRO-1T | |
| HWBOT x265 Benchmark v2.2 / 4k Preset | |
| Lenovo Yoga 6 13ALC6 | |
| Intel NUC11PAQi7 | |
| Intel NUC10i7FNH | |
| Lenovo Yoga 6 13 82ND0009US | |
| Asus Vivobook 15 K513EQ | |
| Intel Hades Canyon NUC8i7HVK | |
| Beelink GTI 11 | |
| Intel NUC11TNKi5 | |
| Gemiddeld Intel Core i5-1135G7 (3.57 - 7.6, n=57) | |
| Infinix INBook X1 Pro | |
| Asus VivoBook S13 S333JA-DS51 | |
| GMK NucBox 2 | |
| Beelink SER3 | |
| Beelink GTR35 II-G-16512D00W64PRO-1T | |
| LibreOffice / 20 Documents To PDF | |
| Beelink SER3 | |
| Beelink GTR35 II-G-16512D00W64PRO-1T | |
| Lenovo Yoga 6 13 82ND0009US | |
| GMK NucBox 2 | |
| Lenovo Yoga 6 13ALC6 | |
| Asus VivoBook S13 S333JA-DS51 | |
| Infinix INBook X1 Pro | |
| Beelink GTI 11 | |
| Gemiddeld Intel Core i5-1135G7 (44.2 - 62.9, n=60) | |
| Intel NUC11TNKi5 | |
| Asus Vivobook 15 K513EQ | |
| Intel NUC11PAQi7 | |
| R Benchmark 2.5 / Overall mean | |
| GMK NucBox 2 | |
| Asus VivoBook S13 S333JA-DS51 | |
| Beelink GTR35 II-G-16512D00W64PRO-1T | |
| Beelink SER3 | |
| Infinix INBook X1 Pro | |
| Intel NUC10i7FNH | |
| Gemiddeld Intel Core i5-1135G7 (0.619 - 0.727, n=59) | |
| Lenovo Yoga 6 13 82ND0009US | |
| Beelink GTI 11 | |
| Intel NUC11TNKi5 | |
| Lenovo Yoga 6 13ALC6 | |
| Asus Vivobook 15 K513EQ | |
| Intel NUC11PAQi7 | |
Cinebench R23: Multi Core | Single Core
Cinebench R20: CPU (Multi Core) | CPU (Single Core)
Cinebench R15: CPU Multi 64Bit | CPU Single 64Bit
Blender: v2.79 BMW27 CPU
7-Zip 18.03: 7z b 4 | 7z b 4 -mmt1
Geekbench 5.5: Multi-Core | Single-Core
HWBOT x265 Benchmark v2.2: 4k Preset
LibreOffice : 20 Documents To PDF
R Benchmark 2.5: Overall mean
* ... kleiner is beter
AIDA64: FP32 Ray-Trace | FPU Julia | CPU SHA3 | CPU Queen | FPU SinJulia | FPU Mandel | CPU AES | CPU ZLib | FP64 Ray-Trace | CPU PhotoWorxx
| Performance rating | |
| Beelink GTI 11 | |
| Intel NUC11TNKi5 | |
| Gemiddeld Intel Core i5-1135G7 | |
| GMK NucBox 2 | |
| Beelink SER3 | |
| AIDA64 / FP32 Ray-Trace | |
| Beelink GTI 11 | |
| Intel NUC11TNKi5 | |
| Gemiddeld Intel Core i5-1135G7 (4313 - 7952, n=45) | |
| GMK NucBox 2 | |
| Beelink SER3 | |
| AIDA64 / FPU Julia | |
| Beelink GTI 11 | |
| Intel NUC11TNKi5 | |
| Gemiddeld Intel Core i5-1135G7 (19402 - 32283, n=45) | |
| GMK NucBox 2 | |
| Beelink SER3 | |
| AIDA64 / CPU SHA3 | |
| Beelink GTI 11 | |
| Intel NUC11TNKi5 | |
| Gemiddeld Intel Core i5-1135G7 (1316 - 2172, n=45) | |
| GMK NucBox 2 | |
| Beelink SER3 | |
| AIDA64 / CPU Queen | |
| Beelink GTI 11 | |
| Intel NUC11TNKi5 | |
| Gemiddeld Intel Core i5-1135G7 (39000 - 46951, n=45) | |
| Beelink SER3 | |
| GMK NucBox 2 | |
| AIDA64 / FPU SinJulia | |
| Beelink SER3 | |
| Intel NUC11TNKi5 | |
| Beelink GTI 11 | |
| GMK NucBox 2 | |
| Gemiddeld Intel Core i5-1135G7 (3497 - 4445, n=45) | |
| AIDA64 / FPU Mandel | |
| Beelink GTI 11 | |
| Intel NUC11TNKi5 | |
| Gemiddeld Intel Core i5-1135G7 (12569 - 19635, n=45) | |
| GMK NucBox 2 | |
| Beelink SER3 | |
| AIDA64 / CPU AES | |
| Beelink GTI 11 | |
| Intel NUC11TNKi5 | |
| Gemiddeld Intel Core i5-1135G7 (28988 - 67977, n=45) | |
| Beelink SER3 | |
| GMK NucBox 2 | |
| AIDA64 / CPU ZLib | |
| Intel NUC11TNKi5 | |
| Beelink GTI 11 | |
| Beelink SER3 | |
| Gemiddeld Intel Core i5-1135G7 (265 - 373, n=51) | |
| GMK NucBox 2 | |
| AIDA64 / FP64 Ray-Trace | |
| Beelink GTI 11 | |
| Intel NUC11TNKi5 | |
| Gemiddeld Intel Core i5-1135G7 (2226 - 4291, n=45) | |
| GMK NucBox 2 | |
| Beelink SER3 | |
| AIDA64 / CPU PhotoWorxx | |
| Beelink GTI 11 | |
| Gemiddeld Intel Core i5-1135G7 (9004 - 45366, n=45) | |
| Intel NUC11TNKi5 | |
| Beelink SER3 | |
| GMK NucBox 2 | |
Systeemprestaties
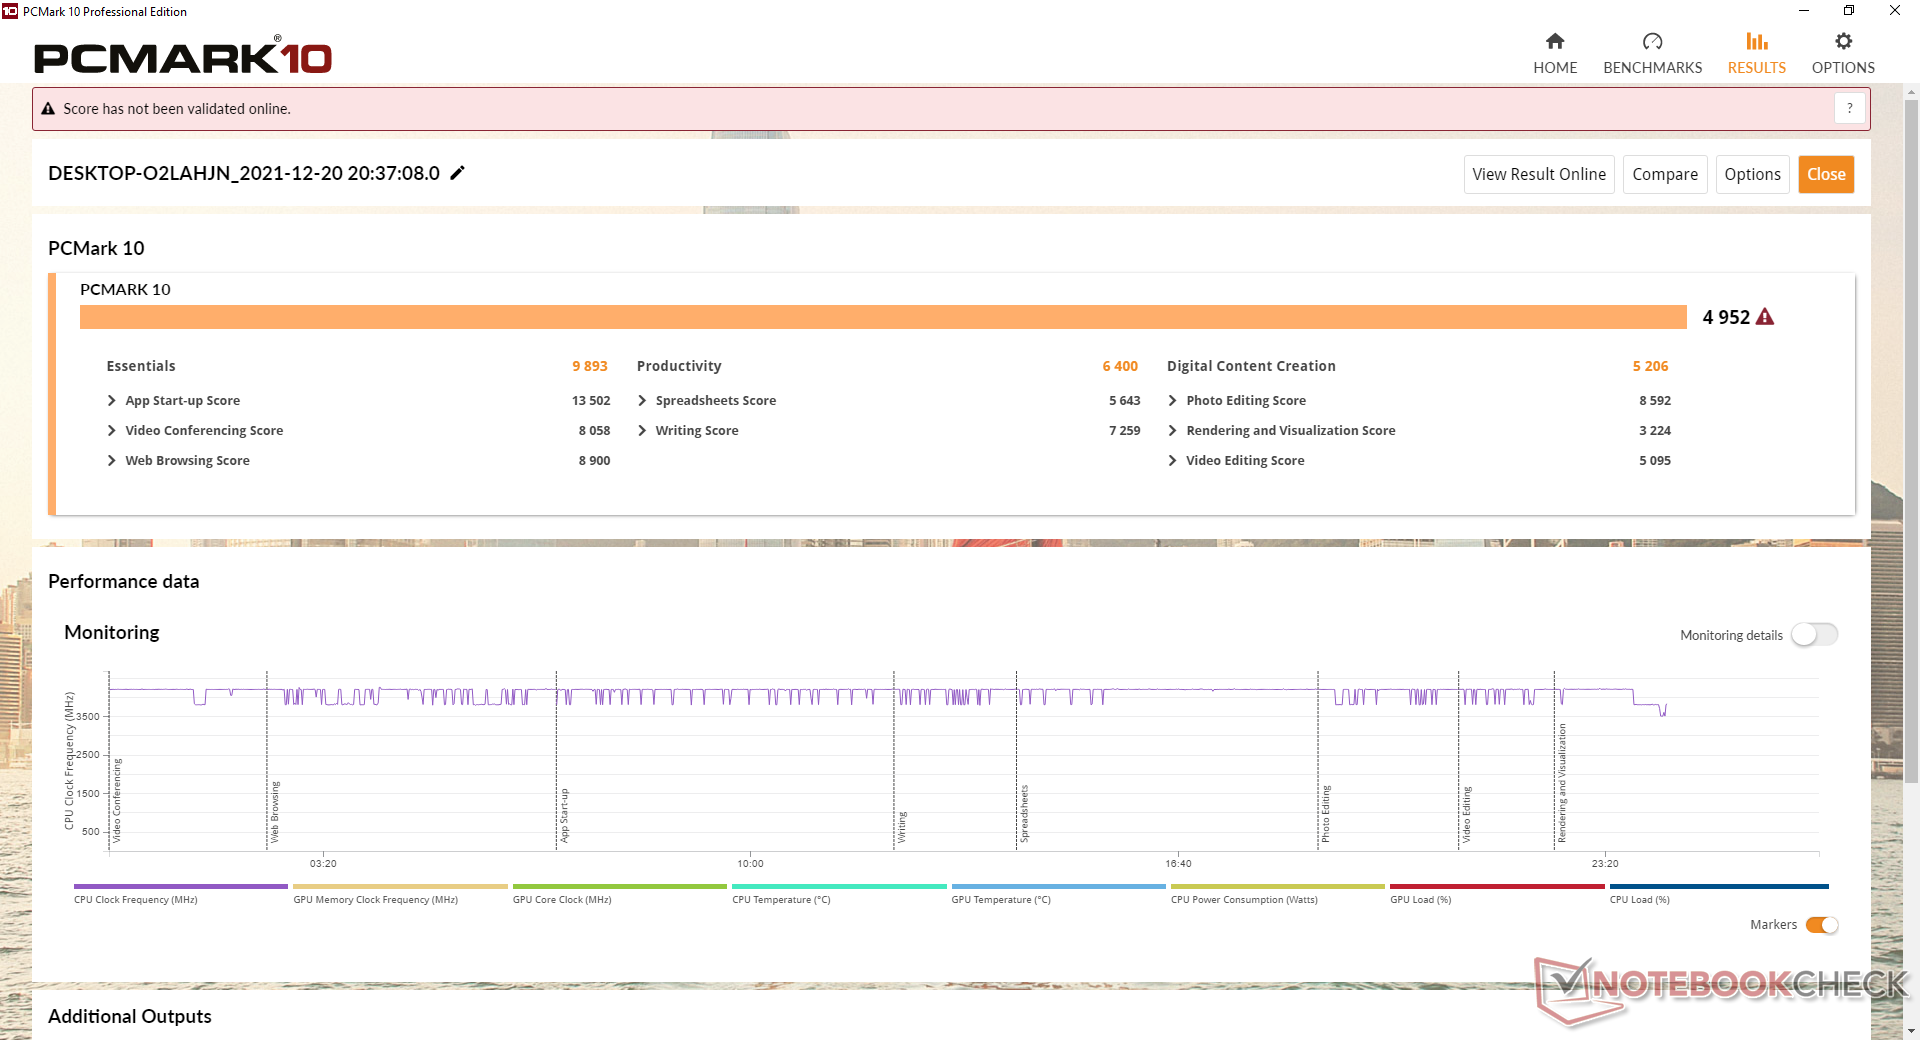
PCMark 10 scores zijn uitstekend en liggen consistent boven elk Beelink systeem dat voor onze GTI 11 kwam. De voordelen van het gebruik van een slankere en meer energie-efficiënte 11e generatie Intel CPU zorgen voor een soepelere gebruikerservaring.
| PCMark 10 / Score | |
| Intel Hades Canyon NUC8i7HVK | |
| Beelink GTI 11 | |
| Gemiddeld Intel Core i5-1135G7, Intel Iris Xe Graphics G7 80EUs (4026 - 4952, n=53) | |
| Intel NUC11TNKi5 | |
| Intel NUC10i7FNH | |
| GMK NucBox 2 | |
| Beelink SER3 | |
| PCMark 10 / Essentials | |
| Beelink GTI 11 | |
| Gemiddeld Intel Core i5-1135G7, Intel Iris Xe Graphics G7 80EUs (8149 - 9917, n=53) | |
| Intel Hades Canyon NUC8i7HVK | |
| Intel NUC10i7FNH | |
| Intel NUC11TNKi5 | |
| GMK NucBox 2 | |
| Beelink SER3 | |
| PCMark 10 / Productivity | |
| Intel Hades Canyon NUC8i7HVK | |
| Intel NUC10i7FNH | |
| Beelink GTI 11 | |
| GMK NucBox 2 | |
| Gemiddeld Intel Core i5-1135G7, Intel Iris Xe Graphics G7 80EUs (5040 - 6619, n=53) | |
| Intel NUC11TNKi5 | |
| Beelink SER3 | |
| PCMark 10 / Digital Content Creation | |
| Intel Hades Canyon NUC8i7HVK | |
| Beelink GTI 11 | |
| Gemiddeld Intel Core i5-1135G7, Intel Iris Xe Graphics G7 80EUs (3548 - 5255, n=53) | |
| Intel NUC11TNKi5 | |
| Intel NUC10i7FNH | |
| GMK NucBox 2 | |
| Beelink SER3 | |
| PCMark 10 Score | 4952 punten | |
Help | ||
| AIDA64 / Memory Copy | |
| GMK NucBox 2 | |
| Beelink GTI 11 | |
| Gemiddeld Intel Core i5-1135G7 (17443 - 63889, n=45) | |
| Intel NUC11TNKi5 | |
| Beelink SER3 | |
| AIDA64 / Memory Read | |
| Beelink GTI 11 | |
| Gemiddeld Intel Core i5-1135G7 (19716 - 63705, n=45) | |
| GMK NucBox 2 | |
| Intel NUC11TNKi5 | |
| Beelink SER3 | |
| AIDA64 / Memory Write | |
| GMK NucBox 2 | |
| Beelink GTI 11 | |
| Gemiddeld Intel Core i5-1135G7 (18722 - 66778, n=45) | |
| Intel NUC11TNKi5 | |
| Beelink SER3 | |
| AIDA64 / Memory Latency | |
| Beelink SER3 | |
| Intel NUC11TNKi5 | |
| Gemiddeld Intel Core i5-1135G7 (68.3 - 107, n=51) | |
| Beelink GTI 11 | |
| GMK NucBox 2 | |
* ... kleiner is beter
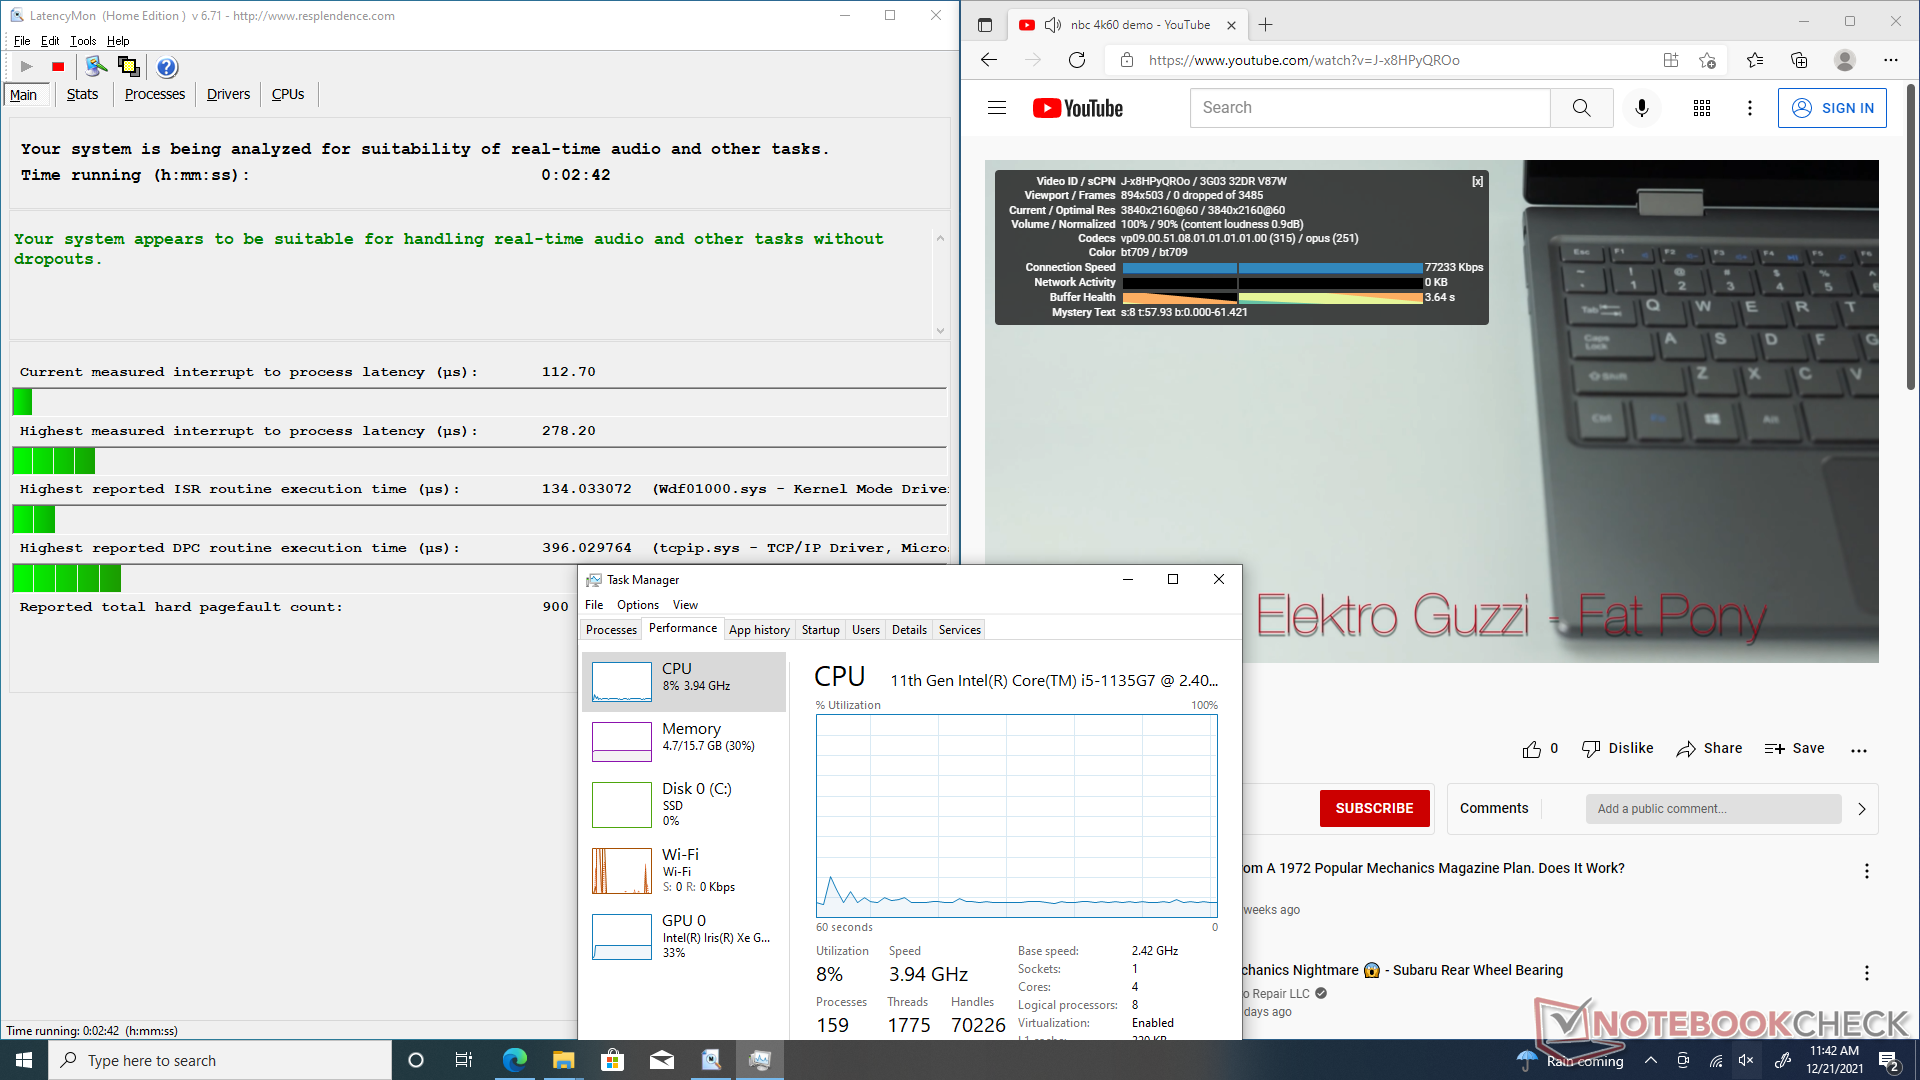
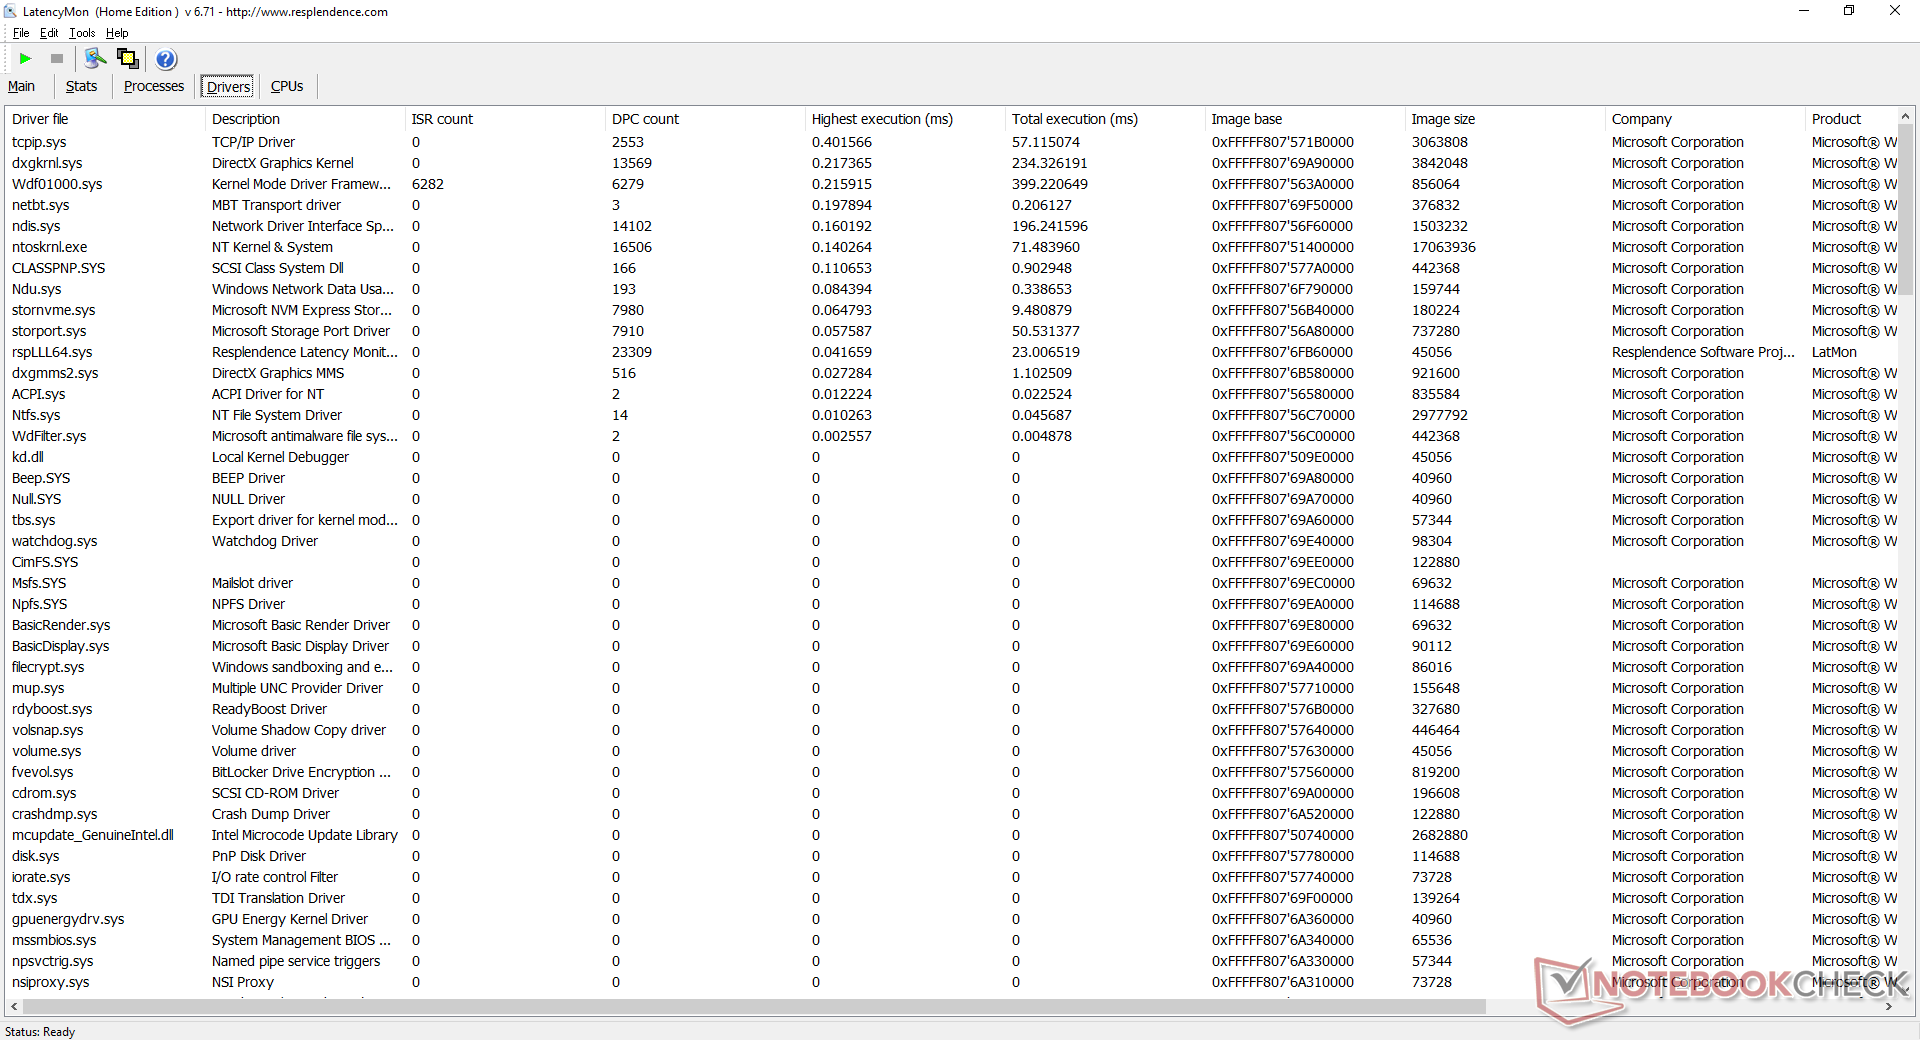
DPC latentie
LatencyMon laat geen DPC-problemen zien bij het openen van meerdere browsertabbladen op onze startpagina. Het afspelen van 4K-video's met 60 FPS verloopt ook vloeiend en zonder wegvallende frames.
| DPC Latencies / LatencyMon - interrupt to process latency (max), Web, Youtube, Prime95 | |
| GMK NucBox 2 | |
| Beelink SER3 | |
| Intel NUC11TNKi5 | |
| Beelink GTI 11 | |
* ... kleiner is beter
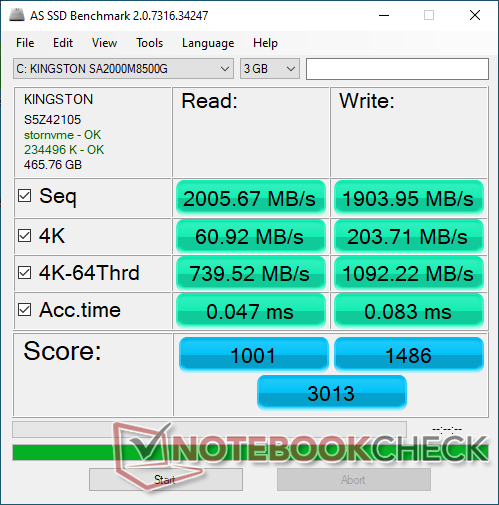
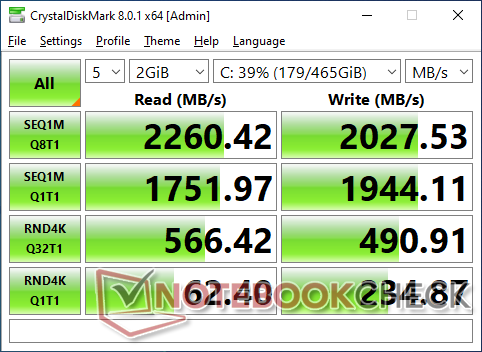
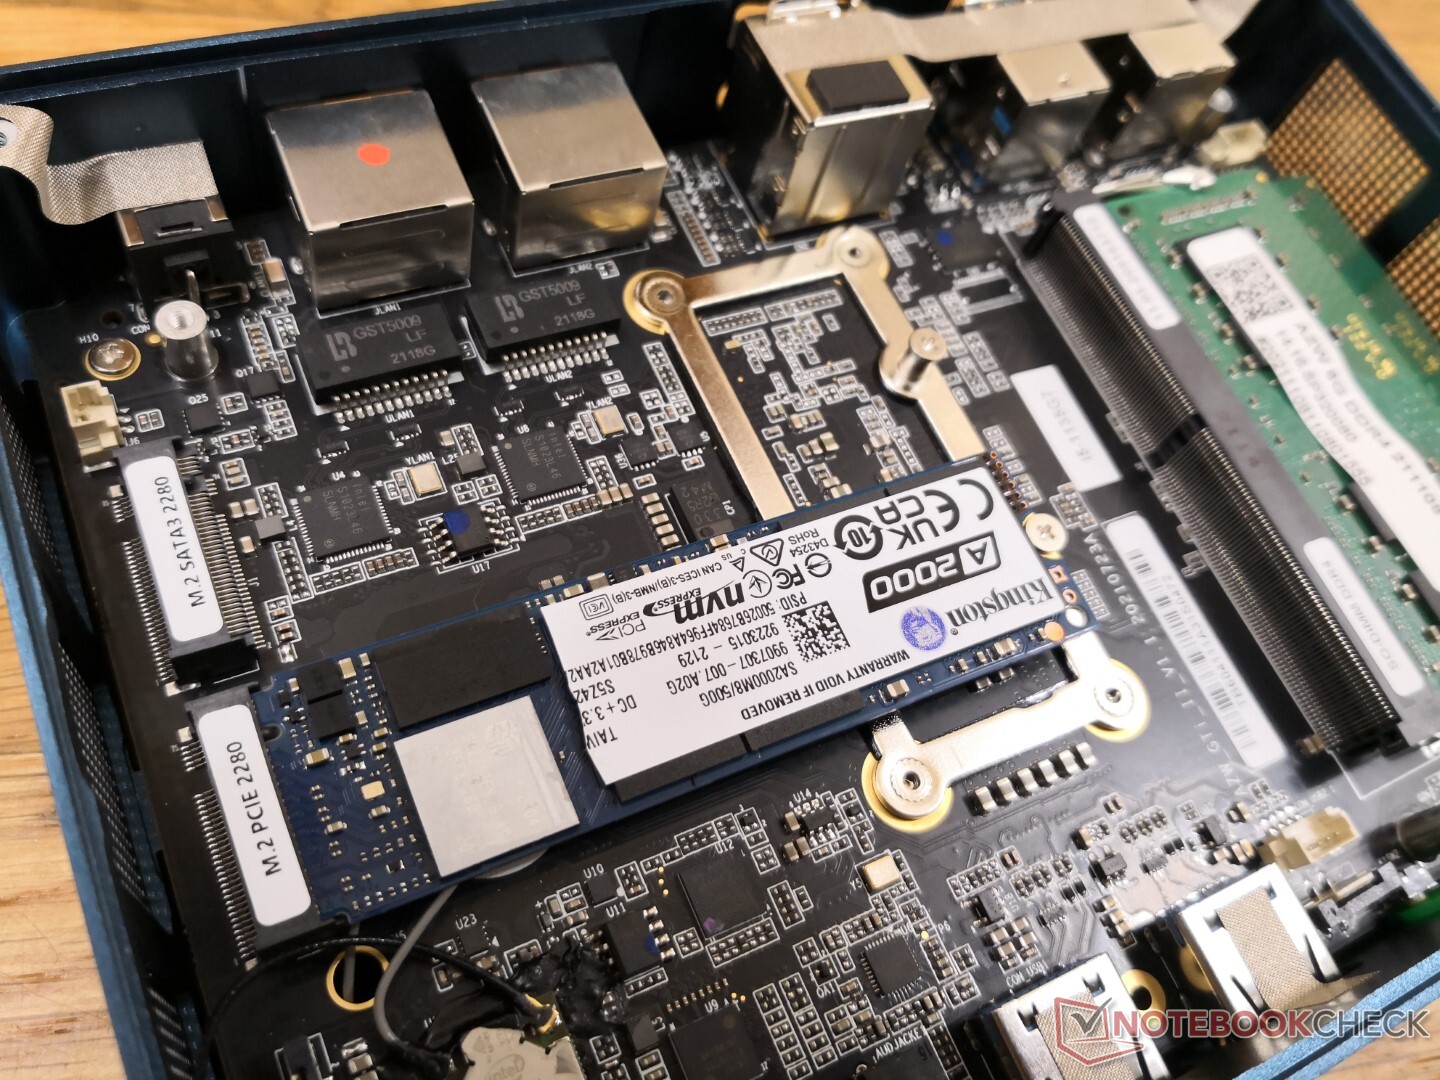
Opslagapparaten
Het systeem kan maximaal drie interne schijven ondersteunen (2x M.2 2280 + 1x 2,5-inch SATA III). Houd er rekening mee dat de tweede M.2 schijf een SATA III-schijf moet zijn en geen NVMe-schijf. De 500 GB Kingston A2000 schijf in onze eenheid is een PCIe3 M.2 schijf uit het middensegment met sequentiële lees- en schrijfsnelheden van ongeveer 2000 tot 2200 MB/s elk. De duurzaamheid van de prestaties is ook uitstekend, zonder thermische problemen bij het draaien van DiskSpd in een lus.
De eenheid wordt geleverd met een PCIe3 schijf in plaats van PCIe4 waarschijnlijk om kosten te besparen. Gebruikers kunnen desgewenst hun eigen PCIe4-schijven installeren.

| Drive Performance rating - Percent | |
| Beelink GTI 11 | |
| Intel Hades Canyon NUC8i7HVK -8! | |
| Beelink SER3 | |
| GMK NucBox 2 | |
| Intel NUC10i7FNH | |
| Intel NUC11TNKi5 | |
| DiskSpd | |
| seq read | |
| GMK NucBox 2 | |
| Beelink GTI 11 | |
| Beelink SER3 | |
| Intel NUC10i7FNH | |
| Intel NUC11TNKi5 | |
| seq write | |
| Beelink GTI 11 | |
| Beelink SER3 | |
| GMK NucBox 2 | |
| Intel NUC10i7FNH | |
| Intel NUC11TNKi5 | |
| seq q8 t1 read | |
| GMK NucBox 2 | |
| Beelink SER3 | |
| Beelink GTI 11 | |
| Intel NUC10i7FNH | |
| Intel NUC11TNKi5 | |
| seq q8 t1 write | |
| Beelink GTI 11 | |
| Beelink SER3 | |
| GMK NucBox 2 | |
| Intel NUC10i7FNH | |
| Intel NUC11TNKi5 | |
| 4k q1 t1 read | |
| Beelink GTI 11 | |
| Beelink SER3 | |
| GMK NucBox 2 | |
| Intel NUC10i7FNH | |
| Intel NUC11TNKi5 | |
| 4k q1 t1 write | |
| Beelink GTI 11 | |
| GMK NucBox 2 | |
| Beelink SER3 | |
| Intel NUC10i7FNH | |
| Intel NUC11TNKi5 | |
| 4k q32 t16 read | |
| Beelink SER3 | |
| Beelink GTI 11 | |
| GMK NucBox 2 | |
| Intel NUC11TNKi5 | |
| Intel NUC10i7FNH | |
| 4k q32 t16 write | |
| Beelink GTI 11 | |
| GMK NucBox 2 | |
| Beelink SER3 | |
| Intel NUC11TNKi5 | |
| Intel NUC10i7FNH | |
* ... kleiner is beter
Disk Throttling: DiskSpd Read Loop, Queue Depth 8
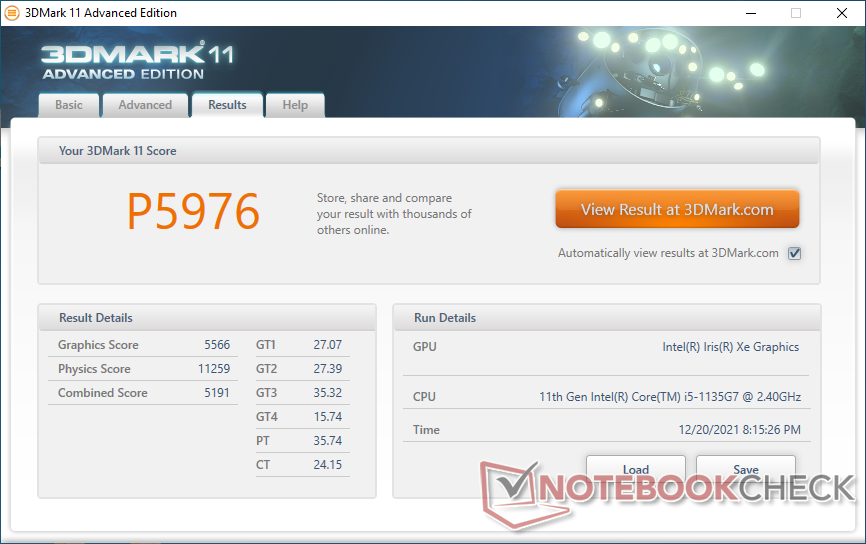
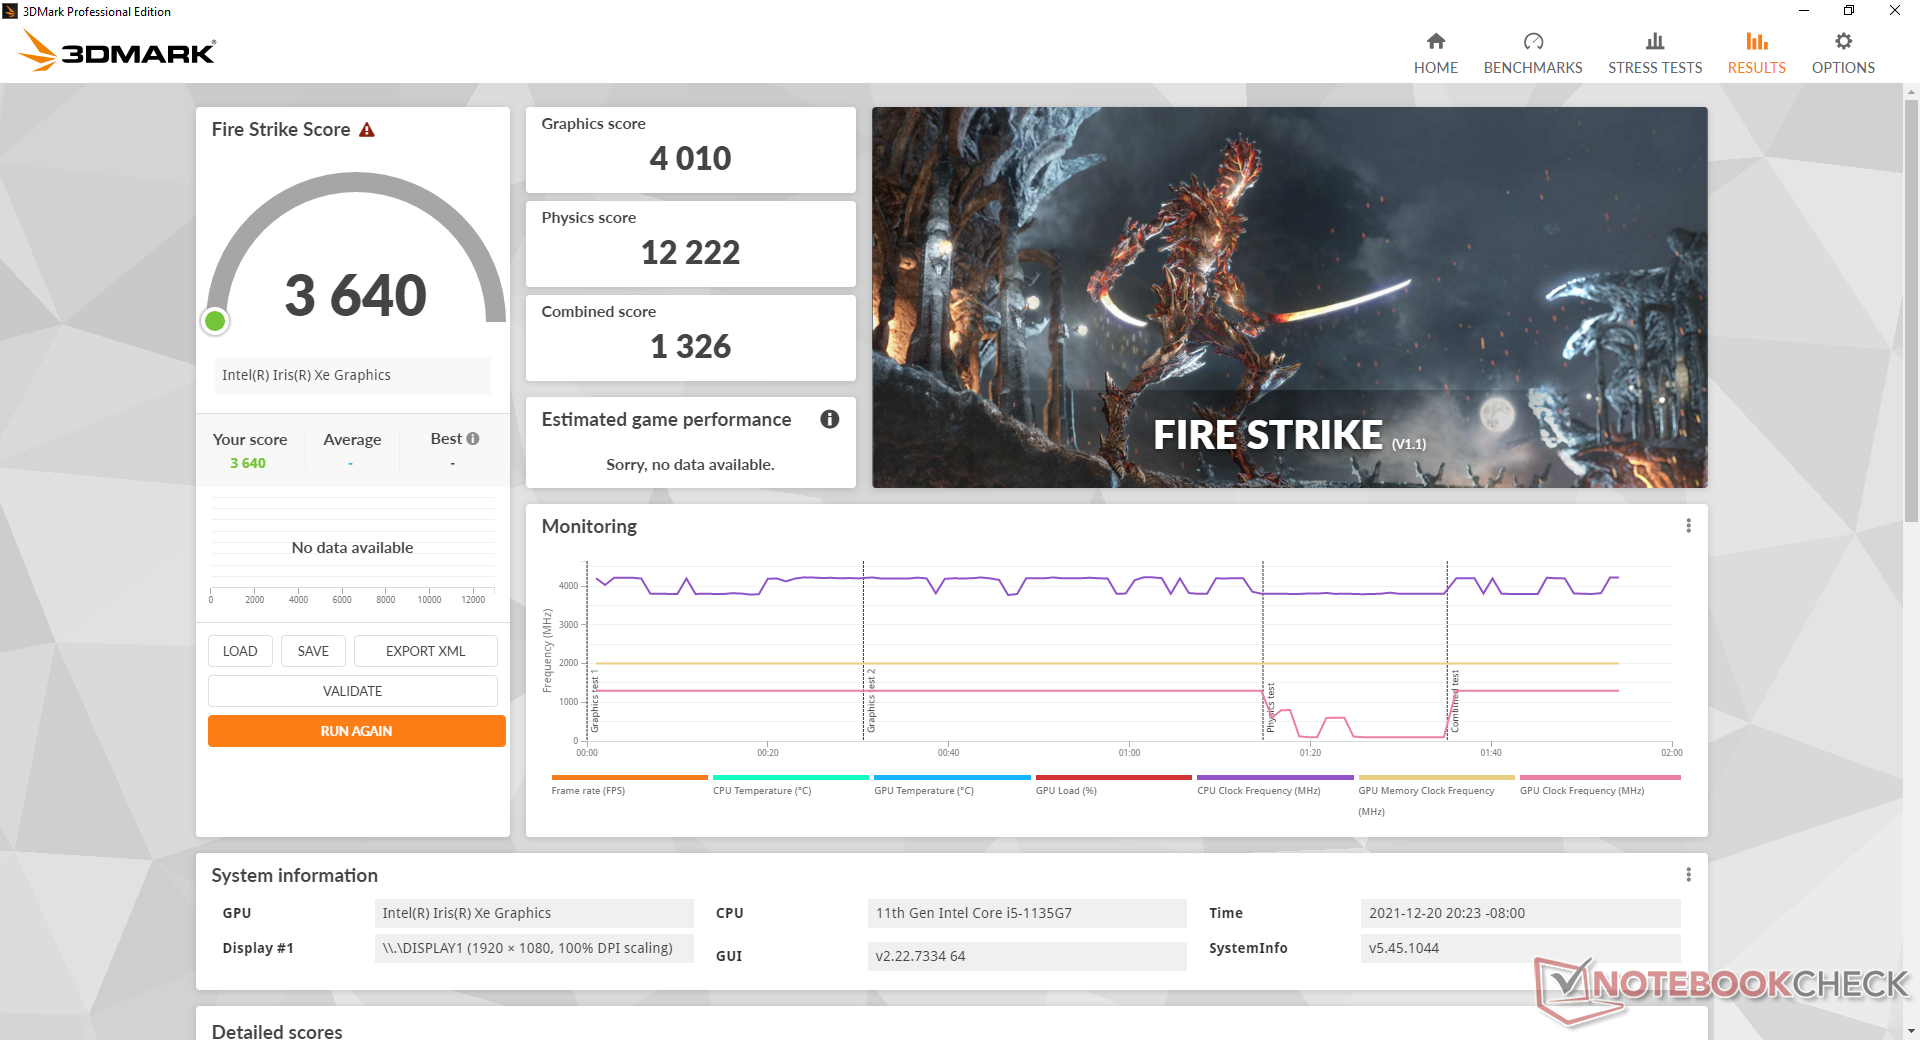
GPU prestatie
De grafische prestaties zijn zeer goed en ruwweg 13 procent sneller dan de gemiddelde laptop of PC die is uitgerust met dezelfde geïntegreerde Iris Xe 80 EU's. De GTI 11 wordt geleverd met dual-channel RAM, in tegenstelling tot onze Intel NUC11TNKi5 test unit die is uitgerust met dezelfde Core i5-1135G7 CPU maar met enkel-kanaals RAM. Grafische prestaties zijn ongeveer 25 procent sneller op onze Beelink, voornamelijk als gevolg van hun verschillende RAM-configuraties
Upgraden naar een PC of laptop met de duurdere Core i7-1165G7 en zijn geïntegreerde Iris Xe 96 EU's zal resulteren in een prestatieverhoging van 25 tot 35 procent, afhankelijk van het model.

| 3DMark 11 - 1280x720 Performance GPU | |
| Intel Hades Canyon NUC8i7HVK | |
| Samsung Galaxy Book Pro 15 NP950XDB-KC5US | |
| Asus Vivobook 15 K513EQ | |
| Intel NUC11PAQi7 | |
| Lenovo Yoga 6 13ALC6 | |
| Beelink GTI 11 | |
| Intel NUC11TNKi5 | |
| Lenovo Yoga 6 13 82ND0009US | |
| Gemiddeld Intel Iris Xe Graphics G7 80EUs (2246 - 6579, n=112) | |
| Infinix INBook X1 Pro | |
| Beelink GTR35 II-G-16512D00W64PRO-1T | |
| Beelink SER3 | |
| GMK NucBox 2 | |
| Asus VivoBook S13 S333JA-DS51 | |
| Intel NUC10i7FNH | |
| 3DMark 11 Performance | 5976 punten | |
| 3DMark Cloud Gate Standard Score | 18036 punten | |
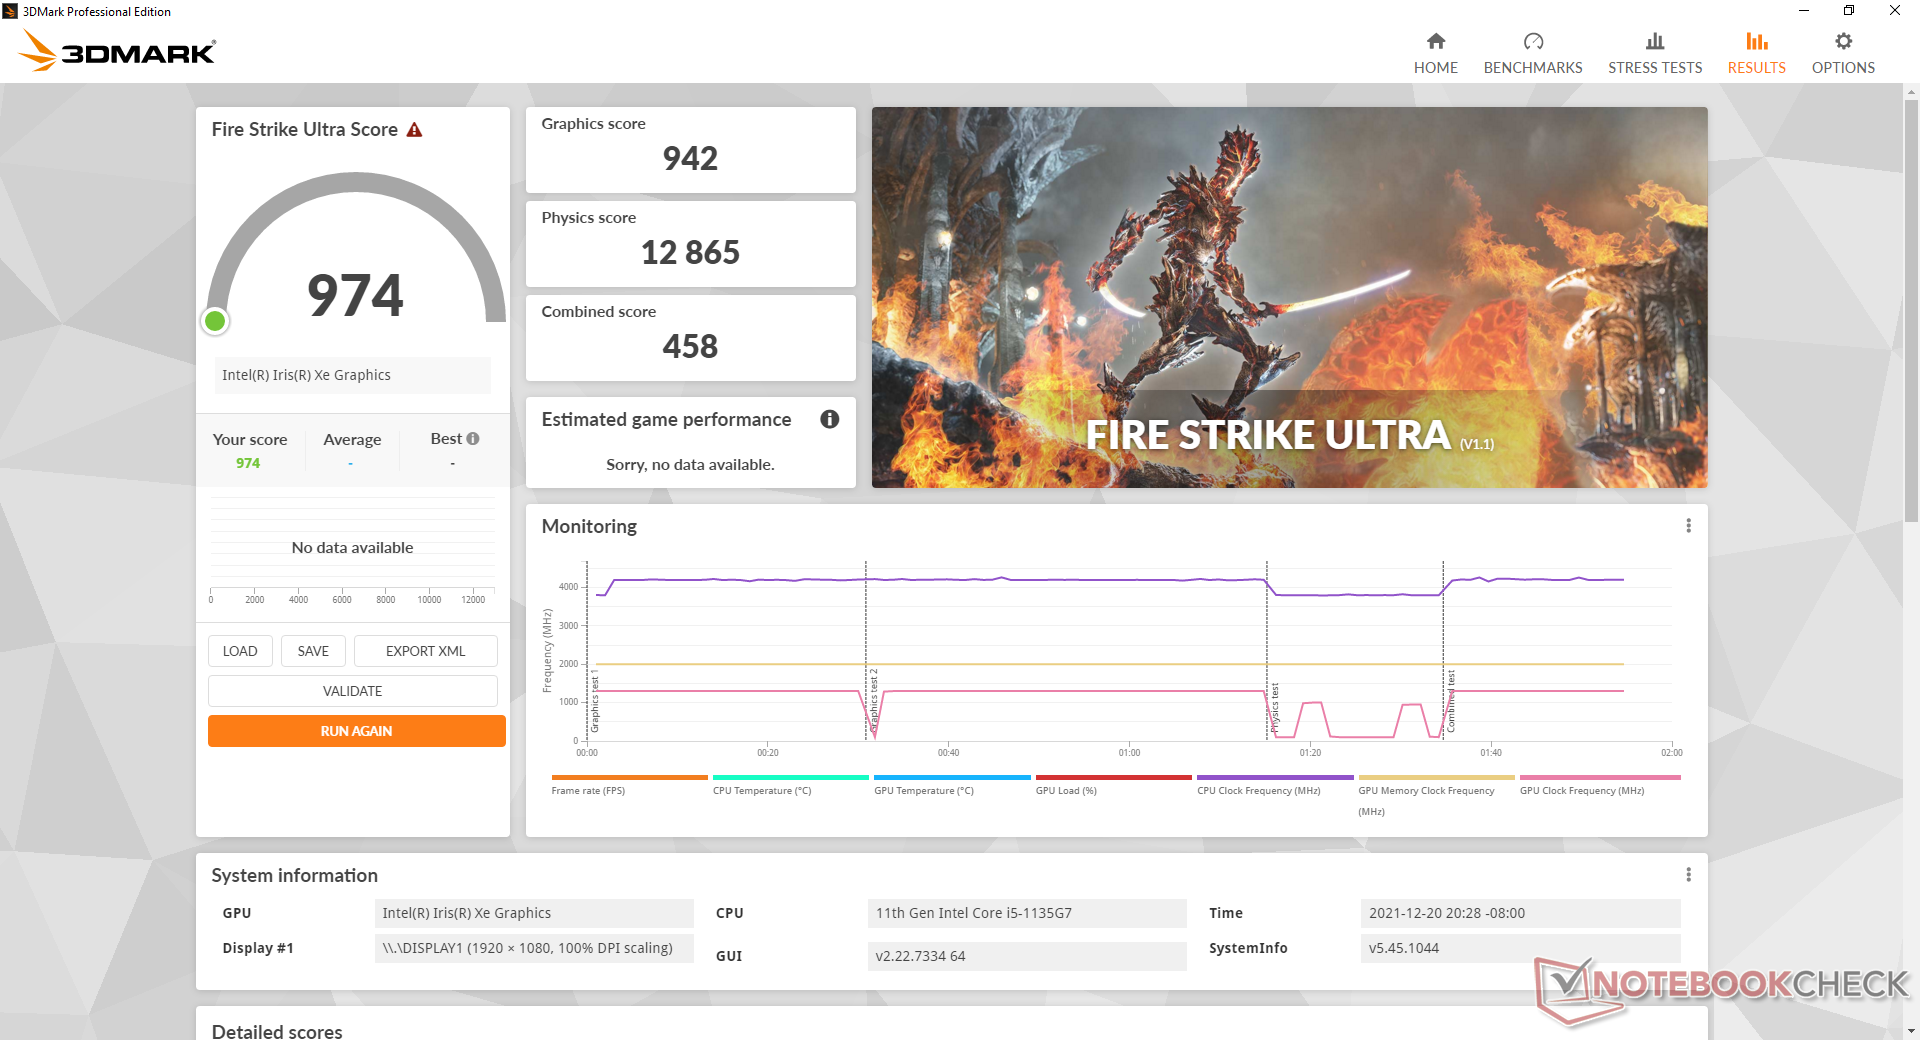
| 3DMark Fire Strike Score | 3640 punten | |
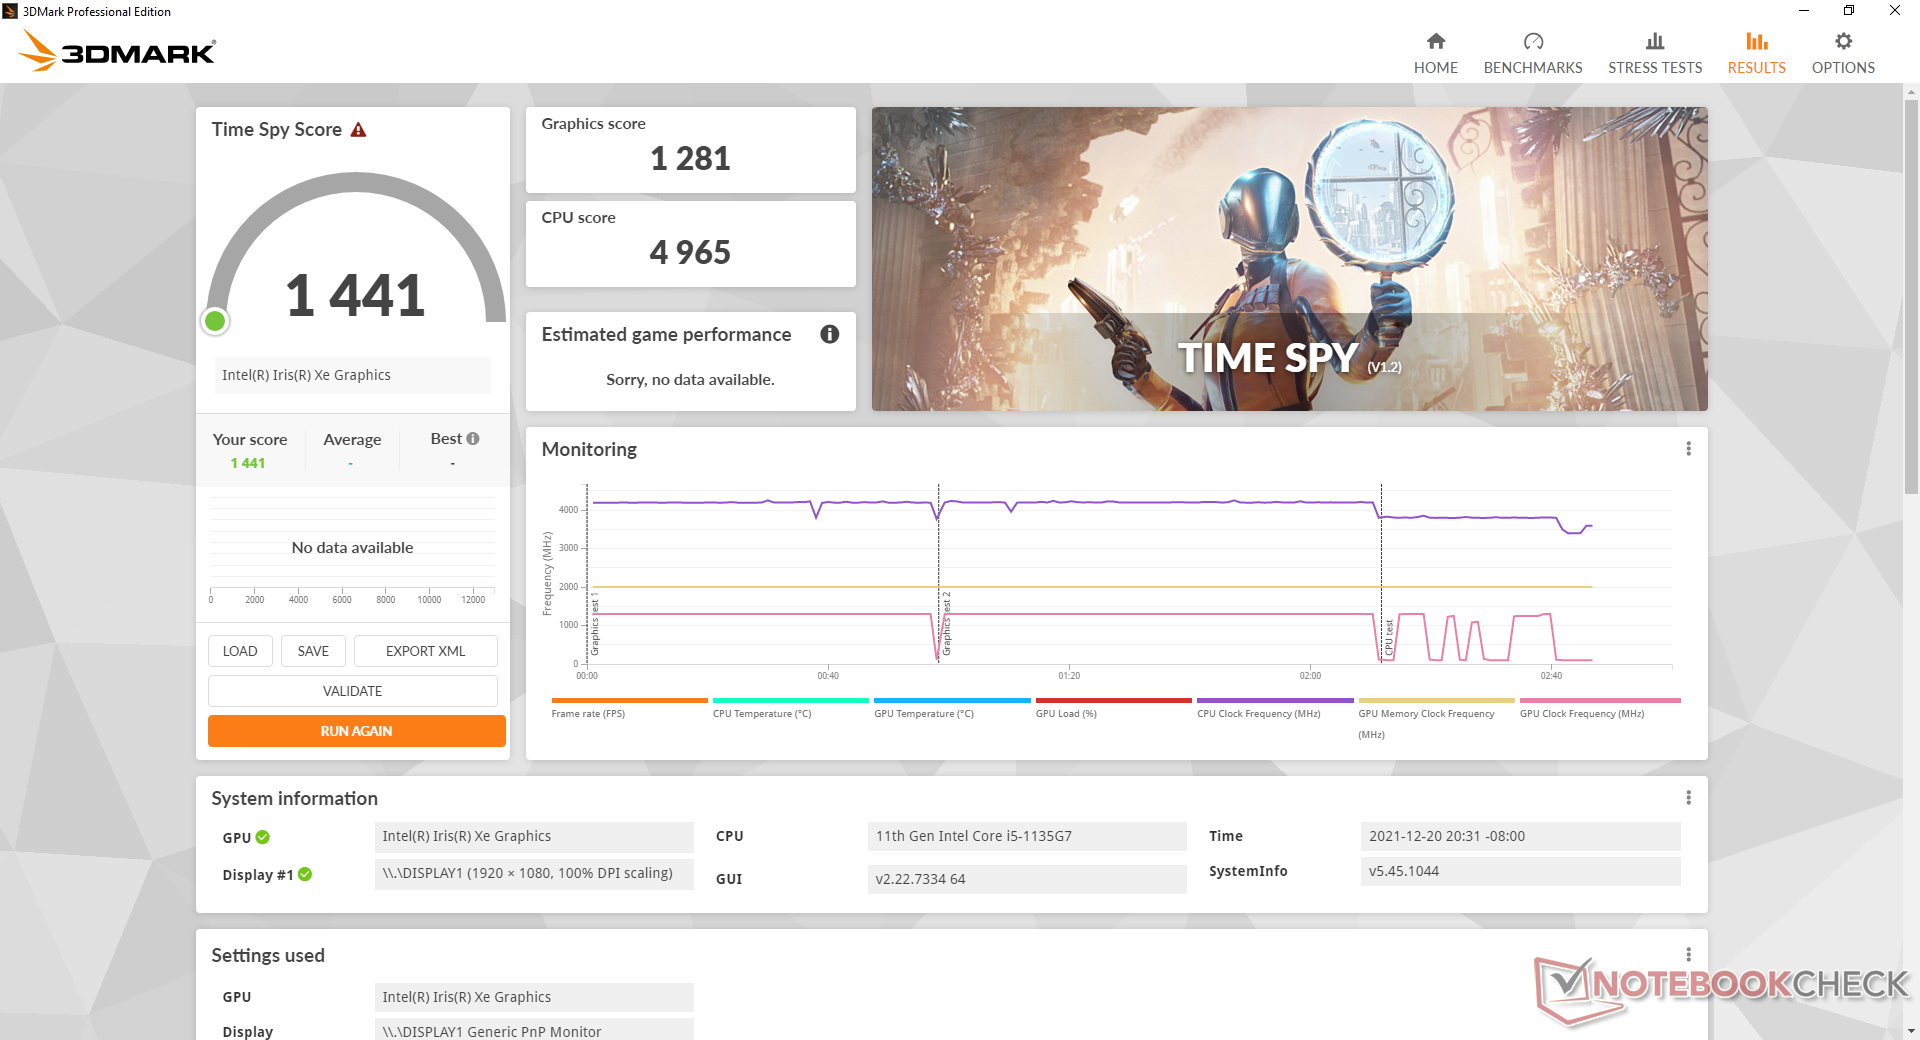
| 3DMark Time Spy Score | 1441 punten | |
Help | ||
Witcher 3 FPS Chart
| lage | gem. | hoge | ultra | |
|---|---|---|---|---|
| GTA V (2015) | 95.1 | 79.5 | 21.1 | 8.17 |
| The Witcher 3 (2015) | 77.1 | 46.6 | 23.1 | 11.5 |
| Dota 2 Reborn (2015) | 123 | 81 | 49.7 | 47.2 |
| Final Fantasy XV Benchmark (2018) | 36.7 | 18.7 | 13.5 | |
| X-Plane 11.11 (2018) | 24 | 21.4 | 21.9 | |
| Far Cry 5 (2018) | 47 | 23 | 22 | 21 |
| Strange Brigade (2018) | 76.5 | 30.8 | 25.2 | 20.2 |
Emissies
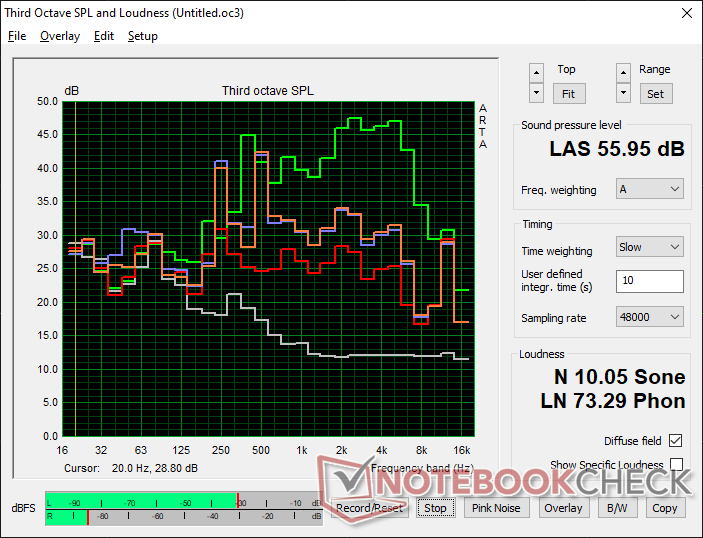
Systeemgeluid
Het geluid van de ventilator is misschien wel het ergste aspect van de GTI 11. De twee interne ventilatoren pulseren regelmatig en merkbaar tussen 28,4 dB(A) en 37,7 dB(A), zelfs wanneer het systeem gewoon op het bureaublad draait of op het web surft. Het gedrag van de ventilatoren verandert ook niet wanneer het systeem in de spaarstand wordt gezet.
Het draaien van hogere belastingen zoals games zal een ventilatorgeluid veroorzaken dat varieert van 44 dB(A) tot 56 dB(A), wat veel luider is dan wat we hebben geregistreerd op de meeste andere mini PC's, inclusief de Intel NUC serie. Onze unit zou ook last hebben van lichte elektronische ruis of spoelgejank en dus is hij nooit echt stil.
Geluidsniveau
| Onbelast |
| 28.4 / 32 / 37.7 dB (A) |
| Belasting |
| 44.2 / 56 dB (A) |
 | ||
30 dB stil 40 dB(A) hoorbaar 50 dB(A) luid |
||
min: | ||
| Beelink GTI 11 Iris Xe G7 80EUs, i5-1135G7, Kingston SA2000M8500G | Beelink SER3 Vega 10, R7 3750H, GSemi AZW GSDFN512TS3F1OGCX | Intel NUC11TNKi5 Iris Xe G7 80EUs, i5-1135G7, Transcend M.2 SSD 430S TS512GMTS430S | GMK NucBox 2 Iris Plus Graphics 655, i5-8259U, Netac S930E8/256GPN | Intel Hades Canyon NUC8i7HVK Vega M GH, i7-8809G, Intel Optane 120 GB SSDPEK1W120GA | |
|---|---|---|---|---|---|
| Noise | 19% | 3% | 20% | 8% | |
| uit / omgeving * (dB) | 25.7 | 23.4 9% | 24.8 4% | 25.6 -0% | 28.7 -12% |
| Idle Minimum * (dB) | 28.4 | 23.4 18% | 35.6 -25% | 25.7 10% | 29 -2% |
| Idle Average * (dB) | 32 | 23.4 27% | 35.6 -11% | 25.7 20% | 29 9% |
| Idle Maximum * (dB) | 37.7 | 29.4 22% | 35.6 6% | 25.7 32% | 29 23% |
| Load Average * (dB) | 44.2 | 35.2 20% | 36.2 18% | 35.3 20% | 36 19% |
| Witcher 3 ultra * (dB) | 44.5 | 37.2 16% | 38 15% | 42 6% | |
| Load Maximum * (dB) | 56 | 43.3 23% | 47.6 15% | 35.1 37% | 49.4 12% |
* ... kleiner is beter
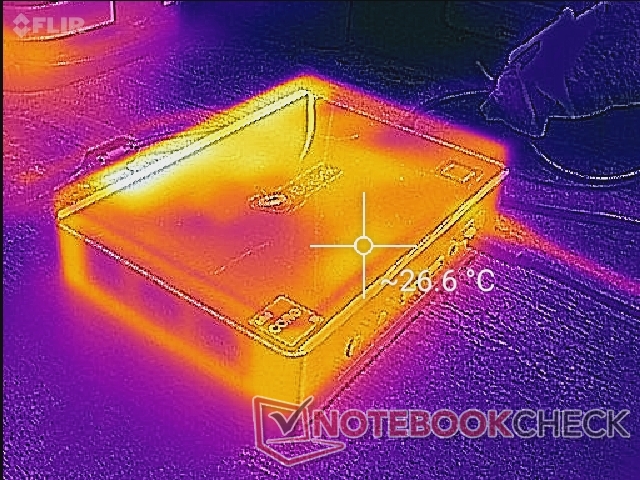
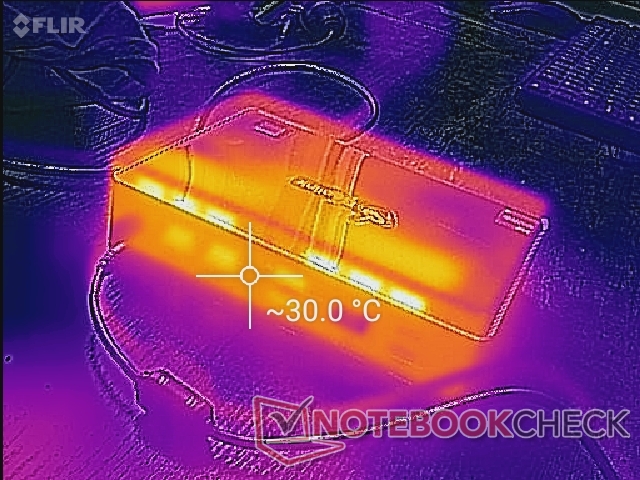
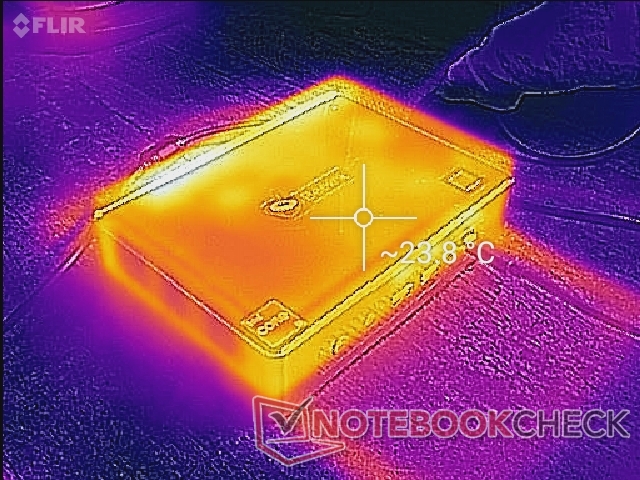
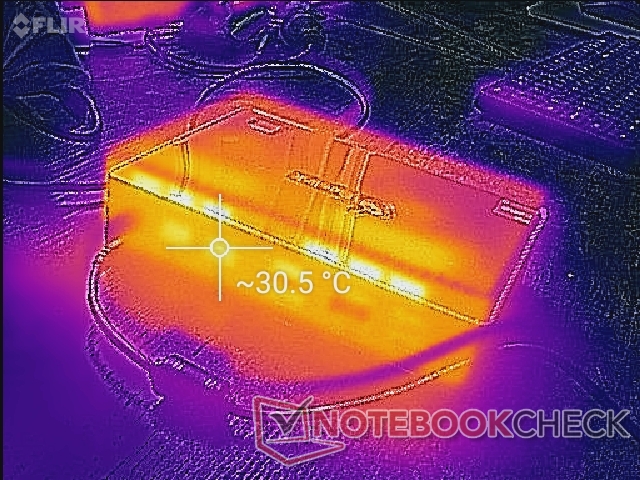
Temperatuur
Oppervlaktetemperaturen zijn geen probleem bij de GTI 11. In feite zijn de verschillen tussen stationair draaien en gaming belasting vrij klein, zoals blijkt uit onze temperatuurkaarten hieronder. Koele lucht komt binnen via de twee zijkanten van het chassis die het verst uit elkaar liggen en warme lucht komt via de achterkant. Voorwerpen kunnen bovenop het apparaat worden geplaatst zonder de luchtstroom te belemmeren, maar een verticale oriëntatie kan van invloed zijn op het ventilatorgeluid of de temperatuur.
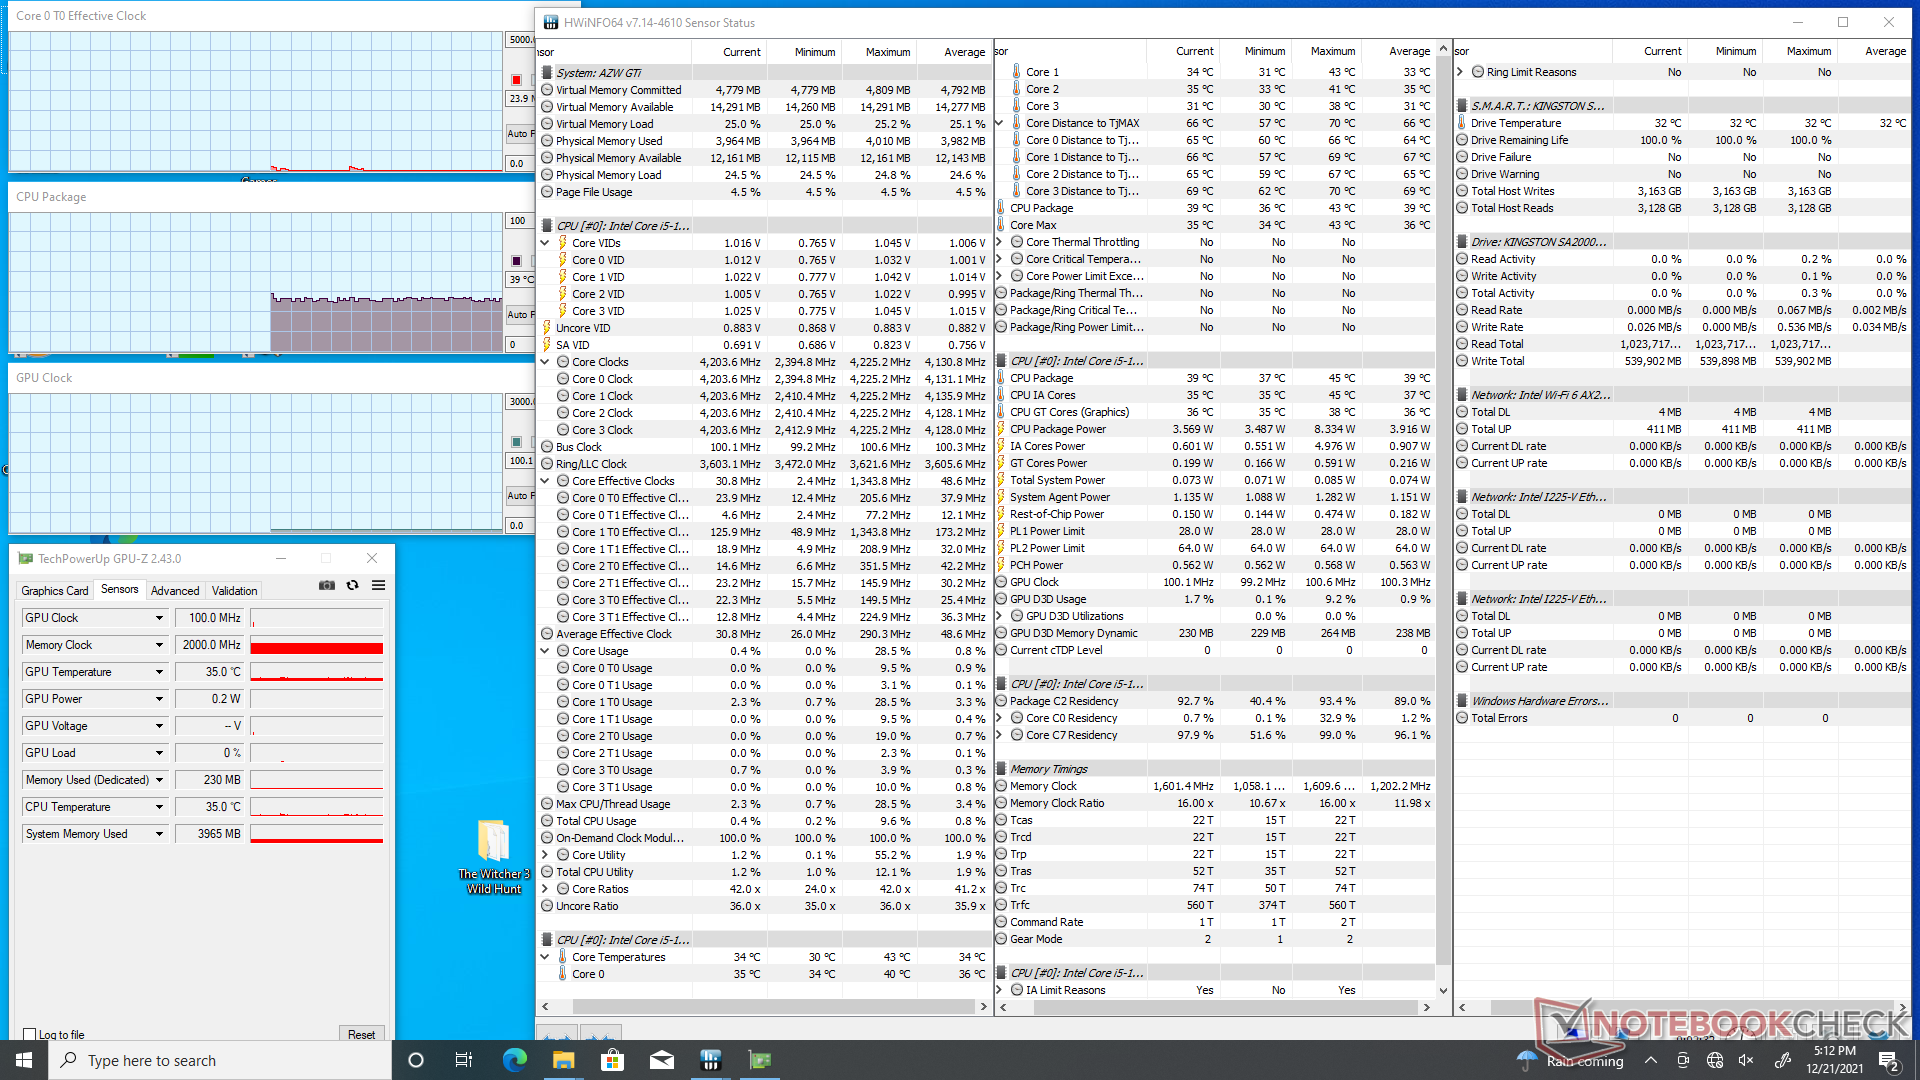
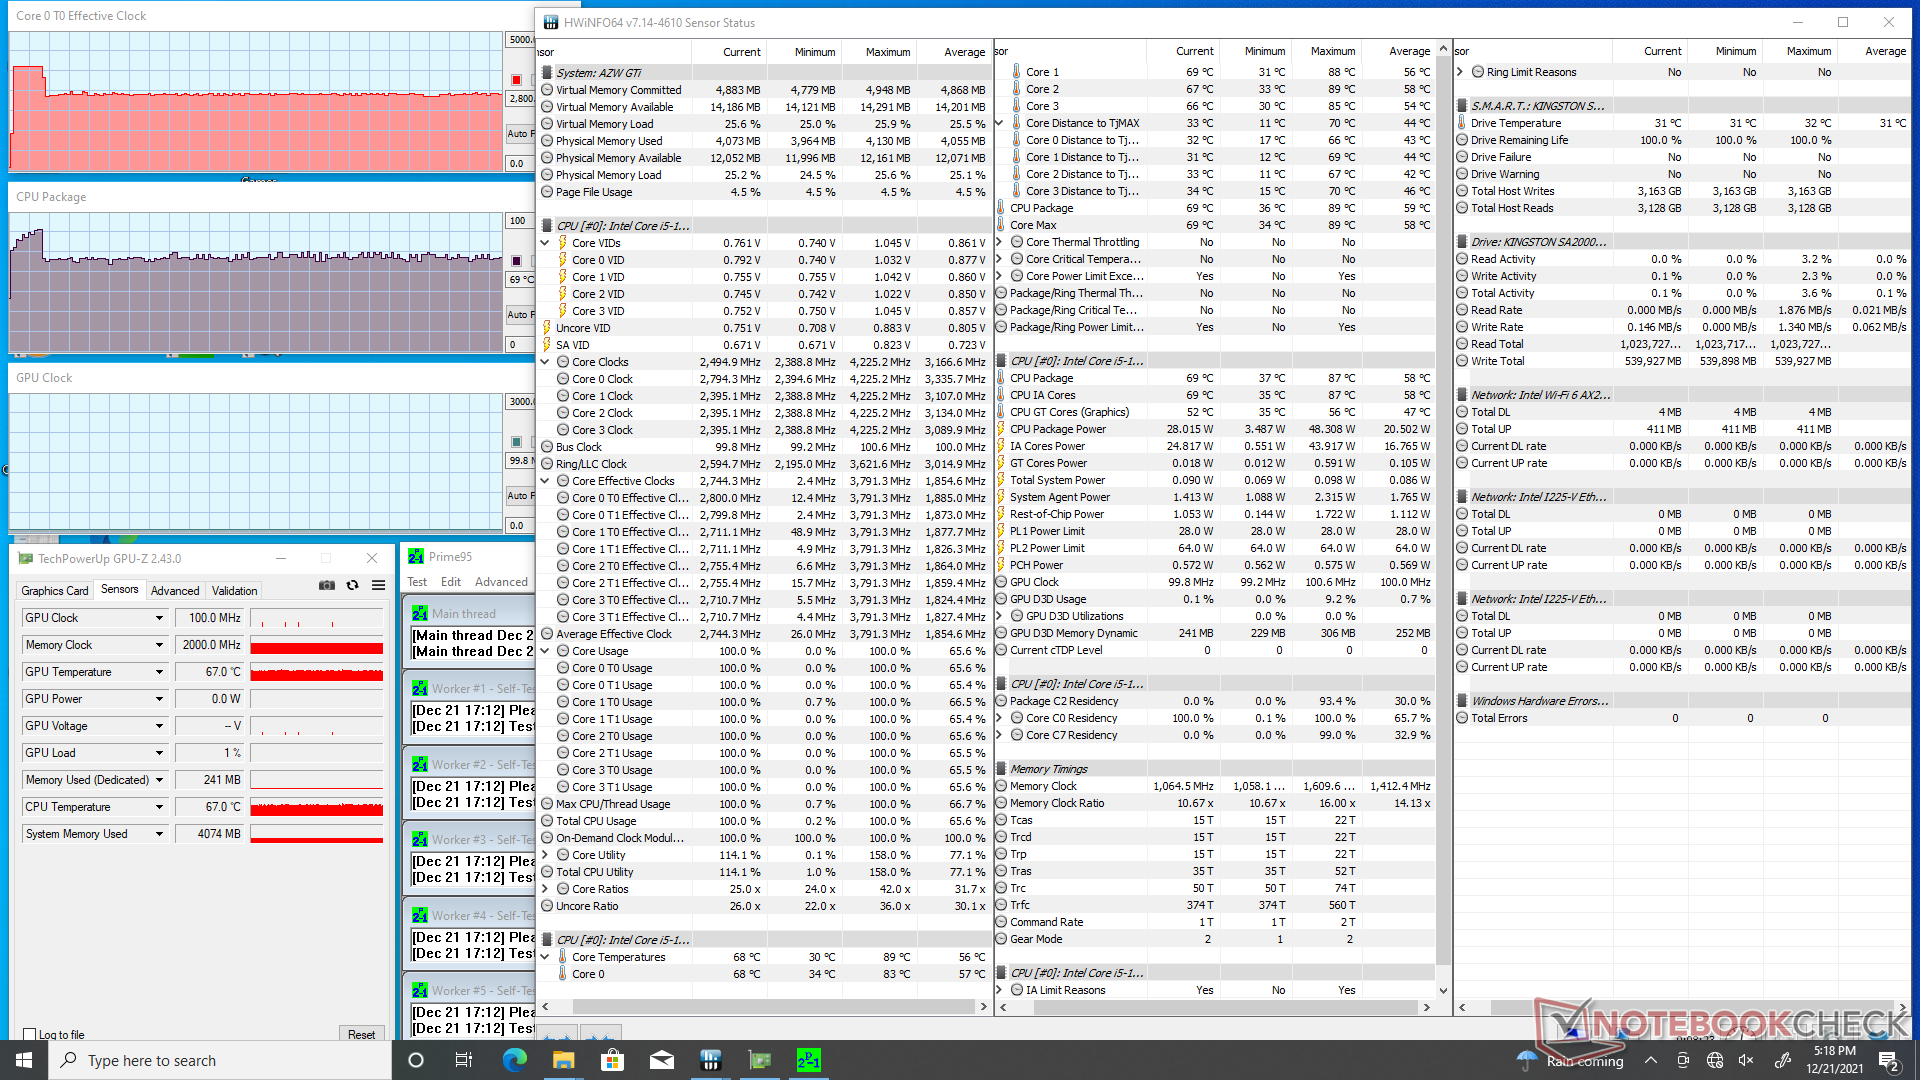
Stresstest
Bij het draaien van Prime95 om de CPU te belasten, werden de kloksnelheden opgevoerd tot 3,8 GHz gedurende de eerste 20 seconden of zo, totdat een kerntemperatuur van 89 C werd bereikt. De kloksnelheden daalden dan tot 2,8 GHz om een koelere kerntemperatuur van 70 C te handhaven. Het vermogen van de CPU-pakket daalde ook van maximaal 48 W naar een stabielere 28 W.
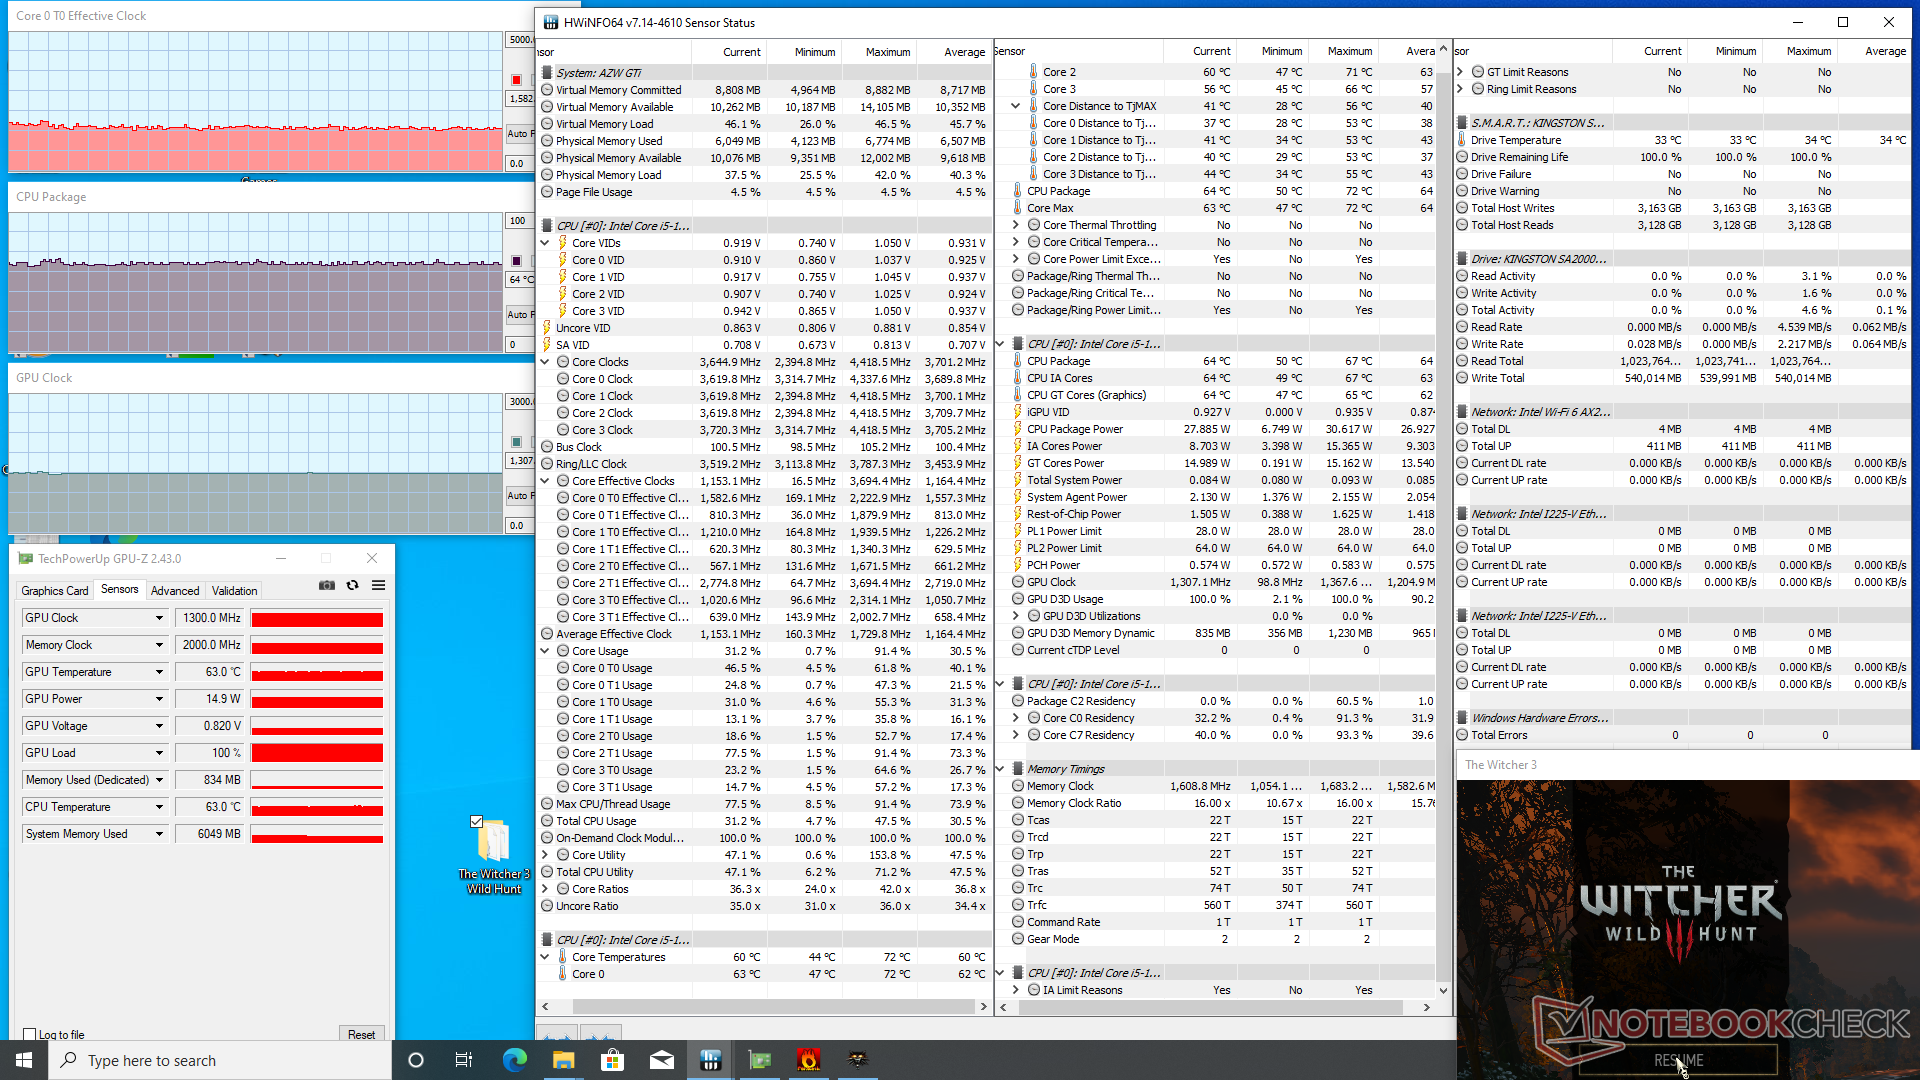
Kerntemperatuur en GPU-kloksnelheid zouden stabiliseren op respectievelijk 64 C en 1300 MHz, wanneer Witcher 3 om hoge belastingen weer te geven. De resultaten zijn zeer vergelijkbaar met wat we registreerden op de concurrerende NUC11TNKi5 wanneer beide systemen werden onderworpen aan vergelijkbare omstandigheden.
| CPUklok (GHz) GPUklok (MHz) GemiddeldeCPU temperatuur (°C) | |
| Systeem inactief | -- |
| Prime95 Stress | 2.8 |
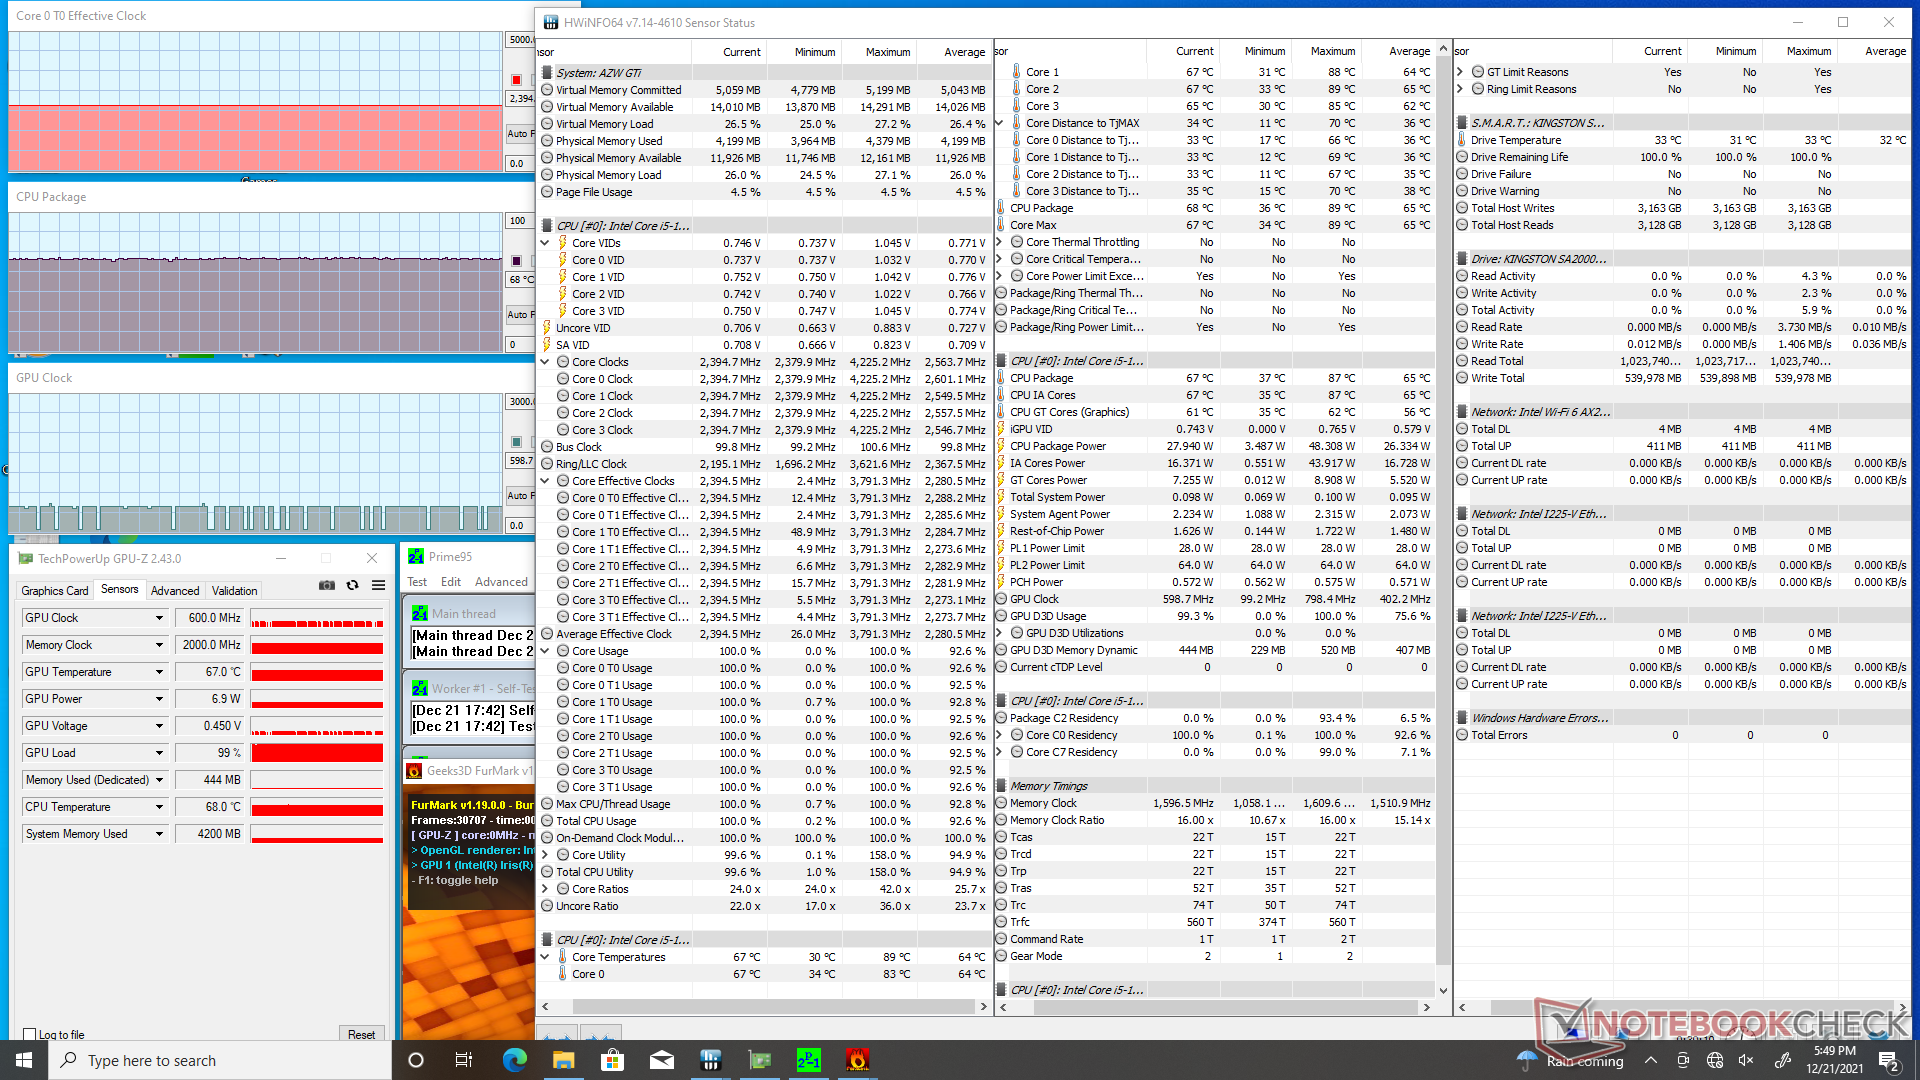
| Prime95 + FurMark Stress 2.4 100 - 600 68 | |
| Witcher 3 Stress | 1.6 |
Energiebeheer
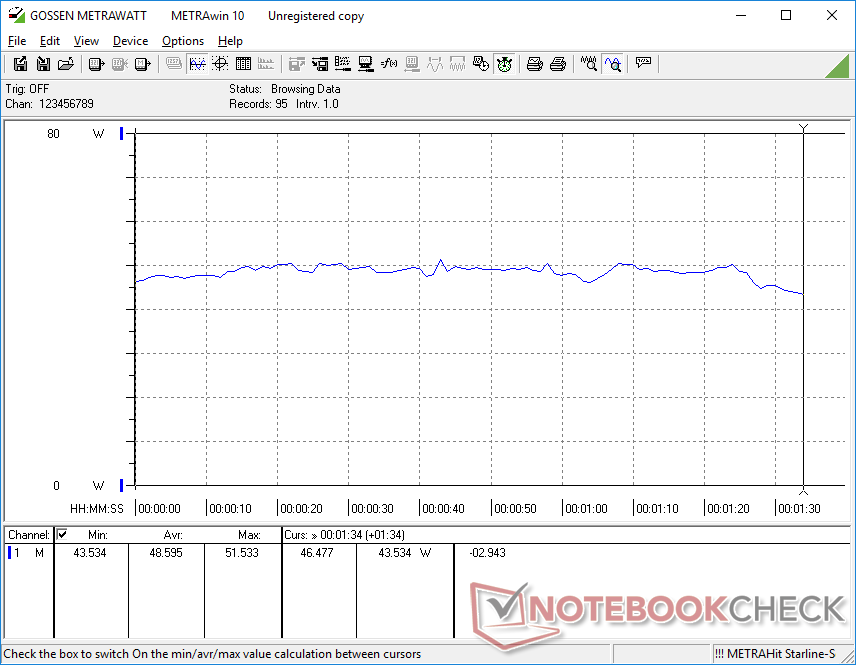
Stroomverbruik
Het totale stroomverbruik is hoger dan verwacht. De Intel NUC11TNKi5 met exact dezelfde CPU, bijvoorbeeld, zou verschillende watts minder vragen onder alle geteste omstandigheden in vergelijking met ons Beelink toestel. De snellere CPU en GPU prestaties van de Beelink in vergelijking met de gemiddelde PC met dezelfde Core i5-1135G7 CPU is waarschijnlijk verantwoordelijk voor zijn hoger stroomverbruik
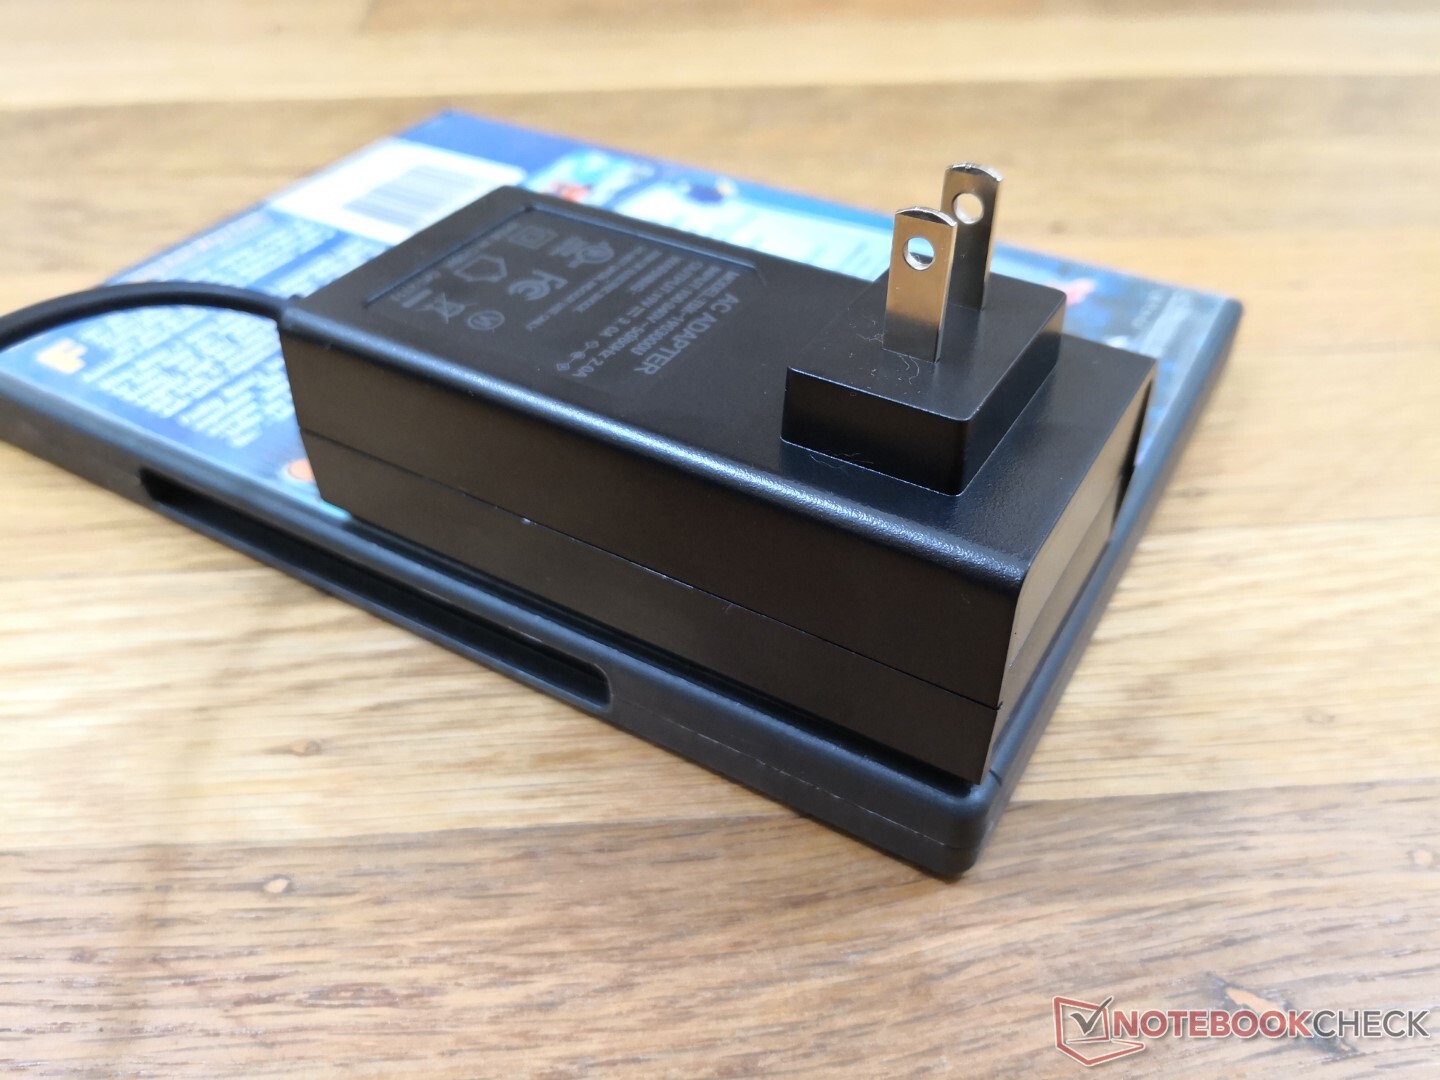
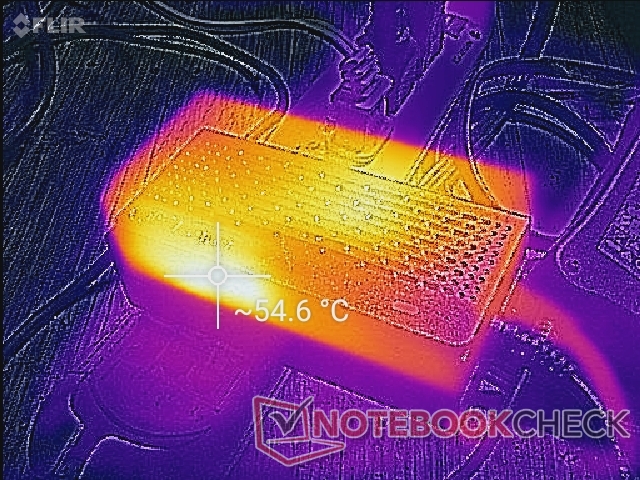
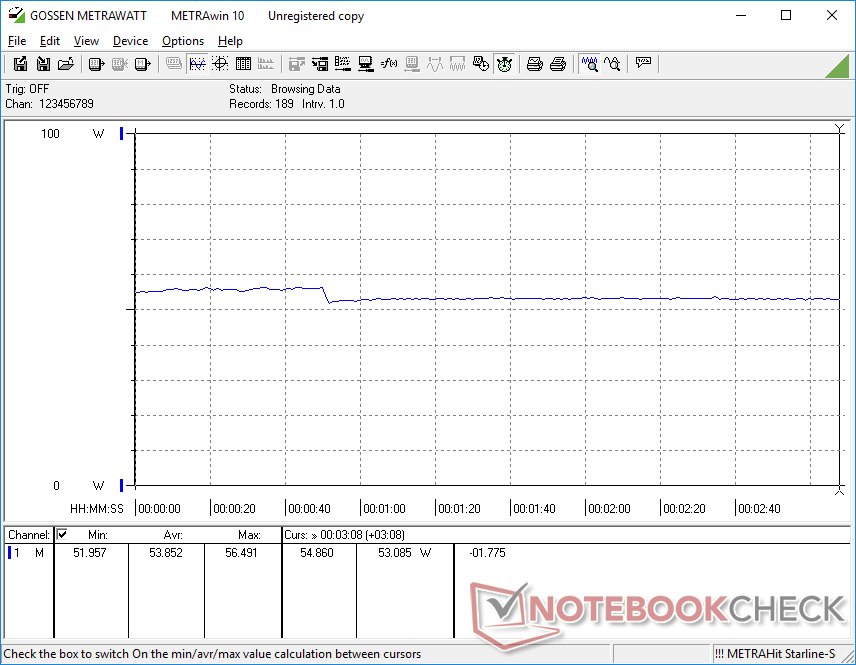
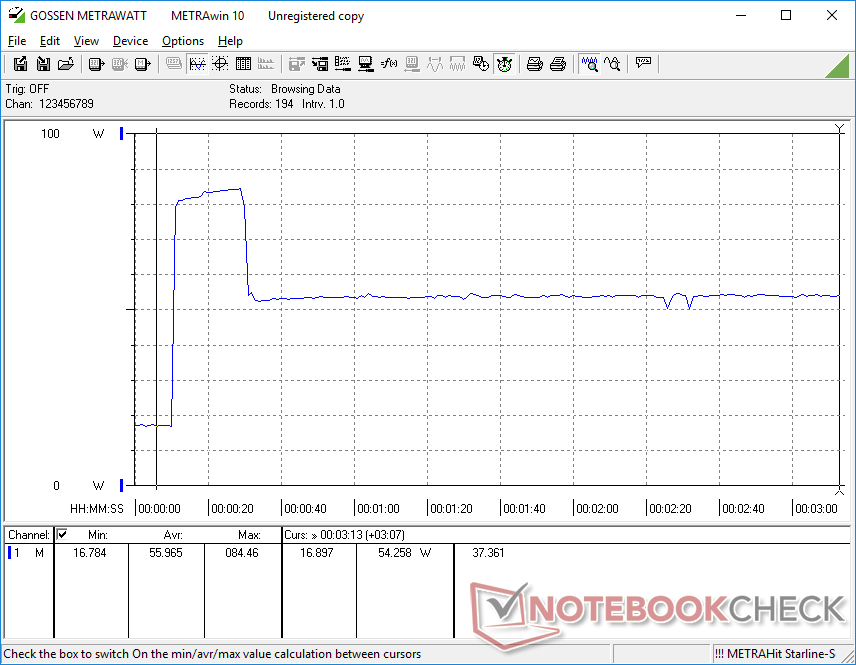
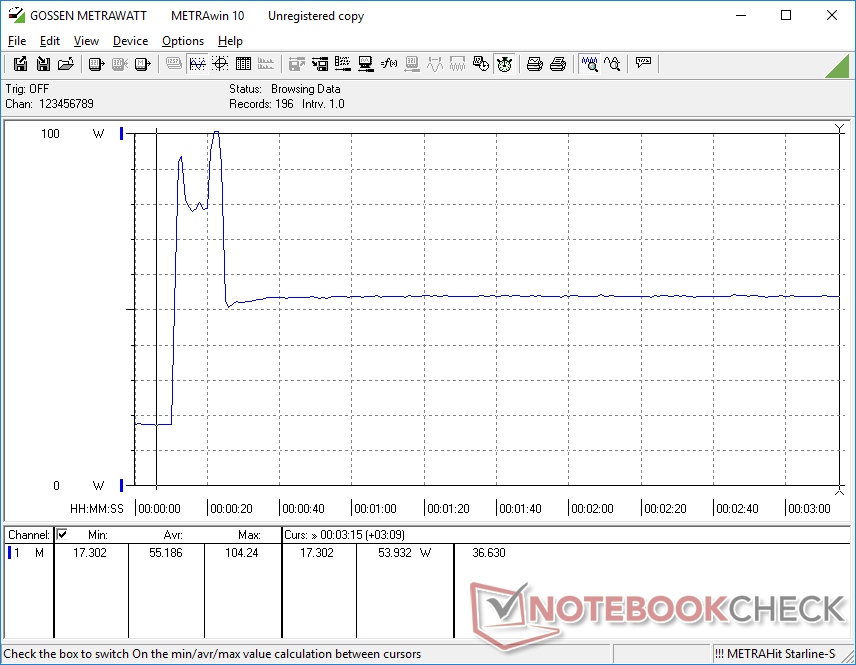
We meten een tijdelijk maximum verbruik van 104 W van de kleine-medium (~9.8 x 5 x 3.4 cm) 57 W (19 V, 3A) AC adapter tijdens het draaien van Prime95. Deze piek duurt ongeveer 20 seconden voordat hij uiteindelijk daalt en stabiliseert op 56 W, zoals te zien is in onze grafieken hieronder.
| Uit / Standby | |
| Inactief | |
| Belasting |
|
Key:
min: | |
| Beelink GTI 11 i5-1135G7, Iris Xe G7 80EUs, Kingston SA2000M8500G, , x, | Beelink SER3 R7 3750H, Vega 10, GSemi AZW GSDFN512TS3F1OGCX, , x, | Intel NUC11TNKi5 i5-1135G7, Iris Xe G7 80EUs, Transcend M.2 SSD 430S TS512GMTS430S, , x, | Intel NUC10i7FNH i7-10710U, UHD Graphics 620, Kingston RBUSNS8154P3256GJ1, , 0x0, 0" | GMK NucBox 2 i5-8259U, Iris Plus Graphics 655, Netac S930E8/256GPN, , x, | Intel Hades Canyon NUC8i7HVK i7-8809G, Vega M GH, Intel Optane 120 GB SSDPEK1W120GA, , x, | |
|---|---|---|---|---|---|---|
| Power Consumption | 45% | 22% | 33% | 45% | -45% | |
| Idle Minimum * (Watt) | 15.2 | 7 54% | 11.5 24% | 6.1 60% | 15.5 -2% | |
| Idle Average * (Watt) | 16 | 9.1 43% | 12.4 22% | 8.4 47% | 6.8 57% | 16.2 -1% |
| Idle Maximum * (Watt) | 16 | 9.7 39% | 12.9 19% | 7.3 54% | 16.5 -3% | |
| Load Average * (Watt) | 48.6 | 29.5 39% | 40.7 16% | 46.3 5% | 83.4 -72% | |
| Witcher 3 ultra * (Watt) | 53.8 | 32.5 40% | 43.9 18% | 121.7 -126% | ||
| Load Maximum * (Watt) | 104.3 | 48.7 53% | 73.5 30% | 86 18% | 50.7 51% | 173.5 -66% |
* ... kleiner is beter
Power Consumption Witcher 3 / Stresstest
Power Consumption external Monitor
Pro
Contra
Verdict - Net als een Intel NUC, maar dan redelijker geprijsd
De Beelink GTI 11 is zeer overtuigend. Voor $600 tot $700 krijgen gebruikers het complete pakket met RAM, opslag en Windows 10 Pro, terwijl een Intel NUC 11 met dezelfde CPU bijna 600 dollar kost als een barebones kit. U zou dus bijna 800 dollar uitgeven aan een Intel NUC alleen maar om de specificaties van de Beelink te evenaren. Het feit dat het Thunderbolt 4 accessoires, Wi-Fi 6 en tot drie interne SSD's kan ondersteunen, betekent dat gebruikers niet veel belangrijke functies hoeven op te geven bij de overstap naar de Beelink.
Het grootste nadeel om in gedachten te houden is het slechte gedrag van de ventilator van de GTI 11. Het toerental van de ventilator verandert regelmatig en merkbaar zonder dat daar een reden voor lijkt te zijn. Verwacht dat het systeem over het algemeen luider zal zijn in vergelijking met de meeste Intel NUC modellen.
Prijs en beschikbaarheid
Price comparison

