Beelink SER3 mini PC review: De oudere Ryzen 7 3750H heeft zijn nut

Beelink heeft verschillende mini PC's aangedreven door oudere Intel en AMD CPU's als goedkopere alternatieven voor de nieuwste Intel NUC's aangedreven door de nieuwste generatie processoren. Bijna alle HTPC toepassingen, van surfen op het web tot 4K video streaming, vereisen niet de snelste en beste CPU's, wat betekent dat de meeste gebruikers weg kunnen komen met minder dure hardware.
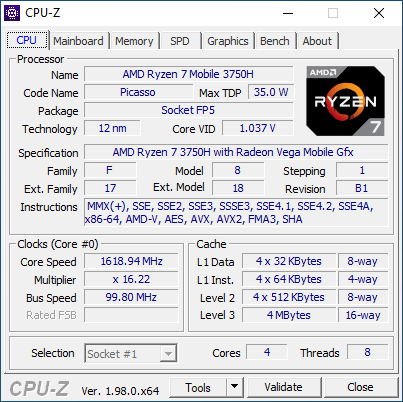
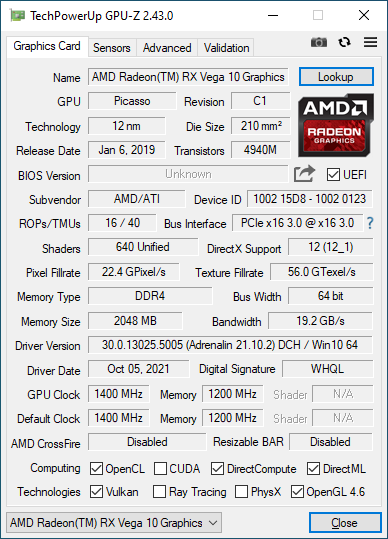
Onze Beelink SER3 test unit is uitgerust met de twee jaar oude AMD Zen+ Ryzen 7 3750H CPU die sindsdien is vervangen door de nieuwere Zen 2 4000H en Zen 3 5000H series.
Meer Beelink reviews
No, or more than one (0) Rating for the given SpecsID 326081 found
Potential Competitors in Comparison
Evaluatie | Datum | Model | Gewicht | Hoogte | Formaat | Resolutie | Beste prijs |
|---|---|---|---|---|---|---|---|
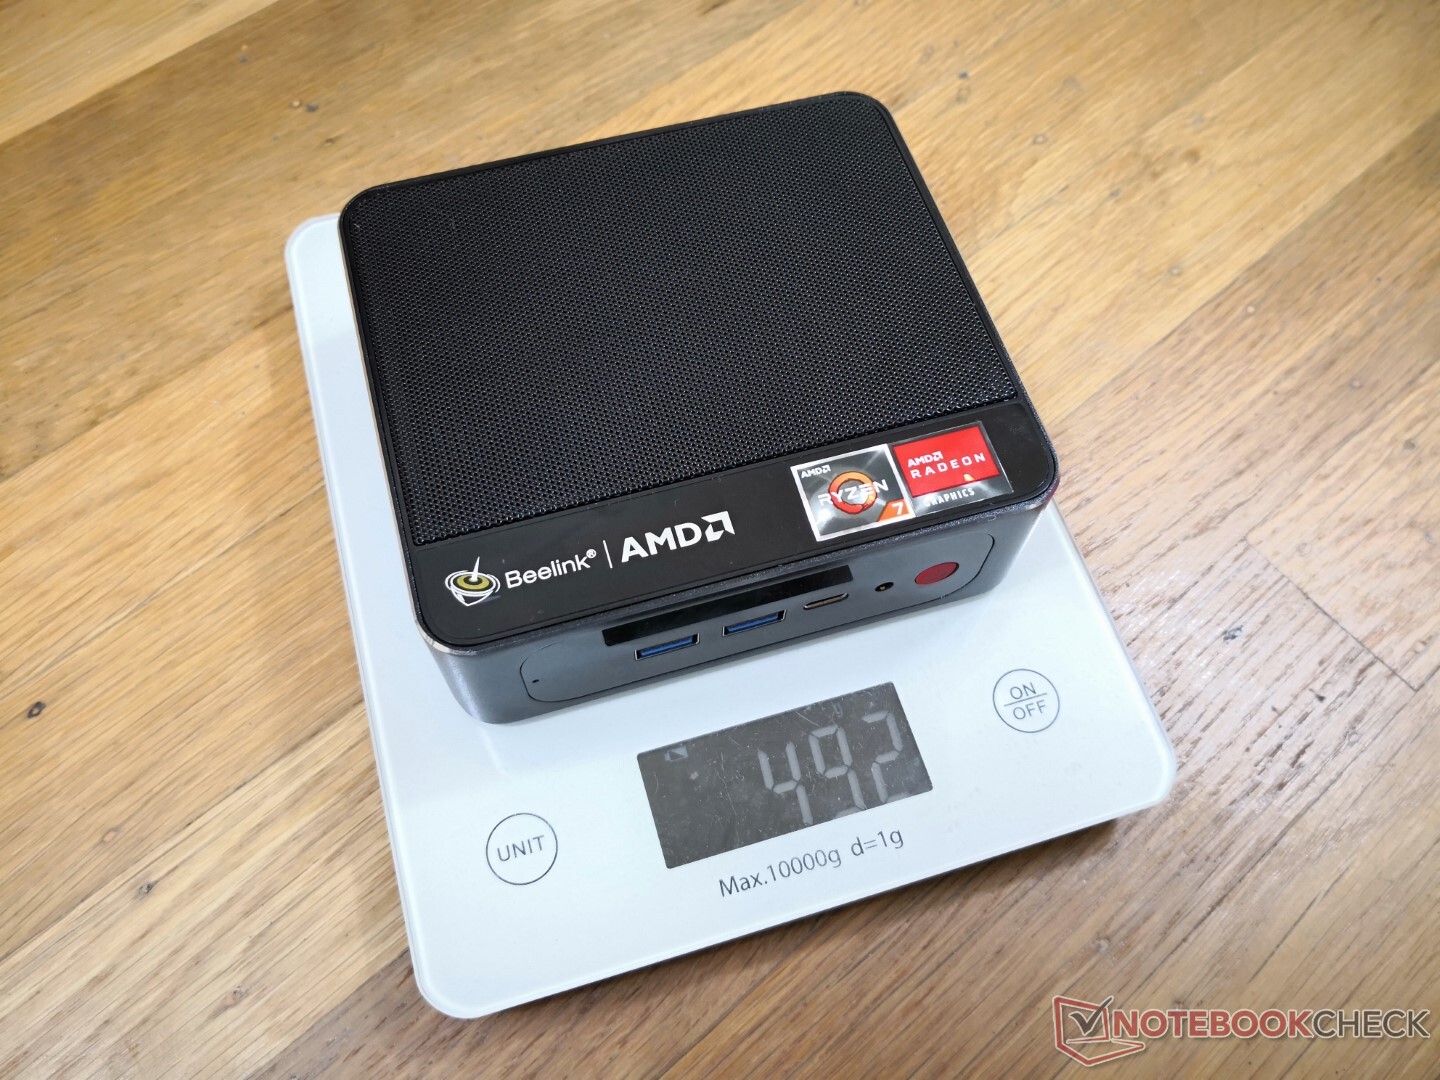
v (old) | 11-2021 | Beelink SER3 R7 3750H, Vega 10 | 492 g | 40 mm | x | ||
v (old) | Beelink SEi10 i3-1005G1, UHD Graphics G1 (Ice Lake 32 EU) | 350 g | 41 mm | x | |||
v (old) | 11-2018 | Intel NUC8i7BE i7-8559U, Iris Plus Graphics 655 | 683 g | 51 mm | x | ||
v (old) | 03-2021 | GMK NucBox 2 i5-8259U, Iris Plus Graphics 655 | 430 g | 50 mm | x | ||
v (old) | Zotac ZBox MI643 i5-10210U, UHD Graphics 620 | 550 g | 28.5 mm | x | |||
v (old) | 04-2021 | Intel NUC11TNKi5 i5-1135G7, Iris Xe G7 80EUs | 504 g | 37 mm | x |
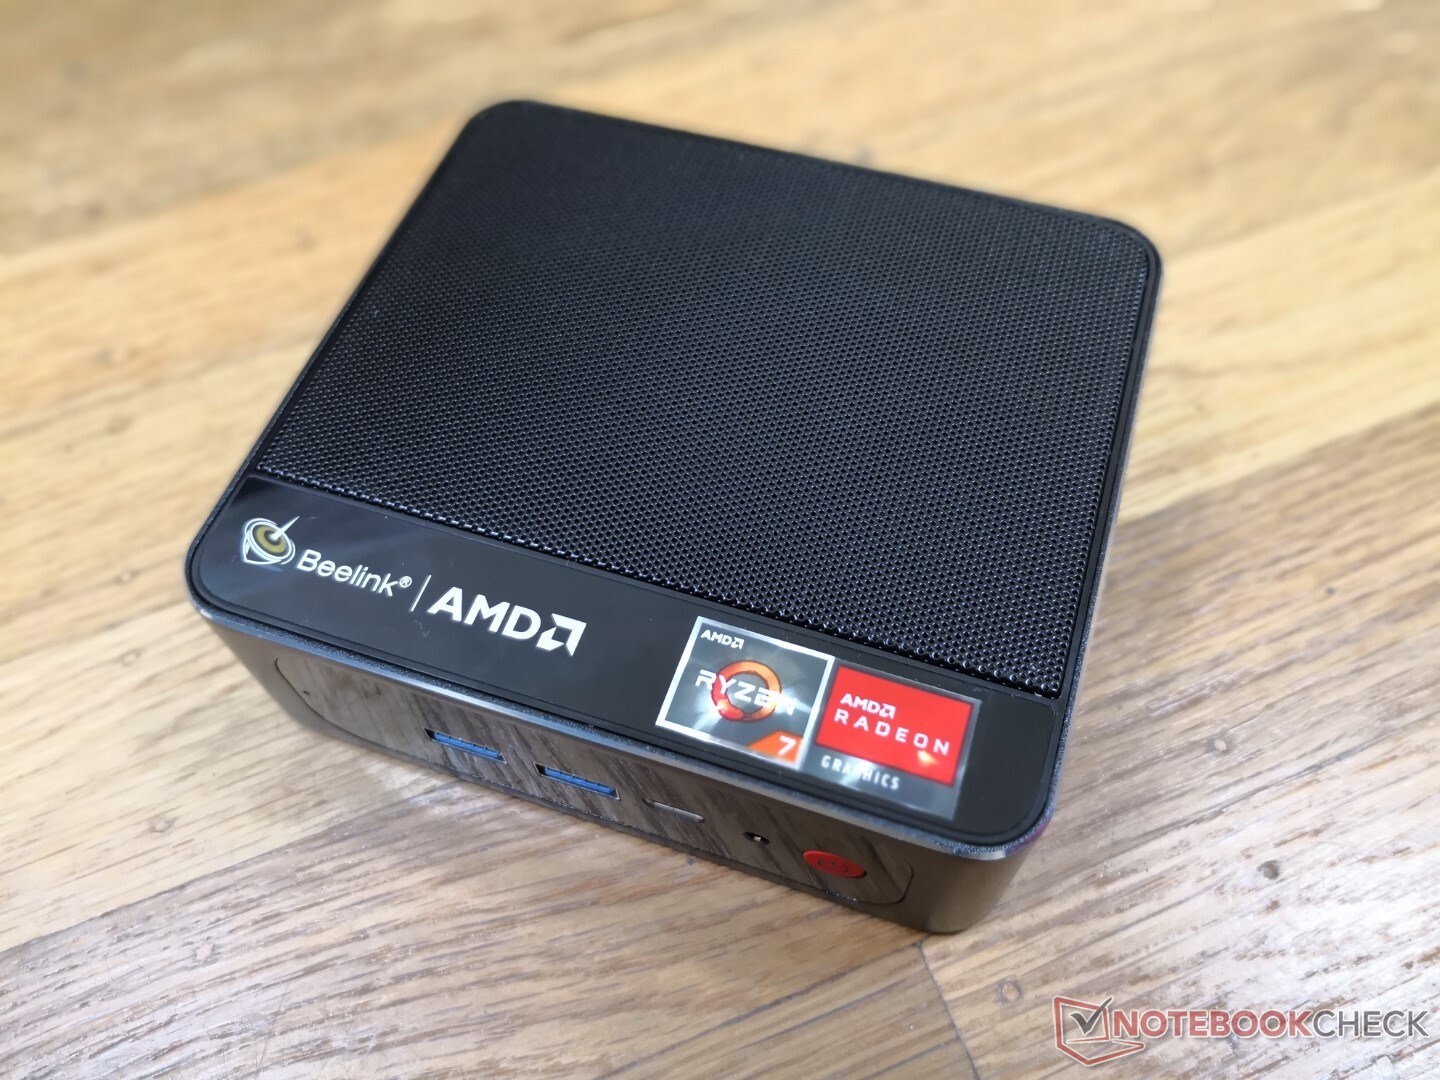
Zaak
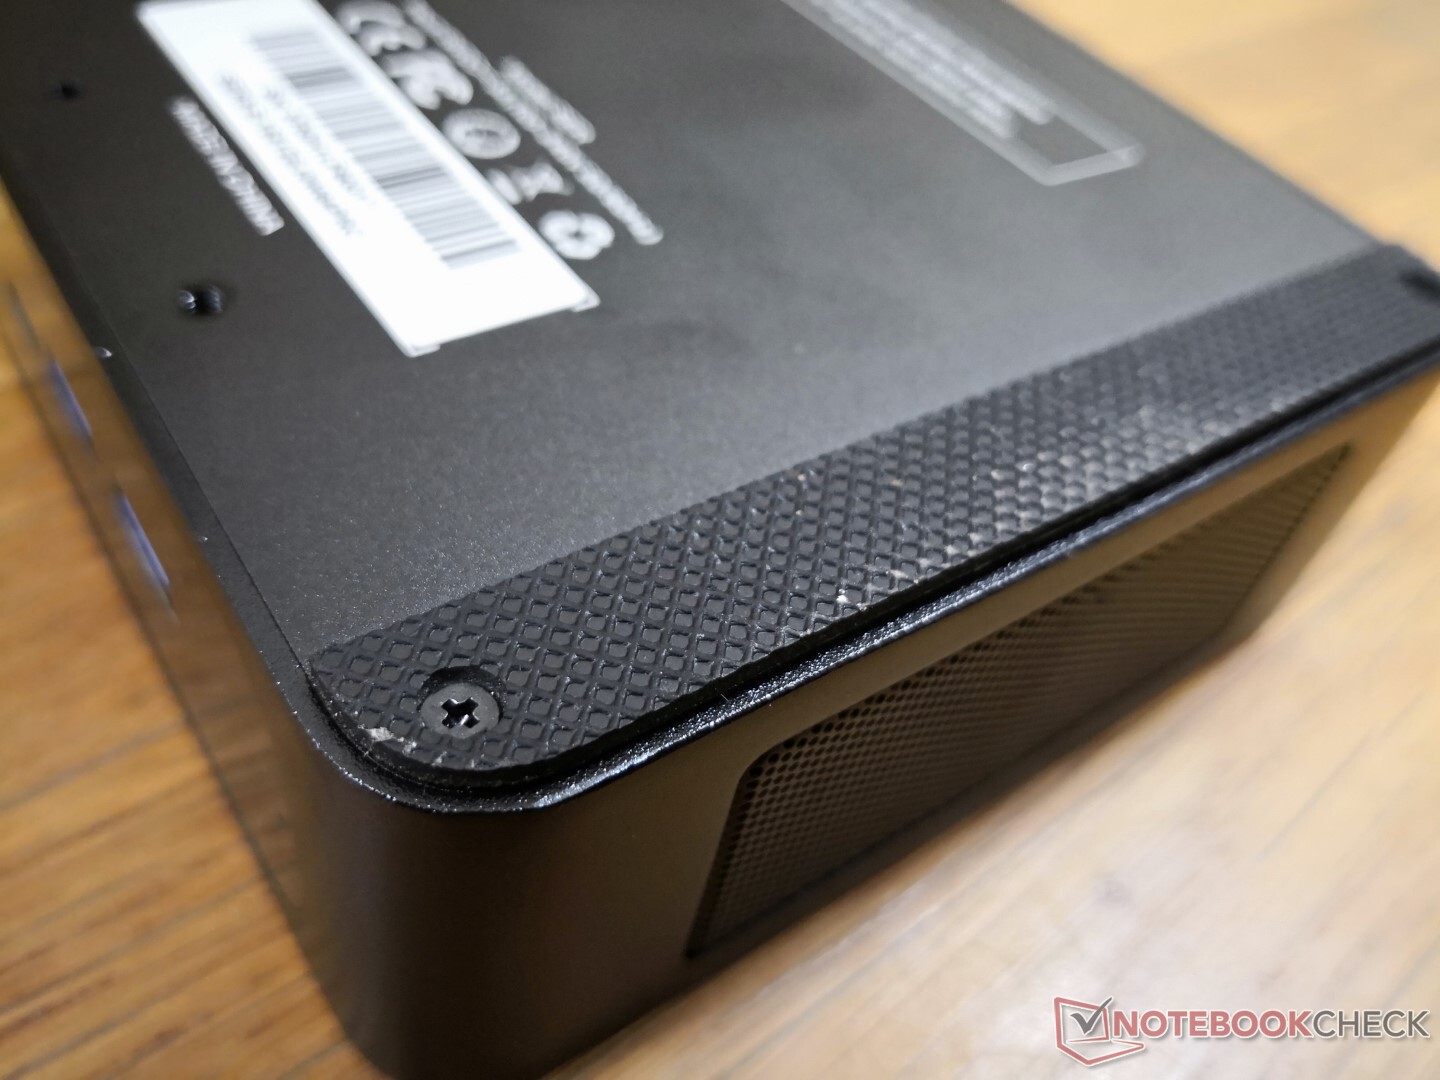
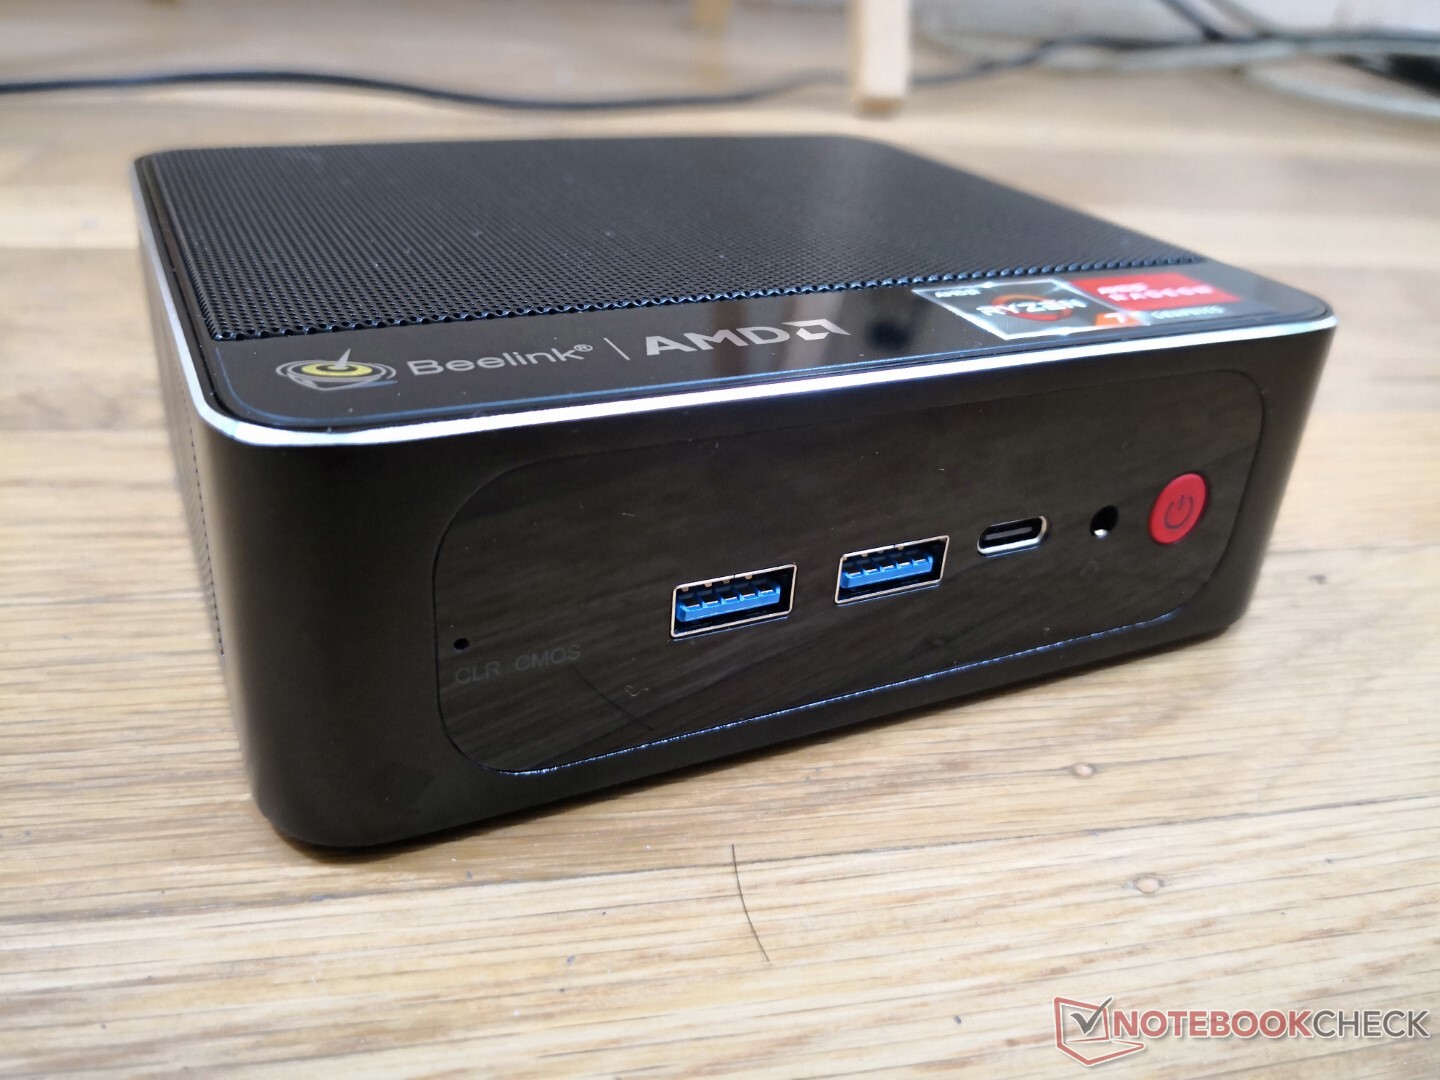
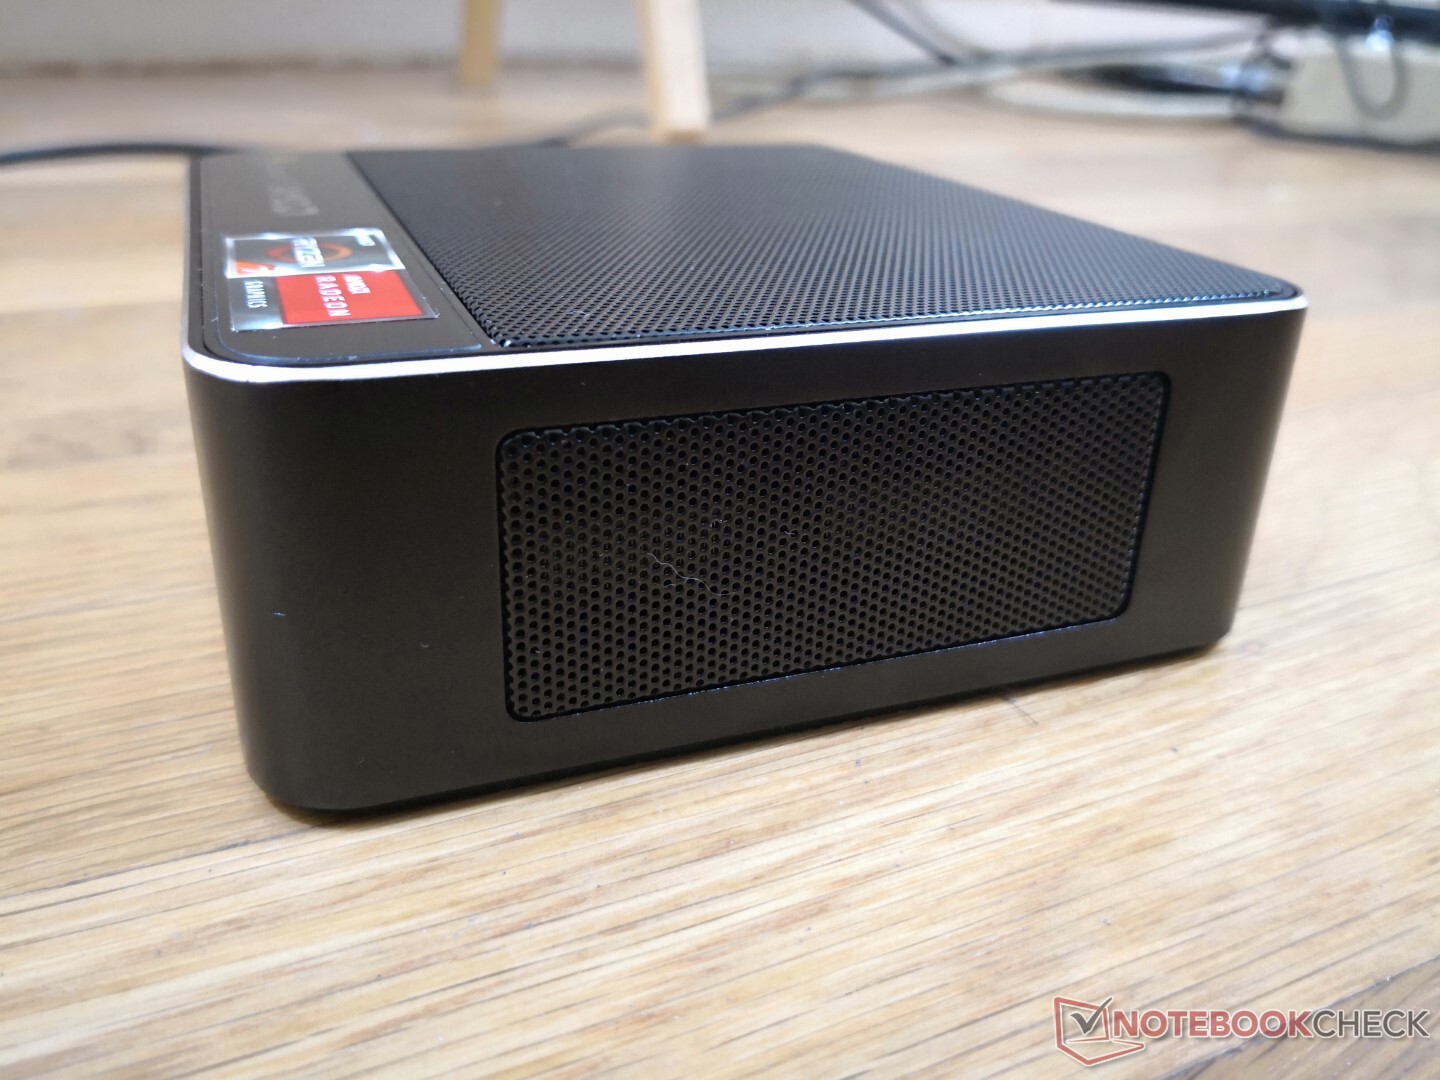
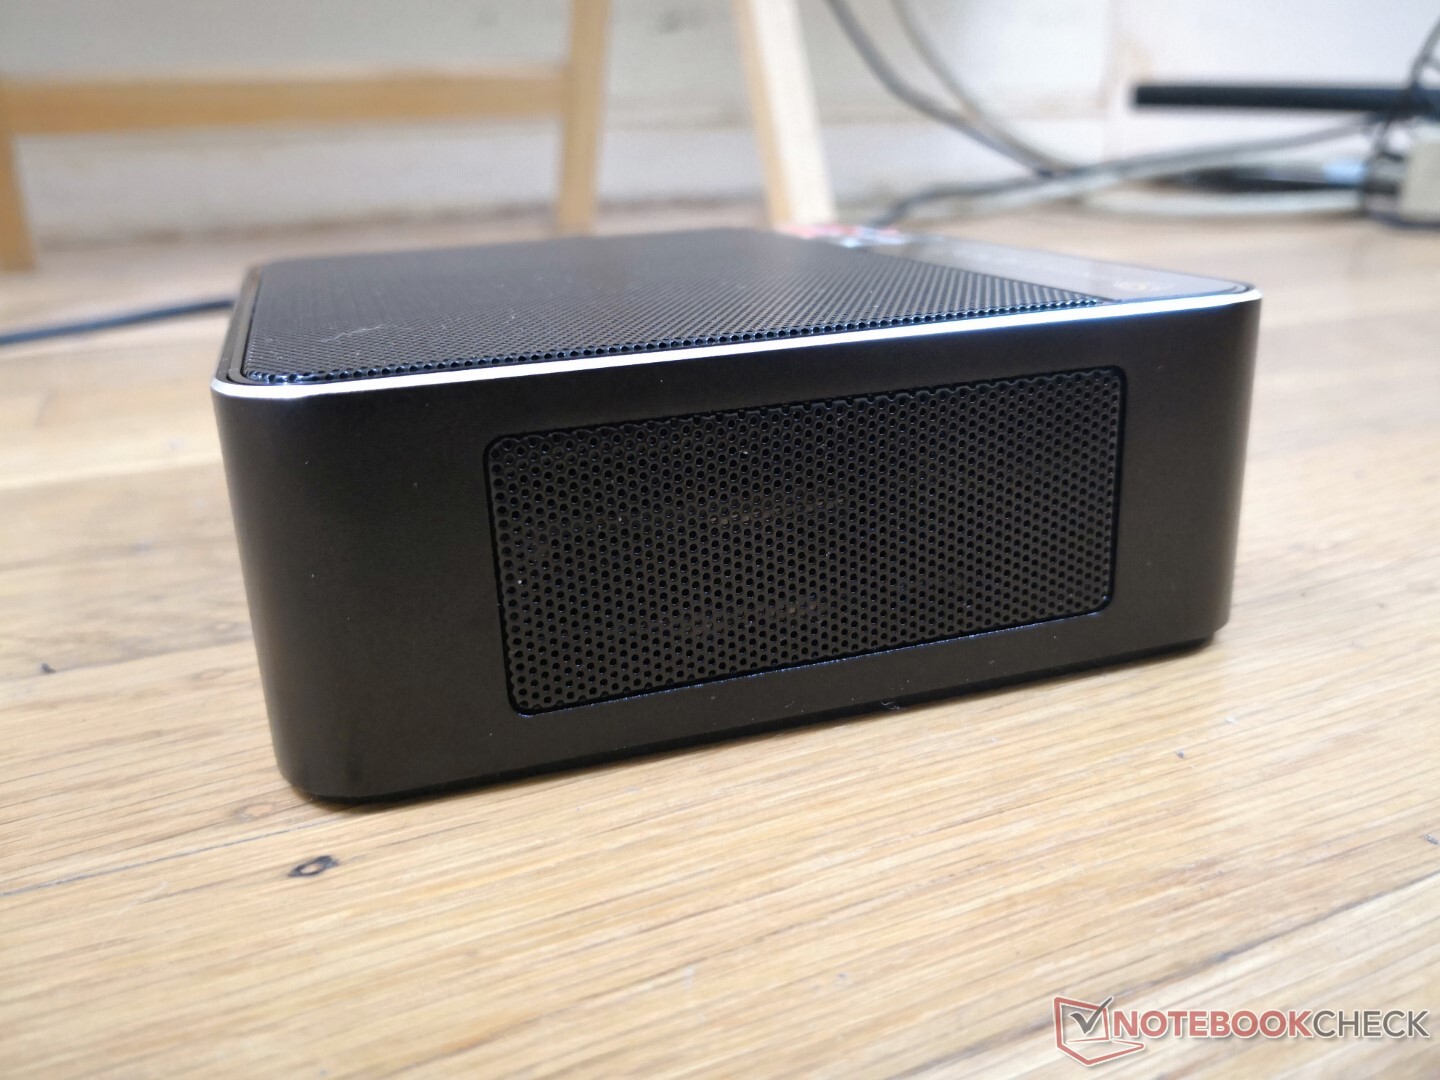
Het chassis is grotendeels van mat metaal met een beetje glanzend plastic aan de voorkant en een deel van de bovenkant. De eerste indrukken zijn sterk, zij het niet zo stevig als een Intel NUC die gebruik maakt van dikkere en zwaardere metalen materialen.
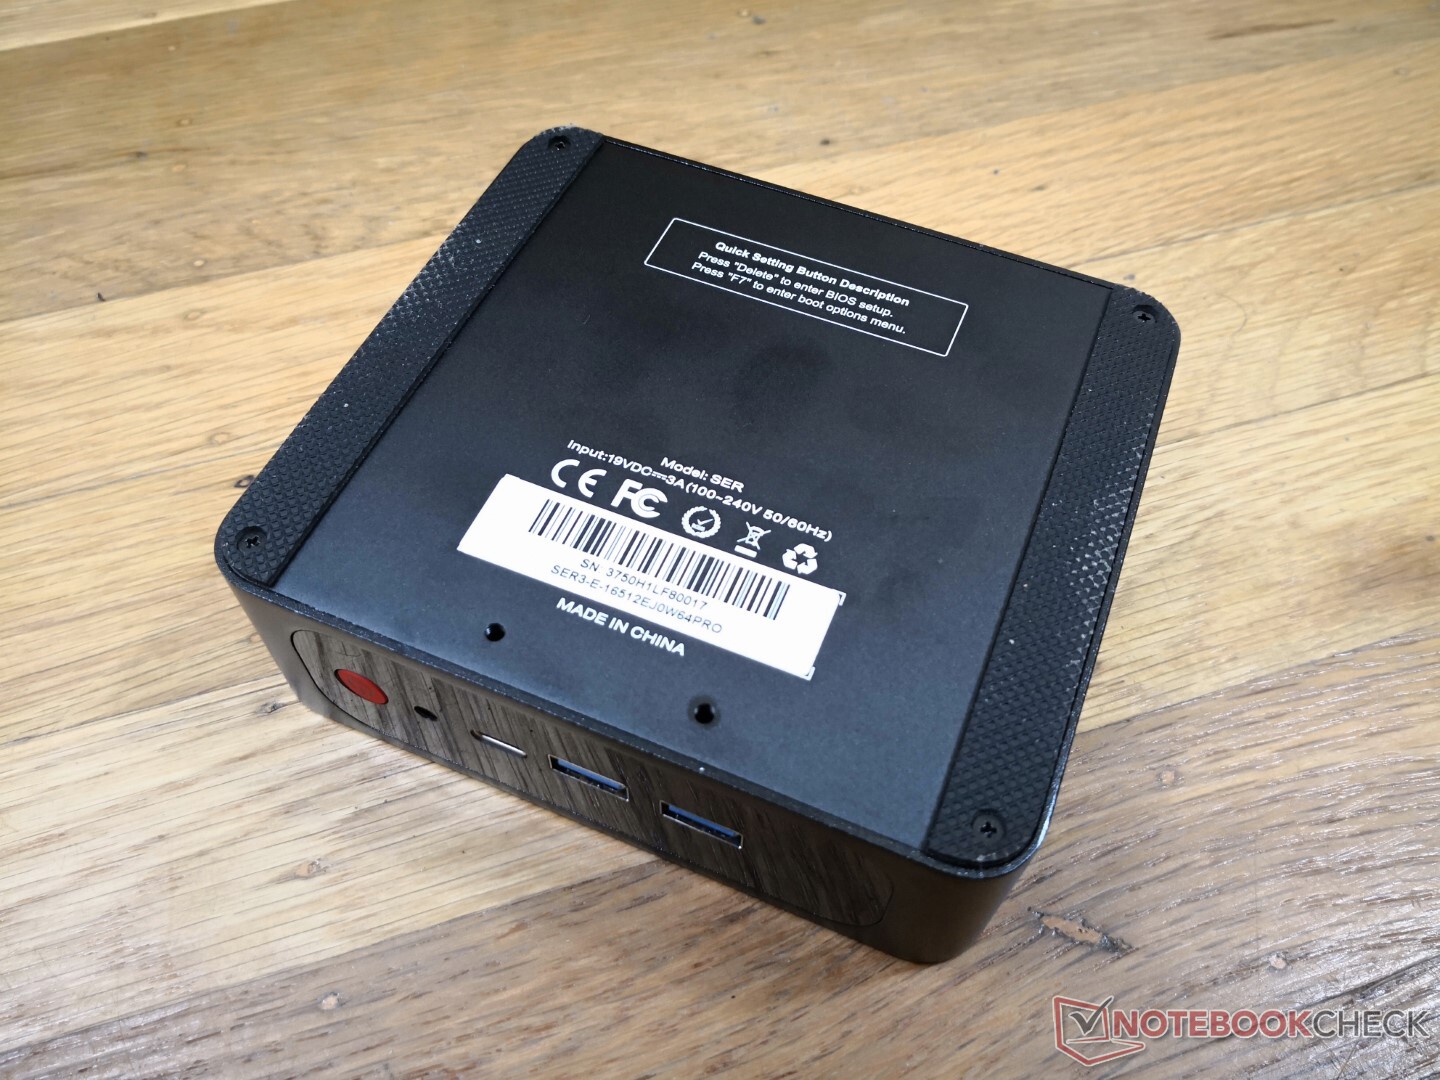
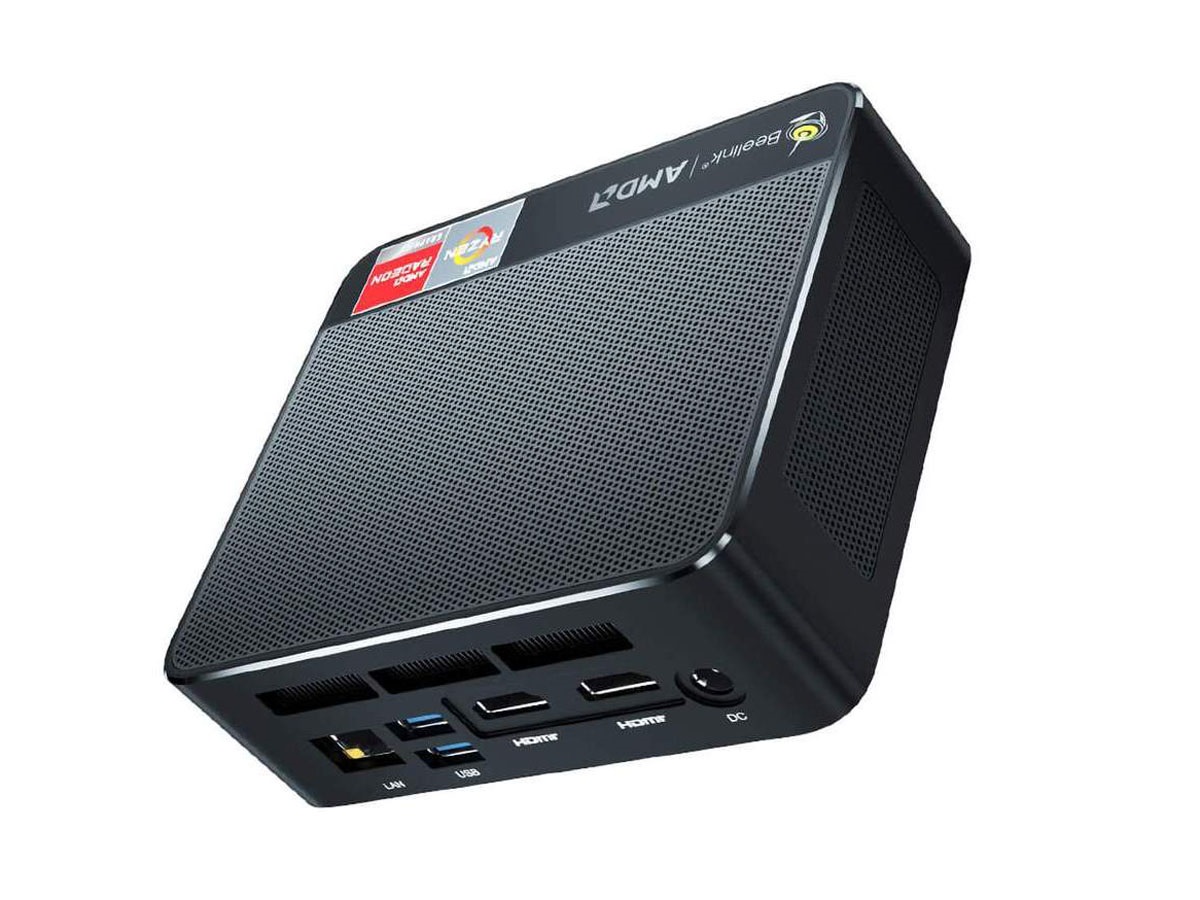
Connectiviteit
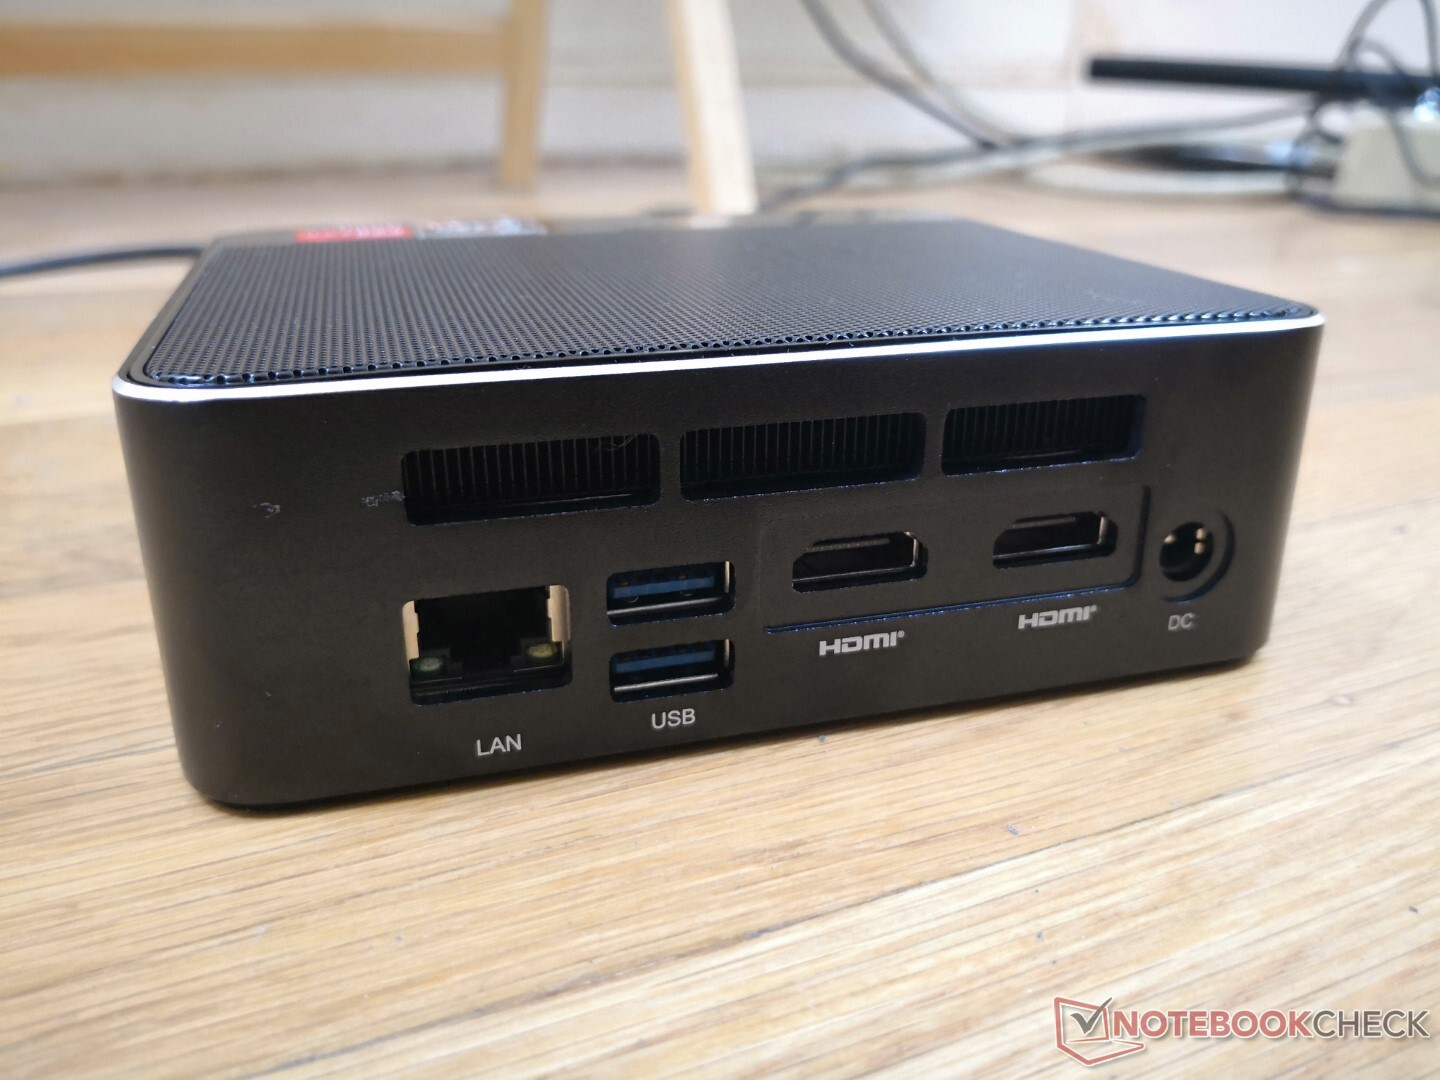
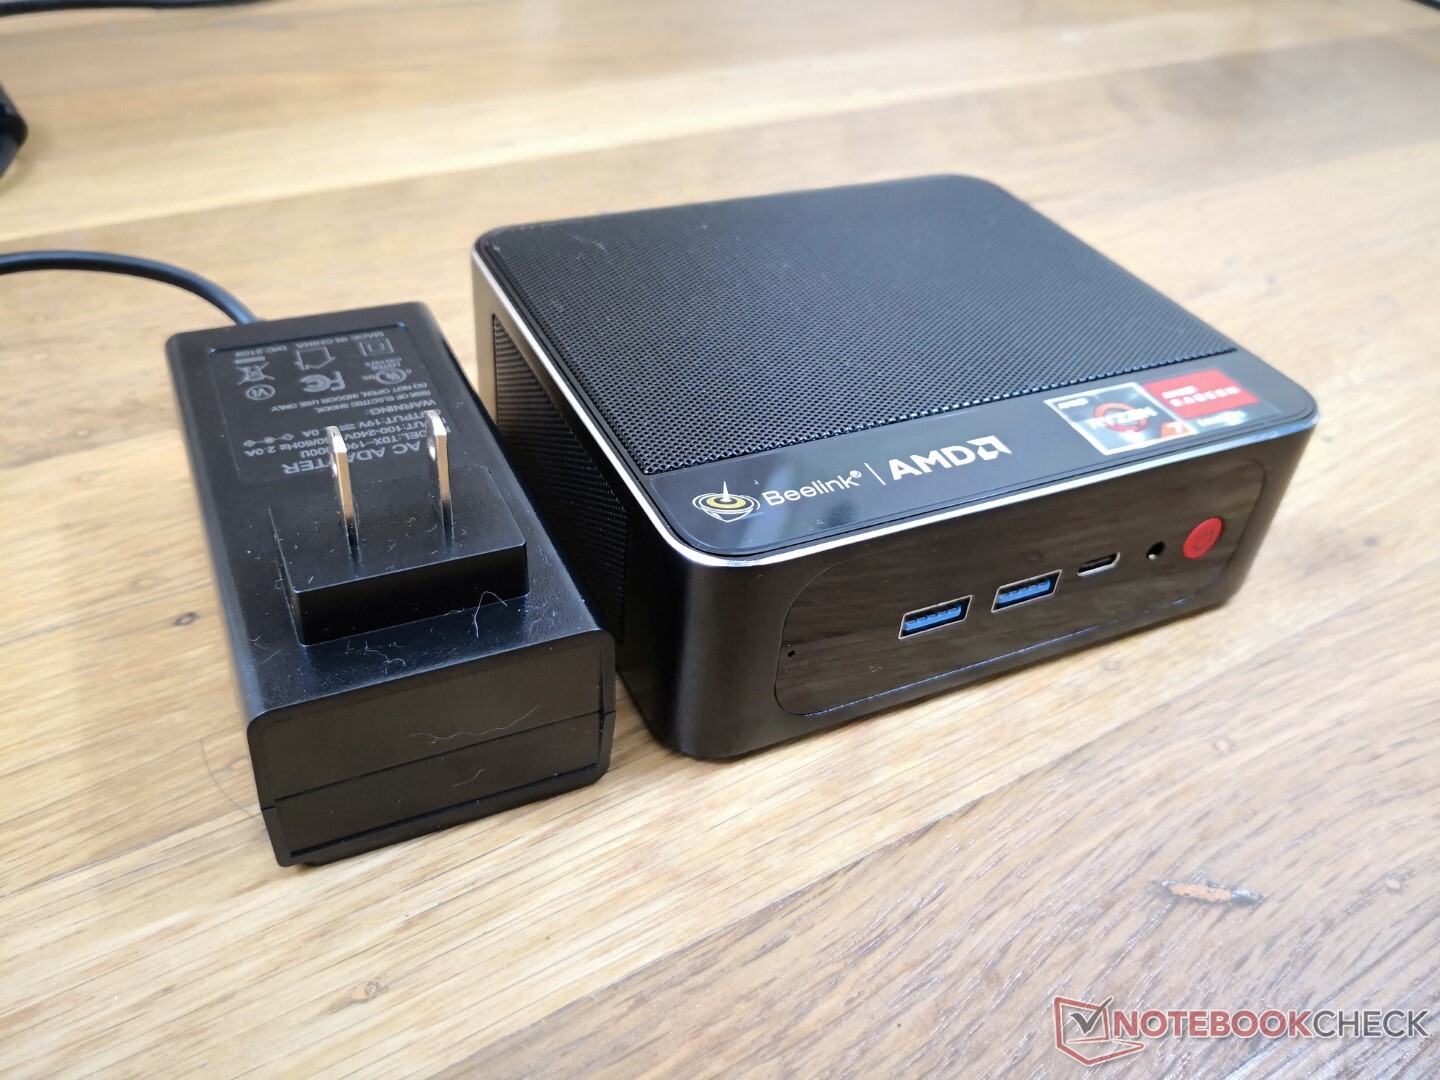
De poortopties zijn exact dezelfde als op de Beelink SEi10. Houd er echter rekening mee dat er geen Thunderbolt is op de SER3, aangezien zijn AMD CPU de interface niet van nature ondersteunt
De USB-C poort ondersteunt DisplayPort-out, maar het zou vreemd genoeg alleen werken met sommige en niet al onze externe monitoren.
Communicatie
| Networking | |
| iperf3 transmit AX12 | |
| Intel NUC11TNKi5 | |
| Beelink SEi10 | |
| Intel NUC8i7BE | |
| GMK NucBox 2 | |
| Beelink SER3 | |
| Zotac ZBox MI643 | |
| iperf3 receive AX12 | |
| Intel NUC11TNKi5 | |
| Beelink SEi10 | |
| Beelink SER3 | |
| GMK NucBox 2 | |
| Intel NUC8i7BE | |
| Zotac ZBox MI643 | |
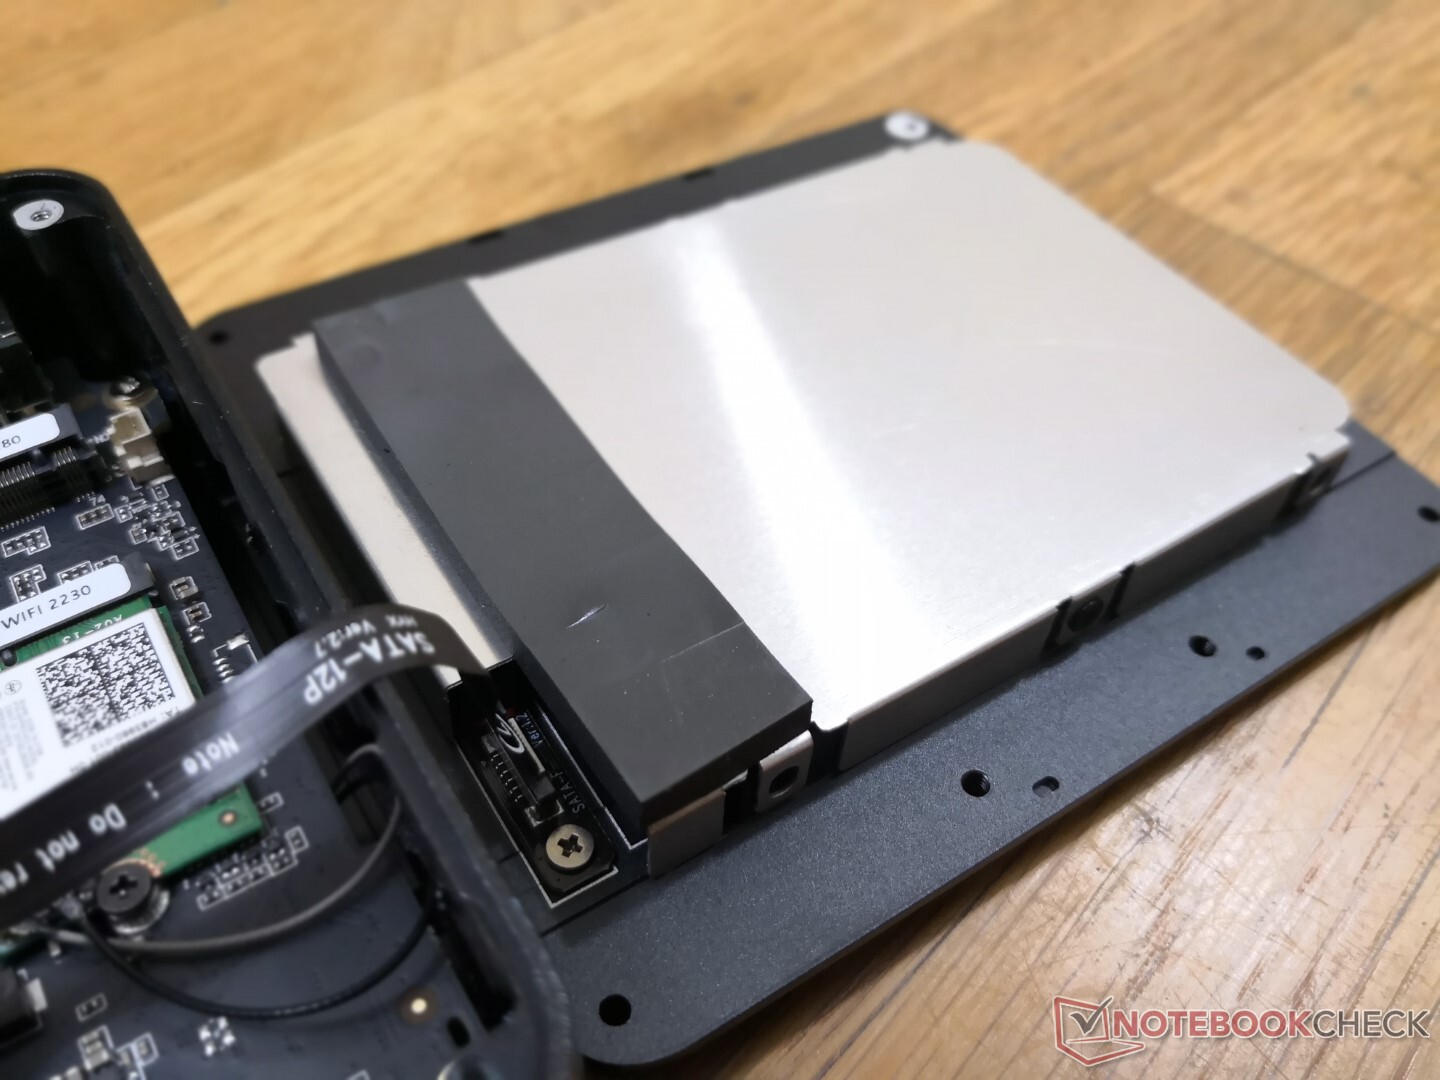
Onderhoud
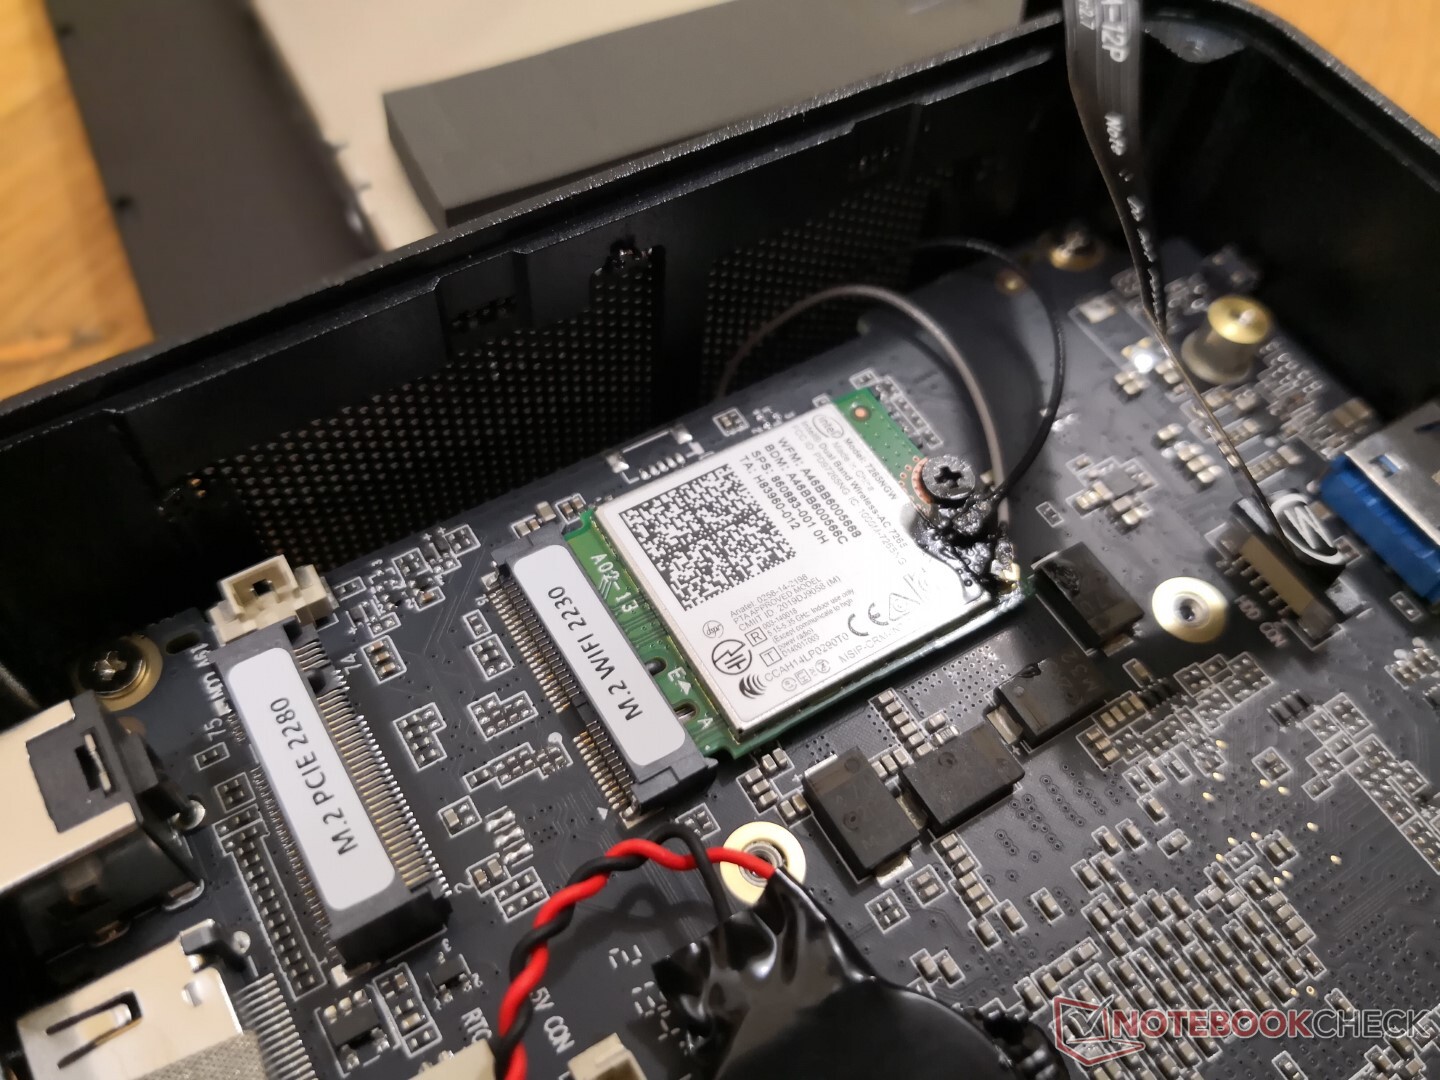
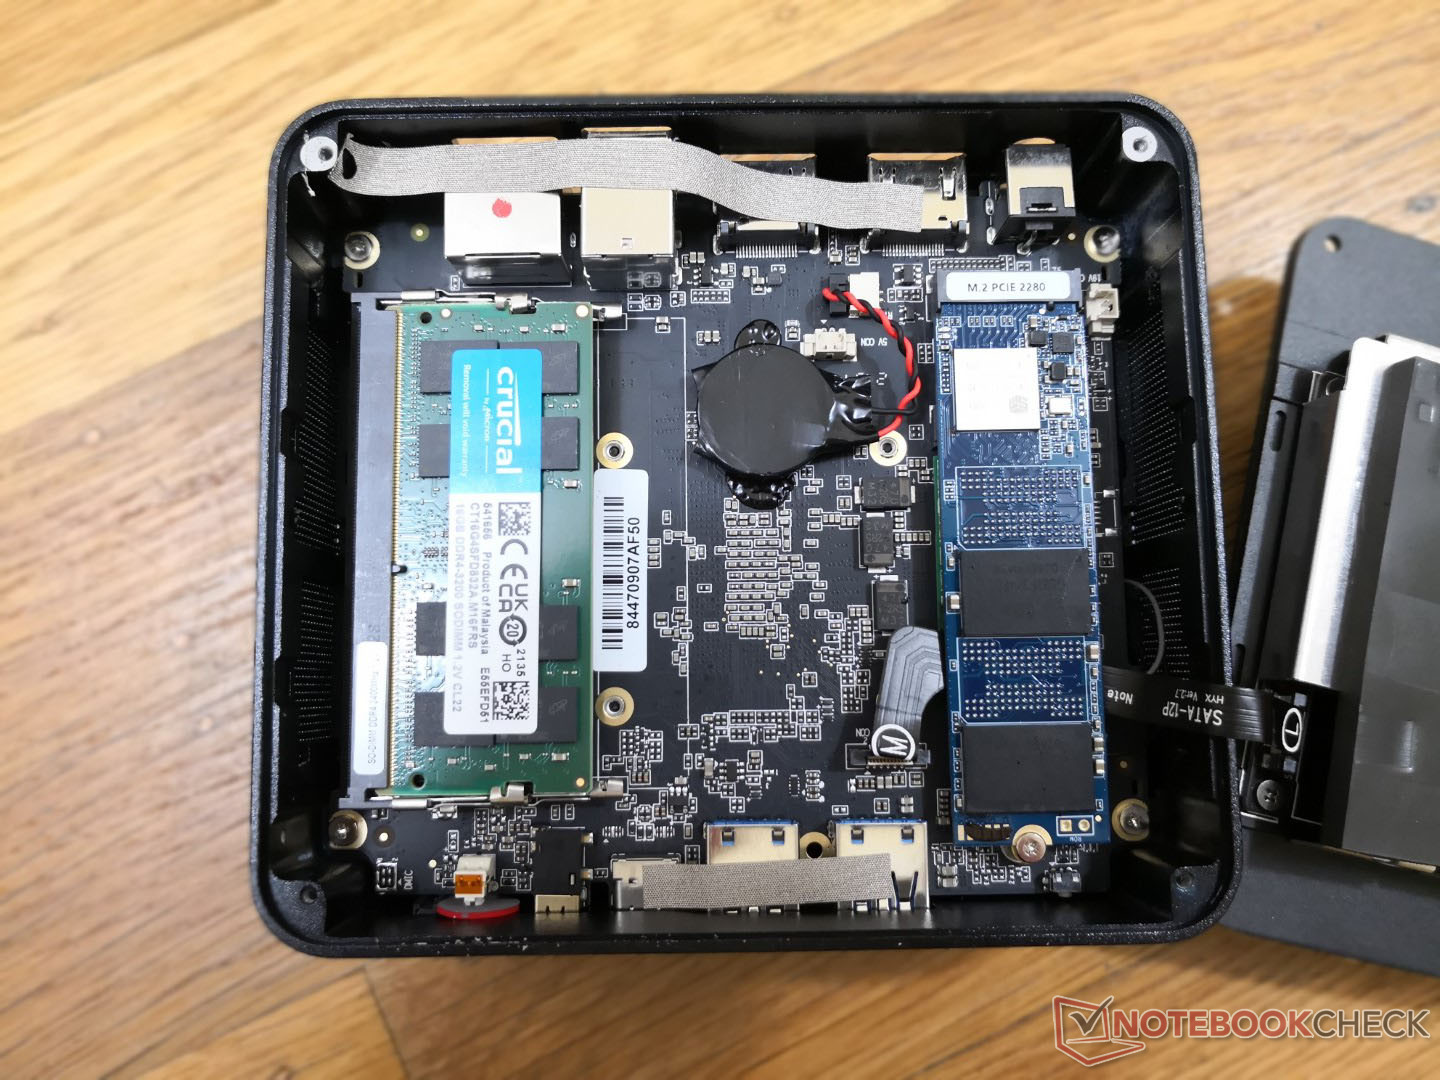
Het bodempaneel kan eenvoudig worden verwijderd met slechts een Philips schroevendraaier om een verwijderbare WLAN module, verwijderbare M.2 2280 NVMe SSD, en 2x SODIMM slots te onthullen.
Accessoires en garantie
De winkelverpakking bevat twee korte HDMI-kabels, een 50 mm of 100 mm montagebeugel en extra schroeven, naast de gebruikelijke handleiding en netstroomadapter. Een jaar fabrieksgarantie is van toepassing
Prestaties
Testomstandigheden
Ons toestel werd ingesteld op de prestatiemodus voordat we onderstaande benchmarks uitvoerden voor de hoogst mogelijke scores.
Processor
De onbewerkte CPU-prestaties zijn vergelijkbaar met deCore i5-8259U in de concurrerende GMK NucBox 2. Het haalt niet helemaal de prestaties van nieuwere Zen 2 of Tiger Lake U-serie CPU's zoals de Ryzen 7 5700U of Core i5-1135G7 die vaak worden aangetroffen in de nieuwste Ultrabooks. Prestaties onder hoge belasting gedurende lange perioden zijn niettemin consistent zonder grote throttling problemen.
Cinebench R15 Multi Loop
Cinebench R23: Multi Core | Single Core
Cinebench R20: CPU (Multi Core) | CPU (Single Core)
Cinebench R15: CPU Multi 64Bit | CPU Single 64Bit
Blender: v2.79 BMW27 CPU
7-Zip 18.03: 7z b 4 | 7z b 4 -mmt1
Geekbench 5.5: Multi-Core | Single-Core
HWBOT x265 Benchmark v2.2: 4k Preset
LibreOffice : 20 Documents To PDF
R Benchmark 2.5: Overall mean
| CPU Performance rating | |
| Intel NUC11TNKi5 | |
| Intel NUC8i7BE -3! | |
| GMK NucBox 2 | |
| Gemiddeld AMD Ryzen 7 3750H | |
| Zotac ZBox MI643 -2! | |
| Beelink SER3 -2! | |
| Beelink SEi10 -2! | |
| Cinebench R23 / Multi Core | |
| Intel NUC11TNKi5 | |
| Beelink SER3 | |
| Gemiddeld AMD Ryzen 7 3750H (n=1) | |
| GMK NucBox 2 | |
| Cinebench R23 / Single Core | |
| Intel NUC11TNKi5 | |
| GMK NucBox 2 | |
| Beelink SER3 | |
| Gemiddeld AMD Ryzen 7 3750H (n=1) | |
| Cinebench R20 / CPU (Multi Core) | |
| Intel NUC11TNKi5 | |
| Intel NUC8i7BE | |
| Gemiddeld AMD Ryzen 7 3750H (1514 - 1825, n=4) | |
| Beelink SER3 | |
| GMK NucBox 2 | |
| Zotac ZBox MI643 | |
| Beelink SEi10 | |
| Cinebench R20 / CPU (Single Core) | |
| Intel NUC11TNKi5 | |
| Intel NUC8i7BE | |
| Zotac ZBox MI643 | |
| Beelink SEi10 | |
| GMK NucBox 2 | |
| Beelink SER3 | |
| Gemiddeld AMD Ryzen 7 3750H (340 - 386, n=4) | |
| Cinebench R15 / CPU Multi 64Bit | |
| Intel NUC8i7BE | |
| Intel NUC11TNKi5 | |
| Gemiddeld AMD Ryzen 7 3750H (672 - 805, n=7) | |
| Beelink SER3 | |
| GMK NucBox 2 | |
| Zotac ZBox MI643 | |
| Beelink SEi10 | |
| Cinebench R15 / CPU Single 64Bit | |
| Intel NUC11TNKi5 | |
| Intel NUC8i7BE | |
| Zotac ZBox MI643 | |
| Beelink SEi10 | |
| GMK NucBox 2 | |
| Beelink SER3 | |
| Gemiddeld AMD Ryzen 7 3750H (135 - 157, n=7) | |
| Blender / v2.79 BMW27 CPU | |
| Beelink SEi10 | |
| Zotac ZBox MI643 | |
| GMK NucBox 2 | |
| Intel NUC8i7BE | |
| Intel NUC8i7BE | |
| Beelink SER3 | |
| Gemiddeld AMD Ryzen 7 3750H (584 - 672, n=3) | |
| Intel NUC11TNKi5 | |
| 7-Zip 18.03 / 7z b 4 | |
| Intel NUC8i7BE | |
| Intel NUC8i7BE | |
| Intel NUC11TNKi5 | |
| GMK NucBox 2 | |
| Gemiddeld AMD Ryzen 7 3750H (17077 - 19187, n=3) | |
| Beelink SER3 | |
| Zotac ZBox MI643 | |
| Beelink SEi10 | |
| 7-Zip 18.03 / 7z b 4 -mmt1 | |
| Intel NUC8i7BE | |
| Intel NUC8i7BE | |
| Intel NUC11TNKi5 | |
| Zotac ZBox MI643 | |
| Beelink SEi10 | |
| GMK NucBox 2 | |
| Beelink SER3 | |
| Gemiddeld AMD Ryzen 7 3750H (3511 - 3752, n=3) | |
| Geekbench 5.5 / Multi-Core | |
| Intel NUC11TNKi5 | |
| Zotac ZBox MI643 | |
| Intel NUC8i7BE | |
| Gemiddeld AMD Ryzen 7 3750H (n=1) | |
| GMK NucBox 2 | |
| Beelink SEi10 | |
| Geekbench 5.5 / Single-Core | |
| Intel NUC11TNKi5 | |
| Zotac ZBox MI643 | |
| Beelink SEi10 | |
| GMK NucBox 2 | |
| Gemiddeld AMD Ryzen 7 3750H (n=1) | |
| Intel NUC8i7BE | |
| HWBOT x265 Benchmark v2.2 / 4k Preset | |
| Intel NUC11TNKi5 | |
| Intel NUC8i7BE | |
| Intel NUC8i7BE | |
| GMK NucBox 2 | |
| Gemiddeld AMD Ryzen 7 3750H (4.14 - 4.4, n=3) | |
| Zotac ZBox MI643 | |
| Beelink SER3 | |
| Beelink SEi10 | |
| LibreOffice / 20 Documents To PDF | |
| Beelink SER3 | |
| Gemiddeld AMD Ryzen 7 3750H (n=1) | |
| GMK NucBox 2 | |
| Zotac ZBox MI643 | |
| Beelink SEi10 | |
| Intel NUC11TNKi5 | |
| R Benchmark 2.5 / Overall mean | |
| GMK NucBox 2 | |
| Beelink SEi10 | |
| Beelink SER3 | |
| Gemiddeld AMD Ryzen 7 3750H (0.69 - 0.723, n=2) | |
| Zotac ZBox MI643 | |
| Intel NUC8i7BE | |
| Intel NUC11TNKi5 | |
* ... kleiner is beter
AIDA64: FP32 Ray-Trace | FPU Julia | CPU SHA3 | CPU Queen | FPU SinJulia | FPU Mandel | CPU AES | CPU ZLib | FP64 Ray-Trace | CPU PhotoWorxx
| Performance rating | |
| Intel NUC11TNKi5 | |
| Intel NUC8i7BE -1! | |
| GMK NucBox 2 | |
| Gemiddeld AMD Ryzen 7 3750H | |
| Zotac ZBox MI643 | |
| Beelink SER3 | |
| AIDA64 / FP32 Ray-Trace | |
| Intel NUC11TNKi5 | |
| Intel NUC8i7BE | |
| GMK NucBox 2 | |
| Zotac ZBox MI643 | |
| Gemiddeld AMD Ryzen 7 3750H (3338 - 3668, n=2) | |
| Beelink SER3 | |
| AIDA64 / FPU Julia | |
| Intel NUC11TNKi5 | |
| Intel NUC8i7BE | |
| GMK NucBox 2 | |
| Zotac ZBox MI643 | |
| Gemiddeld AMD Ryzen 7 3750H (16912 - 19132, n=2) | |
| Beelink SER3 | |
| AIDA64 / CPU SHA3 | |
| Intel NUC11TNKi5 | |
| GMK NucBox 2 | |
| Gemiddeld AMD Ryzen 7 3750H (897 - 1001, n=2) | |
| Zotac ZBox MI643 | |
| Beelink SER3 | |
| AIDA64 / CPU Queen | |
| Intel NUC8i7BE | |
| Zotac ZBox MI643 | |
| Gemiddeld AMD Ryzen 7 3750H (43632 - 50328, n=2) | |
| Intel NUC11TNKi5 | |
| Beelink SER3 | |
| GMK NucBox 2 | |
| AIDA64 / FPU SinJulia | |
| Gemiddeld AMD Ryzen 7 3750H (5639 - 6478, n=2) | |
| Beelink SER3 | |
| Intel NUC8i7BE | |
| Intel NUC11TNKi5 | |
| GMK NucBox 2 | |
| Zotac ZBox MI643 | |
| AIDA64 / FPU Mandel | |
| Intel NUC11TNKi5 | |
| Intel NUC8i7BE | |
| GMK NucBox 2 | |
| Zotac ZBox MI643 | |
| Gemiddeld AMD Ryzen 7 3750H (8846 - 9928, n=2) | |
| Beelink SER3 | |
| AIDA64 / CPU AES | |
| Intel NUC11TNKi5 | |
| Gemiddeld AMD Ryzen 7 3750H (28977 - 32668, n=2) | |
| Beelink SER3 | |
| Intel NUC8i7BE | |
| GMK NucBox 2 | |
| Zotac ZBox MI643 | |
| AIDA64 / CPU ZLib | |
| Intel NUC11TNKi5 | |
| Intel NUC8i7BE | |
| Gemiddeld AMD Ryzen 7 3750H (313 - 350, n=2) | |
| Beelink SER3 | |
| GMK NucBox 2 | |
| Zotac ZBox MI643 | |
| AIDA64 / FP64 Ray-Trace | |
| Intel NUC11TNKi5 | |
| Intel NUC8i7BE | |
| GMK NucBox 2 | |
| Zotac ZBox MI643 | |
| Gemiddeld AMD Ryzen 7 3750H (1758 - 1935, n=2) | |
| Beelink SER3 | |
| AIDA64 / CPU PhotoWorxx | |
| Zotac ZBox MI643 | |
| Intel NUC8i7BE | |
| Intel NUC11TNKi5 | |
| Gemiddeld AMD Ryzen 7 3750H (10338 - 18898, n=2) | |
| Beelink SER3 | |
| GMK NucBox 2 | |
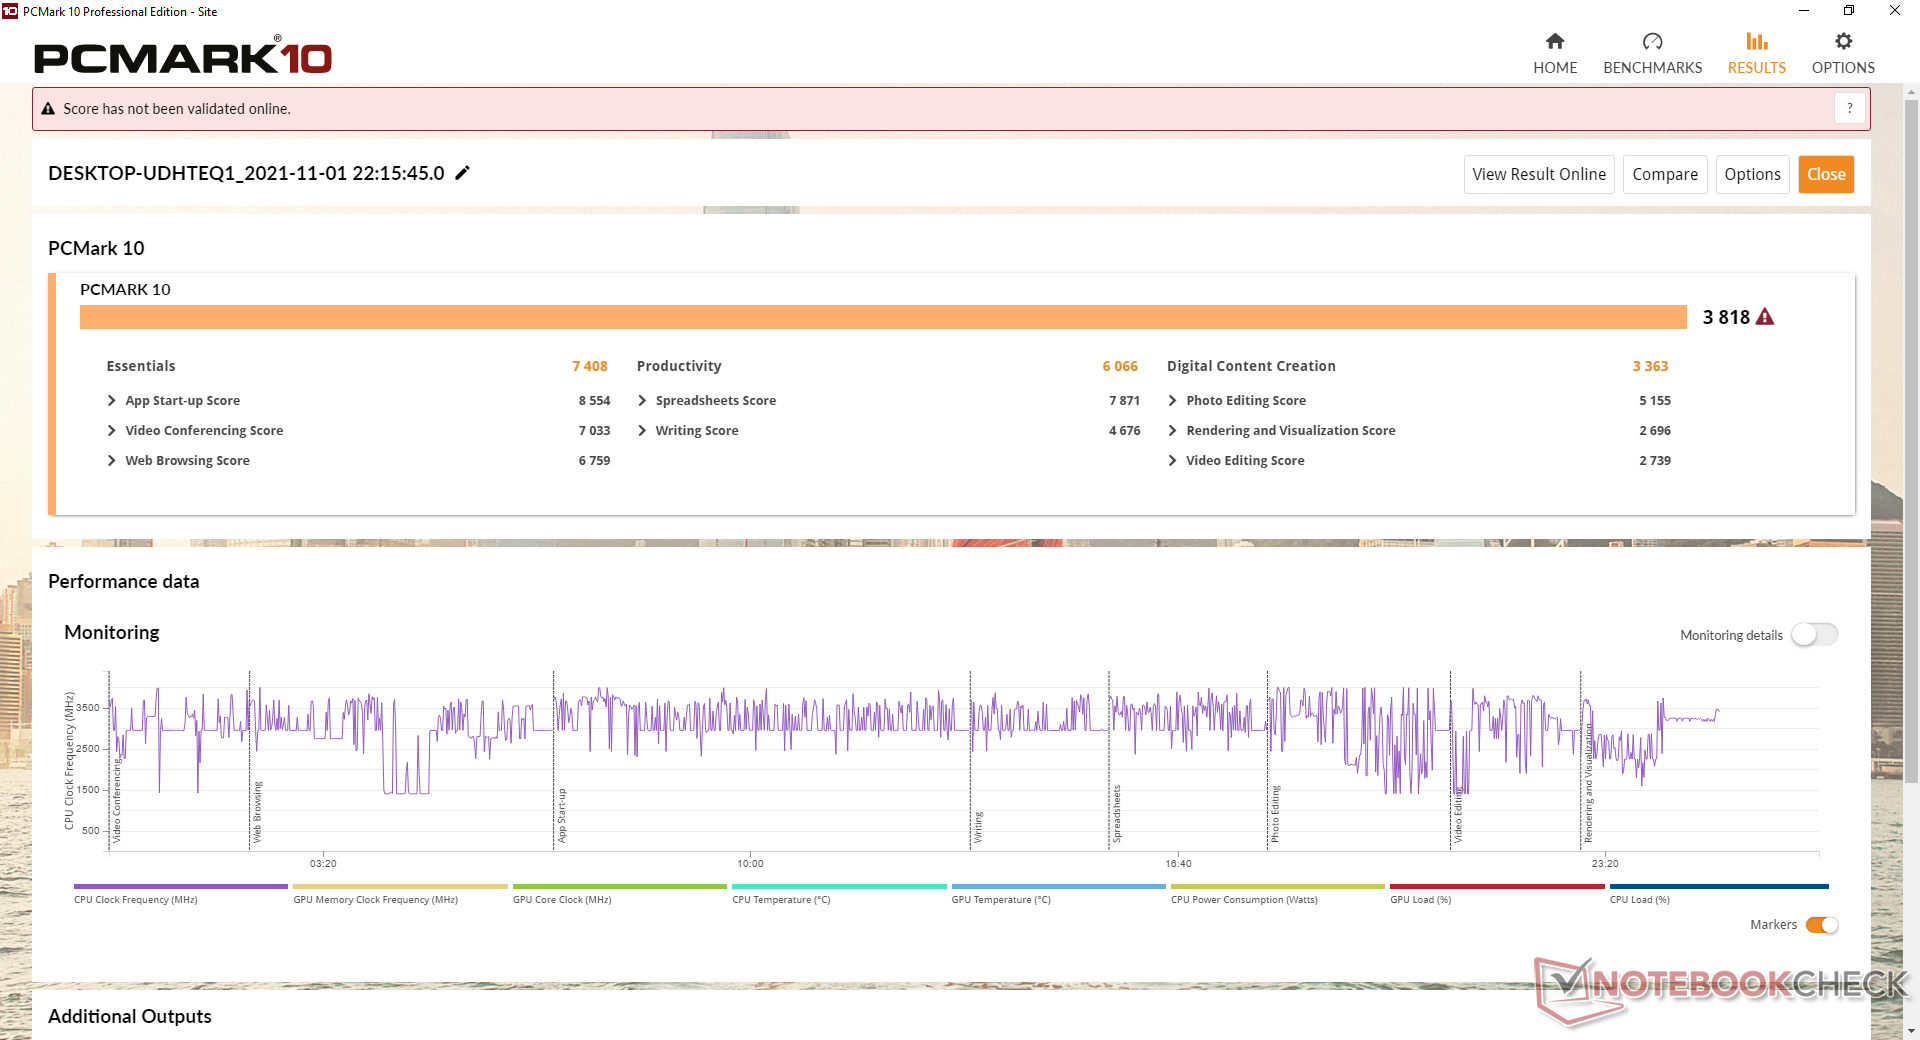
Systeemprestaties
| PCMark 10 / Score | |
| Intel NUC8i7BE | |
| Intel NUC11TNKi5 | |
| Zotac ZBox MI643 | |
| GMK NucBox 2 | |
| Beelink SER3 | |
| Gemiddeld AMD Ryzen 7 3750H, AMD Radeon RX Vega 10 (n=1) | |
| Beelink SEi10 | |
| PCMark 10 / Essentials | |
| Zotac ZBox MI643 | |
| Intel NUC11TNKi5 | |
| Intel NUC8i7BE | |
| GMK NucBox 2 | |
| Beelink SEi10 | |
| Beelink SER3 | |
| Gemiddeld AMD Ryzen 7 3750H, AMD Radeon RX Vega 10 (n=1) | |
| PCMark 10 / Productivity | |
| Intel NUC8i7BE | |
| Zotac ZBox MI643 | |
| GMK NucBox 2 | |
| Intel NUC11TNKi5 | |
| Beelink SER3 | |
| Gemiddeld AMD Ryzen 7 3750H, AMD Radeon RX Vega 10 (n=1) | |
| Beelink SEi10 | |
| PCMark 10 / Digital Content Creation | |
| Intel NUC11TNKi5 | |
| Intel NUC8i7BE | |
| GMK NucBox 2 | |
| Beelink SER3 | |
| Gemiddeld AMD Ryzen 7 3750H, AMD Radeon RX Vega 10 (n=1) | |
| Zotac ZBox MI643 | |
| Beelink SEi10 | |
| PCMark 10 Score | 3818 punten | |
Help | ||
| AIDA64 / Memory Copy | |
| Intel NUC8i7BE | |
| GMK NucBox 2 | |
| Zotac ZBox MI643 | |
| Gemiddeld AMD Ryzen 7 3750H (16249 - 30963, n=2) | |
| Intel NUC11TNKi5 | |
| Beelink SER3 | |
| AIDA64 / Memory Read | |
| Intel NUC8i7BE | |
| GMK NucBox 2 | |
| Zotac ZBox MI643 | |
| Gemiddeld AMD Ryzen 7 3750H (18268 - 35218, n=2) | |
| Intel NUC11TNKi5 | |
| Beelink SER3 | |
| AIDA64 / Memory Write | |
| Intel NUC8i7BE | |
| GMK NucBox 2 | |
| Zotac ZBox MI643 | |
| Gemiddeld AMD Ryzen 7 3750H (18455 - 35988, n=2) | |
| Intel NUC11TNKi5 | |
| Beelink SER3 | |
| AIDA64 / Memory Latency | |
| Gemiddeld AMD Ryzen 7 3750H (95.8 - 118, n=2) | |
| Beelink SER3 | |
| Intel NUC11TNKi5 | |
| Zotac ZBox MI643 | |
| GMK NucBox 2 | |
| Intel NUC8i7BE | |
* ... kleiner is beter
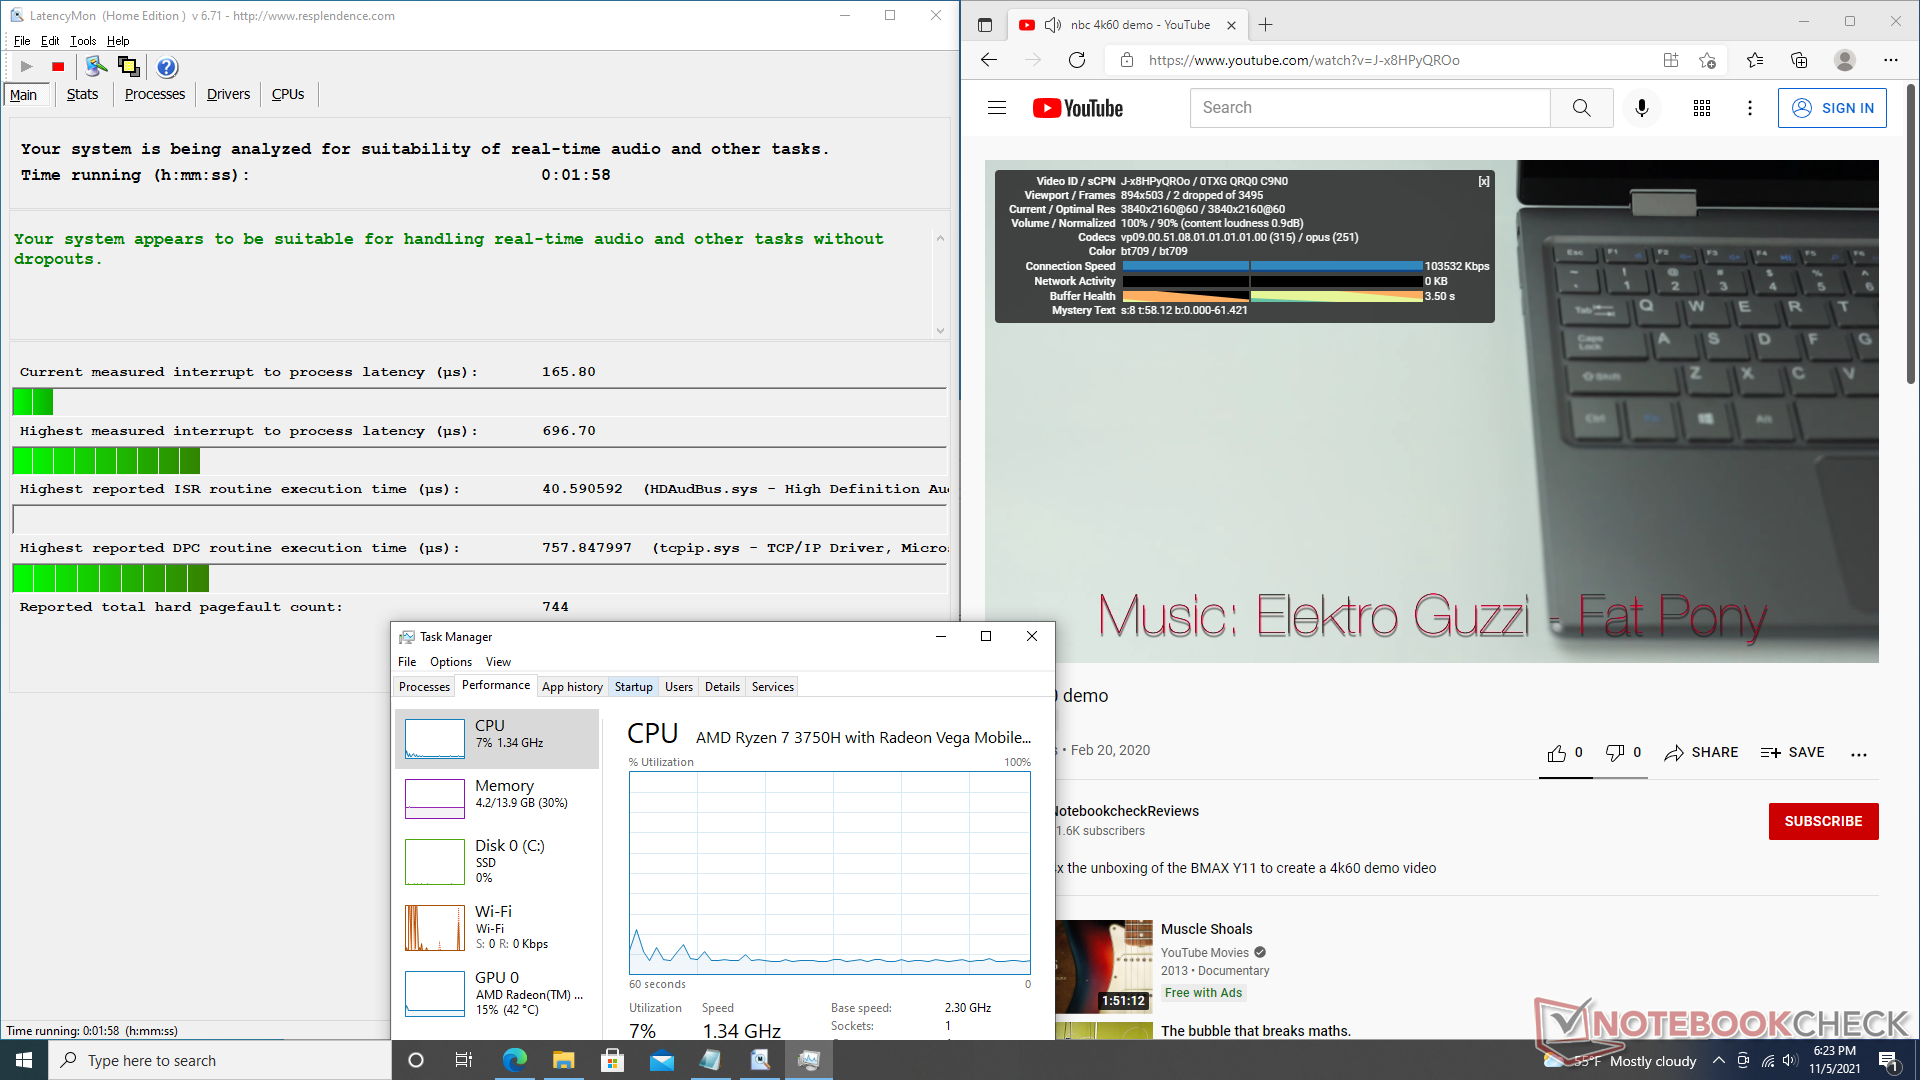
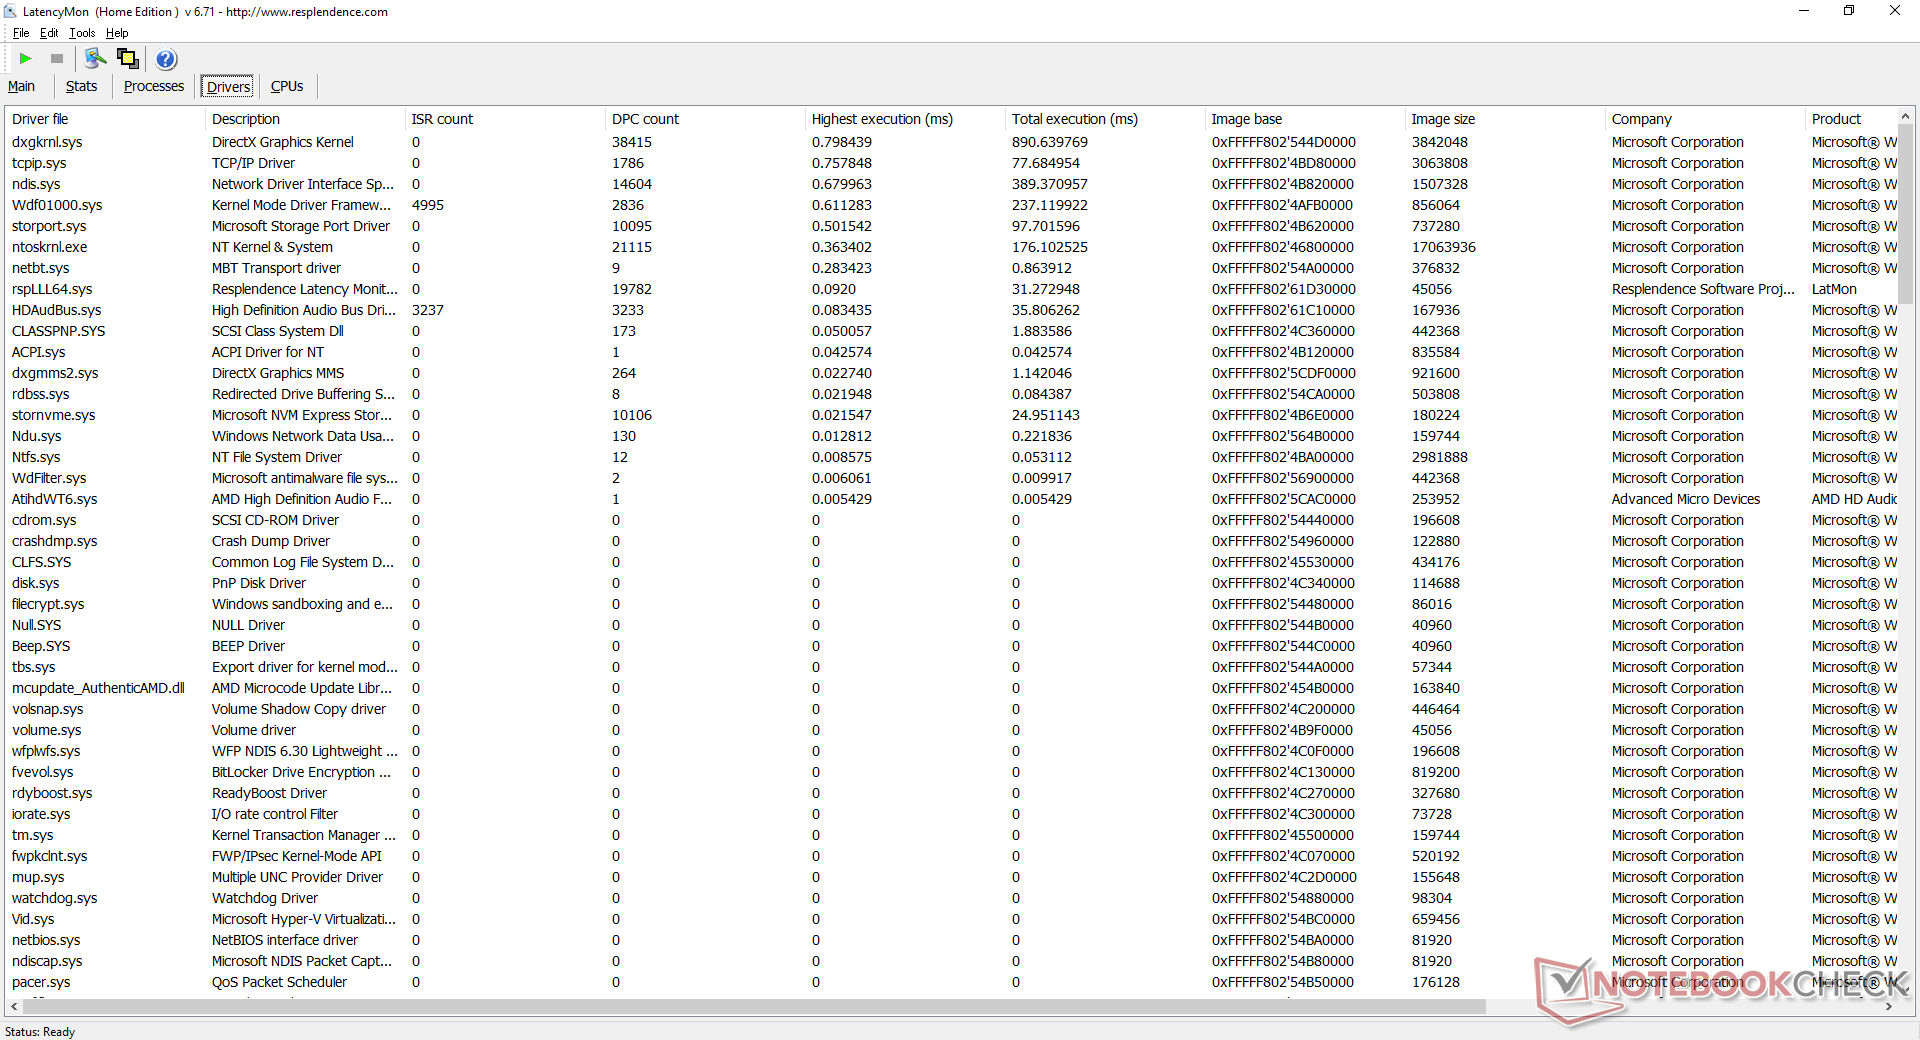
DPC latentie
LatencyMon laat geen DPC problemen zien bij het openen van meerdere browser tabs op onze homepage of bij het uitvoeren van Prime95 stress. Het afspelen van 4K-video's bij 60 FPS verloopt vloeiend en met bijna geen dropped frames.
| DPC Latencies / LatencyMon - interrupt to process latency (max), Web, Youtube, Prime95 | |
| Beelink SEi10 | |
| GMK NucBox 2 | |
| Zotac ZBox MI643 | |
| Beelink SER3 | |
| Intel NUC11TNKi5 | |
* ... kleiner is beter
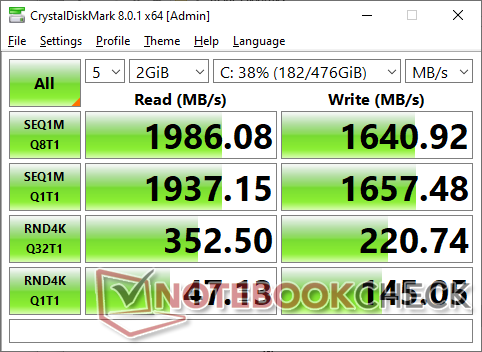
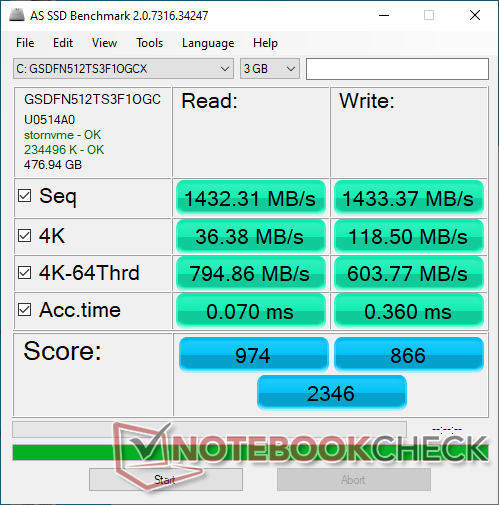
Opslagapparaten
Terwijl onze SEi10 wordt geleverd met een 256 GB Silicon Motion AZW NVMe SSD, wordt onze SER3 geleverd met de 512 GB versie. Sequentiële lees- en schrijfsnelheden laten zien dat de schijf een NVMe-aanbod uit het middensegment is. Overdrachtssnelheden zullen na verloop van tijd vertragen wanneer ze worden belast van 1900 MB/s tot 1400 MB/s of langzamer als gevolg van thermische beperkingen. Veel Intel NUC's integreren een warmteverspreider bovenop de NVMe SSD voor koeling om de prestatievertraging te voorkomen of te vertragen.


| Drive Performance rating - Percent | |
| Zotac ZBox MI643 | |
| Beelink SER3 | |
| GMK NucBox 2 | |
| Beelink SEi10 | |
| Intel NUC11TNKi5 | |
| DiskSpd | |
| seq read | |
| Zotac ZBox MI643 | |
| GMK NucBox 2 | |
| Beelink SER3 | |
| Beelink SEi10 | |
| Intel NUC11TNKi5 | |
| seq write | |
| Zotac ZBox MI643 | |
| Beelink SER3 | |
| GMK NucBox 2 | |
| Beelink SEi10 | |
| Intel NUC11TNKi5 | |
| seq q8 t1 read | |
| GMK NucBox 2 | |
| Zotac ZBox MI643 | |
| Beelink SER3 | |
| Beelink SEi10 | |
| Intel NUC11TNKi5 | |
| seq q8 t1 write | |
| Zotac ZBox MI643 | |
| Beelink SER3 | |
| GMK NucBox 2 | |
| Beelink SEi10 | |
| Intel NUC11TNKi5 | |
| 4k q1 t1 read | |
| Zotac ZBox MI643 | |
| Beelink SEi10 | |
| Beelink SER3 | |
| GMK NucBox 2 | |
| Intel NUC11TNKi5 | |
| 4k q1 t1 write | |
| Zotac ZBox MI643 | |
| Beelink SEi10 | |
| GMK NucBox 2 | |
| Beelink SER3 | |
| Intel NUC11TNKi5 | |
| 4k q32 t16 read | |
| Beelink SER3 | |
| Zotac ZBox MI643 | |
| Beelink SEi10 | |
| GMK NucBox 2 | |
| Intel NUC11TNKi5 | |
| 4k q32 t16 write | |
| Zotac ZBox MI643 | |
| GMK NucBox 2 | |
| Beelink SEi10 | |
| Beelink SER3 | |
| Intel NUC11TNKi5 | |
| AS SSD | |
| Score Total | |
| Zotac ZBox MI643 | |
| Beelink SER3 | |
| GMK NucBox 2 | |
| Beelink SEi10 | |
| Intel NUC11TNKi5 | |
| Score Read | |
| Zotac ZBox MI643 | |
| Beelink SER3 | |
| GMK NucBox 2 | |
| Beelink SEi10 | |
| Intel NUC11TNKi5 | |
| Score Write | |
| Zotac ZBox MI643 | |
| Beelink SER3 | |
| GMK NucBox 2 | |
| Intel NUC11TNKi5 | |
| Beelink SEi10 | |
| Seq Read | |
| GMK NucBox 2 | |
| Zotac ZBox MI643 | |
| Beelink SER3 | |
| Beelink SEi10 | |
| Intel NUC11TNKi5 | |
| Seq Write | |
| Zotac ZBox MI643 | |
| Beelink SER3 | |
| GMK NucBox 2 | |
| Intel NUC11TNKi5 | |
| Beelink SEi10 | |
| 4K Read | |
| Zotac ZBox MI643 | |
| GMK NucBox 2 | |
| Beelink SER3 | |
| Beelink SEi10 | |
| Intel NUC11TNKi5 | |
| 4K Write | |
| GMK NucBox 2 | |
| Zotac ZBox MI643 | |
| Beelink SER3 | |
| Beelink SEi10 | |
| Intel NUC11TNKi5 | |
| 4K-64 Read | |
| Zotac ZBox MI643 | |
| Beelink SER3 | |
| GMK NucBox 2 | |
| Beelink SEi10 | |
| Intel NUC11TNKi5 | |
| 4K-64 Write | |
| Zotac ZBox MI643 | |
| Beelink SER3 | |
| GMK NucBox 2 | |
| Intel NUC11TNKi5 | |
| Beelink SEi10 | |
| Access Time Read | |
| Intel NUC11TNKi5 | |
| Beelink SER3 | |
| Beelink SEi10 | |
| GMK NucBox 2 | |
| Zotac ZBox MI643 | |
| Access Time Write | |
| Beelink SEi10 | |
| Beelink SER3 | |
| GMK NucBox 2 | |
| Intel NUC11TNKi5 | |
| Zotac ZBox MI643 | |
* ... kleiner is beter
Disk Throttling: DiskSpd Read Loop, Queue Depth 8
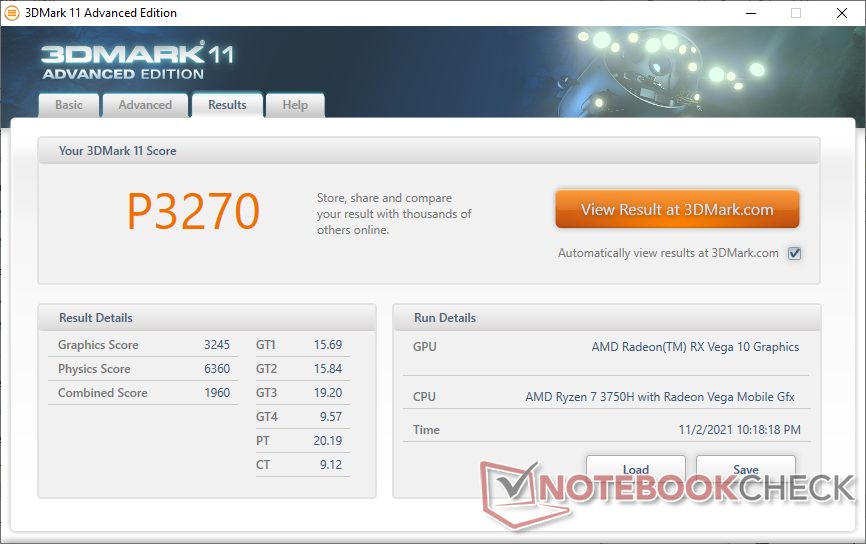
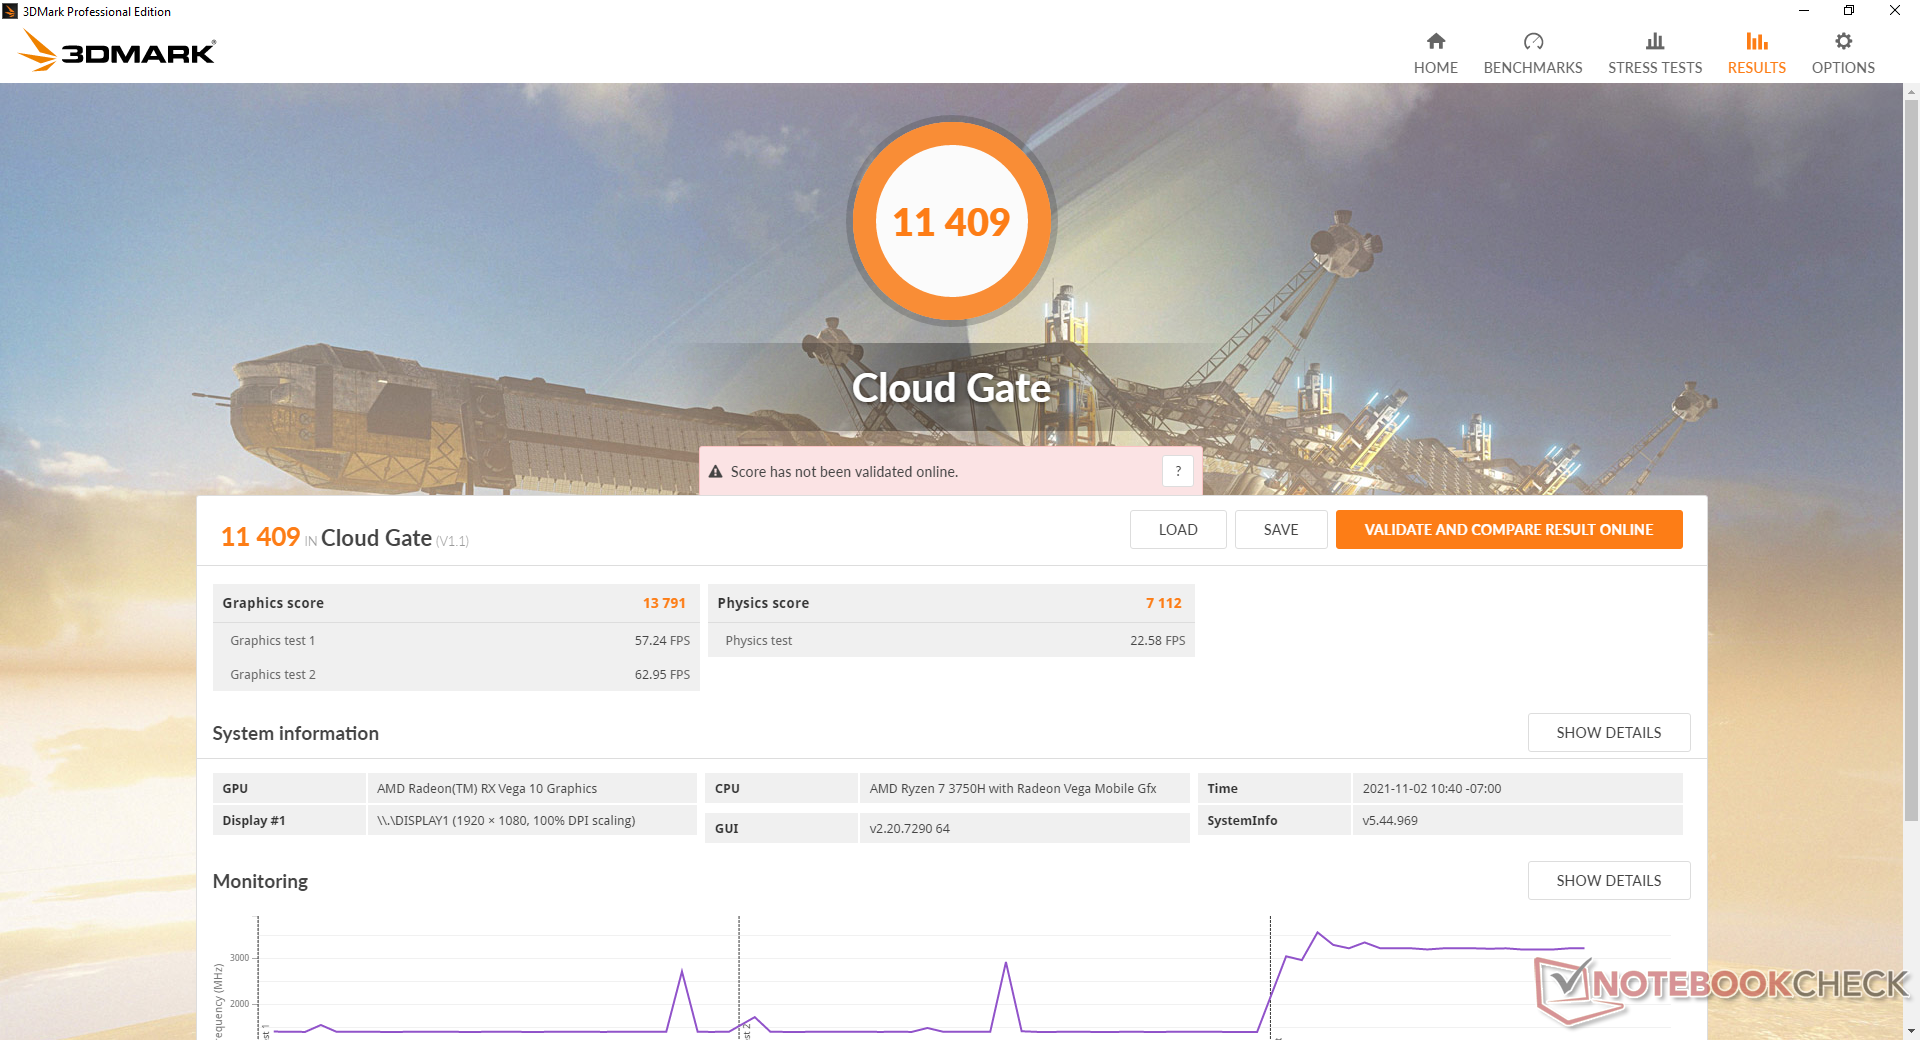
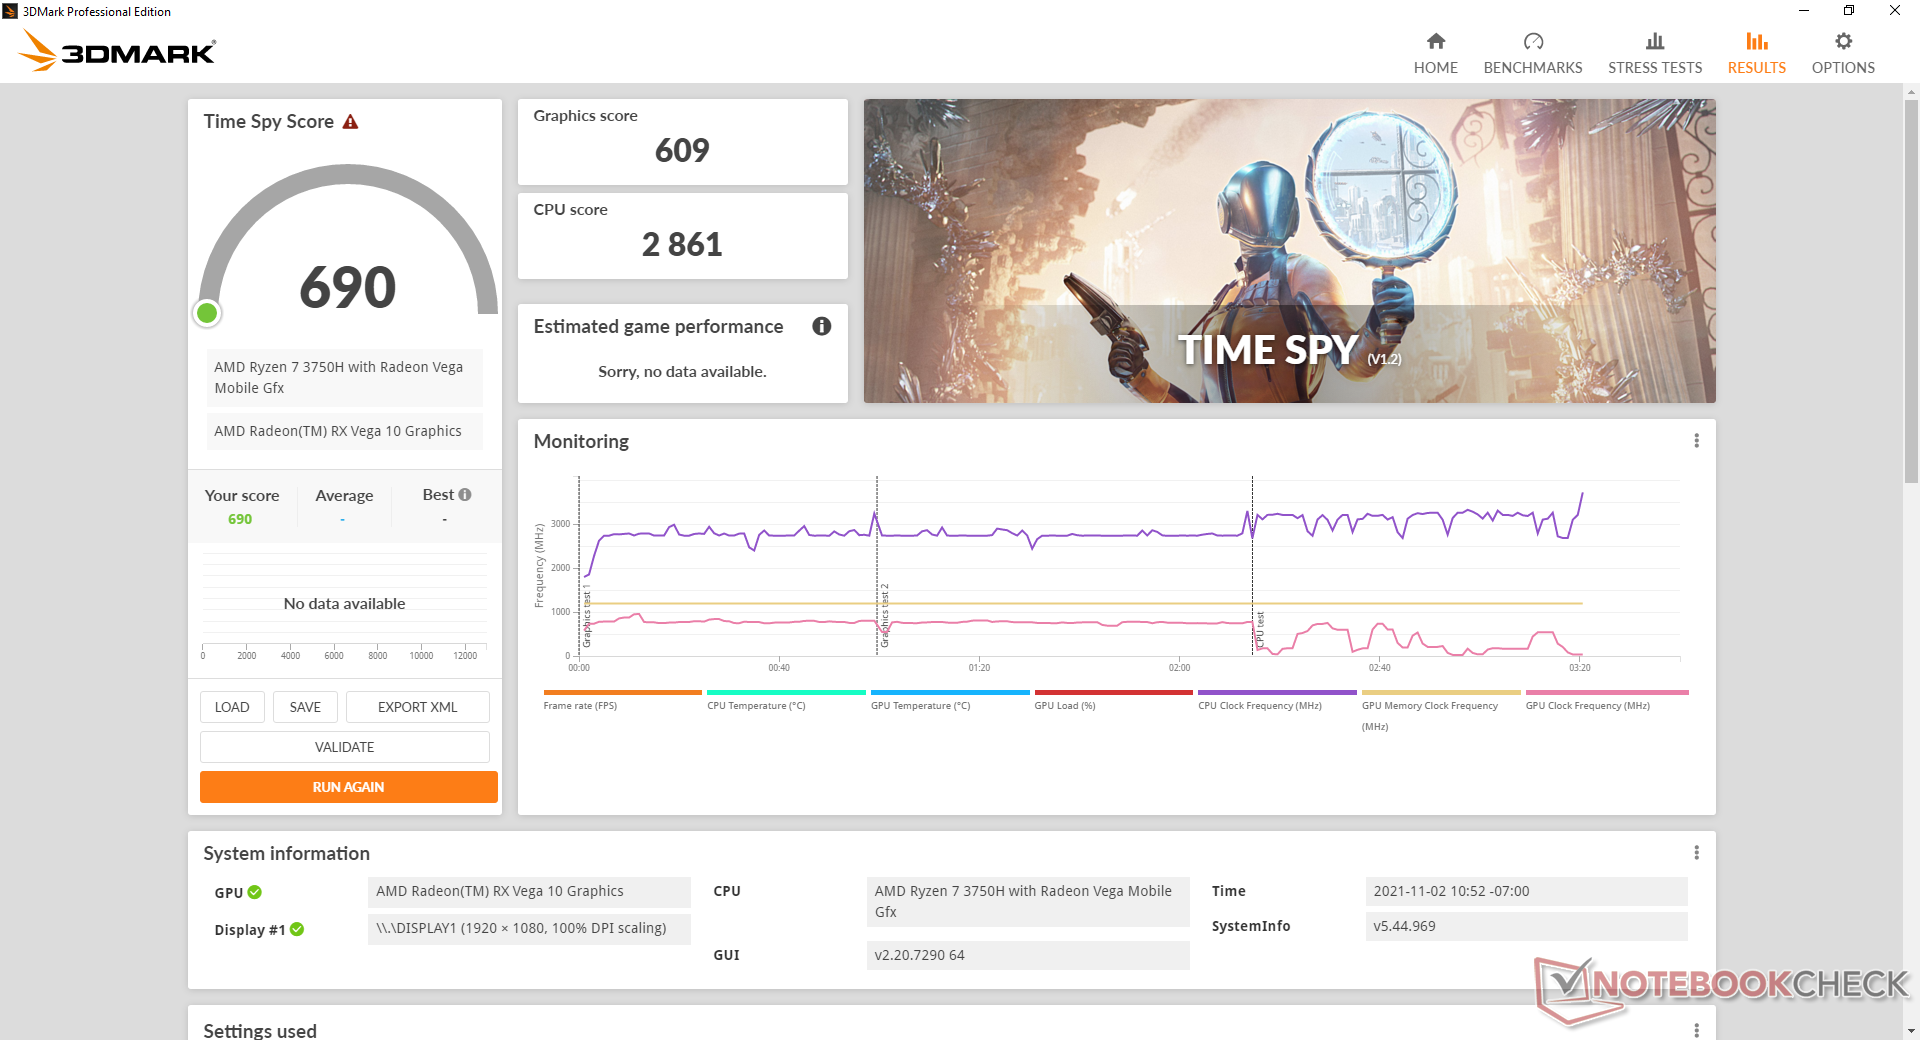
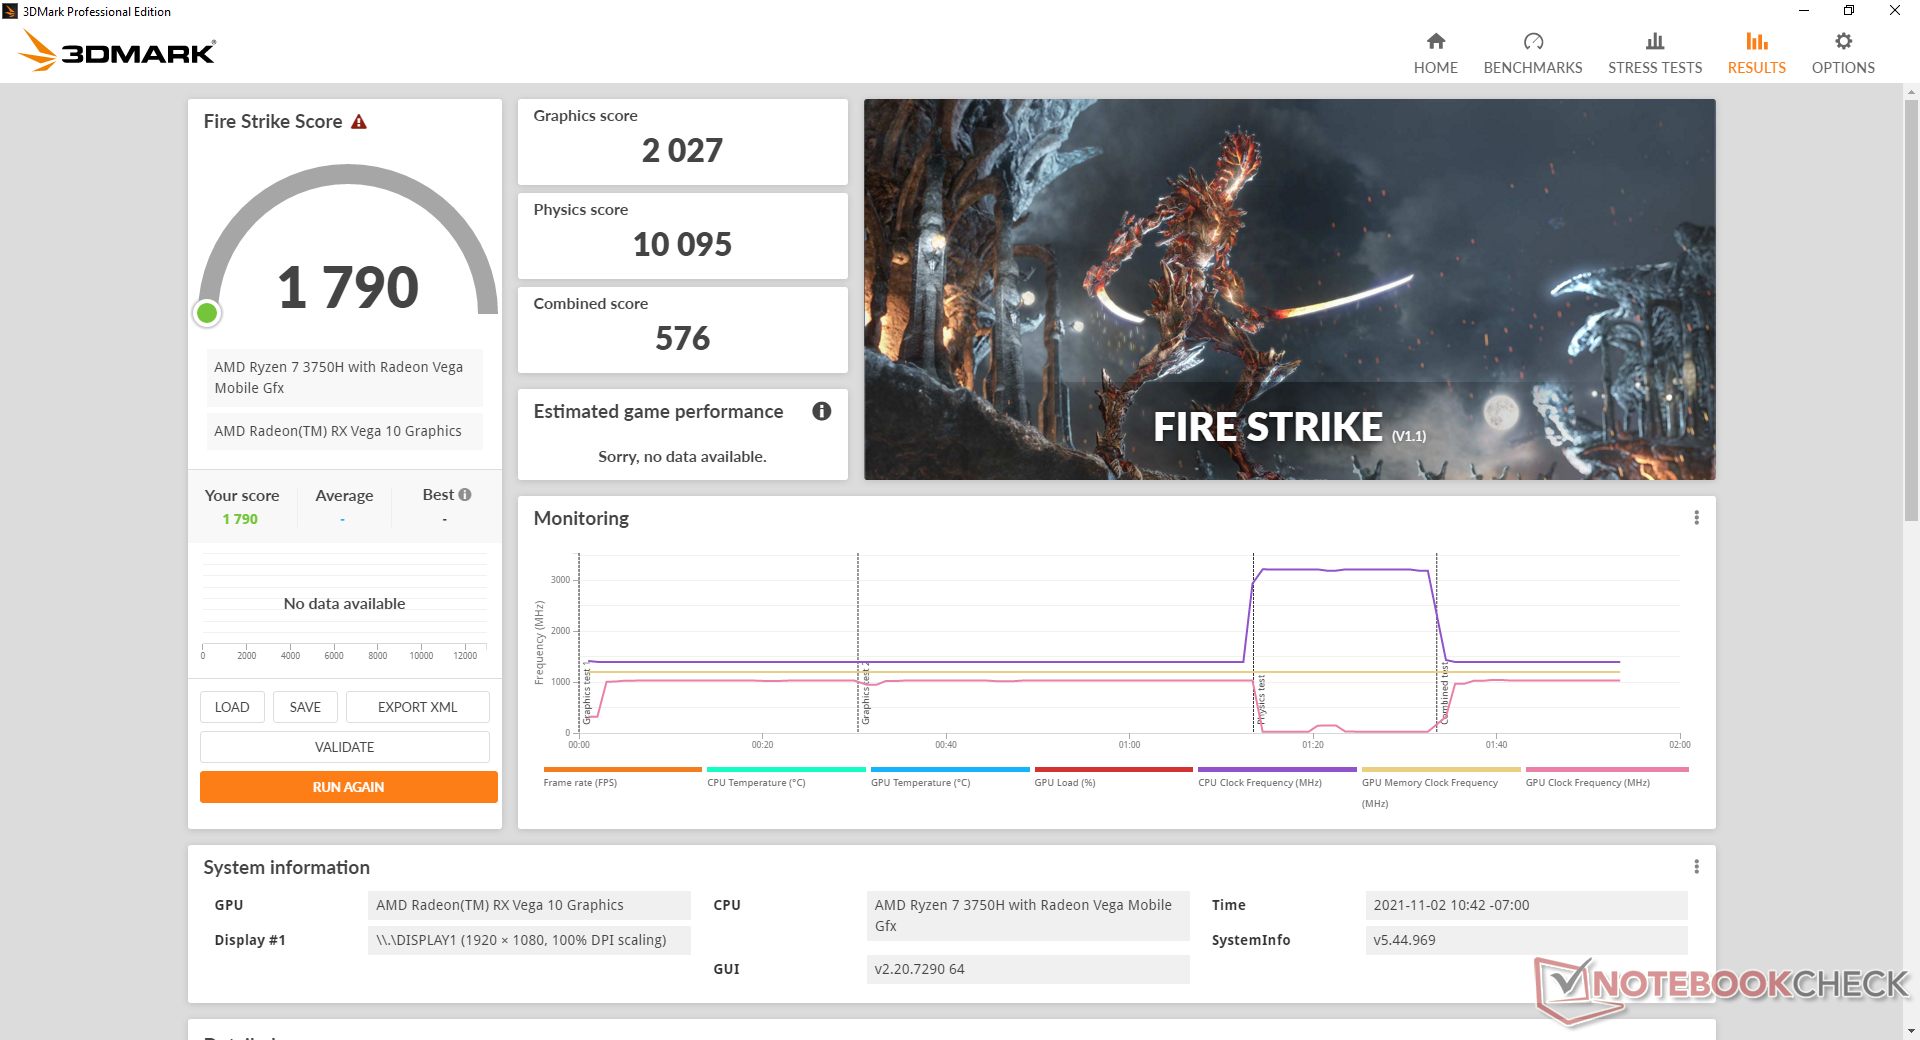
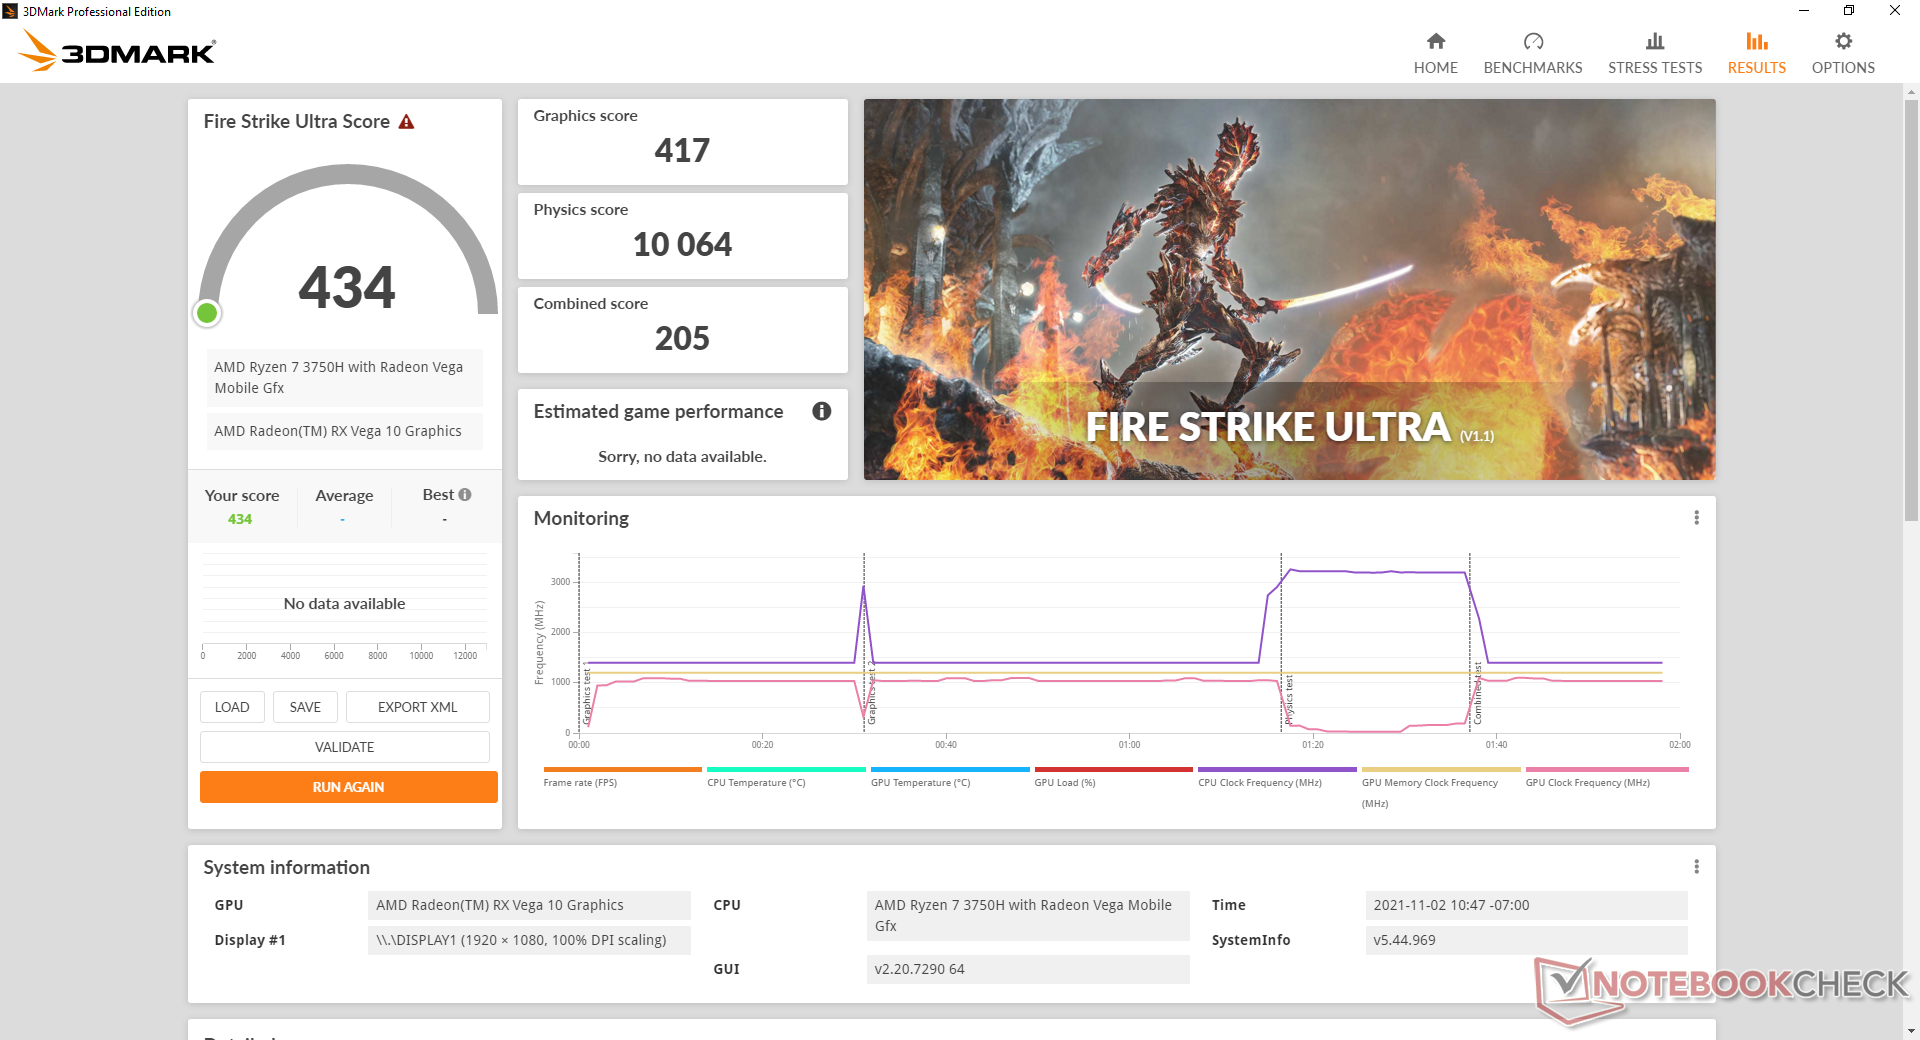
GPU prestatie
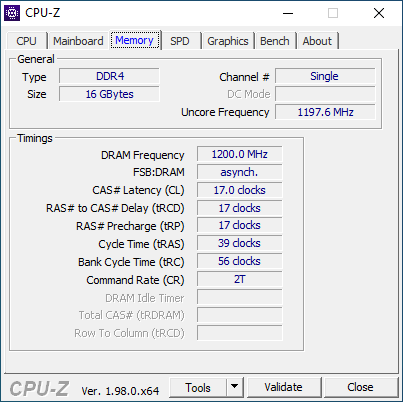
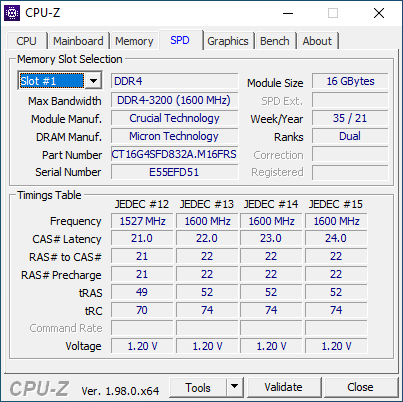
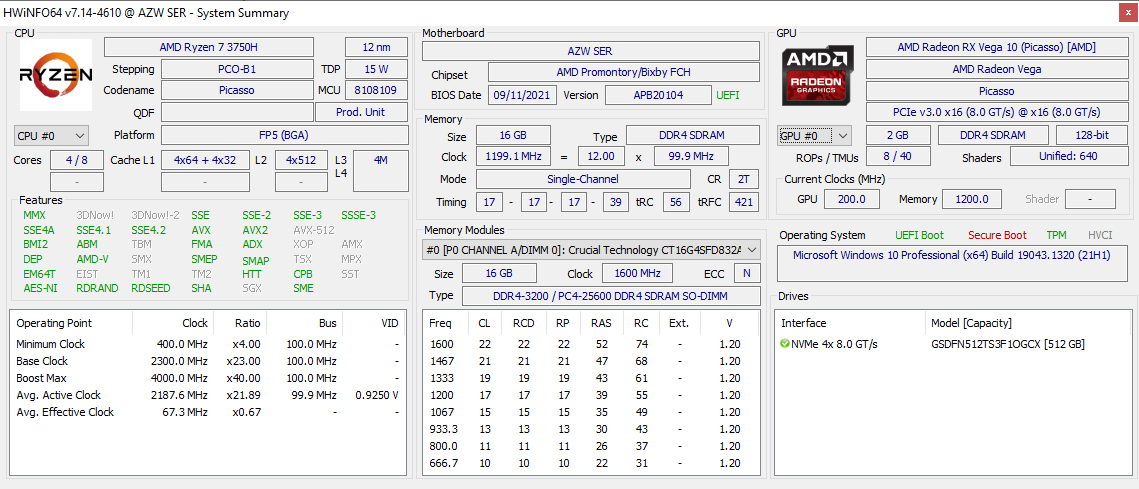
Grafische prestaties zijn het meest vergelijkbaar met de Iris Plus Graphics 655. Terwijl onze Radeon RX Vega 10 een fatsoenlijke upgrade is ten opzichte van de UHD Graphics 620, is het nog steeds aanzienlijk langzamer dan de nieuwste Iris Xe NUC opties van Intel. De algehele prestaties zijn iets langzamer dan de gemiddelde RX Vega 10 in onze database, omdat onze SER3-testunit alleen is uitgerust met enkel-kanaals RAM. Gebruikers kunnen meer prestaties uit de GPU persen als deze is geconfigureerd met dual-channel RAM.
| 3DMark Performance rating - Percent | |
| VAIO SX14 VJS144X0111K | |
| Asus Zenbook 14X UX5400E -1! | |
| Huawei MateBook 16 R7 5800H | |
| Lenovo Yoga 6 13ALC6 | |
| Dell Latitude 14 5411-WJ40N | |
| Intel NUC11TNKi5 | |
| Gemiddeld AMD Radeon RX Vega 10 | |
| Intel NUC8i7BE | |
| Beelink SER3 | |
| GMK NucBox 2 | |
| Zotac ZBox MI643 | |
| Beelink SEi10 | |
| 3DMark | |
| 1920x1080 Fire Strike Graphics | |
| VAIO SX14 VJS144X0111K | |
| Asus Zenbook 14X UX5400E | |
| Dell Latitude 14 5411-WJ40N | |
| Huawei MateBook 16 R7 5800H | |
| Lenovo Yoga 6 13ALC6 | |
| Intel NUC11TNKi5 | |
| Intel NUC8i7BE | |
| Gemiddeld AMD Radeon RX Vega 10 (1567 - 2999, n=17) | |
| Beelink SER3 | |
| GMK NucBox 2 | |
| Zotac ZBox MI643 | |
| Beelink SEi10 | |
| 2560x1440 Time Spy Graphics | |
| VAIO SX14 VJS144X0111K | |
| Asus Zenbook 14X UX5400E | |
| Huawei MateBook 16 R7 5800H | |
| Dell Latitude 14 5411-WJ40N | |
| Lenovo Yoga 6 13ALC6 | |
| Intel NUC11TNKi5 | |
| Gemiddeld AMD Radeon RX Vega 10 (578 - 852, n=7) | |
| Intel NUC8i7BE | |
| Beelink SER3 | |
| GMK NucBox 2 | |
| Zotac ZBox MI643 | |
| Beelink SEi10 | |
| 2560x1440 Time Spy Score | |
| VAIO SX14 VJS144X0111K | |
| Asus Zenbook 14X UX5400E | |
| Huawei MateBook 16 R7 5800H | |
| Dell Latitude 14 5411-WJ40N | |
| Lenovo Yoga 6 13ALC6 | |
| Intel NUC11TNKi5 | |
| Gemiddeld AMD Radeon RX Vega 10 (647 - 955, n=8) | |
| Intel NUC8i7BE | |
| Beelink SER3 | |
| GMK NucBox 2 | |
| Zotac ZBox MI643 | |
| Beelink SEi10 | |
| 3DMark 11 - 1280x720 Performance GPU | |
| VAIO SX14 VJS144X0111K | |
| Huawei MateBook 16 R7 5800H | |
| Lenovo Yoga 6 13ALC6 | |
| Intel NUC11TNKi5 | |
| Dell Latitude 14 5411-WJ40N | |
| Gemiddeld AMD Radeon RX Vega 10 (2688 - 4165, n=17) | |
| Beelink SER3 | |
| Intel NUC8i7BE | |
| GMK NucBox 2 | |
| Zotac ZBox MI643 | |
| Beelink SEi10 | |
| 3DMark 11 Performance | 3270 punten | |
| 3DMark Cloud Gate Standard Score | 11409 punten | |
| 3DMark Fire Strike Score | 1790 punten | |
| 3DMark Time Spy Score | 690 punten | |
Help | ||
Witcher 3 FPS Chart
| lage | gem. | hoge | ultra | |
|---|---|---|---|---|
| GTA V (2015) | 51.8 | 46.3 | 13.2 | 6.76 |
| The Witcher 3 (2015) | 35.7 | 22.9 | 12.2 | 8 |
| Dota 2 Reborn (2015) | 67.4 | 52 | 30.1 | 28.3 |
| Final Fantasy XV Benchmark (2018) | 19 | 9.98 | 6.8 | |
| X-Plane 11.11 (2018) | 23.8 | 18.5 | 16.7 | |
| Far Cry 5 (2018) | 23 | 12 | 11 | 10 |
| Strange Brigade (2018) | 37.9 | 15.1 | 12.6 | 10.9 |
Emissies
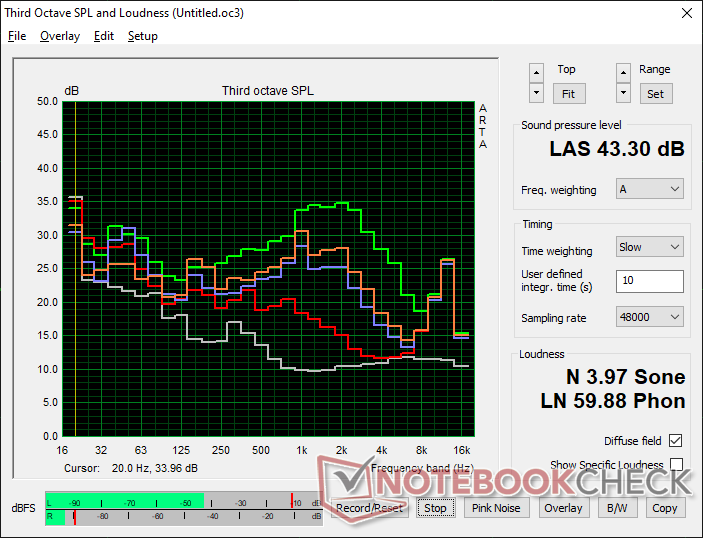
Systeemgeluid
De ventilator pulseert regelmatig bij het uitvoeren van typische HTPC belastingen zoals browsen of video streaming. Het pulseren is niet extreem met slechts maximaal 29,4 dB(A) tegen een stille achtergrond van 23,4 dB(A), maar het is merkbaar in een rustige kantooromgeving. Gelukkig is het niet luid genoeg om storend te zijn tijdens het afspelen van luide muziek of video.
Het draaien van hogere belastingen zoals games kan een ventilatorgeluid veroorzaken van 37 tot 43 dB(A), niet anders dan bij veel Ultrabooks met een U-serie of de oudereIntel NUC8i7BE.
Geluidsniveau
| Onbelast |
| 23.4 / 23.4 / 29.4 dB (A) |
| Belasting |
| 35.2 / 43.3 dB (A) |
 | ||
30 dB stil 40 dB(A) hoorbaar 50 dB(A) luid |
||
min: | ||
| Beelink SER3 Vega 10, R7 3750H, GSemi AZW GSDFN512TS3F1OGCX | Beelink SEi10 UHD Graphics G1 (Ice Lake 32 EU), i3-1005G1, Silicon Motion AZW 256G M.2280 NVMe 4X 200725 D | Intel NUC8i7BE Iris Plus Graphics 655, i7-8559U | GMK NucBox 2 Iris Plus Graphics 655, i5-8259U, Netac S930E8/256GPN | Zotac ZBox MI643 UHD Graphics 620, i5-10210U, Lexar NM610 1TB | Intel NUC11TNKi5 Iris Xe G7 80EUs, i5-1135G7, Transcend M.2 SSD 430S TS512GMTS430S | |
|---|---|---|---|---|---|---|
| Noise | -23% | -13% | 1% | -4% | -21% | |
| uit / omgeving * (dB) | 23.4 | 27.5 -18% | 28.7 -23% | 25.6 -9% | 26.1 -12% | 24.8 -6% |
| Idle Minimum * (dB) | 23.4 | 30.9 -32% | 28.7 -23% | 25.7 -10% | 27.5 -18% | 35.6 -52% |
| Idle Average * (dB) | 23.4 | 33.5 -43% | 29.3 -25% | 25.7 -10% | 27.5 -18% | 35.6 -52% |
| Idle Maximum * (dB) | 29.4 | 33.5 -14% | 31.8 -8% | 25.7 13% | 27.5 6% | 35.6 -21% |
| Load Average * (dB) | 35.2 | 38.5 -9% | 39 -11% | 35.3 -0% | 28.9 18% | 36.2 -3% |
| Witcher 3 ultra * (dB) | 37.2 | 39 -5% | 38 -2% | |||
| Load Maximum * (dB) | 43.3 | 51.6 -19% | 41.4 4% | 35.1 19% | 42 3% | 47.6 -10% |
* ... kleiner is beter
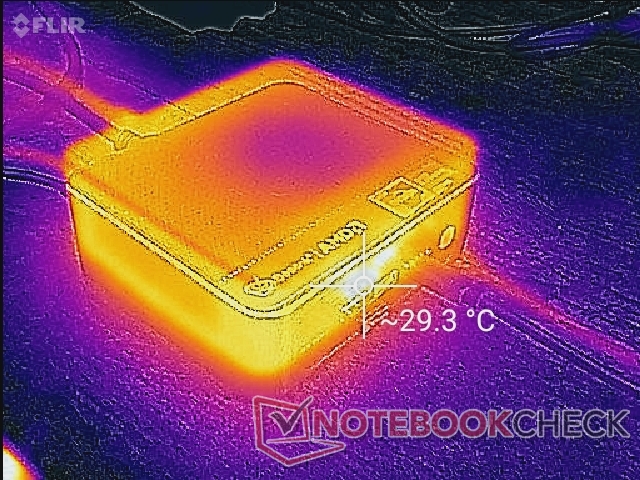
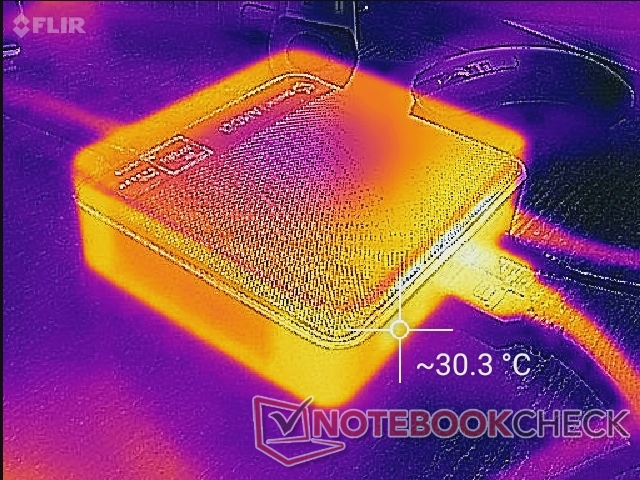
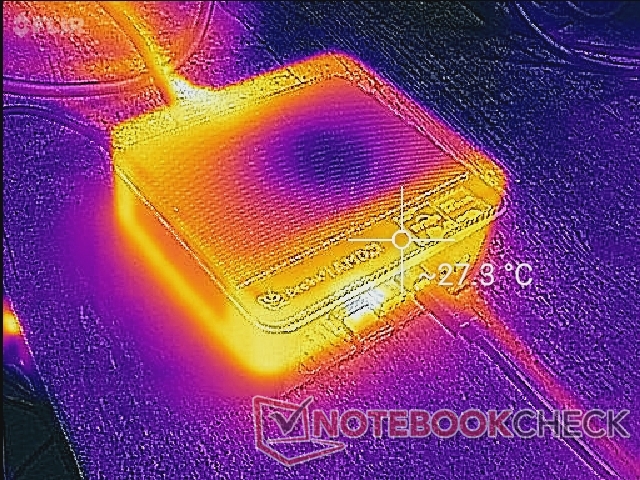
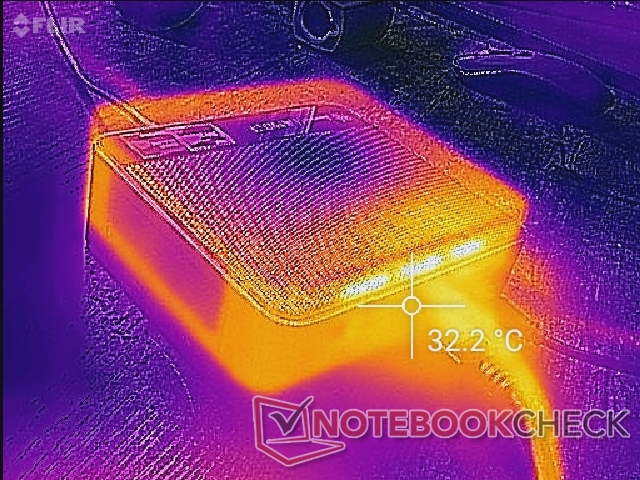
Temperatuur
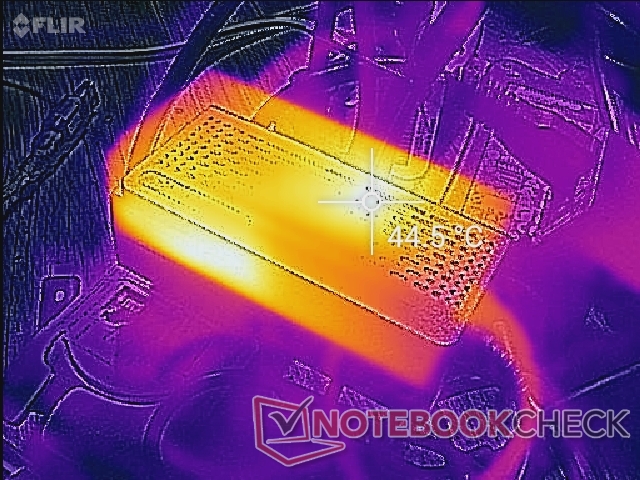
Oppervlaktetemperaturen zijn geen probleem voor de SER3. Warme lucht stroomt van achteren naar binnen, terwijl koele lucht van boven naar binnen stroomt. We raden dan ook af om boeken of papieren op de mini PC te stapelen
De AC adapter kan warmer worden dan de mini PC zelf bij hoge belasting, zoals blijkt uit onze temperatuurkaarten.
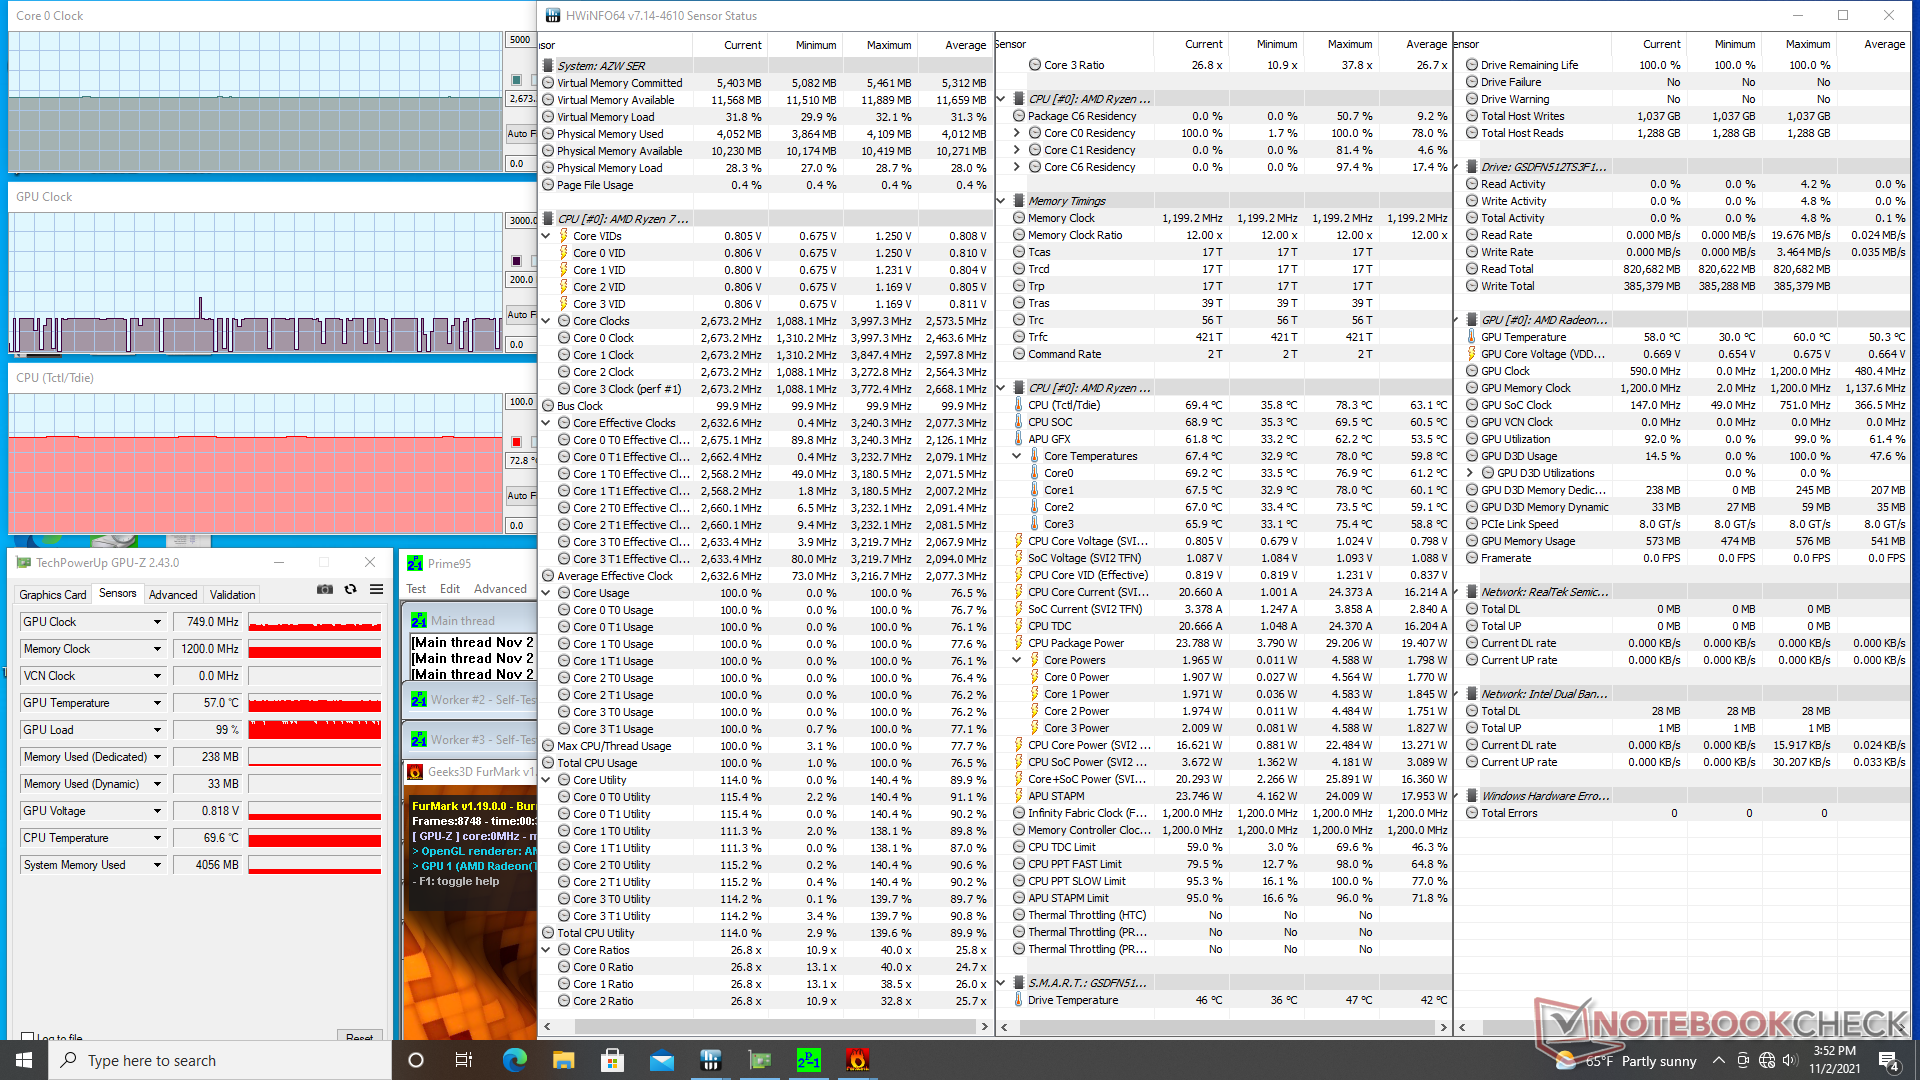
Stresstest
Tijdens het draaien van prime95, werd de CPU kloksnelheid opgevoerd tot 3.3 GHz gedurende de eerste minuut of zo, totdat een kerntemperatuur van 78 C werd bereikt. De kloksnelheid daalde dan tot 3.0 GHz om een koelere kerntemperatuur van 72 C te behouden.
De kerntemperatuur is relatief koel met slechts 56 C tijdens het draaien Witcher 3 vergeleken met 62 C op de Intel NUC11TNKi5 Pro.
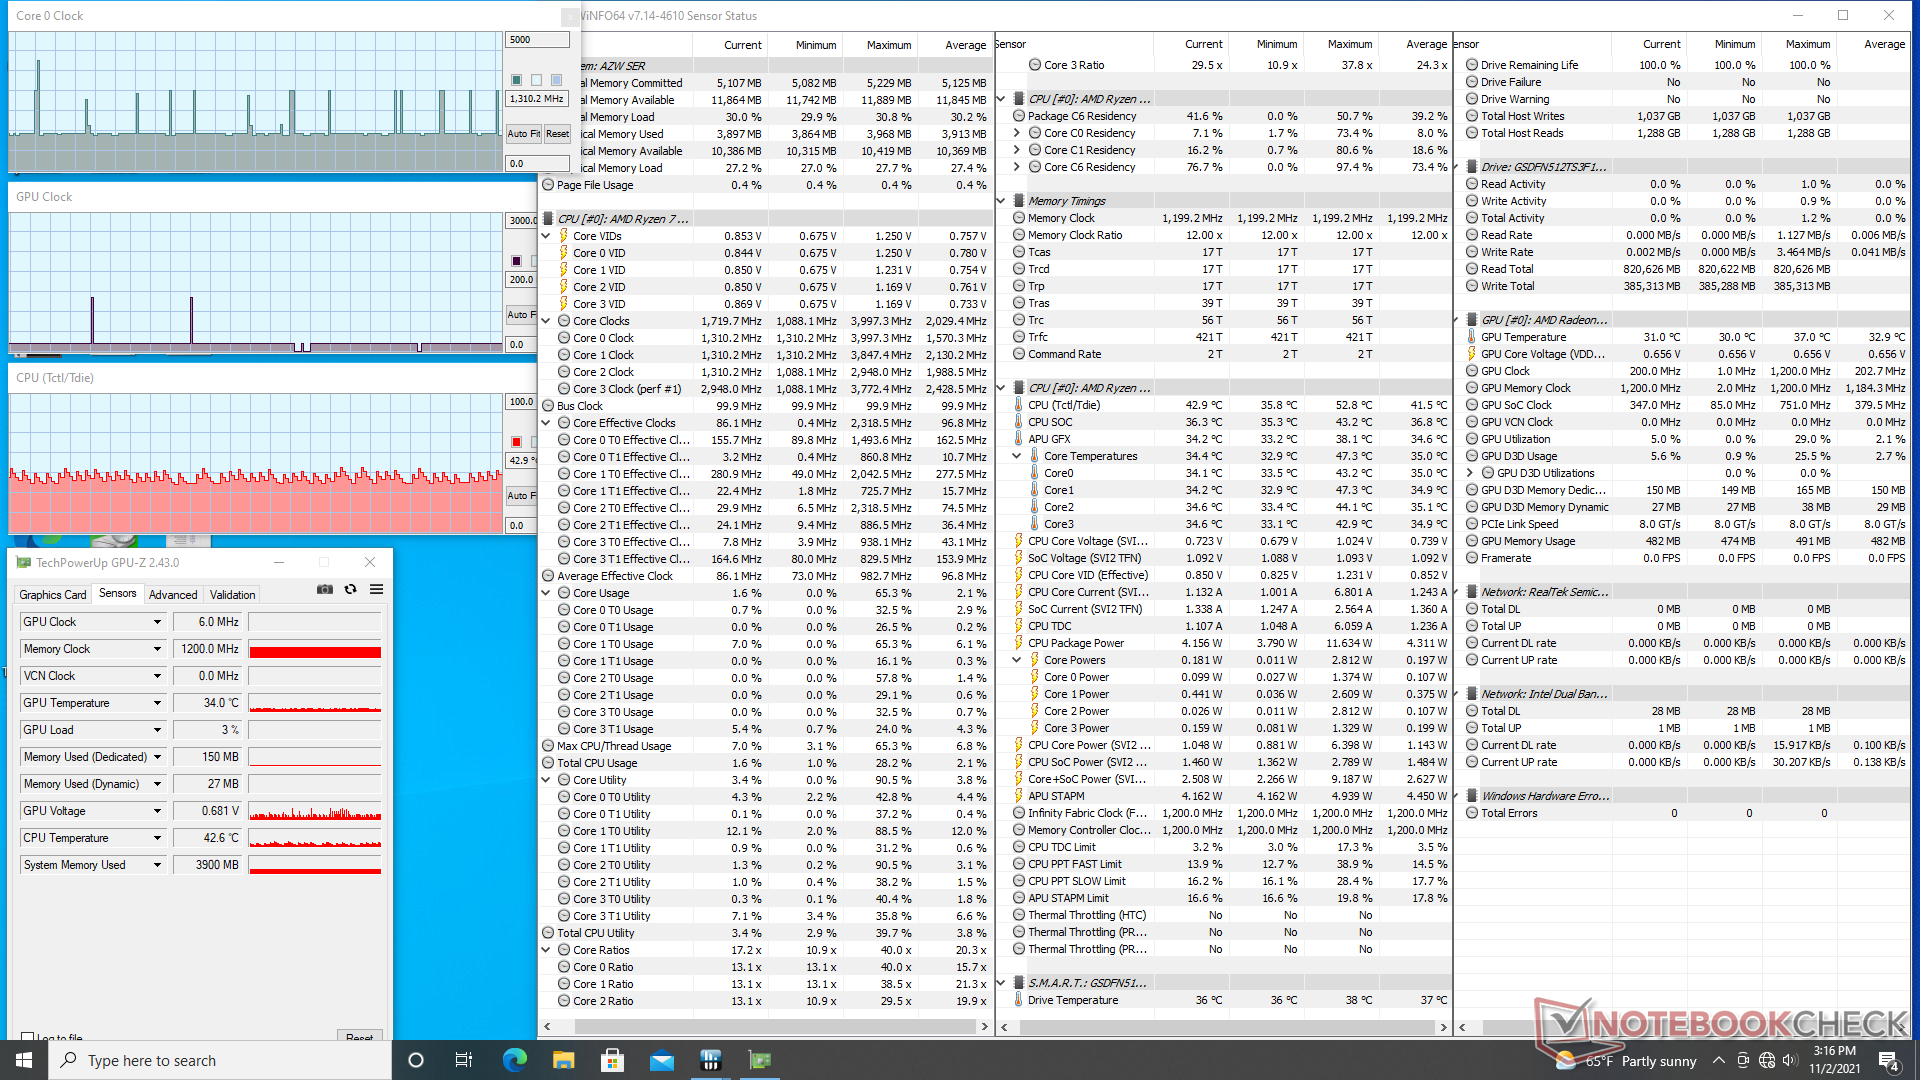
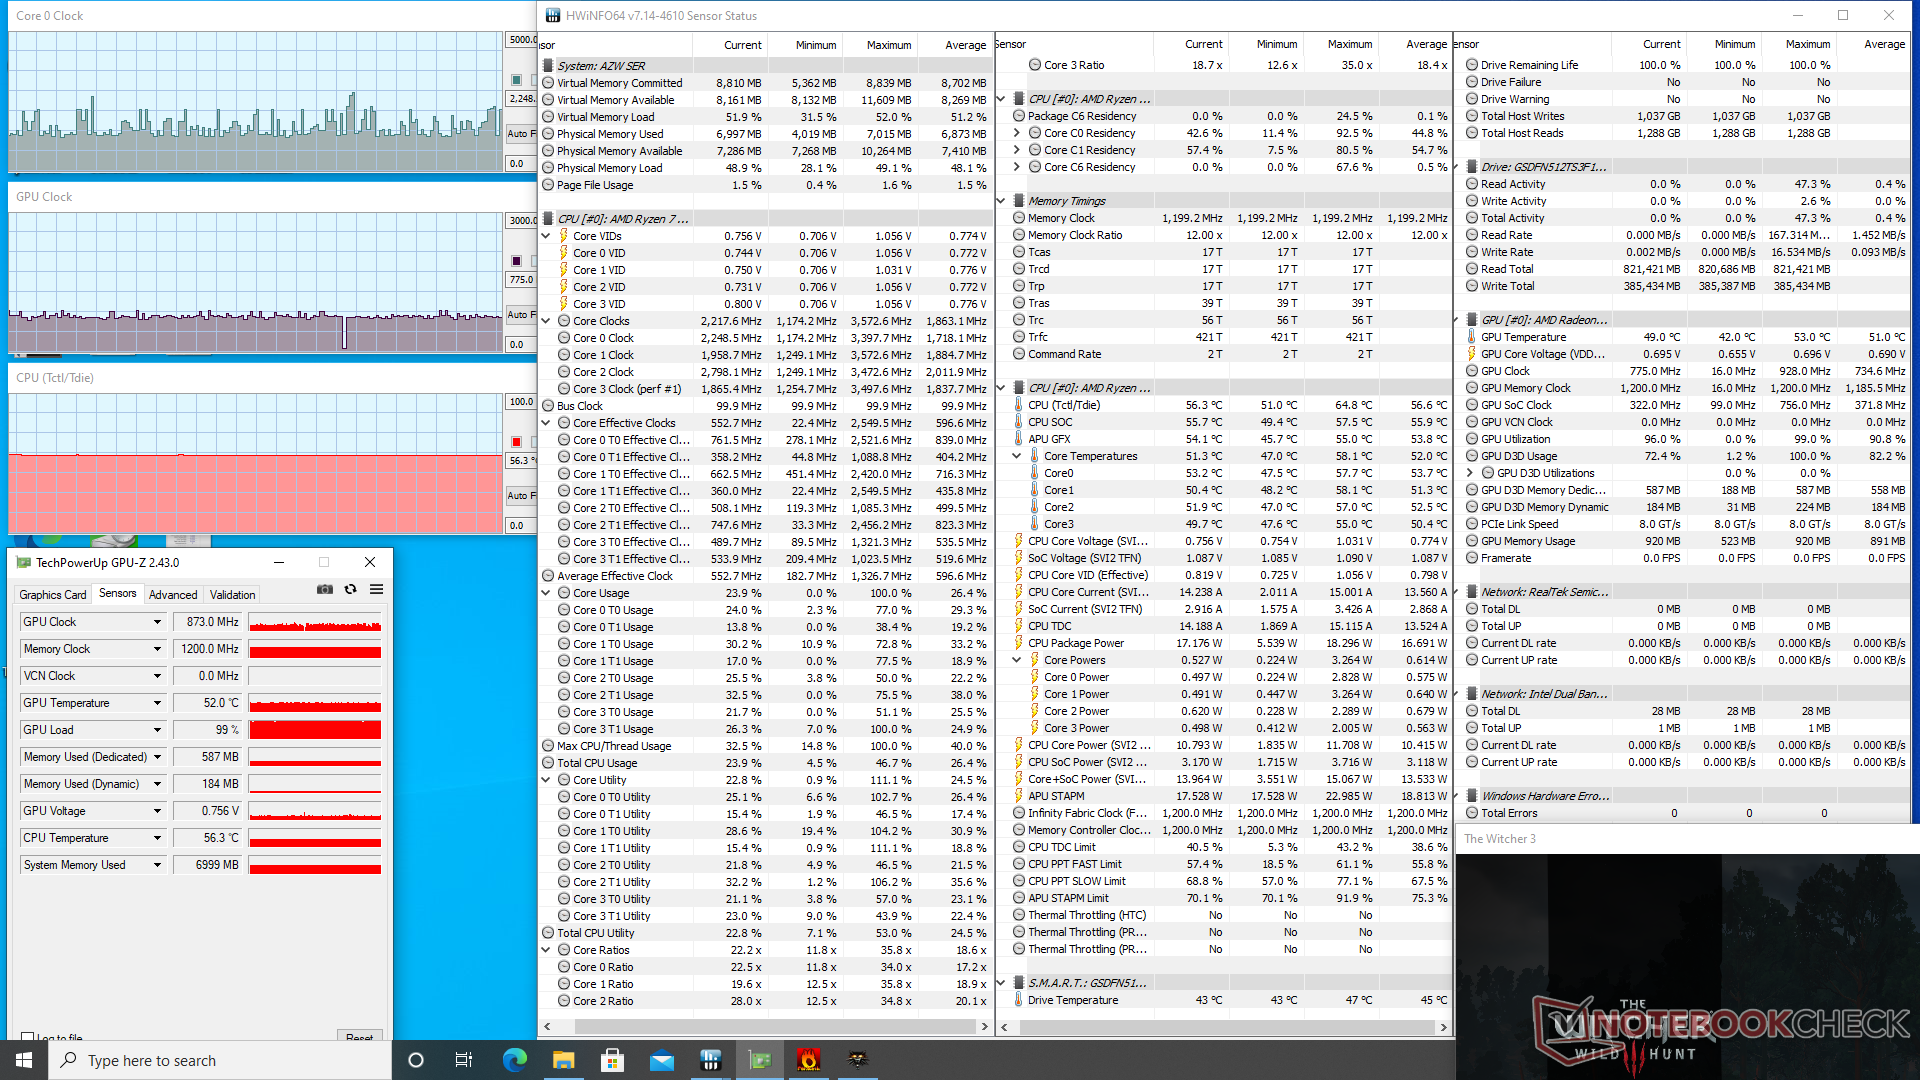
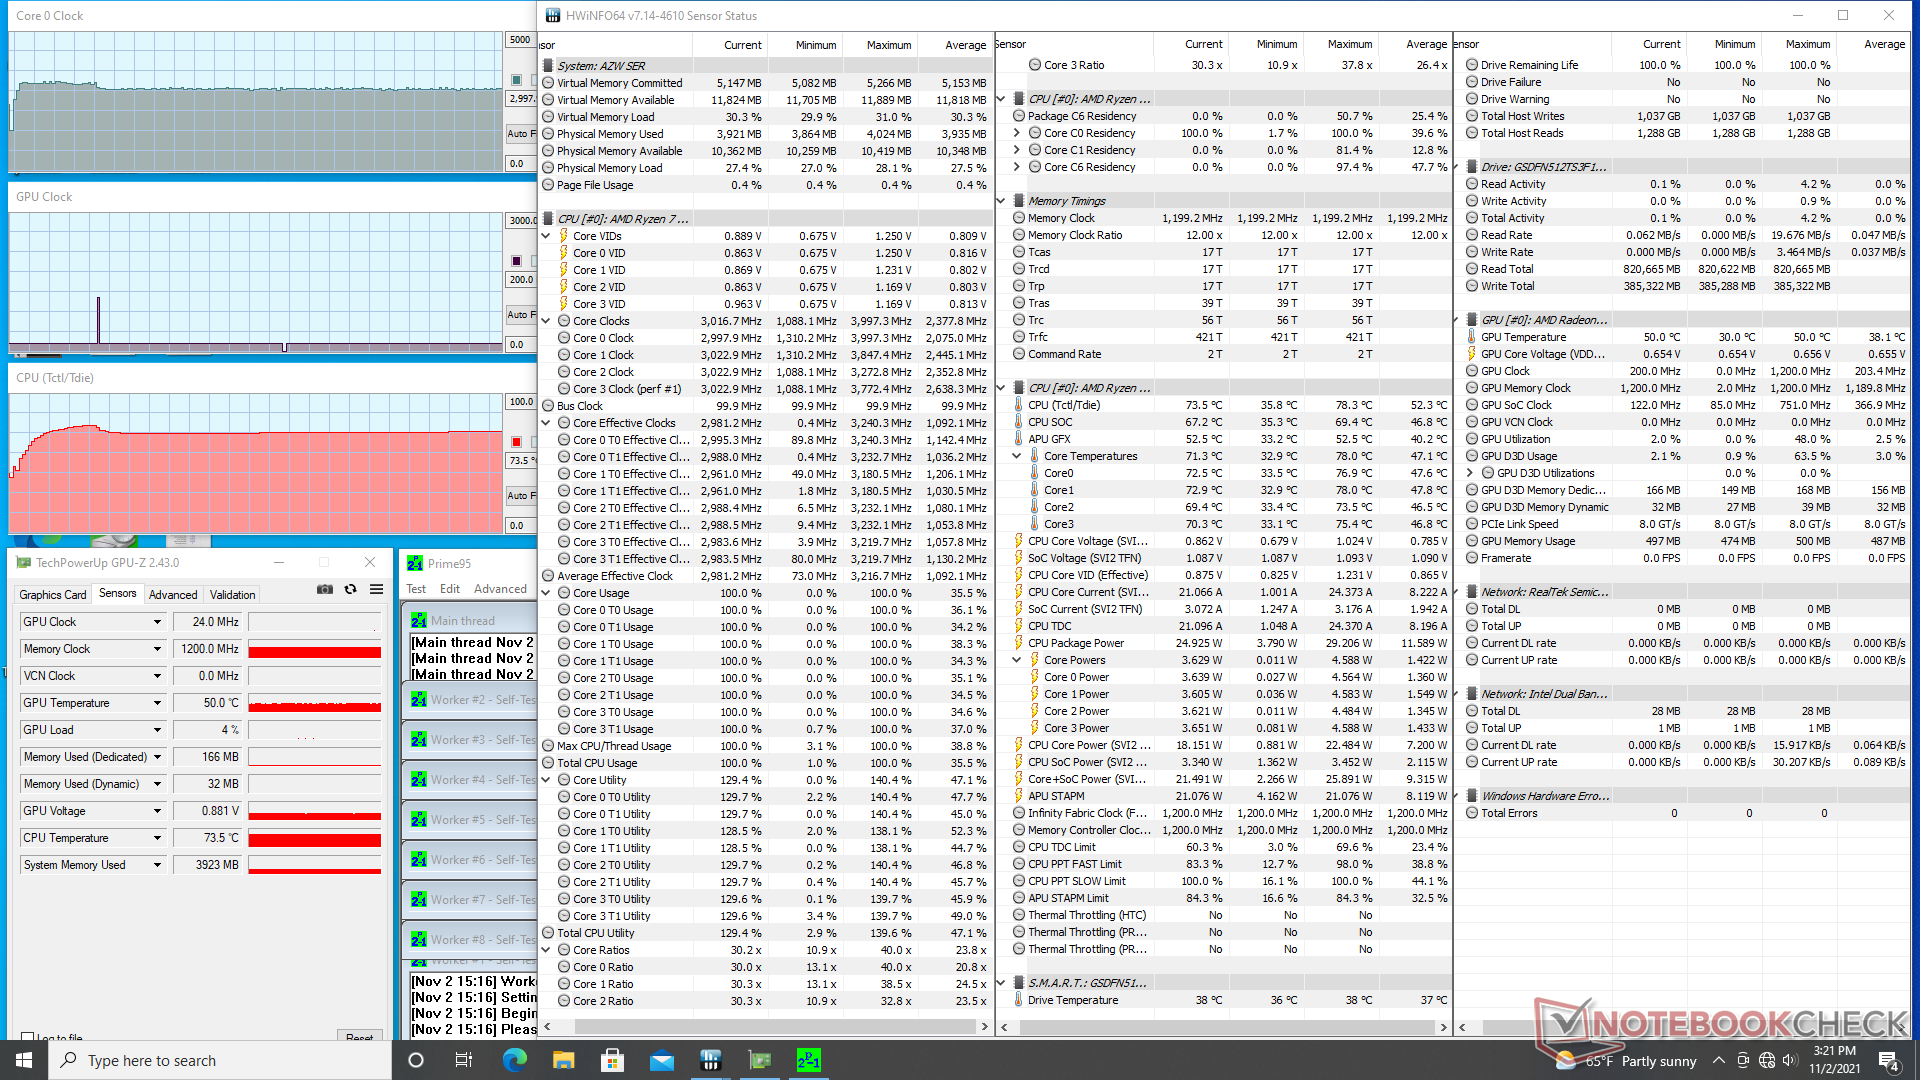
| CPUklok (GHz) GPUklok (MHz) GemiddeldeCPU temperatuur Tctl/Tdie (°C) |
| Systeem Idle |
| Prime95 Stress |
| Prime95 + FurMark Stress |
| Witcher 3 Stress 0.3 - 0.8 ~873 56 |
Energiebeheer
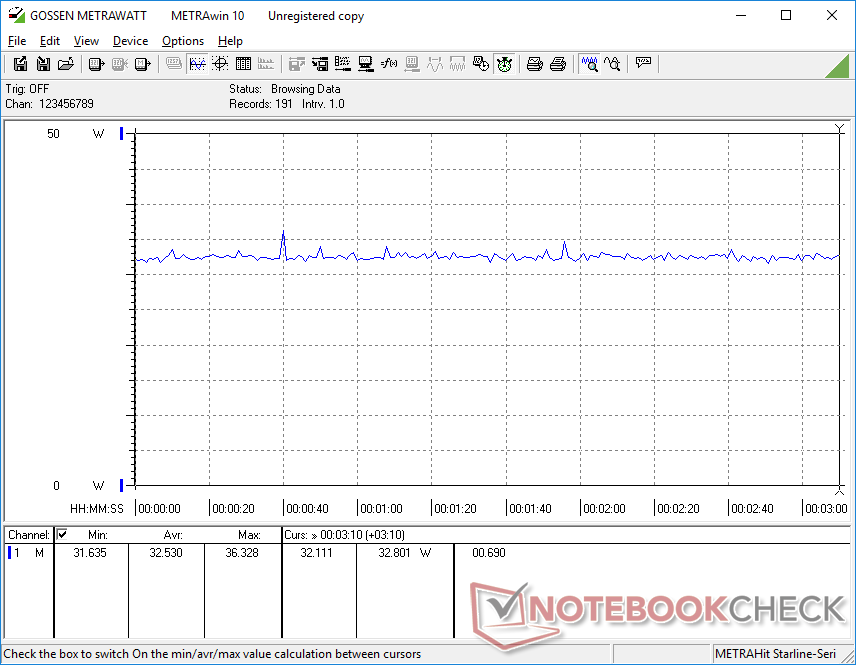
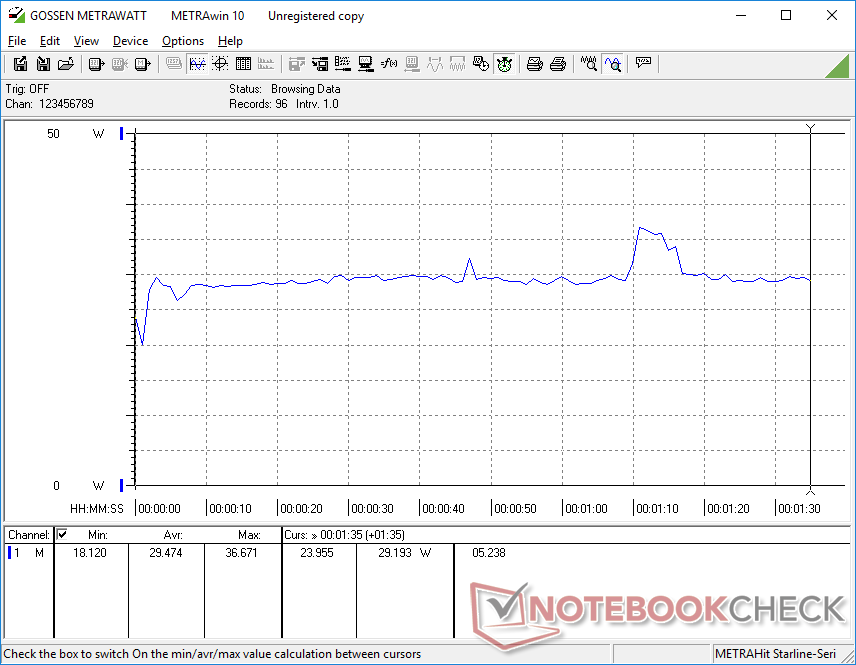
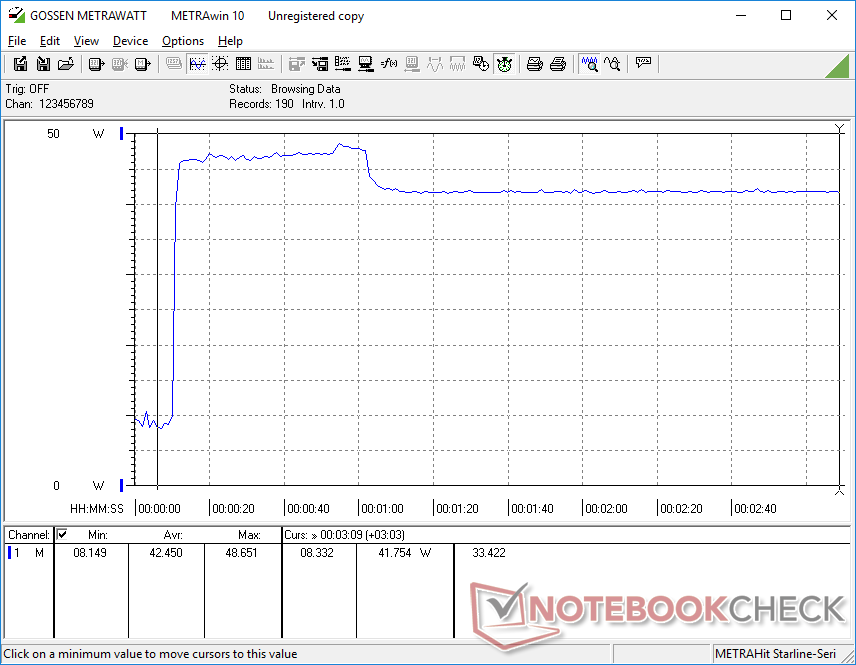
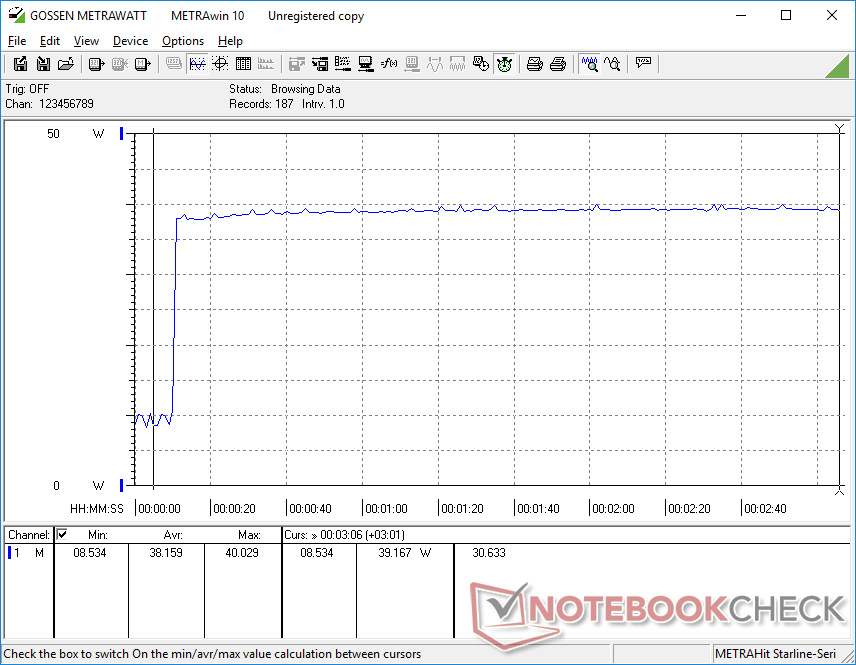
Stroomverbruik
Het energieverbruik bij stationair draaien is iets hoger dan bij de meeste andere mini-pc's met Core CPU's uit de U-serie, omdat onze SER3 gebruik maakt van een veeleisendere processor uit de H-serie. Niettemin is het stroomverbruik bij hogere belastingen lager dan verwacht, gemiddeld slechts 30 W tot 40 W
We zijn in staat om een maximum van iets minder dan 49 W te registreren van de middelgrote (~10 x 5 x 6 cm inclusief pinnen) 57 W AC-adapter bij 100 procent CPU-gebruik. Dit vermogen daalt na ongeveer een minuut als gevolg van thermische beperkingen.
| Uit / Standby | |
| Inactief | |
| Belasting |
|
Key:
min: | |
| Beelink SER3 R7 3750H, Vega 10, GSemi AZW GSDFN512TS3F1OGCX, , x, | Beelink SEi10 i3-1005G1, UHD Graphics G1 (Ice Lake 32 EU), Silicon Motion AZW 256G M.2280 NVMe 4X 200725 D, , x, | Intel NUC8i7BE i7-8559U, Iris Plus Graphics 655, , , x, | GMK NucBox 2 i5-8259U, Iris Plus Graphics 655, Netac S930E8/256GPN, , x, | Zotac ZBox MI643 i5-10210U, UHD Graphics 620, Lexar NM610 1TB, , x, | Intel NUC11TNKi5 i5-1135G7, Iris Xe G7 80EUs, Transcend M.2 SSD 430S TS512GMTS430S, , x, | |
|---|---|---|---|---|---|---|
| Power Consumption | 17% | -8% | 0% | -10% | -43% | |
| Idle Minimum * (Watt) | 7 | 6.3 10% | 2.7 61% | 6.1 13% | 7.5 -7% | 11.5 -64% |
| Idle Average * (Watt) | 9.1 | 6.6 27% | 3.1 66% | 6.8 25% | 9.2 -1% | 12.4 -36% |
| Idle Maximum * (Watt) | 9.7 | 6.7 31% | 6.3 35% | 7.3 25% | 9.6 1% | 12.9 -33% |
| Load Average * (Watt) | 29.5 | 25.9 12% | 59.7 -102% | 46.3 -57% | 34.4 -17% | 40.7 -38% |
| Witcher 3 ultra * (Watt) | 32.5 | 47.2 -45% | 43.9 -35% | |||
| Load Maximum * (Watt) | 48.7 | 46.7 4% | 78 -60% | 50.7 -4% | 60.6 -24% | 73.5 -51% |
* ... kleiner is beter
Power Consumption Witcher 3 / Stresstest
Pro
Contra
Uitspraak
Voor minder dan $500 krijgen gebruikers een HTPC-ready mini PC met een prestatieniveau vergelijkbaar met de Core i5-8259U in sommige Intel NUC's. Het systeem is verschillende stappen hoger dan andere goedkope mini PC's die draaien op Atom of Celeron CPU's zoals de Chuwi LarkBox of GBox die notoir traag zijn, zelfs wanneer ze niet veeleisende toepassingen draaien. We appreciëren dat Beelink de SER3 aanbiedt als kant-en-klare PC's, compleet met RAM en opslag, terwijl Intel NUC's bijna altijd verkocht worden als barebone SKU's.
De Beelink SER3 is een eenvoudig te gebruiken discrete HTPC met toegankelijke upgrade opties. Wees voorbereid op een beetje ventilatorgeluid, vooral bij het draaien van zeer veeleisende toepassingen.
Kopers moeten zich ervan bewust zijn dat de SER3 een handvol extra functies weglaat, waarschijnlijk om de kosten laag te houden. Er is geen Kensington-slot, SD-lezer, IR-ontvanger, of Thunderbolt-ondersteuning, terwijl DP-over-USB-C onbetrouwbaar kan zijn. De ventilator pulseert vaak en de wall wart AC adapter is zowel dik als kort. De meegeleverde NVMe SSD is weliswaar redelijk snel, maar zal bij belasting minder goed presteren door het ontbreken van een ingebouwde warmtespreider.
Prijs en beschikbaarheid
De Beelink SER3 kan gevonden worden op Amazon voor $ 479 USD met 8 GB RAM en 256 GB SSD of $ 559 USD met het dubbele RAM en opslag.
No, or more than one (0) Rating for the given SpecsID 326081 found

