Beelink SER5 Pro 5600H mini PC review: NUC 11 snelheden met AMD Ryzen
")
Net als Zotac en zijn beruchte grote selectie van ZBox mini PC's, wil Beelink hetzelfde doen door om de paar maanden nieuwe modellen te lanceren uitgerust met steeds snellere processoren. De Beelink SER4 lanceerde eerder dit jaar met de Zen 2 Ryzen 7 4800U processor, maar nu is de SER5 op de markt gekomen met een nog snellere Zen 3 Ryzen 5 5600H terwijl de prijs ruim onder de $500 USD blijft
Concurrenten in deze ruimte zijn andere mini PC's of HTPC's zonder discrete graphics, zoals de Ace Magician TK11, Geekom MiniAir 11, Zotac ZBox PI336, en de meeste Intel NUC modellen
Meer Beelink beoordelingen:
Potentiële concurrenten in vergelijking
Evaluatie | Datum | Model | Gewicht | Hoogte | Formaat | Resolutie | Beste prijs |
|---|---|---|---|---|---|---|---|
v (old) | 10-2022 | Beelink SER Pro Ryzen 5 5600H R5 5600H, Vega 7 | 498 g | 42 mm | x | ||
v (old) | 09-2022 | Beelink SEi11 Pro i5-11320H, Iris Xe G7 96EUs | 440 g | 40 mm | x | ||
v (old) | 01-2022 | Beelink GTR5 R9 5900HX, Vega 8 | 686 g | 39 mm | x | ||
v (old) | 04-2021 | Intel NUC11TNKi5 i5-1135G7, Iris Xe G7 80EUs | 504 g | 37 mm | x | ||
v (old) | Intel NUC10i7FNH i7-10710U, UHD Graphics 620 | 697 g | 51 mm | 0.00" | 0x0 | ||
v (old) | 07-2022 | Zotac ZBOX PI336 pico Celeron N6211, UHD Graphics (Elkhart Lake 16 EU) | 293 g | 20.7 mm | x |
Zaak
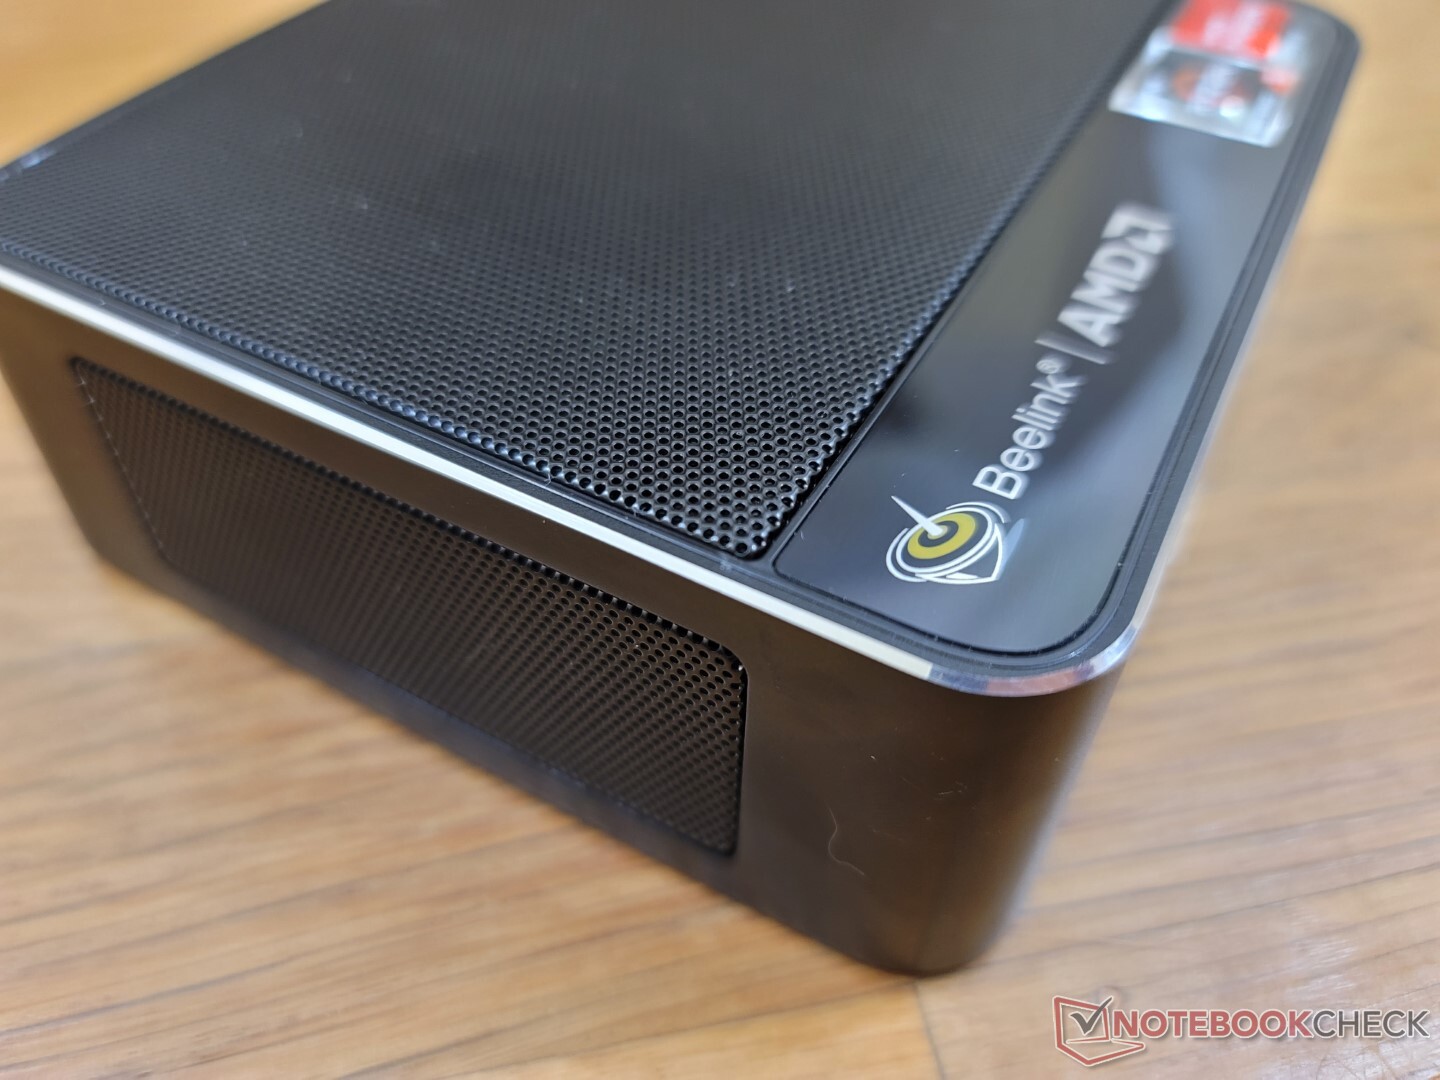
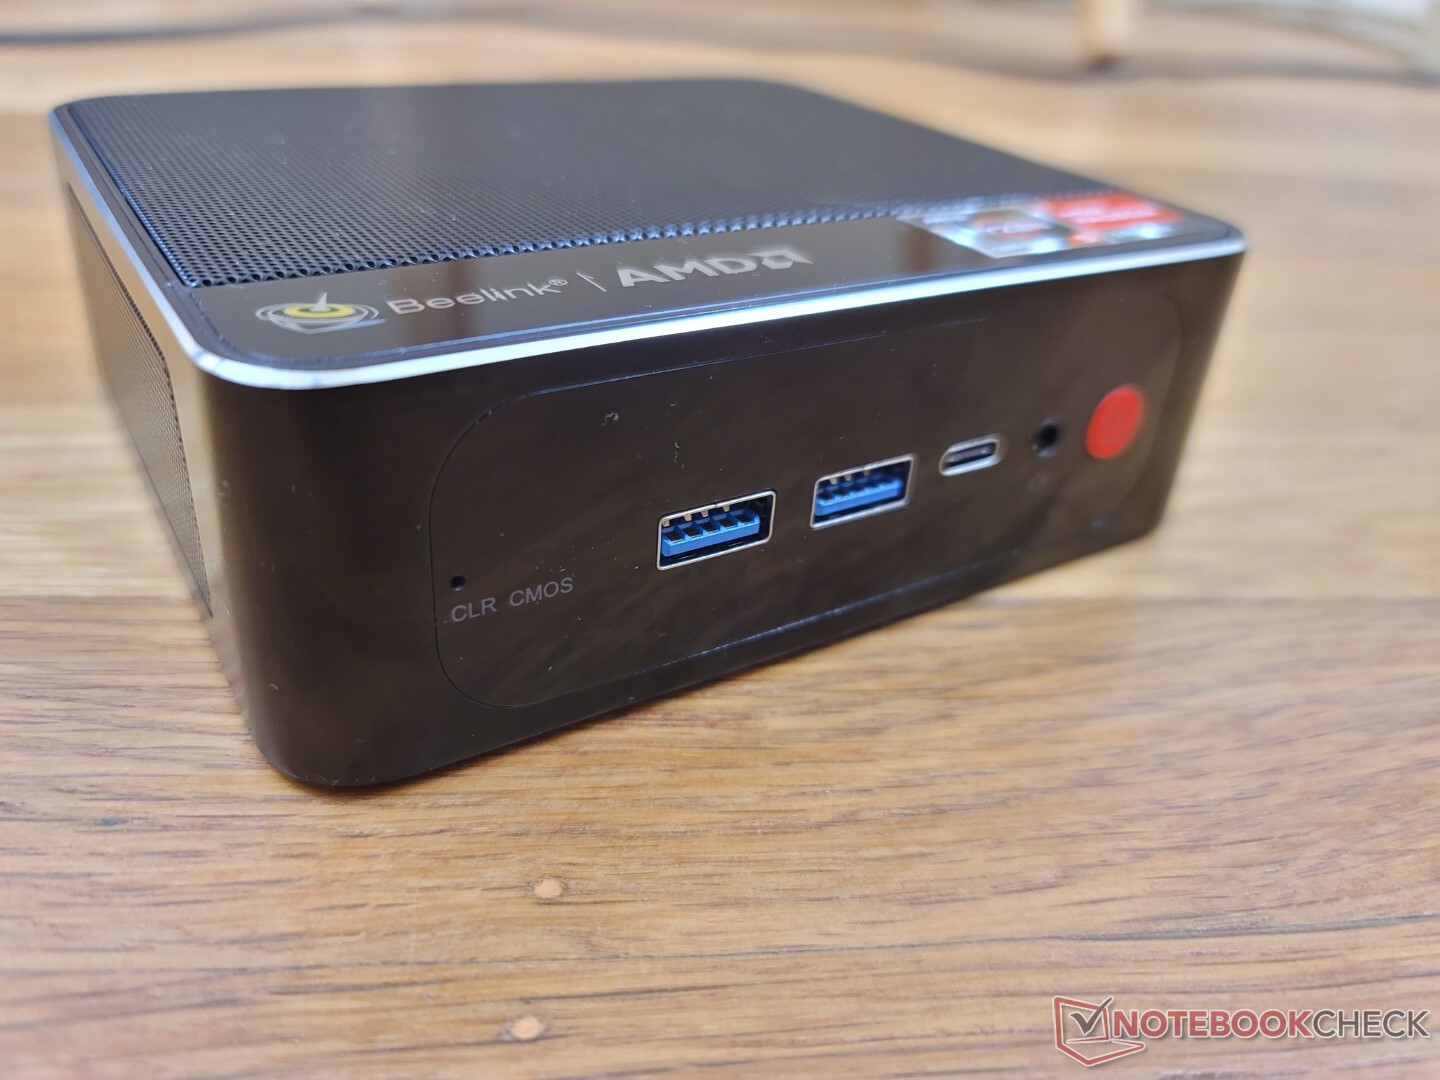
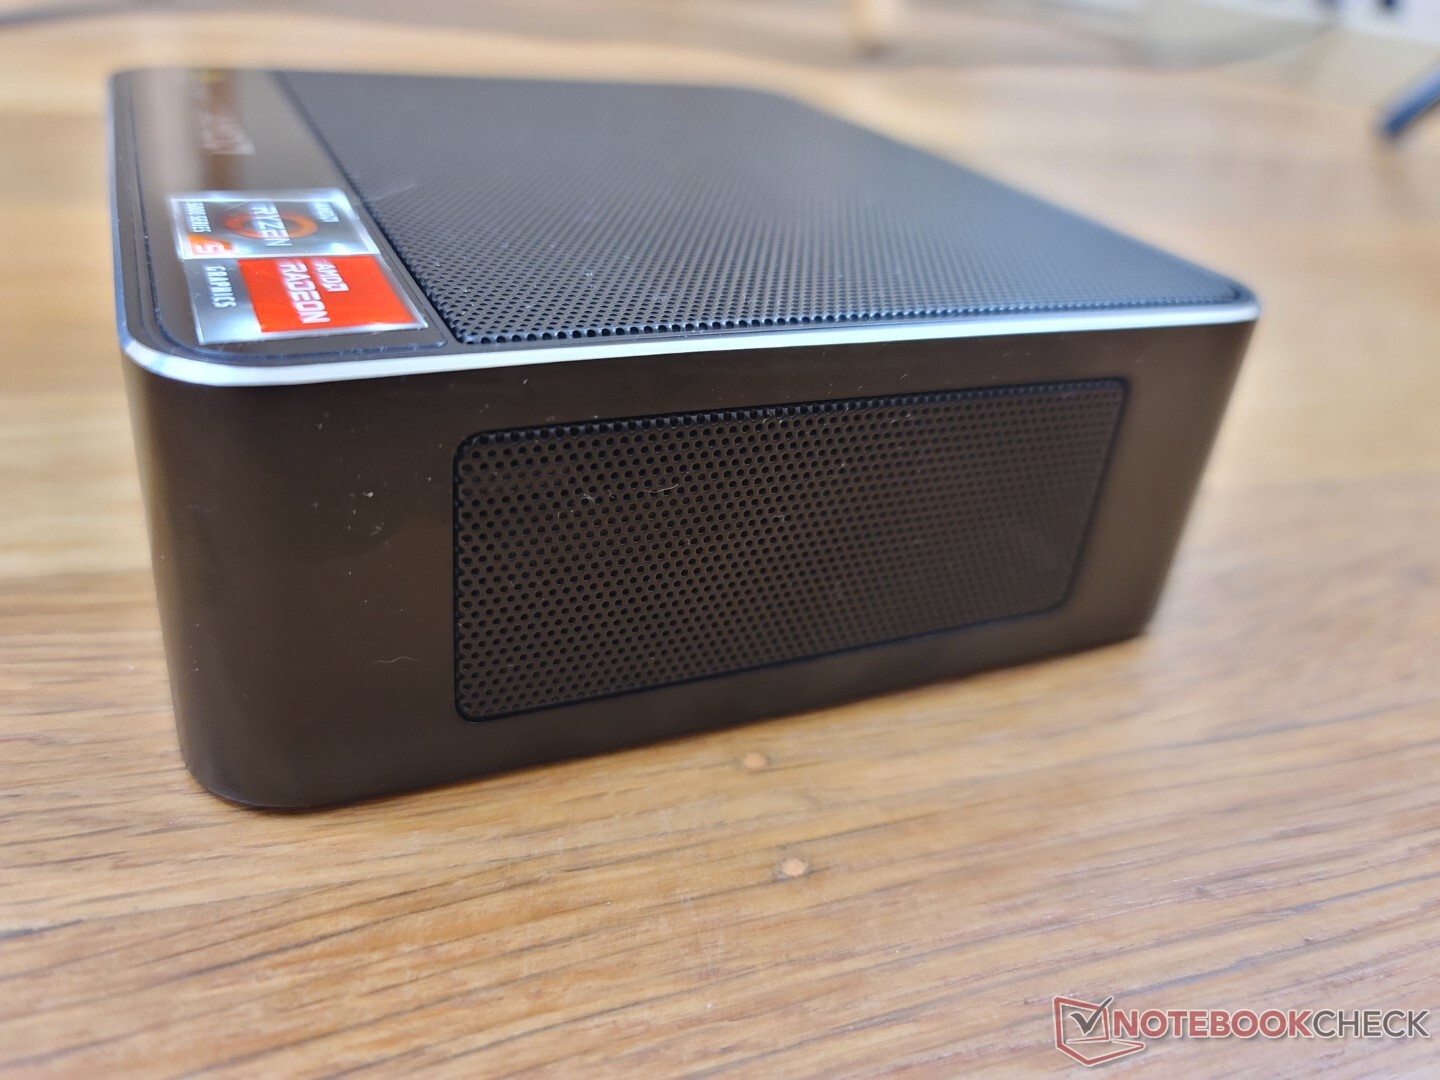
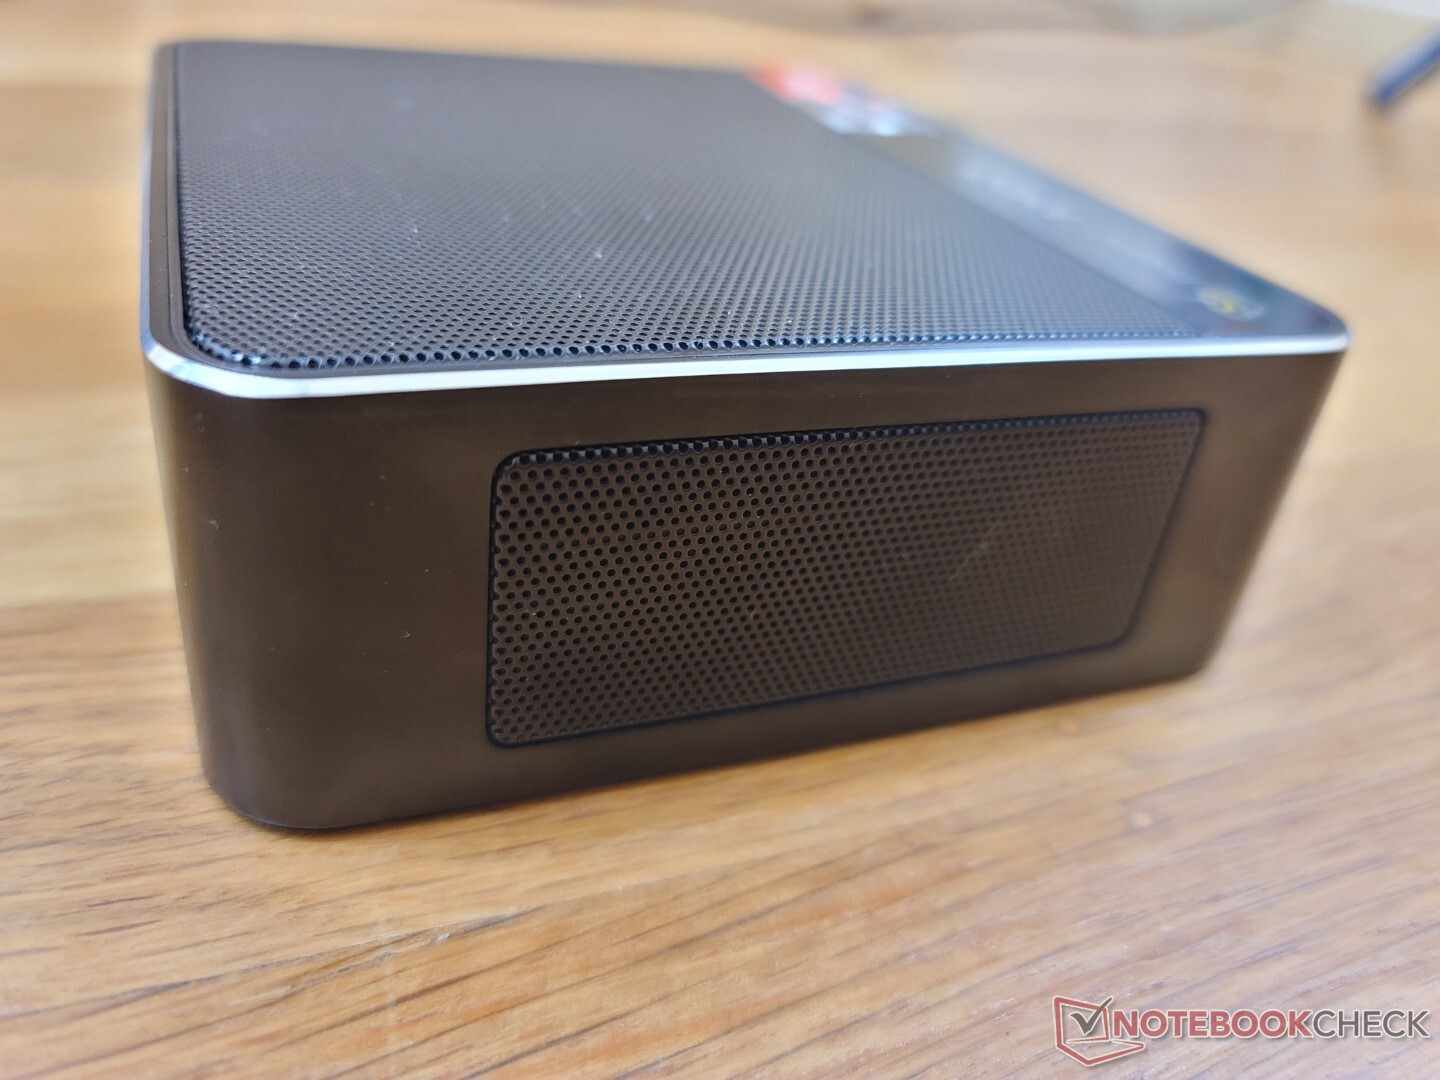
Zowel de SER4 als de SER5 maken gebruik van hetzelfde chassisframe, zij het met iets andere oppervlakkige markeringen en kleuren. Bij de SER5 zijn de ventilatieroosters aan de zijkant zwart in plaats van rood
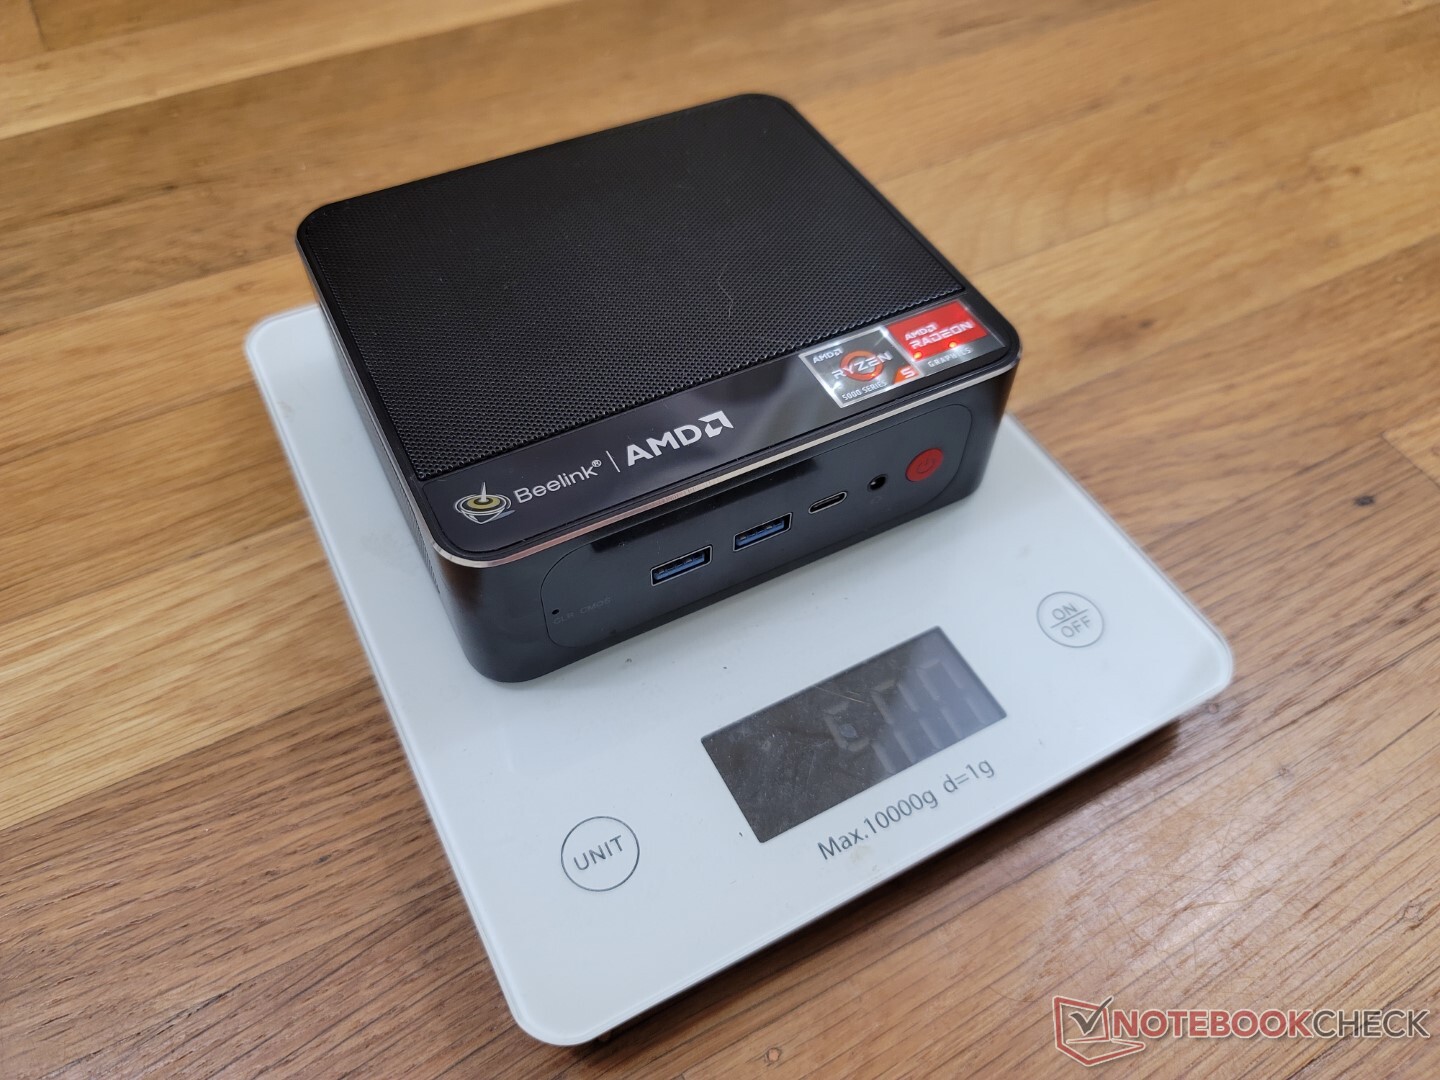
Qua afmetingen is de SER5 net iets dikker dan de Intel NUC 11TNK. Hij is echter net zo zwaar met ongeveer een halve kilo.
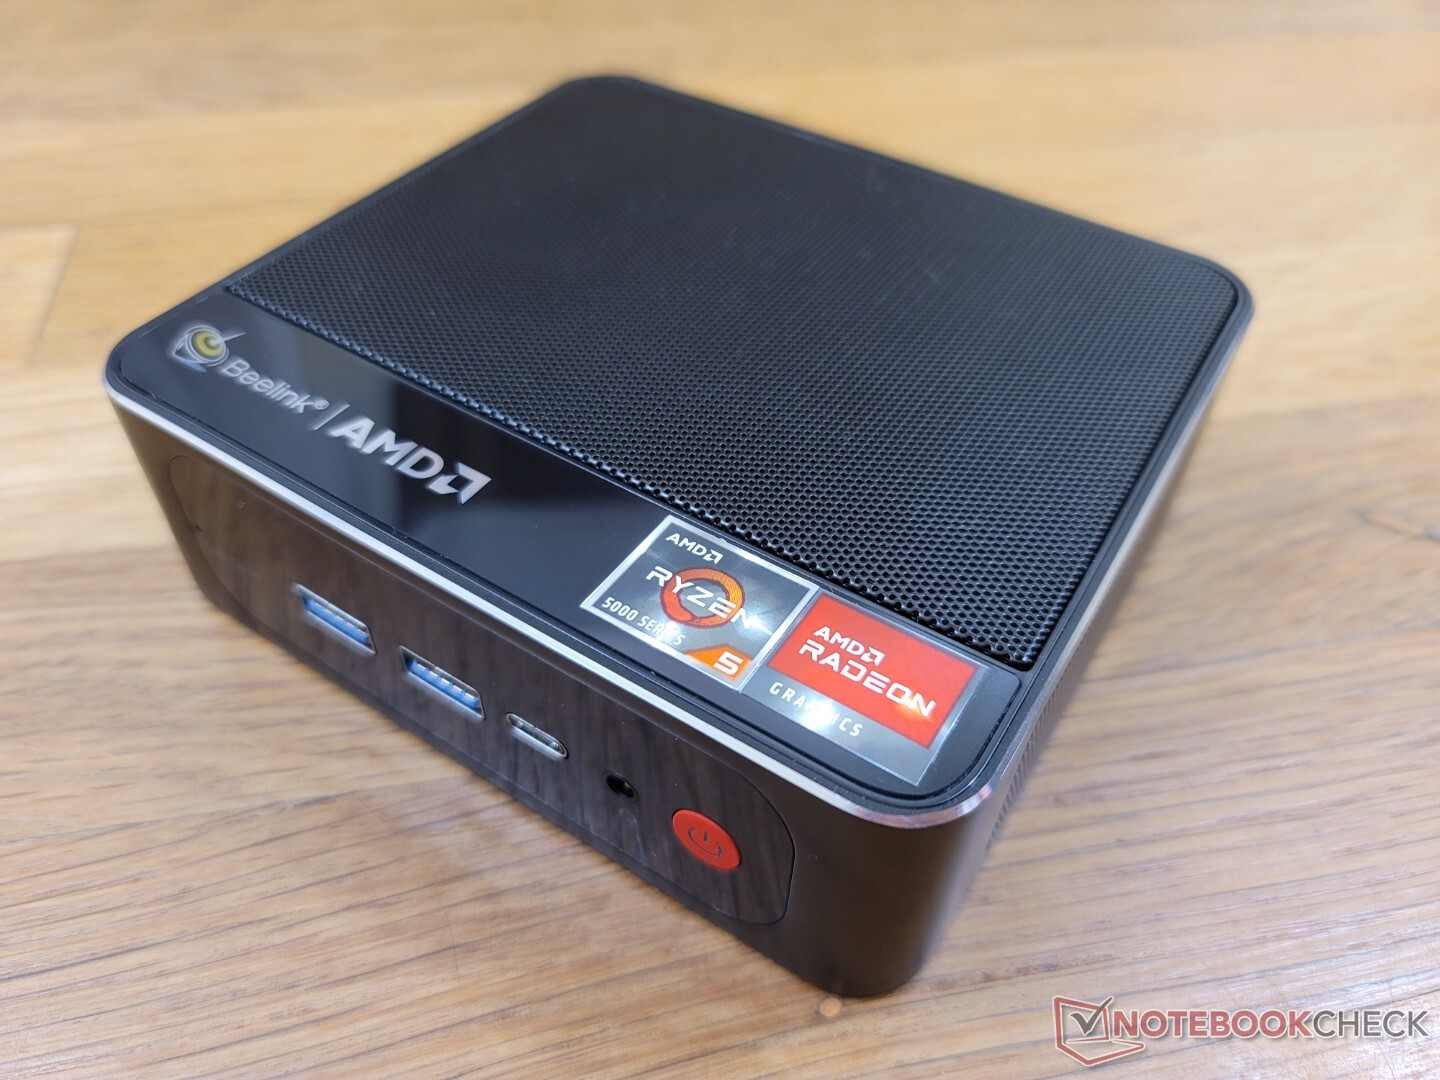
Connectiviteit
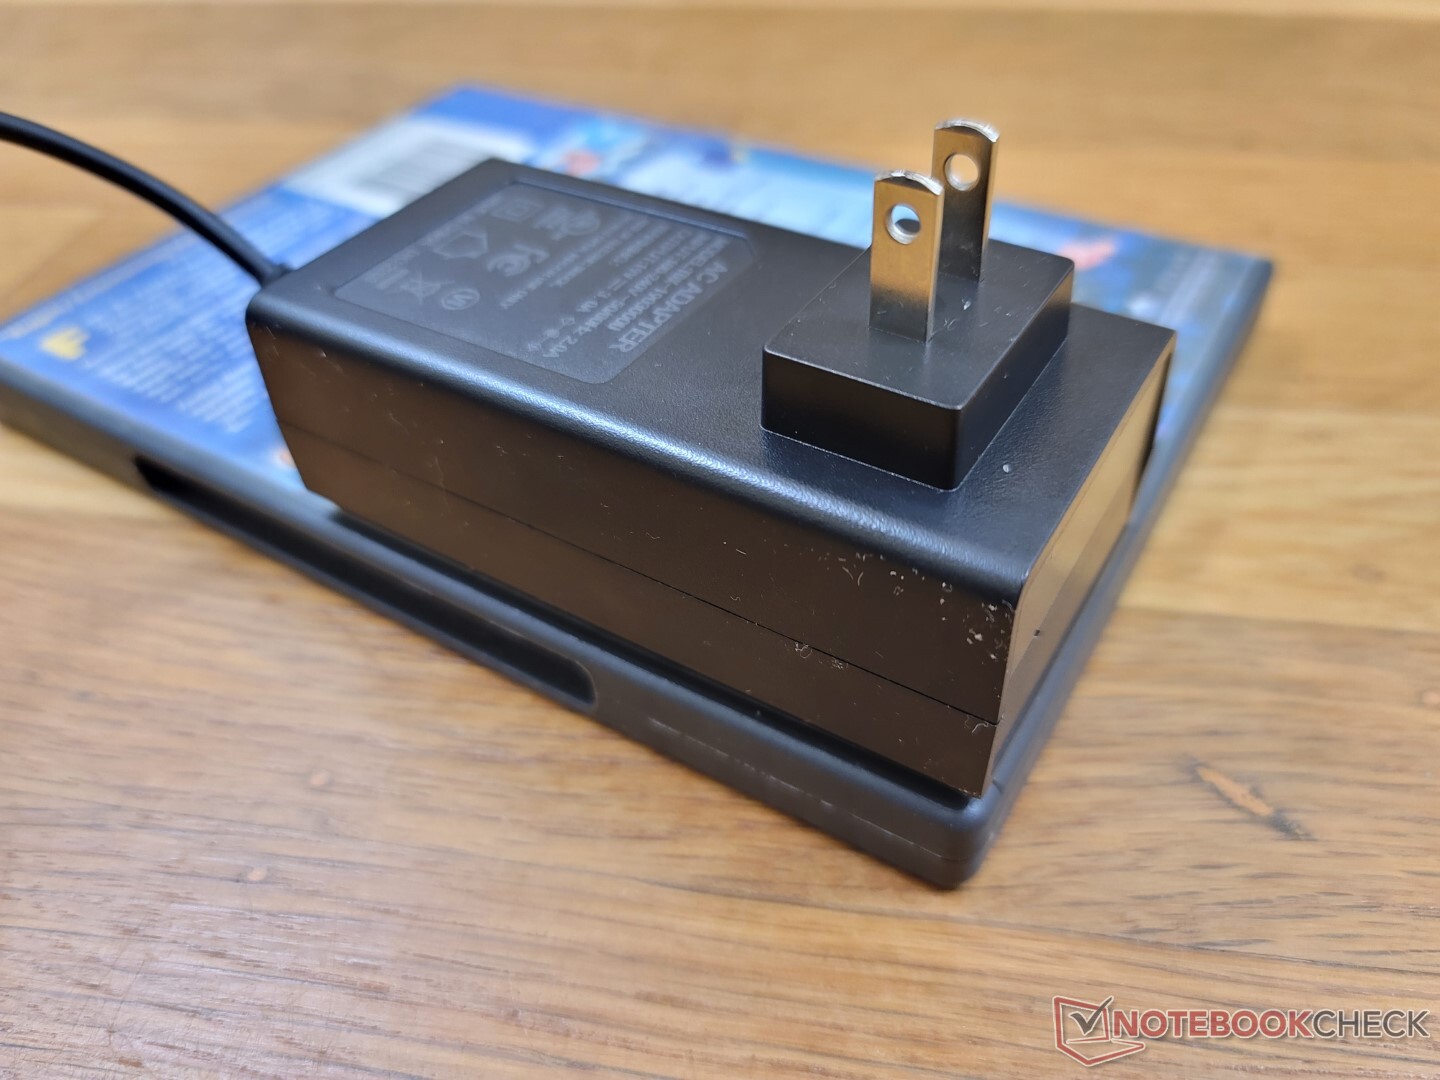
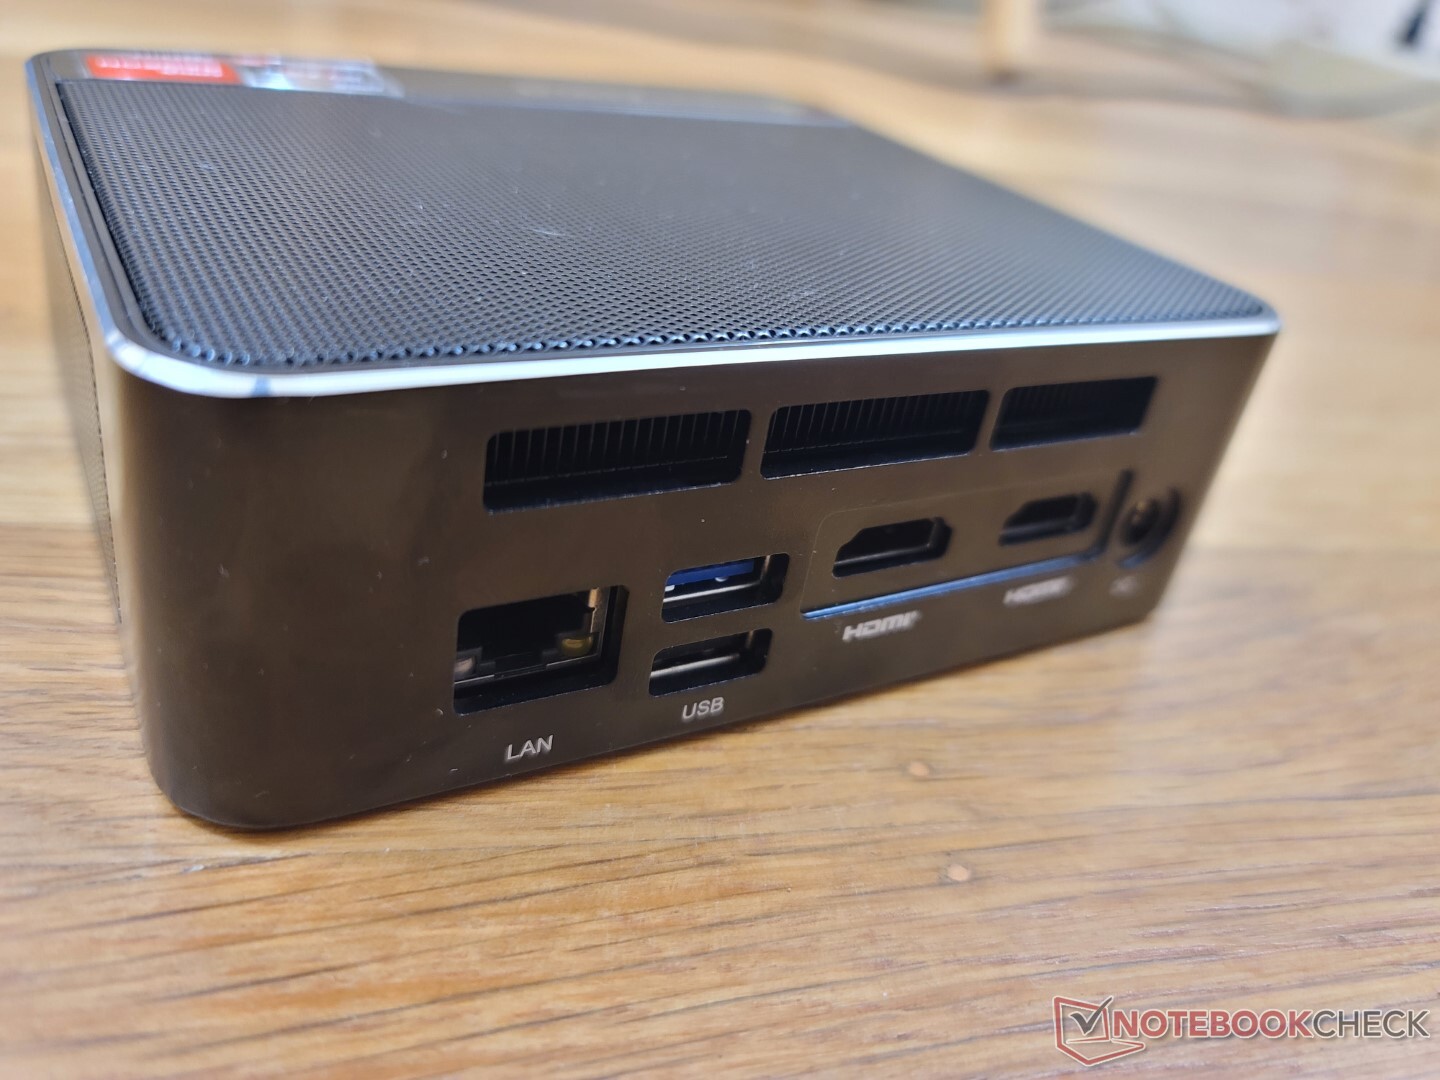
De poortopties zijn dezelfde als op de SER4. Het is teleurstellend dat Beelink nog steeds niet is overgestapt op USB-C AC-adapters, omdat de SER5 in plaats daarvan vertrouwt op een eigen AC barrel adapter. De enkele USB-C poort aan de voorkant ondersteunt DisplayPort 1.4, maar geen PD-in.
Communicatie
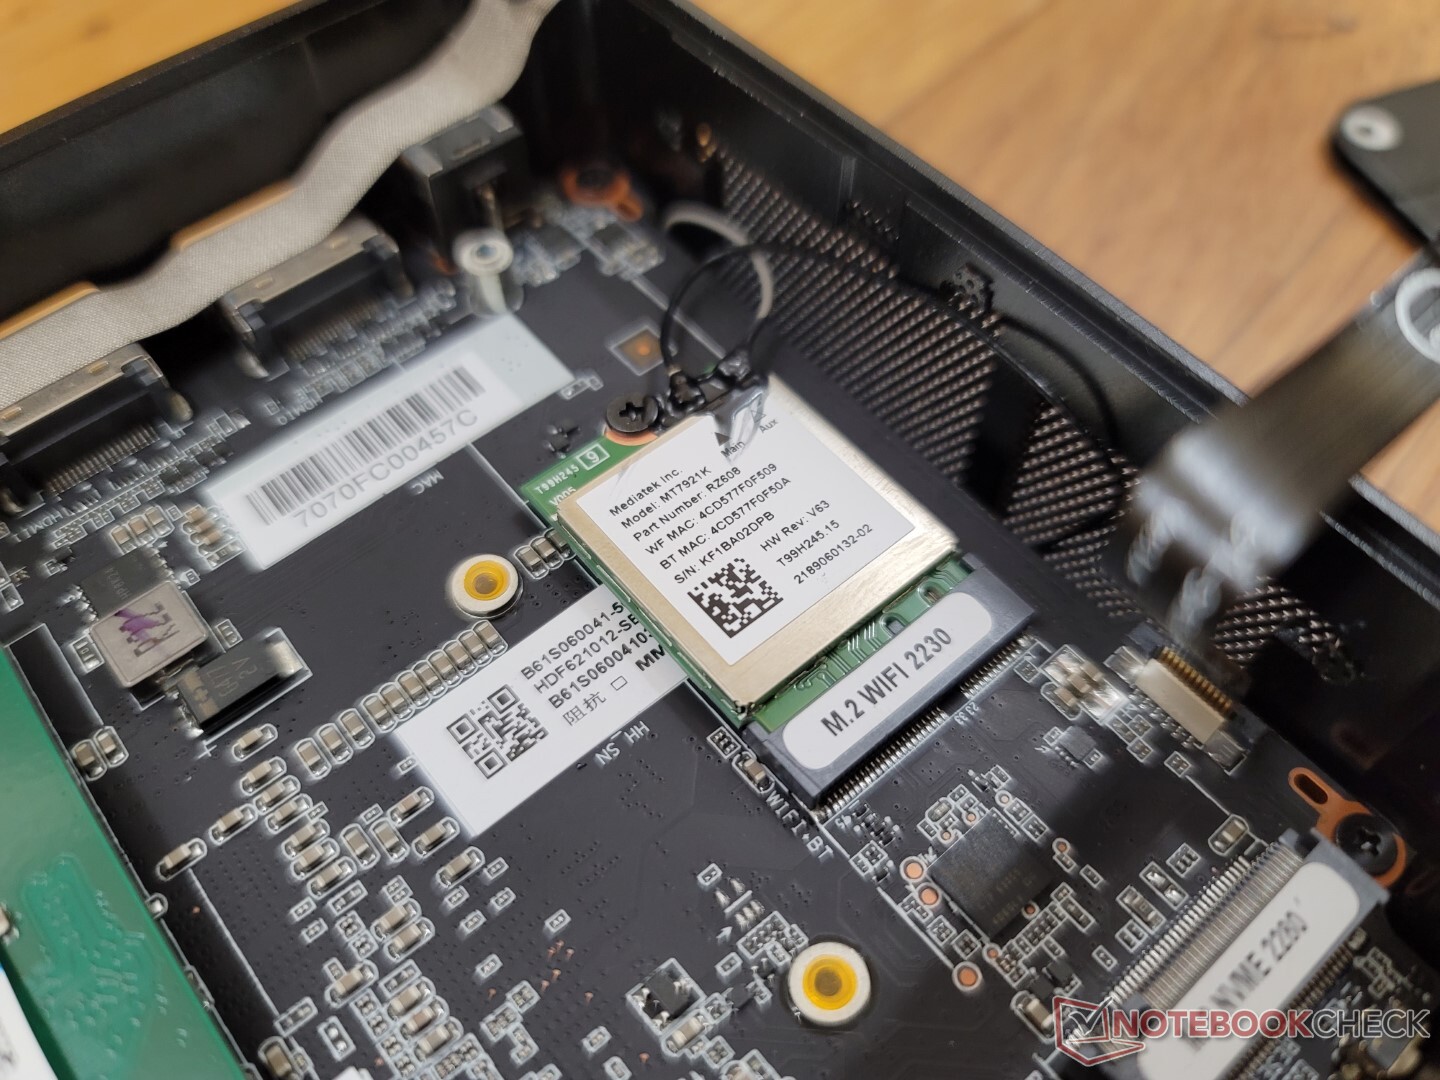
Een MediaTek RZ608 wordt standaard geleverd voor Wi-Fi 6E ondersteuning zoals op de Beelink SEi11 Pro. De prestaties blijven echter achter in vergelijking met de gangbare Intel AX200/210 series, zoals blijkt uit onderstaande grafieken.
| Networking | |
| iperf3 transmit AX12 | |
| Intel NUC11TNKi5 | |
| Beelink GTR5 | |
| iperf3 receive AX12 | |
| Intel NUC11TNKi5 | |
| Beelink GTR5 | |
| iperf3 receive AXE11000 6GHz | |
| Zotac ZBOX PI336 pico | |
| Beelink SER Pro Ryzen 5 5600H | |
| Beelink SEi11 Pro | |
| iperf3 transmit AXE11000 6GHz | |
| Zotac ZBOX PI336 pico | |
| Beelink SER Pro Ryzen 5 5600H | |
| Beelink SEi11 Pro | |
Onderhoud
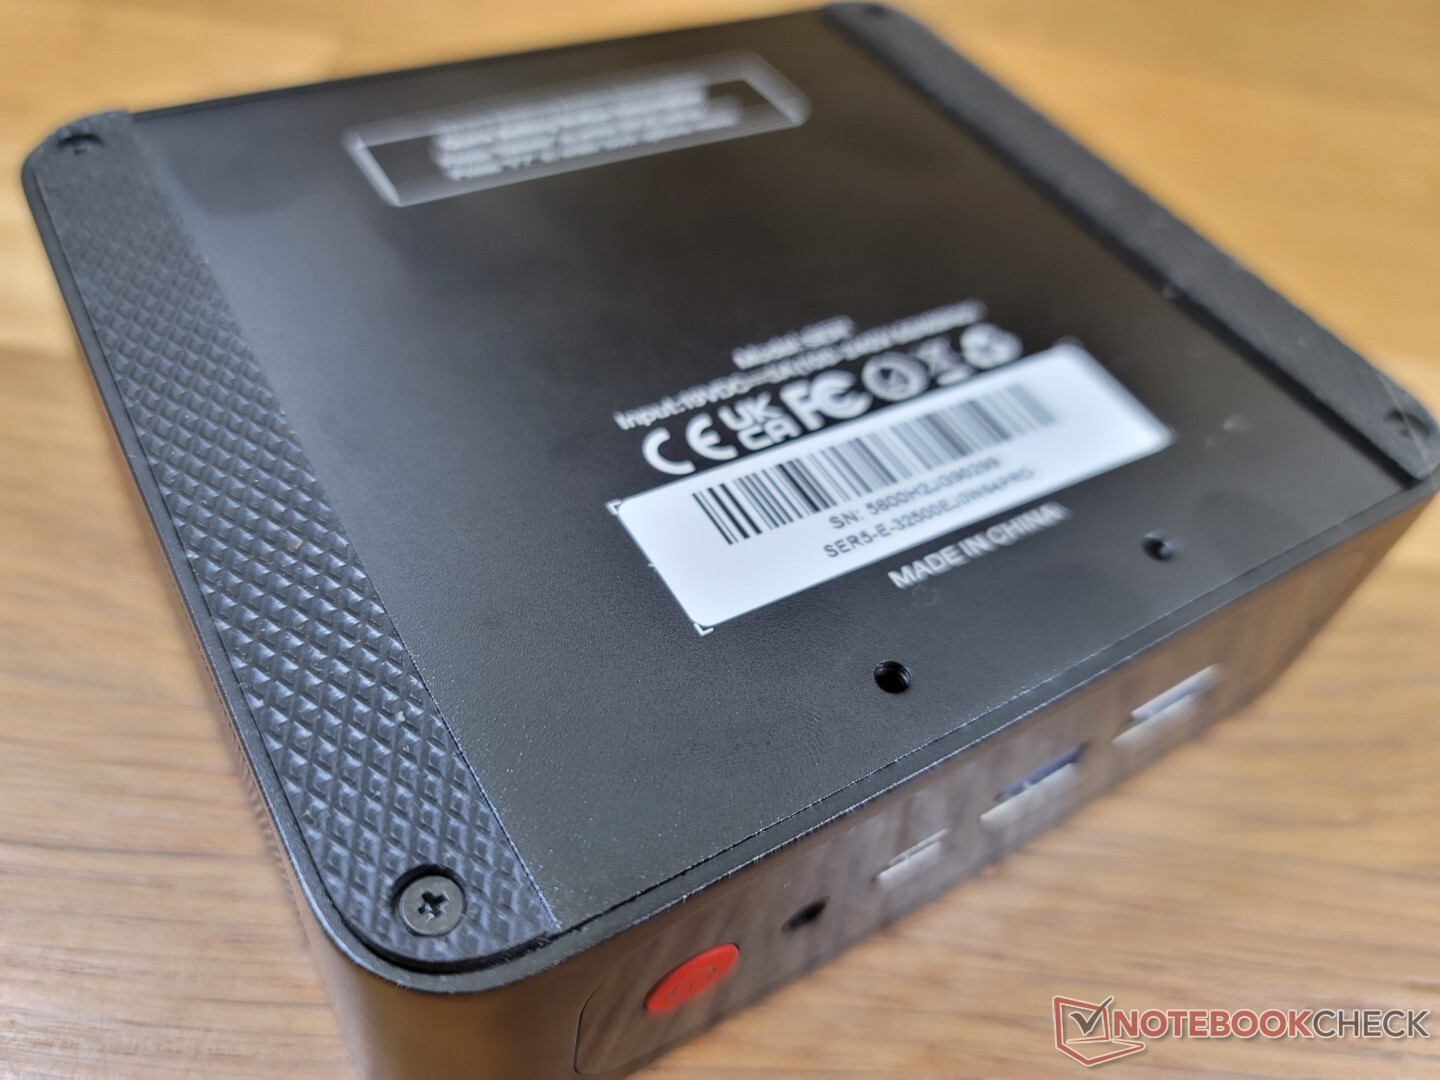
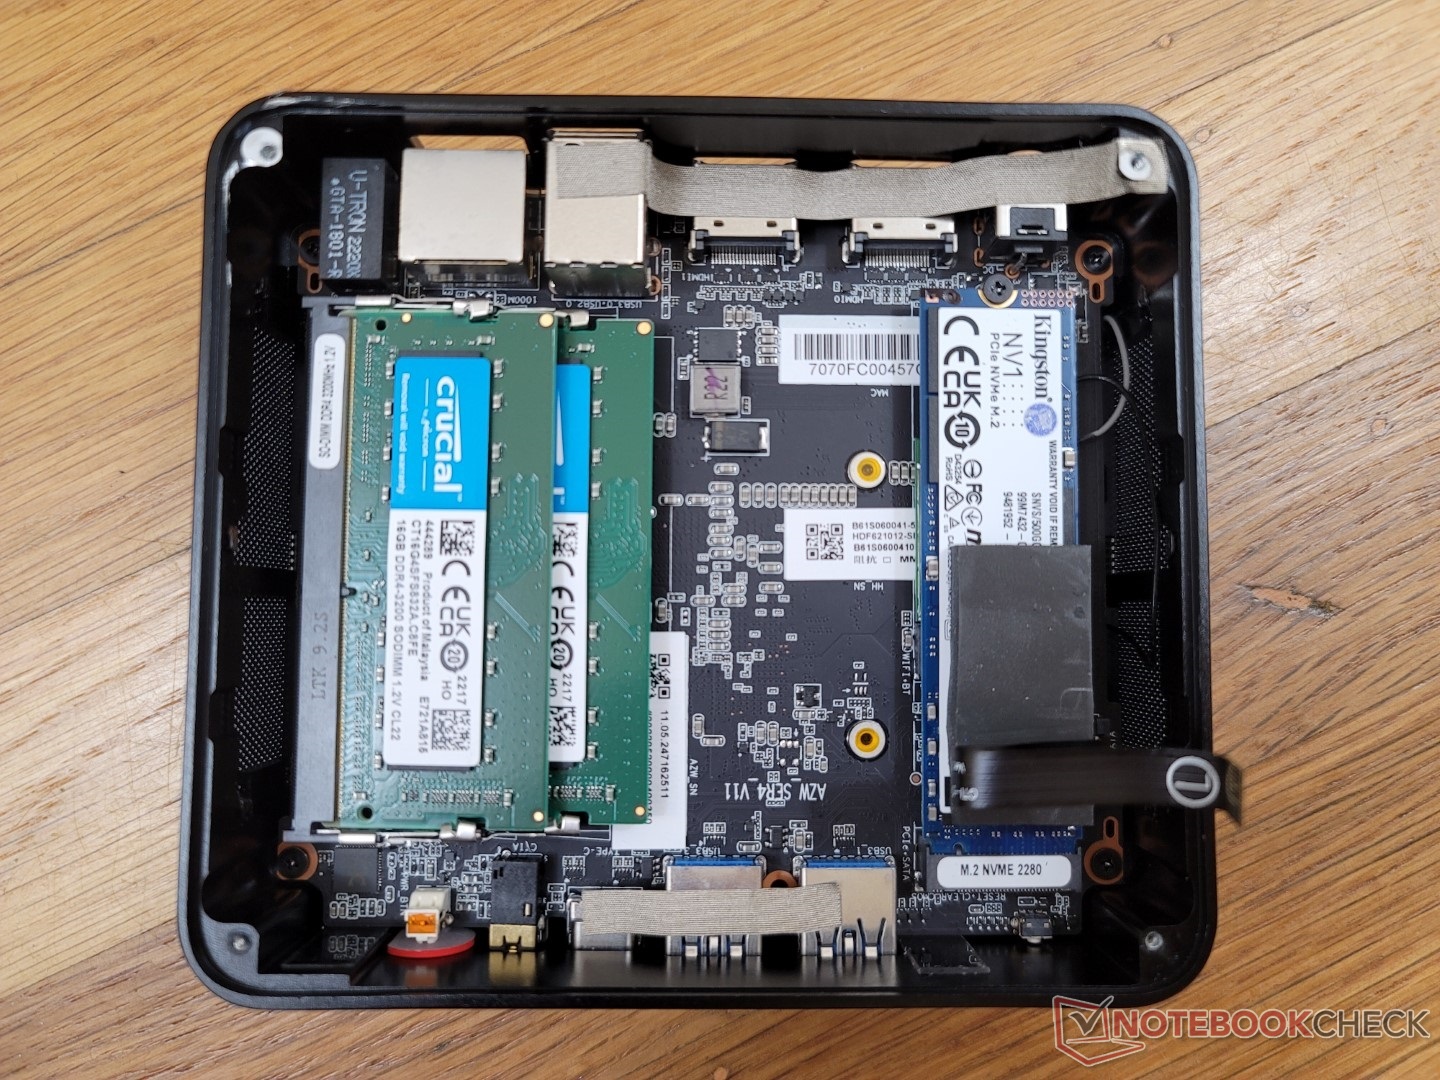
Het bodempaneel wordt vastgezet met vier Philips-schroeven. Deze schroeven zijn veel kleiner dan de handdraaischroeven op een Intel NUC en vereisen een schroevendraaier om ze te verwijderen. Houd er rekening mee dat deze schroeven ook vrij zacht zijn en gemakkelijk kunnen worden gestript als je niet voorzichtig bent.
Accessoires en garantie
De detailhandeldoos bevat een verwijderbare VESA-montagebeugel, extra schroeven, een gebruikershandleiding, twee HDMI-kabels en de AC-adapter.
Bij aankoop in de VS geldt de standaard beperkte fabrieksgarantie van één jaar.
Prestaties
Testomstandigheden
We hebben ons toestel via Windows in de prestatiemodus gezet alvorens onderstaande benchmarks uit te voeren.
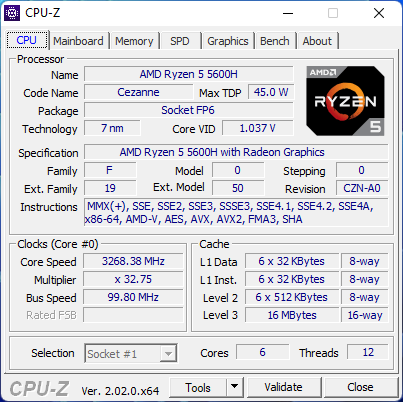
Processor
Multi-thread prestaties zijn ongeveer 15 procent langzamer dan de gemiddelde PC in onze database uitgerust met dezelfde Ryzen 5 5600H CPU. Toch zijn de algemene prestaties nog steeds veel sneller dan de gewone Core i7-1165G7 zoals te vinden op veel Ultrabooks en Intel NUC's.
Cinebench R15 Multi Loop
Cinebench R23: Multi Core | Single Core
Cinebench R15: CPU Multi 64Bit | CPU Single 64Bit
Blender: v2.79 BMW27 CPU
7-Zip 18.03: 7z b 4 | 7z b 4 -mmt1
Geekbench 5.5: Multi-Core | Single-Core
HWBOT x265 Benchmark v2.2: 4k Preset
LibreOffice : 20 Documents To PDF
R Benchmark 2.5: Overall mean
| Cinebench R20 / CPU (Multi Core) | |
| HP Envy 16 h0112nr | |
| Schenker XMG Apex 15 NH57E PS | |
| Honor MagicBook 14 2022 | |
| Beelink GTR5 | |
| Gemiddeld AMD Ryzen 5 5600H (3074 - 4059, n=16) | |
| Beelink SER4 | |
| Beelink SER Pro Ryzen 5 5600H | |
| Intel NUC10i7FNH | |
| Beelink SEi11 Pro | |
| Framework Laptop 13.5 | |
| Intel NUC11TNKi5 | |
| Zotac ZBOX PI336 pico | |
| Cinebench R20 / CPU (Single Core) | |
| HP Envy 16 h0112nr | |
| Honor MagicBook 14 2022 | |
| Framework Laptop 13.5 | |
| Beelink GTR5 | |
| Beelink SEi11 Pro | |
| Schenker XMG Apex 15 NH57E PS | |
| Gemiddeld AMD Ryzen 5 5600H (527 - 538, n=15) | |
| Beelink SER Pro Ryzen 5 5600H | |
| Intel NUC11TNKi5 | |
| Beelink SER4 | |
| Intel NUC10i7FNH | |
| Zotac ZBOX PI336 pico | |
| Cinebench R23 / Multi Core | |
| HP Envy 16 h0112nr | |
| Schenker XMG Apex 15 NH57E PS | |
| Honor MagicBook 14 2022 | |
| Beelink GTR5 | |
| Gemiddeld AMD Ryzen 5 5600H (7945 - 10416, n=13) | |
| Beelink SER4 | |
| Beelink SER Pro Ryzen 5 5600H | |
| Beelink SEi11 Pro | |
| Framework Laptop 13.5 | |
| Intel NUC11TNKi5 | |
| Zotac ZBOX PI336 pico | |
| Cinebench R23 / Single Core | |
| HP Envy 16 h0112nr | |
| Honor MagicBook 14 2022 | |
| Framework Laptop 13.5 | |
| Beelink GTR5 | |
| Beelink SEi11 Pro | |
| Schenker XMG Apex 15 NH57E PS | |
| Intel NUC11TNKi5 | |
| Beelink SER Pro Ryzen 5 5600H | |
| Gemiddeld AMD Ryzen 5 5600H (1316 - 1381, n=13) | |
| Beelink SER4 | |
| Zotac ZBOX PI336 pico | |
| Cinebench R15 / CPU Multi 64Bit | |
| HP Envy 16 h0112nr | |
| Honor MagicBook 14 2022 | |
| Honor MagicBook 14 2022 | |
| Schenker XMG Apex 15 NH57E PS | |
| Beelink GTR5 | |
| Gemiddeld AMD Ryzen 5 5600H (1319 - 1723, n=16) | |
| Beelink SER4 | |
| Beelink SER Pro Ryzen 5 5600H | |
| Intel NUC10i7FNH | |
| Beelink SEi11 Pro | |
| Framework Laptop 13.5 | |
| Intel NUC11TNKi5 | |
| Zotac ZBOX PI336 pico | |
| Cinebench R15 / CPU Single 64Bit | |
| HP Envy 16 h0112nr | |
| Beelink GTR5 | |
| Honor MagicBook 14 2022 | |
| Schenker XMG Apex 15 NH57E PS | |
| Framework Laptop 13.5 | |
| Gemiddeld AMD Ryzen 5 5600H (218 - 225, n=14) | |
| Beelink SER Pro Ryzen 5 5600H | |
| Beelink SEi11 Pro | |
| Intel NUC11TNKi5 | |
| Intel NUC10i7FNH | |
| Beelink SER4 | |
| Zotac ZBOX PI336 pico | |
| Blender / v2.79 BMW27 CPU | |
| Zotac ZBOX PI336 pico | |
| Intel NUC11TNKi5 | |
| Framework Laptop 13.5 | |
| Beelink SEi11 Pro | |
| Intel NUC10i7FNH | |
| Beelink SER Pro Ryzen 5 5600H | |
| Beelink SER4 | |
| Gemiddeld AMD Ryzen 5 5600H (300 - 384, n=14) | |
| Honor MagicBook 14 2022 | |
| Beelink GTR5 | |
| HP Envy 16 h0112nr | |
| Schenker XMG Apex 15 NH57E PS | |
| 7-Zip 18.03 / 7z b 4 | |
| Schenker XMG Apex 15 NH57E PS | |
| Beelink GTR5 | |
| HP Envy 16 h0112nr | |
| Honor MagicBook 14 2022 | |
| Gemiddeld AMD Ryzen 5 5600H (36315 - 46562, n=14) | |
| Beelink SER4 | |
| Beelink SER Pro Ryzen 5 5600H | |
| Intel NUC10i7FNH | |
| Beelink SEi11 Pro | |
| Framework Laptop 13.5 | |
| Intel NUC11TNKi5 | |
| Zotac ZBOX PI336 pico | |
| 7-Zip 18.03 / 7z b 4 -mmt1 | |
| Beelink GTR5 | |
| HP Envy 16 h0112nr | |
| Schenker XMG Apex 15 NH57E PS | |
| Framework Laptop 13.5 | |
| Beelink SER Pro Ryzen 5 5600H | |
| Gemiddeld AMD Ryzen 5 5600H (5213 - 5446, n=14) | |
| Honor MagicBook 14 2022 | |
| Beelink SEi11 Pro | |
| Intel NUC11TNKi5 | |
| Intel NUC10i7FNH | |
| Beelink SER4 | |
| Zotac ZBOX PI336 pico | |
| Geekbench 5.5 / Multi-Core | |
| HP Envy 16 h0112nr | |
| Honor MagicBook 14 2022 | |
| Schenker XMG Apex 15 NH57E PS | |
| Beelink GTR5 | |
| Gemiddeld AMD Ryzen 5 5600H (4990 - 7253, n=14) | |
| Beelink SER4 | |
| Beelink SER Pro Ryzen 5 5600H | |
| Intel NUC10i7FNH | |
| Beelink SEi11 Pro | |
| Intel NUC11TNKi5 | |
| Zotac ZBOX PI336 pico | |
| Geekbench 5.5 / Single-Core | |
| HP Envy 16 h0112nr | |
| Honor MagicBook 14 2022 | |
| Beelink GTR5 | |
| Beelink SEi11 Pro | |
| Schenker XMG Apex 15 NH57E PS | |
| Beelink SER Pro Ryzen 5 5600H | |
| Gemiddeld AMD Ryzen 5 5600H (1365 - 1445, n=14) | |
| Intel NUC11TNKi5 | |
| Intel NUC10i7FNH | |
| Beelink SER4 | |
| Zotac ZBOX PI336 pico | |
| HWBOT x265 Benchmark v2.2 / 4k Preset | |
| Schenker XMG Apex 15 NH57E PS | |
| HP Envy 16 h0112nr | |
| Beelink GTR5 | |
| Honor MagicBook 14 2022 | |
| Gemiddeld AMD Ryzen 5 5600H (9.92 - 13.3, n=14) | |
| Beelink SER Pro Ryzen 5 5600H | |
| Beelink SER4 | |
| Intel NUC10i7FNH | |
| Beelink SEi11 Pro | |
| Framework Laptop 13.5 | |
| Intel NUC11TNKi5 | |
| Zotac ZBOX PI336 pico | |
| LibreOffice / 20 Documents To PDF | |
| Zotac ZBOX PI336 pico | |
| Beelink SER4 | |
| Gemiddeld AMD Ryzen 5 5600H (52.2 - 81.5, n=14) | |
| Schenker XMG Apex 15 NH57E PS | |
| Beelink SER Pro Ryzen 5 5600H | |
| Intel NUC11TNKi5 | |
| Beelink GTR5 | |
| Beelink SEi11 Pro | |
| HP Envy 16 h0112nr | |
| Framework Laptop 13.5 | |
| Honor MagicBook 14 2022 | |
| R Benchmark 2.5 / Overall mean | |
| Zotac ZBOX PI336 pico | |
| Intel NUC10i7FNH | |
| Intel NUC11TNKi5 | |
| Beelink SEi11 Pro | |
| Beelink SER4 | |
| Framework Laptop 13.5 | |
| Gemiddeld AMD Ryzen 5 5600H (0.526 - 0.596, n=14) | |
| Beelink SER Pro Ryzen 5 5600H | |
| Schenker XMG Apex 15 NH57E PS | |
| Honor MagicBook 14 2022 | |
| Beelink GTR5 | |
| HP Envy 16 h0112nr | |
* ... kleiner is beter
AIDA64: FP32 Ray-Trace | FPU Julia | CPU SHA3 | CPU Queen | FPU SinJulia | FPU Mandel | CPU AES | CPU ZLib | FP64 Ray-Trace | CPU PhotoWorxx
| Performance rating | |
| Beelink GTR5 | |
| Beelink SER Pro Ryzen 5 5600H | |
| Beelink SEi11 Pro | |
| Intel NUC11TNKi5 | |
| Zotac ZBOX PI336 pico | |
| AIDA64 / FP32 Ray-Trace | |
| Beelink GTR5 | |
| Beelink SER Pro Ryzen 5 5600H | |
| Beelink SEi11 Pro | |
| Intel NUC11TNKi5 | |
| Zotac ZBOX PI336 pico | |
| AIDA64 / FPU Julia | |
| Beelink GTR5 | |
| Beelink SER Pro Ryzen 5 5600H | |
| Beelink SEi11 Pro | |
| Intel NUC11TNKi5 | |
| Zotac ZBOX PI336 pico | |
| AIDA64 / CPU SHA3 | |
| Beelink GTR5 | |
| Beelink SER Pro Ryzen 5 5600H | |
| Beelink SEi11 Pro | |
| Intel NUC11TNKi5 | |
| Zotac ZBOX PI336 pico | |
| AIDA64 / CPU Queen | |
| Beelink GTR5 | |
| Beelink SER Pro Ryzen 5 5600H | |
| Beelink SEi11 Pro | |
| Intel NUC11TNKi5 | |
| Zotac ZBOX PI336 pico | |
| AIDA64 / FPU SinJulia | |
| Beelink GTR5 | |
| Beelink SER Pro Ryzen 5 5600H | |
| Beelink SEi11 Pro | |
| Intel NUC11TNKi5 | |
| Zotac ZBOX PI336 pico | |
| AIDA64 / FPU Mandel | |
| Beelink GTR5 | |
| Beelink SER Pro Ryzen 5 5600H | |
| Beelink SEi11 Pro | |
| Intel NUC11TNKi5 | |
| Zotac ZBOX PI336 pico | |
| AIDA64 / CPU AES | |
| Beelink GTR5 | |
| Beelink SER Pro Ryzen 5 5600H | |
| Beelink SEi11 Pro | |
| Intel NUC11TNKi5 | |
| Zotac ZBOX PI336 pico | |
| AIDA64 / CPU ZLib | |
| Beelink GTR5 | |
| Beelink SER Pro Ryzen 5 5600H | |
| Intel NUC11TNKi5 | |
| Beelink SEi11 Pro | |
| Zotac ZBOX PI336 pico | |
| AIDA64 / FP64 Ray-Trace | |
| Beelink GTR5 | |
| Beelink SER Pro Ryzen 5 5600H | |
| Beelink SEi11 Pro | |
| Intel NUC11TNKi5 | |
| Zotac ZBOX PI336 pico | |
| AIDA64 / CPU PhotoWorxx | |
| Beelink SEi11 Pro | |
| Beelink GTR5 | |
| Beelink SER Pro Ryzen 5 5600H | |
| Intel NUC11TNKi5 | |
| Zotac ZBOX PI336 pico | |
Systeemprestaties
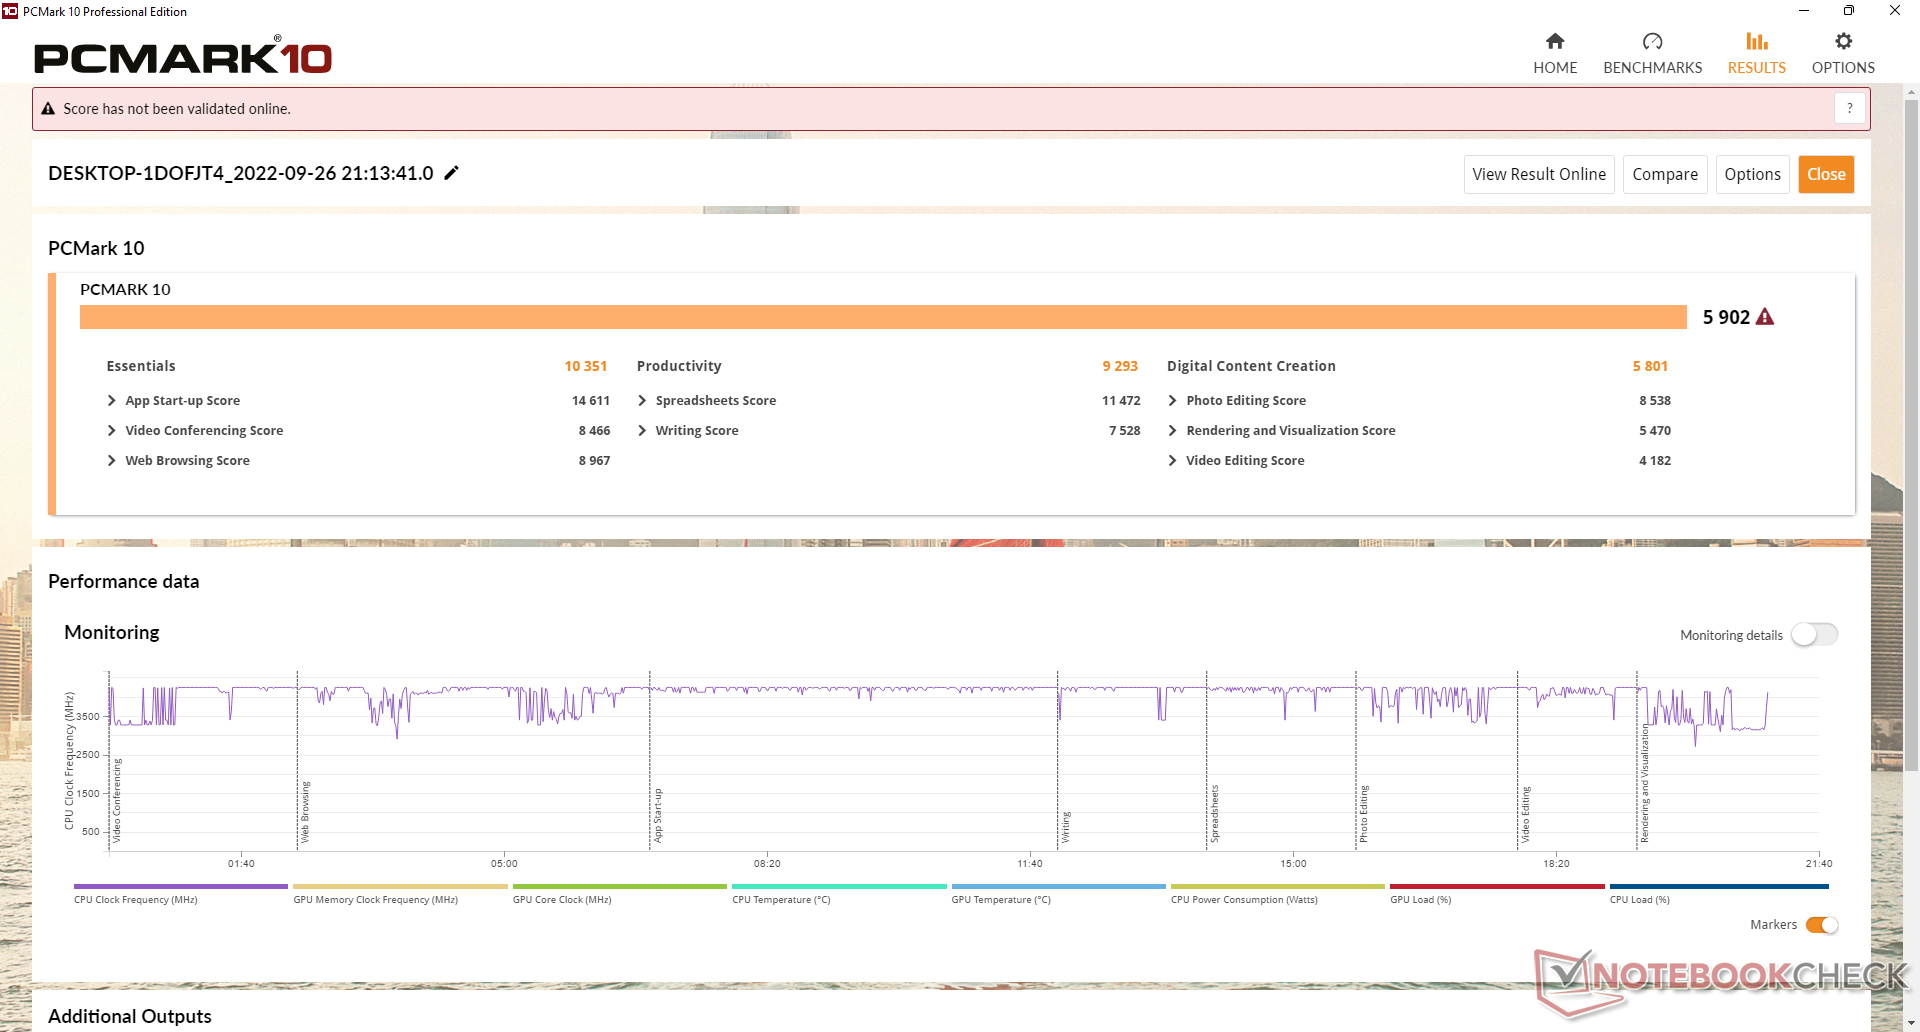
PCMark 10 resultaten zijn waar we ze verwachten te zijn in vergelijking met andere Ryzen 5 5600H laptops of mini PC's, behalve in de Digital Content Creation subtest waar GPU prestaties het belangrijkst zijn. Dit komt omdat veel laptops met deze zelfde processor doorgaans worden geleverd met snellere discrete graphics.
CrossMark: Overall | Productivity | Creativity | Responsiveness
| PCMark 10 / Score | |
| Beelink GTR5 | |
| Gemiddeld AMD Ryzen 5 5600H (5309 - 7091, n=14) | |
| Beelink SER Pro Ryzen 5 5600H | |
| Beelink SEi11 Pro | |
| Intel NUC11TNKi5 | |
| Intel NUC10i7FNH | |
| PCMark 10 / Essentials | |
| Beelink GTR5 | |
| Beelink SER Pro Ryzen 5 5600H | |
| Beelink SEi11 Pro | |
| Gemiddeld AMD Ryzen 5 5600H (9326 - 10506, n=14) | |
| Intel NUC10i7FNH | |
| Intel NUC11TNKi5 | |
| PCMark 10 / Productivity | |
| Beelink GTR5 | |
| Beelink SER Pro Ryzen 5 5600H | |
| Gemiddeld AMD Ryzen 5 5600H (7975 - 9642, n=14) | |
| Beelink SEi11 Pro | |
| Intel NUC10i7FNH | |
| Intel NUC11TNKi5 | |
| PCMark 10 / Digital Content Creation | |
| Gemiddeld AMD Ryzen 5 5600H (4921 - 9907, n=14) | |
| Beelink GTR5 | |
| Beelink SER Pro Ryzen 5 5600H | |
| Beelink SEi11 Pro | |
| Intel NUC11TNKi5 | |
| Intel NUC10i7FNH | |
| CrossMark / Overall | |
| Beelink GTR5 | |
| Beelink SEi11 Pro | |
| Beelink SER Pro Ryzen 5 5600H | |
| Gemiddeld AMD Ryzen 5 5600H (1157 - 1353, n=7) | |
| CrossMark / Productivity | |
| Beelink GTR5 | |
| Beelink SEi11 Pro | |
| Beelink SER Pro Ryzen 5 5600H | |
| Gemiddeld AMD Ryzen 5 5600H (1217 - 1384, n=7) | |
| CrossMark / Creativity | |
| Beelink GTR5 | |
| Gemiddeld AMD Ryzen 5 5600H (1184 - 1377, n=7) | |
| Beelink SER Pro Ryzen 5 5600H | |
| Beelink SEi11 Pro | |
| CrossMark / Responsiveness | |
| Beelink SEi11 Pro | |
| Beelink GTR5 | |
| Beelink SER Pro Ryzen 5 5600H | |
| Gemiddeld AMD Ryzen 5 5600H (926 - 1225, n=7) | |
| PCMark 10 Score | 5902 punten | |
Help | ||
| AIDA64 / Memory Copy | |
| Beelink GTR5 | |
| Beelink SER Pro Ryzen 5 5600H | |
| Beelink SEi11 Pro | |
| Gemiddeld AMD Ryzen 5 5600H (20549 - 42141, n=14) | |
| Intel NUC11TNKi5 | |
| Zotac ZBOX PI336 pico | |
| AIDA64 / Memory Read | |
| Beelink SER Pro Ryzen 5 5600H | |
| Beelink GTR5 | |
| Beelink SEi11 Pro | |
| Gemiddeld AMD Ryzen 5 5600H (22917 - 47595, n=14) | |
| Intel NUC11TNKi5 | |
| Zotac ZBOX PI336 pico | |
| AIDA64 / Memory Write | |
| Beelink SEi11 Pro | |
| Beelink SER Pro Ryzen 5 5600H | |
| Beelink GTR5 | |
| Gemiddeld AMD Ryzen 5 5600H (20226 - 44872, n=14) | |
| Intel NUC11TNKi5 | |
| Zotac ZBOX PI336 pico | |
| AIDA64 / Memory Latency | |
| Intel NUC11TNKi5 | |
| Beelink SEi11 Pro | |
| Beelink SER Pro Ryzen 5 5600H | |
| Beelink GTR5 | |
| Gemiddeld AMD Ryzen 5 5600H (75 - 89.1, n=14) | |
| Zotac ZBOX PI336 pico | |
* ... kleiner is beter
DPC latentie
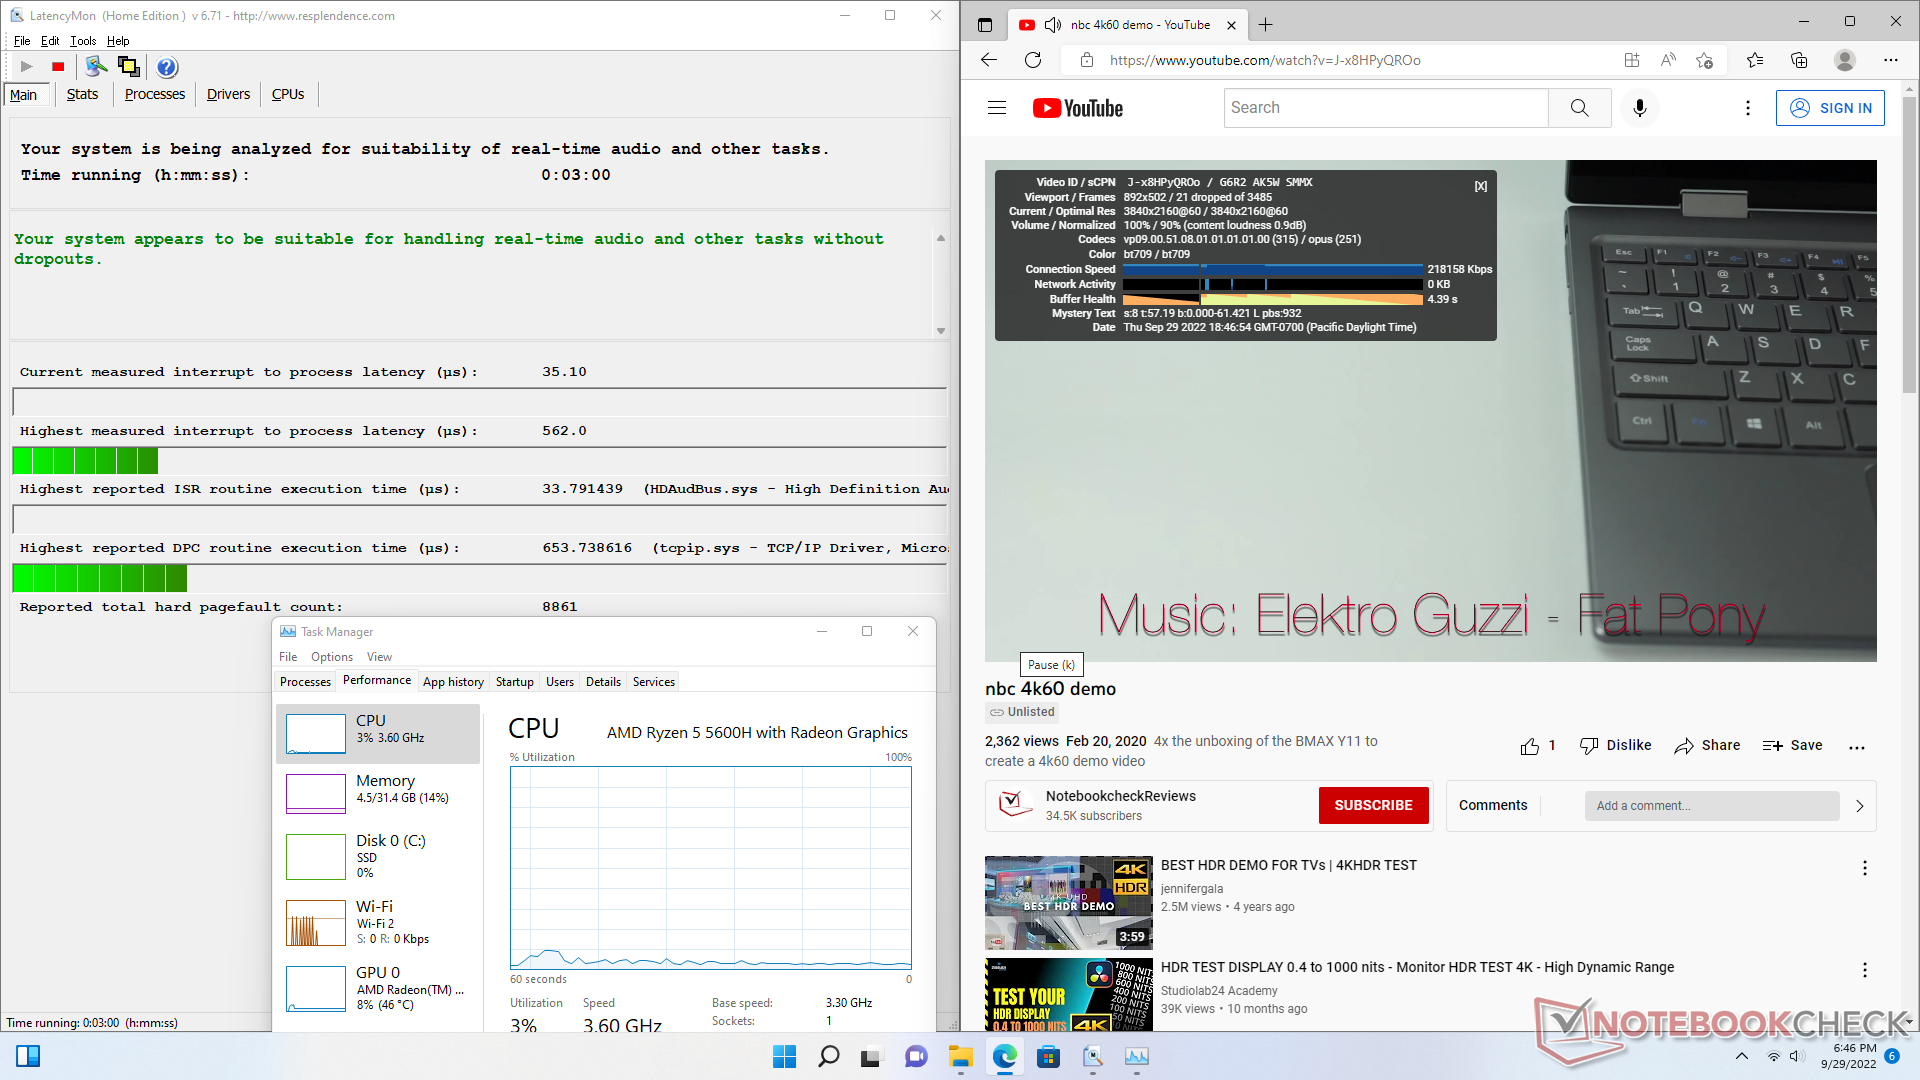
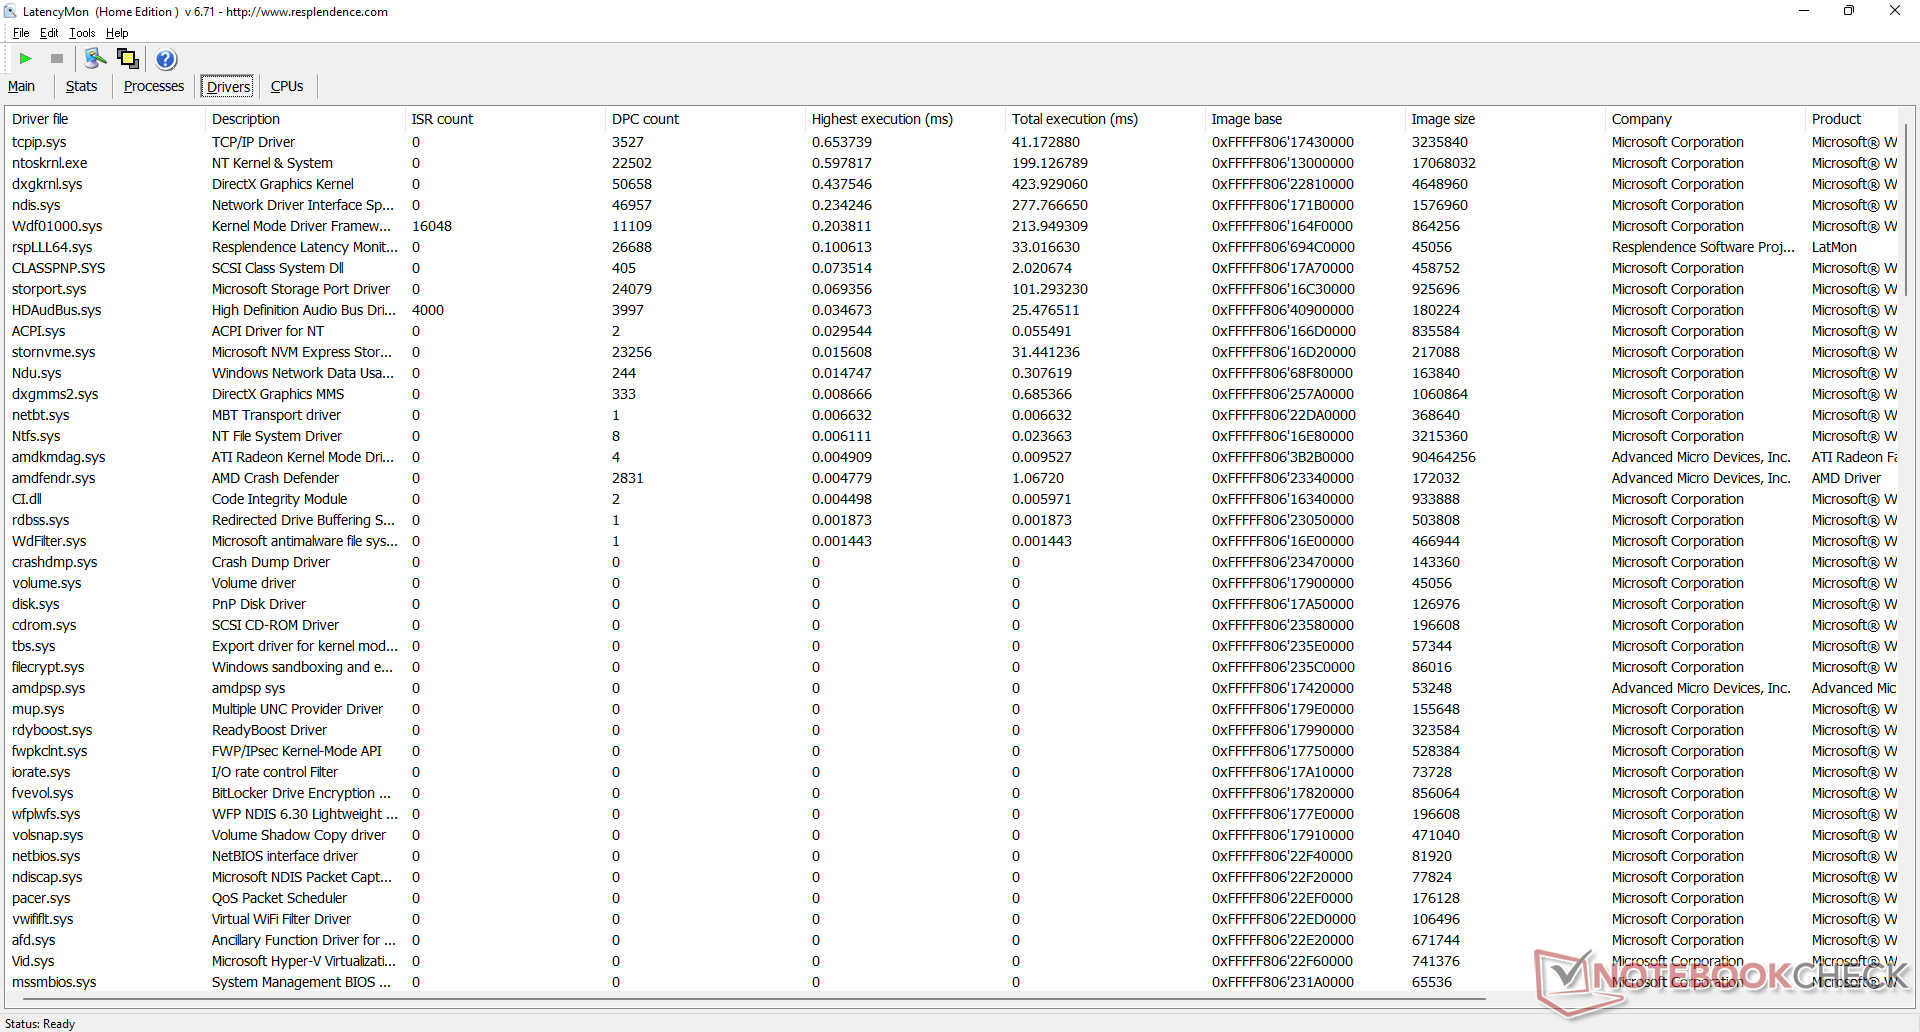
LatencyMon toont geen grote DPC-problemen bij het openen van meerdere browsertabbladen op onze homepage. Helaas is het afspelen van 4K-video's bij 60 FPS onvolmaakt met 21 dropped frames tijdens onze minutenlange video.
| DPC Latencies / LatencyMon - interrupt to process latency (max), Web, Youtube, Prime95 | |
| Zotac ZBOX PI336 pico | |
| Beelink SER Pro Ryzen 5 5600H | |
| Intel NUC11TNKi5 | |
| Beelink SEi11 Pro | |
| Beelink GTR5 | |
* ... kleiner is beter
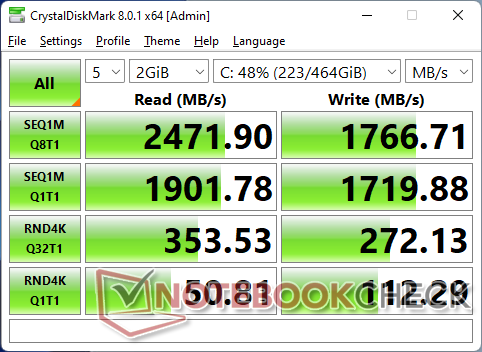
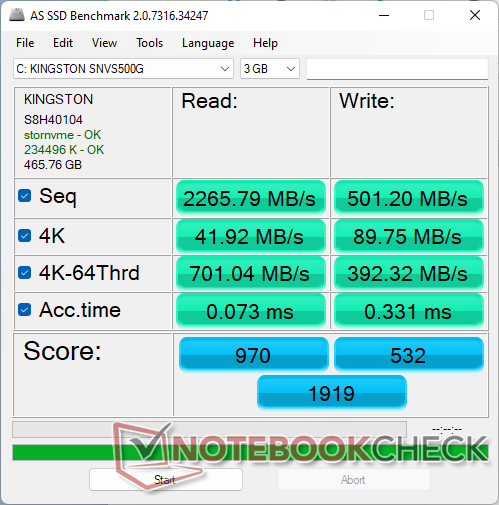
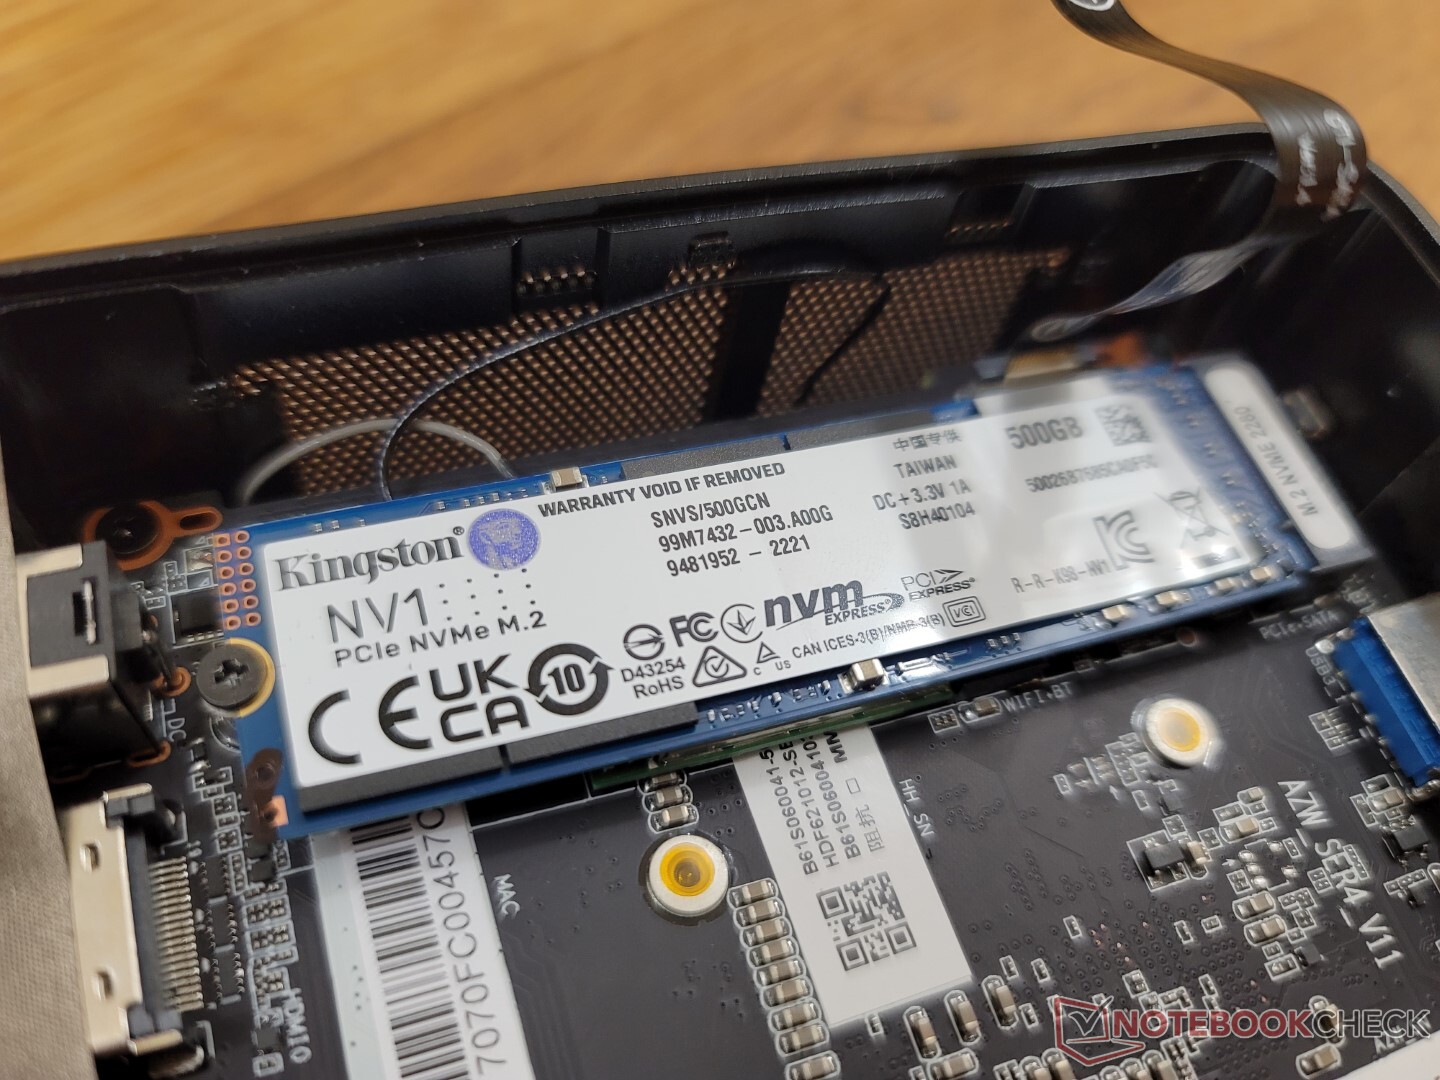
Opslagapparaten
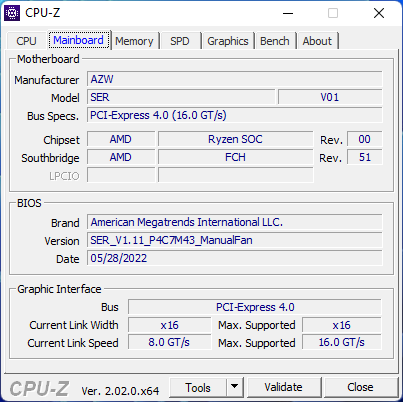
NVMe-snelheden zijn beperkt tot PCIe3 x4, terwijl de meeste nieuwere Intel NUC-modellen PCIe4 x4 volledig ondersteunen. PCIe3 is echter meer dan genoeg voor de meeste gebruikers, en dus is de bezuiniging hier niet significant. Onze midrange 500 GB Kingston NV1 SSD is in staat om de maximale ~2500 MB/s leessnelheid te halen zonder thermische problemen.

| Drive Performance rating - Percent | |
| Beelink SER Pro Ryzen 5 5600H -11! | |
| Beelink GTR5 | |
| Beelink SEi11 Pro | |
| Intel NUC10i7FNH | |
| Intel NUC11TNKi5 | |
| Zotac ZBOX PI336 pico | |
* ... kleiner is beter
Disk Throttling: DiskSpd Read Loop, Queue Depth 8
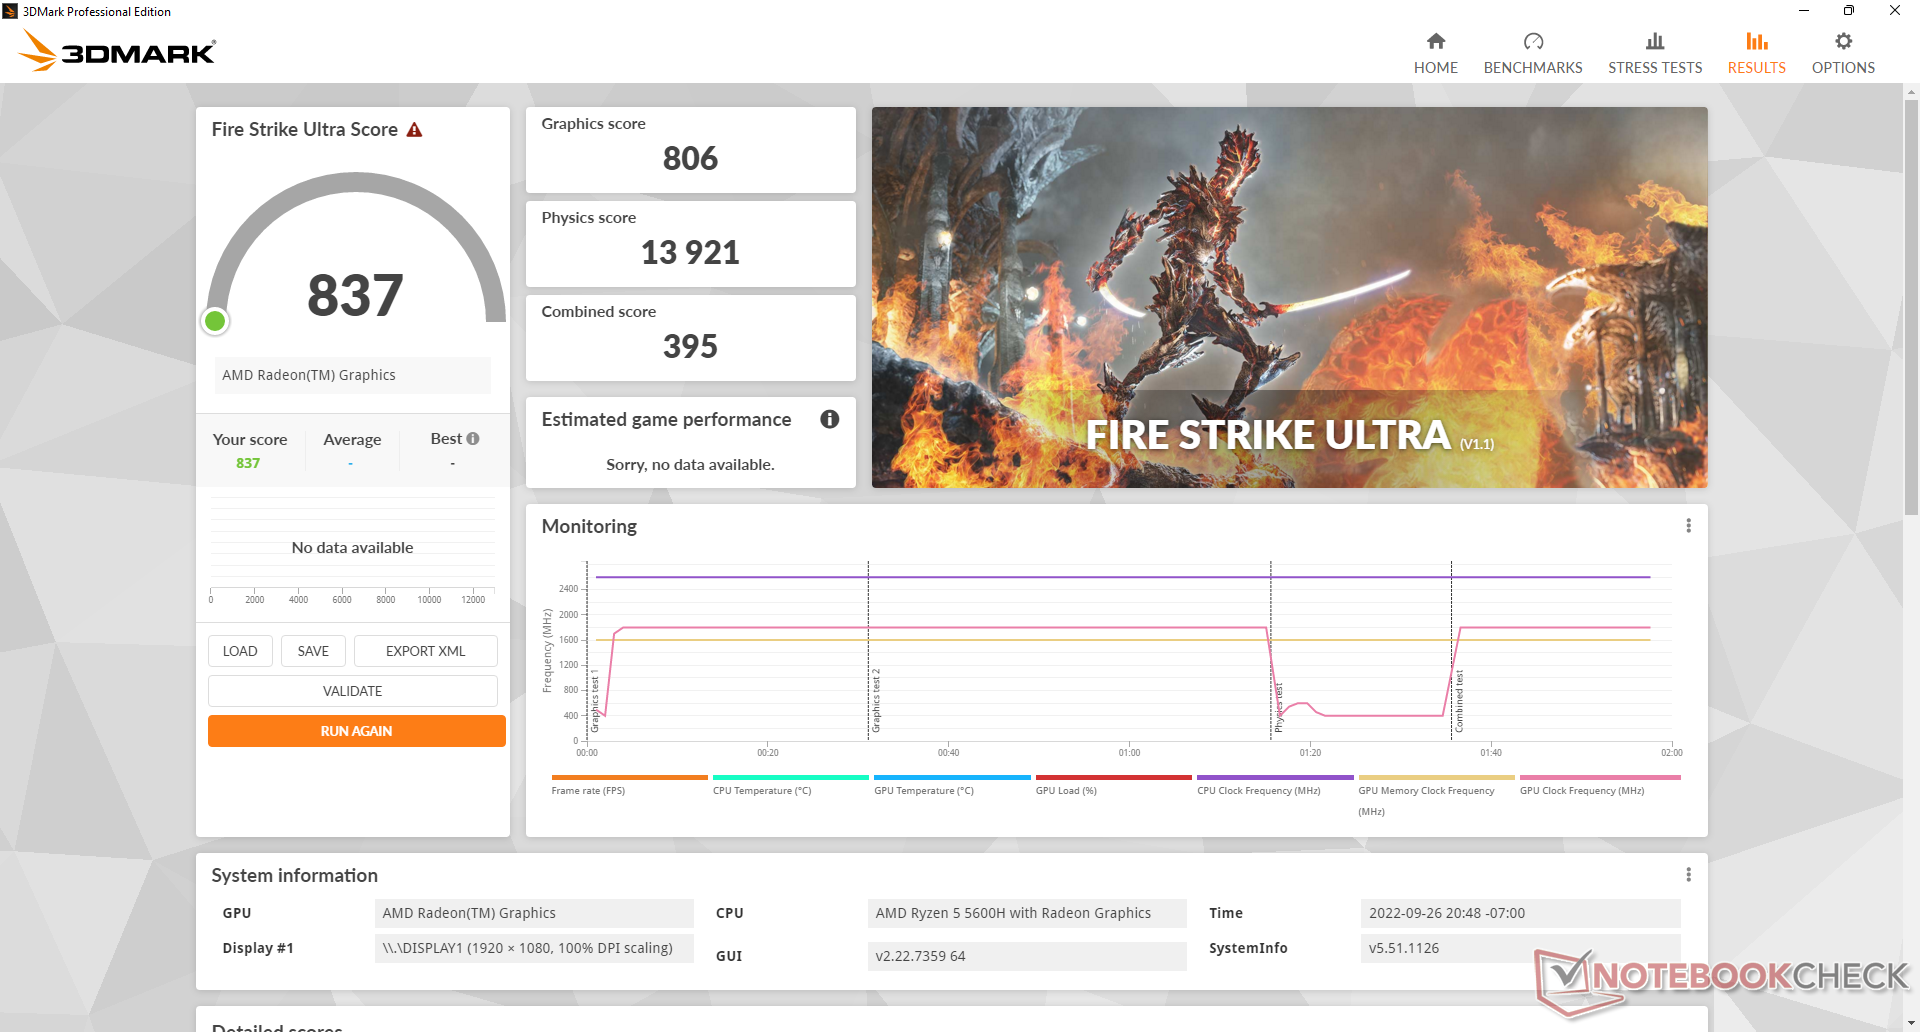
GPU-prestaties
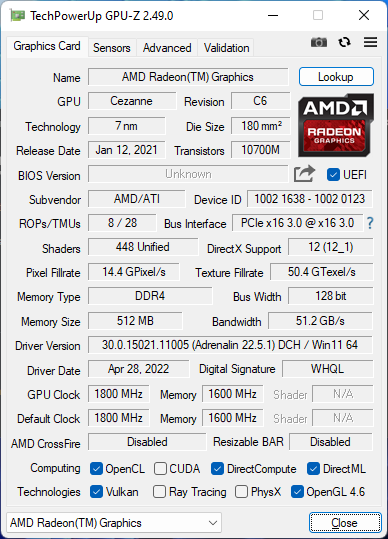
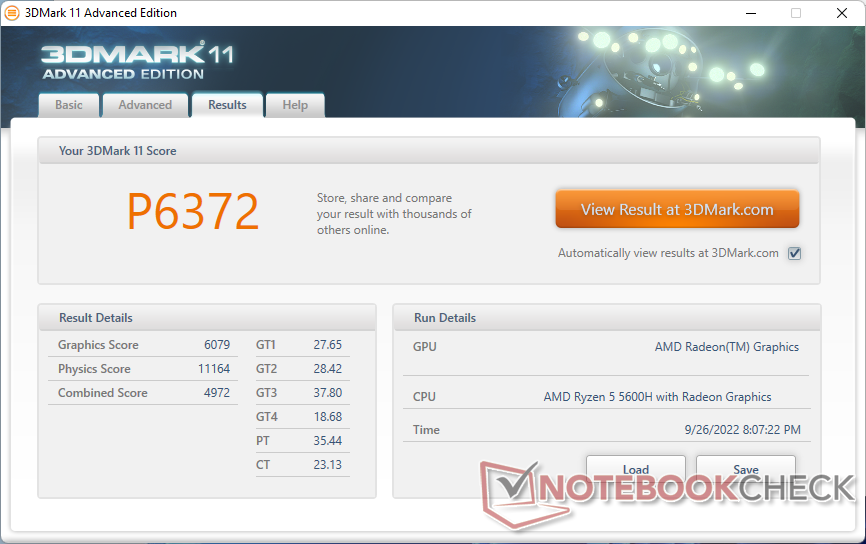
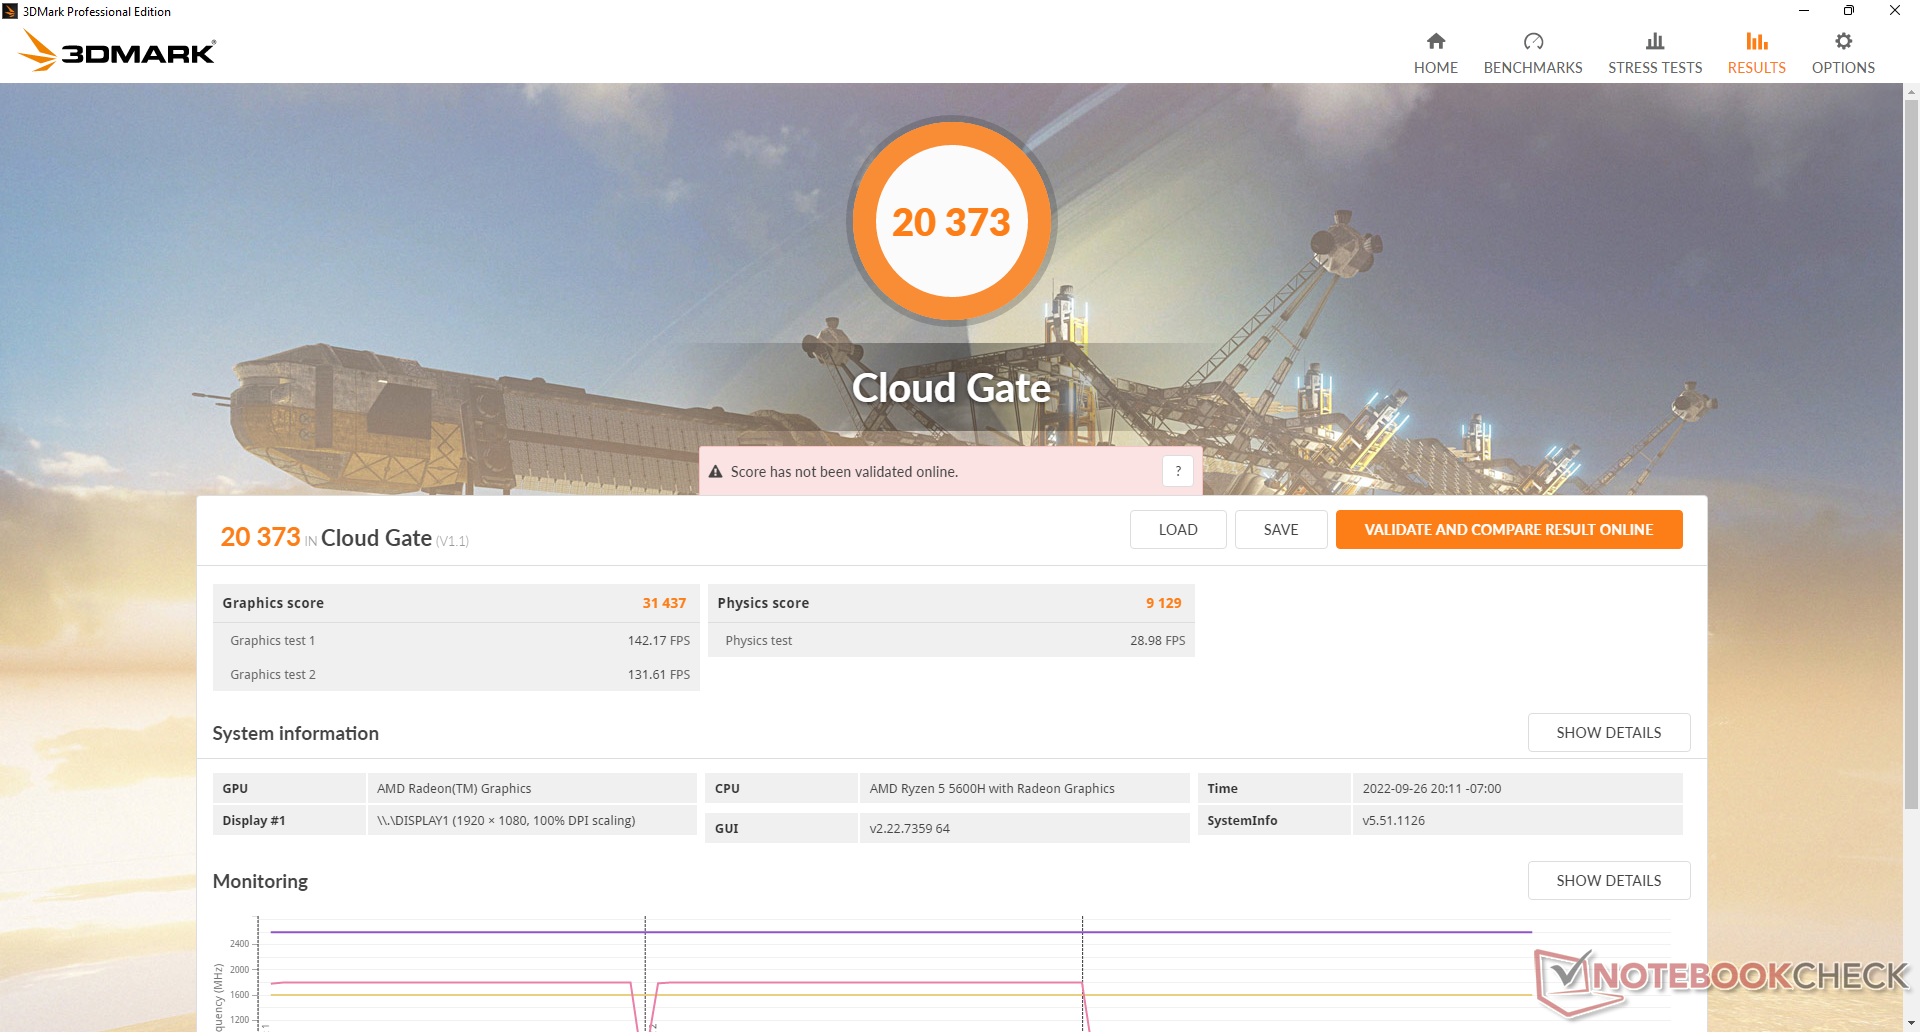
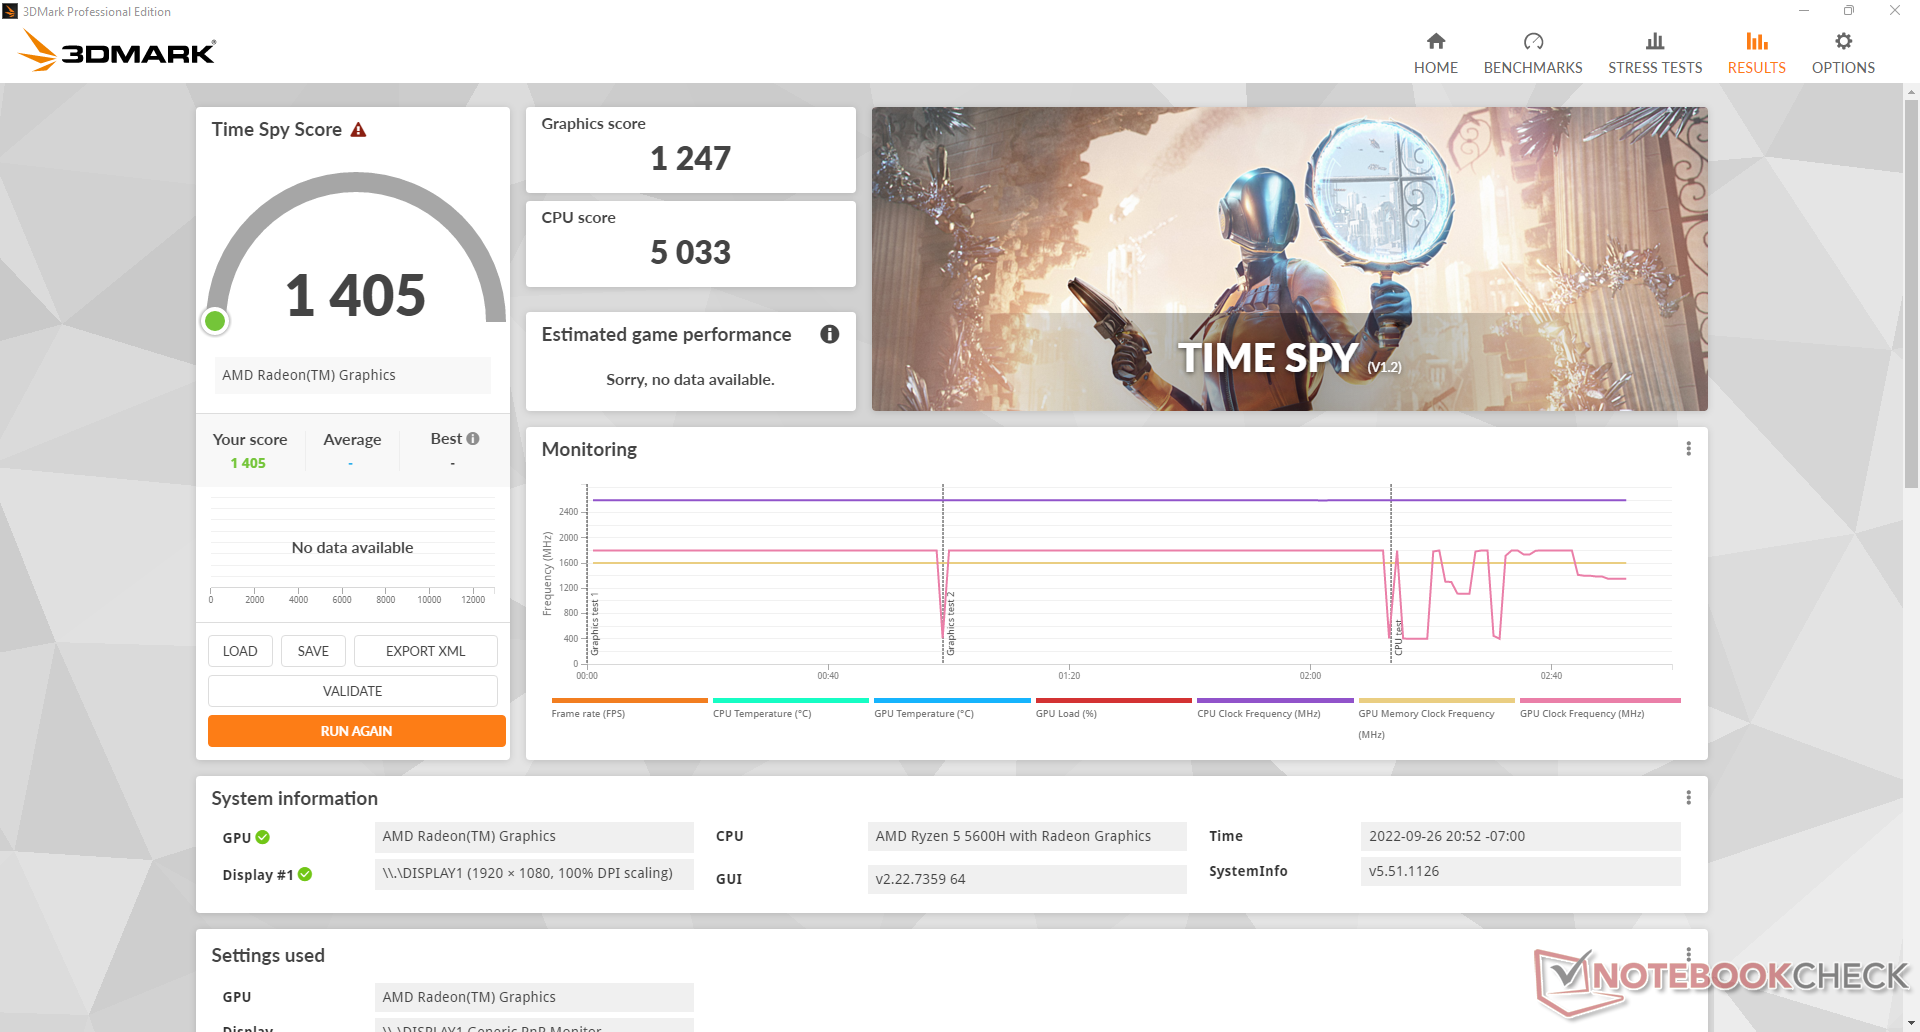
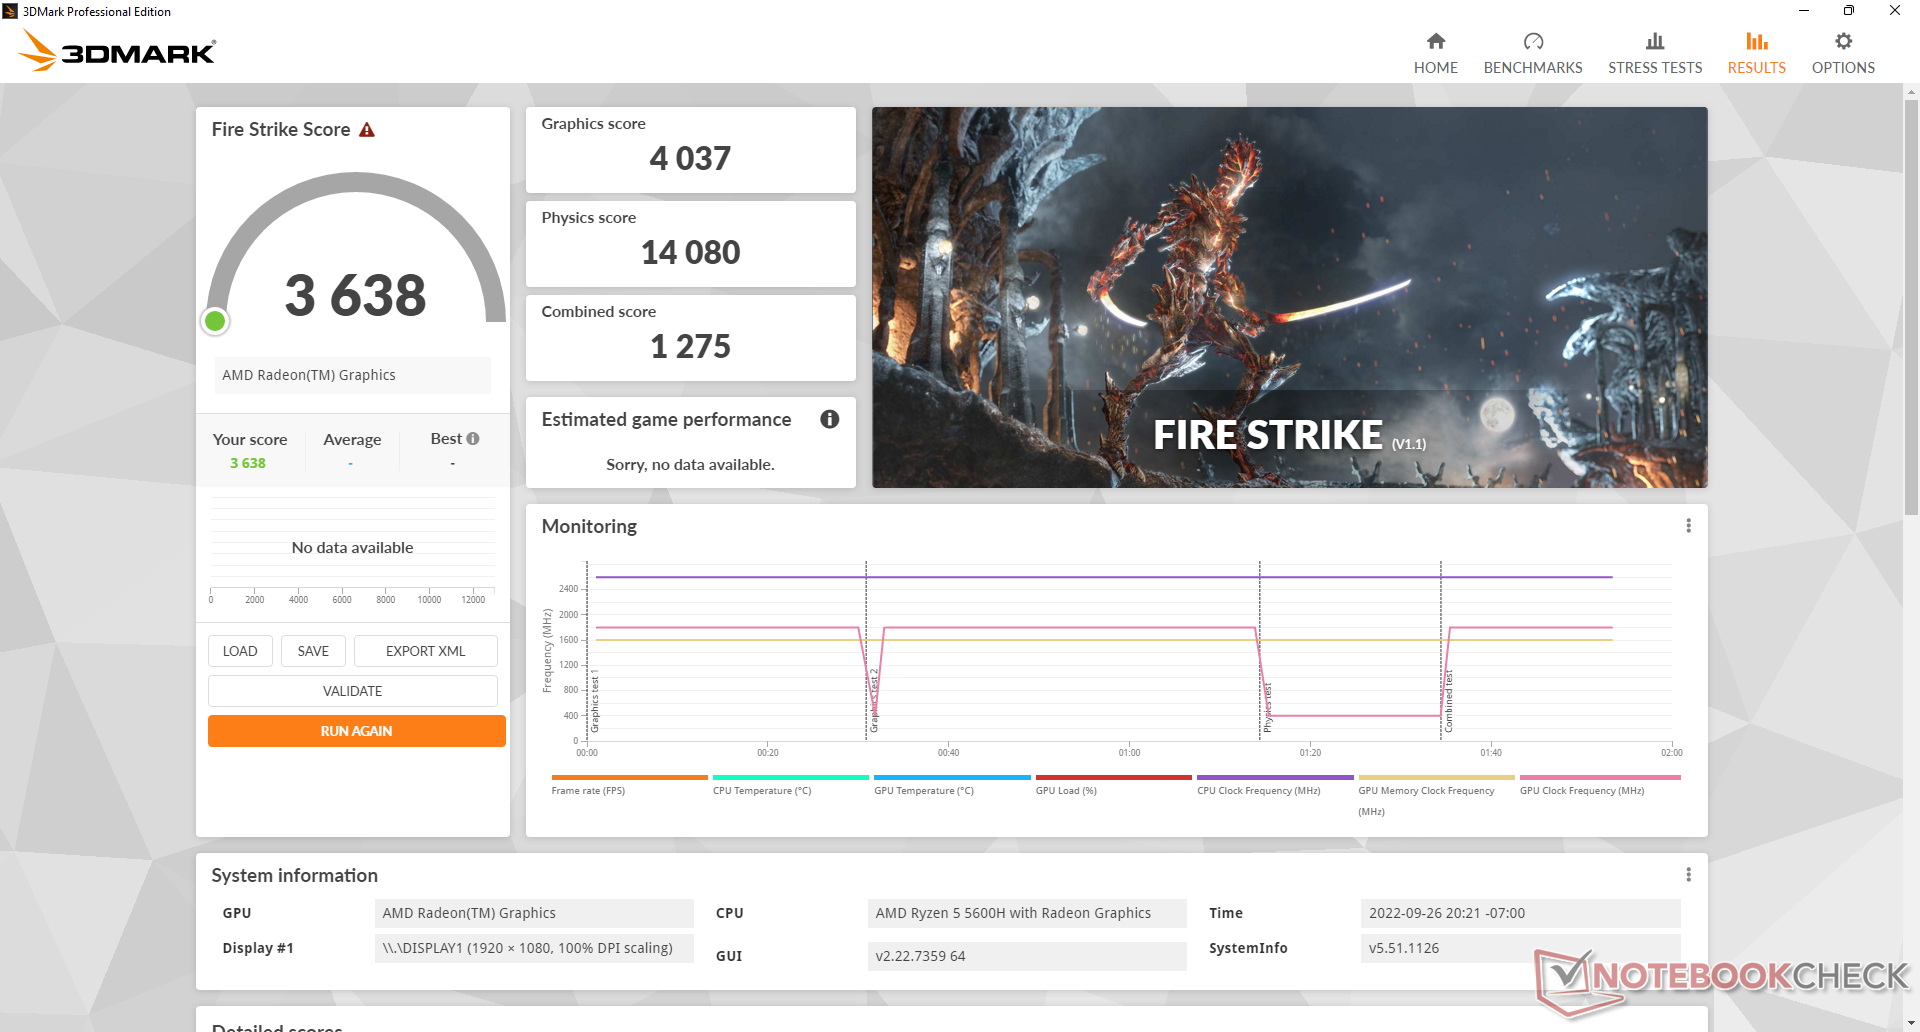
De grafische prestaties zijn veel sneller dan die van de meeste andere laptops of mini-pc's met dezelfde geïntegreerde Radeon RX Vega 7 GPU met 30 tot 35 procent, omdat dergelijke producten de GPU meestal koppelen aan tragere Ryzen U-serie CPU's of alleen single-channel RAM. De Ryzen 5 5600H is minder een knelpunt voor de GPU en de framerates profiteren daarvan. Het is echter nog steeds geen gaming machine.
De Iris Xe 96 EU's die vaak te vinden is op de meeste 11e generatie Core i7 Intel laptops of mini PC's is nog steeds ongeveer 10 tot 15 procent sneller.
| 3DMark 11 - 1280x720 Performance GPU | |
| Intel NUC11PHKi7C | |
| Honor MagicBook 14 2022 | |
| Lenovo Yoga 7-14ARB G7 | |
| Beelink GTR5 | |
| Beelink SEi11 Pro | |
| Beelink SER Pro Ryzen 5 5600H | |
| Beelink SER4 | |
| Intel NUC11TNKi5 | |
| Gemiddeld AMD Radeon RX Vega 7 (3353 - 6249, n=62) | |
| Intel NUC10i7FNH | |
| Zotac ZBOX PI336 pico | |
| 3DMark 11 Performance | 6372 punten | |
| 3DMark Cloud Gate Standard Score | 20373 punten | |
| 3DMark Fire Strike Score | 3638 punten | |
| 3DMark Time Spy Score | 1405 punten | |
Help | ||
| Blender - v3.3 Classroom CPU | |
| Beelink SER Pro Ryzen 5 5600H | |
| Gemiddelde van klas Mini PC (132 - 4571, n=83, laatste 2 jaar) | |
* ... kleiner is beter
| The Witcher 3 | |
| 1024x768 Low Graphics & Postprocessing | |
| Intel NUC11PHKi7C | |
| Honor MagicBook 14 2022 | |
| Lenovo Yoga 7-14ARB G7 | |
| Beelink SEi11 Pro | |
| Beelink GTR5 | |
| Beelink SER Pro Ryzen 5 5600H | |
| Beelink SER4 | |
| Intel NUC11TNKi5 | |
| Gemiddeld AMD Radeon RX Vega 7 (25.5 - 105.8, n=53) | |
| 1366x768 Medium Graphics & Postprocessing | |
| Intel NUC11PHKi7C | |
| Honor MagicBook 14 2022 | |
| Lenovo Yoga 7-14ARB G7 | |
| Beelink GTR5 | |
| Beelink SEi11 Pro | |
| Beelink SER Pro Ryzen 5 5600H | |
| Beelink SER4 | |
| Gemiddeld AMD Radeon RX Vega 7 (9.74 - 81.3, n=39) | |
| 1920x1080 High Graphics & Postprocessing (Nvidia HairWorks Off) | |
| Intel NUC11PHKi7C | |
| Honor MagicBook 14 2022 | |
| Lenovo Yoga 7-14ARB G7 | |
| Beelink SEi11 Pro | |
| Beelink GTR5 | |
| Beelink SER Pro Ryzen 5 5600H | |
| Beelink SER4 | |
| Gemiddeld AMD Radeon RX Vega 7 (8.96 - 26.2, n=52) | |
| 1920x1080 Ultra Graphics & Postprocessing (HBAO+) | |
| Intel NUC11PHKi7C | |
| Honor MagicBook 14 2022 | |
| Lenovo Yoga 7-14ARB G7 | |
| Beelink GTR5 | |
| Beelink SER Pro Ryzen 5 5600H | |
| Beelink SER4 | |
| Beelink SEi11 Pro | |
| Gemiddeld AMD Radeon RX Vega 7 (6.5 - 15.8, n=44) | |
De framerates zijn helaas niet zo stabiel als we hadden gehoopt. Bij stationair draaien op Witcher 3 op lage 720p instellingen, zakte de framerate soms naar 60 FPS of zelfs 19 FPS zonder enige reden, zoals blijkt uit onderstaande grafiek. Slechte afhandeling van achtergrondactiviteit is waarschijnlijk de schuld van de onderbreking in de framerates.
Witcher 3 FPS Chart
| lage | gem. | hoge | ultra | |
|---|---|---|---|---|
| GTA V (2015) | 132.9 | 117.6 | 32.2 | 14.5 |
| The Witcher 3 (2015) | 79.2 | 48.7 | 25.1 | 15.8 |
| Dota 2 Reborn (2015) | 137.5 | 103.1 | 59.3 | 56.3 |
| Final Fantasy XV Benchmark (2018) | 41.1 | 20.3 | 14.3 | |
| X-Plane 11.11 (2018) | 53.4 | 40.3 | 35.7 | |
| Strange Brigade (2018) | 95.3 | 36 | 30.1 | 25.5 |
| Cyberpunk 2077 1.6 (2022) | 20.9 | 16.2 | 11.4 |
Emissies
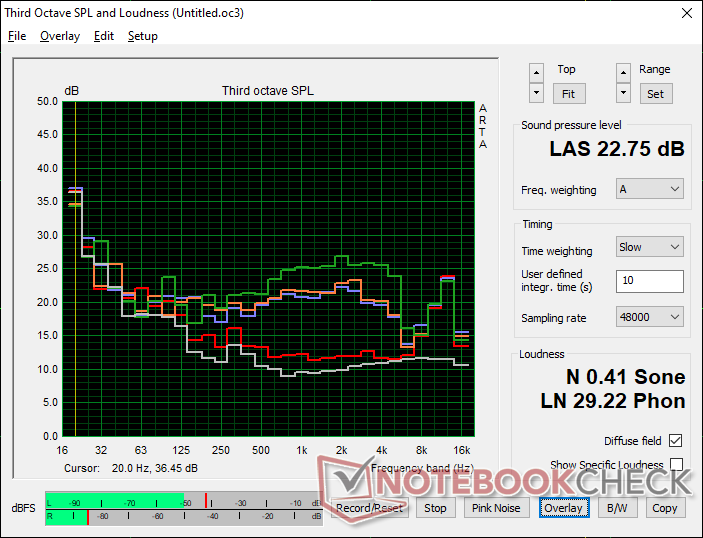
Systeemgeluid
Ons testtoestel heeft last van elektronische ruis of spoelgezeur. Zo zijn we in staat om een geluid van 26,1 dB(A) te registreren tegen een stille achtergrond van 22,8 dB(A), zelfs bij stationair draaien op de desktop zonder draaiende toepassingen. Het geluid van de ventilator schommelt rond de 28,7 dB(A) tijdens typische belastingen zoals surfen op het web of videostreaming, wat stiller is dan de NUC11TNK.
Het geluid van de ventilator schommelt tussen 32 en 37 dB(A) bij zwaardere belastingen zoals games, wat opnieuw stiller is dan de NUC11TNK en de snellere Beelink GTR5. Dit is een stille mini PC in verhouding tot de prestaties die u krijgt.
Geluidsniveau
| Onbelast |
| 26.1 / 26.1 / 28.7 dB (A) |
| Belasting |
| 32.3 / 36.4 dB (A) |
 | ||
30 dB stil 40 dB(A) hoorbaar 50 dB(A) luid |
||
min: | ||
| Beelink SER Pro Ryzen 5 5600H Vega 7, R5 5600H, Kingston NV1 SNVS/500GCN | Beelink SEi11 Pro Iris Xe G7 96EUs, i5-11320H, Kingston NV1 SNVS/500GCN | Beelink GTR5 Vega 8, R9 5900HX, Kingston NV1 SNVS/500GCN | Intel NUC11TNKi5 Iris Xe G7 80EUs, i5-1135G7, Transcend M.2 SSD 430S TS512GMTS430S | Beelink SEi8 Iris Plus Graphics 655, i3-8109U, Intel SSD 660p SSDPEKNW512G8 | Beelink SER4 Vega 8, R7 4800U, Intel SSD 660p SSDPEKNW512G8 | |
|---|---|---|---|---|---|---|
| Noise | 1% | -24% | -23% | -7% | -18% | |
| uit / omgeving * (dB) | 22.8 | 22.8 -0% | 23.1 -1% | 24.8 -9% | 24.5 -7% | 23.4 -3% |
| Idle Minimum * (dB) | 26.1 | 24.7 5% | 34.2 -31% | 35.6 -36% | 26.5 -2% | 33.2 -27% |
| Idle Average * (dB) | 26.1 | 24.7 5% | 34.2 -31% | 35.6 -36% | 26.5 -2% | 33.2 -27% |
| Idle Maximum * (dB) | 28.7 | 25.3 12% | 34.2 -19% | 35.6 -24% | 31.1 -8% | 33.2 -16% |
| Load Average * (dB) | 32.3 | 33.2 -3% | 44.6 -38% | 36.2 -12% | 37.7 -17% | 38.6 -20% |
| Witcher 3 ultra * (dB) | 32.8 | 34.5 -5% | 41.4 -26% | 38 -16% | 39.2 -20% | |
| Load Maximum * (dB) | 36.4 | 37.8 -4% | 45.1 -24% | 47.6 -31% | 37.5 -3% | 40.8 -12% |
* ... kleiner is beter
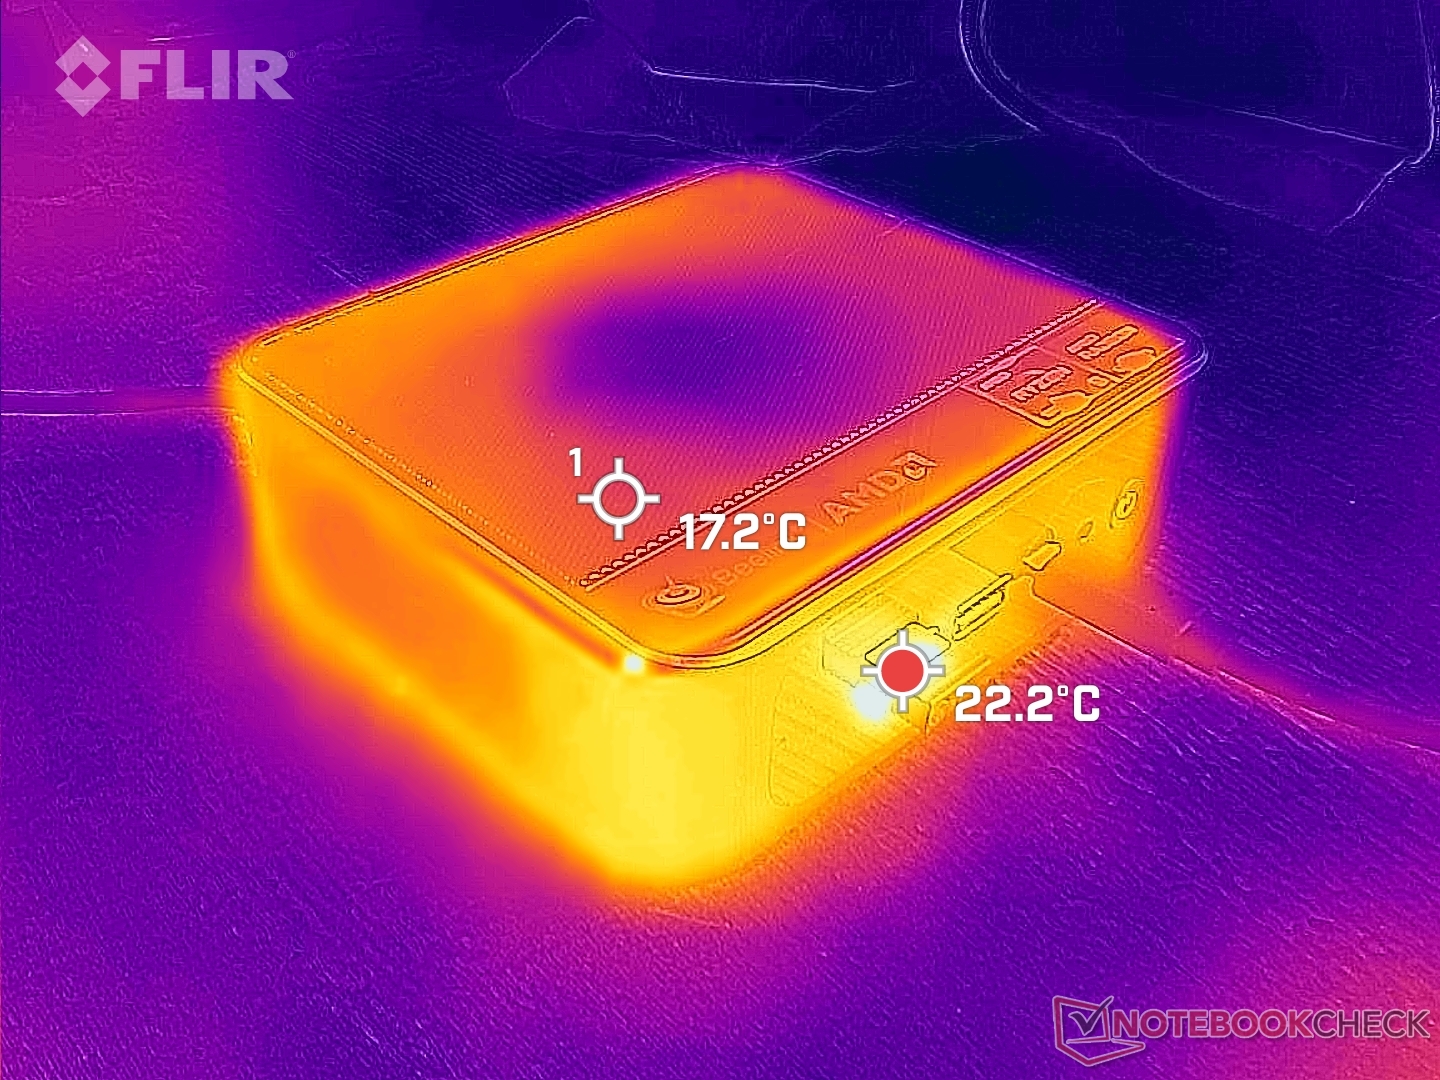
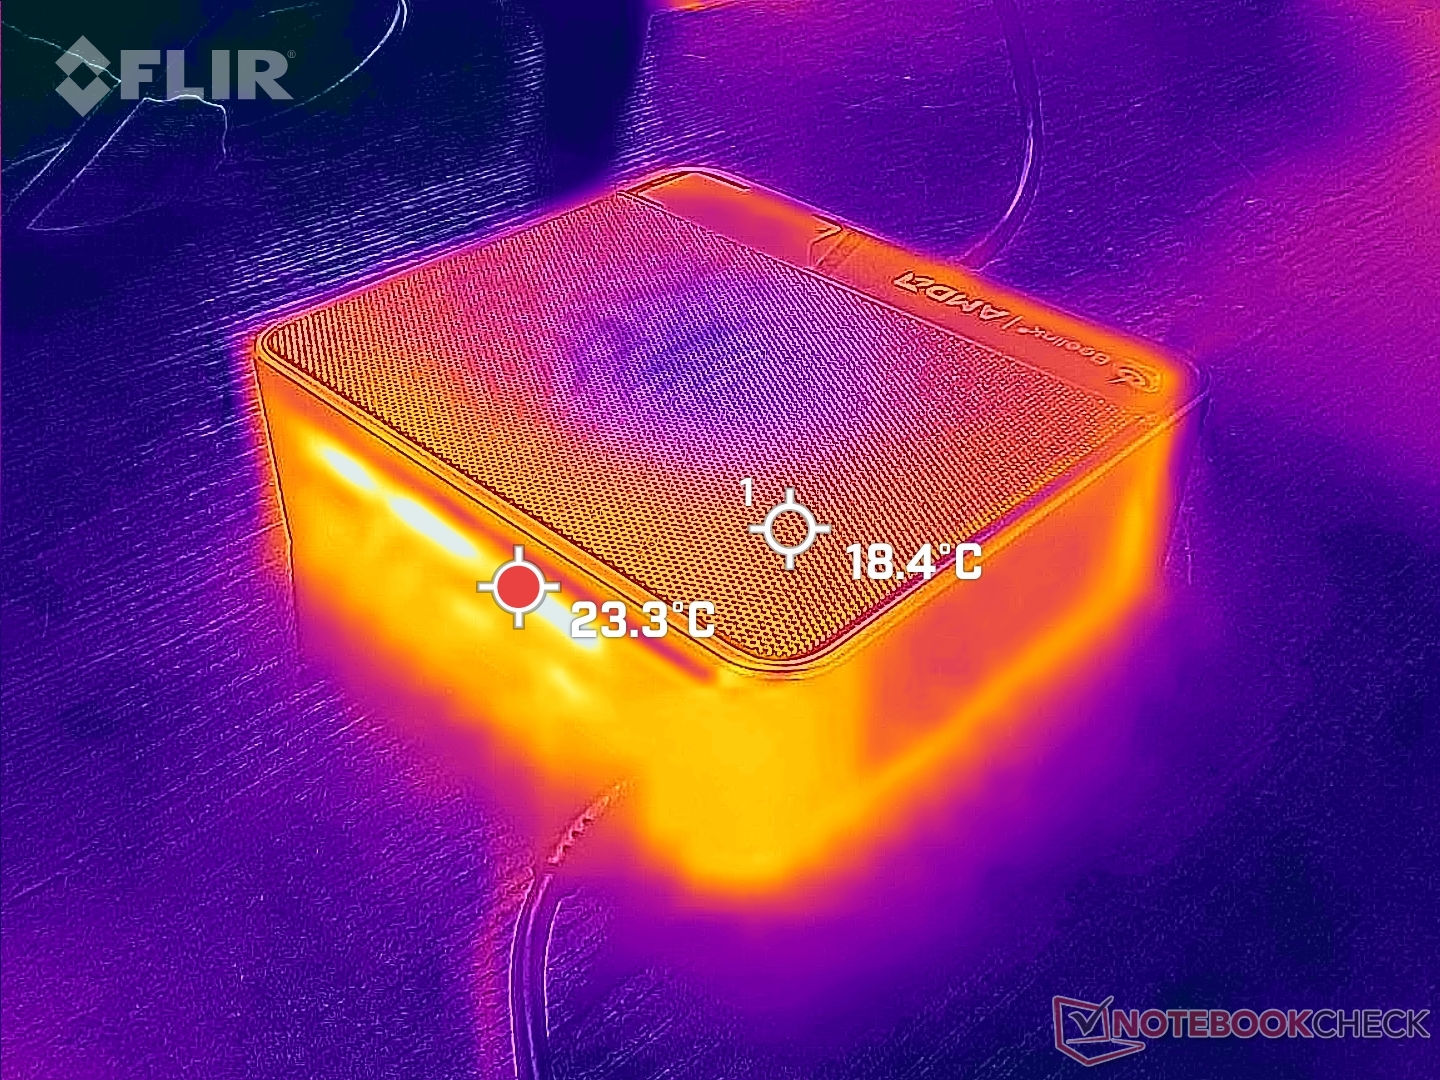
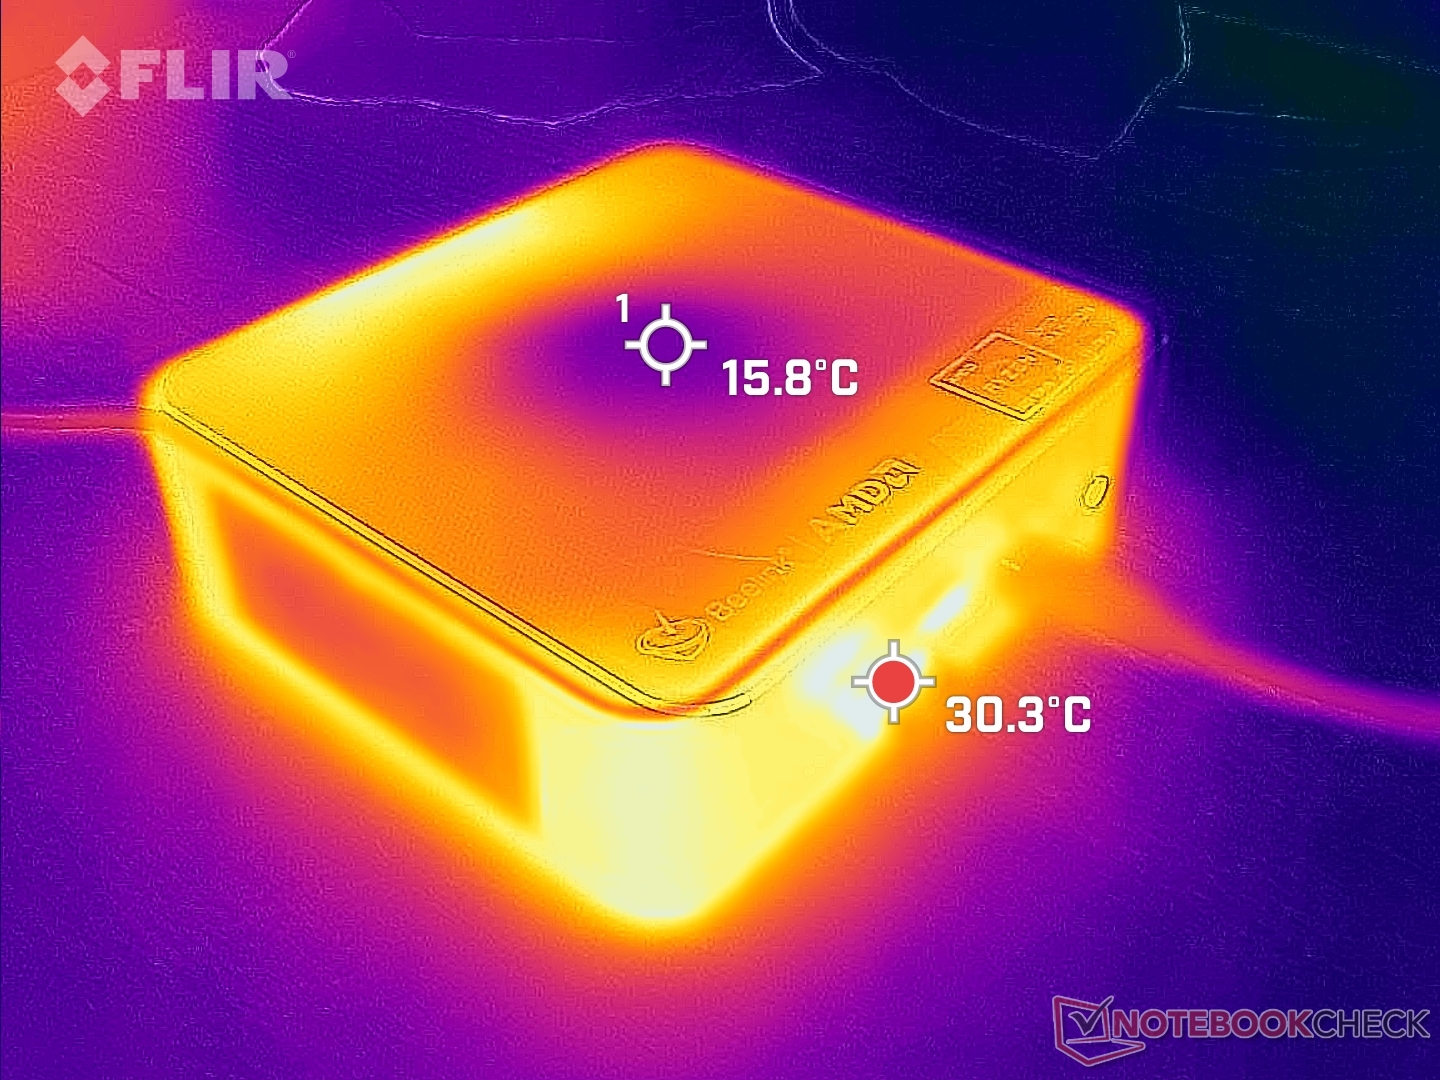
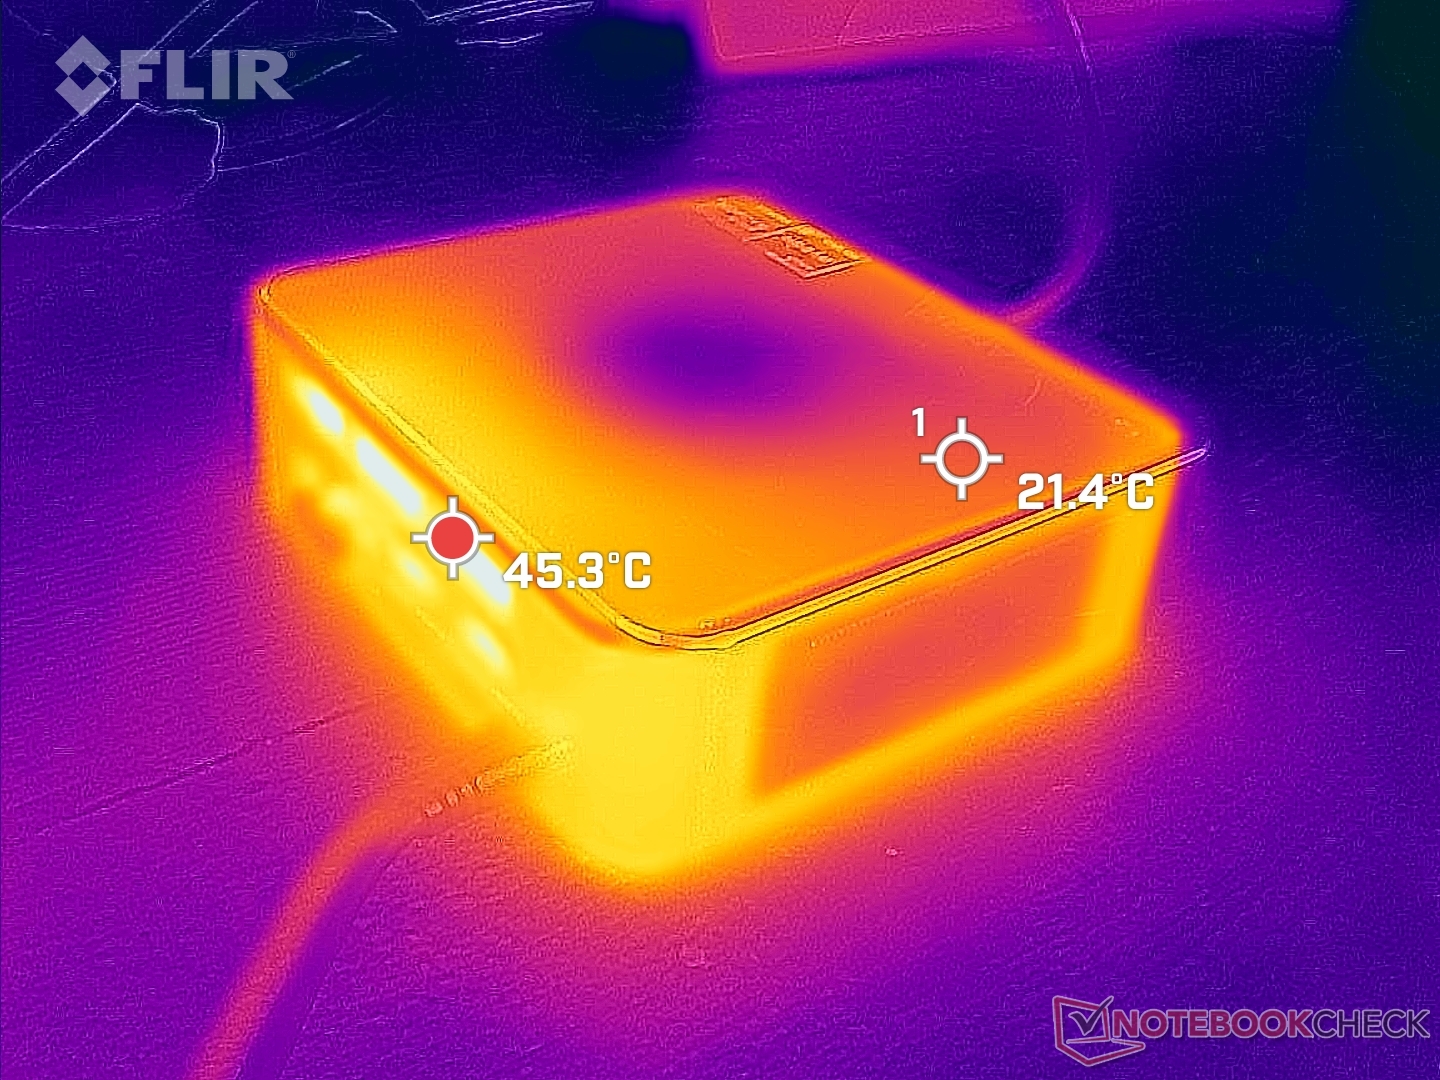
Temperatuur
Koele lucht komt binnen via de bovenkant en afvalwarmte wordt via de achterkant afgevoerd. U zult de bovenkant vrij willen houden van boeken, papieren of andere obstructies voor een optimale koeling.
Stresstest
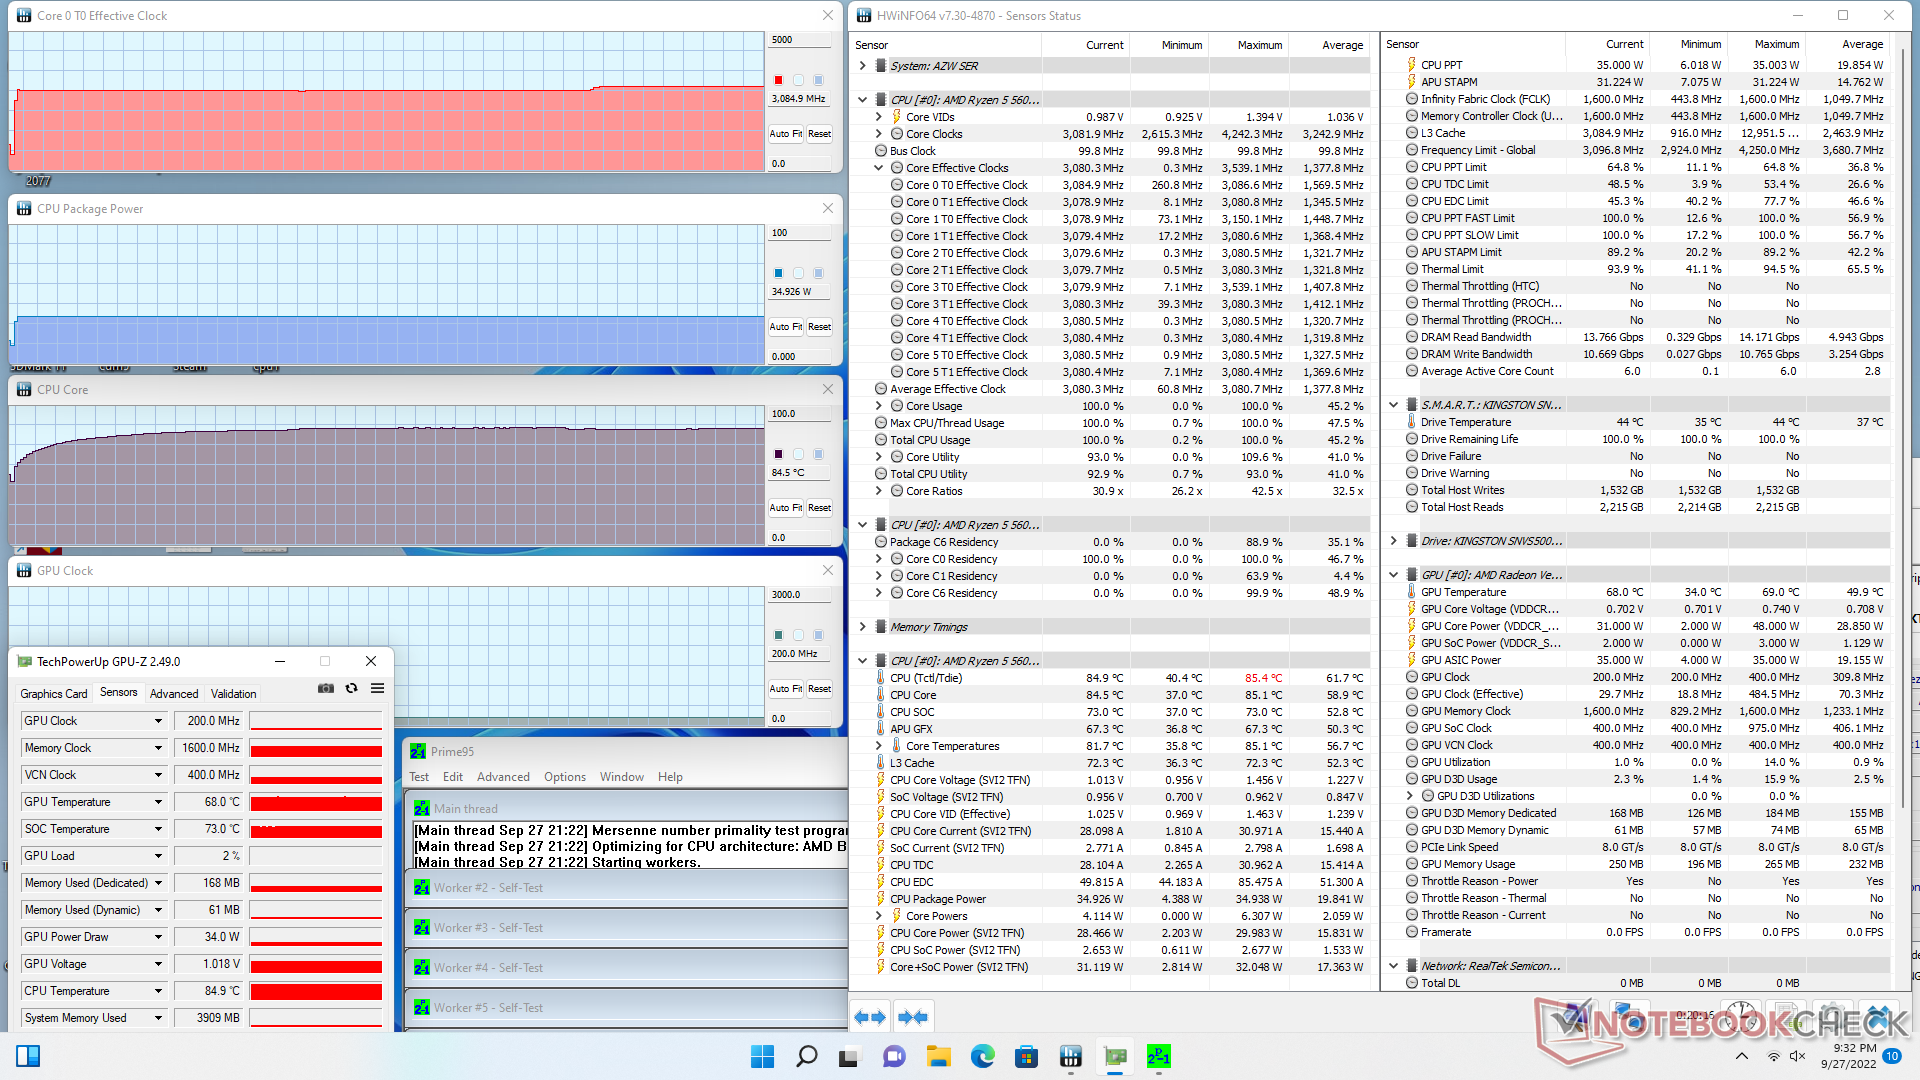
CPU kloksnelheden en board power draw zouden zich stabiliseren op respectievelijk 3,0 GHz en 35 W bij het opstarten van Prime95. 35 W is aan de lage kant van het spectrum voor de Ryzen 5 5600H en dus is het een beetje teleurstellend om geen hogere TDP doelen te zien op de SER5. De kerntemperatuur is met 85 C al vrij hoog, wat de lage 35 W rating kan verklaren.
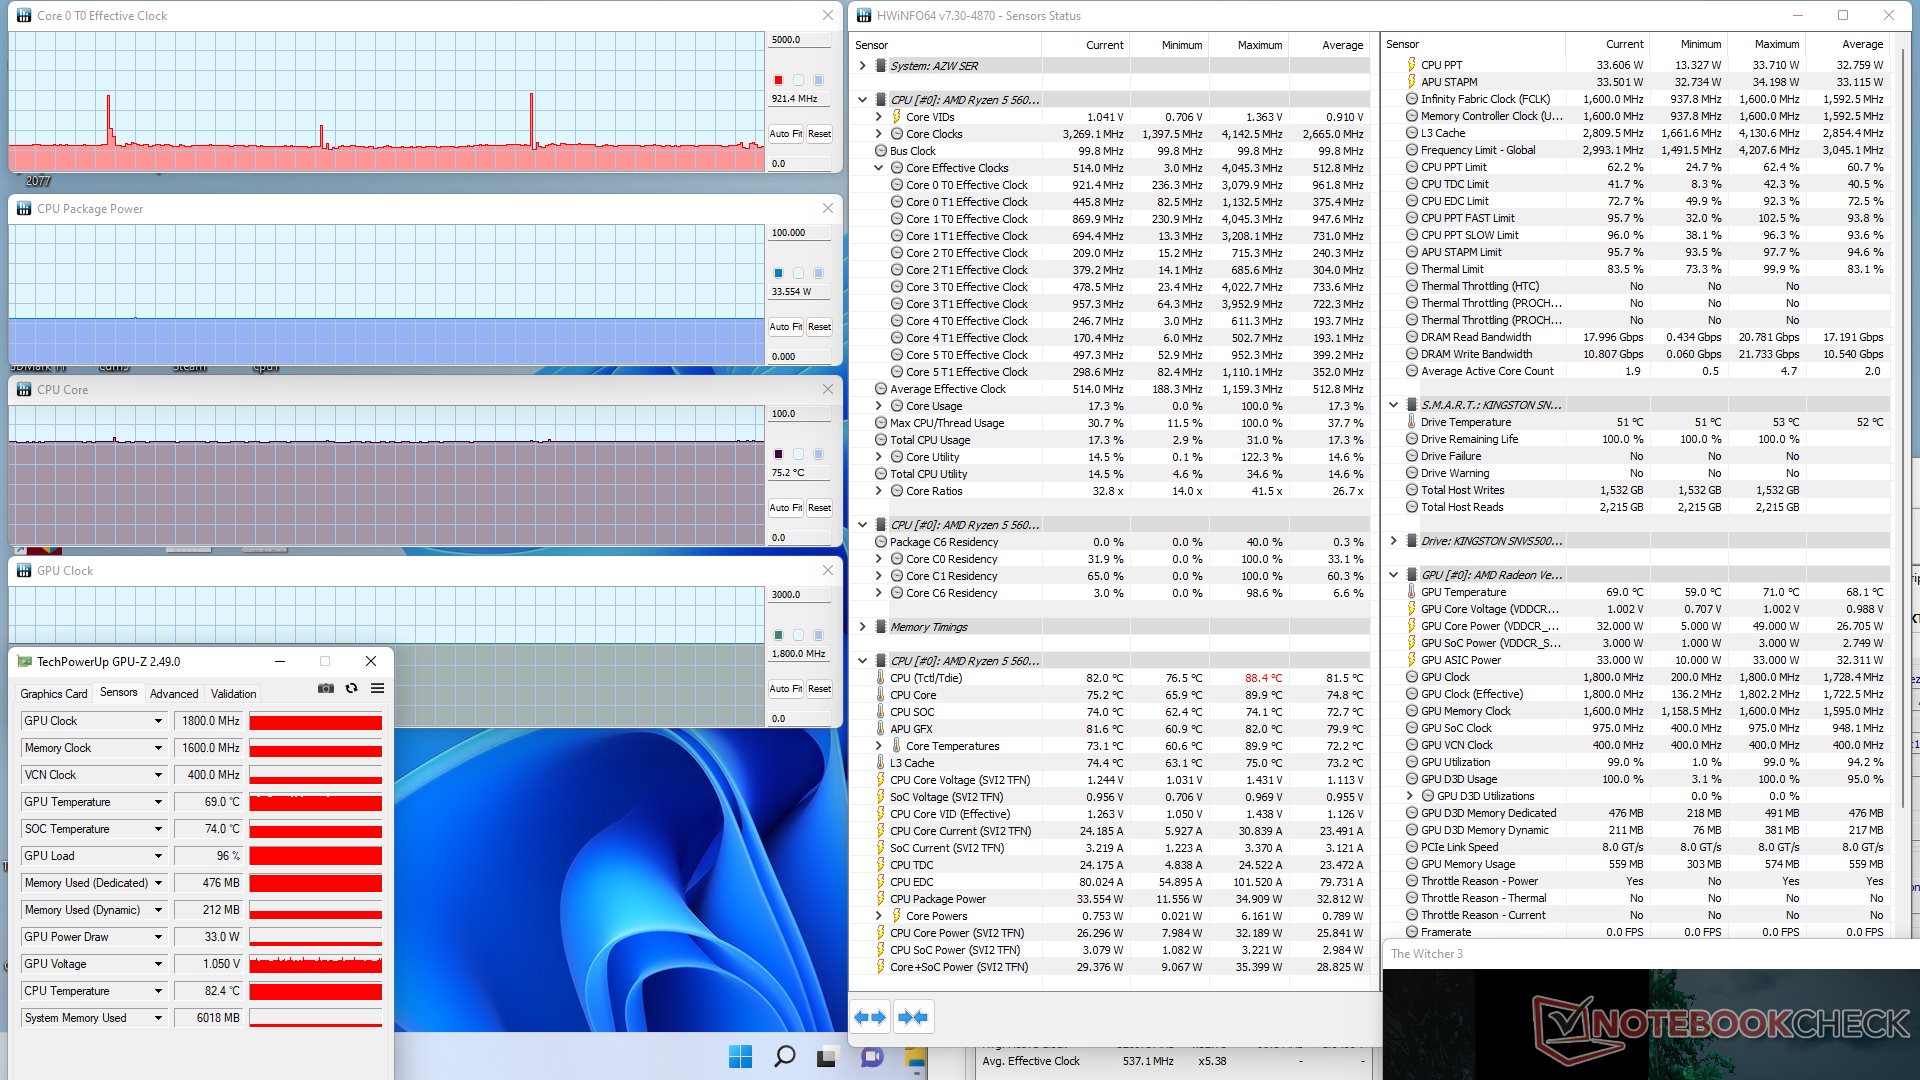
Met Witcher 3 zou resulteren in een kerntemperatuur van 75 C vergeleken met 57 C op de Intel NUC11PAQ. Het Beelink systeem loopt iets warmer dan de Intel in de meeste omstandigheden.
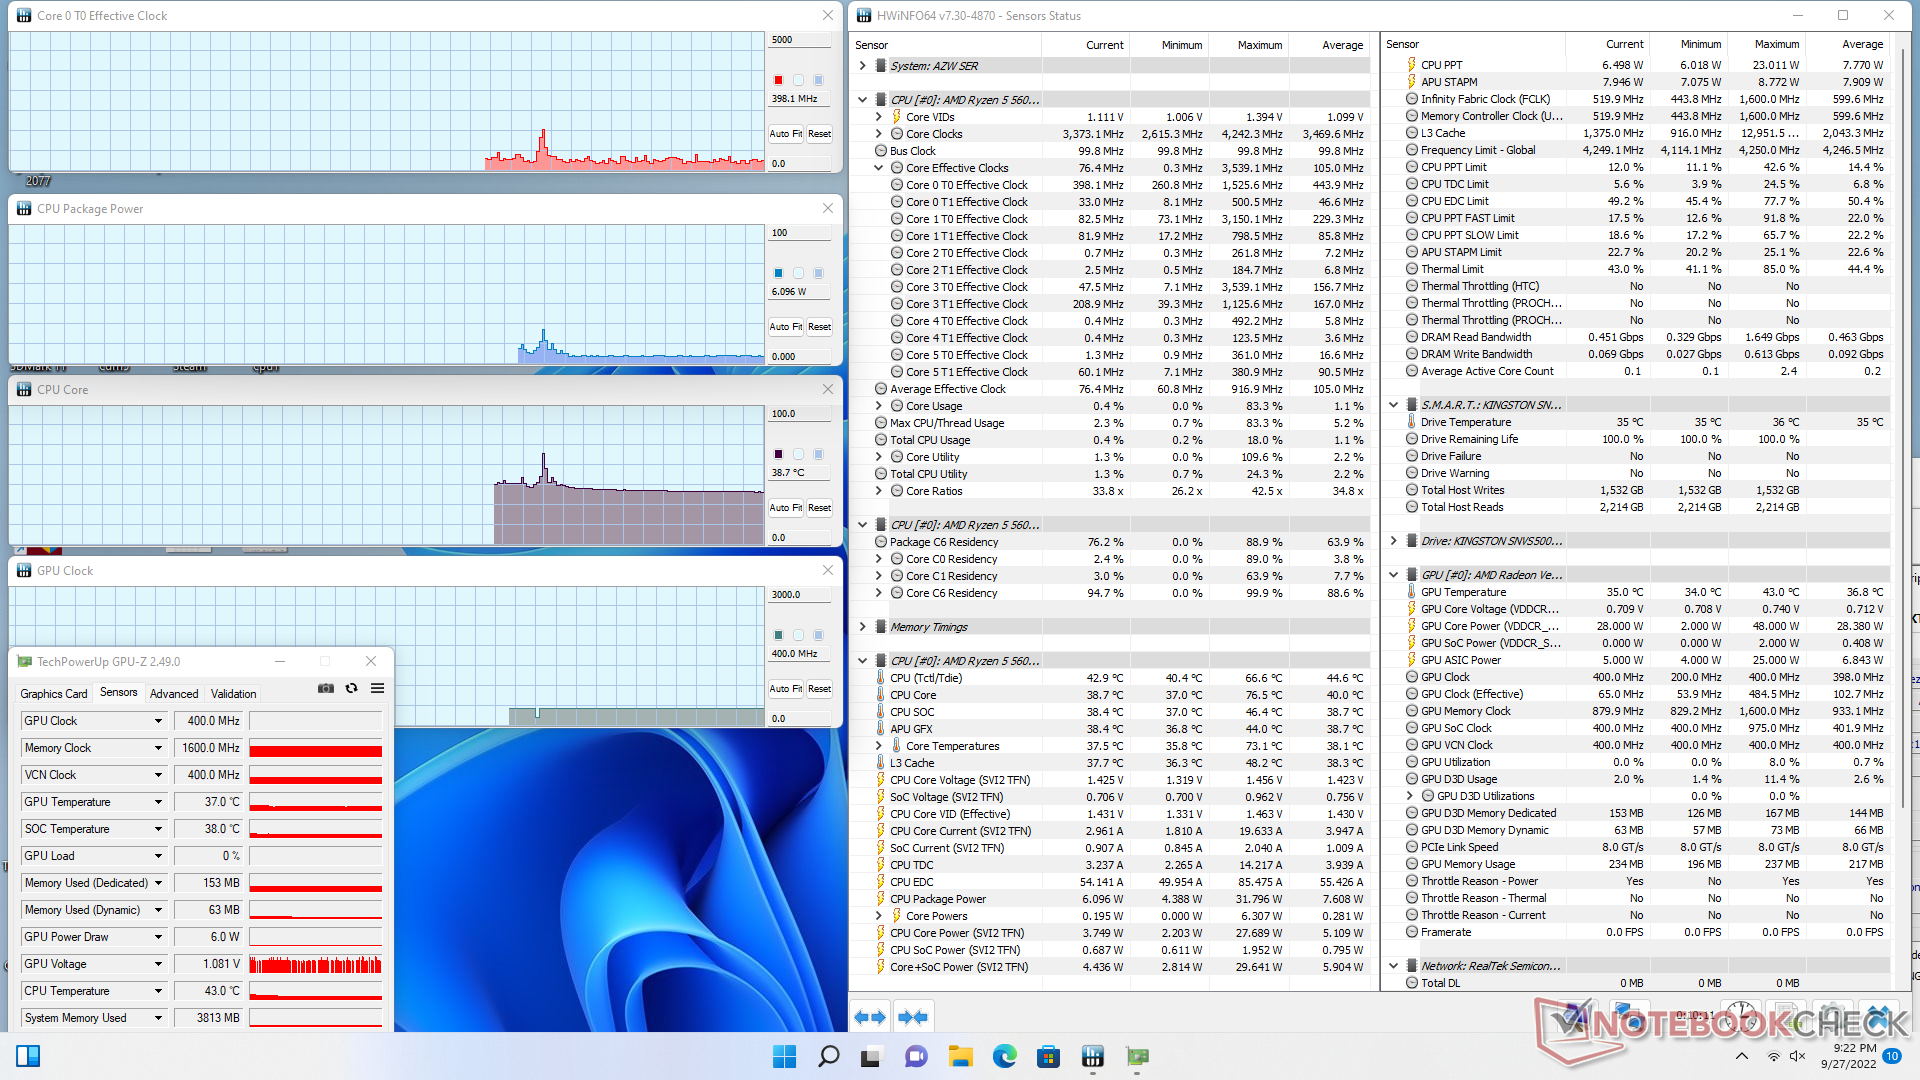
| CPU Klok (GHz) | GPU Klok (MHz) | Gemiddelde CPU Temperatuur (°C) | |
| Systeem Idle | -- | -- | 39 |
| Prime95 Stress | 3.0 | -- | 85 |
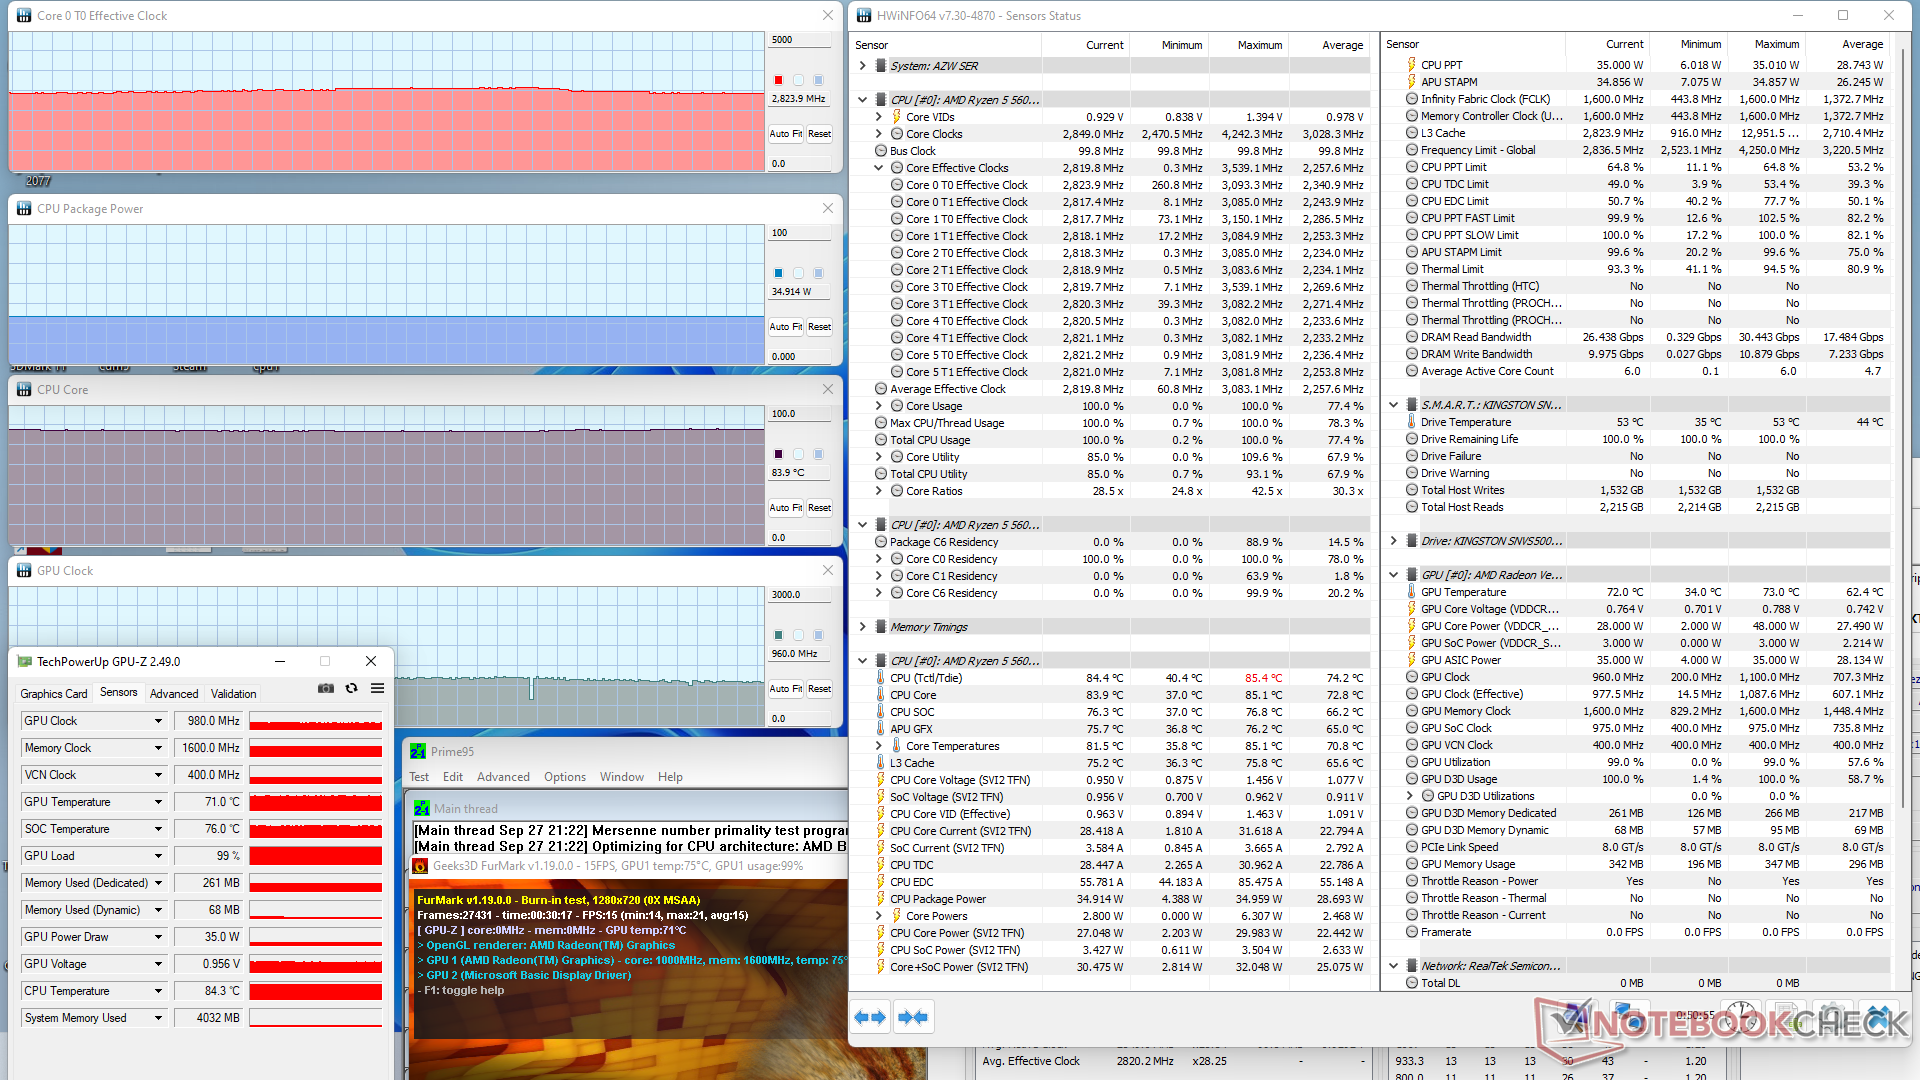
| Prime95 + FurMark Stress | 2.8 | 980 | 84 |
| Witcher 3 Stress | ~0.9 | 1800 | 75 |
Energiebeheer
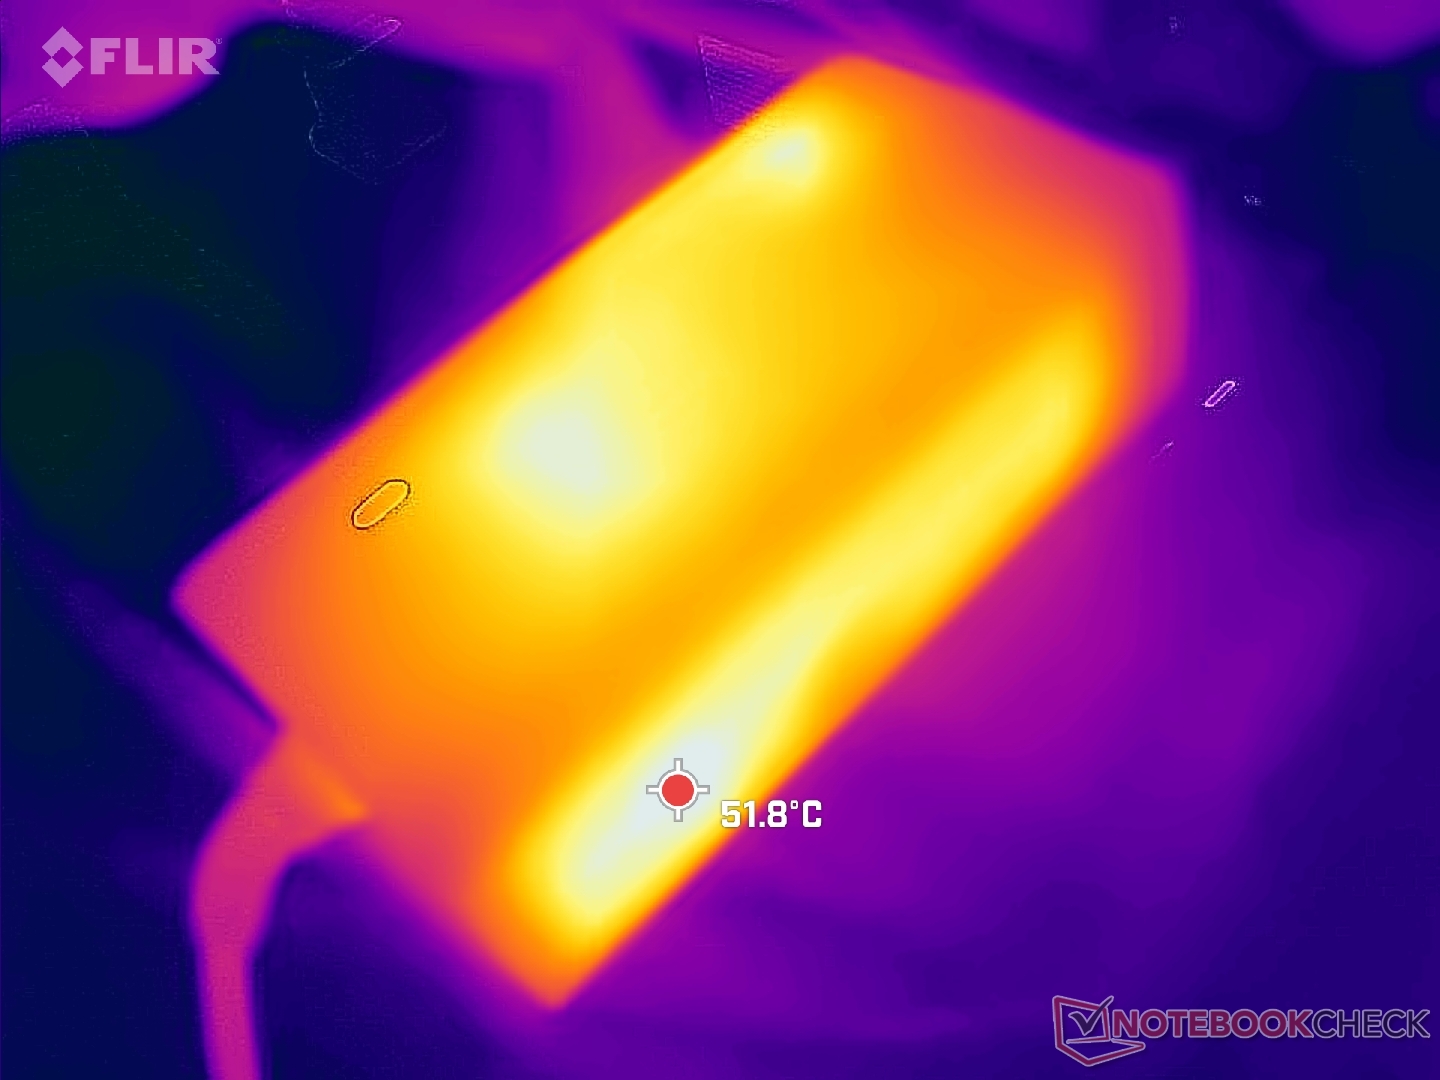
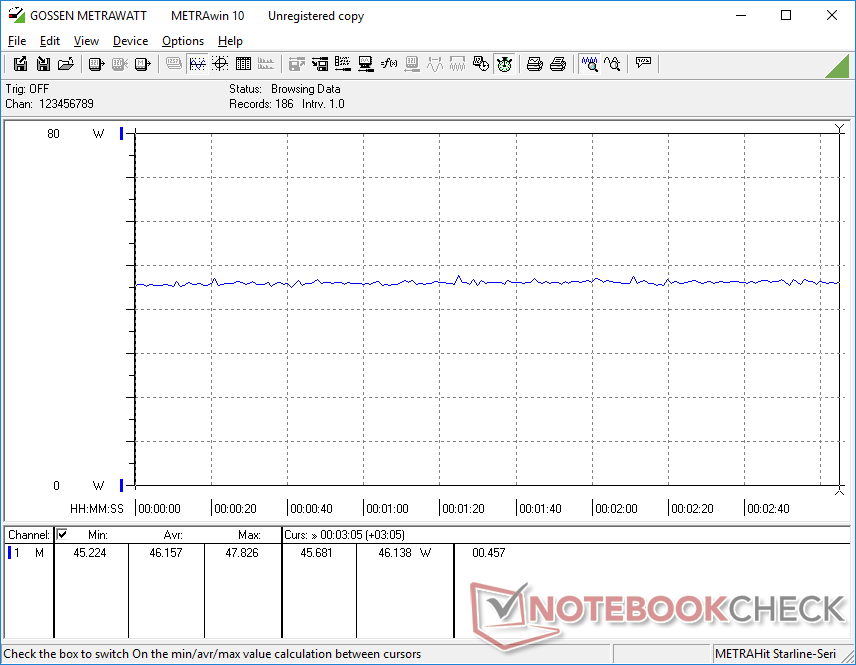
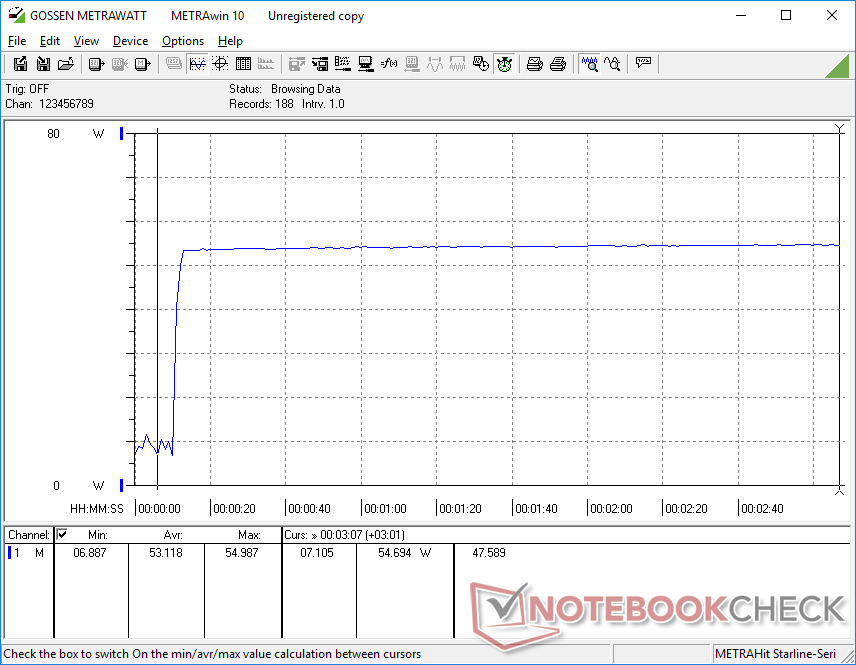
Stroomverbruik
Het stroomverbruik is over het algemeen hoger dan modellen die draaien op CPU's uit de Ryzen U-serie of Core U-serie, aangezien onze CPU uit de Ryzen H-serie zich richt op relatief hogere TDP-niveaus. De Intel NUC11 met de Core i5-1135G7zou bijvoorbeeld tussen 40 en 44 W vragen tijdens het gamen, vergeleken met 46 tot 50 W op onze Beelink. De prestaties per watt zijn nog steeds beter met de Ryzen 5 5600H, vooral in termen van multi-thread CPU prestaties
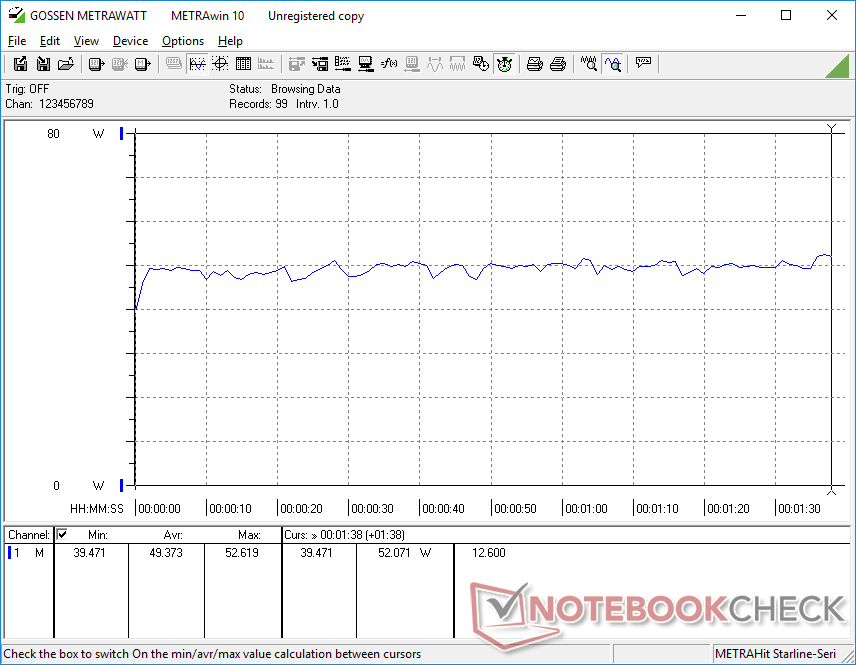
We zijn in staat om een maximale afname van 50,2 W te registreren van de kleine-medium (~10 x 4,9 x 3,3 cm) 57 W wall wart AC adapter wanneer de CPU op 100 procent gebruik staat. We vermoeden dat dit nog hoger kan oplopen als meerdere USB-apparaten of externe USB-C monitoren worden aangesloten.

| Uit / Standby | |
| Inactief | |
| Belasting |
|
Key:
min: | |
| Beelink SER Pro Ryzen 5 5600H R5 5600H, Vega 7, Kingston NV1 SNVS/500GCN, , x, | Beelink SEi11 Pro i5-11320H, Iris Xe G7 96EUs, Kingston NV1 SNVS/500GCN, , x, | Beelink GTR5 R9 5900HX, Vega 8, Kingston NV1 SNVS/500GCN, , x, | Intel NUC11TNKi5 i5-1135G7, Iris Xe G7 80EUs, Transcend M.2 SSD 430S TS512GMTS430S, , x, | Beelink SEi8 i3-8109U, Iris Plus Graphics 655, Intel SSD 660p SSDPEKNW512G8, , x, | Beelink SER4 R7 4800U, Vega 8, Intel SSD 660p SSDPEKNW512G8, , x, | |
|---|---|---|---|---|---|---|
| Power Consumption | -30% | -28% | -41% | -2% | 32% | |
| Idle Minimum * (Watt) | 5.4 | 9.8 -81% | 6.2 -15% | 11.5 -113% | 7.5 -39% | 4.1 24% |
| Idle Average * (Watt) | 8.2 | 10.3 -26% | 8.9 -9% | 12.4 -51% | 7.6 7% | 4.1 50% |
| Idle Maximum * (Watt) | 8.3 | 10.5 -27% | 9 -8% | 12.9 -55% | 9.2 -11% | 4.6 45% |
| Load Average * (Watt) | 49.3 | 54.2 -10% | 66.8 -35% | 40.7 17% | 41.1 17% | 35.6 28% |
| Witcher 3 ultra * (Watt) | 46.1 | 53.1 -15% | 62.6 -36% | 43.9 5% | 35.6 23% | |
| Load Maximum * (Watt) | 50.2 | 59 -18% | 81.6 -63% | 73.5 -46% | 41.4 18% | 39.9 21% |
* ... kleiner is beter
Power Consumption Witcher 3 / Stresstest
Power Consumption external Monitor
Pro
Contra
Verdict - Nog een uitstekend alternatief voor de Intel NUC11

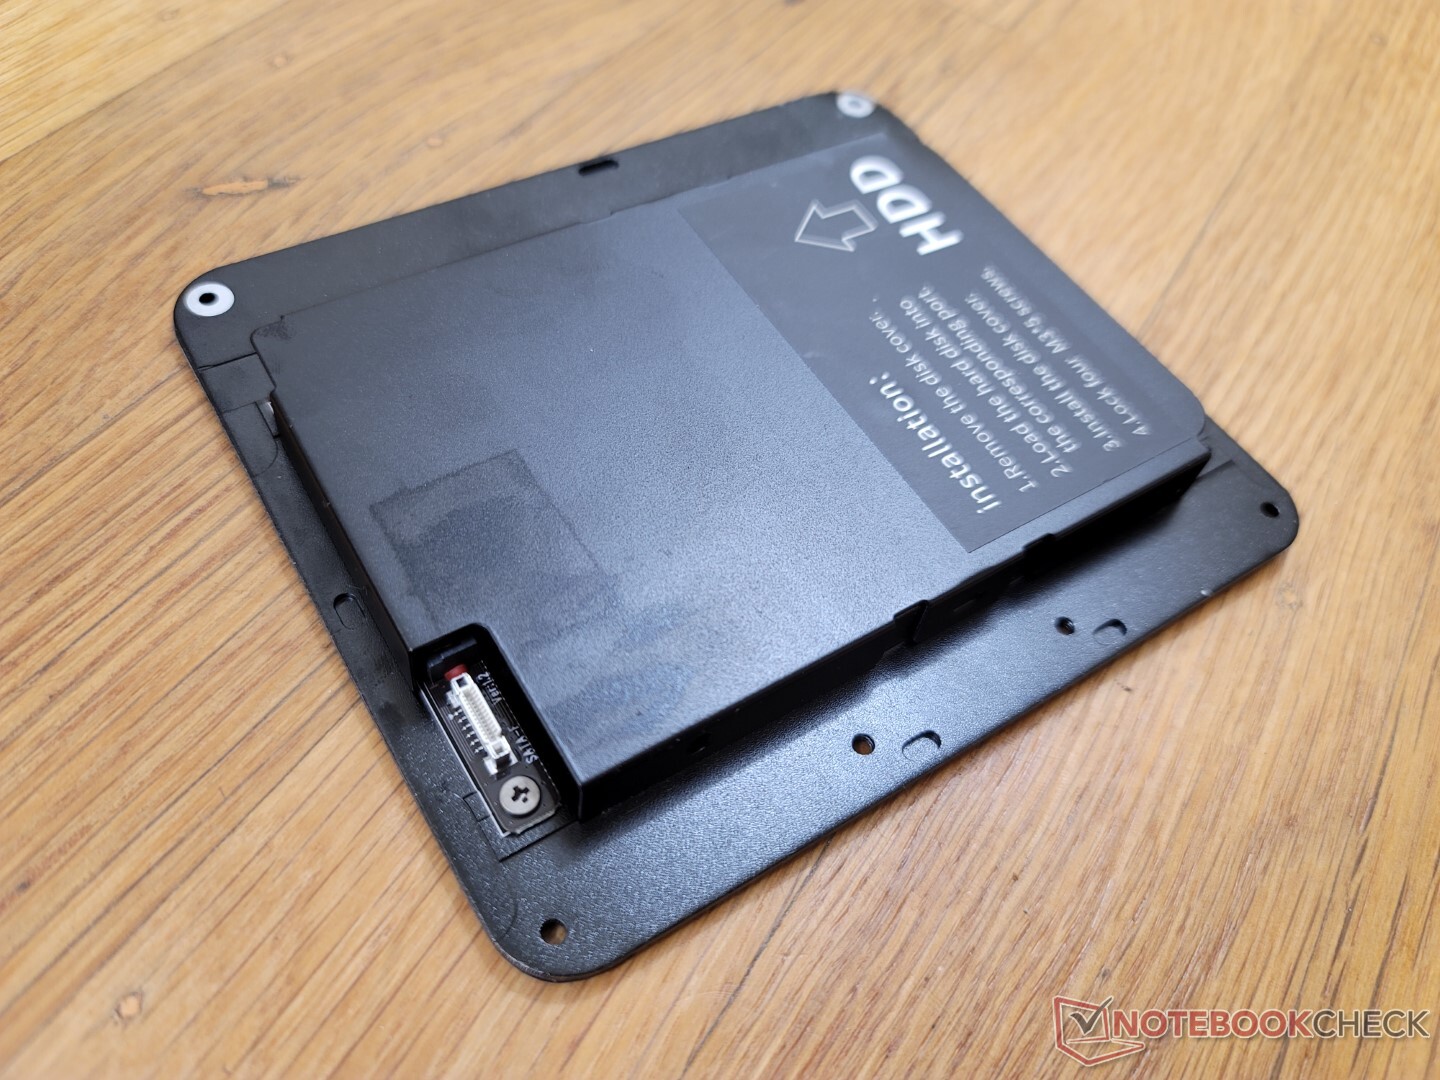
Voor ongeveer 450 USD is de Beelink SER5 Pro volledig uitgerust met 16 GB RAM, 500 GB opslagruimte en een gelicentieerd exemplaar van Windows 11 Pro. Een Intel NUC11PAHi7 met dezelfde opslag- en RAM-capaciteit kost daarentegen bijna 900 dollar. De SER5 biedt zelfs snellere processorprestaties dan de Intel en veel van dezelfde opwaardeerbare opties, waaronder SODIMM en dubbele opslag. Als u een paar honderd dollar wilt besparen, dan moet de Beelink hoog op uw lijstje staan.
De Beelink SER5 Pro is honderden dollars goedkoper dan een Intel NUC met vergelijkbare prestaties. Bedrijven kunnen nog steeds de voorkeur geven aan de betrouwbaarheid van de NUC, maar de meeste thuisgebruikers zullen de meer betaalbare Beelink willen overwegen.
Er zijn een aantal bezuinigingen, maar die hebben geen invloed op de gebruikerservaring. In vergelijking met de Intel NUC mist de SER5 Pro Thunderbolt, een anti-diefstal slot, PCIe4 SSD ondersteuning, drie jaar fabrieksgarantie en een sterker chassisframe. De NUC kan nog steeds de betere investering zijn als dergelijke functies belangrijk voor je zijn, maar de prijsbesparingen zijn anders aanzienlijk.
Prijs en beschikbaarheid
De Beelink SER5 is nu beschikbaar op Amazon voor iets minder dan $400 USD.
Price comparison

