Beelink GTR6 Ryzen 9 6900HX mini PC review: Sneller dan de meeste Intel NUC's

In tegenstelling tot de kleinere Beelink SEi of SER series aangedreven door U-serie processoren, bestaat de GTR serie uit modellen aangedreven door snellere H-serie processoren. De GTR6 volgt direct de oudere GTR5 op met zowel een opgewaardeerde CPU (Zen 3 Ryzen 9 5900HX naar Zen 3+ Ryzen 9 6900HX) als een licht herontwerp van het chassis. Onze onderstaande benchmarks laten zien dat het een van de snelste mini PC's is in Beelink's uitgebreide line-up.
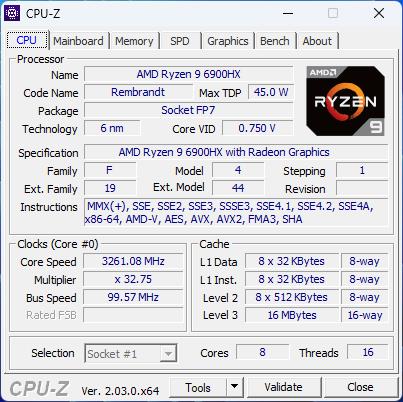
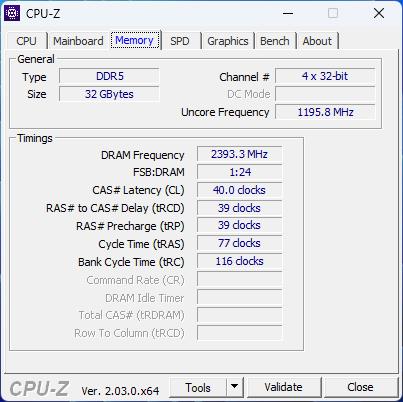
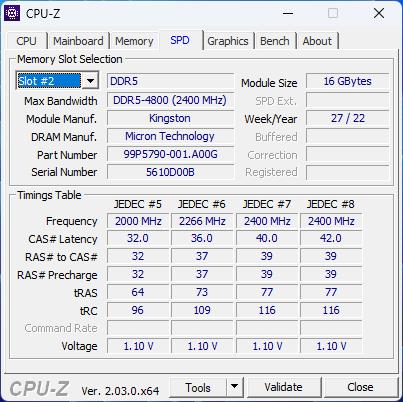
Onze unit in review is een volledig geconfigureerde GTR6 compleet met 32 GB RAM en 512 GB NVMe SSD voor ongeveer $750 USD. Alle opties worden geleverd met dezelfde Ryzen 9 6900HX CPU en geïntegreerde Radeon 680M GPU. De GTR6 concurreert rechtstreeks met Intel NUC's met geïntegreerde graphics.
Meer Beelink reviews:
Potentiële concurrenten in vergelijking
Evaluatie | Datum | Model | Gewicht | Hoogte | Formaat | Resolutie | Beste prijs |
|---|---|---|---|---|---|---|---|
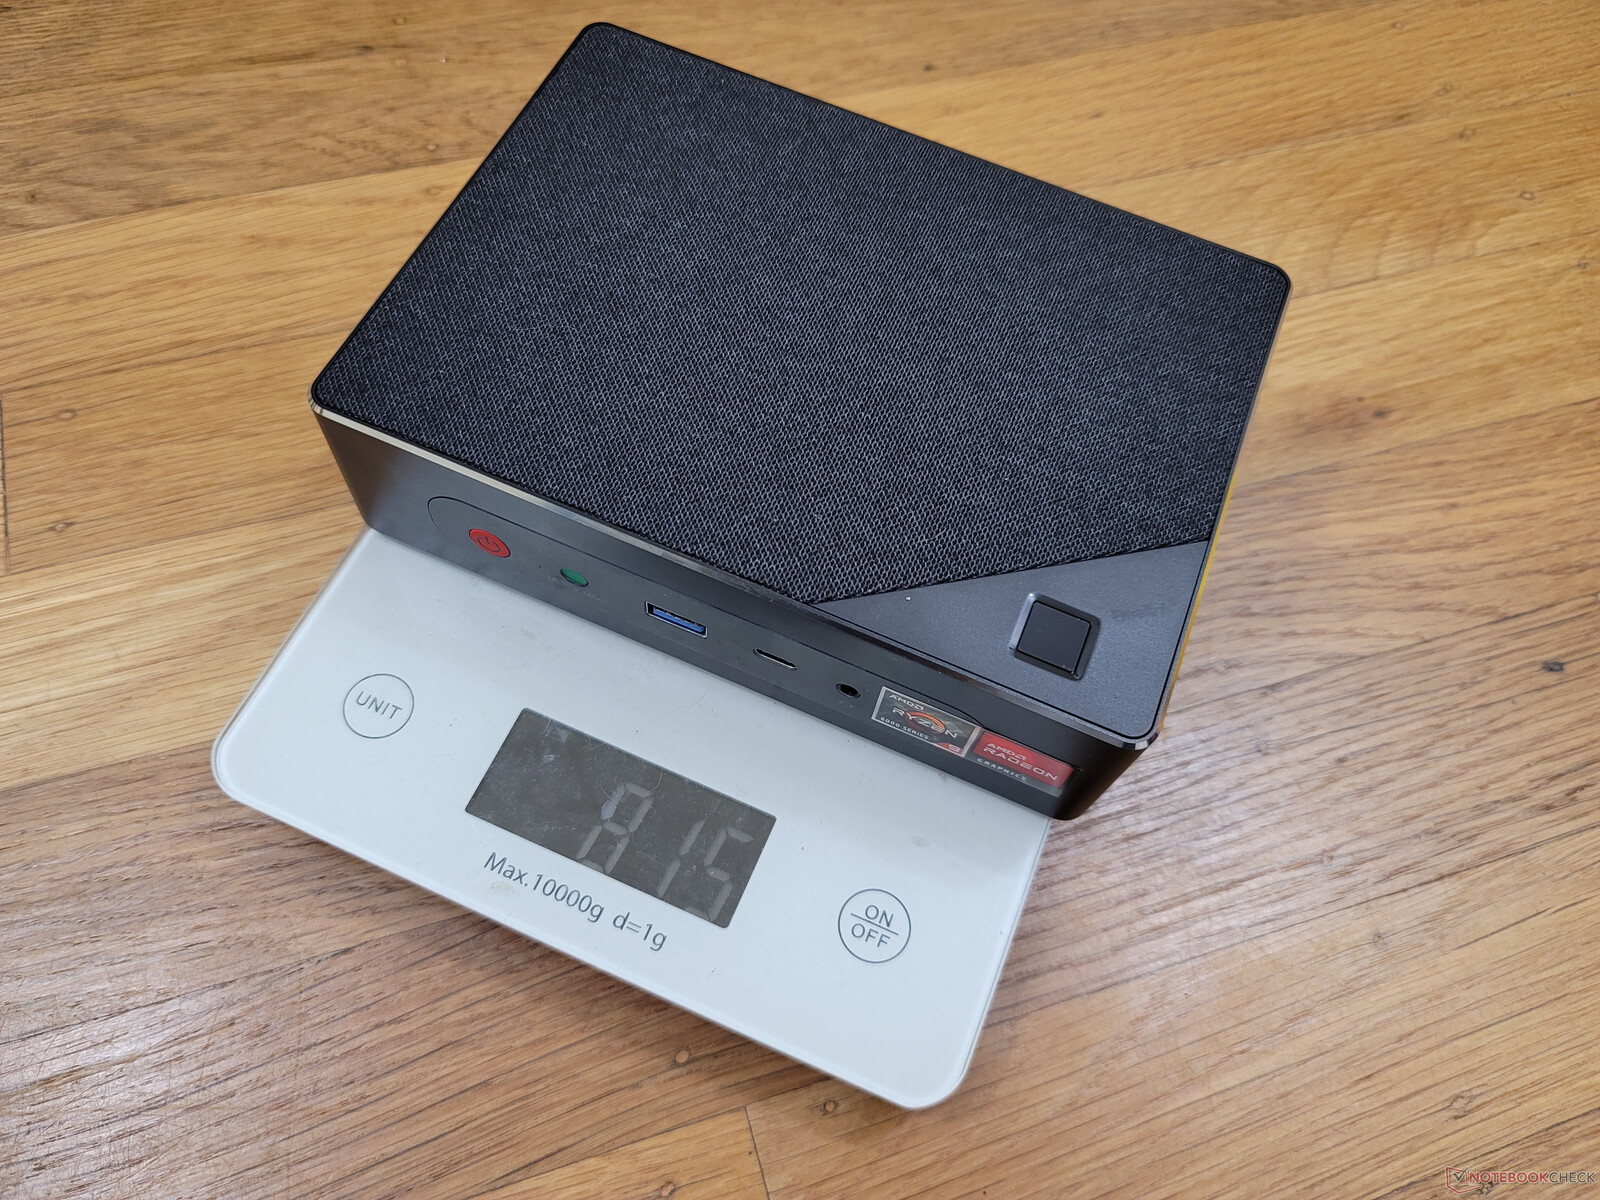
v (old) | 11-2022 | Beelink GTR6 R9 6900HX, Radeon 680M | 815 g | 43 mm | x | ||
v (old) | 09-2022 | Beelink SEi11 Pro i5-11320H, Iris Xe G7 96EUs | 440 g | 40 mm | x | ||
v (old) | 01-2022 | Beelink GTR5 R9 5900HX, Vega 8 | 686 g | 39 mm | x | ||
v (old) | 04-2021 | Intel NUC11PHKi7C i7-1165G7, GeForce RTX 2060 Mobile | 1.4 kg | 42 mm | x | ||
v (old) | 04-2021 | Intel NUC11TNKi5 i5-1135G7, Iris Xe G7 80EUs | 504 g | 37 mm | x | ||
v (old) | 03-2021 | GMK NucBox 2 i5-8259U, Iris Plus Graphics 655 | 430 g | 50 mm | x |
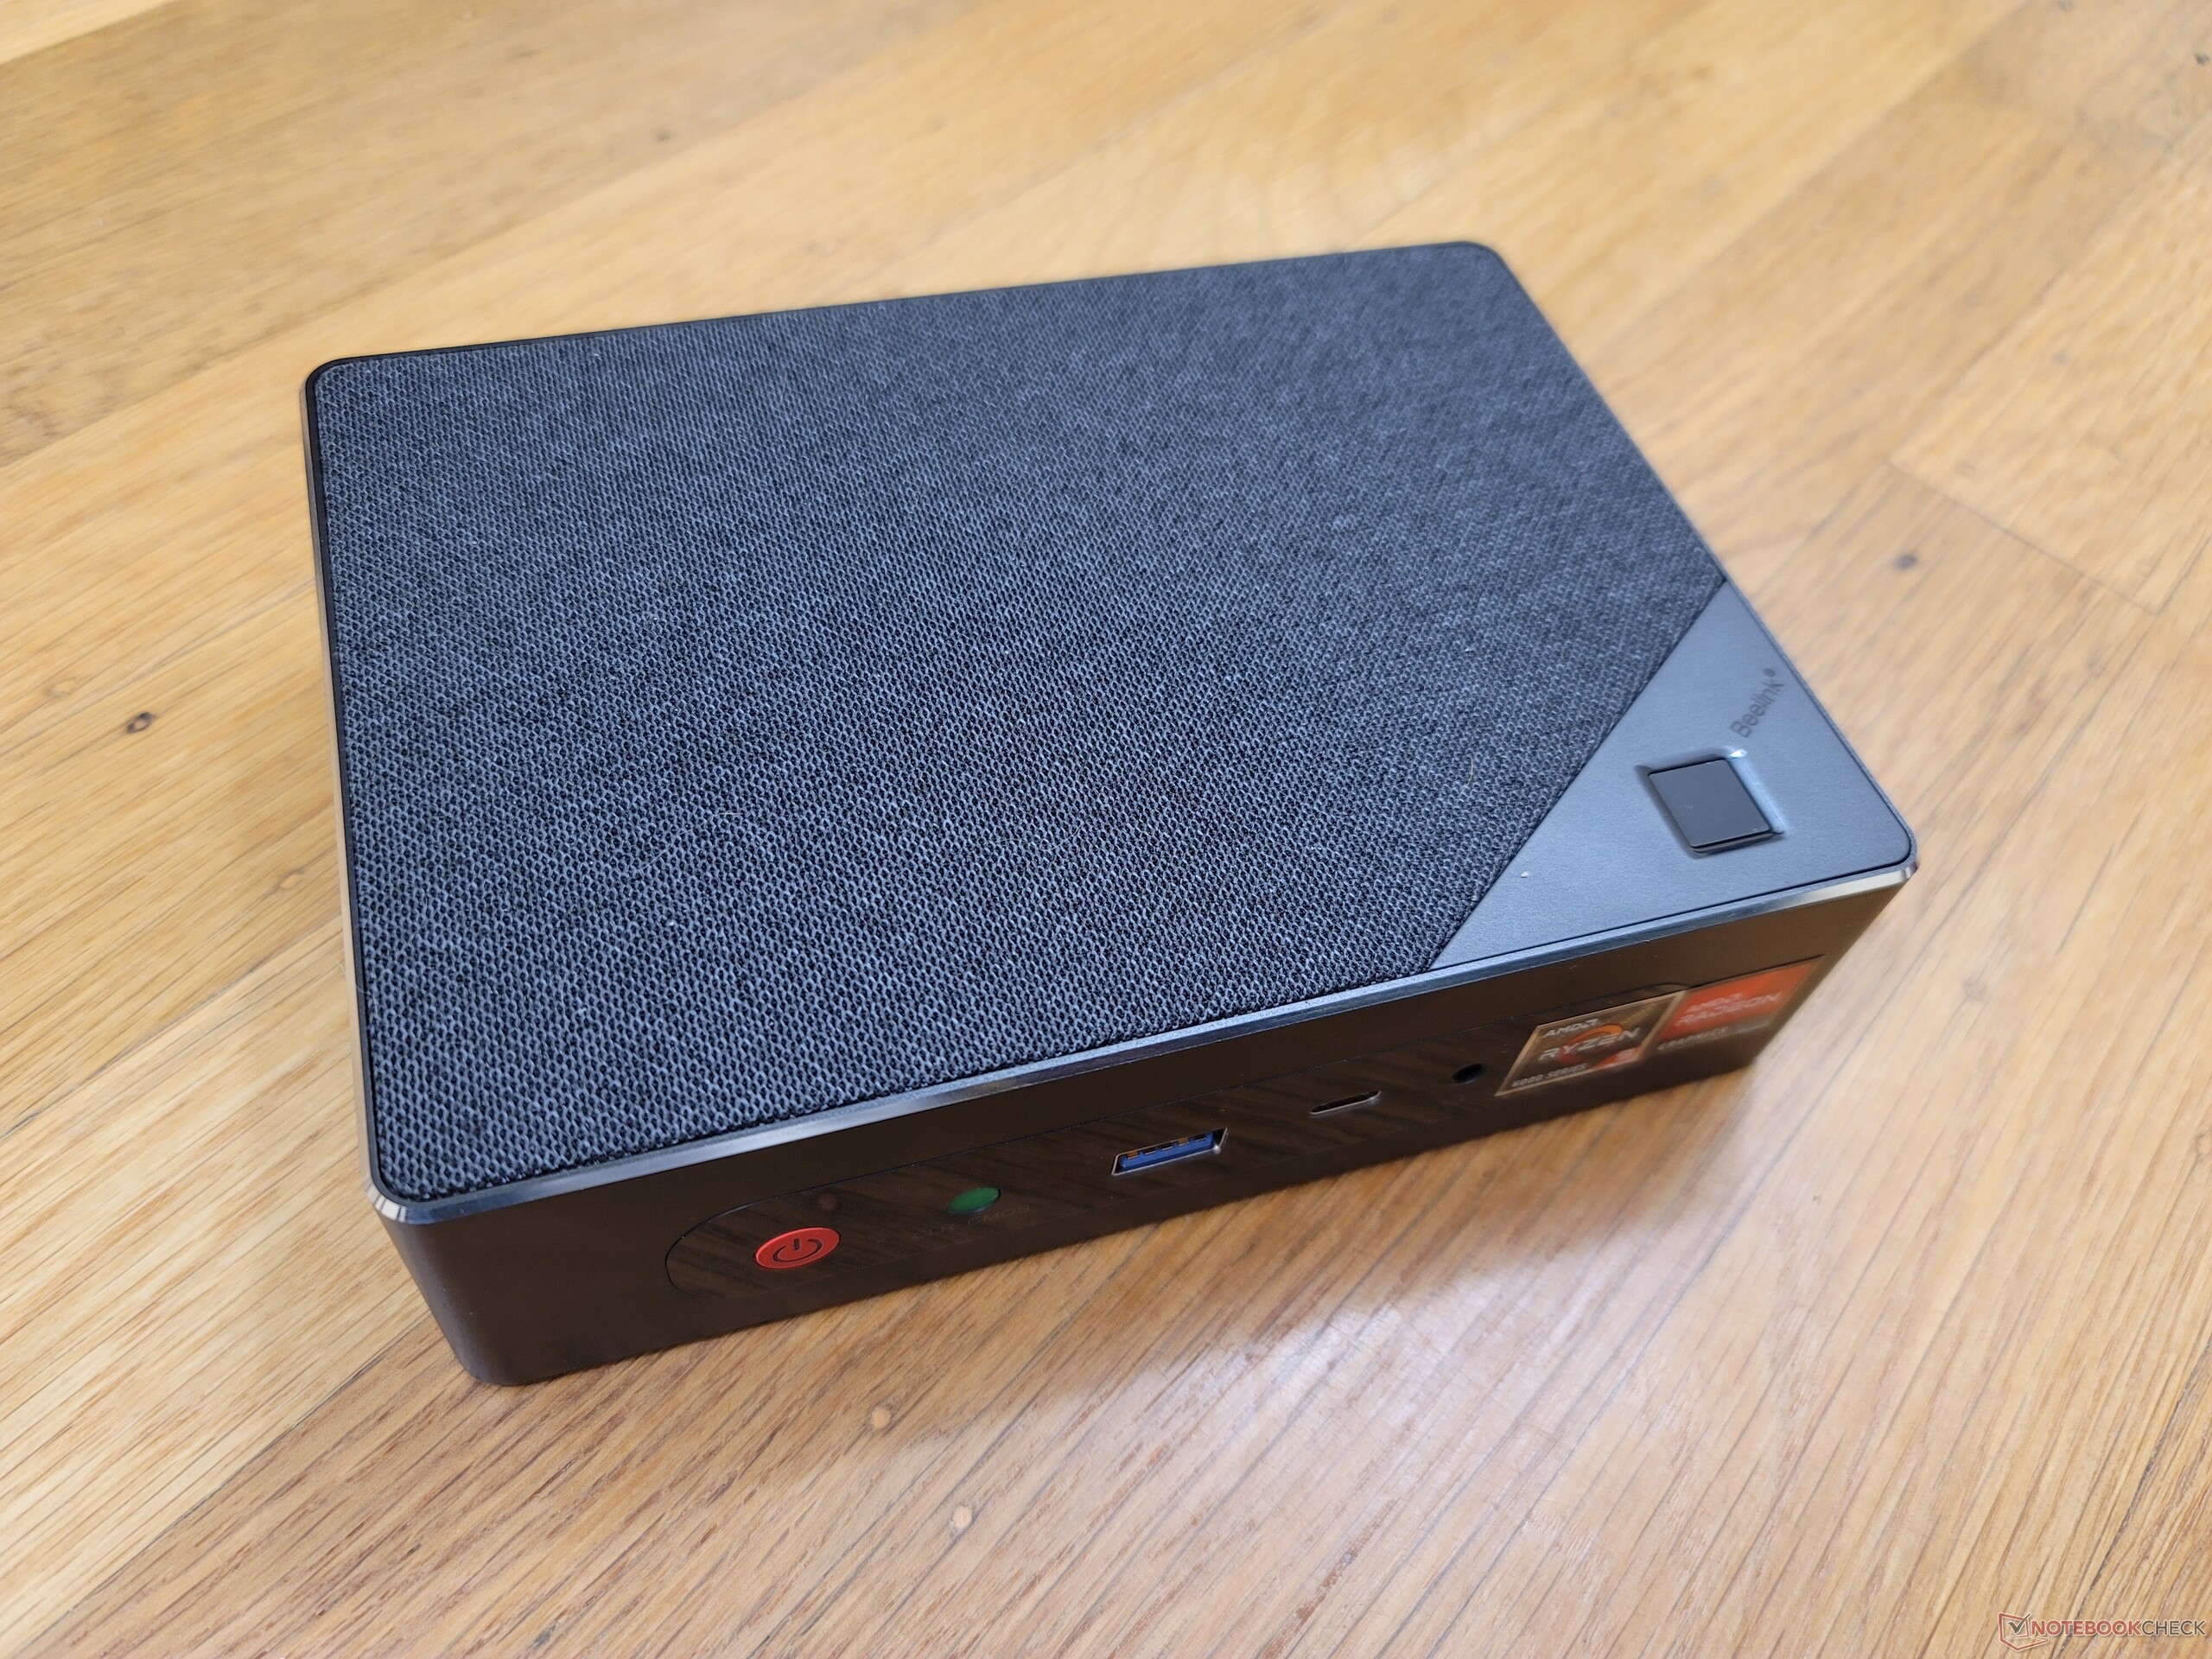
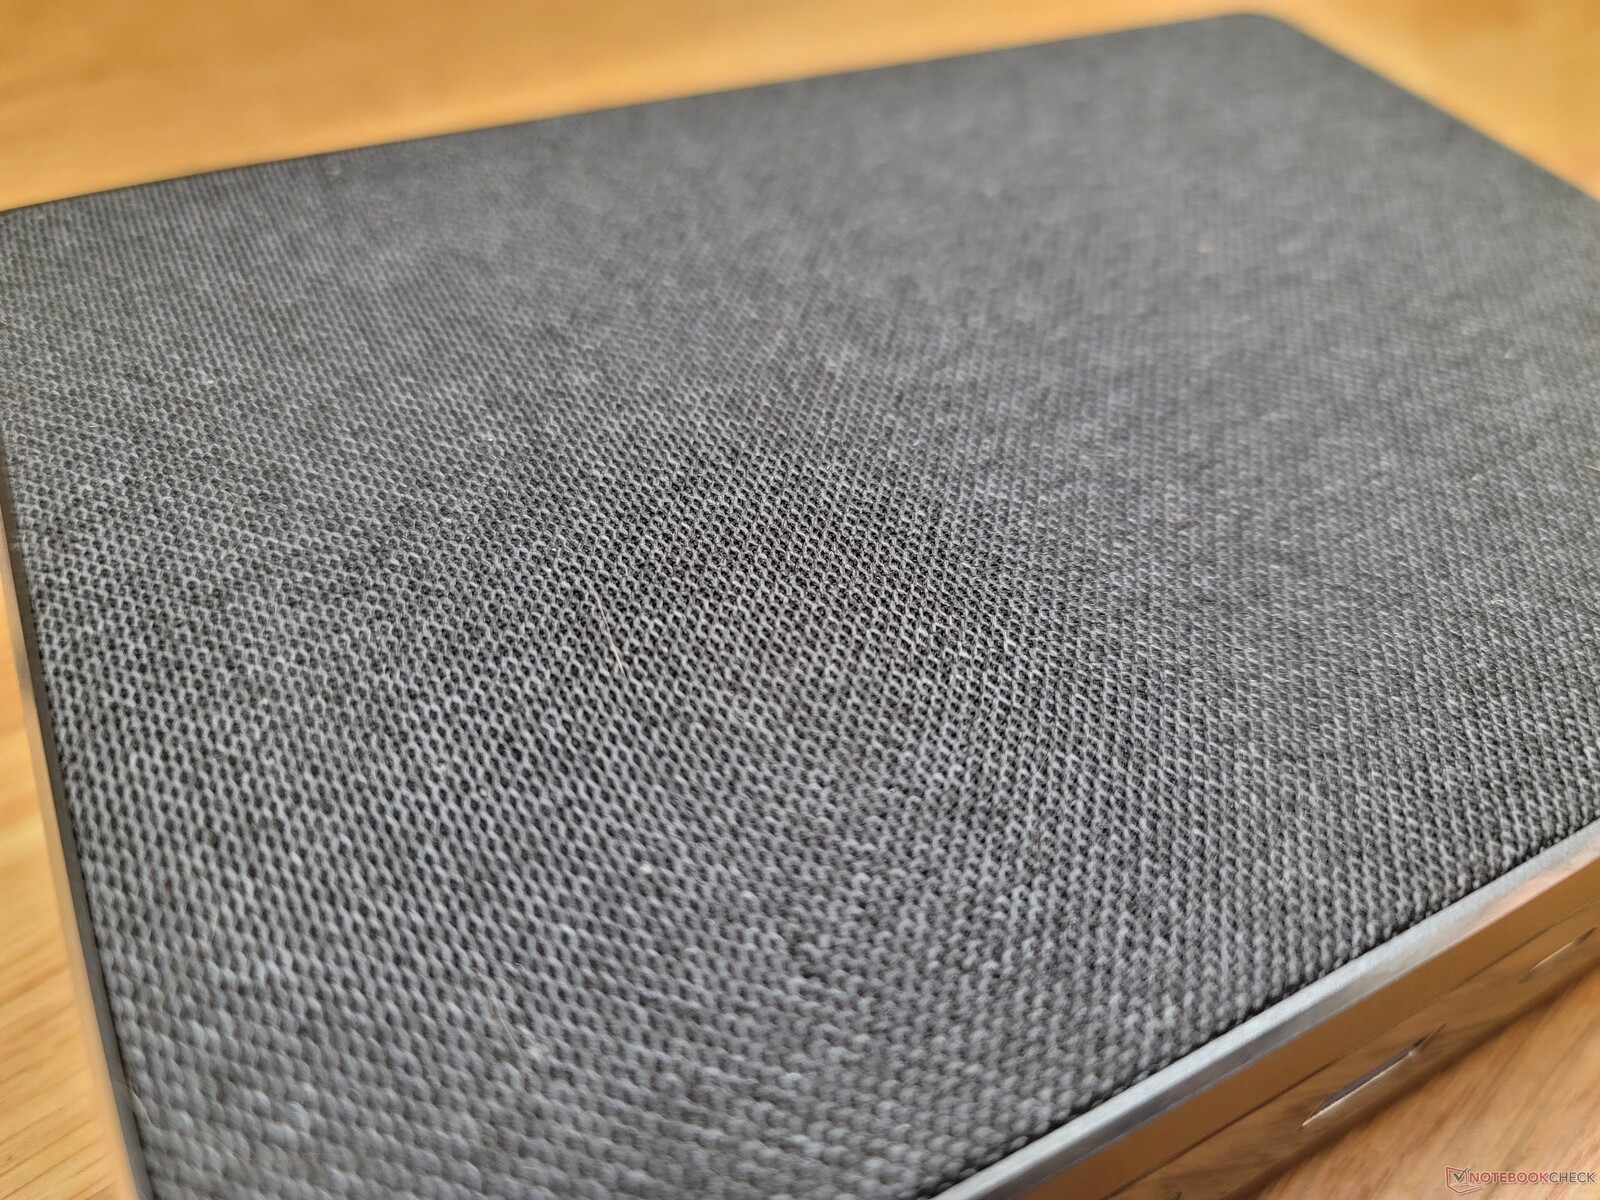
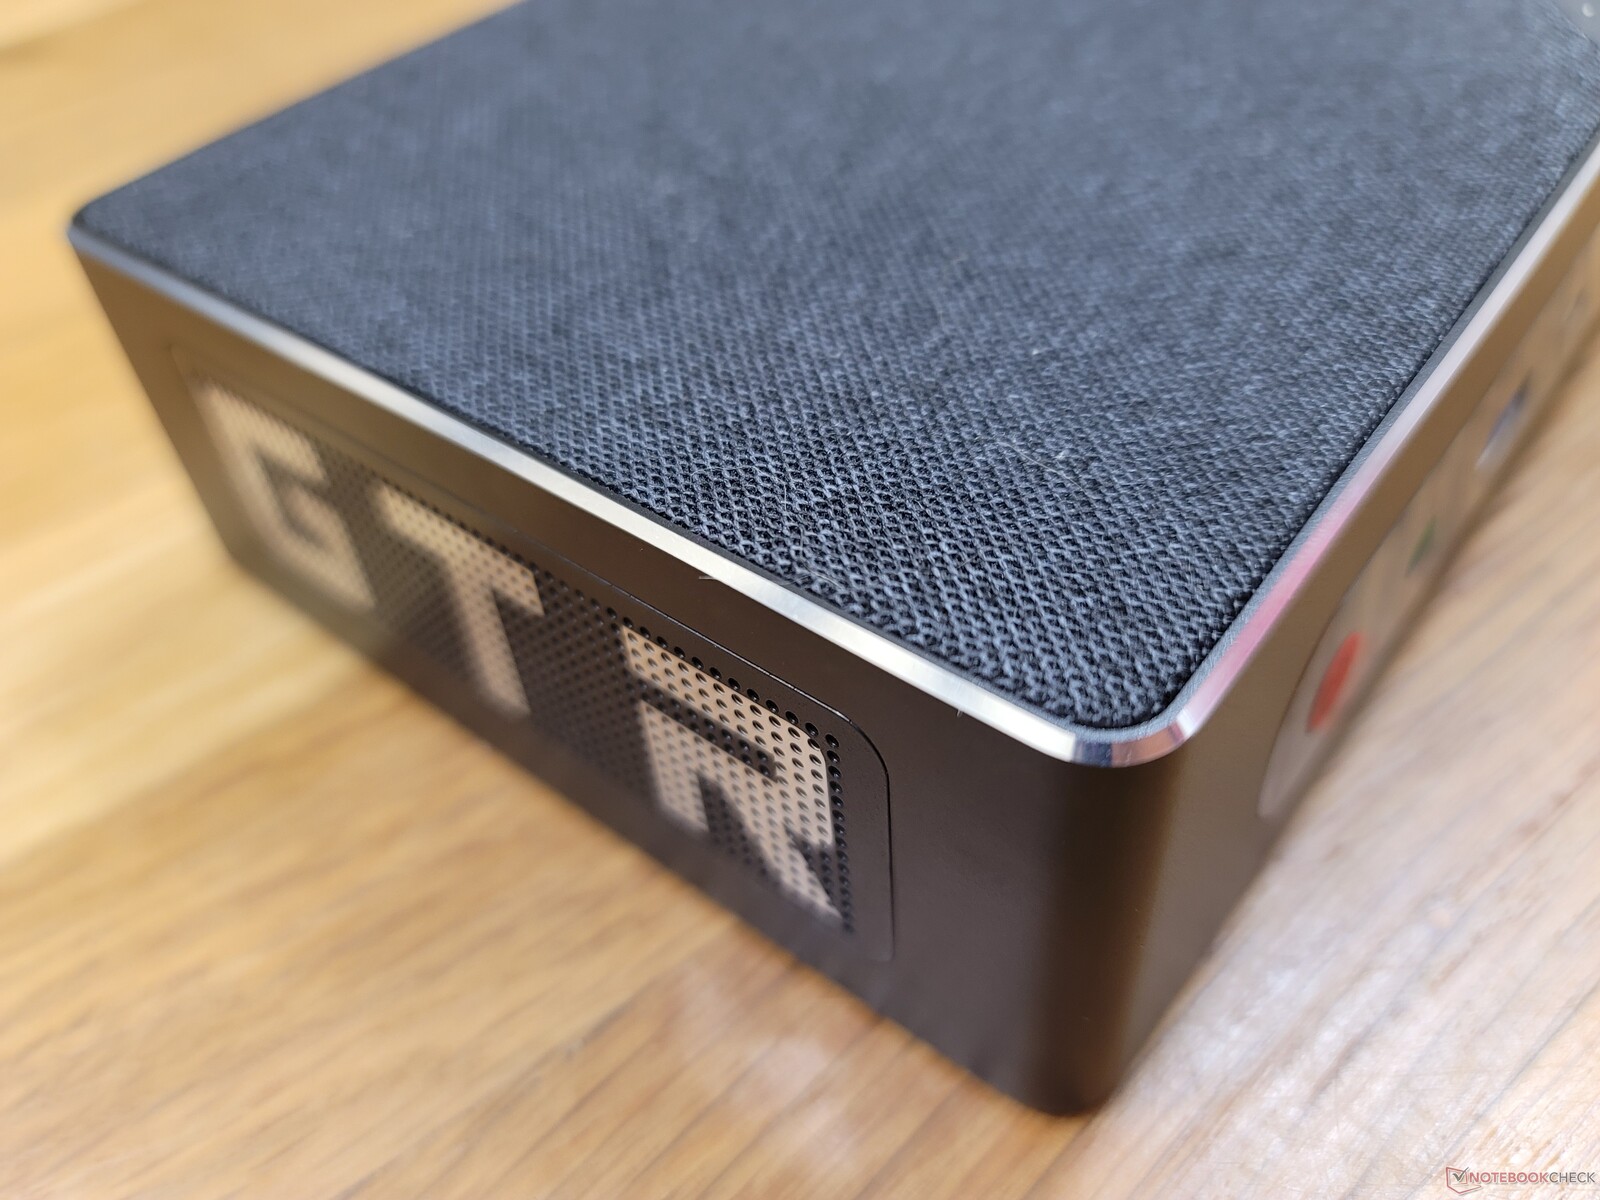
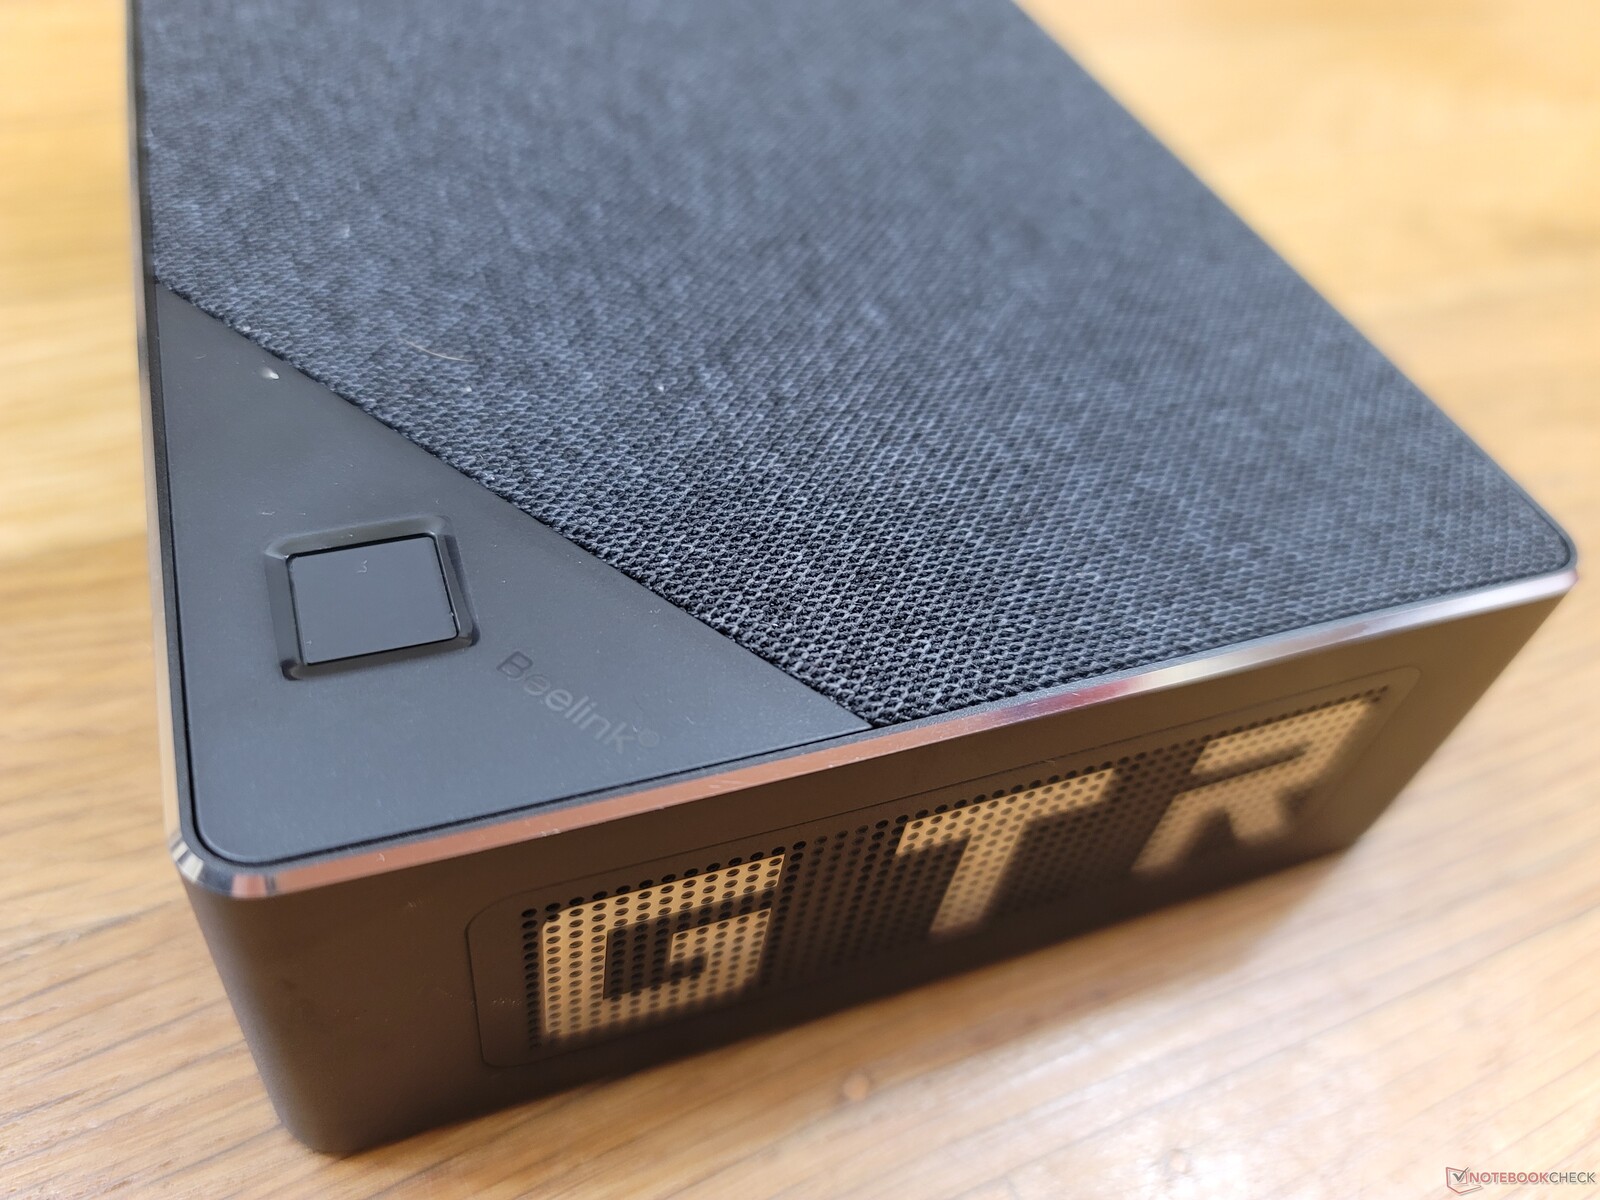
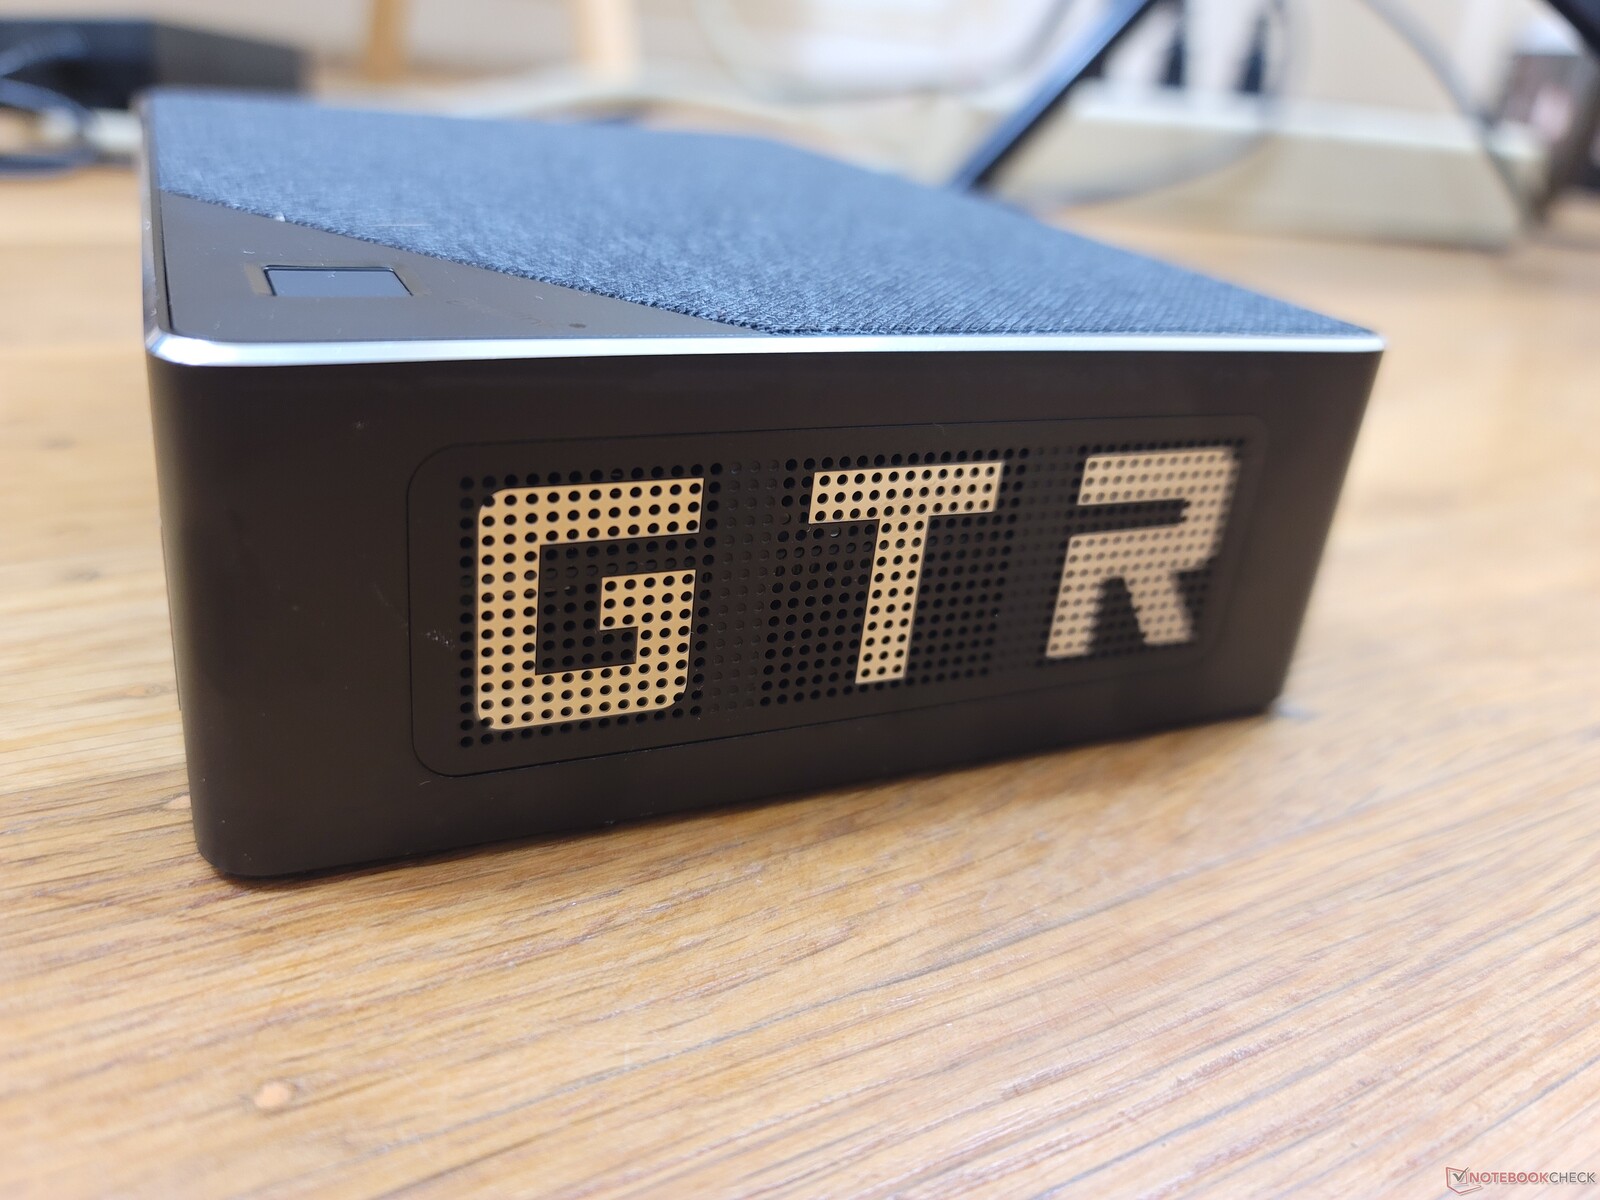
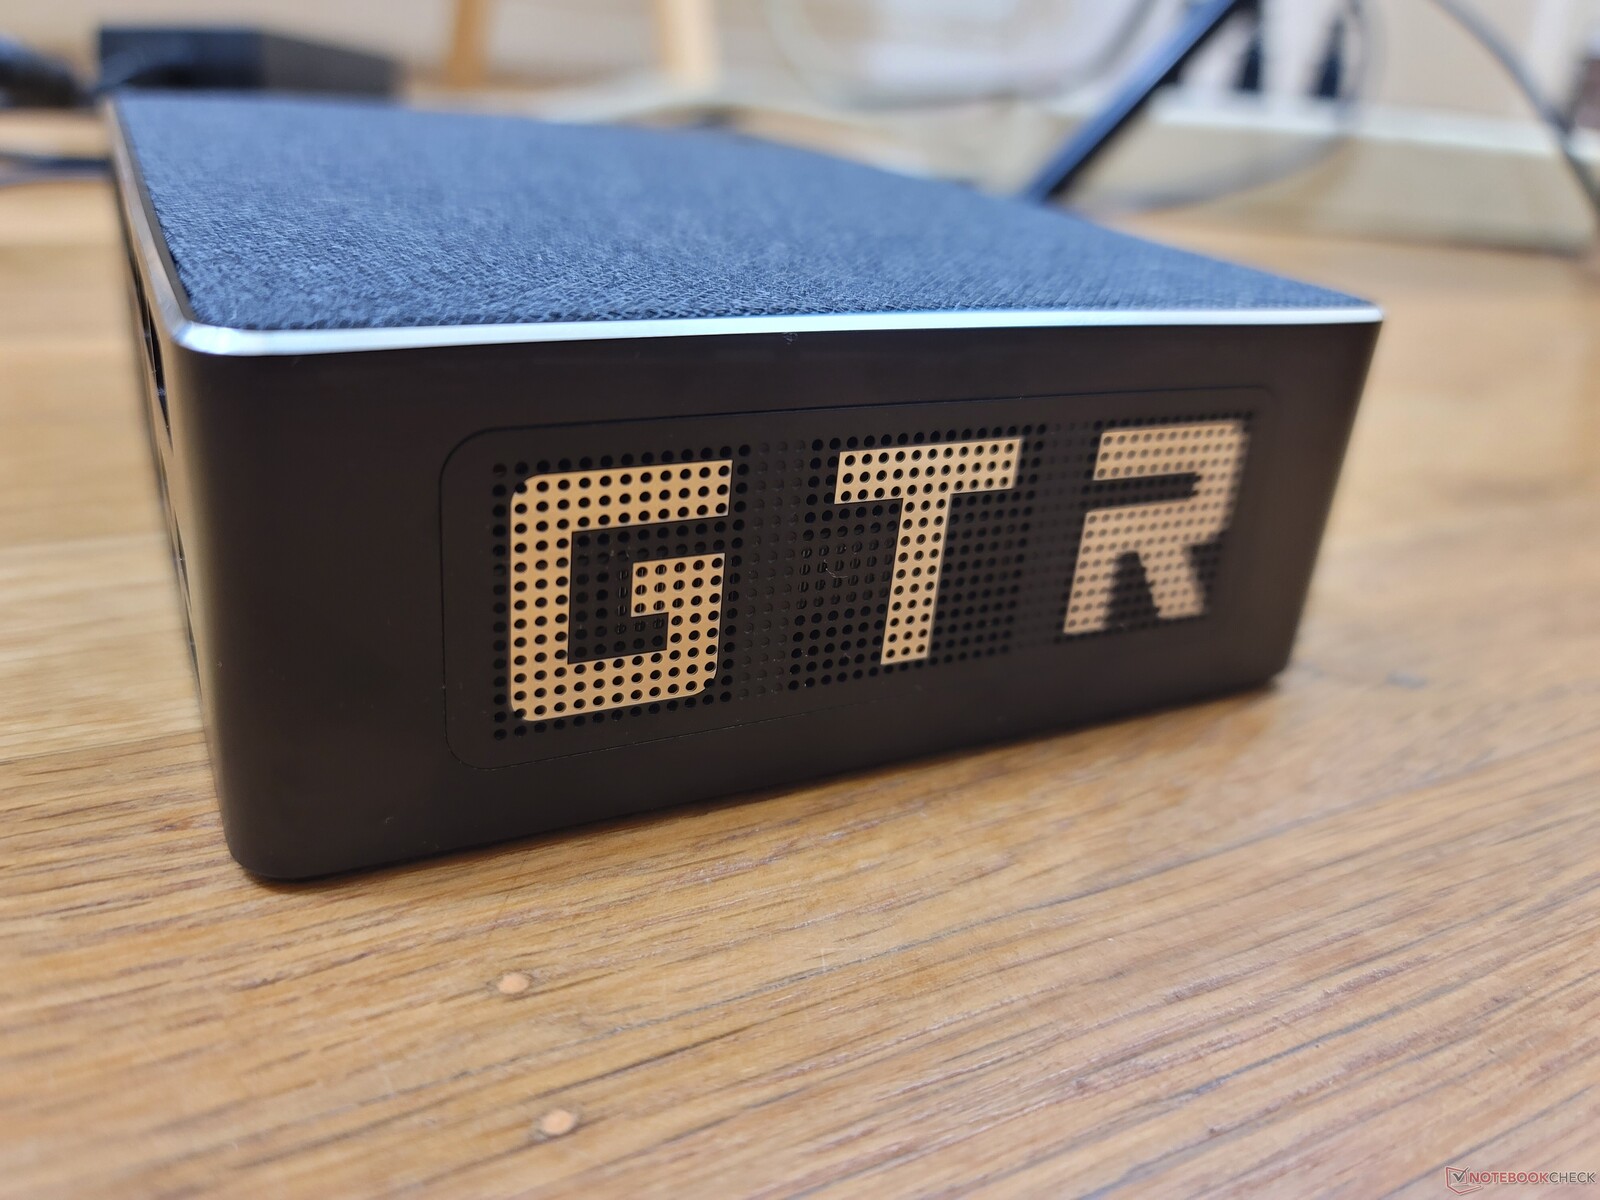
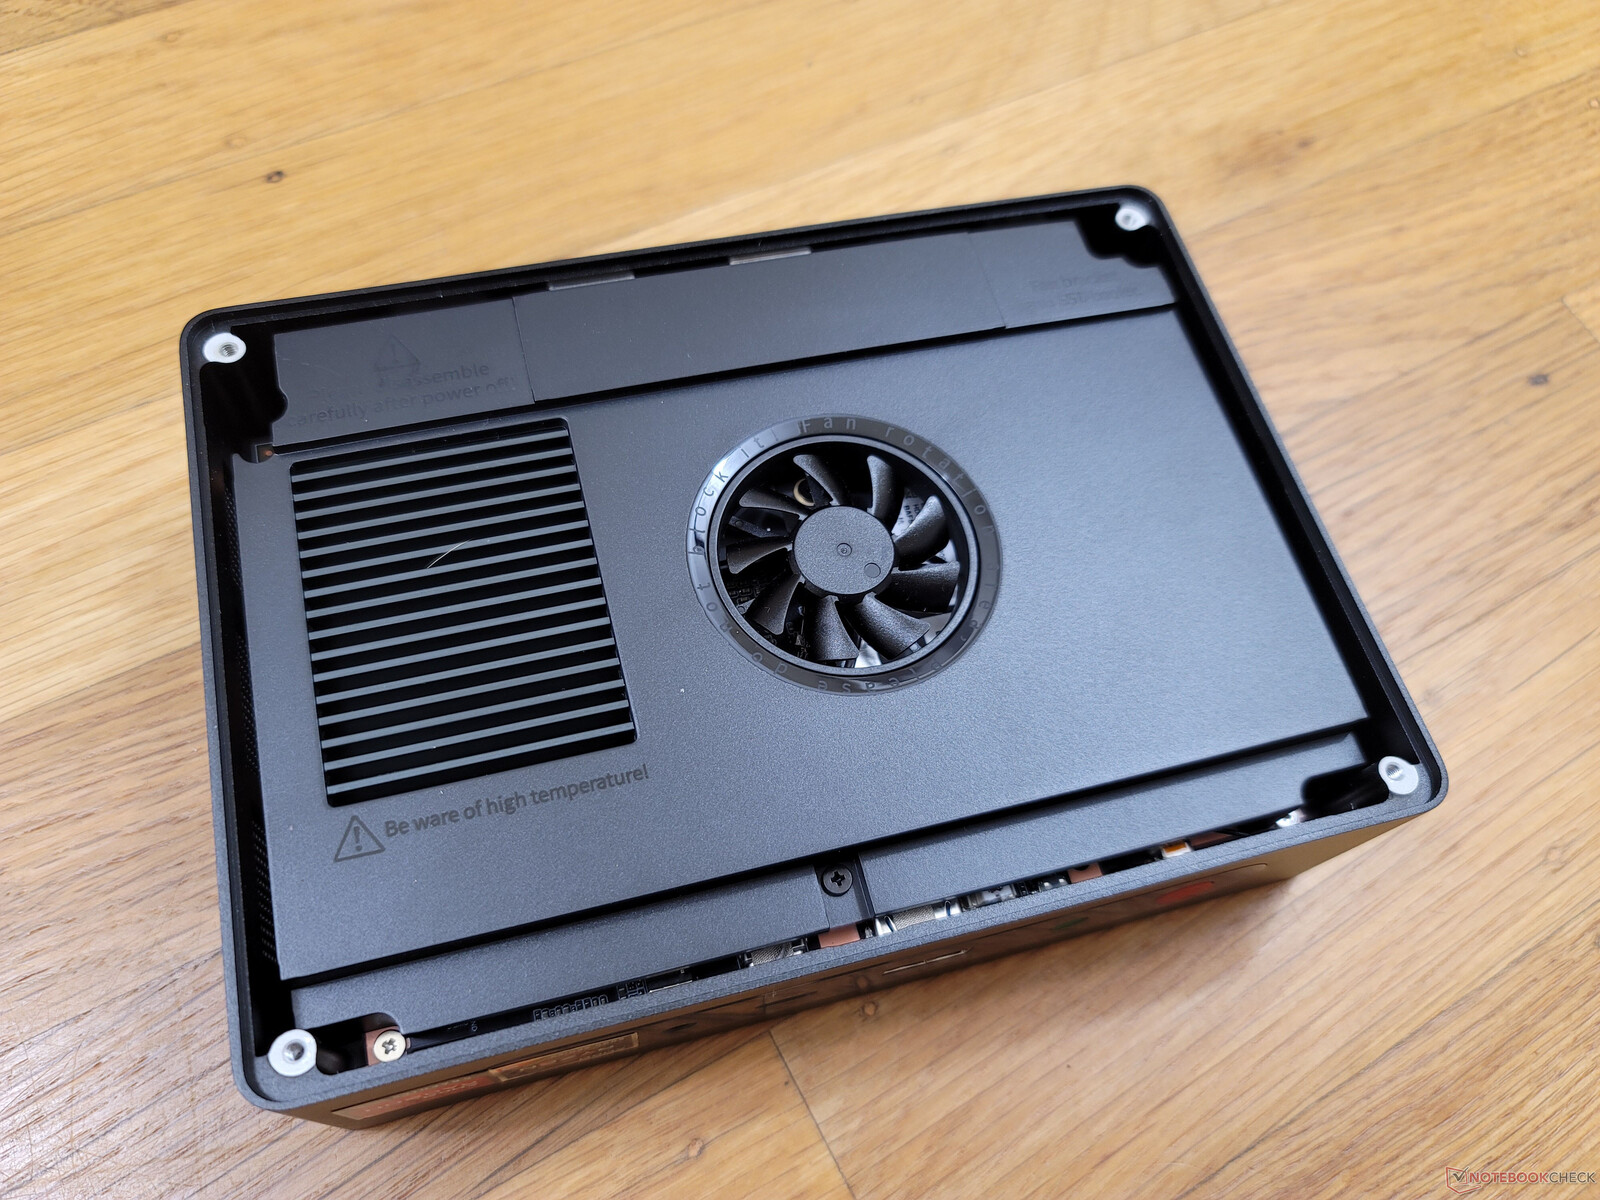
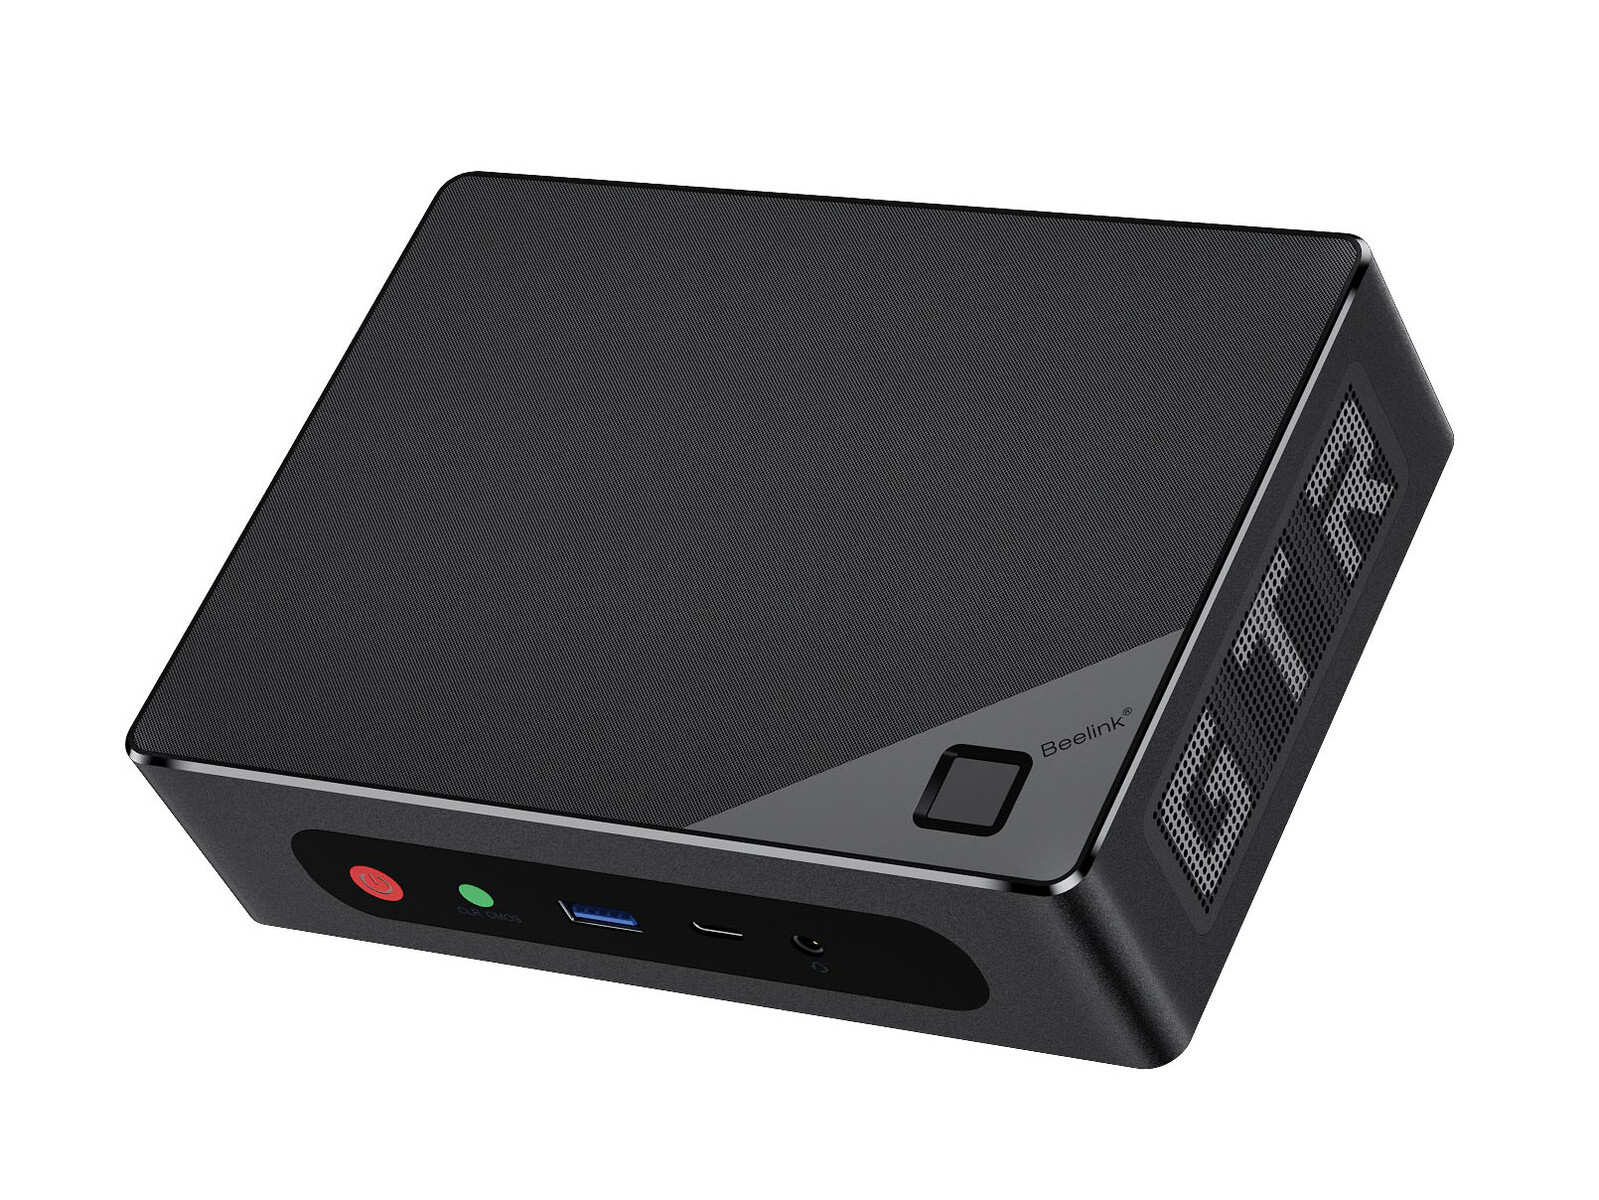
Koffer - Nieuwe Zachte Mesh Top
De case voelt sterk aan met zijn metalen zijkanten en ademende zachte mesh aan de bovenkant voor de luchtstroom. Vooral dit laatste is een primeur voor Beelink, aangezien eerdere mini PC's van het bedrijf plastic of metalen bovenkanten hadden. De verwijderbare mesh voegt een element van kwaliteit of luxe toe aan het totale ontwerp.
De GTR6 is dikker en zwaarder dan de GTR5 en de meeste Intel NUC-modellen. Het grotere formaat is deels te danken aan de zwaardere AMD HX-processor in vergelijking met de Intel Core U-serie.
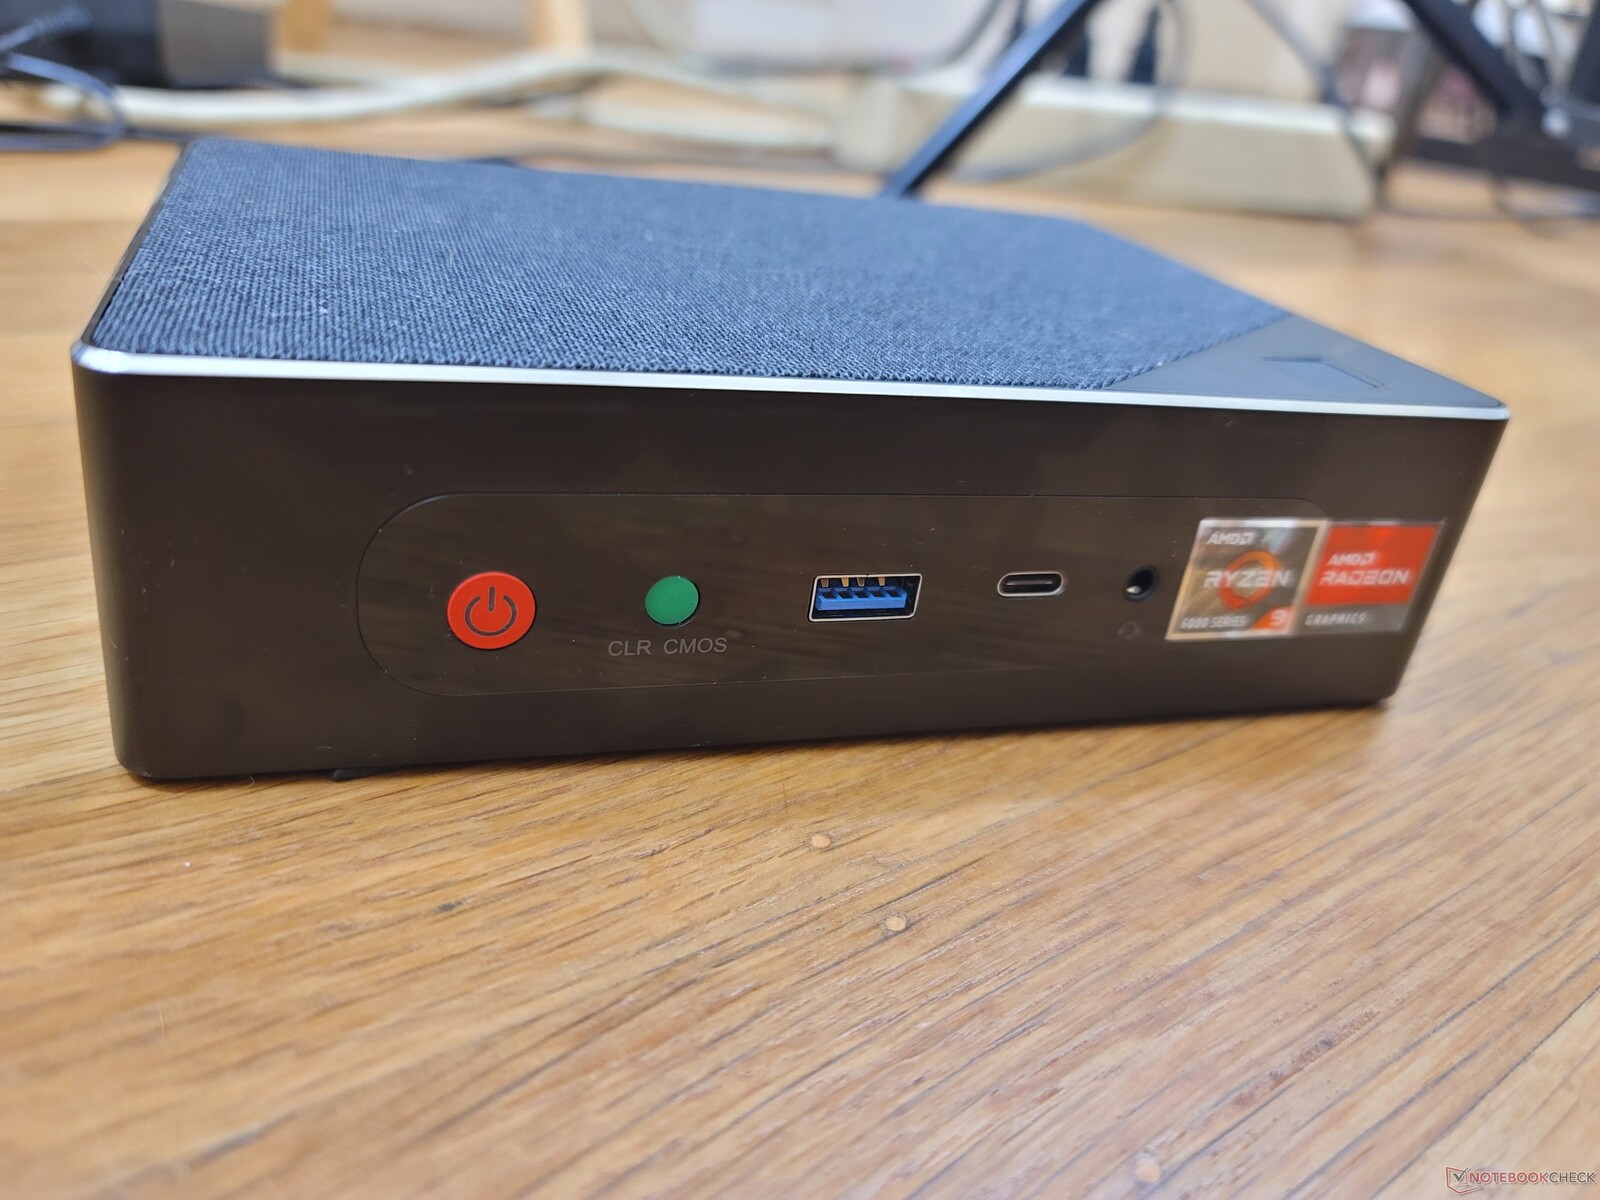
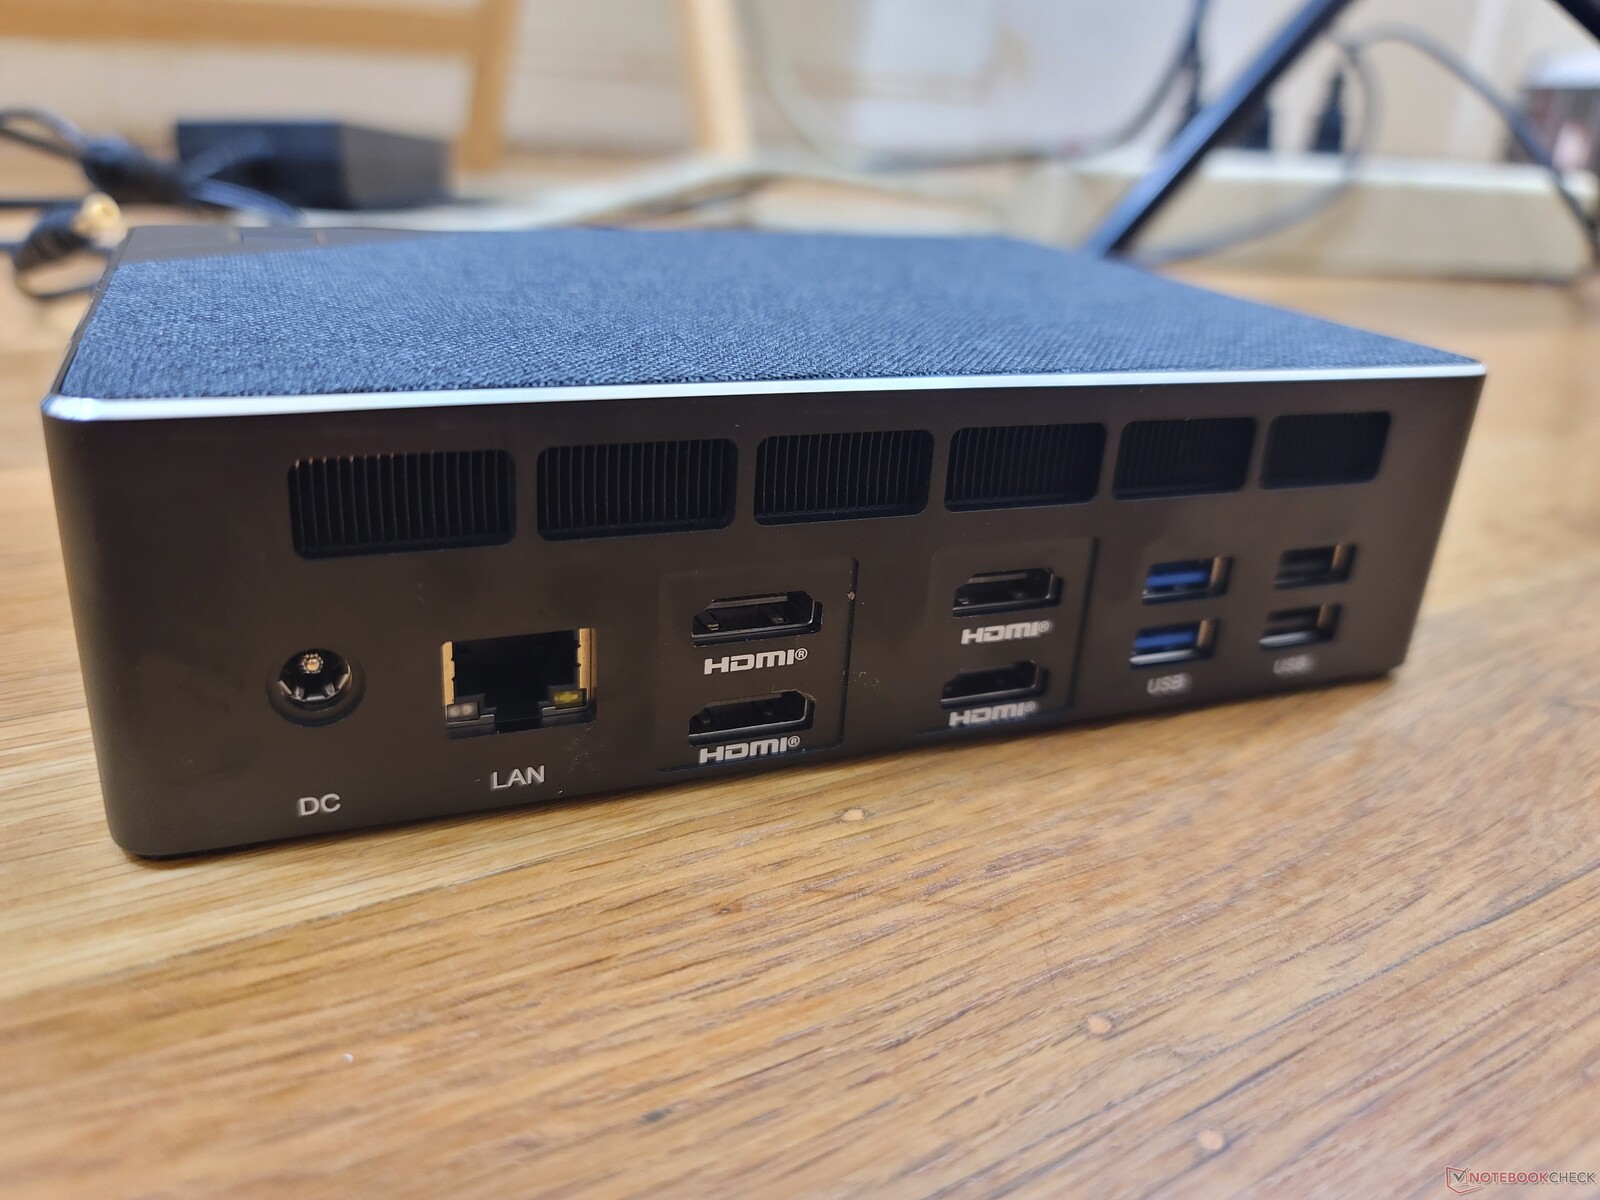
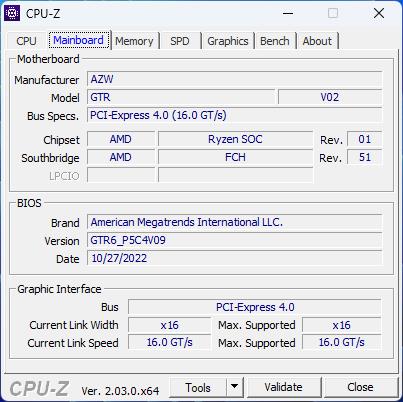
Connectiviteit - Geen Thunderbolt
De poortopties zijn uitstekend met vier individuele HDMI 2.1-poorten die tot 8K-monitoren bij 60 Hz ondersteunen. Er is echter maar één USB-C poort en de LAN-poort is slechts 1 Gbps terwijl veel NUC-modellen nu 10 Gbps ondersteunen
Thunderbolt wordt niet ondersteund vanwege de AMD CPU.
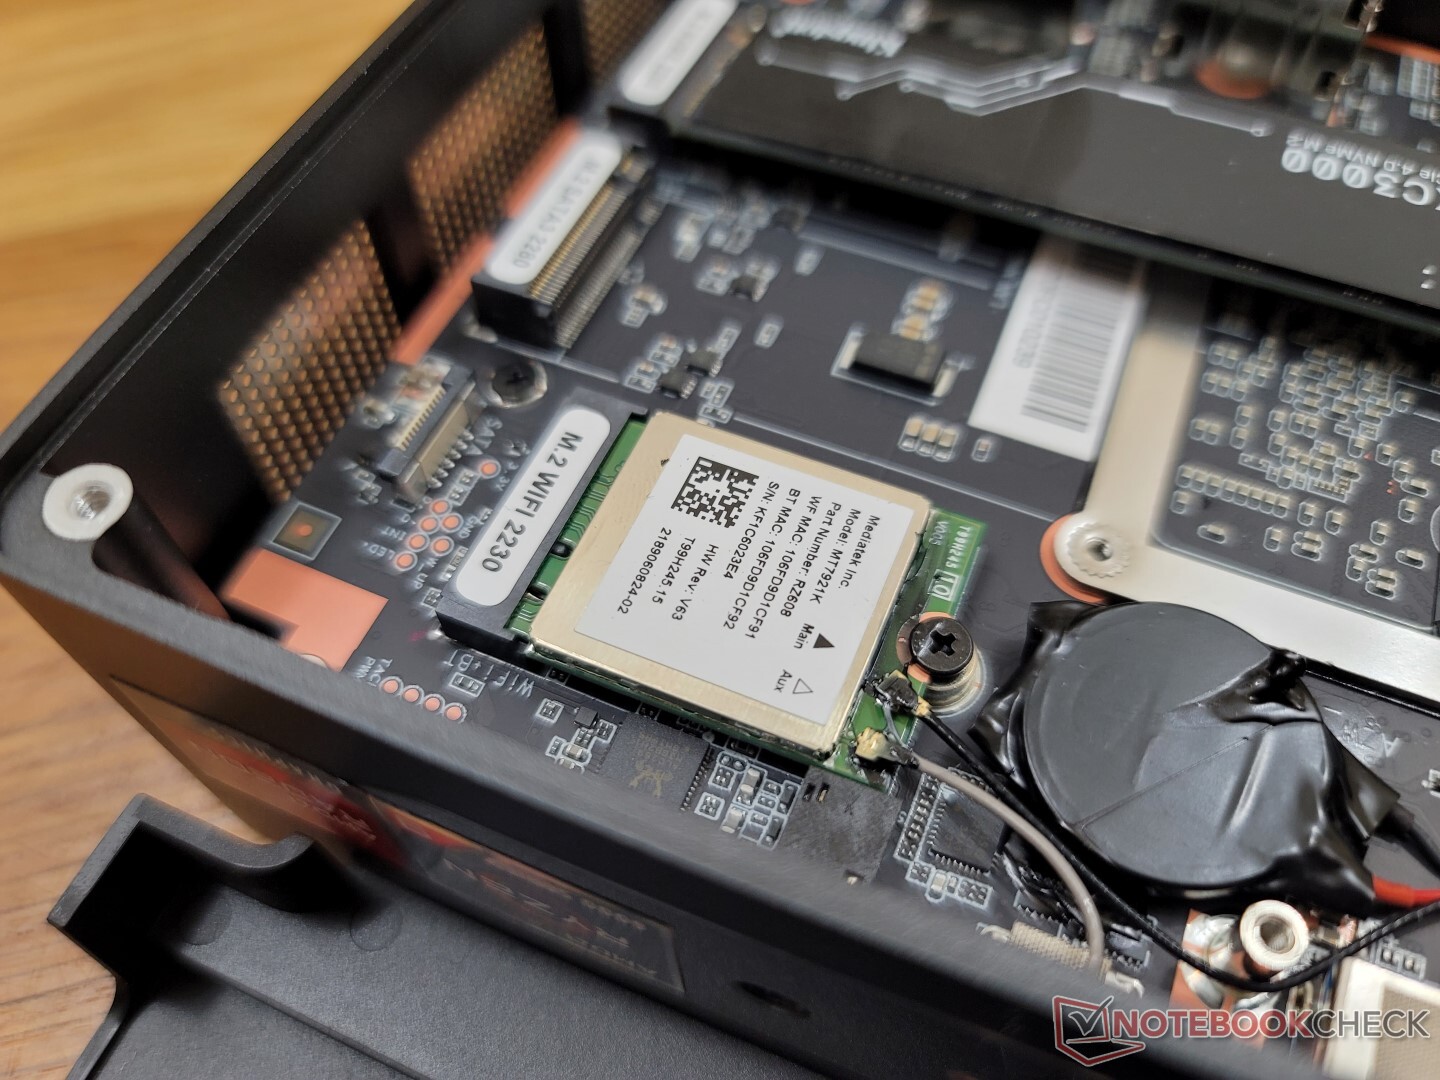
Communicatie - Wi-Fi 6E Standaard
Een MediaTek RZ608 wordt standaard geleverd voor Wi-Fi 6E en Bluetooth 5.2 connectiviteit. De overdrachtssnelheden zijn stabiel, zij het langzamer dan de meeste Intel AX201/210 oplossingen
De RZ608 op onze testunit was traag om ons 6 GHz AXE11000 netwerk te detecteren, zelfs na het updaten naar de nieuwste drivers op het moment van schrijven. Het kan zijn dat u enkele minuten moet wachten voordat het systeem uw 6 GHz netwerk kan detecteren en er verbinding mee kan maken.
| Networking | |
| iperf3 transmit AX12 | |
| Intel NUC11TNKi5 | |
| Intel NUC11PHKi7C | |
| Beelink GTR5 | |
| GMK NucBox 2 | |
| iperf3 receive AX12 | |
| Intel NUC11TNKi5 | |
| Intel NUC11PHKi7C | |
| Beelink GTR5 | |
| GMK NucBox 2 | |
| iperf3 receive AXE11000 6GHz | |
| Beelink GTR6 | |
| Beelink SEi11 Pro | |
| iperf3 receive AXE11000 | |
| Beelink GTR6 | |
| iperf3 transmit AXE11000 | |
| Beelink GTR6 | |
| iperf3 transmit AXE11000 6GHz | |
| Beelink GTR6 | |
| Beelink SEi11 Pro | |
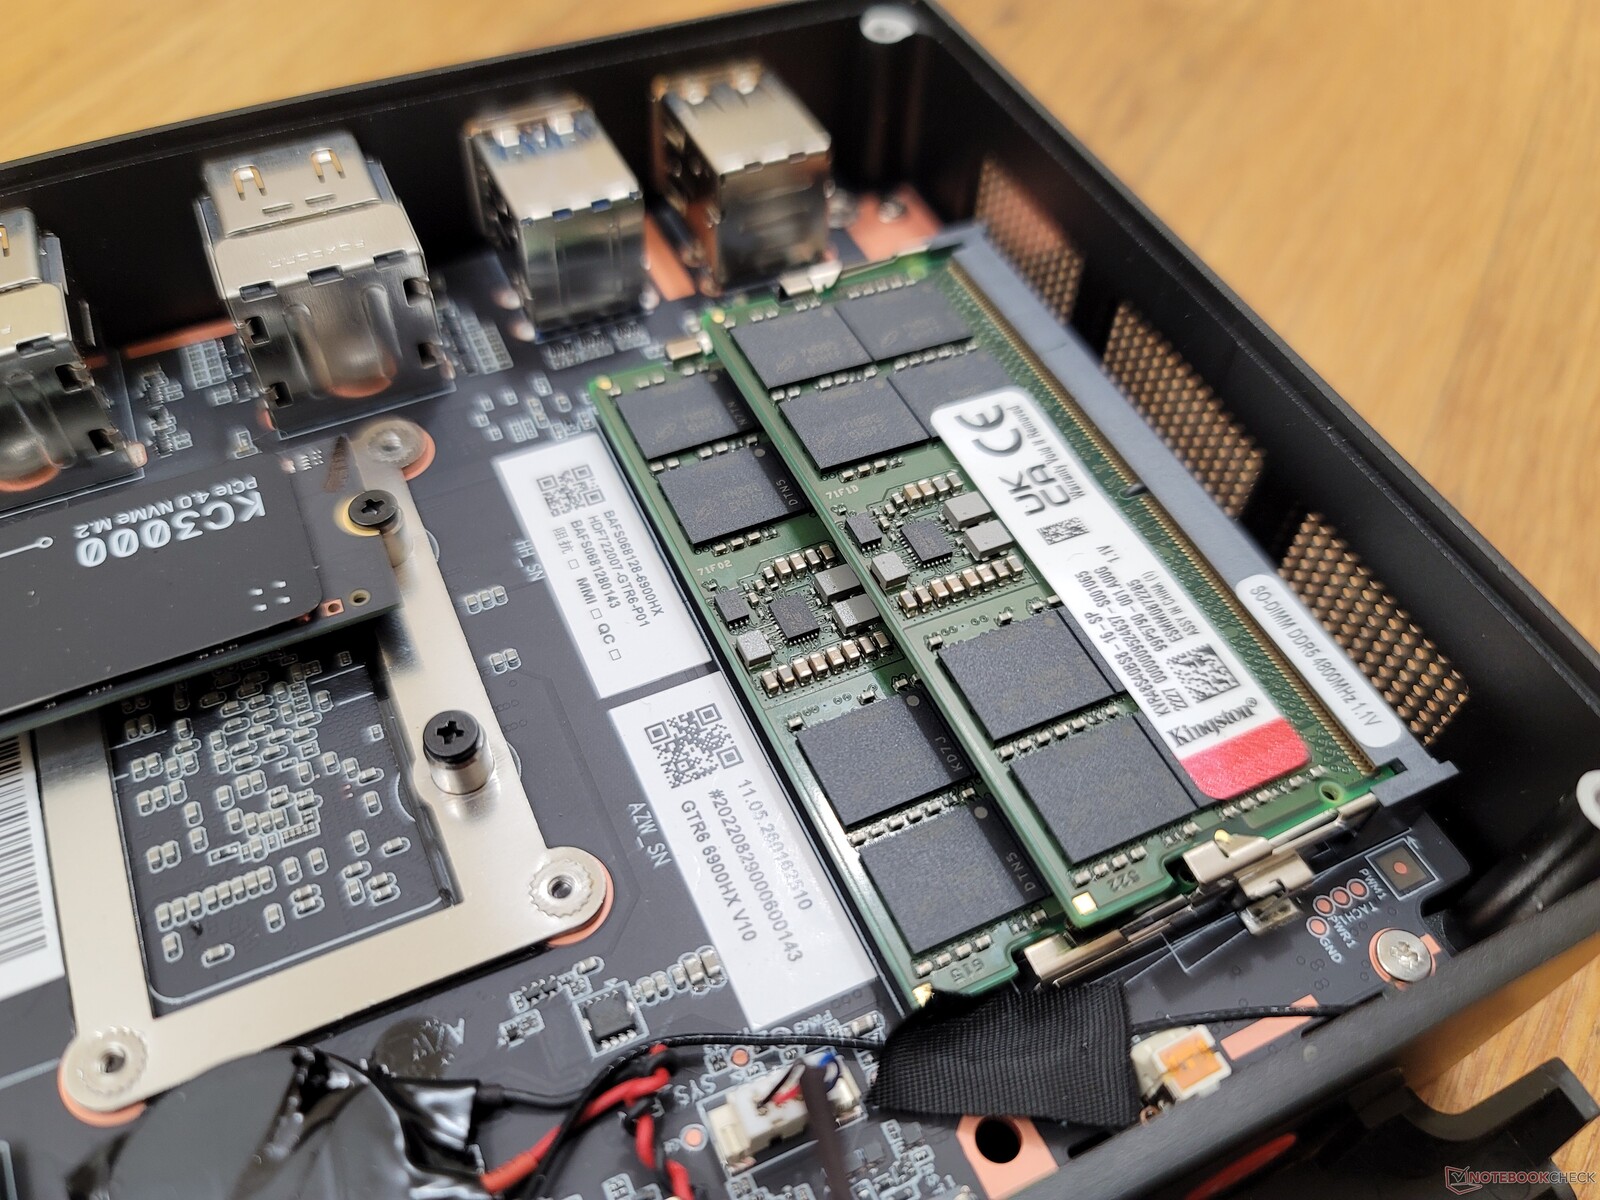
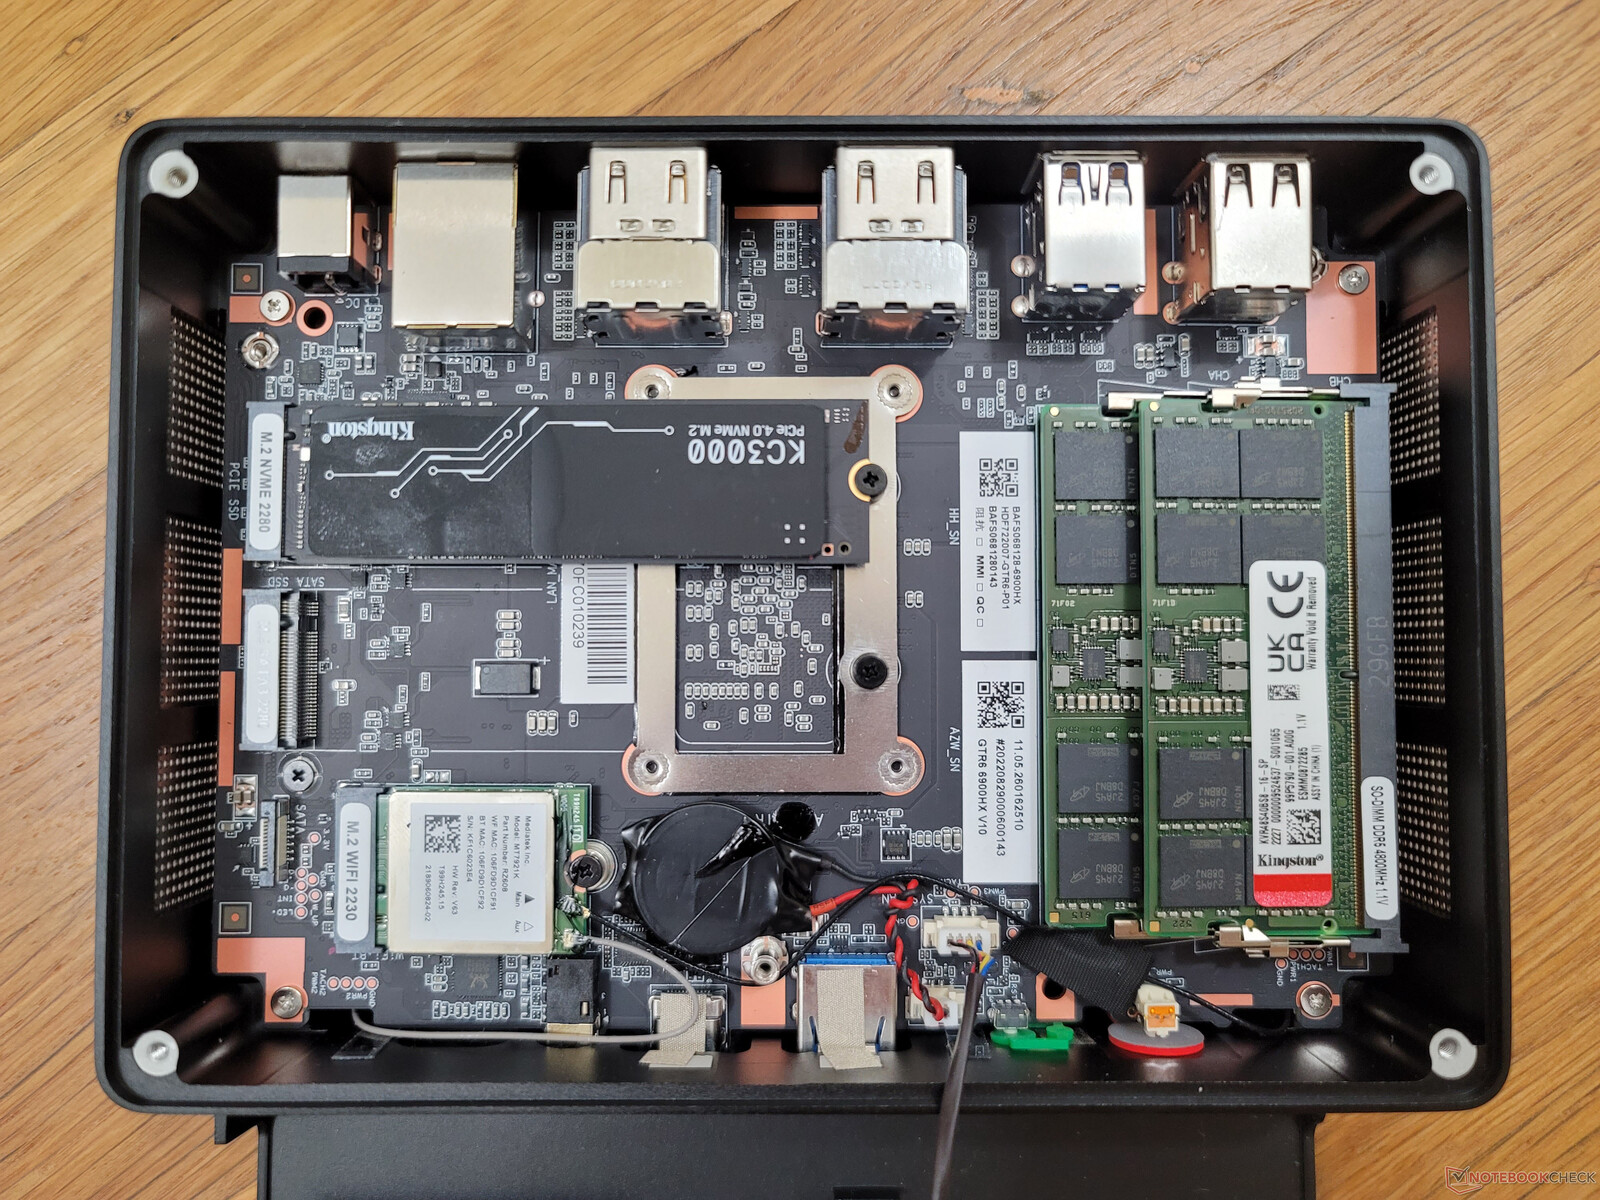
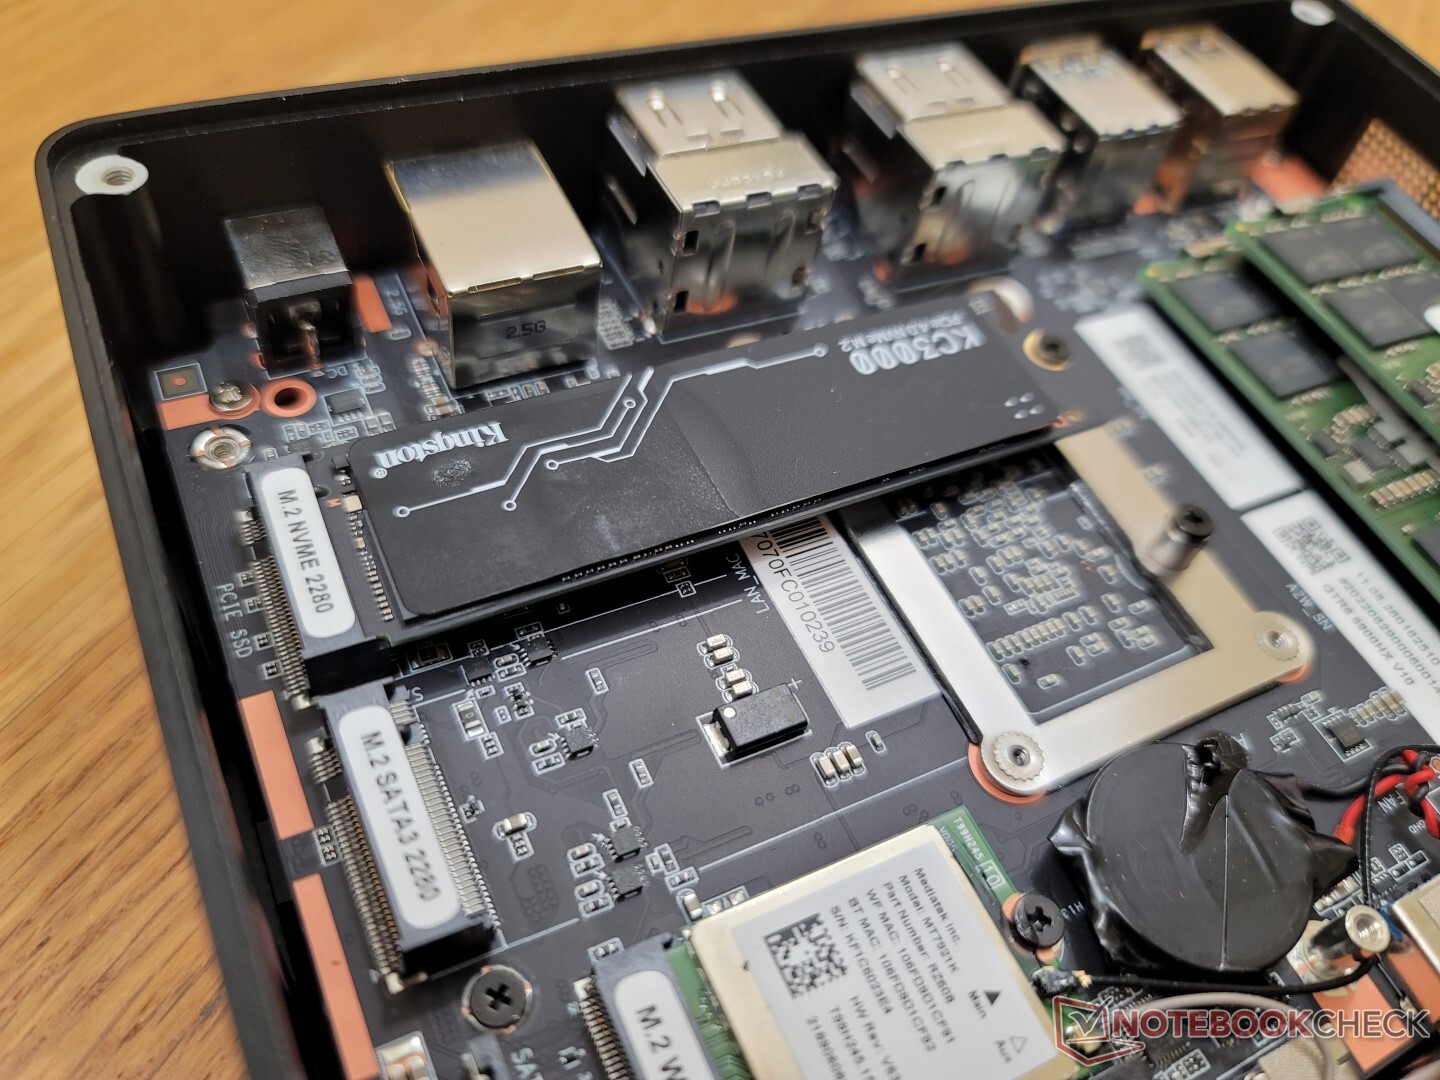
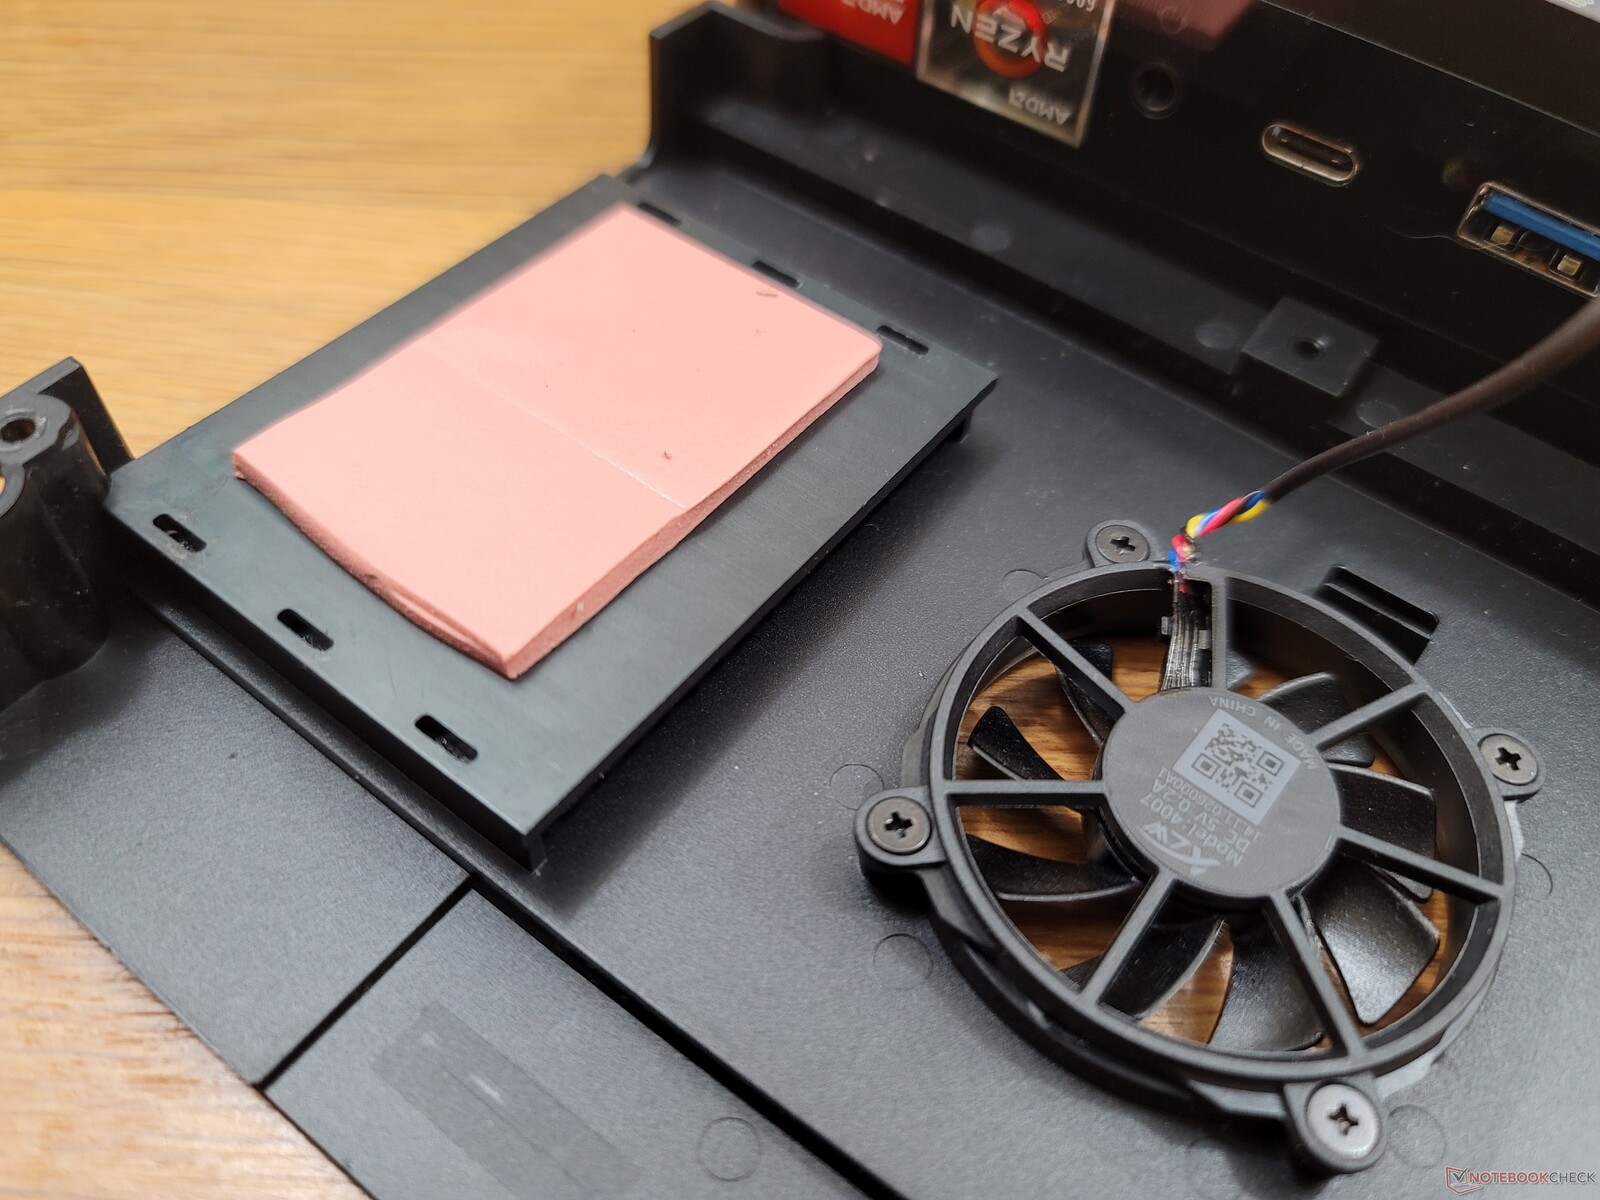
Onderhoud
Het bodempaneel is bevestigd met slechts vier Philips-schroeven voor eenvoudig onderhoud. Er zit echter een andere plaat onder, waarvoor nog eens vier schroeven moeten worden verwijderd, zoals blijkt uit de onderstaande foto's.
Accessoires en garantie
De verkoopdoos bevat twee HDMI-kabels, een verwijderbare VESA-bevestiging met extra schroeven, een gebruikershandleiding en twee extra soft-touch netkappen voor de bovenkant van het apparaat. Een van deze covers is rood als aanvulling op de op AMD gebaseerde hardware en trim kleur.
Prestaties - Zen 3+ Upgrade
Testomstandigheden
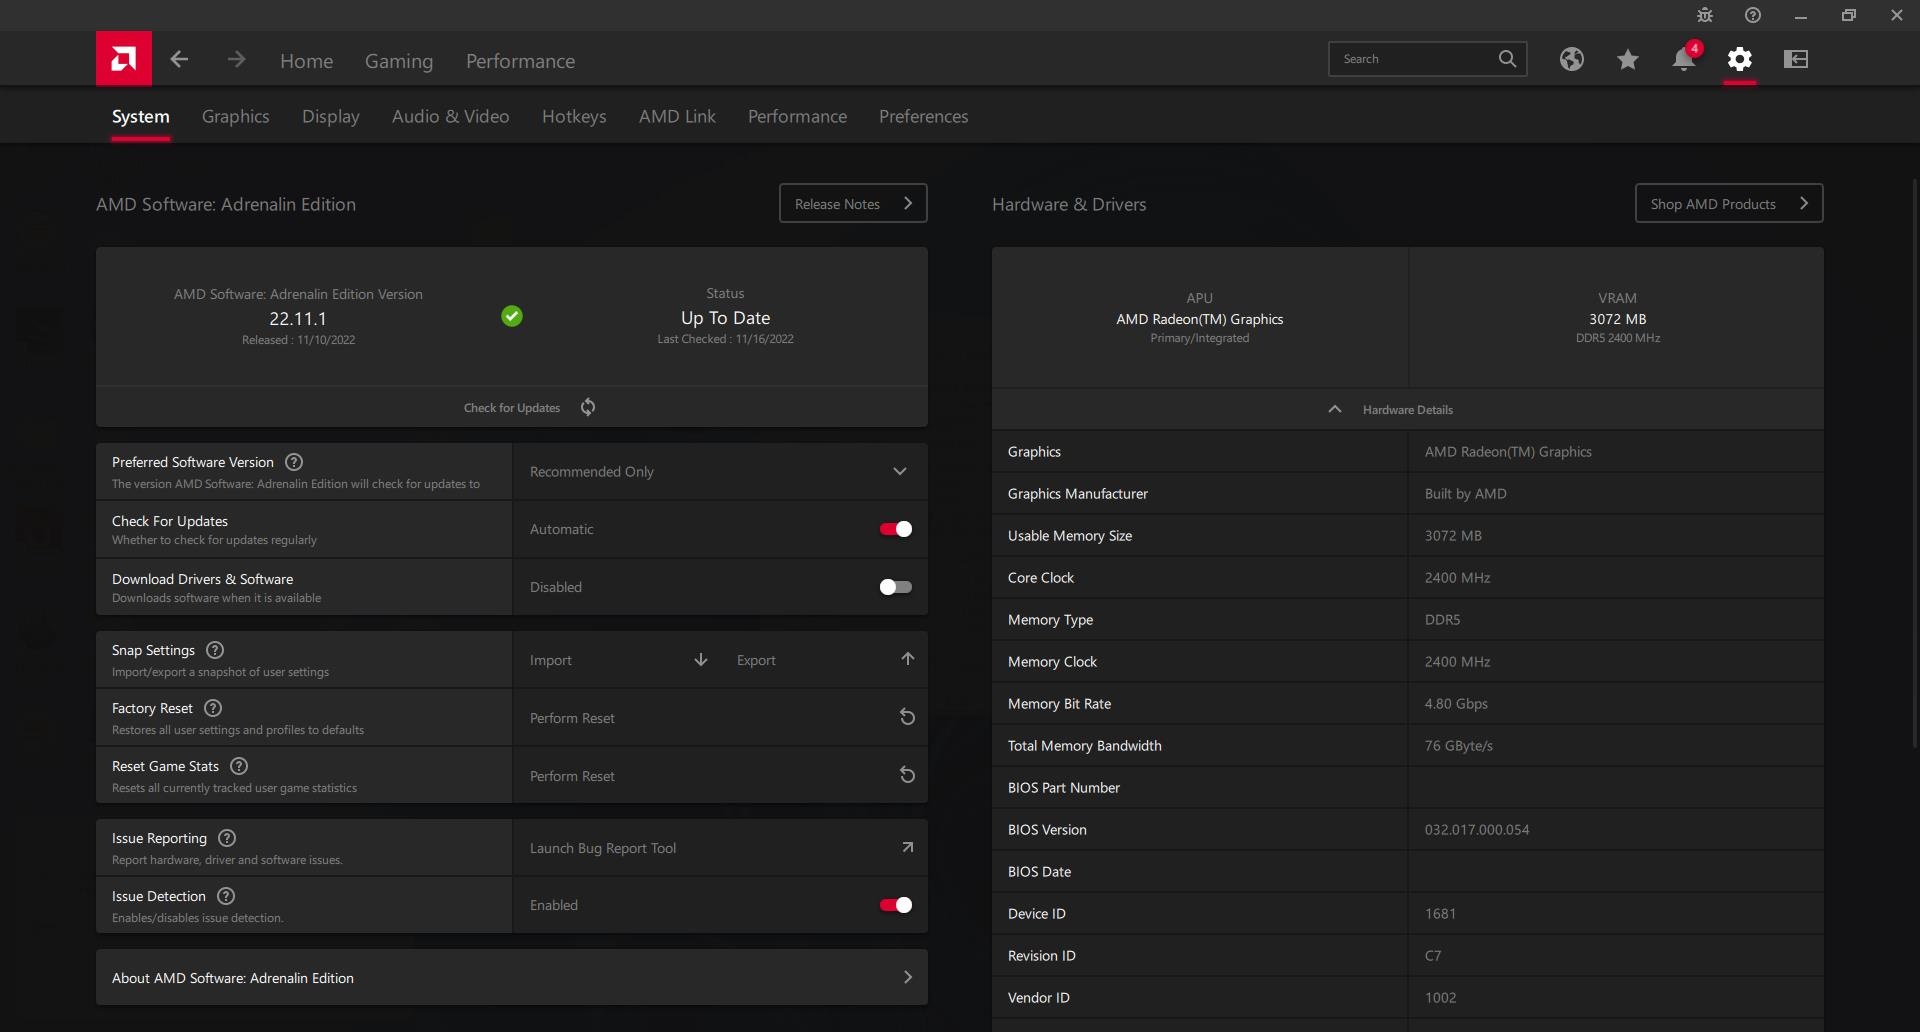
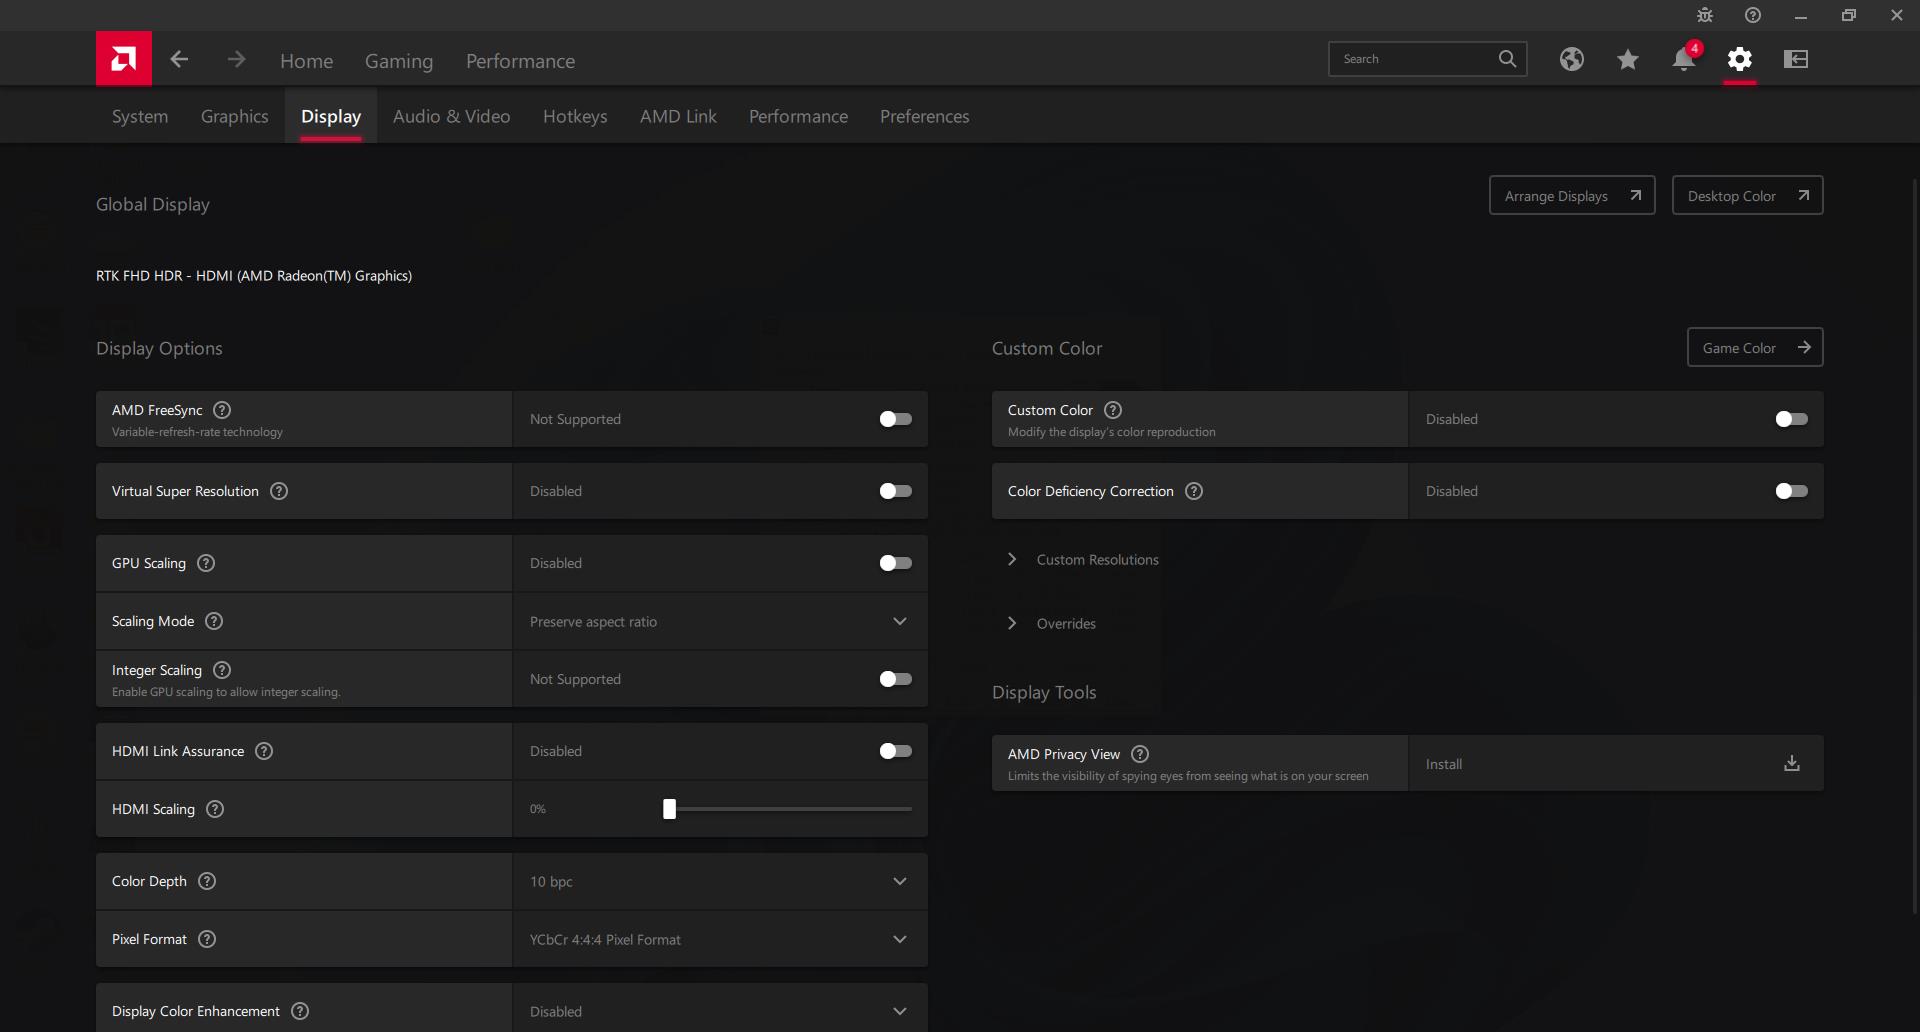
We hebben ons toestel in Performance mode gezet via Windows alvorens onderstaande benchmarks uit te voeren. Beelink bevat geen vooraf geïnstalleerde toepassingen voor een schone Windows 11 Pro ervaring. Toch raden we aan om de AMD Radeon software te installeren voor extra instellingen, zoals blijkt uit onderstaande screenshots.
Processor
De CPU-prestaties zijn helaas slechts een kleine stap omhoog ten opzichte van de Ryzen 9 5900HX op zijn best. Benchmarks tonen identieke multi-thread prestaties als de Ryzen 9 5900HX in de Beelink GTR5 en slechts iets snellere single-thread prestaties tot 10 procent. De gemiddelde multi-thread prestaties zijn ruwweg 15 procent langzamer dan op laptops met dezelfde Ryzen 9 6900HX CPU zoals op de Lenovo Legion S7 16. Desondanks is de GTR6 nog steeds een van de snelste mini-pc's voor het formaat, ondanks de lichte tegenvallende prestaties.
Cinebench R15 Multi Loop
Cinebench R23: Multi Core | Single Core
Cinebench R15: CPU Multi 64Bit | CPU Single 64Bit
Blender: v2.79 BMW27 CPU
7-Zip 18.03: 7z b 4 | 7z b 4 -mmt1
Geekbench 5.5: Multi-Core | Single-Core
HWBOT x265 Benchmark v2.2: 4k Preset
LibreOffice : 20 Documents To PDF
R Benchmark 2.5: Overall mean
| Cinebench R20 / CPU (Multi Core) | |
| MSI GE67 HX 12UGS | |
| Schenker Vision 14 2022 RTX 3050 Ti | |
| Gemiddeld AMD Ryzen 9 6900HX (3742 - 5813, n=19) | |
| Beelink GTR6 | |
| Beelink GTR5 | |
| Alienware m15 R4 RTX 3080 | |
| Lenovo Legion C7 15IMH05 82EH0030GE | |
| Beelink SEi11 Pro | |
| Intel NUC11TNKi5 | |
| Intel NUC11PHKi7C | |
| GMK NucBox 2 | |
| Cinebench R20 / CPU (Single Core) | |
| Schenker Vision 14 2022 RTX 3050 Ti | |
| MSI GE67 HX 12UGS | |
| Beelink GTR6 | |
| Gemiddeld AMD Ryzen 9 6900HX (595 - 631, n=19) | |
| Intel NUC11PHKi7C | |
| Beelink GTR5 | |
| Beelink SEi11 Pro | |
| Intel NUC11TNKi5 | |
| Lenovo Legion C7 15IMH05 82EH0030GE | |
| Alienware m15 R4 RTX 3080 | |
| GMK NucBox 2 | |
| Cinebench R23 / Multi Core | |
| MSI GE67 HX 12UGS | |
| Schenker Vision 14 2022 RTX 3050 Ti | |
| Gemiddeld AMD Ryzen 9 6900HX (9709 - 15100, n=19) | |
| Beelink GTR6 | |
| Beelink GTR5 | |
| Alienware m15 R4 RTX 3080 | |
| Lenovo Legion C7 15IMH05 82EH0030GE | |
| Intel NUC11PHKi7C | |
| Beelink SEi11 Pro | |
| Intel NUC11TNKi5 | |
| GMK NucBox 2 | |
| Cinebench R23 / Single Core | |
| MSI GE67 HX 12UGS | |
| Schenker Vision 14 2022 RTX 3050 Ti | |
| Beelink GTR6 | |
| Gemiddeld AMD Ryzen 9 6900HX (1516 - 1616, n=19) | |
| Intel NUC11PHKi7C | |
| Beelink GTR5 | |
| Beelink SEi11 Pro | |
| Intel NUC11TNKi5 | |
| Lenovo Legion C7 15IMH05 82EH0030GE | |
| Alienware m15 R4 RTX 3080 | |
| GMK NucBox 2 | |
| Cinebench R15 / CPU Multi 64Bit | |
| MSI GE67 HX 12UGS | |
| Schenker Vision 14 2022 RTX 3050 Ti | |
| Gemiddeld AMD Ryzen 9 6900HX (1588 - 2411, n=19) | |
| Beelink GTR6 | |
| Beelink GTR5 | |
| Alienware m15 R4 RTX 3080 | |
| Lenovo Legion C7 15IMH05 82EH0030GE | |
| Intel NUC11PHKi7C | |
| Beelink SEi11 Pro | |
| Intel NUC11TNKi5 | |
| GMK NucBox 2 | |
| Cinebench R15 / CPU Single 64Bit | |
| Schenker Vision 14 2022 RTX 3050 Ti | |
| MSI GE67 HX 12UGS | |
| Beelink GTR6 | |
| Gemiddeld AMD Ryzen 9 6900HX (241 - 261, n=19) | |
| Beelink GTR5 | |
| Intel NUC11PHKi7C | |
| Beelink SEi11 Pro | |
| Lenovo Legion C7 15IMH05 82EH0030GE | |
| Intel NUC11TNKi5 | |
| Alienware m15 R4 RTX 3080 | |
| GMK NucBox 2 | |
| Blender / v2.79 BMW27 CPU | |
| GMK NucBox 2 | |
| Intel NUC11TNKi5 | |
| Intel NUC11PHKi7C | |
| Beelink SEi11 Pro | |
| Lenovo Legion C7 15IMH05 82EH0030GE | |
| Alienware m15 R4 RTX 3080 | |
| Beelink GTR5 | |
| Schenker Vision 14 2022 RTX 3050 Ti | |
| Beelink GTR6 | |
| Gemiddeld AMD Ryzen 9 6900HX (212 - 357, n=21) | |
| MSI GE67 HX 12UGS | |
| 7-Zip 18.03 / 7z b 4 -mmt1 | |
| Beelink GTR6 | |
| Schenker Vision 14 2022 RTX 3050 Ti | |
| Gemiddeld AMD Ryzen 9 6900HX (5090 - 6070, n=20) | |
| Beelink GTR5 | |
| MSI GE67 HX 12UGS | |
| Lenovo Legion C7 15IMH05 82EH0030GE | |
| Alienware m15 R4 RTX 3080 | |
| Intel NUC11PHKi7C | |
| Beelink SEi11 Pro | |
| Intel NUC11TNKi5 | |
| GMK NucBox 2 | |
| Geekbench 5.5 / Multi-Core | |
| MSI GE67 HX 12UGS | |
| Schenker Vision 14 2022 RTX 3050 Ti | |
| Gemiddeld AMD Ryzen 9 6900HX (8313 - 10490, n=21) | |
| Beelink GTR6 | |
| Lenovo Legion C7 15IMH05 82EH0030GE | |
| Beelink GTR5 | |
| Alienware m15 R4 RTX 3080 | |
| Intel NUC11PHKi7C | |
| Beelink SEi11 Pro | |
| Intel NUC11TNKi5 | |
| GMK NucBox 2 | |
| Geekbench 5.5 / Single-Core | |
| Schenker Vision 14 2022 RTX 3050 Ti | |
| MSI GE67 HX 12UGS | |
| Beelink GTR6 | |
| Gemiddeld AMD Ryzen 9 6900HX (1523 - 1652, n=21) | |
| Beelink GTR5 | |
| Intel NUC11PHKi7C | |
| Beelink SEi11 Pro | |
| Intel NUC11TNKi5 | |
| Lenovo Legion C7 15IMH05 82EH0030GE | |
| Alienware m15 R4 RTX 3080 | |
| GMK NucBox 2 | |
| HWBOT x265 Benchmark v2.2 / 4k Preset | |
| MSI GE67 HX 12UGS | |
| Gemiddeld AMD Ryzen 9 6900HX (12.6 - 18.7, n=20) | |
| Beelink GTR6 | |
| Beelink GTR5 | |
| Schenker Vision 14 2022 RTX 3050 Ti | |
| Alienware m15 R4 RTX 3080 | |
| Lenovo Legion C7 15IMH05 82EH0030GE | |
| Beelink SEi11 Pro | |
| Intel NUC11PHKi7C | |
| Intel NUC11TNKi5 | |
| GMK NucBox 2 | |
| LibreOffice / 20 Documents To PDF | |
| Alienware m15 R4 RTX 3080 | |
| GMK NucBox 2 | |
| Lenovo Legion C7 15IMH05 82EH0030GE | |
| Gemiddeld AMD Ryzen 9 6900HX (44.8 - 81.7, n=20) | |
| Intel NUC11TNKi5 | |
| Beelink GTR5 | |
| Beelink SEi11 Pro | |
| Intel NUC11PHKi7C | |
| Beelink GTR6 | |
| Schenker Vision 14 2022 RTX 3050 Ti | |
| MSI GE67 HX 12UGS | |
| R Benchmark 2.5 / Overall mean | |
| GMK NucBox 2 | |
| Intel NUC11TNKi5 | |
| Alienware m15 R4 RTX 3080 | |
| Lenovo Legion C7 15IMH05 82EH0030GE | |
| Beelink SEi11 Pro | |
| Intel NUC11PHKi7C | |
| Gemiddeld AMD Ryzen 9 6900HX (0.4627 - 0.4974, n=20) | |
| Beelink GTR5 | |
| Beelink GTR6 | |
| MSI GE67 HX 12UGS | |
| Schenker Vision 14 2022 RTX 3050 Ti | |
* ... kleiner is beter
AIDA64: FP32 Ray-Trace | FPU Julia | CPU SHA3 | CPU Queen | FPU SinJulia | FPU Mandel | CPU AES | CPU ZLib | FP64 Ray-Trace | CPU PhotoWorxx
| Performance rating | |
| Gemiddeld AMD Ryzen 9 6900HX | |
| Beelink GTR6 | |
| Beelink GTR5 | |
| Intel NUC11PHKi7C | |
| Beelink SEi11 Pro | |
| Intel NUC11TNKi5 | |
| GMK NucBox 2 | |
| AIDA64 / FP32 Ray-Trace | |
| Gemiddeld AMD Ryzen 9 6900HX (10950 - 17963, n=20) | |
| Beelink GTR5 | |
| Beelink GTR6 | |
| Intel NUC11PHKi7C | |
| Beelink SEi11 Pro | |
| Intel NUC11TNKi5 | |
| GMK NucBox 2 | |
| AIDA64 / FPU Julia | |
| Gemiddeld AMD Ryzen 9 6900HX (71414 - 110797, n=20) | |
| Beelink GTR5 | |
| Beelink GTR6 | |
| Intel NUC11PHKi7C | |
| Beelink SEi11 Pro | |
| Intel NUC11TNKi5 | |
| GMK NucBox 2 | |
| AIDA64 / CPU SHA3 | |
| Gemiddeld AMD Ryzen 9 6900HX (2471 - 3804, n=20) | |
| Beelink GTR6 | |
| Beelink GTR5 | |
| Intel NUC11PHKi7C | |
| Beelink SEi11 Pro | |
| Intel NUC11TNKi5 | |
| GMK NucBox 2 | |
| AIDA64 / CPU Queen | |
| Gemiddeld AMD Ryzen 9 6900HX (84185 - 107544, n=20) | |
| Beelink GTR5 | |
| Beelink GTR6 | |
| Intel NUC11PHKi7C | |
| Beelink SEi11 Pro | |
| Intel NUC11TNKi5 | |
| GMK NucBox 2 | |
| AIDA64 / FPU SinJulia | |
| Gemiddeld AMD Ryzen 9 6900HX (10970 - 13205, n=20) | |
| Beelink GTR5 | |
| Beelink GTR6 | |
| Intel NUC11PHKi7C | |
| Beelink SEi11 Pro | |
| Intel NUC11TNKi5 | |
| GMK NucBox 2 | |
| AIDA64 / FPU Mandel | |
| Gemiddeld AMD Ryzen 9 6900HX (39164 - 61370, n=20) | |
| Beelink GTR5 | |
| Beelink GTR6 | |
| Intel NUC11PHKi7C | |
| Beelink SEi11 Pro | |
| Intel NUC11TNKi5 | |
| GMK NucBox 2 | |
| AIDA64 / CPU AES | |
| Beelink GTR6 | |
| Beelink GTR5 | |
| Gemiddeld AMD Ryzen 9 6900HX (54613 - 142360, n=20) | |
| Intel NUC11PHKi7C | |
| Beelink SEi11 Pro | |
| Intel NUC11TNKi5 | |
| GMK NucBox 2 | |
| AIDA64 / CPU ZLib | |
| Gemiddeld AMD Ryzen 9 6900HX (578 - 911, n=20) | |
| Beelink GTR5 | |
| Beelink GTR6 | |
| Intel NUC11PHKi7C | |
| Intel NUC11TNKi5 | |
| Beelink SEi11 Pro | |
| GMK NucBox 2 | |
| AIDA64 / FP64 Ray-Trace | |
| Gemiddeld AMD Ryzen 9 6900HX (5798 - 9540, n=20) | |
| Beelink GTR5 | |
| Beelink GTR6 | |
| Intel NUC11PHKi7C | |
| Beelink SEi11 Pro | |
| Intel NUC11TNKi5 | |
| GMK NucBox 2 | |
| AIDA64 / CPU PhotoWorxx | |
| Beelink GTR6 | |
| Gemiddeld AMD Ryzen 9 6900HX (26873 - 30604, n=20) | |
| Intel NUC11PHKi7C | |
| Beelink SEi11 Pro | |
| Beelink GTR5 | |
| Intel NUC11TNKi5 | |
| GMK NucBox 2 | |
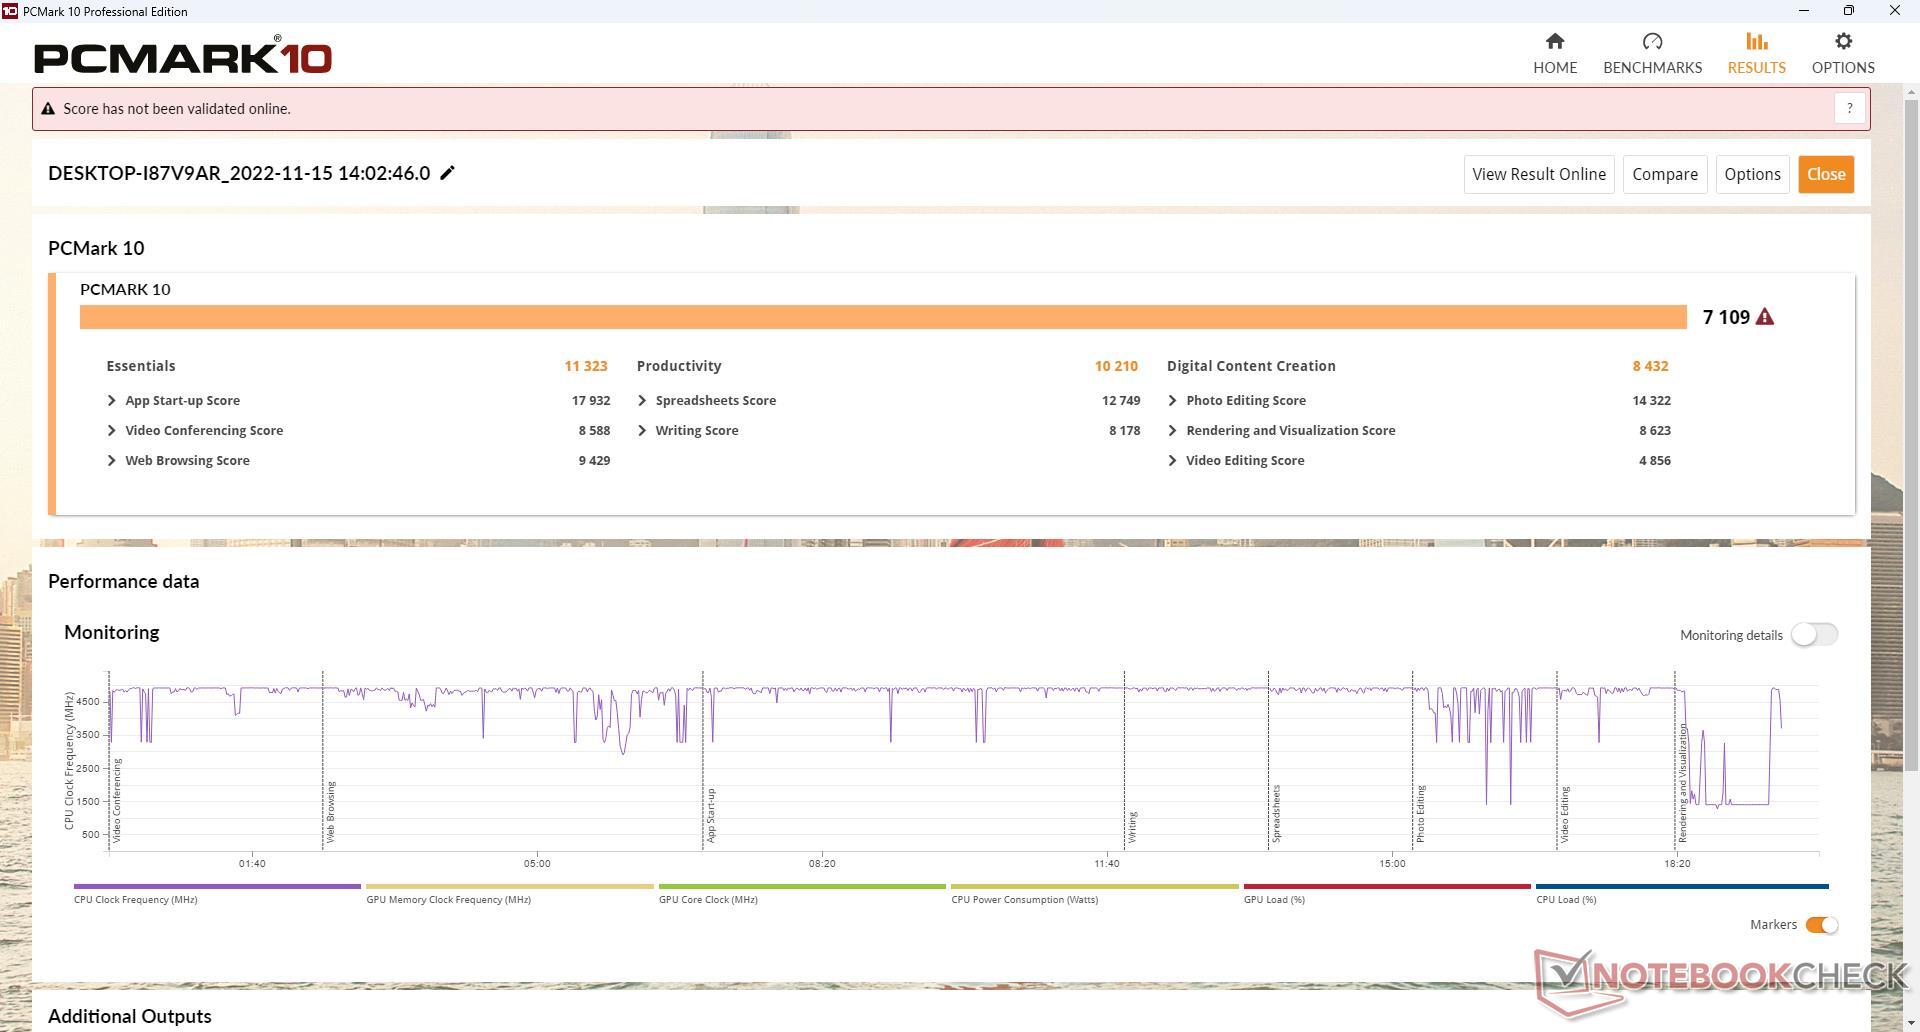
Systeemprestaties
PCMark 10 resultaten zijn consequent hoger dan op de GTR5 vooral in de subtest voor het maken van digitale inhoud, waar grafische prestaties het belangrijkst zijn.
CrossMark: Overall | Productivity | Creativity | Responsiveness
| PCMark 10 / Score | |
| Beelink GTR6 | |
| Gemiddeld AMD Ryzen 9 6900HX, AMD Radeon 680M (6251 - 7109, n=7) | |
| Beelink GTR5 | |
| Intel NUC11PHKi7C | |
| Beelink SEi11 Pro | |
| Intel NUC11TNKi5 | |
| GMK NucBox 2 | |
| PCMark 10 / Essentials | |
| Beelink GTR6 | |
| Beelink GTR5 | |
| Gemiddeld AMD Ryzen 9 6900HX, AMD Radeon 680M (10029 - 11323, n=7) | |
| Beelink SEi11 Pro | |
| Intel NUC11PHKi7C | |
| Intel NUC11TNKi5 | |
| GMK NucBox 2 | |
| PCMark 10 / Productivity | |
| Beelink GTR6 | |
| Beelink GTR5 | |
| Gemiddeld AMD Ryzen 9 6900HX, AMD Radeon 680M (9550 - 10210, n=7) | |
| Intel NUC11PHKi7C | |
| Beelink SEi11 Pro | |
| GMK NucBox 2 | |
| Intel NUC11TNKi5 | |
| PCMark 10 / Digital Content Creation | |
| Beelink GTR6 | |
| Gemiddeld AMD Ryzen 9 6900HX, AMD Radeon 680M (6920 - 8703, n=7) | |
| Beelink GTR5 | |
| Intel NUC11PHKi7C | |
| Beelink SEi11 Pro | |
| Intel NUC11TNKi5 | |
| GMK NucBox 2 | |
| CrossMark / Overall | |
| Beelink GTR6 | |
| Gemiddeld AMD Ryzen 9 6900HX, AMD Radeon 680M (1476 - 1731, n=7) | |
| Beelink GTR5 | |
| Beelink SEi11 Pro | |
| CrossMark / Productivity | |
| Beelink GTR6 | |
| Gemiddeld AMD Ryzen 9 6900HX, AMD Radeon 680M (1451 - 1738, n=7) | |
| Beelink GTR5 | |
| Beelink SEi11 Pro | |
| CrossMark / Creativity | |
| Beelink GTR6 | |
| Gemiddeld AMD Ryzen 9 6900HX, AMD Radeon 680M (1632 - 1745, n=7) | |
| Beelink GTR5 | |
| Beelink SEi11 Pro | |
| CrossMark / Responsiveness | |
| Beelink GTR6 | |
| Gemiddeld AMD Ryzen 9 6900HX, AMD Radeon 680M (1060 - 1671, n=7) | |
| Beelink SEi11 Pro | |
| Beelink GTR5 | |
| PCMark 10 Score | 7109 punten | |
Help | ||
| AIDA64 / Memory Copy | |
| Beelink GTR6 | |
| Gemiddeld AMD Ryzen 9 6900HX (47938 - 53345, n=20) | |
| GMK NucBox 2 | |
| Beelink GTR5 | |
| Beelink SEi11 Pro | |
| Intel NUC11PHKi7C | |
| Intel NUC11TNKi5 | |
| AIDA64 / Memory Read | |
| Beelink GTR6 | |
| Gemiddeld AMD Ryzen 9 6900HX (43892 - 53321, n=20) | |
| Beelink GTR5 | |
| Beelink SEi11 Pro | |
| Intel NUC11PHKi7C | |
| GMK NucBox 2 | |
| Intel NUC11TNKi5 | |
| AIDA64 / Memory Write | |
| Beelink GTR6 | |
| Gemiddeld AMD Ryzen 9 6900HX (51085 - 57202, n=20) | |
| GMK NucBox 2 | |
| Beelink SEi11 Pro | |
| Beelink GTR5 | |
| Intel NUC11PHKi7C | |
| Intel NUC11TNKi5 | |
| AIDA64 / Memory Latency | |
| Intel NUC11PHKi7C | |
| Gemiddeld AMD Ryzen 9 6900HX (80.7 - 120.6, n=20) | |
| Intel NUC11TNKi5 | |
| Beelink GTR6 | |
| Beelink SEi11 Pro | |
| Beelink GTR5 | |
| GMK NucBox 2 | |
* ... kleiner is beter
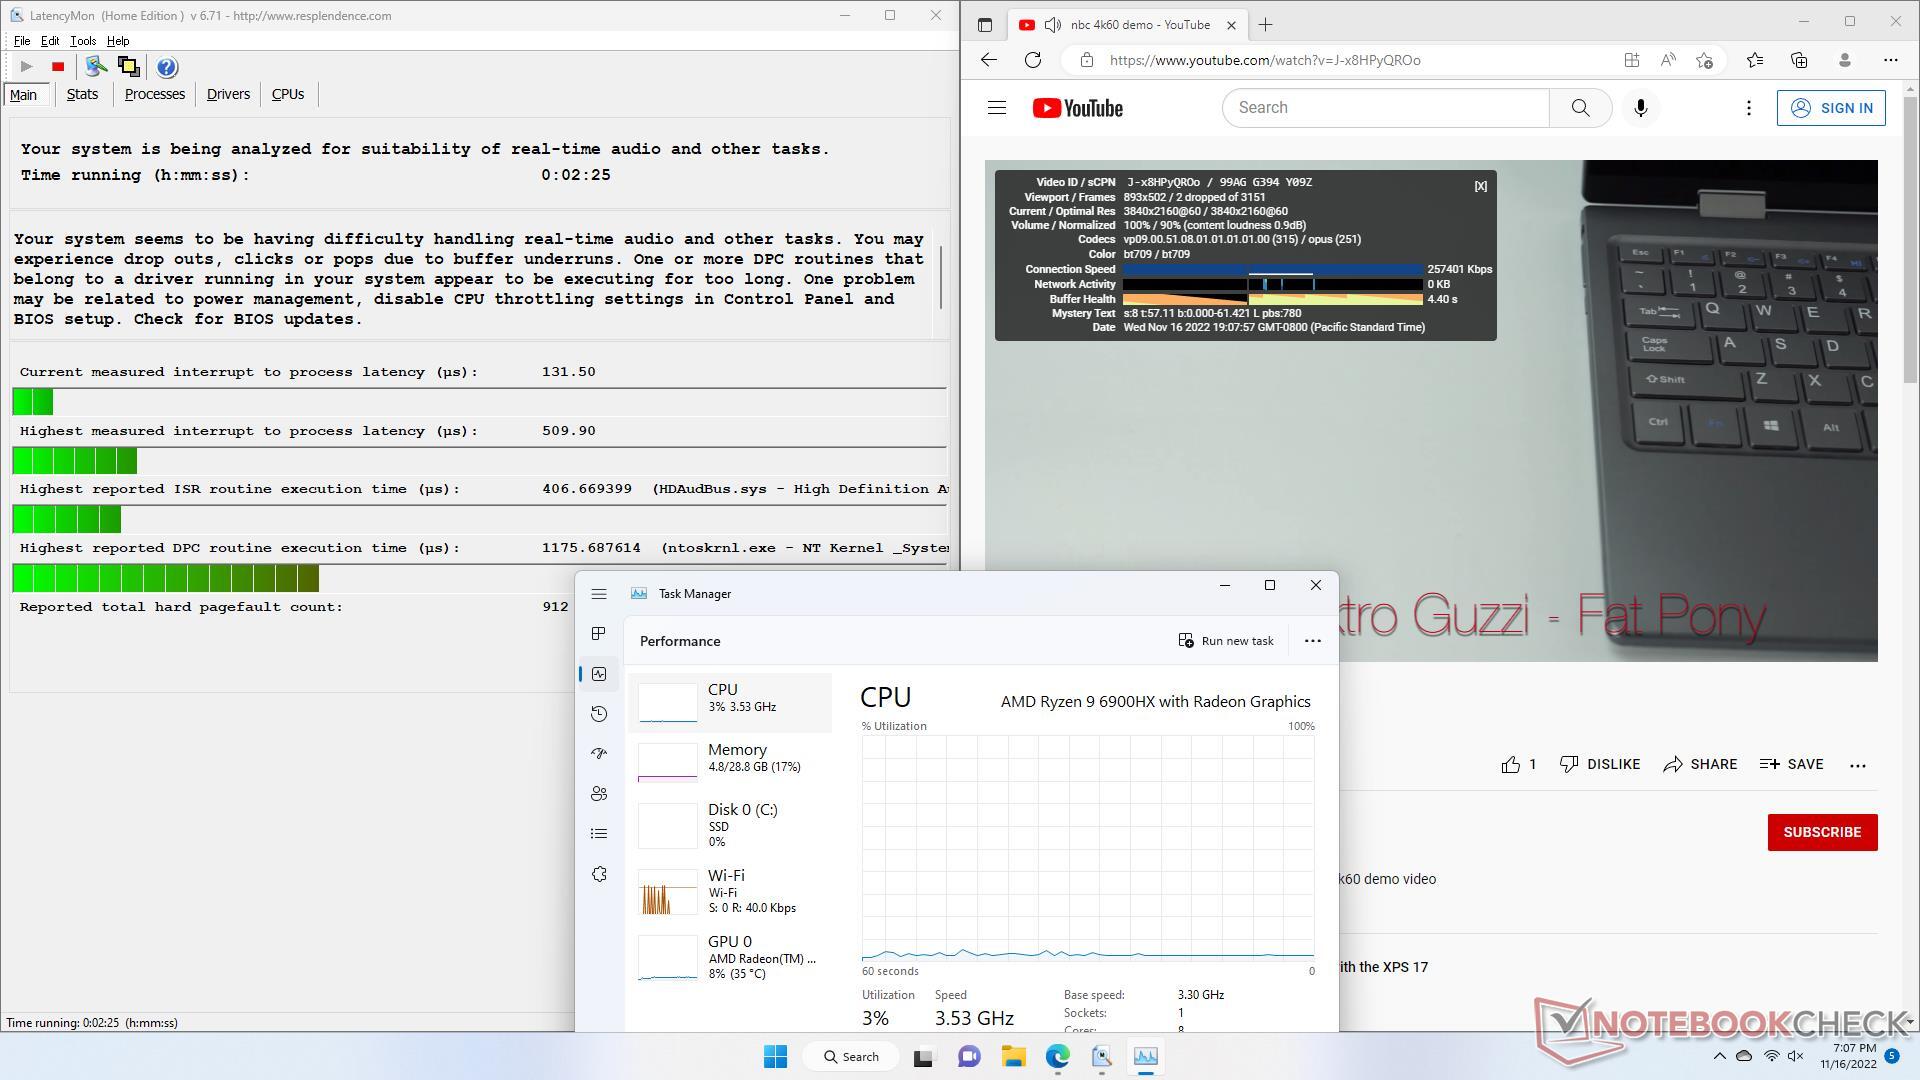
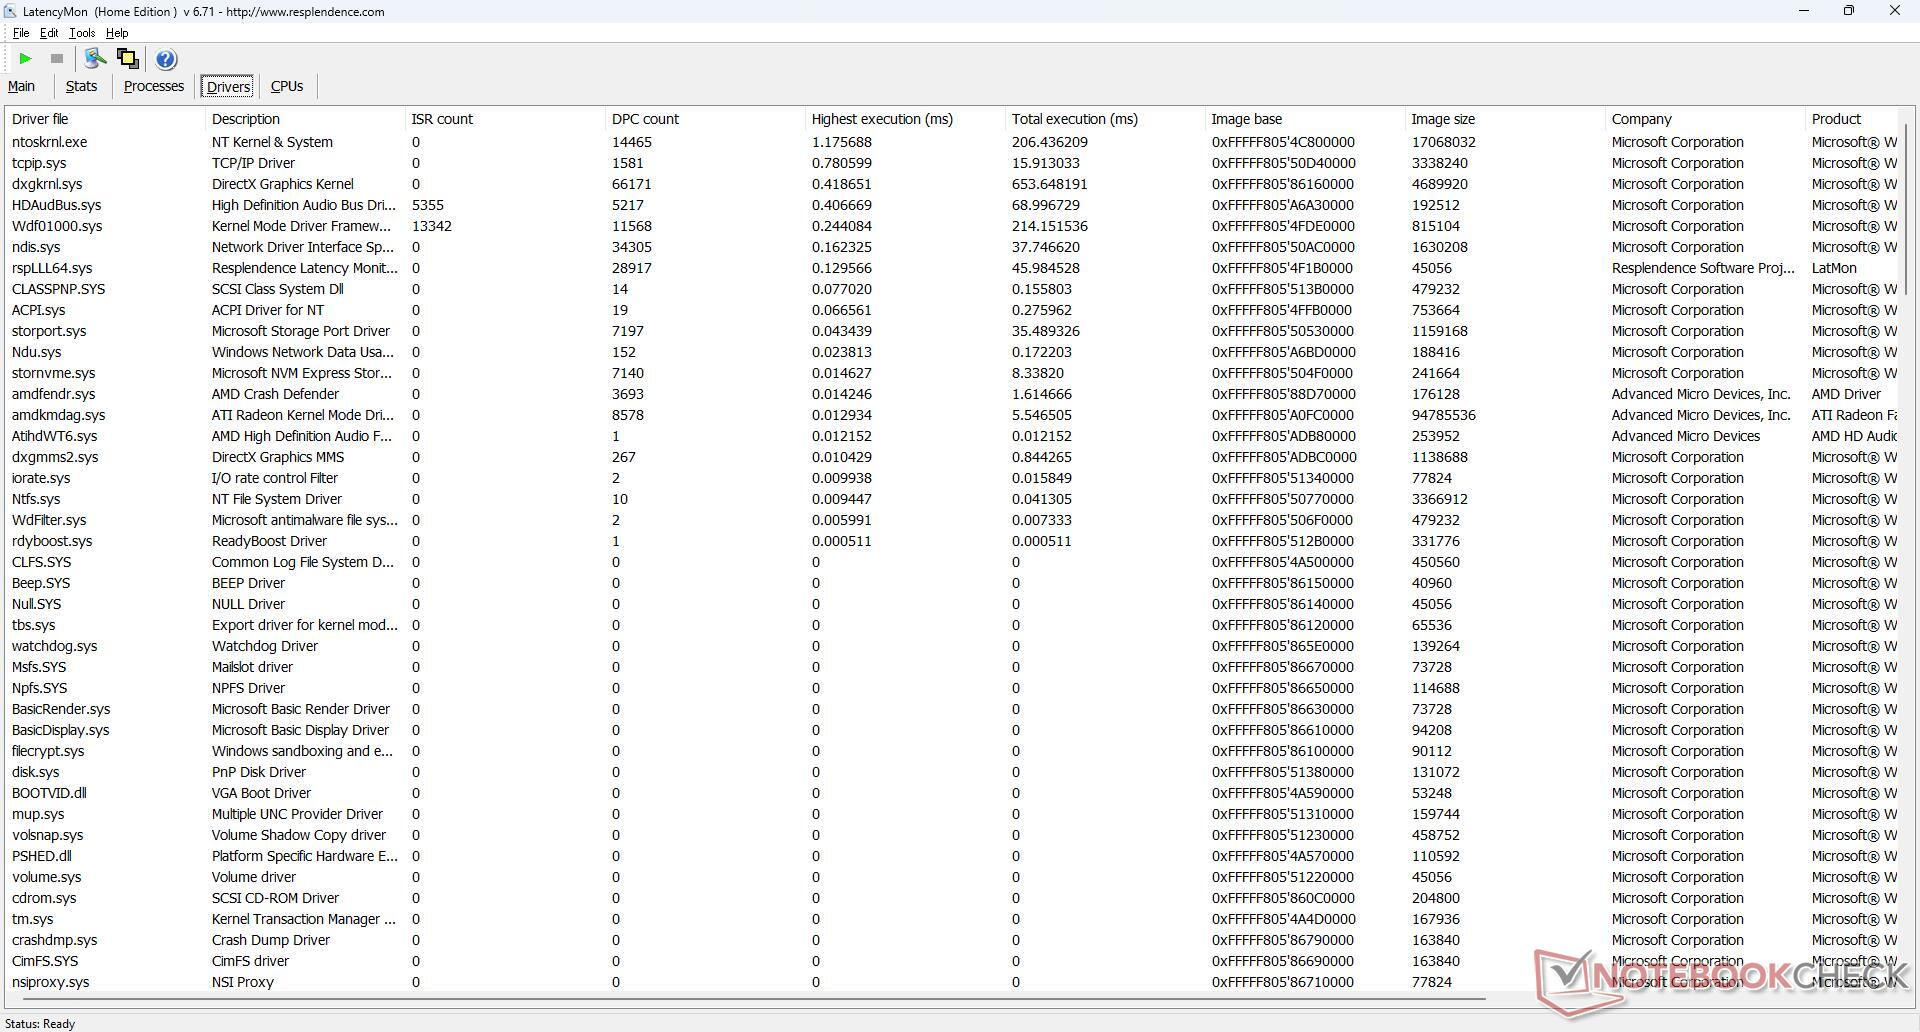
DPC latentie
Er zijn kleine DPC-problemen bij het openen van meerdere browsertabbladen op onze homepage. het afspelen van 4K video bij 60 FPS is verder uitstekend met slechts 2 dropped frames tijdens onze minutenlange testvideo. Het processorgebruik is zeer laag in vergelijking met PC's met tragere CPU's uit de U-serie.
| DPC Latencies / LatencyMon - interrupt to process latency (max), Web, Youtube, Prime95 | |
| Intel NUC11PHKi7C | |
| GMK NucBox 2 | |
| Intel NUC11TNKi5 | |
| Beelink GTR6 | |
| Beelink SEi11 Pro | |
| Beelink GTR5 | |
* ... kleiner is beter
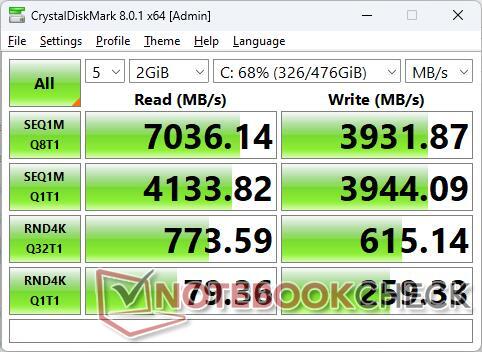
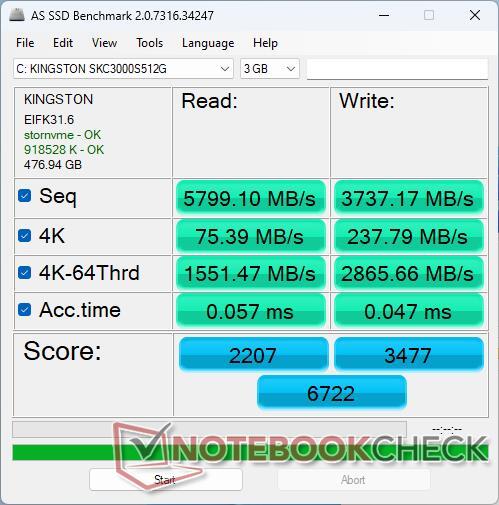
Opslagapparaten - SSD-koeling inbegrepen
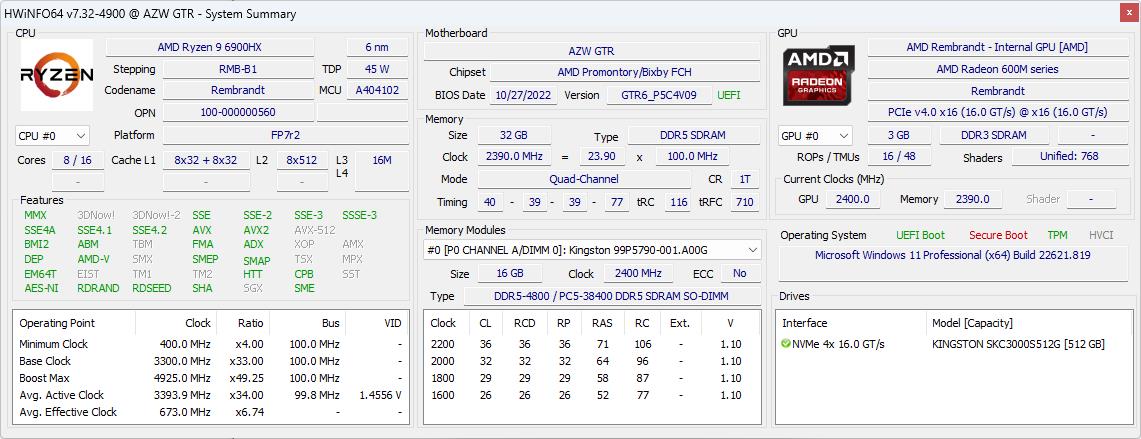
Onze eenheid wordt geleverd met een 512 GB Kingston KC3000 PCIe4 x4 NVMe SSD met sequentiële lees- en schrijfsnelheden tot respectievelijk 7000 MB/s en 4000 MB/s. De schijf vertoont geen problemen om de maximale overdrachtsnelheden gedurende langere tijd vol te houden, aangezien een speciaal SSD koellichaam en thermisch pad vooraf zijn geïnstalleerd.

| Drive Performance rating - Percent | |
| Beelink GTR6 | |
| Intel NUC11PHKi7C | |
| Beelink SEi11 Pro | |
| Beelink GTR5 | |
| GMK NucBox 2 | |
| Intel NUC11TNKi5 | |
* ... kleiner is beter
Disk Throttling: DiskSpd Read Loop, Queue Depth 8
GPU-prestaties - Snelste geïntegreerde graphics
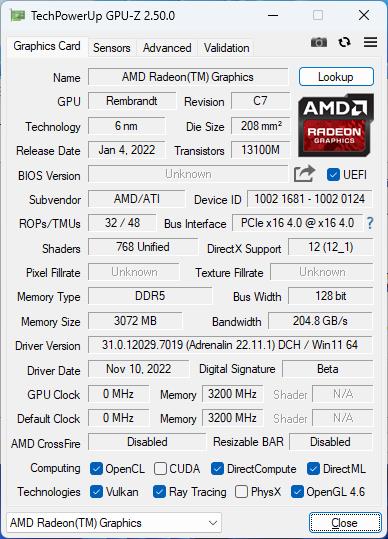
De Radeon 680M blijft indruk maken met resultaten die ruwweg 60 procent sneller zijn dan de uitgaande Radeon RX Vega 8 in de laatste generatie Ryzen 9 5900HX. Dit zet de nieuwe geïntegreerde AMD GPU ruim voor op elke Intel Iris Xe 96 EUs oplossing met 50 procent of meer. Dedicated low-end GPU's zoals de GeForce GTX 1060 of GTX 1650 zijn nog steeds veel sneller, maar de 680M is toch indrukwekkend voor een geïntegreerde GPU. De meeste titels zijn speelbaar op lage tot gemiddelde instellingen bij een resolutie van 1080p, waaronder zelfs Cyberpunk 2077.
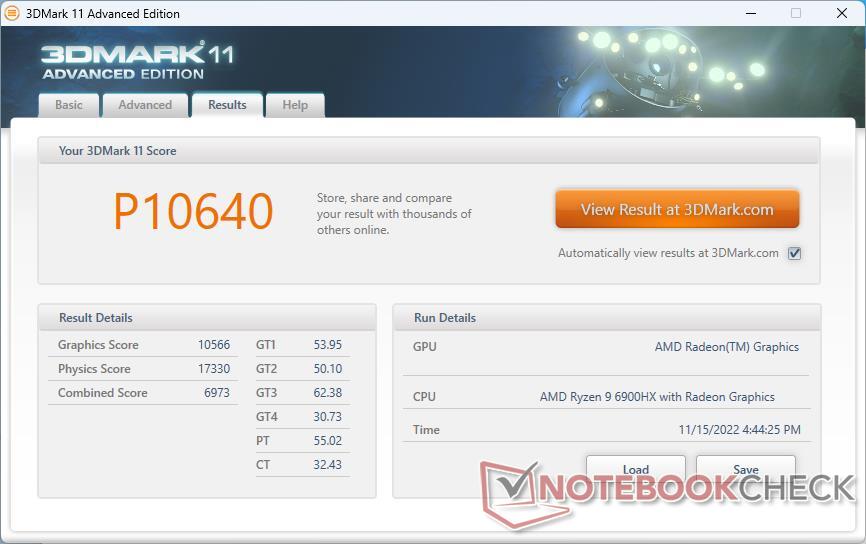
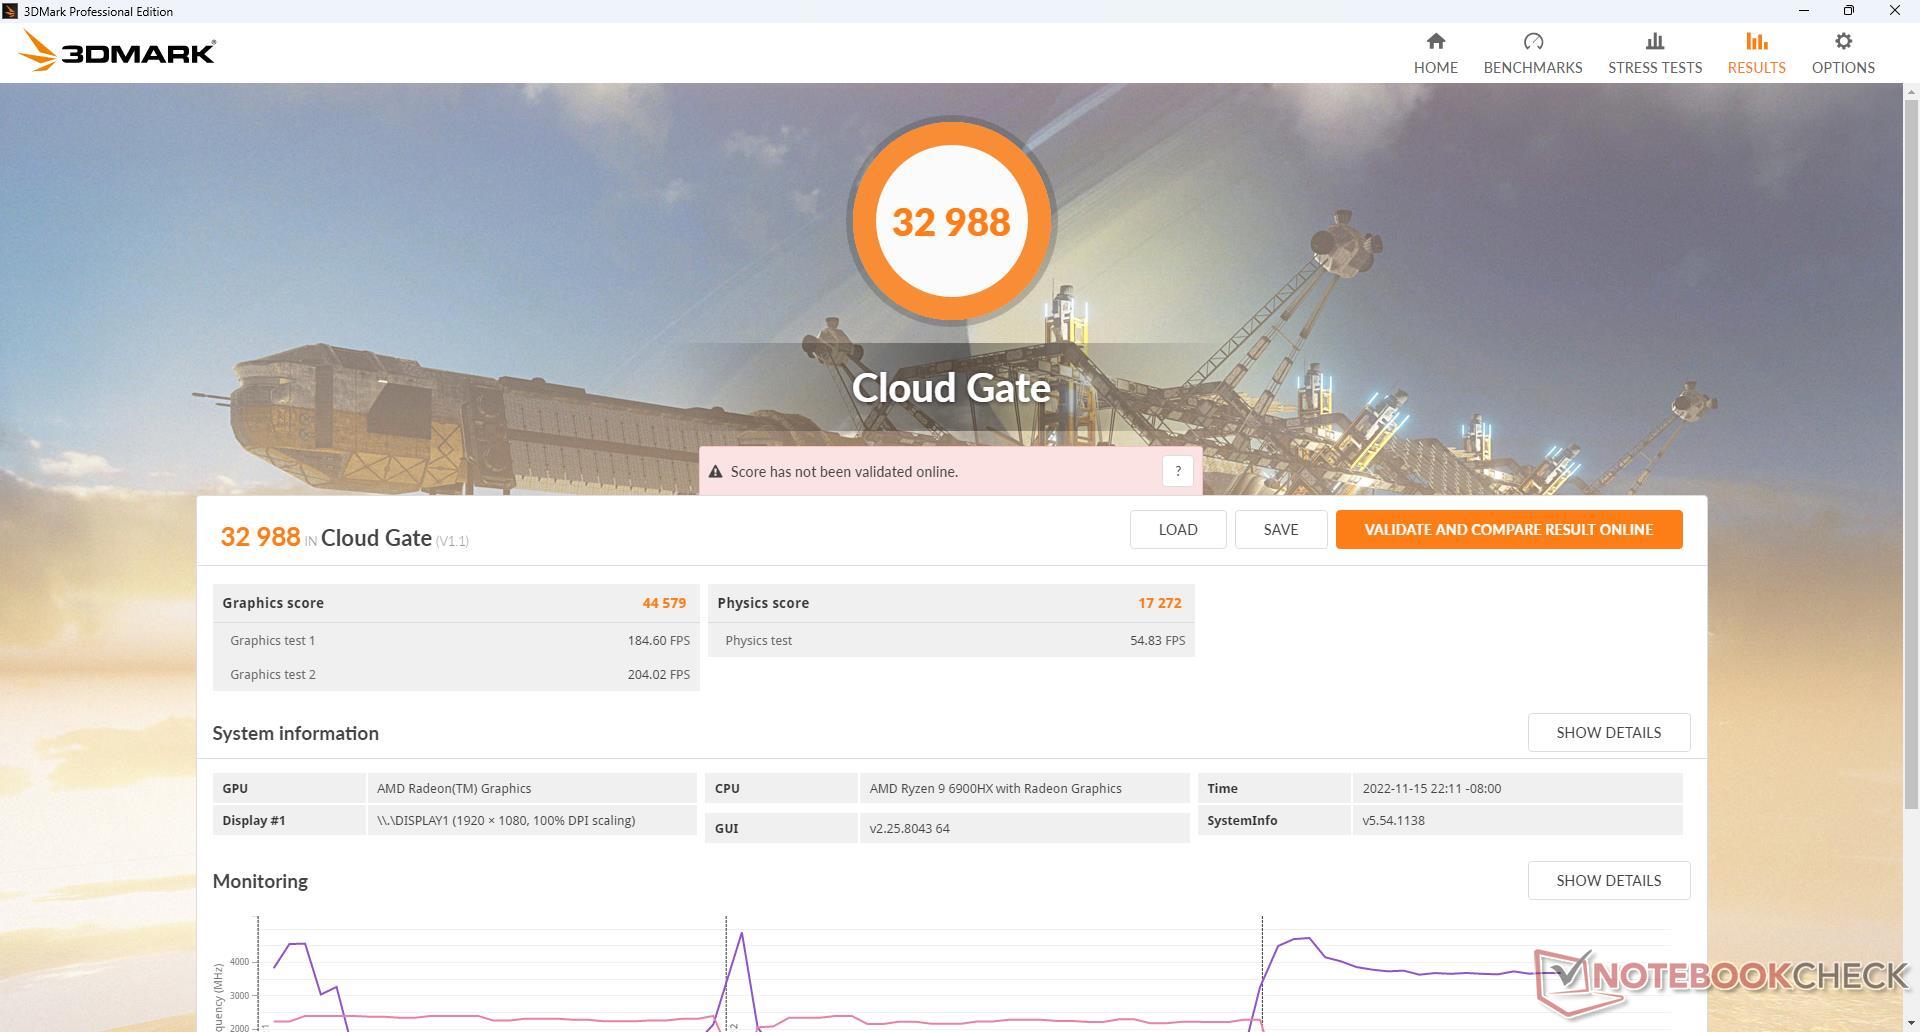
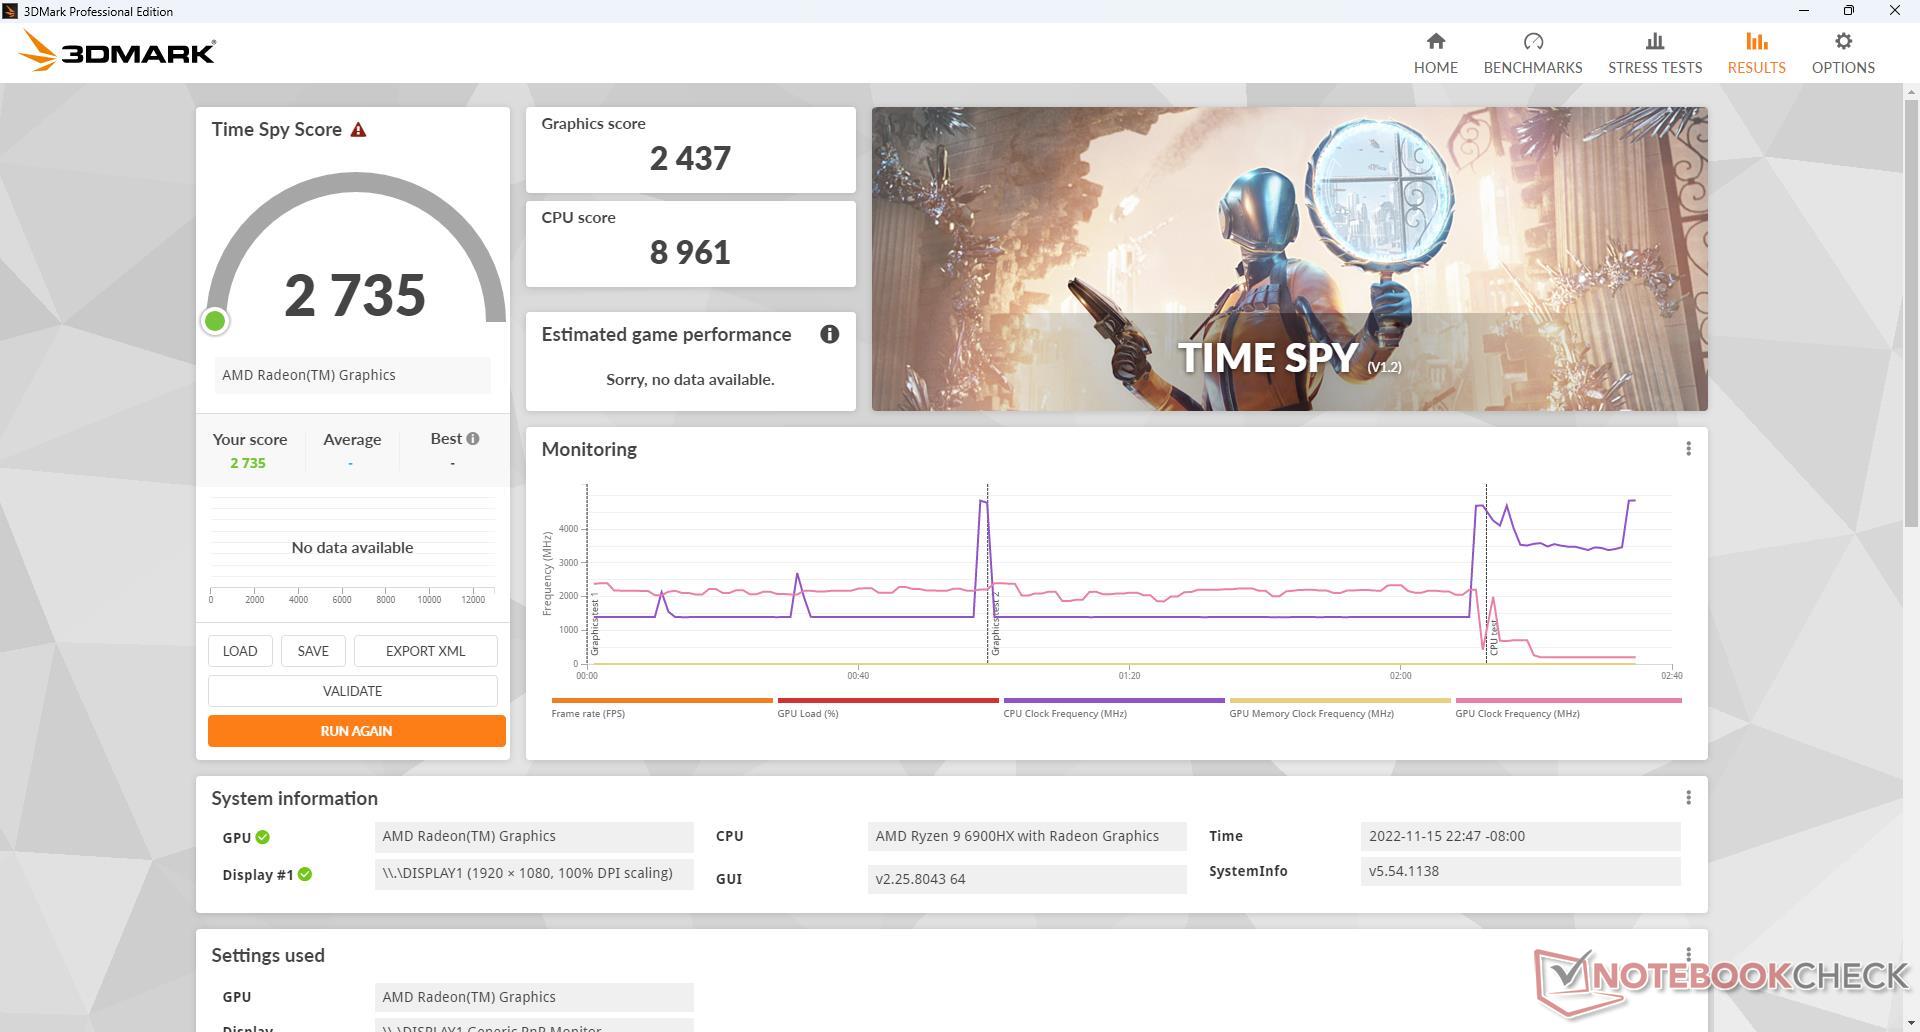
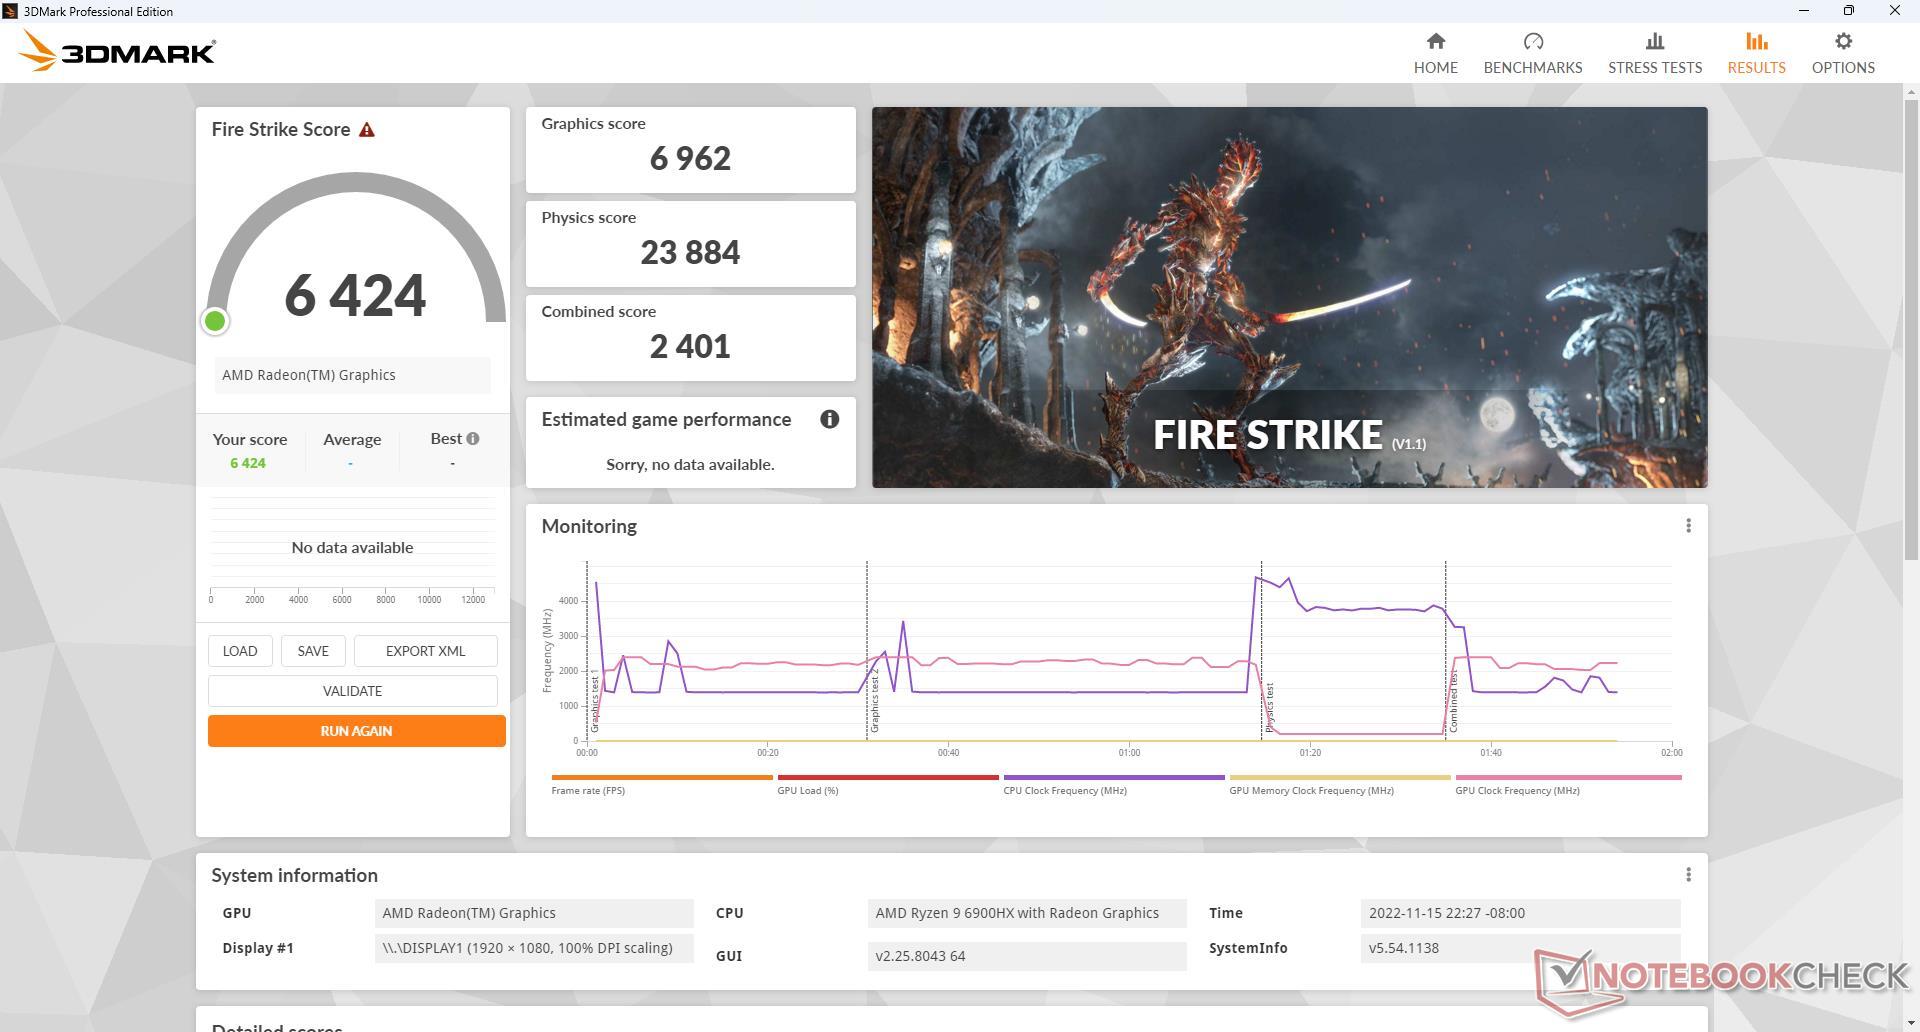
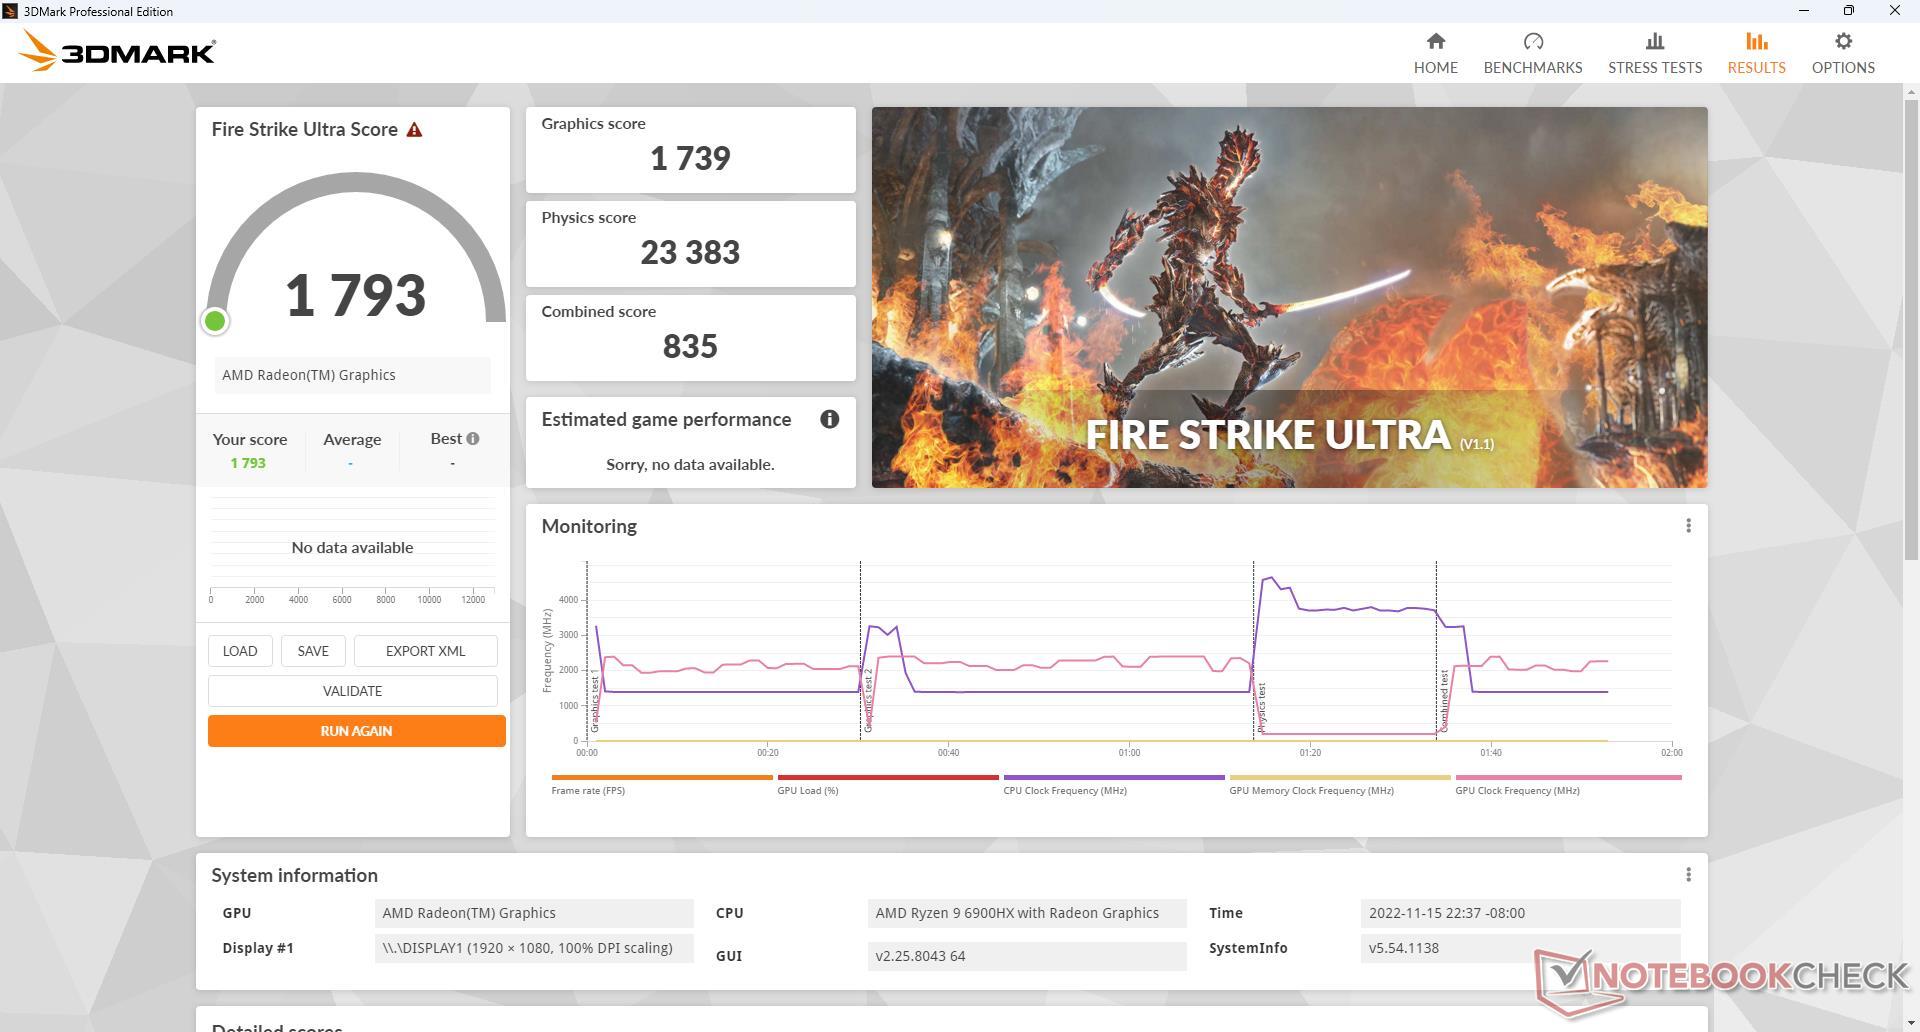
| 3DMark 11 Performance | 10640 punten | |
| 3DMark Cloud Gate Standard Score | 32988 punten | |
| 3DMark Fire Strike Score | 6424 punten | |
| 3DMark Time Spy Score | 2735 punten | |
Help | ||
| Blender | |
| v3.3 Classroom HIP/AMD | |
| Beelink GTR6 | |
| Gemiddeld AMD Radeon 680M (270 - 555, n=34) | |
| v3.3 Classroom CPU | |
| Beelink SEi11 Pro | |
| Gemiddeld AMD Radeon 680M (389 - 980, n=37) | |
| Beelink GTR6 | |
* ... kleiner is beter
| Performance rating - Percent | |
| Intel NUC11PHKi7C | |
| Beelink GTR6 | |
| Beelink GTR5 | |
| Beelink SEi11 Pro -1! | |
| Intel NUC11TNKi5 -3! | |
| GMK NucBox 2 -3! | |
| The Witcher 3 - 1920x1080 Ultra Graphics & Postprocessing (HBAO+) | |
| Intel NUC11PHKi7C | |
| Beelink GTR6 | |
| Beelink GTR5 | |
| Beelink SEi11 Pro | |
| GTA V - 1920x1080 Highest AA:4xMSAA + FX AF:16x | |
| Intel NUC11PHKi7C | |
| Beelink GTR6 | |
| Beelink GTR5 | |
| Final Fantasy XV Benchmark - 1920x1080 High Quality | |
| Intel NUC11PHKi7C | |
| Beelink GTR6 | |
| Beelink GTR5 | |
| Beelink SEi11 Pro | |
| Intel NUC11TNKi5 | |
| GMK NucBox 2 | |
| Strange Brigade - 1920x1080 ultra AA:ultra AF:16 | |
| Intel NUC11PHKi7C | |
| Beelink GTR6 | |
| Beelink GTR5 | |
| Beelink SEi11 Pro | |
| Dota 2 Reborn - 1920x1080 ultra (3/3) best looking | |
| Intel NUC11PHKi7C | |
| Beelink GTR6 | |
| Beelink GTR5 | |
| Beelink SEi11 Pro | |
| Intel NUC11TNKi5 | |
| GMK NucBox 2 | |
| X-Plane 11.11 - 1920x1080 high (fps_test=3) | |
| Intel NUC11PHKi7C | |
| Beelink GTR6 | |
| Beelink GTR5 | |
| Beelink SEi11 Pro | |
| Intel NUC11TNKi5 | |
| GMK NucBox 2 | |
| Final Fantasy XV Benchmark | |
| 1280x720 Lite Quality | |
| Intel NUC11PHKi7C | |
| Beelink GTR6 | |
| Gemiddeld AMD Radeon 680M (34.4 - 74.7, n=39) | |
| Beelink GTR5 | |
| Beelink SEi11 Pro | |
| Intel NUC11TNKi5 | |
| GMK NucBox 2 | |
| 1920x1080 Standard Quality | |
| Intel NUC11PHKi7C | |
| Beelink GTR6 | |
| Gemiddeld AMD Radeon 680M (18.3 - 36.9, n=40) | |
| Beelink GTR5 | |
| Beelink SEi11 Pro | |
| Intel NUC11TNKi5 | |
| GMK NucBox 2 | |
| 1920x1080 High Quality | |
| Intel NUC11PHKi7C | |
| Beelink GTR6 | |
| Gemiddeld AMD Radeon 680M (12.9 - 26.2, n=40) | |
| Beelink GTR5 | |
| Beelink SEi11 Pro | |
| Intel NUC11TNKi5 | |
| GMK NucBox 2 | |
| The Witcher 3 | |
| 1024x768 Low Graphics & Postprocessing | |
| Intel NUC11PHKi7C | |
| Beelink GTR6 | |
| Gemiddeld AMD Radeon 680M (67.4 - 150, n=31) | |
| Beelink SEi11 Pro | |
| Beelink GTR5 | |
| Intel NUC11TNKi5 | |
| 1366x768 Medium Graphics & Postprocessing | |
| Intel NUC11PHKi7C | |
| Beelink GTR6 | |
| Gemiddeld AMD Radeon 680M (44.5 - 85.3, n=24) | |
| Beelink GTR5 | |
| Beelink SEi11 Pro | |
| 1920x1080 High Graphics & Postprocessing (Nvidia HairWorks Off) | |
| Intel NUC11PHKi7C | |
| Beelink GTR6 | |
| Gemiddeld AMD Radeon 680M (22.3 - 48, n=33) | |
| Beelink SEi11 Pro | |
| Beelink GTR5 | |
| 1920x1080 Ultra Graphics & Postprocessing (HBAO+) | |
| Intel NUC11PHKi7C | |
| Beelink GTR6 | |
| Gemiddeld AMD Radeon 680M (14.3 - 27.1, n=33) | |
| Beelink GTR5 | |
| Beelink SEi11 Pro | |
| GTA V | |
| 1024x768 Lowest Settings possible | |
| Intel NUC11PHKi7C | |
| Beelink GTR6 | |
| Beelink GTR5 | |
| Gemiddeld AMD Radeon 680M (67.7 - 155.4, n=35) | |
| Beelink SEi11 Pro | |
| 1920x1080 Lowest Settings possible | |
| Intel NUC11PHKi7C | |
| Beelink GTR6 | |
| Gemiddeld AMD Radeon 680M (56.9 - 115.8, n=27) | |
| Beelink GTR5 | |
| Beelink SEi11 Pro | |
| 1366x768 Normal/Off AF:4x | |
| Intel NUC11PHKi7C | |
| Beelink GTR6 | |
| Beelink GTR5 | |
| Gemiddeld AMD Radeon 680M (60.7 - 143.9, n=32) | |
| Beelink SEi11 Pro | |
| 1920x1080 Normal/Off AF:4x | |
| Intel NUC11PHKi7C | |
| Beelink GTR6 | |
| Gemiddeld AMD Radeon 680M (54.9 - 117.3, n=27) | |
| Beelink GTR5 | |
| Beelink SEi11 Pro | |
| 1920x1080 High/On (Advanced Graphics Off) AA:2xMSAA + FX AF:8x | |
| Intel NUC11PHKi7C | |
| Beelink GTR6 | |
| Gemiddeld AMD Radeon 680M (25.9 - 99.1, n=37) | |
| Beelink GTR5 | |
| Beelink SEi11 Pro | |
| 1920x1080 Highest AA:4xMSAA + FX AF:16x | |
| Intel NUC11PHKi7C | |
| Beelink GTR6 | |
| Gemiddeld AMD Radeon 680M (11.3 - 25.3, n=37) | |
| Beelink GTR5 | |
| Cyberpunk 2077 1.6 | |
| 1280x720 Low Preset | |
| Beelink GTR6 | |
| Gemiddeld AMD Radeon 680M (46.1 - 77.6, n=14) | |
| 1920x1080 Low Preset | |
| Beelink GTR6 | |
| Gemiddeld AMD Radeon 680M (26 - 50.6, n=15) | |
| Beelink SEi11 Pro | |
| 1920x1080 Medium Preset | |
| Beelink GTR6 | |
| Gemiddeld AMD Radeon 680M (20.1 - 41.8, n=15) | |
| Beelink SEi11 Pro | |
| 1920x1080 High Preset | |
| Beelink GTR6 | |
| Gemiddeld AMD Radeon 680M (16.3 - 33.6, n=15) | |
| Beelink SEi11 Pro | |
| 1920x1080 Ultra Preset | |
| Beelink GTR6 | |
| Gemiddeld AMD Radeon 680M (14 - 23.8, n=15) | |
| Beelink SEi11 Pro | |
| X-Plane 11.11 | |
| 1280x720 low (fps_test=1) | |
| Intel NUC11PHKi7C | |
| Beelink GTR6 | |
| Beelink GTR5 | |
| Beelink SEi11 Pro | |
| Gemiddeld AMD Radeon 680M (26.8 - 66.7, n=41) | |
| Intel NUC11TNKi5 | |
| GMK NucBox 2 | |
| 1920x1080 med (fps_test=2) | |
| Intel NUC11PHKi7C | |
| Beelink GTR6 | |
| Beelink GTR5 | |
| Gemiddeld AMD Radeon 680M (21.1 - 53.1, n=41) | |
| Beelink SEi11 Pro | |
| Intel NUC11TNKi5 | |
| GMK NucBox 2 | |
| 1920x1080 high (fps_test=3) | |
| Intel NUC11PHKi7C | |
| Beelink GTR6 | |
| Beelink GTR5 | |
| Beelink SEi11 Pro | |
| Gemiddeld AMD Radeon 680M (16.6 - 44.5, n=41) | |
| Intel NUC11TNKi5 | |
| GMK NucBox 2 | |
| Strange Brigade | |
| 1280x720 lowest AF:1 | |
| Intel NUC11PHKi7C | |
| Beelink GTR6 | |
| Gemiddeld AMD Radeon 680M (72.9 - 167.5, n=38) | |
| Beelink GTR5 | |
| Beelink SEi11 Pro | |
| 1920x1080 medium AA:medium AF:4 | |
| Intel NUC11PHKi7C | |
| Beelink GTR6 | |
| Gemiddeld AMD Radeon 680M (30 - 63, n=38) | |
| Beelink GTR5 | |
| Beelink SEi11 Pro | |
| 1920x1080 high AA:high AF:8 | |
| Intel NUC11PHKi7C | |
| Beelink GTR6 | |
| Gemiddeld AMD Radeon 680M (25.3 - 53.1, n=38) | |
| Beelink GTR5 | |
| Beelink SEi11 Pro | |
| 1920x1080 ultra AA:ultra AF:16 | |
| Intel NUC11PHKi7C | |
| Beelink GTR6 | |
| Gemiddeld AMD Radeon 680M (22 - 46, n=38) | |
| Beelink GTR5 | |
| Beelink SEi11 Pro | |
Witcher 3 FPS Chart
| lage | gem. | hoge | ultra | |
|---|---|---|---|---|
| GTA V (2015) | 152.6 | 138 | 51.8 | 23.7 |
| The Witcher 3 (2015) | 139.2 | 84 | 46 | 27.1 |
| Dota 2 Reborn (2015) | 141.9 | 112.7 | 80.9 | 71.4 |
| Final Fantasy XV Benchmark (2018) | 68.5 | 34.9 | 24.5 | |
| X-Plane 11.11 (2018) | 64.8 | 52.6 | 41.8 | |
| Strange Brigade (2018) | 142.4 | 57.4 | 48.5 | 41.6 |
| Cyberpunk 2077 1.6 (2022) | 43 | 33 | 22.3 | 17.5 |
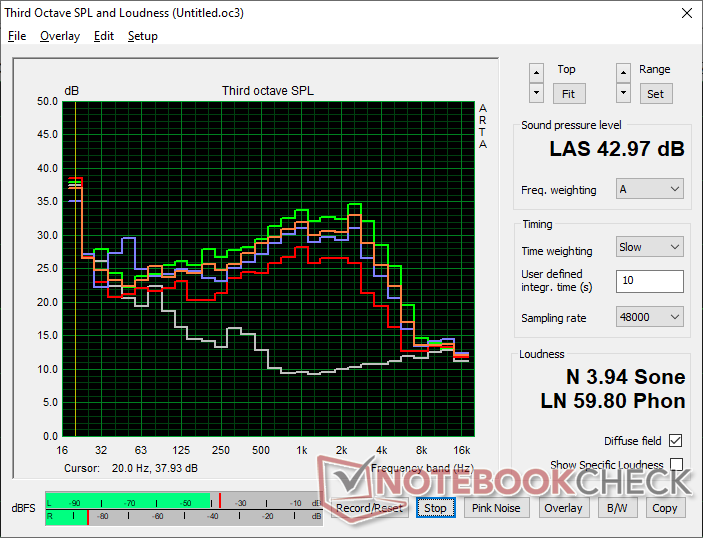
Emissies
Systeemgeluid
Het geluid van de ventilator heeft misschien wel de meeste aandacht van de fabrikant nodig. De GTR6 pulseert constant tussen 23 dB(A) tot wel 36 dB(A), zelfs als er geen activiteit op het scherm is. De veranderingen in het ventilatorgeluid zijn merkbaar en leiden af bij gewoon surfen op het web of videostreaming. De meeste andere mini PC's hebben superieure ventilatorregelingen en RPM gedrag dan de GTR6
Ventilator geluid zou stabiliseren in de lage 40 dB(A) bereik tijdens het gamen, die ten minste vergelijkbaar is met veel Ultrabooks en de oudere GTR5 onder soortgelijke testomstandigheden. Het is alleen jammer dat de ventilator zo vaak pulseert tijdens lage tot gemiddelde belasting.
Geluidsniveau
| Onbelast |
| 23.6 / 23.8 / 36.2 dB (A) |
| Belasting |
| 39.7 / 43 dB (A) |
 | ||
30 dB stil 40 dB(A) hoorbaar 50 dB(A) luid |
||
min: | ||
| Beelink GTR6 Radeon 680M, R9 6900HX, Kingston KC3000 512G SKC3000S512G | Beelink SEi11 Pro Iris Xe G7 96EUs, i5-11320H, Kingston NV1 SNVS/500GCN | Beelink GTR5 Vega 8, R9 5900HX, Kingston NV1 SNVS/500GCN | Intel NUC11PHKi7C GeForce RTX 2060 Mobile, i7-1165G7, Samsung SSD 980 Pro 500GB MZ-V8P500BW | Intel NUC11TNKi5 Iris Xe G7 80EUs, i5-1135G7, Transcend M.2 SSD 430S TS512GMTS430S | GMK NucBox 2 Iris Plus Graphics 655, i5-8259U, Netac S930E8/256GPN | |
|---|---|---|---|---|---|---|
| Noise | 10% | -14% | 2% | -14% | 5% | |
| uit / omgeving * (dB) | 23.2 | 22.8 2% | 23.1 -0% | 24.5 -6% | 24.8 -7% | 25.6 -10% |
| Idle Minimum * (dB) | 23.6 | 24.7 -5% | 34.2 -45% | 25.3 -7% | 35.6 -51% | 25.7 -9% |
| Idle Average * (dB) | 23.8 | 24.7 -4% | 34.2 -44% | 25.3 -6% | 35.6 -50% | 25.7 -8% |
| Idle Maximum * (dB) | 36.2 | 25.3 30% | 34.2 6% | 25.3 30% | 35.6 2% | 25.7 29% |
| Load Average * (dB) | 39.7 | 33.2 16% | 44.6 -12% | 36.4 8% | 36.2 9% | 35.3 11% |
| Witcher 3 ultra * (dB) | 41 | 34.5 16% | 41.4 -1% | 39.7 3% | 38 7% | |
| Load Maximum * (dB) | 43 | 37.8 12% | 45.1 -5% | 47.9 -11% | 47.6 -11% | 35.1 18% |
* ... kleiner is beter
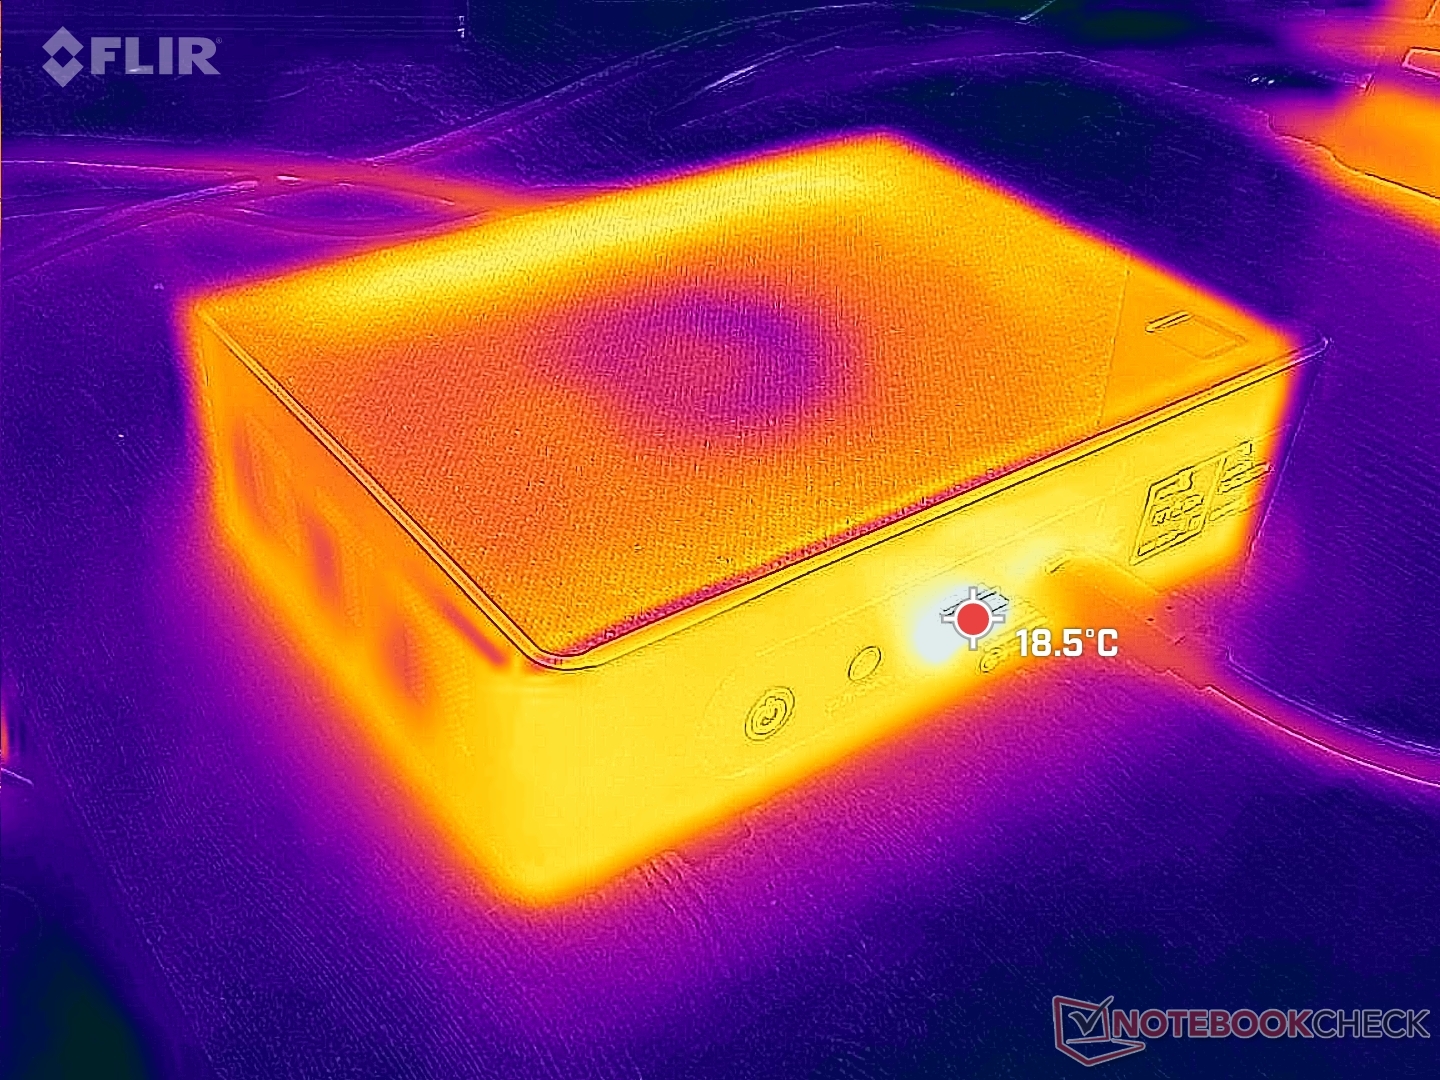
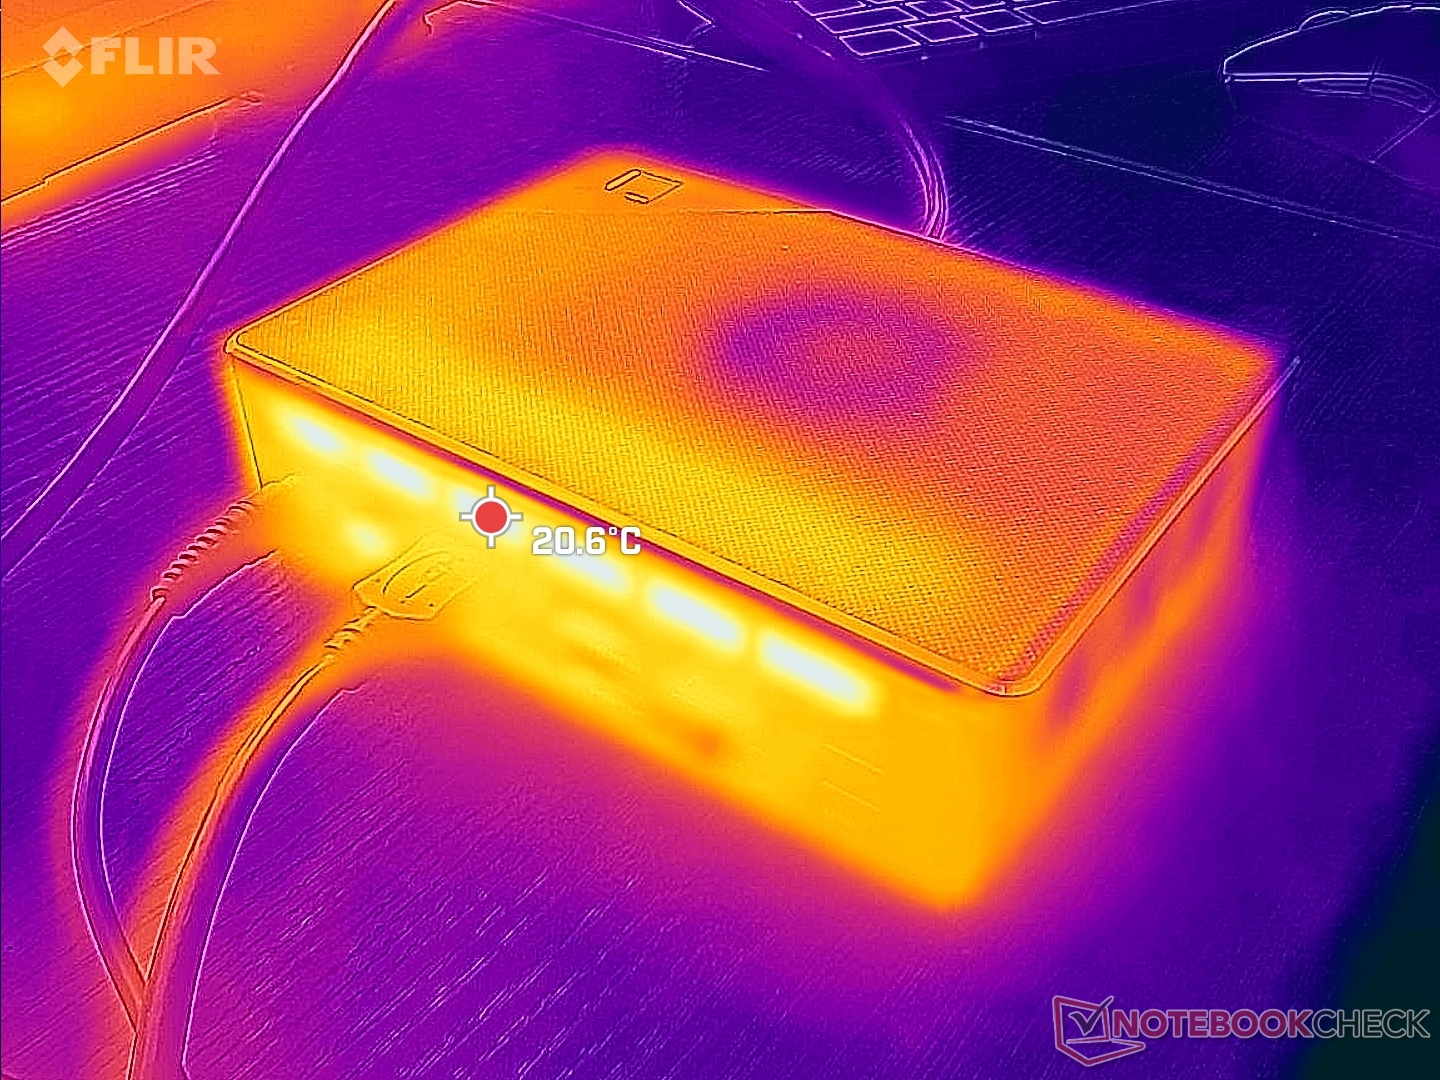
Temperatuur
De temperatuur van het oppervlak is geen probleem, want het is nooit onaangenaam warm. Houd er echter rekening mee dat koele lucht via de bovenkant binnenkomt en dat het dus niet raadzaam is boeken of voorwerpen bovenop het apparaat te plaatsen. Zorg er ook voor dat u voldoende ruimte achter het toestel laat, waar de afvalwarmte vandaan komt.
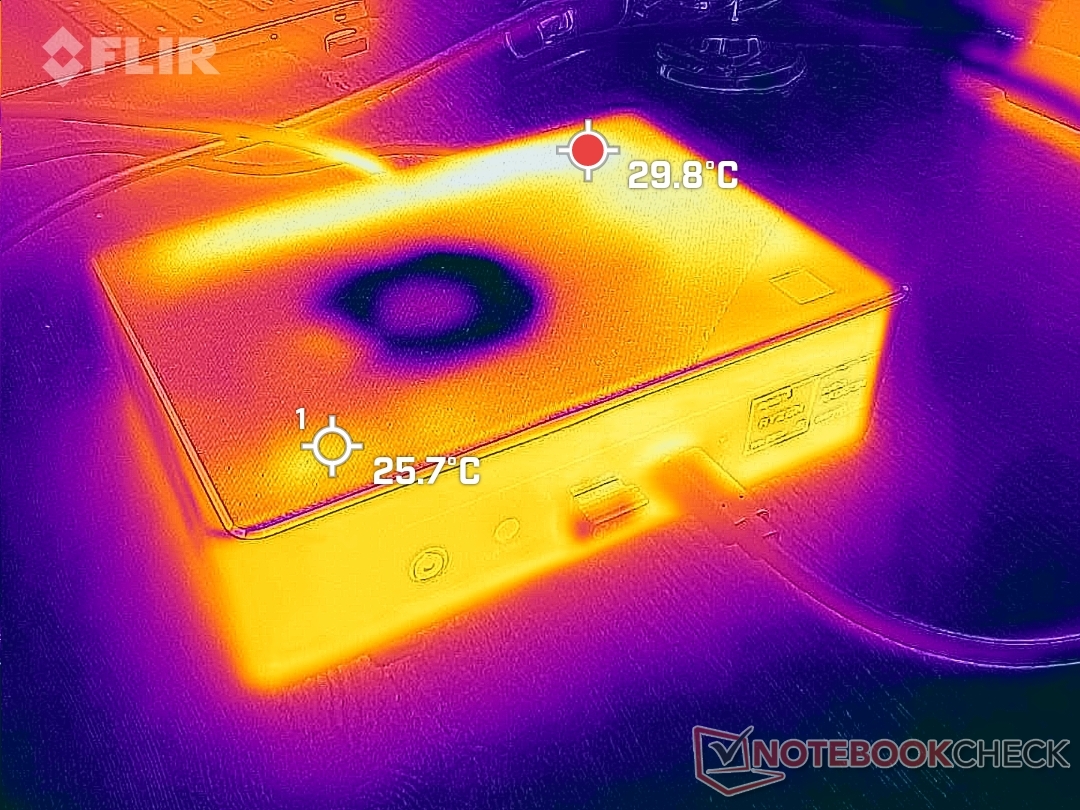
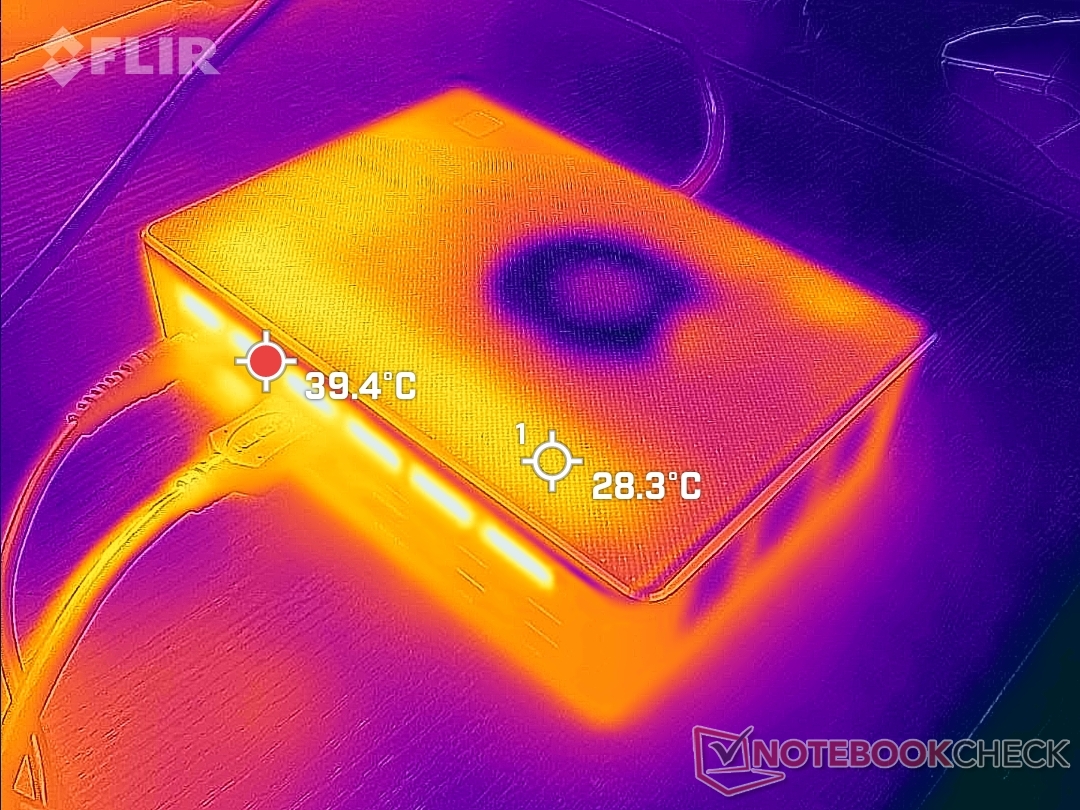
Stresstest
Bij belasting met Prime95 zou de CPU opvoeren tot 3,4 GHz en 45 W voor slechts een paar seconden voordat hij zich stabiliseerde op 3,1 GHz, 38 W en 66 C. Er is zeker ruimte voor overklokken door de eindgebruiker, aangezien de fabrikant blijkbaar een conservatief temperatuurplafond heeft ingesteld bij de standaardinstellingen.
GPU kloksnelheid en temperatuur zouden stabiliseren op 1977 MHz en een redelijk koele 56 C, respectievelijk, wanneer uitgevoerd Witcher 3 om typische gaming belastingen te vertegenwoordigen.
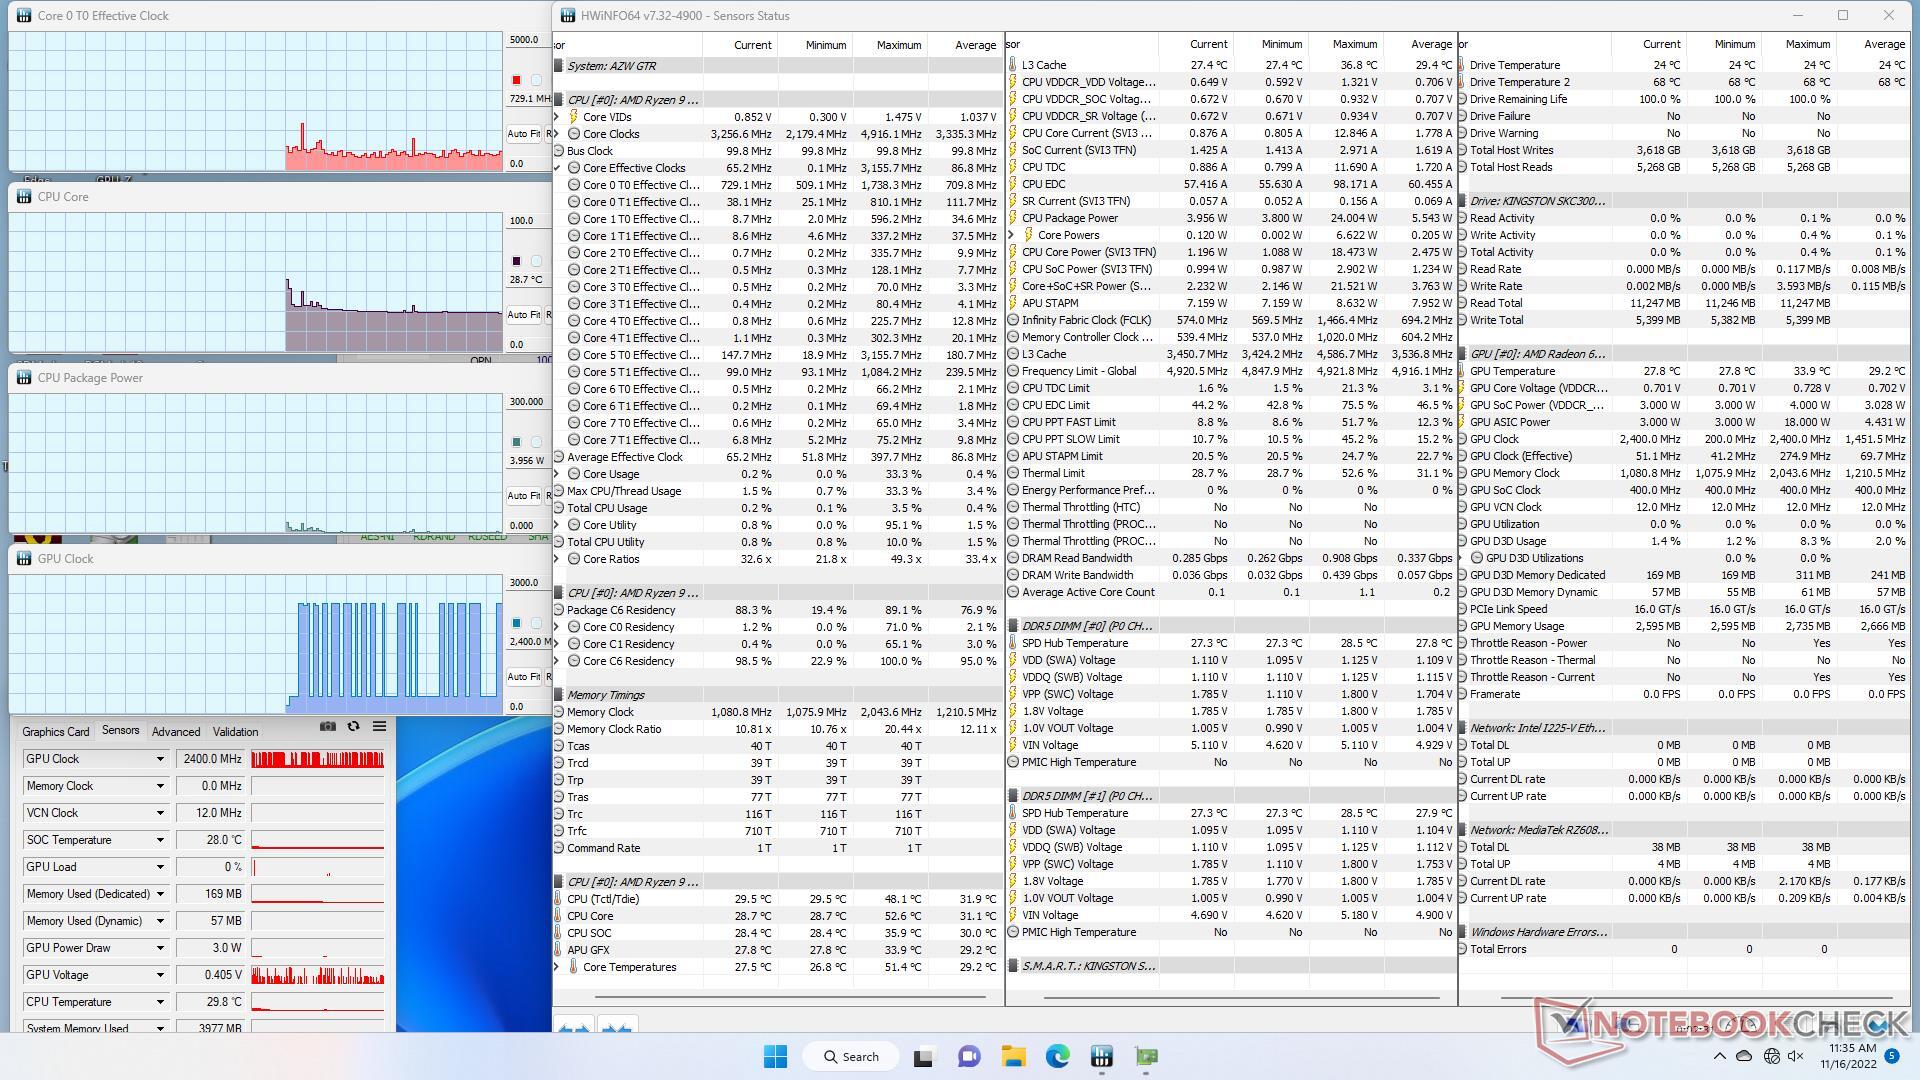
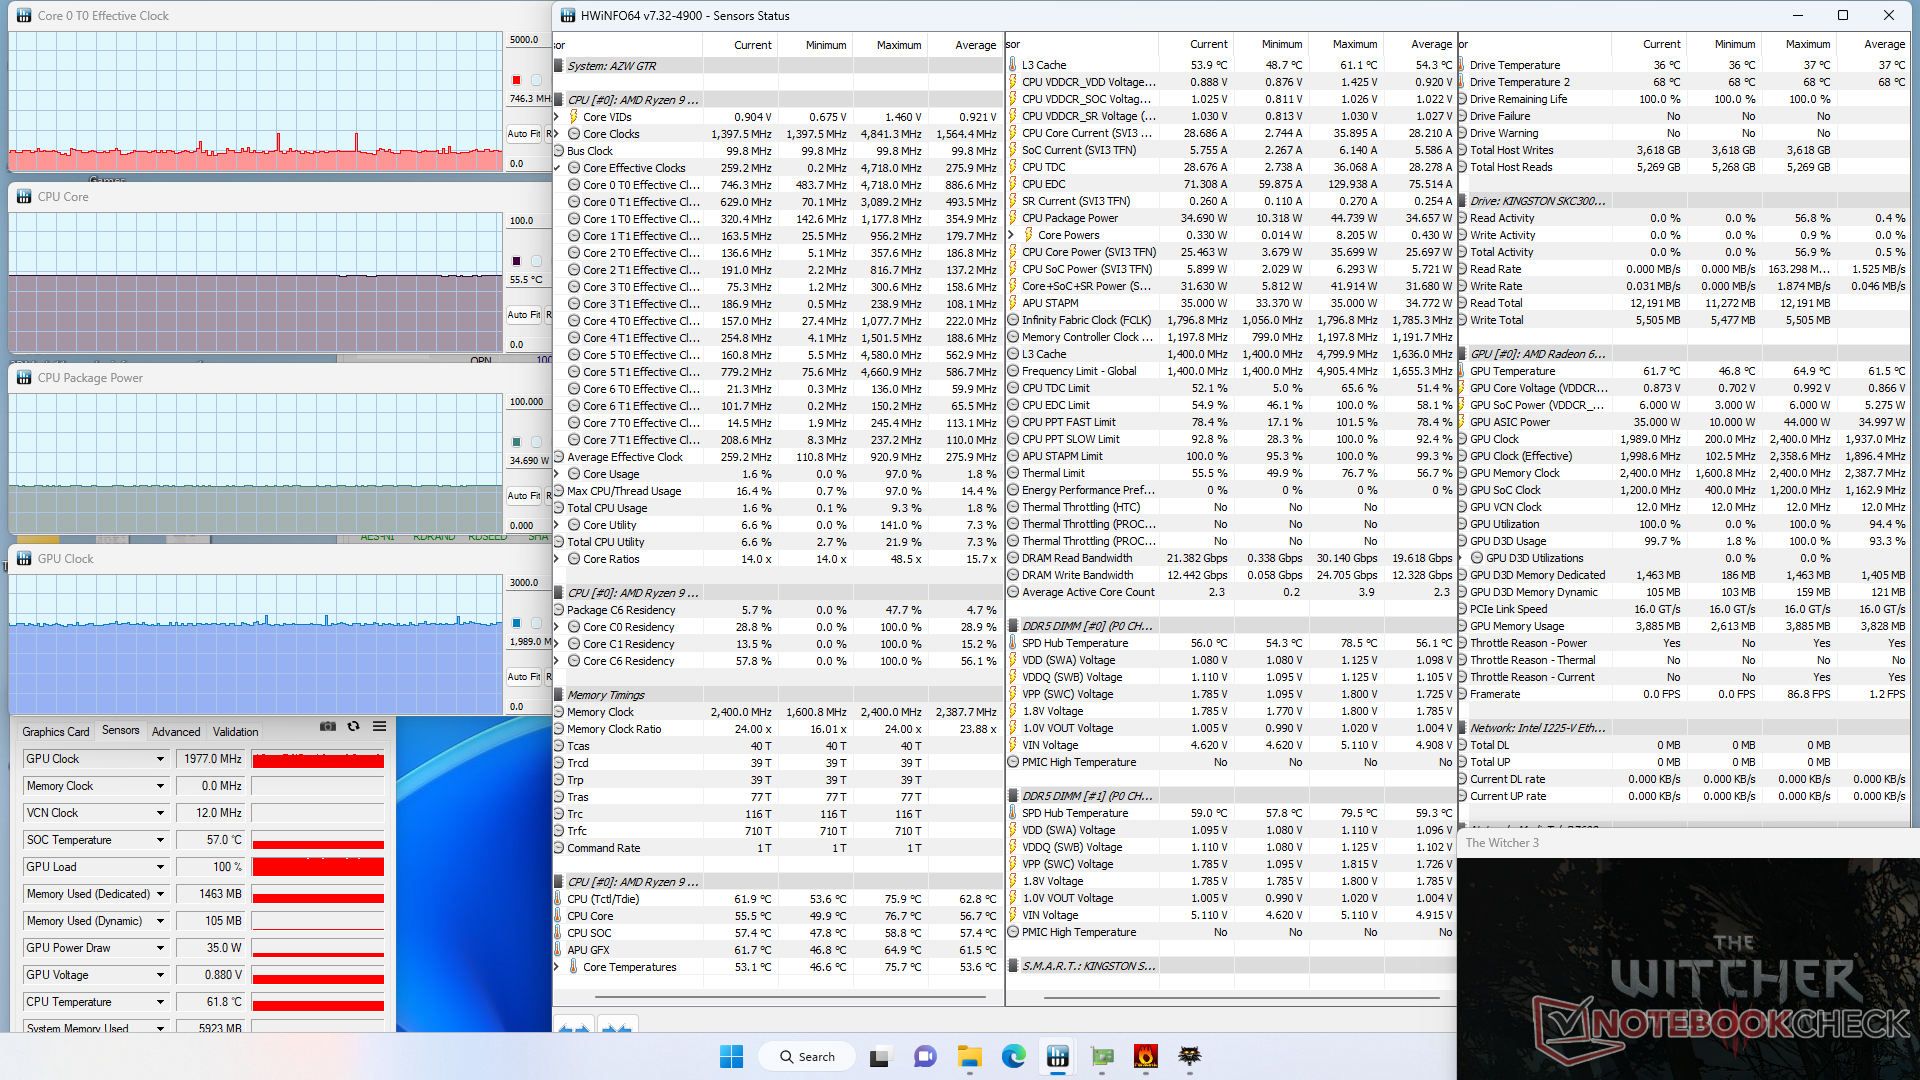
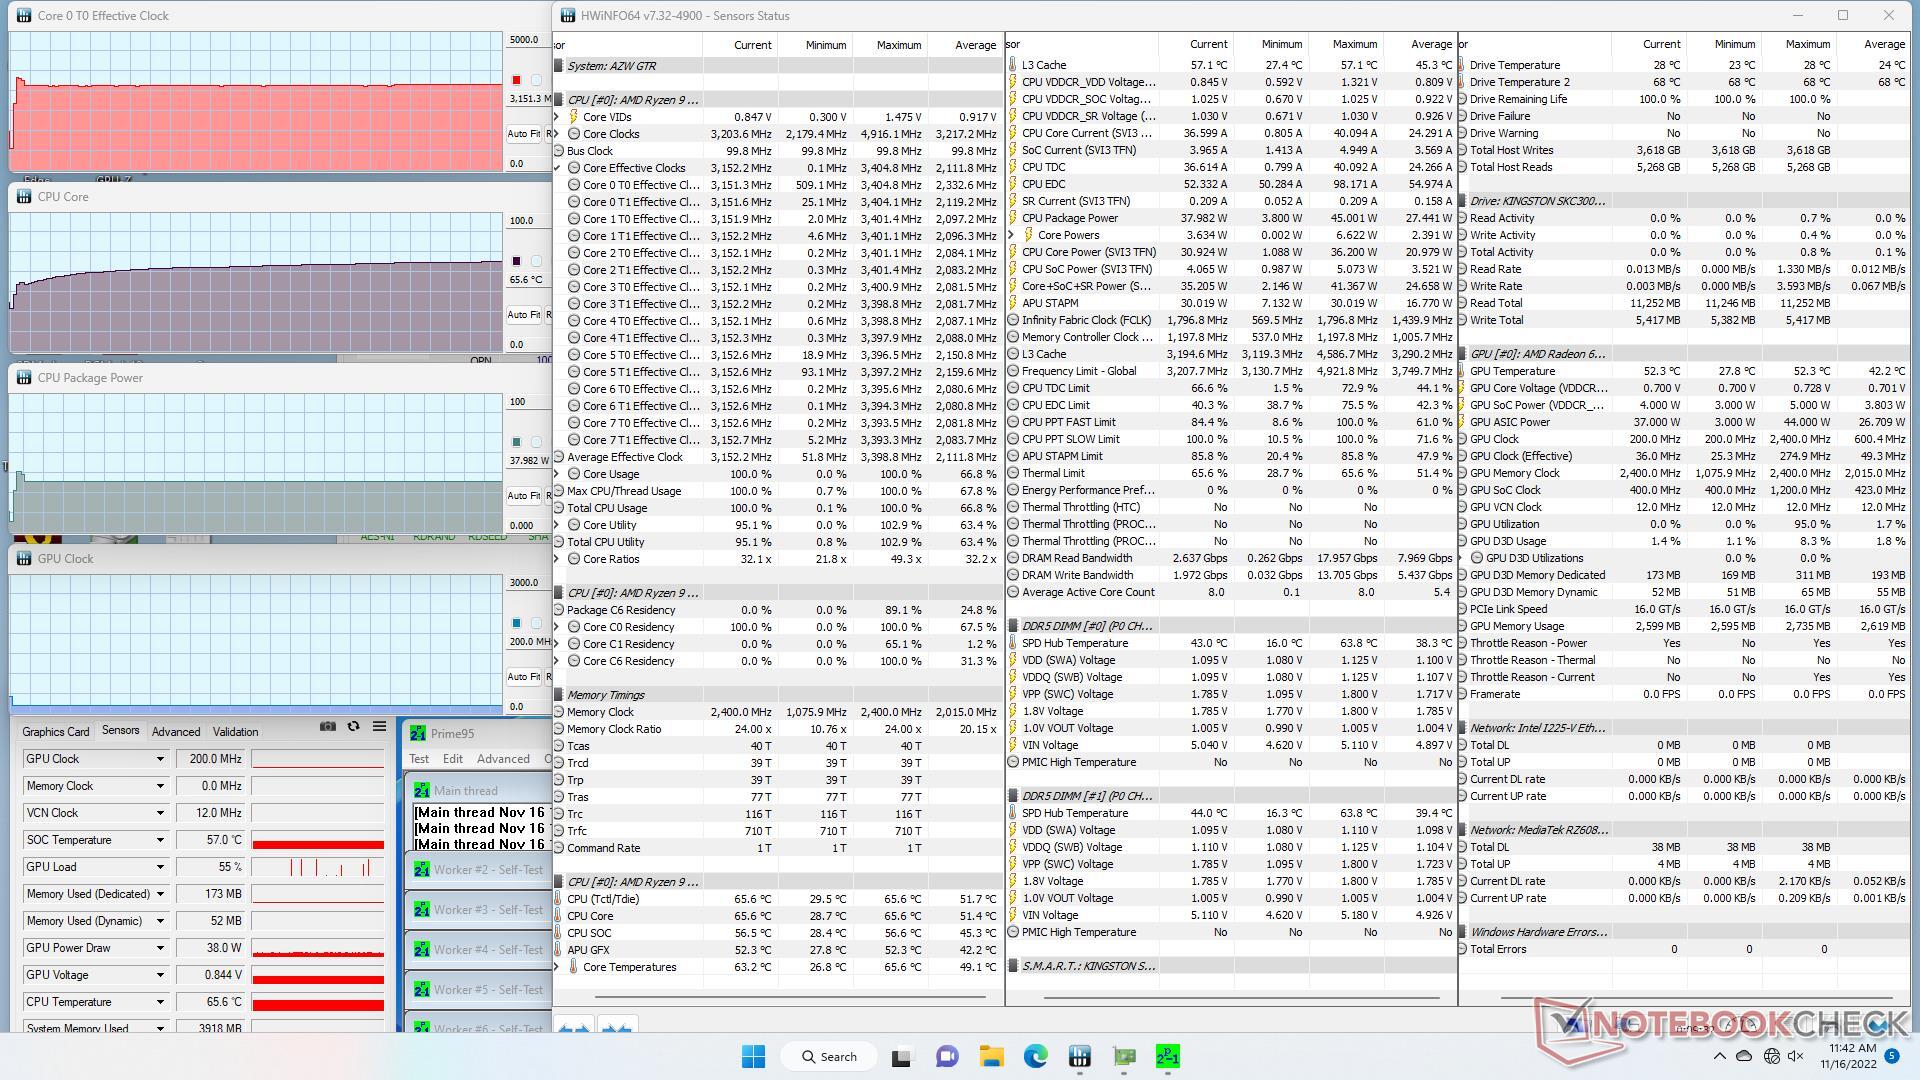
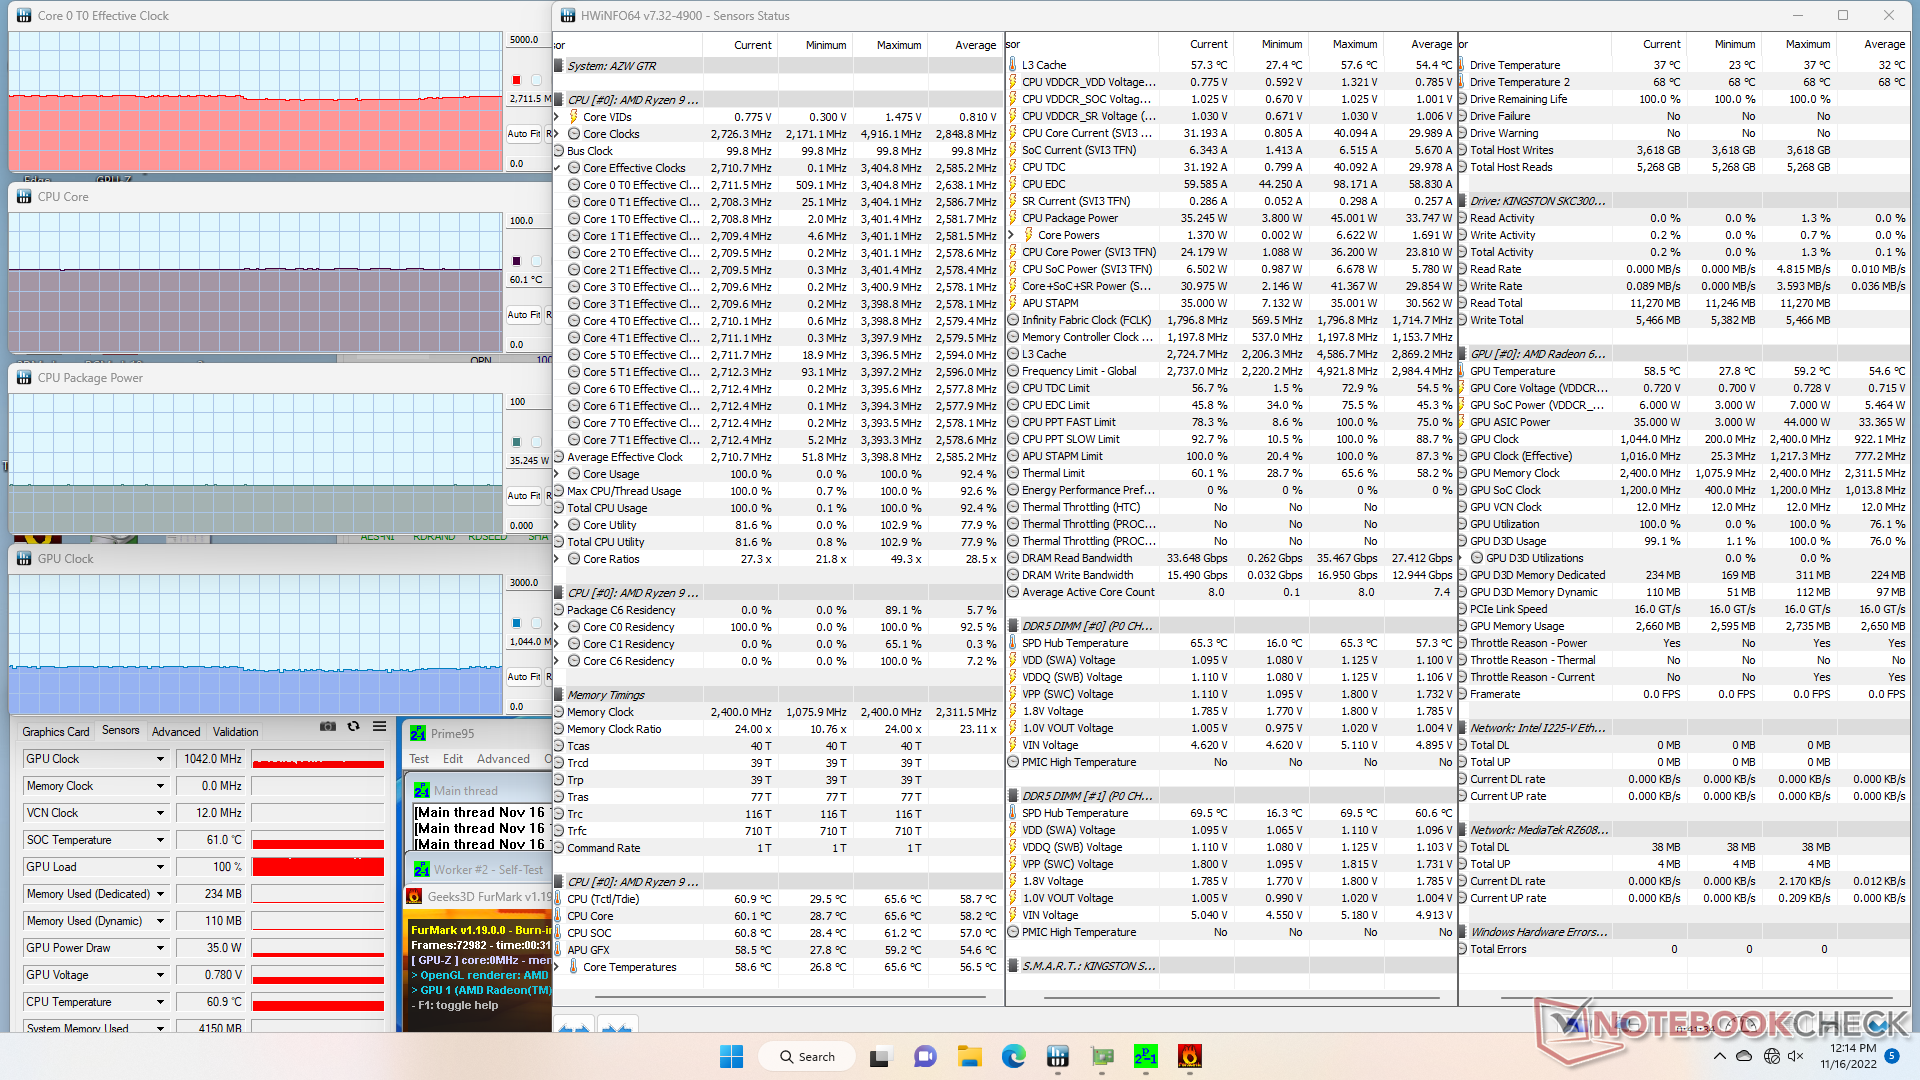
| CPU Klok (GHz) | GPU Klok (MHz) | Gemiddelde CPU Temperatuur (°C) | |
| Systeem Idle | -- | -- | 28 |
| Prime95 Stress | 3.2 | -- | 66 |
| Prime95 + FurMark Stress | 2.7 | 1042 | 60 |
| Witcher 3 Stress | ~0.8 | 1977 | 56 |
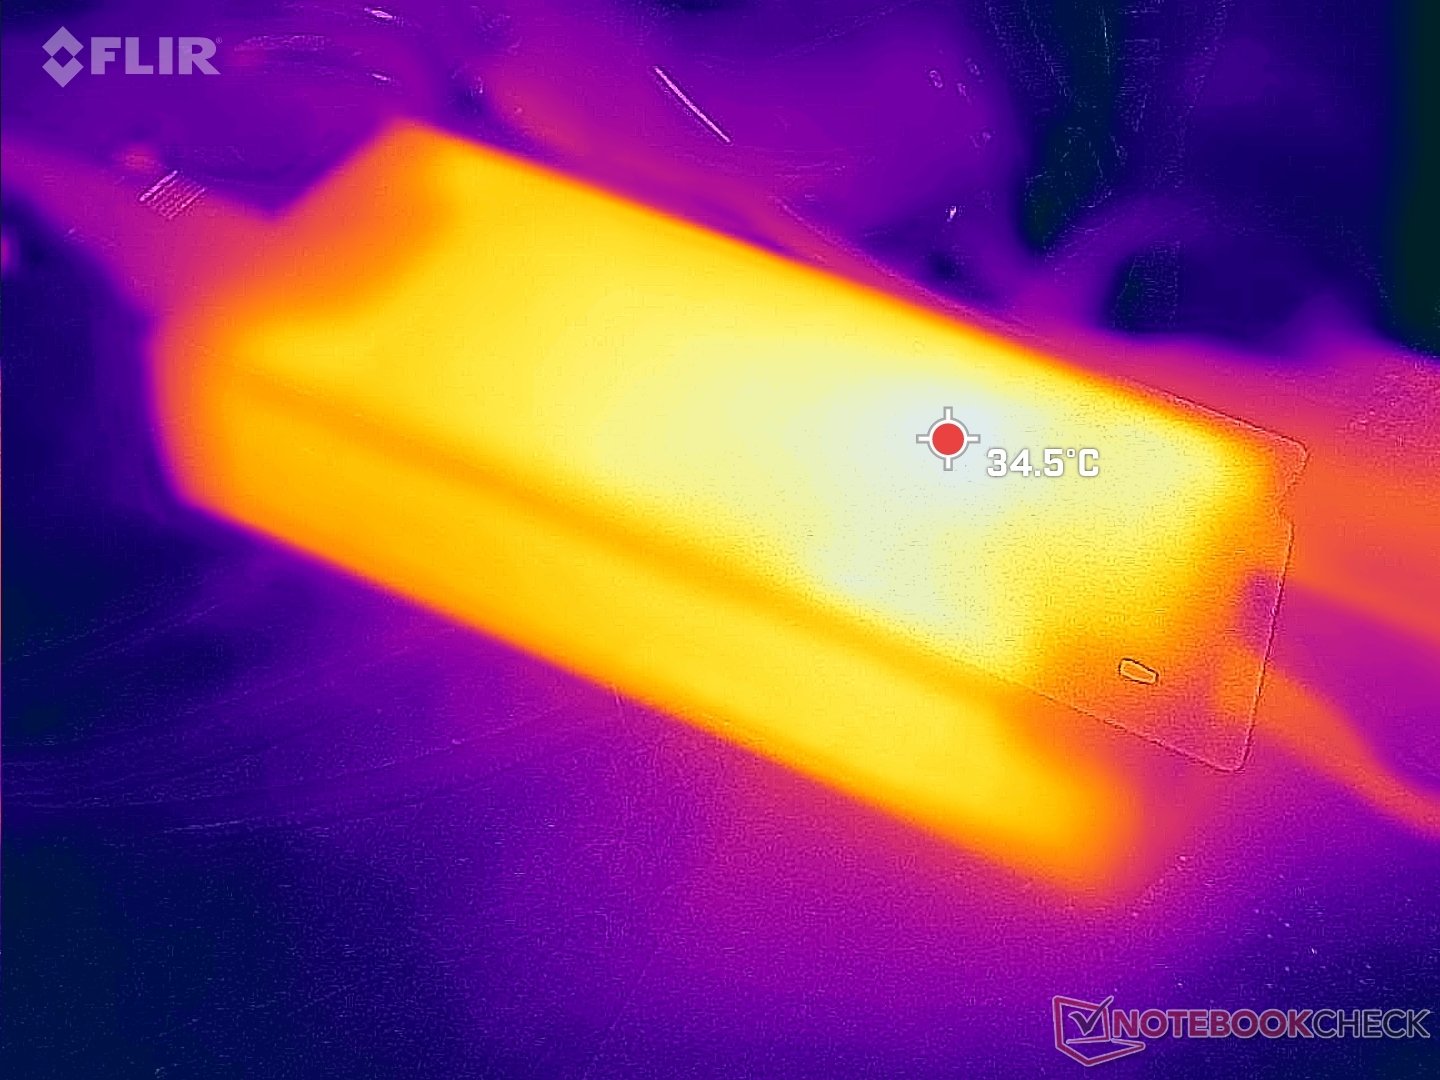
Energiebeheer
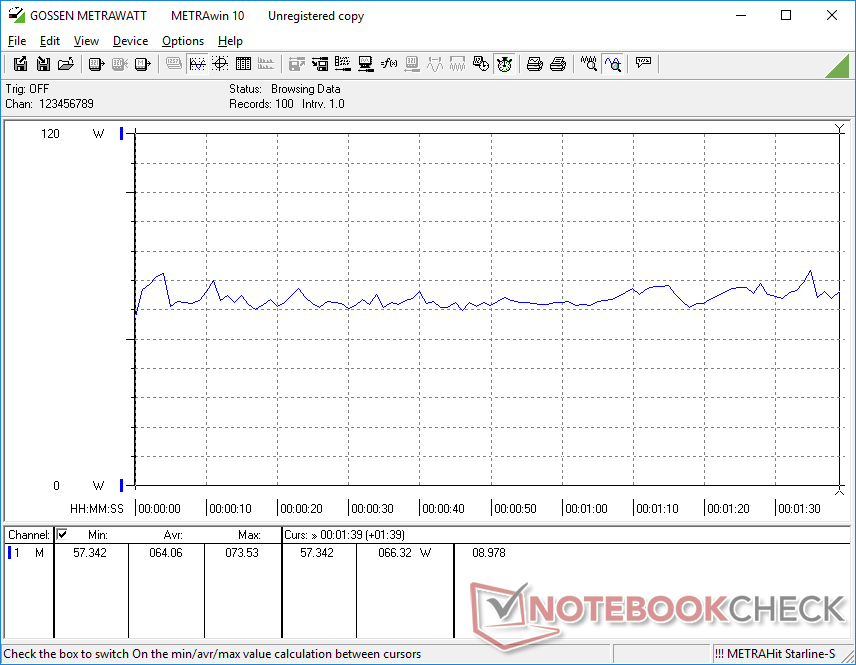
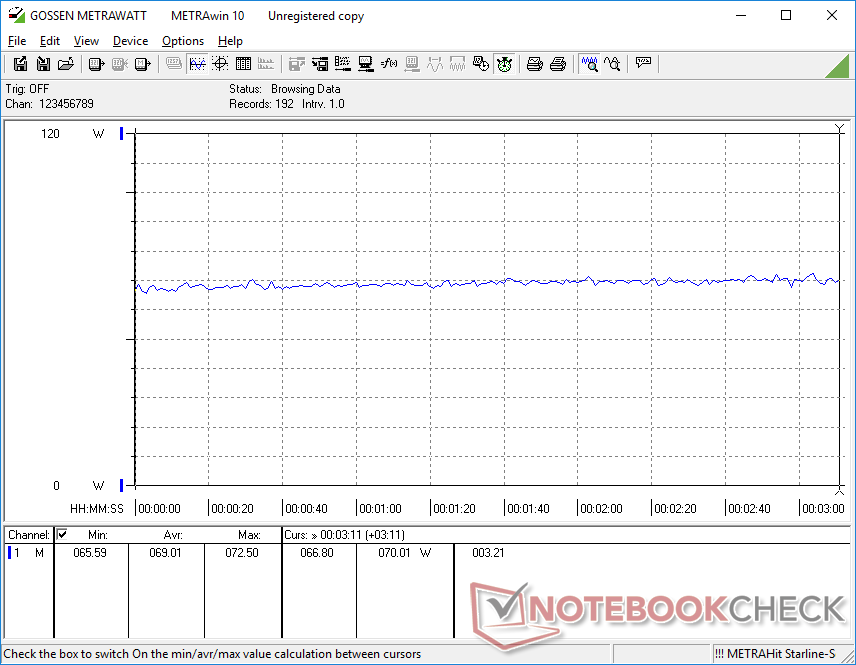
Stroomverbruik
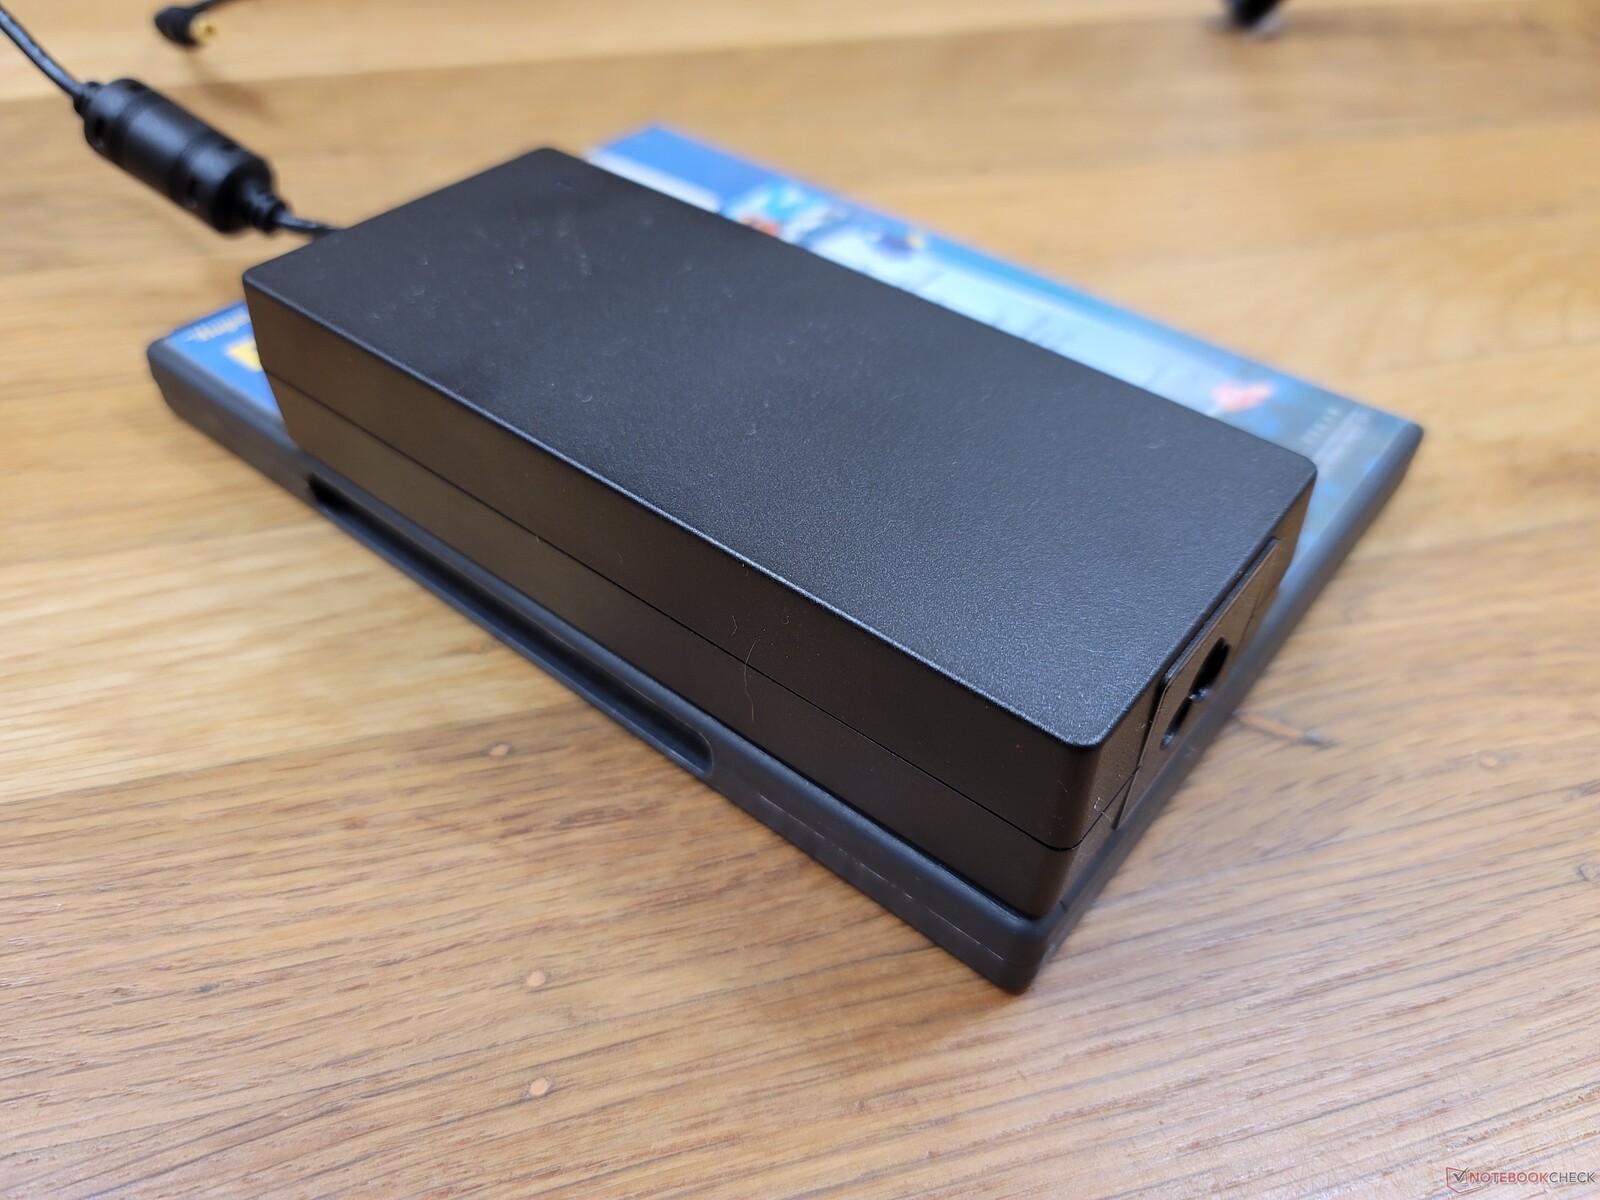
Het totale verbruik is bijna identiek aan wat we registreerden op de GTR5 ondanks de 60 procent hogere grafische prestaties. Met andere woorden, de GTR6 is in staat om aanzienlijk snellere grafische prestaties te leveren dan zijn voorganger onder hetzelfde stroomverbruik voor veel hogere prestaties per watt. Het stroomverbruik is echter nog steeds veel hoger dan bij de meeste laptops en mini-pc's met Intel Core U CPU's en de Iris Xe 96 EU's, wat het grotere fysieke formaat van de GTR6 ten opzichte van veel Intel NUC's verklaart.
We kunnen een tijdelijk maximumverbruik van 81 W registreren van de middelgrote (~14,4 x 6,3 x 3 cm) 120 W AC adapter wanneer de CPU voor 100% wordt gebruikt.


| Uit / Standby | |
| Inactief | |
| Belasting |
|
Key:
min: | |
| Beelink GTR6 R9 6900HX, Radeon 680M, Kingston KC3000 512G SKC3000S512G, , x, | Beelink SEi11 Pro i5-11320H, Iris Xe G7 96EUs, Kingston NV1 SNVS/500GCN, , x, | Beelink GTR5 R9 5900HX, Vega 8, Kingston NV1 SNVS/500GCN, , x, | Intel NUC11PHKi7C i7-1165G7, GeForce RTX 2060 Mobile, Samsung SSD 980 Pro 500GB MZ-V8P500BW, , x, | Intel NUC11TNKi5 i5-1135G7, Iris Xe G7 80EUs, Transcend M.2 SSD 430S TS512GMTS430S, , x, | GMK NucBox 2 i5-8259U, Iris Plus Graphics 655, Netac S930E8/256GPN, , x, | |
|---|---|---|---|---|---|---|
| Power Consumption | 6% | 8% | -73% | -3% | 29% | |
| Idle Minimum * (Watt) | 7.6 | 9.8 -29% | 6.2 18% | 5.8 24% | 11.5 -51% | 6.1 20% |
| Idle Average * (Watt) | 9.9 | 10.3 -4% | 8.9 10% | 5.9 40% | 12.4 -25% | 6.8 31% |
| Idle Maximum * (Watt) | 10.6 | 10.5 1% | 9 15% | 20.7 -95% | 12.9 -22% | 7.3 31% |
| Load Average * (Watt) | 64 | 54.2 15% | 66.8 -4% | 130.8 -104% | 40.7 36% | 46.3 28% |
| Witcher 3 ultra * (Watt) | 69 | 53.1 23% | 62.6 9% | 154.4 -124% | 43.9 36% | |
| Load Maximum * (Watt) | 80.4 | 59 27% | 81.6 -1% | 225.2 -180% | 73.5 9% | 50.7 37% |
* ... kleiner is beter
Power Consumption Witcher 3 / Stresstest
Power Consumption external Monitor
Pro
Contra
Verdict - Alles over die GPU
Het belangrijkste voordeel van de Beelink GTR6 ten opzichte van de GTR5 is voor zijn aanzienlijk verbeterde geïntegreerde graphics. Verder biedt de Zen 3+ Ryzen 9 6900HX slechts marginaal snellere processorprestaties dan de Zen 3 Ryzen 9 5900HX. Als je van plan bent om vooral content te streamen naar je mini PC met af en toe wat gematigde multitasking, dan heeft de GTR5 meer dan genoeg kracht voor je doeleinden. Als u van plan bent om lokaal games of andere GPU-intensieve taken uit te voeren, dan kan de GTR6 de investering waard zijn.
De prijs is een andere belangrijke factor om te overwegen. Voor $750 USD komt de GTR6 compleet met RAM, SSD, Windows 11 Pro met licentie, en een snellere CPU en geïntegreerde GPU dan de meeste Intel NUC opties, inclusief zelfs de nieuwste 12e gen NUC Pro modellen. Beelink biedt zelfs een barebone SKU zonder RAM of opslag voor slechts $540.
De AMD Radeon 680M GPU is het hoogtepunt van de Beelink GTR6. Performance-per-dollar is hoog in vergelijking met concurrerende Intel NUC's in dezelfde $750 prijsklasse.
Ventilator geluid is misschien wel onze grootste klacht over de GTR6, omdat het pulseert voor schijnbaar geen reden wanneer het systeem stationair draait of niet veeleisende belastingen. Verder zijn de prestaties per dollar en de functieset van de GTR6 beide zeer concurrerend.
Prijs en beschikbaarheid
De Beelink GTR6 wordt nu verzonden in onze exacte configuratie op Amazon voor $999 USD of slechts $749 USD indien gekocht rechtstreeks van de fabrikant.
Price comparison

