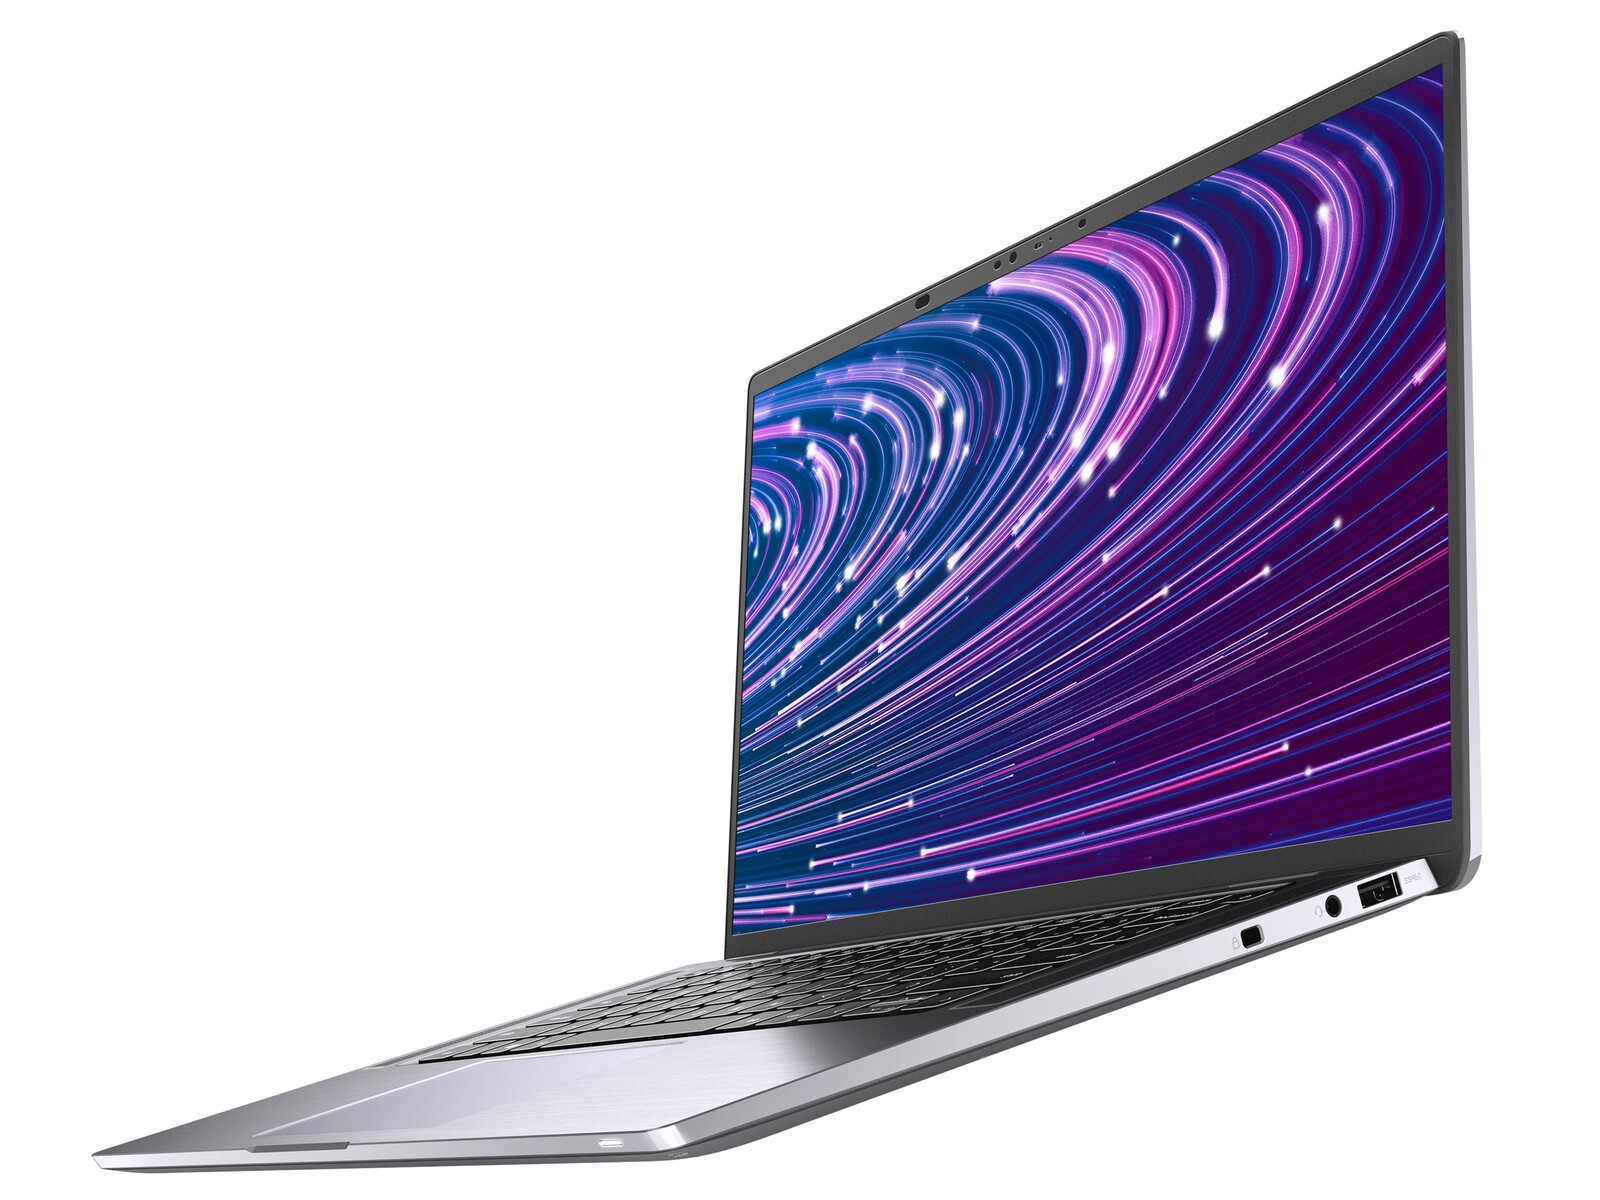
Dell Latitude 15 9520 2-in-1 vs. Latitude 9510 2-in-1: nieuwer is niet altijd beter
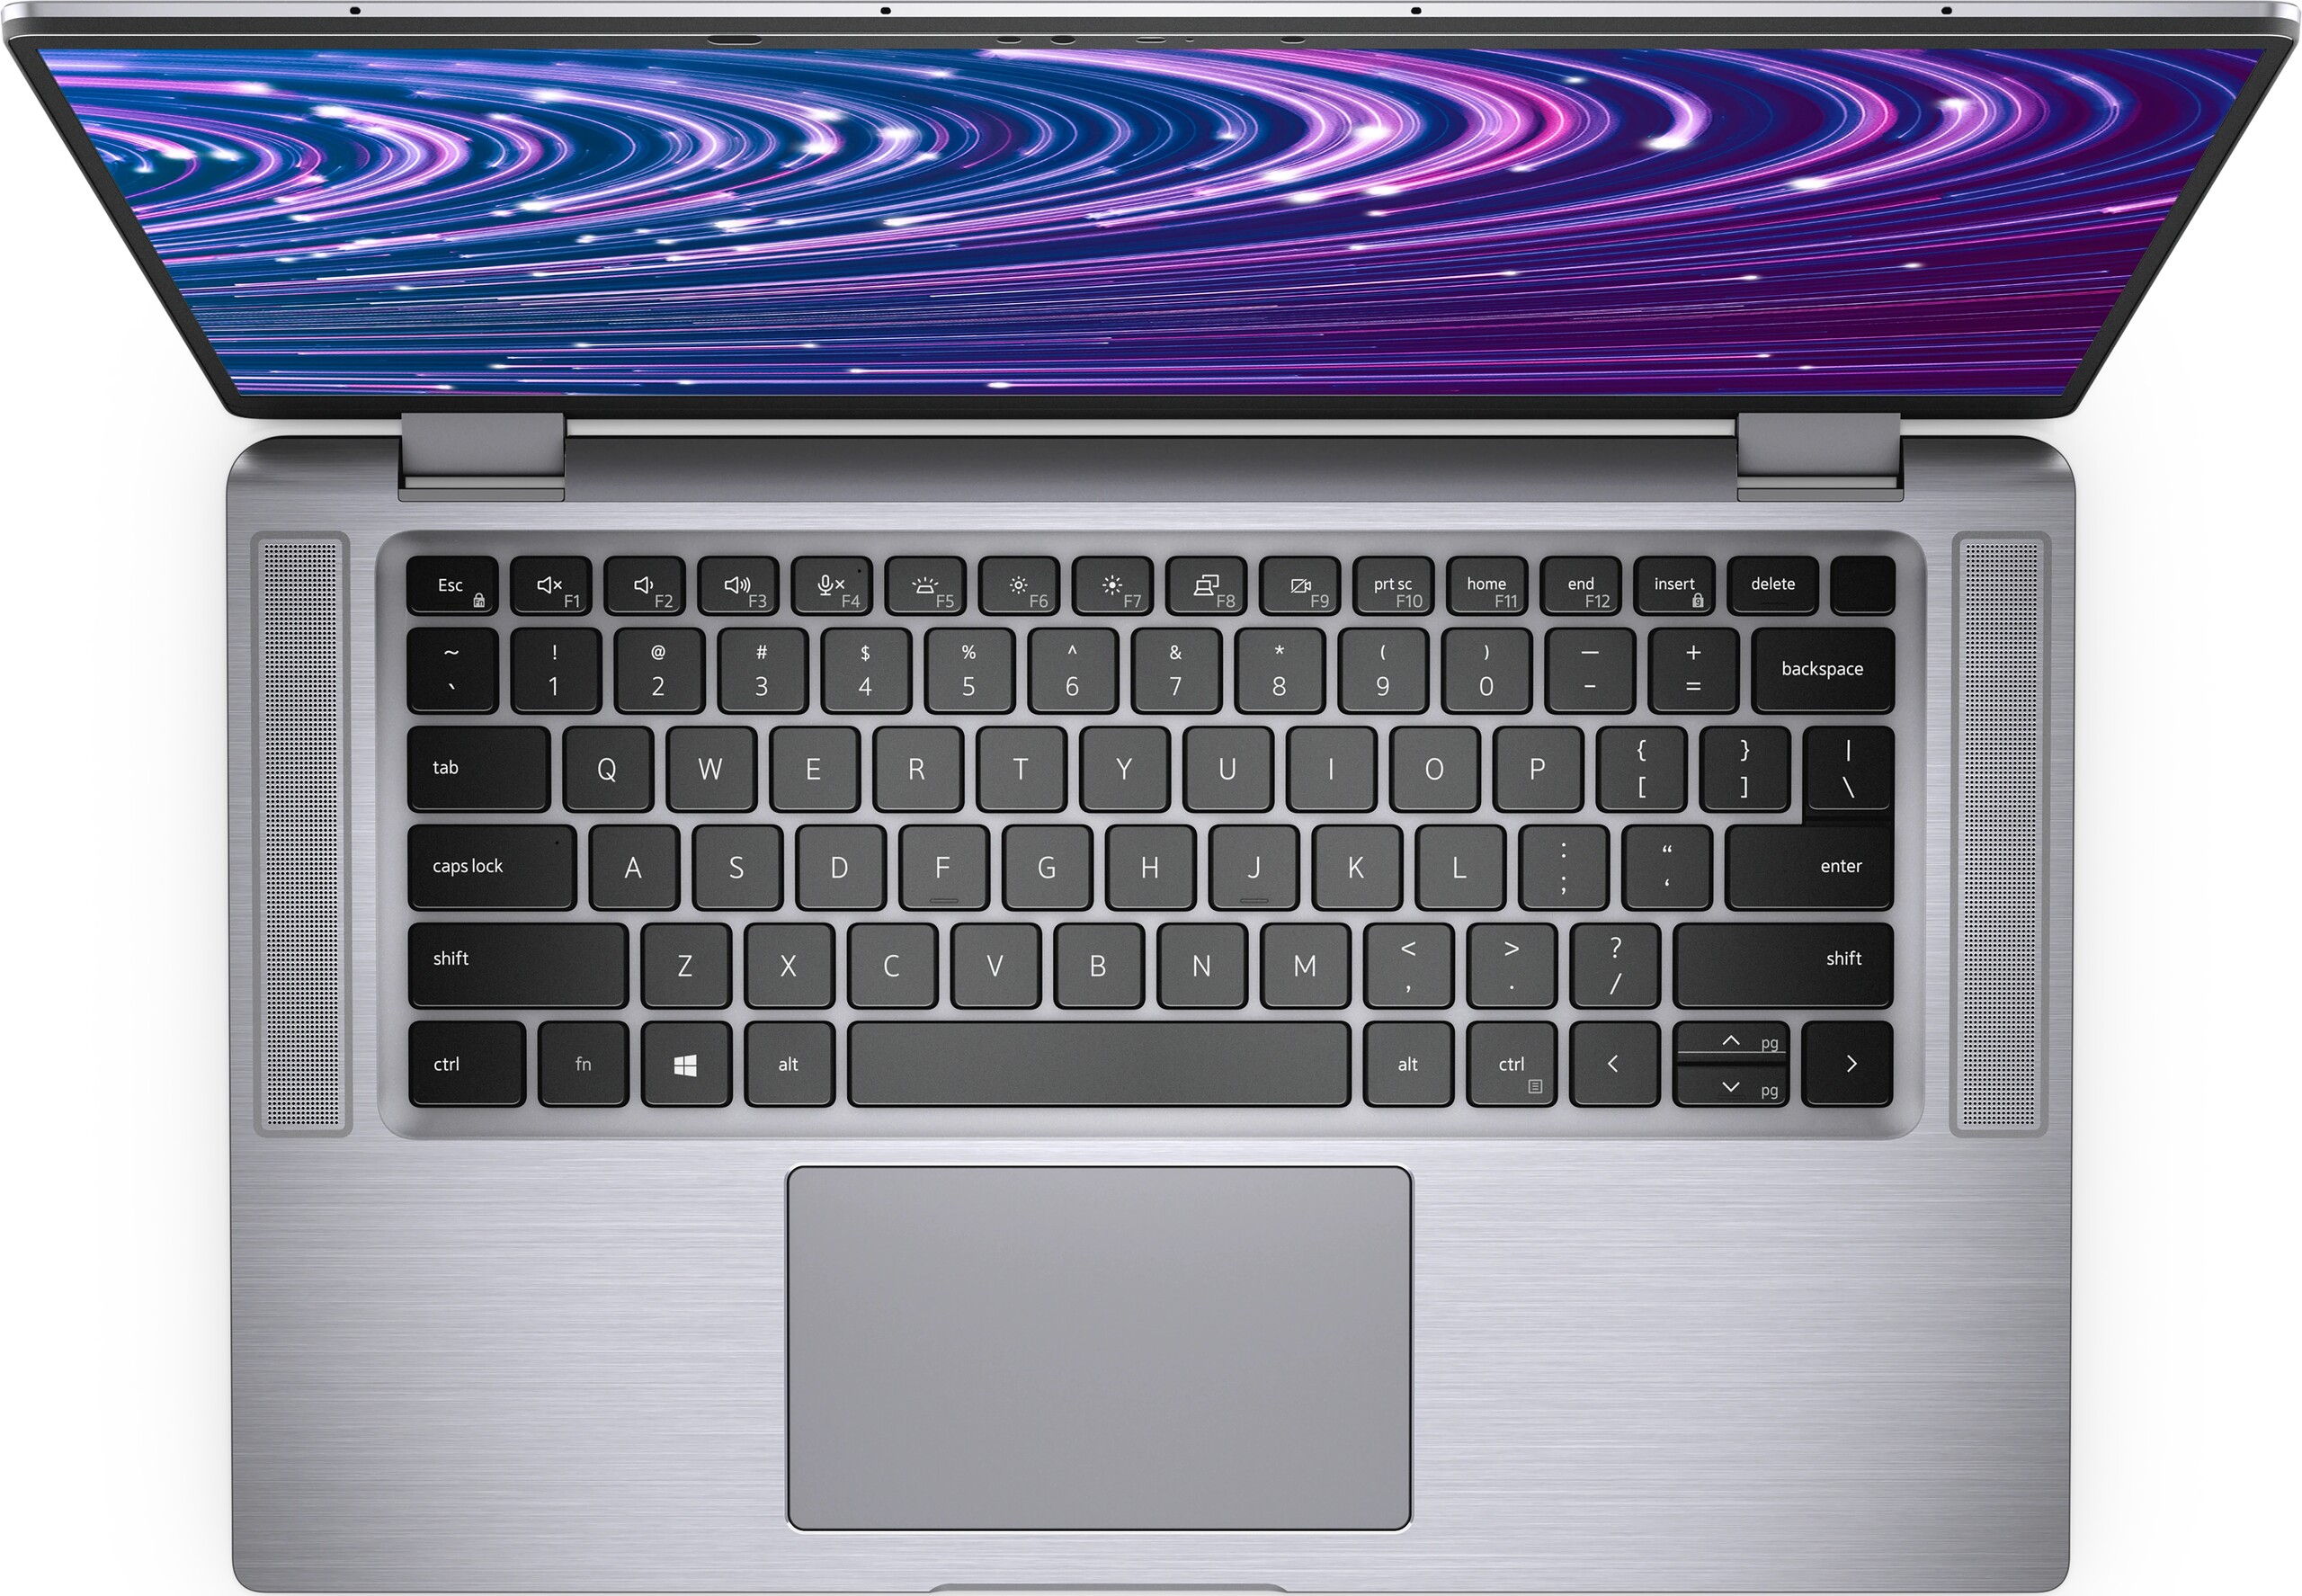
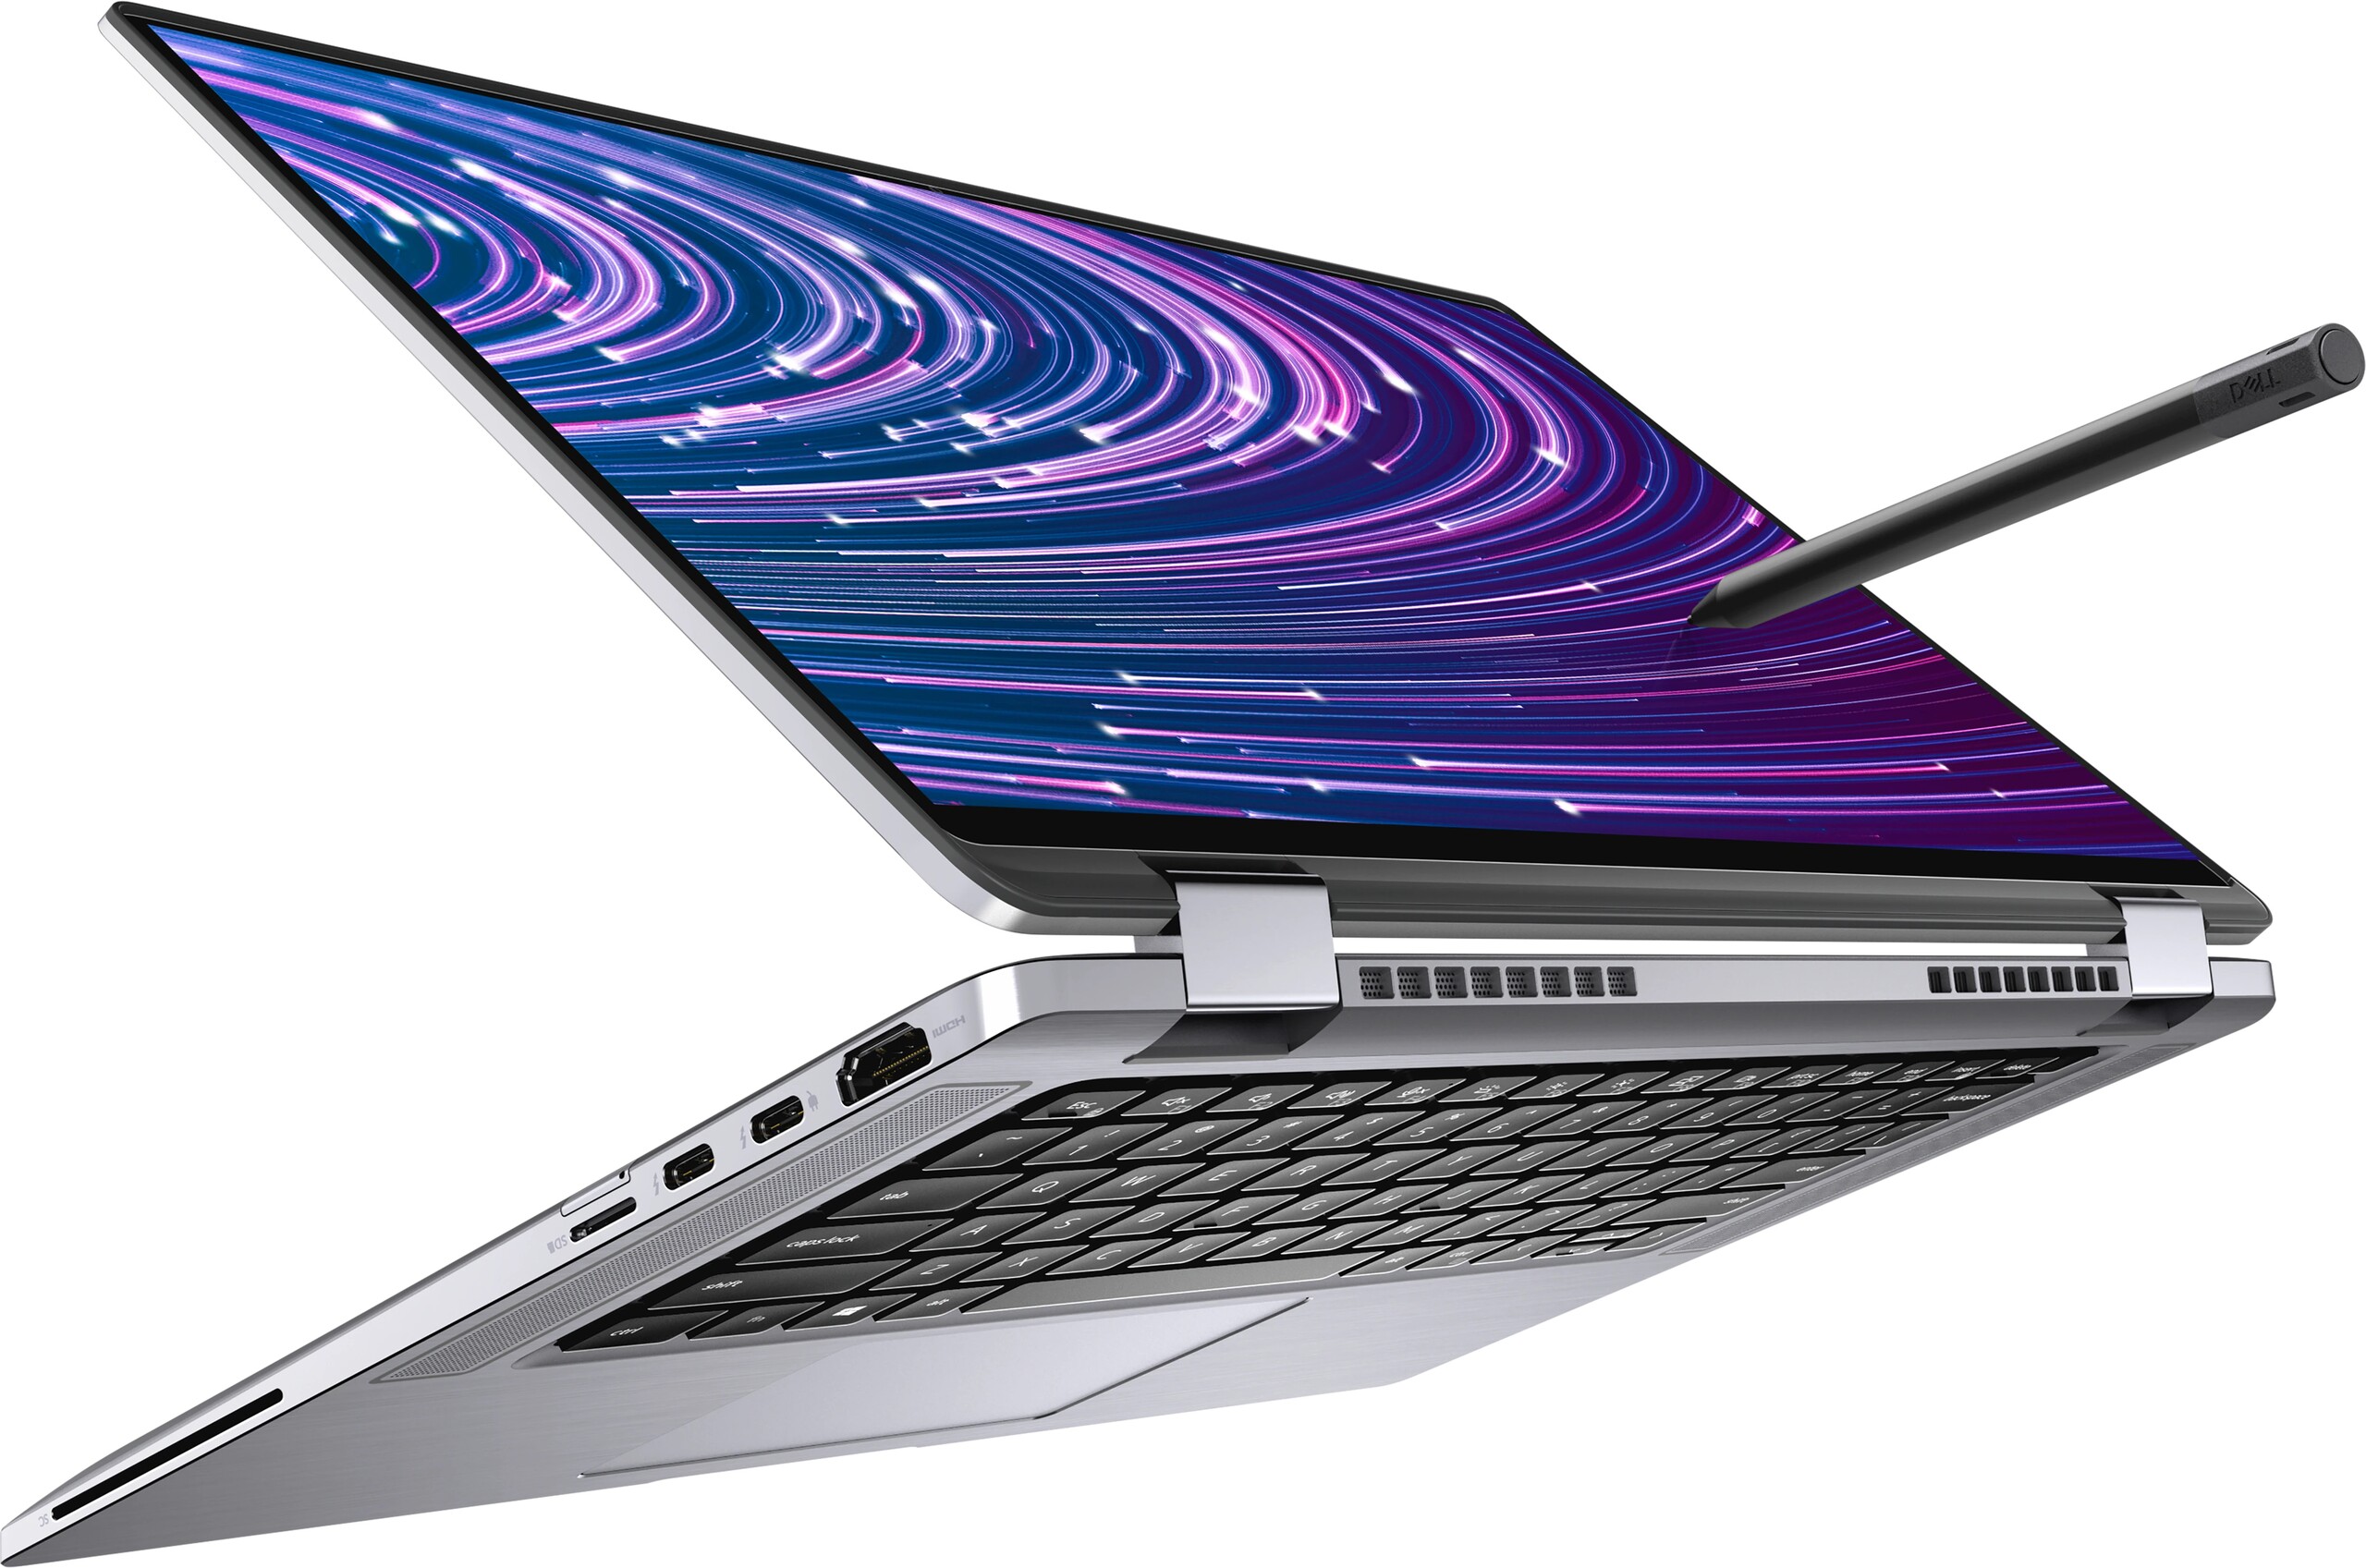
De Latitude 9520 2-in-1 vervangt de 10e generatie Intel CPU van de Latitude 9510 2-in-1 door nieuwere 11e generatie CPU's, terwijl het chassis identiek blijft. Daarom raden we aan onze bestaande review van de Latitude 9510 2-in-1 om meer te weten te komen over onze gedachten over het chassis, toetsenbord en andere fysieke eigenschappen van het systeem. Deze review zal zich richten op de verschillen tussen de twee modellen, inclusief wat gebruikers kunnen verwachten op het gebied van prestaties.
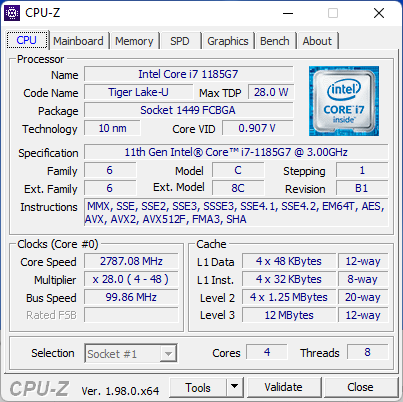
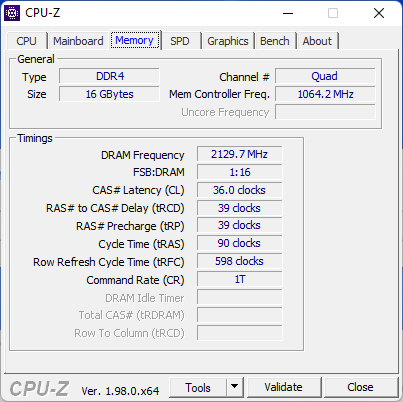
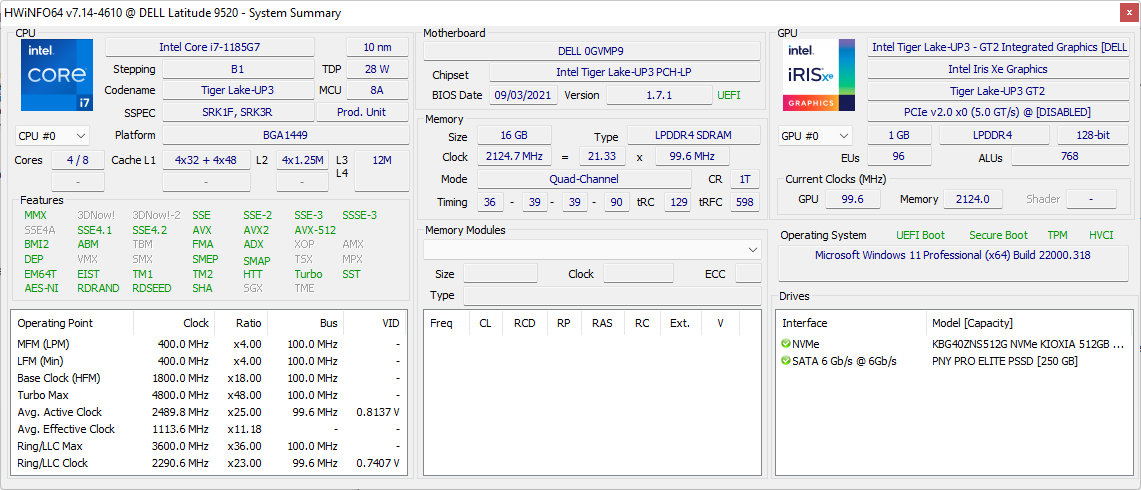
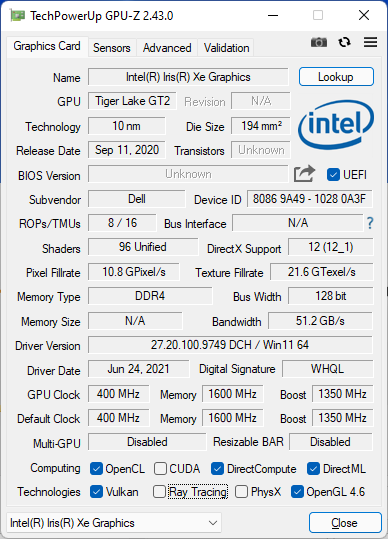
Onze testeenheid is een configuratie in het hogere segment met de vPro Core i7-1185G7 CPU, Iris Xe 96 EUs GPU, 16 GB RAM, en 512 GB NVMe SSD voor ongeveer $2800 USD. Kleinere SKU's met de Core i5-1145G7 CPU en de helft van de opslagcapaciteit zijn beschikbaar voor ongeveer 2300 dollar. Merk op dat alle 2-in-1 SKU's worden geleverd met hetzelfde 15-inch FHD-paneel met nabijheidssensor en elektronische sluiter. Als alternatief kunnen gebruikers ook de Latitude 9520 clamshell kopen als de 2-in-1 vormfactor ongewenst is.
De Latitude 9520 2-in-1 concurreert met andere high-end zakelijke convertibles zoals de MSI Summit E13 Flip, Microsoft Surface Book, HP EliteBook x360 1040 G7, of de Lenovo ThinkPad x13 Yoga.
Meer Dell reviews:
Potential Competitors in Comparison
Evaluatie | Datum | Model | Gewicht | Hoogte | Formaat | Resolutie | Beste prijs |
|---|---|---|---|---|---|---|---|
| 89.2 % v7 (old) | 11-2021 | Dell Latitude 15 9520 2-in-1 i7-1185G7, Iris Xe G7 96EUs | 1.7 kg | 13.99 mm | 15.00" | 1920x1080 | |
| 88.6 % v7 (old) | 07-2020 | Dell Latitude 9510 2-in-1 i7-10810U, UHD Graphics 620 | 1.7 kg | 13.99 mm | 15.00" | 1920x1080 | |
| 86.1 % v7 (old) | 08-2021 | HP EliteBook 850 G8 3C7Z8EA i7-1165G7, Iris Xe G7 96EUs | 1.8 kg | 19 mm | 15.60" | 1920x1080 | |
| 85.1 % v7 (old) | 07-2021 | Lenovo ThinkPad L15 G2 AMD R5 5600U, Vega 7 | 1.9 kg | 21 mm | 15.60" | 1920x1080 | |
| 81.2 % v7 (old) | 05-2021 | MSI Summit B15 A11M i7-1165G7, Iris Xe G7 96EUs | 1.5 kg | 16.9 mm | 15.60" | 1920x1080 | |
| 84.9 % v7 (old) | 04-2021 | Microsoft Surface Laptop 4 15 AMD TFF_00028 R7 4980U, Vega 8 | 1.6 kg | 14.7 mm | 15.00" | 2496x1664 |
Zaak
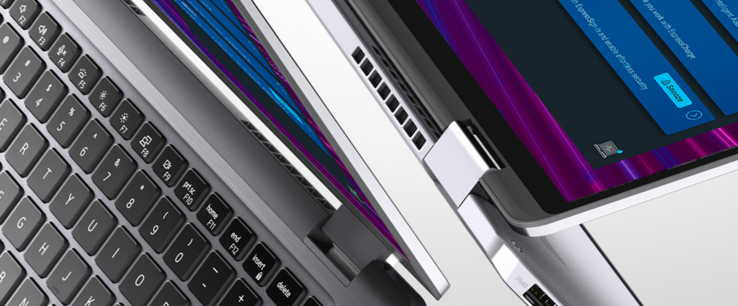
Hoewel het chassis identiek is aan het model van vorig jaar, voelden de scharnieren van onze Latitude 9520 2-in-1 testunit zwakker aan in hoeken tussen 60 en 90 graden. Idealiter zou de stijfheid van de scharnieren in alle hoeken gelijk moeten zijn. We raden aan de scharnieren na aankoop te controleren op eventuele afwijkingen.

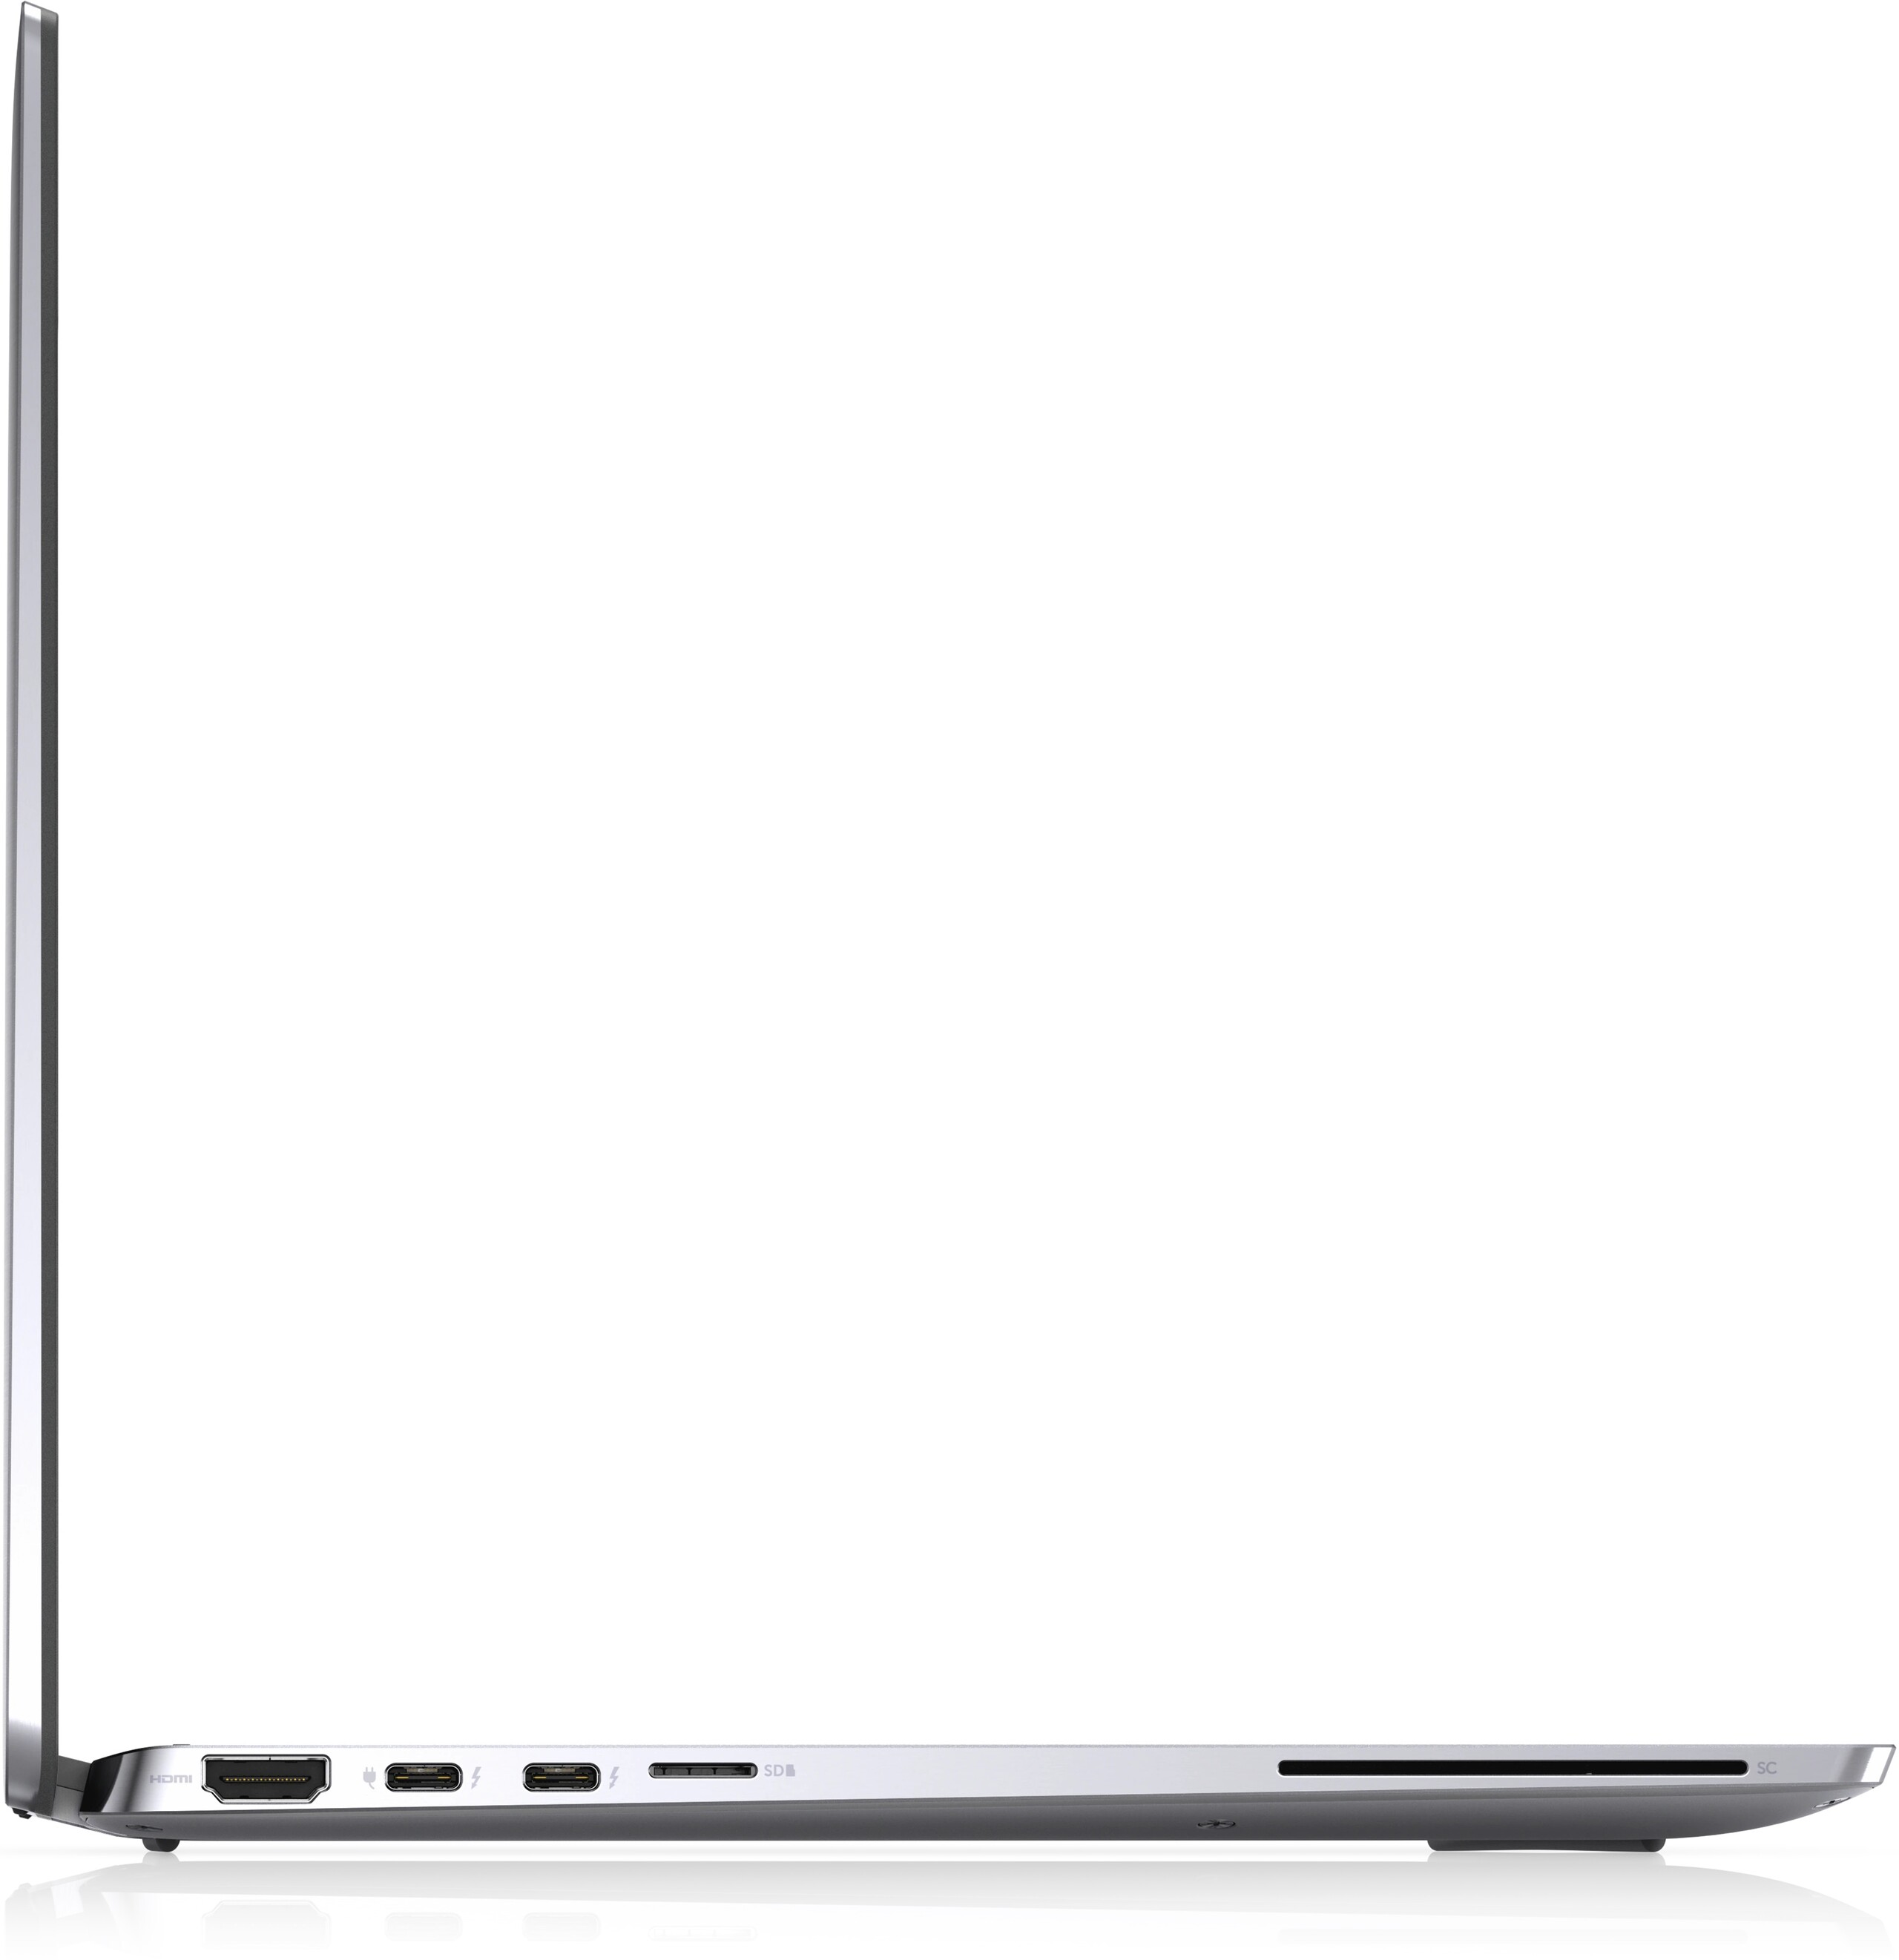
Connectiviteit
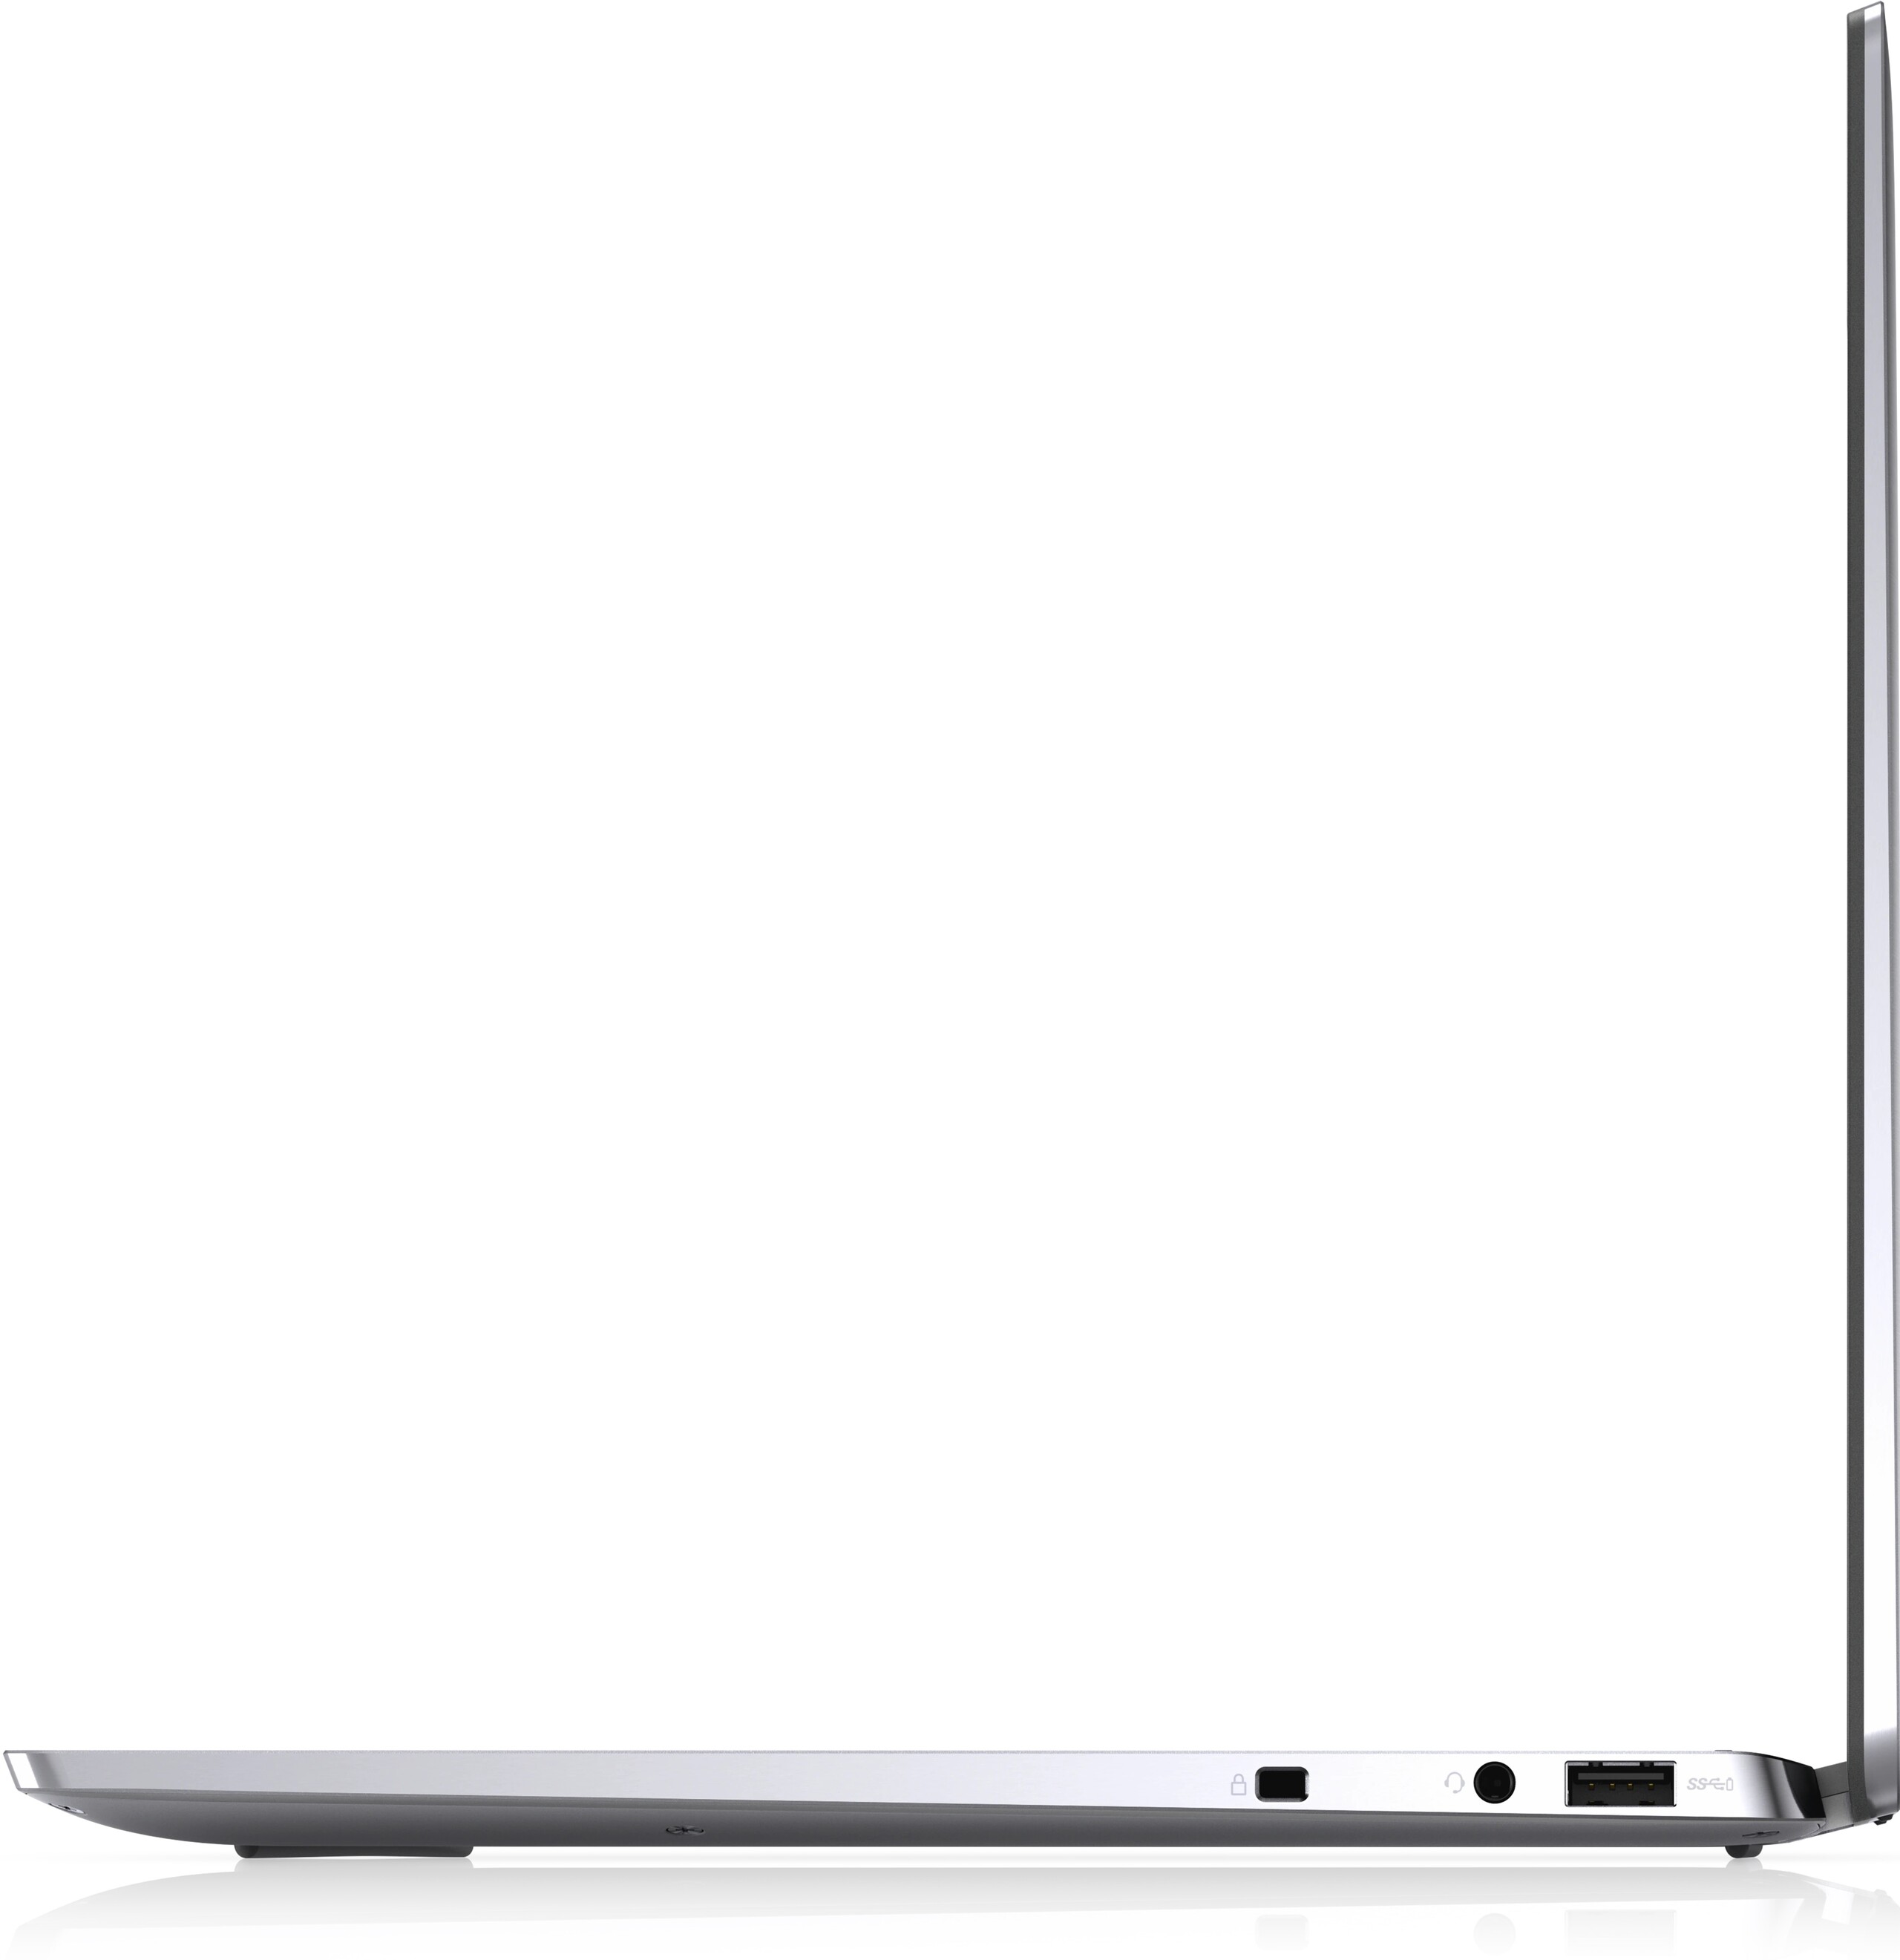
De Thunderbolt 3 poorten op de Latitude 9510 zijn geüpgraded naar Thunderbolt 4 op onze Latitude 9520. Voor de meeste gebruikers zal de upgrade echter van geen belang zijn, tenzij u van plan bent externe GPU's te gebruiken. Alle andere poorten zijn verder identiek tussen de twee modellen.
SD-kaartlezer
| SD Card Reader | |
| average JPG Copy Test (av. of 3 runs) | |
| Dell Latitude 9510 2-in-1 (Toshiba Exceria Pro M501 64 GB UHS-II) | |
| Dell Latitude 15 9520 2-in-1 (AV Pro V60) | |
| MSI Summit B15 A11M (AV PRO microSD 128 GB V60) | |
| Lenovo ThinkPad L15 G2 AMD (AV Pro V60) | |
| maximum AS SSD Seq Read Test (1GB) | |
| MSI Summit B15 A11M (AV PRO microSD 128 GB V60) | |
| Dell Latitude 9510 2-in-1 (Toshiba Exceria Pro M501 64 GB UHS-II) | |
| Dell Latitude 15 9520 2-in-1 (AV Pro V60) | |
| Lenovo ThinkPad L15 G2 AMD (AV Pro V60) | |
Communicatie
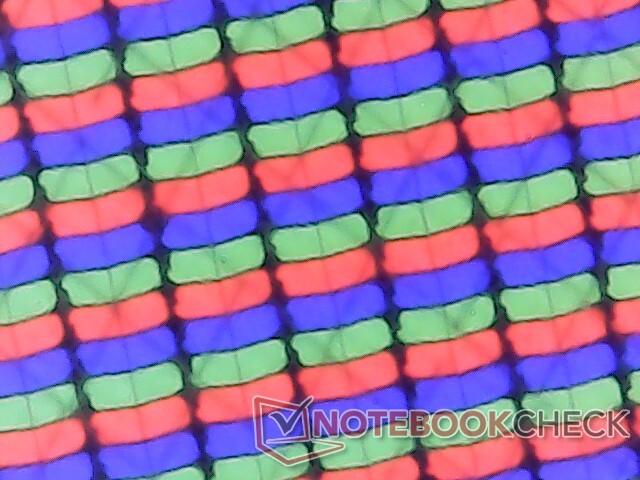
Webcam


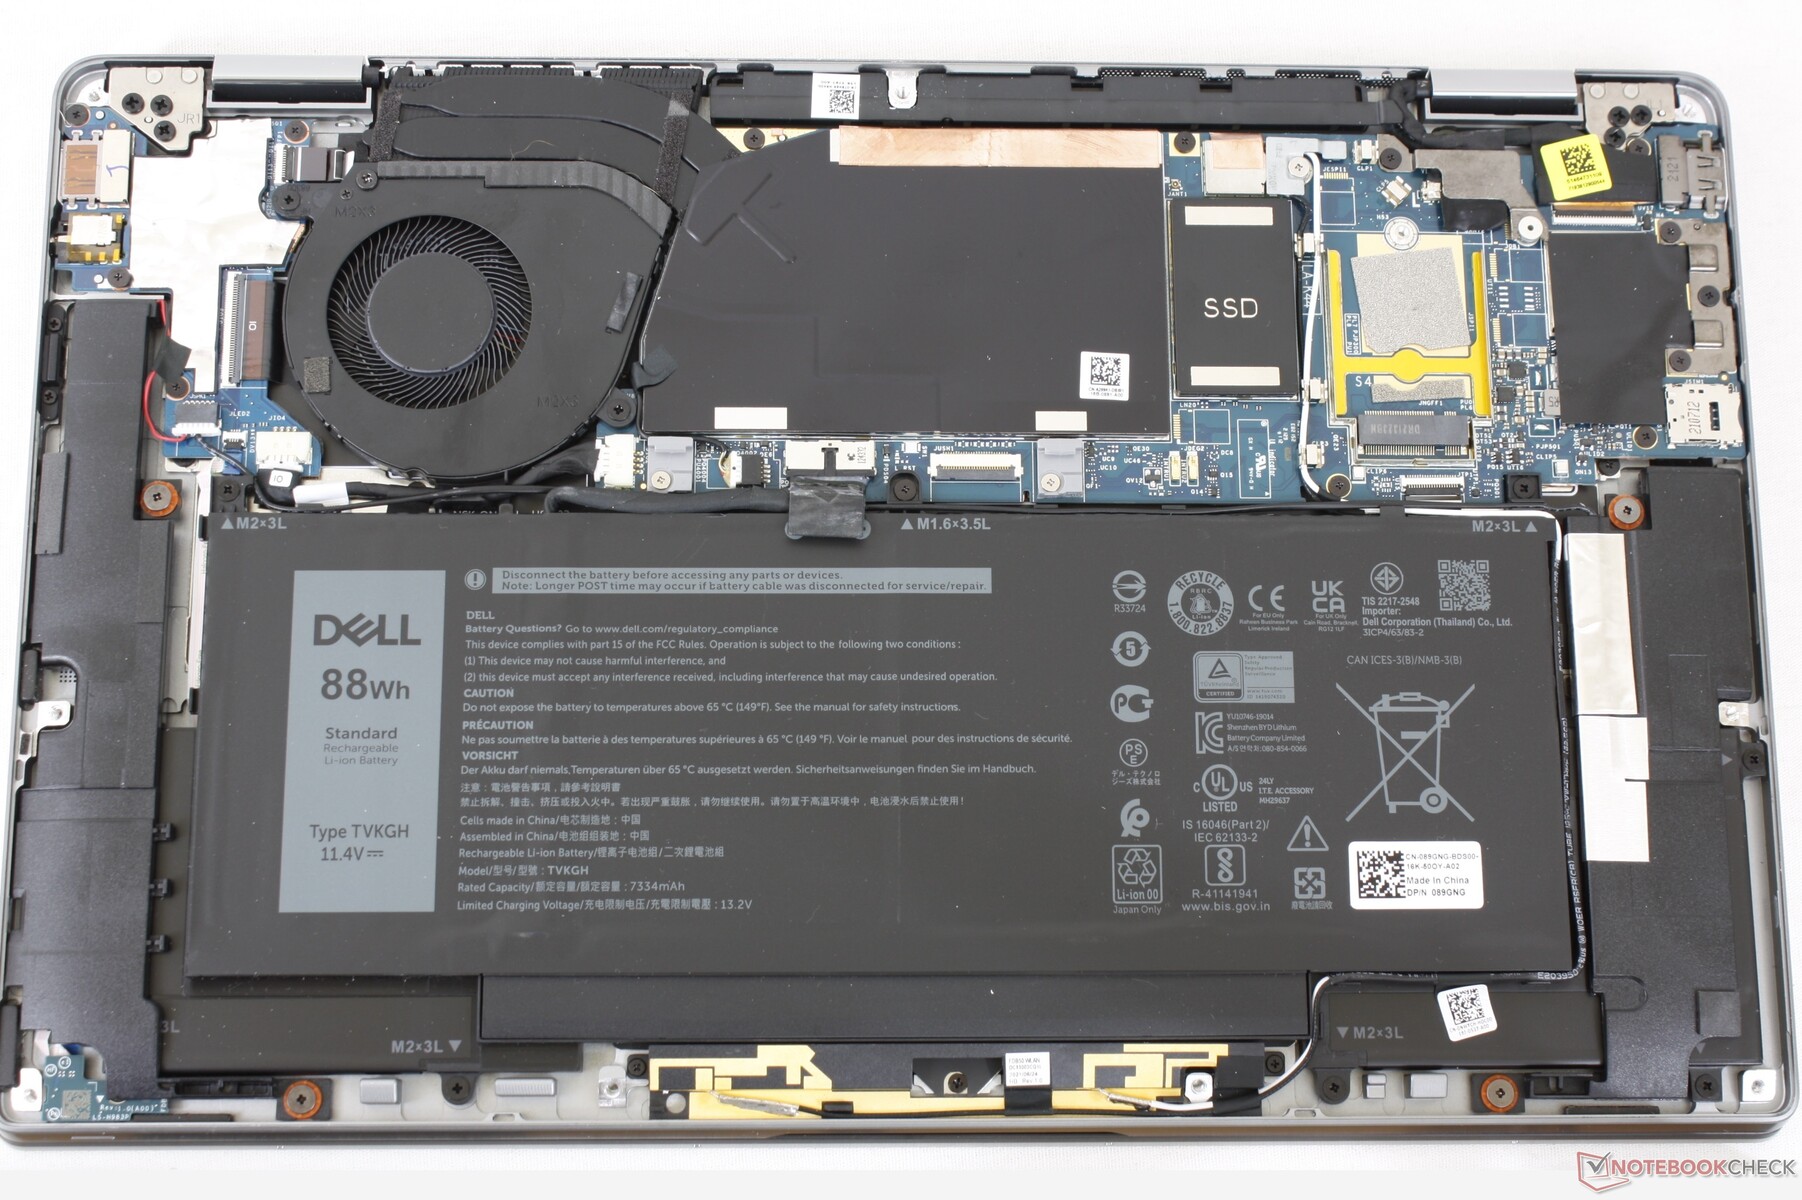
Onderhoud
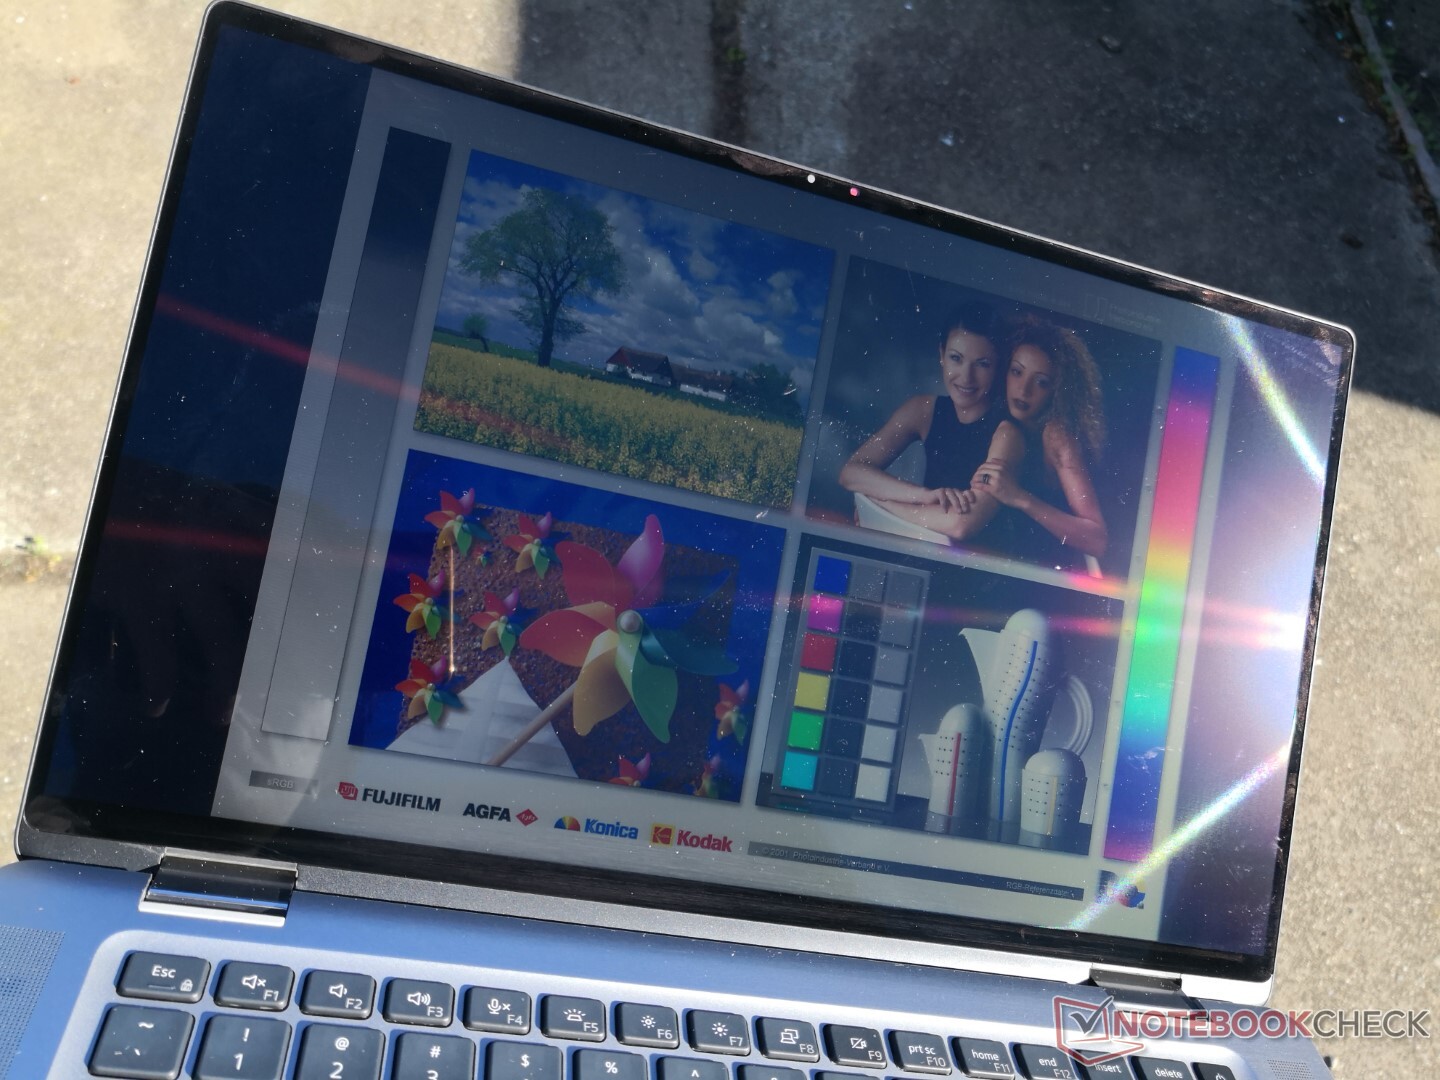
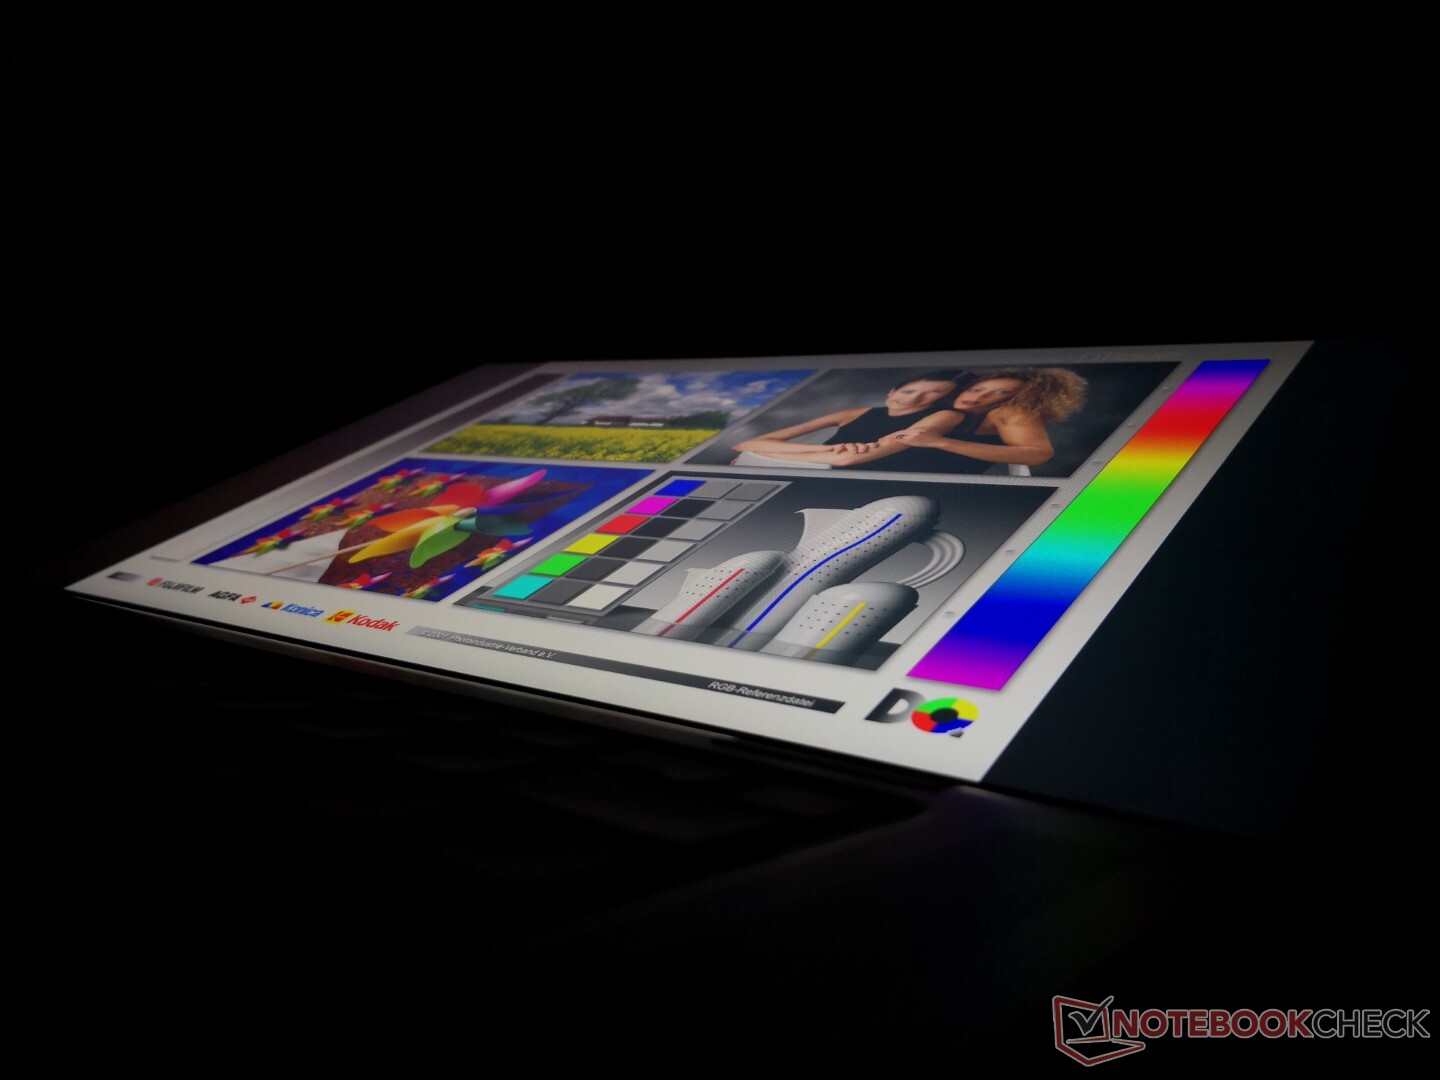
Weergave
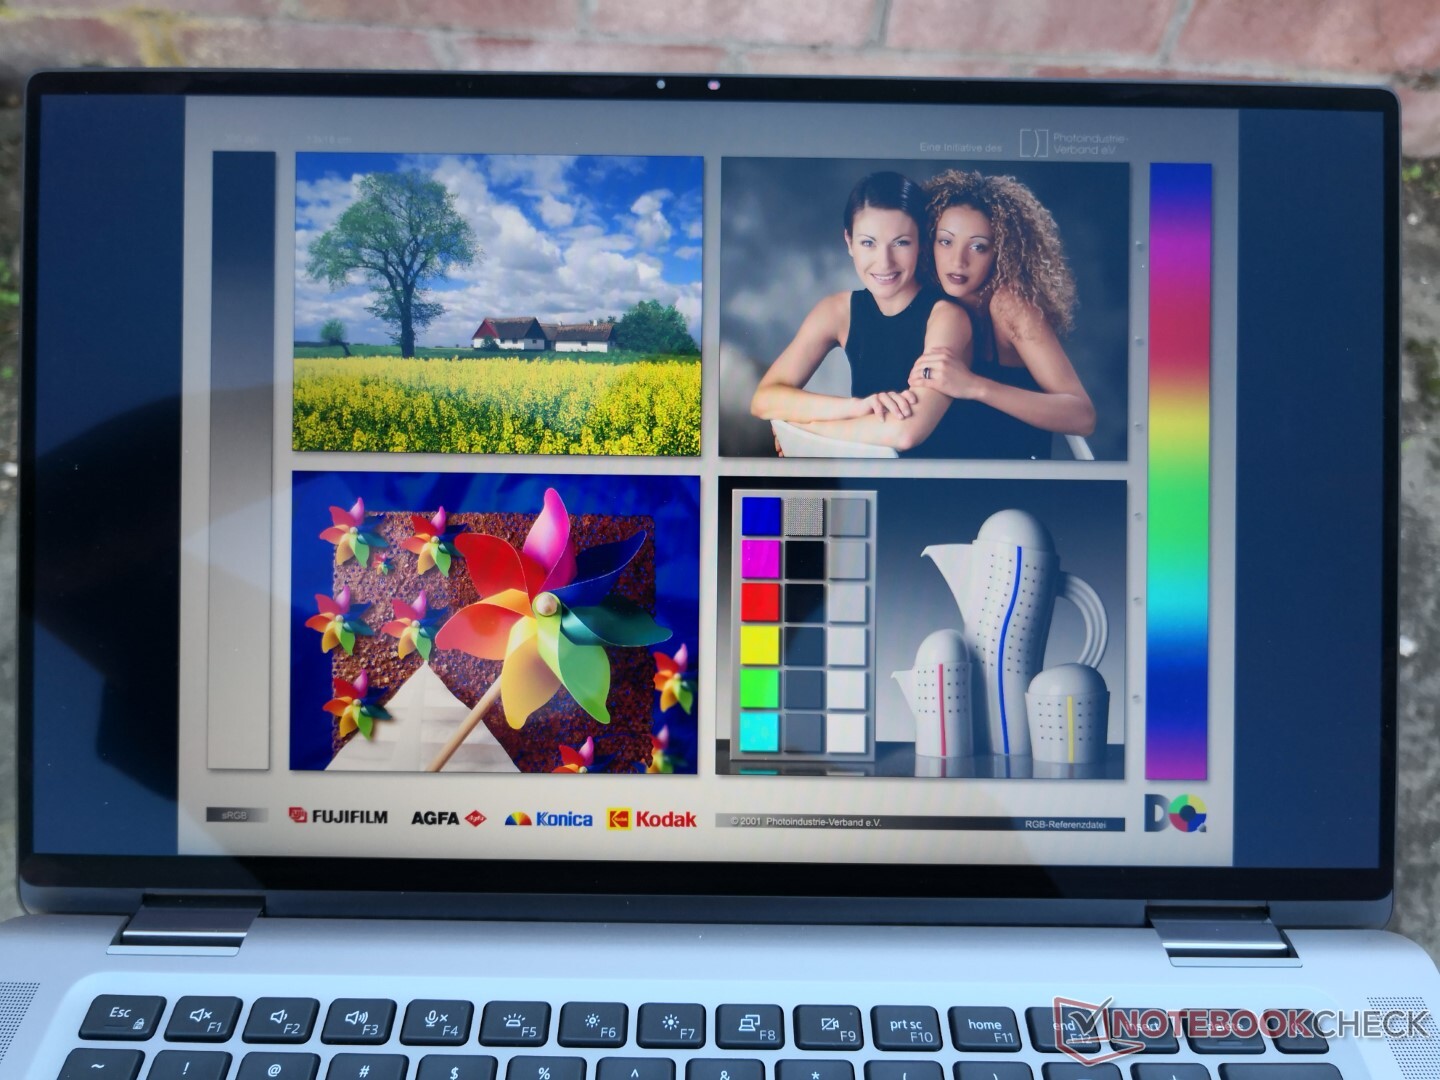
Dell gebruikt hetzelfde AU Optronics B150HAN IPS-paneel tussen zowel de Latitude 9510 2-in-1 als de 9520 2-in-1 voor een vergelijkbare visuele ervaring tussen beide. Er zijn helaas geen nieuwe paneelopties voor de 9520 2-in-1. 4K of OLED opties zouden geweldig zijn om te zien op toekomstige Latitude 2-in-1 revisies.
| |||||||||||||||||||||||||
Helderheidsverdeling: 84 %
Helderheid in Batterij-modus: 403.6 cd/m²
Contrast: 1835:1 (Zwart: 0.22 cd/m²)
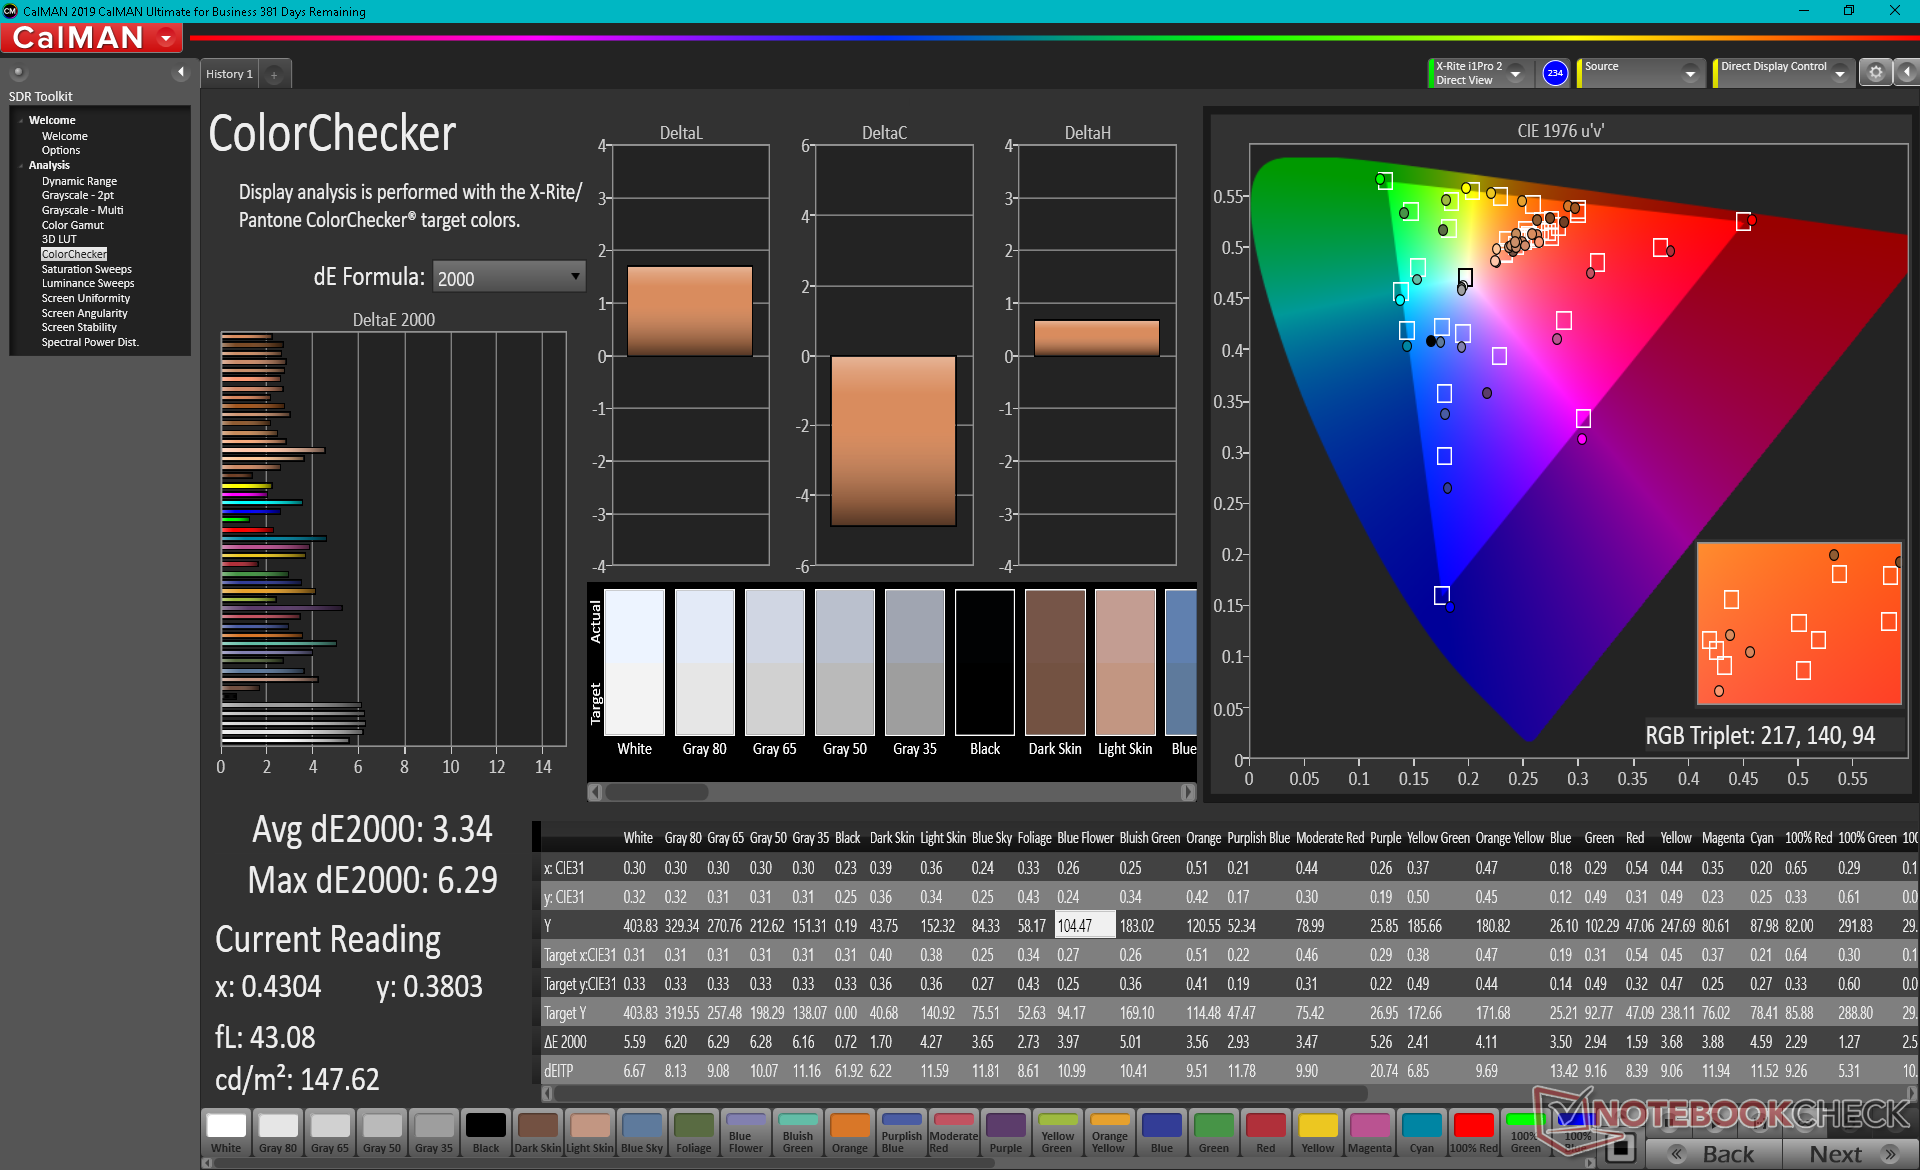
ΔE ColorChecker Calman: 3.34 | ∀{0.5-29.43 Ø4.71}
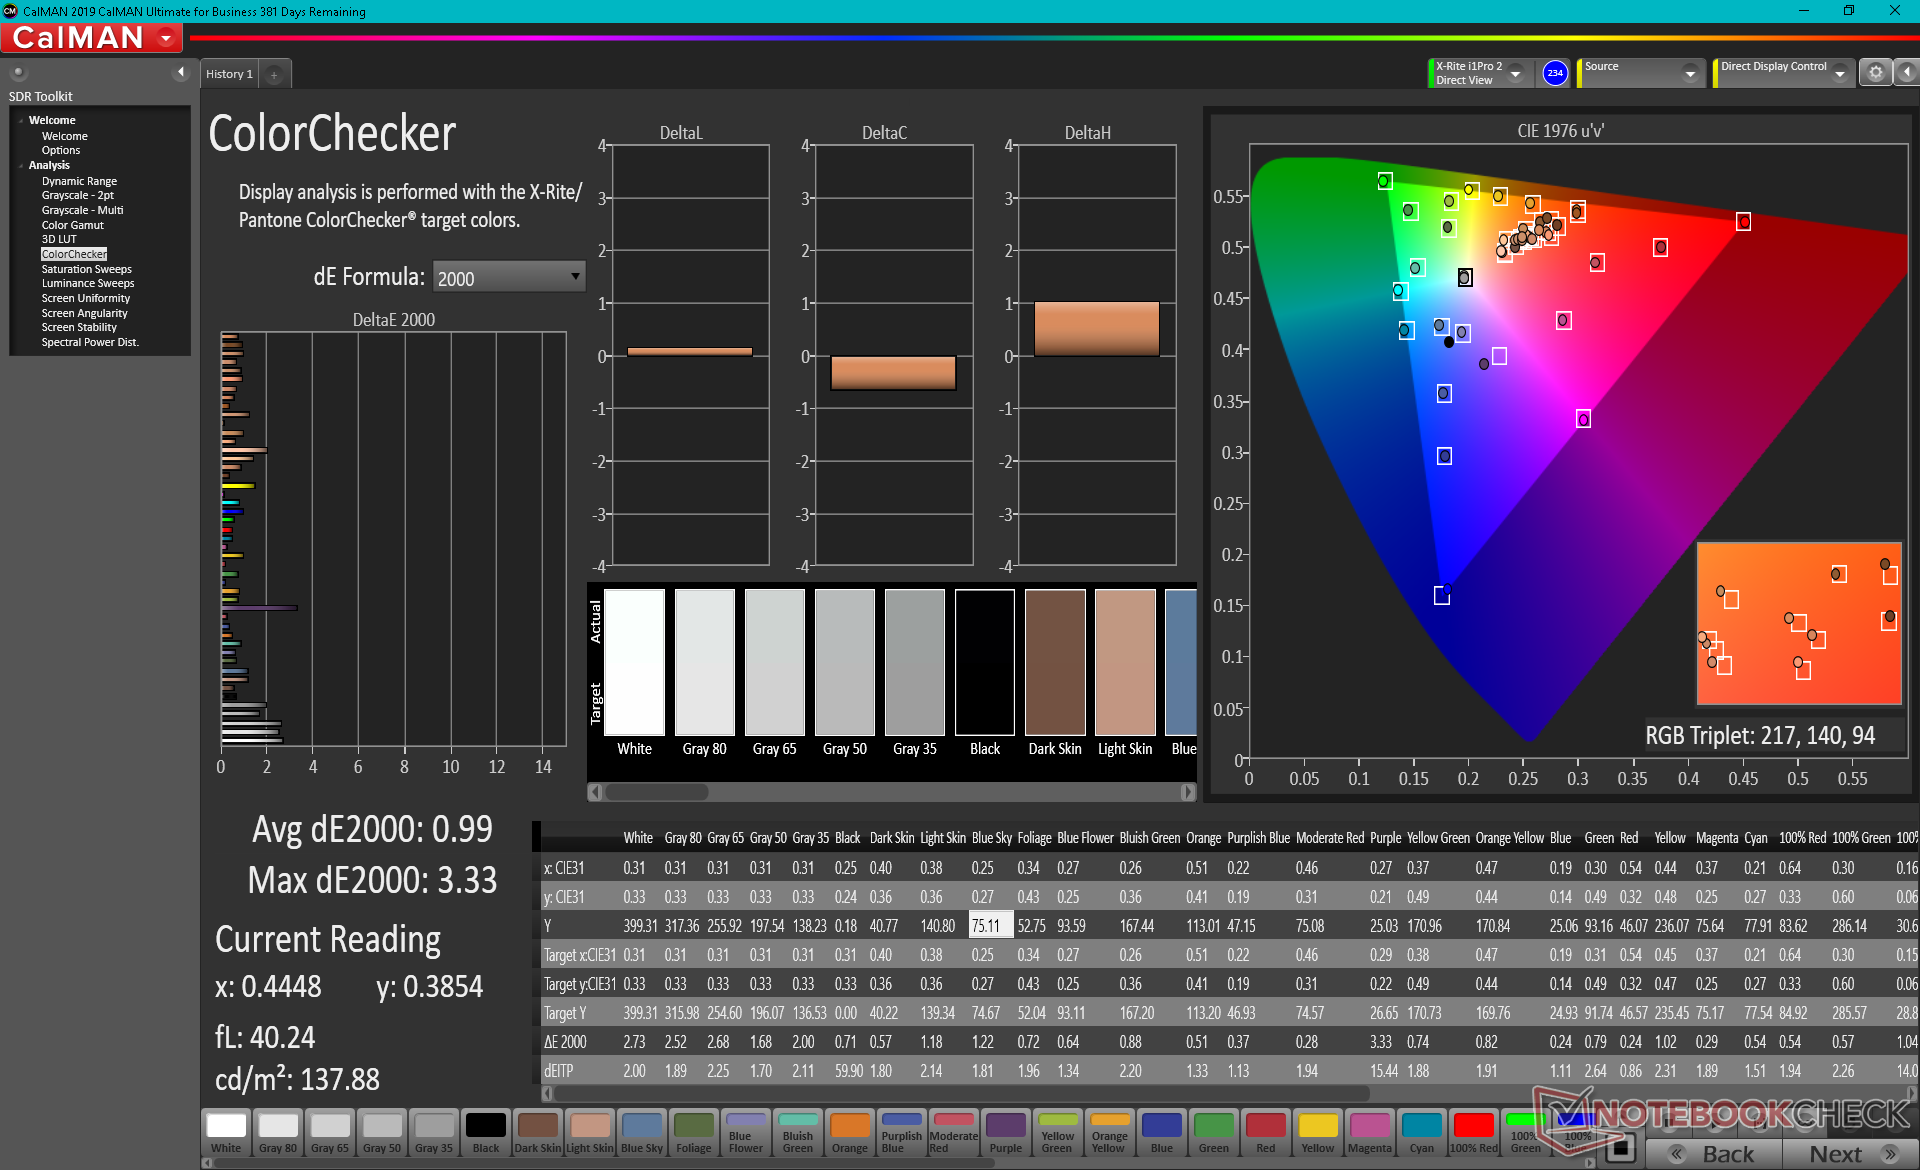
calibrated: 0.99
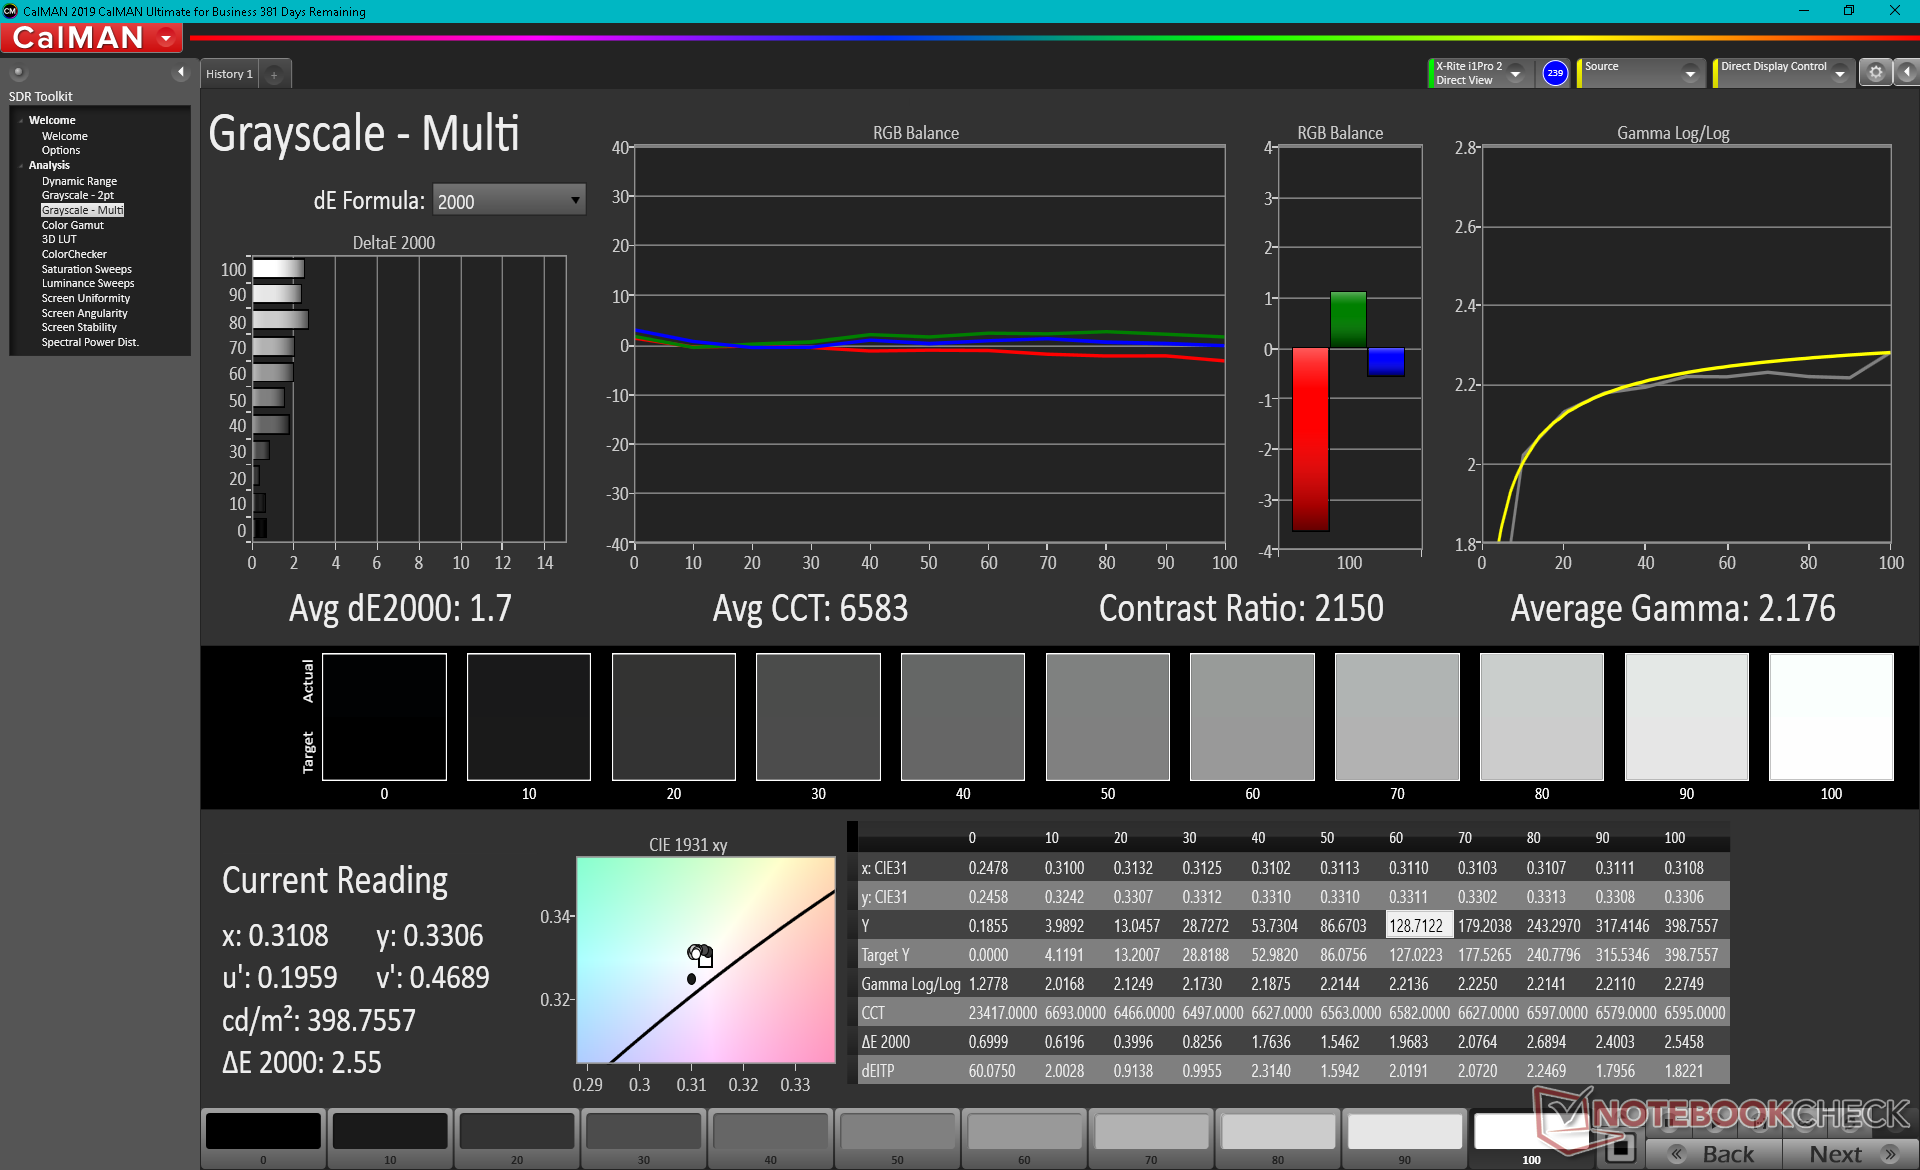
ΔE Greyscale Calman: 5.2 | ∀{0.09-98 Ø4.96}
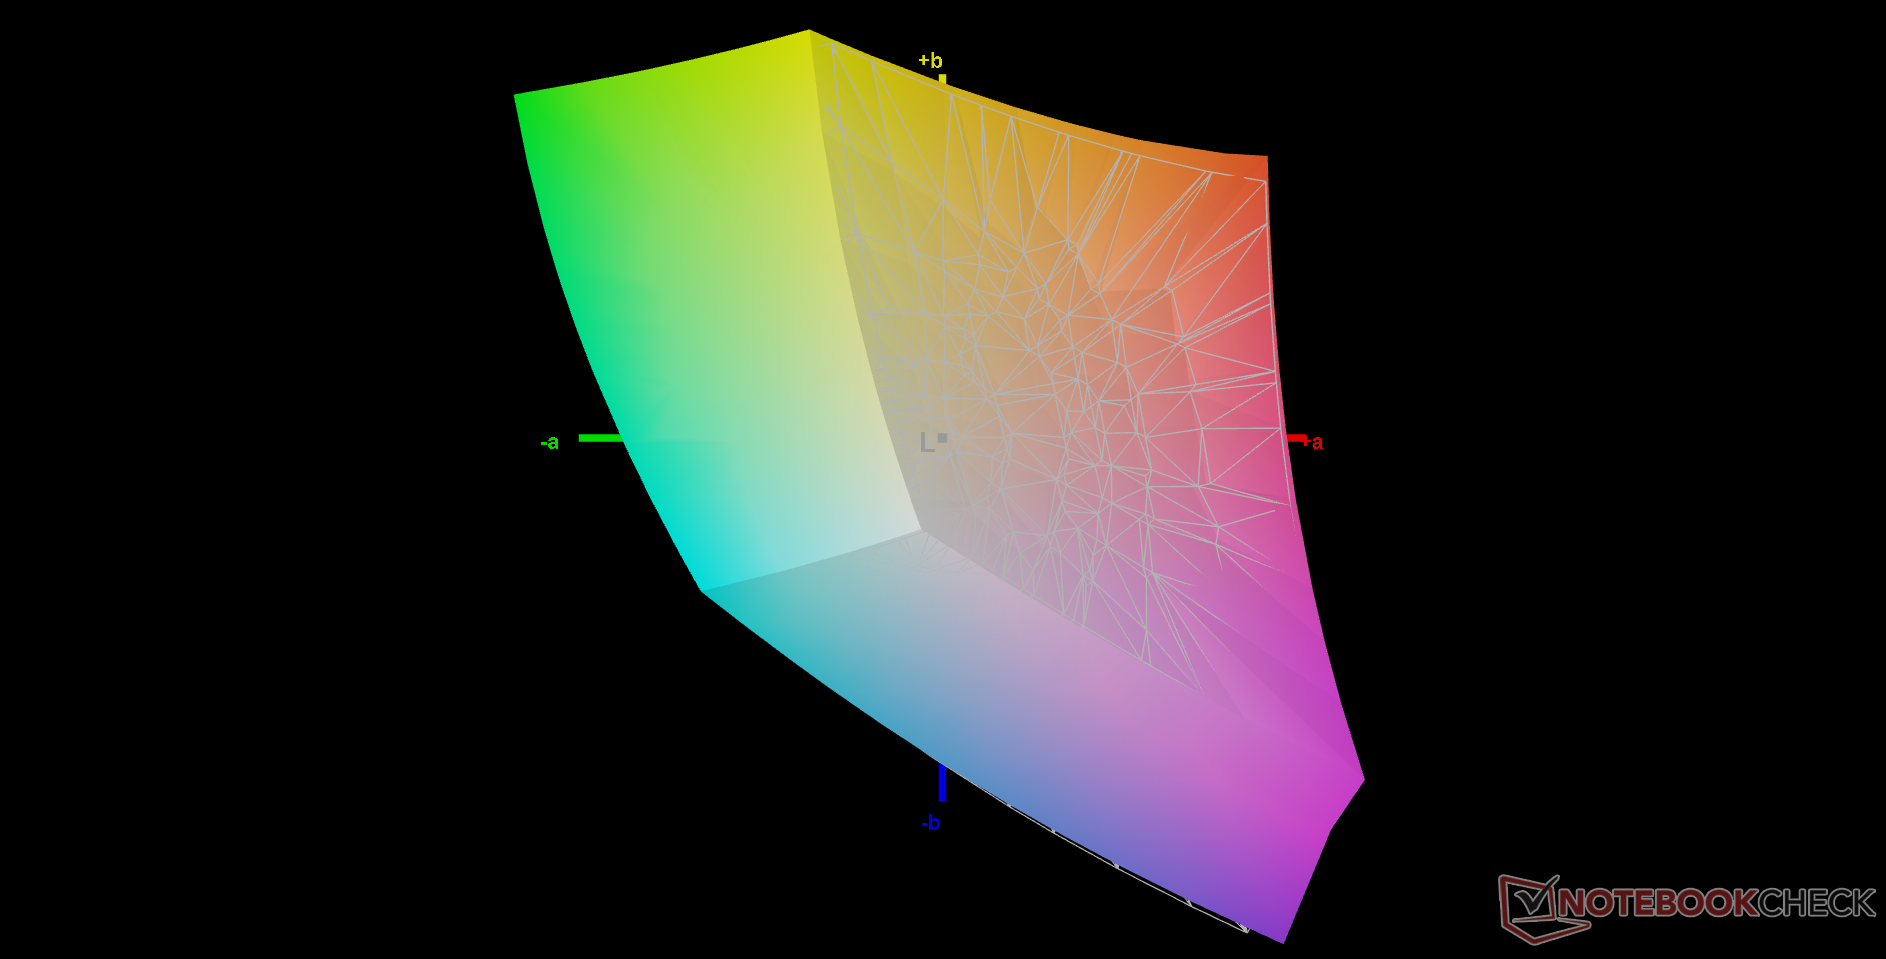
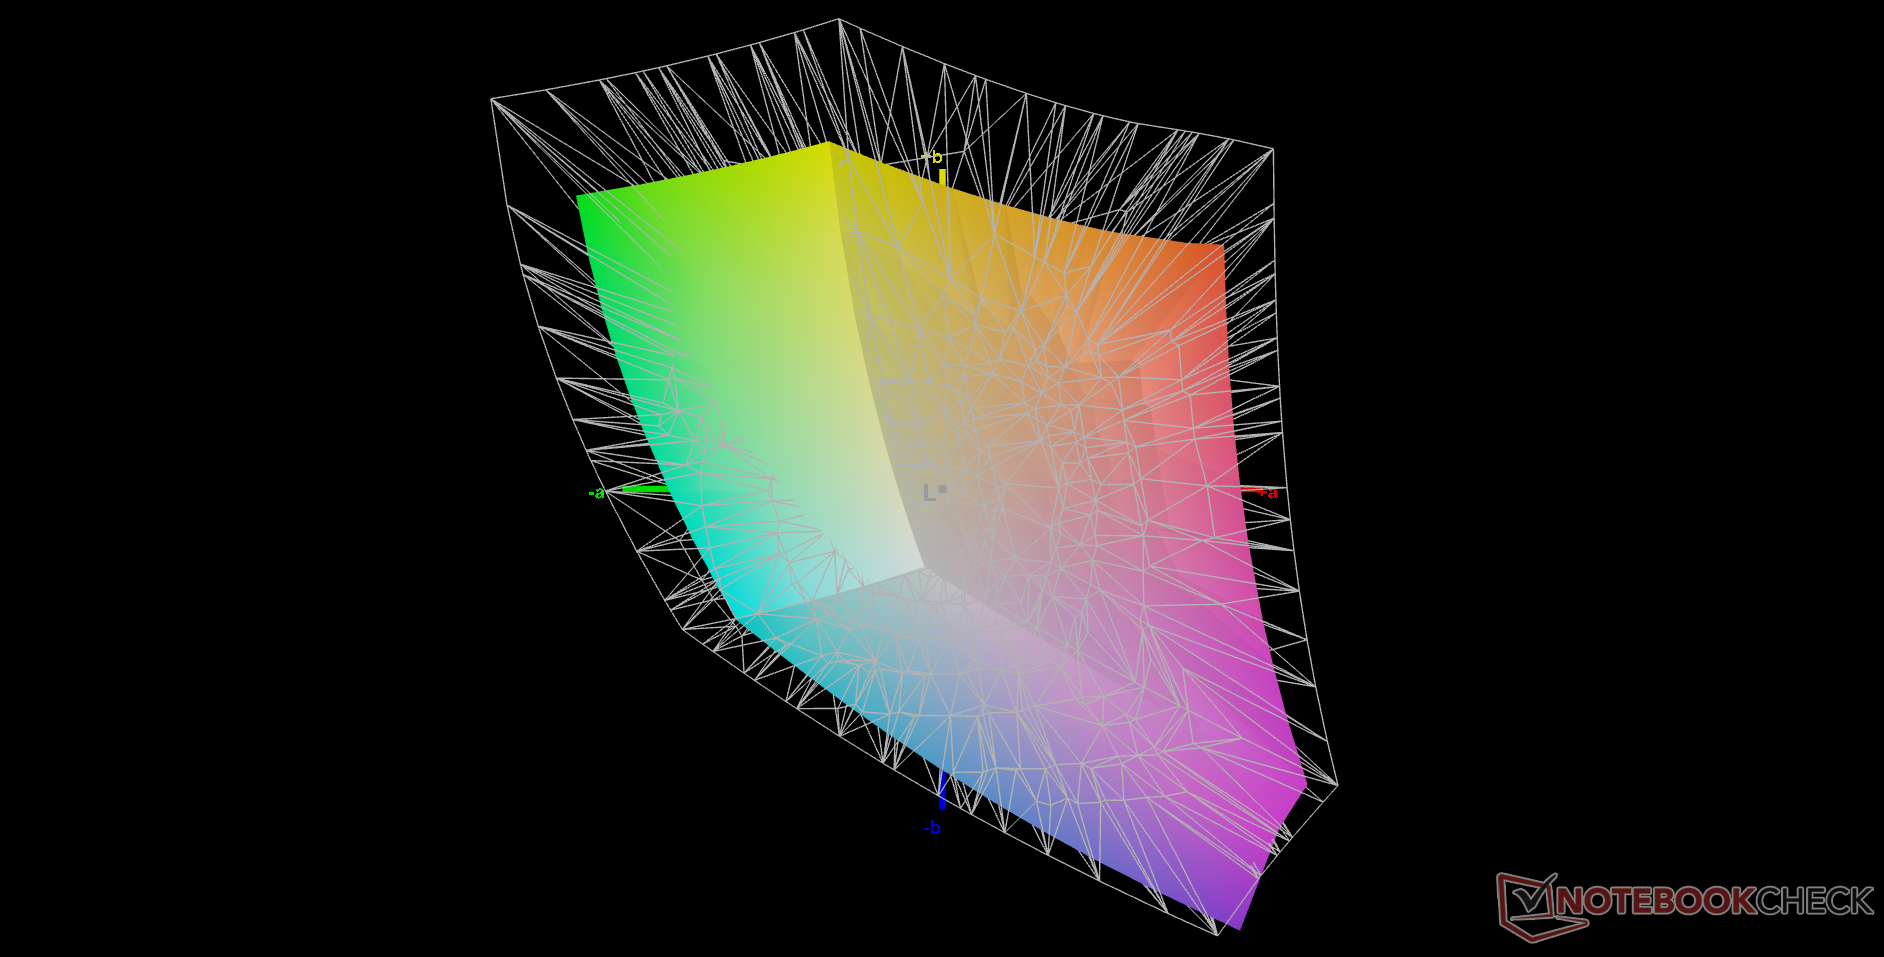
70.4% AdobeRGB 1998 (Argyll 3D)
98.7% sRGB (Argyll 3D)
69.9% Display P3 (Argyll 3D)
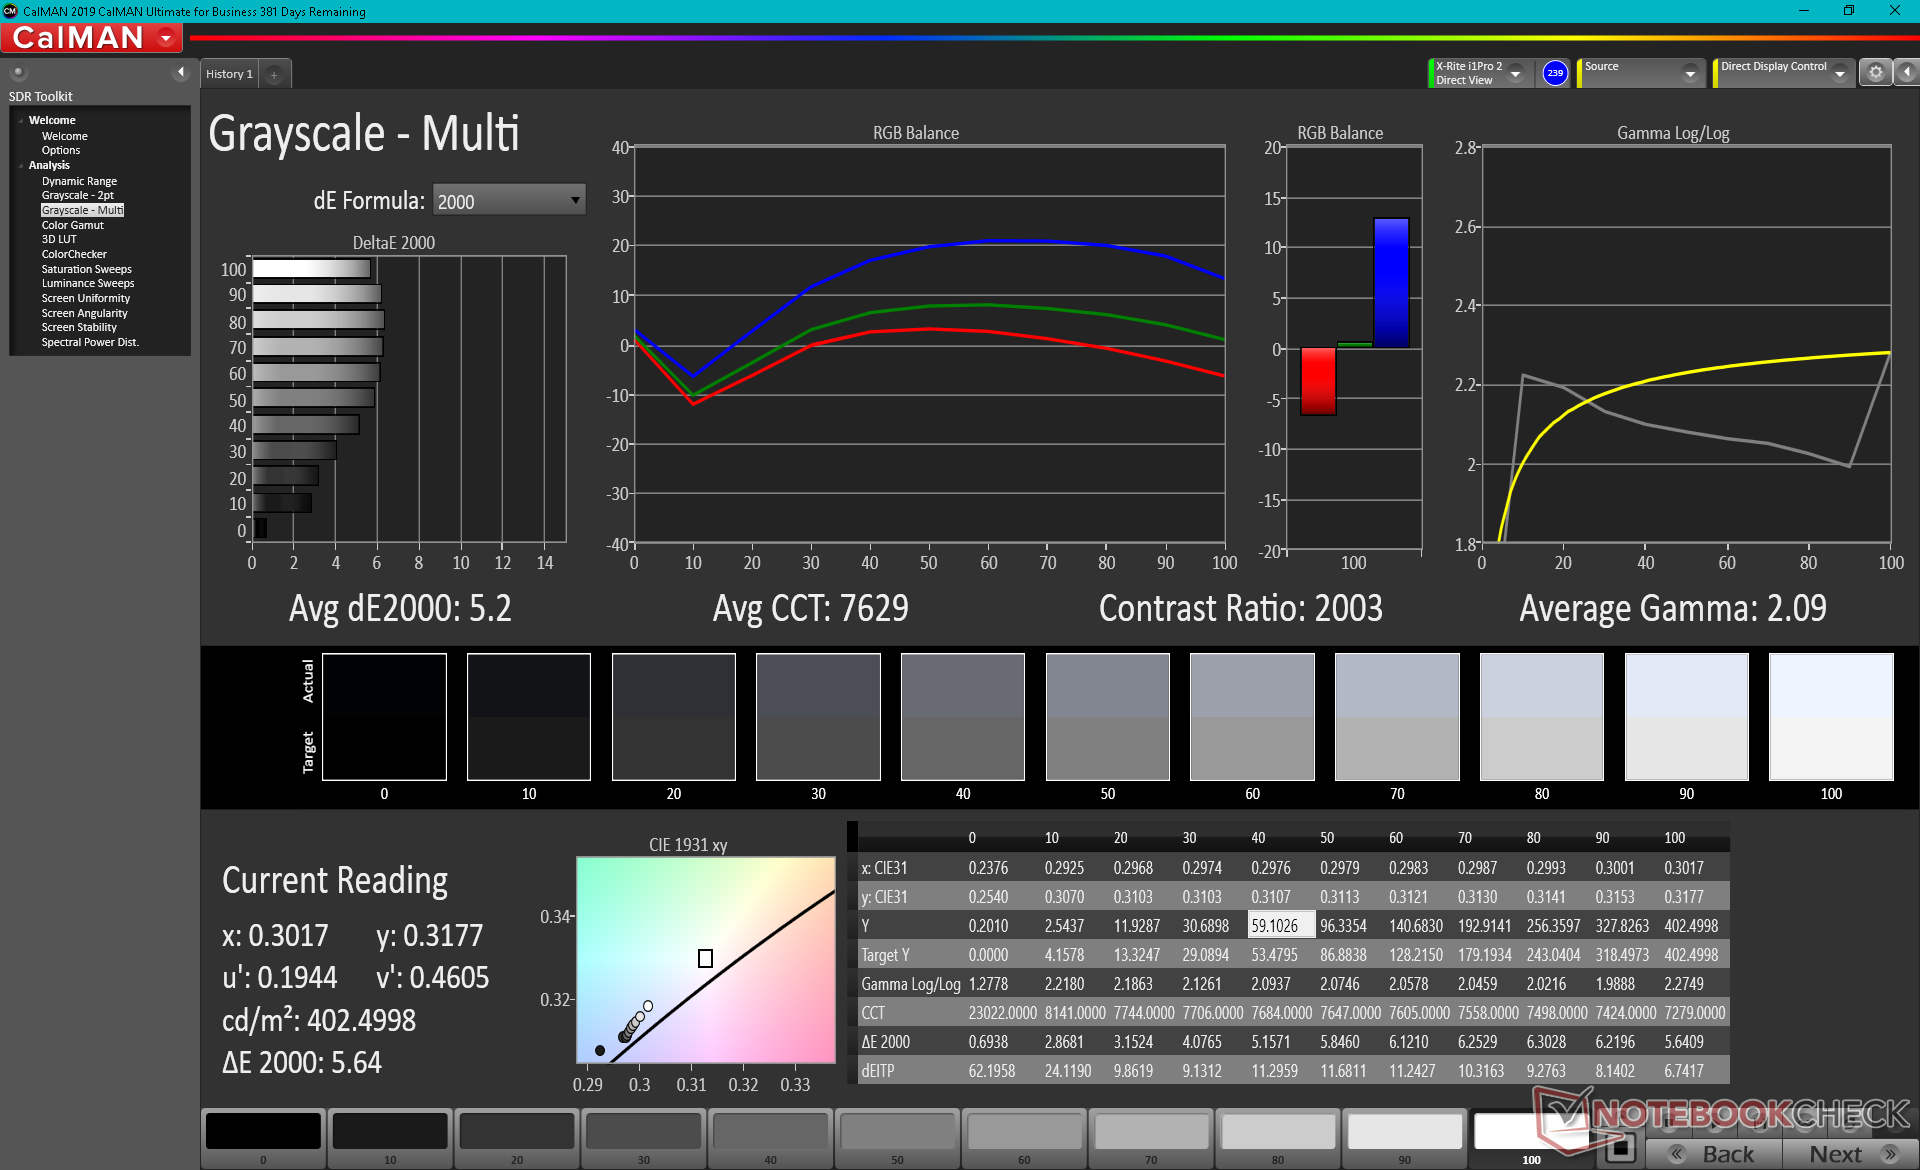
Gamma: 2.09
CCT: 7629 K
| Dell Latitude 15 9520 2-in-1 AU Optronics B150HAN, IPS, 1920x1080, 15" | Dell Latitude 9510 2-in-1 AU Optronics B150HAN, IPS, 1920x1080, 15" | HP EliteBook 850 G8 3C7Z8EA InfoVision X156NVF8 R1, I, 1920x1080, 15.6" | Lenovo ThinkPad L15 G2 AMD N156HCA-EAB, IPS LED, 1920x1080, 15.6" | MSI Summit B15 A11M Chi Mei N156HCE-EN1, IPS, 1920x1080, 15.6" | Microsoft Surface Laptop 4 15 AMD TFF_00028 SHP14B4, IPS, 2496x1664, 15" | |
|---|---|---|---|---|---|---|
| Display | 1% | -6% | -35% | -7% | -4% | |
| Display P3 Coverage (%) | 69.9 | 71.2 2% | 43.8 -37% | 65.7 -6% | 65.2 -7% | |
| sRGB Coverage (%) | 98.7 | 99.3 1% | 95 -4% | 65.7 -33% | 90.6 -8% | 97.7 -1% |
| AdobeRGB 1998 Coverage (%) | 70.4 | 71.3 1% | 65 -8% | 45.3 -36% | 66 -6% | 67.3 -4% |
| Response Times | -27% | -19% | -6% | -11% | -32% | |
| Response Time Grey 50% / Grey 80% * (ms) | 39.2 ? | 52.8 ? -35% | 47 ? -20% | 40 -2% | 40.4 ? -3% | 58.4 ? -49% |
| Response Time Black / White * (ms) | 27.2 ? | 32 ? -18% | 32 ? -18% | 30 -10% | 32.4 ? -19% | 31.2 ? -15% |
| PWM Frequency (Hz) | 312 ? | 25510 ? | 21550 ? | |||
| Screen | -27% | 7% | -49% | -71% | 6% | |
| Brightness middle (cd/m²) | 403.6 | 426.7 6% | 802 99% | 298 -26% | 341.3 -15% | 405 0% |
| Brightness (cd/m²) | 368 | 394 7% | 702 91% | 276 -25% | 310 -16% | 379 3% |
| Brightness Distribution (%) | 84 | 87 4% | 77 -8% | 86 2% | 81 -4% | 79 -6% |
| Black Level * (cd/m²) | 0.22 | 0.3 -36% | 0.245 -11% | 0.26 -18% | 0.45 -105% | 0.26 -18% |
| Contrast (:1) | 1835 | 1422 -23% | 3273 78% | 1146 -38% | 758 -59% | 1558 -15% |
| Colorchecker dE 2000 * | 3.34 | 4.28 -28% | 6.22 -86% | 3.7 -11% | 6.17 -85% | 2.6 22% |
| Colorchecker dE 2000 max. * | 6.29 | 10.43 -66% | 9.92 -58% | 15 -138% | 11.75 -87% | 6.6 -5% |
| Colorchecker dE 2000 calibrated * | 0.99 | 1.46 -47% | 3.5 -254% | 3.3 -233% | 0.9 9% | |
| Greyscale dE 2000 * | 5.2 | 8.1 -56% | 7.69 -48% | 1.7 67% | 7.1 -37% | 1.9 63% |
| Gamma | 2.09 105% | 2.26 97% | 2.75 80% | 2.21 100% | 2.2 100% | 2.11 104% |
| CCT | 7629 85% | 7993 81% | 6135 106% | 6588 99% | 6842 95% | 6825 95% |
| Color Space (Percent of AdobeRGB 1998) (%) | 65.2 | 65 | 58.7 | 62 | ||
| Color Space (Percent of sRGB) (%) | 99.2 | 95 | 90.1 | 97.7 | ||
| Totaal Gemiddelde (Programma / Instellingen) | -18% /
-21% | -6% /
1% | -30% /
-40% | -30% /
-49% | -10% /
-2% |
* ... kleiner is beter
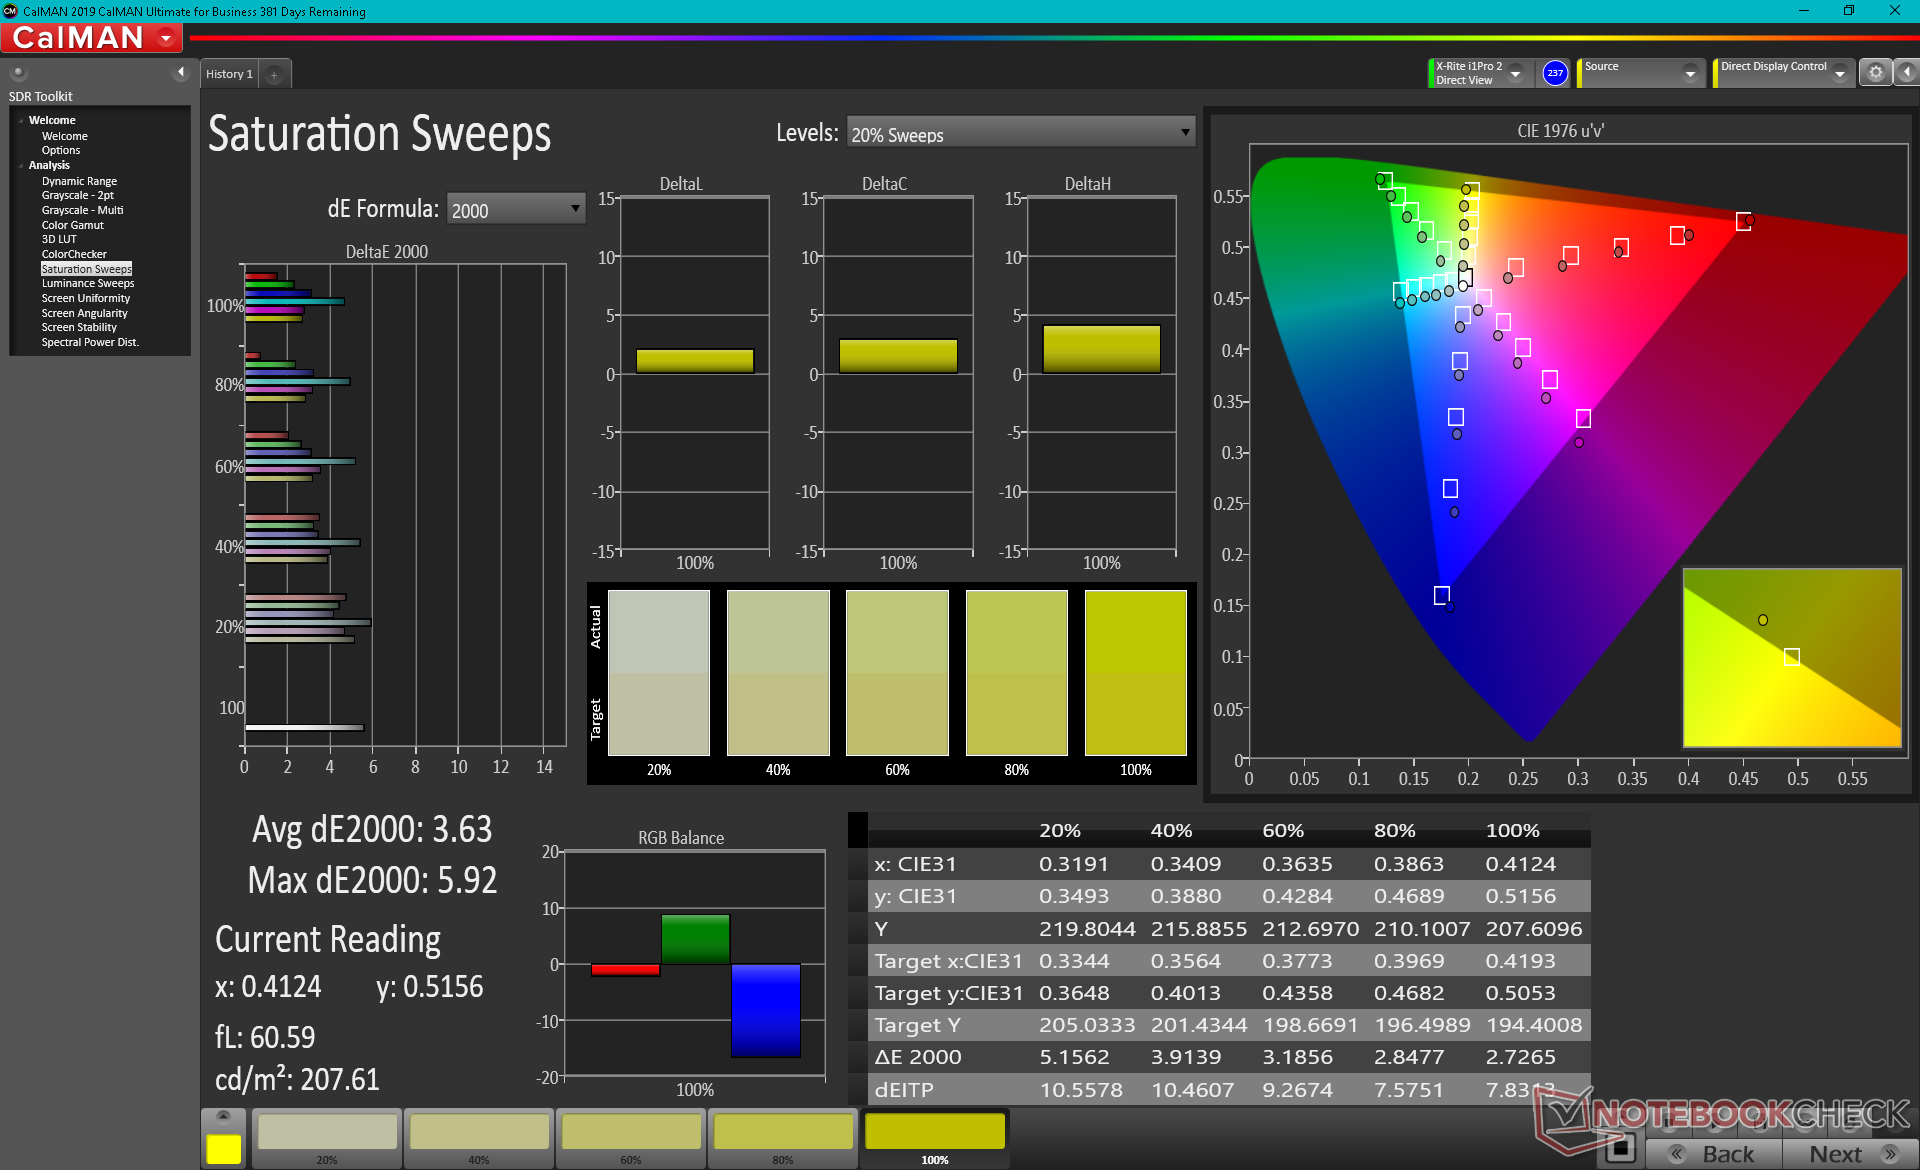
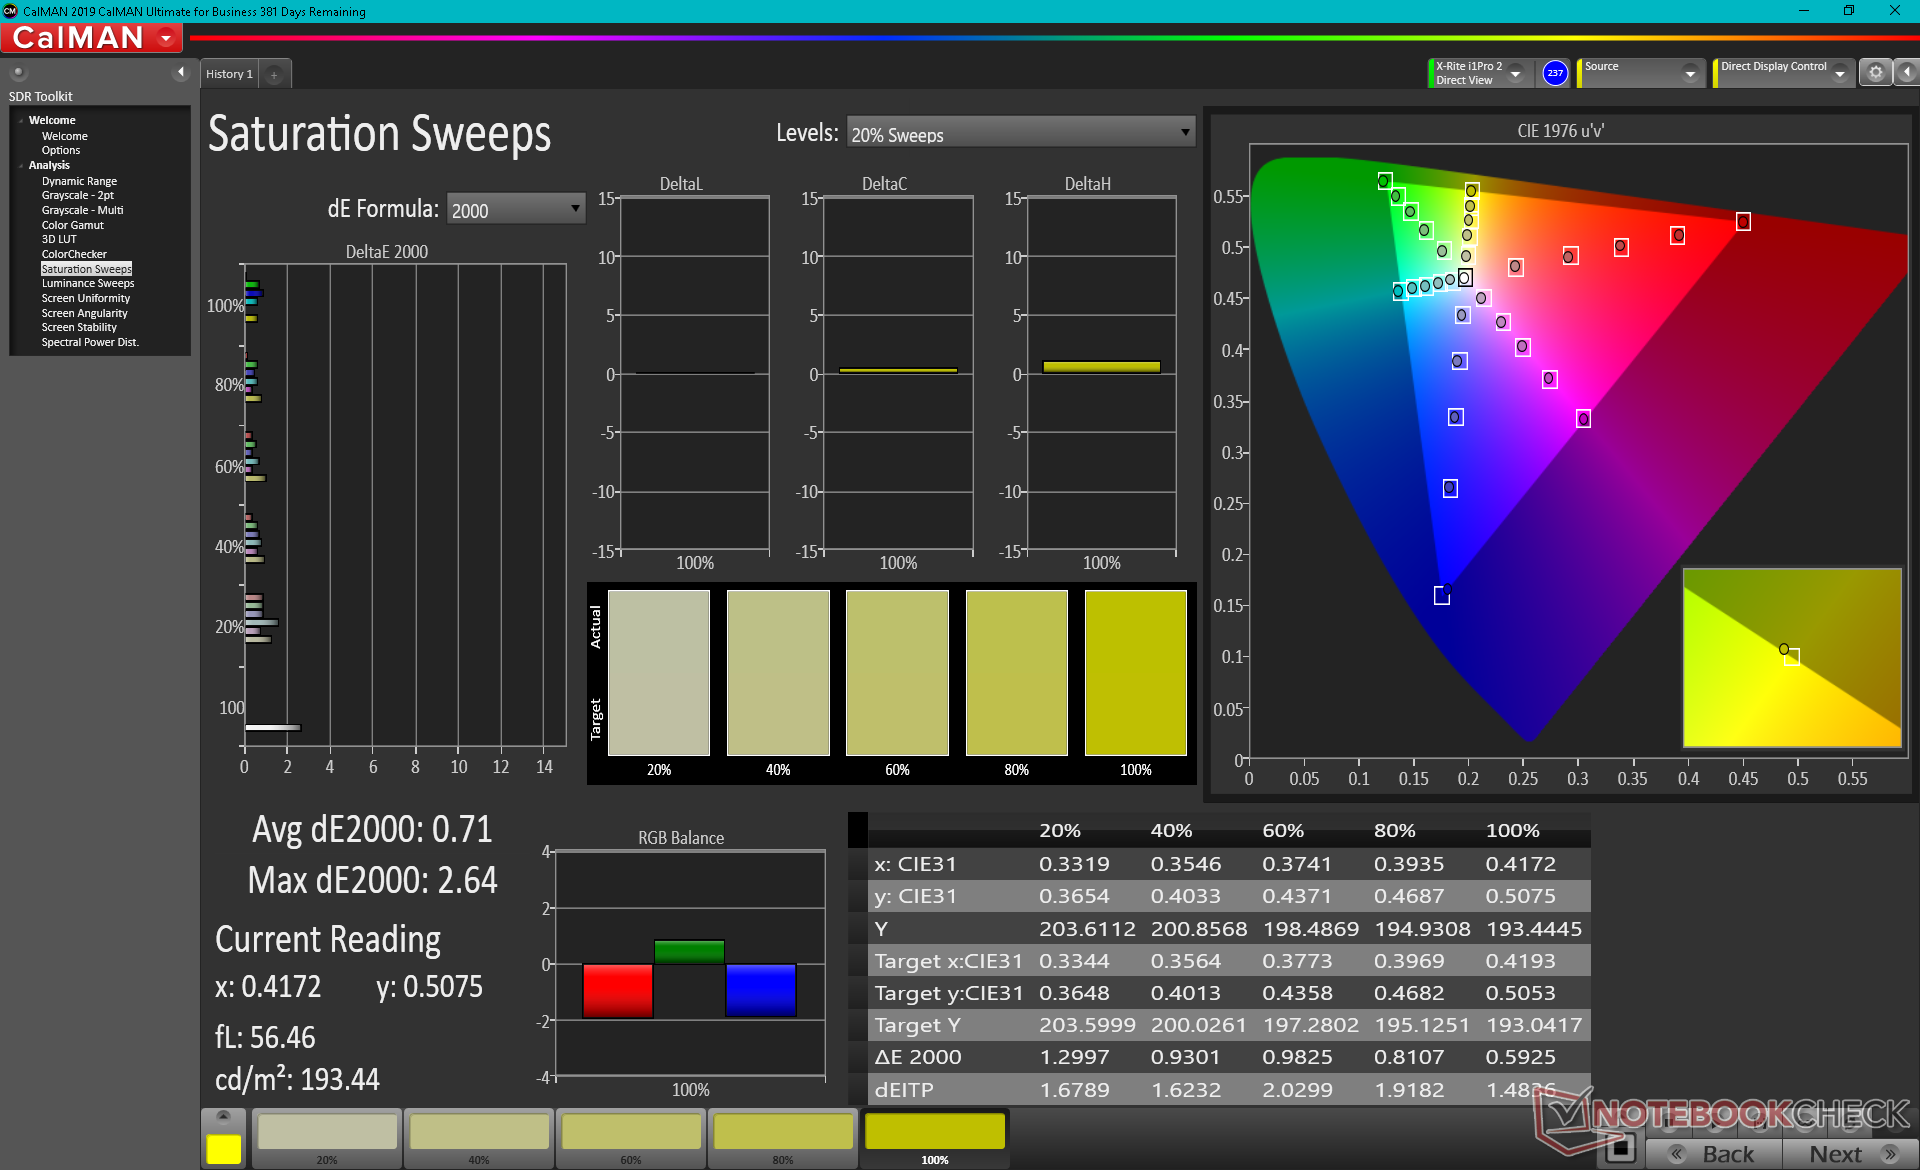
Het scherm is uit de doos behoorlijk gekalibreerd met gemiddelde deltaE-waarden voor grijswaarden en kleuren van respectievelijk slechts 5,2 en 3,34. Een goede kalibratie door de eindgebruiker kan deze waarden terugbrengen tot ruim onder <2 elk, zoals blijkt uit onze CalMAN screenshots hieronder.
Responstijd Scherm
| ↔ Responstijd Zwart naar Wit | ||
|---|---|---|
| 27.2 ms ... stijging ↗ en daling ↘ gecombineerd | ↗ 14 ms stijging | 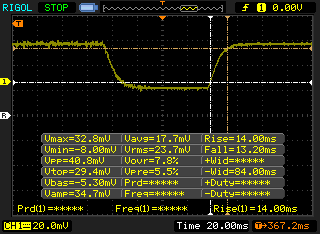 |
| ↘ 13.2 ms daling | ||
| Het scherm vertoonde relatief trage responstijden in onze tests en is misschien te traag voor games. Ter vergelijking: alle testtoestellen variëren van 0.1 (minimum) tot 240 (maximum) ms. » 69 % van alle toestellen zijn beter. Dit betekent dat de gemeten responstijd slechter is dan het gemiddelde (19.8 ms) van alle geteste toestellen. | ||
| ↔ Responstijd 50% Grijs naar 80% Grijs | ||
| 39.2 ms ... stijging ↗ en daling ↘ gecombineerd | ↗ 19.2 ms stijging | 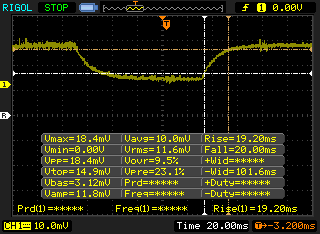 |
| ↘ 20 ms daling | ||
| Het scherm vertoonde trage responstijden in onze tests en is misschien te traag voor games. Ter vergelijking: alle testtoestellen variëren van 0.165 (minimum) tot 636 (maximum) ms. » 60 % van alle toestellen zijn beter. Dit betekent dat de gemeten responstijd slechter is dan het gemiddelde (31 ms) van alle geteste toestellen. | ||
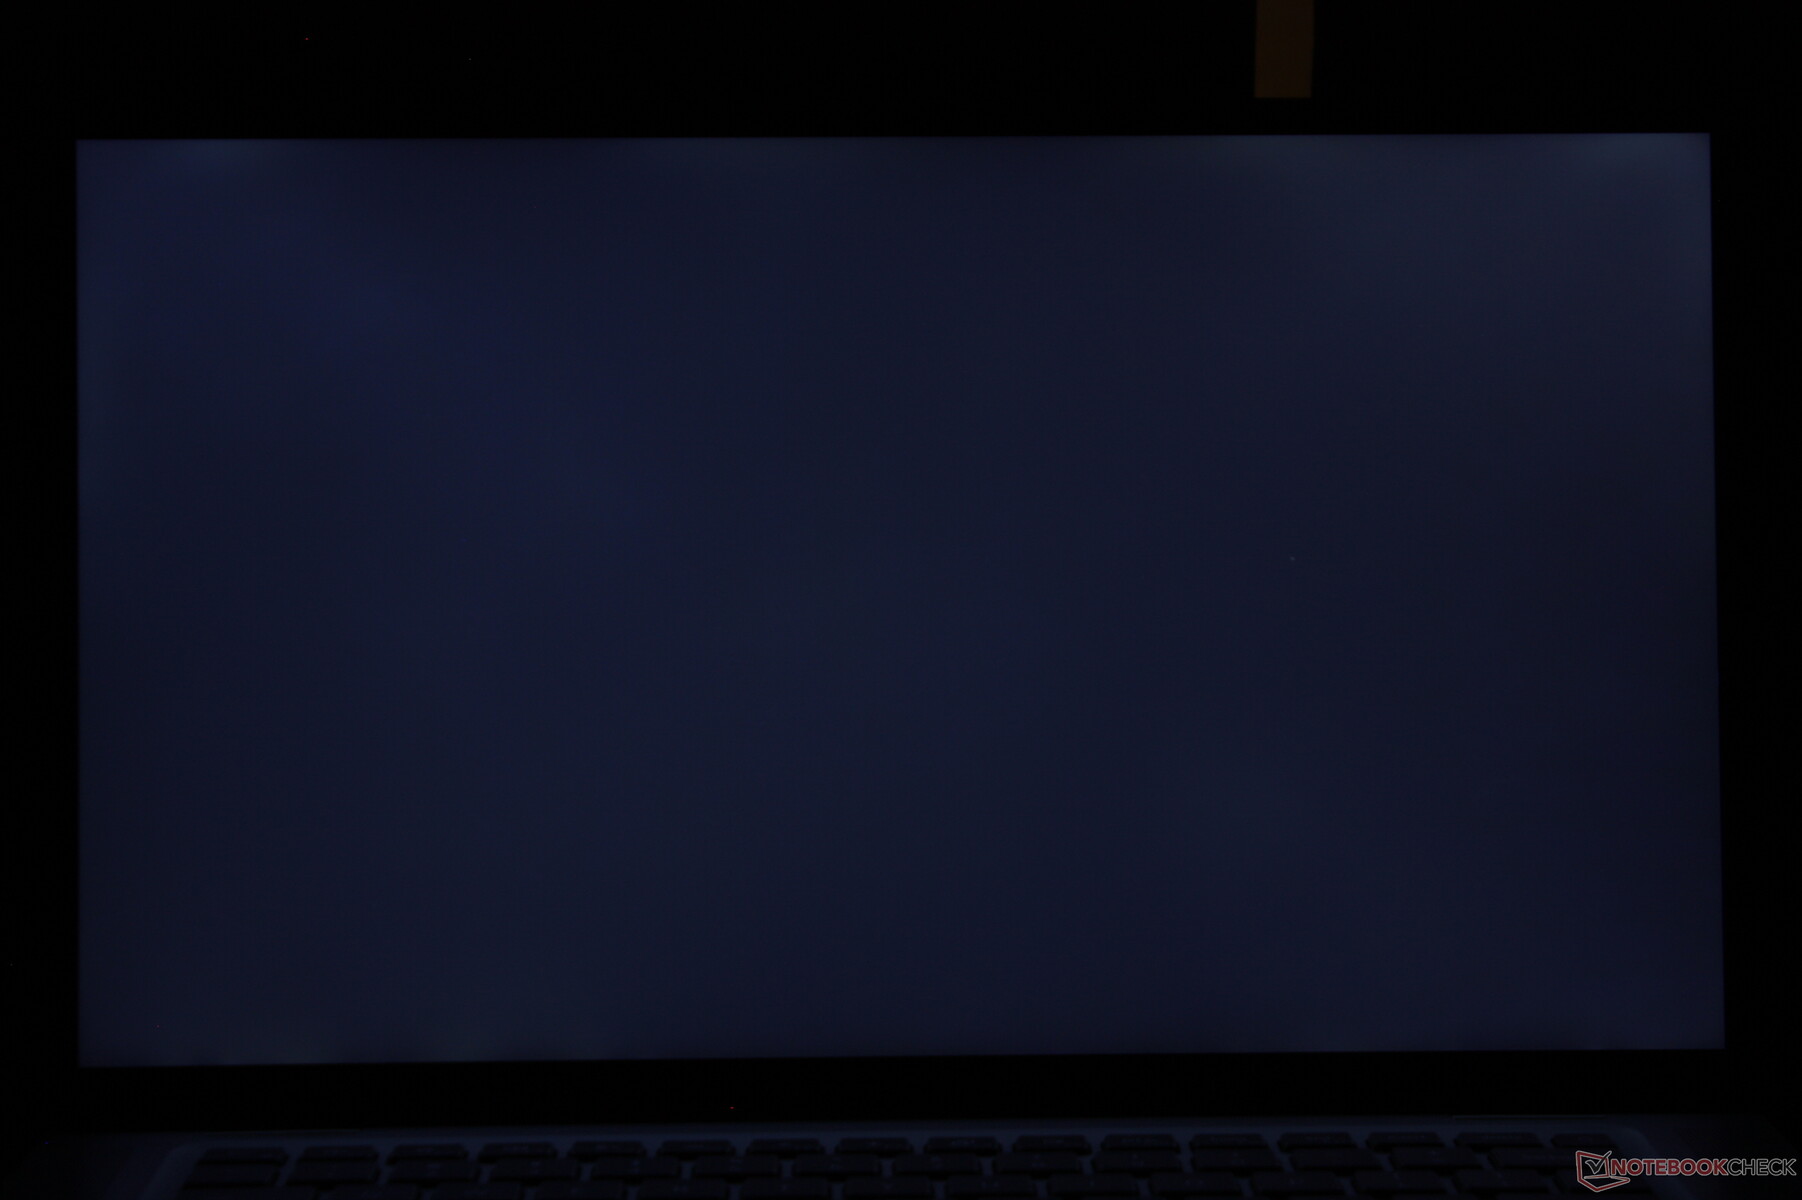
Screen Flickering / PWM (Pulse-Width Modulation)
| Screen flickering / PWM niet waargenomen | 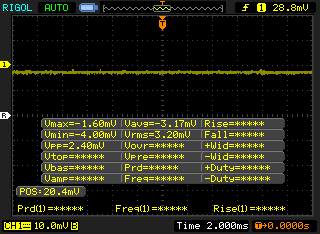 | ||
Ter vergelijking: 52 % van alle geteste toestellen maakten geen gebruik van PWM om de schermhelderheid te verlagen. Als het wel werd gebruikt, werd een gemiddelde van 7754 (minimum: 5 - maximum: 343500) Hz waargenomen. | |||
Prestaties
Testomstandigheden
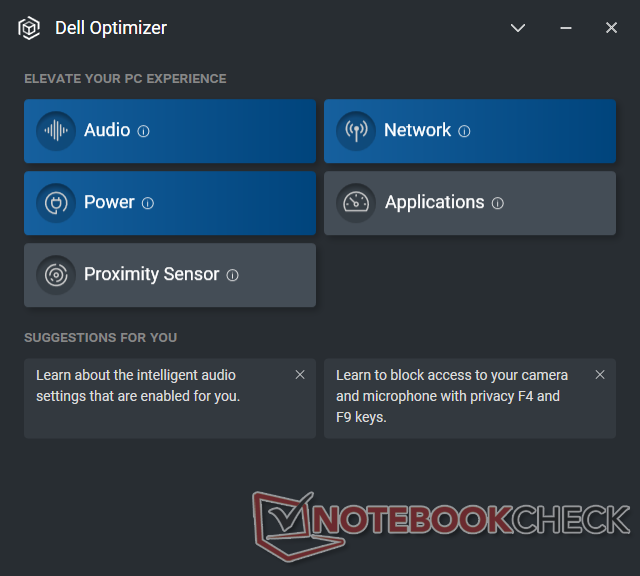
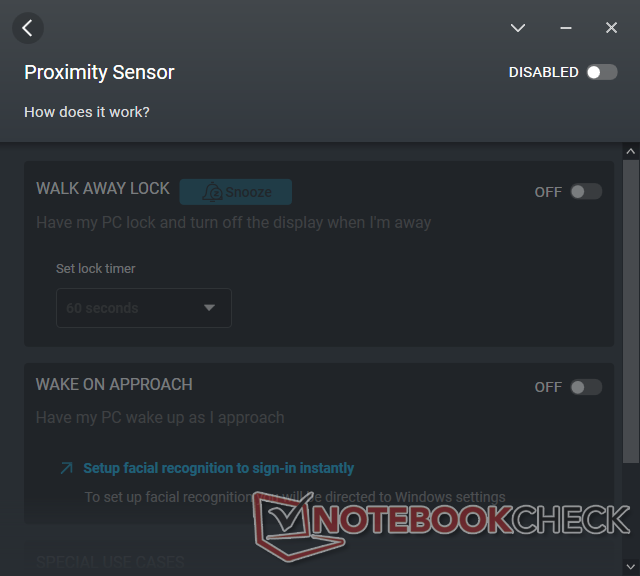
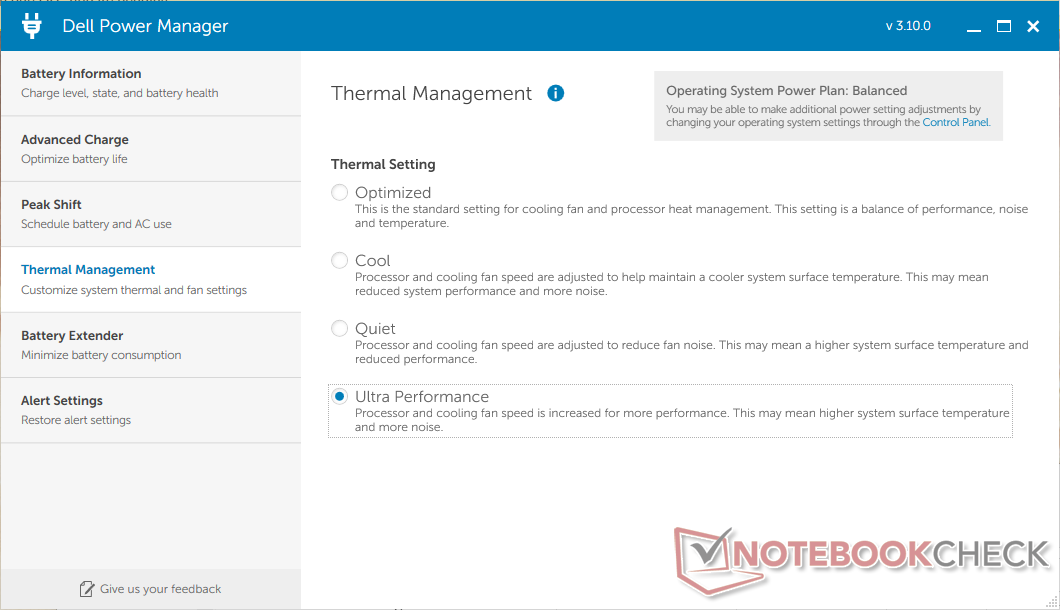
Ons systeem werd ingesteld op de Windows 'Beste prestaties'-modus en met Dell Power Manager ingesteld op Ultra Performance voordat de onderstaande benchmarks werden uitgevoerd voor de hoogst mogelijke scores. Gebruikers moeten ook vertrouwd raken met de vooraf geïnstalleerde Dell Optimizer software die extra instellingen bevat voor audio, netwerk en de nabijheidssensor voor handsfree aanmelden.
Processor
Multi-thread CPU-prestaties zijn een gemengd geval, aangezien de Core i7-1185G7 twee kernen minder heeft dan de Core i7-10810U van vorig jaar Core i7-10810U voor een downgrade van ongeveer 25 tot 35 procent. De delta is groter dan verwacht, aangezien de i7-1185G7 in onze Latitude 9520 2-in-1 minstens 15 tot 20 procent langzamer presteert dan de meeste andere laptops met exact dezelfde CPU. De Core i7-1185G7 CPU in de MSI Stealth 15Mbijvoorbeeld, kan tot 50 procent snellere multi-thread prestaties bieden dan onze Dell
Single-thread prestaties zijn gelukkig waar ze moeten zijn ten opzichte van de gemiddelde Core i7-1185G7. Gebruikers kunnen in dit opzicht ongeveer 30 procent snellere prestaties verwachten dan de Core i7-10810U.
Cinebench R15 Multi Loop
Cinebench R23: Multi Core | Single Core
Cinebench R20: CPU (Multi Core) | CPU (Single Core)
Cinebench R15: CPU Multi 64Bit | CPU Single 64Bit
Blender: v2.79 BMW27 CPU
7-Zip 18.03: 7z b 4 | 7z b 4 -mmt1
Geekbench 5.5: Multi-Core | Single-Core
HWBOT x265 Benchmark v2.2: 4k Preset
LibreOffice : 20 Documents To PDF
R Benchmark 2.5: Overall mean
| CPU Performance rating | |
| HP Pavilion Aero 13 be0097nr -2! | |
| Lenovo ThinkPad E15 G3-20YG003UGE | |
| Microsoft Surface Laptop 4 15 AMD TFF_00028 | |
| Lenovo ThinkPad L15 G2 AMD | |
| MSI Prestige 15 A10SC -10! | |
| Gemiddeld Intel Core i7-1185G7 | |
| HP EliteBook 850 G8 3C7Z8EA | |
| Asus ZenBook 15 UX534FT-DB77 -10! | |
| Dell Latitude 15 9520 2-in-1 -2! | |
| Asus ExpertBook B1 B1500CEAE, i5-1135G7 | |
| Samsung Galaxy Book Flex 15-NP950 -2! | |
| Dell Latitude 9510 2-in-1 -2! | |
| LG Gram 15Z90N -3! | |
| Cinebench R23 / Single Core | |
| HP EliteBook 850 G8 3C7Z8EA | |
| Gemiddeld Intel Core i7-1185G7 (1251 - 1532, n=24) | |
| HP Pavilion Aero 13 be0097nr | |
| Dell Latitude 15 9520 2-in-1 | |
| Lenovo ThinkPad L15 G2 AMD | |
| Microsoft Surface Laptop 4 15 AMD TFF_00028 | |
| Lenovo ThinkPad E15 G3-20YG003UGE | |
| Asus ExpertBook B1 B1500CEAE, i5-1135G7 | |
| Geekbench 5.5 / Multi-Core | |
| Microsoft Surface Laptop 4 15 AMD TFF_00028 | |
| Lenovo ThinkPad E15 G3-20YG003UGE | |
| HP EliteBook 850 G8 3C7Z8EA | |
| Gemiddeld Intel Core i7-1185G7 (4620 - 5944, n=21) | |
| Lenovo ThinkPad L15 G2 AMD | |
| Samsung Galaxy Book Flex 15-NP950 | |
| Asus ExpertBook B1 B1500CEAE, i5-1135G7 | |
| Dell Latitude 9510 2-in-1 | |
| LG Gram 15Z90N | |
| Geekbench 5.5 / Single-Core | |
| HP EliteBook 850 G8 3C7Z8EA | |
| Gemiddeld Intel Core i7-1185G7 (1398 - 1626, n=21) | |
| Lenovo ThinkPad L15 G2 AMD | |
| Asus ExpertBook B1 B1500CEAE, i5-1135G7 | |
| Samsung Galaxy Book Flex 15-NP950 | |
| Dell Latitude 9510 2-in-1 | |
| Lenovo ThinkPad E15 G3-20YG003UGE | |
| LG Gram 15Z90N | |
| Microsoft Surface Laptop 4 15 AMD TFF_00028 | |
| LibreOffice / 20 Documents To PDF | |
| Microsoft Surface Laptop 4 15 AMD TFF_00028 | |
| Dell Latitude 9510 2-in-1 | |
| Lenovo ThinkPad E15 G3-20YG003UGE | |
| Samsung Galaxy Book Flex 15-NP950 | |
| HP EliteBook 850 G8 3C7Z8EA | |
| HP Pavilion Aero 13 be0097nr | |
| Dell Latitude 15 9520 2-in-1 | |
| Asus ExpertBook B1 B1500CEAE, i5-1135G7 | |
| Gemiddeld Intel Core i7-1185G7 (41.3 - 61.7, n=26) | |
| Lenovo ThinkPad L15 G2 AMD | |
| LG Gram 15Z90N | |
| R Benchmark 2.5 / Overall mean | |
| LG Gram 15Z90N | |
| Dell Latitude 9510 2-in-1 | |
| Samsung Galaxy Book Flex 15-NP950 | |
| Asus ExpertBook B1 B1500CEAE, i5-1135G7 | |
| Microsoft Surface Laptop 4 15 AMD TFF_00028 | |
| Dell Latitude 15 9520 2-in-1 | |
| Lenovo ThinkPad E15 G3-20YG003UGE | |
| Gemiddeld Intel Core i7-1185G7 (0.55 - 0.615, n=27) | |
| HP EliteBook 850 G8 3C7Z8EA | |
| Lenovo ThinkPad L15 G2 AMD | |
| HP Pavilion Aero 13 be0097nr | |
Cinebench R23: Multi Core | Single Core
Cinebench R20: CPU (Multi Core) | CPU (Single Core)
Cinebench R15: CPU Multi 64Bit | CPU Single 64Bit
Blender: v2.79 BMW27 CPU
7-Zip 18.03: 7z b 4 | 7z b 4 -mmt1
Geekbench 5.5: Multi-Core | Single-Core
HWBOT x265 Benchmark v2.2: 4k Preset
LibreOffice : 20 Documents To PDF
R Benchmark 2.5: Overall mean
* ... kleiner is beter
AIDA64: FP32 Ray-Trace | FPU Julia | CPU SHA3 | CPU Queen | FPU SinJulia | FPU Mandel | CPU AES | CPU ZLib | FP64 Ray-Trace | CPU PhotoWorxx
| Performance rating | |
| Microsoft Surface Laptop 4 15 AMD TFF_00028 | |
| Lenovo ThinkPad L15 G2 AMD | |
| MSI Summit B15 A11M | |
| Gemiddeld Intel Core i7-1185G7 | |
| HP EliteBook 850 G8 3C7Z8EA | |
| Dell Latitude 15 9520 2-in-1 | |
| Dell Latitude 9510 2-in-1 | |
| AIDA64 / FP32 Ray-Trace | |
| Microsoft Surface Laptop 4 15 AMD TFF_00028 | |
| Lenovo ThinkPad L15 G2 AMD | |
| MSI Summit B15 A11M | |
| Gemiddeld Intel Core i7-1185G7 (5621 - 7453, n=20) | |
| HP EliteBook 850 G8 3C7Z8EA | |
| Dell Latitude 15 9520 2-in-1 | |
| Dell Latitude 9510 2-in-1 | |
| AIDA64 / FPU Julia | |
| Microsoft Surface Laptop 4 15 AMD TFF_00028 | |
| Lenovo ThinkPad L15 G2 AMD | |
| Dell Latitude 9510 2-in-1 | |
| MSI Summit B15 A11M | |
| Gemiddeld Intel Core i7-1185G7 (23248 - 32614, n=20) | |
| HP EliteBook 850 G8 3C7Z8EA | |
| Dell Latitude 15 9520 2-in-1 | |
| AIDA64 / CPU SHA3 | |
| Microsoft Surface Laptop 4 15 AMD TFF_00028 | |
| MSI Summit B15 A11M | |
| Lenovo ThinkPad L15 G2 AMD | |
| Gemiddeld Intel Core i7-1185G7 (1530 - 2209, n=20) | |
| HP EliteBook 850 G8 3C7Z8EA | |
| Dell Latitude 15 9520 2-in-1 | |
| Dell Latitude 9510 2-in-1 | |
| AIDA64 / CPU Queen | |
| Microsoft Surface Laptop 4 15 AMD TFF_00028 | |
| Lenovo ThinkPad L15 G2 AMD | |
| Dell Latitude 9510 2-in-1 | |
| HP EliteBook 850 G8 3C7Z8EA | |
| Gemiddeld Intel Core i7-1185G7 (44677 - 52815, n=20) | |
| Dell Latitude 15 9520 2-in-1 | |
| MSI Summit B15 A11M | |
| AIDA64 / FPU SinJulia | |
| Microsoft Surface Laptop 4 15 AMD TFF_00028 | |
| Lenovo ThinkPad L15 G2 AMD | |
| Dell Latitude 9510 2-in-1 | |
| MSI Summit B15 A11M | |
| Gemiddeld Intel Core i7-1185G7 (3870 - 5027, n=20) | |
| HP EliteBook 850 G8 3C7Z8EA | |
| Dell Latitude 15 9520 2-in-1 | |
| AIDA64 / FPU Mandel | |
| Microsoft Surface Laptop 4 15 AMD TFF_00028 | |
| Lenovo ThinkPad L15 G2 AMD | |
| MSI Summit B15 A11M | |
| Gemiddeld Intel Core i7-1185G7 (14584 - 19594, n=20) | |
| HP EliteBook 850 G8 3C7Z8EA | |
| Dell Latitude 15 9520 2-in-1 | |
| Dell Latitude 9510 2-in-1 | |
| AIDA64 / CPU AES | |
| Lenovo ThinkPad L15 G2 AMD | |
| HP EliteBook 850 G8 3C7Z8EA | |
| Gemiddeld Intel Core i7-1185G7 (33002 - 76826, n=20) | |
| MSI Summit B15 A11M | |
| Microsoft Surface Laptop 4 15 AMD TFF_00028 | |
| Dell Latitude 15 9520 2-in-1 | |
| Dell Latitude 9510 2-in-1 | |
| AIDA64 / CPU ZLib | |
| Microsoft Surface Laptop 4 15 AMD TFF_00028 | |
| Lenovo ThinkPad L15 G2 AMD | |
| Dell Latitude 9510 2-in-1 | |
| MSI Summit B15 A11M | |
| HP EliteBook 850 G8 3C7Z8EA | |
| Gemiddeld Intel Core i7-1185G7 (258 - 412, n=22) | |
| Dell Latitude 15 9520 2-in-1 | |
| AIDA64 / FP64 Ray-Trace | |
| Microsoft Surface Laptop 4 15 AMD TFF_00028 | |
| Lenovo ThinkPad L15 G2 AMD | |
| MSI Summit B15 A11M | |
| Gemiddeld Intel Core i7-1185G7 (2821 - 4094, n=20) | |
| HP EliteBook 850 G8 3C7Z8EA | |
| Dell Latitude 15 9520 2-in-1 | |
| Dell Latitude 9510 2-in-1 | |
| AIDA64 / CPU PhotoWorxx | |
| Dell Latitude 15 9520 2-in-1 | |
| Gemiddeld Intel Core i7-1185G7 (22349 - 43701, n=20) | |
| MSI Summit B15 A11M | |
| HP EliteBook 850 G8 3C7Z8EA | |
| Microsoft Surface Laptop 4 15 AMD TFF_00028 | |
| Dell Latitude 9510 2-in-1 | |
| Lenovo ThinkPad L15 G2 AMD | |
Systeemprestaties
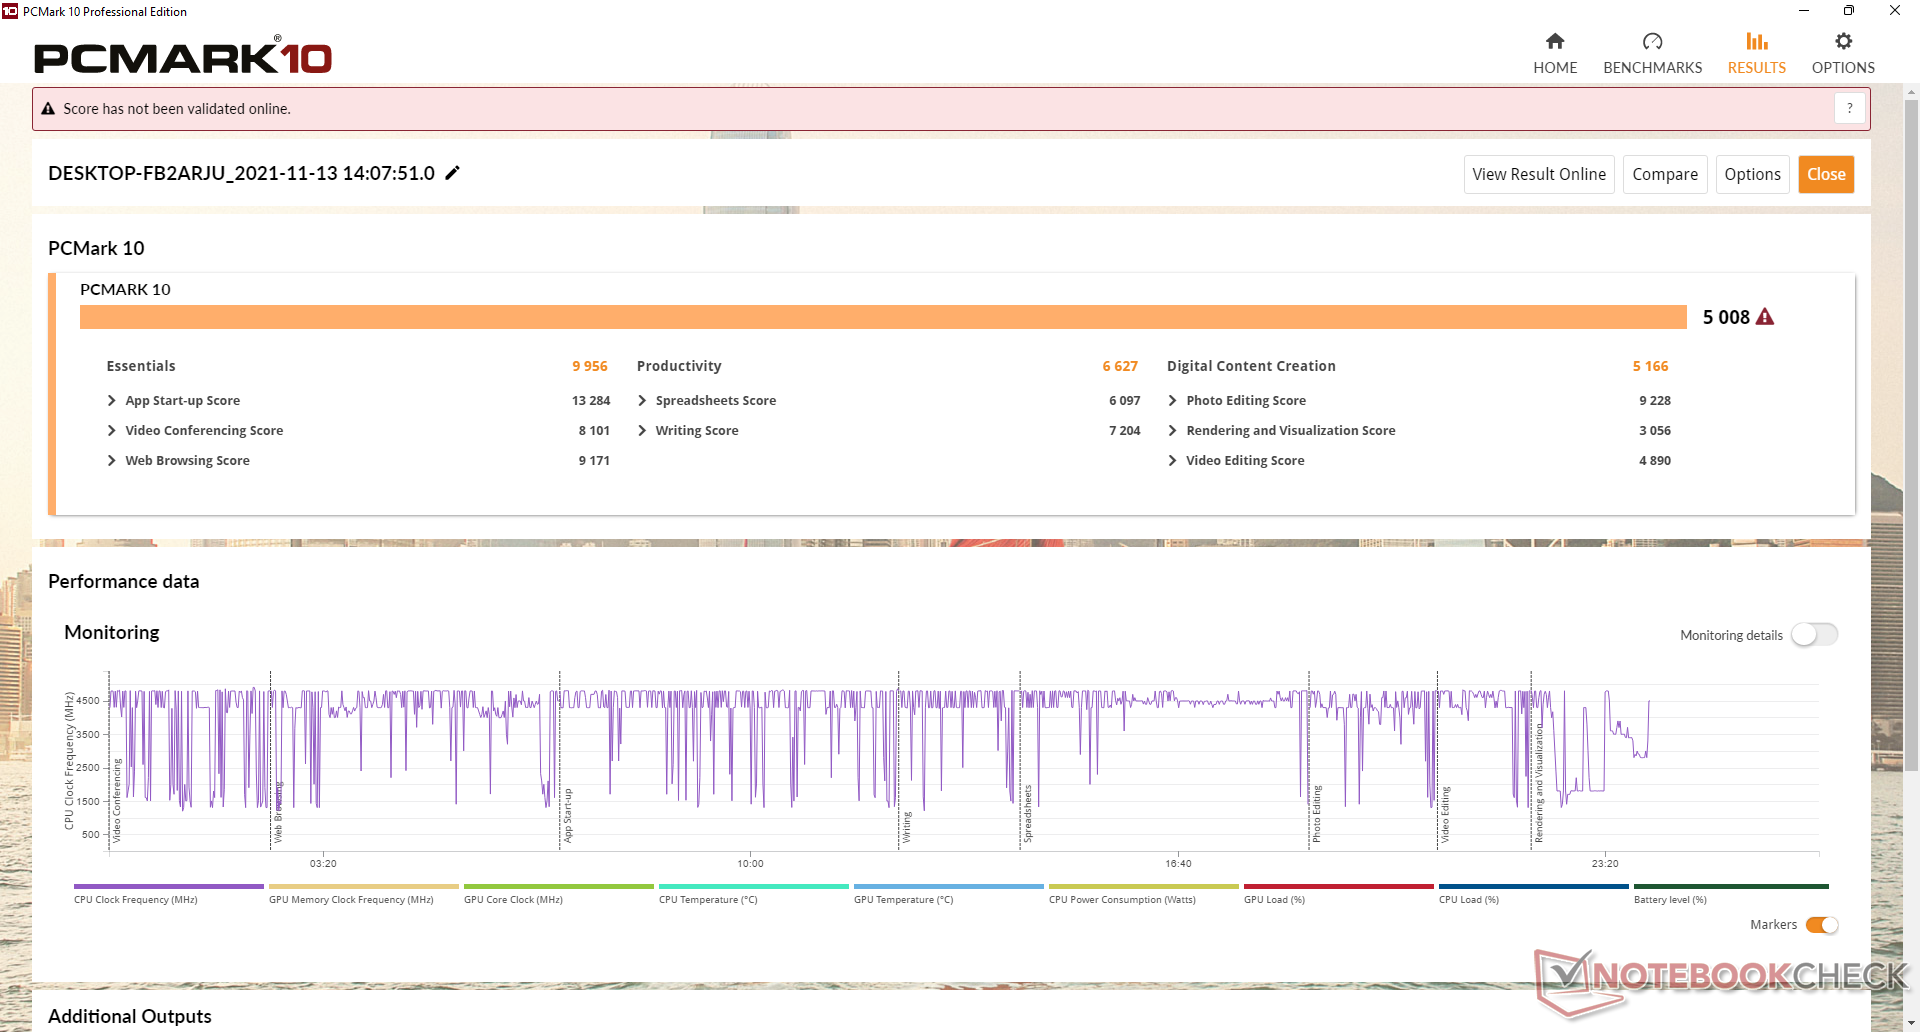
PCMark 10 scores zijn over het algemeen hoger dan wat we registreerden op de Latitude 9510 2-in-1, vooral in Digital Content Creation waar graphics het belangrijkst zijn. Het oudere model heeft een hogere productiviteitsscore, waarschijnlijk dankzij de superieure multi-thread prestaties.
| PCMark 10 / Score | |
| Lenovo ThinkPad L15 G2 AMD | |
| Microsoft Surface Laptop 4 15 AMD TFF_00028 | |
| Dell Latitude 15 9520 2-in-1 | |
| Gemiddeld Intel Core i7-1185G7, Intel Iris Xe Graphics G7 96EUs (4746 - 5561, n=20) | |
| HP EliteBook 850 G8 3C7Z8EA | |
| MSI Summit B15 A11M | |
| Dell Latitude 9510 2-in-1 | |
| PCMark 10 / Essentials | |
| Lenovo ThinkPad L15 G2 AMD | |
| Dell Latitude 15 9520 2-in-1 | |
| Gemiddeld Intel Core i7-1185G7, Intel Iris Xe Graphics G7 96EUs (8279 - 10664, n=20) | |
| Dell Latitude 9510 2-in-1 | |
| MSI Summit B15 A11M | |
| HP EliteBook 850 G8 3C7Z8EA | |
| Microsoft Surface Laptop 4 15 AMD TFF_00028 | |
| PCMark 10 / Productivity | |
| Lenovo ThinkPad L15 G2 AMD | |
| Microsoft Surface Laptop 4 15 AMD TFF_00028 | |
| Dell Latitude 9510 2-in-1 | |
| HP EliteBook 850 G8 3C7Z8EA | |
| Gemiddeld Intel Core i7-1185G7, Intel Iris Xe Graphics G7 96EUs (5799 - 8770, n=20) | |
| Dell Latitude 15 9520 2-in-1 | |
| MSI Summit B15 A11M | |
| PCMark 10 / Digital Content Creation | |
| Microsoft Surface Laptop 4 15 AMD TFF_00028 | |
| Dell Latitude 15 9520 2-in-1 | |
| Gemiddeld Intel Core i7-1185G7, Intel Iris Xe Graphics G7 96EUs (4424 - 5684, n=20) | |
| HP EliteBook 850 G8 3C7Z8EA | |
| Lenovo ThinkPad L15 G2 AMD | |
| MSI Summit B15 A11M | |
| Dell Latitude 9510 2-in-1 | |
| PCMark 10 Score | 5008 punten | |
Help | ||
| AIDA64 / Memory Copy | |
| Dell Latitude 15 9520 2-in-1 | |
| Gemiddeld Intel Core i7-1185G7 (36515 - 68450, n=20) | |
| HP EliteBook 850 G8 3C7Z8EA | |
| Microsoft Surface Laptop 4 15 AMD TFF_00028 | |
| MSI Summit B15 A11M | |
| Dell Latitude 9510 2-in-1 | |
| Lenovo ThinkPad L15 G2 AMD | |
| AIDA64 / Memory Read | |
| Dell Latitude 15 9520 2-in-1 | |
| Gemiddeld Intel Core i7-1185G7 (38394 - 64291, n=20) | |
| HP EliteBook 850 G8 3C7Z8EA | |
| Microsoft Surface Laptop 4 15 AMD TFF_00028 | |
| MSI Summit B15 A11M | |
| Dell Latitude 9510 2-in-1 | |
| Lenovo ThinkPad L15 G2 AMD | |
| AIDA64 / Memory Write | |
| Dell Latitude 15 9520 2-in-1 | |
| Gemiddeld Intel Core i7-1185G7 (37684 - 66873, n=20) | |
| HP EliteBook 850 G8 3C7Z8EA | |
| MSI Summit B15 A11M | |
| Microsoft Surface Laptop 4 15 AMD TFF_00028 | |
| Dell Latitude 9510 2-in-1 | |
| Lenovo ThinkPad L15 G2 AMD | |
| AIDA64 / Memory Latency | |
| Microsoft Surface Laptop 4 15 AMD TFF_00028 | |
| Dell Latitude 15 9520 2-in-1 | |
| Dell Latitude 9510 2-in-1 | |
| Lenovo ThinkPad L15 G2 AMD | |
| Gemiddeld Intel Core i7-1185G7 (78.3 - 117, n=22) | |
| MSI Summit B15 A11M | |
| HP EliteBook 850 G8 3C7Z8EA | |
* ... kleiner is beter
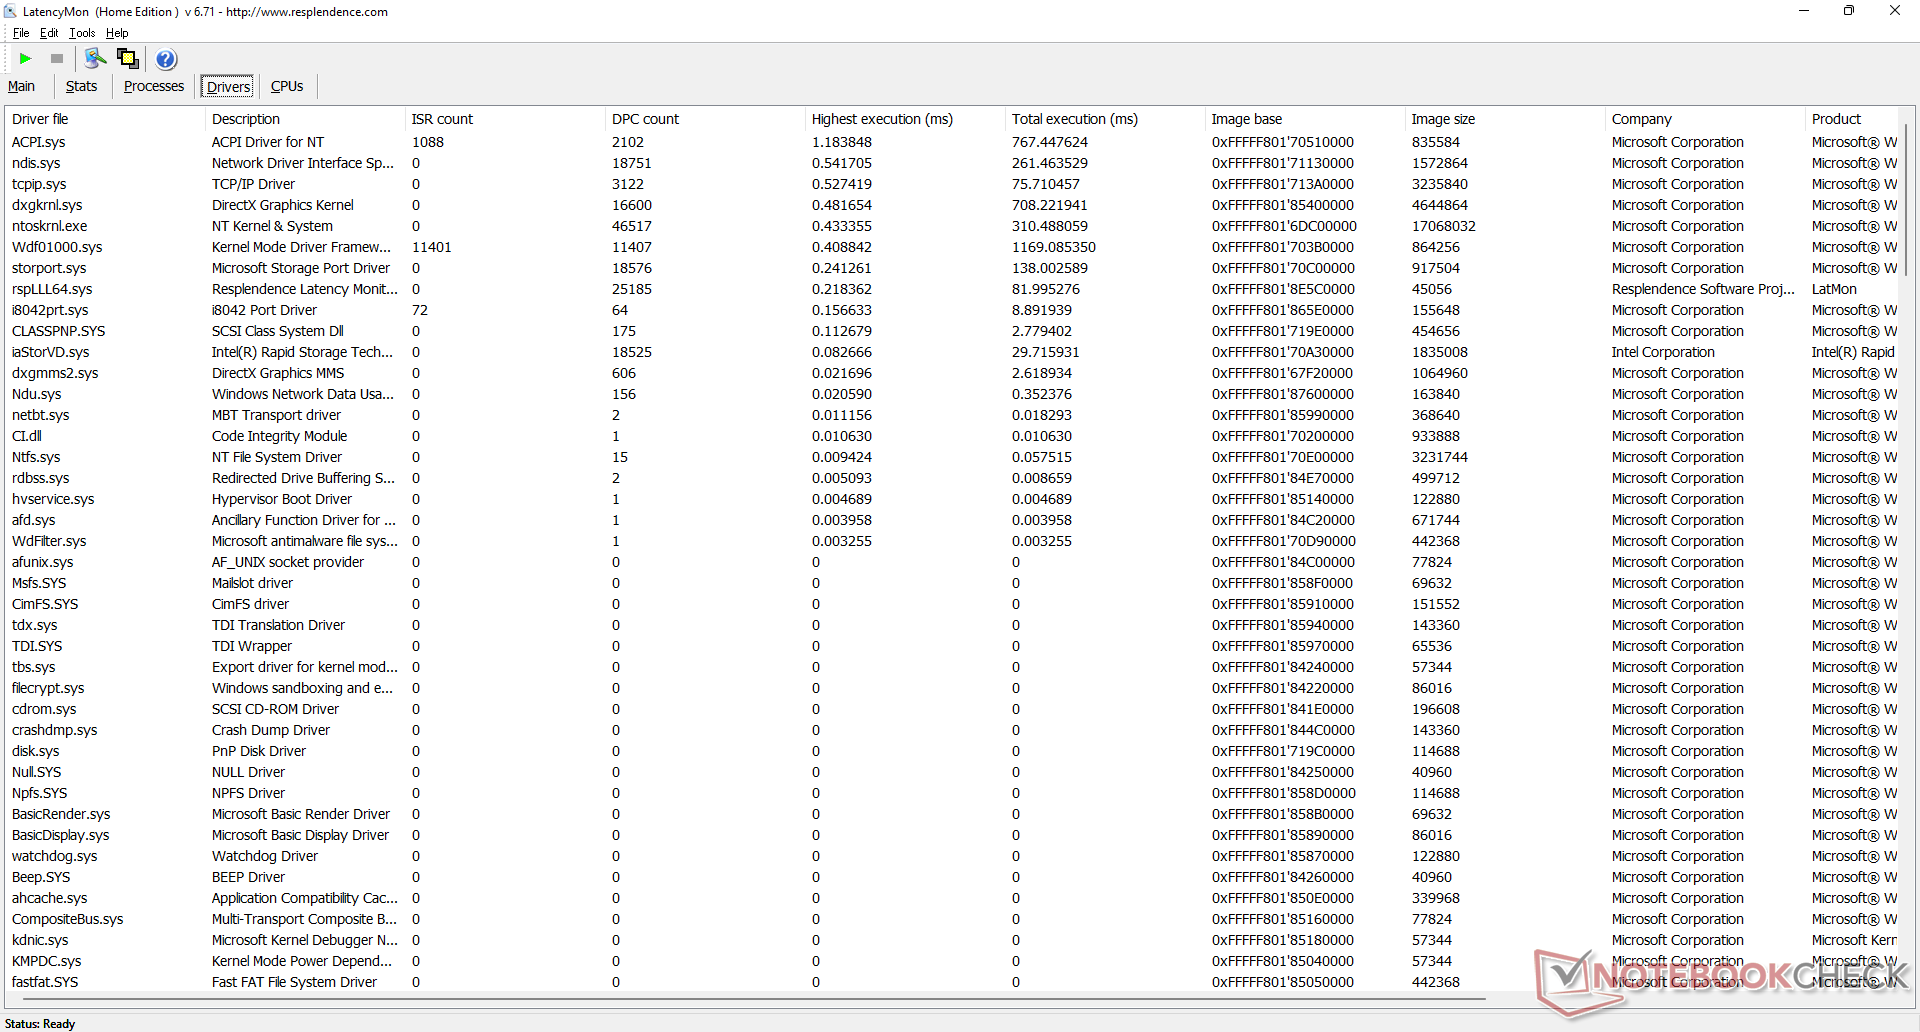
DPC latentie
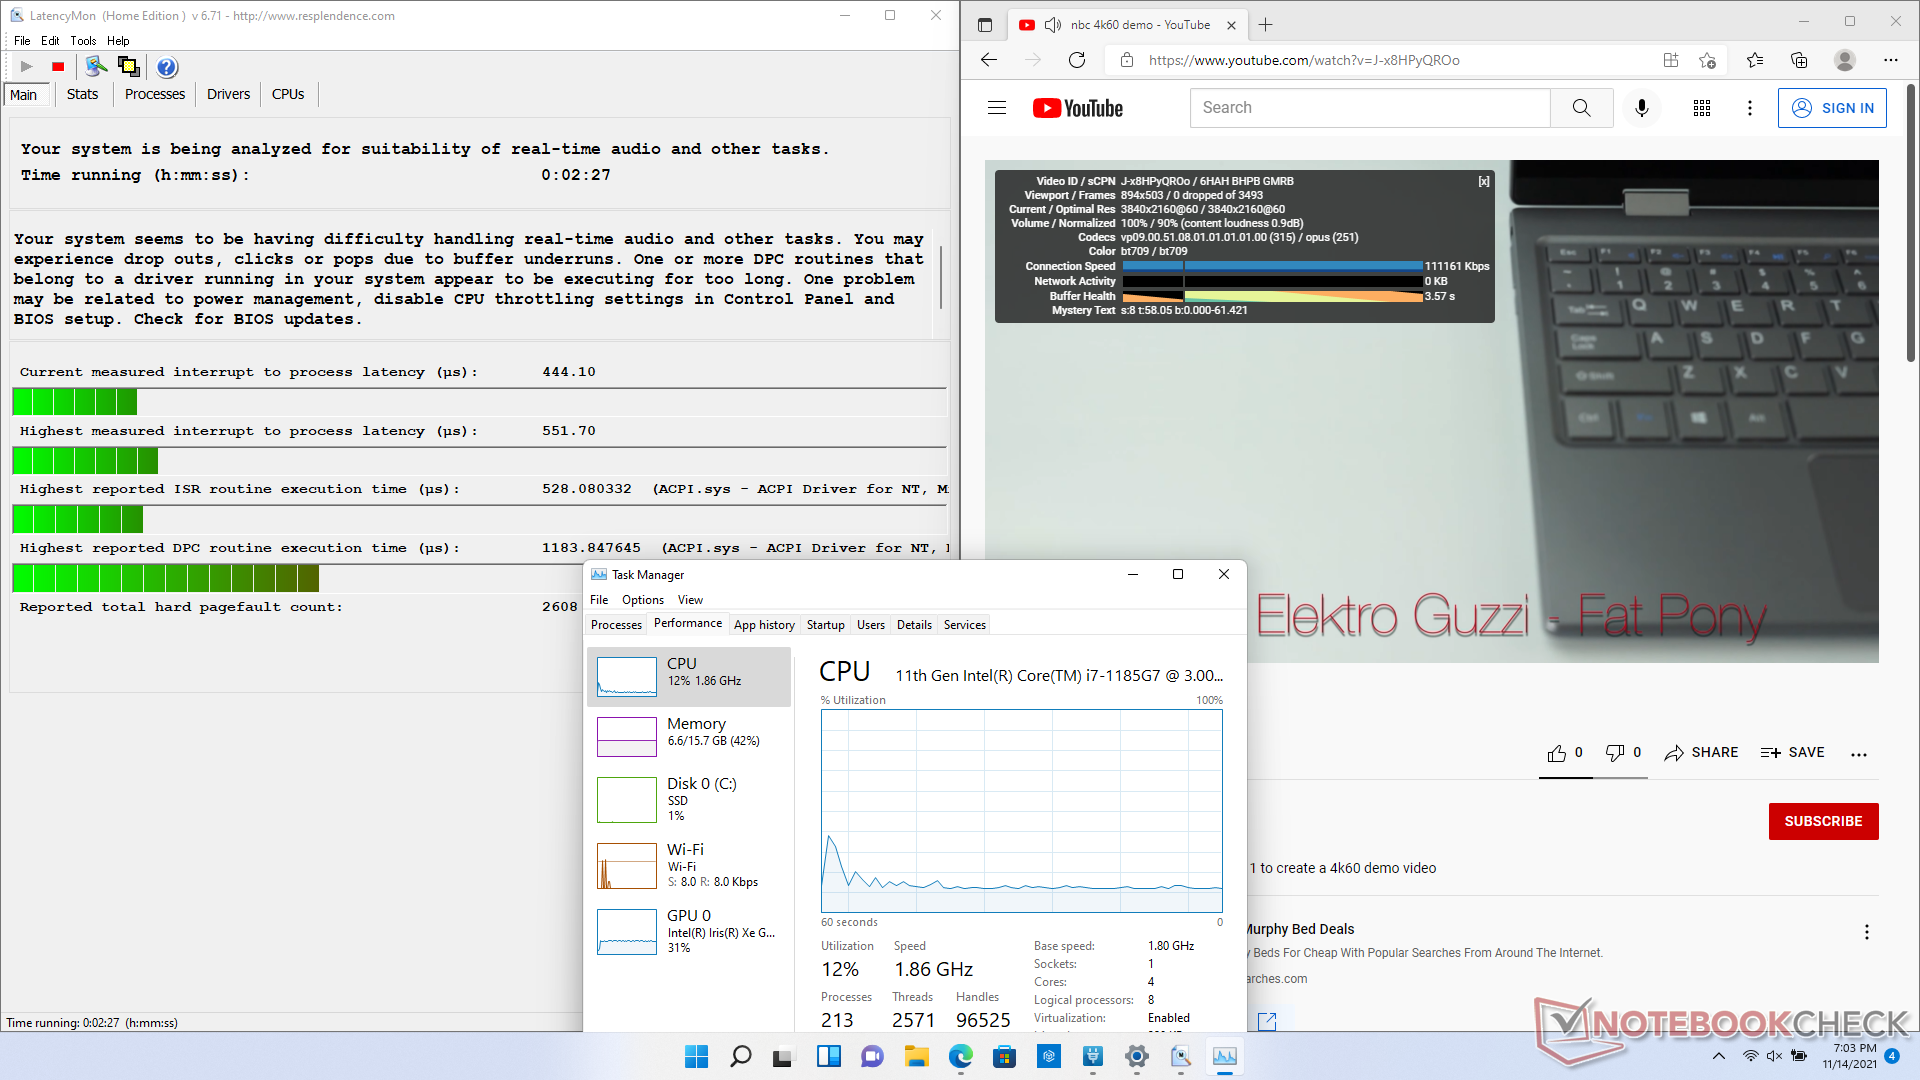
LatencyMon toont kleine DPC latency problemen gerelateerd aan ACPI.sys bij het openen van meerdere browser tabs van onze homepage. Desalniettemin is het nog steeds een verbetering ten opzichte van wat we waarnamen bij het model van vorig jaar
4K video afspelen bij 60 FPS blijft perfect met geen dropped frames en een efficiënter GPU gebruik dan met de UHD Graphics 620.
| DPC Latencies / LatencyMon - interrupt to process latency (max), Web, Youtube, Prime95 | |
| Dell Latitude 9510 2-in-1 | |
| Lenovo ThinkPad L15 G2 AMD | |
| HP EliteBook 850 G8 3C7Z8EA | |
| MSI Summit B15 A11M | |
| Microsoft Surface Laptop 4 15 AMD TFF_00028 | |
| Dell Latitude 15 9520 2-in-1 | |
* ... kleiner is beter
Opslagapparaten
Onze testeenheid maakt gebruik van dezelfde PCIe3 x4 Toshiba KBG40ZNS512G NVMe M.2 2230 SSD zoals gevonden op de Latitude 9510 2-in-1. Dell biedt momenteel geen PCIe4 opties, hoewel de Intel chipset theoretisch in staat zou moeten zijn om dergelijke SSD's te ondersteunen. Het ontbreken van een warmteverspreider zal echter betekenen dat PCIe4 SSD's waarschijnlijk toch na korte tijd zouden afslaan.

* ... kleiner is beter
Disk Throttling: DiskSpd Read Loop, Queue Depth 8
GPU prestatie
3DMark scores tonen de Iris Xe 96 EU's in onze Latitude 9520 2-in-1 goed presteren ten opzichte van andere Iris Xe laptops in onze database. Het venijn zit hem echter in de details, want de werkelijke gaming prestaties zijn slecht door de ongewoon sterk fluctuerende frame rates. De framerates schommelden bijvoorbeeld constant tussen 40 FPS en 90 FPS wanneer gewoon werd doorgespeeld op Witcher 3 op de laagste instellingen, terwijl de Iris Xe aangedreven MSI Summit B15 veel stabieler zou draaien zonder enige van de scherpe FPS dalingen. Dus, terwijl onze Latitude 9520 2-in-1 Iris Xe onbetwistbaar sneller is dan de UHD Graphics 620 op de Latitude 9510 2-in-1 van vorig jaar, had het zeker stabieler kunnen zijn in termen van prestaties na verloop van tijd.
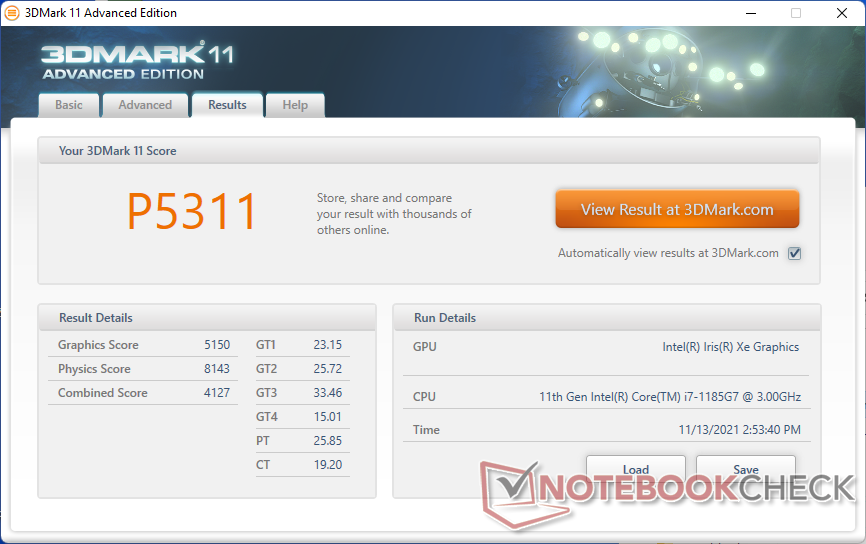
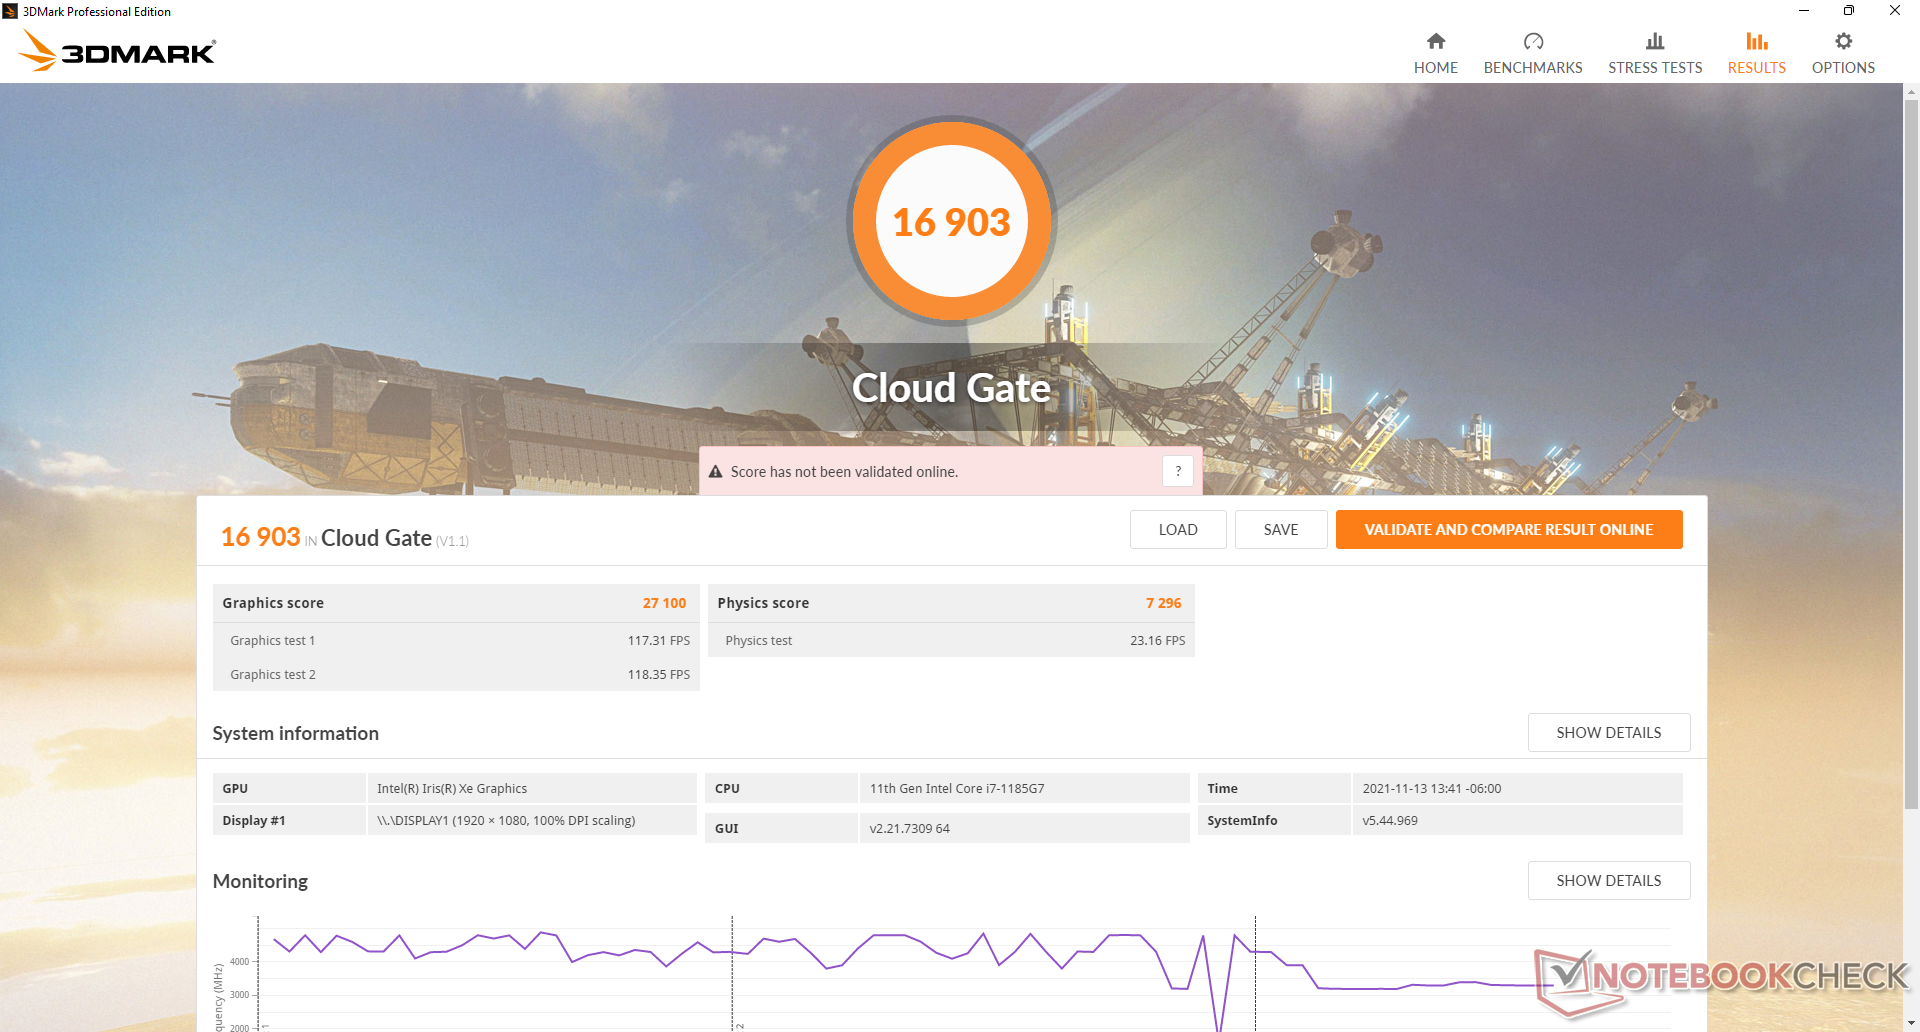
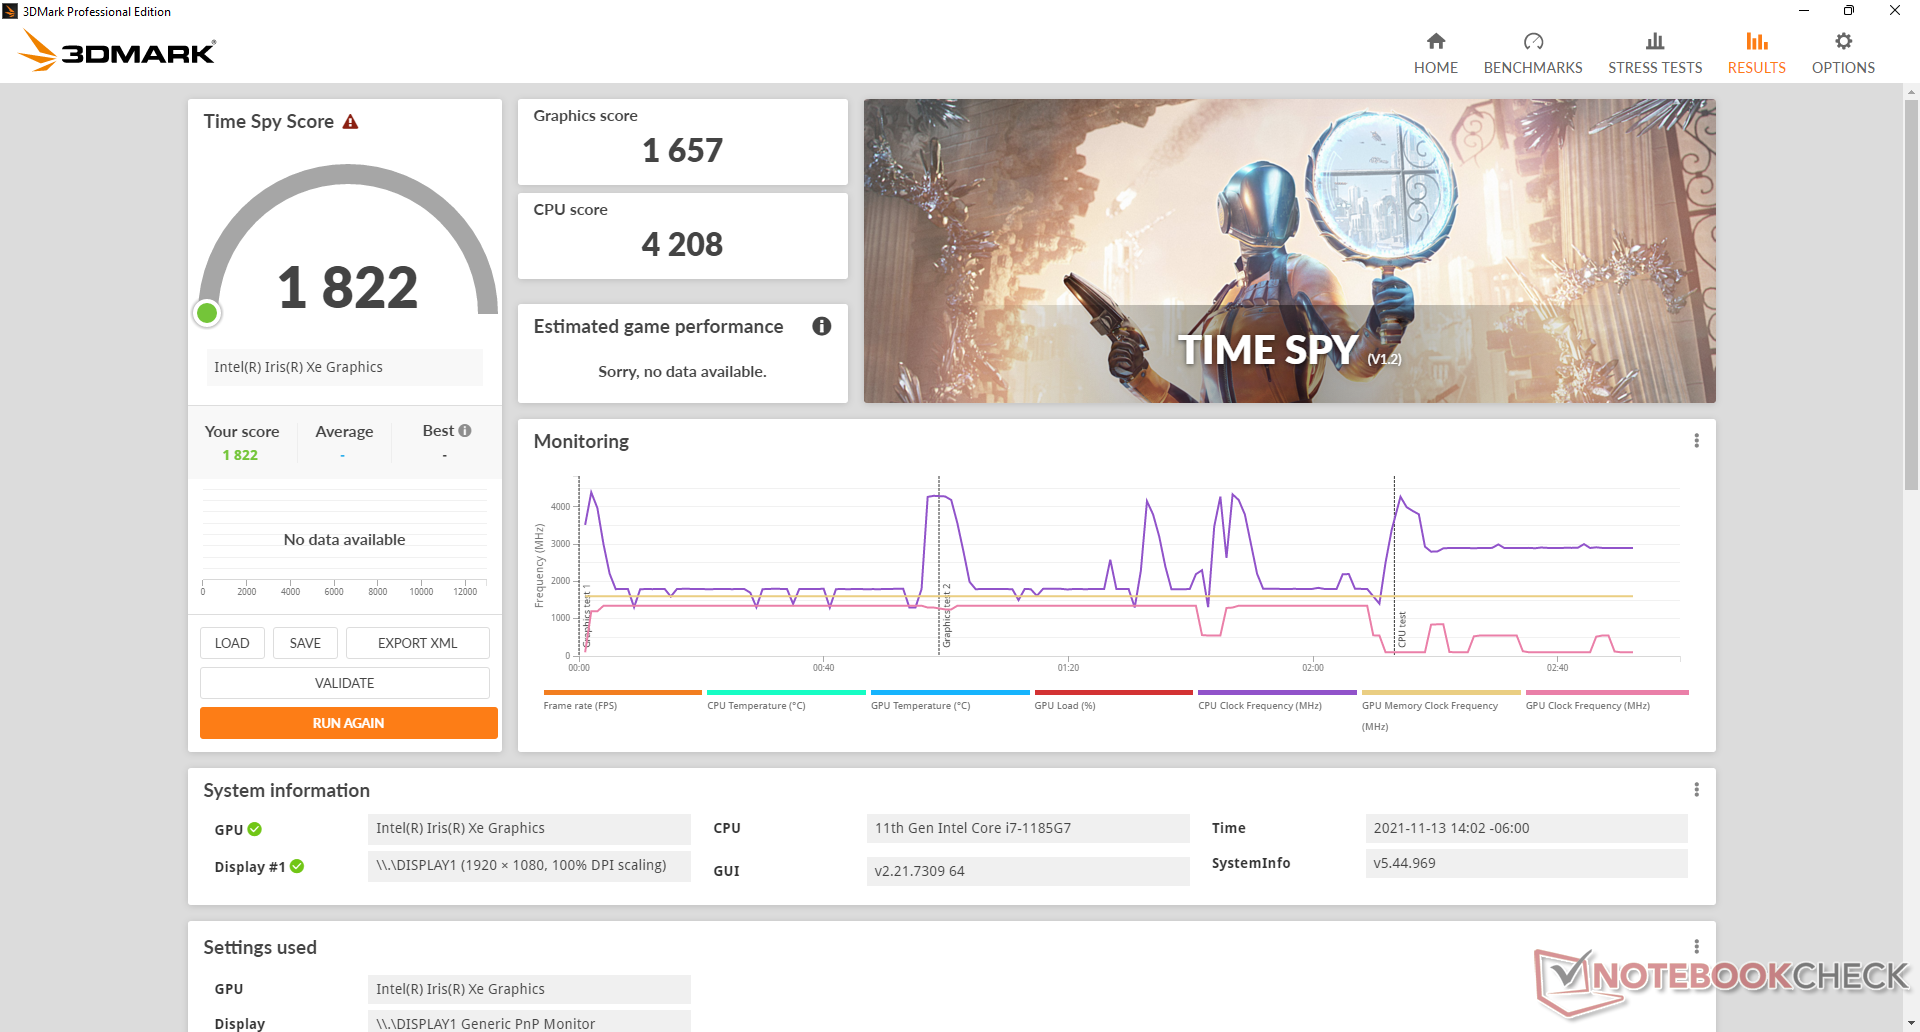
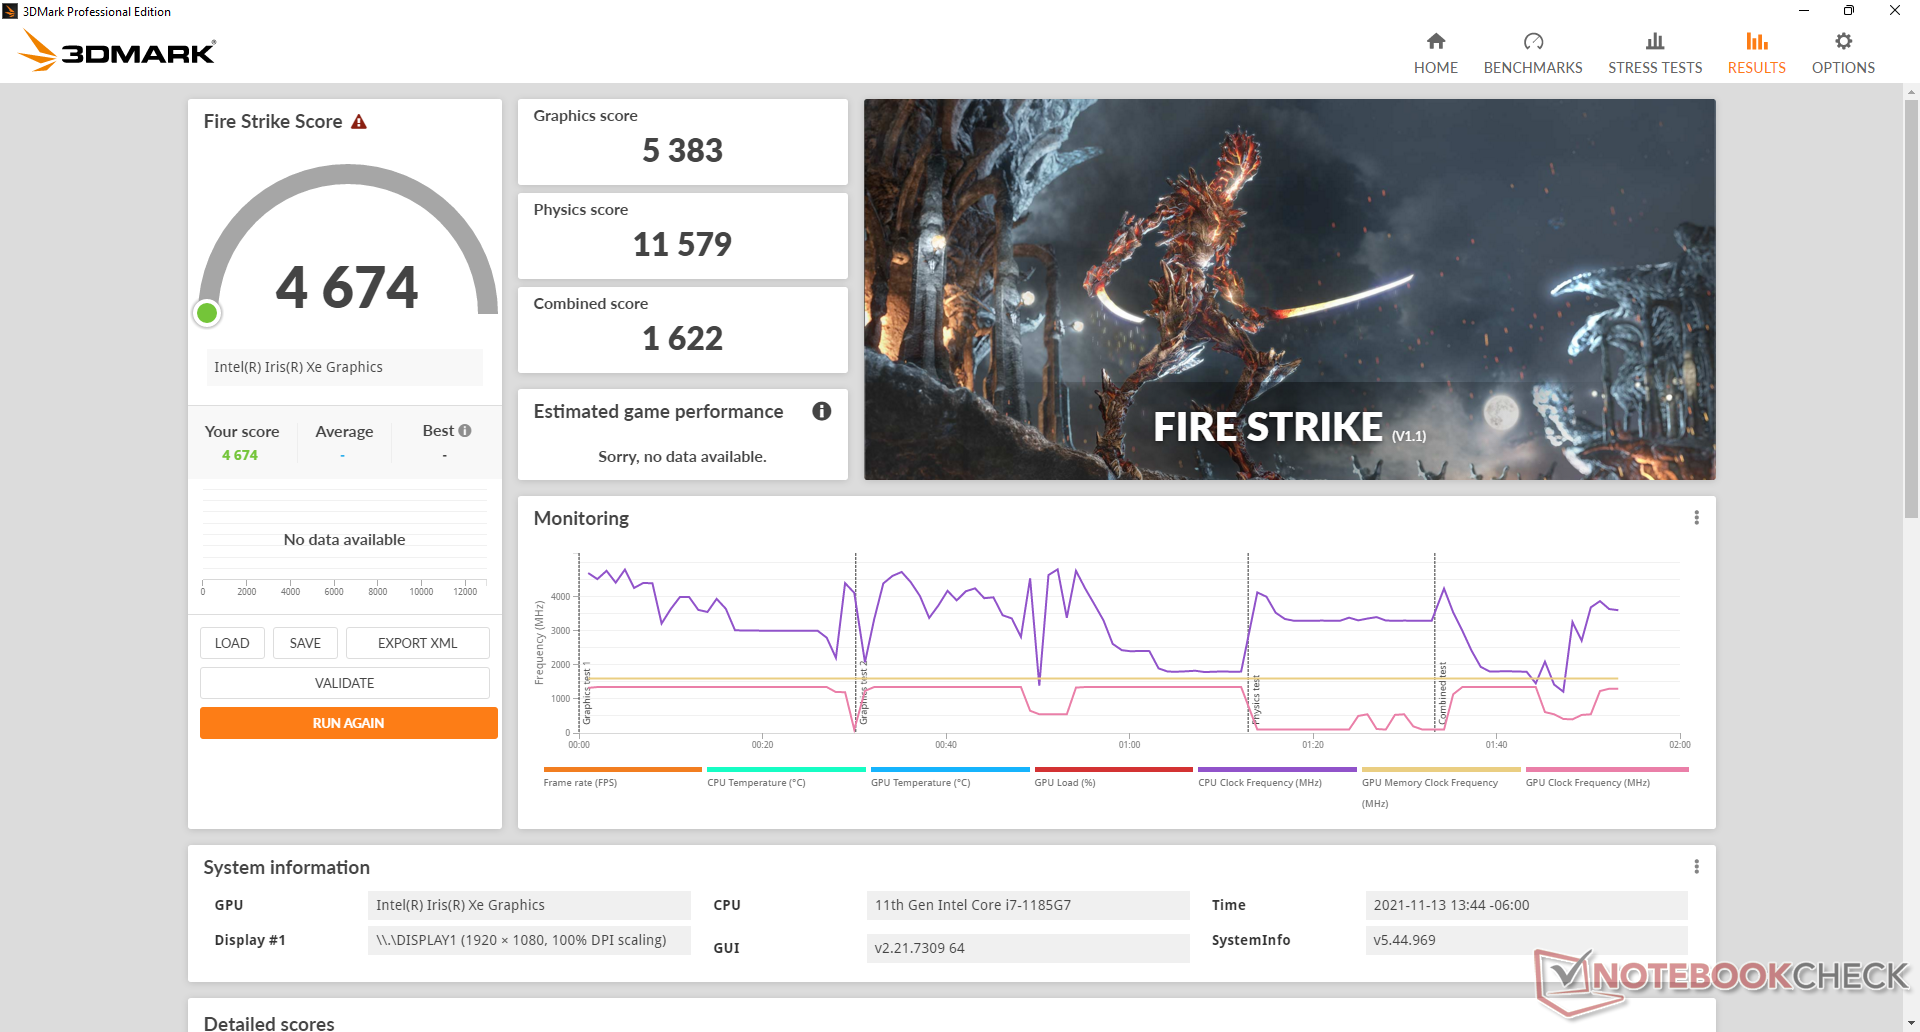
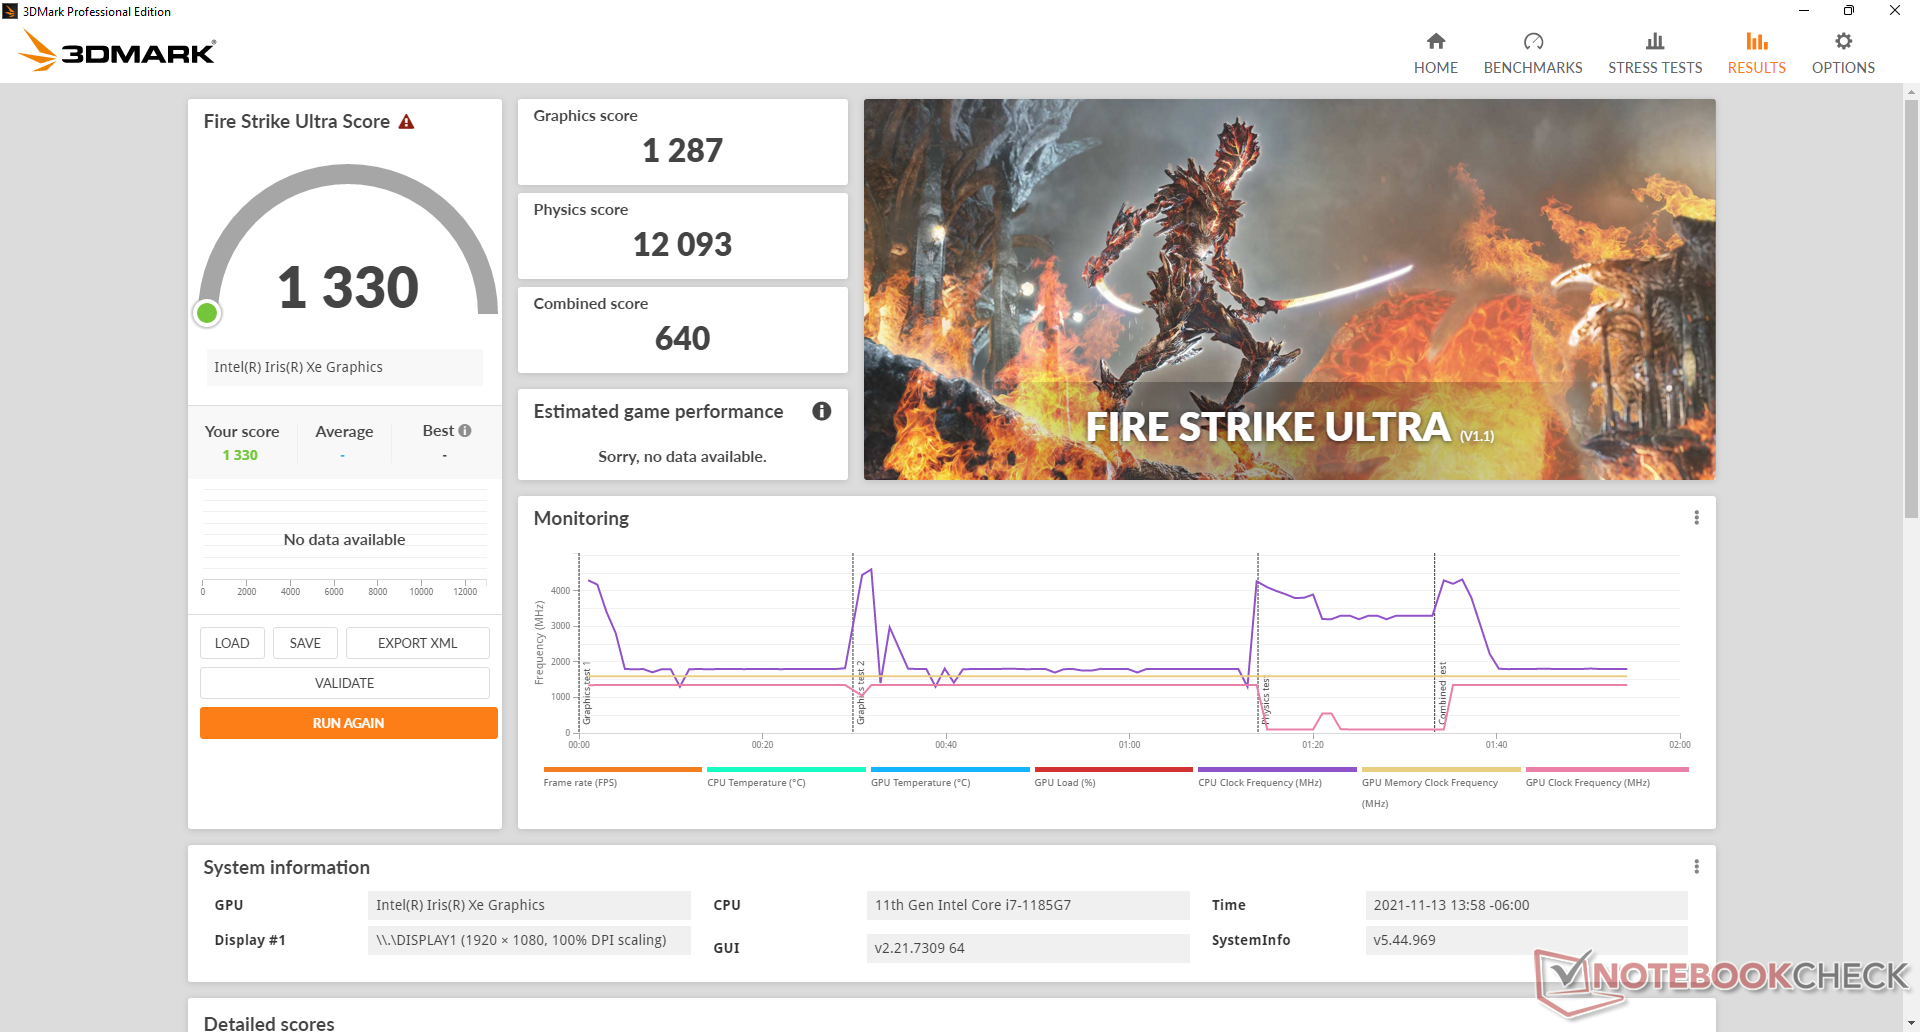
| 3DMark 11 Performance | 5311 punten | |
| 3DMark Cloud Gate Standard Score | 16903 punten | |
| 3DMark Fire Strike Score | 4674 punten | |
| 3DMark Time Spy Score | 1822 punten | |
Help | ||
Witcher 3 FPS Chart
| lage | gem. | hoge | ultra | |
|---|---|---|---|---|
| GTA V (2015) | 81 | 70.5 | 27.2 | 10.6 |
| The Witcher 3 (2015) | 86.8 | 59.4 | 33.5 | 14.3 |
| Dota 2 Reborn (2015) | 103 | 61.7 | 39.8 | 39.8 |
| Final Fantasy XV Benchmark (2018) | 35 | 20 | 14.6 | |
| X-Plane 11.11 (2018) | 36 | 34.4 | 27.5 | |
| Strange Brigade (2018) | 82.8 | 32.7 | 26.3 | 23.2 |
Emissies
Systeemgeluid
De interne ventilator is stil met 24,1 dN(A) bij stationair draaien of surfen op het web in de Balanced of Optimized modus of lager. Hij kan af en toe naar 25,8 dB(A) springen, maar dit zal in de meeste omgevingen niet merkbaar zijn. Gebruikers kunnen het maximale ventilatorgeluid van net onder de 40 dB(A) bereiken wanneer ze hogere belastingen zoals games uitvoeren.
Het ventilatorgeluid zal vaker pulseren als de High Performance-modus is ingeschakeld tijdens het browsen of het streamen van video. Zorg er dus voor dat u het energieprofiel juist instelt als u zich zorgen maakt over het geluid van de ventilator.
Geluidsniveau
| Onbelast |
| 24.1 / 24.1 / 25.8 dB (A) |
| Belasting |
| 34.2 / 39.6 dB (A) |
 | ||
30 dB stil 40 dB(A) hoorbaar 50 dB(A) luid |
||
min: | ||
| Dell Latitude 15 9520 2-in-1 Iris Xe G7 96EUs, i7-1185G7, Toshiba KBG40ZNS512G NVMe | Dell Latitude 9510 2-in-1 UHD Graphics 620, i7-10810U, Toshiba KBG40ZNS512G NVMe | HP EliteBook 850 G8 3C7Z8EA Iris Xe G7 96EUs, i7-1165G7, Samsung PM981a MZVLB1T0HBLR | Lenovo ThinkPad L15 G2 AMD Vega 7, R5 5600U, SK Hynix HFS512 GDE9X081N | MSI Summit B15 A11M Iris Xe G7 96EUs, i7-1165G7, Kingston OM8PCP31024F | Microsoft Surface Laptop 4 15 AMD TFF_00028 Vega 8, R7 4980U, SK Hynix BC511 HFM512GDJTNI | |
|---|---|---|---|---|---|---|
| Noise | -7% | 0% | 6% | -1% | -2% | |
| uit / omgeving * (dB) | 24 | 27.2 -13% | 26 -8% | 24.22 -1% | 25.2 -5% | 24.2 -1% |
| Idle Minimum * (dB) | 24.1 | 27.2 -13% | 26 -8% | 24.22 -0% | 26.4 -10% | 24.2 -0% |
| Idle Average * (dB) | 24.1 | 27.2 -13% | 26 -8% | 24.22 -0% | 26.4 -10% | 24.2 -0% |
| Idle Maximum * (dB) | 25.8 | 27.2 -5% | 26.2 -2% | 24.22 6% | 26.4 -2% | 24.2 6% |
| Load Average * (dB) | 34.2 | 33.4 2% | 29.5 14% | 25.84 24% | 26.8 22% | 39.9 -17% |
| Witcher 3 ultra * (dB) | 39.6 | 28 29% | 39.9 -1% | |||
| Load Maximum * (dB) | 39.6 | 39.5 -0% | 34 14% | 36.02 9% | 52.6 -33% | 39.9 -1% |
* ... kleiner is beter
Temperatuur
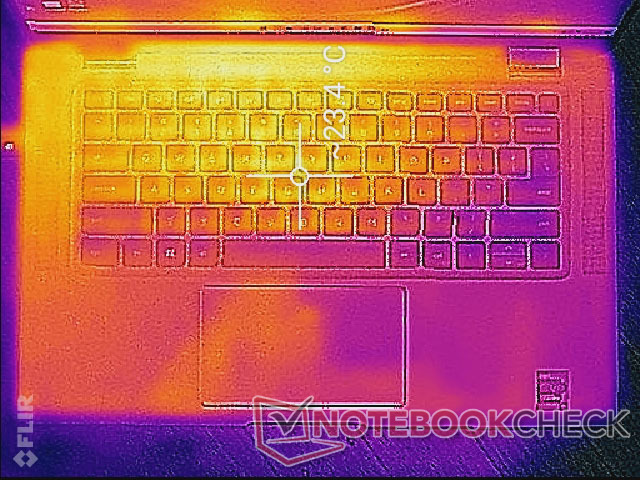
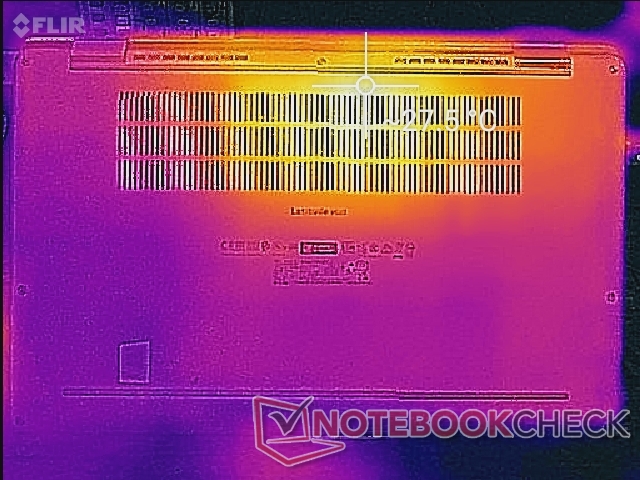
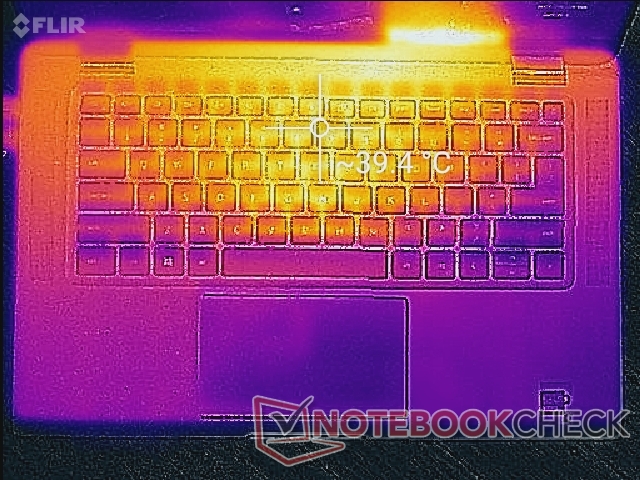
De oppervlaktetemperaturen zijn vergelijkbaar met die van de Latitude 9510 2-in-1 bij een lage tot gemiddelde belasting. Bij hogere belastingen, zoals games, kan de onderste hotspot van de Latitude 9520 2-in-1 echter een paar graden warmer zijn dan bij het oudere model.
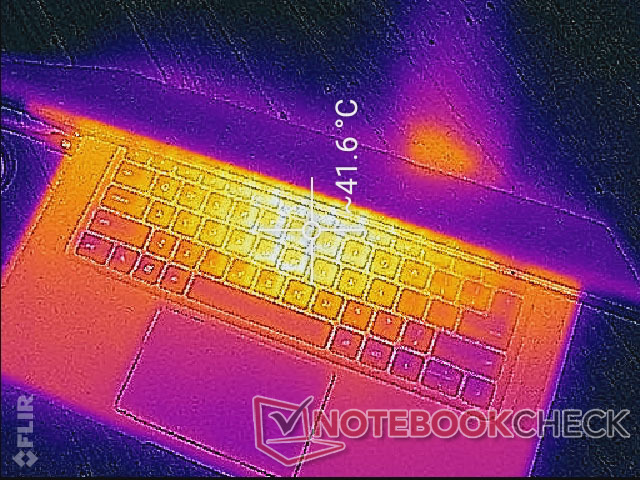
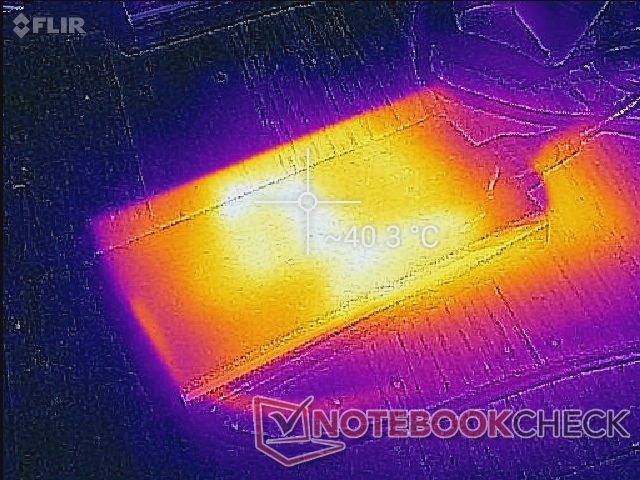
(±) De maximumtemperatuur aan de bovenzijde bedraagt 40 °C / 104 F, vergeleken met het gemiddelde van 34.3 °C / 94 F, variërend van 21.2 tot 62.5 °C voor de klasse Office.
(-) De bodem warmt op tot een maximum van 47.2 °C / 117 F, vergeleken met een gemiddelde van 36.8 °C / 98 F
(+) Bij onbelast gebruik bedraagt de gemiddelde temperatuur voor de bovenzijde 22.5 °C / 73 F, vergeleken met het apparaatgemiddelde van 29.5 °C / 85 F.
(+) De palmsteunen en het touchpad zijn met een maximum van ###max## °C / 83.5 F koeler dan de huidtemperatuur en voelen daarom koel aan.
(±) De gemiddelde temperatuur van de handpalmsteun van soortgelijke toestellen bedroeg 27.5 °C / 81.5 F (-1.1 °C / -2 F).

| Dell Latitude 15 9520 2-in-1 Intel Core i7-1185G7, Intel Iris Xe Graphics G7 96EUs | Dell Latitude 9510 2-in-1 Intel Core i7-10810U, Intel UHD Graphics 620 | HP EliteBook 850 G8 3C7Z8EA Intel Core i7-1165G7, Intel Iris Xe Graphics G7 96EUs | Lenovo ThinkPad L15 G2 AMD AMD Ryzen 5 5600U, AMD Radeon RX Vega 7 | MSI Summit B15 A11M Intel Core i7-1165G7, Intel Iris Xe Graphics G7 96EUs | Microsoft Surface Laptop 4 15 AMD TFF_00028 AMD Ryzen 7 4980U, AMD Radeon RX Vega 8 (Ryzen 4000/5000) | |
|---|---|---|---|---|---|---|
| Heat | -9% | -3% | -8% | -8% | 4% | |
| Maximum Upper Side * (°C) | 40 | 42.8 -7% | 37.9 5% | 42.8 -7% | 42.8 -7% | 41.8 -5% |
| Maximum Bottom * (°C) | 47.2 | 41.8 11% | 39 17% | 46 3% | 52.2 -11% | 44.8 5% |
| Idle Upper Side * (°C) | 23.4 | 29.2 -25% | 31 -32% | 26.9 -15% | 26 -11% | 23 2% |
| Idle Bottom * (°C) | 27.4 | 31 -13% | 27.8 -1% | 31.1 -14% | 28.2 -3% | 23.6 14% |
* ... kleiner is beter
Stresstest
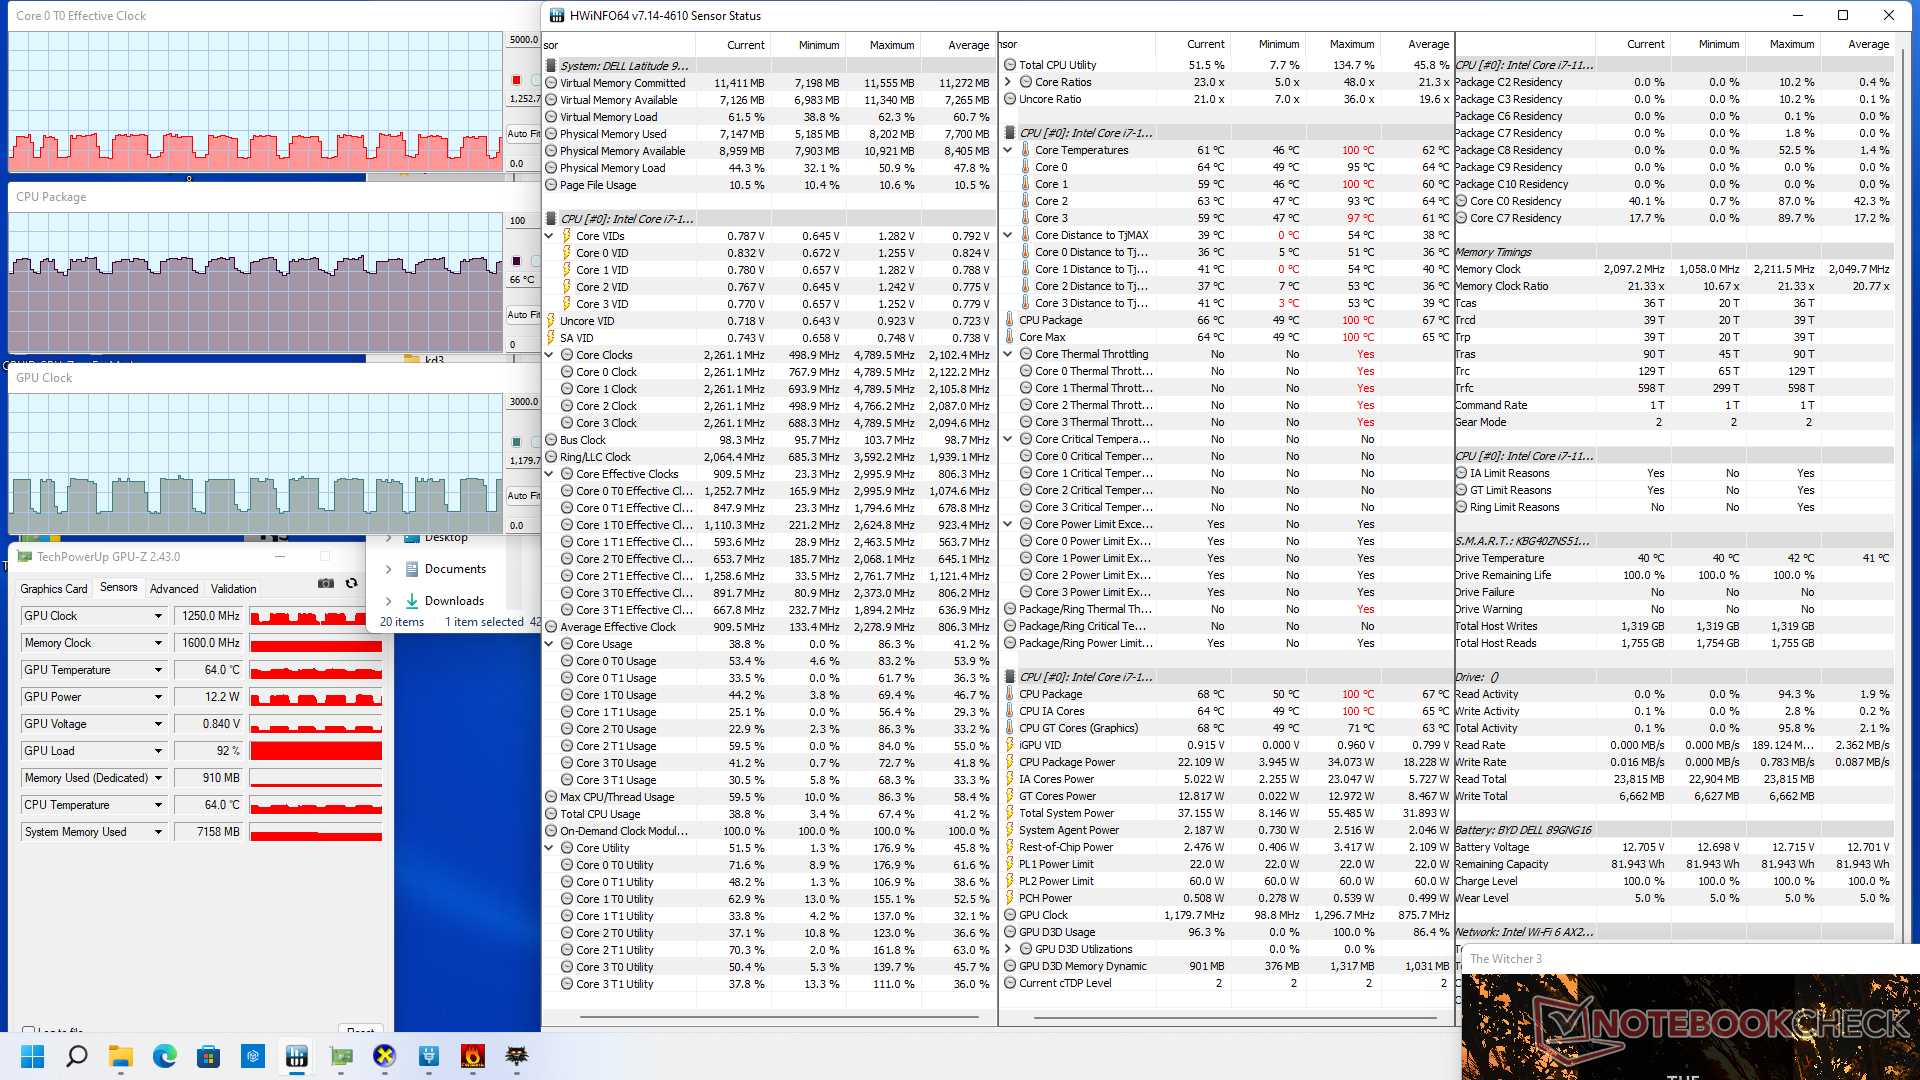
De onstabiele prestaties tijdens het Witcher 3 zoals hierboven vermeld kan worden toegeschreven aan de onstabiele kloksnelheden wanneer de CPU en GPU gelijktijdig worden belast. De GPU kloksnelheden schommelen tussen 500 MHz en 1200 MHz tijdens het spelen van het spel, terwijl de meeste andere Iris Xe laptops stabiel blijven op vaste kloksnelheden voor stabielere prestaties. De MSI Summit B15zou bijvoorbeeld een constante GPU kloksnelheid van 1300 MHz hebben onder dezelfde gaming omstandigheden als onze Dell. Dit ongewenste GPU gedrag maakt de Latitude 9520 2-in-1 een relatief slechtere keuze voor grafisch intensieve taken.
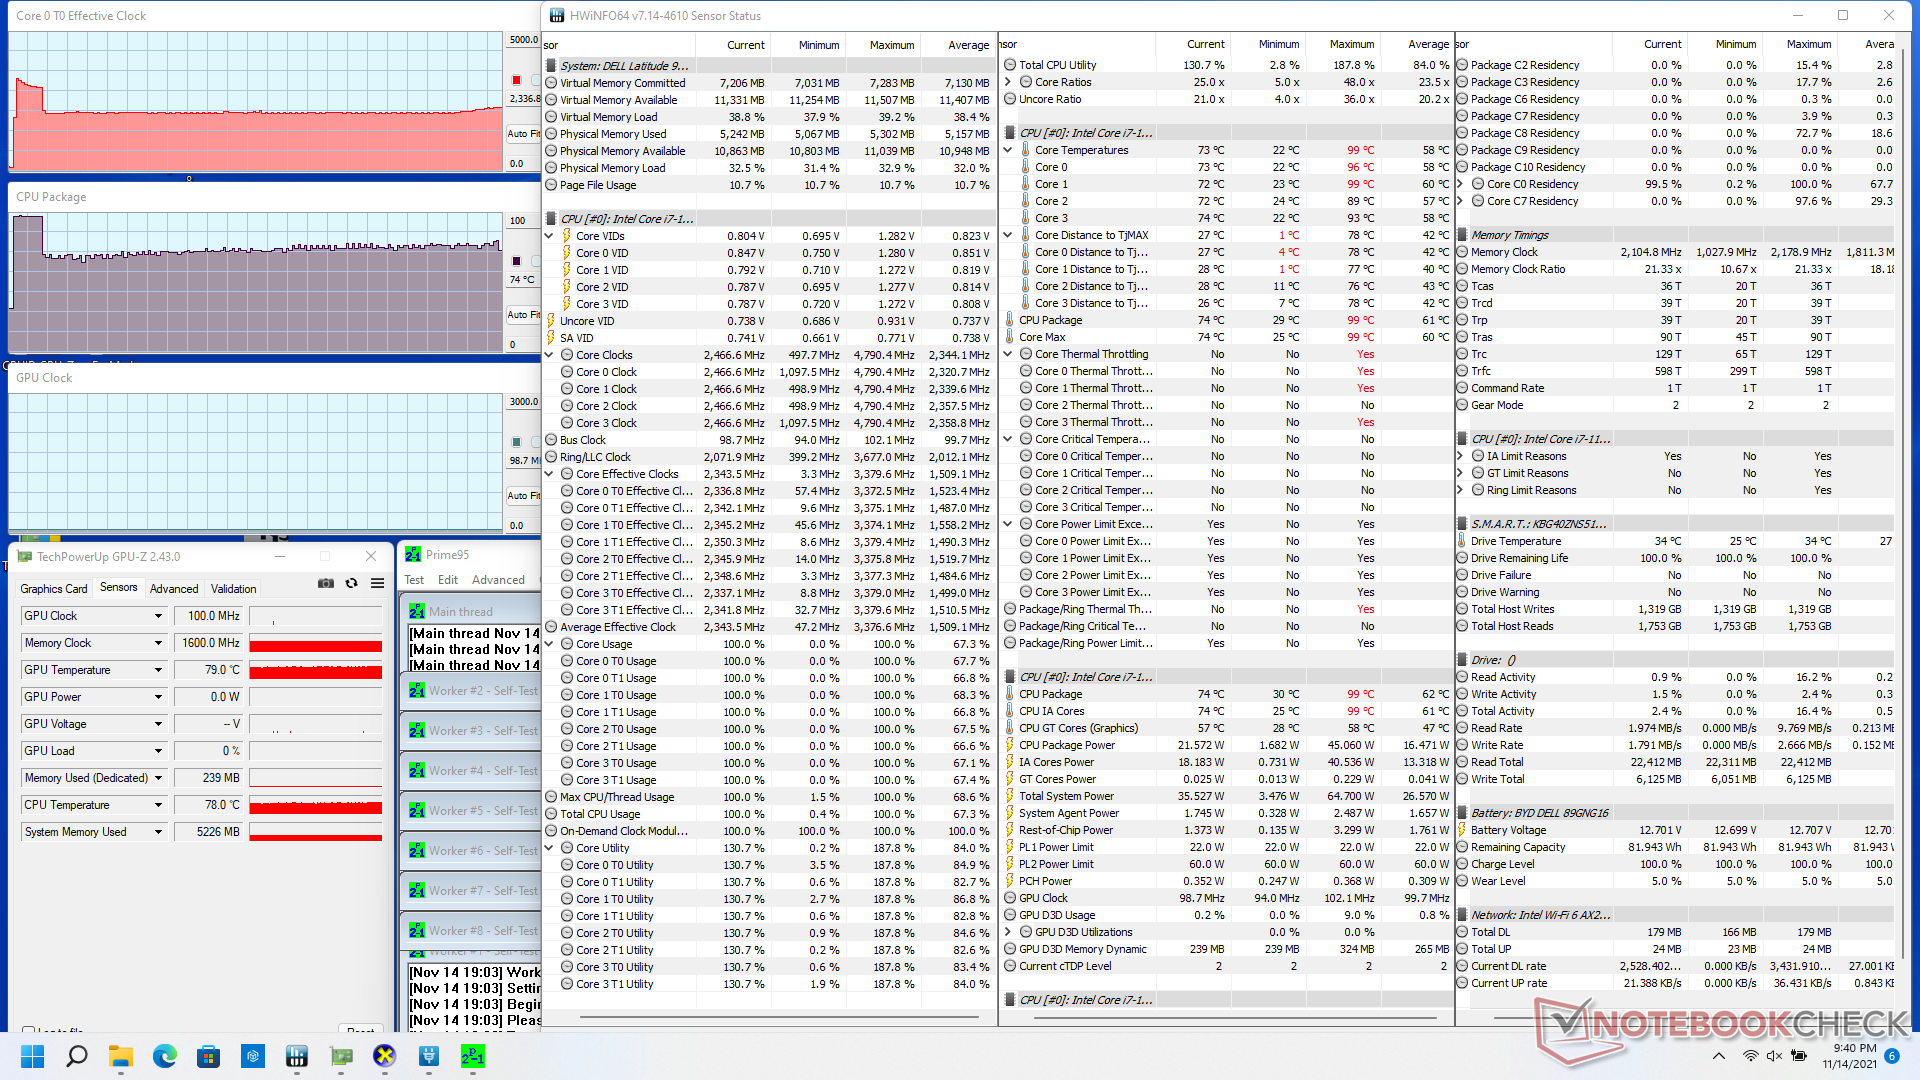
Als alleen de CPU wordt belast via Prime95, zullen de kloksnelheden stijgen tot 3,2 GHz gedurende slechts de eerste paar seconden bij een kerntemperatuur van 98 C. Daarna zullen de kloksnelheden dalen tot het lage 2 GHz bereik om een koelere kerntemperatuur van ongeveer 75 C te behouden. Multi-thread lange termijn PL1 en korte termijn PL2 vermogenslimieten zitten op respectievelijk 22 W en 45 W, wanneer het systeem in de Hoge Prestatie modus staat.
Het draaien op de batterij zal de prestaties niet beperken, aangezien de 3DMark 11 scores vrijwel identiek zijn tussen netstroom en batterijen.
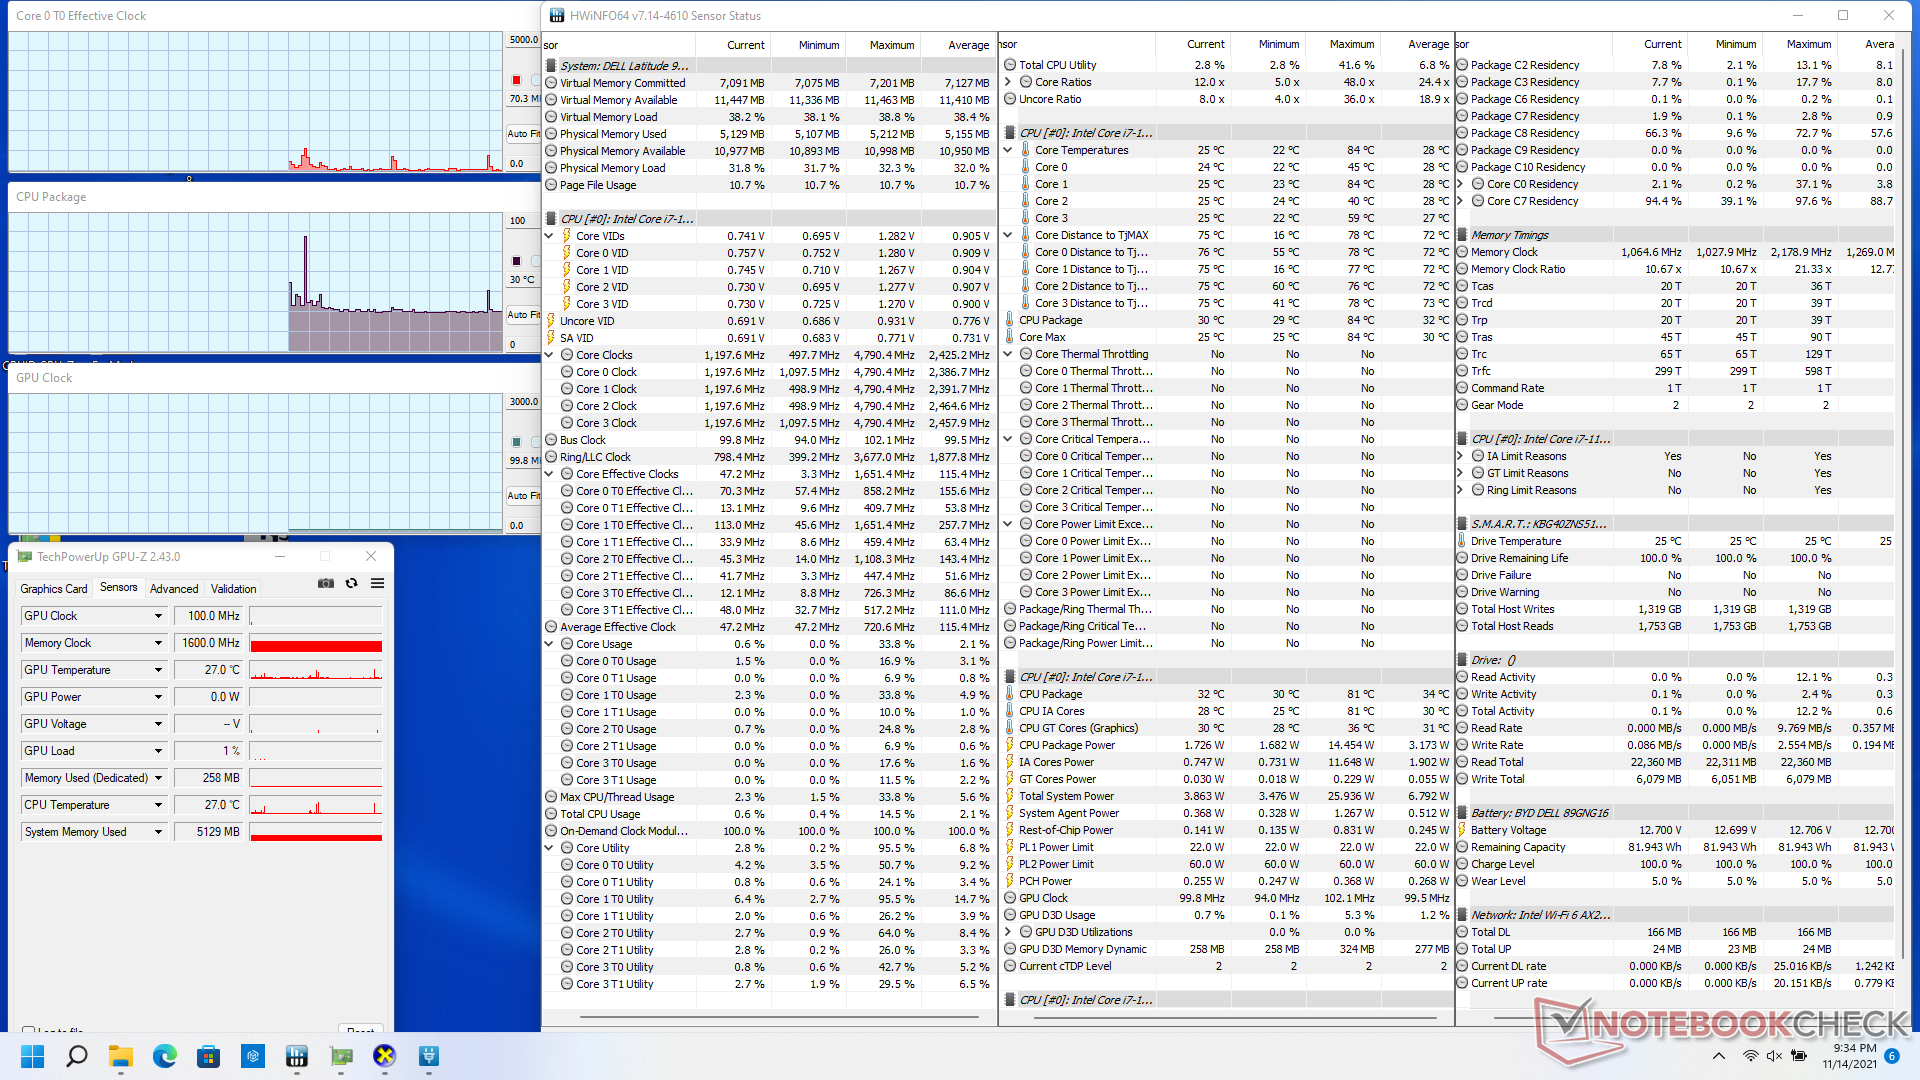
| CPUklok (GHz) GPUklok (MHz) GemiddeldeCPU temperatuur (°C) |
| Systeem Idle |
| Prime95 Stress |
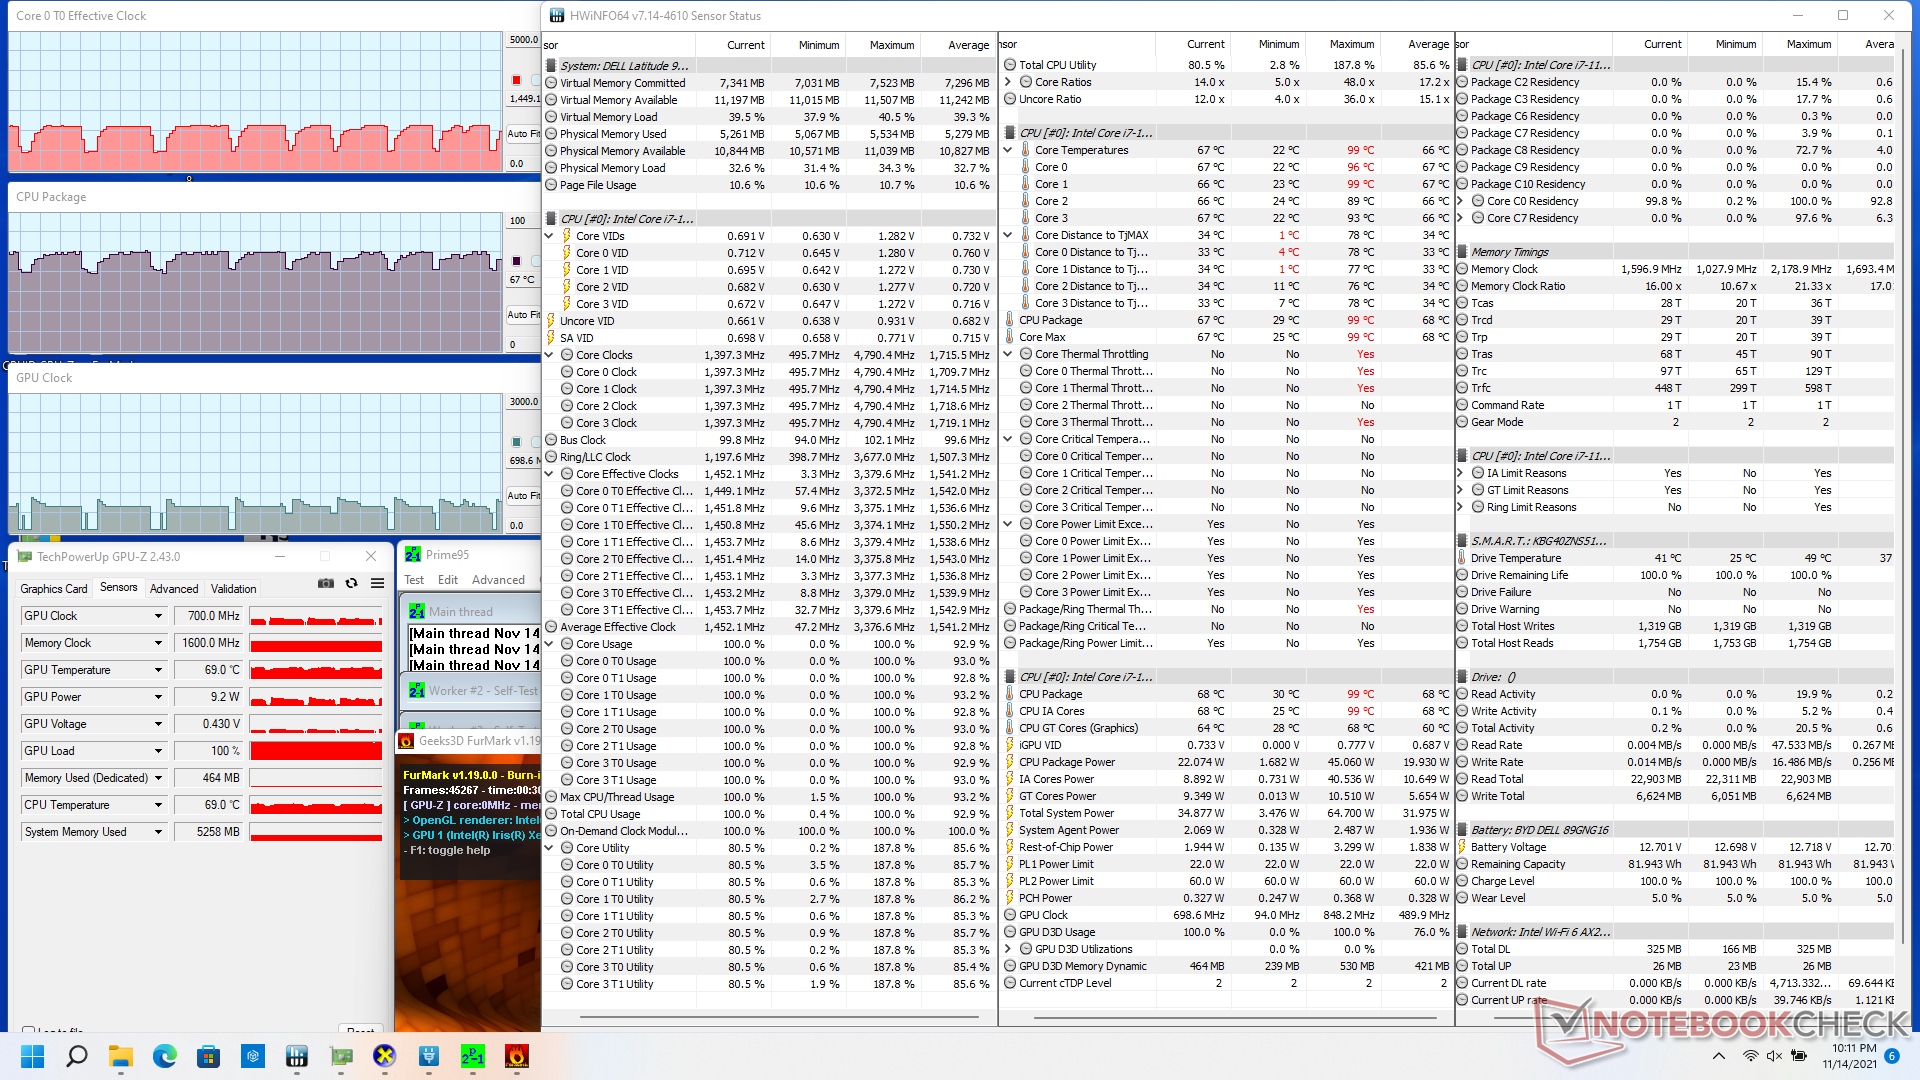
| Prime95 + FurMark Stress 0.6 - 1.7 100 - 800 58 - 73 |
| Witcher 3 Stress 0.5 - 1.3 500 - 1200 57 - 66 |
Sprekers
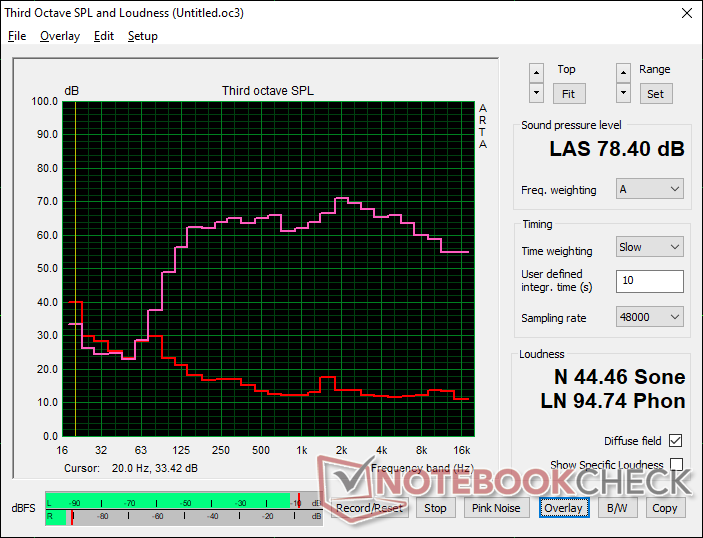
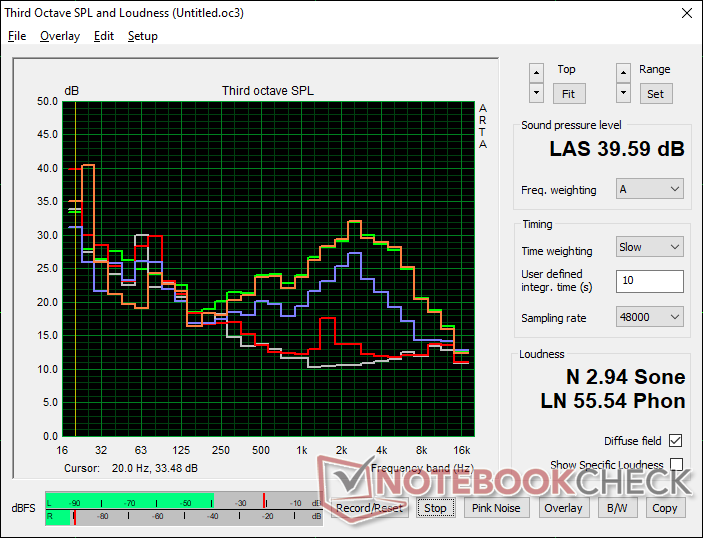
Dell Latitude 15 9520 2-in-1 audioanalyse
(±) | luidspreker luidheid is gemiddeld maar goed (78.4 dB)
Bas 100 - 315 Hz
(+) | goede baars - slechts 4.4% verwijderd van de mediaan
(±) | lineariteit van de lage tonen is gemiddeld (9.4% delta ten opzichte van de vorige frequentie)
Midden 400 - 2000 Hz
(+) | evenwichtige middens - slechts 2.3% verwijderd van de mediaan
(+) | de middentonen zijn lineair (4.5% delta ten opzichte van de vorige frequentie)
Hoog 2 - 16 kHz
(+) | evenwichtige hoogtepunten - slechts 3.3% verwijderd van de mediaan
(+) | de hoge tonen zijn lineair (3.9% delta naar de vorige frequentie)
Algemeen 100 - 16.000 Hz
(+) | het totale geluid is lineair (9.5% verschil met de mediaan)
Vergeleken met dezelfde klasse
» 1% van alle geteste apparaten in deze klasse waren beter, 0% vergelijkbaar, 99% slechter
» De beste had een delta van 7%, het gemiddelde was 21%, de slechtste was 53%
Vergeleken met alle geteste toestellen
» 4% van alle geteste apparaten waren beter, 1% gelijk, 95% slechter
» De beste had een delta van 4%, het gemiddelde was 23%, de slechtste was 134%
Apple MacBook 12 (Early 2016) 1.1 GHz audioanalyse
(+) | luidsprekers kunnen relatief luid spelen (83.6 dB)
Bas 100 - 315 Hz
(±) | verminderde zeebaars - gemiddeld 11.3% lager dan de mediaan
(±) | lineariteit van de lage tonen is gemiddeld (14.2% delta ten opzichte van de vorige frequentie)
Midden 400 - 2000 Hz
(+) | evenwichtige middens - slechts 2.4% verwijderd van de mediaan
(+) | de middentonen zijn lineair (5.5% delta ten opzichte van de vorige frequentie)
Hoog 2 - 16 kHz
(+) | evenwichtige hoogtepunten - slechts 2% verwijderd van de mediaan
(+) | de hoge tonen zijn lineair (4.5% delta naar de vorige frequentie)
Algemeen 100 - 16.000 Hz
(+) | het totale geluid is lineair (10.2% verschil met de mediaan)
Vergeleken met dezelfde klasse
» 7% van alle geteste apparaten in deze klasse waren beter, 2% vergelijkbaar, 90% slechter
» De beste had een delta van 5%, het gemiddelde was 18%, de slechtste was 53%
Vergeleken met alle geteste toestellen
» 5% van alle geteste apparaten waren beter, 1% gelijk, 94% slechter
» De beste had een delta van 4%, het gemiddelde was 23%, de slechtste was 134%
Energiebeheer
Stroomverbruik
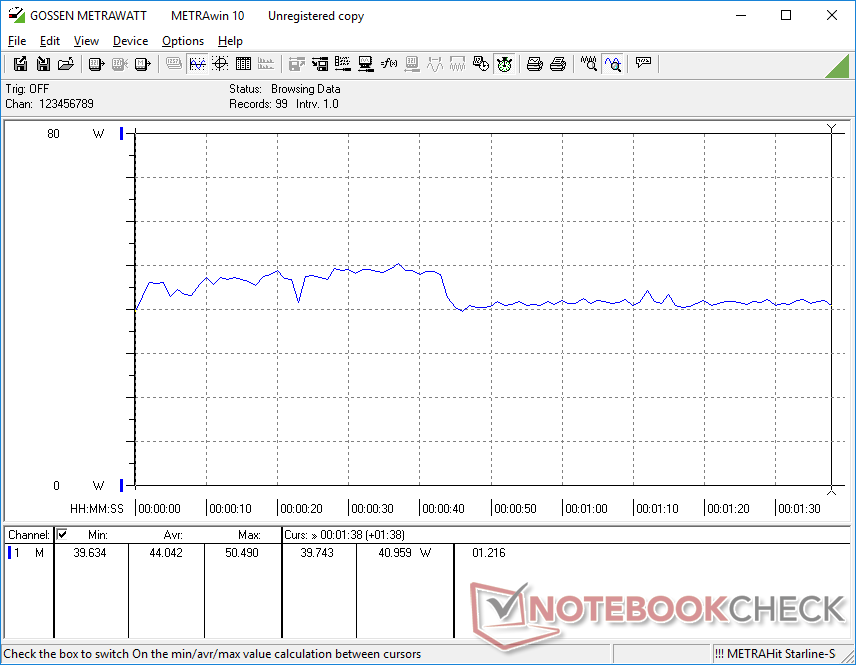
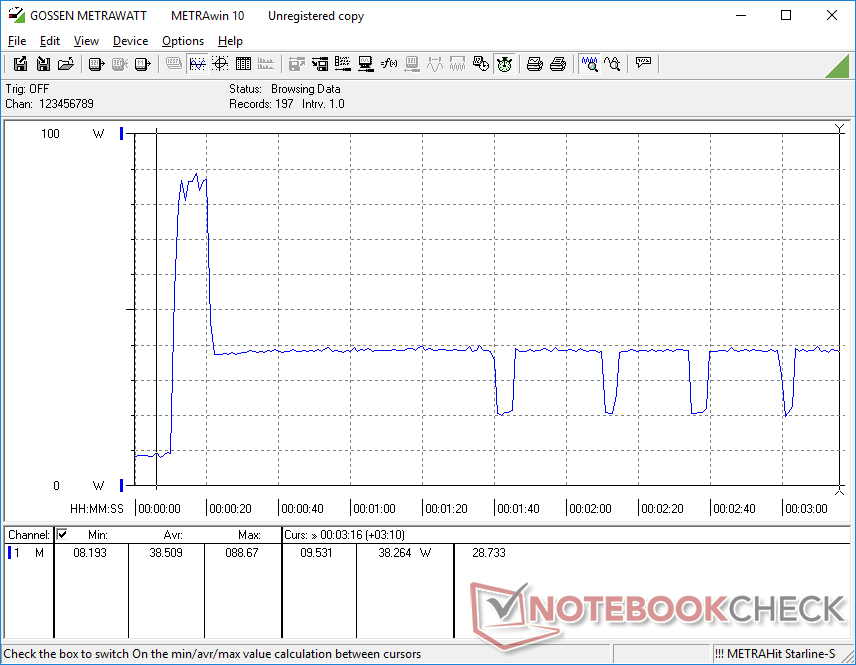
Het uitvoeren van 3DMark 06 zou slechts 44 W verbruiken op onze Latitude 9520 2-in-1, vergeleken met 46 W op de Latitude 9510 2-in-1, ondanks de enorme toename in grafische prestaties op het nieuwere model. Eigenaars krijgen dus een gemiddelde 3x hogere GPU-prestaties bij hetzelfde stroomverbruik. De prestatie-per-watt toename ten opzichte van vorig jaar kan niet worden onderschat.
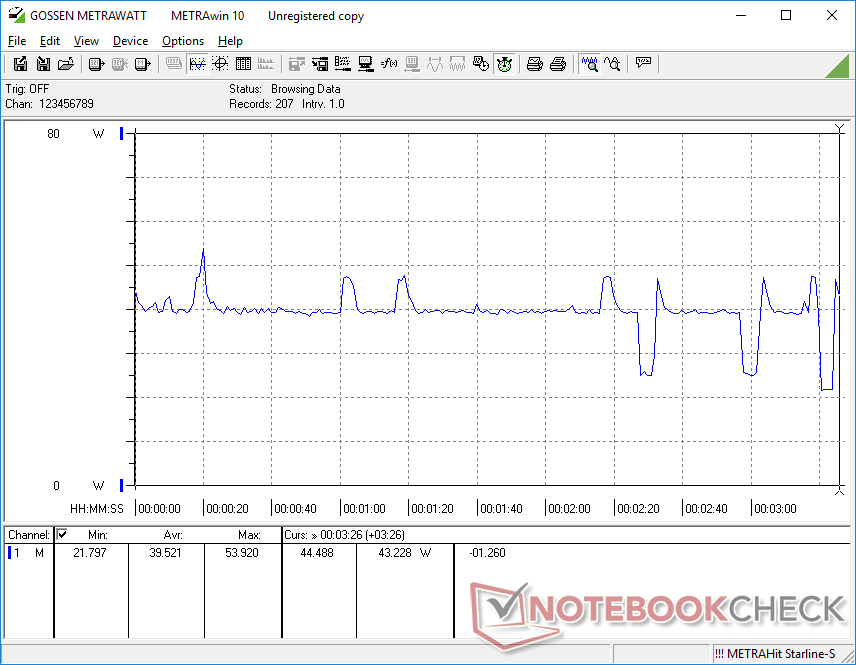
Helaas worden de onstabiele GPU-prestaties weerspiegeld door het onstabiele stroomverbruik, zoals blijkt uit onze onderstaande grafieken. Bij het uitvoeren Witcher 3 om gaming belastingen weer te geven, varieert het verbruik tussen 21 W en 40 W, terwijl het stabiel blijft op slechts 34 W op de HP EliteBook 850 G8 uitgerust met de vergelijkbare Core i7-1165G7 CPU.
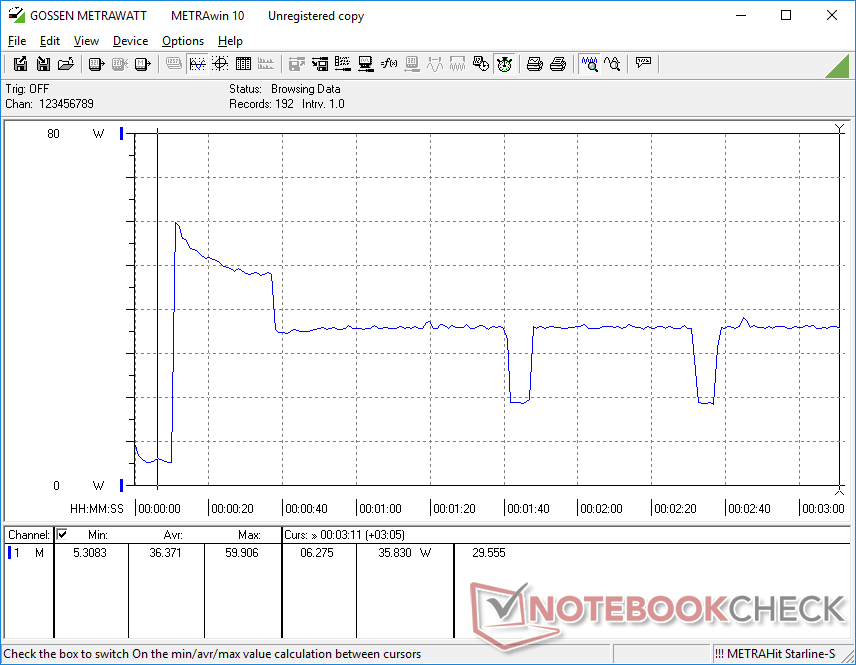
De kleine (~13 x 6,6 x 2,3 cm) 90 W AC adapter verbruikt maximaal 88,7 W. Het systeem is niet in staat om deze snelheid langer dan slechts een paar seconden vast te houden vanwege thermische beperkingen.
| Uit / Standby | |
| Inactief | |
| Belasting |
|
Key:
min: | |
| Dell Latitude 15 9520 2-in-1 i7-1185G7, Iris Xe G7 96EUs, Toshiba KBG40ZNS512G NVMe, IPS, 1920x1080, 15" | Dell Latitude 9510 2-in-1 i7-10810U, UHD Graphics 620, Toshiba KBG40ZNS512G NVMe, IPS, 1920x1080, 15" | HP EliteBook 850 G8 3C7Z8EA i7-1165G7, Iris Xe G7 96EUs, Samsung PM981a MZVLB1T0HBLR, I, 1920x1080, 15.6" | Lenovo ThinkPad L15 G2 AMD R5 5600U, Vega 7, SK Hynix HFS512 GDE9X081N, IPS LED, 1920x1080, 15.6" | MSI Summit B15 A11M i7-1165G7, Iris Xe G7 96EUs, Kingston OM8PCP31024F, IPS, 1920x1080, 15.6" | Microsoft Surface Laptop 4 15 AMD TFF_00028 R7 4980U, Vega 8, SK Hynix BC511 HFM512GDJTNI, IPS, 2496x1664, 15" | |
|---|---|---|---|---|---|---|
| Power Consumption | 8% | -27% | -14% | -15% | -14% | |
| Idle Minimum * (Watt) | 2.6 | 2.1 19% | 5.8 -123% | 4.57 -76% | 4.2 -62% | 3.6 -38% |
| Idle Average * (Watt) | 5 | 4.6 8% | 8.4 -68% | 8.2 -64% | 7.7 -54% | 6.5 -30% |
| Idle Maximum * (Watt) | 7.1 | 5.3 25% | 9.9 -39% | 9.3 -31% | 8.4 -18% | 8.9 -25% |
| Load Average * (Watt) | 44 | 45.8 -4% | 33 25% | 31.9 27% | 37.8 14% | 46.5 -6% |
| Witcher 3 ultra * (Watt) | 39.5 | 34.3 13% | 34.5 13% | 36.6 7% | 43.4 -10% | |
| Load Maximum * (Watt) | 88.7 | 96.3 -9% | 60 32% | 47.4 47% | 67.5 24% | 64.9 27% |
* ... kleiner is beter
Power Consumption Witcher 3 / Stresstest
Levensduur batterij
De gebruikstijd is een paar uur korter dan die van het model van vorig jaar, ondanks de identieke 88 Wh batterijen tussen beide. Desondanks is 14+ uur WLAN-gebruik in de praktijk nog steeds niets om over op te scheppen en ruim boven het gemiddelde voor deze categorie
Dell biedt SKU's met kleinere 46 Wh batterijen voor gebruikers die het niet erg vinden de batterijduur op te offeren voor een lichter toestel
| Dell Latitude 15 9520 2-in-1 i7-1185G7, Iris Xe G7 96EUs, 88 Wh | Dell Latitude 9510 2-in-1 i7-10810U, UHD Graphics 620, 88 Wh | HP EliteBook 850 G8 3C7Z8EA i7-1165G7, Iris Xe G7 96EUs, 56 Wh | Lenovo ThinkPad L15 G2 AMD R5 5600U, Vega 7, 45 Wh | MSI Summit B15 A11M i7-1165G7, Iris Xe G7 96EUs, 52 Wh | Microsoft Surface Laptop 4 15 AMD TFF_00028 R7 4980U, Vega 8, 47.4 Wh | |
|---|---|---|---|---|---|---|
| Batterijduur | 26% | -43% | -47% | -55% | -30% | |
| WiFi v1.3 (h) | 14.8 | 18.7 26% | 8.5 -43% | 7.8 -47% | 6.6 -55% | 10.4 -30% |
| Reader / Idle (h) | 59 | 18.4 | ||||
| Load (h) | 4 | 2.3 | 1 | 2.5 | ||
| H.264 (h) | 6.6 | 14.8 |
Pro
Contra
Uitspraak
De Latitude 9520 2-in-1 biedt aanzienlijke prestatievoordelen ten opzichte van de Latitude 9510 2-in-1 op papier. De oudere UHD Graphics 620 is overbodig geworden nu de Iris Xe steeds gangbaarder wordt. In de praktijk zijn er echter kanttekeningen waar potentiële kopers niet omheen kunnen.
Ten eerste werkt de Iris Xe GPU in de nieuwe Latitude met cyclische kloksnelheden, wat resulteert in wisselende framerates bij het gamen of onstabiele prestaties bij het uitvoeren van GPU-intensieve taken. De framerates zouden zo extreem variëren dat sommige toepassingen waarbij constante framerates van vitaal belang zijn, bijna onspeelbaar zouden worden. We raden aan om te kijken naar andere Tiger Lake-U laptops zoals de MSI Summit E13 Flip ofHP EliteBook 840 Aero G8 als stabielere en betrouwbaardere GPU prestaties gewenst zijn.
Het belangrijkste verkoopargument van de Latitude 9520 2-in-1 ten opzichte van de 9510 2-in-1 zijn de aanzienlijk snellere geïntegreerde grafische prestaties. De ongebruikelijk onstabiele grafische prestaties op het nieuwere model kunnen echter een afknapper zijn voor veel geïnteresseerde kopers.
Ten tweede zijn de multi-thread CPU prestaties van onze Core i7-1185G7 CPU trager in vergelijking met de oudere Core i7-10810U op de Latitude 9510 2-in-1. Hoewel dit nadeel niet uniek is voor Dell PC's, draait de i7-1185G7 in de Latitude 9520 2-in-1 langzamer dan op veel andere laptops met dezelfde processor. Het tekort aan multi-thread prestaties wordt dus versterkt op de Dell.
De redenen om de Latitude 9520 2-in-1 te verkiezen boven de 9510 2-in-1 zijn kleiner dan we zouden willen, vooral omdat het nieuwere model niets nieuws biedt op het gebied van beeldschermkwaliteit, webcamkwaliteit, of batterijduur. Hopelijk kunnen de ongelijke GPU prestaties worden aangepakt met een toekomstige update.
Prijs en beschikbaarheid
De meeste grote detailhandelaren zoals Amazon, Walmart, en Newegg hebben de Latitude 9520 2-in-1 in voorraad in verschillende configuraties. Gebruikers kunnen ook rechtstreeks bij Dell kopen vanaf $2800 USD voor de Core i5 versie.
Dell Latitude 15 9520 2-in-1
- 22-11-2021 v7 (old)
Allen Ngo
Price comparison

