Kort testrapport Dell Latitude 9510 2-in-1: Een 5G 15-inch convertible die niet enorm of onpraktisch is
Evaluatie | Datum | Model | Gewicht | Hoogte | Formaat | Resolutie | Beste prijs |
|---|---|---|---|---|---|---|---|
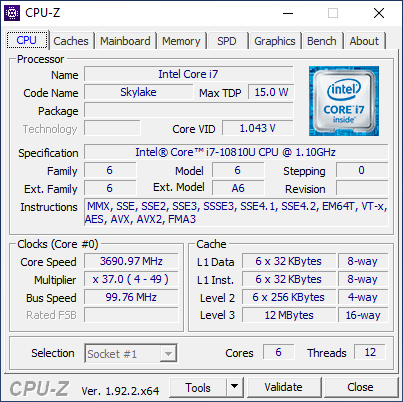
| 88.6 % v7 (old) | 07-2020 | Dell Latitude 9510 2-in-1 i7-10810U, UHD Graphics 620 | 1.7 kg | 13.99 mm | 15.00" | 1920x1080 | |
| 87.2 % v7 (old) | Lenovo ThinkPad T15 Gen1-20S7S02U00 i7-10510U, GeForce MX330 | 1.8 kg | 19.95 mm | 15.60" | 3840x2160 | ||
| 81.8 % v7 (old) | 02-2020 | Lenovo ThinkBook 15 i5-10210U, UHD Graphics 620 | 1.9 kg | 18.9 mm | 15.60" | 1920x1080 | |
| 82.9 % v7 (old) | Dynabook Tecra X50-F i7-8665U, UHD Graphics 620 | 1.4 kg | 17.6 mm | 15.60" | 1920x1080 | ||
| 80.4 % v7 (old) | 06-2020 | HP Envy x360 15-dr1679cl i7-10510U, UHD Graphics 620 | 2.1 kg | 17.2 mm | 15.60" | 1920x1080 | |
| 84.2 % v6 (old) | 08-2018 | Dell Latitude 5591 i7-8850H, GeForce MX130 | 2.3 kg | 24.3 mm | 15.60" | 1920x1080 |
| SD Card Reader | |
| average JPG Copy Test (av. of 3 runs) | |
| Dell Latitude 5591 (Toshiba Exceria Pro SDXC 64 GB UHS-II) | |
| Dell Latitude 9510 2-in-1 (Toshiba Exceria Pro M501 64 GB UHS-II) | |
| Lenovo ThinkPad T15 Gen1-20S7S02U00 (Toshiba Exceria Pro M501 64 GB UHS-II) | |
| HP Envy x360 15-dr1679cl (Toshiba Exceria Pro SDXC 64 GB UHS-II) | |
| Lenovo ThinkBook 15 (Toshiba Exceria Pro SDXC 64 GB UHS-II) | |
| Dynabook Tecra X50-F | |
| maximum AS SSD Seq Read Test (1GB) | |
| Dell Latitude 5591 (Toshiba Exceria Pro SDXC 64 GB UHS-II) | |
| Dell Latitude 9510 2-in-1 (Toshiba Exceria Pro M501 64 GB UHS-II) | |
| Lenovo ThinkPad T15 Gen1-20S7S02U00 (Toshiba Exceria Pro M501 64 GB UHS-II) | |
| Lenovo ThinkBook 15 (Toshiba Exceria Pro SDXC 64 GB UHS-II) | |
| HP Envy x360 15-dr1679cl (Toshiba Exceria Pro SDXC 64 GB UHS-II) | |
| Dynabook Tecra X50-F | |
| Networking | |
| iperf3 transmit AX12 | |
| HP Envy x360 15-dr1679cl | |
| Dell Latitude 9510 2-in-1 | |
| Lenovo ThinkPad T15 Gen1-20S7S02U00 | |
| Honor MagicBook 15 | |
| iperf3 receive AX12 | |
| Lenovo ThinkPad T15 Gen1-20S7S02U00 | |
| Dell Latitude 9510 2-in-1 | |
| HP Envy x360 15-dr1679cl | |
| Honor MagicBook 15 | |


| |||||||||||||||||||||||||
Helderheidsverdeling: 87 %
Helderheid in Batterij-modus: 426.7 cd/m²
Contrast: 1422:1 (Zwart: 0.3 cd/m²)
ΔE ColorChecker Calman: 4.28 | ∀{0.5-29.43 Ø4.73}
calibrated: 1.46
ΔE Greyscale Calman: 8.1 | ∀{0.09-98 Ø4.97}
99.2% sRGB (Argyll 1.6.3 3D)
65.2% AdobeRGB 1998 (Argyll 1.6.3 3D)
71.3% AdobeRGB 1998 (Argyll 3D)
99.3% sRGB (Argyll 3D)
71.2% Display P3 (Argyll 3D)
Gamma: 2.26
CCT: 7993 K
| Dell Latitude 9510 2-in-1 AU Optronics B150HAN, IPS, 15", 1920x1080 | Lenovo ThinkPad T15 Gen1-20S7S02U00 NE156QUM-N66, IPS LED, 15.6", 3840x2160 | Lenovo ThinkBook 15 LP156WFC-SPD1, IPS, 15.6", 1920x1080 | Dynabook Tecra X50-F Toshiba TOS508F, IPS, 15.6", 1920x1080 | HP Envy x360 15-dr1679cl AU Optronics B156HW02, IPS, 15.6", 1920x1080 | Dell Latitude 5591 AU Optronics B156HW03, IPS, 15.6", 1920x1080 | |
|---|---|---|---|---|---|---|
| Display | 15% | -44% | -47% | -43% | -44% | |
| Display P3 Coverage (%) | 71.2 | 80.7 13% | 38.38 -46% | 36.68 -48% | 39.28 -45% | 38.74 -46% |
| sRGB Coverage (%) | 99.3 | 98.1 -1% | 57.7 -42% | 55 -45% | 58.8 -41% | 58.1 -41% |
| AdobeRGB 1998 Coverage (%) | 71.3 | 95.5 34% | 39.67 -44% | 37.92 -47% | 40.58 -43% | 40.03 -44% |
| Response Times | 26% | 21% | 24% | 26% | 17% | |
| Response Time Grey 50% / Grey 80% * (ms) | 52.8 ? | 42 ? 20% | 37.6 ? 29% | 38 ? 28% | 39.6 ? 25% | 45.2 ? 14% |
| Response Time Black / White * (ms) | 32 ? | 21.6 ? 32% | 28 ? 12% | 25.6 ? 20% | 23.6 ? 26% | 26 ? 19% |
| PWM Frequency (Hz) | ||||||
| Screen | 21% | -40% | -54% | -39% | -38% | |
| Brightness middle (cd/m²) | 426.7 | 489 15% | 245 -43% | 295.9 -31% | 261.2 -39% | 245.4 -42% |
| Brightness (cd/m²) | 394 | 501 27% | 239 -39% | 270 -31% | 248 -37% | 234 -41% |
| Brightness Distribution (%) | 87 | 91 5% | 82 -6% | 86 -1% | 92 6% | 88 1% |
| Black Level * (cd/m²) | 0.3 | 0.35 -17% | 0.25 17% | 0.3 -0% | 0.38 -27% | 0.26 13% |
| Contrast (:1) | 1422 | 1397 -2% | 980 -31% | 986 -31% | 687 -52% | 944 -34% |
| Colorchecker dE 2000 * | 4.28 | 3 30% | 5.6 -31% | 6.55 -53% | 5.4 -26% | 5.36 -25% |
| Colorchecker dE 2000 max. * | 10.43 | 5.1 51% | 15.6 -50% | 21.52 -106% | 16.31 -56% | 19.31 -85% |
| Colorchecker dE 2000 calibrated * | 1.46 | 0.8 45% | 4.8 -229% | 5.73 -292% | 3.81 -161% | 4.06 -178% |
| Greyscale dE 2000 * | 8.1 | 4 51% | 3.4 58% | 4.3 47% | 4.1 49% | 3.5 57% |
| Gamma | 2.26 97% | 2.24 98% | 2.3 96% | 2.475 89% | 2.53 87% | 2.53 87% |
| CCT | 7993 81% | 7400 88% | 7156 91% | 7002 93% | 6611 98% | 6430 101% |
| Color Space (Percent of AdobeRGB 1998) (%) | 65.2 | 84.7 30% | 36.5 -44% | 35 -46% | 37.4 -43% | 40 -39% |
| Color Space (Percent of sRGB) (%) | 99.2 | 98.1 -1% | 57.5 -42% | 54 -46% | 58.7 -41% | 58.1 -41% |
| Totaal Gemiddelde (Programma / Instellingen) | 21% /
21% | -21% /
-33% | -26% /
-43% | -19% /
-32% | -22% /
-32% |
* ... kleiner is beter
Responstijd Scherm
| ↔ Responstijd Zwart naar Wit | ||
|---|---|---|
| 32 ms ... stijging ↗ en daling ↘ gecombineerd | ↗ 16.4 ms stijging | 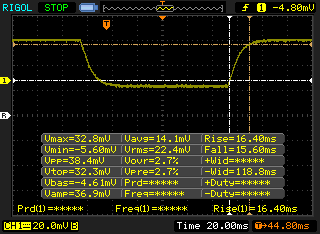 |
| ↘ 15.6 ms daling | ||
| Het scherm vertoonde trage responstijden in onze tests en is misschien te traag voor games. Ter vergelijking: alle testtoestellen variëren van 0.1 (minimum) tot 240 (maximum) ms. » 86 % van alle toestellen zijn beter. Dit betekent dat de gemeten responstijd slechter is dan het gemiddelde (19.9 ms) van alle geteste toestellen. | ||
| ↔ Responstijd 50% Grijs naar 80% Grijs | ||
| 52.8 ms ... stijging ↗ en daling ↘ gecombineerd | ↗ 25.2 ms stijging | 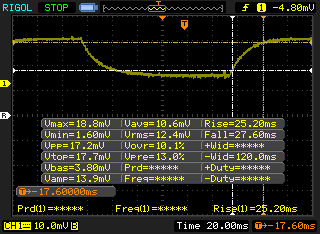 |
| ↘ 27.6 ms daling | ||
| Het scherm vertoonde trage responstijden in onze tests en is misschien te traag voor games. Ter vergelijking: alle testtoestellen variëren van 0.165 (minimum) tot 636 (maximum) ms. » 89 % van alle toestellen zijn beter. Dit betekent dat de gemeten responstijd slechter is dan het gemiddelde (31.1 ms) van alle geteste toestellen. | ||
Screen Flickering / PWM (Pulse-Width Modulation)
| Screen flickering / PWM niet waargenomen | 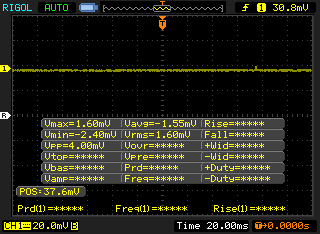 | ||
Ter vergelijking: 52 % van alle geteste toestellen maakten geen gebruik van PWM om de schermhelderheid te verlagen. Als het wel werd gebruikt, werd een gemiddelde van 7798 (minimum: 5 - maximum: 343500) Hz waargenomen. | |||
Cinebench R15: CPU Multi 64Bit | CPU Single 64Bit
Blender: v2.79 BMW27 CPU
7-Zip 18.03: 7z b 4 -mmt1 | 7z b 4
Geekbench 5.5: Single-Core | Multi-Core
HWBOT x265 Benchmark v2.2: 4k Preset
LibreOffice : 20 Documents To PDF
R Benchmark 2.5: Overall mean
| Cinebench R20 / CPU (Multi Core) | |
| HP ProBook 455 G7-175W8EA | |
| Razer Blade 15 RZ09-0328 | |
| Dell XPS 13 7390 Core i7-10710U | |
| Dell Latitude 9510 2-in-1 | |
| Dell XPS 15 9500 Core i5 | |
| Lenovo ThinkPad T15 Gen1-20S7S02U00 | |
| Microsoft Surface Book 3 15 | |
| Honor MagicBook 15 | |
| HP EliteBook 735 G6 7KN29EA | |
| Acer Aspire 5 A515-54G | |
| Dynabook Portege A30-E-174 | |
| Lenovo ThinkPad E590-20NB0012GE | |
| Cinebench R20 / CPU (Single Core) | |
| Lenovo ThinkPad T15 Gen1-20S7S02U00 | |
| Razer Blade 15 RZ09-0328 | |
| HP ProBook 455 G7-175W8EA | |
| Dell XPS 13 7390 Core i7-10710U | |
| Microsoft Surface Book 3 15 | |
| Dell XPS 15 9500 Core i5 | |
| Lenovo ThinkPad E590-20NB0012GE | |
| Acer Aspire 5 A515-54G | |
| Dell Latitude 9510 2-in-1 | |
| Dynabook Portege A30-E-174 | |
| Honor MagicBook 15 | |
| HP EliteBook 735 G6 7KN29EA | |
| Cinebench R15 / CPU Multi 64Bit | |
| Razer Blade 15 RZ09-0328 | |
| Dell Latitude 9510 2-in-1 | |
| Dell XPS 13 7390 Core i7-10710U | |
| HP ProBook 455 G7-175W8EA | |
| Dell XPS 15 9500 Core i5 | |
| Lenovo ThinkPad T15 Gen1-20S7S02U00 | |
| Honor MagicBook 15 | |
| HP EliteBook 735 G6 7KN29EA | |
| Microsoft Surface Book 3 15 | |
| Acer Aspire 5 A515-54G | |
| Lenovo ThinkPad E590-20NB0012GE | |
| Dynabook Portege A30-E-174 | |
| Cinebench R15 / CPU Single 64Bit | |
| Razer Blade 15 RZ09-0328 | |
| Lenovo ThinkPad T15 Gen1-20S7S02U00 | |
| Dell XPS 15 9500 Core i5 | |
| Lenovo ThinkPad E590-20NB0012GE | |
| HP ProBook 455 G7-175W8EA | |
| Microsoft Surface Book 3 15 | |
| Dell XPS 13 7390 Core i7-10710U | |
| Acer Aspire 5 A515-54G | |
| Dell Latitude 9510 2-in-1 | |
| Dynabook Portege A30-E-174 | |
| Honor MagicBook 15 | |
| HP EliteBook 735 G6 7KN29EA | |
| Blender / v2.79 BMW27 CPU | |
| Dell Latitude 9510 2-in-1 | |
| Lenovo ThinkPad E590-20NB0012GE | |
| Microsoft Surface Book 3 15 | |
| Acer Aspire 5 A515-54G | |
| HP EliteBook 735 G6 7KN29EA | |
| Honor MagicBook 15 | |
| Lenovo ThinkPad T15 Gen1-20S7S02U00 | |
| Dell XPS 13 7390 Core i7-10710U | |
| HP ProBook 455 G7-175W8EA | |
| Dell XPS 15 9500 Core i5 | |
| Razer Blade 15 RZ09-0328 | |
| 7-Zip 18.03 / 7z b 4 -mmt1 | |
| Razer Blade 15 RZ09-0328 | |
| Dell XPS 15 9500 Core i5 | |
| Lenovo ThinkPad T15 Gen1-20S7S02U00 | |
| Lenovo ThinkPad E590-20NB0012GE | |
| Dell XPS 13 7390 Core i7-10710U | |
| Dell Latitude 9510 2-in-1 | |
| Microsoft Surface Book 3 15 | |
| Acer Aspire 5 A515-54G | |
| HP ProBook 455 G7-175W8EA | |
| Honor MagicBook 15 | |
| HP EliteBook 735 G6 7KN29EA | |
| 7-Zip 18.03 / 7z b 4 | |
| Razer Blade 15 RZ09-0328 | |
| HP ProBook 455 G7-175W8EA | |
| Dell XPS 13 7390 Core i7-10710U | |
| Dell XPS 15 9500 Core i5 | |
| Lenovo ThinkPad T15 Gen1-20S7S02U00 | |
| Microsoft Surface Book 3 15 | |
| Acer Aspire 5 A515-54G | |
| Honor MagicBook 15 | |
| Lenovo ThinkPad E590-20NB0012GE | |
| Dell Latitude 9510 2-in-1 | |
| HP EliteBook 735 G6 7KN29EA | |
| Geekbench 5.5 / Single-Core | |
| Microsoft Surface Book 3 15 | |
| Dell Latitude 9510 2-in-1 | |
| Lenovo ThinkPad T15 Gen1-20S7S02U00 | |
| Dell XPS 15 9500 Core i5 | |
| Razer Blade 15 RZ09-0328 | |
| HP ProBook 455 G7-175W8EA | |
| Acer Aspire 5 A515-54G | |
| Honor MagicBook 15 | |
| HP EliteBook 735 G6 7KN29EA | |
| Geekbench 5.5 / Multi-Core | |
| Razer Blade 15 RZ09-0328 | |
| HP ProBook 455 G7-175W8EA | |
| Microsoft Surface Book 3 15 | |
| Dell XPS 15 9500 Core i5 | |
| Lenovo ThinkPad T15 Gen1-20S7S02U00 | |
| Acer Aspire 5 A515-54G | |
| Dell Latitude 9510 2-in-1 | |
| Honor MagicBook 15 | |
| HP EliteBook 735 G6 7KN29EA | |
| HWBOT x265 Benchmark v2.2 / 4k Preset | |
| Razer Blade 15 RZ09-0328 | |
| Dell XPS 15 9500 Core i5 | |
| HP ProBook 455 G7-175W8EA | |
| Dell XPS 13 7390 Core i7-10710U | |
| Lenovo ThinkPad T15 Gen1-20S7S02U00 | |
| Microsoft Surface Book 3 15 | |
| Acer Aspire 5 A515-54G | |
| Lenovo ThinkPad E590-20NB0012GE | |
| Honor MagicBook 15 | |
| Dell Latitude 9510 2-in-1 | |
| HP EliteBook 735 G6 7KN29EA | |
| LibreOffice / 20 Documents To PDF | |
| HP EliteBook 735 G6 7KN29EA | |
| HP ProBook 455 G7-175W8EA | |
| Honor MagicBook 15 | |
| Dell Latitude 9510 2-in-1 | |
| Microsoft Surface Book 3 15 | |
| Dell XPS 15 9500 Core i5 | |
| Acer Aspire 5 A515-54G | |
| Lenovo ThinkPad T15 Gen1-20S7S02U00 | |
| Razer Blade 15 RZ09-0328 | |
| R Benchmark 2.5 / Overall mean | |
| HP EliteBook 735 G6 7KN29EA | |
| Honor MagicBook 15 | |
| Dell Latitude 9510 2-in-1 | |
| Acer Aspire 5 A515-54G | |
| Microsoft Surface Book 3 15 | |
| HP ProBook 455 G7-175W8EA | |
| Lenovo ThinkPad T15 Gen1-20S7S02U00 | |
| Dell XPS 15 9500 Core i5 | |
Cinebench R15: CPU Multi 64Bit | CPU Single 64Bit
Blender: v2.79 BMW27 CPU
7-Zip 18.03: 7z b 4 -mmt1 | 7z b 4
Geekbench 5.5: Single-Core | Multi-Core
HWBOT x265 Benchmark v2.2: 4k Preset
LibreOffice : 20 Documents To PDF
R Benchmark 2.5: Overall mean
* ... kleiner is beter
| PCMark 10 | |
| Score | |
| HP Envy x360 15-dr1679cl | |
| Dell Latitude 9510 2-in-1 | |
| Lenovo ThinkBook 15 | |
| Dell Latitude 5591 | |
| Lenovo ThinkPad T15 Gen1-20S7S02U00 | |
| Dynabook Tecra X50-F | |
| Essentials | |
| Dell Latitude 9510 2-in-1 | |
| HP Envy x360 15-dr1679cl | |
| Lenovo ThinkBook 15 | |
| Dell Latitude 5591 | |
| Dynabook Tecra X50-F | |
| Lenovo ThinkPad T15 Gen1-20S7S02U00 | |
| Productivity | |
| Dell Latitude 9510 2-in-1 | |
| HP Envy x360 15-dr1679cl | |
| Lenovo ThinkBook 15 | |
| Dynabook Tecra X50-F | |
| Dell Latitude 5591 | |
| Lenovo ThinkPad T15 Gen1-20S7S02U00 | |
| Digital Content Creation | |
| Dell Latitude 5591 | |
| Lenovo ThinkBook 15 | |
| HP Envy x360 15-dr1679cl | |
| Dell Latitude 9510 2-in-1 | |
| Lenovo ThinkPad T15 Gen1-20S7S02U00 | |
| Dynabook Tecra X50-F | |
| PCMark 8 | |
| Home Score Accelerated v2 | |
| Lenovo ThinkBook 15 | |
| Dell Latitude 5591 | |
| Dell Latitude 9510 2-in-1 | |
| HP Envy x360 15-dr1679cl | |
| Lenovo ThinkPad T15 Gen1-20S7S02U00 | |
| Work Score Accelerated v2 | |
| Dell Latitude 5591 | |
| HP Envy x360 15-dr1679cl | |
| Dell Latitude 9510 2-in-1 | |
| Lenovo ThinkBook 15 | |
| Lenovo ThinkPad T15 Gen1-20S7S02U00 | |
| PCMark 8 Home Score Accelerated v2 | 3969 punten | |
| PCMark 8 Work Score Accelerated v2 | 5149 punten | |
| PCMark 10 Score | 4335 punten | |
Help | ||
| DPC Latencies / LatencyMon - interrupt to process latency (max), Web, Youtube, Prime95 | |
| Dell Latitude 9510 2-in-1 | |
| HP Envy x360 15-dr1679cl | |
| Lenovo ThinkPad T15 Gen1-20S7S02U00 | |
| Honor Magicbook 14 | |
| HP EliteBook 735 G6 7KN29EA | |
| Honor MagicBook 15 | |
| HP Envy x360 13-ay0010nr | |
| Microsoft Surface Book 3 15 | |
| HP ProBook 455 G7-175W8EA | |
* ... kleiner is beter
| Dell Latitude 9510 2-in-1 Toshiba KBG40ZNS512G NVMe | Lenovo ThinkPad T15 Gen1-20S7S02U00 Toshiba XG6 KXG6AZNV1T02 | Lenovo ThinkBook 15 Samsung SSD PM981 MZVLB512HAJQ | Dynabook Tecra X50-F Samsung SSD PM981 MZVLB512HAJQ | HP Envy x360 15-dr1679cl Intel Optane Memory H10 with Solid State Storage 32GB + 512GB HBRPEKNX0202A(L/H) | Dell Latitude 5591 Toshiba XG5 KXG50ZNV512G | |
|---|---|---|---|---|---|---|
| AS SSD | 88% | 105% | 49% | -5% | -11% | |
| Seq Read (MB/s) | 1427 | 2372 66% | 2564 80% | 1461 2% | 931 -35% | 2573 80% |
| Seq Write (MB/s) | 741 | 2230 201% | 2268 206% | 1039 40% | 331.5 -55% | 426.5 -42% |
| 4K Read (MB/s) | 48.7 | 50.2 3% | 57 17% | 45.98 -6% | 72.8 49% | 21.95 -55% |
| 4K Write (MB/s) | 108.2 | 139.8 29% | 141.4 31% | 125.5 16% | 119 10% | 97.2 -10% |
| 4K-64 Read (MB/s) | 1023 | 1430 40% | 1175 15% | 560 -45% | 389.7 -62% | 719 -30% |
| 4K-64 Write (MB/s) | 315.3 | 1368 334% | 1665 428% | 1162 269% | 573 82% | 430.3 36% |
| Access Time Read * (ms) | 0.058 | 0.059 -2% | 0.032 45% | 0.045 22% | 0.07 -21% | 0.122 -110% |
| Access Time Write * (ms) | 0.523 | 0.03 94% | 0.025 95% | 0.032 94% | 0.138 74% | 0.065 88% |
| Score Read (Points) | 1215 | 1718 41% | 1488 22% | 752 -38% | 556 -54% | 998 -18% |
| Score Write (Points) | 498 | 1731 248% | 2033 308% | 1391 179% | 725 46% | 570 14% |
| Score Total (Points) | 2310 | 4325 87% | 4279 85% | 2521 9% | 1565 -32% | 1971 -15% |
| Copy ISO MB/s (MB/s) | 1090 | 1540 41% | 2118 94% | 593 -46% | 782 -28% | |
| Copy Program MB/s (MB/s) | 406.8 | 583 43% | 495.6 22% | 495.5 22% | 365.7 -10% | |
| Copy Game MB/s (MB/s) | 1008 | 1046 4% | 1174 16% | 566 -44% | 457.9 -55% | |
| CrystalDiskMark 5.2 / 6 | 36% | 43% | 1% | 18% | ||
| Write 4K (MB/s) | 114.1 | 159.1 39% | 176.3 55% | 100.1 -12% | 125.6 10% | |
| Read 4K (MB/s) | 50.6 | 55.6 10% | 48.98 -3% | 42.4 -16% | 145.8 188% | |
| Write Seq (MB/s) | 1368 | 1435 5% | 1789 31% | 509 -63% | ||
| Read Seq (MB/s) | 1696 | 1435 -15% | 1671 -1% | 1536 -9% | ||
| Write 4K Q32T1 (MB/s) | 282.8 | 512 81% | 433.5 53% | 245.9 -13% | 362.4 28% | |
| Read 4K Q32T1 (MB/s) | 354.8 | 541 52% | 526 48% | 230.3 -35% | 307.3 -13% | |
| Write Seq Q32T1 (MB/s) | 1418 | 2682 89% | 2983 110% | 1910 35% | 1320 -7% | |
| Read Seq Q32T1 (MB/s) | 2359 | 2902 23% | 3555 51% | 3454 46% | 2489 6% | |
| Write 4K Q8T8 (MB/s) | 1688 | |||||
| Read 4K Q8T8 (MB/s) | 1036 | |||||
| Totaal Gemiddelde (Programma / Instellingen) | 62% /
69% | 74% /
82% | 25% /
32% | 7% /
3% | -11% /
-11% |
* ... kleiner is beter

Disk Throttling: DiskSpd Read Loop, Queue Depth 8
| 3DMark 06 Standard Score | 12453 punten | |
| 3DMark 11 Performance | 2187 punten | |
| 3DMark Cloud Gate Standard Score | 10960 punten | |
| 3DMark Fire Strike Score | 1130 punten | |
| 3DMark Time Spy Score | 488 punten | |
Help | ||
| lage | gem. | hoge | ultra | |
|---|---|---|---|---|
| The Witcher 3 (2015) | 19.9 | 12.1 | ||
| Dota 2 Reborn (2015) | 71.7 | 44.1 | 19 | 17 |
| X-Plane 11.11 (2018) | 12.9 | 13.1 | 11.7 |
| Dell Latitude 9510 2-in-1 UHD Graphics 620, i7-10810U, Toshiba KBG40ZNS512G NVMe | Lenovo ThinkPad T15 Gen1-20S7S02U00 GeForce MX330, i7-10510U, Toshiba XG6 KXG6AZNV1T02 | Lenovo ThinkBook 15 UHD Graphics 620, i5-10210U, Samsung SSD PM981 MZVLB512HAJQ | Dynabook Tecra X50-F UHD Graphics 620, i7-8665U, Samsung SSD PM981 MZVLB512HAJQ | HP Envy x360 15-dr1679cl UHD Graphics 620, i7-10510U, Intel Optane Memory H10 with Solid State Storage 32GB + 512GB HBRPEKNX0202A(L/H) | Dell Latitude 5591 GeForce MX130, i7-8850H, Toshiba XG5 KXG50ZNV512G | |
|---|---|---|---|---|---|---|
| Noise | -4% | -2% | -7% | -8% | -16% | |
| uit / omgeving * (dB) | 27.2 | 29.4 -8% | 29.2 -7% | 30.2 -11% | 28 -3% | 29 -7% |
| Idle Minimum * (dB) | 27.2 | 29.4 -8% | 29.2 -7% | 30.2 -11% | 28 -3% | 29 -7% |
| Idle Average * (dB) | 27.2 | 29.4 -8% | 29.2 -7% | 30.2 -11% | 30.2 -11% | 29 -7% |
| Idle Maximum * (dB) | 27.2 | 29.4 -8% | 29.9 -10% | 30.2 -11% | 31.5 -16% | 30.3 -11% |
| Load Average * (dB) | 33.4 | 34.2 -2% | 30.6 8% | 33.4 -0% | 35.7 -7% | 46.5 -39% |
| Load Maximum * (dB) | 39.5 | 34.2 13% | 33.8 14% | 39 1% | 43.1 -9% | 48.6 -23% |
| Witcher 3 ultra * (dB) | 34.2 |
* ... kleiner is beter
Geluidsniveau
| Onbelast |
| 27.2 / 27.2 / 27.2 dB (A) |
| Belasting |
| 33.4 / 39.5 dB (A) |
 | ||
30 dB stil 40 dB(A) hoorbaar 50 dB(A) luid |
||
min: | ||
(±) De maximumtemperatuur aan de bovenzijde bedraagt 42.8 °C / 109 F, vergeleken met het gemiddelde van 34.3 °C / 94 F, variërend van 21.2 tot 62.5 °C voor de klasse Office.
(±) De bodem warmt op tot een maximum van 41.8 °C / 107 F, vergeleken met een gemiddelde van 36.8 °C / 98 F
(+) Bij onbelast gebruik bedraagt de gemiddelde temperatuur voor de bovenzijde 27.2 °C / 81 F, vergeleken met het apparaatgemiddelde van 29.5 °C / 85 F.
(+) De palmsteunen en het touchpad zijn met een maximum van ###max## °C / 87.1 F koeler dan de huidtemperatuur en voelen daarom koel aan.
(-) De gemiddelde temperatuur van de handpalmsteun van soortgelijke toestellen bedroeg 27.5 °C / 81.5 F (-3.1 °C / -5.6 F).
Dell Latitude 9510 2-in-1 audioanalyse
(±) | luidspreker luidheid is gemiddeld maar goed (77.9 dB)
Bas 100 - 315 Hz
(+) | goede baars - slechts 3% verwijderd van de mediaan
(±) | lineariteit van de lage tonen is gemiddeld (9.6% delta ten opzichte van de vorige frequentie)
Midden 400 - 2000 Hz
(+) | evenwichtige middens - slechts 3.5% verwijderd van de mediaan
(±) | lineariteit van de middentonen is gemiddeld (7.1% delta ten opzichte van de vorige frequentie)
Hoog 2 - 16 kHz
(+) | evenwichtige hoogtepunten - slechts 4.9% verwijderd van de mediaan
(±) | lineariteit van de hoogtepunten is gemiddeld (12.2% delta ten opzichte van de vorige frequentie)
Algemeen 100 - 16.000 Hz
(+) | het totale geluid is lineair (10% verschil met de mediaan)
Vergeleken met dezelfde klasse
» 1% van alle geteste apparaten in deze klasse waren beter, 0% vergelijkbaar, 98% slechter
» De beste had een delta van 7%, het gemiddelde was 21%, de slechtste was 53%
Vergeleken met alle geteste toestellen
» 4% van alle geteste apparaten waren beter, 1% gelijk, 94% slechter
» De beste had een delta van 4%, het gemiddelde was 24%, de slechtste was 134%
Apple MacBook 12 (Early 2016) 1.1 GHz audioanalyse
(+) | luidsprekers kunnen relatief luid spelen (83.6 dB)
Bas 100 - 315 Hz
(±) | verminderde zeebaars - gemiddeld 11.3% lager dan de mediaan
(±) | lineariteit van de lage tonen is gemiddeld (14.2% delta ten opzichte van de vorige frequentie)
Midden 400 - 2000 Hz
(+) | evenwichtige middens - slechts 2.4% verwijderd van de mediaan
(+) | de middentonen zijn lineair (5.5% delta ten opzichte van de vorige frequentie)
Hoog 2 - 16 kHz
(+) | evenwichtige hoogtepunten - slechts 2% verwijderd van de mediaan
(+) | de hoge tonen zijn lineair (4.5% delta naar de vorige frequentie)
Algemeen 100 - 16.000 Hz
(+) | het totale geluid is lineair (10.2% verschil met de mediaan)
Vergeleken met dezelfde klasse
» 7% van alle geteste apparaten in deze klasse waren beter, 2% vergelijkbaar, 91% slechter
» De beste had een delta van 5%, het gemiddelde was 18%, de slechtste was 53%
Vergeleken met alle geteste toestellen
» 5% van alle geteste apparaten waren beter, 1% gelijk, 94% slechter
» De beste had een delta van 4%, het gemiddelde was 24%, de slechtste was 134%
| Uit / Standby | |
| Inactief | |
| Belasting |
|
Key:
min: | |
| Dell Latitude 9510 2-in-1 i7-10810U, UHD Graphics 620, Toshiba KBG40ZNS512G NVMe, IPS, 1920x1080, 15" | Lenovo ThinkPad T15 Gen1-20S7S02U00 i7-10510U, GeForce MX330, Toshiba XG6 KXG6AZNV1T02, IPS LED, 3840x2160, 15.6" | Lenovo ThinkBook 15 i5-10210U, UHD Graphics 620, Samsung SSD PM981 MZVLB512HAJQ, IPS, 1920x1080, 15.6" | Dynabook Tecra X50-F i7-8665U, UHD Graphics 620, Samsung SSD PM981 MZVLB512HAJQ, IPS, 1920x1080, 15.6" | HP Envy x360 15-dr1679cl i7-10510U, UHD Graphics 620, Intel Optane Memory H10 with Solid State Storage 32GB + 512GB HBRPEKNX0202A(L/H), IPS, 1920x1080, 15.6" | Dell Latitude 5591 i7-8850H, GeForce MX130, Toshiba XG5 KXG50ZNV512G, IPS, 1920x1080, 15.6" | |
|---|---|---|---|---|---|---|
| Power Consumption | -105% | -24% | -21% | -32% | -69% | |
| Idle Minimum * (Watt) | 2.1 | 4.3 -105% | 3.5 -67% | 3.9 -86% | 4.3 -105% | 4.4 -110% |
| Idle Average * (Watt) | 4.6 | 13.8 -200% | 7.1 -54% | 7 -52% | 7.2 -57% | 8.4 -83% |
| Idle Maximum * (Watt) | 5.3 | 16.2 -206% | 7.8 -47% | 7.3 -38% | 7.5 -42% | 10.2 -92% |
| Load Average * (Watt) | 45.8 | 66 -44% | 38.9 15% | 32.7 29% | 40.4 12% | 71 -55% |
| Load Maximum * (Watt) | 96.3 | 67.4 30% | 65.4 32% | 57.8 40% | 65.7 32% | 100.1 -4% |
| Witcher 3 ultra * (Watt) | 53 |
* ... kleiner is beter
| Dell Latitude 9510 2-in-1 i7-10810U, UHD Graphics 620, 88 Wh | Lenovo ThinkPad T15 Gen1-20S7S02U00 i7-10510U, GeForce MX330, 57 Wh | Lenovo ThinkBook 15 i5-10210U, UHD Graphics 620, 45 Wh | Dynabook Tecra X50-F i7-8665U, UHD Graphics 620, 48 Wh | HP Envy x360 15-dr1679cl i7-10510U, UHD Graphics 620, 55.67 Wh | Dell Latitude 5591 i7-8850H, GeForce MX130, 92 Wh | |
|---|---|---|---|---|---|---|
| Batterijduur | -66% | -65% | -74% | -50% | -52% | |
| Reader / Idle (h) | 59 | 17.9 -70% | 5.8 -90% | 25.4 -57% | 22.4 -62% | |
| WiFi v1.3 (h) | 18.7 | 7.1 -62% | 6.8 -64% | 4.6 -75% | 9.2 -51% | 12.5 -33% |
| Load (h) | 4 | 1.2 -70% | 1.5 -62% | 1.7 -57% | 2.3 -43% | 1.5 -62% |
Pro
Contra
Voor het volledige, Engelse testrapport, klik hier.
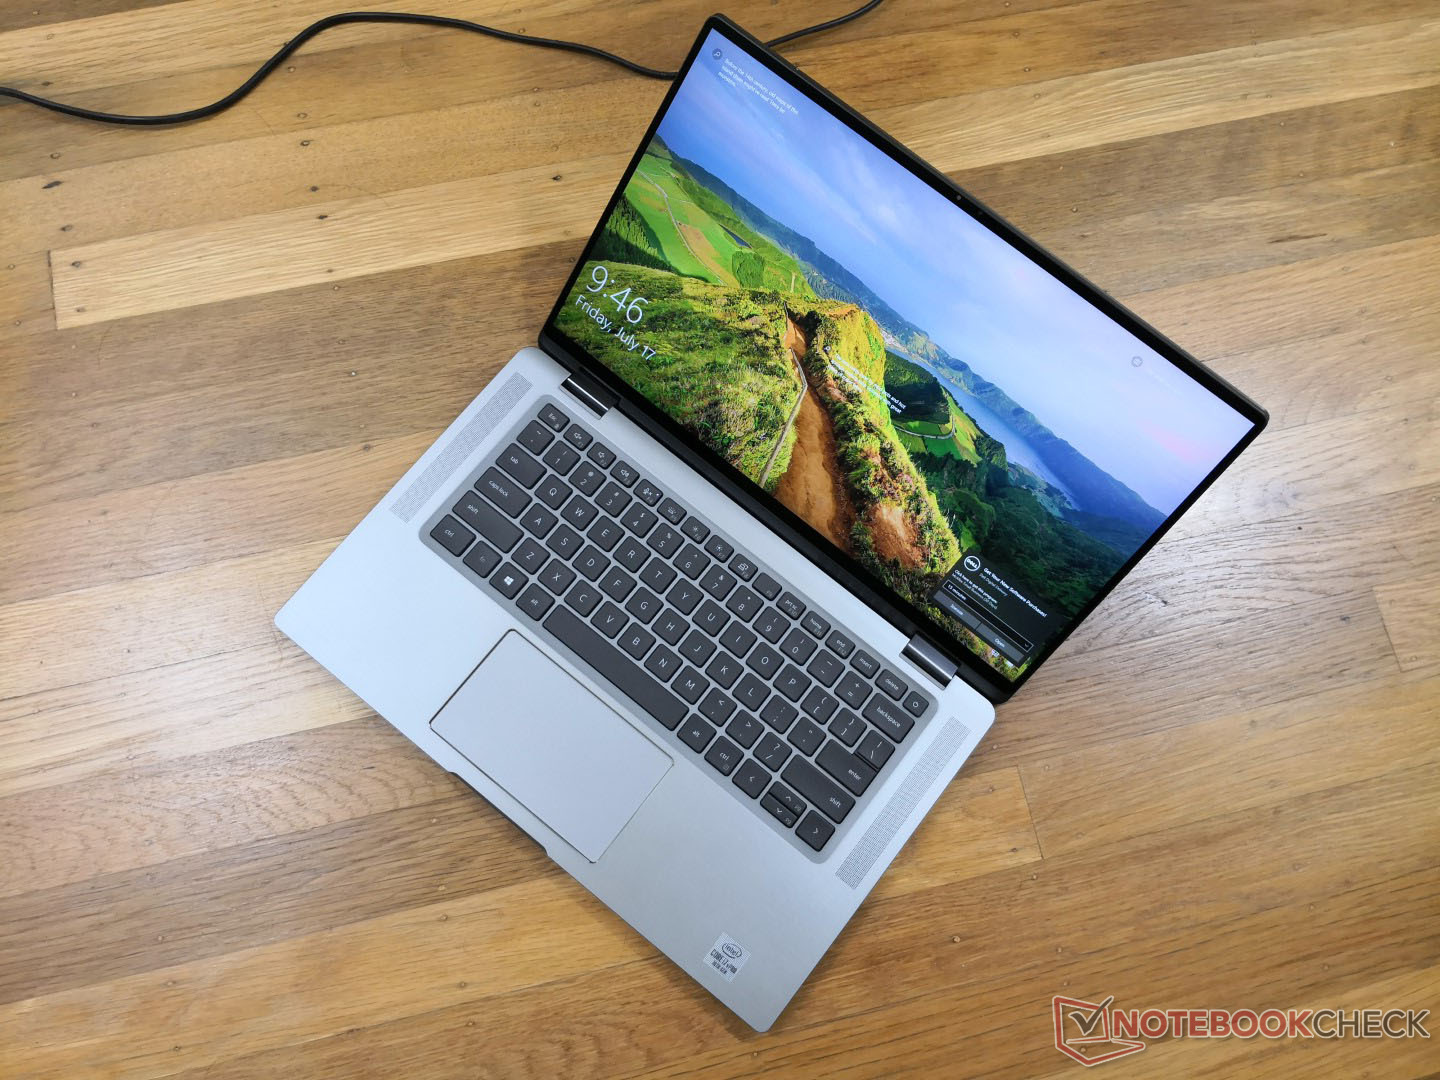
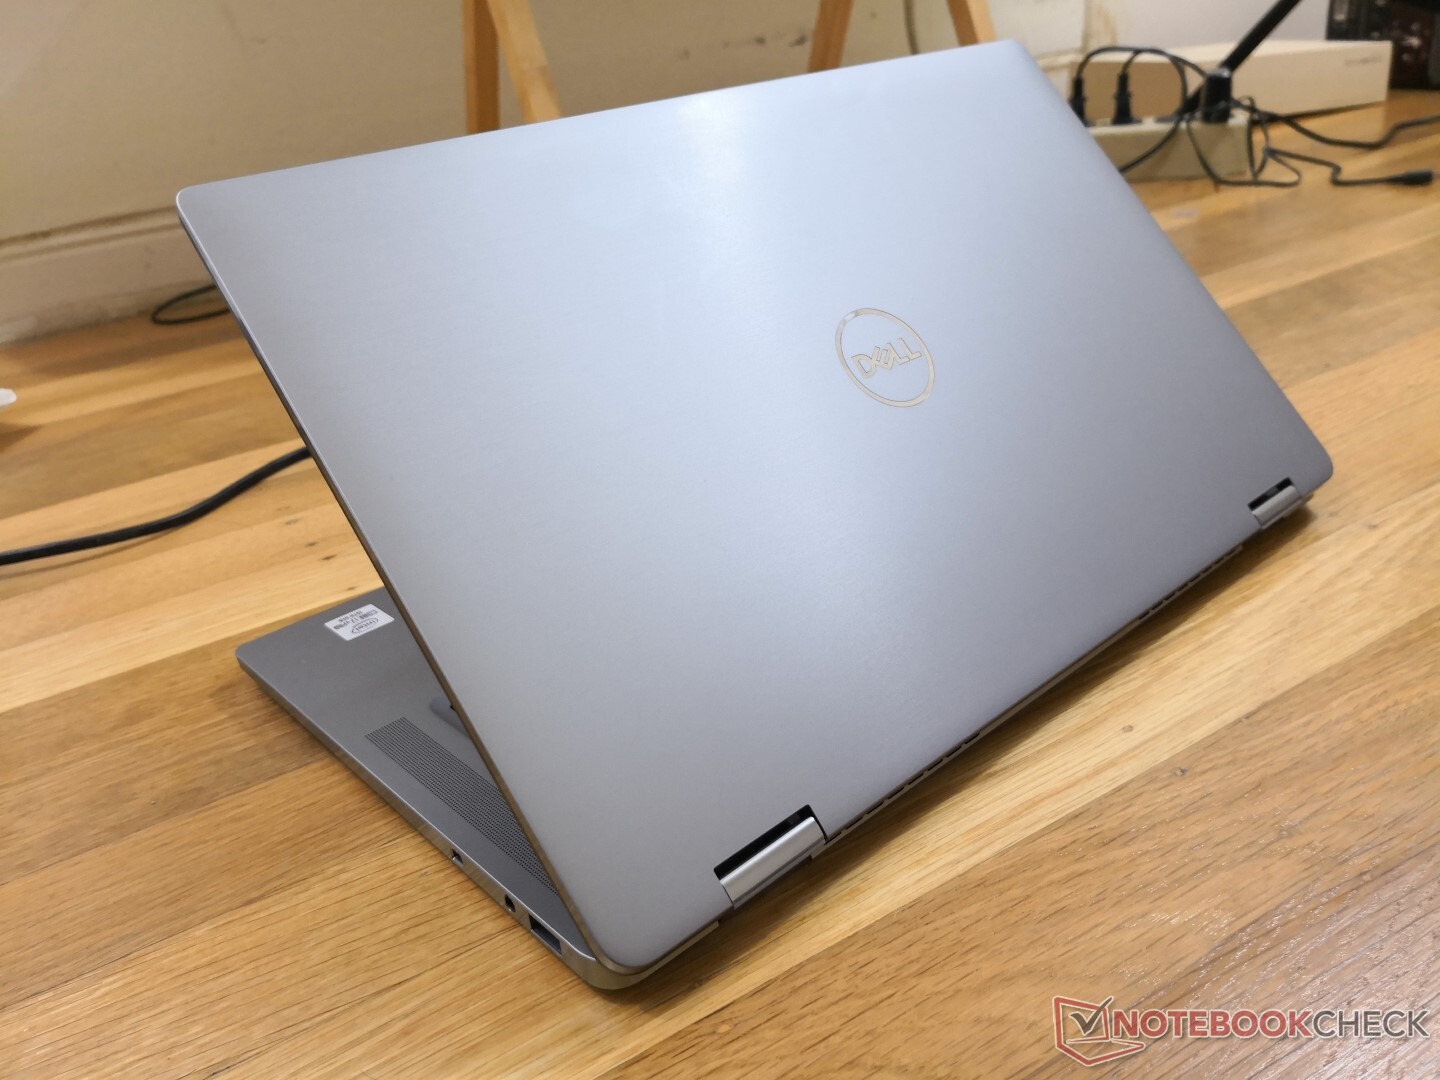
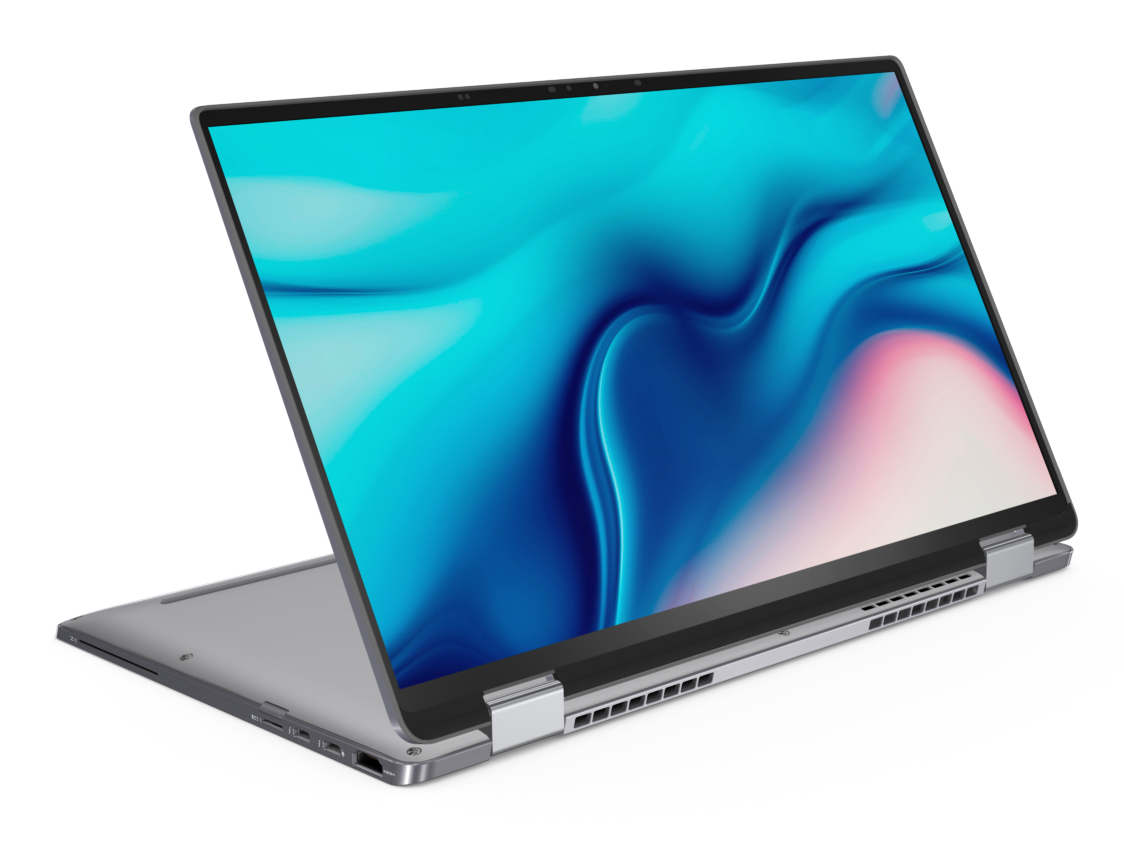
De meest onderscheidende kenmerken van de Latitude 9510 2-in-1 zijn de buitengewoon lange looptijden, 5G-enabled draadloze verbinding, metalen chassis en het gebruiksgemak, vooral voor een 15-inch convertible. Deze kenmerken maken het geschikt voor reizigers die iets groters willen dan het typische 13-inch of 14-inch zakelijke subnotebook zoals de HP EliteBook x360 1040 of Lenovo X1 Carbon zonder te veel op te offeren op het gebied van draagbaarheid en gewicht. Hij is nog steeds zwaarder en groter dan de eerder genoemde HP of Lenovo, maar hij is zeker kleiner dan elke 15,6-inch convertible voor een comfortabele middenwegoplossing.
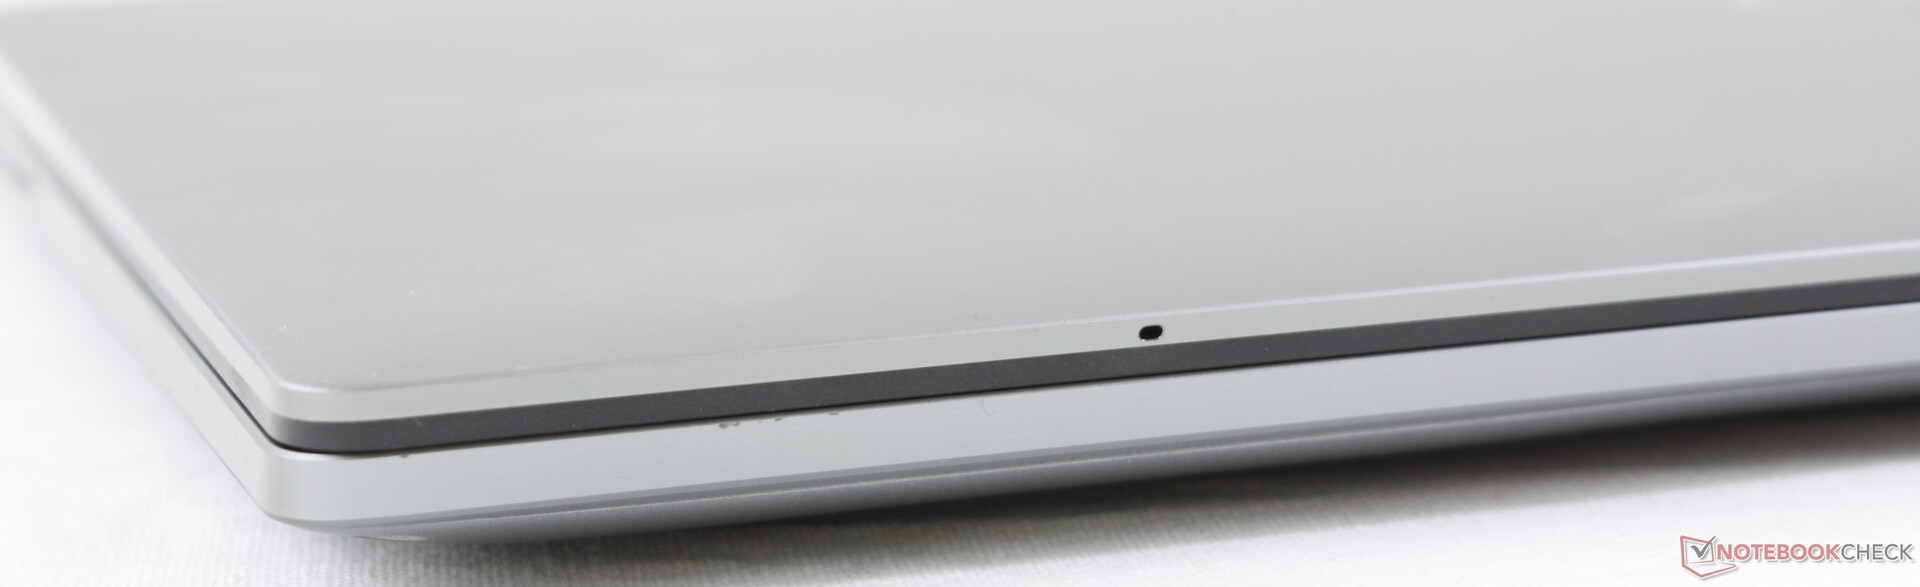
Hoe boordevol goede dingen het apparaat ook is, er ontbreken nog een aantal functies. Het ontbreken van een webcam-sluiter voor het converteerbare model is vreemd, vooral voor een serie die zoveel aandacht besteedt aan beveiliging. Bovendien zou een 1000-nit beeldschermoptie helpen om het systeem vergelijkbaar te maken met de HP EliteBook x360-serie wat betreft leesbaarheid buitenshuis.
Gebruikers die lange en veeleisende belastingen willen uitvoeren, moeten ergens anders zoeken. CPU-prestaties nemen sterk af na slechts een paar minuten van extreme verwerkingsbelastingen en het ontbreken van Ryzen of extra GPU-opties wordt duidelijk bij het uitvoeren van grafisch intensieve taken. Het systeem werkt erg stil en met een lange batterijduur als resultaat, maar de middelmatige processorprestaties staat daar tegenover.
Veelzijdig voor bijna al je in-en out-of-office-behoeften, zolang je behoeften geen intensieve verwerkingslasten met zich meebrengen. Het ongebruikelijke 15,0-inch schermformaat werkt goed voor een convertible notebook die zowel groter is dan 14-inch subnotebooks en toch kleiner en draagbaarder is dan de gebruikelijke 15,6-inch alternatieven.
Dell Latitude 9510 2-in-1
- 20-07-2020 v7 (old)
Allen Ngo
Price comparison
