Kort testrapport Surface Book 3 13.5: Microsoft's convertible wordt langzaamaan oud
Evaluatie | Datum | Model | Gewicht | Hoogte | Formaat | Resolutie | Beste prijs |
|---|---|---|---|---|---|---|---|
| 86.9 % v7 (old) | 06-2020 | Microsoft Surface Book 3 13.5 i7-1065G7, GeForce GTX 1650 Max-Q | 1.6 kg | 23 mm | 13.50" | 3000x2000 | |
| 85 % v7 (old) | 05-2020 | Asus ZenBook Flip 14 UX463FA-AI039T i5-10210U, UHD Graphics 620 | 1.4 kg | 18 mm | 14.00" | 1920x1080 | |
| 89.8 % v7 (old) | 04-2020 | Lenovo ThinkPad X1 Yoga 20SA000GUS i7-10510U, UHD Graphics 620 | 1.3 kg | 15.5 mm | 14.00" | 2560x1440 | |
| 88.1 % v7 (old) | 02-2020 | Microsoft Surface Pro 7 i7-1065G7, Iris Plus Graphics G7 (Ice Lake 64 EU) | 790 g | 8.5 mm | 12.30" | 2736x1824 | |
| 88.4 % v7 (old) | 12-2019 | HP Spectre x360 13-aw0013dx i7-1065G7, Iris Plus Graphics G7 (Ice Lake 64 EU) | 1.2 kg | 16.9 mm | 13.30" | 1920x1080 | |
| 87.4 % v6 (old) | 11-2017 | Microsoft Surface Book 2 i7-8650U, GeForce GTX 1050 Mobile | 1.6 kg | 23 mm | 13.50" | 3000x2000 |
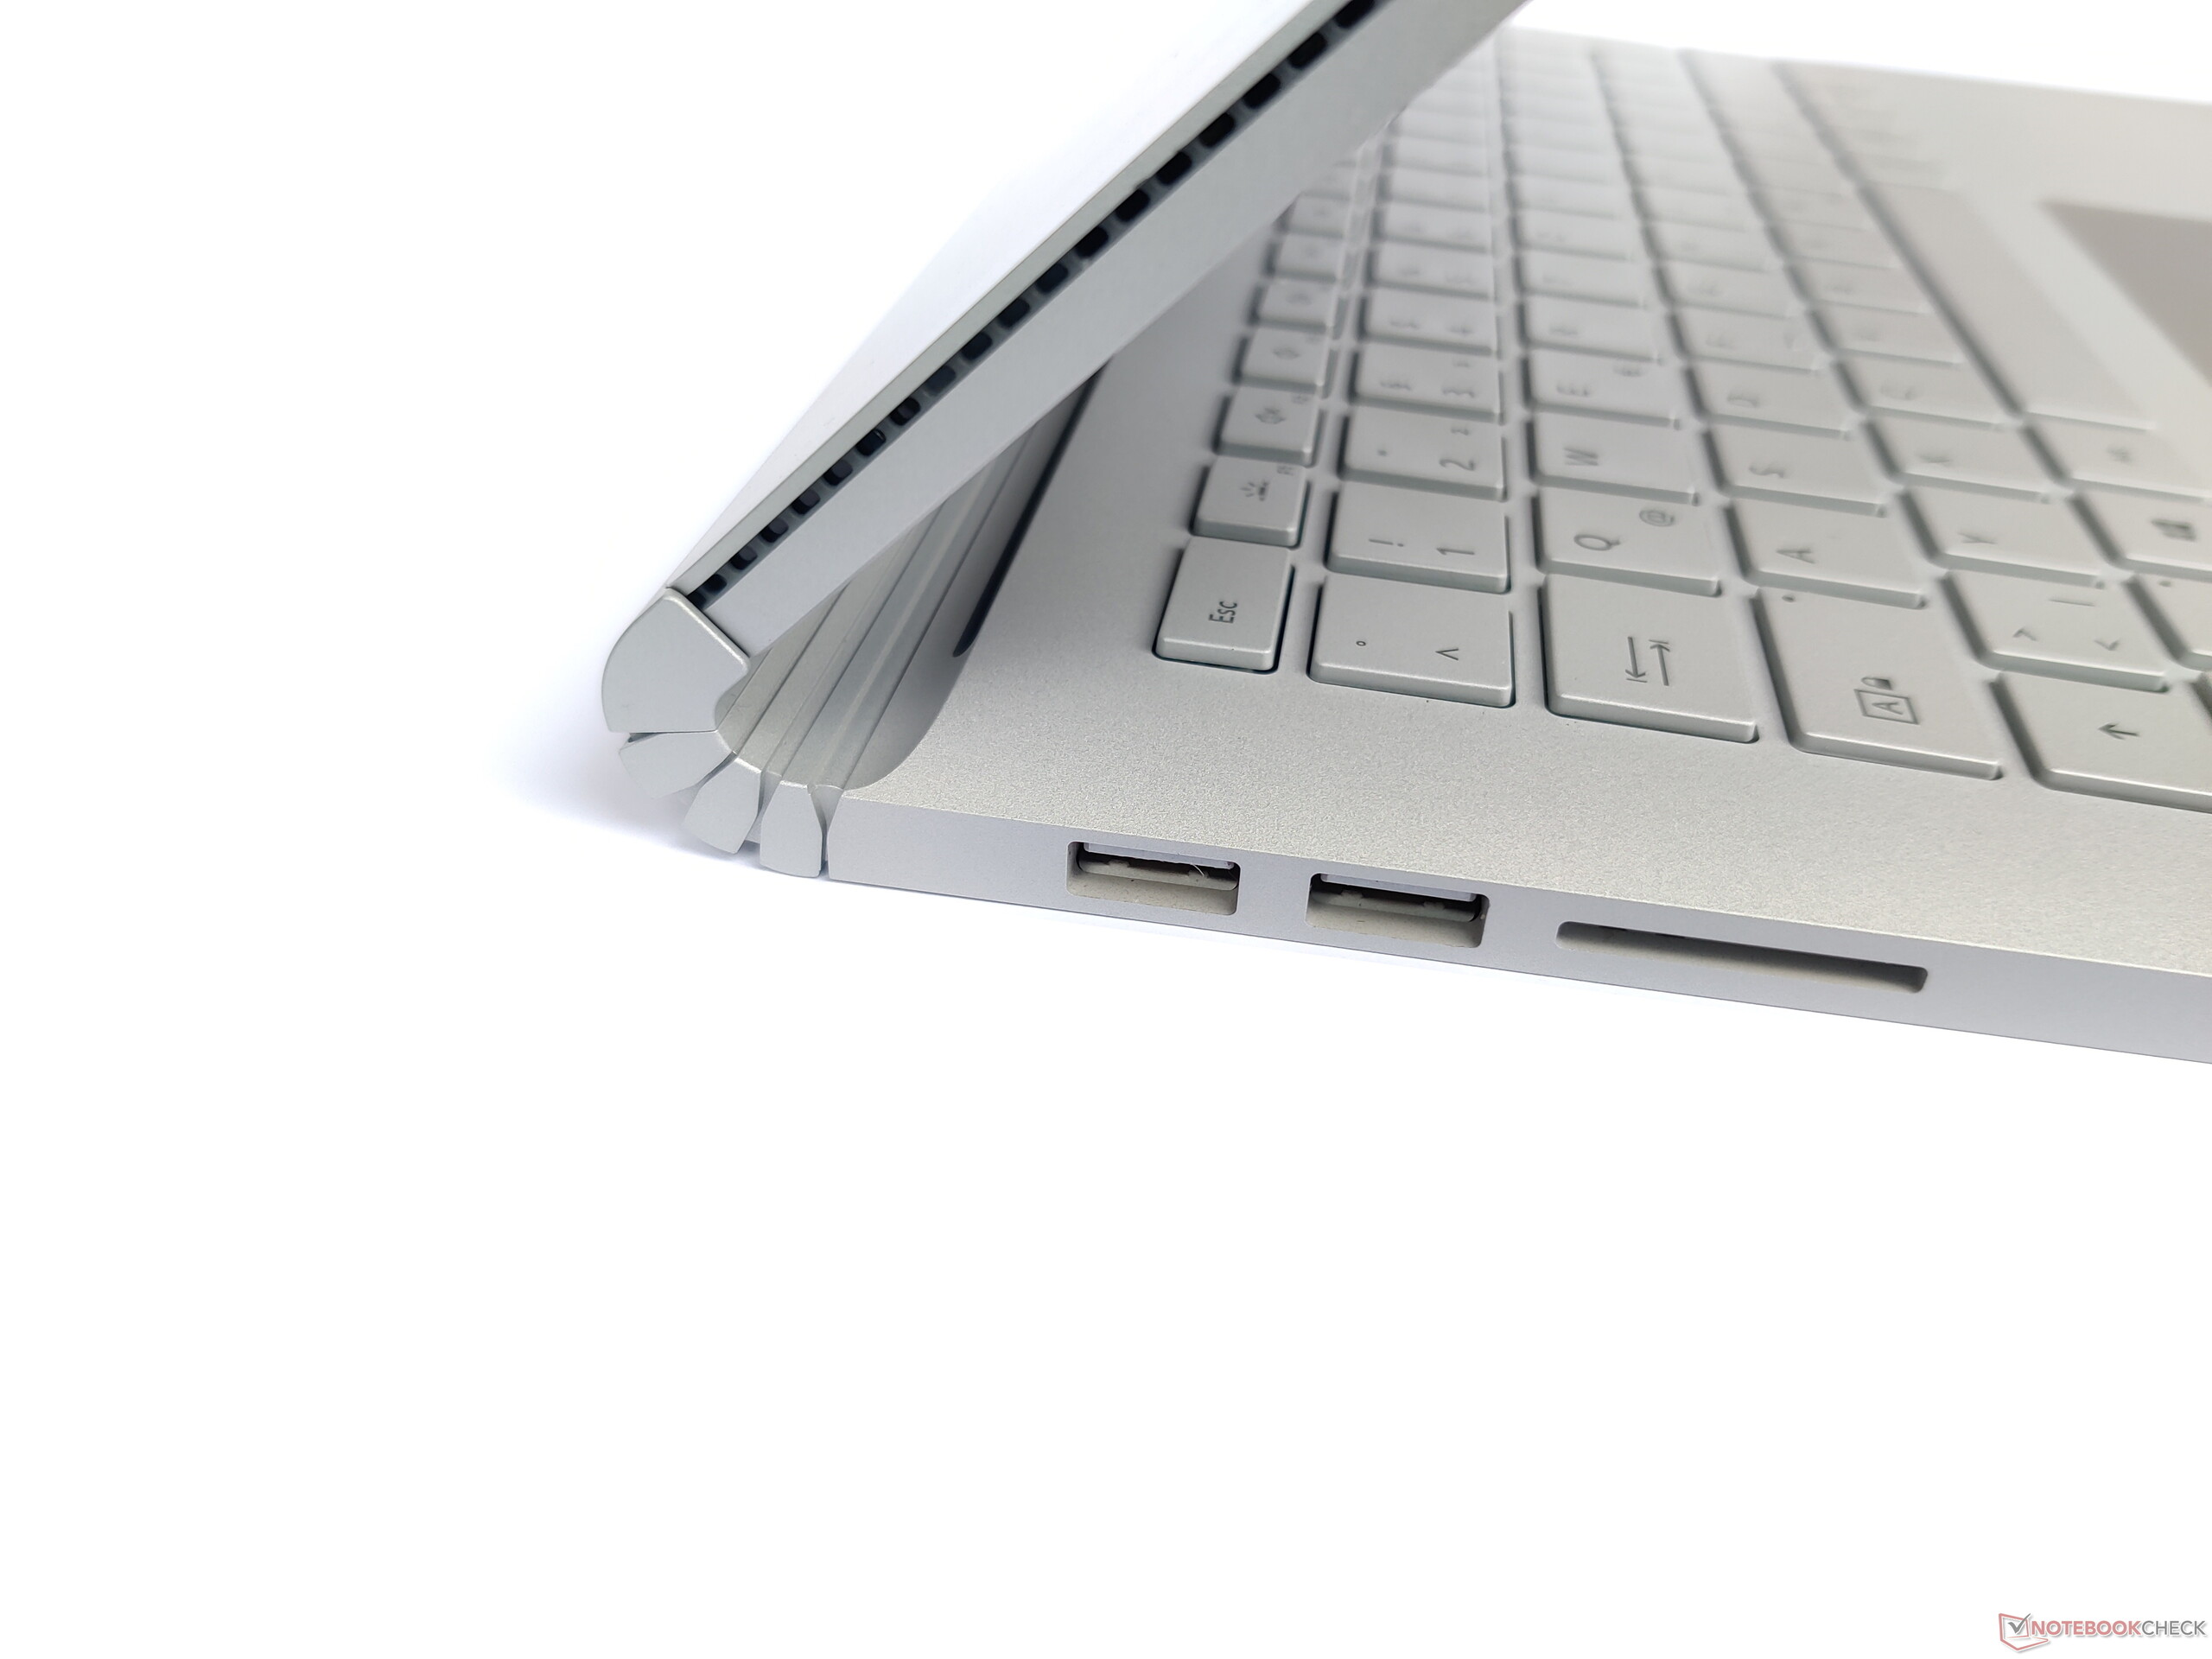
| SD Card Reader | |
| average JPG Copy Test (av. of 3 runs) | |
| HP Spectre x360 13-aw0013dx (Toshiba Exceria Pro M501 microSDXC 64GB) | |
| Microsoft Surface Book 3 13.5 (Toshiba Exceria Pro M501 microSDXC 64GB) | |
| Microsoft Surface Pro 7 (Toshiba Exceria Pro M501 microSDXC 64GB) | |
| Gemiddelde van klas Convertible (28.1 - 197, n=23, laatste 2 jaar) | |
| Asus ZenBook Flip 14 UX463FA-AI039T (Toshiba Exceria Pro M501 microSDXC 64GB) | |
| maximum AS SSD Seq Read Test (1GB) | |
| Microsoft Surface Book 3 13.5 (Toshiba Exceria Pro M501 microSDXC 64GB) | |
| HP Spectre x360 13-aw0013dx (Toshiba Exceria Pro M501 microSDXC 64GB) | |
| Gemiddelde van klas Convertible (28.9 - 254, n=22, laatste 2 jaar) | |
| Microsoft Surface Pro 7 (Toshiba Exceria Pro M501 microSDXC 64GB) | |
| Asus ZenBook Flip 14 UX463FA-AI039T (Toshiba Exceria Pro M501 microSDXC 64GB) | |


| |||||||||||||||||||||||||
Helderheidsverdeling: 86 %
Helderheid in Batterij-modus: 391 cd/m²
Contrast: 2058:1 (Zwart: 0.19 cd/m²)
ΔE ColorChecker Calman: 3.07 | ∀{0.5-29.43 Ø4.73}
calibrated: 1.52
ΔE Greyscale Calman: 3.6 | ∀{0.09-98 Ø4.97}
95% sRGB (Argyll 1.6.3 3D)
61% AdobeRGB 1998 (Argyll 1.6.3 3D)
65.7% AdobeRGB 1998 (Argyll 3D)
95.1% sRGB (Argyll 3D)
63.5% Display P3 (Argyll 3D)
Gamma: 2.29
CCT: 6330 K
| Microsoft Surface Book 3 13.5 Panasonic MEI96A2, IPS, 3000x2000, 13.5" | Microsoft Surface Book 2 Panasonic MEI96A2 , IPS, 3000x2000, 13.5" | Asus ZenBook Flip 14 UX463FA-AI039T AU AUO323D, IPS, 1920x1080, 14" | Lenovo ThinkPad X1 Yoga 20SA000GUS AU Optronics B140QAN02.2, IPS, 2560x1440, 14" | HP Spectre x360 13-aw0013dx AU Optronics AUO5E2D, IPS, 1920x1080, 13.3" | |
|---|---|---|---|---|---|
| Display | 5% | -7% | 3% | 8% | |
| Display P3 Coverage (%) | 63.5 | 67.9 7% | 60.1 -5% | 66.6 5% | 69.6 10% |
| sRGB Coverage (%) | 95.1 | 95.7 1% | 85.5 -10% | 95.9 1% | 98.9 4% |
| AdobeRGB 1998 Coverage (%) | 65.7 | 69.4 6% | 61.1 -7% | 67.5 3% | 71.5 9% |
| Response Times | 14% | 32% | 41% | -2% | |
| Response Time Grey 50% / Grey 80% * (ms) | 57 ? | 52.8 ? 7% | 36 ? 37% | 32 ? 44% | 60.8 ? -7% |
| Response Time Black / White * (ms) | 38 ? | 30 ? 21% | 28 ? 26% | 23.6 ? 38% | 36.8 ? 3% |
| PWM Frequency (Hz) | |||||
| Screen | 10% | -30% | -7% | -22% | |
| Brightness middle (cd/m²) | 391 | 385 -2% | 280 -28% | 284.6 -27% | 447.4 14% |
| Brightness (cd/m²) | 367 | 372 1% | 286 -22% | 269 -27% | 420 14% |
| Brightness Distribution (%) | 86 | 89 3% | 78 -9% | 86 0% | 85 -1% |
| Black Level * (cd/m²) | 0.19 | 0.21 -11% | 0.208 -9% | 0.28 -47% | 0.31 -63% |
| Contrast (:1) | 2058 | 1833 -11% | 1346 -35% | 1016 -51% | 1443 -30% |
| Colorchecker dE 2000 * | 3.07 | 1.6 48% | 3.97 -29% | 2.07 33% | 4.23 -38% |
| Colorchecker dE 2000 max. * | 4.74 | 4.5 5% | 8.29 -75% | 3.75 21% | 9.34 -97% |
| Colorchecker dE 2000 calibrated * | 1.52 | 3.42 -125% | 2.05 -35% | 1.32 13% | |
| Greyscale dE 2000 * | 3.6 | 1.5 58% | 2.83 21% | 1.7 53% | 6.1 -69% |
| Gamma | 2.29 96% | 2.22 99% | 2.34 94% | 2.17 101% | 2.11 104% |
| CCT | 6330 103% | 6502 100% | 6556 99% | 6627 98% | 6136 106% |
| Color Space (Percent of AdobeRGB 1998) (%) | 61 | 64 5% | 56 -8% | 61.7 1% | 64.8 6% |
| Color Space (Percent of sRGB) (%) | 95 | 95.9 1% | 85 -11% | 95.8 1% | 98.9 4% |
| Totaal Gemiddelde (Programma / Instellingen) | 10% /
9% | -2% /
-18% | 12% /
1% | -5% /
-14% |
* ... kleiner is beter
Responstijd Scherm
| ↔ Responstijd Zwart naar Wit | ||
|---|---|---|
| 38 ms ... stijging ↗ en daling ↘ gecombineerd | ↗ 22 ms stijging | 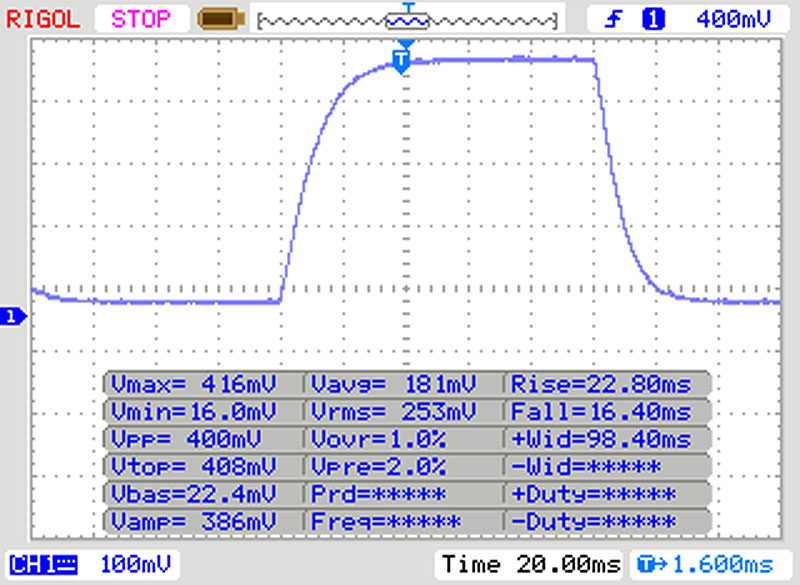 |
| ↘ 16 ms daling | ||
| Het scherm vertoonde trage responstijden in onze tests en is misschien te traag voor games. Ter vergelijking: alle testtoestellen variëren van 0.1 (minimum) tot 240 (maximum) ms. » 96 % van alle toestellen zijn beter. Dit betekent dat de gemeten responstijd slechter is dan het gemiddelde (19.9 ms) van alle geteste toestellen. | ||
| ↔ Responstijd 50% Grijs naar 80% Grijs | ||
| 57 ms ... stijging ↗ en daling ↘ gecombineerd | ↗ 28 ms stijging |  |
| ↘ 29 ms daling | ||
| Het scherm vertoonde trage responstijden in onze tests en is misschien te traag voor games. Ter vergelijking: alle testtoestellen variëren van 0.165 (minimum) tot 636 (maximum) ms. » 94 % van alle toestellen zijn beter. Dit betekent dat de gemeten responstijd slechter is dan het gemiddelde (31.1 ms) van alle geteste toestellen. | ||
Screen Flickering / PWM (Pulse-Width Modulation)
| Screen flickering / PWM niet waargenomen | 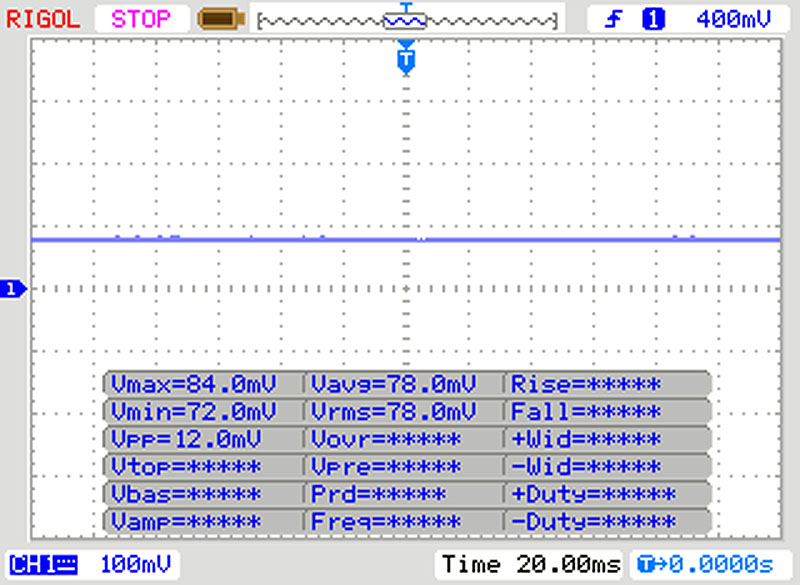 | ||
Ter vergelijking: 52 % van alle geteste toestellen maakten geen gebruik van PWM om de schermhelderheid te verlagen. Als het wel werd gebruikt, werd een gemiddelde van 7798 (minimum: 5 - maximum: 343500) Hz waargenomen. | |||
Cinebench R15: CPU Single 64Bit | CPU Multi 64Bit
Blender: v2.79 BMW27 CPU
7-Zip 18.03: 7z b 4 -mmt1 | 7z b 4
Geekbench 5.5: Single-Core | Multi-Core
HWBOT x265 Benchmark v2.2: 4k Preset
LibreOffice : 20 Documents To PDF
R Benchmark 2.5: Overall mean
| Cinebench R20 / CPU (Single Core) | |
| Gemiddelde van klas Convertible (273 - 834, n=49, laatste 2 jaar) | |
| Microsoft Surface Pro 7 | |
| Lenovo ThinkPad X1 Yoga 20SA000GUS | |
| Gemiddeld Intel Core i7-1065G7 (358 - 474, n=31) | |
| Microsoft Surface Book 3 13.5 | |
| HP Spectre x360 13-aw0013dx | |
| Cinebench R20 / CPU (Multi Core) | |
| Gemiddelde van klas Convertible (595 - 12102, n=49, laatste 2 jaar) | |
| Microsoft Surface Pro 7 | |
| HP Spectre x360 13-aw0013dx | |
| Lenovo ThinkPad X1 Yoga 20SA000GUS | |
| Gemiddeld Intel Core i7-1065G7 (1081 - 2024, n=31) | |
| Microsoft Surface Book 3 13.5 | |
| Cinebench R15 / CPU Single 64Bit | |
| Gemiddelde van klas Convertible (149.8 - 317, n=48, laatste 2 jaar) | |
| Microsoft Surface Pro 7 | |
| Lenovo ThinkPad X1 Yoga 20SA000GUS | |
| Microsoft Surface Book 3 13.5 | |
| HP Spectre x360 13-aw0013dx | |
| Microsoft Surface Book 2 | |
| Gemiddeld Intel Core i7-1065G7 (141 - 190, n=35) | |
| Asus ZenBook Flip 14 UX463FA-AI039T | |
| Cinebench R15 / CPU Multi 64Bit | |
| Gemiddelde van klas Convertible (478 - 4940, n=48, laatste 2 jaar) | |
| Microsoft Surface Pro 7 | |
| Lenovo ThinkPad X1 Yoga 20SA000GUS | |
| Asus ZenBook Flip 14 UX463FA-AI039T | |
| Microsoft Surface Book 2 | |
| Gemiddeld Intel Core i7-1065G7 (288 - 836, n=36) | |
| HP Spectre x360 13-aw0013dx | |
| Microsoft Surface Book 3 13.5 | |
| Blender / v2.79 BMW27 CPU | |
| Microsoft Surface Book 3 13.5 | |
| Gemiddeld Intel Core i7-1065G7 (675 - 1650, n=23) | |
| Lenovo ThinkPad X1 Yoga 20SA000GUS | |
| Gemiddelde van klas Convertible (105 - 1051, n=48, laatste 2 jaar) | |
| 7-Zip 18.03 / 7z b 4 -mmt1 | |
| Gemiddelde van klas Convertible (3672 - 6655, n=48, laatste 2 jaar) | |
| Lenovo ThinkPad X1 Yoga 20SA000GUS | |
| Gemiddeld Intel Core i7-1065G7 (3289 - 4589, n=24) | |
| Microsoft Surface Book 3 13.5 | |
| 7-Zip 18.03 / 7z b 4 | |
| Gemiddelde van klas Convertible (12977 - 121368, n=48, laatste 2 jaar) | |
| Gemiddeld Intel Core i7-1065G7 (10406 - 22898, n=24) | |
| Lenovo ThinkPad X1 Yoga 20SA000GUS | |
| Microsoft Surface Book 3 13.5 | |
| Geekbench 5.5 / Single-Core | |
| Gemiddelde van klas Convertible (806 - 2275, n=48, laatste 2 jaar) | |
| Microsoft Surface Book 3 13.5 | |
| Gemiddeld Intel Core i7-1065G7 (948 - 1348, n=18) | |
| Lenovo ThinkPad X1 Yoga 20SA000GUS | |
| Geekbench 5.5 / Multi-Core | |
| Gemiddelde van klas Convertible (1608 - 22023, n=48, laatste 2 jaar) | |
| Lenovo ThinkPad X1 Yoga 20SA000GUS | |
| Gemiddeld Intel Core i7-1065G7 (2464 - 4855, n=18) | |
| Microsoft Surface Book 3 13.5 | |
| HWBOT x265 Benchmark v2.2 / 4k Preset | |
| Gemiddelde van klas Convertible (3.43 - 36.2, n=48, laatste 2 jaar) | |
| Lenovo ThinkPad X1 Yoga 20SA000GUS | |
| Gemiddeld Intel Core i7-1065G7 (2.2 - 6.38, n=22) | |
| Microsoft Surface Book 3 13.5 | |
| LibreOffice / 20 Documents To PDF | |
| Microsoft Surface Book 3 13.5 | |
| Gemiddeld Intel Core i7-1065G7 (46.9 - 85.3, n=19) | |
| Gemiddelde van klas Convertible (42.5 - 84.3, n=48, laatste 2 jaar) | |
| Lenovo ThinkPad X1 Yoga 20SA000GUS | |
| R Benchmark 2.5 / Overall mean | |
| Microsoft Surface Book 3 13.5 | |
| Gemiddeld Intel Core i7-1065G7 (0.661 - 0.798, n=18) | |
| Lenovo ThinkPad X1 Yoga 20SA000GUS | |
| Gemiddelde van klas Convertible (0.3915 - 0.84, n=48, laatste 2 jaar) | |
* ... kleiner is beter
| PCMark 8 Home Score Accelerated v2 | 3369 punten | |
| PCMark 8 Work Score Accelerated v2 | 4466 punten | |
| PCMark 10 Score | 4184 punten | |
Help | ||
| DPC Latencies / LatencyMon - interrupt to process latency (max), Web, Youtube, Prime95 | |
| Lenovo ThinkPad X1 Yoga 20SA000GUS | |
| Microsoft Surface Book 3 13.5 | |
| Asus ZenBook Flip 14 UX463FA-AI039T | |
* ... kleiner is beter
| Microsoft Surface Book 3 13.5 SK Hynix BC501 HFM512GDJTNG | Microsoft Surface Book 2 Samsung PM961 MZVLW256HEHP | Asus ZenBook Flip 14 UX463FA-AI039T Kingston RBUSNS8154P3512GJ1 | Lenovo ThinkPad X1 Yoga 20SA000GUS WDC PC SN730 SDBQNTY-512GB | HP Spectre x360 13-aw0013dx Intel Optane Memory H10 with Solid State Storage 32GB + 512GB HBRPEKNX0202A(L/H) | Microsoft Surface Pro 7 Toshiba KBG40ZNS256G NVMe | Gemiddeld SK Hynix BC501 HFM512GDJTNG | |
|---|---|---|---|---|---|---|---|
| CrystalDiskMark 5.2 / 6 | 17% | -0% | 94% | 45% | 65% | 4% | |
| Write 4K (MB/s) | 88.4 | 140.6 59% | 54.6 -38% | 152 72% | 112.6 27% | 131.3 49% | 95.5 ? 8% |
| Read 4K (MB/s) | 39.53 | 43.62 10% | 28.19 -29% | 45.96 16% | 131 231% | 52.4 33% | 38.3 ? -3% |
| Write Seq (MB/s) | 691 | 343.3 -50% | 840 22% | 2069 199% | 458.9 -34% | 1613 133% | 759 ? 10% |
| Read Seq (MB/s) | 1032 | 1452 41% | 905 -12% | 1708 66% | 1355 31% | 1613 56% | 1022 ? -1% |
| Write 4K Q32T1 (MB/s) | 279.6 | 344.4 23% | 409.5 46% | 465.4 66% | 341.3 22% | 411.6 47% | 303 ? 8% |
| Read 4K Q32T1 (MB/s) | 261.6 | 457.2 75% | 292.4 12% | 410.1 57% | 320.6 23% | 415.6 59% | 317 ? 21% |
| Write Seq Q32T1 (MB/s) | 868 | 344.3 -60% | 1038 20% | 2713 213% | 1219 40% | 2340 170% | 885 ? 2% |
| Read Seq Q32T1 (MB/s) | 2075 | 2885 39% | 1607 -23% | 3399 64% | 2462 19% | 1568 -24% | 1803 ? -13% |
| Write 4K Q8T8 (MB/s) | 410.9 | 306 ? | |||||
| Read 4K Q8T8 (MB/s) | 1033 | 698 ? | |||||
| AS SSD | -22% | 38% | -37% | -19% | 4% | ||
| Seq Read (MB/s) | 1707 | 1336 -22% | 1939 14% | 1039 -39% | 1881 10% | 1323 ? -22% | |
| Seq Write (MB/s) | 510 | 653 28% | 1380 171% | 310.1 -39% | 703 38% | 697 ? 37% | |
| 4K Read (MB/s) | 38.77 | 26.65 -31% | 41.38 7% | 76 96% | 52.3 35% | 40.4 ? 4% | |
| 4K Write (MB/s) | 100.9 | 52.7 -48% | 154.9 54% | 118 17% | 154.1 53% | 100.8 ? 0% | |
| 4K-64 Read (MB/s) | 630 | 644 2% | 970 54% | 371.8 -41% | 1048 66% | 686 ? 9% | |
| 4K-64 Write (MB/s) | 707 | 482.9 -32% | 990 40% | 469.5 -34% | 703 -1% | 660 ? -7% | |
| Access Time Read * (ms) | 0.085 | 0.074 13% | 0.055 35% | 0.067 21% | 0.069 19% | 0.06071 ? 29% | |
| Access Time Write * (ms) | 0.035 | 0.072 -106% | 0.07 -100% | 0.138 -294% | 0.221 -531% | 0.037 ? -6% | |
| Score Read (Points) | 839 | 804 -4% | 1205 44% | 552 -34% | 1288 54% | 858 ? 2% | |
| Score Write (Points) | 859 | 601 -30% | 1283 49% | 618 -28% | 927 8% | 830 ? -3% | |
| Score Total (Points) | 2077 | 1786 -14% | 3083 48% | 1448 -30% | 2826 36% | 2107 ? 1% | |
| Copy ISO MB/s (MB/s) | 2074 | 764 | 1160 | 802 ? | |||
| Copy Program MB/s (MB/s) | 630 | 465.8 | 454.7 | 265 ? | |||
| Copy Game MB/s (MB/s) | 1326 | 764 | 991 | 487 ? | |||
| Totaal Gemiddelde (Programma / Instellingen) | 17% /
17% | -11% /
-13% | 66% /
62% | 4% /
-2% | 23% /
16% | 4% /
4% |
* ... kleiner is beter

Continuous reading: DiskSpd Read Loop, Queue Depth 8
| 3DMark 11 Performance | 9665 punten | |
| 3DMark Cloud Gate Standard Score | 15476 punten | |
| 3DMark Fire Strike Score | 6602 punten | |
Help | ||
| lage | gem. | hoge | ultra | |
|---|---|---|---|---|
| The Witcher 3 (2015) | 141.5 | 83.2 | 41.5 | 30.1 |
| Dota 2 Reborn (2015) | 61.2 | 85.6 | 81.6 | 68.3 |
| X-Plane 11.11 (2018) | 83.5 | 57.2 | 51.8 |
Geluidsniveau
| Onbelast |
| 30.2 / 30.2 / 30.2 dB (A) |
| Belasting |
| 32.4 / 33.6 dB (A) |
 | ||
30 dB stil 40 dB(A) hoorbaar 50 dB(A) luid |
||
min: | ||
(±) De maximumtemperatuur aan de bovenzijde bedraagt 41 °C / 106 F, vergeleken met het gemiddelde van 35.4 °C / 96 F, variërend van 19.6 tot 60 °C voor de klasse Convertible.
(±) De bodem warmt op tot een maximum van 43.7 °C / 111 F, vergeleken met een gemiddelde van 36.9 °C / 98 F
(+) Bij onbelast gebruik bedraagt de gemiddelde temperatuur voor de bovenzijde 27.2 °C / 81 F, vergeleken met het apparaatgemiddelde van 30.3 °C / 87 F.
(-) Bij het spelen van The Witcher 3 is de gemiddelde temperatuur voor de bovenzijde 38.9 °C / 102 F, vergeleken met het apparaatgemiddelde van 30.3 °C / 87 F.
(-) De palmsteunen en het touchpad kunnen zeer heet aanvoelen met een maximum van ###max## °C / 107.2 F.
(-) De gemiddelde temperatuur van de handpalmsteun van soortgelijke toestellen bedroeg 28 °C / 82.4 F (-13.8 °C / -24.8 F).
Microsoft Surface Book 3 13.5 audioanalyse
(-) | niet erg luide luidsprekers (61.8 dB)
Bas 100 - 315 Hz
(±) | verminderde zeebaars - gemiddeld 10.4% lager dan de mediaan
(±) | lineariteit van de lage tonen is gemiddeld (8.2% delta ten opzichte van de vorige frequentie)
Midden 400 - 2000 Hz
(+) | evenwichtige middens - slechts 4.7% verwijderd van de mediaan
(+) | de middentonen zijn lineair (6% delta ten opzichte van de vorige frequentie)
Hoog 2 - 16 kHz
(+) | evenwichtige hoogtepunten - slechts 2.7% verwijderd van de mediaan
(+) | de hoge tonen zijn lineair (6.8% delta naar de vorige frequentie)
Algemeen 100 - 16.000 Hz
(±) | lineariteit van het totale geluid is gemiddeld (19% verschil met de mediaan)
Vergeleken met dezelfde klasse
» 44% van alle geteste apparaten in deze klasse waren beter, 7% vergelijkbaar, 48% slechter
» De beste had een delta van 6%, het gemiddelde was 20%, de slechtste was 57%
Vergeleken met alle geteste toestellen
» 45% van alle geteste apparaten waren beter, 7% gelijk, 48% slechter
» De beste had een delta van 4%, het gemiddelde was 24%, de slechtste was 134%
Apple MacBook 12 (Early 2016) 1.1 GHz audioanalyse
(+) | luidsprekers kunnen relatief luid spelen (83.6 dB)
Bas 100 - 315 Hz
(±) | verminderde zeebaars - gemiddeld 11.3% lager dan de mediaan
(±) | lineariteit van de lage tonen is gemiddeld (14.2% delta ten opzichte van de vorige frequentie)
Midden 400 - 2000 Hz
(+) | evenwichtige middens - slechts 2.4% verwijderd van de mediaan
(+) | de middentonen zijn lineair (5.5% delta ten opzichte van de vorige frequentie)
Hoog 2 - 16 kHz
(+) | evenwichtige hoogtepunten - slechts 2% verwijderd van de mediaan
(+) | de hoge tonen zijn lineair (4.5% delta naar de vorige frequentie)
Algemeen 100 - 16.000 Hz
(+) | het totale geluid is lineair (10.2% verschil met de mediaan)
Vergeleken met dezelfde klasse
» 7% van alle geteste apparaten in deze klasse waren beter, 2% vergelijkbaar, 91% slechter
» De beste had een delta van 5%, het gemiddelde was 18%, de slechtste was 53%
Vergeleken met alle geteste toestellen
» 5% van alle geteste apparaten waren beter, 1% gelijk, 94% slechter
» De beste had een delta van 4%, het gemiddelde was 24%, de slechtste was 134%
| Uit / Standby | |
| Inactief | |
| Belasting |
|
Key:
min: | |
| Microsoft Surface Book 3 13.5 i7-1065G7, GeForce GTX 1650 Max-Q, SK Hynix BC501 HFM512GDJTNG, IPS, 3000x2000, 13.5" | Microsoft Surface Book 2 i7-8650U, GeForce GTX 1050 Mobile, Samsung PM961 MZVLW256HEHP, IPS, 3000x2000, 13.5" | Asus ZenBook Flip 14 UX463FA-AI039T i5-10210U, UHD Graphics 620, Kingston RBUSNS8154P3512GJ1, IPS, 1920x1080, 14" | Lenovo ThinkPad X1 Yoga 20SA000GUS i7-10510U, UHD Graphics 620, WDC PC SN730 SDBQNTY-512GB, IPS, 2560x1440, 14" | HP Spectre x360 13-aw0013dx i7-1065G7, Iris Plus Graphics G7 (Ice Lake 64 EU), Intel Optane Memory H10 with Solid State Storage 32GB + 512GB HBRPEKNX0202A(L/H), IPS, 1920x1080, 13.3" | Microsoft Surface Pro 7 i7-1065G7, Iris Plus Graphics G7 (Ice Lake 64 EU), Toshiba KBG40ZNS256G NVMe, IPS, 2736x1824, 12.3" | Gemiddeld NVIDIA GeForce GTX 1650 Max-Q | Gemiddelde van klas Convertible | |
|---|---|---|---|---|---|---|---|---|
| Power Consumption | -9% | 29% | 35% | 36% | 20% | -31% | 24% | |
| Idle Minimum * (Watt) | 4.8 | 4.7 2% | 3.6 25% | 3.5 27% | 3.9 19% | 4.4 8% | 7.75 ? -61% | 4.29 ? 11% |
| Idle Average * (Watt) | 9.4 | 10.6 -13% | 7.5 20% | 5.6 40% | 6.3 33% | 8.7 7% | 11.8 ? -26% | 7.08 ? 25% |
| Idle Maximum * (Watt) | 11.2 | 12.3 -10% | 9.4 16% | 6.5 42% | 6.8 39% | 9.6 14% | 16.6 ? -48% | 8.68 ? 22% |
| Load Average * (Watt) | 72 | 81 -13% | 42 42% | 42.7 41% | 32.6 55% | 44 39% | 75.2 ? -4% | 44 ? 39% |
| Load Maximum * (Watt) | 90 | 100.3 -11% | 51 43% | 66.5 26% | 59 34% | 61 32% | 105.5 ? -17% | 67.3 ? 25% |
| Witcher 3 ultra * (Watt) | 97 | 25.6 |
* ... kleiner is beter
| Microsoft Surface Book 3 13.5 i7-1065G7, GeForce GTX 1650 Max-Q, 69 Wh | Microsoft Surface Book 2 i7-8650U, GeForce GTX 1050 Mobile, 75 Wh | Asus ZenBook Flip 14 UX463FA-AI039T i5-10210U, UHD Graphics 620, 50 Wh | Lenovo ThinkPad X1 Yoga 20SA000GUS i7-10510U, UHD Graphics 620, 51 Wh | HP Spectre x360 13-aw0013dx i7-1065G7, Iris Plus Graphics G7 (Ice Lake 64 EU), 60 Wh | Microsoft Surface Pro 7 i7-1065G7, Iris Plus Graphics G7 (Ice Lake 64 EU), 45 Wh | Gemiddelde van klas Convertible | |
|---|---|---|---|---|---|---|---|
| Batterijduur | 40% | 17% | 4% | 54% | -7% | 35% | |
| Reader / Idle (h) | 16.5 | 24.5 48% | 19.9 21% | 37.1 125% | 11.5 -30% | 27.7 ? 68% | |
| WiFi v1.3 (h) | 6.6 | 11.1 68% | 7.7 17% | 9.2 39% | 9.9 50% | 9.8 48% | 11.9 ? 80% |
| Load (h) | 3.1 | 3.2 3% | 1.6 -48% | 2.7 -13% | 1.9 -39% | 1.779 ? -43% | |
| Witcher 3 ultra (h) | 3.8 |
Pro
Contra
Dit is de verkorte versie van het originele artikel. Het volledige, Engelse testrapport vind je hier.
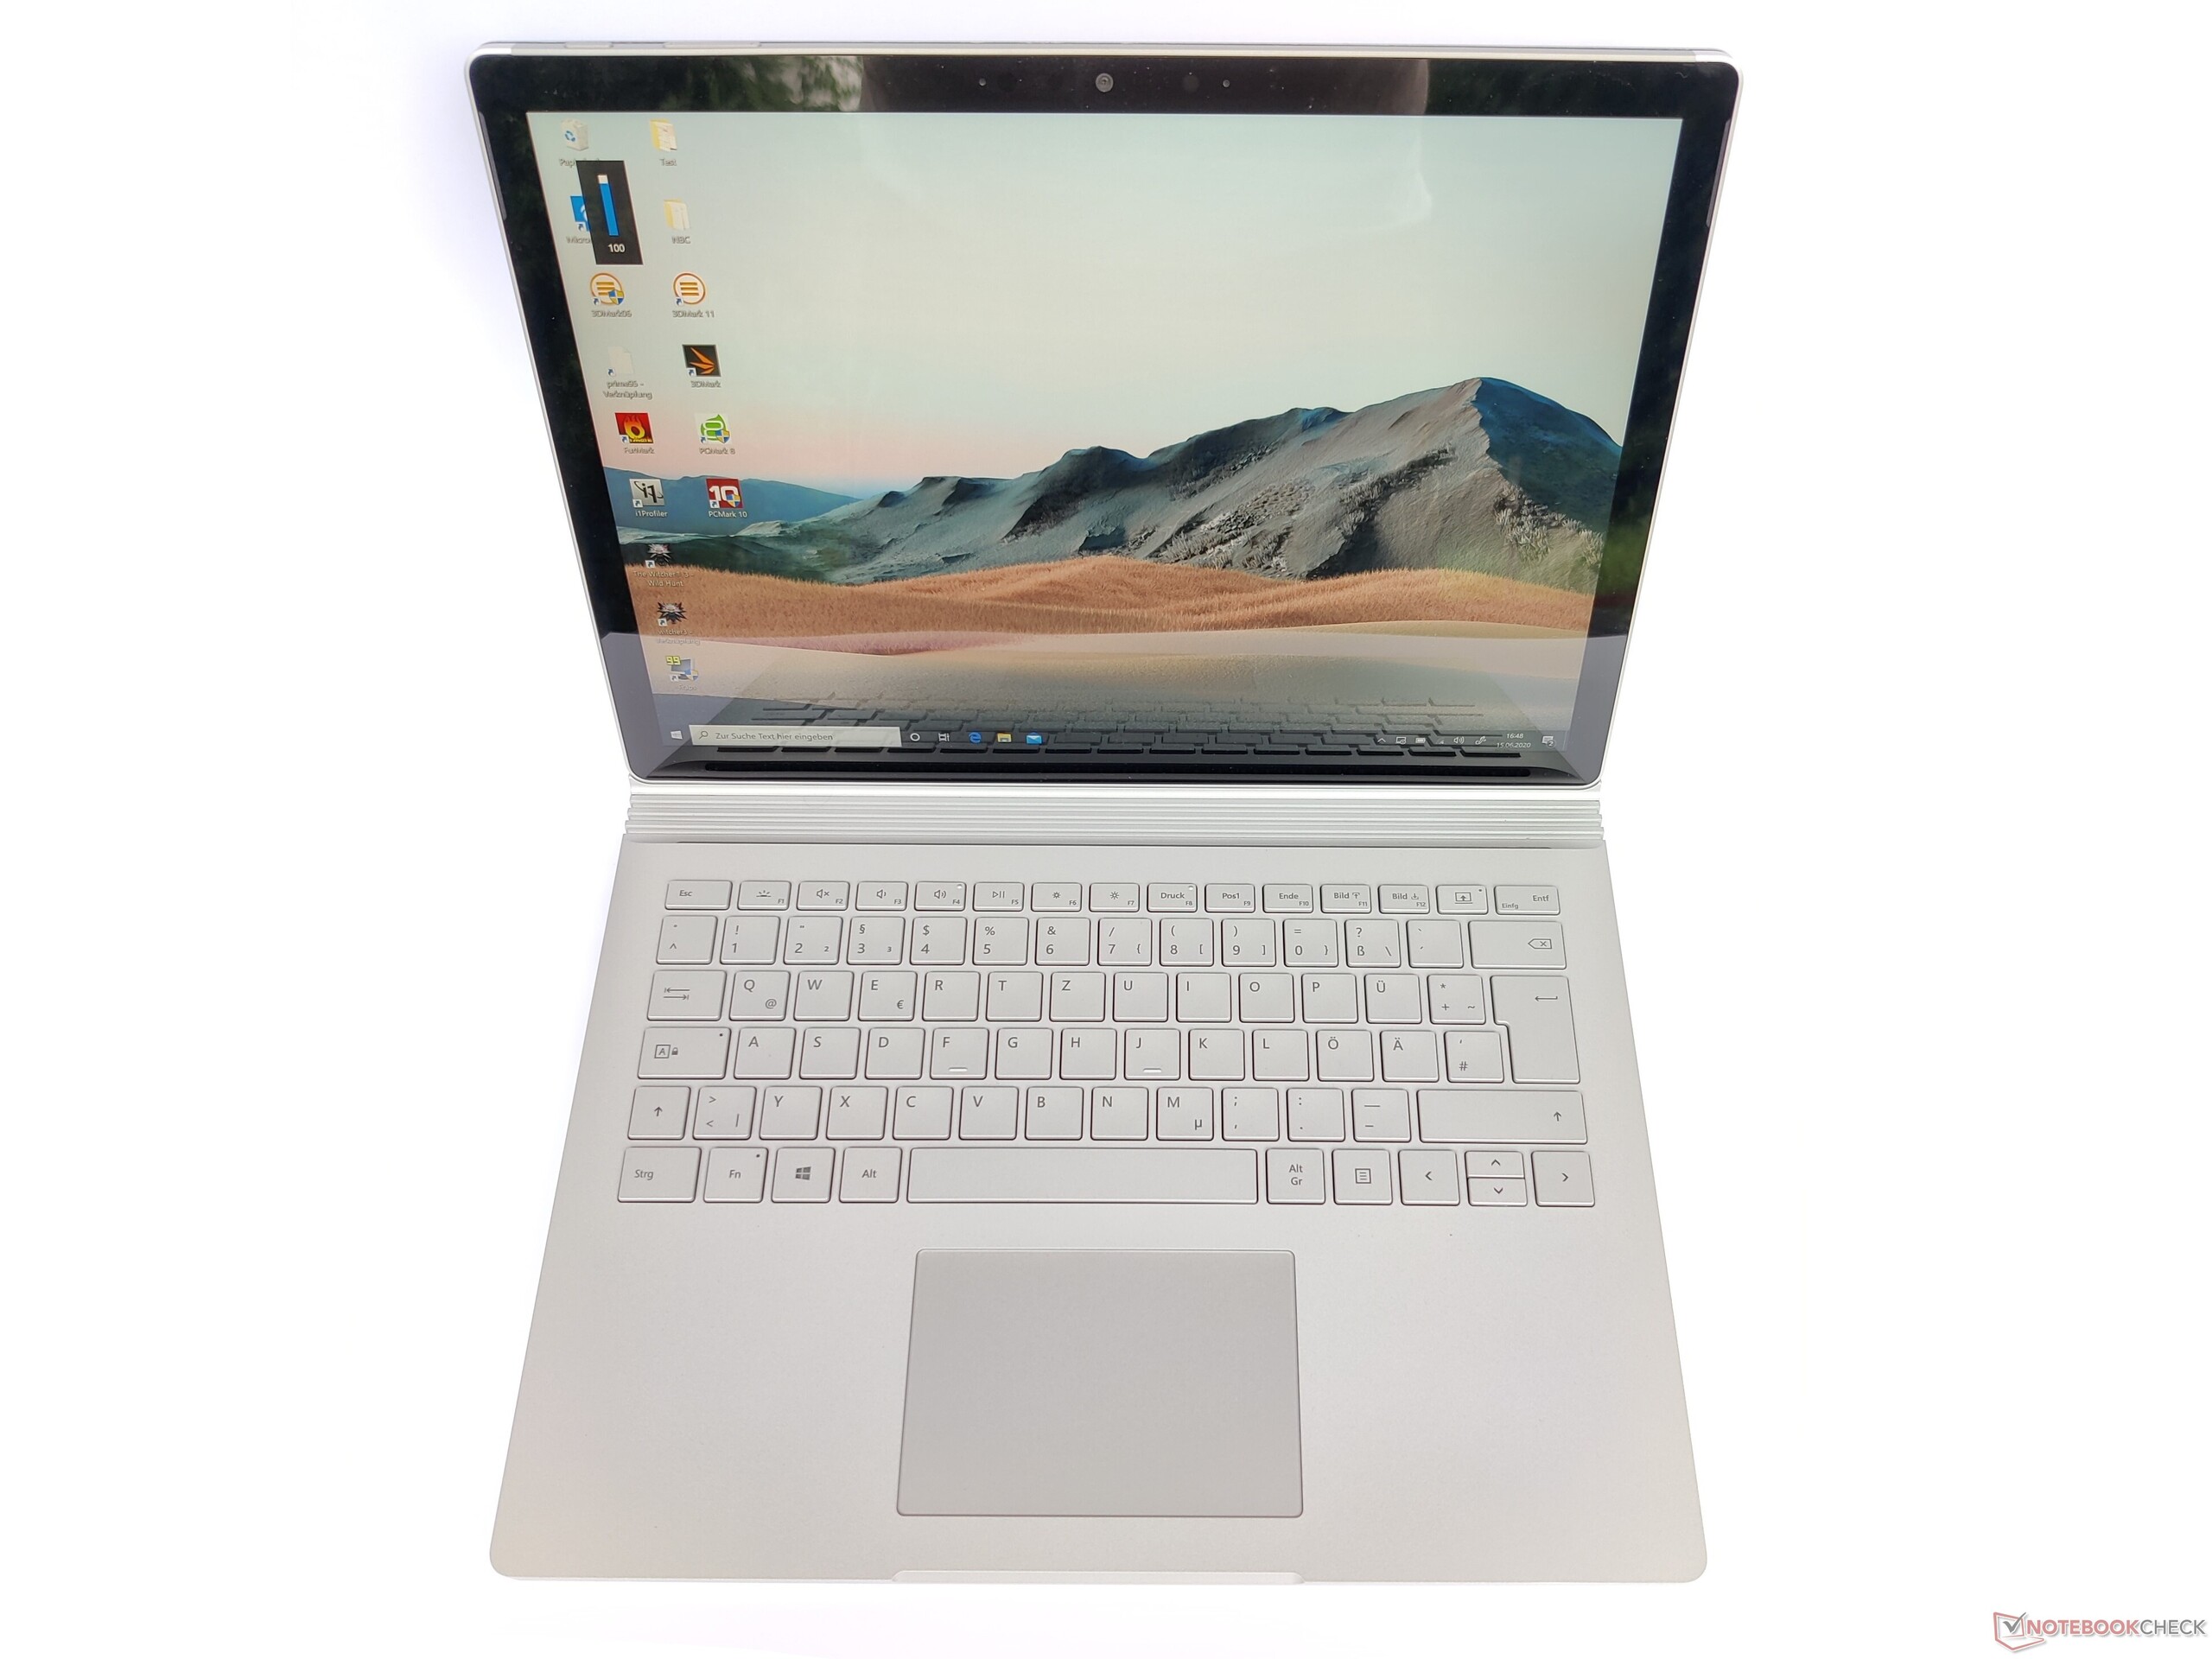
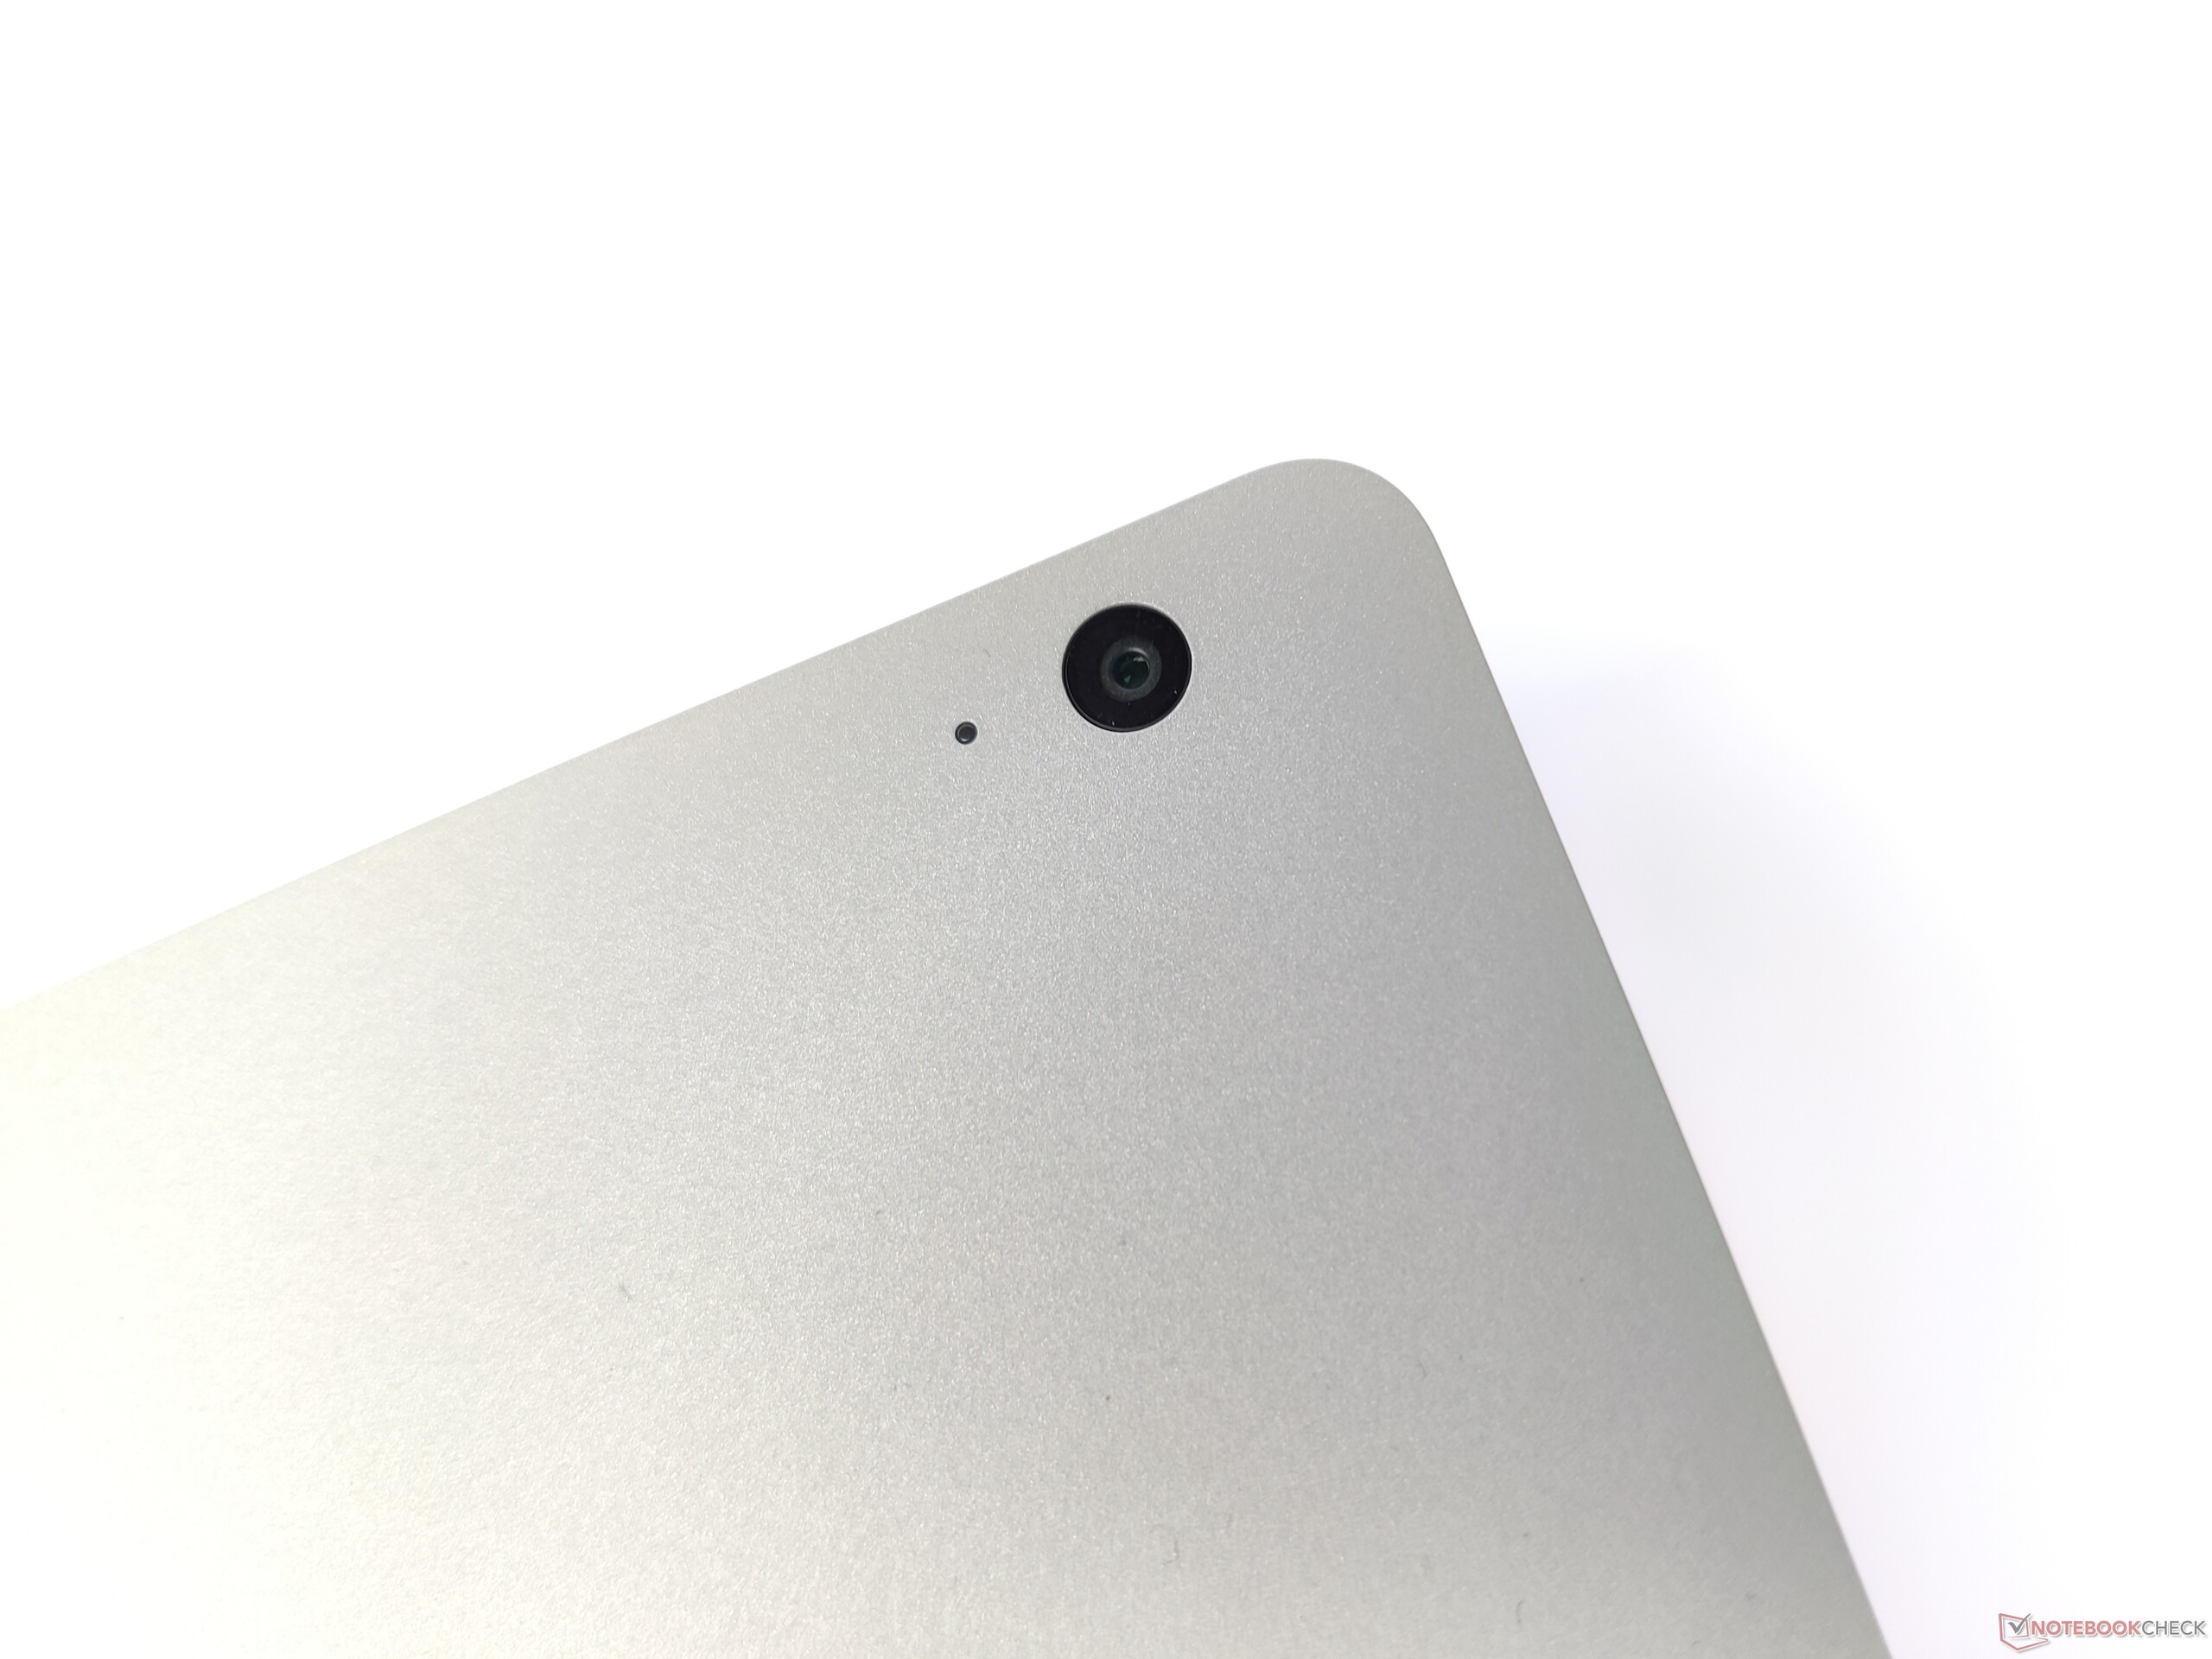
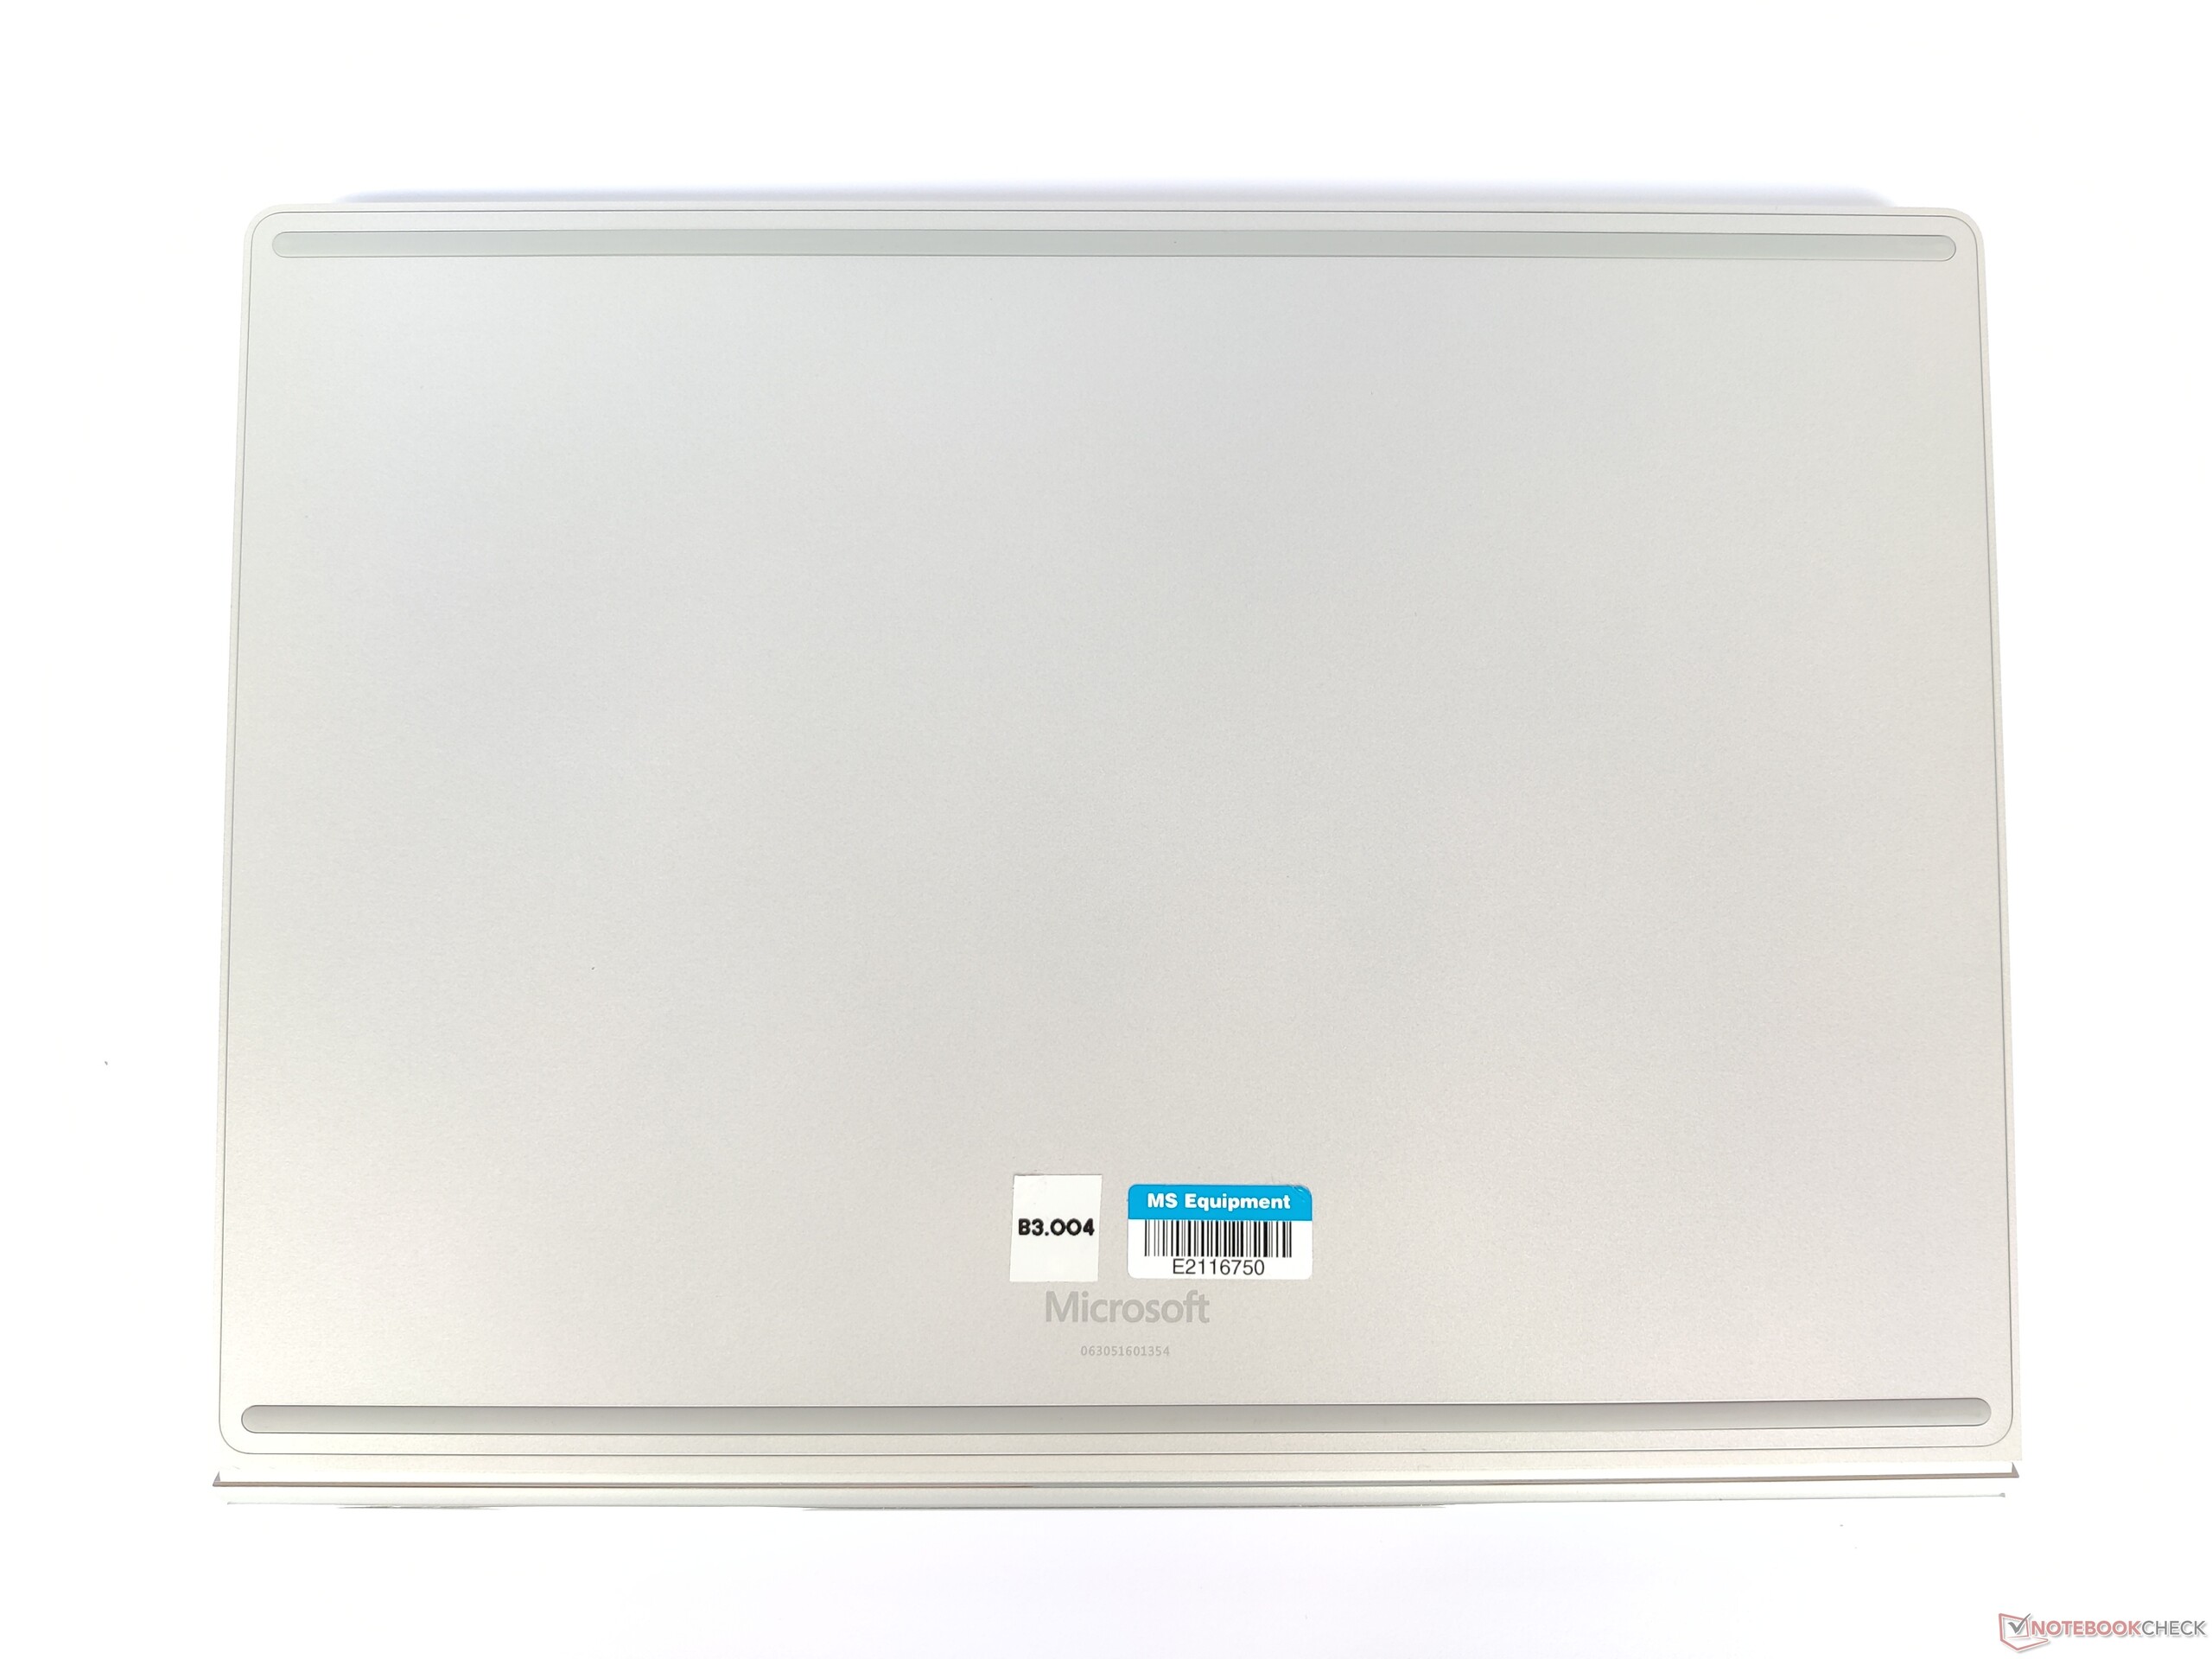
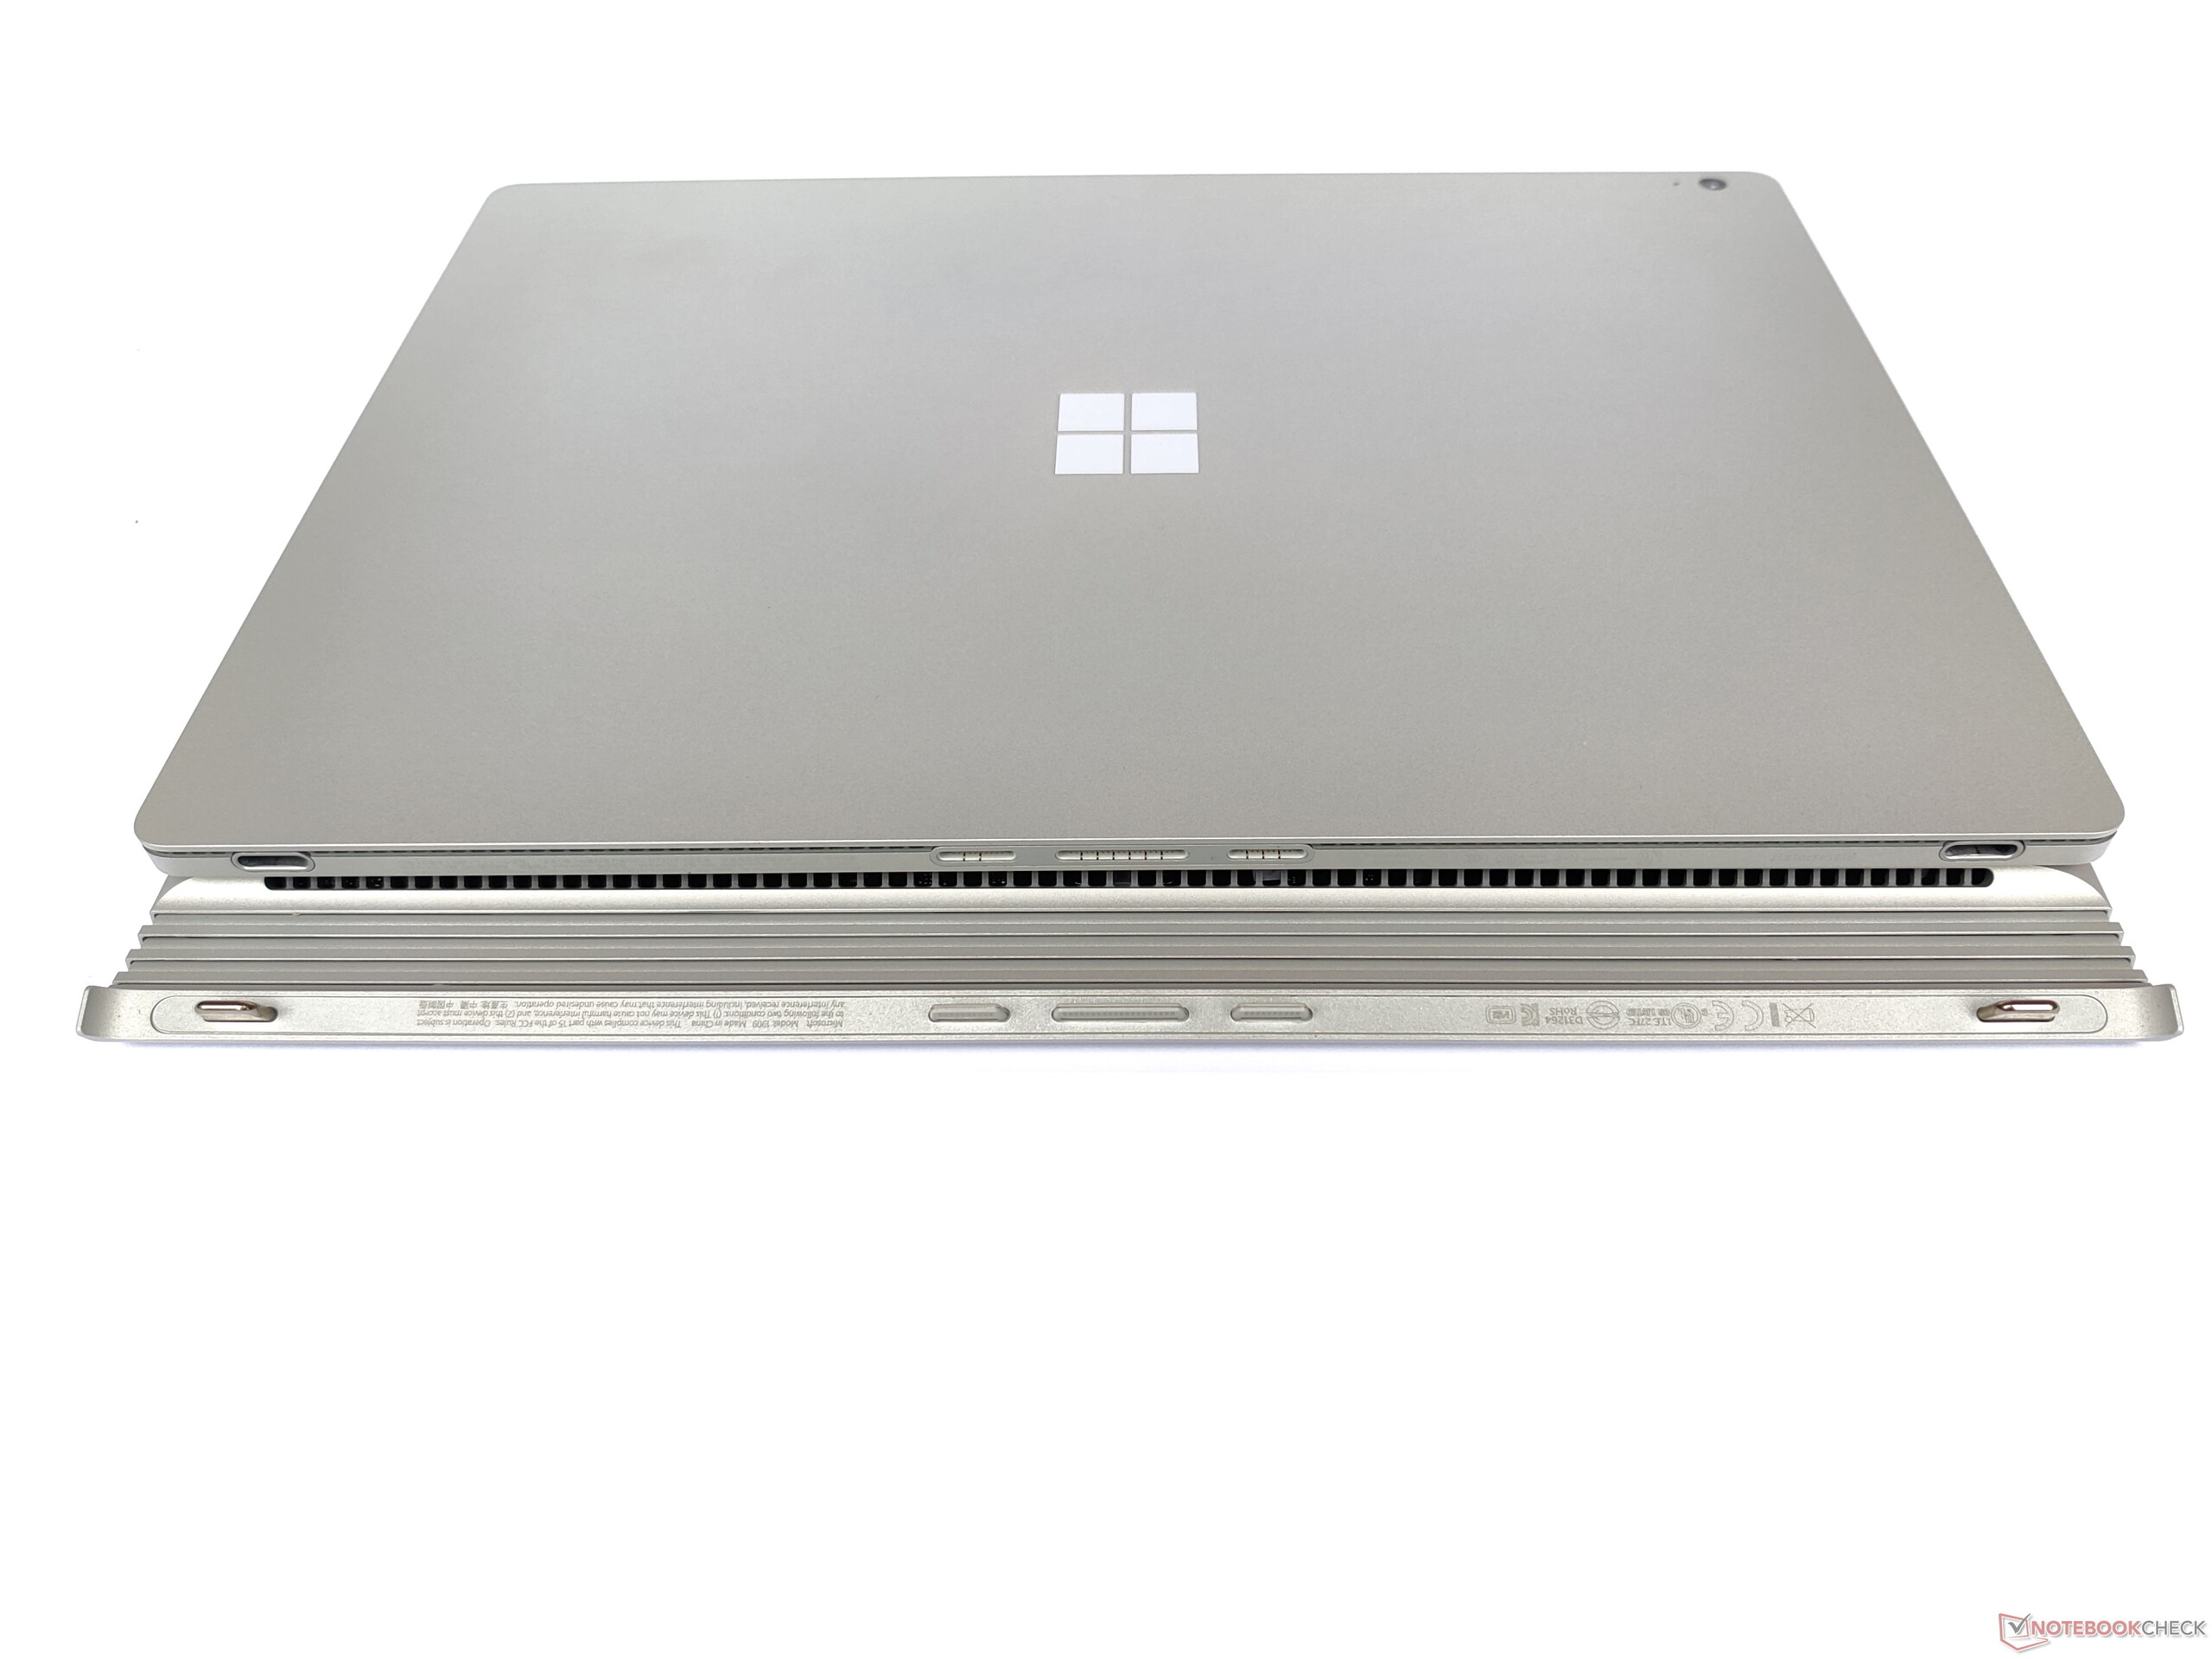
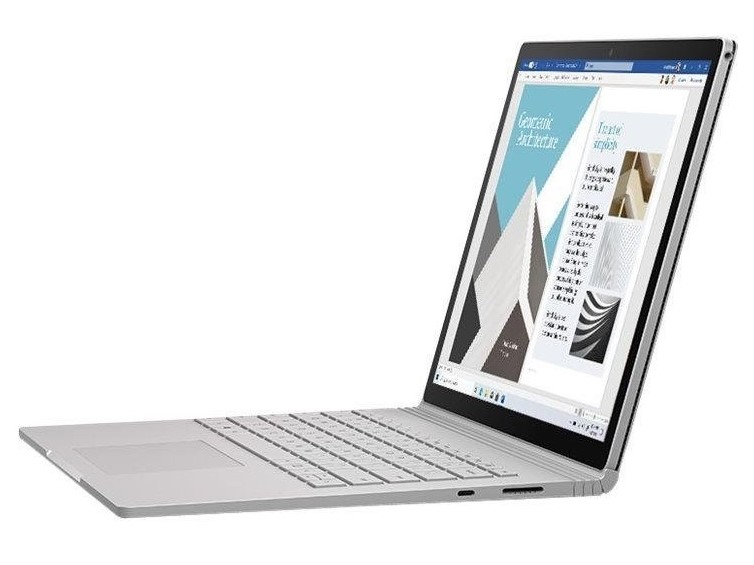
Microsoft gaat verder met de Surface Book 3 13.5 alle kwaliteiten van de kleinere convertible. De afwerking is uitstekend en het scharnier is ook uniek in verband met het houdmechanisme van het display. Maar het is ook langzaam een gewoonte geworden, want er is vrijwel niets veranderd aan de Surface Book. Een verfrissende vormgeving zou daarom ten goede komen aan het Windows-apparaat.
Het Microsoft Surface Book 3 13.5 is een kwalitatief hoogwaardig apparaat, maar de prestaties worden niet optimaal benut.
Microsoft wil gebruikers aanmoedigen om het apparaat te kopen met de nieuwste hardware. Vooral de CPU is niet krachtiger dan het vorige model en de soms zware toeslagen voor meer RAM en een grotere SSD doen de portemonnee niet springen van vreugde. Een aankoop is daarom zeker alleen de moeite waard voor gebruikers die het concept van het Surface Book 3 13.5 specifiek leuk vinden en bereid zijn een hogere prijs te betalen voor een ongewoon apparaat. Eigenaren van het vorige model zouden alleen moeten overwegen om over te stappen als ze de hogere grafische prestaties willen gebruiken. In termen van systeemprestaties en levensduur van de batterij is er geen sprake van een toegevoegde waarde.
Microsoft Surface Book 3 13.5
- 29-06-2020 v7 (old)
Mike Wobker
Price comparison
