
Notebookcheck Logo
Teaser

Intel verslaat Snapdragon duidelijk - Review van de Microsoft Surface Laptop 15 Gen 8

Core Ultra X vs. Snapdragon X2.

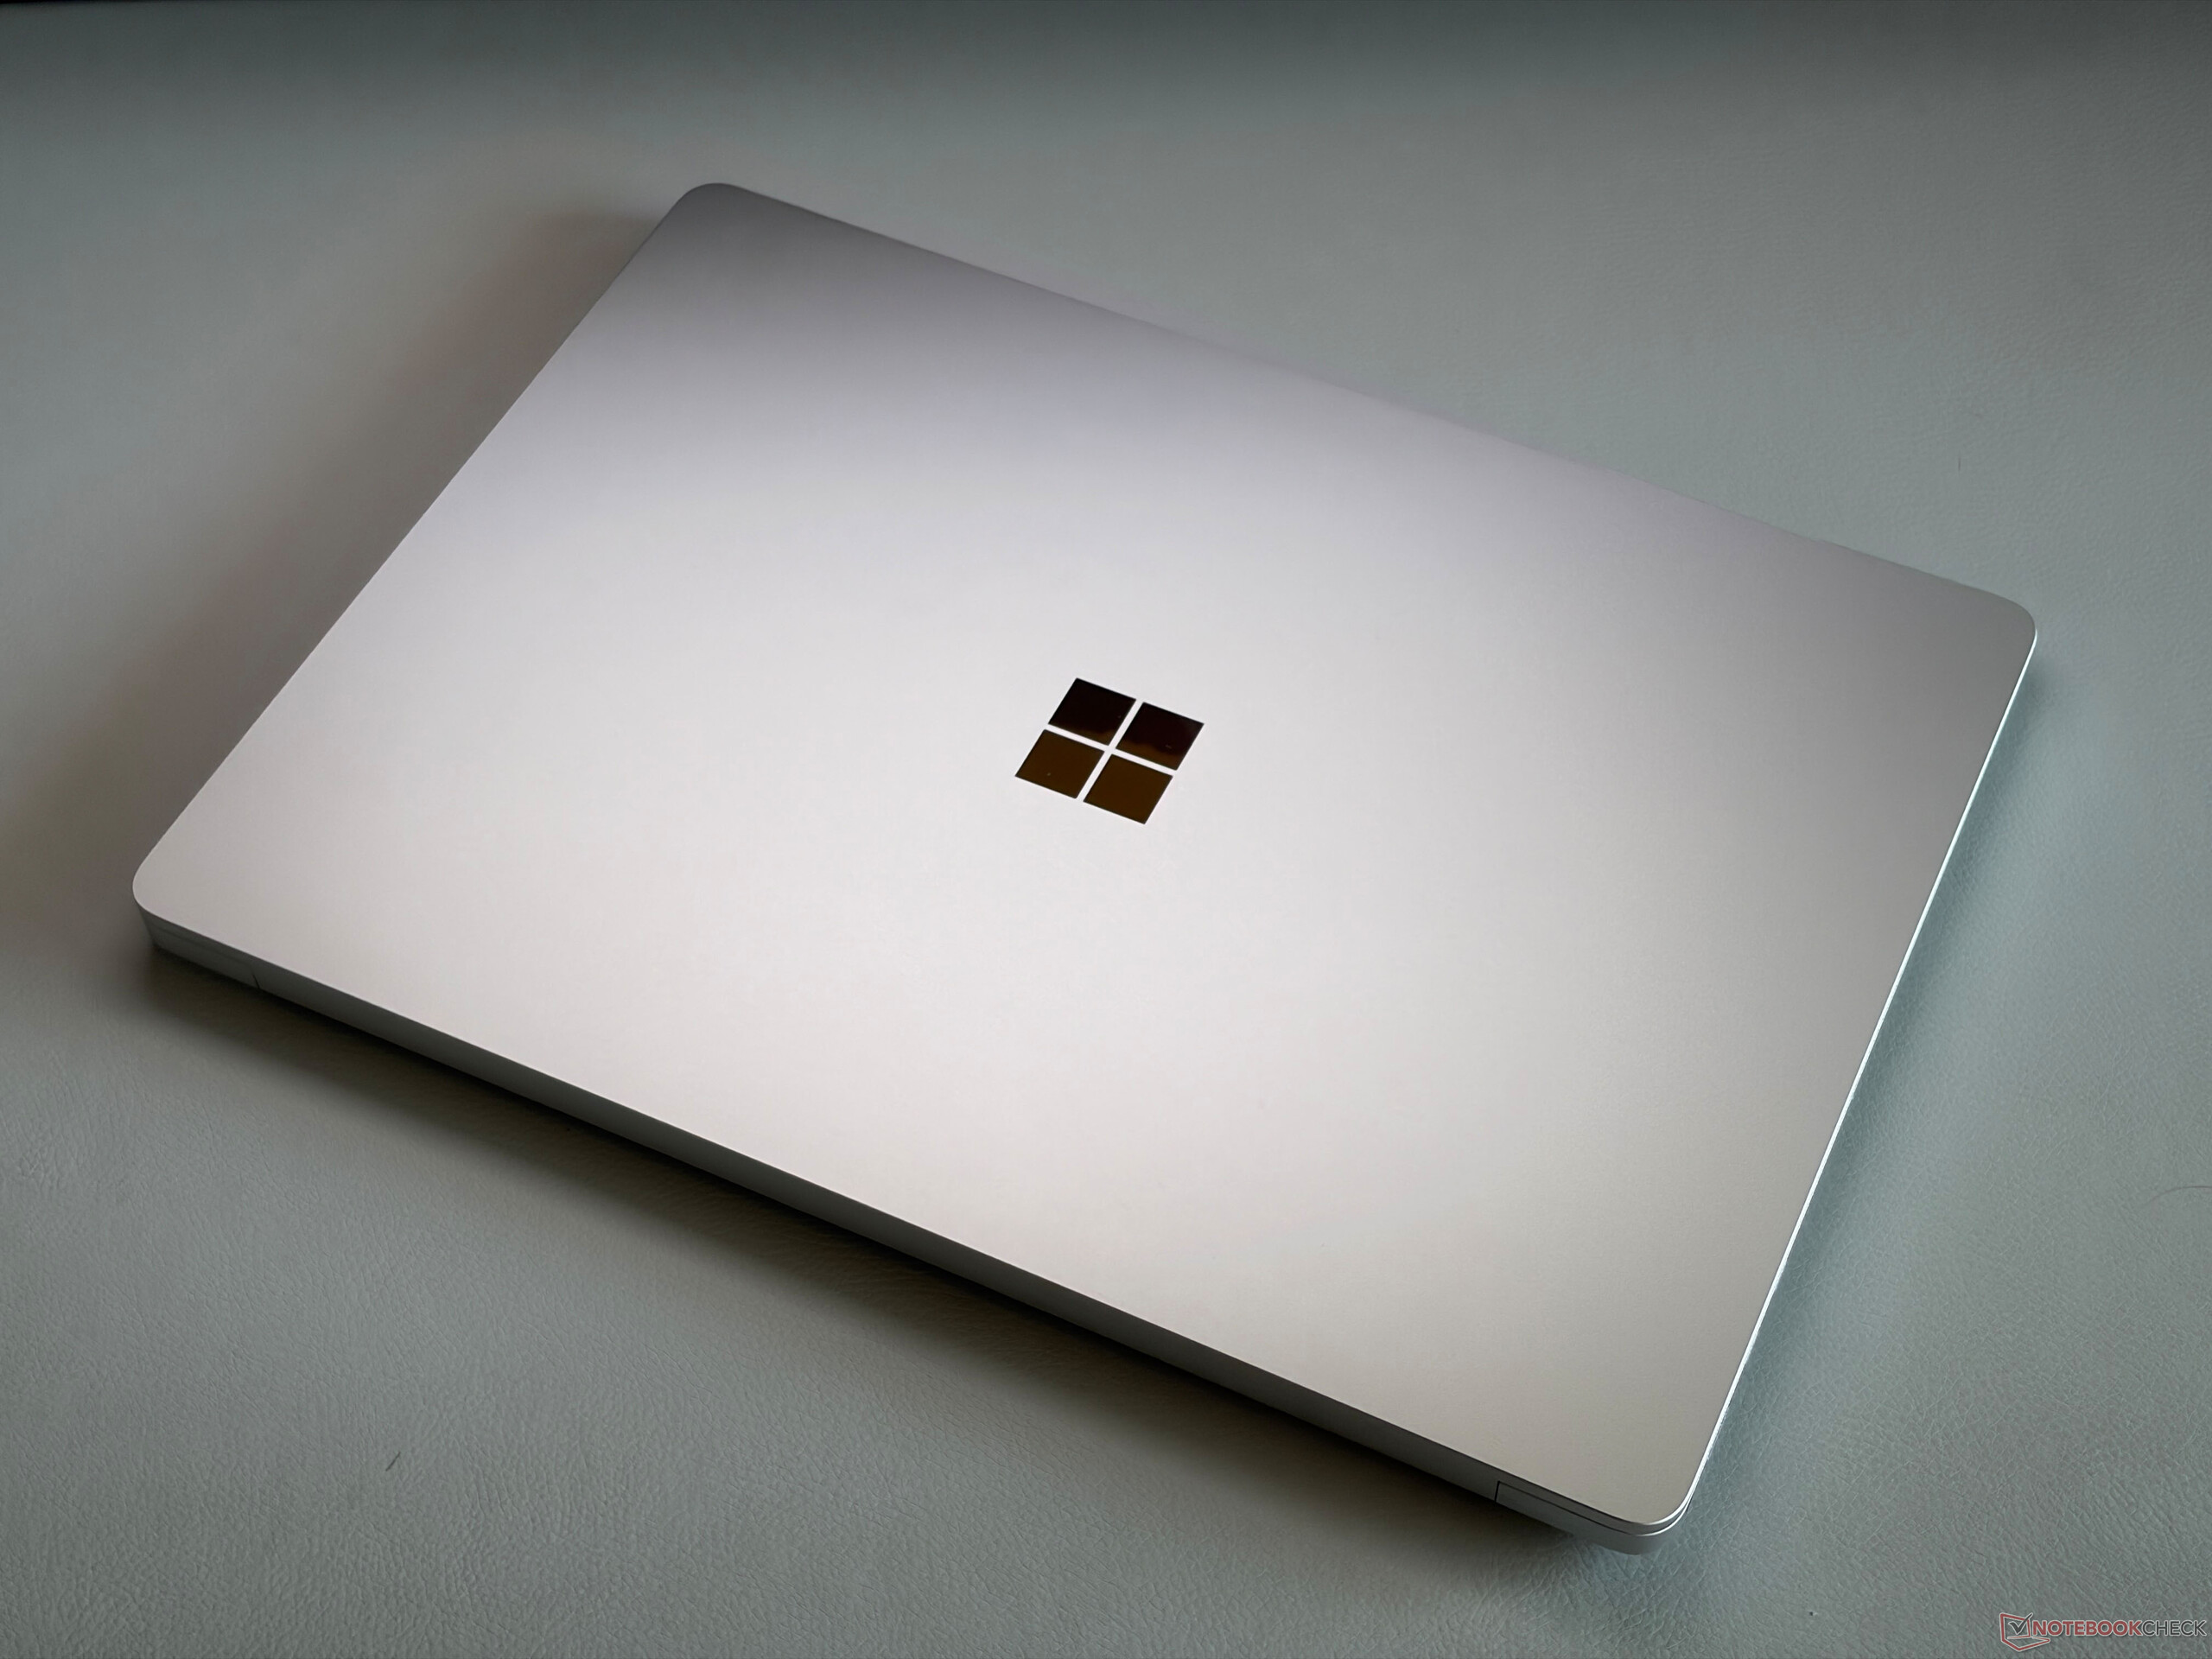
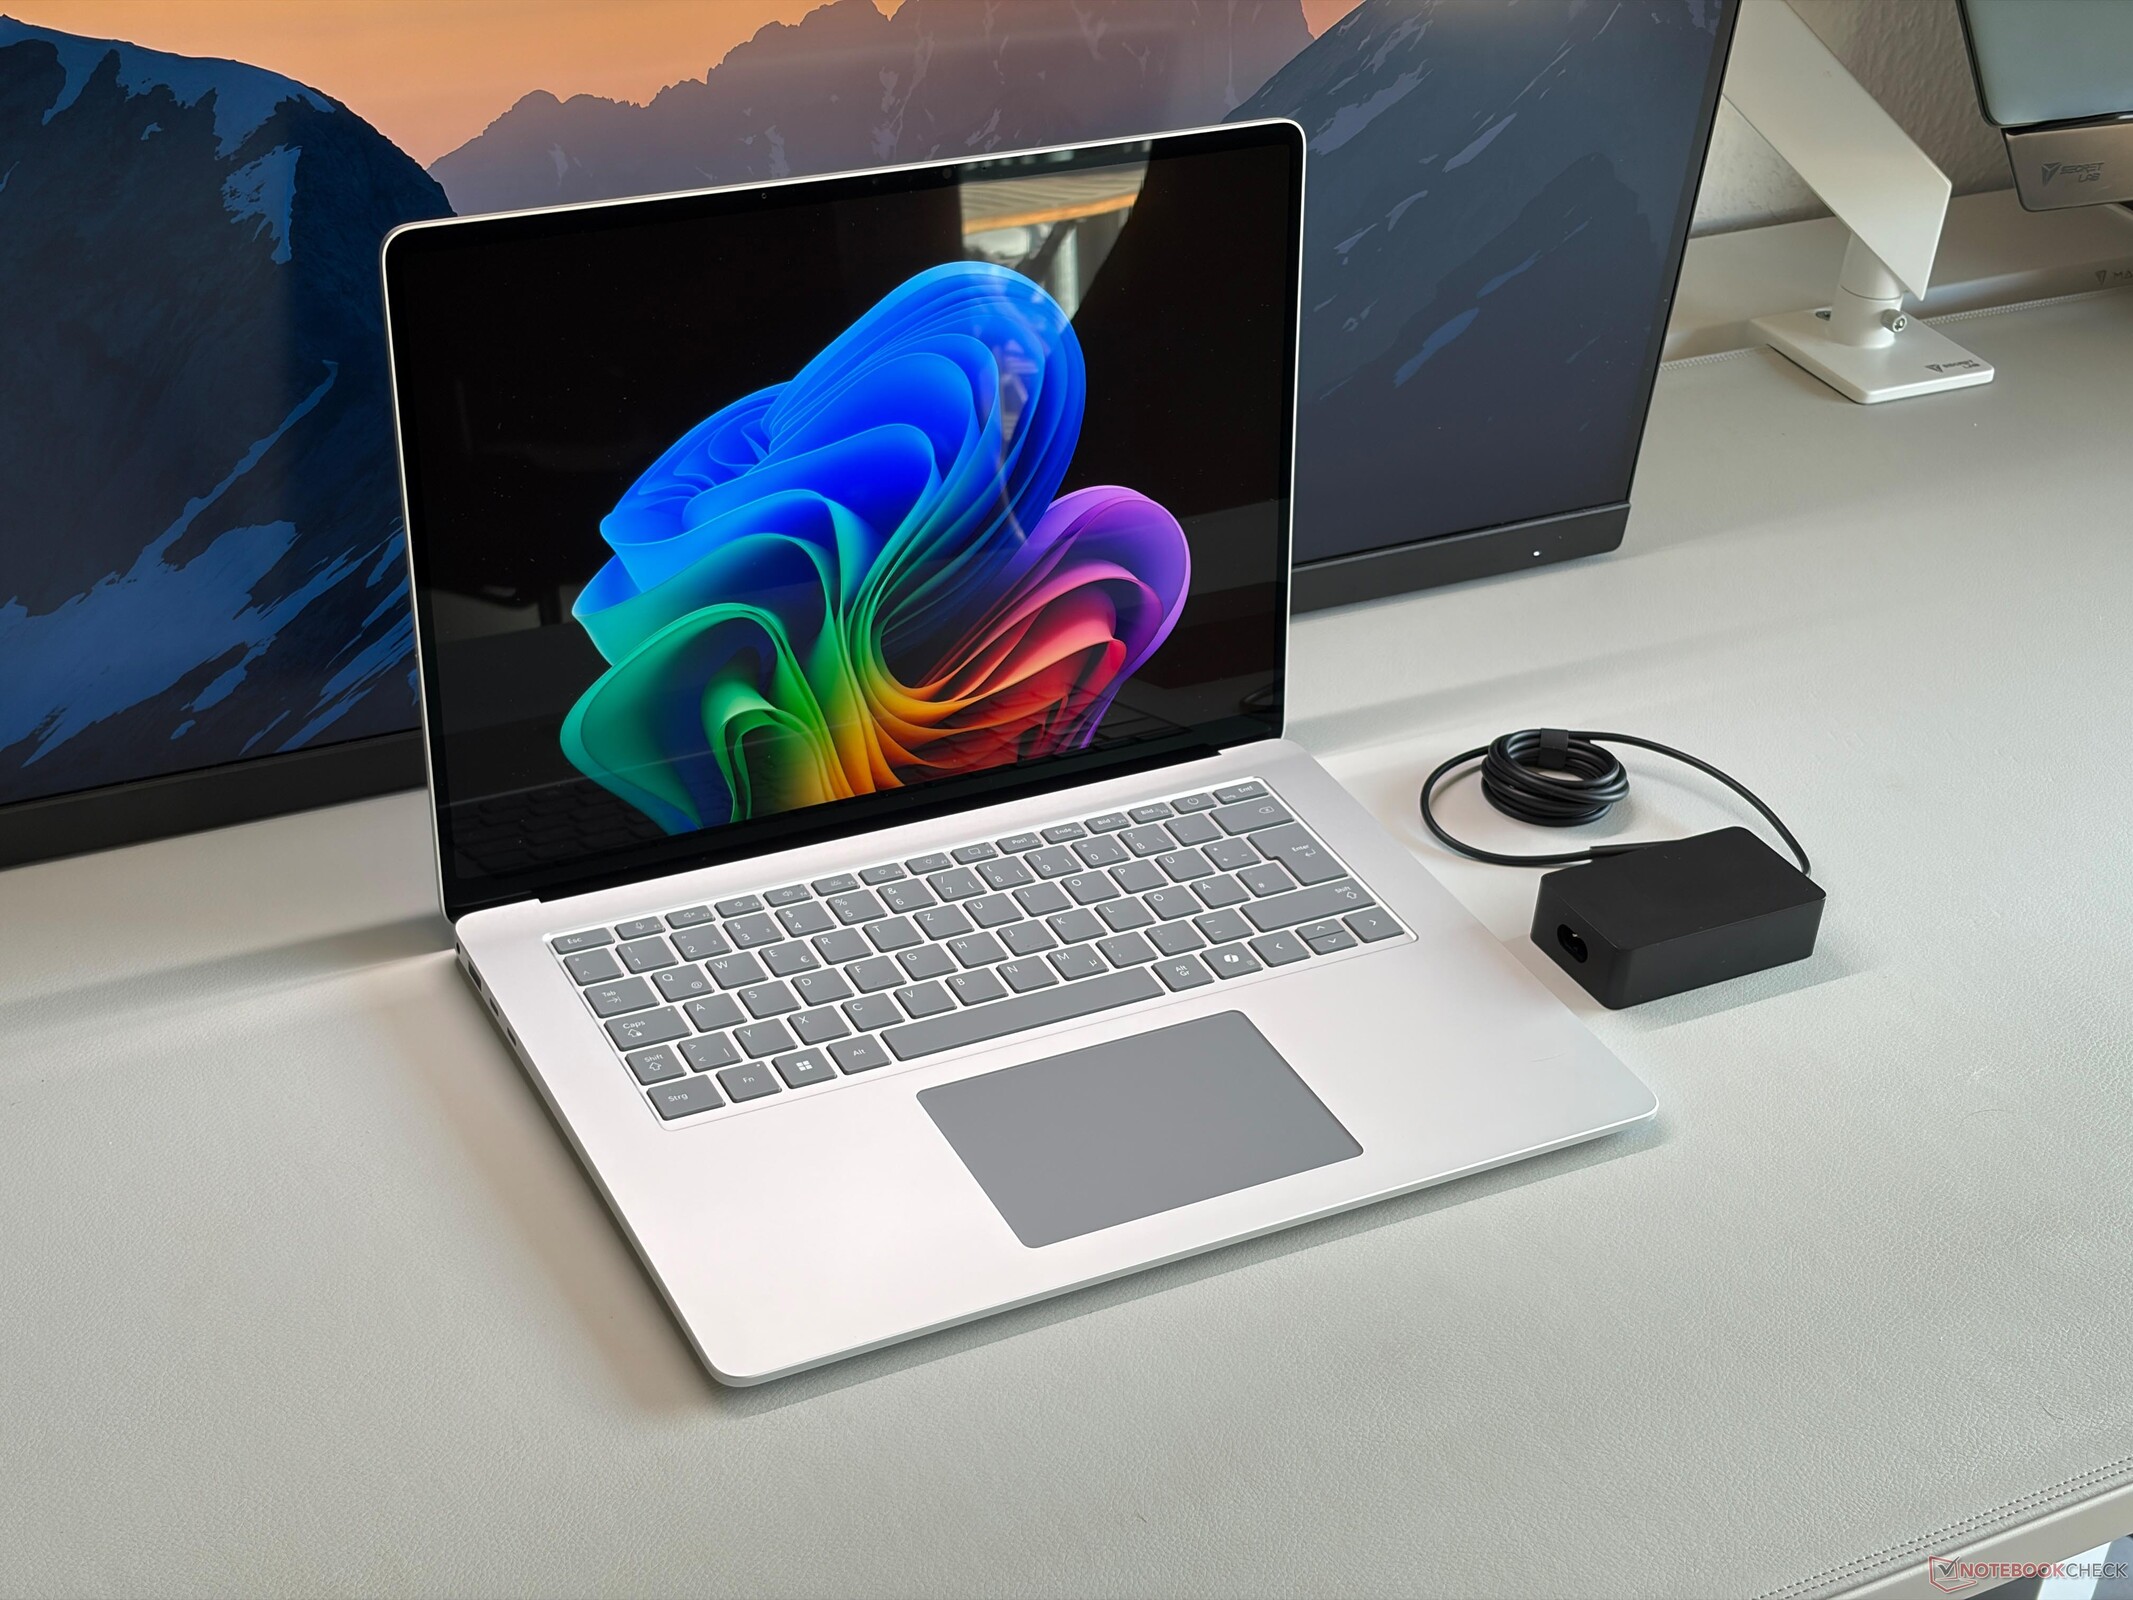
Microsofts huidige Surface Laptop 15 for Business is verkrijgbaar met Intels krachtige Core Ultra X-CPU's, die ook de snelle Arc B390-iGPU bevatten. Het resultaat is de beste Windows-laptop die je momenteel kunt krijgen, en hij is ook beter dan de Snapdragon-modellen voor particuliere klanten.
Andreas Osthoff, 👁 Andreas Osthoff (vertaald door DeepL / Ninh Duy) Gepubliceerd 🇺🇸 🇫🇷 ...
Arc Business Laptop / Notebook MS Surface Microsoft Panther Lake Thunderbolt Touchscreen Wi-Fi 7 Windows

Conclusie - Surface Laptop 15 is beter met Intel

De Surface Laptop 15 Gen 8 is een goede multimedialaptop en de Intel-versie biedt meer GPU-prestaties, betere compatibiliteit met apps en games en Thunderbolt 4-connectiviteit. De ruwe CPU-prestaties zijn waarschijnlijk beter bij de Snapdragon-uitvoering, maar het totaalpakket van de Intel-versie met de superieure iGPU is voor de meeste gebruikers beslist beter. Microsofts aanpak met Snapdragon-modellen voor particuliere gebruikers is naar onze mening verkeerd en wij vinden dat gebruikers moeten kunnen kiezen tegen concurrerende prijzen, wat bij de zakelijke modellen meestal niet het geval is (hoewel deze ook door particuliere gebruikers kunnen worden gekocht).

We waarderen de hoogwaardige bouwkwaliteit, het comfortabele toetsenbord, de goede luidsprekers en de kwaliteit van de webcam. Het is ook een van de weinige premium apparaten met een IPS-touchscreen. Het biedt een goede beeldkwaliteit met nauwkeurige kleuren, 120 Hz en geen PWM-flikkering, wat prettig is als je gevoelig bent voor het flikkeren van OLED-schermen. De accuduur van de Intel-uitvoering is ook zeer goed (Microsoft adverteert voor het Snapdragon-model zelfs met een iets kortere accuduur).

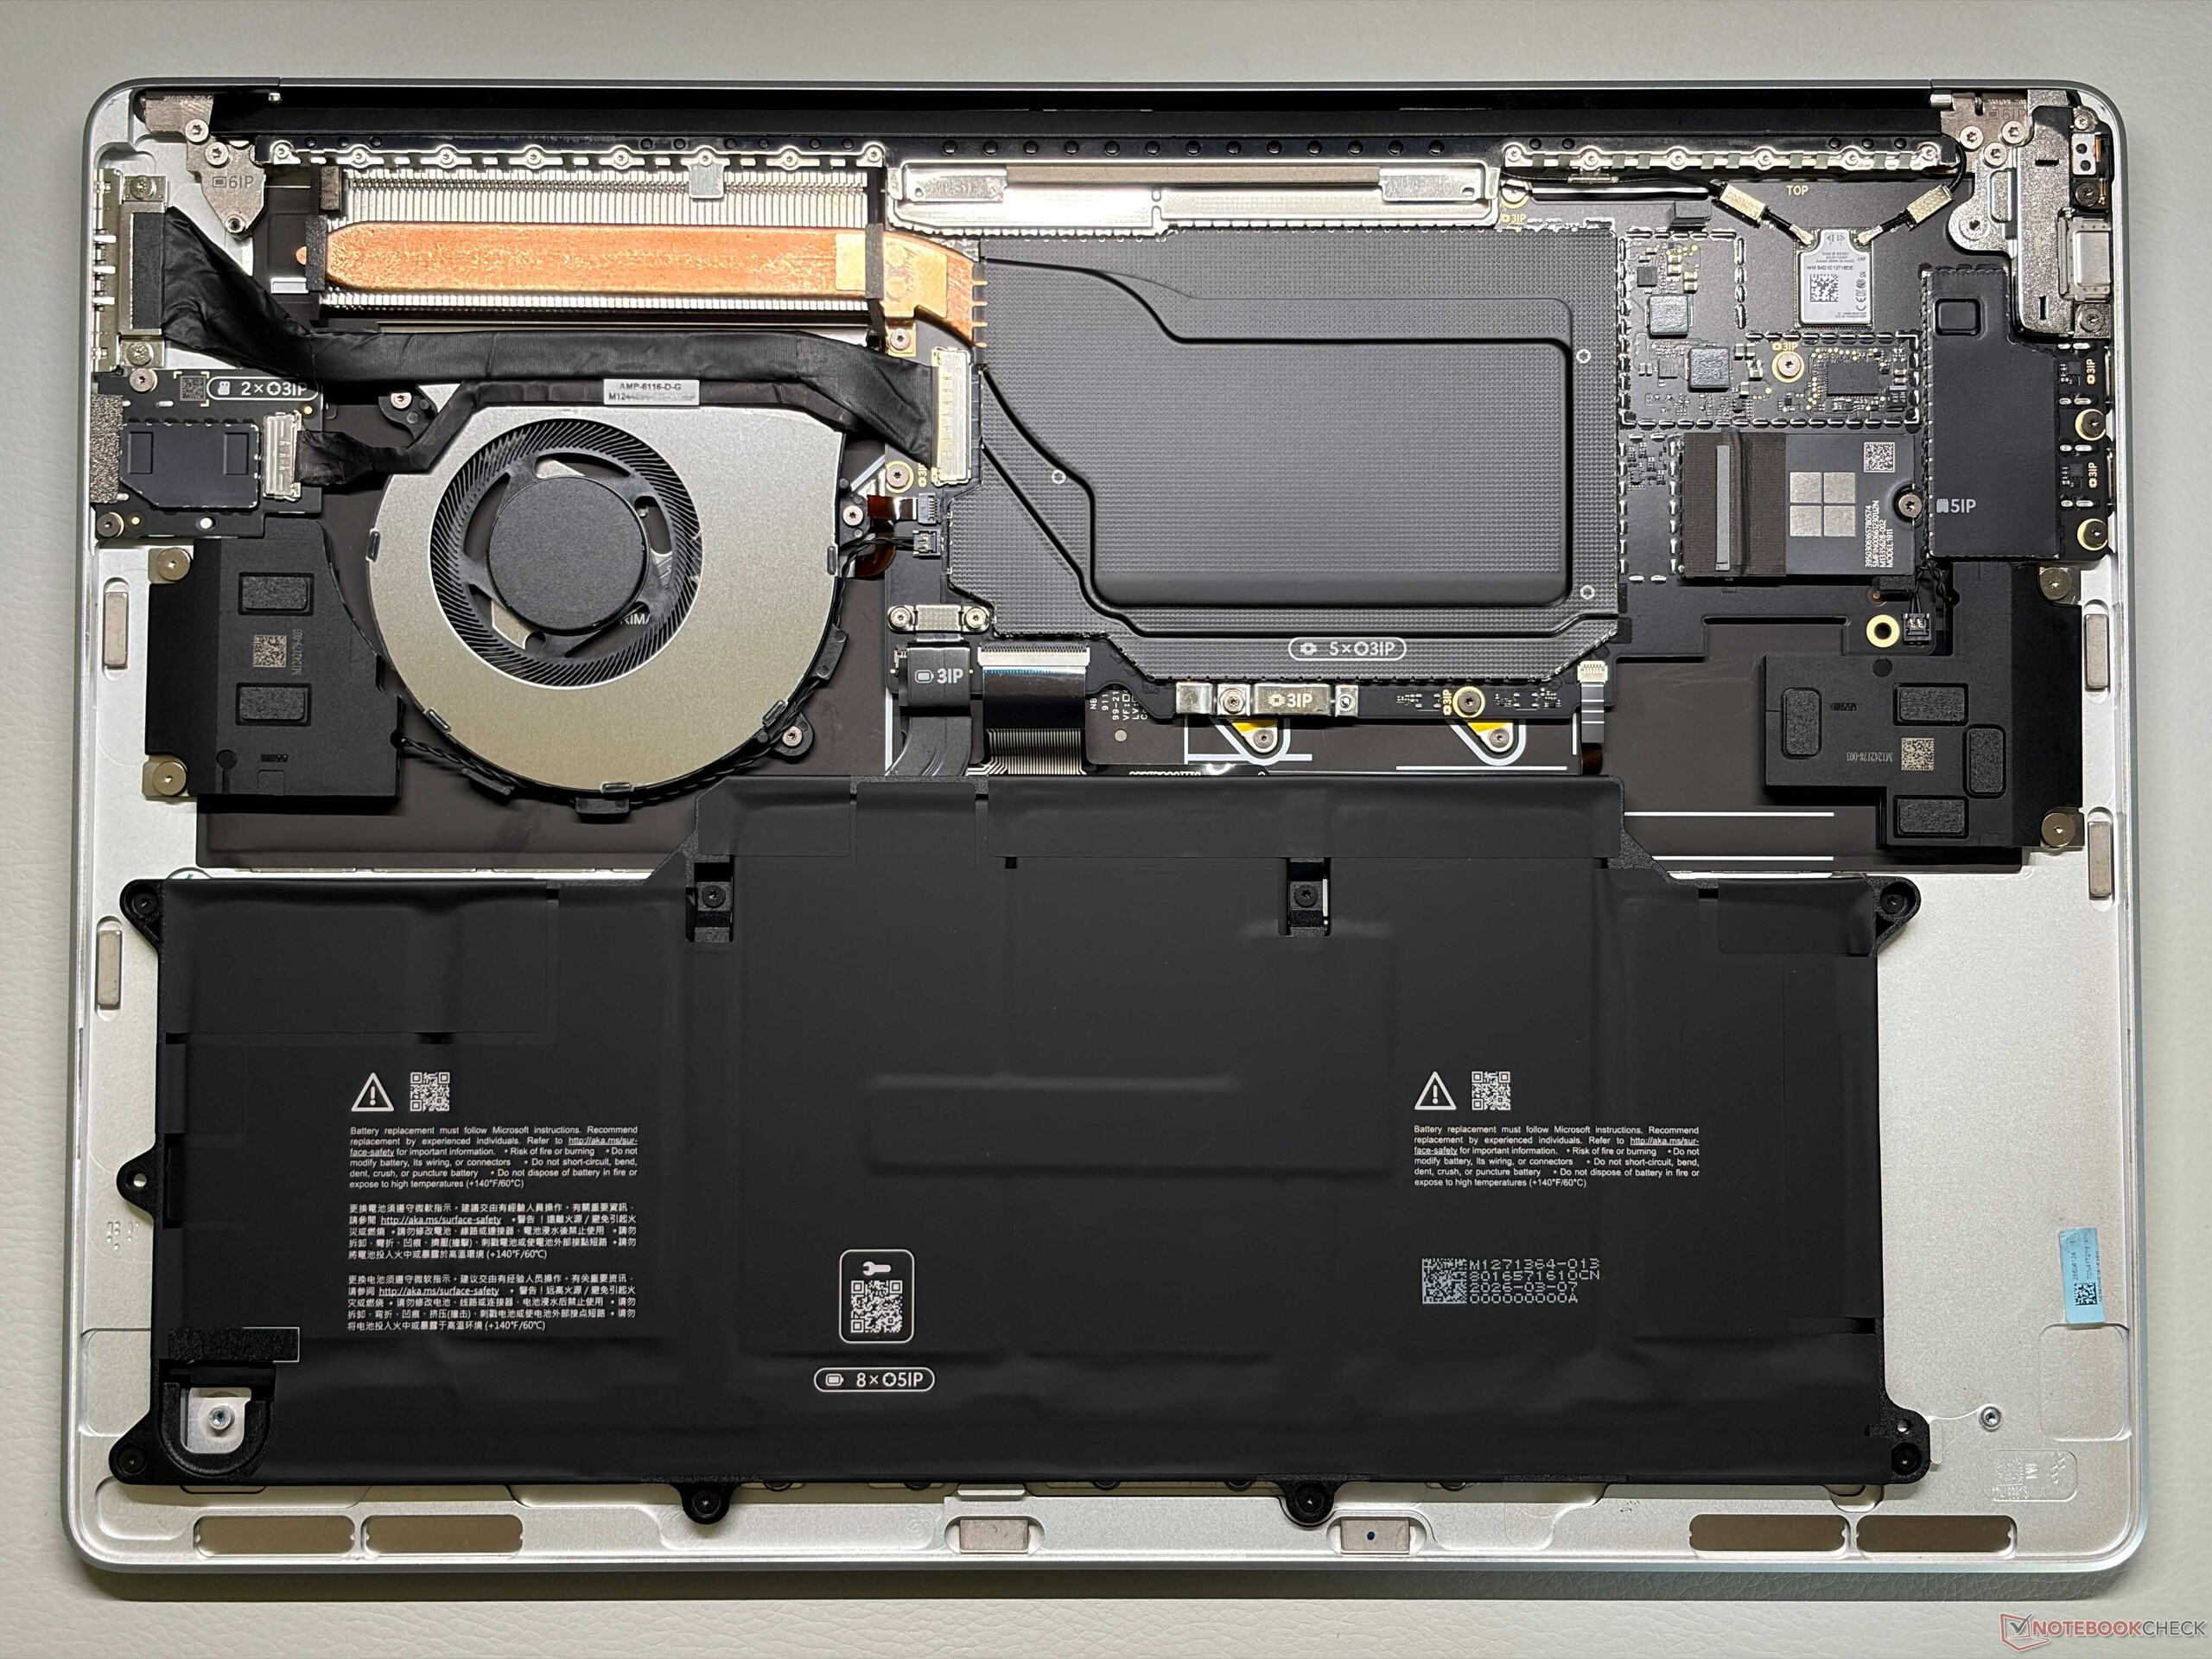
Dit betekent niet dat de Surface Laptop 15 het perfecte apparaat is, want er zijn zeker problemen. De koelprestaties met de enkele ventilator zijn niet geweldig en de prestaties bij langdurige belasting lijden daar enigszins onder. Voor de oude Lunar Lake-processor was dat prima, maar het volledige potentieel van de snelle Panther Lake-chip kan niet worden benut. De 65W-voedingsadapter schiet onder belasting ook tekort, in elk geval gedurende enkele minuten voordat de prestaties worden teruggeschroefd. We zouden ook graag reguliere M.2-2280-SSD's zien, aangezien er volop vrije ruimte in de behuizing is. De Surface Connect-poort is vrij groot en we zouden liever een extra USB-C-poort zien en misschien een reguliere SD-kaartlezer in plaats van microSD. De prijzen voor RAM- en opslagupgrades zijn ook astronomisch.

Al met al is de Surface Laptop 15 Gen 8 een goede multimedialaptop en is de Intel-versie voor de meeste gebruikers de betere keuze, maar concurrenten zoals de Lenovo ThinkPad X9-15p bieden een beter totaalpakket. We hopen dat Microsoft het apparaat volgend jaar bijwerkt en enkele van de genoemde problemen verhelpt, en zich niet alleen richt op de aankomende Surface Laptop Ultra met RTX Spark.

Pro

+ hoogwaardige en stevige behuizing
+ goede systeemprestaties
+ goede accuduur
+ snelle microSD-Express-kaartlezer
+ comfortabele invoerapparaten
+ uitstekende kleurprofielen af fabriek
+ zeer stil bij dagelijks gebruik
+ goede onderhoudsmogelijkheden/toegankelijkheid

Contra

- RAM kan niet worden uitgebreid
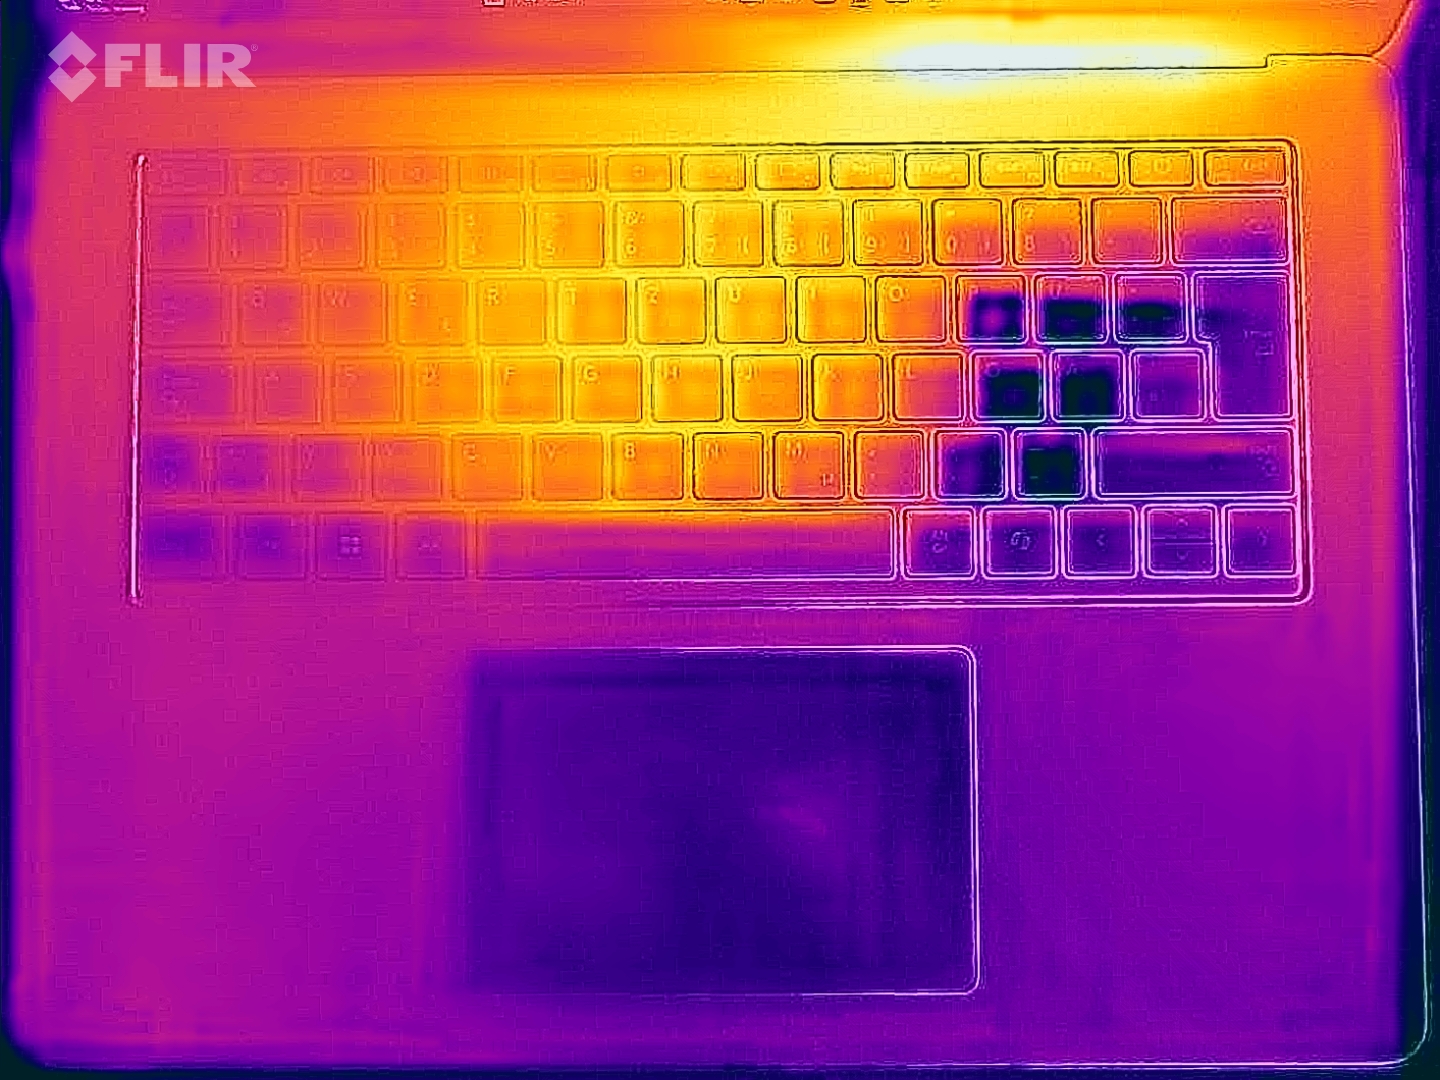
- toetsenbord wordt merkbaar warm onder belasting
- coil whine
- ontoereikende voeding
- dure upgrades
- geen WWAN-module
- slechts 1 jaar garantie

Prijs en beschikbaarheid

Je kunt de Surface Laptop 8 15 for Business met de Core Ultra X CPU rechtstreeks bij Microsoft bestellen vanaf $2749.99.

Amazon Logo
  • $238.94
    Microsoft Surface Laptop 3 15" Touch-Screen - CORE I5 1035G7 - 8GB Memory - 128GB Solid State Drive Platinum (Renewed)
  • $483.98
    Microsoft Surface Laptop 5 13.5" Touchscreen Notebook - 2256 x 1504 - Intel Core i7 12th Gen i7-1265U - Intel Evo Platform - 16 GB Total RAM - 512 GB SSD (Platinum) (Renewed)
  • $685.00
    Microsoft Surface Laptop 4 15” Touch-Screen – Intel Core i7 - 32GB - 1TB Solid State Drive - Matte Black

Specificaties

Microsoft Surface Laptop 15 Gen 8 (Surface Laptop Serie)
Processor
Intel Core Ultra X7 368H 16c/16t, 4 x 4.9 GHz Intel Cougar Cove P-Core, 8 x 4.0 GHz Intel Darkmont E-Core, 4 x 3.6 GHz Intel Darkmont E-Core, 65 W PL2 / Short Burst, 35 W PL1 / Sustained, Panther Lake
Grafische kaart
Intel Arc B390 12 Xe3 Panther Lake iGPU, Core: 2500 MHz, RAM: 800 MHz, 32.0.101.8738
Geheugen
16 GB 
, LPDDR5x-8533, Dual-Channel, onboard
Beeldscherm
15.00 inch 3:2, 3270 x 2180 pixel 262 PPI, capacitive, LP150UD2-SPA1, IPS, glimmend: ja, 120 Hz
Moederbord
Intel Panther Lake-H PCH
Opslag
SK hynix PVC10 HFS256GEM4X182N, 256 GB 
, 188 GB beschikbaar
Geluidskaart
Intel Panther Lake-H PCH - High Definition Audio - AVS (Audio, Voice, Speech)
Verbindingen
1 USB 3.0, 2 Thunderbolt 4, USB-C Power Delivery (PD), 2 DisplayPort, 1 Docking Station Port, Audio Verbindingen: 3.5 mm stereo, Card Reader: microSD Express, Helderheidssensor
Netwerkmogelijkheden
Intel BE201 320MHz (a/b/g/h/n = Wi-Fi 4/ac = Wi-Fi 5/ax = Wi-Fi 6/ Wi-Fi 6E 6 GHz be = Wi-Fi 7), Bluetooth 5.4
Afmetingen
hoogte x breedte x diepte (in mm): 18.3 x 329 x 239
Batterij
66 Wh Lithium-Polymer
Besturingssysteem
Microsoft Windows 11 Home
Camera
Webcam: IR
Primaire camera: 2 MPix
Bijkomende functionaliteiten
Luidsprekers: Stereo, Toetsenbord: Chiclet, 65W PSU, 12 Maanden Garantie
Gewicht
1.651 kg, Voeding: 255 g
Prijs
2400 Euro
Opmerking: De fabrikant kan onderdelen van verschillende leveranciers gebruiken, waaronder beeldschermen, schijven of geheugensticks met vergelijkbare specificaties.


Behuizing, connectiviteit en invoerapparaten

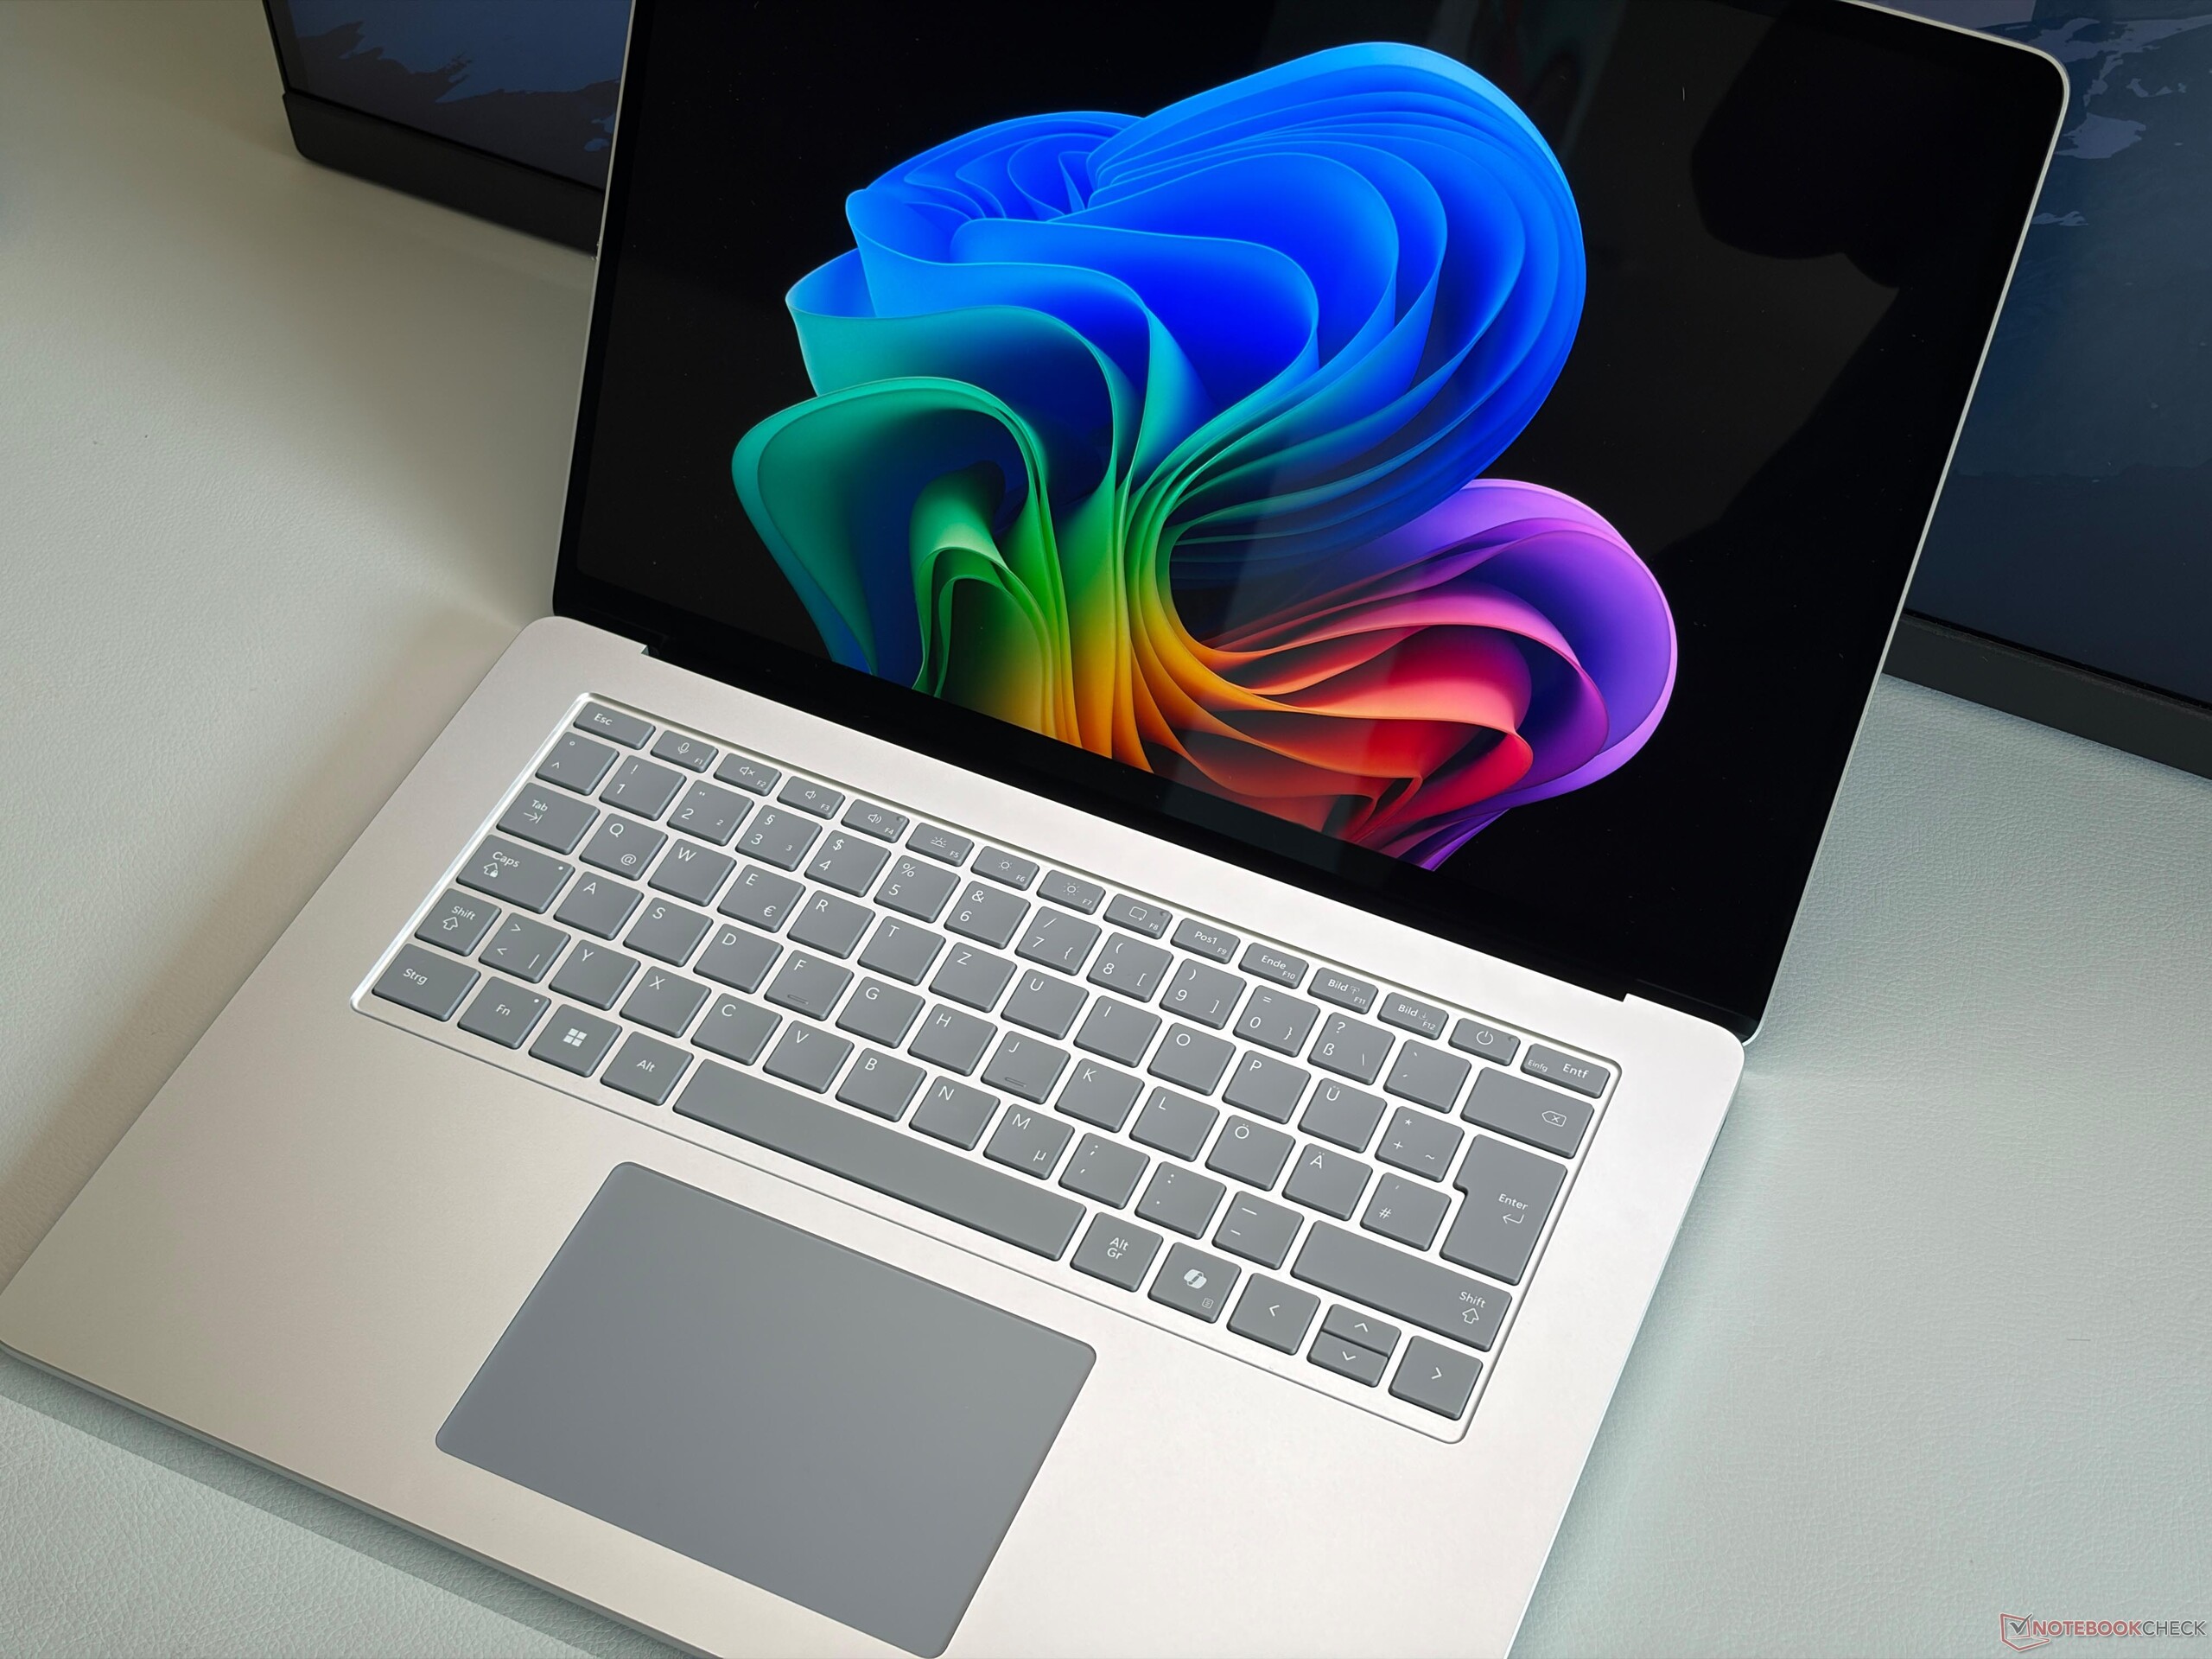
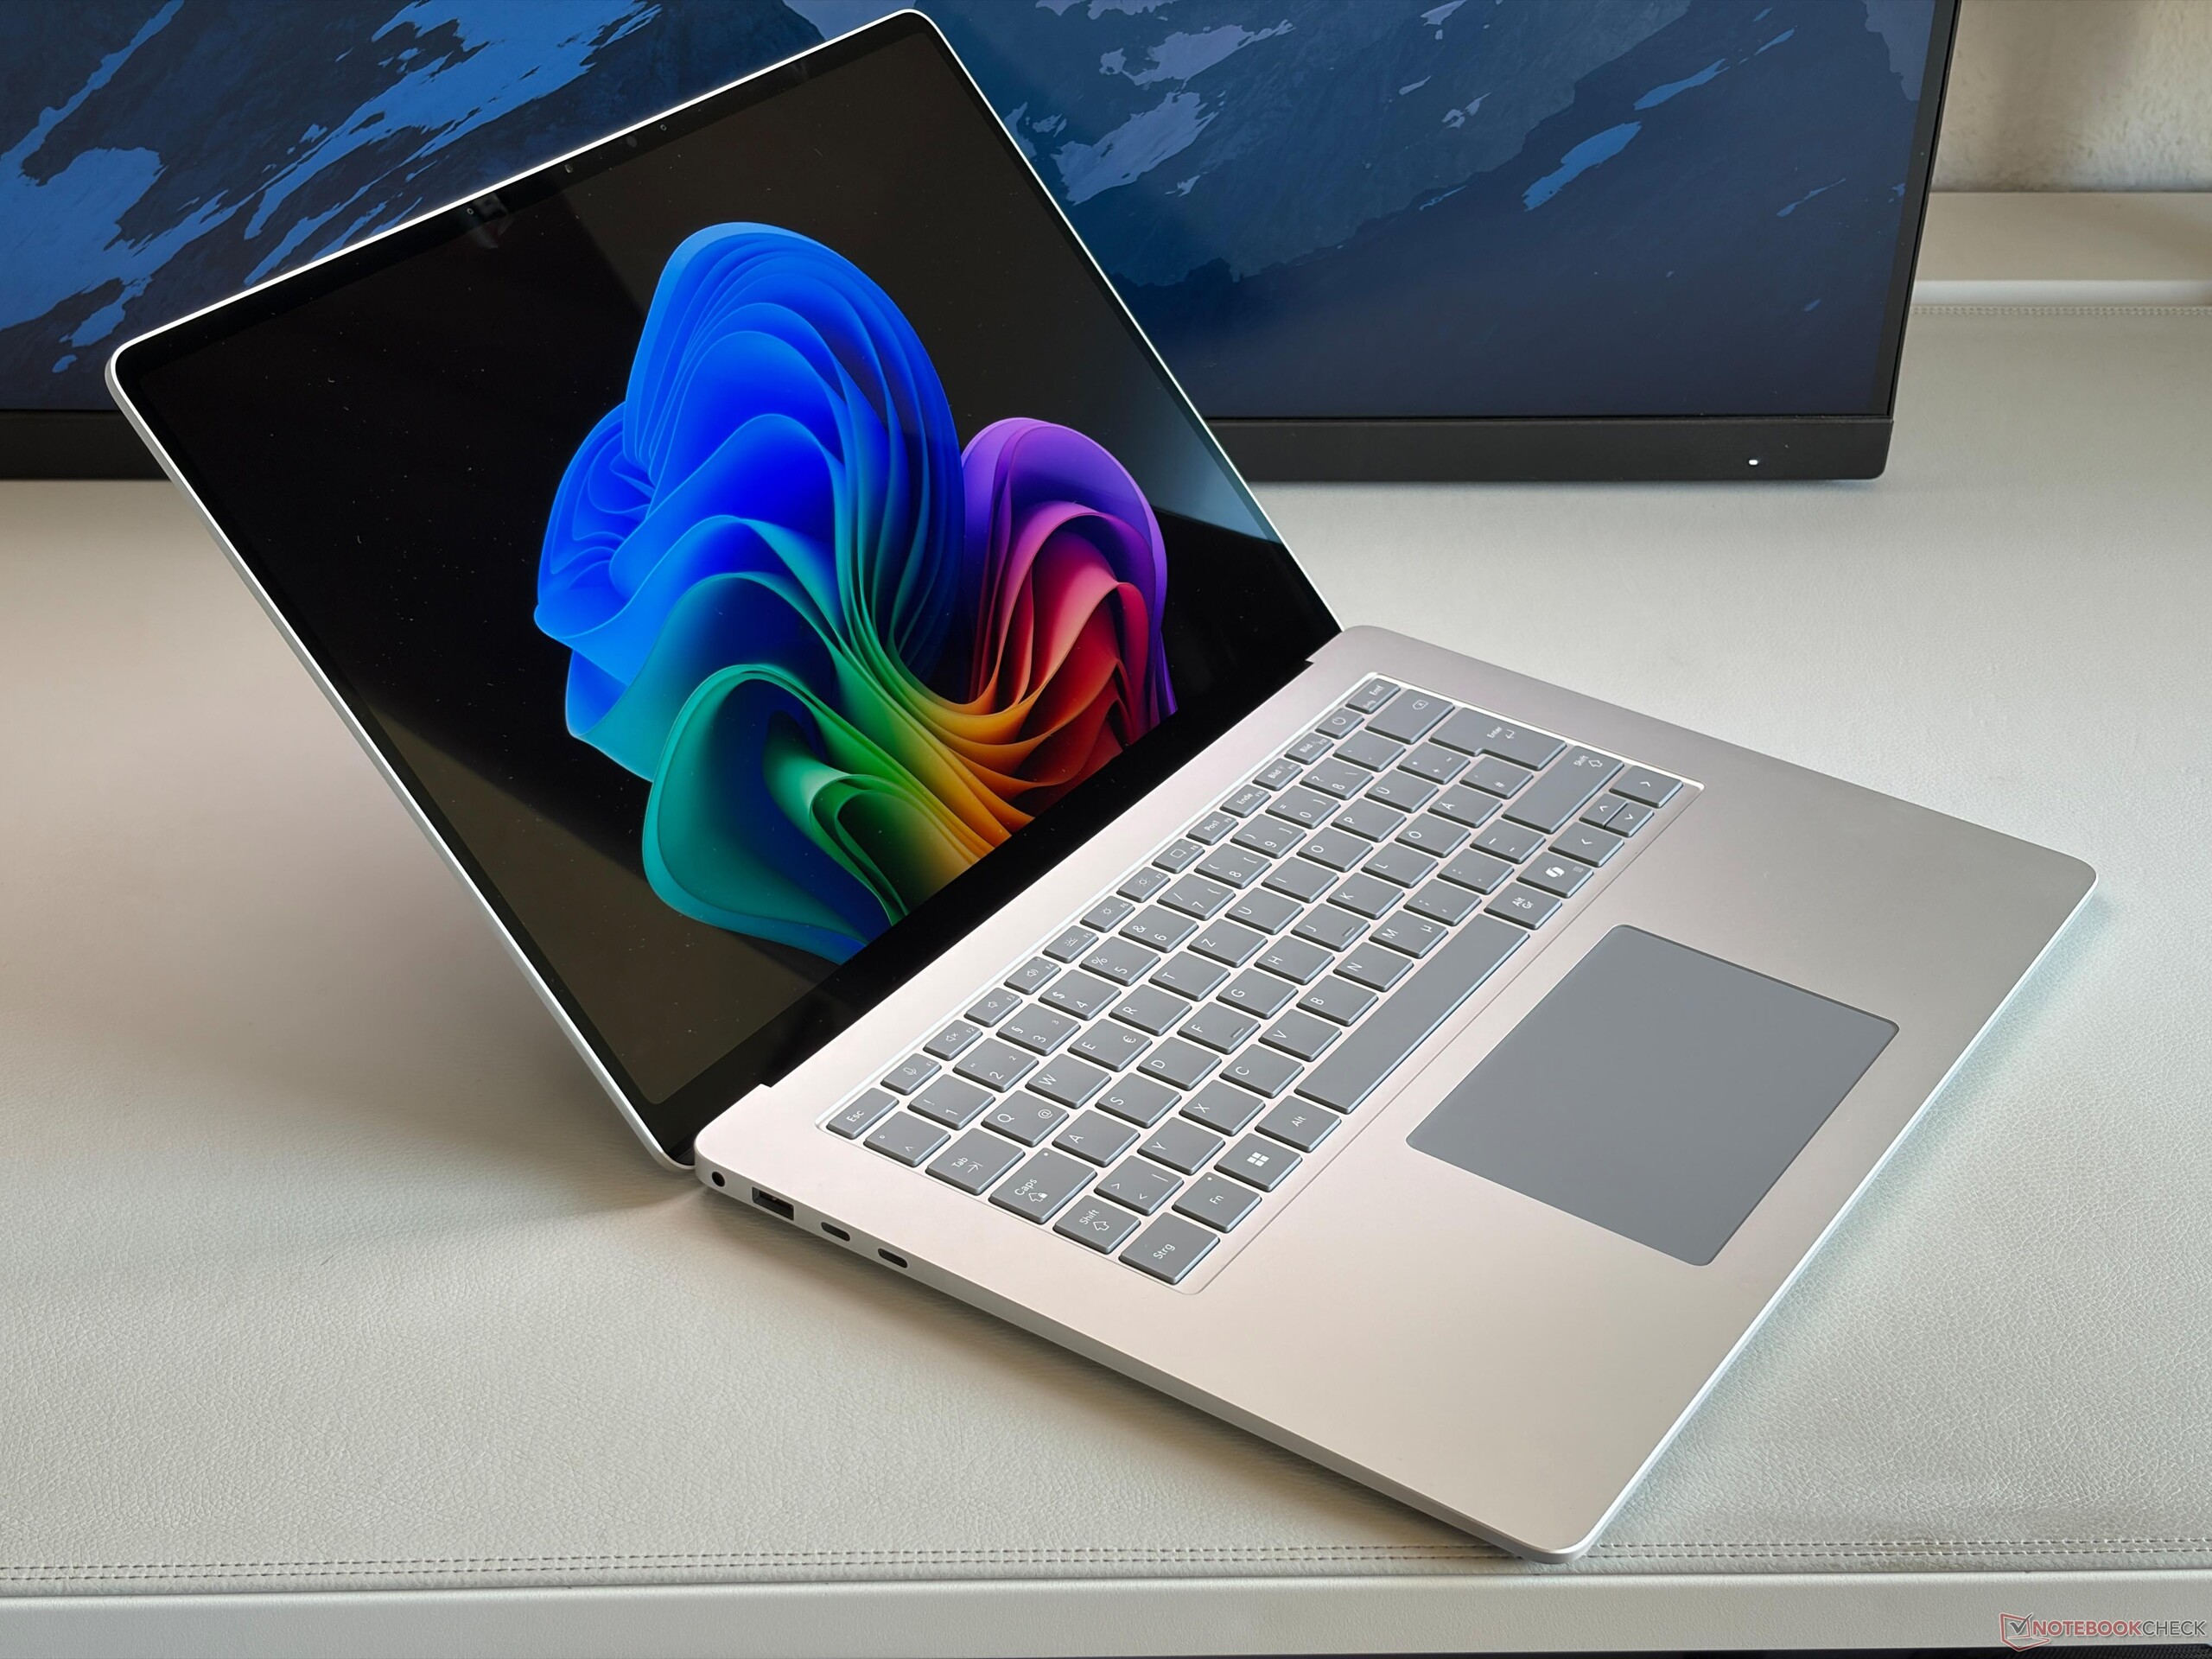
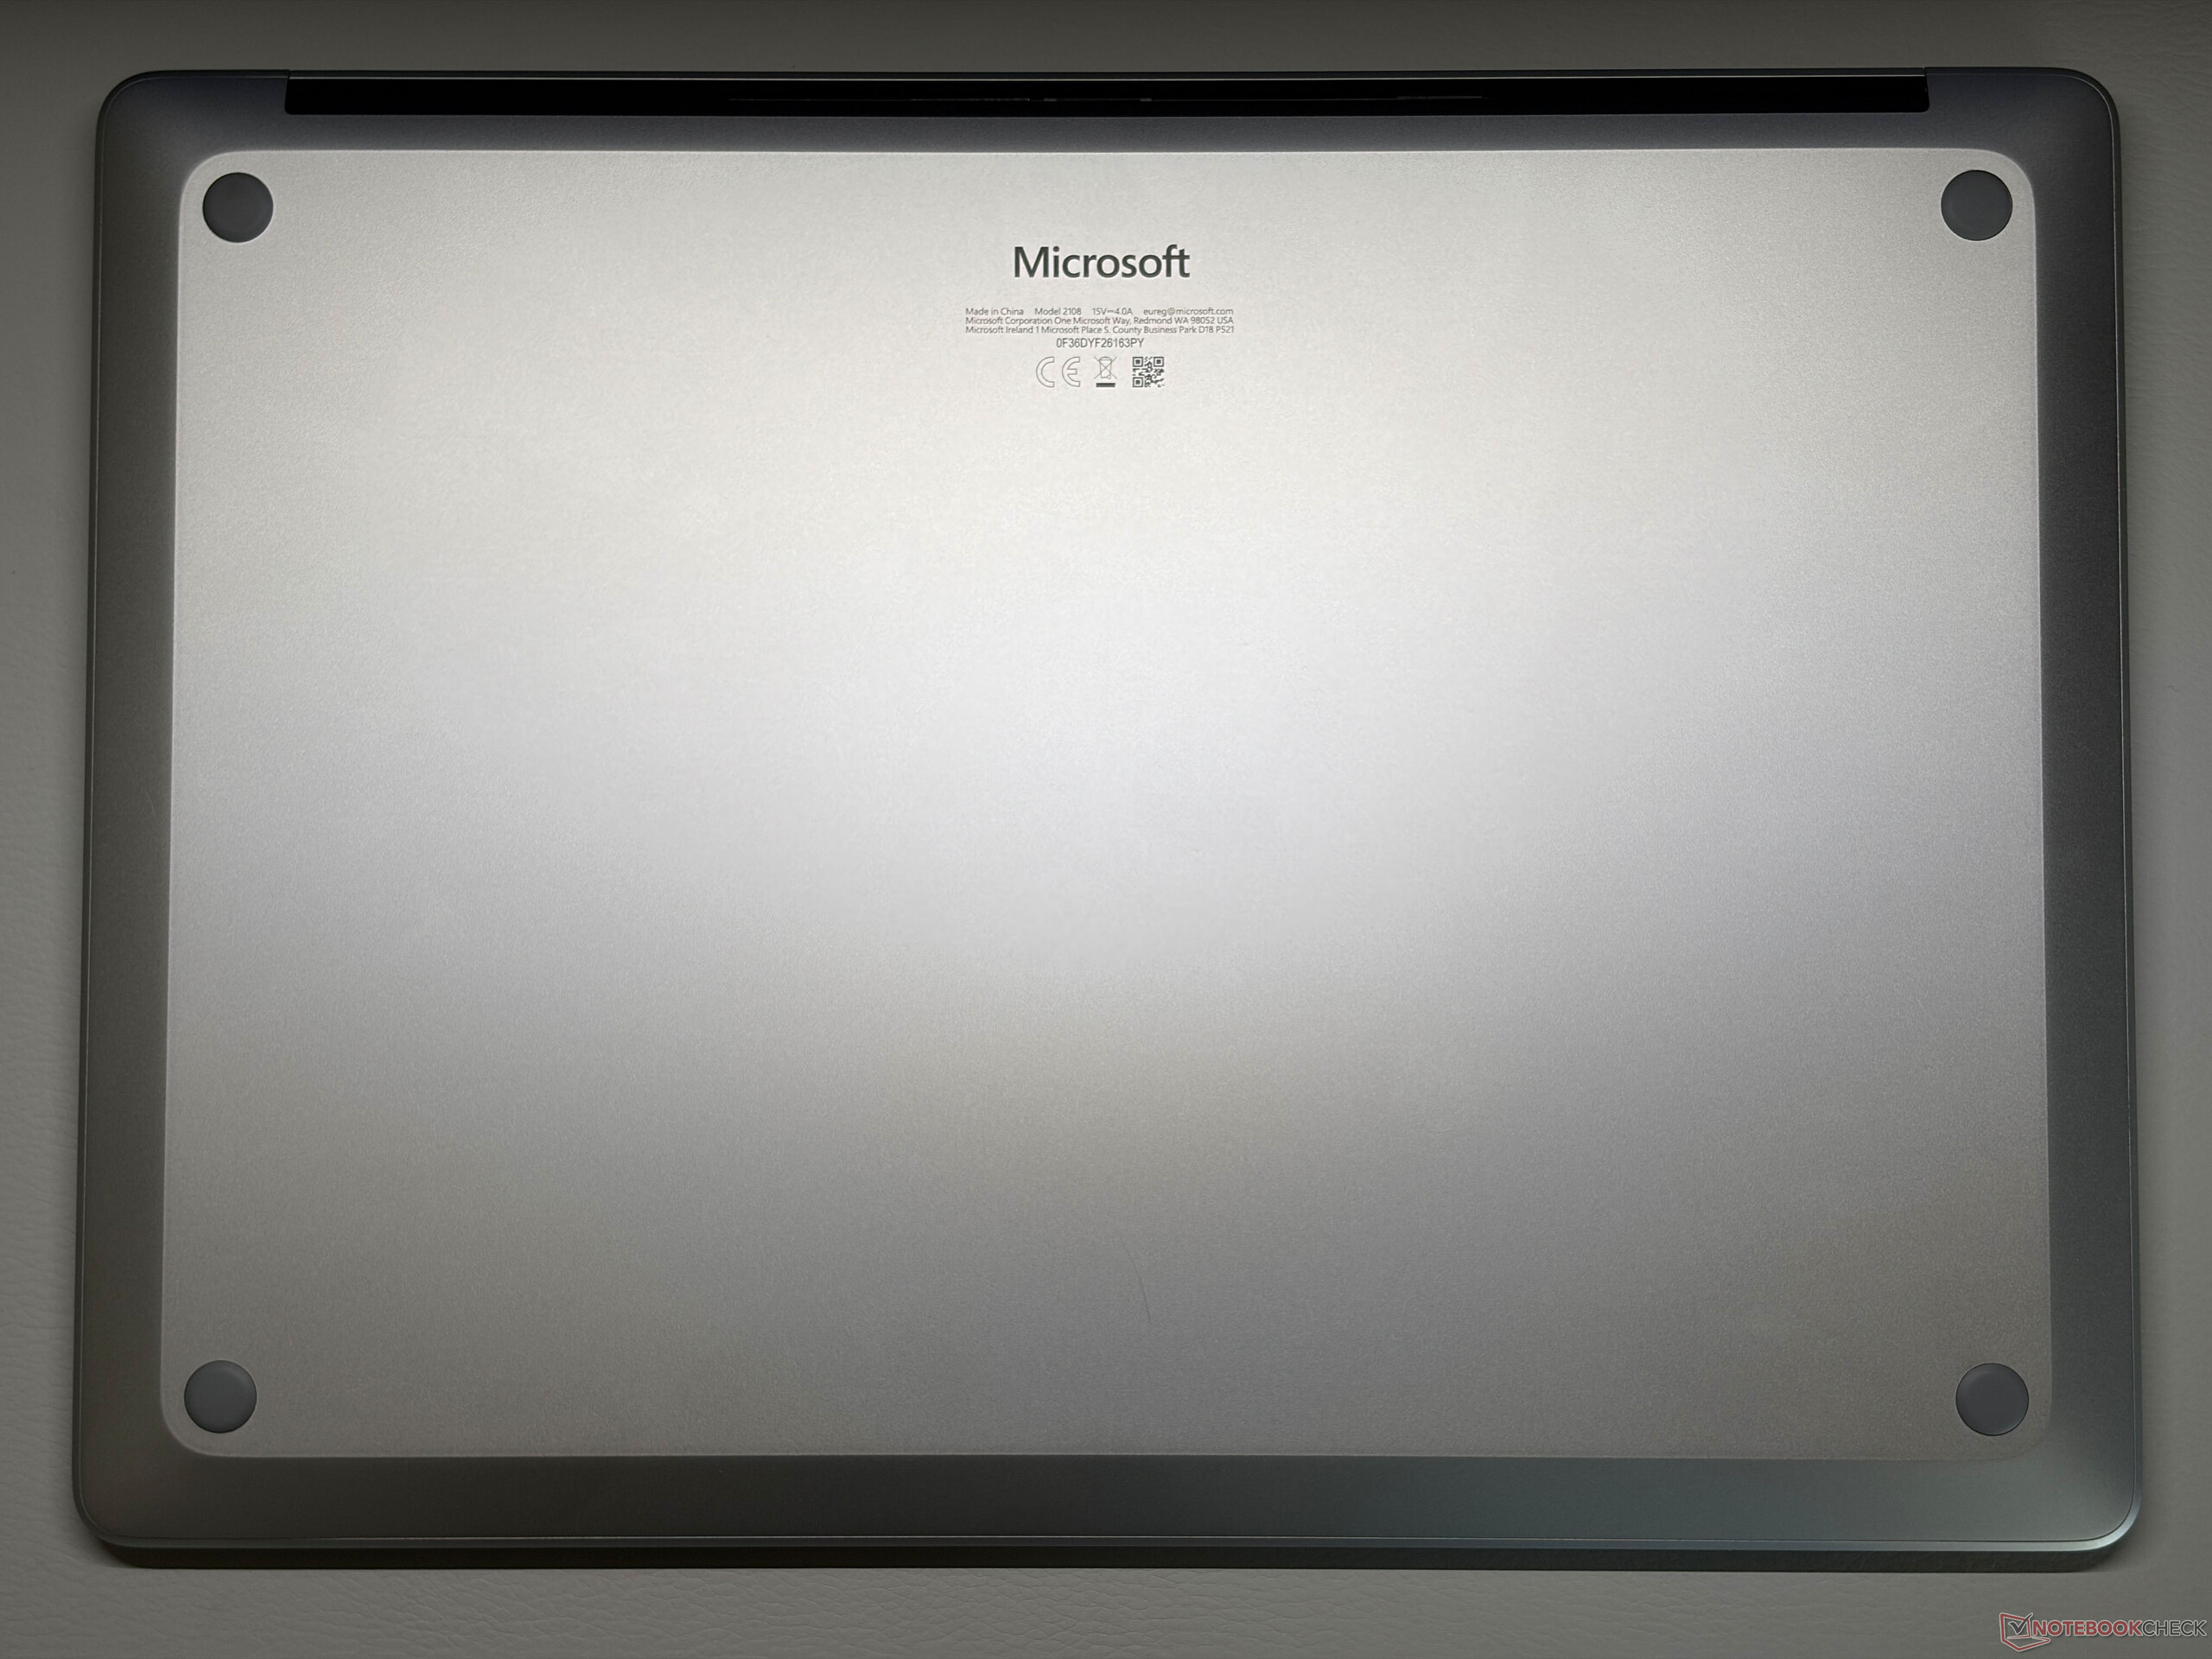
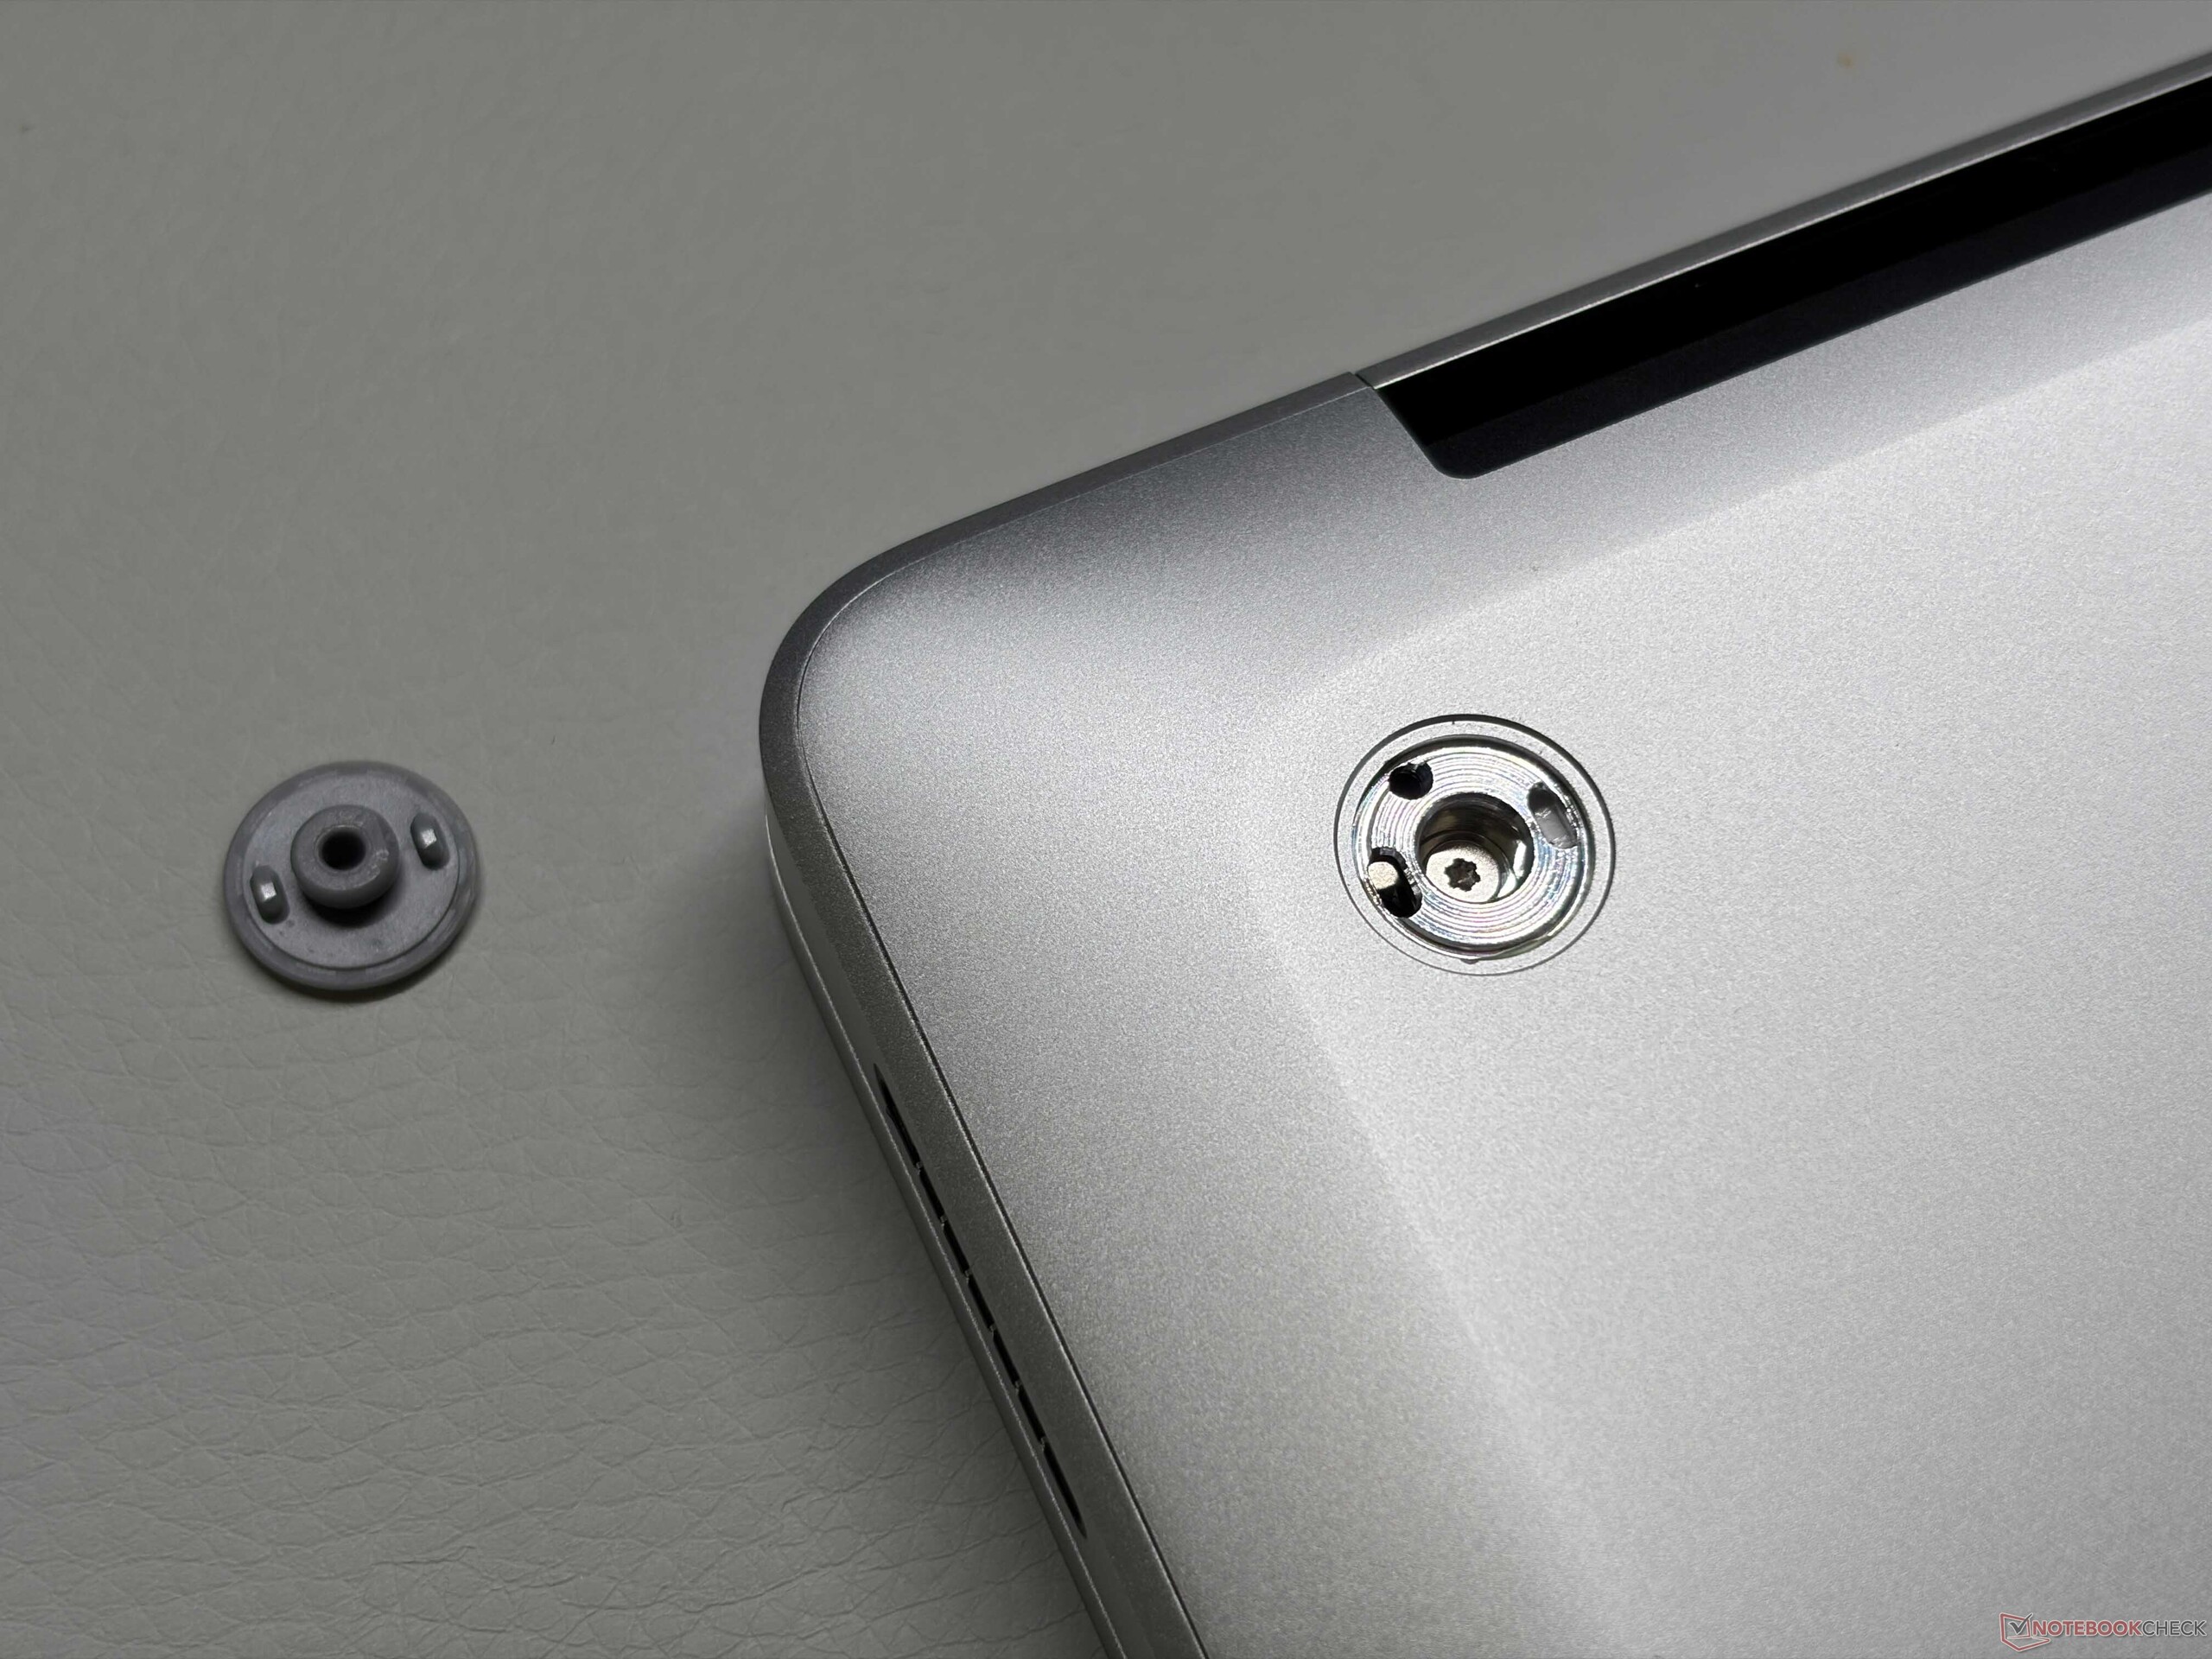
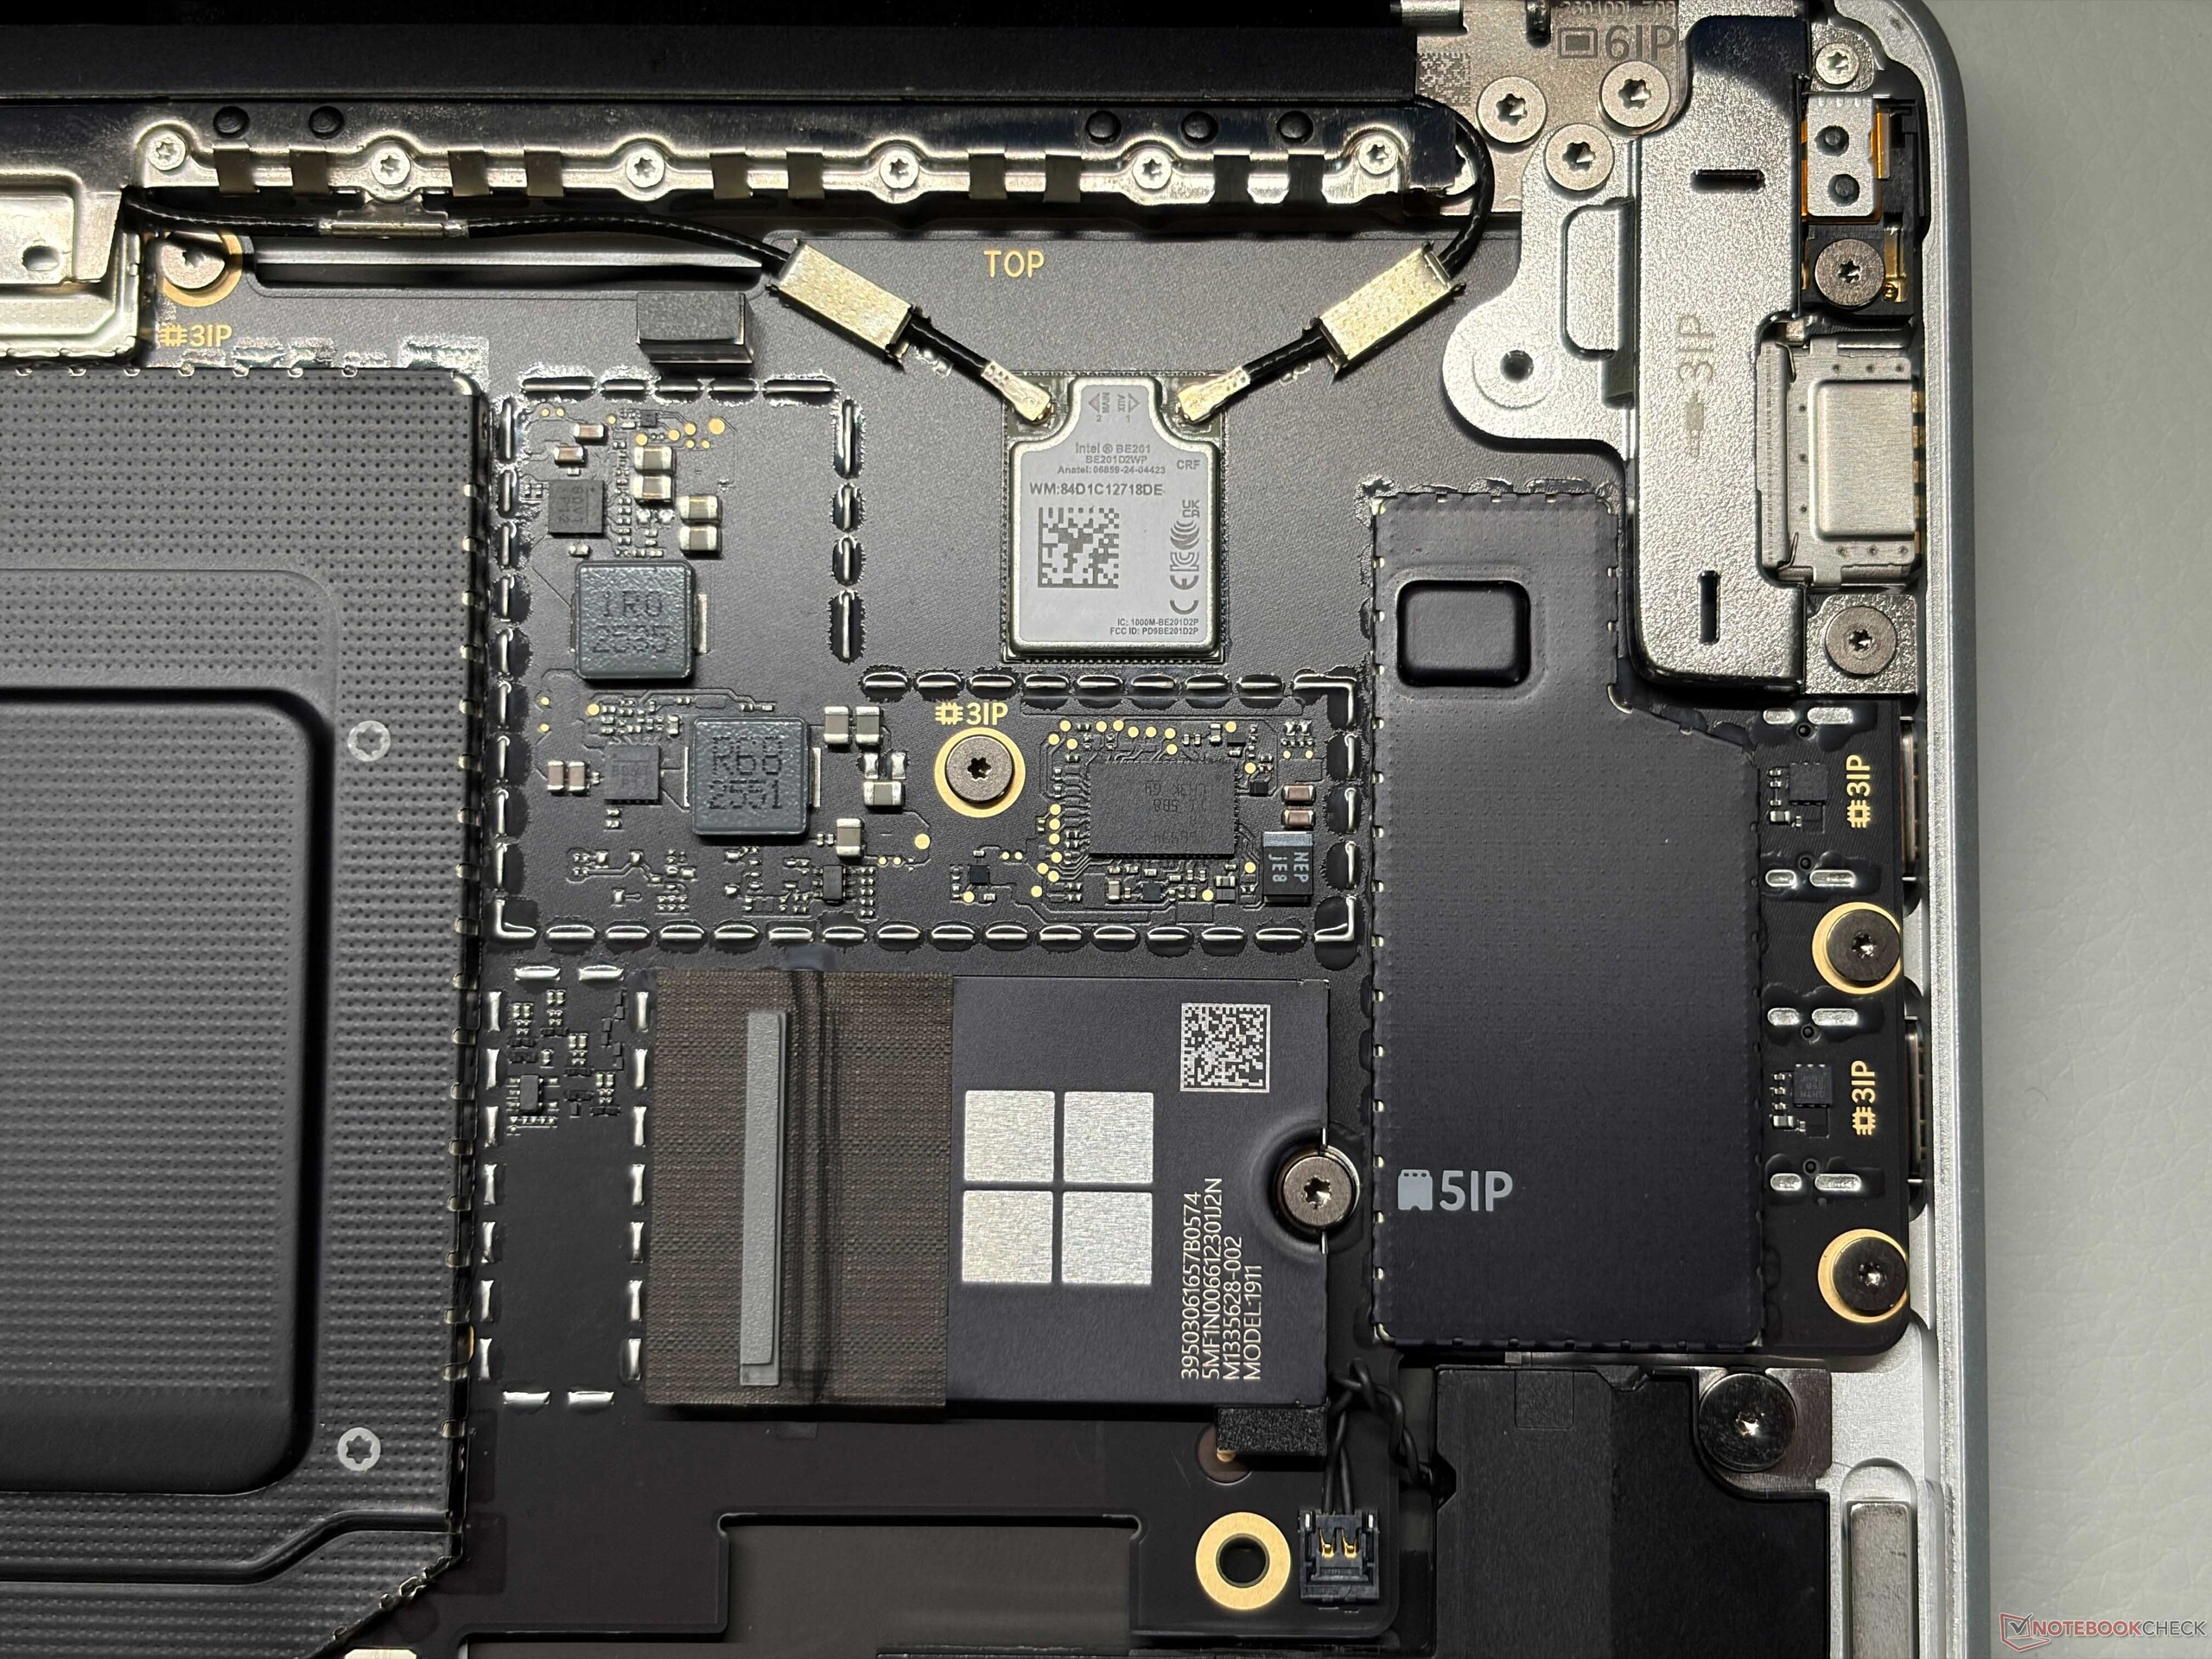
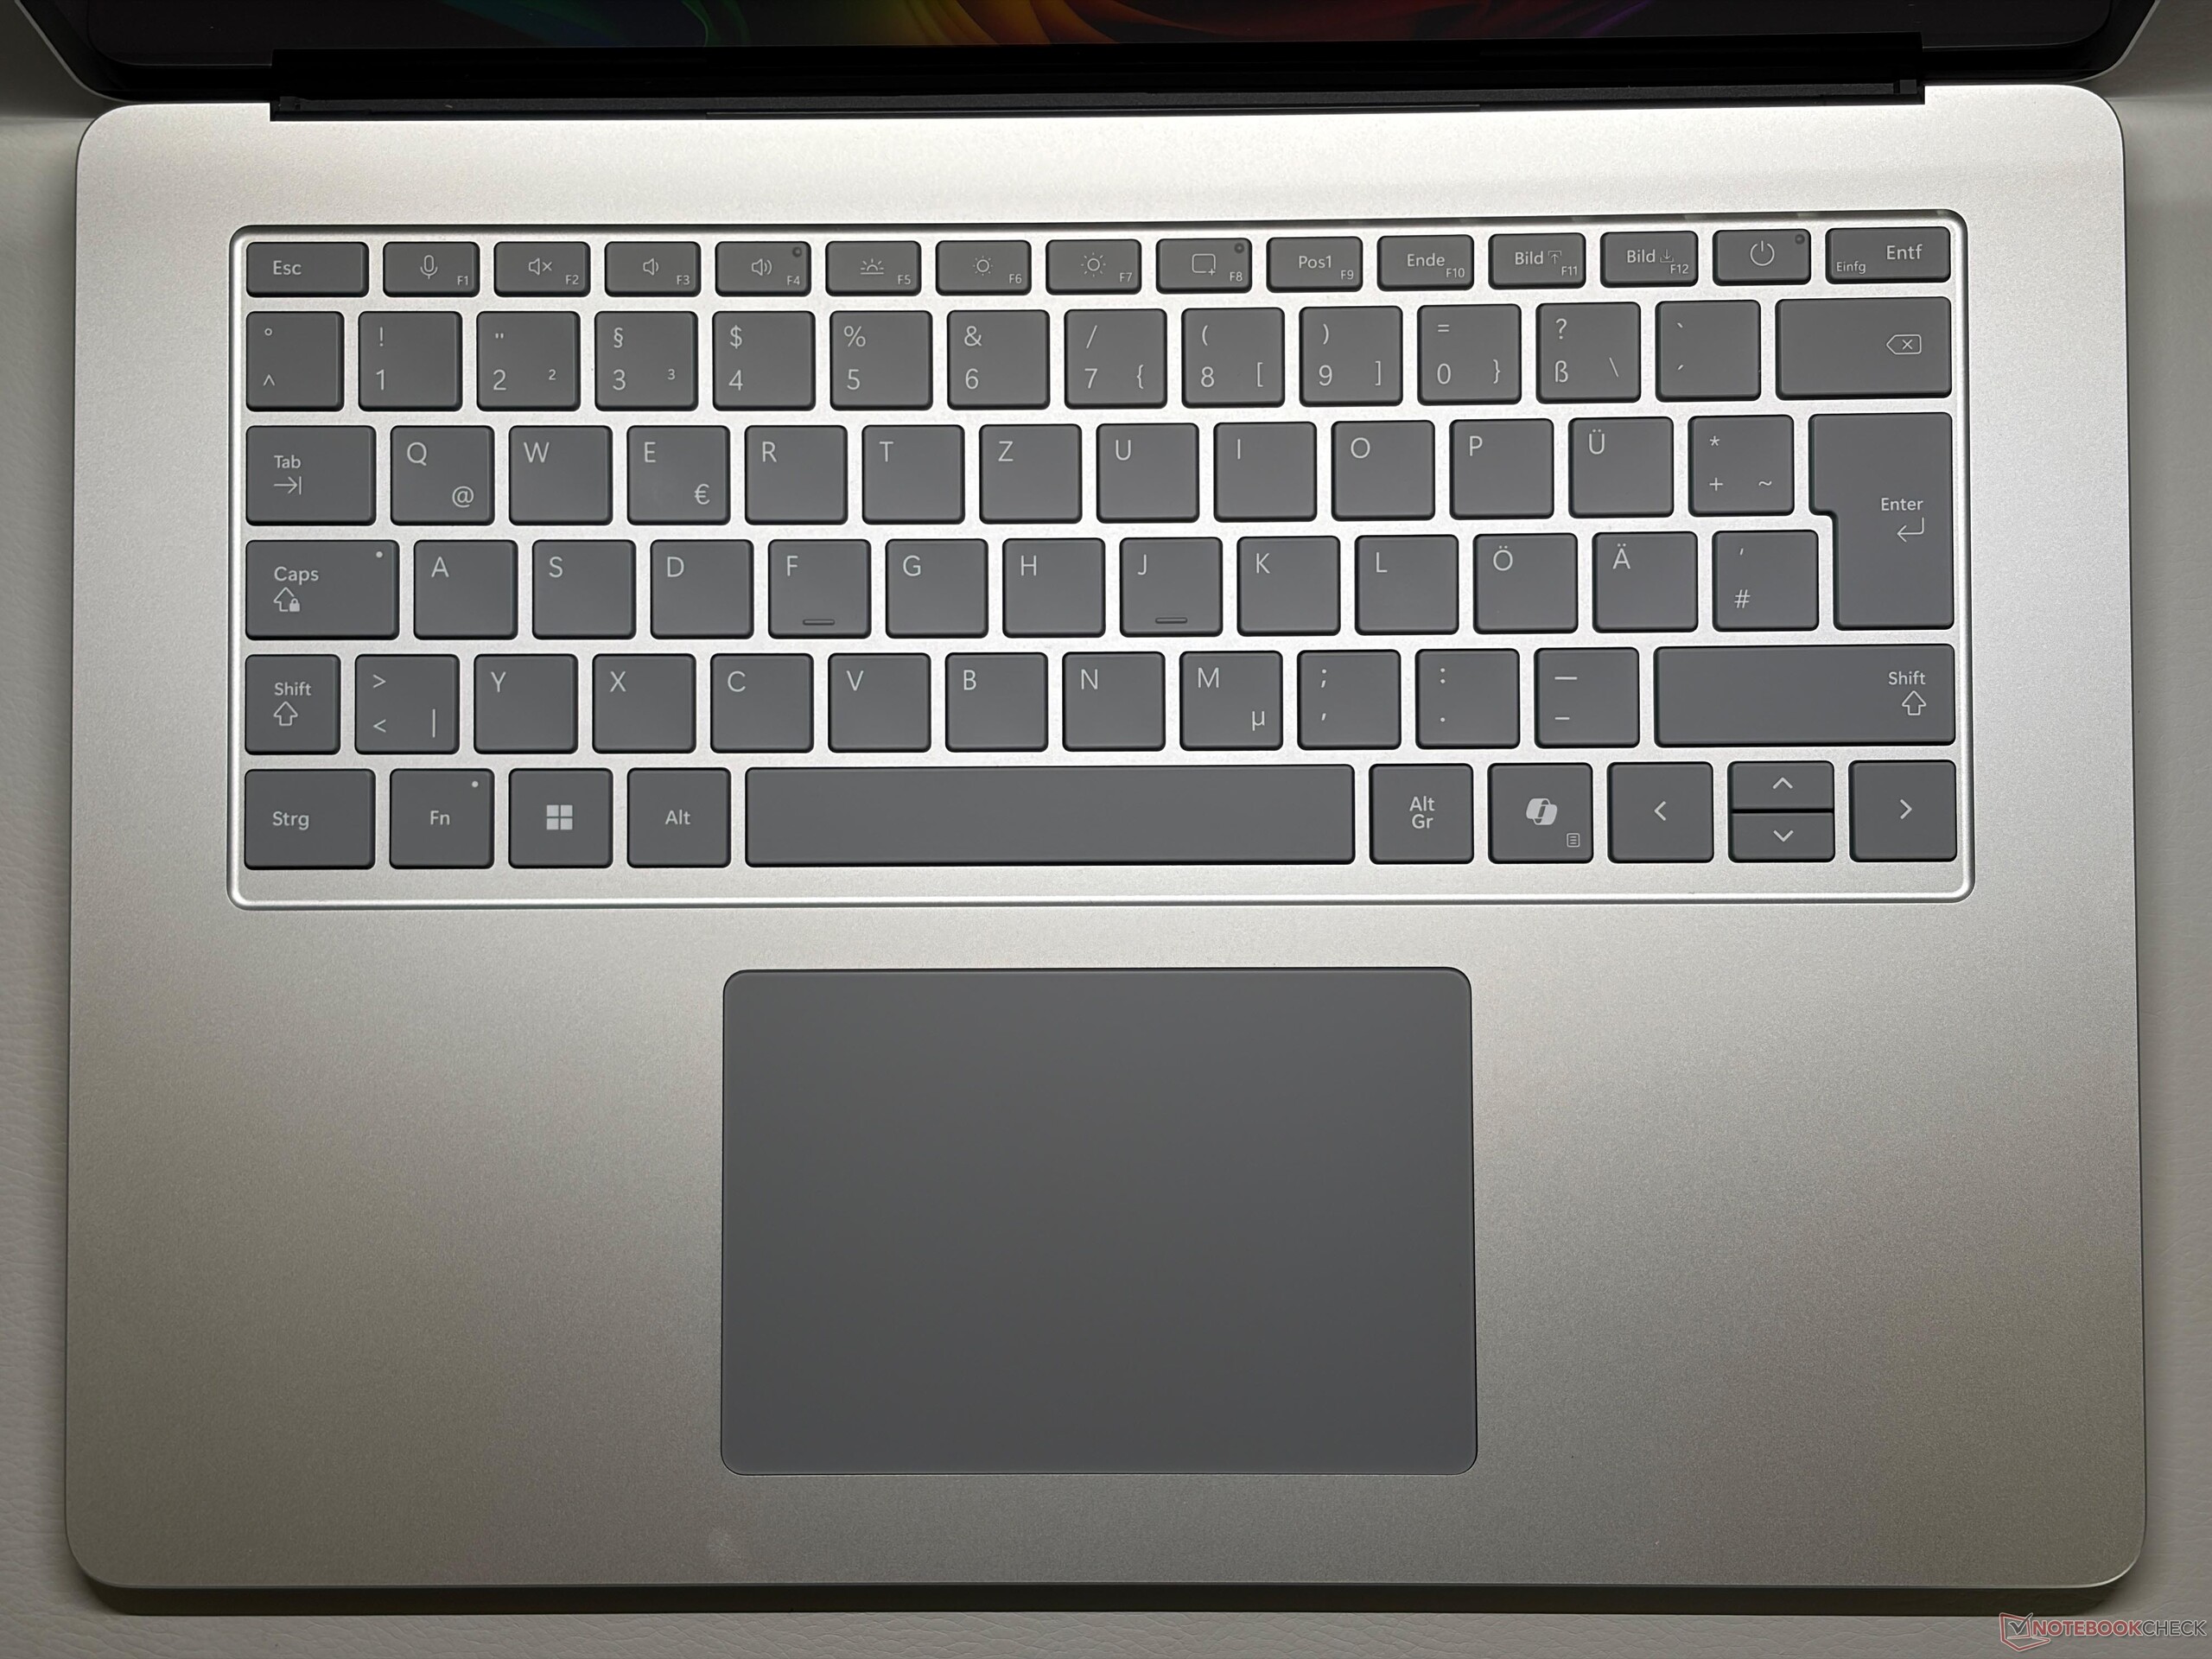
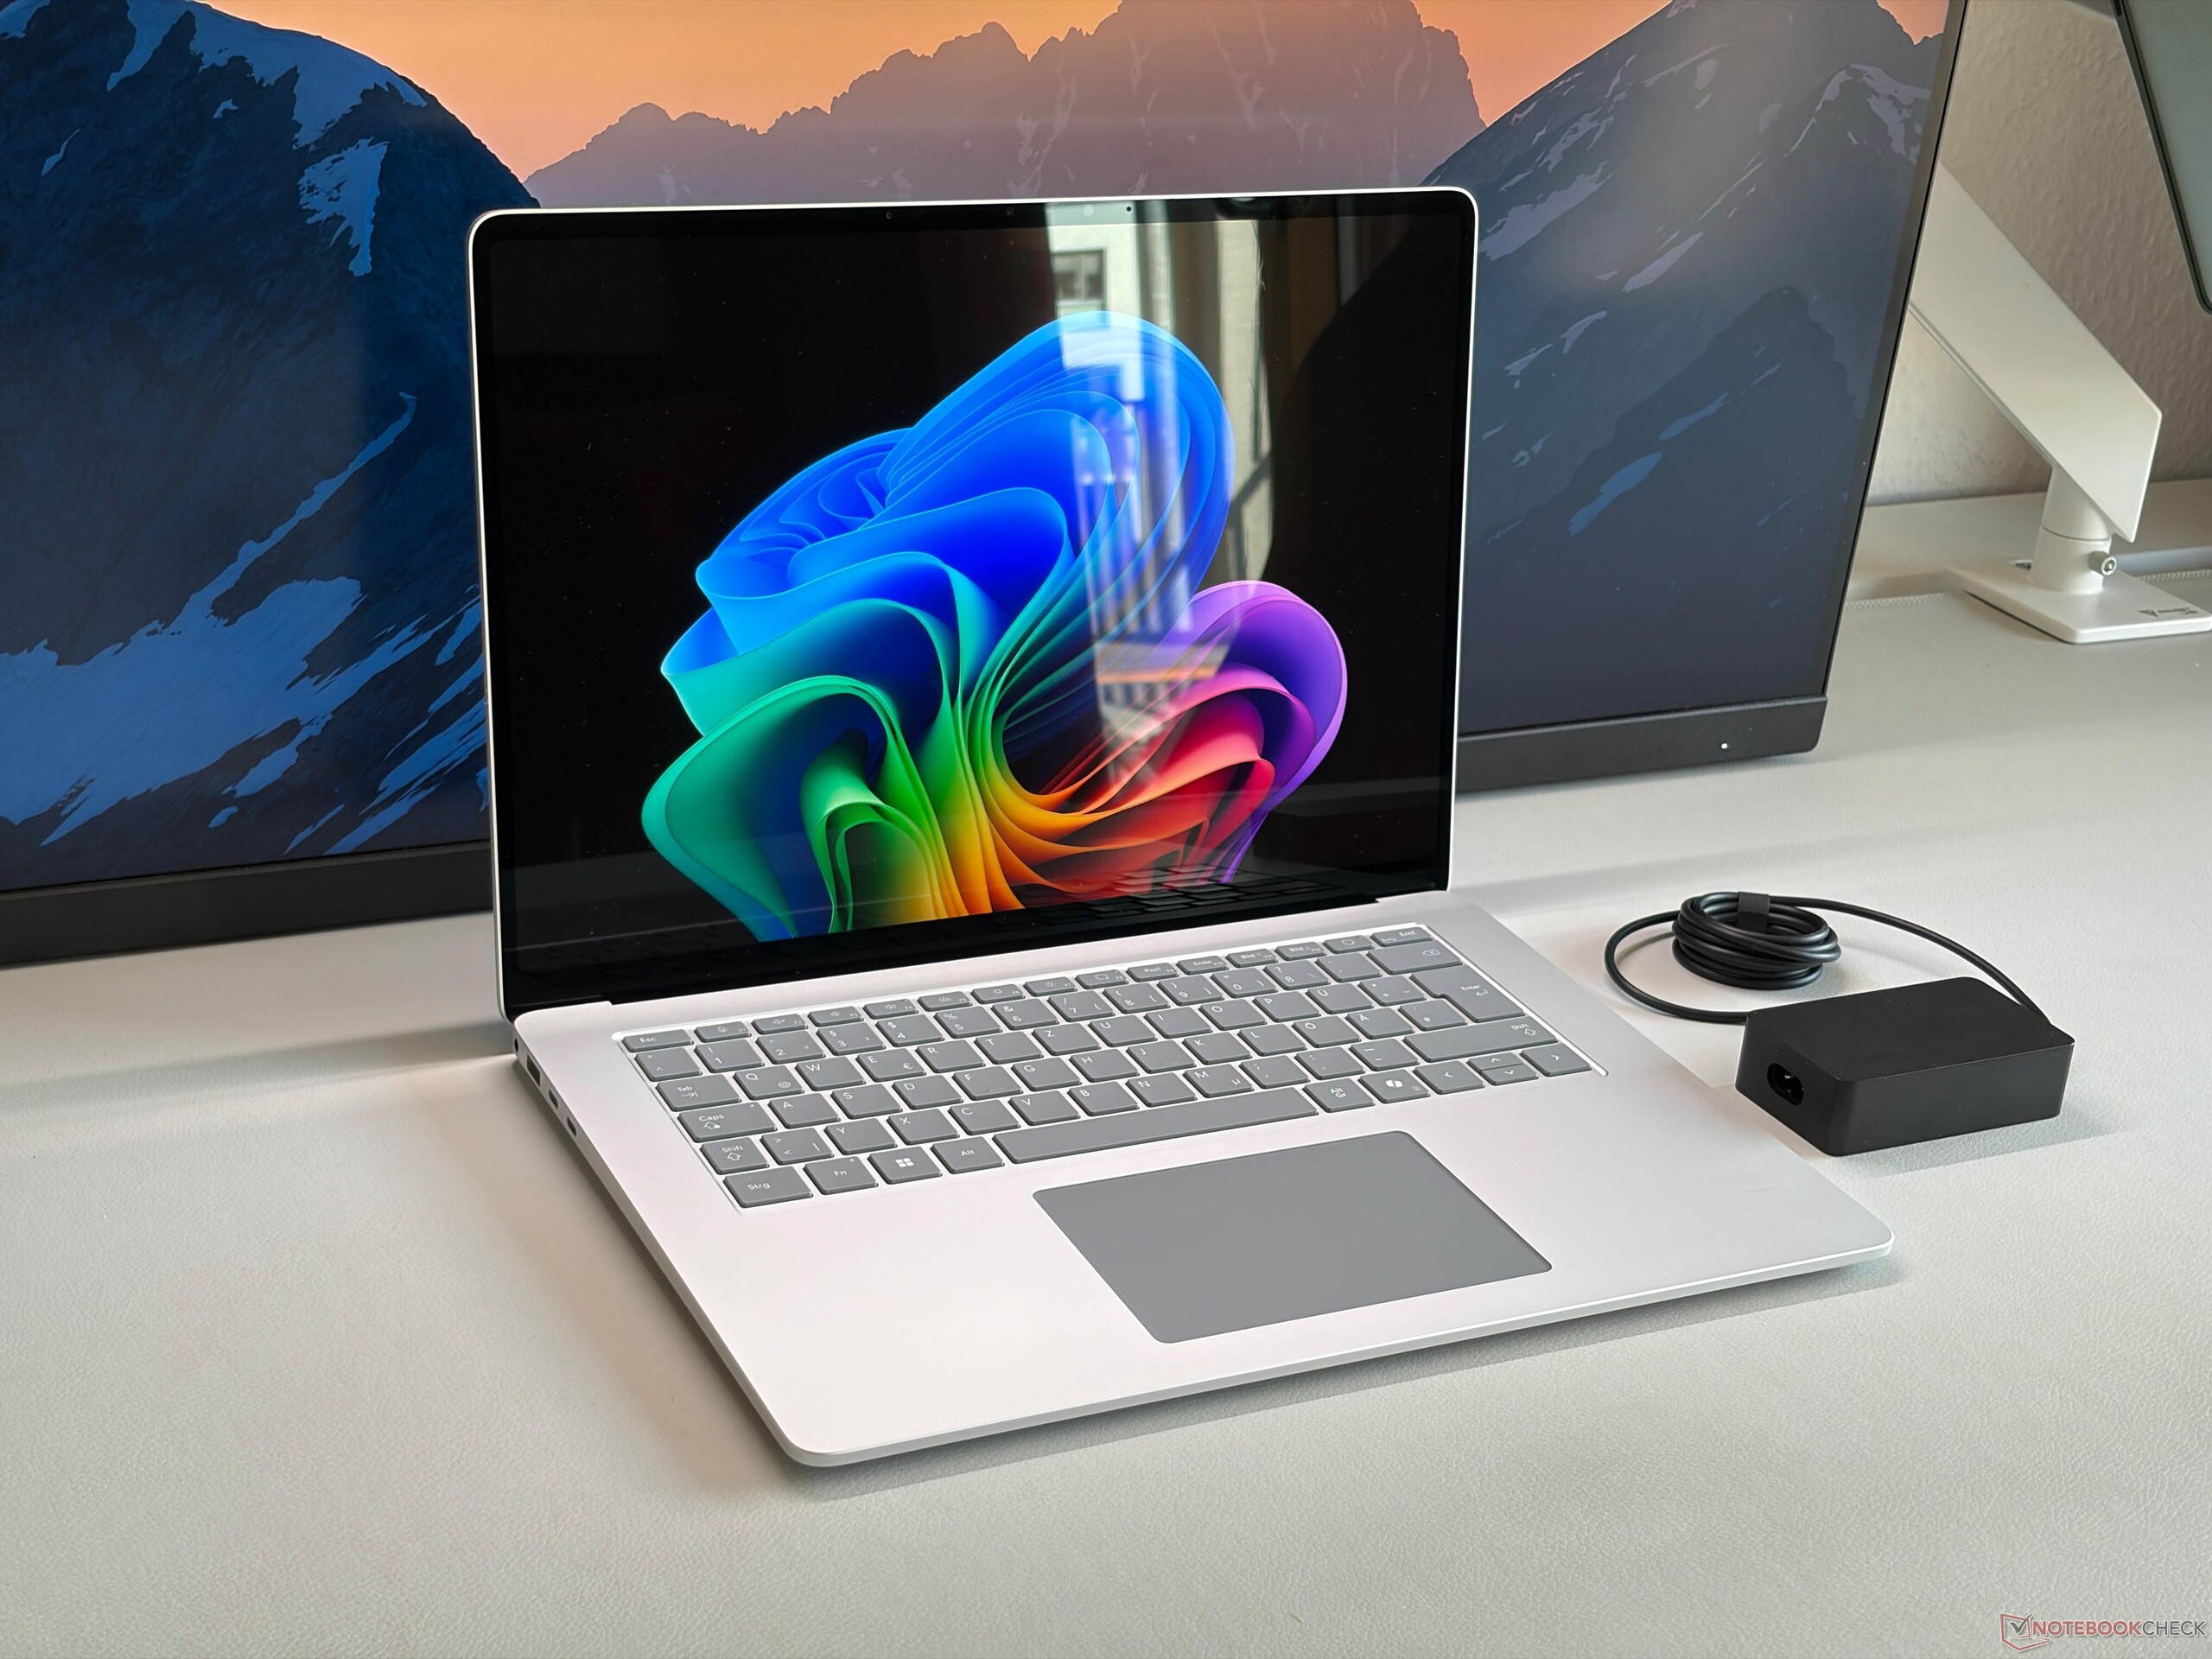
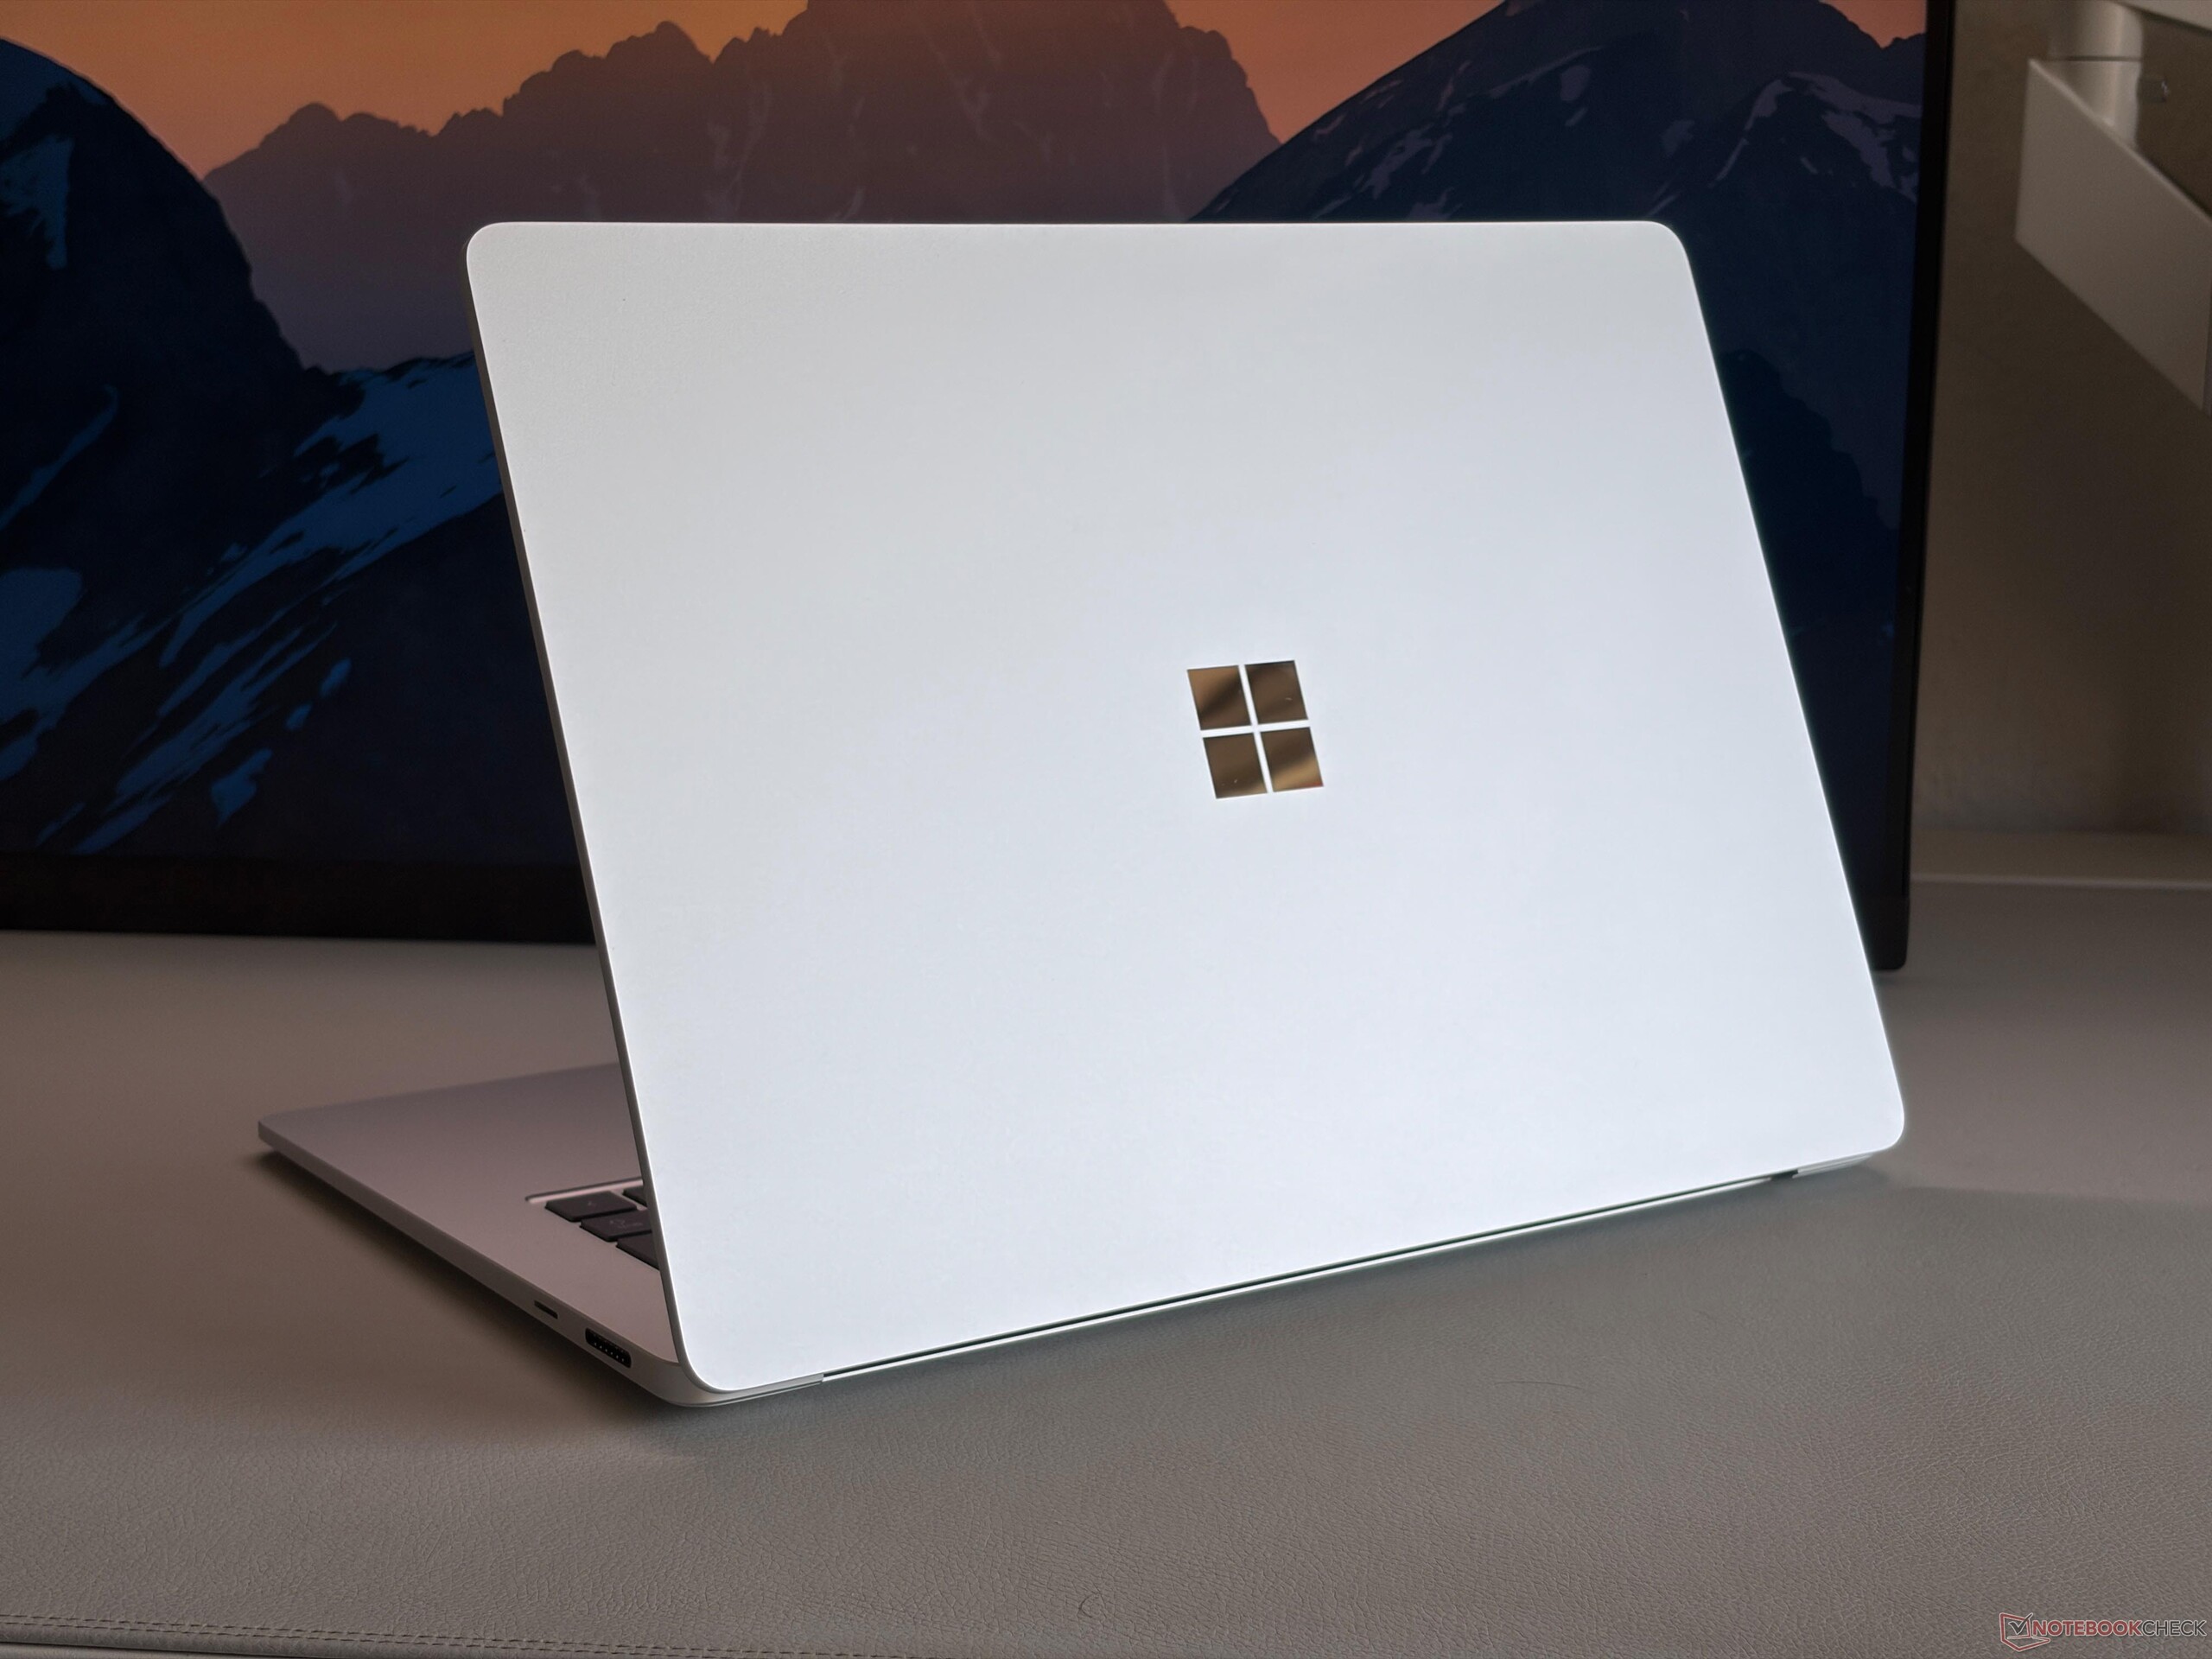
Microsoft heeft de behuizing van de Surface Laptop 15 niet veranderd, dus je krijgt nog steeds een hoogwaardige aluminium behuizing met uitstekende stabiliteit en bouwkwaliteit. De typervaring is zeer comfortabel en het haptische trackpad werkt erg goed, hoewel het iets groter zou mogen zijn. Het scherm is ook zeer stabiel, maar de scharnieren zouden iets steviger mogen zijn. Op ons zilverkleurige testexemplaar zijn geen vingerafdrukken te zien. De interne componenten zijn gemakkelijk toegankelijk en je kunt de M.2-2242 SSD vervangen, maar je merkt ook dat er veel ongebruikte ruimte is, die benut zou kunnen worden voor extra poorten, een reguliere M.2-2280 SSD of een extra koelventilator.

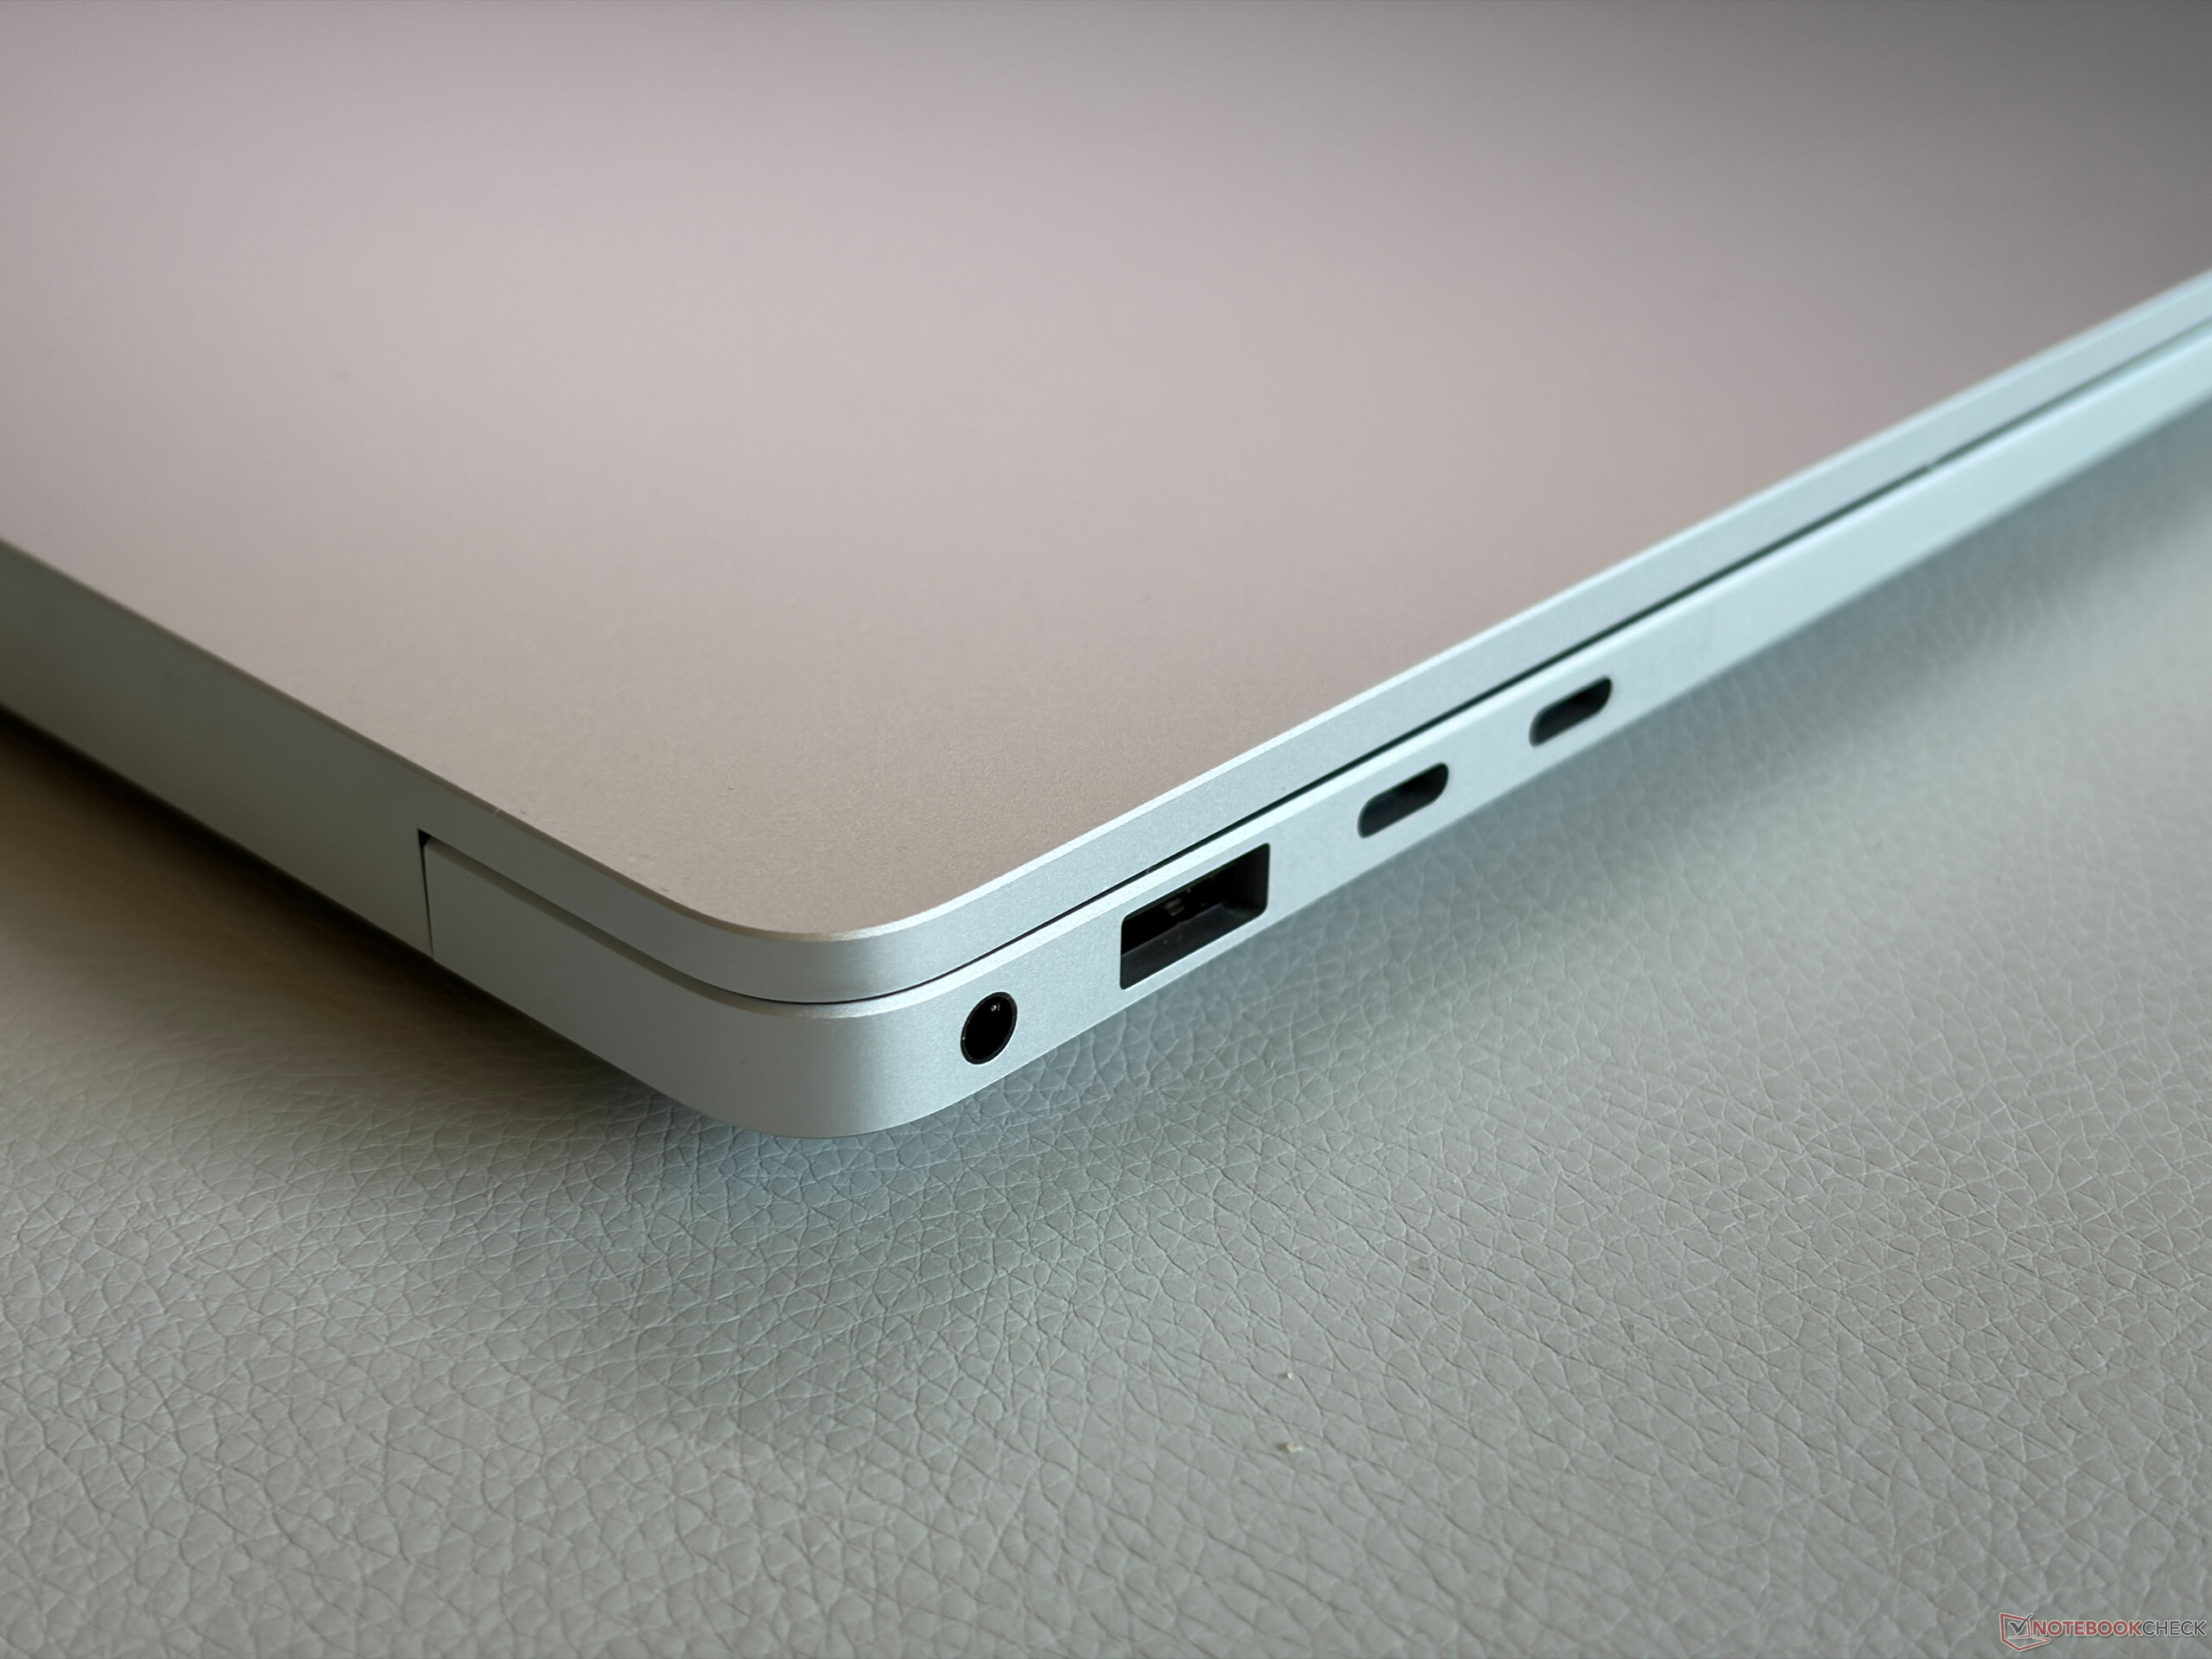
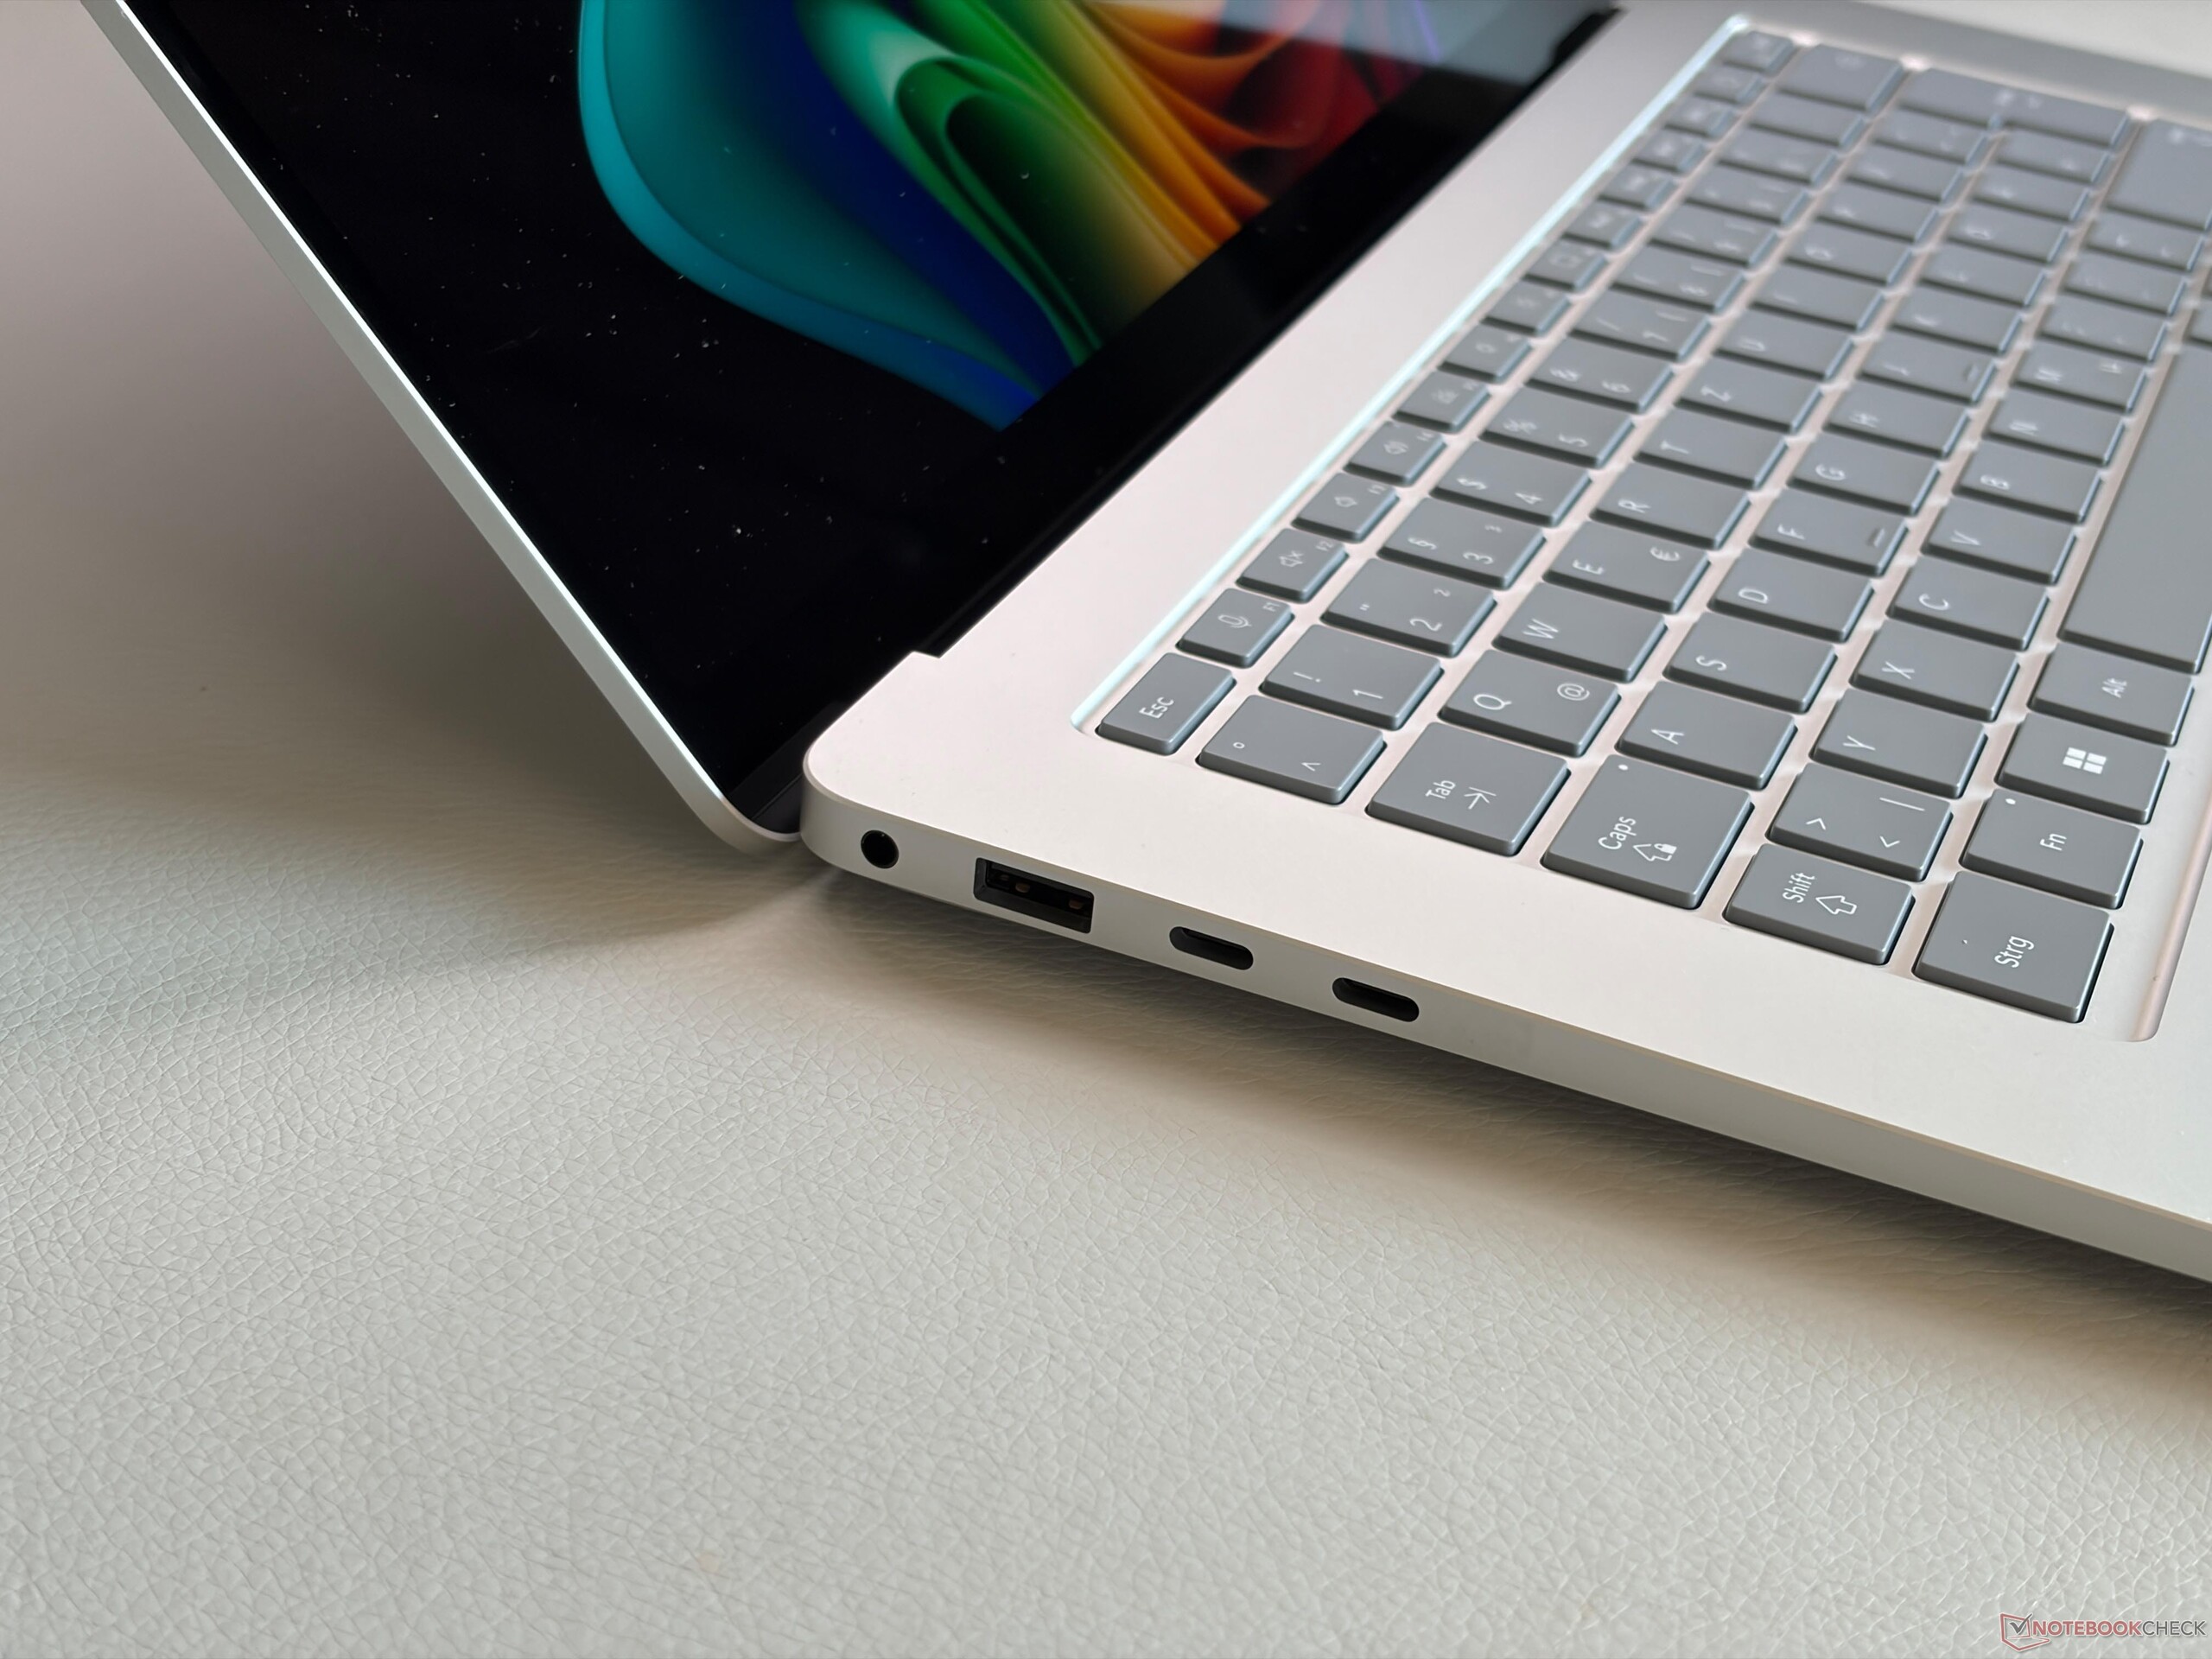
Het Intel-model biedt twee Thunderbolt 4-poorten (Snapdragon alleen USB 4) en kan zelfs worden uitgerust met een SmartCard-lezer. De Surface Connect-poort aan de rechterkant is naar onze mening wat verouderd en ook vrij groot; we hadden liever een extra USB-C-poort en misschien een reguliere SD-kaartlezer gezien. De microSD-versie is dankzij SD-Express-ondersteuning nog steeds erg snel (overdrachtssnelheden tot 834 MB/s) en de camerakwaliteit is erg goed. De Wi-Fi 7-module haalt stabiele overdrachtssnelheden.
Groottevergelijking

❌
353.5 mm 242.4 mm 16.5 mm 1.2 kg352.58 mm 237.47 mm 14.62 mm 1.7 kg339.5 mm 228.5 mm 18 mm 1.5 kg340.4 mm 237.6 mm 11.5 mm 1.5 kg329 mm 239 mm 18.3 mm 1.7 kg329 mm 239 mm 18.3 mm 1.7 kg297 mm 210 mm 1 mm 5.7 g
Links: 3,5-mm audio, USB-A 3.2 Gen 1 (5 Gbit/s), 2x USB-C 4.0 met Thunderbolt 4 (40 Gbit/s, DisplayPort ALT Mode 2.1, Power Delivery 3.0)
Rechts: microSD-Express-kaartlezer, Surface Connect-poort
SD Card Reader
average JPG Copy Test (av. of 3 runs)
Microsoft Surface Laptop 15 Gen 8
Intel Core Ultra X7 368H (SanDisk microSD Express 256 GB)
567 MB/s
Asus Zenbook A16 UX3607
Qualcomm Snapdragon X2 Elite Extreme X2E-94-100 (Angelbird AV Pro V60)
211 MB/s -63%
Gemiddelde van klas Multimedia
  (22.3 - 567, n=34, laatste 2 jaar)
140.2 MB/s -75%
Microsoft Surface Laptop 7 15 Lunar Lake
Intel Core Ultra 7 268V (Angelbird AV Pro V60)
86.2 MB/s -85%
Lenovo ThinkPad X9-15p Gen 1
Intel Core Ultra X7 358H
22.3 MB/s -96%
maximum AS SSD Seq Read Test (1GB)
Microsoft Surface Laptop 15 Gen 8
Intel Core Ultra X7 368H (SanDisk microSD Express 256 GB)
833.8 MB/s
Asus Zenbook A16 UX3607
Qualcomm Snapdragon X2 Elite Extreme X2E-94-100 (Angelbird AV Pro V60)
246.4 MB/s -70%
Gemiddelde van klas Multimedia
  (37.3 - 1455, n=33, laatste 2 jaar)
218 MB/s -74%
Lenovo ThinkPad X9-15p Gen 1
Intel Core Ultra X7 358H
91.9 MB/s -89%
Microsoft Surface Laptop 7 15 Lunar Lake
Intel Core Ultra 7 268V (Angelbird AV Pro V60)
88.5 MB/s -89%
Networking
Microsoft Surface Laptop 15 Gen 8
Intel BE201 320MHz
iperf3 transmit Wi-Fi6/7 RT-BE96U
2440 (min: 2250) MBit/s ∼67%
iperf3 receive Wi-Fi6/7 RT-BE96U
2038 (min: 1980) MBit/s ∼71%
Lenovo ThinkPad X9-15p Gen 1
Intel Wi-Fi 7 BE211 320MHz
iperf3 transmit Wi-Fi6/7 RT-BE96U
3618 (min: 2749) MBit/s ∼100%
iperf3 receive Wi-Fi6/7 RT-BE96U
2878 (min: 2594) MBit/s ∼100%
Dell XPS 16 Core Ultra X7 358H
Intel Wi-Fi 7 BE211 320MHz
iperf3 receive AXE11000 6GHz
1735 (min: 1715) MBit/s ∼100%
iperf3 transmit AXE11000 6GHz
1619 (min: 1525) MBit/s ∼100%
iperf3 receive AXE11000
852 (min: 701) MBit/s ∼47%
iperf3 transmit AXE11000
875 (min: 459) MBit/s ∼49%
Apple MacBook Air 15 M5
Wi-Fi 7
iperf3 receive AXE11000
1827 (min: 1707) MBit/s ∼100%
iperf3 transmit AXE11000
1794 (min: 1717) MBit/s ∼100%
Microsoft Surface Laptop 7 15 Lunar Lake
Intel BE201 320MHz
iperf3 receive AXE11000
1562 (min: 1469) MBit/s ∼85%
iperf3 transmit AXE11000
1640 (min: 1449) MBit/s ∼91%
01002003004005006007008009001000110012001300140015001600170018001900200021002200230024002500Tooltip
Microsoft Surface Laptop 15 Gen 8; iperf3 transmit Wi-Fi6/7 RT-BE96U; iperf 3.1.3: Ø2440 (2250-2581) MBit/s
Microsoft Surface Laptop 15 Gen 8; iperf3 receive Wi-Fi6/7 RT-BE96U; iperf 3.1.3: Ø2038 (1980-2077) MBit/s
ColorChecker
10.8 ∆E
10.6 ∆E
14.9 ∆E
12.7 ∆E
10.3 ∆E
10.4 ∆E
9.7 ∆E
17.1 ∆E
13.9 ∆E
7.8 ∆E
11.8 ∆E
6.6 ∆E
9.7 ∆E
13.2 ∆E
18.6 ∆E
4.4 ∆E
12.9 ∆E
15.9 ∆E
5 ∆E
4.9 ∆E
8.6 ∆E
9.4 ∆E
4.3 ∆E
4.2 ∆E
ColorChecker Microsoft Surface Laptop 15 Gen 8: 10.32 ∆E min: 4.22 - max: 18.55 ∆E

Display - IPS-touchscreen met hogere resolutie

Subpixelarray
Subpixelarray
Slechts geringe backlight bleeding

Microsoft heeft het glanzende IPS-touchscreen vernieuwd. De beeldverhouding is nog steeds 3:2, maar de resolutie is hoger met 3270 x 2180 pixels. De subjectieve beeldindruk is zeer goed, met scherpe beelden en rijke kleuren, maar de zwartwaarden kunnen uiteraard niet concurreren met die van OLED-concurrenten. Het paneel ondersteunt 120 Hz, maar we merken nog steeds enige ghosting op door de trage responstijden. Er is geen PWM-flikkering en ook backlight bleeding is geen probleem. Het scherm is zeer glanzend, wat buiten en in heldere omgevingen een echte uitdaging vormt. Zowel de helderheid als de kleur kan automatisch worden aangepast.

Onze analyse met de professionele CalMAN-software toont nauwkeurige kleuren direct uit de doos (nauwkeurige profielen voor sRGB en P3) en de contrastverhouding is met ~1800:1 beter dan opgegeven, maar de maximale helderheid is lager dan bij het model van vorig jaar. We meten maximaal 537 nits en gemiddeld 520 nits. HDR wordt ondersteund, maar de helderheid wordt niet verhoogd.

530
cd/m²
516
cd/m²
505
cd/m²
533
cd/m²
537
cd/m²
505
cd/m²
534
cd/m²
525
cd/m²
498
cd/m²
Helderheidsverdeling
LP150UD2-SPA1 getest met X-Rite i1Pro 3
Maximum: 537 cd/m² (Nits) Gemiddelde: 520.3 cd/m² Minimum: 1.7 cd/m²
Helderheidsverdeling: 93 %
Helderheid in Batterij-modus: 537 cd/m²
Contrast: 1852:1 (Zwart: 0.29 cd/m²)
ΔE ColorChecker Calman: 1 | ∀{0.5-29.43 Ø4.69}
ΔE Greyscale Calman: 1.6 | ∀{0.09-98 Ø4.94}
86.3% AdobeRGB 1998 (Argyll 3D)
100% sRGB (Argyll 3D)
97.9% Display P3 (Argyll 3D)
Gamma: 2.2
CCT: 6804 K
Microsoft Surface Laptop 15 Gen 8
LP150UD2-SPA1, IPS, 3270x2180, 15", 120 Hz
Lenovo ThinkPad X9-15p Gen 1
ATNA53JB03-0, OLED, 2880x1800, 15.3", 120 Hz
Asus Zenbook A16 UX3607
ATNA60HR07-0, OLED, 2880x1800, 16", 120 Hz
Dell XPS 16 Core Ultra X7 358H
LG Philips 160WV1, OLED, 3200x2000, 16", 120 Hz
Apple MacBook Air 15 M5
IPS, 2880x1864, 15.3", 60 Hz
Microsoft Surface Laptop 7 15 Lunar Lake
LQ150P1JX61, IPS, 2496x1664, 15", 120 Hz
Display
3%
2%
5%
-1%
0%
HDR Peak Brightness (cd/m²)
518
Display P3 Coverage (%)
97.9
99.1
1%
99.8
2%
99.5
2%
97.5
0%
98.1
0%
sRGB Coverage (%)
100
100
0%
100
0%
100
0%
98.3
-2%
100
0%
AdobeRGB 1998 Coverage (%)
86.3
94.3
9%
89
3%
96.5
12%
86.3
0%
87.2
1%
Response Times
96%
97%
98%
34%
30%
Response Time Grey 50% / Grey 80% * (ms)
45.7
1.1 ?(0.5, 0.6)
98%
2 ?(1, 1)
96%
0.65 ?(0.36, 0.29)
99%
26.9 ?(13.4, 13.5)
41%
33.4 ?(12.5, 20.9)
27%
Response Time Black / White * (ms)
21.5
1.4 ?(0.7, 0.7)
93%
0.48 ?(0.23, 0.25)
98%
0.87 ?(0.43, 0.44)
96%
15.9 ?(4.9, 11)
26%
14.7 ?(5.5, 9.2)
32%
PWM Frequency (Hz)
1194 ?(100)
960 ?(100)
240.2 ?(100)
PWM Amplitude * (%)
35
56
31
Screen
-112%
152%
-95%
-46%
18%
Brightness middle (cd/m²)
537
489
-9%
493
-8%
395.4
-26%
538
0%
599
12%
Brightness (cd/m²)
520
492
-5%
495
-5%
392
-25%
521
0%
590
13%
Brightness Distribution (%)
93
98
5%
98
5%
95
2%
90
-3%
93
0%
Black Level * (cd/m²)
0.29
0.02
93%
0.44
-52%
0.4
-38%
Contrast (:1)
1852
24650
1231%
1223
-34%
1498
-19%
Colorchecker dE 2000 *
1
4.6
-360%
1.1
-10%
3.69
-269%
2.1
-110%
0.5
50%
Colorchecker dE 2000 max. *
2.4
8.2
-242%
3.9
-63%
7.94
-231%
4.1
-71%
0.9
62%
Greyscale dE 2000 *
1.6
2.6
-63%
2.1
-31%
1.9
-19%
3.1
-94%
0.6
63%
Gamma
2.2 100%
2.18 101%
2.15 102%
2.28 96%
2.19 100%
2.16 102%
CCT
6804 96%
6334 103%
6544 99%
6274 104%
7075 92%
6543 99%
Colorchecker dE 2000 calibrated *
5
0.68
0.7
Totaal Gemiddelde (Programma / Instellingen)
-4% / -43%
84% / 109%
3% / -33%
-4% / -23%
16% / 16%

* ... kleiner is beter

CalMAN Grijswaarden
CalMAN Grijswaarden
CalMAN Colorchecker
CalMAN Colorchecker
vs. sRGB
vs. sRGB
vs. P3
vs. P3
vs. AdobeRGB
vs. AdobeRGB

Responstijd Scherm

ℹ
De responstijden van het scherm tonen hoe snel het scherm in staat is om van één kleur naar de andere te veranderen. Trage responstijden kunnen aanleiding geven tot 'nabeelden' rond bewegende objecten of het scherm wazig maken (blur). Vooral spelers van snelle 3D-games hebben baat bij een scherm met snelle responstijden.
   ↔    Responstijd Zwart naar Wit
21.5 ms ... stijging ↗ en daling ↘ gecombineerd↗ ms stijging
↘ ms daling
Het scherm vertoonde prima responstijden in onze tests maar is misschien wat te traag voor competitieve games.
Ter vergelijking: alle testtoestellen variëren van 0.1 (minimum) tot 240 (maximum) ms. » 48 % van alle toestellen zijn beter.
Dit betekent dat de gemeten responstijd vergelijkbaar is met het gemiddelde (19.7 ms) van alle geteste toestellen.
   ↔    Responstijd 50% Grijs naar 80% Grijs
45.7 ms ... stijging ↗ en daling ↘ gecombineerd↗ ms stijging
↘ ms daling
Het scherm vertoonde trage responstijden in onze tests en is misschien te traag voor games.
Ter vergelijking: alle testtoestellen variëren van 0.13 (minimum) tot 636 (maximum) ms. » 79 % van alle toestellen zijn beter.
Dit betekent dat de gemeten responstijd slechter is dan het gemiddelde (30.7 ms) van alle geteste toestellen.

Screen Flickering / PWM (Pulse-Width Modulation)

ℹ
Om de schermhelderheid te verlagen schakelen sommige laptops het backlight erg snel aan en uit. Dit gebeurt aan een dergelijk hoge frequentie dat het niet zichtbaar is voor het menselijk oog. Als de frequentie te laag is kunnen personen met gevoelige ogen geïrriteerd geraken, hoofdpijn krijgen en zelfs flickering waarnemen.
Screen flickering / PWM niet waargenomen

Ter vergelijking: 52 % van alle geteste toestellen maakten geen gebruik van PWM om de schermhelderheid te verlagen. Als het wel werd gebruikt, werd een gemiddelde van 7611 (minimum: 5 - maximum: 343500) Hz waargenomen.

In de zon
In de zon
Buiten (heldere dag, geen direct zonlicht)
Kijkhoeken
Kijkhoeken

Prestaties - Intel Core Ultra X7
Testomstandigheden

We gebruikten de modus Best Performance voor onze benchmarks en metingen.

Processorprestaties

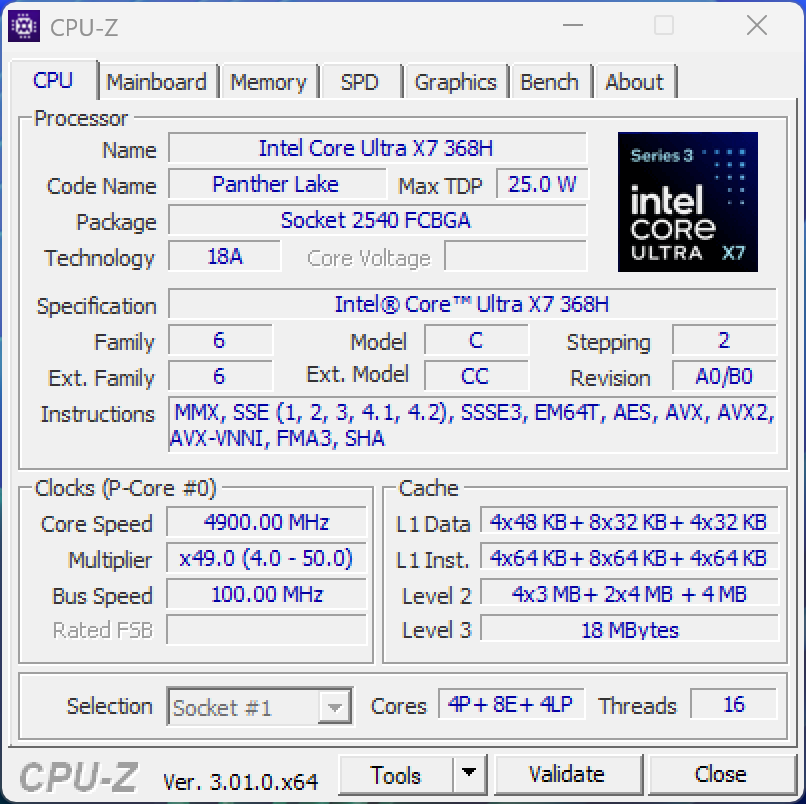
De Intel Core Ultra X7 368H is een van de snelste mobiele Panther Lake-processors en kan 65/35 watt verbruiken. Dit is niet ideaal voor een 15-inch laptop en de multicoreprestaties zouden iets beter kunnen zijn. Panther Lake richt zich echter meer op efficiëntie dan op pure multicoreprestaties. De prestaties lijken sterk op die van de Dell XPS 16 met vergelijkbare vermogenslimieten. Het Snapdragon-model gebruikt Snapdragon X2 Plus- of X2 Elite-CPU's (X2E-78-100), die iets betere multicore-CPU-prestaties zouden moeten bieden. 

CPU Performance rating: Percent
Cinebench 2024: CPU Multi Core | CPU Single Core
Geekbench 6.7: Multi-Core | Single-Core
CPU Performance rating
Asus Zenbook A16 UX3607
Qualcomm Snapdragon X2 Elite Extreme X2E-94-100
91.8 pt
Apple MacBook Air 15 M5
Apple M5 10-Core
82 pt
Lenovo ThinkPad X9-15p Gen 1 -2!
Intel Core Ultra X7 358H
70.9 pt
Microsoft Surface Pro 13 OLED
Qualcomm Snapdragon X2 Elite X2E-78-100
67.9 pt
Gemiddelde van klas Multimedia
 
67.1 pt
Microsoft Surface Laptop 15 Gen 8
Intel Core Ultra X7 368H
65.6 pt
Dell XPS 16 Core Ultra X7 358H
Intel Core Ultra X7 358H
65.3 pt
Gemiddeld Intel Core Ultra X7 368H
 
65 pt
Microsoft Surface Laptop 8 13.8
Qualcomm Snapdragon X2 Plus X2P-64-100
63.8 pt
Microsoft Surface Laptop 7 15 Lunar Lake
Intel Core Ultra 7 268V
53.3 pt
Cinebench 2024 / CPU Multi Core
Asus Zenbook A16 UX3607
Qualcomm Snapdragon X2 Elite Extreme X2E-94-100
1761 Points +83%
Gemiddelde van klas Multimedia
  (327 - 2490, n=61, laatste 2 jaar)
1120 Points +17%
Microsoft Surface Pro 13 OLED
Qualcomm Snapdragon X2 Elite X2E-78-100
1078 Points +12%
Gemiddeld Intel Core Ultra X7 368H
  (960 - 1104, n=2)
1032 Points +8%
Dell XPS 16 Core Ultra X7 358H
Intel Core Ultra X7 358H
1004 Points +5%
Apple MacBook Air 15 M5
Apple M5 10-Core
962 Points 0%
Microsoft Surface Laptop 15 Gen 8
Intel Core Ultra X7 368H
960 Points
Microsoft Surface Laptop 8 13.8
Qualcomm Snapdragon X2 Plus X2P-64-100
854 Points -11%
Microsoft Surface Laptop 7 15 Lunar Lake
Intel Core Ultra 7 268V
600 Points -37%
Cinebench 2024 / CPU Single Core
Apple MacBook Air 15 M5
Apple M5 10-Core
199 Points +57%
Asus Zenbook A16 UX3607
Qualcomm Snapdragon X2 Elite Extreme X2E-94-100
151 Points +19%
Microsoft Surface Laptop 8 13.8
Qualcomm Snapdragon X2 Plus X2P-64-100
134 Points +5%
Microsoft Surface Pro 13 OLED
Qualcomm Snapdragon X2 Elite X2E-78-100
133 Points +5%
Gemiddelde van klas Multimedia
  (72.5 - 201, n=55, laatste 2 jaar)
130.6 Points +3%
Gemiddeld Intel Core Ultra X7 368H
  (127.1 - 128.8, n=2)
128 Points +1%
Microsoft Surface Laptop 15 Gen 8
Intel Core Ultra X7 368H
127.1 Points
Dell XPS 16 Core Ultra X7 358H
Intel Core Ultra X7 358H
123.7 Points -3%
Microsoft Surface Laptop 7 15 Lunar Lake
Intel Core Ultra 7 268V
123.3 Points -3%
Geekbench 6.7 / Multi-Core
Asus Zenbook A16 UX3607
Qualcomm Snapdragon X2 Elite Extreme X2E-94-100
23204 Points +37%
Apple MacBook Air 15 M5
Apple M5 10-Core
16995 Points 0%
Dell XPS 16 Core Ultra X7 358H
Intel Core Ultra X7 358H
16943 Points 0%
Microsoft Surface Laptop 15 Gen 8
Intel Core Ultra X7 368H
16943 Points
Lenovo ThinkPad X9-15p Gen 1
Intel Core Ultra X7 358H
16876 Points 0%
Gemiddelde van klas Multimedia
  (4983 - 30057, n=61, laatste 2 jaar)
15748 Points -7%
Gemiddeld Intel Core Ultra X7 368H
  (12050 - 17352, n=4)
15438 Points -9%
Microsoft Surface Pro 13 OLED
Qualcomm Snapdragon X2 Elite X2E-78-100
15102 Points -11%
Microsoft Surface Laptop 8 13.8
Qualcomm Snapdragon X2 Plus X2P-64-100
14277 Points -16%
Microsoft Surface Laptop 7 15 Lunar Lake
Intel Core Ultra 7 268V
11279 Points -33%
Geekbench 6.7 / Single-Core
Apple MacBook Air 15 M5
Apple M5 10-Core
4195 Points +41%
Asus Zenbook A16 UX3607
Qualcomm Snapdragon X2 Elite Extreme X2E-94-100
3826 Points +28%
Microsoft Surface Pro 13 OLED
Qualcomm Snapdragon X2 Elite X2E-78-100
3287 Points +10%
Microsoft Surface Laptop 8 13.8
Qualcomm Snapdragon X2 Plus X2P-64-100
3265 Points +10%
Gemiddelde van klas Multimedia
  (1591 - 4336, n=61, laatste 2 jaar)
2990 Points 0%
Microsoft Surface Laptop 15 Gen 8
Intel Core Ultra X7 368H
2980 Points
Gemiddeld Intel Core Ultra X7 368H
  (2924 - 2983, n=3)
2962 Points -1%
Dell XPS 16 Core Ultra X7 358H
Intel Core Ultra X7 358H
2903 Points -3%
Lenovo ThinkPad X9-15p Gen 1
Intel Core Ultra X7 358H
2901 Points -3%
Microsoft Surface Laptop 7 15 Lunar Lake
Intel Core Ultra 7 268V
2871 Points -4%

Cinebench R15 Multi Loop

075150225300375450525600675750825900975105011251200127513501425150015751650172518001875195020252100217522502325240024752550262527002775285029253000307531503225330033753450352536003675Tooltip
Microsoft Surface Laptop 15 Gen 8 Intel Core Ultra X7 368H: Ø2462 (2121.79-3156.32) Points
Lenovo ThinkPad X9-15p Gen 1 Intel Core Ultra X7 358H: Ø2913 (2846.57-3015.45) Points
Asus Zenbook A16 UX3607 Qualcomm Snapdragon X2 Elite Extreme X2E-94-100: Ø3638 (3524.54-3682.9) Points
Dell XPS 16 Core Ultra X7 358H Intel Core Ultra X7 358H: Ø2543 (2491.75-2985.52) Points
Microsoft Surface Laptop 7 15 Lunar Lake Intel Core Ultra 7 268V: Ø1469 (1435.9-1615.7) Points
CPU Performance rating: Percent
Cinebench R23: Multi Core | Single Core
Cinebench R20: CPU (Multi Core) | CPU (Single Core)
Cinebench R15: CPU Multi 64Bit | CPU Single 64Bit
Blender: v2.79 BMW27 CPU
7-Zip 18.03: 7z b 4 | 7z b 4 -mmt1
HWBOT x265 Benchmark v2.2: 4k Preset
LibreOffice : 20 Documents To PDF
R Benchmark 2.5: Overall mean
CPU Performance rating
Lenovo ThinkPad X9-15p Gen 1
Intel Core Ultra X7 358H
77.9 pt
Gemiddeld Intel Core Ultra X7 368H
 
76.2 pt
Microsoft Surface Laptop 15 Gen 8
Intel Core Ultra X7 368H
75.8 pt
Dell XPS 16 Core Ultra X7 358H
Intel Core Ultra X7 358H
75.2 pt
Gemiddelde van klas Multimedia
 
69.1 pt
Asus Zenbook A16 UX3607 -1!
Qualcomm Snapdragon X2 Elite Extreme X2E-94-100
68.9 pt
Microsoft Surface Laptop 7 15 Lunar Lake
Intel Core Ultra 7 268V
53.1 pt
Cinebench R23 / Multi Core
Lenovo ThinkPad X9-15p Gen 1
Intel Core Ultra X7 358H
19360 Points +14%
Asus Zenbook A16 UX3607
Qualcomm Snapdragon X2 Elite Extreme X2E-94-100
19037 Points +12%
Dell XPS 16 Core Ultra X7 358H
Intel Core Ultra X7 358H
17884 (15984.6min - 17883.7max) Points +5%
Gemiddeld Intel Core Ultra X7 368H
  (17052 - 17350, n=2)
17201 Points +1%
Microsoft Surface Laptop 15 Gen 8
Intel Core Ultra X7 368H
17052 Points
Gemiddelde van klas Multimedia
  (4861 - 33362, n=60, laatste 2 jaar)
17050 Points 0%
Microsoft Surface Laptop 7 15 Lunar Lake
Intel Core Ultra 7 268V
10535 Points -38%
Cinebench R23 / Single Core
Gemiddeld Intel Core Ultra X7 368H
  (2140 - 2169, n=2)
2155 Points +1%
Microsoft Surface Laptop 15 Gen 8
Intel Core Ultra X7 368H
2140 Points
Dell XPS 16 Core Ultra X7 358H
Intel Core Ultra X7 358H
2087 Points -2%
Lenovo ThinkPad X9-15p Gen 1
Intel Core Ultra X7 358H
2080 Points -3%
Gemiddelde van klas Multimedia
  (1237 - 2459, n=59, laatste 2 jaar)
1982 Points -7%
Microsoft Surface Laptop 7 15 Lunar Lake
Intel Core Ultra 7 268V
1910 Points -11%
Asus Zenbook A16 UX3607
Qualcomm Snapdragon X2 Elite Extreme X2E-94-100
1622 Points -24%
Cinebench R20 / CPU (Multi Core)
Lenovo ThinkPad X9-15p Gen 1
Intel Core Ultra X7 358H
7531 Points +13%
Gemiddeld Intel Core Ultra X7 368H
  (6681 - 7938, n=2)
7310 Points +9%
Asus Zenbook A16 UX3607
Qualcomm Snapdragon X2 Elite Extreme X2E-94-100
7298 Points +9%
Dell XPS 16 Core Ultra X7 358H
Intel Core Ultra X7 358H
7195 Points +8%
Microsoft Surface Laptop 15 Gen 8
Intel Core Ultra X7 368H
6681 Points
Gemiddelde van klas Multimedia
  (1887 - 12912, n=51, laatste 2 jaar)
6585 Points -1%
Microsoft Surface Laptop 7 15 Lunar Lake
Intel Core Ultra 7 268V
4129 Points -38%
Cinebench R20 / CPU (Single Core)
Gemiddeld Intel Core Ultra X7 368H
  (809 - 820, n=2)
815 Points +1%
Microsoft Surface Laptop 15 Gen 8
Intel Core Ultra X7 368H
809 Points
Lenovo ThinkPad X9-15p Gen 1
Intel Core Ultra X7 358H
785 Points -3%
Dell XPS 16 Core Ultra X7 358H
Intel Core Ultra X7 358H
780 Points -4%
Gemiddelde van klas Multimedia
  (482 - 833, n=51, laatste 2 jaar)
744 Points -8%
Microsoft Surface Laptop 7 15 Lunar Lake
Intel Core Ultra 7 268V
736 Points -9%
Asus Zenbook A16 UX3607
Qualcomm Snapdragon X2 Elite Extreme X2E-94-100
620 Points -23%
Cinebench R15 / CPU Multi 64Bit
Asus Zenbook A16 UX3607
Qualcomm Snapdragon X2 Elite Extreme X2E-94-100
3683 (3524.54min - 3682.9max) Points +17%
Microsoft Surface Laptop 15 Gen 8
Intel Core Ultra X7 368H
3156 (2121.79min - 3156.32max) Points
Gemiddeld Intel Core Ultra X7 368H
  (2976 - 3156, n=2)
3066 Points -3%
Lenovo ThinkPad X9-15p Gen 1
Intel Core Ultra X7 358H
3015 (2846.57min - 3015.45max) Points -4%
Dell XPS 16 Core Ultra X7 358H
Intel Core Ultra X7 358H
2986 (2491.75min - 2985.52max) Points -5%
Gemiddelde van klas Multimedia
  (856 - 5224, n=56, laatste 2 jaar)
2713 Points -14%
Microsoft Surface Laptop 7 15 Lunar Lake
Intel Core Ultra 7 268V
1616 (1435.9min - 1615.7max) Points -49%
Cinebench R15 / CPU Single 64Bit
Gemiddeld Intel Core Ultra X7 368H
  (308 - 323, n=2)
316 Points +3%
Microsoft Surface Laptop 15 Gen 8
Intel Core Ultra X7 368H
308 Points
Dell XPS 16 Core Ultra X7 358H
Intel Core Ultra X7 358H
304 Points -1%
Asus Zenbook A16 UX3607
Qualcomm Snapdragon X2 Elite Extreme X2E-94-100
303 Points -2%
Lenovo ThinkPad X9-15p Gen 1
Intel Core Ultra X7 358H
299 Points -3%
Microsoft Surface Laptop 7 15 Lunar Lake
Intel Core Ultra 7 268V
287 Points -7%
Gemiddelde van klas Multimedia
  (184.8 - 326, n=53, laatste 2 jaar)
285 Points -7%
Blender / v2.79 BMW27 CPU
Microsoft Surface Laptop 7 15 Lunar Lake
Intel Core Ultra 7 268V
337 Seconds * -66%
Gemiddelde van klas Multimedia
  (100 - 557, n=52, laatste 2 jaar)
239 Seconds * -18%
Microsoft Surface Laptop 15 Gen 8
Intel Core Ultra X7 368H
203 Seconds *
Dell XPS 16 Core Ultra X7 358H
Intel Core Ultra X7 358H
196 Seconds * +3%
Gemiddeld Intel Core Ultra X7 368H
  (179 - 203, n=2)
191 Seconds * +6%
Lenovo ThinkPad X9-15p Gen 1
Intel Core Ultra X7 358H
175 Seconds * +14%
Asus Zenbook A16 UX3607
Qualcomm Snapdragon X2 Elite Extreme X2E-94-100
172 Seconds * +15%
7-Zip 18.03 / 7z b 4
Lenovo ThinkPad X9-15p Gen 1
Intel Core Ultra X7 358H
68930 MIPS +11%
Dell XPS 16 Core Ultra X7 358H
Intel Core Ultra X7 358H
64852 MIPS +4%
Gemiddeld Intel Core Ultra X7 368H
  (62173 - 63679, n=2)
62926 MIPS +1%
Microsoft Surface Laptop 15 Gen 8
Intel Core Ultra X7 368H
62173 MIPS
Gemiddelde van klas Multimedia
  (26062 - 130368, n=49, laatste 2 jaar)
58487 MIPS -6%
Microsoft Surface Laptop 7 15 Lunar Lake
Intel Core Ultra 7 268V
35687 MIPS -43%
7-Zip 18.03 / 7z b 4 -mmt1
Microsoft Surface Laptop 15 Gen 8
Intel Core Ultra X7 368H
6637 MIPS
Gemiddeld Intel Core Ultra X7 368H
  (6434 - 6637, n=2)
6536 MIPS -2%
Lenovo ThinkPad X9-15p Gen 1
Intel Core Ultra X7 358H
6449 MIPS -3%
Dell XPS 16 Core Ultra X7 358H
Intel Core Ultra X7 358H
6441 MIPS -3%
Asus Zenbook A16 UX3607
Qualcomm Snapdragon X2 Elite Extreme X2E-94-100
6247 MIPS -6%
Microsoft Surface Laptop 7 15 Lunar Lake
Intel Core Ultra 7 268V
6021 MIPS -9%
Gemiddelde van klas Multimedia
  (4526 - 7337, n=50, laatste 2 jaar)
5944 MIPS -10%
HWBOT x265 Benchmark v2.2 / 4k Preset
Lenovo ThinkPad X9-15p Gen 1
Intel Core Ultra X7 358H
22.1 fps +18%
Dell XPS 16 Core Ultra X7 358H
Intel Core Ultra X7 358H
21 fps +12%
Gemiddelde van klas Multimedia
  (6.08 - 36.1, n=50, laatste 2 jaar)
19.3 fps +3%
Microsoft Surface Laptop 15 Gen 8
Intel Core Ultra X7 368H
18.7 fps
Gemiddeld Intel Core Ultra X7 368H
  (14.1 - 18.7, n=2)
16.4 fps -12%
Asus Zenbook A16 UX3607
Qualcomm Snapdragon X2 Elite Extreme X2E-94-100
13.6 fps -27%
Microsoft Surface Laptop 7 15 Lunar Lake
Intel Core Ultra 7 268V
12.9 fps -31%
LibreOffice / 20 Documents To PDF
Dell XPS 16 Core Ultra X7 358H
Intel Core Ultra X7 358H
49.5 s * -22%
Microsoft Surface Laptop 7 15 Lunar Lake
Intel Core Ultra 7 268V
48 s * -19%
Gemiddelde van klas Multimedia
  (23.9 - 72.5, n=51, laatste 2 jaar)
47.9 s * -18%
Lenovo ThinkPad X9-15p Gen 1
Intel Core Ultra X7 358H
47.6 s * -18%
Asus Zenbook A16 UX3607
Qualcomm Snapdragon X2 Elite Extreme X2E-94-100
44.2 s * -9%
Microsoft Surface Laptop 15 Gen 8
Intel Core Ultra X7 368H
40.5 s *
Gemiddeld Intel Core Ultra X7 368H
  (39.1 - 40.5, n=2)
39.8 s * +2%
R Benchmark 2.5 / Overall mean
Asus Zenbook A16 UX3607
Qualcomm Snapdragon X2 Elite Extreme X2E-94-100
0.507 sec * -22%
Microsoft Surface Laptop 7 15 Lunar Lake
Intel Core Ultra 7 268V
0.4565 sec * -10%
Gemiddelde van klas Multimedia
  (0.3903 - 0.609, n=50, laatste 2 jaar)
0.4464 sec * -8%
Lenovo ThinkPad X9-15p Gen 1
Intel Core Ultra X7 358H
0.4236 sec * -2%
Dell XPS 16 Core Ultra X7 358H
Intel Core Ultra X7 358H
0.4216 sec * -2%
Microsoft Surface Laptop 15 Gen 8
Intel Core Ultra X7 368H
0.4144 sec *
Gemiddeld Intel Core Ultra X7 368H
  (0.4137 - 0.4144, n=2)
0.4141 sec * -0%

* ... kleiner is beter

Cinebench R15 CPU Multi 64Bit
3156 Points
Cinebench R15 OpenGL 64Bit
253 fps
Cinebench R15 Ref. Match 64Bit
97.8 %
Cinebench R15 CPU Single 64Bit
308 Points
Cinebench R20 CPU (Multi Core)
6681 Points
Cinebench R20 CPU (Single Core)
809 Points
Cinebench R23 Single Core
2140 Points
Cinebench R23 Multi Core
17052 Points
Cinebench 2024 CPU Single Core
127.1 Points
Cinebench 2024 CPU Multi Core
960 Points
Help
Performance rating
Lenovo ThinkPad X9-15p Gen 1 -1!
Intel Core Ultra X7 358H, Arc B390 Panther Lake iGPU
91.4 pt
Gemiddeld Intel Core Ultra X7 368H -1!
 
84.2 pt
Gemiddelde van klas Multimedia
 
83.6 pt
Dell XPS 16 Core Ultra X7 358H -1!
Intel Core Ultra X7 358H, Arc B390 Panther Lake iGPU
82.6 pt
Microsoft Surface Laptop 15 Gen 8 -1!
Intel Core Ultra X7 368H, Arc B390 Panther Lake iGPU
79.2 pt
Asus Zenbook A16 UX3607 -1!
Qualcomm Snapdragon X2 Elite Extreme X2E-94-100, X2-90
70 pt
Microsoft Surface Laptop 7 15 Lunar Lake -1!
Intel Core Ultra 7 268V, Arc 140V
55 pt
AIDA64 / FP32 Ray-Trace
Lenovo ThinkPad X9-15p Gen 1
Intel Core Ultra X7 358H, Arc B390 Panther Lake iGPU (v8.20.8100)
18710 KRay/s +21%
Gemiddelde van klas Multimedia
  (2214 - 50388, n=48, laatste 2 jaar)
18202 KRay/s +18%
Gemiddeld Intel Core Ultra X7 368H
  (15419 - 17245, n=2)
16332 KRay/s +6%
Dell XPS 16 Core Ultra X7 358H
Intel Core Ultra X7 358H, Arc B390 Panther Lake iGPU (v8.20.8100)
15681 KRay/s +2%
Microsoft Surface Laptop 15 Gen 8
Intel Core Ultra X7 368H, Arc B390 Panther Lake iGPU (v8.20.8100)
15419 KRay/s
Asus Zenbook A16 UX3607
Qualcomm Snapdragon X2 Elite Extreme X2E-94-100, X2-90 (v8.20.8100)
12578 KRay/s -18%
Microsoft Surface Laptop 7 15 Lunar Lake
Intel Core Ultra 7 268V, Arc 140V (v6.92.6600)
11547 KRay/s -25%
AIDA64 / FPU Julia
Lenovo ThinkPad X9-15p Gen 1
Intel Core Ultra X7 358H, Arc B390 Panther Lake iGPU (v8.20.8100)
96559 Points +15%
Gemiddeld Intel Core Ultra X7 368H
  (84167 - 90689, n=2)
87428 Points +4%
Gemiddelde van klas Multimedia
  (12867 - 201874, n=48, laatste 2 jaar)
85899 Points +2%
Microsoft Surface Laptop 15 Gen 8
Intel Core Ultra X7 368H, Arc B390 Panther Lake iGPU (v8.20.8100)
84167 Points
Dell XPS 16 Core Ultra X7 358H
Intel Core Ultra X7 358H, Arc B390 Panther Lake iGPU (v8.20.8100)
83114 Points -1%
Microsoft Surface Laptop 7 15 Lunar Lake
Intel Core Ultra 7 268V, Arc 140V (v6.92.6600)
56299 Points -33%
Asus Zenbook A16 UX3607
Qualcomm Snapdragon X2 Elite Extreme X2E-94-100, X2-90 (v8.20.8100)
49008 Points -42%
AIDA64 / CPU SHA3
Asus Zenbook A16 UX3607
Qualcomm Snapdragon X2 Elite Extreme X2E-94-100, X2-90 (v8.20.8100)
5433 MB/s +34%
Lenovo ThinkPad X9-15p Gen 1
Intel Core Ultra X7 358H, Arc B390 Panther Lake iGPU (v8.20.8100)
4955 MB/s +22%
Gemiddeld Intel Core Ultra X7 368H
  (4052 - 4537, n=2)
4295 MB/s +6%
Dell XPS 16 Core Ultra X7 358H
Intel Core Ultra X7 358H, Arc B390 Panther Lake iGPU (v8.20.8100)
4200 MB/s +4%
Microsoft Surface Laptop 15 Gen 8
Intel Core Ultra X7 368H, Arc B390 Panther Lake iGPU (v8.20.8100)
4052 MB/s
Gemiddelde van klas Multimedia
  (626 - 8623, n=48, laatste 2 jaar)
3988 MB/s -2%
Microsoft Surface Laptop 7 15 Lunar Lake
Intel Core Ultra 7 268V, Arc 140V (v6.92.6600)
2538 MB/s -37%
AIDA64 / CPU Queen
Gemiddelde van klas Multimedia
  (13483 - 181505, n=31, laatste 2 jaar)
70972 Points
Microsoft Surface Laptop 7 15 Lunar Lake
Intel Core Ultra 7 268V, Arc 140V (v6.92.6600)
49645 Points
AIDA64 / FPU SinJulia
Gemiddelde van klas Multimedia
  (886 - 28794, n=48, laatste 2 jaar)
8498 Points +26%
Gemiddeld Intel Core Ultra X7 368H
  (6765 - 7511, n=2)
7138 Points +6%
Lenovo ThinkPad X9-15p Gen 1
Intel Core Ultra X7 358H, Arc B390 Panther Lake iGPU (v8.20.8100)
7033 Points +4%
Dell XPS 16 Core Ultra X7 358H
Intel Core Ultra X7 358H, Arc B390 Panther Lake iGPU (v8.20.8100)
6892 Points +2%
Microsoft Surface Laptop 15 Gen 8
Intel Core Ultra X7 368H, Arc B390 Panther Lake iGPU (v8.20.8100)
6765 Points
Microsoft Surface Laptop 7 15 Lunar Lake
Intel Core Ultra 7 268V, Arc 140V (v6.92.6600)
4426 Points -35%
Asus Zenbook A16 UX3607
Qualcomm Snapdragon X2 Elite Extreme X2E-94-100, X2-90 (v8.20.8100)
4199 Points -38%
AIDA64 / FPU Mandel
Lenovo ThinkPad X9-15p Gen 1
Intel Core Ultra X7 358H, Arc B390 Panther Lake iGPU (v8.20.8100)
50766 Points +13%
Gemiddeld Intel Core Ultra X7 368H
  (44784 - 48562, n=2)
46673 Points +4%
Gemiddelde van klas Multimedia
  (6395 - 105740, n=48, laatste 2 jaar)
45242 Points +1%
Microsoft Surface Laptop 15 Gen 8
Intel Core Ultra X7 368H, Arc B390 Panther Lake iGPU (v8.20.8100)
44784 Points
Dell XPS 16 Core Ultra X7 358H
Intel Core Ultra X7 358H, Arc B390 Panther Lake iGPU (v8.20.8100)
44733 Points 0%
Microsoft Surface Laptop 7 15 Lunar Lake
Intel Core Ultra 7 268V, Arc 140V (v6.92.6600)
29637 Points -34%
Asus Zenbook A16 UX3607
Qualcomm Snapdragon X2 Elite Extreme X2E-94-100, X2-90 (v8.20.8100)
26387 Points -41%
AIDA64 / CPU AES
Asus Zenbook A16 UX3607
Qualcomm Snapdragon X2 Elite Extreme X2E-94-100, X2-90 (v8.20.8100)
110260 MB/s +88%
Lenovo ThinkPad X9-15p Gen 1
Intel Core Ultra X7 358H, Arc B390 Panther Lake iGPU (v8.20.8100)
68737 MB/s +17%
Gemiddelde van klas Multimedia
  (8171 - 126790, n=48, laatste 2 jaar)
64193 MB/s +10%
Gemiddeld Intel Core Ultra X7 368H
  (58572 - 68180, n=2)
63376 MB/s +8%
Dell XPS 16 Core Ultra X7 358H
Intel Core Ultra X7 358H, Arc B390 Panther Lake iGPU (v8.20.8100)
61102 MB/s +4%
Microsoft Surface Laptop 15 Gen 8
Intel Core Ultra X7 368H, Arc B390 Panther Lake iGPU (v8.20.8100)
58572 MB/s
Microsoft Surface Laptop 7 15 Lunar Lake
Intel Core Ultra 7 268V, Arc 140V (v6.92.6600)
38706 MB/s -34%
AIDA64 / CPU ZLib
Asus Zenbook A16 UX3607
Qualcomm Snapdragon X2 Elite Extreme X2E-94-100, X2-90 (v8.20.8100)
1337 MB/s +67%
Lenovo ThinkPad X9-15p Gen 1
Intel Core Ultra X7 358H, Arc B390 Panther Lake iGPU (v8.20.8100)
1111 MB/s +38%
Dell XPS 16 Core Ultra X7 358H
Intel Core Ultra X7 358H, Arc B390 Panther Lake iGPU (v8.20.8100)
991 MB/s +23%
Gemiddelde van klas Multimedia
  (143.8 - 2022, n=48, laatste 2 jaar)
982 MB/s +22%
Gemiddeld Intel Core Ultra X7 368H
  (803 - 1130, n=2)
967 MB/s +20%
Microsoft Surface Laptop 15 Gen 8
Intel Core Ultra X7 368H, Arc B390 Panther Lake iGPU (v8.20.8100)
803 MB/s
Microsoft Surface Laptop 7 15 Lunar Lake
Intel Core Ultra 7 268V, Arc 140V (v6.92.6600)
583 MB/s -27%
AIDA64 / FP64 Ray-Trace
Gemiddelde van klas Multimedia
  (1014 - 26875, n=48, laatste 2 jaar)
9692 KRay/s +19%
Lenovo ThinkPad X9-15p Gen 1
Intel Core Ultra X7 358H, Arc B390 Panther Lake iGPU (v8.20.8100)
9612 KRay/s +18%
Gemiddeld Intel Core Ultra X7 368H
  (8151 - 9131, n=2)
8641 KRay/s +6%
Dell XPS 16 Core Ultra X7 358H
Intel Core Ultra X7 358H, Arc B390 Panther Lake iGPU (v8.20.8100)
8285 KRay/s +2%
Microsoft Surface Laptop 15 Gen 8
Intel Core Ultra X7 368H, Arc B390 Panther Lake iGPU (v8.20.8100)
8151 KRay/s
Asus Zenbook A16 UX3607
Qualcomm Snapdragon X2 Elite Extreme X2E-94-100, X2-90 (v8.20.8100)
6811 KRay/s -16%
Microsoft Surface Laptop 7 15 Lunar Lake
Intel Core Ultra 7 268V, Arc 140V (v6.92.6600)
6214 KRay/s -24%
AIDA64 / CPU PhotoWorxx
Lenovo ThinkPad X9-15p Gen 1
Intel Core Ultra X7 358H, Arc B390 Panther Lake iGPU (v8.20.8100)
88533 MPixel/s +17%
Dell XPS 16 Core Ultra X7 358H
Intel Core Ultra X7 358H, Arc B390 Panther Lake iGPU (v8.20.8100)
88154 MPixel/s +16%
Gemiddeld Intel Core Ultra X7 368H
  (75761 - 84065, n=2)
79913 MPixel/s +5%
Microsoft Surface Laptop 15 Gen 8
Intel Core Ultra X7 368H, Arc B390 Panther Lake iGPU (v8.20.8100)
75761 MPixel/s
Asus Zenbook A16 UX3607
Qualcomm Snapdragon X2 Elite Extreme X2E-94-100, X2-90 (v8.20.8100)
66951 MPixel/s -12%
Microsoft Surface Laptop 7 15 Lunar Lake
Intel Core Ultra 7 268V, Arc 140V (v6.92.6600)
53540 MPixel/s -29%
Gemiddelde van klas Multimedia
  (8187 - 88533, n=48, laatste 2 jaar)
53006 MPixel/s -30%
AIDA64 / CPU CheckMate
Gemiddeld Intel Core Ultra X7 368H
  (4328 - 4613, n=2)
4471 MP/s +3%
Microsoft Surface Laptop 15 Gen 8
Intel Core Ultra X7 368H, Arc B390 Panther Lake iGPU (v8.20.8100)
4328 MP/s
Lenovo ThinkPad X9-15p Gen 1
Intel Core Ultra X7 358H, Arc B390 Panther Lake iGPU (v8.20.8100)
4279 MP/s -1%
Dell XPS 16 Core Ultra X7 358H
Intel Core Ultra X7 358H, Arc B390 Panther Lake iGPU (v8.20.8100)
4269 MP/s -1%
Gemiddelde van klas Multimedia
  (569 - 4742, n=20, laatste 2 jaar)
3548 MP/s -18%
Asus Zenbook A16 UX3607
Qualcomm Snapdragon X2 Elite Extreme X2E-94-100, X2-90 (v8.20.8100)
1570 MP/s -64%

Systeem- en opslagapparaten

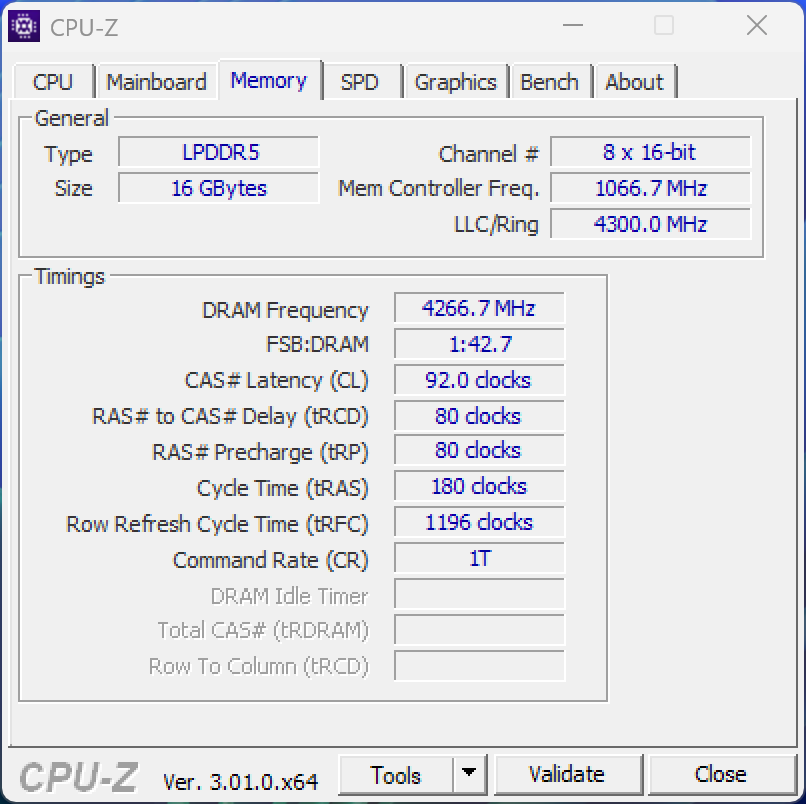
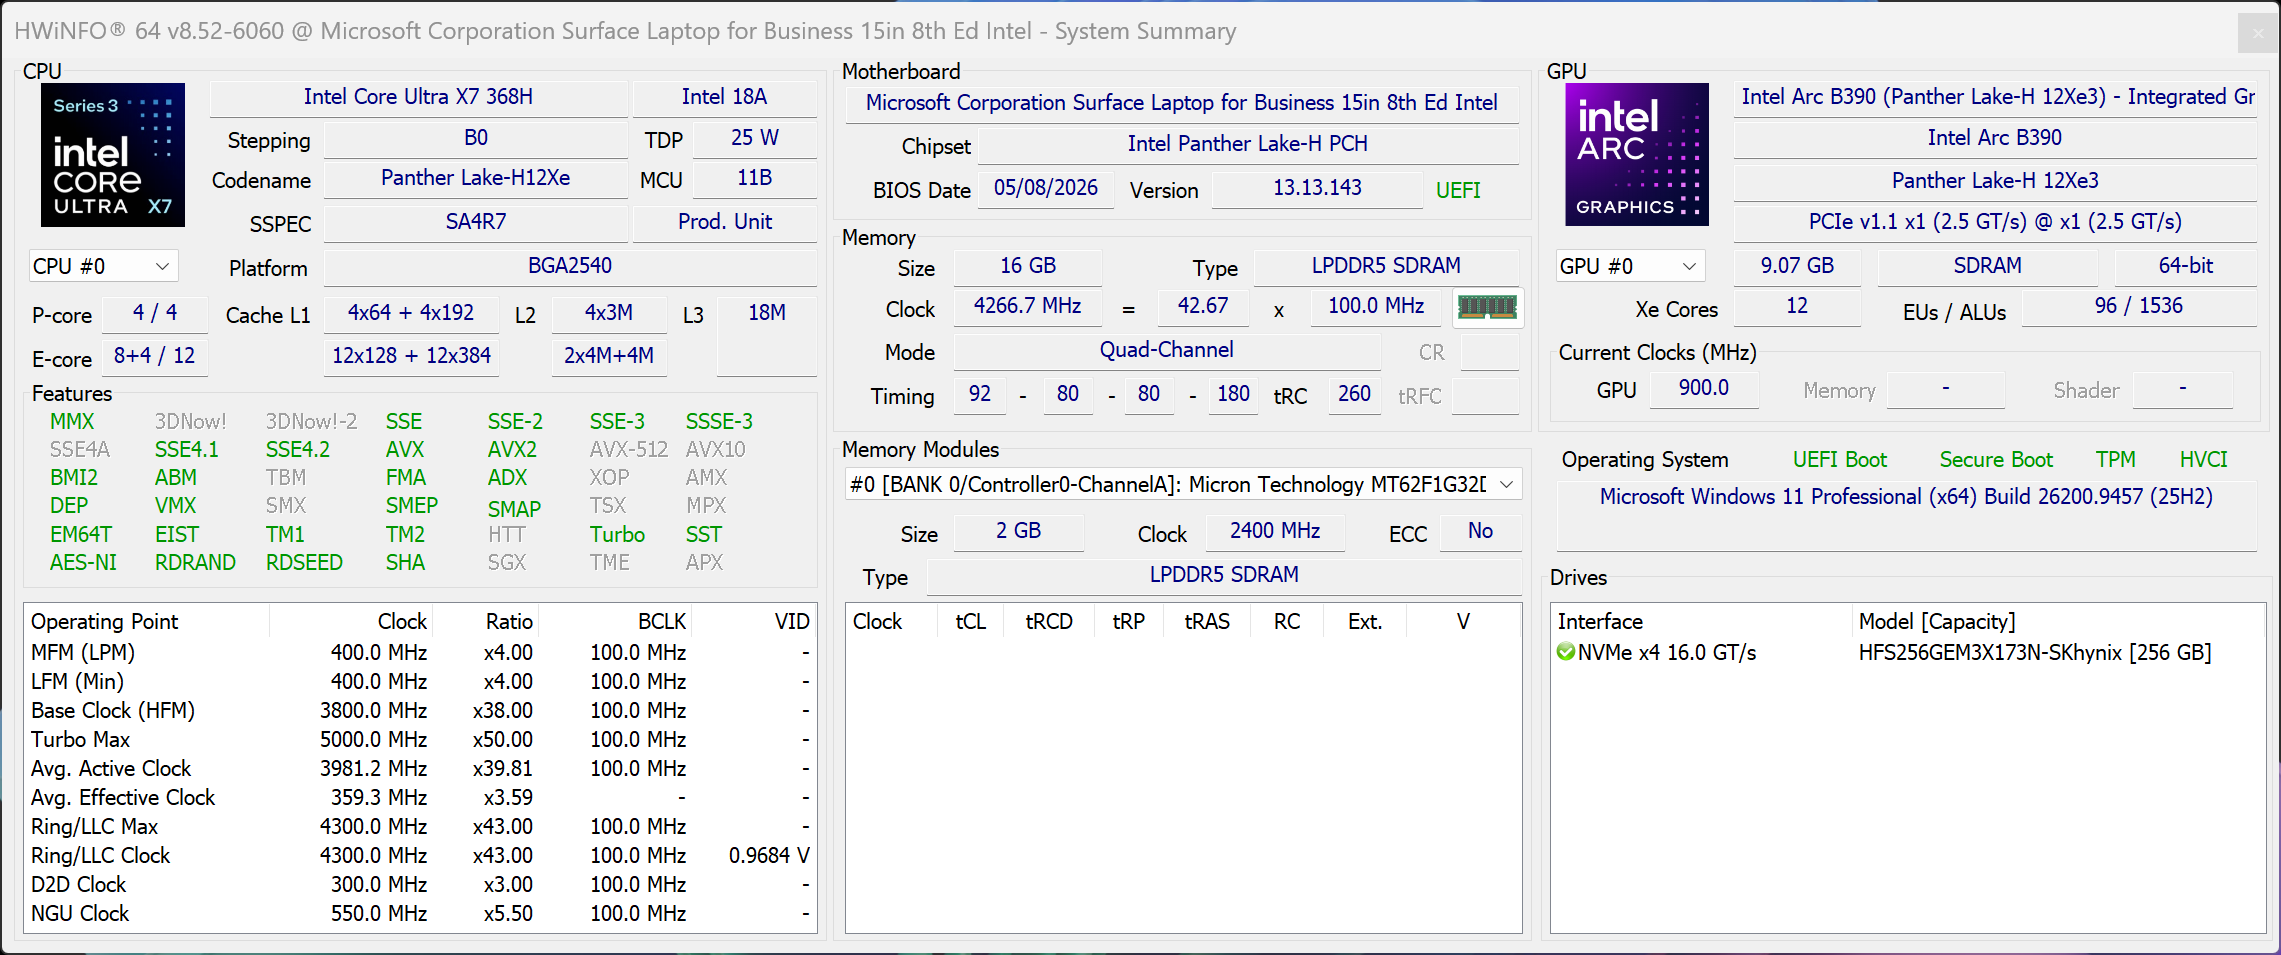
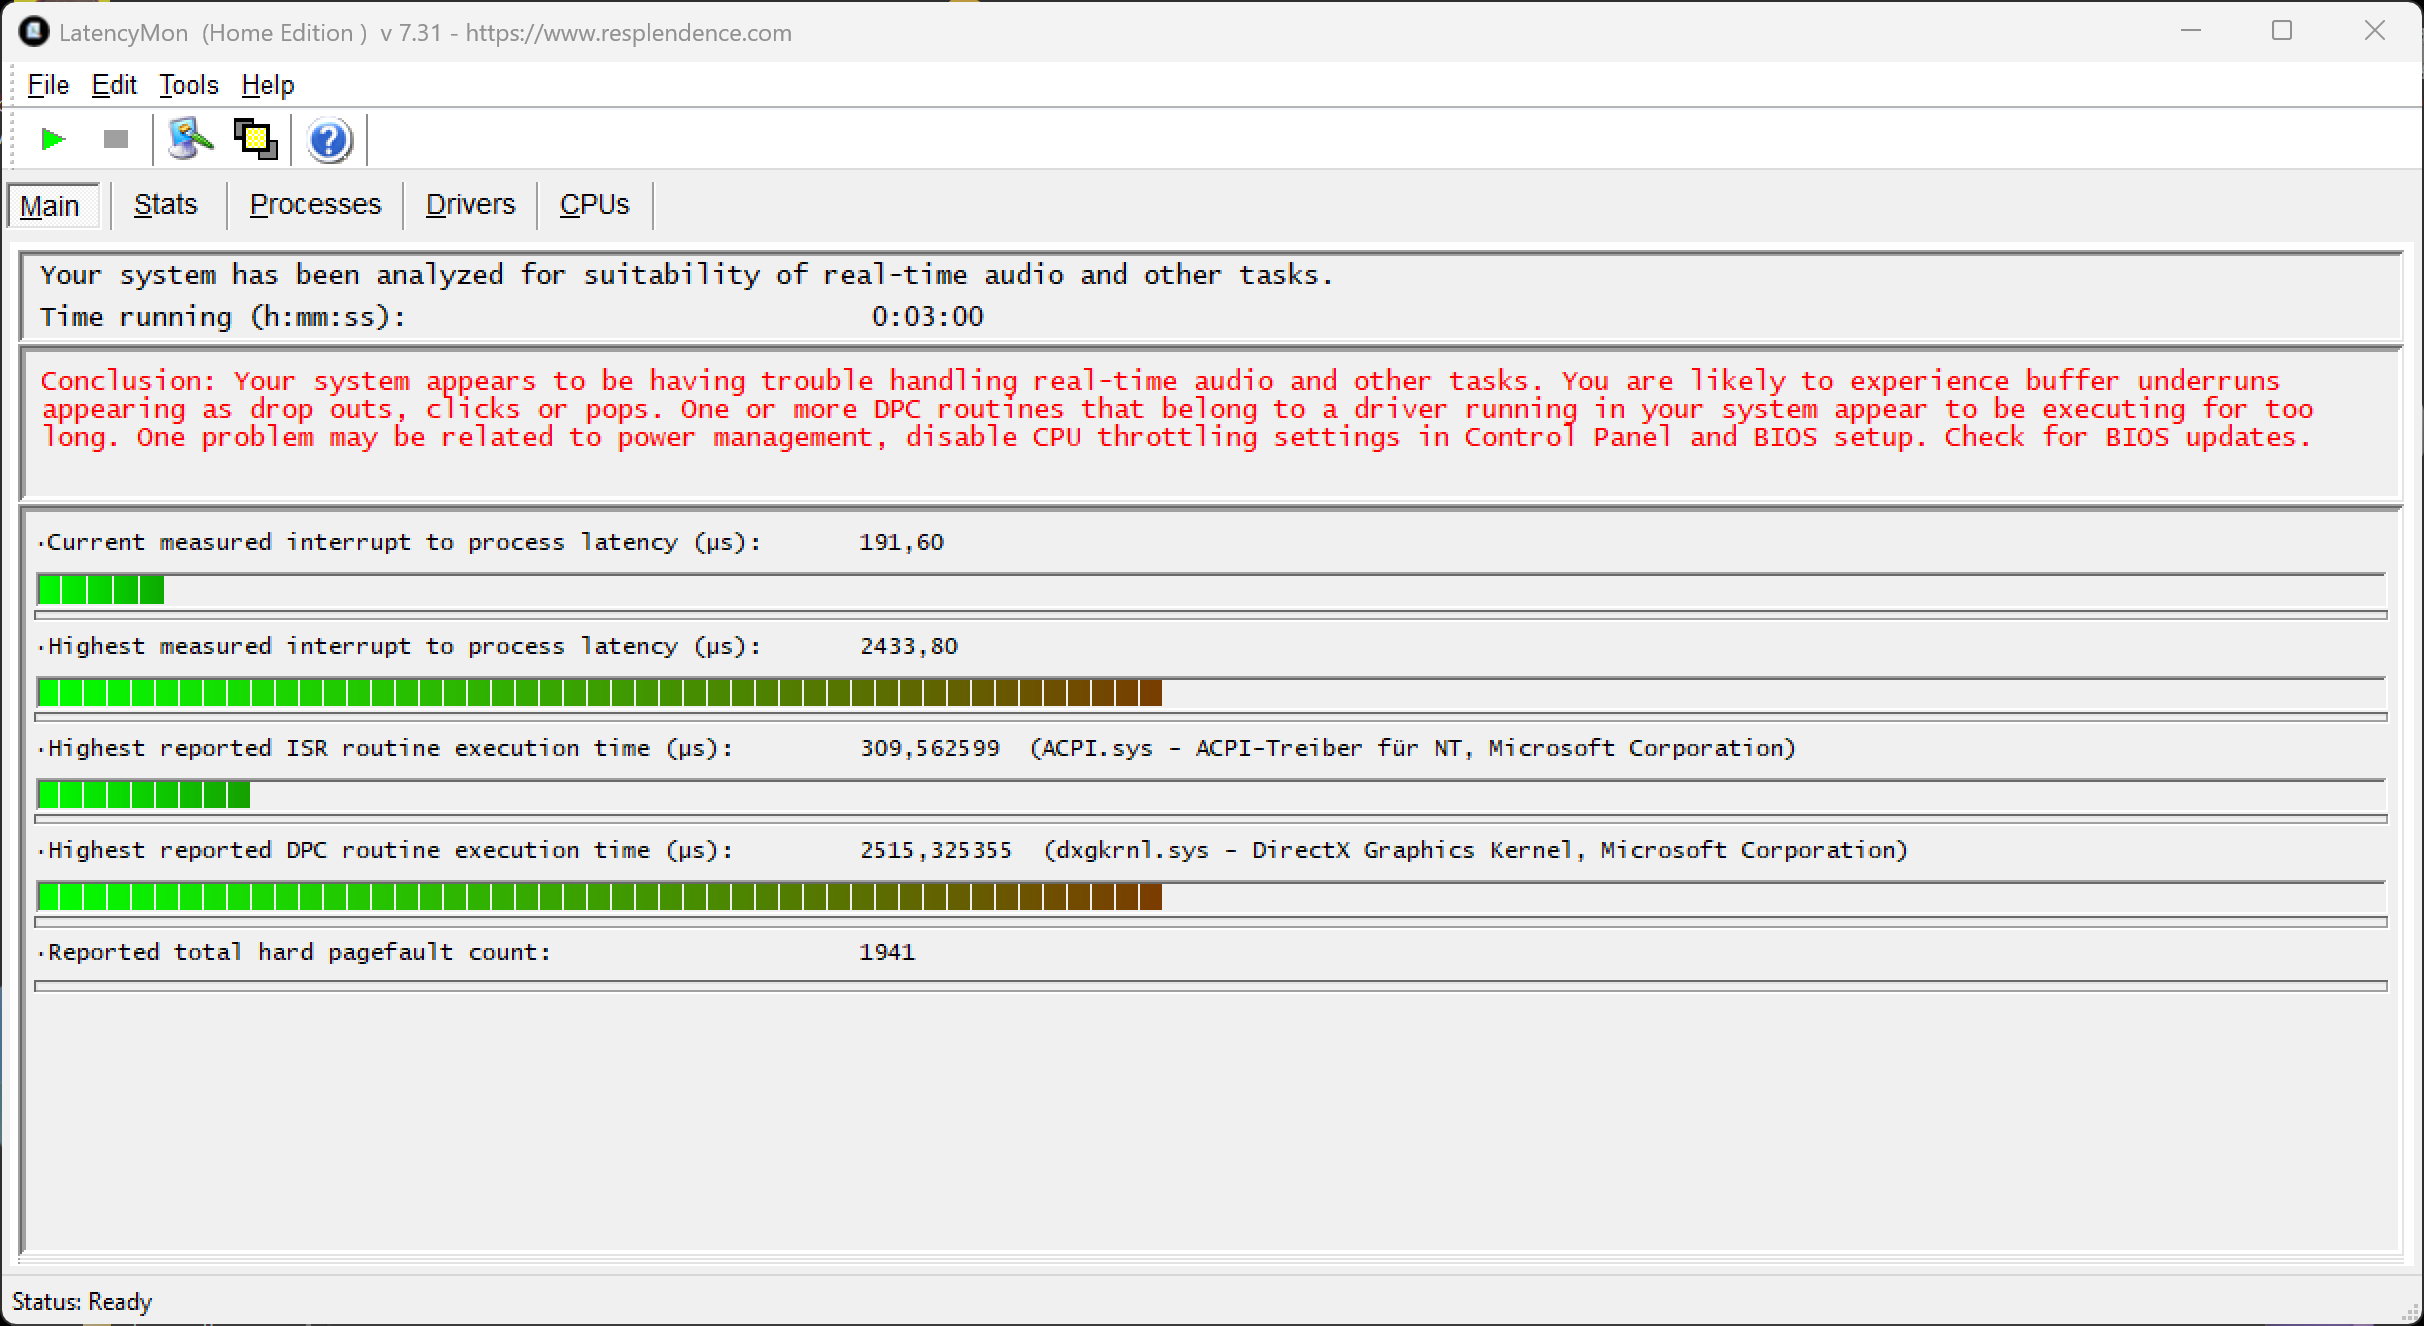
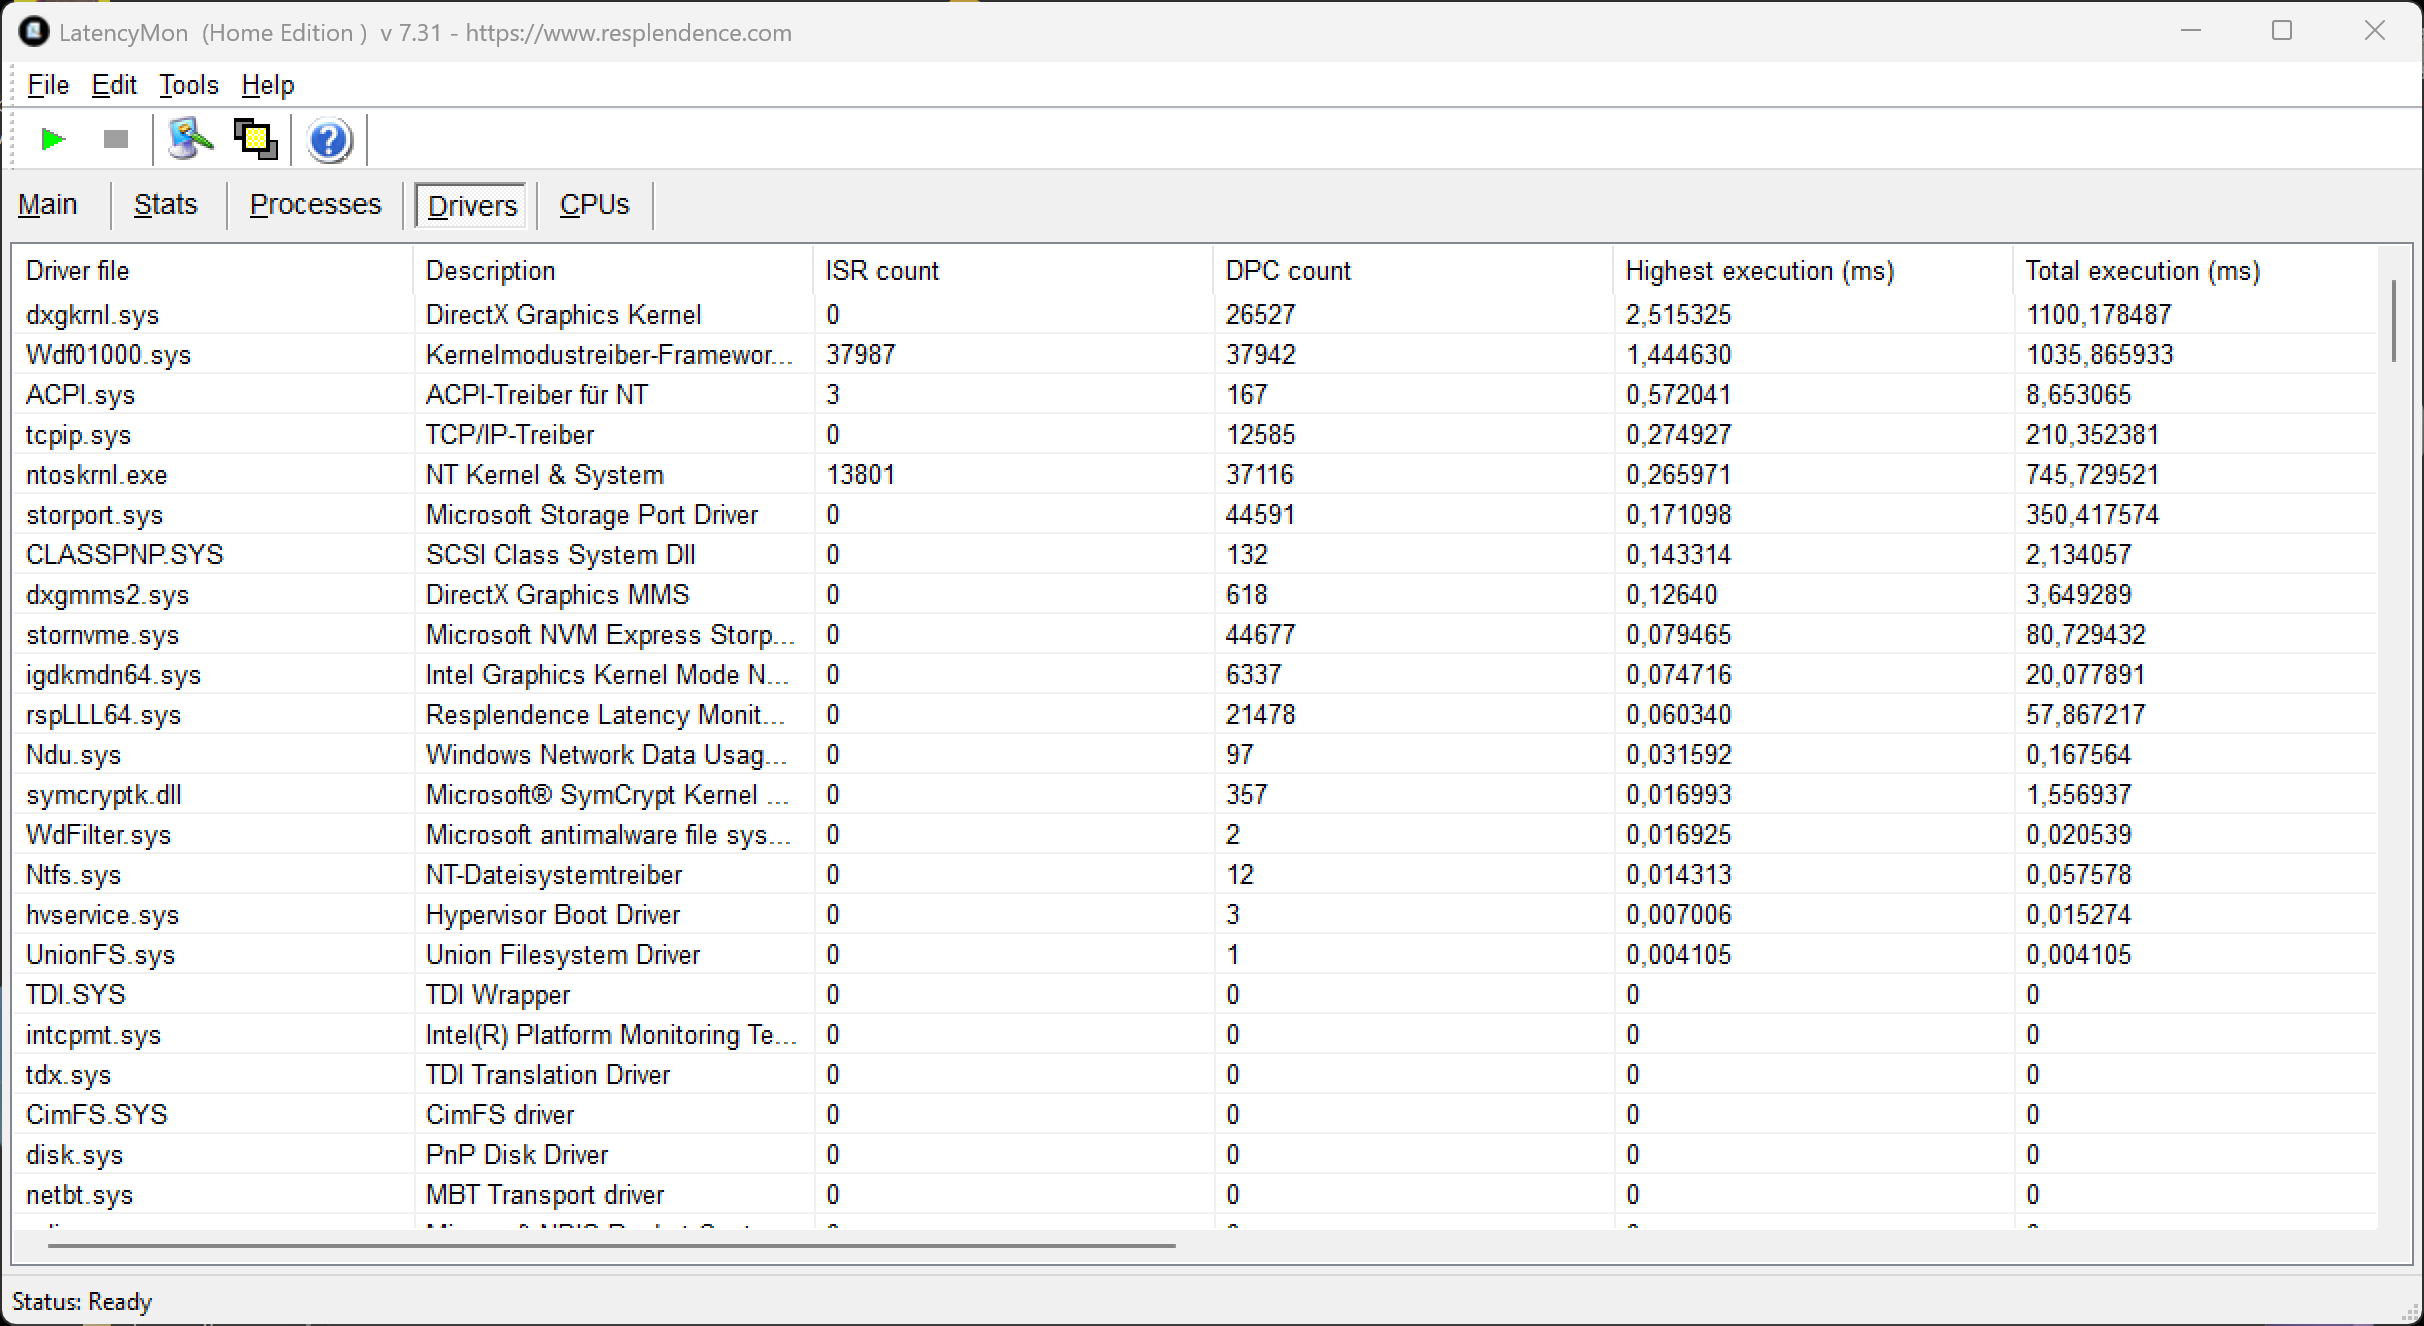
De algehele systeemprestaties zijn uitstekend en we hebben ook geen stabiliteitsproblemen opgemerkt. Er zijn uiteraard geen compatibiliteitsproblemen met de Intel-uitvoering, wat een voordeel is ten opzichte van de Snapdragon-versie. Ons testexemplaar heeft slechts 16 GB RAM, maar we hebben geen problemen ondervonden en als je niet te veel multitaskt, zou deze goedkopere versie prima moeten voldoen. 32 GB zou uiteraard beter zijn (je kunt maximaal 64 GB configureren), maar de meerprijzen zijn hoog. Onze latentietest bracht enkele problemen aan het licht voor realtime audiotoepassingen. De SSD-prestaties (PCIe 4.0) zijn goed en stabiel.

Performance rating: Percent
PCMark 10: Score | Essentials | Productivity | Digital Content Creation
CrossMark: Overall | Productivity | Creativity | Responsiveness
WebXPRT 3: Overall
WebXPRT 4: Overall
Mozilla Kraken 1.1: Total
Performance rating
Apple MacBook Air 15 M5 -4!
M5 10-Core GPU, M5 10-Core, Apple SSD AP2048Z
91.1 pt
Asus Zenbook A16 UX3607 -4!
X2-90, X2E-94-100, Samsung PM9C1b MZVL81T0HFLB-00BTW
83.5 pt
Microsoft Surface Laptop 15 Gen 8
Arc B390 Panther Lake iGPU, Ultra X7 368H, SK hynix PVC10 HFS256GEM4X182N
83.3 pt
Gemiddeld Intel Core Ultra X7 368H, Intel Arc B390 12 Xe3 Panther Lake iGPU
 
83.1 pt
Lenovo ThinkPad X9-15p Gen 1
Arc B390 Panther Lake iGPU, Ultra X7 358H, Samsung PM9E1 1 TB MZVLC1T0HFLU
80.6 pt
Dell XPS 16 Core Ultra X7 358H
Arc B390 Panther Lake iGPU, Ultra X7 358H
80 pt
Gemiddelde van klas Multimedia
 
72.5 pt
Microsoft Surface Laptop 7 15 Lunar Lake
Arc 140V, Core Ultra 7 268V, Samsung PM9C1a MZ9L81T0HDLB
64.9 pt
PCMark 10 / Score
Gemiddeld Intel Core Ultra X7 368H, Intel Arc B390 12 Xe3 Panther Lake iGPU
  (9923 - 10456, n=2)
10190 Points +3%
Microsoft Surface Laptop 15 Gen 8
Arc B390 Panther Lake iGPU, Ultra X7 368H, SK hynix PVC10 HFS256GEM4X182N
9923 Points
Dell XPS 16 Core Ultra X7 358H
Arc B390 Panther Lake iGPU, Ultra X7 358H
9717 Points -2%
Lenovo ThinkPad X9-15p Gen 1
Arc B390 Panther Lake iGPU, Ultra X7 358H, Samsung PM9E1 1 TB MZVLC1T0HFLU
9303 Points -6%
Gemiddelde van klas Multimedia
  (4325 - 10386, n=48, laatste 2 jaar)
8022 Points -19%
Microsoft Surface Laptop 7 15 Lunar Lake
Arc 140V, Core Ultra 7 268V, Samsung PM9C1a MZ9L81T0HDLB
7236 Points -27%
PCMark 10 / Essentials
Gemiddeld Intel Core Ultra X7 368H, Intel Arc B390 12 Xe3 Panther Lake iGPU
  (11288 - 11715, n=2)
11502 Points +2%
Microsoft Surface Laptop 15 Gen 8
Arc B390 Panther Lake iGPU, Ultra X7 368H, SK hynix PVC10 HFS256GEM4X182N
11288 Points
Dell XPS 16 Core Ultra X7 358H
Arc B390 Panther Lake iGPU, Ultra X7 358H
11122 Points -1%
Lenovo ThinkPad X9-15p Gen 1
Arc B390 Panther Lake iGPU, Ultra X7 358H, Samsung PM9E1 1 TB MZVLC1T0HFLU
10762 Points -5%
Microsoft Surface Laptop 7 15 Lunar Lake
Arc 140V, Core Ultra 7 268V, Samsung PM9C1a MZ9L81T0HDLB
10701 Points -5%
Gemiddelde van klas Multimedia
  (8025 - 11664, n=47, laatste 2 jaar)
10507 Points -7%
PCMark 10 / Productivity
Gemiddeld Intel Core Ultra X7 368H, Intel Arc B390 12 Xe3 Panther Lake iGPU
  (17463 - 18738, n=2)
18101 Points +4%
Microsoft Surface Laptop 15 Gen 8
Arc B390 Panther Lake iGPU, Ultra X7 368H, SK hynix PVC10 HFS256GEM4X182N
17463 Points
Dell XPS 16 Core Ultra X7 358H
Arc B390 Panther Lake iGPU, Ultra X7 358H
16422 Points -6%
Lenovo ThinkPad X9-15p Gen 1
Arc B390 Panther Lake iGPU, Ultra X7 358H, Samsung PM9E1 1 TB MZVLC1T0HFLU
14870 Points -15%
Gemiddelde van klas Multimedia
  (7323 - 18233, n=47, laatste 2 jaar)
12568 Points -28%
Microsoft Surface Laptop 7 15 Lunar Lake
Arc 140V, Core Ultra 7 268V, Samsung PM9C1a MZ9L81T0HDLB
9217 Points -47%
PCMark 10 / Digital Content Creation
Gemiddeld Intel Core Ultra X7 368H, Intel Arc B390 12 Xe3 Panther Lake iGPU
  (13454 - 14129, n=2)
13792 Points +3%
Lenovo ThinkPad X9-15p Gen 1
Arc B390 Panther Lake iGPU, Ultra X7 358H, Samsung PM9E1 1 TB MZVLC1T0HFLU
13652 Points +1%
Dell XPS 16 Core Ultra X7 358H
Arc B390 Panther Lake iGPU, Ultra X7 358H
13633 Points +1%
Microsoft Surface Laptop 15 Gen 8
Arc B390 Panther Lake iGPU, Ultra X7 368H, SK hynix PVC10 HFS256GEM4X182N
13454 Points
Gemiddelde van klas Multimedia
  (3738 - 16240, n=47, laatste 2 jaar)
10853 Points -19%
Microsoft Surface Laptop 7 15 Lunar Lake
Arc 140V, Core Ultra 7 268V, Samsung PM9C1a MZ9L81T0HDLB
10427 Points -22%
CrossMark / Overall
Apple MacBook Air 15 M5
M5 10-Core GPU, M5 10-Core, Apple SSD AP2048Z
2356 Points +8%
Lenovo ThinkPad X9-15p Gen 1
Arc B390 Panther Lake iGPU, Ultra X7 358H, Samsung PM9E1 1 TB MZVLC1T0HFLU
2182 Points 0%
Microsoft Surface Laptop 15 Gen 8
Arc B390 Panther Lake iGPU, Ultra X7 368H, SK hynix PVC10 HFS256GEM4X182N
2182 Points
Dell XPS 16 Core Ultra X7 358H
Arc B390 Panther Lake iGPU, Ultra X7 358H
2114 Points -3%
Gemiddeld Intel Core Ultra X7 368H, Intel Arc B390 12 Xe3 Panther Lake iGPU
  (2032 - 2182, n=2)
2107 Points -3%
Asus Zenbook A16 UX3607
X2-90, X2E-94-100, Samsung PM9C1b MZVL81T0HFLB-00BTW
1978 Points -9%
Gemiddelde van klas Multimedia
  (866 - 3231, n=56, laatste 2 jaar)
1949 Points -11%
Microsoft Surface Laptop 7 15 Lunar Lake
Arc 140V, Core Ultra 7 268V, Samsung PM9C1a MZ9L81T0HDLB
1738 Points -20%
CrossMark / Productivity
Apple MacBook Air 15 M5
M5 10-Core GPU, M5 10-Core, Apple SSD AP2048Z
2277 Points +14%
Microsoft Surface Laptop 15 Gen 8
Arc B390 Panther Lake iGPU, Ultra X7 368H, SK hynix PVC10 HFS256GEM4X182N
1995 Points
Lenovo ThinkPad X9-15p Gen 1
Arc B390 Panther Lake iGPU, Ultra X7 358H, Samsung PM9E1 1 TB MZVLC1T0HFLU
1960 Points -2%
Gemiddeld Intel Core Ultra X7 368H, Intel Arc B390 12 Xe3 Panther Lake iGPU
  (1916 - 1995, n=2)
1956 Points -2%
Dell XPS 16 Core Ultra X7 358H
Arc B390 Panther Lake iGPU, Ultra X7 358H
1898 Points -5%
Gemiddelde van klas Multimedia
  (931 - 2677, n=56, laatste 2 jaar)
1817 Points -9%
Asus Zenbook A16 UX3607
X2-90, X2E-94-100, Samsung PM9C1b MZVL81T0HFLB-00BTW
1732 Points -13%
Microsoft Surface Laptop 7 15 Lunar Lake
Arc 140V, Core Ultra 7 268V, Samsung PM9C1a MZ9L81T0HDLB
1680 Points -16%
CrossMark / Creativity
Apple MacBook Air 15 M5
M5 10-Core GPU, M5 10-Core, Apple SSD AP2048Z
2743 Points +8%
Lenovo ThinkPad X9-15p Gen 1
Arc B390 Panther Lake iGPU, Ultra X7 358H, Samsung PM9E1 1 TB MZVLC1T0HFLU
2563 Points +1%
Microsoft Surface Laptop 15 Gen 8
Arc B390 Panther Lake iGPU, Ultra X7 368H, SK hynix PVC10 HFS256GEM4X182N
2530 Points
Dell XPS 16 Core Ultra X7 358H
Arc B390 Panther Lake iGPU, Ultra X7 358H
2529 Points 0%
Gemiddeld Intel Core Ultra X7 368H, Intel Arc B390 12 Xe3 Panther Lake iGPU
  (2241 - 2530, n=2)
2386 Points -6%
Asus Zenbook A16 UX3607
X2-90, X2E-94-100, Samsung PM9C1b MZVL81T0HFLB-00BTW
2327 Points -8%
Gemiddelde van klas Multimedia
  (907 - 4522, n=56, laatste 2 jaar)
2261 Points -11%
Microsoft Surface Laptop 7 15 Lunar Lake
Arc 140V, Core Ultra 7 268V, Samsung PM9C1a MZ9L81T0HDLB
1976 Points -22%
CrossMark / Responsiveness
Lenovo ThinkPad X9-15p Gen 1
Arc B390 Panther Lake iGPU, Ultra X7 358H, Samsung PM9E1 1 TB MZVLC1T0HFLU
1855 Points +1%
Microsoft Surface Laptop 15 Gen 8
Arc B390 Panther Lake iGPU, Ultra X7 368H, SK hynix PVC10 HFS256GEM4X182N
1832 Points
Gemiddeld Intel Core Ultra X7 368H, Intel Arc B390 12 Xe3 Panther Lake iGPU
  (1808 - 1832, n=2)
1820 Points -1%
Asus Zenbook A16 UX3607
X2-90, X2E-94-100, Samsung PM9C1b MZVL81T0HFLB-00BTW
1811 Points -1%
Dell XPS 16 Core Ultra X7 358H
Arc B390 Panther Lake iGPU, Ultra X7 358H
1706 Points -7%
Apple MacBook Air 15 M5
M5 10-Core GPU, M5 10-Core, Apple SSD AP2048Z
1657 Points -10%
Gemiddelde van klas Multimedia
  (605 - 2073, n=56, laatste 2 jaar)
1568 Points -14%
Microsoft Surface Laptop 7 15 Lunar Lake
Arc 140V, Core Ultra 7 268V, Samsung PM9C1a MZ9L81T0HDLB
1311 Points -28%
WebXPRT 3 / Overall
Apple MacBook Air 15 M5
M5 10-Core GPU, M5 10-Core, Apple SSD AP2048Z
530 Points +57%
Asus Zenbook A16 UX3607
X2-90, X2E-94-100, Samsung PM9C1b MZVL81T0HFLB-00BTW
514 Points +52%
Lenovo ThinkPad X9-15p Gen 1
Arc B390 Panther Lake iGPU, Ultra X7 358H, Samsung PM9E1 1 TB MZVLC1T0HFLU
350 Points +4%
Gemiddelde van klas Multimedia
  (197.4 - 622, n=59, laatste 2 jaar)
346 Points +2%
Gemiddeld Intel Core Ultra X7 368H, Intel Arc B390 12 Xe3 Panther Lake iGPU
  (338 - 342, n=2)
340 Points +1%
Microsoft Surface Laptop 15 Gen 8
Arc B390 Panther Lake iGPU, Ultra X7 368H, SK hynix PVC10 HFS256GEM4X182N
338 Points
Microsoft Surface Laptop 7 15 Lunar Lake
Arc 140V, Core Ultra 7 268V, Samsung PM9C1a MZ9L81T0HDLB
310 Points -8%
Dell XPS 16 Core Ultra X7 358H
Arc B390 Panther Lake iGPU, Ultra X7 358H
304 Points -10%
WebXPRT 4 / Overall
Asus Zenbook A16 UX3607
X2-90, X2E-94-100, Samsung PM9C1b MZVL81T0HFLB-00BTW
383 Points +22%
Apple MacBook Air 15 M5
M5 10-Core GPU, M5 10-Core, Apple SSD AP2048Z
378 Points +20%
Microsoft Surface Laptop 15 Gen 8
Arc B390 Panther Lake iGPU, Ultra X7 368H, SK hynix PVC10 HFS256GEM4X182N
314 Points
Gemiddeld Intel Core Ultra X7 368H, Intel Arc B390 12 Xe3 Panther Lake iGPU
  (304 - 314, n=2)
309 Points -2%
Lenovo ThinkPad X9-15p Gen 1
Arc B390 Panther Lake iGPU, Ultra X7 358H, Samsung PM9E1 1 TB MZVLC1T0HFLU
307 Points -2%
Dell XPS 16 Core Ultra X7 358H
Arc B390 Panther Lake iGPU, Ultra X7 358H
300 Points -4%
Gemiddelde van klas Multimedia
  (167.3 - 415, n=59, laatste 2 jaar)
295 Points -6%
Microsoft Surface Laptop 7 15 Lunar Lake
Arc 140V, Core Ultra 7 268V, Samsung PM9C1a MZ9L81T0HDLB
287 Points -9%
Mozilla Kraken 1.1 / Total
Microsoft Surface Laptop 7 15 Lunar Lake
Arc 140V, Core Ultra 7 268V, Samsung PM9C1a MZ9L81T0HDLB
475 ms * -11%
Lenovo ThinkPad X9-15p Gen 1
Arc B390 Panther Lake iGPU, Ultra X7 358H, Samsung PM9E1 1 TB MZVLC1T0HFLU
465 ms * -8%
Dell XPS 16 Core Ultra X7 358H
Arc B390 Panther Lake iGPU, Ultra X7 358H
450 ms * -5%
Gemiddelde van klas Multimedia
  (228 - 835, n=60, laatste 2 jaar)
440 ms * -3%
Gemiddeld Intel Core Ultra X7 368H, Intel Arc B390 12 Xe3 Panther Lake iGPU
  (429 - 437, n=2)
433 ms * -1%
Microsoft Surface Laptop 15 Gen 8
Arc B390 Panther Lake iGPU, Ultra X7 368H, SK hynix PVC10 HFS256GEM4X182N
429 ms *
Asus Zenbook A16 UX3607
X2-90, X2E-94-100, Samsung PM9C1b MZVL81T0HFLB-00BTW
261.4 ms * +39%
Apple MacBook Air 15 M5
M5 10-Core GPU, M5 10-Core, Apple SSD AP2048Z
238.6 ms * +44%

* ... kleiner is beter

PCMark 10 Score
9923 punten
Help
AIDA64 / Memory Copy
Dell XPS 16 Core Ultra X7 358H
Intel Core Ultra X7 358H, Arc B390 Panther Lake iGPU
132135 MB/s +20%
Lenovo ThinkPad X9-15p Gen 1
Intel Core Ultra X7 358H, Arc B390 Panther Lake iGPU
129389 MB/s +18%
Gemiddeld Intel Core Ultra X7 368H
  (109931 - 114339, n=2)
112135 MB/s +2%
Microsoft Surface Laptop 15 Gen 8
Intel Core Ultra X7 368H, Arc B390 Panther Lake iGPU
109931 MB/s
Microsoft Surface Laptop 7 15 Lunar Lake
Intel Core Ultra 7 268V, Arc 140V
107108 MB/s -3%
Asus Zenbook A16 UX3607
Qualcomm Snapdragon X2 Elite Extreme X2E-94-100, X2-90
104879 MB/s -5%
Gemiddelde van klas Multimedia
  (11299 - 132135, n=48, laatste 2 jaar)
85254 MB/s -22%
AIDA64 / Memory Read
Asus Zenbook A16 UX3607
Qualcomm Snapdragon X2 Elite Extreme X2E-94-100, X2-90
174586 MB/s +55%
Lenovo ThinkPad X9-15p Gen 1
Intel Core Ultra X7 358H, Arc B390 Panther Lake iGPU
120727 MB/s +7%
Dell XPS 16 Core Ultra X7 358H
Intel Core Ultra X7 358H, Arc B390 Panther Lake iGPU
118888 MB/s +6%
Microsoft Surface Laptop 15 Gen 8
Intel Core Ultra X7 368H, Arc B390 Panther Lake iGPU
112338 MB/s
Gemiddeld Intel Core Ultra X7 368H
  (106702 - 112338, n=2)
109520 MB/s -3%
Microsoft Surface Laptop 7 15 Lunar Lake
Intel Core Ultra 7 268V, Arc 140V
88341 MB/s -21%
Gemiddelde van klas Multimedia
  (11624 - 174586, n=48, laatste 2 jaar)
81379 MB/s -28%
AIDA64 / Memory Write
Dell XPS 16 Core Ultra X7 358H
Intel Core Ultra X7 358H, Arc B390 Panther Lake iGPU
134998 MB/s +12%
Lenovo ThinkPad X9-15p Gen 1
Intel Core Ultra X7 358H, Arc B390 Panther Lake iGPU
134848 MB/s +12%
Gemiddeld Intel Core Ultra X7 368H
  (120698 - 120732, n=2)
120715 MB/s 0%
Microsoft Surface Laptop 15 Gen 8
Intel Core Ultra X7 368H, Arc B390 Panther Lake iGPU
120698 MB/s
Microsoft Surface Laptop 7 15 Lunar Lake
Intel Core Ultra 7 268V, Arc 140V
117888 MB/s -2%
Gemiddelde van klas Multimedia
  (11755 - 134998, n=48, laatste 2 jaar)
86357 MB/s -28%
Asus Zenbook A16 UX3607
Qualcomm Snapdragon X2 Elite Extreme X2E-94-100, X2-90
73995 MB/s -39%
AIDA64 / Memory Latency
Gemiddelde van klas Multimedia
  (84.1 - 535, n=47, laatste 2 jaar)
127.5 ns * -43%
Microsoft Surface Laptop 7 15 Lunar Lake
Intel Core Ultra 7 268V, Arc 140V
97.4 ns * -10%
Gemiddeld Intel Core Ultra X7 368H
  (88.9 - 90.3, n=2)
89.6 ns * -1%
Microsoft Surface Laptop 15 Gen 8
Intel Core Ultra X7 368H, Arc B390 Panther Lake iGPU
88.9 ns *
Dell XPS 16 Core Ultra X7 358H
Intel Core Ultra X7 358H, Arc B390 Panther Lake iGPU
84.6 ns * +5%
Lenovo ThinkPad X9-15p Gen 1
Intel Core Ultra X7 358H, Arc B390 Panther Lake iGPU
84.1 ns * +5%

* ... kleiner is beter

LatencyMon - Overzicht
LatencyMon - Stuurprogramma's
DPC Latencies / LatencyMon - interrupt to process latency (max), Web, Youtube, Prime95
Lenovo ThinkPad X9-15p Gen 1
Arc B390 Panther Lake iGPU, Ultra X7 358H, Samsung PM9E1 1 TB MZVLC1T0HFLU
3844.3 μs * -58%
Microsoft Surface Laptop 15 Gen 8
Arc B390 Panther Lake iGPU, Ultra X7 368H, SK hynix PVC10 HFS256GEM4X182N
2433.8 μs *
Gemiddelde van klas Multimedia
  (327 - 7067, n=46, laatste 2 jaar)
1815 μs * +25%
Microsoft Surface Laptop 7 15 Lunar Lake
Arc 140V, Core Ultra 7 268V, Samsung PM9C1a MZ9L81T0HDLB
891.9 μs * +63%
Dell XPS 16 Core Ultra X7 358H
Arc B390 Panther Lake iGPU, Ultra X7 358H
513.7 μs * +79%

* ... kleiner is beter

SK hynix PVC10 HFS256GEM4X182N
CDM 5/6 Read Seq Q32T1: 5688 MB/s
CDM 5/6 Write Seq Q32T1: 2845 MB/s
CDM 5/6 Read 4K Q32T1: 602 MB/s
CDM 5/6 Write 4K Q32T1: 766 MB/s
CDM 5/6 Read 4K: 81.8 MB/s
CDM 5/6 Write 4K: 151.3 MB/s
CDM 6 Write 4K Q8T8: 2141 MB/s
CDM 6 Read 4K Q8T8: 1777 MB/s
Drive Performance rating - Percent
Lenovo ThinkPad X9-15p Gen 1
Samsung PM9E1 1 TB MZVLC1T0HFLU
93.3 pt
Asus Zenbook A16 UX3607
Samsung PM9C1b MZVL81T0HFLB-00BTW
54.4 pt
Microsoft Surface Laptop 15 Gen 8
SK hynix PVC10 HFS256GEM4X182N
51.3 pt
Gemiddelde van klas Multimedia
 
47.5 pt
Dell XPS 16 Core Ultra X7 358H
 
43.4 pt
Microsoft Surface Laptop 7 15 Lunar Lake
Samsung PM9C1a MZ9L81T0HDLB
42.9 pt
Gemiddeld SK hynix PVC10 HFS256GEM4X182N
 
41.3 pt
DiskSpd
seq read
Lenovo ThinkPad X9-15p Gen 1
Samsung PM9E1 1 TB MZVLC1T0HFLU
7663 (7579.05min - 7663.4max) MB/s +241%
Dell XPS 16 Core Ultra X7 358H
 
3600 (3100.64min - 3600.18max) MB/s +60%
Asus Zenbook A16 UX3607
Samsung PM9C1b MZVL81T0HFLB-00BTW
3256 (3194.8min - 3255.62max) MB/s +45%
Gemiddelde van klas Multimedia
  (453 - 7811, n=51, laatste 2 jaar)
3140 MB/s +40%
Gemiddeld SK hynix PVC10 HFS256GEM4X182N
  (2249 - 3278, n=2)
2764 MB/s +23%
Microsoft Surface Laptop 7 15 Lunar Lake
Samsung PM9C1a MZ9L81T0HDLB
2302 (2064.86min - 2301.62max) MB/s +2%
Microsoft Surface Laptop 15 Gen 8
SK hynix PVC10 HFS256GEM4X182N
2249 (2210.19min - 2248.78max) MB/s
seq write
Lenovo ThinkPad X9-15p Gen 1
Samsung PM9E1 1 TB MZVLC1T0HFLU
9312 (3040.03min - 9311.98max) MB/s +433%
Asus Zenbook A16 UX3607
Samsung PM9C1b MZVL81T0HFLB-00BTW
3644 (3588.65min - 3643.8max) MB/s +109%
Gemiddelde van klas Multimedia
  (384 - 9952, n=51, laatste 2 jaar)
3319 MB/s +90%
Dell XPS 16 Core Ultra X7 358H
 
2599 (796.92min - 2599.25max) MB/s +49%
Gemiddeld SK hynix PVC10 HFS256GEM4X182N
  (1747 - 2155, n=2)
1951 MB/s +12%
Microsoft Surface Laptop 15 Gen 8
SK hynix PVC10 HFS256GEM4X182N
1747 (1666.63min - 1747.42max) MB/s
Microsoft Surface Laptop 7 15 Lunar Lake
Samsung PM9C1a MZ9L81T0HDLB
1718 (1595.51min - 1717.99max) MB/s -2%
seq q8 t1 read
Lenovo ThinkPad X9-15p Gen 1
Samsung PM9E1 1 TB MZVLC1T0HFLU
14162 (13273.2min - 14161.6max) MB/s +133%
Dell XPS 16 Core Ultra X7 358H
 
7039 (5536.1min - 7039.48max) MB/s +16%
Asus Zenbook A16 UX3607
Samsung PM9C1b MZVL81T0HFLB-00BTW
6940 (5727.82min - 6940.07max) MB/s +14%
Microsoft Surface Laptop 7 15 Lunar Lake
Samsung PM9C1a MZ9L81T0HDLB
6158 (5002.91min - 6158.13max) MB/s +1%
Gemiddelde van klas Multimedia
  (467 - 14162, n=51, laatste 2 jaar)
6122 MB/s +1%
Microsoft Surface Laptop 15 Gen 8
SK hynix PVC10 HFS256GEM4X182N
6074 (4968.99min - 6073.77max) MB/s
Gemiddeld SK hynix PVC10 HFS256GEM4X182N
  (5911 - 6074, n=2)
5993 MB/s -1%
seq q8 t1 write
Lenovo ThinkPad X9-15p Gen 1
Samsung PM9E1 1 TB MZVLC1T0HFLU
13512 (13475.9min - 13511.8max) MB/s +305%
Dell XPS 16 Core Ultra X7 358H
 
6101 (5938.22min - 6101.03max) MB/s +83%
Gemiddelde van klas Multimedia
  (247 - 13512, n=51, laatste 2 jaar)
5102 MB/s +53%
Asus Zenbook A16 UX3607
Samsung PM9C1b MZVL81T0HFLB-00BTW
4986 (4743.29min - 4986.07max) MB/s +50%
Microsoft Surface Laptop 7 15 Lunar Lake
Samsung PM9C1a MZ9L81T0HDLB
4651 (3142.37min - 4651.2max) MB/s +40%
Microsoft Surface Laptop 15 Gen 8
SK hynix PVC10 HFS256GEM4X182N
3333 (2050.9min - 3333.21max) MB/s
Gemiddeld SK hynix PVC10 HFS256GEM4X182N
  (3041 - 3333, n=2)
3187 MB/s -4%
4k q1 t1 read
Lenovo ThinkPad X9-15p Gen 1
Samsung PM9E1 1 TB MZVLC1T0HFLU
85.1 (79.62min - 85.09max) MB/s +35%
Asus Zenbook A16 UX3607
Samsung PM9C1b MZVL81T0HFLB-00BTW
81.4 (73.37min - 81.4max) MB/s +29%
Gemiddeld SK hynix PVC10 HFS256GEM4X182N
  (63 - 68, n=2)
65.5 MB/s +4%
Gemiddelde van klas Multimedia
  (18.8 - 94.1, n=51, laatste 2 jaar)
64.4 MB/s +2%
Microsoft Surface Laptop 15 Gen 8
SK hynix PVC10 HFS256GEM4X182N
63 (62.83min - 63max) MB/s
Dell XPS 16 Core Ultra X7 358H
 
59.1 (53.74min - 59.08max) MB/s -6%
Microsoft Surface Laptop 7 15 Lunar Lake
Samsung PM9C1a MZ9L81T0HDLB
55 (51.05min - 55.02max) MB/s -13%
4k q1 t1 write
Asus Zenbook A16 UX3607
Samsung PM9C1b MZVL81T0HFLB-00BTW
249 (236.18min - 248.88max) MB/s +33%
Lenovo ThinkPad X9-15p Gen 1
Samsung PM9E1 1 TB MZVLC1T0HFLU
206 (194.33min - 205.81max) MB/s +10%
Microsoft Surface Laptop 15 Gen 8
SK hynix PVC10 HFS256GEM4X182N
186.6 (149.98min - 186.58max) MB/s
Gemiddelde van klas Multimedia
  (40.3 - 278, n=51, laatste 2 jaar)
161.6 MB/s -13%
Gemiddeld SK hynix PVC10 HFS256GEM4X182N
  (115.1 - 186.6, n=2)
150.9 MB/s -19%
Dell XPS 16 Core Ultra X7 358H
 
145.5 (139.46min - 145.49max) MB/s -22%
Microsoft Surface Laptop 7 15 Lunar Lake
Samsung PM9C1a MZ9L81T0HDLB
113.9 (108.41min - 113.89max) MB/s -39%
4k q32 t16 read
Lenovo ThinkPad X9-15p Gen 1
Samsung PM9E1 1 TB MZVLC1T0HFLU
5278 (5224.04min - 5277.98max) MB/s +116%
Microsoft Surface Laptop 15 Gen 8
SK hynix PVC10 HFS256GEM4X182N
2446 (2400.1min - 2445.99max) MB/s
Gemiddeld SK hynix PVC10 HFS256GEM4X182N
  (1450 - 2446, n=2)
1948 MB/s -20%
Gemiddelde van klas Multimedia
  (190.3 - 6121, n=51, laatste 2 jaar)
1626 MB/s -34%
Microsoft Surface Laptop 7 15 Lunar Lake
Samsung PM9C1a MZ9L81T0HDLB
1546 (1446.52min - 1545.71max) MB/s -37%
Asus Zenbook A16 UX3607
Samsung PM9C1b MZVL81T0HFLB-00BTW
1184 (1174.4min - 1183.69max) MB/s -52%
Dell XPS 16 Core Ultra X7 358H
 
652 (602.16min - 651.54max) MB/s -73%
4k q32 t16 write
Lenovo ThinkPad X9-15p Gen 1
Samsung PM9E1 1 TB MZVLC1T0HFLU
3134 (3116.91min - 3133.98max) MB/s +30%
Microsoft Surface Laptop 15 Gen 8
SK hynix PVC10 HFS256GEM4X182N
2414 (735.3min - 2413.9max) MB/s
Gemiddeld SK hynix PVC10 HFS256GEM4X182N
  (635 - 2414, n=2)
1525 MB/s -37%
Microsoft Surface Laptop 7 15 Lunar Lake
Samsung PM9C1a MZ9L81T0HDLB
1244 (771.44min - 1244.07max) MB/s -48%
Gemiddelde van klas Multimedia
  (154.9 - 4447, n=51, laatste 2 jaar)
1148 MB/s -52%
Asus Zenbook A16 UX3607
Samsung PM9C1b MZVL81T0HFLB-00BTW
805 (790.83min - 804.52max) MB/s -67%
Dell XPS 16 Core Ultra X7 358H
 
447 (308.53min - 447.08max) MB/s -81%
AS SSD
Score Total
Lenovo ThinkPad X9-15p Gen 1
Samsung PM9E1 1 TB MZVLC1T0HFLU
11377 Points +108%
Microsoft Surface Laptop 15 Gen 8
SK hynix PVC10 HFS256GEM4X182N
5467 Points
Gemiddelde van klas Multimedia
  (482 - 11377, n=49, laatste 2 jaar)
5379 Points -2%
Dell XPS 16 Core Ultra X7 358H
 
5309 Points -3%
Asus Zenbook A16 UX3607
Samsung PM9C1b MZVL81T0HFLB-00BTW
5124 Points -6%
Gemiddeld SK hynix PVC10 HFS256GEM4X182N
  (2859 - 5467, n=2)
4163 Points -24%
Microsoft Surface Laptop 7 15 Lunar Lake
Samsung PM9C1a MZ9L81T0HDLB
3869 Points -29%
Score Read
Lenovo ThinkPad X9-15p Gen 1
Samsung PM9E1 1 TB MZVLC1T0HFLU
4351 Points +99%
Microsoft Surface Laptop 15 Gen 8
SK hynix PVC10 HFS256GEM4X182N
2182 Points
Gemiddeld SK hynix PVC10 HFS256GEM4X182N
  (1628 - 2182, n=2)
1905 Points -13%
Gemiddelde van klas Multimedia
  (192 - 4351, n=49, laatste 2 jaar)
1761 Points -19%
Microsoft Surface Laptop 7 15 Lunar Lake
Samsung PM9C1a MZ9L81T0HDLB
1470 Points -33%
Dell XPS 16 Core Ultra X7 358H
 
1423 Points -35%
Asus Zenbook A16 UX3607
Samsung PM9C1b MZVL81T0HFLB-00BTW
1188 Points -46%
Score Write
Lenovo ThinkPad X9-15p Gen 1
Samsung PM9E1 1 TB MZVLC1T0HFLU
4851 Points +113%
Asus Zenbook A16 UX3607
Samsung PM9C1b MZVL81T0HFLB-00BTW
3402 Points +49%
Dell XPS 16 Core Ultra X7 358H
 
3277 Points +44%
Gemiddelde van klas Multimedia
  (191 - 4851, n=49, laatste 2 jaar)
2777 Points +22%
Microsoft Surface Laptop 15 Gen 8
SK hynix PVC10 HFS256GEM4X182N
2278 Points
Microsoft Surface Laptop 7 15 Lunar Lake
Samsung PM9C1a MZ9L81T0HDLB
1716 Points -25%
Gemiddeld SK hynix PVC10 HFS256GEM4X182N
  (506 - 2278, n=2)
1392 Points -39%
Seq Read
Lenovo ThinkPad X9-15p Gen 1
Samsung PM9E1 1 TB MZVLC1T0HFLU
10401 MB/s +120%
Asus Zenbook A16 UX3607
Samsung PM9C1b MZVL81T0HFLB-00BTW
5391 MB/s +14%
Dell XPS 16 Core Ultra X7 358H
 
5083.41 MB/s +7%
Gemiddelde van klas Multimedia
  (484 - 10494, n=49, laatste 2 jaar)
4775 MB/s +1%
Microsoft Surface Laptop 15 Gen 8
SK hynix PVC10 HFS256GEM4X182N
4734 MB/s
Microsoft Surface Laptop 7 15 Lunar Lake
Samsung PM9C1a MZ9L81T0HDLB
4668 MB/s -1%
Gemiddeld SK hynix PVC10 HFS256GEM4X182N
  (3681 - 4734, n=2)
4208 MB/s -11%
Seq Write
Lenovo ThinkPad X9-15p Gen 1
Samsung PM9E1 1 TB MZVLC1T0HFLU
9596 MB/s +329%
Asus Zenbook A16 UX3607
Samsung PM9C1b MZVL81T0HFLB-00BTW
3527 MB/s +58%
Gemiddelde van klas Multimedia
  (344 - 9596, n=49, laatste 2 jaar)
3353 MB/s +50%
Microsoft Surface Laptop 7 15 Lunar Lake
Samsung PM9C1a MZ9L81T0HDLB
3049 MB/s +36%
Dell XPS 16 Core Ultra X7 358H
 
2509.02 MB/s +12%
Microsoft Surface Laptop 15 Gen 8
SK hynix PVC10 HFS256GEM4X182N
2239 MB/s
Gemiddeld SK hynix PVC10 HFS256GEM4X182N
  (1427 - 2239, n=2)
1833 MB/s -18%
4K Read
Microsoft Surface Laptop 15 Gen 8
SK hynix PVC10 HFS256GEM4X182N
80.7 MB/s
Lenovo ThinkPad X9-15p Gen 1
Samsung PM9E1 1 TB MZVLC1T0HFLU
78.9 MB/s -2%
Asus Zenbook A16 UX3607
Samsung PM9C1b MZVL81T0HFLB-00BTW
65.7 MB/s -19%
Gemiddeld SK hynix PVC10 HFS256GEM4X182N
  (47.2 - 80.7, n=2)
64 MB/s -21%
Gemiddelde van klas Multimedia
  (17.5 - 89.9, n=49, laatste 2 jaar)
63.4 MB/s -21%
Microsoft Surface Laptop 7 15 Lunar Lake
Samsung PM9C1a MZ9L81T0HDLB
57.6 MB/s -29%
Dell XPS 16 Core Ultra X7 358H
 
52.53 MB/s -35%
4K Write
Asus Zenbook A16 UX3607
Samsung PM9C1b MZVL81T0HFLB-00BTW
225 MB/s +50%
Lenovo ThinkPad X9-15p Gen 1
Samsung PM9E1 1 TB MZVLC1T0HFLU
181.3 MB/s +20%
Gemiddelde van klas Multimedia
  (43.1 - 265, n=49, laatste 2 jaar)
181 MB/s +20%
Microsoft Surface Laptop 15 Gen 8
SK hynix PVC10 HFS256GEM4X182N
150.5 MB/s
Gemiddeld SK hynix PVC10 HFS256GEM4X182N
  (110.8 - 150.5, n=2)
130.7 MB/s -13%
Microsoft Surface Laptop 7 15 Lunar Lake
Samsung PM9C1a MZ9L81T0HDLB
130.6 MB/s -13%
Dell XPS 16 Core Ultra X7 358H
 
125.58 MB/s -17%
4K-64 Read
Lenovo ThinkPad X9-15p Gen 1
Samsung PM9E1 1 TB MZVLC1T0HFLU
3232 MB/s +99%
Microsoft Surface Laptop 15 Gen 8
SK hynix PVC10 HFS256GEM4X182N
1628 MB/s
Gemiddeld SK hynix PVC10 HFS256GEM4X182N
  (1213 - 1628, n=2)
1421 MB/s -13%
Gemiddelde van klas Multimedia
  (125.7 - 3394, n=49, laatste 2 jaar)
1220 MB/s -25%
Microsoft Surface Laptop 7 15 Lunar Lake
Samsung PM9C1a MZ9L81T0HDLB
945 MB/s -42%
Dell XPS 16 Core Ultra X7 358H
 
862.49 MB/s -47%
Asus Zenbook A16 UX3607
Samsung PM9C1b MZVL81T0HFLB-00BTW
583 MB/s -64%
4K-64 Write
Lenovo ThinkPad X9-15p Gen 1
Samsung PM9E1 1 TB MZVLC1T0HFLU
3710 MB/s +95%
Dell XPS 16 Core Ultra X7 358H
 
2900.39 MB/s +52%
Asus Zenbook A16 UX3607
Samsung PM9C1b MZVL81T0HFLB-00BTW
2825 MB/s +48%
Gemiddelde van klas Multimedia
  (75.2 - 4042, n=49, laatste 2 jaar)
2261 MB/s +19%
Microsoft Surface Laptop 15 Gen 8
SK hynix PVC10 HFS256GEM4X182N
1903 MB/s
Microsoft Surface Laptop 7 15 Lunar Lake
Samsung PM9C1a MZ9L81T0HDLB
1281 MB/s -33%
Gemiddeld SK hynix PVC10 HFS256GEM4X182N
  (252 - 1903, n=2)
1078 MB/s -43%
Access Time Read
Gemiddeld SK hynix PVC10 HFS256GEM4X182N
  (0.087 - 0.162, n=2)
0.1245 ms * -43%
Microsoft Surface Laptop 15 Gen 8
SK hynix PVC10 HFS256GEM4X182N
0.087 ms *
Lenovo ThinkPad X9-15p Gen 1
Samsung PM9E1 1 TB MZVLC1T0HFLU
0.077 ms * +11%
Asus Zenbook A16 UX3607
Samsung PM9C1b MZVL81T0HFLB-00BTW
0.075 ms * +14%
Gemiddelde van klas Multimedia
  (0.018 - 0.168, n=49, laatste 2 jaar)
0.06484 ms * +25%
Dell XPS 16 Core Ultra X7 358H
 
0.059 ms * +32%
Microsoft Surface Laptop 7 15 Lunar Lake
Samsung PM9C1a MZ9L81T0HDLB
0.034 ms * +61%
Access Time Write
Dell XPS 16 Core Ultra X7 358H
 
0.082 ms * -273%
Gemiddelde van klas Multimedia
  (0.015 - 0.754, n=49, laatste 2 jaar)
0.0771 ms * -250%
Gemiddeld SK hynix PVC10 HFS256GEM4X182N
  (0.022 - 0.045, n=2)
0.0335 ms * -52%
Microsoft Surface Laptop 7 15 Lunar Lake
Samsung PM9C1a MZ9L81T0HDLB
0.03 ms * -36%
Microsoft Surface Laptop 15 Gen 8
SK hynix PVC10 HFS256GEM4X182N
0.022 ms *
Lenovo ThinkPad X9-15p Gen 1
Samsung PM9E1 1 TB MZVLC1T0HFLU
0.021 ms * +5%
Asus Zenbook A16 UX3607
Samsung PM9C1b MZVL81T0HFLB-00BTW
0.019 ms * +14%

* ... kleiner is beter

Schijfbeperking: DiskSpd-leeslus, wachtrijdiepte 8

0285570855114014251710199522802565285031353420370539904275456048455130541557005985627065556840712574107695798082658550883591209405969099751026010545108301111511400116851197012255125401282513110133951368013965Tooltip
Microsoft Surface Laptop 15 Gen 8 SK hynix PVC10 HFS256GEM4X182N; diskspd 2.0.17 f: Ø6131 (5502.51-6156.25) MB/s
Lenovo ThinkPad X9-15p Gen 1 Samsung PM9E1 1 TB MZVLC1T0HFLU; diskspd 2.0.17 f: Ø8537 (5788.93-14160.38) MB/s
Asus Zenbook A16 UX3607 Samsung PM9C1b MZVL81T0HFLB-00BTW; diskspd 2.0.17 f: Ø6739 (2925.13-6893.49) MB/s
Dell XPS 16 Core Ultra X7 358H  ; diskspd 2.0.17 f: Ø7017 (6000.16-7049.37) MB/s
Microsoft Surface Laptop 7 15 Lunar Lake Samsung PM9C1a MZ9L81T0HDLB; diskspd 2.0.17 f: Ø6146 (4937.32-6171.08) MB/s

GPU- en gamingprestaties

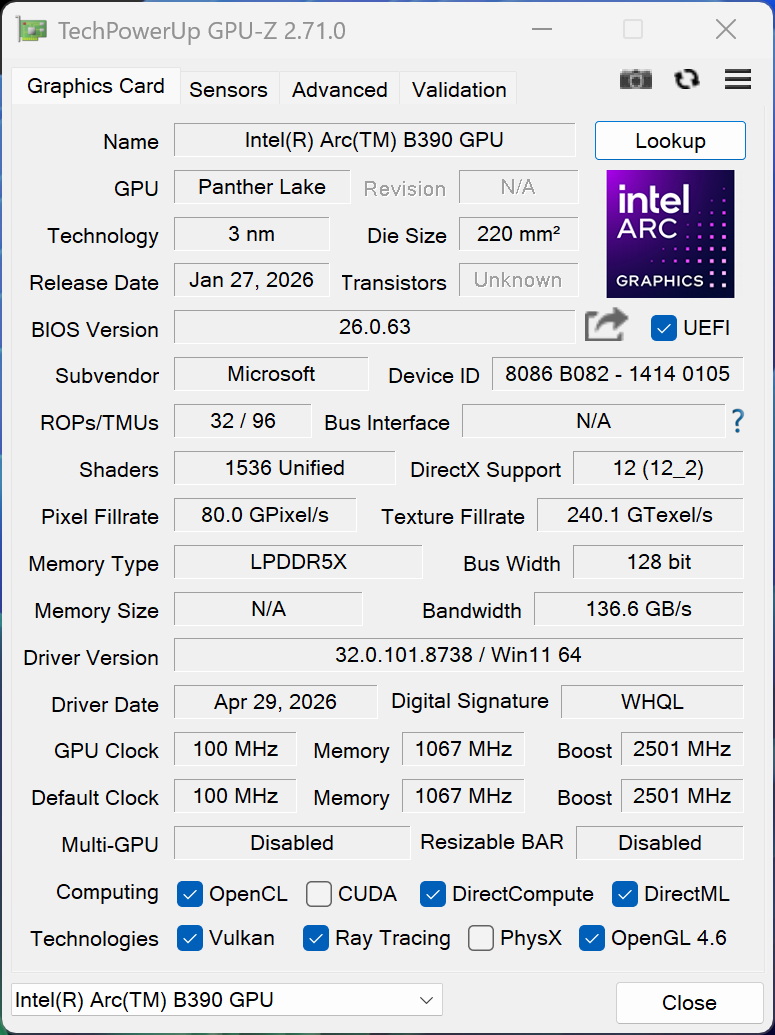
Het hoogtepunt van de Core Ultra X CPU is de krachtige Arc B390 iGPU, die veel sneller is dan de Adreno X2-85 die je bij de Snapdragon SKU's krijgt. De Surface Laptop kan echter niet het volledige potentieel benutten doordat het vermogen bij langdurige belasting daalt tot 35 watt, wat na een paar minuten resulteert in een prestatiedaling van ongeveer 20 %, die ook duidelijk merkbaar is in onze Cyberpunk-gamingtest. Dit is niet ideaal, maar de Arc B390 is nog steeds de betere keuze voor een multimedialaptop en er zijn ook geen compatibiliteitsproblemen met games. 

3DMark Performance rating - Percent
Lenovo ThinkPad X9-15p Gen 1 -2!
Intel Arc B390 12 Xe3 Panther Lake iGPU, Intel Core Ultra X7 358H
98.5 pt
Dell XPS 16 Core Ultra X7 358H -2!
Intel Arc B390 12 Xe3 Panther Lake iGPU, Intel Core Ultra X7 358H
95.4 pt
Gemiddelde van klas Multimedia
 
94.8 pt
Gemiddeld Intel Arc B390 12 Xe3 Panther Lake iGPU
 
85.4 pt
Microsoft Surface Laptop 15 Gen 8
Intel Arc B390 12 Xe3 Panther Lake iGPU, Intel Core Ultra X7 368H
83.5 pt
Asus Zenbook A16 UX3607
Qualcomm Adreno X2-90, Qualcomm Snapdragon X2 Elite Extreme X2E-94-100
64.5 pt
Apple MacBook Air 15 M5 -3!
Apple M5 10-Core GPU, Apple M5 10-Core
57.2 pt
Microsoft Surface Laptop 7 15 Lunar Lake
Intel Arc Graphics 140V, Intel Core Ultra 7 268V
54.7 pt
Microsoft Surface Pro 13 OLED
Qualcomm Adreno X2-85, Qualcomm Snapdragon X2 Elite X2E-78-100
40 pt
Microsoft Surface Laptop 8 13.8
Qualcomm SD X2 Adreno X2-45, Qualcomm Snapdragon X2 Plus X2P-64-100
34.8 pt
3DMark 11 - 1280x720 Performance GPU
Gemiddelde van klas Multimedia
  (3749 - 60002, n=49, laatste 2 jaar)
19892 Points +3%
Microsoft Surface Laptop 15 Gen 8
Intel Arc B390 12 Xe3 Panther Lake iGPU, Intel Core Ultra X7 368H
19256 Points
Lenovo ThinkPad X9-15p Gen 1
Intel Arc B390 12 Xe3 Panther Lake iGPU, Intel Core Ultra X7 358H
18972 Points -1%
Gemiddeld Intel Arc B390 12 Xe3 Panther Lake iGPU
  (14637 - 19804, n=16)
18495 Points -4%
Dell XPS 16 Core Ultra X7 358H
Intel Arc B390 12 Xe3 Panther Lake iGPU, Intel Core Ultra X7 358H
18308 Points -5%
Asus Zenbook A16 UX3607
Qualcomm Adreno X2-90, Qualcomm Snapdragon X2 Elite Extreme X2E-94-100
13847 Points -28%
Microsoft Surface Laptop 7 15 Lunar Lake
Intel Arc Graphics 140V, Intel Core Ultra 7 268V
12772 Points -34%
Microsoft Surface Pro 13 OLED
Qualcomm Adreno X2-85, Qualcomm Snapdragon X2 Elite X2E-78-100
8565 Points -56%
Microsoft Surface Laptop 8 13.8
Qualcomm SD X2 Adreno X2-45, Qualcomm Snapdragon X2 Plus X2P-64-100
7647 Points -60%
3DMark
1920x1080 Fire Strike Graphics
Lenovo ThinkPad X9-15p Gen 1
Intel Arc B390 12 Xe3 Panther Lake iGPU, Intel Core Ultra X7 358H
17351 Points +3%
Dell XPS 16 Core Ultra X7 358H
Intel Arc B390 12 Xe3 Panther Lake iGPU, Intel Core Ultra X7 358H
17018 Points +1%
Microsoft Surface Laptop 15 Gen 8
Intel Arc B390 12 Xe3 Panther Lake iGPU, Intel Core Ultra X7 368H
16839 Points
Gemiddeld Intel Arc B390 12 Xe3 Panther Lake iGPU
  (13410 - 18327, n=16)
16743 Points -1%
Gemiddelde van klas Multimedia
  (2328 - 48907, n=53, laatste 2 jaar)
15695 Points -7%
Asus Zenbook A16 UX3607
Qualcomm Adreno X2-90, Qualcomm Snapdragon X2 Elite Extreme X2E-94-100
11834 Points -30%
Microsoft Surface Laptop 7 15 Lunar Lake
Intel Arc Graphics 140V, Intel Core Ultra 7 268V
10476 Points -38%
Microsoft Surface Pro 13 OLED
Qualcomm Adreno X2-85, Qualcomm Snapdragon X2 Elite X2E-78-100
7617 Points -55%
Microsoft Surface Laptop 8 13.8
Qualcomm SD X2 Adreno X2-45, Qualcomm Snapdragon X2 Plus X2P-64-100
6626 Points -61%
2560x1440 Time Spy Graphics
Lenovo ThinkPad X9-15p Gen 1
Intel Arc B390 12 Xe3 Panther Lake iGPU, Intel Core Ultra X7 358H
7257 Points +13%
Dell XPS 16 Core Ultra X7 358H
Intel Arc B390 12 Xe3 Panther Lake iGPU, Intel Core Ultra X7 358H
6972 Points +9%
Gemiddeld Intel Arc B390 12 Xe3 Panther Lake iGPU
  (4567 - 7257, n=23)
6497 Points +1%
Microsoft Surface Laptop 15 Gen 8
Intel Arc B390 12 Xe3 Panther Lake iGPU, Intel Core Ultra X7 368H
6407 Points
Gemiddelde van klas Multimedia
  (696 - 19403, n=53, laatste 2 jaar)
6065 Points -5%
Microsoft Surface Laptop 7 15 Lunar Lake
Intel Arc Graphics 140V, Intel Core Ultra 7 268V
4415 Points -31%
Asus Zenbook A16 UX3607
Qualcomm Adreno X2-90, Qualcomm Snapdragon X2 Elite Extreme X2E-94-100
4064 Points -37%
Microsoft Surface Pro 13 OLED
Qualcomm Adreno X2-85, Qualcomm Snapdragon X2 Elite X2E-78-100
2605 Points -59%
Microsoft Surface Laptop 8 13.8
Qualcomm SD X2 Adreno X2-45, Qualcomm Snapdragon X2 Plus X2P-64-100
2262 Points -65%
Steel Nomad Score
Gemiddelde van klas Multimedia
  (342 - 4959, n=39, laatste 2 jaar)
2011 Points +55%
Gemiddeld Intel Arc B390 12 Xe3 Panther Lake iGPU
  (1301 - 1667, n=11)
1539 Points +18%
Microsoft Surface Laptop 15 Gen 8
Intel Arc B390 12 Xe3 Panther Lake iGPU, Intel Core Ultra X7 368H
1301 Points
Asus Zenbook A16 UX3607
Qualcomm Adreno X2-90, Qualcomm Snapdragon X2 Elite Extreme X2E-94-100
1264 Points -3%
Apple MacBook Air 15 M5
Apple M5 10-Core GPU, Apple M5 10-Core
1070 Points -18%
Microsoft Surface Laptop 7 15 Lunar Lake
Intel Arc Graphics 140V, Intel Core Ultra 7 268V
910 Points -30%
Microsoft Surface Pro 13 OLED
Qualcomm Adreno X2-85, Qualcomm Snapdragon X2 Elite X2E-78-100
711 Points -45%
Microsoft Surface Laptop 8 13.8
Qualcomm SD X2 Adreno X2-45, Qualcomm Snapdragon X2 Plus X2P-64-100
622 Points -52%
Steel Nomad Light Score
Gemiddelde van klas Multimedia
  (2001 - 21012, n=38, laatste 2 jaar)
8315 Points +41%
Gemiddeld Intel Arc B390 12 Xe3 Panther Lake iGPU
  (5562 - 6338, n=8)
5927 Points +1%
Microsoft Surface Laptop 15 Gen 8
Intel Arc B390 12 Xe3 Panther Lake iGPU, Intel Core Ultra X7 368H
5878 Points
Asus Zenbook A16 UX3607
Qualcomm Adreno X2-90, Qualcomm Snapdragon X2 Elite Extreme X2E-94-100
5492 Points -7%
Apple MacBook Air 15 M5
Apple M5 10-Core GPU, Apple M5 10-Core
5084 Points -14%
Microsoft Surface Laptop 7 15 Lunar Lake
Intel Arc Graphics 140V, Intel Core Ultra 7 268V
3555 Points -40%
Microsoft Surface Pro 13 OLED
Qualcomm Adreno X2-85, Qualcomm Snapdragon X2 Elite X2E-78-100
3464 Points -41%
Microsoft Surface Laptop 8 13.8
Qualcomm SD X2 Adreno X2-45, Qualcomm Snapdragon X2 Plus X2P-64-100
2935 Points -50%
3DMark 11 Performance
18531 punten
3DMark Fire Strike Score
13306 punten
3DMark Time Spy Score
6854 punten
3DMark Steel Nomad Score
1301 punten
3DMark Steel Nomad Light Score
5878 punten
Help
Blender / v3.3 Classroom CPU
Microsoft Surface Laptop 7 15 Lunar Lake
Intel Arc Graphics 140V, Intel Core Ultra 7 268V
555 Seconds * -62%
Gemiddelde van klas Multimedia
  (133 - 1042, n=57, laatste 2 jaar)
372 Seconds * -8%
Apple MacBook Air 15 M5
Apple M5 10-Core GPU, Apple M5 10-Core
344 Seconds * -0%
Microsoft Surface Laptop 15 Gen 8
Intel Arc B390 12 Xe3 Panther Lake iGPU, Intel Core Ultra X7 368H
343 Seconds *
Dell XPS 16 Core Ultra X7 358H
Intel Arc B390 12 Xe3 Panther Lake iGPU, Intel Core Ultra X7 358H
328 Seconds * +4%
Gemiddeld Intel Arc B390 12 Xe3 Panther Lake iGPU
  (282 - 409, n=16)
327 Seconds * +5%
Asus Zenbook A16 UX3607
Qualcomm Adreno X2-90, Qualcomm Snapdragon X2 Elite Extreme X2E-94-100
320 Seconds * +7%
Lenovo ThinkPad X9-15p Gen 1
Intel Arc B390 12 Xe3 Panther Lake iGPU, Intel Core Ultra X7 358H
288 Seconds * +16%
Blender / v3.3 Classroom METAL
Apple MacBook Air 15 M5
Apple M5 10-Core GPU, Apple M5 10-Core
76.3 Seconds *
Gemiddelde van klas Multimedia
  (17.8 - 68, n=6, laatste 2 jaar)
37.2 Seconds *
Blender / v3.3 Classroom oneAPI/Intel
Gemiddelde van klas Multimedia
  (105 - 492, n=17, laatste 2 jaar)
249 Seconds *
Gemiddeld Intel Arc B390 12 Xe3 Panther Lake iGPU
  (105 - 254, n=6)
131.5 Seconds *
Dell XPS 16 Core Ultra X7 358H
Intel Arc B390 12 Xe3 Panther Lake iGPU, Intel Core Ultra X7 358H
105 Seconds *

* ... kleiner is beter

Performance rating - Percent
Gemiddelde van klas Multimedia
 
95 pt
Lenovo ThinkPad X9-15p Gen 1 -1!
Intel Core Ultra X7 358H, Intel Arc B390 12 Xe3 Panther Lake iGPU
93 pt
Dell XPS 16 Core Ultra X7 358H
Intel Core Ultra X7 358H, Intel Arc B390 12 Xe3 Panther Lake iGPU
88.9 pt
Microsoft Surface Laptop 15 Gen 8
Intel Core Ultra X7 368H, Intel Arc B390 12 Xe3 Panther Lake iGPU
79.3 pt
Asus Zenbook A16 UX3607
Qualcomm Snapdragon X2 Elite Extreme X2E-94-100, Qualcomm Adreno X2-90
73.1 pt
Microsoft Surface Laptop 7 15 Lunar Lake
Intel Core Ultra 7 268V, Intel Arc Graphics 140V
60.5 pt
Apple MacBook Air 15 M5 -5!
Apple M5 10-Core, Apple M5 10-Core GPU
58.3 pt
Cyberpunk 2077 - 1920x1080 Ultra Preset (FSR off)
Lenovo ThinkPad X9-15p Gen 1
Intel Core Ultra X7 358H, Intel Arc B390 12 Xe3 Panther Lake iGPU
50.4 (41.6min, 39.8P1) fps +19%
Dell XPS 16 Core Ultra X7 358H
Intel Core Ultra X7 358H, Intel Arc B390 12 Xe3 Panther Lake iGPU
48.7 (40min, 37.6P1) fps +15%
Gemiddelde van klas Multimedia
  (6.41 - 112.3, n=64, laatste 2 jaar)
45.3 fps +7%
Microsoft Surface Laptop 15 Gen 8
Intel Core Ultra X7 368H, Intel Arc B390 12 Xe3 Panther Lake iGPU
42.3 (33.3min) fps
Asus Zenbook A16 UX3607
Qualcomm Snapdragon X2 Elite Extreme X2E-94-100, Qualcomm Adreno X2-90
38.2 (30.9min) fps -10%
Microsoft Surface Laptop 7 15 Lunar Lake
Intel Core Ultra 7 268V, Intel Arc Graphics 140V
29.6 (25min) fps -30%
Apple MacBook Air 15 M5
Apple M5 10-Core, Apple M5 10-Core GPU
23.3 fps -45%
Baldur's Gate 3 - 1920x1080 Ultra Preset AA:T
Gemiddelde van klas Multimedia
  (7.8 - 158.7, n=61, laatste 2 jaar)
56 fps +20%
Dell XPS 16 Core Ultra X7 358H
Intel Core Ultra X7 358H, Intel Arc B390 12 Xe3 Panther Lake iGPU
54.3 (48.6min, 49.6P0.1, 51P1) fps +17%
Lenovo ThinkPad X9-15p Gen 1
Intel Core Ultra X7 358H, Intel Arc B390 12 Xe3 Panther Lake iGPU
50.1 (29.6min, 29.8P0.1, 29.9P1) fps +8%
Microsoft Surface Laptop 15 Gen 8
Intel Core Ultra X7 368H, Intel Arc B390 12 Xe3 Panther Lake iGPU
46.6 (42.1min, 42.2P0.1, 43.4P1) fps
Asus Zenbook A16 UX3607
Qualcomm Snapdragon X2 Elite Extreme X2E-94-100, Qualcomm Adreno X2-90
42.5 (28.7min, 29.8P0.1, 39.3P1) fps -9%
Apple MacBook Air 15 M5
Apple M5 10-Core, Apple M5 10-Core GPU
39.4 fps -15%
Microsoft Surface Laptop 7 15 Lunar Lake
Intel Core Ultra 7 268V, Intel Arc Graphics 140V
27.4 fps -41%
GTA V - 1920x1080 Highest AA:4xMSAA + FX AF:16x
Gemiddelde van klas Multimedia
  (7.92 - 141.6, n=48, laatste 2 jaar)
55 fps +66%
Lenovo ThinkPad X9-15p Gen 1
Intel Core Ultra X7 358H, Intel Arc B390 12 Xe3 Panther Lake iGPU
46.2 (9.48min, 35.7P1) fps +39%
Dell XPS 16 Core Ultra X7 358H
Intel Core Ultra X7 358H, Intel Arc B390 12 Xe3 Panther Lake iGPU
45.2 (6.18min, 34.5P1) fps +36%
Asus Zenbook A16 UX3607
Qualcomm Snapdragon X2 Elite Extreme X2E-94-100, Qualcomm Adreno X2-90
41.1 (4.34min, 23.8P1) fps +24%
Microsoft Surface Laptop 15 Gen 8
Intel Core Ultra X7 368H, Intel Arc B390 12 Xe3 Panther Lake iGPU
33.2 (4.78min, 24.4P1) fps
Microsoft Surface Laptop 7 15 Lunar Lake
Intel Core Ultra 7 268V, Intel Arc Graphics 140V
25.3 (11.4min, 14.5P1) fps -24%
Final Fantasy XV Benchmark - 1920x1080 High Quality
Lenovo ThinkPad X9-15p Gen 1
Intel Core Ultra X7 358H, Intel Arc B390 12 Xe3 Panther Lake iGPU
57.9 fps +16%
Dell XPS 16 Core Ultra X7 358H
Intel Core Ultra X7 358H, Intel Arc B390 12 Xe3 Panther Lake iGPU
56.2 fps +12%
Gemiddelde van klas Multimedia
  (7.61 - 144.4, n=51, laatste 2 jaar)
55.6 fps +11%
Microsoft Surface Laptop 15 Gen 8
Intel Core Ultra X7 368H, Intel Arc B390 12 Xe3 Panther Lake iGPU
50 fps
Microsoft Surface Laptop 7 15 Lunar Lake
Intel Core Ultra 7 268V, Intel Arc Graphics 140V
36.4 fps -27%
Asus Zenbook A16 UX3607
Qualcomm Snapdragon X2 Elite Extreme X2E-94-100, Qualcomm Adreno X2-90
34.5 fps -31%
Strange Brigade - 1920x1080 ultra AA:ultra AF:16
Gemiddelde van klas Multimedia
  (13.3 - 303, n=50, laatste 2 jaar)
100.4 fps +13%
Dell XPS 16 Core Ultra X7 358H
Intel Core Ultra X7 358H, Intel Arc B390 12 Xe3 Panther Lake iGPU
90.6 (24.7min, 39.3P1) fps +2%
Microsoft Surface Laptop 15 Gen 8
Intel Core Ultra X7 368H, Intel Arc B390 12 Xe3 Panther Lake iGPU
89.2 (28.1min, 39.2P1) fps
Asus Zenbook A16 UX3607
Qualcomm Snapdragon X2 Elite Extreme X2E-94-100, Qualcomm Adreno X2-90
81.7 (17min, 25.1P1) fps -8%
Microsoft Surface Laptop 7 15 Lunar Lake
Intel Core Ultra 7 268V, Intel Arc Graphics 140V
61.7 (41.5min, 46.9P1) fps -31%
Dota 2 Reborn - 1920x1080 ultra (3/3) best looking
Lenovo ThinkPad X9-15p Gen 1
Intel Core Ultra X7 358H, Intel Arc B390 12 Xe3 Panther Lake iGPU
117.2 (87.1min) fps +47%
Dell XPS 16 Core Ultra X7 358H
Intel Core Ultra X7 358H, Intel Arc B390 12 Xe3 Panther Lake iGPU
96.9 (57min) fps +21%
Gemiddelde van klas Multimedia
  (30.3 - 170.9, n=52, laatste 2 jaar)
92.8 fps +16%
Microsoft Surface Laptop 7 15 Lunar Lake
Intel Core Ultra 7 268V, Intel Arc Graphics 140V
82.4 (50.6min) fps +3%
Microsoft Surface Laptop 15 Gen 8
Intel Core Ultra X7 368H, Intel Arc B390 12 Xe3 Panther Lake iGPU
80 (48.4min) fps
Asus Zenbook A16 UX3607
Qualcomm Snapdragon X2 Elite Extreme X2E-94-100, Qualcomm Adreno X2-90
70.7 (51.1min) fps -12%
X-Plane 11.11 - 1920x1080 high (fps_test=3)
Gemiddelde van klas Multimedia
  (16.9 - 103, n=50, laatste 2 jaar)
50.6 fps +19%
Lenovo ThinkPad X9-15p Gen 1
Intel Core Ultra X7 358H, Intel Arc B390 12 Xe3 Panther Lake iGPU
42.8 fps +1%
Asus Zenbook A16 UX3607
Qualcomm Snapdragon X2 Elite Extreme X2E-94-100, Qualcomm Adreno X2-90
42.6 fps 0%
Microsoft Surface Laptop 15 Gen 8
Intel Core Ultra X7 368H, Intel Arc B390 12 Xe3 Panther Lake iGPU
42.4 fps
Dell XPS 16 Core Ultra X7 358H
Intel Core Ultra X7 358H, Intel Arc B390 12 Xe3 Panther Lake iGPU
38.8 fps -8%
Microsoft Surface Laptop 7 15 Lunar Lake
Intel Core Ultra 7 268V, Intel Arc Graphics 140V
37.9 fps -11%

Cyberpunk 2077 ultra FPS-grafiek

051015202530354045Tooltip
Microsoft Surface Laptop 15 Gen 8 Ultra X7 368H, Arc B390 Panther Lake iGPU: Ø34.9 (28.4-37.5) fps
Lenovo ThinkPad X9-15p Gen 1 Ultra X7 358H, Arc B390 Panther Lake iGPU: Ø44.9 (42.5-46.2) fps
Asus Zenbook A16 UX3607 X2E-94-100, X2-90: Ø32.7 (31.5-33.5) fps
Dell XPS 16 Core Ultra X7 358H Ultra X7 358H, Arc B390 Panther Lake iGPU: Ø46 (42.5-47) fps
Microsoft Surface Laptop 7 15 Lunar Lake Core Ultra 7 268V, Arc 140V: Ø26.8 (25-28) fps
lagegem.hogeultra
GTA V (2015) 176.4 170.4 87.7 33.2
Dota 2 Reborn (2015) 127 85.6 86.9 80
Final Fantasy XV Benchmark (2018) 116.7 68.7 50
X-Plane 11.11 (2018) 61.8 50.2 42.4
Strange Brigade (2018) 307 120.8 101.7 89.2
Baldur's Gate 3 (2023) 71.6 54.3 47.7 46.6
Cyberpunk 2077 (2023) 67.9 60.4 50 42.3
F1 24 (2024) 111.5 109.1 82 28.5

Emissies & Energieverbruik

Systeemruis

Koelunit
Koelunit

De Surface Laptop 15 is over het algemeen een zeer stille laptop, maar de koeleenheid met één ventilator heeft moeite met de hoge kortstondige TDP van 65 watt, waardoor de ventilator bij zwaardere belasting vrij snel hoorbaar wordt. Tijdens het gamen en onze stresstest meten we tot 41,3 dB(A) en ongeveer 36-37 dB(A) in de twee minder krachtige bedrijfsmodi. GPU-belasting leidde op ons testsysteem ook tot enige coil whine.

Geluidsniveau

Onbelast
24.9 / 24.9 / 24.9 dB (A)
Belasting
32.2 / 41.3 dB (A)
  red to green bar
 
 
30 dB
stil
40 dB(A)
hoorbaar
50 dB(A)
luid
 
min: dark, med: mid, max: light   Earthworks M23R, Arta (15 cm afstand)   omgevingslawaai: 24.9 dB(A)
dB(A) 0102030405060708090Deep BassMiddle BassHigh BassLower RangeMidsHigher MidsLower HighsMid HighsUpper HighsSuper Highs2042.340.438.242.72533.333.93533.93138.940.440.136.14040.841.439.639.55039.139.237.339.16335.735.832.532.18031.430.826.925.110028.632.927.324.612525.130.120.822.316025.527.52220.820026.228.524.121.225026.130.624.321.831528.42518.319.14003121.514.416.350031.422.312.614.163030.522.612.413.880028211112.1100027.319.810.912.8125029.319.910.712.616003320.710.412.2200032.62110.111.8250031.520.610.411.8315028.514.910.812.1400025.313.911.212.3500024.71811.512.4630023.816.911.812.6800027.713.711.612.61000018.213.211.612.41250015.313.311.412.21600013.212.410.611.5SPL41.332.224.925.5N3.81.70.70.7median 27.7median 20.7median 11.6median 12.6Delta2.66.13.32.9hearing rangehide median Fan NoiseMicrosoft Surface Laptop 15 Gen 8
Microsoft Surface Laptop 15 Gen 8
Ultra X7 368H, Arc B390 Panther Lake iGPU
Lenovo ThinkPad X9-15p Gen 1
Ultra X7 358H, Arc B390 Panther Lake iGPU
Asus Zenbook A16 UX3607
X2E-94-100, X2-90
Dell XPS 16 Core Ultra X7 358H
Ultra X7 358H, Arc B390 Panther Lake iGPU
Apple MacBook Air 15 M5
M5 10-Core, M5 10-Core GPU
Microsoft Surface Laptop 7 15 Lunar Lake
Core Ultra 7 268V, Arc 140V
Noise
3%
-5%
-2%
3%
uit / omgeving * (dB)
24.9
22.9
8%
24.9
-0%
23.3
6%
23.9
4%
Idle Minimum * (dB)
24.9
22.9
8%
24.9
-0%
23.4
6%
23.9
4%
Idle Average * (dB)
24.9
22.9
8%
24.9
-0%
23.4
6%
23.9
4%
Idle Maximum * (dB)
24.9
22.9
8%
24.9
-0%
25.8
-4%
23.9
4%
Load Average * (dB)
32.2
31.4
2%
27.9
13%
38
-18%
31.8
1%
Cyberpunk 2077 ultra * (dB)
41.3
43.8
-6%
51.1
-24%
38.1
8%
38
8%
Load Maximum * (dB)
41.3
43.7
-6%
51.1
-24%
48.6
-18%
41.9
-1%

* ... kleiner is beter

Temperatuur

De aluminium oppervlakken kunnen behoorlijk warm worden onder zware belasting, en dat voel je duidelijk tijdens het typen. Het bodempaneel blijft merkbaar koeler en je kunt het apparaat zonder problemen op schoot zetten. Tijdens onze stresstest stabiliseert de CPU zich al snel op 28 watt (~79 °C).

CPU/iGPU-datastresstest
Max. Belasting
40.7 °C44.2 °C43 °C
40.2 °C41.5 °C35.6 °C
31.7 °C29.2 °C30.7 °C
Maximum: 44.2 °C
Gemiddelde: 37.4 °C
39.9 °C41 °C39.4 °C
37.2 °C38.2 °C37.2 °C
31.7 °C32.5 °C32 °C
Maximum: 40.3 °C
Gemiddelde: 36.3 °C
Stroomadapter (max.)  42.4 °C | Kamertemperatuur 21 °C | Fluke t3000FC (calibrated), Voltcraft IR-900
(±) De gemiddelde temperatuur voor de bovenzijde bij maximale belasting bedraagt 37.4 °C / 99 F, vergeleken met het gemiddelde van 31.3 °C / ###class_avg_f## F voor de apparaten van de klasse Multimedia.
(±) De maximumtemperatuur aan de bovenzijde bedraagt 44.2 °C / 112 F, vergeleken met het gemiddelde van 36.8 °C / 98 F, variërend van 21 tot 71 °C voor de klasse Multimedia.
(±) De bodem warmt op tot een maximum van 40.3 °C / 105 F, vergeleken met een gemiddelde van 39.1 °C / 102 F
(+) Bij onbelast gebruik bedraagt de gemiddelde temperatuur voor de bovenzijde 25.4 °C / 78 F, vergeleken met het apparaatgemiddelde van 31.3 °C / 88 F.
(±) 3: The average temperature for the upper side is 37.1 °C / 99 F, compared to the average of 31.3 °C / 88 F for the class Multimedia.
(+) De palmsteunen en het touchpad zijn met een maximum van ###max## °C / 89.1 F koeler dan de huidtemperatuur en voelen daarom koel aan.
(-) De gemiddelde temperatuur van de handpalmsteun van soortgelijke toestellen bedroeg 28.7 °C / 83.7 F (-3 °C / -5.4 F).
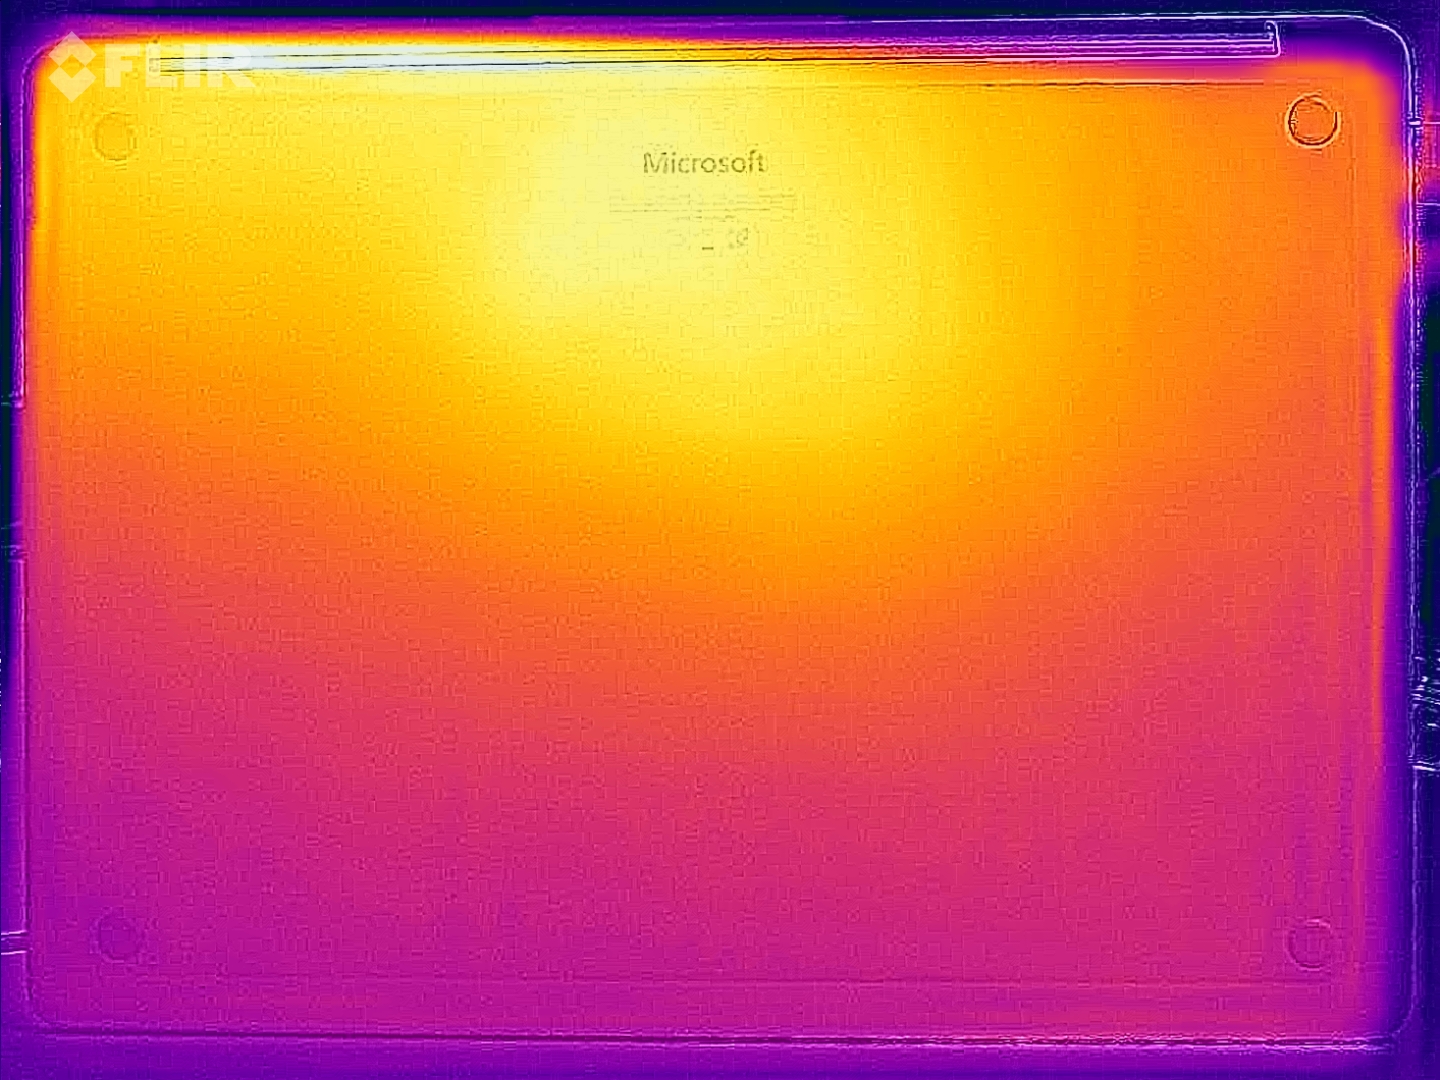
Heatmap-stresstest (boven)
Heatmap-stresstest (onderaan)
Microsoft Surface Laptop 15 Gen 8
Ultra X7 368H, Arc B390 Panther Lake iGPU
Lenovo ThinkPad X9-15p Gen 1
Ultra X7 358H, Arc B390 Panther Lake iGPU
Asus Zenbook A16 UX3607
X2E-94-100, X2-90
Dell XPS 16 Core Ultra X7 358H
Ultra X7 358H, Arc B390 Panther Lake iGPU
Apple MacBook Air 15 M5
M5 10-Core, M5 10-Core GPU
Microsoft Surface Laptop 7 15 Lunar Lake
Core Ultra 7 268V, Arc 140V
Heat
-9%
-2%
7%
2%
3%
Maximum Upper Side * (°C)
44.2
43.3
2%
43.2
2%
40.6
8%
44.1
-0%
45.7
-3%
Maximum Bottom * (°C)
40.3
38.6
4%
43.3
-7%
39.8
1%
43.1
-7%
42.9
-6%
Idle Upper Side * (°C)
26
32.6
-25%
26.7
-3%
23.2
11%
24
8%
23.6
9%
Idle Bottom * (°C)
25.8
30.4
-18%
26
-1%
23.8
8%
23.9
7%
23.1
10%

* ... kleiner is beter

Luidsprekers

Het geluidssysteem is nog steeds erg goed, ook al zijn de concurrenten iets beter.

dB(A) 0102030405060708090Deep BassMiddle BassHigh BassLower RangeMidsHigher MidsLower HighsMid HighsUpper HighsSuper Highs2038.242.4253533.43140.140.54039.642.15037.339.66332.534.68026.937.110027.34212520.847.51602251.320024.158.125024.360.531518.364.740014.463.150012.665.963012.464.68001168.4100010.971.6125010.770.8160010.471.1200010.170250010.468.3315010.871.7400011.267500011.565.1630011.866.2800011.665.31000011.662.11250011.4621600010.661.8SPL24.980.8N0.750.4median 11.6median 65.1Delta3.34.332.233.127.830.126.326.32829.135.135.621.822.81941.718.454.715.761.618.464.914.470.320.167.112.468.91371.31369.512.373.31275.411.971.312.367.712.467.911.762.812.461.312.360.512.760.612.660.112.664.714.566.412.465.812.370.11270.225.180.30.651.3median 12.4median 67.10.74.337.338.429.33024.725.526.131.42729.526.136.121.545.418.953.61860.116.76219.268.721.570.415.473.313.269.410.469.51173.19.978.510.574.610.874.710.574.410.672.811.972.512.871.913.669.41465.314.466.11468.713.26013.458.413.25524.984.50.665median 13.2median 69.435.134.430.125.621.323.921.219.421.428.424.821.432.619.852.916.560.314.161.514.464.614.464.11468.914.274.212.473.710.977.910.373.110.274.49.475.29.675.41073.41070.510.8731172.611.473.312.369.412.167.712.766.112.772.712.672.812.472.323.485.10.570median 12.3median 72.71.82.744.343.434.933.735.236.733.532.227.330.334.739.425.149.92254.918.260.918.159.720.466.322.268.41770.414.568.413.368.613.370.412.268.11267.911.773.211.773.911.571.31270.212.36912.373.612.775.112.775.912.876.612.973.612.870.212.759.625.284.80.766.8median 12.8median 70.223.240.442.830.834.230.432.534.935.728.63326.533.92139.318.84418.650.916.350.71857.918.761.215.564.912.562.711.366.411.467.210.769.910.168.710.368.810.670.210.969.711.365.311.46611.964.412.263.912.159.912.158.612.260.712.261.811.859.123.978.80.545.3median 12.1median 63.92.14.1hearing rangehide median Pink NoiseMicrosoft Surface Laptop 15 Gen 8Lenovo ThinkPad X9-15p Gen 1Asus Zenbook A16 UX3607Dell XPS 16 Core Ultra X7 358HApple MacBook Air 15 M5Microsoft Surface Laptop 7 15 Lunar Lake
Frequentiediagram (selectievakjes kunnen worden aan- en uitgezet om toestellen te vergelijken)
Microsoft Surface Laptop 15 Gen 8 audioanalyse

(±) | luidspreker luidheid is gemiddeld maar goed (80.8 dB)
Bas 100 - 315 Hz
(±) | verminderde zeebaars - gemiddeld 11.1% lager dan de mediaan
(±) | lineariteit van de lage tonen is gemiddeld (8.6% delta ten opzichte van de vorige frequentie)
Midden 400 - 2000 Hz
(+) | evenwichtige middens - slechts 3.7% verwijderd van de mediaan
(+) | de middentonen zijn lineair (3.5% delta ten opzichte van de vorige frequentie)
Hoog 2 - 16 kHz
(+) | evenwichtige hoogtepunten - slechts 2.3% verwijderd van de mediaan
(+) | de hoge tonen zijn lineair (4.5% delta naar de vorige frequentie)
Algemeen 100 - 16.000 Hz
(+) | het totale geluid is lineair (11.1% verschil met de mediaan)
Vergeleken met dezelfde klasse
» 17% van alle geteste apparaten in deze klasse waren beter, 3% vergelijkbaar, 80% slechter
» De beste had een delta van 5%, het gemiddelde was 17%, de slechtste was 45%
Vergeleken met alle geteste toestellen
» 7% van alle geteste apparaten waren beter, 2% gelijk, 91% slechter
» De beste had een delta van 4%, het gemiddelde was 23%, de slechtste was 136%

Lenovo ThinkPad X9-15p Gen 1 audioanalyse

(±) | luidspreker luidheid is gemiddeld maar goed (80.3 dB)
Bas 100 - 315 Hz
(+) | goede baars - slechts 4.2% verwijderd van de mediaan
(±) | lineariteit van de lage tonen is gemiddeld (10.2% delta ten opzichte van de vorige frequentie)
Midden 400 - 2000 Hz
(+) | evenwichtige middens - slechts 3.9% verwijderd van de mediaan
(+) | de middentonen zijn lineair (5.2% delta ten opzichte van de vorige frequentie)
Hoog 2 - 16 kHz
(+) | evenwichtige hoogtepunten - slechts 4.3% verwijderd van de mediaan
(+) | de hoge tonen zijn lineair (2.6% delta naar de vorige frequentie)
Algemeen 100 - 16.000 Hz
(+) | het totale geluid is lineair (8.9% verschil met de mediaan)
Vergeleken met dezelfde klasse
» 11% van alle geteste apparaten in deze klasse waren beter, 2% vergelijkbaar, 87% slechter
» De beste had een delta van 5%, het gemiddelde was 17%, de slechtste was 45%
Vergeleken met alle geteste toestellen
» 3% van alle geteste apparaten waren beter, 1% gelijk, 96% slechter
» De beste had een delta van 4%, het gemiddelde was 23%, de slechtste was 136%

Asus Zenbook A16 UX3607 audioanalyse

(+) | luidsprekers kunnen relatief luid spelen (84.5 dB)
Bas 100 - 315 Hz
(±) | verminderde zeebaars - gemiddeld 6.4% lager dan de mediaan
(±) | lineariteit van de lage tonen is gemiddeld (8.3% delta ten opzichte van de vorige frequentie)
Midden 400 - 2000 Hz
(+) | evenwichtige middens - slechts 3.9% verwijderd van de mediaan
(+) | de middentonen zijn lineair (4.2% delta ten opzichte van de vorige frequentie)
Hoog 2 - 16 kHz
(+) | evenwichtige hoogtepunten - slechts 3.3% verwijderd van de mediaan
(+) | de hoge tonen zijn lineair (5% delta naar de vorige frequentie)
Algemeen 100 - 16.000 Hz
(+) | het totale geluid is lineair (9.8% verschil met de mediaan)
Vergeleken met dezelfde klasse
» 14% van alle geteste apparaten in deze klasse waren beter, 2% vergelijkbaar, 84% slechter
» De beste had een delta van 5%, het gemiddelde was 17%, de slechtste was 45%
Vergeleken met alle geteste toestellen
» 4% van alle geteste apparaten waren beter, 1% gelijk, 95% slechter
» De beste had een delta van 4%, het gemiddelde was 23%, de slechtste was 136%

Dell XPS 16 Core Ultra X7 358H audioanalyse

(+) | luidsprekers kunnen relatief luid spelen (85.1 dB)
Bas 100 - 315 Hz
(±) | verminderde zeebaars - gemiddeld 7.6% lager dan de mediaan
(+) | de lage tonen zijn lineair (6.1% delta naar de vorige frequentie)
Midden 400 - 2000 Hz
(+) | evenwichtige middens - slechts 2.1% verwijderd van de mediaan
(+) | de middentonen zijn lineair (3.4% delta ten opzichte van de vorige frequentie)
Hoog 2 - 16 kHz
(+) | evenwichtige hoogtepunten - slechts 2.3% verwijderd van de mediaan
(+) | de hoge tonen zijn lineair (4.1% delta naar de vorige frequentie)
Algemeen 100 - 16.000 Hz
(+) | het totale geluid is lineair (6.2% verschil met de mediaan)
Vergeleken met dezelfde klasse
» 4% van alle geteste apparaten in deze klasse waren beter, 0% vergelijkbaar, 96% slechter
» De beste had een delta van 5%, het gemiddelde was 17%, de slechtste was 45%
Vergeleken met alle geteste toestellen
» 0% van alle geteste apparaten waren beter, 0% gelijk, 99% slechter
» De beste had een delta van 4%, het gemiddelde was 23%, de slechtste was 136%

Apple MacBook Air 15 M5 audioanalyse

(+) | luidsprekers kunnen relatief luid spelen (84.8 dB)
Bas 100 - 315 Hz
(±) | verminderde zeebaars - gemiddeld 6.8% lager dan de mediaan
(+) | de lage tonen zijn lineair (6.6% delta naar de vorige frequentie)
Midden 400 - 2000 Hz
(+) | evenwichtige middens - slechts 2% verwijderd van de mediaan
(+) | de middentonen zijn lineair (3.3% delta ten opzichte van de vorige frequentie)
Hoog 2 - 16 kHz
(+) | evenwichtige hoogtepunten - slechts 3.6% verwijderd van de mediaan
(+) | de hoge tonen zijn lineair (3.2% delta naar de vorige frequentie)
Algemeen 100 - 16.000 Hz
(+) | het totale geluid is lineair (7.7% verschil met de mediaan)
Vergeleken met dezelfde klasse
» 2% van alle geteste apparaten in deze klasse waren beter, 0% vergelijkbaar, 98% slechter
» De beste had een delta van 5%, het gemiddelde was 18%, de slechtste was 53%
Vergeleken met alle geteste toestellen
» 1% van alle geteste apparaten waren beter, 0% gelijk, 98% slechter
» De beste had een delta van 4%, het gemiddelde was 23%, de slechtste was 136%

Microsoft Surface Laptop 7 15 Lunar Lake audioanalyse

(±) | luidspreker luidheid is gemiddeld maar goed (78.8 dB)
Bas 100 - 315 Hz
(±) | verminderde zeebaars - gemiddeld 9.3% lager dan de mediaan
(±) | lineariteit van de lage tonen is gemiddeld (8.4% delta ten opzichte van de vorige frequentie)
Midden 400 - 2000 Hz
(+) | evenwichtige middens - slechts 4.4% verwijderd van de mediaan
(+) | de middentonen zijn lineair (3% delta ten opzichte van de vorige frequentie)
Hoog 2 - 16 kHz
(+) | evenwichtige hoogtepunten - slechts 2.4% verwijderd van de mediaan
(+) | de hoge tonen zijn lineair (4.1% delta naar de vorige frequentie)
Algemeen 100 - 16.000 Hz
(+) | het totale geluid is lineair (11.4% verschil met de mediaan)
Vergeleken met dezelfde klasse
» 4% van alle geteste apparaten in deze klasse waren beter, 2% vergelijkbaar, 95% slechter
» De beste had een delta van 7%, het gemiddelde was 21%, de slechtste was 53%
Vergeleken met alle geteste toestellen
» 8% van alle geteste apparaten waren beter, 2% gelijk, 90% slechter
» De beste had een delta van 4%, het gemiddelde was 23%, de slechtste was 136%

Energieverbruik en batterijduur

De 65W-voeding is onvoldoende.

De Panther Lake-SKU is in rust efficiënter dan het oude Lunar Lake-model, ondanks het vernieuwde scherm. De accuduur in onze wifi-test is toch iets korter, wat het gevolg is van de hogere kortstondige TDP. De resultaten zijn echter nog steeds erg goed, met bijna 16 uur in onze wifi-test bij 150 nits en 8,5 uur bij maximale helderheid. De 65W-voedingsadapter is echter ontoereikend, wat nauwelijks verrassend is gezien de kortstondige TDP van 65 watt. Dit betekent dat de accu moet bijspringen bij piekbelasting. We hebben ook een 140W-voedingsadapter geprobeerd, maar het apparaat accepteert simpelweg niet meer vermogen.

Stroomgebruik
Uit / Standbydarklight 0.28 / 0.38 Watt
Inactiefdarkmidlight 2 / 7.6 / 8.1 Watt
Belasting midlight 54.4 / 62.6 Watt
 color bar
Key: min: dark, med: mid, max: light        Metrahit Energy

Stroomverbruik Cyberpunk / Stresstest

051015202530354045505560Tooltip
Microsoft Surface Laptop 15 Gen 8; 1280x720 Prime95 28.10 and Furmark 1.25: Ø51.8 (46.4-62.3) Watt
Microsoft Surface Laptop 15 Gen 8; Idle 150cd/m2: Ø4.01 (3.89-4.61) Watt
Microsoft Surface Laptop 15 Gen 8; Cyberpunk 2077 FHD ultra no FSR 150cd: Ø51.1 (47.7-57.2) Watt

Stroomverbruik externe monitor

051015202530354045505560Tooltip
Microsoft Surface Laptop 15 Gen 8; Prime95 V2810 Stress (external Monitor): Ø54.6 (38.9-62.5) Watt
Microsoft Surface Laptop 15 Gen 8; Cinebench R23 Single (external Monitor): Ø25.1 (23.8-34.4) Watt
Microsoft Surface Laptop 15 Gen 8; Cinebench R23 Multi (external Monitor): Ø57.3 (53.5-62.6) Watt
Microsoft Surface Laptop 15 Gen 8; 1280x720 FurMark 1.19 GPU Stress Test (external Monitor): Ø56.4 (50.3-61.2) Watt
Microsoft Surface Laptop 15 Gen 8; Idle 1min (external Monitor): Ø6.93 (6.67-7.61) Watt
Microsoft Surface Laptop 15 Gen 8; Cyberpunk 2077 FHD ultra no FSR (external Monitor): Ø51.8 (50.9-55.1) Watt
Batterijduur
WiFi Websurfing
15h 46min
WiFi Websurfing max. Brightness
8h 35min
Battery Runtime
WiFi Websurfing
Lenovo ThinkPad X9-15p Gen 1
Ultra X7 358H, Arc B390 Panther Lake iGPU, 88 Wh (Edge 150, 60 Hz)
18.3 h +16%
Microsoft Surface Laptop 7 15 Lunar Lake
Core Ultra 7 268V, Arc 140V, 64 Wh
17.7 h +12%
Apple MacBook Air 15 M5
M5 10-Core, M5 10-Core GPU, 66.5 Wh
17.2 h +9%
Microsoft Surface Laptop 15 Gen 8
Ultra X7 368H, Arc B390 Panther Lake iGPU, 66 Wh
15.8 h
Asus Zenbook A16 UX3607
X2E-94-100, X2-90, 70 Wh
13 h -18%
Gemiddelde van klas Multimedia
  (4.37 - 26.6, n=59, laatste 2 jaar)
13 h -18%
Dell XPS 16 Core Ultra X7 358H
Ultra X7 358H, Arc B390 Panther Lake iGPU, 70 Wh
10.3 h -35%
WiFi Websurfing max. Brightness
Lenovo ThinkPad X9-15p Gen 1
Ultra X7 358H, Arc B390 Panther Lake iGPU, 88 Wh (Edge 150, 30 - 120 Hz VRR)
9.6 h +12%
Lenovo ThinkPad X9-15p Gen 1
Ultra X7 358H, Arc B390 Panther Lake iGPU, 88 Wh (Edge 150, 60 Hz)
9.2 h +7%
Microsoft Surface Laptop 7 15 Lunar Lake
Core Ultra 7 268V, Arc 140V, 64 Wh
8.8 h +2%
Microsoft Surface Laptop 15 Gen 8
Ultra X7 368H, Arc B390 Panther Lake iGPU, 66 Wh
8.6 h
Gemiddelde van klas Multimedia
  (3.53 - 11.6, n=30, laatste 2 jaar)
7.28 h -15%
Apple MacBook Air 15 M5
M5 10-Core, M5 10-Core GPU, 66.5 Wh
6.7 h -22%
Asus Zenbook A16 UX3607
X2E-94-100, X2-90, 70 Wh
6.4 h -26%

Notebookcheck-beoordeling

Microsoft Surface Laptop 15 Gen 8 - 05-10-2026 v8
Andreas Osthoff

Behuizing
84 / 98 → 86%
Toetsenbord
85%
Aanwijsapparaat
94%
Aansluitmogelijkheden
75 / 80 → 93%
Gewicht
67 / 20-74 → 87%
Batterij
90 / 95 → 95%
Beeldscherm
84%
Gaming-performance
58 / 88 → 65%
Applicatie-performance
89 / 92 → 96%
AI Performance
90%
Temperatuur
91%
Luidheid
77 / 95 → 81%
Audio
87%
Camera
40 / 75 → 53%
Gemiddelde
75%
85%
Multimedia - Gewogen Gemiddelde
CO2 Emissions
77.1%
Materials
50%
Packaging
100%
Power Use
88.7%
Repairability
60%
Software Updates
22.3%
Recycle Logo Total Sustainability Score: 66.4%

Potentiële concurrenten vergeleken

Afbeelding
Model / recensie
prijs
Gewicht
Hoogte
Scherm
1.
85.3%
Microsoft Surface Laptop 15 Gen 8
Intel Core Ultra X7 368H ⎘
Intel Arc B390 12 Xe3 Panther Lake iGPU ⎘
16 GB Geheugen, 256 GB SSD
Amazon:
1. $238.94
Microsoft Surface Laptop 3 1...
2. $483.98
Microsoft Surface Laptop 5 1...
3. $685.00
Microsoft Surface Laptop 4 1...
Catalogusprijs: 2400€
1.7 kg18.3 mm15.00"
3270x2180
262 PPI
IPS
2.
89.9%
Lenovo ThinkPad X9-15p Gen 1
Intel Core Ultra X7 358H ⎘
Intel Arc B390 12 Xe3 Panther Lake iGPU ⎘
32 GB Geheugen, 1024 GB SSD
Catalogusprijs: 2500 Euro1.5 kg18 mm15.30"
2880x1800
222 PPI
OLED
3.
87.5%
Asus Zenbook A16 UX3607
Qualcomm Snapdragon X2 Elite Extreme X2E-94-100 ⎘
Qualcomm Adreno X2-90 ⎘
48 GB Geheugen, 1000 GB SSD
Amazon:
1. $2,299.99
ASUS Zenbook A16 AI Laptop, ...
2. $2,299.99
ASUS Zenbook A16 16" Laptop,...
3. $2,059.99
ASUS Zenbook A16 AI Laptop, ...
1.2 kg16.5 mm16.00"
2880x1800
212 PPI
OLED
4.
87.2%
Dell XPS 16 Core Ultra X7 358H
Intel Core Ultra X7 358H ⎘
Intel Arc B390 12 Xe3 Panther Lake iGPU ⎘
32 GB Geheugen
Amazon:
1. $1,977.99
Dell Premium 16 (Previously ...
2. $2,599.00
Dell Premium 16 (XPS 16 2025...
3. $3,624.48
Dell 16 Premium (XPS 16 2025...
Catalogusprijs: 2350 USD
1.7 kg14.62 mm16.00"
3200x2000
236 PPI
OLED
5.
91.6%
Apple MacBook Air 15 M5
Apple M5 10-Core ⎘
Apple M5 10-Core GPU ⎘
32 GB Geheugen, 2048 GB SSD
1.5 kg11.5 mm15.30"
2880x1864
224 PPI
IPS
6.
87.4%
Microsoft Surface Laptop 7 15 Lunar Lake
Intel Core Ultra 7 268V ⎘
Intel Arc Graphics 140V ⎘
32 GB Geheugen, 1024 GB SSD
Catalogusprijs: 2760€1.7 kg18.3 mm15.00"
2496x1664
200 PPI
IPS

Transparantie

De selectie van te beoordelen apparaten wordt gemaakt door onze redactie. Het testexemplaar werd ten behoeve van deze beoordeling door de fabrikant of detailhandelaar in bruikleen aan de auteur verstrekt. De kredietverstrekker had geen invloed op deze recensie, noch ontving de fabrikant vóór publicatie een exemplaar van deze recensie. Er bestond geen verplichting om deze recensie te publiceren. Als onafhankelijk mediabedrijf is Notebookcheck niet onderworpen aan het gezag van fabrikanten, detailhandelaren of uitgevers.

[transparency_disclaimer]

Dit is hoe Notebookcheck test

Elk jaar beoordeelt Notebookcheck onafhankelijk honderden laptops en smartphones met behulp van gestandaardiseerde procedures om ervoor te zorgen dat alle resultaten vergelijkbaar zijn. We hebben onze testmethoden al zo'n 20 jaar voortdurend ontwikkeld en daarbij de industriestandaard bepaald. In onze testlaboratoria wordt gebruik gemaakt van hoogwaardige meetapparatuur door ervaren technici en redacteuren. Deze tests omvatten een validatieproces in meerdere fasen. Ons complexe beoordelingssysteem is gebaseerd op honderden goed onderbouwde metingen en benchmarks, waardoor de objectiviteit behouden blijft. Meer informatie over onze testmethoden kunt u hier vinden.

Google LogoAdd as a preferred source on Google
Mail Logo
> Overzichten en testrapporten over laptops en mobieltjes > Testrapporten > Intel verslaat Snapdragon duidelijk - Review van de Microsoft Surface Laptop 15 Gen 8
Andreas Osthoff, 2026-10- 6 (Update: 2026-10- 6)