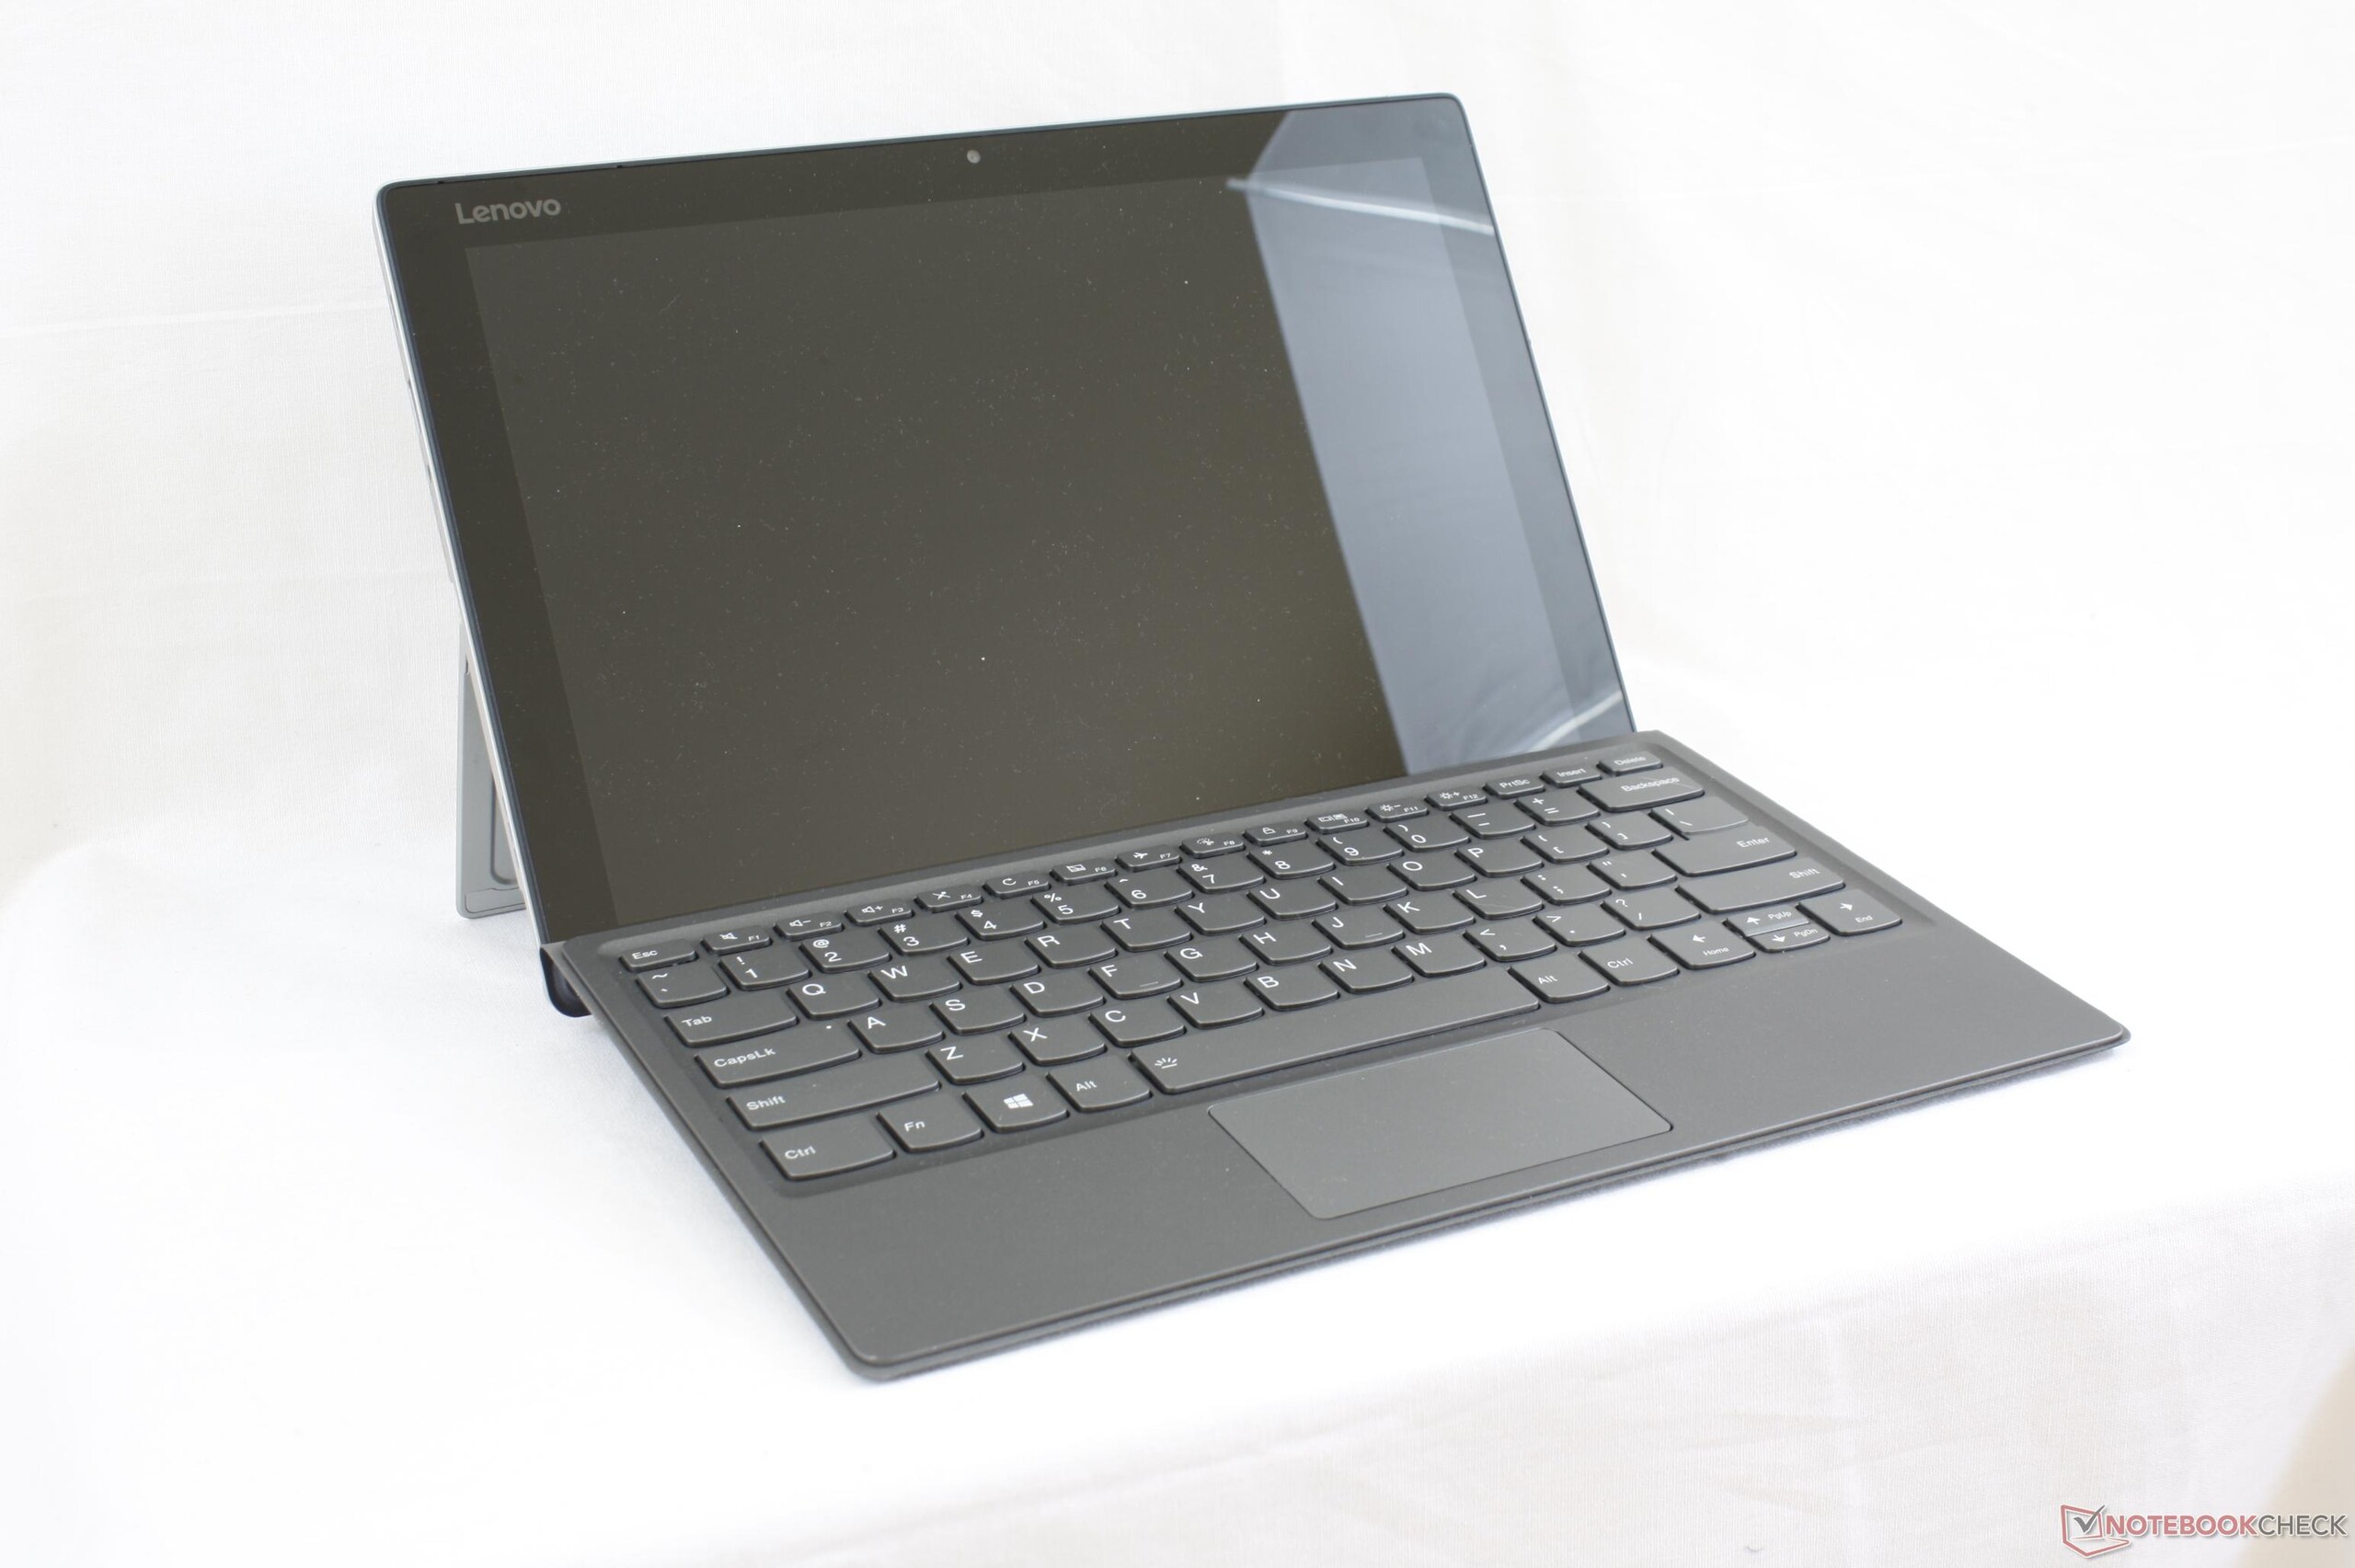
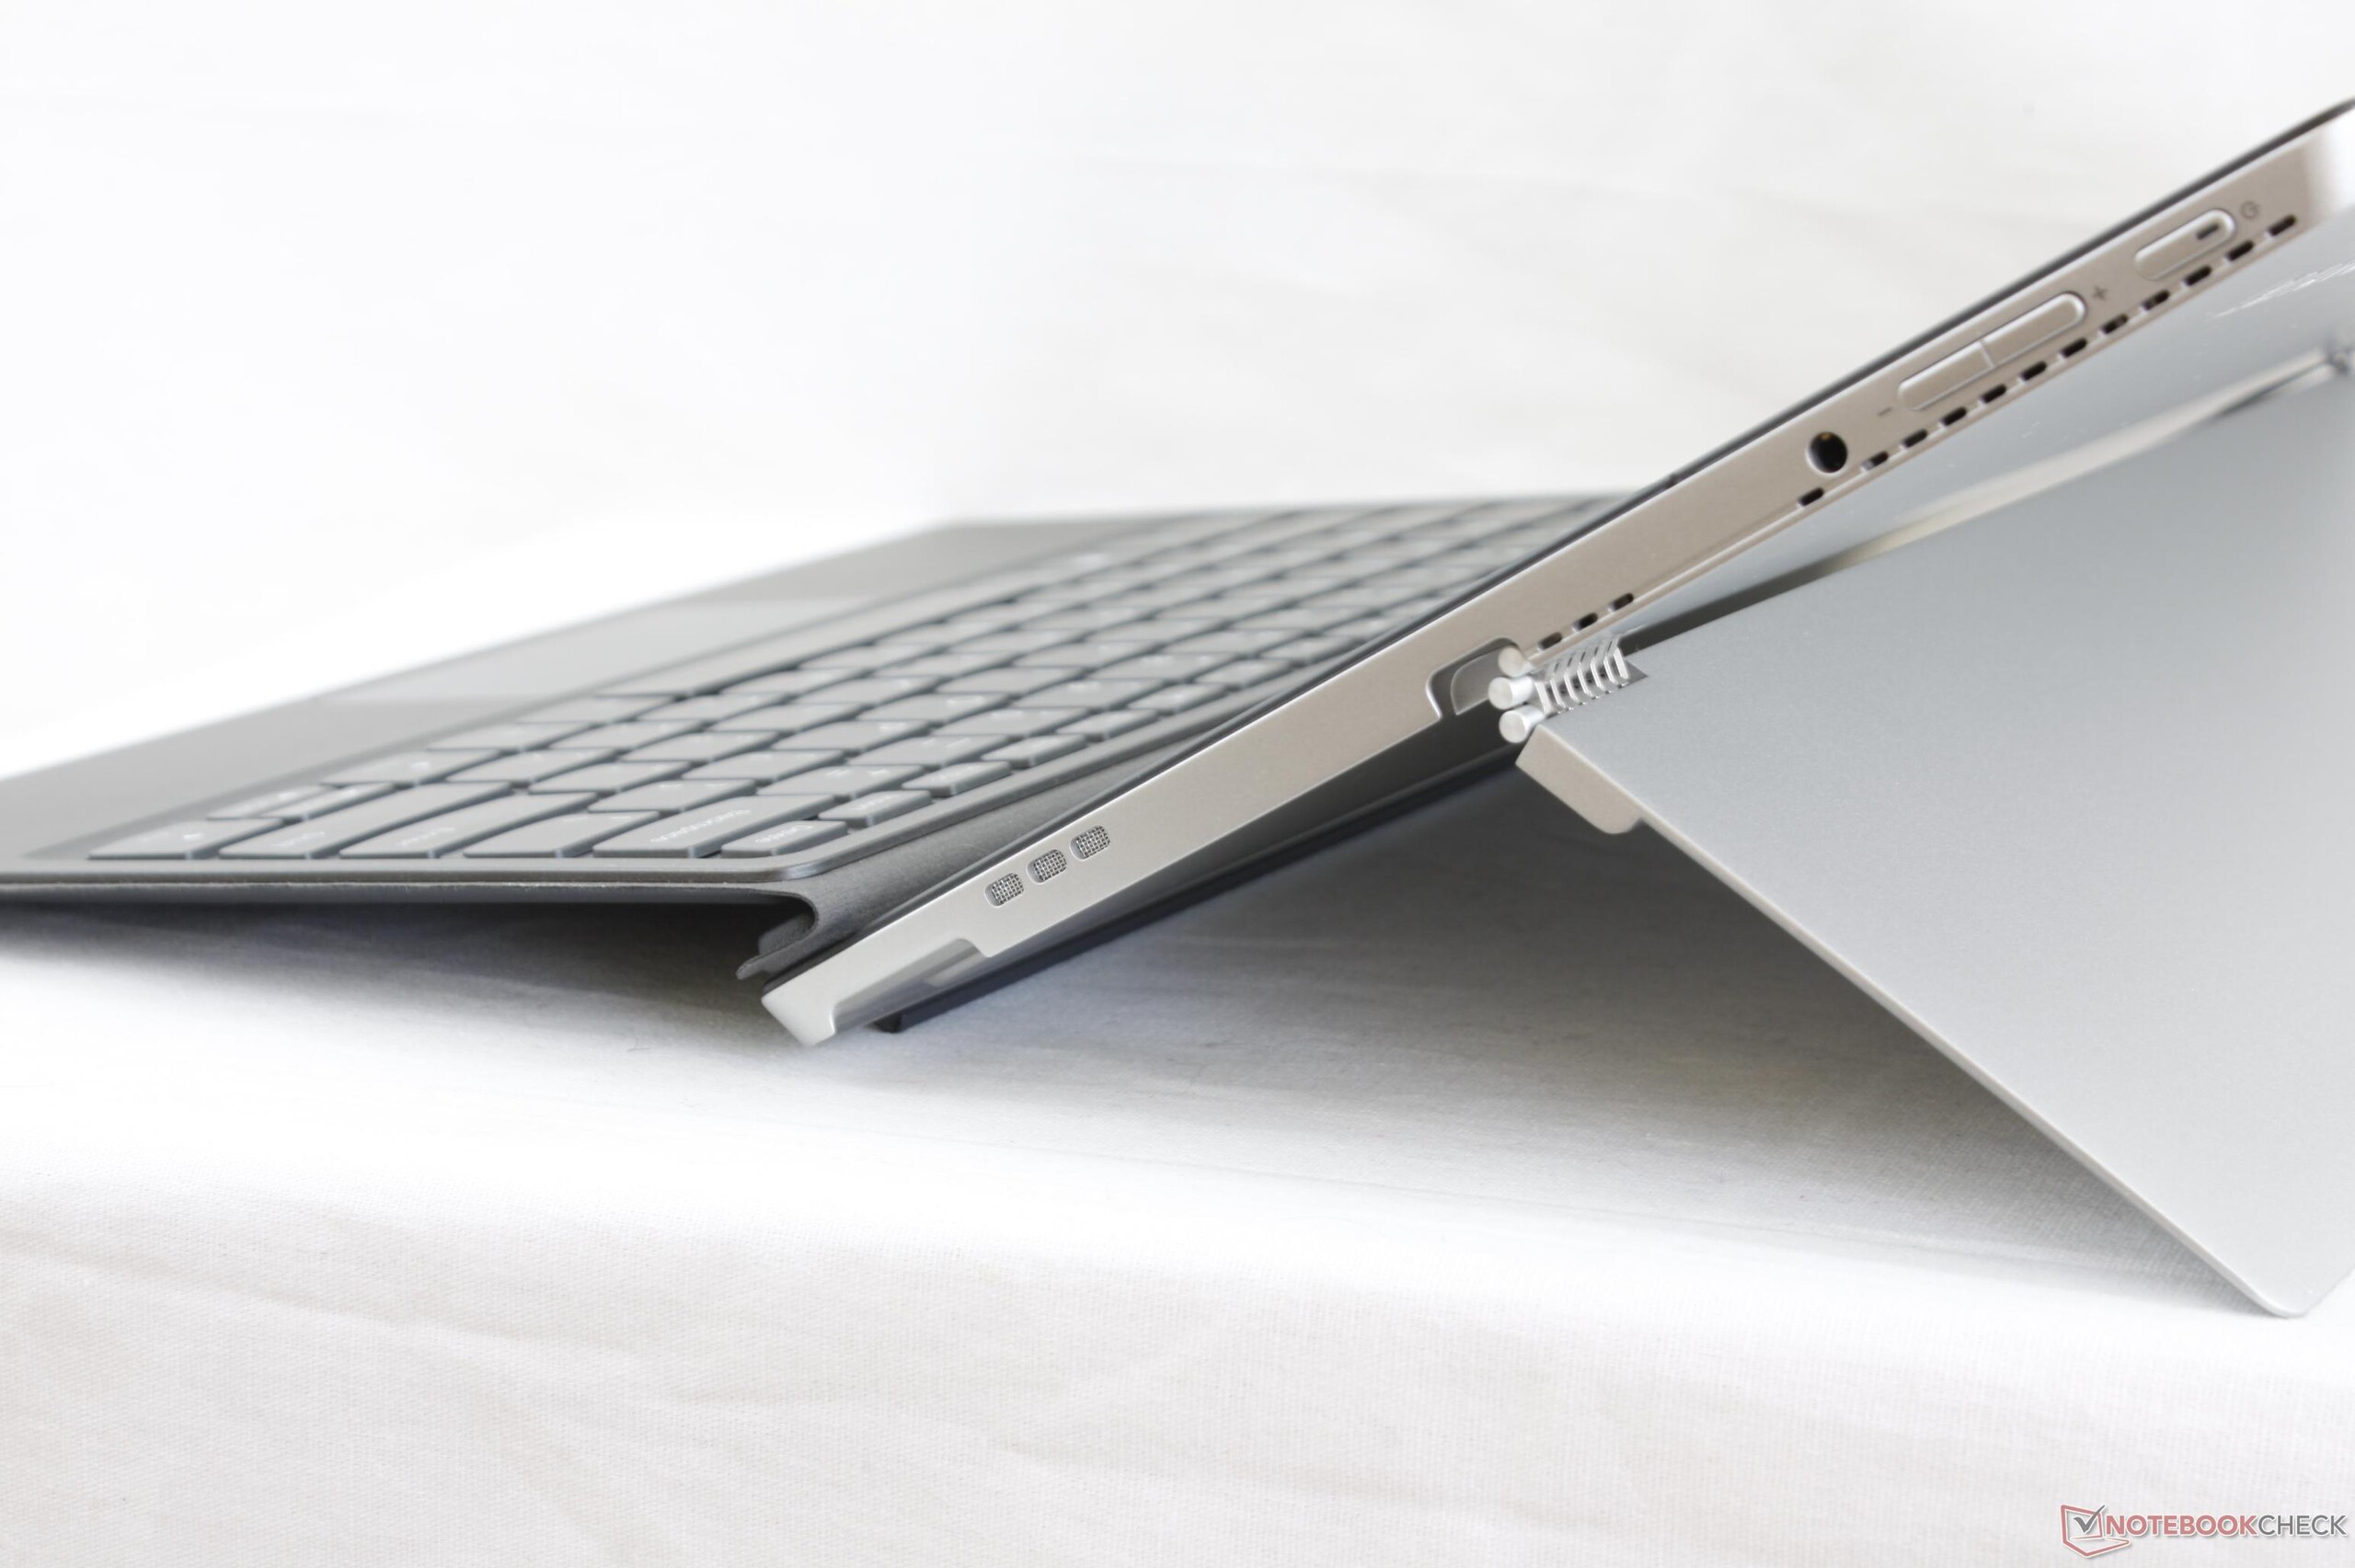
Kort testrapport Lenovo Miix 520 (i5-8250U, FHD) Convertible
| SD Card Reader | |
| average JPG Copy Test (av. of 3 runs) | |
| HP Elite x2 1012 G2-1LV76EA | |
| Lenovo Miix 520-12IKB 81CG | |
| Lenovo ThinkPad X1 Tablet Gen 2 | |
| maximum AS SSD Seq Read Test (1GB) | |
| Lenovo ThinkPad X1 Tablet Gen 2 | |
| HP Elite x2 1012 G2-1LV76EA | |
| Lenovo Miix 520-12IKB 81CG | |
| Networking | |
| iperf3 transmit AX12 | |
| Lenovo Miix 520-12IKB 81CG | |
| Lenovo Miix 510 Pro 80U10006GE (jseb) | |
| Dell XPS 13-9365 2-in-1 | |
| HP Elite x2 1012 G2-1LV76EA | |
| iperf3 receive AX12 | |
| Lenovo Miix 510 Pro 80U10006GE (jseb) | |
| HP Elite x2 1012 G2-1LV76EA | |
| Lenovo Miix 520-12IKB 81CG | |
| Dell XPS 13-9365 2-in-1 | |
| |||||||||||||||||||||||||
Helderheidsverdeling: 87 %
Helderheid in Batterij-modus: 348.8 cd/m²
Contrast: 872:1 (Zwart: 0.4 cd/m²)
ΔE ColorChecker Calman: 7 | ∀{0.5-29.43 Ø4.71}
ΔE Greyscale Calman: 10.1 | ∀{0.09-98 Ø4.96}
90.9% sRGB (Argyll 1.6.3 3D)
58.7% AdobeRGB 1998 (Argyll 1.6.3 3D)
65.4% AdobeRGB 1998 (Argyll 3D)
90.8% sRGB (Argyll 3D)
64.4% Display P3 (Argyll 3D)
Gamma: 2.22
CCT: 9065 K
| Lenovo Miix 520-12IKB 81CG Unknown, IPS, 12.2", 1920x1200 | Microsoft Surface Pro (2017) m3 LG Display LP123WQ112604, IPS, 12.3", 2736x1826 | Lenovo Miix 510 Pro 80U10006GE Unknown, IPS, 12.2", 1920x1200 | HP Elite x2 1012 G2-1LV76EA Samsung SDC4A49, IPS, 12.3", 2716x1824 | Dell XPS 13 9365-4537 2-in-1 Sharp LQ133Z1, IPS, 13.3", 3200x1800 | Lenovo ThinkPad X1 Tablet Gen 2 LSN120QL01L01, IPS, 12", 2160x1440 | |
|---|---|---|---|---|---|---|
| Display | 7% | 0% | 6% | 1% | ||
| Display P3 Coverage (%) | 64.4 | 68.5 6% | 64.5 0% | 66.7 4% | 64.4 0% | |
| sRGB Coverage (%) | 90.8 | 99.2 9% | 92 1% | 98 8% | 92.9 2% | |
| AdobeRGB 1998 Coverage (%) | 65.4 | 70.1 7% | 65.5 0% | 68.7 5% | 66.1 1% | |
| Response Times | -9% | 13% | -3% | -18% | 20% | |
| Response Time Grey 50% / Grey 80% * (ms) | 35.6 ? | 42 ? -18% | 33 ? 7% | 45.6 ? -28% | 48 ? -35% | 28.4 ? 20% |
| Response Time Black / White * (ms) | 28 ? | 28 ? -0% | 23 ? 18% | 21.6 ? 23% | 28 ? -0% | 22.8 ? 19% |
| PWM Frequency (Hz) | 198.4 ? | 125 ? | 2119 ? | 221.2 ? | ||
| Screen | 35% | 3% | 31% | 33% | 14% | |
| Brightness middle (cd/m²) | 348.8 | 461 32% | 327 -6% | 443 27% | 348 0% | 388.1 11% |
| Brightness (cd/m²) | 339 | 444 31% | 324 -4% | 446 32% | 306 -10% | 344 1% |
| Brightness Distribution (%) | 87 | 93 7% | 88 1% | 88 1% | 78 -10% | 78 -10% |
| Black Level * (cd/m²) | 0.4 | 0.34 15% | 0.35 13% | 0.41 -2% | 0.2 50% | 0.39 2% |
| Contrast (:1) | 872 | 1356 56% | 934 7% | 1080 24% | 1740 100% | 995 14% |
| Colorchecker dE 2000 * | 7 | 3.43 51% | 6.54 7% | 2.6 63% | 2.79 60% | 4.6 34% |
| Colorchecker dE 2000 max. * | 16.2 | 5.55 66% | 15.59 4% | 4 75% | 5.53 66% | 9.1 44% |
| Greyscale dE 2000 * | 10.1 | 3.08 70% | 9.52 6% | 3 70% | 3.47 66% | 6.1 40% |
| Gamma | 2.22 99% | 3.03 73% | 2.35 94% | 2.38 92% | 2.54 87% | 2.07 106% |
| CCT | 9065 72% | 7014 93% | 8802 74% | 6780 96% | 6564 99% | 7104 91% |
| Color Space (Percent of AdobeRGB 1998) (%) | 58.7 | 64 9% | 59 1% | 62.6 7% | 60 2% | 59 1% |
| Color Space (Percent of sRGB) (%) | 90.9 | 99 9% | 92 1% | 98 8% | 93 2% | 91 0% |
| Totaal Gemiddelde (Programma / Instellingen) | 11% /
23% | 5% /
4% | 11% /
21% | 5% /
20% | 17% /
15% |
* ... kleiner is beter
Responstijd Scherm
| ↔ Responstijd Zwart naar Wit | ||
|---|---|---|
| 28 ms ... stijging ↗ en daling ↘ gecombineerd | ↗ 14.8 ms stijging | 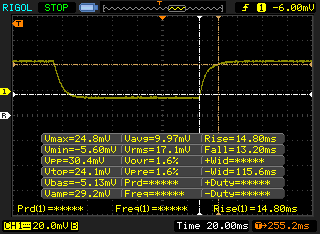 |
| ↘ 13.2 ms daling | ||
| Het scherm vertoonde relatief trage responstijden in onze tests en is misschien te traag voor games. Ter vergelijking: alle testtoestellen variëren van 0.1 (minimum) tot 240 (maximum) ms. » 71 % van alle toestellen zijn beter. Dit betekent dat de gemeten responstijd slechter is dan het gemiddelde (19.8 ms) van alle geteste toestellen. | ||
| ↔ Responstijd 50% Grijs naar 80% Grijs | ||
| 35.6 ms ... stijging ↗ en daling ↘ gecombineerd | ↗ 17.2 ms stijging | 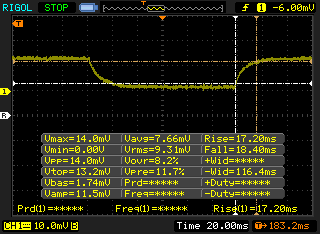 |
| ↘ 18.4 ms daling | ||
| Het scherm vertoonde trage responstijden in onze tests en is misschien te traag voor games. Ter vergelijking: alle testtoestellen variëren van 0.165 (minimum) tot 636 (maximum) ms. » 50 % van alle toestellen zijn beter. Dit betekent dat de gemeten responstijd slechter is dan het gemiddelde (31 ms) van alle geteste toestellen. | ||
Screen Flickering / PWM (Pulse-Width Modulation)
| Screen flickering / PWM waargenomen | 198.4 Hz | ≤ 99 % helderheid instelling | 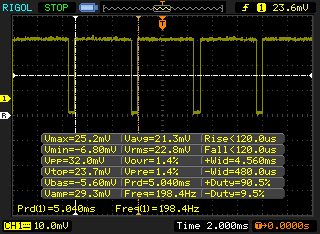 |
De achtergrondverlichting van het scherm flikkert op 198.4 Hz (in het slechtste geval, bijvoorbeeld bij gebruik van PWM) aan een helderheid van 99 % en lager. Boven deze helderheid zou er geen flickering / PWM mogen optreden. De frequentie van 198.4 Hz is redelijk laag en de meeste mensen die gevoelig zijn aan flickering kunnen dit dus waarnemen of geïrriteerde ogen krijgen (gebruikmakend van de vermelde helderheid en lager). Ter vergelijking: 52 % van alle geteste toestellen maakten geen gebruik van PWM om de schermhelderheid te verlagen. Als het wel werd gebruikt, werd een gemiddelde van 7754 (minimum: 5 - maximum: 343500) Hz waargenomen. | |||

| wPrime 2.10 - 1024m | |
| Microsoft Surface Pro (2017) i7 | |
| HP Spectre x360 15t-bl100 | |
| Dell Inspiron 15 7000 7577 | |
| Lenovo Miix 520-12IKB 81CG | |
| HP Envy x360 15m-bq121dx | |
| MSI GF62VR 7RF-877 | |
* ... kleiner is beter
| PCMark 8 | |
| Home Score Accelerated v2 | |
| Lenovo Miix 520-12IKB 81CG | |
| HP Elite x2 1012 G2-1LV76EA | |
| Lenovo Miix 510 Pro 80U10006GE | |
| Microsoft Surface Pro (2017) m3 | |
| Work Score Accelerated v2 | |
| Lenovo Miix 510 Pro 80U10006GE | |
| HP Elite x2 1012 G2-1LV76EA | |
| Microsoft Surface Pro (2017) m3 | |
| Lenovo Miix 520-12IKB 81CG | |
| Creative Score Accelerated v2 | |
| Lenovo Miix 520-12IKB 81CG | |
| HP Elite x2 1012 G2-1LV76EA | |
| Microsoft Surface Pro (2017) m3 | |
| PCMark 10 - Score | |
| Lenovo Miix 520-12IKB 81CG | |
| HP Elite x2 1012 G2-1LV76EA | |
| Microsoft Surface Pro (2017) m3 | |
| PCMark 8 Home Score Accelerated v2 | 3733 punten | |
| PCMark 8 Creative Score Accelerated v2 | 4869 punten | |
| PCMark 8 Work Score Accelerated v2 | 2699 punten | |
| PCMark 10 Score | 3295 punten | |
Help | ||
| Lenovo Miix 520-12IKB 81CG Samsung PM961 MZVLW256HEHP | Microsoft Surface Pro (2017) m3 Samsung PM971 KUS020203M | Lenovo Miix 510 Pro 80U10006GE Samsung PM951 NVMe MZVLV256 | HP Elite x2 1012 G2-1LV76EA Samsung PM961 MZVLW256HEHP | Dell XPS 13 9365-4537 2-in-1 Toshiba NVMe THNSN5256GPUK | |
|---|---|---|---|---|---|
| AS SSD | -22% | -146% | 48% | -11% | |
| Copy Game MB/s (MB/s) | 410.8 | 140.7 -66% | 379.9 -8% | 457.8 11% | |
| Copy Program MB/s (MB/s) | 310.4 | 83.8 -73% | 198.2 -36% | 264.7 -15% | |
| Copy ISO MB/s (MB/s) | 659 | 173.2 -74% | 791 20% | 714 8% | |
| Score Total (Points) | 2378 | 1847 -22% | 1190 -50% | 4653 96% | 1388 -42% |
| Score Write (Points) | 572 | 284 -50% | 60 -90% | 879 54% | 389 -32% |
| Score Read (Points) | 1200 | 1053 -12% | 777 -35% | 2545 112% | 681 -43% |
| Access Time Write * (ms) | 0.33 | 0.04 88% | 4.206 -1175% | 0.027 92% | 0.041 88% |
| Access Time Read * (ms) | 0.49 | 0.074 85% | 0.053 89% | 0.041 92% | 0.169 66% |
| 4K-64 Write (MB/s) | 345.5 | 144.3 -58% | 43.14 -88% | 657 90% | 249.4 -28% |
| 4K-64 Read (MB/s) | 999 | 891 -11% | 611 -39% | 2280 128% | 512 -49% |
| 4K Write (MB/s) | 107.9 | 88.6 -18% | 0.96 -99% | 132.2 23% | 85.8 -20% |
| 4K Read (MB/s) | 48.69 | 38.82 -20% | 39.6 -19% | 45.24 -7% | 34.77 -29% |
| Seq Write (MB/s) | 1182 | 514 -57% | 158.3 -87% | 897 -24% | 543 -54% |
| Seq Read (MB/s) | 1523 | 1226 -20% | 1260 -17% | 2197 44% | 1342 -12% |
* ... kleiner is beter

| 3DMark 11 | |
| 1280x720 Performance GPU | |
| Intel Skull Canyon NUC6i7KYK | |
| Lenovo IdeaPad 320S-13IKB | |
| Microsoft Surface Laptop i7 | |
| Microsoft Surface Laptop i7 | |
| Razer Blade Stealth QHD i7-8550U | |
| Dell XPS 13 i5-8250U | |
| Toshiba Tecra X40-D | |
| Lenovo Miix 520-12IKB 81CG | |
| Acer TravelMate P249-M-5452 | |
| Lenovo Miix 510 Pro 80U10006GE | |
| 1280x720 Performance Combined | |
| Lenovo IdeaPad 320S-13IKB | |
| Intel Skull Canyon NUC6i7KYK | |
| Microsoft Surface Laptop i7 | |
| Microsoft Surface Laptop i7 | |
| Razer Blade Stealth QHD i7-8550U | |
| Dell XPS 13 i5-8250U | |
| Toshiba Tecra X40-D | |
| Lenovo Miix 520-12IKB 81CG | |
| Acer TravelMate P249-M-5452 | |
| Lenovo Miix 510 Pro 80U10006GE | |
| 3DMark | |
| 1280x720 Cloud Gate Standard Graphics | |
| Lenovo IdeaPad 320S-13IKB | |
| Intel Skull Canyon NUC6i7KYK | |
| Microsoft Surface Laptop i7 | |
| Razer Blade Stealth QHD i7-8550U | |
| Dell XPS 13 i5-8250U | |
| Toshiba Tecra X40-D | |
| Lenovo Miix 520-12IKB 81CG | |
| Acer TravelMate P249-M-5452 | |
| Lenovo Miix 510 Pro 80U10006GE | |
| 1920x1080 Fire Strike Graphics | |
| Lenovo IdeaPad 320S-13IKB | |
| Intel Skull Canyon NUC6i7KYK | |
| Microsoft Surface Laptop i7 | |
| Toshiba Tecra X40-D | |
| Lenovo Miix 520-12IKB 81CG | |
| Acer TravelMate P249-M-5452 | |
| 1920x1080 Ice Storm Extreme Graphics | |
| Intel Skull Canyon NUC6i7KYK | |
| Lenovo Miix 520-12IKB 81CG | |
| Acer TravelMate P249-M-5452 | |
| 3DMark 11 Performance | 1800 punten | |
| 3DMark Ice Storm Standard Score | 65197 punten | |
| 3DMark Cloud Gate Standard Score | 7775 punten | |
| 3DMark Fire Strike Score | 952 punten | |
| 3DMark Fire Strike Extreme Score | 437 punten | |
Help | ||
| lage | gem. | hoge | ultra | |
|---|---|---|---|---|
| BioShock Infinite (2013) | 54.3 | 29.3 | 24.1 | 7.4 |
| Rise of the Tomb Raider (2016) | 21.3 | 11 |
Geluidsniveau
| Onbelast |
| 28.2 / 28.2 / 29.6 dB (A) |
| Belasting |
| 34 / 36 dB (A) |
 | ||
30 dB stil 40 dB(A) hoorbaar 50 dB(A) luid |
||
min: | ||
| Lenovo Miix 520-12IKB 81CG UHD Graphics 620, i5-8250U, Samsung PM961 MZVLW256HEHP | Microsoft Surface Pro (2017) i7 Iris Plus Graphics 640, i7-7660U, Samsung PM971 KUS040202M | Lenovo Miix 510 Pro 80U10006GE HD Graphics 520, 6200U, Samsung PM951 NVMe MZVLV256 | HP Elite x2 1012 G2-1LV76EA HD Graphics 620, i5-7200U, Samsung PM961 MZVLW256HEHP | Dell XPS 13 9365-4537 2-in-1 HD Graphics 615, i5-7Y54, Toshiba NVMe THNSN5256GPUK | Lenovo ThinkPad X1 Tablet Gen 2 HD Graphics 615, i5-7Y54, Samsung PM961 MZVLW256HEHP | |
|---|---|---|---|---|---|---|
| Noise | -1% | -5% | 1% | |||
| uit / omgeving * (dB) | 28.2 | 29.6 -5% | 30.15 -7% | 29.5 -5% | ||
| Idle Minimum * (dB) | 28.2 | 29.6 -5% | 30.15 -7% | 29.5 -5% | ||
| Idle Average * (dB) | 28.2 | 29.6 -5% | 30.8 -9% | 29.5 -5% | ||
| Idle Maximum * (dB) | 29.6 | 29.6 -0% | 31 -5% | 29.5 -0% | ||
| Load Average * (dB) | 34 | 33.4 2% | 36.8 -8% | 30.6 10% | ||
| Load Maximum * (dB) | 36 | 34.1 5% | 33.8 6% | 32.5 10% | ||
| Witcher 3 ultra * (dB) | 33.4 |
* ... kleiner is beter
(±) De maximumtemperatuur aan de bovenzijde bedraagt 44.8 °C / 113 F, vergeleken met het gemiddelde van 35.4 °C / 96 F, variërend van 19.6 tot 60 °C voor de klasse Convertible.
(±) De bodem warmt op tot een maximum van 44.2 °C / 112 F, vergeleken met een gemiddelde van 36.9 °C / 98 F
(+) Bij onbelast gebruik bedraagt de gemiddelde temperatuur voor de bovenzijde 28 °C / 82 F, vergeleken met het apparaatgemiddelde van 30.3 °C / 87 F.
(+) De handpalmsteunen en het touchpad bereiken maximaal de huidtemperatuur (35 °C / 95 F) en zijn dus niet heet.
(-) De gemiddelde temperatuur van de handpalmsteun van soortgelijke toestellen bedroeg 28 °C / 82.4 F (-7 °C / -12.6 F).
Lenovo Miix 520-12IKB 81CG audioanalyse
(-) | niet erg luide luidsprekers (61.3 dB)
Bas 100 - 315 Hz
(-) | bijna geen lage tonen - gemiddeld 18.1% lager dan de mediaan
(±) | lineariteit van de lage tonen is gemiddeld (12.5% delta ten opzichte van de vorige frequentie)
Midden 400 - 2000 Hz
(+) | evenwichtige middens - slechts 4% verwijderd van de mediaan
(±) | lineariteit van de middentonen is gemiddeld (9.9% delta ten opzichte van de vorige frequentie)
Hoog 2 - 16 kHz
(±) | higher highs - on average 5.1% higher than median
(±) | lineariteit van de hoogtepunten is gemiddeld (10.9% delta ten opzichte van de vorige frequentie)
Algemeen 100 - 16.000 Hz
(-) | het totale geluid is niet lineair (31% verschil met de mediaan)
Vergeleken met dezelfde klasse
» 90% van alle geteste apparaten in deze klasse waren beter, 2% vergelijkbaar, 8% slechter
» De beste had een delta van 6%, het gemiddelde was 20%, de slechtste was 57%
Vergeleken met alle geteste toestellen
» 90% van alle geteste apparaten waren beter, 2% gelijk, 8% slechter
» De beste had een delta van 4%, het gemiddelde was 23%, de slechtste was 134%
Apple MacBook 12 (Early 2016) 1.1 GHz audioanalyse
(+) | luidsprekers kunnen relatief luid spelen (83.6 dB)
Bas 100 - 315 Hz
(±) | verminderde zeebaars - gemiddeld 11.3% lager dan de mediaan
(±) | lineariteit van de lage tonen is gemiddeld (14.2% delta ten opzichte van de vorige frequentie)
Midden 400 - 2000 Hz
(+) | evenwichtige middens - slechts 2.4% verwijderd van de mediaan
(+) | de middentonen zijn lineair (5.5% delta ten opzichte van de vorige frequentie)
Hoog 2 - 16 kHz
(+) | evenwichtige hoogtepunten - slechts 2% verwijderd van de mediaan
(+) | de hoge tonen zijn lineair (4.5% delta naar de vorige frequentie)
Algemeen 100 - 16.000 Hz
(+) | het totale geluid is lineair (10.2% verschil met de mediaan)
Vergeleken met dezelfde klasse
» 7% van alle geteste apparaten in deze klasse waren beter, 2% vergelijkbaar, 90% slechter
» De beste had een delta van 5%, het gemiddelde was 18%, de slechtste was 53%
Vergeleken met alle geteste toestellen
» 5% van alle geteste apparaten waren beter, 1% gelijk, 94% slechter
» De beste had een delta van 4%, het gemiddelde was 23%, de slechtste was 134%
| Uit / Standby | |
| Inactief | |
| Belasting |
|
Key:
min: | |
| Lenovo Miix 520-12IKB 81CG i5-8250U, UHD Graphics 620, Samsung PM961 MZVLW256HEHP, IPS, 1920x1200, 12.2" | Microsoft Surface Pro (2017) i7 i7-7660U, Iris Plus Graphics 640, Samsung PM971 KUS040202M, IPS, 2736x1824, 12.3" | Microsoft Surface Pro (2017) i5 i5-7300U, HD Graphics 620, Samsung PM971 KUS030202M, IPS, 2736x1824, 12.3" | Lenovo Miix 510 Pro 80U10006GE 6200U, HD Graphics 520, Samsung PM951 NVMe MZVLV256, IPS, 1920x1200, 12.2" | HP Elite x2 1012 G2-1LV76EA i5-7200U, HD Graphics 620, Samsung PM961 MZVLW256HEHP, IPS, 2716x1824, 12.3" | Dell XPS 13 9365-4537 2-in-1 i5-7Y54, HD Graphics 615, Toshiba NVMe THNSN5256GPUK, IPS, 3200x1800, 13.3" | |
|---|---|---|---|---|---|---|
| Power Consumption | -2% | 26% | 6% | -0% | -3% | |
| Idle Minimum * (Watt) | 5.5 | 4.2 24% | 3.6 35% | 4.2 24% | 4.1 25% | 8.2 -49% |
| Idle Average * (Watt) | 8.3 | 10.1 -22% | 8.1 2% | 11.5 -39% | 9.2 -11% | 10.8 -30% |
| Idle Maximum * (Watt) | 11.5 | 14 -22% | 8.7 24% | 11.7 -2% | 11.1 3% | 12.7 -10% |
| Load Average * (Watt) | 38.3 | 37.4 2% | 25.5 33% | 31 19% | 33.8 12% | 22.6 41% |
| Load Maximum * (Watt) | 37.7 | 34 10% | 23.5 38% | 27.4 27% | 49.2 -31% | 24.6 35% |
| Witcher 3 ultra * (Watt) | 38.1 |
* ... kleiner is beter
| Lenovo Miix 520-12IKB 81CG i5-8250U, UHD Graphics 620, 38 Wh | Microsoft Surface Pro (2017) i5 i5-7300U, HD Graphics 620, 45 Wh | Lenovo Miix 510 Pro 80U10006GE 6200U, HD Graphics 520, 50 Wh | HP Elite x2 1012 G2-1LV76EA i5-7200U, HD Graphics 620, 47 Wh | Dell XPS 13 9365-4537 2-in-1 i5-7Y54, HD Graphics 615, 46 Wh | Lenovo ThinkPad X1 Tablet Gen 2 i5-7Y54, HD Graphics 615, 37 Wh | |
|---|---|---|---|---|---|---|
| Batterijduur | 106% | 21% | 45% | 21% | 40% | |
| Reader / Idle (h) | 12.3 | 17.6 43% | 11.6 -6% | 13.9 13% | 11 -11% | |
| WiFi v1.3 (h) | 5.6 | 12.4 121% | 5.4 -4% | 6.3 13% | 6.8 21% | 7.4 32% |
| Load (h) | 1.1 | 2.8 155% | 1.9 73% | 2.3 109% | 2.2 100% |
Pro
Contra
Dit is de verkorte versie van het originele artikel. Het volledige, Engelse testrapport vind je hier.
De beste eigenschappen van de Miix 520 zijn de processor prestaties, SSD prestaties, veelzijdigheid van poorten en de prijs. De prestaties-per-euro zijn een van de beste op de markt op dit moment, doordat de meeste andere Windows tablets nog een processor uit de Core Y-serie of Core i van de 7e generatie gebruiken. Gebruikers die deze extra rekenkracht kunnen gebruiken zullen de Miix 520 dan ook een bijna-Ultrabook niveau reisgezel vinden.
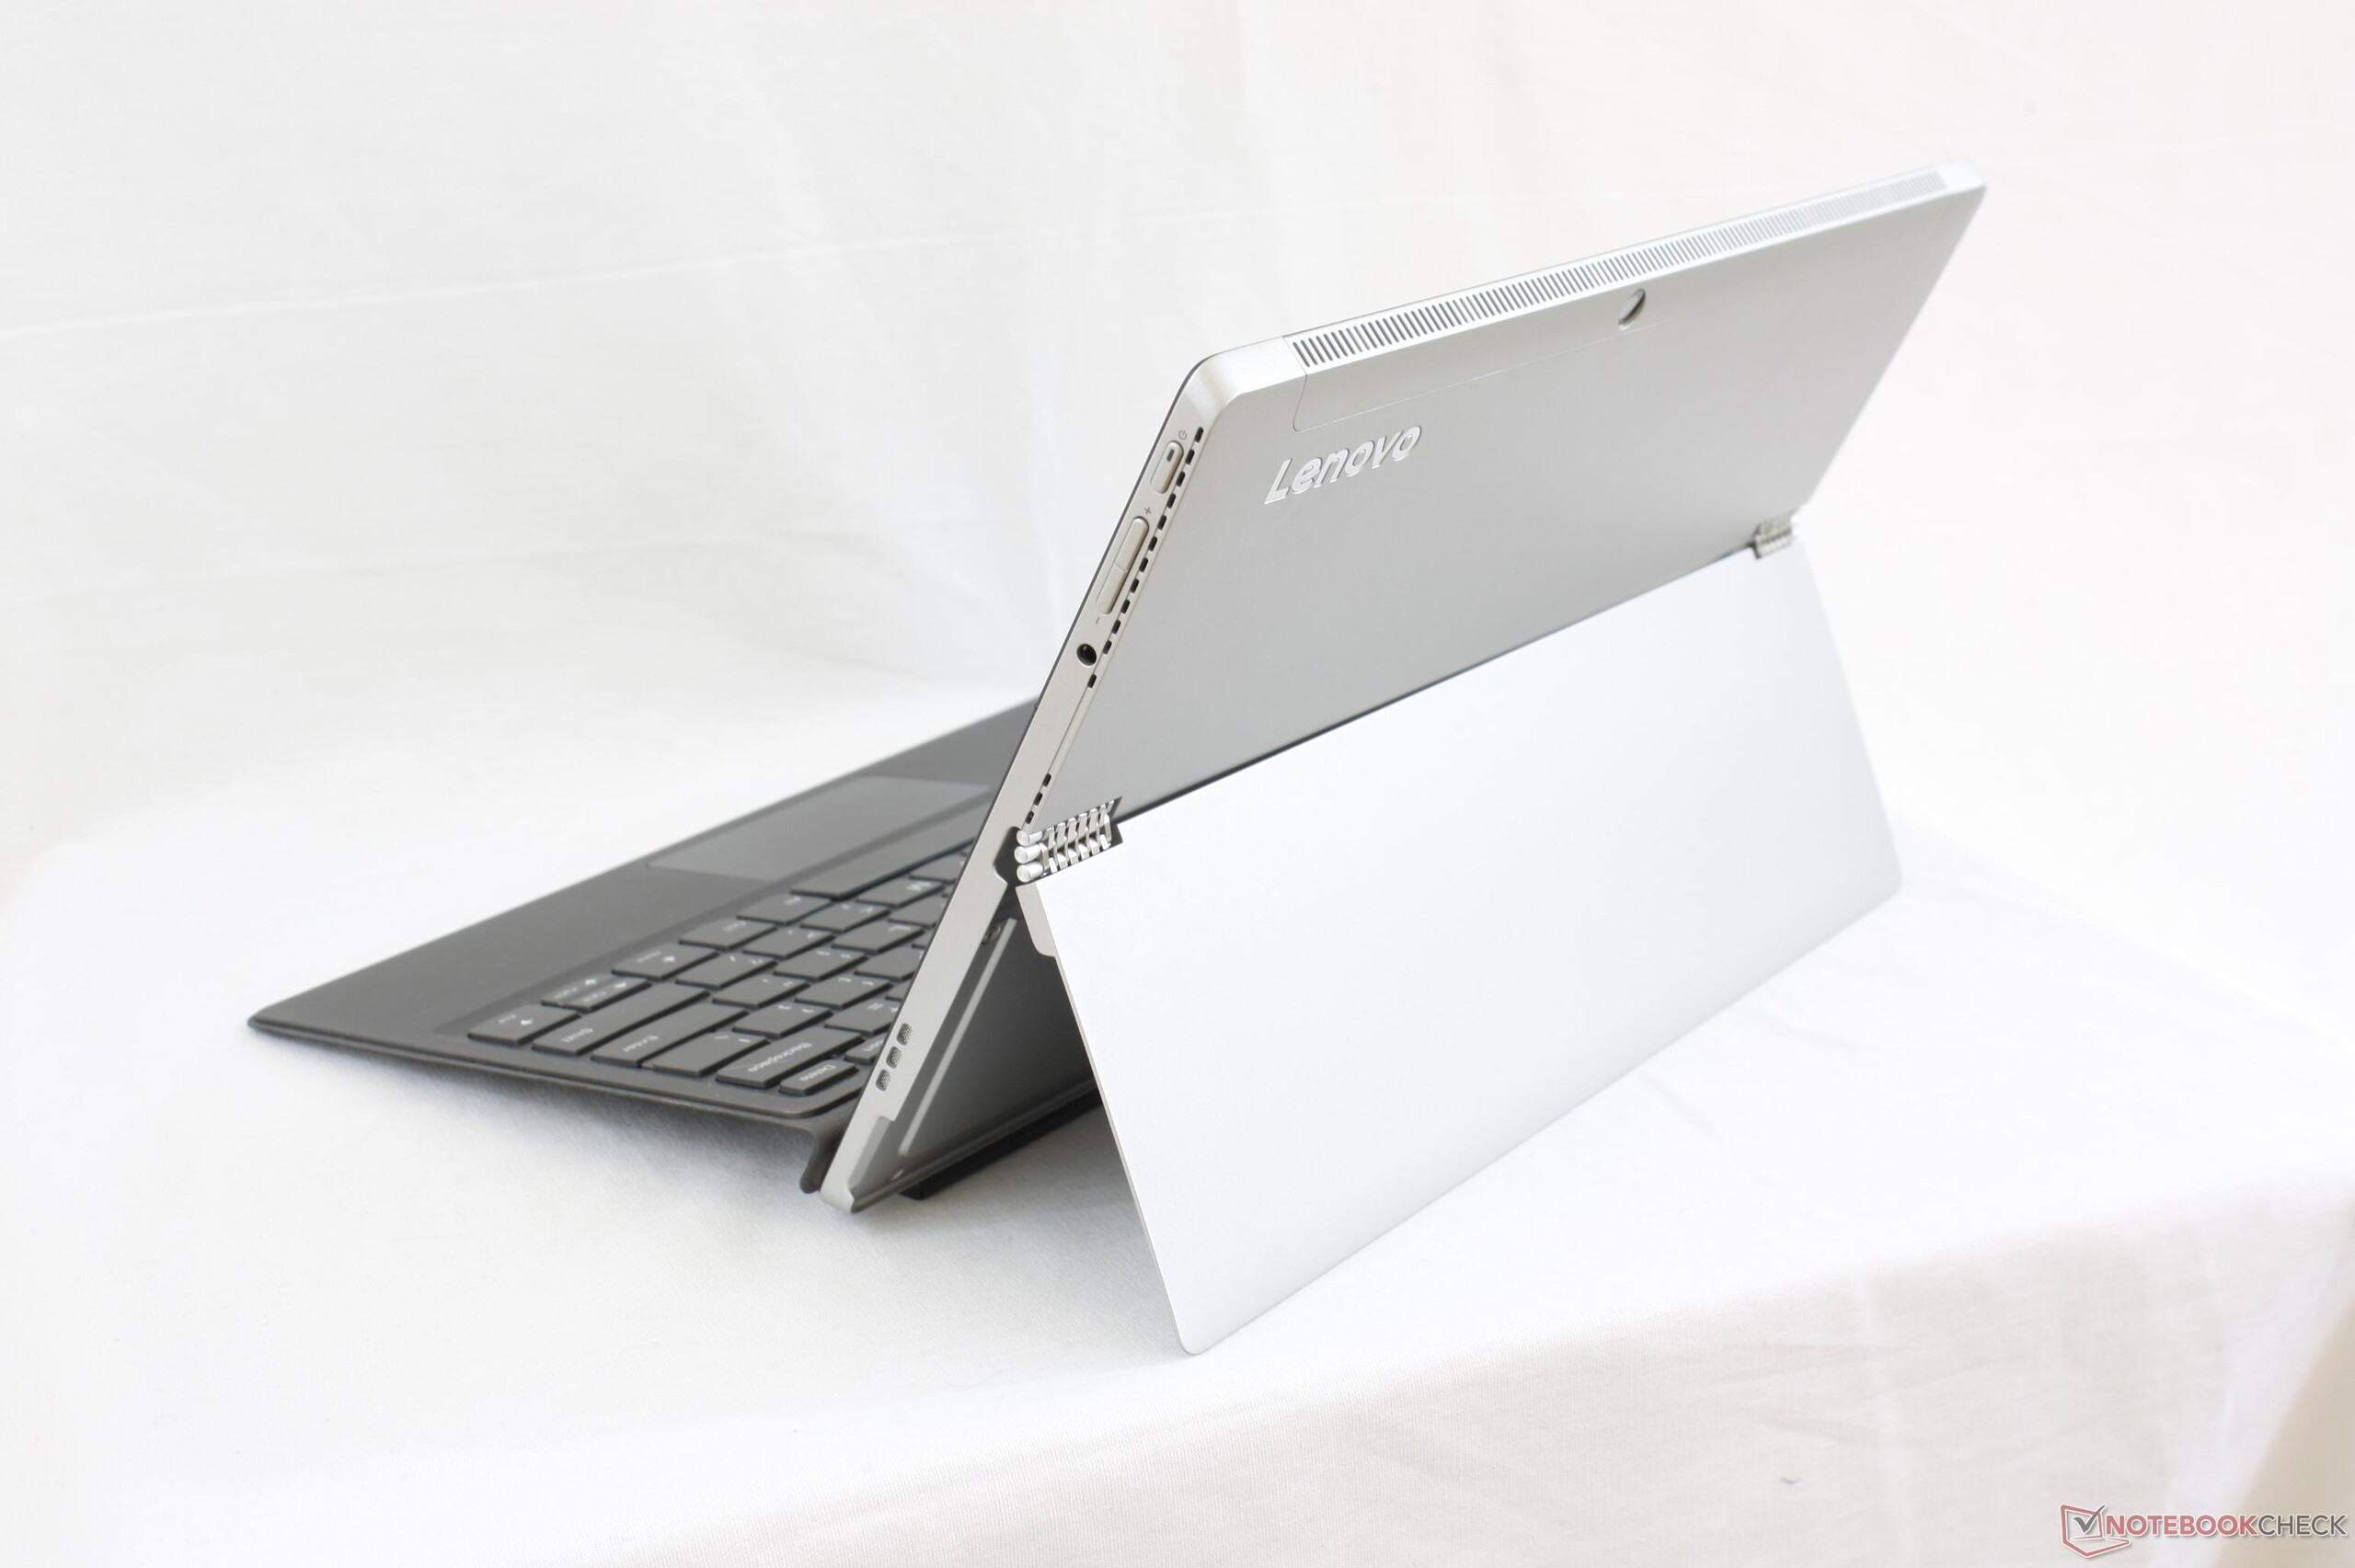
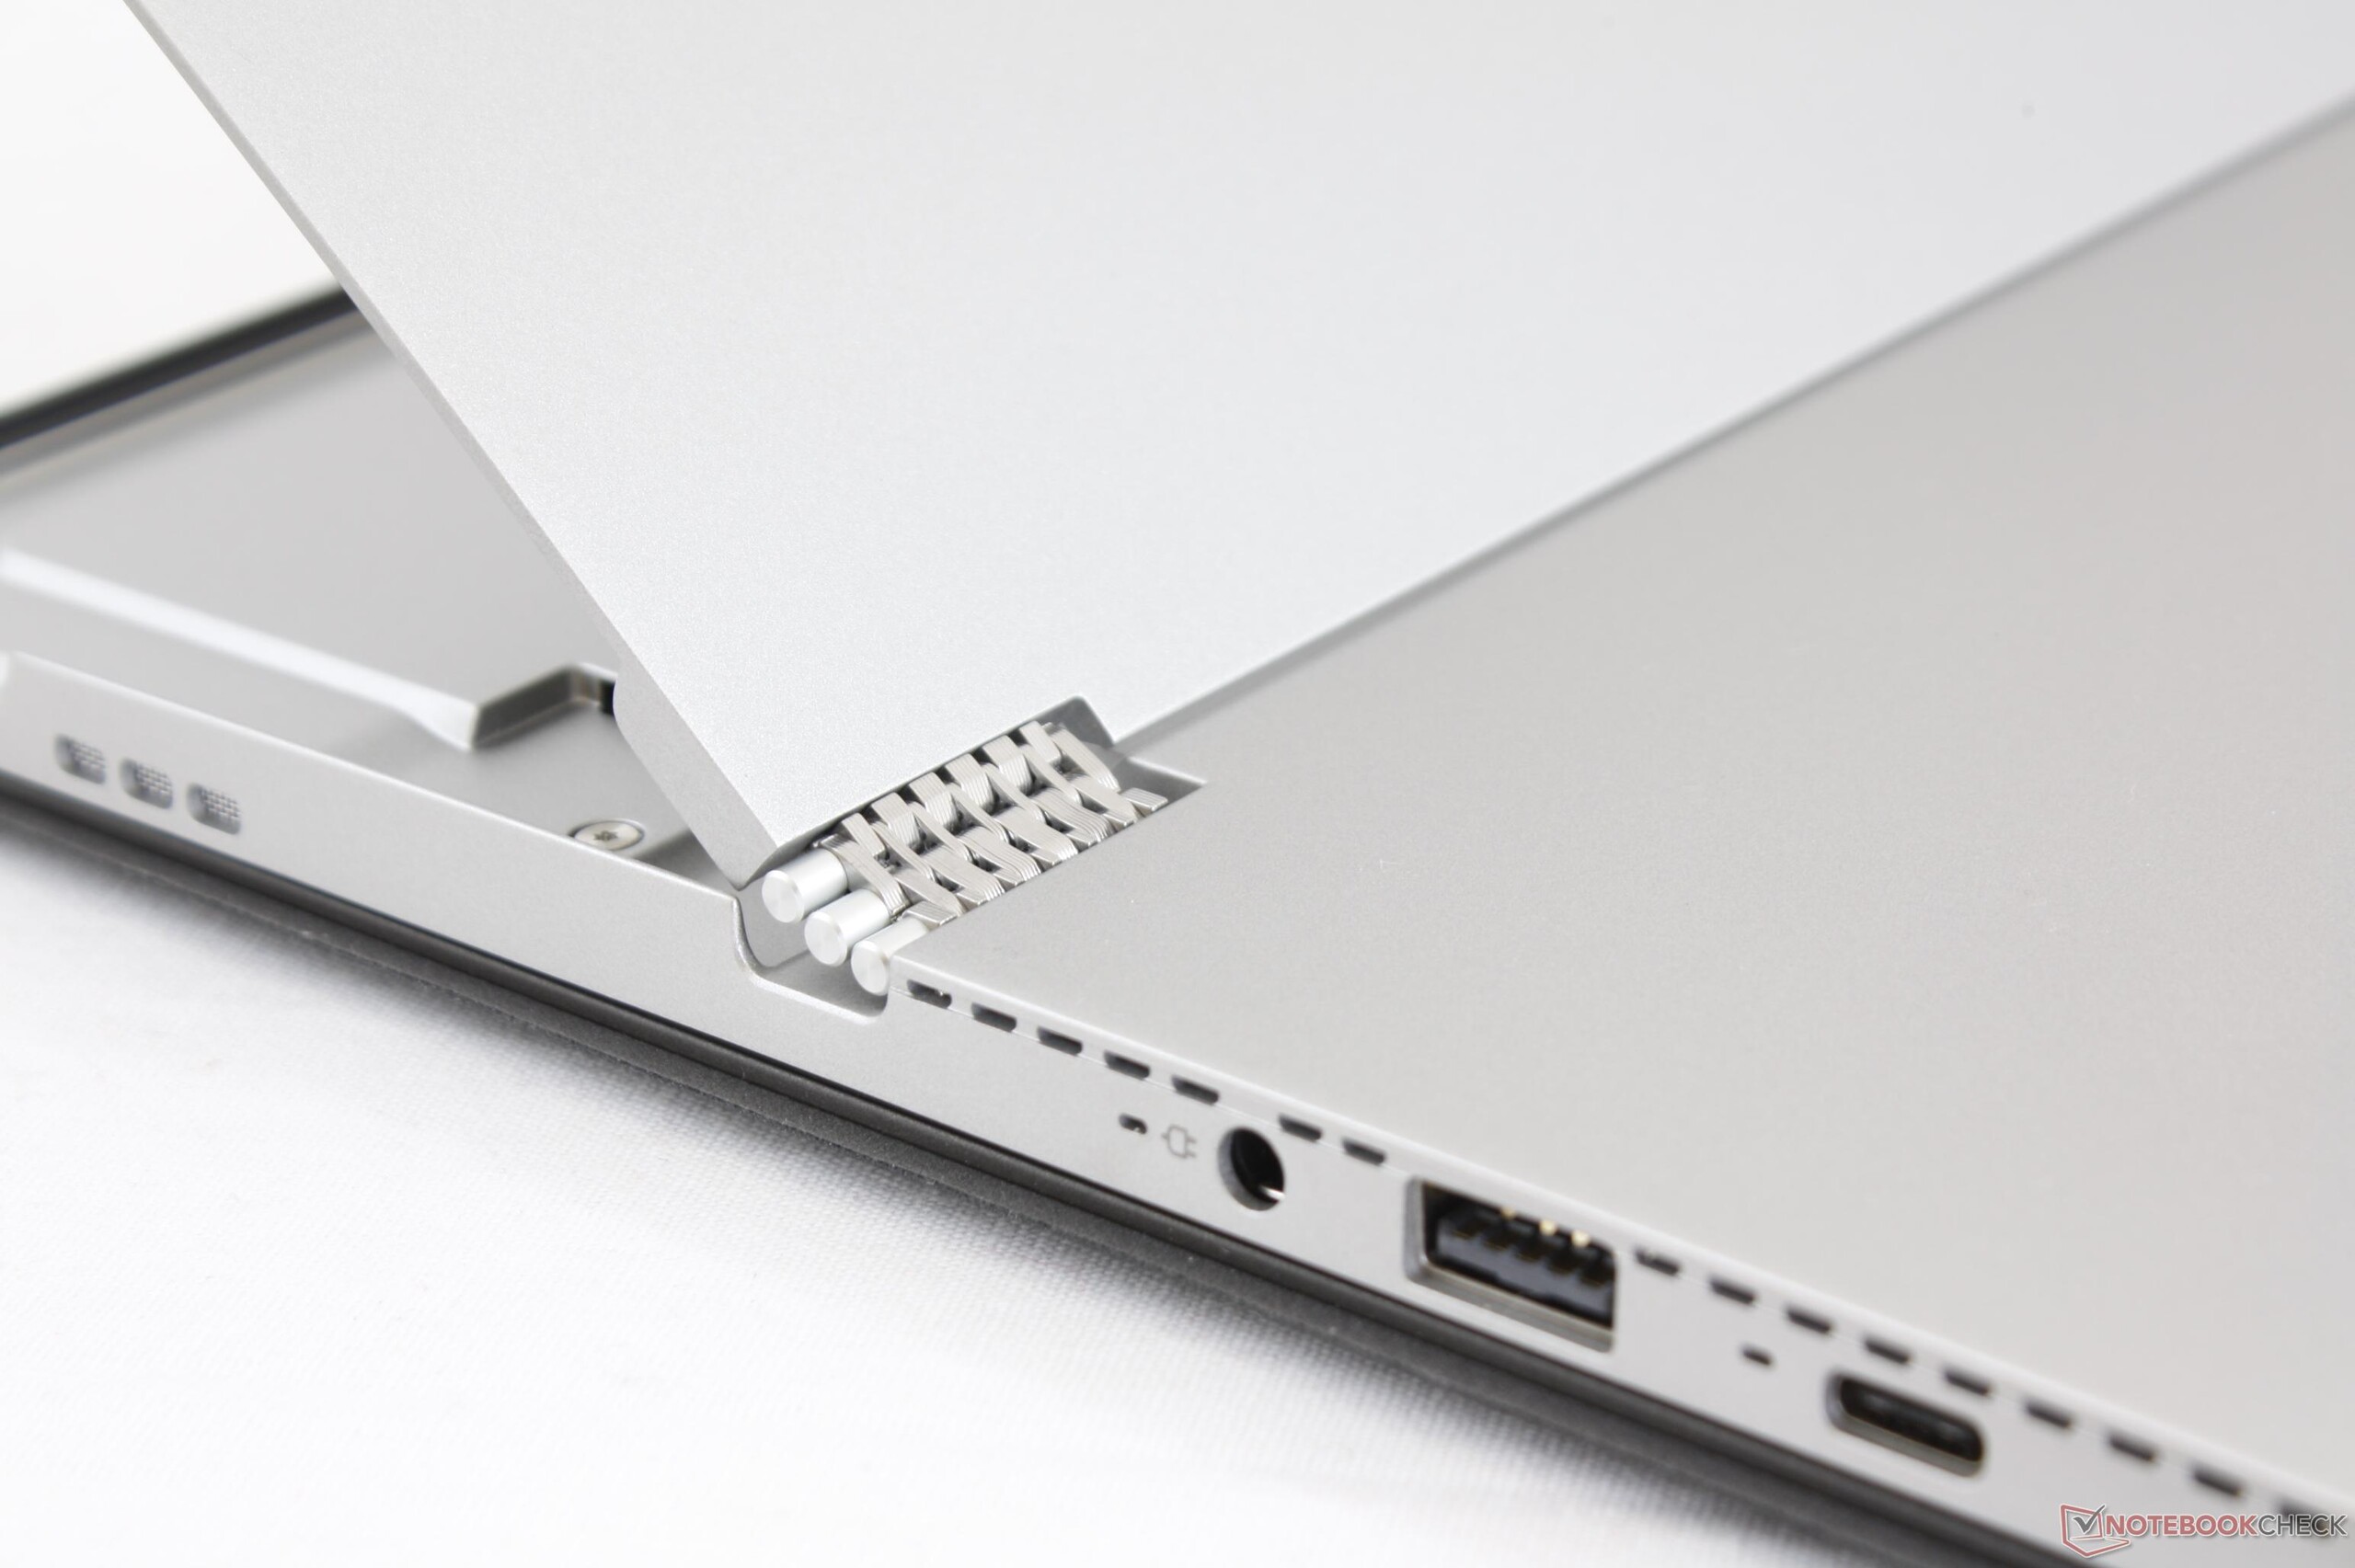
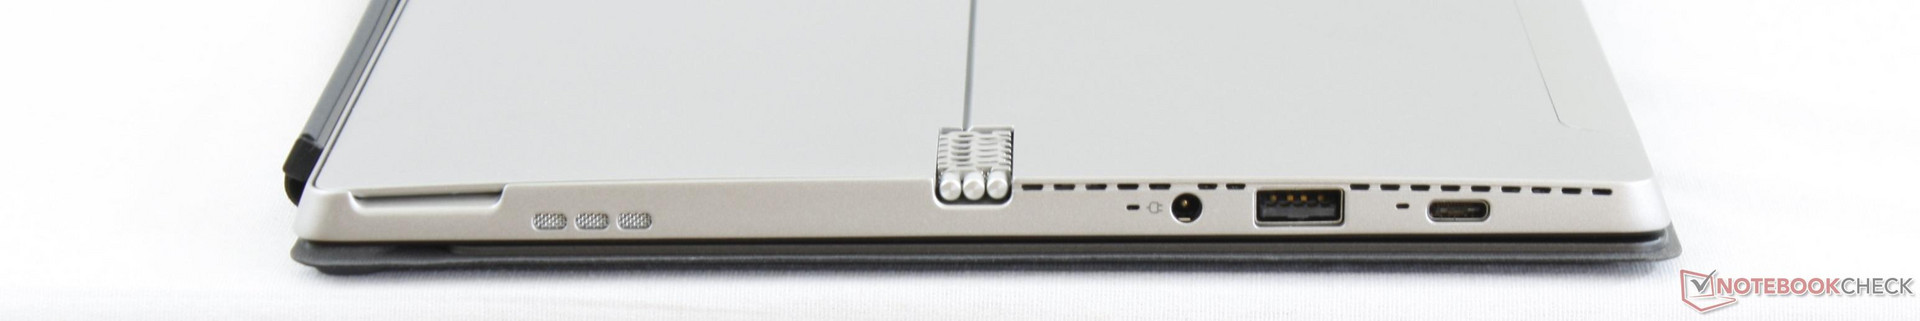
Al het andere aan de Lenovo convertible is niet noodzakelijk slecht of matig, maar er is zeker ruimte voor verbetering in vergelijking met enkele alternatieven. De Surface Pro en Elite x2 hebben een robuuster ontwerp, een helderder en hogere resolutie beeldscherm, nauwkeuriger kleuren en langere batterijlevensduur. Met name het HP tablet, die ook over Thunderbolt 3 beschikt om een nog bredere selectie van aansluitingen te bieden. Een steviger toetsenbord zou de Lenovo ook helpen om de sponzige type-ervaring te verbeteren tot een niveau dat meer past bij de meeste Ultrabooks.
Het grootste nadeel van de snellere processor is het ventilatorgeluid. De ventilator is iets luider dan de Surface Pro en zal vaker opspinnen bij dagelijkse taken. Het geluid wordt niet zo hoog als de HP Spectre-series convertibles, maar is toch duidelijk aanwezig, zeker bij gebruik als tablet.
De Miix 520 is een erg goede aankoop zolang kopers zich bewust zijn van de nadelen. De snelle CPU zorgt voor een hoger systeemgeluid en vaker duidelijk hoorbare ventilator. We hopen dat toekomstige versies het beeldscherm verbeteren en inclusief Thunderbolt 3 geleverd worden. Zo kan de Miix-serie nog beter concurreren met Microsoft.
Lenovo Miix 520-12IKB 81CG
- 10-12-2017 v6 (old)
Allen Ngo
Price comparison
