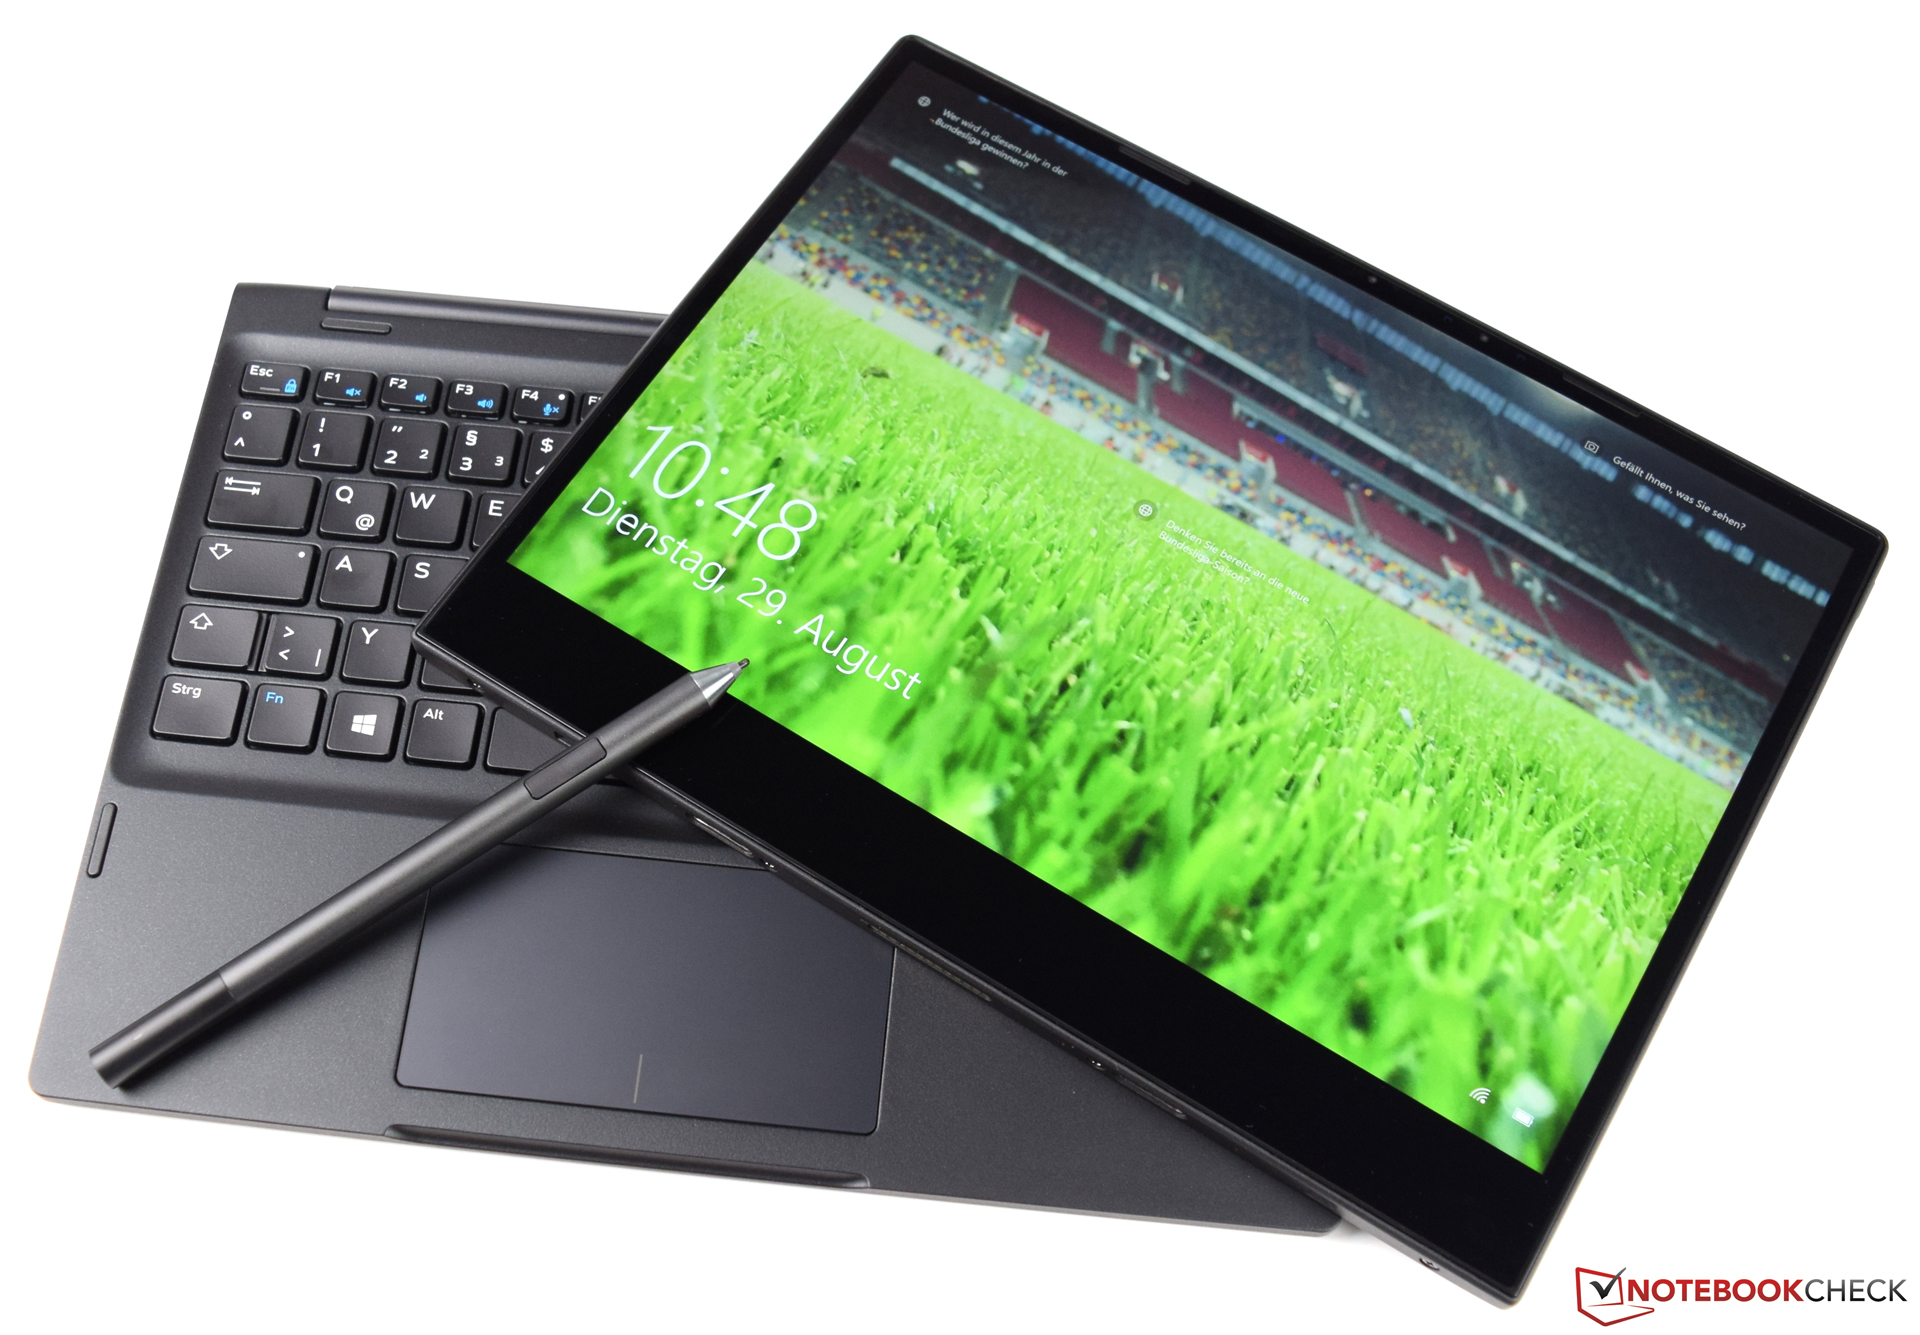
Kort testrapport Dell Latitude 7285 (i5-7Y57, 256 GB, 3K) Convertible
| SD Card Reader | |
| average JPG Copy Test (av. of 3 runs) | |
| Lenovo ThinkPad X1 Yoga 2017 20JES03T00 (Toshiba Exceria Pro M401) | |
| Dell Latitude 12 5285 2-in-1 (Toshiba THN-M401S0640E2) | |
| Dell Latitude 7285 (Toshiba Exceria Pro M501) | |
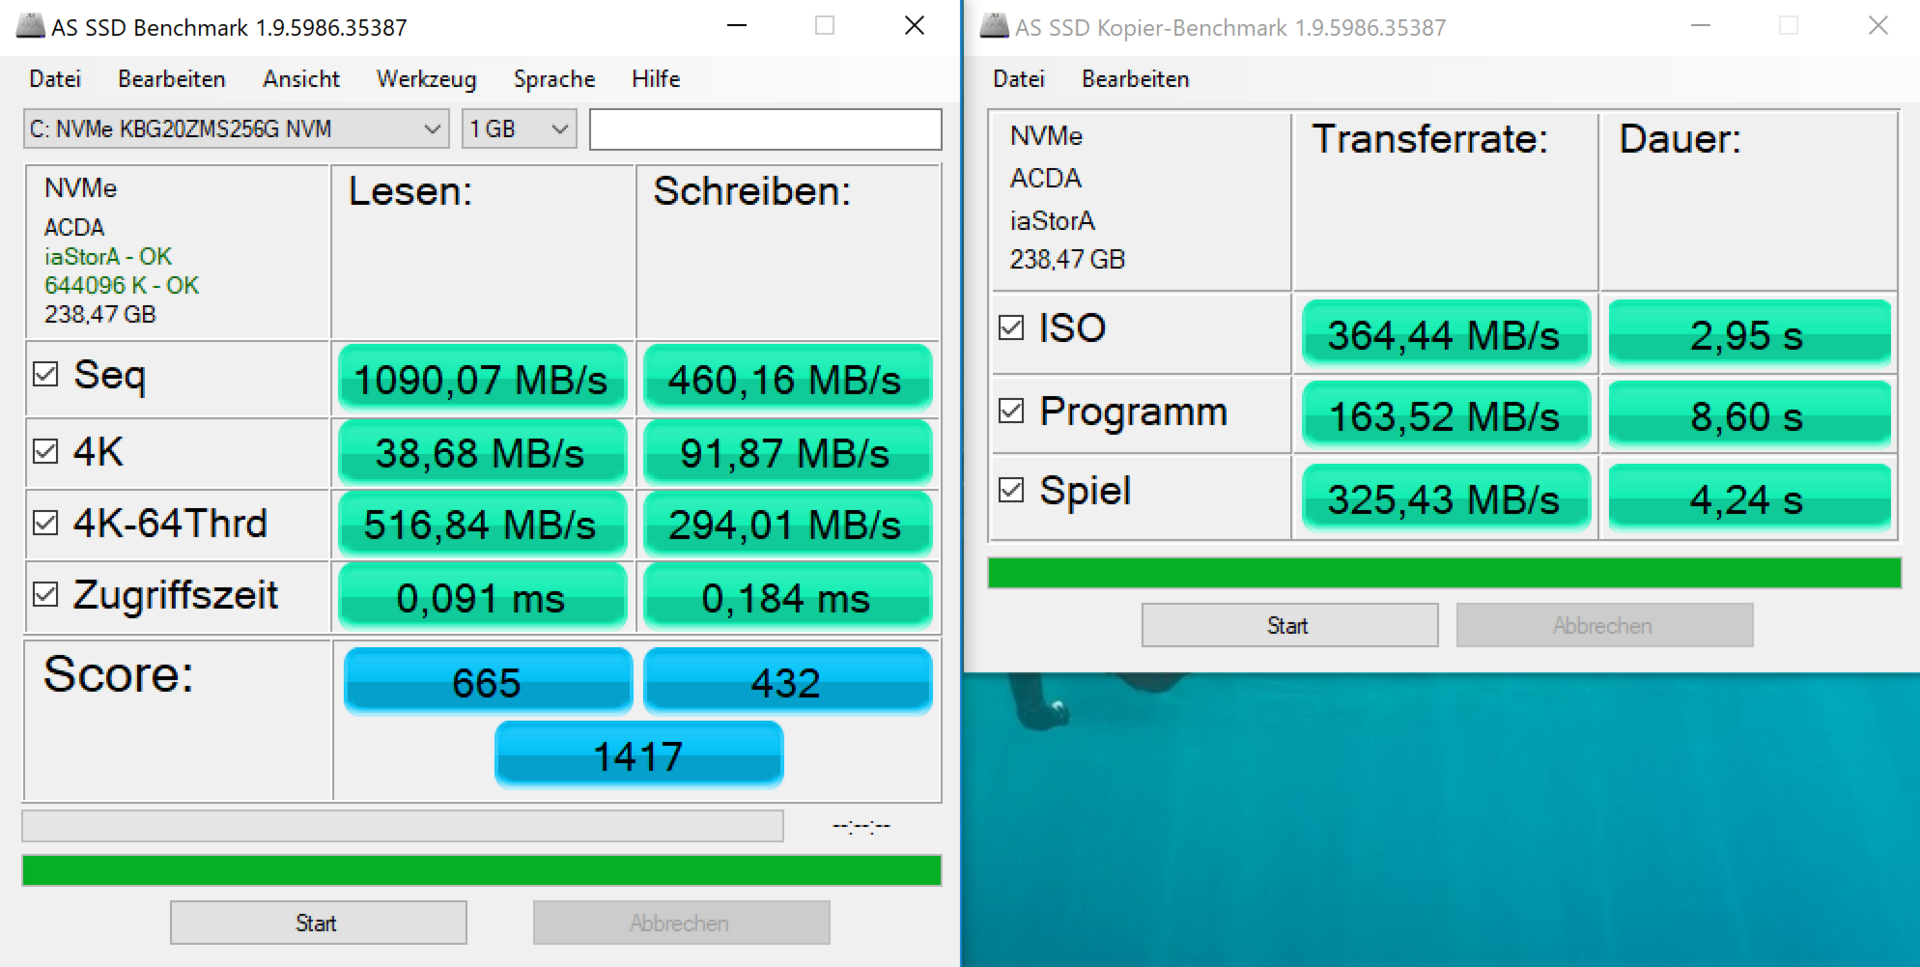
| maximum AS SSD Seq Read Test (1GB) | |
| Lenovo ThinkPad X1 Yoga 2017 20JES03T00 (Toshiba Exceria Pro M401) | |
| Dell Latitude 12 5285 2-in-1 (Toshiba THN-M401S0640E2) | |
| Dell Latitude 7285 (Toshiba Exceria Pro M501) | |
| |||||||||||||||||||||||||
Helderheidsverdeling: 86 %
Helderheid in Batterij-modus: 525 cd/m²
Contrast: 1435:1 (Zwart: 0.37 cd/m²)
ΔE ColorChecker Calman: 3.5 | ∀{0.5-29.43 Ø4.73}
ΔE Greyscale Calman: 4.7 | ∀{0.09-98 Ø4.97}
99.8% sRGB (Argyll 1.6.3 3D)
67.6% AdobeRGB 1998 (Argyll 1.6.3 3D)
74.1% AdobeRGB 1998 (Argyll 3D)
99.8% sRGB (Argyll 3D)
73.3% Display P3 (Argyll 3D)
Gamma: 2.04
CCT: 6581 K
| Dell Latitude 7285 SHP1482 (LQ123Z1), , 2880x1920, 12.3" | Microsoft Surface Pro (2017) i5 LG Display LP123WQ112604, , 2736x1824, 12.3" | Lenovo ThinkPad X1 Yoga 2017 20JES03T00 LEN4140, , 2560x1440, 14" | Dell Latitude 12 5285 2-in-1 BOE06DC, , 1920x1280, 12.3" | Acer Switch 5 SW512-52-5819 WST KL.1200w.004, , 2160x1440, 12" | Toshiba Portege X20W-D-10R Toshiba TOS508F, , 1920x1080, 12.5" | HP Elite x2 1012 G1 LG Philips, , 1920x1280, 12.1" | |
|---|---|---|---|---|---|---|---|
| Display | -5% | -11% | -17% | -5% | -27% | ||
| Display P3 Coverage (%) | 73.3 | 67.6 -8% | 62.8 -14% | 58.8 -20% | 68.7 -6% | 53.8 -27% | |
| sRGB Coverage (%) | 99.8 | 99 -1% | 94 -6% | 87.5 -12% | 96.8 -3% | 73.7 -26% | |
| AdobeRGB 1998 Coverage (%) | 74.1 | 69.1 -7% | 64.7 -13% | 60.6 -18% | 70.4 -5% | 53.8 -27% | |
| Response Times | 5% | 91% | 2% | 15% | -40% | 25% | |
| Response Time Grey 50% / Grey 80% * (ms) | 44 ? | 42 ? 5% | 3.6 ? 92% | 42.4 ? 4% | 37 ? 16% | 67 ? -52% | 33.2 ? 25% |
| Response Time Black / White * (ms) | 30.4 ? | 29 ? 5% | 3.2 ? 89% | 30.8 ? -1% | 26 ? 14% | 39 ? -28% | 22.8 ? 25% |
| PWM Frequency (Hz) | 922 ? | 21000 | 240.4 ? | 210.1 ? | |||
| Screen | 2% | -18% | -10% | -33% | -17% | -35% | |
| Brightness middle (cd/m²) | 531 | 417 -21% | 243 -54% | 523.2 -1% | 369 -31% | 442 -17% | 322 -39% |
| Brightness (cd/m²) | 490 | 401 -18% | 240 -51% | 522 7% | 331 -32% | 410 -16% | 319 -35% |
| Brightness Distribution (%) | 86 | 88 2% | 95 10% | 88 2% | 75 -13% | 86 0% | 97 13% |
| Black Level * (cd/m²) | 0.37 | 0.29 22% | 0.42 -14% | 0.46 -24% | 0.22 41% | 0.42 -14% | |
| Contrast (:1) | 1435 | 1438 0% | 1246 -13% | 802 -44% | 2009 40% | 767 -47% | |
| Colorchecker dE 2000 * | 3.5 | 3.63 -4% | 5.3 -51% | 4 -14% | 5.52 -58% | 5.22 -49% | 6.02 -72% |
| Colorchecker dE 2000 max. * | 6.2 | 6.74 -9% | 8.9 -44% | 8.6 -39% | 9.29 -50% | 11.84 -91% | 10.06 -62% |
| Greyscale dE 2000 * | 4.7 | 2.18 54% | 3.7 21% | 5.5 -17% | 6.95 -48% | 7.88 -68% | 6.29 -34% |
| Gamma | 2.04 108% | 3.09 71% | 1.78 124% | 2.16 102% | 2.58 85% | 2.51 88% | 2.4 92% |
| CCT | 6581 99% | 6767 96% | 6202 105% | 7546 86% | 7009 93% | 6756 96% | 7712 84% |
| Color Space (Percent of AdobeRGB 1998) (%) | 67.6 | 63 -7% | 84.8 25% | 64.86 -4% | 56 -17% | 64 -5% | 47.8 -29% |
| Color Space (Percent of sRGB) (%) | 99.8 | 99 -1% | 100 0% | 93.97 -6% | 88 -12% | 97 -3% | 73.2 -27% |
| Totaal Gemiddelde (Programma / Instellingen) | 1% /
1% | 37% /
4% | -6% /
-9% | -12% /
-23% | -21% /
-17% | -12% /
-25% |
* ... kleiner is beter
Responstijd Scherm
| ↔ Responstijd Zwart naar Wit | ||
|---|---|---|
| 30.4 ms ... stijging ↗ en daling ↘ gecombineerd | ↗ 15.6 ms stijging | 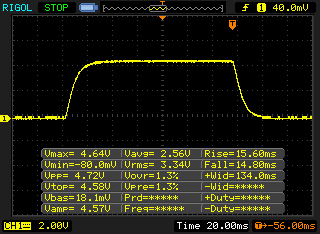 |
| ↘ 14.8 ms daling | ||
| Het scherm vertoonde trage responstijden in onze tests en is misschien te traag voor games. Ter vergelijking: alle testtoestellen variëren van 0.1 (minimum) tot 240 (maximum) ms. » 82 % van alle toestellen zijn beter. Dit betekent dat de gemeten responstijd slechter is dan het gemiddelde (19.9 ms) van alle geteste toestellen. | ||
| ↔ Responstijd 50% Grijs naar 80% Grijs | ||
| 44 ms ... stijging ↗ en daling ↘ gecombineerd | ↗ 19.6 ms stijging | 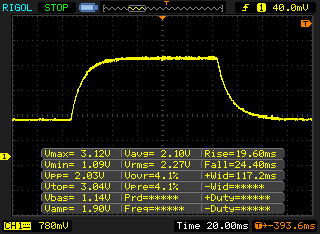 |
| ↘ 24.4 ms daling | ||
| Het scherm vertoonde trage responstijden in onze tests en is misschien te traag voor games. Ter vergelijking: alle testtoestellen variëren van 0.165 (minimum) tot 636 (maximum) ms. » 73 % van alle toestellen zijn beter. Dit betekent dat de gemeten responstijd slechter is dan het gemiddelde (31.1 ms) van alle geteste toestellen. | ||
Screen Flickering / PWM (Pulse-Width Modulation)
| Screen flickering / PWM waargenomen | 922 Hz | ≤ 20 % helderheid instelling | 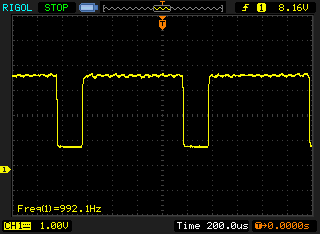 |
De achtergrondverlichting van het scherm flikkert op 922 Hz (in het slechtste geval, bijvoorbeeld bij gebruik van PWM) aan een helderheid van 20 % en lager. Boven deze helderheid zou er geen flickering / PWM mogen optreden. De frequentie van 922 Hz is redelijk hoog en de meeste mensen die gevoelig zijn aan flickering zouden dit dus niet mogen waarnemen of geïrriteerde ogen krijgen. Ter vergelijking: 52 % van alle geteste toestellen maakten geen gebruik van PWM om de schermhelderheid te verlagen. Als het wel werd gebruikt, werd een gemiddelde van 7794 (minimum: 5 - maximum: 343500) Hz waargenomen. | |||
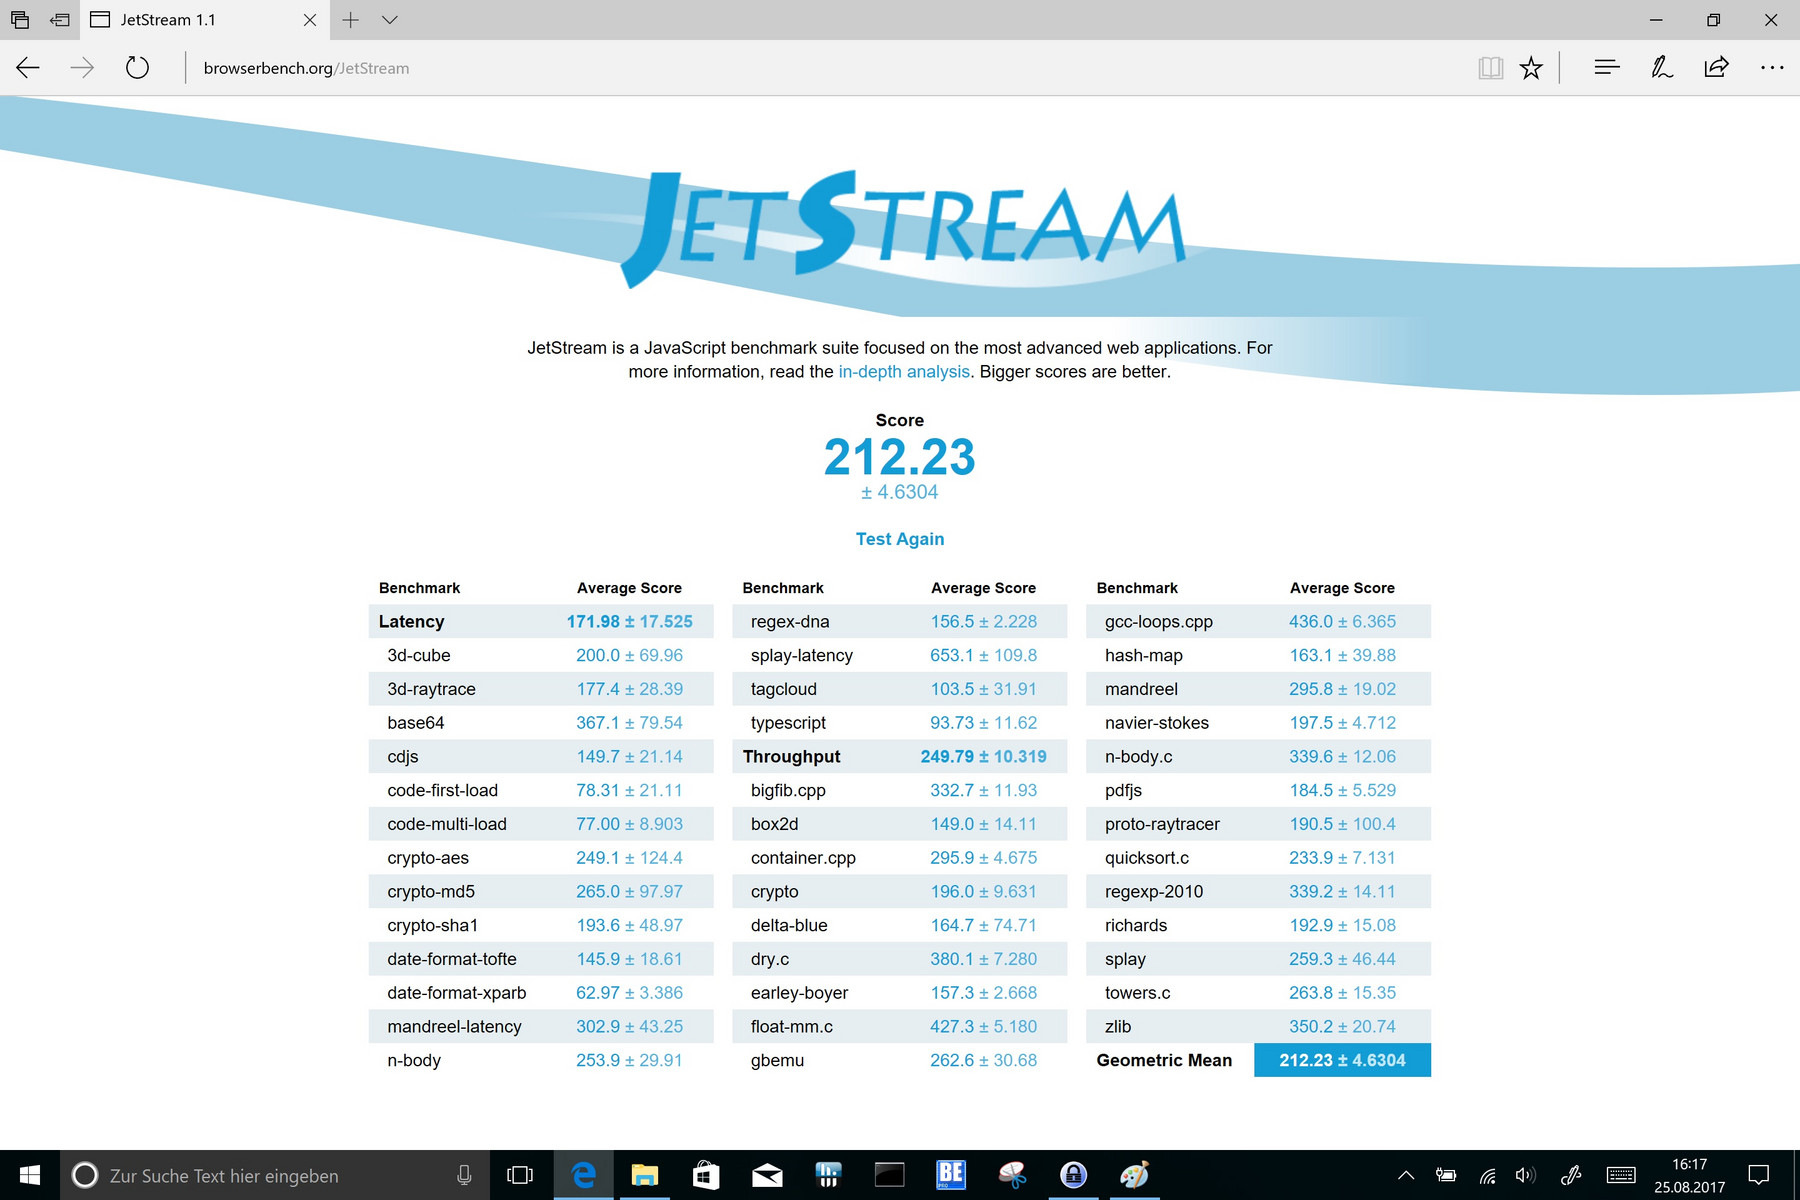
| JetStream 1.1 - 1.1 Total | |
| Lenovo ThinkPad X1 Yoga 2017 20JES03T00 | |
| Toshiba Portege X20W-D-10R | |
| Acer Switch 5 SW512-52-5819 | |
| Microsoft Surface Pro (2017) i5 | |
| Dell Latitude 7285 | |
| HP Elite x2 1012 G1 | |
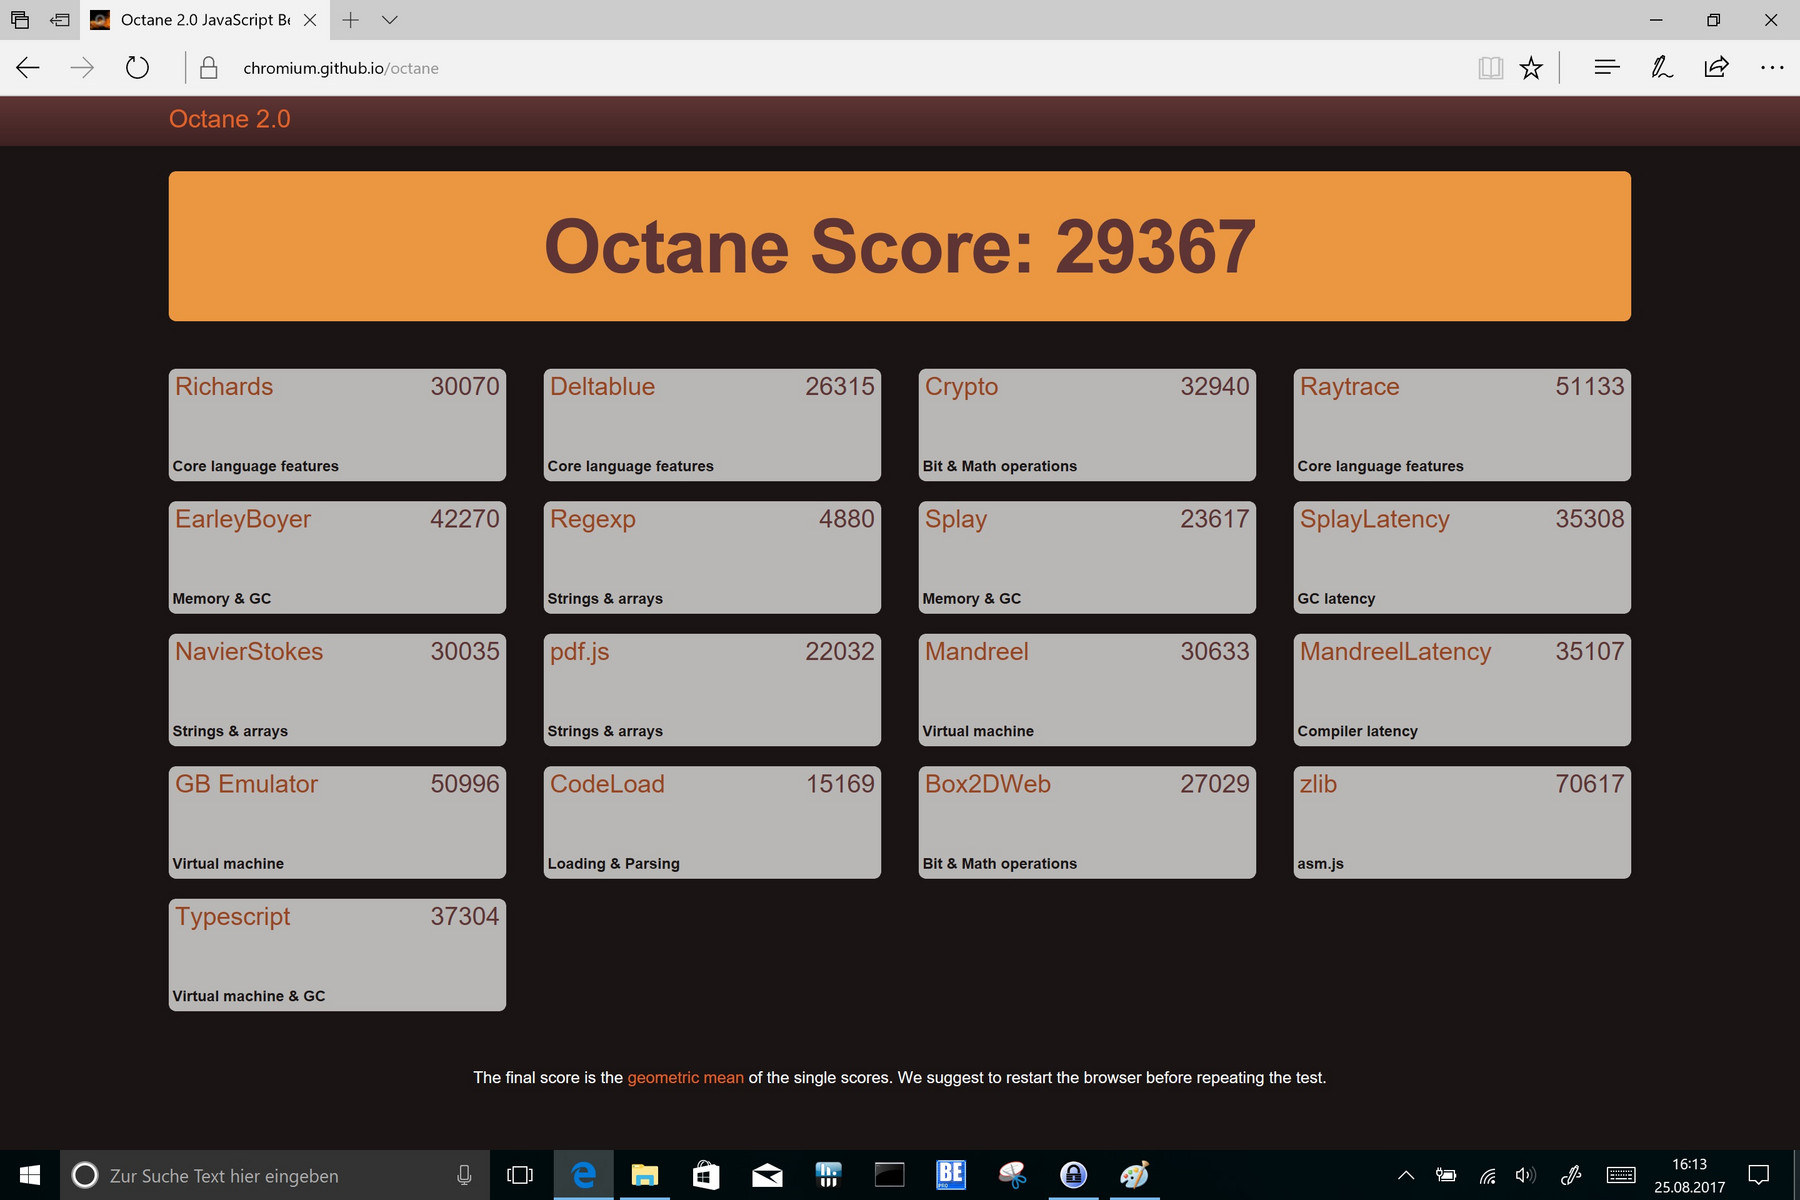
| Octane V2 - Total Score | |
| Toshiba Portege X20W-D-10R | |
| Microsoft Surface Pro (2017) i5 | |
| Acer Switch 5 SW512-52-5819 | |
| Lenovo ThinkPad X1 Yoga 2017 20JES03T00 | |
| Dell Latitude 7285 | |
| HP Elite x2 1012 G1 | |
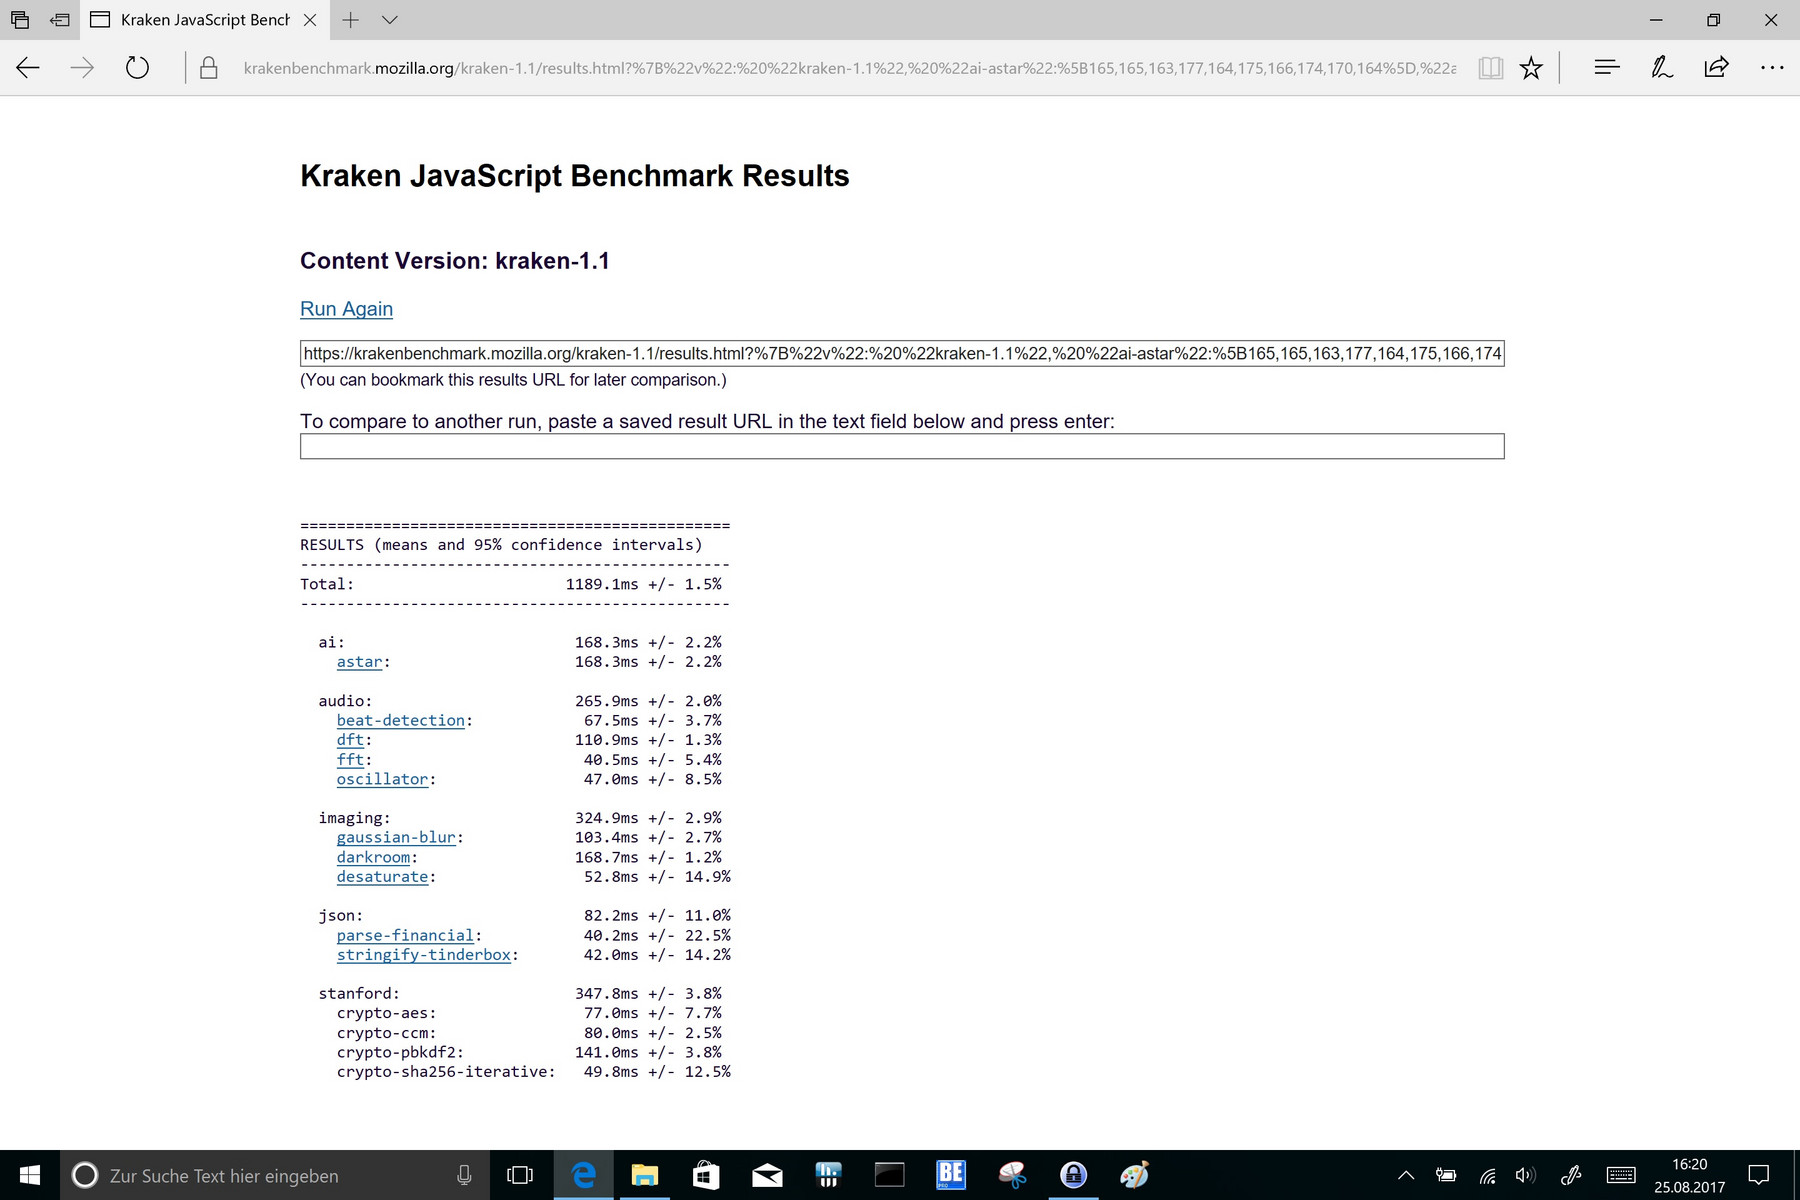
| Mozilla Kraken 1.1 - Total | |
| HP Elite x2 1012 G1 | |
| Dell Latitude 7285 | |
| Acer Switch 5 SW512-52-5819 | |
| Toshiba Portege X20W-D-10R | |
| Lenovo ThinkPad X1 Yoga 2017 20JES03T00 | |
* ... kleiner is beter
| PCMark 10 | |
| Score | |
| Acer Switch 5 SW512-52-5819 | |
| Microsoft Surface Pro (2017) i5 | |
| Dell Latitude 7285 | |
| Productivity | |
| Acer Switch 5 SW512-52-5819 | |
| Microsoft Surface Pro (2017) i5 | |
| Dell Latitude 7285 | |
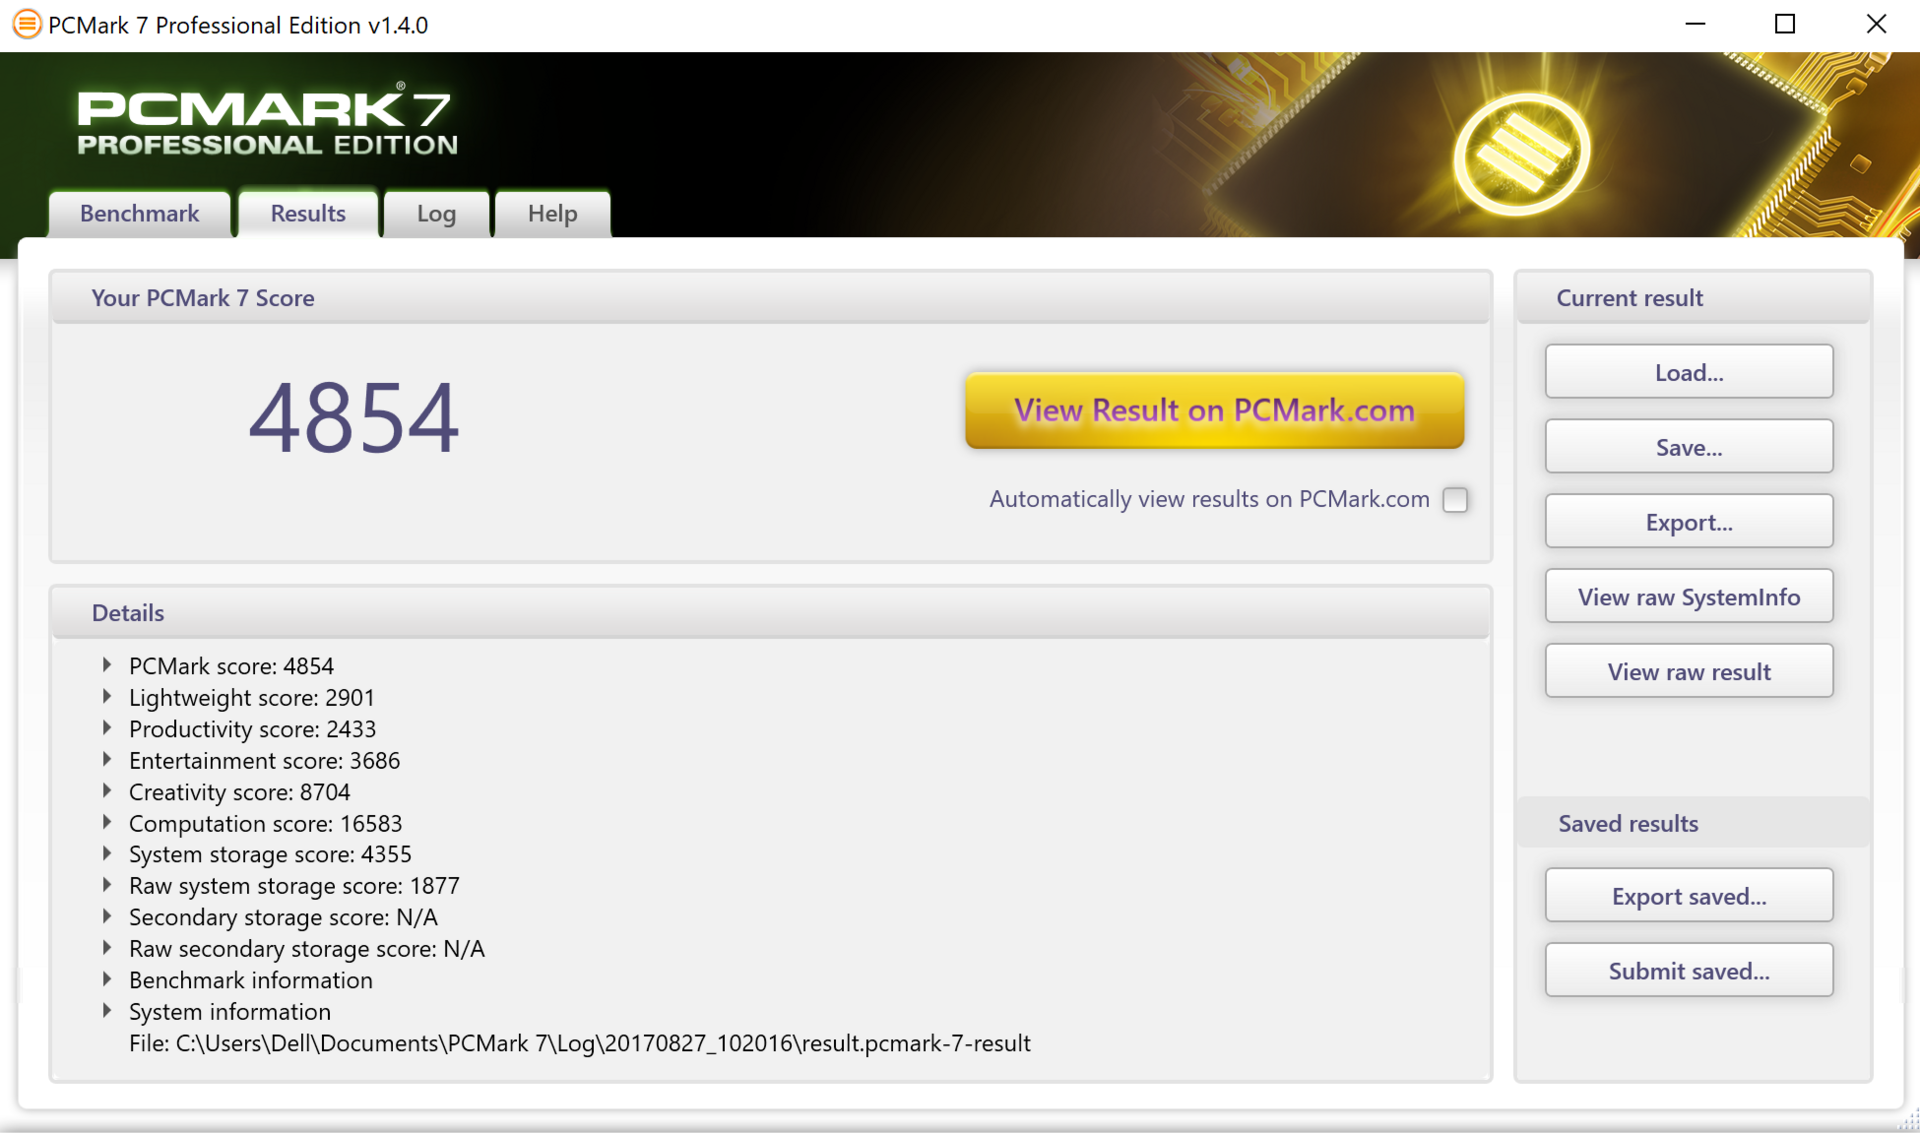
| PCMark 7 Score | 4854 punten | |
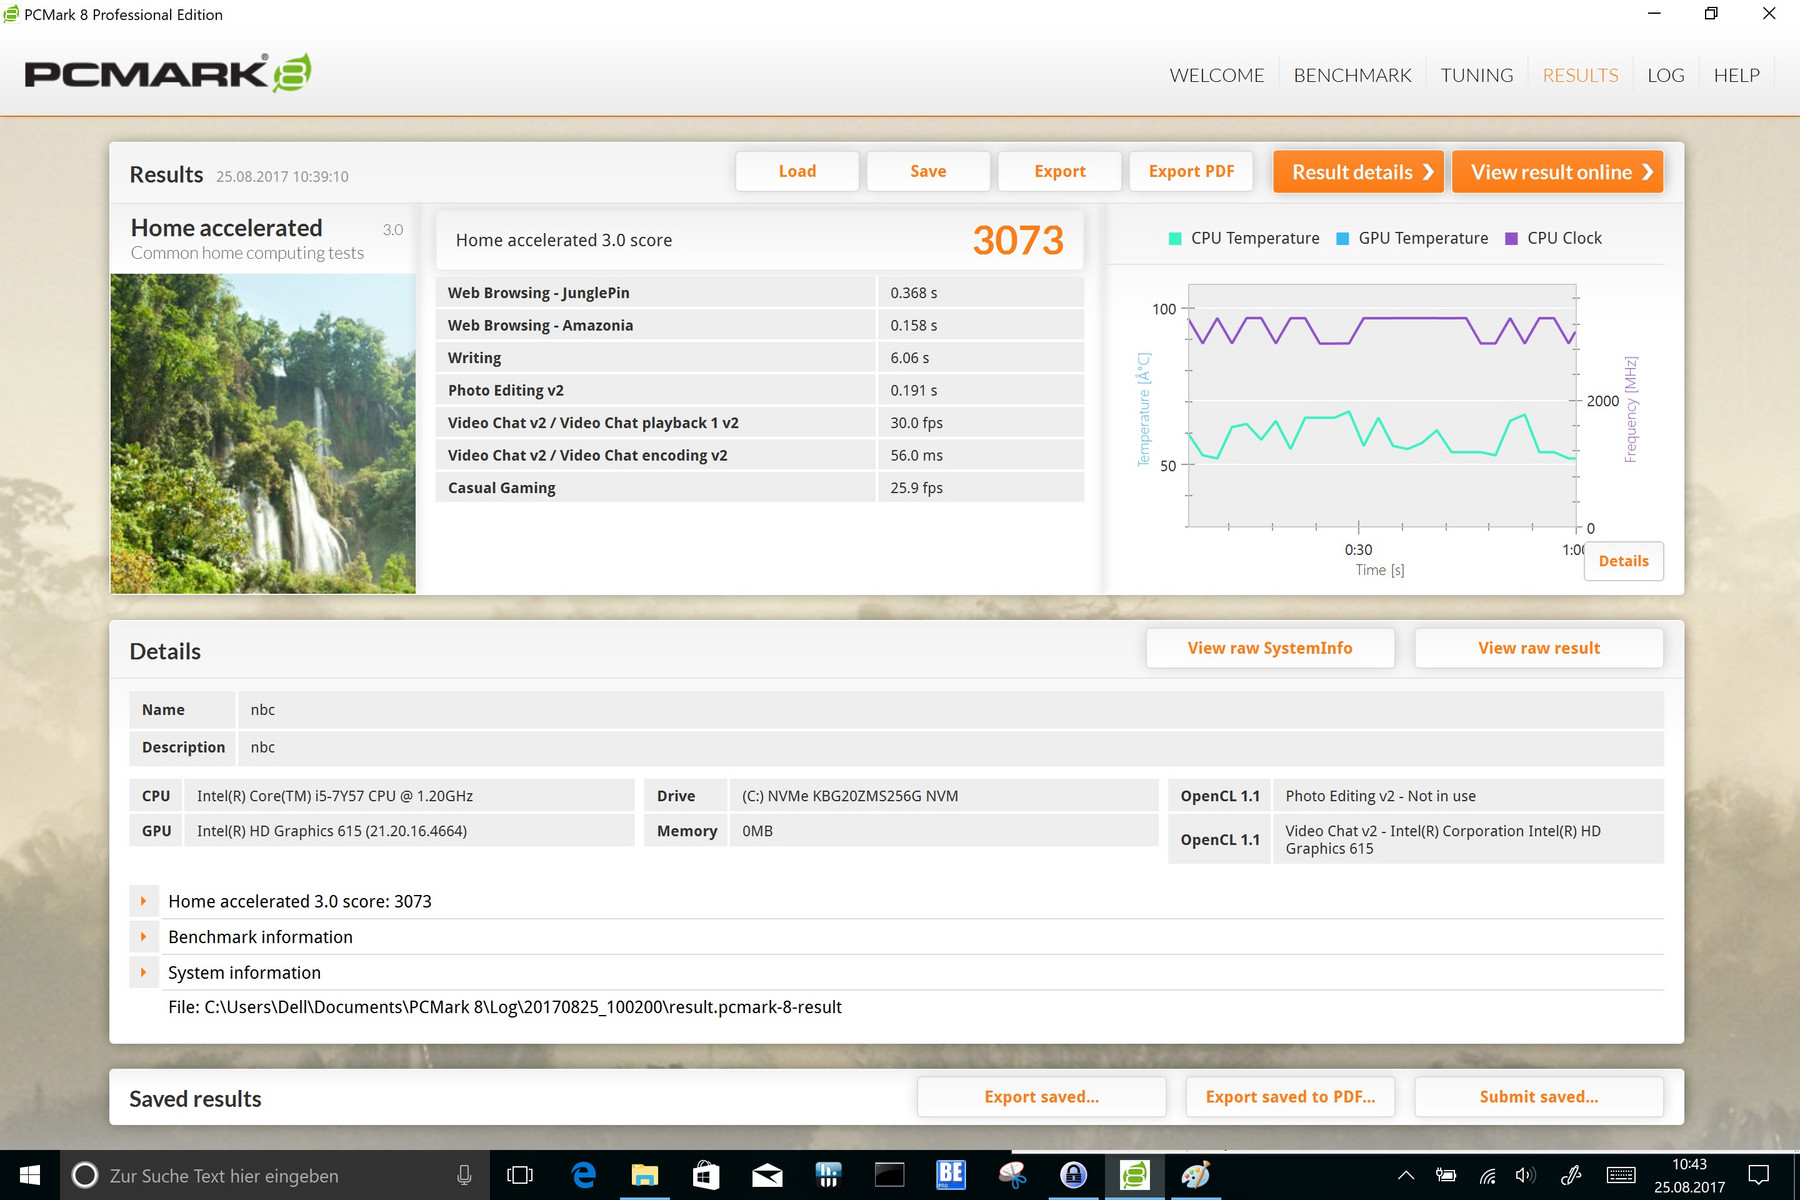
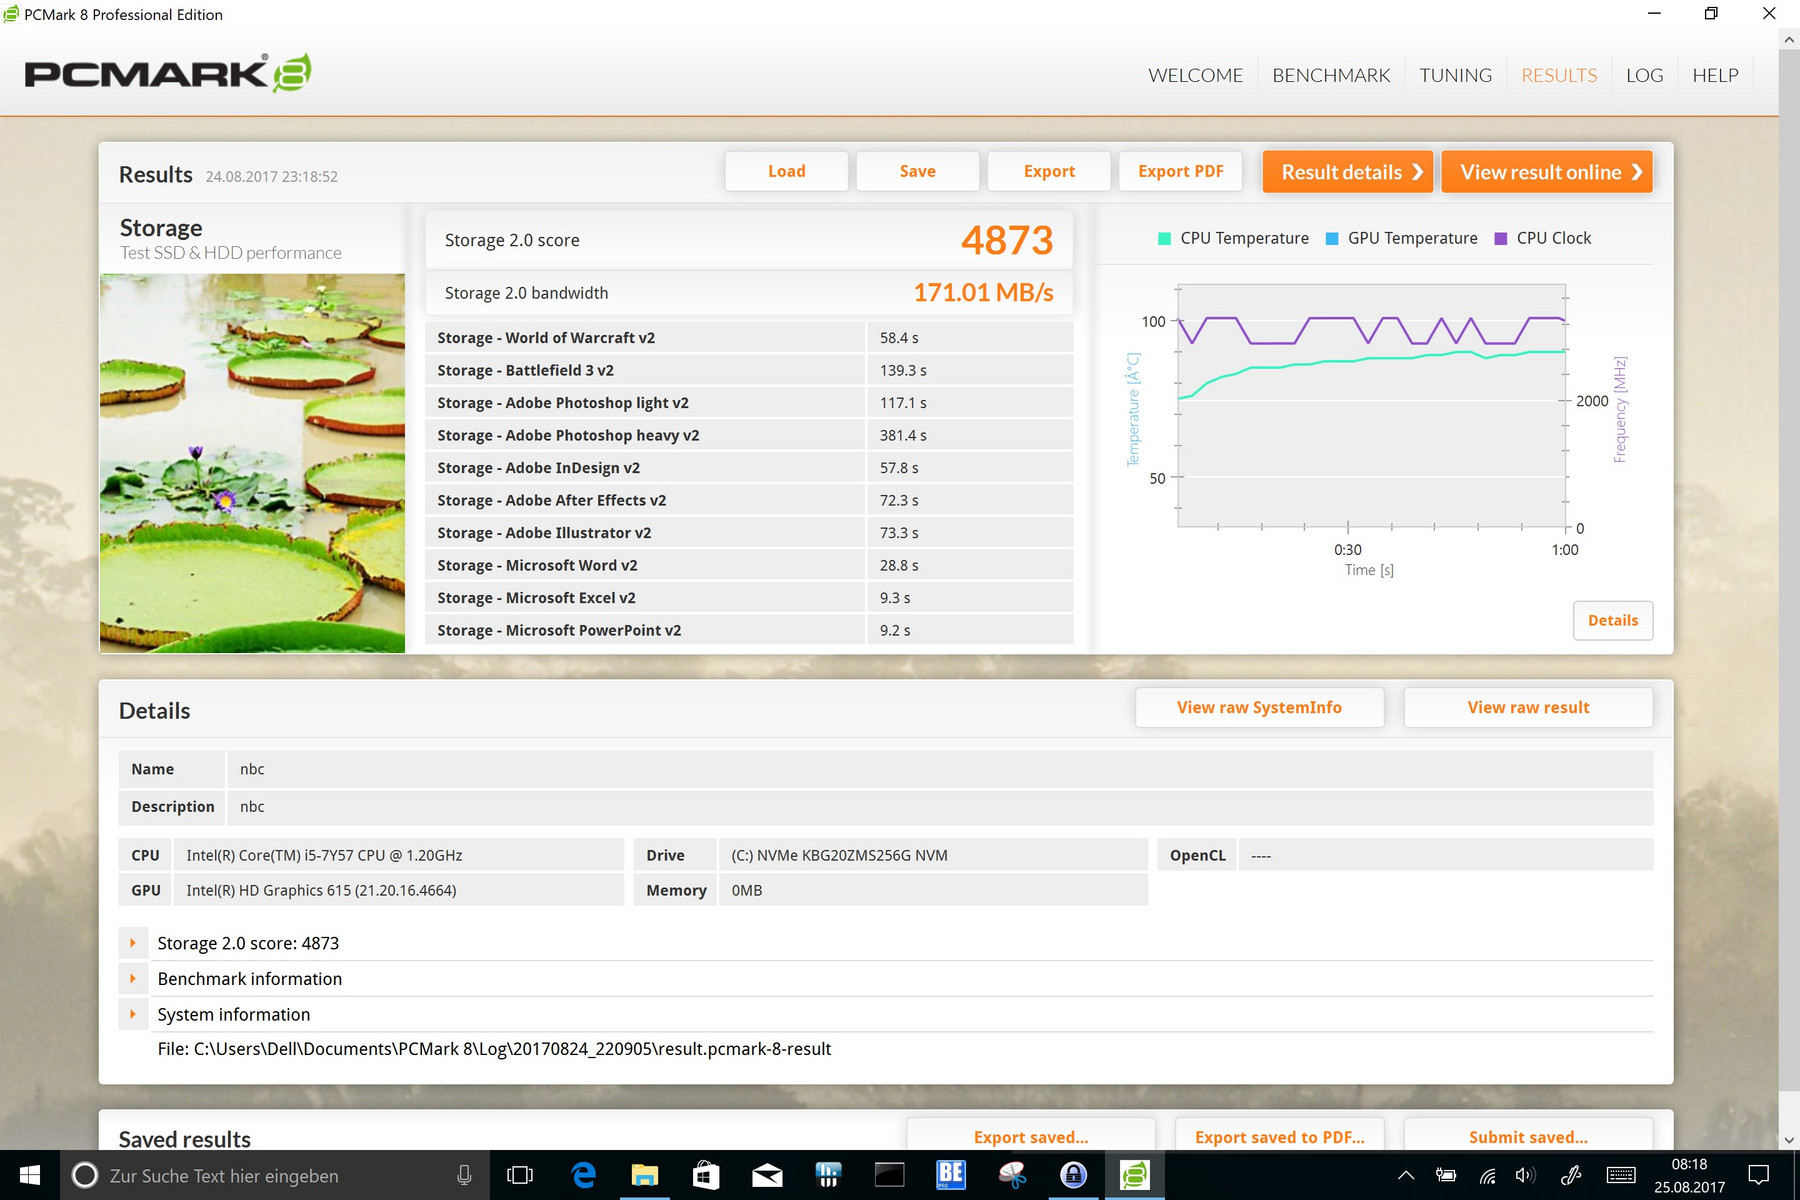
| PCMark 8 Home Score Accelerated v2 | 3073 punten | |
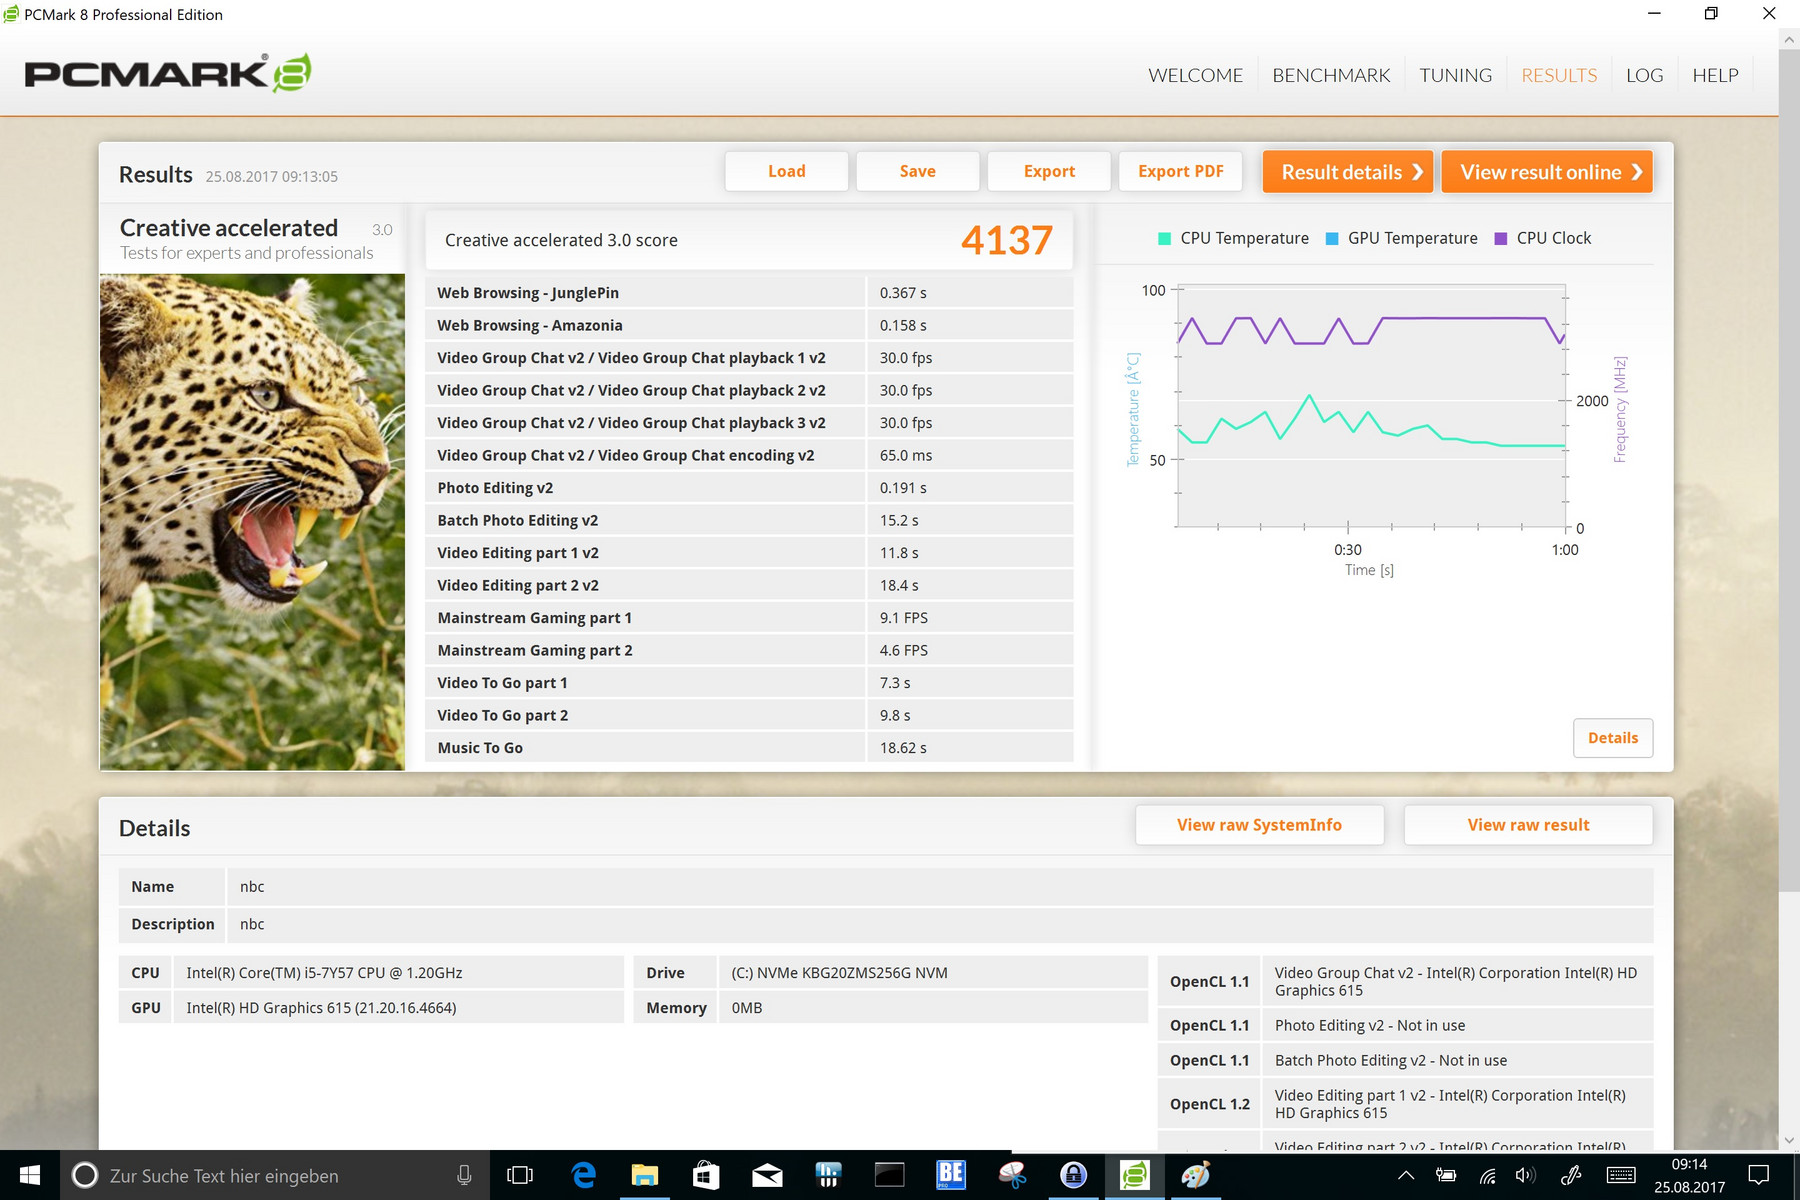
| PCMark 8 Creative Score Accelerated v2 | 4137 punten | |
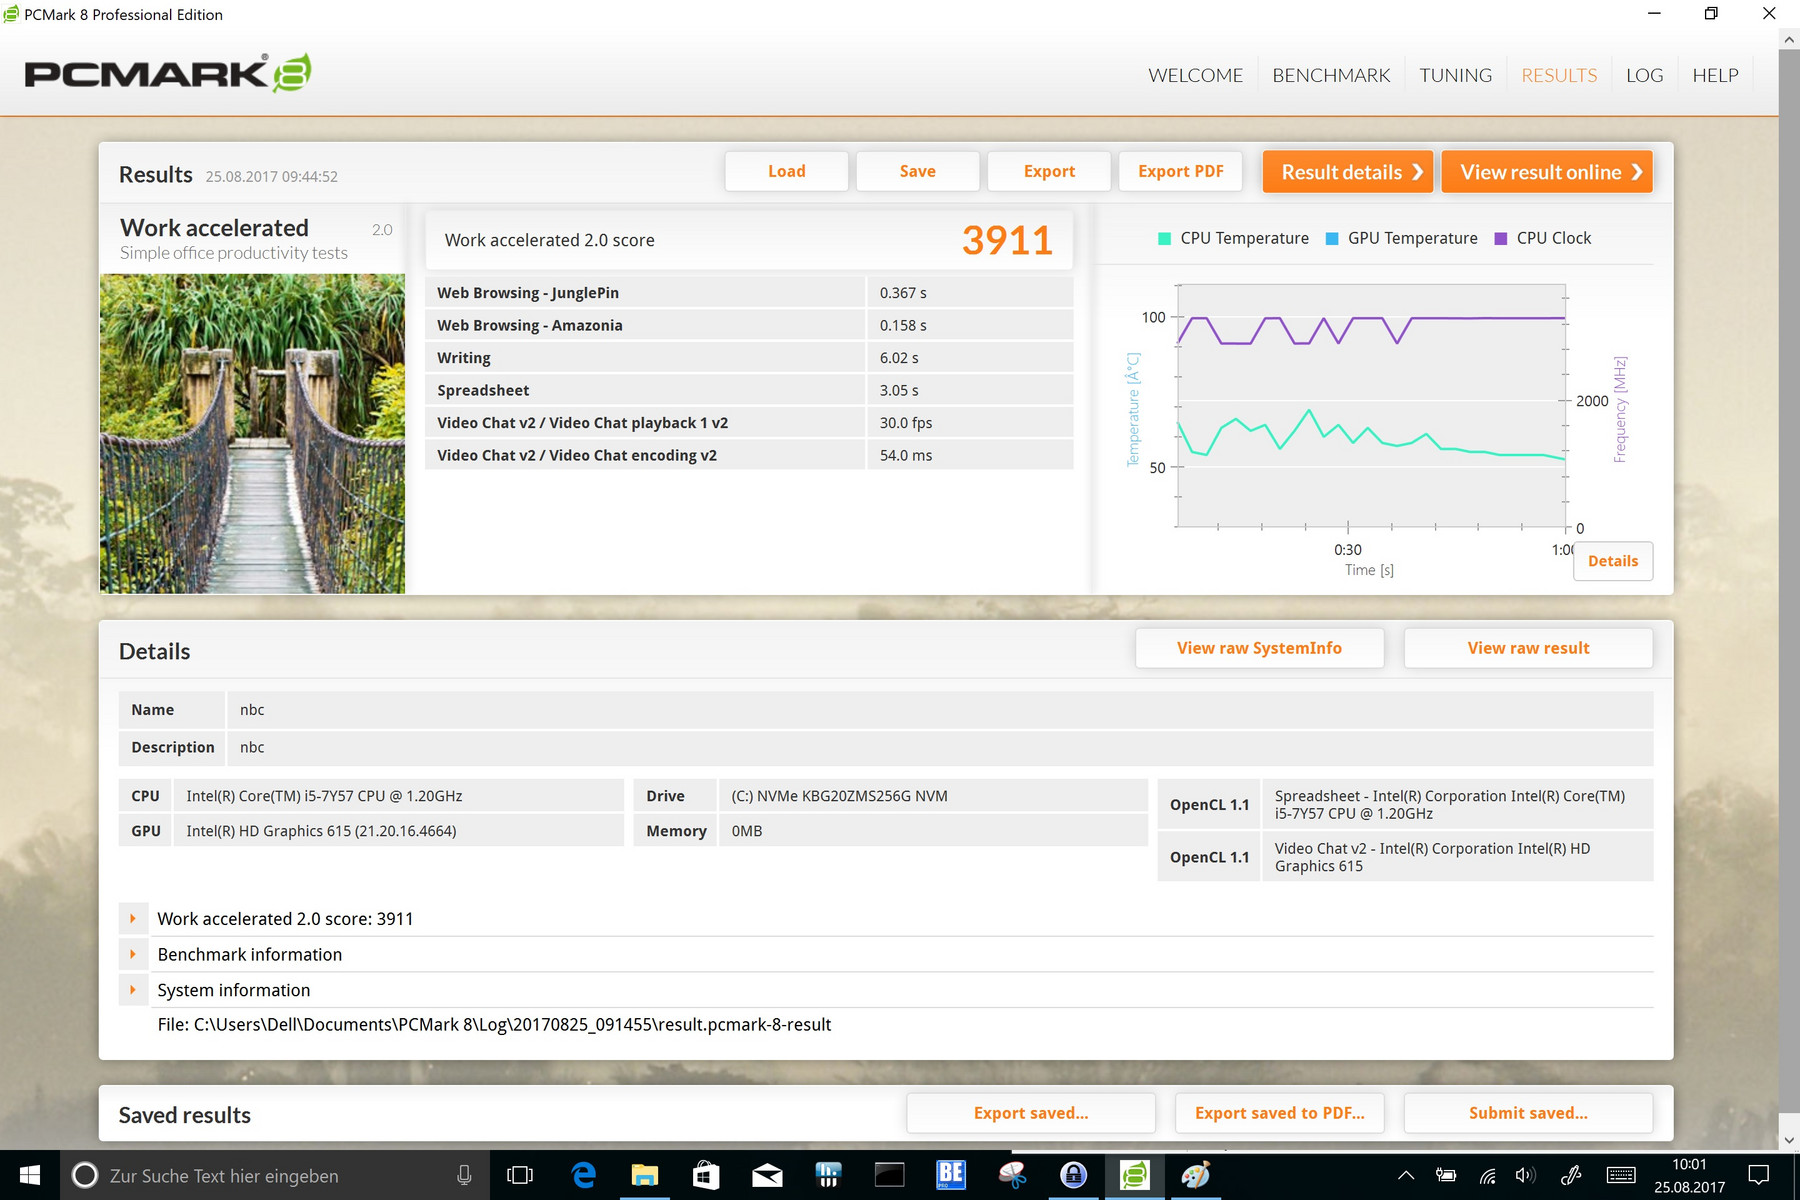
| PCMark 8 Work Score Accelerated v2 | 3911 punten | |
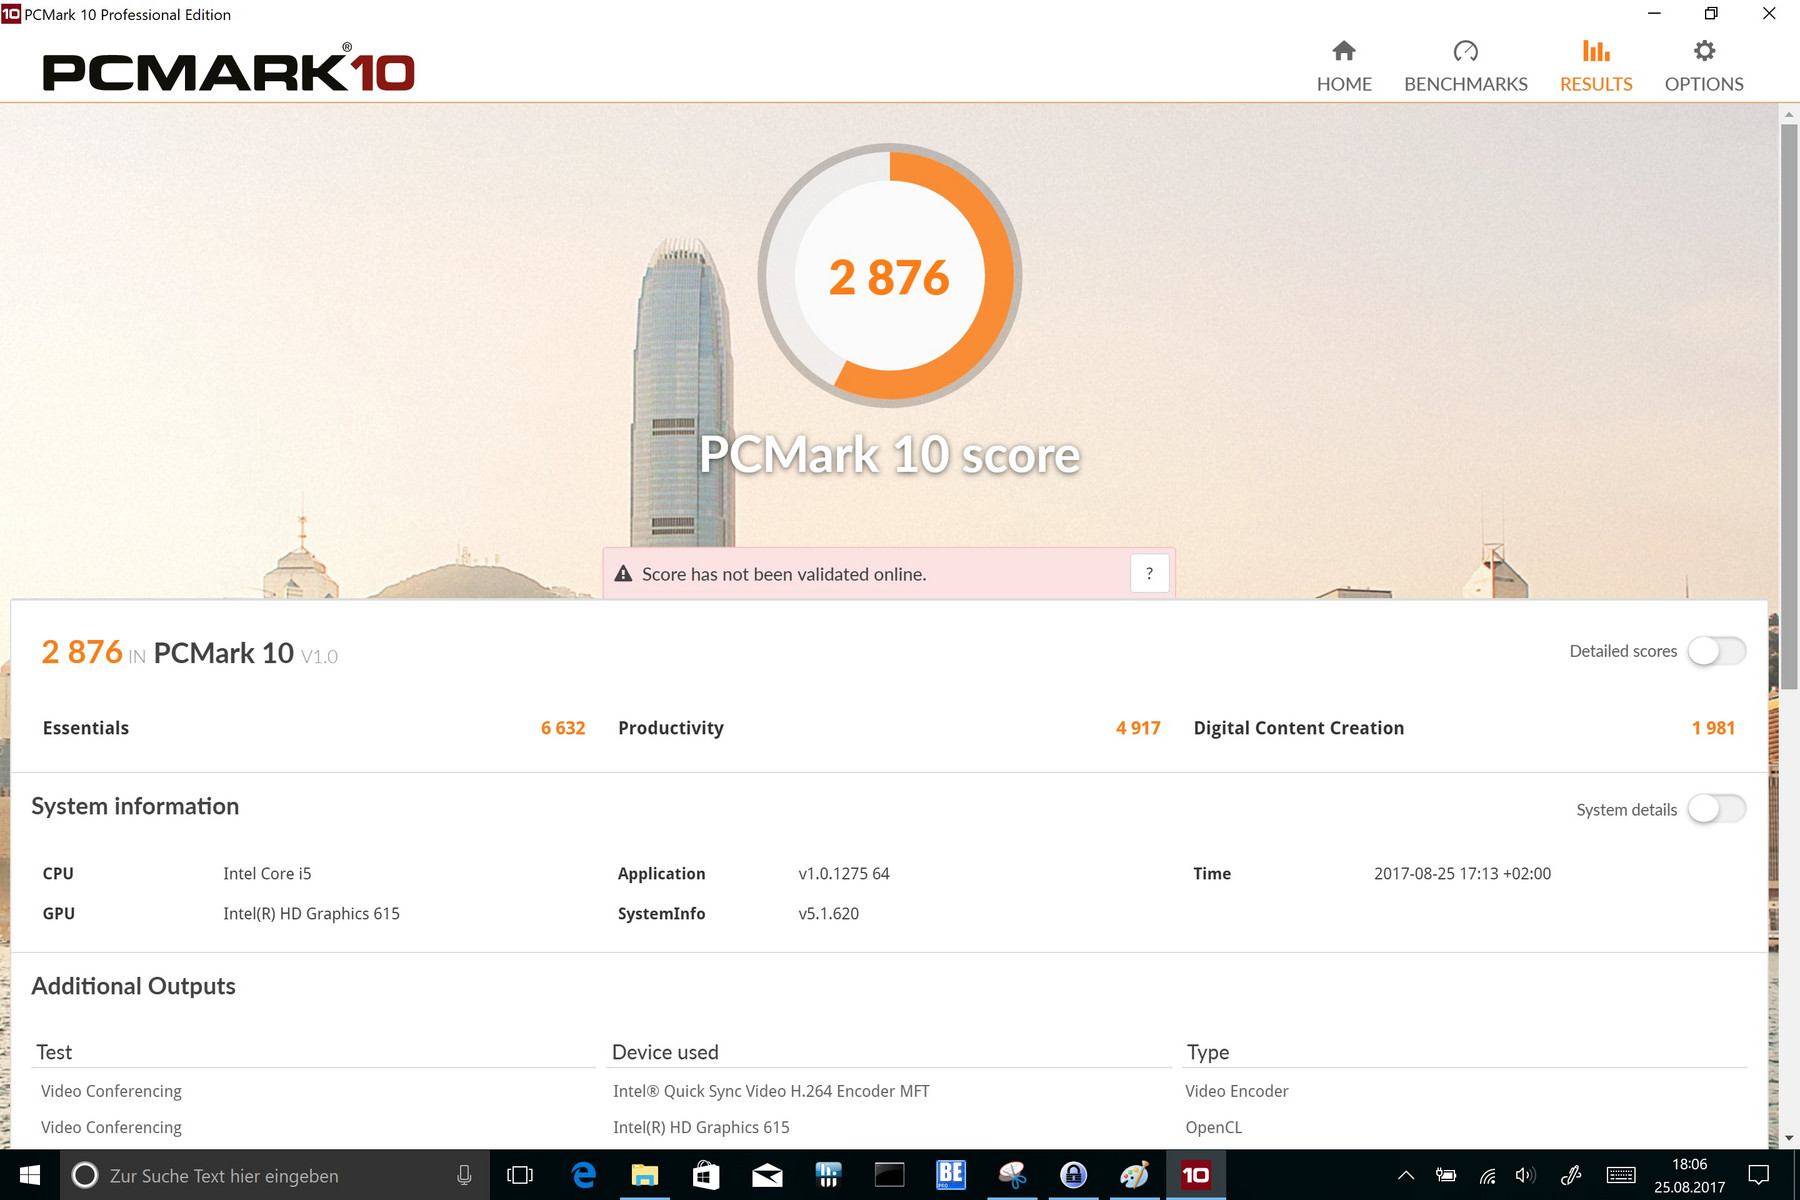
| PCMark 10 Score | 2876 punten | |
Help | ||
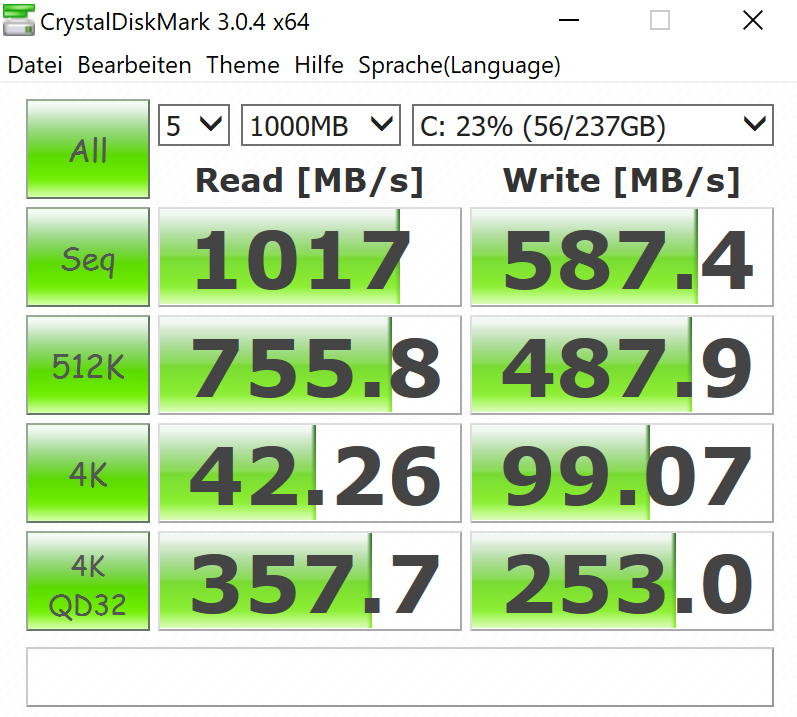
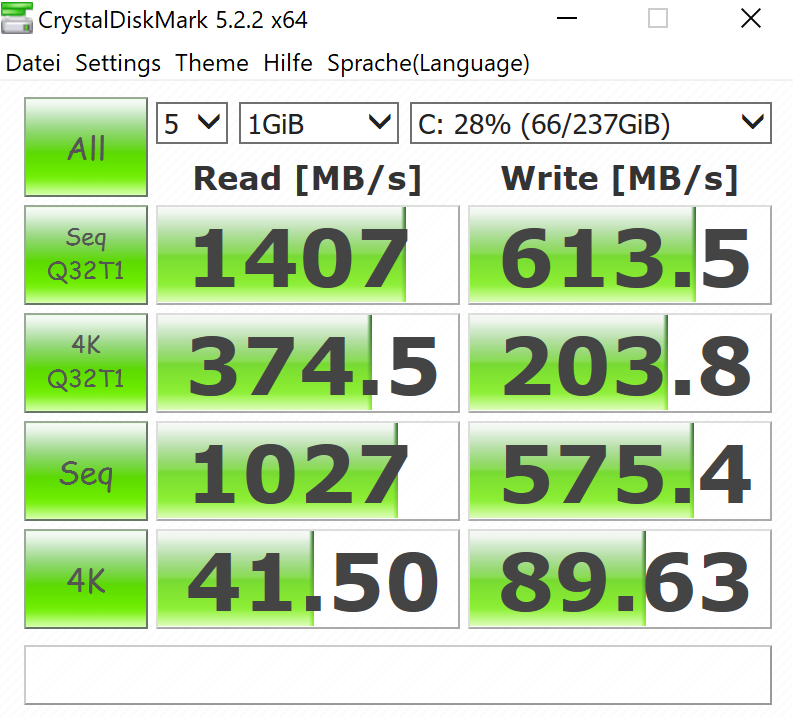
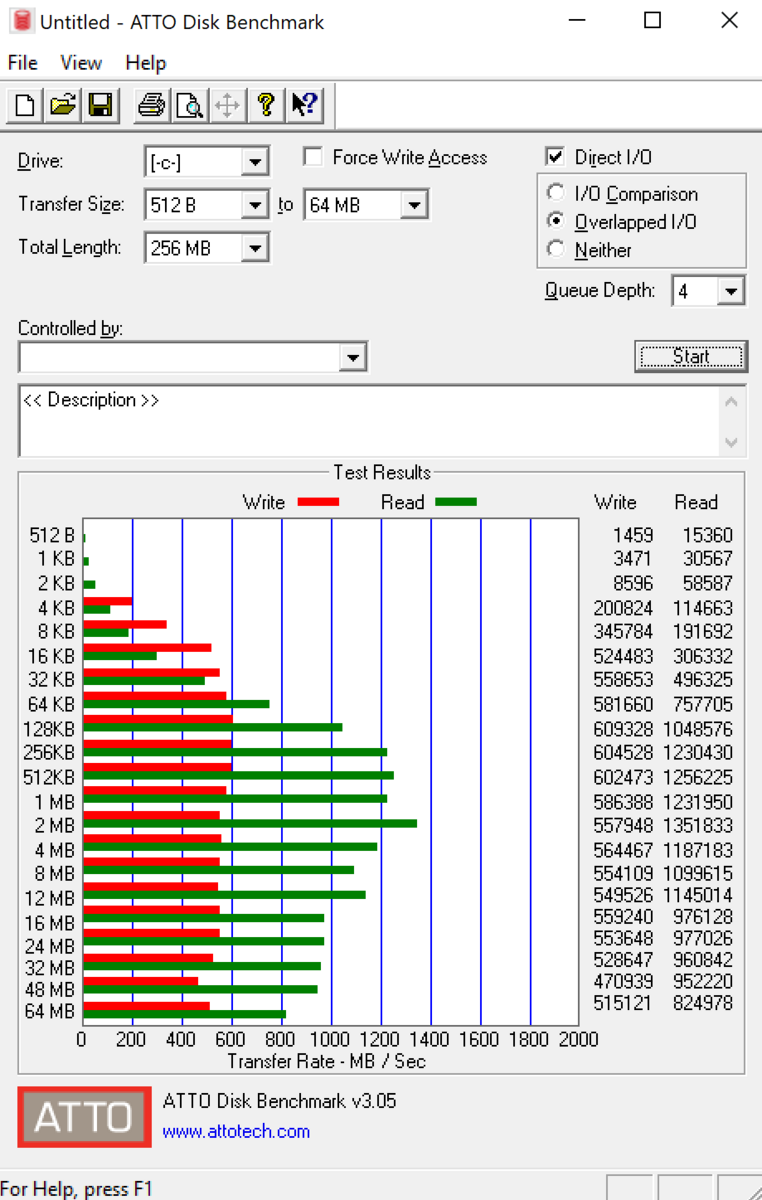
| Dell Latitude 7285 Toshiba KBG20ZMS256G | Microsoft Surface Pro (2017) i5 Samsung PM971 KUS030202M | Lenovo ThinkPad X1 Yoga 2017 20JES03T00 Samsung SSD PM961 1TB M.2 PCIe 3.0 x4 NVMe (MZVLW1T0) | Dell Latitude 12 5285 2-in-1 Samsung PM961 MZVLW256HEHP | Acer Switch 5 SW512-52-5819 Intel SSD 600p SSDPEKKW512G7 | Toshiba Portege X20W-D-10R Toshiba SG5 THNSNK512GVN8 | HP Elite x2 1012 G1 Liteon L8H-256V2G | |
|---|---|---|---|---|---|---|---|
| CrystalDiskMark 3.0 | 4% | 97% | 13% | 13% | -35% | -32% | |
| Read Seq (MB/s) | 1017 | 723 -29% | 2004 97% | 1294 27% | 1066 5% | 469 -54% | 501 -51% |
| Write Seq (MB/s) | 587 | 853 45% | 1693 188% | 865 47% | 593 1% | 277.3 -53% | 297.2 -49% |
| Read 512 (MB/s) | 756 | 225 -70% | 1040 38% | 406 -46% | 653 -14% | 404.4 -47% | 351.7 -53% |
| Write 512 (MB/s) | 487.9 | 445 -9% | 1292 165% | 589 21% | 535 10% | 266.6 -45% | 295.7 -39% |
| Read 4k (MB/s) | 45.26 | 46 2% | 58.2 29% | 31.75 -30% | 35.92 -21% | 25.24 -44% | 28.31 -37% |
| Write 4k (MB/s) | 99.1 | 125 26% | 182.2 84% | 72.2 -27% | 128.3 29% | 89.4 -10% | 90.3 -9% |
| Read 4k QD32 (MB/s) | 357.7 | 423 18% | 632 77% | 493.3 38% | 460.6 29% | 322.5 -10% | 285 -20% |
| Write 4k QD32 (MB/s) | 253 | 373 47% | 507 100% | 434.5 72% | 425.4 68% | 208.1 -18% | 268.4 6% |

| 3DMark 11 - 1280x720 Performance GPU | |
| Lenovo ThinkPad X1 Yoga 2017 20JES03T00 | |
| Acer Switch 5 SW512-52-5819 | |
| Dell Latitude 12 5285 2-in-1 | |
| Toshiba Portege X20W-D-10R | |
| Dell Latitude 7285 | |
| HP Elite x2 1012 G1 | |
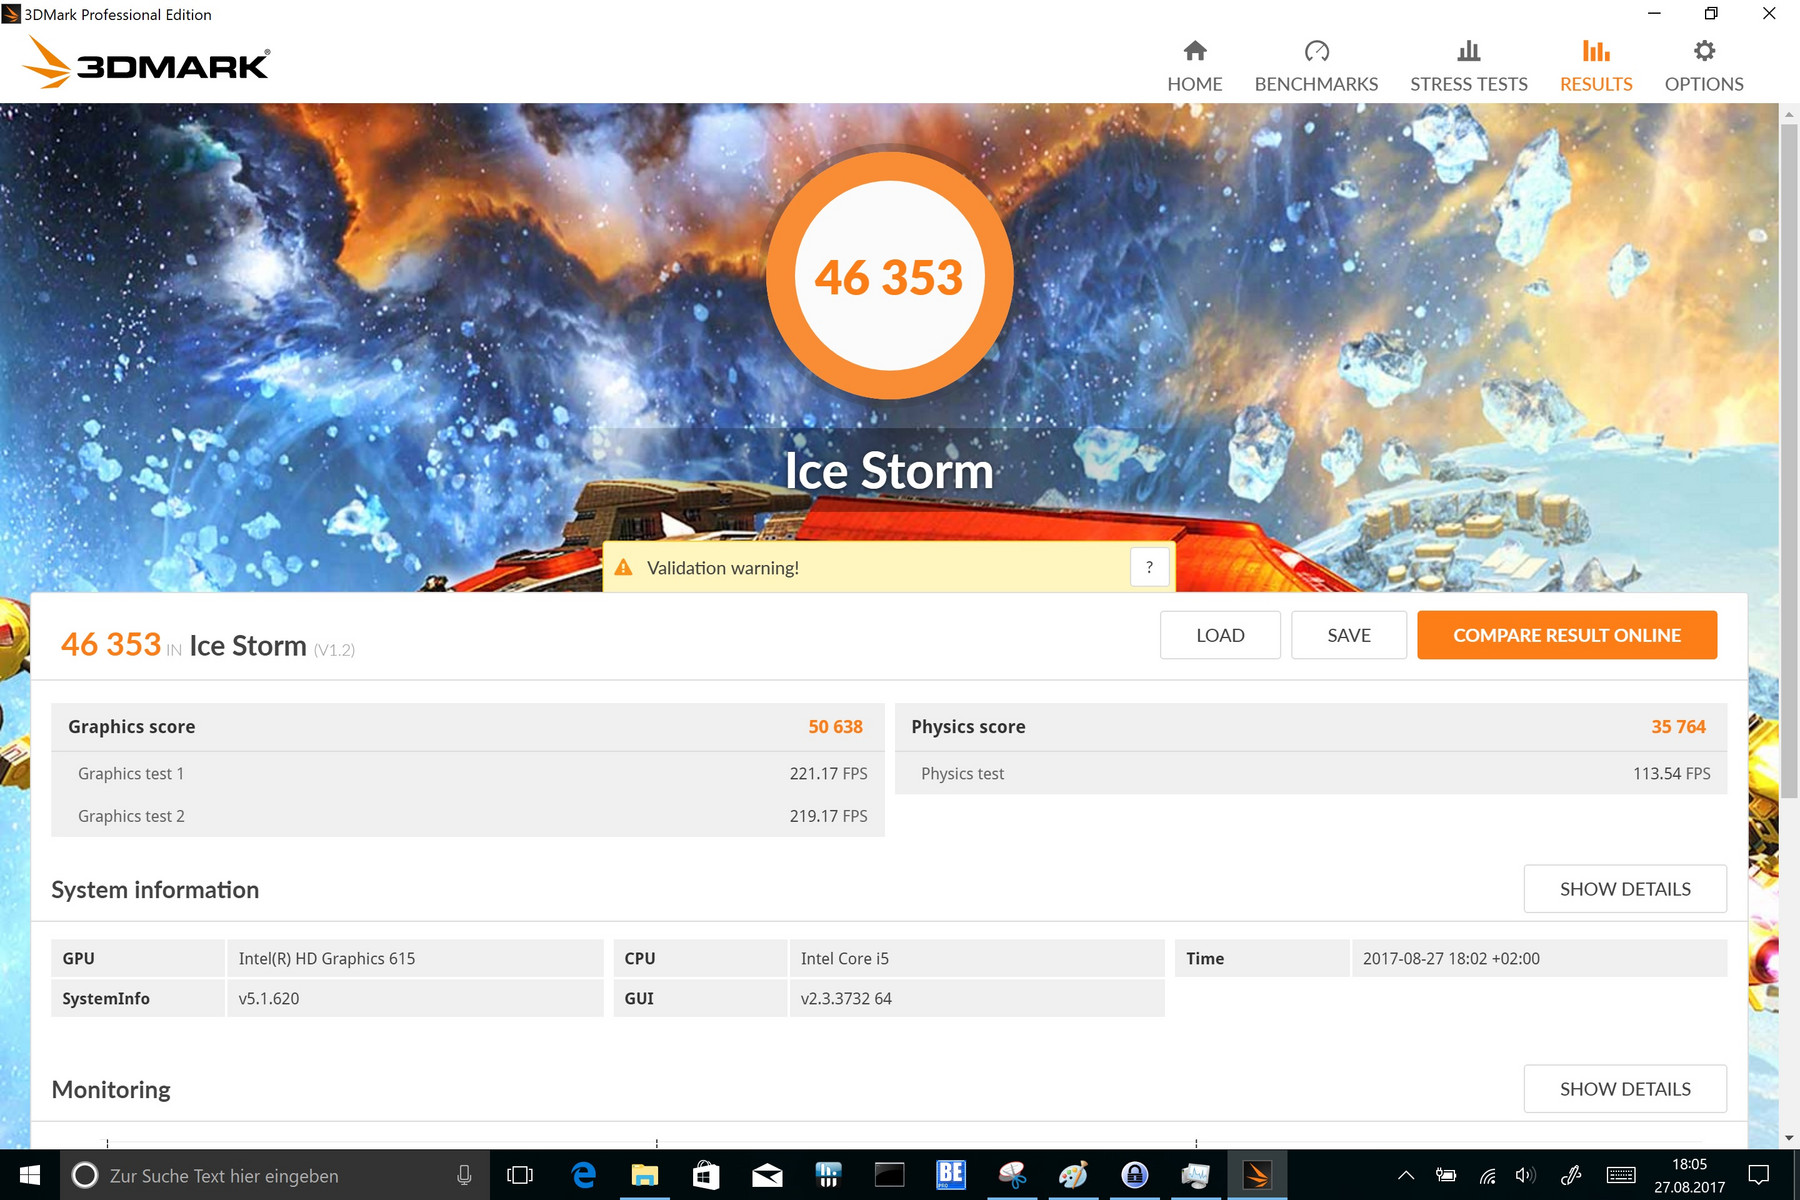
| 3DMark 06 Standard Score | 7909 punten | |
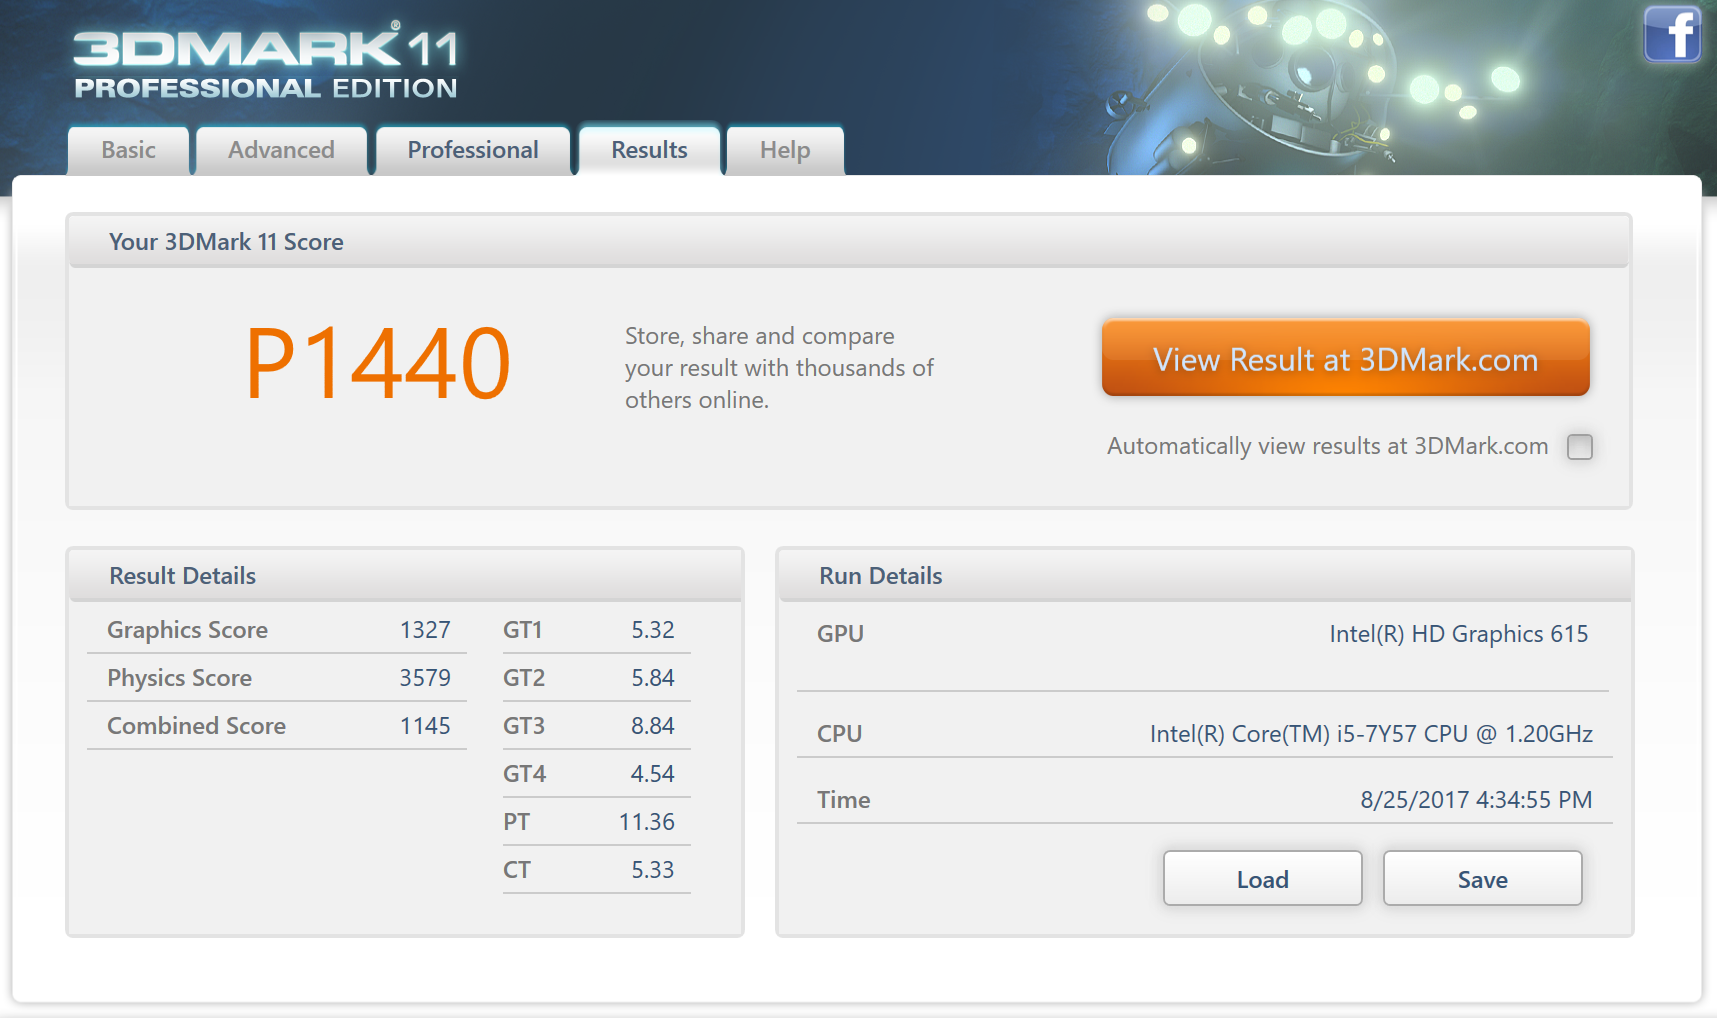
| 3DMark 11 Performance | 1440 punten | |
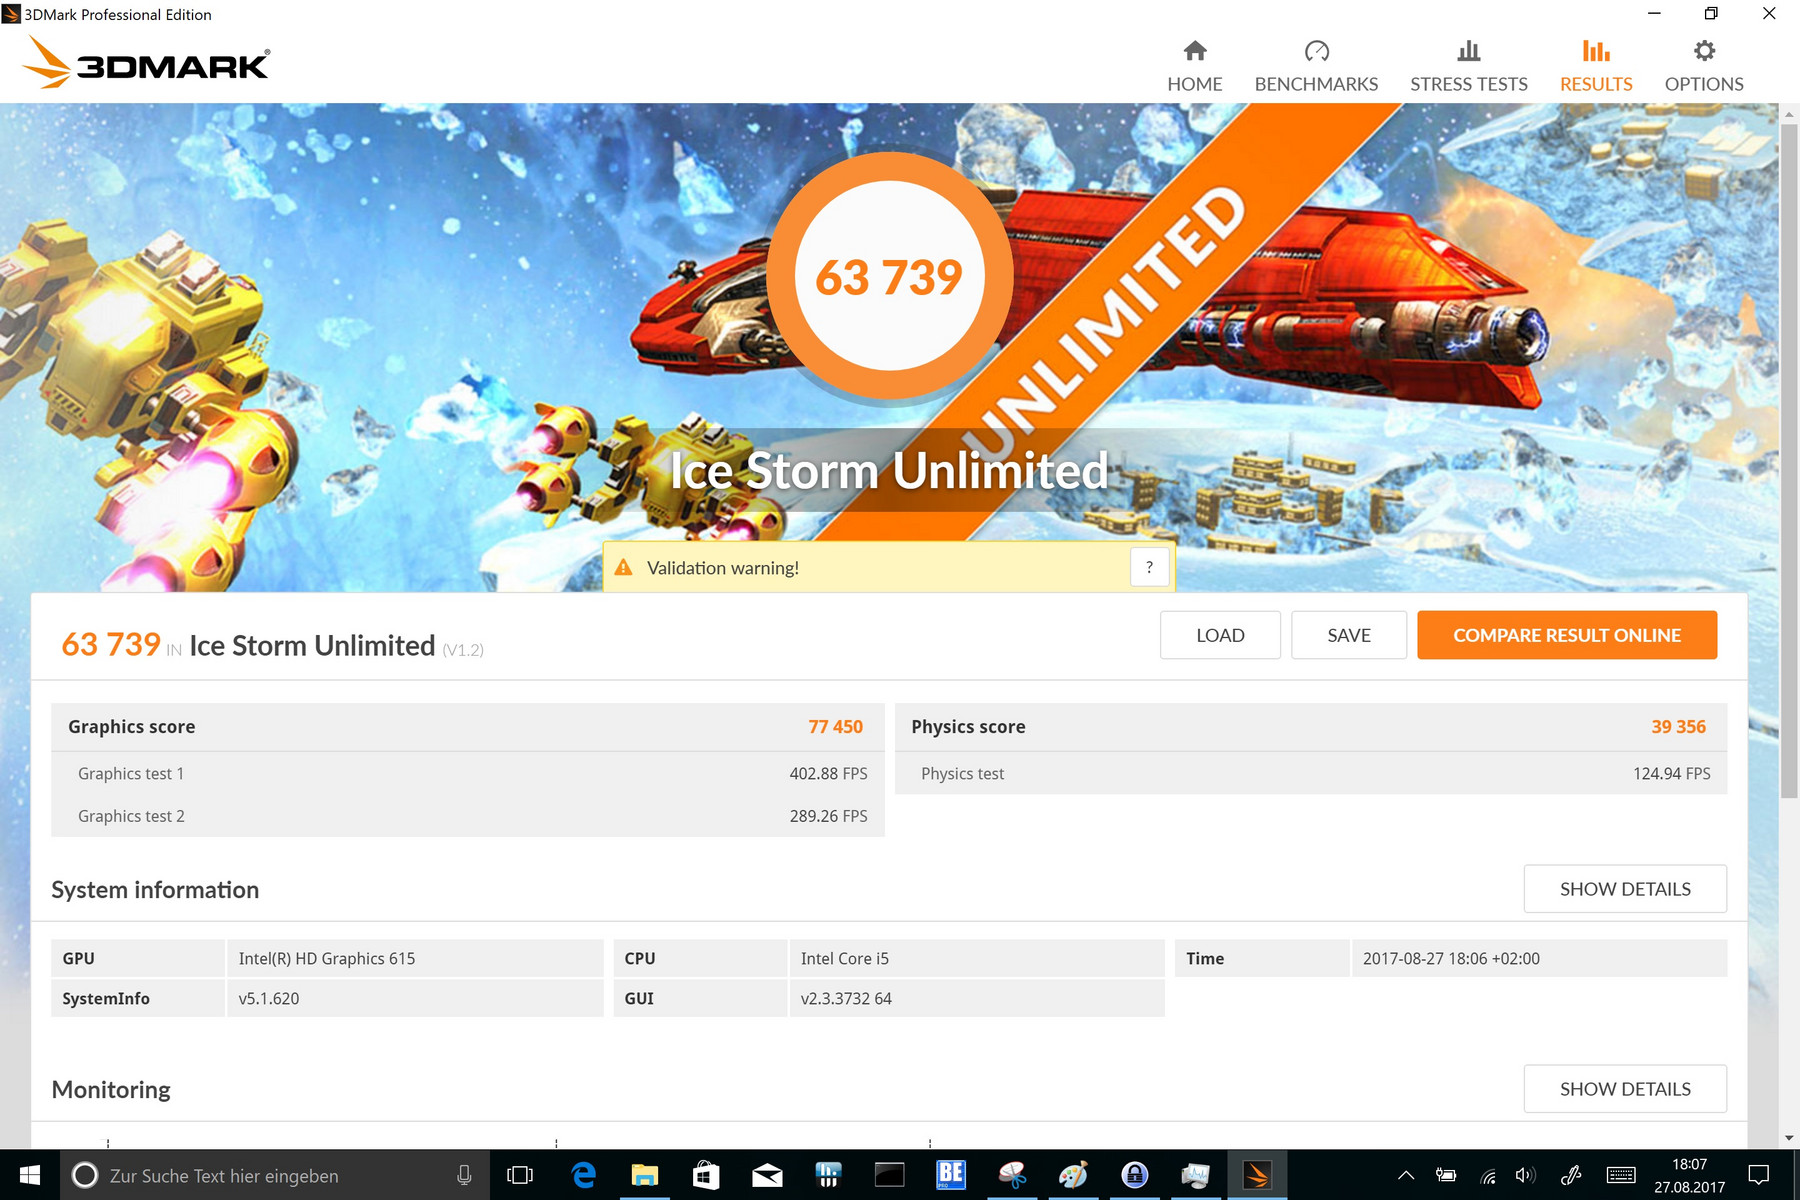
| 3DMark Ice Storm Standard Score | 46353 punten | |
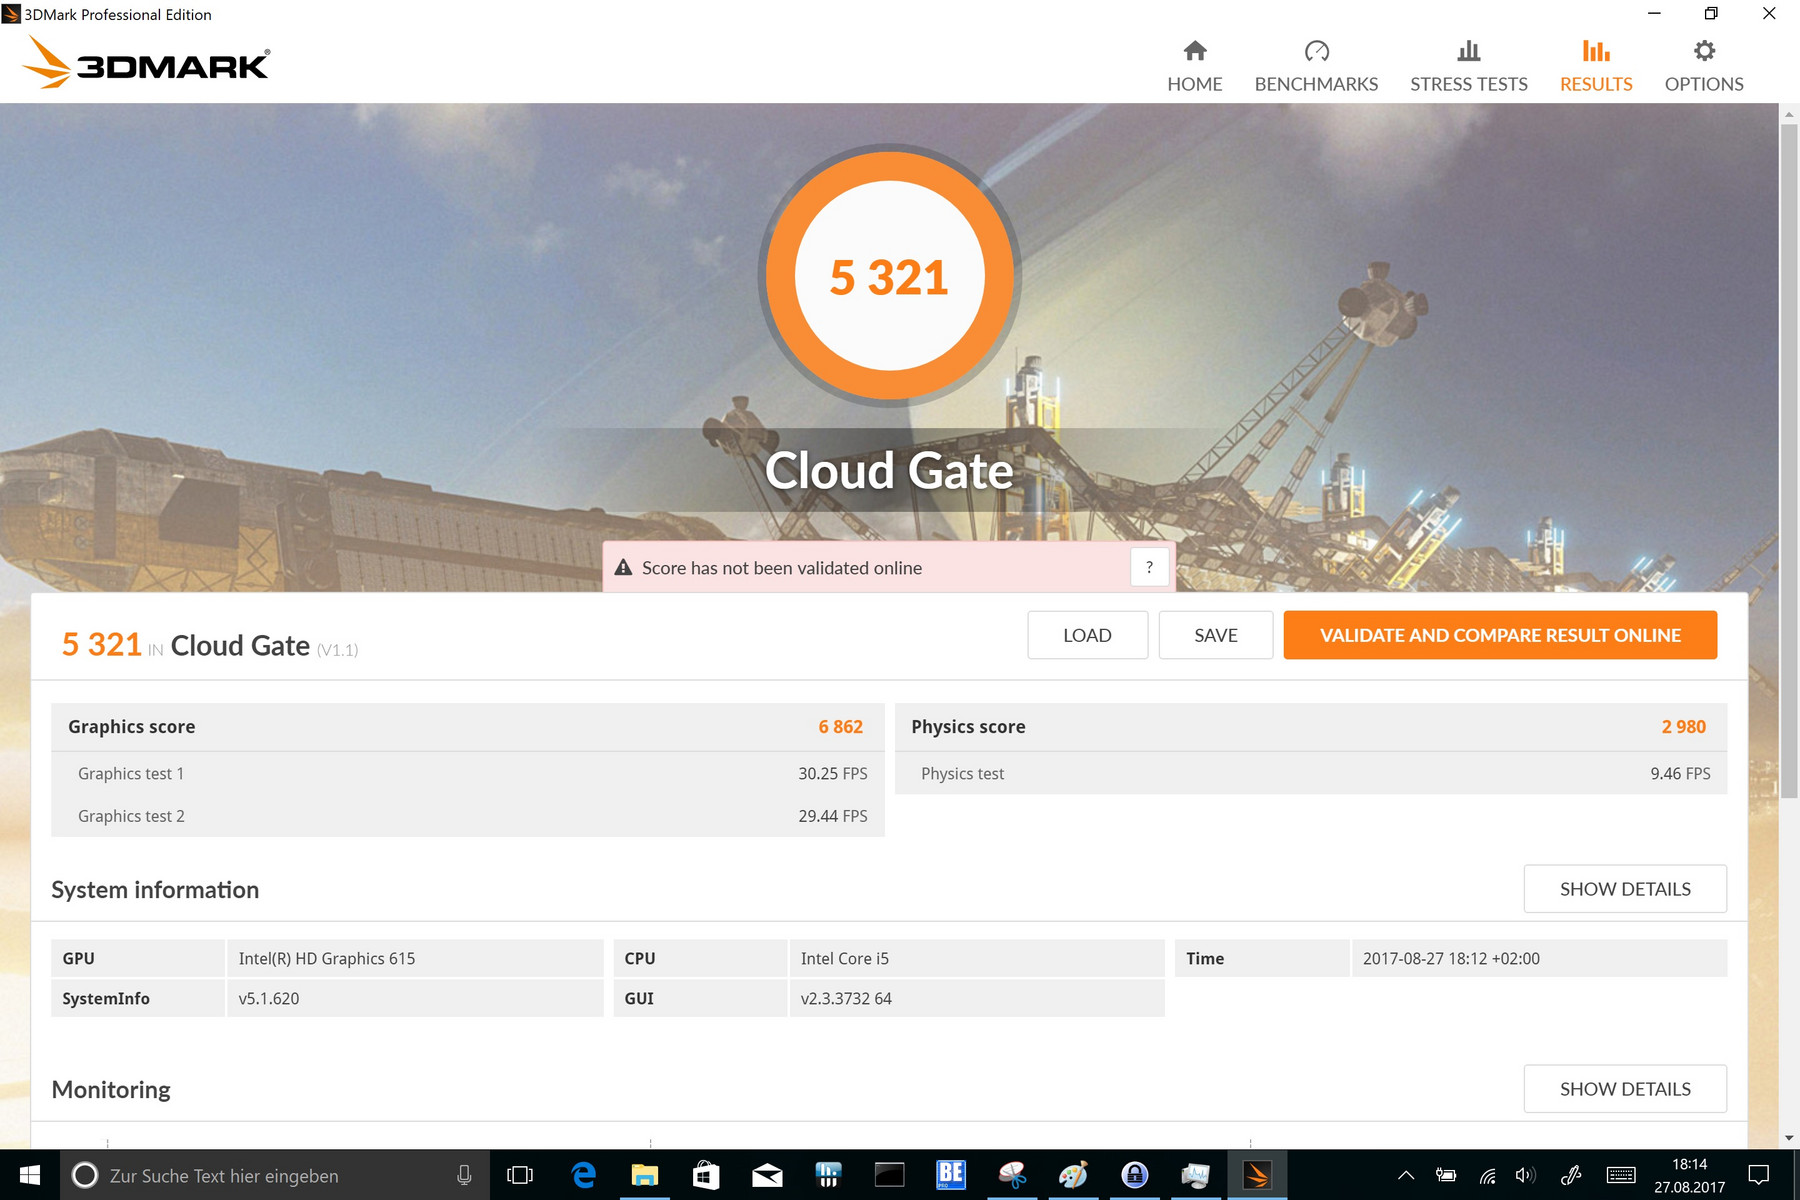
| 3DMark Cloud Gate Standard Score | 5321 punten | |
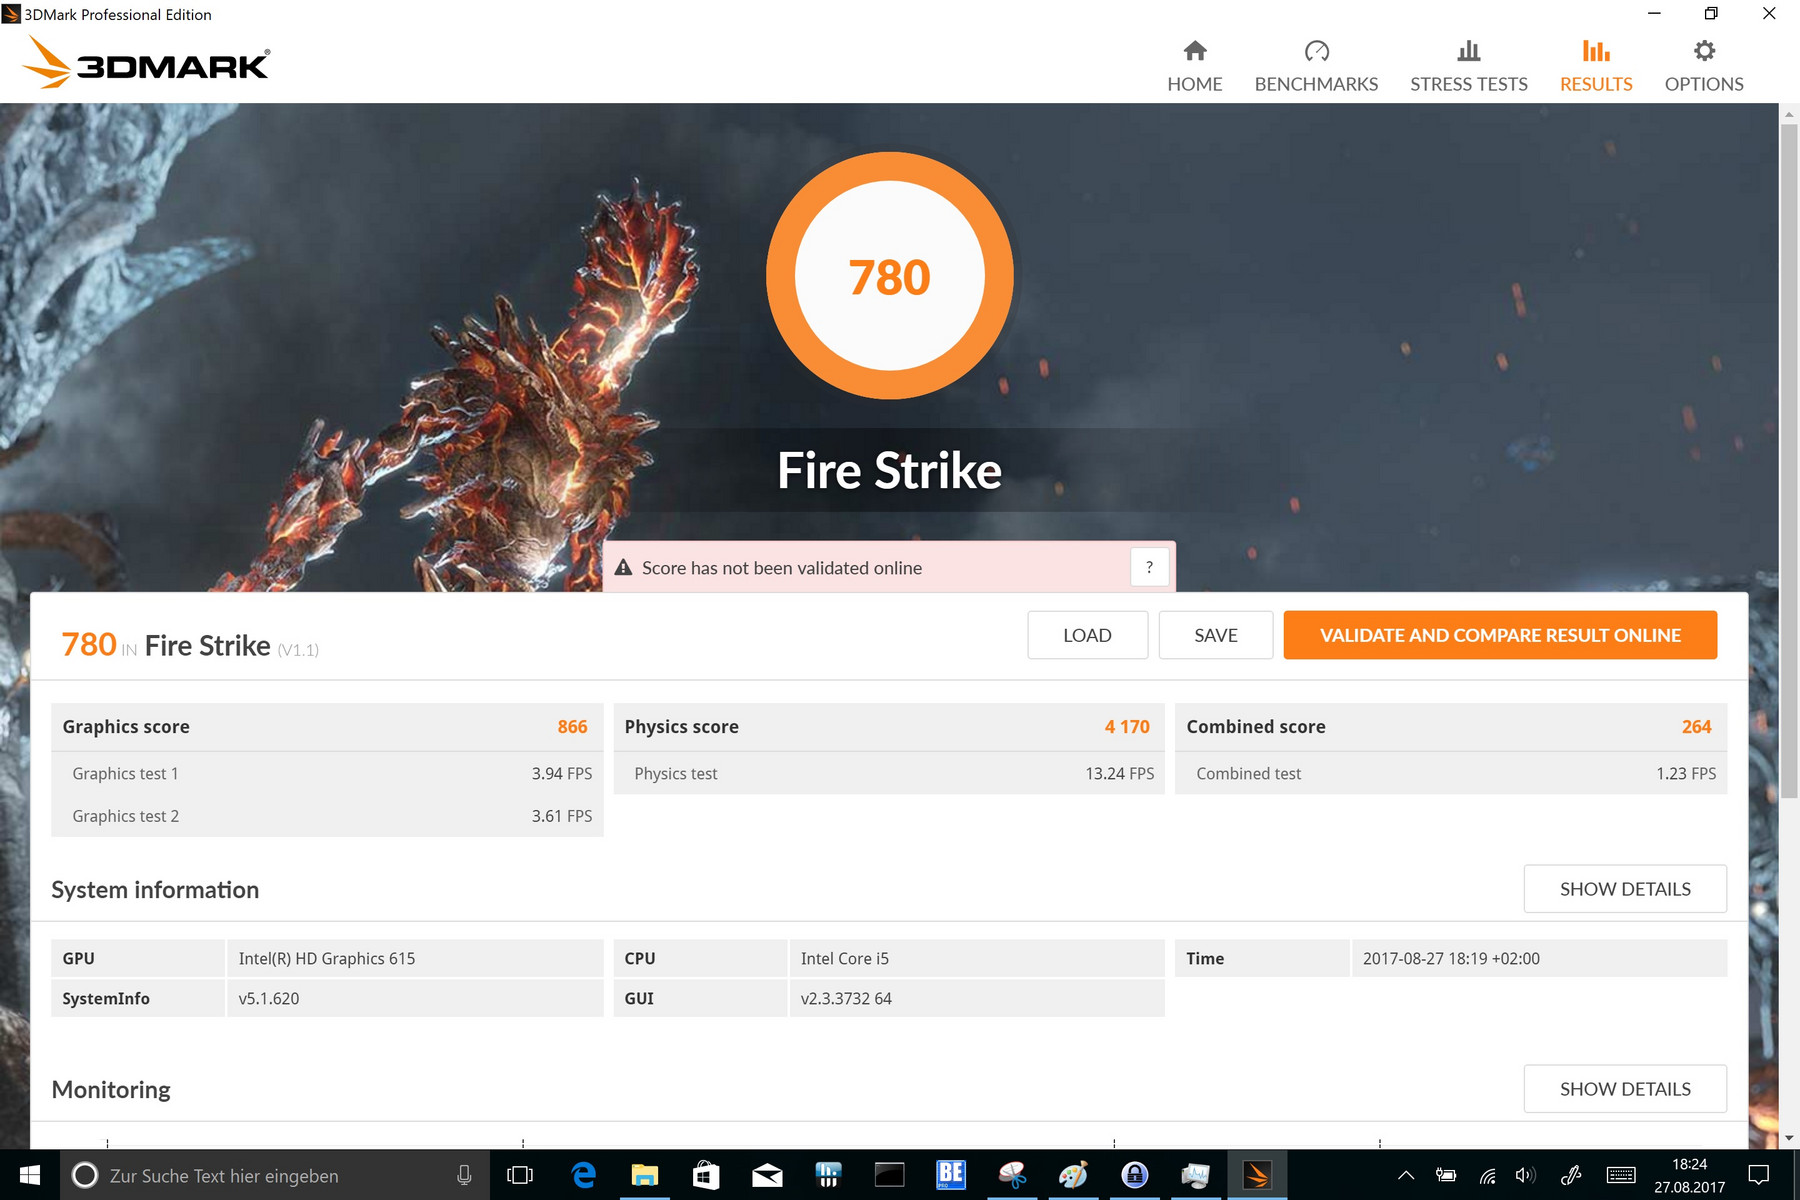
| 3DMark Fire Strike Score | 780 punten | |
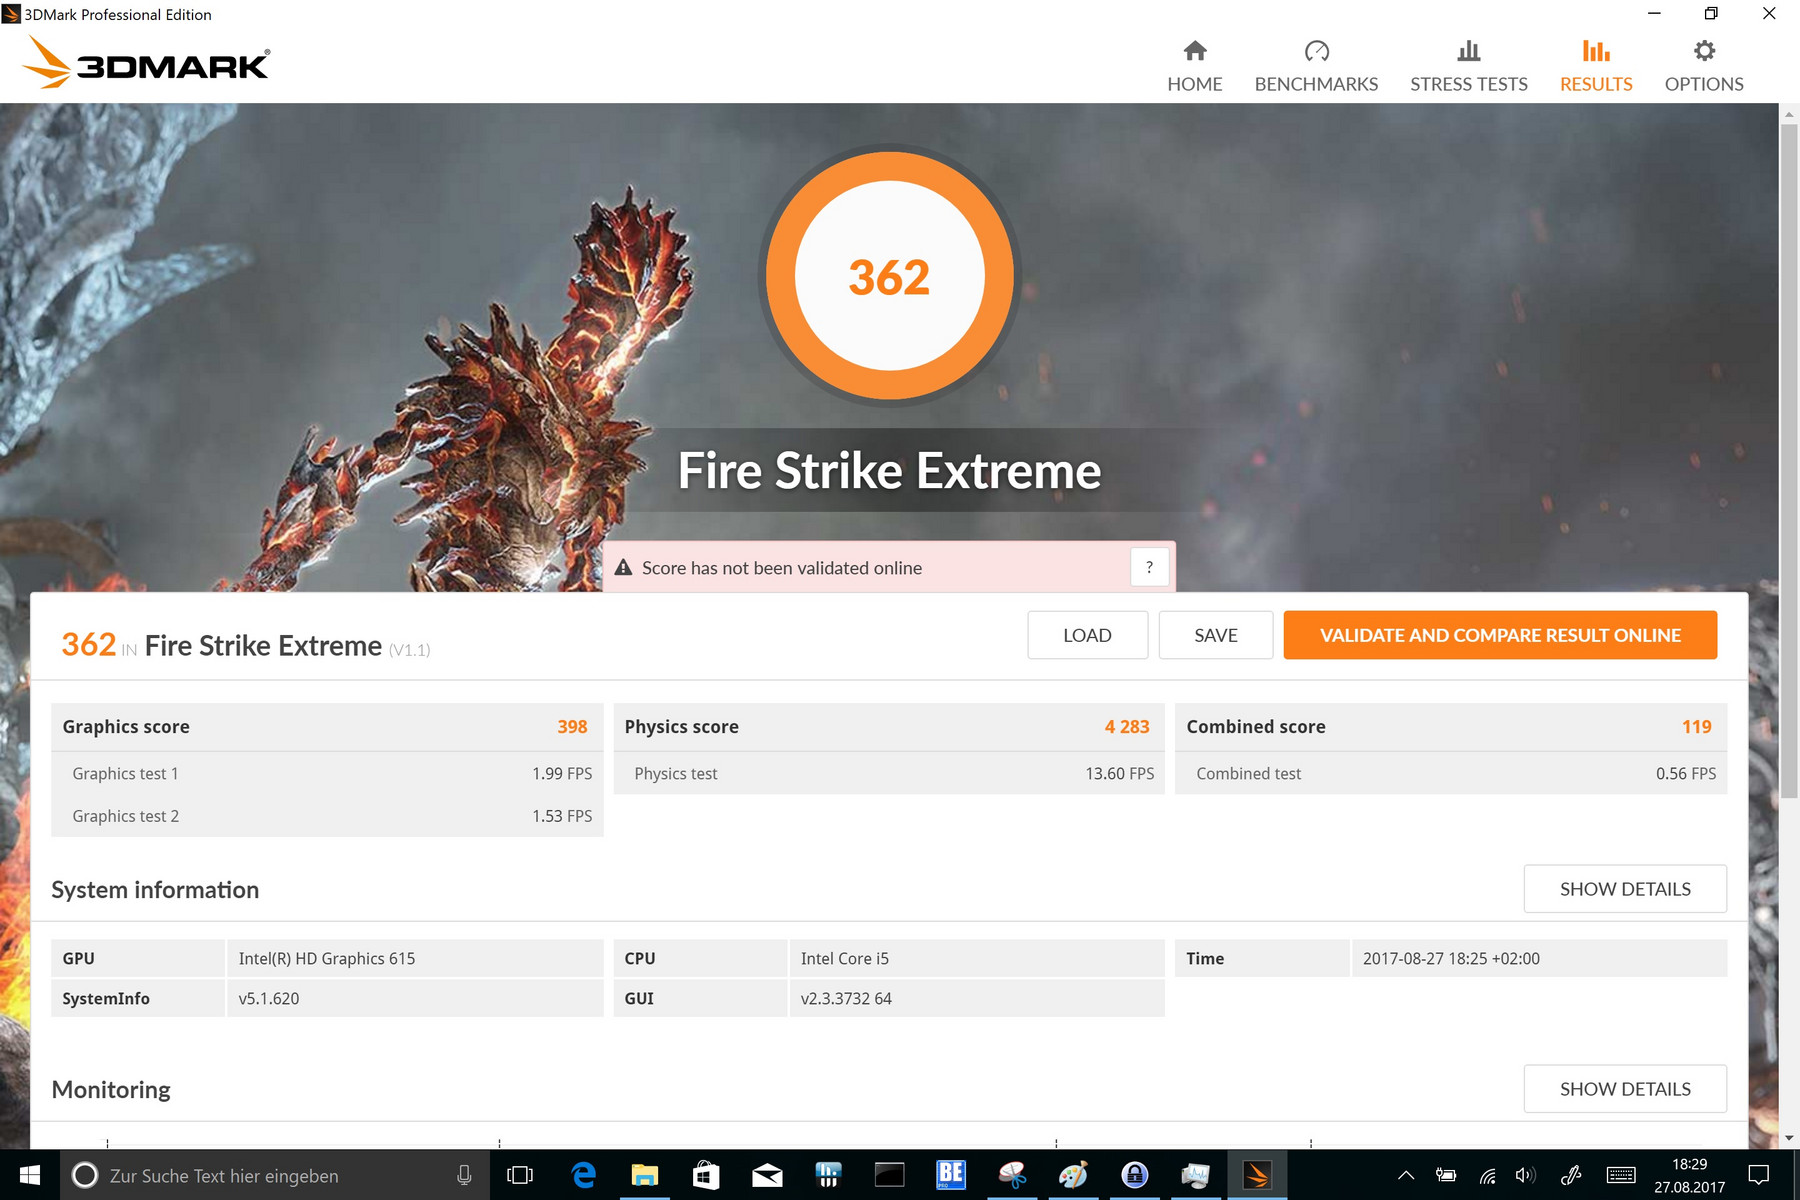
| 3DMark Fire Strike Extreme Score | 362 punten | |
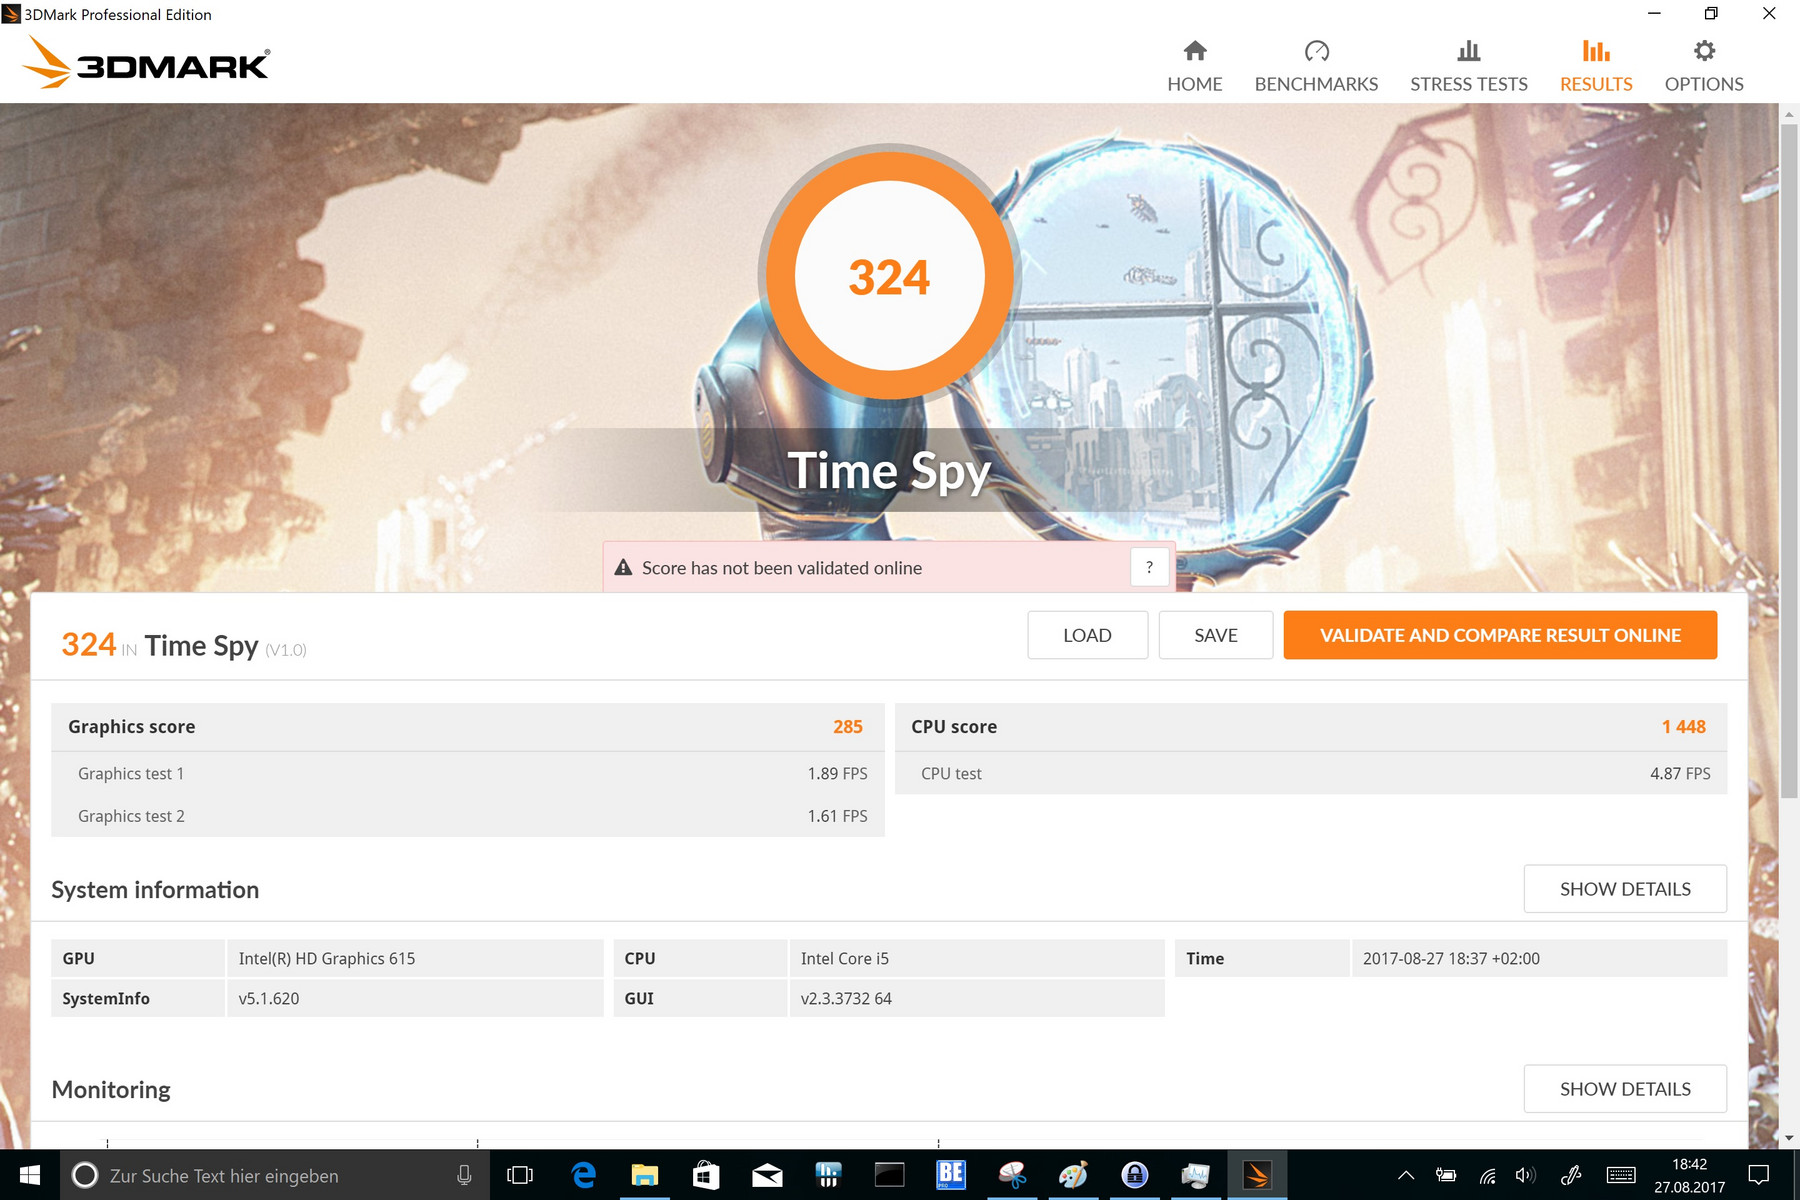
| 3DMark Time Spy Score | 324 punten | |
Help | ||
| lage | gem. | hoge | ultra | |
|---|---|---|---|---|
| BioShock Infinite (2013) | 40.4 | 25.8 | 21.7 | 6.4 |
| Battlefield 4 (2013) | 32.7 | 19.8 | 18.3 | |
| Rise of the Tomb Raider (2016) | 13.8 | 9.1 |
(-) De maximumtemperatuur aan de bovenzijde bedraagt 46.8 °C / 116 F, vergeleken met het gemiddelde van 35.4 °C / 96 F, variërend van 19.6 tot 60 °C voor de klasse Convertible.
(-) De bodem warmt op tot een maximum van 49.6 °C / 121 F, vergeleken met een gemiddelde van 36.9 °C / 98 F
(+) Bij onbelast gebruik bedraagt de gemiddelde temperatuur voor de bovenzijde 28 °C / 82 F, vergeleken met het apparaatgemiddelde van 30.3 °C / 87 F.
(-) De palmsteunen en het touchpad kunnen zeer heet aanvoelen met een maximum van ###max## °C / 107.8 F.
(-) De gemiddelde temperatuur van de handpalmsteun van soortgelijke toestellen bedroeg 28 °C / 82.4 F (-14.1 °C / -25.4 F).
| Dell Latitude 7285 i5-7Y57, HD Graphics 615 | Microsoft Surface Pro (2017) i5 i5-7300U, HD Graphics 620 | Lenovo ThinkPad X1 Yoga 2017 20JES03T00 i7-7600U, HD Graphics 620 | Dell Latitude 12 5285 2-in-1 i7-7600U, HD Graphics 620 | Acer Switch 5 SW512-52-5819 i7-7500U, HD Graphics 620 | Toshiba Portege X20W-D-10R i7-7600U, HD Graphics 620 | HP Elite x2 1012 G1 6Y54, HD Graphics 515 | |
|---|---|---|---|---|---|---|---|
| Heat | -0% | 11% | 5% | 0% | 28% | 8% | |
| Maximum Upper Side * (°C) | 46.8 | 39.2 16% | 47.5 -1% | 38.2 18% | 44.7 4% | 35.7 24% | 39 17% |
| Maximum Bottom * (°C) | 49.6 | 40.3 19% | 44.8 10% | 48.6 2% | 47.5 4% | 24.2 51% | 41.2 17% |
| Idle Upper Side * (°C) | 30.1 | 37 -23% | 23.7 21% | 29.6 2% | 29.7 1% | 23.4 22% | 29.5 2% |
| Idle Bottom * (°C) | 28.5 | 32.3 -13% | 24.6 14% | 28.8 -1% | 30.7 -8% | 24.2 15% | 29.8 -5% |
* ... kleiner is beter
Dell Latitude 7285 audioanalyse
(-) | niet erg luide luidsprekers (69.1 dB)
Bas 100 - 315 Hz
(±) | verminderde zeebaars - gemiddeld 13.6% lager dan de mediaan
(±) | lineariteit van de lage tonen is gemiddeld (8.1% delta ten opzichte van de vorige frequentie)
Midden 400 - 2000 Hz
(+) | evenwichtige middens - slechts 3.4% verwijderd van de mediaan
(+) | de middentonen zijn lineair (5.9% delta ten opzichte van de vorige frequentie)
Hoog 2 - 16 kHz
(+) | evenwichtige hoogtepunten - slechts 0.9% verwijderd van de mediaan
(+) | de hoge tonen zijn lineair (4% delta naar de vorige frequentie)
Algemeen 100 - 16.000 Hz
(±) | lineariteit van het totale geluid is gemiddeld (17.4% verschil met de mediaan)
Vergeleken met dezelfde klasse
» 33% van alle geteste apparaten in deze klasse waren beter, 8% vergelijkbaar, 59% slechter
» De beste had een delta van 6%, het gemiddelde was 20%, de slechtste was 57%
Vergeleken met alle geteste toestellen
» 33% van alle geteste apparaten waren beter, 8% gelijk, 59% slechter
» De beste had een delta van 4%, het gemiddelde was 24%, de slechtste was 134%
Lenovo ThinkPad X1 Yoga 2017 20JES03T00 audioanalyse
(±) | luidspreker luidheid is gemiddeld maar goed (73.3 dB)
Bas 100 - 315 Hz
(-) | bijna geen lage tonen - gemiddeld 19.1% lager dan de mediaan
(±) | lineariteit van de lage tonen is gemiddeld (8.6% delta ten opzichte van de vorige frequentie)
Midden 400 - 2000 Hz
(+) | evenwichtige middens - slechts 2.6% verwijderd van de mediaan
(±) | lineariteit van de middentonen is gemiddeld (8% delta ten opzichte van de vorige frequentie)
Hoog 2 - 16 kHz
(+) | evenwichtige hoogtepunten - slechts 2.6% verwijderd van de mediaan
(+) | de hoge tonen zijn lineair (6.6% delta naar de vorige frequentie)
Algemeen 100 - 16.000 Hz
(±) | lineariteit van het totale geluid is gemiddeld (21.7% verschil met de mediaan)
Vergeleken met dezelfde klasse
» 59% van alle geteste apparaten in deze klasse waren beter, 10% vergelijkbaar, 31% slechter
» De beste had een delta van 6%, het gemiddelde was 20%, de slechtste was 57%
Vergeleken met alle geteste toestellen
» 61% van alle geteste apparaten waren beter, 7% gelijk, 31% slechter
» De beste had een delta van 4%, het gemiddelde was 24%, de slechtste was 134%
| Uit / Standby | |
| Inactief | |
| Belasting |
|
Key:
min: | |
| Dell Latitude 7285 i5-7Y57, HD Graphics 615, Toshiba KBG20ZMS256G, IPS LED, 2880x1920, 12.3" | Microsoft Surface Pro (2017) i5 i5-7300U, HD Graphics 620, Samsung PM971 KUS030202M, IPS, 2736x1824, 12.3" | Lenovo ThinkPad X1 Yoga 2017 20JES03T00 i7-7600U, HD Graphics 620, Samsung SSD PM961 1TB M.2 PCIe 3.0 x4 NVMe (MZVLW1T0), OLED, 2560x1440, 14" | Dell Latitude 12 5285 2-in-1 i7-7600U, HD Graphics 620, Samsung PM961 MZVLW256HEHP, IPS, 1920x1280, 12.3" | Acer Switch 5 SW512-52-5819 i7-7500U, HD Graphics 620, Intel SSD 600p SSDPEKKW512G7, IPS, 2160x1440, 12" | Toshiba Portege X20W-D-10R i7-7600U, HD Graphics 620, Toshiba SG5 THNSNK512GVN8, IPS, 1920x1080, 12.5" | HP Elite x2 1012 G1 6Y54, HD Graphics 515, Liteon L8H-256V2G, IPS, 1920x1280, 12.1" | |
|---|---|---|---|---|---|---|---|
| Power Consumption | 21% | -11% | 16% | 18% | 35% | 22% | |
| Idle Minimum * (Watt) | 6.6 | 3.6 45% | 4.9 26% | 2.85 57% | 3.86 42% | 3.4 48% | 3.7 44% |
| Idle Average * (Watt) | 9.3 | 8.1 13% | 7.6 18% | 6.76 27% | 6.4 31% | 5.8 38% | 6.8 27% |
| Idle Maximum * (Watt) | 10.2 | 8.7 15% | 13.8 -35% | 6.91 32% | 7.17 30% | 6.7 34% | 7.6 25% |
| Load Average * (Watt) | 25.1 | 25.5 -2% | 33.4 -33% | 32.88 -31% | 30.5 -22% | 21.4 15% | 22.5 10% |
| Load Maximum * (Watt) | 36.1 | 23.5 35% | 46.5 -29% | 37.41 -4% | 32.4 10% | 21.6 40% | 34.5 4% |
* ... kleiner is beter
| Dell Latitude 7285 i5-7Y57, HD Graphics 615, 54 Wh | Microsoft Surface Pro (2017) i5 i5-7300U, HD Graphics 620, 45 Wh | Lenovo ThinkPad X1 Yoga 2017 20JES03T00 i7-7600U, HD Graphics 620, 56 Wh | Dell Latitude 12 5285 2-in-1 i7-7600U, HD Graphics 620, 42 Wh | Acer Switch 5 SW512-52-5819 i7-7500U, HD Graphics 620, Wh | Toshiba Portege X20W-D-10R i7-7600U, HD Graphics 620, 44 Wh | HP Elite x2 1012 G1 6Y54, HD Graphics 515, 37 Wh | |
|---|---|---|---|---|---|---|---|
| Batterijduur | 32% | -12% | -1% | -27% | 25% | -5% | |
| Reader / Idle (h) | 17.2 | 17.6 2% | 13.1 -24% | 17.9 4% | 11.9 -31% | 16.7 -3% | 12.2 -29% |
| H.264 (h) | 6.2 | 6.8 10% | 7.2 16% | ||||
| WiFi v1.3 (h) | 6.5 | 12.4 91% | 6.1 -6% | 8.1 25% | 5.9 -9% | 12 85% | 7.4 14% |
| Load (h) | 2.7 | 2.8 4% | 2 -26% | 1.8 -33% | 1.6 -41% | 2.5 -7% | 2.2 -19% |
Pro
Contra

Dit is de verkorte versie van het originele artikel. Het volledige, Engelse testrapport vind je hier.
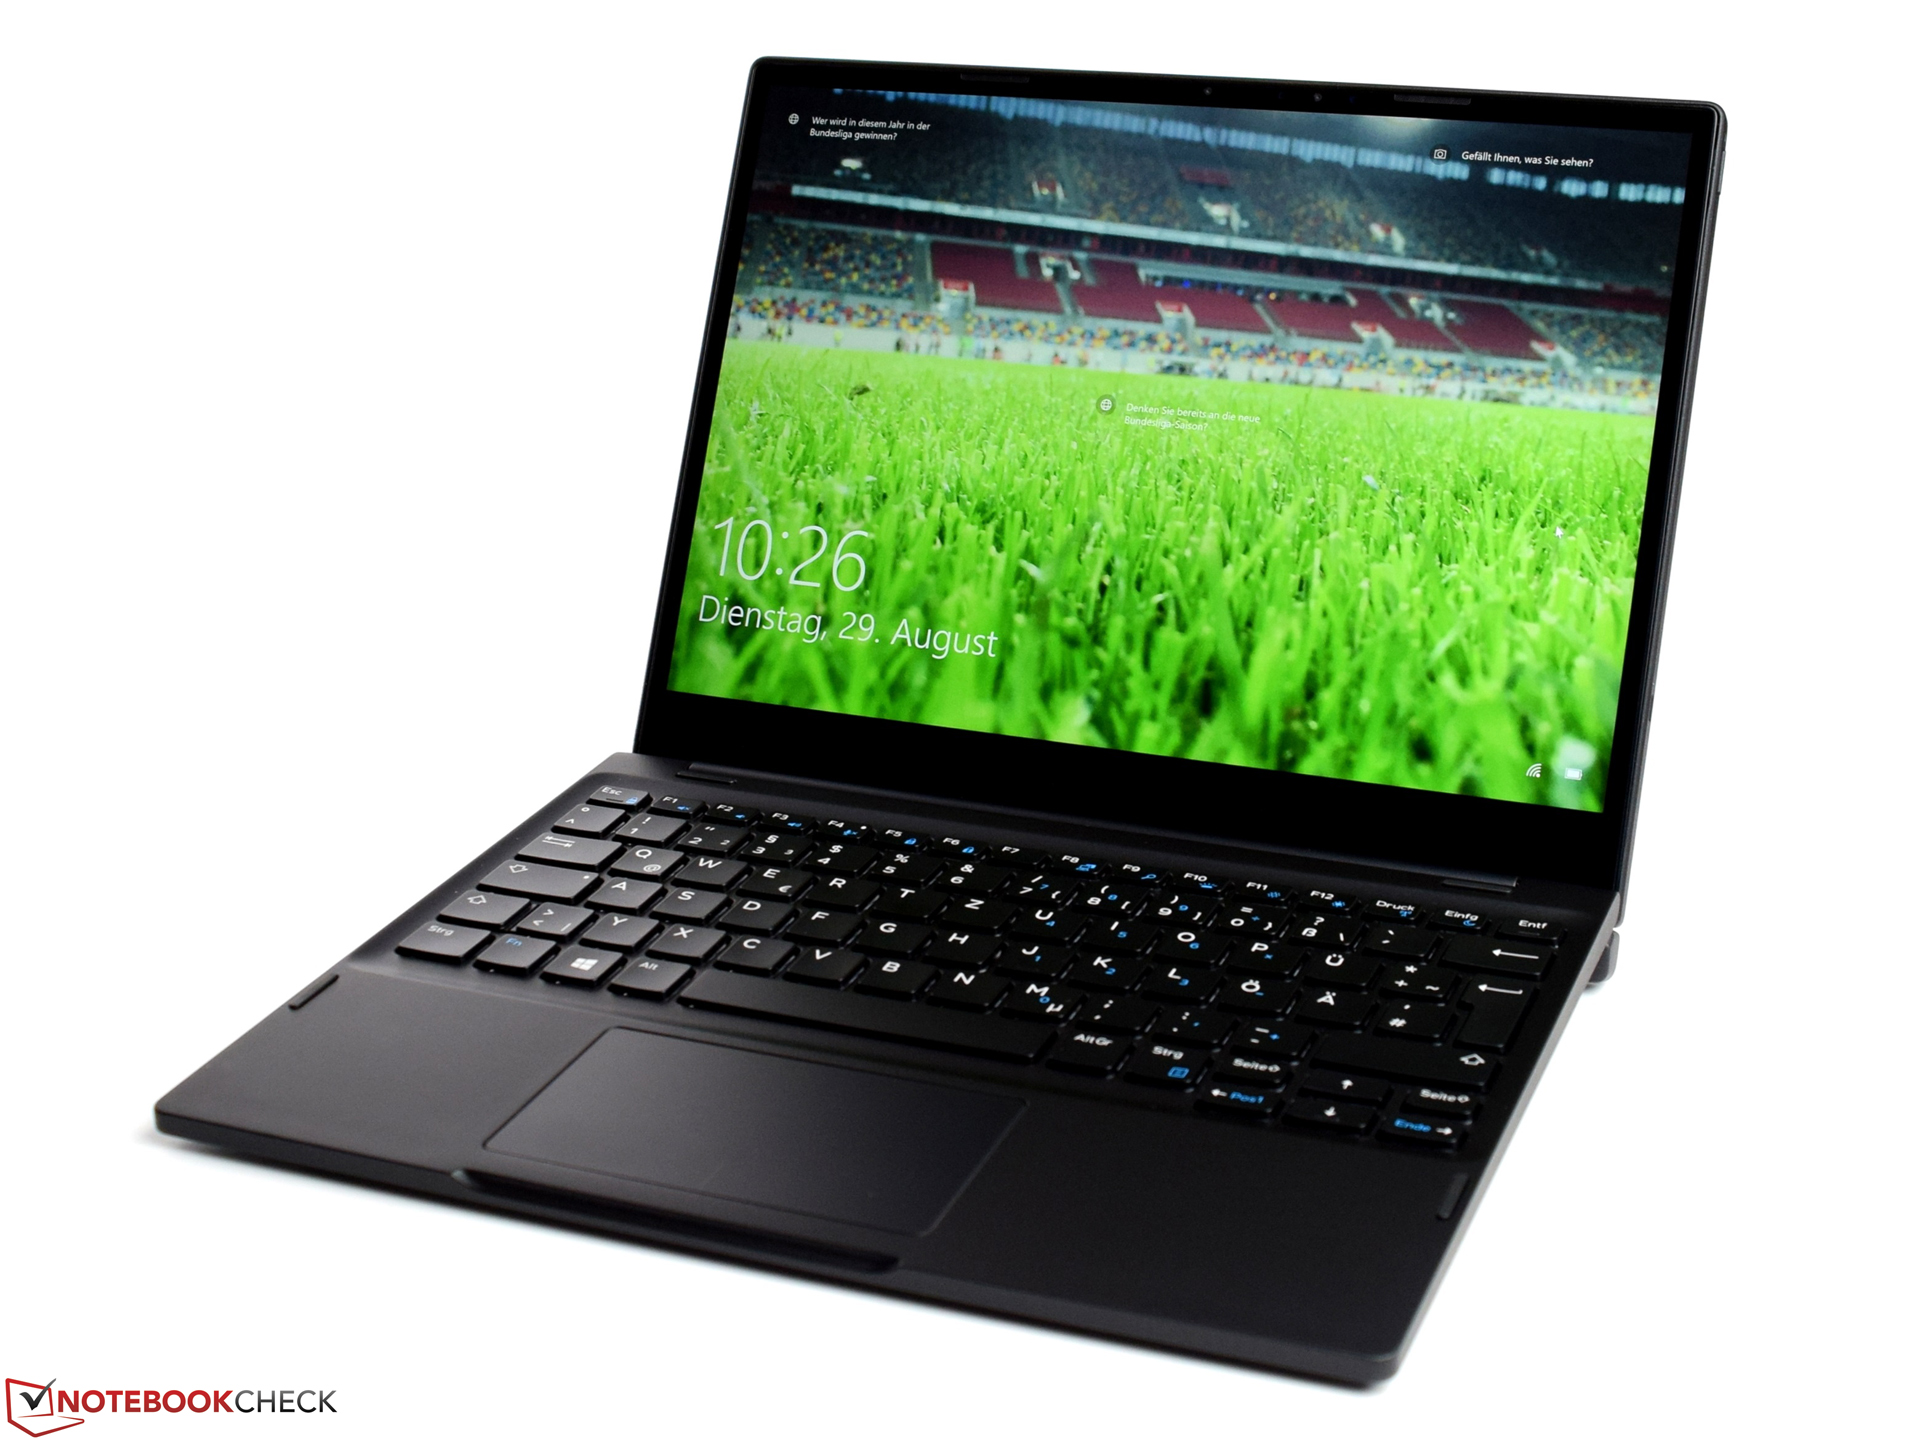
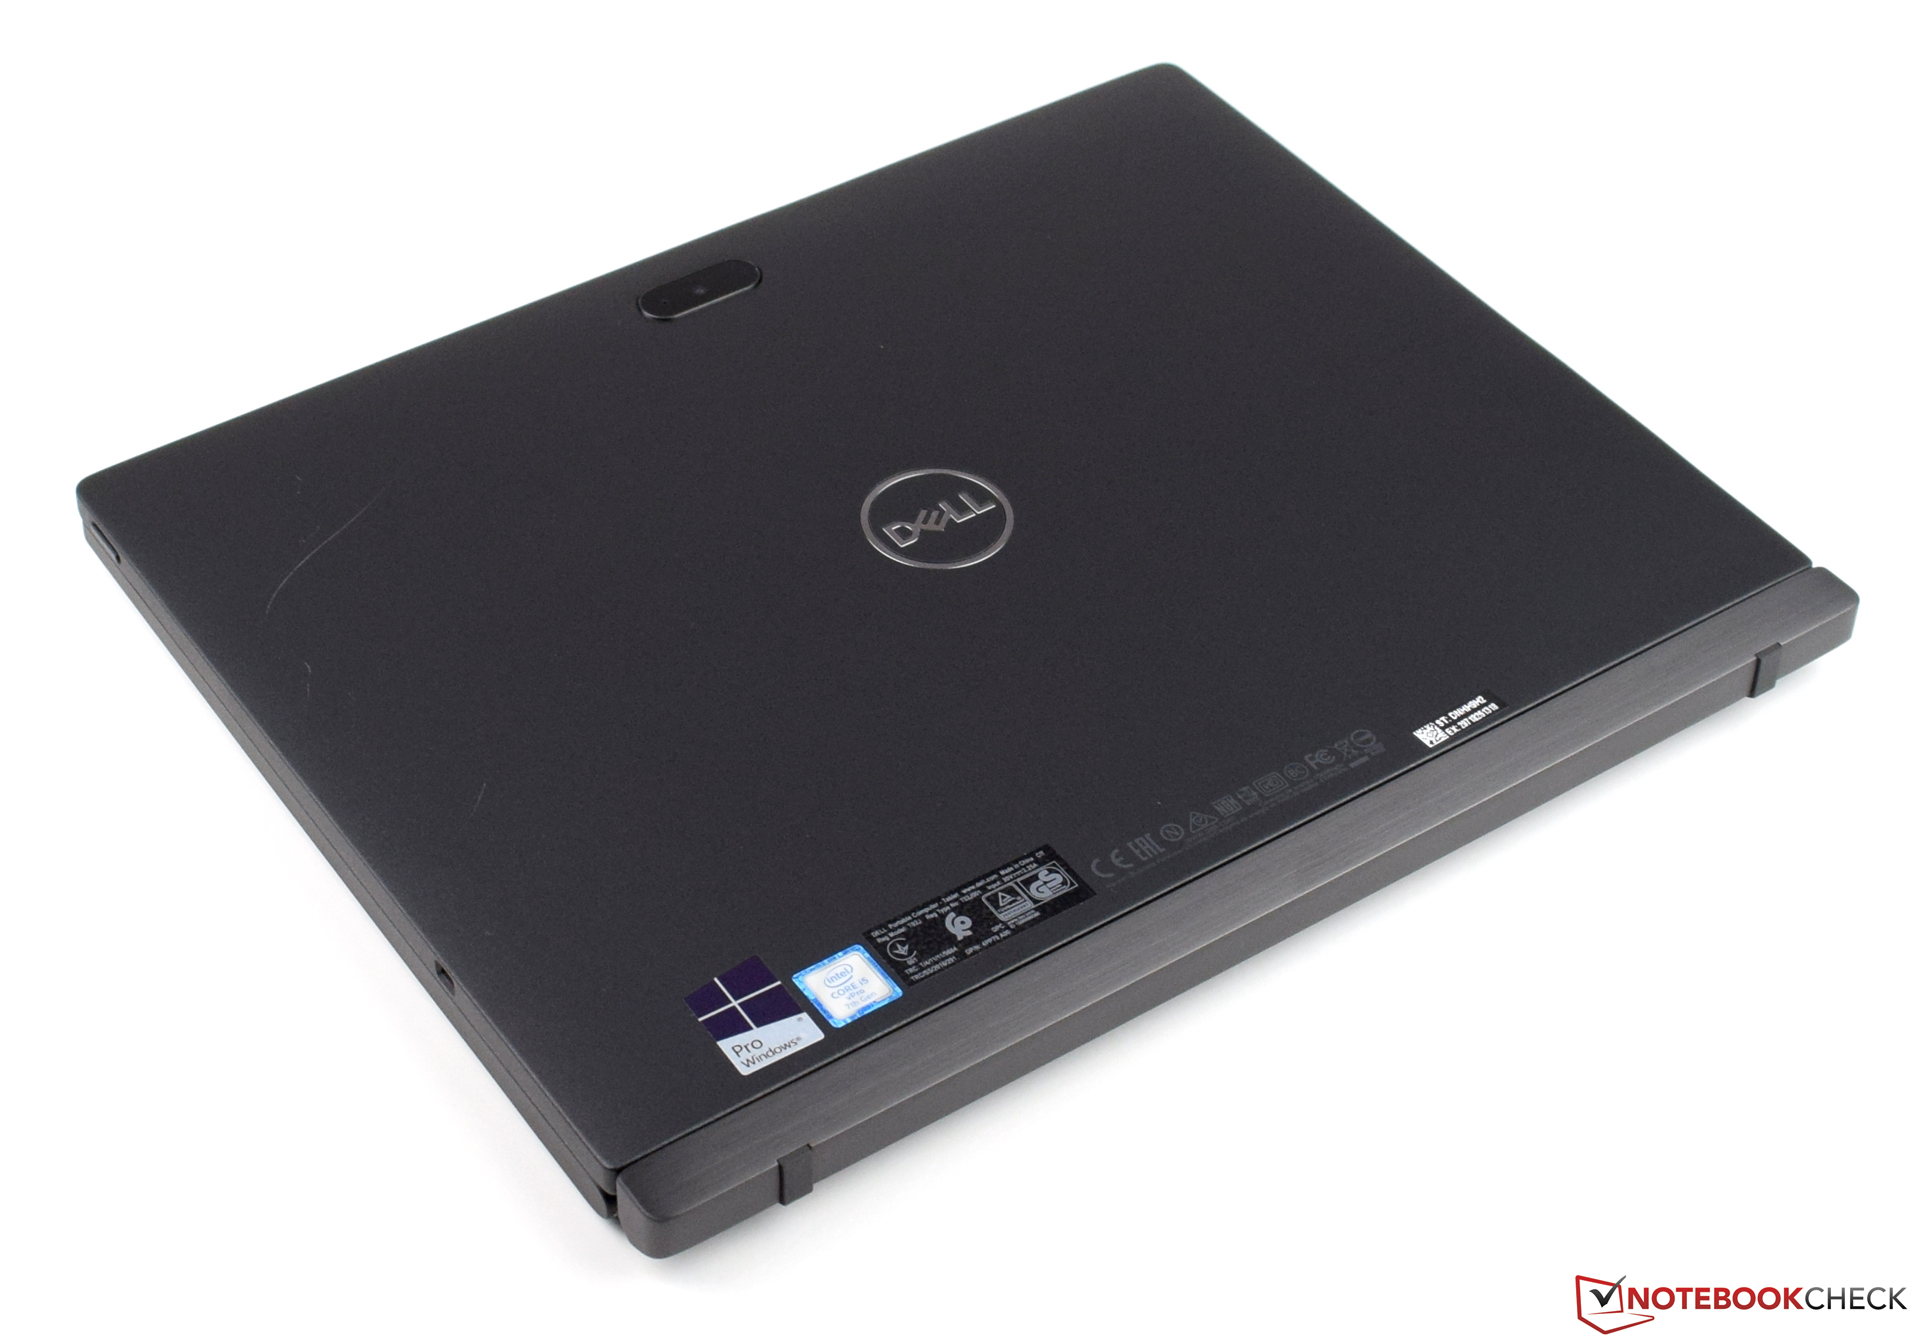
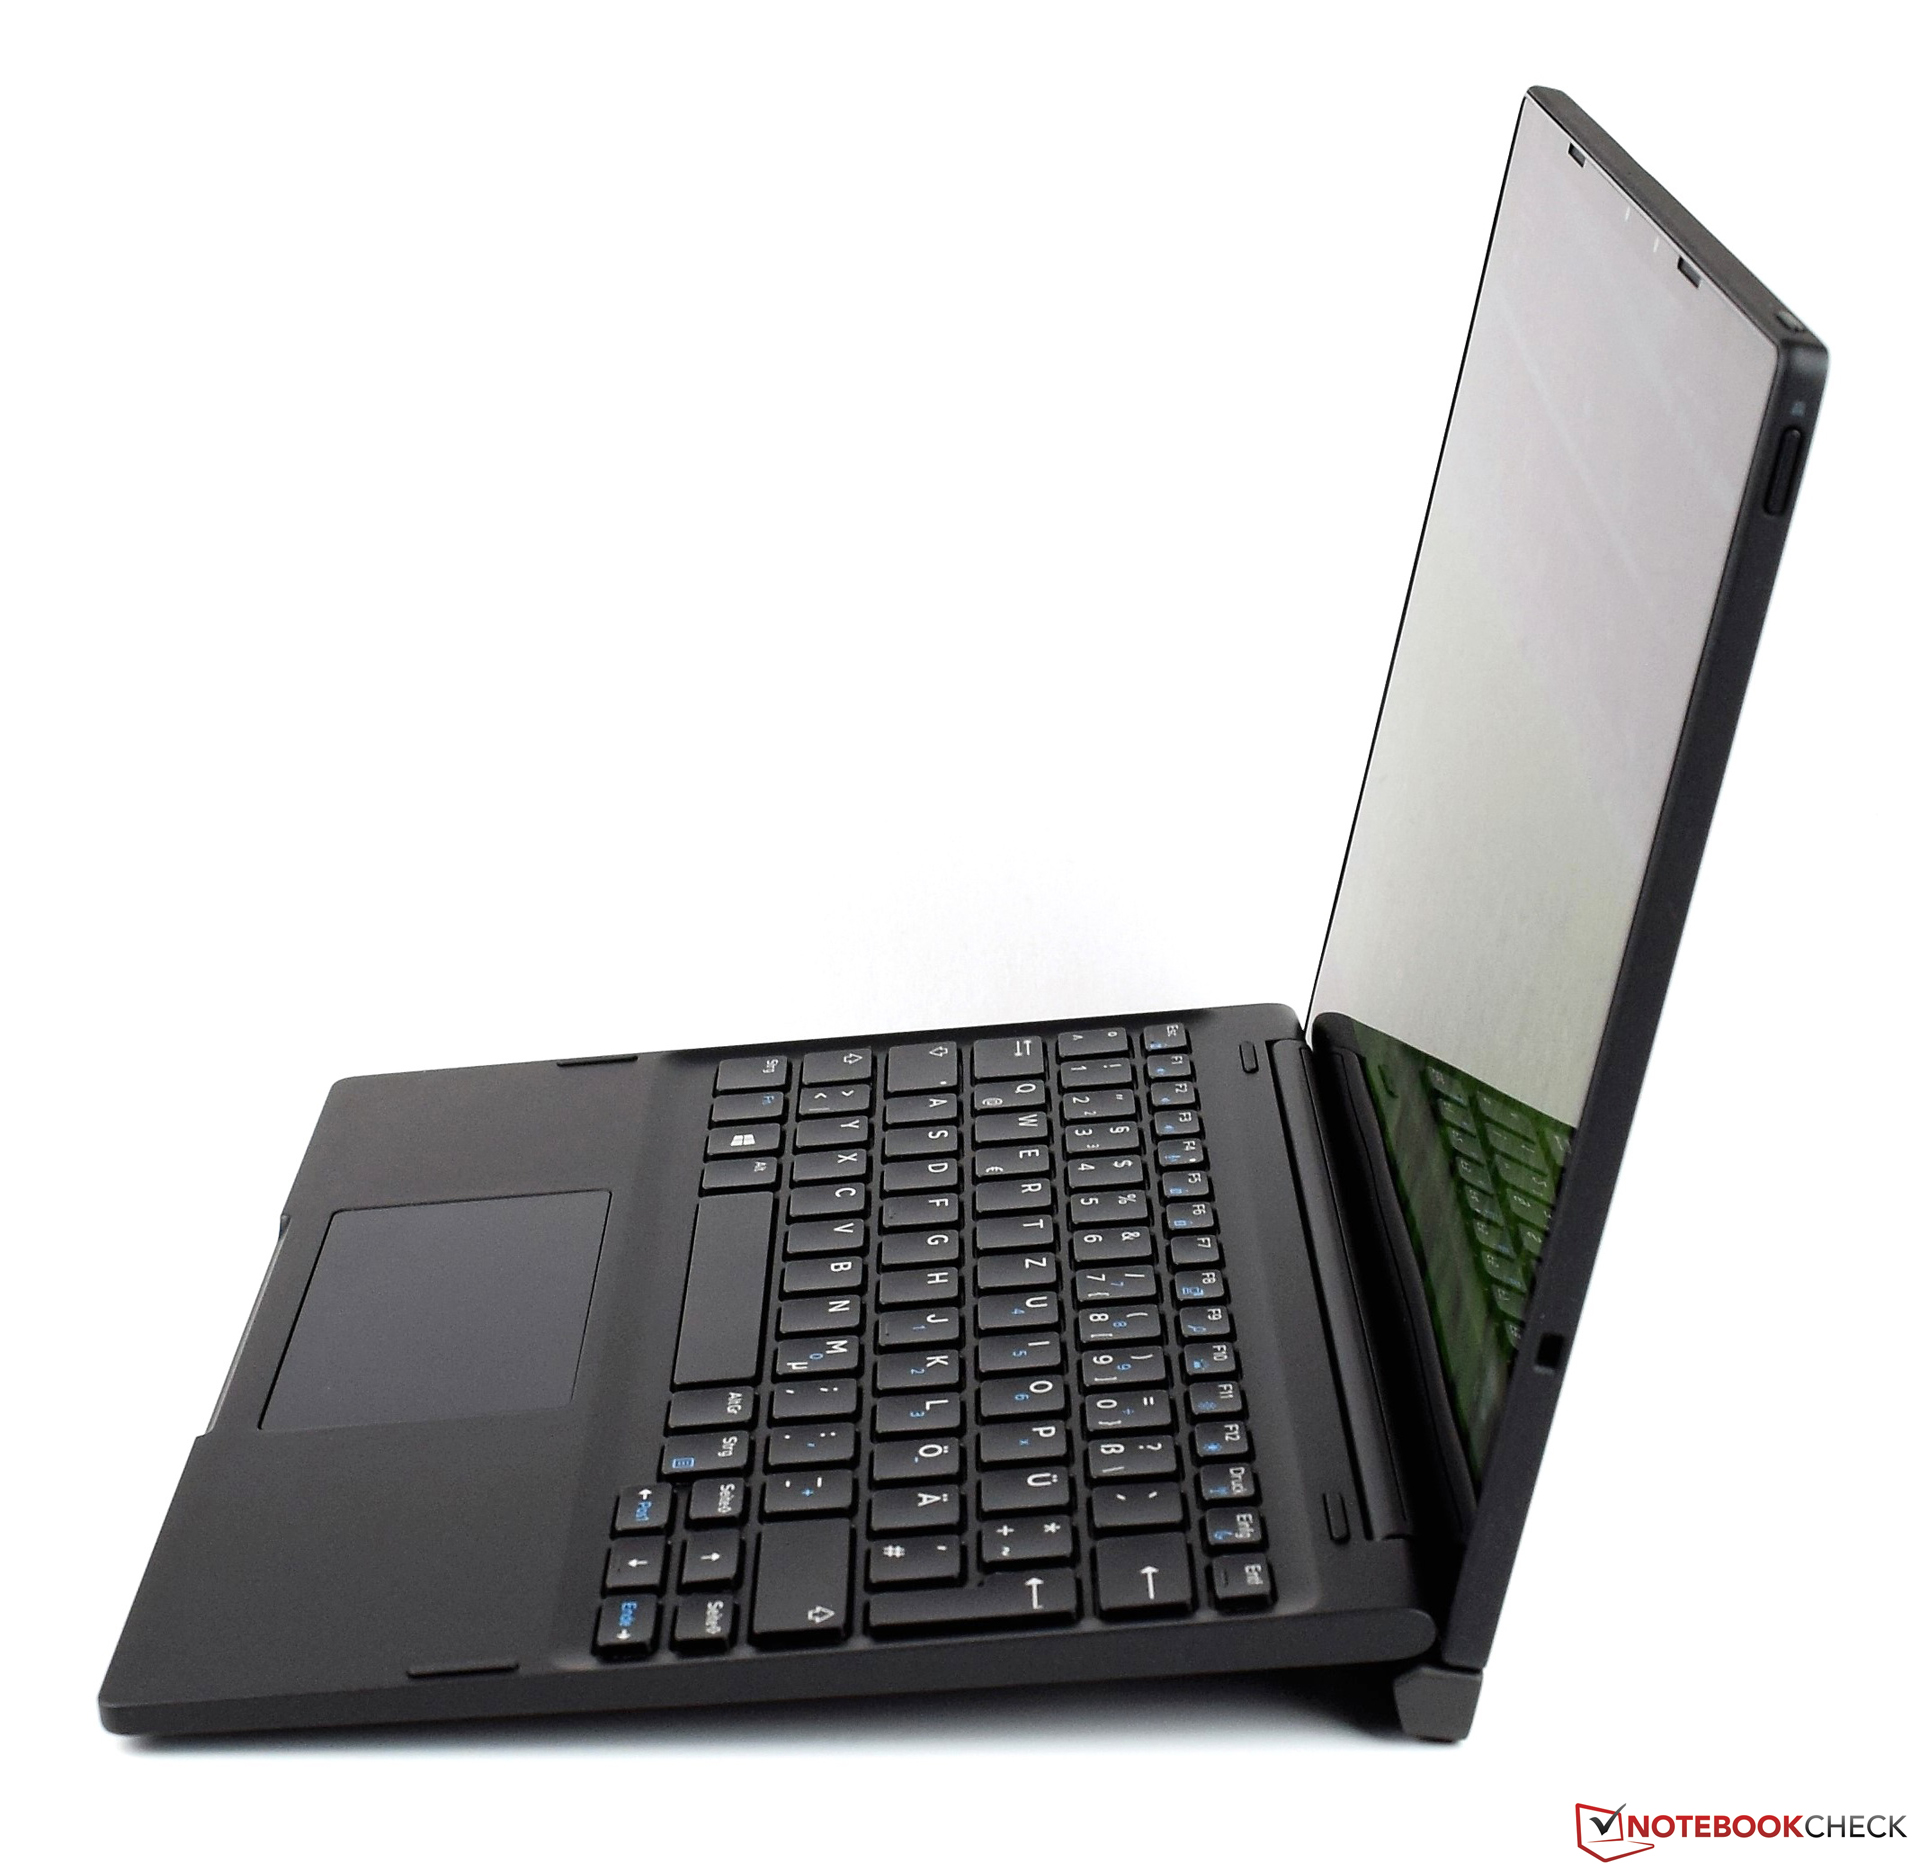
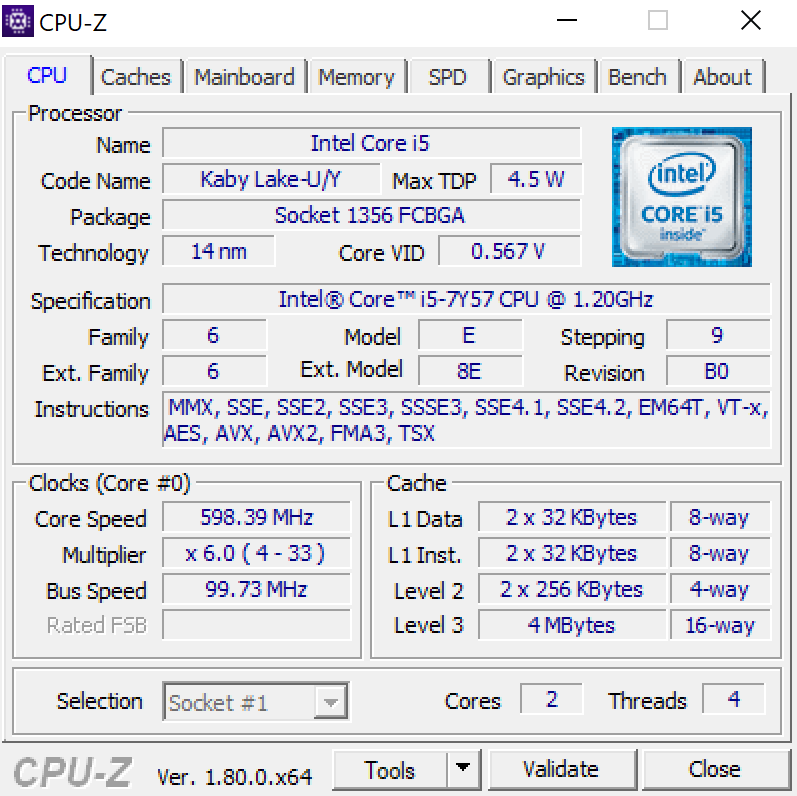
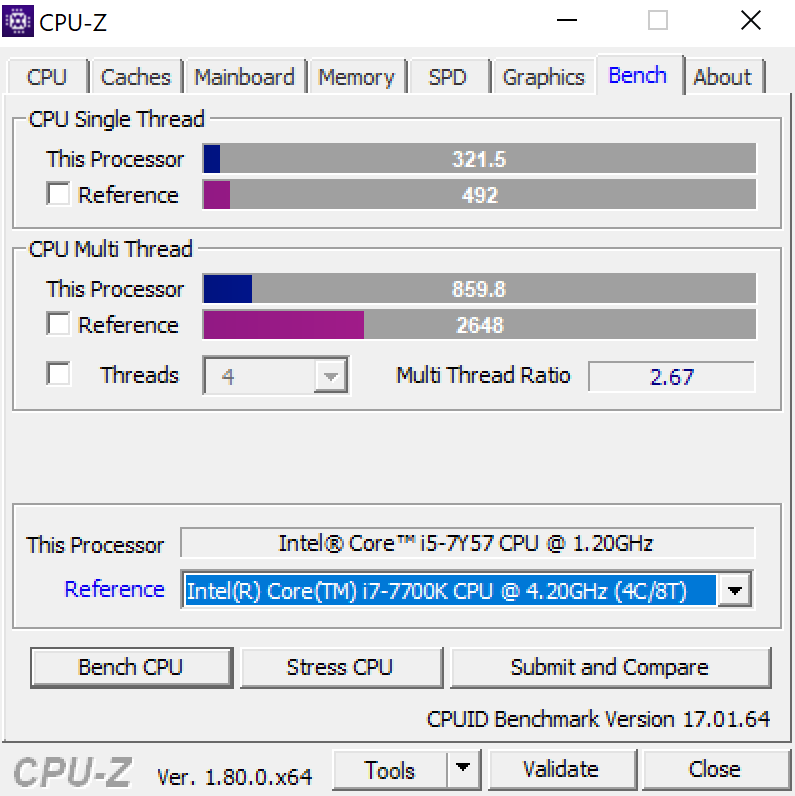
Met de Dell Latitude 7285 presenteert de fabrikant ons een erg hoge kwaliteit convertible met moderne componenten. De Intel Core i5-7Y57 biedt solide prestaties en kan alledaagse kantoorwerkzaamheden aan. De CPU kan ook multimedia toepassingen goed af. Op veel vlakken kan de zuinige SoC de snellere ULV processoren bijhouden. € 2.300 voor een apparaat met de uitrusting zoals we getest hebben is een behoorlijk bedrag. De klant krijgt daarvoor wel een foutloos geproduceerd apparaat, dat in alle opzichten high-end ademt.
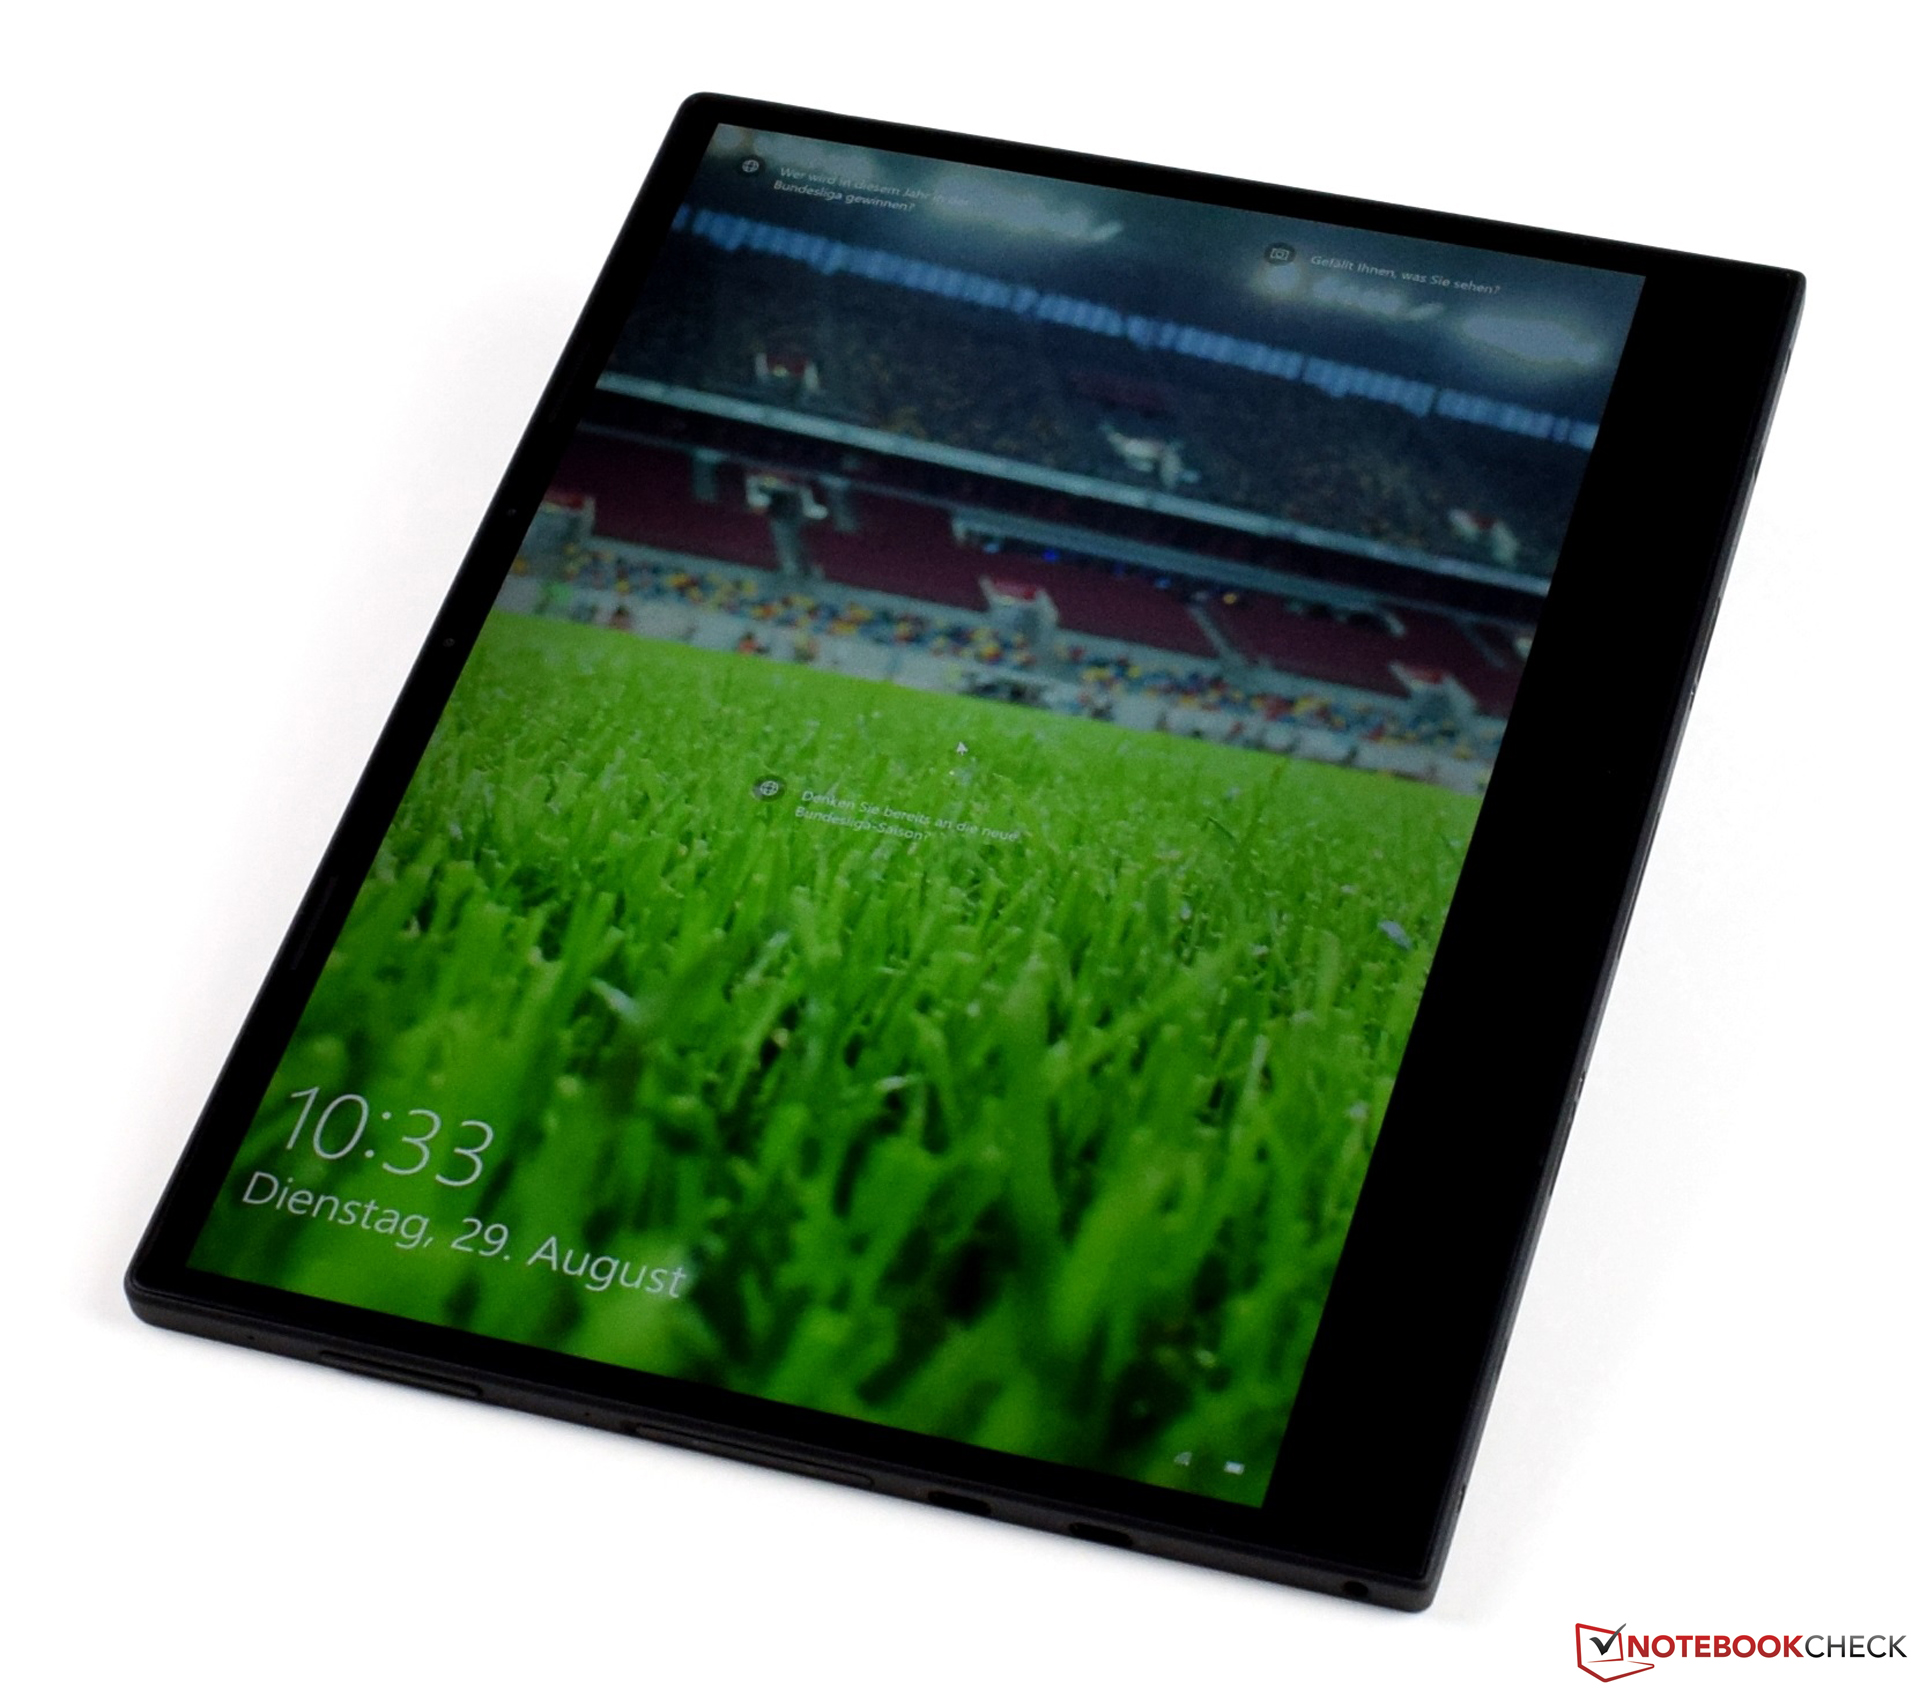
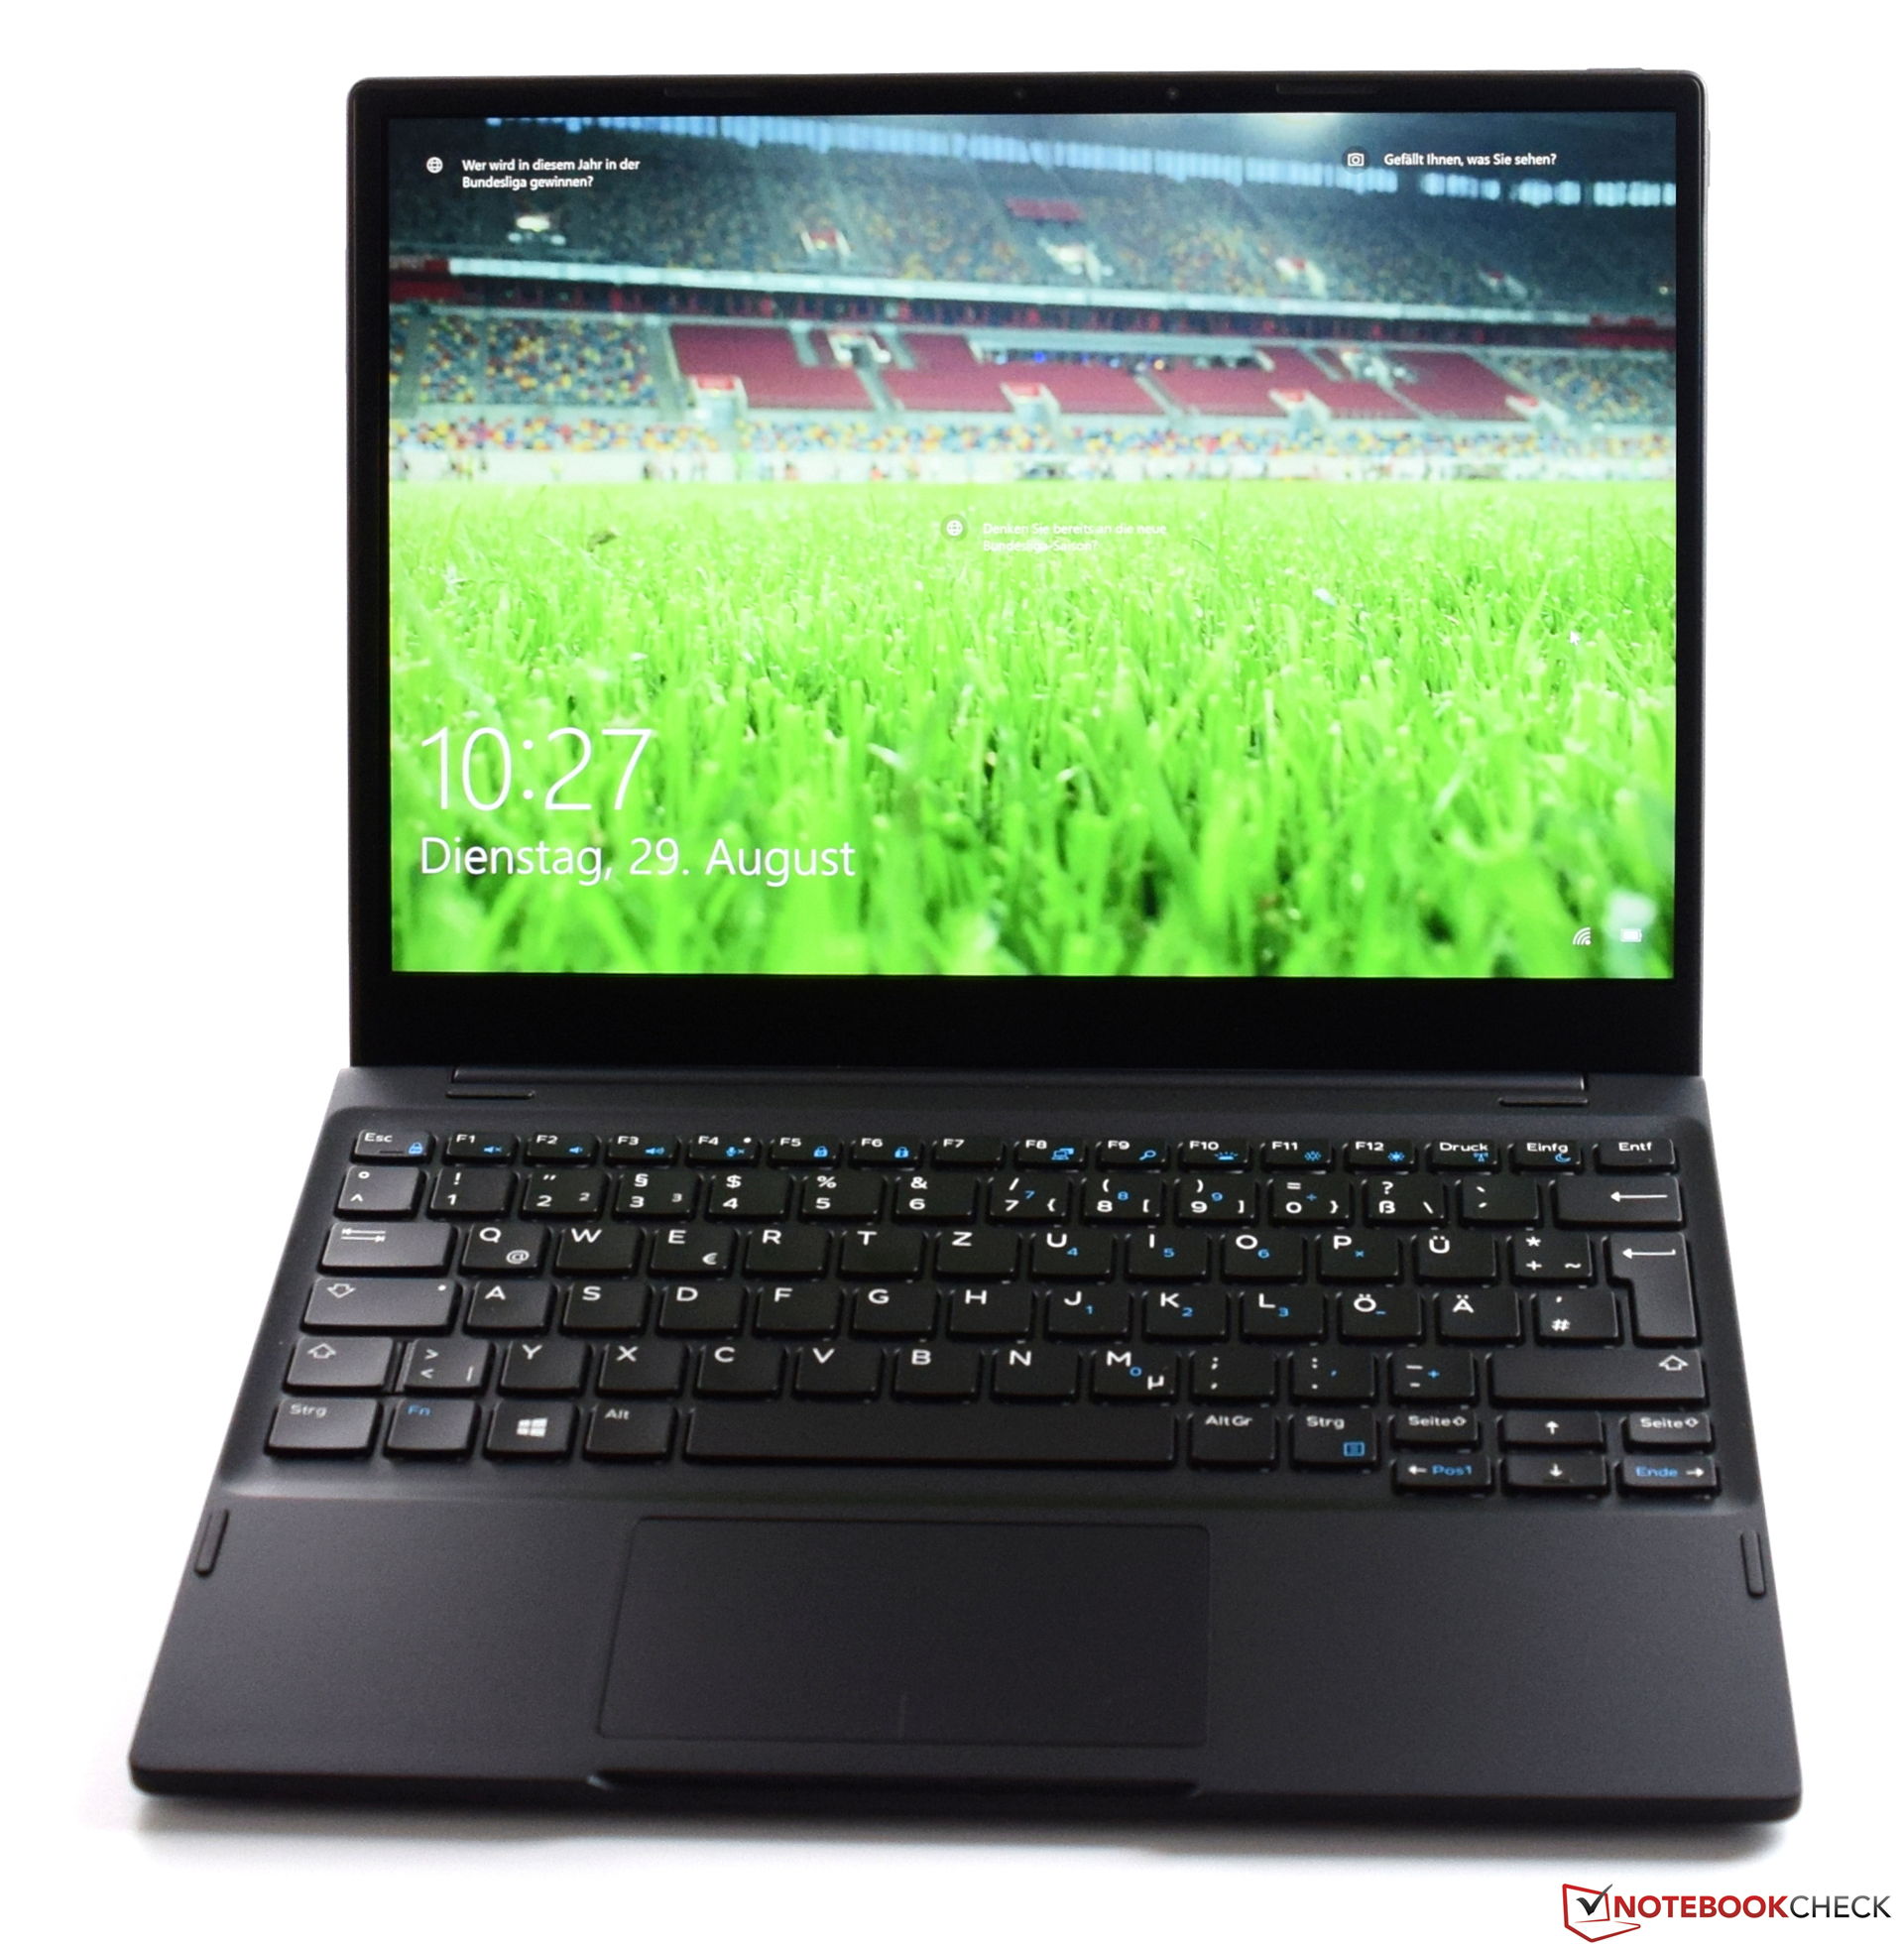
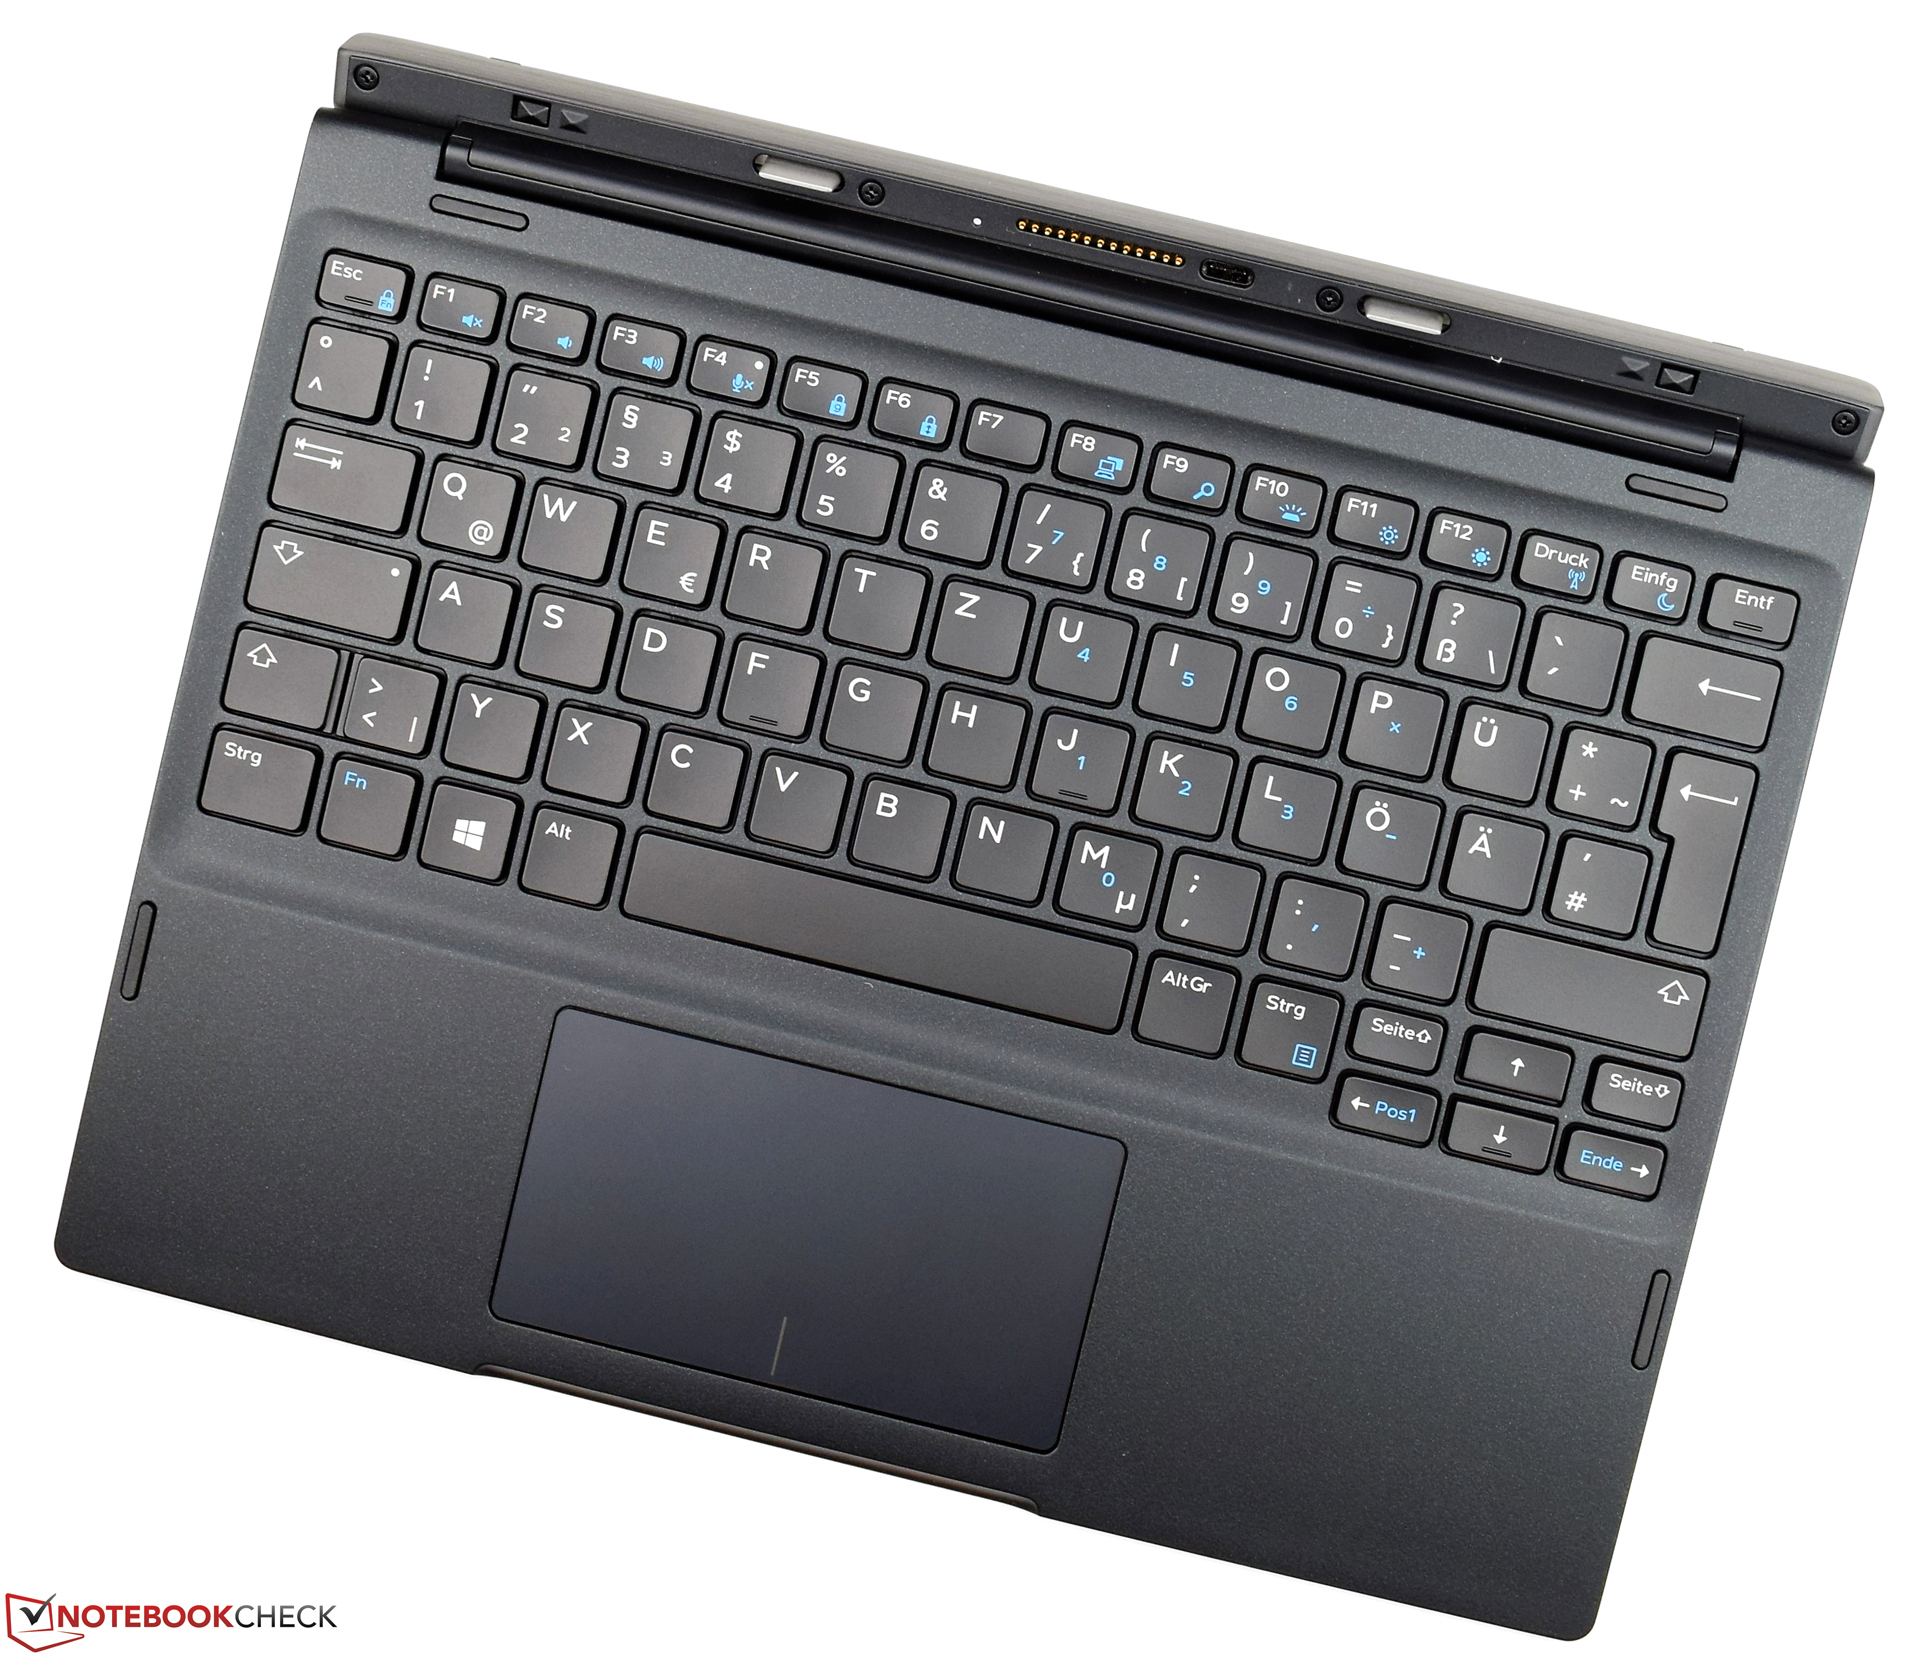
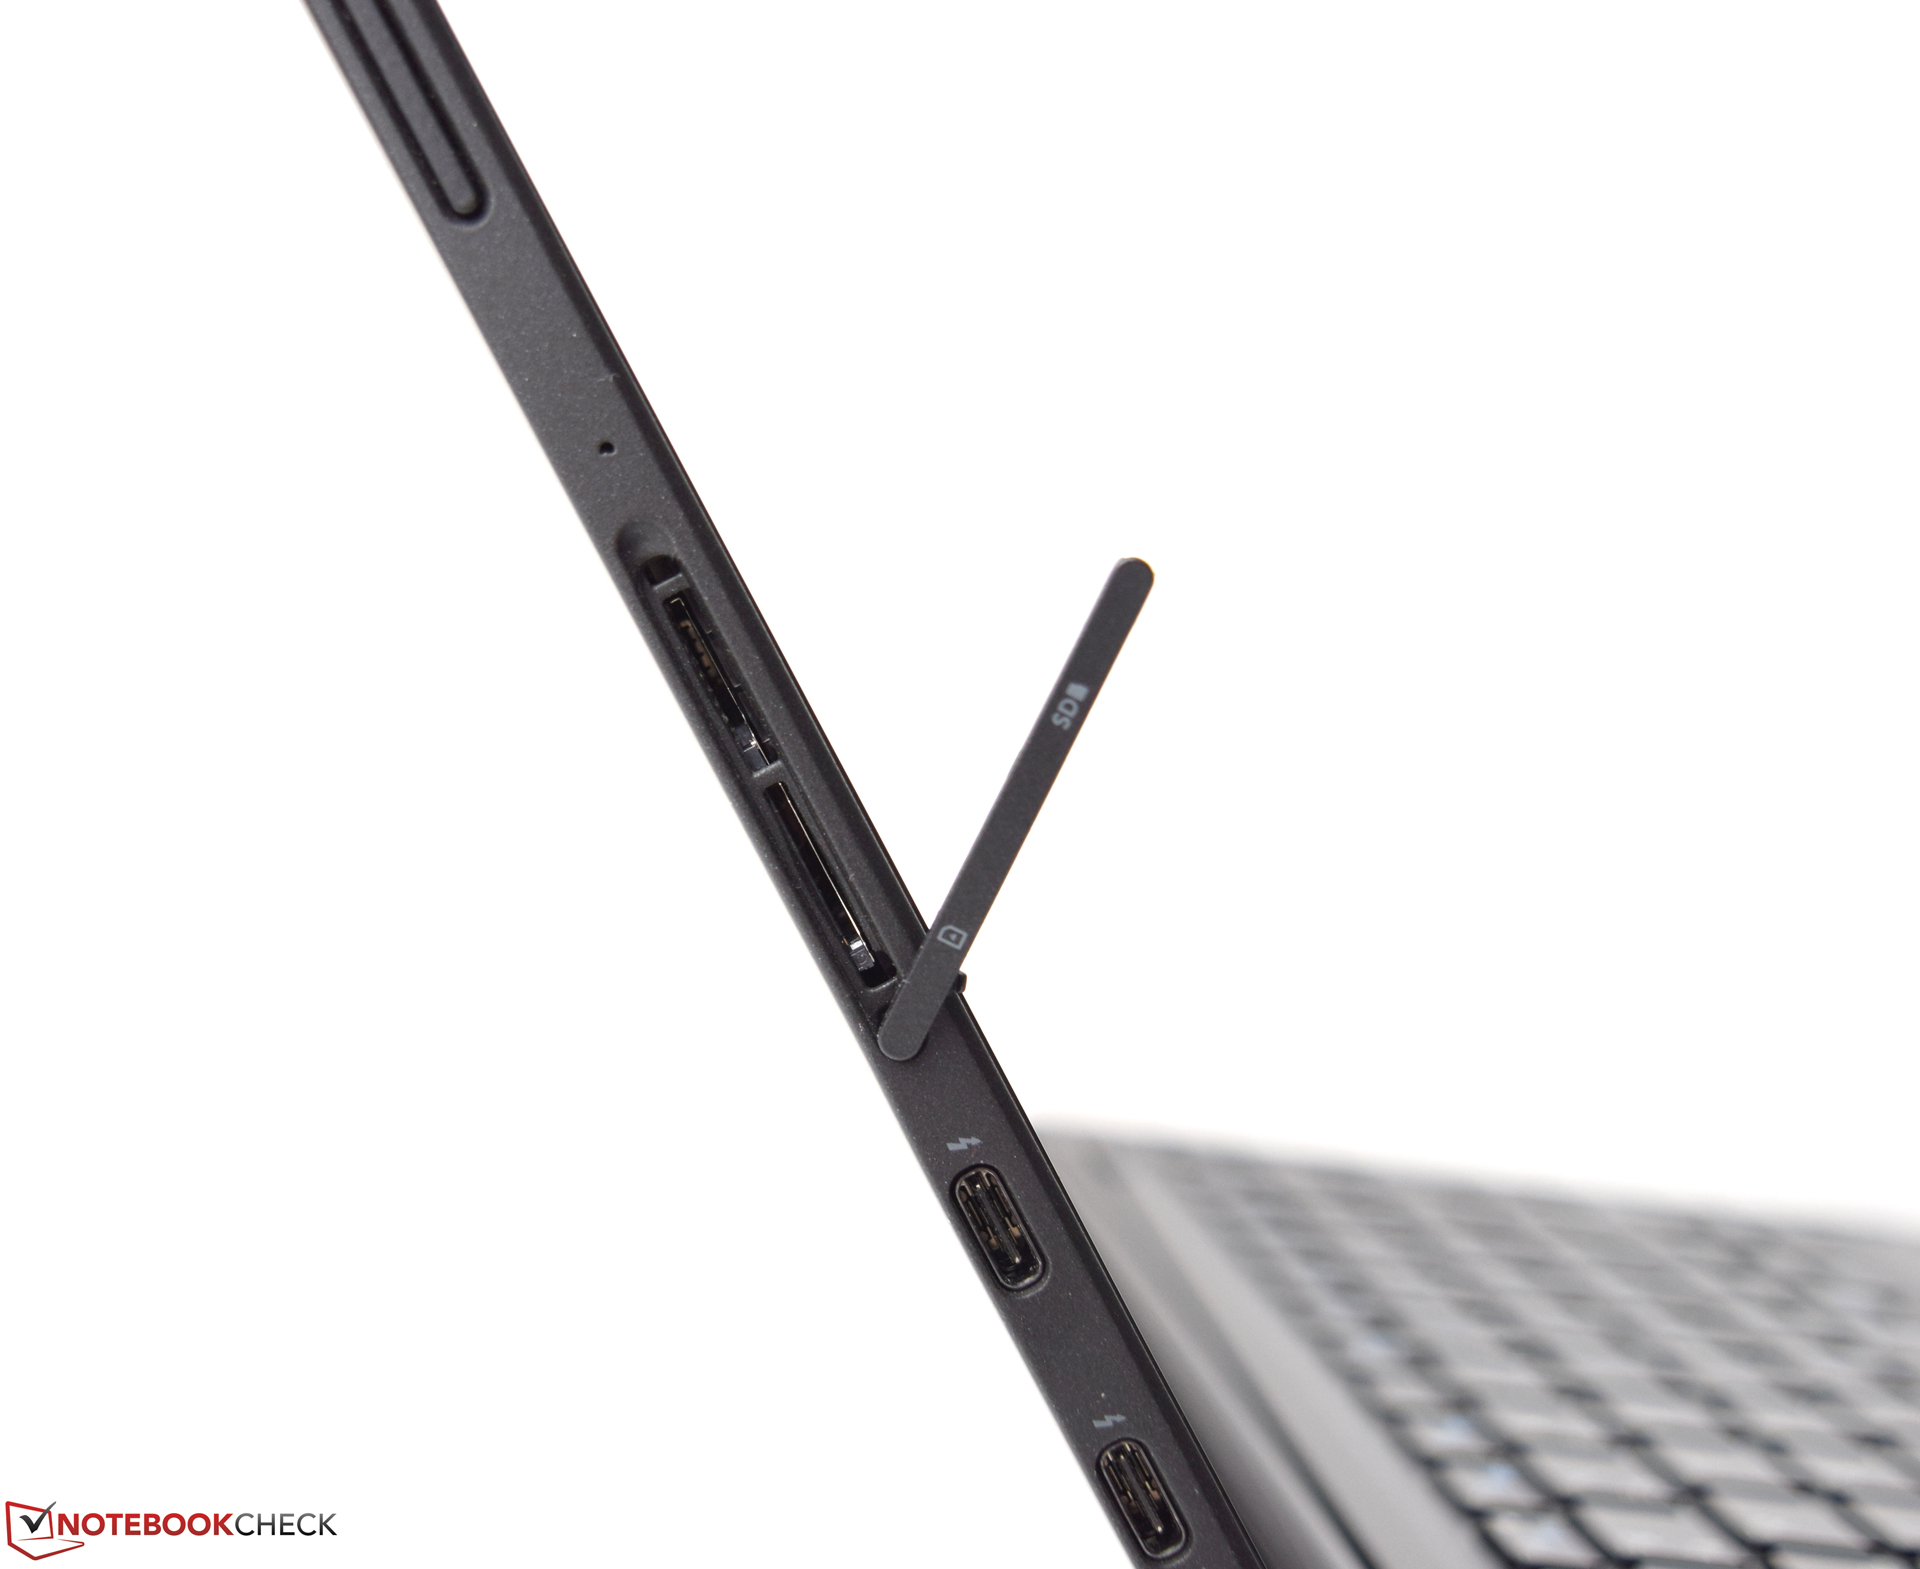
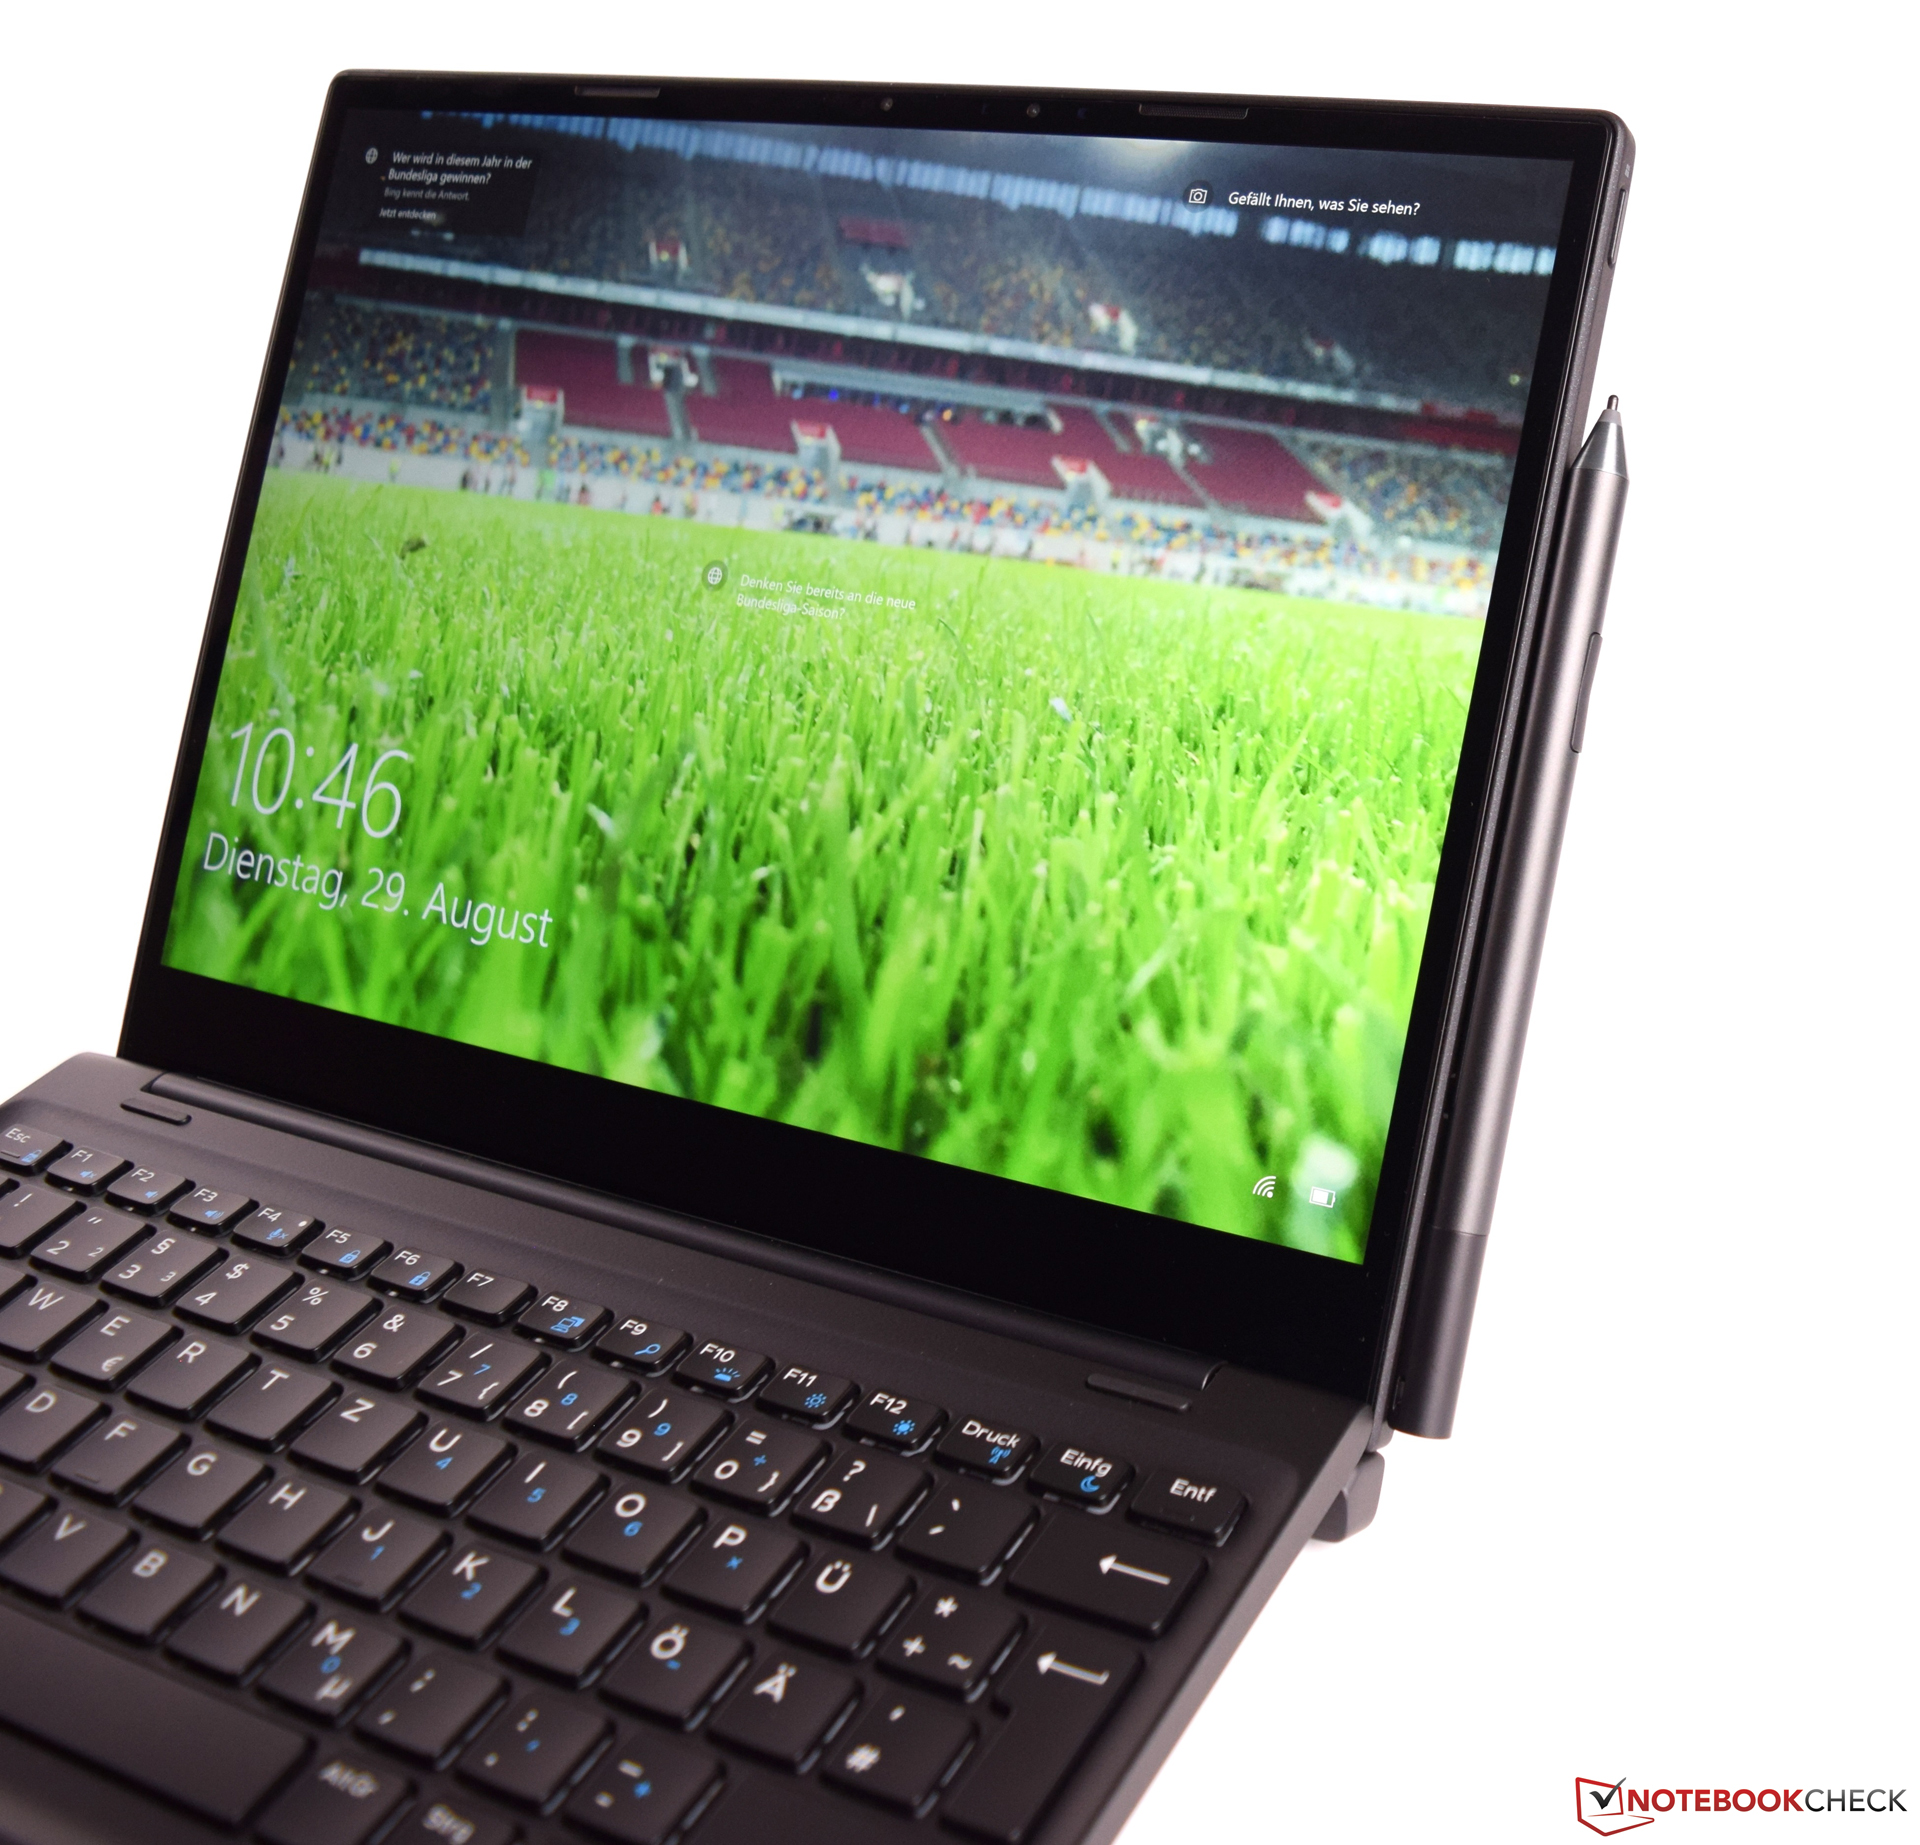
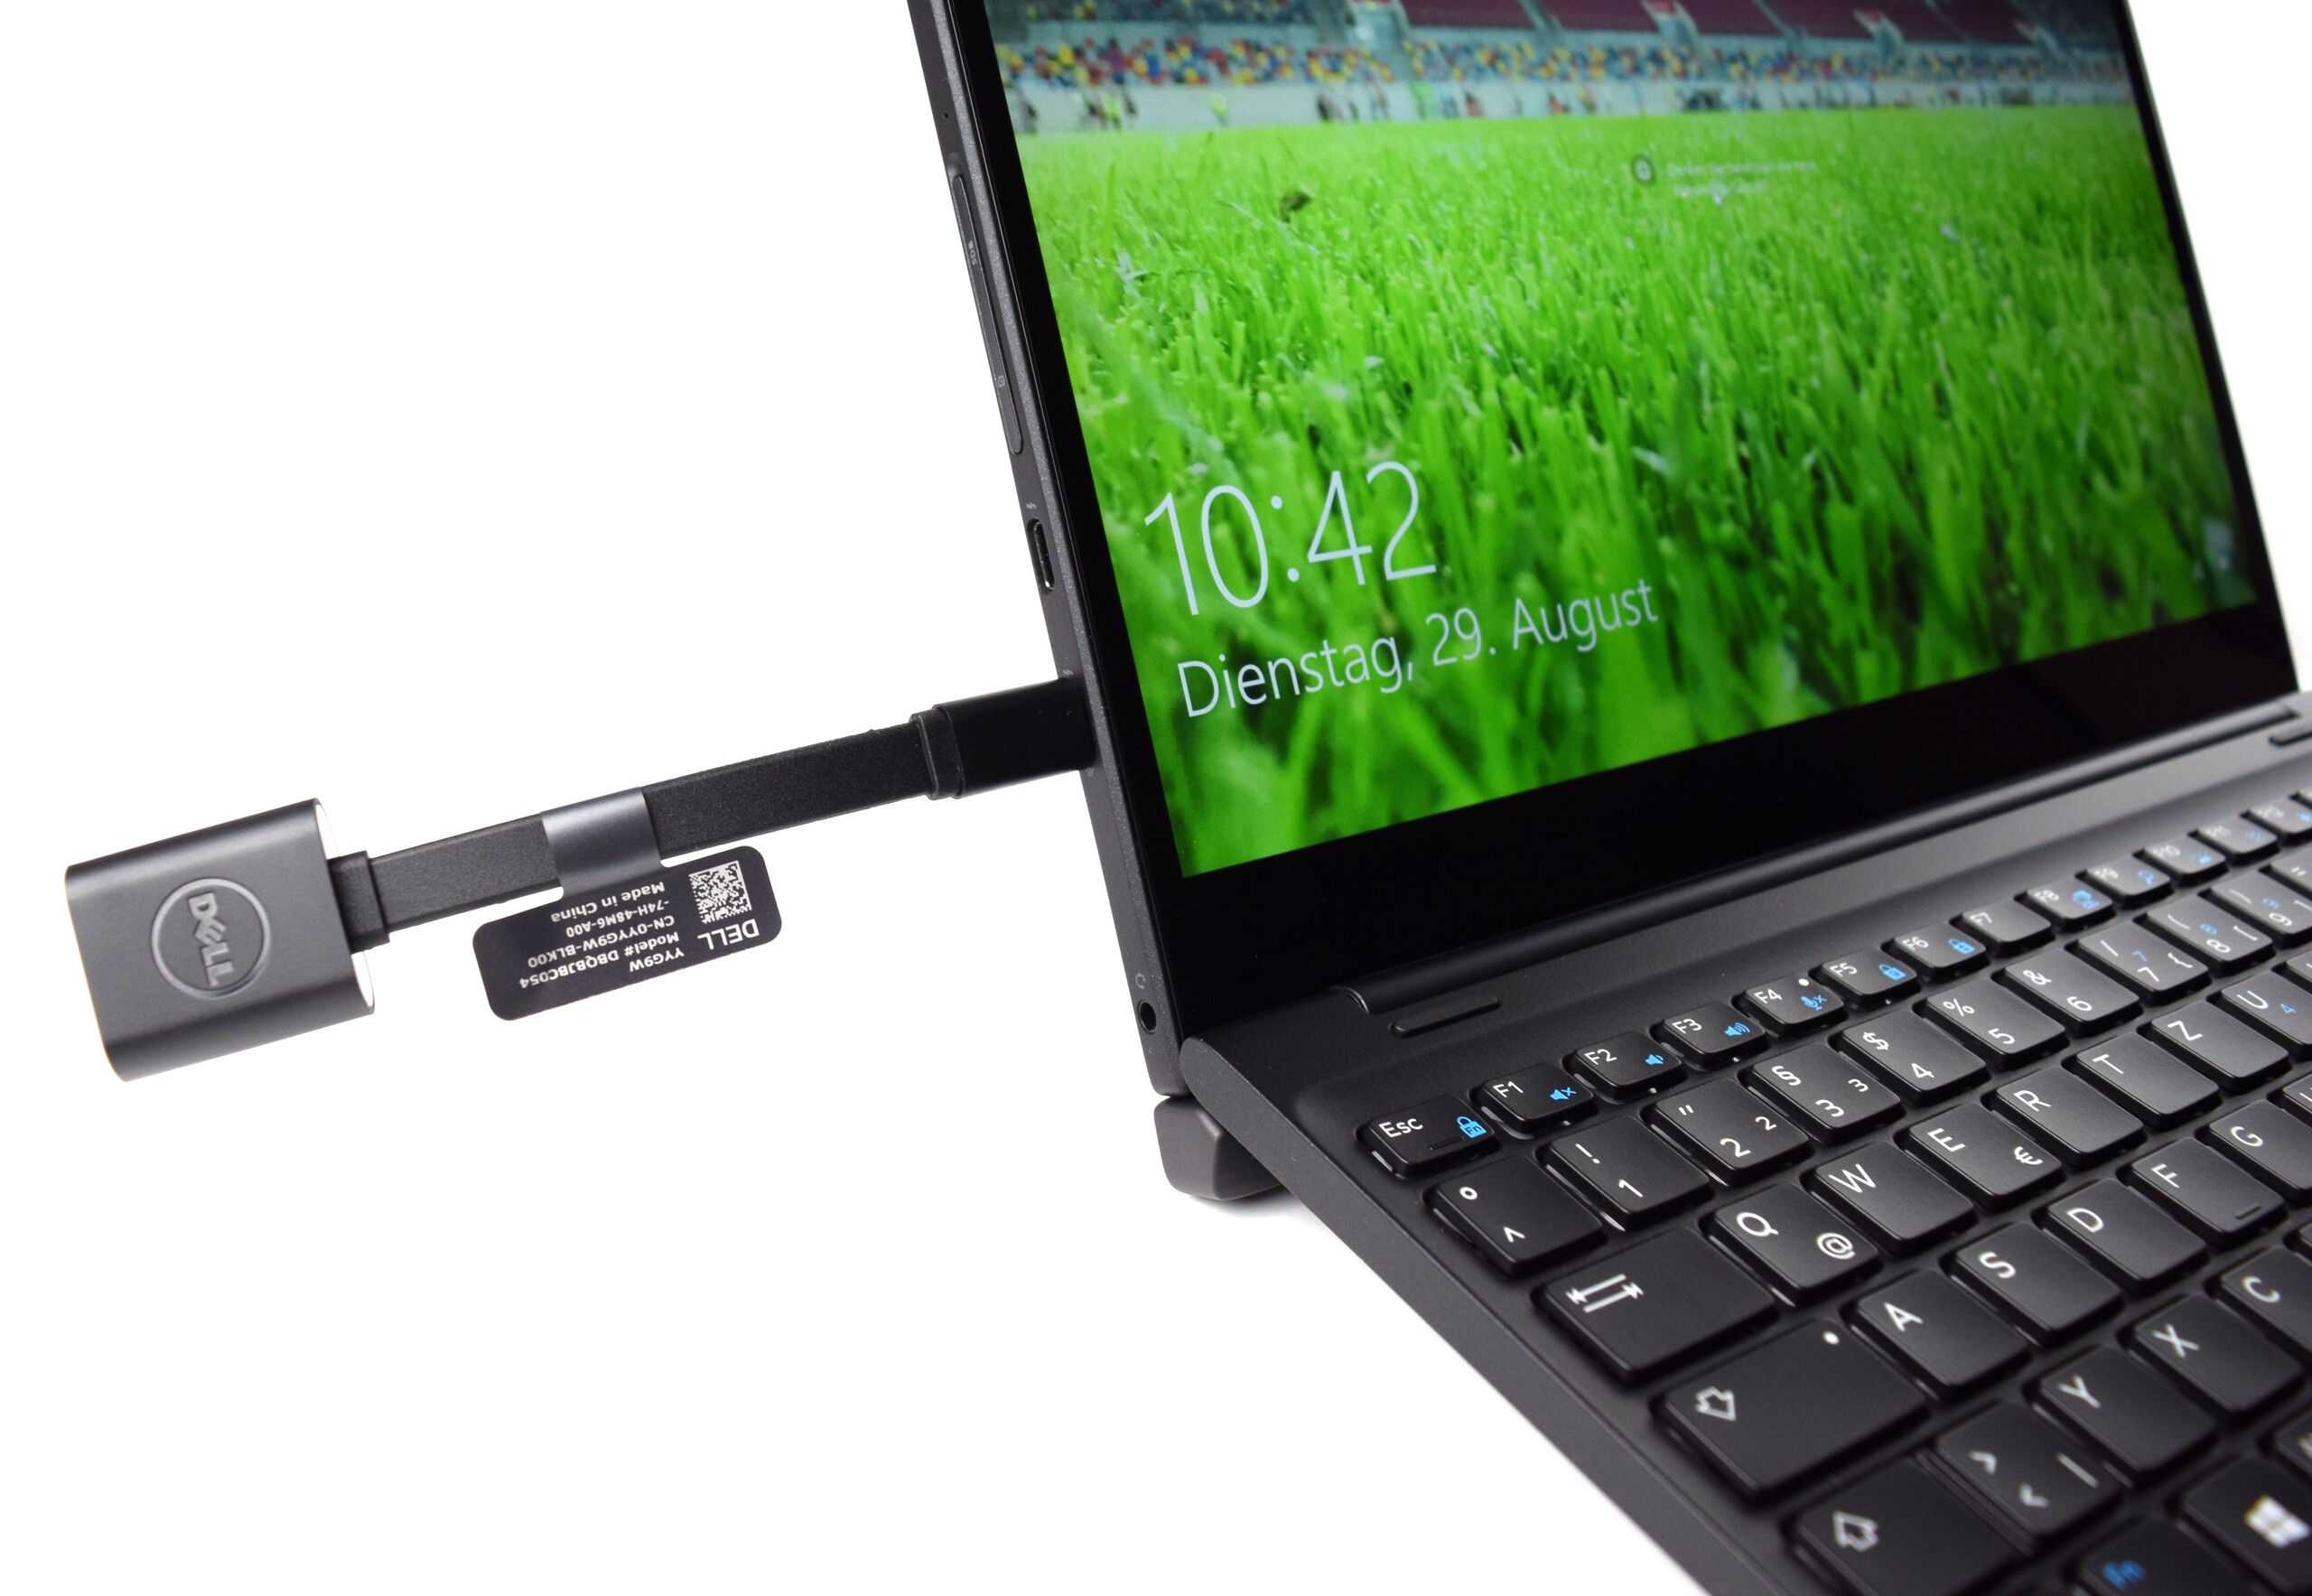
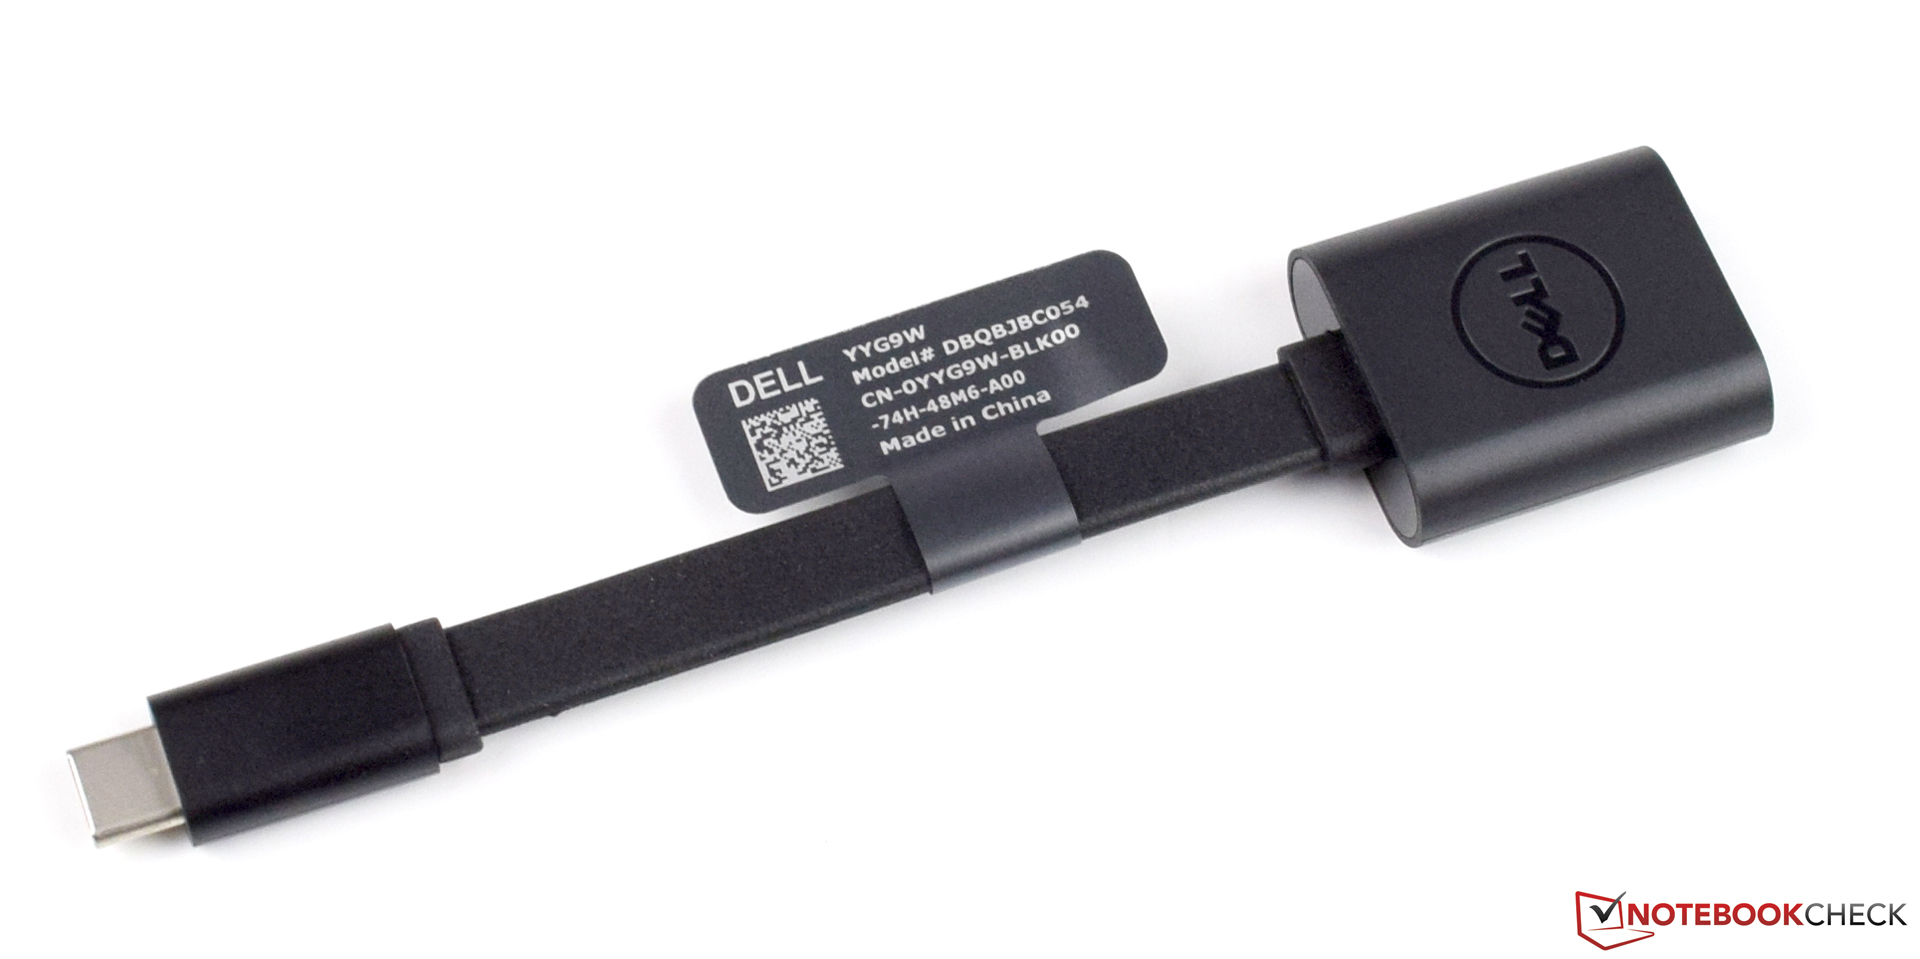
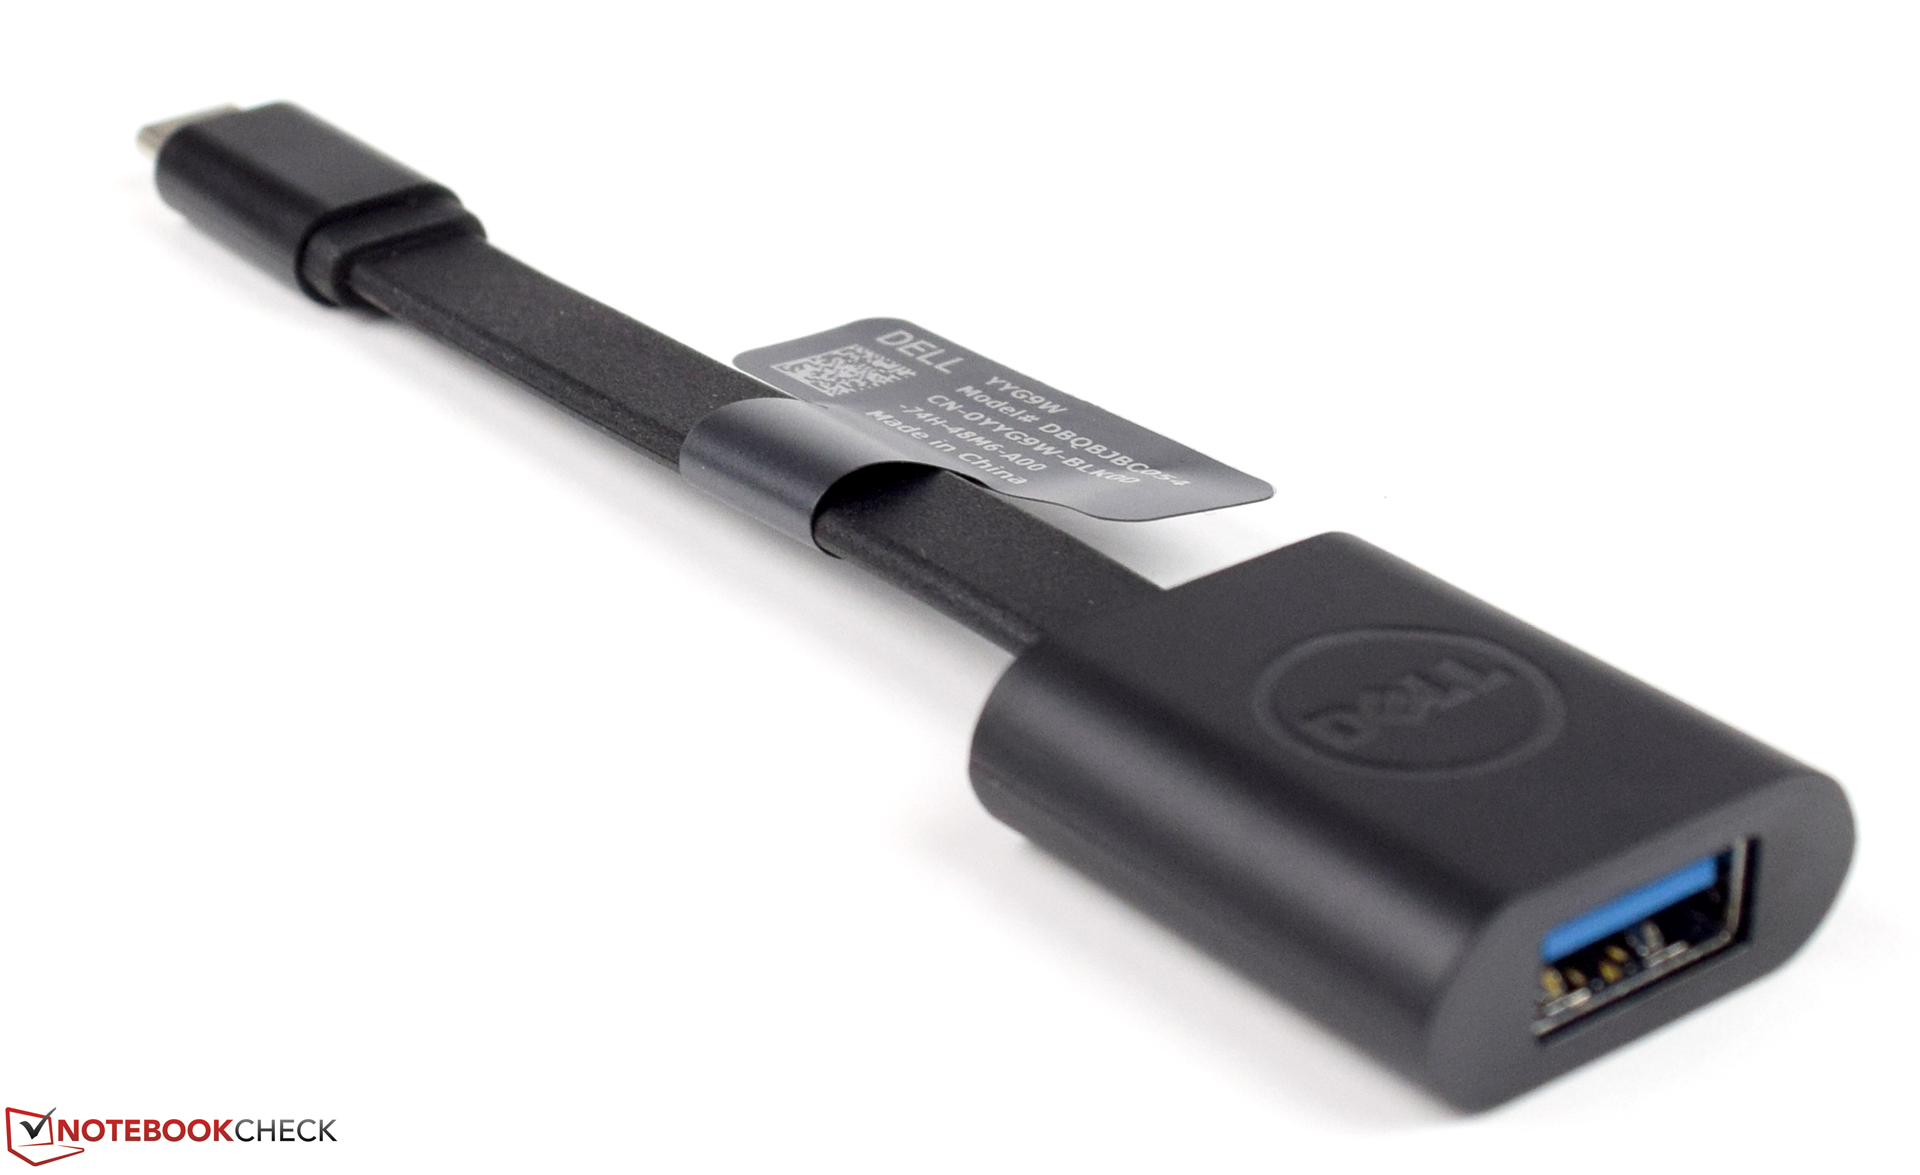
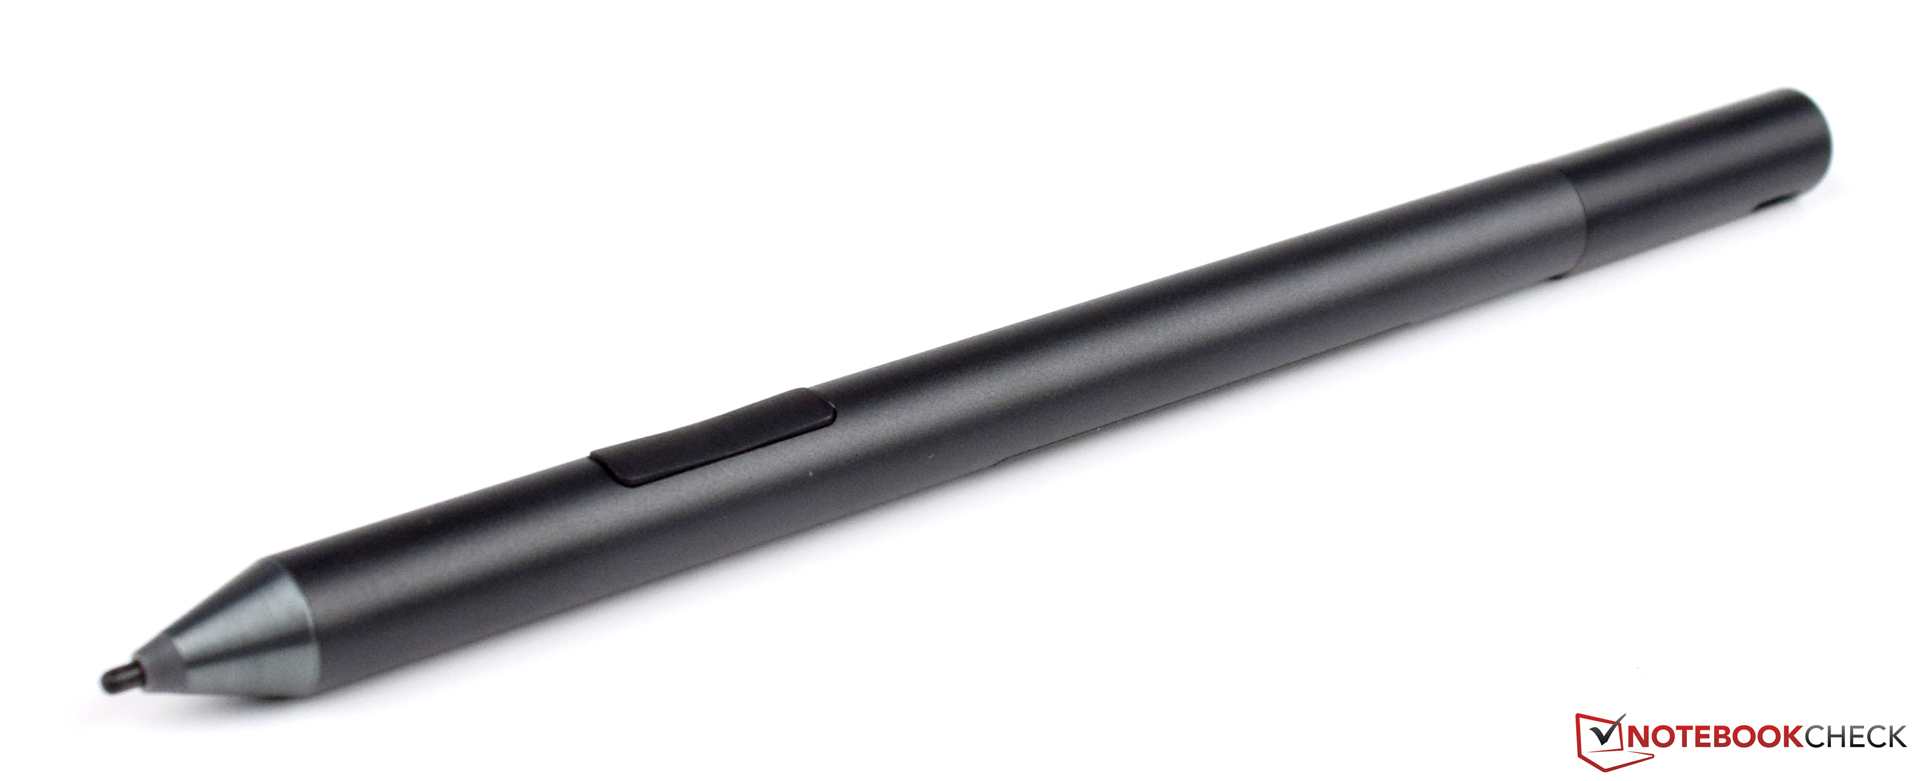
De verkoopprijs mag initieel afschrikken, maar Dell biedt een erg goedgebouwd apparaat met eerste klas 3K beeldscherm en een aanbod van moderne aansluitingen. Behalve het tablet en het toetsenborddock, bevat het pakket ook de Dell Active Pen en een 36-maanden garantiepakket.
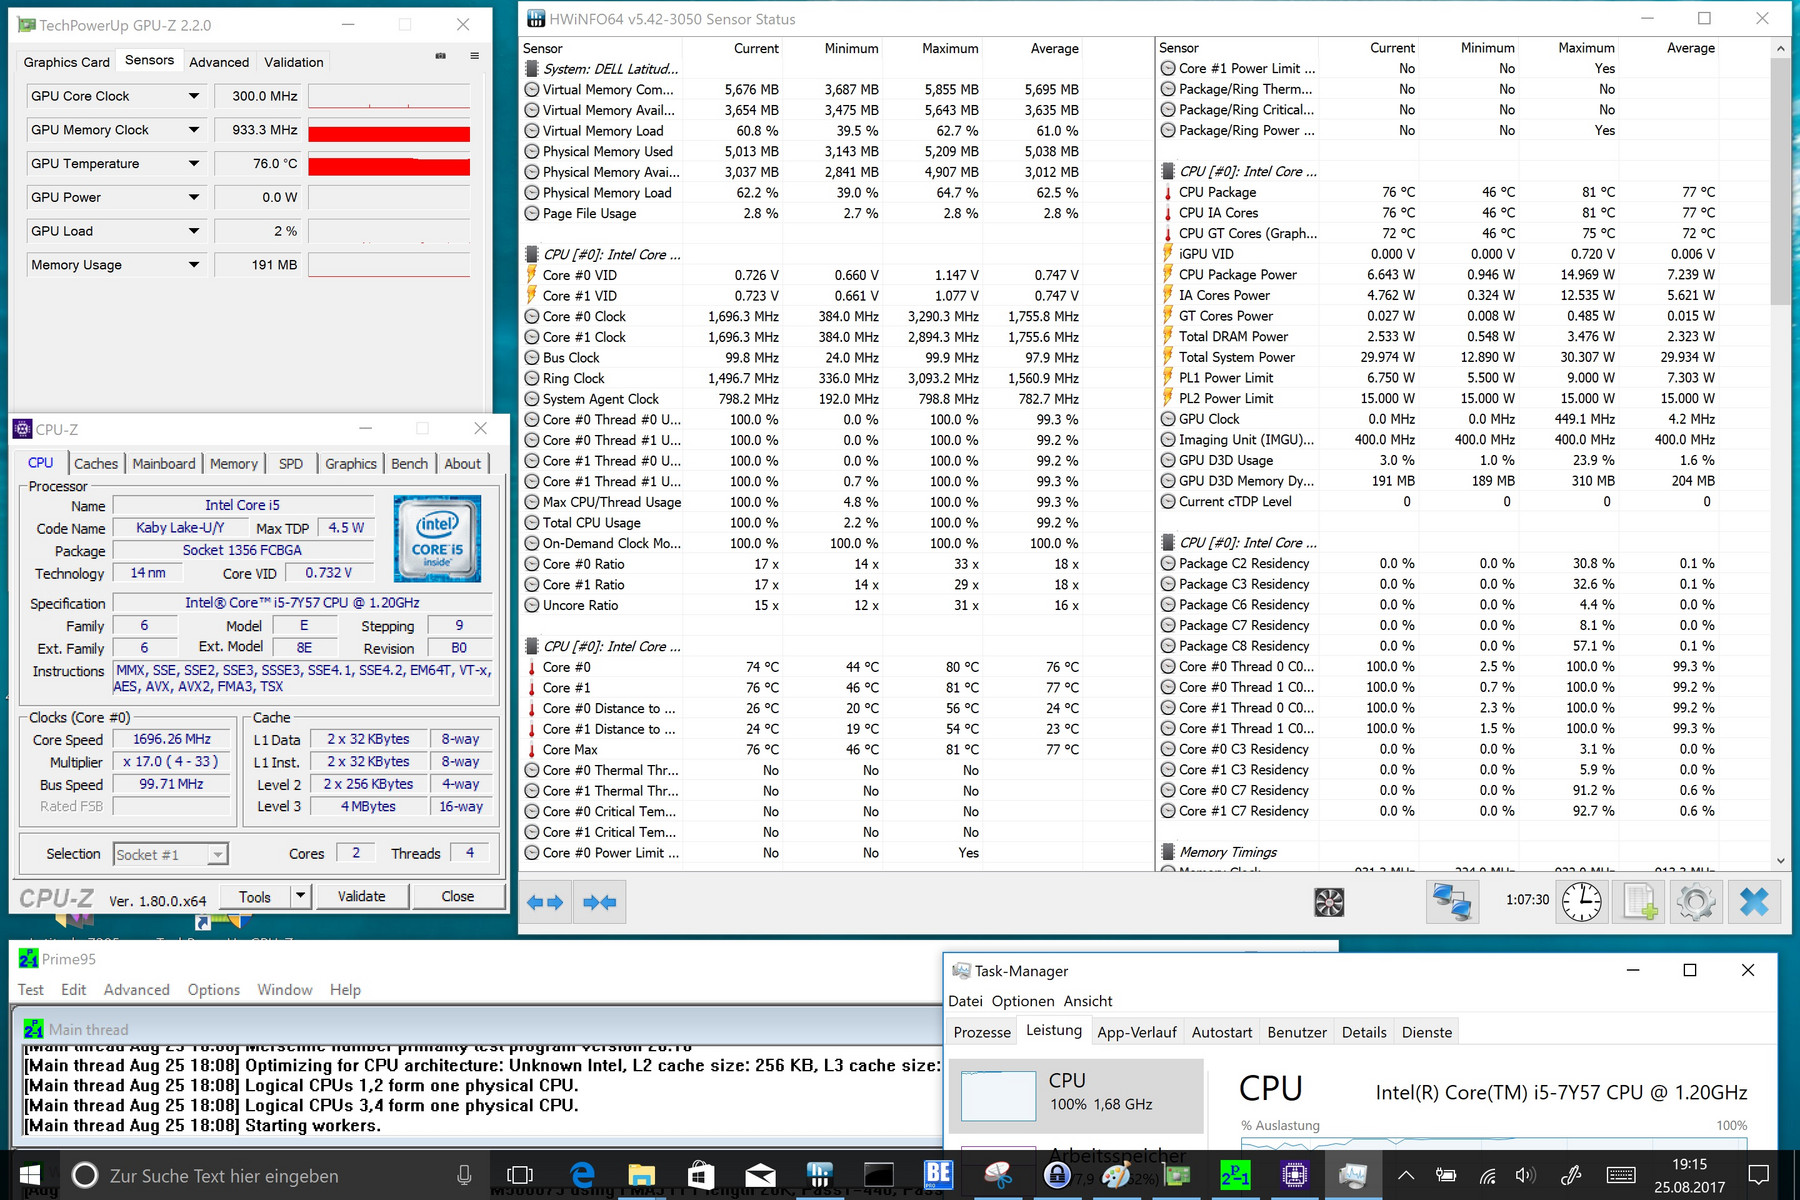
We waarderen de erg goede selectie van materialen en het ingetogen ontwerp. De Dell Latitude 7285 scoort erg goed met het beeldscherm, dat een erg hoge helderheid heeft en een groot kleurbereik. Eerlijk gezegd hadden we minder prestaties van de processor verwacht, maar omdat Dell zich niet beperkt tot het TDP van 4.5 watt zijn de prestaties iets hoger dan we verwacht hadden. Alle testresultaten tonen zonder uitzondering aan dat de Dell Latitude 7285, gebaseerd op de Intel Core i5-7Y57, de concurrentie bij kan houden.
Qua stroomverbruik stelt het apparaat ons wat teleur, omdat we door de zuinige componenten hoge verwachtingen hadden. Dit resulteert ook in gemixte batterijlevensduurresultaten. Het idee om een extra batterij in het toetsenbordock te plaatsen is goed en voorkomt een lagere plaats in onze vergelijkingen.
Dell Latitude 7285
- 06-09-2017 v6 (old)
Sebastian Bade