Kort testrapport HP Elite x2 1012 G2 (i5-7200U, 256 GB, 8 GB) Convertible
| SD Card Reader | |
| average JPG Copy Test (av. of 3 runs) | |
| HP Elite x2 1012 G2-1LV76EA (Toshiba Exceria Pro M501) | |
| Lenovo ThinkPad X1 Yoga 2017 20JES03T00 (Toshiba Exceria Pro M401) | |
| Dell Latitude 12 5285 2-in-1 (Toshiba THN-M401S0640E2) | |
| maximum AS SSD Seq Read Test (1GB) | |
| Lenovo ThinkPad X1 Yoga 2017 20JES03T00 (Toshiba Exceria Pro M401) | |
| HP Elite x2 1012 G2-1LV76EA (Toshiba Exceria Pro M501) | |
| Dell Latitude 12 5285 2-in-1 (Toshiba THN-M401S0640E2) | |
| |||||||||||||||||||||||||
Helderheidsverdeling: 88 %
Helderheid in Batterij-modus: 440 cd/m²
Contrast: 1080:1 (Zwart: 0.41 cd/m²)
ΔE ColorChecker Calman: 2.6 | ∀{0.5-29.43 Ø4.71}
ΔE Greyscale Calman: 3 | ∀{0.09-98 Ø4.96}
98% sRGB (Argyll 1.6.3 3D)
62.6% AdobeRGB 1998 (Argyll 1.6.3 3D)
68.7% AdobeRGB 1998 (Argyll 3D)
98% sRGB (Argyll 3D)
66.7% Display P3 (Argyll 3D)
Gamma: 2.38
CCT: 6780 K
| HP Elite x2 1012 G2-1LV76EA Samsung SDC4A49, , 2716x1824, 12.3" | Microsoft Surface Pro (2017) i5 LG Display LP123WQ112604, , 2736x1824, 12.3" | Lenovo ThinkPad X1 Yoga 2017 20JES03T00 LEN4140, , 2560x1440, 14" | Dell Latitude 12 5285 2-in-1 BOE06DC, , 1920x1280, 12.3" | Acer Switch 5 SW512-52-5819 WST KL.1200w.004, , 2160x1440, 12" | Toshiba Portege X20W-D-10R Toshiba TOS508F, , 1920x1080, 12.5" | HP Elite x2 1012 G1 LG Philips, , 1920x1280, 12.1" | |
|---|---|---|---|---|---|---|---|
| Display | 1% | -5% | -12% | 1% | -22% | ||
| Display P3 Coverage (%) | 66.7 | 67.6 1% | 62.8 -6% | 58.8 -12% | 68.7 3% | 53.8 -19% | |
| sRGB Coverage (%) | 98 | 99 1% | 94 -4% | 87.5 -11% | 96.8 -1% | 73.7 -25% | |
| AdobeRGB 1998 Coverage (%) | 68.7 | 69.1 1% | 64.7 -6% | 60.6 -12% | 70.4 2% | 53.8 -22% | |
| Response Times | -13% | 89% | -18% | -1% | -64% | 11% | |
| Response Time Grey 50% / Grey 80% * (ms) | 45.6 ? | 42 ? 8% | 3.6 ? 92% | 42.4 ? 7% | 37 ? 19% | 67 ? -47% | 33.2 ? 27% |
| Response Time Black / White * (ms) | 21.6 ? | 29 ? -34% | 3.2 ? 85% | 30.8 ? -43% | 26 ? -20% | 39 ? -81% | 22.8 ? -6% |
| PWM Frequency (Hz) | 2119 ? | 21000 | 240.4 ? | 210.1 ? | |||
| Screen | -3% | -37% | -20% | -49% | -34% | -52% | |
| Brightness middle (cd/m²) | 443 | 417 -6% | 243 -45% | 523.2 18% | 369 -17% | 442 0% | 322 -27% |
| Brightness (cd/m²) | 446 | 401 -10% | 240 -46% | 522 17% | 331 -26% | 410 -8% | 319 -28% |
| Brightness Distribution (%) | 88 | 88 0% | 95 8% | 88 0% | 75 -15% | 86 -2% | 97 10% |
| Black Level * (cd/m²) | 0.41 | 0.29 29% | 0.42 -2% | 0.46 -12% | 0.22 46% | 0.42 -2% | |
| Contrast (:1) | 1080 | 1438 33% | 1246 15% | 802 -26% | 2009 86% | 767 -29% | |
| Colorchecker dE 2000 * | 2.6 | 3.63 -40% | 5.3 -104% | 4 -54% | 5.52 -112% | 5.22 -101% | 6.02 -132% |
| Colorchecker dE 2000 max. * | 4 | 6.74 -69% | 8.9 -123% | 8.6 -115% | 9.29 -132% | 11.84 -196% | 10.06 -152% |
| Greyscale dE 2000 * | 3 | 2.18 27% | 3.7 -23% | 5.5 -83% | 6.95 -132% | 7.88 -163% | 6.29 -110% |
| Gamma | 2.38 92% | 3.09 71% | 1.78 124% | 2.16 102% | 2.58 85% | 2.51 88% | 2.4 92% |
| CCT | 6780 96% | 6767 96% | 6202 105% | 7546 86% | 7009 93% | 6756 96% | 7712 84% |
| Color Space (Percent of AdobeRGB 1998) (%) | 62.6 | 63 1% | 84.8 35% | 64.86 4% | 56 -11% | 64 2% | 47.8 -24% |
| Color Space (Percent of sRGB) (%) | 98 | 99 1% | 100 2% | 93.97 -4% | 88 -10% | 97 -1% | 73.2 -25% |
| Totaal Gemiddelde (Programma / Instellingen) | -5% /
-4% | 26% /
-12% | -14% /
-17% | -21% /
-35% | -32% /
-31% | -21% /
-38% |
* ... kleiner is beter
Responstijd Scherm
| ↔ Responstijd Zwart naar Wit | ||
|---|---|---|
| 21.6 ms ... stijging ↗ en daling ↘ gecombineerd | ↗ 9.2 ms stijging | 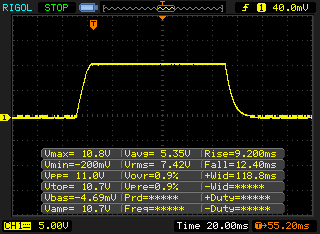 |
| ↘ 12.4 ms daling | ||
| Het scherm vertoonde prima responstijden in onze tests maar is misschien wat te traag voor competitieve games. Ter vergelijking: alle testtoestellen variëren van 0.1 (minimum) tot 240 (maximum) ms. » 48 % van alle toestellen zijn beter. Dit betekent dat de gemeten responstijd vergelijkbaar is met het gemiddelde (19.8 ms) van alle geteste toestellen. | ||
| ↔ Responstijd 50% Grijs naar 80% Grijs | ||
| 45.6 ms ... stijging ↗ en daling ↘ gecombineerd | ↗ 23.6 ms stijging | 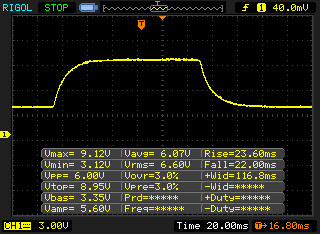 |
| ↘ 22 ms daling | ||
| Het scherm vertoonde trage responstijden in onze tests en is misschien te traag voor games. Ter vergelijking: alle testtoestellen variëren van 0.165 (minimum) tot 636 (maximum) ms. » 78 % van alle toestellen zijn beter. Dit betekent dat de gemeten responstijd slechter is dan het gemiddelde (31 ms) van alle geteste toestellen. | ||
Screen Flickering / PWM (Pulse-Width Modulation)
| Screen flickering / PWM waargenomen | 2119 Hz | ≤ 50 % helderheid instelling | 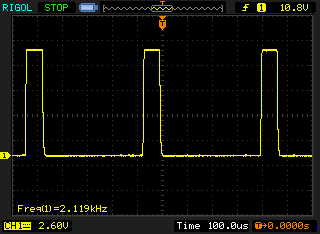 |
De achtergrondverlichting van het scherm flikkert op 2119 Hz (in het slechtste geval, bijvoorbeeld bij gebruik van PWM) aan een helderheid van 50 % en lager. Boven deze helderheid zou er geen flickering / PWM mogen optreden. De frequentie van 2119 Hz is redelijk hoog en de meeste mensen die gevoelig zijn aan flickering zouden dit dus niet mogen waarnemen of geïrriteerde ogen krijgen. Ter vergelijking: 52 % van alle geteste toestellen maakten geen gebruik van PWM om de schermhelderheid te verlagen. Als het wel werd gebruikt, werd een gemiddelde van 7754 (minimum: 5 - maximum: 343500) Hz waargenomen. | |||
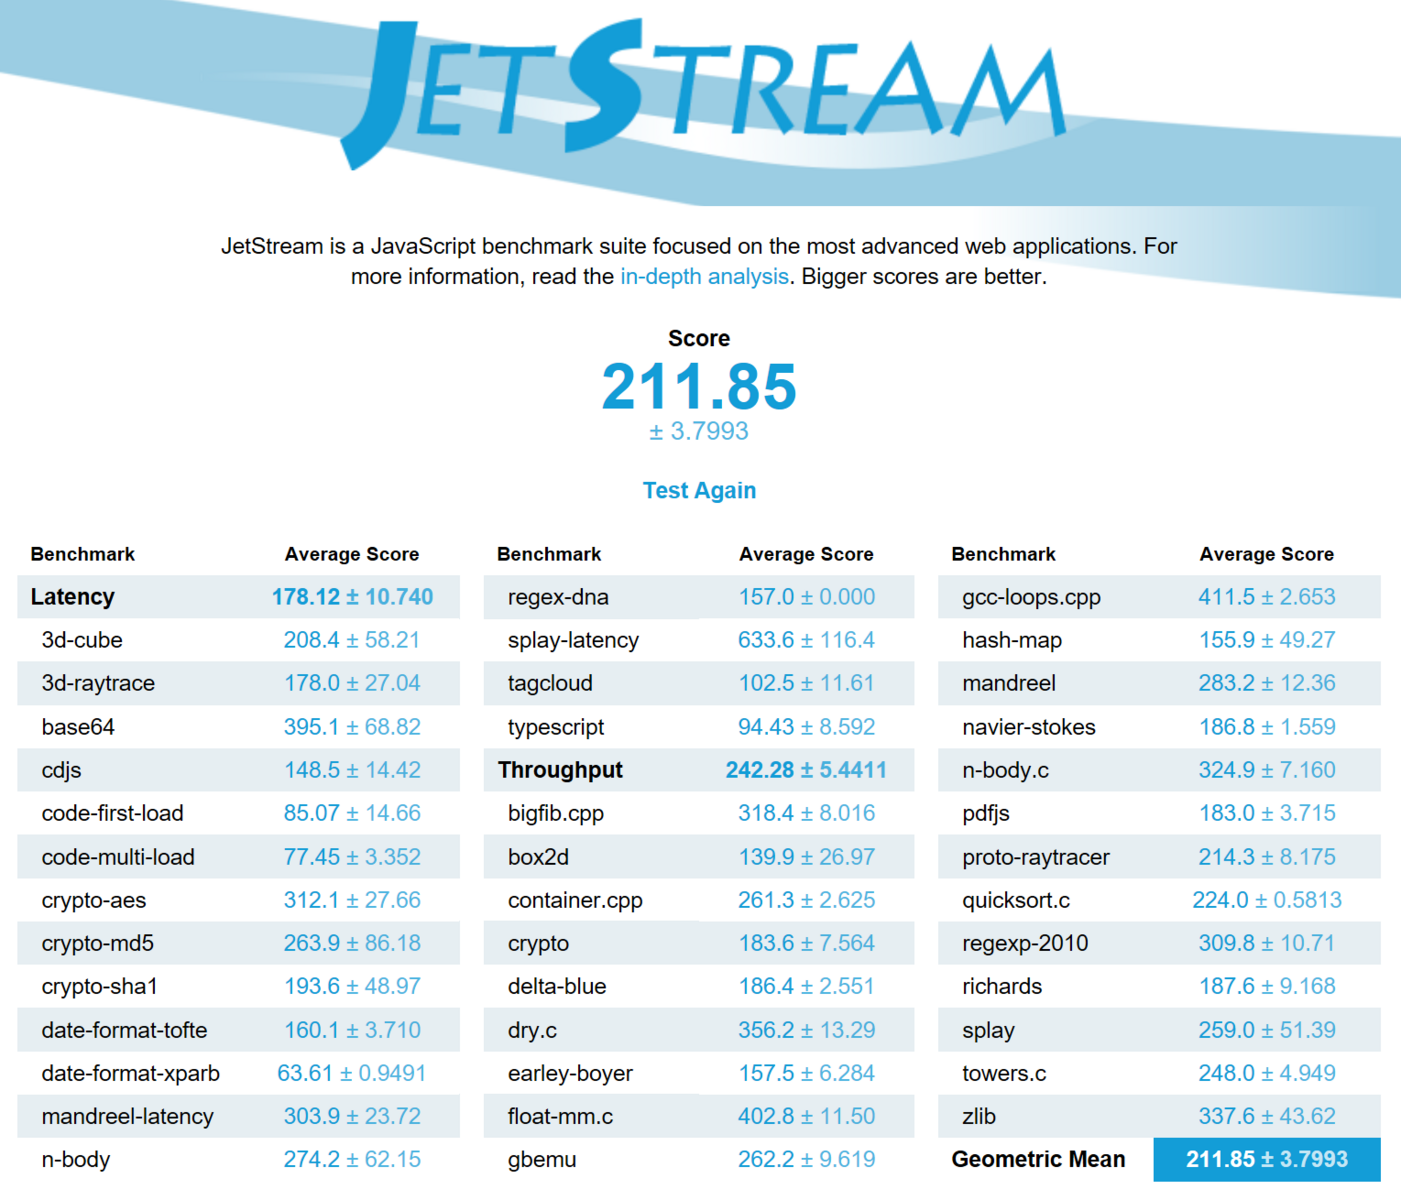
| JetStream 1.1 - 1.1 Total | |
| Lenovo ThinkPad X1 Yoga 2017 20JES03T00 | |
| Toshiba Portege X20W-D-10R | |
| Acer Switch 5 SW512-52-5819 | |
| Microsoft Surface Pro (2017) i5 | |
| HP Elite x2 1012 G2-1LV76EA | |
| HP Elite x2 1012 G1 | |
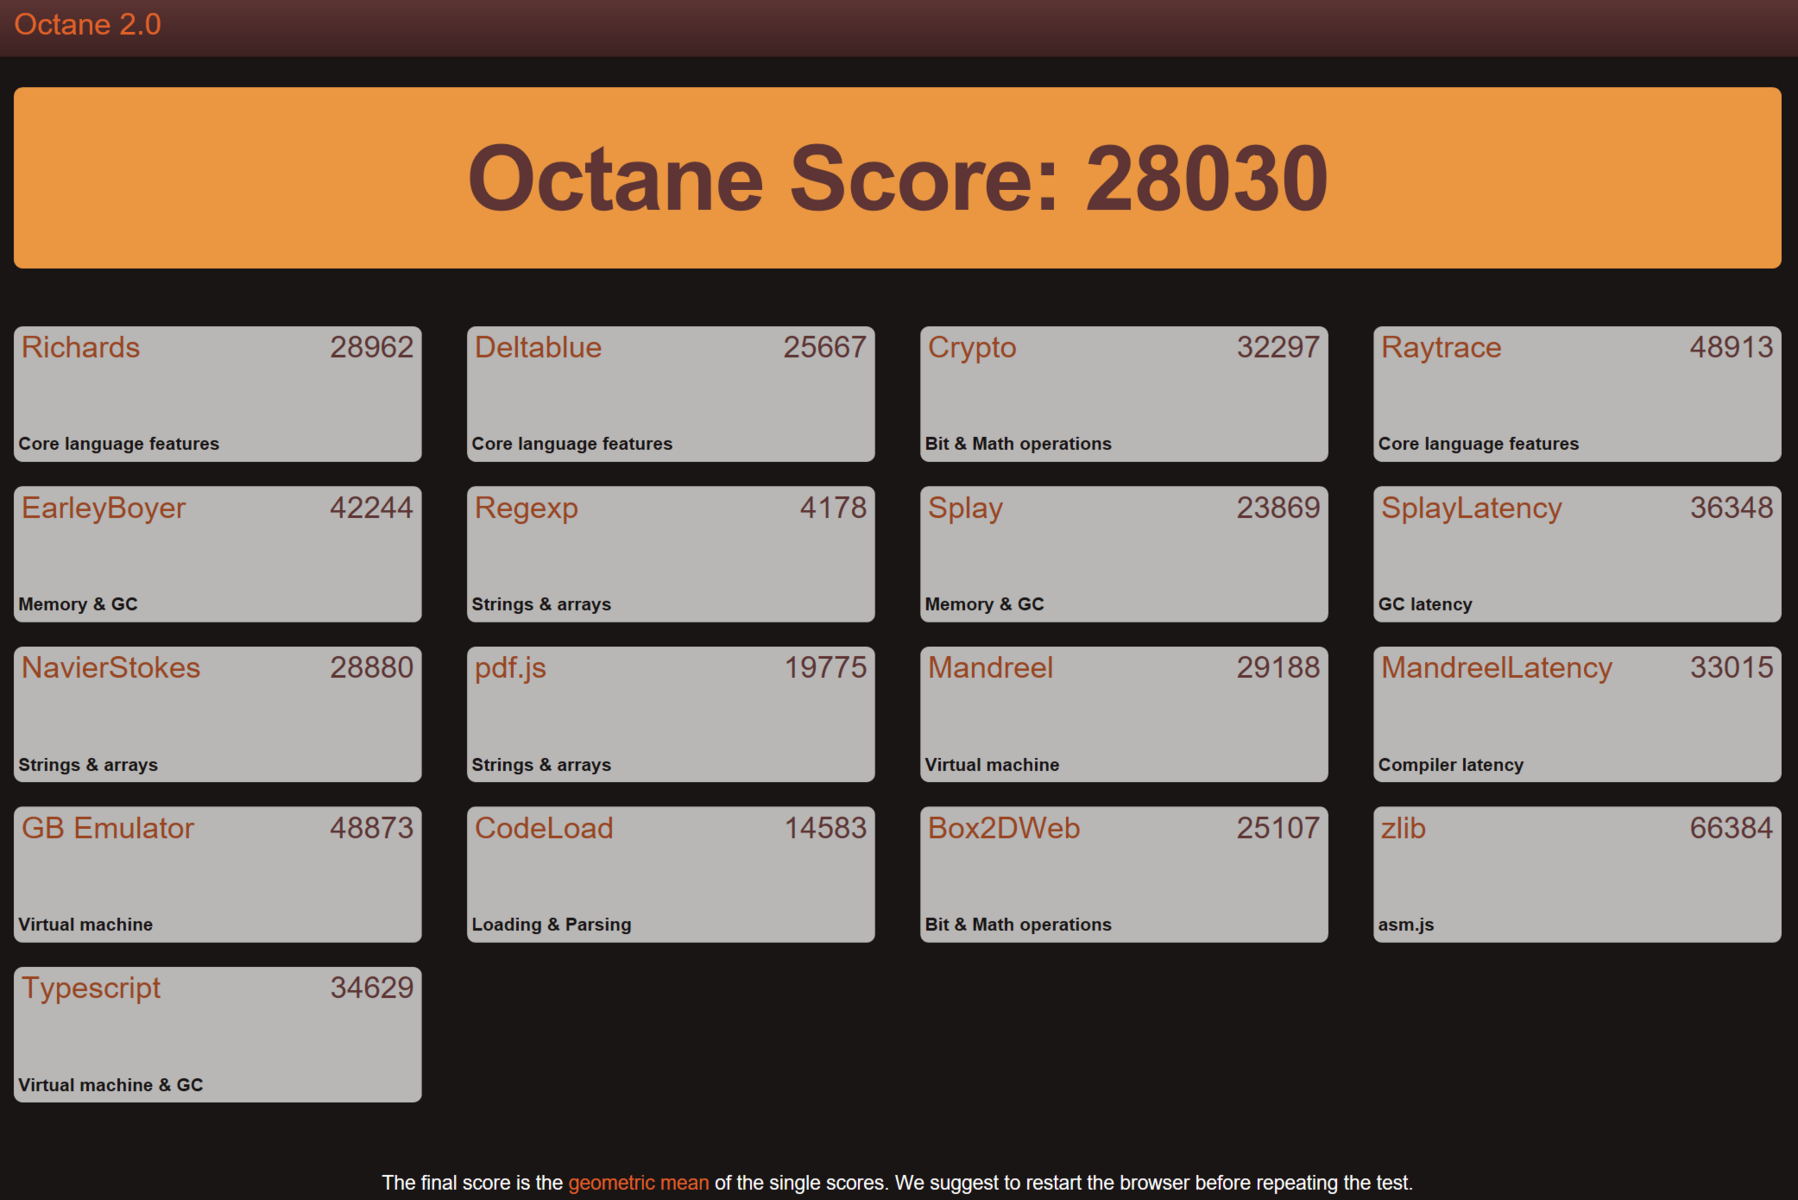
| Octane V2 - Total Score | |
| Toshiba Portege X20W-D-10R | |
| Microsoft Surface Pro (2017) i5 | |
| Acer Switch 5 SW512-52-5819 | |
| Lenovo ThinkPad X1 Yoga 2017 20JES03T00 | |
| HP Elite x2 1012 G2-1LV76EA | |
| HP Elite x2 1012 G1 | |
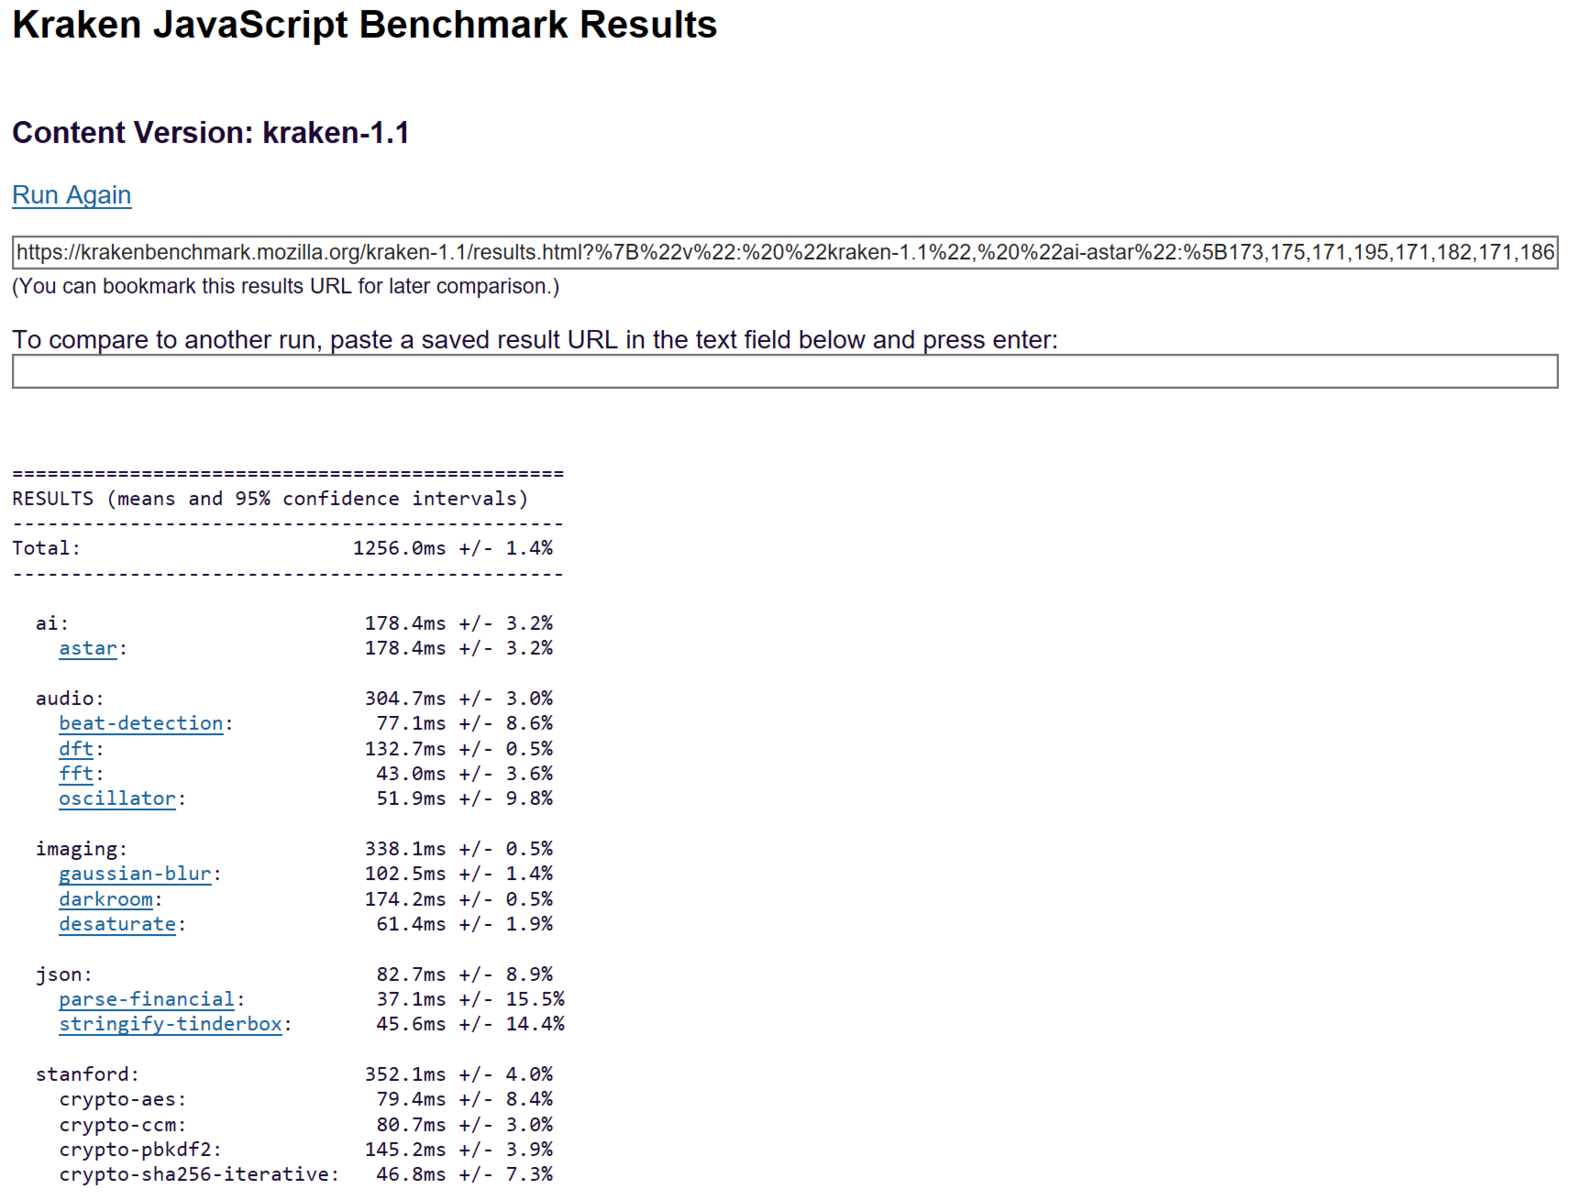
| Mozilla Kraken 1.1 - Total | |
| HP Elite x2 1012 G1 | |
| HP Elite x2 1012 G2-1LV76EA | |
| Acer Switch 5 SW512-52-5819 | |
| Toshiba Portege X20W-D-10R | |
| Lenovo ThinkPad X1 Yoga 2017 20JES03T00 | |
* ... kleiner is beter
| PCMark 10 | |
| Score | |
| Acer Switch 5 SW512-52-5819 | |
| HP Elite x2 1012 G2-1LV76EA | |
| Microsoft Surface Pro (2017) i5 | |
| Productivity | |
| Acer Switch 5 SW512-52-5819 | |
| HP Elite x2 1012 G2-1LV76EA | |
| Microsoft Surface Pro (2017) i5 | |
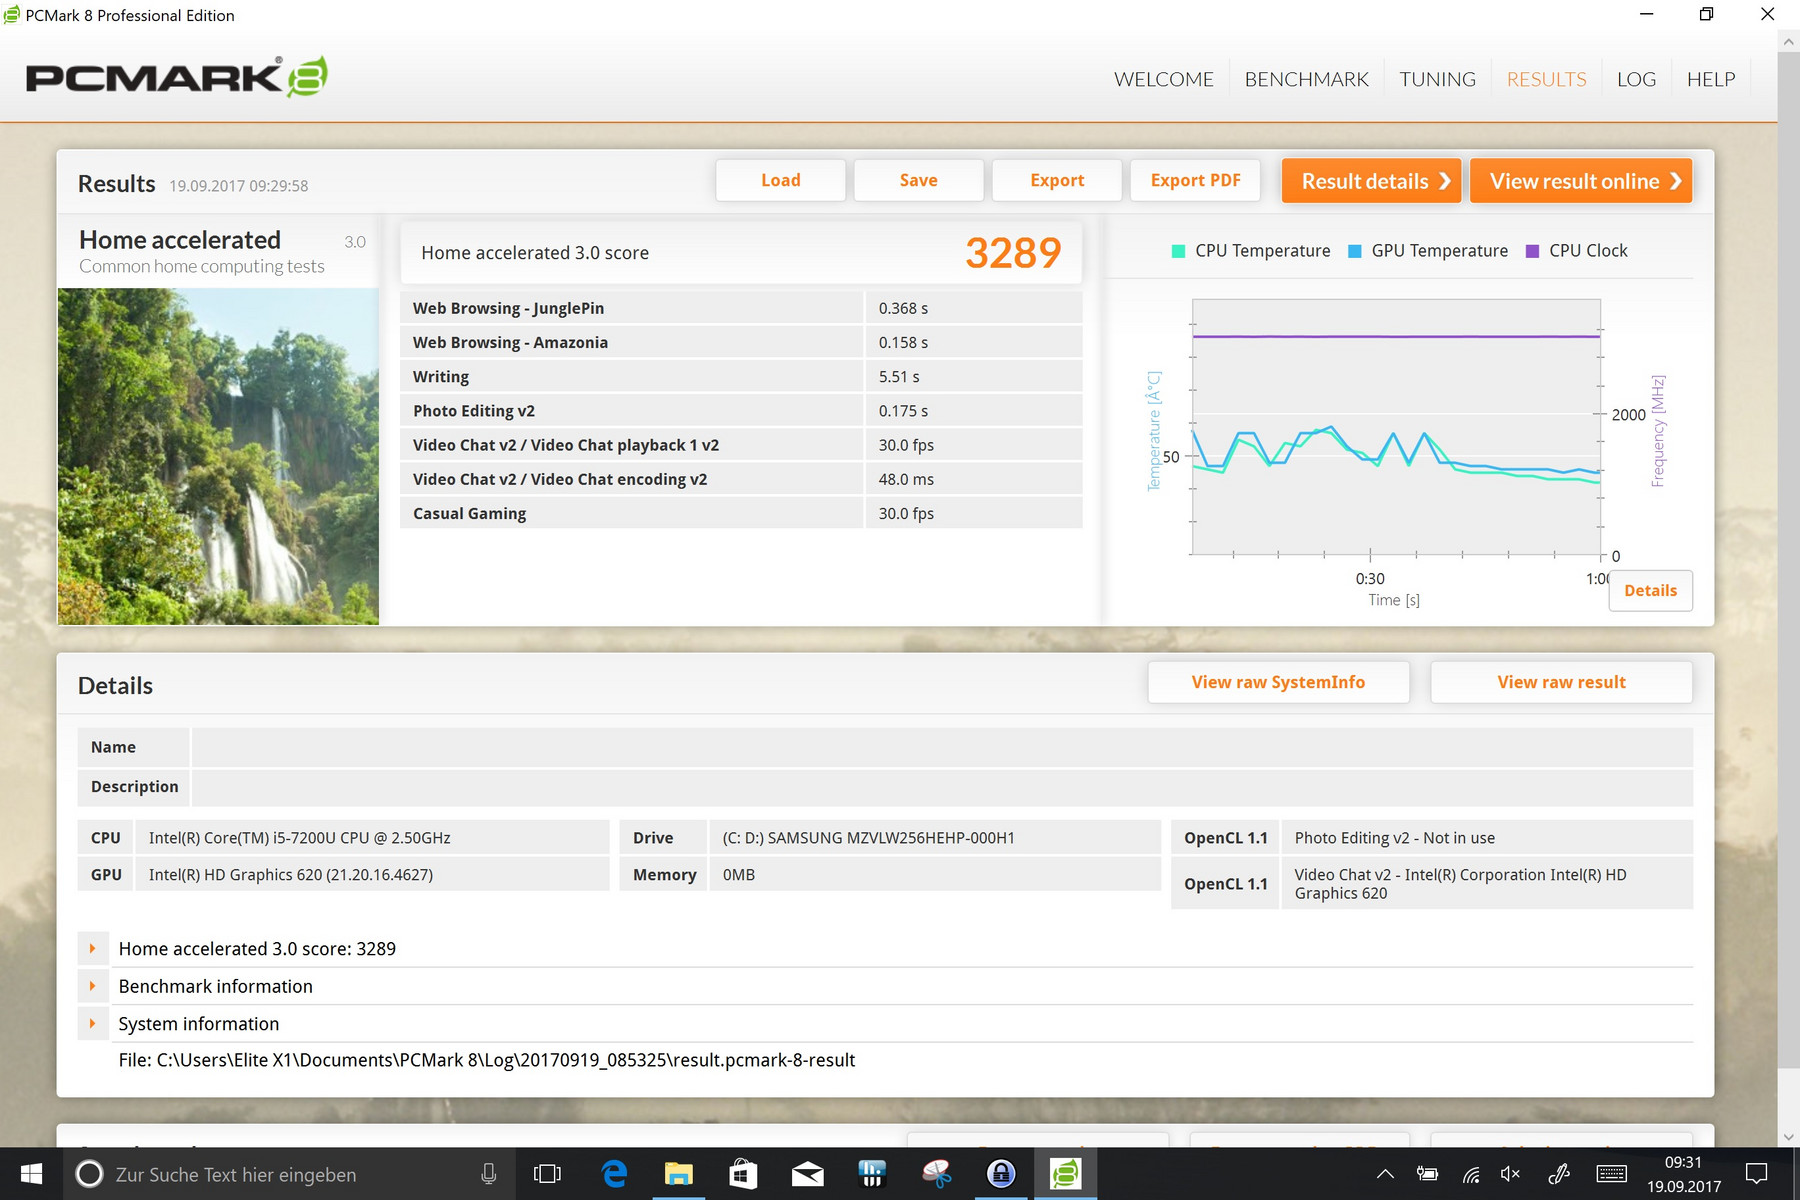
| PCMark 8 Home Score Accelerated v2 | 3289 punten | |
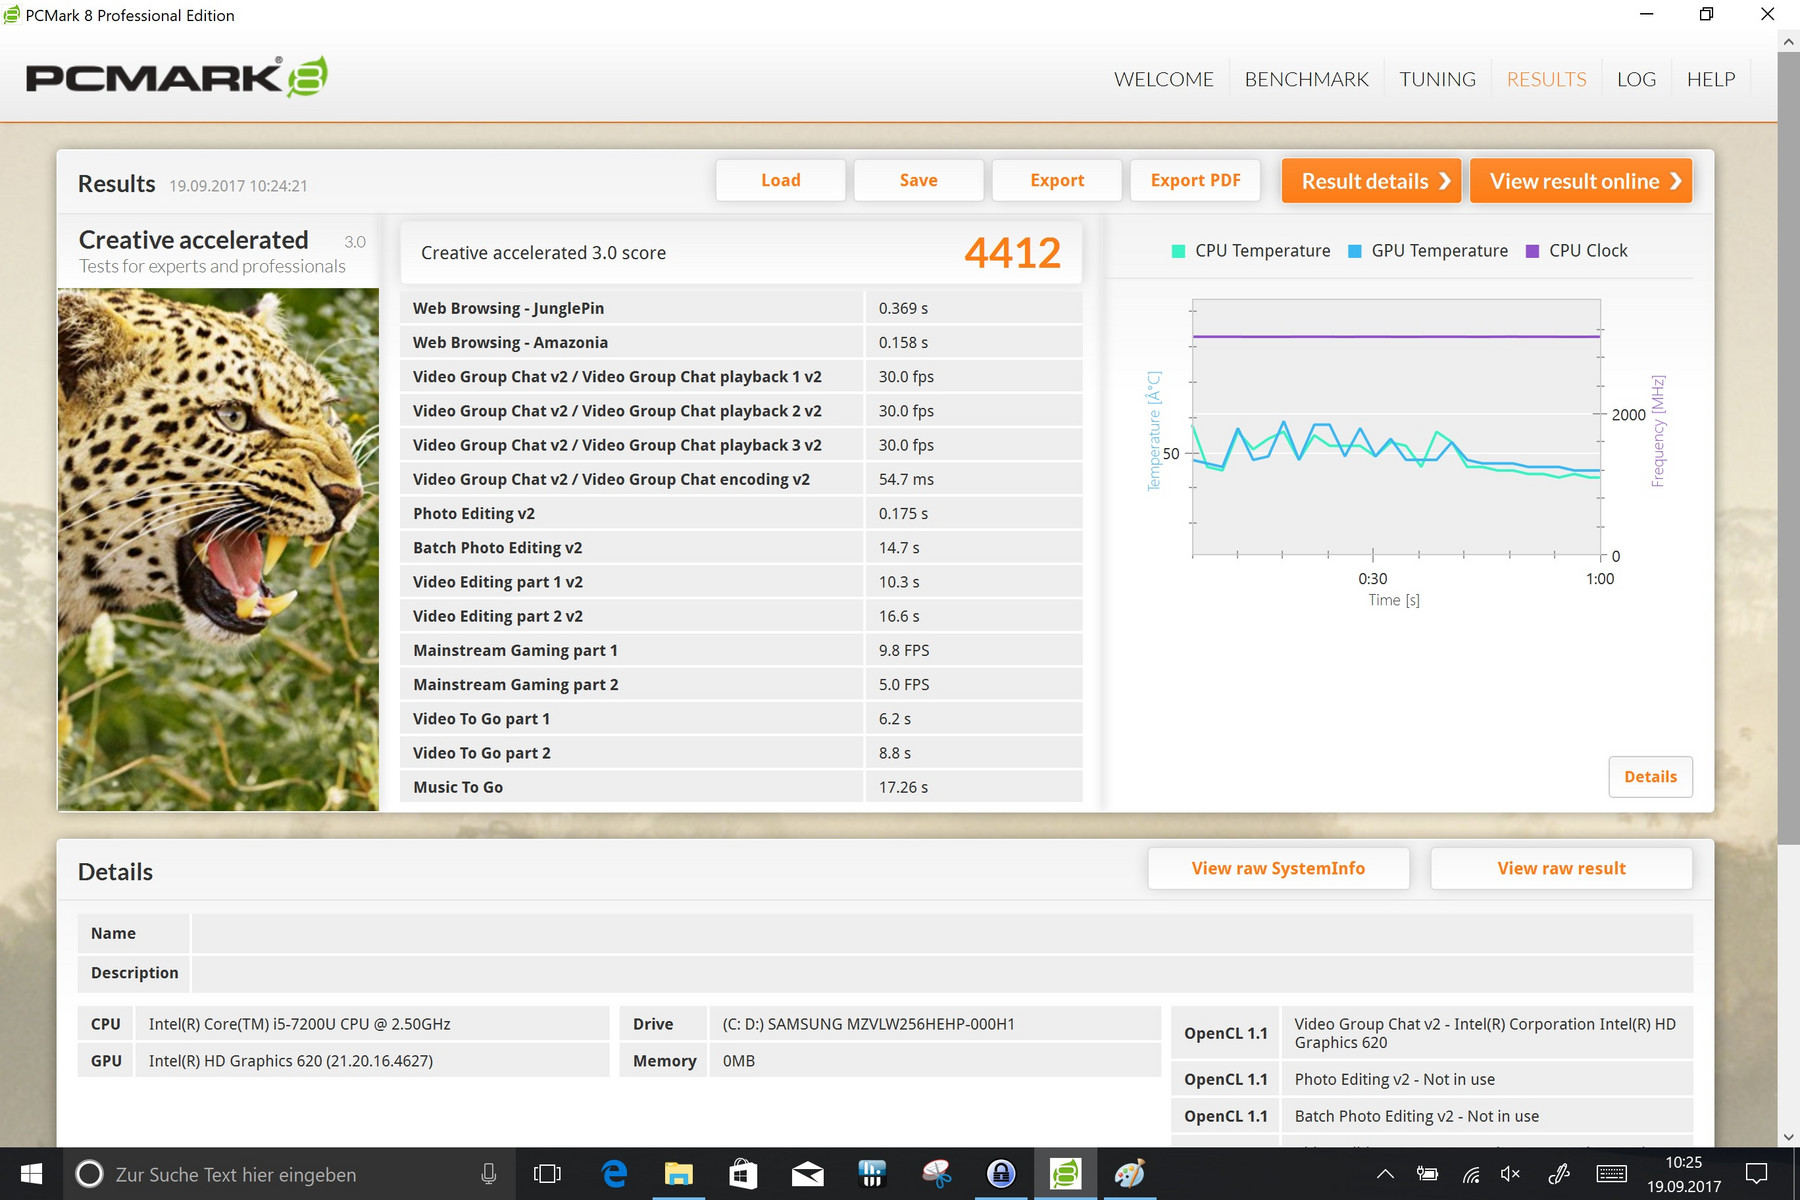
| PCMark 8 Creative Score Accelerated v2 | 4412 punten | |
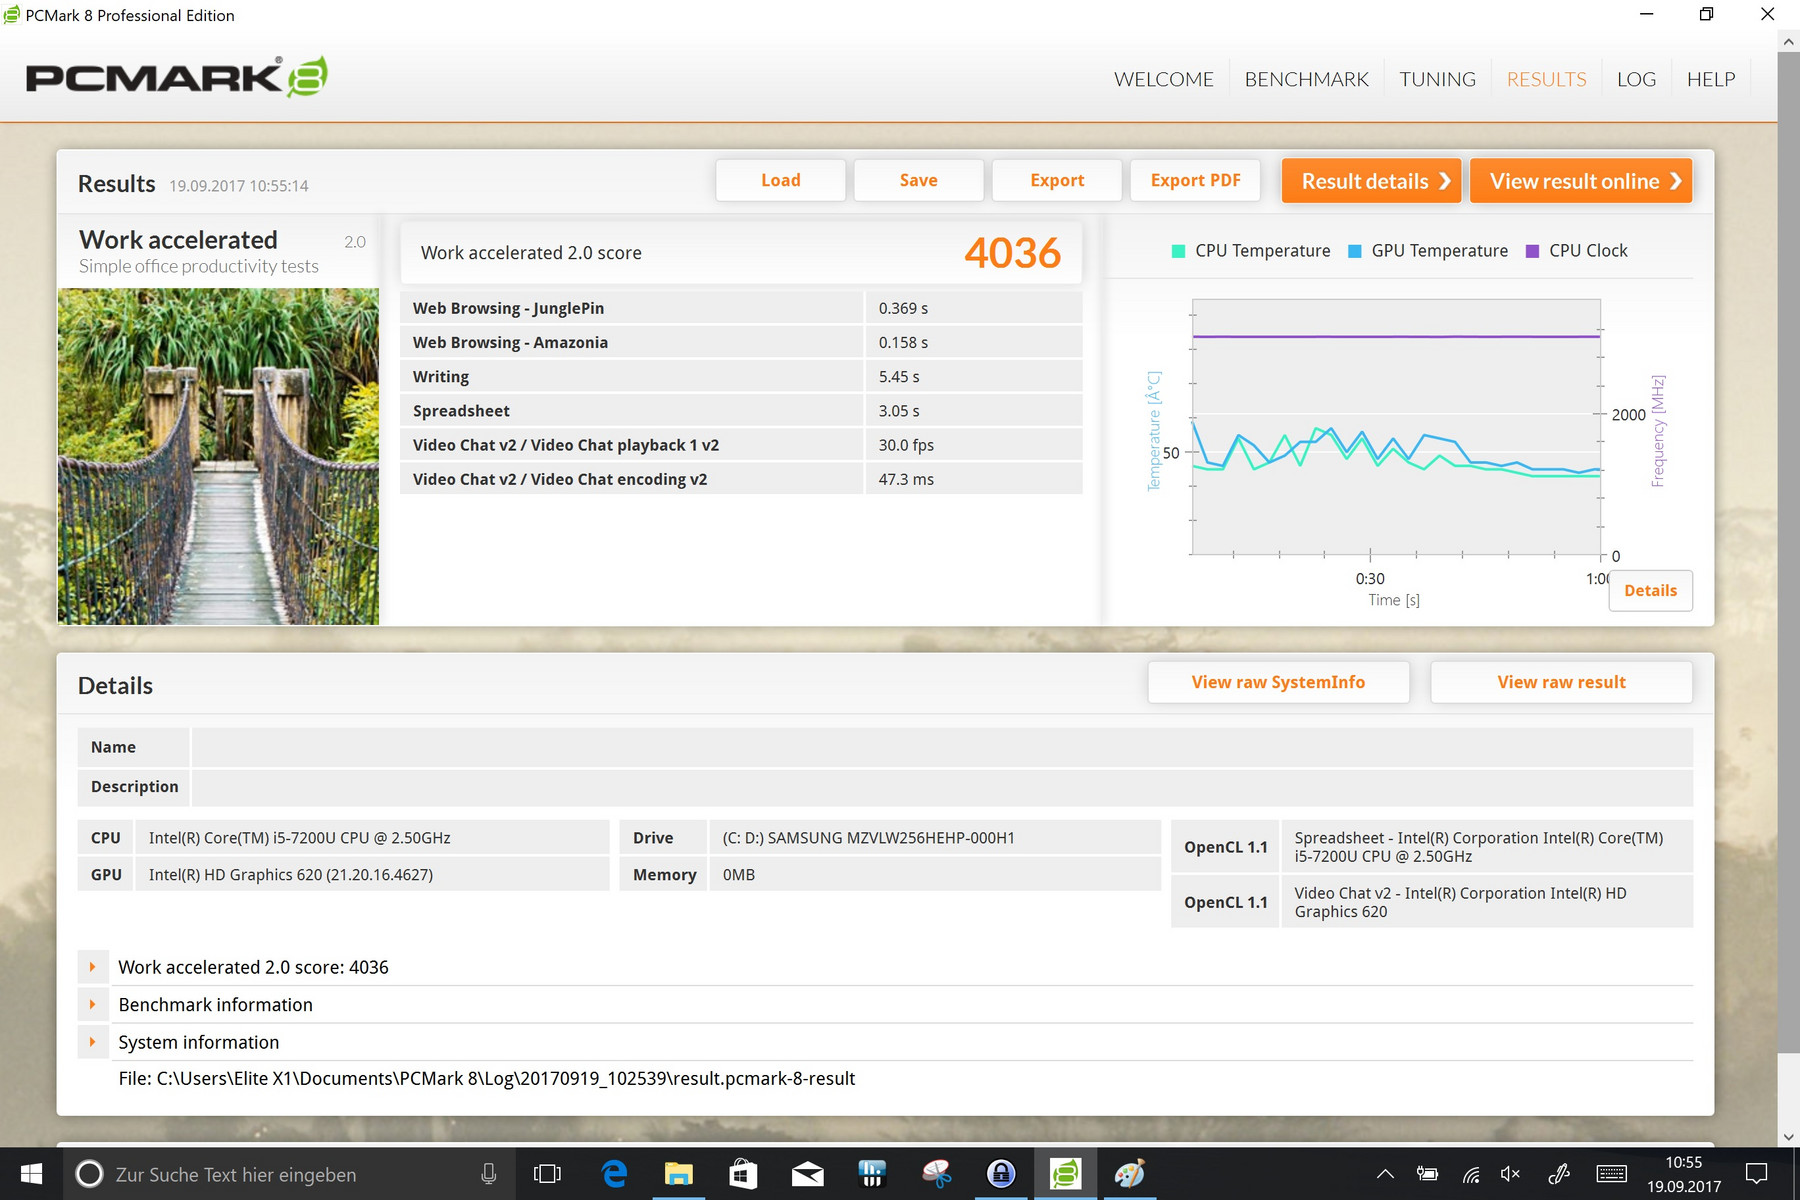
| PCMark 8 Work Score Accelerated v2 | 4036 punten | |
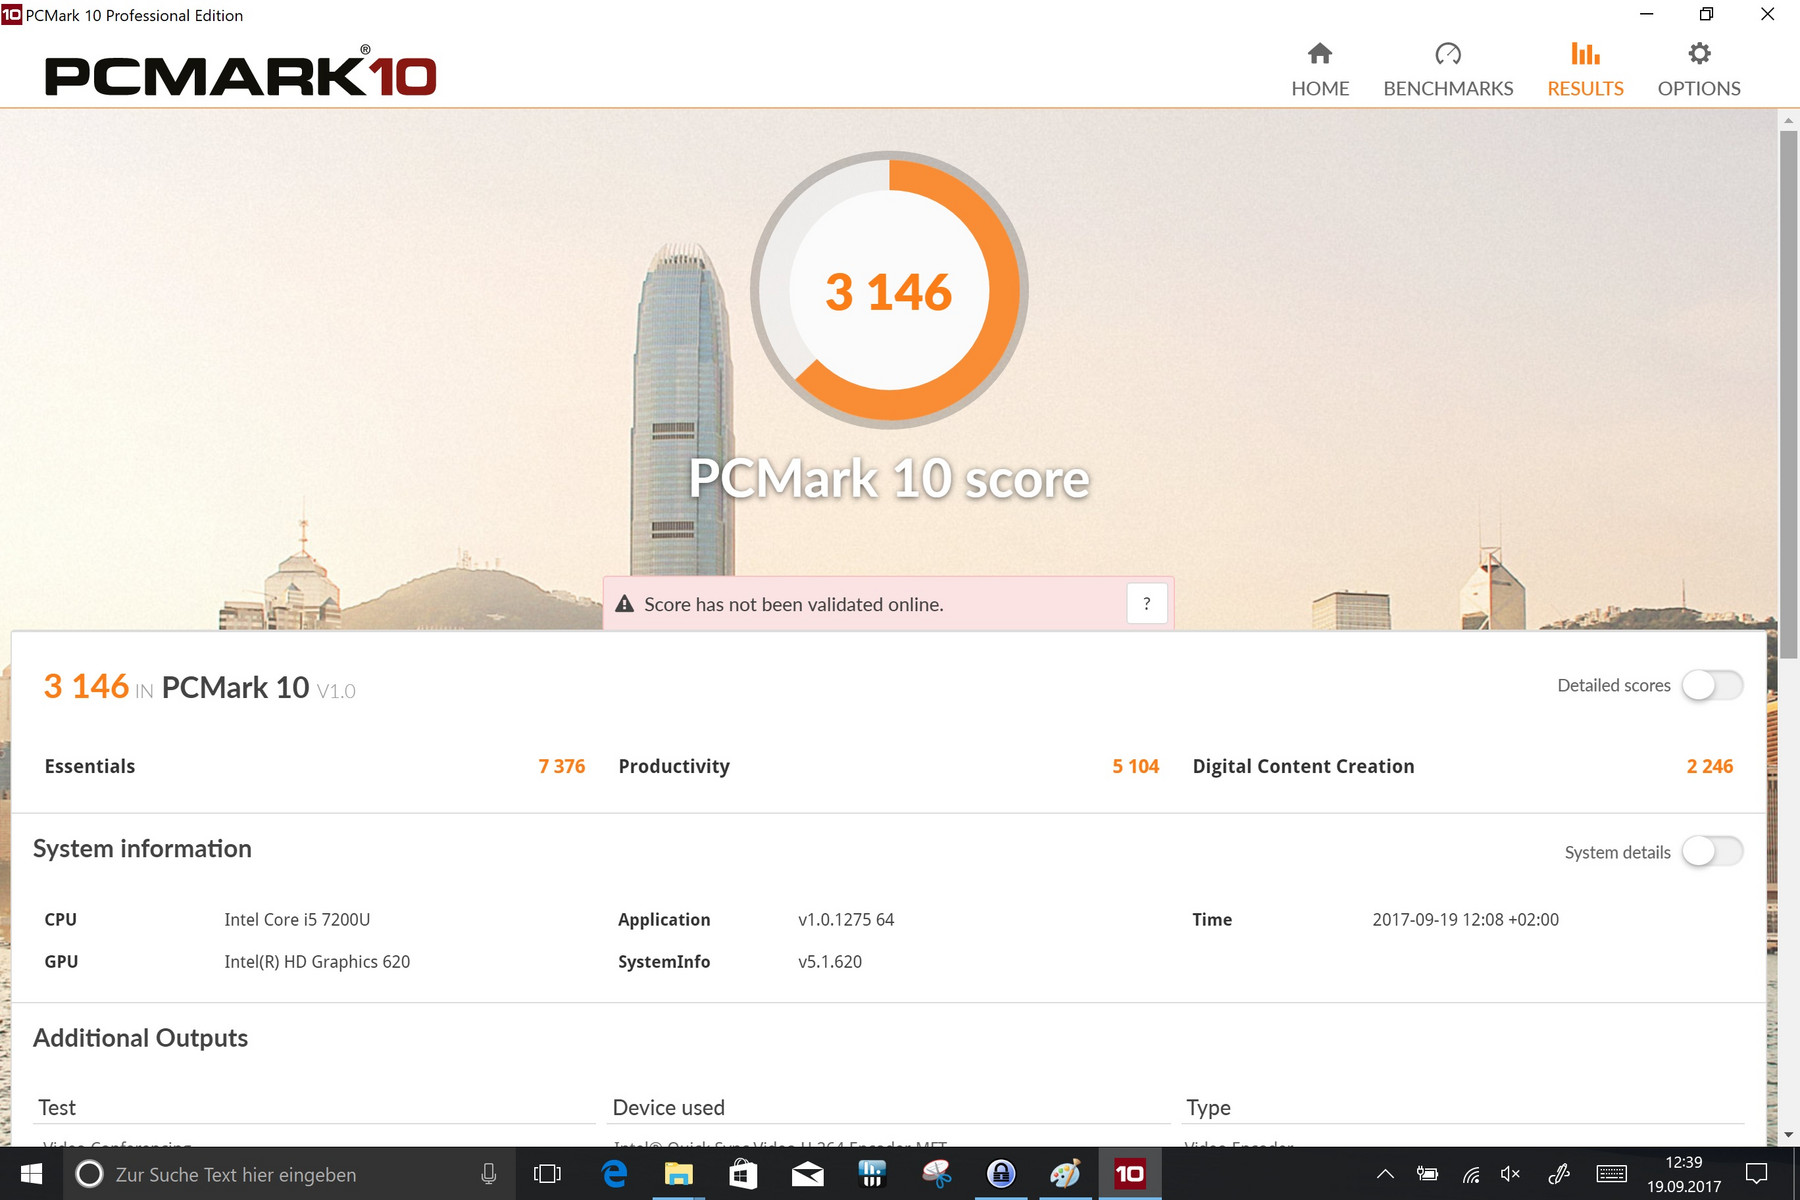
| PCMark 10 Score | 3146 punten | |
Help | ||
| HP Elite x2 1012 G2-1LV76EA Samsung PM961 MZVLW256HEHP | Microsoft Surface Pro (2017) i5 Samsung PM971 KUS030202M | Lenovo ThinkPad X1 Yoga 2017 20JES03T00 Samsung SSD PM961 1TB M.2 PCIe 3.0 x4 NVMe (MZVLW1T0) | Dell Latitude 12 5285 2-in-1 Samsung PM961 MZVLW256HEHP | Acer Switch 5 SW512-52-5819 Intel SSD 600p SSDPEKKW512G7 | Toshiba Portege X20W-D-10R Toshiba SG5 THNSNK512GVN8 | HP Elite x2 1012 G1 Liteon L8H-256V2G | |
|---|---|---|---|---|---|---|---|
| CrystalDiskMark 3.0 | -34% | 21% | -30% | -28% | -57% | -56% | |
| Read Seq (MB/s) | 1875 | 723 -61% | 2004 7% | 1294 -31% | 1066 -43% | 469 -75% | 501 -73% |
| Write Seq (MB/s) | 1261 | 853 -32% | 1693 34% | 865 -31% | 593 -53% | 277.3 -78% | 297.2 -76% |
| Read 512 (MB/s) | 1235 | 225 -82% | 1040 -16% | 406 -67% | 653 -47% | 404.4 -67% | 351.7 -72% |
| Write 512 (MB/s) | 844 | 445 -47% | 1292 53% | 589 -30% | 535 -37% | 266.6 -68% | 295.7 -65% |
| Read 4k (MB/s) | 56.9 | 46 -19% | 58.2 2% | 31.75 -44% | 35.92 -37% | 25.24 -56% | 28.31 -50% |
| Write 4k (MB/s) | 145.4 | 125 -14% | 182.2 25% | 72.2 -50% | 128.3 -12% | 89.4 -39% | 90.3 -38% |
| Read 4k QD32 (MB/s) | 398.3 | 423 6% | 632 59% | 493.3 24% | 460.6 16% | 322.5 -19% | 285 -28% |
| Write 4k QD32 (MB/s) | 472.5 | 373 -21% | 507 7% | 434.5 -8% | 425.4 -10% | 208.1 -56% | 268.4 -43% |

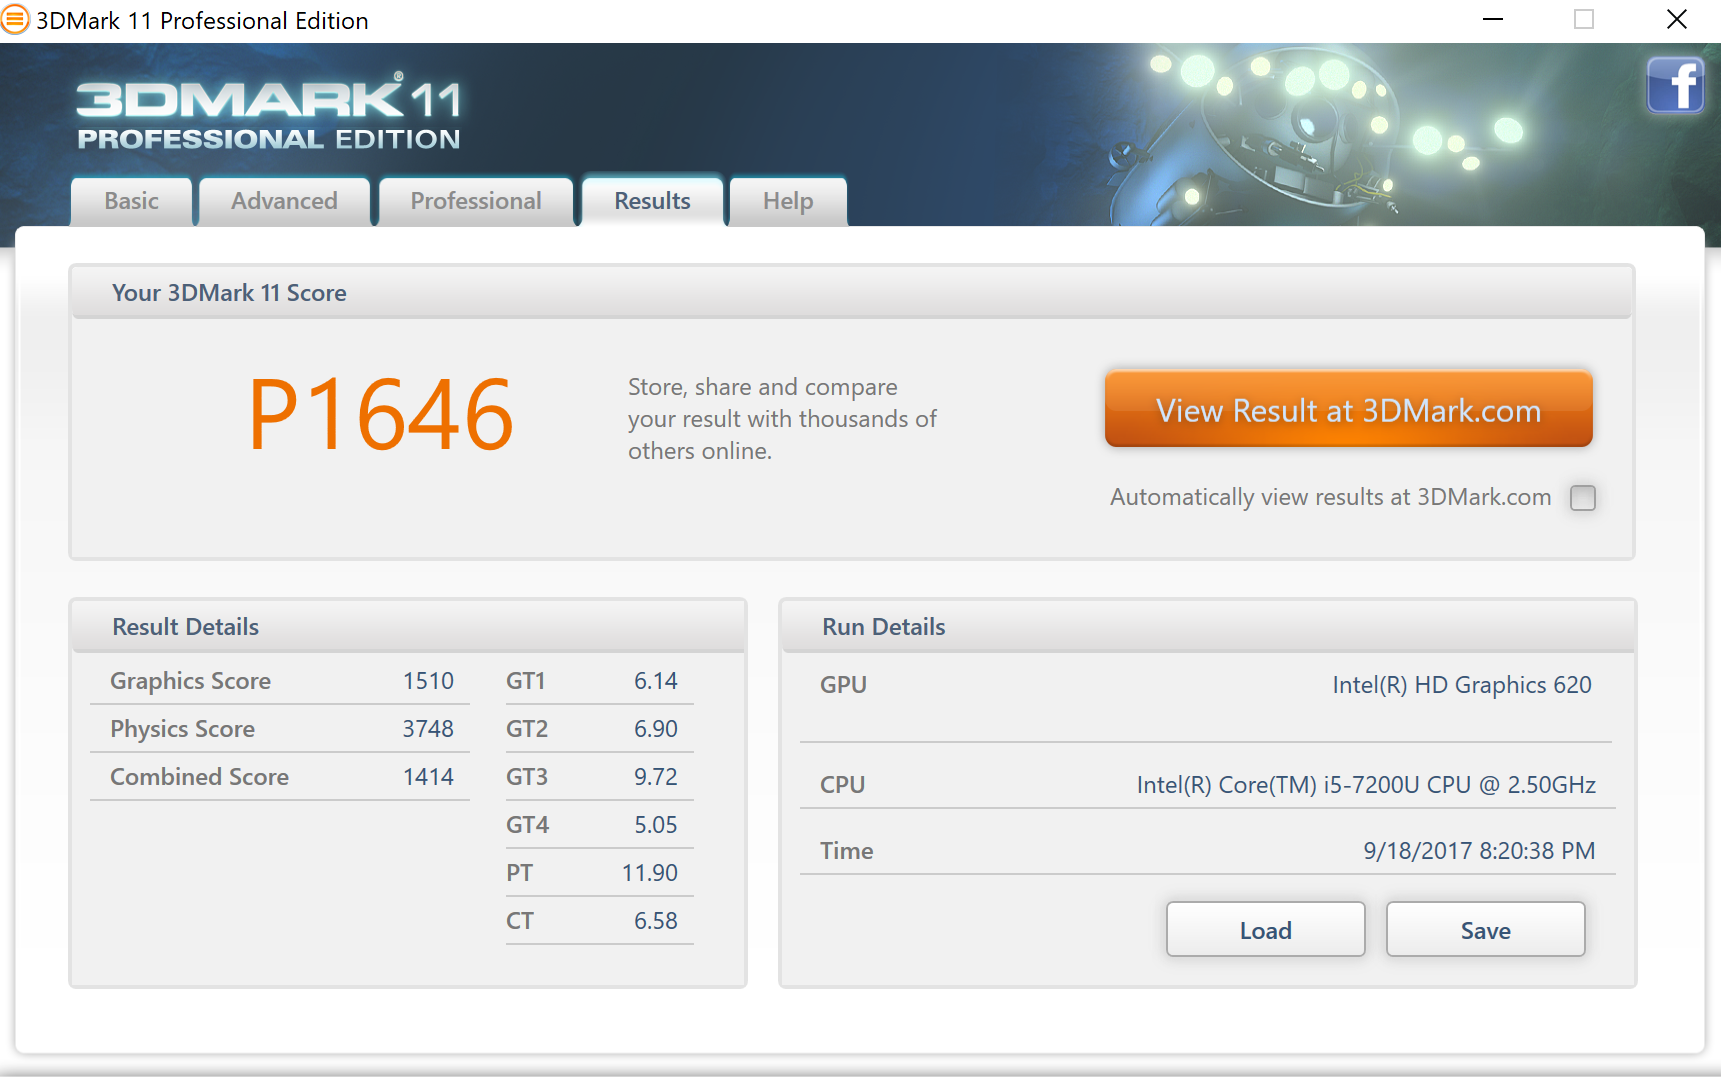
| 3DMark 11 Performance | 1646 punten | |
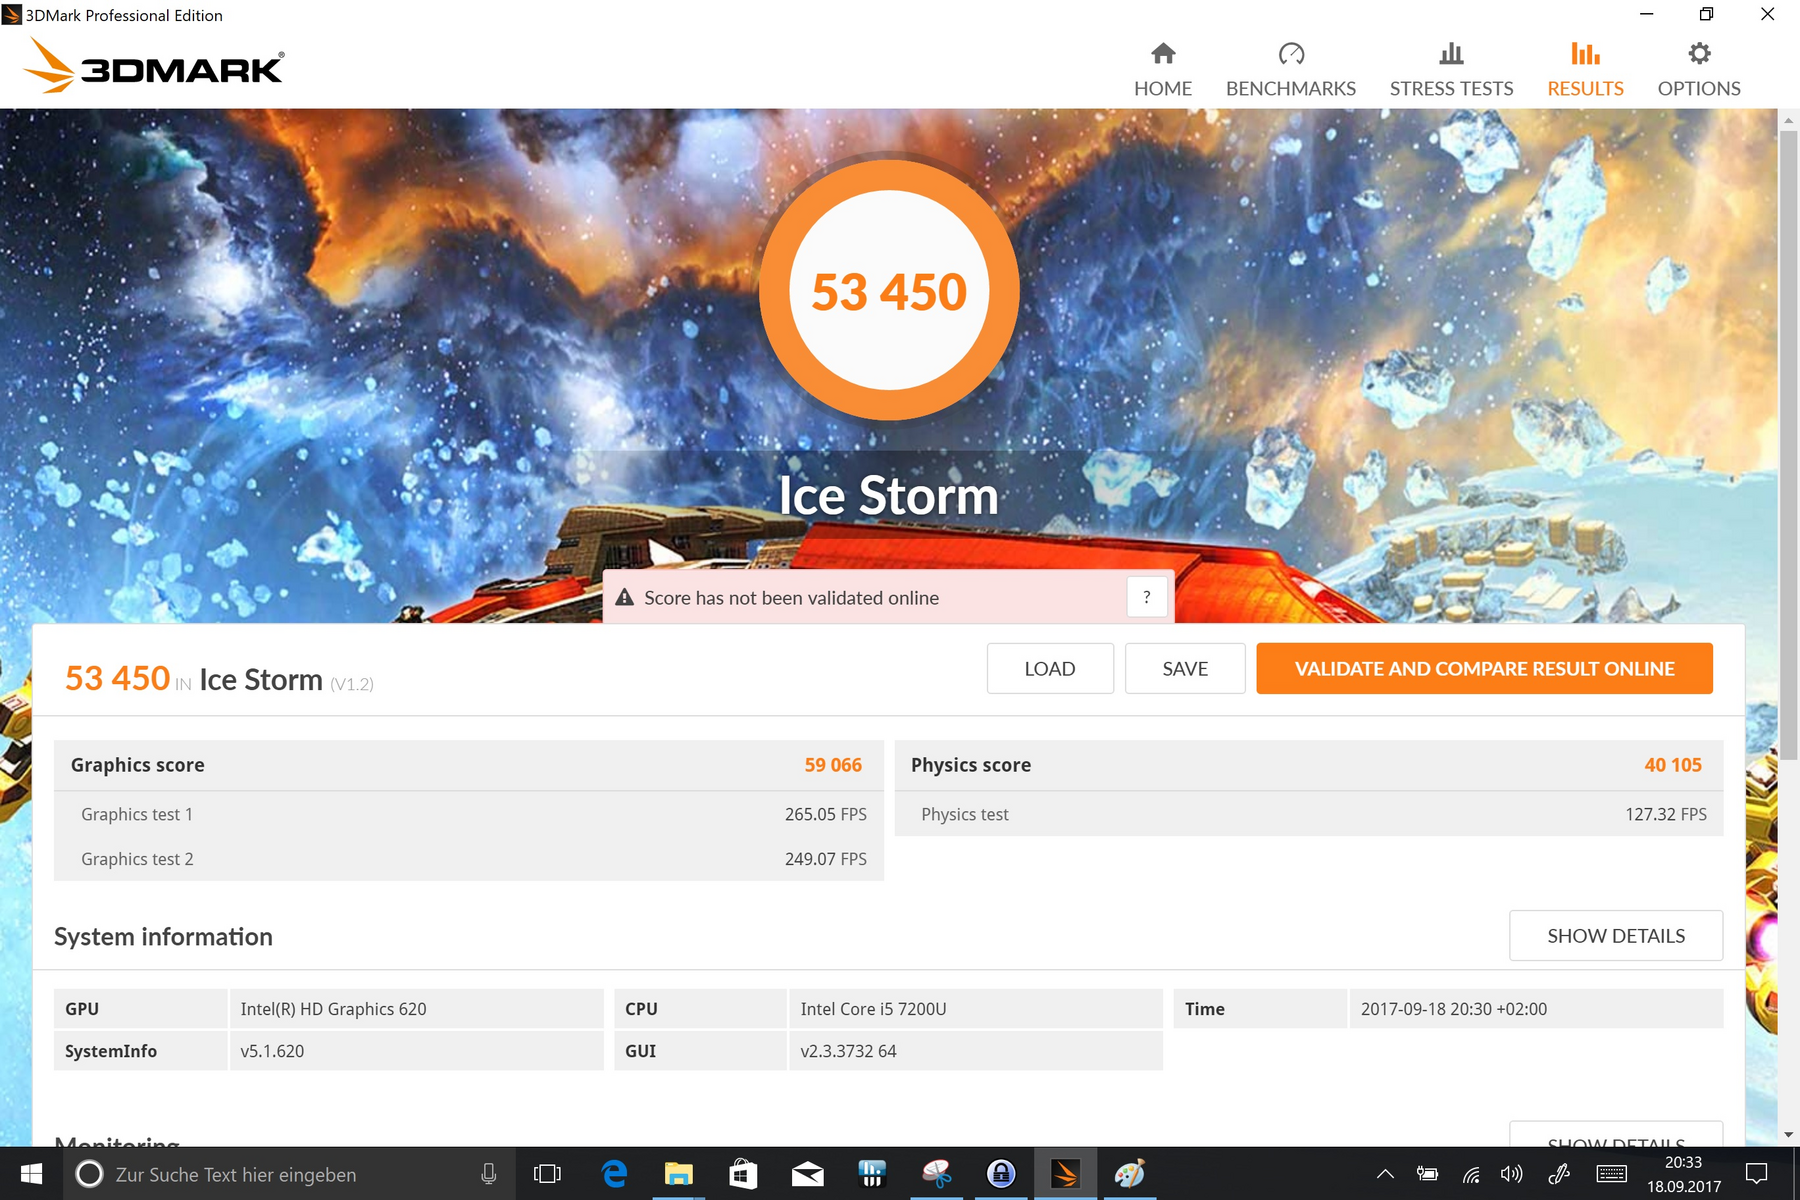
| 3DMark Ice Storm Standard Score | 53450 punten | |
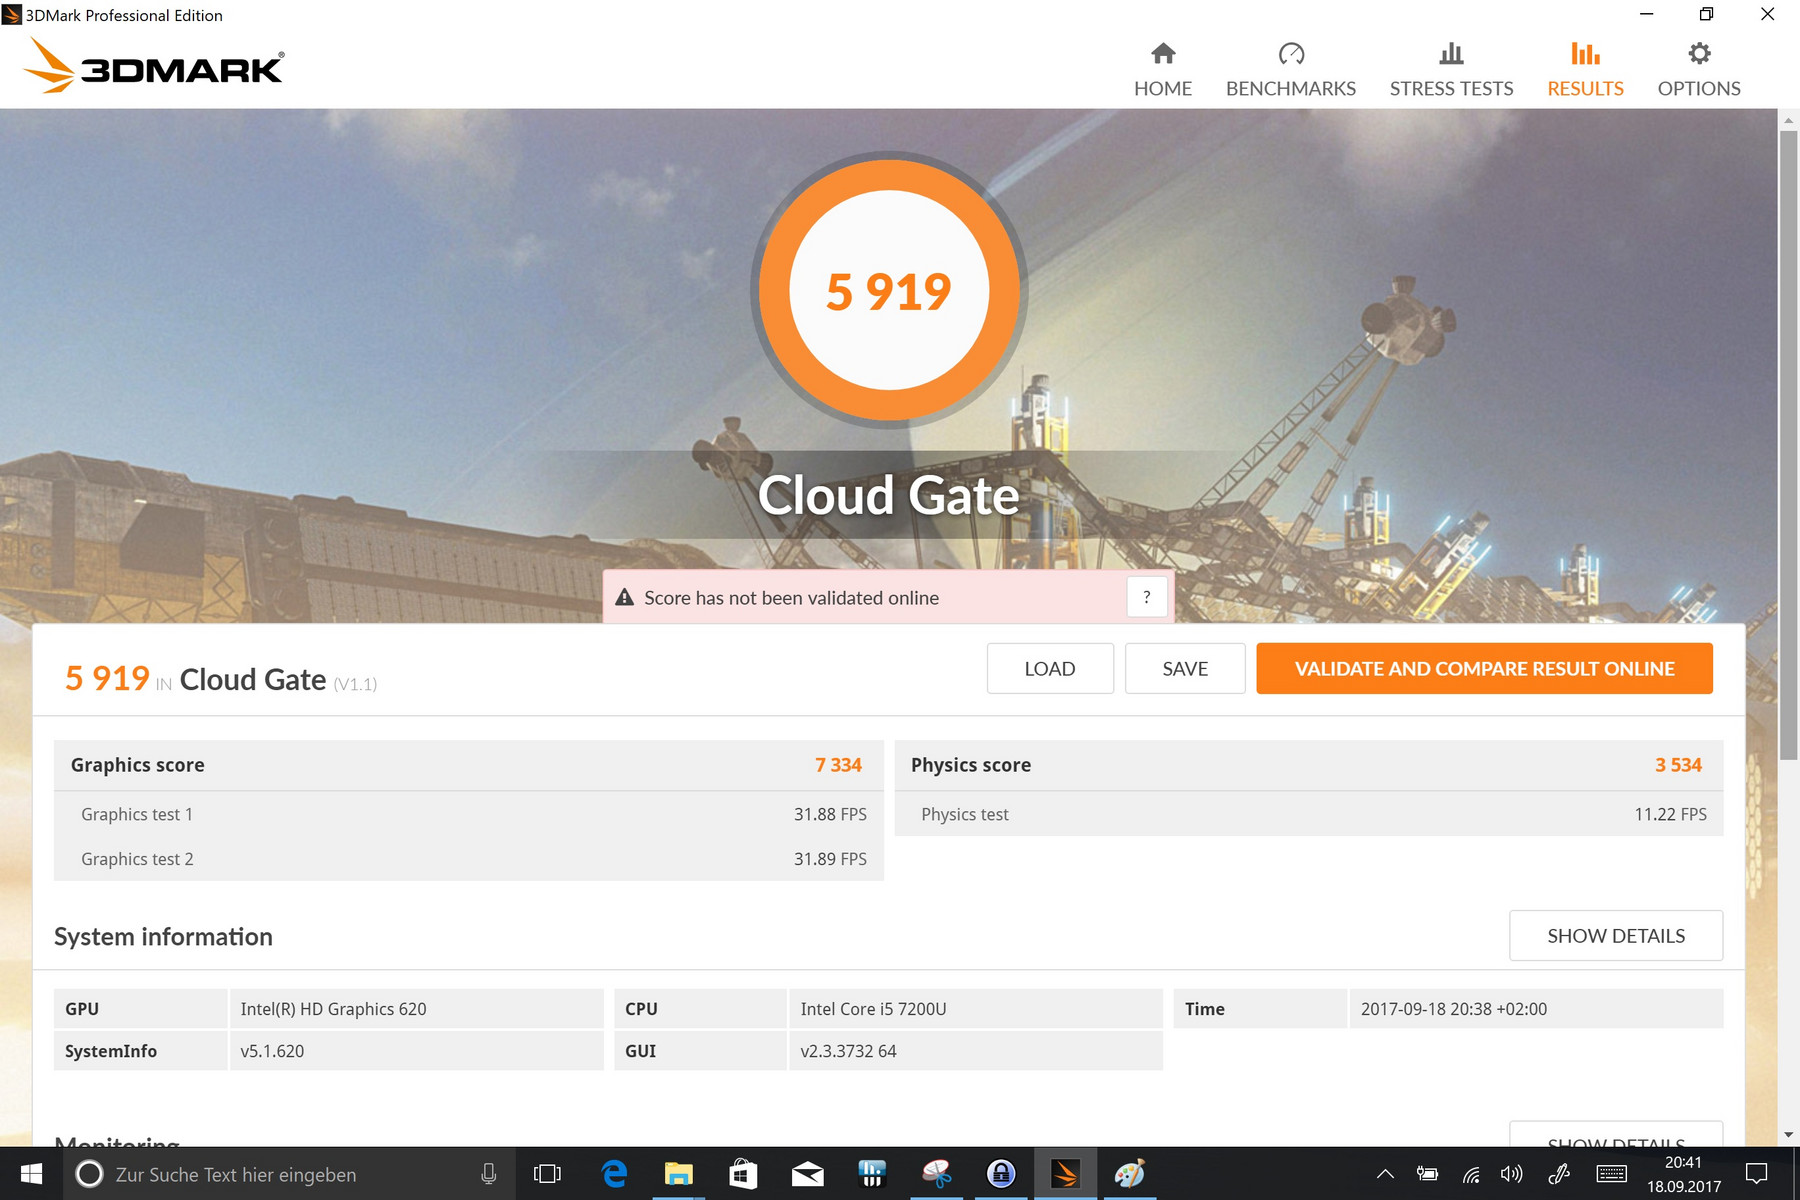
| 3DMark Cloud Gate Standard Score | 5919 punten | |
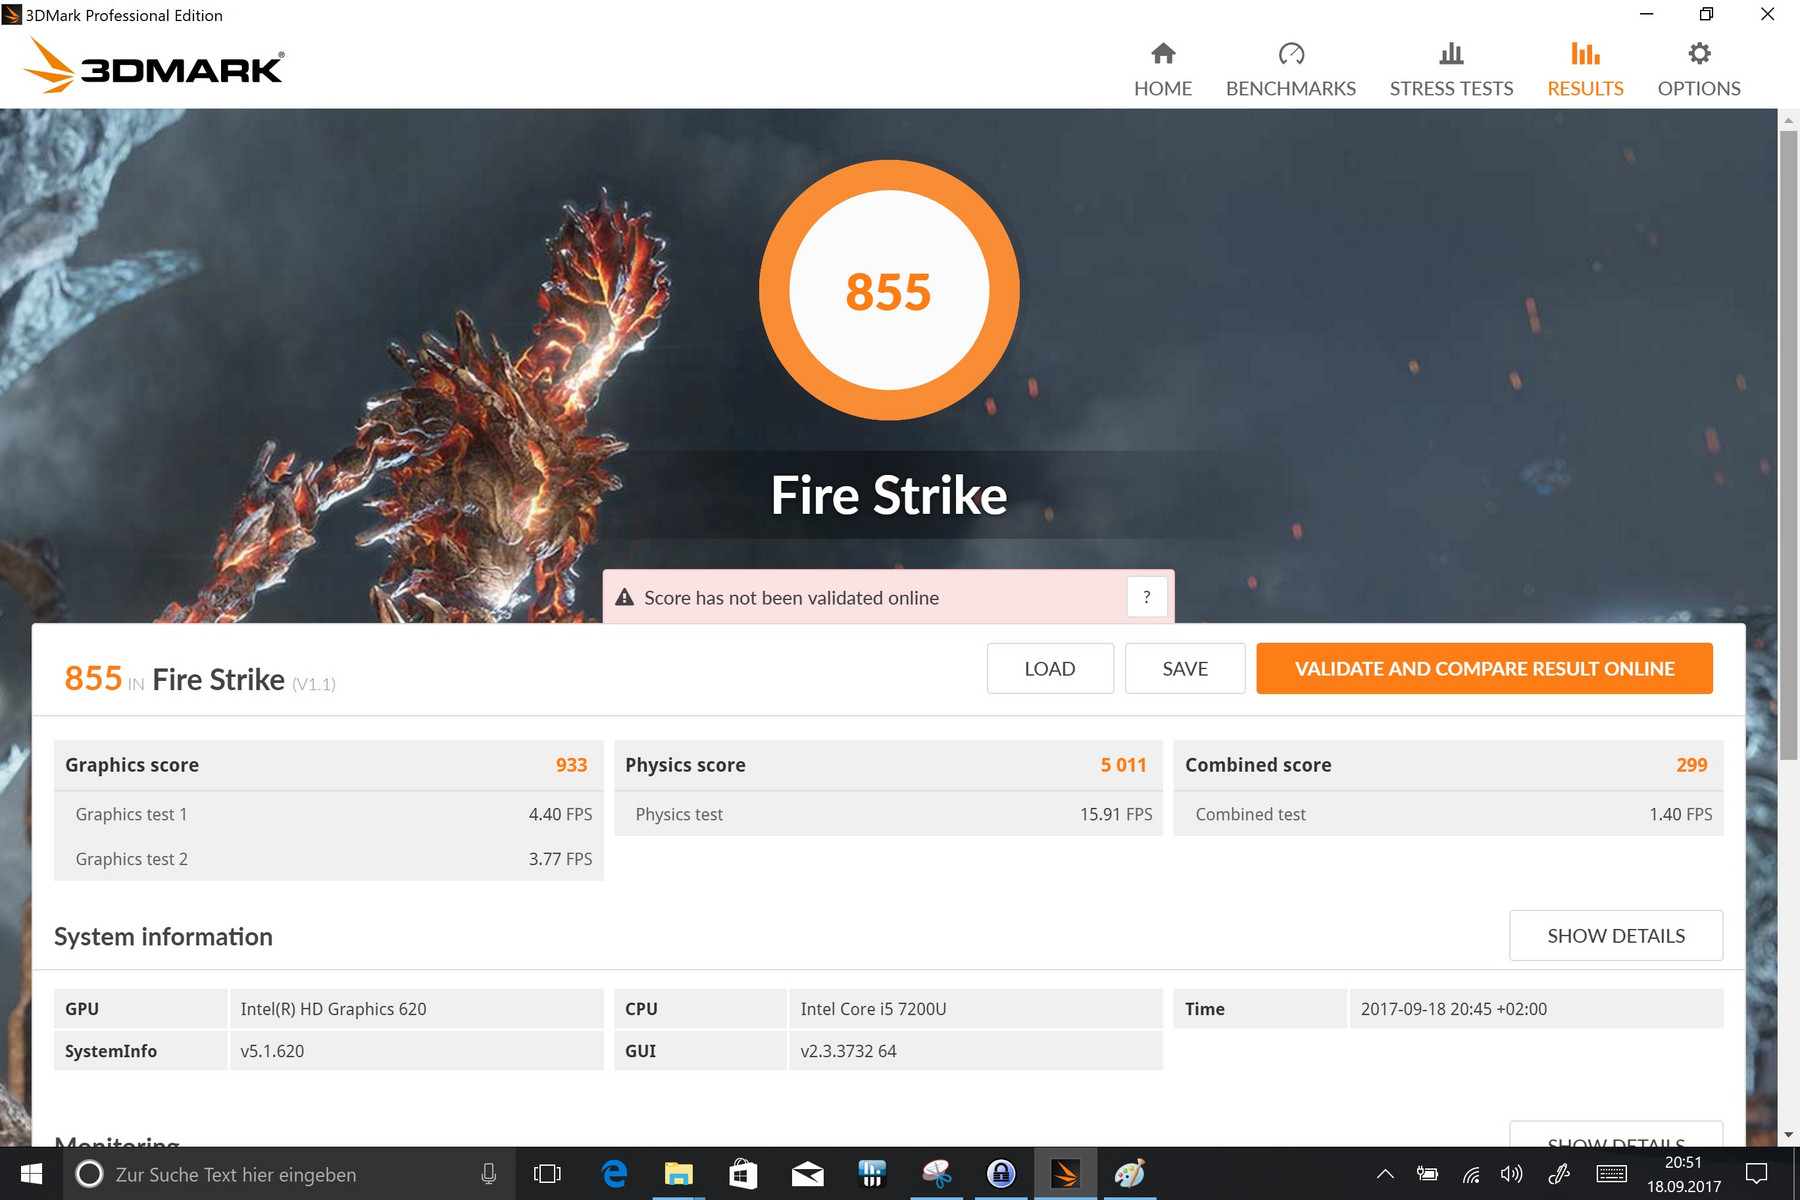
| 3DMark Fire Strike Score | 855 punten | |
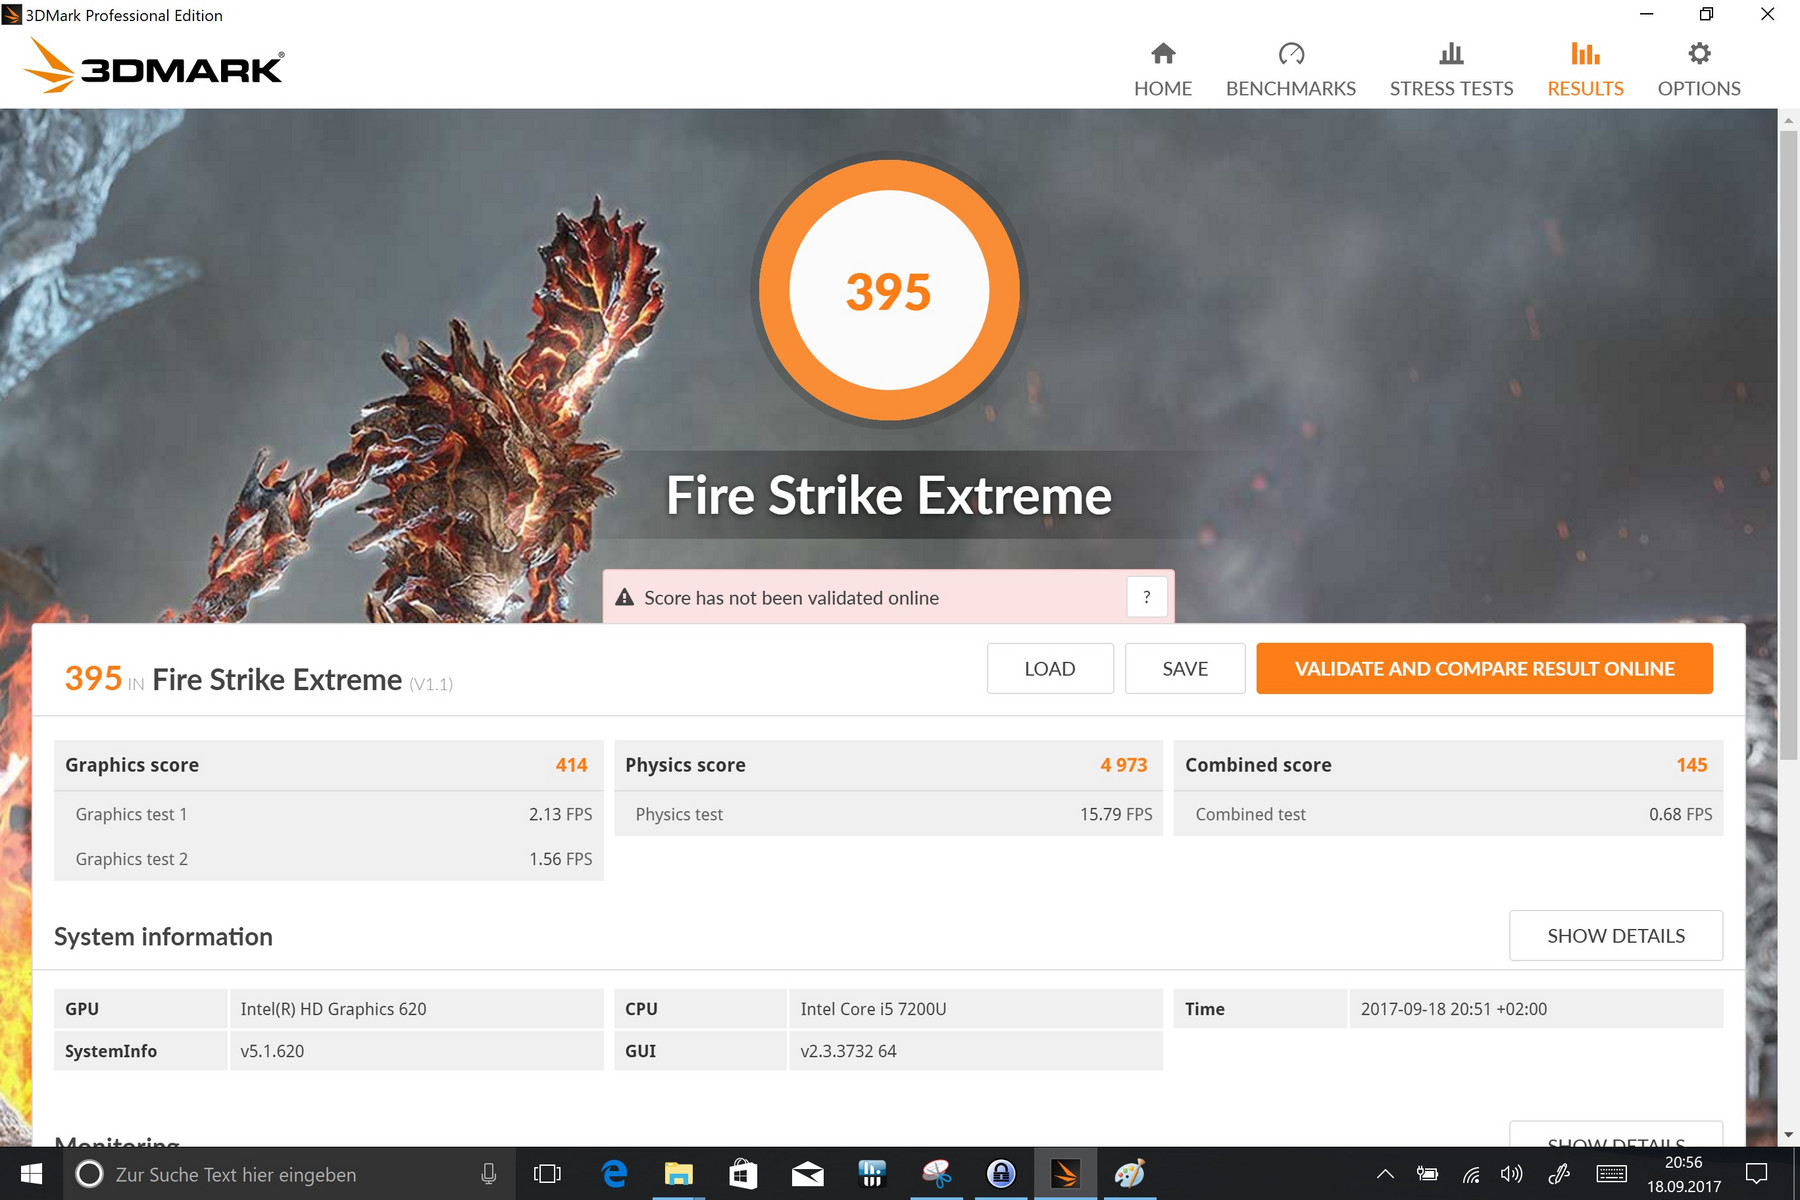
| 3DMark Fire Strike Extreme Score | 395 punten | |
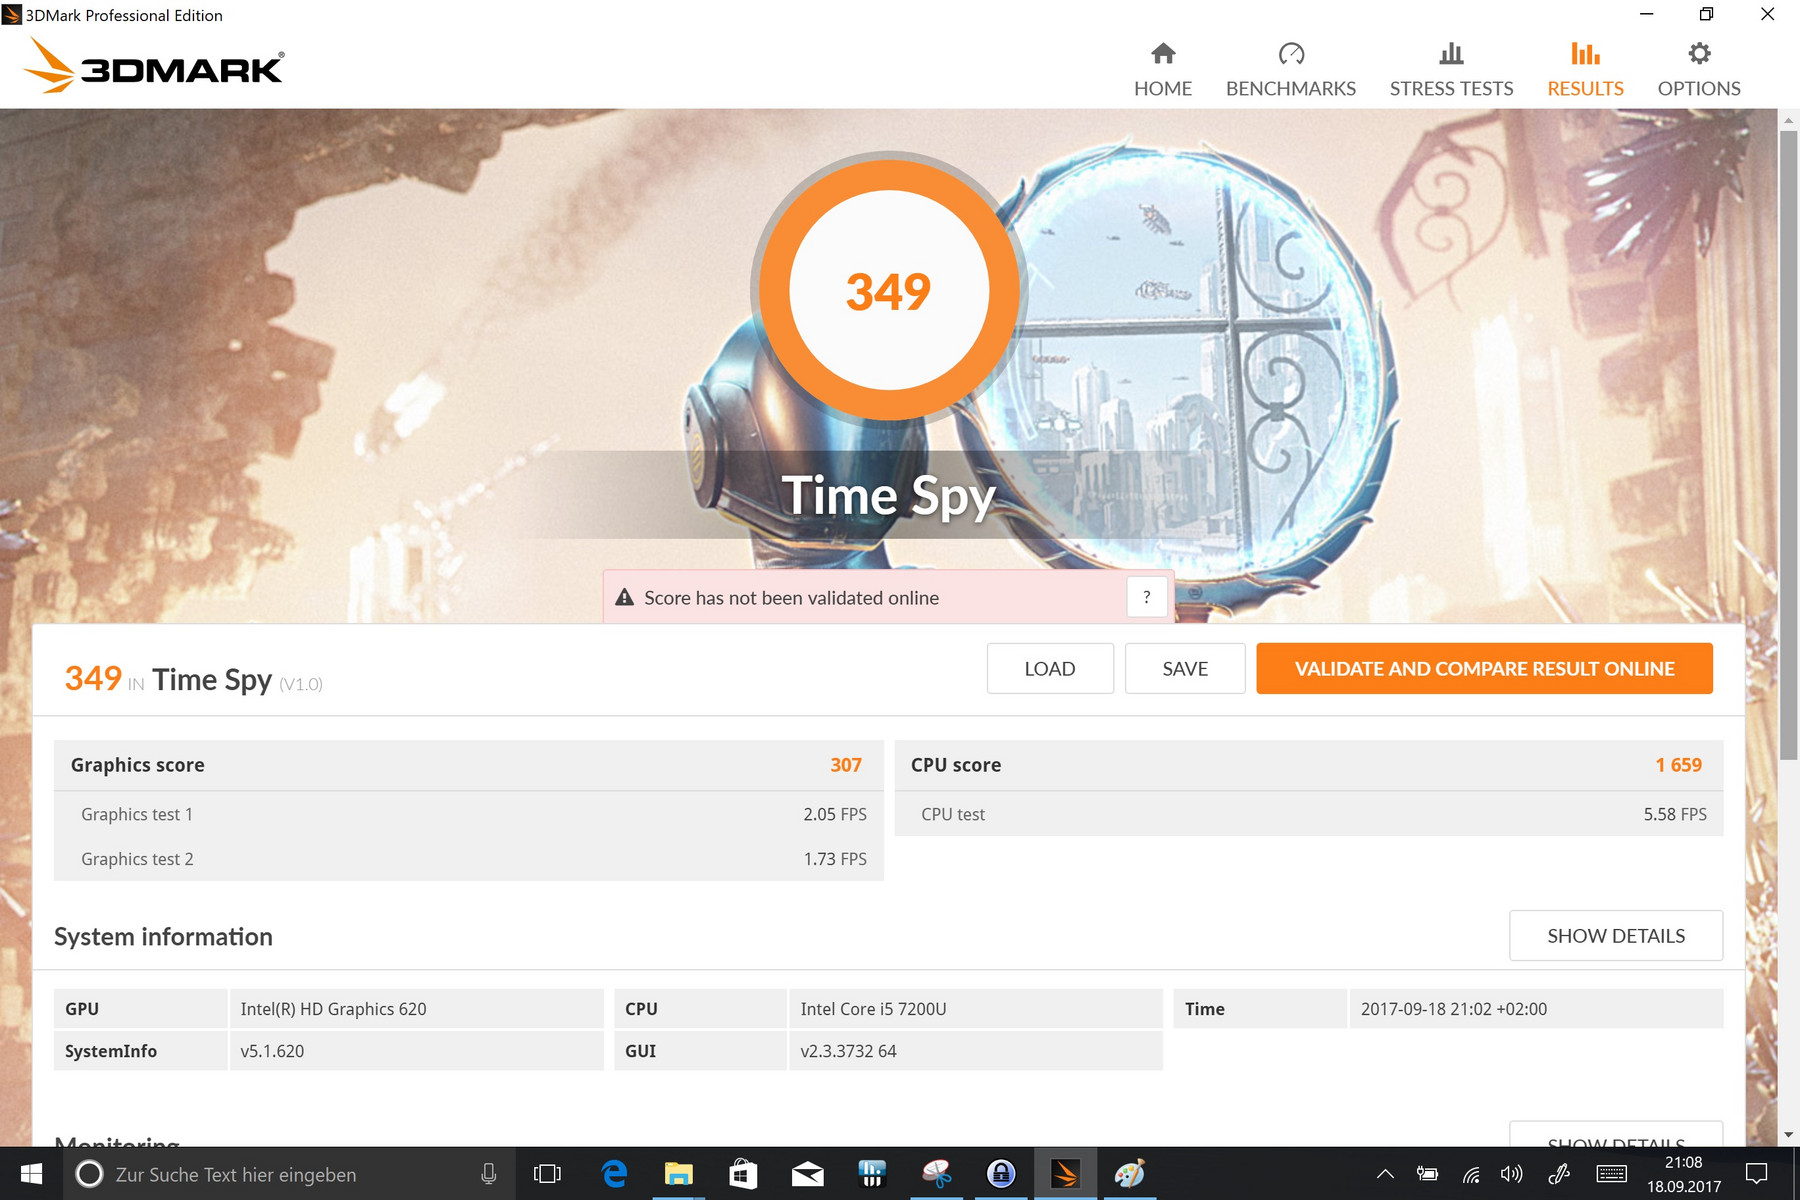
| 3DMark Time Spy Score | 349 punten | |
Help | ||
| lage | gem. | hoge | ultra | |
|---|---|---|---|---|
| BioShock Infinite (2013) | 52.9 | 30.5 | 25.2 | 7.5 |
| Battlefield 4 (2013) | 40.6 | 27.2 | 18.3 | 6.1 |
| Rise of the Tomb Raider (2016) | 20.1 | 11.9 | 6.8 | 4.3 |
Geluidsniveau
| Onbelast |
| 29.5 / 29.5 / 29.5 dB (A) |
| Belasting |
| 30.6 / 32.5 dB (A) |
 | ||
30 dB stil 40 dB(A) hoorbaar 50 dB(A) luid |
||
min: | ||
| HP Elite x2 1012 G2-1LV76EA HD Graphics 620, i5-7200U, Samsung PM961 MZVLW256HEHP | Microsoft Surface Pro (2017) i5 HD Graphics 620, i5-7300U, Samsung PM971 KUS030202M | Lenovo ThinkPad X1 Yoga 2017 20JES03T00 HD Graphics 620, i7-7600U, Samsung SSD PM961 1TB M.2 PCIe 3.0 x4 NVMe (MZVLW1T0) | Dell Latitude 12 5285 2-in-1 HD Graphics 620, i7-7600U, Samsung PM961 MZVLW256HEHP | Acer Switch 5 SW512-52-5819 HD Graphics 620, i7-7500U, Intel SSD 600p SSDPEKKW512G7 | Toshiba Portege X20W-D-10R HD Graphics 620, i7-7600U, Toshiba SG5 THNSNK512GVN8 | HP Elite x2 1012 G1 HD Graphics 515, 6Y54, Liteon L8H-256V2G | |
|---|---|---|---|---|---|---|---|
| Noise | -8% | 2% | -2% | ||||
| uit / omgeving * (dB) | 29.5 | 29.3 1% | 28.2 4% | 30.4 -3% | |||
| Idle Minimum * (dB) | 29.5 | 29.3 1% | 28.2 4% | 30.5 -3% | |||
| Idle Average * (dB) | 29.5 | 31.1 -5% | 28.2 4% | 30.5 -3% | |||
| Idle Maximum * (dB) | 29.5 | 33.3 -13% | 28.2 4% | 30.5 -3% | |||
| Load Average * (dB) | 30.6 | 33.3 -9% | 30.4 1% | 31.2 -2% | |||
| Load Maximum * (dB) | 32.5 | 38.9 -20% | 34 -5% | 31.3 4% |
* ... kleiner is beter
| HP Elite x2 1012 G2-1LV76EA HD Graphics 620, i5-7200U, Samsung PM961 MZVLW256HEHP | Microsoft Surface Pro (2017) i5 HD Graphics 620, i5-7300U, Samsung PM971 KUS030202M | Lenovo ThinkPad X1 Yoga 2017 20JES03T00 HD Graphics 620, i7-7600U, Samsung SSD PM961 1TB M.2 PCIe 3.0 x4 NVMe (MZVLW1T0) | Dell Latitude 12 5285 2-in-1 HD Graphics 620, i7-7600U, Samsung PM961 MZVLW256HEHP | Acer Switch 5 SW512-52-5819 HD Graphics 620, i7-7500U, Intel SSD 600p SSDPEKKW512G7 | Toshiba Portege X20W-D-10R HD Graphics 620, i7-7600U, Toshiba SG5 THNSNK512GVN8 | HP Elite x2 1012 G1 HD Graphics 515, 6Y54, Liteon L8H-256V2G | |
|---|---|---|---|---|---|---|---|
| Heat | -9% | 2% | -3% | -9% | 22% | -1% | |
| Maximum Upper Side * (°C) | 42.3 | 39.2 7% | 47.5 -12% | 38.2 10% | 44.7 -6% | 35.7 16% | 39 8% |
| Maximum Bottom * (°C) | 44.5 | 40.3 9% | 44.8 -1% | 48.6 -9% | 47.5 -7% | 24.2 46% | 41.2 7% |
| Idle Upper Side * (°C) | 29.5 | 37 -25% | 23.7 20% | 29.6 -0% | 29.7 -1% | 23.4 21% | 29.5 -0% |
| Idle Bottom * (°C) | 25.2 | 32.3 -28% | 24.6 2% | 28.8 -14% | 30.7 -22% | 24.2 4% | 29.8 -18% |
* ... kleiner is beter
(±) De maximumtemperatuur aan de bovenzijde bedraagt 42.3 °C / 108 F, vergeleken met het gemiddelde van 35.4 °C / 96 F, variërend van 19.6 tot 60 °C voor de klasse Convertible.
(±) De bodem warmt op tot een maximum van 44.5 °C / 112 F, vergeleken met een gemiddelde van 36.9 °C / 98 F
(+) Bij onbelast gebruik bedraagt de gemiddelde temperatuur voor de bovenzijde 26.9 °C / 80 F, vergeleken met het apparaatgemiddelde van 30.3 °C / 87 F.
(+) De handpalmsteunen en het touchpad bereiken maximaal de huidtemperatuur (35.9 °C / 96.6 F) en zijn dus niet heet.
(-) De gemiddelde temperatuur van de handpalmsteun van soortgelijke toestellen bedroeg 28 °C / 82.4 F (-7.9 °C / -14.2 F).
HP Elite x2 1012 G2-1LV76EA audioanalyse
(-) | niet erg luide luidsprekers (71 dB)
Bas 100 - 315 Hz
(-) | bijna geen lage tonen - gemiddeld 21.3% lager dan de mediaan
(±) | lineariteit van de lage tonen is gemiddeld (10% delta ten opzichte van de vorige frequentie)
Midden 400 - 2000 Hz
(+) | evenwichtige middens - slechts 4.2% verwijderd van de mediaan
(±) | lineariteit van de middentonen is gemiddeld (7.9% delta ten opzichte van de vorige frequentie)
Hoog 2 - 16 kHz
(±) | higher highs - on average 8.9% higher than median
(-) | hoogten zijn niet lineair (16.8% delta tot vorige frequentie)
Algemeen 100 - 16.000 Hz
(-) | het totale geluid is niet lineair (35.1% verschil met de mediaan)
Vergeleken met dezelfde klasse
» 94% van alle geteste apparaten in deze klasse waren beter, 2% vergelijkbaar, 4% slechter
» De beste had een delta van 6%, het gemiddelde was 20%, de slechtste was 57%
Vergeleken met alle geteste toestellen
» 93% van alle geteste apparaten waren beter, 1% gelijk, 6% slechter
» De beste had een delta van 4%, het gemiddelde was 23%, de slechtste was 134%
Microsoft Surface Pro (2017) i5 audioanalyse
(-) | niet erg luide luidsprekers (68 dB)
Bas 100 - 315 Hz
(±) | verminderde zeebaars - gemiddeld 9.7% lager dan de mediaan
(±) | lineariteit van de lage tonen is gemiddeld (7% delta ten opzichte van de vorige frequentie)
Midden 400 - 2000 Hz
(+) | evenwichtige middens - slechts 4.6% verwijderd van de mediaan
(+) | de middentonen zijn lineair (6.3% delta ten opzichte van de vorige frequentie)
Hoog 2 - 16 kHz
(+) | evenwichtige hoogtepunten - slechts 2.1% verwijderd van de mediaan
(+) | de hoge tonen zijn lineair (5.2% delta naar de vorige frequentie)
Algemeen 100 - 16.000 Hz
(±) | lineariteit van het totale geluid is gemiddeld (18.2% verschil met de mediaan)
Vergeleken met dezelfde klasse
» 40% van alle geteste apparaten in deze klasse waren beter, 7% vergelijkbaar, 53% slechter
» De beste had een delta van 6%, het gemiddelde was 20%, de slechtste was 57%
Vergeleken met alle geteste toestellen
» 39% van alle geteste apparaten waren beter, 8% gelijk, 53% slechter
» De beste had een delta van 4%, het gemiddelde was 23%, de slechtste was 134%
| Uit / Standby | |
| Inactief | |
| Belasting |
|
Key:
min: | |
| HP Elite x2 1012 G2-1LV76EA i5-7200U, HD Graphics 620, Samsung PM961 MZVLW256HEHP, IPS, 2716x1824, 12.3" | Microsoft Surface Pro (2017) i5 i5-7300U, HD Graphics 620, Samsung PM971 KUS030202M, IPS, 2736x1824, 12.3" | Lenovo ThinkPad X1 Yoga 2017 20JES03T00 i7-7600U, HD Graphics 620, Samsung SSD PM961 1TB M.2 PCIe 3.0 x4 NVMe (MZVLW1T0), OLED, 2560x1440, 14" | Dell Latitude 12 5285 2-in-1 i7-7600U, HD Graphics 620, Samsung PM961 MZVLW256HEHP, IPS, 1920x1280, 12.3" | Acer Switch 5 SW512-52-5819 i7-7500U, HD Graphics 620, Intel SSD 600p SSDPEKKW512G7, IPS, 2160x1440, 12" | Toshiba Portege X20W-D-10R i7-7600U, HD Graphics 620, Toshiba SG5 THNSNK512GVN8, IPS, 1920x1080, 12.5" | HP Elite x2 1012 G1 6Y54, HD Graphics 515, Liteon L8H-256V2G, IPS, 1920x1280, 12.1" | |
|---|---|---|---|---|---|---|---|
| Power Consumption | 25% | -4% | 24% | 23% | 37% | 26% | |
| Idle Minimum * (Watt) | 4.1 | 3.6 12% | 4.9 -20% | 2.85 30% | 3.86 6% | 3.4 17% | 3.7 10% |
| Idle Average * (Watt) | 9.2 | 8.1 12% | 7.6 17% | 6.76 27% | 6.4 30% | 5.8 37% | 6.8 26% |
| Idle Maximum * (Watt) | 11.1 | 8.7 22% | 13.8 -24% | 6.91 38% | 7.17 35% | 6.7 40% | 7.6 32% |
| Load Average * (Watt) | 33.8 | 25.5 25% | 33.4 1% | 32.88 3% | 30.5 10% | 21.4 37% | 22.5 33% |
| Load Maximum * (Watt) | 49.2 | 23.5 52% | 46.5 5% | 37.41 24% | 32.4 34% | 21.6 56% | 34.5 30% |
* ... kleiner is beter

| HP Elite x2 1012 G2-1LV76EA i5-7200U, HD Graphics 620, 47 Wh | Microsoft Surface Pro (2017) i5 i5-7300U, HD Graphics 620, 45 Wh | Lenovo ThinkPad X1 Yoga 2017 20JES03T00 i7-7600U, HD Graphics 620, 56 Wh | Dell Latitude 12 5285 2-in-1 i7-7600U, HD Graphics 620, 42 Wh | Acer Switch 5 SW512-52-5819 i7-7500U, HD Graphics 620, Wh | Toshiba Portege X20W-D-10R i7-7600U, HD Graphics 620, 44 Wh | HP Elite x2 1012 G1 6Y54, HD Graphics 515, 37 Wh | |
|---|---|---|---|---|---|---|---|
| Batterijduur | 49% | -4% | 12% | -17% | 40% | 4% | |
| Reader / Idle (h) | 13.9 | 17.6 27% | 13.1 -6% | 17.9 29% | 11.9 -14% | 16.7 20% | 12.2 -12% |
| H.264 (h) | 6.3 | 6.8 8% | 7.2 14% | ||||
| WiFi v1.3 (h) | 6.3 | 12.4 97% | 6.1 -3% | 8.1 29% | 5.9 -6% | 12 90% | 7.4 17% |
| Load (h) | 2.3 | 2.8 22% | 2 -13% | 1.8 -22% | 1.6 -30% | 2.5 9% | 2.2 -4% |
Pro
Contra

Dit is de verkorte versie van het originele artikel. Het volledige, Engelse testrapport vind je hier.
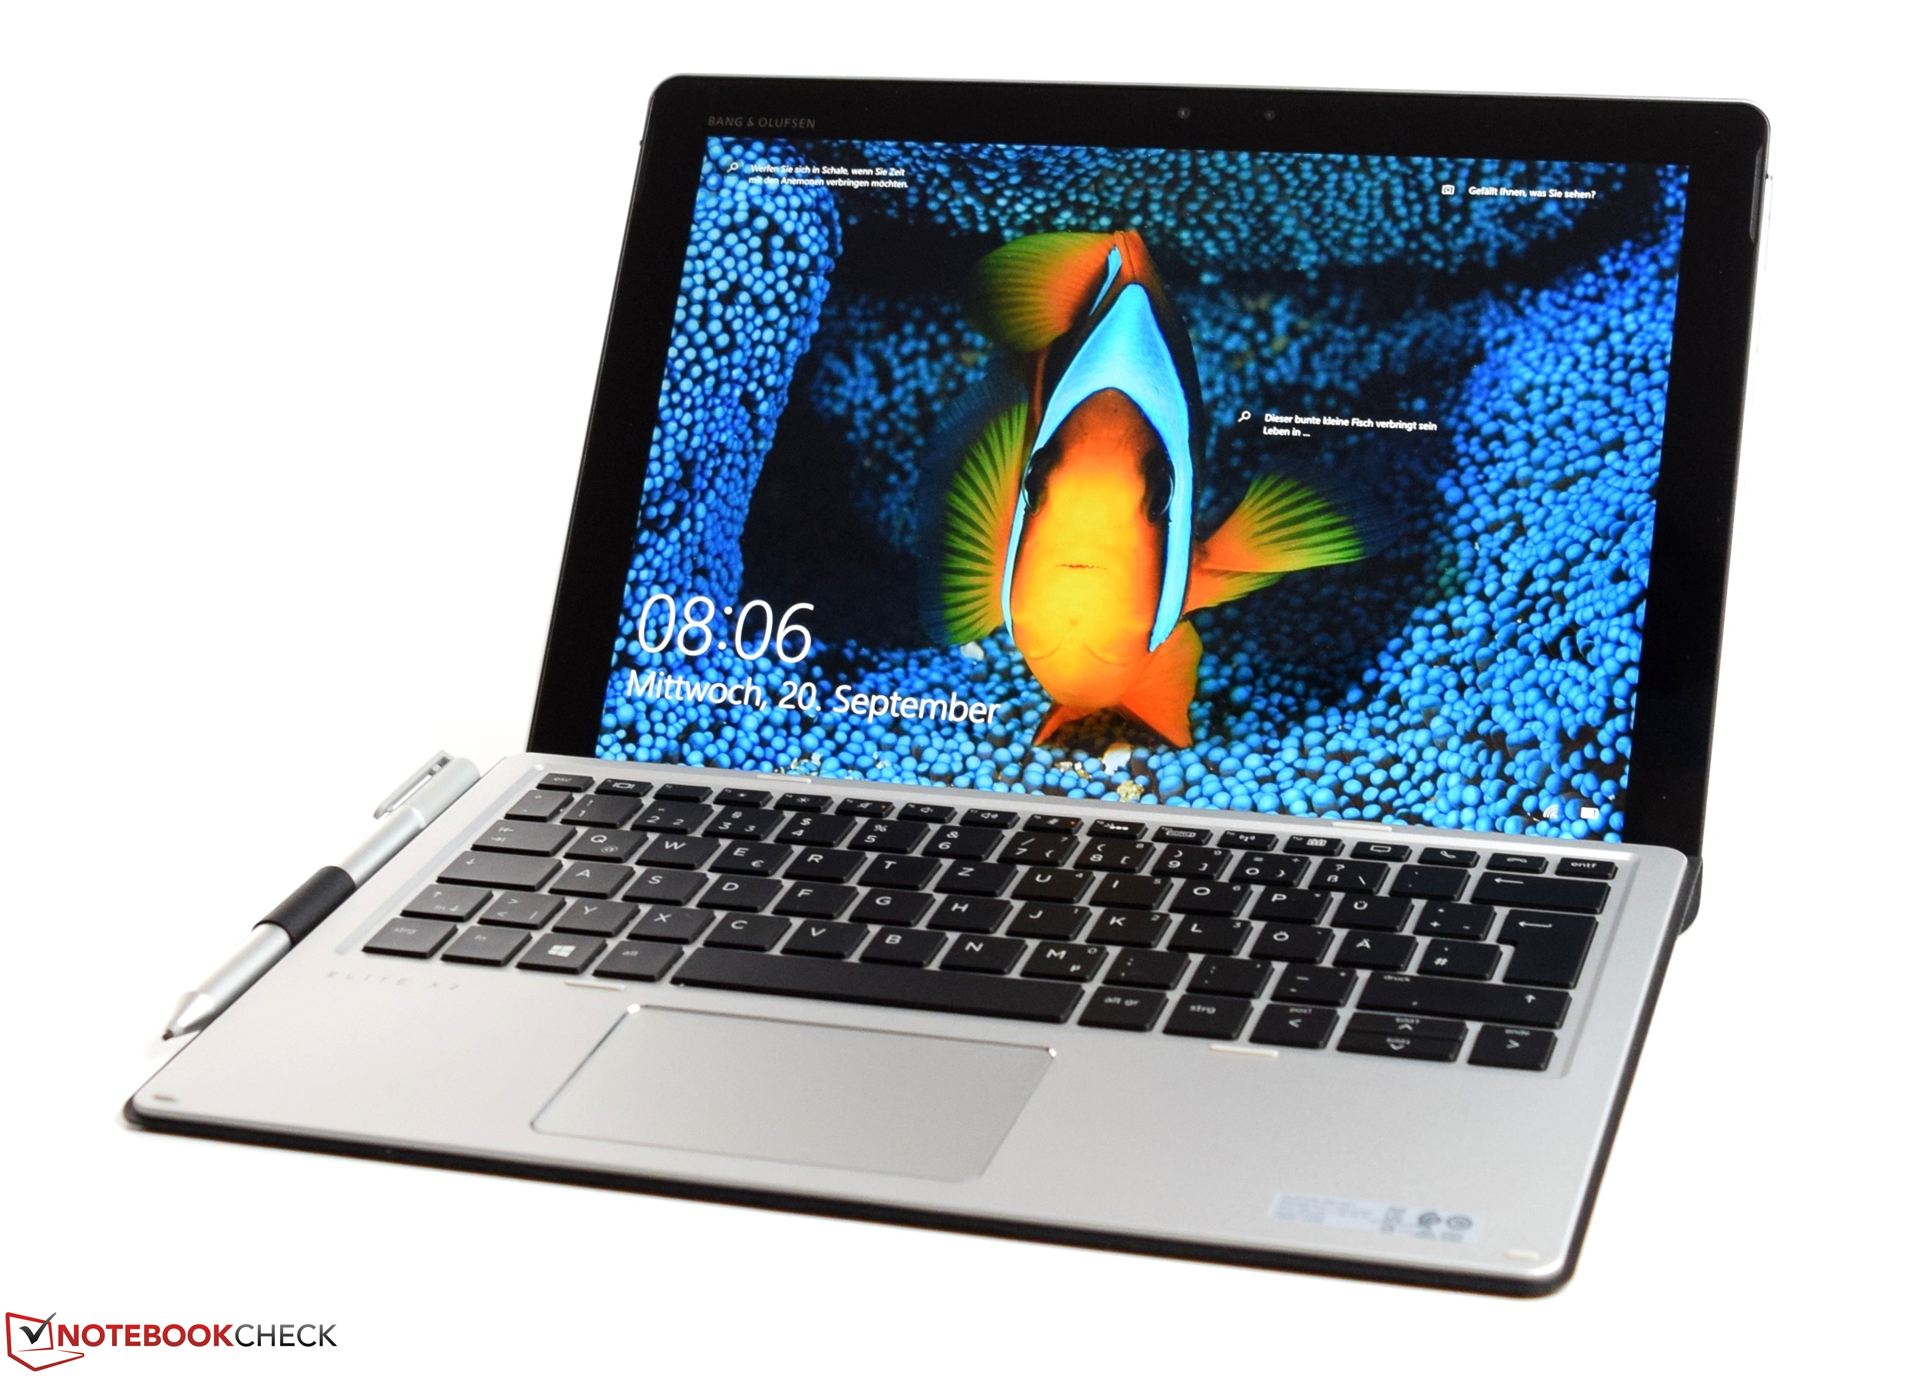
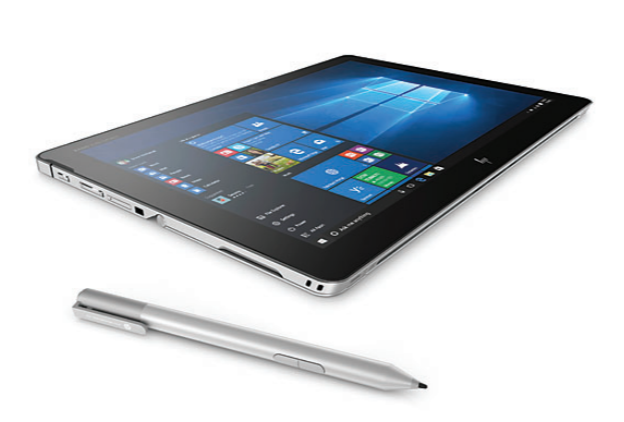
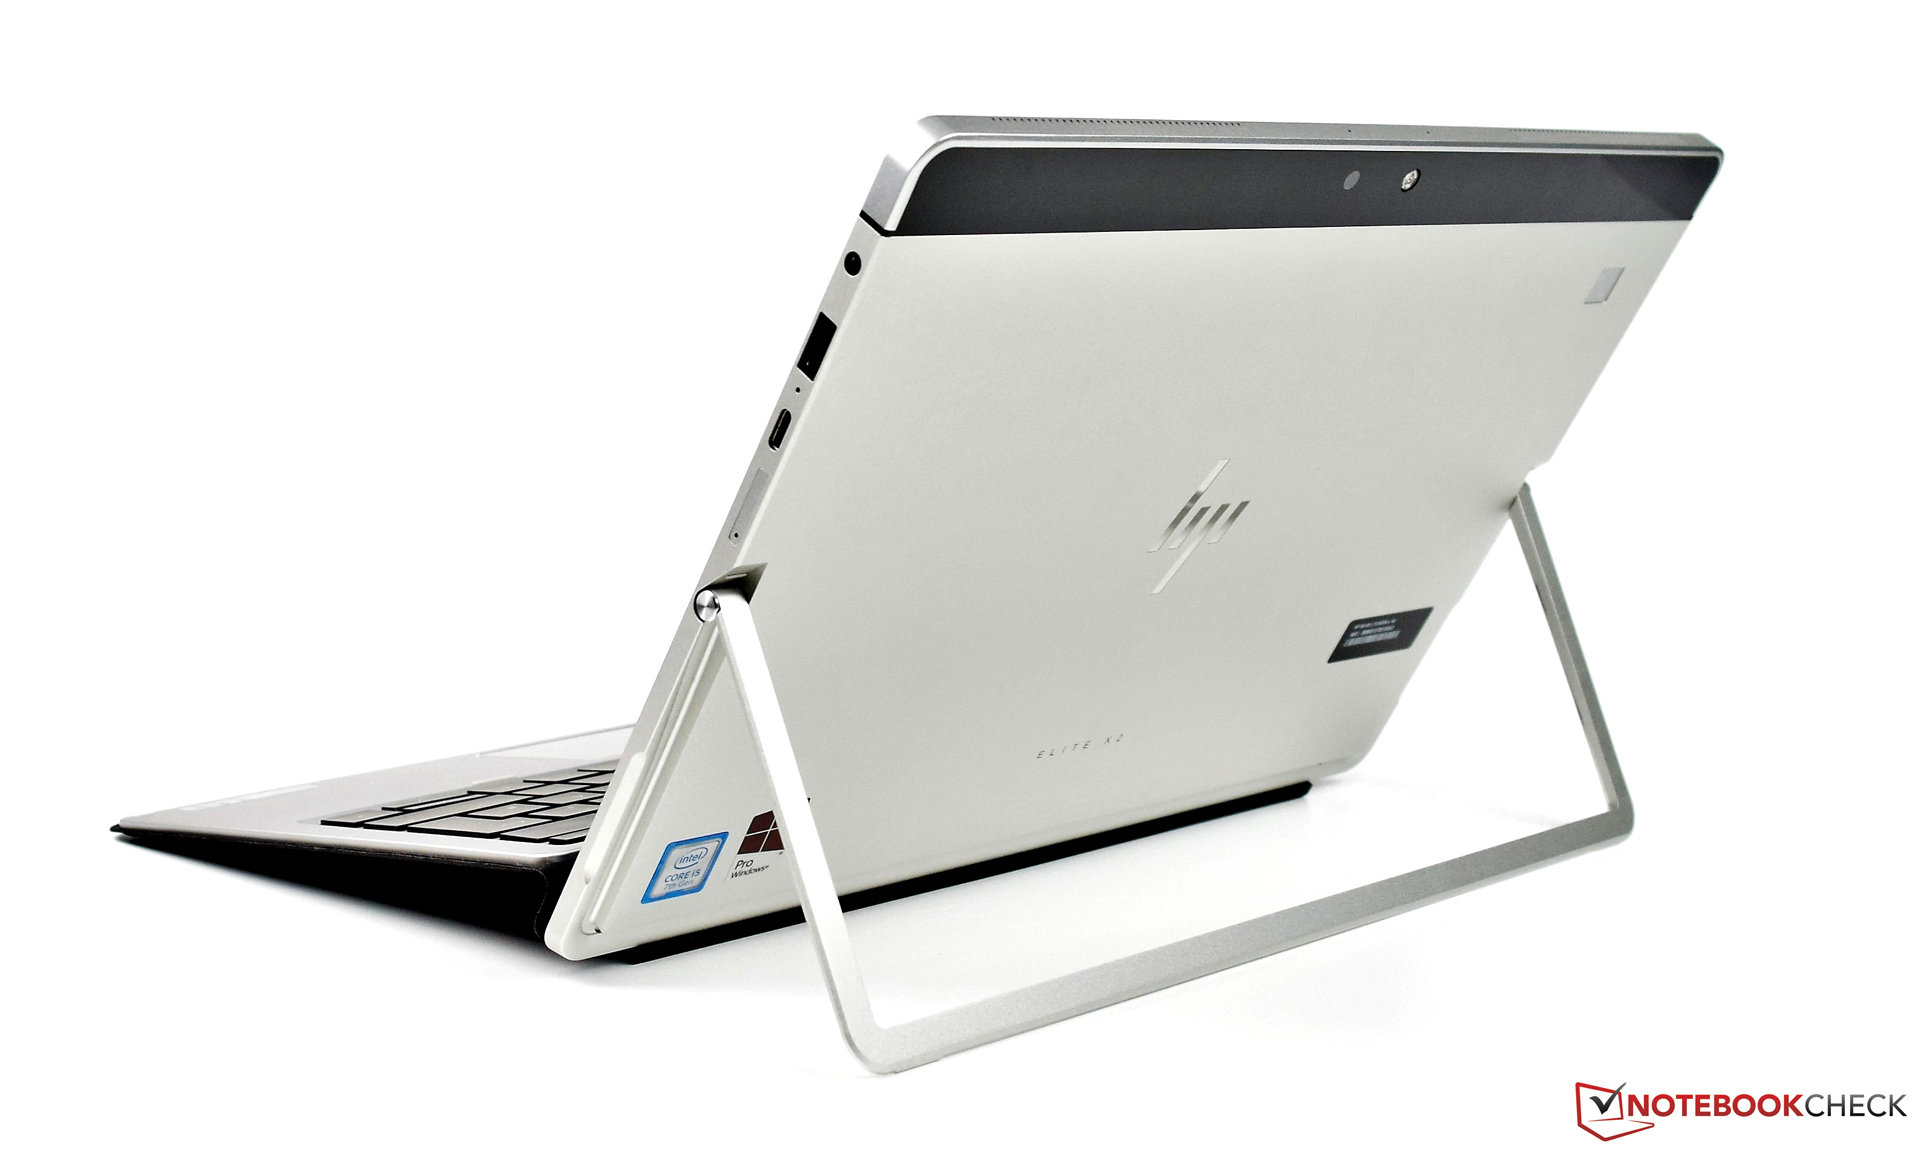
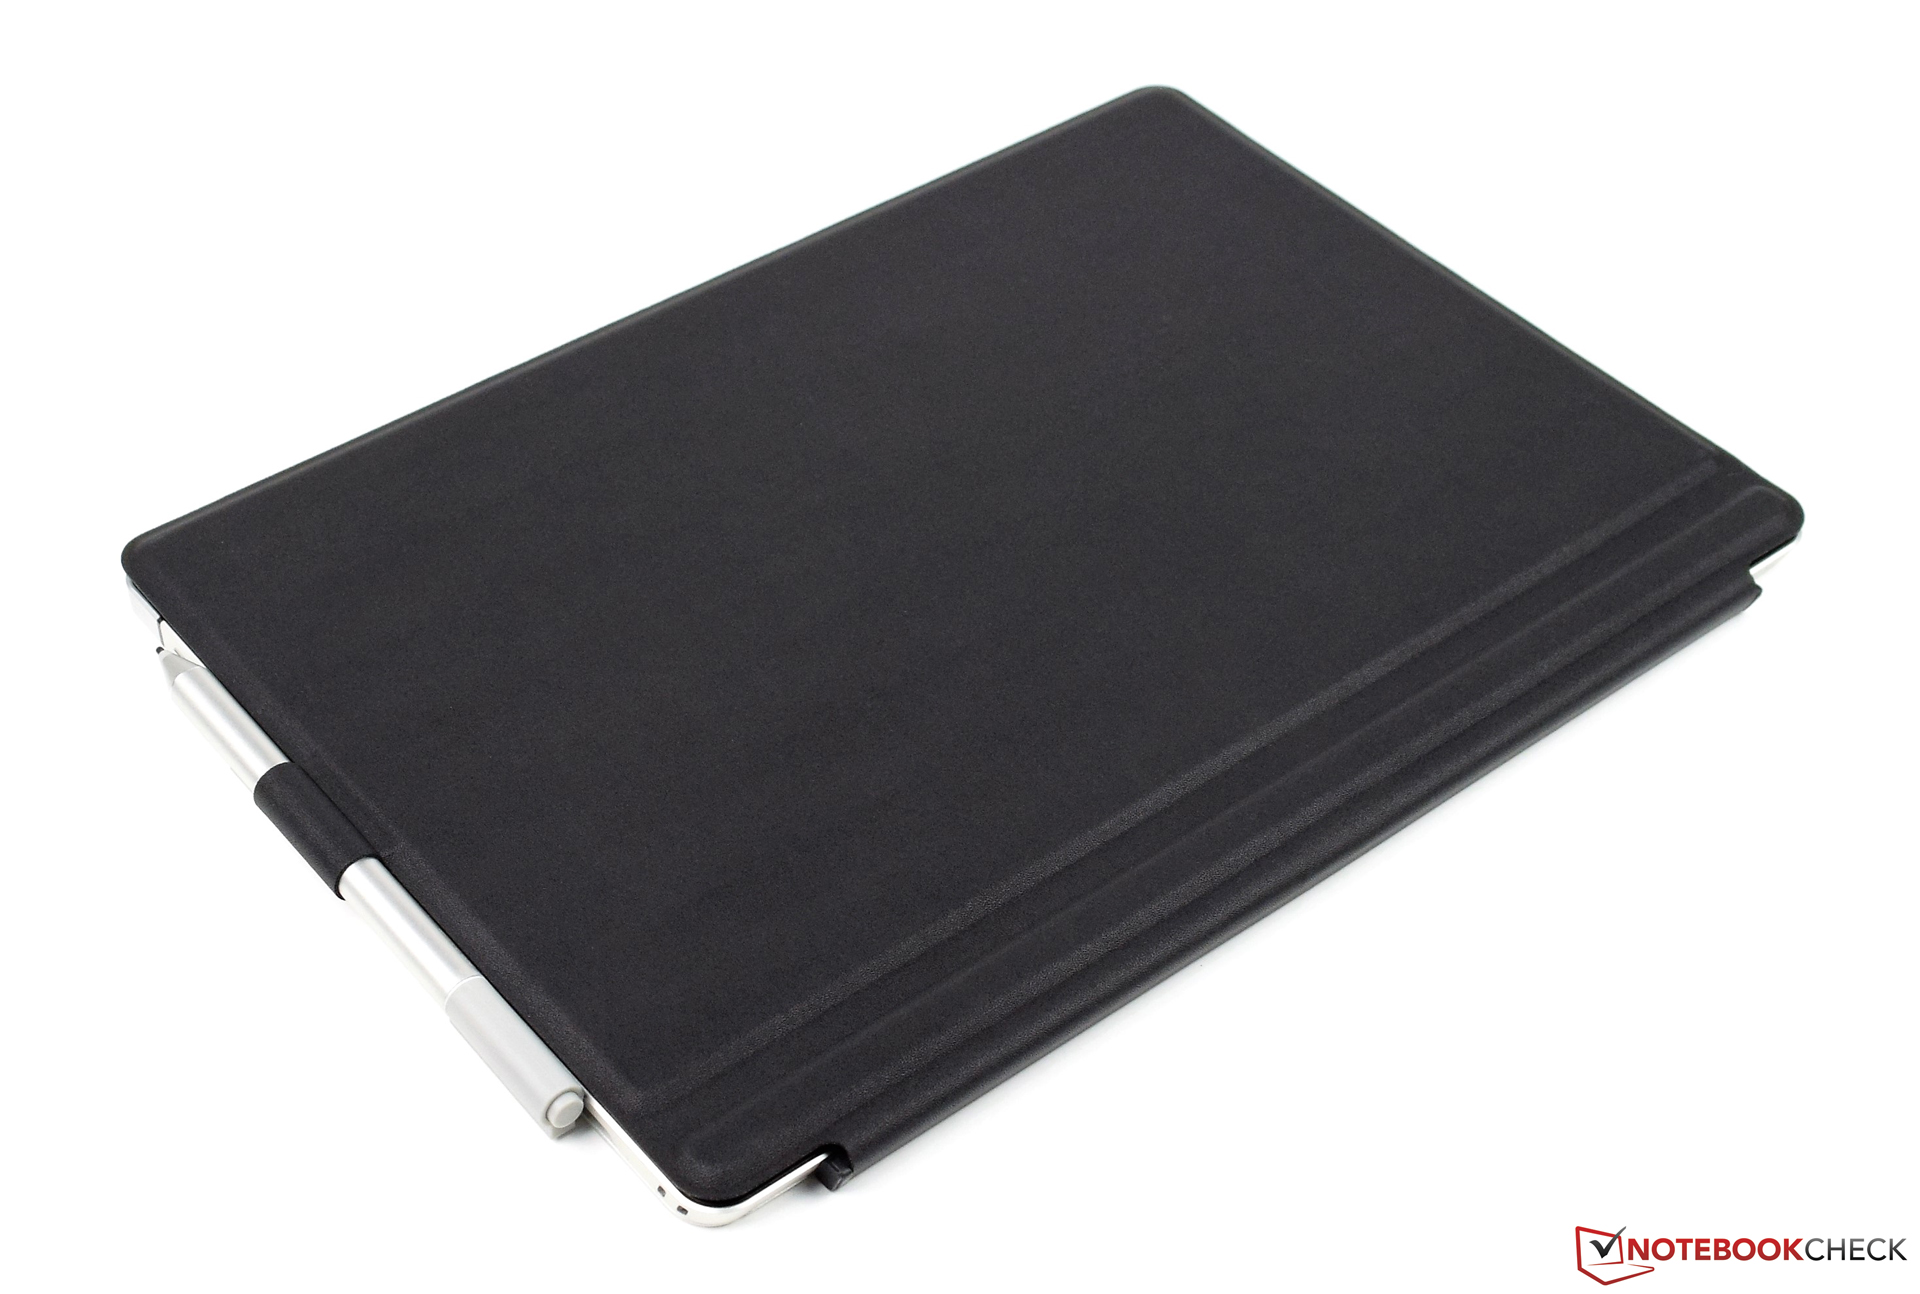
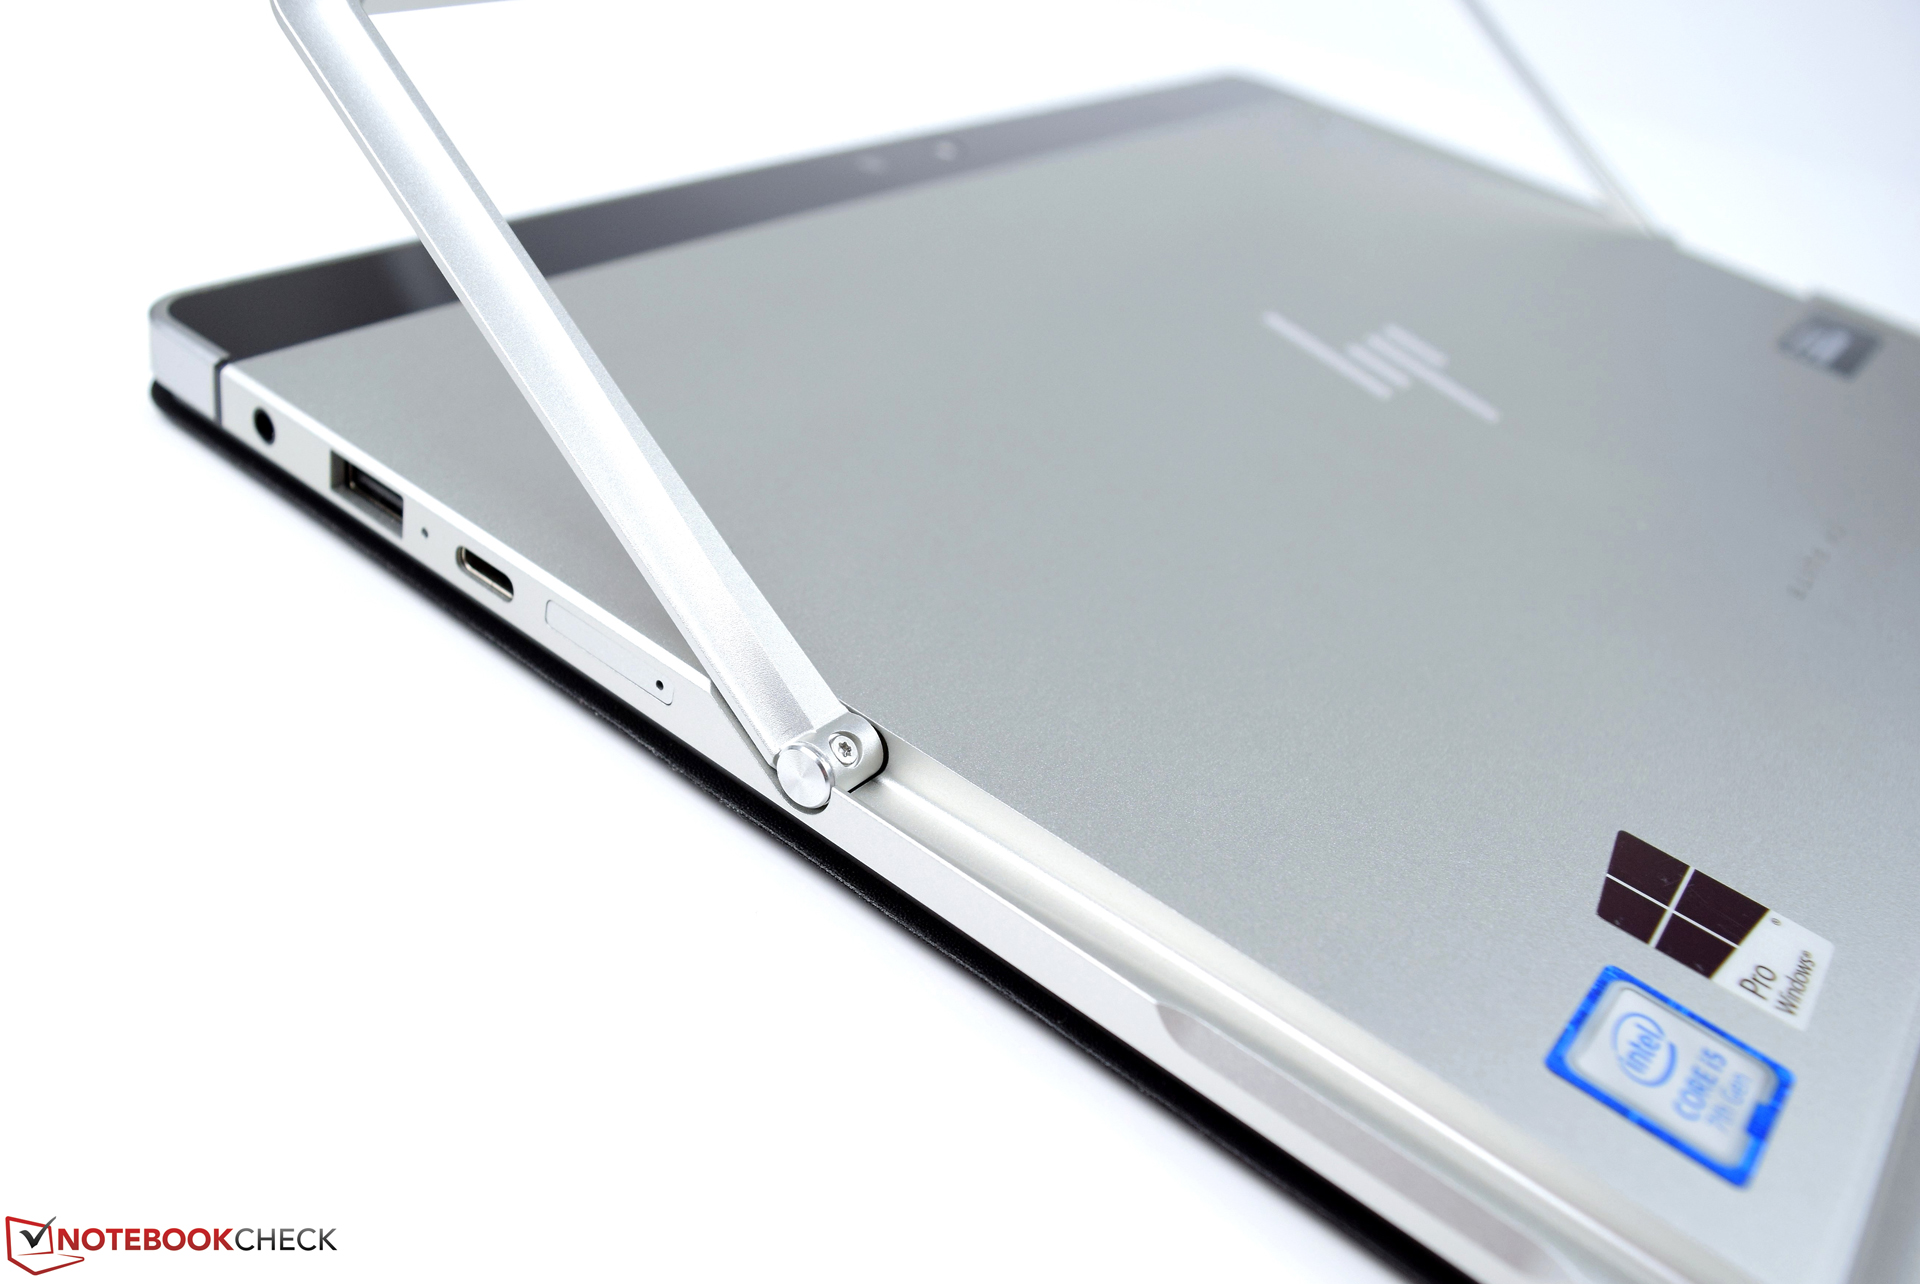
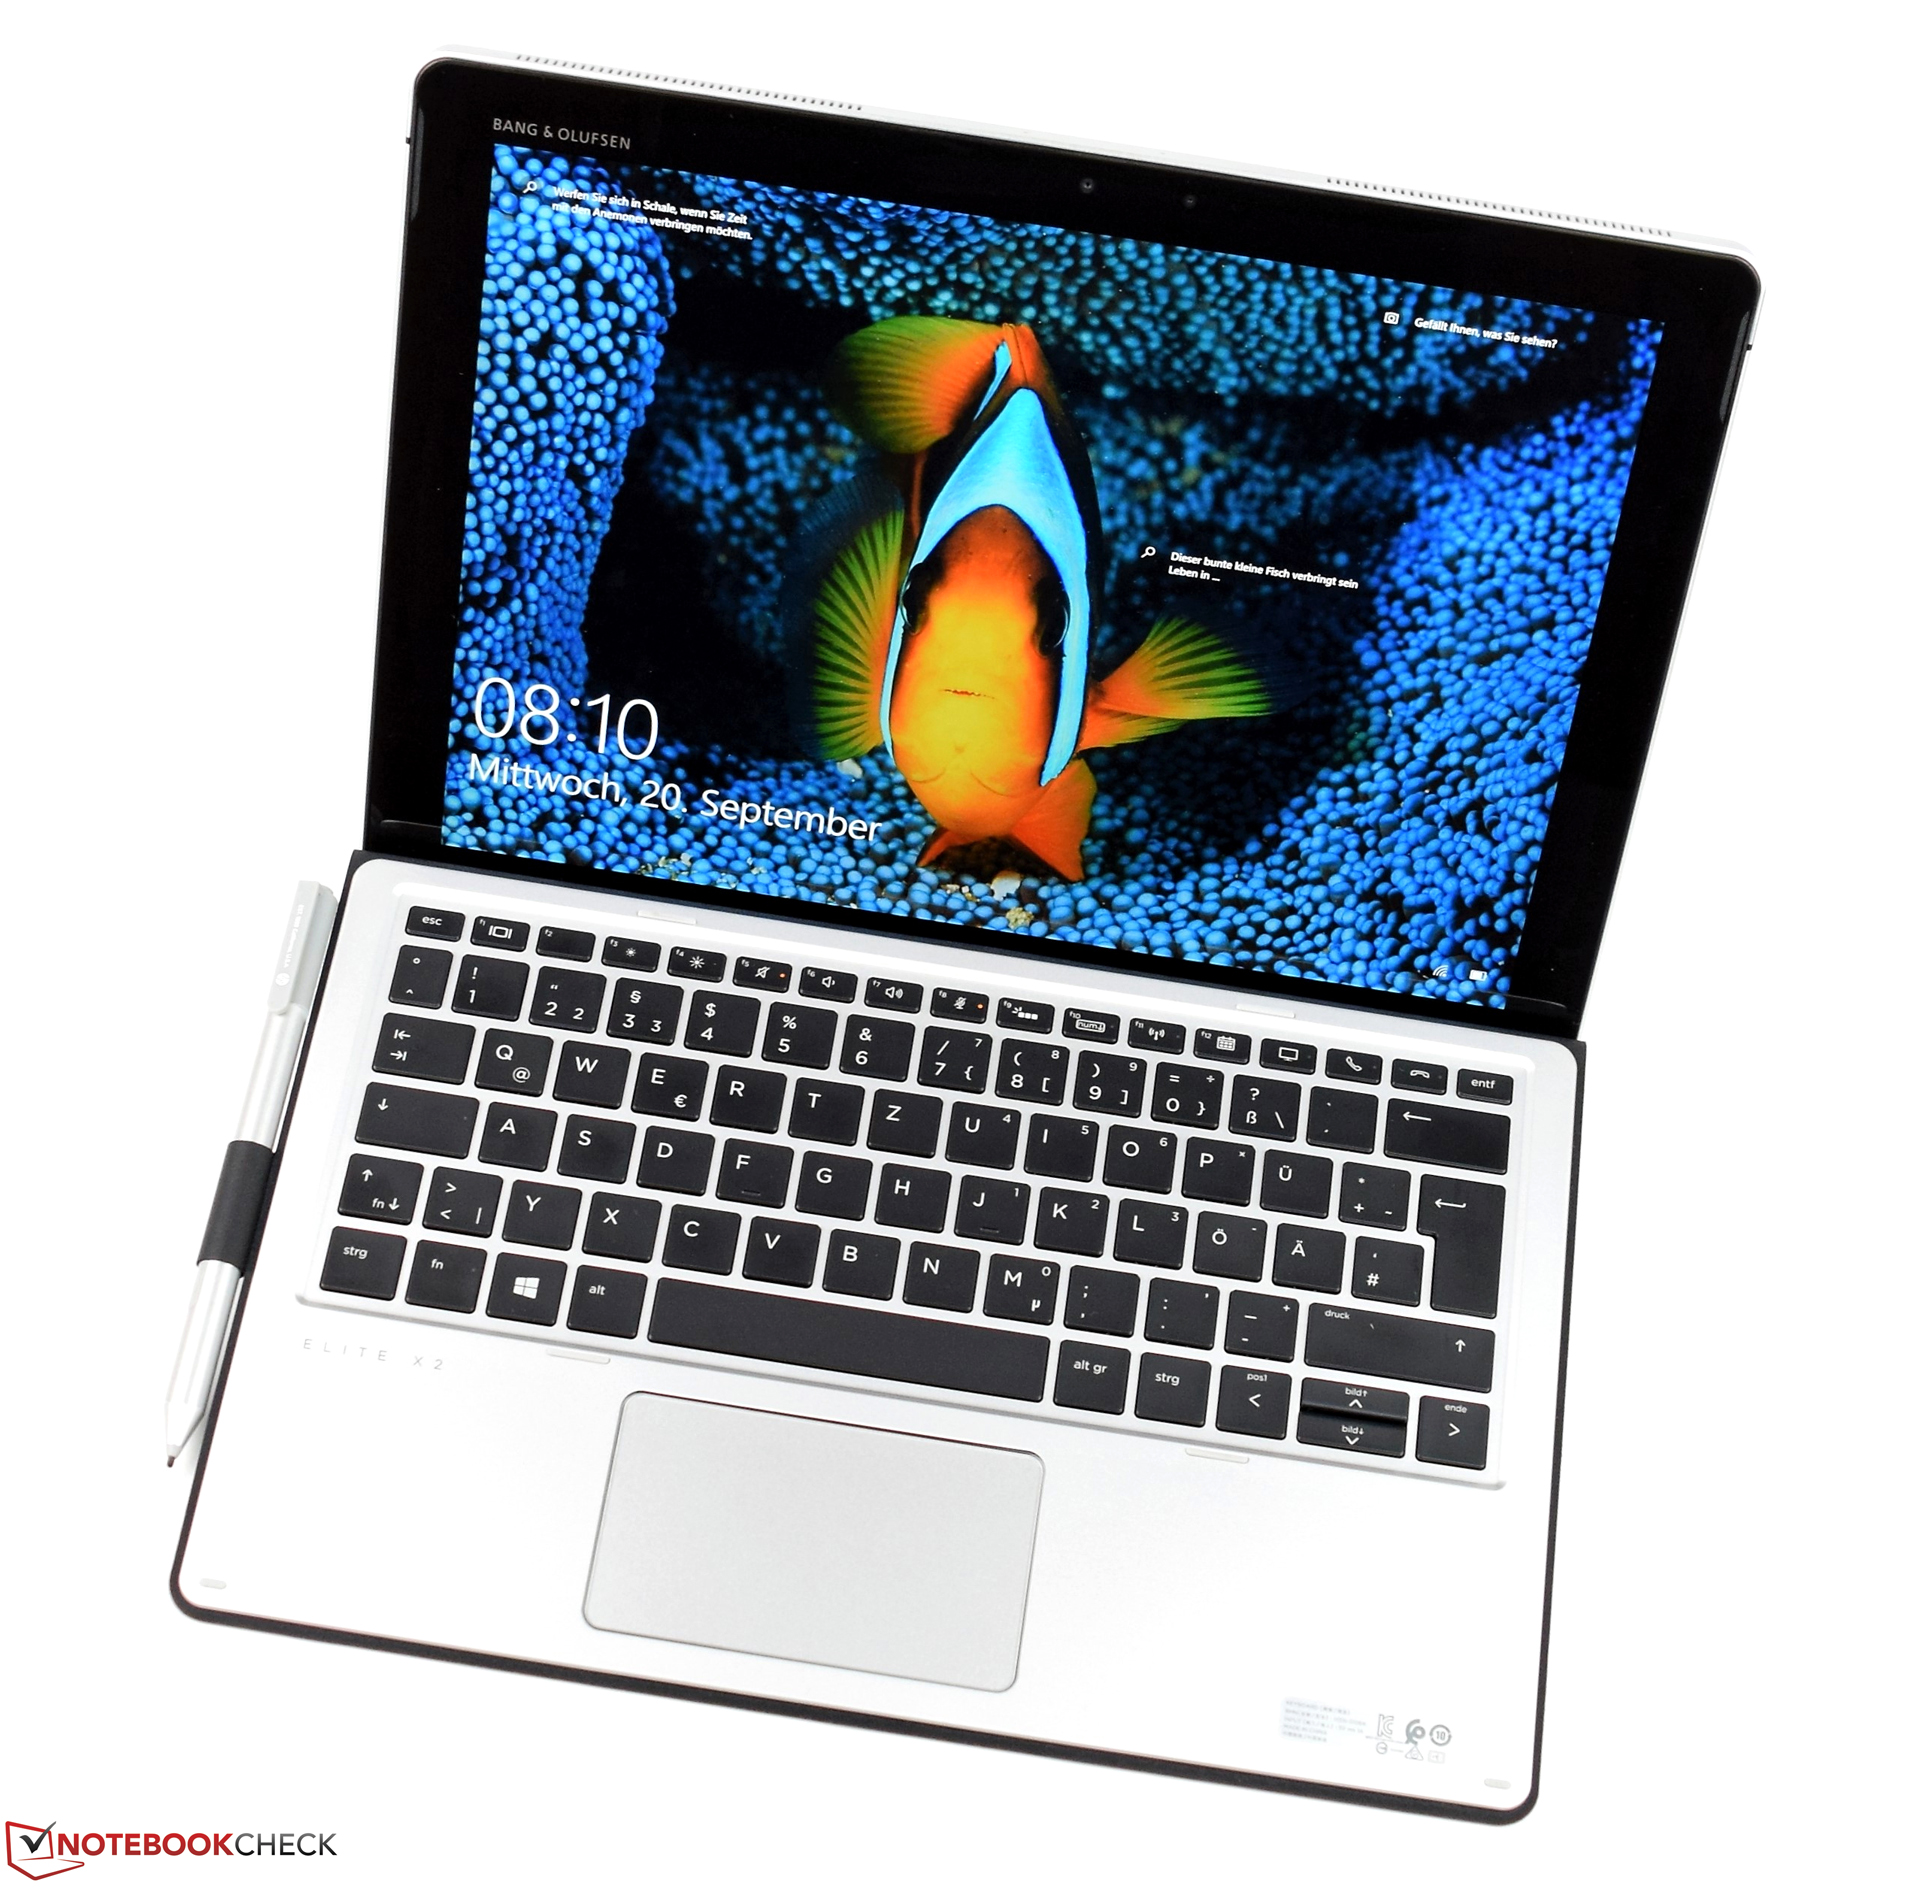
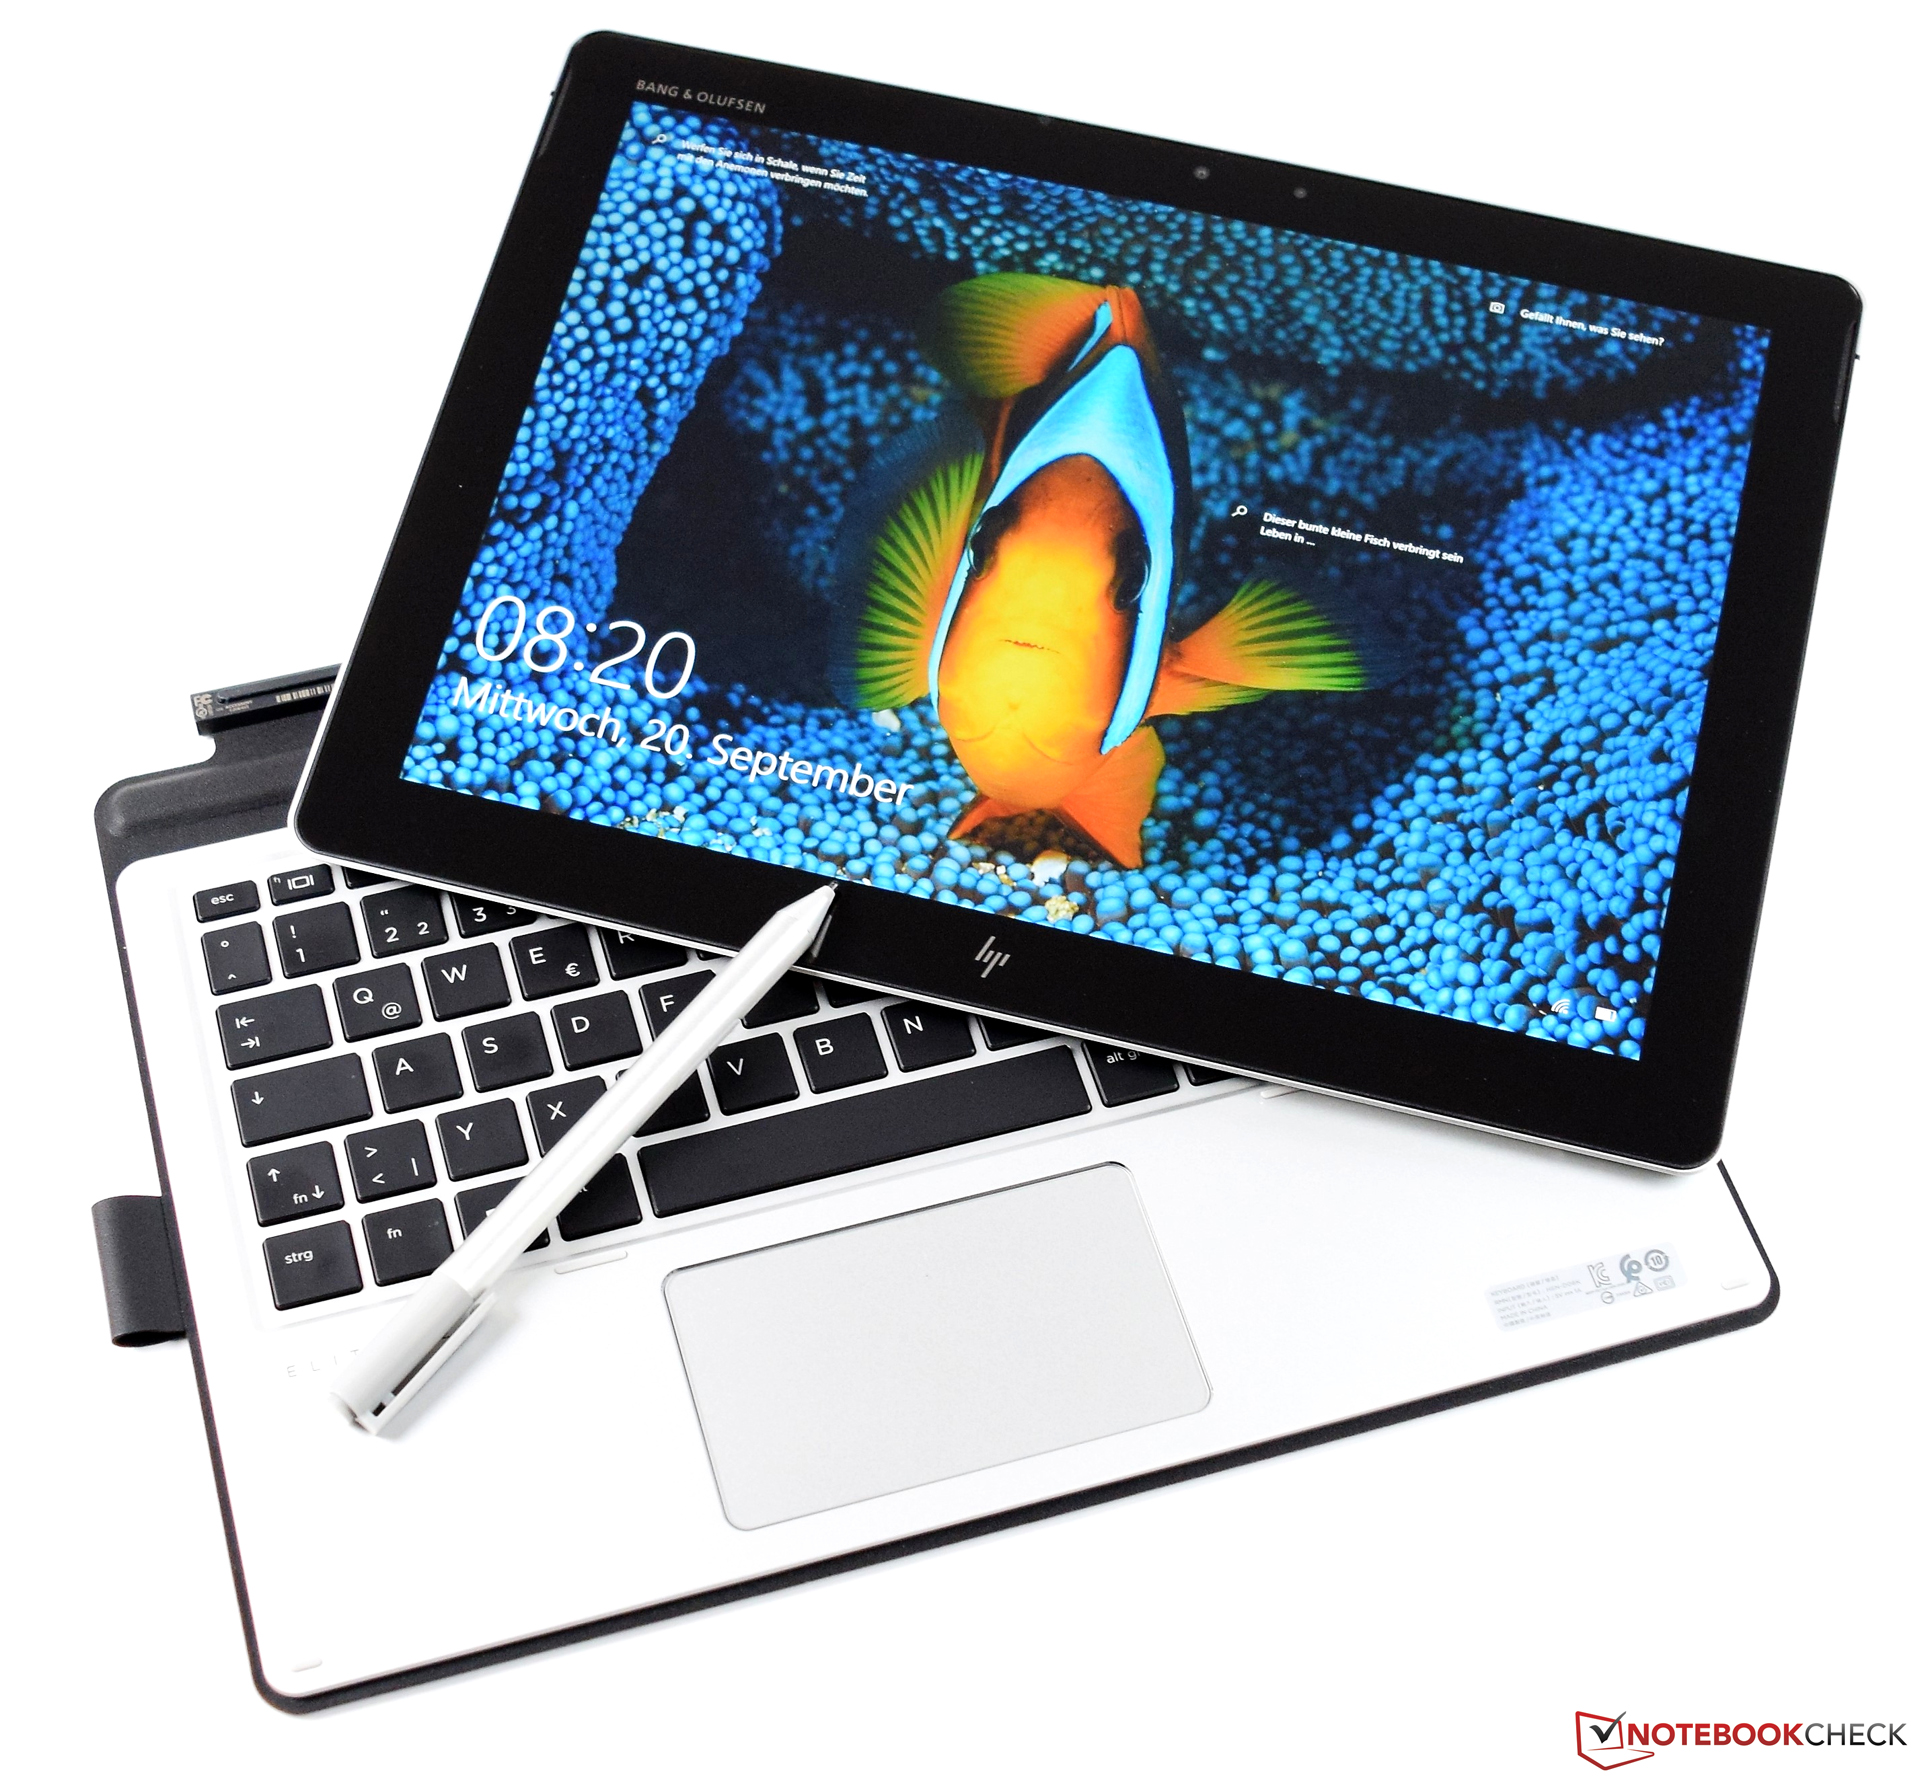
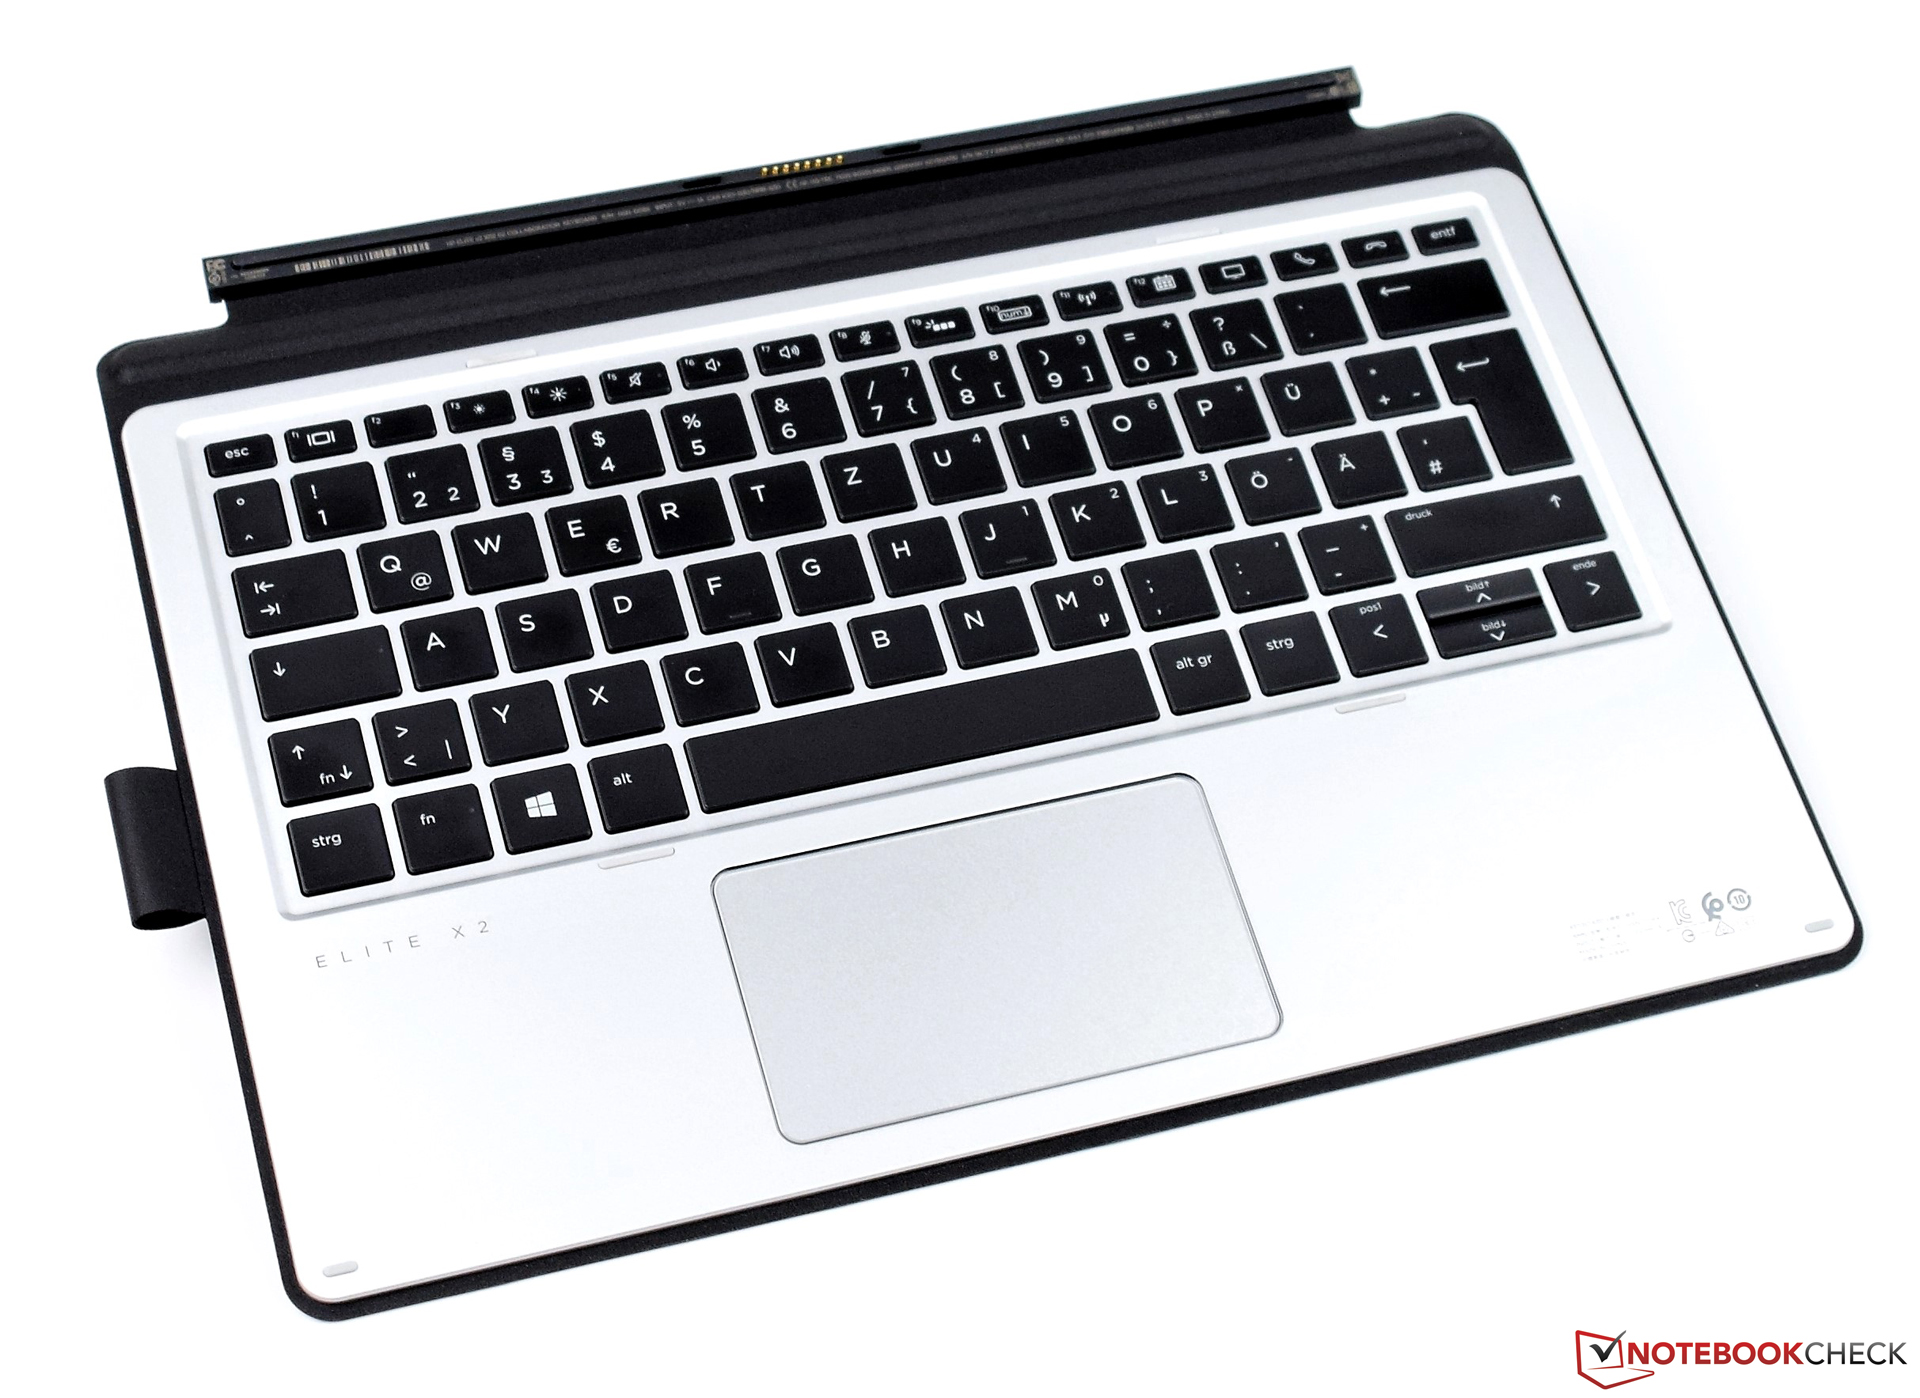
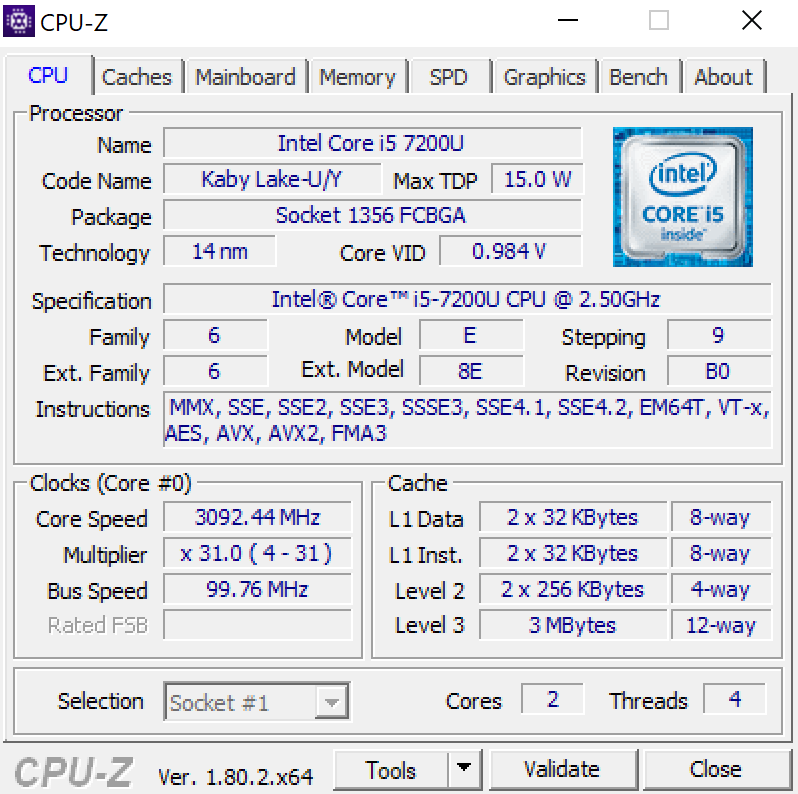
De HP Elite x2 1012 G2 is een elegante convertible die primair gericht is op de zakelijke sector en neemt het stokje over van de HP Elite x2 1012 G1. Het familiair stijlvolle, basis design ziet er aantrekkelijk uit en de goede gekozen materialen geven de gebruiker het gevoel een apparaat van hoge kwaliteit in handen te hebben. De door ons geteste configuratie van de HP Elite x2 1012 G2 kost € 1270. De koper krijgt hiervoor een snelle Intel Core i5-7200U processor die de eisen van dagelijkse kantoorwerkzaamheden prima aankan. De 8 GB RAM en de 256 GB SSD verzekeren beiden een erg snel systeem.
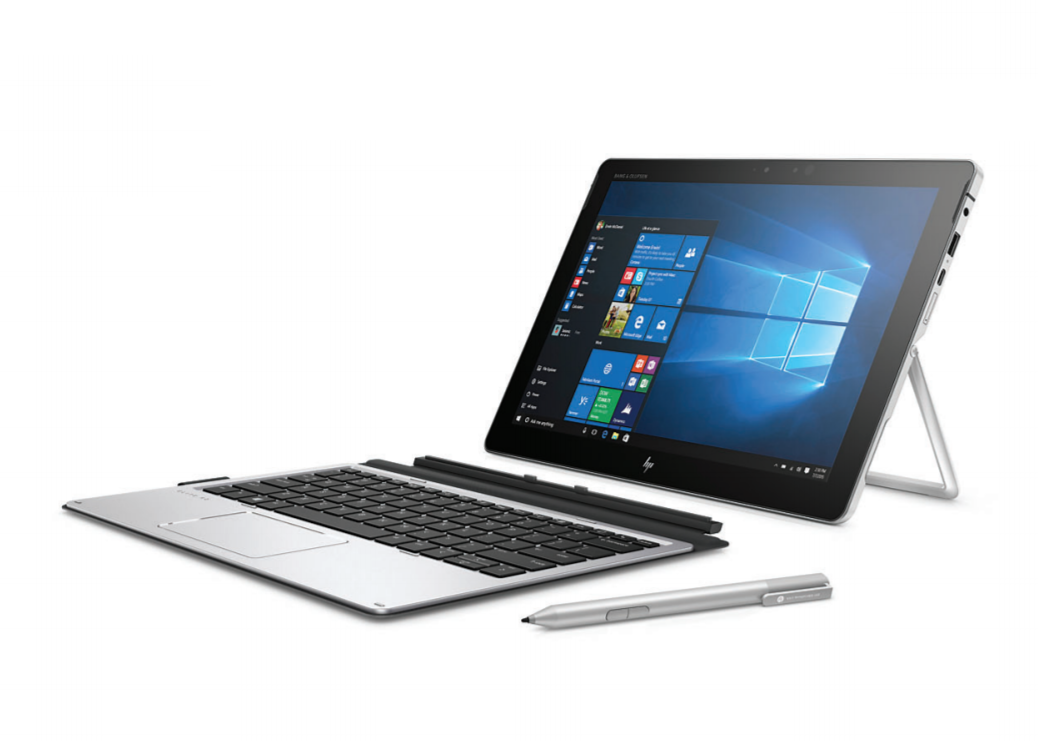
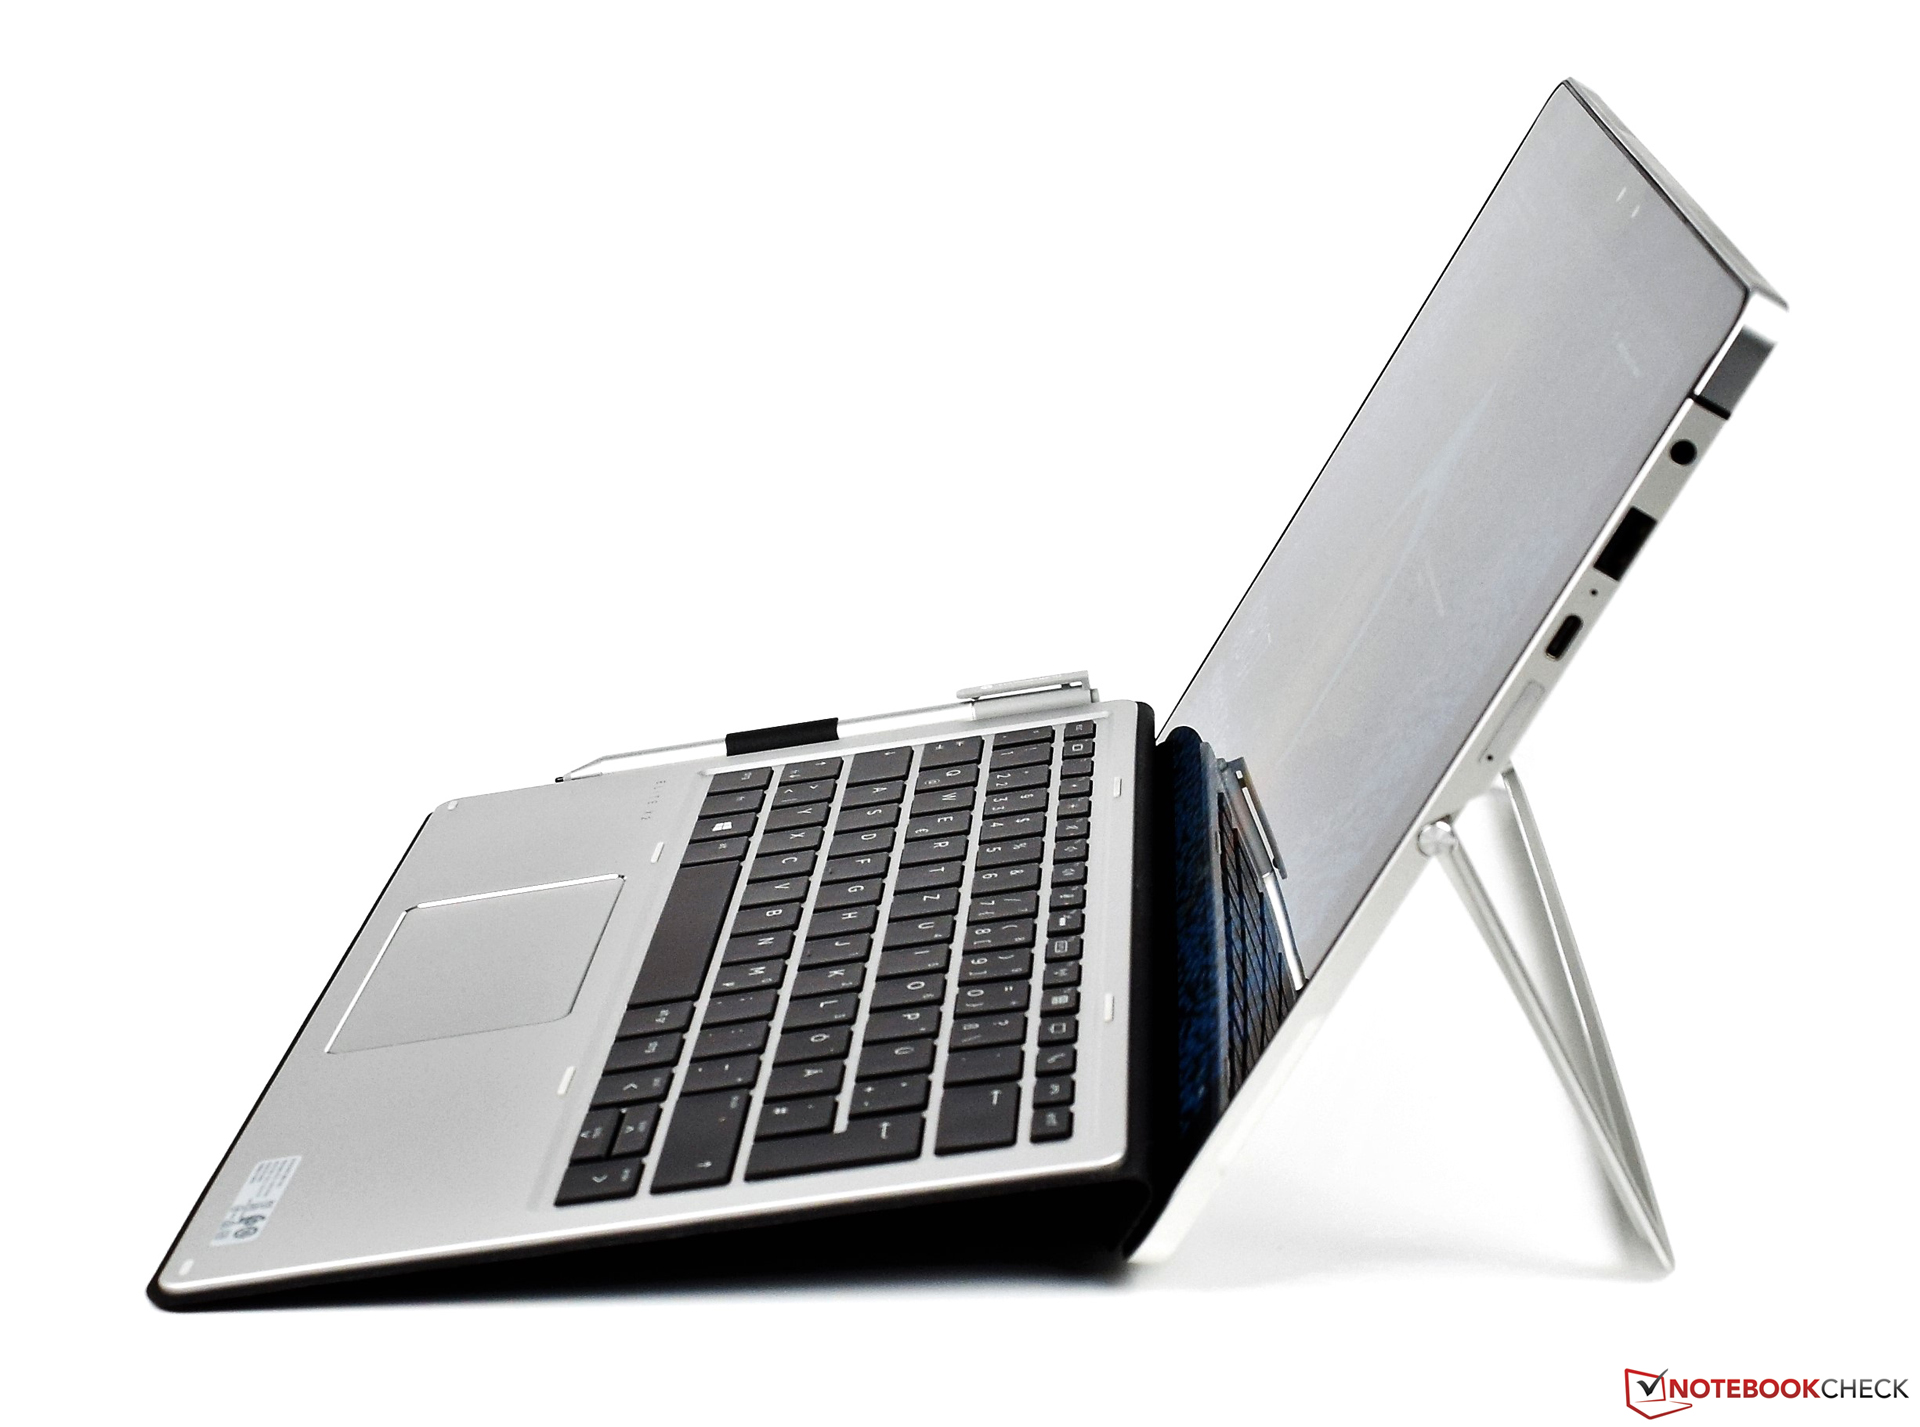
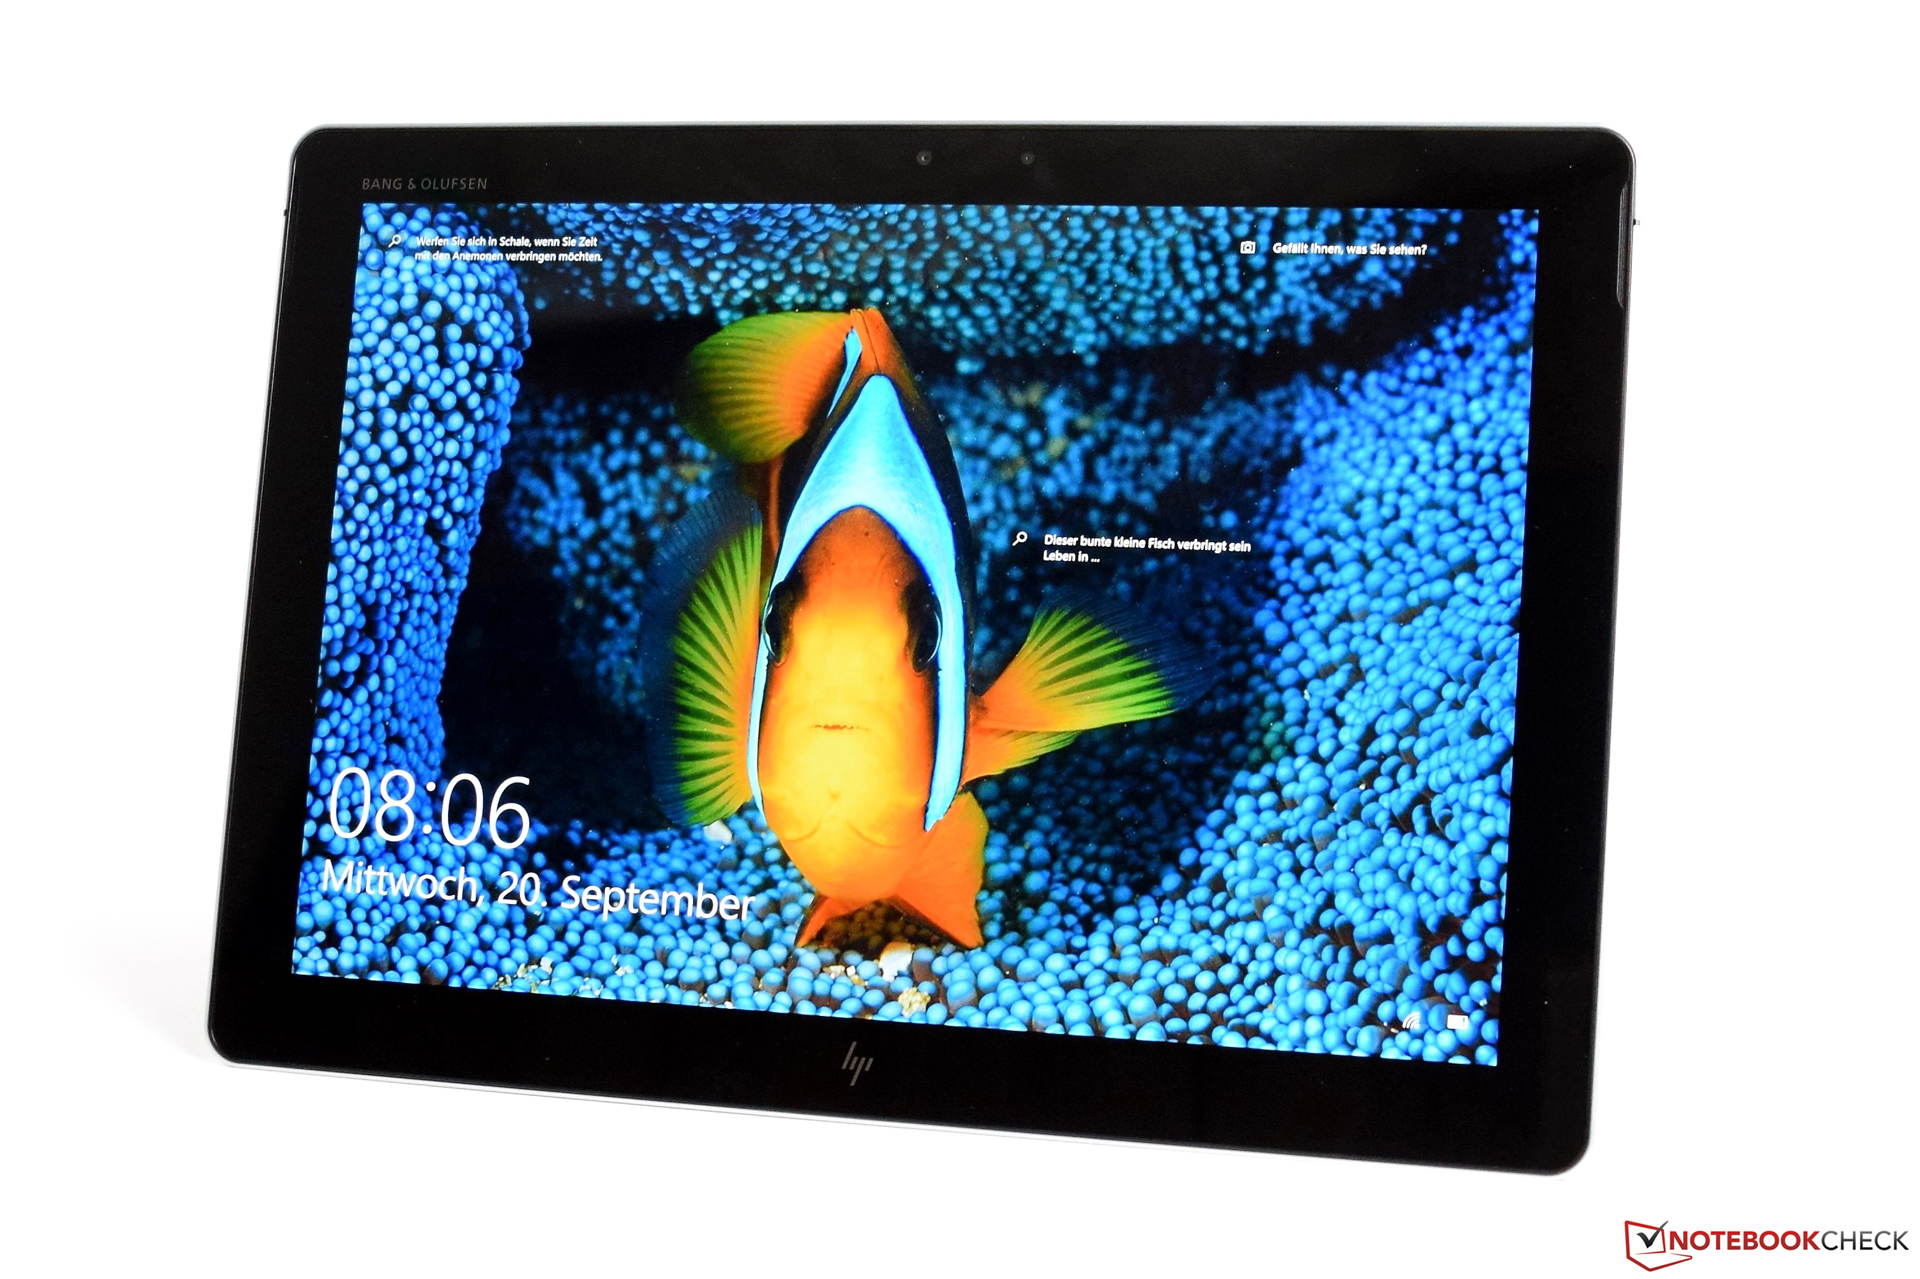
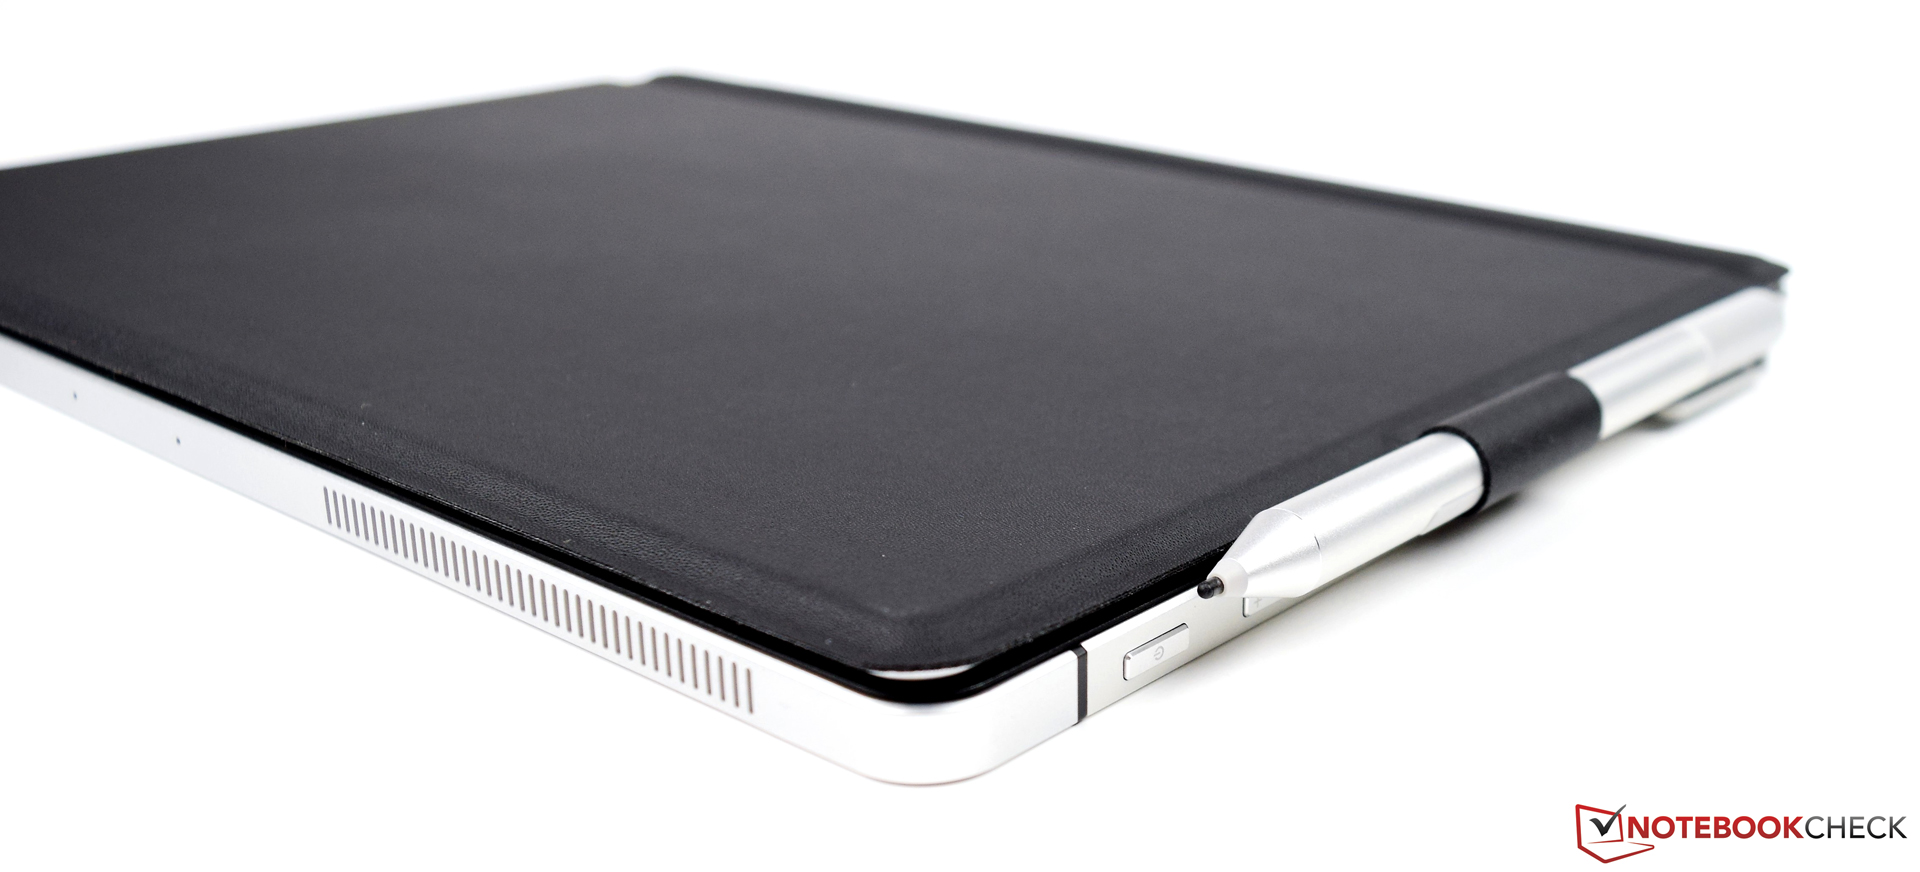
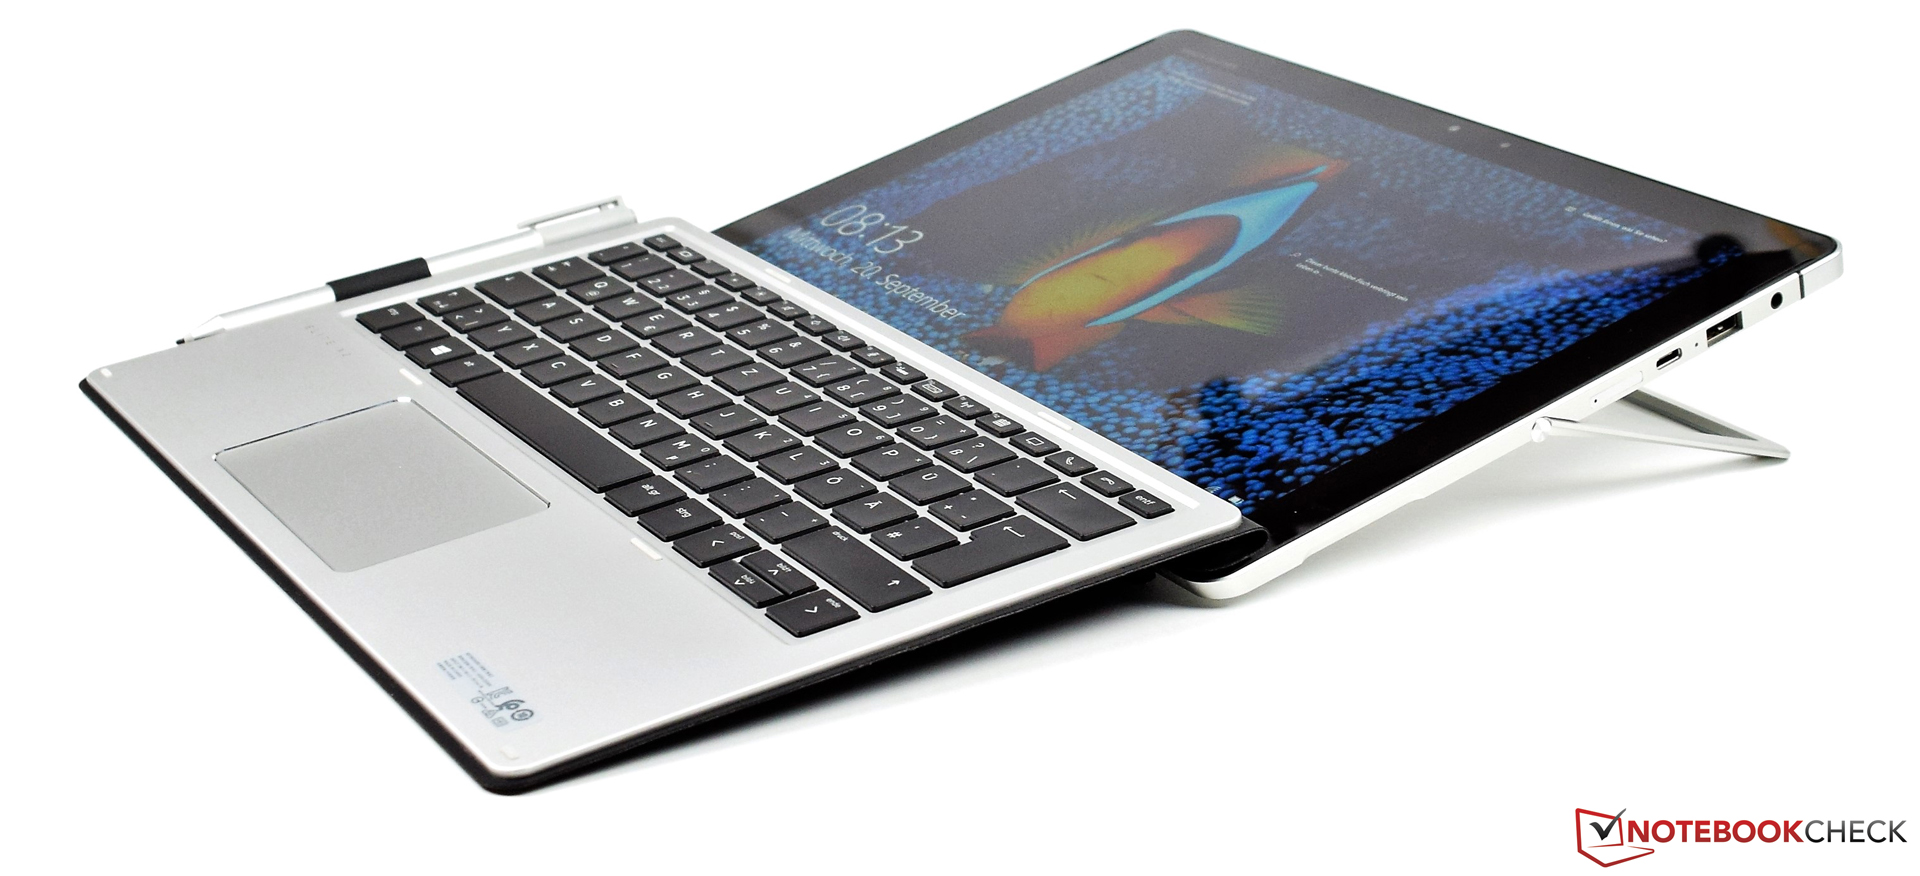
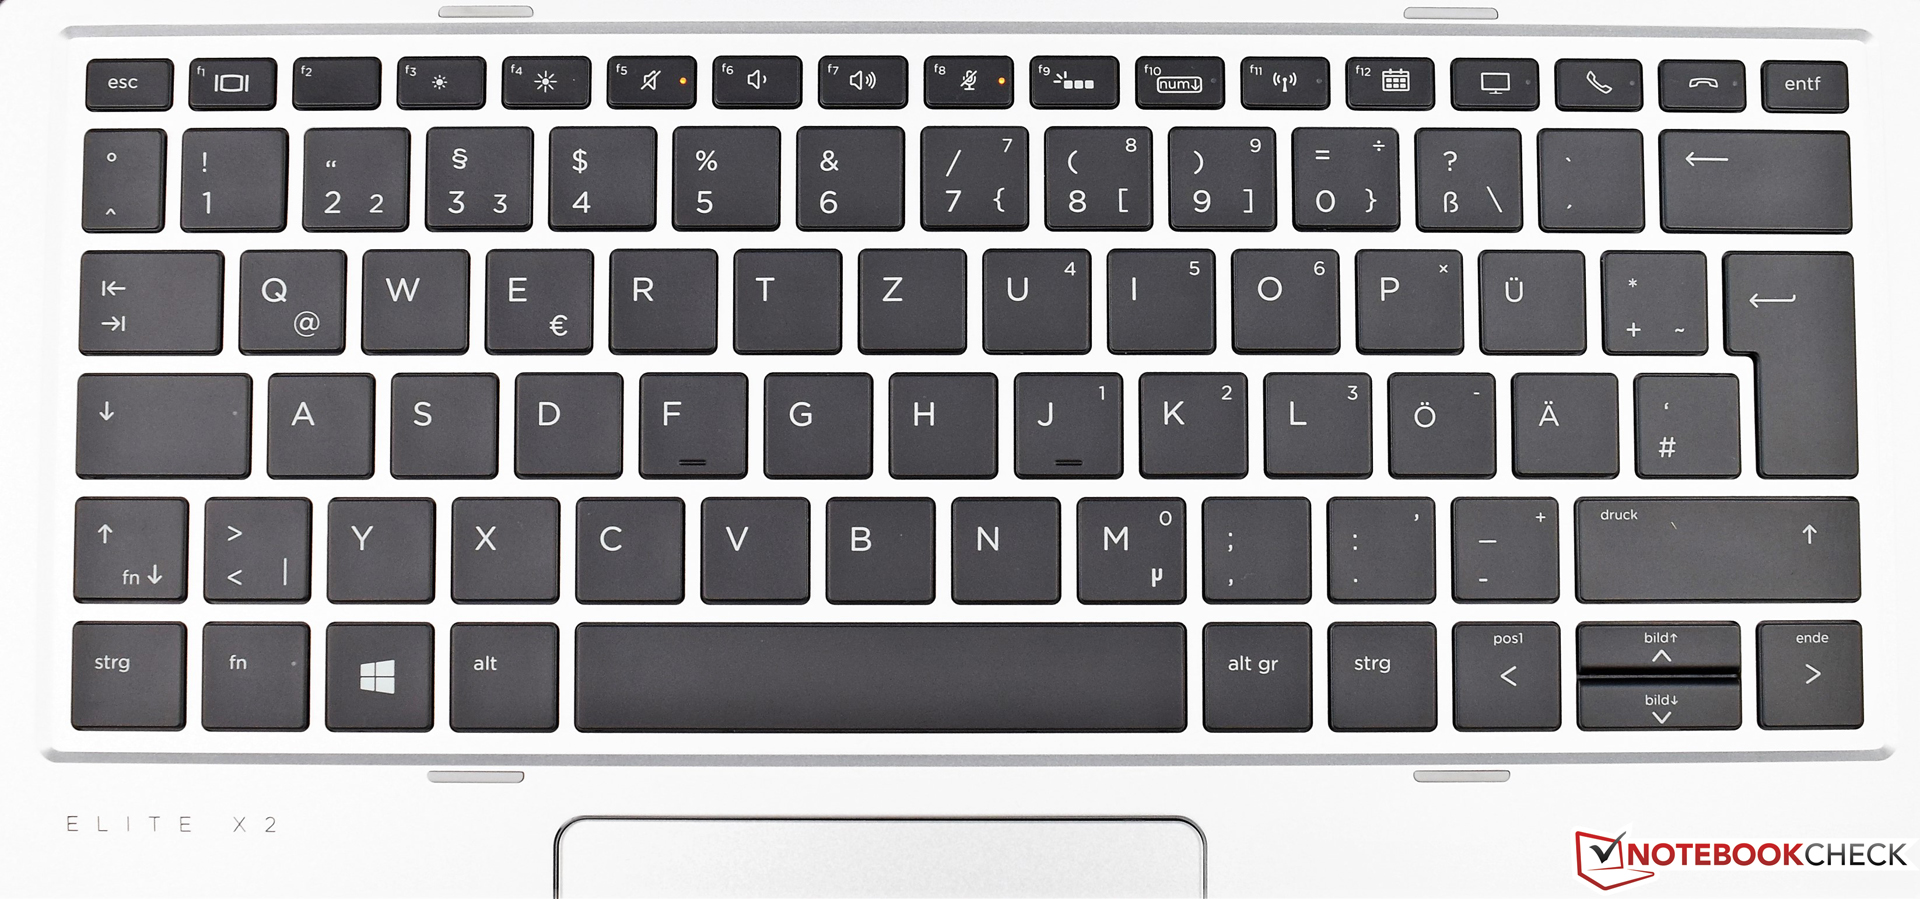
De HP Elite x2 1012 G2 kan overtuigen met foutloze bouwkwaliteit en erg beeldscherm. Bruikbare accessoires zoals het toetsenbord dock en actieve stylus maken de mogelijke toepassingen erg uitgebreid en moedigen de nodige creativiteit aan.
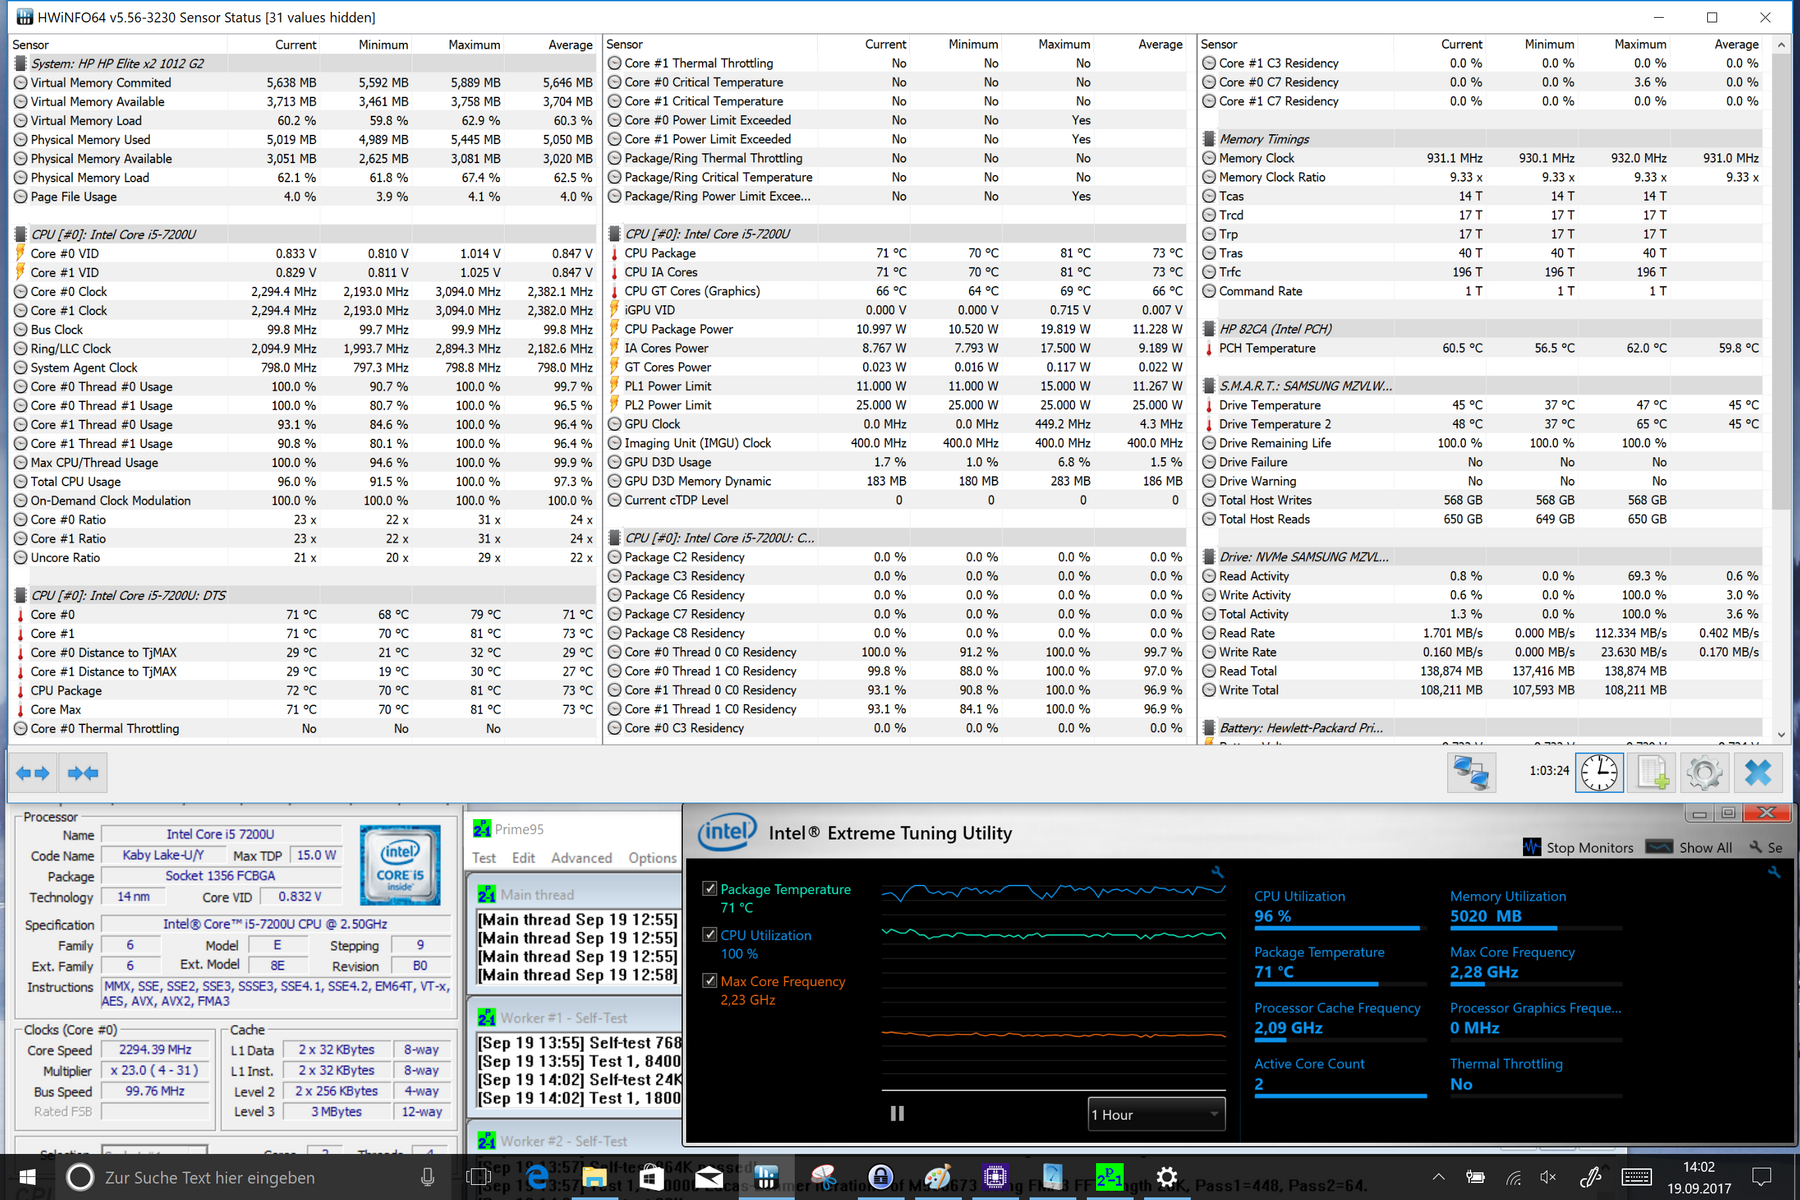
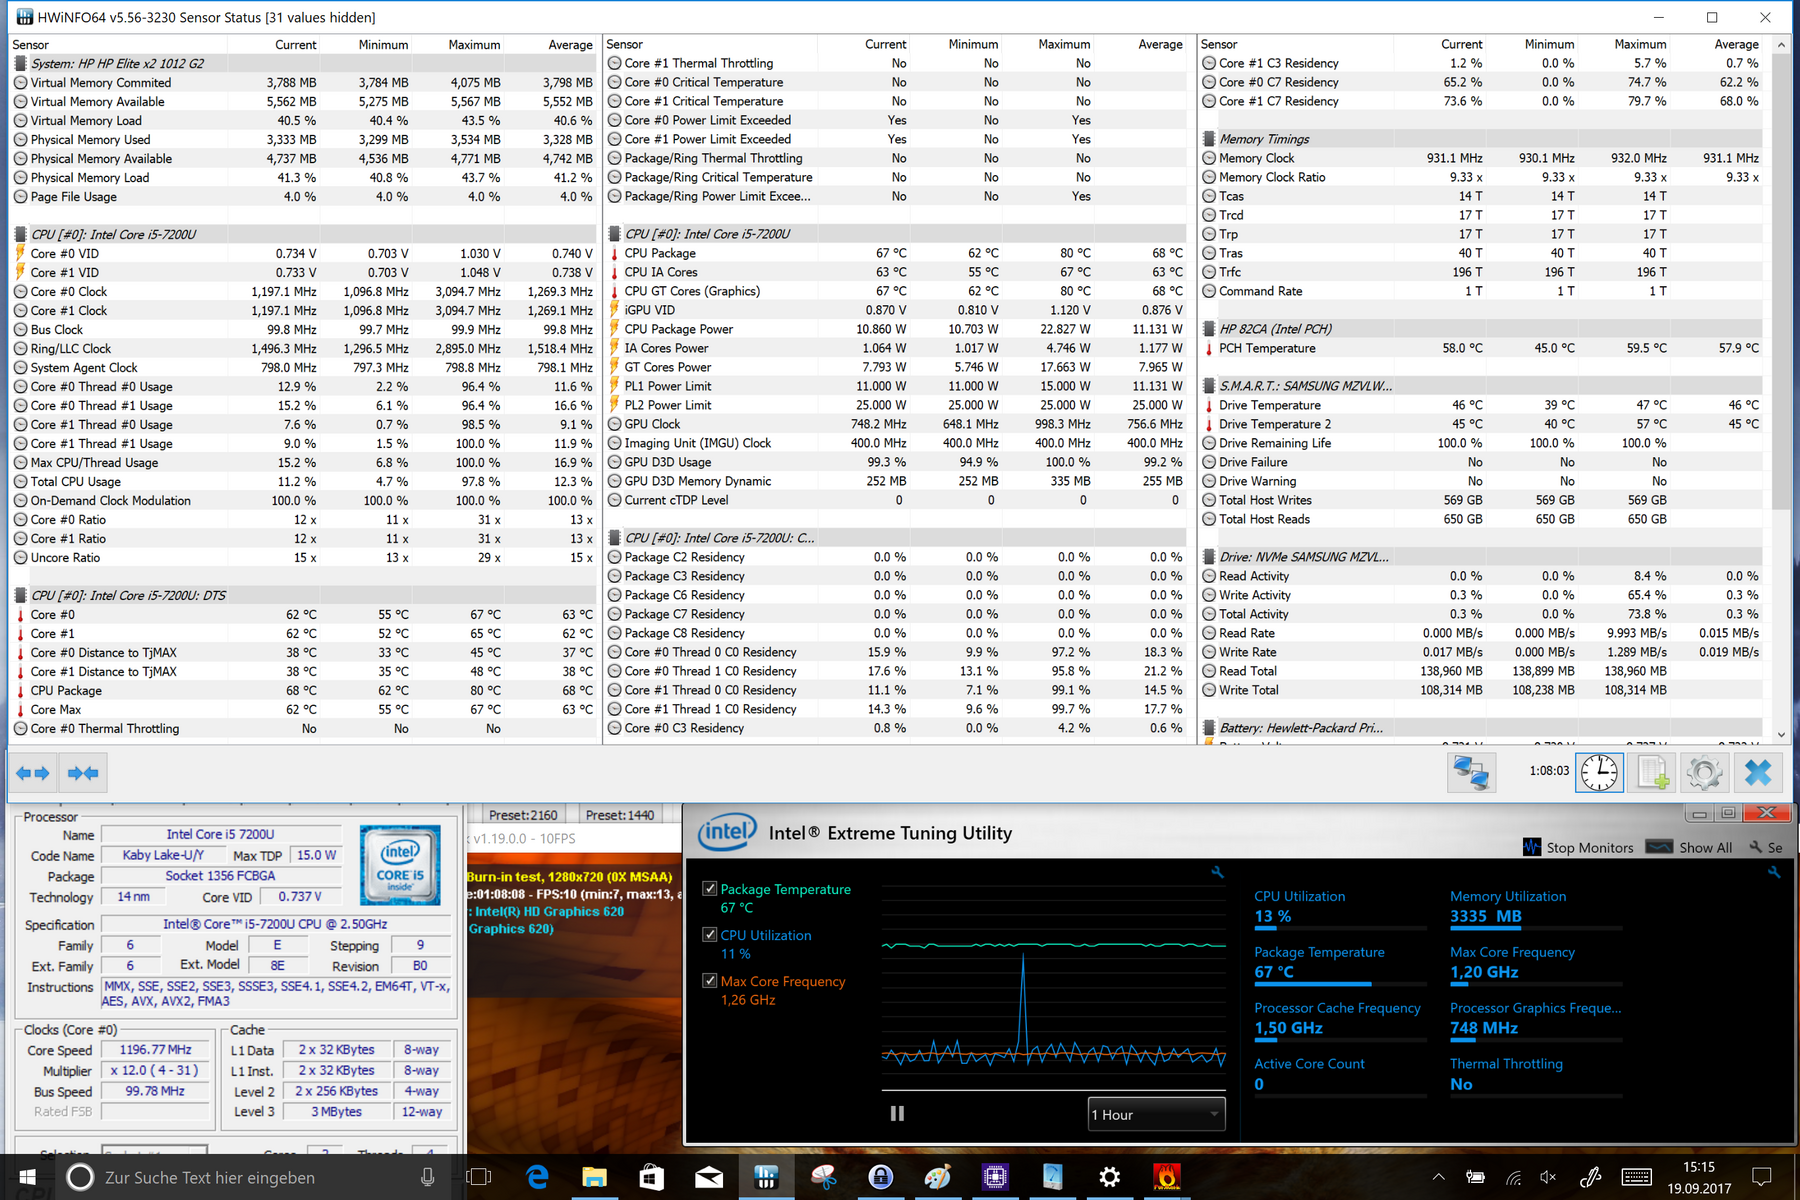
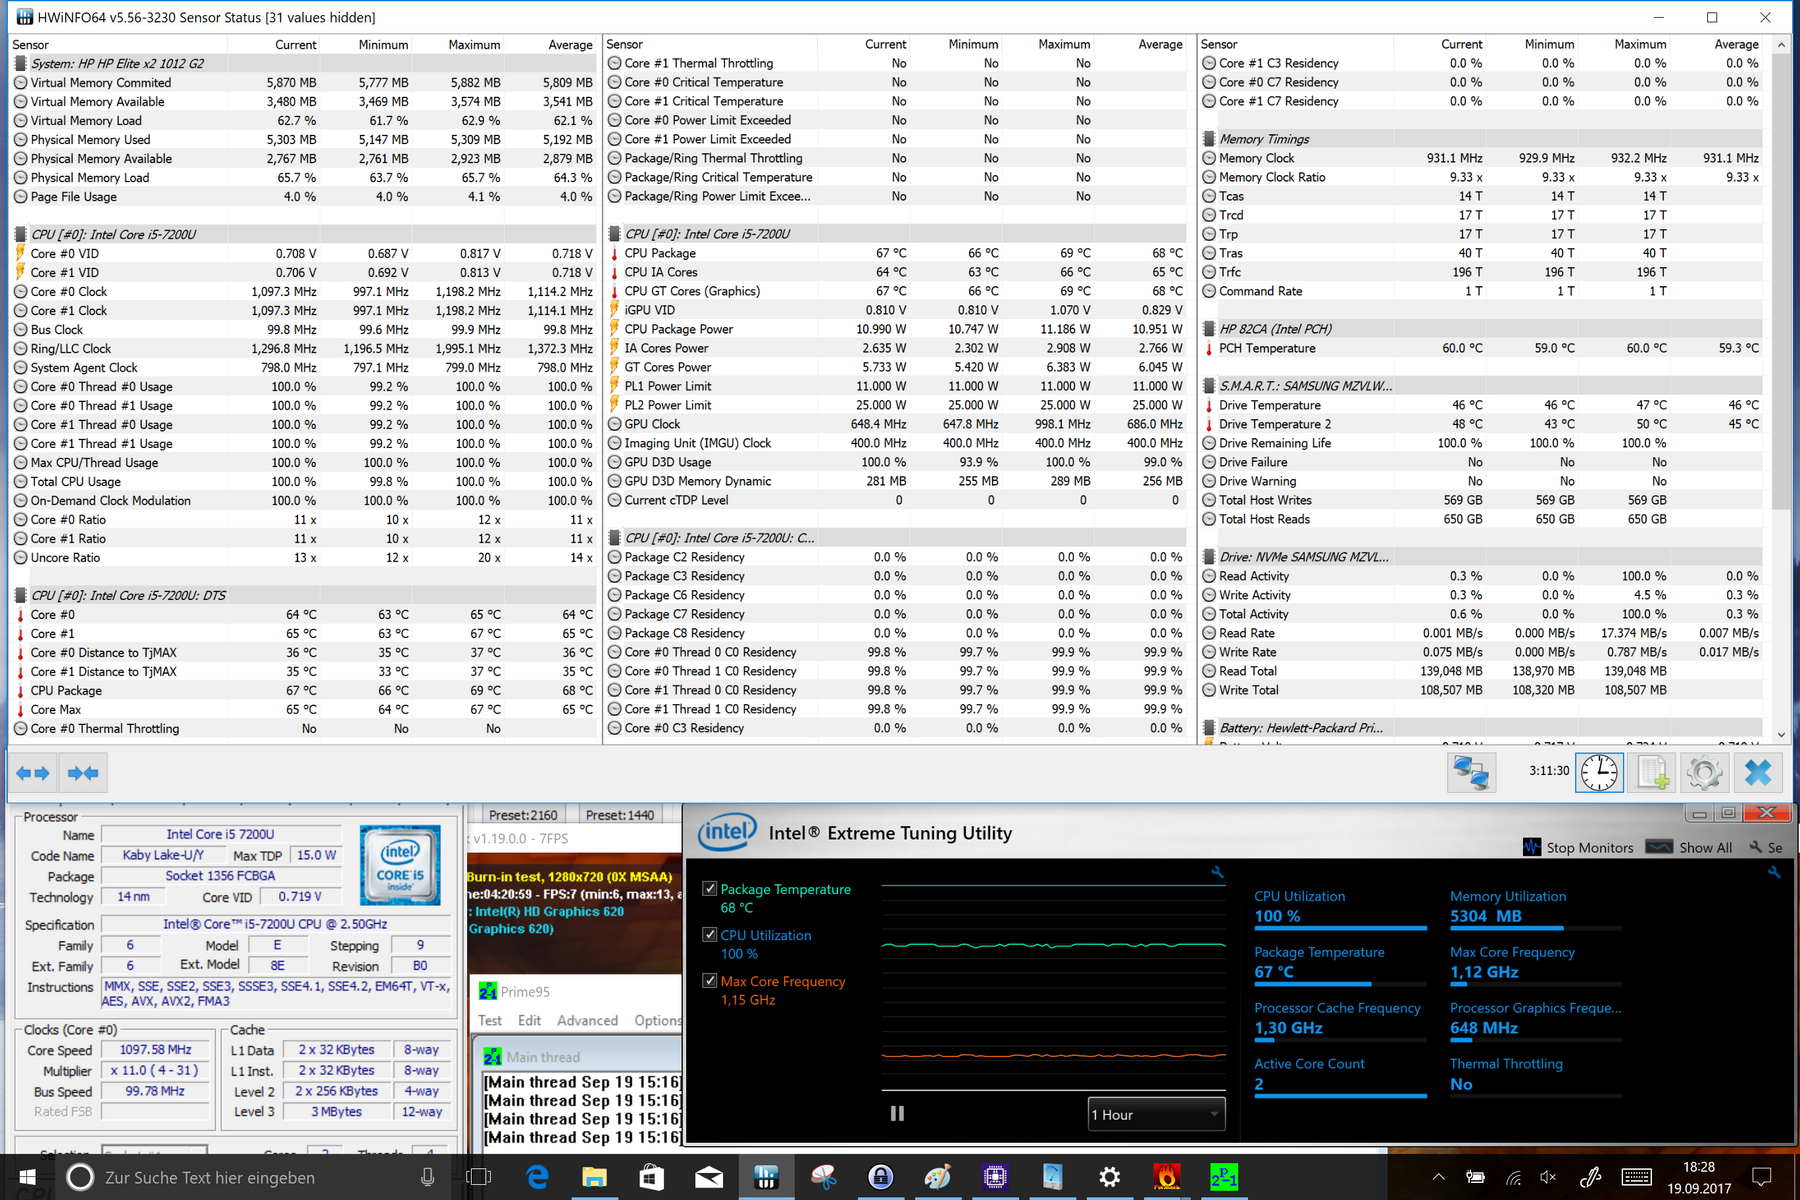
Naast het foutloze fabricage, waarderen we ook het hoge resolutie paneel en de accessoires in de vorm van het toetsenbord dock en actieve stylus. De systeemprestaties zijn ook van een goed niveau, hoewel de koeleenheid al snel zijn limieten bereikt bij langdurige belasting. Kopers zullen dan ook goed moeten overwegen of het zijn heeft om voor het Core i7 model te kiezen. Het is HP duidelijk gelukt om in vergelijking met de voorganger de prestaties op alle vlakken te verbeteren.
HP Elite x2 1012 G2-1LV76EA
- 22-09-2017 v6 (old)
Sebastian Bade