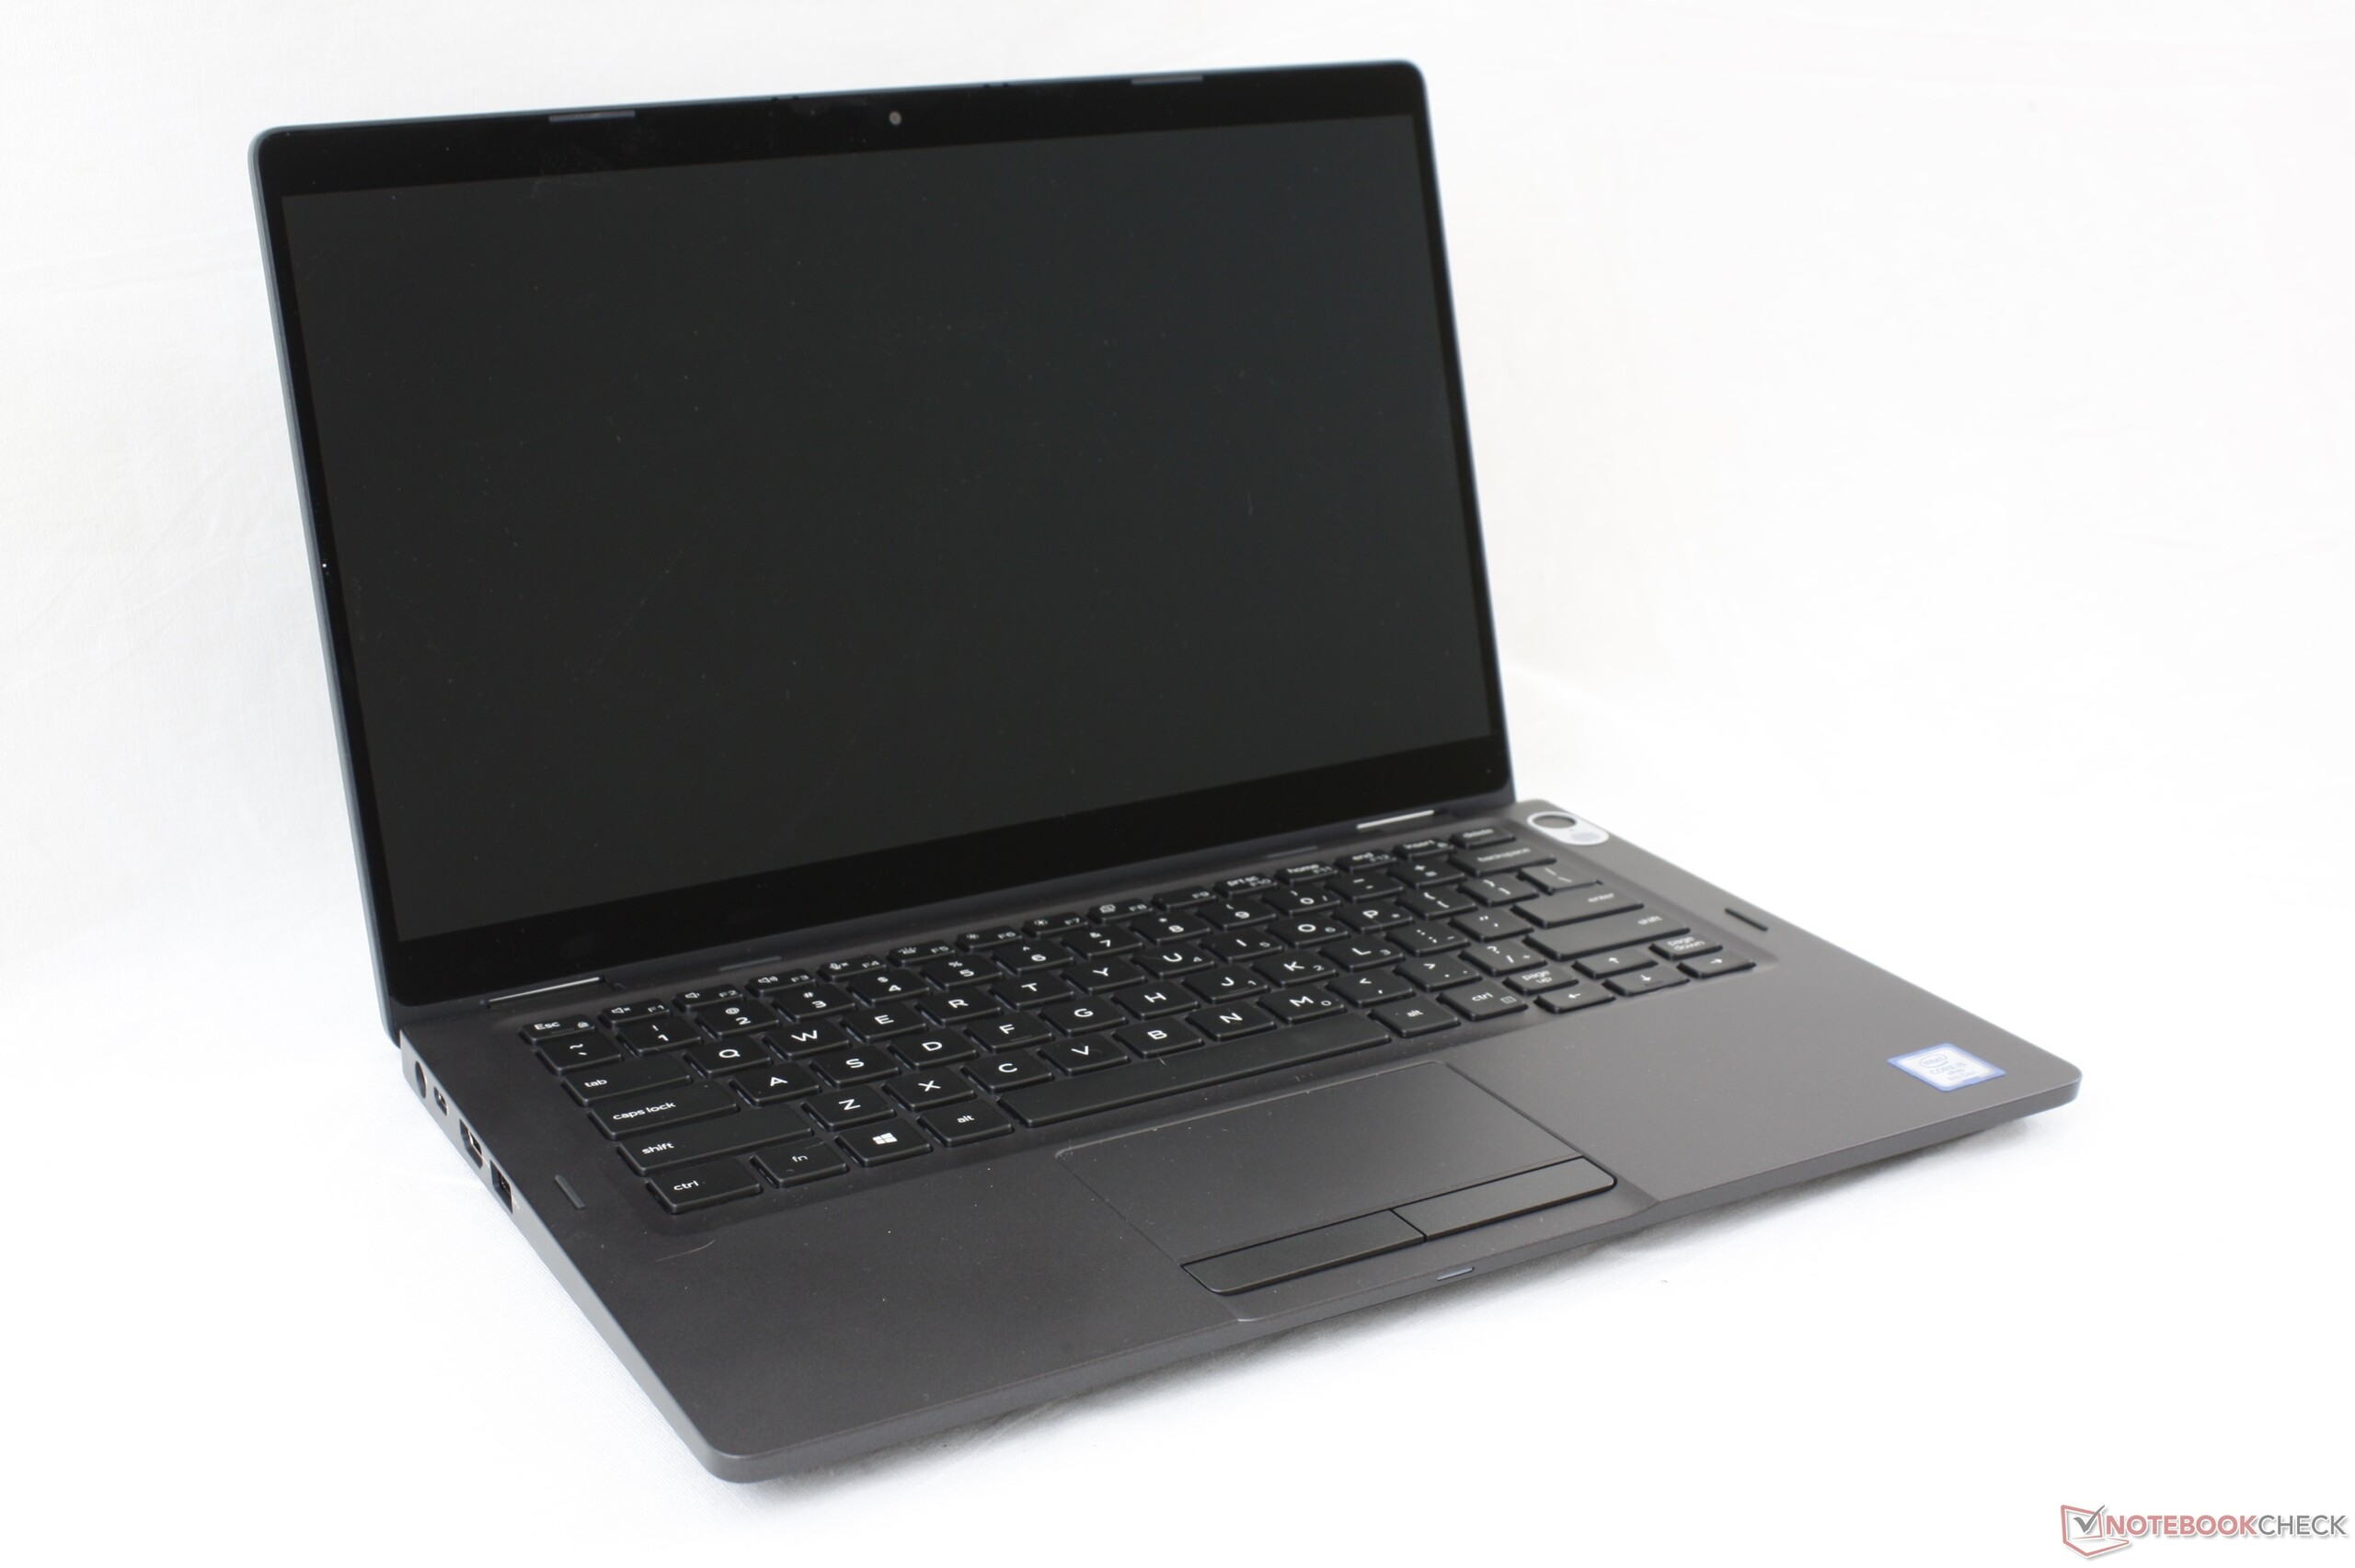
Kort testrapport Dell Latitude 13 5300 2-in-1 Convertible: een alternatief voor de ThinkPad X390 Yoga
| SD Card Reader | |
| average JPG Copy Test (av. of 3 runs) | |
| Dell XPS 13 9380 2019 (Toshiba Exceria Pro SDXC 64 GB UHS-II) | |
| Dell Latitude 13 5300 2-in-1 (Toshiba Exceria Pro M501) | |
| Samsung Notebook 9 NP930QAA (Toshiba Exceria Pro M501 microSDXC 64GB) | |
| Lenovo ThinkPad X390-20Q1S02M00 (Toshiba Exceria Pro M501) | |
| HP ProBook 430 G6-5TJ89EA (Toshiba Exceria Pro SDXC 64 GB UHS-II) | |
| maximum AS SSD Seq Read Test (1GB) | |
| Dell XPS 13 9380 2019 (Toshiba Exceria Pro SDXC 64 GB UHS-II) | |
| Dell Latitude 13 5300 2-in-1 (Toshiba Exceria Pro M501) | |
| Samsung Notebook 9 NP930QAA (Toshiba Exceria Pro M501 microSDXC 64GB) | |
| Lenovo ThinkPad X390-20Q1S02M00 (Toshiba Exceria Pro M501) | |
| HP ProBook 430 G6-5TJ89EA (Toshiba Exceria Pro SDXC 64 GB UHS-II) | |
| |||||||||||||||||||||||||
Helderheidsverdeling: 89 %
Helderheid in Batterij-modus: 316.2 cd/m²
Contrast: 1171:1 (Zwart: 0.27 cd/m²)
ΔE ColorChecker Calman: 5.67 | ∀{0.5-29.43 Ø4.71}
calibrated: 1.26
ΔE Greyscale Calman: 7 | ∀{0.09-98 Ø4.96}
95.7% sRGB (Argyll 1.6.3 3D)
61.4% AdobeRGB 1998 (Argyll 1.6.3 3D)
66.5% AdobeRGB 1998 (Argyll 3D)
95.7% sRGB (Argyll 3D)
64.9% Display P3 (Argyll 3D)
Gamma: 2.64
CCT: 6440 K
| Dell Latitude 13 5300 2-in-1 LG Philips LGD05DC, IPS, 13.3", 1920x1080 | Lenovo ThinkPad X390-20Q1S02M00 LP133WF7-SPB1, IPS LED, 13.3", 1920x1080 | Samsung Notebook 9 NP930QAA BOE075E, IPS, 13.3", 1920x1080 | Dell XPS 13 9380 2019 ID: AUO 282B B133ZAN Dell: 90NTH, IPS, 13.3", 3840x2160 | HP Spectre x360 13t-ae000 LGD0588, IPS, 13.3", 3840x2160 | HP EliteBook x360 1030 G3 45X96UT Chi Mei CMN1380, IPS, 13.3", 1920x1080 | |
|---|---|---|---|---|---|---|
| Display | 0% | -1% | -2% | 8% | 3% | |
| Display P3 Coverage (%) | 64.9 | 65.3 1% | 65.4 1% | 64.7 0% | 71.9 11% | 66.7 3% |
| sRGB Coverage (%) | 95.7 | 95.9 0% | 91.5 -4% | 93.1 -3% | 98.1 3% | 98.6 3% |
| AdobeRGB 1998 Coverage (%) | 66.5 | 66.6 0% | 66.2 0% | 65.3 -2% | 73.1 10% | 68.7 3% |
| Response Times | -48% | -23% | -52% | -36% | -9% | |
| Response Time Grey 50% / Grey 80% * (ms) | 37.6 ? | 57.6 ? -53% | 49.2 ? -31% | 58 ? -54% | 51.6 ? -37% | 39.6 ? -5% |
| Response Time Black / White * (ms) | 24 ? | 34 ? -42% | 27.6 ? -15% | 36 ? -50% | 32.4 ? -35% | 27.2 ? -13% |
| PWM Frequency (Hz) | 3049 ? | 26040 ? | ||||
| Screen | 25% | -5% | 2% | 19% | 17% | |
| Brightness middle (cd/m²) | 316.2 | 356 13% | 473 50% | 404 28% | 329.8 4% | 467.2 48% |
| Brightness (cd/m²) | 298 | 336 13% | 441 48% | 389 31% | 318 7% | 445 49% |
| Brightness Distribution (%) | 89 | 88 -1% | 88 -1% | 85 -4% | 74 -17% | 91 2% |
| Black Level * (cd/m²) | 0.27 | 0.16 41% | 0.57 -111% | 0.37 -37% | 0.25 7% | 0.4 -48% |
| Contrast (:1) | 1171 | 2225 90% | 830 -29% | 1092 -7% | 1319 13% | 1168 0% |
| Colorchecker dE 2000 * | 5.67 | 3.6 37% | 3.72 34% | 3.72 34% | 2.37 58% | 2.41 57% |
| Colorchecker dE 2000 max. * | 7.97 | 5.5 31% | 7.83 2% | 7.38 7% | 4.08 49% | 5.58 30% |
| Colorchecker dE 2000 calibrated * | 1.26 | 1.1 13% | 2.14 -70% | 2.06 -63% | 1.33 -6% | |
| Greyscale dE 2000 * | 7 | 4.7 33% | 5.1 27% | 4.44 37% | 2.8 60% | 3.7 47% |
| Gamma | 2.64 83% | 2.48 89% | 2.31 95% | 2.34 94% | 2.145 103% | 2.37 93% |
| CCT | 6440 101% | 6374 102% | 7569 86% | 7095 92% | 6441 101% | 7158 91% |
| Color Space (Percent of AdobeRGB 1998) (%) | 61.4 | 61.3 0% | 58.9 -4% | 60 -2% | 67 9% | 62.5 2% |
| Color Space (Percent of sRGB) (%) | 95.7 | 95.7 0% | 90.8 -5% | 93 -3% | 98 2% | 99.6 4% |
| Totaal Gemiddelde (Programma / Instellingen) | -8% /
11% | -10% /
-7% | -17% /
-6% | -3% /
10% | 4% /
11% |
* ... kleiner is beter
Responstijd Scherm
| ↔ Responstijd Zwart naar Wit | ||
|---|---|---|
| 24 ms ... stijging ↗ en daling ↘ gecombineerd | ↗ 13.2 ms stijging | 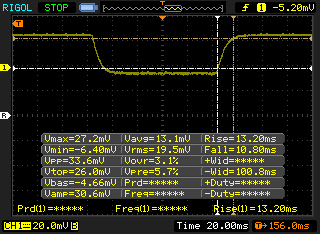 |
| ↘ 10.8 ms daling | ||
| Het scherm vertoonde prima responstijden in onze tests maar is misschien wat te traag voor competitieve games. Ter vergelijking: alle testtoestellen variëren van 0.1 (minimum) tot 240 (maximum) ms. » 54 % van alle toestellen zijn beter. Dit betekent dat de gemeten responstijd slechter is dan het gemiddelde (19.8 ms) van alle geteste toestellen. | ||
| ↔ Responstijd 50% Grijs naar 80% Grijs | ||
| 37.6 ms ... stijging ↗ en daling ↘ gecombineerd | ↗ 18.8 ms stijging | 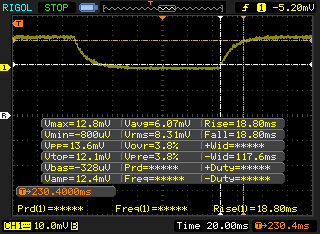 |
| ↘ 18.8 ms daling | ||
| Het scherm vertoonde trage responstijden in onze tests en is misschien te traag voor games. Ter vergelijking: alle testtoestellen variëren van 0.165 (minimum) tot 636 (maximum) ms. » 55 % van alle toestellen zijn beter. Dit betekent dat de gemeten responstijd slechter is dan het gemiddelde (31 ms) van alle geteste toestellen. | ||
Screen Flickering / PWM (Pulse-Width Modulation)
| Screen flickering / PWM niet waargenomen | 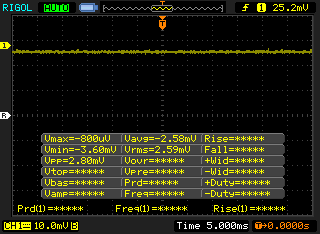 | ||
Ter vergelijking: 52 % van alle geteste toestellen maakten geen gebruik van PWM om de schermhelderheid te verlagen. Als het wel werd gebruikt, werd een gemiddelde van 7757 (minimum: 5 - maximum: 343500) Hz waargenomen. | |||
| Cinebench R15 | |
| CPU Single 64Bit | |
| Dell Latitude 7400 2-in-1 | |
| Dell Inspiron 13 7380 | |
| Dell G3 15 3579 | |
| Dell XPS 13 9370 i7 UHD | |
| Dell Latitude 13 5300 2-in-1 | |
| Dell XPS 13 9360 FHD i7 Iris | |
| Dell XPS 13 9380 2019 | |
| Dell Latitude 14 5495 | |
| Dell Latitude 13 3390 | |
| Dell XPS 13 9360-4764 | |
| HP 14-dk0008ng | |
| CPU Multi 64Bit | |
| Dell G3 15 3579 | |
| Dell Latitude 14 5495 | |
| Dell XPS 13 9380 2019 | |
| Dell XPS 13 9370 i7 UHD | |
| Dell Latitude 7400 2-in-1 | |
| Dell Latitude 13 5300 2-in-1 | |
| Dell Inspiron 13 7380 | |
| Dell Latitude 13 3390 | |
| HP 14-dk0008ng | |
| Dell XPS 13 9360-4764 | |
| Dell XPS 13 9360 FHD i7 Iris | |
| PCMark 8 Home Score Accelerated v2 | 3485 punten | |
| PCMark 8 Work Score Accelerated v2 | 4911 punten | |
| PCMark 10 Score | 3863 punten | |
Help | ||
| Dell Latitude 13 5300 2-in-1 SK hynix PC401 HFS256GD9TNG | Lenovo ThinkPad X390-20Q1S02M00 Intel SSD Pro 7600p SSDPEKKF512G8L | Huawei MateBook 13 i7 Samsung SSD PM981 MZVLB512HAJQ | HP Spectre x360 13t-ae000 Lite-On CA1-8D256-HP | HP EliteBook x360 1030 G3 45X96UT Samsung SSD PM981 MZVLB512HAJQ | |
|---|---|---|---|---|---|
| AS SSD | 93% | 123% | 5% | 89% | |
| Seq Read (MB/s) | 1236 | 2689 118% | 1889 53% | 2133 73% | 1798 45% |
| Seq Write (MB/s) | 500 | 1462 192% | 1812 262% | 945 89% | 1374 175% |
| 4K Read (MB/s) | 40.1 | 63.8 59% | 55.5 38% | 29.84 -26% | 46.05 15% |
| 4K Write (MB/s) | 115.7 | 139.8 21% | 118.4 2% | 91.4 -21% | 104.3 -10% |
| 4K-64 Read (MB/s) | 474.1 | 865 82% | 1257 165% | 725 53% | 1408 197% |
| 4K-64 Write (MB/s) | 350.4 | 1041 197% | 1571 348% | 404.1 15% | 790 125% |
| Access Time Read * (ms) | 0.04 | 0.037 7% | 0.041 -2% | 0.121 -203% | 0.041 -2% |
| Access Time Write * (ms) | 0.051 | 0.024 53% | 0.032 37% | 0.13 -155% | 0.036 29% |
| Score Read (Points) | 638 | 1198 88% | 1502 135% | 968 52% | 1634 156% |
| Score Write (Points) | 516 | 1328 157% | 1871 263% | 590 14% | 1032 100% |
| Score Total (Points) | 1456 | 3095 113% | 4147 185% | 1998 37% | 3484 139% |
| Copy ISO MB/s (MB/s) | 818 | 1290 58% | 1800 120% | 1492 82% | 1947 138% |
| Copy Program MB/s (MB/s) | 395.5 | 436.5 10% | 385.6 -3% | 300.9 -24% | 453.9 15% |
| Copy Game MB/s (MB/s) | 452.5 | 1147 153% | 982 117% | 839 85% | 990 119% |
* ... kleiner is beter

| 3DMark | |
| 1280x720 Cloud Gate Standard Graphics | |
| Dell G3 15 3579 | |
| Huawei MateBook 13 i7 | |
| HP 14-dk0008ng | |
| Dell XPS 13 9360 FHD i7 Iris | |
| Dell Latitude 14 5495 | |
| Dell Inspiron 13 7380 | |
| Dell XPS 13 9380 2019 | |
| Dell XPS 13 9370 i7 UHD | |
| Gemiddeld Intel UHD Graphics 620 (6205 - 16400, n=225) | |
| Dell Latitude 13 3390 | |
| Dell XPS 13 9360-4764 | |
| Dell Latitude 13 5300 2-in-1 | |
| HP ProBook 430 G6-5TJ89EA | |
| 1280x720 Cloud Gate Standard Score | |
| Dell G3 15 3579 | |
| Huawei MateBook 13 i7 | |
| HP 14-dk0008ng | |
| Dell XPS 13 9380 2019 | |
| Dell Latitude 14 5495 | |
| Dell Inspiron 13 7380 | |
| Dell XPS 13 9370 i7 UHD | |
| Gemiddeld Intel UHD Graphics 620 (5358 - 10960, n=225) | |
| Dell Latitude 13 5300 2-in-1 | |
| Dell Latitude 13 3390 | |
| Dell XPS 13 9360 FHD i7 Iris | |
| HP ProBook 430 G6-5TJ89EA | |
| Dell XPS 13 9360-4764 | |
| 3DMark 11 | |
| 1280x720 Performance GPU | |
| Dell G3 15 3579 | |
| Huawei MateBook 13 i7 | |
| HP 14-dk0008ng | |
| Dell Latitude 14 5495 | |
| Dell XPS 13 9360 FHD i7 Iris | |
| Dell XPS 13 9370 i7 UHD | |
| Dell Inspiron 13 7380 | |
| Dell XPS 13 9380 2019 | |
| Gemiddeld Intel UHD Graphics 620 (1144 - 3432, n=244) | |
| Dell Latitude 13 5300 2-in-1 | |
| HP ProBook 430 G6-5TJ89EA | |
| Dell XPS 13 9360-4764 | |
| Dell Latitude 13 3390 | |
| 1280x720 Performance Combined | |
| Dell G3 15 3579 | |
| Huawei MateBook 13 i7 | |
| HP 14-dk0008ng | |
| Dell Latitude 14 5495 | |
| Dell XPS 13 9360 FHD i7 Iris | |
| Dell XPS 13 9380 2019 | |
| Dell XPS 13 9370 i7 UHD | |
| Dell Inspiron 13 7380 | |
| Gemiddeld Intel UHD Graphics 620 (927 - 2505, n=244) | |
| Dell XPS 13 9360-4764 | |
| Dell Latitude 13 3390 | |
| Dell Latitude 13 5300 2-in-1 | |
| HP ProBook 430 G6-5TJ89EA | |
| 3DMark 06 Standard Score | 10108 punten | |
| 3DMark 11 Performance | 1896 punten | |
| 3DMark Ice Storm Standard Score | 51629 punten | |
| 3DMark Cloud Gate Standard Score | 8000 punten | |
Help | ||
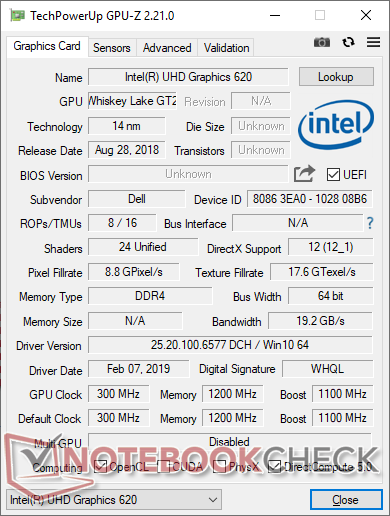
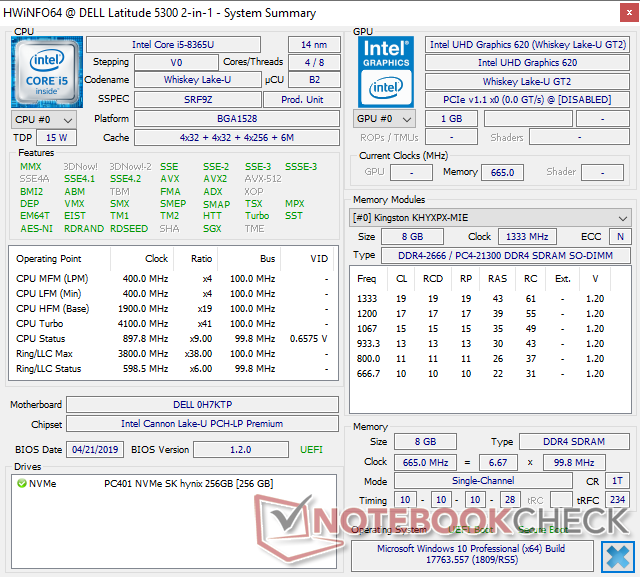
| Dell Latitude 13 5300 2-in-1 UHD Graphics 620, i5-8365U, SK hynix PC401 HFS256GD9TNG | Lenovo ThinkPad X390-20Q1S02M00 UHD Graphics 620, i5-8265U, Intel SSD Pro 7600p SSDPEKKF512G8L | Huawei MateBook 13 i7 GeForce MX150, i7-8565U, Samsung SSD PM981 MZVLB512HAJQ | Samsung Notebook 9 NP930QAA UHD Graphics 620, i5-8550U, Samsung PM961 MZVLW256HEHP | HP Spectre x360 13t-ae000 UHD Graphics 620, i5-8550U, Lite-On CA1-8D256-HP | HP EliteBook x360 1030 G3 45X96UT UHD Graphics 620, i7-8650U, Samsung SSD PM981 MZVLB512HAJQ | |
|---|---|---|---|---|---|---|
| Noise | 2% | -1% | 2% | 7% | 6% | |
| uit / omgeving * (dB) | 28.5 | 29.2 -2% | 28.6 -0% | 29 -2% | 28.2 1% | 28.5 -0% |
| Idle Minimum * (dB) | 28.5 | 29.2 -2% | 28.6 -0% | 29 -2% | 28.2 1% | 28.5 -0% |
| Idle Average * (dB) | 28.5 | 29.2 -2% | 28.6 -0% | 29 -2% | 28.2 1% | 28.5 -0% |
| Idle Maximum * (dB) | 28.5 | 29.2 -2% | 28.6 -0% | 29 -2% | 28.2 1% | 28.5 -0% |
| Load Average * (dB) | 35.5 | 34.8 2% | 34.2 4% | 32.6 8% | 30.7 14% | 30.8 13% |
| Load Maximum * (dB) | 42.1 | 34.8 17% | 47 -12% | 36.7 13% | 32.9 22% | 32.8 22% |
| Witcher 3 ultra * (dB) | 43 |
* ... kleiner is beter
Geluidsniveau
| Onbelast |
| 28.5 / 28.5 / 28.5 dB (A) |
| Belasting |
| 35.5 / 42.1 dB (A) |
 | ||
30 dB stil 40 dB(A) hoorbaar 50 dB(A) luid |
||
min: | ||
(-) De maximumtemperatuur aan de bovenzijde bedraagt 47.2 °C / 117 F, vergeleken met het gemiddelde van 34.3 °C / 94 F, variërend van 21.2 tot 62.5 °C voor de klasse Office.
(-) De bodem warmt op tot een maximum van 60 °C / 140 F, vergeleken met een gemiddelde van 36.8 °C / 98 F
(+) Bij onbelast gebruik bedraagt de gemiddelde temperatuur voor de bovenzijde 28.7 °C / 84 F, vergeleken met het apparaatgemiddelde van 29.5 °C / 85 F.
(+) De palmsteunen en het touchpad zijn met een maximum van ###max## °C / 88.2 F koeler dan de huidtemperatuur en voelen daarom koel aan.
(-) De gemiddelde temperatuur van de handpalmsteun van soortgelijke toestellen bedroeg 27.5 °C / 81.5 F (-3.7 °C / -6.7 F).
Dell Latitude 13 5300 2-in-1 audioanalyse
(+) | luidsprekers kunnen relatief luid spelen (83.7 dB)
Bas 100 - 315 Hz
(±) | verminderde zeebaars - gemiddeld 12.5% lager dan de mediaan
(±) | lineariteit van de lage tonen is gemiddeld (10.6% delta ten opzichte van de vorige frequentie)
Midden 400 - 2000 Hz
(+) | evenwichtige middens - slechts 3.9% verwijderd van de mediaan
(+) | de middentonen zijn lineair (6.8% delta ten opzichte van de vorige frequentie)
Hoog 2 - 16 kHz
(+) | evenwichtige hoogtepunten - slechts 1.6% verwijderd van de mediaan
(+) | de hoge tonen zijn lineair (4.9% delta naar de vorige frequentie)
Algemeen 100 - 16.000 Hz
(+) | het totale geluid is lineair (14.5% verschil met de mediaan)
Vergeleken met dezelfde klasse
» 12% van alle geteste apparaten in deze klasse waren beter, 4% vergelijkbaar, 84% slechter
» De beste had een delta van 7%, het gemiddelde was 21%, de slechtste was 53%
Vergeleken met alle geteste toestellen
» 18% van alle geteste apparaten waren beter, 4% gelijk, 77% slechter
» De beste had een delta van 4%, het gemiddelde was 23%, de slechtste was 134%
Apple MacBook 12 (Early 2016) 1.1 GHz audioanalyse
(+) | luidsprekers kunnen relatief luid spelen (83.6 dB)
Bas 100 - 315 Hz
(±) | verminderde zeebaars - gemiddeld 11.3% lager dan de mediaan
(±) | lineariteit van de lage tonen is gemiddeld (14.2% delta ten opzichte van de vorige frequentie)
Midden 400 - 2000 Hz
(+) | evenwichtige middens - slechts 2.4% verwijderd van de mediaan
(+) | de middentonen zijn lineair (5.5% delta ten opzichte van de vorige frequentie)
Hoog 2 - 16 kHz
(+) | evenwichtige hoogtepunten - slechts 2% verwijderd van de mediaan
(+) | de hoge tonen zijn lineair (4.5% delta naar de vorige frequentie)
Algemeen 100 - 16.000 Hz
(+) | het totale geluid is lineair (10.2% verschil met de mediaan)
Vergeleken met dezelfde klasse
» 7% van alle geteste apparaten in deze klasse waren beter, 2% vergelijkbaar, 90% slechter
» De beste had een delta van 5%, het gemiddelde was 18%, de slechtste was 53%
Vergeleken met alle geteste toestellen
» 5% van alle geteste apparaten waren beter, 1% gelijk, 94% slechter
» De beste had een delta van 4%, het gemiddelde was 23%, de slechtste was 134%
| Uit / Standby | |
| Inactief | |
| Belasting |
|
Key:
min: | |
| Dell Latitude 13 5300 2-in-1 i5-8365U, UHD Graphics 620, SK hynix PC401 HFS256GD9TNG, IPS, 1920x1080, 13.3" | Lenovo ThinkPad X390-20Q1S02M00 i5-8265U, UHD Graphics 620, Intel SSD Pro 7600p SSDPEKKF512G8L, IPS LED, 1920x1080, 13.3" | Huawei MateBook 13 i7 i7-8565U, GeForce MX150, Samsung SSD PM981 MZVLB512HAJQ, IPS, 2160x1440, 13" | Samsung Notebook 9 NP930QAA i5-8550U, UHD Graphics 620, Samsung PM961 MZVLW256HEHP, IPS, 1920x1080, 13.3" | HP Spectre x360 13t-ae000 i5-8550U, UHD Graphics 620, Lite-On CA1-8D256-HP, IPS, 3840x2160, 13.3" | HP EliteBook 735 G5 3UN62EA R7 2700U, Vega 10, Toshiba KBG30ZMV256G, IPS, 1920x1080, 13.3" | HP EliteBook x360 1030 G3 45X96UT i7-8650U, UHD Graphics 620, Samsung SSD PM981 MZVLB512HAJQ, IPS, 1920x1080, 13.3" | |
|---|---|---|---|---|---|---|---|
| Power Consumption | -14% | -43% | -53% | -40% | -43% | -21% | |
| Idle Minimum * (Watt) | 2.8 | 3.4 -21% | 3.5 -25% | 4.4 -57% | 5.9 -111% | 5.5 -96% | 3.4 -21% |
| Idle Average * (Watt) | 5.1 | 5.6 -10% | 7.5 -47% | 11.8 -131% | 9.8 -92% | 9.4 -84% | 7.6 -49% |
| Idle Maximum * (Watt) | 7.1 | 8.7 -23% | 12.4 -75% | 15.5 -118% | 10.6 -49% | 11.6 -63% | 11.5 -62% |
| Load Average * (Watt) | 39.9 | 43.6 -9% | 64.2 -61% | 38 5% | 36.6 8% | 39 2% | 35.4 11% |
| Load Maximum * (Watt) | 60.3 | 65 -8% | 65.7 -9% | 39.8 34% | 34.3 43% | 45.6 24% | 51.9 14% |
| Witcher 3 ultra * (Watt) | 52.5 |
* ... kleiner is beter
| Dell Latitude 13 5300 2-in-1 i5-8365U, UHD Graphics 620, 60 Wh | Lenovo ThinkPad X390-20Q1S02M00 i5-8265U, UHD Graphics 620, 48 Wh | Huawei MateBook 13 i7 i7-8565U, GeForce MX150, 41.7 Wh | Samsung Notebook 9 NP930QAA i5-8550U, UHD Graphics 620, 39 Wh | HP Spectre x360 13t-ae000 i5-8550U, UHD Graphics 620, 60 Wh | HP EliteBook x360 1030 G3 45X96UT i7-8650U, UHD Graphics 620, 56.2 Wh | |
|---|---|---|---|---|---|---|
| Batterijduur | -22% | -43% | -43% | -19% | -6% | |
| Reader / Idle (h) | 28.3 | 15.4 -46% | 14.6 -48% | |||
| WiFi v1.3 (h) | 10.4 | 8.3 -20% | 7.6 -27% | 6.6 -37% | 7.1 -32% | 9.8 -6% |
| Load (h) | 2.1 | 1.6 -24% | 0.9 -57% | 1.2 -43% | 2 -5% |
Pro
Contra
Dit is de verkorte versie van het originele artikel. Het volledige, Engelse testrapport vind je hier.
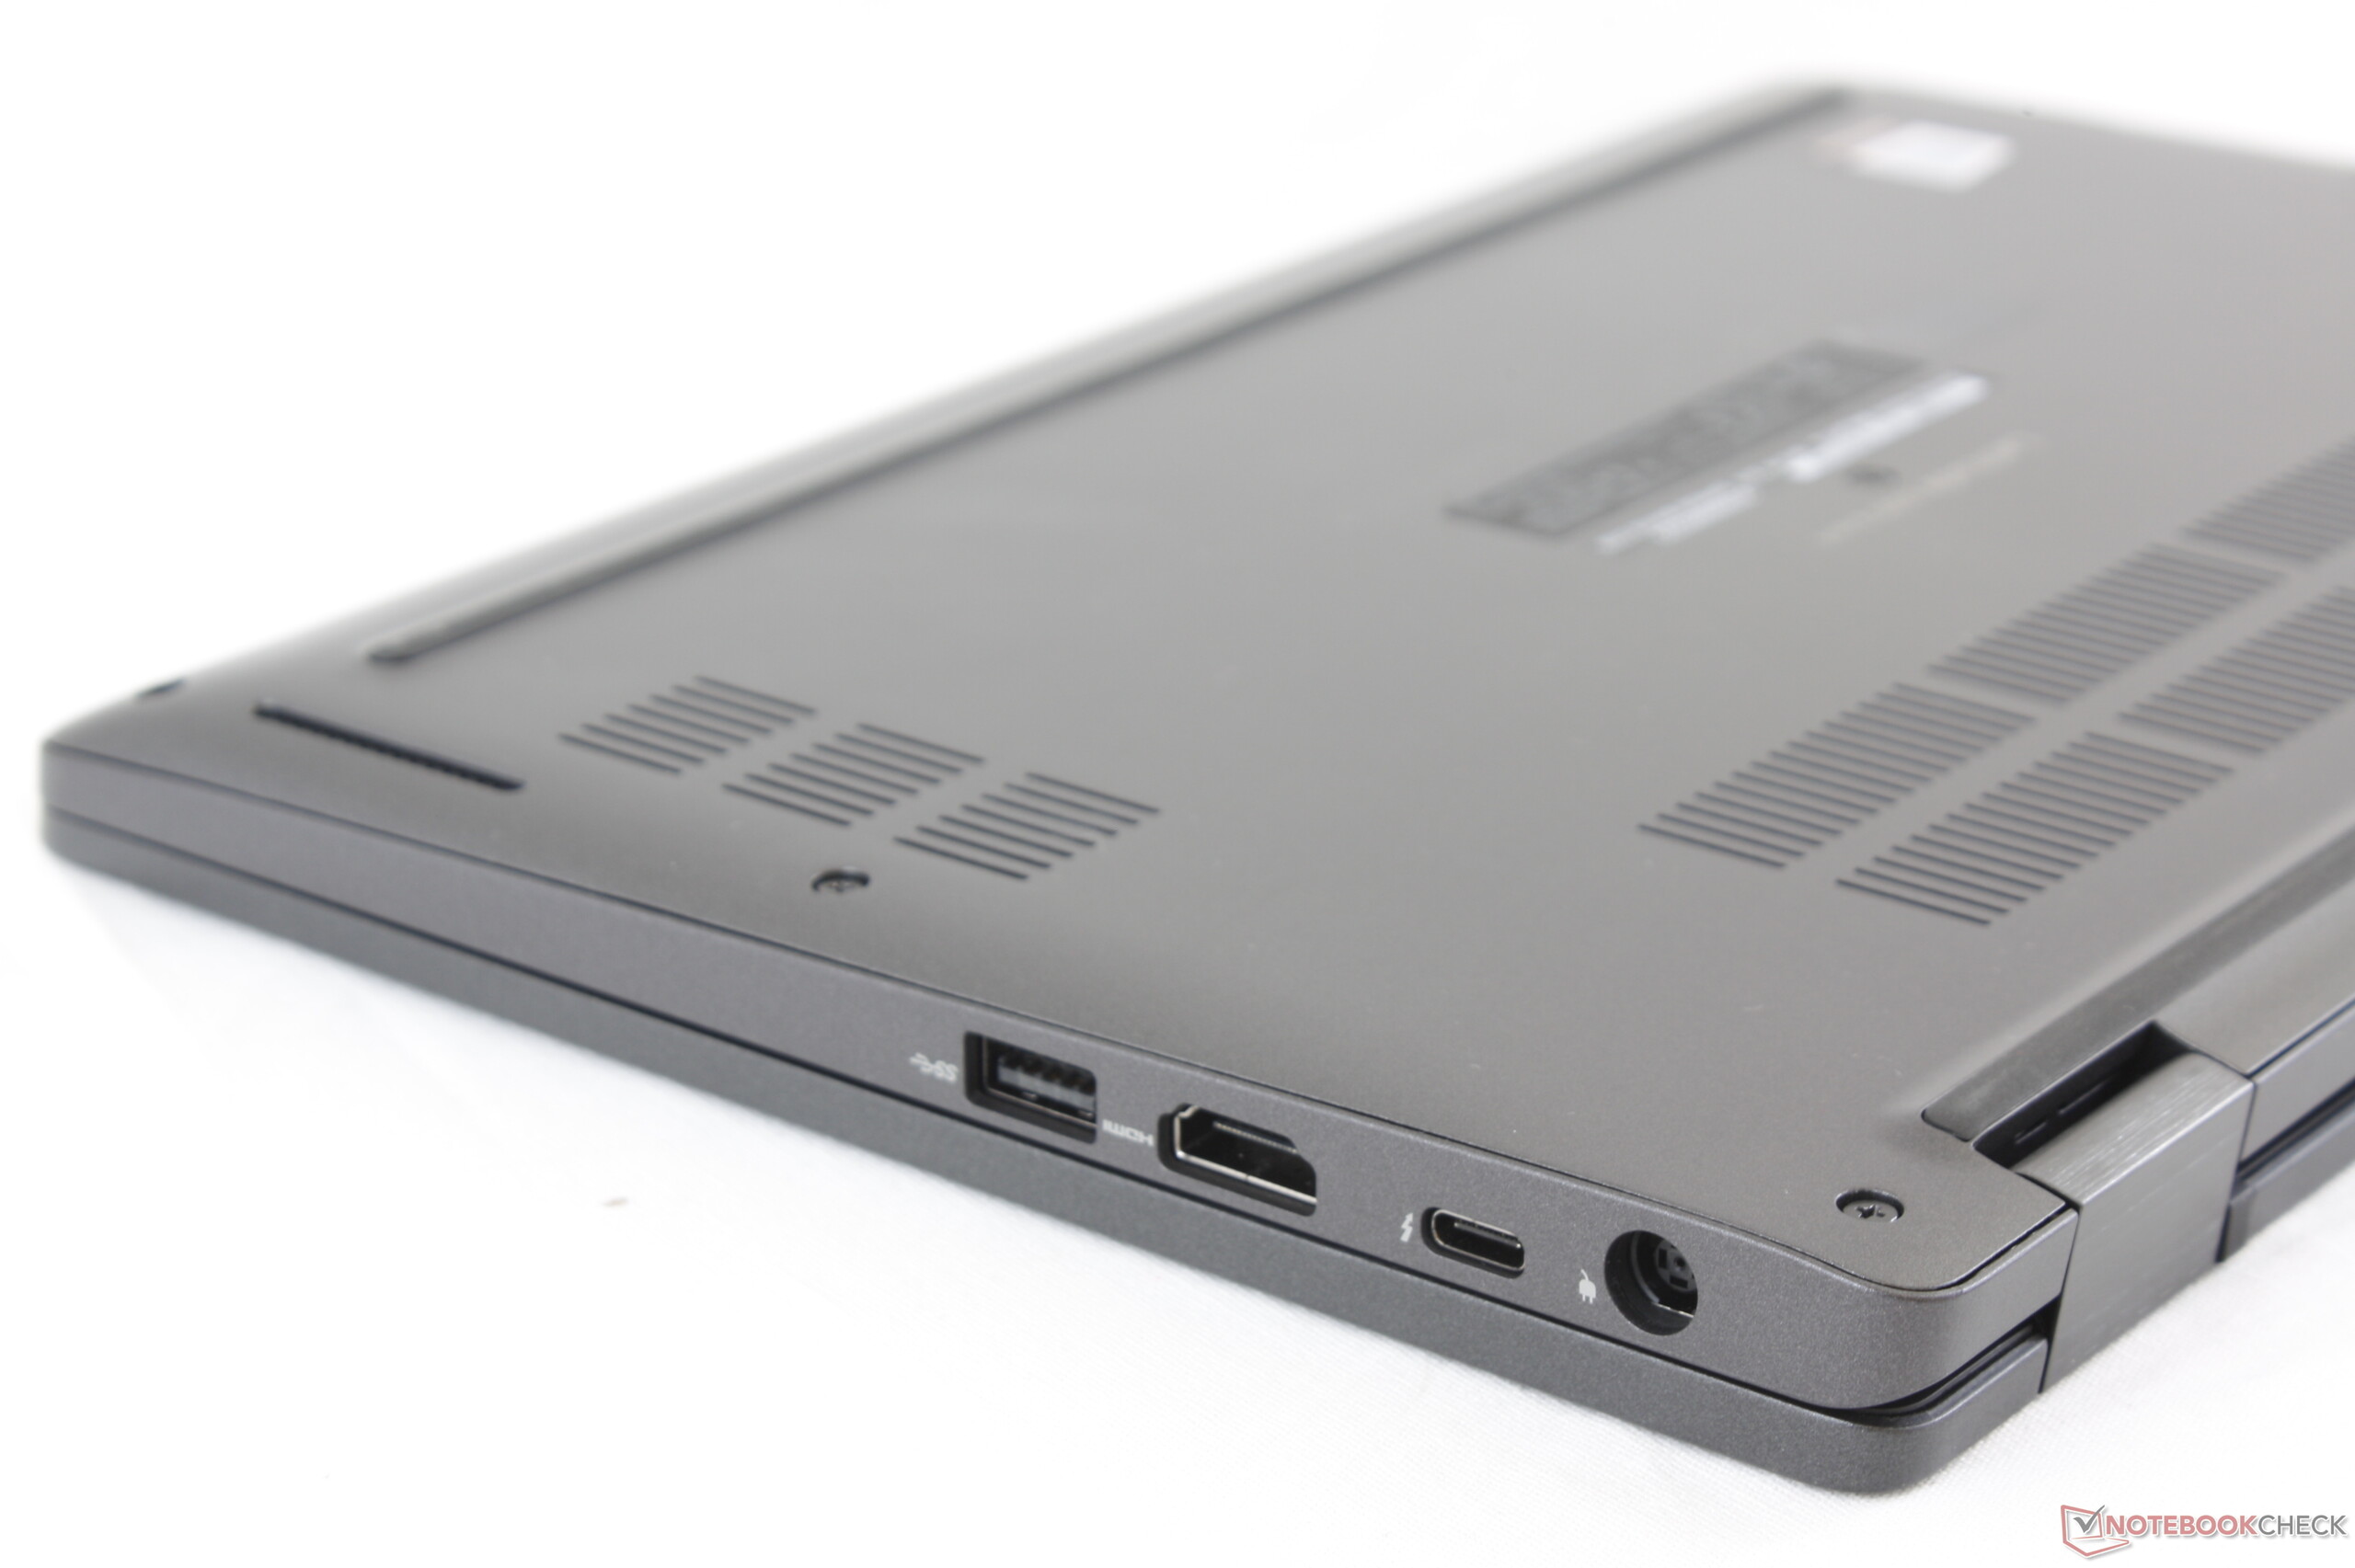
De Dell Latitude 13 5300 2-in-1 doet wat hij moet doen, maar hij doet het niet beter of slechter dan de andere zakelijke subnotebooks om zich te kunnen onderscheiden van de massa. Zijn 360-graden-scharnier is handig, maar weegt ook wat meer dan die van Lenovo of HP. Het toestel ondersteunt een stylus, maar de magnetische houder is minder veilig dan een ingebouwde sleuf of een fysiek bandje. De batterijduur is lang, maar de meegeleverde voeding maakt nog altijd gebruik van een gepatenteerde aansluiting in plaats van het meer universele USB Type-C.
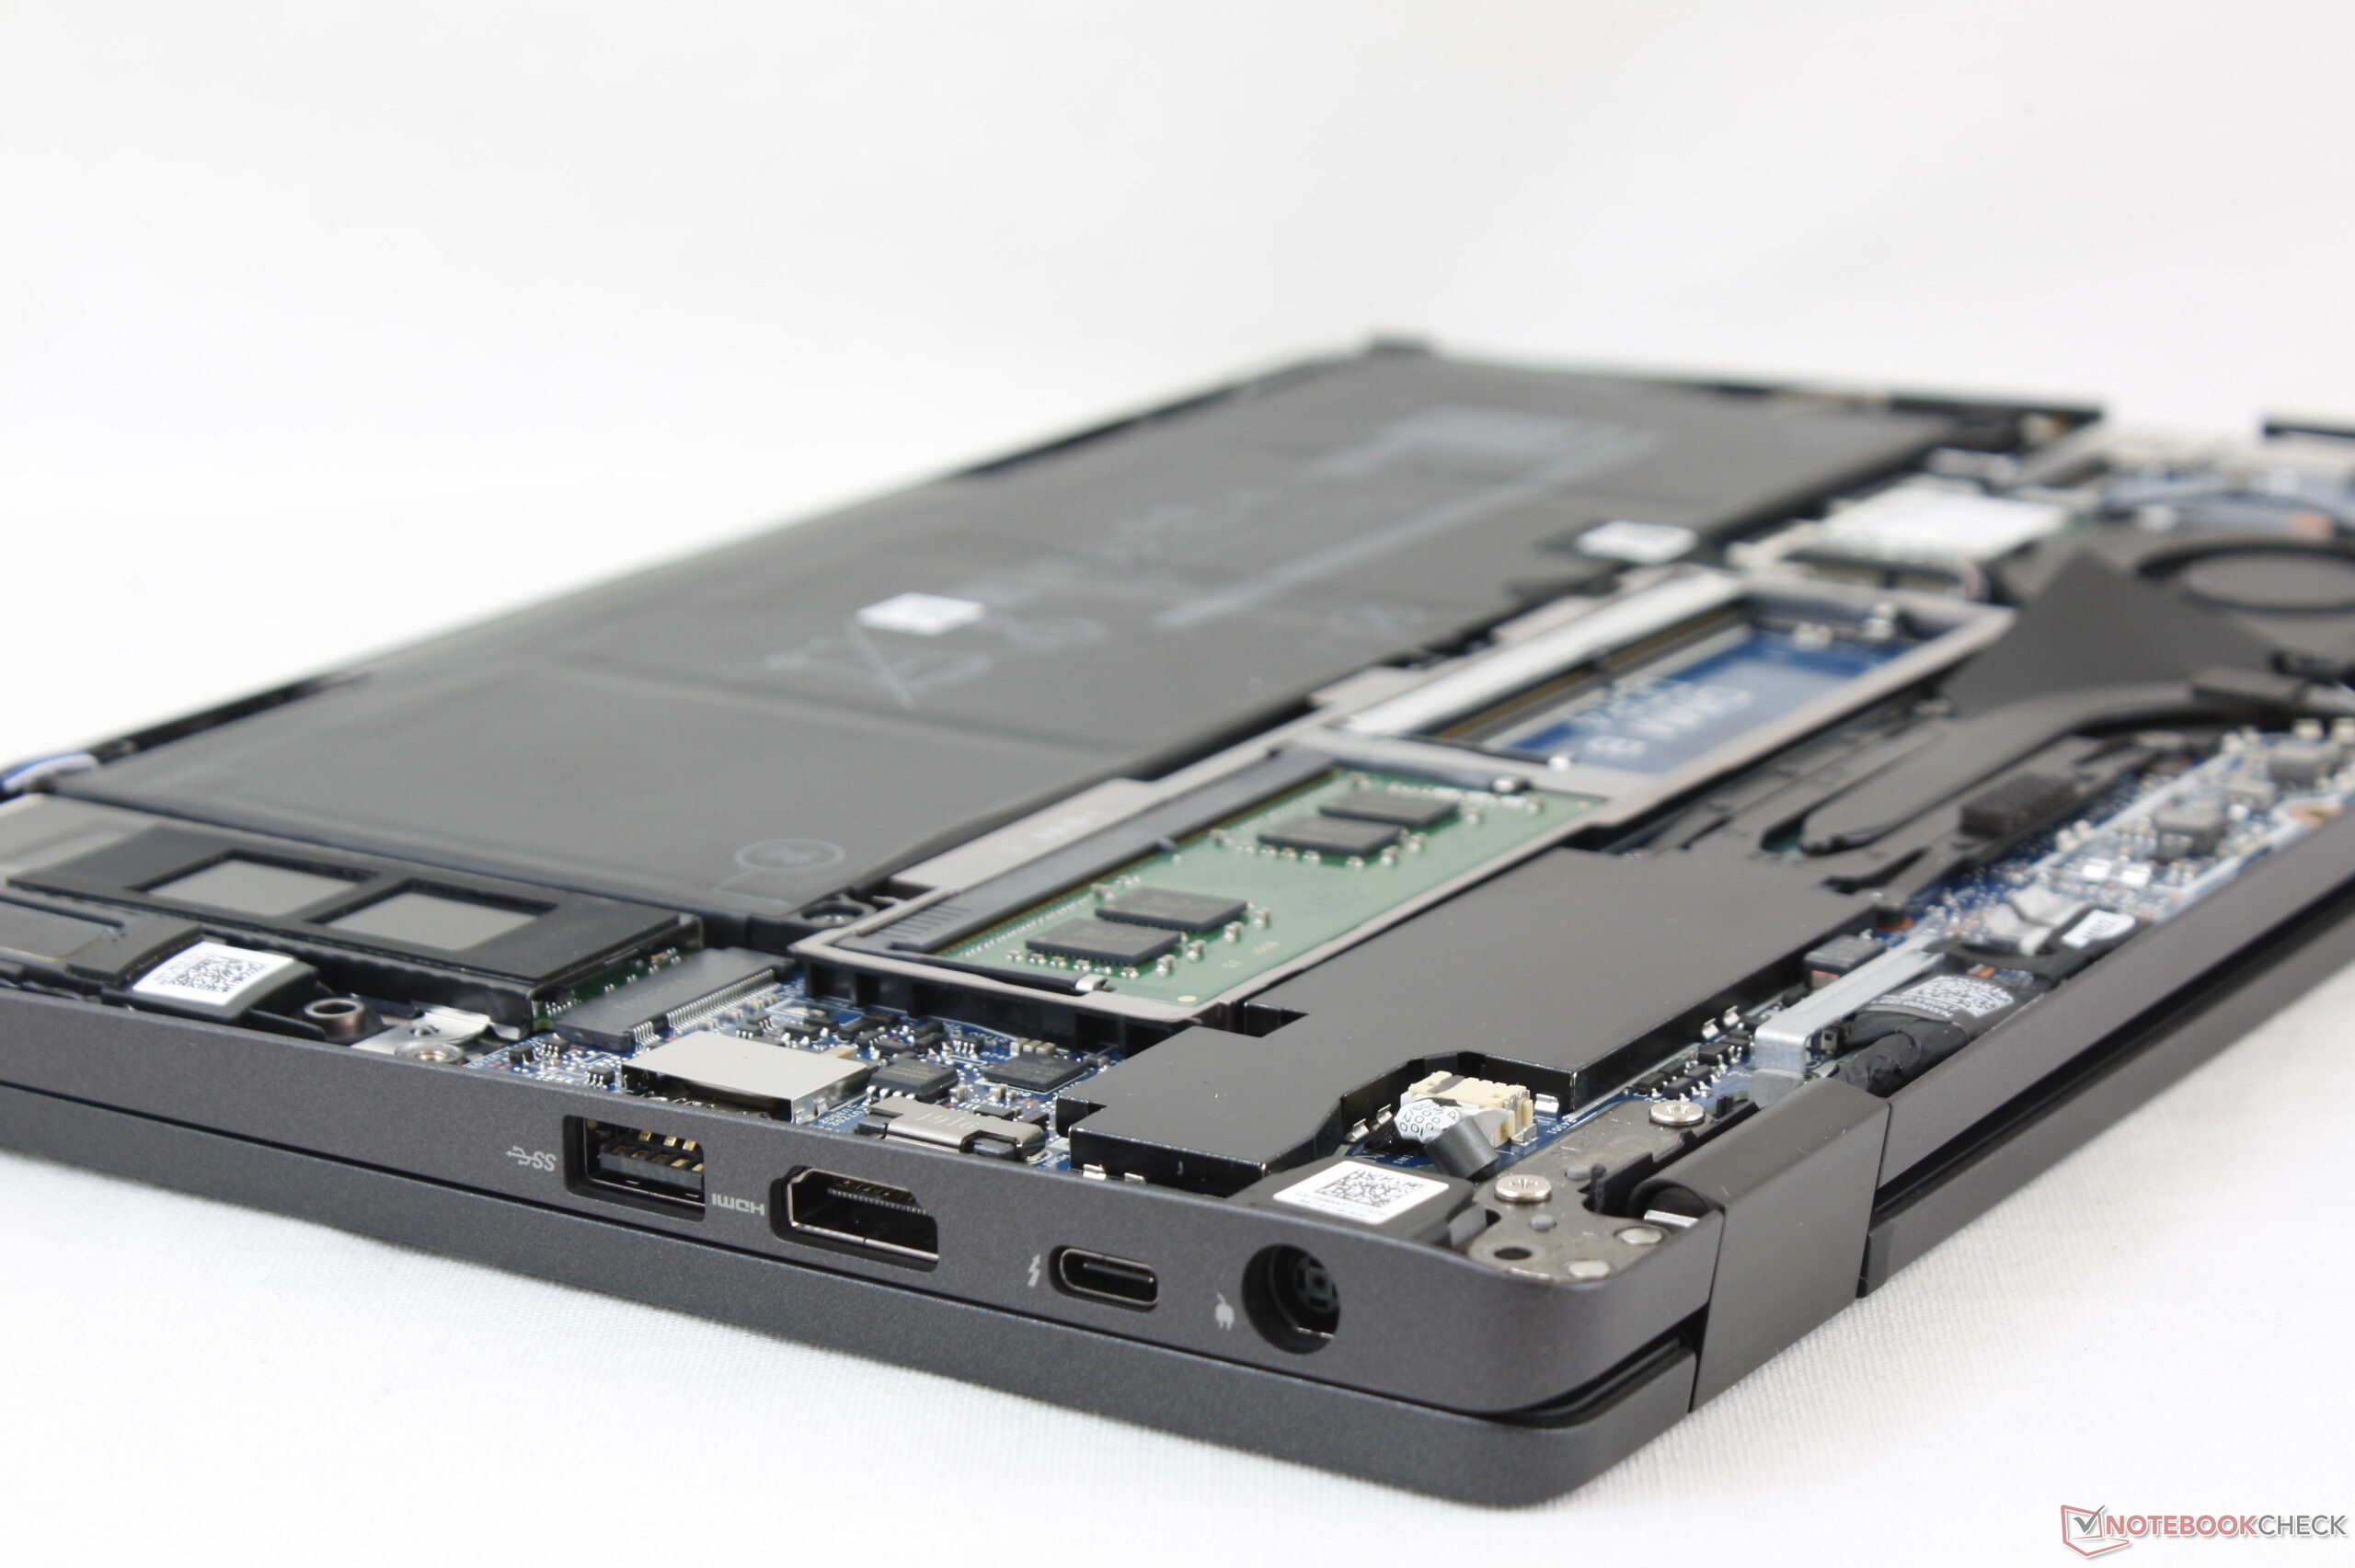
Het beste aspect van de Latitude-convertible is nog altijd zijn onderhoudsvriendelijkheid. Dell heeft het erg eenvoudig gemaakt voor eindgebruikers om de belangrijkste onderdelen te vervangen zonder meer nodig te hebben dan een Philips-schroevendraaier. Meer high-end features zoals Thunderbolt 3, Smart Card-lezer en WWAN zijn stuk voor stuk optioneel om de basisprijs zo laag mogelijk te houden voor gebruikers die geen nood hebben aan deze extra's. Mid-range modellen zouden altijd rond opties moeten draaien en die zijn er met de Latitude 5000-serie in overvloed voor gebruikers die precies willen kunnen kopen wat ze willen.
Als je bereid bent om iets meer uit te geven, dan is de HP EliteBook x360 1030 G3 een lichtere optie met een helderder scherm en steviger toetsenbord. Voor de rest is de Latitude 13 5300 2-in-1 een valabel alternatief voor de gelijkaardig geprijsde ThinkPad X390 Yoga, aangezien het een iets krachtiger model is met een langere batterijduur. We raden aan om de Core i7-CPU over te slaan en te investeren in een Core i5-variant met meer tastbare extra's zoals WWAN, Thunderbolt 3, meer opslag of uitgebreidere garantie.
Alles draait om onderhoudsvriendelijkheid, opties en connectiviteit. De Latitude 13 5300 2-in-1 scoort op alle drie punten voor de typische scenario's op kantoor en buiten kantoor. Het toestel had wel wat lichter gemogen met een helderder scherm voor betere bruikbaarheid buitenshuis en om zijn convertible-vormfactor extra te kunnen benutten.
Dell Latitude 13 5300 2-in-1
- 17-10-2019 v7 (old)
Allen Ngo
Price comparison
