



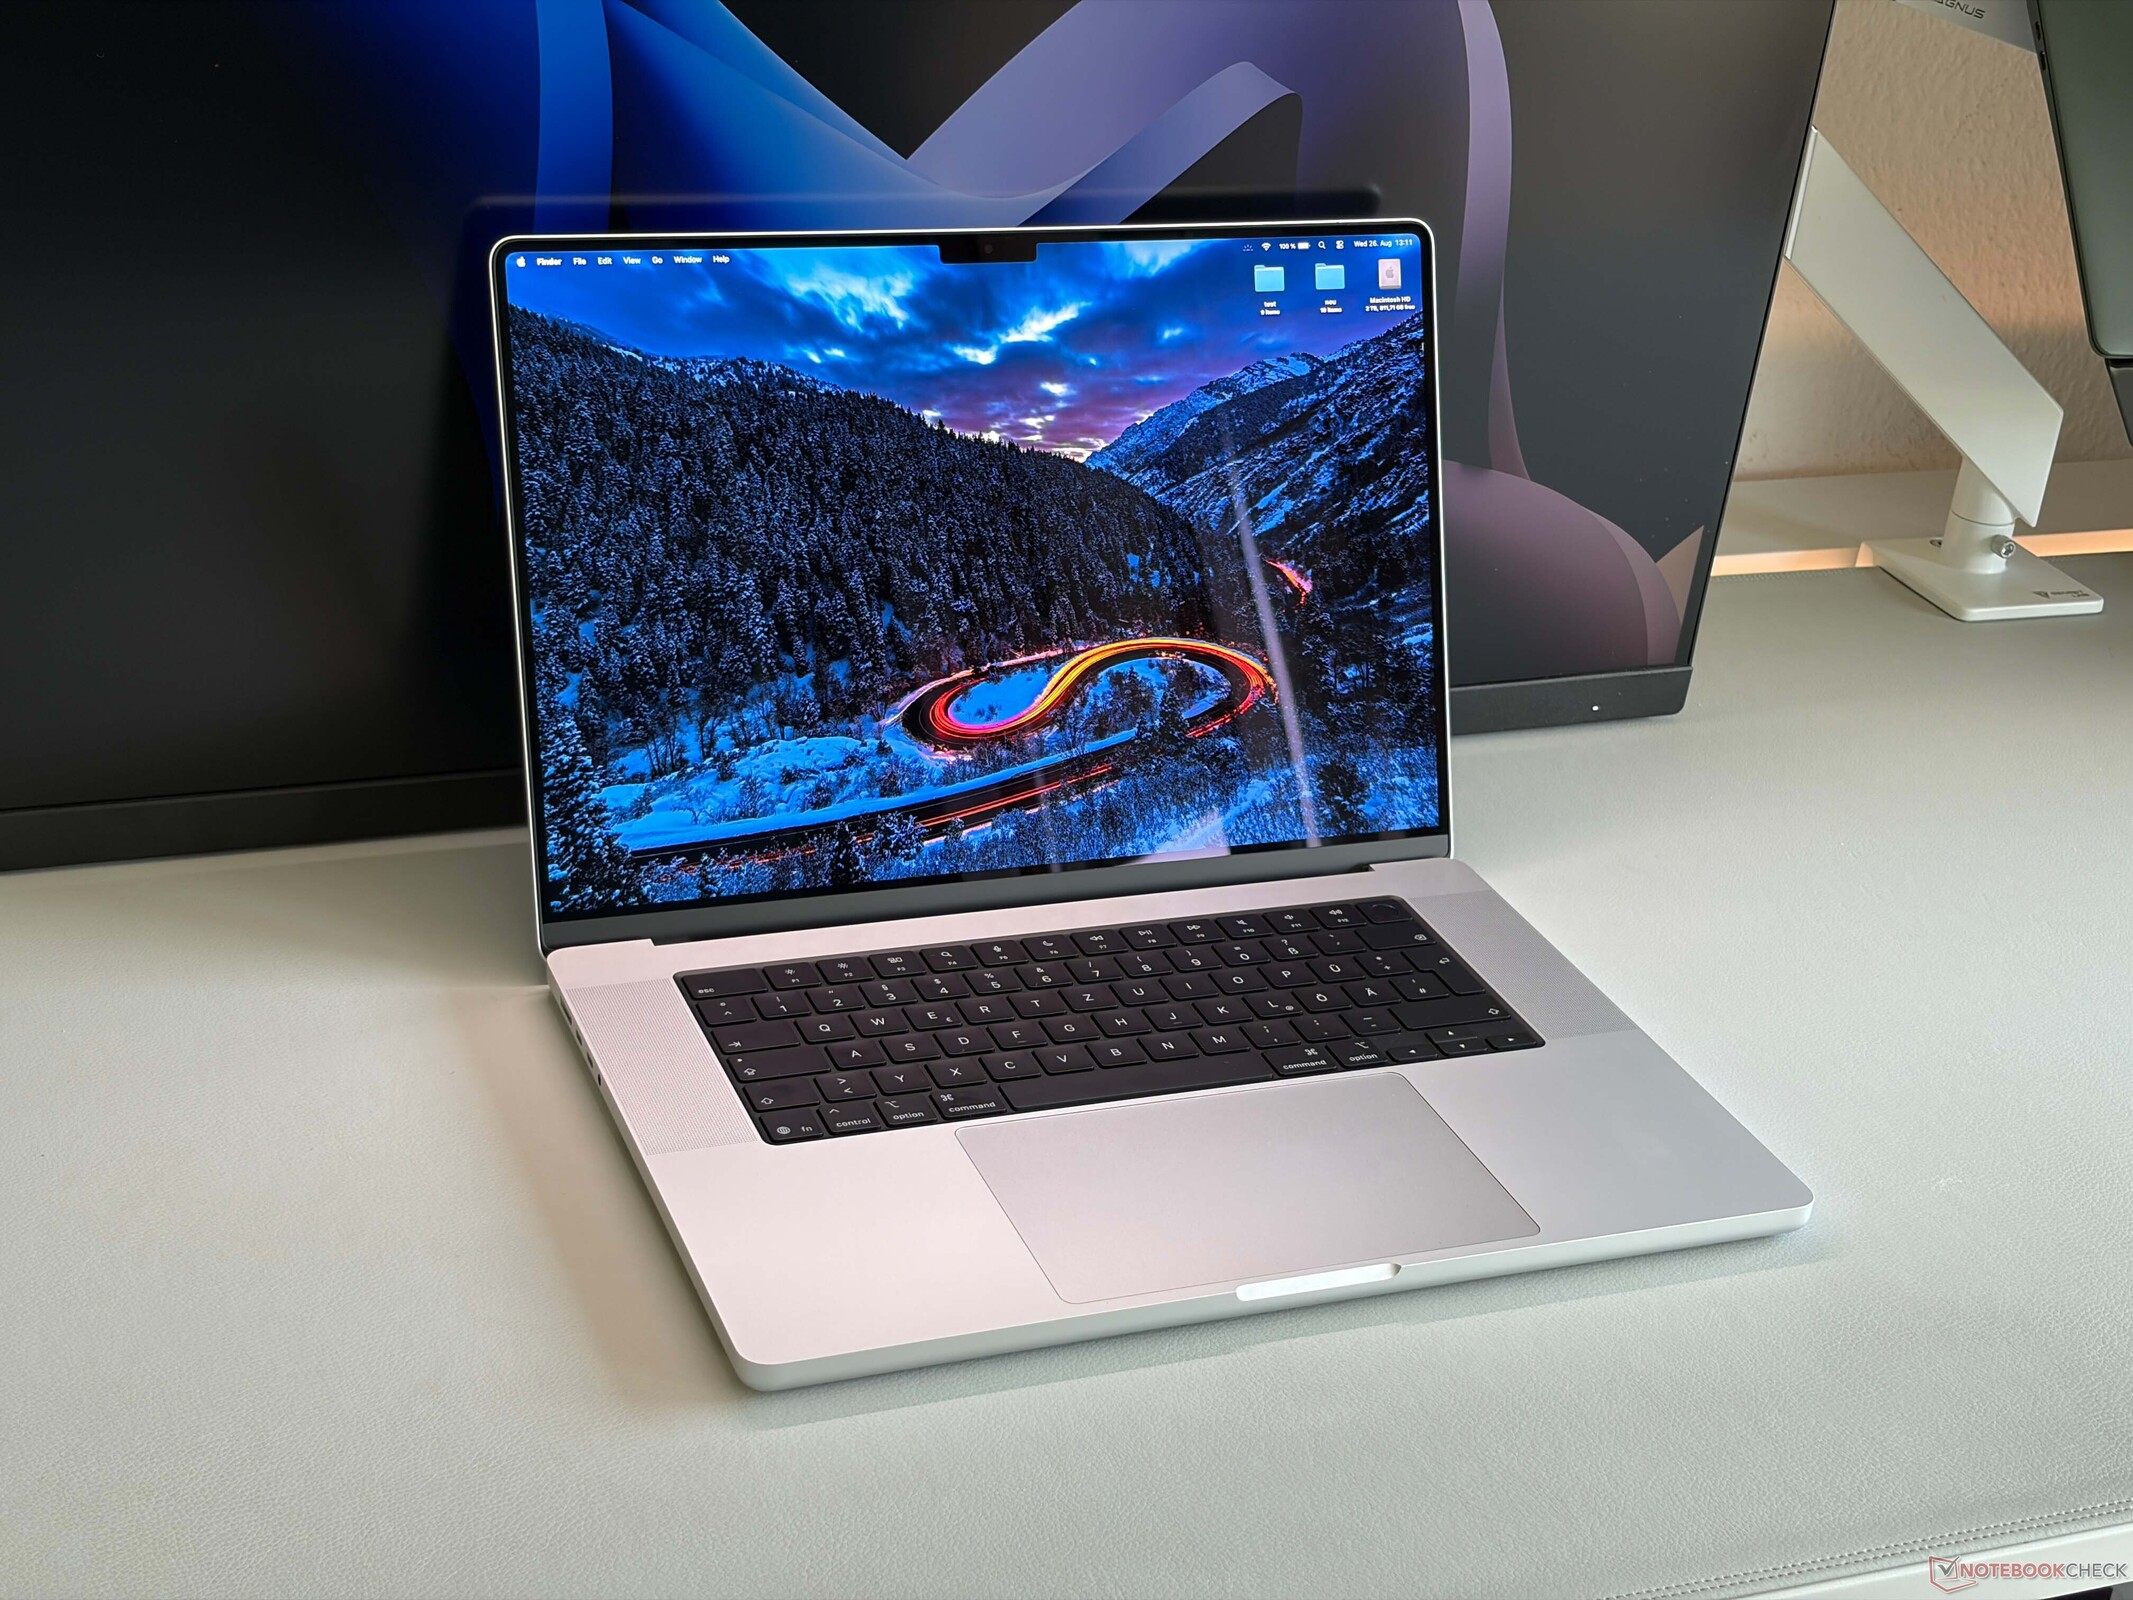
Oordeel – De MacBook Pro is nog steeds een uitstekende multimedialaptop, maar begint zijn leeftijd te vertonen
Uit onze test van het M5 Pro-toestel enkele maanden geleden weten wij al dat de MacBook Pro 16 uit 2026 een uitstekende multimedialaptop is, maar de grotere 16-inch behuizing kan de krachtige M5 Max SoC veel beter aan dan de MacBook Pro 14, en de prestaties zijn zowel beter als consistenter. Zelfs de MacBook Pro 16 kan echter niet het volledige potentieel van de M5 Max benutten en het koelsysteem kan slechts 70 watt aan. Hoewel dit vier of vijf jaar geleden voldoende was voor de oudere chips zoals de M1 Max en M2 Max, is het vandaag de dag simpelweg niet meer voldoende. In combinatie met de ontoereikende voedingsadapter en de beperkingen wat betreft de stroomtoevoer (het batterijniveau daalt bij volledige belasting met 12 % in één uur, zelfs bij gebruik van krachtigere voedingen) blijkt hieruit duidelijk dat de huidige behuizing en het koelsysteem een herontwerp behoeven.
Begrijp ons niet verkeerd: de MacBook Pro 16 is nog steeds een zeer krachtig systeem en de koeling is doorgaans zeer stil of zelfs onhoorbaar, maar gezien de prijzen die u ervoor moet betalen, zijn deze beperkingen niet ideaal. Dit geldt ook voor de Wi-Fi 7-module, die slechts 160 MHz ondersteunt, waardoor de overdrachtssnelheden beperkt blijven tot ongeveer 2 Gbps (in plaats van 3-4 Gbps bij 320 MHz-modules).
Het Mini-LED-scherm daarentegen kan qua beeldkwaliteit, helderheid en kleurnauwkeurigheid nog steeds moeiteloos concurreren met de beste OLED-schermen. U kunt ook kiezen voor een matte versie en als de geruchten kloppen, komt er binnenkort een MacBook Pro met een OLED-touchscreen. Al met al is de MacBook Pro 16 met de M5 Max, ondanks de nadelen, een van de krachtigste en meest complete pakketten die u in het multimediasegment kunt krijgen.
Pro
Contra
Prijs en beschikbaarheid
U kunt ons testexemplaar met de M5 Max, 48 GB RAM en 2 TB SSD-opslag voor $ 4499 bij Amazon aanschaffen.

Inhoudsopgave
- Oordeel – De MacBook Pro is nog steeds een uitstekende multimedialaptop, maar begint zijn leeftijd te vertonen
- Specificaties
- Behuizing, connectiviteit en invoerapparaten
- Scherm – Prachtig Mini-LED-scherm
- Prestaties – M5 Max met 48 GB RAM
- Emissies en stroomverbruik
- Notebookcheck-beoordeling
- Vergelijking van potentiële concurrenten
Specificaties
Behuizing, connectiviteit en invoerapparaten
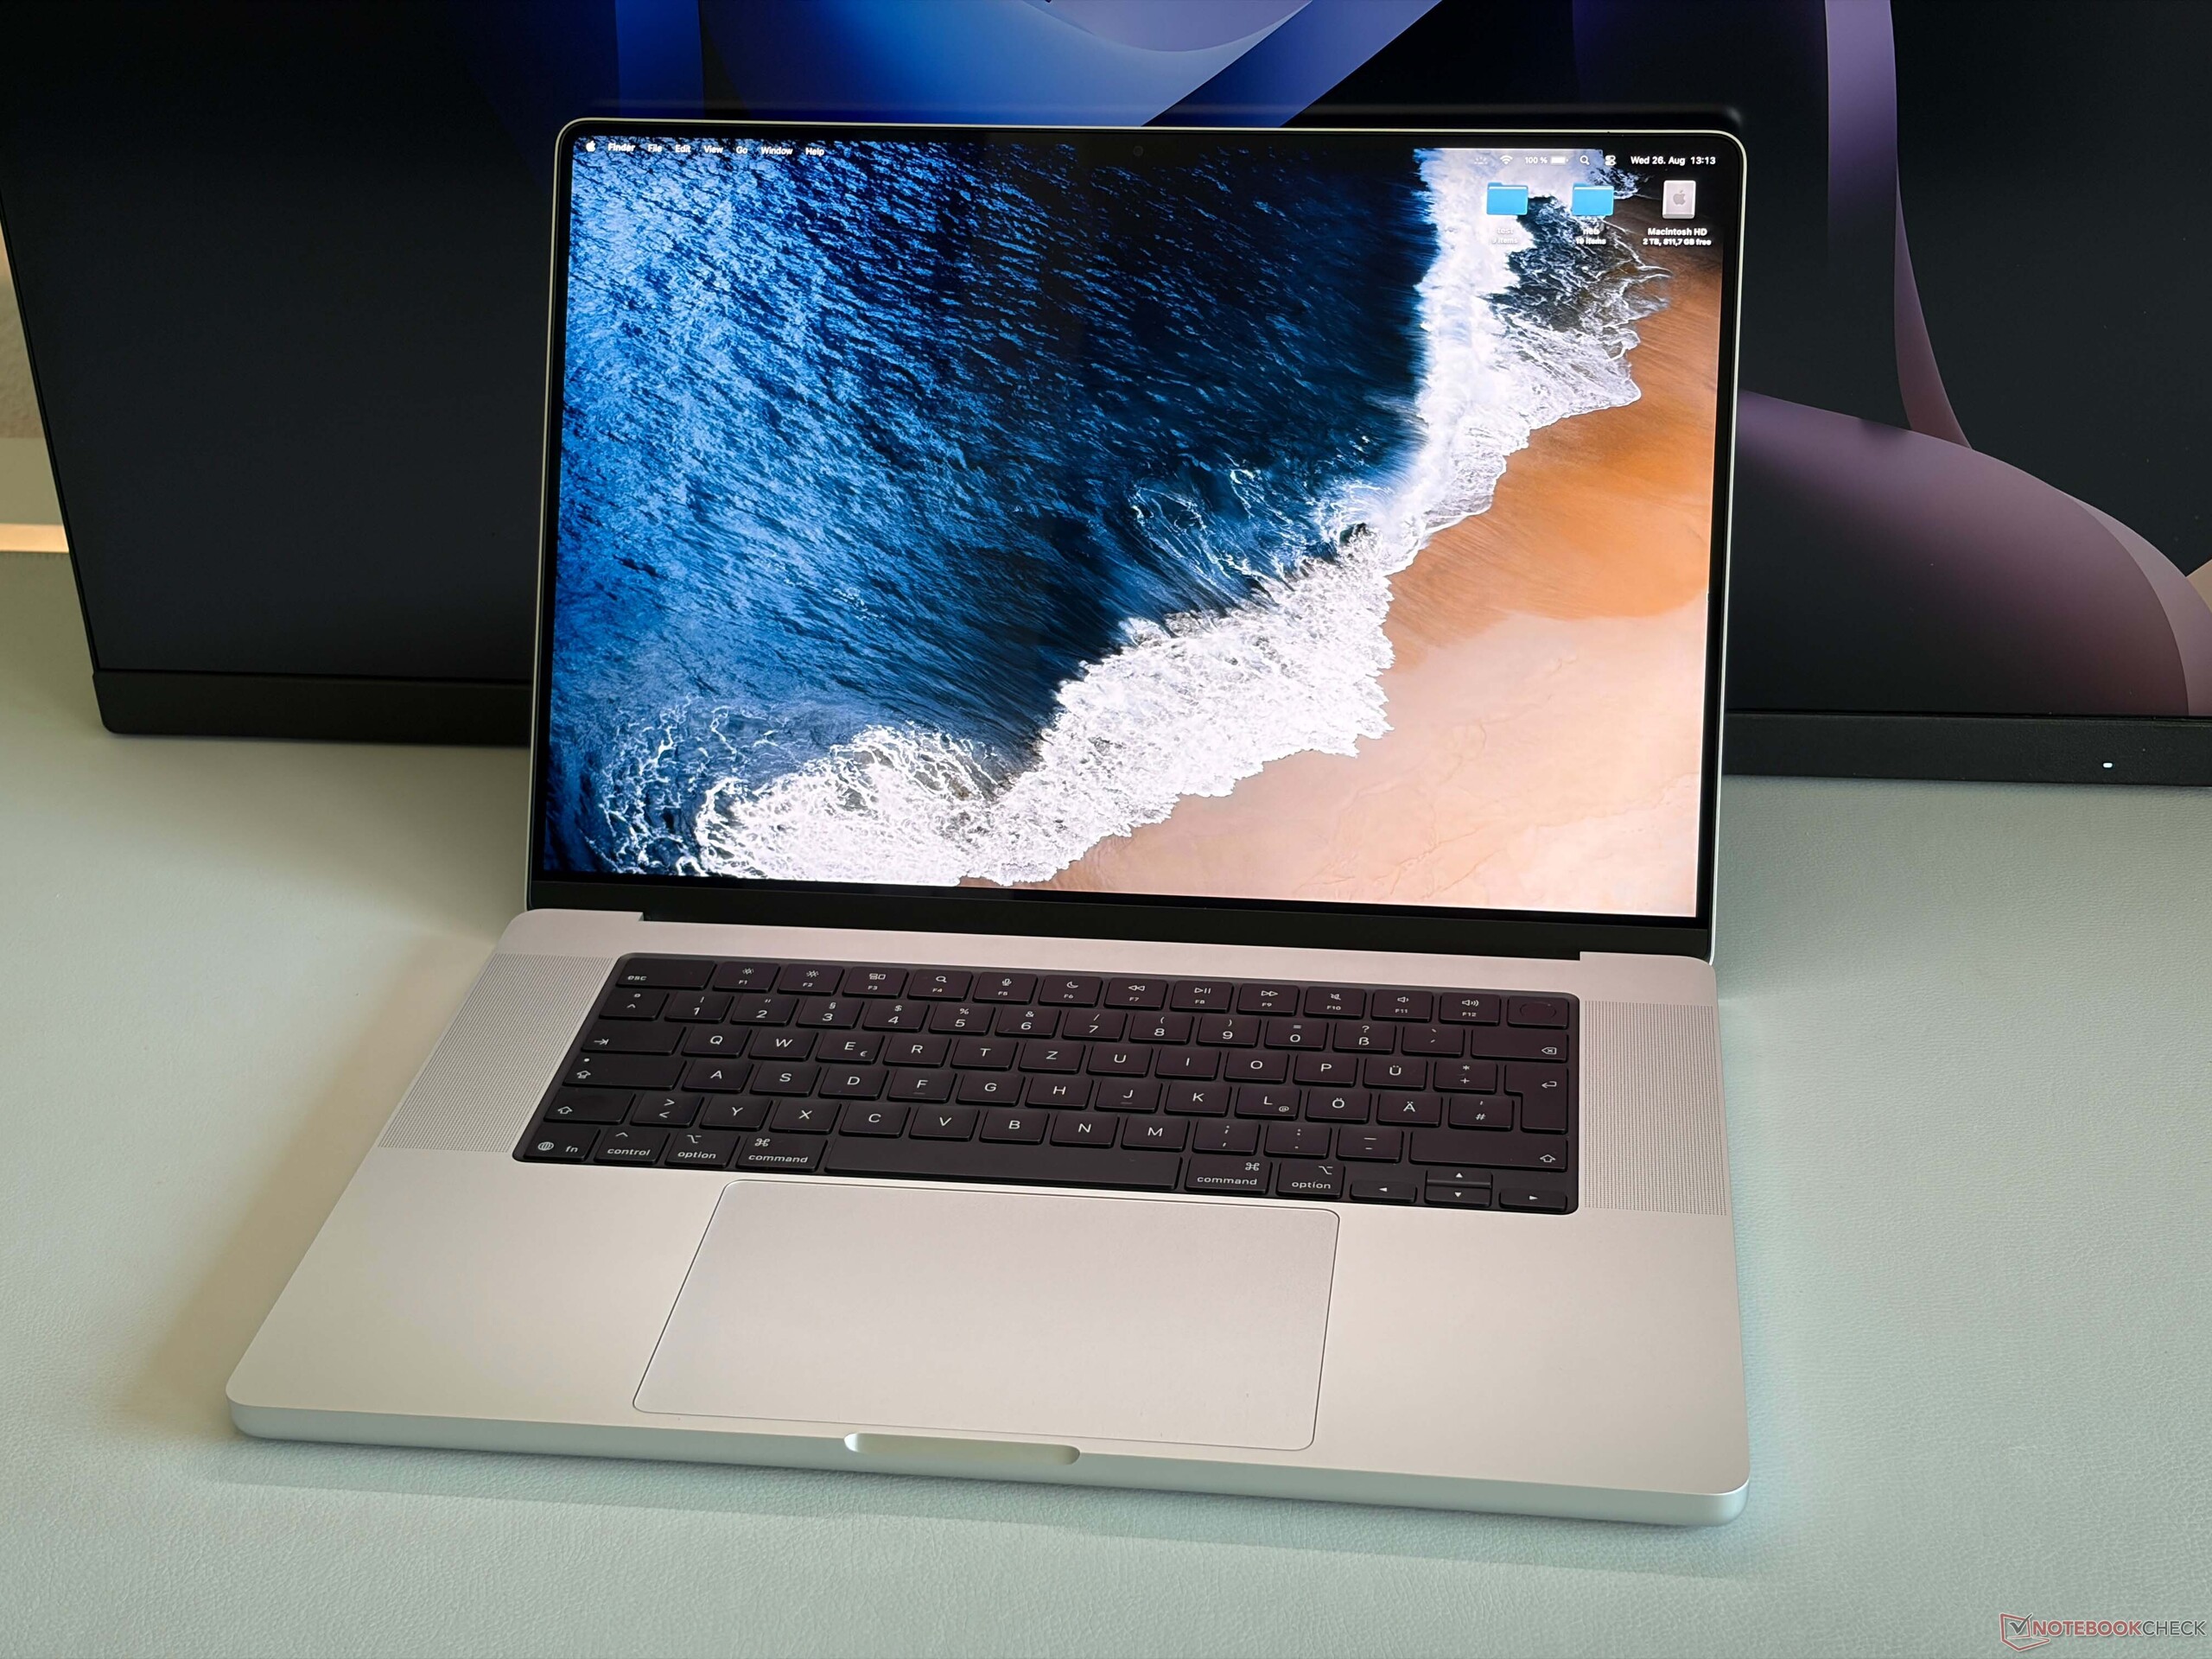
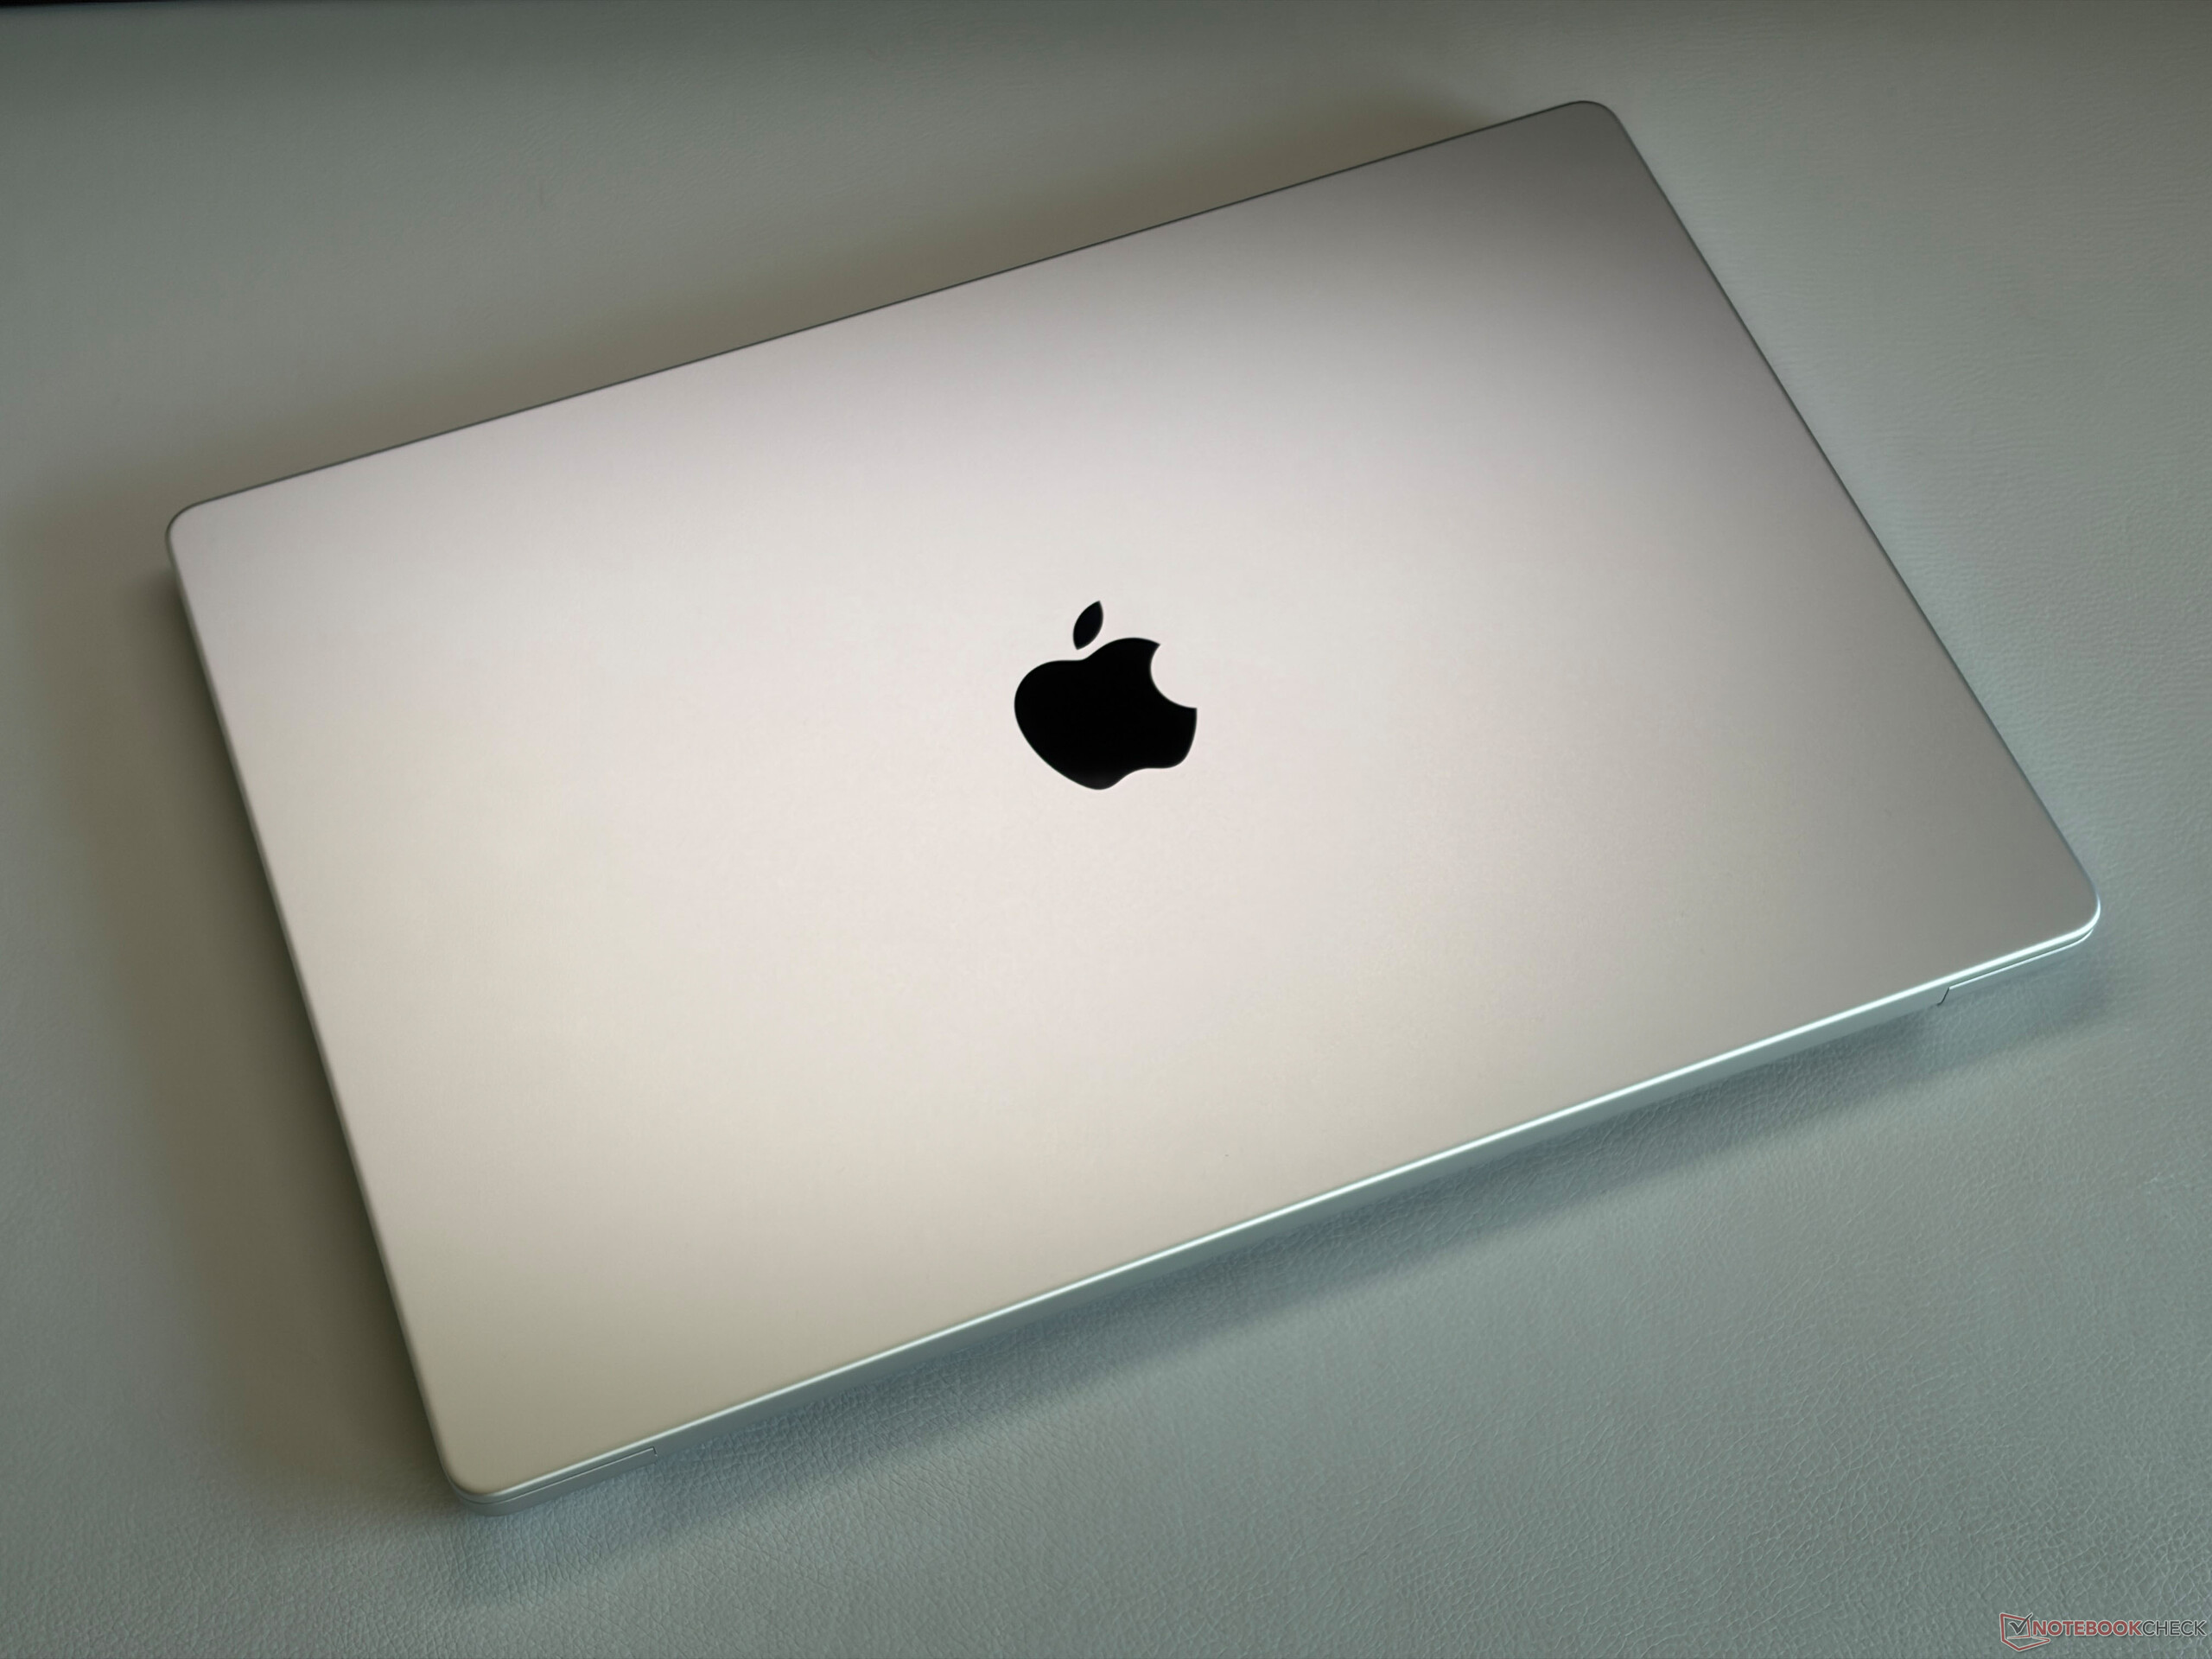
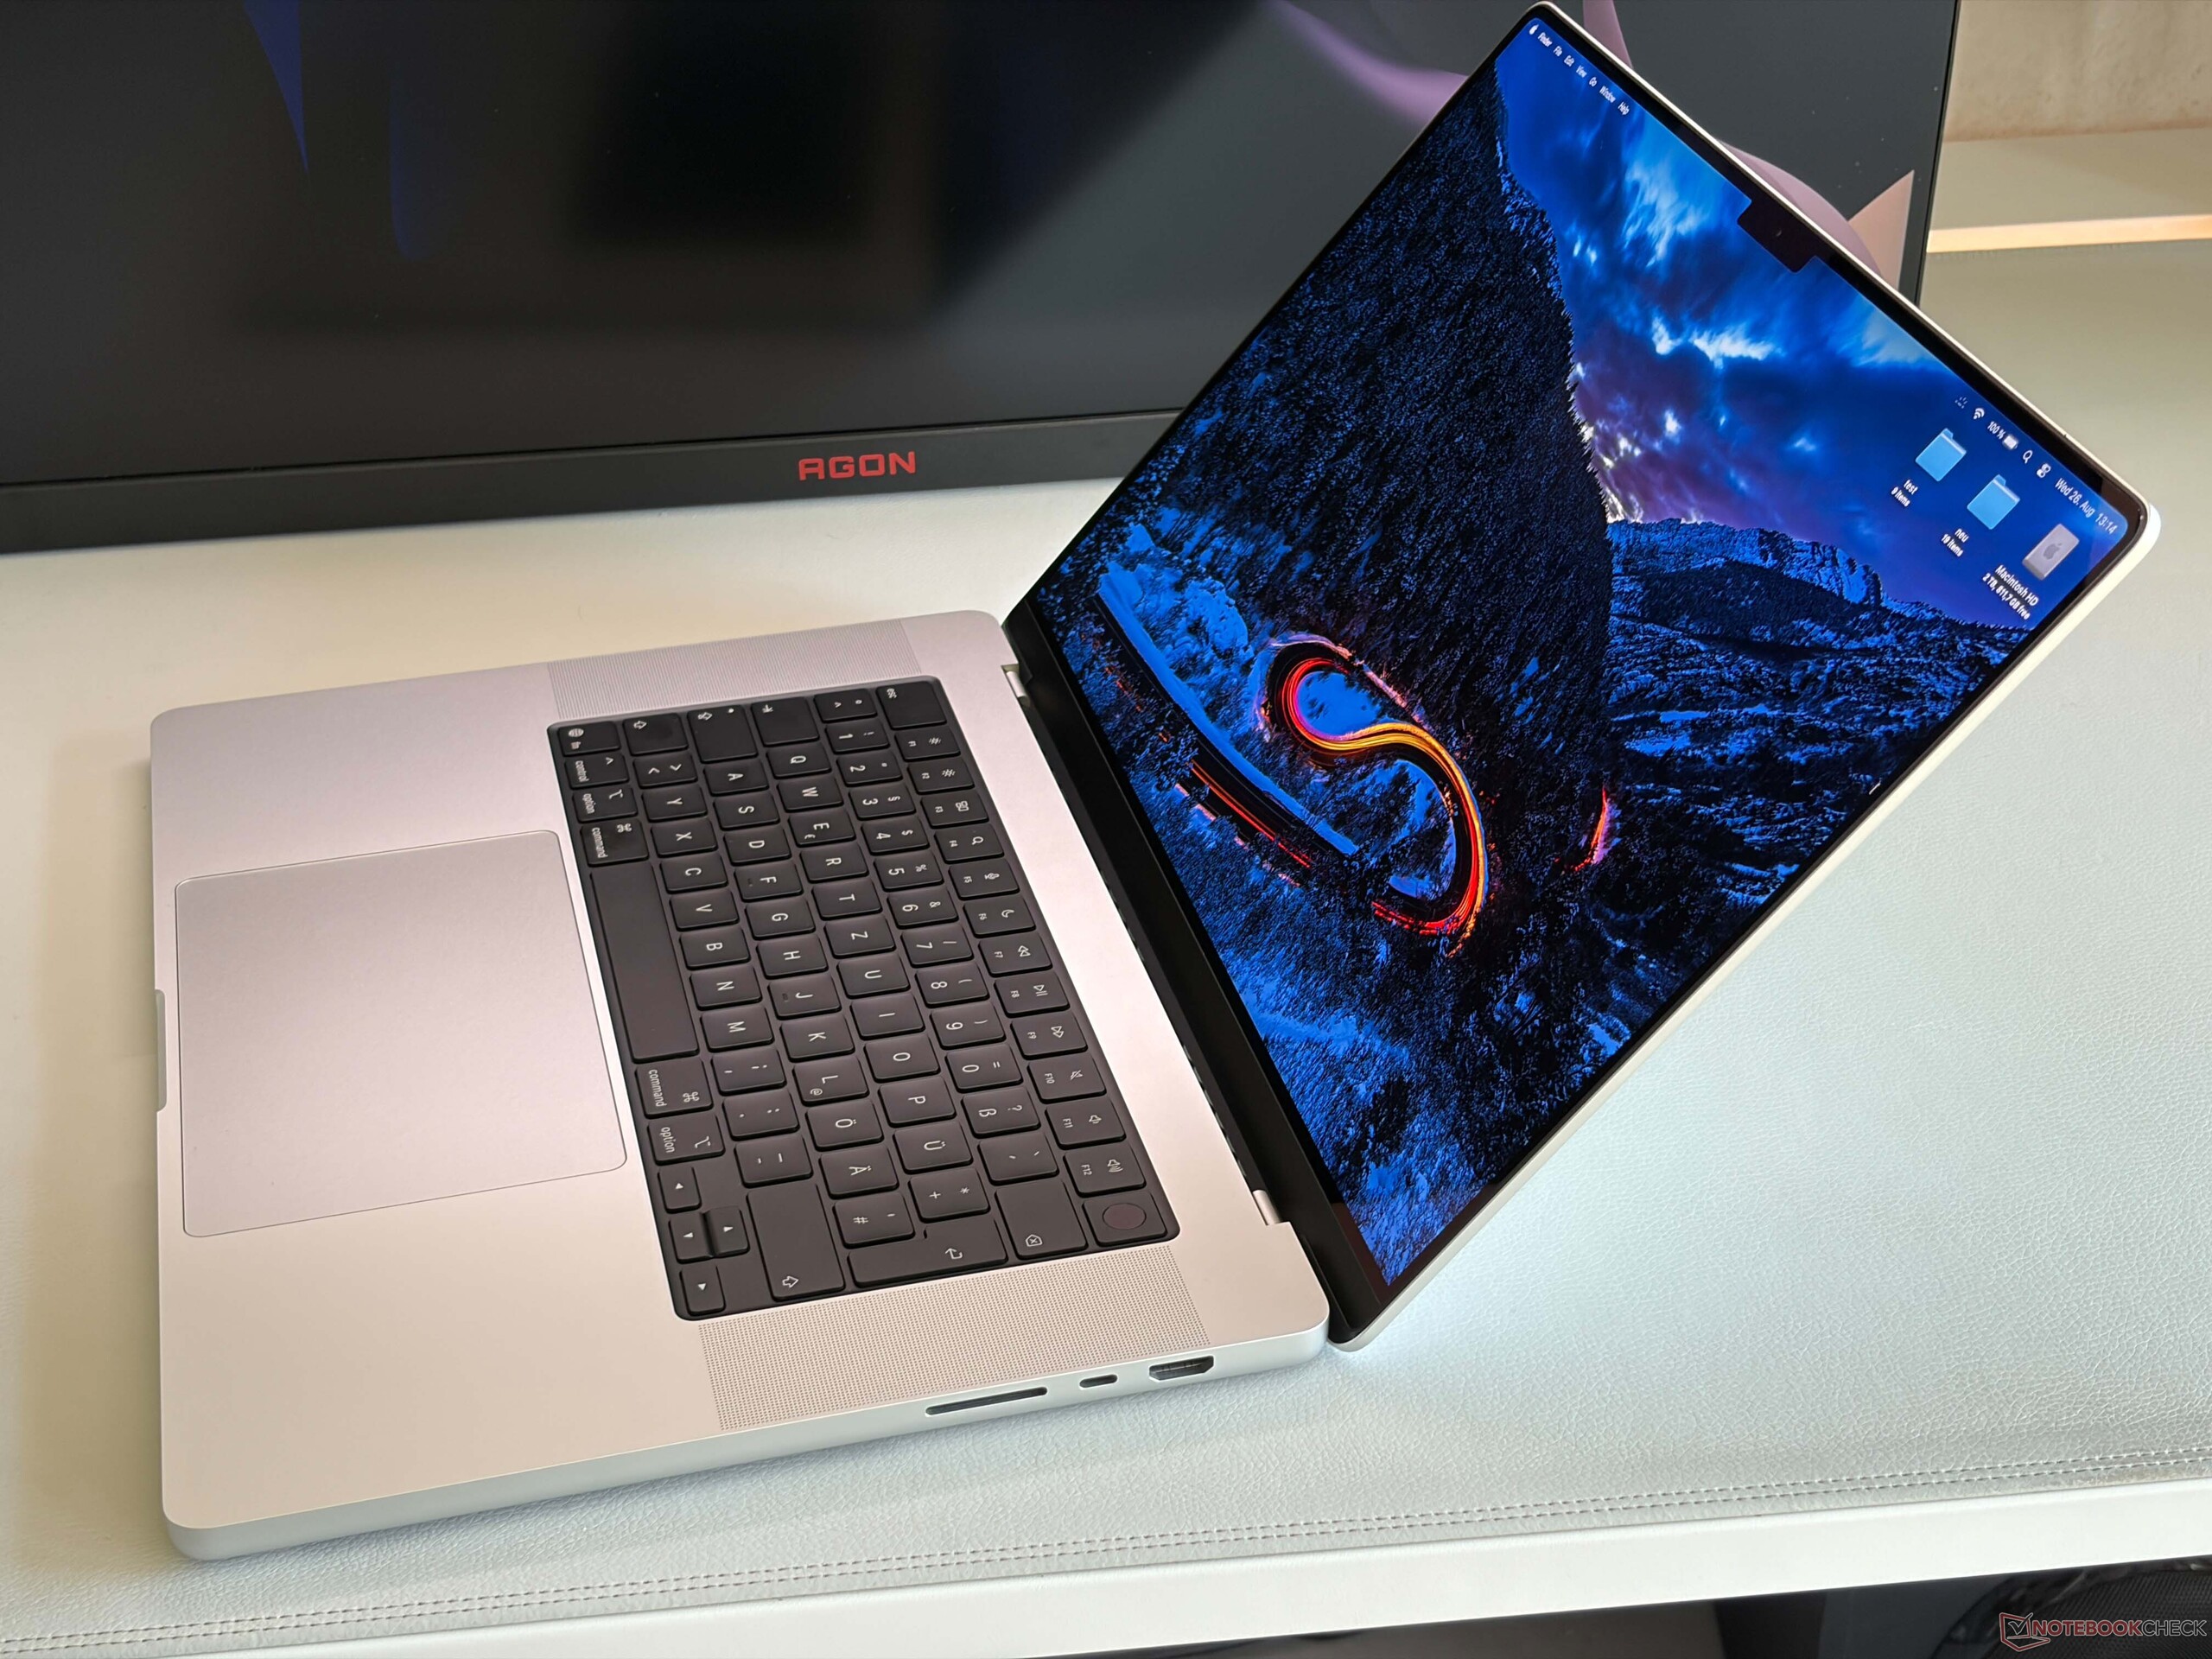
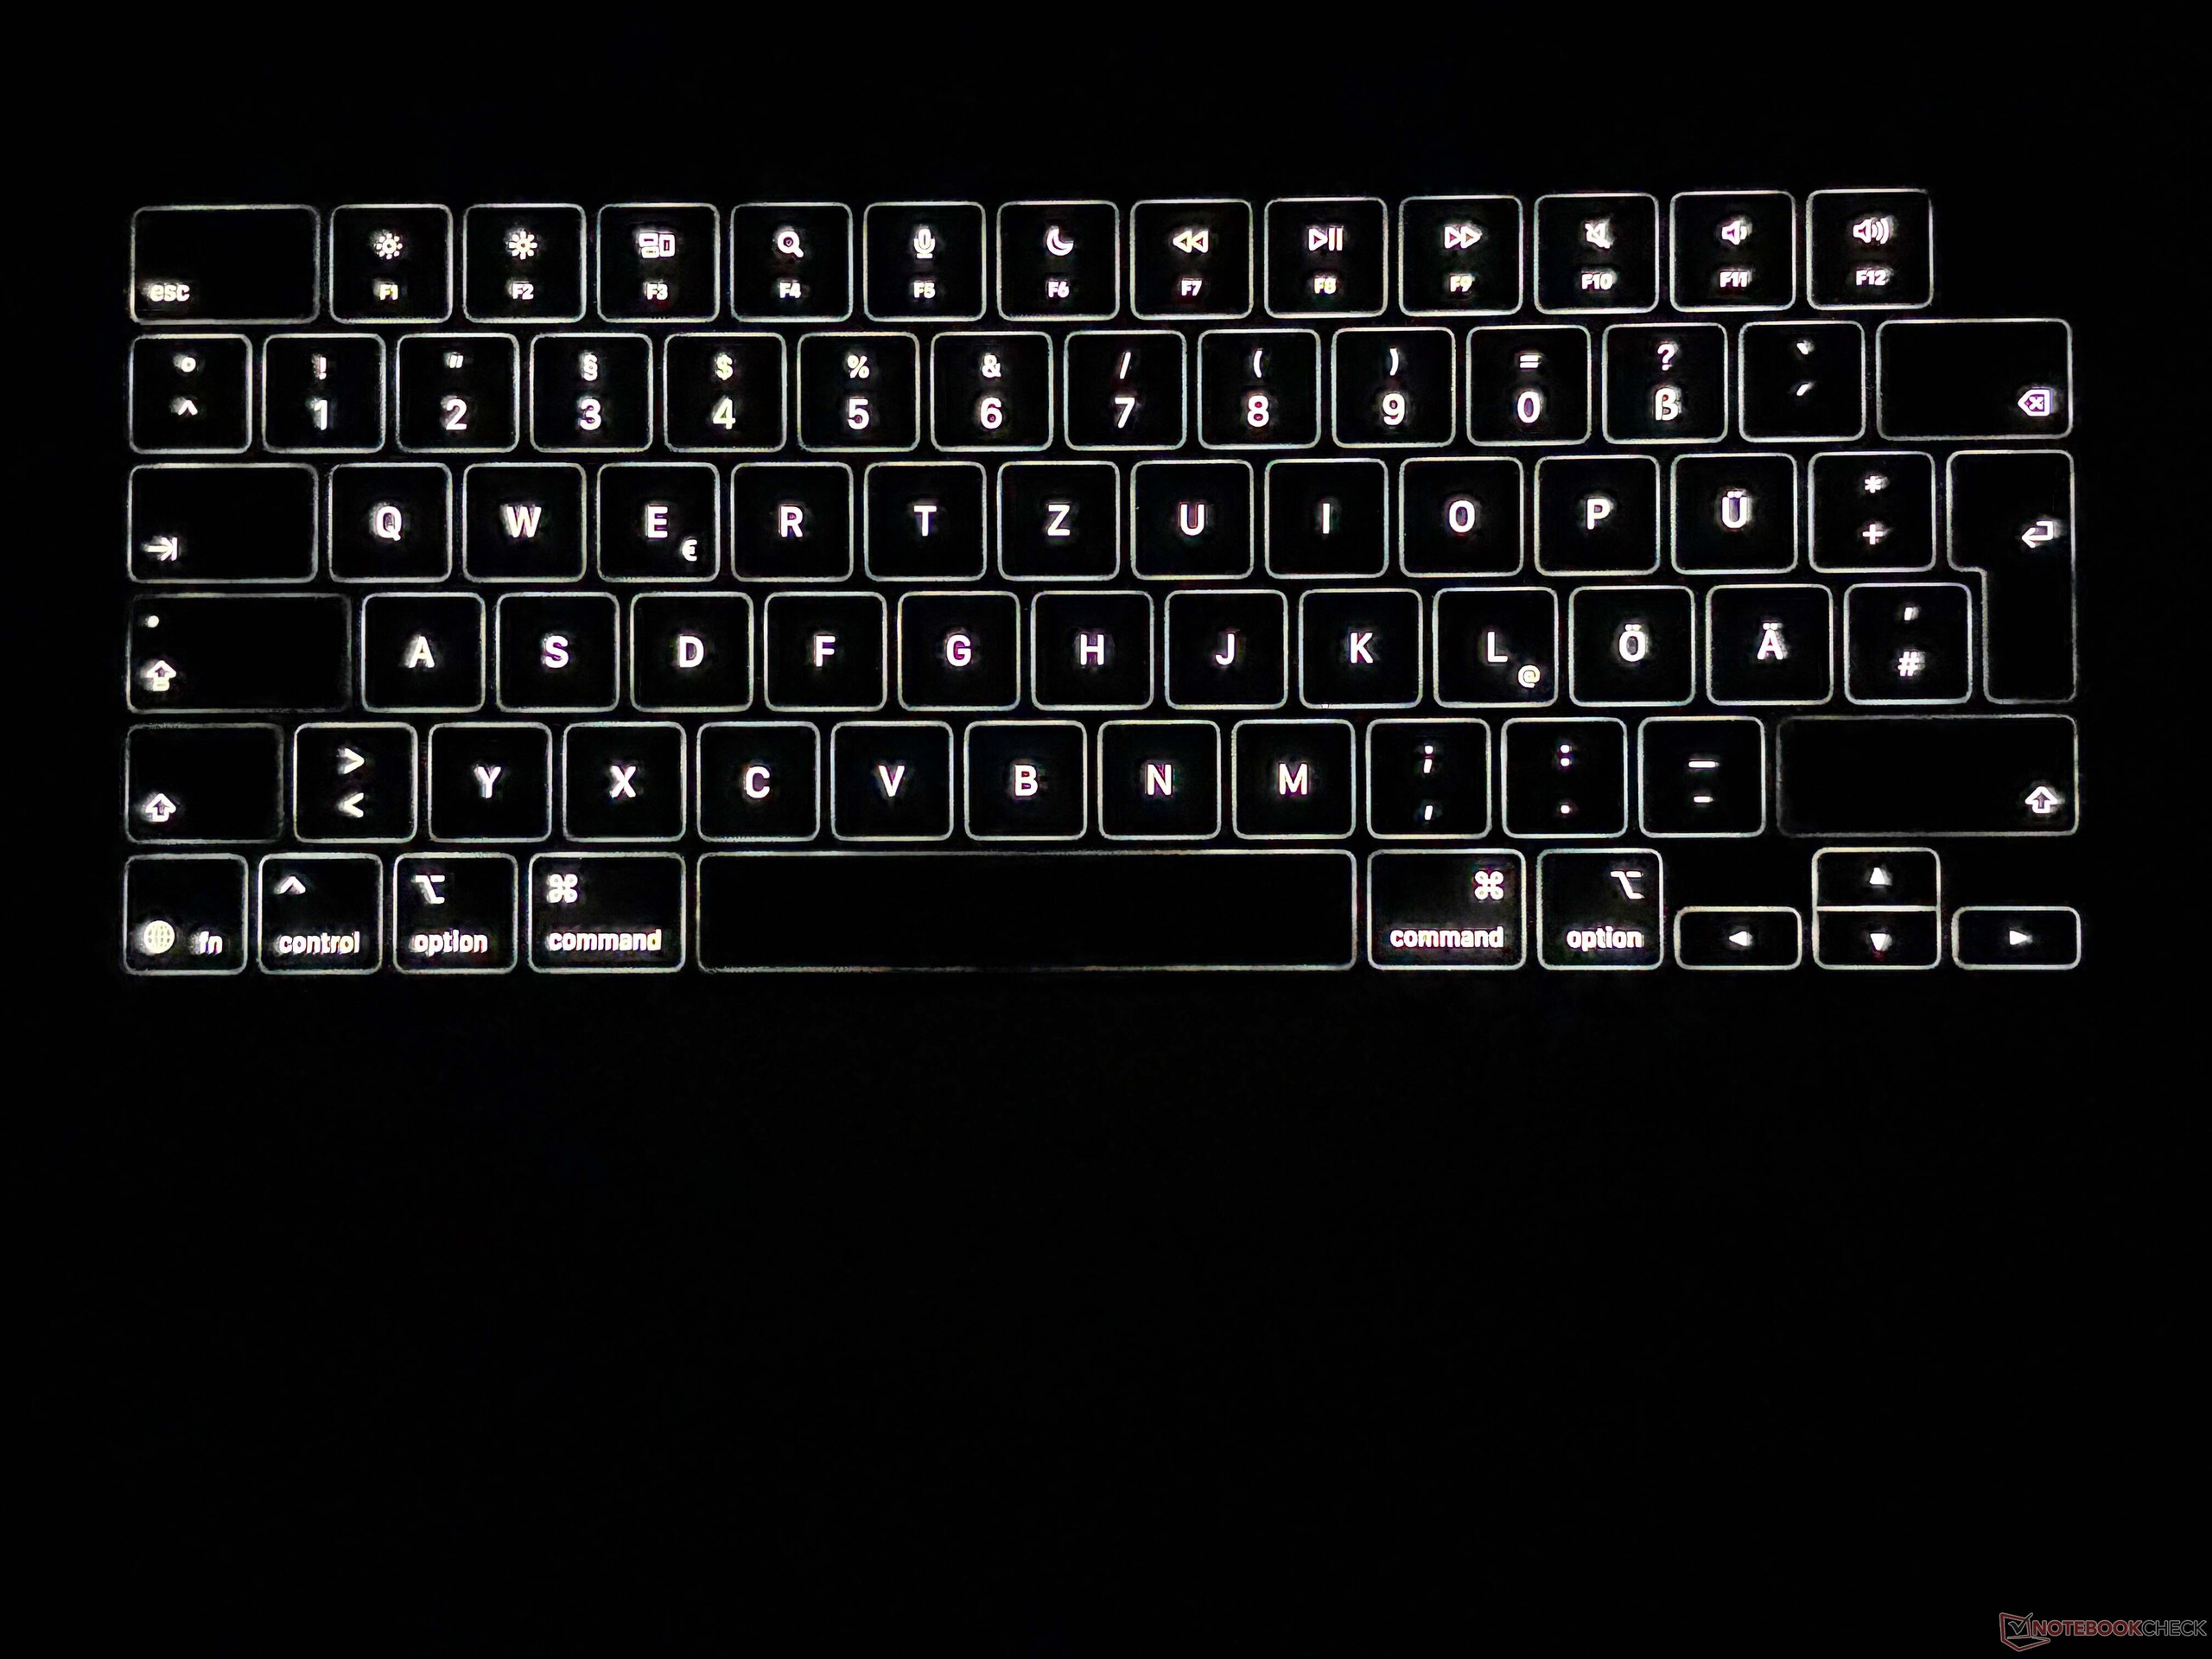
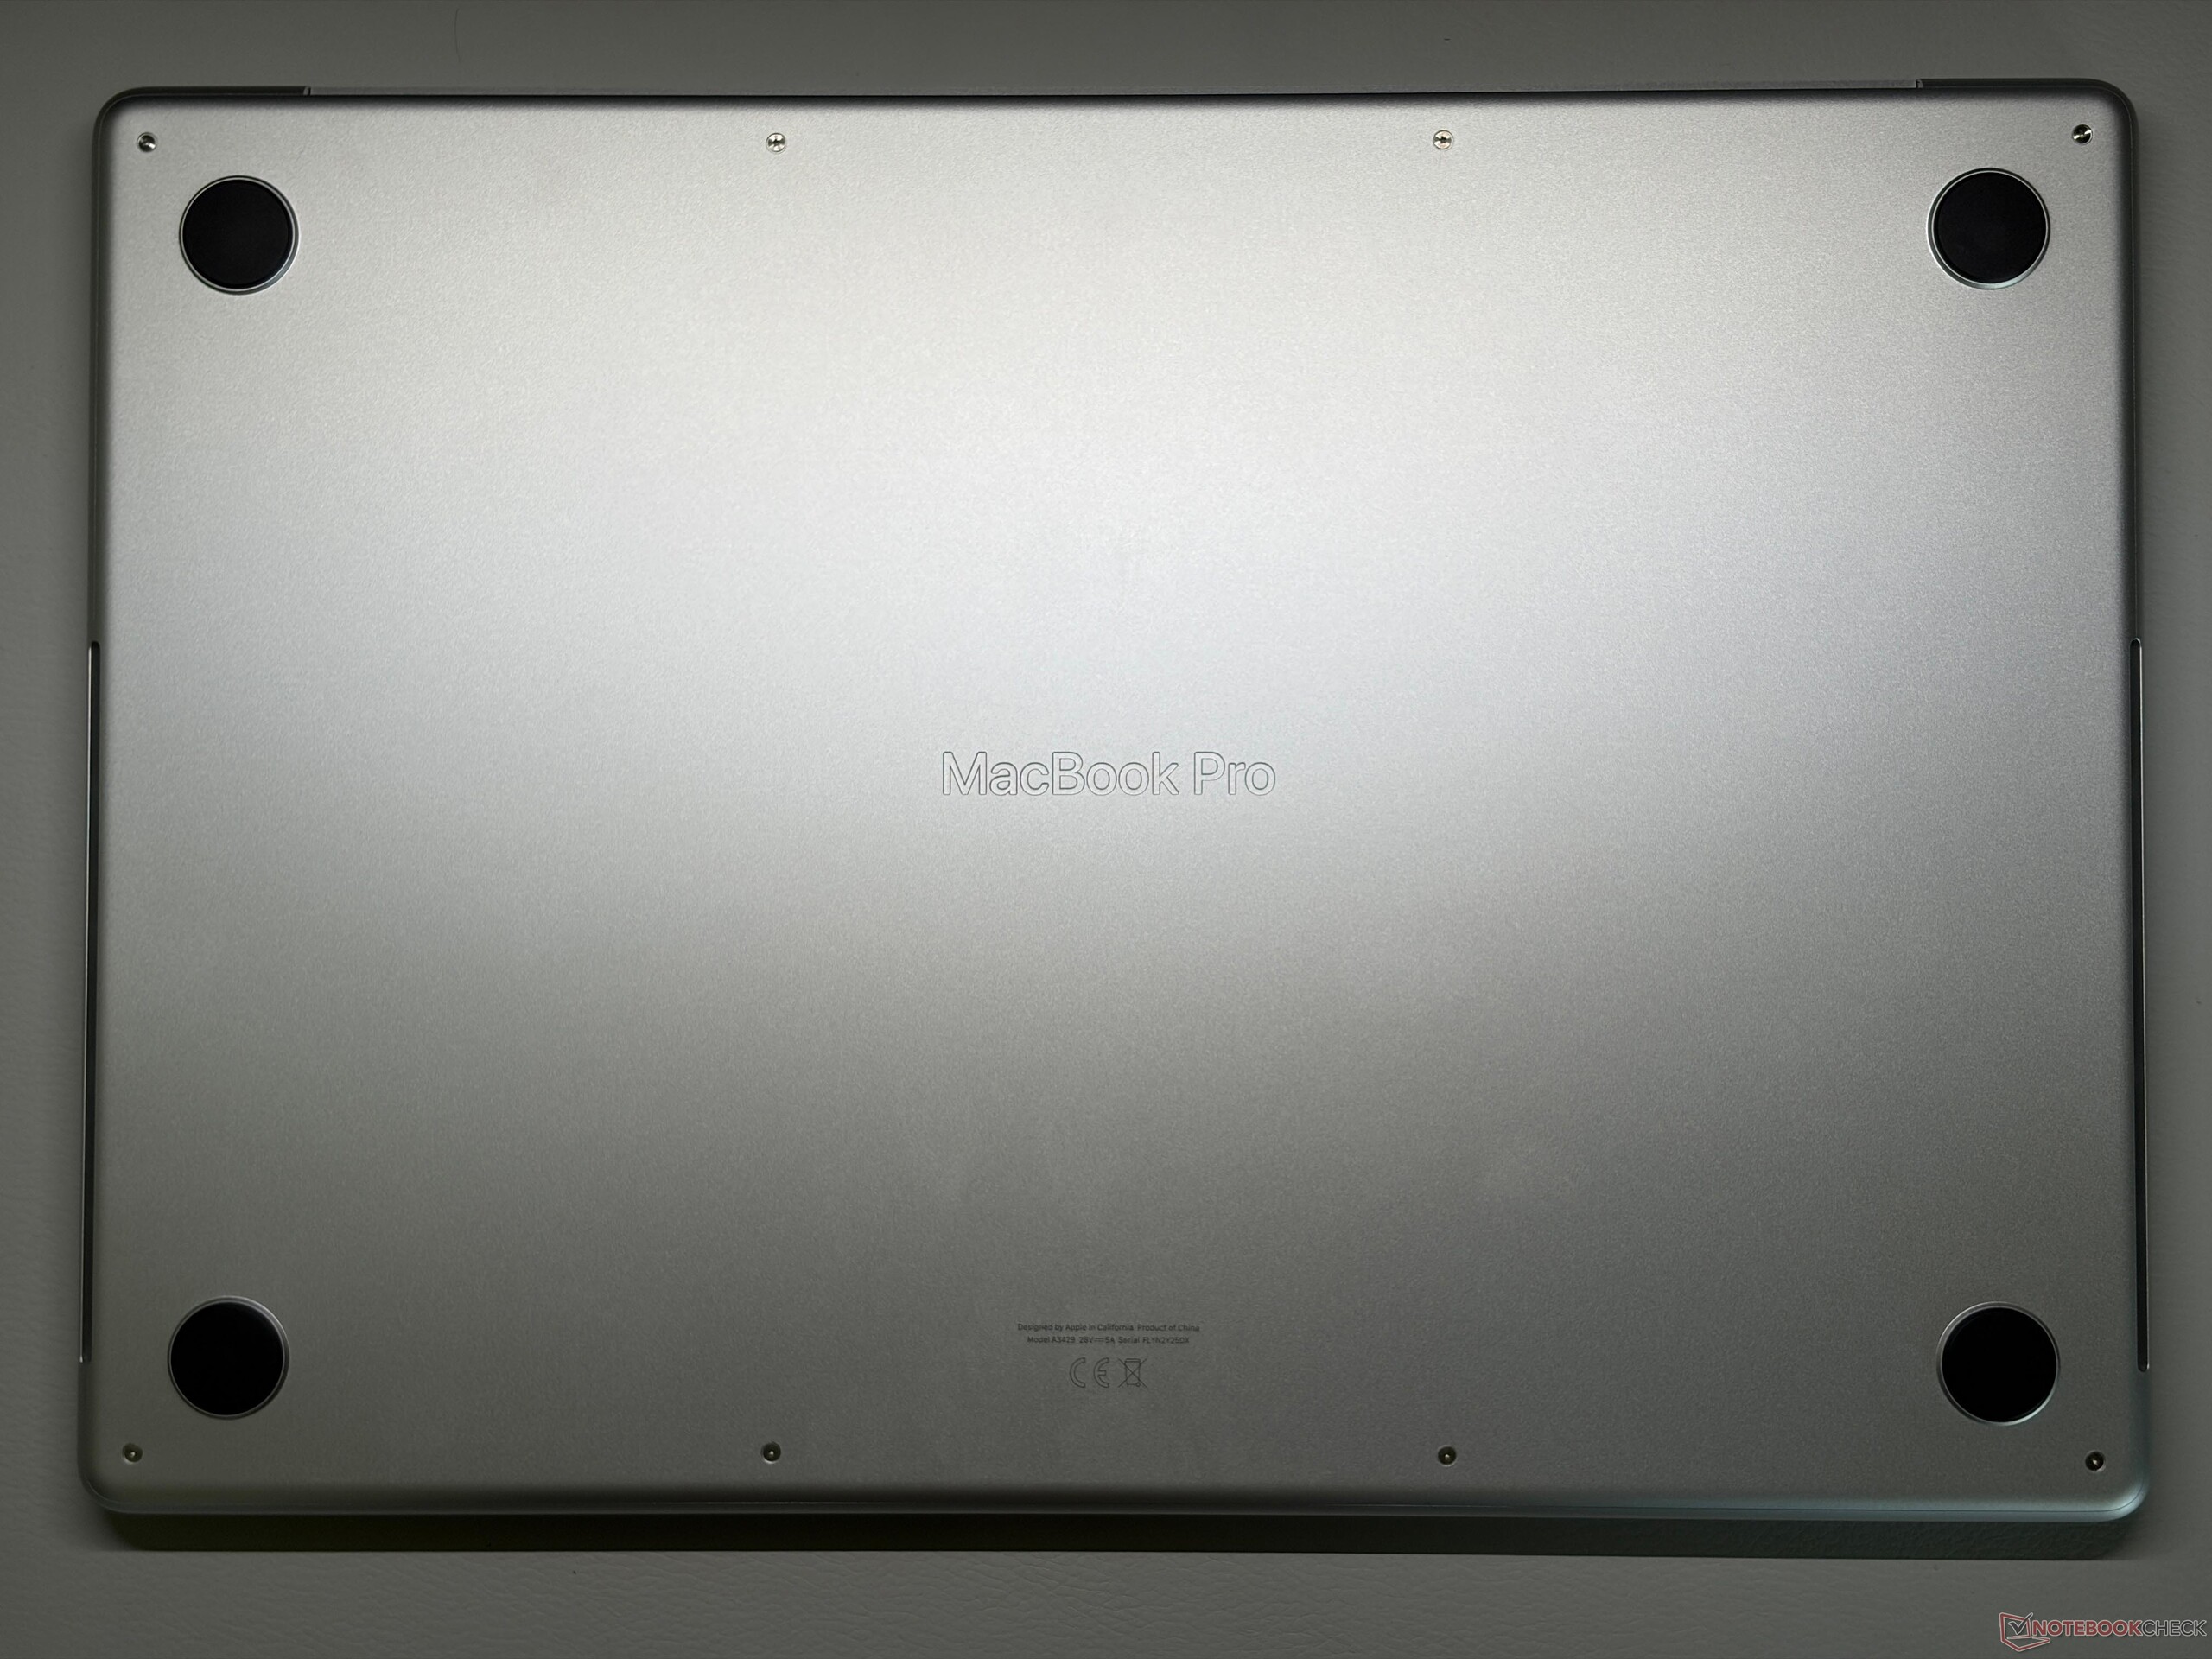
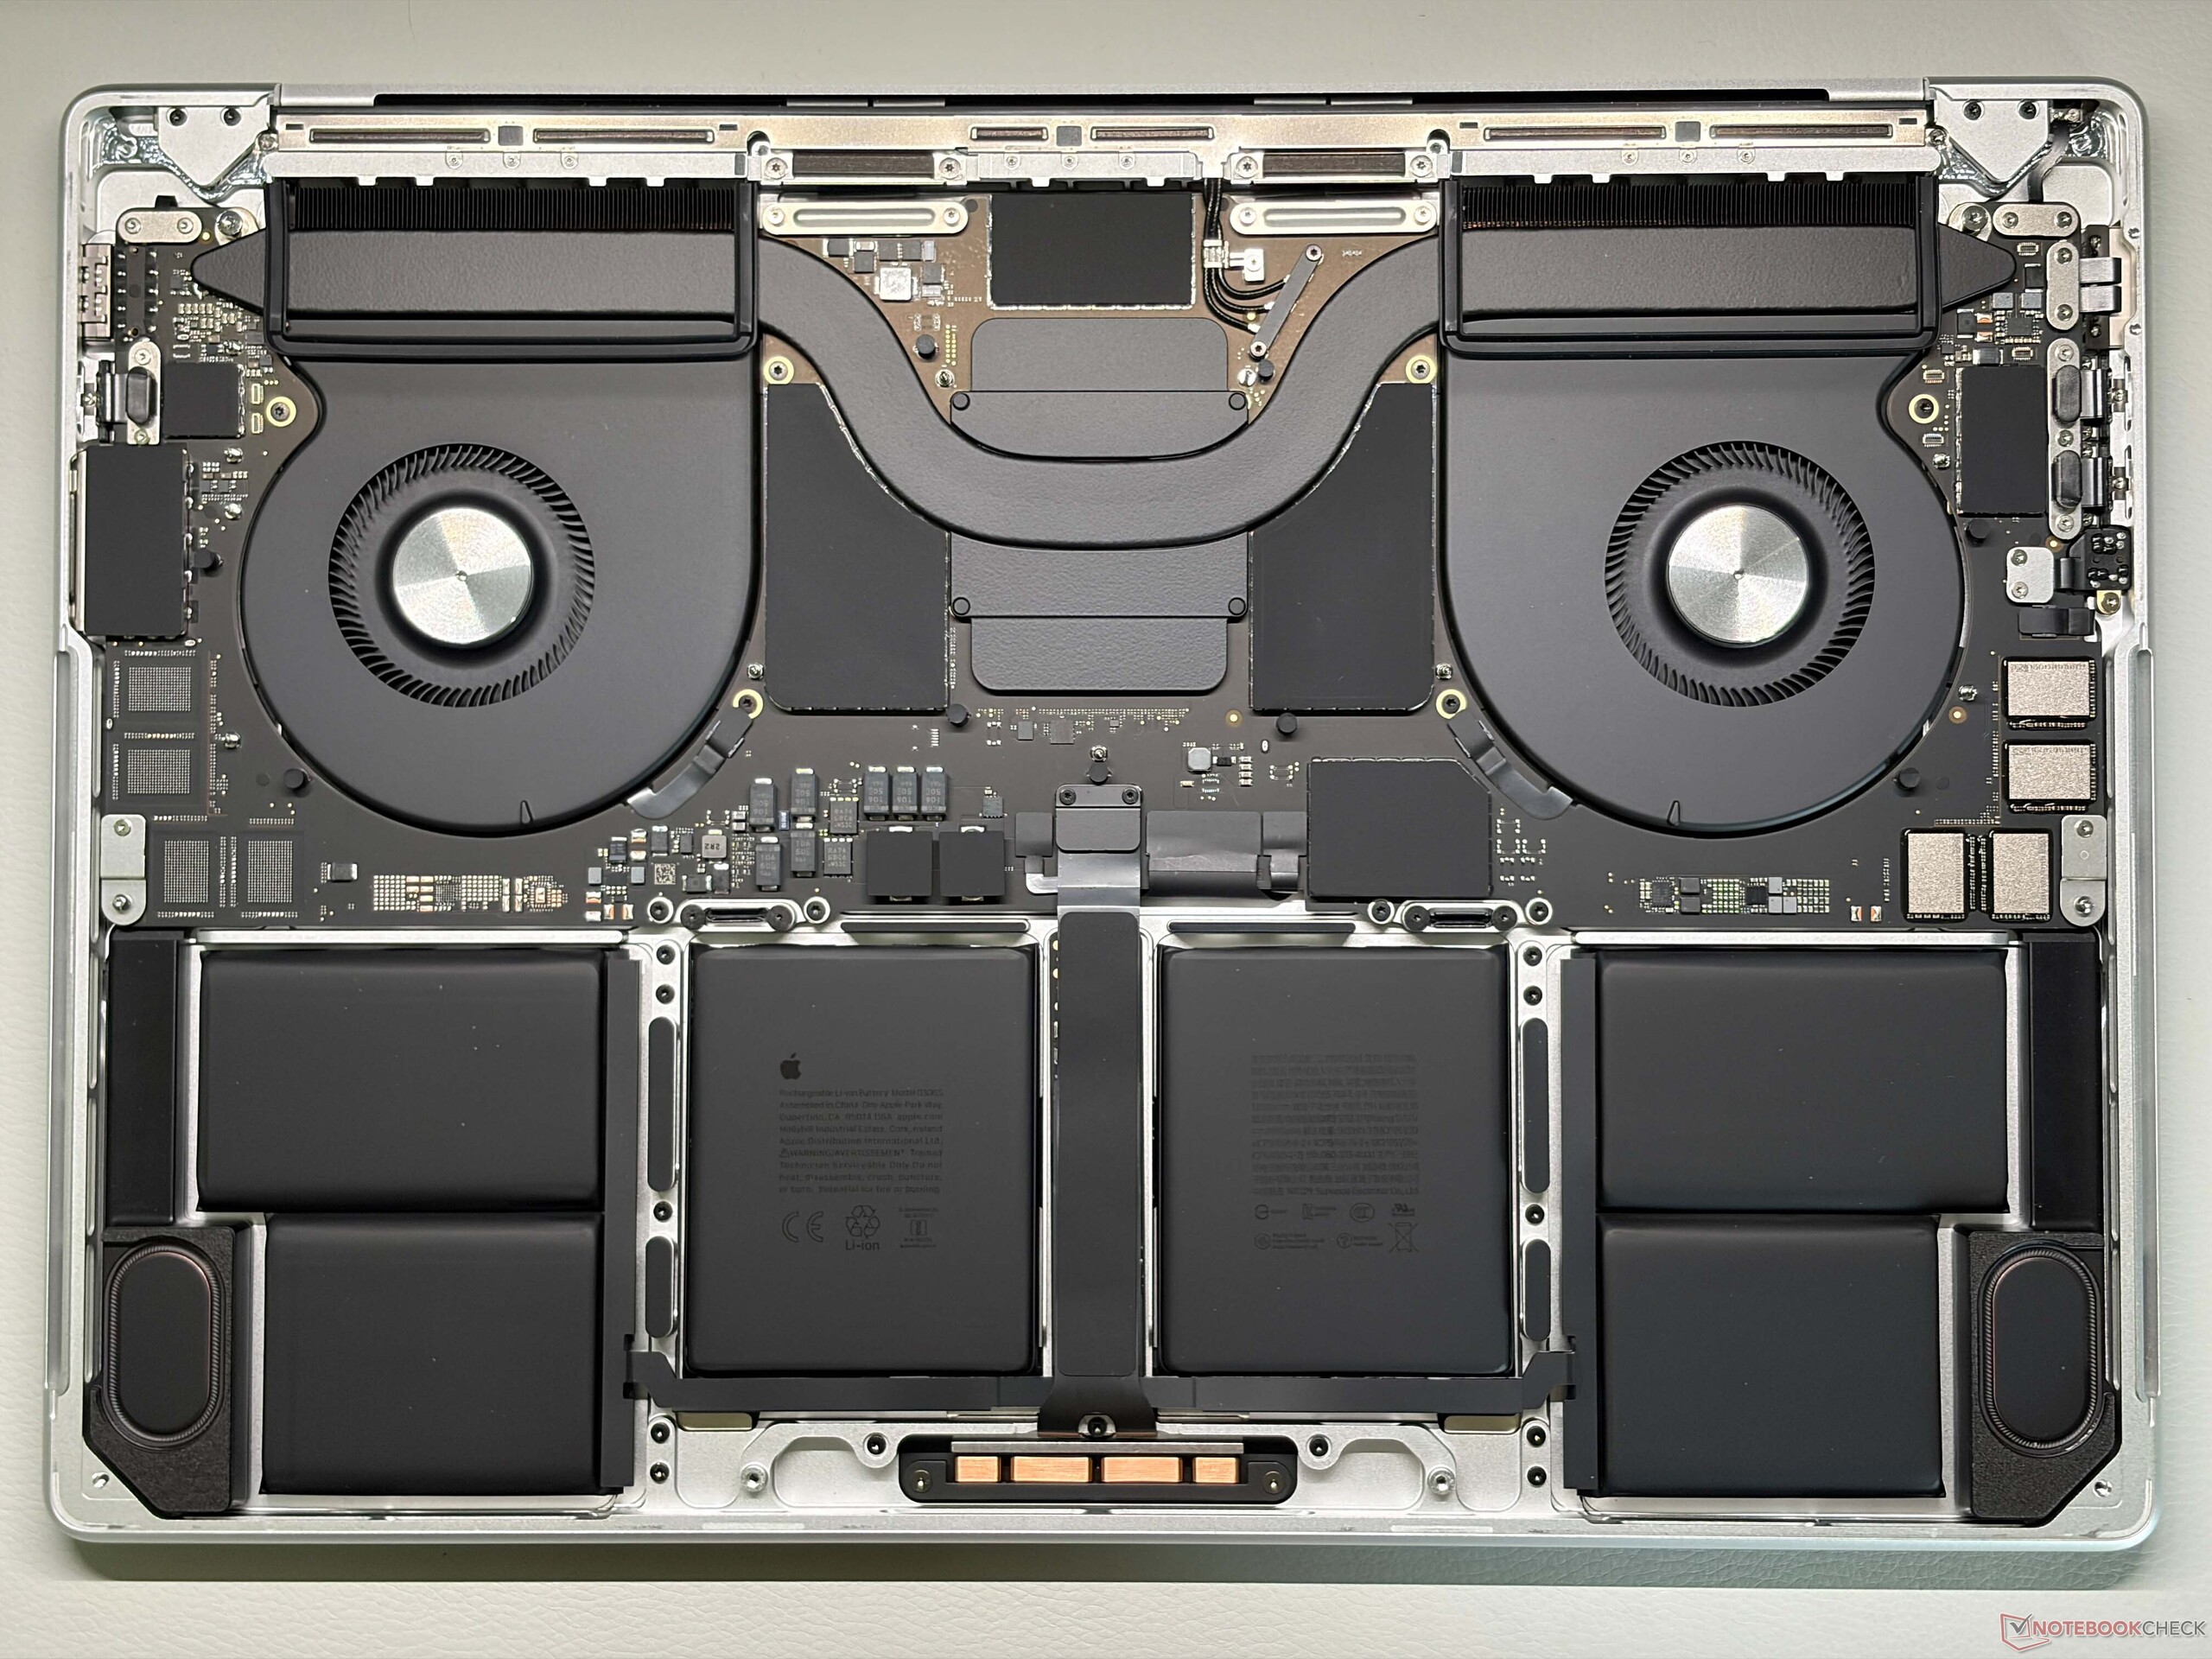
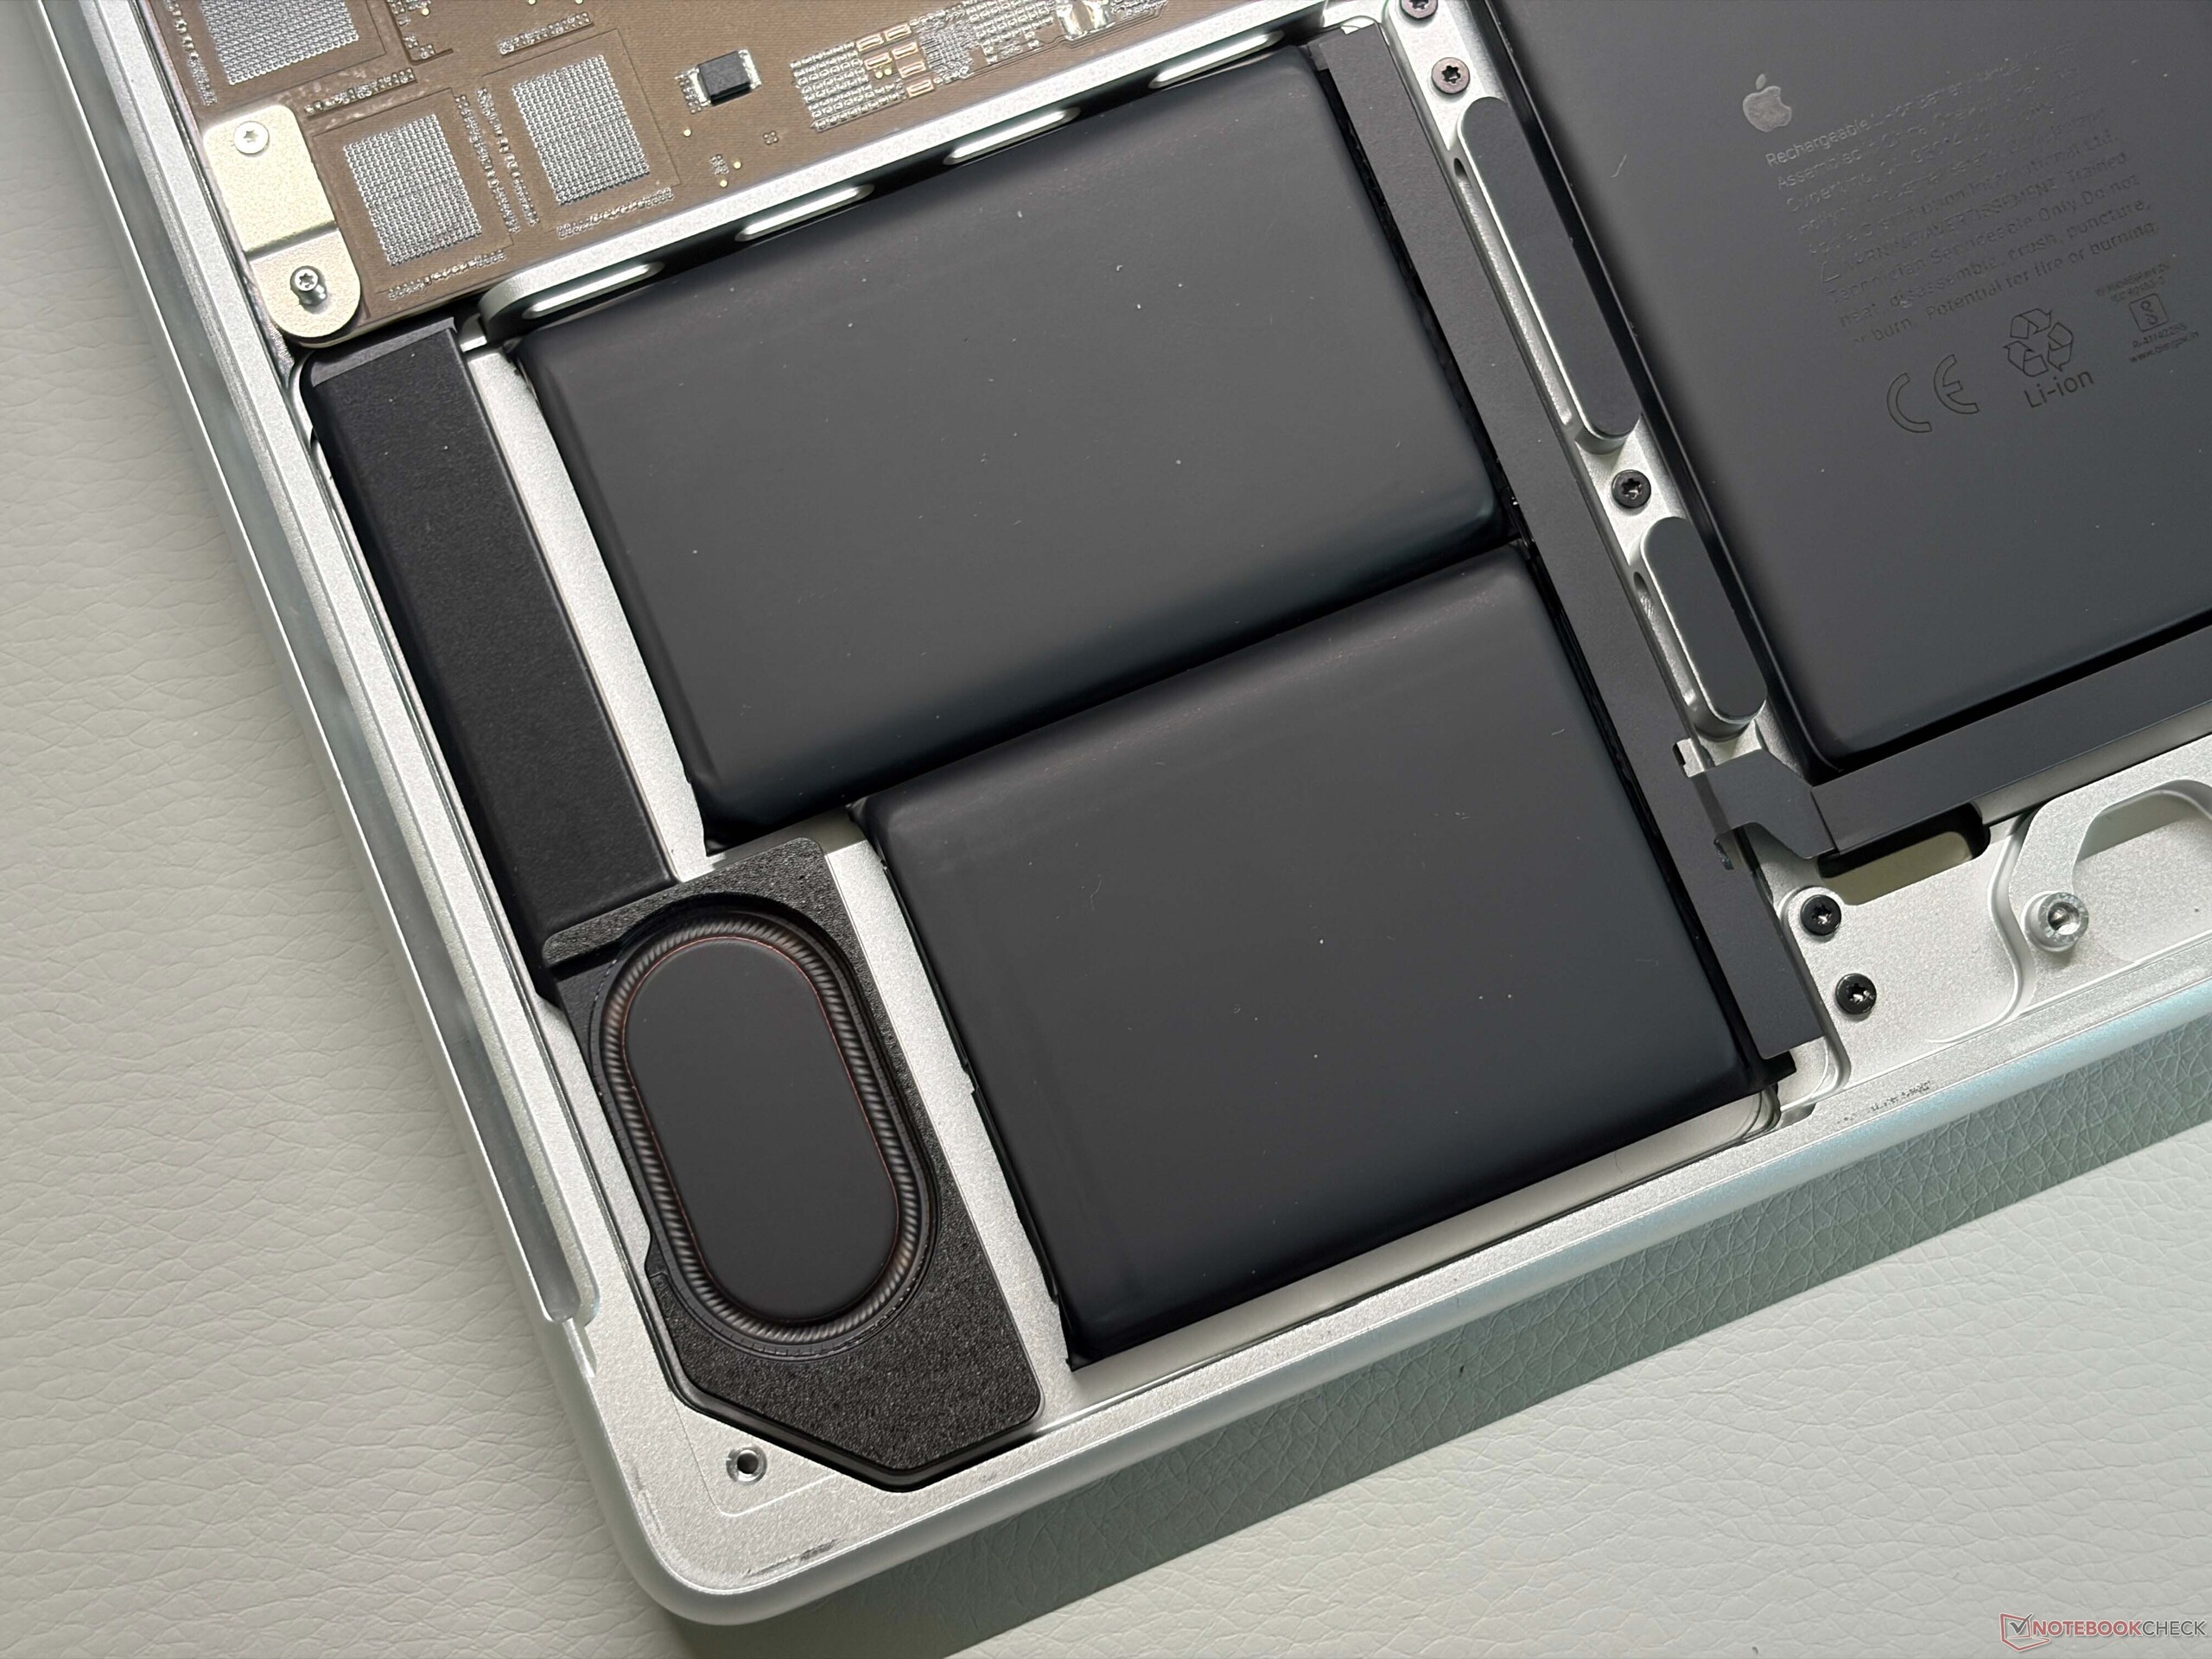
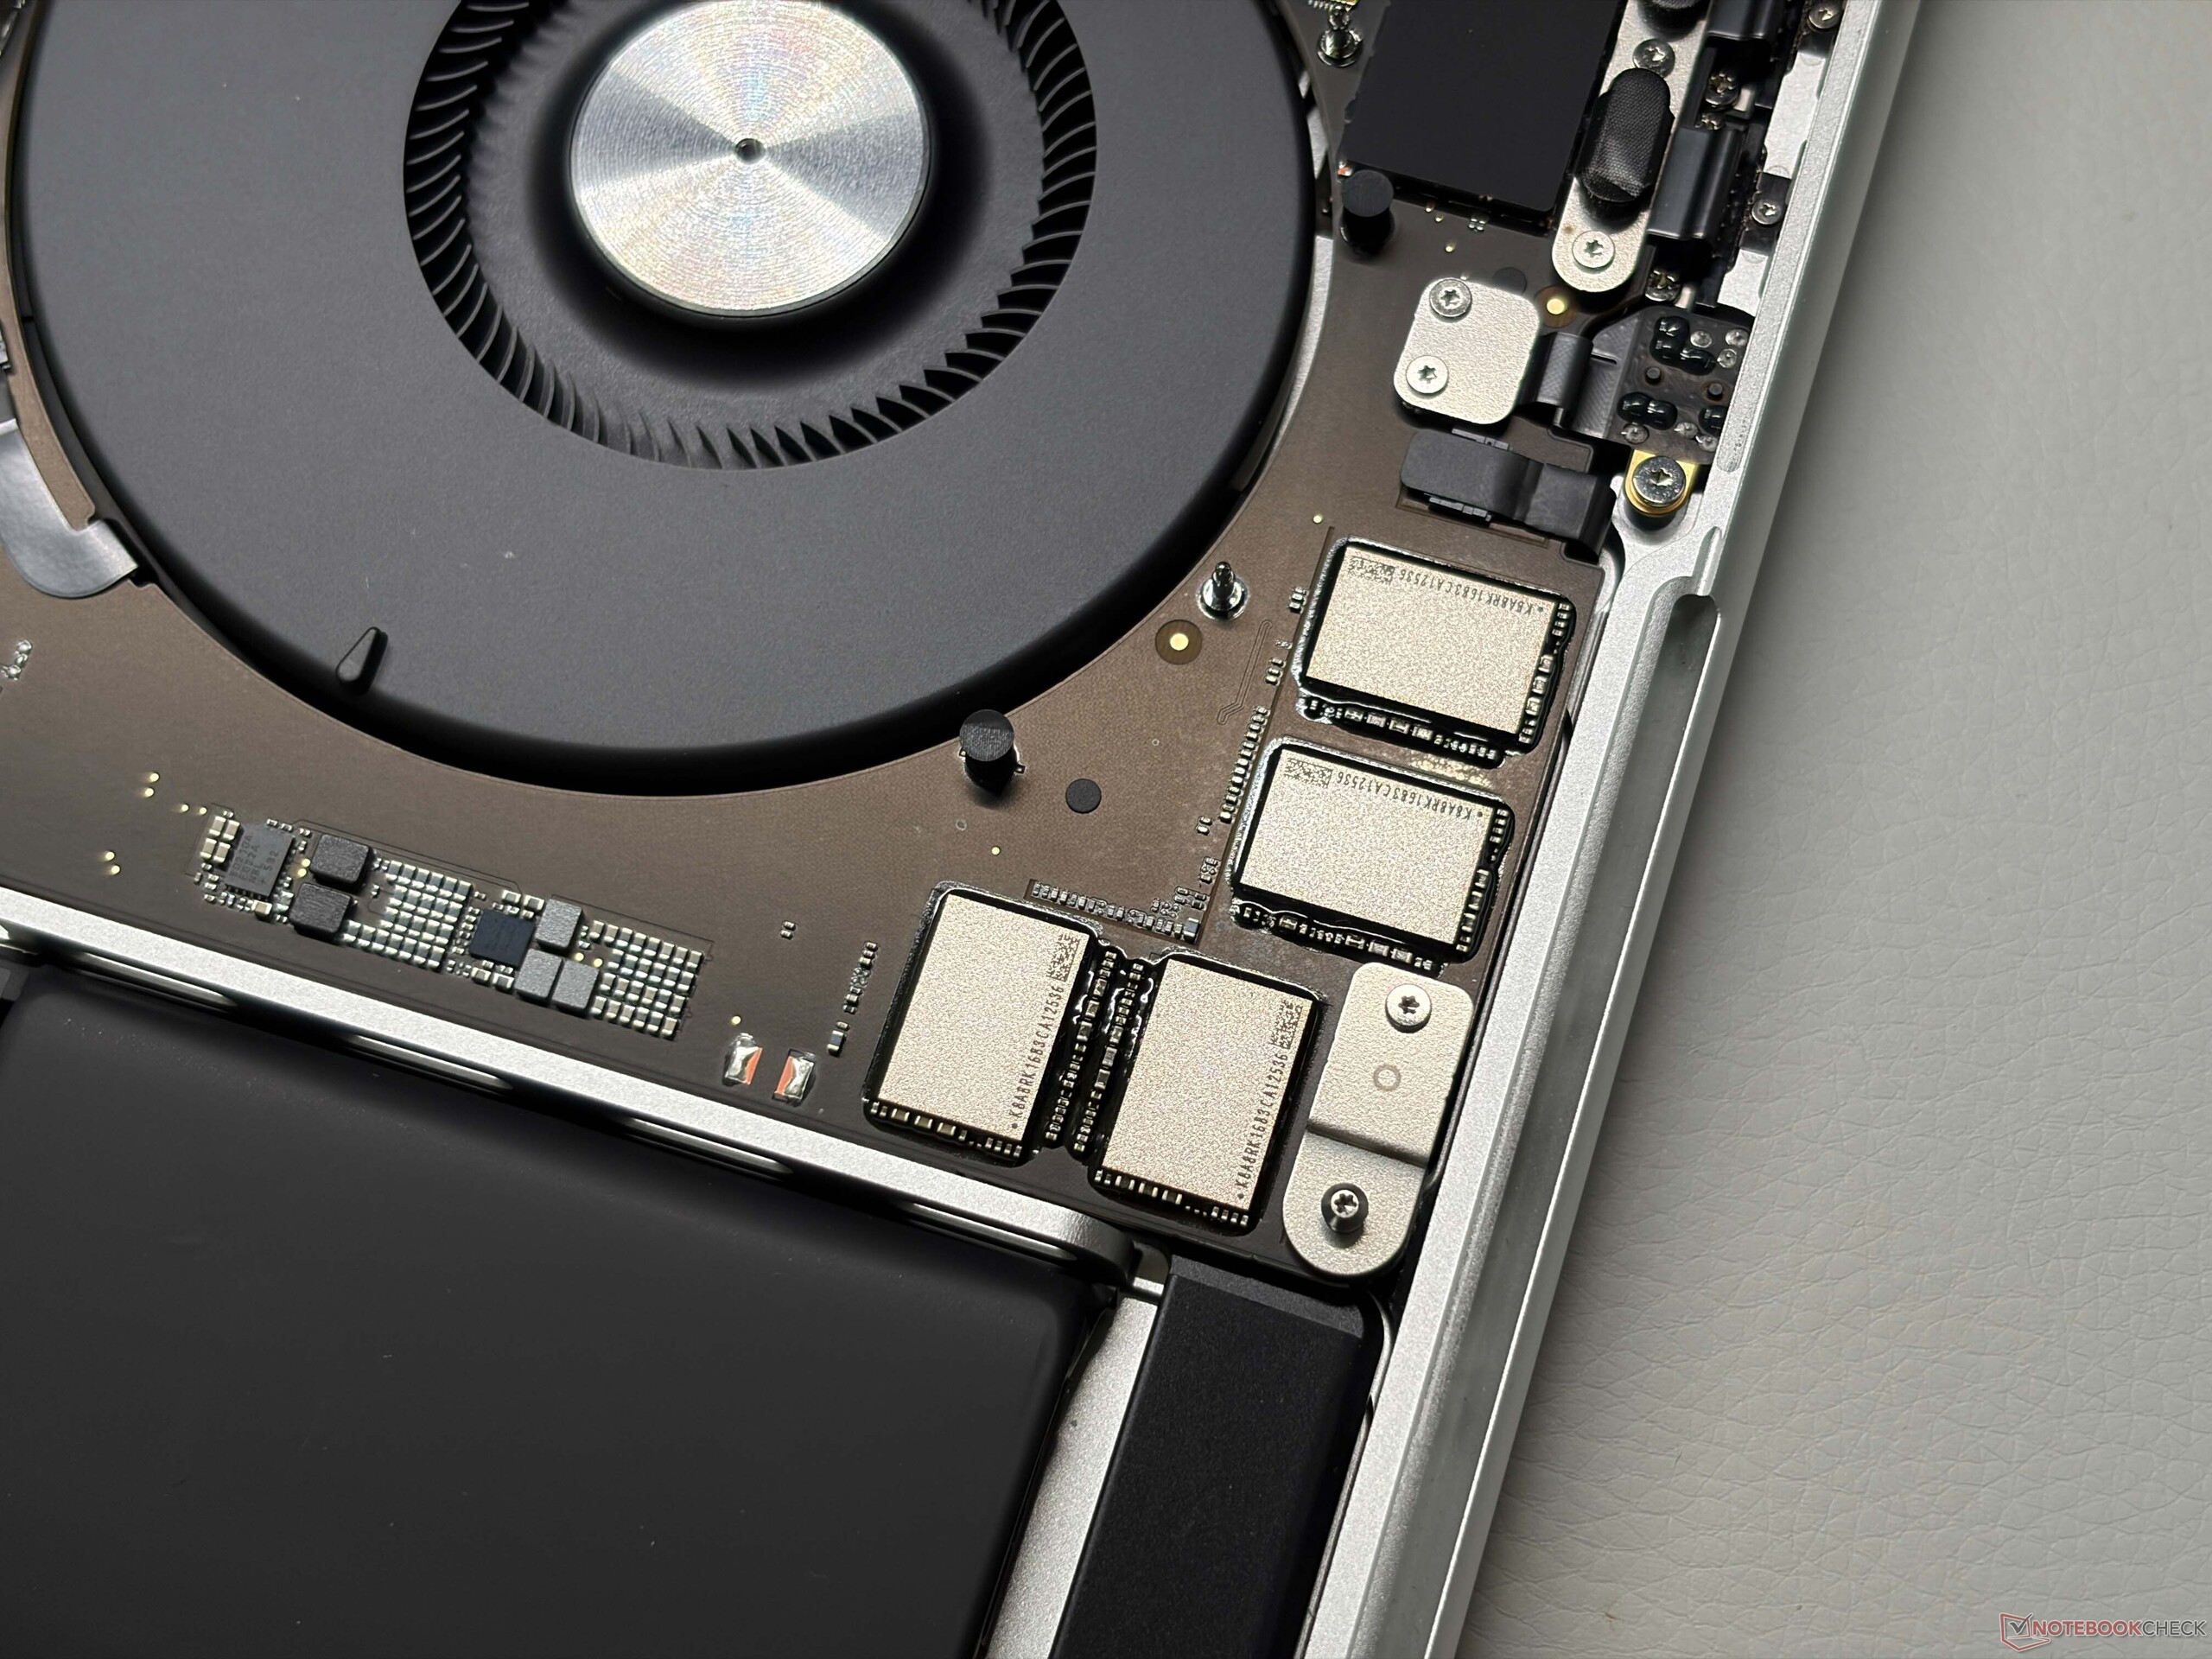
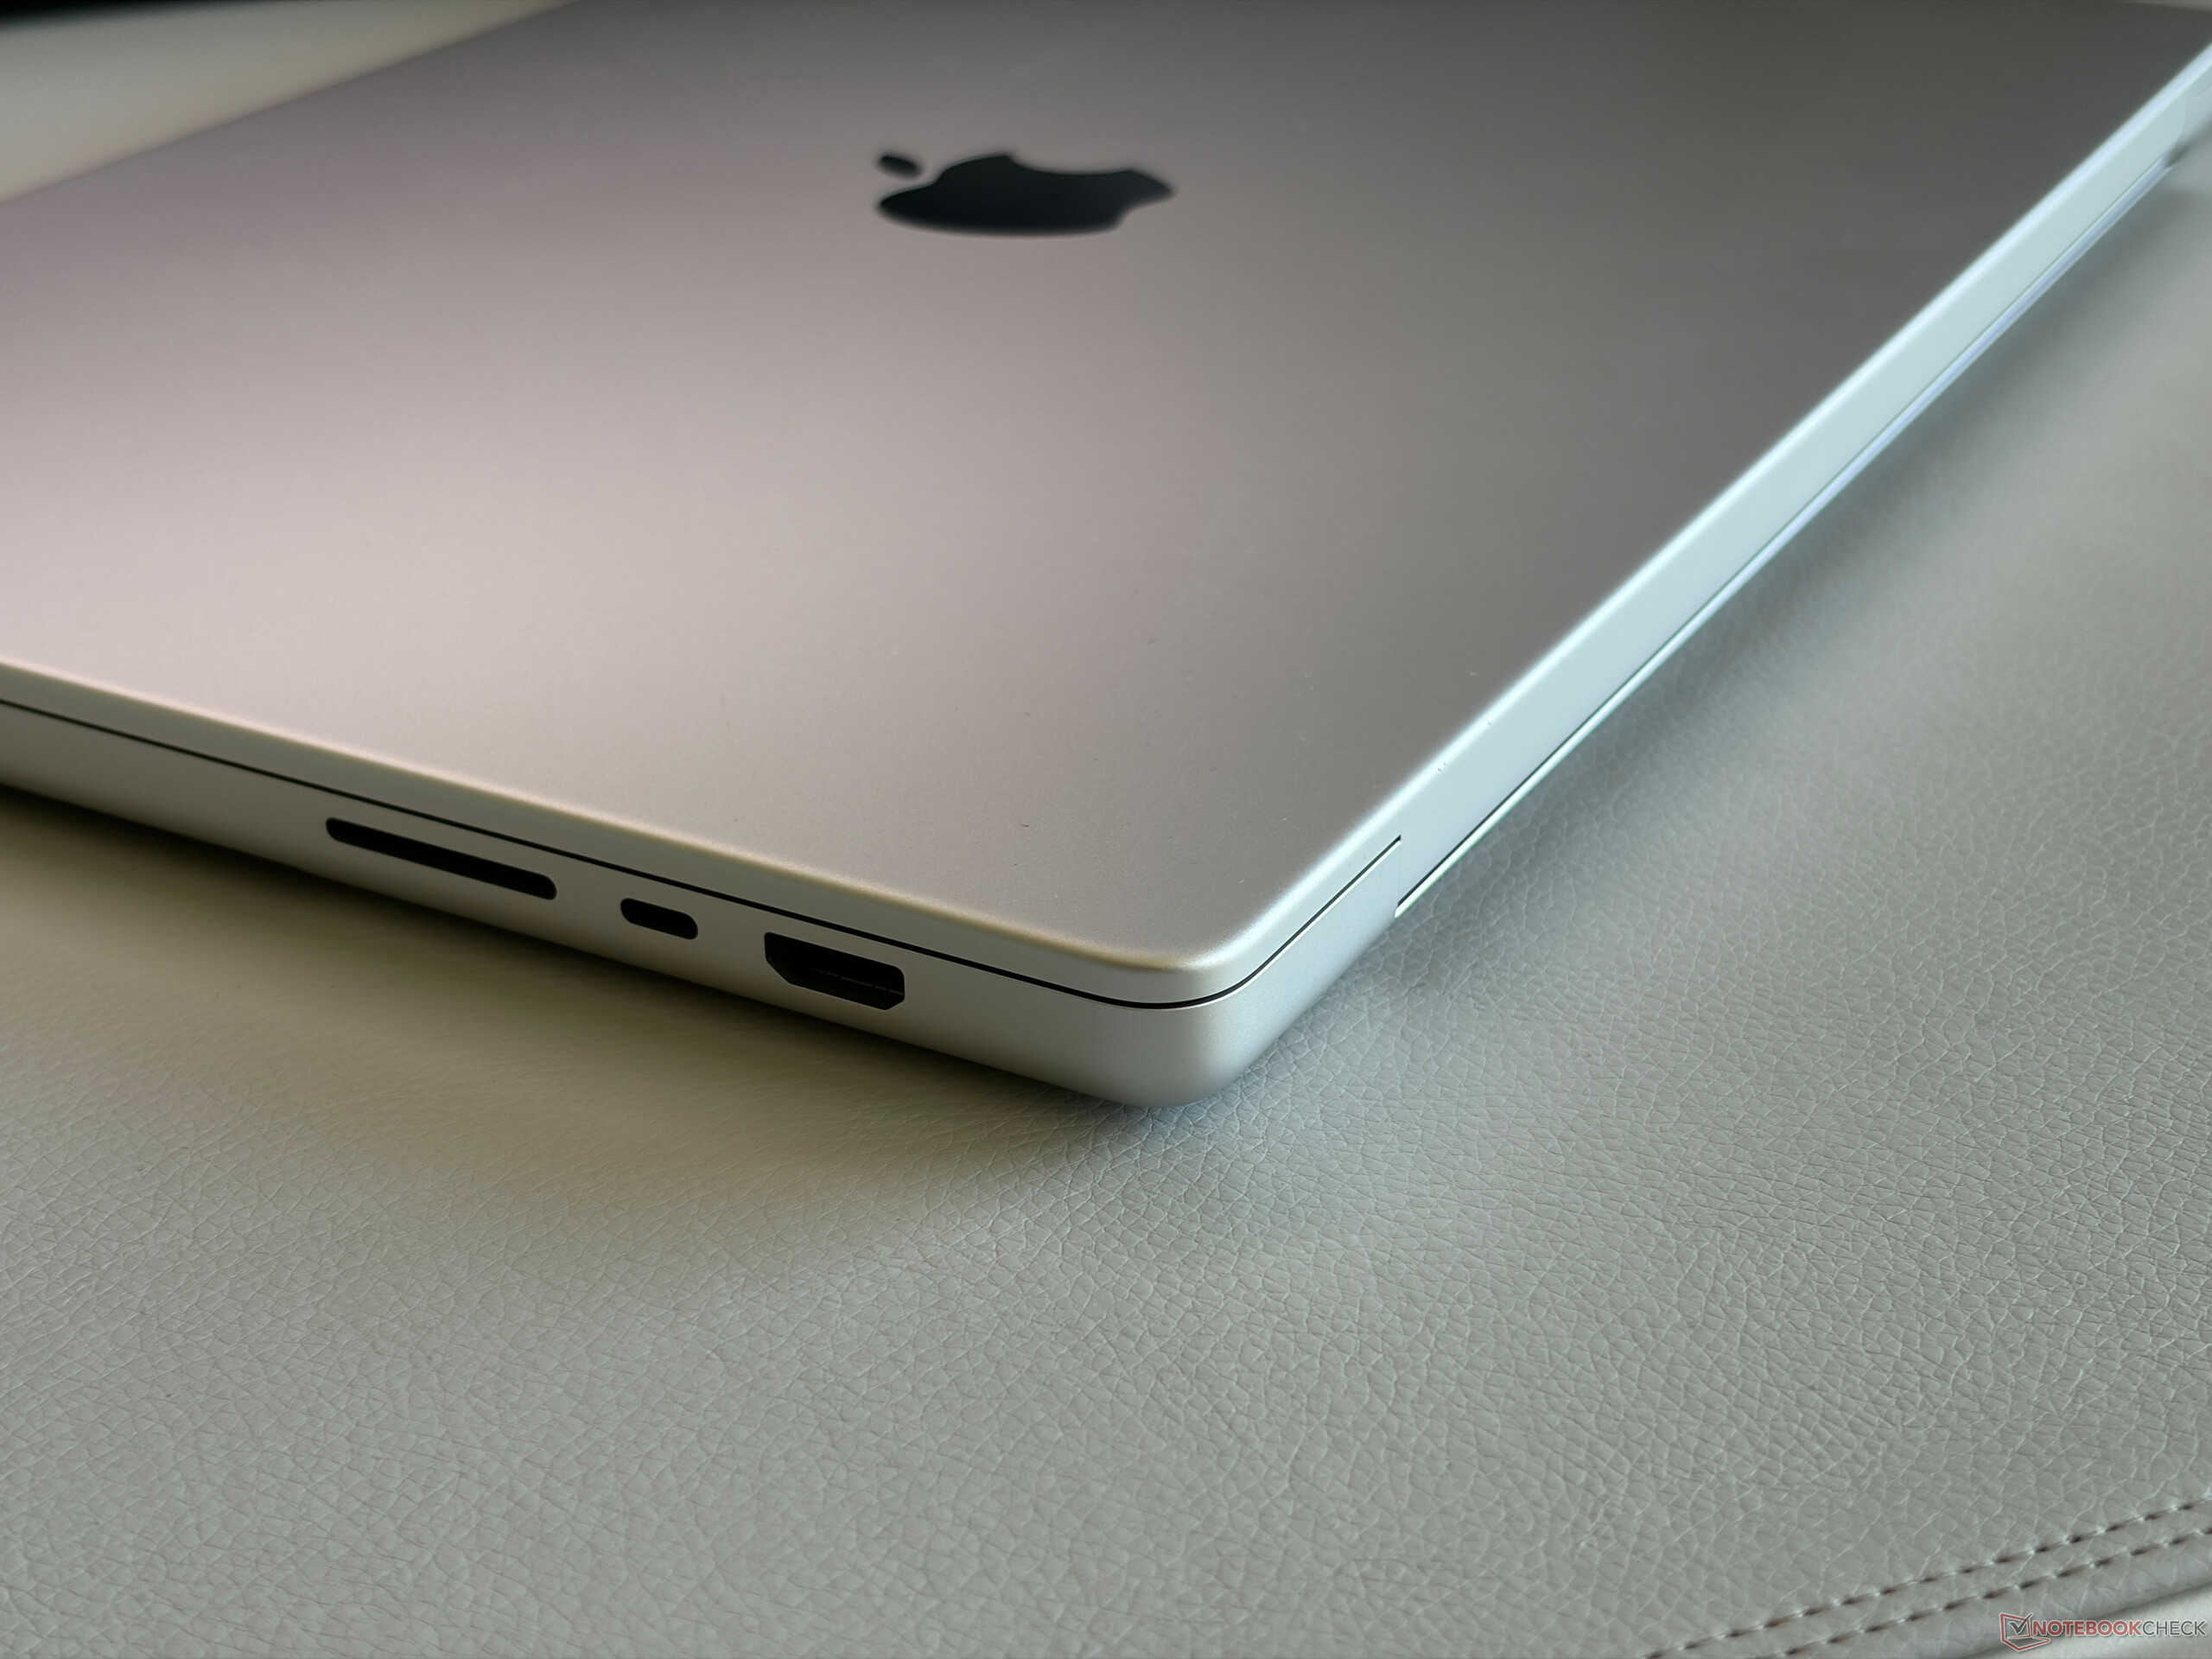
De behuizing is bekend van eerdere generaties en u krijgt een hoogwaardige aluminium behuizing met goede invoerapparaten en Thunderbolt 5-connectiviteit (drie poorten). De behuizing is echter met 2,14 kg ook behoorlijk zwaar en er zijn lichtere alternatieven. De onderhoudsmogelijkheden blijven beperkt tot het reinigen van de ventilatoren, aangezien alle componenten zijn gesoldeerd. De N1-chip van Apple biedt zowel Bluetooth 6 als Wi-Fi 7, maar is beperkt tot 160 MHz, waardoor de overdrachtssnelheden worden beperkt tot ongeveer 2 Gbps. De SDXC-kaartlezer is snel, maar ondersteunt de SD-Express-standaard niet. De 12 MP CenterStage-webcam werkt goed, maar de resolutie van foto’s en video’s is laag en Face ID wordt nog steeds niet ondersteund.



| Networking | |
| Apple MacBook Pro 16 2026 M5 Max | |
| iperf3 receive Wi-Fi6/7 RT-BE96U | |
| iperf3 transmit Wi-Fi6/7 RT-BE96U | |
| Apple MacBook Pro 16 2026 M5 Pro | |
| iperf3 transmit AXE11000 | |
| iperf3 receive AXE11000 | |
| Dell XPS 16 Core Ultra X7 358H | |
| iperf3 transmit AXE11000 | |
| iperf3 receive AXE11000 | |
| iperf3 transmit AXE11000 6GHz | |
| iperf3 receive AXE11000 6GHz | |
| Samsung Galaxy Book6 Ultra | |
| iperf3 transmit AXE11000 | |
| iperf3 receive AXE11000 | |
| Lenovo ThinkPad T1g Gen 8 21TD003GE | |
| iperf3 transmit AXE11000 | |
| iperf3 receive AXE11000 | |
| Lenovo ThinkBook 16p G6 21R00013GE | |
| iperf3 transmit AXE11000 | |
| iperf3 receive AXE11000 | |
| Lenovo Yoga Pro 9i 16 RTX 5070 | |
| iperf3 transmit AXE11000 | |
| iperf3 receive AXE11000 | |


Scherm – Prachtig Mini-LED-scherm
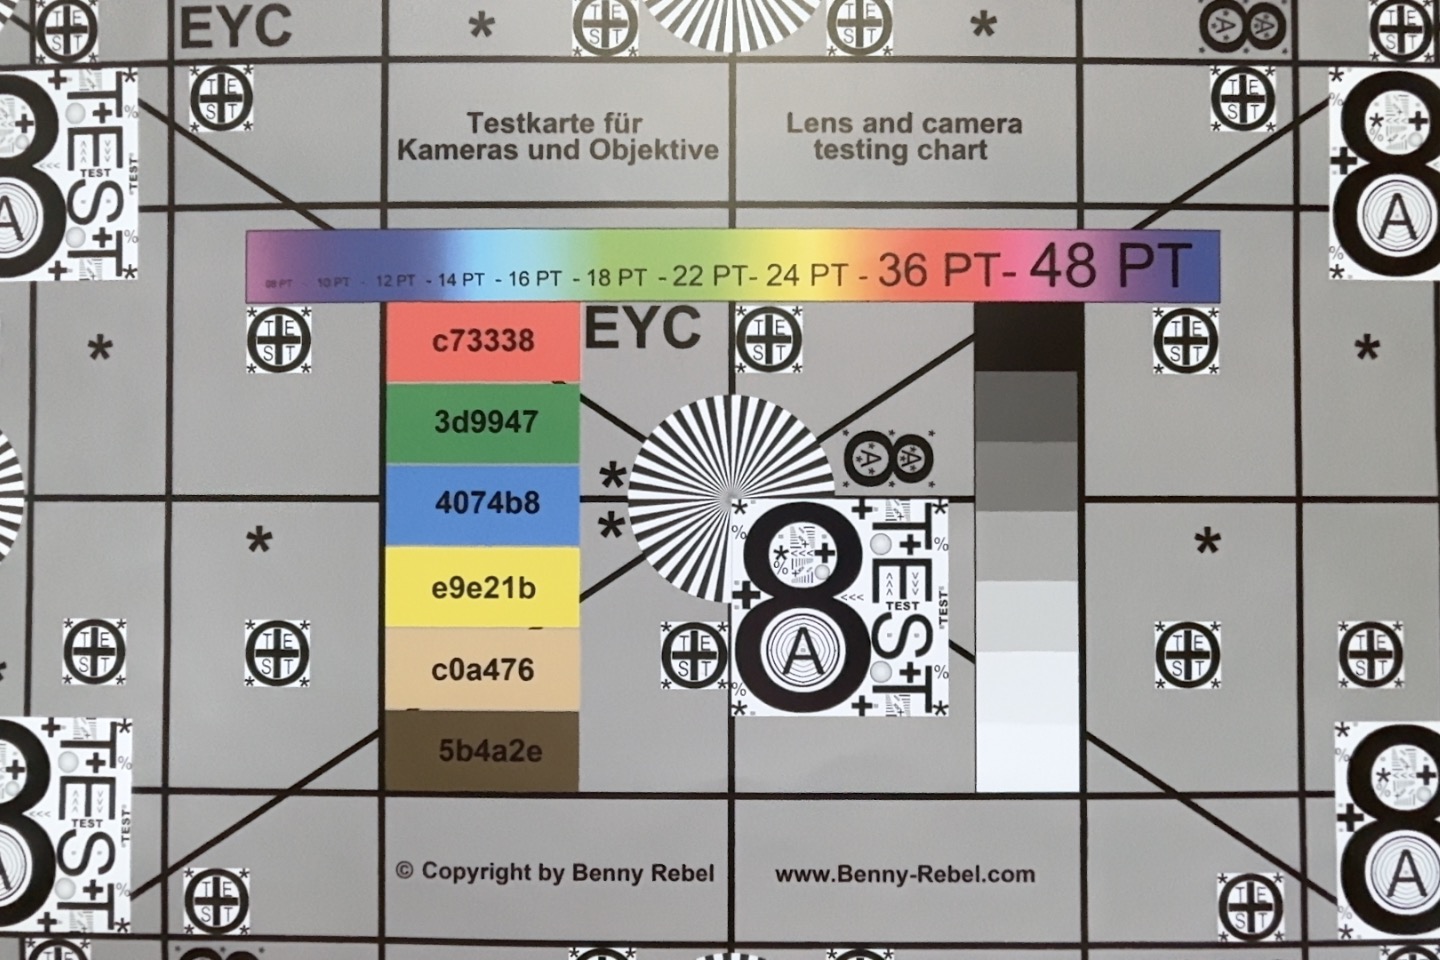
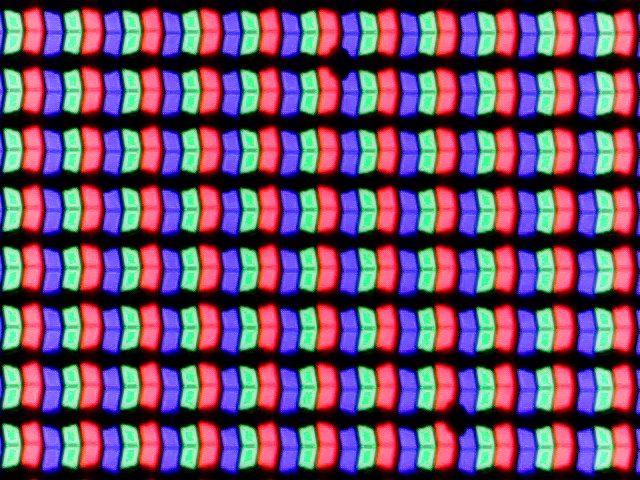
Apple maakt nog steeds gebruik van hetzelfde Mini-LED-scherm (16,2 inch, 3456 x 2204 pixels, 120 Hz, glanzend, geen touchscreen), dat ook in een matte uitvoering verkrijgbaar is. De beeldkwaliteit is na vele jaren nog steeds indrukwekkend en u profiteert van perfecte zwartwaarden en zeer nauwkeurige kleuren. Er is sprake van flikkering als gevolg van de Mini-LED-achtergrondverlichting, maar de frequentie is met bijna 15 kHz zeer hoog, dus dit zou geen problemen moeten opleveren. Vanwege de voortdurende flikkering beschikken wij nog steeds niet over een nauwkeurige methode om de responstijden van Mini-LED-panelen te bepalen, waardoor de weergegeven resultaten niet volledig nauwkeurig zijn. Houd er rekening mee dat het paneel zelf een IPS-scherm is, waardoor de responstijden altijd langzamer zullen zijn in vergelijking met OLED-panelen. In de praktijk hebben wij echter geen problemen met ghosting geconstateerd.
Wat de helderheid betreft, kan het Mini-HDR-paneel nog steeds moeiteloos gelijke tred houden met de beste tandem-OLED-panelen op de markt. Wij hebben een SDR-helderheid vastgesteld van bijna 700 nits zonder de lichtsensor en tot 1164 nits wanneer de sensor actief is. Voor HDR-inhoud hebben wij tot 1737 nits gemeten en 1325 nits voor een volledig wit beeld. De HDR-verwerking in macOS is ook nog steeds superieur aan die van Windows. Het scherm bestrijkt de sRGB- en P3-kleurruimten volledig en de kleurnauwkeurigheid is uitstekend volgens onze analyse met de professionele CalMAN-software, maar houd er rekening mee dat de helderheid door macOS wordt beperkt wanneer u in de sRGB-kleurruimte werkt.


| |||||||||||||||||||||||||
Helderheidsverdeling: 93 %
Helderheid in Batterij-modus: 710 cd/m²
Contrast: ∞:1 (Zwart: 0 cd/m²)
ΔE ColorChecker Calman: 1.1 | ∀{0.5-29.43 Ø4.69}
ΔE Greyscale Calman: 2.7 | ∀{0.09-98 Ø4.94}
88.2% AdobeRGB 1998 (Argyll 3D)
100% sRGB (Argyll 3D)
99.3% Display P3 (Argyll 3D)
Gamma: 2
CCT: 6760 K
| Apple MacBook Pro 16 2026 M5 Max Mini-LED, 3456x2234, 16.2", 120 Hz | Lenovo Yoga Pro 9i 16 RTX 5070 ATNA60KA01-0, OLED, 3200x2000, 16", 120 Hz | Asus ProArt P16 RTX 5090 ATNA60HC03-0, OLED, 3840x2400, 16", 120 Hz | Dell XPS 16 Core Ultra X7 358H LG Philips 160WV1, OLED, 3200x2000, 16", 120 Hz | Samsung Galaxy Book6 Ultra ATNA60HR05-0, OLED, 2880x1800, 16", 120 Hz | Lenovo ThinkPad T1g Gen 8 21TD003GE ATNA60KA02-0, Tandem-OLED, 3200x2000, 16", 120 Hz | Lenovo ThinkBook 16p G6 21R00013GE NE160QDM-NZB, IPS, 2560x1600, 16", 240 Hz | |
|---|---|---|---|---|---|---|---|
| Display | 0% | -2% | -15% | -9% | -3% | -2% | |
| HDR Peak Brightness (cd/m²) | 1737 | 1600 -8% | 1600 -8% | 518 -70% | 1182 -32% | 1530 -12% | |
| Display P3 Coverage (%) | 99.3 | 97.4 -2% | 98.9 0% | 99.5 0% | 97 -2% | 98.8 -1% | 96.7 -3% |
| sRGB Coverage (%) | 100 | 100 0% | 100 0% | 100 0% | 99.9 0% | 100 0% | 99.8 0% |
| AdobeRGB 1998 Coverage (%) | 88.2 | 96.8 10% | 88.6 0% | 96.5 9% | 85.3 -3% | 88.9 1% | 86.5 -2% |
| Response Times | 91% | 85% | 87% | 62% | 91% | 78% | |
| Response Time Grey 50% / Grey 80% * (ms) | 43 ? | 0.27 ? 99% | 0.3 ? 99% | 0.65 ? 98% | 0.5 ? 99% | 0.26 ? 99% | 13.2 ? 69% |
| Response Time Black / White * (ms) | 41.2 ? | 0.37 ? 99% | 0.45 ? 99% | 0.87 ? 98% | 0.4 ? 99% | 0.42 ? 99% | 5.8 ? 86% |
| PWM Frequency (Hz) | 14880 | 1200 | 480 ? | 240.2 ? | 240 ? | 1200 ? | |
| PWM Amplitude * (%) | 90 | 22 76% | 38 58% | 31 66% | 100 -11% | 22 76% | |
| Screen | 29% | 27% | -95% | 1% | -31% | -47% | |
| Brightness middle (cd/m²) | 710 | 974 37% | 661 -7% | 395.4 -44% | 499 -30% | 578 -19% | 504 -29% |
| Brightness (cd/m²) | 682 | 979 44% | 663 -3% | 392 -43% | 505 -26% | 583 -15% | 504 -26% |
| Brightness Distribution (%) | 93 | 98 5% | 99 6% | 95 2% | 97 4% | 98 5% | 94 1% |
| Black Level * (cd/m²) | 0.37 | ||||||
| Colorchecker dE 2000 * | 1.1 | 0.9 18% | 0.5 55% | 3.69 -235% | 0.9 18% | 1.6 -45% | 2 -82% |
| Colorchecker dE 2000 max. * | 2.1 | 1.7 19% | 1.4 33% | 7.94 -278% | 2.1 -0% | 4.5 -114% | 4.7 -124% |
| Greyscale dE 2000 * | 2.7 | 1.3 52% | 0.6 78% | 1.9 30% | 1.6 41% | 2.6 4% | 3.2 -19% |
| Gamma | 2 110% | 2.21 100% | 2.19 100% | 2.28 96% | 2.22 99% | 2.19 100% | 2.22 99% |
| CCT | 6760 96% | 6751 96% | 6565 99% | 6274 104% | 6445 101% | 6527 100% | 7188 90% |
| Colorchecker dE 2000 calibrated * | 0.68 | 0.7 | |||||
| Contrast (:1) | 1362 | ||||||
| Totaal Gemiddelde (Programma / Instellingen) | 40% /
35% | 37% /
32% | -8% /
-28% | 18% /
12% | 19% /
6% | 10% /
-12% |
* ... kleiner is beter


Prestaties – M5 Max met 48 GB RAM


Testomstandigheden
De onderstaande tabel toont de verschillende vermogensprofielen en de prestatiecijfers. Wij hebben voor onze benchmarks en metingen de High Power-modus gebruikt om het maximale prestatiepotentieel van de M5 Max te laten zien. De Automatic-modus is nog steeds zeer krachtig en wij raden deze aan voor dagelijkse taken. De resultaten zijn identiek bij gebruik op batterijvoeding.
| CPU (Watt) | CB2024 Multi (punten) |
GPU (Watt) | Steel Nomad (punten) |
Cyberpunk 2077 QHD Ultra (fps) |
TDP-stresstest CPU & GPU (Watt) |
, max. ventilatorgeluid (dB(A)) | |
|---|---|---|---|---|---|---|---|
| Laag vermogen | 13 | 999 | 9 | 2096 | 30 | 13 | 24,8 |
| Auto | 75/54 | 2312 | 72/38 | 4373 | 62,7 | 94/48 | 40,9 |
| High Power | 2490 | 2073 | 72/42 | 4386 | 63,1 | 114/70 | 53,9 |
Processor
De M5 Max-CPU kan tot 75 watt verbruiken en stabiliseert zich bij 70 watt bij langdurige belasting, waardoor de prestaties zeer stabiel zijn. De single-coreprestaties van de huidige M5-generatie zijn nog steeds buitengewoon hoog en lopen minstens twee generaties voor op de concurrentie (zelfs Qualcomm heeft pas de M3-generatie ingehaald), en ook de multi-coreprestaties zijn uitstekend. In vergelijking met de directe Windows-concurrentie kan deze tot wel twee keer zo krachtig zijn; alleen de HX-CPU’s van Intel en AMD in krachtige gaminglaptops kunnen tot op zekere hoogte gelijke tred houden. U profiteert echter ook van dit prestatieniveau op batterijvoeding op de MacBook, wat niet het geval is bij Windows-laptops.
Cinebench 2024: CPU Multi Core | CPU Single Core
Geekbench 6.7: Multi-Core | Single-Core
| CPU Performance rating | |
| Apple MacBook Pro 16 2026 M5 Max | |
| Gemiddeld Apple M5 Max | |
| Apple MacBook Pro 16 2026 M5 Pro | |
| Lenovo ThinkBook 16p G6 21R00013GE | |
| Lenovo Yoga Pro 9i 16 RTX 5070 | |
| Lenovo ThinkPad T1g Gen 8 21TD003GE | |
| Samsung Galaxy Book6 Ultra | |
| Gemiddelde van klas Multimedia | |
| Asus ProArt P16 RTX 5090 | |
| Dell XPS 16 Core Ultra X7 358H | |
| Cinebench 2024 / CPU Multi Core | |
| Apple MacBook Pro 16 2026 M5 Max | |
| Apple MacBook Pro 16 2026 M5 Pro | |
| Gemiddeld Apple M5 Max (2073 - 2490, n=3) | |
| Lenovo ThinkBook 16p G6 21R00013GE | |
| Asus ProArt P16 RTX 5090 | |
| Samsung Galaxy Book6 Ultra | |
| Lenovo Yoga Pro 9i 16 RTX 5070 | |
| Lenovo ThinkPad T1g Gen 8 21TD003GE | |
| Gemiddelde van klas Multimedia (327 - 2490, n=61, laatste 2 jaar) | |
| Dell XPS 16 Core Ultra X7 358H | |
| Cinebench 2024 / CPU Single Core | |
| Apple MacBook Pro 16 2026 M5 Pro | |
| Gemiddeld Apple M5 Max (199 - 201, n=3) | |
| Apple MacBook Pro 16 2026 M5 Max | |
| Lenovo ThinkBook 16p G6 21R00013GE | |
| Gemiddelde van klas Multimedia (72.5 - 201, n=55, laatste 2 jaar) | |
| Lenovo Yoga Pro 9i 16 RTX 5070 | |
| Lenovo ThinkPad T1g Gen 8 21TD003GE | |
| Dell XPS 16 Core Ultra X7 358H | |
| Samsung Galaxy Book6 Ultra | |
| Asus ProArt P16 RTX 5090 | |
| Geekbench 6.7 / Multi-Core | |
| Apple MacBook Pro 16 2026 M5 Max | |
| Gemiddeld Apple M5 Max (29000 - 30057, n=5) | |
| Apple MacBook Pro 16 2026 M5 Pro | |
| Lenovo ThinkBook 16p G6 21R00013GE | |
| Lenovo Yoga Pro 9i 16 RTX 5070 | |
| Lenovo ThinkPad T1g Gen 8 21TD003GE | |
| Dell XPS 16 Core Ultra X7 358H | |
| Samsung Galaxy Book6 Ultra | |
| Gemiddelde van klas Multimedia (4983 - 30057, n=61, laatste 2 jaar) | |
| Asus ProArt P16 RTX 5090 | |
| Geekbench 6.7 / Single-Core | |
| Apple MacBook Pro 16 2026 M5 Max | |
| Apple MacBook Pro 16 2026 M5 Pro | |
| Gemiddeld Apple M5 Max (4200 - 4336, n=5) | |
| Lenovo Yoga Pro 9i 16 RTX 5070 | |
| Gemiddelde van klas Multimedia (1591 - 4336, n=61, laatste 2 jaar) | |
| Lenovo ThinkBook 16p G6 21R00013GE | |
| Lenovo ThinkPad T1g Gen 8 21TD003GE | |
| Asus ProArt P16 RTX 5090 | |
| Dell XPS 16 Core Ultra X7 358H | |
| Samsung Galaxy Book6 Ultra | |
Systeem- en SSD-prestaties
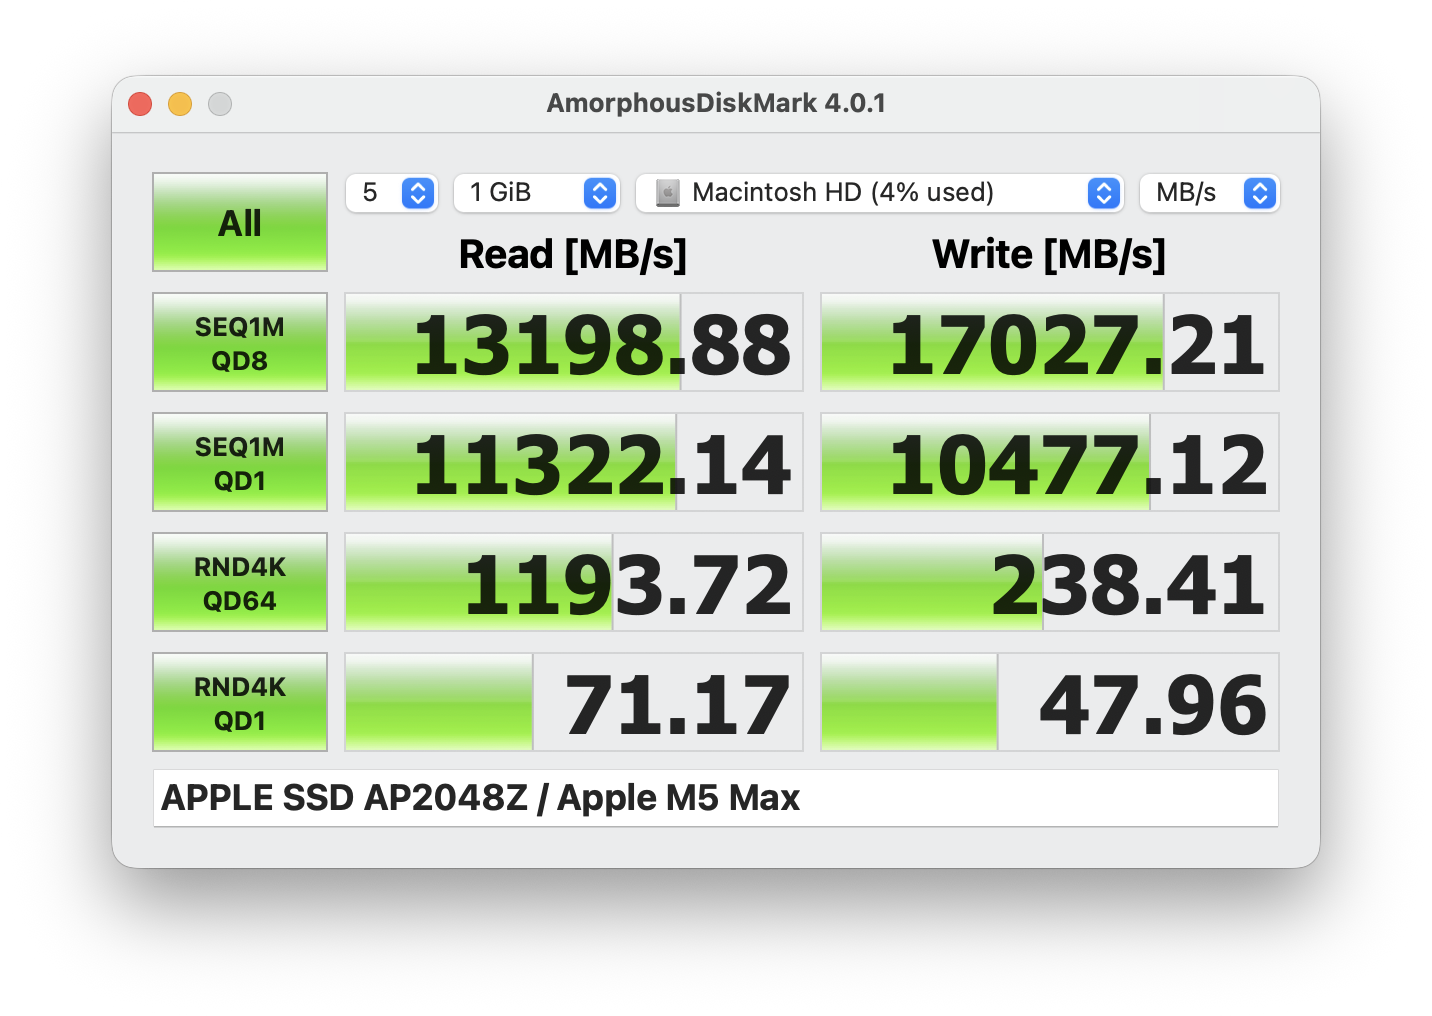
De systeemprestaties zijn uitstekend en de MacBook Pro 16 reageert zeer snel, hoewel u in alledaagse situaties geen verschil zult merken tussen de M5 Max en het basismodel. Apple maakt gebruik van PCIe 5.0 SSD’s en onze schijf van 2 TB (1,94 TB vrij) haalt overdrachtssnelheden van respectievelijk maximaal 17 GB/s (schrijven) en 13 GB/s (lezen).

CrossMark: Overall | Productivity | Creativity | Responsiveness
WebXPRT 3: Overall
WebXPRT 4: Overall
Mozilla Kraken 1.1: Total
| Performance rating | |
| Apple MacBook Pro 16 2026 M5 Max | |
| Gemiddeld Apple M5 Max, Apple M5 Max 40-Core GPU | |
| Apple MacBook Pro 16 2026 M5 Pro | |
| Lenovo ThinkPad T1g Gen 8 21TD003GE | |
| Lenovo Yoga Pro 9i 16 RTX 5070 | |
| Lenovo ThinkBook 16p G6 21R00013GE | |
| Dell XPS 16 Core Ultra X7 358H | |
| Gemiddelde van klas Multimedia | |
| Samsung Galaxy Book6 Ultra | |
| Asus ProArt P16 RTX 5090 | |
| CrossMark / Overall | |
| Apple MacBook Pro 16 2026 M5 Max | |
| Gemiddeld Apple M5 Max, Apple M5 Max 40-Core GPU (2728 - 3231, n=2) | |
| Apple MacBook Pro 16 2026 M5 Pro | |
| Lenovo ThinkPad T1g Gen 8 21TD003GE | |
| Dell XPS 16 Core Ultra X7 358H | |
| Lenovo Yoga Pro 9i 16 RTX 5070 | |
| Lenovo ThinkBook 16p G6 21R00013GE | |
| Asus ProArt P16 RTX 5090 | |
| Gemiddelde van klas Multimedia (866 - 3231, n=56, laatste 2 jaar) | |
| Samsung Galaxy Book6 Ultra | |
| CrossMark / Productivity | |
| Apple MacBook Pro 16 2026 M5 Max | |
| Gemiddeld Apple M5 Max, Apple M5 Max 40-Core GPU (2477 - 2677, n=2) | |
| Apple MacBook Pro 16 2026 M5 Pro | |
| Lenovo ThinkPad T1g Gen 8 21TD003GE | |
| Lenovo ThinkBook 16p G6 21R00013GE | |
| Lenovo Yoga Pro 9i 16 RTX 5070 | |
| Dell XPS 16 Core Ultra X7 358H | |
| Gemiddelde van klas Multimedia (931 - 2677, n=56, laatste 2 jaar) | |
| Asus ProArt P16 RTX 5090 | |
| Samsung Galaxy Book6 Ultra | |
| CrossMark / Creativity | |
| Apple MacBook Pro 16 2026 M5 Max | |
| Gemiddeld Apple M5 Max, Apple M5 Max 40-Core GPU (3465 - 4522, n=2) | |
| Apple MacBook Pro 16 2026 M5 Pro | |
| Dell XPS 16 Core Ultra X7 358H | |
| Lenovo ThinkPad T1g Gen 8 21TD003GE | |
| Lenovo Yoga Pro 9i 16 RTX 5070 | |
| Lenovo ThinkBook 16p G6 21R00013GE | |
| Asus ProArt P16 RTX 5090 | |
| Samsung Galaxy Book6 Ultra | |
| Gemiddelde van klas Multimedia (907 - 4522, n=56, laatste 2 jaar) | |
| CrossMark / Responsiveness | |
| Apple MacBook Pro 16 2026 M5 Max | |
| Lenovo ThinkPad T1g Gen 8 21TD003GE | |
| Gemiddeld Apple M5 Max, Apple M5 Max 40-Core GPU (1777 - 2073, n=2) | |
| Apple MacBook Pro 16 2026 M5 Pro | |
| Dell XPS 16 Core Ultra X7 358H | |
| Lenovo Yoga Pro 9i 16 RTX 5070 | |
| Lenovo ThinkBook 16p G6 21R00013GE | |
| Gemiddelde van klas Multimedia (605 - 2073, n=56, laatste 2 jaar) | |
| Samsung Galaxy Book6 Ultra | |
| Asus ProArt P16 RTX 5090 | |
| WebXPRT 3 / Overall | |
| Apple MacBook Pro 16 2026 M5 Max | |
| Gemiddeld Apple M5 Max, Apple M5 Max 40-Core GPU (584 - 622, n=2) | |
| Apple MacBook Pro 16 2026 M5 Pro | |
| Gemiddelde van klas Multimedia (197.4 - 622, n=59, laatste 2 jaar) | |
| Lenovo Yoga Pro 9i 16 RTX 5070 | |
| Lenovo ThinkPad T1g Gen 8 21TD003GE | |
| Lenovo ThinkBook 16p G6 21R00013GE | |
| Samsung Galaxy Book6 Ultra | |
| Dell XPS 16 Core Ultra X7 358H | |
| Asus ProArt P16 RTX 5090 | |
| WebXPRT 4 / Overall | |
| Apple MacBook Pro 16 2026 M5 Max | |
| Gemiddeld Apple M5 Max, Apple M5 Max 40-Core GPU (397 - 415, n=2) | |
| Apple MacBook Pro 16 2026 M5 Pro | |
| Lenovo ThinkBook 16p G6 21R00013GE | |
| Lenovo Yoga Pro 9i 16 RTX 5070 | |
| Lenovo ThinkPad T1g Gen 8 21TD003GE | |
| Dell XPS 16 Core Ultra X7 358H | |
| Gemiddelde van klas Multimedia (167.3 - 415, n=59, laatste 2 jaar) | |
| Samsung Galaxy Book6 Ultra | |
| Asus ProArt P16 RTX 5090 | |
| Mozilla Kraken 1.1 / Total | |
| Samsung Galaxy Book6 Ultra | |
| Dell XPS 16 Core Ultra X7 358H | |
| Lenovo ThinkPad T1g Gen 8 21TD003GE | |
| Gemiddelde van klas Multimedia (228 - 835, n=60, laatste 2 jaar) | |
| Lenovo Yoga Pro 9i 16 RTX 5070 | |
| Asus ProArt P16 RTX 5090 | |
| Lenovo ThinkBook 16p G6 21R00013GE | |
| Apple MacBook Pro 16 2026 M5 Max | |
| Gemiddeld Apple M5 Max, Apple M5 Max 40-Core GPU (233 - 236, n=2) | |
| Apple MacBook Pro 16 2026 M5 Pro | |
* ... kleiner is beter
GPU-prestaties
De M5 Max GPU heeft toegang tot het systeemgeheugen, wat betekent dat deze een voordeel heeft ten opzichte van de meeste Windows-concurrenten met Nvidia-GPU’s, die doorgaans beperkt zijn tot 8 of 16 GB VRAM. Systemen met AMD’s Strix Halo en de binnenkort te verschijnen Nvidia RTX Spark-machines zullen dit voordeel eveneens hebben. Wat de ruwe prestaties betreft, is de M5 Max-GPU met 40 kernen zeer krachtig en slechts 12 % langzamer dan de RTX 5090 (bij 120 W) in de ProArt P16 in de veeleisende 3DMark Steel Nomad-test en is hij duidelijk sneller dan directe concurrenten die zijn uitgerust met de RTX 5060- of RTX 5070-GPU’s. De gamingprestaties zijn in vergelijking iets minder, maar nog steeds goed en u kunt alle ondersteunde titels op de hoogste instellingen spelen. Het aantal games is op macOS echter nog steeds beperkt, waardoor een Windows-computer in dit opzicht nog steeds superieur is.
| 3DMark Steel Nomad Score | 4386 punten | |
| 3DMark Steel Nomad Light Score | 17649 punten | |
Help | ||
| Blender / v3.3 Classroom METAL | |
| Gemiddelde van klas Multimedia (17.8 - 68, n=6, laatste 2 jaar) | |
| Apple MacBook Pro 16 2026 M5 Pro | |
| Apple MacBook Pro 16 2023 M3 Max | |
| Gemiddeld Apple M5 Max 40-Core GPU (23.3 - 25.6, n=2) | |
| Apple MacBook Pro 16 2026 M5 Max | |
| Apple MacBook Pro 16 M4 Max | |
| Blender / v3.3 Classroom OPTIX/RTX | |
| Gemiddelde van klas Multimedia (12 - 105, n=17, laatste 2 jaar) | |
| Lenovo Yoga Pro 9i 16 RTX 5070 | |
| Lenovo ThinkPad T1g Gen 8 21TD003GE | |
| Lenovo ThinkBook 16p G6 21R00013GE | |
| Samsung Galaxy Book6 Ultra | |
| Asus ProArt P16 RTX 5090 | |
| Blender / v3.3 Classroom CUDA | |
| Lenovo ThinkBook 16p G6 21R00013GE | |
| Lenovo ThinkBook 16p G6 21R00013GE | |
| Gemiddelde van klas Multimedia (20 - 186, n=17, laatste 2 jaar) | |
| Lenovo ThinkPad T1g Gen 8 21TD003GE | |
| Lenovo Yoga Pro 9i 16 RTX 5070 | |
| Samsung Galaxy Book6 Ultra | |
| Asus ProArt P16 RTX 5090 | |
| Blender / v3.3 Classroom CPU | |
| Gemiddelde van klas Multimedia (133 - 1042, n=57, laatste 2 jaar) | |
| Dell XPS 16 Core Ultra X7 358H | |
| Samsung Galaxy Book6 Ultra | |
| Lenovo ThinkPad T1g Gen 8 21TD003GE | |
| Lenovo Yoga Pro 9i 16 RTX 5070 | |
| Asus ProArt P16 RTX 5090 | |
| Apple MacBook Pro 16 2023 M3 Max | |
| Lenovo ThinkBook 16p G6 21R00013GE | |
| Apple MacBook Pro 16 M4 Max | |
| Gemiddeld Apple M5 Max 40-Core GPU (133 - 149, n=2) | |
| Apple MacBook Pro 16 2026 M5 Pro | |
| Apple MacBook Pro 16 2026 M5 Max | |
| Blender / v3.3 Classroom oneAPI/Intel | |
| Gemiddelde van klas Multimedia (105 - 492, n=17, laatste 2 jaar) | |
| Dell XPS 16 Core Ultra X7 358H | |
* ... kleiner is beter
| Assassin's Creed Shadows - 2560x1440 Ultra High | |
| Asus ProArt P16 RTX 5090 | |
| Apple MacBook Pro 16 2026 M5 Max | |
| Lenovo Yoga Pro 9i 16 RTX 5070 | |
| Gemiddelde van klas Multimedia (18 - 49, n=12, laatste 2 jaar) | |
| Apple MacBook Pro 16 2026 M5 Pro | |
| Total War Pharaoh - 2560x1440 Ultra Preset | |
| Apple MacBook Pro 16 2026 M5 Max | |
| Apple MacBook Pro 16 2026 M5 Pro | |
| Gemiddelde van klas Multimedia (35.3 - 58.9, n=10, laatste 2 jaar) | |
| lage | gem. | hoge | ultra | QHD | 4K | |
|---|---|---|---|---|---|---|
| Baldur's Gate 3 (2023) | 210.6 | 170.3 | 141.7 | 134.6 | 96.4 | 50.6 |
| Cyberpunk 2077 (2023) | 152.7 | 136.4 | 117.2 | 102.8 | 63.1 | 25.4 |
| Total War Pharaoh (2023) | 55.3 | 55.5 | 54.3 | |||
| Assassin's Creed Shadows (2025) | 75 | 67 | 61 | 42 | 37 | 26 |
Emissies en stroomverbruik
Systeemgeluid

De MacBook Pro is nog steeds een zeer stille laptop en de ventilatorcurves zijn nog steeds zeer conservatief, zodat korte pieken in de belasting (met name in de automatische modus) doorgaans niet leiden tot hoorbare ventilatoractiviteit. Als u de laptop echt zwaar belast, zullen de ventilatoren in de modus ‘High Power’ zeer luid zijn met bijna 54 dB(A) en veel stiller met ~41 dB(A) in de automatische modus. In de modus ‘Low Power’ zijn de ventilatoren echter helemaal niet hoorbaar op hun laagste snelheid.
Geluidsniveau
| Onbelast |
| 24.8 / 24.8 / 24.8 dB (A) |
| Belasting |
| 33.8 / 53.9 dB (A) |
 | ||
30 dB stil 40 dB(A) hoorbaar 50 dB(A) luid |
||
min:  , med: , med:  , max: , max:  Earthworks M23R, Arta (15 cm afstand) omgevingslawaai: 24.8 dB(A) Earthworks M23R, Arta (15 cm afstand) omgevingslawaai: 24.8 dB(A) | ||
| Apple MacBook Pro 16 2026 M5 Max M5 Max, M5 Max 40-Core GPU | Dell XPS 16 Core Ultra X7 358H Ultra X7 358H, Arc B390 Panther Lake iGPU | Samsung Galaxy Book6 Ultra Ultra 7 356H, GeForce RTX 5070 Laptop | Lenovo ThinkPad T1g Gen 8 21TD003GE Ultra 9 285H, GeForce RTX 5070 Laptop | Lenovo ThinkBook 16p G6 21R00013GE Ultra 7 255HX, GeForce RTX 5060 Laptop | Lenovo Yoga Pro 9i 16 RTX 5070 Ultra 9 285H, GeForce RTX 5070 Laptop | Asus ProArt P16 RTX 5090 Ryzen AI 9 HX 370, GeForce RTX 5090 Laptop | |
|---|---|---|---|---|---|---|---|
| Noise | 5% | -0% | -1% | -2% | -4% | -10% | |
| uit / omgeving * (dB) | 24.8 | 23.3 6% | 25.1 -1% | 25 -1% | 24.3 2% | 24.1 3% | 24.2 2% |
| Idle Minimum * (dB) | 24.8 | 23.4 6% | 25.1 -1% | 25 -1% | 24.3 2% | 24.1 3% | 24.2 2% |
| Idle Average * (dB) | 24.8 | 23.4 6% | 25.1 -1% | 25 -1% | 24.3 2% | 24.1 3% | 27.6 -11% |
| Idle Maximum * (dB) | 24.8 | 25.8 -4% | 25.1 -1% | 27.3 -10% | 28.3 -14% | 25.1 -1% | 32.6 -31% |
| Load Average * (dB) | 33.8 | 38 -12% | 36.9 -9% | 37.3 -10% | 38 -12% | 44.2 -31% | 42.6 -26% |
| Cyberpunk 2077 ultra * (dB) | 48.9 | 38.1 22% | 48.5 1% | 47.8 2% | 48.5 1% | 52.7 -8% | 51.2 -5% |
| Load Maximum * (dB) | 53.9 | 48.6 10% | 48.5 10% | 47.8 11% | 51.9 4% | 52.7 2% | 53.2 1% |
* ... kleiner is beter
Temperatuur
De oppervlaktetemperaturen vormen zelfs bij volledige belasting geen probleem. Wij meten slechts waarden tot 43 °C, dus er zijn geen beperkingen. Tijdens de stresstest verbruikt de M5 Max maximaal 114 watt en stabiliseert vervolgens snel op 70 watt.
(±) De maximumtemperatuur aan de bovenzijde bedraagt 43.3 °C / 110 F, vergeleken met het gemiddelde van 36.8 °C / 98 F, variërend van 21 tot 71 °C voor de klasse Multimedia.
(±) De bodem warmt op tot een maximum van 42.9 °C / 109 F, vergeleken met een gemiddelde van 39.1 °C / 102 F
(+) Bij onbelast gebruik bedraagt de gemiddelde temperatuur voor de bovenzijde 23.2 °C / 74 F, vergeleken met het apparaatgemiddelde van 31.2 °C / 88 F.
(-) 3: The average temperature for the upper side is 38.3 °C / 101 F, compared to the average of 31.2 °C / 88 F for the class Multimedia.
(+) De handpalmsteunen en het touchpad bereiken maximaal de huidtemperatuur (32.5 °C / 90.5 F) en zijn dus niet heet.
(-) De gemiddelde temperatuur van de handpalmsteun van soortgelijke toestellen bedroeg 28.7 °C / 83.7 F (-3.8 °C / -6.8 F).


| Apple MacBook Pro 16 2026 M5 Max M5 Max, M5 Max 40-Core GPU | Apple MacBook Pro 16 2026 M5 Pro M5 Pro 18-Core, M5 Pro 20-Core GPU | Dell XPS 16 Core Ultra X7 358H Ultra X7 358H, Arc B390 Panther Lake iGPU | Samsung Galaxy Book6 Ultra Ultra 7 356H, GeForce RTX 5070 Laptop | Lenovo ThinkPad T1g Gen 8 21TD003GE Ultra 9 285H, GeForce RTX 5070 Laptop | Lenovo ThinkBook 16p G6 21R00013GE Ultra 7 255HX, GeForce RTX 5060 Laptop | Lenovo Yoga Pro 9i 16 RTX 5070 Ultra 9 285H, GeForce RTX 5070 Laptop | Asus ProArt P16 RTX 5090 Ryzen AI 9 HX 370, GeForce RTX 5090 Laptop | |
|---|---|---|---|---|---|---|---|---|
| Heat | 1% | 3% | -8% | -9% | -2% | -10% | -11% | |
| Maximum Upper Side * (°C) | 43.3 | 40.6 6% | 40.6 6% | 42.7 1% | 44.7 -3% | 41.3 5% | 41.8 3% | 47 -9% |
| Maximum Bottom * (°C) | 42.9 | 42.4 1% | 39.8 7% | 49.1 -14% | 42.8 -0% | 41.8 3% | 47.9 -12% | 51.6 -20% |
| Idle Upper Side * (°C) | 23.4 | 23.8 -2% | 23.2 1% | 25.4 -9% | 26.9 -15% | 25.5 -9% | 26.3 -12% | 24.9 -6% |
| Idle Bottom * (°C) | 23.5 | 23.6 -0% | 23.8 -1% | 25.5 -9% | 27.3 -16% | 25.4 -8% | 27.6 -17% | 25.5 -9% |
* ... kleiner is beter
Sprekers
Het luidsprekersysteem met zes modules behoort nog steeds tot de beste die er te krijgen zijn en presteert iets beter dan de concurrenten, hoewel het verschil niet groot is.
Apple MacBook Pro 16 2026 M5 Max audioanalyse
(+) | luidsprekers kunnen relatief luid spelen (83.5 dB)
Bas 100 - 315 Hz
(+) | goede baars - slechts 4.7% verwijderd van de mediaan
(+) | de lage tonen zijn lineair (5.5% delta naar de vorige frequentie)
Midden 400 - 2000 Hz
(+) | evenwichtige middens - slechts 0.9% verwijderd van de mediaan
(+) | de middentonen zijn lineair (2.7% delta ten opzichte van de vorige frequentie)
Hoog 2 - 16 kHz
(+) | evenwichtige hoogtepunten - slechts 2.3% verwijderd van de mediaan
(+) | de hoge tonen zijn lineair (2.6% delta naar de vorige frequentie)
Algemeen 100 - 16.000 Hz
(+) | het totale geluid is lineair (5.4% verschil met de mediaan)
Vergeleken met dezelfde klasse
» 1% van alle geteste apparaten in deze klasse waren beter, 1% vergelijkbaar, 98% slechter
» De beste had een delta van 5%, het gemiddelde was 17%, de slechtste was 45%
Vergeleken met alle geteste toestellen
» 0% van alle geteste apparaten waren beter, 0% gelijk, 100% slechter
» De beste had een delta van 4%, het gemiddelde was 23%, de slechtste was 136%
Apple MacBook Pro 16 2026 M5 Pro audioanalyse
(+) | luidsprekers kunnen relatief luid spelen (84.7 dB)
Bas 100 - 315 Hz
(+) | goede baars - slechts 4.9% verwijderd van de mediaan
(+) | de lage tonen zijn lineair (6% delta naar de vorige frequentie)
Midden 400 - 2000 Hz
(+) | evenwichtige middens - slechts 1% verwijderd van de mediaan
(+) | de middentonen zijn lineair (2.7% delta ten opzichte van de vorige frequentie)
Hoog 2 - 16 kHz
(+) | evenwichtige hoogtepunten - slechts 2.7% verwijderd van de mediaan
(+) | de hoge tonen zijn lineair (2.9% delta naar de vorige frequentie)
Algemeen 100 - 16.000 Hz
(+) | het totale geluid is lineair (5.2% verschil met de mediaan)
Vergeleken met dezelfde klasse
» 1% van alle geteste apparaten in deze klasse waren beter, 1% vergelijkbaar, 98% slechter
» De beste had een delta van 5%, het gemiddelde was 17%, de slechtste was 45%
Vergeleken met alle geteste toestellen
» 0% van alle geteste apparaten waren beter, 0% gelijk, 100% slechter
» De beste had een delta van 4%, het gemiddelde was 23%, de slechtste was 136%
Dell XPS 16 Core Ultra X7 358H audioanalyse
(+) | luidsprekers kunnen relatief luid spelen (85.1 dB)
Bas 100 - 315 Hz
(±) | verminderde zeebaars - gemiddeld 7.6% lager dan de mediaan
(+) | de lage tonen zijn lineair (6.1% delta naar de vorige frequentie)
Midden 400 - 2000 Hz
(+) | evenwichtige middens - slechts 2.1% verwijderd van de mediaan
(+) | de middentonen zijn lineair (3.4% delta ten opzichte van de vorige frequentie)
Hoog 2 - 16 kHz
(+) | evenwichtige hoogtepunten - slechts 2.3% verwijderd van de mediaan
(+) | de hoge tonen zijn lineair (4.1% delta naar de vorige frequentie)
Algemeen 100 - 16.000 Hz
(+) | het totale geluid is lineair (6.2% verschil met de mediaan)
Vergeleken met dezelfde klasse
» 4% van alle geteste apparaten in deze klasse waren beter, 0% vergelijkbaar, 96% slechter
» De beste had een delta van 5%, het gemiddelde was 17%, de slechtste was 45%
Vergeleken met alle geteste toestellen
» 0% van alle geteste apparaten waren beter, 0% gelijk, 99% slechter
» De beste had een delta van 4%, het gemiddelde was 23%, de slechtste was 136%
Samsung Galaxy Book6 Ultra audioanalyse
(+) | luidsprekers kunnen relatief luid spelen (85.6 dB)
Bas 100 - 315 Hz
(±) | verminderde zeebaars - gemiddeld 5.9% lager dan de mediaan
(±) | lineariteit van de lage tonen is gemiddeld (7.9% delta ten opzichte van de vorige frequentie)
Midden 400 - 2000 Hz
(+) | evenwichtige middens - slechts 3.7% verwijderd van de mediaan
(+) | de middentonen zijn lineair (4.3% delta ten opzichte van de vorige frequentie)
Hoog 2 - 16 kHz
(+) | evenwichtige hoogtepunten - slechts 2.2% verwijderd van de mediaan
(+) | de hoge tonen zijn lineair (3.4% delta naar de vorige frequentie)
Algemeen 100 - 16.000 Hz
(+) | het totale geluid is lineair (7.3% verschil met de mediaan)
Vergeleken met dezelfde klasse
» 6% van alle geteste apparaten in deze klasse waren beter, 1% vergelijkbaar, 93% slechter
» De beste had een delta van 5%, het gemiddelde was 17%, de slechtste was 45%
Vergeleken met alle geteste toestellen
» 1% van alle geteste apparaten waren beter, 0% gelijk, 99% slechter
» De beste had een delta van 4%, het gemiddelde was 23%, de slechtste was 136%
Lenovo ThinkPad T1g Gen 8 21TD003GE audioanalyse
(+) | luidsprekers kunnen relatief luid spelen (85.6 dB)
Bas 100 - 315 Hz
(±) | verminderde zeebaars - gemiddeld 9.3% lager dan de mediaan
(±) | lineariteit van de lage tonen is gemiddeld (11.9% delta ten opzichte van de vorige frequentie)
Midden 400 - 2000 Hz
(+) | evenwichtige middens - slechts 2.5% verwijderd van de mediaan
(+) | de middentonen zijn lineair (4% delta ten opzichte van de vorige frequentie)
Hoog 2 - 16 kHz
(+) | evenwichtige hoogtepunten - slechts 3.4% verwijderd van de mediaan
(±) | lineariteit van de hoogtepunten is gemiddeld (7.5% delta ten opzichte van de vorige frequentie)
Algemeen 100 - 16.000 Hz
(+) | het totale geluid is lineair (8.7% verschil met de mediaan)
Vergeleken met dezelfde klasse
» 11% van alle geteste apparaten in deze klasse waren beter, 2% vergelijkbaar, 87% slechter
» De beste had een delta van 5%, het gemiddelde was 17%, de slechtste was 45%
Vergeleken met alle geteste toestellen
» 3% van alle geteste apparaten waren beter, 1% gelijk, 97% slechter
» De beste had een delta van 4%, het gemiddelde was 23%, de slechtste was 136%
Lenovo ThinkBook 16p G6 21R00013GE audioanalyse
(+) | luidsprekers kunnen relatief luid spelen (83.3 dB)
Bas 100 - 315 Hz
(±) | verminderde zeebaars - gemiddeld 6.8% lager dan de mediaan
(±) | lineariteit van de lage tonen is gemiddeld (9.8% delta ten opzichte van de vorige frequentie)
Midden 400 - 2000 Hz
(±) | hogere middens - gemiddeld 5.4% hoger dan de mediaan
(+) | de middentonen zijn lineair (4.2% delta ten opzichte van de vorige frequentie)
Hoog 2 - 16 kHz
(+) | evenwichtige hoogtepunten - slechts 2.8% verwijderd van de mediaan
(+) | de hoge tonen zijn lineair (3.8% delta naar de vorige frequentie)
Algemeen 100 - 16.000 Hz
(+) | het totale geluid is lineair (10.1% verschil met de mediaan)
Vergeleken met dezelfde klasse
» 14% van alle geteste apparaten in deze klasse waren beter, 2% vergelijkbaar, 84% slechter
» De beste had een delta van 5%, het gemiddelde was 17%, de slechtste was 45%
Vergeleken met alle geteste toestellen
» 5% van alle geteste apparaten waren beter, 2% gelijk, 94% slechter
» De beste had een delta van 4%, het gemiddelde was 23%, de slechtste was 136%
Lenovo Yoga Pro 9i 16 RTX 5070 audioanalyse
(±) | luidspreker luidheid is gemiddeld maar goed (81.4 dB)
Bas 100 - 315 Hz
(±) | verminderde zeebaars - gemiddeld 5.5% lager dan de mediaan
(±) | lineariteit van de lage tonen is gemiddeld (7.5% delta ten opzichte van de vorige frequentie)
Midden 400 - 2000 Hz
(+) | evenwichtige middens - slechts 1.7% verwijderd van de mediaan
(+) | de middentonen zijn lineair (3.1% delta ten opzichte van de vorige frequentie)
Hoog 2 - 16 kHz
(±) | lagere maxima - gemiddeld 6.2% lager dan de mediaan
(+) | de hoge tonen zijn lineair (3.9% delta naar de vorige frequentie)
Algemeen 100 - 16.000 Hz
(+) | het totale geluid is lineair (9.7% verschil met de mediaan)
Vergeleken met dezelfde klasse
» 14% van alle geteste apparaten in deze klasse waren beter, 1% vergelijkbaar, 85% slechter
» De beste had een delta van 5%, het gemiddelde was 17%, de slechtste was 45%
Vergeleken met alle geteste toestellen
» 4% van alle geteste apparaten waren beter, 1% gelijk, 95% slechter
» De beste had een delta van 4%, het gemiddelde was 23%, de slechtste was 136%
Asus ProArt P16 RTX 5090 audioanalyse
(±) | luidspreker luidheid is gemiddeld maar goed (80.8 dB)
Bas 100 - 315 Hz
(+) | goede baars - slechts 3.3% verwijderd van de mediaan
(±) | lineariteit van de lage tonen is gemiddeld (7.7% delta ten opzichte van de vorige frequentie)
Midden 400 - 2000 Hz
(+) | evenwichtige middens - slechts 2.9% verwijderd van de mediaan
(+) | de middentonen zijn lineair (1.9% delta ten opzichte van de vorige frequentie)
Hoog 2 - 16 kHz
(+) | evenwichtige hoogtepunten - slechts 4.1% verwijderd van de mediaan
(+) | de hoge tonen zijn lineair (5.5% delta naar de vorige frequentie)
Algemeen 100 - 16.000 Hz
(+) | het totale geluid is lineair (8.3% verschil met de mediaan)
Vergeleken met dezelfde klasse
» 9% van alle geteste apparaten in deze klasse waren beter, 2% vergelijkbaar, 89% slechter
» De beste had een delta van 5%, het gemiddelde was 17%, de slechtste was 45%
Vergeleken met alle geteste toestellen
» 2% van alle geteste apparaten waren beter, 1% gelijk, 97% slechter
» De beste had een delta van 4%, het gemiddelde was 23%, de slechtste was 136%
Stroomverbruik en batterijduur

Hoewel de MacBook Pro 16 efficiënt is bij lichte belasting en in ruststand, vormt het stroomverbruik bij zware belasting een probleem. Wij registreren een maximumwaarde van 150 watt, die vervolgens tijdens de stresstest schommelt tussen 130 en 140 watt. Het batterijniveau daalt echter van 100 naar slechts 88 % na één uur gecombineerde belasting, wat een probleem vormt. Wij hebben ook een krachtigere adapter van 180 W getest, maar het gedrag bleef hetzelfde. De batterijduur bij 150 nits is uitstekend met 18,5 uur in onze Wi-Fi-test en nog steeds behoorlijk (gezien de hoge helderheid) bij maximale SDR-helderheid met bijna 7 uur.
| Uit / Standby | 0.08 / 1.1 Watt |
| Inactief | 2.7 / 13.3 / 13.5 Watt |
| Belasting |
141 / 150.3 Watt |
   
| |
Key:
min: ,
med: ,
max: Metrahit Energy | |
| Apple MacBook Pro 16 2026 M5 Max M5 Max, M5 Max 40-Core GPU, Apple SSD AP2048Z, Mini-LED, 3456x2234, 16.2" | Apple MacBook Pro 16 2026 M5 Pro M5 Pro 18-Core, M5 Pro 20-Core GPU, Apple SSD AP4096Z, Mini-LED, 3456x2234, 16.2" | Dell XPS 16 Core Ultra X7 358H Ultra X7 358H, Arc B390 Panther Lake iGPU, , OLED, 3200x2000, 16" | Samsung Galaxy Book6 Ultra Ultra 7 356H, GeForce RTX 5070 Laptop, Samsung PM9C1b MZVL81T0HFLB-00BH1, OLED, 2880x1800, 16" | Lenovo ThinkPad T1g Gen 8 21TD003GE Ultra 9 285H, GeForce RTX 5070 Laptop, Samsung PM9E1 MZVLC2T0HBLD, Tandem-OLED, 3200x2000, 16" | Lenovo ThinkBook 16p G6 21R00013GE Ultra 7 255HX, GeForce RTX 5060 Laptop, SK hynix PVC10 HFS001TEM4X182N, IPS, 2560x1600, 16" | Lenovo Yoga Pro 9i 16 RTX 5070 Ultra 9 285H, GeForce RTX 5070 Laptop, WD PC SN7100S SDFPMSL-1T00-1101, OLED, 3200x2000, 16" | Asus ProArt P16 RTX 5090 Ryzen AI 9 HX 370, GeForce RTX 5090 Laptop, Micron 2500 2TB MTFDKBA2T0QGN-1BN1AABGA, OLED, 3840x2400, 16" | Gemiddeld Apple M5 Max 40-Core GPU | Gemiddelde van klas Multimedia | |
|---|---|---|---|---|---|---|---|---|---|---|
| Power Consumption | -2% | 36% | 14% | -22% | -63% | -42% | -57% | 10% | 2% | |
| Idle Minimum * (Watt) | 2.7 | 4.4 -63% | 4 -48% | 4.4 -63% | 8.5 -215% | 9 -233% | 8.8 -226% | 10.9 -304% | 2.6 ? 4% | 5.39 ? -100% |
| Idle Average * (Watt) | 13.3 | 18.3 -38% | 4.4 67% | 6.4 52% | 13.6 -2% | 14.8 -11% | 16.1 -21% | 12.1 9% | 12.5 ? 6% | 10.2 ? 23% |
| Idle Maximum * (Watt) | 13.5 | 18.4 -36% | 10.2 24% | 7.1 47% | 14.1 -4% | 16.7 -24% | 16.5 -22% | 12.5 7% | 12.7 ? 6% | 12.4 ? 8% |
| Load Average * (Watt) | 141 | 84.2 40% | 44.2 69% | 55.1 61% | 84.5 40% | 92.8 34% | 89.3 37% | 129.3 8% | 118.3 ? 16% | 65.5 ? 54% |
| Cyberpunk 2077 ultra external monitor * (Watt) | 136.7 | 79.8 42% | 62.4 54% | 133 3% | 118.1 14% | 212 -55% | 157.9 -16% | 172.8 -26% | ||
| Cyberpunk 2077 ultra * (Watt) | 128.9 | 82.5 36% | 62.6 51% | 134.3 -4% | 120.3 7% | 215 -67% | 160.6 -25% | 176.6 -37% | ||
| Load Maximum * (Watt) | 150.3 | 145 4% | 94.6 37% | 143.9 4% | 143 5% | 281.5 -87% | 177.4 -18% | 233.9 -56% | 124.6 ? 17% | 111 ? 26% |
* ... kleiner is beter
Stroomverbruik Cyberpunk / Stresstest
Stroomverbruik externe monitor
Notebookcheck-beoordeling
Apple MacBook Pro 16 2026 M5 Max
- 27-08-2026 v8
Andreas Osthoff
 Total Sustainability Score:
 Vergelijking van potentiële concurrenten
Afbeelding | Model / recensie | prijs | Gewicht | Hoogte | Scherm |
|---|---|---|---|---|---|
1. 92.4%  | Apple MacBook Pro 16 2026 M5 Max Apple M5 Max ⎘ Apple M5 Max 40-Core GPU ⎘ 48 GB Geheugen, 2048 GB SSD | Catalogusprijs: 5699€ | 2.1 kg | 16.8 mm | 16.20" 3456x2234 254 PPI Mini-LED |
2. 92.3%  | Apple MacBook Pro 16 2026 M5 Pro Apple M5 Pro 18-Core ⎘ Apple M5 Pro 20-Core GPU ⎘ 64 GB Geheugen, 4096 GB SSD | Catalogusprijs: 5298€ | 2.1 kg | 16.8 mm | 16.20" 3456x2234 254 PPI Mini-LED |
3. 87.2%  | Dell XPS 16 Core Ultra X7 358H Intel Core Ultra X7 358H ⎘ Intel Arc B390 12 Xe3 Panther Lake iGPU ⎘ 32 GB Geheugen | Amazon: 1. $1,977.99 Dell Premium 16 (Previously ... 2. $2,599.00 Dell Premium 16 (XPS 16 2025... 3. $1,999.00 Dell Premium 16 (Previously ... Catalogusprijs: 2350 USD | 1.7 kg | 14.62 mm | 16.00" 3200x2000 236 PPI OLED |
4. 90.7%  | Samsung Galaxy Book6 Ultra Intel Core Ultra 7 356H ⎘ NVIDIA GeForce RTX 5070 Laptop ⎘ 32 GB Geheugen, 1000 GB SSD | Catalogusprijs: 3599€ | 1.9 kg | 15.4 mm | 16.00" 2880x1800 212 PPI OLED |
5. 92.4%  | Lenovo ThinkPad T1g Gen 8 21TD003GE Intel Core Ultra 9 285H ⎘ NVIDIA GeForce RTX 5070 Laptop ⎘ 64 GB Geheugen, 2048 GB SSD | Catalogusprijs: 4500€ | 1.9 kg | 15.8 mm | 16.00" 3200x2000 236 PPI Tandem-OLED |
6. 89.9%  | Lenovo ThinkBook 16p G6 21R00013GE Intel Core Ultra 7 255HX ⎘ NVIDIA GeForce RTX 5060 Laptop ⎘ 32 GB Geheugen, 1024 GB SSD | Catalogusprijs: 1939€ | 2.1 kg | 17.9 mm | 16.00" 2560x1600 189 PPI IPS |
7. 90.4%  | Lenovo Yoga Pro 9i 16 RTX 5070 Intel Core Ultra 9 285H ⎘ NVIDIA GeForce RTX 5070 Laptop ⎘ 64 GB Geheugen, 1024 GB SSD | Catalogusprijs: 2800€ | 1.9 kg | 17.9 mm | 16.00" 3200x2000 236 PPI OLED |
8. 89.7%  | Asus ProArt P16 RTX 5090 AMD Ryzen AI 9 HX 370 ⎘ NVIDIA GeForce RTX 5090 Laptop ⎘ 64 GB Geheugen, 2048 GB SSD | Amazon: $4,390.64 Catalogusprijs: 4799€ | 2 kg | 18.3 mm | 16.00" 3840x2400 283 PPI OLED |
Transparantie
De selectie van te beoordelen apparaten wordt gemaakt door onze redactie. Het testexemplaar werd ten behoeve van deze beoordeling door de fabrikant of detailhandelaar in bruikleen aan de auteur verstrekt. De kredietverstrekker had geen invloed op deze recensie, noch ontving de fabrikant vóór publicatie een exemplaar van deze recensie. Er bestond geen verplichting om deze recensie te publiceren. Als onafhankelijk mediabedrijf is Notebookcheck niet onderworpen aan het gezag van fabrikanten, detailhandelaren of uitgevers.
[transparency_disclaimer]Dit is hoe Notebookcheck test
Elk jaar beoordeelt Notebookcheck onafhankelijk honderden laptops en smartphones met behulp van gestandaardiseerde procedures om ervoor te zorgen dat alle resultaten vergelijkbaar zijn. We hebben onze testmethoden al zo'n 20 jaar voortdurend ontwikkeld en daarbij de industriestandaard bepaald. In onze testlaboratoria wordt gebruik gemaakt van hoogwaardige meetapparatuur door ervaren technici en redacteuren. Deze tests omvatten een validatieproces in meerdere fasen. Ons complexe beoordelingssysteem is gebaseerd op honderden goed onderbouwde metingen en benchmarks, waardoor de objectiviteit behouden blijft. Meer informatie over onze testmethoden kunt u hier vinden.
 Add as a preferred source on Google