Conclusie
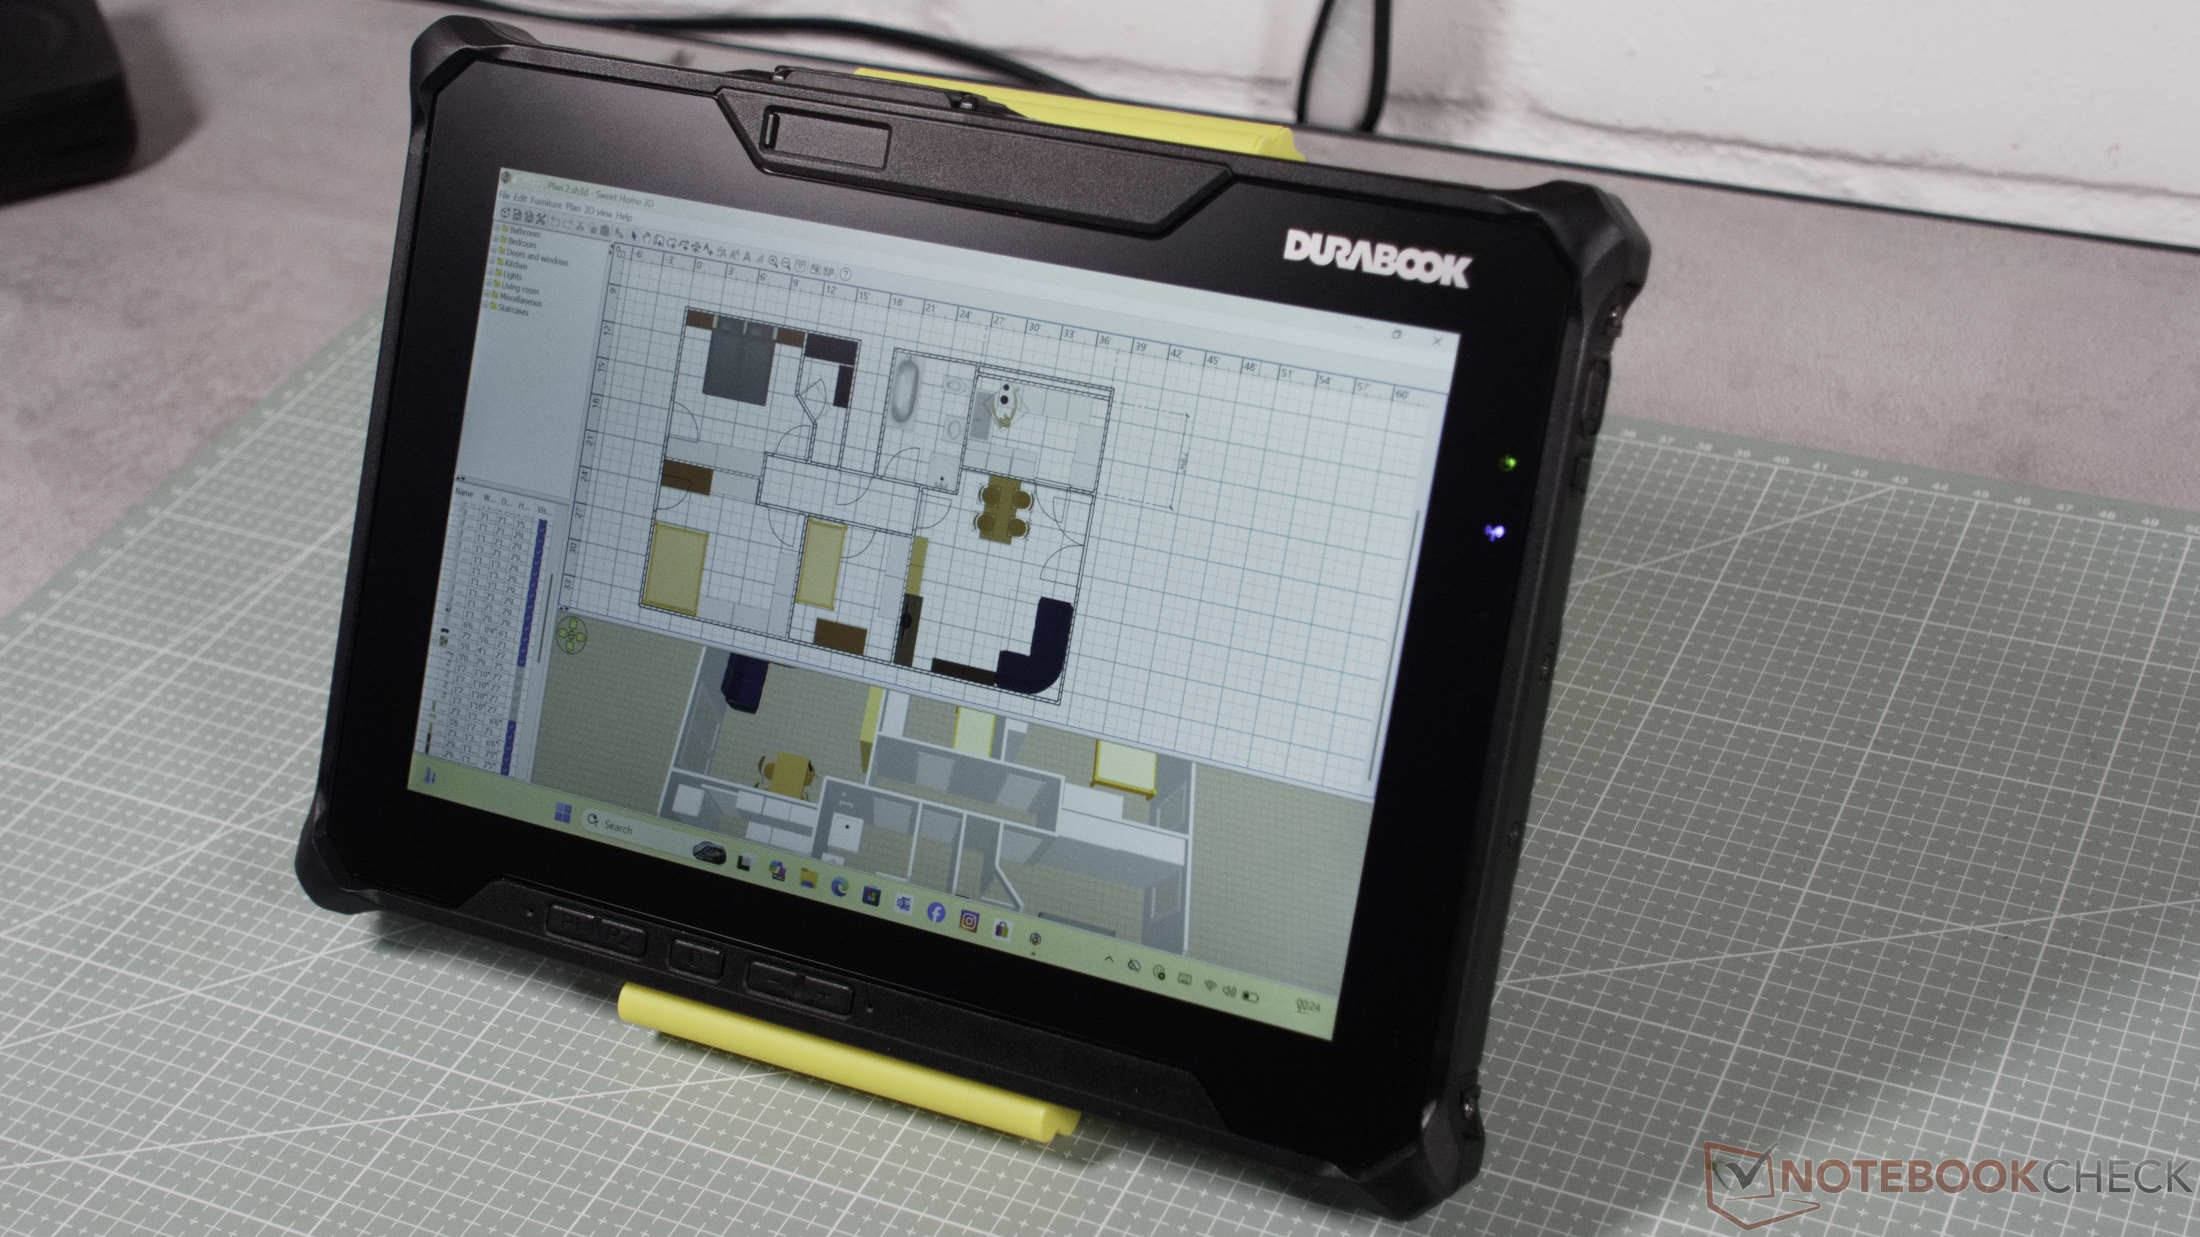
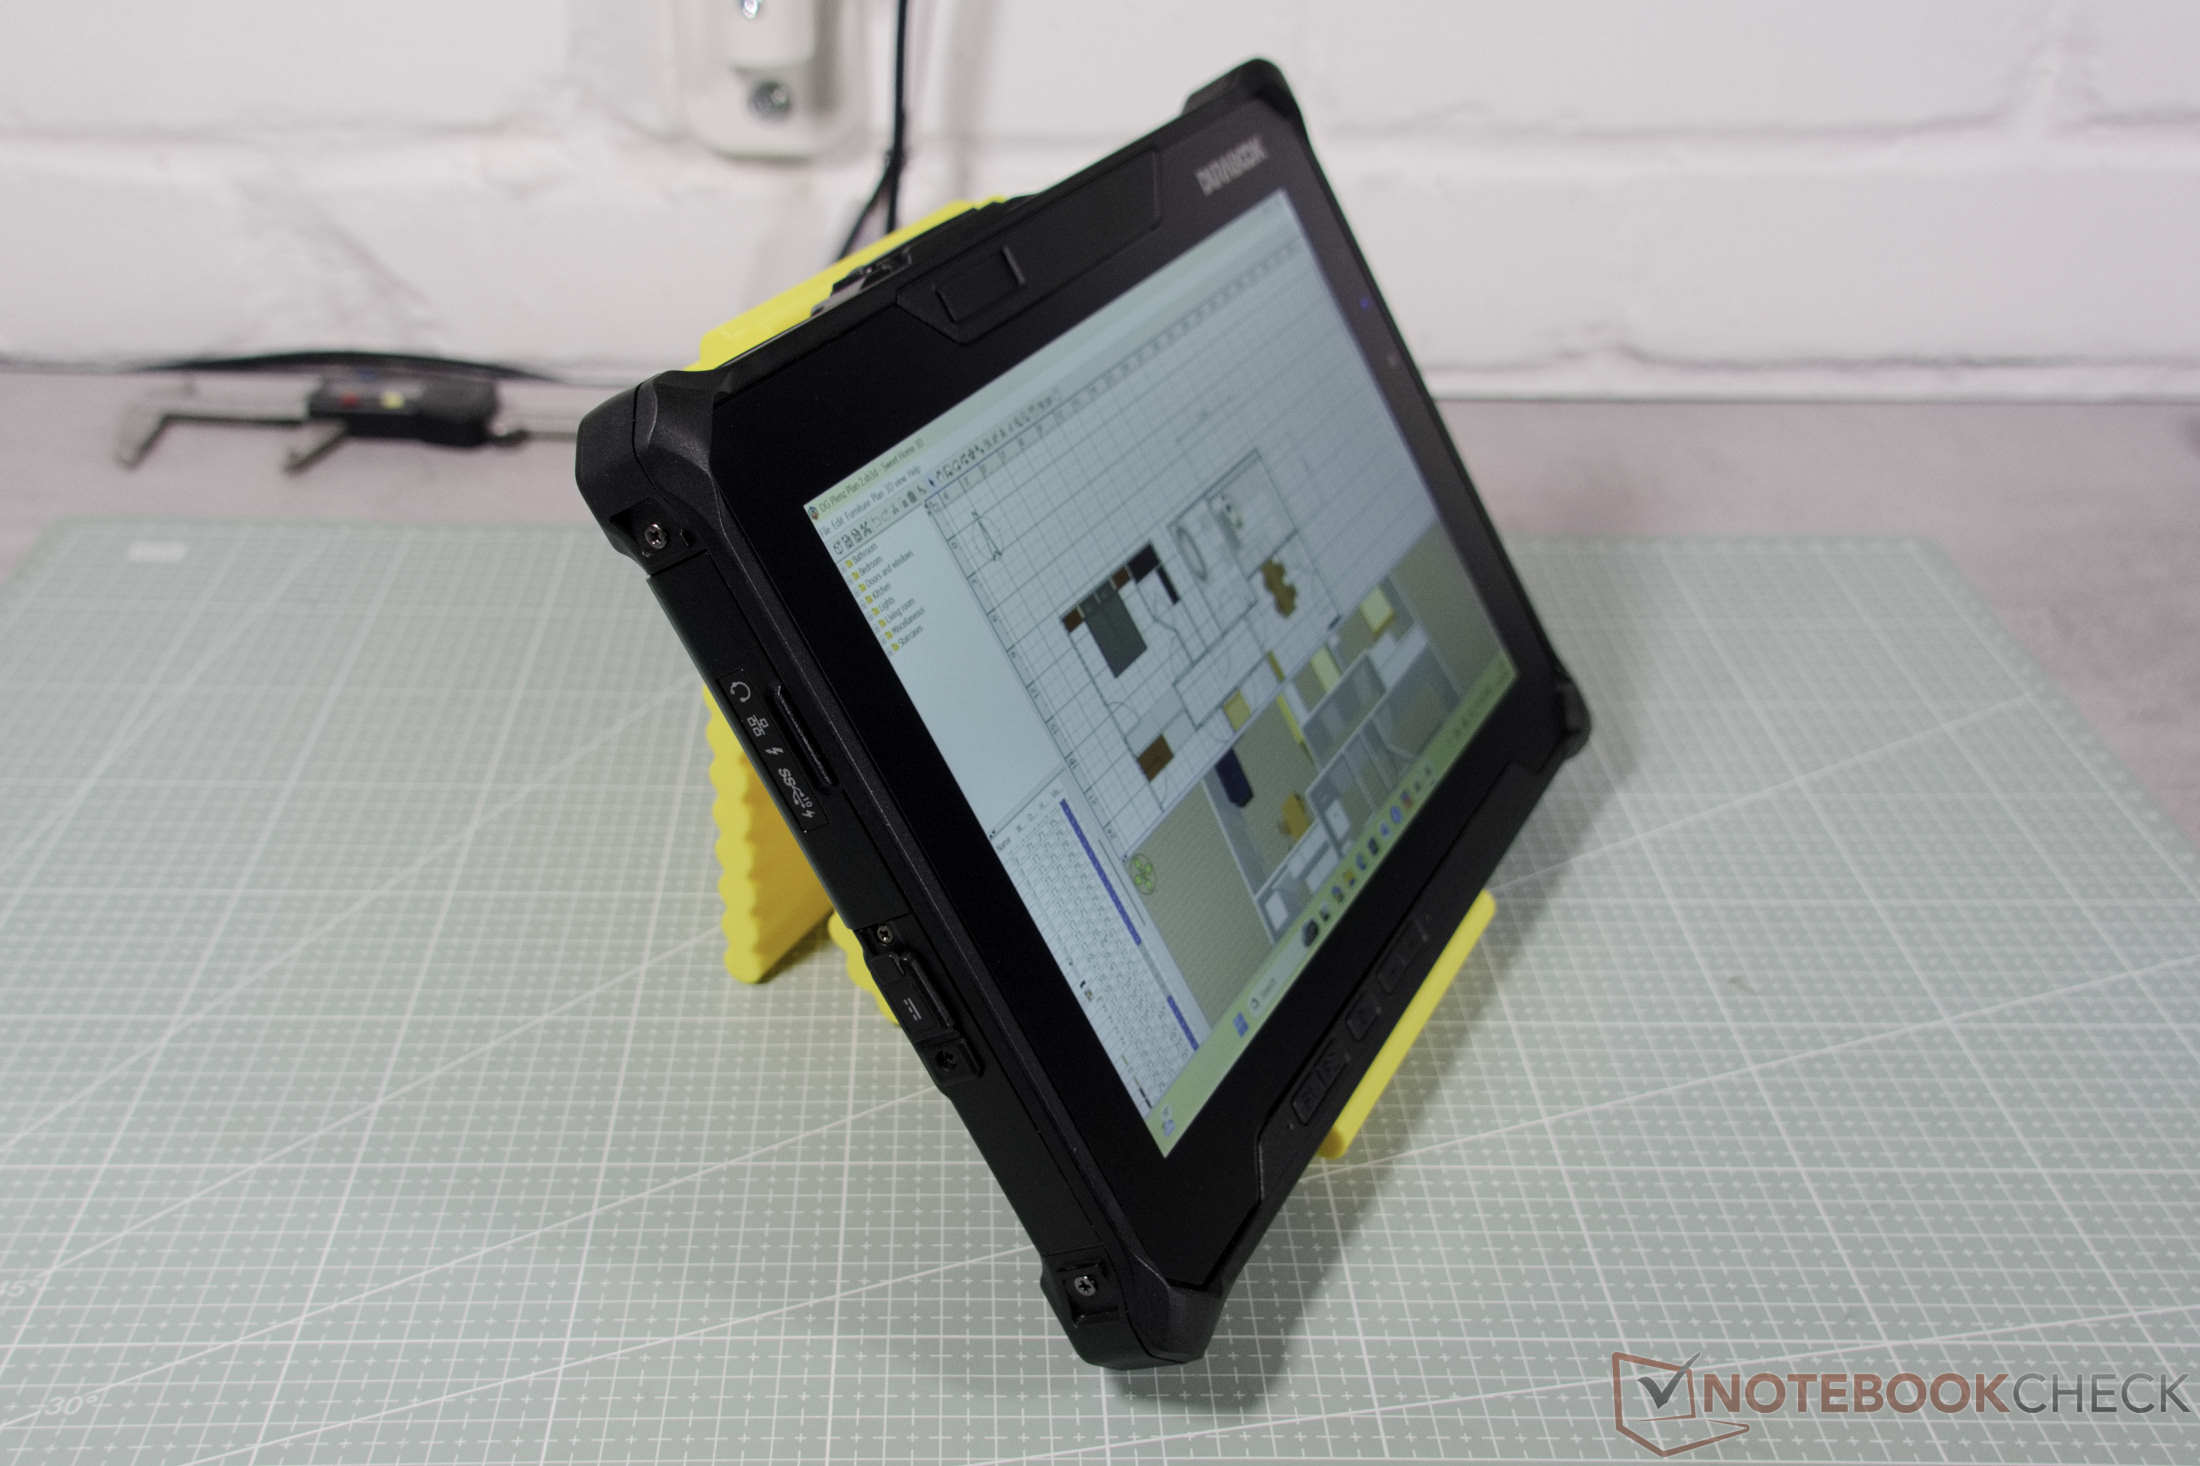
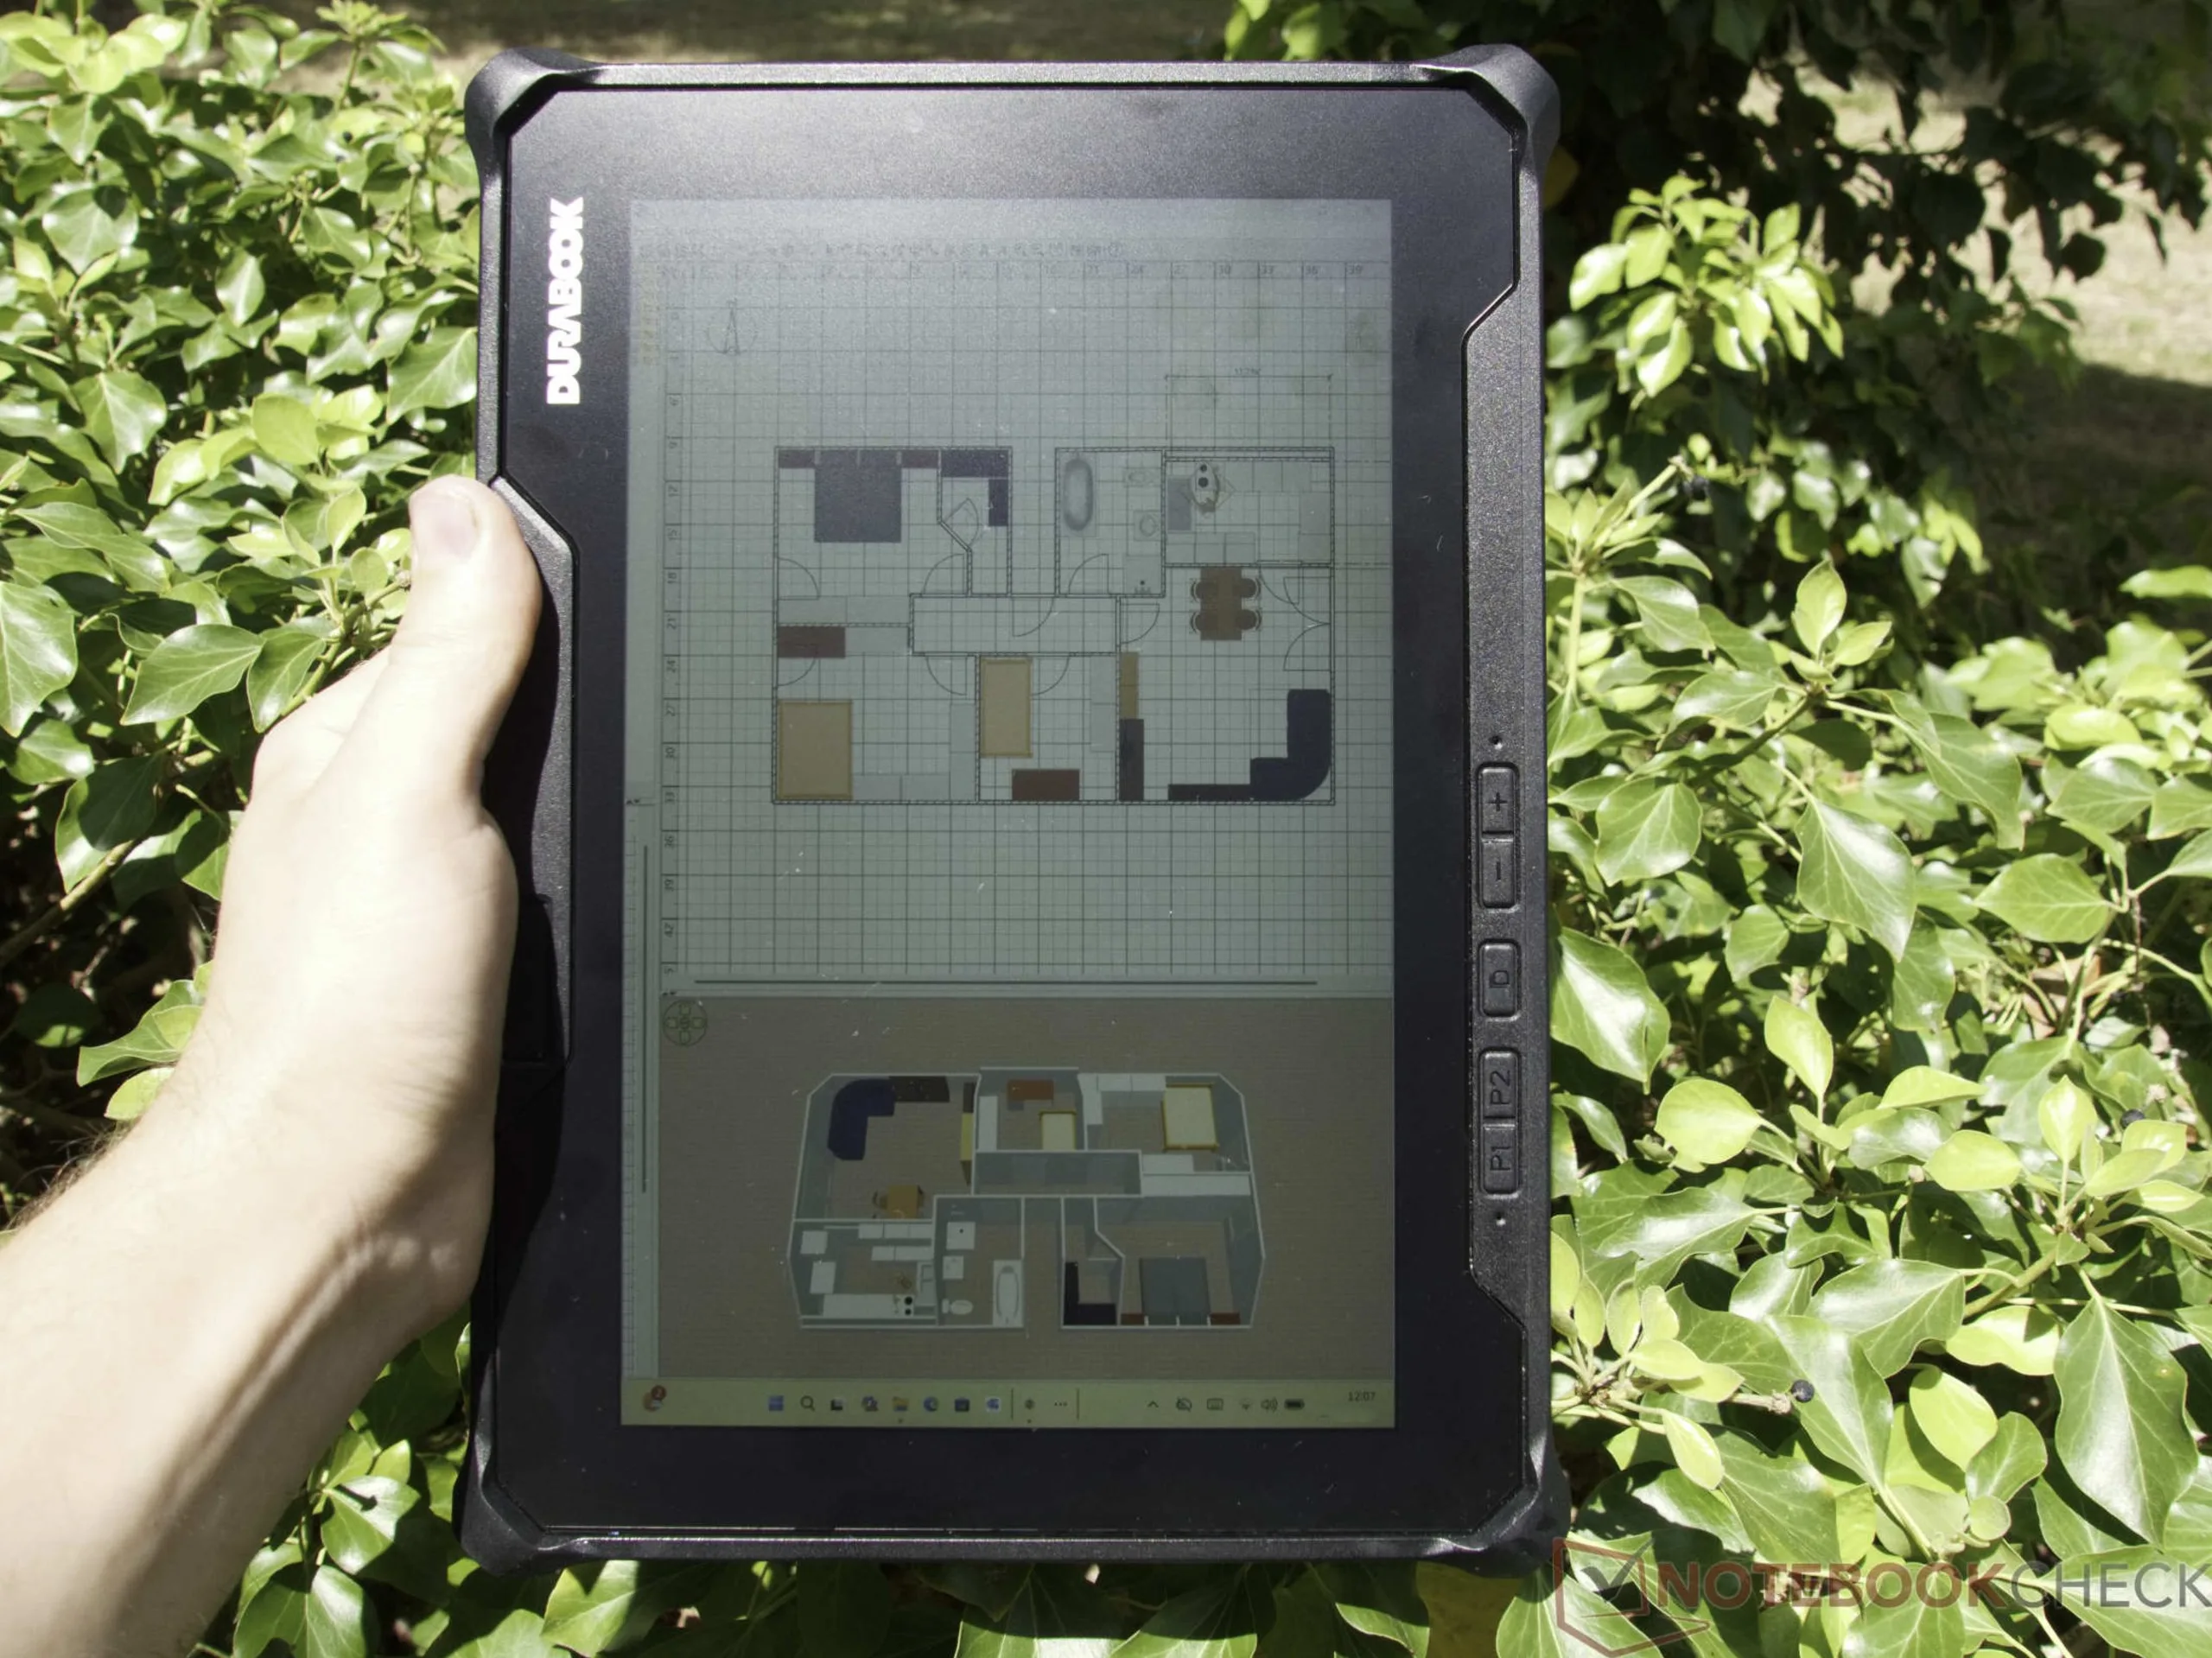
Als u naar de Durabook R10 kijkt, lijkt het wel een baksteen in vergelijking met gangbare consumententablets. Met een hoogte van iets minder dan drie centimeter, dikke schermranden en een gewicht van meer dan 1,2 kilogram (~2,65 lbs) voelt het 10,1-inch apparaat zwaar aan in de hand. Dun en vederlicht zijn hier niet de doelstellingen. De fabrikant bouwt compromisloze apparaten voor gebruik in uiterst veeleisende omgevingen – of dat nu op een stoffige bouwplaats, in een industriële faciliteit of in het veld is.
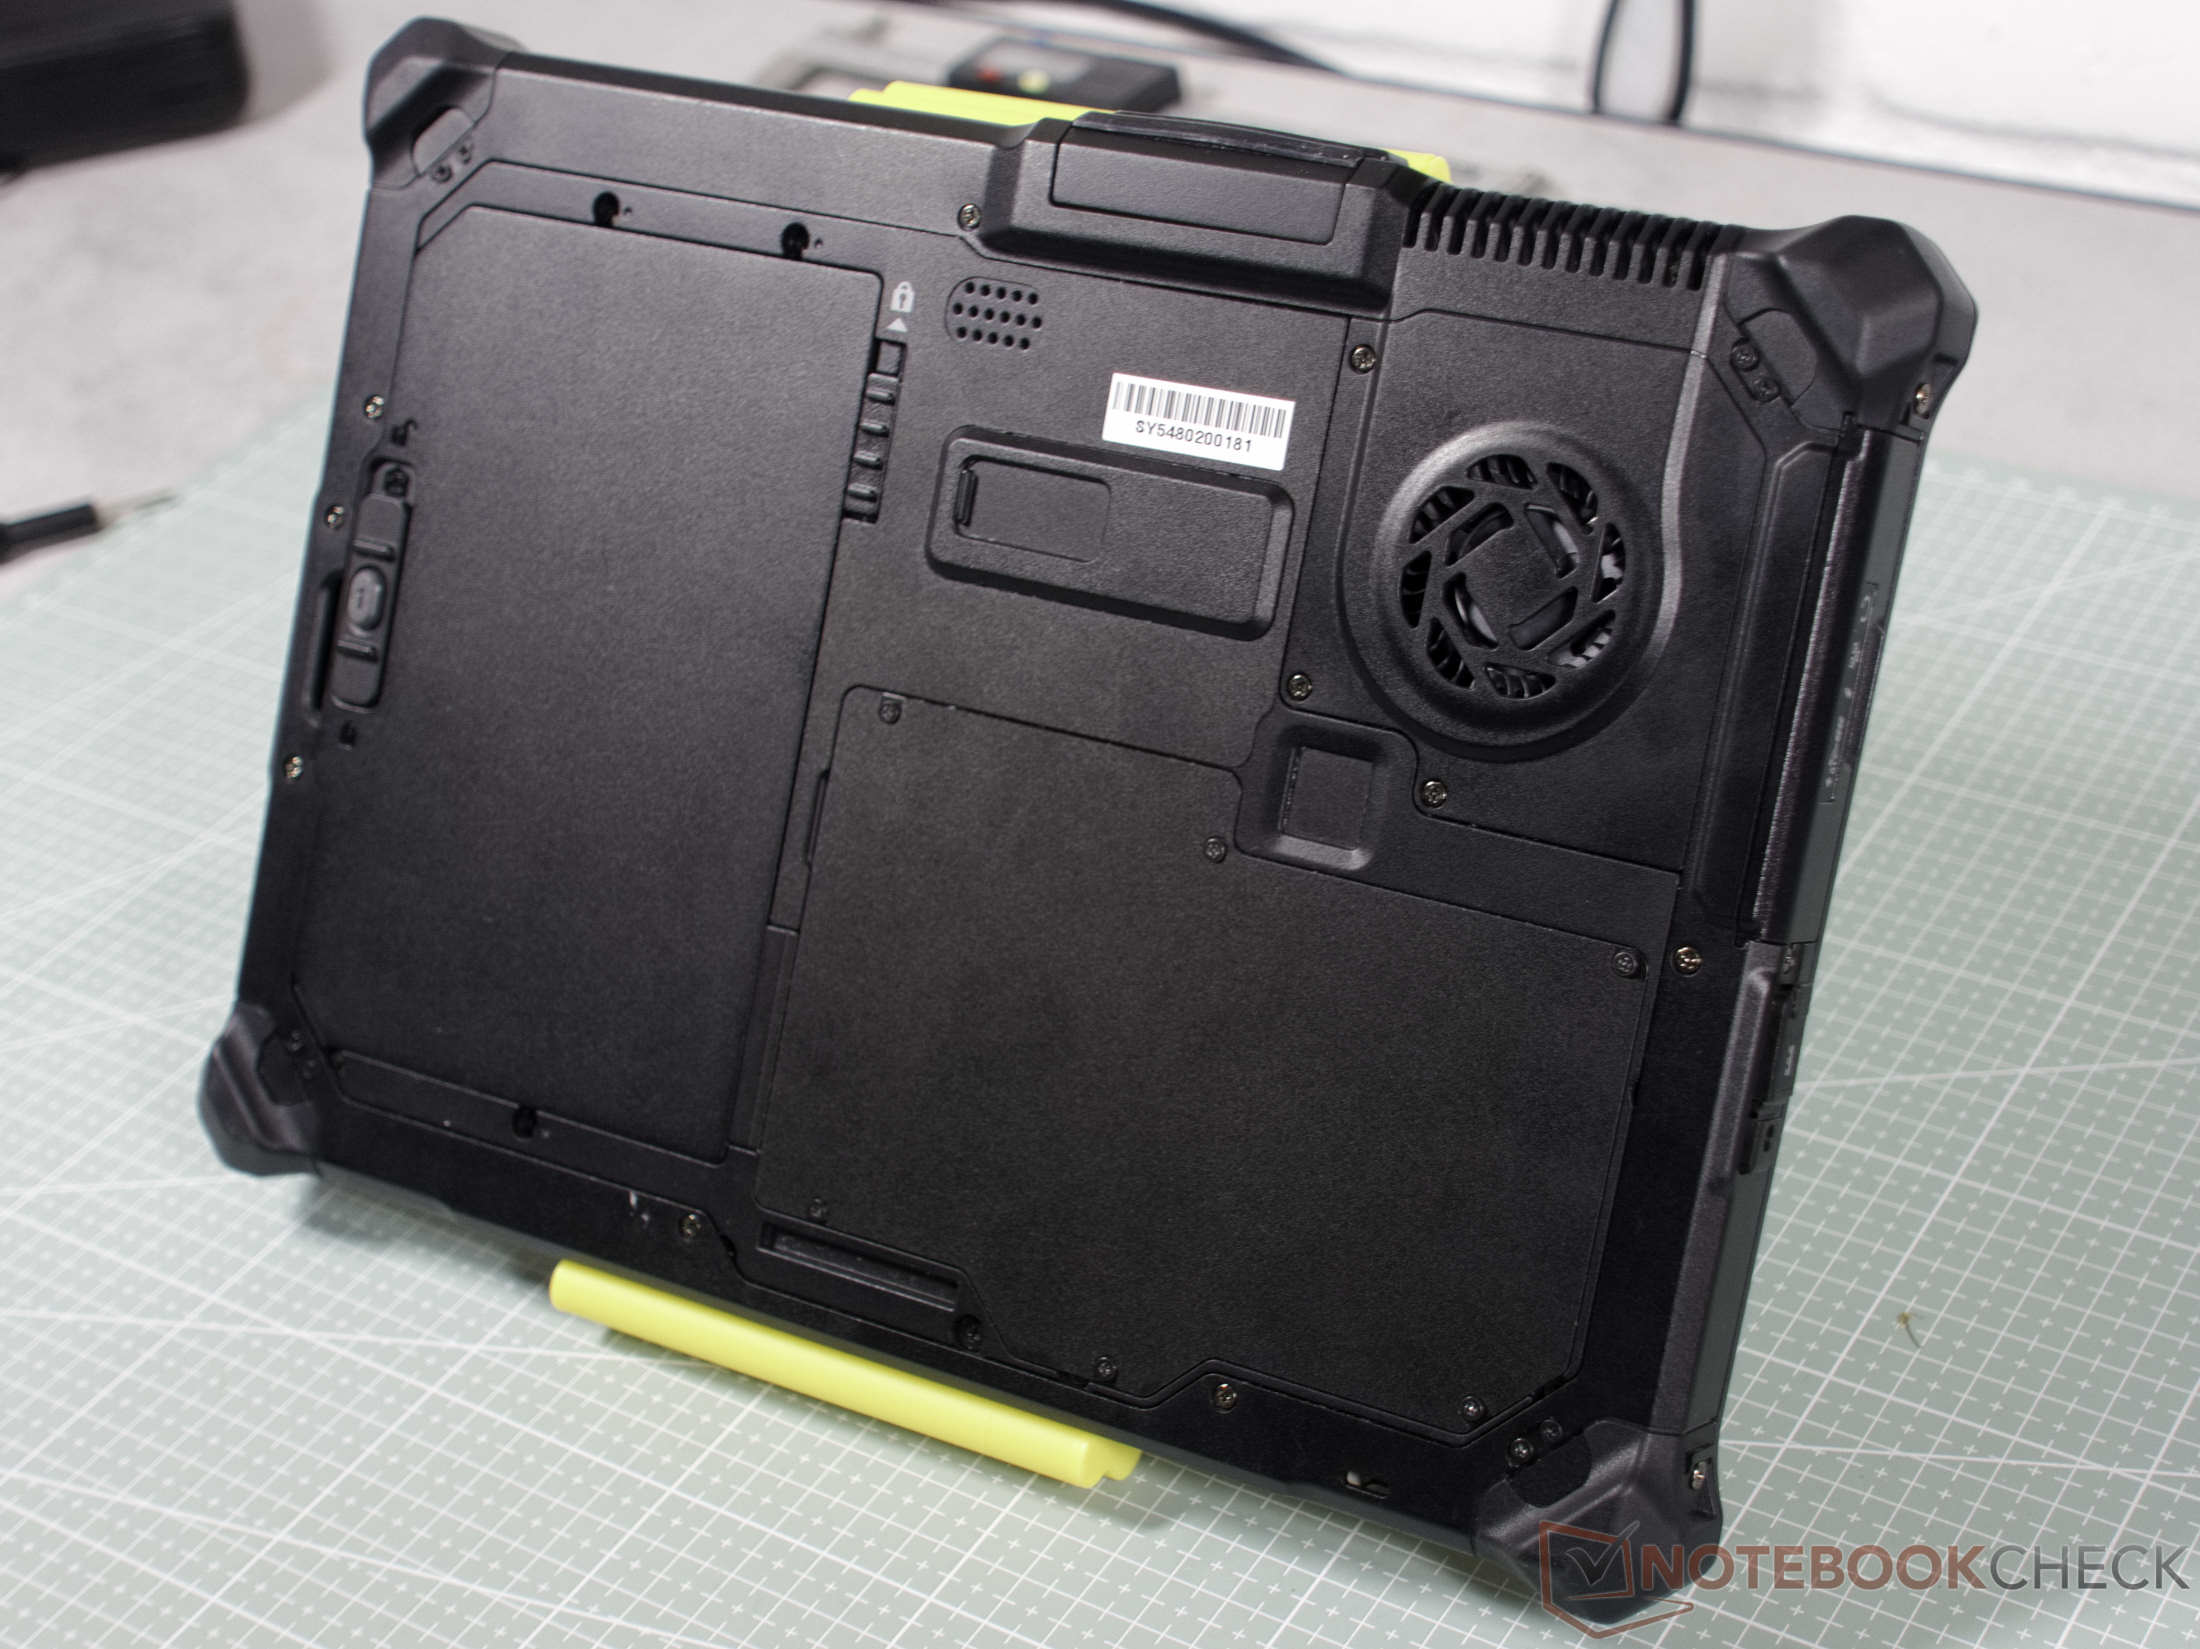
De R10 is juist voor deze zware omstandigheden ontworpen. De behuizing van magnesiumlegering is gebouwd als een tank, is bestand tegen harde valpartijen en is grondig afgedicht tegen water en vuil. De absolute uitschieters voor gebruik buitenshuis zijn echter het scherm en het voedingssysteem. Met een helderheid van ruim 1.000 cd/m² – bevestigd in onze test – is de robuuste tablet zelfs tegen direct zonlicht moeiteloos bestand. Daarnaast beschikt hij over een ingebouwde reservebatterij voor echte hot-swapping. Dit betekent dat de hoofdbatterij eenvoudig uit het apparaat kan worden verwijderd en vervangen terwijl het nog in werking is.
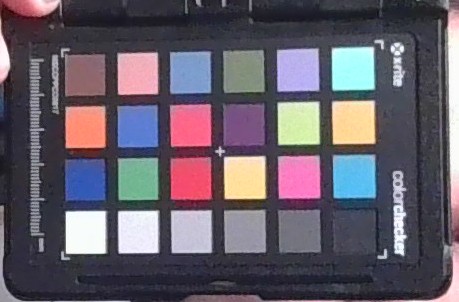
Uiteraard brengt dit niveau van specialisatie compromissen met zich mee. Voor kleurkritisch werk is het scherm – met zijn zichtbare groene tint – onbruikbaar, en de camera’s en de ingebouwde monoluidspreker volstaan slechts voor basisdoeleinden. De ingebouwde Intel Core Ultra 7 258V verwerkt alledaagse kantoor- en documenttaken met gemak, maar kampt tijdens tests met hoge DPC-latenties, wat tot problemen kan leiden bij het in realtime vastleggen van gegevens. Bovendien is de kaartlezer onhandig weggestopt achter de batterij. Een pluspunt is dat de omvangrijke behuizing zelfs bij zware belasting niet al te warm wordt, terwijl de interne ventilator aangenaam stil op de achtergrond zoemt.
Prijs en beschikbaarheid
De prijsstelling en beschikbaarheid van de Durabook R10 zijn in de eerste plaats gericht op professionele klanten. De fabrikant vermeldt geen prijzen op zijn website; in plaats daarvan worden de prijzen uitsluitend op individuele aanvraag berekend. Dit komt ook doordat veel van de zeer gespecialiseerde configuraties – afgestemd op de individuele behoeften van de klant – uitsluitend rechtstreeks via Durabook worden verkocht. De robuuste tablet is af en toe te vinden in gespecialiseerde winkels. Zo biedt de webwinkel Ruggedbooks het basismodel met een Intel Core Ultra 5 226V voor ongeveer 2.759 euro (~$3.146). Bij Elmark-Automation is een vergelijkbare configuratie met dezelfde processor verkrijgbaar vanaf ongeveer 2.730 euro (~$3.113).
Technische gegevens
Behuizing, accessoires en invoerapparaten
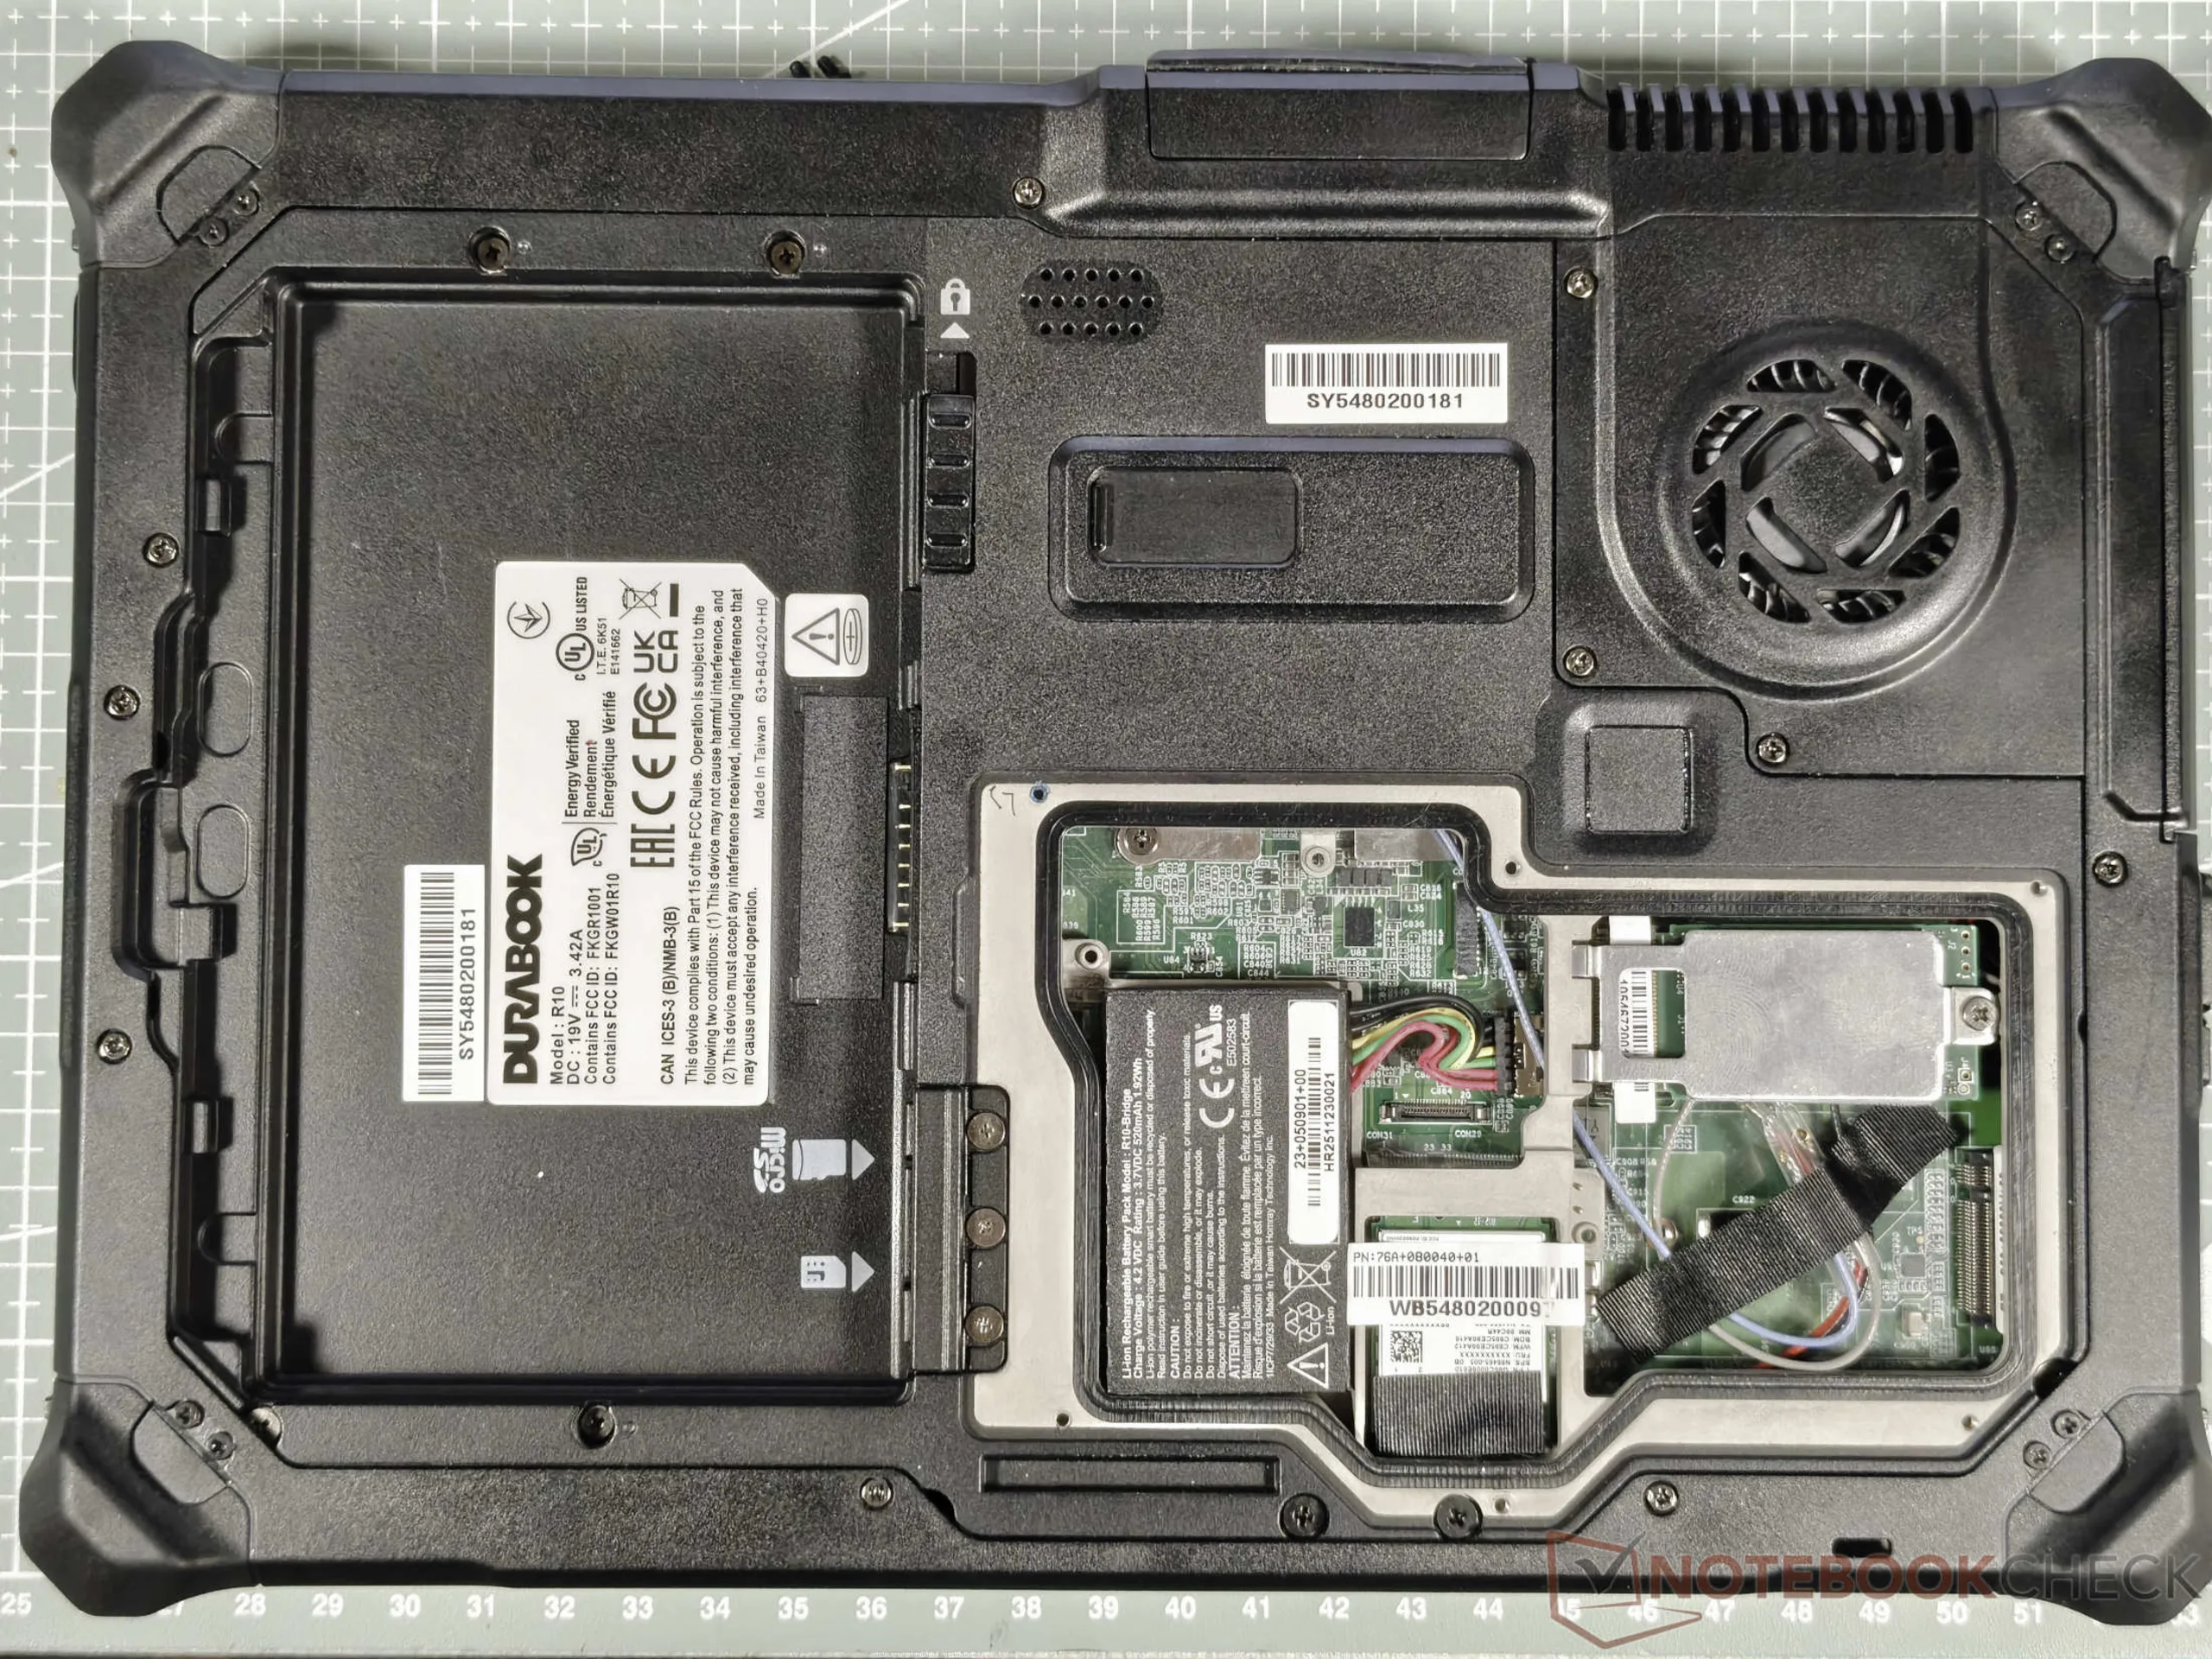
De behuizing van de Durabook R10 is vervaardigd uit een robuuste magnesiumlegering en is bij uitstek geschikt voor de zwaarste werkomstandigheden. De tablet is gecertificeerd volgens de Amerikaanse militaire norm MIL-STD-810H en is ontworpen om valpartijen vanaf een hoogte van maximaal 1,8 meter (~5,9 voet) en extreme omgevingsomstandigheden te weerstaan. Bovendien garandeert de IP66-certificering bescherming tegen stof en waterstralen onder hoge druk. Voor gevoelige toepassingen garandeert de MIL-STD-461F-certificering tevens uitstekende elektromagnetische compatibiliteit.
Durabook Z14I-HG: AI-kracht voor extreme omstandigheden
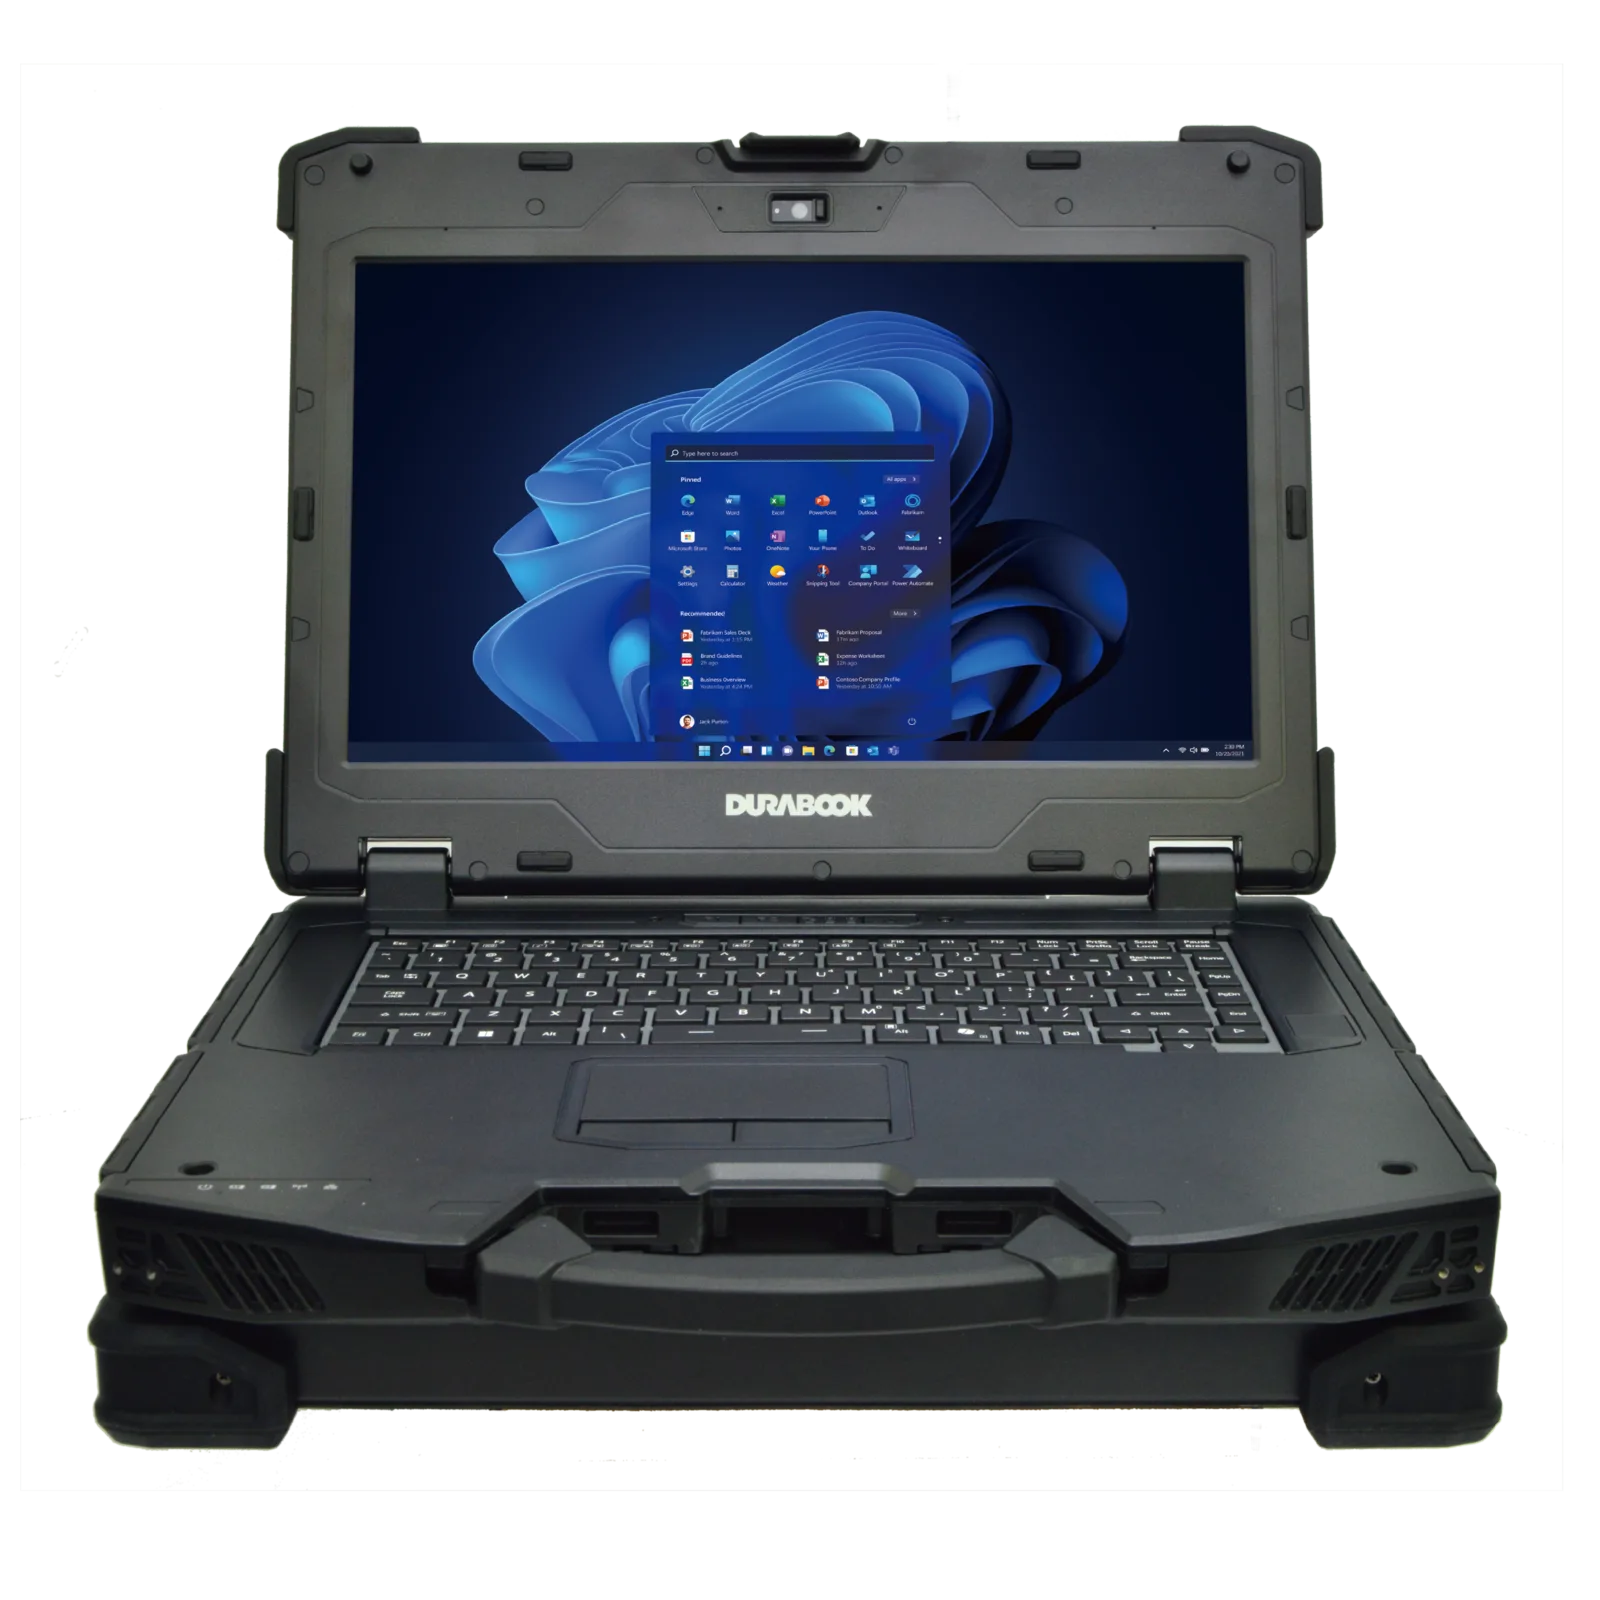
Met de Z14I-HG introduceert Durabook een nieuwe generatie mobiele werkstations: volledig robuust, geschikt voor AI en ontworpen voor de meest veeleisende toepassingen, direct op de werkplek. Het 14-inch systeem combineert edge-AI-prestaties tot 682 TOPS met krachtige Intel® Core™ Ultra-processors. Het beschikt tevens over een AI Boost NPU en, optioneel, een NVIDIA® RTX™ 3500 Ada (12 GB) of RTX™ 5000 Ada (16 GB) GPU. Iedereen die afhankelijk is van krachtige en robuuste hardware – bijvoorbeeld in industriële automatisering, buitendienst of technisch onderzoek – profiteert van snelle AI-analyses en grafische prestaties van professionele kwaliteit voor mobiele high-performance computing.
Of het nu gaat om realtime 3D-rendering, AI-inferentie of data-intensieve simulaties: de Z14I-HG verwerkt veeleisende workloads lokaal. Dit vermindert de latentie. Tegelijkertijd verhoogt de onafhankelijkheid van cloudproviders de gegevensbeveiliging, bijvoorbeeld tijdens inspecties, voorspellend onderhoud of digitale-twin-toepassingen.
Het systeem is gecertificeerd volgens MIL-STD-810H, MIL-STD-461G en IP66. Het is bestand tegen extreme temperaturen, vochtigheid en elektromagnetische interferentie. Bovendien blijft het 1200-nit DynaVue®-scherm zelfs in direct zonlicht perfect afleesbaar en ondersteunt het meerdere invoermodi en opstellingen met meerdere schermen.
Het Z14I-HG-werkstation is nu verkrijgbaar en kan rechtstreeks bij Durabook worden besteld.
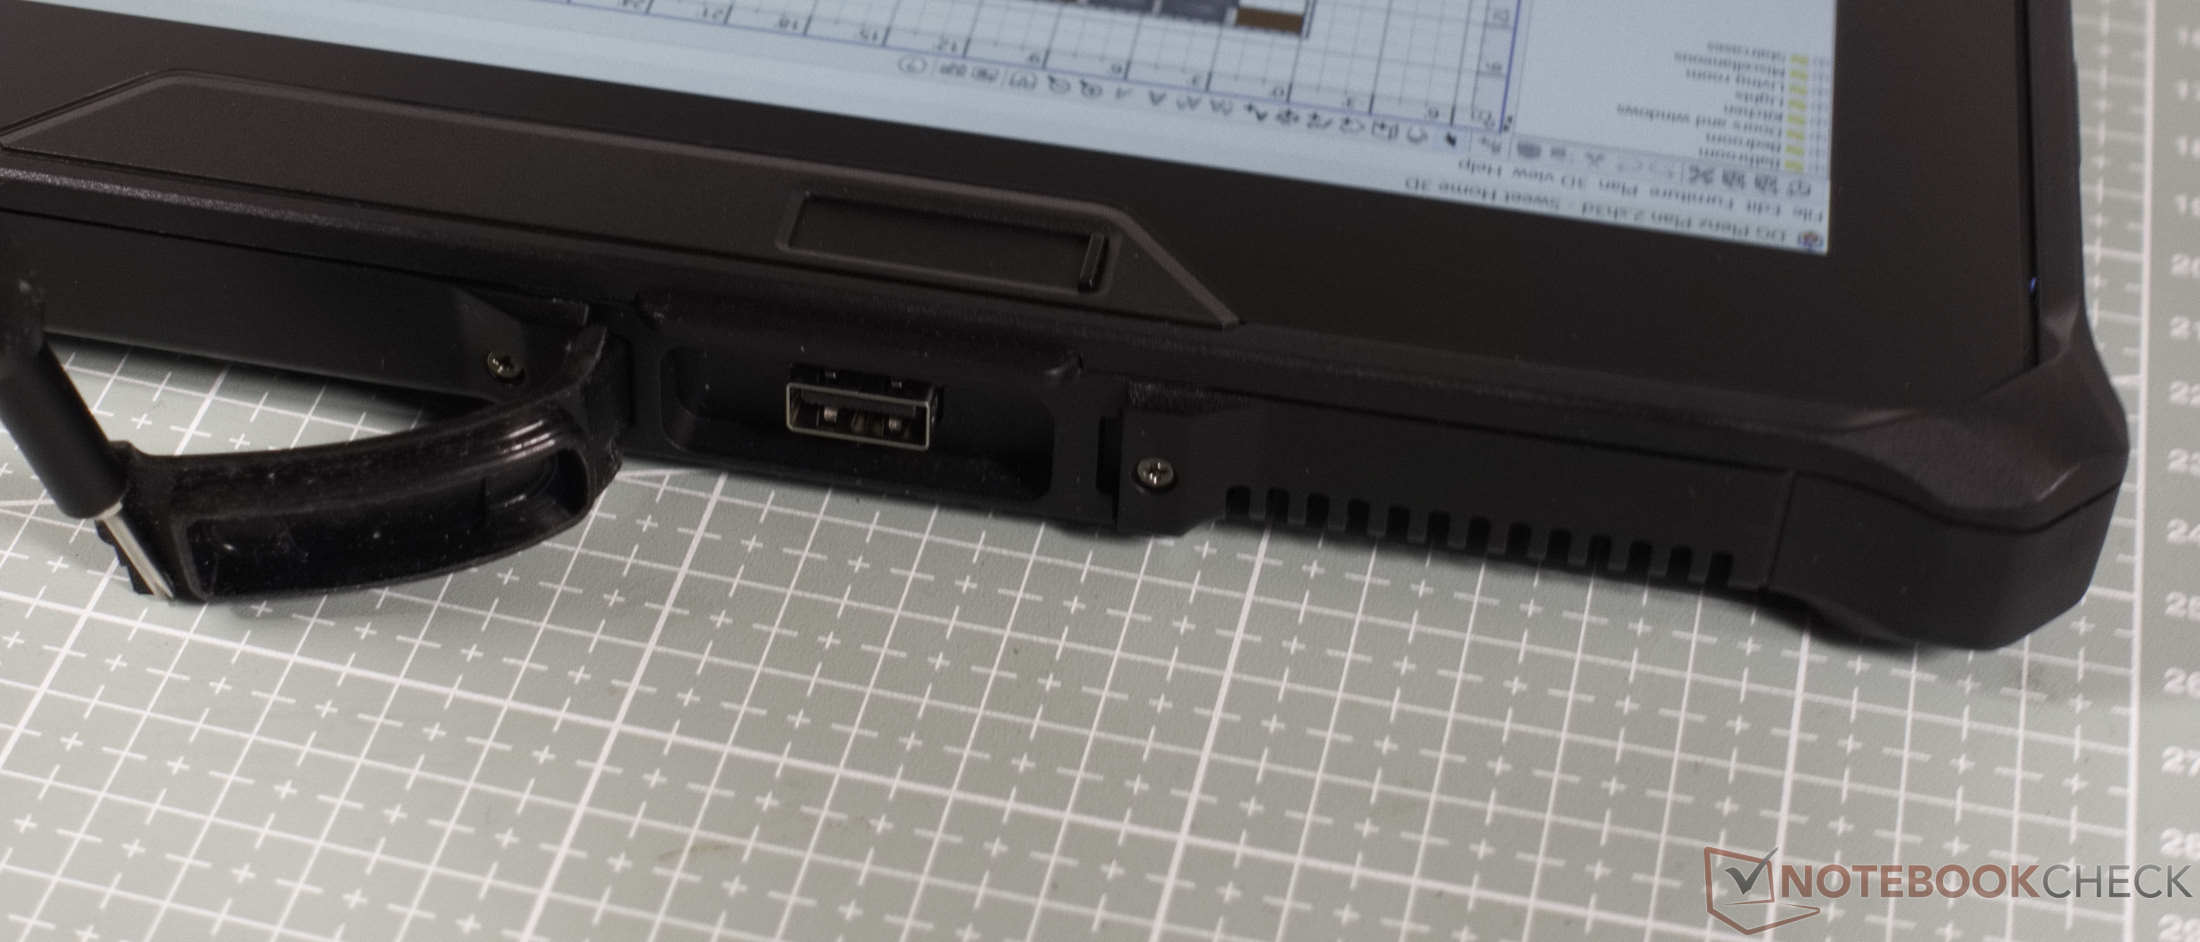
Connectiviteit
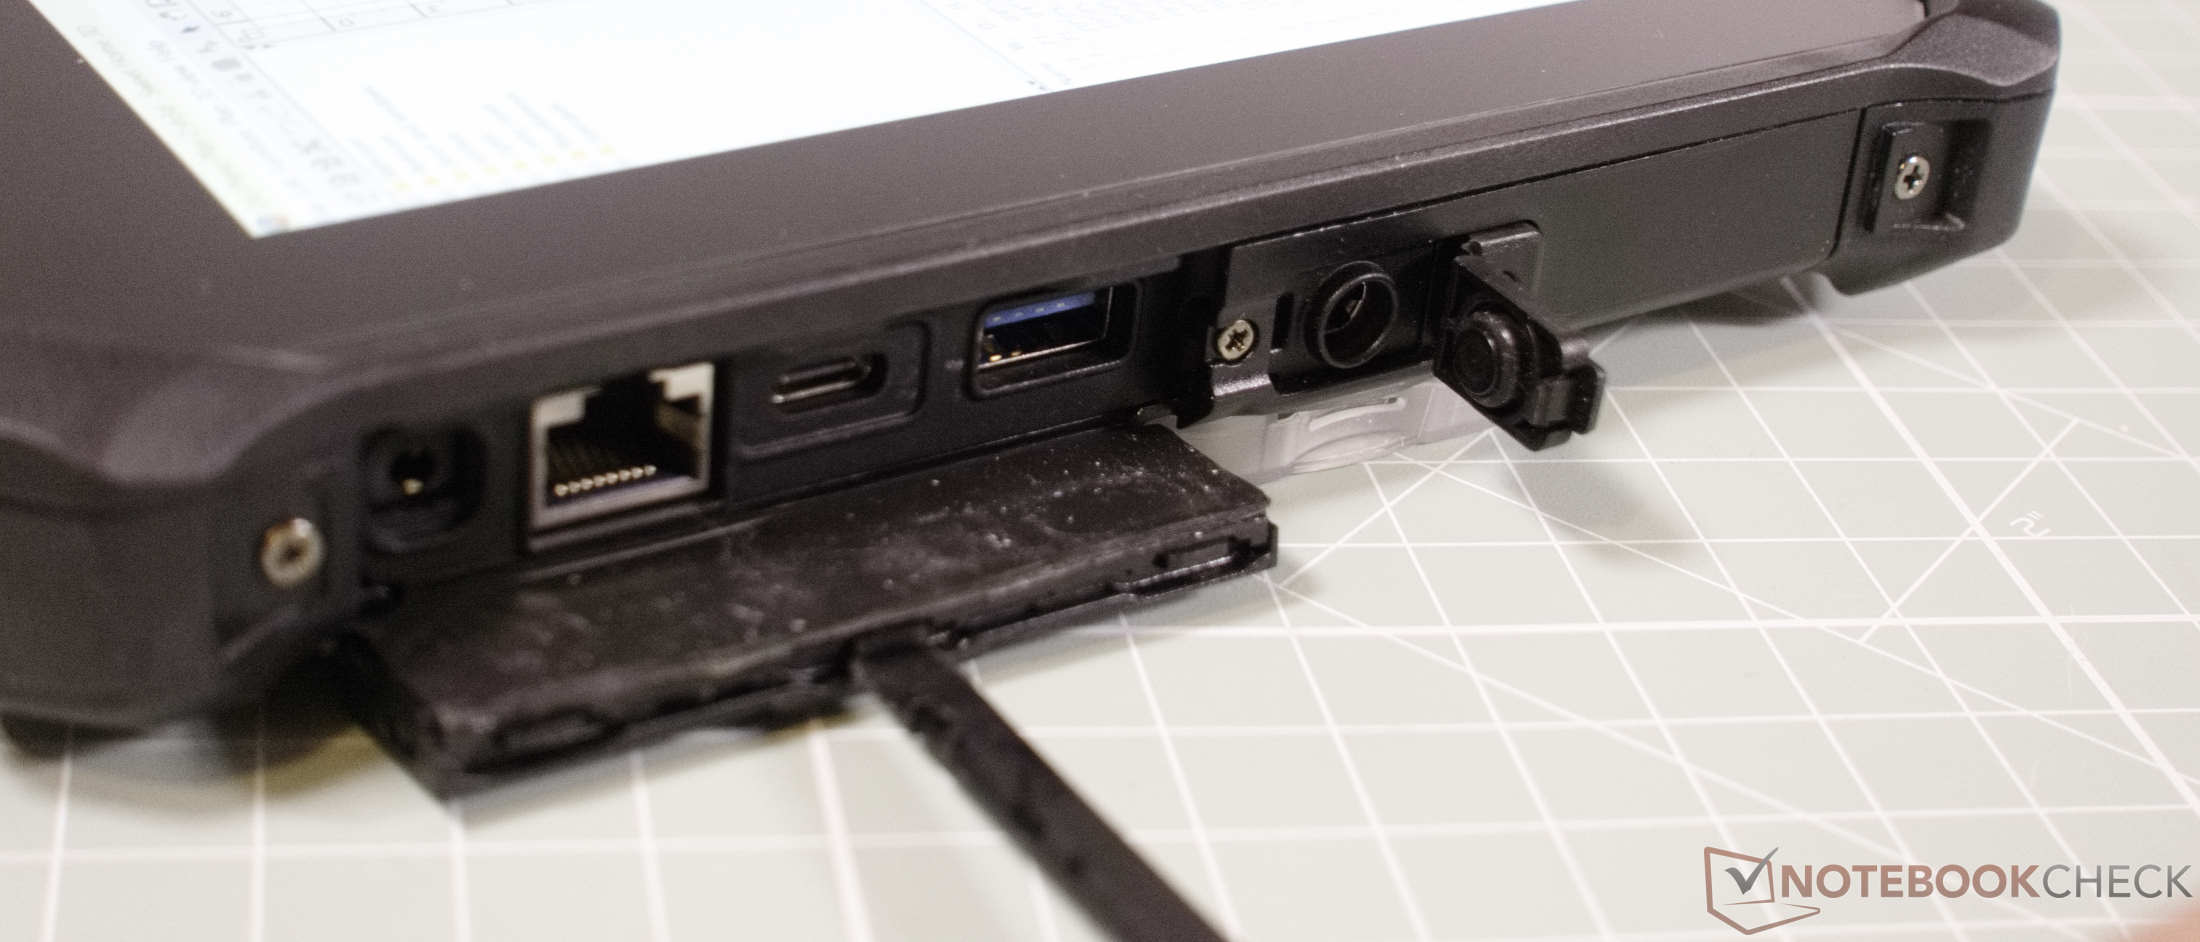
Alle poorten zijn verborgen achter stevige beschermkappen. De tablet is voorzien van een moderne USB-C-poort met Thunderbolt, DisplayPort en Power Delivery. Daarnaast beschikt hij over een RJ-45 Gigabit Ethernet-poort, een hoofdtelefoonaansluiting en een standaard voedingsaansluiting.
Aan de achterzijde van de tablet bevindt zich tevens een biometrische vingerafdrukscanner voor veilige aanmelding bij het systeem. Helaas is de ingebouwde SD-kaartlezer enigszins moeilijk bereikbaar, aangezien deze zich aan de binnenkant achter de batterij bevindt. De lezer werkt echter redelijk snel. Binnenin de tablet bevinden zich tevens lege sleuven voor uitbreidingskaarten. Wat draadloze connectiviteit betreft, biedt de robuuste tablet Wi-Fi 7 en Bluetooth 5.4.
| SD Card Reader | |
| average JPG Copy Test (av. of 3 runs) | |
| Durabook R10 | |
| Dell Latitude 7030 Rugged Extreme (AV Pro V60) | |
| Durabook R8 Tablet (AV Pro V60) | |
| Gemiddelde van klas Tablet (10.2 - 79.2, n=44, laatste 2 jaar) | |
| Dynabook Portege Z40L-N (AV PRO microSD 128 GB V60) | |
| maximum AS SSD Seq Read Test (1GB) | |
| Dell Latitude 7030 Rugged Extreme (AV Pro V60) | |
| Durabook R10 | |
| Dynabook Portege Z40L-N (AV PRO microSD 128 GB V60) | |
| Gemiddelde van klas Tablet (n=1laatste 2 jaar) | |
| Durabook R8 Tablet (AV Pro V60) | |
Camera
De Full HD-camera aan de voorzijde is meer dan voldoende voor videoconferenties. De 11-megapixel hoofdcamera aan de achterzijde maakt indrukwekkend goede macrofoto’s, maar heeft moeite met groothoekopnames vanwege de trage autofocus en een beperkt dynamisch bereik. Dankzij de ingebouwde flitser blijft de camera ook in donkere ruimtes bruikbaar.


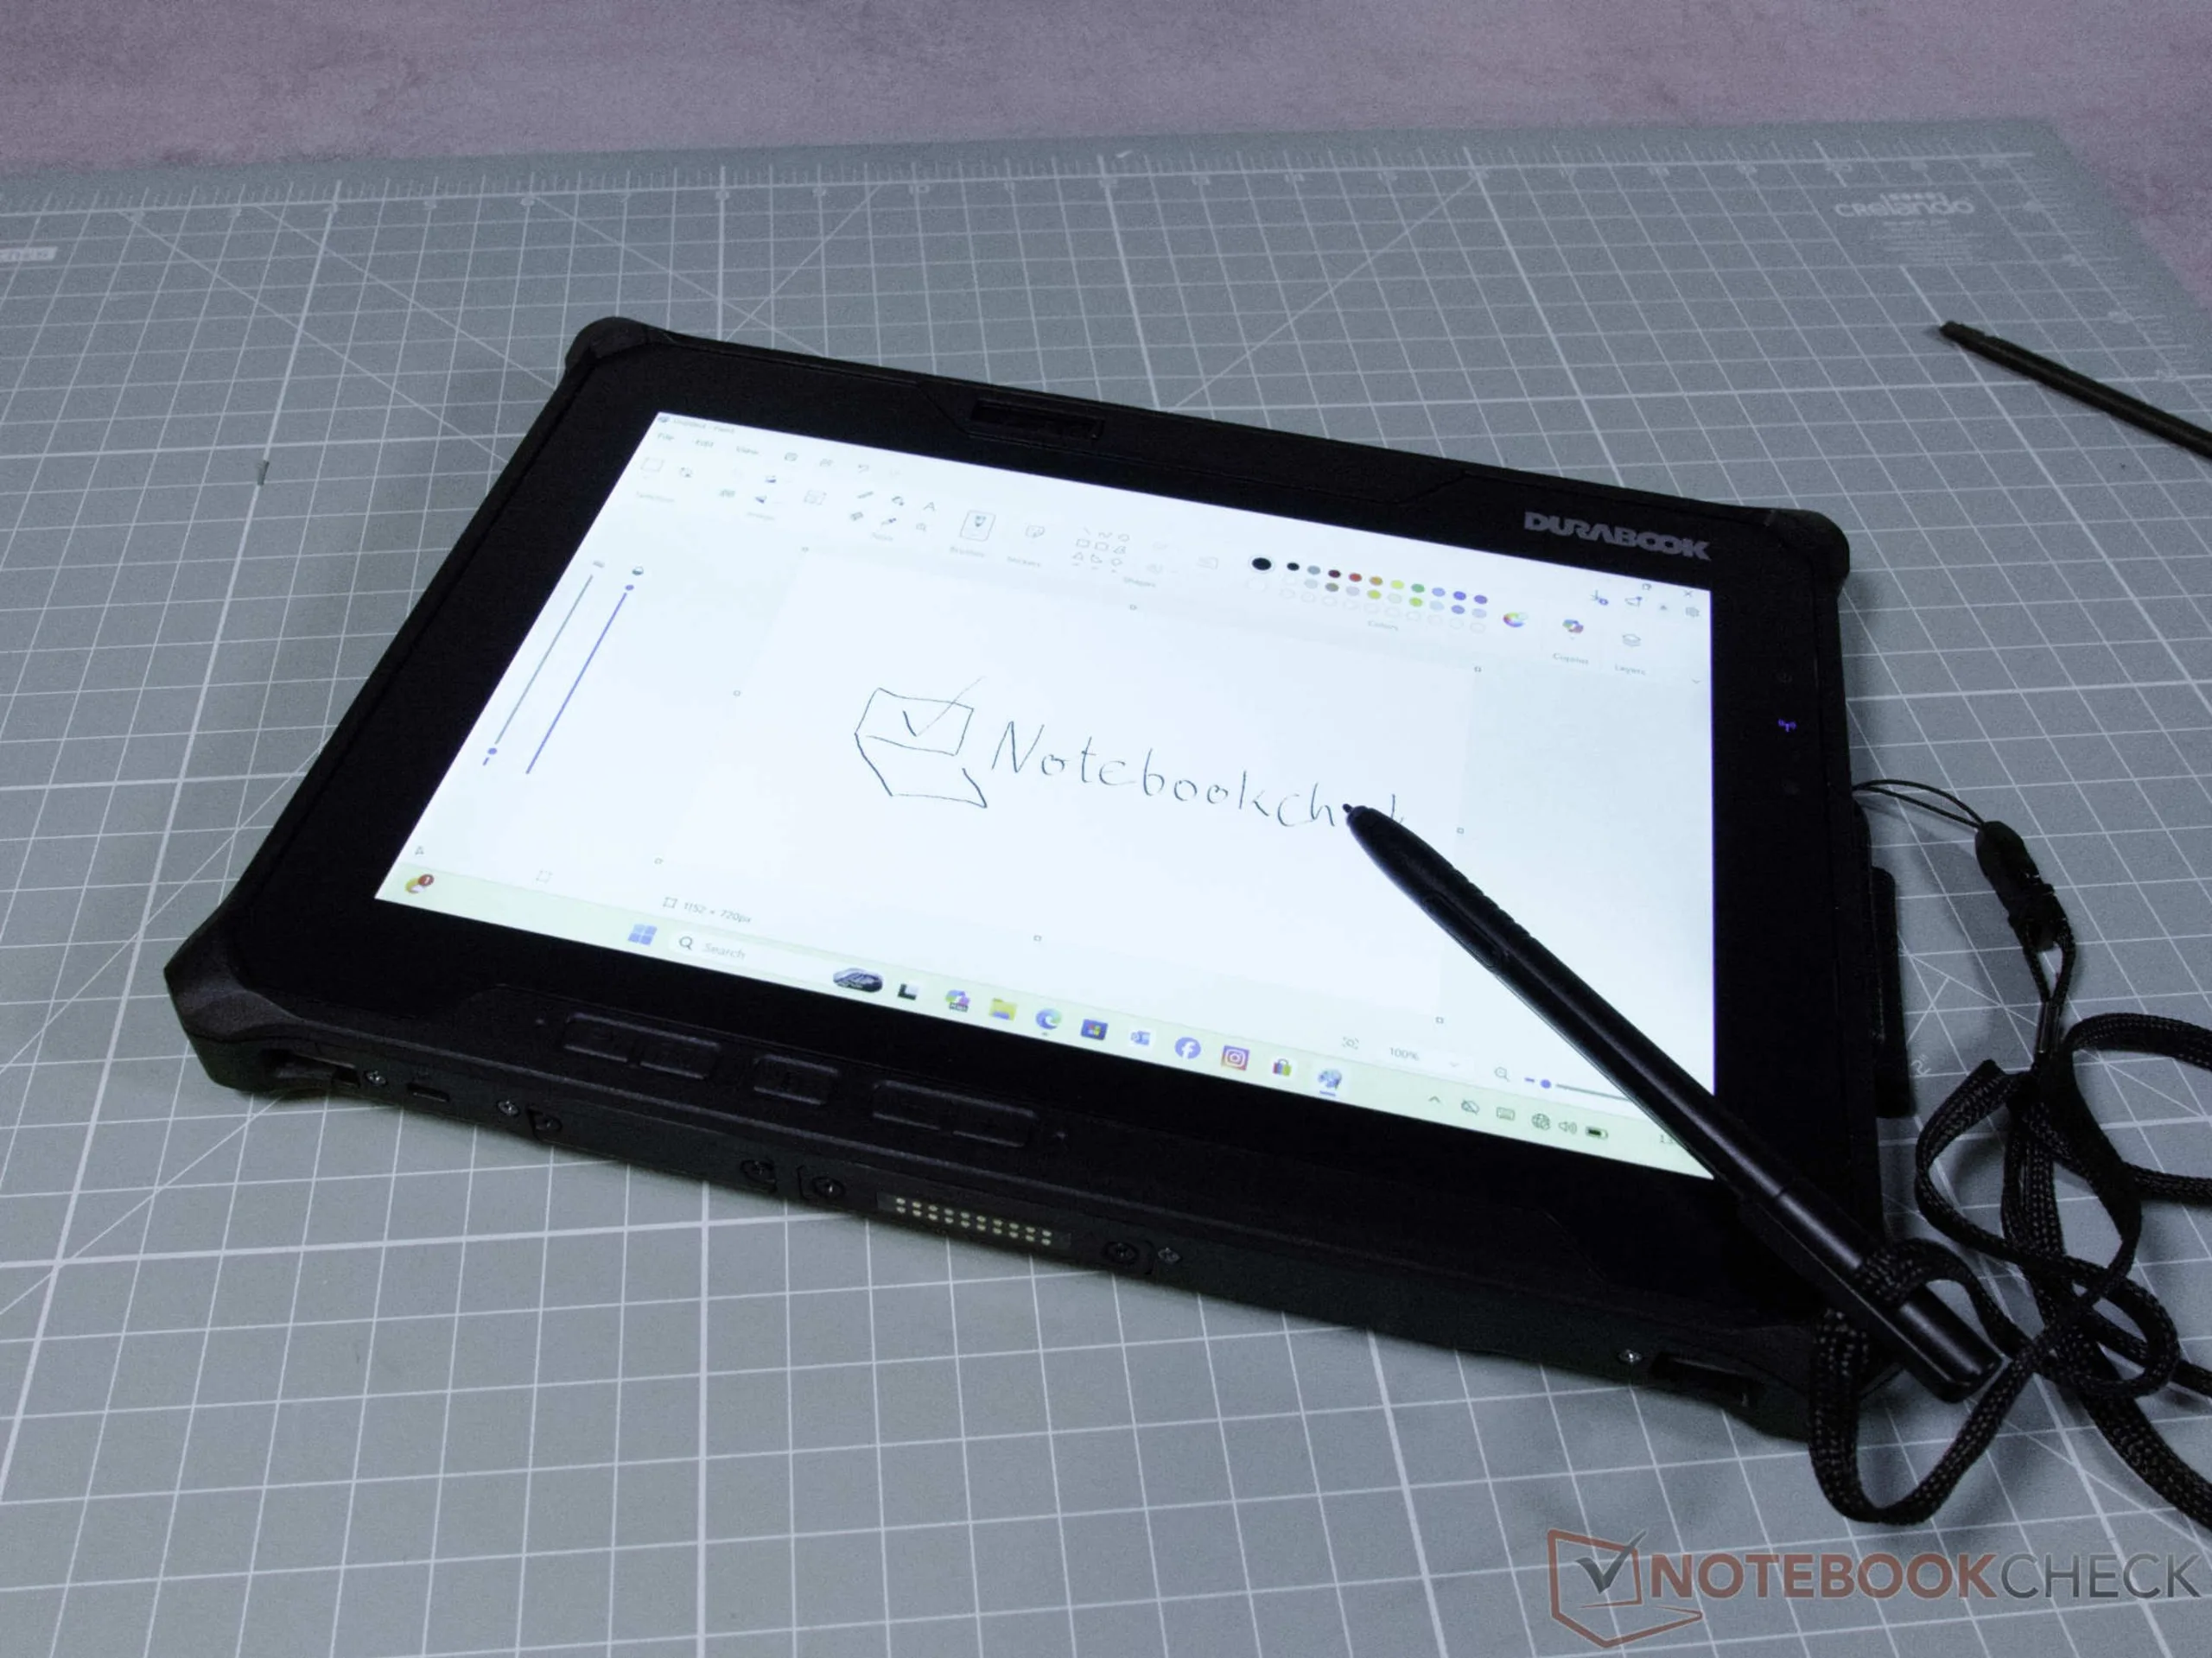
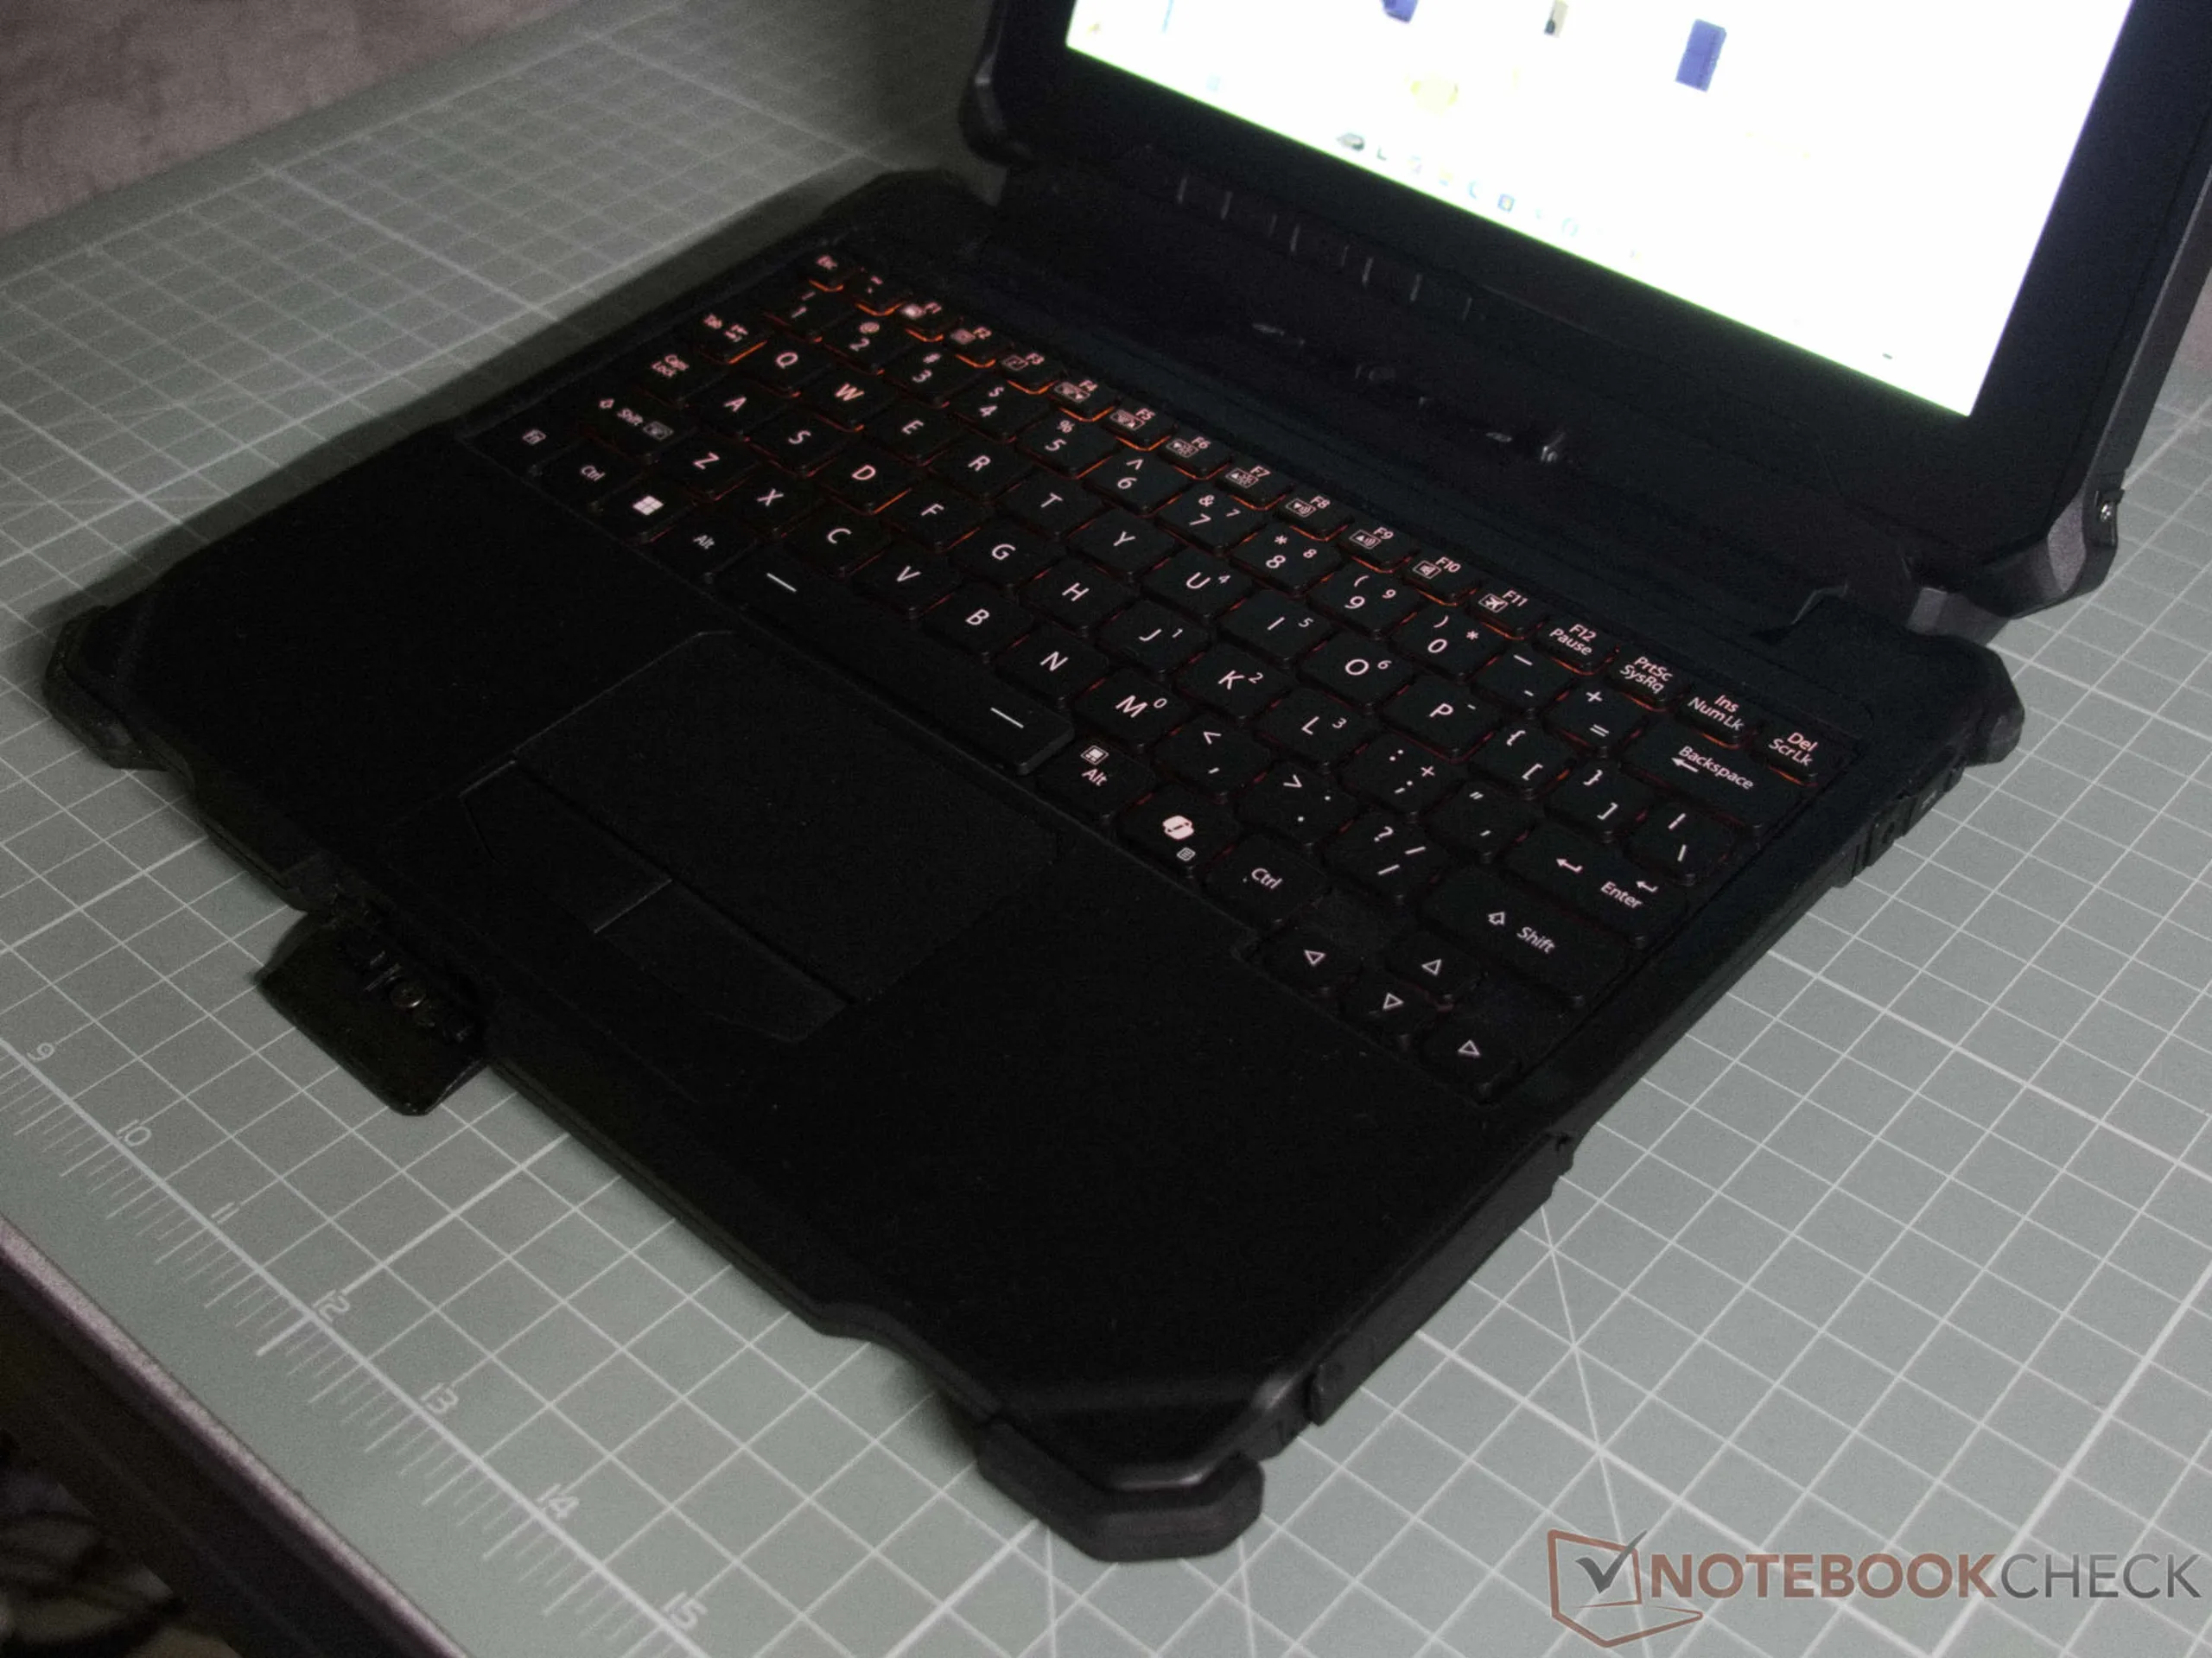
Invoerapparaten
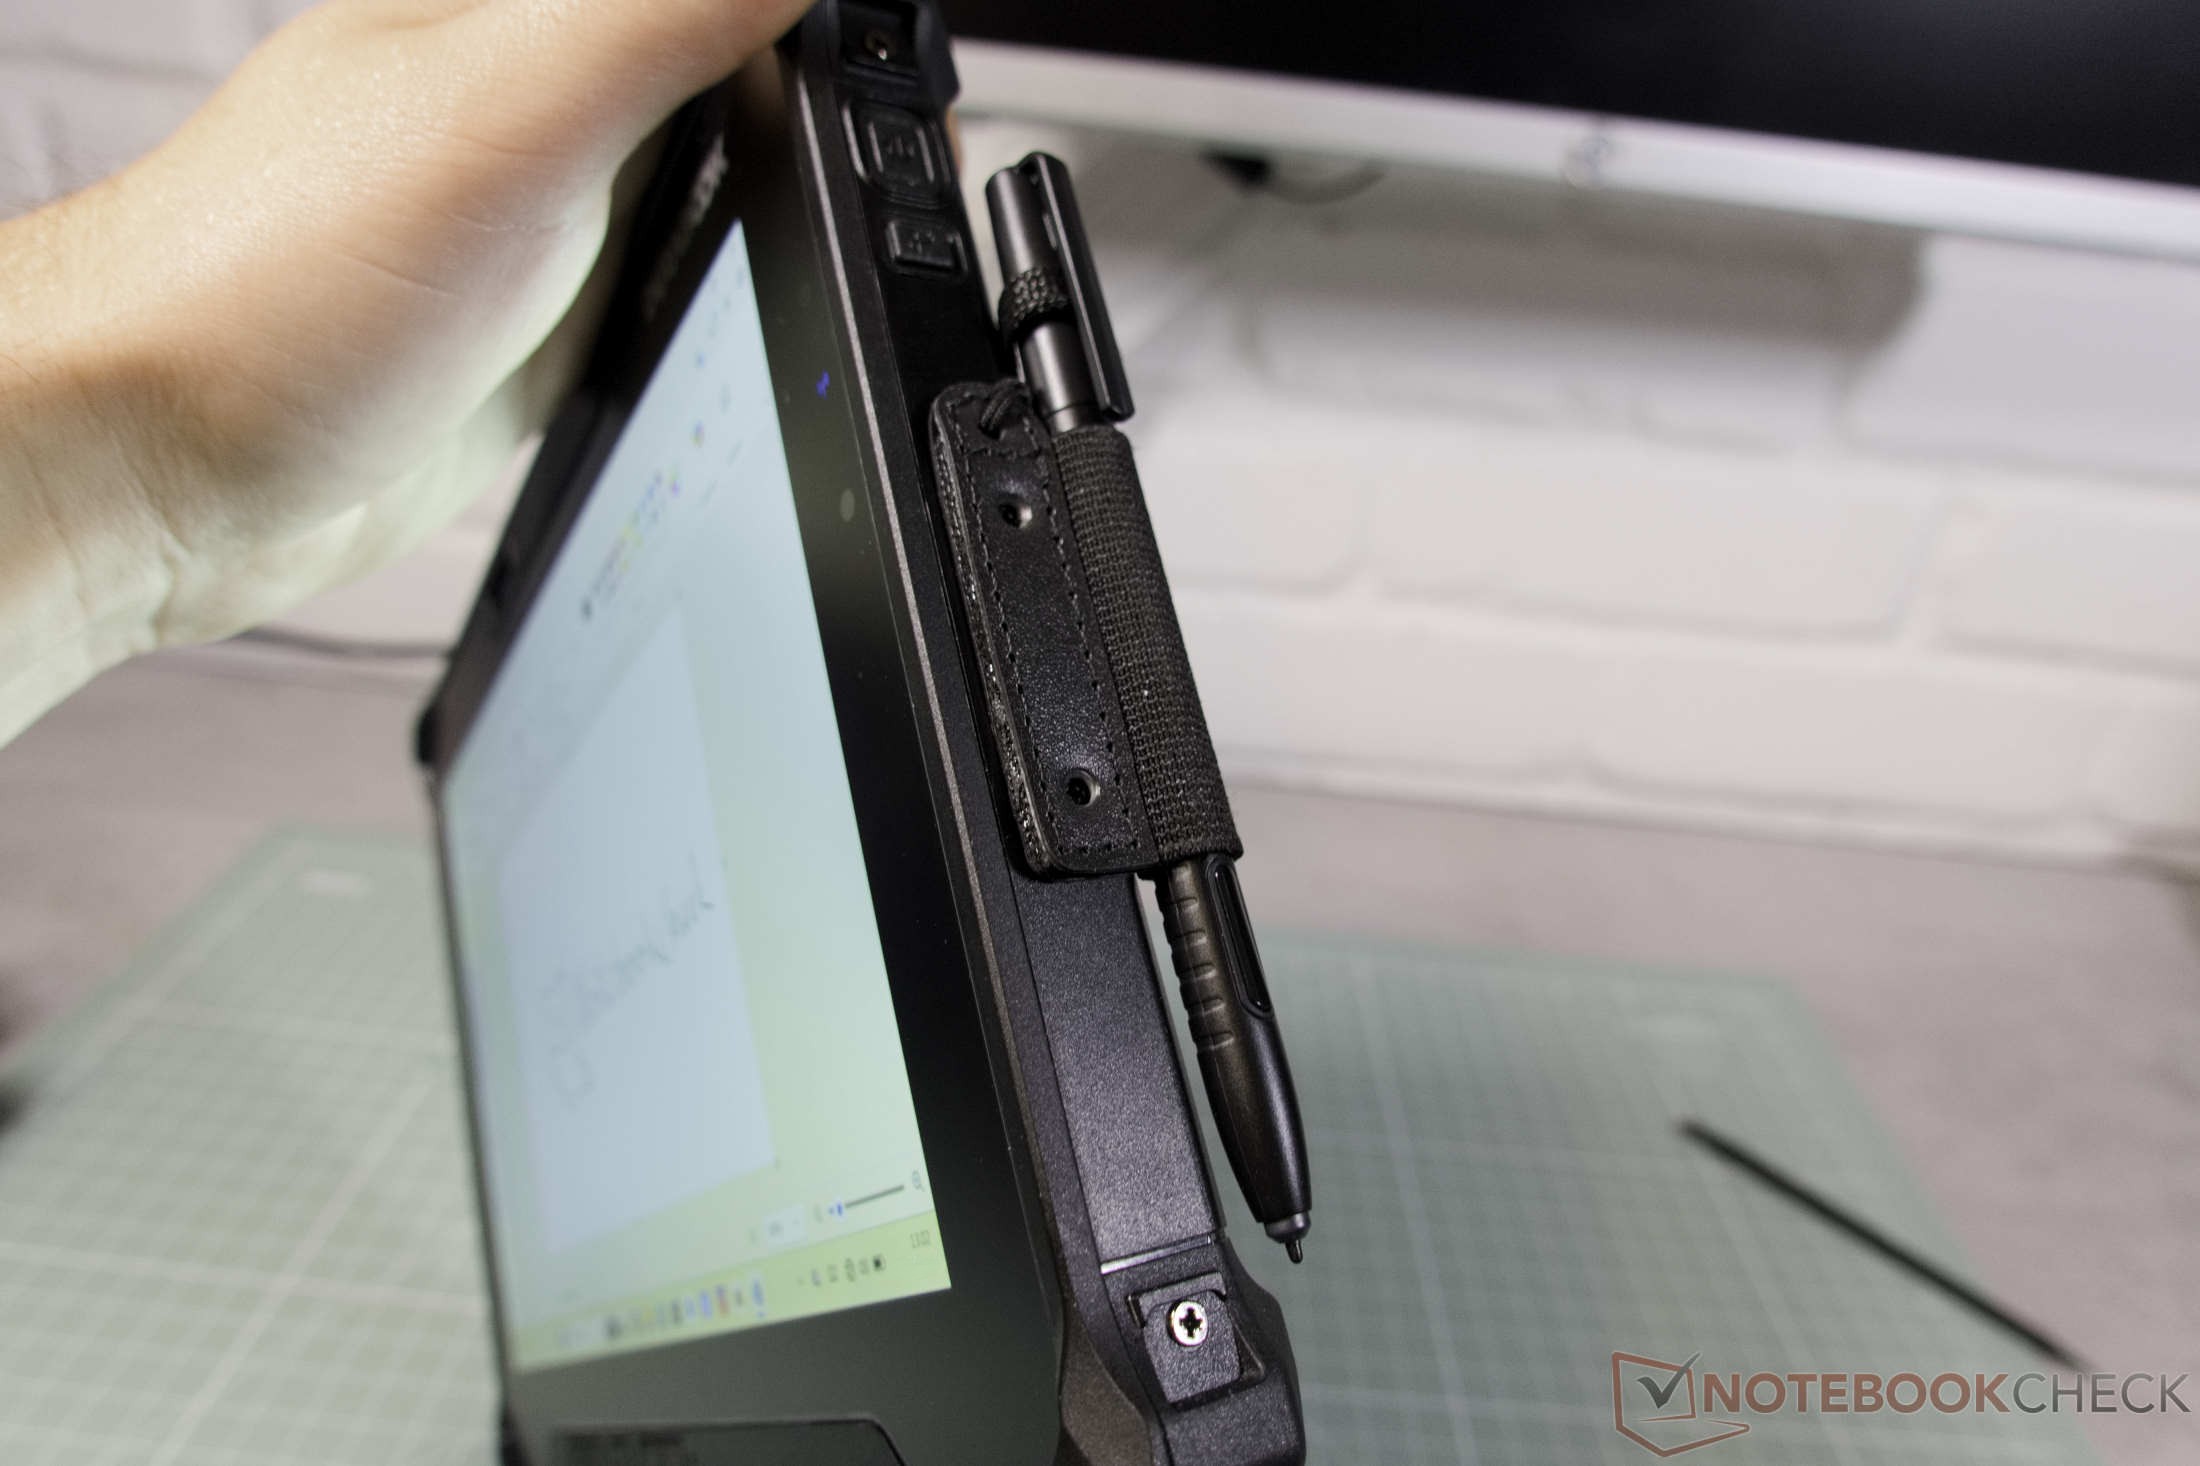
Naast het touchscreen beschikt de Durabook R10 over zes knoppen waarvan de functies naar wens kunnen worden aangepast. Het touchscreen blijft echter het centrale bedieningselement en kan flexibel worden geoptimaliseerd voor veeleisende werkomgevingen. Zo kan de aanraakmodus worden aangepast, zodat het scherm invoer betrouwbaar herkent, zowel bij het dragen van dikke beschermende handschoenen als in natte omstandigheden. Voor gedetailleerde blauwdrukken of schetsen ondersteunt het scherm het Microsoft Pen Protocol 1.51.
De Durabook-stylus is verrassend licht en toch nauwkeurig. Een optionele penhouder kan op de tablet worden geschroefd; deze is bovendien voorzien van een veiligheidsriempje voor de pen.
Optioneel kan de tablet worden opgewaardeerd tot een afneembaar model. De bijbehorende toetsenbordmodule biedt oogvriendelijke rode achtergrondverlichting en diverse extra poorten. Twee USB-A 3.2-poorten zijn standaard aanwezig, en HDMI- of LAN-poorten kunnen naar behoefte worden geconfigureerd. De toetsenbordmodule beschikt tevens over een extra oplaadpoort.
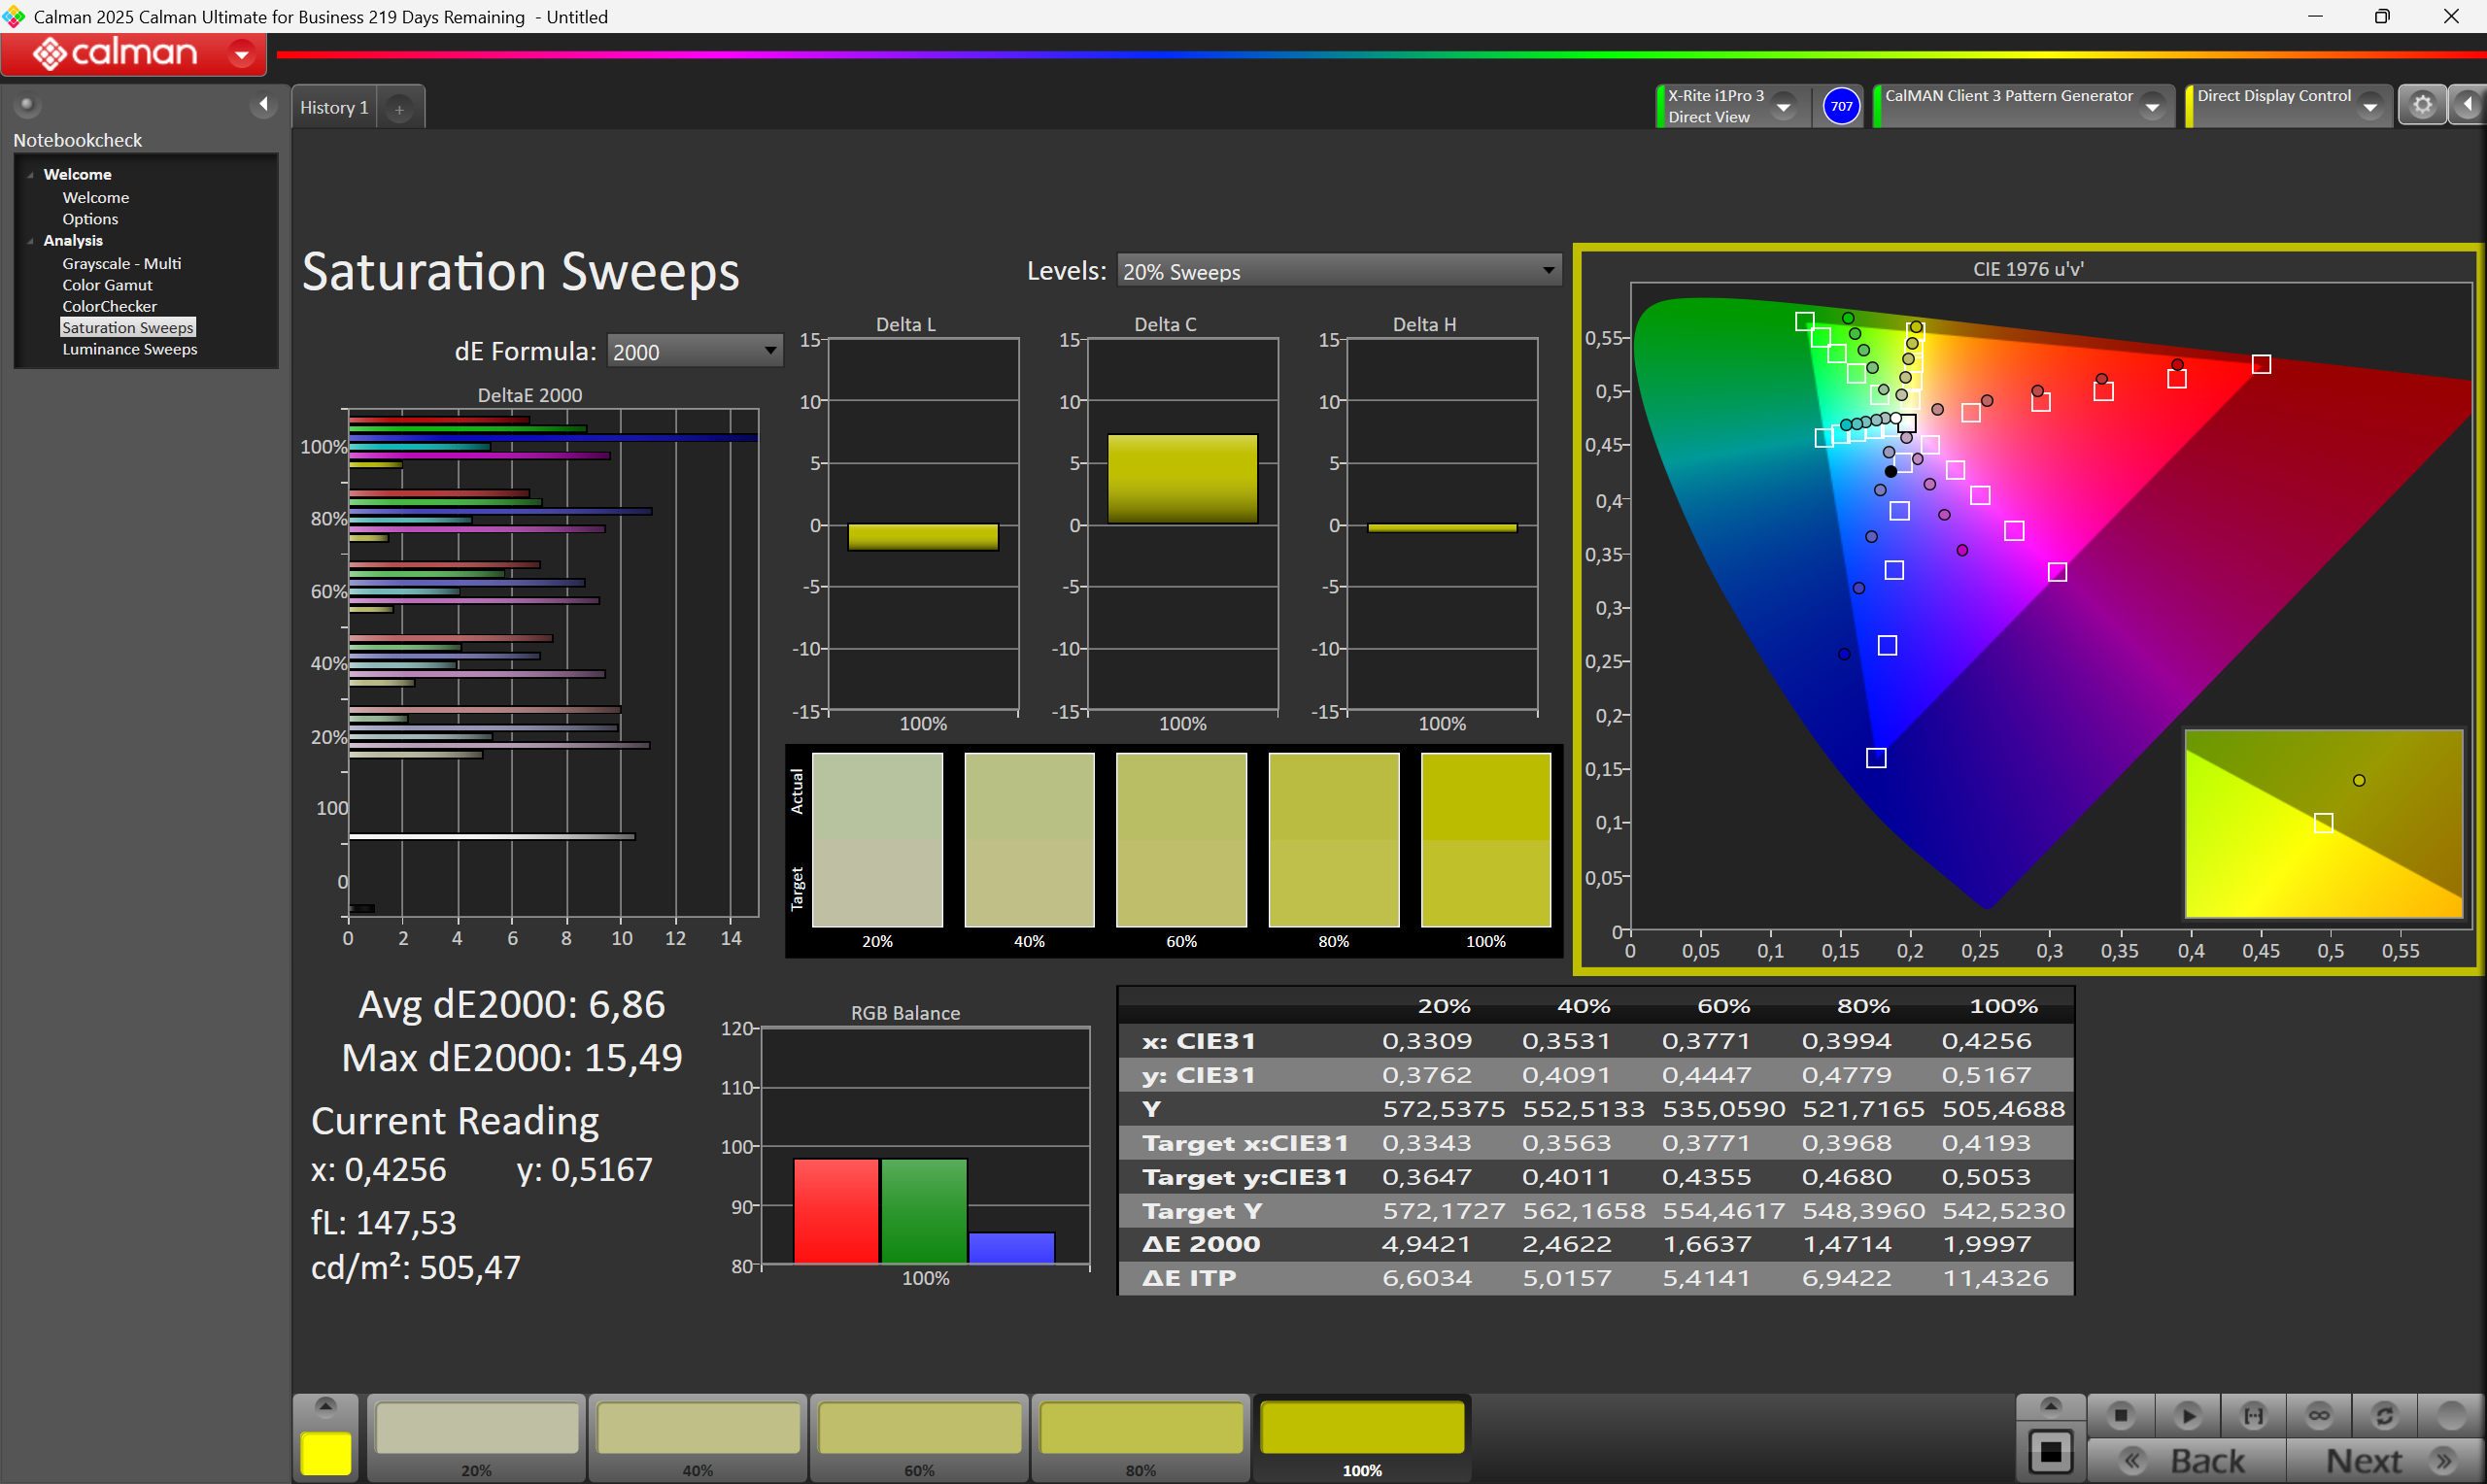
Weergave
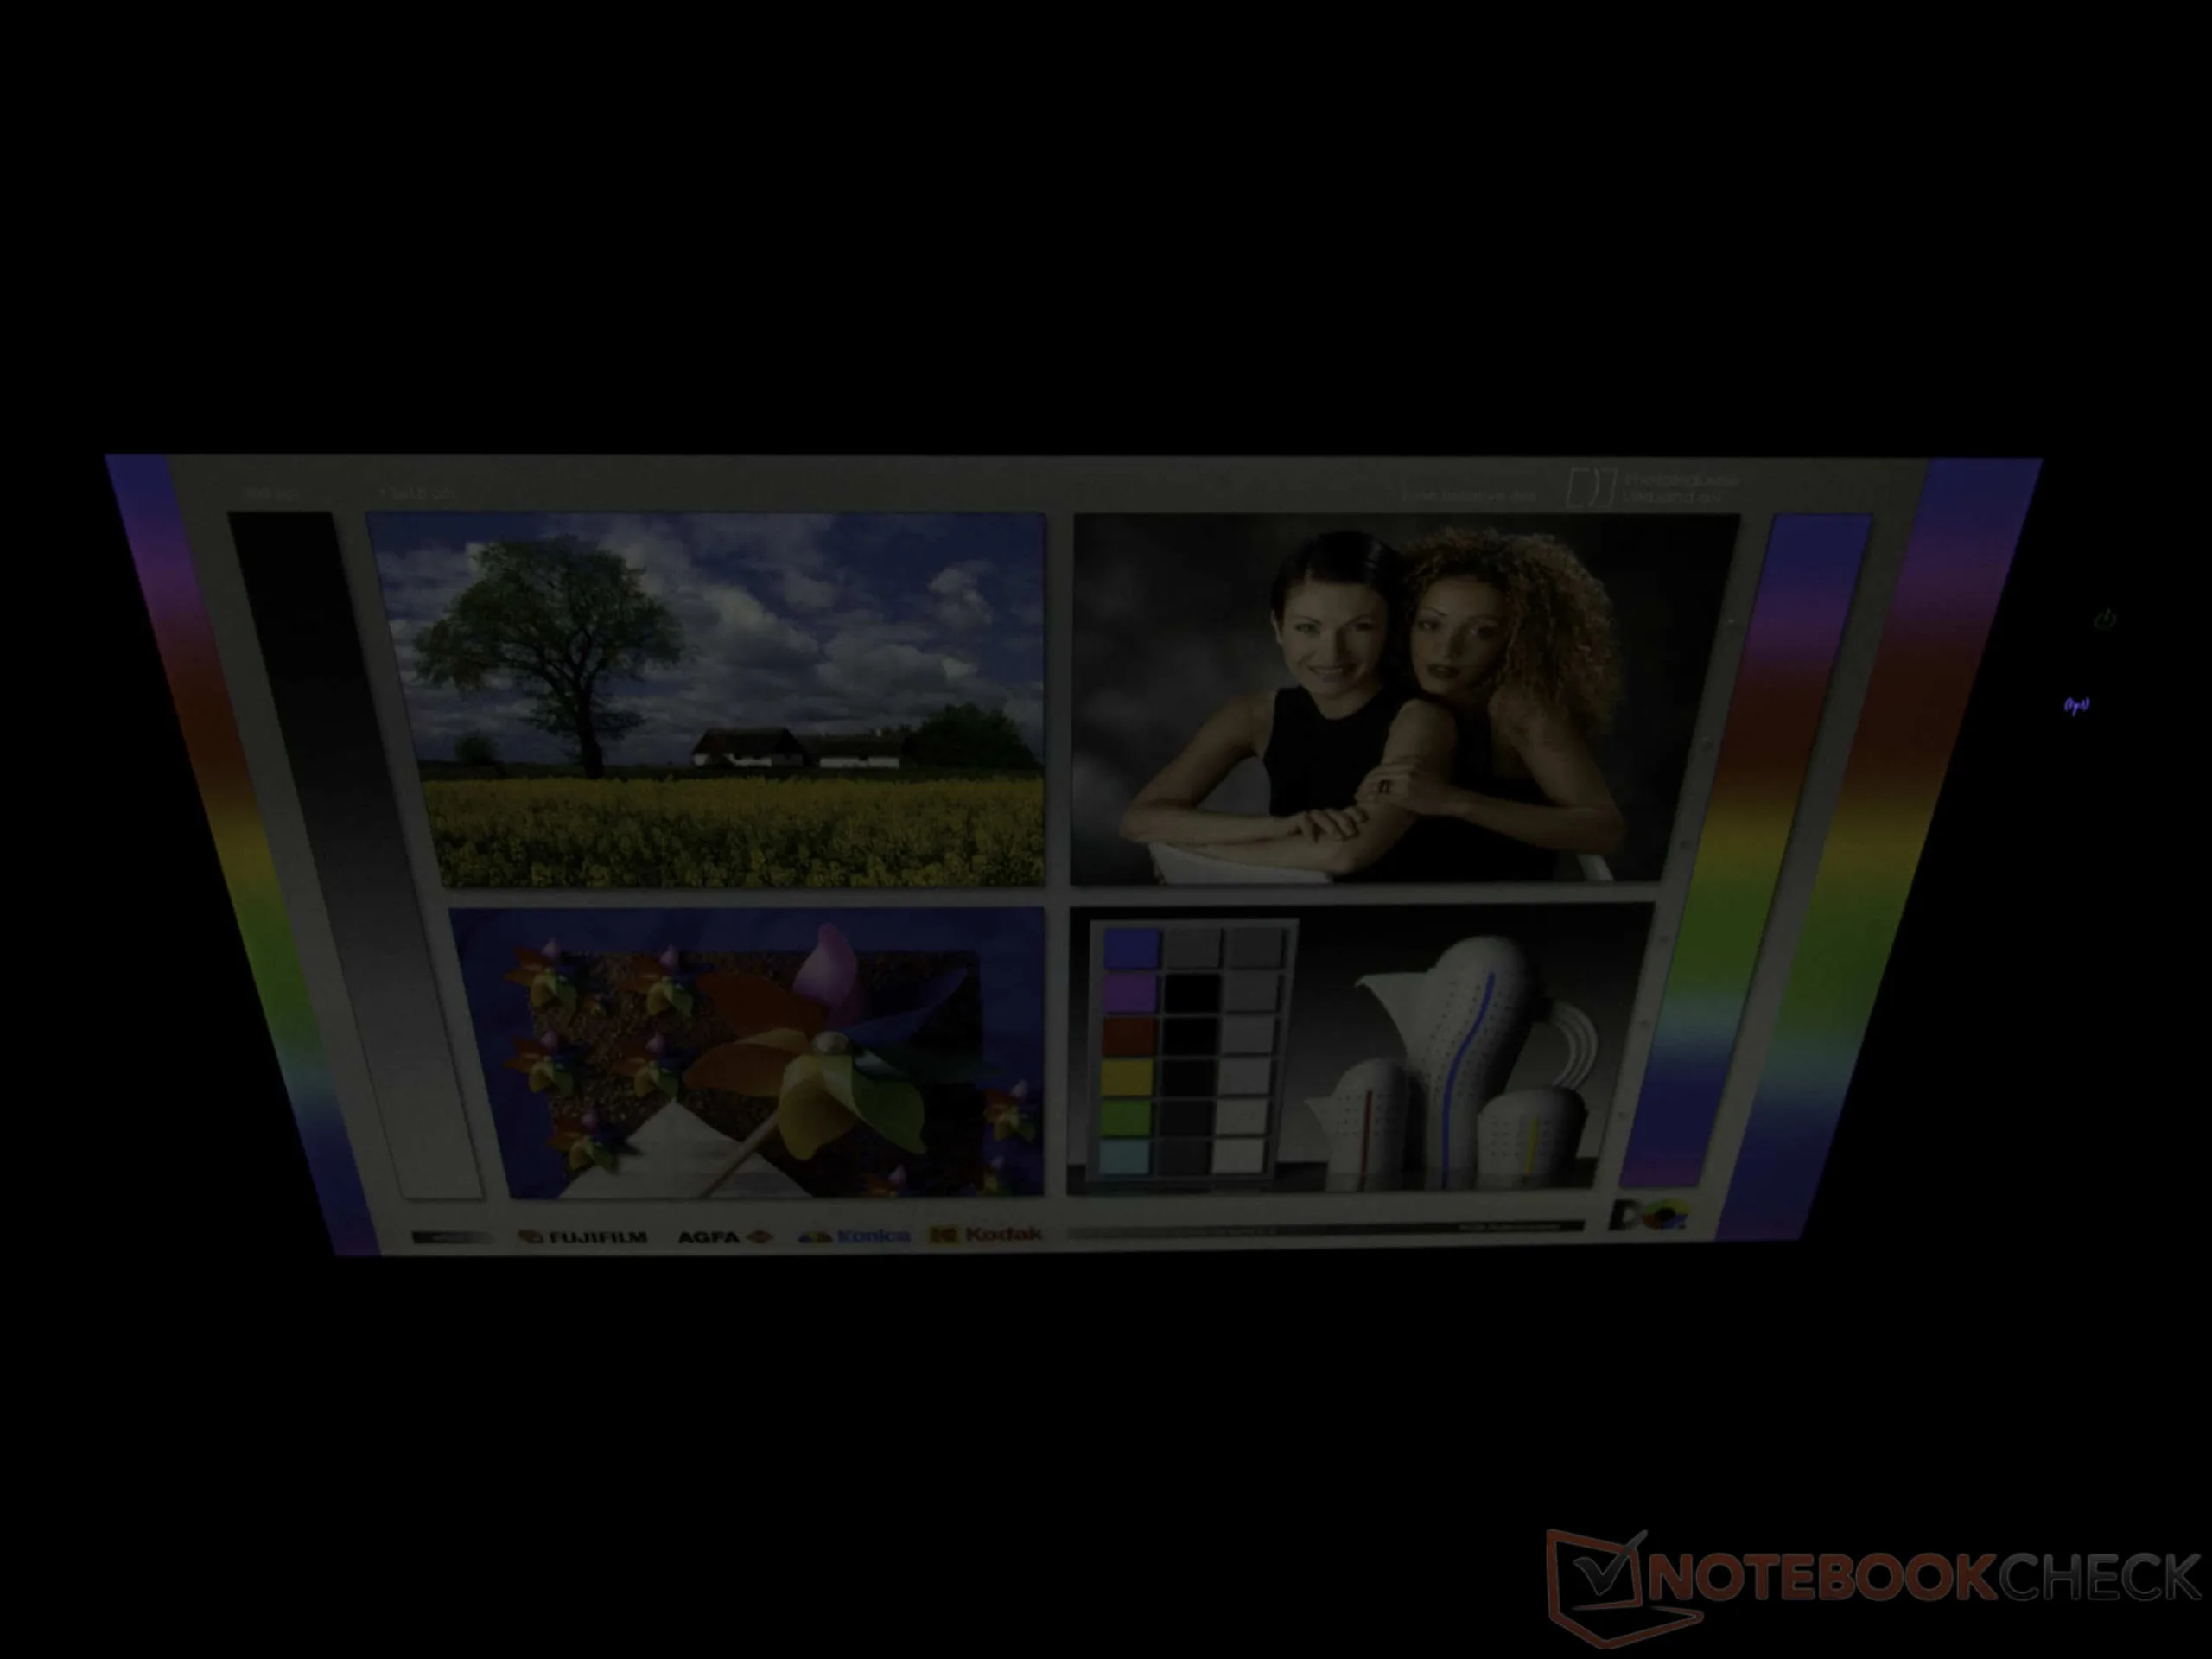
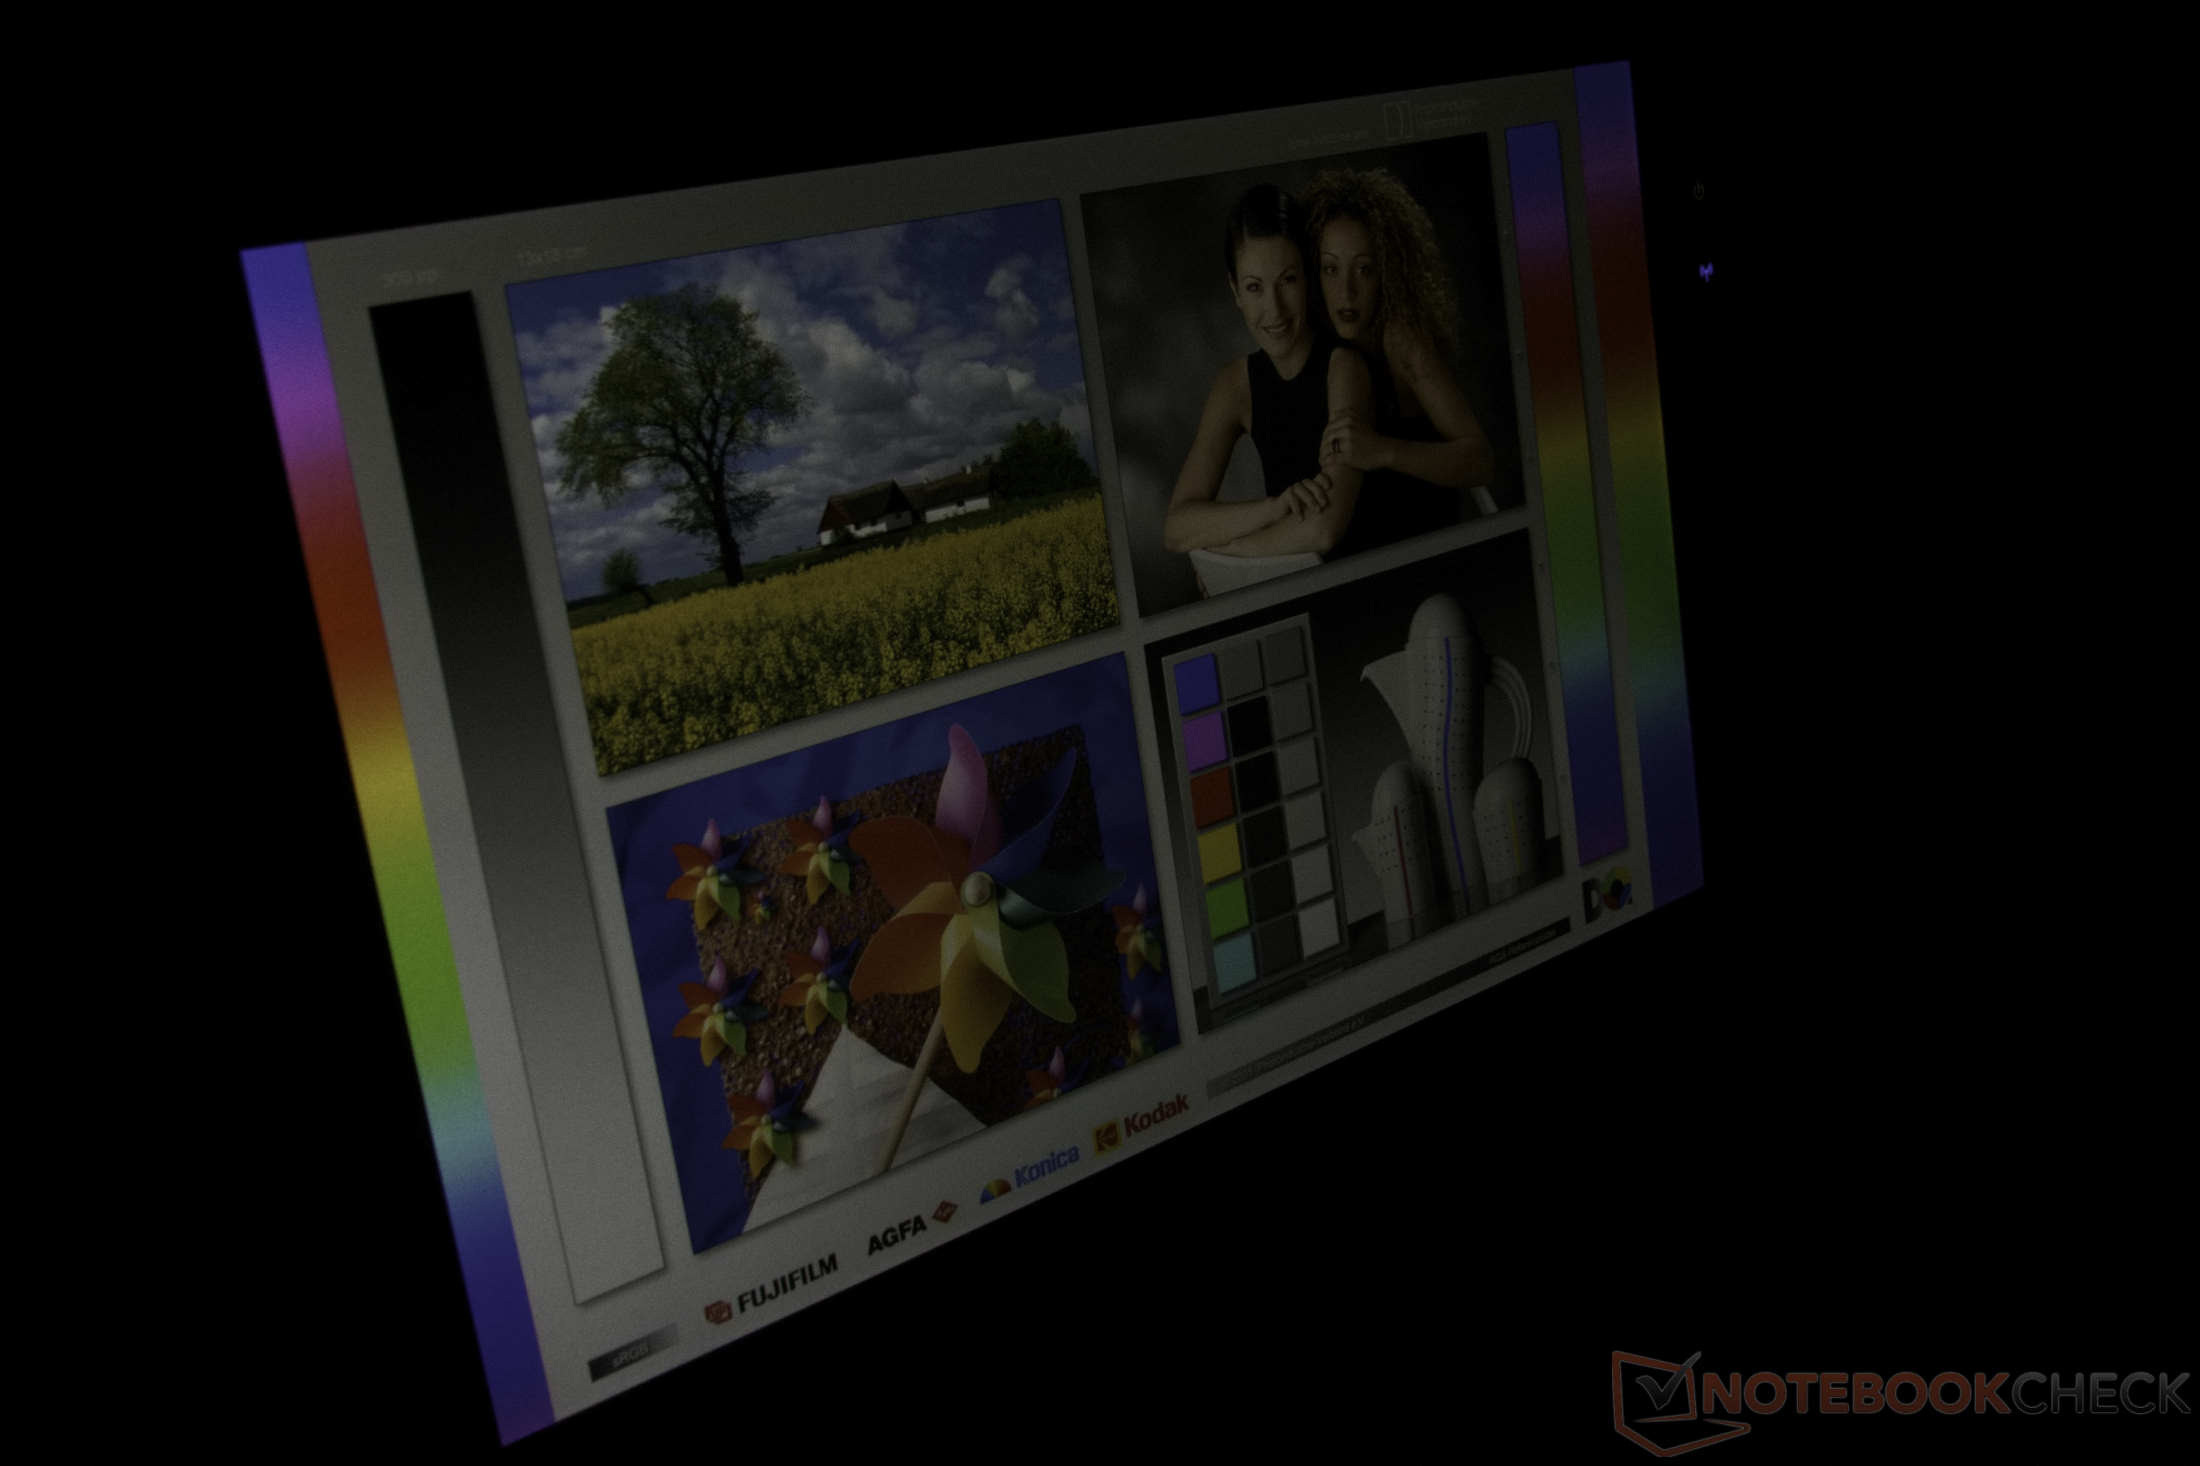
Het 10,1-inch WUXGA-scherm is zonder compromissen ontworpen voor gebruik buitenshuis. Met een enorme helderheid van meer dan 1.000 cd/m² is het scherm zo helder dat alle inhoud op het scherm zelfs in direct zonlicht perfect leesbaar blijft. Een vooraf geïnstalleerde matte schermbeschermer vermindert storende reflecties effectief, hoewel deze bij heldere gebieden wel een licht regenboogeffect veroorzaakt. De adaptieve helderheid is een praktische functie die het gebruiksgemak vergroot.
| |||||||||||||||||||||||||
Helderheidsverdeling: 92 %
Helderheid in Batterij-modus: 1040 cd/m²
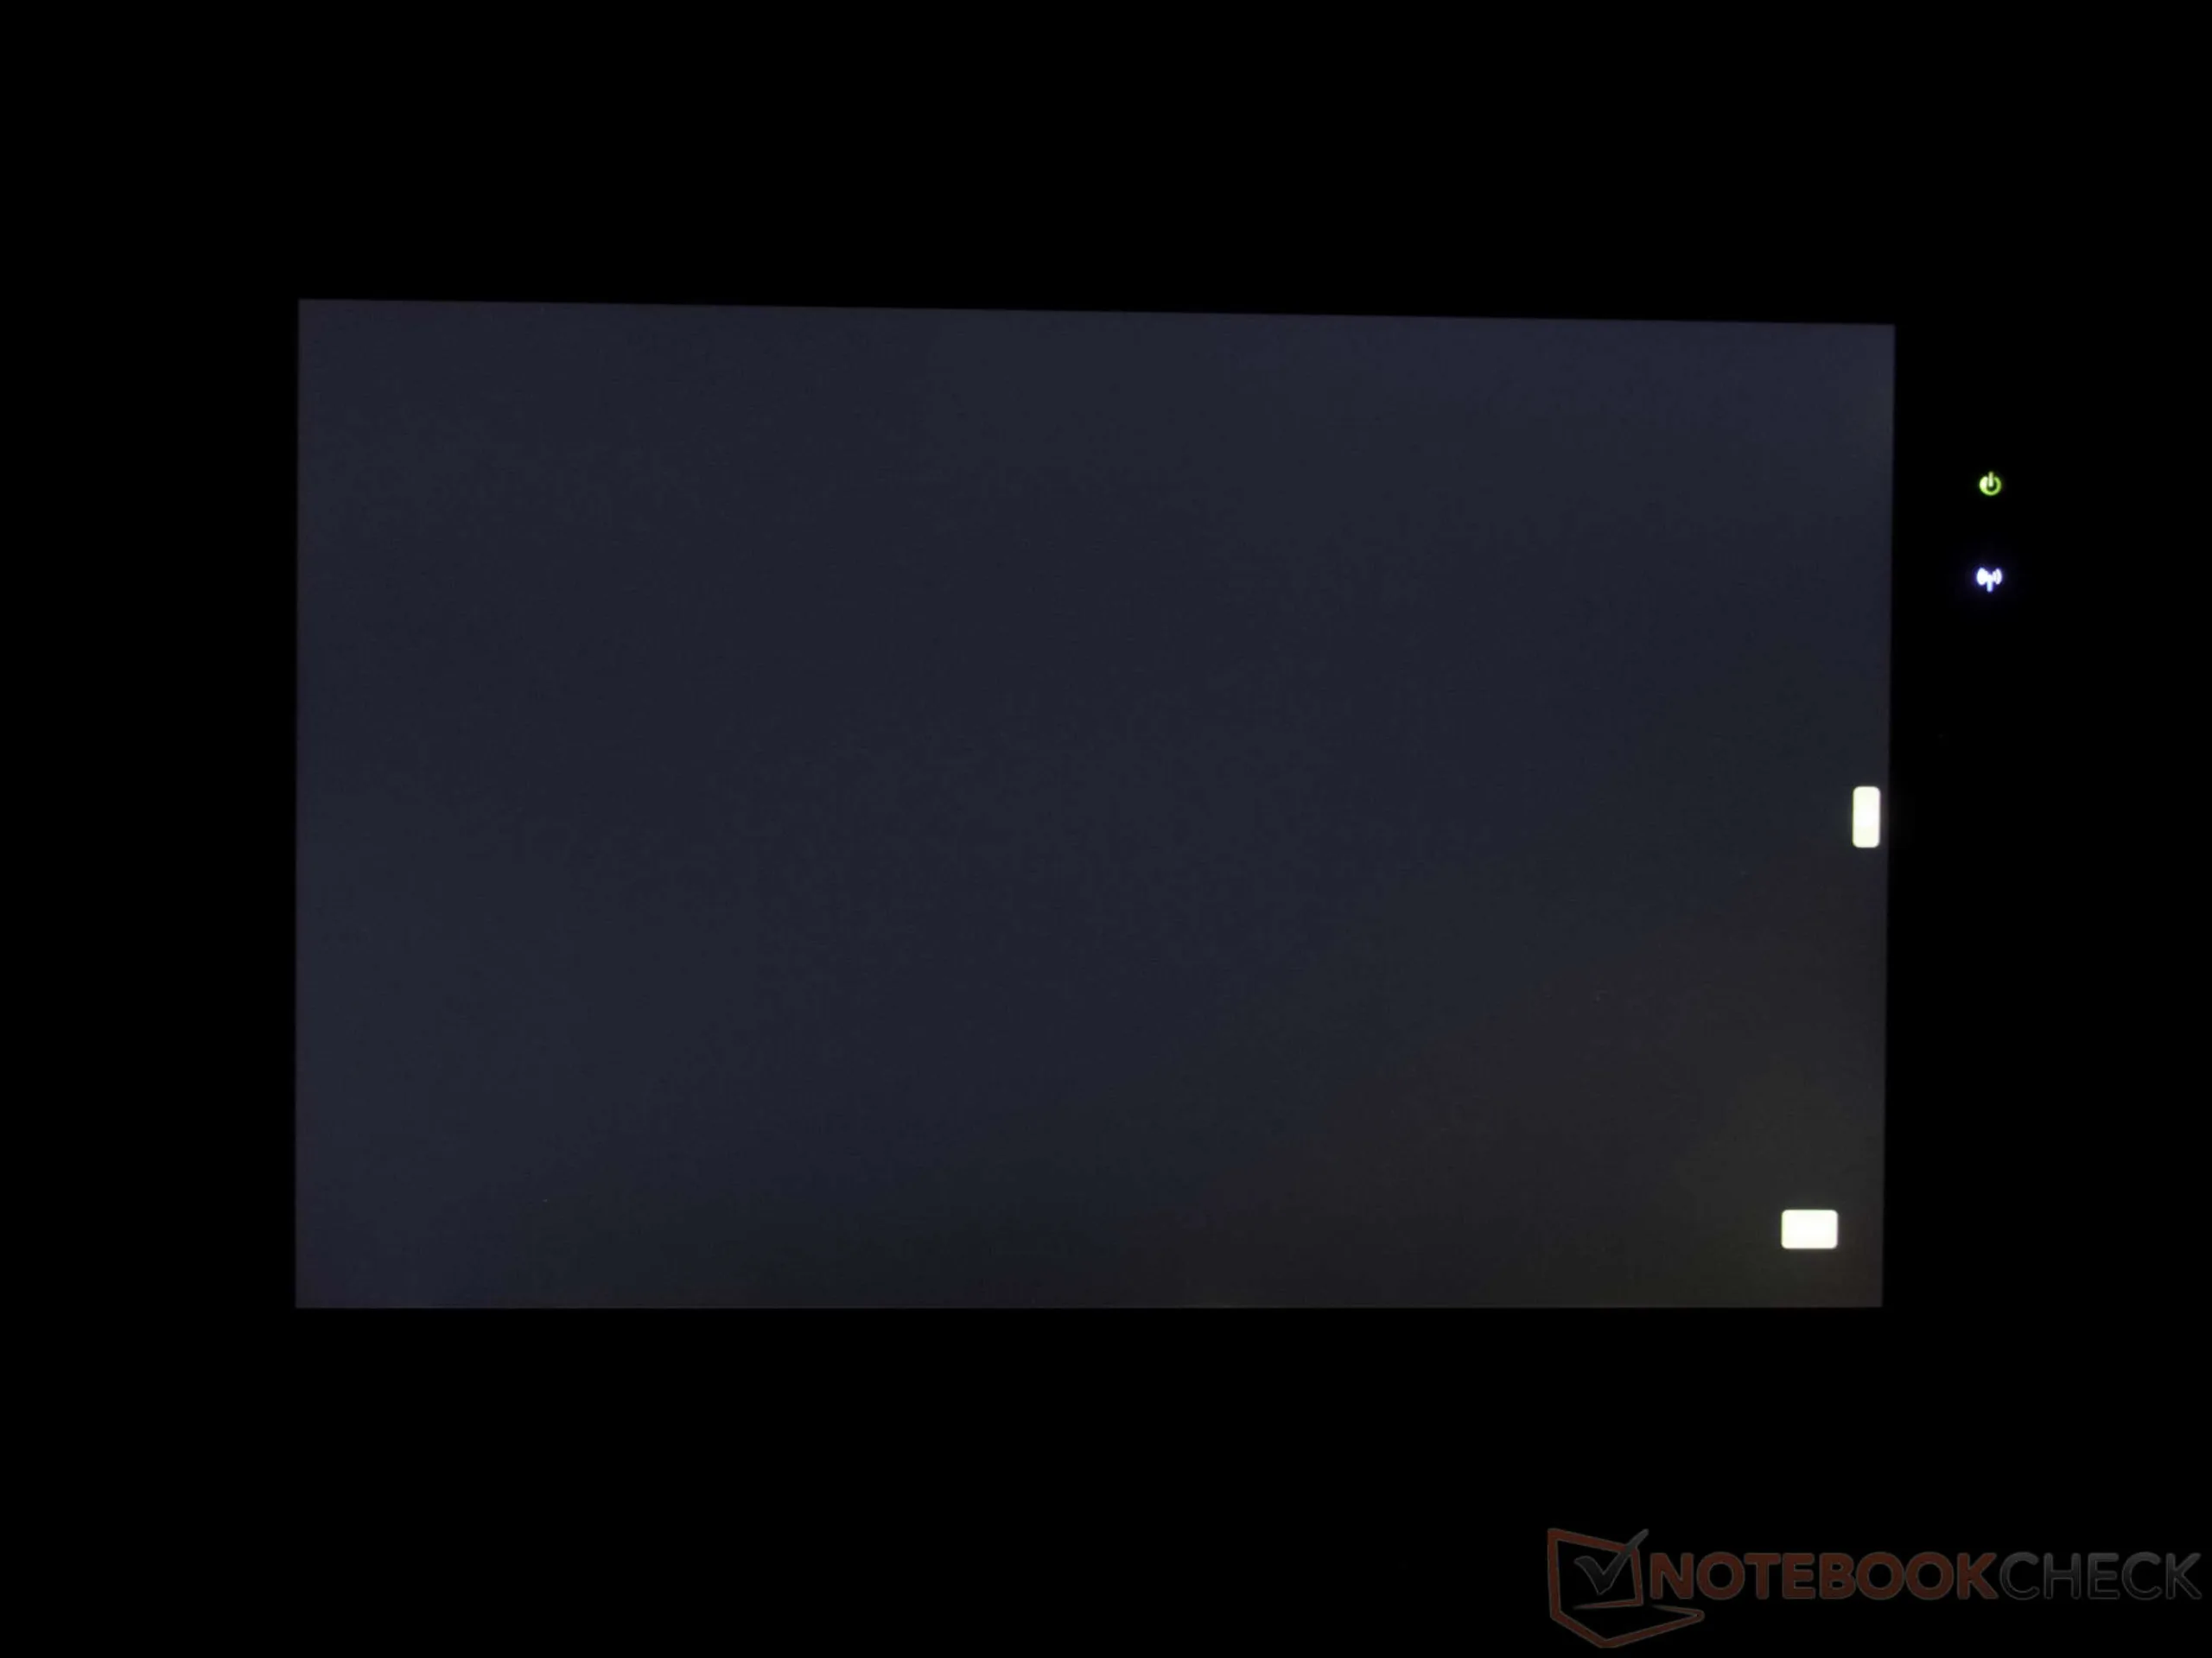
Contrast: 1024:1 (Zwart: 1.05 cd/m²)
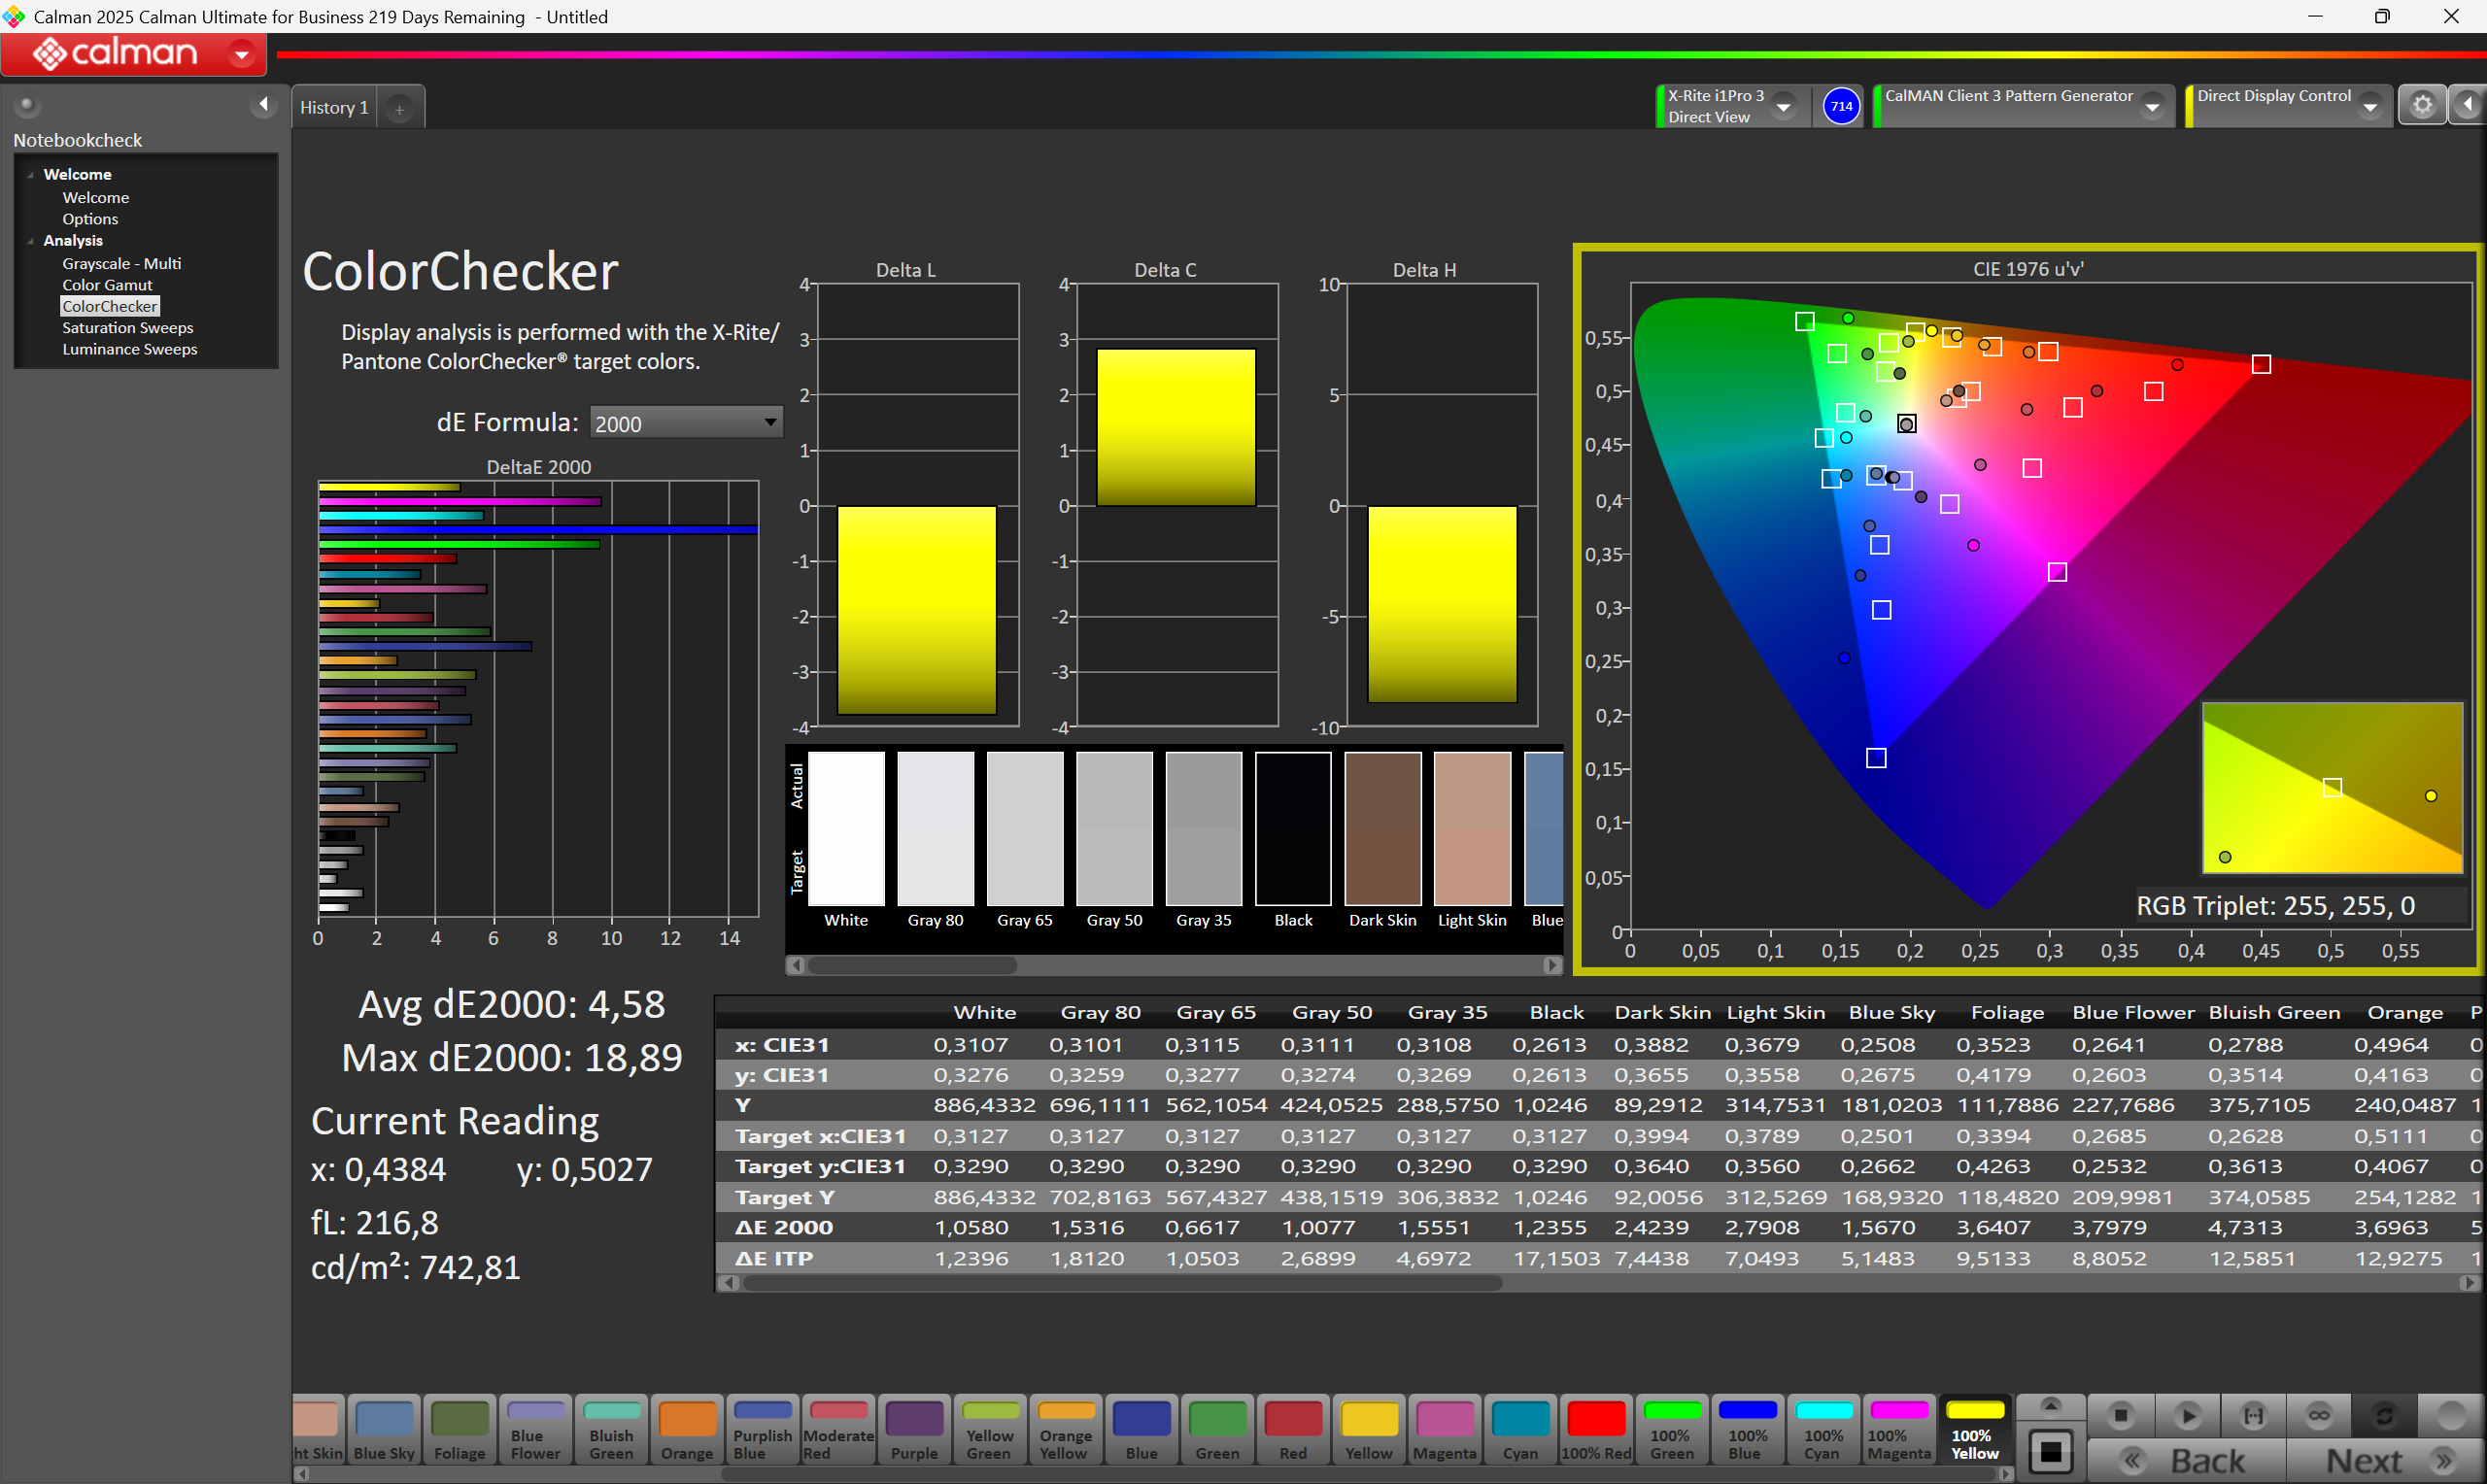
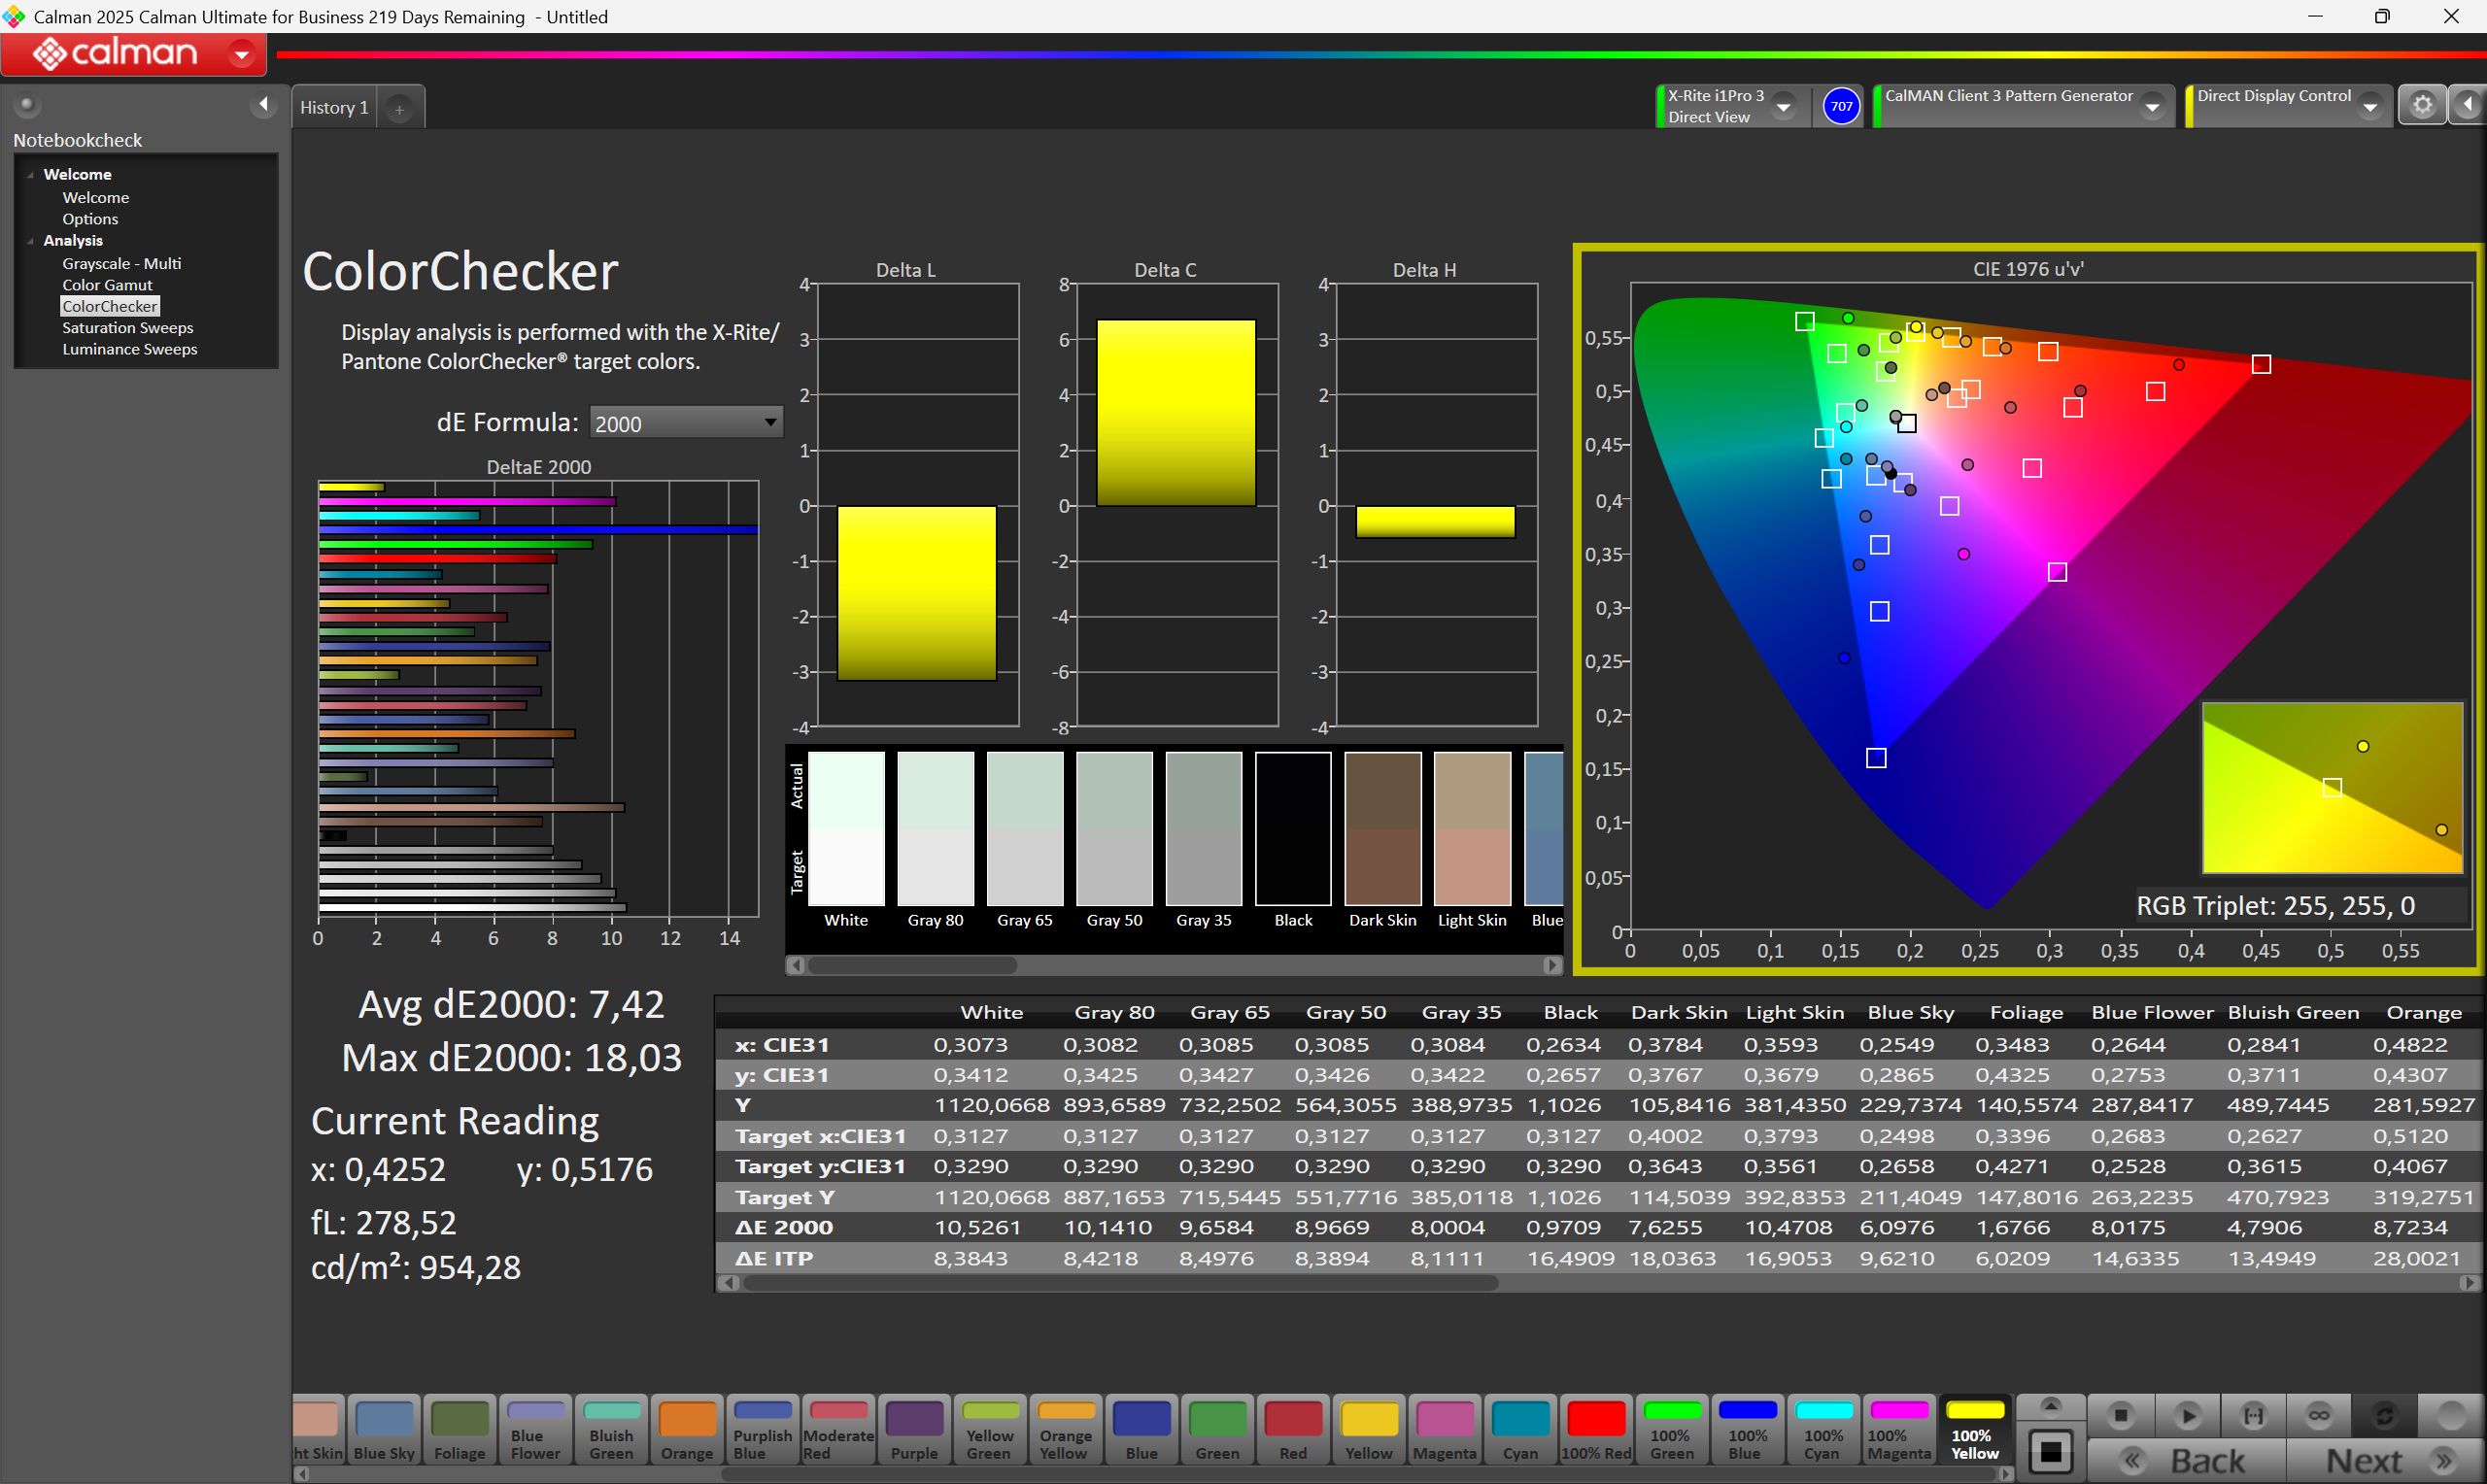
ΔE ColorChecker Calman: 7.42 | ∀{0.5-29.43 Ø4.72}
calibrated: 4.58
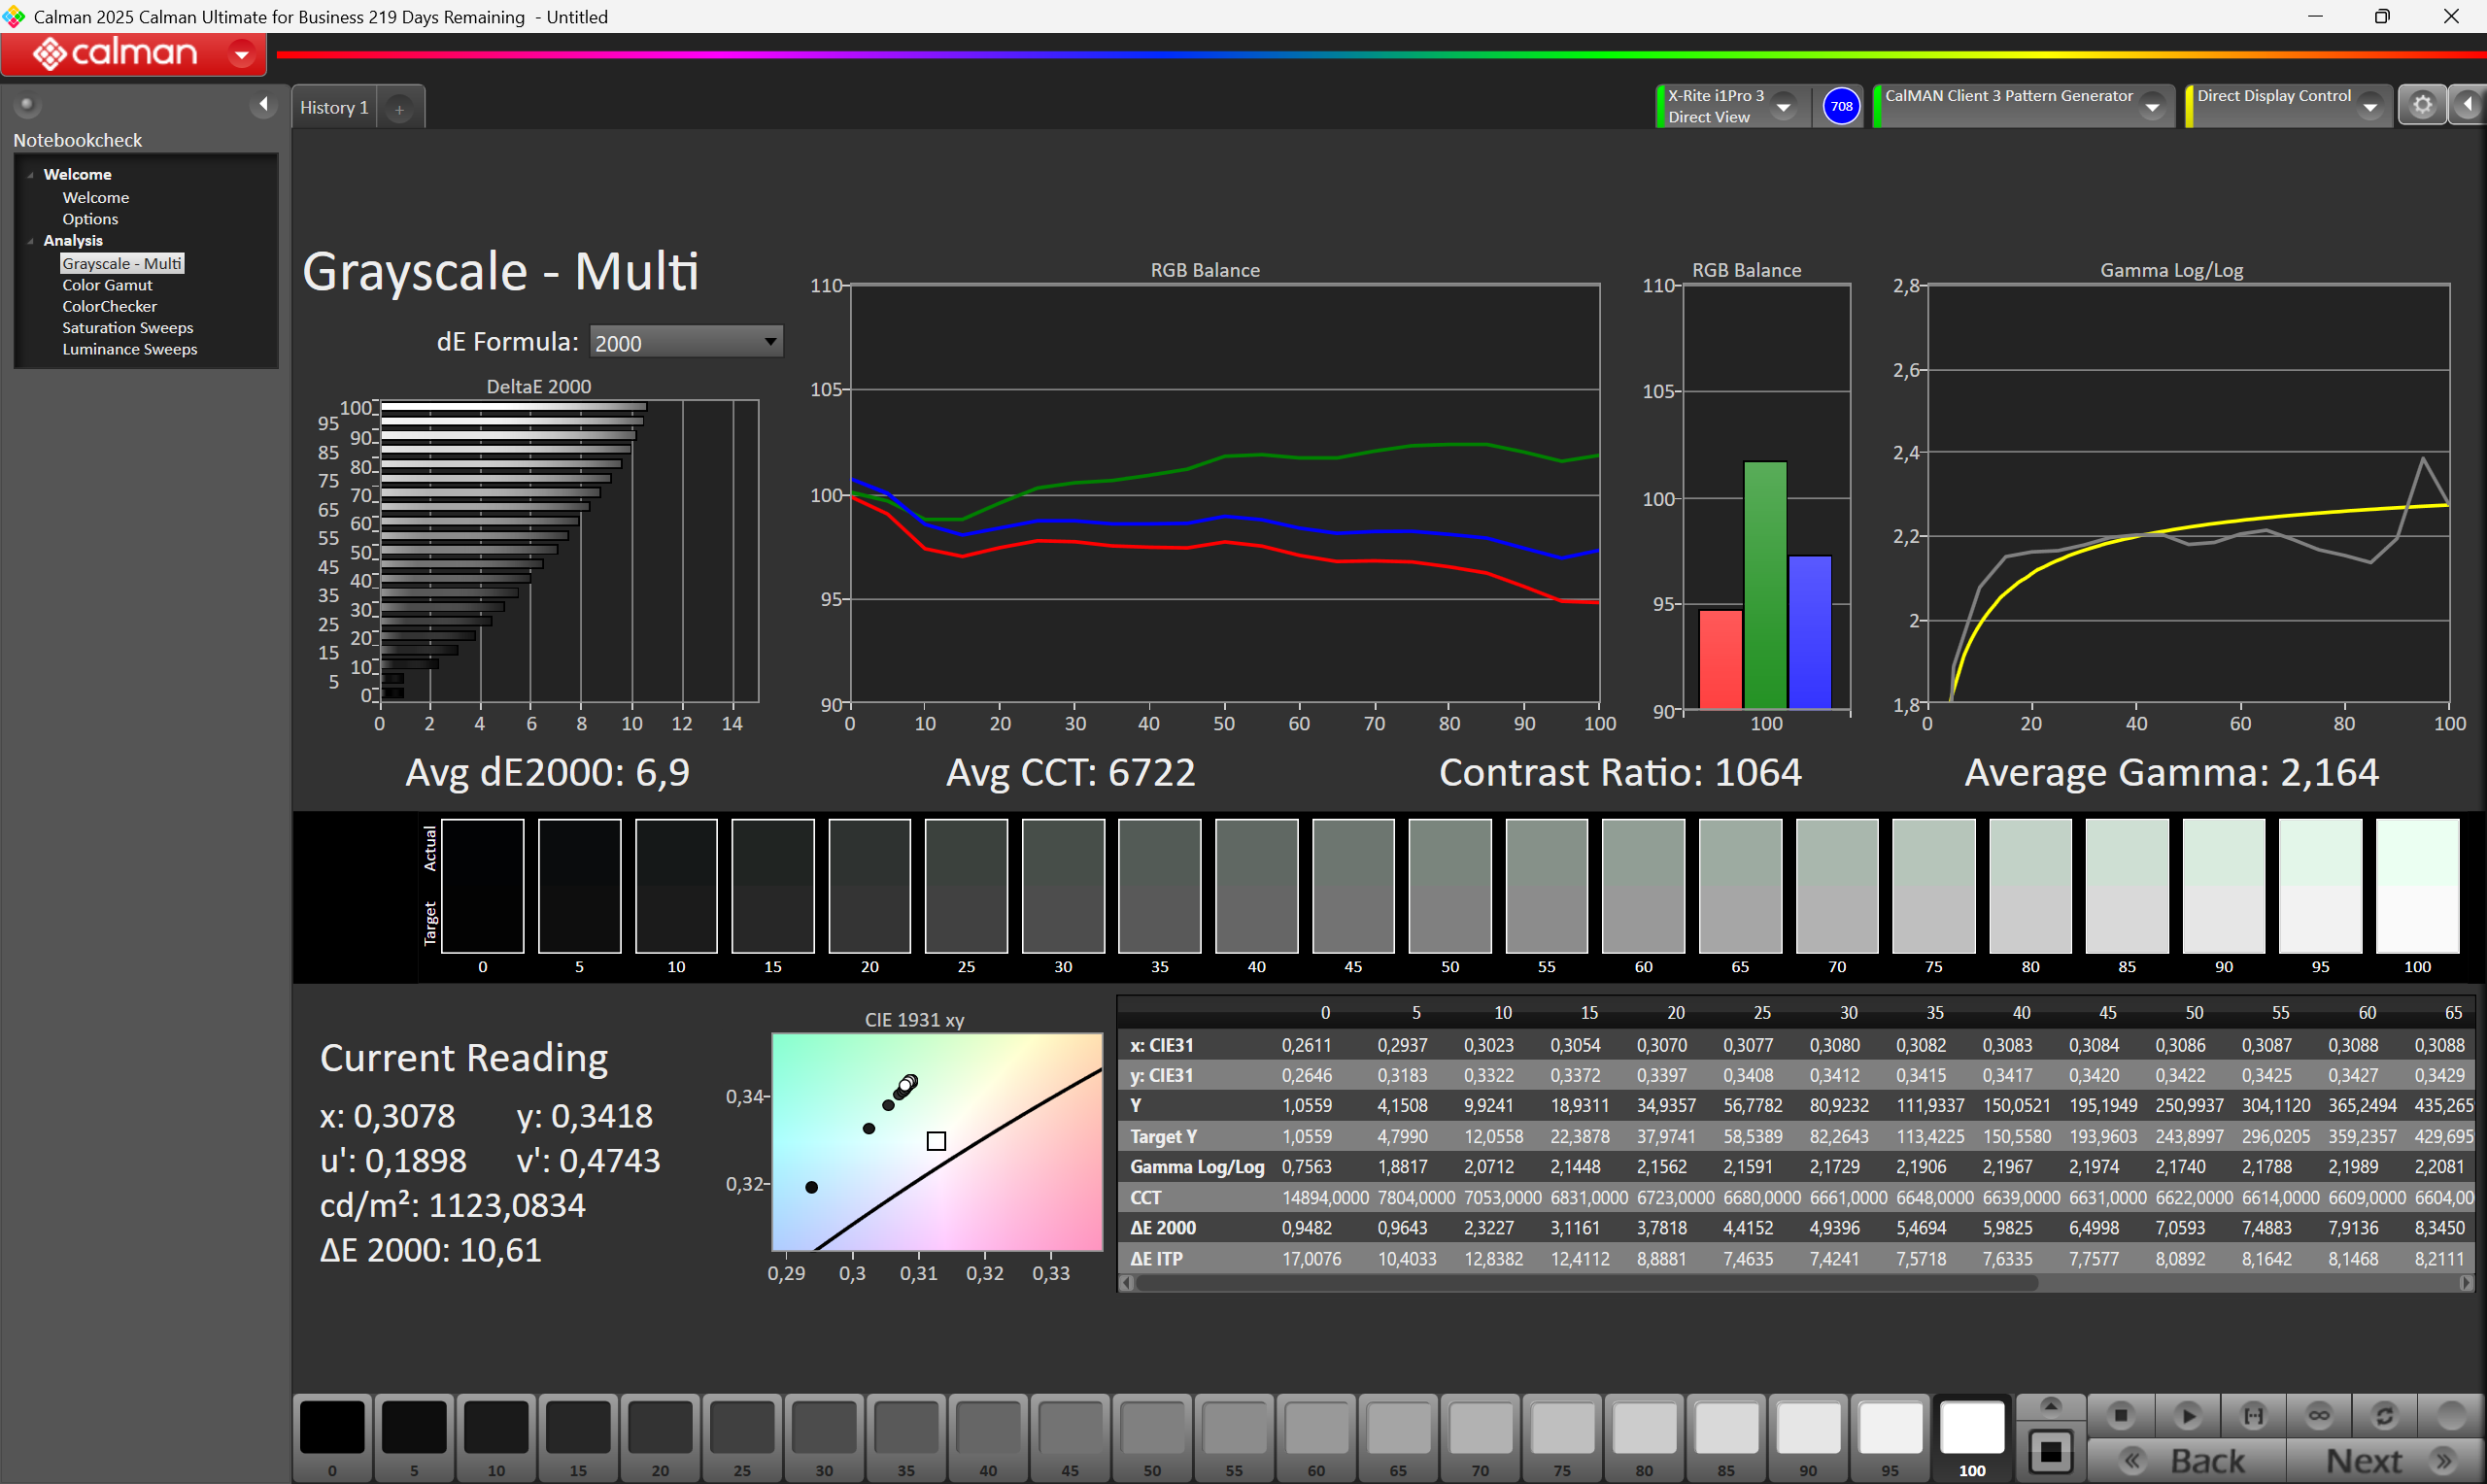
ΔE Greyscale Calman: 6.9 | ∀{0.09-98 Ø4.97}
44.17% AdobeRGB 1998 (Argyll 3D)
61.77% sRGB (Argyll 3D)
42.75% Display P3 (Argyll 3D)
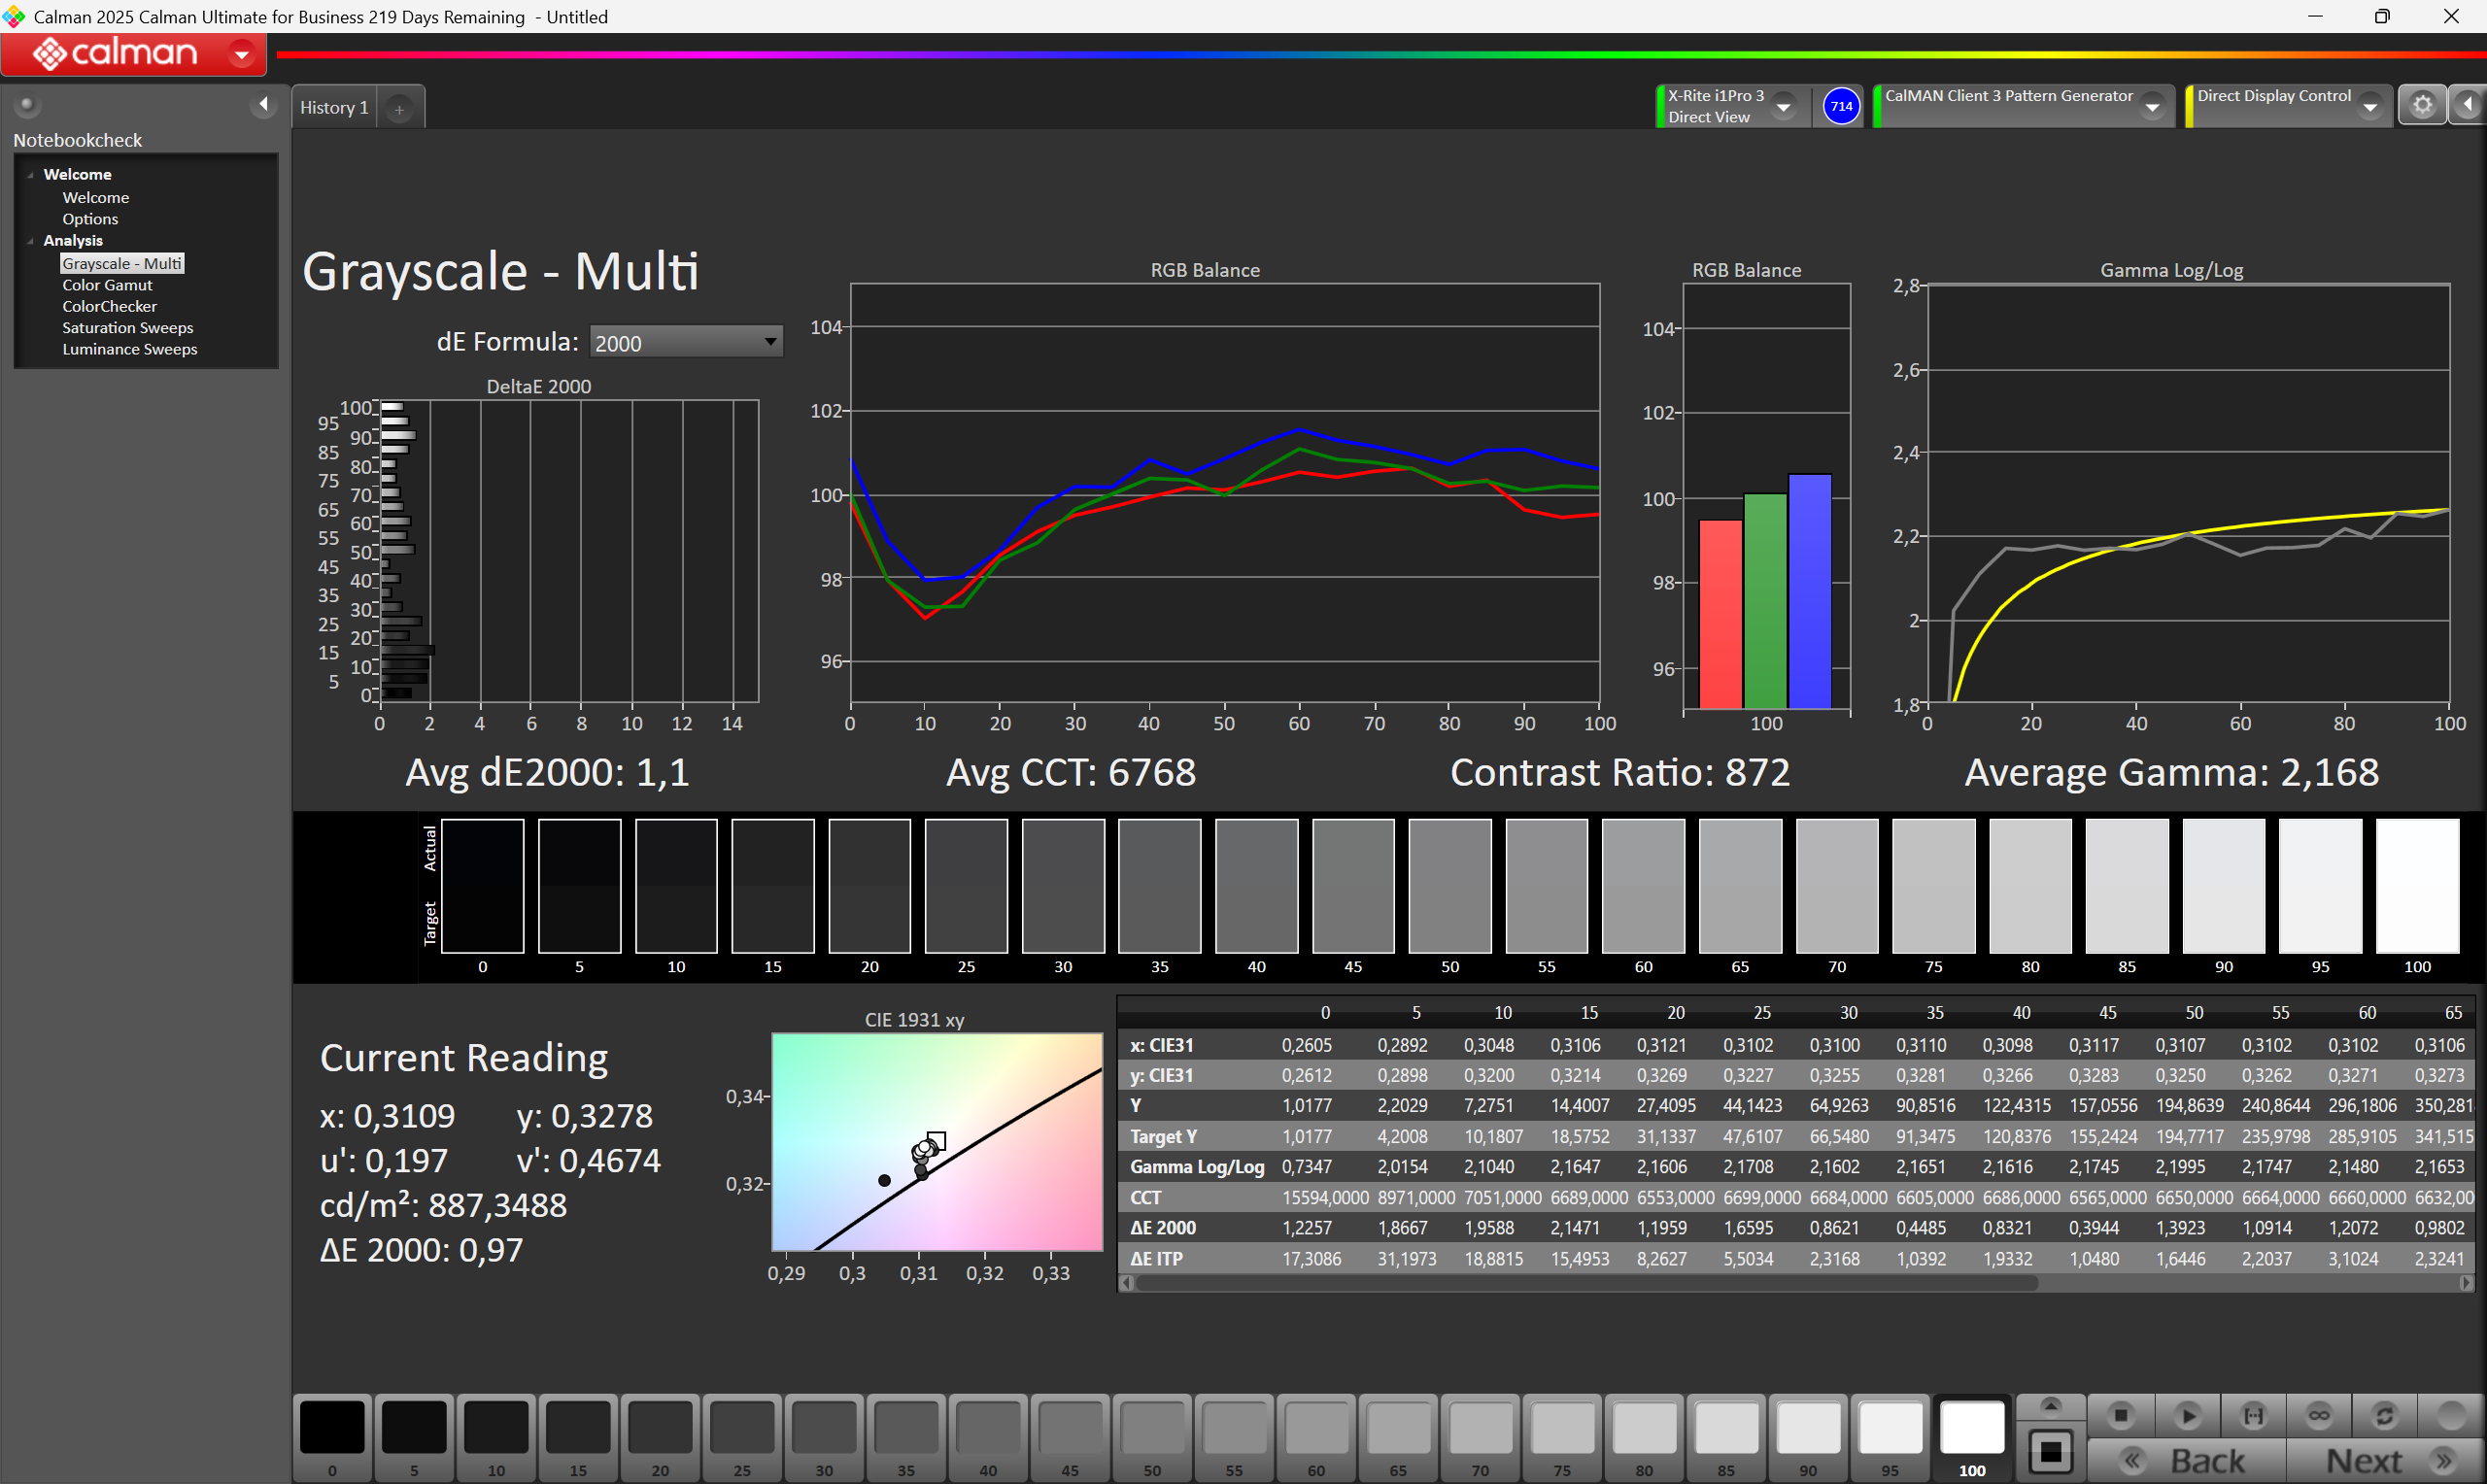
Gamma: 2.164
CCT: 6722 K
| Durabook R10 HannStar 101GUW2, TFT, 1920x1200, 10.1", 60 Hz | Dell Latitude 7030 Rugged Extreme Sharp LQ101N1, IPS, 1920x1200, 10", 60 Hz | Lenovo ThinkPad T14 Gen 6 21QG001VGE MNE007JA1-3, IPS LED, 1920x1200, 14", 60 Hz | Dynabook Portege Z40L-N BOE NE140WUM-N6K, IPS, 1920x1200, 14", 60 Hz | Durabook R8 Tablet Digital Flat Panel, IPS, 1280x800, 8", 60 Hz | Lenovo ThinkPad T14 Gen 6 AMD NE140WUM-N6M, , 1920x1200, 14", 60 Hz | |
|---|---|---|---|---|---|---|
| Display | 65% | 58% | 62% | 22% | 57% | |
| Display P3 Coverage (%) | 42.75 | 72.2 69% | 67.7 58% | 70.1 64% | 51.5 20% | 66.9 56% |
| sRGB Coverage (%) | 61.77 | 99 60% | 98.3 59% | 99 60% | 77.4 25% | 98.5 59% |
| AdobeRGB 1998 Coverage (%) | 44.17 | 72.7 65% | 69.9 58% | 71.8 63% | 53.1 20% | 68.9 56% |
| Response Times | 26% | 10% | 8% | 30% | 28% | |
| Response Time Grey 50% / Grey 80% * (ms) | 53.2 ? | 35.9 ? 33% | 40.2 ? 24% | 42.1 ? 21% | 32.4 ? 39% | 31.1 ? 42% |
| Response Time Black / White * (ms) | 27.6 ? | 22.4 ? 19% | 29.1 ? -5% | 26.7 ? 3% | 21.9 ? 21% | 24.1 ? 13% |
| PWM Frequency (Hz) | 300 | 300 ? | ||||
| PWM Amplitude * (%) | 100 | 100 -0% | ||||
| Screen | 45% | 45% | 34% | 5% | 28% | |
| Brightness middle (cd/m²) | 1075 | 1183.9 10% | 554 -48% | 445.4 -59% | 943.7 -12% | 557 -48% |
| Brightness (cd/m²) | 1042 | 1140 9% | 516 -50% | 424 -59% | 870 -17% | 526 -50% |
| Brightness Distribution (%) | 92 | 88 -4% | 91 -1% | 91 -1% | 85 -8% | 84 -9% |
| Black Level * (cd/m²) | 1.05 | 0.74 30% | 0.24 77% | 0.23 78% | 0.85 19% | 0.4 62% |
| Contrast (:1) | 1024 | 1600 56% | 2308 125% | 1937 89% | 1110 8% | 1393 36% |
| Colorchecker dE 2000 * | 7.42 | 2.03 73% | 1.5 80% | 2.85 62% | 6.35 14% | 2.4 68% |
| Colorchecker dE 2000 max. * | 18.03 | 3.44 81% | 3.4 81% | 4.57 75% | 8.86 51% | 5.9 67% |
| Colorchecker dE 2000 calibrated * | 4.58 | 0.53 88% | 0.9 80% | 1.54 66% | 5.1 -11% | 0.7 85% |
| Greyscale dE 2000 * | 6.9 | 2.6 62% | 2.7 61% | 3.3 52% | 6.9 -0% | 4 42% |
| Gamma | 2.164 102% | 2.27 97% | 2.25 98% | 2.03 108% | 2.65 83% | 2.15 102% |
| CCT | 6722 97% | 6102 107% | 6882 94% | 6497 100% | 6956 93% | 7017 93% |
| Totaal Gemiddelde (Programma / Instellingen) | 45% /
47% | 38% /
43% | 35% /
34% | 19% /
12% | 38% /
34% |
* ... kleiner is beter
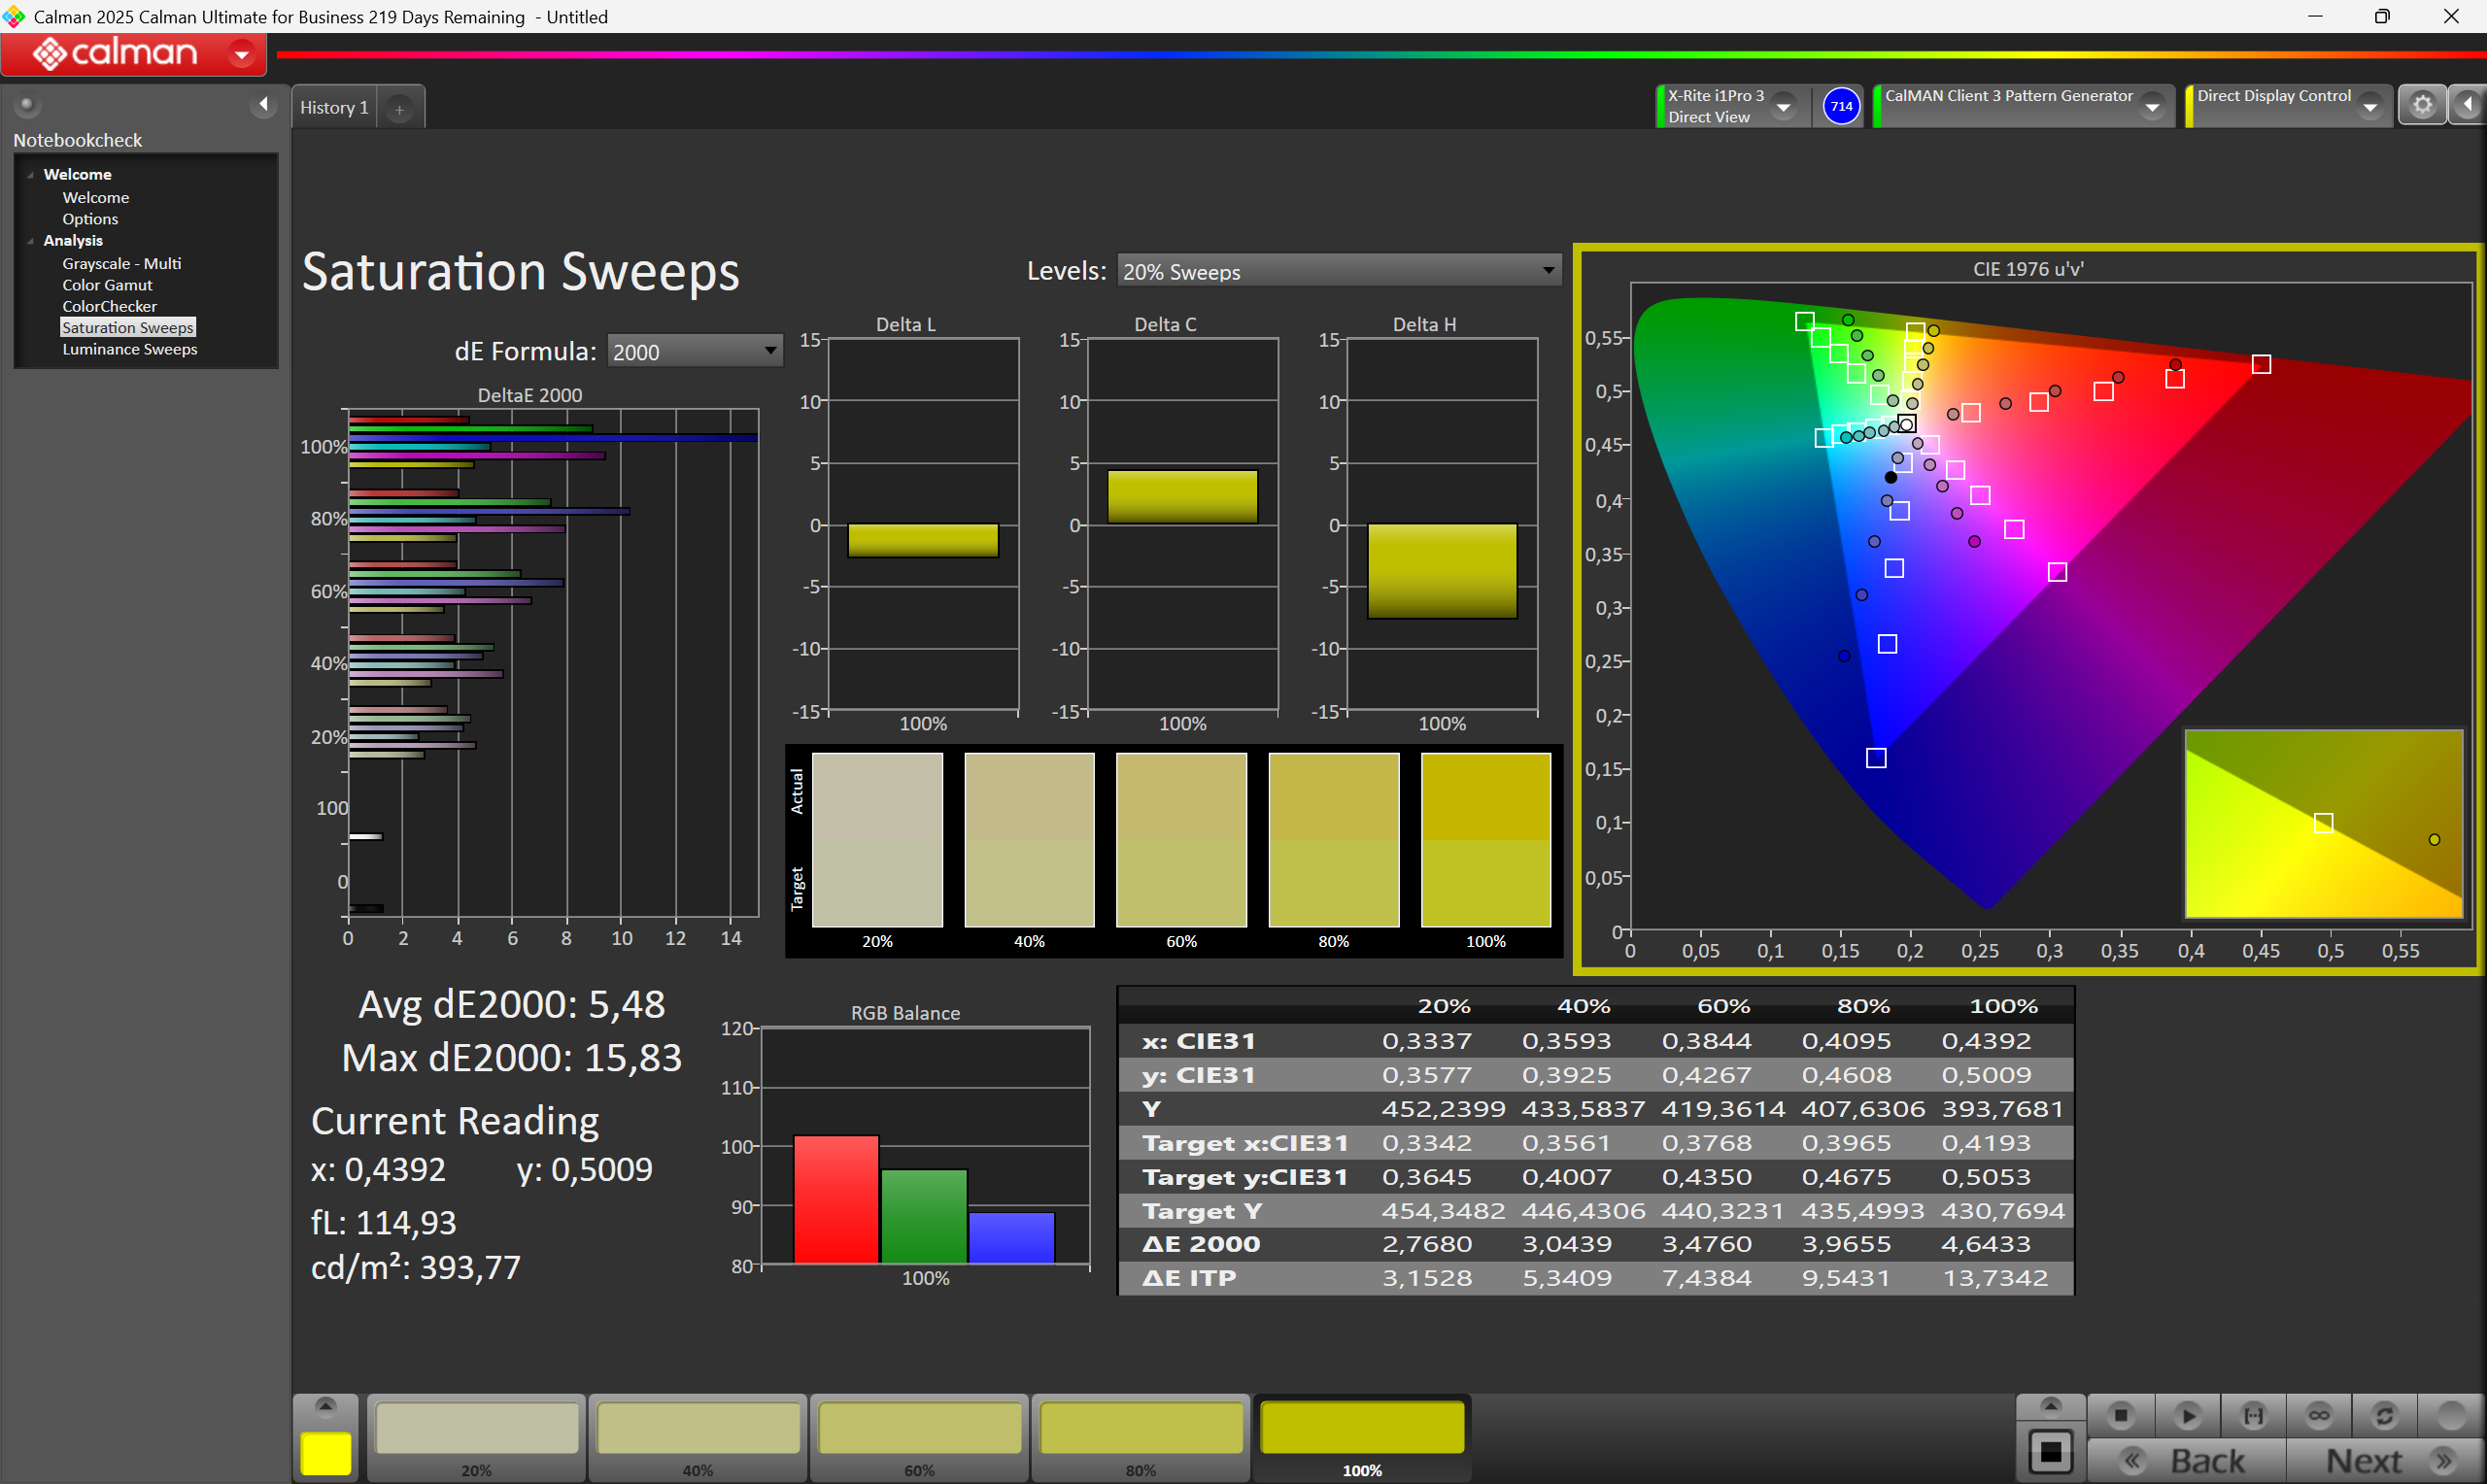
Deze tablet is niet geschikt voor kleurgevoelig werk. Met een sRGB-kleurbereik van slechts 61 procent zien de kleuren er vaal uit. Direct na het uitpakken vertoont het scherm een opvallende groene tint.
Responstijd Scherm
| ↔ Responstijd Zwart naar Wit | ||
|---|---|---|
| 27.6 ms ... stijging ↗ en daling ↘ gecombineerd | ↗ 16 ms stijging |   |
| ↘ 11.6 ms daling | ||
| Het scherm vertoonde relatief trage responstijden in onze tests en is misschien te traag voor games. Ter vergelijking: alle testtoestellen variëren van 0.1 (minimum) tot 240 (maximum) ms. » 70 % van alle toestellen zijn beter. Dit betekent dat de gemeten responstijd slechter is dan het gemiddelde (19.8 ms) van alle geteste toestellen. | ||
| ↔ Responstijd 50% Grijs naar 80% Grijs | ||
| 53.2 ms ... stijging ↗ en daling ↘ gecombineerd | ↗ 20 ms stijging |   |
| ↘ 33.2 ms daling | ||
| Het scherm vertoonde trage responstijden in onze tests en is misschien te traag voor games. Ter vergelijking: alle testtoestellen variëren van 0.165 (minimum) tot 636 (maximum) ms. » 90 % van alle toestellen zijn beter. Dit betekent dat de gemeten responstijd slechter is dan het gemiddelde (31 ms) van alle geteste toestellen. | ||
Screen Flickering / PWM (Pulse-Width Modulation)
| Screen flickering / PWM waargenomen | 300 Hz Amplitude: 100 % |  | |
De achtergrondverlichting van het scherm flikkert op 300 Hz (in het slechtste geval, bijvoorbeeld bij gebruik van PWM) . De frequentie van 300 Hz is relatief hoog en de meeste mensen die gevoelig zijn aan flickering zouden dit dus niet mogen waarnemen of geïrriteerde ogen krijgen. Er zijn echter rapporten die beweren dat sommige mensen toch flickering met 500 Hz en hoger kunnen waarnemen: opgelet dus. Ter vergelijking: 52 % van alle geteste toestellen maakten geen gebruik van PWM om de schermhelderheid te verlagen. Als het wel werd gebruikt, werd een gemiddelde van 7781 (minimum: 5 - maximum: 343500) Hz waargenomen. | |||


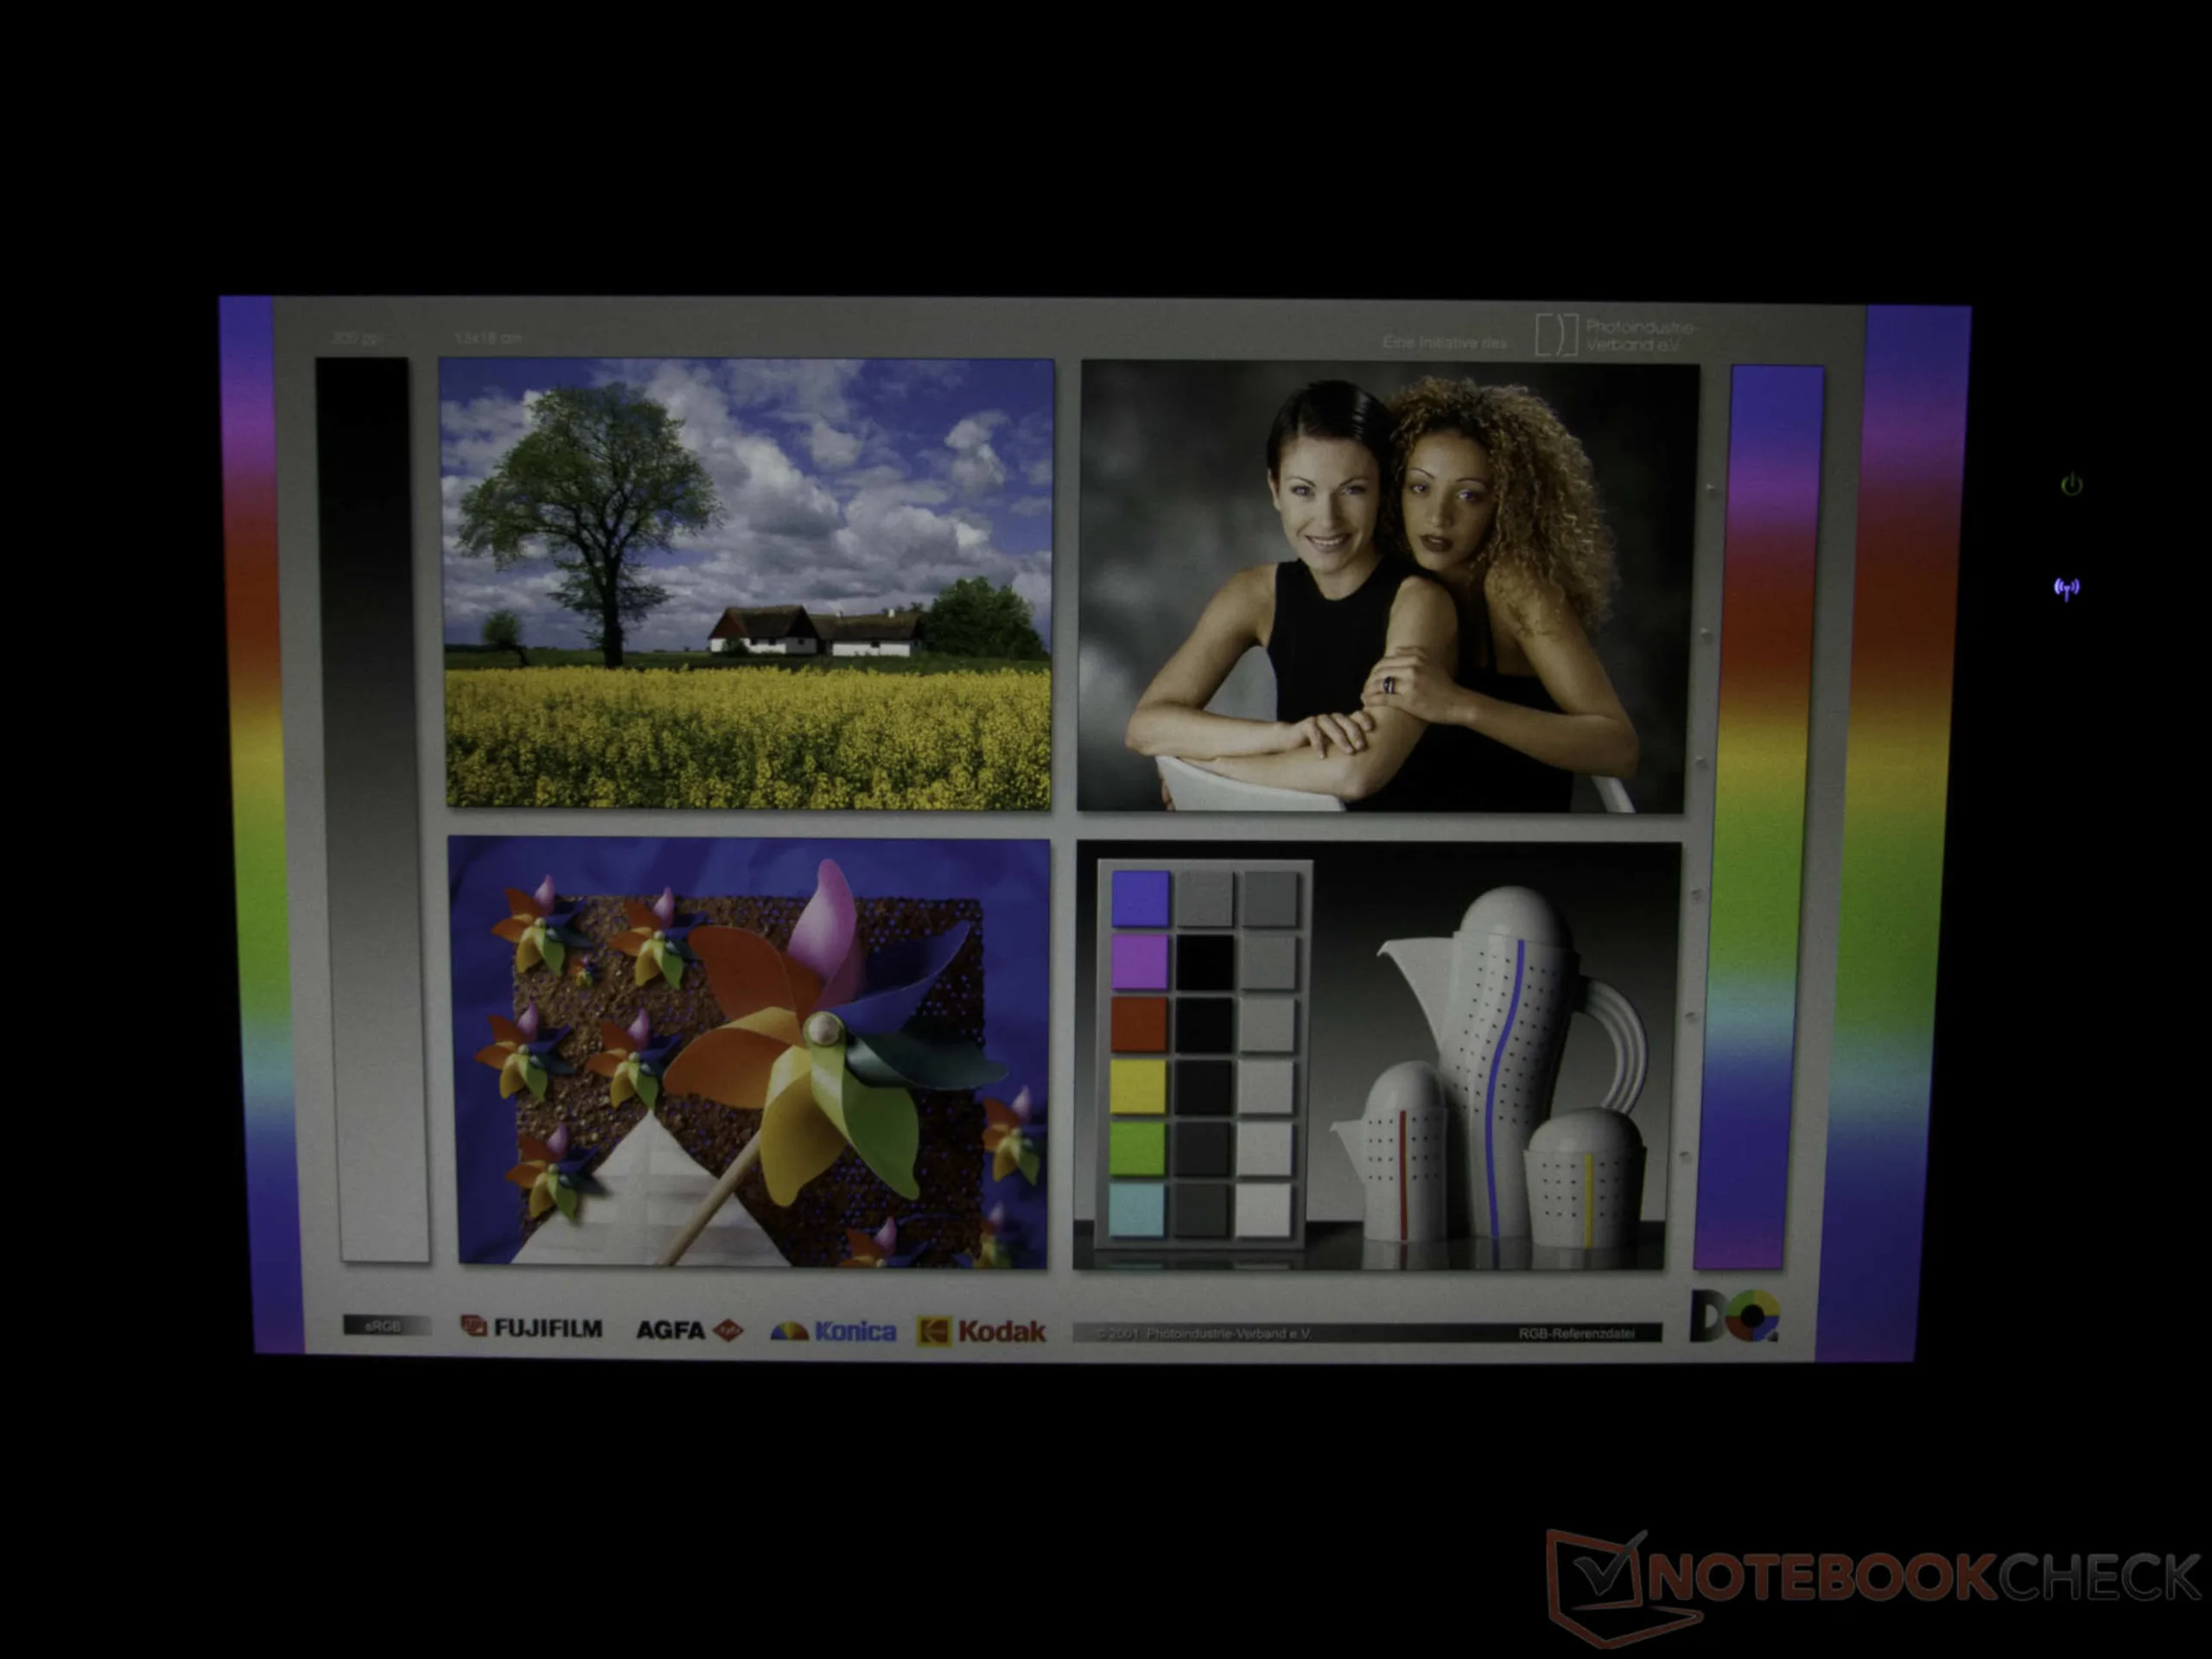
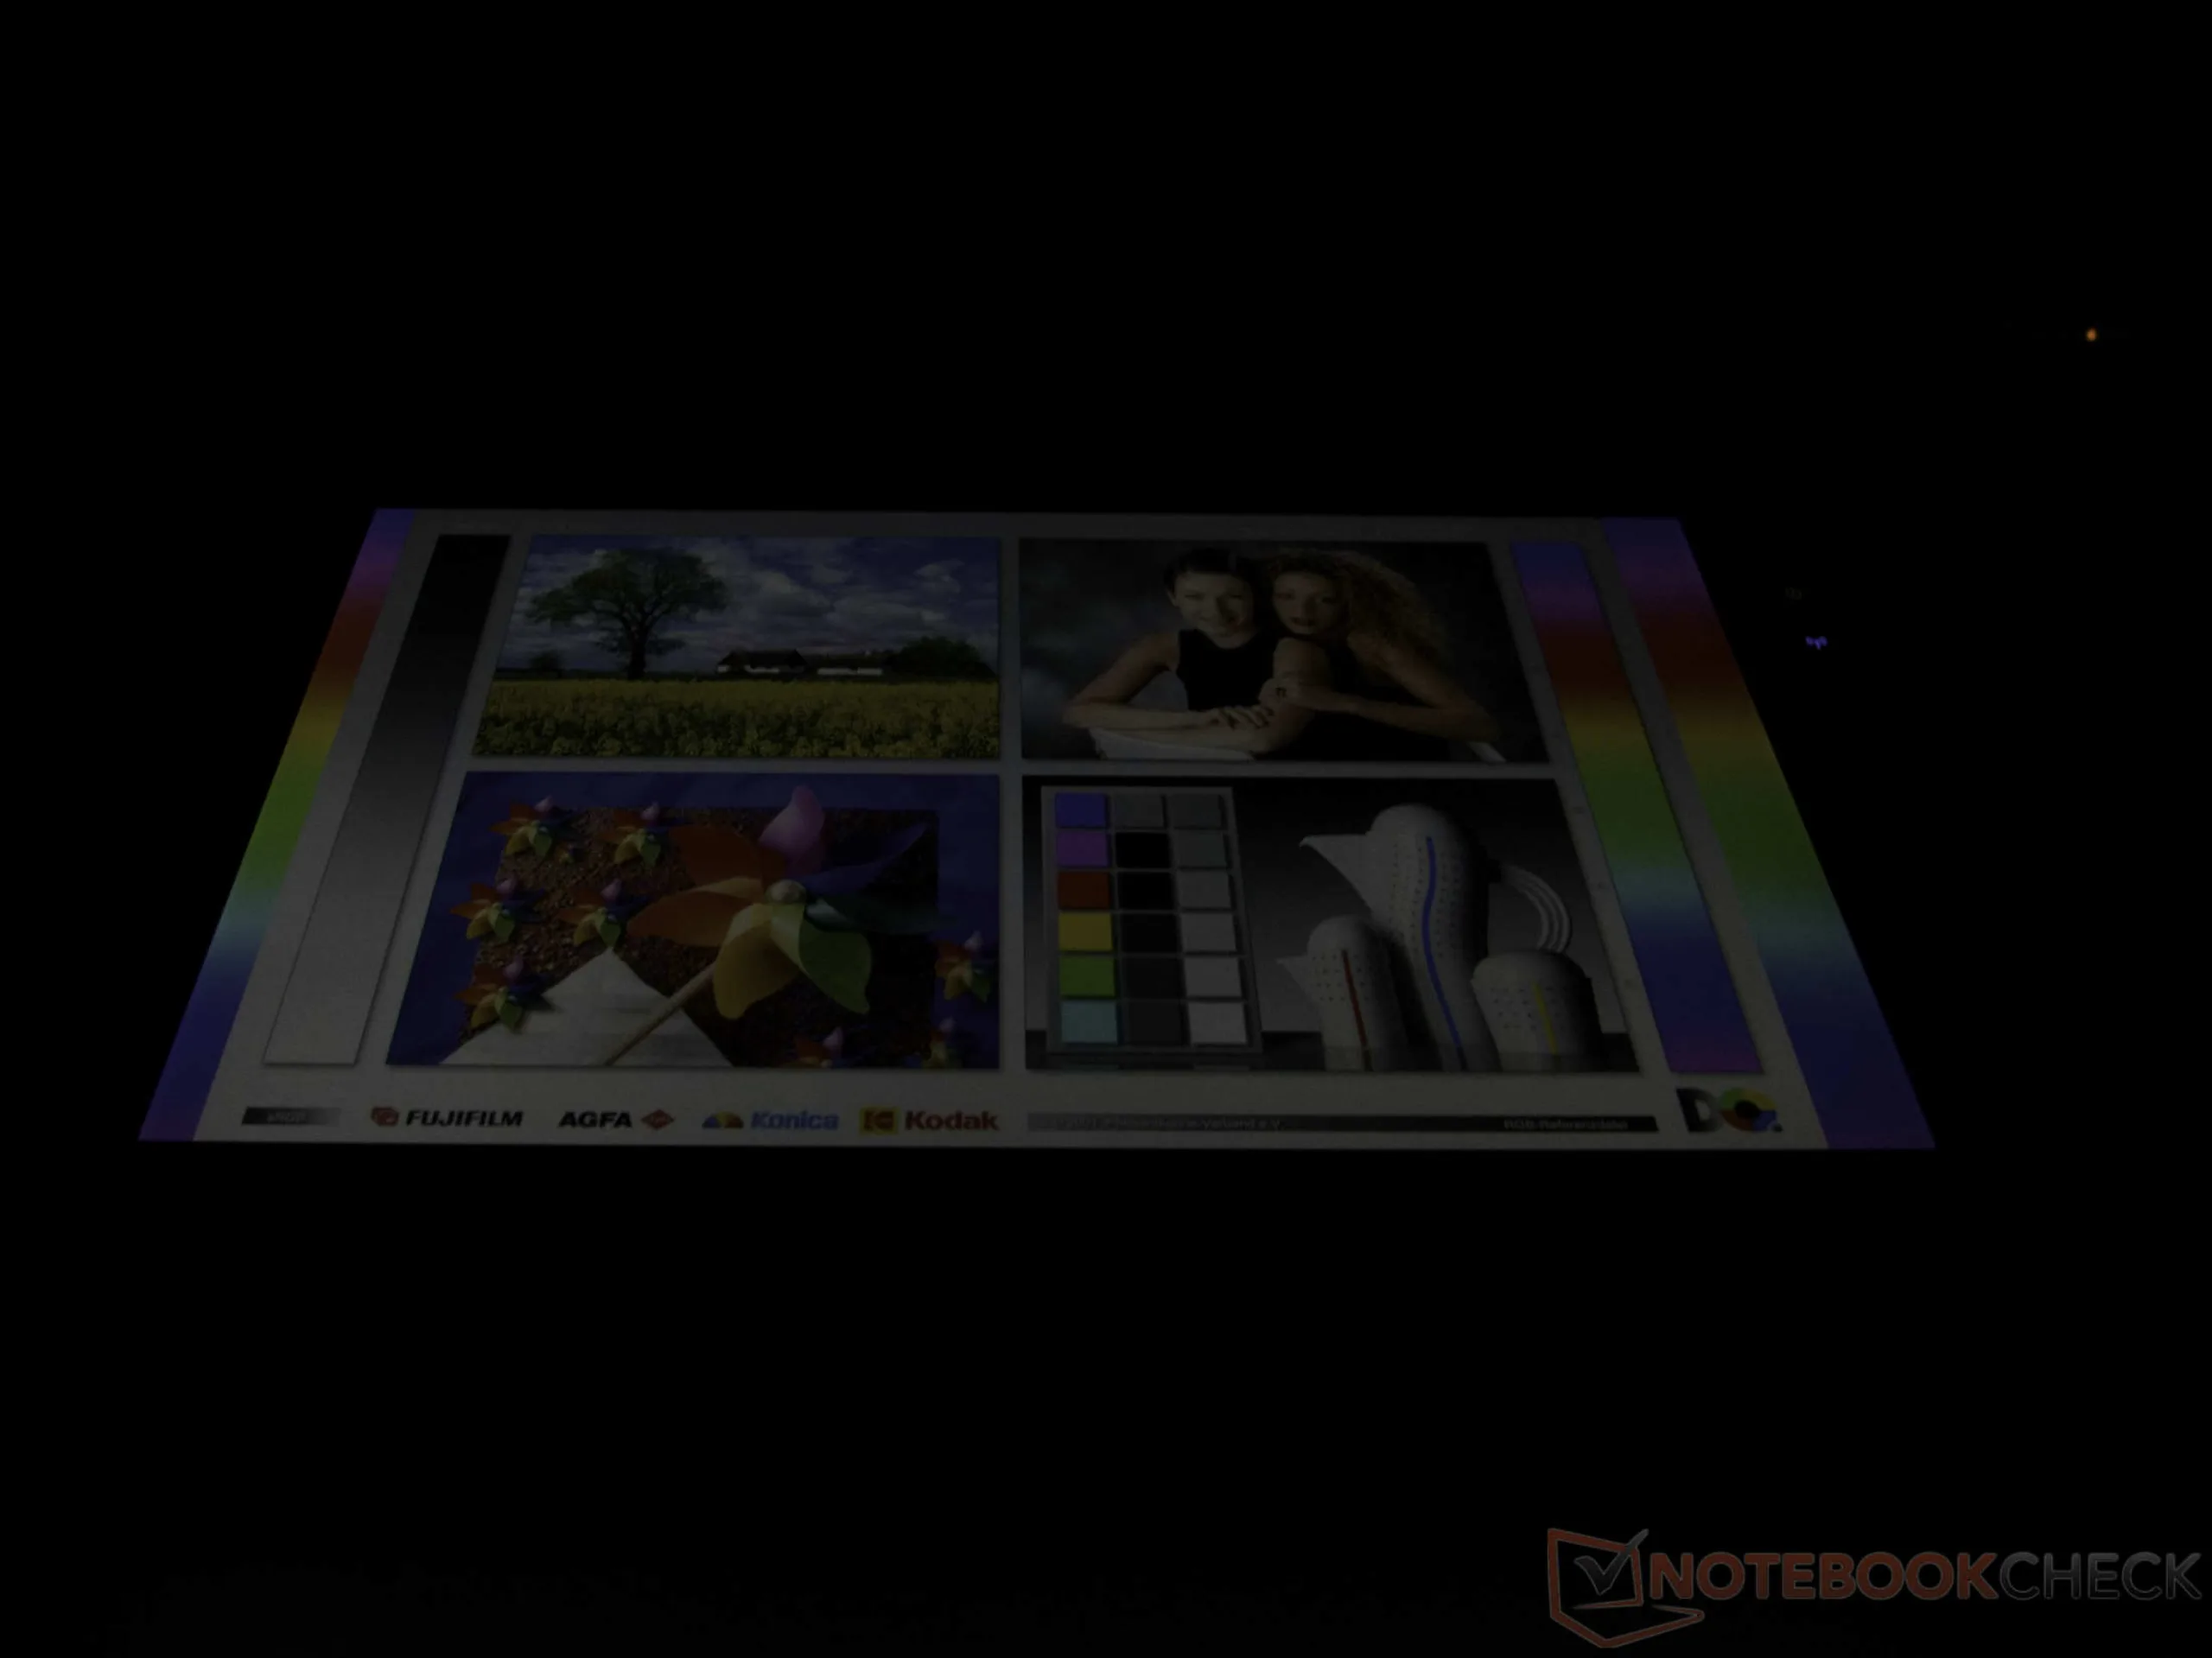
Gebruik buitenshuis
Perspectiefanalyse
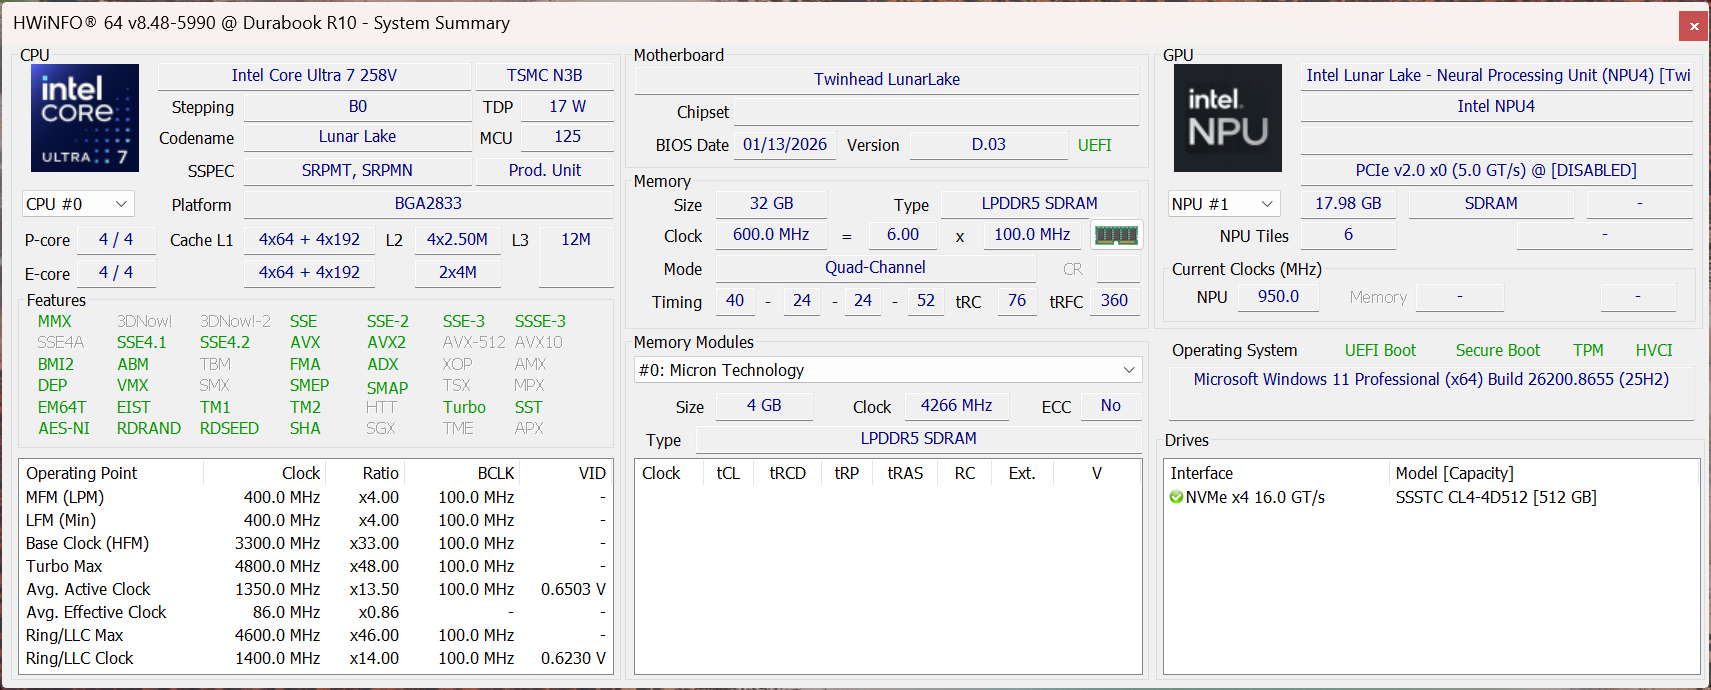
Prestaties
Onder de robuuste behuizing werkt een ultramoderne Intel Core Ultra-processor onophoudelijk. Voor de R10 kunnen vrijwel alle Core Ultra 5- en Core Ultra 7-processors uit de Lunar Lake-generatie worden geconfigureerd. Afhankelijk van de processorklasse zijn er vPro Enterprise-versies beschikbaar.
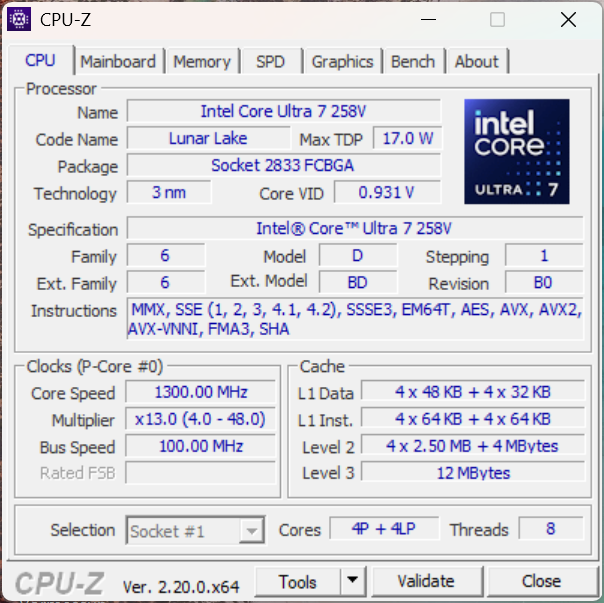
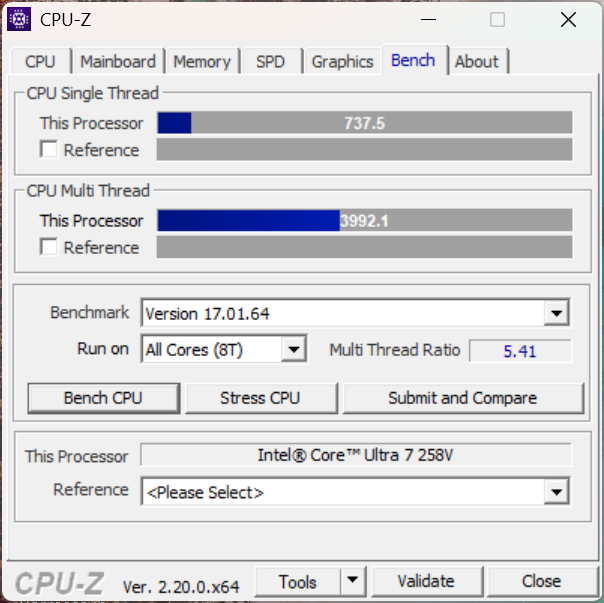
Prestaties van de processor
De 258V in het testexemplaar beschikt over acht kernen zonder multithreading. Tijdens korte piekbelastingen laat het systeem een vermogen tot 32 watt toe, waarna het stroomverbruik permanent wordt teruggeschroefd tot ongeveer 17 watt. Daardoor blijven de prestaties van de Core Ultra 7 in onze vergelijking onder het gemiddelde. Er is hier geen energiebeheerfunctie met instelbare TDP-waarden.
Cinebench R15 Multi-Core-duurproef
Cinebench R23: Multi Core | Single Core
Cinebench R20: CPU (Multi Core) | CPU (Single Core)
Cinebench R15: CPU Multi 64Bit | CPU Single 64Bit
Blender: v2.79 BMW27 CPU
7-Zip 18.03: 7z b 4 | 7z b 4 -mmt1
Geekbench 6.7: Multi-Core | Single-Core
Geekbench 5.5: Multi-Core | Single-Core
HWBOT x265 Benchmark v2.2: 4k Preset
LibreOffice : 20 Documents To PDF
R Benchmark 2.5: Overall mean
| CPU Performance rating | |
| Lenovo ThinkPad T14 Gen 6 AMD | |
| Lenovo ThinkPad T14 Gen 6 21QG001VGE | |
| Gemiddeld Intel Core Ultra 7 258V | |
| Dynabook Portege Z40L-N | |
| Durabook R10 | |
| Dell Latitude 7030 Rugged Extreme | |
| Gemiddelde van klas Tablet | |
| Durabook R8 Tablet -2! | |
| Cinebench R23 / Multi Core | |
| Lenovo ThinkPad T14 Gen 6 AMD | |
| Lenovo ThinkPad T14 Gen 6 21QG001VGE | |
| Gemiddeld Intel Core Ultra 7 258V (7920 - 11097, n=25) | |
| Gemiddelde van klas Tablet (8043 - 10868, n=3, laatste 2 jaar) | |
| Dell Latitude 7030 Rugged Extreme | |
| Durabook R10 | |
| Durabook R10 | |
| Dynabook Portege Z40L-N | |
| Durabook R8 Tablet | |
| Cinebench R23 / Single Core | |
| Lenovo ThinkPad T14 Gen 6 AMD | |
| Lenovo ThinkPad T14 Gen 6 21QG001VGE | |
| Durabook R10 | |
| Durabook R10 | |
| Gemiddelde van klas Tablet (1822 - 1921, n=3, laatste 2 jaar) | |
| Gemiddeld Intel Core Ultra 7 258V (1664 - 1957, n=25) | |
| Dynabook Portege Z40L-N | |
| Dell Latitude 7030 Rugged Extreme | |
| Durabook R8 Tablet | |
| Cinebench R20 / CPU (Multi Core) | |
| Lenovo ThinkPad T14 Gen 6 AMD | |
| Lenovo ThinkPad T14 Gen 6 21QG001VGE | |
| Gemiddeld Intel Core Ultra 7 258V (3130 - 4314, n=24) | |
| Gemiddelde van klas Tablet (3137 - 4255, n=2, laatste 2 jaar) | |
| Dell Latitude 7030 Rugged Extreme | |
| Durabook R10 | |
| Dynabook Portege Z40L-N | |
| Durabook R8 Tablet | |
| Cinebench R20 / CPU (Single Core) | |
| Lenovo ThinkPad T14 Gen 6 AMD | |
| Lenovo ThinkPad T14 Gen 6 21QG001VGE | |
| Gemiddelde van klas Tablet (705 - 739, n=2, laatste 2 jaar) | |
| Dynabook Portege Z40L-N | |
| Gemiddeld Intel Core Ultra 7 258V (643 - 749, n=24) | |
| Durabook R10 | |
| Dell Latitude 7030 Rugged Extreme | |
| Durabook R8 Tablet | |
| Cinebench R15 / CPU Multi 64Bit | |
| Lenovo ThinkPad T14 Gen 6 AMD | |
| Lenovo ThinkPad T14 Gen 6 21QG001VGE | |
| Gemiddeld Intel Core Ultra 7 258V (1280 - 1656, n=24) | |
| Gemiddelde van klas Tablet (1285 - 1651, n=2, laatste 2 jaar) | |
| Dell Latitude 7030 Rugged Extreme | |
| Durabook R10 | |
| Dynabook Portege Z40L-N | |
| Durabook R8 Tablet | |
| Cinebench R15 / CPU Single 64Bit | |
| Gemiddelde van klas Tablet (274 - 299, n=2, laatste 2 jaar) | |
| Lenovo ThinkPad T14 Gen 6 21QG001VGE | |
| Gemiddeld Intel Core Ultra 7 258V (258 - 298, n=24) | |
| Dynabook Portege Z40L-N | |
| Durabook R10 | |
| Dell Latitude 7030 Rugged Extreme | |
| Lenovo ThinkPad T14 Gen 6 AMD | |
| Durabook R8 Tablet | |
| Blender / v2.79 BMW27 CPU | |
| Durabook R8 Tablet | |
| Durabook R10 | |
| Dynabook Portege Z40L-N | |
| Gemiddelde van klas Tablet (337 - 484, n=2, laatste 2 jaar) | |
| Dell Latitude 7030 Rugged Extreme | |
| Gemiddeld Intel Core Ultra 7 258V (315 - 484, n=24) | |
| Lenovo ThinkPad T14 Gen 6 21QG001VGE | |
| Lenovo ThinkPad T14 Gen 6 AMD | |
| 7-Zip 18.03 / 7z b 4 | |
| Lenovo ThinkPad T14 Gen 6 AMD | |
| Lenovo ThinkPad T14 Gen 6 21QG001VGE | |
| Dell Latitude 7030 Rugged Extreme | |
| Gemiddeld Intel Core Ultra 7 258V (24486 - 36724, n=24) | |
| Gemiddelde van klas Tablet (24486 - 36610, n=2, laatste 2 jaar) | |
| Dynabook Portege Z40L-N | |
| Durabook R10 | |
| Durabook R8 Tablet | |
| 7-Zip 18.03 / 7z b 4 -mmt1 | |
| Lenovo ThinkPad T14 Gen 6 AMD | |
| Lenovo ThinkPad T14 Gen 6 21QG001VGE | |
| Dynabook Portege Z40L-N | |
| Gemiddeld Intel Core Ultra 7 258V (4769 - 5869, n=24) | |
| Gemiddelde van klas Tablet (4769 - 5991, n=2, laatste 2 jaar) | |
| Dell Latitude 7030 Rugged Extreme | |
| Durabook R10 | |
| Durabook R8 Tablet | |
| Geekbench 6.7 / Multi-Core | |
| Lenovo ThinkPad T14 Gen 6 AMD | |
| Lenovo ThinkPad T14 Gen 6 21QG001VGE | |
| Gemiddeld Intel Core Ultra 7 258V (8964 - 11334, n=24) | |
| Dynabook Portege Z40L-N | |
| Durabook R10 | |
| Dell Latitude 7030 Rugged Extreme | |
| Gemiddelde van klas Tablet (1104 - 16544, n=86, laatste 2 jaar) | |
| Geekbench 6.7 / Single-Core | |
| Lenovo ThinkPad T14 Gen 6 AMD | |
| Lenovo ThinkPad T14 Gen 6 21QG001VGE | |
| Dynabook Portege Z40L-N | |
| Gemiddeld Intel Core Ultra 7 258V (2593 - 2795, n=24) | |
| Durabook R10 | |
| Dell Latitude 7030 Rugged Extreme | |
| Gemiddelde van klas Tablet (323 - 4128, n=86, laatste 2 jaar) | |
| Geekbench 5.5 / Multi-Core | |
| Lenovo ThinkPad T14 Gen 6 AMD | |
| Lenovo ThinkPad T14 Gen 6 21QG001VGE | |
| Gemiddeld Intel Core Ultra 7 258V (7574 - 9918, n=24) | |
| Dynabook Portege Z40L-N | |
| Durabook R10 | |
| Dell Latitude 7030 Rugged Extreme | |
| Gemiddelde van klas Tablet (303 - 10522, n=39, laatste 2 jaar) | |
| Durabook R8 Tablet | |
| Geekbench 5.5 / Single-Core | |
| Lenovo ThinkPad T14 Gen 6 AMD | |
| Lenovo ThinkPad T14 Gen 6 21QG001VGE | |
| Dynabook Portege Z40L-N | |
| Gemiddeld Intel Core Ultra 7 258V (1891 - 2046, n=24) | |
| Durabook R10 | |
| Dell Latitude 7030 Rugged Extreme | |
| Durabook R8 Tablet | |
| Gemiddelde van klas Tablet (103 - 2286, n=39, laatste 2 jaar) | |
| HWBOT x265 Benchmark v2.2 / 4k Preset | |
| Lenovo ThinkPad T14 Gen 6 AMD | |
| Lenovo ThinkPad T14 Gen 6 21QG001VGE | |
| Gemiddeld Intel Core Ultra 7 258V (7.11 - 14.2, n=24) | |
| Gemiddelde van klas Tablet (7.11 - 12.9, n=2, laatste 2 jaar) | |
| Dynabook Portege Z40L-N | |
| Dell Latitude 7030 Rugged Extreme | |
| Durabook R10 | |
| Durabook R8 Tablet | |
| LibreOffice / 20 Documents To PDF | |
| Durabook R10 | |
| Durabook R8 Tablet | |
| Gemiddelde van klas Tablet (48.3 - 62.8, n=2, laatste 2 jaar) | |
| Lenovo ThinkPad T14 Gen 6 AMD | |
| Gemiddeld Intel Core Ultra 7 258V (41.1 - 62.8, n=24) | |
| Lenovo ThinkPad T14 Gen 6 21QG001VGE | |
| Dell Latitude 7030 Rugged Extreme | |
| Dynabook Portege Z40L-N | |
| R Benchmark 2.5 / Overall mean | |
| Durabook R8 Tablet | |
| Durabook R10 | |
| Dell Latitude 7030 Rugged Extreme | |
| Gemiddelde van klas Tablet (0.4361 - 0.542, n=2, laatste 2 jaar) | |
| Dynabook Portege Z40L-N | |
| Gemiddeld Intel Core Ultra 7 258V (0.443 - 0.542, n=24) | |
| Lenovo ThinkPad T14 Gen 6 21QG001VGE | |
| Lenovo ThinkPad T14 Gen 6 AMD | |
* ... kleiner is beter
AIDA64: FP32 Ray-Trace | FPU Julia | CPU SHA3 | FPU SinJulia | FPU Mandel | CPU AES | CPU ZLib | FP64 Ray-Trace | CPU PhotoWorxx | CPU CheckMate
| Performance rating | |
| Lenovo ThinkPad T14 Gen 6 AMD | |
| Lenovo ThinkPad T14 Gen 6 21QG001VGE -1! | |
| Gemiddeld Intel Core Ultra 7 258V | |
| Gemiddelde van klas Tablet | |
| Durabook R10 | |
| Dynabook Portege Z40L-N -1! | |
| Dell Latitude 7030 Rugged Extreme -1! | |
| Durabook R8 Tablet -1! | |
| AIDA64 / FP32 Ray-Trace | |
| Lenovo ThinkPad T14 Gen 6 AMD (v8.20.8100) | |
| Lenovo ThinkPad T14 Gen 6 AMD (v6.92.6600) | |
| Lenovo ThinkPad T14 Gen 6 21QG001VGE (v6.92.6600) | |
| Gemiddeld Intel Core Ultra 7 258V (8454 - 12781, n=26) | |
| Gemiddelde van klas Tablet (8485 - 12759, n=2, laatste 2 jaar) | |
| Dynabook Portege Z40L-N (v6.92.6600) | |
| Durabook R10 (v8.20.8100) | |
| Dell Latitude 7030 Rugged Extreme (v6.92.6600) | |
| Durabook R8 Tablet (v6.85.6300) | |
| AIDA64 / FPU Julia | |
| Lenovo ThinkPad T14 Gen 6 AMD (v8.20.8100) | |
| Lenovo ThinkPad T14 Gen 6 AMD (v6.92.6600) | |
| Lenovo ThinkPad T14 Gen 6 21QG001VGE (v6.92.6600) | |
| Gemiddeld Intel Core Ultra 7 258V (40875 - 63401, n=26) | |
| Gemiddelde van klas Tablet (42586 - 62102, n=2, laatste 2 jaar) | |
| Dynabook Portege Z40L-N (v6.92.6600) | |
| Durabook R10 (v8.20.8100) | |
| Dell Latitude 7030 Rugged Extreme (v6.92.6600) | |
| Durabook R8 Tablet (v6.85.6300) | |
| AIDA64 / CPU SHA3 | |
| Lenovo ThinkPad T14 Gen 6 AMD (v6.92.6600) | |
| Lenovo ThinkPad T14 Gen 6 AMD (v8.20.8100) | |
| Lenovo ThinkPad T14 Gen 6 21QG001VGE (v6.92.6600) | |
| Gemiddeld Intel Core Ultra 7 258V (1930 - 2817, n=26) | |
| Gemiddelde van klas Tablet (2056 - 2784, n=2, laatste 2 jaar) | |
| Durabook R10 (v8.20.8100) | |
| Dynabook Portege Z40L-N (v6.92.6600) | |
| Dell Latitude 7030 Rugged Extreme (v6.92.6600) | |
| Durabook R8 Tablet (v6.85.6300) | |
| AIDA64 / FPU SinJulia | |
| Lenovo ThinkPad T14 Gen 6 AMD (v8.20.8100) | |
| Lenovo ThinkPad T14 Gen 6 AMD (v6.92.6600) | |
| Lenovo ThinkPad T14 Gen 6 21QG001VGE (v6.92.6600) | |
| Gemiddeld Intel Core Ultra 7 258V (3817 - 4440, n=26) | |
| Gemiddelde van klas Tablet (4083 - 4429, n=2, laatste 2 jaar) | |
| Dell Latitude 7030 Rugged Extreme (v6.92.6600) | |
| Durabook R10 (v8.20.8100) | |
| Dynabook Portege Z40L-N (v6.92.6600) | |
| Durabook R8 Tablet (v6.85.6300) | |
| AIDA64 / FPU Mandel | |
| Lenovo ThinkPad T14 Gen 6 AMD (v8.20.8100) | |
| Lenovo ThinkPad T14 Gen 6 AMD (v6.92.6600) | |
| Lenovo ThinkPad T14 Gen 6 21QG001VGE (v6.92.6600) | |
| Gemiddeld Intel Core Ultra 7 258V (21670 - 33565, n=26) | |
| Gemiddelde van klas Tablet (22775 - 31836, n=2, laatste 2 jaar) | |
| Dynabook Portege Z40L-N (v6.92.6600) | |
| Durabook R10 (v8.20.8100) | |
| Dell Latitude 7030 Rugged Extreme (v6.92.6600) | |
| Durabook R8 Tablet (v6.85.6300) | |
| AIDA64 / CPU AES | |
| Lenovo ThinkPad T14 Gen 6 AMD (v6.92.6600) | |
| Lenovo ThinkPad T14 Gen 6 AMD (v8.20.8100) | |
| Lenovo ThinkPad T14 Gen 6 21QG001VGE (v6.92.6600) | |
| Gemiddeld Intel Core Ultra 7 258V (30957 - 40753, n=26) | |
| Gemiddelde van klas Tablet (34551 - 38941, n=2, laatste 2 jaar) | |
| Dell Latitude 7030 Rugged Extreme (v6.92.6600) | |
| Durabook R10 (v8.20.8100) | |
| Dynabook Portege Z40L-N (v6.92.6600) | |
| Durabook R8 Tablet (v6.85.6300) | |
| AIDA64 / CPU ZLib | |
| Lenovo ThinkPad T14 Gen 6 AMD (v6.92.6600) | |
| Lenovo ThinkPad T14 Gen 6 AMD (v8.20.8100) | |
| Lenovo ThinkPad T14 Gen 6 21QG001VGE (v6.92.6600) | |
| Dell Latitude 7030 Rugged Extreme (v6.92.6600) | |
| Gemiddeld Intel Core Ultra 7 258V (422 - 632, n=26) | |
| Gemiddelde van klas Tablet (434 - 631, n=2, laatste 2 jaar) | |
| Dynabook Portege Z40L-N (v6.92.6600) | |
| Durabook R10 (v8.20.8100) | |
| Durabook R8 Tablet (v6.85.6300) | |
| AIDA64 / FP64 Ray-Trace | |
| Lenovo ThinkPad T14 Gen 6 AMD (v6.92.6600) | |
| Lenovo ThinkPad T14 Gen 6 AMD (v8.20.8100) | |
| Lenovo ThinkPad T14 Gen 6 21QG001VGE (v6.92.6600) | |
| Gemiddeld Intel Core Ultra 7 258V (4258 - 6930, n=26) | |
| Gemiddelde van klas Tablet (4660 - 6803, n=2, laatste 2 jaar) | |
| Dynabook Portege Z40L-N (v6.92.6600) | |
| Durabook R10 (v8.20.8100) | |
| Dell Latitude 7030 Rugged Extreme (v6.92.6600) | |
| Durabook R8 Tablet (v6.85.6300) | |
| AIDA64 / CPU PhotoWorxx | |
| Lenovo ThinkPad T14 Gen 6 21QG001VGE (v6.92.6600) | |
| Gemiddelde van klas Tablet (52755 - 54886, n=2, laatste 2 jaar) | |
| Gemiddeld Intel Core Ultra 7 258V (44223 - 59245, n=26) | |
| Durabook R10 (v8.20.8100) | |
| Dynabook Portege Z40L-N (v6.92.6600) | |
| Dell Latitude 7030 Rugged Extreme (v6.92.6600) | |
| Lenovo ThinkPad T14 Gen 6 AMD (v8.20.8100) | |
| Lenovo ThinkPad T14 Gen 6 AMD (v6.92.6600) | |
| Durabook R8 Tablet (v6.85.6300) | |
| AIDA64 / CPU CheckMate | |
| Lenovo ThinkPad T14 Gen 6 AMD (v8.20.8100) | |
| Gemiddeld Intel Core Ultra 7 258V (2014 - 2513, n=2) | |
| Durabook R10 (v8.20.8100) | |
| Gemiddelde van klas Tablet (n=1laatste 2 jaar) | |
Systeem- en opslagprestaties
In het dagelijks gebruik zorgt het platform voor soepele prestaties bij Office-taken. Als we echter naar de benchmarkscores kijken, liggen de prestaties van de tablet over het algemeen onder het gemiddelde voor Lunar Lake. Alleen wat betreft de opslagsnelheid blinkt de tablet uit en levert hij de sterke prestaties die kenmerkend zijn voor Lunar Lake.
PCMark 10: Score | Essentials | Productivity | Digital Content Creation
CrossMark: Overall | Productivity | Creativity | Responsiveness
WebXPRT 3: Overall
WebXPRT 4: Overall
Mozilla Kraken 1.1: Total
| Performance rating | |
| Lenovo ThinkPad T14 Gen 6 AMD | |
| Lenovo ThinkPad T14 Gen 6 21QG001VGE | |
| Gemiddeld Intel Core Ultra 7 258V, Intel Arc Graphics 140V | |
| Dynabook Portege Z40L-N | |
| Durabook R10 | |
| Dell Latitude 7030 Rugged Extreme | |
| Gemiddelde van klas Tablet | |
| Durabook R8 Tablet | |
| PCMark 10 / Score | |
| Durabook R10 | |
| Lenovo ThinkPad T14 Gen 6 21QG001VGE | |
| Gemiddelde van klas Tablet (6924 - 7420, n=2, laatste 2 jaar) | |
| Lenovo ThinkPad T14 Gen 6 AMD | |
| Gemiddeld Intel Core Ultra 7 258V, Intel Arc Graphics 140V (6265 - 7420, n=23) | |
| Dynabook Portege Z40L-N | |
| Dell Latitude 7030 Rugged Extreme | |
| Durabook R8 Tablet | |
| PCMark 10 / Essentials | |
| Lenovo ThinkPad T14 Gen 6 AMD | |
| Lenovo ThinkPad T14 Gen 6 21QG001VGE | |
| Gemiddeld Intel Core Ultra 7 258V, Intel Arc Graphics 140V (9295 - 11467, n=23) | |
| Dynabook Portege Z40L-N | |
| Gemiddelde van klas Tablet (9991 - 10351, n=2, laatste 2 jaar) | |
| Durabook R10 | |
| Dell Latitude 7030 Rugged Extreme | |
| Durabook R8 Tablet | |
| PCMark 10 / Productivity | |
| Durabook R10 | |
| Gemiddelde van klas Tablet (8823 - 13600, n=2, laatste 2 jaar) | |
| Lenovo ThinkPad T14 Gen 6 AMD | |
| Dynabook Portege Z40L-N | |
| Lenovo ThinkPad T14 Gen 6 21QG001VGE | |
| Gemiddeld Intel Core Ultra 7 258V, Intel Arc Graphics 140V (7357 - 13600, n=23) | |
| Dell Latitude 7030 Rugged Extreme | |
| Durabook R8 Tablet | |
| PCMark 10 / Digital Content Creation | |
| Lenovo ThinkPad T14 Gen 6 21QG001VGE | |
| Gemiddeld Intel Core Ultra 7 258V, Intel Arc Graphics 140V (8160 - 10308, n=23) | |
| Gemiddelde van klas Tablet (8160 - 9863, n=2, laatste 2 jaar) | |
| Dynabook Portege Z40L-N | |
| Lenovo ThinkPad T14 Gen 6 AMD | |
| Durabook R10 | |
| Dell Latitude 7030 Rugged Extreme | |
| Durabook R8 Tablet | |
| CrossMark / Overall | |
| Lenovo ThinkPad T14 Gen 6 AMD | |
| Lenovo ThinkPad T14 Gen 6 21QG001VGE | |
| Gemiddeld Intel Core Ultra 7 258V, Intel Arc Graphics 140V (1275 - 1742, n=22) | |
| Dynabook Portege Z40L-N | |
| Dell Latitude 7030 Rugged Extreme | |
| Durabook R10 | |
| Durabook R8 Tablet | |
| Gemiddelde van klas Tablet (319 - 2375, n=46, laatste 2 jaar) | |
| CrossMark / Productivity | |
| Lenovo ThinkPad T14 Gen 6 AMD | |
| Lenovo ThinkPad T14 Gen 6 21QG001VGE | |
| Gemiddeld Intel Core Ultra 7 258V, Intel Arc Graphics 140V (1267 - 1684, n=22) | |
| Dynabook Portege Z40L-N | |
| Dell Latitude 7030 Rugged Extreme | |
| Durabook R10 | |
| Durabook R8 Tablet | |
| Gemiddelde van klas Tablet (346 - 2036, n=44, laatste 2 jaar) | |
| CrossMark / Creativity | |
| Lenovo ThinkPad T14 Gen 6 AMD | |
| Lenovo ThinkPad T14 Gen 6 21QG001VGE | |
| Gemiddeld Intel Core Ultra 7 258V, Intel Arc Graphics 140V (1393 - 1977, n=22) | |
| Dynabook Portege Z40L-N | |
| Dell Latitude 7030 Rugged Extreme | |
| Durabook R10 | |
| Durabook R8 Tablet | |
| Gemiddelde van klas Tablet (288 - 2620, n=44, laatste 2 jaar) | |
| CrossMark / Responsiveness | |
| Gemiddelde van klas Tablet (333 - 12671, n=44, laatste 2 jaar) | |
| Lenovo ThinkPad T14 Gen 6 AMD | |
| Lenovo ThinkPad T14 Gen 6 21QG001VGE | |
| Gemiddeld Intel Core Ultra 7 258V, Intel Arc Graphics 140V (999 - 1411, n=22) | |
| Dynabook Portege Z40L-N | |
| Dell Latitude 7030 Rugged Extreme | |
| Durabook R10 | |
| Durabook R8 Tablet | |
| WebXPRT 3 / Overall | |
| Lenovo ThinkPad T14 Gen 6 AMD | |
| Dynabook Portege Z40L-N | |
| Lenovo ThinkPad T14 Gen 6 21QG001VGE | |
| Gemiddeld Intel Core Ultra 7 258V, Intel Arc Graphics 140V (219 - 317, n=22) | |
| Durabook R10 | |
| Dell Latitude 7030 Rugged Extreme | |
| Gemiddelde van klas Tablet (108 - 480, n=10, laatste 2 jaar) | |
| Durabook R8 Tablet | |
| WebXPRT 4 / Overall | |
| Dynabook Portege Z40L-N | |
| Lenovo ThinkPad T14 Gen 6 21QG001VGE | |
| Lenovo ThinkPad T14 Gen 6 AMD | |
| Gemiddeld Intel Core Ultra 7 258V, Intel Arc Graphics 140V (199.5 - 291, n=22) | |
| Durabook R10 | |
| Dell Latitude 7030 Rugged Extreme | |
| Durabook R8 Tablet | |
| Gemiddelde van klas Tablet (39 - 376, n=56, laatste 2 jaar) | |
| Mozilla Kraken 1.1 / Total | |
| Gemiddelde van klas Tablet (243 - 27101, n=66, laatste 2 jaar) | |
| Durabook R8 Tablet | |
| Dell Latitude 7030 Rugged Extreme | |
| Durabook R10 | |
| Gemiddeld Intel Core Ultra 7 258V, Intel Arc Graphics 140V (468 - 559, n=24) | |
| Lenovo ThinkPad T14 Gen 6 21QG001VGE | |
| Dynabook Portege Z40L-N | |
| Lenovo ThinkPad T14 Gen 6 AMD | |
* ... kleiner is beter
| PCMark 10 Score | 7420 punten | |
Help | ||
| AIDA64 / Memory Copy | |
| Durabook R10 | |
| Lenovo ThinkPad T14 Gen 6 21QG001VGE | |
| Gemiddelde van klas Tablet (108317 - 110050, n=2, laatste 2 jaar) | |
| Gemiddeld Intel Core Ultra 7 258V (104408 - 114336, n=24) | |
| Dynabook Portege Z40L-N | |
| Dell Latitude 7030 Rugged Extreme | |
| Lenovo ThinkPad T14 Gen 6 AMD | |
| Lenovo ThinkPad T14 Gen 6 AMD | |
| Durabook R8 Tablet | |
| AIDA64 / Memory Read | |
| Lenovo ThinkPad T14 Gen 6 21QG001VGE | |
| Gemiddeld Intel Core Ultra 7 258V (82846 - 89417, n=24) | |
| Dynabook Portege Z40L-N | |
| Gemiddelde van klas Tablet (85395 - 87747, n=2, laatste 2 jaar) | |
| Durabook R10 | |
| Dell Latitude 7030 Rugged Extreme | |
| Lenovo ThinkPad T14 Gen 6 AMD | |
| Lenovo ThinkPad T14 Gen 6 AMD | |
| Durabook R8 Tablet | |
| AIDA64 / Memory Write | |
| Lenovo ThinkPad T14 Gen 6 21QG001VGE | |
| Gemiddeld Intel Core Ultra 7 258V (108824 - 117989, n=24) | |
| Gemiddelde van klas Tablet (108824 - 117859, n=2, laatste 2 jaar) | |
| Dynabook Portege Z40L-N | |
| Durabook R10 | |
| Dell Latitude 7030 Rugged Extreme | |
| Lenovo ThinkPad T14 Gen 6 AMD | |
| Lenovo ThinkPad T14 Gen 6 AMD | |
| Durabook R8 Tablet | |
| AIDA64 / Memory Latency | |
| Dell Latitude 7030 Rugged Extreme | |
| Lenovo ThinkPad T14 Gen 6 AMD | |
| Lenovo ThinkPad T14 Gen 6 AMD | |
| Durabook R8 Tablet | |
| Durabook R10 | |
| Dynabook Portege Z40L-N | |
| Lenovo ThinkPad T14 Gen 6 21QG001VGE | |
| Gemiddelde van klas Tablet (94.4 - 101.7, n=2, laatste 2 jaar) | |
| Gemiddeld Intel Core Ultra 7 258V (95 - 101.7, n=24) | |
* ... kleiner is beter
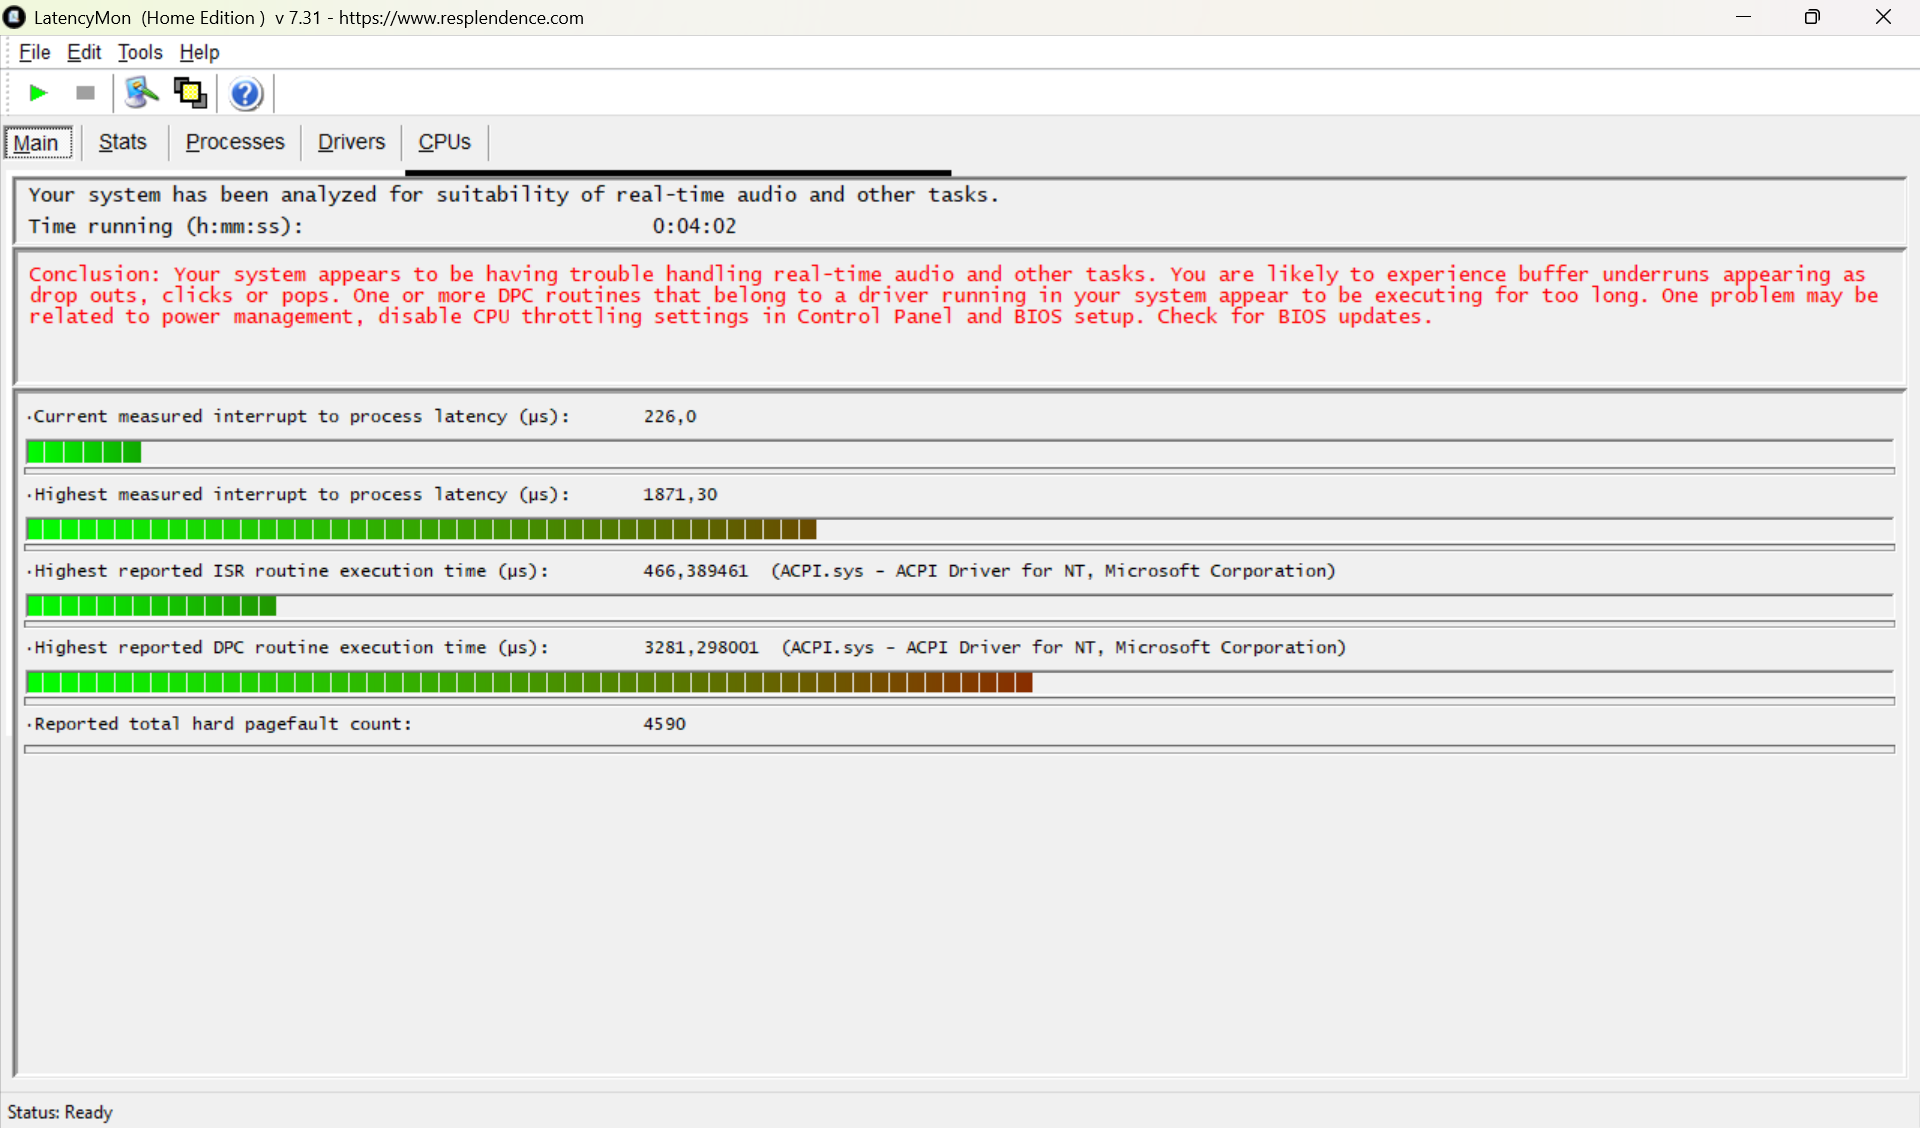
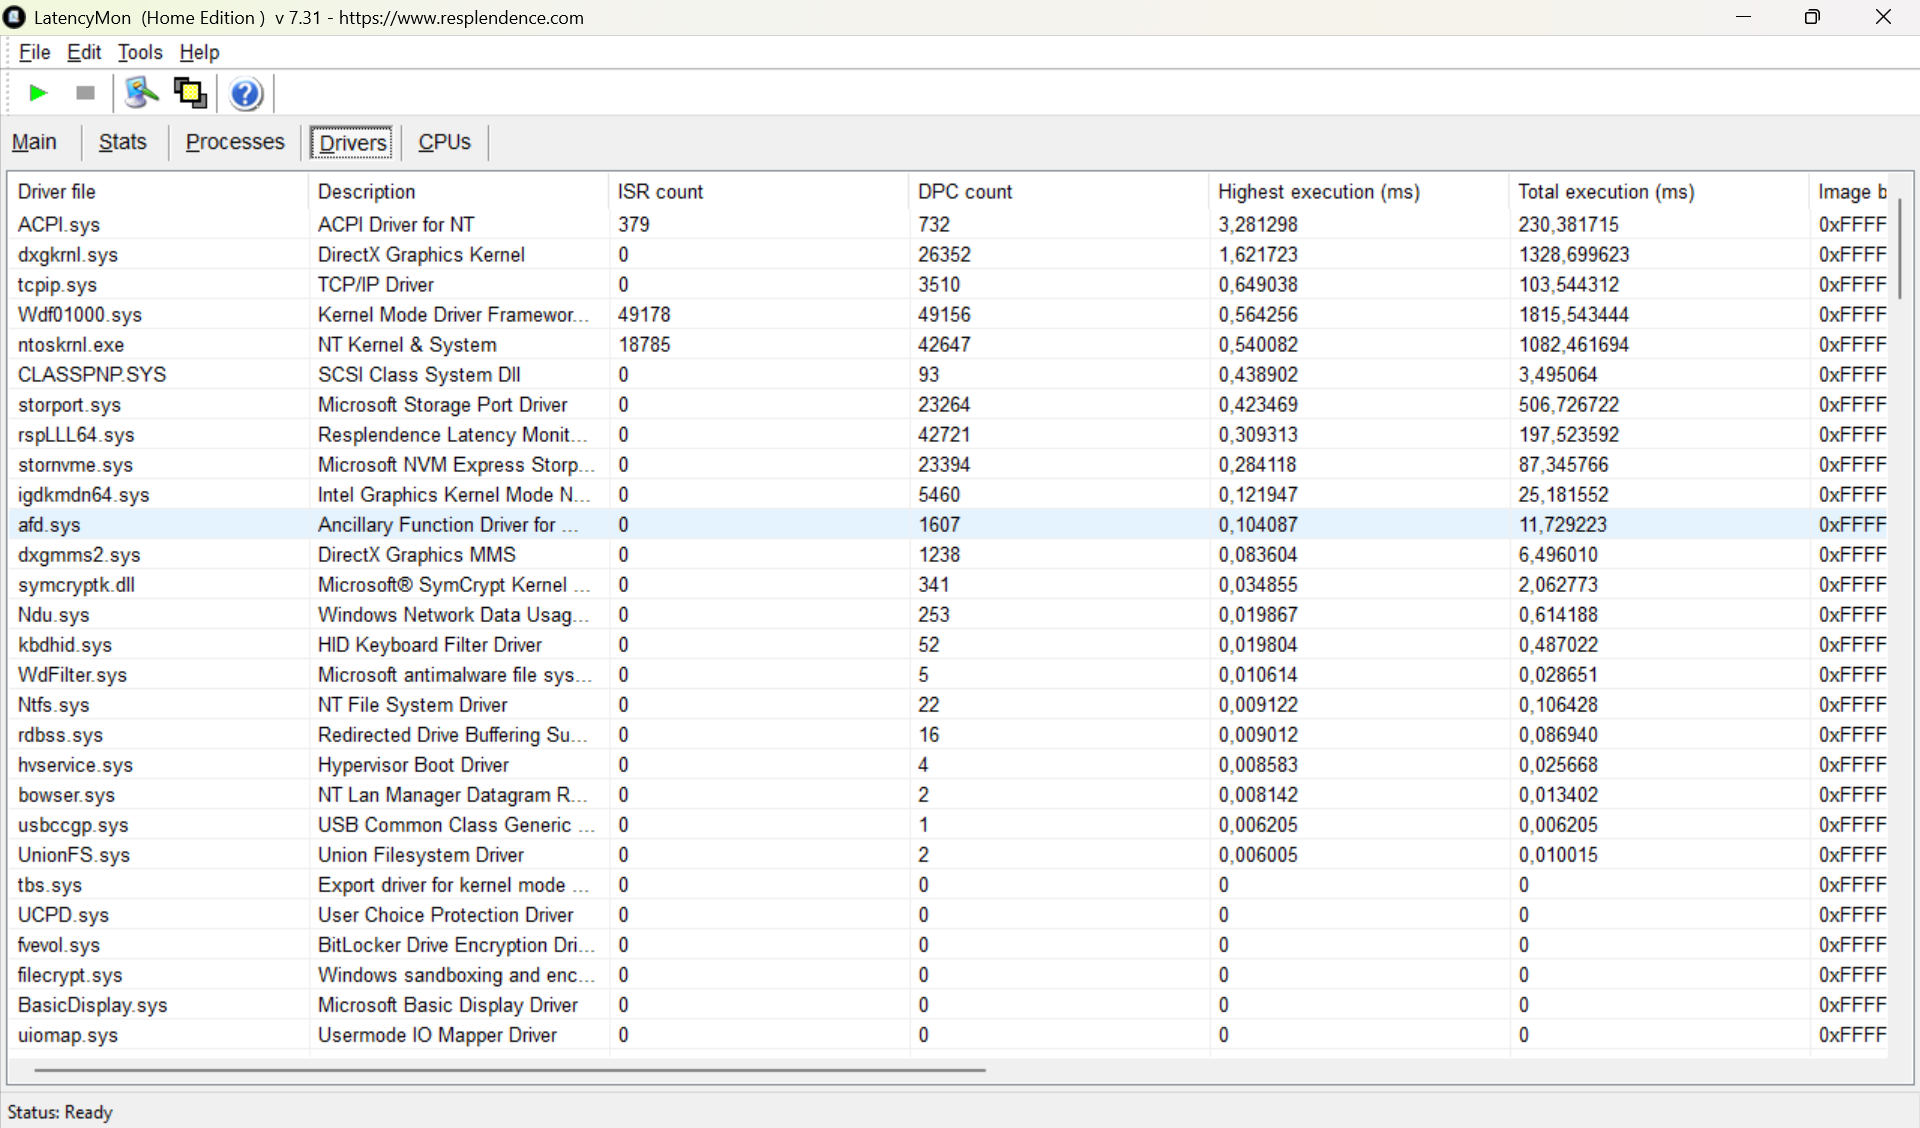
DPC-vertragingen
Uit de analyse van LatencyMon blijkt dat het ACPI-stuurprogramma op de tablet vertragingen tot 3.281 microseconden veroorzaakt. Dit kan leiden tot storingen bij tijdgevoelige taken, zoals het bewerken van audio of het verzamelen van gegevens met een hoge frequentie.
| DPC Latencies / LatencyMon - interrupt to process latency (max), Web, Youtube, Prime95 | |
| Durabook R10 | |
| Dell Latitude 7030 Rugged Extreme | |
| Durabook R8 Tablet | |
| Lenovo ThinkPad T14 Gen 6 21QG001VGE | |
| Dynabook Portege Z40L-N | |
| Gemiddelde van klas Tablet (482 - 1871, n=2, laatste 2 jaar) | |
* ... kleiner is beter
Massaopslag

* ... kleiner is beter
Aanhoudende leesprestaties: DiskSpd-leeslus, wachtrijdiepte 8
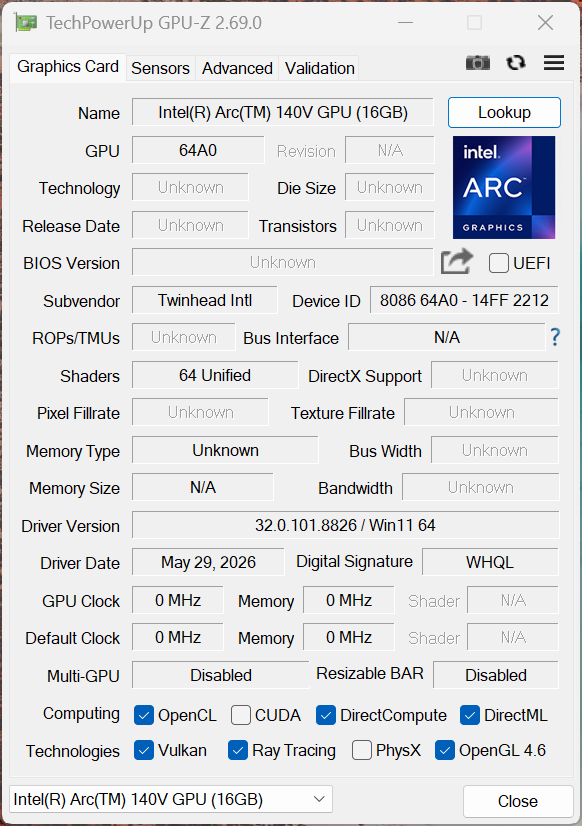
GPU- en gamingprestaties
De grafische verwerking wordt verzorgd door de Intel Arc Graphics 140V, die in de processor is geïntegreerd. Deze kaart kan moeiteloos omgaan met video’s in hoge resolutie, lichte 3D-taken en opstellingen met meerdere beeldschermen. Grote CAD-bestanden of grafisch veeleisende toepassingen kunnen echter een uitdaging vormen voor de Intel-grafische kaart.
| 3DMark 11 Performance | 9563 punten | |
| 3DMark Ice Storm Standard Score | 178031 punten | |
| 3DMark Cloud Gate Standard Score | 26729 punten | |
| 3DMark Fire Strike Score | 7287 punten | |
| 3DMark Time Spy Score | 3373 punten | |
| 3DMark Steel Nomad Score | 743 punten | |
| 3DMark Steel Nomad Light Score | 2843 punten | |
Help | ||
* ... kleiner is beter
| Performance rating - Percent | |
| Lenovo ThinkPad T14 Gen 6 21QG001VGE -1! | |
| Gemiddelde van klas Tablet | |
| Dynabook Portege Z40L-N | |
| Durabook R10 | |
| Lenovo ThinkPad T14 Gen 6 AMD -1! | |
| Dell Latitude 7030 Rugged Extreme -1! | |
| Durabook R8 Tablet -5! | |
| Cyberpunk 2077 - 1920x1080 Ultra Preset (FSR off) | |
| Lenovo ThinkPad T14 Gen 6 21QG001VGE | |
| Gemiddelde van klas Tablet (21.2 - 28.7, n=2, laatste 2 jaar) | |
| Durabook R10 | |
| Dynabook Portege Z40L-N | |
| Lenovo ThinkPad T14 Gen 6 AMD | |
| Dell Latitude 7030 Rugged Extreme | |
| Baldur's Gate 3 - 1920x1080 Ultra Preset AA:T | |
| Lenovo ThinkPad T14 Gen 6 21QG001VGE | |
| Gemiddelde van klas Tablet (22.8 - 28.3, n=2, laatste 2 jaar) | |
| Dynabook Portege Z40L-N | |
| Durabook R10 | |
| Lenovo ThinkPad T14 Gen 6 AMD | |
| GTA V - 1920x1080 Highest AA:4xMSAA + FX AF:16x | |
| Lenovo ThinkPad T14 Gen 6 21QG001VGE | |
| Gemiddelde van klas Tablet (21.1 - 27.8, n=2, laatste 2 jaar) | |
| Dynabook Portege Z40L-N | |
| Durabook R10 | |
| Lenovo ThinkPad T14 Gen 6 AMD | |
| Dell Latitude 7030 Rugged Extreme | |
| Final Fantasy XV Benchmark - 1920x1080 High Quality | |
| Lenovo ThinkPad T14 Gen 6 21QG001VGE | |
| Gemiddelde van klas Tablet (25.4 - 34.4, n=3, laatste 2 jaar) | |
| Durabook R10 | |
| Durabook R10 | |
| Dynabook Portege Z40L-N | |
| Lenovo ThinkPad T14 Gen 6 AMD | |
| Dell Latitude 7030 Rugged Extreme | |
| Strange Brigade - 1920x1080 ultra AA:ultra AF:16 | |
| Gemiddelde van klas Tablet (44.4 - 58, n=2, laatste 2 jaar) | |
| Dynabook Portege Z40L-N | |
| Durabook R10 | |
| Dell Latitude 7030 Rugged Extreme | |
| Dota 2 Reborn - 1920x1080 ultra (3/3) best looking | |
| Lenovo ThinkPad T14 Gen 6 21QG001VGE | |
| Gemiddelde van klas Tablet (70.9 - 84.5, n=2, laatste 2 jaar) | |
| Durabook R10 | |
| Dynabook Portege Z40L-N | |
| Dell Latitude 7030 Rugged Extreme | |
| Lenovo ThinkPad T14 Gen 6 AMD | |
| Durabook R8 Tablet | |
Cyberpunk 2077: Ultra FPS-grafiek
| lage | gem. | hoge | ultra | |
|---|---|---|---|---|
| GTA V (2015) | 128.8 | 125.6 | 50.7 | 21.1 |
| Dota 2 Reborn (2015) | 92.5 | 75 | 51.7 | 70.9 |
| Final Fantasy XV Benchmark (2018) | 63.8 | 35.9 | 25.4 | |
| X-Plane 11.11 (2018) | 34.5 | 31.4 | 30.1 | |
| Strange Brigade (2018) | 161.3 | 52.1 | 52.9 | 44.4 |
| Baldur's Gate 3 (2023) | 34.1 | 24.9 | 22.8 | |
| Cyberpunk 2077 (2023) | 37.9 | 21.2 | ||
| F1 24 (2024) | 40.4 | 14.6 | ||
| F1 25 (2025) | 55.8 | 48.6 | 34.9 |
Emissies en energie
Geluidsemissies
De interne ventilator draait vrijwel continu. Hoewel deze vrijwel onhoorbaar is wanneer het systeem in ruststand staat, wordt hij zelfs tijdens een stresstest niet erg luid en meet hij 31 dB(A). Dit zachte gezoem wordt echter volledig overstemd wanneer het apparaat buitenshuis wordt gebruikt.
Geluidsniveau
| Onbelast |
| 27.7 / 27.7 / 27.7 dB (A) |
| Belasting |
| / 31.6 dB (A) |
 | ||
30 dB stil 40 dB(A) hoorbaar 50 dB(A) luid |
||
min: | ||
| Durabook R10 Core Ultra 7 258V, Arc 140V | Dell Latitude 7030 Rugged Extreme i7-1260U, Iris Xe G7 96EUs | Lenovo ThinkPad T14 Gen 6 21QG001VGE Core Ultra 7 258V, Arc 140V | Dynabook Portege Z40L-N Core Ultra 7 258V, Arc 140V | Durabook R8 Tablet i5-1230U, Iris Xe G7 80EUs | Lenovo ThinkPad T14 Gen 6 AMD Ryzen AI 7 PRO 350, Radeon 860M | |
|---|---|---|---|---|---|---|
| Noise | -1% | 0% | 6% | 7% | ||
| uit / omgeving * (dB) | 25.9 | 23 11% | 25.1 3% | 23.5 9% | 24.5 5% | |
| Idle Minimum * (dB) | 27.7 | 23.5 15% | 25.1 9% | 23.6 15% | 24.5 12% | |
| Idle Average * (dB) | 27.7 | 23.5 15% | 25.1 9% | 23.6 15% | 24.5 12% | |
| Idle Maximum * (dB) | 27.7 | 23.5 15% | 27.1 2% | 23.6 15% | 24.5 12% | |
| Load Maximum * (dB) | 31.6 | 50.6 -60% | 38.5 -22% | 39 -23% | 33.7 -7% | |
| Load Average * (dB) | 24.1 | 34.8 | 37 | 26.8 | ||
| Cyberpunk 2077 ultra * (dB) | 50.5 | 38.3 | 37.8 | 35.3 |
* ... kleiner is beter
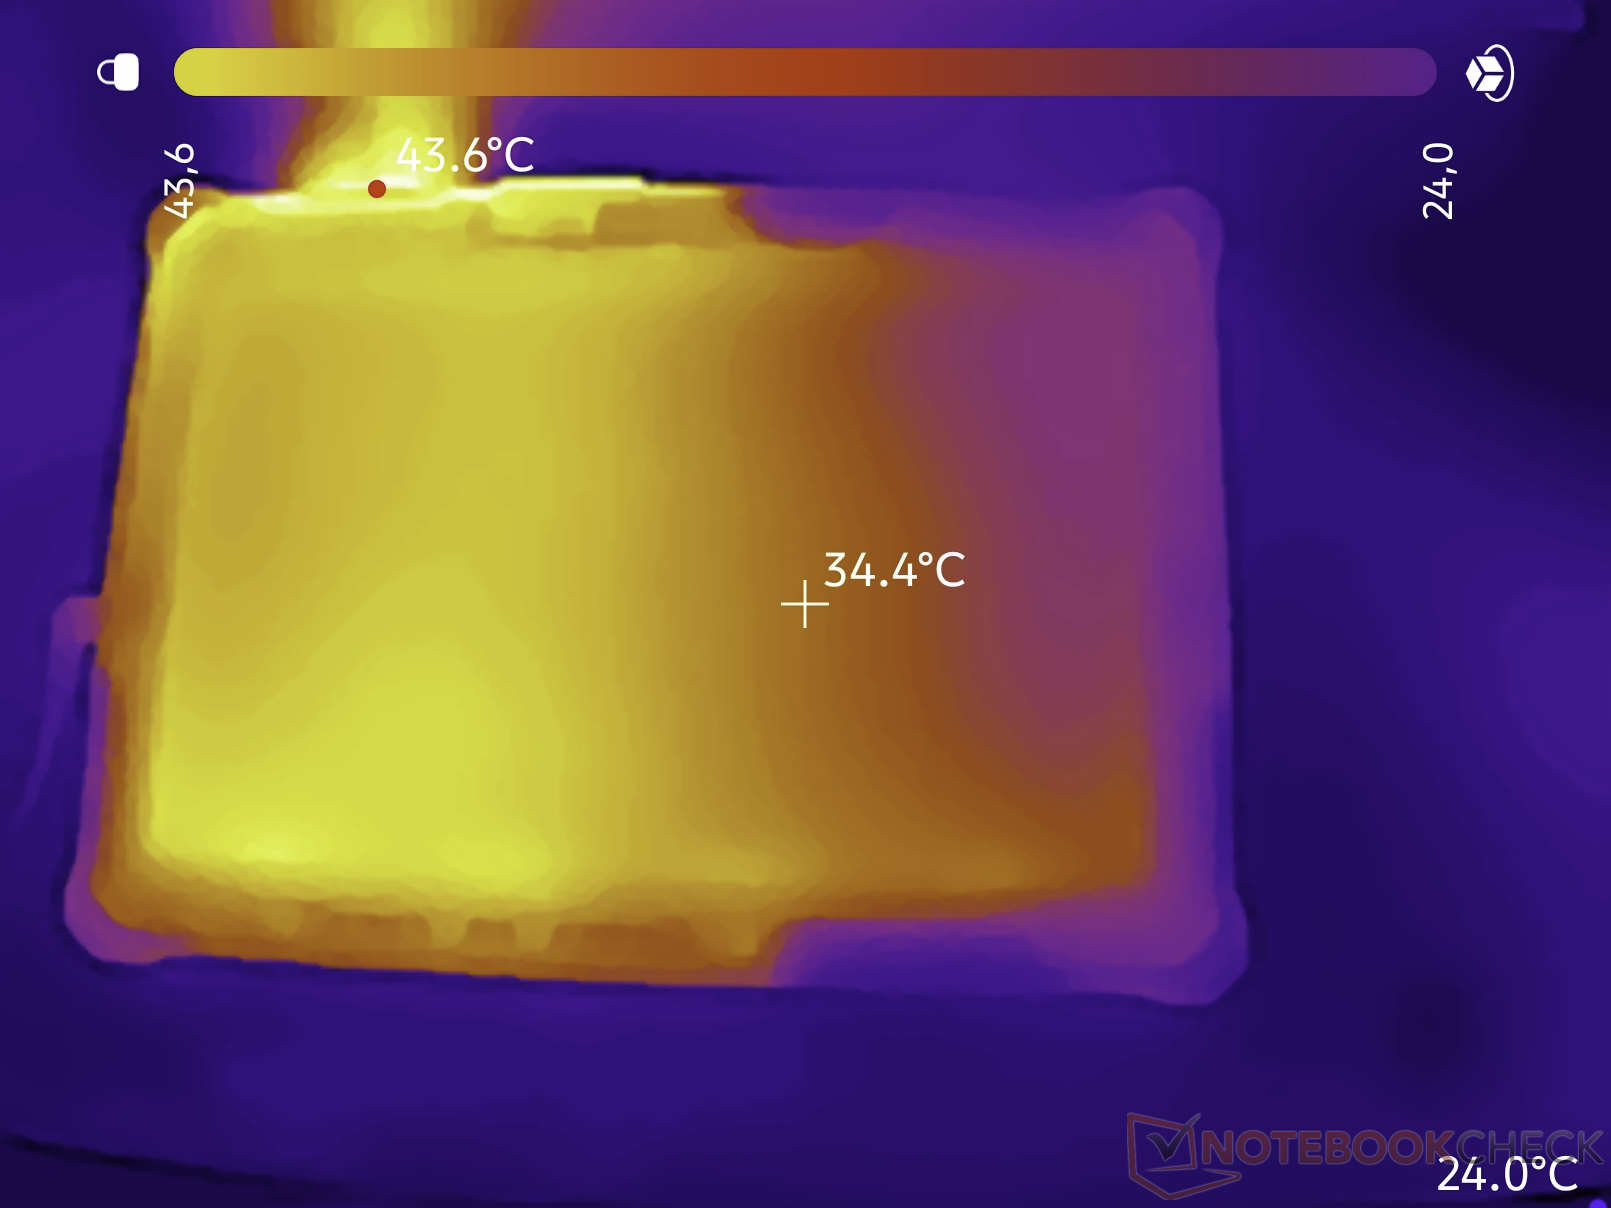
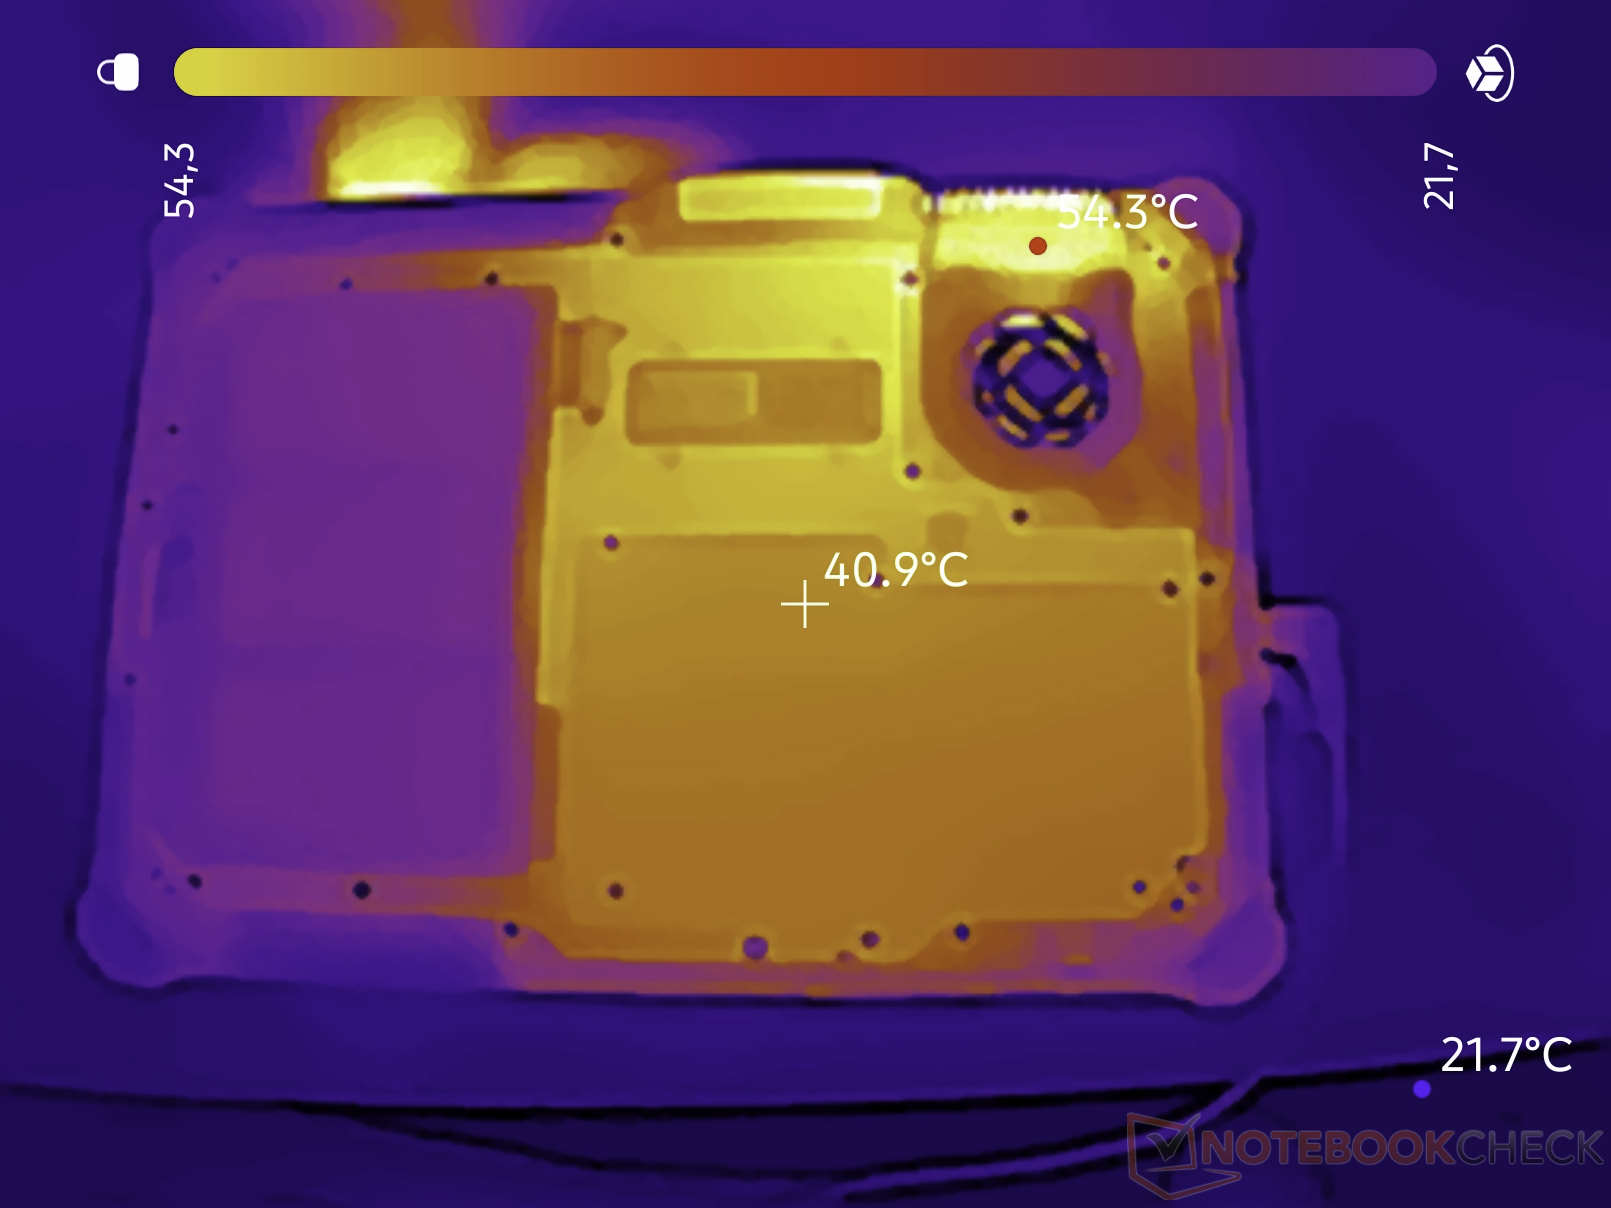
Temperatuur
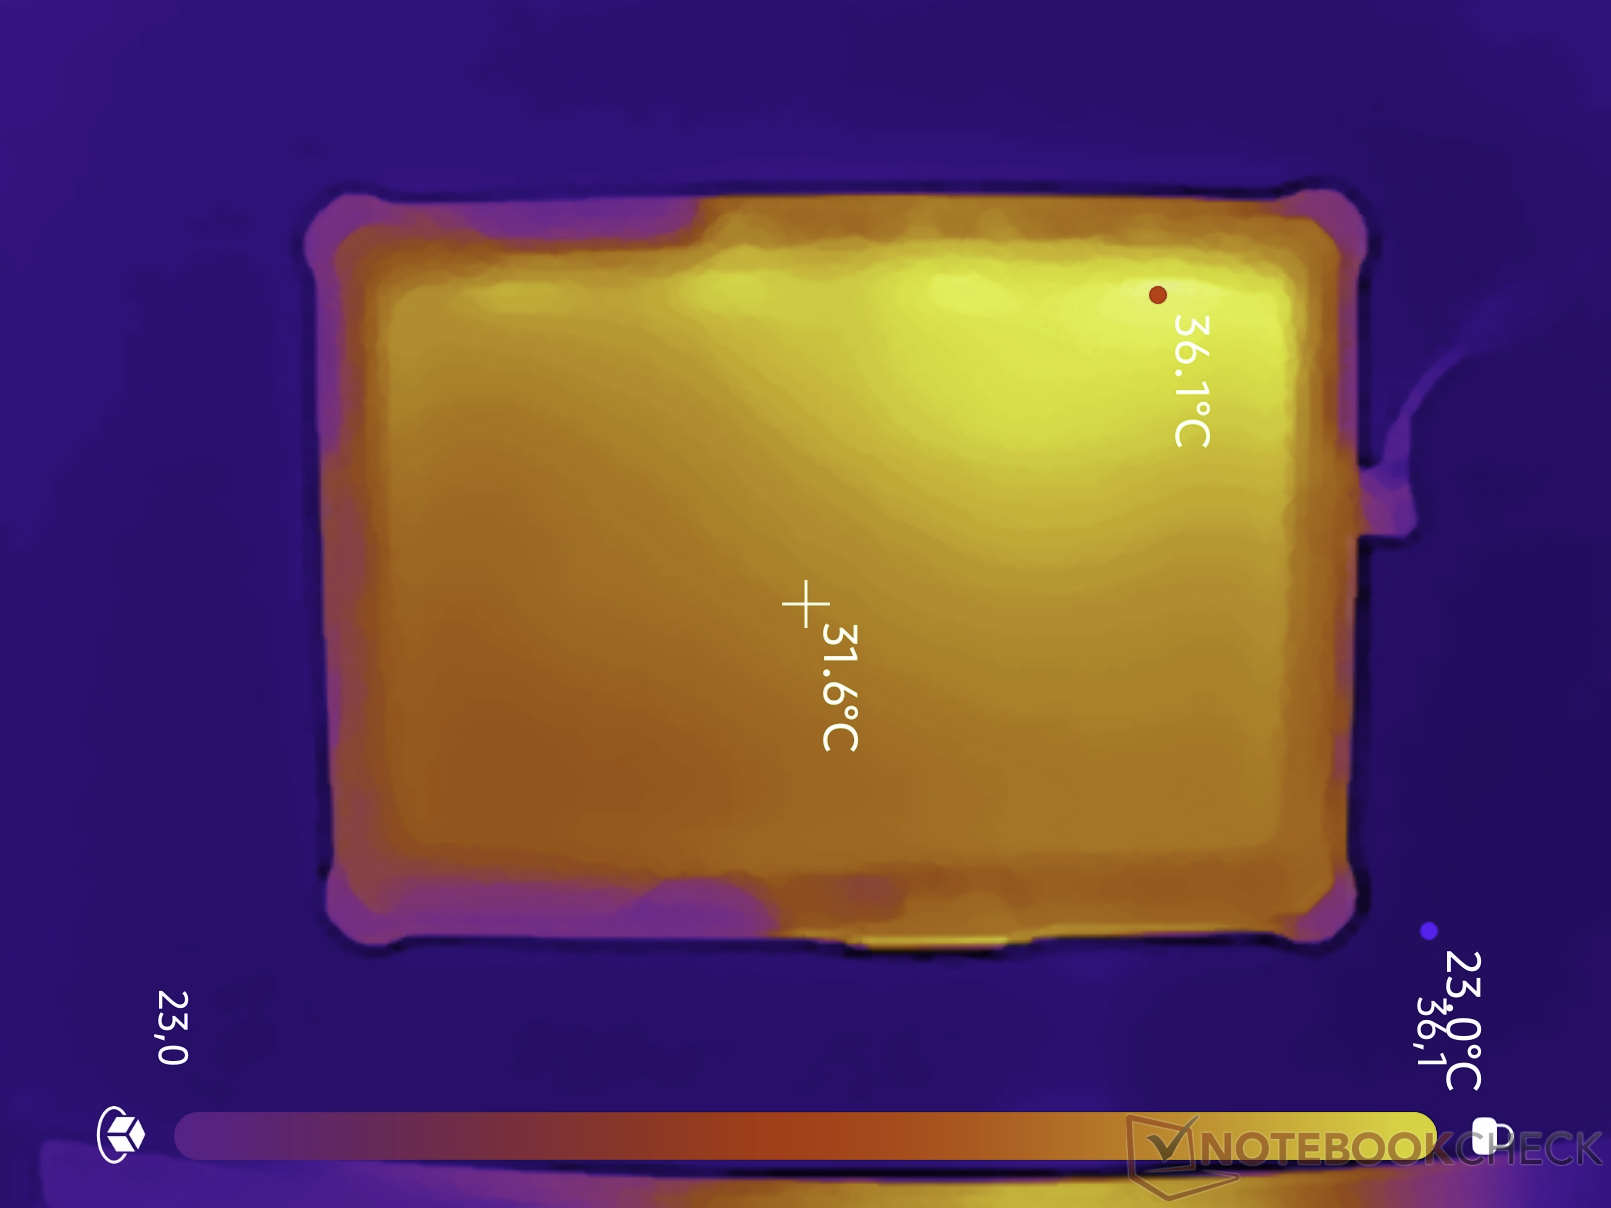
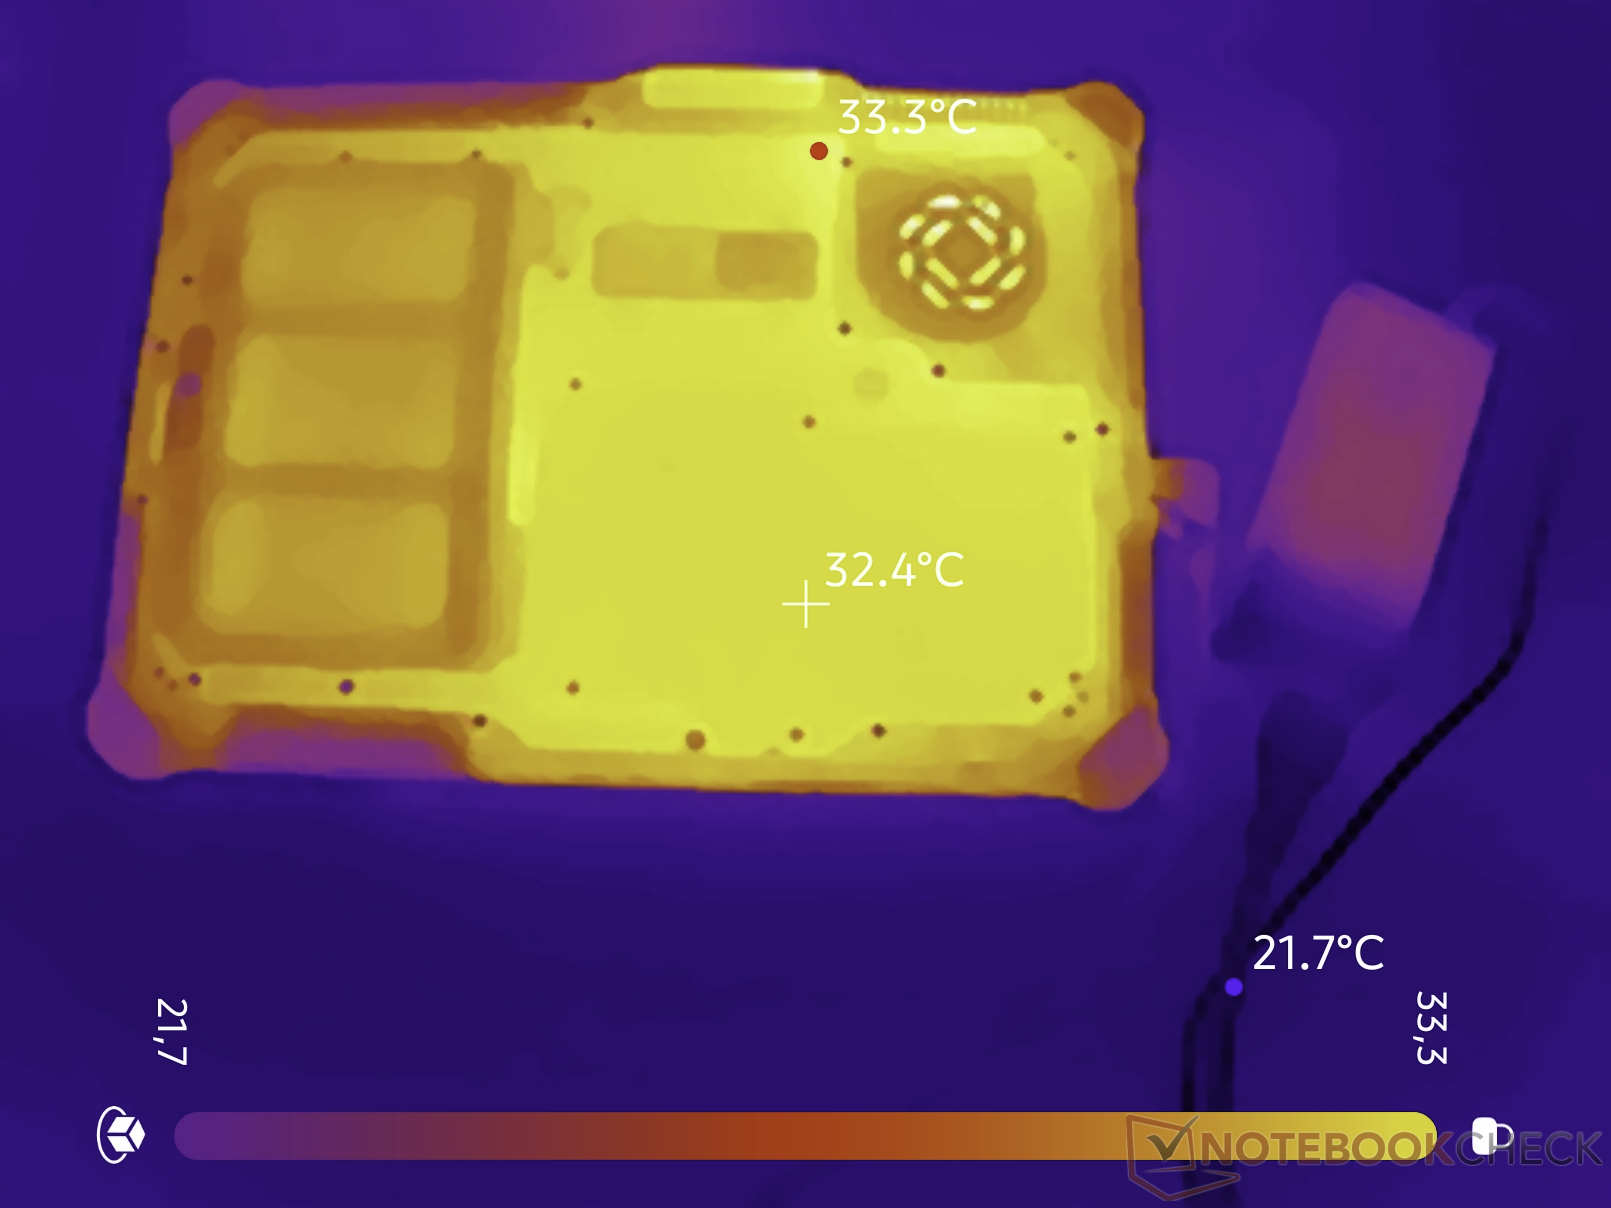
Het koelsysteem presteert uitzonderlijk goed. Tijdens de stresstest bereikt de tablet slechts op enkele plaatsen temperaturen boven de 40 °C (104 °F). De rest van de stevige behuizing blijft op een aangename temperatuur.
(±) De maximumtemperatuur aan de bovenzijde bedraagt 43.6 °C / 110 F, vergeleken met het gemiddelde van 33.6 °C / 92 F, variërend van 20.7 tot 53.2 °C voor de klasse Tablet.
(±) De bodem warmt op tot een maximum van 40 °C / 104 F, vergeleken met een gemiddelde van 33.2 °C / 92 F
(±) Bij onbelast gebruik bedraagt de gemiddelde temperatuur voor de bovenzijde 33.3 °C / 92 F, vergeleken met het apparaatgemiddelde van 30 °C / 86 F.
| Durabook R10 Core Ultra 7 258V, Arc 140V | Dell Latitude 7030 Rugged Extreme i7-1260U, Iris Xe G7 96EUs | Lenovo ThinkPad T14 Gen 6 21QG001VGE Core Ultra 7 258V, Arc 140V | Dynabook Portege Z40L-N Core Ultra 7 258V, Arc 140V | Durabook R8 Tablet i5-1230U, Iris Xe G7 80EUs | Lenovo ThinkPad T14 Gen 6 AMD Ryzen AI 7 PRO 350, Radeon 860M | |
|---|---|---|---|---|---|---|
| Heat | 11% | 16% | -2% | -0% | -3% | |
| Maximum Upper Side * (°C) | 43.6 | 37.2 15% | 39.7 9% | 41.2 6% | 38.2 12% | 47.7 -9% |
| Maximum Bottom * (°C) | 40 | 43.4 -9% | 38.1 5% | 38 5% | 49.6 -24% | 49.5 -24% |
| Idle Upper Side * (°C) | 36.1 | 26.4 27% | 24.3 33% | 35.4 2% | 32.2 11% | 30.7 15% |
| Idle Bottom * (°C) | 33.3 | 29.6 11% | 27.7 17% | 39.8 -20% | 33.4 -0% | 31.6 5% |
* ... kleiner is beter
Spreker
De audiomogelijkheden van het apparaat zijn bescheiden. De ingebouwde monoluidspreker aan de achterzijde van de tablet bereikt een maximaal volume van 54 dB(A) en levert een nogal matige geluidskwaliteit. Dit is voldoende voor het afspelen van systeemwaarschuwingstonen, althans in een rustige omgeving.
Durabook R10 audioanalyse
(-) | niet erg luide luidsprekers (58.3 dB)
Bas 100 - 315 Hz
(-) | bijna geen lage tonen - gemiddeld 17.7% lager dan de mediaan
(±) | lineariteit van de lage tonen is gemiddeld (7.6% delta ten opzichte van de vorige frequentie)
Midden 400 - 2000 Hz
(+) | evenwichtige middens - slechts 2.9% verwijderd van de mediaan
(±) | lineariteit van de middentonen is gemiddeld (13.7% delta ten opzichte van de vorige frequentie)
Hoog 2 - 16 kHz
(+) | evenwichtige hoogtepunten - slechts 4.7% verwijderd van de mediaan
(±) | lineariteit van de hoogtepunten is gemiddeld (10.2% delta ten opzichte van de vorige frequentie)
Algemeen 100 - 16.000 Hz
(-) | het totale geluid is niet lineair (31.3% verschil met de mediaan)
Vergeleken met dezelfde klasse
» 90% van alle geteste apparaten in deze klasse waren beter, 3% vergelijkbaar, 7% slechter
» De beste had een delta van 7%, het gemiddelde was 20%, de slechtste was 129%
Vergeleken met alle geteste toestellen
» 90% van alle geteste apparaten waren beter, 2% gelijk, 8% slechter
» De beste had een delta van 4%, het gemiddelde was 24%, de slechtste was 134%
Apple MacBook Pro 16 2021 M1 Pro audioanalyse
(+) | luidsprekers kunnen relatief luid spelen (84.7 dB)
Bas 100 - 315 Hz
(+) | goede baars - slechts 3.8% verwijderd van de mediaan
(+) | de lage tonen zijn lineair (5.2% delta naar de vorige frequentie)
Midden 400 - 2000 Hz
(+) | evenwichtige middens - slechts 1.3% verwijderd van de mediaan
(+) | de middentonen zijn lineair (2.1% delta ten opzichte van de vorige frequentie)
Hoog 2 - 16 kHz
(+) | evenwichtige hoogtepunten - slechts 1.9% verwijderd van de mediaan
(+) | de hoge tonen zijn lineair (2.7% delta naar de vorige frequentie)
Algemeen 100 - 16.000 Hz
(+) | het totale geluid is lineair (4.6% verschil met de mediaan)
Vergeleken met dezelfde klasse
» 0% van alle geteste apparaten in deze klasse waren beter, 0% vergelijkbaar, 100% slechter
» De beste had een delta van 5%, het gemiddelde was 17%, de slechtste was 45%
Vergeleken met alle geteste toestellen
» 0% van alle geteste apparaten waren beter, 0% gelijk, 100% slechter
» De beste had een delta van 4%, het gemiddelde was 24%, de slechtste was 134%
Energieverbruik en batterijduur
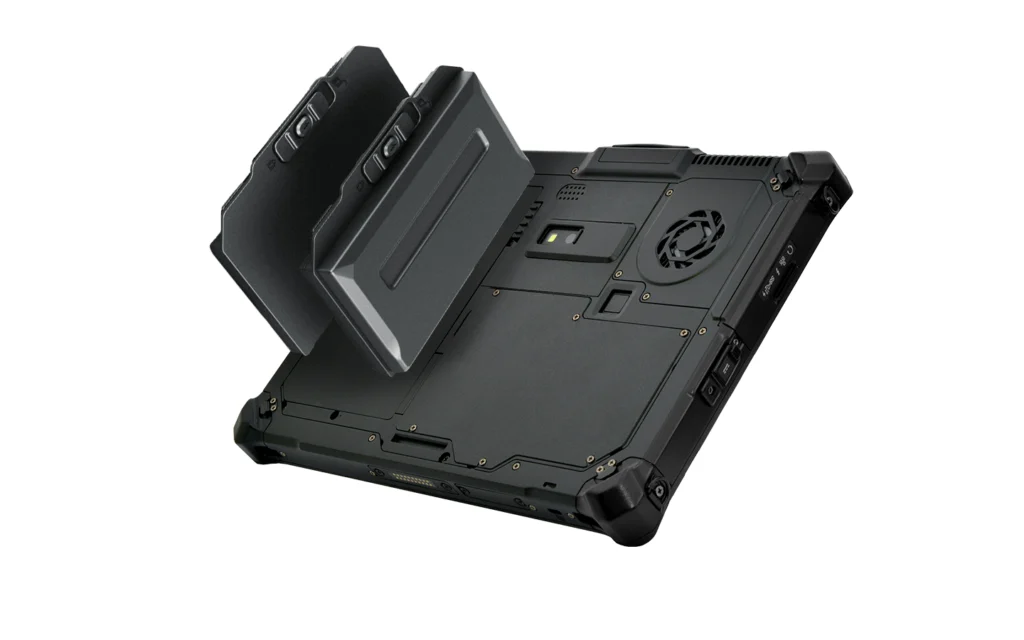
Tijdens onze stresstest hebben we een maximaal stroomverbruik van 55 watt gemeten. Veruit de grootste verbruiker is het extreem heldere scherm, dat de batterij of de voedingsadapter aanzienlijk belast. Zonder aansluiting op het stopcontact leverde de batterij in onze test een gebruiksduur van acht uur bij continu surfen op het internet via Wi-Fi. Dankzij de hot-swap-functie kan de batterij worden vervangen terwijl het apparaat in werking is. In de Durabook zit een kleine batterij, die iets meer dan een minuut stroom levert en het mogelijk maakt de batterij te vervangen zonder het apparaat uit te schakelen. Voor nog langer gebruik zonder opladen of batterijvervanging biedt de fabrikant ook een batterij met hoge capaciteit aan, hoewel deze aanzienlijk uit het apparaat steekt.
| Uit / Standby | |
| Inactief | |
| Belasting |
|
Key:
min: | |
Energieverbruik Cyberpunk / Stresstest
Energieverbruik bij gebruik van een externe monitor
| Durabook R10 Core Ultra 7 258V, Arc 140V, 48 Wh | Dell Latitude 7030 Rugged Extreme i7-1260U, Iris Xe G7 96EUs, 36 Wh | Lenovo ThinkPad T14 Gen 6 21QG001VGE Core Ultra 7 258V, Arc 140V, 57 Wh | Dynabook Portege Z40L-N Core Ultra 7 258V, Arc 140V, 56 Wh | Durabook R8 Tablet i5-1230U, Iris Xe G7 80EUs, 27.4 Wh | Lenovo ThinkPad T14 Gen 6 AMD Ryzen AI 7 PRO 350, Radeon 860M, 57 Wh | Gemiddelde van klas Tablet | |
|---|---|---|---|---|---|---|---|
| Battery Runtime | |||||||
| WiFi Websurfing (h) | 8.4 | 6.1 -27% | 19.4 131% | 19.1 127% | 5.3 -37% | 13.8 64% | 15.8 ? 88% |
| Batterijduur | -27% | 131% | 127% | -37% | 64% | 88% | |
| WiFi v1.3 (h) | 8.4 | 6.1 -27% | 19.4 131% | 19.1 127% | 5.3 -37% | 13.8 64% | 15.8 ? 88% |
| Load (h) | 1.6 | 1.1 | 4.16 ? | ||||
| Totaal Gemiddelde (Programma / Instellingen) | -27% /
-27% | 131% /
131% | 127% /
127% | -37% /
-37% | 64% /
64% | 88% /
88% |
| Durabook R10 Core Ultra 7 258V, Arc 140V, 48 Wh | Dell Latitude 7030 Rugged Extreme i7-1260U, Iris Xe G7 96EUs, 36 Wh | Lenovo ThinkPad T14 Gen 6 21QG001VGE Core Ultra 7 258V, Arc 140V, 57 Wh | Dynabook Portege Z40L-N Core Ultra 7 258V, Arc 140V, 56 Wh | Durabook R8 Tablet i5-1230U, Iris Xe G7 80EUs, 27.4 Wh | Lenovo ThinkPad T14 Gen 6 AMD Ryzen AI 7 PRO 350, Radeon 860M, 57 Wh | Gemiddelde van klas Tablet | |
|---|---|---|---|---|---|---|---|
| Batterijduur | -27% | 131% | 127% | -37% | 64% | 88% | |
| WiFi v1.3 (h) | 8.4 | 6.1 -27% | 19.4 131% | 19.1 127% | 5.3 -37% | 13.8 64% | 15.8 ? 88% |
| Load (h) | 1.6 | 1.1 | 4.16 ? |
Algemene beoordeling van Notebookcheck
De Durabook R10 is een echte zwaargewicht, ontworpen voor extreme werkomstandigheden. De gecertificeerde militaire normen, het heldere scherm en de naadloze stroomvoorziening zijn werkelijk indrukwekkend. De ondermaatse CPU-prestaties, de hoge latentie en het enigszins groenachtige scherm vragen echter om enkele concessies.
Durabook R10
- 18-06-2026 v8
Marc Herter
 Total Sustainability Score:
 Een vergelijking van mogelijke alternatieven
Afbeelding | Model / recensie | prijs | Gewicht | Hoogte | Scherm |
|---|---|---|---|---|---|
1. 76.5%  | Durabook R10 Intel Core Ultra 7 258V ⎘ Intel Arc Graphics 140V ⎘ 32 GB Geheugen | Amazon: 1. $14.99 ZBAGUG for Durabook R10 Tabl... 2. $17.99 ZBAGUG 2-Pack for Durabook R... | 1.3 kg | 29 mm | 10.10" 1920x1200 224 PPI TFT |
2. 82.3% 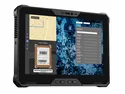 | Dell Latitude 7030 Rugged Extreme Intel Core i7-1260U ⎘ Intel Iris Xe Graphics G7 96EUs ⎘ 32 GB Geheugen, 1024 GB SSD | Amazon: 1. $2,049.00 Dell Latitude Rugged Extreme... 2. $2,199.00 Dell Latitude 7330 Rugged Ex... 3. $1,850.00 Dell Latitude Rugged Extreme... Catalogusprijs: 3000 USD | 1.1 kg | 25.4 mm | 10.00" 1920x1200 226 PPI IPS |
3. 79.6% v7 (old)  | Durabook R8 Tablet Intel Core i5-1230U ⎘ Intel Iris Xe Graphics G7 80EUs ⎘ 8 GB Geheugen, 128 GB SSD | Amazon: 1. $38.99 PowerHOOD DC19V AC Power Ada... 2. $39.95 BoxWave Screen Protector Com... 3. $39.95 BoxWave Screen Protector Com... | 856 g | 20.6 mm | 8.00" 1280x800 189 PPI IPS |
Transparantie
De selectie van te beoordelen apparaten wordt gemaakt door onze redactie. Het testexemplaar werd ten behoeve van deze beoordeling door de fabrikant of detailhandelaar in bruikleen aan de auteur verstrekt. De kredietverstrekker had geen invloed op deze recensie, noch ontving de fabrikant vóór publicatie een exemplaar van deze recensie. Er bestond geen verplichting om deze recensie te publiceren. Als onafhankelijk mediabedrijf is Notebookcheck niet onderworpen aan het gezag van fabrikanten, detailhandelaren of uitgevers.
[transparency_disclaimer]Dit is hoe Notebookcheck test
Elk jaar beoordeelt Notebookcheck onafhankelijk honderden laptops en smartphones met behulp van gestandaardiseerde procedures om ervoor te zorgen dat alle resultaten vergelijkbaar zijn. We hebben onze testmethoden al zo'n 20 jaar voortdurend ontwikkeld en daarbij de industriestandaard bepaald. In onze testlaboratoria wordt gebruik gemaakt van hoogwaardige meetapparatuur door ervaren technici en redacteuren. Deze tests omvatten een validatieproces in meerdere fasen. Ons complexe beoordelingssysteem is gebaseerd op honderden goed onderbouwde metingen en benchmarks, waardoor de objectiviteit behouden blijft. Meer informatie over onze testmethoden kunt u hier vinden.
