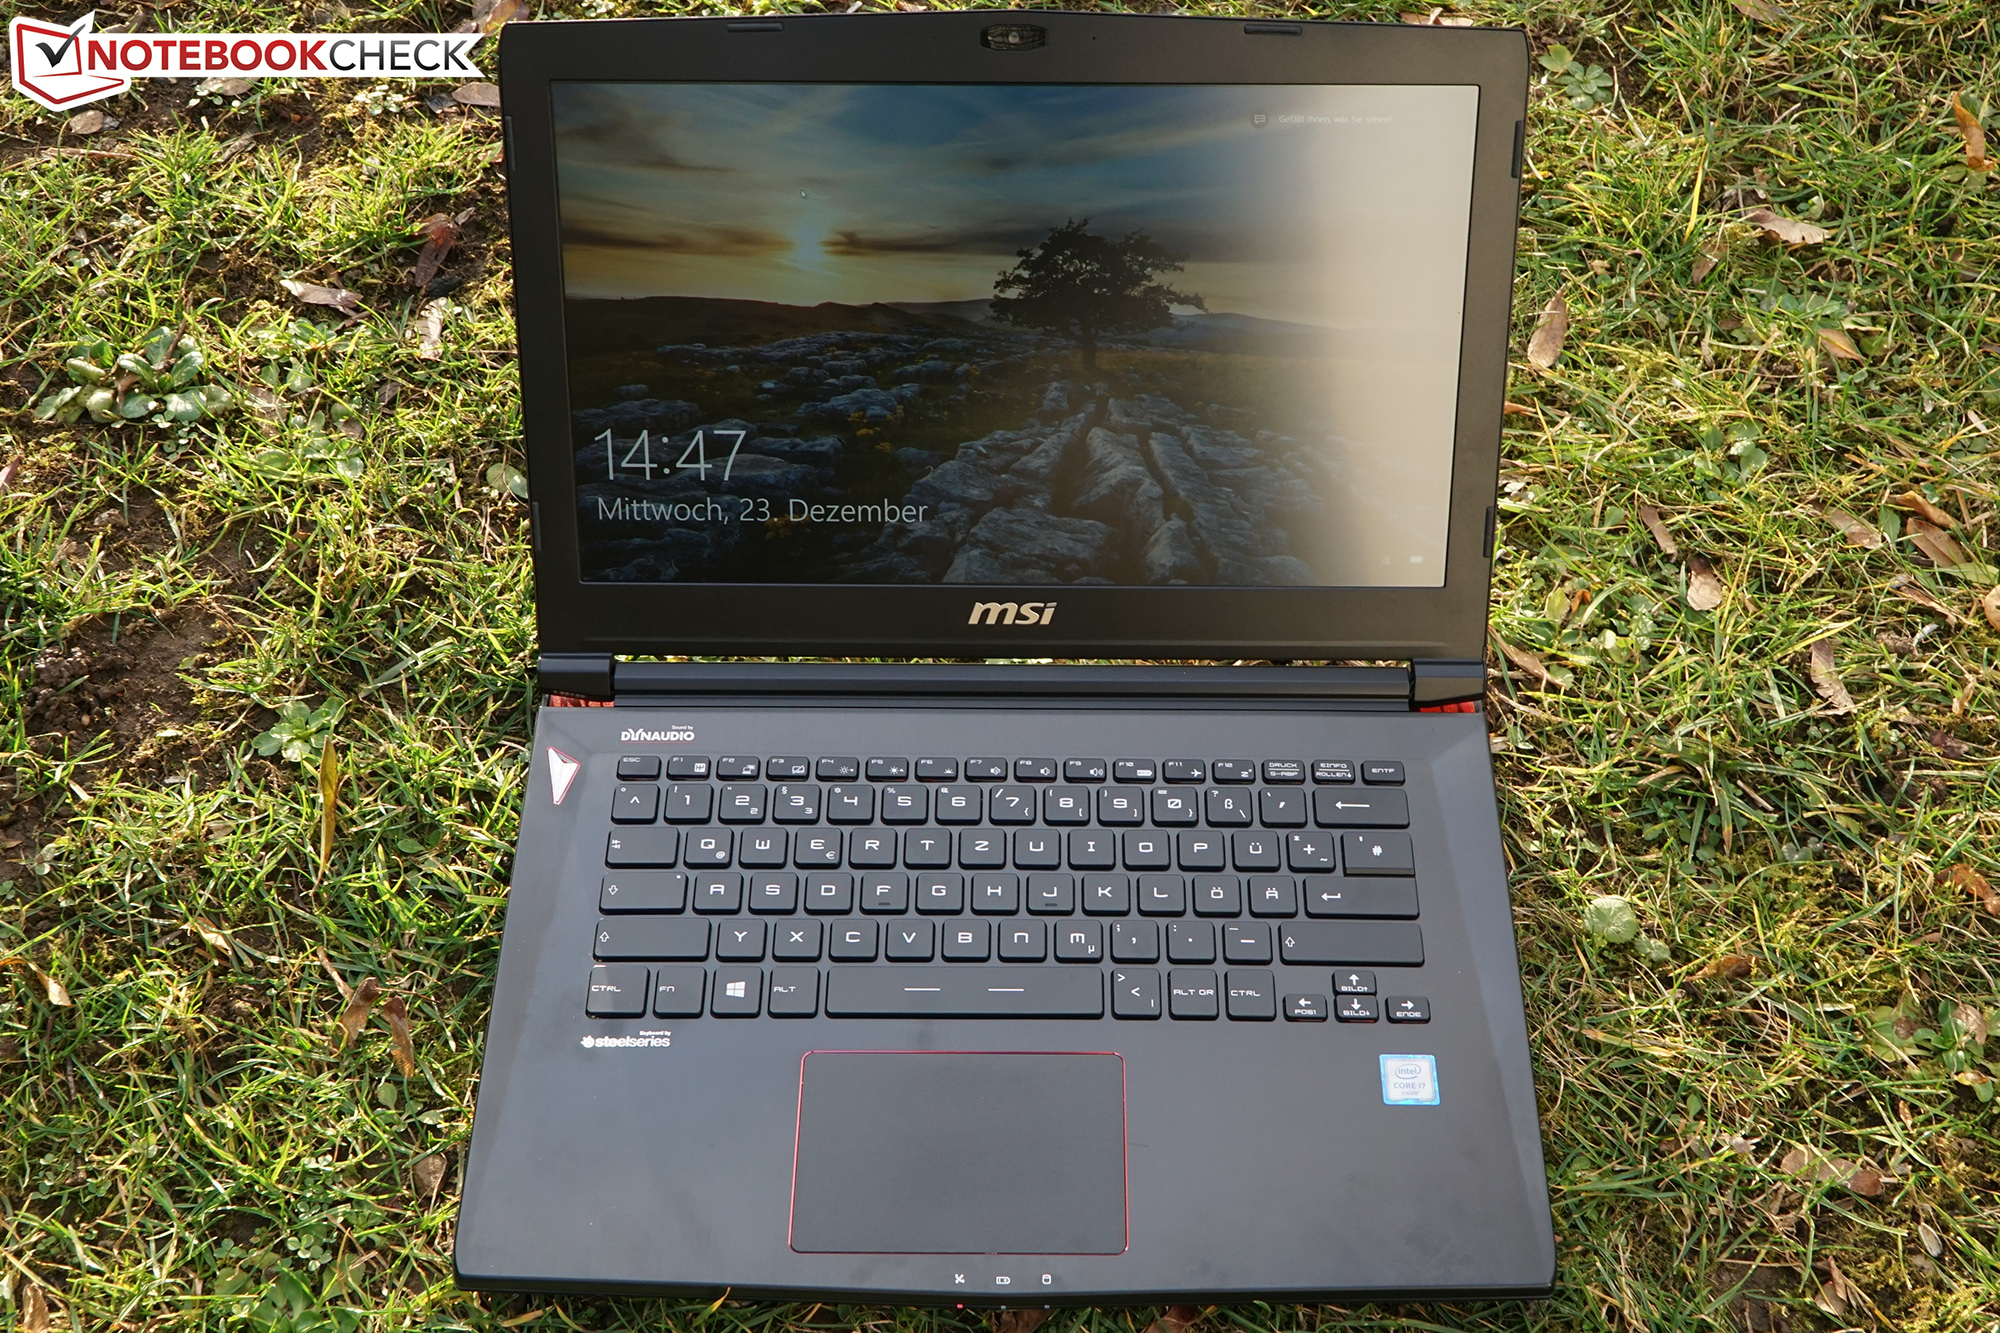
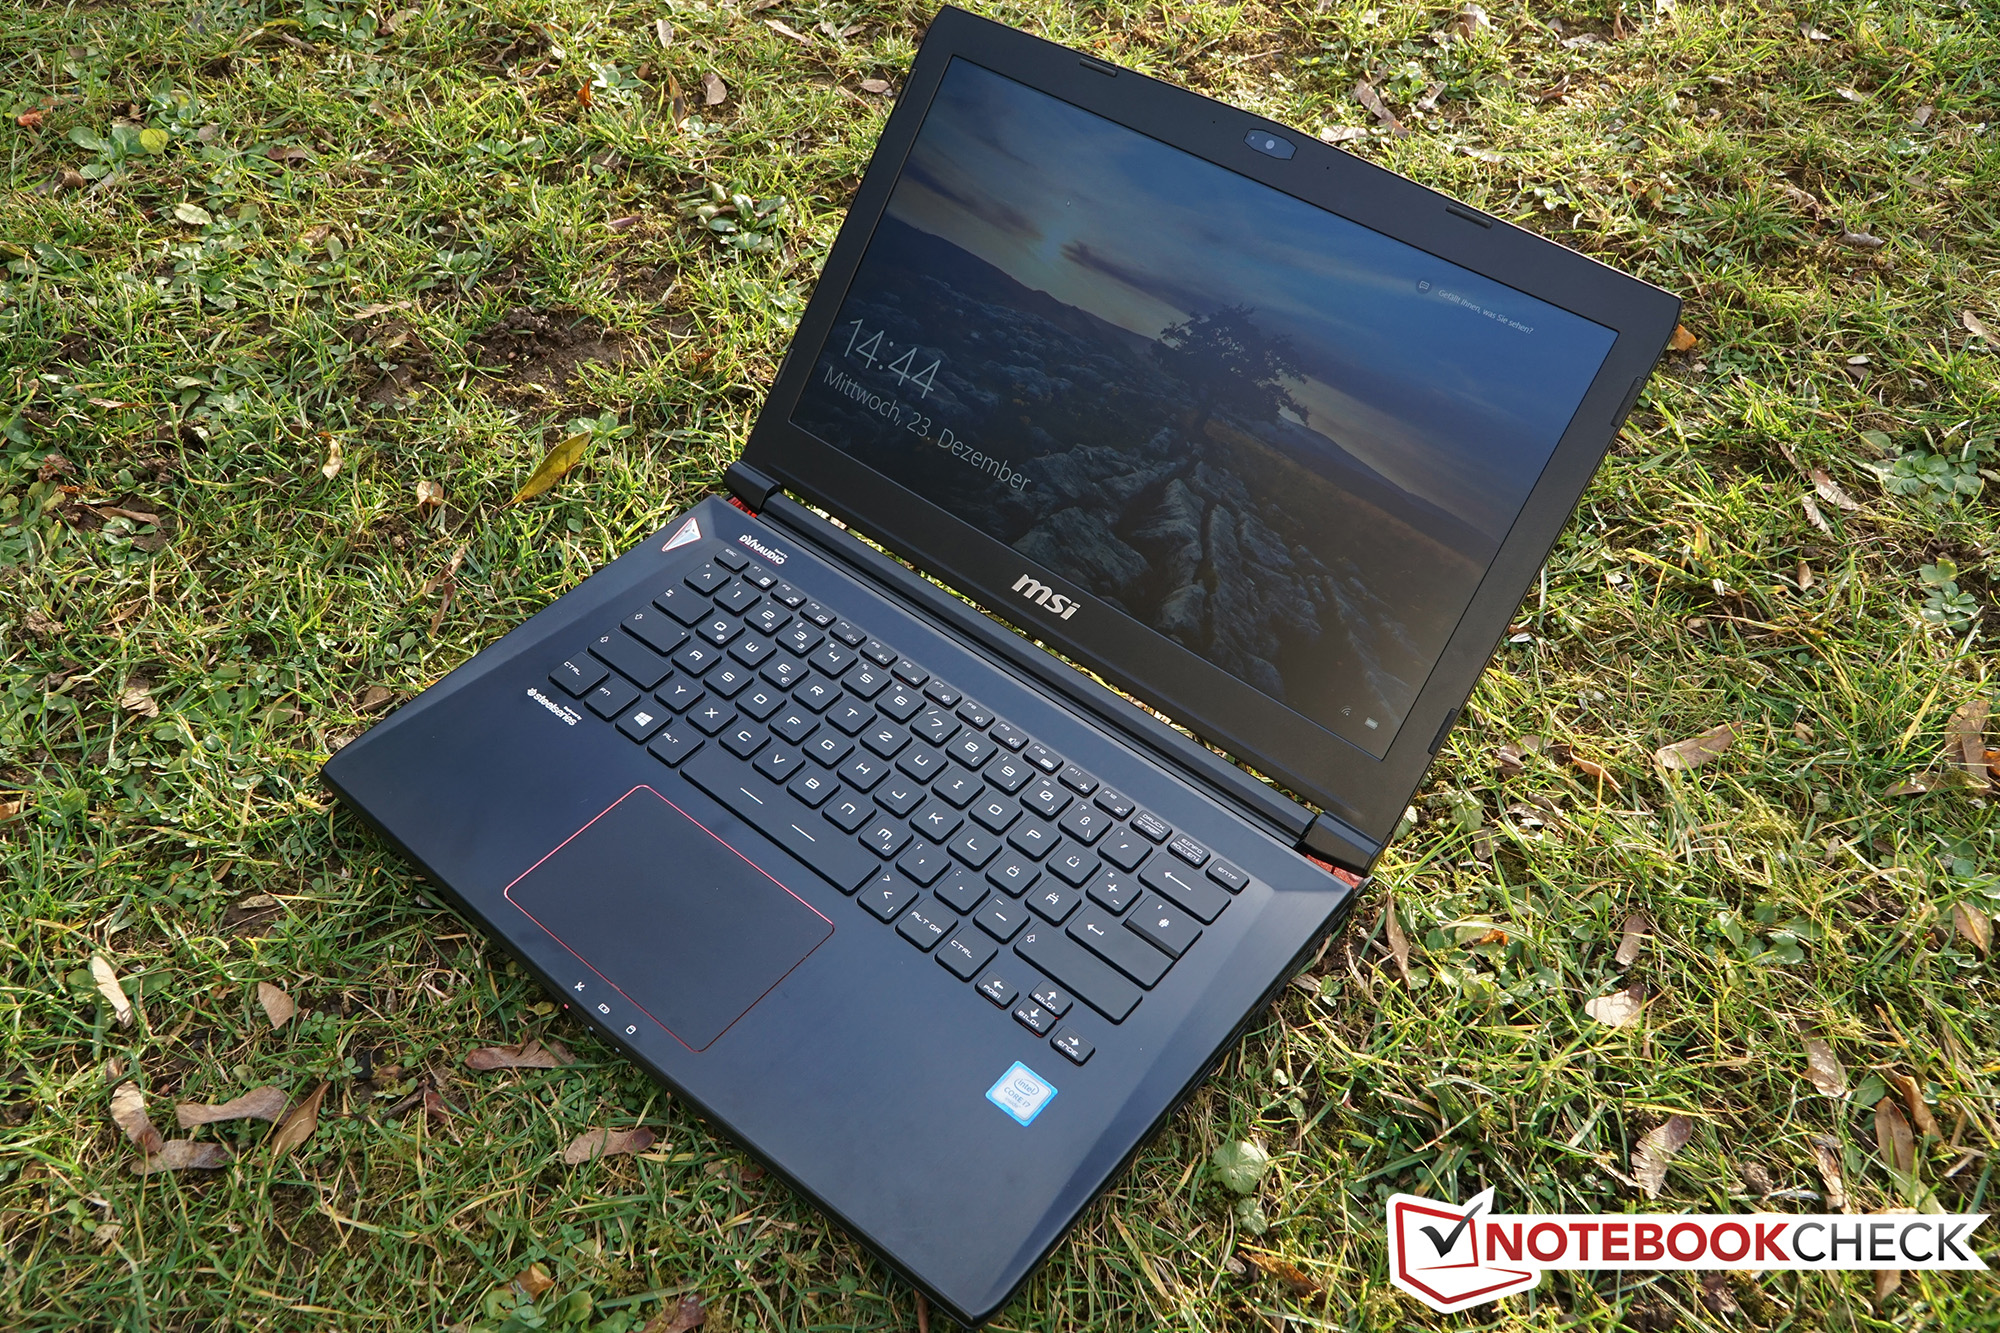
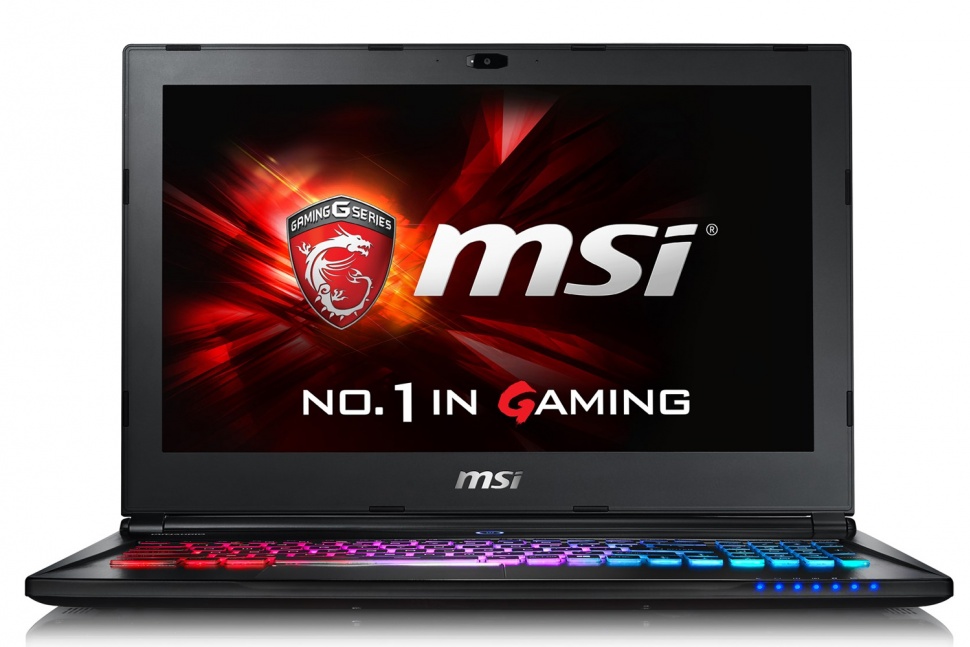
Kort testrapport MSI GS40 6QE Phantom Notebook


| |||||||||||||||||||||||||
Helderheidsverdeling: 88 %
Helderheid in Batterij-modus: 304 cd/m²
Contrast: 822:1 (Zwart: 0.37 cd/m²)
ΔE ColorChecker Calman: 7.47 | ∀{0.5-29.43 Ø4.72}
ΔE Greyscale Calman: 6.51 | ∀{0.09-98 Ø4.97}
86% sRGB (Argyll 1.6.3 3D)
56% AdobeRGB 1998 (Argyll 1.6.3 3D)
62.6% AdobeRGB 1998 (Argyll 3D)
85.7% sRGB (Argyll 3D)
66.2% Display P3 (Argyll 3D)
Gamma: 3.71
CCT: 7840 K
| MSI GS40-6QE16H11 LG Philips LP140WF3-SPD1 (LGD046D), IPS, 14", 1920x1080 | Schenker XMG P406 LG Philips 140WF1 (LGD040A), IPS, 14", 1920x1080 | Gigabyte P34W V3 AU Optronics B140HAN01.1, IPS, 14", 1920x1080 | Schenker XMG C405 AU Optronics B140HAN01.1 (AUO113ED), AHVA, 14", 1920x1080 | Asus Zenbook UX303UB-R4100T ChiMei N133HSE-EA3, IPS, 13.3", 1920x1080 | Alienware 15 R2 (Skylake) Samsung 4NDDJ_156HL (SDC4C48), IPS, 15.6", 1920x1080 | |
|---|---|---|---|---|---|---|
| Display | -2% | 7% | 4% | 6% | -34% | |
| Display P3 Coverage (%) | 66.2 | 66.2 0% | 69.4 5% | 66.8 1% | 66.9 1% | 40.3 -39% |
| sRGB Coverage (%) | 85.7 | 82.8 -3% | 92.6 8% | 89.6 5% | 92.3 8% | 60.2 -30% |
| AdobeRGB 1998 Coverage (%) | 62.6 | 60.5 -3% | 67.4 8% | 65.6 5% | 67.6 8% | 41.67 -33% |
| Response Times | -56% | -86% | -40% | |||
| Response Time Grey 50% / Grey 80% * (ms) | 31 ? | 56 ? -81% | 68 ? -119% | 48.8 ? -57% | ||
| Response Time Black / White * (ms) | 23 ? | 30 ? -30% | 35 ? -52% | 28 ? -22% | ||
| PWM Frequency (Hz) | 178 ? | 200 ? | ||||
| Screen | 15% | -1% | 7% | 20% | -8% | |
| Brightness middle (cd/m²) | 304 | 282 -7% | 305.4 0% | 280 -8% | 385 27% | 180 -41% |
| Brightness (cd/m²) | 282 | 266 -6% | 277 -2% | 267 -5% | 394 40% | 179 -37% |
| Brightness Distribution (%) | 88 | 81 -8% | 84 -5% | 85 -3% | 89 1% | 83 -6% |
| Black Level * (cd/m²) | 0.37 | 0.22 41% | 0.72 -95% | 0.32 14% | 0.41 -11% | 0.19 49% |
| Contrast (:1) | 822 | 1282 56% | 424 -48% | 875 6% | 939 14% | 947 15% |
| Colorchecker dE 2000 * | 7.47 | 4.98 33% | 2.81 62% | 4.75 36% | 3.84 49% | 6.74 10% |
| Greyscale dE 2000 * | 6.51 | 4.08 37% | 1.92 71% | 5.91 9% | 3.79 42% | 6.44 1% |
| Gamma | 3.71 59% | 2.51 88% | 2.21 100% | 2.52 87% | 2.23 99% | 2.29 96% |
| CCT | 7840 83% | 5877 111% | 6384 102% | 5742 113% | 6499 100% | 6465 101% |
| Color Space (Percent of AdobeRGB 1998) (%) | 56 | 54 -4% | 60.4 8% | 59 5% | 60 7% | 38 -32% |
| Color Space (Percent of sRGB) (%) | 86 | 83 -3% | 92 7% | 60 -30% | ||
| Colorchecker dE 2000 max. * | 10.2 | |||||
| Totaal Gemiddelde (Programma / Instellingen) | -14% /
2% | 3% /
1% | 6% /
6% | -20% /
2% | -27% /
-18% |
* ... kleiner is beter
Responstijd Scherm
| ↔ Responstijd Zwart naar Wit | ||
|---|---|---|
| 23 ms ... stijging ↗ en daling ↘ gecombineerd | ↗ 5 ms stijging | 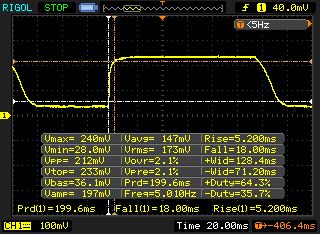 |
| ↘ 18 ms daling | ||
| Het scherm vertoonde prima responstijden in onze tests maar is misschien wat te traag voor competitieve games. Ter vergelijking: alle testtoestellen variëren van 0.1 (minimum) tot 240 (maximum) ms. » 52 % van alle toestellen zijn beter. Dit betekent dat de gemeten responstijd slechter is dan het gemiddelde (19.8 ms) van alle geteste toestellen. | ||
| ↔ Responstijd 50% Grijs naar 80% Grijs | ||
| 31 ms ... stijging ↗ en daling ↘ gecombineerd | ↗ 12 ms stijging | 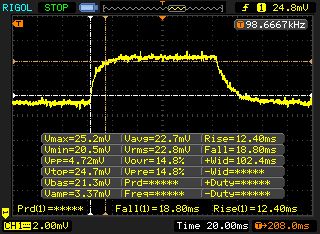 |
| ↘ 19 ms daling | ||
| Het scherm vertoonde trage responstijden in onze tests en is misschien te traag voor games. Ter vergelijking: alle testtoestellen variëren van 0.165 (minimum) tot 636 (maximum) ms. » 42 % van alle toestellen zijn beter. Dit betekent dat de gemeten responstijd vergelijkbaar is met het gemiddelde (31 ms) van alle geteste toestellen. | ||
Screen Flickering / PWM (Pulse-Width Modulation)
| Screen flickering / PWM niet waargenomen | 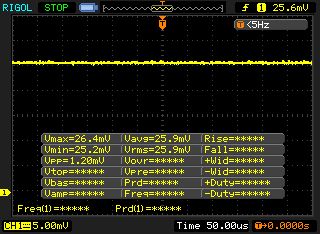 | ||
Ter vergelijking: 52 % van alle geteste toestellen maakten geen gebruik van PWM om de schermhelderheid te verlagen. Als het wel werd gebruikt, werd een gemiddelde van 7747 (minimum: 5 - maximum: 343500) Hz waargenomen. | |||
| Cinebench R15 | |
| CPU Multi 64Bit (sorteer op waarde) | |
| MSI GS40-6QE16H11 | |
| Schenker XMG P406 | |
| Gigabyte P34W V3 | |
| Schenker XMG C405 | |
| Asus Zenbook UX303UB-R4100T | |
| Alienware 15 R2 (Skylake) | |
| MSI GT72S 6QF | |
| CPU Single 64Bit (sorteer op waarde) | |
| MSI GS40-6QE16H11 | |
| Schenker XMG P406 | |
| Gigabyte P34W V3 | |
| Schenker XMG C405 | |
| Asus Zenbook UX303UB-R4100T | |
| Alienware 15 R2 (Skylake) | |
| MSI GT72S 6QF | |
| Cinebench R11.5 | |
| CPU Multi 64Bit (sorteer op waarde) | |
| MSI GS40-6QE16H11 | |
| Schenker XMG P406 | |
| Gigabyte P34W V3 | |
| Schenker XMG C405 | |
| Asus Zenbook UX303UB-R4100T | |
| Alienware 15 R2 (Skylake) | |
| MSI GT72S 6QF | |
| CPU Single 64Bit (sorteer op waarde) | |
| MSI GS40-6QE16H11 | |
| Schenker XMG P406 | |
| Gigabyte P34W V3 | |
| Schenker XMG C405 | |
| Asus Zenbook UX303UB-R4100T | |
| Alienware 15 R2 (Skylake) | |
| MSI GT72S 6QF | |
| PCMark 7 Score | 5451 punten | |
| PCMark 8 Home Score Accelerated v2 | 3776 punten | |
| PCMark 8 Creative Score Accelerated v2 | 4742 punten | |
| PCMark 8 Work Score Accelerated v2 | 4831 punten | |
Help | ||
| PCMark 7 - Score (sorteer op waarde) | |
| MSI GS40-6QE16H11 | |
| Schenker XMG P406 | |
| Gigabyte P34W V3 | |
| Asus Zenbook UX303UB-R4100T | |
| Alienware 15 R2 (Skylake) | |
| PCMark 8 | |
| Home Score Accelerated v2 (sorteer op waarde) | |
| MSI GS40-6QE16H11 | |
| Schenker XMG P406 | |
| Gigabyte P34W V3 | |
| Schenker XMG C405 | |
| Asus Zenbook UX303UB-R4100T | |
| Alienware 15 R2 (Skylake) | |
| Creative Score Accelerated v2 (sorteer op waarde) | |
| MSI GS40-6QE16H11 | |
| Gigabyte P34W V3 | |
| Schenker XMG C405 | |
| Asus Zenbook UX303UB-R4100T | |
| Alienware 15 R2 (Skylake) | |
| Work Score Accelerated v2 (sorteer op waarde) | |
| MSI GS40-6QE16H11 | |
| Schenker XMG P406 | |
| Gigabyte P34W V3 | |
| Schenker XMG C405 | |
| Asus Zenbook UX303UB-R4100T | |
| Alienware 15 R2 (Skylake) | |

| MSI GS40-6QE16H11 Samsung MZFLV128 NVMe | Schenker XMG P406 Samsung SM951 MZHPV256HDGL m.2 PCI-e | Gigabyte P34W V3 Lite-On LMT-128L9M | Schenker XMG C405 Crucial M550 CT256M550SSD3 | Asus Zenbook UX303UB-R4100T Micron M600 MTFDDAK512MBF | Alienware 15 R2 (Skylake) Samsung PM951 NVMe MZ-VLV256D | |
|---|---|---|---|---|---|---|
| CrystalDiskMark 3.0 | 20% | -48% | -36% | -44% | -19% | |
| Read Seq (MB/s) | 1332 | 1634 23% | 504 -62% | 517 -61% | 484.2 -64% | 1213 -9% |
| Write Seq (MB/s) | 687 | 1290 88% | 337.4 -51% | 496.6 -28% | 444.9 -35% | 306 -55% |
| Read 4k (MB/s) | 49.57 | 43.82 -12% | 33.13 -33% | 33.03 -33% | 28.74 -42% | 42.62 -14% |
| Write 4k (MB/s) | 138.8 | 110.3 -21% | 75 -46% | 111.3 -20% | 90.5 -35% | 143.7 4% |
| AS SSD | 165% | 64% | 98% | 62% | ||
| Seq Read (MB/s) | 1834 | 1875 2% | 487 -73% | 523 -71% | 514 -72% | |
| Seq Write (MB/s) | 289.1 | 1252 333% | 322.9 12% | 475.6 65% | 399.9 38% | |
| 4K Read (MB/s) | 45.54 | 39.68 -13% | 30.97 -32% | 30.61 -33% | 26.51 -42% | |
| 4K Write (MB/s) | 102.4 | 92 -10% | 67.9 -34% | 97.6 -5% | 76.1 -26% | |
| 4K-64 Read (MB/s) | 738 | 707 -4% | 366.8 -50% | 384.8 -48% | 308.1 -58% | |
| 4K-64 Write (MB/s) | 34.73 | 351.2 911% | 256.3 638% | 304.5 777% | 254 631% | |
| Access Time Read * (ms) | 0.062 | 0.061 2% | 0.094 -52% | 0.063 -2% | 0.11 -77% | |
| Access Time Write * (ms) | 4.234 | 0.042 99% | 0.054 99% | 0.046 99% | 0.064 98% | |
| Totaal Gemiddelde (Programma / Instellingen) | 93% /
117% | 8% /
26% | 31% /
53% | 9% /
26% | -19% /
-19% |
* ... kleiner is beter
| 3DMark 11 Performance | 9544 punten | |
| 3DMark Ice Storm Standard Score | 87313 punten | |
| 3DMark Cloud Gate Standard Score | 21133 punten | |
| 3DMark Fire Strike Score | 6530 punten | |
Help | ||
| 3DMark | |
| 1920x1080 Fire Strike Score (sorteer op waarde) | |
| MSI GS40-6QE16H11 | |
| Schenker XMG P406 | |
| Gigabyte P55 V4 | |
| Gigabyte P34W V3 | |
| Schenker XMG C405 | |
| Asus Zenbook UX303UB-R4100T | |
| Alienware 15 R2 (Skylake) | |
| 1280x720 Cloud Gate Standard Score (sorteer op waarde) | |
| MSI GS40-6QE16H11 | |
| Schenker XMG P406 | |
| Gigabyte P55 V4 | |
| Gigabyte P34W V3 | |
| Schenker XMG C405 | |
| Asus Zenbook UX303UB-R4100T | |
| Alienware 15 R2 (Skylake) | |
| 3DMark 11 - 1280x720 Performance (sorteer op waarde) | |
| MSI GS40-6QE16H11 | |
| Schenker XMG P406 | |
| Gigabyte P55 V4 | |
| Gigabyte P34W V3 | |
| Schenker XMG C405 | |
| Asus Zenbook UX303UB-R4100T | |
| Alienware 15 R2 (Skylake) | |
| lage | gem. | hoge | ultra | |
|---|---|---|---|---|
| Tomb Raider (2013) | 307.5 | 270.3 | 185 | 86.6 |
| The Witcher 3 (2015) | 134.5 | 84.6 | 38.9 | 26.4 |
| Fallout 4 (2015) | 135.5 | 101.3 | 53.5 | 43.7 |
| Tomb Raider - 1920x1080 Ultra Preset AA:FX AF:16x (sorteer op waarde) | |
| MSI GS40-6QE16H11 | |
| Gigabyte P34W V3 | |
| Schenker XMG C405 | |
| Asus Zenbook UX303UB-R4100T | |
| Alienware 15 R2 (Skylake) | |
| The Witcher 3 | |
| 1920x1080 High Graphics & Postprocessing (Nvidia HairWorks Off) (sorteer op waarde) | |
| MSI GS40-6QE16H11 | |
| Alienware 15 R2 (Skylake) | |
| 1920x1080 Ultra Graphics & Postprocessing (HBAO+) (sorteer op waarde) | |
| MSI GS40-6QE16H11 | |
| Alienware 15 R2 (Skylake) | |
| Fallout 4 | |
| 1920x1080 High Preset AA:T AF:16x (sorteer op waarde) | |
| MSI GS40-6QE16H11 | |
| Schenker XMG P406 | |
| Asus Zenbook UX303UB-R4100T | |
| 1920x1080 Ultra Preset AA:T AF:16x (sorteer op waarde) | |
| MSI GS40-6QE16H11 | |
| Schenker XMG P406 | |
| Asus Zenbook UX303UB-R4100T | |
Geluidsniveau
| Onbelast |
| 33 / 34 / 38 dB (A) |
| HDD |
| 34 dB (A) |
| Belasting |
| 44 / 52 dB (A) |
 | ||
30 dB stil 40 dB(A) hoorbaar 50 dB(A) luid |
||
min: | ||
| MSI GS40-6QE16H11 GeForce GTX 970M, 6700HQ | Schenker XMG P406 GeForce GTX 970M, 6700HQ | Gigabyte P34W V3 GeForce GTX 970M, 4720HQ | Schenker XMG C405 GeForce GTX 965M, 4720HQ | Asus Zenbook UX303UB-R4100T GeForce 940M, 6500U | Alienware 15 R2 (Skylake) GeForce GTX 980M, 6700HQ | |
|---|---|---|---|---|---|---|
| Noise | 1% | -2% | -4% | 15% | 4% | |
| Idle Minimum * (dB) | 33 | 30 9% | 34.2 -4% | 29.2 12% | 31.5 5% | 33.6 -2% |
| Idle Average * (dB) | 34 | 32 6% | 34.3 -1% | 34.6 -2% | 31.5 7% | 33.8 1% |
| Idle Maximum * (dB) | 38 | 40 -5% | 38 -0% | 38.8 -2% | 31.5 17% | 34 11% |
| Load Average * (dB) | 44 | 47 -7% | 43.8 -0% | 54 -23% | 35.9 18% | 39.3 11% |
| Load Maximum * (dB) | 52 | 51 2% | 55 -6% | 54.4 -5% | 38.2 27% | 51.4 1% |
* ... kleiner is beter
(-) De maximumtemperatuur aan de bovenzijde bedraagt 57.4 °C / 135 F, vergeleken met het gemiddelde van 40.4 °C / 105 F, variërend van 21.2 tot 68.8 °C voor de klasse Gaming.
(-) De bodem warmt op tot een maximum van 68.8 °C / 156 F, vergeleken met een gemiddelde van 43.2 °C / 110 F
(±) Bij onbelast gebruik bedraagt de gemiddelde temperatuur voor de bovenzijde 34.1 °C / 93 F, vergeleken met het apparaatgemiddelde van 33.9 °C / 93 F.
(+) De handpalmsteunen en het touchpad bereiken maximaal de huidtemperatuur (35.3 °C / 95.5 F) en zijn dus niet heet.
(-) De gemiddelde temperatuur van de handpalmsteun van soortgelijke toestellen bedroeg 28.8 °C / 83.8 F (-6.5 °C / -11.7 F).
| MSI GS40-6QE16H11 GeForce GTX 970M, 6700HQ | Schenker XMG P406 GeForce GTX 970M, 6700HQ | Gigabyte P34W V3 GeForce GTX 970M, 4720HQ | Schenker XMG C405 GeForce GTX 965M, 4720HQ | Asus Zenbook UX303UB-R4100T GeForce 940M, 6500U | Alienware 15 R2 (Skylake) GeForce GTX 980M, 6700HQ | |
|---|---|---|---|---|---|---|
| Heat | 4% | 9% | 4% | 24% | 16% | |
| Maximum Upper Side * (°C) | 57.4 | 55 4% | 45.2 21% | 47.8 17% | 56.6 1% | 48 16% |
| Maximum Bottom * (°C) | 68.8 | 58.7 15% | 56.8 17% | 60.4 12% | 54.3 21% | 57.3 17% |
| Idle Upper Side * (°C) | 36.3 | 36.9 -2% | 34.6 5% | 37.7 -4% | 24 34% | 31.9 12% |
| Idle Bottom * (°C) | 41.2 | 41.7 -1% | 43.6 -6% | 44.8 -9% | 24.2 41% | 33.4 19% |
* ... kleiner is beter
| Uit / Standby | |
| Inactief | |
| Belasting |
|
Key:
min: | |
| MSI GS40-6QE16H11 GeForce GTX 970M, 6700HQ | Schenker XMG P406 GeForce GTX 970M, 6700HQ | MSI GS60-6QE4K16H21 GeForce GTX 970M, 6700HQ | Schenker XMG C405 GeForce GTX 965M, 4720HQ | Asus Zenbook UX303UB-R4100T GeForce 940M, 6500U | Alienware 15 R2 (Skylake) GeForce GTX 980M, 6700HQ | |
|---|---|---|---|---|---|---|
| Power Consumption | -5% | -26% | -28% | 59% | -8% | |
| Idle Minimum * (Watt) | 10 | 12 -20% | 17 -70% | 15.8 -58% | 3.2 68% | 11.4 -14% |
| Idle Average * (Watt) | 14 | 16 -14% | 22 -57% | 22.8 -63% | 7.6 46% | 16.5 -18% |
| Idle Maximum * (Watt) | 24 | 22 8% | 28 -17% | 27.3 -14% | 8 67% | 22 8% |
| Load Average * (Watt) | 90 | 90 -0% | 91 -1% | 106.8 -19% | 47 48% | 94.2 -5% |
| Load Maximum * (Watt) | 172 | 170 1% | 149 13% | 152 12% | 55 68% | 192.2 -12% |
* ... kleiner is beter
| MSI GS40-6QE16H11 GeForce GTX 970M, 6700HQ, 61 Wh | Schenker XMG P406 GeForce GTX 970M, 6700HQ, 45 Wh | MSI GS60-6QE4K16H21 GeForce GTX 970M, 6700HQ, 47 Wh | Schenker XMG C405 GeForce GTX 965M, 4720HQ, 61 Wh | Asus Zenbook UX303UB-R4100T GeForce 940M, 6500U, 50 Wh | Alienware 15 R2 (Skylake) GeForce GTX 980M, 6700HQ, 96 Wh | |
|---|---|---|---|---|---|---|
| Batterijduur | -9% | -26% | -22% | 98% | 84% | |
| Reader / Idle (h) | 5.2 | 4.6 -12% | 3.6 -31% | 16.6 219% | 12.8 146% | |
| H.264 (h) | 5 | 6.9 38% | 7.6 52% | |||
| WiFi v1.3 (h) | 5 | 3.3 -34% | 2.6 -48% | 3.9 -22% | 6.8 36% | 7.4 48% |
| Load (h) | 1 | 1.2 20% | 1 0% | 2 100% | 1.9 90% |
Pro
Contra
Dit is de verkorte versie van het originele artikel. Het volledige, Engelse testrapport vind je hier.
De GS40 is een geslaagd compromis tussen performance en compacte dimensies. De weinige zwaktes zijn vooral het resultaat van het 'Mini-Max'-concept, maar zeker geen deal-breakers. De gaming-prestaties staan buiten kijf - de GS40 kan zelfs erg veeleisende games aan. Het scherm is indrukwekkend, het stroomverbruik redelijk en de batterijduur zelfs best goed.
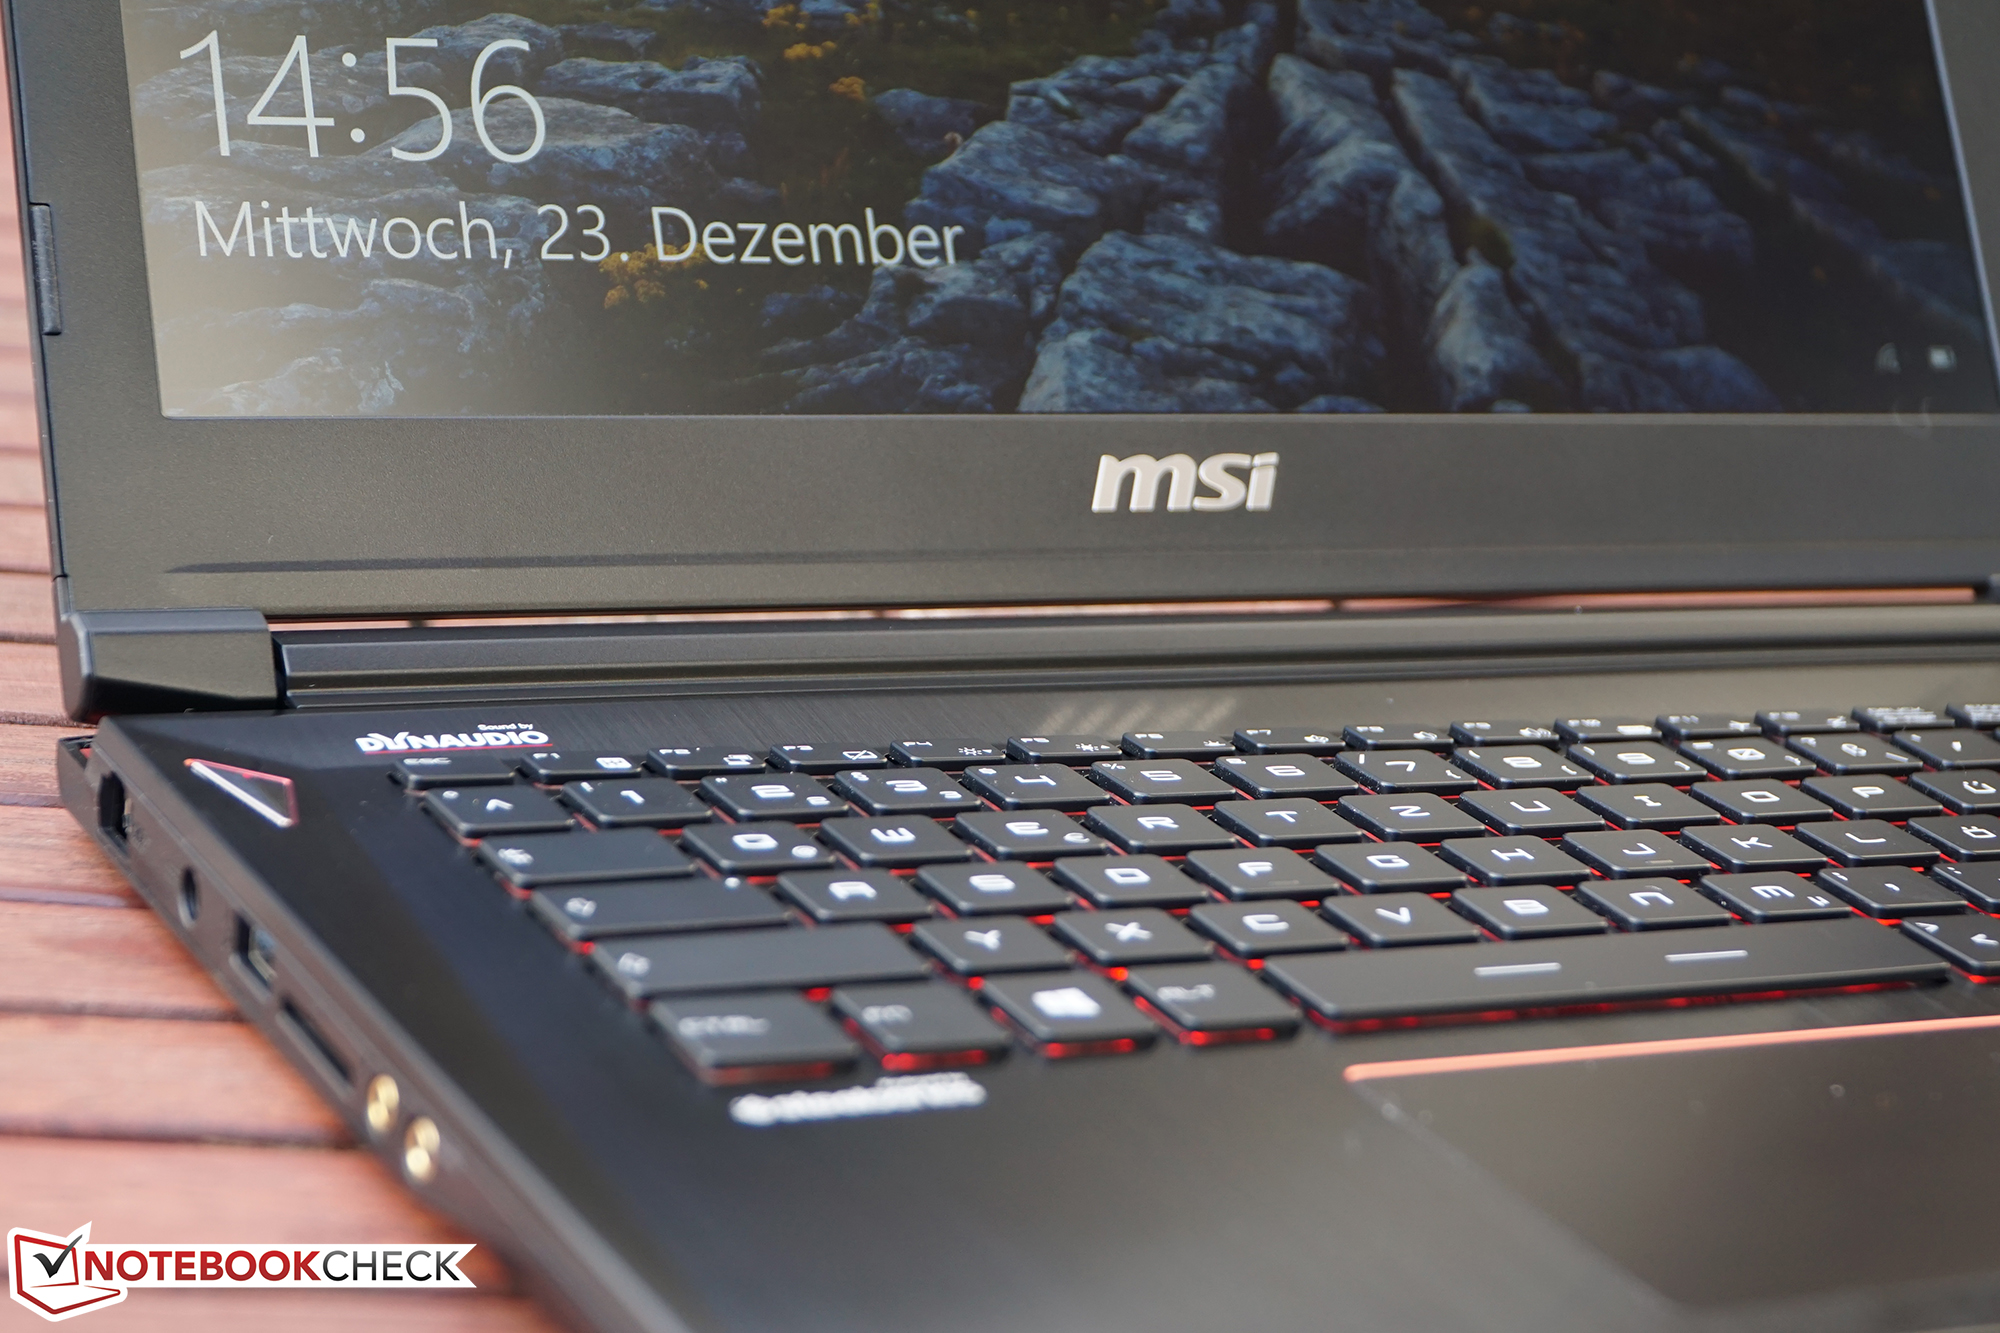
Het kleine gewicht heeft een invloed op de stabiliteit van de behuizing, die meer meegeeft onder druk (inclusief bij het aanslaan van toetsen). De ventilatoren hebben het ook moeilijk om de overtollige hitte af te voeren - misschien zou het geen kwaad kunnen om aan een stabiele snelheid te draaien in plaats van voortdurend te pulseren tussen twee snelheden? Dit zou de geluidsontwikkeling zeker geholpen hebben.
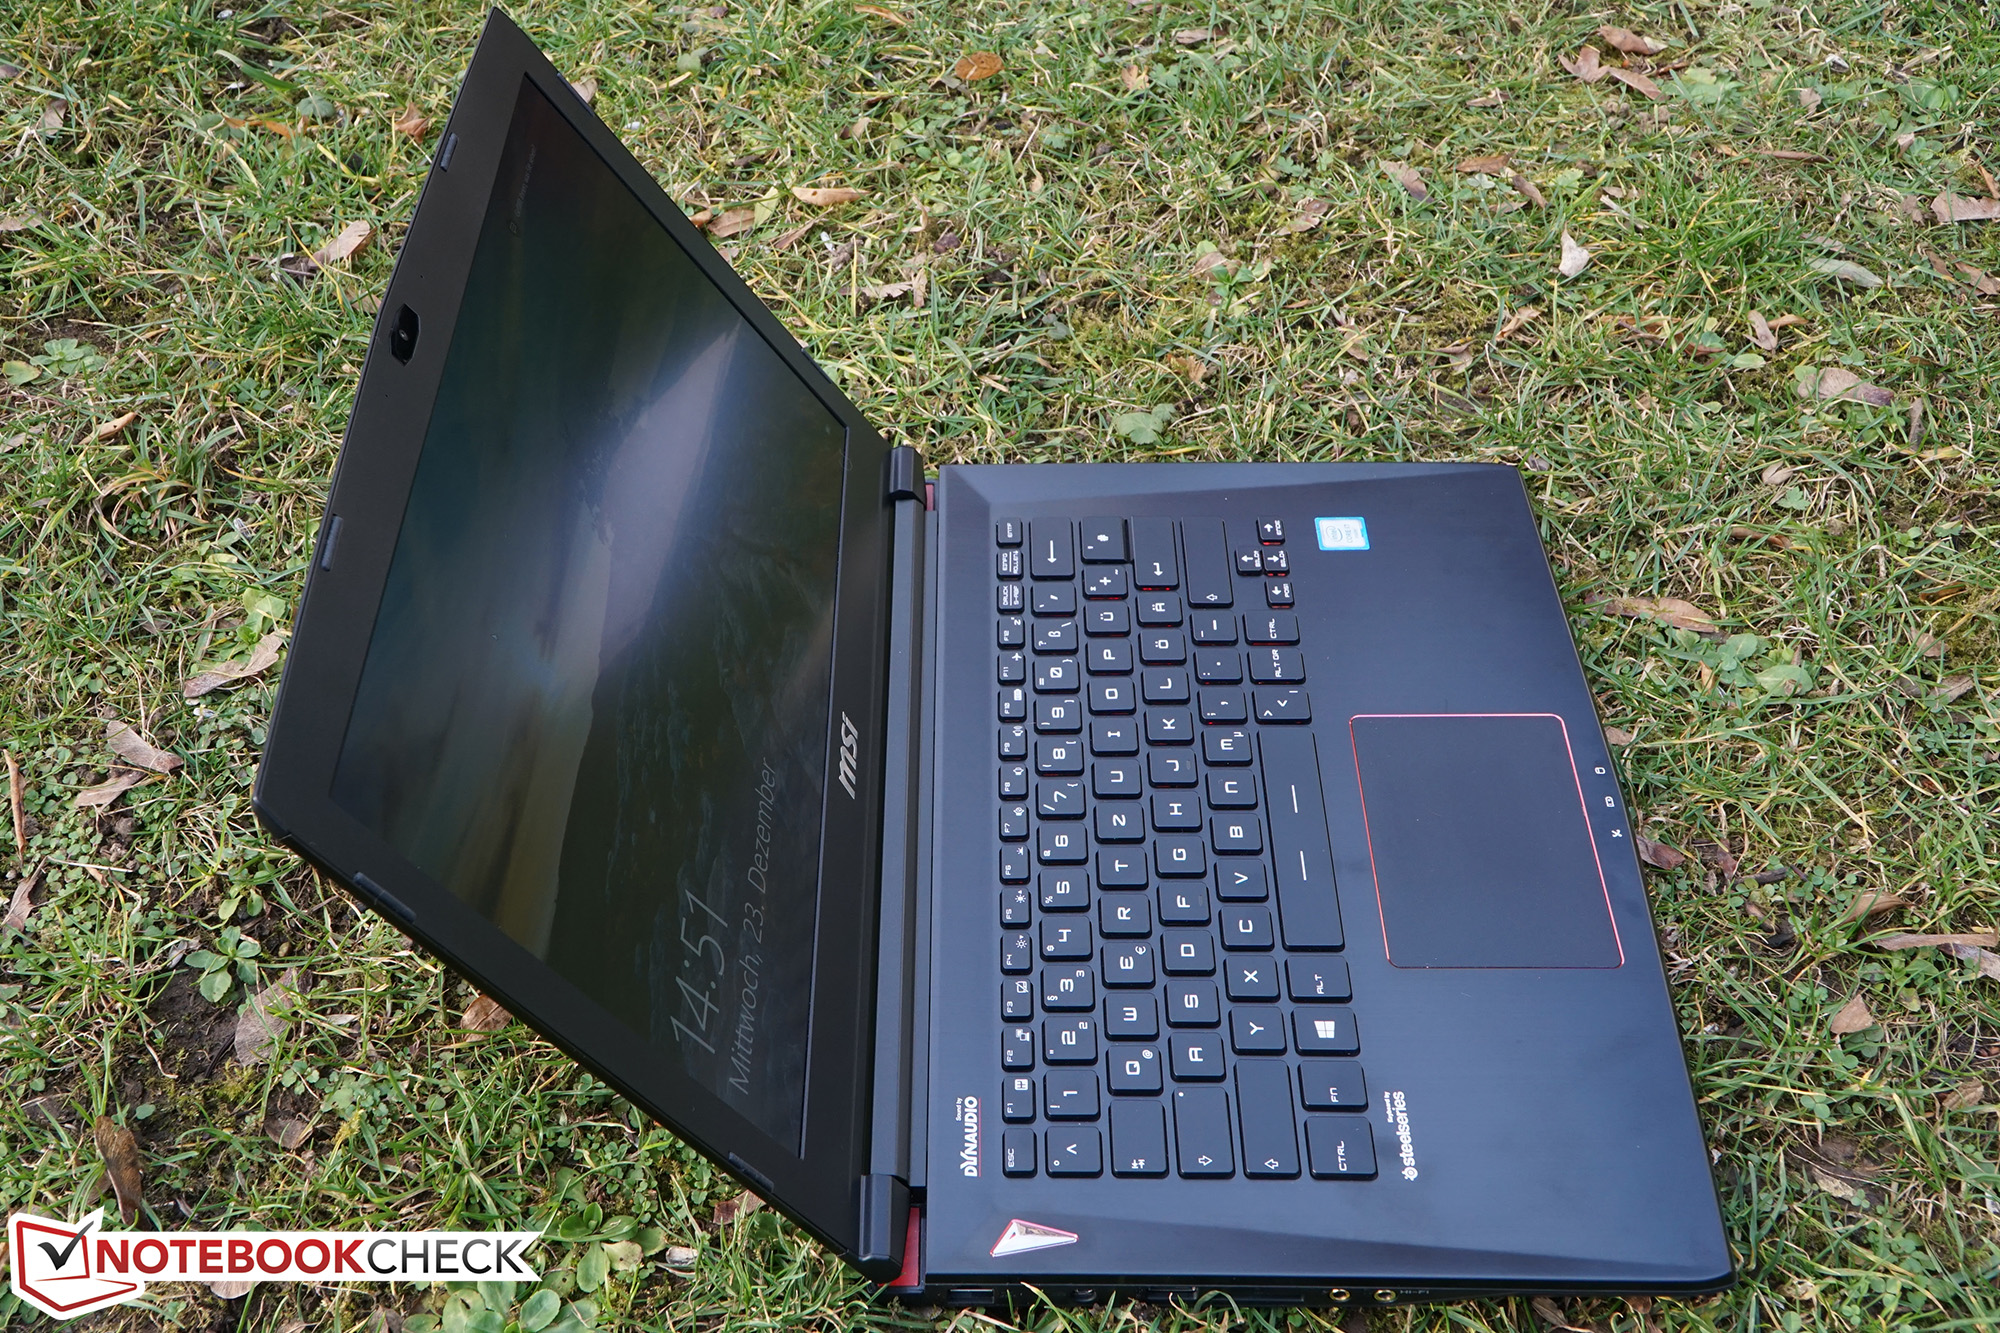
Deze minpunten kunnen onze positieve indruk van de GS40 echter nauwelijks aantasten. Er zijn niet veel 14-inch-alternatieven, tenminste als je moderne features zoals een Skylake-CPU, DDR4-RAM en USB 3.1 wenst. Dit zou wel eens snel kunnen veranderen (ons testrapport van de Schenker XMG P406 komt er binnenkort aan), maar voorlopig kan je alleen voor een kleiner, minder krachtig toestel of een zwaardere 15- of zelfs 17-inch gaming-notebook kiezen.
Met een prijskaartje van ongeveer 1700 euro (~$1851) is de GS40 zeker geen koopje, maar de prijs is vergelijkbaar met die van de concurrentie.
MSI GS40-6QE16H11
- 08-03-2016 v5 (old)
Oliver Moebel
Price comparison
