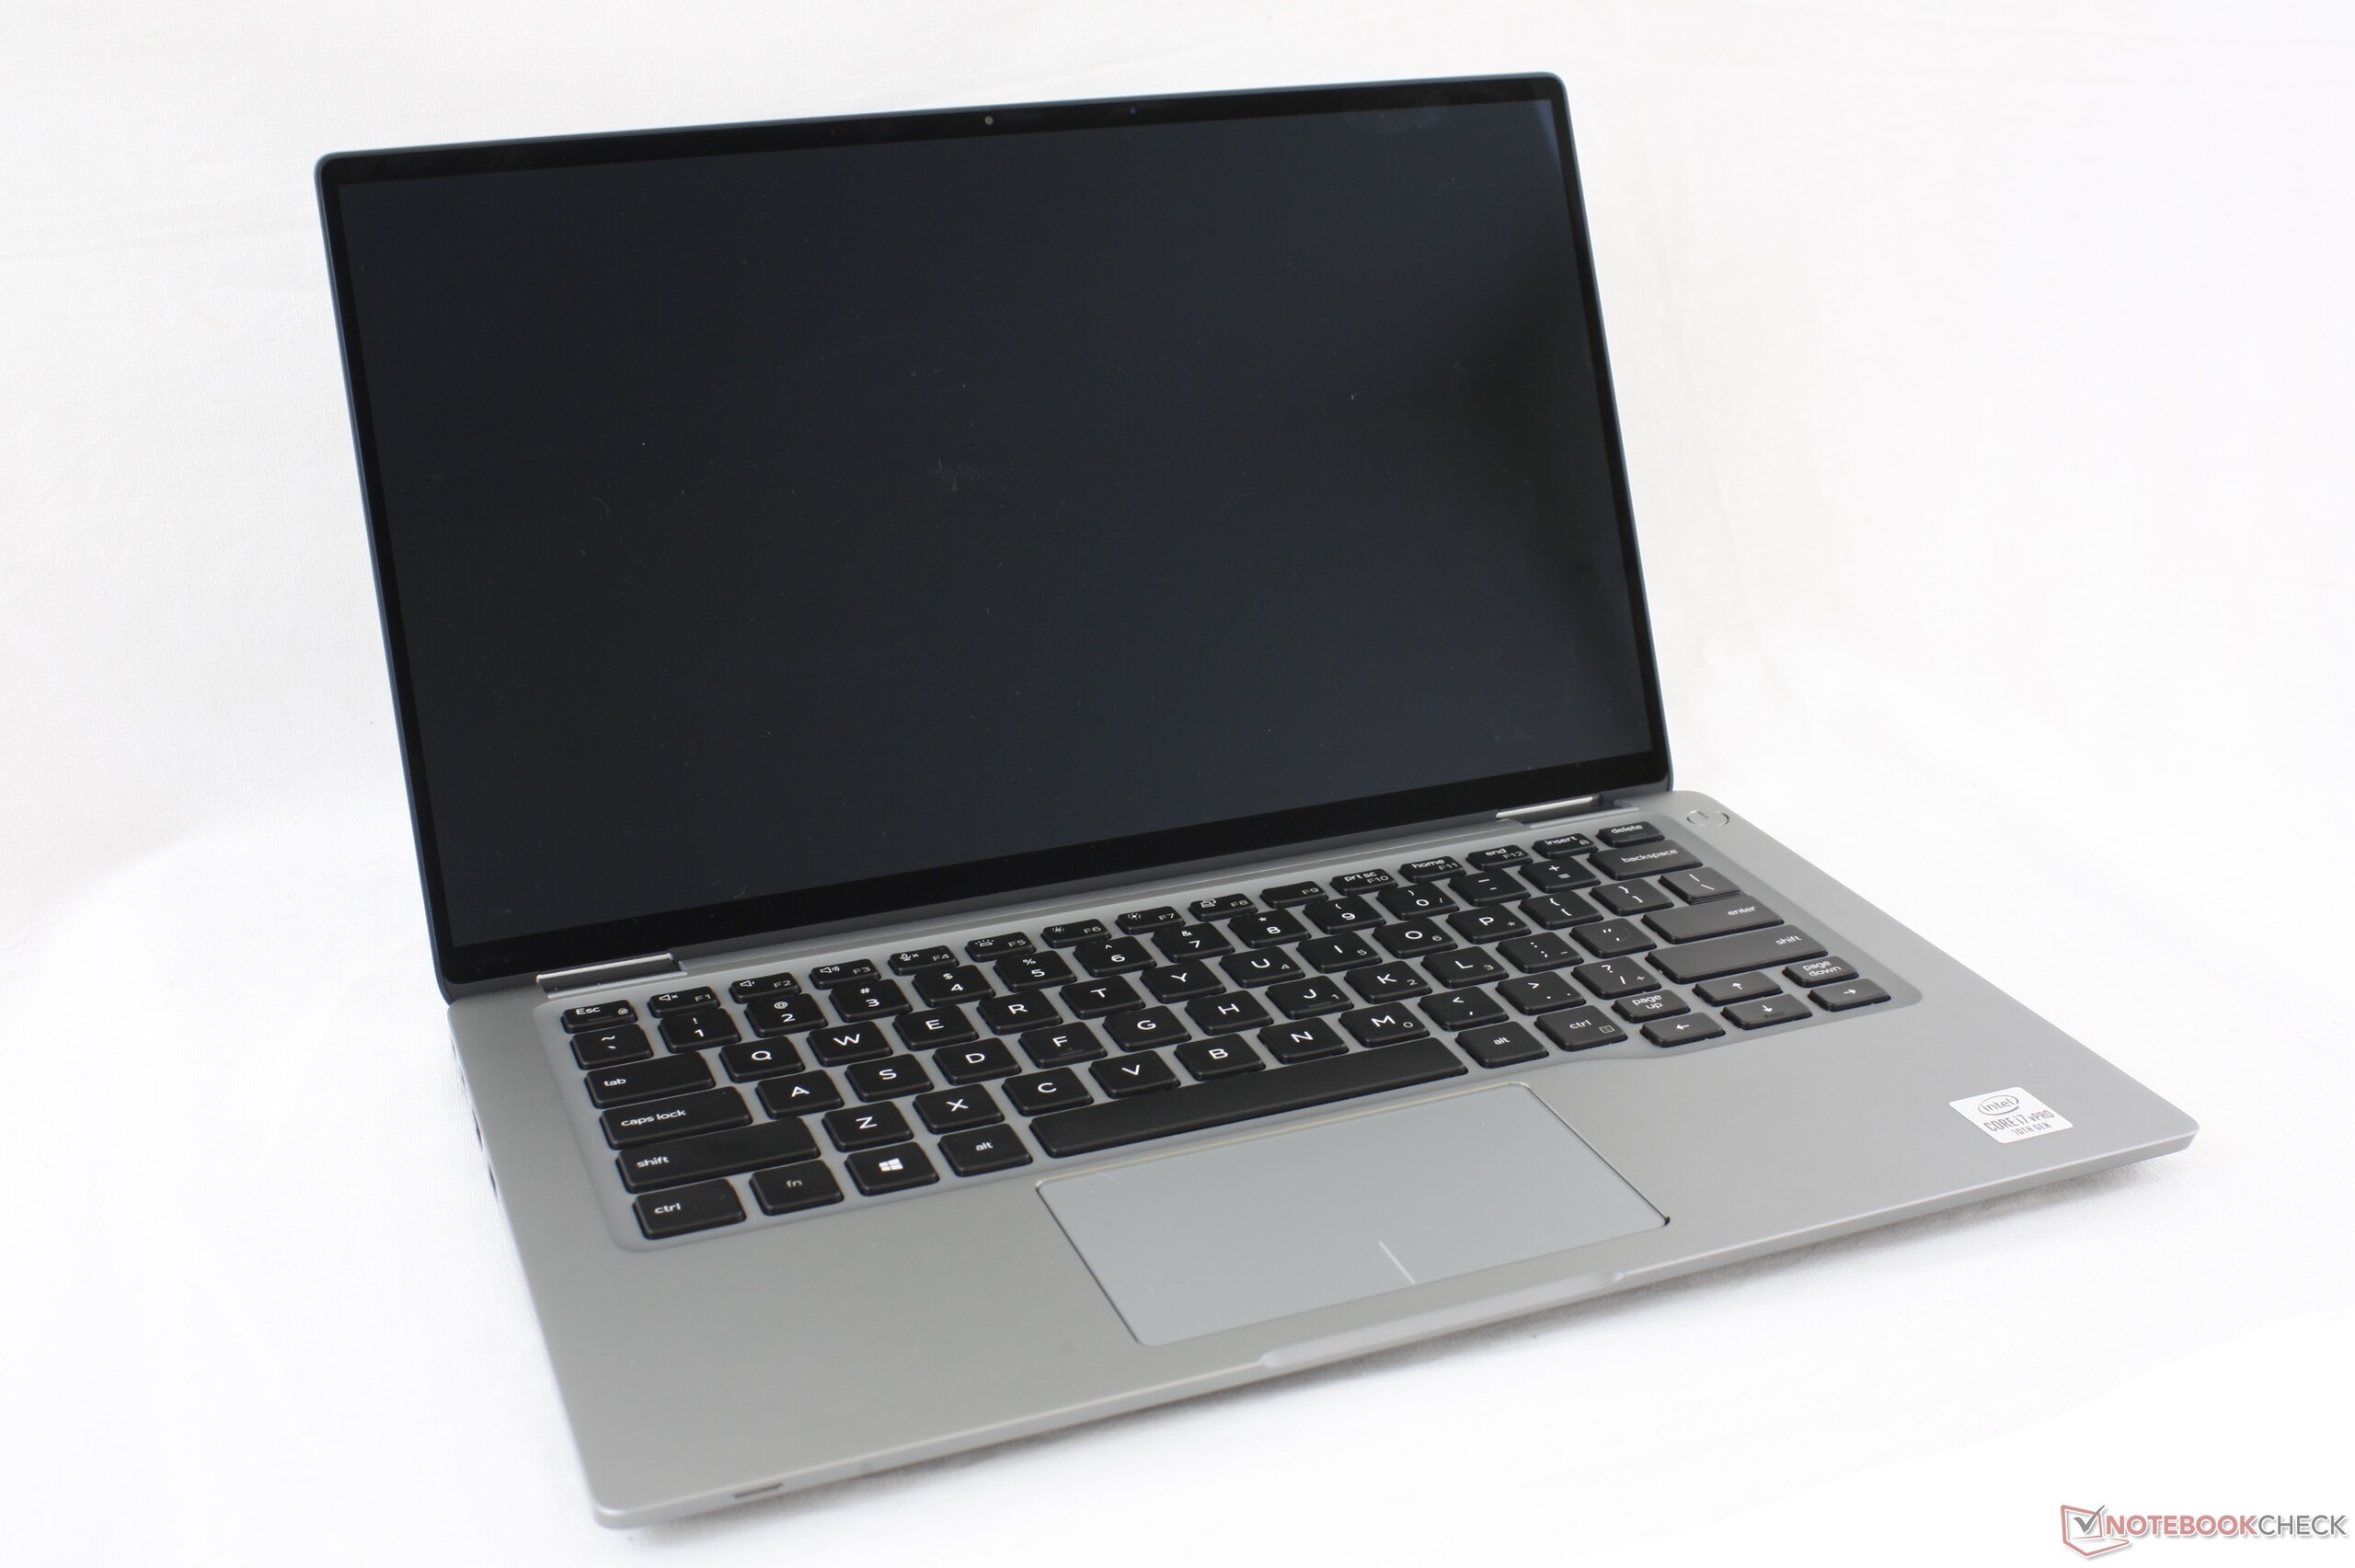
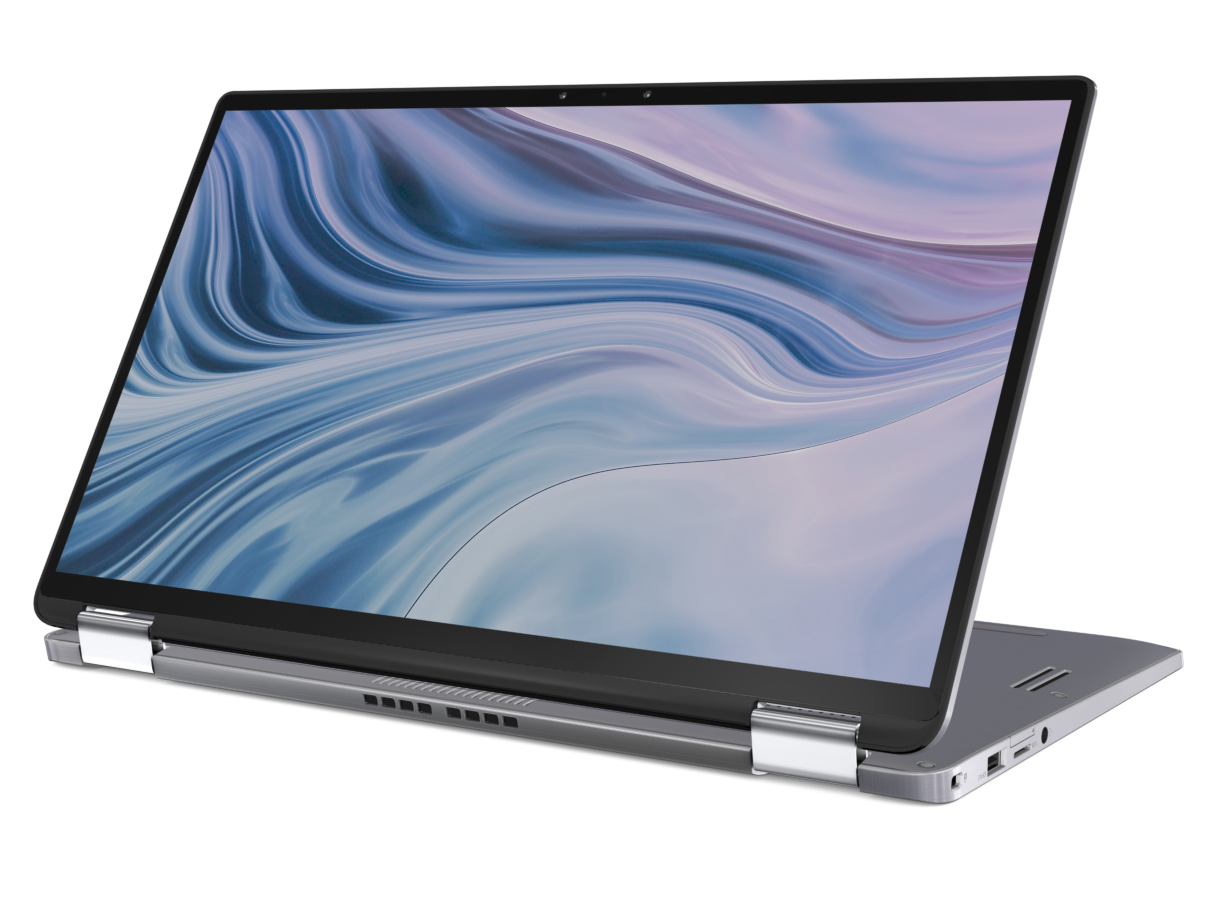
Kort testrapport Dell Latitude 14 9410 2-in-1 Convertible: Eigenlijk een Latitude 7400
Evaluatie | Datum | Model | Gewicht | Hoogte | Formaat | Resolutie | Beste prijs |
|---|---|---|---|---|---|---|---|
| 88.7 % v7 (old) | 09-2020 | Dell Latitude 14 9410 2-in-1 P110G i7-10610U, UHD Graphics 620 | 1.5 kg | 14.89 mm | 14.00" | 1920x1080 | |
| 88.2 % v7 (old) | 10-2019 | Lenovo Yoga C940-14IIL i7-1065G7, Iris Plus Graphics G7 (Ice Lake 64 EU) | 1.4 kg | 14.95 mm | 14.00" | 1920x1080 | |
| 81.2 % v7 (old) | 04-2020 | LG Gram 14T90N i7-10510U, UHD Graphics 620 | 1.2 kg | 18 mm | 14.00" | 1920x1080 | |
| 90.5 % v7 (old) | 02-2019 | HP Elitebook x360 1040 G5 i7-8650U, UHD Graphics 620 | 1.4 kg | 16.9 mm | 14.00" | 1920x1080 | |
| 87.8 % v7 (old) | 06-2019 | Dell Latitude 7400 2-in-1 i7-8665U, UHD Graphics 620 | 1.5 kg | 15 mm | 14.00" | 1920x1080 | |
| 85 % v7 (old) | 05-2020 | Asus ZenBook Flip 14 UX463FA-AI039T i5-10210U, UHD Graphics 620 | 1.4 kg | 18 mm | 14.00" | 1920x1080 |
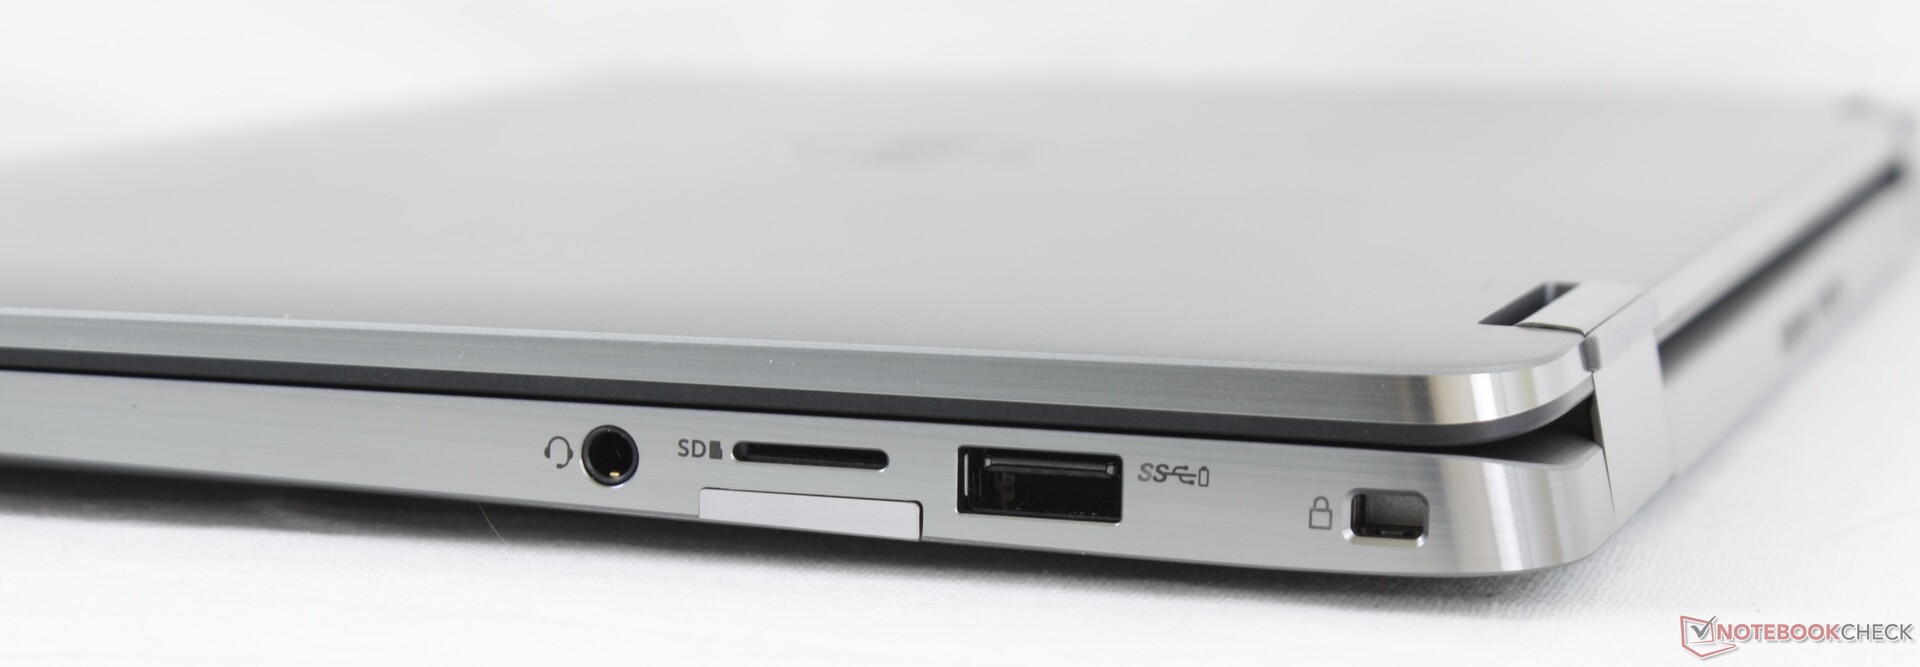
| SD Card Reader | |
| average JPG Copy Test (av. of 3 runs) | |
| Dell Latitude 14 9410 2-in-1 P110G (Toshiba Exceria Pro M501 64 GB UHS-II) | |
| Dell Latitude 7400 2-in-1 (Toshiba Exceria Pro M501 UHS-II) | |
| LG Gram 14T90N (Toshiba Exceria Pro M501 64 GB UHS-II) | |
| Asus ZenBook Flip 14 UX463FA-AI039T (Toshiba Exceria Pro M501 microSDXC 64GB) | |
| maximum AS SSD Seq Read Test (1GB) | |
| Dell Latitude 7400 2-in-1 (Toshiba Exceria Pro M501 UHS-II) | |
| Dell Latitude 14 9410 2-in-1 P110G (Toshiba Exceria Pro M501 64 GB UHS-II) | |
| LG Gram 14T90N (Toshiba Exceria Pro M501 64 GB UHS-II) | |
| Asus ZenBook Flip 14 UX463FA-AI039T (Toshiba Exceria Pro M501 microSDXC 64GB) | |


| |||||||||||||||||||||||||
Helderheidsverdeling: 92 %
Helderheid in Batterij-modus: 293.4 cd/m²
Contrast: 1544:1 (Zwart: 0.19 cd/m²)
ΔE ColorChecker Calman: 1.29 | ∀{0.5-29.43 Ø4.72}
calibrated: 0.88
ΔE Greyscale Calman: 1.7 | ∀{0.09-98 Ø4.97}
99.1% sRGB (Argyll 1.6.3 3D)
63.8% AdobeRGB 1998 (Argyll 1.6.3 3D)
69.4% AdobeRGB 1998 (Argyll 3D)
99.2% sRGB (Argyll 3D)
68.1% Display P3 (Argyll 3D)
Gamma: 2.18
CCT: 6394 K
| Dell Latitude 14 9410 2-in-1 P110G Sharp LQ140M1, IPS, 14", 1920x1080 | Lenovo Yoga C940-14IIL LP140WF9-SPE2, IPS LED, 14", 1920x1080 | LG Gram 14T90N LG Philips LP140WFA-SPY1, IPS, 14", 1920x1080 | HP Elitebook x360 1040 G5 AU Optronics AUO533D, IPS, 14", 1920x1080 | Dell Latitude 7400 2-in-1 SHP14A2, IPS, 14", 1920x1080 | Asus ZenBook Flip 14 UX463FA-AI039T AU AUO323D, IPS, 14", 1920x1080 | |
|---|---|---|---|---|---|---|
| Display | -2% | -4% | -6% | 1% | -13% | |
| Display P3 Coverage (%) | 68.1 | 66 -3% | 65 -5% | 64.3 -6% | 68.6 1% | 60.1 -12% |
| sRGB Coverage (%) | 99.2 | 97.9 -1% | 95.7 -4% | 94.1 -5% | 99.6 0% | 85.5 -14% |
| AdobeRGB 1998 Coverage (%) | 69.4 | 67.3 -3% | 66.7 -4% | 65.5 -6% | 70 1% | 61.1 -12% |
| Response Times | 17% | 10% | -7% | 1% | 32% | |
| Response Time Grey 50% / Grey 80% * (ms) | 58.4 ? | 49.6 ? 15% | 54 ? 8% | 70.8 ? -21% | 56 ? 4% | 36 ? 38% |
| Response Time Black / White * (ms) | 37.2 ? | 30 ? 19% | 32.8 ? 12% | 34.4 ? 8% | 38 ? -2% | 28 ? 25% |
| PWM Frequency (Hz) | 1667 ? | 735 ? | 1667 ? | |||
| Screen | -27% | -45% | -32% | -26% | -69% | |
| Brightness middle (cd/m²) | 293.4 | 384 31% | 322.2 10% | 416.3 42% | 277.2 -6% | 280 -5% |
| Brightness (cd/m²) | 290 | 363 25% | 301 4% | 400 38% | 263 -9% | 286 -1% |
| Brightness Distribution (%) | 92 | 90 -2% | 86 -7% | 89 -3% | 83 -10% | 78 -15% |
| Black Level * (cd/m²) | 0.19 | 0.17 11% | 0.25 -32% | 0.29 -53% | 0.2 -5% | 0.208 -9% |
| Contrast (:1) | 1544 | 2259 46% | 1289 -17% | 1436 -7% | 1386 -10% | 1346 -13% |
| Colorchecker dE 2000 * | 1.29 | 3.5 -171% | 3.62 -181% | 2.69 -109% | 2.1 -63% | 3.97 -208% |
| Colorchecker dE 2000 max. * | 3.61 | 5.5 -52% | 6.9 -91% | 4.95 -37% | 5.91 -64% | 8.29 -130% |
| Colorchecker dE 2000 calibrated * | 0.88 | 1 -14% | 1.22 -39% | 2.13 -142% | 1.03 -17% | 3.42 -289% |
| Greyscale dE 2000 * | 1.7 | 4.6 -171% | 3.9 -129% | 2.9 -71% | 3.4 -100% | 2.83 -66% |
| Gamma | 2.18 101% | 2.32 95% | 2.43 91% | 2.4 92% | 2.241 98% | 2.34 94% |
| CCT | 6394 102% | 6884 94% | 6344 102% | 6623 98% | 6030 108% | 6556 99% |
| Color Space (Percent of AdobeRGB 1998) (%) | 63.8 | 62 -3% | 61.3 -4% | 60.1 -6% | 64 0% | 56 -12% |
| Color Space (Percent of sRGB) (%) | 99.1 | 97.7 -1% | 95.6 -4% | 94.5 -5% | 100 1% | 85 -14% |
| Totaal Gemiddelde (Programma / Instellingen) | -4% /
-17% | -13% /
-30% | -15% /
-24% | -8% /
-17% | -17% /
-46% |
* ... kleiner is beter
Responstijd Scherm
| ↔ Responstijd Zwart naar Wit | ||
|---|---|---|
| 37.2 ms ... stijging ↗ en daling ↘ gecombineerd | ↗ 18.4 ms stijging | 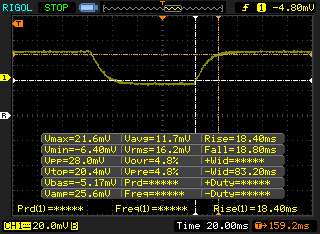 |
| ↘ 18.8 ms daling | ||
| Het scherm vertoonde trage responstijden in onze tests en is misschien te traag voor games. Ter vergelijking: alle testtoestellen variëren van 0.1 (minimum) tot 240 (maximum) ms. » 95 % van alle toestellen zijn beter. Dit betekent dat de gemeten responstijd slechter is dan het gemiddelde (19.9 ms) van alle geteste toestellen. | ||
| ↔ Responstijd 50% Grijs naar 80% Grijs | ||
| 58.4 ms ... stijging ↗ en daling ↘ gecombineerd | ↗ 26 ms stijging | 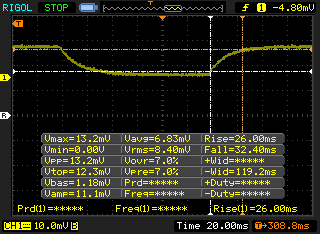 |
| ↘ 32.4 ms daling | ||
| Het scherm vertoonde trage responstijden in onze tests en is misschien te traag voor games. Ter vergelijking: alle testtoestellen variëren van 0.165 (minimum) tot 636 (maximum) ms. » 95 % van alle toestellen zijn beter. Dit betekent dat de gemeten responstijd slechter is dan het gemiddelde (31.1 ms) van alle geteste toestellen. | ||
Screen Flickering / PWM (Pulse-Width Modulation)
| Screen flickering / PWM waargenomen | 1667 Hz | ≤ 44 % helderheid instelling | 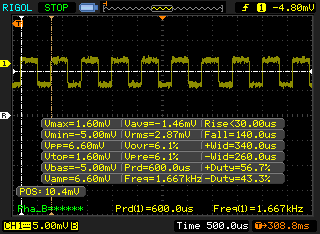 |
De achtergrondverlichting van het scherm flikkert op 1667 Hz (in het slechtste geval, bijvoorbeeld bij gebruik van PWM) aan een helderheid van 44 % en lager. Boven deze helderheid zou er geen flickering / PWM mogen optreden. De frequentie van 1667 Hz is redelijk hoog en de meeste mensen die gevoelig zijn aan flickering zouden dit dus niet mogen waarnemen of geïrriteerde ogen krijgen. Ter vergelijking: 52 % van alle geteste toestellen maakten geen gebruik van PWM om de schermhelderheid te verlagen. Als het wel werd gebruikt, werd een gemiddelde van 7784 (minimum: 5 - maximum: 343500) Hz waargenomen. | |||
Cinebench R15: CPU Multi 64Bit | CPU Single 64Bit
Blender: v2.79 BMW27 CPU
7-Zip 18.03: 7z b 4 -mmt1 | 7z b 4
Geekbench 5.5: Single-Core | Multi-Core
HWBOT x265 Benchmark v2.2: 4k Preset
LibreOffice : 20 Documents To PDF
R Benchmark 2.5: Overall mean
| Geekbench 5.5 / Single-Core | |
| LG Gram 14T90N | |
| Gemiddeld Intel Core i7-10610U (1155 - 1261, n=6) | |
| Acer TravelMate P6 P614-51T-G2-72ZU | |
| Dell Latitude 14 9410 2-in-1 P110G | |
| Asus VivoBook Flip 14 TM420IA | |
| Lenovo ThinkPad E14 Gen2-20T7S00W00 | |
| Lenovo ThinkPad T14s-20T00044GE | |
| Geekbench 5.5 / Multi-Core | |
| Asus VivoBook Flip 14 TM420IA | |
| Lenovo ThinkPad E14 Gen2-20T7S00W00 | |
| Acer TravelMate P6 P614-51T-G2-72ZU | |
| Gemiddeld Intel Core i7-10610U (3731 - 4622, n=6) | |
| Dell Latitude 14 9410 2-in-1 P110G | |
| Lenovo ThinkPad T14s-20T00044GE | |
| LG Gram 14T90N | |
| LibreOffice / 20 Documents To PDF | |
| Dell Latitude 14 9410 2-in-1 P110G | |
| Gemiddeld Intel Core i7-10610U (56.1 - 106, n=6) | |
| Lenovo ThinkPad E14 Gen2-20T7S00W00 | |
| LG Gram 14T90N | |
| Asus VivoBook Flip 14 TM420IA | |
| Acer TravelMate P6 P614-51T-G2-72ZU | |
| Lenovo ThinkPad T14s-20T00044GE | |
| R Benchmark 2.5 / Overall mean | |
| Dell Latitude 14 9410 2-in-1 P110G | |
| Lenovo ThinkPad T14s-20T00044GE | |
| Gemiddeld Intel Core i7-10610U (0.637 - 0.855, n=6) | |
| LG Gram 14T90N | |
| Acer TravelMate P6 P614-51T-G2-72ZU | |
| Lenovo ThinkPad E14 Gen2-20T7S00W00 | |
| Asus VivoBook Flip 14 TM420IA | |
Cinebench R15: CPU Multi 64Bit | CPU Single 64Bit
Blender: v2.79 BMW27 CPU
7-Zip 18.03: 7z b 4 -mmt1 | 7z b 4
Geekbench 5.5: Single-Core | Multi-Core
HWBOT x265 Benchmark v2.2: 4k Preset
LibreOffice : 20 Documents To PDF
R Benchmark 2.5: Overall mean
* ... kleiner is beter
| PCMark 8 | |
| Home Score Accelerated v2 | |
| Lenovo Yoga C940-14IIL | |
| Dell Latitude 14 9410 2-in-1 P110G | |
| LG Gram 14T90N | |
| Dell Latitude 7400 2-in-1 | |
| HP Elitebook x360 1040 G5 | |
| Work Score Accelerated v2 | |
| Lenovo Yoga C940-14IIL | |
| LG Gram 14T90N | |
| Dell Latitude 14 9410 2-in-1 P110G | |
| Dell Latitude 7400 2-in-1 | |
| HP Elitebook x360 1040 G5 | |
| PCMark 8 Home Score Accelerated v2 | 3725 punten | |
| PCMark 8 Work Score Accelerated v2 | 5071 punten | |
| PCMark 10 Score | 4410 punten | |
Help | ||
| DPC Latencies / LatencyMon - interrupt to process latency (max), Web, Youtube, Prime95 | |
| Acer TravelMate P6 P614-51T-G2-72ZU | |
| Lenovo ThinkPad T14s-20T00044GE | |
| LG Gram 14T90N | |
| Dell Latitude 14 9410 2-in-1 P110G | |
| Lenovo ThinkPad E14 Gen2-20T7S00W00 | |
| Asus VivoBook Flip 14 TM420IA | |
| Asus ZenBook Flip 14 UX463FA-AI039T | |
* ... kleiner is beter
| Dell Latitude 14 9410 2-in-1 P110G Micron 2200S 512GB | Lenovo Yoga C940-14IIL Samsung SSD PM981 MZVLB512HAJQ | LG Gram 14T90N Samsung SSD PM981a MZVLB512HBJQ | HP Elitebook x360 1040 G5 Samsung SSD PM981 MZVLB512HAJQ | Dell Latitude 7400 2-in-1 Toshiba XG6 KXG60ZNV512G | Asus ZenBook Flip 14 UX463FA-AI039T Kingston RBUSNS8154P3512GJ1 | |
|---|---|---|---|---|---|---|
| AS SSD | 48% | 60% | 38% | -24% | -16% | |
| Seq Read (MB/s) | 1117 | 2525 126% | 1829 64% | 1816 63% | 2289 105% | 1336 20% |
| Seq Write (MB/s) | 969 | 1253 29% | 2048 111% | 1270 31% | 1163 20% | 653 -33% |
| 4K Read (MB/s) | 41.93 | 59.1 41% | 54.2 29% | 46.25 10% | 22.29 -47% | 26.65 -36% |
| 4K Write (MB/s) | 76.4 | 134.1 76% | 120.5 58% | 104.1 36% | 28.92 -62% | 52.7 -31% |
| 4K-64 Read (MB/s) | 827 | 1010 22% | 1512 83% | 1342 62% | 415.6 -50% | 644 -22% |
| 4K-64 Write (MB/s) | 792 | 1461 84% | 1573 99% | 1209 53% | 199.5 -75% | 482.9 -39% |
| Access Time Read * (ms) | 0.055 | 0.052 5% | 0.046 16% | 0.043 22% | 0.122 -122% | 0.074 -35% |
| Access Time Write * (ms) | 0.366 | 0.029 92% | 0.091 75% | 0.035 90% | 0.143 61% | 0.072 80% |
| Score Read (Points) | 981 | 1322 35% | 1749 78% | 1569 60% | 667 -32% | 804 -18% |
| Score Write (Points) | 966 | 1721 78% | 1899 97% | 1440 49% | 345 -64% | 601 -38% |
| Score Total (Points) | 2450 | 3670 50% | 4560 86% | 3790 55% | 1300 -47% | 1786 -27% |
| Copy ISO MB/s (MB/s) | 1290 | 2016 56% | 1891 47% | 2034 58% | 1767 37% | |
| Copy Program MB/s (MB/s) | 661 | 542 -18% | 569 -14% | 450.3 -32% | 379.4 -43% | |
| Copy Game MB/s (MB/s) | 1271 | 1278 1% | 1425 12% | 1024 -19% | 1055 -17% | |
| CrystalDiskMark 5.2 / 6 | 30% | 42% | 20% | -29% | -32% | |
| Write 4K (MB/s) | 81.2 | 128.4 58% | 181.4 123% | 122.7 51% | 35.06 -57% | 54.6 -33% |
| Read 4K (MB/s) | 45.41 | 46.37 2% | 52.5 16% | 46.57 3% | 23.64 -48% | 28.19 -38% |
| Write Seq (MB/s) | 1190 | 1863 57% | 1592 34% | 1725 45% | 1537 29% | 840 -29% |
| Read Seq (MB/s) | 1766 | 2340 33% | 1617 -8% | 2392 35% | 1782 1% | 905 -49% |
| Write 4K Q32T1 (MB/s) | 436 | 451.1 3% | 556 28% | 470.6 8% | 100.3 -77% | 409.5 -6% |
| Read 4K Q32T1 (MB/s) | 374.4 | 415.3 11% | 539 44% | 313.2 -16% | 62.7 -83% | 292.4 -22% |
| Write Seq Q32T1 (MB/s) | 1582 | 2985 89% | 2955 87% | 1869 18% | 2698 71% | 1038 -34% |
| Read Seq Q32T1 (MB/s) | 3017 | 2565 -15% | 3270 8% | 3380 12% | 1073 -64% | 1607 -47% |
| Write 4K Q8T8 (MB/s) | 451.4 | |||||
| Read 4K Q8T8 (MB/s) | 1004 | |||||
| Totaal Gemiddelde (Programma / Instellingen) | 39% /
42% | 51% /
53% | 29% /
32% | -27% /
-26% | -24% /
-23% |
* ... kleiner is beter

Disk Throttling: DiskSpd Read Loop, Queue Depth 8
| 3DMark 11 Performance | 2206 punten | |
| 3DMark Cloud Gate Standard Score | 9933 punten | |
| 3DMark Fire Strike Score | 1218 punten | |
| 3DMark Time Spy Score | 486 punten | |
Help | ||
| lage | gem. | hoge | ultra | |
|---|---|---|---|---|
| Dota 2 Reborn (2015) | 59.1 | 48.4 | 20.5 | 18.7 |
| X-Plane 11.11 (2018) | 12 | 10.9 | 10.5 |
| Dell Latitude 14 9410 2-in-1 P110G UHD Graphics 620, i7-10610U, Micron 2200S 512GB | Lenovo Yoga C940-14IIL Iris Plus Graphics G7 (Ice Lake 64 EU), i7-1065G7, Samsung SSD PM981 MZVLB512HAJQ | LG Gram 14T90N UHD Graphics 620, i7-10510U, Samsung SSD PM981a MZVLB512HBJQ | HP Elitebook x360 1040 G5 UHD Graphics 620, i7-8650U, Samsung SSD PM981 MZVLB512HAJQ | Dell Latitude 7400 2-in-1 UHD Graphics 620, i7-8665U, Toshiba XG6 KXG60ZNV512G | Asus ZenBook Flip 14 UX463FA-AI039T UHD Graphics 620, i5-10210U, Kingston RBUSNS8154P3512GJ1 | |
|---|---|---|---|---|---|---|
| Noise | -1% | -5% | 1% | 6% | -1% | |
| uit / omgeving * (dB) | 26.1 | 29.3 -12% | 29 -11% | 28.3 -8% | 28.2 -8% | 30.1 -15% |
| Idle Minimum * (dB) | 26.1 | 29.3 -12% | 30 -15% | 28.3 -8% | 28.2 -8% | 30.1 -15% |
| Idle Average * (dB) | 26.1 | 29.3 -12% | 30 -15% | 28.3 -8% | 28.2 -8% | 30.1 -15% |
| Idle Maximum * (dB) | 26.1 | 29.3 -12% | 30 -15% | 28.3 -8% | 28.3 -8% | 30.1 -15% |
| Load Average * (dB) | 39.9 | 33.3 17% | 35.2 12% | 32.6 18% | 28.2 29% | 30.1 25% |
| Load Maximum * (dB) | 44.7 | 33.3 26% | 37 17% | 36.6 18% | 28.8 36% | 32.02 28% |
* ... kleiner is beter
Geluidsniveau
| Onbelast |
| 26.1 / 26.1 / 26.1 dB (A) |
| Belasting |
| 39.9 / 44.7 dB (A) |
 | ||
30 dB stil 40 dB(A) hoorbaar 50 dB(A) luid |
||
min: | ||
(-) De maximumtemperatuur aan de bovenzijde bedraagt 48.4 °C / 119 F, vergeleken met het gemiddelde van 35.4 °C / 96 F, variërend van 19.6 tot 60 °C voor de klasse Convertible.
(-) De bodem warmt op tot een maximum van 55.2 °C / 131 F, vergeleken met een gemiddelde van 36.9 °C / 98 F
(+) Bij onbelast gebruik bedraagt de gemiddelde temperatuur voor de bovenzijde 23.8 °C / 75 F, vergeleken met het apparaatgemiddelde van 30.3 °C / 87 F.
(+) De handpalmsteunen en het touchpad bereiken maximaal de huidtemperatuur (32.2 °C / 90 F) en zijn dus niet heet.
(-) De gemiddelde temperatuur van de handpalmsteun van soortgelijke toestellen bedroeg 28 °C / 82.4 F (-4.2 °C / -7.6 F).
Dell Latitude 14 9410 2-in-1 P110G audioanalyse
(±) | luidspreker luidheid is gemiddeld maar goed (80.8 dB)
Bas 100 - 315 Hz
(±) | verminderde zeebaars - gemiddeld 14.6% lager dan de mediaan
(±) | lineariteit van de lage tonen is gemiddeld (12.9% delta ten opzichte van de vorige frequentie)
Midden 400 - 2000 Hz
(+) | evenwichtige middens - slechts 4.1% verwijderd van de mediaan
(+) | de middentonen zijn lineair (4% delta ten opzichte van de vorige frequentie)
Hoog 2 - 16 kHz
(±) | higher highs - on average 5.3% higher than median
(+) | de hoge tonen zijn lineair (6.6% delta naar de vorige frequentie)
Algemeen 100 - 16.000 Hz
(±) | lineariteit van het totale geluid is gemiddeld (16.3% verschil met de mediaan)
Vergeleken met dezelfde klasse
» 30% van alle geteste apparaten in deze klasse waren beter, 3% vergelijkbaar, 67% slechter
» De beste had een delta van 6%, het gemiddelde was 20%, de slechtste was 57%
Vergeleken met alle geteste toestellen
» 27% van alle geteste apparaten waren beter, 6% gelijk, 68% slechter
» De beste had een delta van 4%, het gemiddelde was 24%, de slechtste was 134%
Apple MacBook 12 (Early 2016) 1.1 GHz audioanalyse
(+) | luidsprekers kunnen relatief luid spelen (83.6 dB)
Bas 100 - 315 Hz
(±) | verminderde zeebaars - gemiddeld 11.3% lager dan de mediaan
(±) | lineariteit van de lage tonen is gemiddeld (14.2% delta ten opzichte van de vorige frequentie)
Midden 400 - 2000 Hz
(+) | evenwichtige middens - slechts 2.4% verwijderd van de mediaan
(+) | de middentonen zijn lineair (5.5% delta ten opzichte van de vorige frequentie)
Hoog 2 - 16 kHz
(+) | evenwichtige hoogtepunten - slechts 2% verwijderd van de mediaan
(+) | de hoge tonen zijn lineair (4.5% delta naar de vorige frequentie)
Algemeen 100 - 16.000 Hz
(+) | het totale geluid is lineair (10.2% verschil met de mediaan)
Vergeleken met dezelfde klasse
» 7% van alle geteste apparaten in deze klasse waren beter, 2% vergelijkbaar, 91% slechter
» De beste had een delta van 5%, het gemiddelde was 18%, de slechtste was 53%
Vergeleken met alle geteste toestellen
» 5% van alle geteste apparaten waren beter, 1% gelijk, 94% slechter
» De beste had een delta van 4%, het gemiddelde was 24%, de slechtste was 134%
| Uit / Standby | |
| Inactief | |
| Belasting |
|
Key:
min: | |
| Dell Latitude 14 9410 2-in-1 P110G i7-10610U, UHD Graphics 620, Micron 2200S 512GB, IPS, 1920x1080, 14" | Lenovo Yoga C940-14IIL i7-1065G7, Iris Plus Graphics G7 (Ice Lake 64 EU), Samsung SSD PM981 MZVLB512HAJQ, IPS LED, 1920x1080, 14" | LG Gram 14T90N i7-10510U, UHD Graphics 620, Samsung SSD PM981a MZVLB512HBJQ, IPS, 1920x1080, 14" | HP Elitebook x360 1040 G5 i7-8650U, UHD Graphics 620, Samsung SSD PM981 MZVLB512HAJQ, IPS, 1920x1080, 14" | Dell Latitude 7400 2-in-1 i7-8665U, UHD Graphics 620, Toshiba XG6 KXG60ZNV512G, IPS, 1920x1080, 14" | Asus ZenBook Flip 14 UX463FA-AI039T i5-10210U, UHD Graphics 620, Kingston RBUSNS8154P3512GJ1, IPS, 1920x1080, 14" | |
|---|---|---|---|---|---|---|
| Power Consumption | -40% | -9% | -37% | -3% | -42% | |
| Idle Minimum * (Watt) | 2.6 | 3.2 -23% | 2.9 -12% | 2.7 -4% | 2.6 -0% | 3.6 -38% |
| Idle Average * (Watt) | 3.9 | 7 -79% | 5.8 -49% | 6.5 -67% | 4.3 -10% | 7.5 -92% |
| Idle Maximum * (Watt) | 4.6 | 8.9 -93% | 6.2 -35% | 11.5 -150% | 5.5 -20% | 9.4 -104% |
| Load Average * (Watt) | 38.9 | 47.6 -22% | 32.9 15% | 38.7 1% | 32 18% | 42 -8% |
| Load Maximum * (Watt) | 76.2 | 63.1 17% | 48.5 36% | 50.5 34% | 78.8 -3% | 51 33% |
* ... kleiner is beter
| Dell Latitude 14 9410 2-in-1 P110G i7-10610U, UHD Graphics 620, 78 Wh | Lenovo Yoga C940-14IIL i7-1065G7, Iris Plus Graphics G7 (Ice Lake 64 EU), 60 Wh | LG Gram 14T90N i7-10510U, UHD Graphics 620, 72 Wh | HP Elitebook x360 1040 G5 i7-8650U, UHD Graphics 620, 56 Wh | Dell Latitude 7400 2-in-1 i7-8665U, UHD Graphics 620, 78 Wh | Asus ZenBook Flip 14 UX463FA-AI039T i5-10210U, UHD Graphics 620, 50 Wh | |
|---|---|---|---|---|---|---|
| Batterijduur | -56% | -30% | -32% | -36% | -59% | |
| Reader / Idle (h) | 48.2 | 32.8 -32% | 27.9 -42% | |||
| WiFi v1.3 (h) | 19 | 10.6 -44% | 12.5 -34% | 10.4 -45% | 12.2 -36% | 7.7 -59% |
| Load (h) | 3.4 | 1.1 -68% | 2.6 -24% | 3.1 -9% |
Pro
Contra
Voor het volledige, Engelse testrapport, klik hier.
Het goede nieuws is dat de Latitude 9410 2-in-1 niet zo heel veel verschilt van de toch al uitstekende Latitude 7400 2-in-1. Dell heeft niet geknoeid met iets goeds en heeft in plaats daarvan enkele componenten zoals de CPU en WLAN geüpgraded om concurrerend te blijven met de HP EliteBook x360 en Lenovo Yoga convertible-serie.
Aan de andere kant is het slechte nieuws dat de Latitude 9410 2-in-1 niet zo heel veel verschilt van de toch al uitstekende Latitude 7400 2-in-1. Het is een gemengde boodschap, omdat gebruikers de Latitude 7400 2-in-1 van vorig jaar kunnen kopen voor in wezen dezelfde ervaring en prestaties als de duurdere 2020 Latitude 9410 2-in-1. Kleine nadelen, zoals het ontbreken van een goede webcam of helderdere beeldscherm-opties, zijn niet aangepakt en GPU-opties bestaan nog steeds niet, maar ze doen niets af aan een uitstekend chassisontwerp dat amper een jaar oud is.
Laat je niet misleiden door de gloednieuwe naam, want de Latitude 9410 2-in-1 is slechts een kleine opfrisbeurt van de toch al uitstekende Latitude 7400 2-in-1. Het is nog steeds een van de beste 14-inch zakelijke convertible die je op dit moment kunt krijgen, ook al heeft hij misschien niet het helderste beeldscherm dat er is.
Dell Latitude 14 9410 2-in-1 P110G
- 31-08-2020 v7 (old)
Allen Ngo
Price comparison
