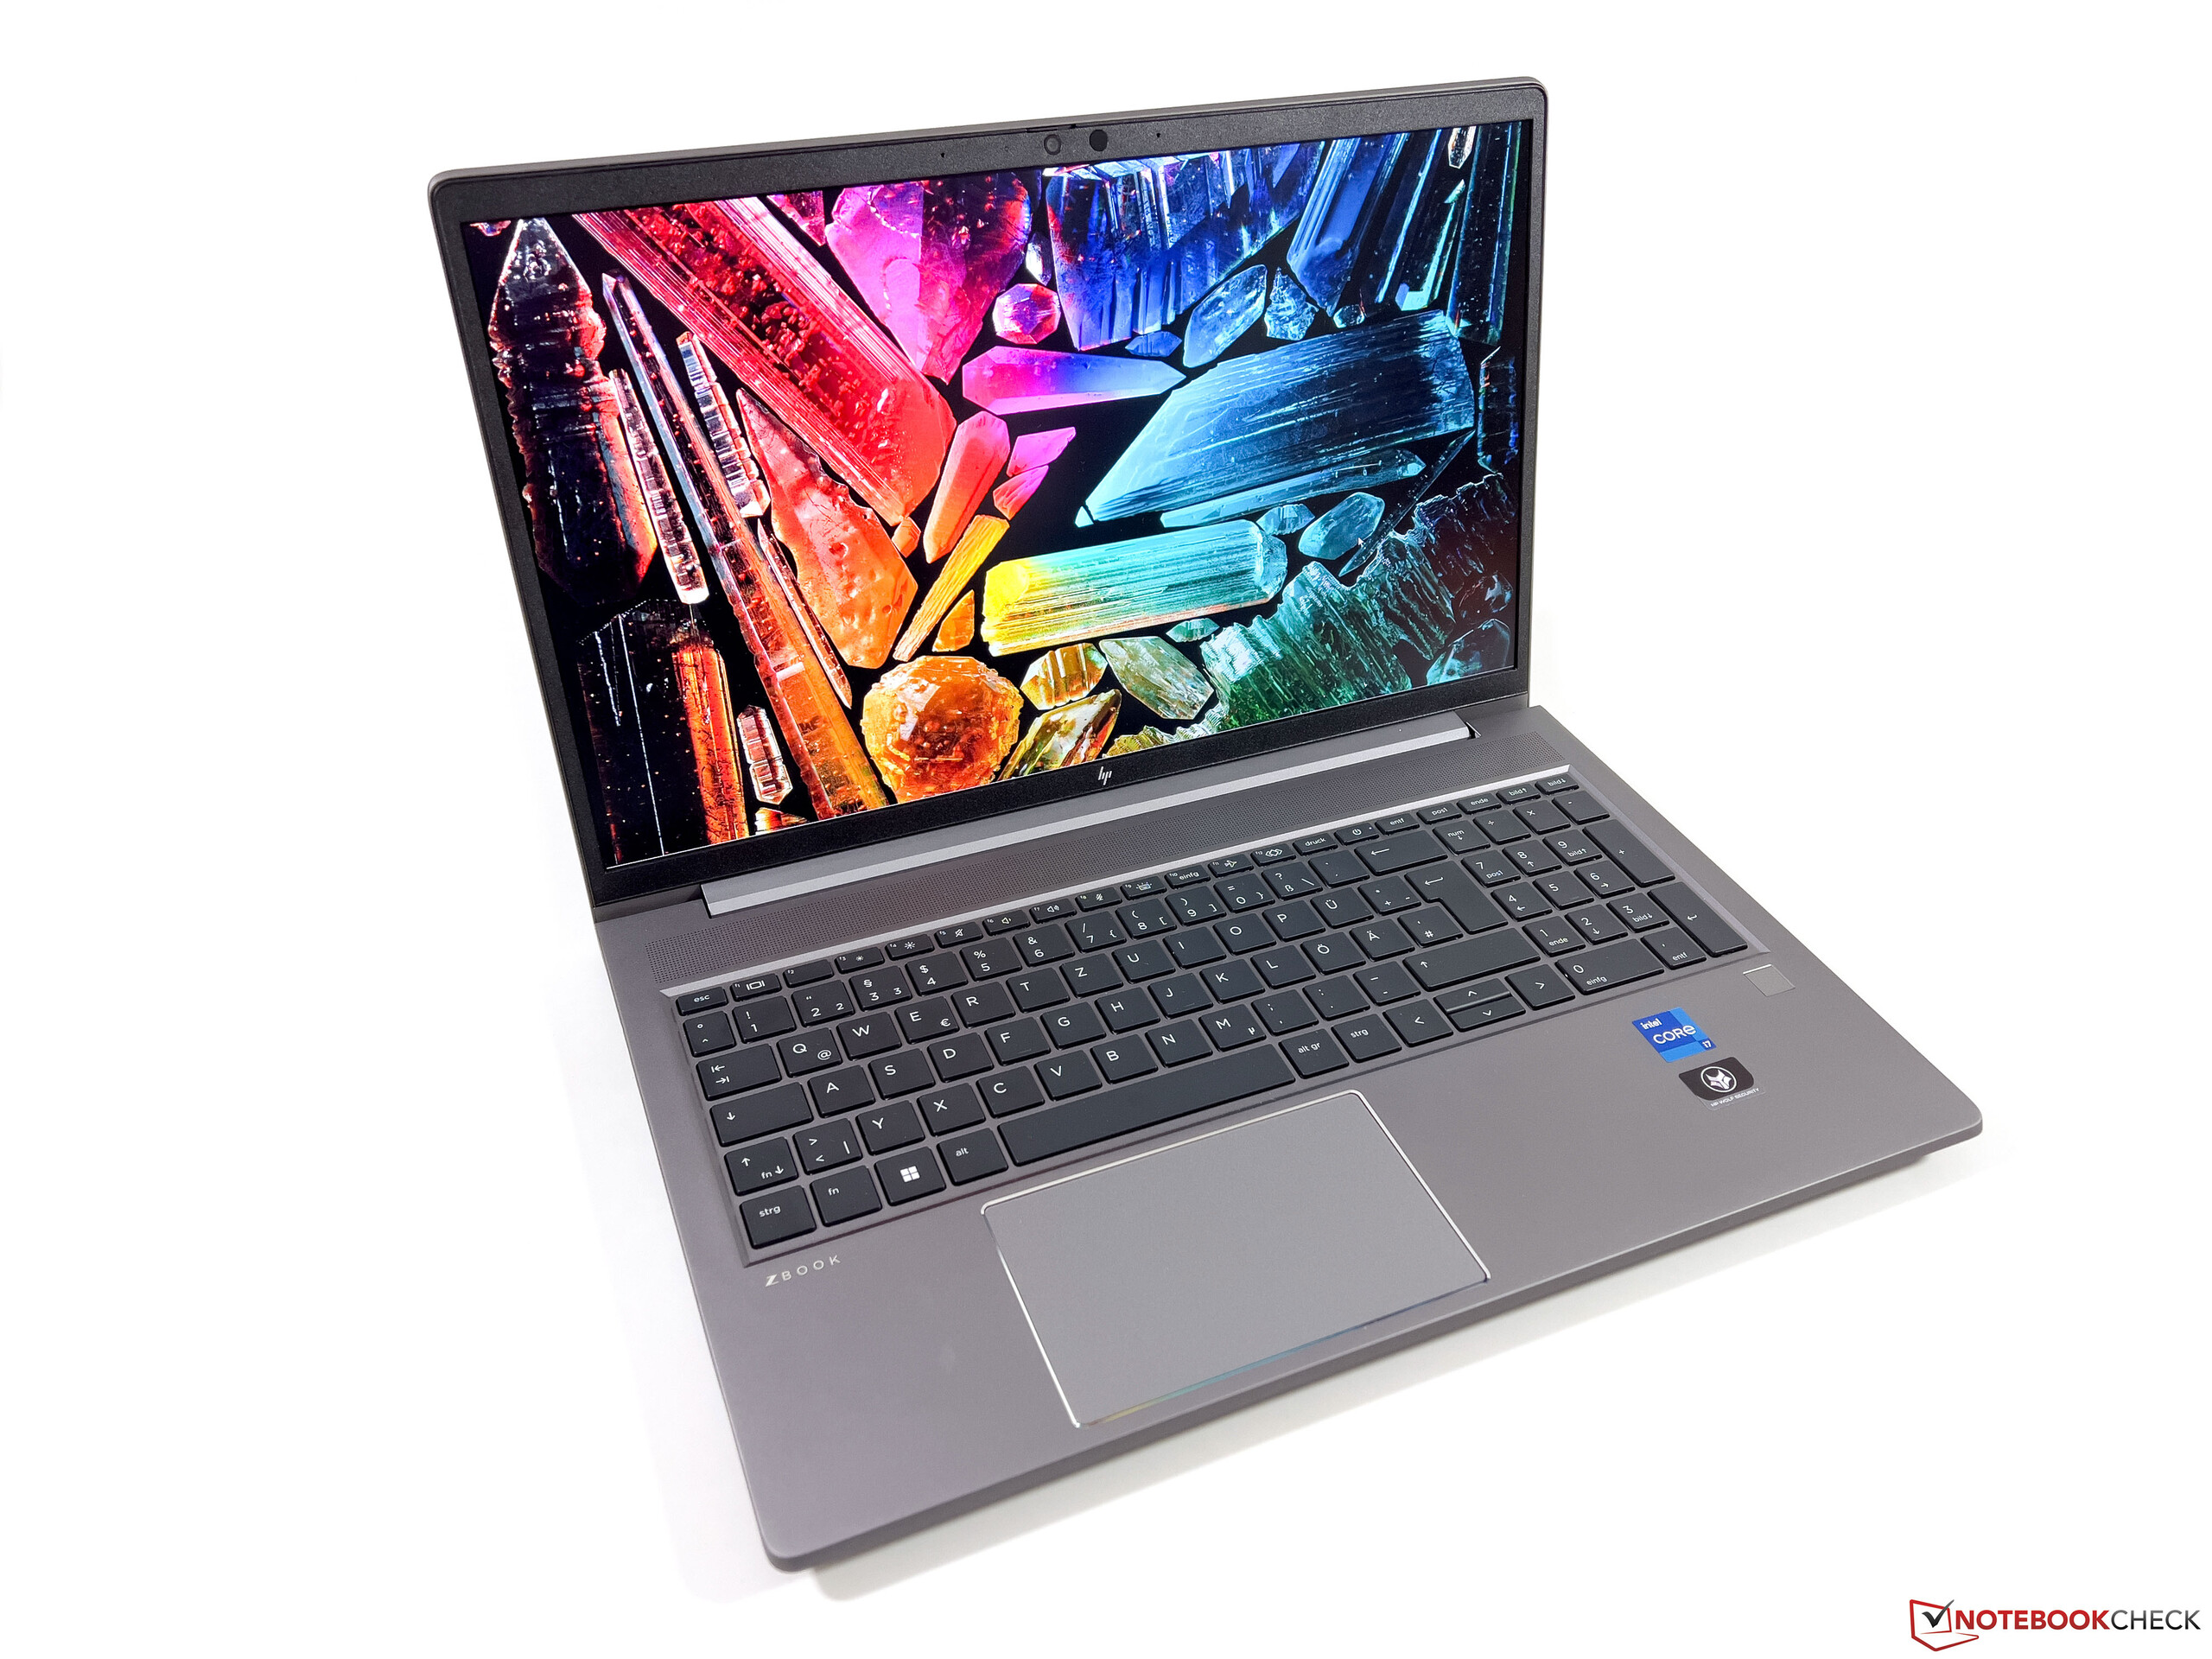
HP ZBook Power 15 G10 workstation test: Uitstekend alternatief voor de ThinkPad P15v

De HP ZBook Power 15 G10 vervangt de ZBook Power 15 G9 van vorig jaar door de Alder Lake 12e generatie Intel CPU's te vervangen door nieuwere Raptor Lake 13e generatie en AMD Ryzen Zen 4 opties. De behuizing is verder identiek aan de ZBook Power 15 G9 of ZBook Power 15 G8 en daarom raden we u aan om onze oudere reviews te bekijken voor meer informatie over de fysieke kenmerken van het model.
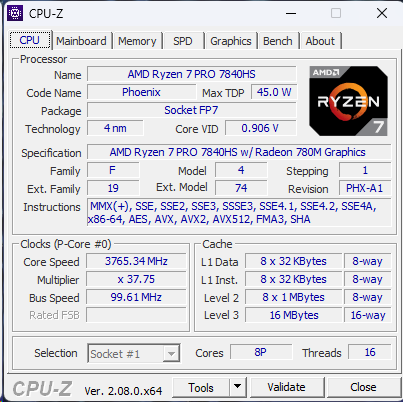
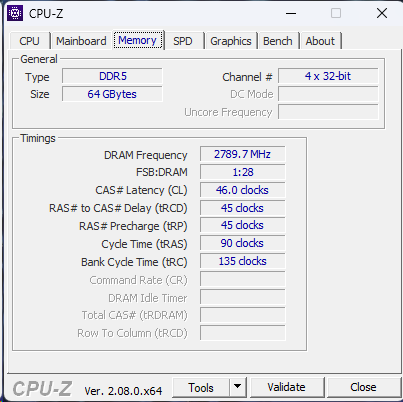
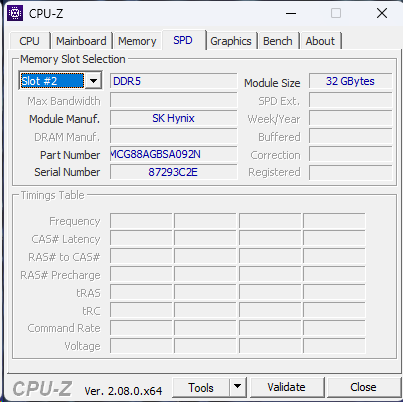
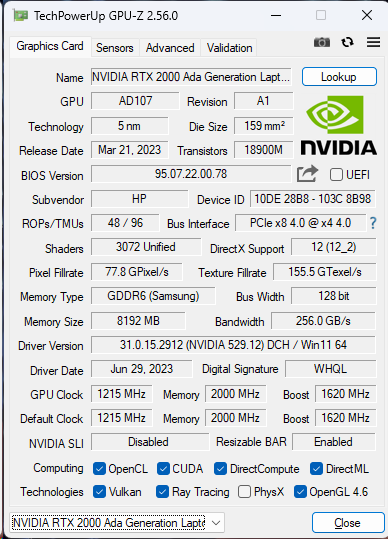
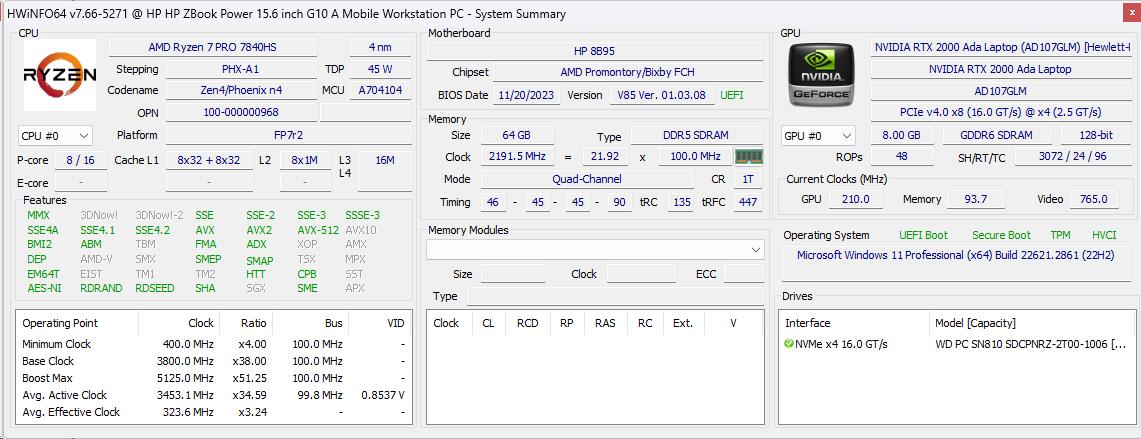
Onze specifieke evaluatie-eenheid is de meest geavanceerde AMD-configuratie met de Ryzen 7 Pro 7940HS CPU, Nvidia RTX 2000 Ada GPU, 1440p IPS-beeldscherm en 64 GB DDR5-5600 RAM voor ongeveer $2600 USD. Kleinere SKU's beginnend met de Ryzen 5 7640HS, 1080p beeldscherm en alleen geïntegreerde graphics zijn ook beschikbaar vanaf $1600. Merk op dat configuraties met Intel CPU's de ZBook Power 15 G10 worden genoemd, terwijl configuraties met AMD CPU's worden verkocht als de ZBook Power 15 G10 A.
Alternatieven voor de ZBook Power 15 G10 zijn andere ultradunne werkstations zoals de Dell Precision 5560, Lenovo ThinkPad P15v G3, of Asus ExpertBook B6 Flip.
Meer HP beoordelingen:
Potentiële concurrenten in vergelijking
Evaluatie | Datum | Model | Gewicht | Hoogte | Formaat | Resolutie | Beste prijs |
|---|---|---|---|---|---|---|---|
| 88.9 % v7 (old) | 12-2023 | HP ZBook Power 15 G10 R7 PRO 7840HS, RTX 2000 Ada Generation Laptop | 2 kg | 22.9 mm | 15.60" | 2560x1440 | |
| 87.4 % v7 (old) | 01-2023 | HP ZBook Power 15 G9 6B8C4EA i7-12700H, RTX A2000 Laptop GPU | 2 kg | 22.8 mm | 15.60" | 3840x2160 | |
| 87.8 % v7 (old) | 04-2023 | Lenovo ThinkPad P15v G3 21EM001AGE R7 PRO 6850H, RTX A2000 Laptop GPU | 2.2 kg | 22.7 mm | 15.60" | 3840x2160 | |
| 88.3 % v7 (old) | 10-2021 | Dell Precision 5000 5560 i7-11850H, RTX A2000 Laptop GPU | 2 kg | 18 mm | 15.60" | 3840x2400 | |
| 91.7 % v7 (old) | 10-2023 | Lenovo ThinkPad P1 G6-21FV000DGE i9-13900H, RTX 2000 Ada Generation Laptop | 1.9 kg | 17.5 mm | 16.00" | 2560x1600 | |
| 89.6 % v7 (old) | 01-2023 | Asus ExpertBook B6 Flip B6602FC2 i9-12950HX, RTX A2000 Laptop GPU | 2.8 kg | 27.2 mm | 16.00" | 2560x1600 |
Zaak
Communicatie
| Networking | |
| iperf3 transmit AX12 | |
| Dell Precision 5000 5560 | |
| iperf3 receive AX12 | |
| Dell Precision 5000 5560 | |
| iperf3 transmit AXE11000 | |
| HP ZBook Power 15 G10 | |
| Lenovo ThinkPad P1 G6-21FV000DGE | |
| Asus ExpertBook B6 Flip B6602FC2 | |
| Lenovo ThinkPad P15v G3 21EM001AGE | |
| iperf3 receive AXE11000 | |
| Lenovo ThinkPad P1 G6-21FV000DGE | |
| Lenovo ThinkPad P15v G3 21EM001AGE | |
| Asus ExpertBook B6 Flip B6602FC2 | |
| HP ZBook Power 15 G10 | |
| iperf3 transmit AXE11000 6GHz | |
| HP ZBook Power 15 G9 6B8C4EA | |
| HP ZBook Power 15 G10 | |
| Asus ExpertBook B6 Flip B6602FC2 | |
| Lenovo ThinkPad P15v G3 21EM001AGE | |
| iperf3 receive AXE11000 6GHz | |
| HP ZBook Power 15 G9 6B8C4EA | |
| Asus ExpertBook B6 Flip B6602FC2 | |
| Lenovo ThinkPad P15v G3 21EM001AGE | |
| HP ZBook Power 15 G10 | |
Webcam
Terwijl onze ZBook Power G9 geconfigureerd was met een 1 MP webcam, heeft onze Power G10 in plaats daarvan een 5 MP webcam voor een veel scherper beeld. De IR- en fysieke sluiterfuncties blijven ongewijzigd.


Onderhoud
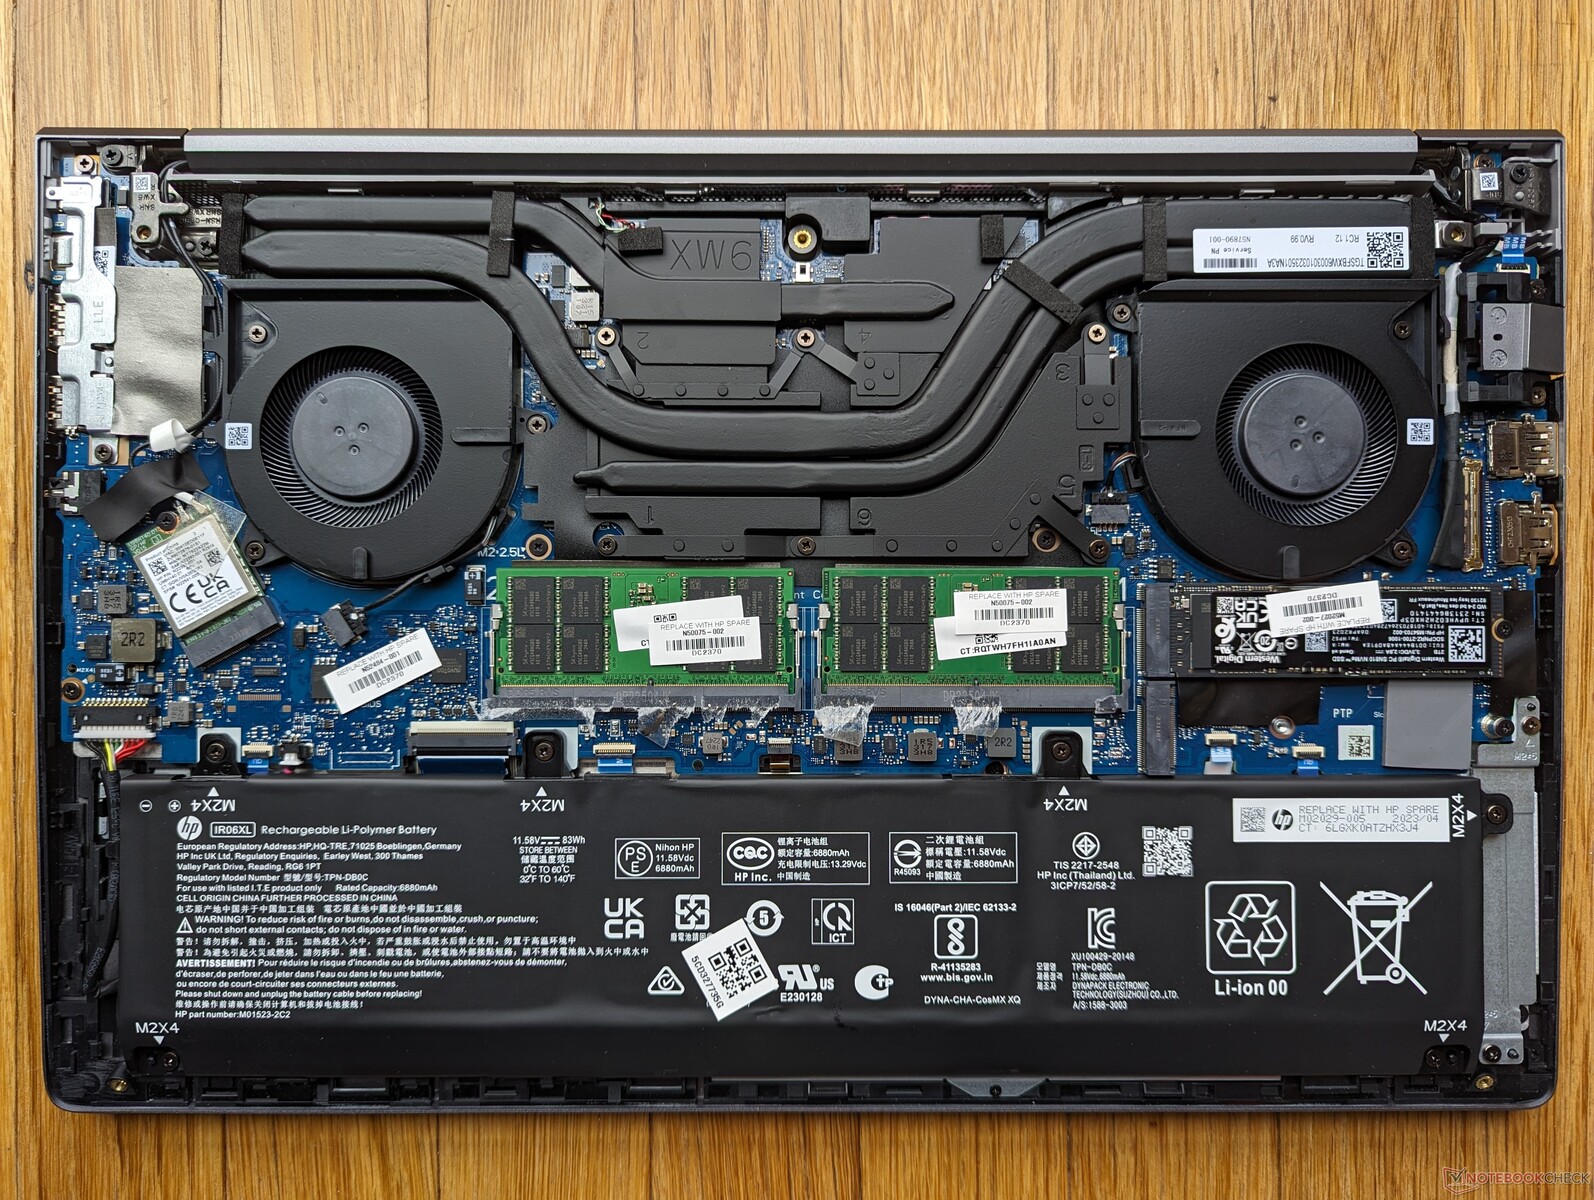
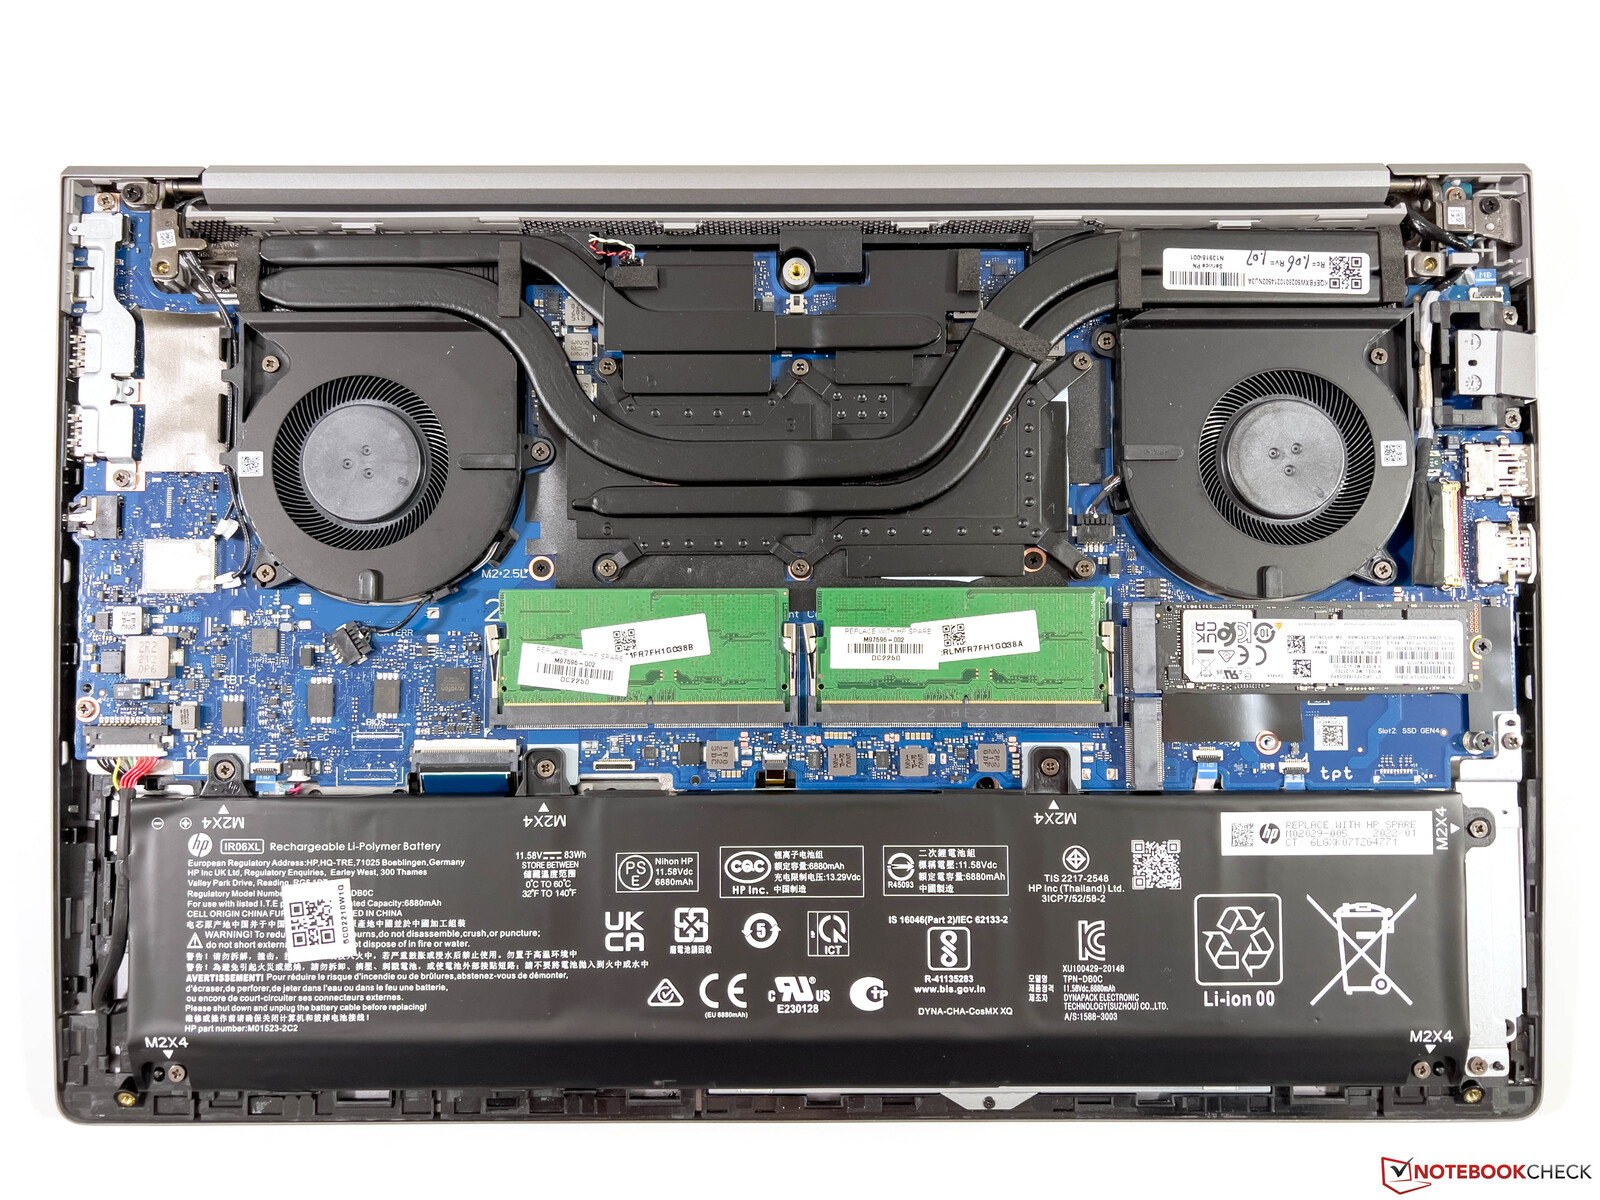
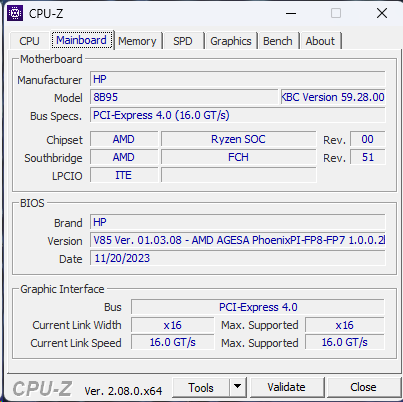
HP heeft één kleine maar opmerkelijke wijziging aangebracht: de M.2 WLAN-module is nu vervangbaar, terwijl deze op de ZBook Power 15 G9 van vorig jaar nog gesoldeerd was. Bijna al het andere blijft ongewijzigd, inclusief de twee DDR5 SODIMM-sleuven en twee M.2 PCIe4 x4-sleuven.
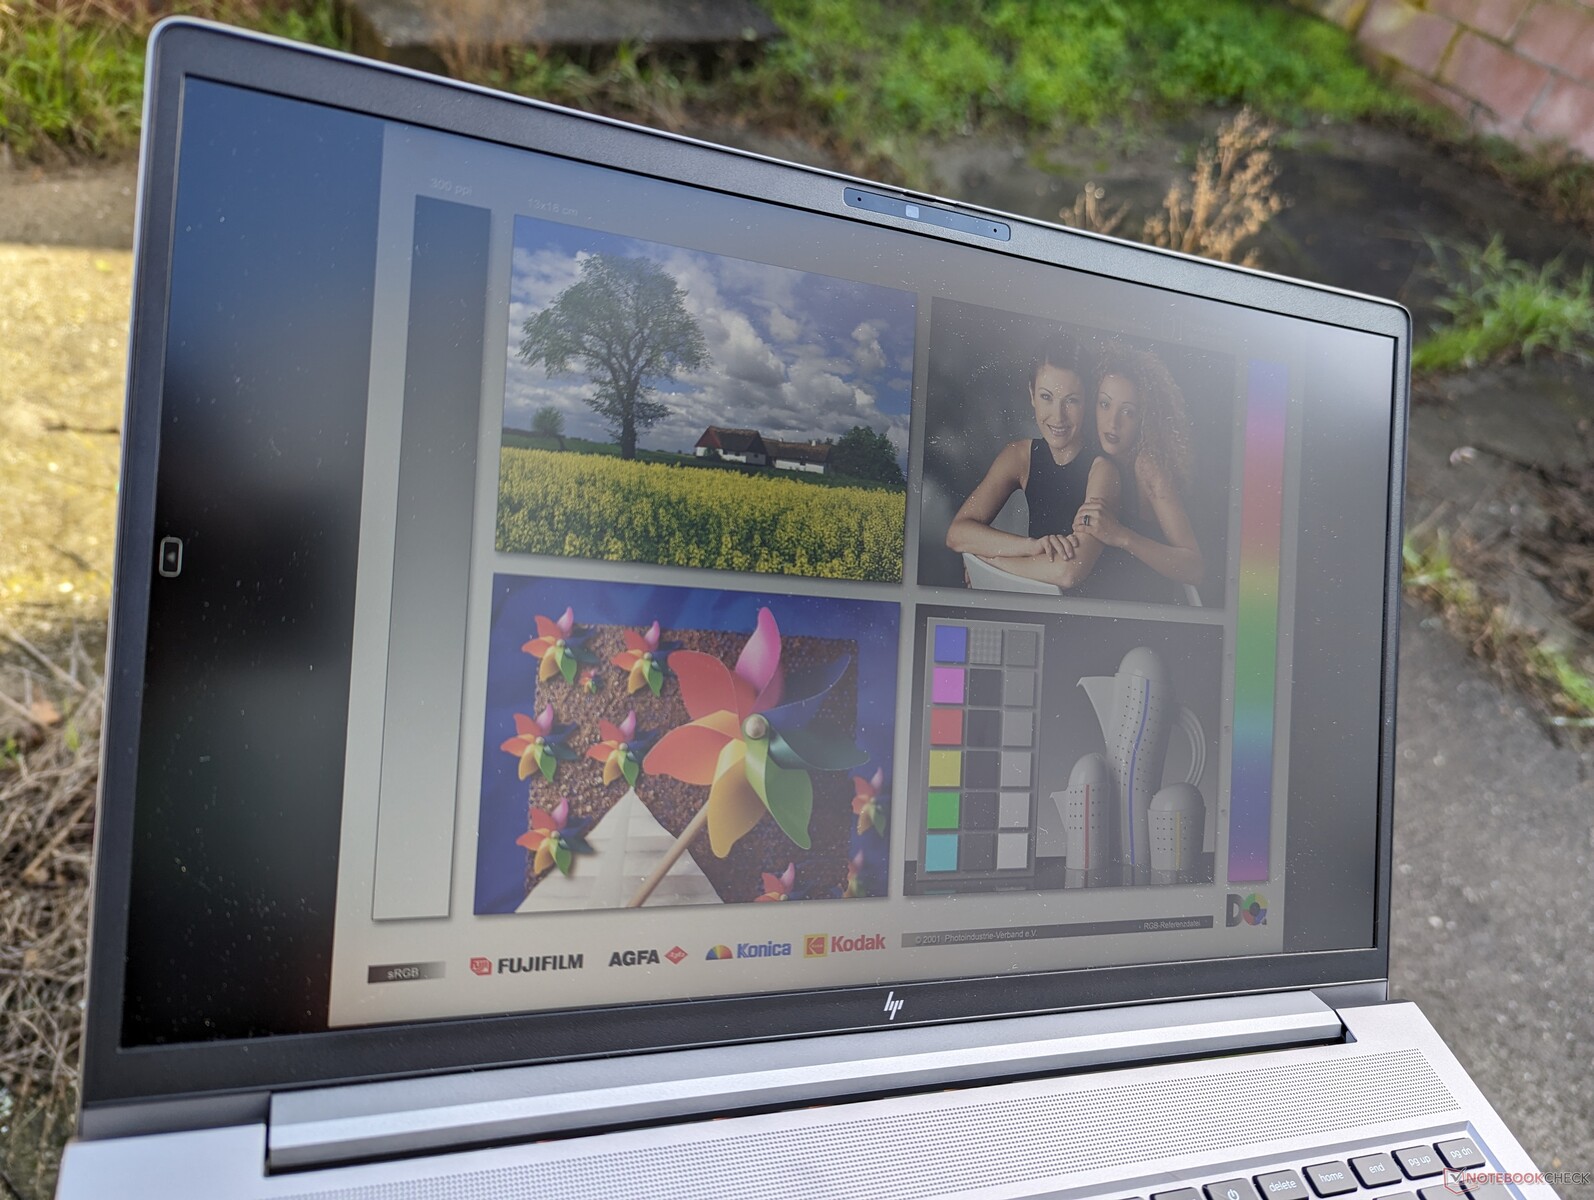
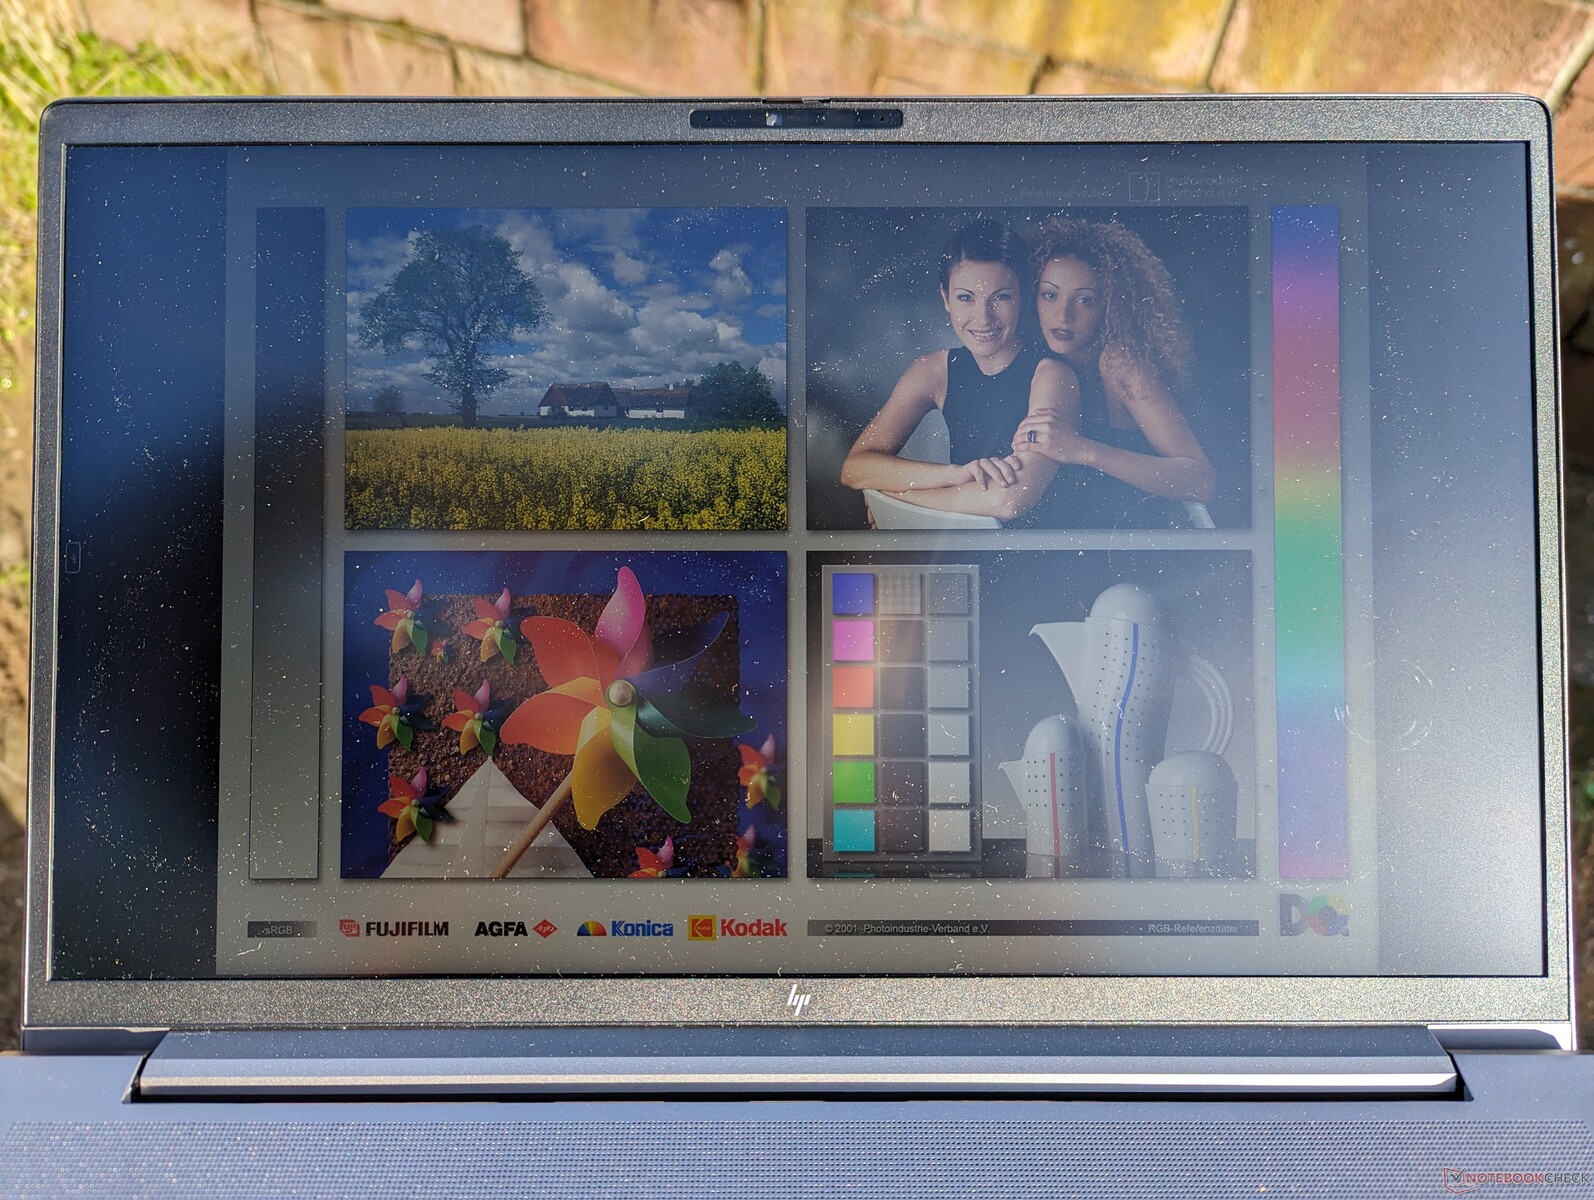
Weergave
Het model biedt de volgende vier matte schermopties:
- 1080p, 250 nits, 60% sRGB, aanraakscherm
- 1080p, 250 nits, 60% sRGB, zonder aanraakscherm
- 1080p, 400 nits, 100% sRGB, zonder aanraakscherm
- 1440p, 300 nits, 100% sRGB, niet-touch, 120 Hz
Tenzij een aanraakscherm een must is, raden wij aan om de twee opties met 250 nits te vermijden, omdat ze elk slechts 45% van NTSC dekken en dus merkbaar minder heldere kleuren hebben.
Om onbekende redenen biedt HP voor geen enkele ZBook Power G10-configuratie 4K-opties aan, hoewel deze voorheen wel beschikbaar waren op de ZBook Power G9. We vermoeden dat dit te maken kan hebben met leveringsproblemen, aangezien fabrikanten momenteel overstappen van 16:9 15,6-inch panelen naar 16:10 16-inch panelen.
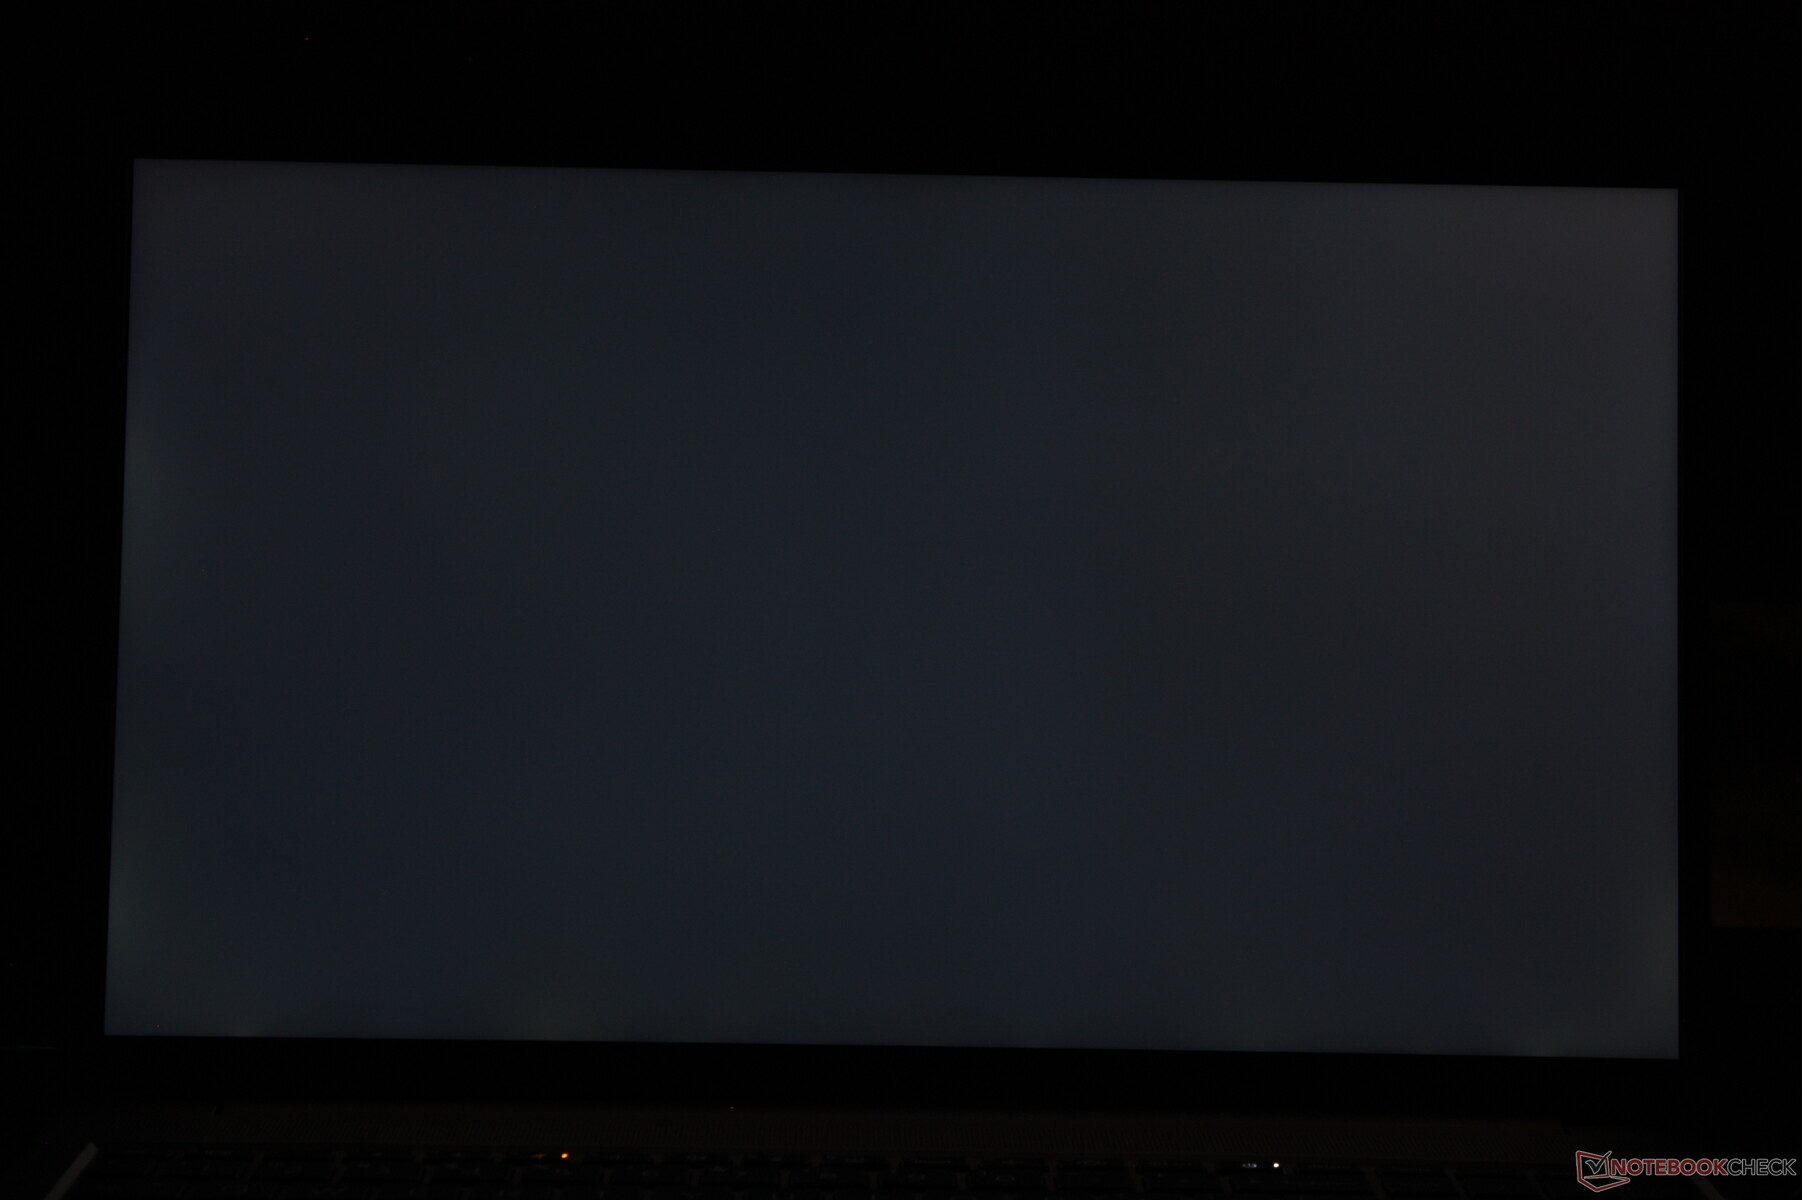
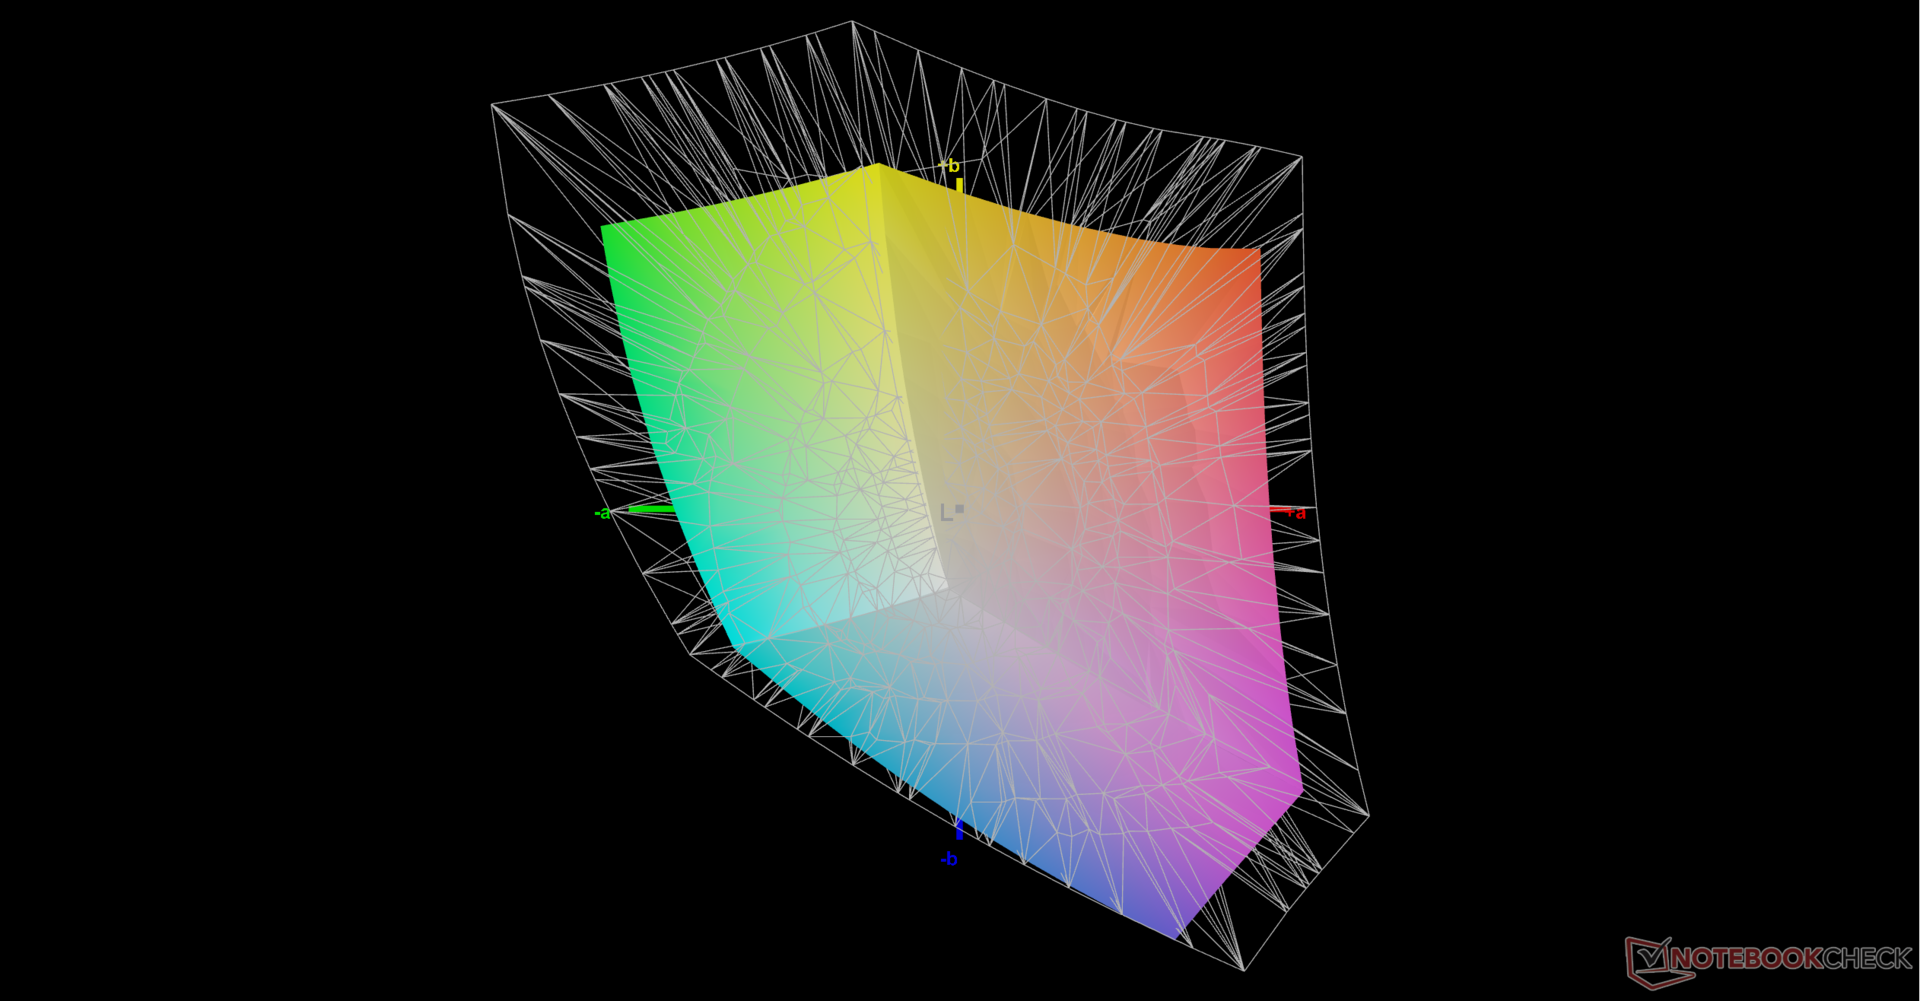
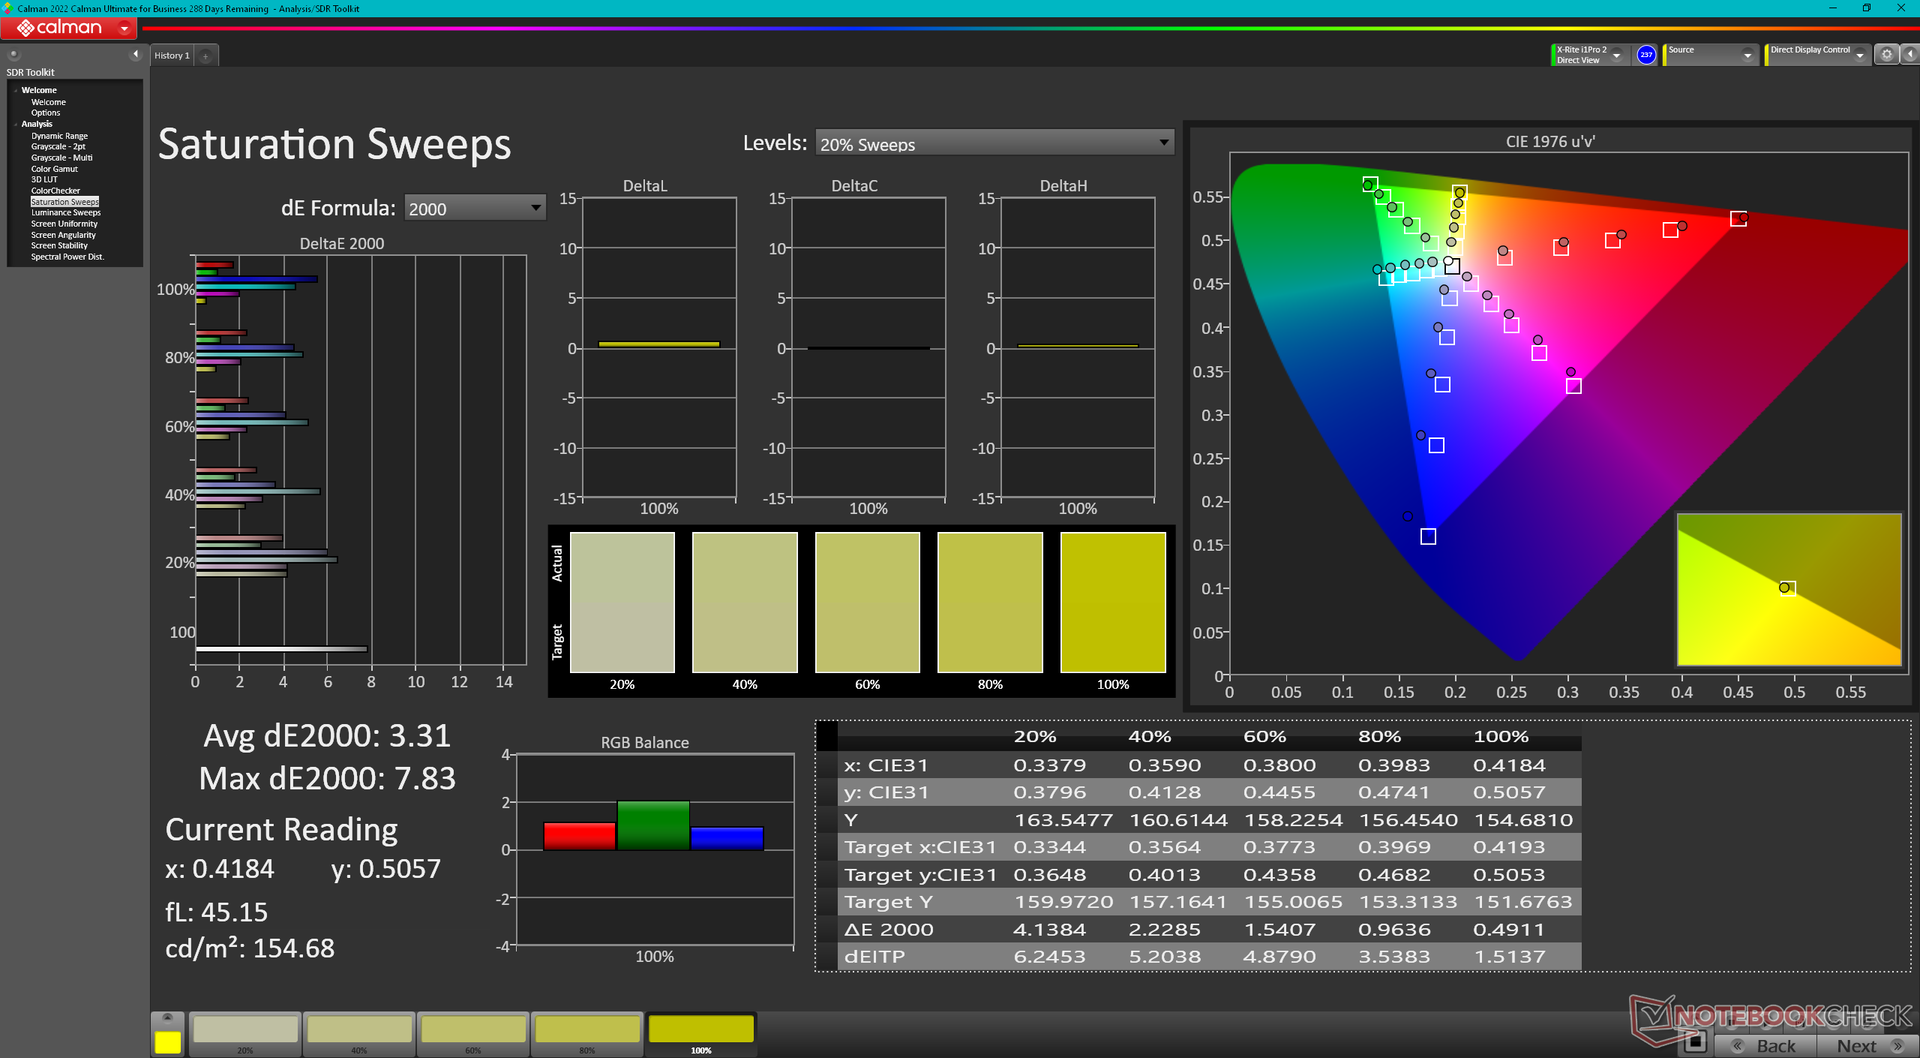
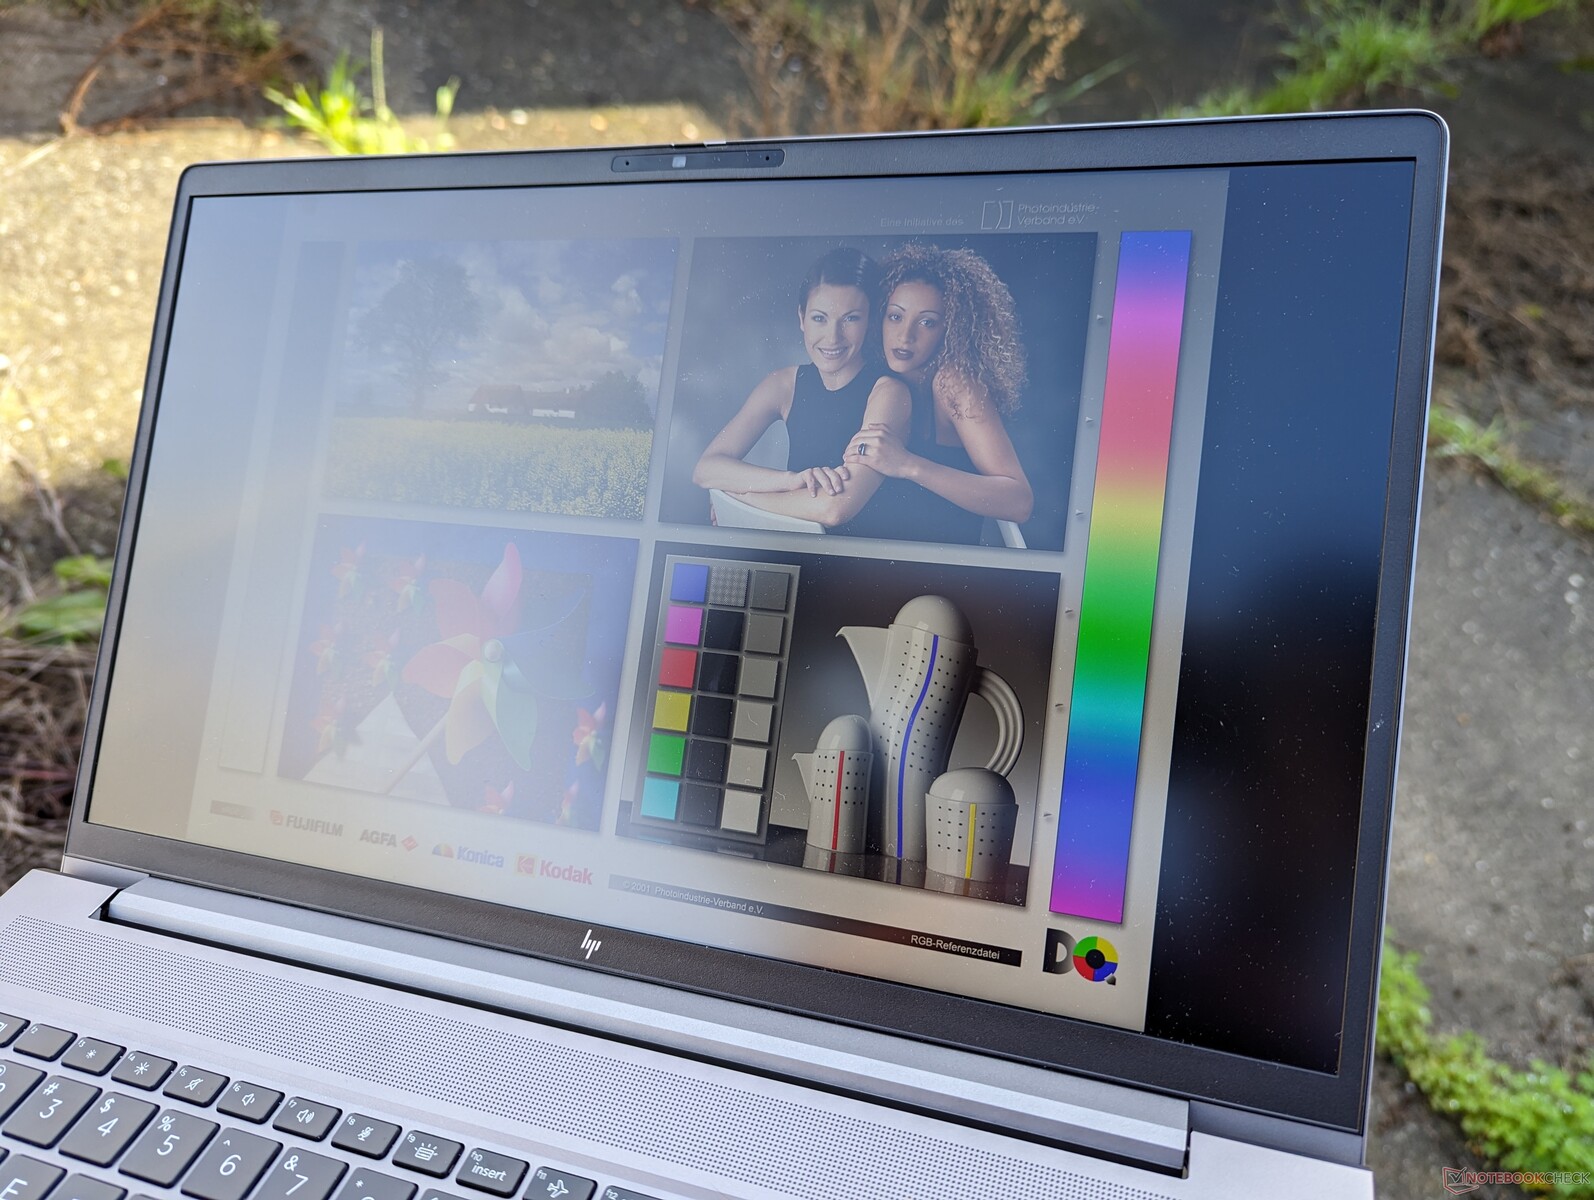
Ons 1440p-paneel is desondanks uitstekend met zijn snelle vernieuwingsfrequentie, snelle responstijden en nauwkeurige sRGB-kleuren die geschikt zijn voor het maken van inhoud en zelfs gaming. Het is dan wel geen OLED of 4K, maar het is nog steeds een van de betere 15,6 inch IPS-schermen die er zijn.

| |||||||||||||||||||||||||
Helderheidsverdeling: 83 %
Helderheid in Batterij-modus: 313.8 cd/m²
Contrast: 1082:1 (Zwart: 0.29 cd/m²)
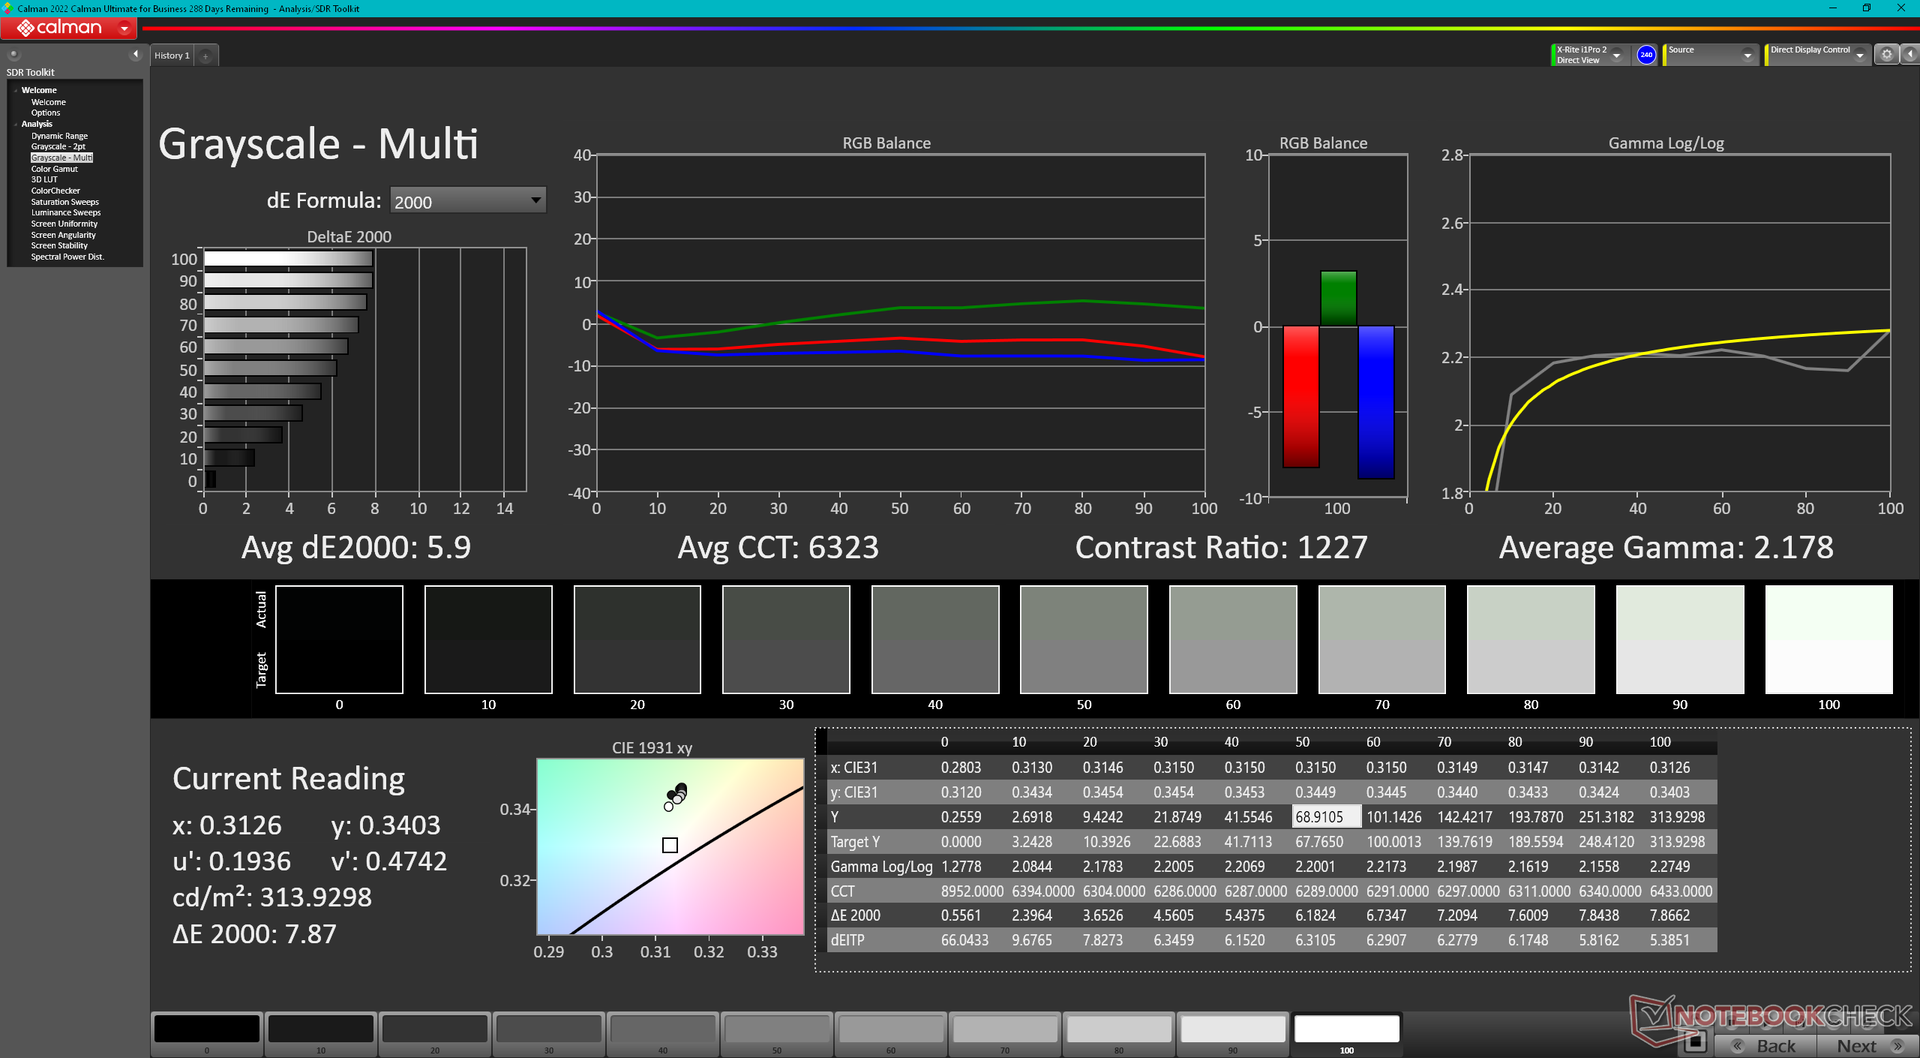
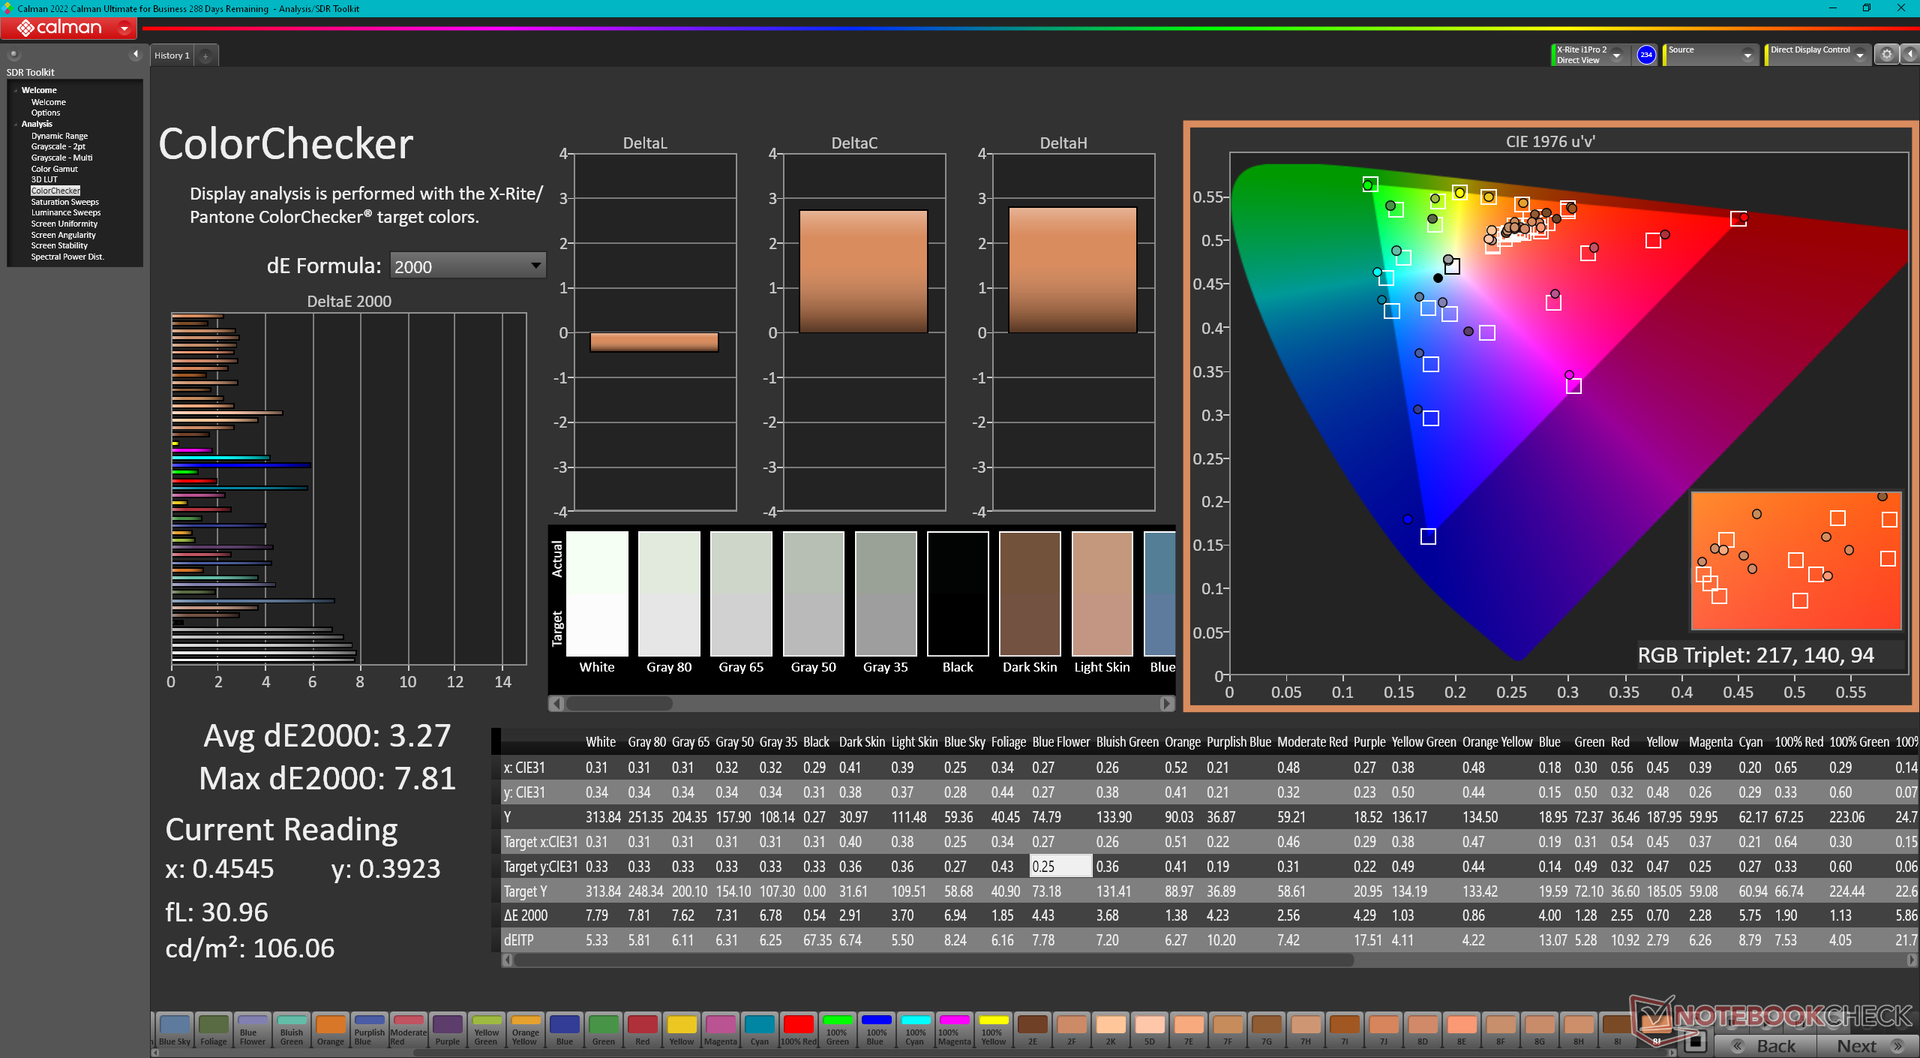
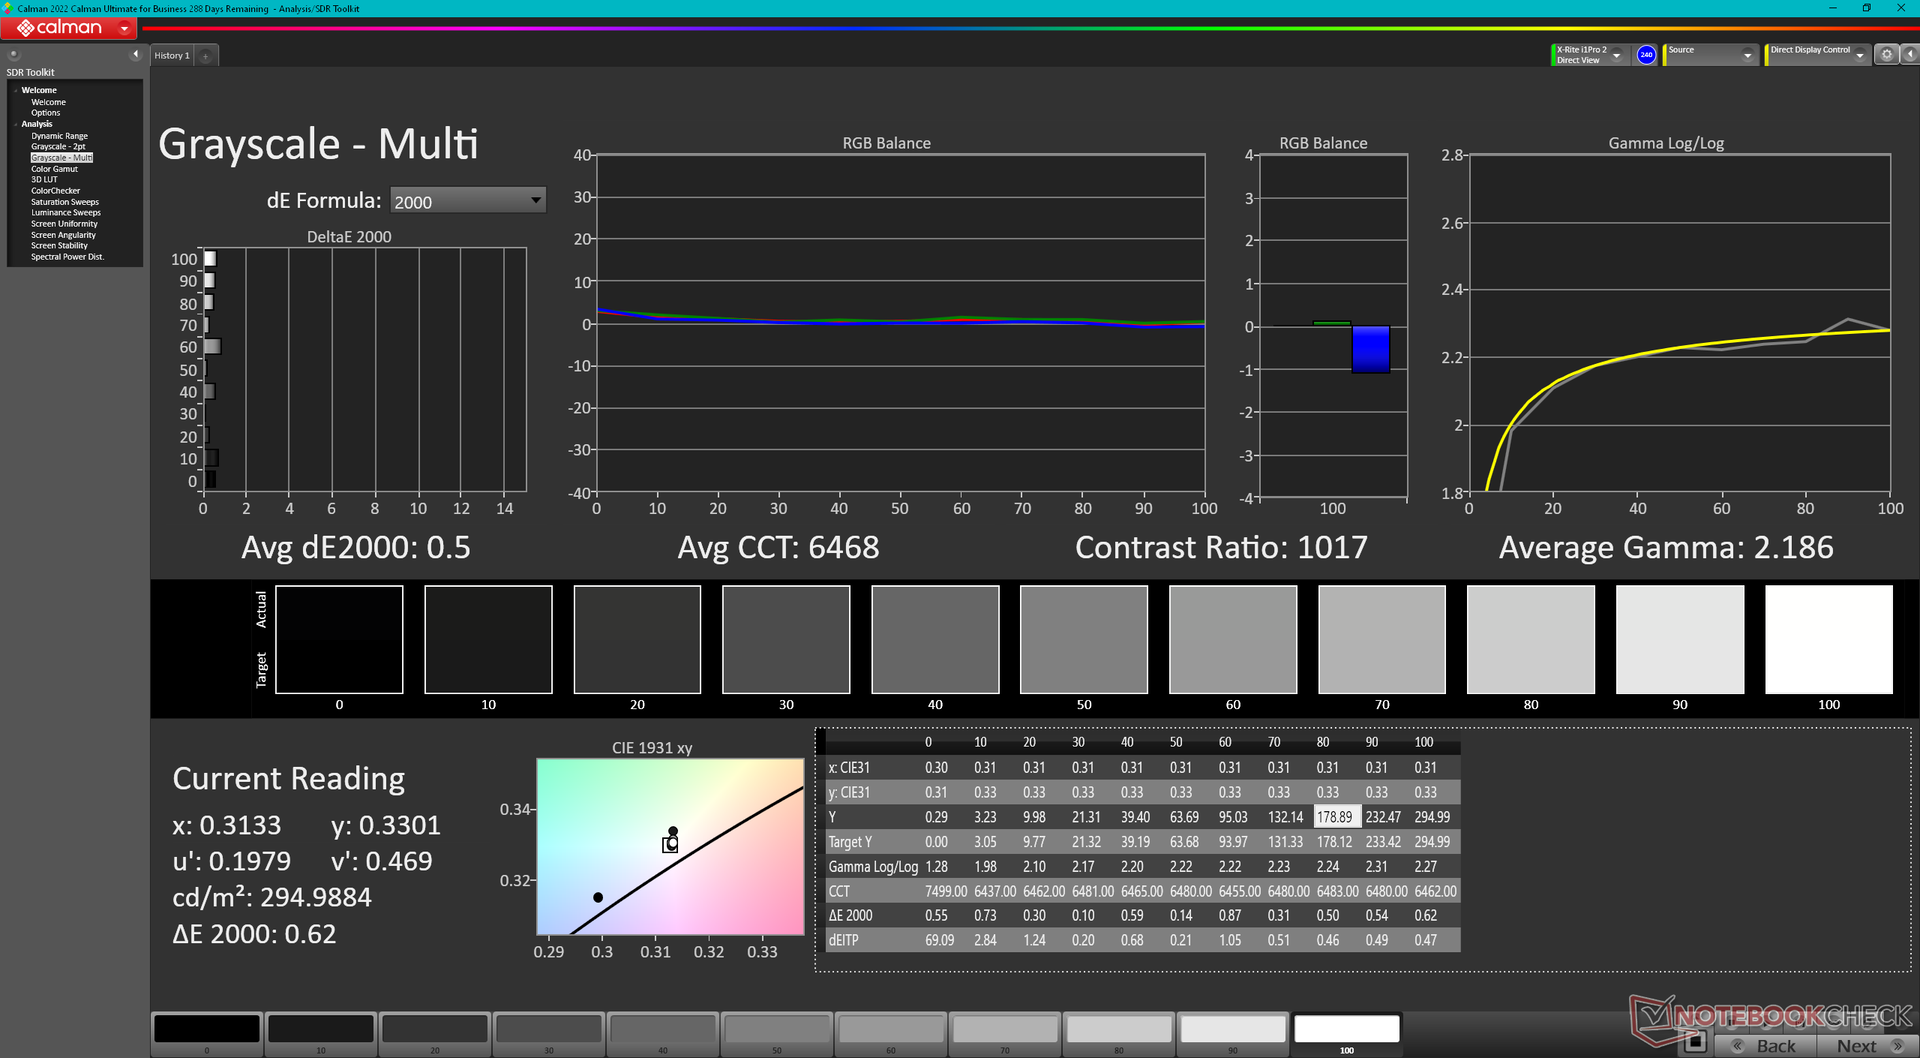
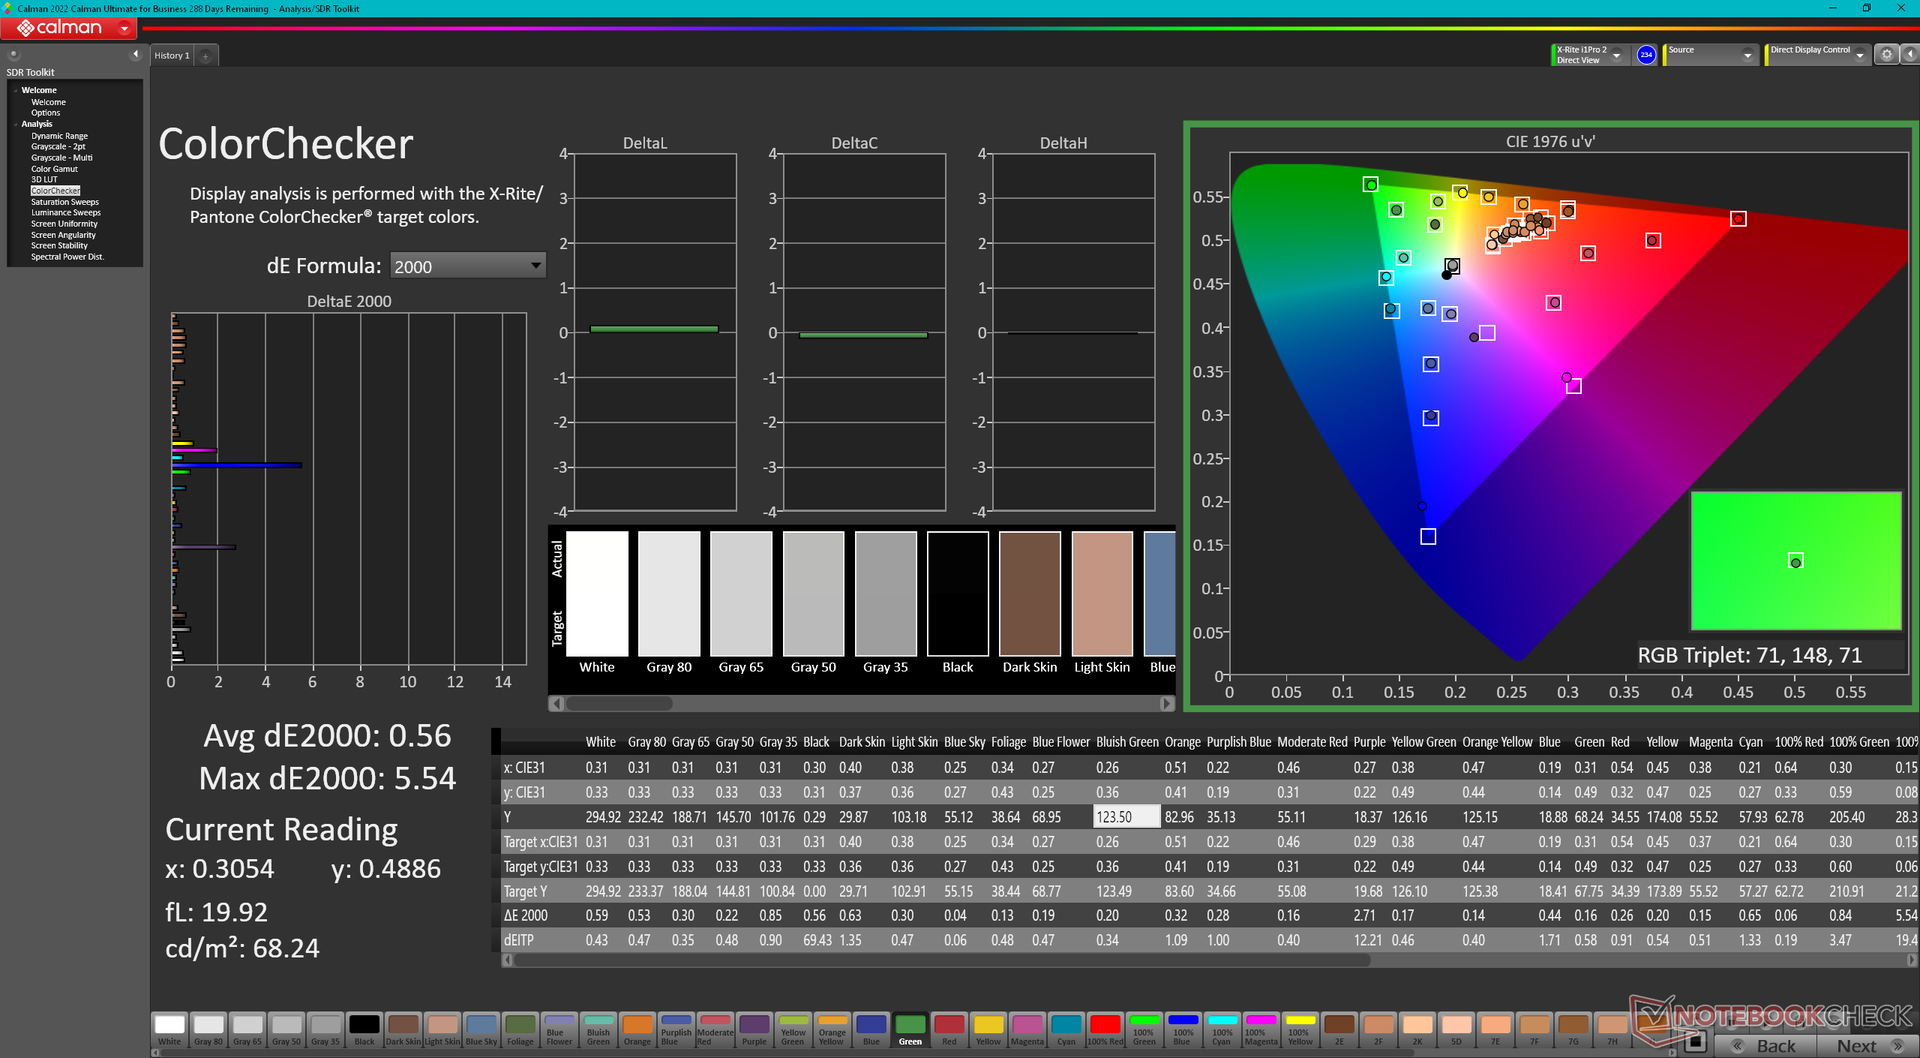
ΔE ColorChecker Calman: 3.27 | ∀{0.5-29.43 Ø4.71}
calibrated: 0.56
ΔE Greyscale Calman: 5.9 | ∀{0.09-98 Ø4.96}
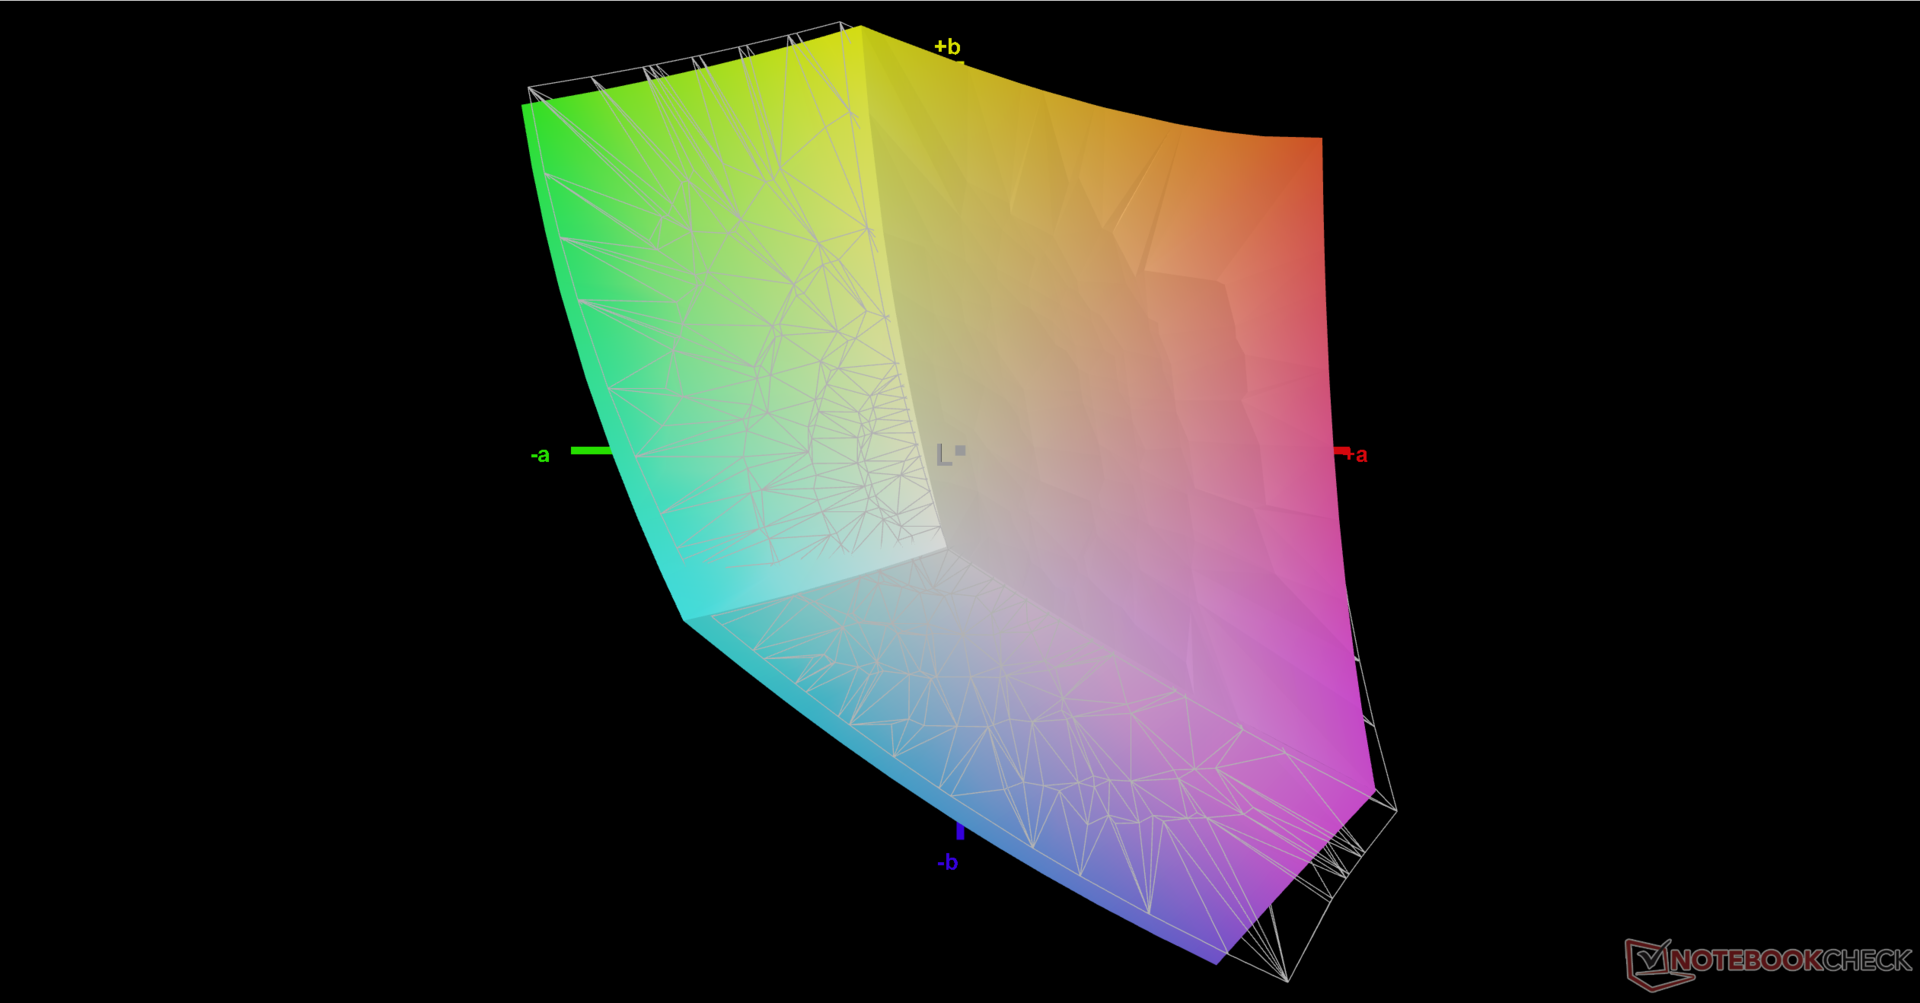
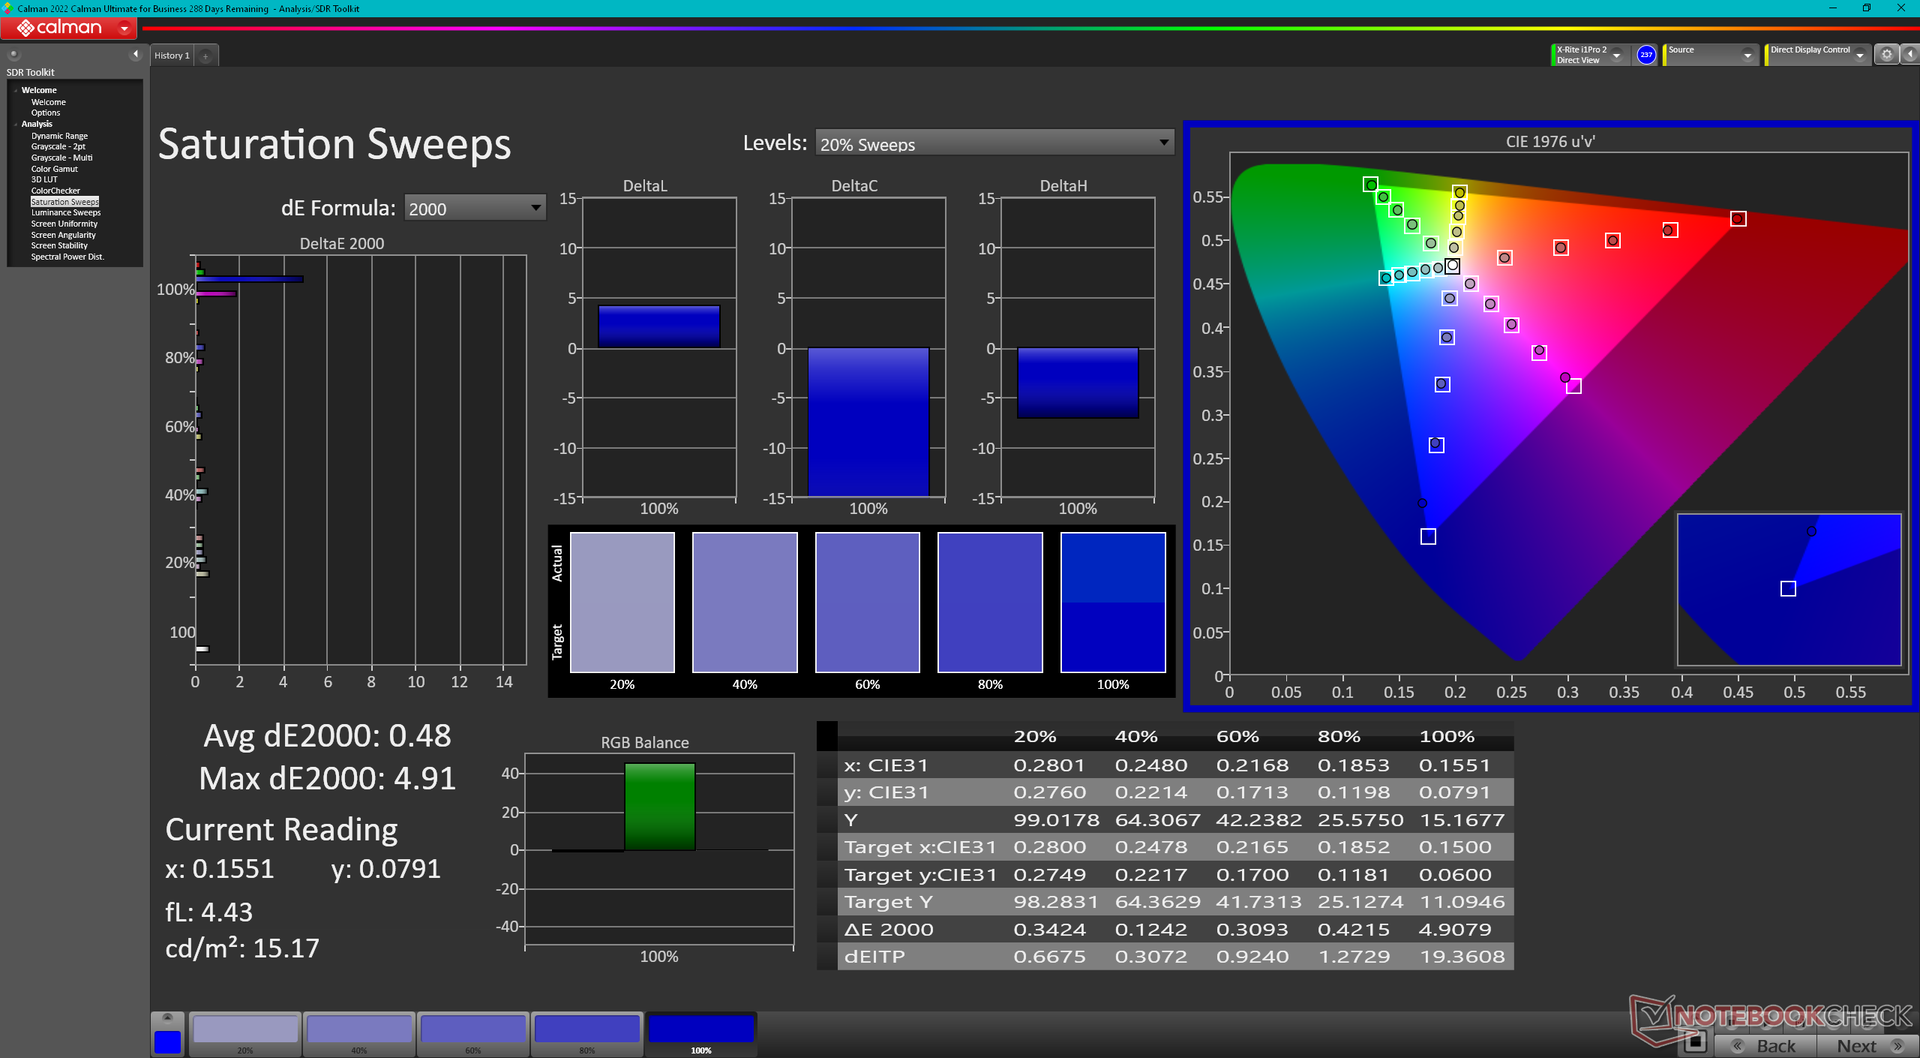
70.5% AdobeRGB 1998 (Argyll 3D)
95.6% sRGB (Argyll 3D)
68.2% Display P3 (Argyll 3D)
Gamma: 2.18
CCT: 6323 K
| HP ZBook Power 15 G10 BOE0B6A, IPS, 2560x1440, 15.6" | HP ZBook Power 15 G9 6B8C4EA LGD073F, IPS, 3840x2160, 15.6" | Lenovo ThinkPad P15v G3 21EM001AGE NE156QUM-N6C, IPS LED, 3840x2160, 15.6" | Dell Precision 5000 5560 Sharp LQ156R1, IPS, 3840x2400, 15.6" | Lenovo ThinkPad P1 G6-21FV000DGE NE160QDM-NY1, IPS, 2560x1600, 16" | Asus ExpertBook B6 Flip B6602FC2 AU Optronics Model: AUOE495, IPS, 2560x1600, 16" | |
|---|---|---|---|---|---|---|
| Display | 1% | 26% | 29% | 1% | 23% | |
| Display P3 Coverage (%) | 68.2 | 69.1 1% | 89.9 32% | 94.9 39% | 68.1 0% | 97.9 44% |
| sRGB Coverage (%) | 95.6 | 97.7 2% | 100 5% | 100 5% | 97.5 2% | 99.89 4% |
| AdobeRGB 1998 Coverage (%) | 70.5 | 69.6 -1% | 99.9 42% | 100 42% | 70.2 0% | 85.52 21% |
| Response Times | -214% | -211% | -228% | 2% | -120% | |
| Response Time Grey 50% / Grey 80% * (ms) | 13 ? | 45.8 ? -252% | 46.7 ? -259% | 47.2 ? -263% | 13.7 ? -5% | 36 ? -177% |
| Response Time Black / White * (ms) | 10.4 ? | 28.6 ? -175% | 27.3 ? -163% | 30.4 ? -192% | 9.6 ? 8% | 17 ? -63% |
| PWM Frequency (Hz) | ||||||
| Screen | 18% | 5% | 7% | 30% | -20% | |
| Brightness middle (cd/m²) | 313.8 | 392 25% | 588 87% | 501.5 60% | 521 66% | 440 40% |
| Brightness (cd/m²) | 302 | 388 28% | 536 77% | 467 55% | 484 60% | 418 38% |
| Brightness Distribution (%) | 83 | 88 6% | 83 0% | 83 0% | 89 7% | 82 -1% |
| Black Level * (cd/m²) | 0.29 | 0.15 48% | 0.38 -31% | 0.44 -52% | 0.36 -24% | 0.3 -3% |
| Contrast (:1) | 1082 | 2613 141% | 1547 43% | 1140 5% | 1447 34% | 1467 36% |
| Colorchecker dE 2000 * | 3.27 | 3.2 2% | 3.9 -19% | 4.73 -45% | 1.2 63% | 2.81 14% |
| Colorchecker dE 2000 max. * | 7.81 | 7 10% | 8.8 -13% | 8.45 -8% | 2.5 68% | 4.62 41% |
| Colorchecker dE 2000 calibrated * | 0.56 | 1.2 -114% | 1 -79% | 0.51 9% | 1 -79% | 2.99 -434% |
| Greyscale dE 2000 * | 5.9 | 4.9 17% | 7.1 -20% | 3.6 39% | 1.4 76% | 0.91 85% |
| Gamma | 2.18 101% | 2.13 103% | 2.12 104% | 2.08 106% | 2.25 98% | 2.2 100% |
| CCT | 6323 103% | 5982 109% | 7268 89% | 6447 101% | 6682 97% | 6600 98% |
| Totaal Gemiddelde (Programma / Instellingen) | -65% /
-19% | -60% /
-21% | -64% /
-22% | 11% /
20% | -39% /
-25% |
* ... kleiner is beter
HP levert het model niet voorgekalibreerd, wat jammer is voor een ZBook-klasse laptop. De gemiddelde DeltaE-waarden voor grijswaarden en kleuren uit de doos zouden respectievelijk 5,9 en 3,27 zijn, waarbij de kleurtemperatuur iets te warm is. Door het beeldscherm zelf te kalibreren zouden de gemiddelde deltaE-waarden verbeteren tot slechts 0,5 en 0,56. Ons gekalibreerde ICM-bestand kunt u hierboven gratis downloaden.
Responstijd Scherm
| ↔ Responstijd Zwart naar Wit | ||
|---|---|---|
| 10.4 ms ... stijging ↗ en daling ↘ gecombineerd | ↗ 5.5 ms stijging | 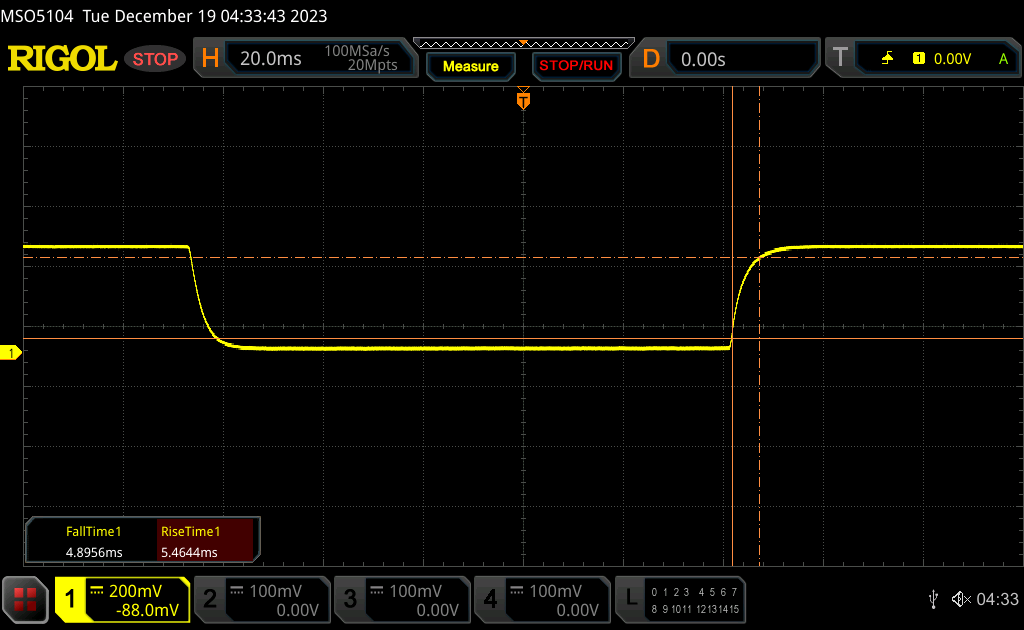 |
| ↘ 4.9 ms daling | ||
| Het scherm vertoonde prima responstijden in onze tests maar is misschien wat te traag voor competitieve games. Ter vergelijking: alle testtoestellen variëren van 0.1 (minimum) tot 240 (maximum) ms. » 28 % van alle toestellen zijn beter. Dit betekent dat de gemeten responstijd beter is dan het gemiddelde (19.8 ms) van alle geteste toestellen. | ||
| ↔ Responstijd 50% Grijs naar 80% Grijs | ||
| 13 ms ... stijging ↗ en daling ↘ gecombineerd | ↗ 6.4 ms stijging | 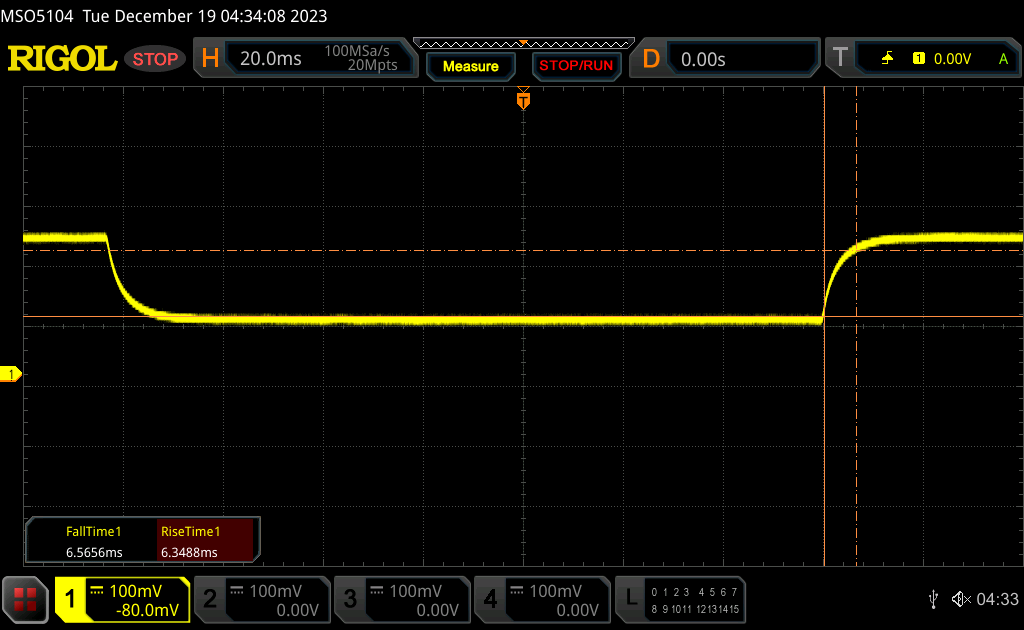 |
| ↘ 6.6 ms daling | ||
| Het scherm vertoonde prima responstijden in onze tests maar is misschien wat te traag voor competitieve games. Ter vergelijking: alle testtoestellen variëren van 0.165 (minimum) tot 636 (maximum) ms. » 27 % van alle toestellen zijn beter. Dit betekent dat de gemeten responstijd beter is dan het gemiddelde (31 ms) van alle geteste toestellen. | ||
Screen Flickering / PWM (Pulse-Width Modulation)
| Screen flickering / PWM niet waargenomen | 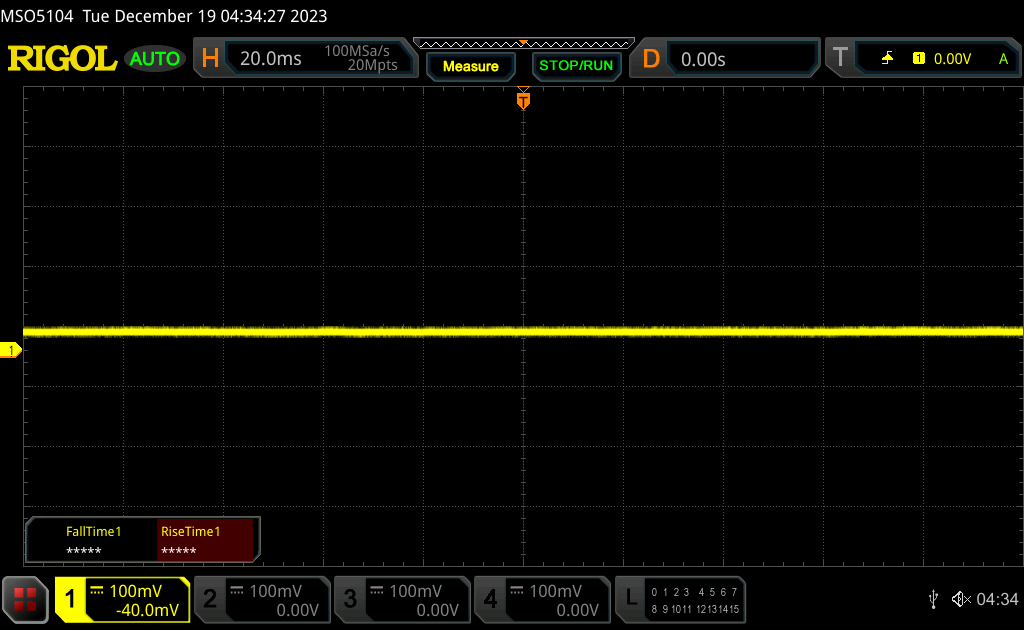 | ||
Ter vergelijking: 52 % van alle geteste toestellen maakten geen gebruik van PWM om de schermhelderheid te verlagen. Als het wel werd gebruikt, werd een gemiddelde van 7757 (minimum: 5 - maximum: 343500) Hz waargenomen. | |||
Prestaties
Testomstandigheden
We hebben zowel Windows als het configuratiescherm van Nvidia in de modus Prestaties gezet voordat we de onderstaande benchmarks uitvoerden. Het systeem lijkt geen extra energieprofielen van HP te hebben.
Optimus wordt zoals verwacht ondersteund, maar er is geen ECC VRAM-modus in tegenstelling tot de dikkere ZBook Fury 16 G10 met de snellere RTX 5000 Ada.
Processor
De Ryzen 7 Pro 7840HS biedt tot 20 procent snellere multi-thread prestaties dan de Core i7-12700H in de ZBook Power 15 G9 van vorig jaar. Voor nog snellere prestaties moeten gebruikers echter configureren met de Intel Core i9-13900H die tot 30 procent sneller kan zijn dan onze Ryzen 7.
Downgraden naar de Ryzen 5 Pro 7640HS configuratie van onze Ryzen 7 Pro 7840HS zal naar verwachting de prestaties met wel 25 tot 30 procent beïnvloeden. Aan de andere kant zal upgraden naar de Ryzen 9 Pro 7940HS zal de prestaties naar verwachting slechts marginaal verbeteren met ongeveer 5 tot 10 procent, gebaseerd op onze tijd met de Lenovo ThinkPad Z16 Gen 2. De prestaties per dollar nemen dus aanzienlijk af bij een configuratie met Ryzen 9 in plaats van Ryzen 7.
Cinebench R15 Multi Loop
Cinebench R23: Multi Core | Single Core
Cinebench R20: CPU (Multi Core) | CPU (Single Core)
Cinebench R15: CPU Multi 64Bit | CPU Single 64Bit
Blender: v2.79 BMW27 CPU
7-Zip 18.03: 7z b 4 | 7z b 4 -mmt1
Geekbench 5.5: Multi-Core | Single-Core
HWBOT x265 Benchmark v2.2: 4k Preset
LibreOffice : 20 Documents To PDF
R Benchmark 2.5: Overall mean
* ... kleiner is beter
AIDA64: FP32 Ray-Trace | FPU Julia | CPU SHA3 | CPU Queen | FPU SinJulia | FPU Mandel | CPU AES | CPU ZLib | FP64 Ray-Trace | CPU PhotoWorxx
| Performance rating | |
| HP ZBook Power 15 G10 | |
| Gemiddeld AMD Ryzen 7 PRO 7840HS | |
| Lenovo ThinkPad P1 G6-21FV000DGE | |
| Lenovo ThinkPad P15v G3 21EM001AGE | |
| Asus ExpertBook B6 Flip B6602FC2 | |
| HP ZBook Power 15 G9 6B8C4EA | |
| Dell Precision 5000 5560 -9! | |
| AIDA64 / FP32 Ray-Trace | |
| HP ZBook Power 15 G10 | |
| Gemiddeld AMD Ryzen 7 PRO 7840HS (25606 - 25776, n=2) | |
| Lenovo ThinkPad P1 G6-21FV000DGE | |
| Asus ExpertBook B6 Flip B6602FC2 | |
| Lenovo ThinkPad P15v G3 21EM001AGE | |
| HP ZBook Power 15 G9 6B8C4EA | |
| AIDA64 / FPU Julia | |
| HP ZBook Power 15 G10 | |
| Gemiddeld AMD Ryzen 7 PRO 7840HS (107907 - 109059, n=2) | |
| Lenovo ThinkPad P15v G3 21EM001AGE | |
| Lenovo ThinkPad P1 G6-21FV000DGE | |
| Asus ExpertBook B6 Flip B6602FC2 | |
| HP ZBook Power 15 G9 6B8C4EA | |
| AIDA64 / CPU SHA3 | |
| HP ZBook Power 15 G10 | |
| Gemiddeld AMD Ryzen 7 PRO 7840HS (4631 - 4656, n=2) | |
| Lenovo ThinkPad P1 G6-21FV000DGE | |
| Asus ExpertBook B6 Flip B6602FC2 | |
| HP ZBook Power 15 G9 6B8C4EA | |
| Lenovo ThinkPad P15v G3 21EM001AGE | |
| AIDA64 / CPU Queen | |
| Lenovo ThinkPad P1 G6-21FV000DGE | |
| HP ZBook Power 15 G10 | |
| Gemiddeld AMD Ryzen 7 PRO 7840HS (97729 - 115640, n=2) | |
| Asus ExpertBook B6 Flip B6602FC2 | |
| Lenovo ThinkPad P15v G3 21EM001AGE | |
| HP ZBook Power 15 G9 6B8C4EA | |
| AIDA64 / FPU SinJulia | |
| HP ZBook Power 15 G10 | |
| Gemiddeld AMD Ryzen 7 PRO 7840HS (14693 - 14742, n=2) | |
| Lenovo ThinkPad P15v G3 21EM001AGE | |
| Asus ExpertBook B6 Flip B6602FC2 | |
| Lenovo ThinkPad P1 G6-21FV000DGE | |
| HP ZBook Power 15 G9 6B8C4EA | |
| AIDA64 / FPU Mandel | |
| HP ZBook Power 15 G10 | |
| Gemiddeld AMD Ryzen 7 PRO 7840HS (57502 - 58181, n=2) | |
| Lenovo ThinkPad P15v G3 21EM001AGE | |
| Lenovo ThinkPad P1 G6-21FV000DGE | |
| Asus ExpertBook B6 Flip B6602FC2 | |
| HP ZBook Power 15 G9 6B8C4EA | |
| AIDA64 / CPU AES | |
| Lenovo ThinkPad P15v G3 21EM001AGE | |
| HP ZBook Power 15 G10 | |
| Gemiddeld AMD Ryzen 7 PRO 7840HS (84454 - 85341, n=2) | |
| Lenovo ThinkPad P1 G6-21FV000DGE | |
| Asus ExpertBook B6 Flip B6602FC2 | |
| HP ZBook Power 15 G9 6B8C4EA | |
| AIDA64 / CPU ZLib | |
| Lenovo ThinkPad P1 G6-21FV000DGE | |
| HP ZBook Power 15 G10 | |
| Gemiddeld AMD Ryzen 7 PRO 7840HS (1032 - 1043, n=2) | |
| Asus ExpertBook B6 Flip B6602FC2 | |
| HP ZBook Power 15 G9 6B8C4EA | |
| Lenovo ThinkPad P15v G3 21EM001AGE | |
| Dell Precision 5000 5560 | |
| AIDA64 / FP64 Ray-Trace | |
| HP ZBook Power 15 G10 | |
| Gemiddeld AMD Ryzen 7 PRO 7840HS (13545 - 13800, n=2) | |
| Lenovo ThinkPad P1 G6-21FV000DGE | |
| Asus ExpertBook B6 Flip B6602FC2 | |
| Lenovo ThinkPad P15v G3 21EM001AGE | |
| HP ZBook Power 15 G9 6B8C4EA | |
| AIDA64 / CPU PhotoWorxx | |
| HP ZBook Power 15 G10 | |
| HP ZBook Power 15 G9 6B8C4EA | |
| Asus ExpertBook B6 Flip B6602FC2 | |
| Gemiddeld AMD Ryzen 7 PRO 7840HS (24325 - 42810, n=2) | |
| Lenovo ThinkPad P1 G6-21FV000DGE | |
| Lenovo ThinkPad P15v G3 21EM001AGE | |
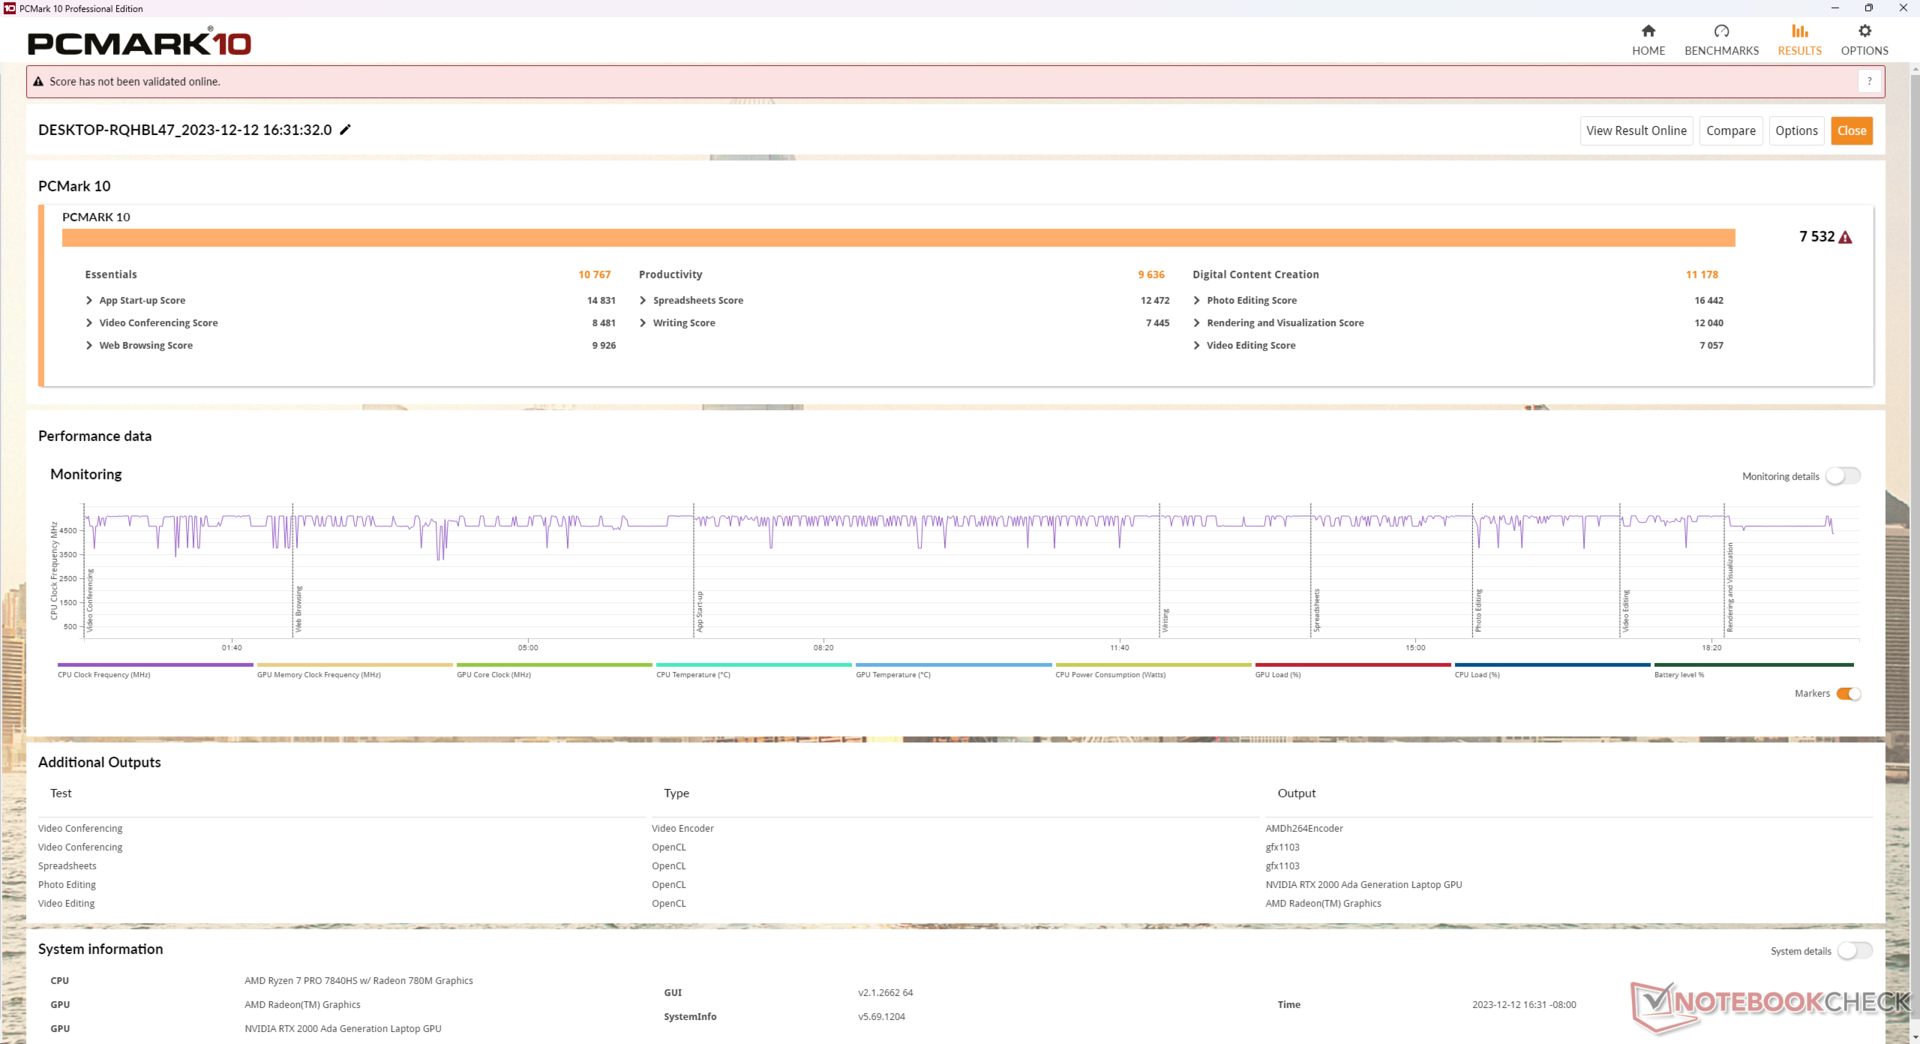
Systeemprestaties
De PCMark resultaten zijn uitstekend met scores die constant hoger zijn dan die van andere werkstations die op de oudere Nvidia RTX A2000 draaien, waaronder de ZBook Power 15 G9. Het snelle 5600 MHz RAM is ook een hoogtepunt, zoals blijkt uit de hoge AIDA64 geheugenscores.
CrossMark: Overall | Productivity | Creativity | Responsiveness
WebXPRT 3: Overall
WebXPRT 4: Overall
Mozilla Kraken 1.1: Total
| PCMark 10 / Score | |
| HP ZBook Power 15 G10 | |
| Gemiddeld AMD Ryzen 7 PRO 7840HS, NVIDIA RTX 2000 Ada Generation Laptop (n=1) | |
| Lenovo ThinkPad P1 G6-21FV000DGE | |
| Asus ExpertBook B6 Flip B6602FC2 | |
| Dell Precision 5000 5560 | |
| Lenovo ThinkPad P15v G3 21EM001AGE | |
| HP ZBook Power 15 G9 6B8C4EA | |
| PCMark 10 / Essentials | |
| Lenovo ThinkPad P1 G6-21FV000DGE | |
| Asus ExpertBook B6 Flip B6602FC2 | |
| HP ZBook Power 15 G10 | |
| Gemiddeld AMD Ryzen 7 PRO 7840HS, NVIDIA RTX 2000 Ada Generation Laptop (n=1) | |
| Dell Precision 5000 5560 | |
| Lenovo ThinkPad P15v G3 21EM001AGE | |
| HP ZBook Power 15 G9 6B8C4EA | |
| PCMark 10 / Productivity | |
| Asus ExpertBook B6 Flip B6602FC2 | |
| Lenovo ThinkPad P1 G6-21FV000DGE | |
| HP ZBook Power 15 G10 | |
| Gemiddeld AMD Ryzen 7 PRO 7840HS, NVIDIA RTX 2000 Ada Generation Laptop (n=1) | |
| Dell Precision 5000 5560 | |
| Lenovo ThinkPad P15v G3 21EM001AGE | |
| HP ZBook Power 15 G9 6B8C4EA | |
| PCMark 10 / Digital Content Creation | |
| HP ZBook Power 15 G10 | |
| Gemiddeld AMD Ryzen 7 PRO 7840HS, NVIDIA RTX 2000 Ada Generation Laptop (n=1) | |
| Lenovo ThinkPad P1 G6-21FV000DGE | |
| Asus ExpertBook B6 Flip B6602FC2 | |
| Lenovo ThinkPad P15v G3 21EM001AGE | |
| HP ZBook Power 15 G9 6B8C4EA | |
| Dell Precision 5000 5560 | |
| CrossMark / Overall | |
| Asus ExpertBook B6 Flip B6602FC2 | |
| Lenovo ThinkPad P1 G6-21FV000DGE | |
| HP ZBook Power 15 G9 6B8C4EA | |
| HP ZBook Power 15 G10 | |
| Gemiddeld AMD Ryzen 7 PRO 7840HS, NVIDIA RTX 2000 Ada Generation Laptop (n=1) | |
| Lenovo ThinkPad P15v G3 21EM001AGE | |
| CrossMark / Productivity | |
| Asus ExpertBook B6 Flip B6602FC2 | |
| Lenovo ThinkPad P1 G6-21FV000DGE | |
| HP ZBook Power 15 G10 | |
| Gemiddeld AMD Ryzen 7 PRO 7840HS, NVIDIA RTX 2000 Ada Generation Laptop (n=1) | |
| HP ZBook Power 15 G9 6B8C4EA | |
| Lenovo ThinkPad P15v G3 21EM001AGE | |
| CrossMark / Creativity | |
| Asus ExpertBook B6 Flip B6602FC2 | |
| Lenovo ThinkPad P1 G6-21FV000DGE | |
| HP ZBook Power 15 G9 6B8C4EA | |
| HP ZBook Power 15 G10 | |
| Gemiddeld AMD Ryzen 7 PRO 7840HS, NVIDIA RTX 2000 Ada Generation Laptop (n=1) | |
| Lenovo ThinkPad P15v G3 21EM001AGE | |
| CrossMark / Responsiveness | |
| Asus ExpertBook B6 Flip B6602FC2 | |
| Lenovo ThinkPad P1 G6-21FV000DGE | |
| HP ZBook Power 15 G9 6B8C4EA | |
| HP ZBook Power 15 G10 | |
| Gemiddeld AMD Ryzen 7 PRO 7840HS, NVIDIA RTX 2000 Ada Generation Laptop (n=1) | |
| Lenovo ThinkPad P15v G3 21EM001AGE | |
| WebXPRT 3 / Overall | |
| Lenovo ThinkPad P1 G6-21FV000DGE | |
| HP ZBook Power 15 G10 | |
| Gemiddeld AMD Ryzen 7 PRO 7840HS, NVIDIA RTX 2000 Ada Generation Laptop (n=1) | |
| Asus ExpertBook B6 Flip B6602FC2 | |
| HP ZBook Power 15 G9 6B8C4EA | |
| Dell Precision 5000 5560 | |
| Lenovo ThinkPad P15v G3 21EM001AGE | |
| WebXPRT 4 / Overall | |
| Lenovo ThinkPad P1 G6-21FV000DGE | |
| Asus ExpertBook B6 Flip B6602FC2 | |
| HP ZBook Power 15 G9 6B8C4EA | |
| HP ZBook Power 15 G10 | |
| Gemiddeld AMD Ryzen 7 PRO 7840HS, NVIDIA RTX 2000 Ada Generation Laptop (n=1) | |
| Lenovo ThinkPad P15v G3 21EM001AGE | |
| Mozilla Kraken 1.1 / Total | |
| Lenovo ThinkPad P15v G3 21EM001AGE | |
| Dell Precision 5000 5560 | |
| HP ZBook Power 15 G10 | |
| Gemiddeld AMD Ryzen 7 PRO 7840HS, NVIDIA RTX 2000 Ada Generation Laptop (n=1) | |
| HP ZBook Power 15 G9 6B8C4EA | |
| Asus ExpertBook B6 Flip B6602FC2 | |
| Lenovo ThinkPad P1 G6-21FV000DGE | |
* ... kleiner is beter
| PCMark 10 Score | 7532 punten | |
Help | ||
| AIDA64 / Memory Copy | |
| HP ZBook Power 15 G10 | |
| HP ZBook Power 15 G9 6B8C4EA | |
| Asus ExpertBook B6 Flip B6602FC2 | |
| Gemiddeld AMD Ryzen 7 PRO 7840HS (34323 - 67943, n=2) | |
| Lenovo ThinkPad P1 G6-21FV000DGE | |
| Lenovo ThinkPad P15v G3 21EM001AGE | |
| AIDA64 / Memory Read | |
| HP ZBook Power 15 G9 6B8C4EA | |
| HP ZBook Power 15 G10 | |
| Asus ExpertBook B6 Flip B6602FC2 | |
| Gemiddeld AMD Ryzen 7 PRO 7840HS (30787 - 61660, n=2) | |
| Lenovo ThinkPad P1 G6-21FV000DGE | |
| Lenovo ThinkPad P15v G3 21EM001AGE | |
| AIDA64 / Memory Write | |
| HP ZBook Power 15 G10 | |
| HP ZBook Power 15 G9 6B8C4EA | |
| Gemiddeld AMD Ryzen 7 PRO 7840HS (39362 - 83167, n=2) | |
| Asus ExpertBook B6 Flip B6602FC2 | |
| Lenovo ThinkPad P1 G6-21FV000DGE | |
| Lenovo ThinkPad P15v G3 21EM001AGE | |
| AIDA64 / Memory Latency | |
| Gemiddeld AMD Ryzen 7 PRO 7840HS (99.6 - 101.2, n=2) | |
| HP ZBook Power 15 G10 | |
| Lenovo ThinkPad P15v G3 21EM001AGE | |
| Asus ExpertBook B6 Flip B6602FC2 | |
| HP ZBook Power 15 G9 6B8C4EA | |
| Lenovo ThinkPad P1 G6-21FV000DGE | |
* ... kleiner is beter
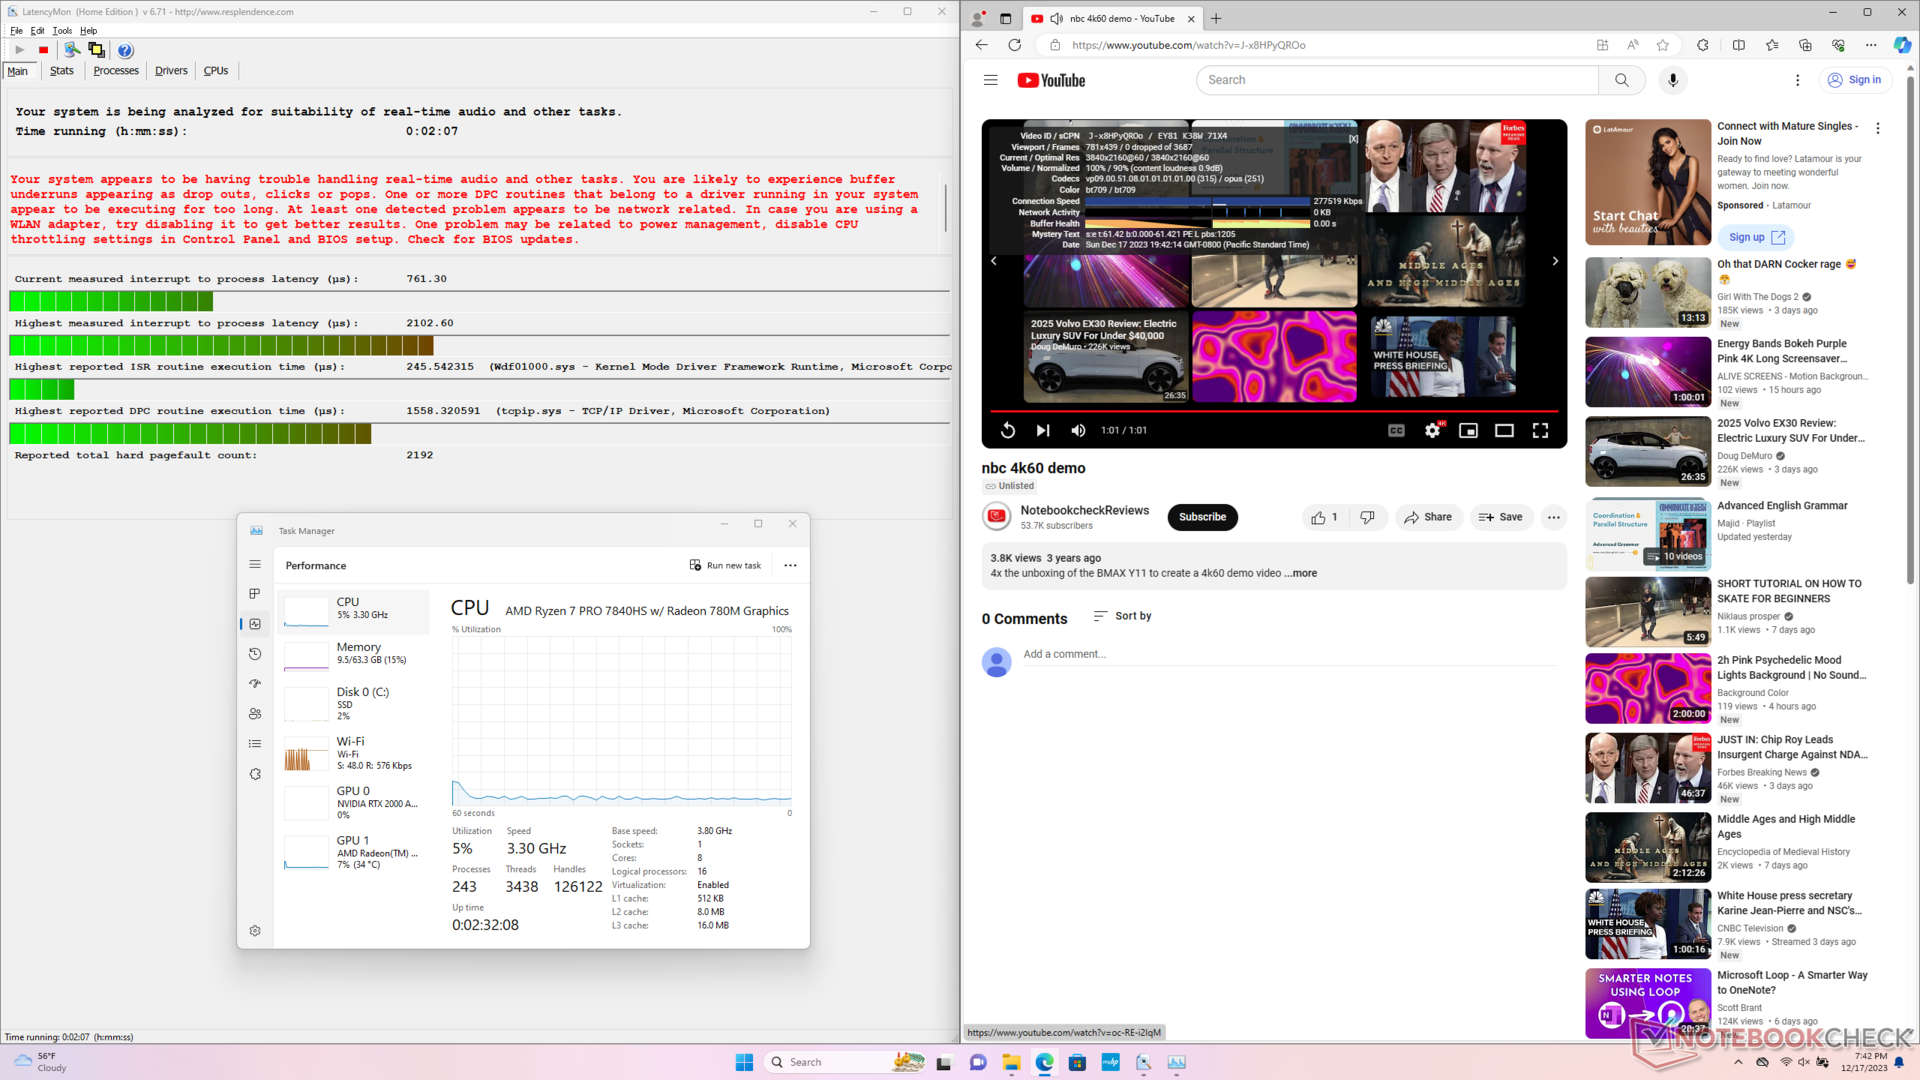
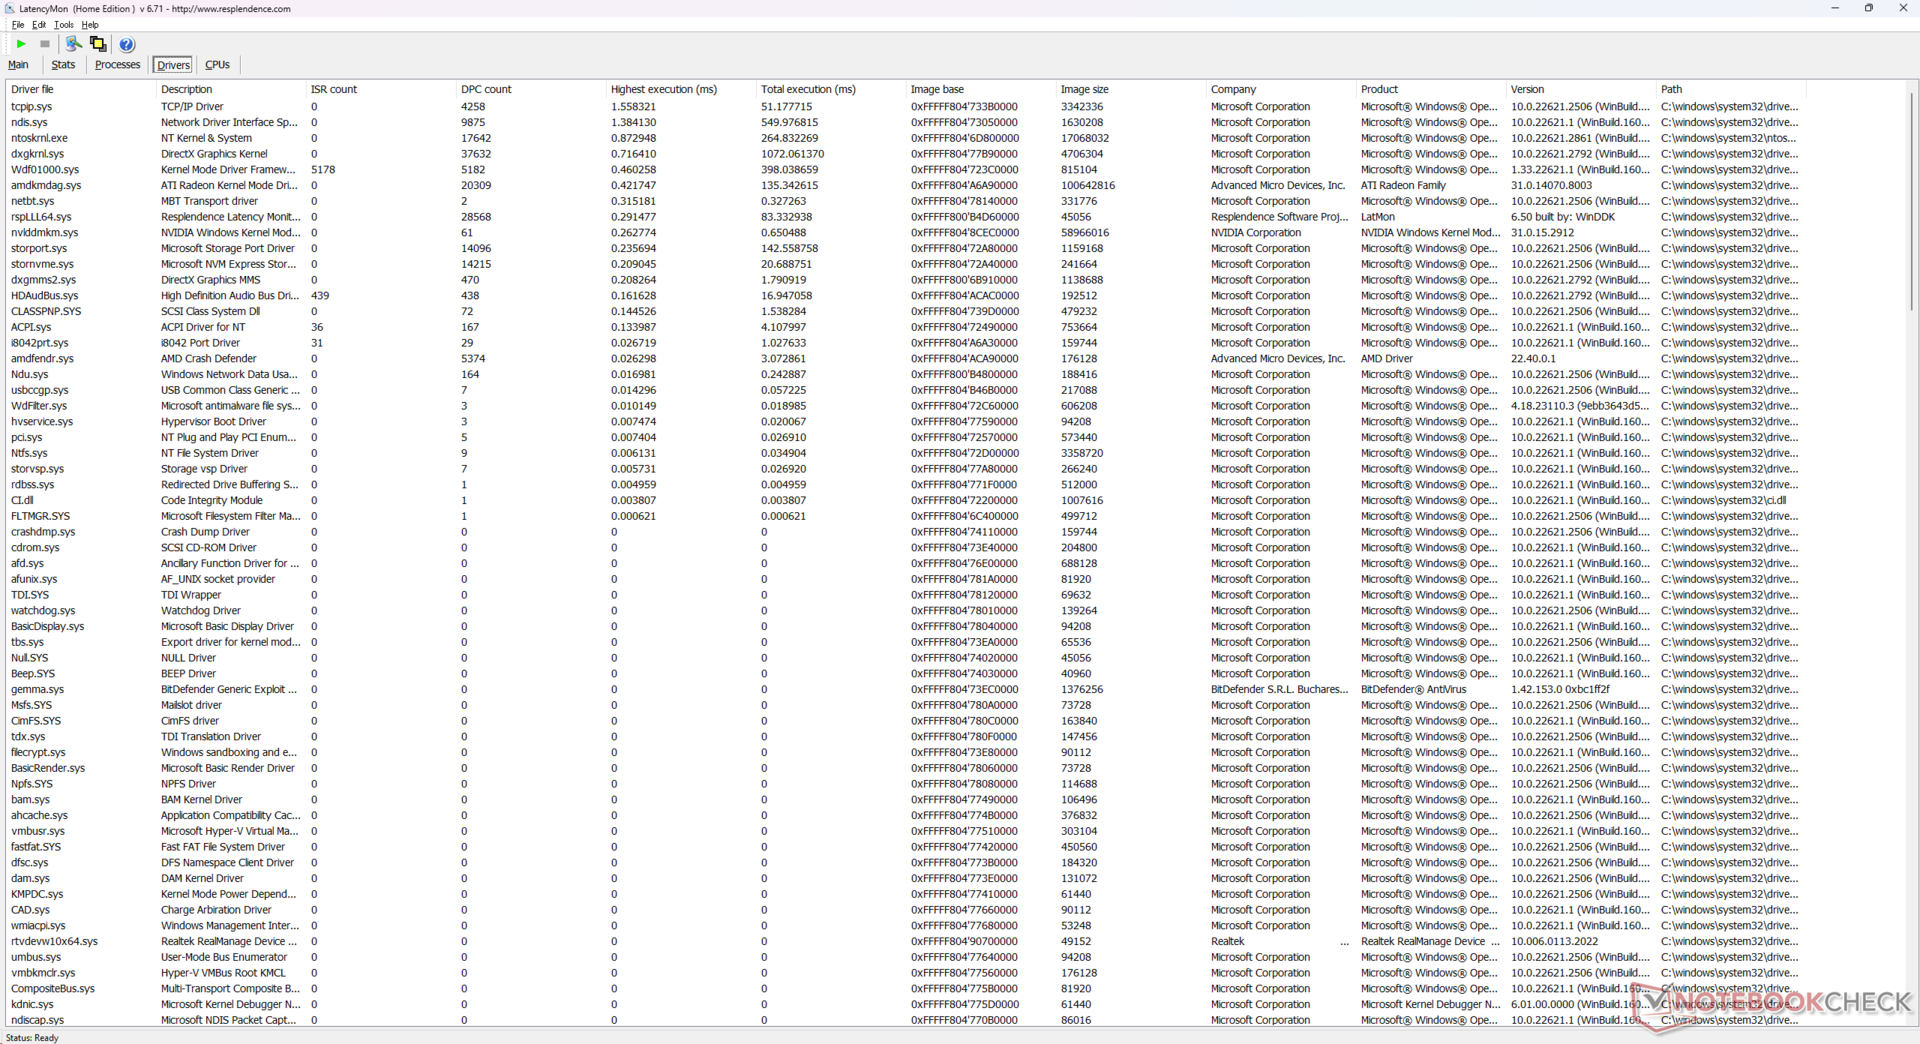
DPC latentie
LatencyMon onthult DPC-problemen bij het openen van meerdere browsertabbladen van onze startpagina. het afspelen van 4K-video's met 60 FPS verloopt verder perfect, zonder dropped frames.
| DPC Latencies / LatencyMon - interrupt to process latency (max), Web, Youtube, Prime95 | |
| Lenovo ThinkPad P1 G6-21FV000DGE | |
| Asus ExpertBook B6 Flip B6602FC2 | |
| HP ZBook Power 15 G10 | |
| HP ZBook Power 15 G9 6B8C4EA | |
| Dell Precision 5000 5560 | |
| Lenovo ThinkPad P15v G3 21EM001AGE | |
* ... kleiner is beter
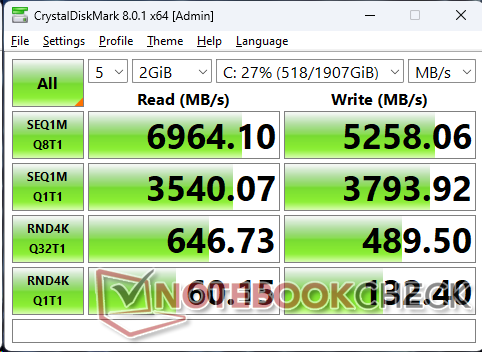
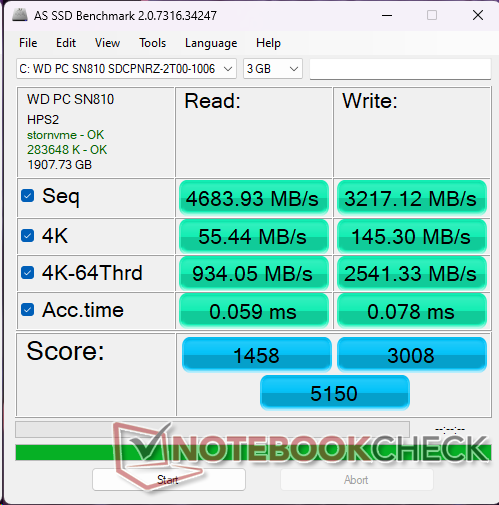
Opslagapparaten
Ons apparaat is geconfigureerd met de WDC PC SN810 in plaats van de Samsung PM9A1 van het model van vorig jaar. Over het algemeen is de WDC schijf langzamer dan de Samsung als het gaat om het lezen en schrijven van kleine 4K blokken met een hoge wachtrijdiepte. HP biedt kopers de mogelijkheid om te configureren met SED of niet-SED schijven, maar HP vermeldt niet expliciet om welke SSD-merken het gaat.

* ... kleiner is beter
Disk Throttling: DiskSpd Read Loop, Queue Depth 8
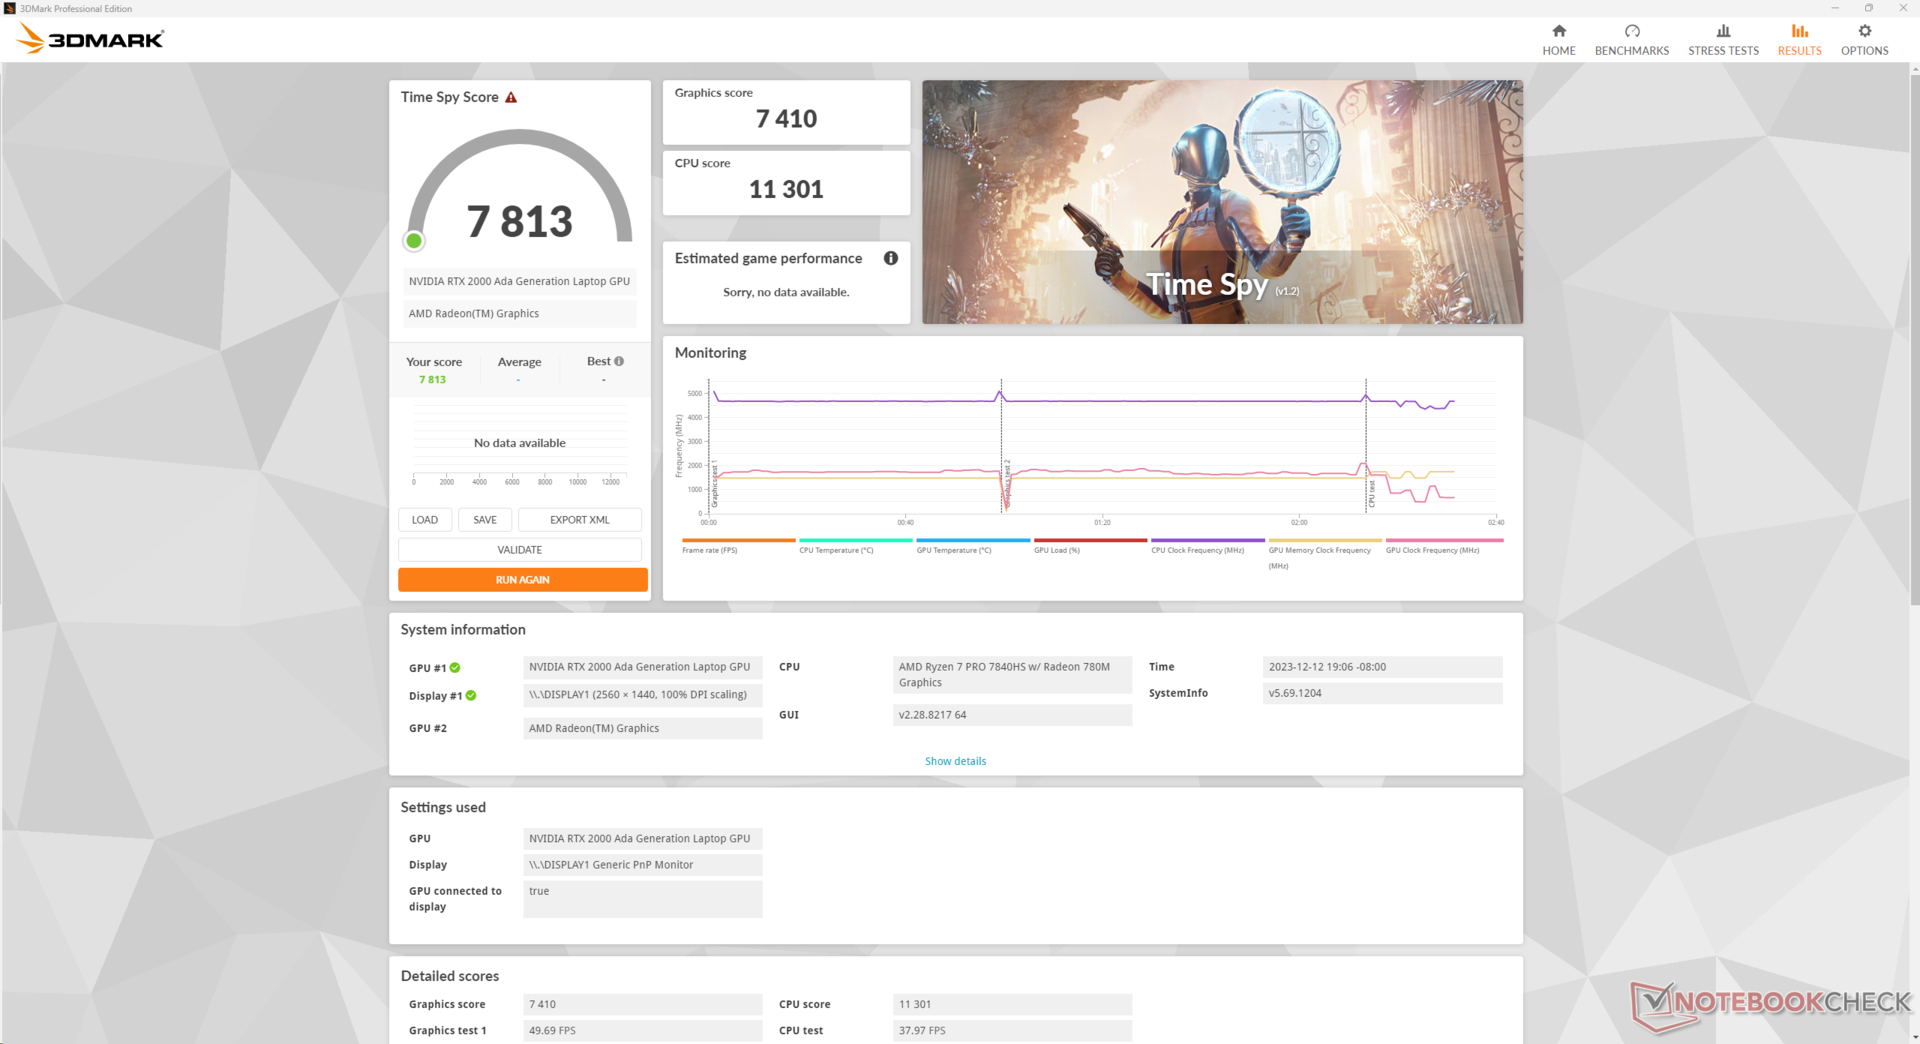
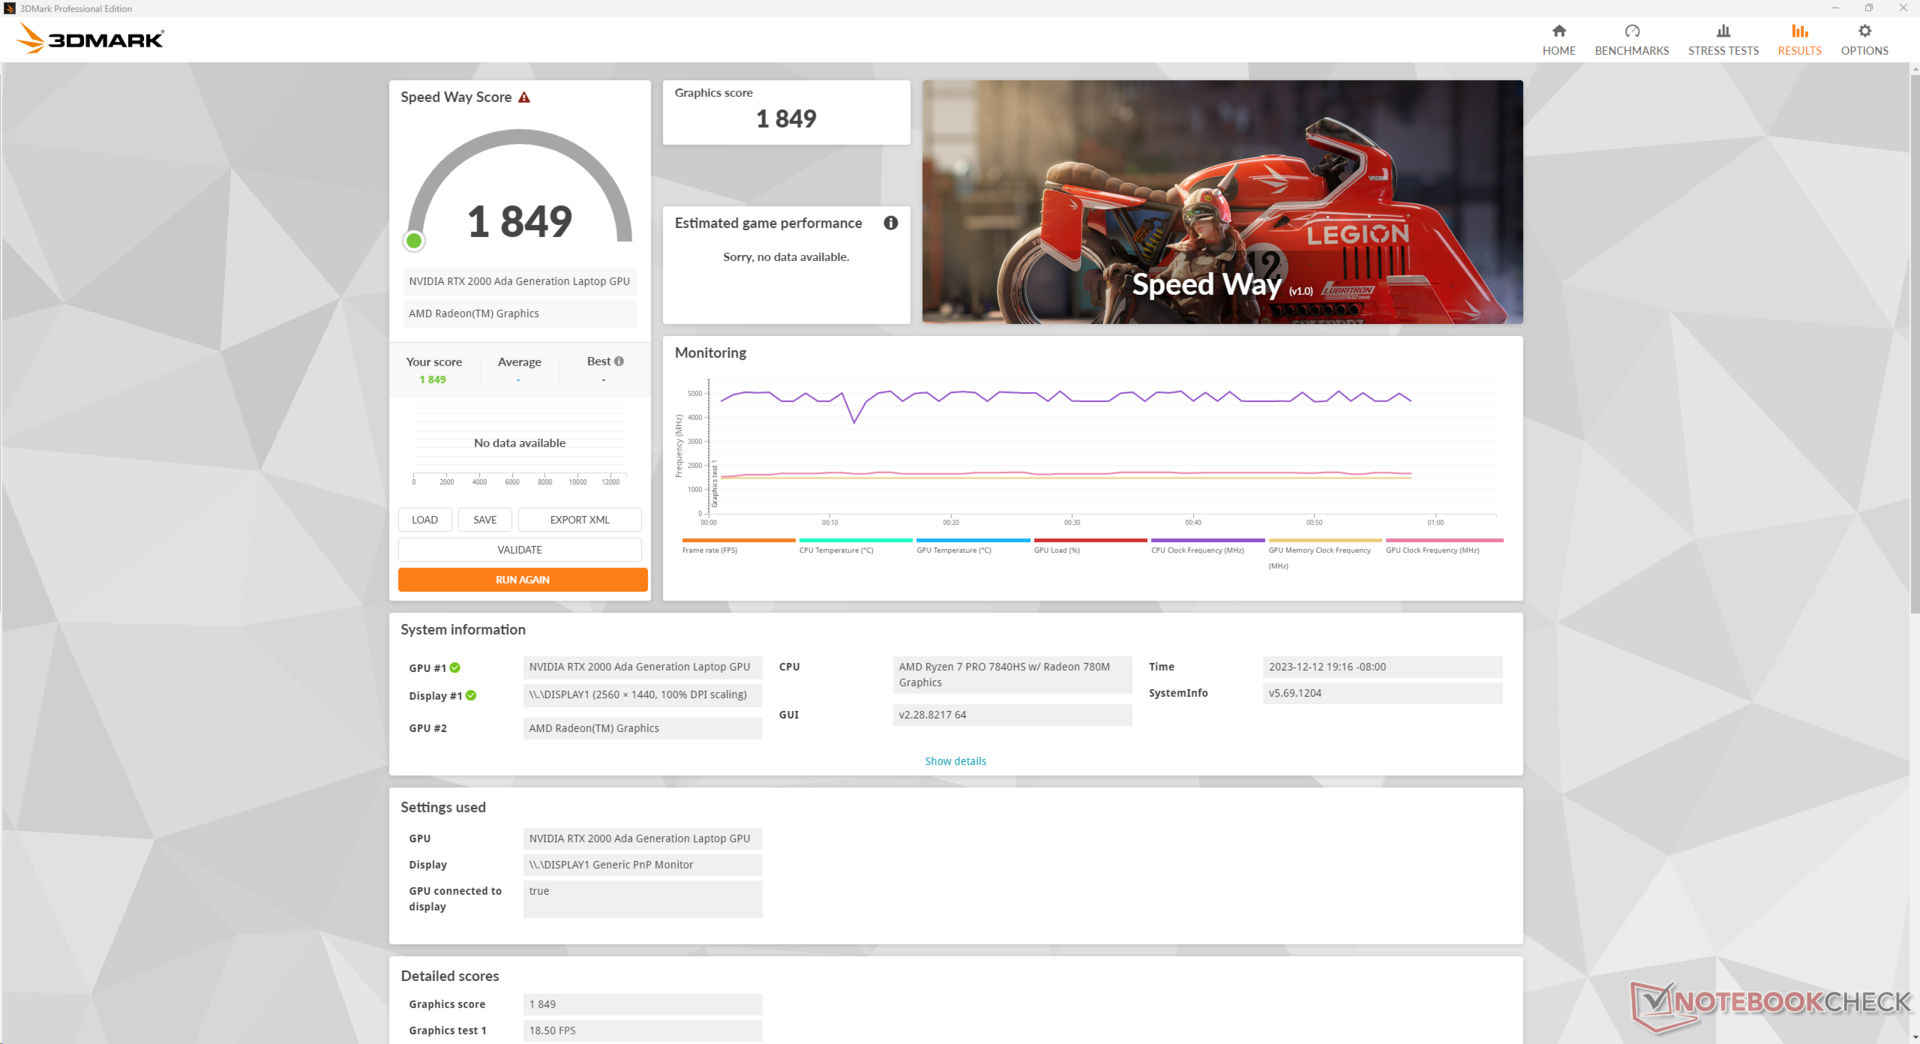
GPU-prestaties
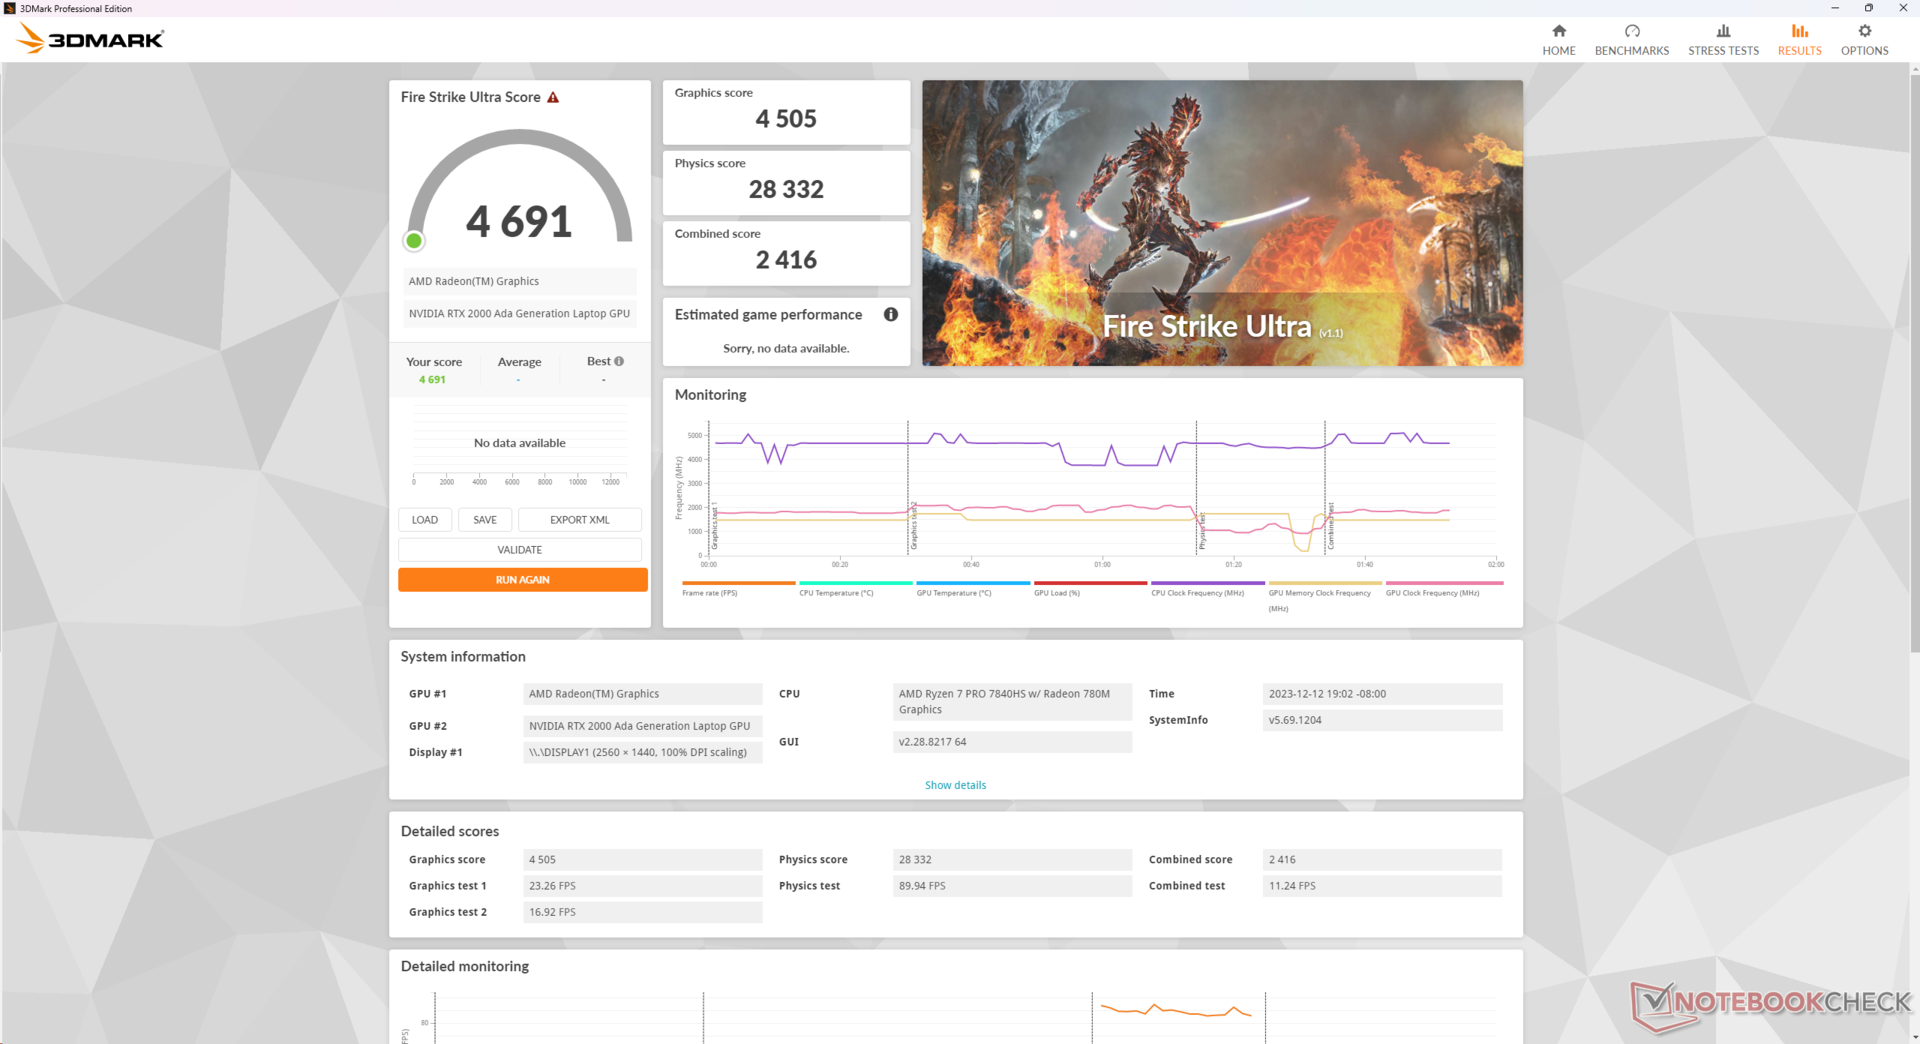
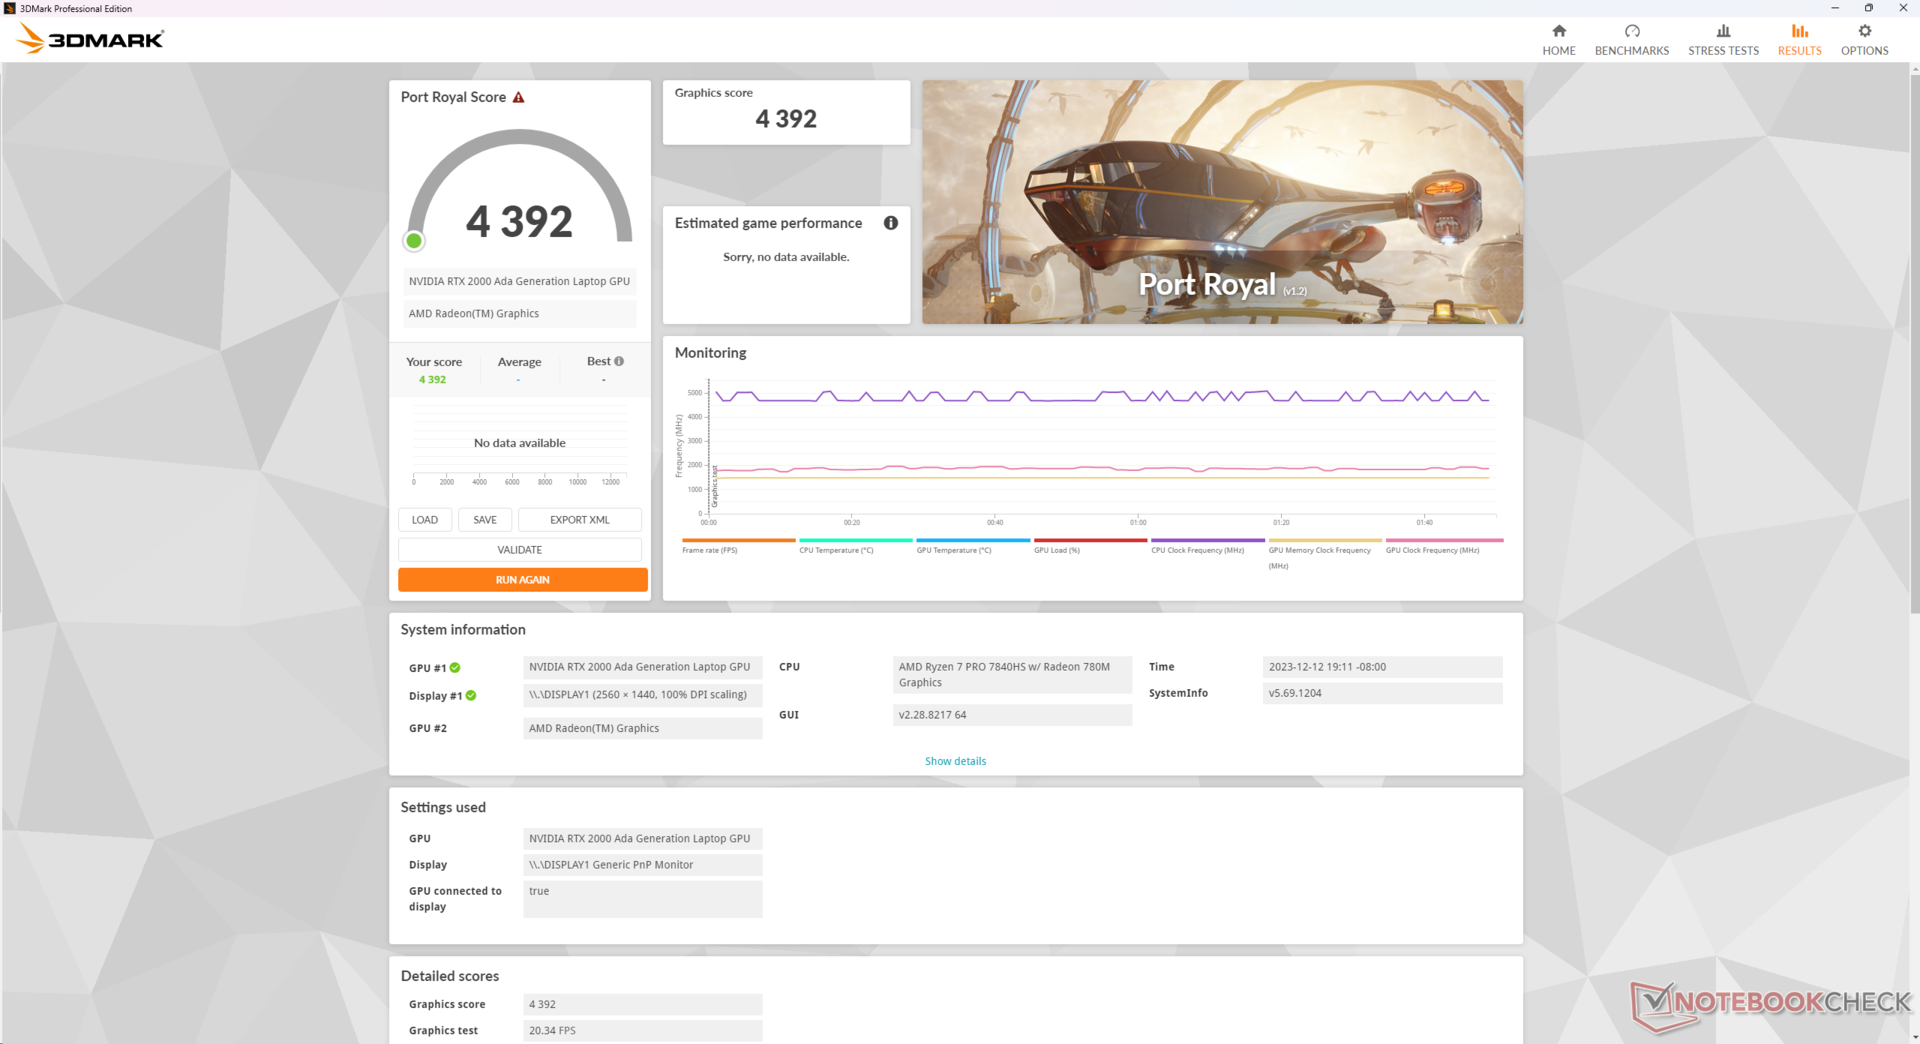
De Nvidia RTX 2000 Ada is een duidelijke upgrade ten opzichte van de RTX A2000 in de ZBook Power 15 G9 van vorig jaar en een belangrijke reden om het nieuwere G10-model te verkiezen boven de vorige versie. Het ruwe grafische vermogen is ruwweg 55 tot 65 procent sneller en SpecViewPerf resultaten zijn ook consistent hoger.
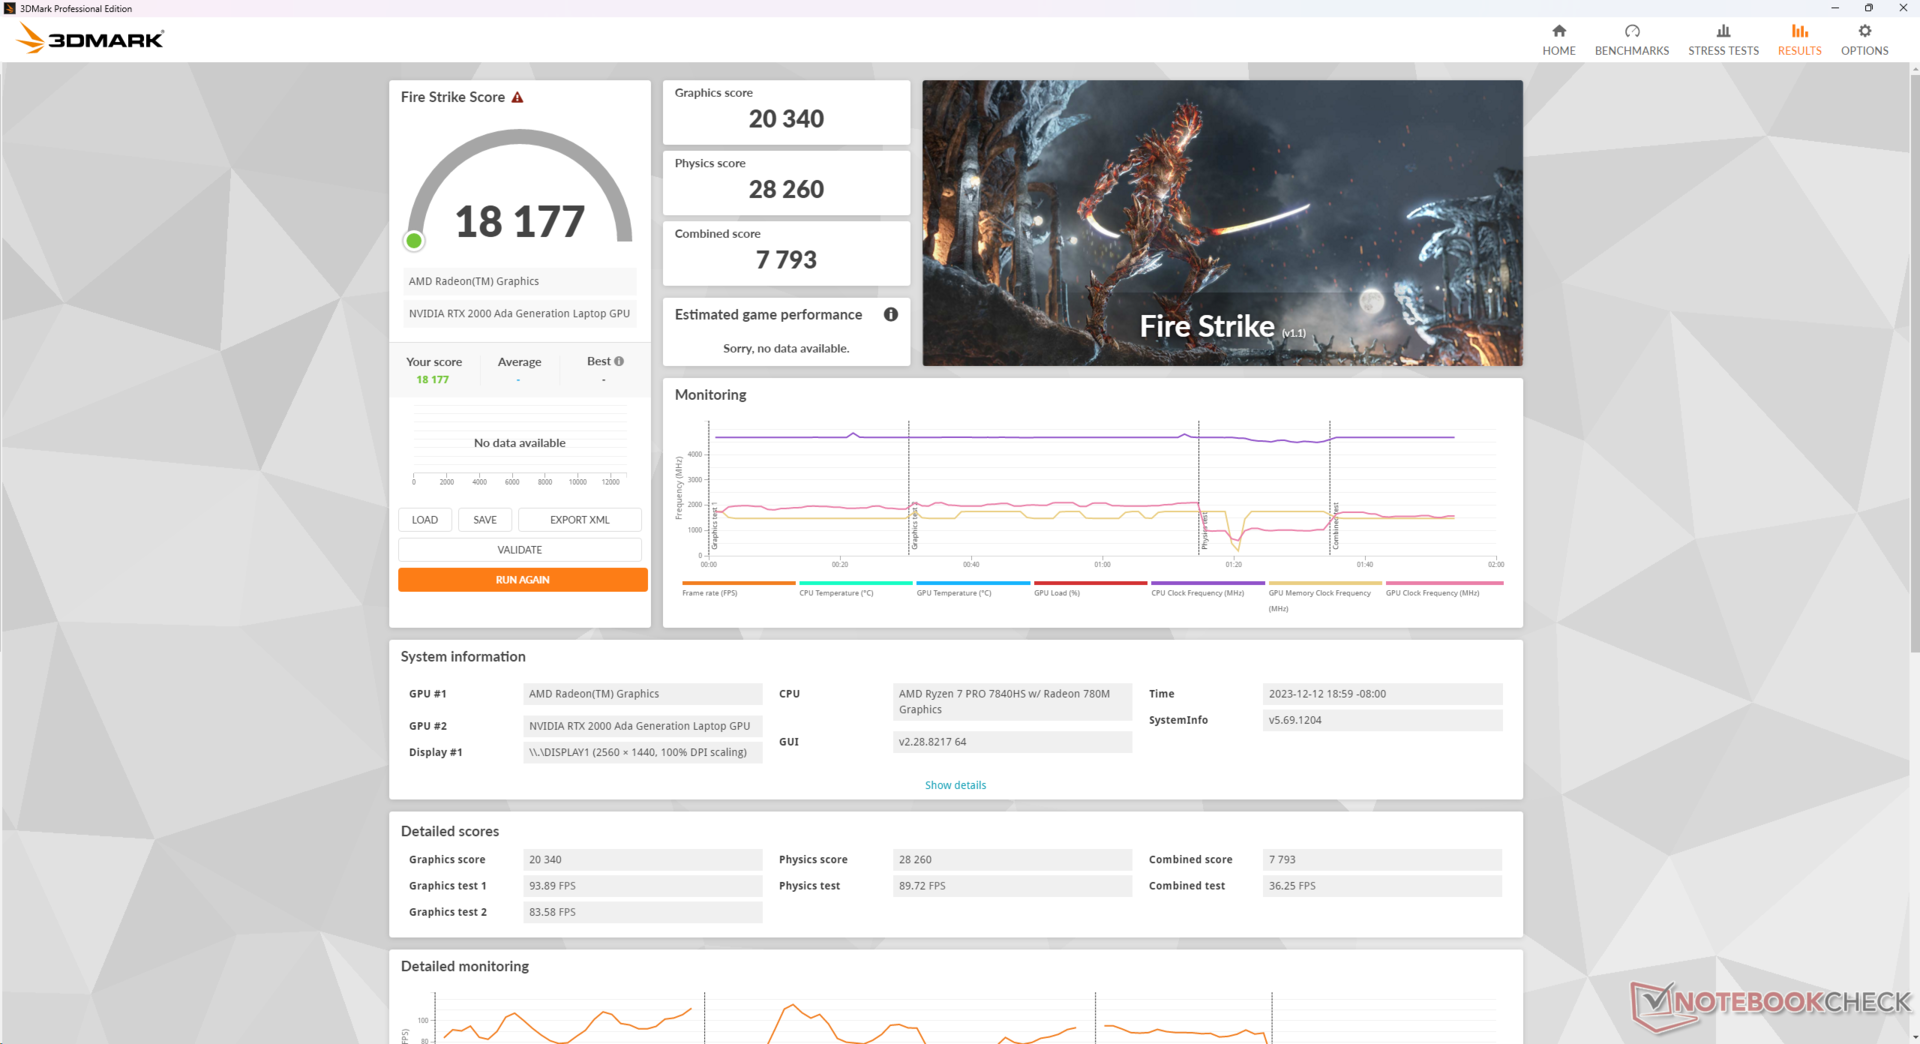
Het draaien in de Balanced modus in plaats van de Performance modus lijkt geen invloed te hebben op de CPU- of GPU-prestaties, zoals blijkt uit onze onderstaande Fire Strike resultaten. Als u echter op batterijvoeding werkt, nemen de prestaties aanzienlijk af, zelfs als u de modus Prestaties gebruikt.
| Energieprofiel | Fysieke Score | Grafische Score | Gecombineerde Score |
| Prestatiemodus (op hoofdtaak) | 28260 | 20340 | 7793 |
| Gebalanceerde modus (op netstroom) | 27579 (-0%) | 20812 (-0%) | 7877 (-0%) |
| Prestatiemodus (op batterij) | 6105 (-78%) | 12744 (-37%) | 2392 (-69%) |
Vervelend genoeg biedt HP de RTX 3000 Ada GPU alleen aan voor Intel-configuraties van de ZBook Power 15 G10, terwijl AMD-configuraties beperkt zijn tot de RTX 2000 Ada. De 3000 Ada GPU biedt ruwweg 5 tot 15 procent snellere prestaties dan de 2000 Ada, gebaseerd op onze tijd met de kleinere Dell Precision 5480.
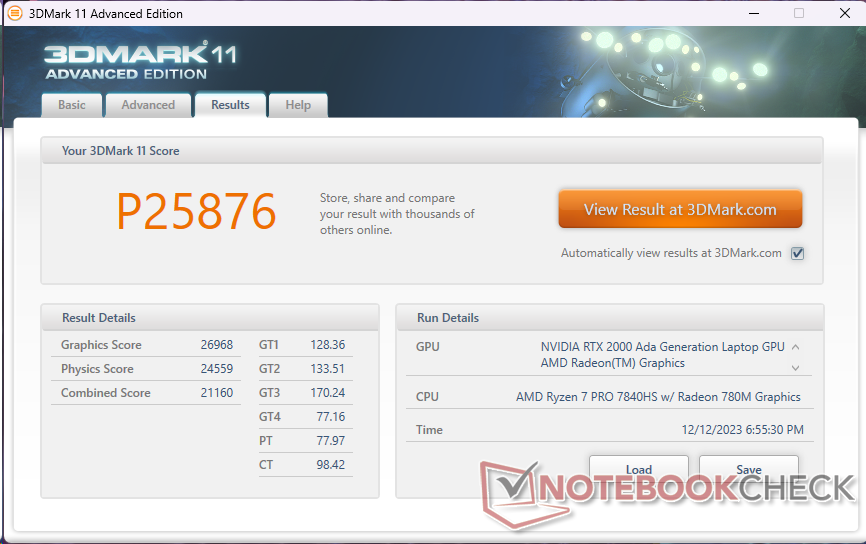
| 3DMark 11 Performance | 25876 punten | |
| 3DMark Fire Strike Score | 18177 punten | |
| 3DMark Time Spy Score | 7813 punten | |
Help | ||
* ... kleiner is beter
Gaming prestaties
De algemene gamingprestaties lijken het meest op die van de GeForce RTX 4050 hoewel de 2000 Ada meer verenigde pijplijnen, TMU's, VRAM en een grotere geheugenbandbreedte heeft. Veeleisende games zoals Cyberpunk 2077 zijn speelbaar op 1080p en Extreme instellingen, maar lagere instellingen zijn vereist als u op de native 1440p resolutie speelt.
| Cyberpunk 2077 | |
| 1920x1080 Low Preset (FSR off) | |
| HP ZBook Power 15 G10 | |
| Gemiddeld NVIDIA RTX 2000 Ada Generation Laptop (81.1 - 85.4, n=2) | |
| Lenovo ThinkPad Z16 Gen 2 | |
| 1920x1080 Medium Preset (FSR off) | |
| HP ZBook Power 15 G10 | |
| Gemiddeld NVIDIA RTX 2000 Ada Generation Laptop (61.4 - 64.5, n=2) | |
| Lenovo ThinkPad Z16 Gen 2 | |
| 1920x1080 High Preset (FSR off) | |
| HP ZBook Power 15 G10 | |
| Gemiddeld NVIDIA RTX 2000 Ada Generation Laptop (51.7 - 55.2, n=2) | |
| Lenovo ThinkPad Z16 Gen 2 | |
| 1920x1080 Ultra Preset (FSR off) | |
| HP ZBook Power 15 G10 | |
| Gemiddeld NVIDIA RTX 2000 Ada Generation Laptop (44.8 - 48.3, n=2) | |
| Lenovo ThinkPad Z16 Gen 2 | |
| 2560x1440 Ultra Preset (FSR off) | |
| HP ZBook Power 15 G10 | |
| Gemiddeld NVIDIA RTX 2000 Ada Generation Laptop (29.7 - 29.9, n=2) | |
| Lenovo ThinkPad Z16 Gen 2 | |
| 1920x1080 Ray Tracing Ultra Preset (DLSS off) | |
| HP ZBook Power 15 G10 | |
| Gemiddeld NVIDIA RTX 2000 Ada Generation Laptop (19.2 - 21.6, n=2) | |
| Lenovo ThinkPad Z16 Gen 2 | |
Witcher 3 FPS Chart
| lage | gem. | hoge | ultra | QHD | |
|---|---|---|---|---|---|
| GTA V (2015) | 178.1 | 170.6 | 157.7 | 86.2 | 60.6 |
| The Witcher 3 (2015) | 336.4 | 219 | 127.9 | 65.5 | |
| Dota 2 Reborn (2015) | 155 | 140.8 | 136.9 | 132 | |
| Final Fantasy XV Benchmark (2018) | 173.3 | 93.5 | 67.7 | 50.3 | |
| X-Plane 11.11 (2018) | 80.6 | 73 | 52.5 | ||
| Far Cry 5 (2018) | 151 | 110 | 102 | 95 | 63 |
| Strange Brigade (2018) | 332 | 183 | 148.4 | 132.5 | 94.1 |
| Tiny Tina's Wonderlands (2022) | 119.8 | 110.5 | 77.3 | 62.3 | 43.5 |
| F1 22 (2022) | 166.7 | 151.8 | 119.9 | 44.2 | 28.9 |
| Cyberpunk 2077 (2023) | 85.4 | 64.5 | 55.2 | 48.3 | 29.9 |
Uitstoot
Systeemgeluid
Het ventilatorgeluid is in wezen identiek aan dat van het model van vorig jaar, met vergelijkbare minima en maxima ondanks de prestatieverschillen. Voor wat het waard is, de interne ventilatoren van onze G10-eenheid zijn in staat om iets langer stiller te blijven dan op onze G9-eenheid tijdens het uitvoeren van 3DMark 06, maar dit is natuurlijk afhankelijk van de begintemperatuur.
Ventilatorgeluid tijdens het draaien Witcher 3 blijft hetzelfde tussen de Balanced en Performance modi, wat overeenkomt met onze testresultaten die minimale verschillen tussen de twee energieprofielen laten zien.
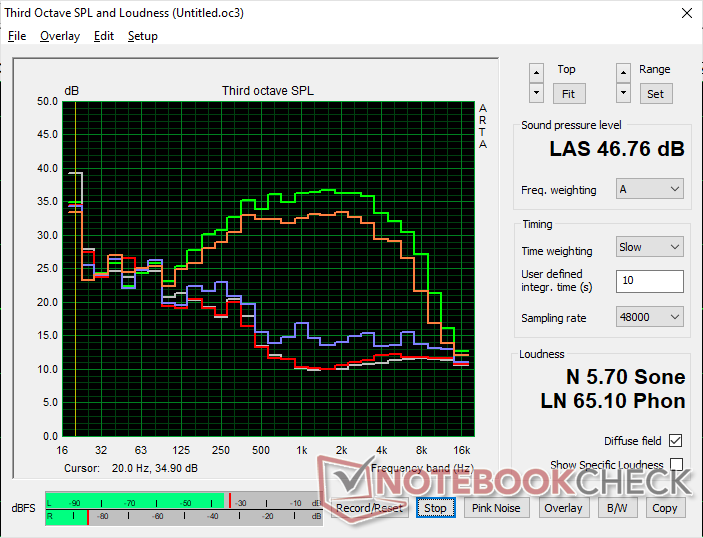
Geluidsniveau
| Onbelast |
| 24.4 / 24.4 / 24.4 dB (A) |
| Belasting |
| 27.4 / 46.8 dB (A) |
 | ||
30 dB stil 40 dB(A) hoorbaar 50 dB(A) luid |
||
min: | ||
| HP ZBook Power 15 G10 RTX 2000 Ada Generation Laptop, R7 PRO 7840HS, WDC PC SN810 2TB | HP ZBook Power 15 G9 6B8C4EA RTX A2000 Laptop GPU, i7-12700H, Samsung PM9A1 MZVL21T0HCLR | Lenovo ThinkPad P15v G3 21EM001AGE RTX A2000 Laptop GPU, R7 PRO 6850H, SK Hynix PC711 1TB HFS001TDE9X081N | Dell Precision 5000 5560 RTX A2000 Laptop GPU, i7-11850H, Samsung PM9A1 MZVL22T0HBLB | Lenovo ThinkPad P1 G6-21FV000DGE RTX 2000 Ada Generation Laptop, i9-13900H, SK Hynix PC711 1TB HFS001TDE9X084N | Asus ExpertBook B6 Flip B6602FC2 RTX A2000 Laptop GPU, i9-12950HX, Samsung PM9A1 MZVL21T0HCLR | |
|---|---|---|---|---|---|---|
| Noise | -8% | 3% | 5% | -10% | -34% | |
| uit / omgeving * (dB) | 24.2 | 23.8 2% | 23.2 4% | 23.4 3% | 24.5 -1% | 26 -7% |
| Idle Minimum * (dB) | 24.4 | 23.8 2% | 23.2 5% | 23.6 3% | 24.5 -0% | 32.4 -33% |
| Idle Average * (dB) | 24.4 | 23.8 2% | 23.2 5% | 23.6 3% | 24.5 -0% | 32.4 -33% |
| Idle Maximum * (dB) | 24.4 | 23.8 2% | 23.2 5% | 23.6 3% | 24.5 -0% | 32.4 -33% |
| Load Average * (dB) | 27.4 | 42.9 -57% | 35 -28% | 25.8 6% | 48 -75% | 51.9 -89% |
| Witcher 3 ultra * (dB) | 43.3 | 44.5 -3% | 37.9 12% | 40.1 7% | 40.7 6% | |
| Load Maximum * (dB) | 46.8 | 47.9 -2% | 37.5 20% | 41.4 12% | 48 -3% | 52.1 -11% |
* ... kleiner is beter
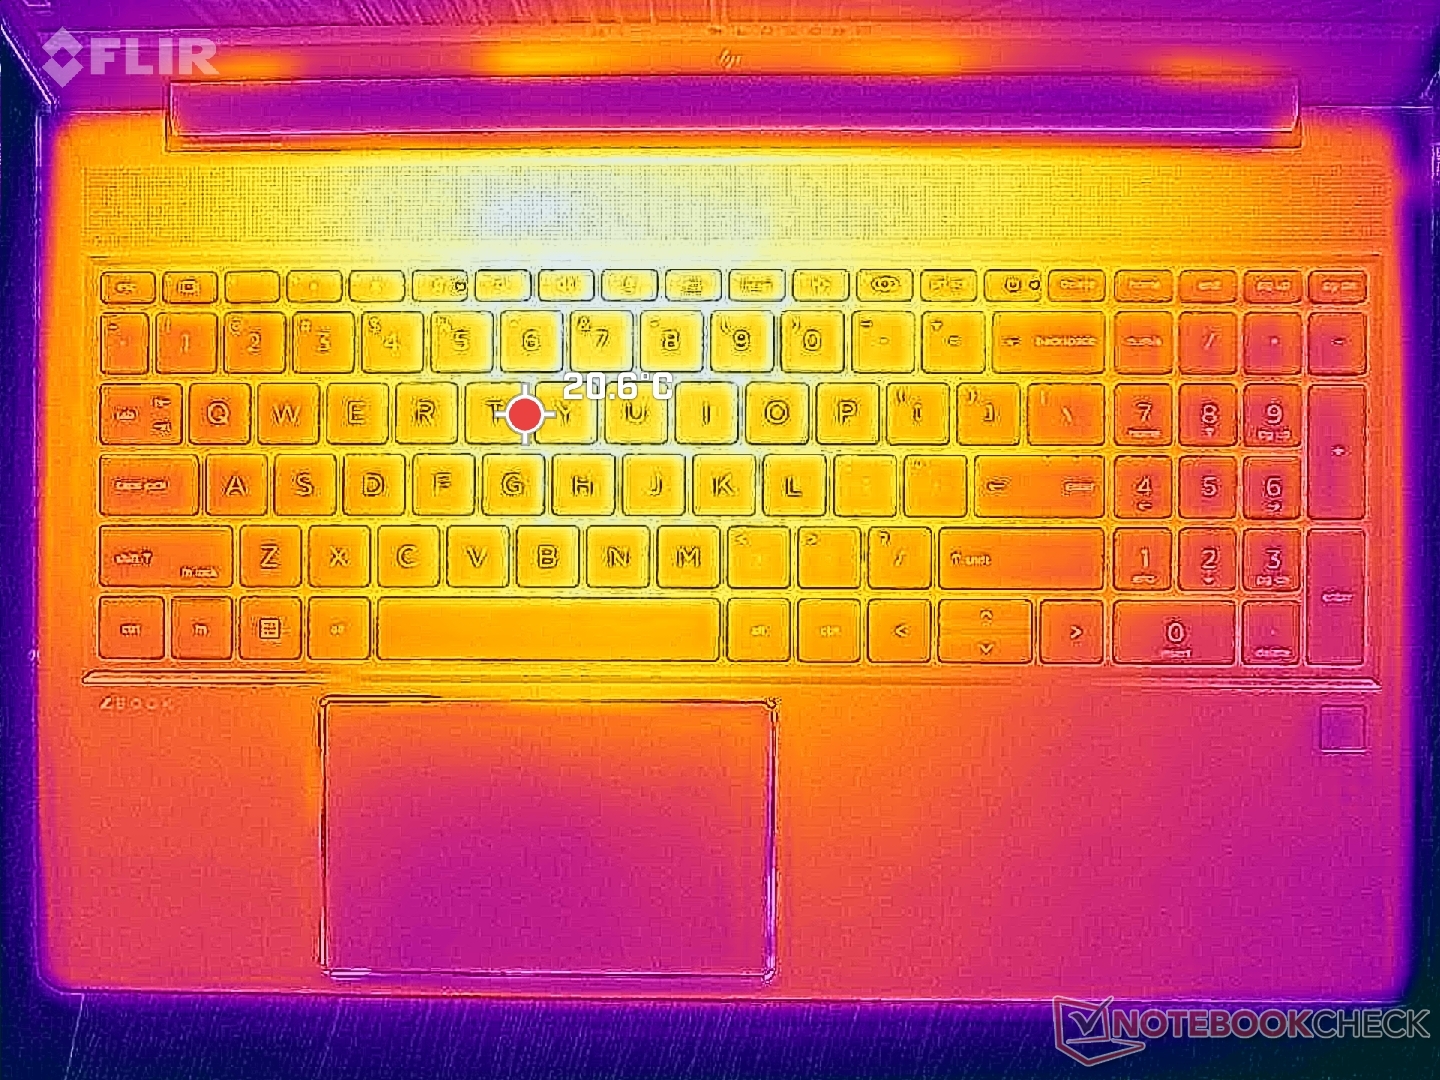
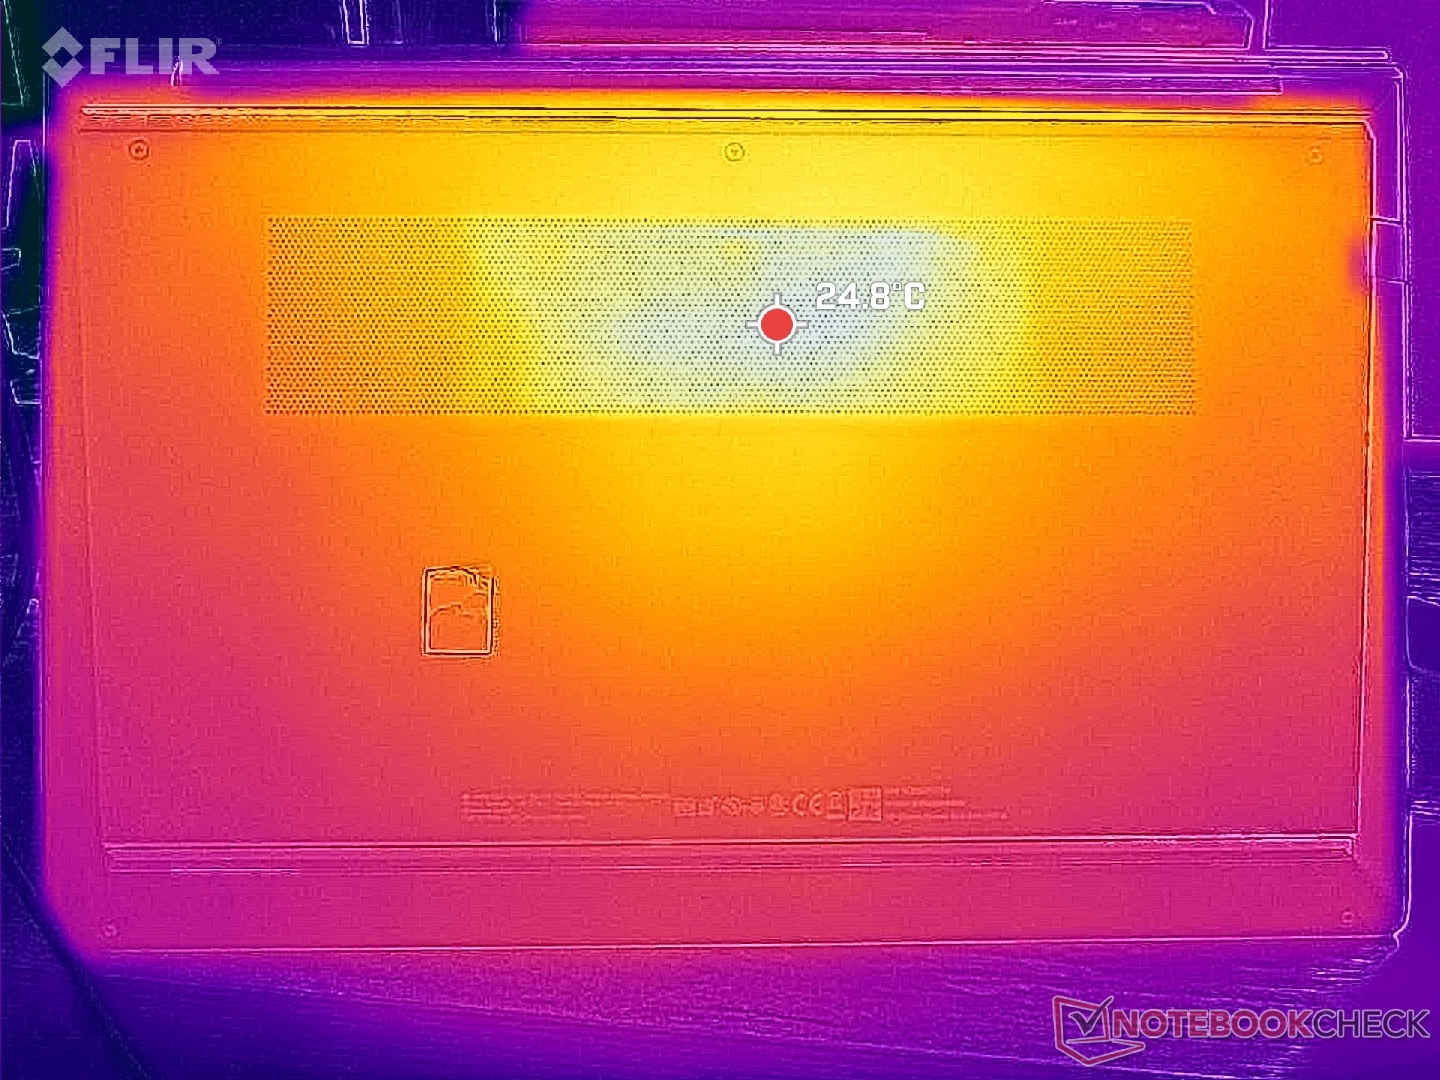
Temperatuur
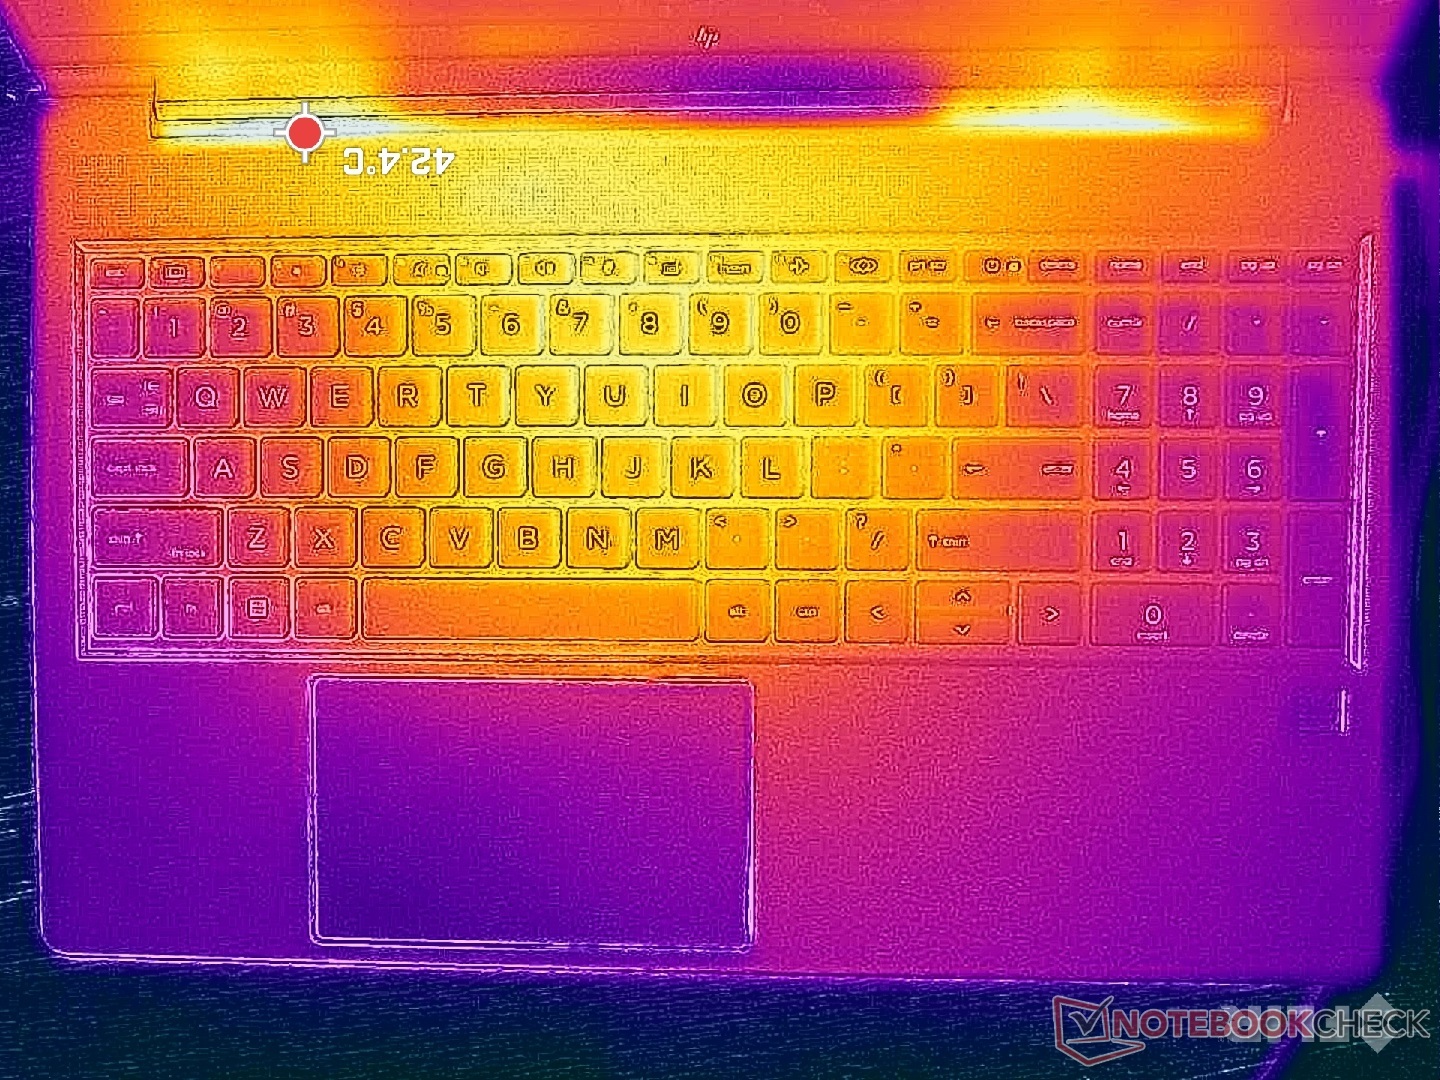
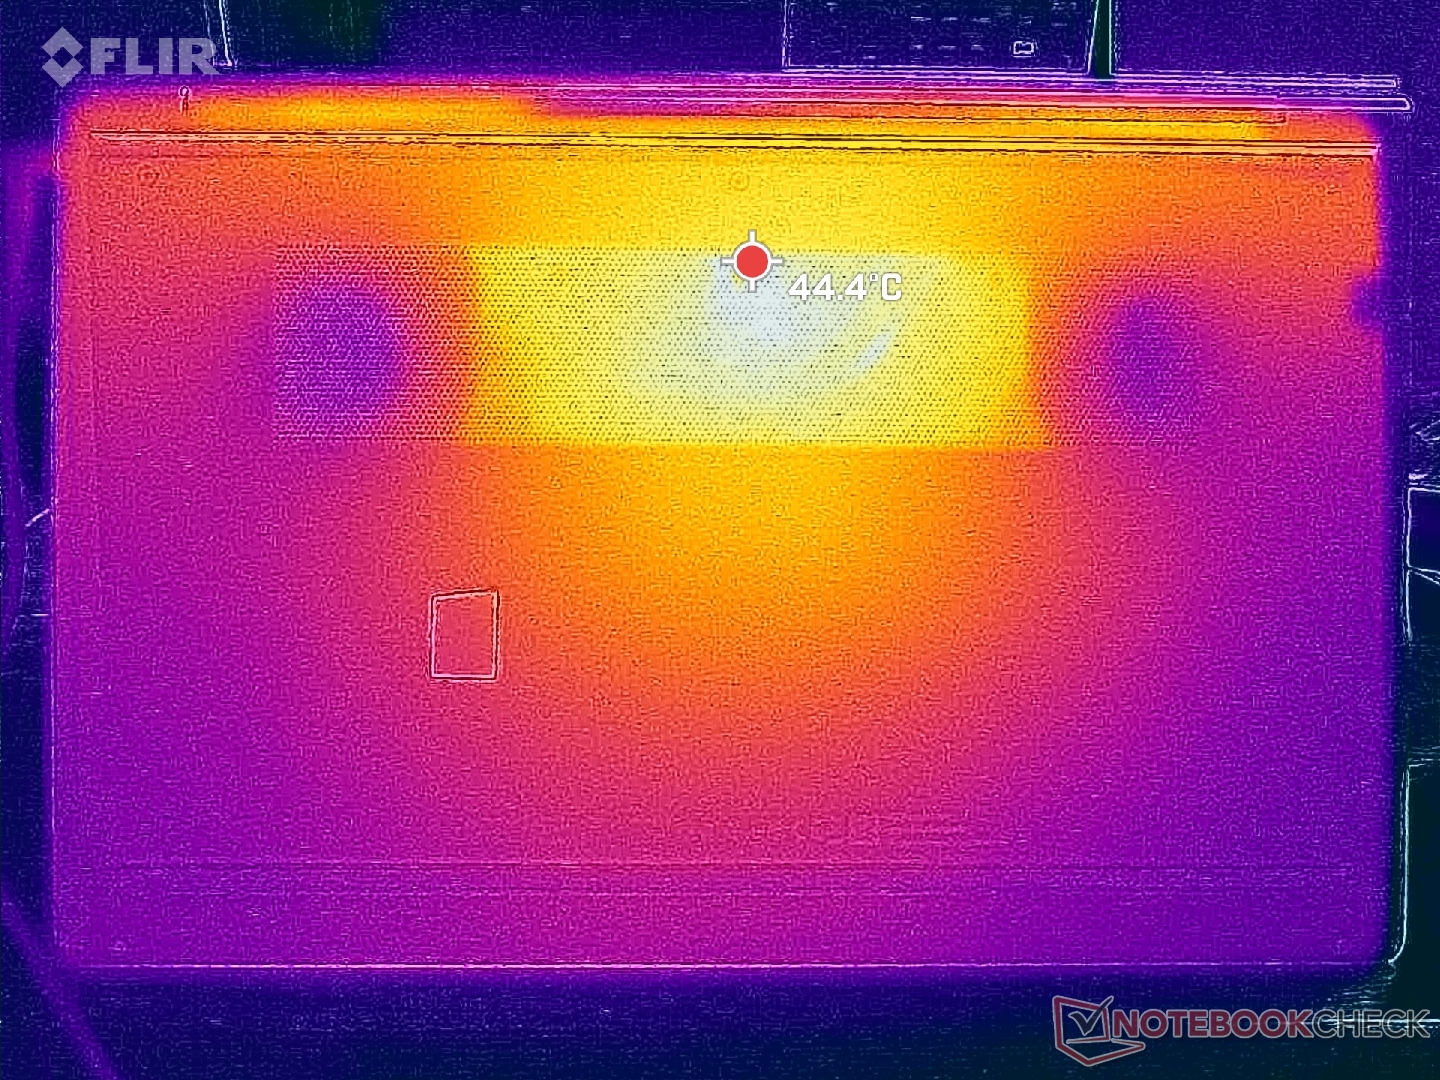
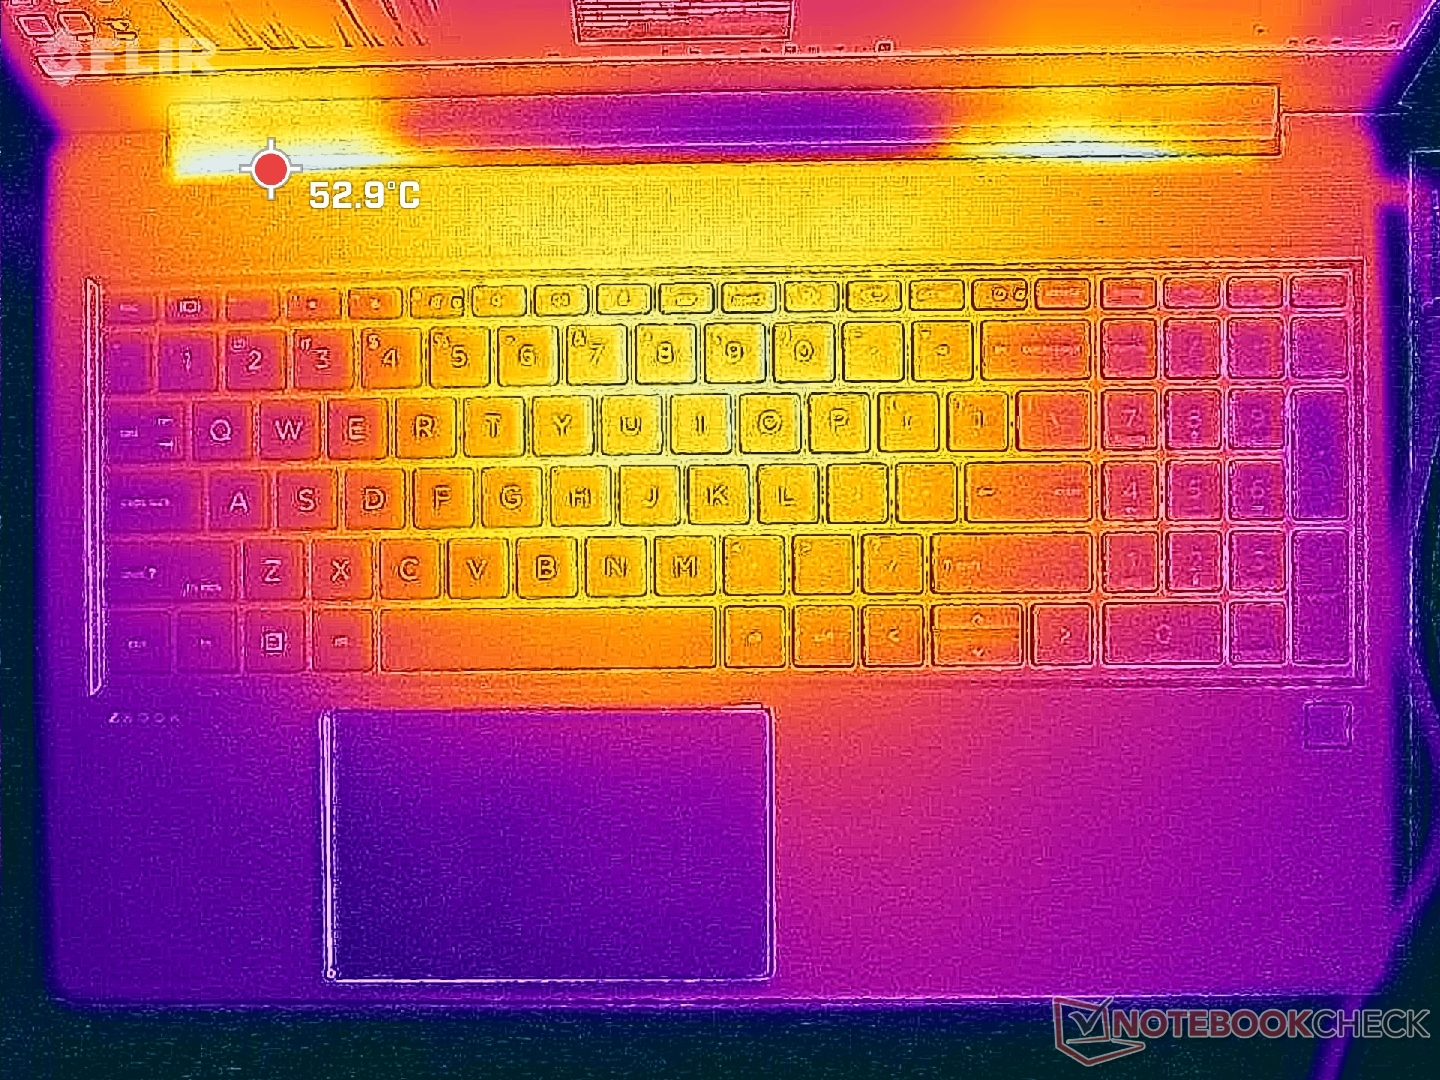
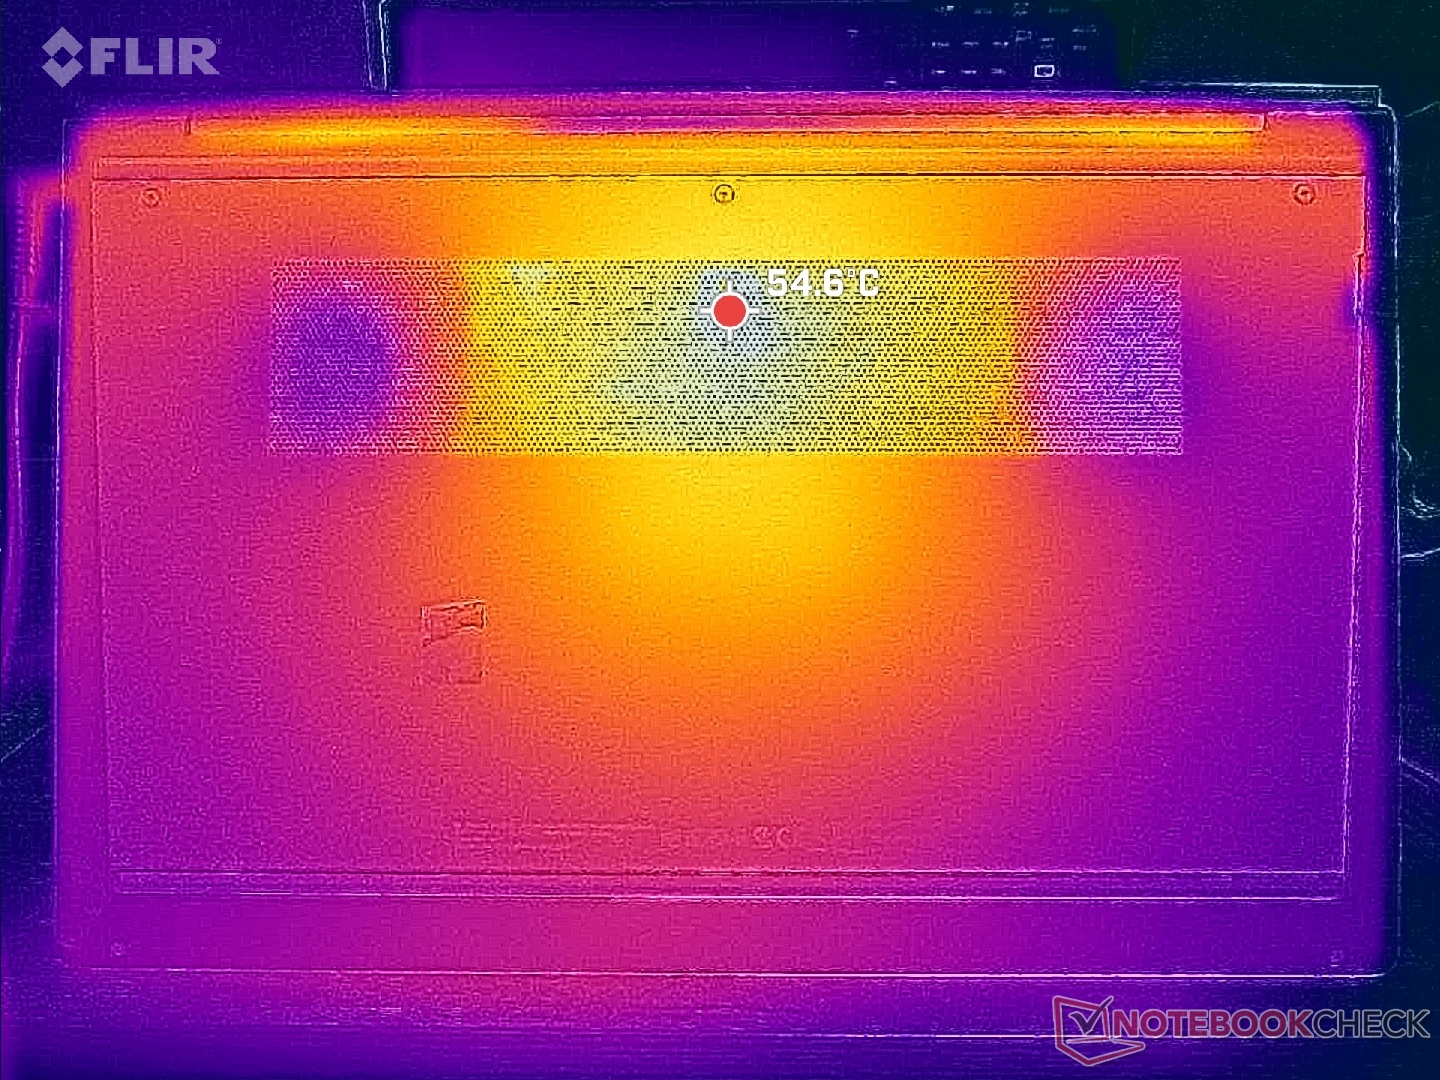
De oppervlaktetemperaturen zijn het warmst in het midden en koeler langs de zijkanten van het toetsenbord of de randen van de behuizing. Hete plekken in het midden en aan de onderkant van het toetsenbord kunnen oplopen tot meer dan 42 C, wat enkele graden koeler is dan bij de concurrerende ThinkPad P1 G6 ThinkPad P1 G6 met dezelfde RTX 2000 GPU.
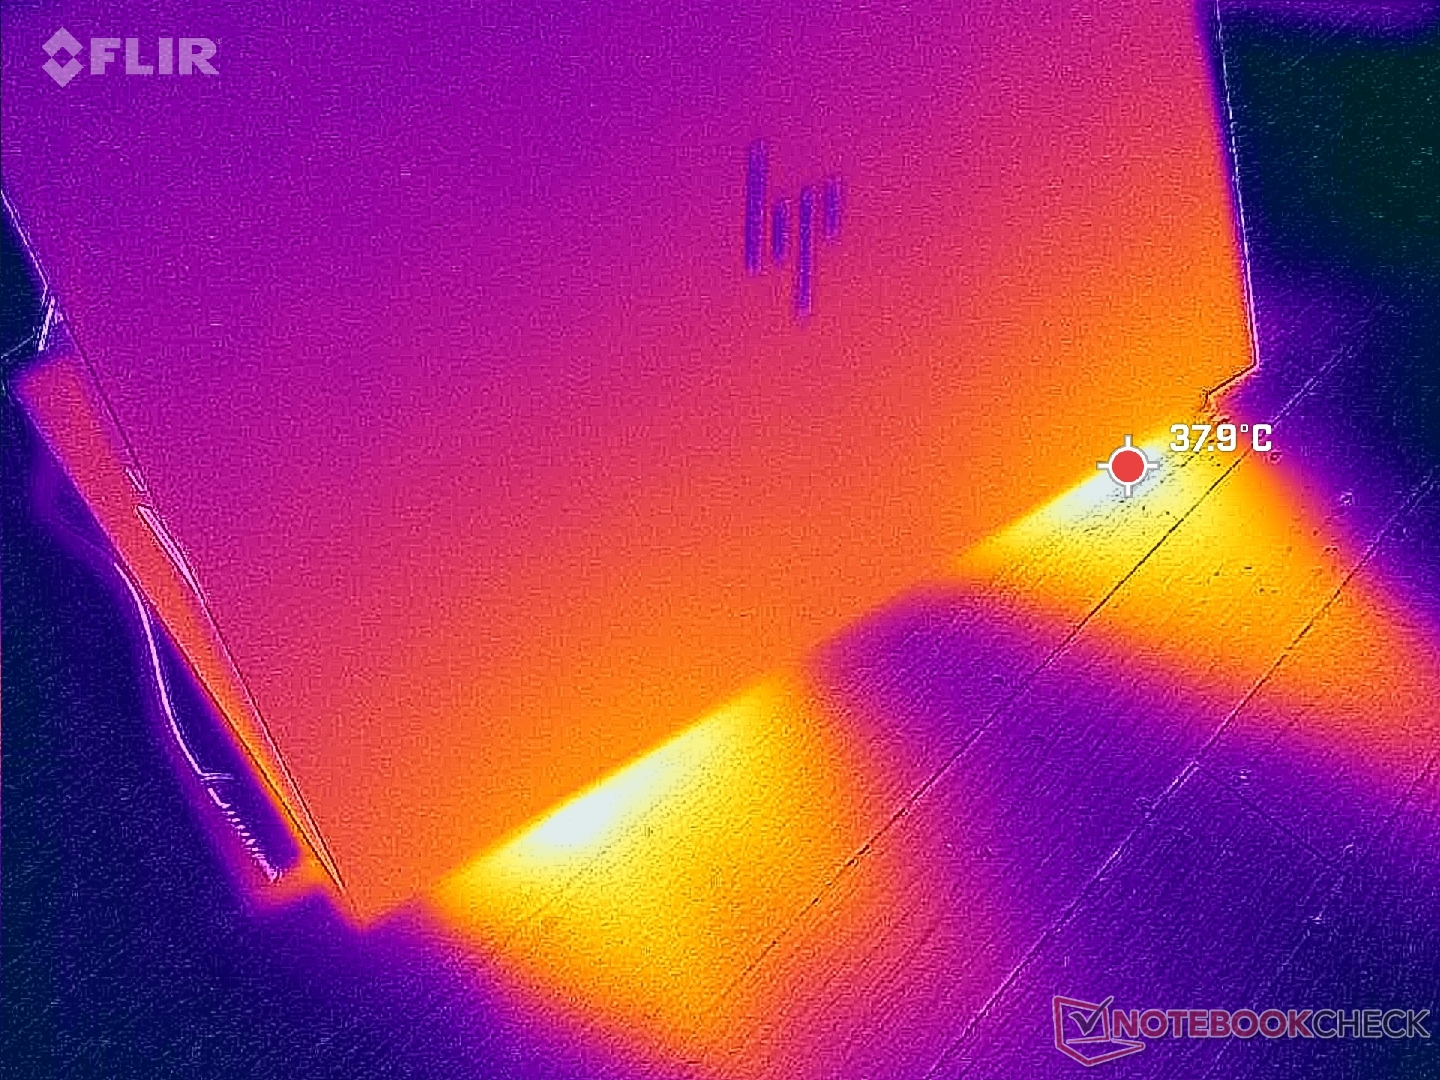
(±) De maximumtemperatuur aan de bovenzijde bedraagt 42.4 °C / 108 F, vergeleken met het gemiddelde van 38.2 °C / 101 F, variërend van 22.2 tot 69.8 °C voor de klasse Workstation.
(-) De bodem warmt op tot een maximum van 47.8 °C / 118 F, vergeleken met een gemiddelde van 41.1 °C / 106 F
(+) Bij onbelast gebruik bedraagt de gemiddelde temperatuur voor de bovenzijde 24.4 °C / 76 F, vergeleken met het apparaatgemiddelde van 32 °C / 90 F.
(+) Bij het spelen van The Witcher 3 is de gemiddelde temperatuur voor de bovenzijde 31.2 °C / 88 F, vergeleken met het apparaatgemiddelde van 32 °C / 90 F.
(+) De palmsteunen en het touchpad zijn met een maximum van ###max## °C / 81.7 F koeler dan de huidtemperatuur en voelen daarom koel aan.
(±) De gemiddelde temperatuur van de handpalmsteun van soortgelijke toestellen bedroeg 27.8 °C / 82 F (+0.2 °C / 0.3 F).
| HP ZBook Power 15 G10 AMD Ryzen 7 PRO 7840HS, NVIDIA RTX 2000 Ada Generation Laptop | HP ZBook Power 15 G9 6B8C4EA Intel Core i7-12700H, NVIDIA RTX A2000 Laptop GPU | Lenovo ThinkPad P15v G3 21EM001AGE AMD Ryzen 7 PRO 6850H, NVIDIA RTX A2000 Laptop GPU | Dell Precision 5000 5560 Intel Core i7-11850H, NVIDIA RTX A2000 Laptop GPU | Lenovo ThinkPad P1 G6-21FV000DGE Intel Core i9-13900H, NVIDIA RTX 2000 Ada Generation Laptop | Asus ExpertBook B6 Flip B6602FC2 Intel Core i9-12950HX, NVIDIA RTX A2000 Laptop GPU | |
|---|---|---|---|---|---|---|
| Heat | 7% | -2% | -16% | -9% | -10% | |
| Maximum Upper Side * (°C) | 42.4 | 40.3 5% | 48.7 -15% | 48.2 -14% | 47.1 -11% | 48.4 -14% |
| Maximum Bottom * (°C) | 47.8 | 48.3 -1% | 50.5 -6% | 42.6 11% | 56.5 -18% | 52.3 -9% |
| Idle Upper Side * (°C) | 26.8 | 23.7 12% | 25 7% | 34.8 -30% | 28.1 -5% | 27.8 -4% |
| Idle Bottom * (°C) | 27.2 | 23.8 12% | 25.4 7% | 35.2 -29% | 27.6 -1% | 30.3 -11% |
* ... kleiner is beter
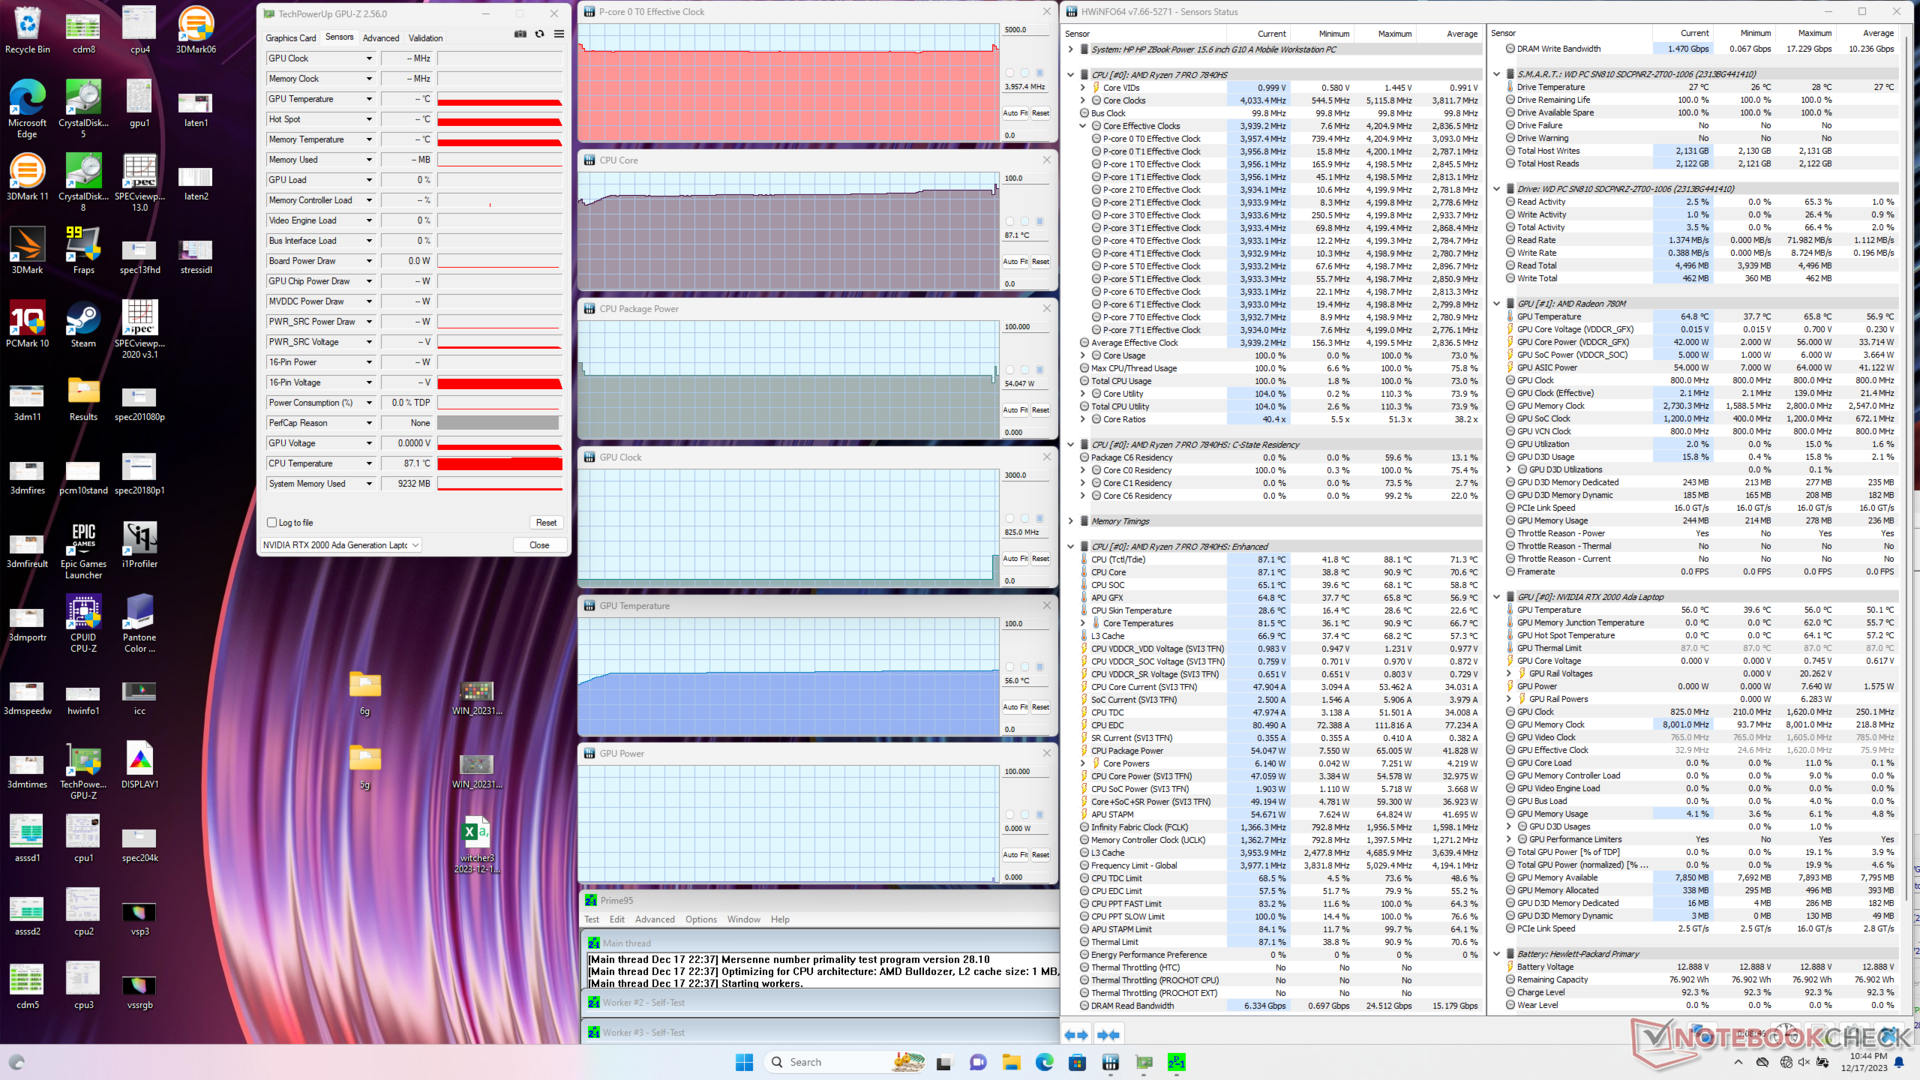
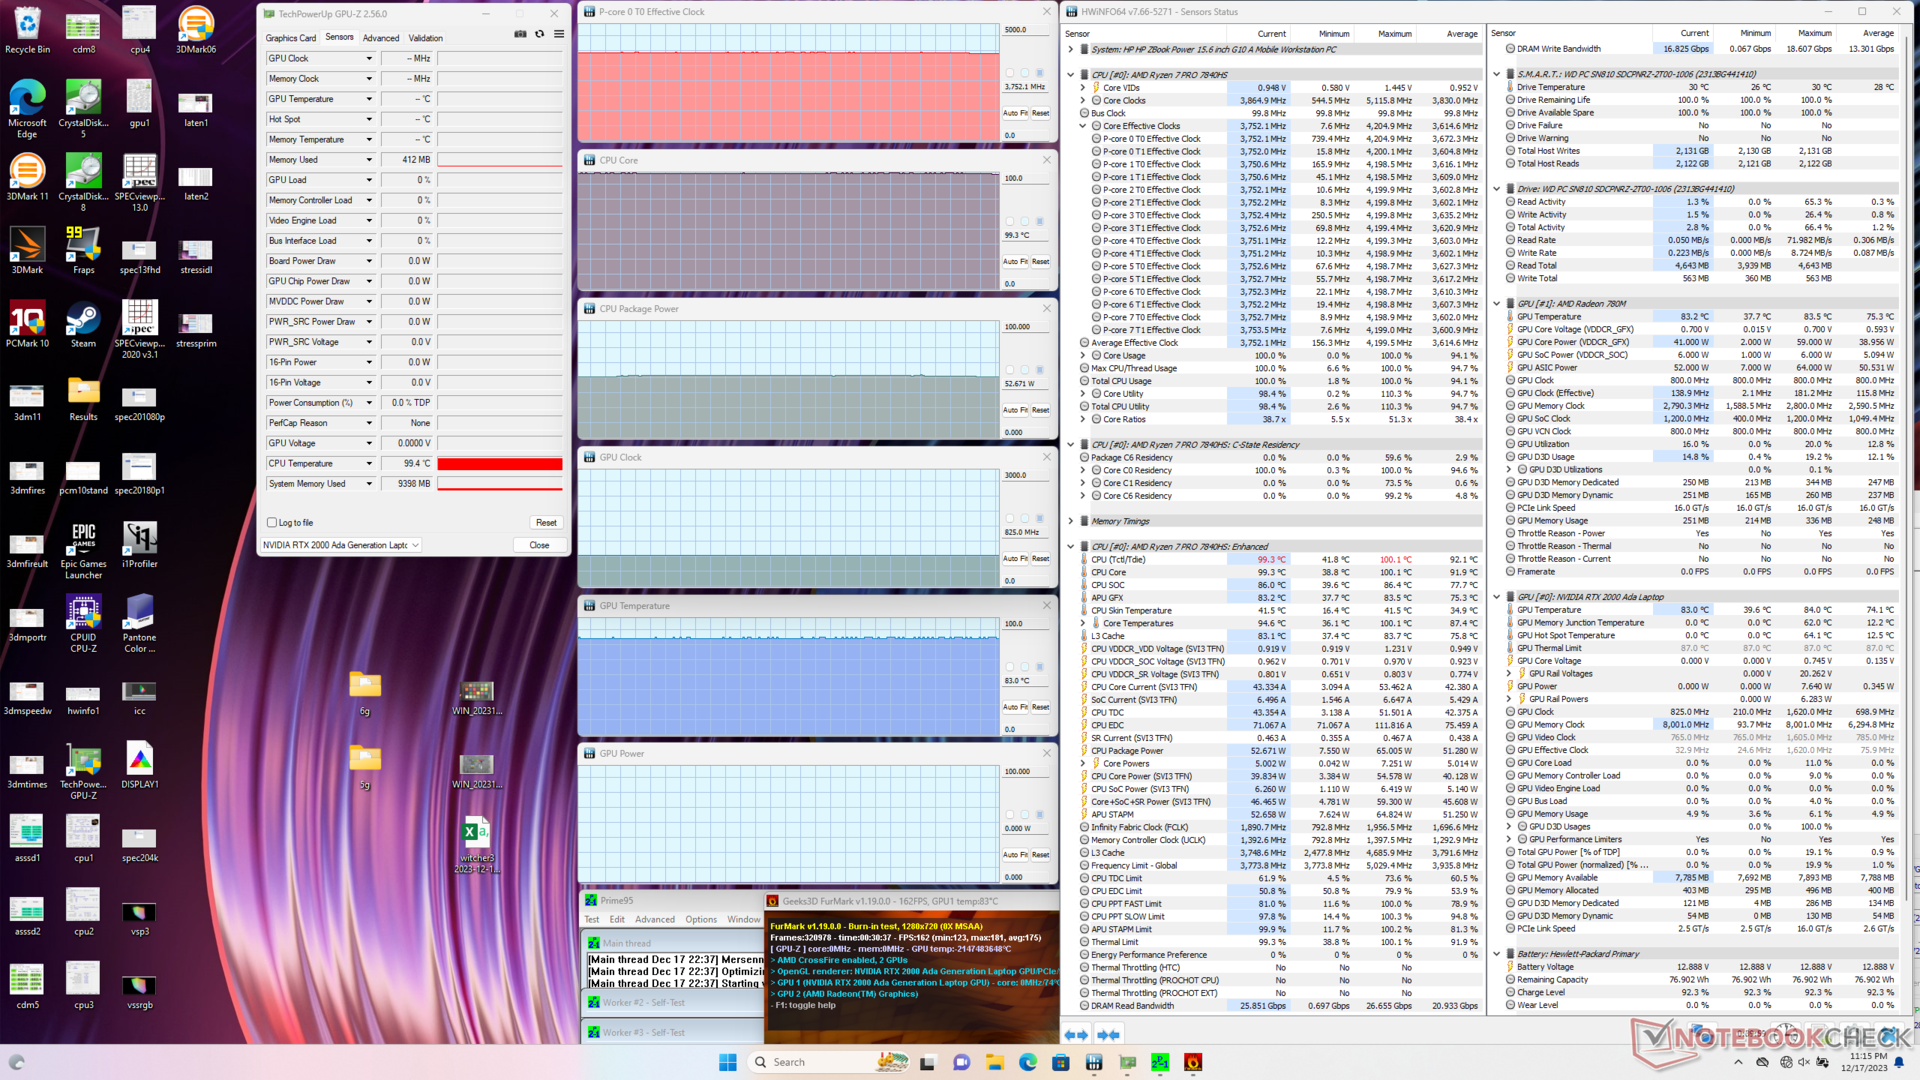
Stresstest
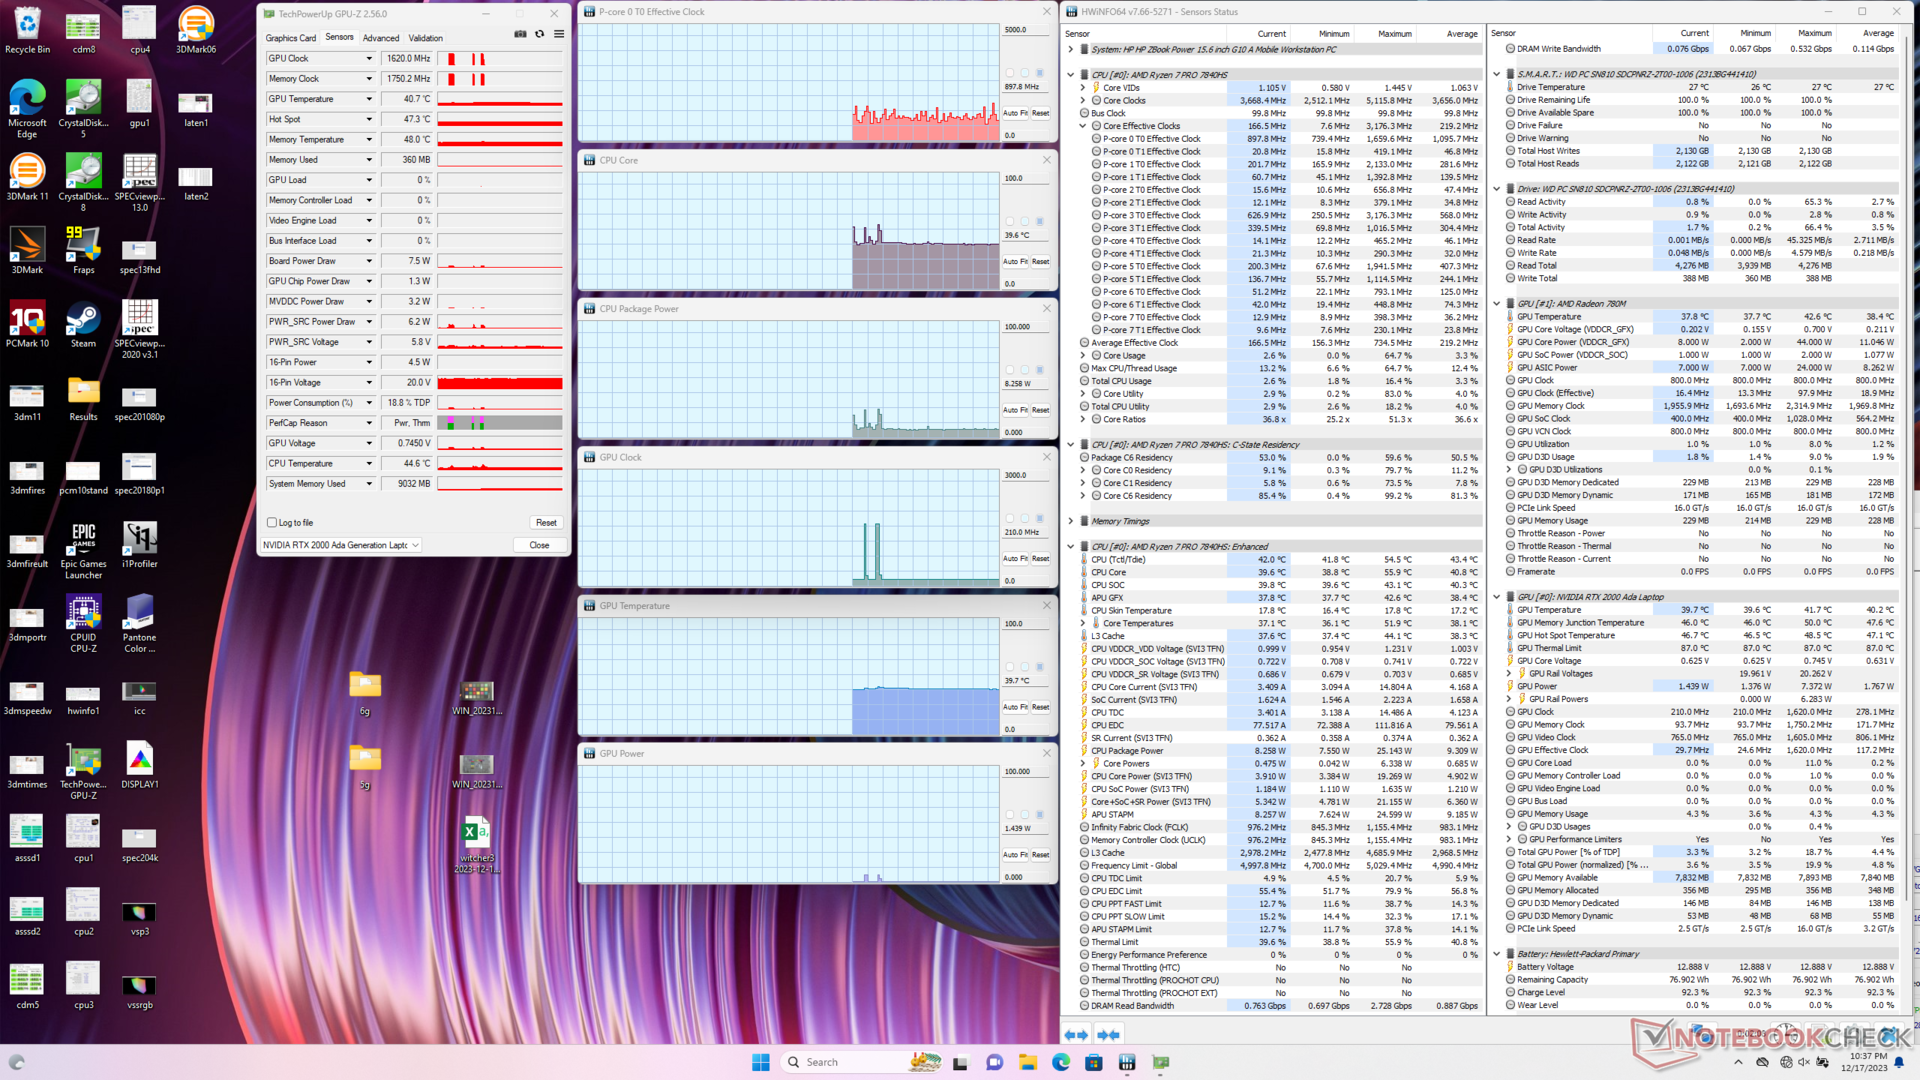
Toen de CPU werd belast met Prime95, steeg hij alleen de eerste paar seconden naar 4,2 GHz en 65 W, waarna hij iets daalde en zich stabiliseerde op 4,0 GHz en 54 W. De kerntemperatuur was met 87 C behoorlijk warm, maar dit is misschien normaal voor veel laptops met een Zen 4. Deze test herhalen op de ThinkPad Z16 G2zou zijn Ryzen 9 CPU bijvoorbeeld stabiliseren op een nog warmere 100 C.
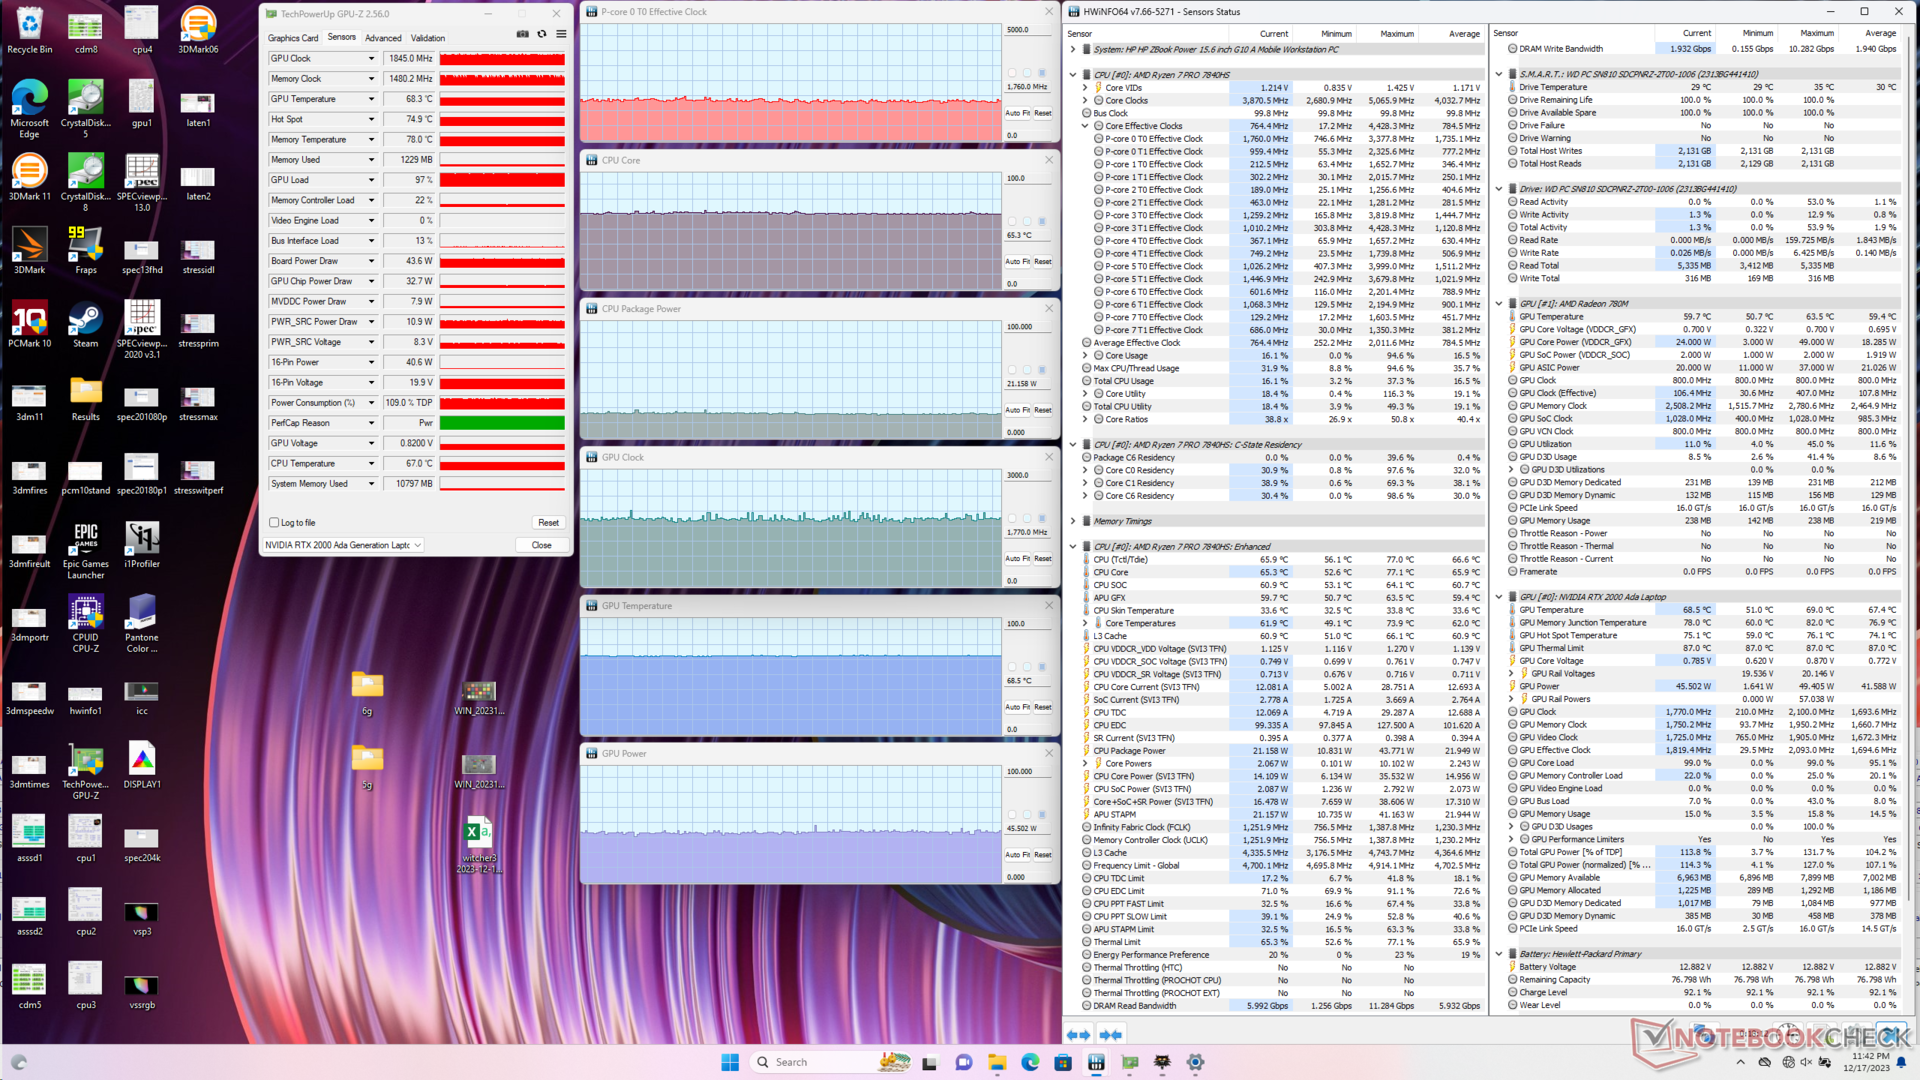
Als u Witcher 3 in de Gebalanceerde modus vertoont geen significante verschillen in temperaturen of kloksnelheden in vergelijking met de Prestatiemodus, wat overeenkomt met onze waarnemingen op Fire Strike in de bovenstaande sectie. Het stroomverbruik van de GPU op het bord schommelt rond de 44 W tegen het doel van 50 W.
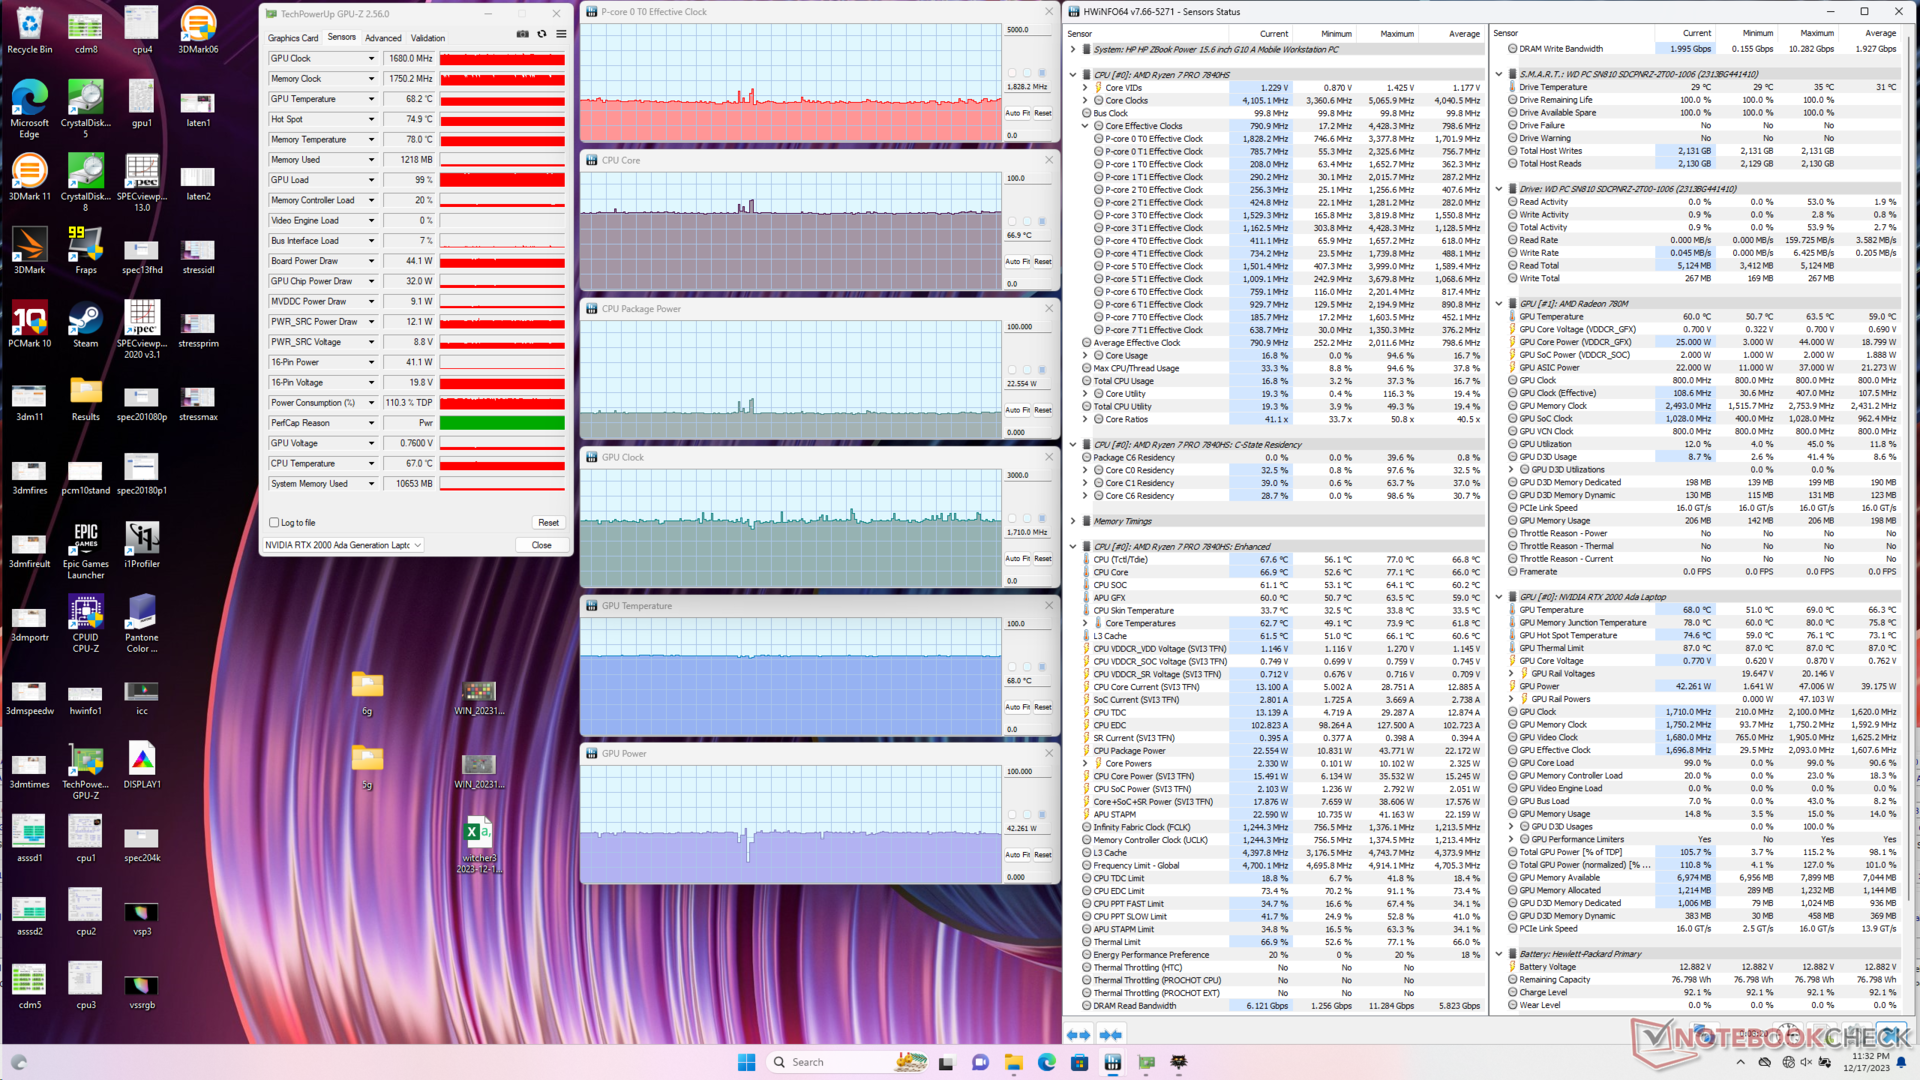
| CPU-klok (GHz) | GPU-klok (MHz) | Gemiddelde CPU-temperatuur (°C) | Gemiddelde GPU-temperatuur (°C) | |
| Systeem inactief | -- | -- | 40 | 40 |
| Prime95 Stress | 4.0 | -- | 87 | 56 |
| Prime95 + FurMark-stress | 3.8 | 825 | 99 | 83 |
| Witcher 3 Stress (evenwichtige modus) | 1,8 | 1770 | 65 | 69 |
| Witcher 3 Belasting ( prestatiemodus) | 1,8 | 1710 | 67 | 68 |
Energiebeheer
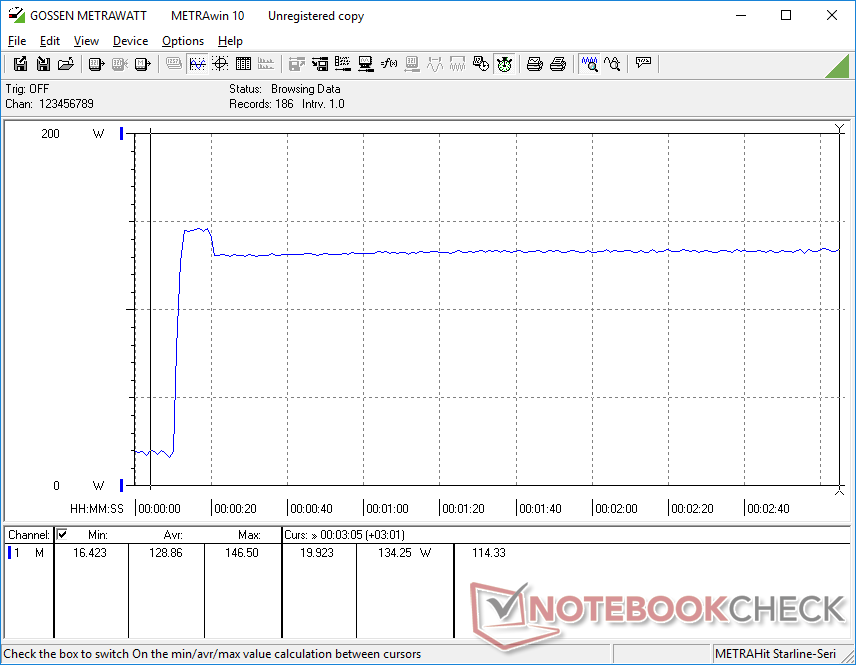
Stroomverbruik
Het totale stroomverbruik is hoger dan bij het model van vorig jaar, wat overeenkomt met de hogere prestaties van onze configuratie. De prestaties-per-watt zijn echter nog steeds in het voordeel van ons nieuwere model, vooral als het gaat om grafische prestaties. Het uitvoeren van Prime95 vraagt bijvoorbeeld 16 procent meer stroom voor 20 procent snellere multi-thread prestaties ten opzichte van de Core i7-12700H in de ZBook Power 15 G9, terwijl het uitvoeren van FurMark slechts 14 procent meer stroom zou vragen voor 65 procent meer grafische prestaties.
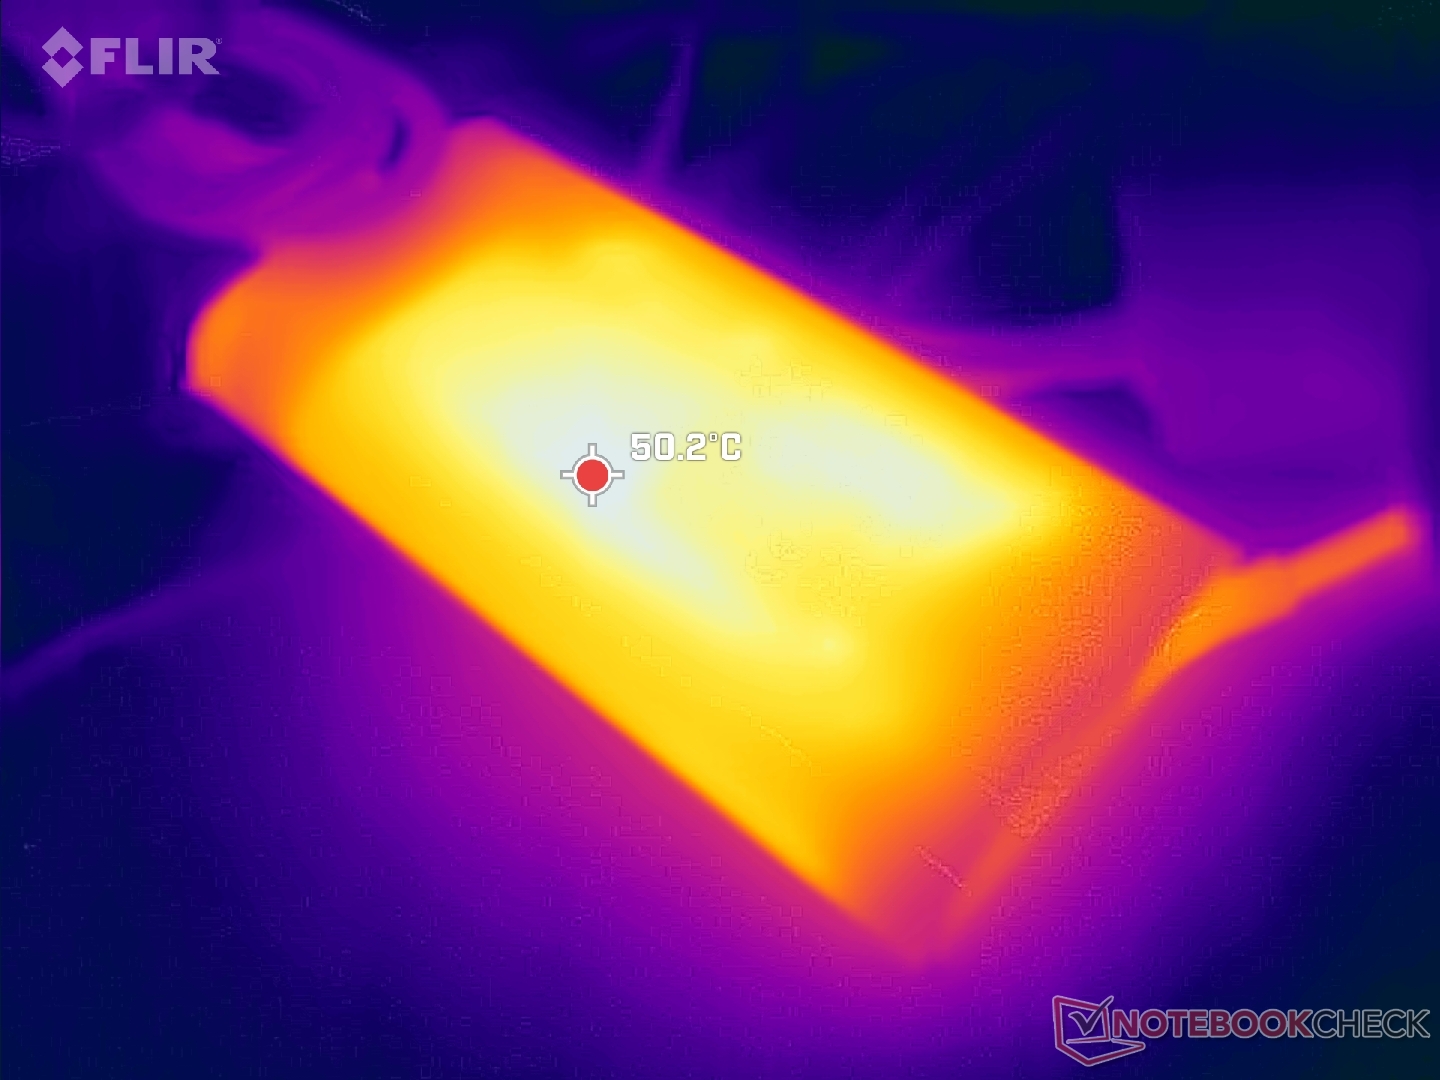
De middelgrote (~13,8 x 6,5 x 2,3 cm) 150 W wisselstroomadapter is niet veranderd, aangezien de ZBook Power 15 G10 met hetzelfde vermogen werkt als de ZBook Power 15 G9. Opladen via USB-C wordt wel ondersteund; onze 135 W USB-C oplader van Lenovo is bijvoorbeeld compatibel met ons HP testapparaat.
| Uit / Standby | |
| Inactief | |
| Belasting |
|
Key:
min: | |
| HP ZBook Power 15 G10 R7 PRO 7840HS, RTX 2000 Ada Generation Laptop, WDC PC SN810 2TB, IPS, 2560x1440, 15.6" | HP ZBook Power 15 G9 6B8C4EA i7-12700H, RTX A2000 Laptop GPU, Samsung PM9A1 MZVL21T0HCLR, IPS, 3840x2160, 15.6" | Lenovo ThinkPad P15v G3 21EM001AGE R7 PRO 6850H, RTX A2000 Laptop GPU, SK Hynix PC711 1TB HFS001TDE9X081N, IPS LED, 3840x2160, 15.6" | Dell Precision 5000 5560 i7-11850H, RTX A2000 Laptop GPU, Samsung PM9A1 MZVL22T0HBLB, IPS, 3840x2400, 15.6" | Lenovo ThinkPad P1 G6-21FV000DGE i9-13900H, RTX 2000 Ada Generation Laptop, SK Hynix PC711 1TB HFS001TDE9X084N, IPS, 2560x1600, 16" | Asus ExpertBook B6 Flip B6602FC2 i9-12950HX, RTX A2000 Laptop GPU, Samsung PM9A1 MZVL21T0HCLR, IPS, 2560x1600, 16" | |
|---|---|---|---|---|---|---|
| Power Consumption | 11% | -11% | -24% | -30% | -81% | |
| Idle Minimum * (Watt) | 5.3 | 3.9 26% | 6.3 -19% | 6.2 -17% | 8.3 -57% | 10.5 -98% |
| Idle Average * (Watt) | 9.9 | 7.2 27% | 13.9 -40% | 13.9 -40% | 14.5 -46% | 11.9 -20% |
| Idle Maximum * (Watt) | 16.7 | 8.5 49% | 14.5 13% | 23.8 -43% | 15.3 8% | 18 -8% |
| Load Average * (Watt) | 61.3 | 87.2 -42% | 82.8 -35% | 95.7 -56% | 91.8 -50% | 182 -197% |
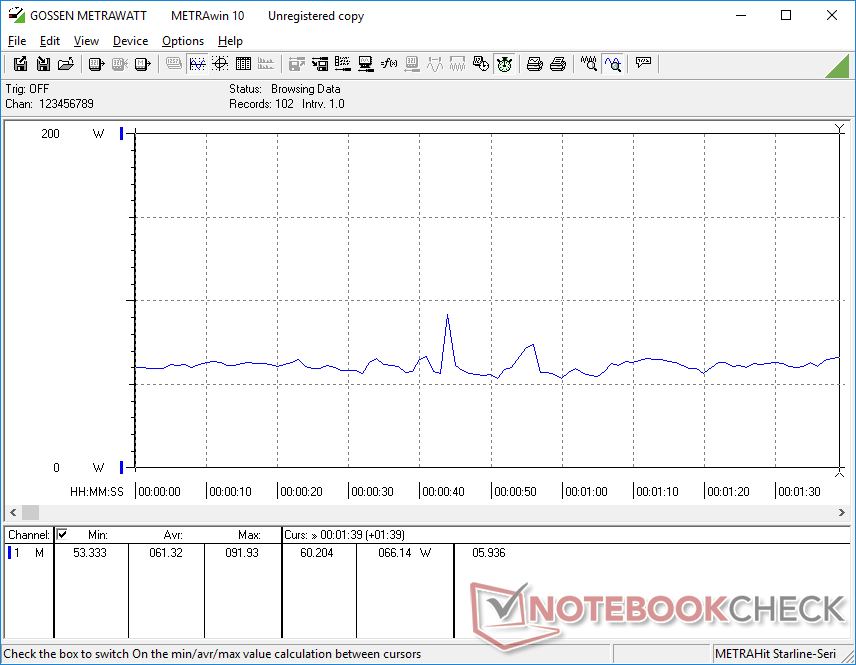
| Witcher 3 ultra * (Watt) | 87.9 | 86.8 1% | 88.8 -1% | 87 1% | 104.7 -19% | 177.5 -102% |
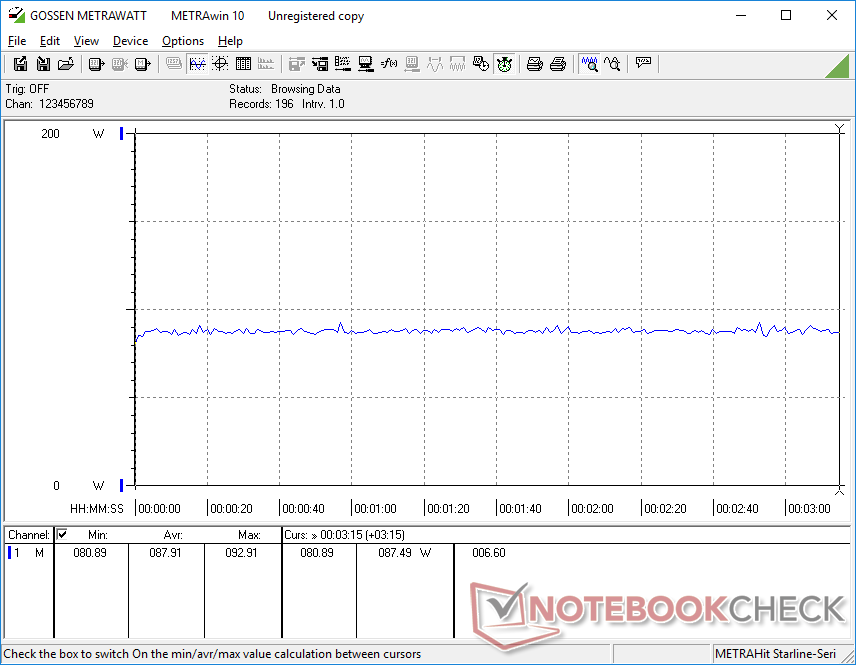
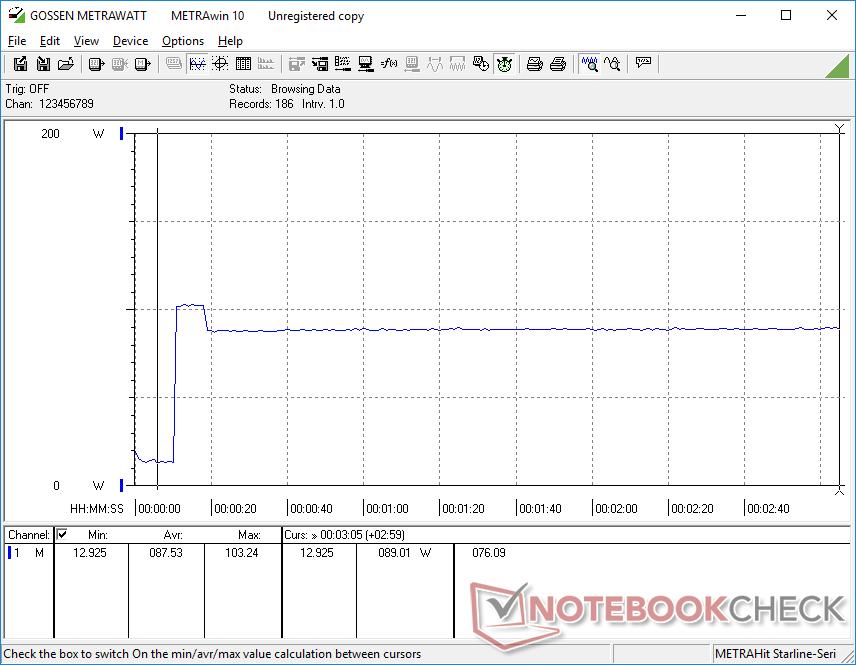
| Load Maximum * (Watt) | 145.3 | 139 4% | 124.8 14% | 132.6 9% | 164.5 -13% | 229 -58% |
* ... kleiner is beter
Power Consumption Witcher 3 / Stresstest
Power Consumption external Monitor
Levensduur batterij
Ondanks de verschillen in CPU, GPU en beeldscherm zijn de looptijden vrijwel gelijk aan die van het model van vorig jaar. Tien uur surfen in de echte wereld is vergelijkbaar met veel Ultrabooks op consumentenniveau.
| HP ZBook Power 15 G10 R7 PRO 7840HS, RTX 2000 Ada Generation Laptop, 83 Wh | HP ZBook Power 15 G9 6B8C4EA i7-12700H, RTX A2000 Laptop GPU, 83 Wh | Lenovo ThinkPad P15v G3 21EM001AGE R7 PRO 6850H, RTX A2000 Laptop GPU, 68 Wh | Dell Precision 5000 5560 i7-11850H, RTX A2000 Laptop GPU, 86 Wh | Lenovo ThinkPad P1 G6-21FV000DGE i9-13900H, RTX 2000 Ada Generation Laptop, 90 Wh | Asus ExpertBook B6 Flip B6602FC2 i9-12950HX, RTX A2000 Laptop GPU, 90 Wh | |
|---|---|---|---|---|---|---|
| Batterijduur | 0% | -31% | -37% | -5% | -13% | |
| WiFi v1.3 (h) | 10 | 10 0% | 6.9 -31% | 6.3 -37% | 9.5 -5% | 8.7 -13% |
| H.264 (h) | 10.7 | 11.2 | 5.8 | |||
| Load (h) | 1.8 | 1.8 | 1.1 | 1.7 | ||
| Reader / Idle (h) | 12 | 12.5 |
Pro
Contra
Uitspraak - Als het niet kapot is, repareer het dan niet
Het ontwerp van de ZBook Power 15 G10 is bijna drie jaar oud. Het is een van de weinige overgebleven 16:19 15,6-inch werkstations met zowel AMD Zen 4 Pro CPU's als Nvidia RTX Ada GPU's, terwijl de meeste andere in deze categorie zijn overgestapt op 16:10 16-inch vormfactoren met extra beeldschermopties, waaronder OLED en 4K. Als de grotere vormfactor en nieuwere beeldschermen belangrijk zijn voor uw werkbelasting, dan wilt u misschien wachten tot HP het ZBook Power-ontwerp vernieuwt of alternatieven zoeken zoals de Lenovo ThinkPad P1 G6 . Zo niet, dan is de ZBook Power 15 G10 nog steeds een klassieke en betrouwbare optie.
Voor mogelijke 16:10 revisies in de toekomst zouden we graag zien dat HP een stap verder gaat door zowel ECC RAM als ECC VRAM ondersteuning toe te voegen en alleen USB-C opladen. De eigen AC-lader wordt steeds moeilijker te rechtvaardigen nu de volgende generatie Thunderbolt USB-C opladen tot 240 W kan ondersteunen.
De ZBook Power 15 G10 zal waarschijnlijk een van HP's laatste 15,6 inch werkstations zijn voordat de serie wordt opgefrist met een moderner 16:10 ontwerp.
De belangrijkste onderscheidende factor tussen de ZBook Power 15 G9 en G10 is dat de laatste wordt geleverd met Ada Lovelace GPU's voor veel hogere prestaties per watt dan de oudere Ampere GPU's. Als de nieuwere CPU's en GPU's waardevol zijn, dan wordt de G10 aanbevolen boven de G9. Voor de rest is de gebruikerservaring tussen de modellen in wezen identiek, zelfs wat betreft de batterijduur.
Prijs en beschikbaarheid
HP ZBook Power 15 G10
- 20-12-2023 v7 (old)
Allen Ngo
Transparantie
De selectie van te beoordelen apparaten wordt gemaakt door onze redactie. Het testexemplaar werd ten behoeve van deze beoordeling door de fabrikant of detailhandelaar in bruikleen aan de auteur verstrekt. De kredietverstrekker had geen invloed op deze recensie, noch ontving de fabrikant vóór publicatie een exemplaar van deze recensie. Er bestond geen verplichting om deze recensie te publiceren. Als onafhankelijk mediabedrijf is Notebookcheck niet onderworpen aan het gezag van fabrikanten, detailhandelaren of uitgevers.
[transparency_disclaimer]Dit is hoe Notebookcheck test
Elk jaar beoordeelt Notebookcheck onafhankelijk honderden laptops en smartphones met behulp van gestandaardiseerde procedures om ervoor te zorgen dat alle resultaten vergelijkbaar zijn. We hebben onze testmethoden al zo'n 20 jaar voortdurend ontwikkeld en daarbij de industriestandaard bepaald. In onze testlaboratoria wordt gebruik gemaakt van hoogwaardige meetapparatuur door ervaren technici en redacteuren. Deze tests omvatten een validatieproces in meerdere fasen. Ons complexe beoordelingssysteem is gebaseerd op honderden goed onderbouwde metingen en benchmarks, waardoor de objectiviteit behouden blijft. Meer informatie over onze testmethoden kunt u hier vinden.
Price comparison

