Radeon RX 6550M prestatiedebuut: Lenovo ThinkPad Z16 Gen 2 laptop test

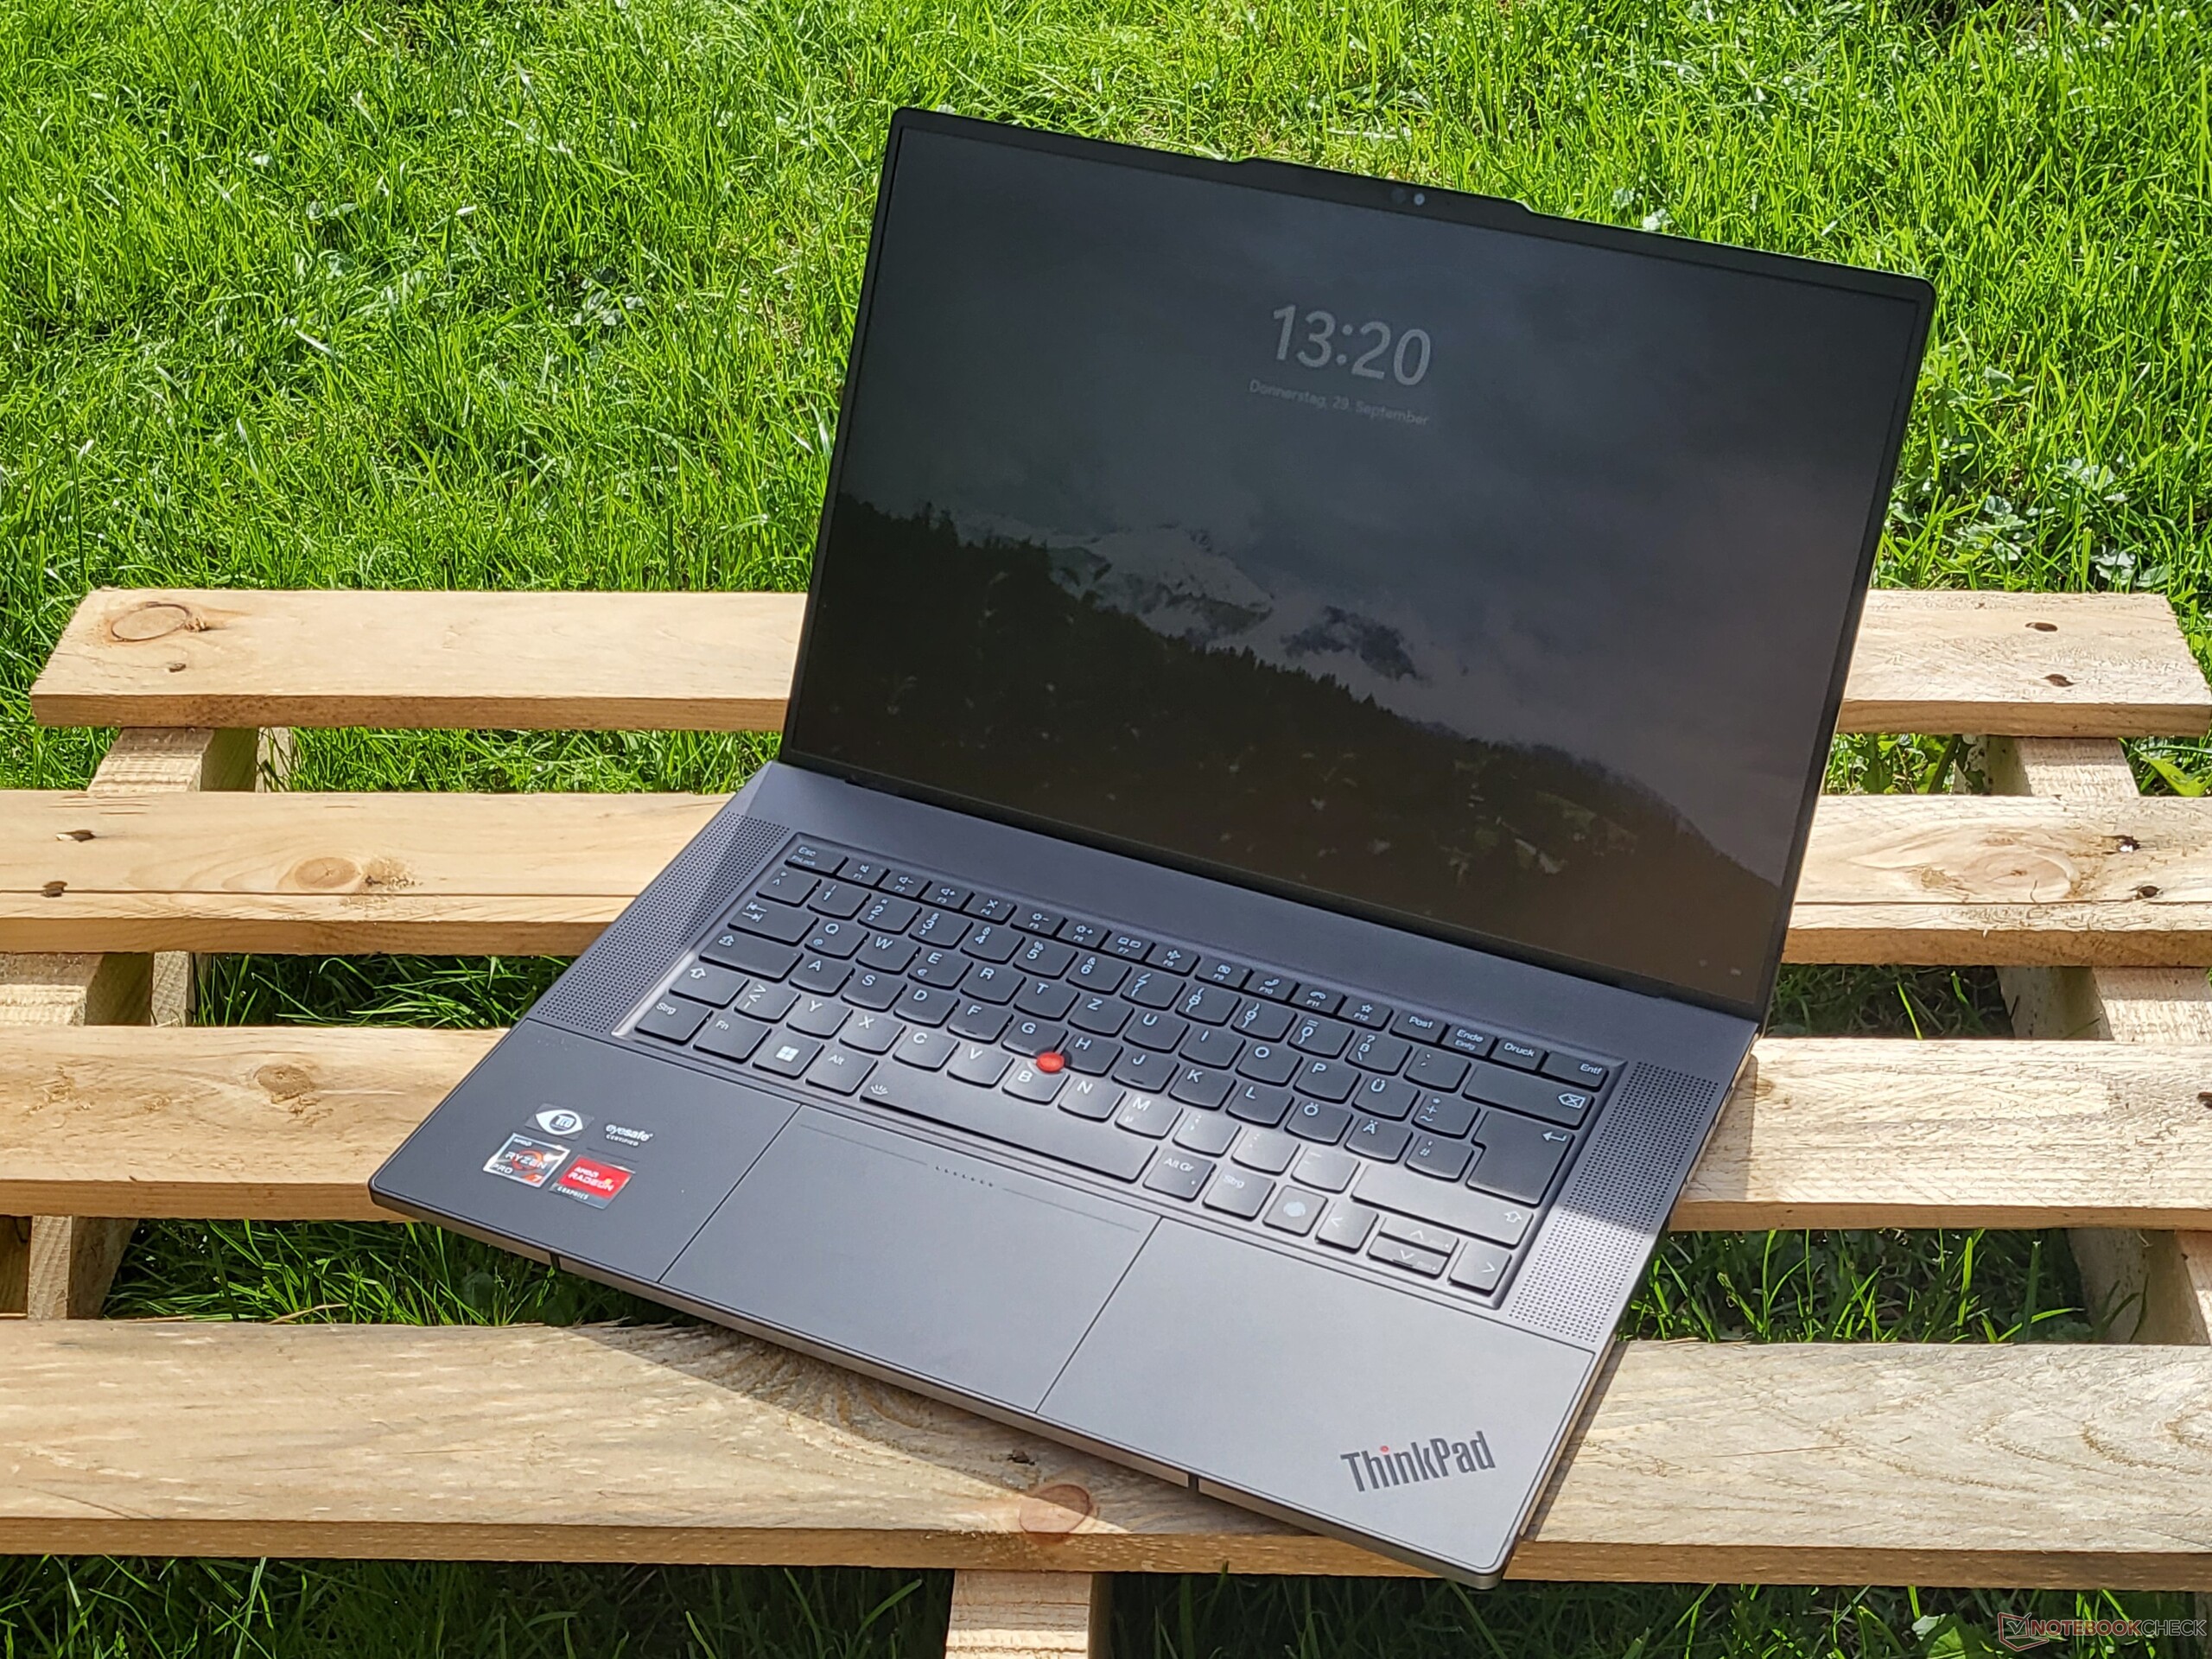
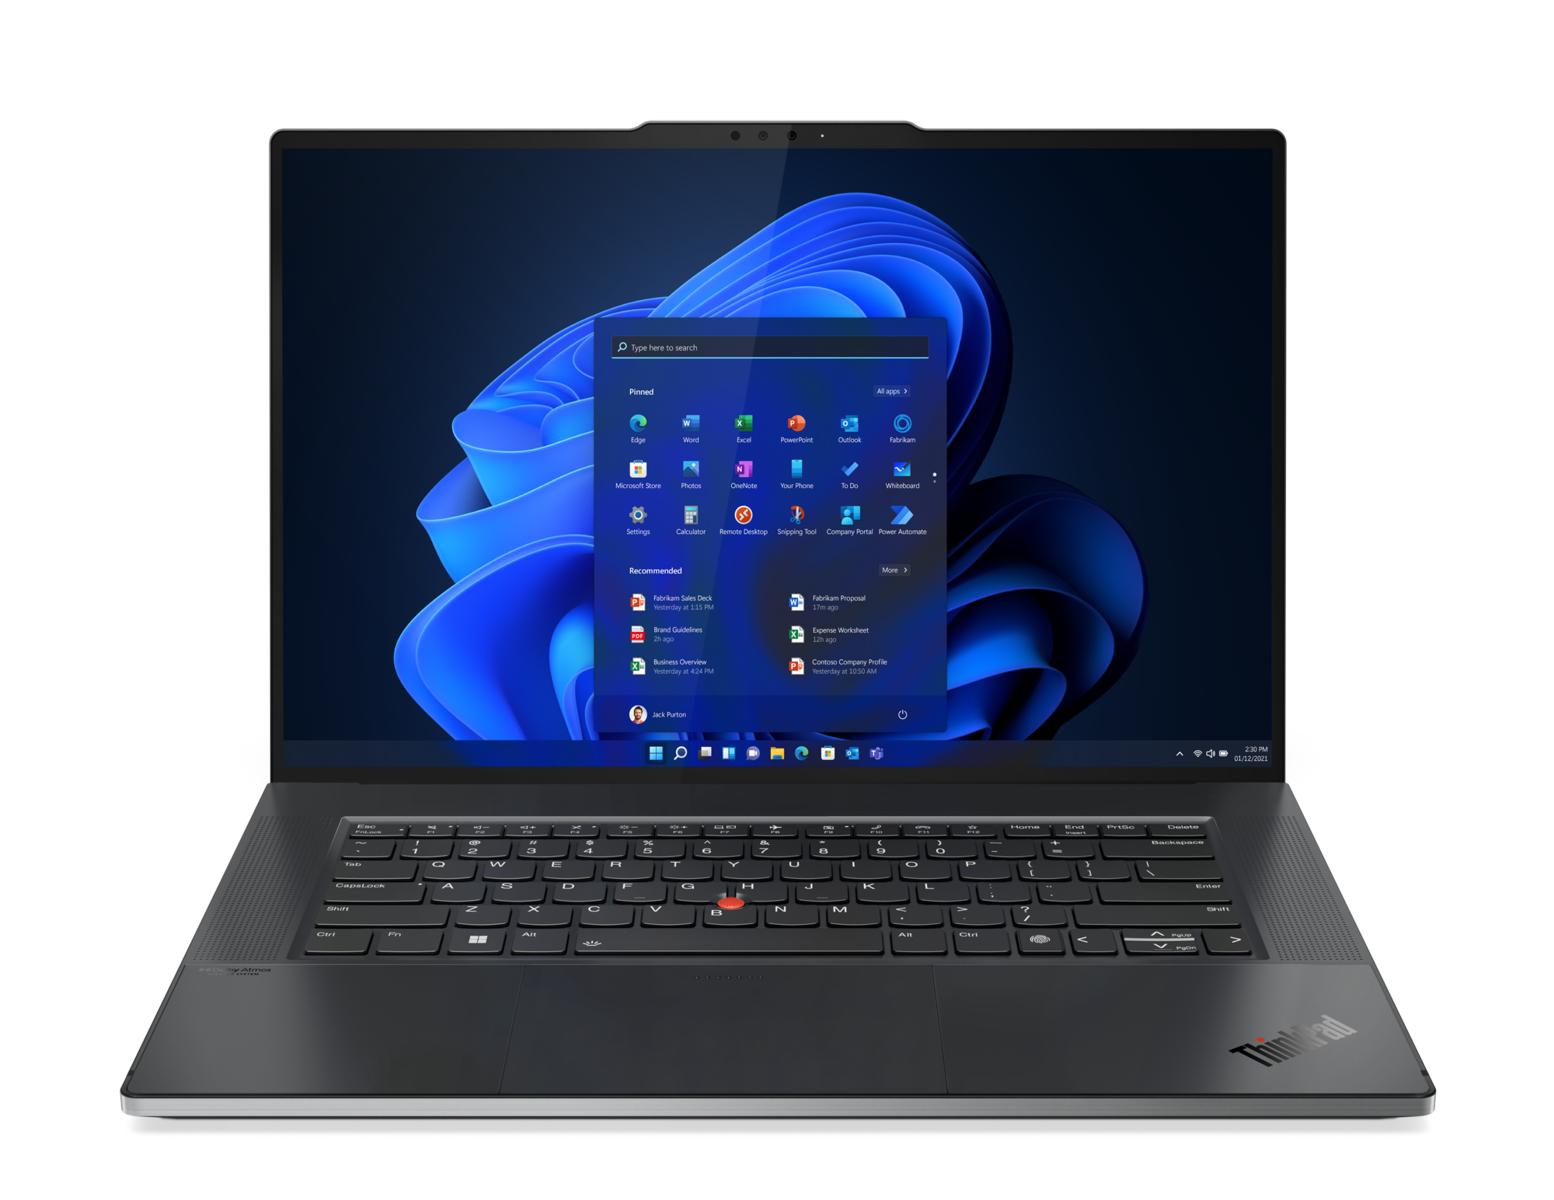
De ThinkPad Z16 G2 volgt de een jaar oude ThinkPad Z16 G1 op met nieuwe AMD Zen 4 CPU-opties, snellere Radeon RX graphics en een nieuw 2400p OLED-touchscreen. Het is toevallig ook een van de weinige laptops met het ongebruikelijke instapmodel Radeon RX 6550M. De behuizing is verder identiek aan die van de ThinkPad Z16 G1 en daarom raden we u aan om eens te kijken naar onze review van het eerste generatie model om meer te weten te komen over de fysieke kenmerken en connectiviteitsopties van de serie.
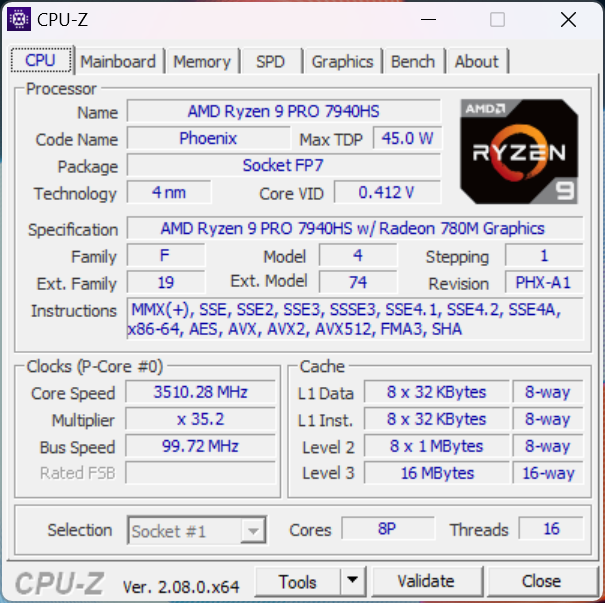
Onze specifieke revieweenheid is de meest geavanceerde configuratie met de Ryzen 9 Pro 7940HS, Radeon RX 6550M, OLED aanraakscherm en 64 GB RAM voor ongeveer $2600 USD. Kleinere SKU's beginnen met de Ryzen 5 Pro 7640HS, geïntegreerde graphics en een 1200p IPS-scherm voor $1600. De ThinkPad Z16 kan worden beschouwd als een semi-professionele multimedia- of content creator-laptop, omdat hij uitgerust is met Ryzen Pro CPU's in plaats van de typische non-Pro opties.
Alternatieven voor de ThinkPad Z16 G2 zijn andere high-end 16-inch laptops voor content creators, zoals de MSI Creator Z16P, Apple MacBook Pro 16, Asus Vivobook Pro 16Xof de Dell XPS serie.
Meer Lenovo beoordelingen:
Potentiële concurrenten in vergelijking
Evaluatie | Datum | Model | Gewicht | Hoogte | Formaat | Resolutie | Beste prijs |
|---|---|---|---|---|---|---|---|
| 88.6 % v7 (old) | 12-2023 | Lenovo ThinkPad Z16 Gen 2 R9 PRO 7940HS, Radeon RX 6550M | 1.8 kg | 15.8 mm | 16.00" | 3840x2400 | |
| 87.3 % v7 (old) | 10-2022 | Lenovo ThinkPad Z16 G1 21D5S00T00 R7 PRO 6850H, Radeon RX 6500M | 1.9 kg | 15.8 mm | 16.00" | 1920x1200 | |
| 85.7 % v7 (old) | 11-2023 | Lenovo ThinkBook 16 G6 ABP R5 7530U, Vega 7 | 1.8 kg | 17.5 mm | 16.00" | 1920x1200 | |
| 83.7 % v7 (old) | 06-2022 | MSI Creator Z16P B12UHST i9-12900H, GeForce RTX 3080 Ti Laptop GPU | 2.4 kg | 20.4 mm | 16.00" | 2560x1600 | |
| 93.7 % v7 (old) | 11-2023 | Apple MacBook Pro 16 2023 M3 Pro Apple M3 Pro 12-Core, M3 Pro 18-Core GPU | 2.1 kg | 16.9 mm | 16.20" | 3456x2234 | |
| 86.2 % v7 (old) | 07-2023 | Asus Vivobook Pro 16X K6604JV-MX016W i9-13980HX, GeForce RTX 4060 Laptop GPU | 2.1 kg | 22.8 mm | 16.00" | 3200x2000 |
Zaak
SD-kaartlezer
| SD Card Reader | |
| average JPG Copy Test (av. of 3 runs) | |
| Lenovo ThinkPad Z16 Gen 2 (Toshiba Exceria Pro SDXC 64 GB UHS-II) | |
| Asus Vivobook Pro 16X K6604JV-MX016W | |
| Lenovo ThinkPad Z16 G1 21D5S00T00 | |
| Lenovo ThinkBook 16 G6 ABP (Angelbird AV Pro V60) | |
| MSI Creator Z16P B12UHST (AV PRO microSD 128 GB V60) | |
| maximum AS SSD Seq Read Test (1GB) | |
| Lenovo ThinkPad Z16 G1 21D5S00T00 | |
| Lenovo ThinkPad Z16 Gen 2 (Toshiba Exceria Pro SDXC 64 GB UHS-II) | |
| Asus Vivobook Pro 16X K6604JV-MX016W | |
| Lenovo ThinkBook 16 G6 ABP (Angelbird AV Pro V60) | |
Communicatie
Lenovo heeft de Qualcomm WCN685x van het model van vorig jaar vervangen door een MediaTek MT7922 op het model van dit jaar. De overdrachtsnelheden blijven stabiel en uitstekend bij koppeling met onze Wi-Fi 6 of Wi-Fi 6E netwerken.
| Networking | |
| iperf3 transmit AXE11000 | |
| Lenovo ThinkPad Z16 G1 21D5S00T00 | |
| Asus Vivobook Pro 16X K6604JV-MX016W | |
| Lenovo ThinkPad Z16 Gen 2 | |
| Lenovo ThinkBook 16 G6 ABP | |
| iperf3 receive AXE11000 | |
| Lenovo ThinkPad Z16 G1 21D5S00T00 | |
| Asus Vivobook Pro 16X K6604JV-MX016W | |
| MSI Creator Z16P B12UHST | |
| Lenovo ThinkPad Z16 Gen 2 | |
| Lenovo ThinkBook 16 G6 ABP | |
| iperf3 transmit AXE11000 6GHz | |
| Lenovo ThinkPad Z16 G1 21D5S00T00 | |
| Asus Vivobook Pro 16X K6604JV-MX016W | |
| Lenovo ThinkPad Z16 Gen 2 | |
| iperf3 receive AXE11000 6GHz | |
| Lenovo ThinkPad Z16 G1 21D5S00T00 | |
| Asus Vivobook Pro 16X K6604JV-MX016W | |
| Lenovo ThinkPad Z16 Gen 2 | |
Webcam
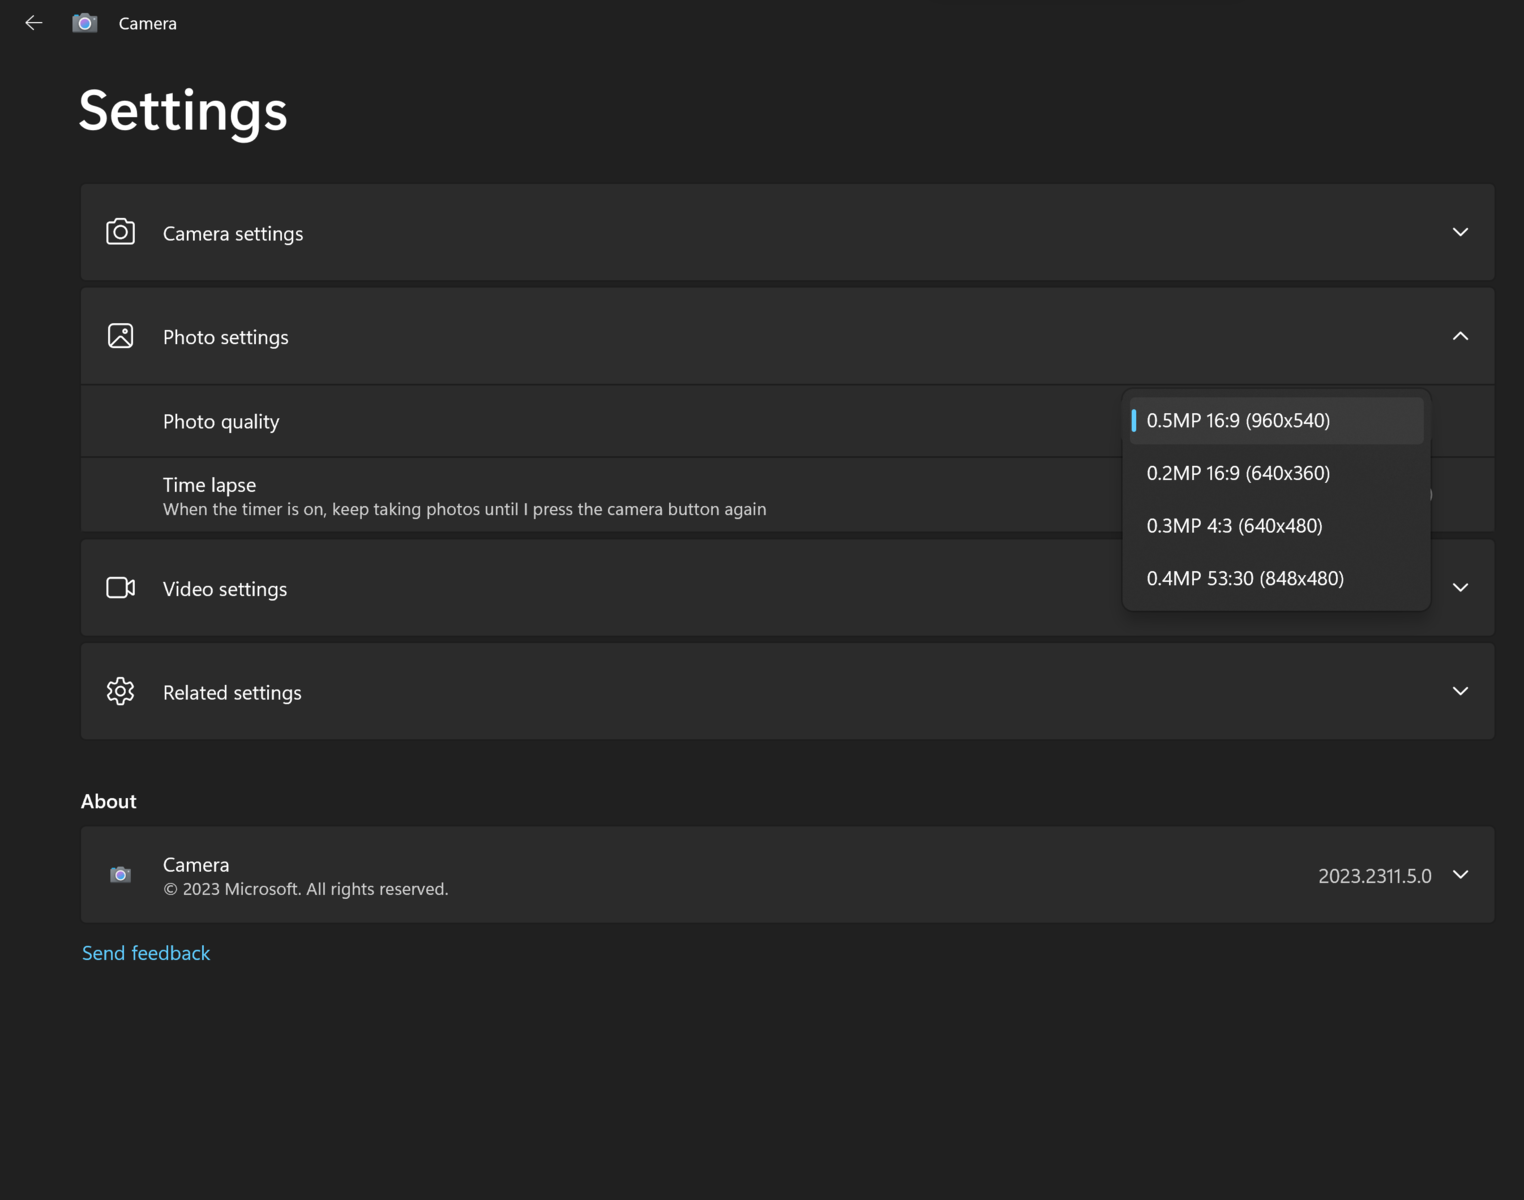
Hoewel Lenovo adverteert met een webcam van 2 MP, kunnen we slechts maximaal 0,5 MP selecteren met de ingebouwde camera-app, zoals de schermafbeelding rechts laat zien. We hebben Lenovo op de hoogte gesteld van de bug en zullen dit gedeelte bijwerken als we een reactie ontvangen.


Onderhoud
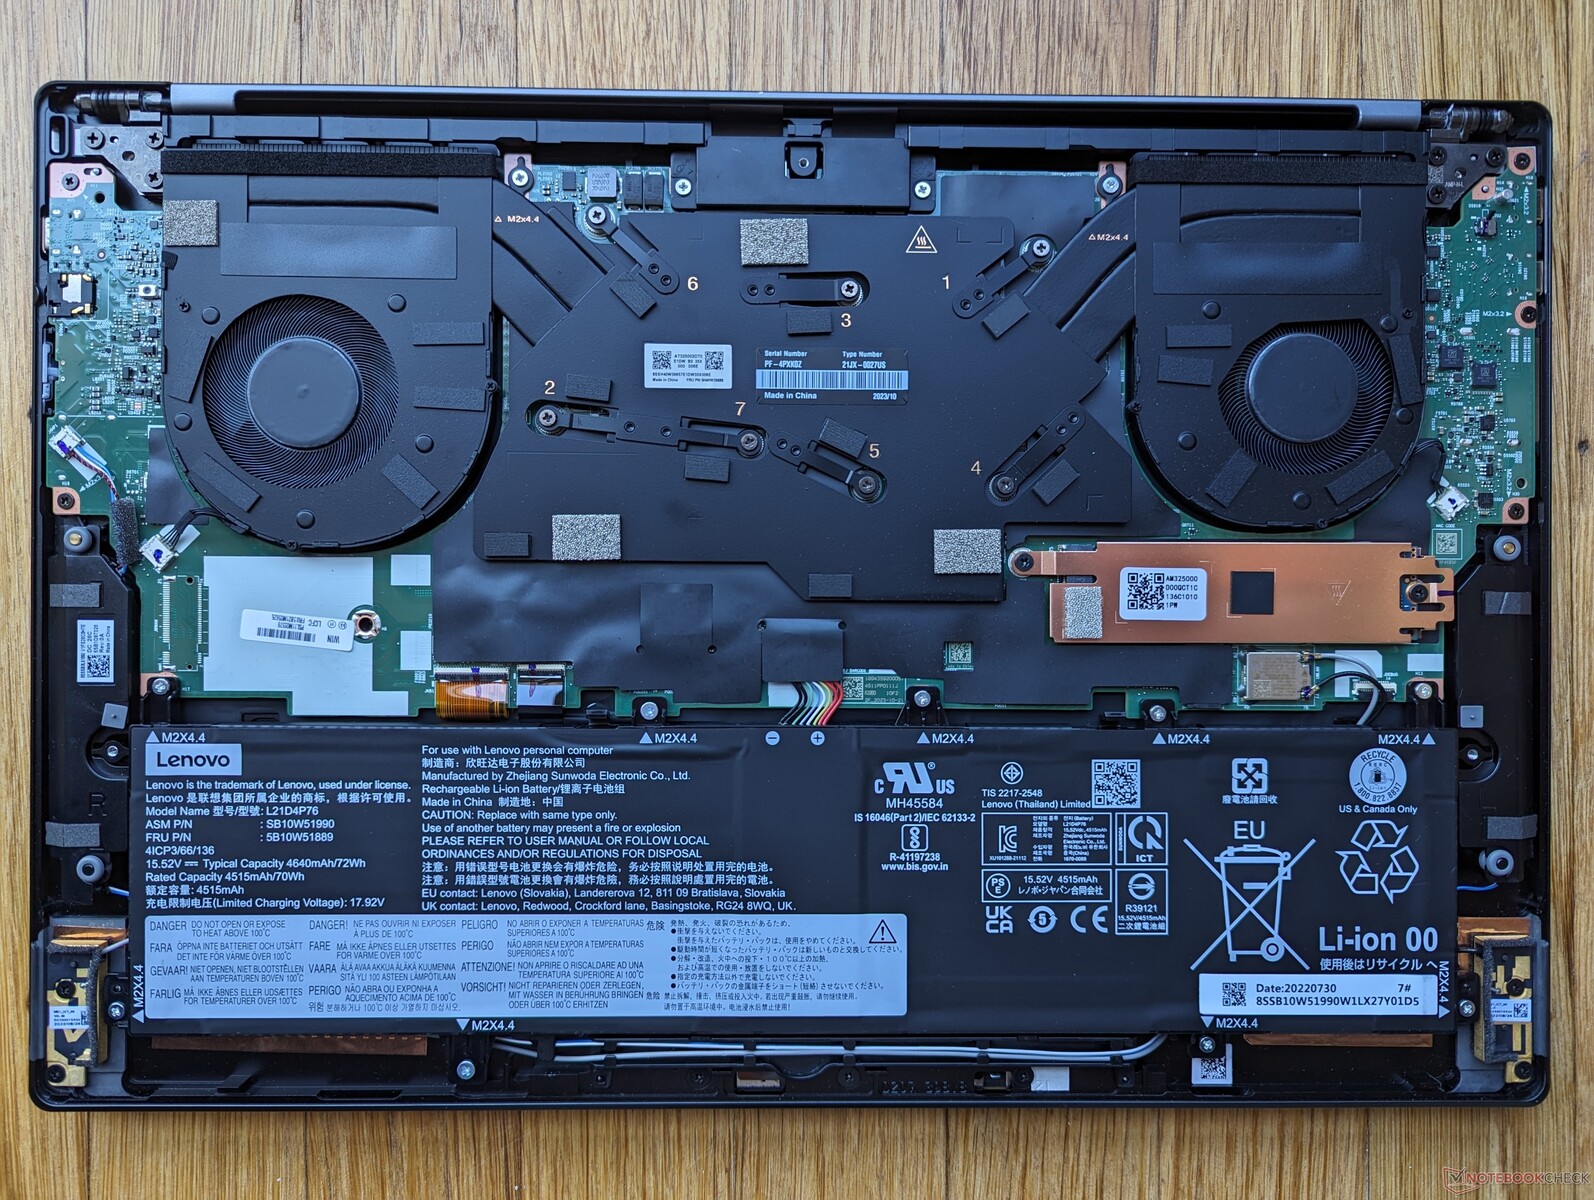
Als u het onderste paneel verwijdert, ziet u geen grote interne verschillen tussen de Gen 1 en Gen 2 versies. Onze Gen 2 configuratie bevat echter geen WAN-ondersteuning en dus zijn de M.2 WAN-sleuf en antenne afwezig. Dit betekent helaas dat gebruikers geen WAN-loze SKU kunnen kopen met de bedoeling om in de toekomst een WAN-module toe te voegen.

Weergave
Lenovo biedt de volgende vier schermopties die allemaal alleen 60 Hz zijn en geen ondersteuning voor FreeSync bieden:
- 1920 x 1200, IPS, mat, niet-touch, 100% sRGB, 400 nits
- 1920 x 1200, IPS, glanzend, aanraakgevoelig, 100% sRGB, 400 nits
- 3840 x 2400, OLED, glanzend, aanraakgevoelig, 100% DCI-P3, 400 nits, HDR400
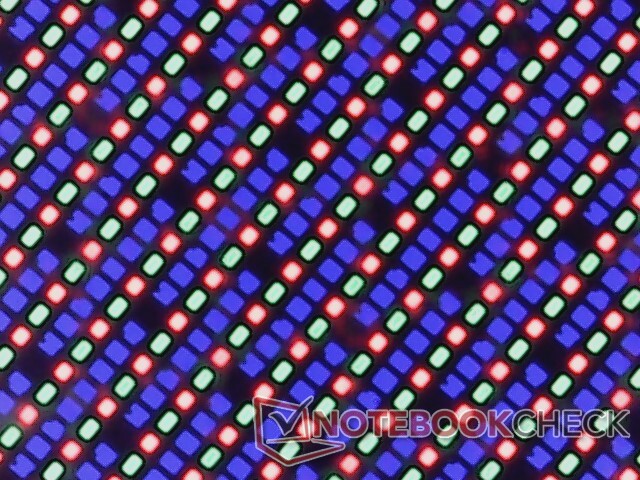
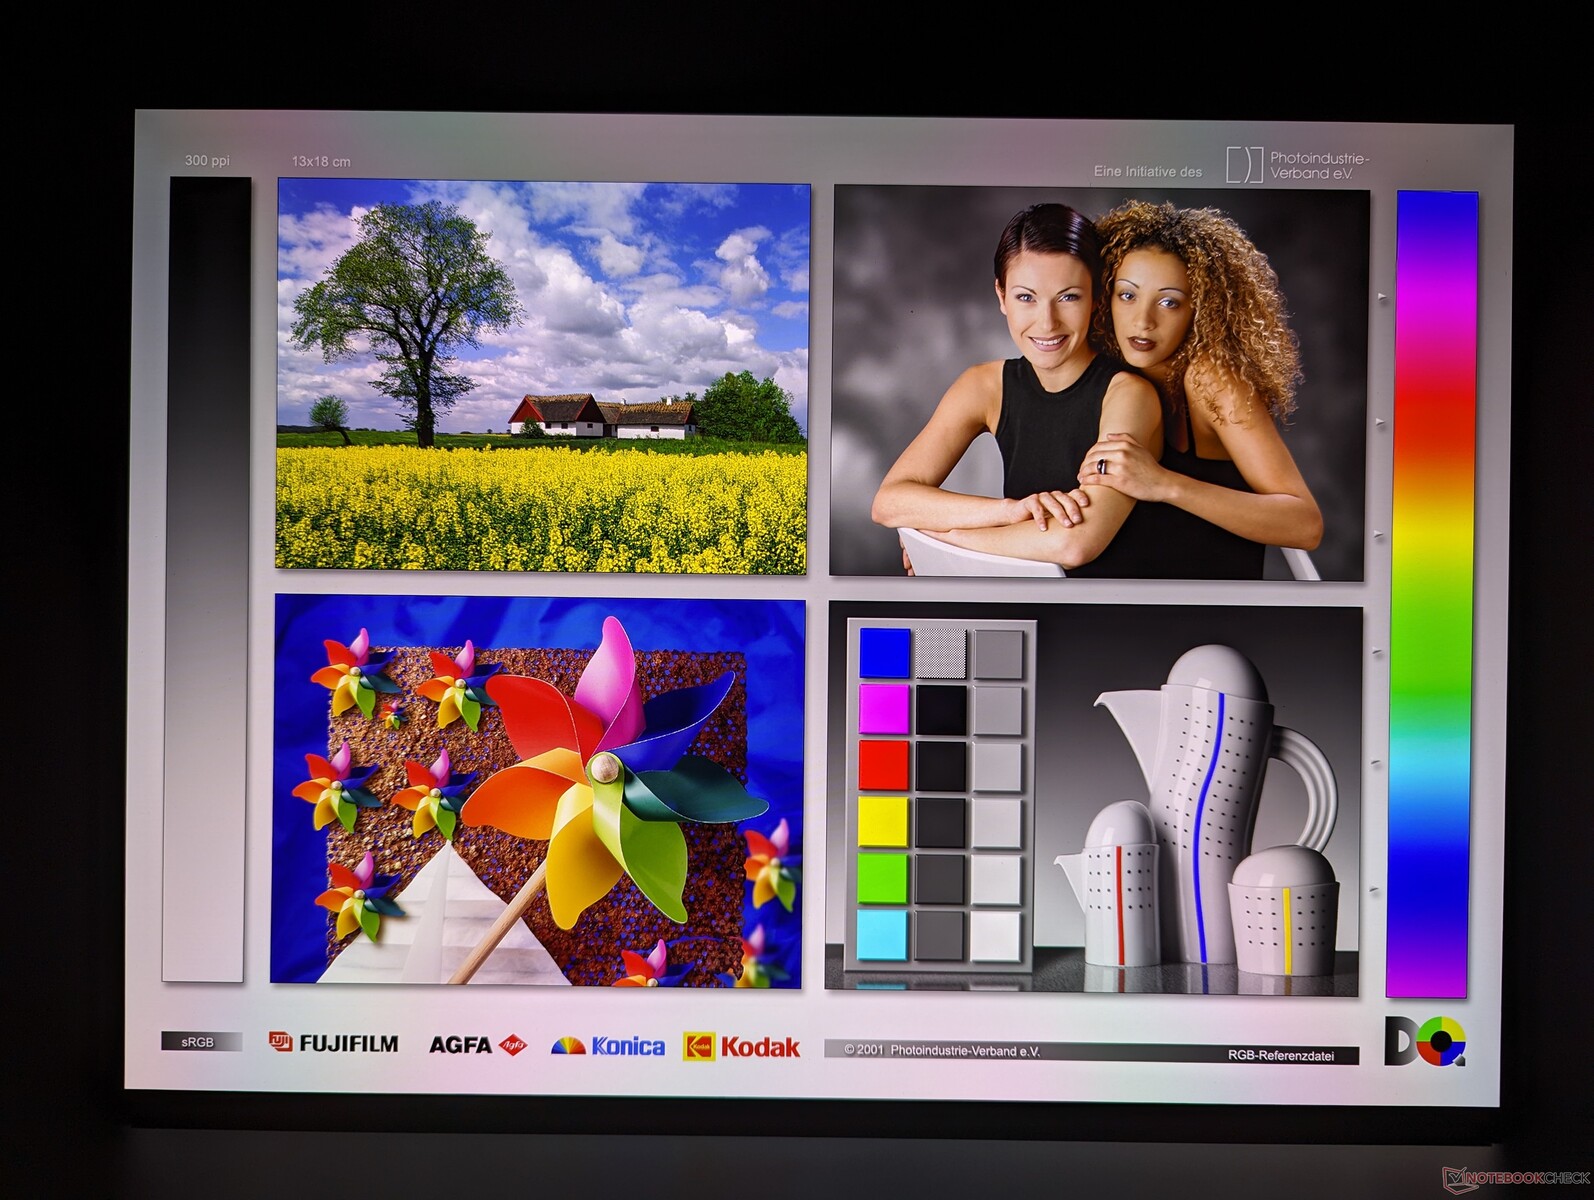
Hetzelfde Samsung ATNA60YV04-0 OLED-paneel op onze evaluatie-eenheid is ook te vinden op de recente ThinkPad P1 G6 en dus is de kijkervaring tussen deze twee modellen vergelijkbaar. Het is niet ongewoon dat een fabrikant dezelfde paneelopties gebruikt op meerdere modellen.
Vergeleken met het 1200p paneel op onze Gen 1 eenheid, biedt het OLED paneel diepere zwartniveaus, HDR ondersteuning, snellere zwart-wit responstijden, levendigere kleuren en een hogere native resolutie. Ongeacht de optie zijn we blij dat volledige sRGB-dekking standaard is en dat we geen low-end SKU's hoeven te vermijden. We hopen dat toekomstige revisies panelen met een hoge verversingsfrequentie zullen bevatten, zoals de Asus VivoBook-serie.

| |||||||||||||||||||||||||
Helderheidsverdeling: 97 %
Helderheid in Batterij-modus: 390.1 cd/m²
Contrast: ∞:1 (Zwart: 0 cd/m²)
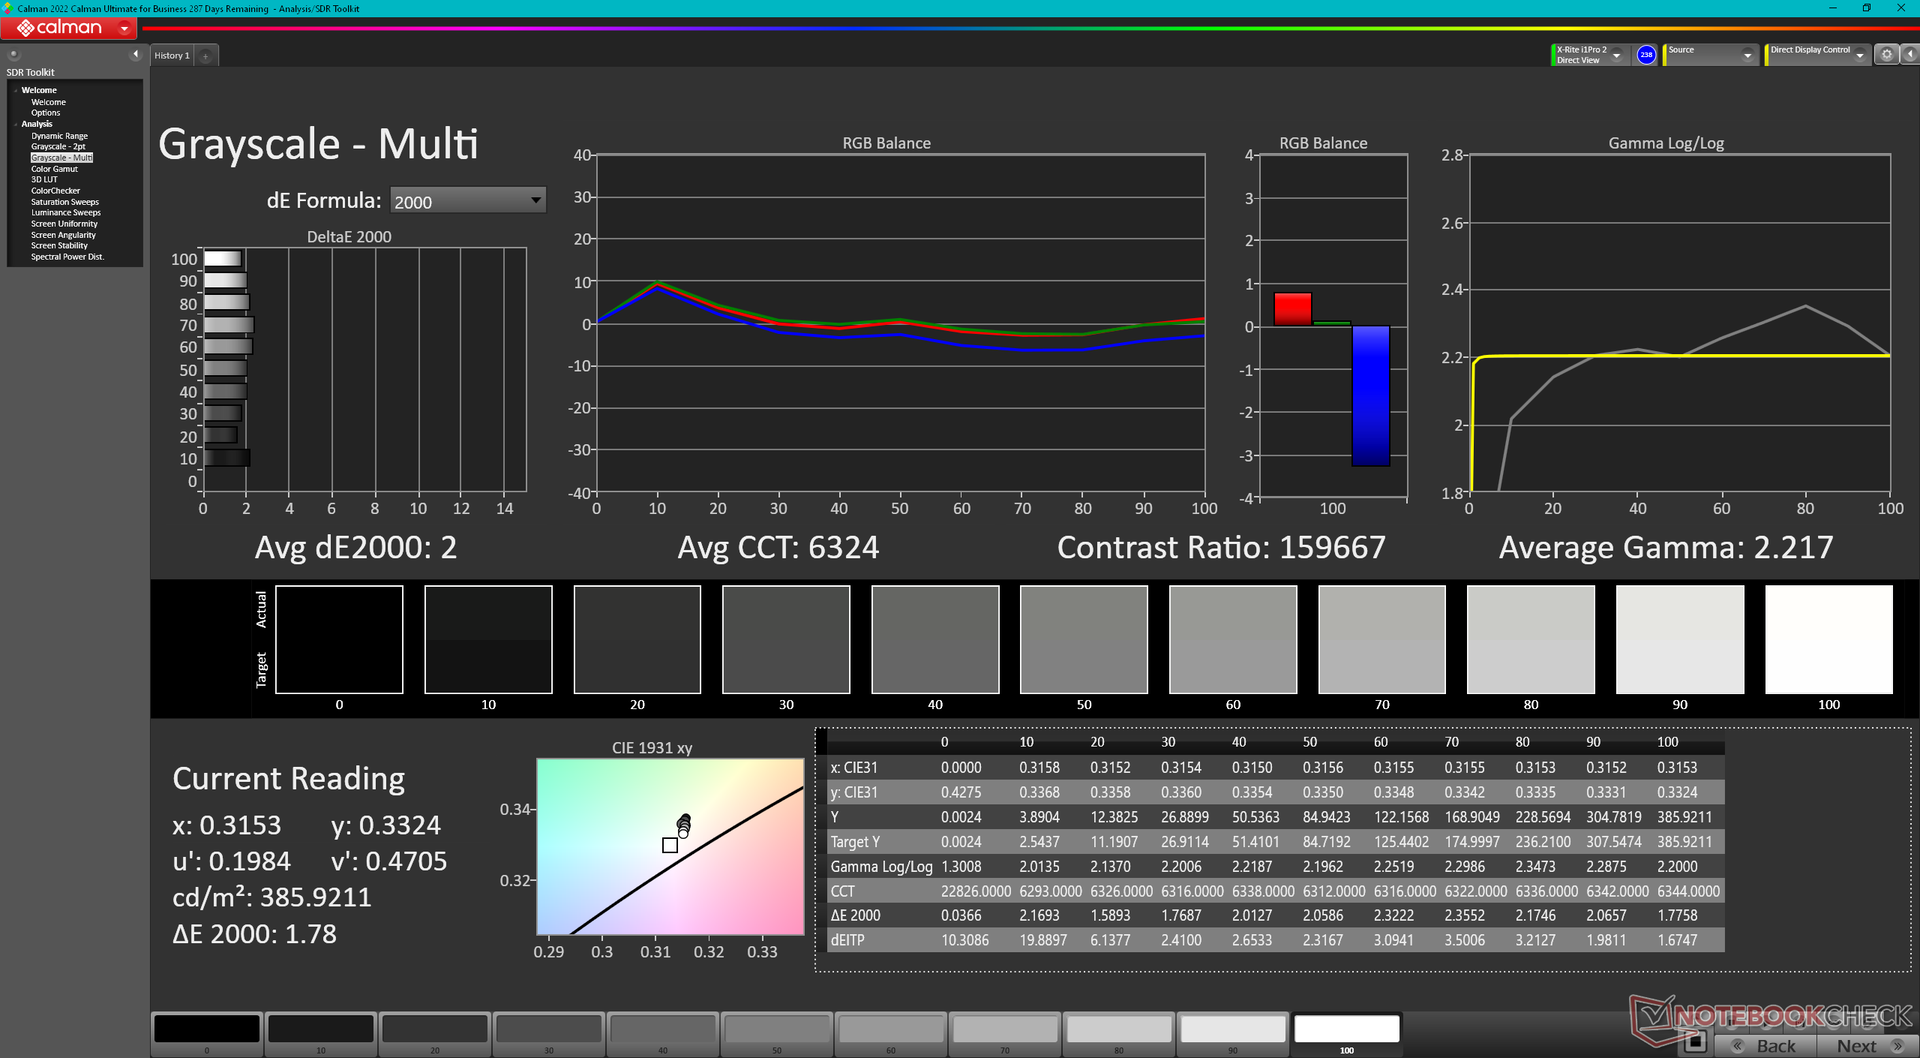
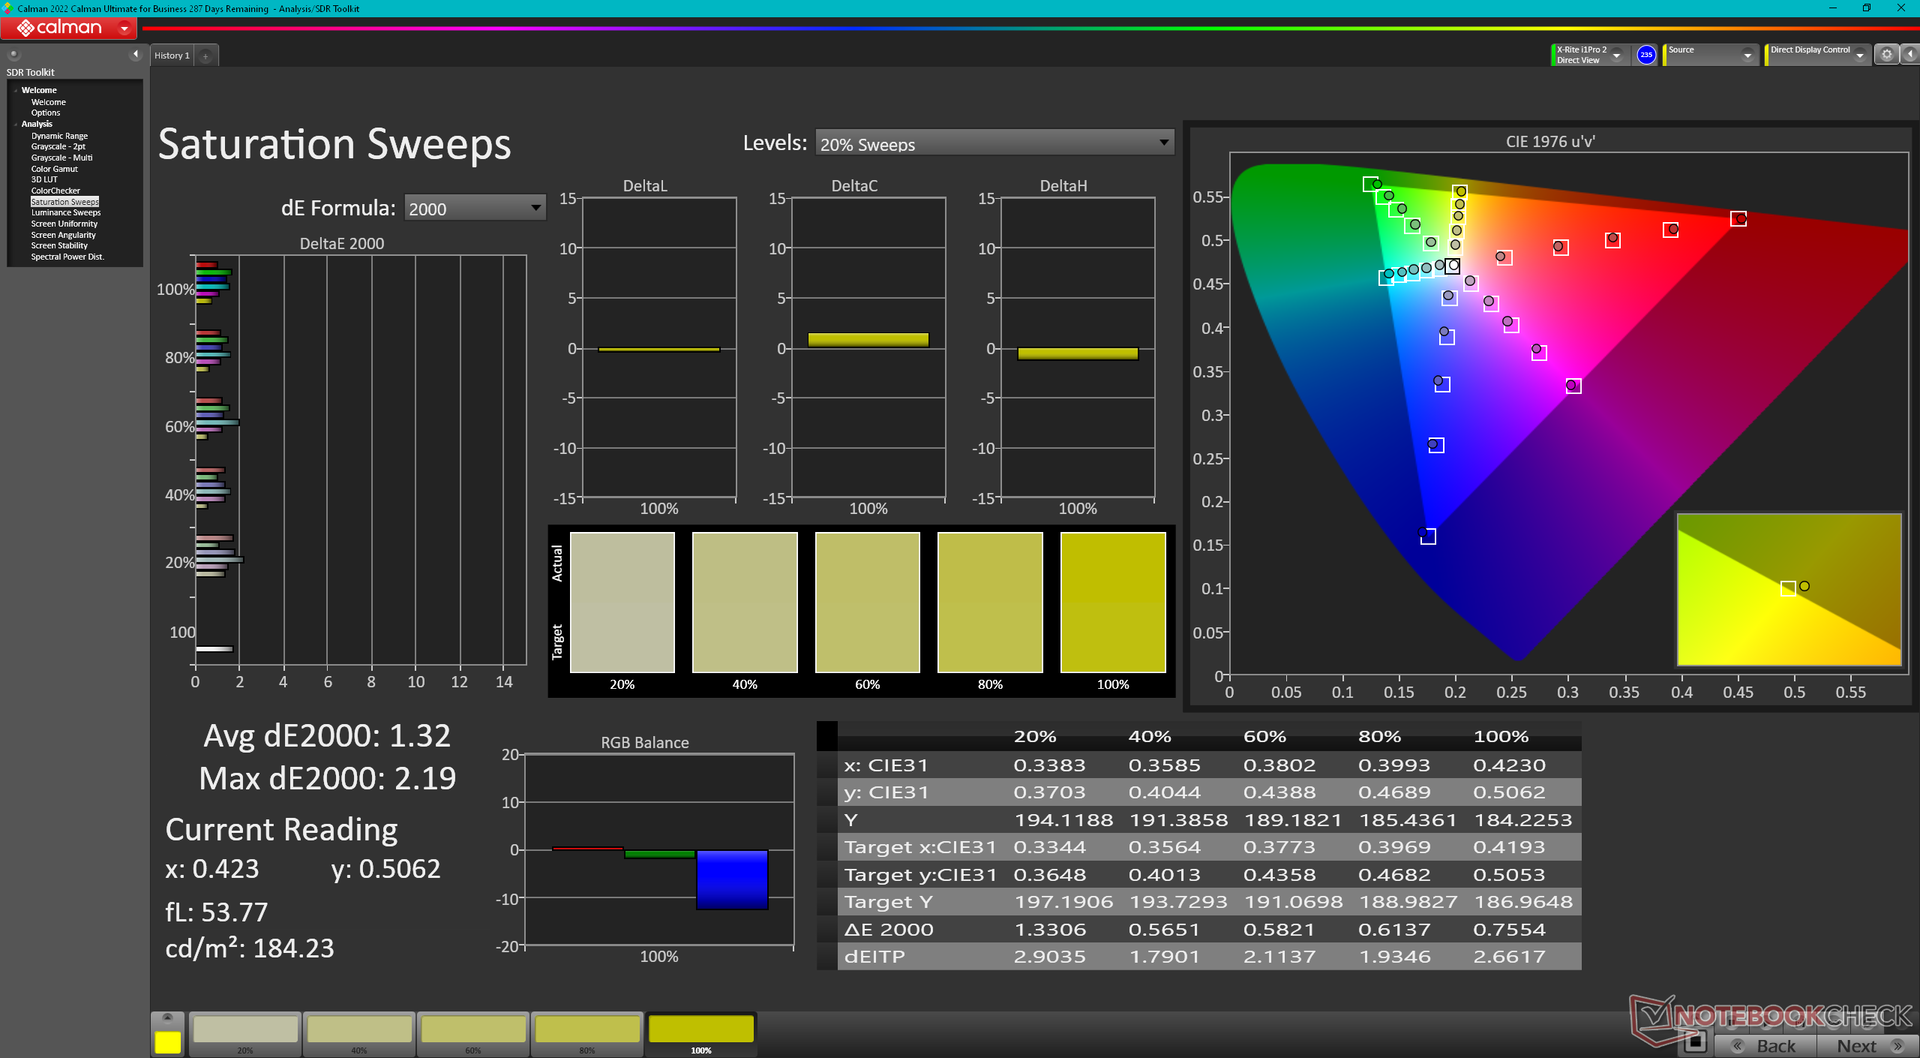
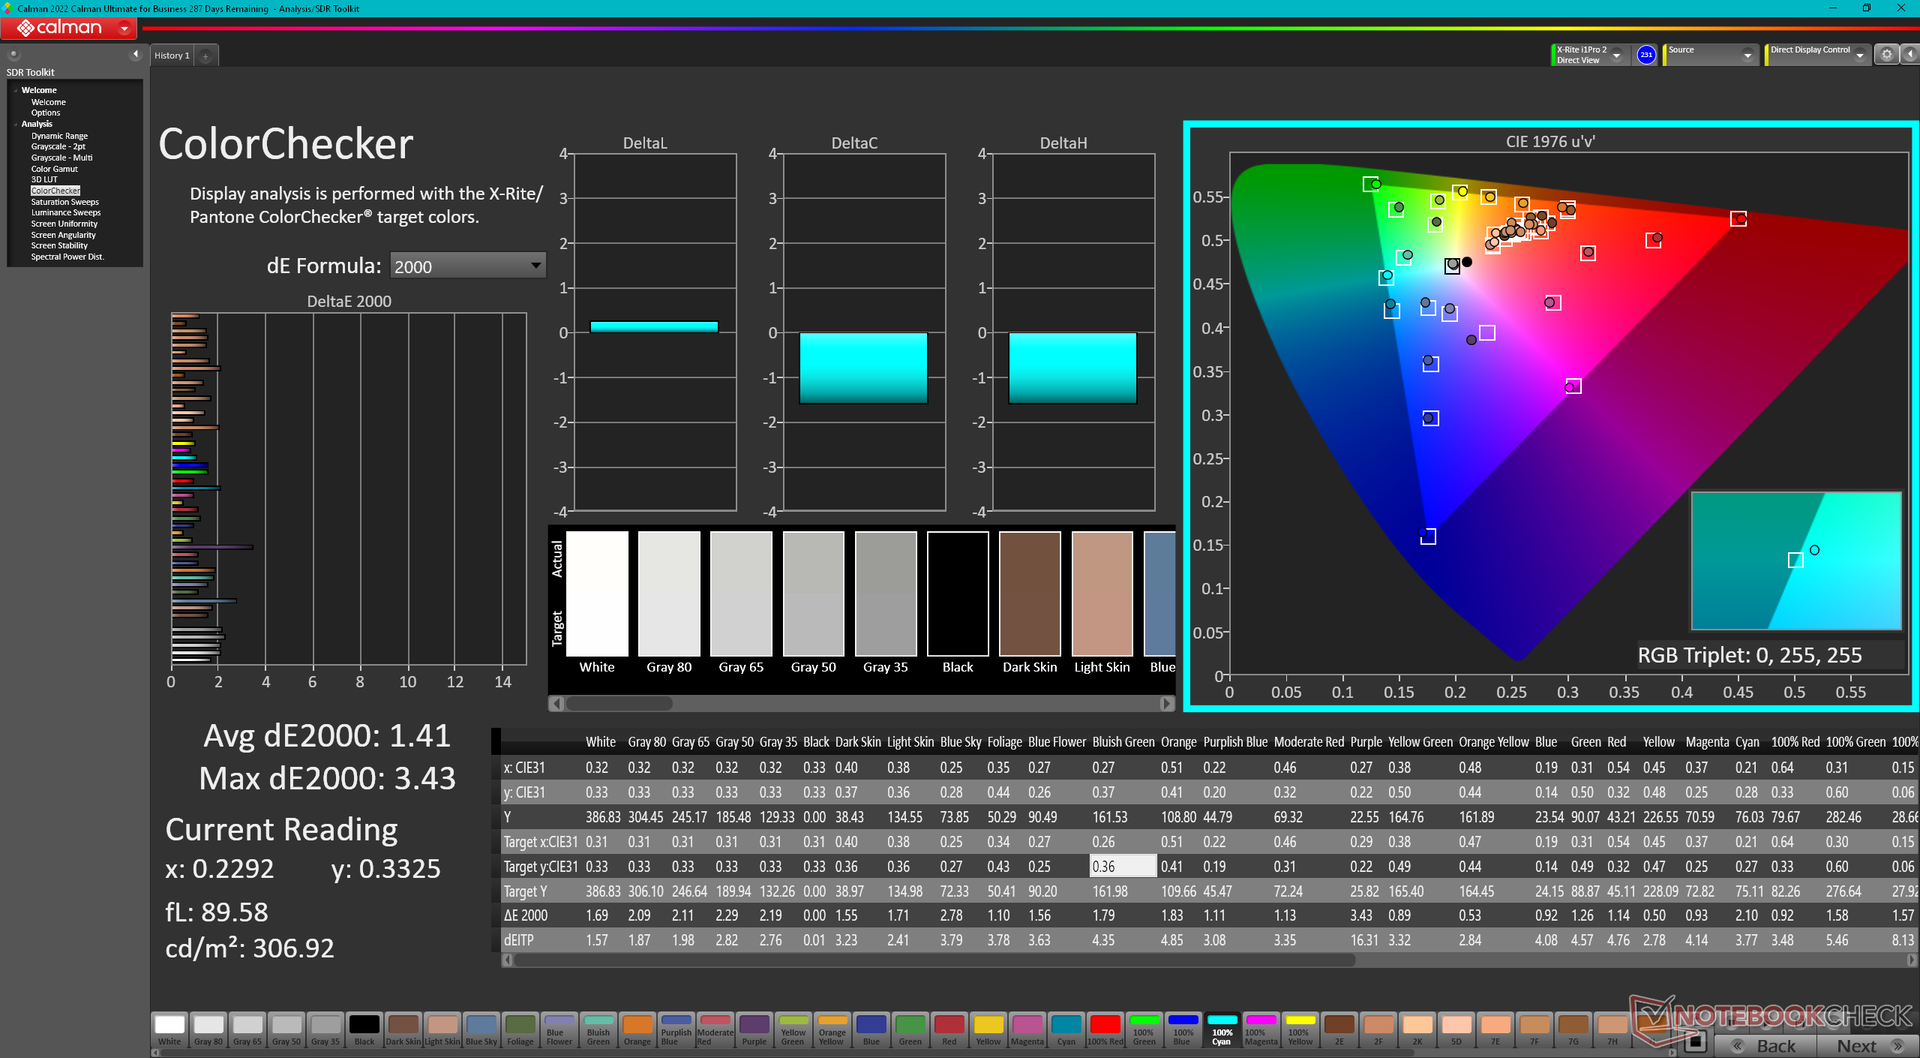
ΔE ColorChecker Calman: 1.41 | ∀{0.5-29.43 Ø4.71}
ΔE Greyscale Calman: 2 | ∀{0.09-98 Ø4.96}
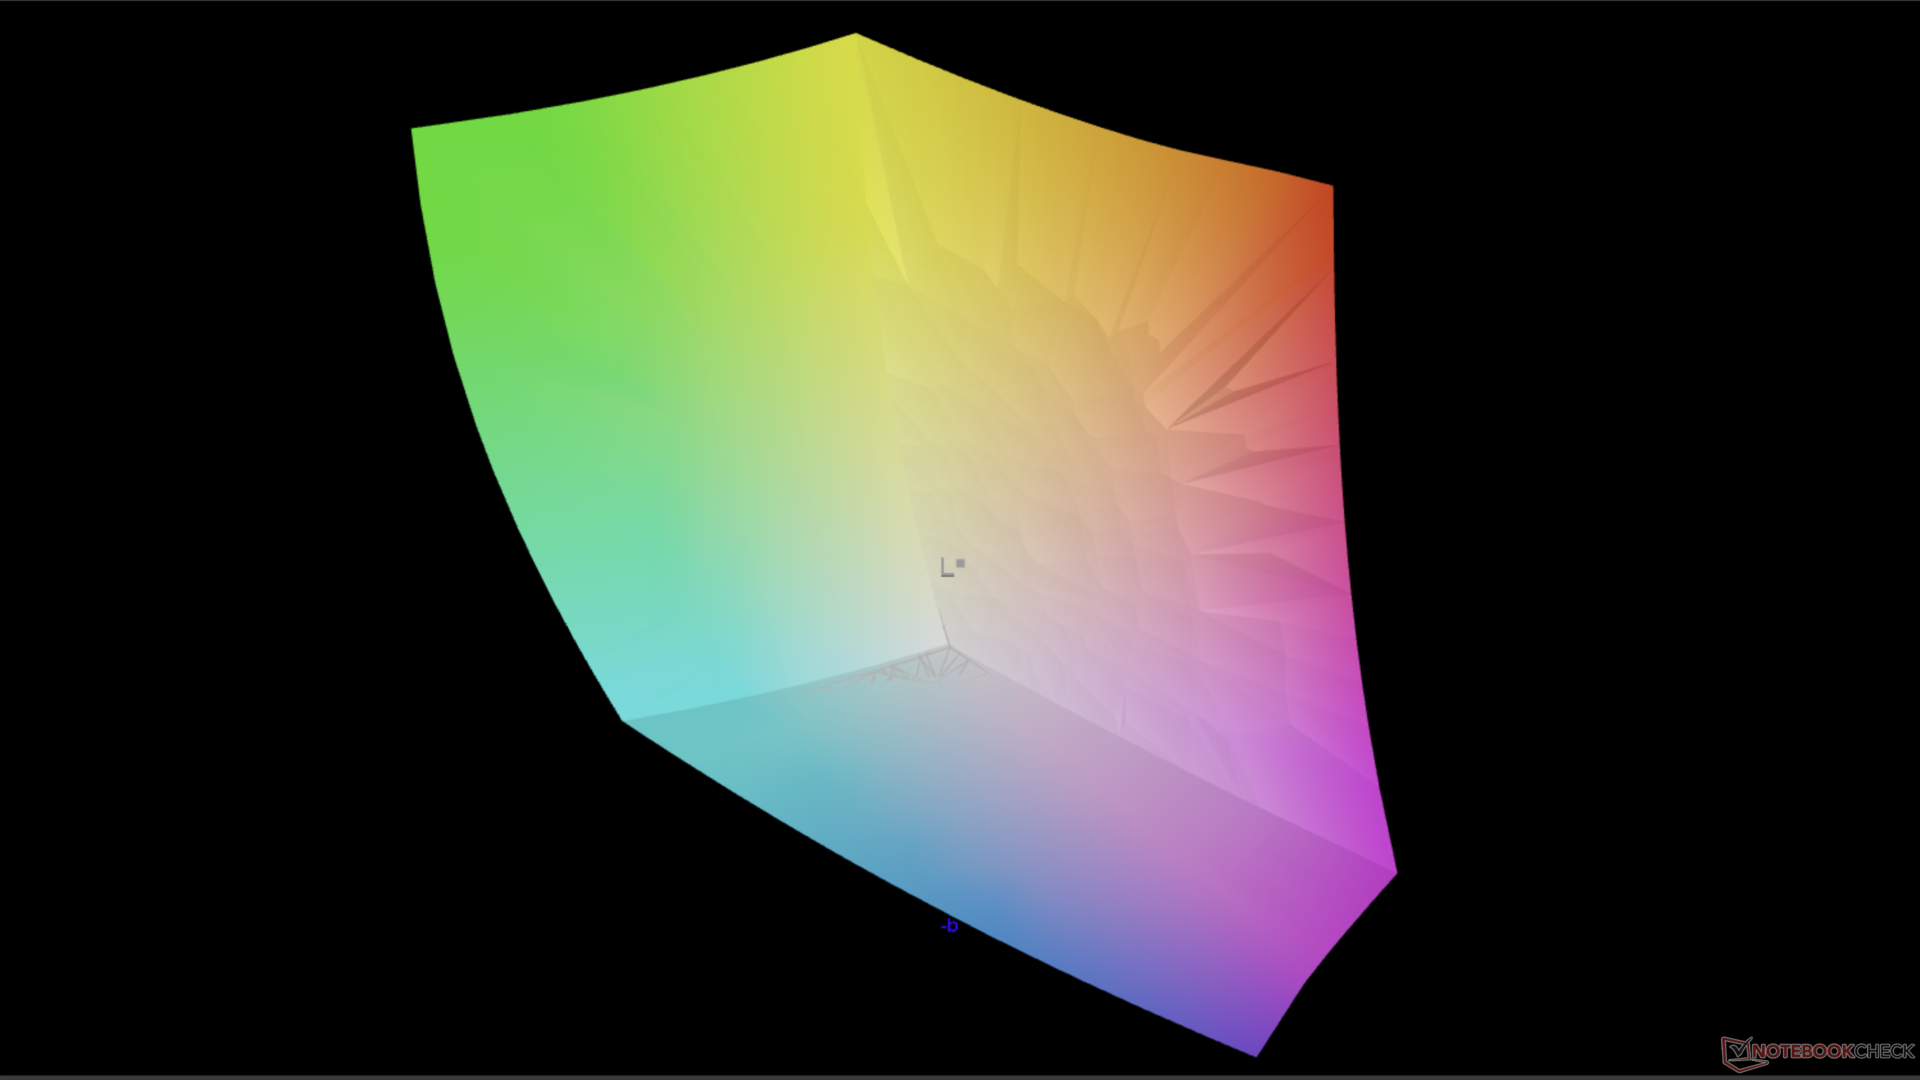
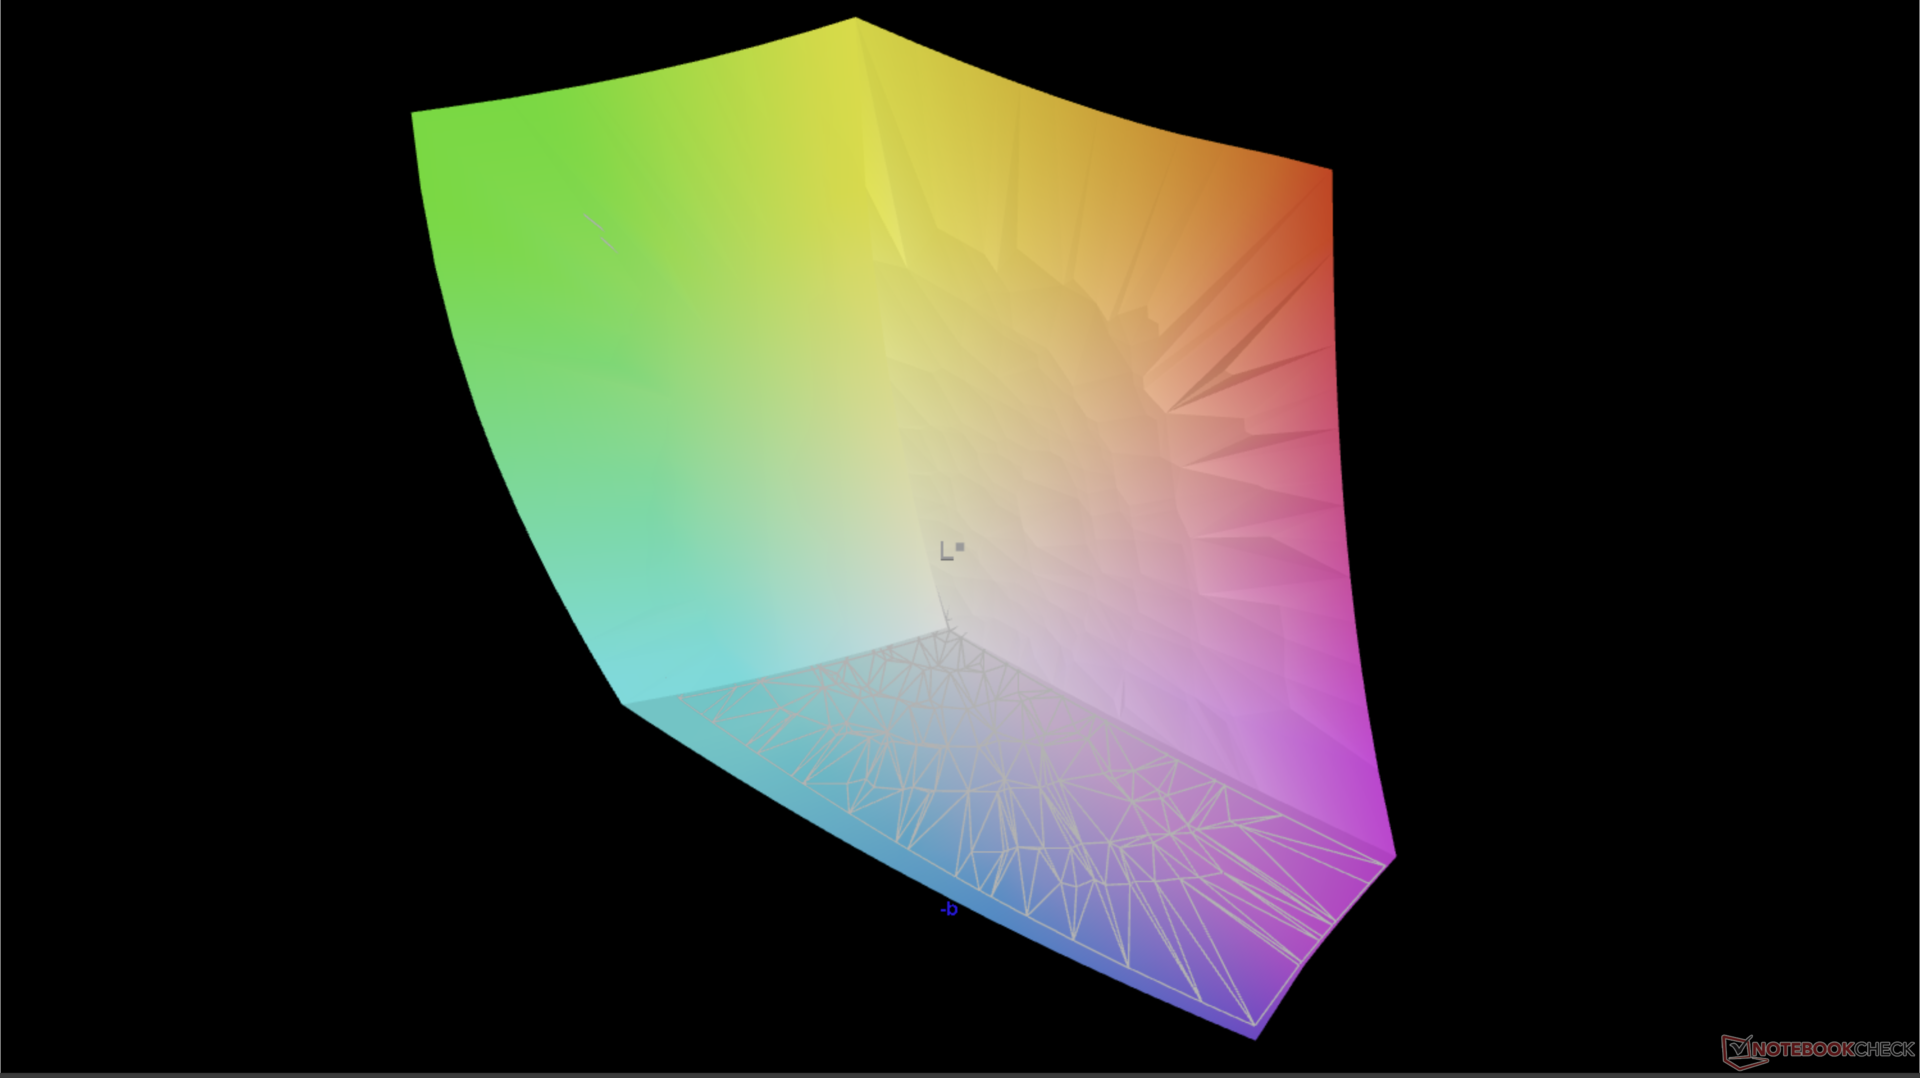
96.7% AdobeRGB 1998 (Argyll 3D)
100% sRGB (Argyll 3D)
99.7% Display P3 (Argyll 3D)
Gamma: 2.22
CCT: 6324 K
| Lenovo ThinkPad Z16 Gen 2 Samsung ATNA60YV04-0, OLED, 3840x2400, 16" | Lenovo ThinkPad Z16 G1 21D5S00T00 NE160WUM-N62 , IPS LED, 1920x1200, 16" | Lenovo ThinkBook 16 G6 ABP LEN160WUXGA, IPS, 1920x1200, 16" | MSI Creator Z16P B12UHST AUOD298, IPS True Pixel (~100% DCI-P3), 2560x1600, 16" | Asus Vivobook Pro 16X K6604JV-MX016W Samsung SDC4178 ATNA60BX01-1, OLED, 3200x2000, 16" | Apple MacBook Pro 16 2023 M3 Max Mini-LED, 3456x2234, 16" | |
|---|---|---|---|---|---|---|
| Display | -18% | -52% | -4% | -1% | -1% | |
| Display P3 Coverage (%) | 99.7 | 70 -30% | 40.4 -59% | 97.6 -2% | 98.4 -1% | 99.2 -1% |
| sRGB Coverage (%) | 100 | 99.7 0% | 59.8 -40% | 99.9 0% | 99.7 0% | |
| AdobeRGB 1998 Coverage (%) | 96.7 | 72.1 -25% | 42 -57% | 86.8 -10% | 95.8 -1% | |
| Response Times | -1637% | -1414% | -417% | 20% | -2852% | |
| Response Time Grey 50% / Grey 80% * (ms) | 1.86 ? | 40 ? -2051% | 32.8 ? -1663% | 12.9 ? -594% | 1.6 ? 14% | 66.9 ? -3497% |
| Response Time Black / White * (ms) | 1.89 ? | 25 ? -1223% | 23.9 ? -1165% | 6.4 ? -239% | 1.4 ? 26% | 43.6 ? -2207% |
| PWM Frequency (Hz) | 60 ? | 120 ? | 14877 | |||
| Screen | -3% | -185% | -23% | -5% | 25% | |
| Brightness middle (cd/m²) | 390.1 | 487 25% | 310 -21% | 428 10% | 347 -11% | 630 61% |
| Brightness (cd/m²) | 393 | 446 13% | 290 -26% | 394 0% | 346 -12% | 604 54% |
| Brightness Distribution (%) | 97 | 83 -14% | 86 -11% | 86 -11% | 97 0% | 94 -3% |
| Black Level * (cd/m²) | 0.31 | 0.22 | 0.42 | 0.06 | ||
| Colorchecker dE 2000 * | 1.41 | 1.8 -28% | 6.2 -340% | 1.67 -18% | 1.89 -34% | 1.2 15% |
| Colorchecker dE 2000 max. * | 3.43 | 3.3 4% | 24.7 -620% | 5.71 -66% | 3.26 5% | 2.8 18% |
| Greyscale dE 2000 * | 2 | 2.3 -15% | 3.8 -90% | 3.1 -55% | 1.55 22% | 1.9 5% |
| Gamma | 2.22 99% | 2.16 102% | 2.22 99% | 2.195 100% | 2.39 92% | 2.29 96% |
| CCT | 6324 103% | 6867 95% | 6011 108% | 6498 100% | 6458 101% | 6812 95% |
| Contrast (:1) | 1571 | 1409 | 1019 | 5783 | ||
| Colorchecker dE 2000 calibrated * | 0.8 | 5.3 | 0.71 | 1.97 | ||
| Totaal Gemiddelde (Programma / Instellingen) | -553% /
-304% | -550% /
-372% | -148% /
-90% | 5% /
1% | -943% /
-617% |
* ... kleiner is beter
Het OLED-beeldscherm is goed gekalibreerd uit de doos met gemiddelde grijswaarden en kleurdeltaE-waarden van respectievelijk slechts 2,0 en 1,41. Een kalibratie door de eindgebruiker is daarom niet nodig voor de overgrote meerderheid van de gebruikers. Een kalibratie door de eindgebruiker is daarom voor de overgrote meerderheid van de gebruikers niet nodig.
Responstijd Scherm
| ↔ Responstijd Zwart naar Wit | ||
|---|---|---|
| 1.89 ms ... stijging ↗ en daling ↘ gecombineerd | ↗ ms stijging | 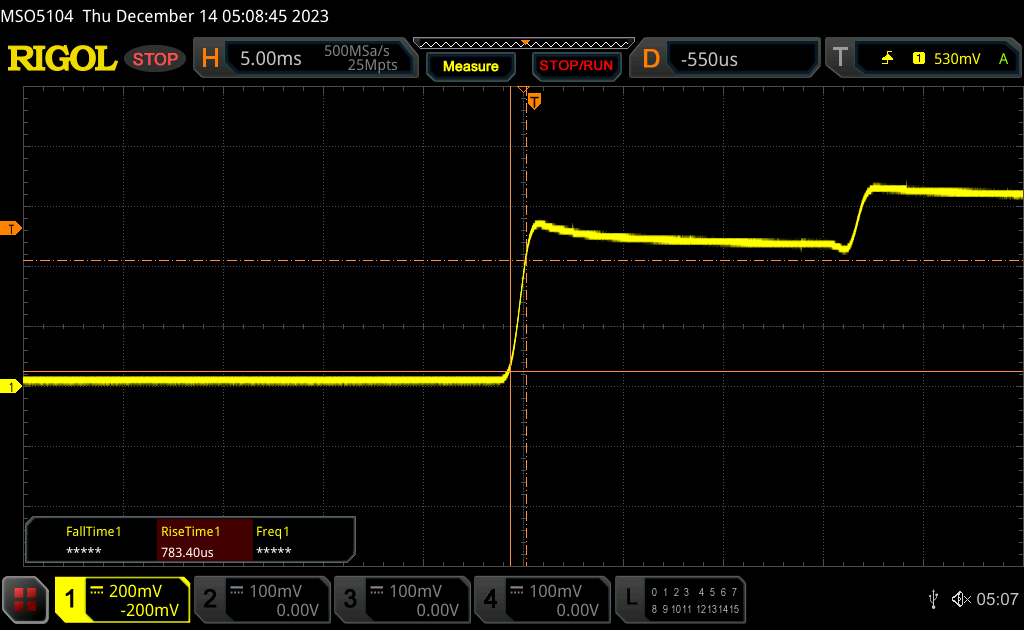 |
| ↘ 0.89 ms daling | ||
| Het scherm vertoonde erg snelle responstijden in onze tests en zou zeer geschikt moeten zijn voor snelle games. Ter vergelijking: alle testtoestellen variëren van 0.1 (minimum) tot 240 (maximum) ms. » 11 % van alle toestellen zijn beter. Dit betekent dat de gemeten responstijd beter is dan het gemiddelde (19.8 ms) van alle geteste toestellen. | ||
| ↔ Responstijd 50% Grijs naar 80% Grijs | ||
| 1.86 ms ... stijging ↗ en daling ↘ gecombineerd | ↗ 0.96 ms stijging | 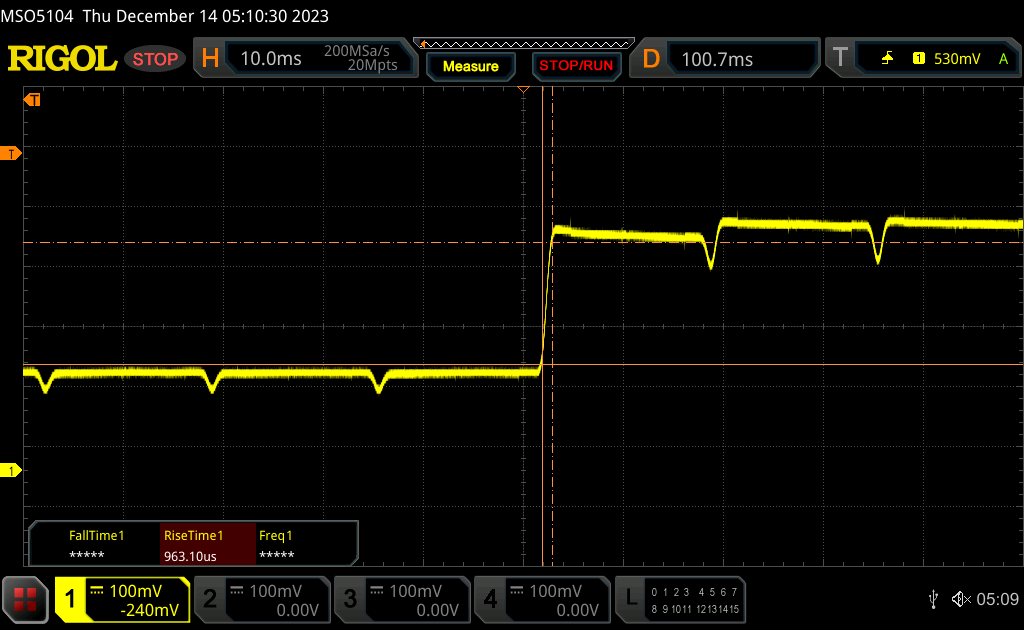 |
| ↘ 0.9 ms daling | ||
| Het scherm vertoonde erg snelle responstijden in onze tests en zou zeer geschikt moeten zijn voor snelle games. Ter vergelijking: alle testtoestellen variëren van 0.165 (minimum) tot 636 (maximum) ms. » 9 % van alle toestellen zijn beter. Dit betekent dat de gemeten responstijd beter is dan het gemiddelde (31 ms) van alle geteste toestellen. | ||
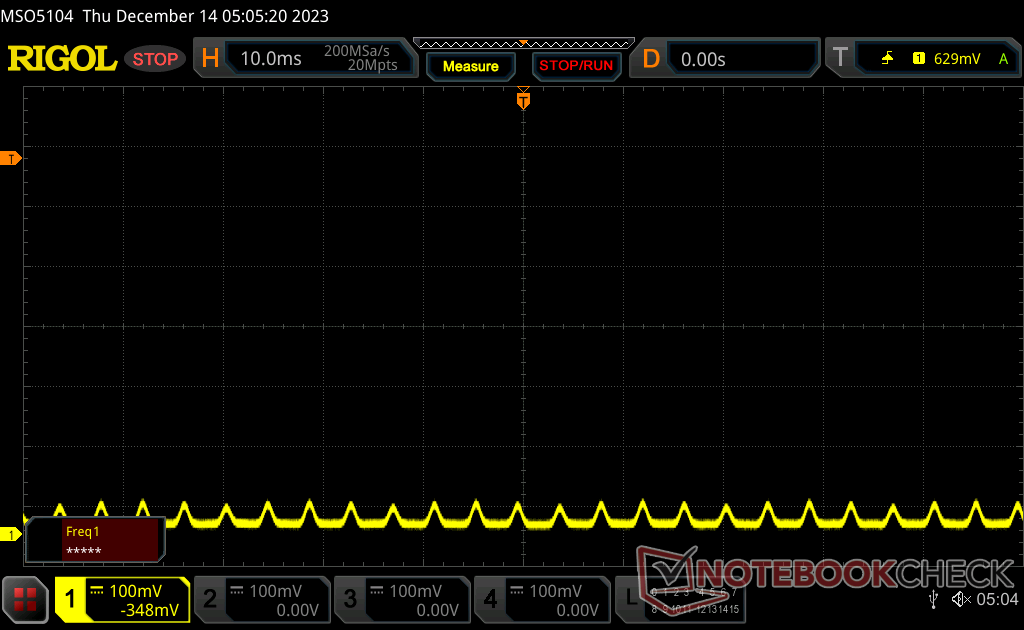
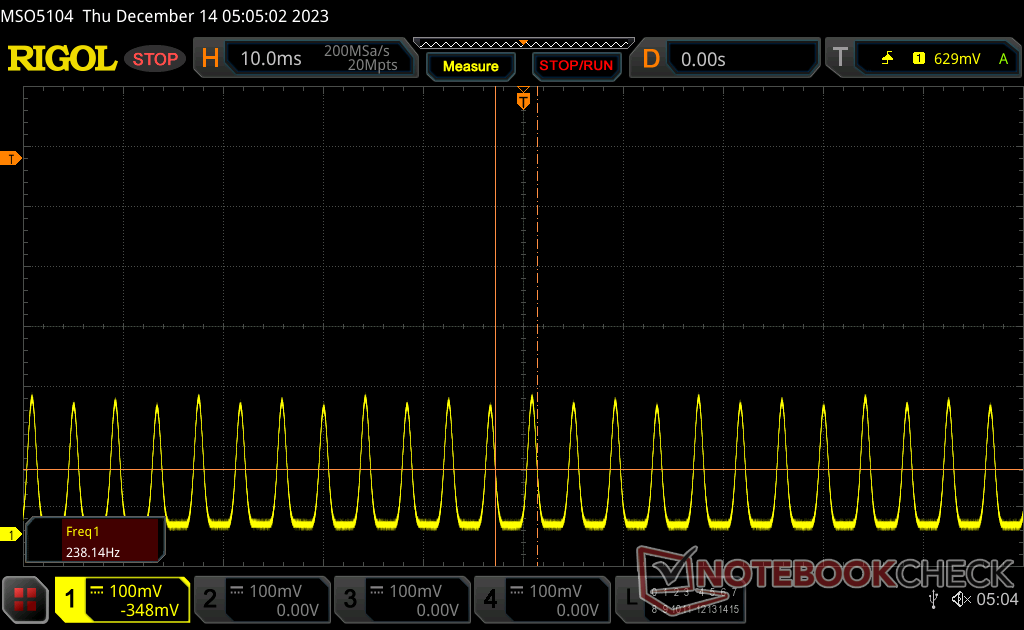
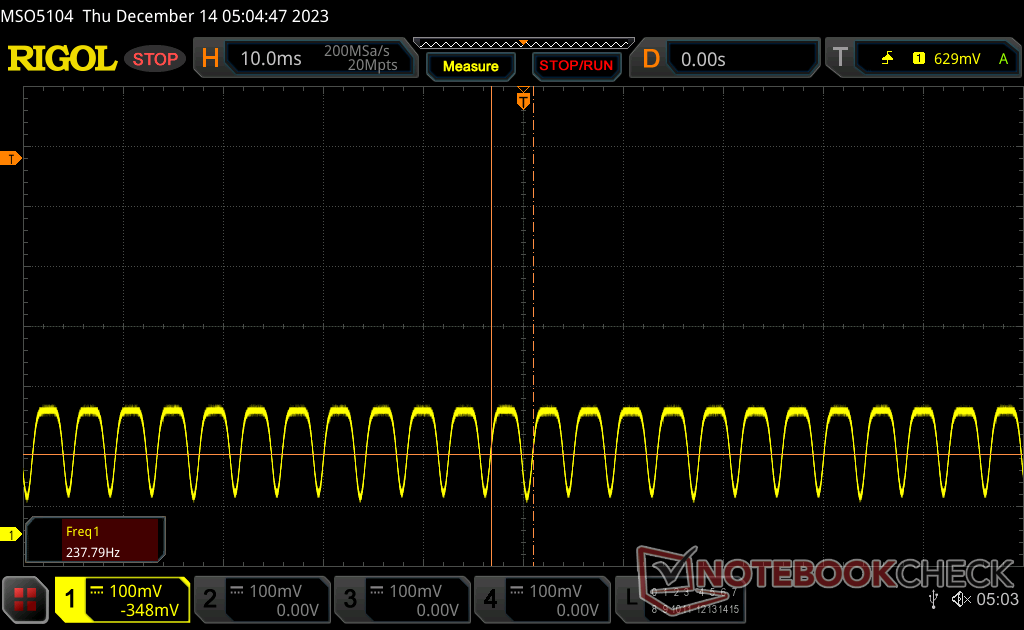
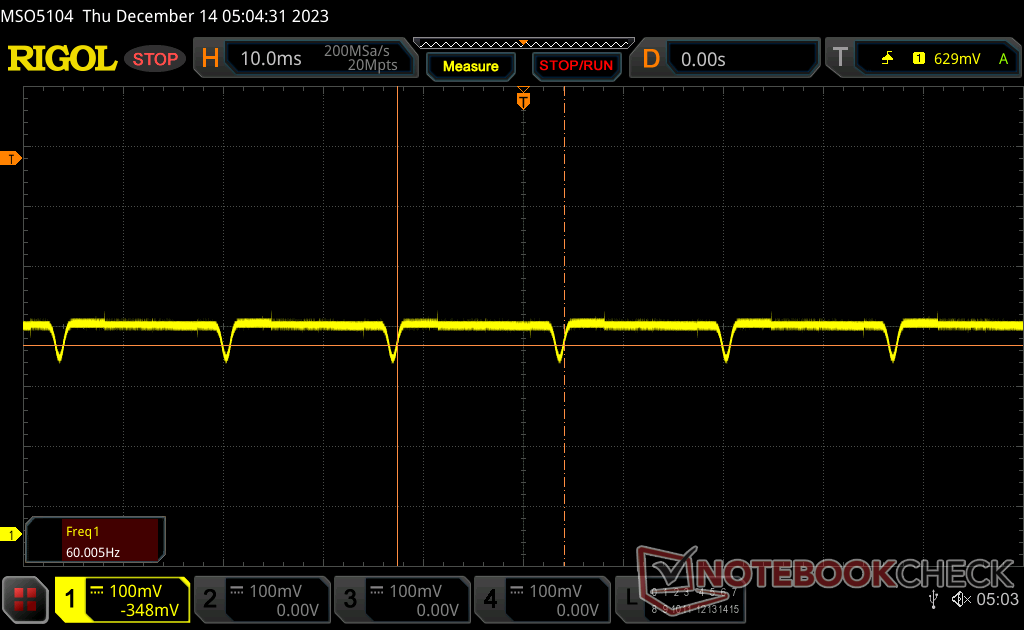
Screen Flickering / PWM (Pulse-Width Modulation)
| Screen flickering / PWM waargenomen | 60 Hz | ≤ 100 % helderheid instelling | 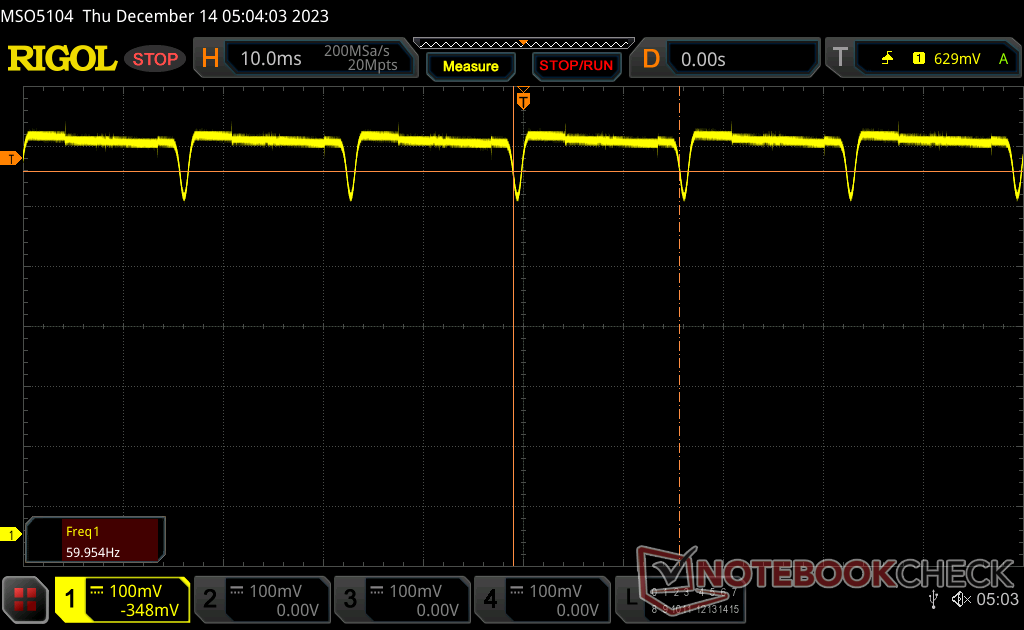 |
De achtergrondverlichting van het scherm flikkert op 60 Hz (in het slechtste geval, bijvoorbeeld bij gebruik van PWM) aan een helderheid van 100 % en lager. Boven deze helderheid zou er geen flickering / PWM mogen optreden. De frequentie van 60 Hz is erg laag en kan dus aanleiding geven tot geïrriteerde ogen en hoofdpijn bij langer gebruik. Ter vergelijking: 52 % van alle geteste toestellen maakten geen gebruik van PWM om de schermhelderheid te verlagen. Als het wel werd gebruikt, werd een gemiddelde van 7757 (minimum: 5 - maximum: 343500) Hz waargenomen. | |||
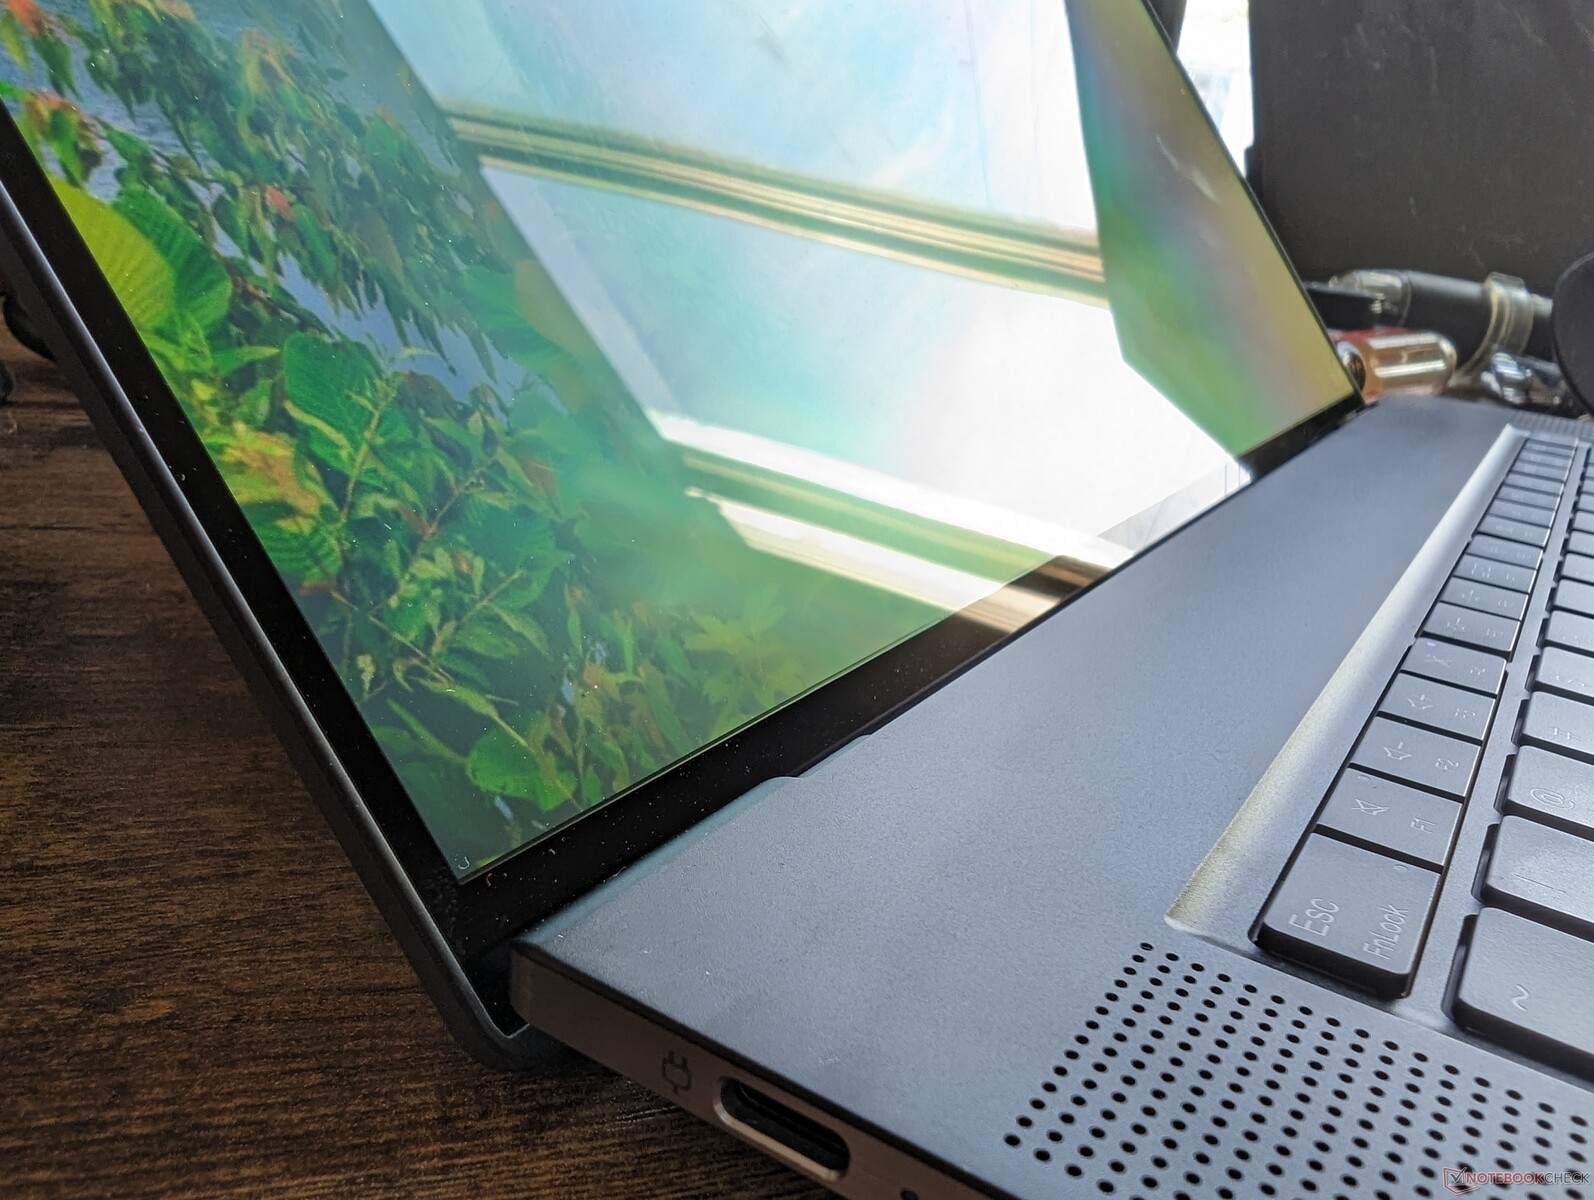
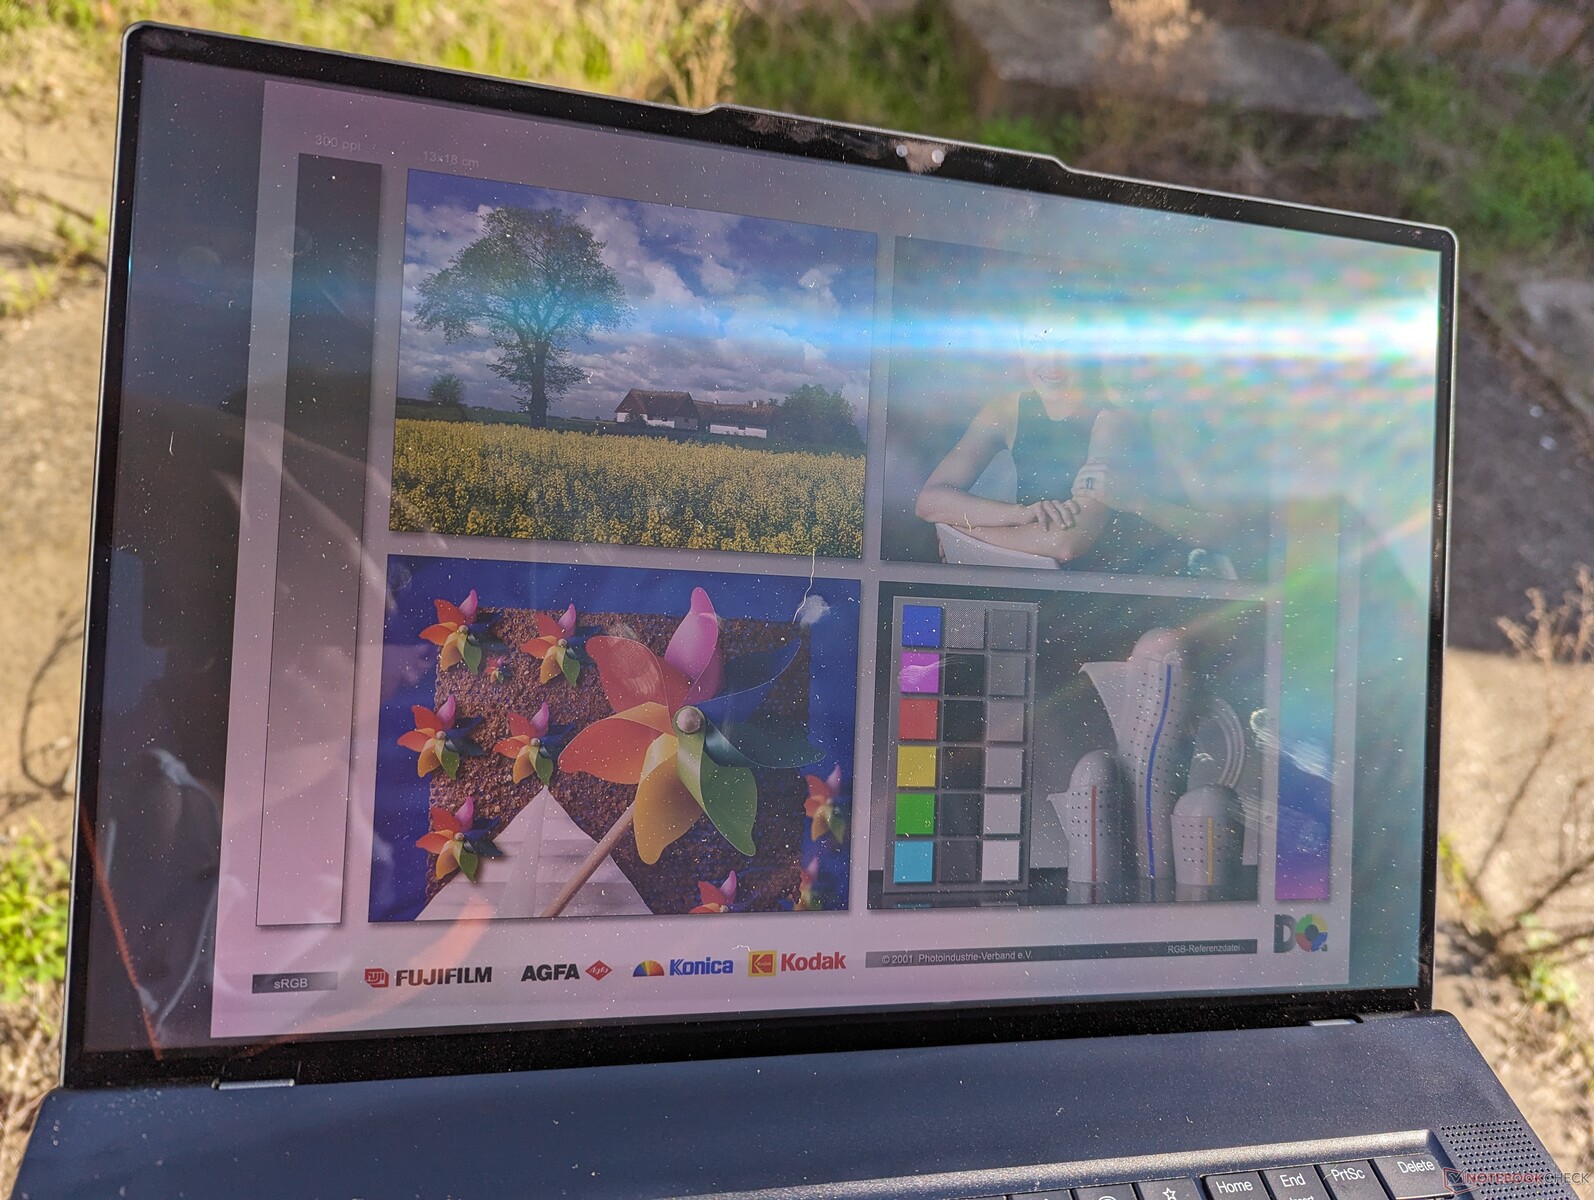
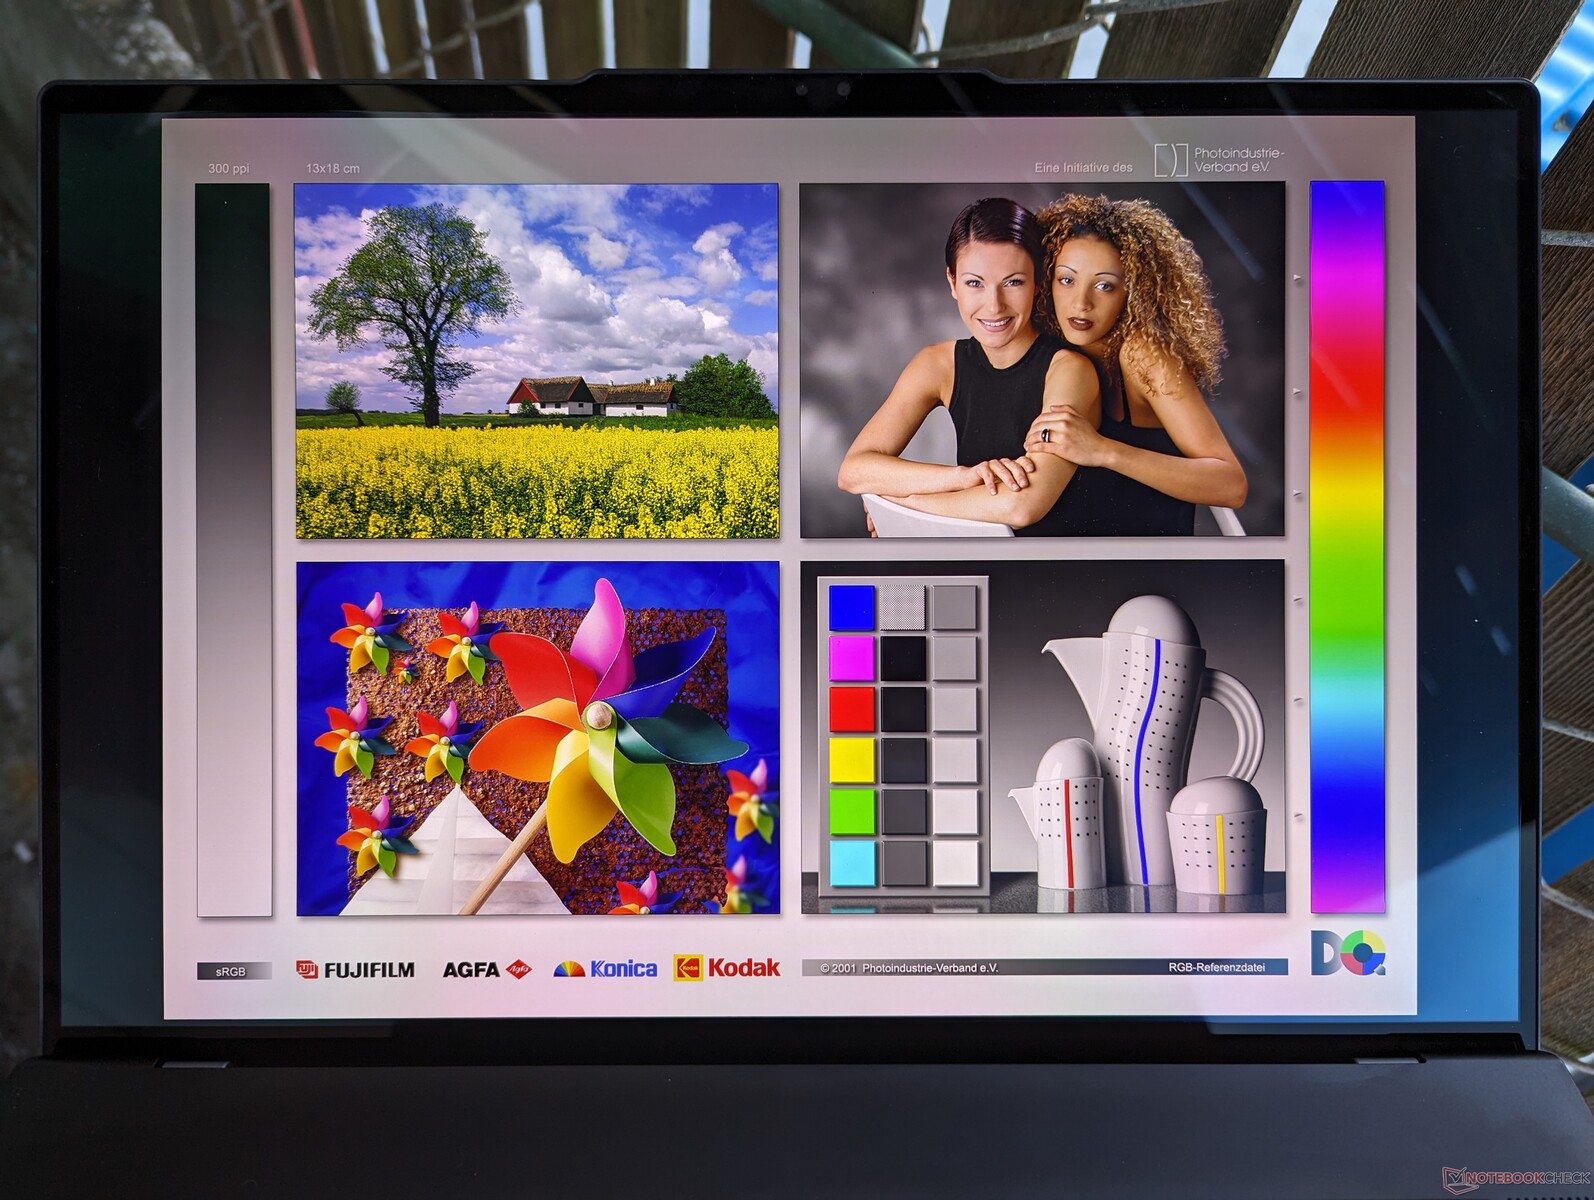
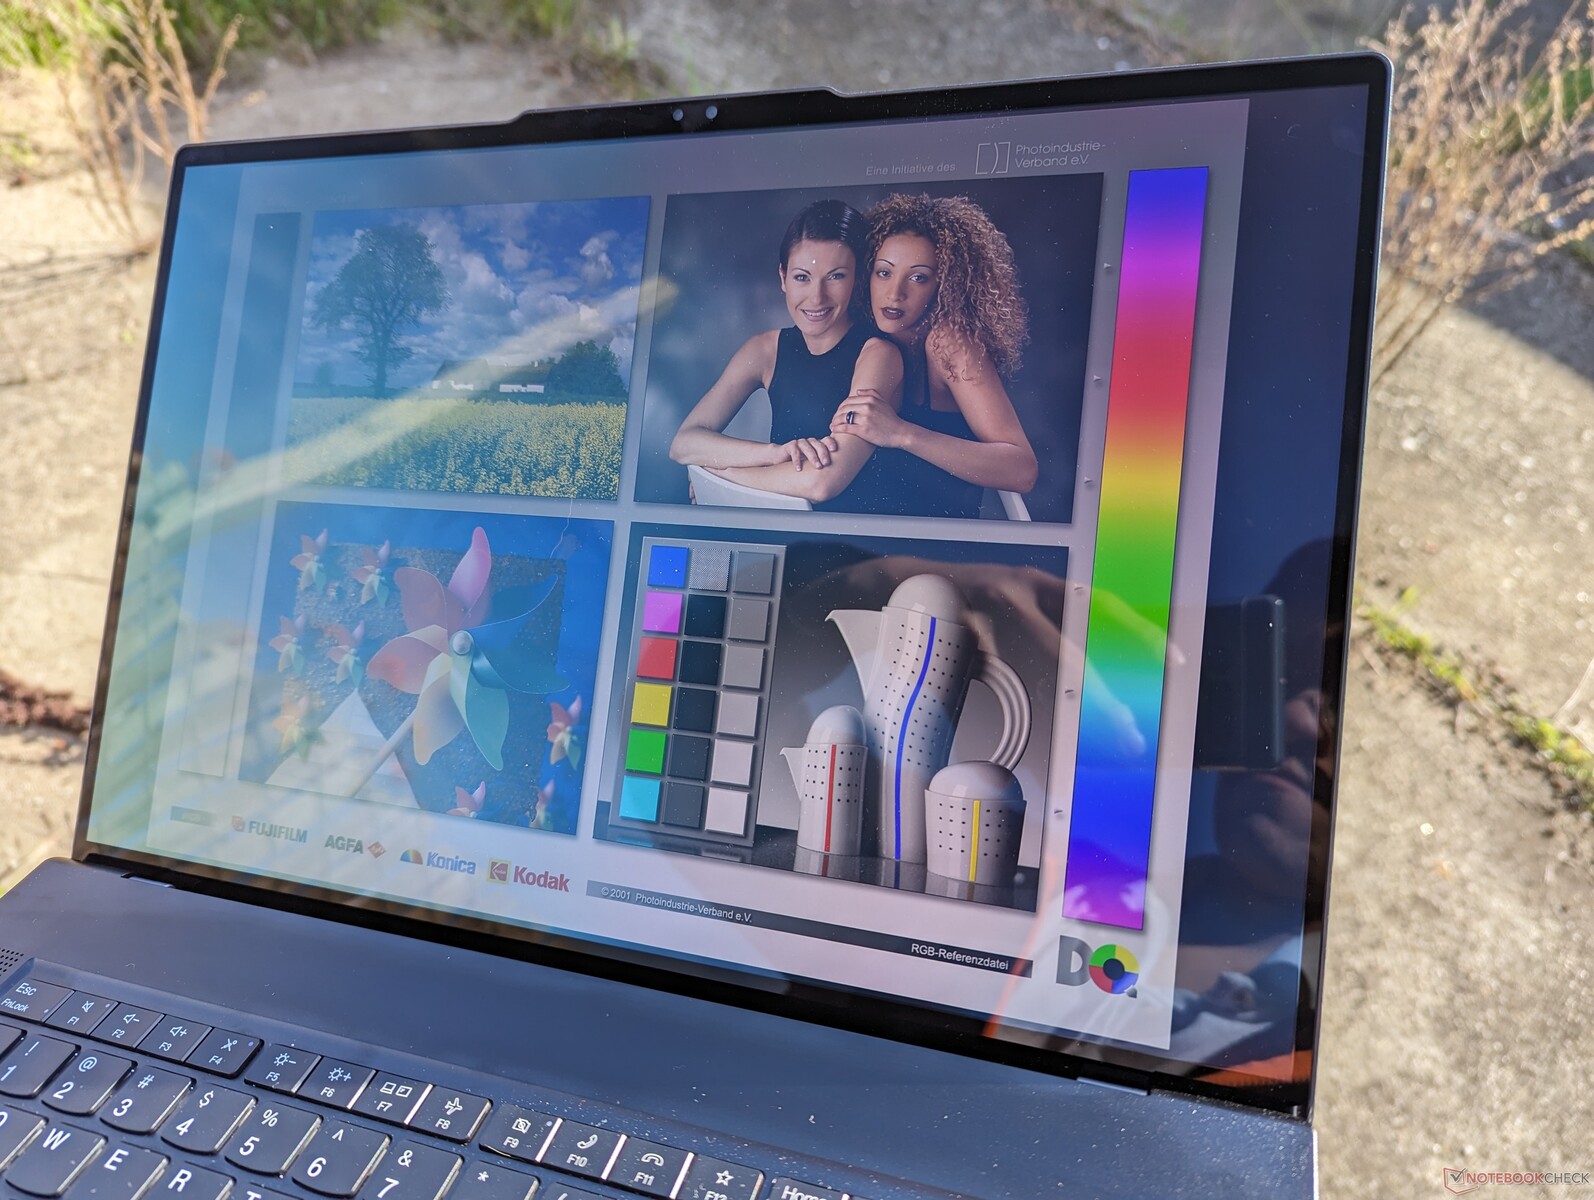
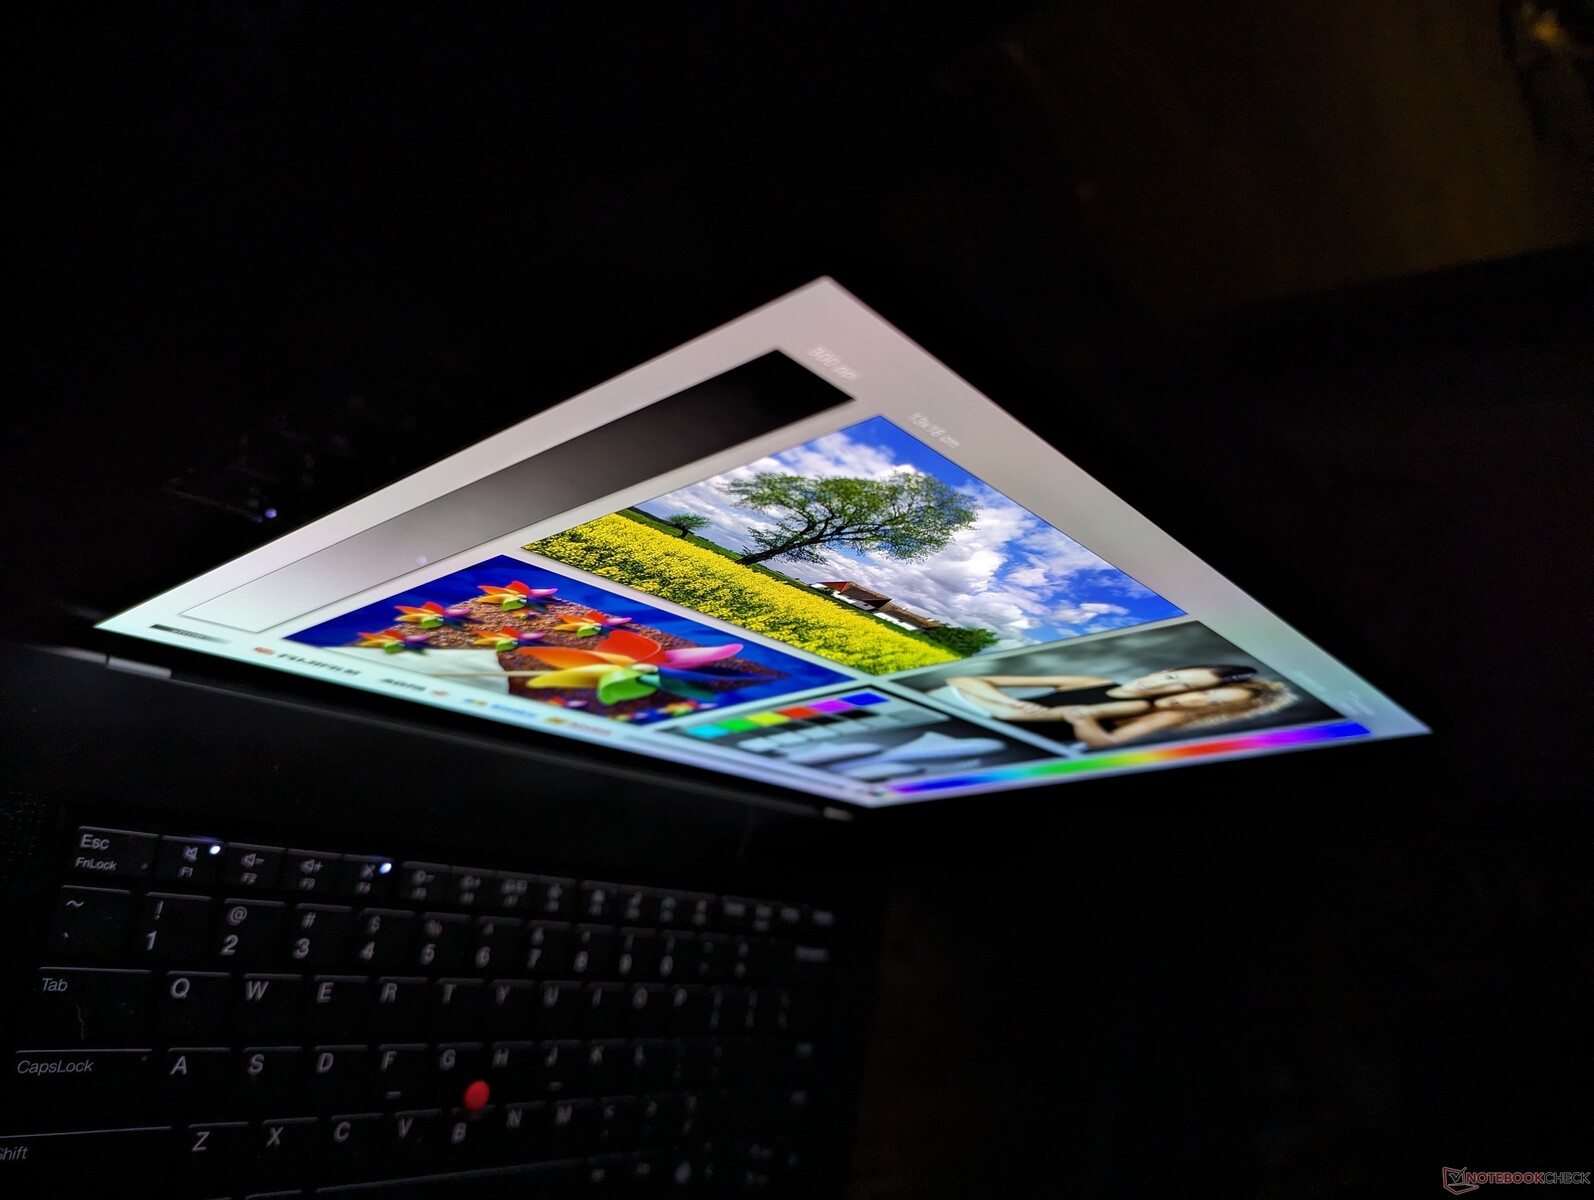
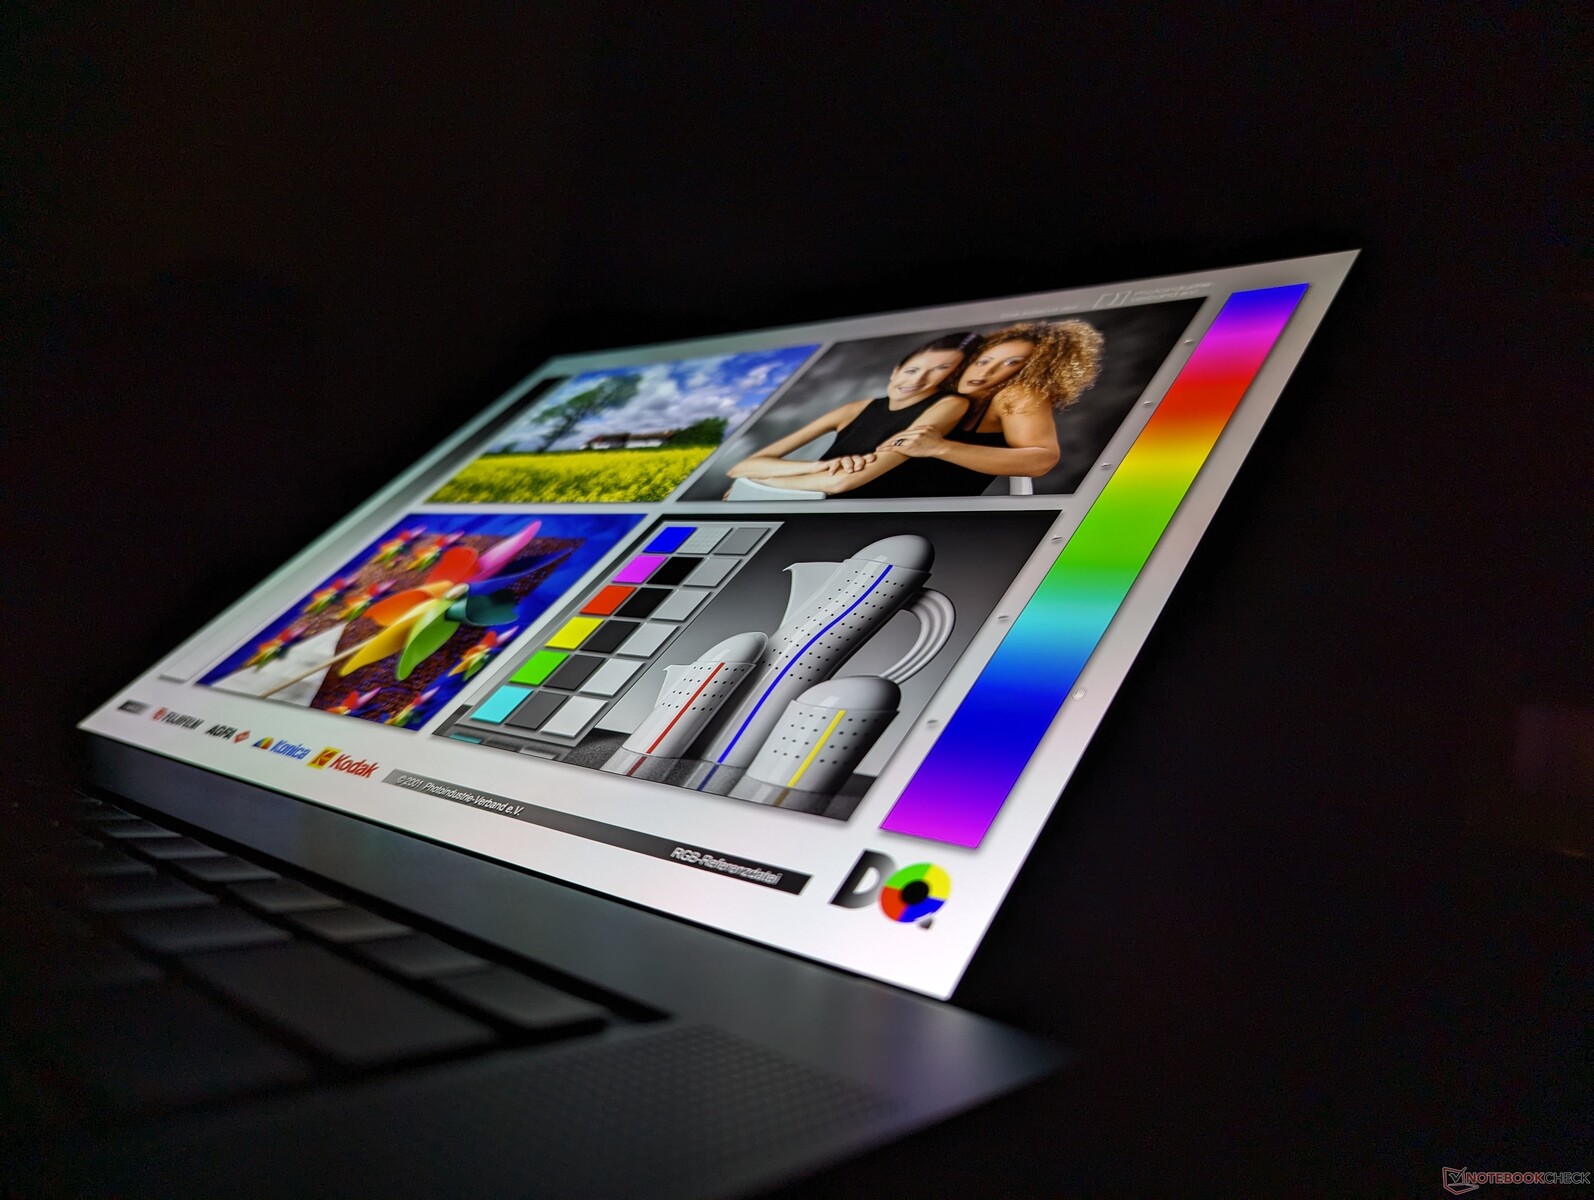
De kijkhoeken zijn breder dan bij IPS, terwijl de diepere zwartniveaus helpen om kleuren te behouden bij helder omgevingslicht. Toch is schittering van de glanzende overlay onvermijdelijk en is de maximale helderheid niet helderder dan de basis 1200p IPS-configuratie. Ter vergelijking: het beeldscherm van de MacBook Pro 16 50 procent helderder voor een betere zichtbaarheid buitenshuis.
Prestaties
Testomstandigheden
We hebben Windows in de modus Prestaties gezet voordat we de onderstaande benchmarks uitvoerden. De vooraf geïnstalleerde Lenovo Commercial Vantage software bevat geen extra energieprofielinstellingen naast de gebruikelijke Windows-selectie. Het is echter van vitaal belang voor BIOS-updates en het aanpassen van het laadgedrag van de batterij.
Processor
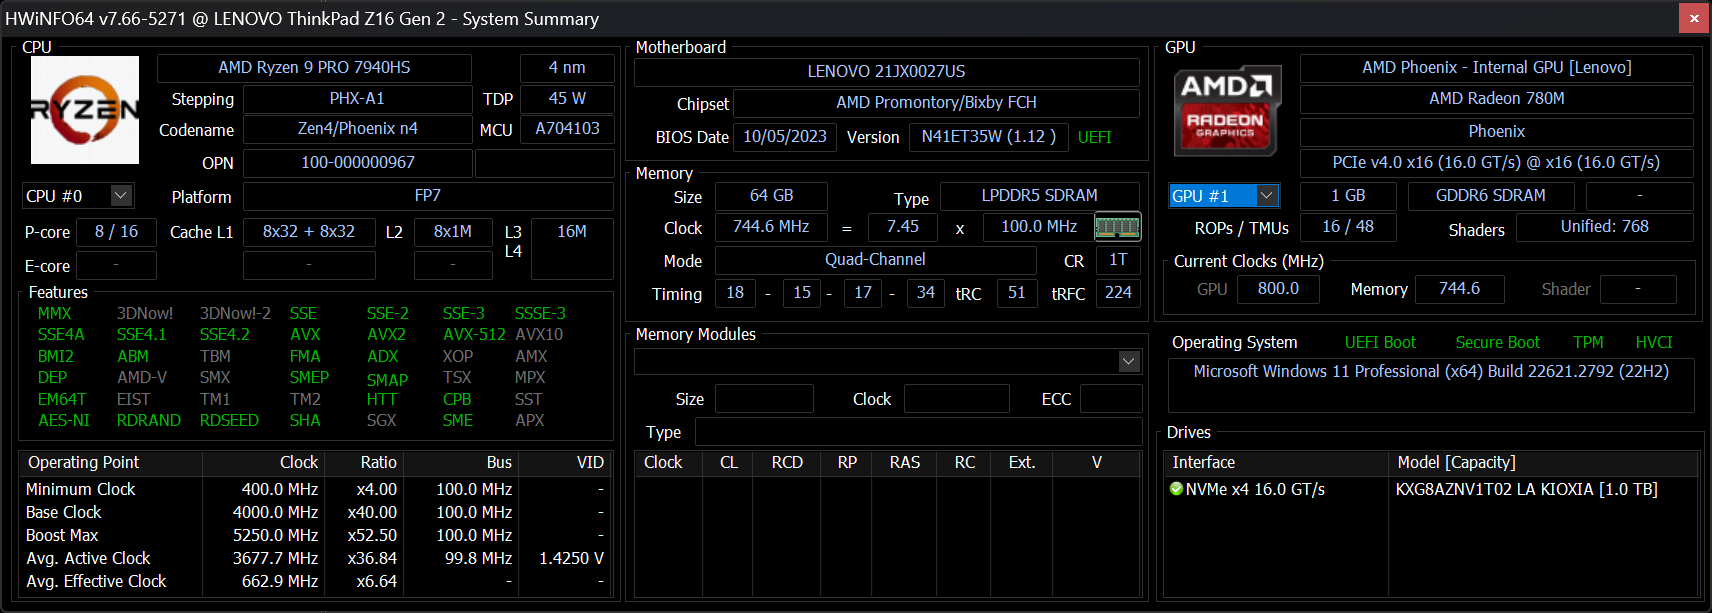
De Ryzen 9 Pro 7940HS presteert identiek aan de Ryzen 9 7940HS zoals gevonden op de Asus TUF Gaming A16. Gebruikers hoeven dus niet in te leveren op prestaties om te kunnen profiteren van Pro-functies. De algehele prestaties zijn vergelijkbaar met die van de 12e generatie van vorig jaar Core i9-12900H in zowel single- als multi-threaded workloads.
De prestatieverschillen tussen onze Zen 4 Ryzen 9 Pro 7940HS en de Zen 3+ Ryzen 7 Pro 6850H in de ThinkPad Z16 Gen 1 van vorig jaar kunnen met 35 tot 45 procent behoorlijk significant zijn voor multi-threaded werklasten vanwege het grotere aantal cores. De prestatiewinst met Zen 4 is dus een van de belangrijkste redenen om de Gen 2-versie van de ThinkPad Z16 te kiezen in plaats van de Gen 1-versie.
De configuraties in het lagere segment bieden de Ryzen 7 Pro 7840HS of Ryzen 5 Pro 7640HS in plaats daarvan. De Ryzen 7 optie presteert bijna identiek aan de Ryzen 9 optie gebaseerd op onze tijd met de Lenovo Legion Slim 5 16 en dus is het aan te raden om een Ryzen 7 configuratie te kiezen om kosten te besparen. In feite heeft de Ryzen 7 Pro 7840HS exact hetzelfde aantal cores en functies als de Ryzen 9 Pro 7940HS met slechts zeer kleine 100 tot 200 MHz verschillen in de doelkloksnelheden.
Downgraden naar de Ryzen 5 Pro 7640HS-configuratie zal naar verwachting de processorprestaties aanzienlijker beïnvloeden, met ongeveer 30 tot 35 procent, gebaseerd op onze tijd met de HP ZBook Firefly 14 G10. De prestatieverschillen tussen de Ryzen 5, Ryzen 7 en Ryzen 9 opties zijn daarom sterk verdeeld tussen de Ryzen 5 en Ryzen 7 SKU's.
Cinebench R15 Multi Loop
Cinebench R23: Multi Core | Single Core
Cinebench R20: CPU (Multi Core) | CPU (Single Core)
Cinebench R15: CPU Multi 64Bit | CPU Single 64Bit
Blender: v2.79 BMW27 CPU
7-Zip 18.03: 7z b 4 | 7z b 4 -mmt1
Geekbench 5.5: Multi-Core | Single-Core
HWBOT x265 Benchmark v2.2: 4k Preset
LibreOffice : 20 Documents To PDF
R Benchmark 2.5: Overall mean
* ... kleiner is beter
AIDA64: FP32 Ray-Trace | FPU Julia | CPU SHA3 | CPU Queen | FPU SinJulia | FPU Mandel | CPU AES | CPU ZLib | FP64 Ray-Trace | CPU PhotoWorxx
| Performance rating | |
| Lenovo ThinkPad Z16 Gen 2 | |
| Asus Vivobook Pro 16X K6604JV-MX016W | |
| Gemiddeld AMD Ryzen 9 PRO 7940HS | |
| Lenovo ThinkPad Z16 G1 21D5S00T00 | |
| MSI Creator Z16P B12UHST | |
| Lenovo ThinkBook 16 G6 ABP | |
| AIDA64 / FP32 Ray-Trace | |
| Lenovo ThinkPad Z16 Gen 2 | |
| Gemiddeld AMD Ryzen 9 PRO 7940HS (24034 - 27411, n=3) | |
| Asus Vivobook Pro 16X K6604JV-MX016W | |
| Lenovo ThinkPad Z16 G1 21D5S00T00 | |
| Lenovo ThinkBook 16 G6 ABP | |
| MSI Creator Z16P B12UHST | |
| AIDA64 / FPU Julia | |
| Lenovo ThinkPad Z16 Gen 2 | |
| Asus Vivobook Pro 16X K6604JV-MX016W | |
| Gemiddeld AMD Ryzen 9 PRO 7940HS (101262 - 116960, n=3) | |
| Lenovo ThinkPad Z16 G1 21D5S00T00 | |
| Lenovo ThinkBook 16 G6 ABP | |
| MSI Creator Z16P B12UHST | |
| AIDA64 / CPU SHA3 | |
| Asus Vivobook Pro 16X K6604JV-MX016W | |
| Lenovo ThinkPad Z16 Gen 2 | |
| Gemiddeld AMD Ryzen 9 PRO 7940HS (4418 - 4944, n=3) | |
| Lenovo ThinkPad Z16 G1 21D5S00T00 | |
| MSI Creator Z16P B12UHST | |
| Lenovo ThinkBook 16 G6 ABP | |
| AIDA64 / CPU Queen | |
| Asus Vivobook Pro 16X K6604JV-MX016W | |
| Lenovo ThinkPad Z16 Gen 2 | |
| Gemiddeld AMD Ryzen 9 PRO 7940HS (112873 - 124565, n=3) | |
| MSI Creator Z16P B12UHST | |
| Lenovo ThinkPad Z16 G1 21D5S00T00 | |
| Lenovo ThinkBook 16 G6 ABP | |
| AIDA64 / FPU SinJulia | |
| Lenovo ThinkPad Z16 Gen 2 | |
| Gemiddeld AMD Ryzen 9 PRO 7940HS (14147 - 15304, n=3) | |
| Asus Vivobook Pro 16X K6604JV-MX016W | |
| Lenovo ThinkPad Z16 G1 21D5S00T00 | |
| MSI Creator Z16P B12UHST | |
| Lenovo ThinkBook 16 G6 ABP | |
| AIDA64 / FPU Mandel | |
| Lenovo ThinkPad Z16 Gen 2 | |
| Gemiddeld AMD Ryzen 9 PRO 7940HS (54003 - 62357, n=3) | |
| Asus Vivobook Pro 16X K6604JV-MX016W | |
| Lenovo ThinkPad Z16 G1 21D5S00T00 | |
| Lenovo ThinkBook 16 G6 ABP | |
| MSI Creator Z16P B12UHST | |
| AIDA64 / CPU AES | |
| Asus Vivobook Pro 16X K6604JV-MX016W | |
| MSI Creator Z16P B12UHST | |
| Lenovo ThinkPad Z16 Gen 2 | |
| Gemiddeld AMD Ryzen 9 PRO 7940HS (76133 - 88705, n=3) | |
| Lenovo ThinkPad Z16 G1 21D5S00T00 | |
| Lenovo ThinkBook 16 G6 ABP | |
| AIDA64 / CPU ZLib | |
| Asus Vivobook Pro 16X K6604JV-MX016W | |
| MSI Creator Z16P B12UHST | |
| Lenovo ThinkPad Z16 Gen 2 | |
| Gemiddeld AMD Ryzen 9 PRO 7940HS (976 - 1079, n=3) | |
| Lenovo ThinkPad Z16 G1 21D5S00T00 | |
| Lenovo ThinkBook 16 G6 ABP | |
| AIDA64 / FP64 Ray-Trace | |
| Lenovo ThinkPad Z16 Gen 2 | |
| Gemiddeld AMD Ryzen 9 PRO 7940HS (12715 - 14590, n=3) | |
| Asus Vivobook Pro 16X K6604JV-MX016W | |
| Lenovo ThinkPad Z16 G1 21D5S00T00 | |
| Lenovo ThinkBook 16 G6 ABP | |
| MSI Creator Z16P B12UHST | |
| AIDA64 / CPU PhotoWorxx | |
| Asus Vivobook Pro 16X K6604JV-MX016W | |
| MSI Creator Z16P B12UHST | |
| Lenovo ThinkPad Z16 Gen 2 | |
| Gemiddeld AMD Ryzen 9 PRO 7940HS (24030 - 37800, n=3) | |
| Lenovo ThinkPad Z16 G1 21D5S00T00 | |
| Lenovo ThinkBook 16 G6 ABP | |
Systeemprestaties
CrossMark: Overall | Productivity | Creativity | Responsiveness
WebXPRT 3: Overall
WebXPRT 4: Overall
Mozilla Kraken 1.1: Total
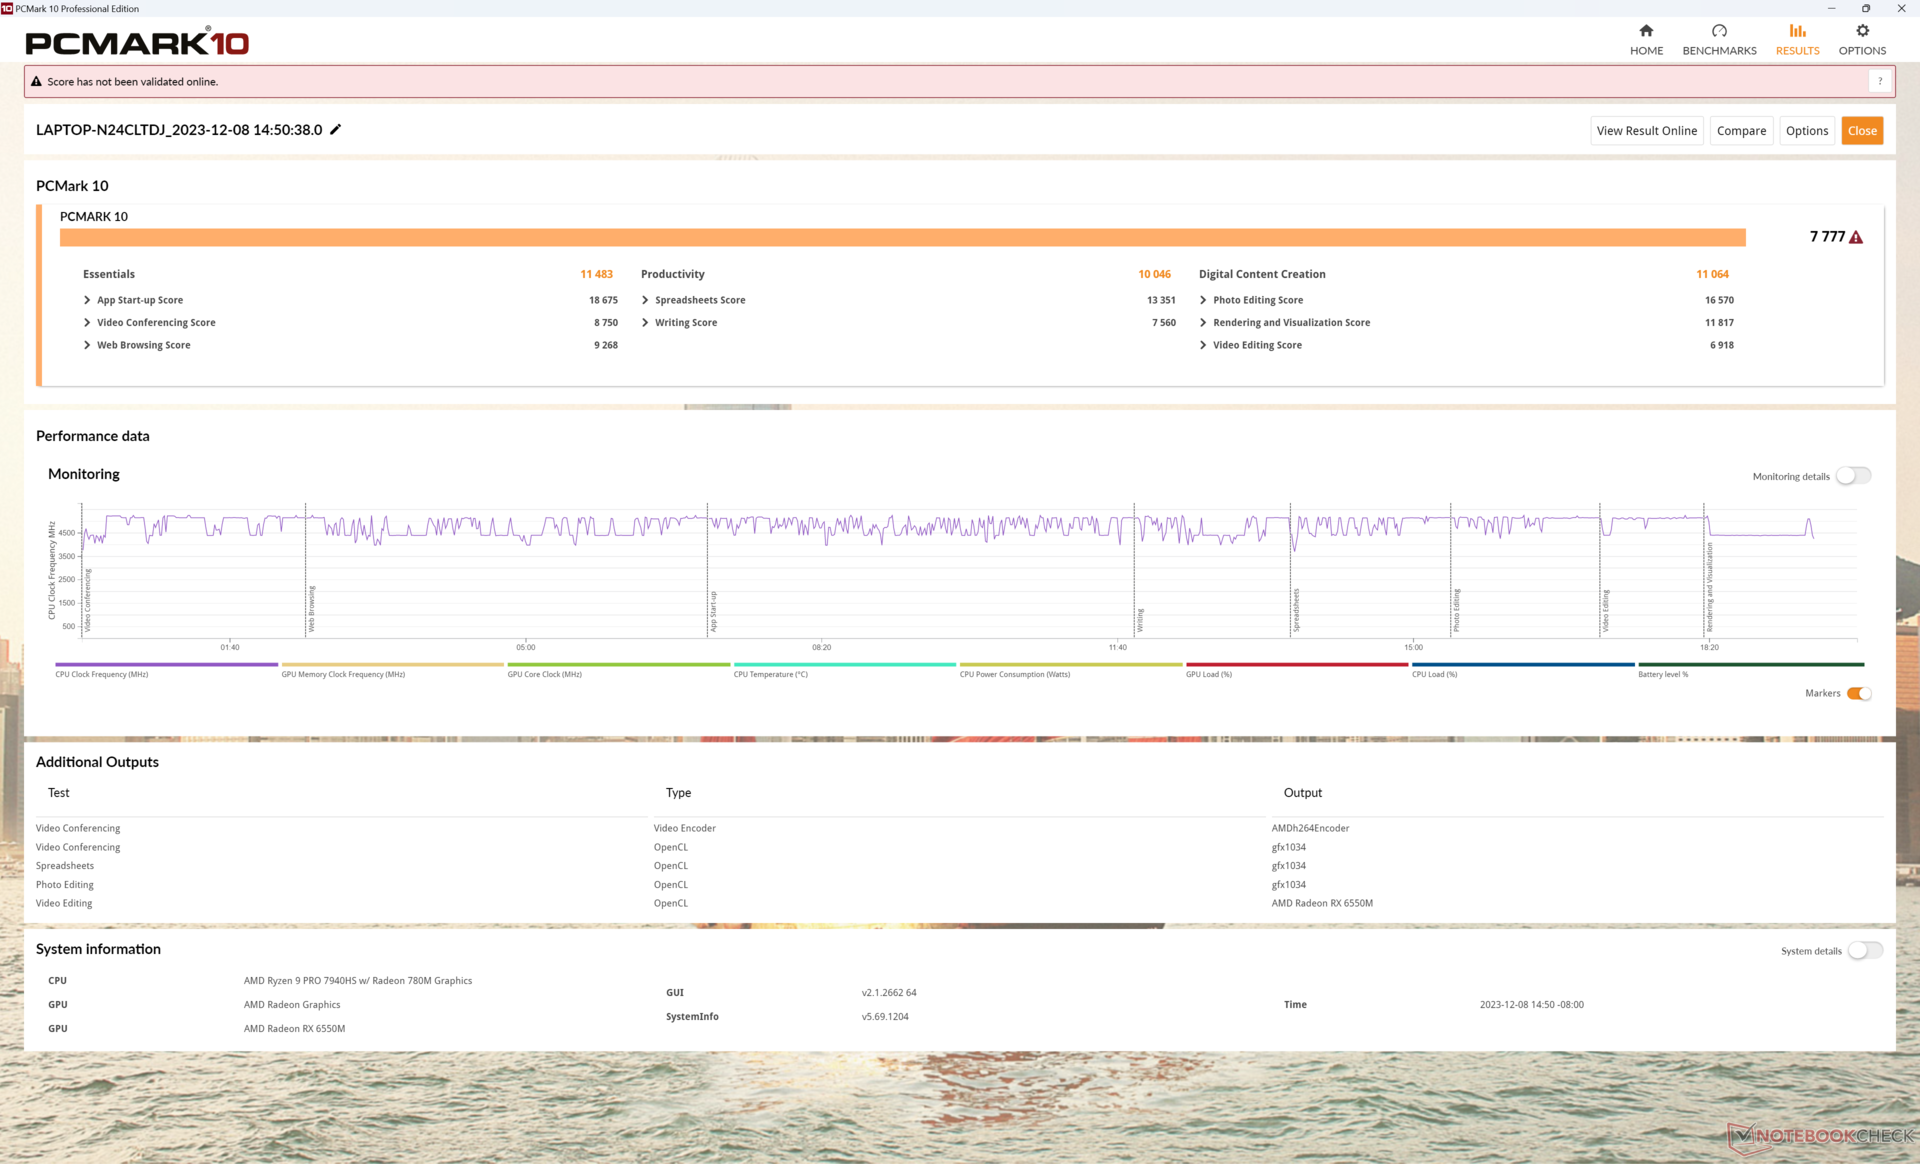
| PCMark 10 / Score | |
| MSI Creator Z16P B12UHST | |
| Lenovo ThinkPad Z16 Gen 2 | |
| Gemiddeld AMD Ryzen 9 PRO 7940HS, AMD Radeon RX 6550M (n=1) | |
| Asus Vivobook Pro 16X K6604JV-MX016W | |
| Lenovo ThinkPad Z16 G1 21D5S00T00 | |
| Lenovo ThinkBook 16 G6 ABP | |
| PCMark 10 / Essentials | |
| Lenovo ThinkPad Z16 Gen 2 | |
| Gemiddeld AMD Ryzen 9 PRO 7940HS, AMD Radeon RX 6550M (n=1) | |
| MSI Creator Z16P B12UHST | |
| Lenovo ThinkBook 16 G6 ABP | |
| Asus Vivobook Pro 16X K6604JV-MX016W | |
| Lenovo ThinkPad Z16 G1 21D5S00T00 | |
| PCMark 10 / Productivity | |
| MSI Creator Z16P B12UHST | |
| Lenovo ThinkPad Z16 Gen 2 | |
| Gemiddeld AMD Ryzen 9 PRO 7940HS, AMD Radeon RX 6550M (n=1) | |
| Lenovo ThinkBook 16 G6 ABP | |
| Asus Vivobook Pro 16X K6604JV-MX016W | |
| Lenovo ThinkPad Z16 G1 21D5S00T00 | |
| PCMark 10 / Digital Content Creation | |
| MSI Creator Z16P B12UHST | |
| Lenovo ThinkPad Z16 Gen 2 | |
| Gemiddeld AMD Ryzen 9 PRO 7940HS, AMD Radeon RX 6550M (n=1) | |
| Asus Vivobook Pro 16X K6604JV-MX016W | |
| Lenovo ThinkPad Z16 G1 21D5S00T00 | |
| Lenovo ThinkBook 16 G6 ABP | |
| CrossMark / Overall | |
| Asus Vivobook Pro 16X K6604JV-MX016W | |
| Apple MacBook Pro 16 2023 M3 Pro | |
| Lenovo ThinkPad Z16 Gen 2 | |
| Gemiddeld AMD Ryzen 9 PRO 7940HS, AMD Radeon RX 6550M (n=1) | |
| Lenovo ThinkPad Z16 G1 21D5S00T00 | |
| Lenovo ThinkBook 16 G6 ABP | |
| CrossMark / Productivity | |
| Asus Vivobook Pro 16X K6604JV-MX016W | |
| Apple MacBook Pro 16 2023 M3 Pro | |
| Lenovo ThinkPad Z16 Gen 2 | |
| Gemiddeld AMD Ryzen 9 PRO 7940HS, AMD Radeon RX 6550M (n=1) | |
| Lenovo ThinkPad Z16 G1 21D5S00T00 | |
| Lenovo ThinkBook 16 G6 ABP | |
| CrossMark / Creativity | |
| Apple MacBook Pro 16 2023 M3 Pro | |
| Asus Vivobook Pro 16X K6604JV-MX016W | |
| Lenovo ThinkPad Z16 Gen 2 | |
| Gemiddeld AMD Ryzen 9 PRO 7940HS, AMD Radeon RX 6550M (n=1) | |
| Lenovo ThinkPad Z16 G1 21D5S00T00 | |
| Lenovo ThinkBook 16 G6 ABP | |
| CrossMark / Responsiveness | |
| Asus Vivobook Pro 16X K6604JV-MX016W | |
| Apple MacBook Pro 16 2023 M3 Pro | |
| Lenovo ThinkPad Z16 Gen 2 | |
| Gemiddeld AMD Ryzen 9 PRO 7940HS, AMD Radeon RX 6550M (n=1) | |
| Lenovo ThinkPad Z16 G1 21D5S00T00 | |
| Lenovo ThinkBook 16 G6 ABP | |
| WebXPRT 3 / Overall | |
| Apple MacBook Pro 16 2023 M3 Pro | |
| MSI Creator Z16P B12UHST | |
| Lenovo ThinkPad Z16 Gen 2 | |
| Gemiddeld AMD Ryzen 9 PRO 7940HS, AMD Radeon RX 6550M (n=1) | |
| Asus Vivobook Pro 16X K6604JV-MX016W | |
| Lenovo ThinkBook 16 G6 ABP | |
| Lenovo ThinkPad Z16 G1 21D5S00T00 | |
| WebXPRT 4 / Overall | |
| Lenovo ThinkPad Z16 Gen 2 | |
| Gemiddeld AMD Ryzen 9 PRO 7940HS, AMD Radeon RX 6550M (n=1) | |
| Asus Vivobook Pro 16X K6604JV-MX016W | |
| Lenovo ThinkBook 16 G6 ABP | |
| Lenovo ThinkPad Z16 G1 21D5S00T00 | |
| Mozilla Kraken 1.1 / Total | |
| Lenovo ThinkBook 16 G6 ABP | |
| Lenovo ThinkPad Z16 G1 21D5S00T00 | |
| Lenovo ThinkPad Z16 Gen 2 | |
| Gemiddeld AMD Ryzen 9 PRO 7940HS, AMD Radeon RX 6550M (n=1) | |
| Asus Vivobook Pro 16X K6604JV-MX016W | |
| MSI Creator Z16P B12UHST | |
| Apple MacBook Pro 16 2023 M3 Pro | |
* ... kleiner is beter
| PCMark 10 Score | 7777 punten | |
Help | ||
| AIDA64 / Memory Copy | |
| Asus Vivobook Pro 16X K6604JV-MX016W | |
| Lenovo ThinkPad Z16 Gen 2 | |
| MSI Creator Z16P B12UHST | |
| Lenovo ThinkPad Z16 G1 21D5S00T00 | |
| Gemiddeld AMD Ryzen 9 PRO 7940HS (34339 - 66740, n=3) | |
| Lenovo ThinkBook 16 G6 ABP | |
| AIDA64 / Memory Read | |
| Asus Vivobook Pro 16X K6604JV-MX016W | |
| MSI Creator Z16P B12UHST | |
| Lenovo ThinkPad Z16 Gen 2 | |
| Lenovo ThinkPad Z16 G1 21D5S00T00 | |
| Lenovo ThinkBook 16 G6 ABP | |
| Gemiddeld AMD Ryzen 9 PRO 7940HS (30289 - 50398, n=3) | |
| AIDA64 / Memory Write | |
| Lenovo ThinkPad Z16 Gen 2 | |
| Asus Vivobook Pro 16X K6604JV-MX016W | |
| MSI Creator Z16P B12UHST | |
| Gemiddeld AMD Ryzen 9 PRO 7940HS (39877 - 91516, n=3) | |
| Lenovo ThinkPad Z16 G1 21D5S00T00 | |
| Lenovo ThinkBook 16 G6 ABP | |
| AIDA64 / Memory Latency | |
| Lenovo ThinkPad Z16 G1 21D5S00T00 | |
| Lenovo ThinkPad Z16 Gen 2 | |
| Gemiddeld AMD Ryzen 9 PRO 7940HS (102.2 - 121.3, n=3) | |
| Lenovo ThinkBook 16 G6 ABP | |
| MSI Creator Z16P B12UHST | |
| Asus Vivobook Pro 16X K6604JV-MX016W | |
* ... kleiner is beter
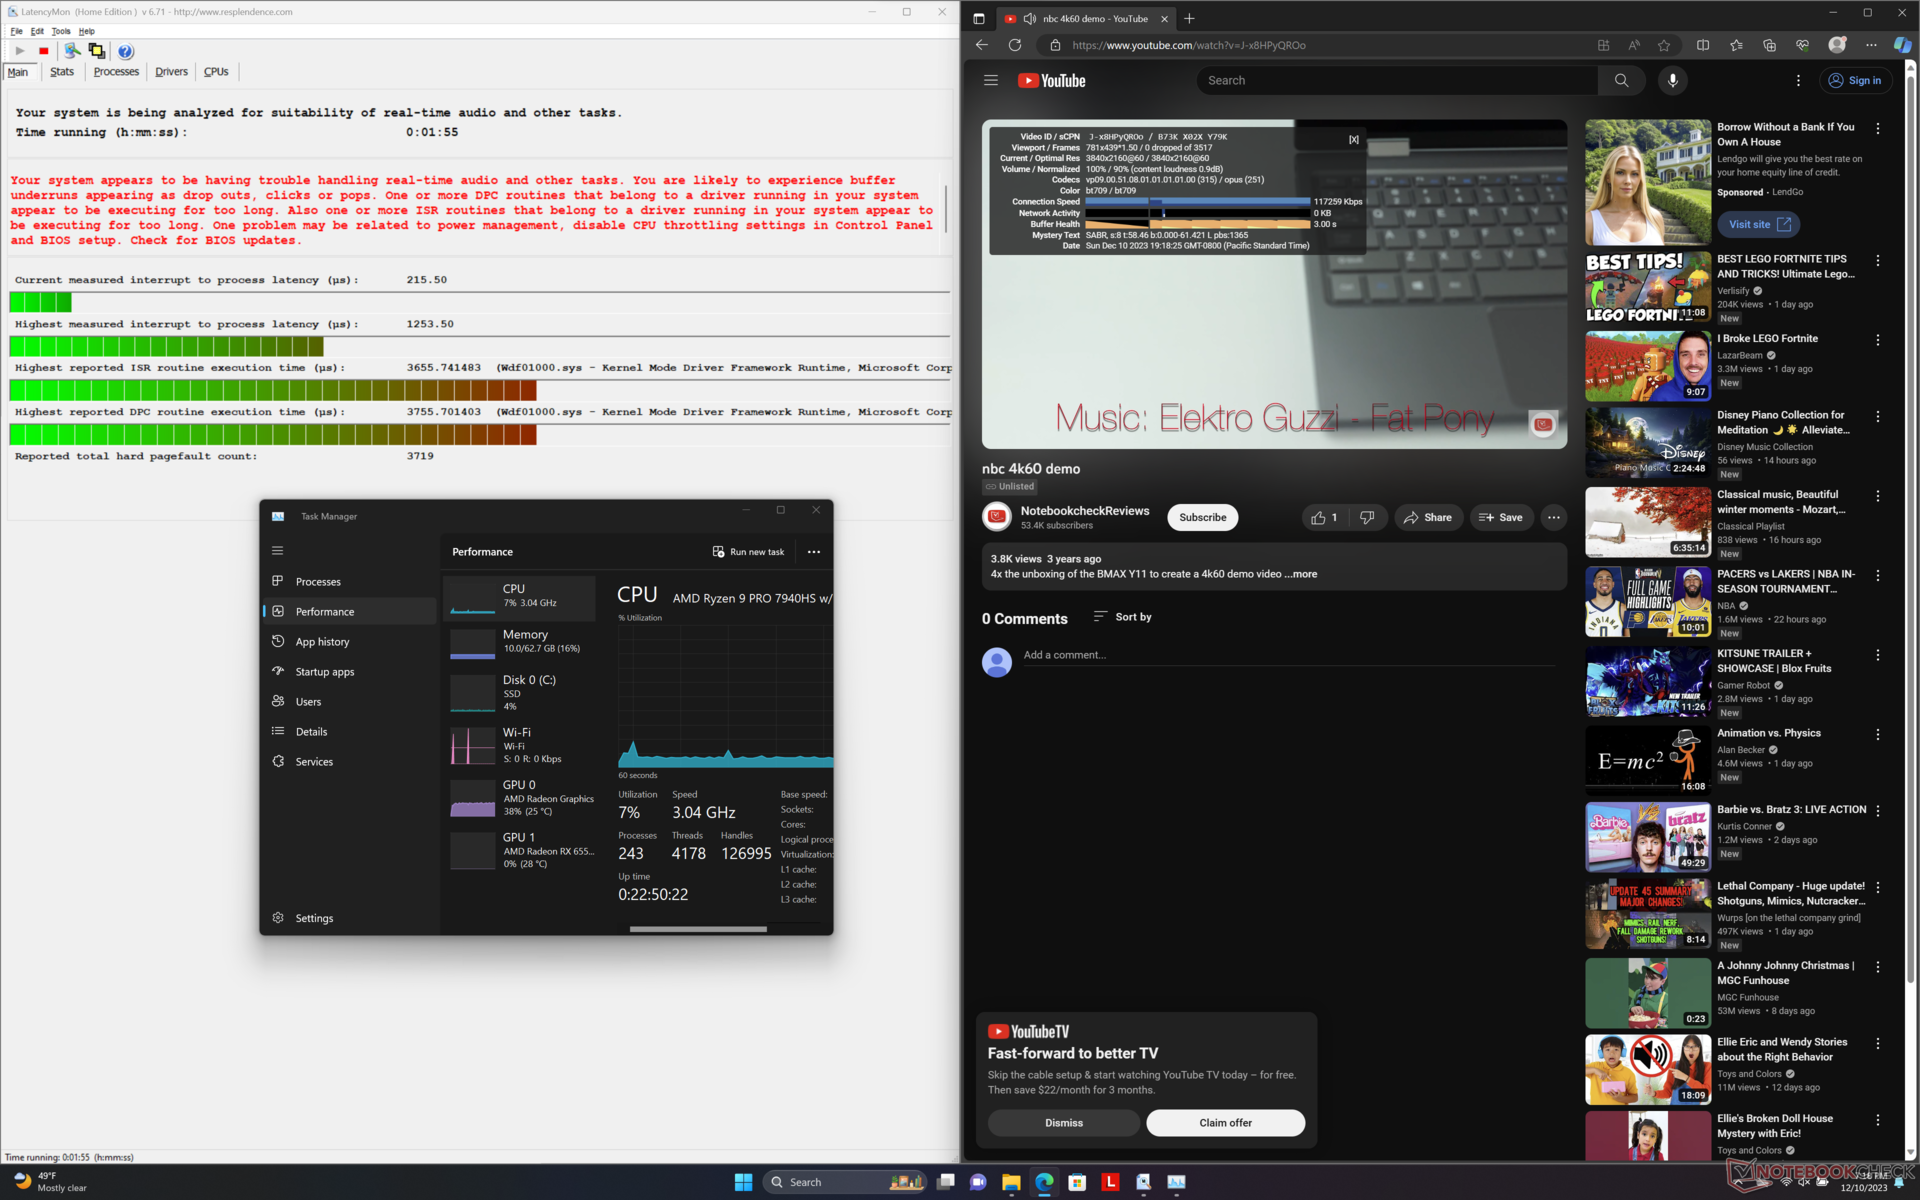
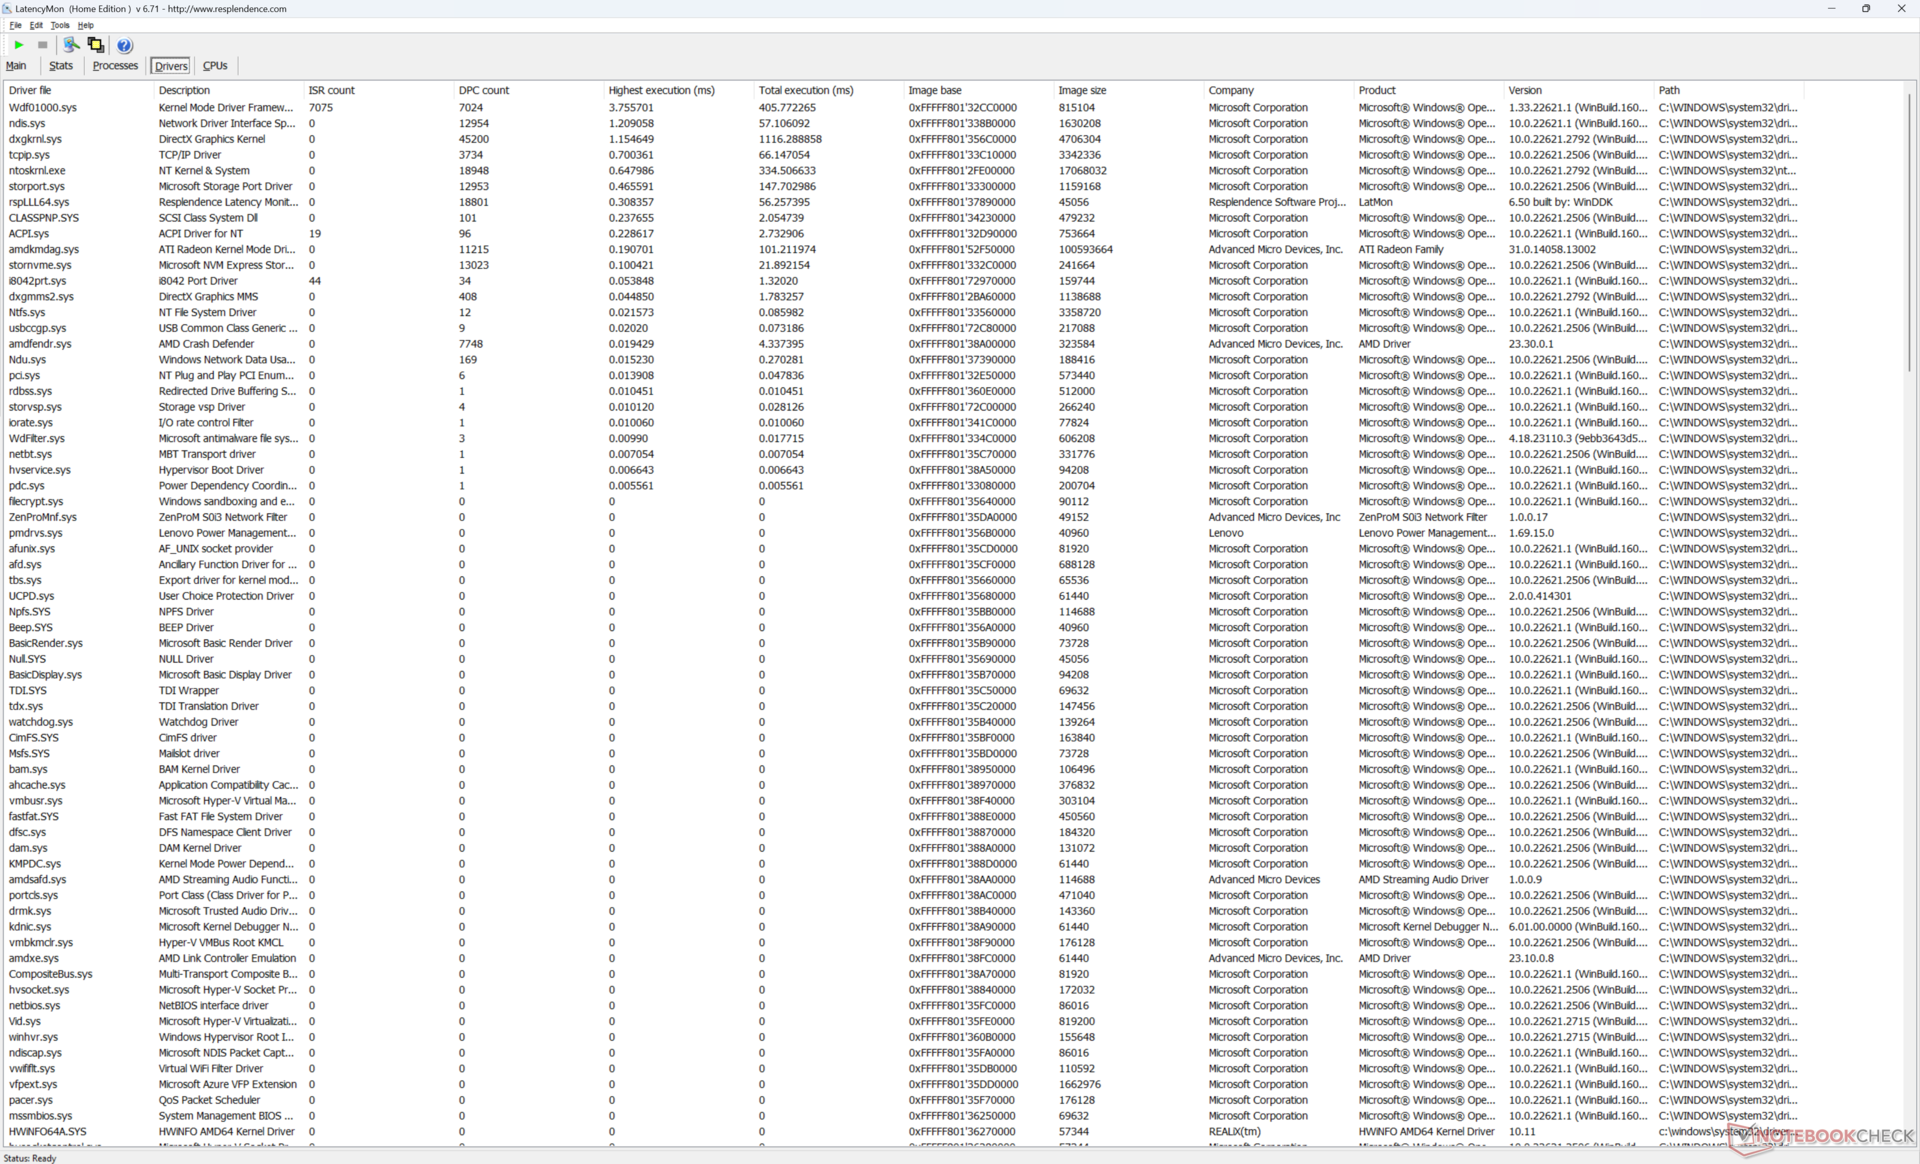
DPC latentie
LatencyMon laat kleine DPC-problemen zien bij het openen van meerdere browsertabbladen van onze startpagina. het afspelen van 4K-video's bij 60 FPS is verder perfect zonder dropped frames, in tegenstelling tot wat we hebben ervaren op de recente Intel-Nvidia-aangedreven ThinkPad P1 G6.
| DPC Latencies / LatencyMon - interrupt to process latency (max), Web, Youtube, Prime95 | |
| Asus Vivobook Pro 16X K6604JV-MX016W | |
| Lenovo ThinkPad Z16 Gen 2 | |
| Lenovo ThinkBook 16 G6 ABP | |
| MSI Creator Z16P B12UHST | |
| Lenovo ThinkPad Z16 G1 21D5S00T00 | |
* ... kleiner is beter
Opslagapparaten
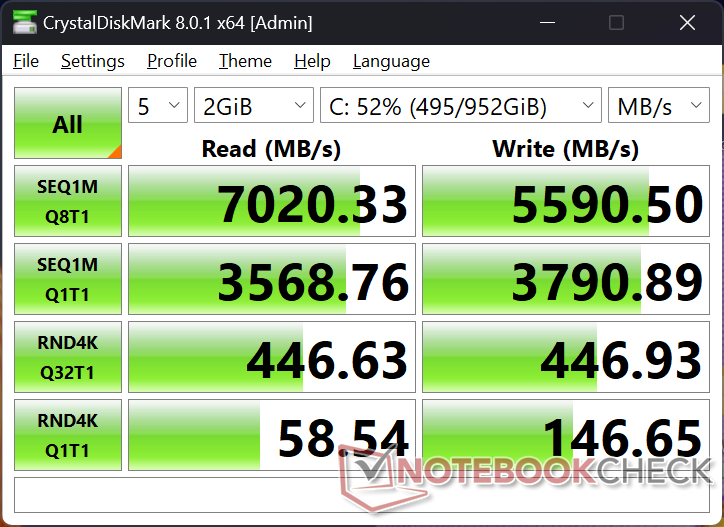
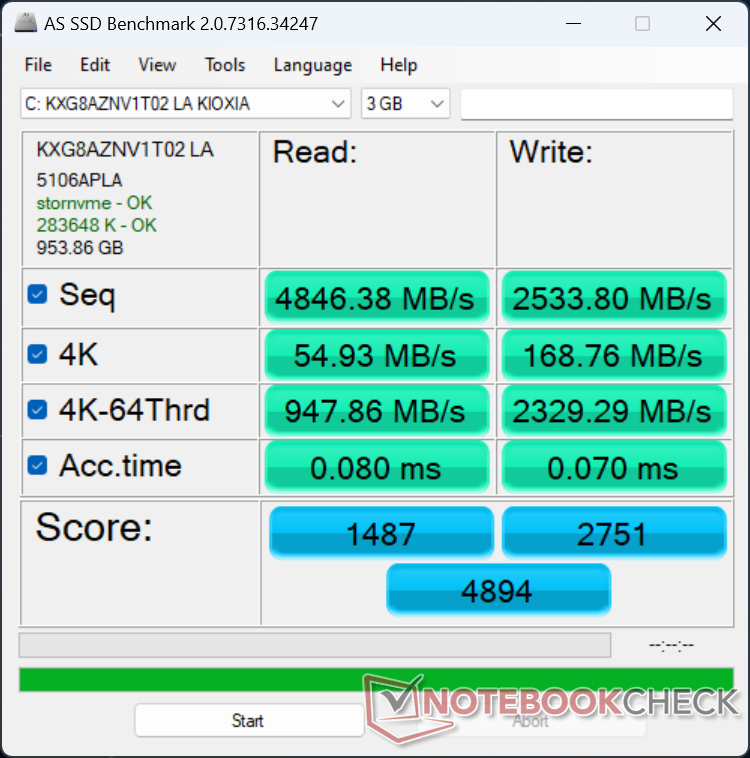
Onze testunit wordt geleverd met de Kioxia XG8 terwijl onze oudere ThinkPad Z16 Gen 1 zou worden geleverd met de Samsung PM9A1. Desalniettemin zijn de twee SSD's high-end PCIe4 x4 NVMe-schijven met vergelijkbare maximale leessnelheden van ~7000 MB/s elk.
Helaas vertoonde de Kioxia-schijf ook prestatieproblemen na een paar minuten belasting, net als de Samsung-schijf op onze ThinkPad Z16 Gen 1, zoals blijkt uit de onderstaande vergelijkingsgrafiek. De leessnelheid daalde na verloop van tijd van ~7000 MB/s naar ~5800 MB/s, waarschijnlijk door onvoldoende warmteafvoer. Het aanbrengen van een groot thermisch pad tussen de SSD en de metalen onderkap kan de prestaties verbeteren.
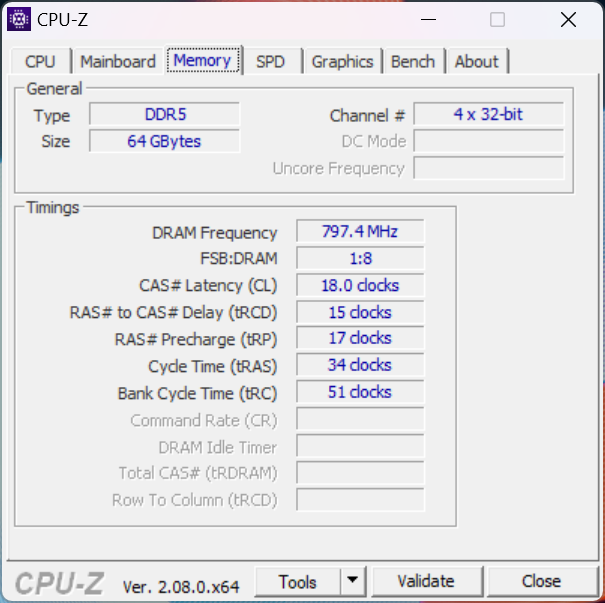
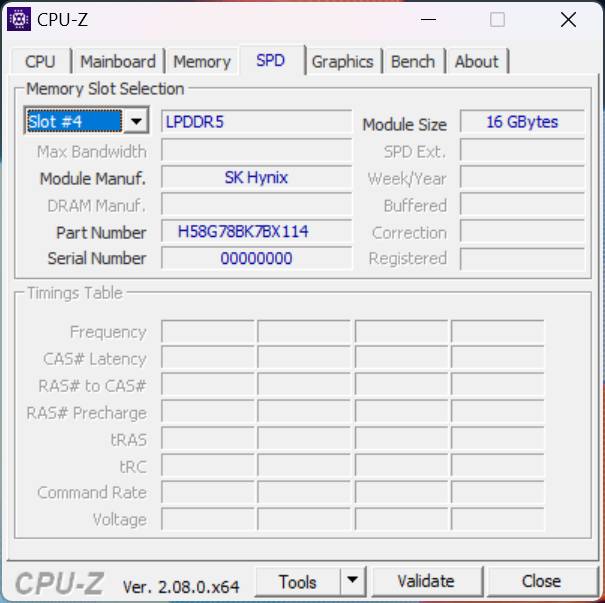
Het RAM is gesoldeerd en er is geen ondersteuning voor een tweede SSD in tegenstelling tot de MSI Schepper Z16P die twee RAM-sleuven en twee M.2 SSD-sleuven heeft.

| Drive Performance rating - Percent | |
| MSI Creator Z16P B12UHST | |
| Lenovo ThinkPad Z16 G1 21D5S00T00 | |
| Lenovo ThinkPad Z16 Gen 2 | |
| Lenovo ThinkBook 16 G6 ABP | |
| Asus Vivobook Pro 16X K6604JV-MX016W | |
* ... kleiner is beter
Disk Throttling: DiskSpd Read Loop, Queue Depth 8
GPU-prestaties
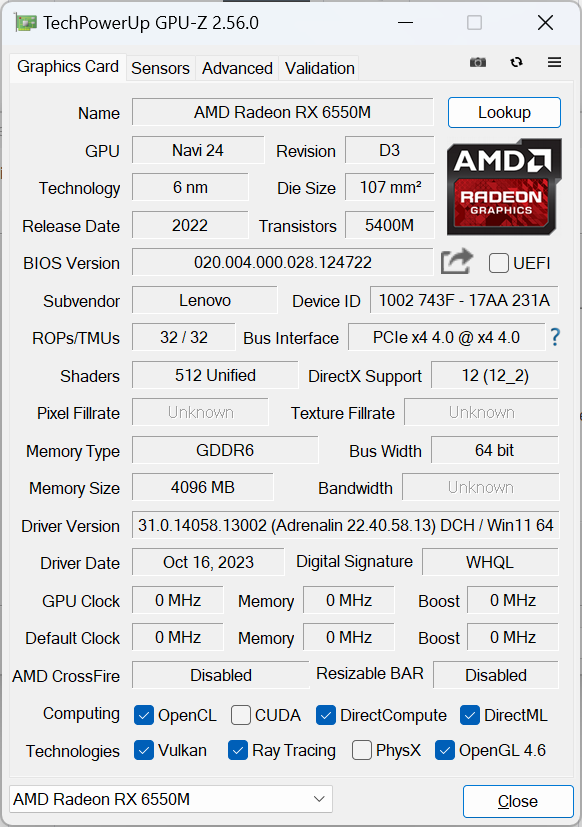
De relatie tussen de Radeon RX 6550M en RX 6500M is vergelijkbaar met die tussen de GeForce RTX 3050 Ti en RTX 3050; hun verschillen zijn klein en liggen gemiddeld binnen 10 procentpunten. De twee Radeon GPU's hebben namelijk dezelfde 64-bits geheugenbusbreedte, RDNA2 architectuur, 1024 stream processors, 4 GB GDDR6 VRAM en meer. De Radeon RX 6550M haalt iets hogere doelkloksnelheden (2560 MHz vs. 2191 MHz) en maximale TGP (60 W vs. 55 W) dan de 6500M, maar dat is het dan ook.
De kleine toename in kloksnelheden leidt tot slechts kleine toenames in benchmarkscores, zoals blijkt uit de onderstaande vergelijkingstabel.
Het draaien in de Balanced-modus in plaats van de Performance-modus heeft slechts een kleine invloed op de prestaties, zoals blijkt uit onze Fire Strike resultaten in de tabel hieronder. Als u op batterijvoeding werkt, zullen de grafische prestaties veel sterker afnemen dan de processorprestaties.
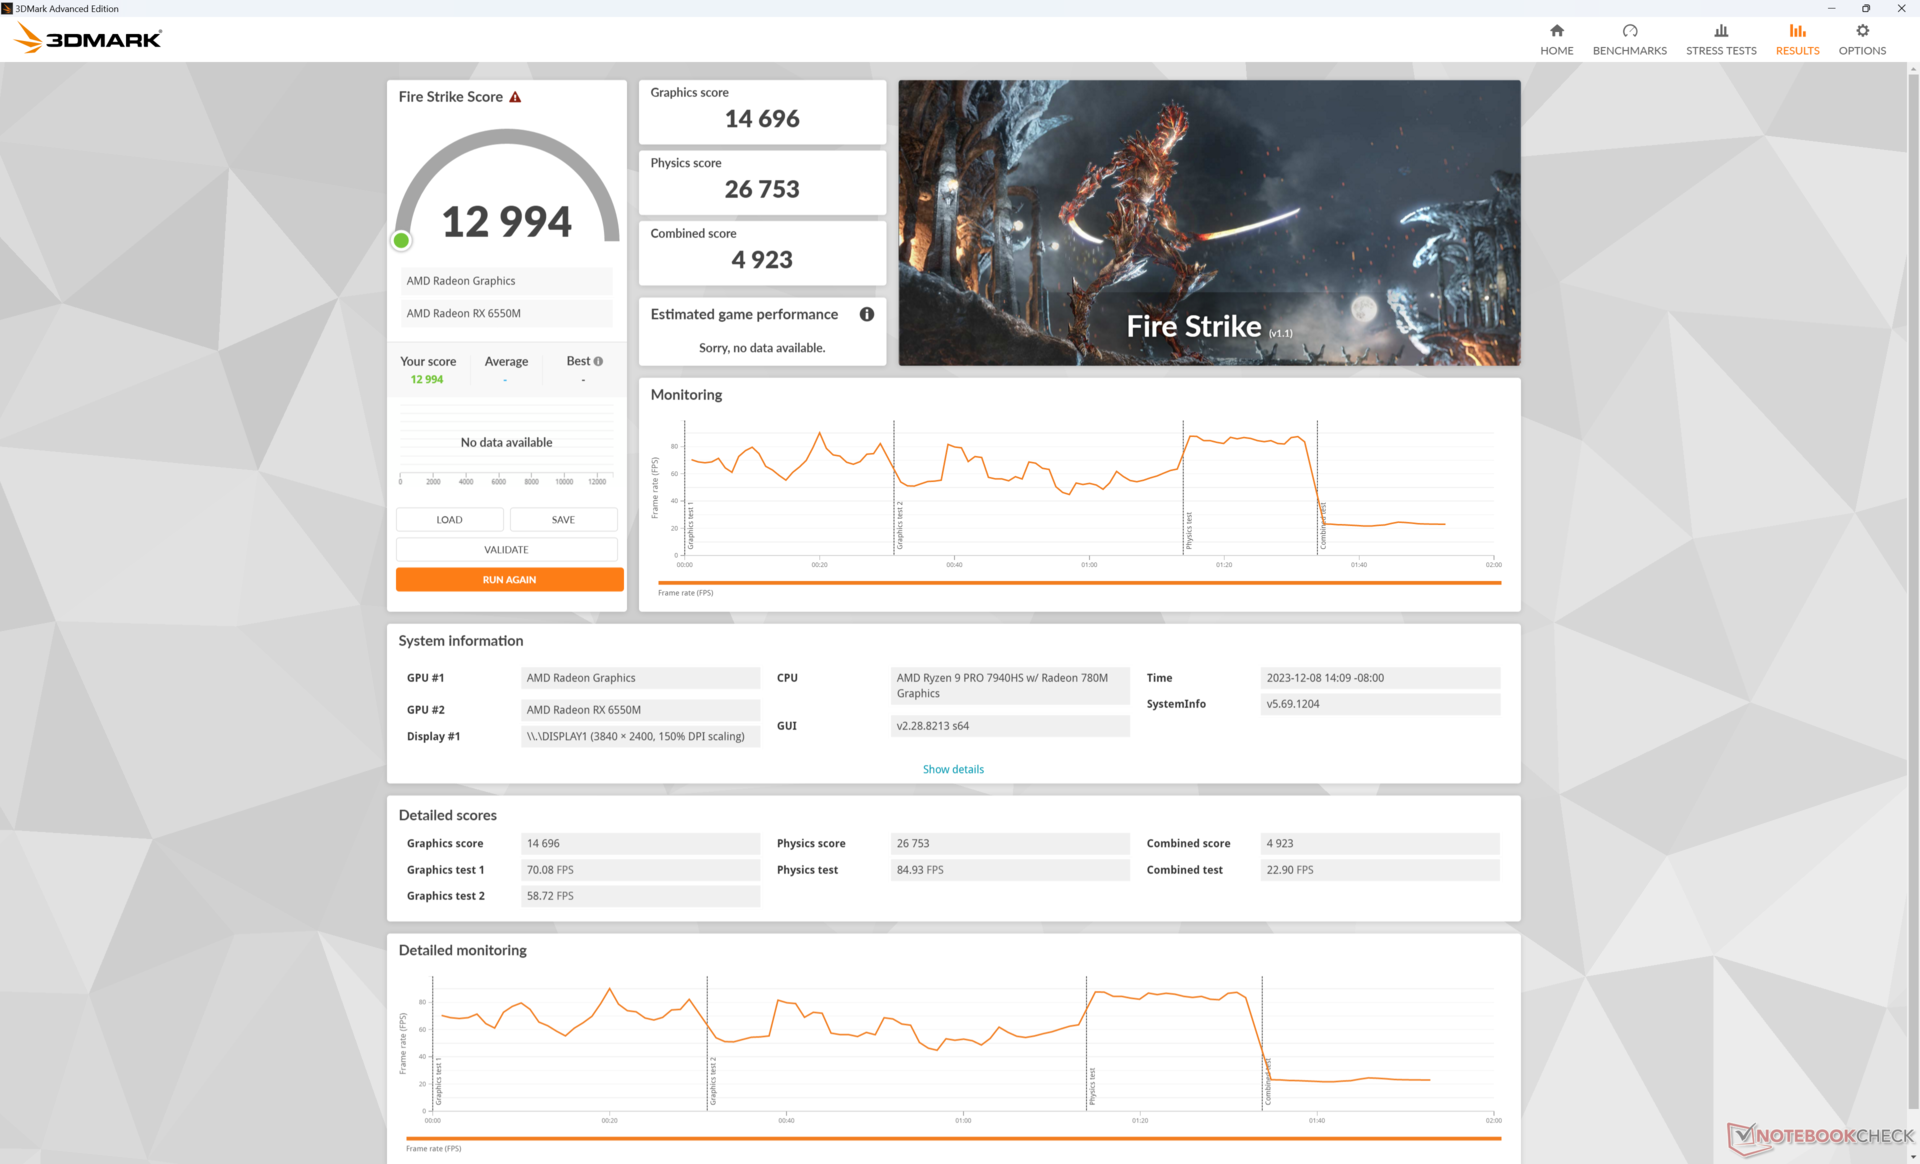
| Energieprofiel | Fysieke Score | Grafische Score | Gecombineerde Score |
| Prestatiemodus | 26753 | 14696 | 4923 |
| Evenwichtige modus | 26333 (-2%) | 13975 (-5%) | 4776 (-3%) |
| Batterijvoeding | 25622 (-4%) | 9649 (-34%) | 3114 (-37%) |
Houd er rekening mee dat de RDNA2-gebaseerde Radeon RX 6550M vlak na de lancering van de high-end RDNA3-gebaseerde Radeon RX 7900M komt, wat betekent dat er binnenkort meer RDNA3 GPU's voor het middensegment komen. RDNA3 is een aanzienlijke verbetering ten opzichte van RDNA2 op het gebied van prestaties, stroomverbruik, ondersteuning voor AI-upscaling en vooral ray-tracing-mogelijkheden.
| 3DMark Performance rating - Percent | |
| Asus Zephyrus Duo 16 GX650PY-NM006W | |
| Alienware m16 R1 AMD | |
| Lenovo ThinkPad P1 G6 21FV001KUS | |
| MSI Raider GE68 HX 13VG, i7-13700HX | |
| MSI Raider GE68HX 13VF | |
| HP Victus 16-r0076TX -1! | |
| MSI Creator Z16P B12UHST -1! | |
| Lenovo ThinkPad Z16 G1 21D5S00T00 -1! | |
| Asus VivoBook Pro 16 -1! | |
| Lenovo ThinkPad Z16 Gen 2 | |
| Gemiddeld AMD Radeon RX 6550M | |
| HP Victus 15 fa0020nr | |
| Asus VivoBook Pro 16X OLED N7600PC-L2026X -1! | |
| LG Gram 2in1 16 16T90R - G.AA78G -1! | |
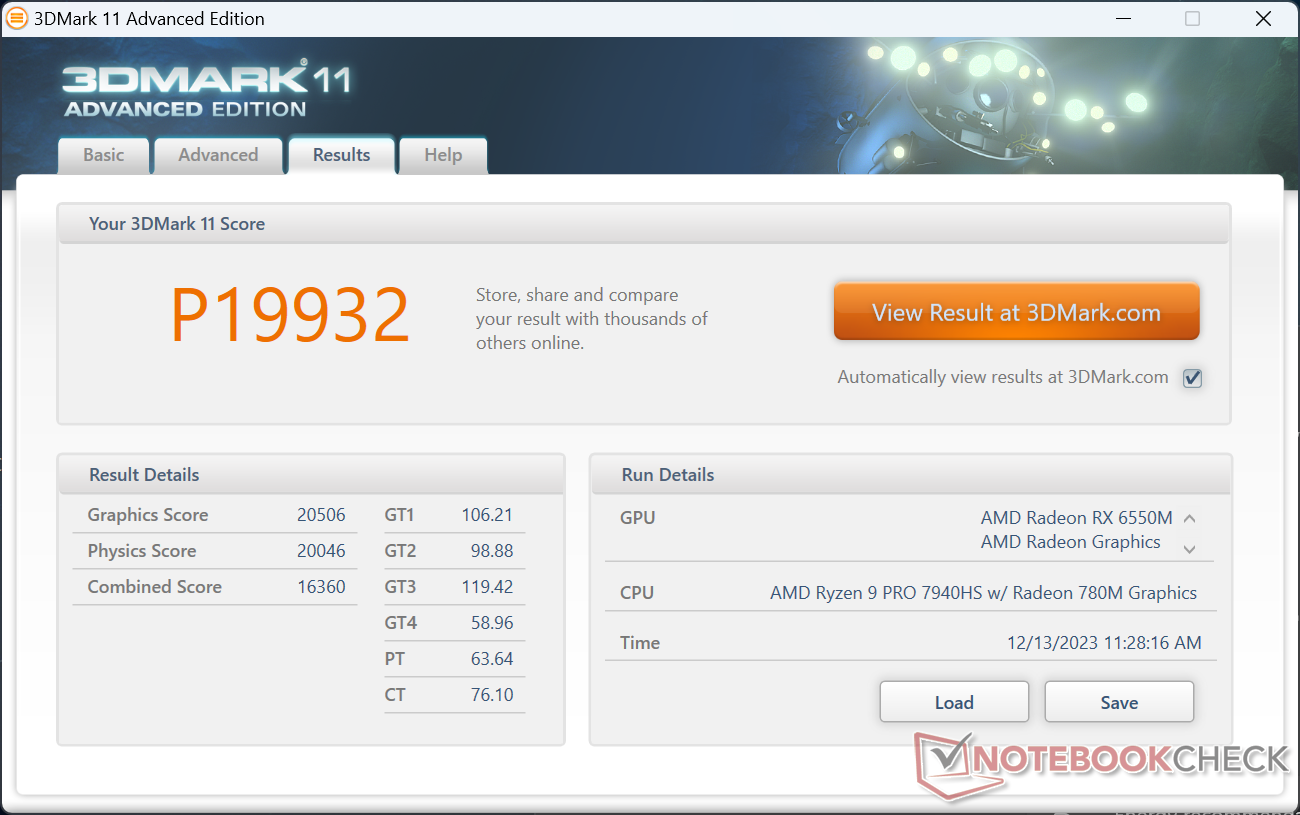
| 3DMark 11 Performance | 19932 punten | |
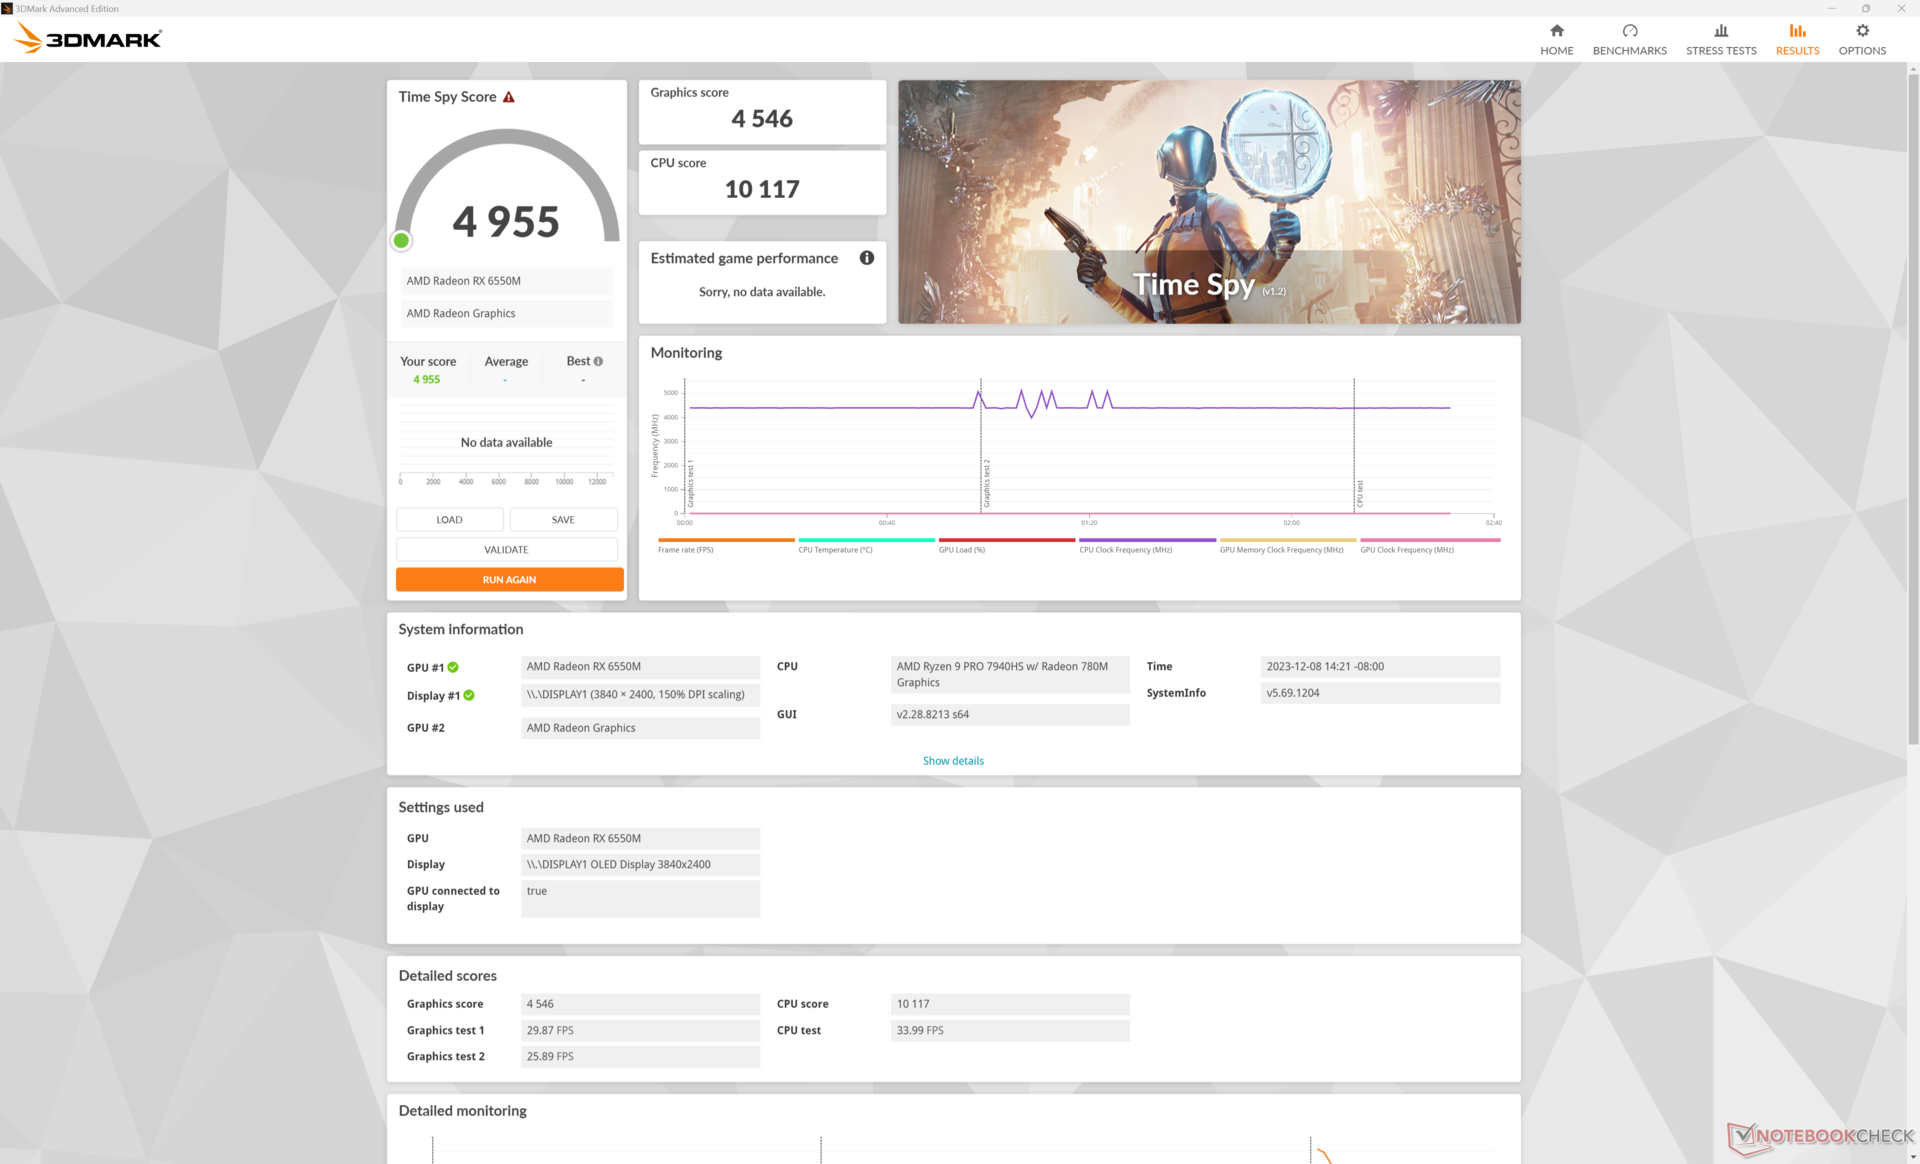
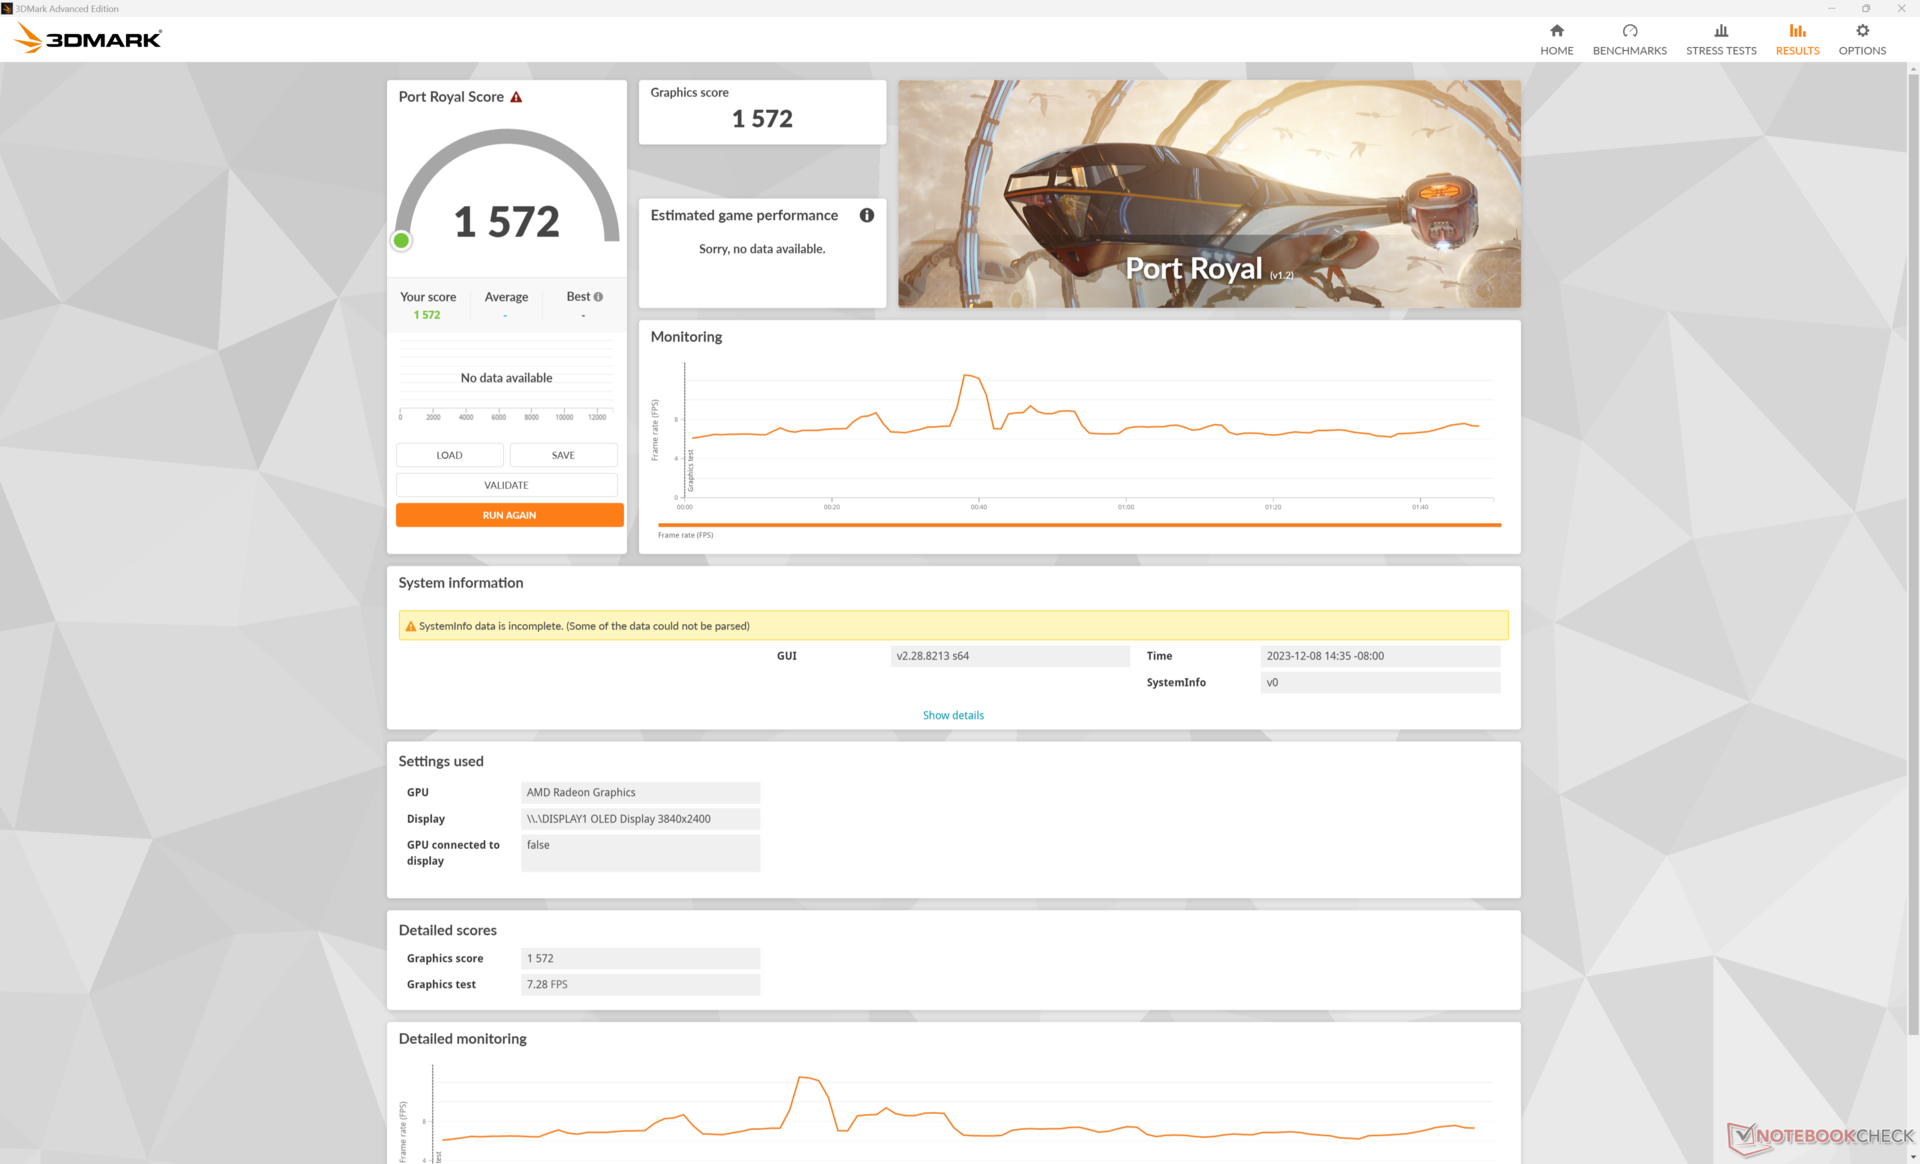
| 3DMark Fire Strike Score | 12994 punten | |
| 3DMark Time Spy Score | 4955 punten | |
Help | ||
| Blender | |
| v3.3 Classroom METAL | |
| Apple MacBook Pro 16 2023 M3 Pro | |
| v3.3 Classroom HIP/AMD | |
| Lenovo ThinkPad Z16 G1 21D5S00T00 | |
| v3.3 Classroom OPTIX/RTX | |
| Asus VivoBook Pro 16 | |
| HP Victus 16-r0076TX | |
| MSI Raider GE68HX 13VF | |
| MSI Raider GE68 HX 13VG, i7-13700HX | |
| Alienware m16 R1 AMD | |
| Lenovo ThinkPad P1 G6 21FV001KUS | |
| Asus Zephyrus Duo 16 GX650PY-NM006W | |
| v3.3 Classroom CUDA | |
| Asus VivoBook Pro 16 | |
| HP Victus 16-r0076TX | |
| MSI Raider GE68HX 13VF | |
| MSI Raider GE68 HX 13VG, i7-13700HX | |
| Lenovo ThinkPad P1 G6 21FV001KUS | |
| Alienware m16 R1 AMD | |
| Asus Zephyrus Duo 16 GX650PY-NM006W | |
| v3.3 Classroom CPU | |
| LG Gram 2in1 16 16T90R - G.AA78G | |
| Lenovo ThinkPad Z16 G1 21D5S00T00 | |
| Asus VivoBook Pro 16 | |
| HP Victus 16-r0076TX | |
| Lenovo ThinkPad P1 G6 21FV001KUS | |
| Apple MacBook Pro 16 2023 M3 Pro | |
| Lenovo ThinkPad Z16 Gen 2 | |
| Gemiddeld AMD Radeon RX 6550M (n=1) | |
| MSI Raider GE68 HX 13VG, i7-13700HX | |
| MSI Raider GE68HX 13VF | |
| Alienware m16 R1 AMD | |
| Asus Zephyrus Duo 16 GX650PY-NM006W | |
* ... kleiner is beter
Gaming prestaties
De prestaties tijdens het gamen kunnen variëren van bijna identiek aan de Radeon RX 6500M tot wel 30 procent sneller, afhankelijk van de titel en instellingen. Final Fantasy XV presteert bijvoorbeeld bijna hetzelfde tussen onze Radeon RX 6550M en 6500M modellen, terwijl andere titels zoals Far Cry 5 of F1 22 tot 15 tot 30 procent sneller kunnen zijn. Ondertussen kan Tiny Tina's Wonderlands alleen tot 30 procent sneller draaien bij hogere grafische instellingen. De resultaten zijn dus erg afhankelijk van de toepassing, maar de prestatievoordelen zijn over het algemeen hoger dan wat de 3DMark-scores anders zouden suggereren, wat geweldig nieuws is voor gamers.
Interessant is dat de algehele prestaties nek-aan-nek zijn met de MacBook Pro 16 M3 bij het testen van nieuwere games zoals Cyberpunk 2077 en Baldur's Gate 3. Als we bedenken dat onze Radeon een grotere discrete GPU is, spreekt dit boekdelen over de efficiëntie van de geïntegreerde Apple SoC-oplossing.
| Performance rating - Percent | |
| Asus Zephyrus Duo 16 GX650PY-NM006W | |
| Alienware m16 R1 AMD -1! | |
| Lenovo ThinkPad P1 G6 21FV001KUS -1! | |
| MSI Raider GE68 HX 13VG, i7-13700HX | |
| MSI Raider GE68HX 13VF -1! | |
| MSI Creator Z16P B12UHST | |
| HP Victus 16-r0076TX -1! | |
| Lenovo ThinkPad Z16 Gen 2 -1! | |
| Apple MacBook Pro 16 2023 M3 Pro -4! | |
| Lenovo ThinkPad Z16 G1 21D5S00T00 | |
| LG Gram 2in1 16 16T90R - G.AA78G | |
| The Witcher 3 - 1920x1080 Ultra Graphics & Postprocessing (HBAO+) | |
| Asus Zephyrus Duo 16 GX650PY-NM006W | |
| Alienware m16 R1 AMD | |
| Lenovo ThinkPad P1 G6 21FV001KUS | |
| MSI Raider GE68 HX 13VG, i7-13700HX | |
| MSI Raider GE68HX 13VF | |
| HP Victus 16-r0076TX | |
| MSI Creator Z16P B12UHST | |
| Lenovo ThinkPad Z16 Gen 2 | |
| Apple MacBook Pro 16 2023 M3 Pro | |
| Lenovo ThinkPad Z16 G1 21D5S00T00 | |
| LG Gram 2in1 16 16T90R - G.AA78G | |
| GTA V - 1920x1080 Highest AA:4xMSAA + FX AF:16x | |
| Asus Zephyrus Duo 16 GX650PY-NM006W | |
| Lenovo ThinkPad P1 G6 21FV001KUS | |
| MSI Raider GE68 HX 13VG, i7-13700HX | |
| MSI Creator Z16P B12UHST | |
| Apple MacBook Pro 16 2023 M3 Pro | |
| Lenovo ThinkPad Z16 G1 21D5S00T00 | |
| LG Gram 2in1 16 16T90R - G.AA78G | |
| Final Fantasy XV Benchmark - 1920x1080 High Quality | |
| Asus Zephyrus Duo 16 GX650PY-NM006W | |
| Alienware m16 R1 AMD | |
| Lenovo ThinkPad P1 G6 21FV001KUS | |
| MSI Raider GE68 HX 13VG, i7-13700HX | |
| MSI Raider GE68HX 13VF | |
| MSI Creator Z16P B12UHST | |
| HP Victus 16-r0076TX | |
| Lenovo ThinkPad Z16 Gen 2 | |
| Lenovo ThinkPad Z16 G1 21D5S00T00 | |
| LG Gram 2in1 16 16T90R - G.AA78G | |
| Strange Brigade - 1920x1080 ultra AA:ultra AF:16 | |
| Alienware m16 R1 AMD | |
| Asus Zephyrus Duo 16 GX650PY-NM006W | |
| MSI Raider GE68 HX 13VG, i7-13700HX | |
| MSI Raider GE68HX 13VF | |
| MSI Creator Z16P B12UHST | |
| HP Victus 16-r0076TX | |
| Lenovo ThinkPad Z16 Gen 2 | |
| Lenovo ThinkPad Z16 G1 21D5S00T00 | |
| LG Gram 2in1 16 16T90R - G.AA78G | |
| Dota 2 Reborn - 1920x1080 ultra (3/3) best looking | |
| MSI Raider GE68HX 13VF | |
| Asus Zephyrus Duo 16 GX650PY-NM006W | |
| MSI Raider GE68 HX 13VG, i7-13700HX | |
| Alienware m16 R1 AMD | |
| MSI Creator Z16P B12UHST | |
| Lenovo ThinkPad P1 G6 21FV001KUS | |
| HP Victus 16-r0076TX | |
| Lenovo ThinkPad Z16 Gen 2 | |
| Lenovo ThinkPad Z16 G1 21D5S00T00 | |
| LG Gram 2in1 16 16T90R - G.AA78G | |
| X-Plane 11.11 - 1920x1080 high (fps_test=3) | |
| MSI Raider GE68HX 13VF | |
| MSI Raider GE68 HX 13VG, i7-13700HX | |
| Lenovo ThinkPad P1 G6 21FV001KUS | |
| Asus Zephyrus Duo 16 GX650PY-NM006W | |
| Alienware m16 R1 AMD | |
| HP Victus 16-r0076TX | |
| MSI Creator Z16P B12UHST | |
| LG Gram 2in1 16 16T90R - G.AA78G | |
| Lenovo ThinkPad Z16 G1 21D5S00T00 | |
| Lenovo ThinkPad Z16 Gen 2 | |
| Cyberpunk 2077 | |
| 1280x720 Low Preset (FSR off) | |
| Lenovo ThinkPad Z16 Gen 2 | |
| Gemiddeld AMD Radeon RX 6550M (n=1) | |
| LG Gram 2in1 16 16T90R - G.AA78G | |
| 1920x1080 Low Preset (FSR off) | |
| Lenovo ThinkPad Z16 Gen 2 | |
| Gemiddeld AMD Radeon RX 6550M (n=1) | |
| Apple MacBook Pro 16 2023 M3 Pro | |
| LG Gram 2in1 16 16T90R - G.AA78G | |
| 1920x1080 Medium Preset (FSR off) | |
| Lenovo ThinkPad Z16 Gen 2 | |
| Gemiddeld AMD Radeon RX 6550M (n=1) | |
| Apple MacBook Pro 16 2023 M3 Pro | |
| LG Gram 2in1 16 16T90R - G.AA78G | |
| 1920x1080 High Preset (FSR off) | |
| Lenovo ThinkPad P1 G6 21FV001KUS | |
| Apple MacBook Pro 16 2023 M3 Pro | |
| Lenovo ThinkPad Z16 Gen 2 | |
| Gemiddeld AMD Radeon RX 6550M (n=1) | |
| LG Gram 2in1 16 16T90R - G.AA78G | |
| 1920x1080 Ultra Preset (FSR off) | |
| Lenovo ThinkPad P1 G6 21FV001KUS | |
| Apple MacBook Pro 16 2023 M3 Pro | |
| Lenovo ThinkPad Z16 Gen 2 | |
| Gemiddeld AMD Radeon RX 6550M (n=1) | |
| LG Gram 2in1 16 16T90R - G.AA78G | |
| 2560x1440 Ultra Preset (FSR off) | |
| Lenovo ThinkPad P1 G6 21FV001KUS | |
| Lenovo ThinkPad Z16 Gen 2 | |
| Gemiddeld AMD Radeon RX 6550M (n=1) | |
| Baldur's Gate 3 | |
| 1920x1080 Low Preset AA:SM | |
| Lenovo ThinkPad Z16 Gen 2 | |
| Gemiddeld AMD Radeon RX 6550M (n=1) | |
| 1920x1080 Medium Preset AA:T | |
| Lenovo ThinkPad Z16 Gen 2 | |
| Gemiddeld AMD Radeon RX 6550M (n=1) | |
| 1920x1080 High Preset AA:T | |
| Apple MacBook Pro 16 2023 M3 Pro | |
| Lenovo ThinkPad Z16 Gen 2 | |
| Gemiddeld AMD Radeon RX 6550M (n=1) | |
| 1920x1080 Ultra Preset AA:T | |
| Lenovo ThinkPad P1 G6 21FV001KUS | |
| Apple MacBook Pro 16 2023 M3 Pro | |
| Lenovo ThinkPad Z16 Gen 2 | |
| Gemiddeld AMD Radeon RX 6550M (n=1) | |
| 2560x1440 Ultra Preset AA:T | |
| Lenovo ThinkPad P1 G6 21FV001KUS | |
| Lenovo ThinkPad Z16 Gen 2 | |
| Gemiddeld AMD Radeon RX 6550M (n=1) | |
Witcher 3 FPS Chart
| lage | gem. | hoge | ultra | QHD | |
|---|---|---|---|---|---|
| The Witcher 3 (2015) | 277.2 | 171.5 | 83.2 | 49.4 | |
| Dota 2 Reborn (2015) | 137.1 | 127.3 | 112.3 | 103 | |
| Final Fantasy XV Benchmark (2018) | 129.3 | 67.4 | 47.8 | 31.2 | |
| X-Plane 11.11 (2018) | 53.7 | 41.2 | 33 | ||
| Far Cry 5 (2018) | 115 | 91 | 84 | 79 | |
| Strange Brigade (2018) | 319 | 122.5 | 101.1 | 88.4 | |
| Tiny Tina's Wonderlands (2022) | 124.1 | 95.5 | 59.7 | 30.3 | 27.2 |
| F1 22 (2022) | 132.5 | 120.8 | 87.5 | 19.3 | 11.3 |
| Baldur's Gate 3 (2023) | 61.6 | 52.9 | 44.7 | 43 | 29 |
| Cyberpunk 2077 (2023) | 62.8 | 45.9 | 34.7 | 28.6 | 17.3 |
Uitstoot
Systeemgeluid
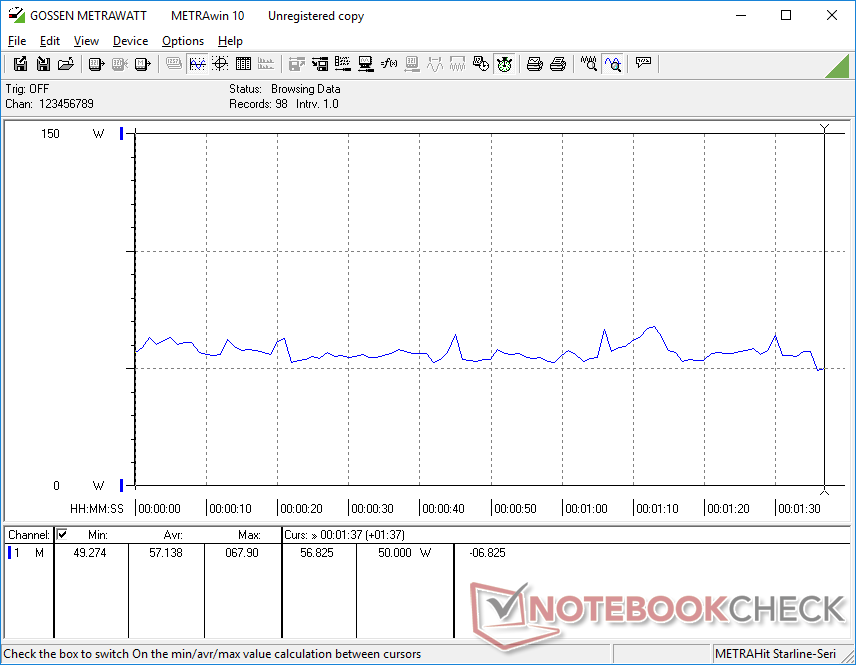
Het geluid van de ventilatoren is sterk afhankelijk van het gekozen energieprofiel. De ventilatoren zijn bijvoorbeeld alleen echt stil in het energiebesparingsprofiel, omdat ze anders altijd actief zijn met bijna 30 dB(A), ongeacht de belasting van het scherm. Op dezelfde manier is het ventilatorgeluid in de modus Gebalanceerd ongeveer 41 tot 45 dB(A) vergeleken met 52 dB(A) in de modus Prestaties, wat een aanzienlijk verschil is ondanks de kleine prestatieverschillen tussen de twee profielen zoals hierboven vermeld. Vooral de modus Prestaties is merkbaar luider dan veel andere 16-inch laptops zoals de MSI Creator Z16P of MacBook Pro 16.
Het pulseren van de ventilator wordt verder tot een minimum beperkt. Bij het uitvoeren van 3DMark 06 bijvoorbeeld, was het ventilatorgeluid gedurende de hele eerste benchmarkscène constant 29,5 dB(A), zonder plotselinge pieken.
Geluidsniveau
| Onbelast |
| 22.9 / 29.4 / 29.4 dB (A) |
| Belasting |
| 29.5 / 52 dB (A) |
 | ||
30 dB stil 40 dB(A) hoorbaar 50 dB(A) luid |
||
min: | ||
| Lenovo ThinkPad Z16 Gen 2 Radeon RX 6550M, R9 PRO 7940HS, Kioxia XG8 KXG8AZNV1T02 | Lenovo ThinkPad Z16 G1 21D5S00T00 Radeon RX 6500M, R7 PRO 6850H, Samsung PM9A1 MZVL21T0HCLR | Lenovo ThinkBook 16 G6 ABP Vega 7, R5 7530U, SK hynix HFS512GEJ9X125N | MSI Creator Z16P B12UHST GeForce RTX 3080 Ti Laptop GPU, i9-12900H, Samsung PM9A1 MZVL22T0HBLB | Apple MacBook Pro 16 2023 M3 Pro M3 Pro 18-Core GPU, Apple M3 Pro 12-Core, Apple SSD AP0512Z | Asus Vivobook Pro 16X K6604JV-MX016W GeForce RTX 4060 Laptop GPU, i9-13980HX, Solidigm P41 Plus SSDPFKNU010TZ | |
|---|---|---|---|---|---|---|
| Noise | 9% | 11% | -8% | 12% | -18% | |
| uit / omgeving * (dB) | 22.6 | 23.7 -5% | 24.3 -8% | 26 -15% | 24.4 -8% | 25.2 -12% |
| Idle Minimum * (dB) | 22.9 | 23.7 -3% | 24.3 -6% | 27 -18% | 24.4 -7% | 26.6 -16% |
| Idle Average * (dB) | 29.4 | 23.7 19% | 24.3 17% | 29 1% | 24.4 17% | 26.6 10% |
| Idle Maximum * (dB) | 29.4 | 23.7 19% | 24.3 17% | 31 -5% | 24.4 17% | 29.2 1% |
| Load Average * (dB) | 29.5 | 25.9 12% | 29.7 -1% | 43 -46% | 26.9 9% | 53.4 -81% |
| Witcher 3 ultra * (dB) | 52 | 46.9 10% | 32.1 38% | 43 17% | 25.1 52% | |
| Load Maximum * (dB) | 52 | 46.9 10% | 41.4 20% | 46 12% | 50.4 3% | 56.9 -9% |
* ... kleiner is beter
Temperatuur
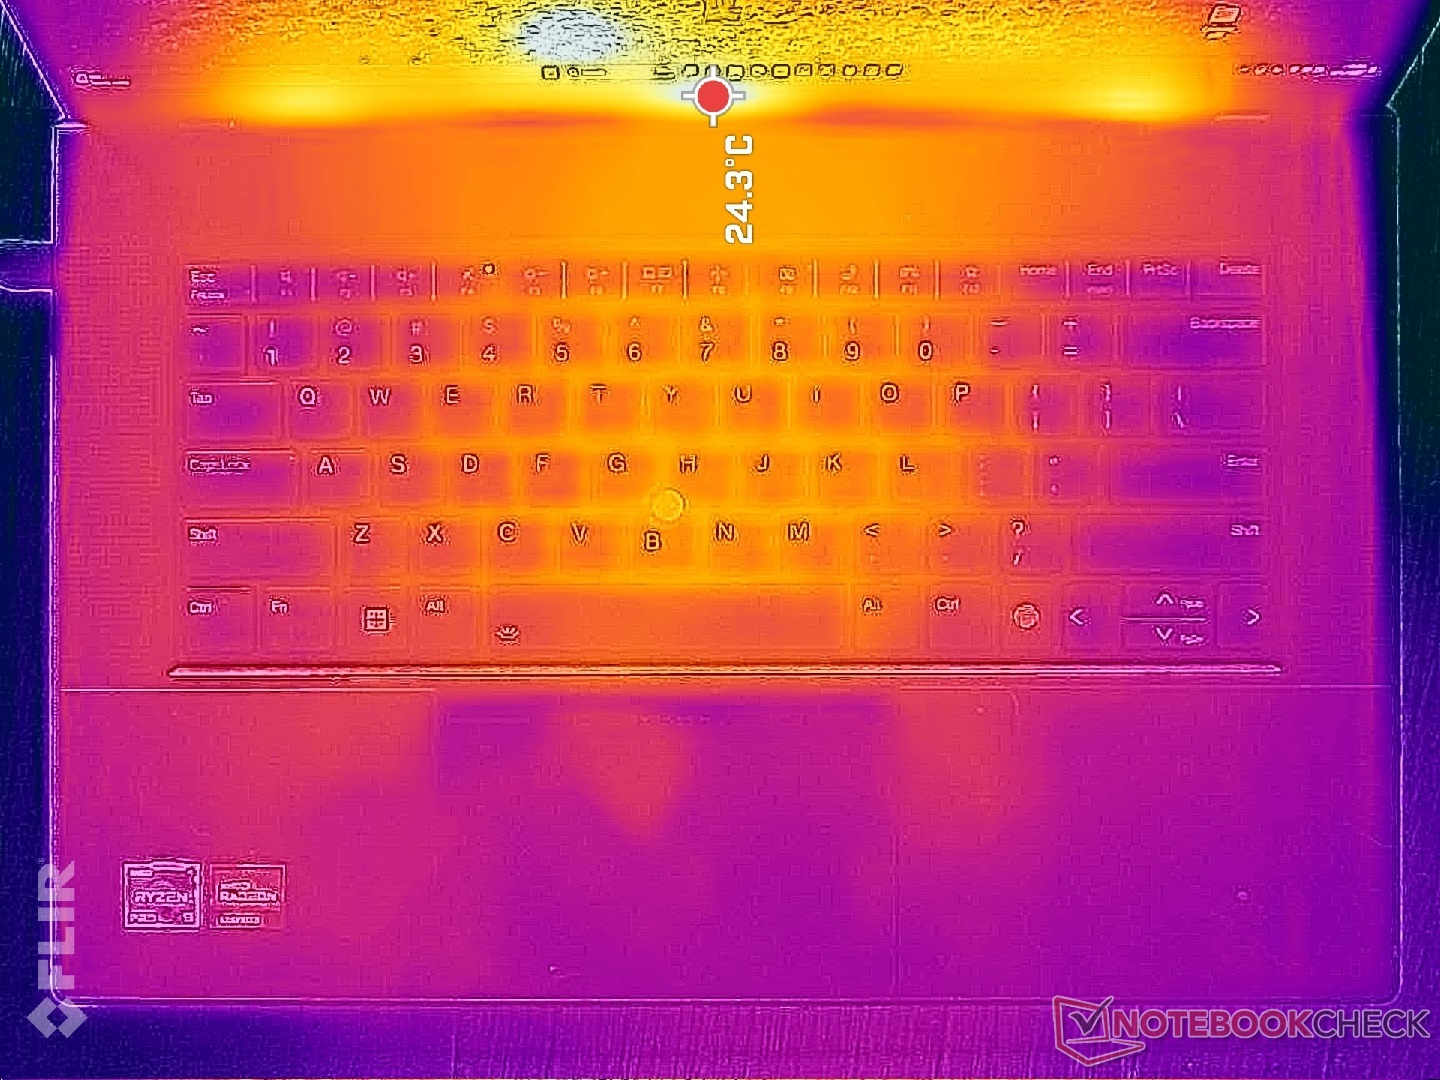
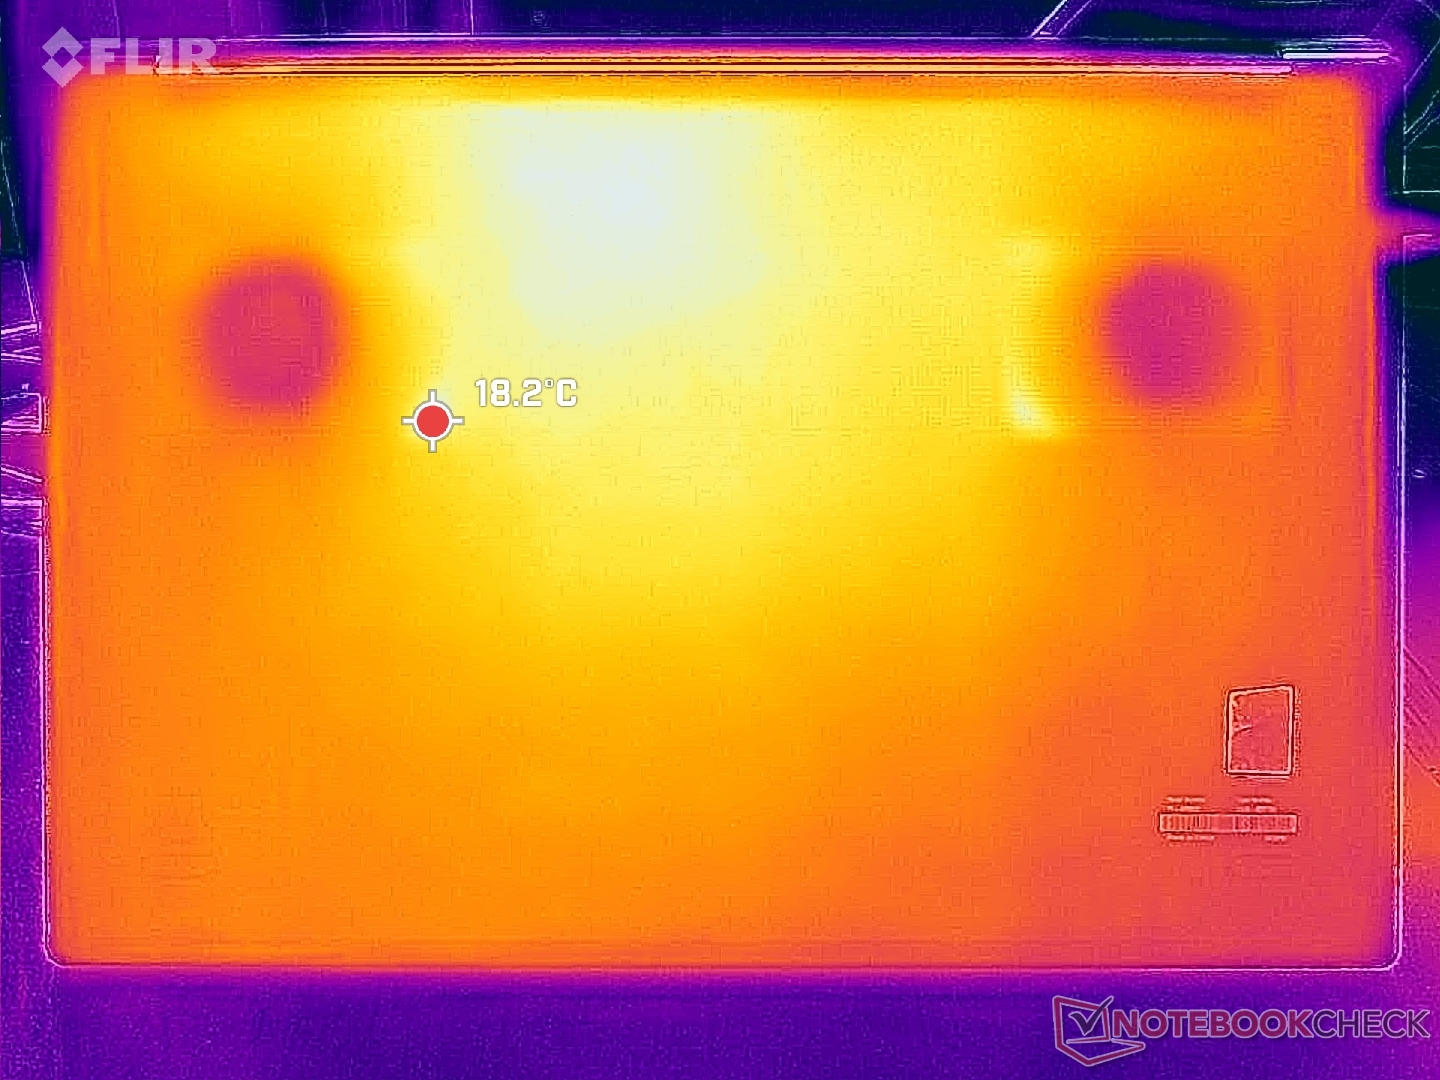
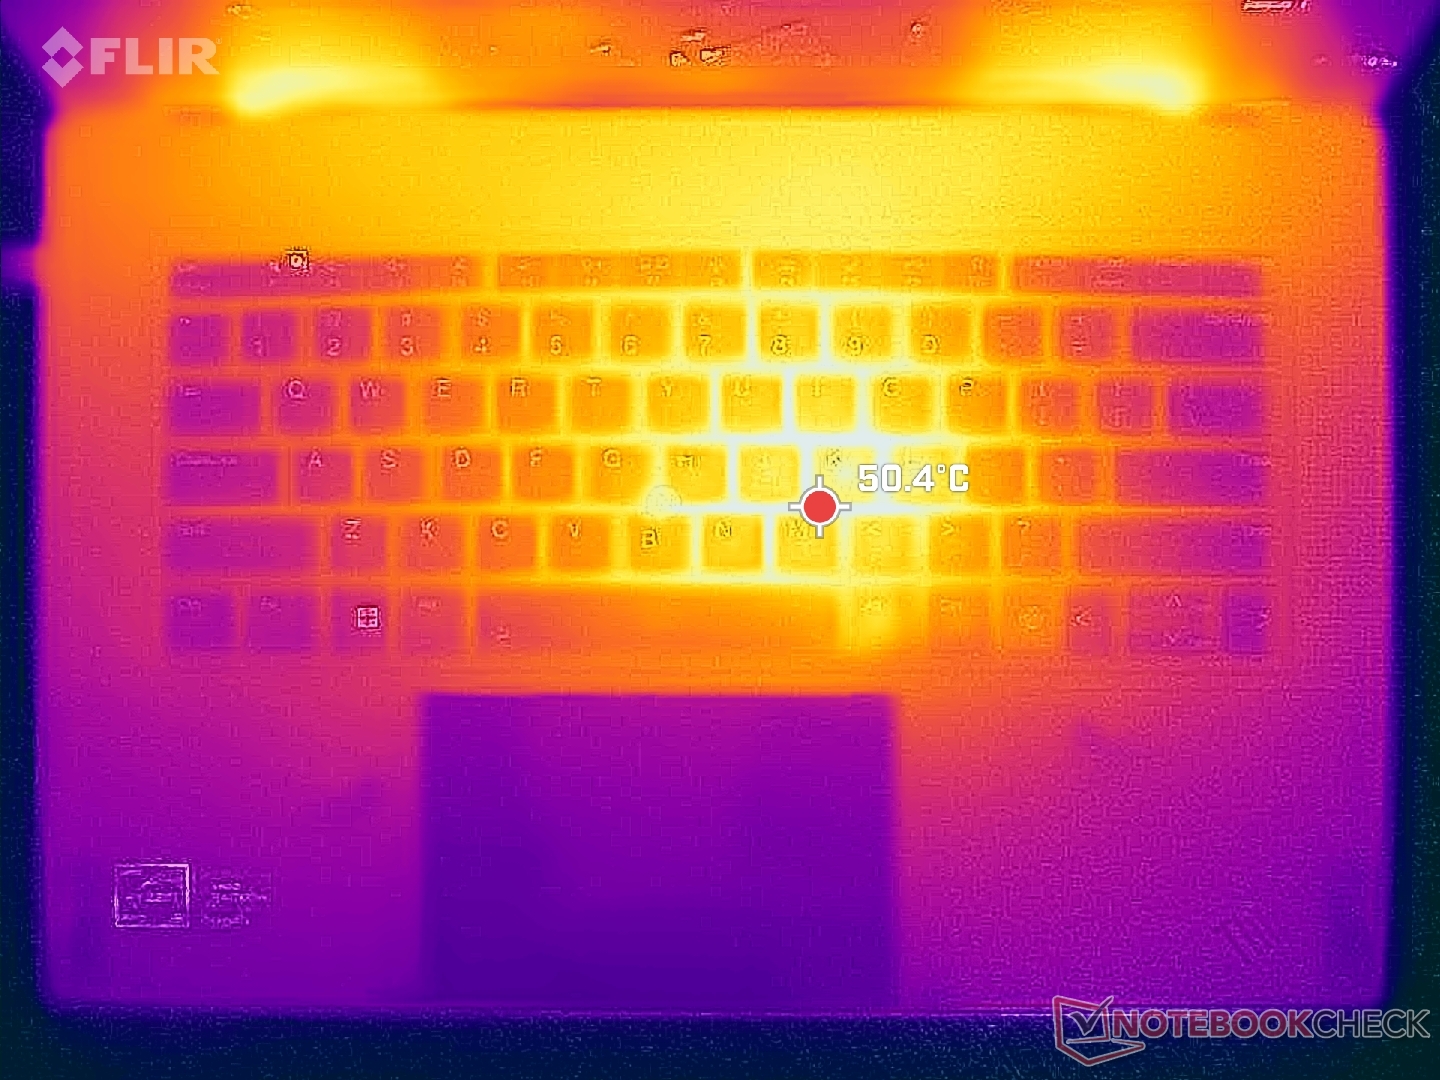
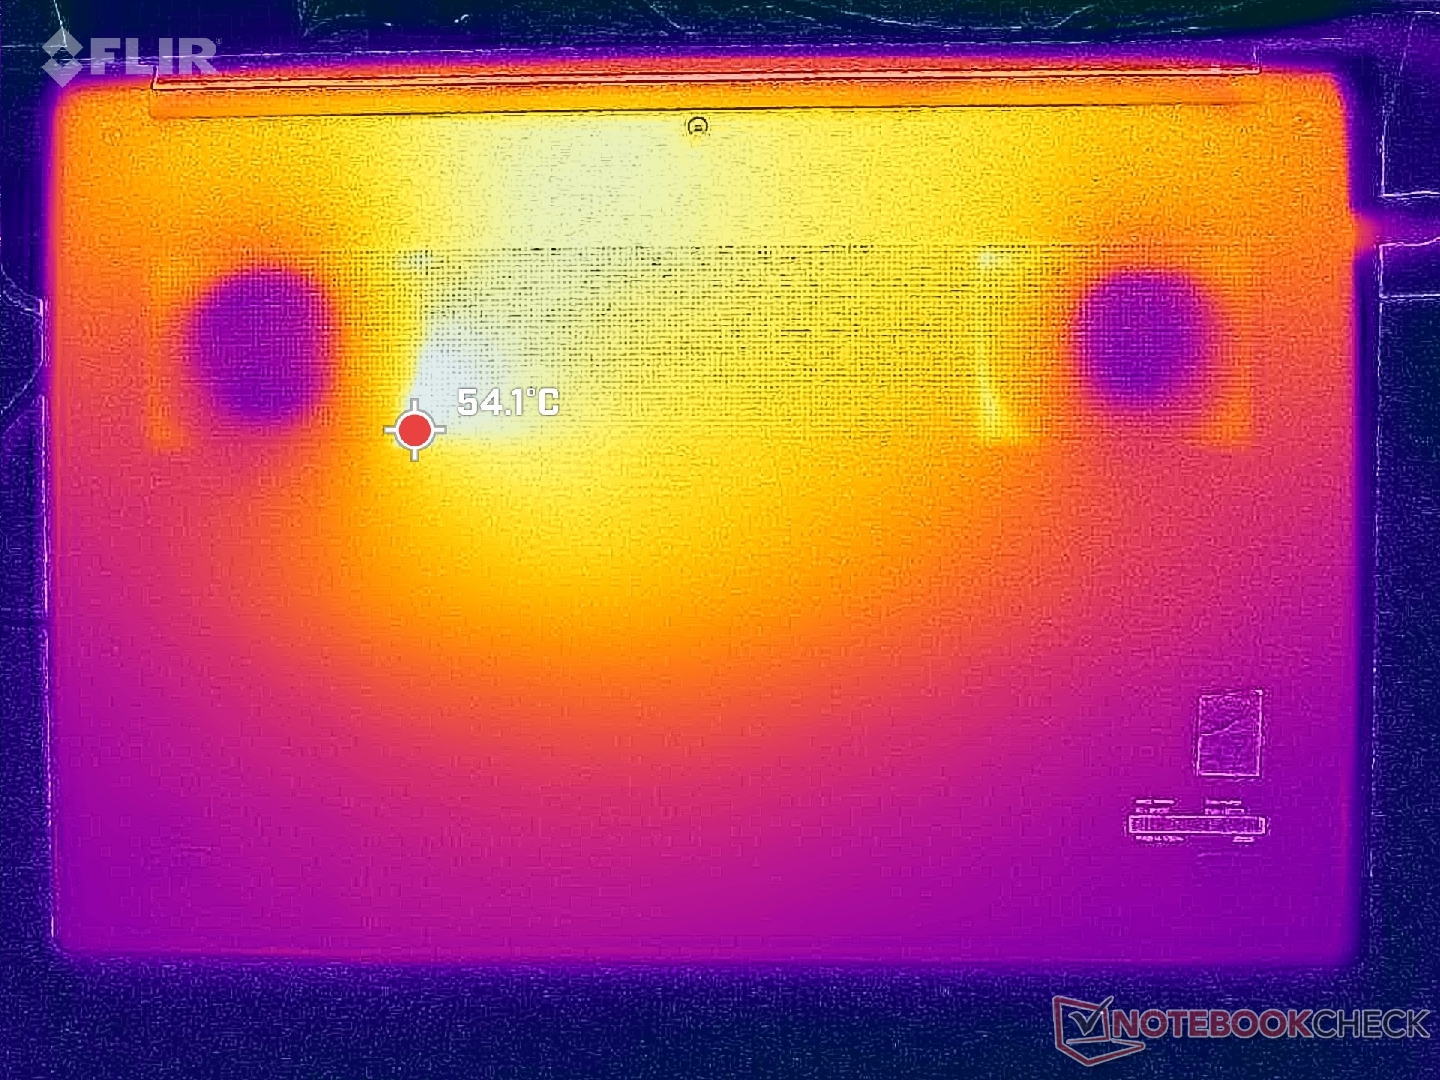
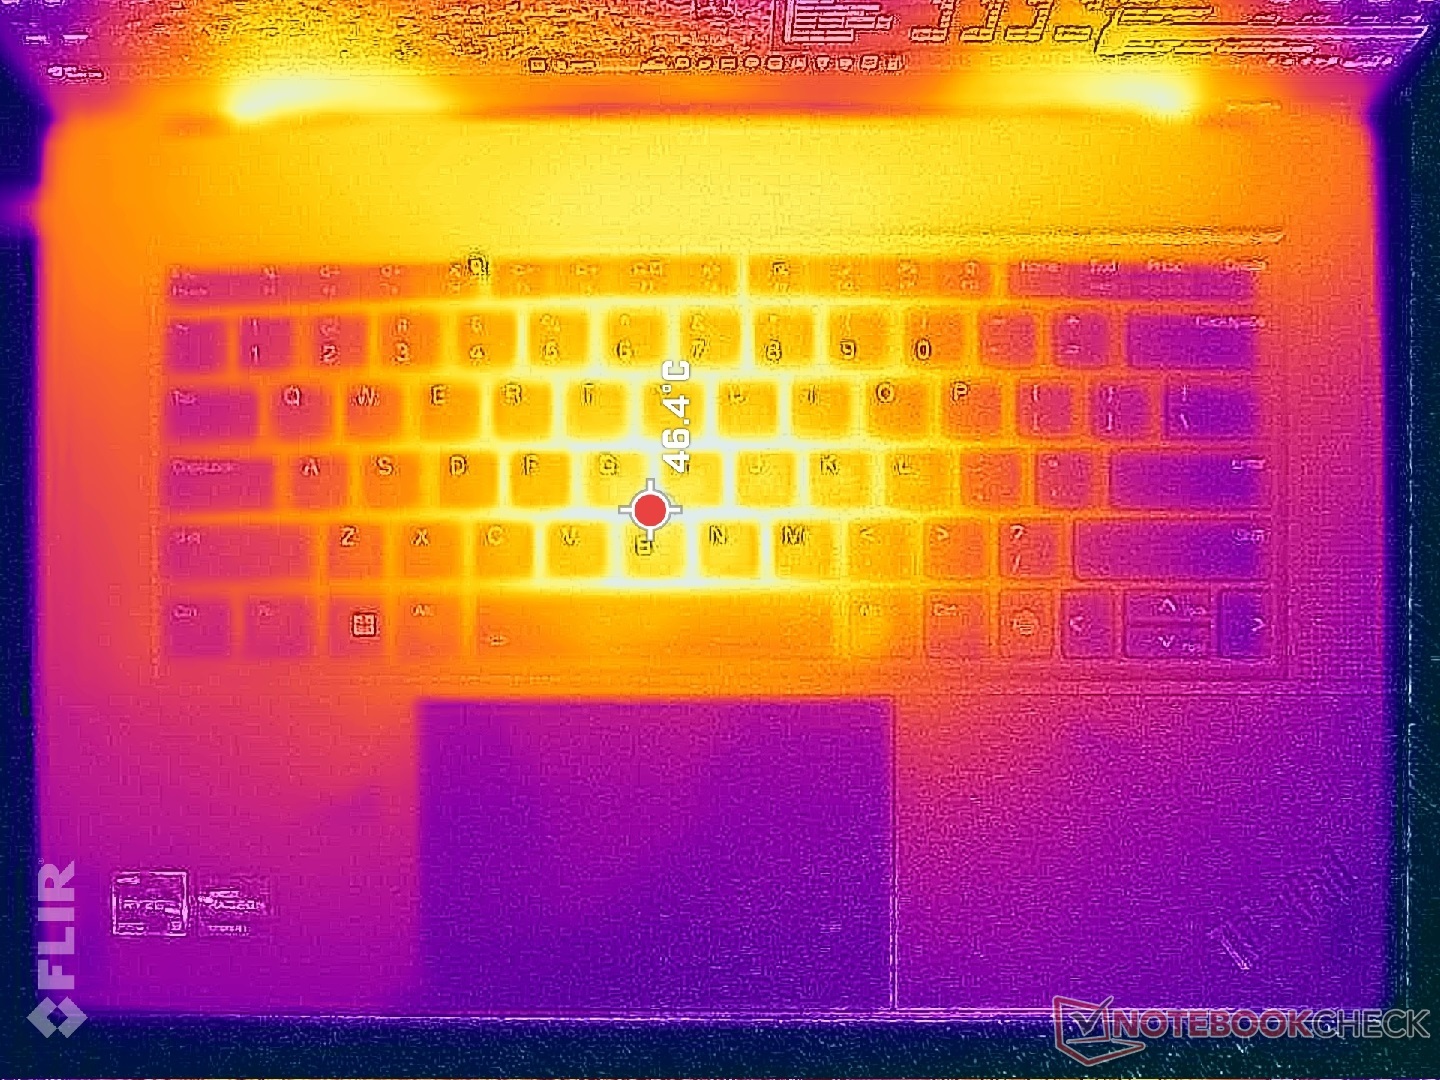
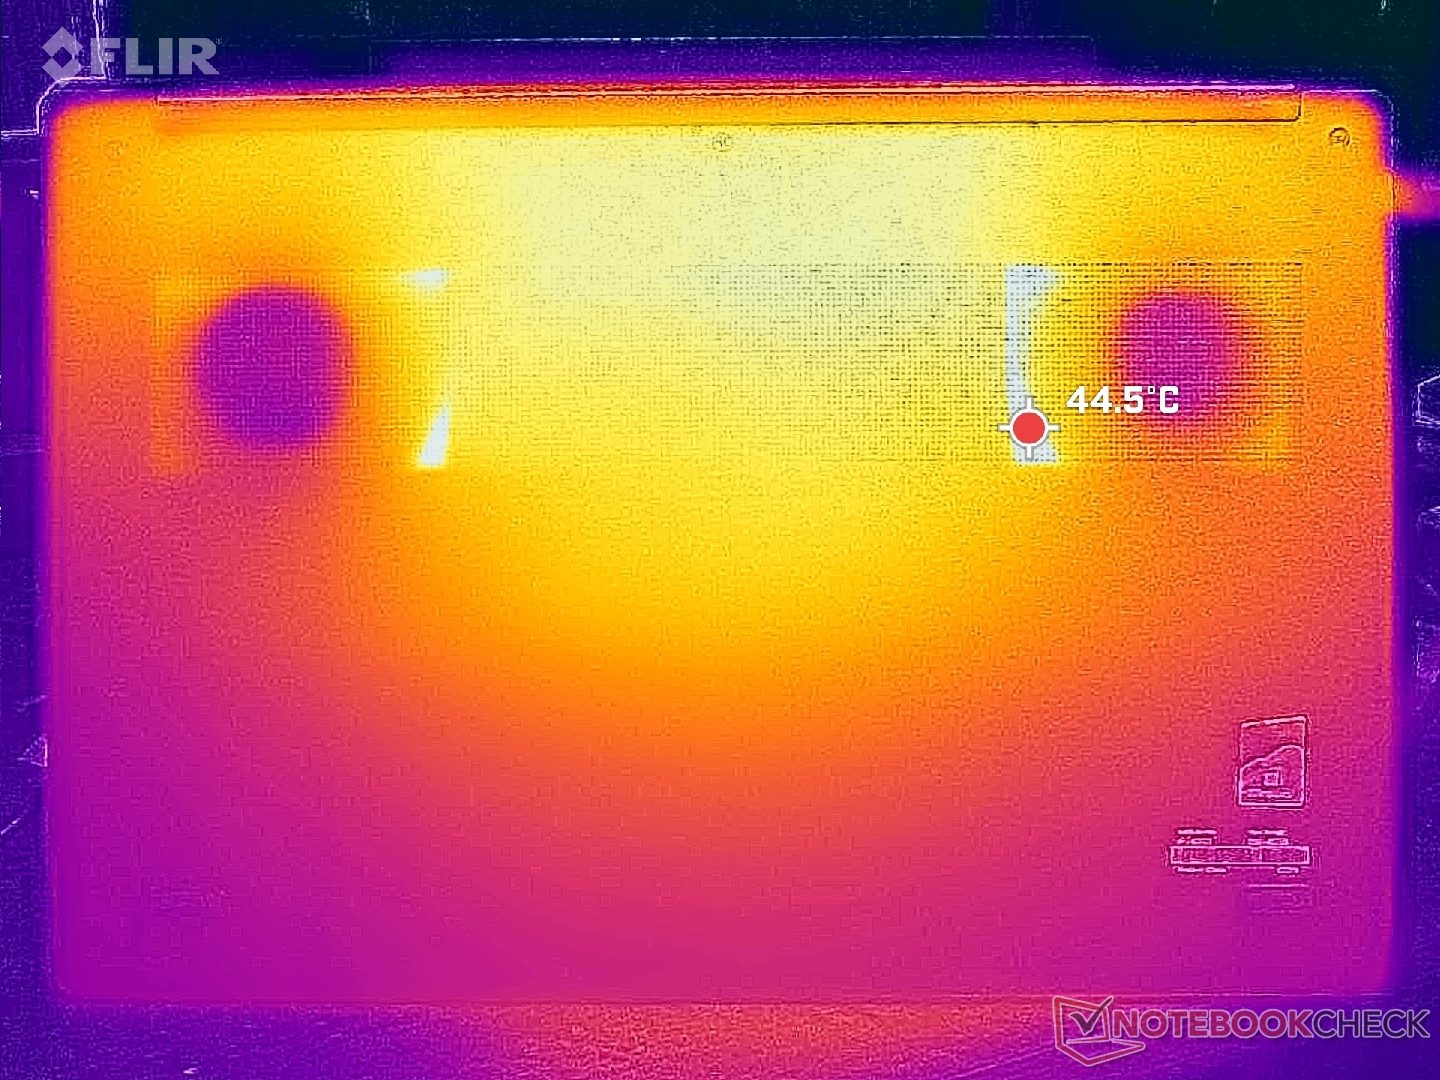
De oppervlaktetemperaturen stijgen en dalen vrij snel en met grotere extremen, aangezien het grootste deel van de behuizing van metaal is. Bij het uitvoeren van veeleisende belastingen zoals games, kunnen hete plekken wel 47 C en 43 C warm worden op respectievelijk het midden en de bodemplaat van het toetsenbord, maar dit kan nog warmer worden tot meer dan 50 C afhankelijk van de omgevingstemperatuur, zoals we hebben waargenomen op de ThinkPad Z16 Gen 1. De resultaten zijn desalniettemin veel koeler dan wat we hebben gemeten op de MSI Creator Z16P die veel te heet zou worden voor zijn eigen bestwil.
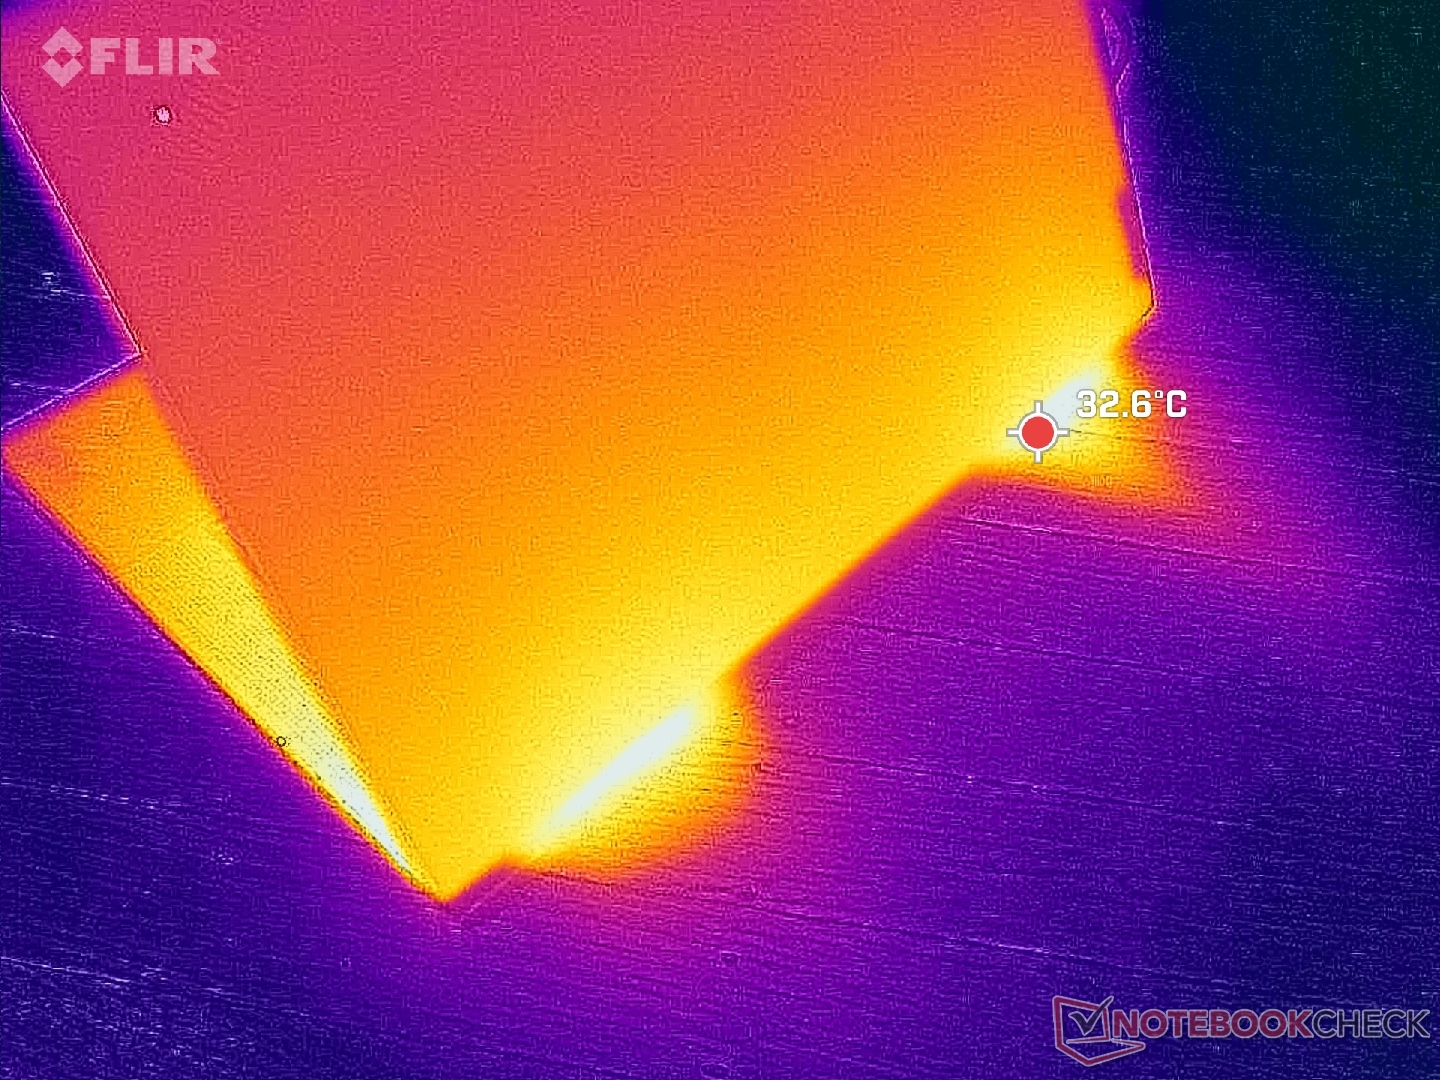
(±) De maximumtemperatuur aan de bovenzijde bedraagt 43 °C / 109 F, vergeleken met het gemiddelde van 36.8 °C / 98 F, variërend van 21 tot 71 °C voor de klasse Multimedia.
(±) De bodem warmt op tot een maximum van 41.6 °C / 107 F, vergeleken met een gemiddelde van 39.1 °C / 102 F
(+) Bij onbelast gebruik bedraagt de gemiddelde temperatuur voor de bovenzijde 20.3 °C / 69 F, vergeleken met het apparaatgemiddelde van 31.3 °C / 88 F.
(-) Bij het spelen van The Witcher 3 is de gemiddelde temperatuur voor de bovenzijde 38.1 °C / 101 F, vergeleken met het apparaatgemiddelde van 31.3 °C / 88 F.
(+) De palmsteunen en het touchpad zijn met een maximum van ###max## °C / 86 F koeler dan de huidtemperatuur en voelen daarom koel aan.
(±) De gemiddelde temperatuur van de handpalmsteun van soortgelijke toestellen bedroeg 28.7 °C / 83.7 F (-1.3 °C / -2.3 F).
| Lenovo ThinkPad Z16 Gen 2 AMD Ryzen 9 PRO 7940HS, AMD Radeon RX 6550M | Lenovo ThinkPad Z16 G1 21D5S00T00 AMD Ryzen 7 PRO 6850H, AMD Radeon RX 6500M | Lenovo ThinkBook 16 G6 ABP AMD Ryzen 5 7530U, AMD Radeon RX Vega 7 | MSI Creator Z16P B12UHST Intel Core i9-12900H, NVIDIA GeForce RTX 3080 Ti Laptop GPU | Apple MacBook Pro 16 2023 M3 Pro Apple M3 Pro 12-Core, Apple M3 Pro 18-Core GPU | Asus Vivobook Pro 16X K6604JV-MX016W Intel Core i9-13980HX, NVIDIA GeForce RTX 4060 Laptop GPU | |
|---|---|---|---|---|---|---|
| Heat | -33% | -30% | -49% | -2% | -36% | |
| Maximum Upper Side * (°C) | 43 | 56.8 -32% | 40.8 5% | 67 -56% | 38.1 11% | 39.7 8% |
| Maximum Bottom * (°C) | 41.6 | 53.3 -28% | 50.5 -21% | 69 -66% | 37 11% | 60 -44% |
| Idle Upper Side * (°C) | 21.2 | 28.2 -33% | 29.3 -38% | 29 -37% | 24.2 -14% | 30.9 -46% |
| Idle Bottom * (°C) | 21.4 | 29.4 -37% | 35.2 -64% | 29 -36% | 24.6 -15% | 34.7 -62% |
* ... kleiner is beter
Stresstest
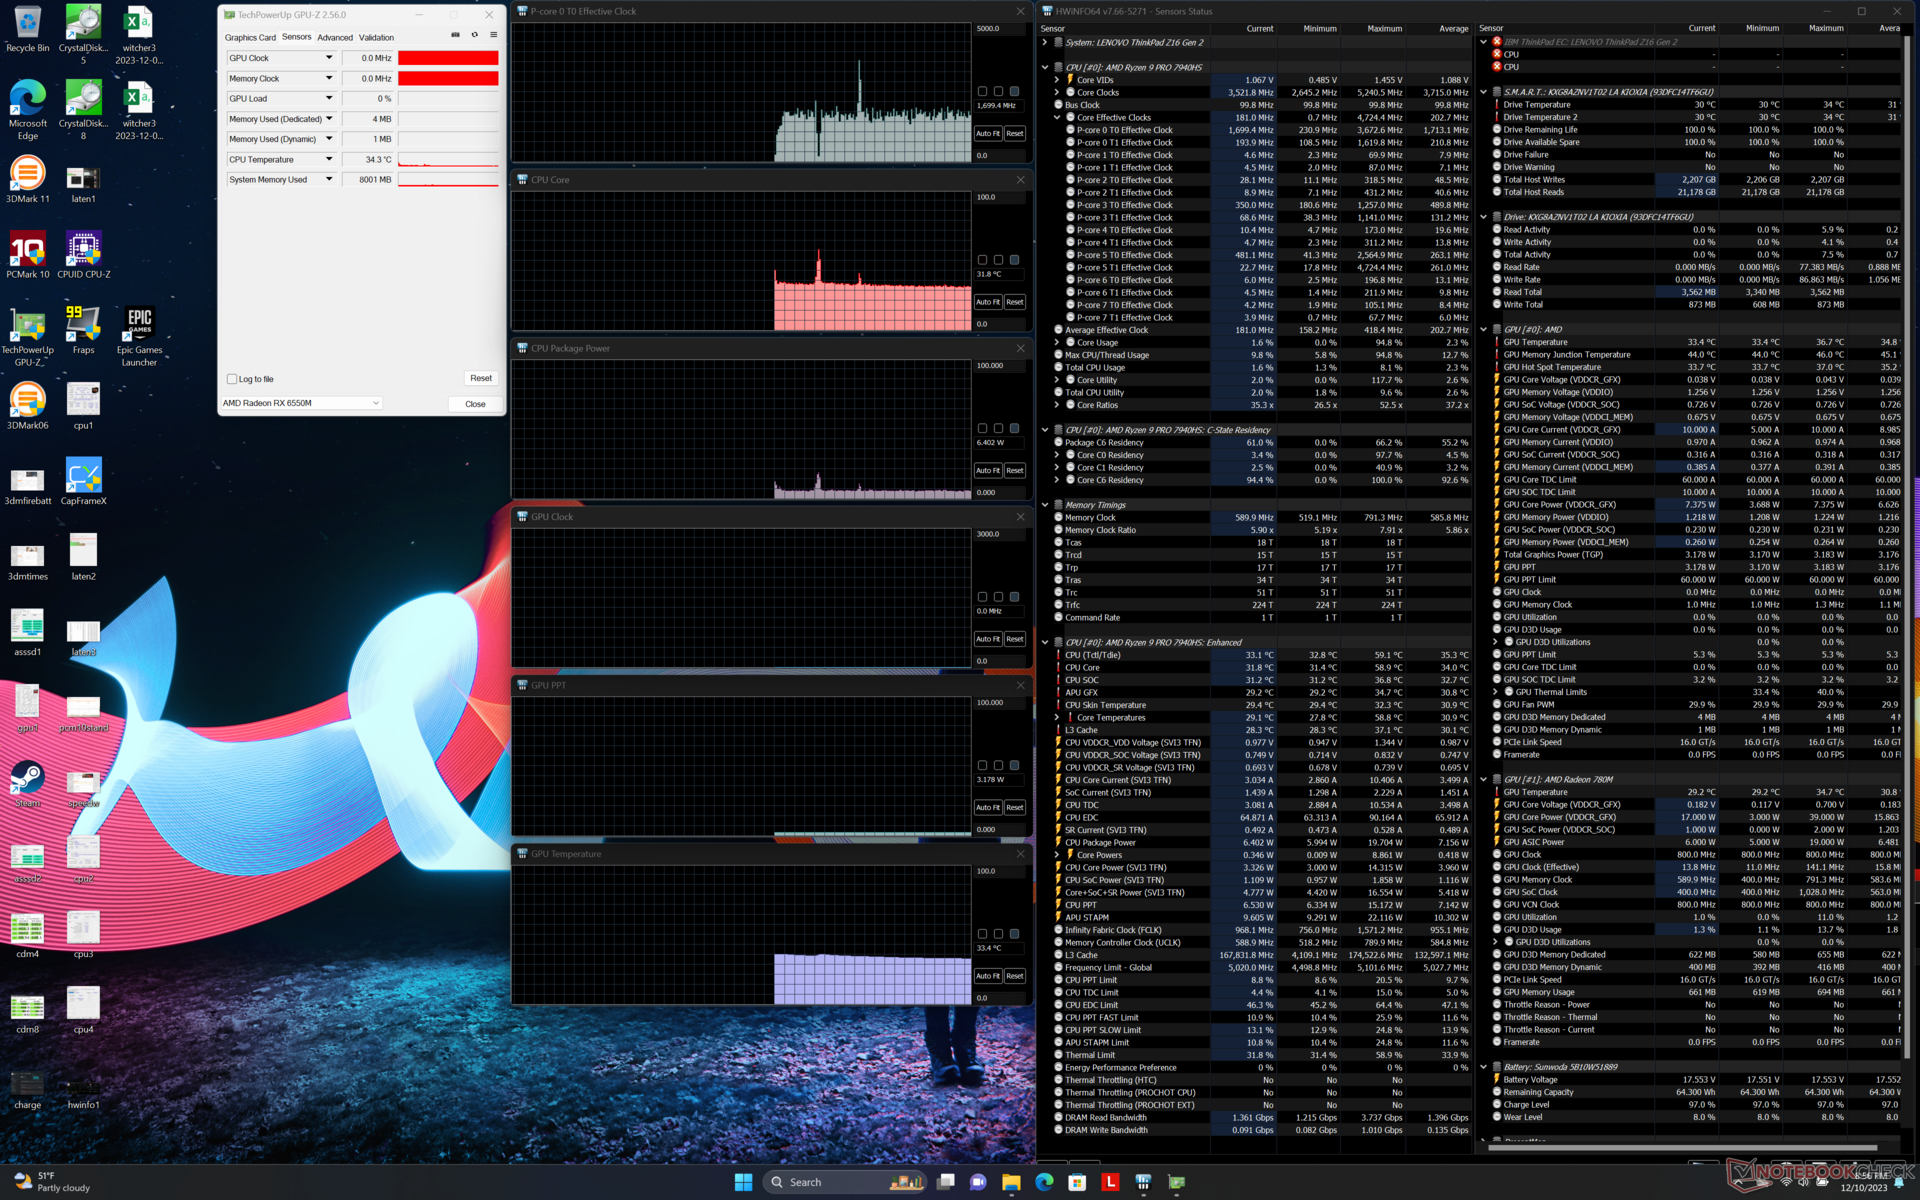
Tijdens het uitvoeren van Prime95 stress, steeg de CPU naar 4,6 GHz en 82 W voor slechts een paar seconden voordat hij daalde en zich stabiliseerde op 4,4 GHz, 69 W en een aangename 100 C. Het is duidelijk dat de CPU zo snel draait als hij kan binnen de grenzen van de koeling die erboven zit.
De kloksnelheden van de GPU en het stroomverbruik van de kaart stabiliseren zich in de modus Prestaties op respectievelijk 2630 MHz en 59 W, vergeleken met 2133 MHz en 39 W in de modus Gebalanceerd. Het meest opmerkelijke is dat het prestatieverschil tussen de twee modi bij het uitvoeren van Witcher 3 is minimaal bij slechts een paar frames, ook al zijn de verschillen in ventilatorgeluid aanzienlijk. Gebruikers kunnen dus overwegen om te gamen in de gebalanceerde modus vanwege de veel stillere ventilatoren en iets koelere kerntemperaturen.

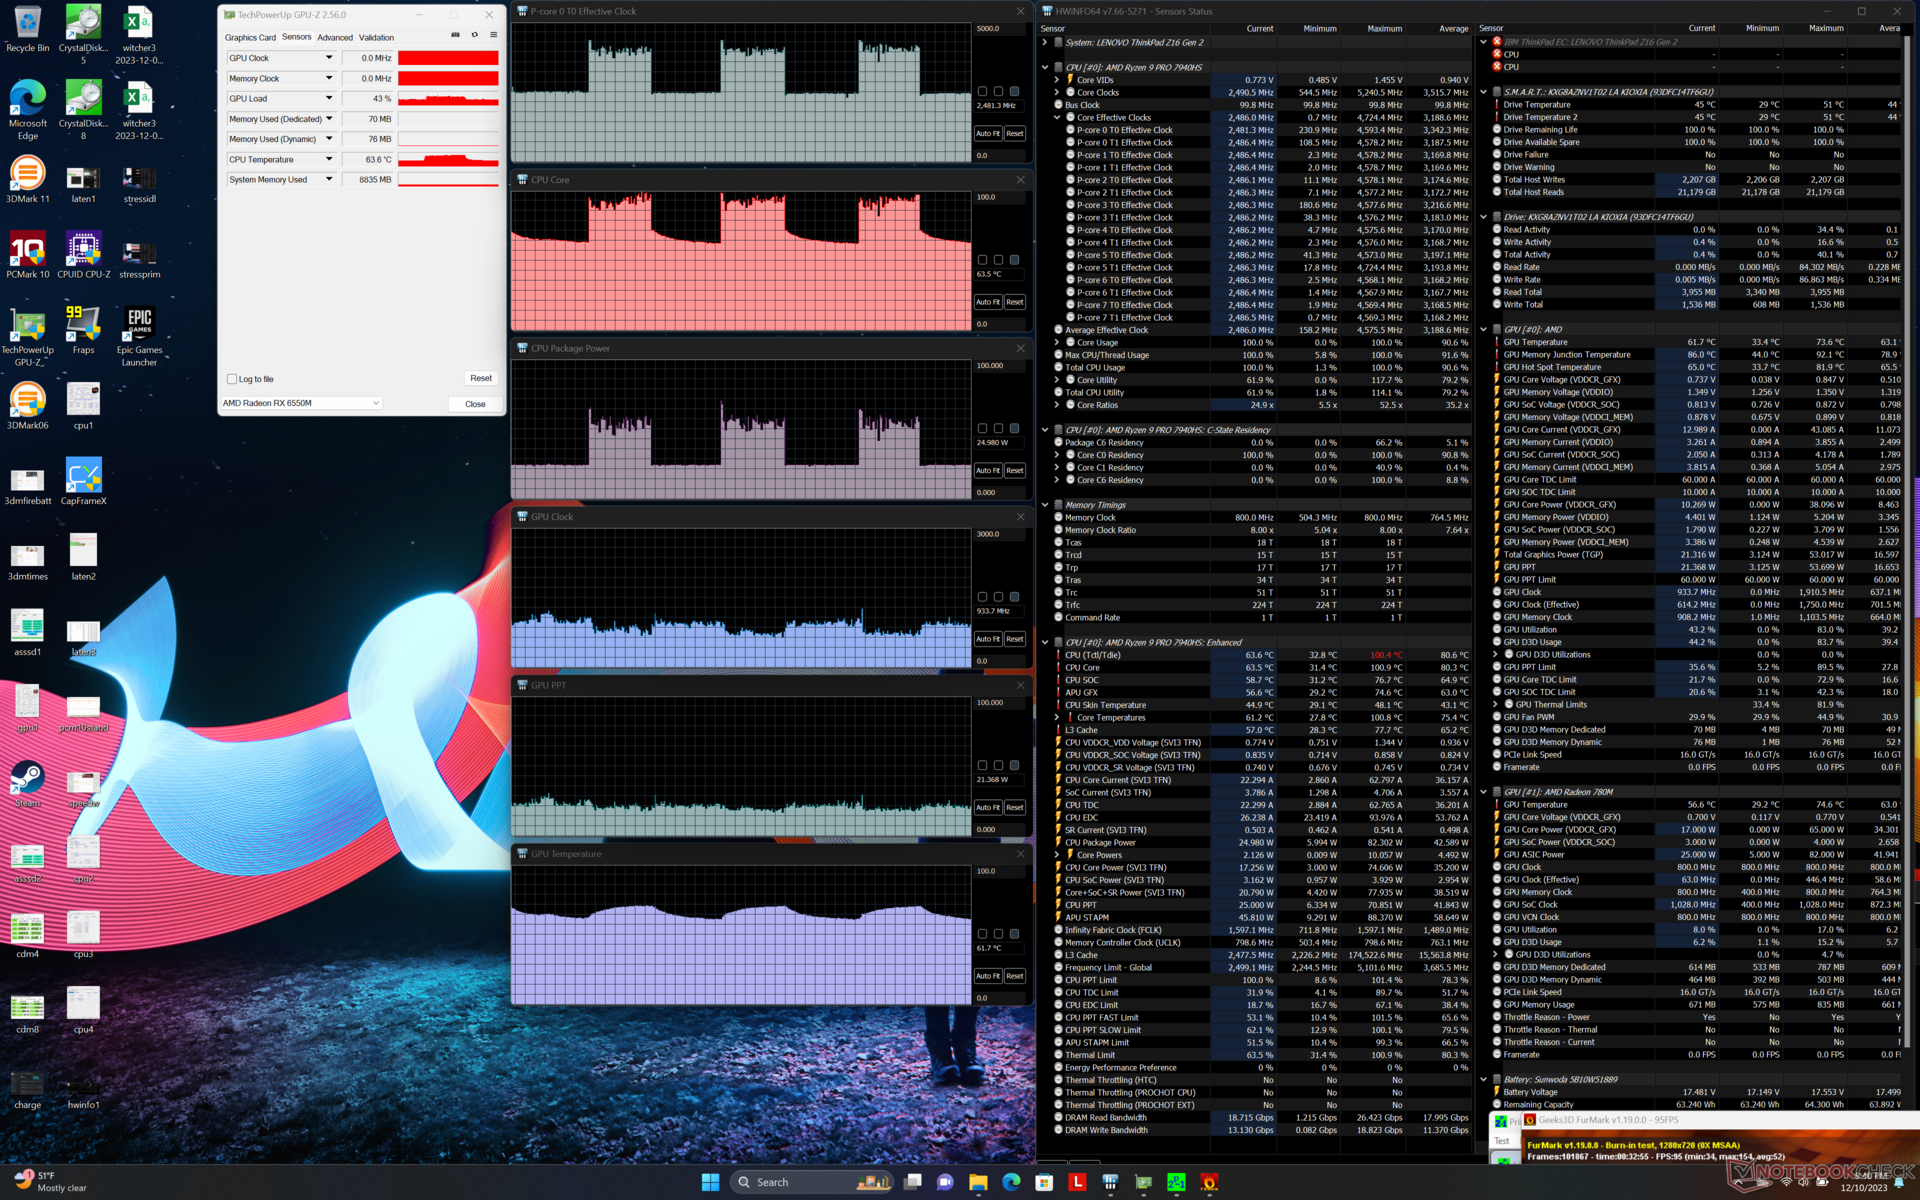
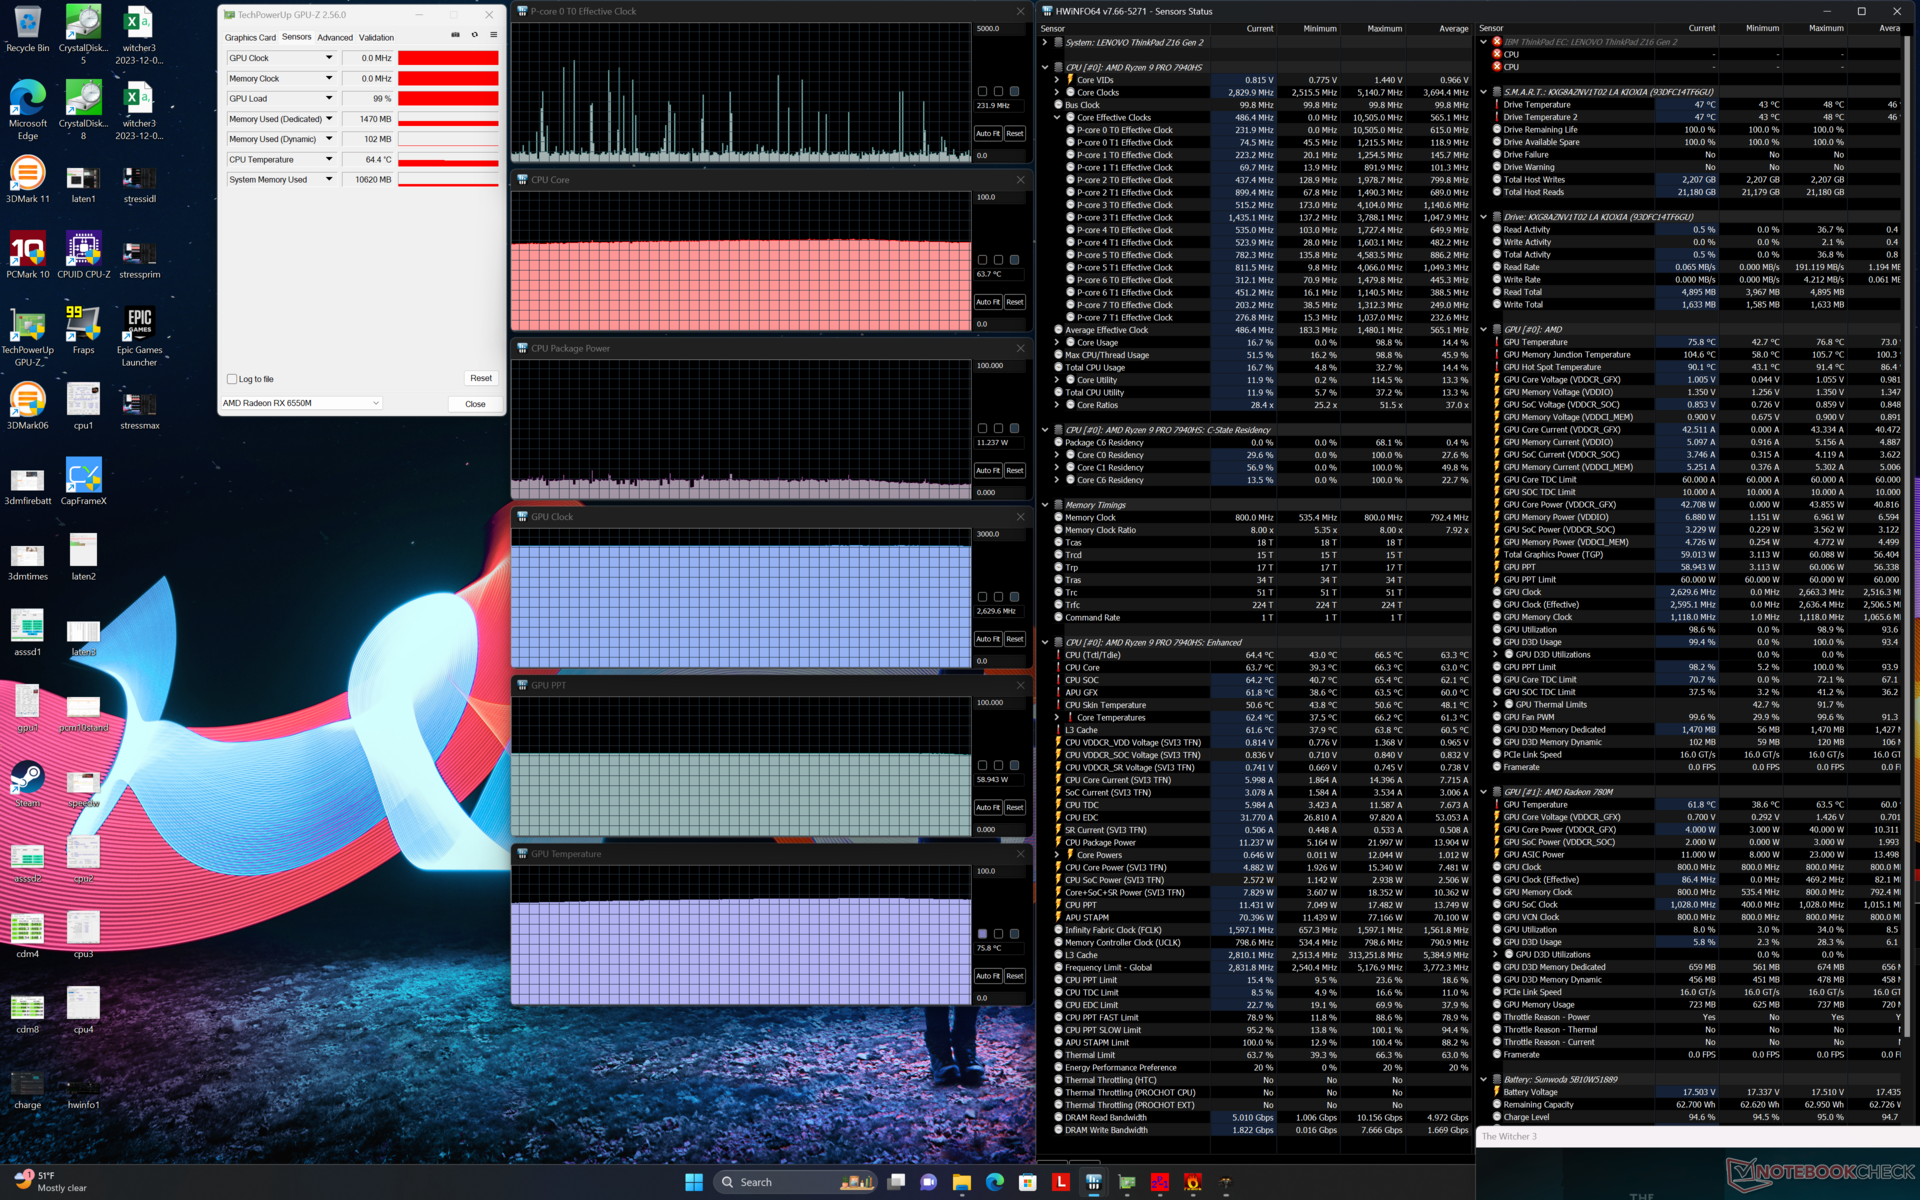
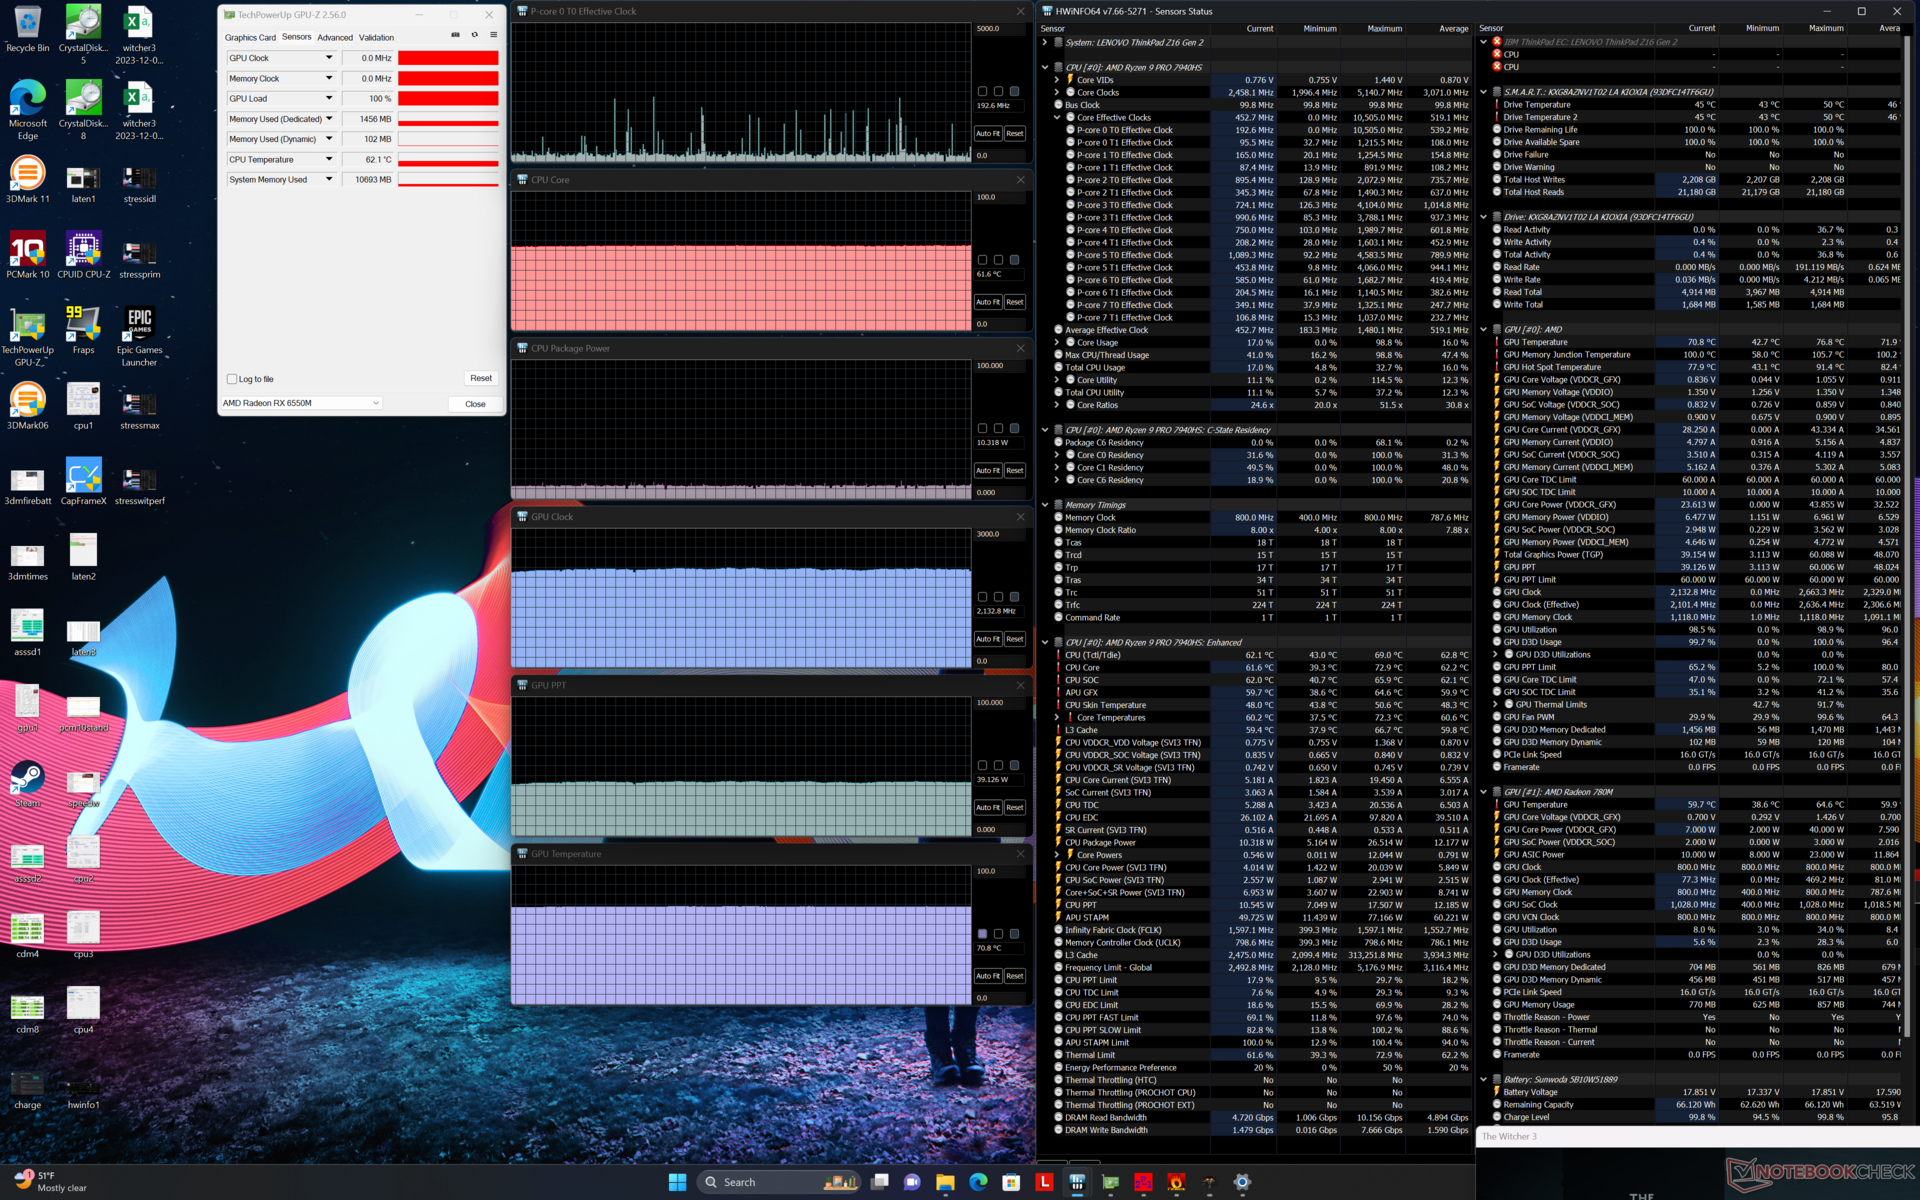
| CPU-klok (GHz) | GPU-klok (MHz) | Gemiddelde CPU-temperatuur (°C) | Gemiddelde GPU-temperatuur (°C) | |
| Systeem inactief | -- | -- | 32 | 33 |
| Prime95 Stress | 4.2 | -- | 100 | 64 |
| Prime95 + FurMark Stress | 2.5 - 4.0 | 750 - 1000 | 64 - 100 | 62 - 72 |
| Witcher 3 Belasting (evenwichtige modus) | ~0,2 | 2133 | 62 | 71 |
| Witcher 3 Stress (prestatiemodus) | ~0.2 | 2630 | 64 | 76 |
Luidsprekers
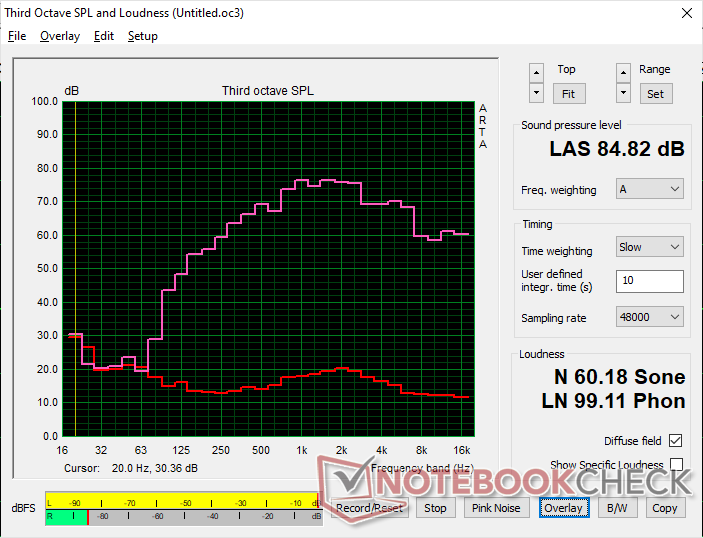
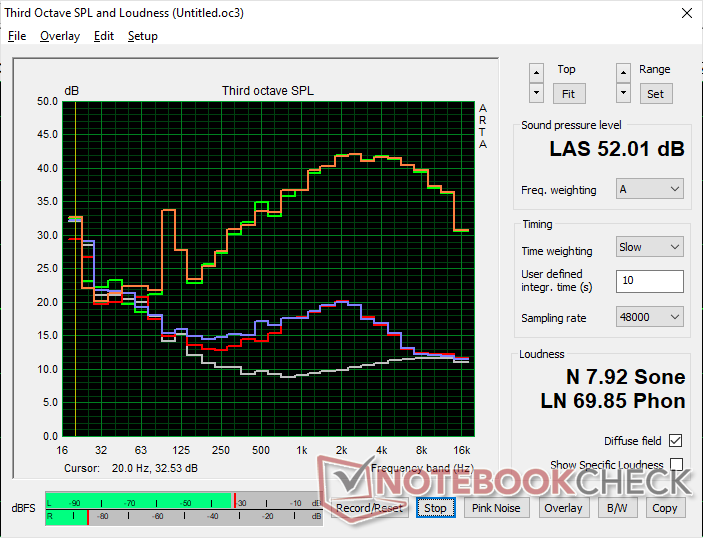
Lenovo ThinkPad Z16 Gen 2 audioanalyse
(+) | luidsprekers kunnen relatief luid spelen (84.8 dB)
Bas 100 - 315 Hz
(±) | verminderde zeebaars - gemiddeld 13% lager dan de mediaan
(±) | lineariteit van de lage tonen is gemiddeld (11.1% delta ten opzichte van de vorige frequentie)
Midden 400 - 2000 Hz
(±) | hogere middens - gemiddeld 5.5% hoger dan de mediaan
(+) | de middentonen zijn lineair (4.9% delta ten opzichte van de vorige frequentie)
Hoog 2 - 16 kHz
(+) | evenwichtige hoogtepunten - slechts 4.7% verwijderd van de mediaan
(+) | de hoge tonen zijn lineair (5.2% delta naar de vorige frequentie)
Algemeen 100 - 16.000 Hz
(+) | het totale geluid is lineair (14.8% verschil met de mediaan)
Vergeleken met dezelfde klasse
» 35% van alle geteste apparaten in deze klasse waren beter, 4% vergelijkbaar, 61% slechter
» De beste had een delta van 5%, het gemiddelde was 17%, de slechtste was 45%
Vergeleken met alle geteste toestellen
» 20% van alle geteste apparaten waren beter, 4% gelijk, 76% slechter
» De beste had een delta van 4%, het gemiddelde was 23%, de slechtste was 134%
Apple MacBook Pro 16 2021 M1 Pro audioanalyse
(+) | luidsprekers kunnen relatief luid spelen (84.7 dB)
Bas 100 - 315 Hz
(+) | goede baars - slechts 3.8% verwijderd van de mediaan
(+) | de lage tonen zijn lineair (5.2% delta naar de vorige frequentie)
Midden 400 - 2000 Hz
(+) | evenwichtige middens - slechts 1.3% verwijderd van de mediaan
(+) | de middentonen zijn lineair (2.1% delta ten opzichte van de vorige frequentie)
Hoog 2 - 16 kHz
(+) | evenwichtige hoogtepunten - slechts 1.9% verwijderd van de mediaan
(+) | de hoge tonen zijn lineair (2.7% delta naar de vorige frequentie)
Algemeen 100 - 16.000 Hz
(+) | het totale geluid is lineair (4.6% verschil met de mediaan)
Vergeleken met dezelfde klasse
» 0% van alle geteste apparaten in deze klasse waren beter, 0% vergelijkbaar, 100% slechter
» De beste had een delta van 5%, het gemiddelde was 17%, de slechtste was 45%
Vergeleken met alle geteste toestellen
» 0% van alle geteste apparaten waren beter, 0% gelijk, 100% slechter
» De beste had een delta van 4%, het gemiddelde was 23%, de slechtste was 134%
Energiebeheer
Stroomverbruik
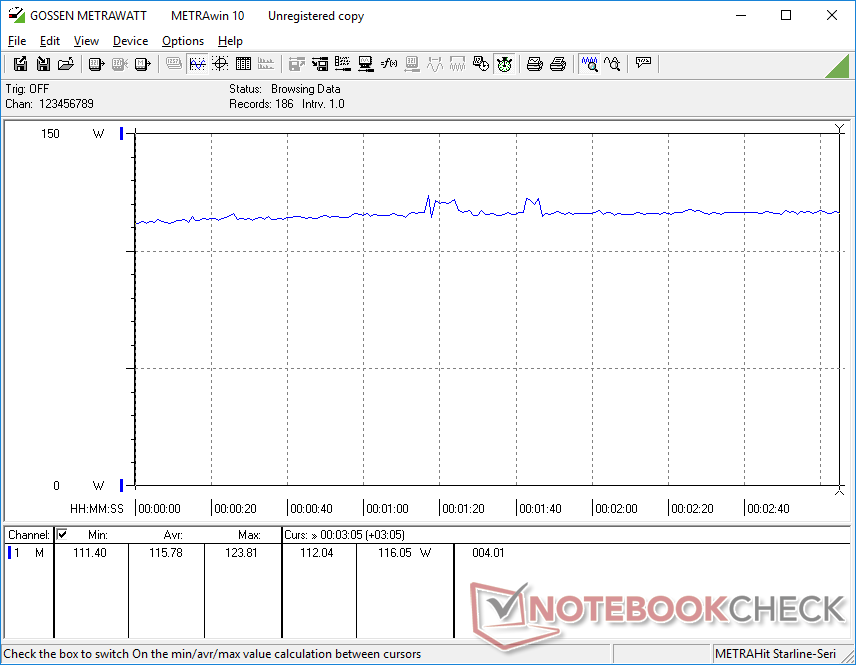
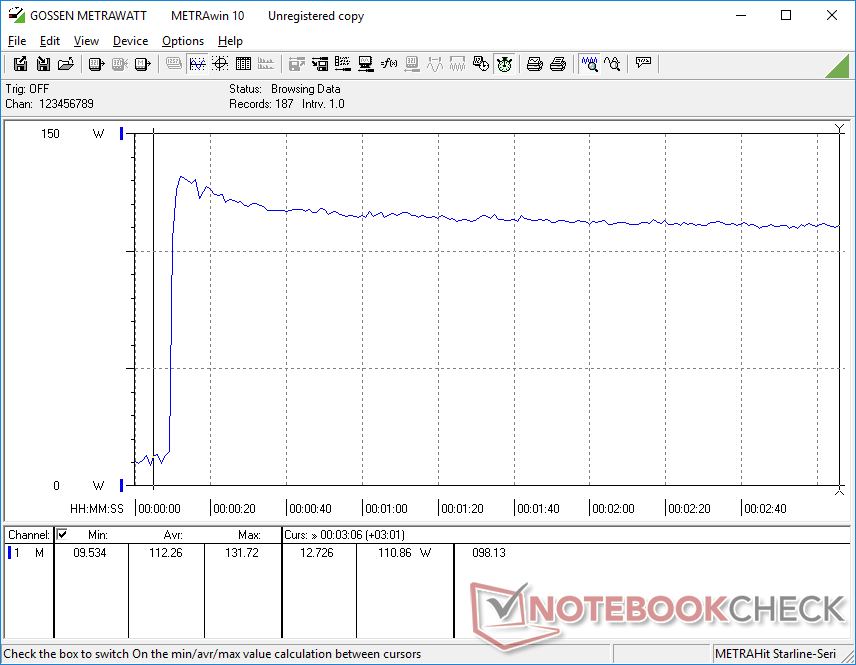
Het 4K OLED paneel heeft een aanzienlijke invloed op het stroomverbruik. Het stroomverbruik is bijvoorbeeld slechts 7 W wanneer het scherm inactief is op een volledig zwart scherm, terwijl een volledig wit scherm op maximale helderheid bijna 19 W kan vragen, vergeleken met slechts 10 W op de IPS-configuratie. De verschillen in stroomverbruik tussen IPS en OLED worden hier in meer detail besproken hier.
Het verbruik bij intensieve CPU- of GPU-taken is iets hoger dan op de ThinkPad Z16 Gen 1, zelfs als rekening wordt gehouden met het veeleisendere OLED-paneel. De verschillen zijn echter klein in verhouding tot de grote prestatieverbeteringen die de Zen 4 Ryzen 9 CPU biedt.
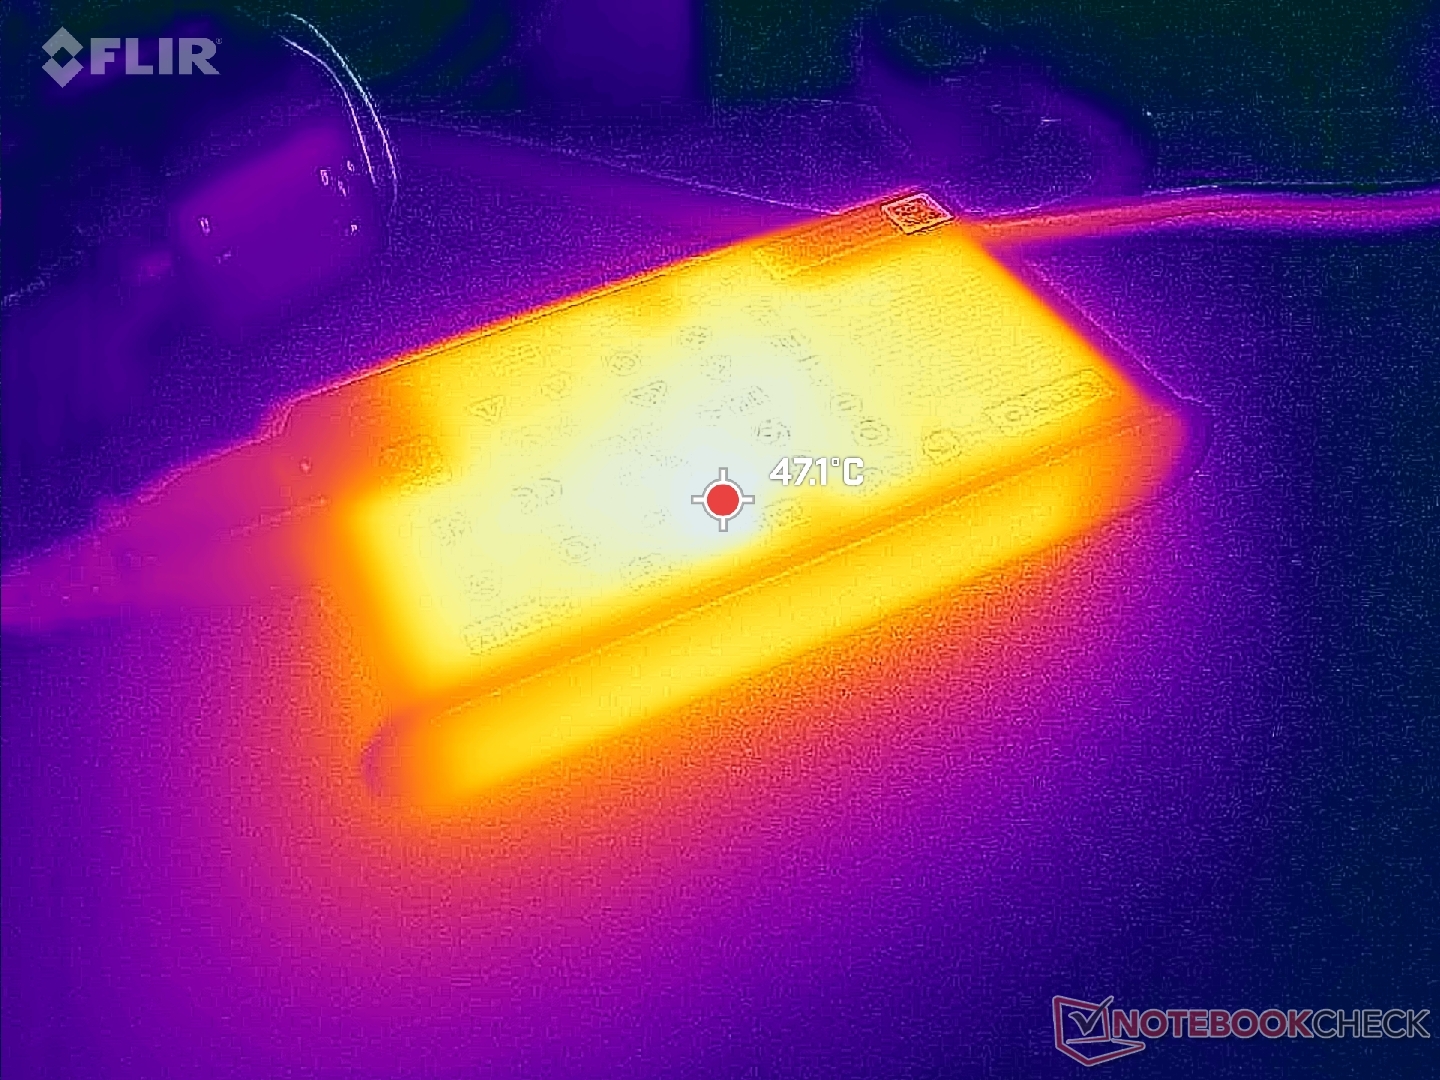
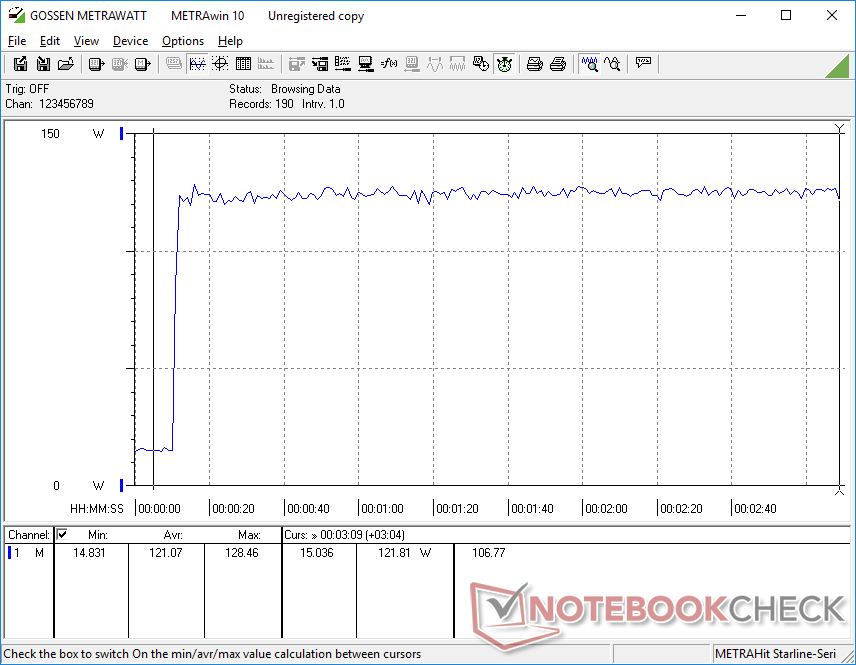
We hebben een maximaal verbruik van 132 W gemeten met de middelgrote (~14,6 x 7,7 x 2,3 cm) 135 W USB-C netadapter. Gaming vraagt al bijna 120 W, wat betekent dat de oplaadsnelheid tot een kruipsnelheid zal vertragen als er veeleisende belastingen tegelijkertijd worden uitgevoerd.
| Uit / Standby | |
| Inactief | |
| Belasting |
|
Key:
min: | |
| Lenovo ThinkPad Z16 Gen 2 R9 PRO 7940HS, Radeon RX 6550M, Kioxia XG8 KXG8AZNV1T02, OLED, 3840x2400, 16" | Lenovo ThinkPad Z16 G1 21D5S00T00 R7 PRO 6850H, Radeon RX 6500M, Samsung PM9A1 MZVL21T0HCLR, IPS LED, 1920x1200, 16" | Lenovo ThinkBook 16 G6 ABP R5 7530U, Vega 7, SK hynix HFS512GEJ9X125N, IPS, 1920x1200, 16" | MSI Creator Z16P B12UHST i9-12900H, GeForce RTX 3080 Ti Laptop GPU, Samsung PM9A1 MZVL22T0HBLB, IPS True Pixel (~100% DCI-P3), 2560x1600, 16" | Asus Vivobook Pro 16X K6604JV-MX016W i9-13980HX, GeForce RTX 4060 Laptop GPU, Solidigm P41 Plus SSDPFKNU010TZ, OLED, 3200x2000, 16" | Apple MacBook Pro 16 2023 M3 Max Apple M3 Max 16-Core, M3 Max 40-Core GPU, Apple SSD AP8192Z, Mini-LED, 3456x2234, 16" | |
|---|---|---|---|---|---|---|
| Power Consumption | 15% | 45% | -60% | -71% | -17% | |
| Idle Minimum * (Watt) | 7.5 | 5.3 29% | 3.7 51% | 11 -47% | 13.8 -84% | 5.2 31% |
| Idle Average * (Watt) | 9.6 | 8.6 10% | 7.1 26% | 17 -77% | 16 -67% | 16.9 -76% |
| Idle Maximum * (Watt) | 18.5 | 9.5 49% | 7.7 58% | 26 -41% | 19 -3% | 17.2 7% |
| Load Average * (Watt) | 57.1 | 65.2 -14% | 43.9 23% | 124 -117% | 147 -157% | 90.5 -58% |
| Witcher 3 ultra * (Watt) | 115.8 | 93.6 19% | 40.8 65% | 133.5 -15% | 147.8 -28% | 109 6% |
| Load Maximum * (Watt) | 131.7 | 133.81 -2% | 66.6 49% | 212 -61% | 244 -85% | 145.2 -10% |
* ... kleiner is beter
Power Consumption Witcher 3 / Stresstest
Power Consumption external Monitor
Levensduur batterij
De looptijden zijn over het algemeen korter dan bij het model van vorig jaar, wat grotendeels te wijten is aan ons veeleisender OLED-paneel. Aangezien de meeste webpagina's overwegend wit van kleur zijn, kan het stroomverbruik 10 W hoger liggen, zelfs als de actieve toepassingen niet veeleisend zijn, zoals vermeld in het gedeelte Stroomverbruik hierboven. We hebben slechts een WLAN werktijd van 6 uur geregistreerd, vergeleken met 10 uur op de ThinkPad Z16 IPS configuratie of meer dan 16 uur op de MacBook Pro 16.
Het opladen van lege naar volle capaciteit gaat langzamer dan normaal en duurt ongeveer 2,5 uur, vergeleken met 1,5 tot 2 uur bij de meeste Ultrabooks. Dit is een van de weinige laptops met zowel Ryzen 9 als discrete graphics die worden gevoed via USB-C.
| Lenovo ThinkPad Z16 Gen 2 R9 PRO 7940HS, Radeon RX 6550M, 72 Wh | Lenovo ThinkPad Z16 G1 21D5S00T00 R7 PRO 6850H, Radeon RX 6500M, 72 Wh | Lenovo ThinkBook 16 G6 ABP R5 7530U, Vega 7, 45 Wh | MSI Creator Z16P B12UHST i9-12900H, GeForce RTX 3080 Ti Laptop GPU, 90 Wh | Asus Vivobook Pro 16X K6604JV-MX016W i9-13980HX, GeForce RTX 4060 Laptop GPU, 90 Wh | Apple MacBook Pro 16 2023 M3 Max Apple M3 Max 16-Core, M3 Max 40-Core GPU, 99.6 Wh | |
|---|---|---|---|---|---|---|
| Batterijduur | 45% | 68% | -27% | -2% | 75% | |
| Reader / Idle (h) | 10.2 | |||||
| WiFi v1.3 (h) | 6 | 9.9 65% | 10.1 68% | 5.2 -13% | 6.5 8% | 16.7 178% |
| Load (h) | 1.7 | 2.1 24% | 1 -41% | 1.5 -12% | 1.2 -29% | |
| H.264 (h) | 11.9 | 11.6 | 5.8 | 5.3 | 20.4 |
Pro
Contra
Verdict - Geweldig ontwerp tegengehouden door een middelmatige GPU
In onze review van het originele Gen 1 model prezen we de ThinkPad Z16 voor zijn stevige en aantrekkelijke bouw en comfortabele toetsenbord en trackpad. Het Gen 2-model behoudt al deze voordelen, maar voegt een veel snellere Ryzen Pro CPU en een hoogwaardig OLED-touchscreen toe voor respectievelijk merkbaar betere prestaties en kleuren. Deze twee toevoegingen zijn de belangrijkste redenen om de Gen 2-versie te verkiezen boven de Gen 1-versie.
De ThinkPad Z16 Gen 2 is absoluut slank en sexy en de nieuwe Zen 4 Pro CPU is niet onbelangrijk. De Radeon RX 6550M is echter te laat, vooral in deze prijsklasse.
De nieuwe Radeon RX 6550M helpt ook om onderscheid te maken tussen de twee modelversies, maar de prestaties zijn niet indrukwekkend, vooral niet als u de hoge vraagprijs van $1600+ meerekent. Niet alleen is de GPU van een oudere AMD-architectuur, laptops met de GeForce RTX 3050 Ti zijn te vinden voor minder dan duizend euro en bieden een vergelijkbaar prestatieniveau. De Radeon GPU is absoluut een van de zwakste aspecten van de ThinkPad Z16-serie tot nu toe.
Als u niet van Ryzen Pro houdt, dan is de
Asus Vivobook Pro 16X of zelfs HP Spectre x360 16 serie uitstekende alternatieven zijn voor de ThinkPad Z16 Gen 2, omdat ze allemaal vergelijkbare OLED- en discrete grafische opties bieden in een dun ontwerp van het chassis. Hopelijk zullen toekomstige revisies van Lenovo GeForce RTX of nieuwere RDNA3 opties bevatten.Prijs en beschikbaarheid
Lenovo levert de ThinkPad Z16 Gen 2 nu vanaf $1600 USD voor de Ryzen 5, geïntegreerde GPU en 1200p IPS-configuratie tot meer dan $2600 zoals beoordeeld.
Lenovo ThinkPad Z16 Gen 2
- 16-12-2023 v7 (old)
Allen Ngo
Transparantie
De selectie van te beoordelen apparaten wordt gemaakt door onze redactie. Het testexemplaar werd ten behoeve van deze beoordeling door de fabrikant of detailhandelaar in bruikleen aan de auteur verstrekt. De kredietverstrekker had geen invloed op deze recensie, noch ontving de fabrikant vóór publicatie een exemplaar van deze recensie. Er bestond geen verplichting om deze recensie te publiceren. Als onafhankelijk mediabedrijf is Notebookcheck niet onderworpen aan het gezag van fabrikanten, detailhandelaren of uitgevers.
[transparency_disclaimer]Dit is hoe Notebookcheck test
Elk jaar beoordeelt Notebookcheck onafhankelijk honderden laptops en smartphones met behulp van gestandaardiseerde procedures om ervoor te zorgen dat alle resultaten vergelijkbaar zijn. We hebben onze testmethoden al zo'n 20 jaar voortdurend ontwikkeld en daarbij de industriestandaard bepaald. In onze testlaboratoria wordt gebruik gemaakt van hoogwaardige meetapparatuur door ervaren technici en redacteuren. Deze tests omvatten een validatieproces in meerdere fasen. Ons complexe beoordelingssysteem is gebaseerd op honderden goed onderbouwde metingen en benchmarks, waardoor de objectiviteit behouden blijft. Meer informatie over onze testmethoden kunt u hier vinden.
Price comparison

