Notebookcheck Logo

Intel Raptor Lake-HX vernieuwingsanalyse - Core i9-14900HX met meer single-core prestaties

Prestaties vóór efficiëntie. Intel's Raptor Lake-HX Refresh is een update van de snelste mobiele processors die worden gebruikt in krachtige multimedia- en gaminglaptops, en belooft betere prestaties tijdens het gamen en in single-core scenario's. We hebben de nieuwe Core i9-14900HX getest en vergeleken met de oude Core i9-13900HX en de AMD Ryzen 9 7945HX.

Afgelopen december onthulde Intel zijn gloednieuwe Meteor-Lake gen Core-Ultra mobiele processors (hier besproken), die voor het eerst gebruikmaken van een tile/chiplet-ontwerp en draaien in een gebied tussen 28 en 115 watt. Voor de krachtigere HX mobiele processors blijft Intel het bekende Raptor-Lake gen gebruiken en heeft de nieuwe chips de naam "Raptor Lake Refresh" gegeven, waarbij hun oude etikettering "Core i9-14xxxHX" hetzelfde blijft. Over het algemeen is er niets veranderd aan de architectuur en configuratie van de cores, maar hun maximale turbokloksnelheid is verhoogd. Naast meer single-core prestaties belooft Intel dat de nieuwe processors betere prestaties zullen leveren bij gemengde single/multi-core belasting, wat vooral nodig is voor gaming. Natuurlijk willen we dit controleren en zullen we de nieuwe Core i9-14900HX vergelijken met de oude 13e generatie processors (Core i9-13900HX, Core i9-13950HX, Core i9-13980HX) en beide vlaggenschepen van AMD, namelijk de Ryzen 9 7945HX en de Ryzen 9 7945HX3D.

Overzicht 14e generatie Raptor Lake-HX

Intel heeft zijn 14e generatie Raptor-Lake-HX model line-up enigszins herzien, aangezien de Core i9-14900HX nu het nieuwe vlaggenschip voor mobiele processoren is. Op dit moment is het ook de enige HX-chip met in totaal 24 cores (32 threads), aangezien er op dit moment geen opvolgers zijn voor de Core i9-13950HX en de Core i9-13980HX. We hebben ook geen informatie over de vraag of er zelfs opvolgers voor deze modellen zullen komen. De kloksnelheid is veranderd, aangezien de acht P-cores nu tot 5,8 GHz kunnen bereiken (met één of twee actieve cores, anders max. 5,2 GHz), waarmee ze zelfs beter presteren dan de Core i9-13980HX met 200 MHz en de Core i9-13900HX met 400 MHz. De maximale kloksnelheid van de 16 E-cores is nu maximaal 4,1 GHz (in plaats van 4,0 GHz). De grootte van de cache blijft 36 MB en Intel geeft nog steeds een basisvermogen van 55 watt en een maximaal verbruik van 157 watt op. Hoewel we uit het verleden weten dat de 13e HX-gen modellen nog meer kunnen verbruiken.

Raptor Lake-HX SKU's (bron: Intel)
Kenmerken Raptor Lake-HX platform (bron: Intel)

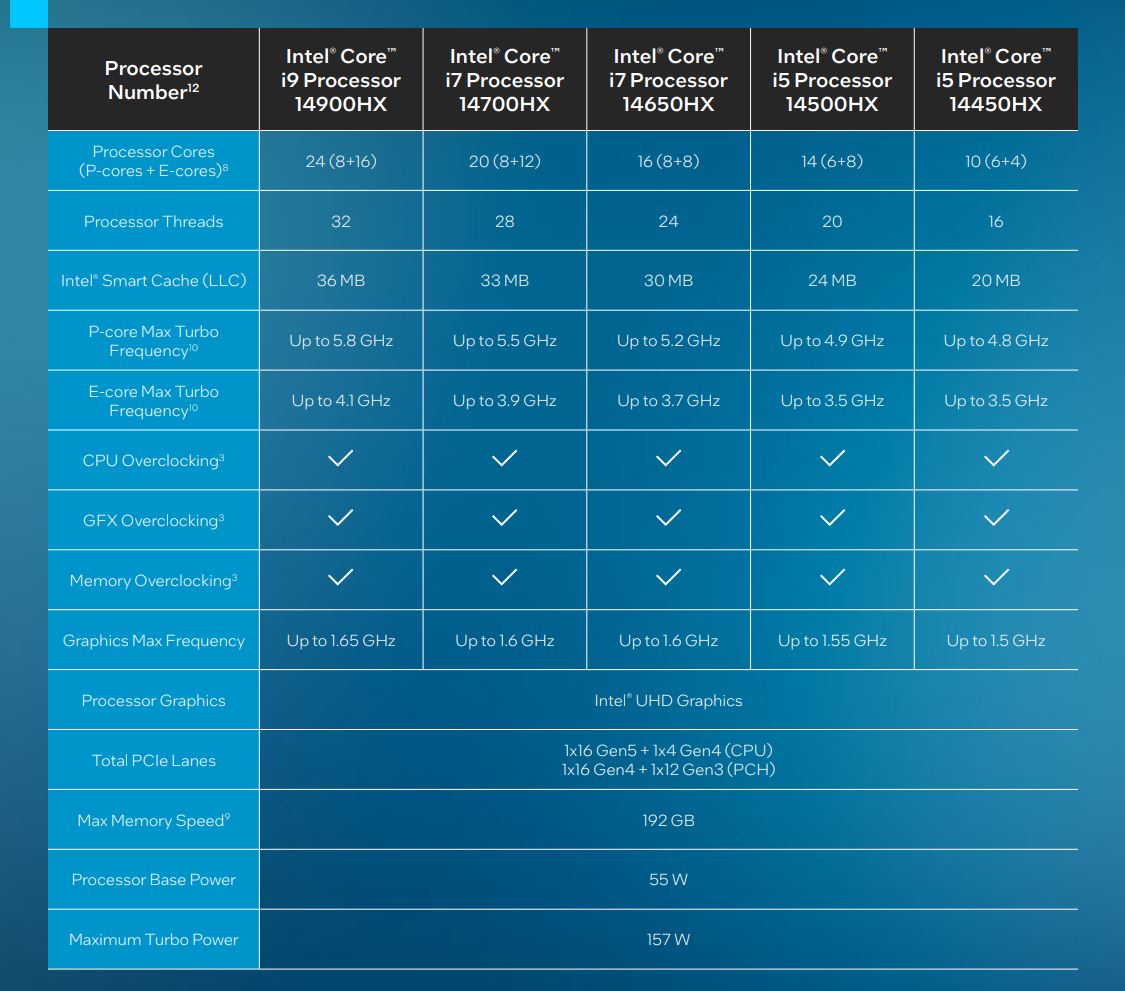
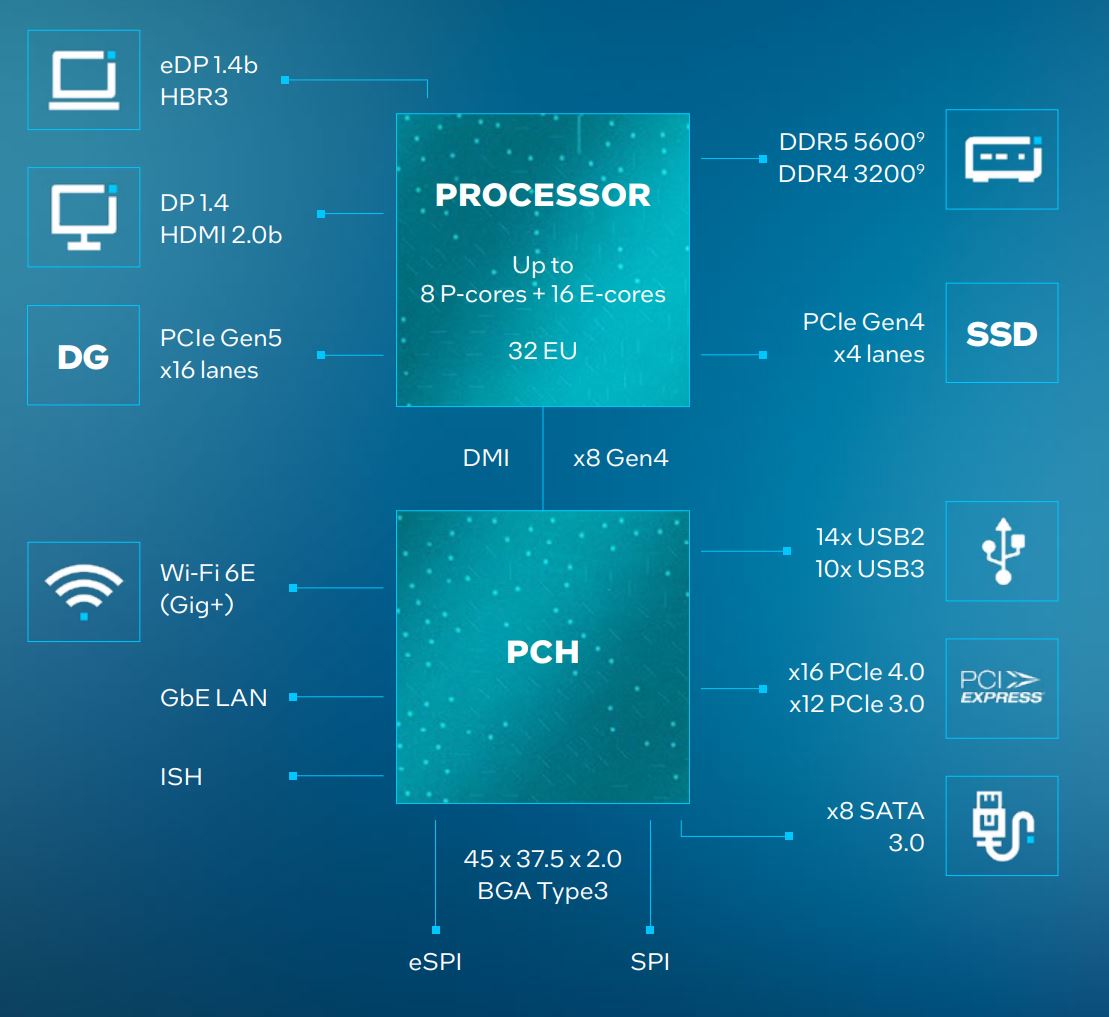
De Core i7-14700HX heeft vier extra E-cores gekregen, waardoor het totale aantal cores is verhoogd van 16 naar 20 (28 threads). Bovendien zijn hun kloksnelheden ook verhoogd. De line-up wordt gecompleteerd door de Core i7-14650HX, de Core i5-14500HX en de Core i5-14450HX. In totaal is het aantal HX-processoren teruggebracht van negen naar vijf. De nieuwe HX-modellen ondersteunen maximaal 192 GB RAM (DDR5-5600).

Raptor Lake-HX optioneel met Wi-Fi 7
Thunderbolt 5 met 240 watt opladen via USB-C is optioneel compatibel.

Wat betreft hun connectiviteit worden de nieuwste functies zoals Wi-Fi 7 of Thunderbolt 5 ondersteund, maar alleen optioneel. In dit geval hangt alles af van welke functies individuele fabrikanten besluiten beschikbaar te maken voor gebruikers. Bovendien kunnen alle HX-modellen overklokt worden en dankzij Intels eigen XTU-software gaat dat heel gemakkelijk.

Testsysteem - XMG Neo 17 (E24)

XMG Neo 17 (E24)
XMG Neo 17 (E24)

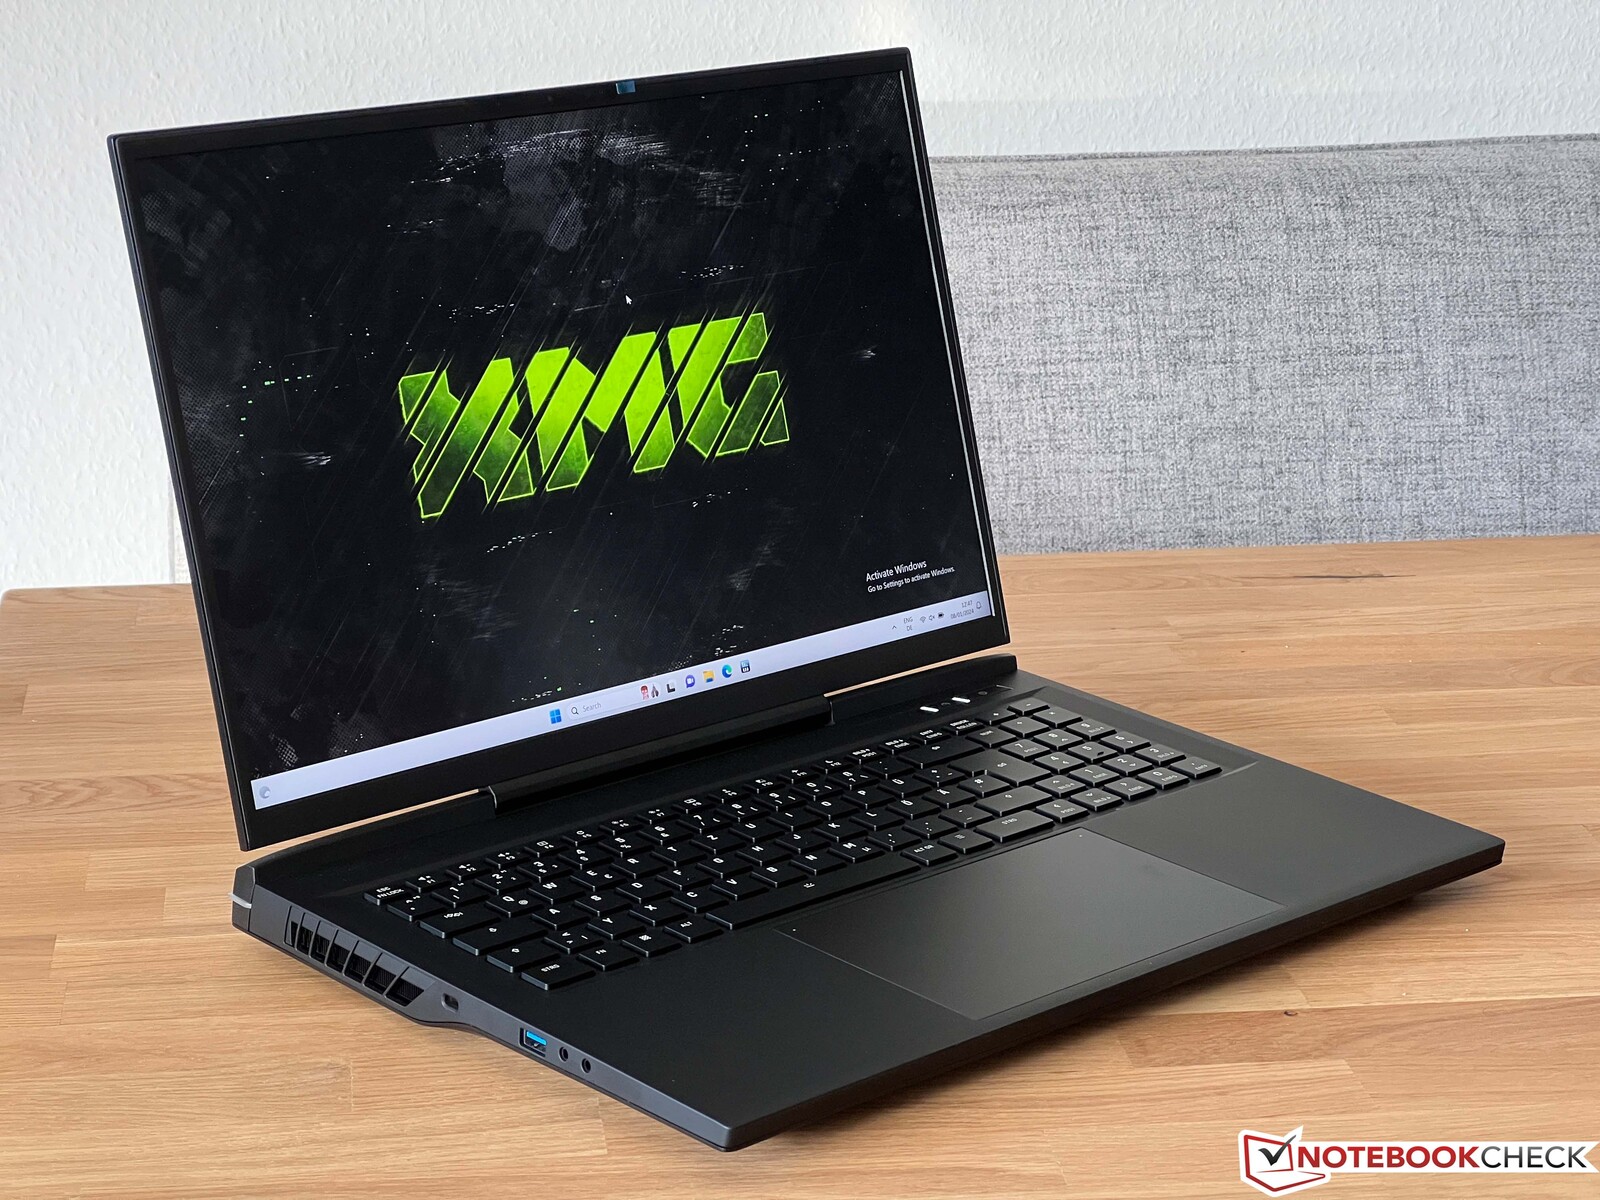
Als testsysteem hebben we een vroeg monster van de nieuwe XMG Neo 17 (E24)uitgerust met de Core i9-14900HX, een speciale Nvidia GeForce RTX 4090 laptop en 32 GB DDR5-5600 RAM. De nieuwe XMG Neo 17 (E24) maakt gebruik van dezelfde behuizing als de 2023 versie, maar er zijn nogal wat verschillen aan de binnenkant. Zo is er een nieuwe pure-iGPU-modus, kan de batterij worden opgeladen via USB-C (100 watt), en bedekt de heat pipe voor de Oasis waterkoeling nu beter het CPU-gebied. Met de Neo 17 kunt u ook het voltage van de CPU verlagen (undervolting) in het BIOS.

Het apparaat maakt nog steeds gebruik van een G-Sync-compatibel 17-inch IPS-paneel met een resolutie van 2.560 x 1.600 pixels, een beeldverhouding van 16:10 en een vernieuwingsfrequentie van 240 Hz. U hebt de keuze tussen een stil membraantoetsenbord en een optioneel mechanisch toetsenbord (Cherry MX Ultra Low Profile Tactile Switches).

HWiNFO XMG Neo 17 (E24)

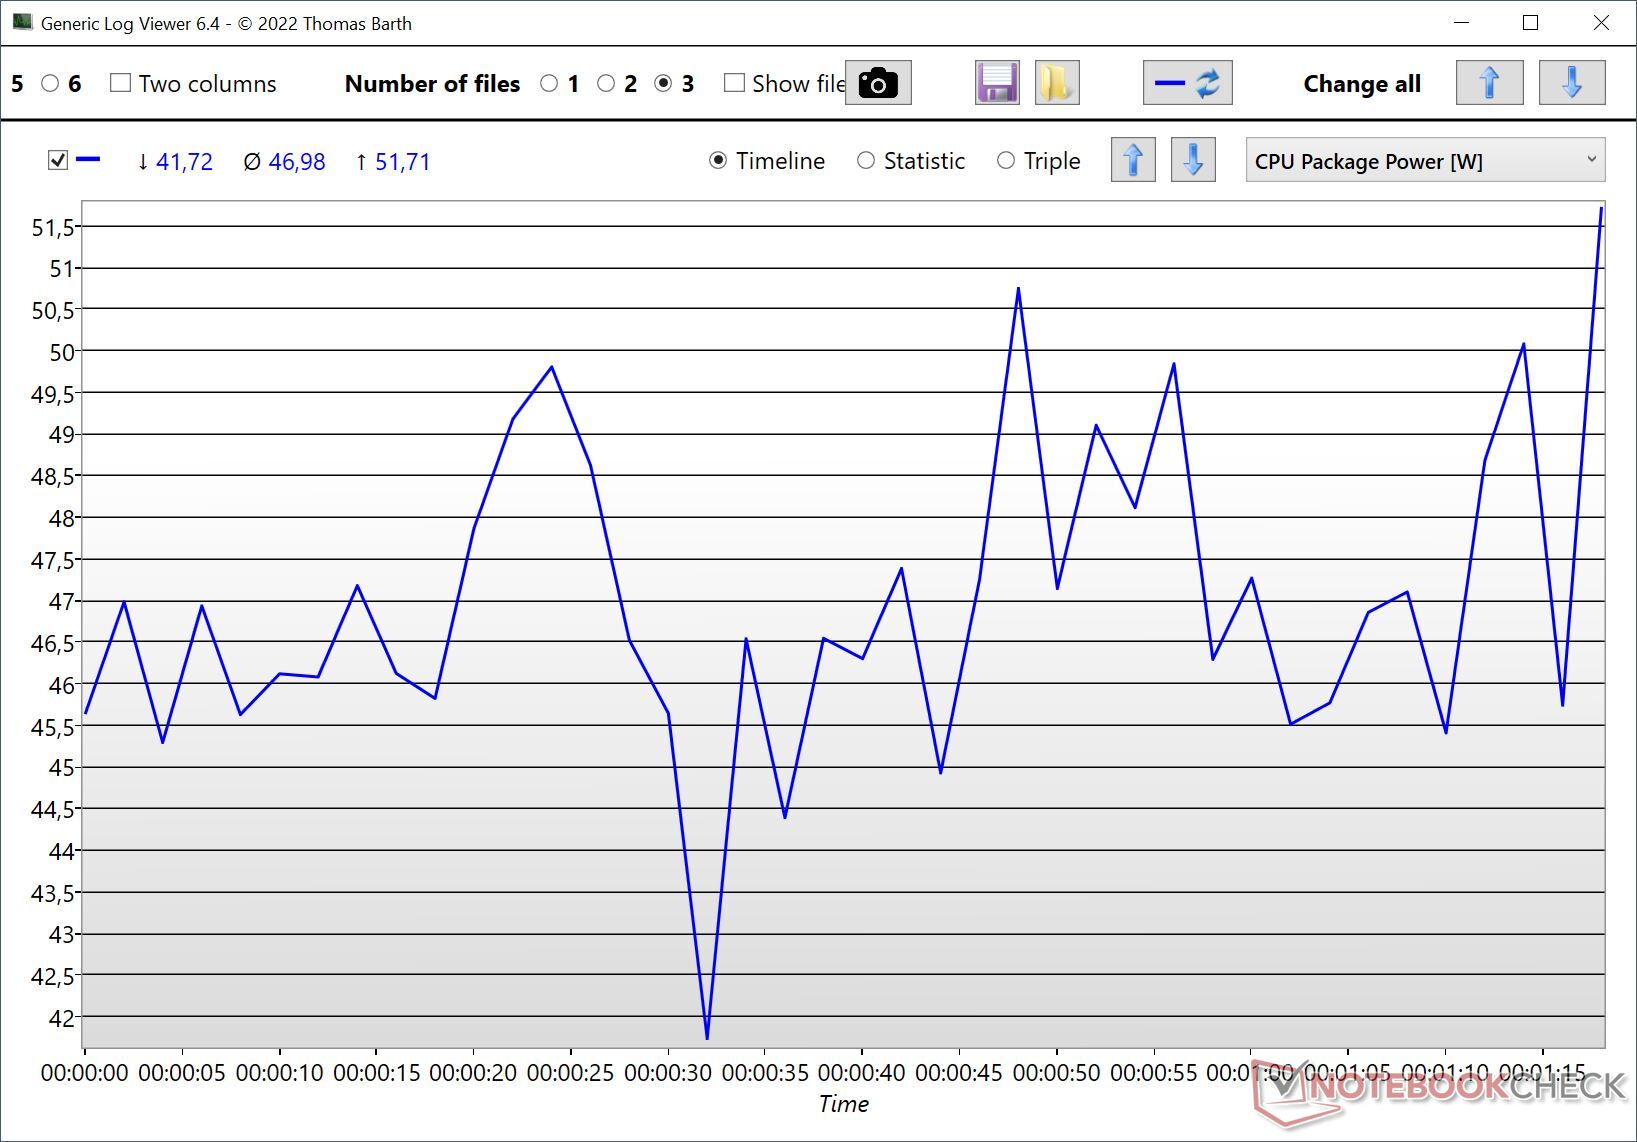
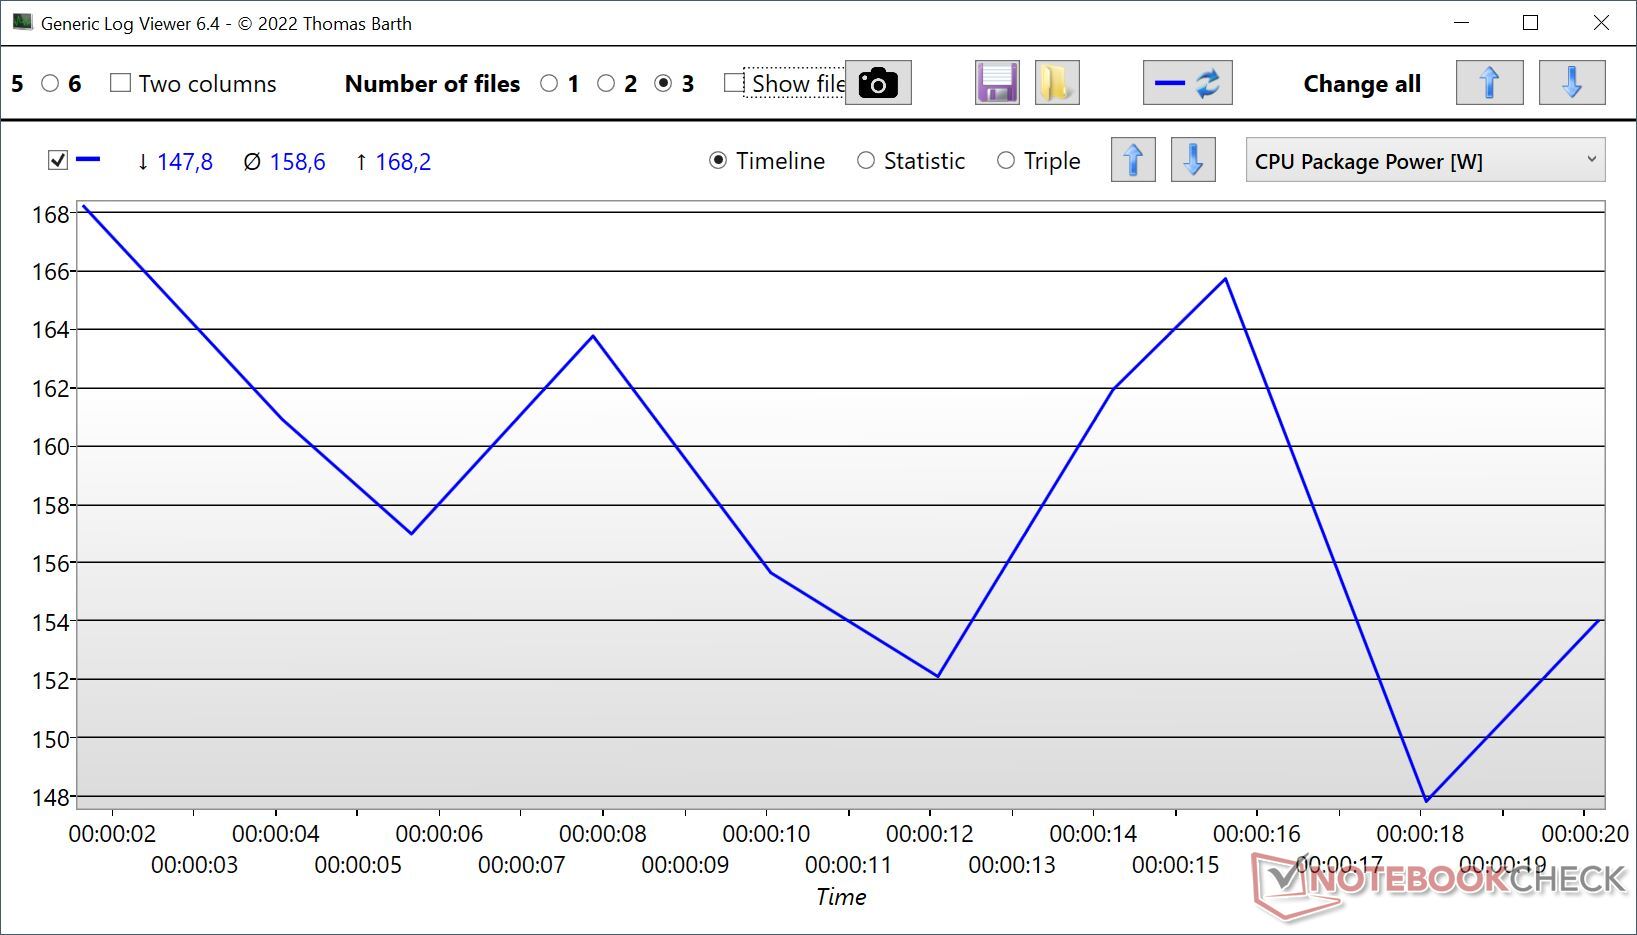
De GPU kan weer maximaal 150 watt gebruiken (+25 watt Dynamic Boost), terwijl de processor permanent op maximaal 160 watt draait (PL4: 250 watt) - hoewel we tijdens onze tests 170 watt hebben gemeten. We hebben de volgende benchmarks uitgevoerd zonder gebruik te maken van de extra Oasis waterkoeling. We zullen binnenkort een volledige review van de XMG Neo 17 E24 publiceren.

Let op: Tijdens onze energiemetingen met een extern beeldscherm was de dedicated grafische kaart actief, wat ook het geval was bij een aantal systemen die we vergeleken. De configuratie van de video-uitgang hangt grotendeels af van de configuratie van de laptopfabrikant, de HDMI-uitgang van de XMG Neo 17 (E24) en de USB-C poort zijn rechtstreeks aangesloten op de dGPU.

Single-core prestaties en efficiëntie

Dankzij de hogere turboklok tot 5,8 GHz heeft Intel de single-core prestaties nog verder verbeterd, waardoor de nieuwe Core i9-14900HX 3% voor ligt op de Core i9-13980HX Core i9-13980HX en 9% voor ligt op de snelste Core i9-13900HX tijdens Cinebench R23. Apple de nieuwe M3 Max (16 CPU-kernen) werd met 13 % verslagen, maar bleef de nieuwe Core i9-14900HX voor in Geekbench 6.2 en de nieuwe Cinebench 2024. AMD's Ryzen 9 7945HX werd met 15% verslagen.

Cinebench R23: Single Core
Cinebench R20: CPU (Single Core)
Cinebench R15: CPU Single 64Bit
7-Zip 18.03: 7z b 4 -mmt1
Geekbench 5.5: Single-Core
Geekbench 6.2: Single-Core
Cinebench 2024: CPU Single Core
Cinebench R23 / Single Core
Intel Core i9-14900HX
SCHENKER XMG Neo 17 2024 Engineering Sample
2232 Points
Intel Core i9-13980HX
MSI Titan GT77 HX 13VI
2169 Points -3%
Intel Core i9-13950HX
MSI Titan GT77 HX 13VI
2100 Points -6%
Intel Core i9-13900HX
SCHENKER XMG Neo 16 Raptor Lake
2055 Points -8%
Intel Core i9-13900HX
Lenovo Legion Pro 7 16IRX8H
2043 Points -8%
Intel Core i9-13950HX
Razer Blade 16 Early 2023
2029 Points -9%
Apple M3 Max 16-Core
Apple MacBook Pro 16 2023 M3 Max
1968 Points -12%
AMD Ryzen 9 7945HX
Asus Zephyrus Duo 16 GX650PY-NM006W
1940 Points -13%
AMD Ryzen 9 7945HX
Asus ROG Strix G17 G713PI (Turbo Mode)
1936 Points -13%
AMD Ryzen 9 7945HX3D
Asus ROG Strix Scar 17 G733PYV-LL053X
1935 Points -13%
Intel Core i9-12900HX
MSI Titan GT77 12UHS
1913 Points -14%
AMD Ryzen 9 7945HX
Asus ROG Strix G17 G713PI
1863 Points -17%
AMD Ryzen 9 6900HX
Asus ROG Zephyrus Duo 16 GX650RX
1566 Points -30%
AMD Ryzen 9 6900HX
SCHENKER XMG Neo 17 M22
1557 Points -30%
Cinebench R20 / CPU (Single Core)
Intel Core i9-14900HX
SCHENKER XMG Neo 17 2024 Engineering Sample
859 Points
Intel Core i9-13980HX
MSI Titan GT77 HX 13VI
825 Points -4%
Intel Core i9-13950HX
MSI Titan GT77 HX 13VI
803 Points -7%
Intel Core i9-13900HX
Lenovo Legion Pro 7 16IRX8H
788 Points -8%
Intel Core i9-13900HX
SCHENKER XMG Neo 16 Raptor Lake
756 Points -12%
AMD Ryzen 9 7945HX
Asus Zephyrus Duo 16 GX650PY-NM006W
756 Points -12%
AMD Ryzen 9 7945HX3D
Asus ROG Strix Scar 17 G733PYV-LL053X
755 Points -12%
AMD Ryzen 9 7945HX
Asus ROG Strix G17 G713PI (Turbo Mode)
753 Points -12%
Intel Core i9-13950HX
Razer Blade 16 Early 2023
742 Points -14%
Intel Core i9-12900HX
MSI Titan GT77 12UHS
738 Points -14%
AMD Ryzen 9 7945HX
Asus ROG Strix G17 G713PI
712 Points -17%
AMD Ryzen 9 6900HX
SCHENKER XMG Neo 17 M22
605 Points -30%
AMD Ryzen 9 6900HX
Asus ROG Zephyrus Duo 16 GX650RX
595 Points -31%
Apple M3 Max 16-Core
Apple MacBook Pro 16 2023 M3 Max
497 Points -42%
Cinebench R15 / CPU Single 64Bit
Intel Core i9-14900HX
SCHENKER XMG Neo 17 2024 Engineering Sample
320 Points
Intel Core i9-13980HX
MSI Titan GT77 HX 13VI
312 Points -2%
AMD Ryzen 9 7945HX3D
Asus ROG Strix Scar 17 G733PYV-LL053X
311 Points -3%
AMD Ryzen 9 7945HX
Asus Zephyrus Duo 16 GX650PY-NM006W
307 Points -4%
Intel Core i9-13900HX
Lenovo Legion Pro 7 16IRX8H
301 Points -6%
AMD Ryzen 9 7945HX
Asus ROG Strix G17 G713PI (Turbo Mode)
301 Points -6%
Intel Core i9-13950HX
MSI Titan GT77 HX 13VI
300 Points -6%
Intel Core i9-13900HX
SCHENKER XMG Neo 16 Raptor Lake
295 Points -8%
Intel Core i9-13900HX
SCHENKER XMG Neo 16 Raptor Lake
294 Points -8%
AMD Ryzen 9 7945HX
Asus ROG Strix G17 G713PI
294 Points -8%
Intel Core i9-12900HX
MSI Titan GT77 12UHS
278 Points -13%
Intel Core i9-13950HX
Razer Blade 16 Early 2023
274 Points -14%
Apple M3 Max 16-Core
Apple MacBook Pro 16 2023 M3 Max
269 Points -16%
AMD Ryzen 9 6900HX
Asus ROG Zephyrus Duo 16 GX650RX
249 Points -22%
AMD Ryzen 9 6900HX
SCHENKER XMG Neo 17 M22
248 Points -22%
7-Zip 18.03 / 7z b 4 -mmt1
AMD Ryzen 9 7945HX3D
Asus ROG Strix Scar 17 G733PYV-LL053X
7573 MIPS +2%
Intel Core i9-14900HX
SCHENKER XMG Neo 17 2024 Engineering Sample
7405 MIPS
AMD Ryzen 9 7945HX
Asus ROG Strix G17 G713PI (Turbo Mode)
7379 MIPS 0%
AMD Ryzen 9 7945HX
Asus ROG Strix G17 G713PI
7332 MIPS -1%
AMD Ryzen 9 7945HX
Asus Zephyrus Duo 16 GX650PY-NM006W
7319 MIPS -1%
Intel Core i9-13900HX
Lenovo Legion Pro 7 16IRX8H
7035 MIPS -5%
Intel Core i9-13980HX
MSI Titan GT77 HX 13VI
7018 MIPS -5%
Intel Core i9-13950HX
MSI Titan GT77 HX 13VI
6897 MIPS -7%
Intel Core i9-13900HX
SCHENKER XMG Neo 16 Raptor Lake
6800 MIPS -8%
Intel Core i9-13950HX
Razer Blade 16 Early 2023
6445 MIPS -13%
Intel Core i9-12900HX
MSI Titan GT77 12UHS
6256 MIPS -16%
AMD Ryzen 9 6900HX
SCHENKER XMG Neo 17 M22
5872 MIPS -21%
AMD Ryzen 9 6900HX
Asus ROG Zephyrus Duo 16 GX650RX
5727 MIPS -23%
Geekbench 5.5 / Single-Core
Apple M3 Max 16-Core
Apple MacBook Pro 16 2023 M3 Max
2331 Points +7%
Intel Core i9-14900HX
SCHENKER XMG Neo 17 2024 Engineering Sample
2184 Points
Intel Core i9-13980HX
MSI Titan GT77 HX 13VI
2139 Points -2%
AMD Ryzen 9 7945HX3D
Asus ROG Strix Scar 17 G733PYV-LL053X
2133 Points -2%
AMD Ryzen 9 7945HX
Asus Zephyrus Duo 16 GX650PY-NM006W
2132 Points -2%
AMD Ryzen 9 7945HX
Asus ROG Strix G17 G713PI (Turbo Mode)
2103 Points -4%
AMD Ryzen 9 7945HX
Asus ROG Strix G17 G713PI
2053 Points -6%
Intel Core i9-13950HX
MSI Titan GT77 HX 13VI
2043 Points -6%
Intel Core i9-13900HX
Lenovo Legion Pro 7 16IRX8H
2025 Points -7%
Intel Core i9-13900HX
SCHENKER XMG Neo 16 Raptor Lake
2023 Points -7%
Intel Core i9-12900HX
MSI Titan GT77 12UHS
1923 Points -12%
Intel Core i9-13950HX
Razer Blade 16 Early 2023
1805 Points -17%
AMD Ryzen 9 6900HX
Asus ROG Zephyrus Duo 16 GX650RX
1594 Points -27%
AMD Ryzen 9 6900HX
SCHENKER XMG Neo 17 M22
1590 Points -27%
Geekbench 6.2 / Single-Core
Apple M3 Max 16-Core
Apple MacBook Pro 16 2023 M3 Max
3096 Points +2%
Intel Core i9-14900HX
SCHENKER XMG Neo 17 2024 Engineering Sample (6.2.1)
3045 Points
AMD Ryzen 9 7945HX3D
Asus ROG Strix Scar 17 G733PYV-LL053X
2916 Points -4%
Cinebench 2024 / CPU Single Core
Apple M3 Max 16-Core
Apple MacBook Pro 16 2023 M3 Max
139 Points +7%
Intel Core i9-14900HX
SCHENKER XMG Neo 17 2024 Engineering Sample
130 Points
AMD Ryzen 9 7945HX3D
Asus ROG Strix Scar 17 G733PYV-LL053X
115 Points -12%
Cinebench R23: Single Core
Cinebench R20: CPU (Single Core)
Cinebench R15: CPU Single 64Bit
7-Zip 18.03: 7z b 4 -mmt1
Geekbench 5.5: Single-Core
Geekbench 6.2: Single-Core
Cinebench 2024: CPU Single Core
Pakketvermogen Core i9-14900HX Cinebench R23 Single

Het beeld verandert enigszins als we naar het stroomverbruik kijken. Terwijl de prestatiekern in de Raptor-Lake CPU's van vorig jaar ongeveer 34-36 watt verbruikte, verbruikt de nieuwe Core i9-14900HX 38 watt onder pure single-core belasting dankzij de hogere turboklok van 5,8 GHz (IA cores, het pakketvermogen is zelfs nog hoger). De CPU-efficiëntie van AMD is dus een stuk beter, maar de testresultaten van de AMD-modellen en de nieuwe Core i9-14900HX zijn enigszins vertekend, omdat de dedicated GPU actief was tijdens onze energiemetingen en we het verbruik van het hele systeem hebben gemeten. Bij de oude Raptor-Lake-HX modellen was daarentegen alleen de iGPU actief. Intel noch AMD hebben een kans tegen de efficiëntie van Apple's huidige M3 Max (~5,5 watt onder single-core belasting).

Power Consumption / Cinebench R23 Single Power Efficiency - external Monitor
Apple M3 Max 16-Core
Apple MacBook Pro 16 2023 M3 Max
113.8 Points per Watt +338%
Intel Core i9-13950HX
MSI Titan GT77 HX 13VI
28.5 Points per Watt +10%
AMD Ryzen 9 7945HX
Asus ROG Strix G17 G713PI
28.2 Points per Watt +8%
Intel Core i9-12900HX
MSI Titan GT77 12UHS
27.8 Points per Watt +7%
AMD Ryzen 9 7945HX3D
Asus ROG Strix Scar 17 G733PYV-LL053X
26.9 Points per Watt +3%
AMD Ryzen 9 7945HX
Asus ROG Strix G17 G713PI
26.8 Points per Watt +3%
AMD Ryzen 9 7945HX
Asus Zephyrus Duo 16 GX650PY-NM006W
26.4 Points per Watt +2%
Intel Core i9-14900HX
SCHENKER XMG Neo 17 2024 Engineering Sample
26 Points per Watt
Power Consumption / Cinebench R23 Single (external Monitor)
Intel Core i9-14900HX
SCHENKER XMG Neo 17 2024 Engineering Sample
85.8 (78.3min, 81.4P1 - 168.8max) Watt *
Intel Core i9-13950HX
MSI Titan GT77 HX 13VI
73.8 (69.8min, 70.2P1 - 100.2max) Watt * +14%
AMD Ryzen 9 7945HX
Asus Zephyrus Duo 16 GX650PY-NM006W
73.4 (69.8min, 69.9P1 - 99.9max) Watt * +14%
AMD Ryzen 9 7945HX
Asus ROG Strix G17 G713PI (Turbo Mode)
72.2 (62.6min, 63.8P1 - 92.5max) Watt * +16%
AMD Ryzen 9 7945HX3D
Asus ROG Strix Scar 17 G733PYV-LL053X
71.9 (70.8min, 71P1 - 86max) Watt * +16%
Intel Core i9-12900HX
MSI Titan GT77 12UHS
68.7 (63.7min, 64.8P1 - 87.6max) Watt * +20%
AMD Ryzen 9 7945HX
Asus ROG Strix G17 G713PI
66.1 (57.7min, 58.2P1 - 93.6max) Watt * +23%
Apple M3 Max 16-Core
Apple MacBook Pro 16 2023 M3 Max
17.3 (16.2min, 16.2P1 - 21.4max) Watt * +80%

* ... kleiner is beter

Multi-core prestaties

De multi-core prestaties van de Raptor Lake-HX Refresh zijn in principe helemaal niet veranderd en de werkelijke prestaties van de Core i9-14900HX hangen af van de vermogenslimieten van elke afzonderlijke laptop. De XMG Neo 17 (E24) toonde tijdens de benchmarks een gemiddeld pakketvermogen van 160 watt, wat zijn lichte voordeel ten opzichte van de Core i9-13900HX verklaart. Zowel de Core i9-13950HX als de Core i9-13980HX in de MSI Titan GT77 HX waren in het voordeel, omdat ze aan het begin van de benchmarks meer dan 200 watt mochten verbruiken. De AMD modellen Ryzen 9 7945HX en Ryzen 9 7945HX3D waren ook iets sneller.

Cinebench R23: Multi Core
Cinebench R20: CPU (Multi Core)
Cinebench R15: CPU Multi 64Bit
Blender: v2.79 BMW27 CPU | v3.3 Classroom CPU
7-Zip 18.03: 7z b 4
Geekbench 5.5: Multi-Core
Cinebench 2024: CPU Multi Core
Geekbench 6.2: Multi-Core
Cinebench R23 / Multi Core
AMD Ryzen 9 7945HX
Asus Zephyrus Duo 16 GX650PY-NM006W
34521 (32987.6min - 34521.3max) Points +7%
AMD Ryzen 9 7945HX
Asus ROG Strix G17 G713PI (Turbo Mode)
34202 Points +6%
Intel Core i9-13950HX
MSI Titan GT77 HX 13VI
33277 Points +3%
Intel Core i9-13980HX
MSI Titan GT77 HX 13VI
33052 Points +2%
AMD Ryzen 9 7945HX3D
Asus ROG Strix Scar 17 G733PYV-LL053X
32782 Points +1%
AMD Ryzen 9 7945HX
Asus ROG Strix G17 G713PI
32379 Points 0%
Intel Core i9-14900HX
SCHENKER XMG Neo 17 2024 Engineering Sample
32336 Points
Intel Core i9-13900HX
Lenovo Legion Pro 7 16IRX8H
30162 Points -7%
Intel Core i9-13900HX
SCHENKER XMG Neo 16 Raptor Lake
28707 (26191.7min - 28706.8max) Points -11%
Intel Core i9-13900HX
SCHENKER XMG Neo 16 Raptor Lake
28010 (26406.1min - 28009.8max) Points -13%
Intel Core i9-13900HX
SCHENKER XMG Neo 16 Raptor Lake
26703 Points -17%
Intel Core i9-13950HX
Razer Blade 16 Early 2023
26736 (22394.1min - 26736.1max) Points -17%
Apple M3 Max 16-Core
Apple MacBook Pro 16 2023 M3 Max
24024 Points -26%
Intel Core i9-12900HX
MSI Titan GT77 12UHS
22982 Points -29%
AMD Ryzen 9 6900HX
Asus ROG Zephyrus Duo 16 GX650RX
14085 Points -56%
Cinebench R20 / CPU (Multi Core)
AMD Ryzen 9 7945HX
Asus ROG Strix G17 G713PI (Turbo Mode)
13769 Points +13%
AMD Ryzen 9 7945HX
Asus Zephyrus Duo 16 GX650PY-NM006W
13457 Points +10%
AMD Ryzen 9 7945HX3D
Asus ROG Strix Scar 17 G733PYV-LL053X
13033 Points +7%
Intel Core i9-13950HX
MSI Titan GT77 HX 13VI
12648 Points +3%
Intel Core i9-13980HX
MSI Titan GT77 HX 13VI
12437 Points +2%
Intel Core i9-14900HX
SCHENKER XMG Neo 17 2024 Engineering Sample
12233 Points
Intel Core i9-13900HX
Lenovo Legion Pro 7 16IRX8H
11500 Points -6%
Intel Core i9-13900HX
SCHENKER XMG Neo 16 Raptor Lake
11289 Points -8%
AMD Ryzen 9 7945HX
Asus ROG Strix G17 G713PI
10025 Points -18%
Intel Core i9-13950HX
Razer Blade 16 Early 2023
8697 Points -29%
Intel Core i9-12900HX
MSI Titan GT77 12UHS
8667 Points -29%
Apple M3 Max 16-Core
Apple MacBook Pro 16 2023 M3 Max
6327 Points -48%
AMD Ryzen 9 6900HX
Asus ROG Zephyrus Duo 16 GX650RX
5489 Points -55%
Cinebench R15 / CPU Multi 64Bit
AMD Ryzen 9 7945HX
Asus ROG Strix G17 G713PI (Turbo Mode)
5663 Points +16%
AMD Ryzen 9 7945HX3D
Asus ROG Strix Scar 17 G733PYV-LL053X
5600 (5177.32min - 5599.89max) Points +15%
AMD Ryzen 9 7945HX
Asus Zephyrus Duo 16 GX650PY-NM006W
5554 (5255.55min - 5554.01max) Points +14%
Intel Core i9-13950HX
MSI Titan GT77 HX 13VI
5227 (4889.98min - 5226.71max) Points +7%
AMD Ryzen 9 7945HX
Asus ROG Strix G17 G713PI
5205 (4749.47min - 5204.94max) Points +7%
Intel Core i9-13980HX
MSI Titan GT77 HX 13VI
5172 (4917.63min - 5171.97max) Points +6%
Intel Core i9-13900HX
SCHENKER XMG Neo 16 Raptor Lake
4913 Points +1%
Intel Core i9-13900HX
SCHENKER XMG Neo 16 Raptor Lake
4875 (4298.3min - 4875.08max) Points 0%
Intel Core i9-14900HX
SCHENKER XMG Neo 17 2024 Engineering Sample
4875 (4783.54min - 4875.08max) Points
Intel Core i9-13900HX
Lenovo Legion Pro 7 16IRX8H
4819 (4429.68min - 4819.28max) Points -1%
Intel Core i9-13950HX
Razer Blade 16 Early 2023
4529 (4463.29min - 4528.99max) Points -7%
Intel Core i9-12900HX
MSI Titan GT77 12UHS
3570 (3259.45min - 3569.52max) Points -27%
Apple M3 Max 16-Core
Apple MacBook Pro 16 2023 M3 Max
3401 (3260min - 3401max) Points -30%
AMD Ryzen 9 6900HX
Asus ROG Zephyrus Duo 16 GX650RX
2292 Points -53%
Blender / v2.79 BMW27 CPU
AMD Ryzen 9 6900HX
Asus ROG Zephyrus Duo 16 GX650RX
220 Seconds * -116%
Apple M3 Max 16-Core
Apple MacBook Pro 16 2023 M3 Max
215 Seconds * -111%
Intel Core i9-12900HX
MSI Titan GT77 12UHS
147 Seconds * -44%
Intel Core i9-13950HX
Razer Blade 16 Early 2023
114 Seconds * -12%
Intel Core i9-13900HX
SCHENKER XMG Neo 16 Raptor Lake
111 Seconds * -9%
Intel Core i9-13900HX
Lenovo Legion Pro 7 16IRX8H
105 Seconds * -3%
Intel Core i9-14900HX
SCHENKER XMG Neo 17 2024 Engineering Sample
102 Seconds *
Intel Core i9-13980HX
MSI Titan GT77 HX 13VI
101 Seconds * +1%
Intel Core i9-13950HX
MSI Titan GT77 HX 13VI
100 Seconds * +2%
AMD Ryzen 9 7945HX
Asus ROG Strix G17 G713PI
100 Seconds * +2%
AMD Ryzen 9 7945HX
Asus ROG Strix G17 G713PI (Turbo Mode)
95 Seconds * +7%
AMD Ryzen 9 7945HX3D
Asus ROG Strix Scar 17 G733PYV-LL053X
95 Seconds * +7%
AMD Ryzen 9 7945HX
Asus Zephyrus Duo 16 GX650PY-NM006W
93 Seconds * +9%
Blender / v3.3 Classroom CPU
Intel Core i9-12900HX
MSI Titan GT77 12UHS
263 Seconds * -47%
Intel Core i9-13950HX
Razer Blade 16 Early 2023 (3.3.3)
207 Seconds * -16%
Intel Core i9-13900HX
SCHENKER XMG Neo 16 Raptor Lake (3.3.3)
200 Seconds * -12%
Apple M3 Max 16-Core
Apple MacBook Pro 16 2023 M3 Max
194 Seconds * -8%
Intel Core i9-13900HX
Lenovo Legion Pro 7 16IRX8H (3.3.3)
192 Seconds * -7%
Intel Core i9-14900HX
SCHENKER XMG Neo 17 2024 Engineering Sample (3.3.3)
179 Seconds *
Intel Core i9-13980HX
MSI Titan GT77 HX 13VI (3.3.3)
176 Seconds * +2%
Intel Core i9-13950HX
MSI Titan GT77 HX 13VI (3.3.3)
175 Seconds * +2%
AMD Ryzen 9 7945HX
Asus ROG Strix G17 G713PI
158 Seconds * +12%
AMD Ryzen 9 7945HX3D
Asus ROG Strix Scar 17 G733PYV-LL053X (3.3.3)
150 Seconds * +16%
AMD Ryzen 9 7945HX
Asus Zephyrus Duo 16 GX650PY-NM006W (3.3.3)
147 Seconds * +18%
7-Zip 18.03 / 7z b 4
AMD Ryzen 9 7945HX
Asus ROG Strix G17 G713PI (Turbo Mode)
140471 MIPS +11%
AMD Ryzen 9 7945HX3D
Asus ROG Strix Scar 17 G733PYV-LL053X
136201 MIPS +7%
AMD Ryzen 9 7945HX
Asus Zephyrus Duo 16 GX650PY-NM006W
135927 MIPS +7%
Intel Core i9-13950HX
MSI Titan GT77 HX 13VI
127295 MIPS 0%
Intel Core i9-14900HX
SCHENKER XMG Neo 17 2024 Engineering Sample
127108 MIPS
Intel Core i9-13980HX
MSI Titan GT77 HX 13VI
125720 MIPS -1%
AMD Ryzen 9 7945HX
Asus ROG Strix G17 G713PI
123364 MIPS -3%
Intel Core i9-13900HX
Lenovo Legion Pro 7 16IRX8H
122254 MIPS -4%
Intel Core i9-13900HX
SCHENKER XMG Neo 16 Raptor Lake
118715 MIPS -7%
Intel Core i9-13950HX
Razer Blade 16 Early 2023
109330 MIPS -14%
Intel Core i9-12900HX
MSI Titan GT77 12UHS
86234 MIPS -32%
AMD Ryzen 9 6900HX
Asus ROG Zephyrus Duo 16 GX650RX
64457 MIPS -49%
Geekbench 5.5 / Multi-Core
Apple M3 Max 16-Core
Apple MacBook Pro 16 2023 M3 Max
22816 Points +6%
Intel Core i9-14900HX
SCHENKER XMG Neo 17 2024 Engineering Sample
21606 Points
Intel Core i9-13900HX
Lenovo Legion Pro 7 16IRX8H
21058 Points -3%
Intel Core i9-13900HX
SCHENKER XMG Neo 16 Raptor Lake
20784 Points -4%
Intel Core i9-13950HX
MSI Titan GT77 HX 13VI
20634 Points -4%
Intel Core i9-13980HX
MSI Titan GT77 HX 13VI
20329 Points -6%
AMD Ryzen 9 7945HX
Asus ROG Strix G17 G713PI (Turbo Mode)
19954 Points -8%
AMD Ryzen 9 7945HX3D
Asus ROG Strix Scar 17 G733PYV-LL053X
19875 Points -8%
AMD Ryzen 9 7945HX
Asus Zephyrus Duo 16 GX650PY-NM006W
19583 Points -9%
AMD Ryzen 9 7945HX
Asus ROG Strix G17 G713PI
18372 Points -15%
Intel Core i9-13950HX
Razer Blade 16 Early 2023
18152 Points -16%
Intel Core i9-12900HX
MSI Titan GT77 12UHS
16250 Points -25%
AMD Ryzen 9 6900HX
Asus ROG Zephyrus Duo 16 GX650RX
10167 Points -53%
Cinebench 2024 / CPU Multi Core
Intel Core i9-14900HX
SCHENKER XMG Neo 17 2024 Engineering Sample
1780 Points
AMD Ryzen 9 7945HX3D
Asus ROG Strix Scar 17 G733PYV-LL053X
1772 Points 0%
Apple M3 Max 16-Core
Apple MacBook Pro 16 2023 M3 Max
1612 Points -9%
Geekbench 6.2 / Multi-Core
Apple M3 Max 16-Core
Apple MacBook Pro 16 2023 M3 Max
21243 Points +14%
Intel Core i9-14900HX
SCHENKER XMG Neo 17 2024 Engineering Sample (6.2.1)
18643 Points
AMD Ryzen 9 7945HX3D
Asus ROG Strix Scar 17 G733PYV-LL053X
16957 Points -9%
Cinebench R23: Multi Core
Cinebench R20: CPU (Multi Core)
Cinebench R15: CPU Multi 64Bit
Blender: v2.79 BMW27 CPU | v3.3 Classroom CPU
7-Zip 18.03: 7z b 4
Geekbench 5.5: Multi-Core
Cinebench 2024: CPU Multi Core
Geekbench 6.2: Multi-Core

* ... kleiner is beter

Pakket vermogen Core i9-14900HX Cinebench R23 Multi

Bij het bekijken van de efficiëntie moet u in gedachten houden dat de dedicated GPU actief was. Door de hogere totale verbruikswaarden is de invloed hier minder groot dan tijdens de single-core tests. De Core i9-14900HX mag dan wel voorliggen op de meeste van zijn Intel broers en zussen, maar de Dragon Range Ryzen 9 7945HX van AMD lag een stuk voor op het gebied van efficiëntie. Het is geen verrassing dat de efficiëntie van Apple als beste uit de bus kwam, maar voor het eerst is de nieuwe M3 Max in staat om prestatieniveaus te halen die dicht in de buurt komen van de kleinere HX-processoren (Core i7).

Power Consumption / Cinebench R23 Multi Power Efficiency - external Monitor
Apple M3 Max 16-Core
Apple MacBook Pro 16 2023 M3 Max
306 Points per Watt +111%
AMD Ryzen 9 7945HX3D
Asus ROG Strix Scar 17 G733PYV-LL053X
207 Points per Watt +43%
AMD Ryzen 9 7945HX
Asus Zephyrus Duo 16 GX650PY-NM006W
194.4 Points per Watt +34%
AMD Ryzen 9 7945HX
Asus ROG Strix G17 G713PI
191.1 Points per Watt +32%
Intel Core i9-13980HX
Asus ROG Strix Scar 18 2023 G834JY-N6005W
160.9 Points per Watt +11%
Intel Core i9-14900HX
SCHENKER XMG Neo 17 2024 Engineering Sample
145 Points per Watt
Intel Core i9-13950HX
Razer Blade 16 Early 2023 RTX 4090
144.1 Points per Watt -1%
Intel Core i9-13900HX
Lenovo Legion Pro 7 RTX4090
141.4 Points per Watt -2%
Intel Core i9-13950HX
MSI Titan GT77 HX 13VI
135.3 Points per Watt -7%
Intel Core i9-12900HX
MSI Titan GT77 12UHS
122.6 Points per Watt -15%
Power Consumption / Cinebench R23 Multi (external Monitor)
Intel Core i9-13950HX
MSI Titan GT77 HX 13VI
246 (227min, 227P1 - 264max) Watt * -10%
Intel Core i9-14900HX
SCHENKER XMG Neo 17 2024 Engineering Sample
223 (216min, 216P1 - 229max) Watt *
Intel Core i9-13900HX
Lenovo Legion Pro 7 RTX4090
220 (215min, 215P1 - 224max) Watt * +1%
Intel Core i9-13950HX
Razer Blade 16 Early 2023 RTX 4090
197.3 (191.9min, 192.7P1 - 200max) Watt * +12%
Intel Core i9-12900HX
MSI Titan GT77 12UHS
187.5 (166.8min, 167.1P1 - 230max) Watt * +16%
Intel Core i9-13900HX
SCHENKER XMG Neo 16 E23
182.4 (172.3min, 172.3P1 - 207max) Watt * +18%
AMD Ryzen 9 7945HX
Asus ROG Strix G17 G713PI (Turbo Mode)
179 (171.5min, 171.8P1 - 181.3max) Watt * +20%
AMD Ryzen 9 7945HX
Asus Zephyrus Duo 16 GX650PY-NM006W
177.6 (166.7min, 166.8P1 - 187.3max) Watt * +20%
Intel Core i9-13980HX
Asus ROG Strix Scar 18 2023 G834JY-N6005W
175.9 (93.7min, 95.8P1 - 193.7max) Watt * +21%
AMD Ryzen 9 7945HX3D
Asus ROG Strix Scar 17 G733PYV-LL053X
158.5 (149.9min, 150.4P1 - 171.1max) Watt * +29%
Intel Core i7-13700HX
Aorus 15X ASF
148.3 (116.3min, 116.3P1 - 185.2max) Watt * +33%
Apple M3 Max 16-Core
Apple MacBook Pro 16 2023 M3 Max
78.6 (71.7min, 73.3P1 - 80.2max) Watt * +65%

* ... kleiner is beter

Prestaties met lage vermogenslimieten

Zoals al het geval was in eerdere analyseartikelen, hebben we ook gekeken naar de prestaties met lagere vermogenslimieten en we hebben onze bevindingen in de volgende tabel samengevat. Twee dingen worden snel duidelijk. Ten eerste is de Core i9-14900HX uiteindelijk gewoon een Core i9-13900HX met een hogere turboklok, en met lagere vermogenslimieten verschillen de twee chips niet zoveel. Ten tweede kunt u duidelijk zien dat AMD dezelfde multi-core prestaties kan leveren met aanzienlijk minder stroomverbruik. De Apple M3 Max is ook indrukwekkend - met een vergelijkbare vermogenslimiet presteerde hij ongeveer 32% sneller dan de Core i9-14900HX.

Cinebench R23 Multi
Vermogenslimiet Core i9-14900HX Core i9-13900HX Core i9-13950HX Core i9-13980HX Ryzen 9 7945HX Ryzen 9 7945HX3D M3 Max 16-Core
170 watt 31.958 31.903
150 watt 30.308 30.655 30.623
130 watt 28.933 28.239 29.141 29.281 34.202
115 watt 27.750 27.369 28.199 28.073 33.361
100 watt 26.323 25.942 26.653 26.507 32.947 32.977
80 watt 23.334 23.216 23.950 23.766 30.907 30.804
55 watt 18.258 18.843 19.772 19.478 26.045 24.024

Stroomverbruik in ruststand

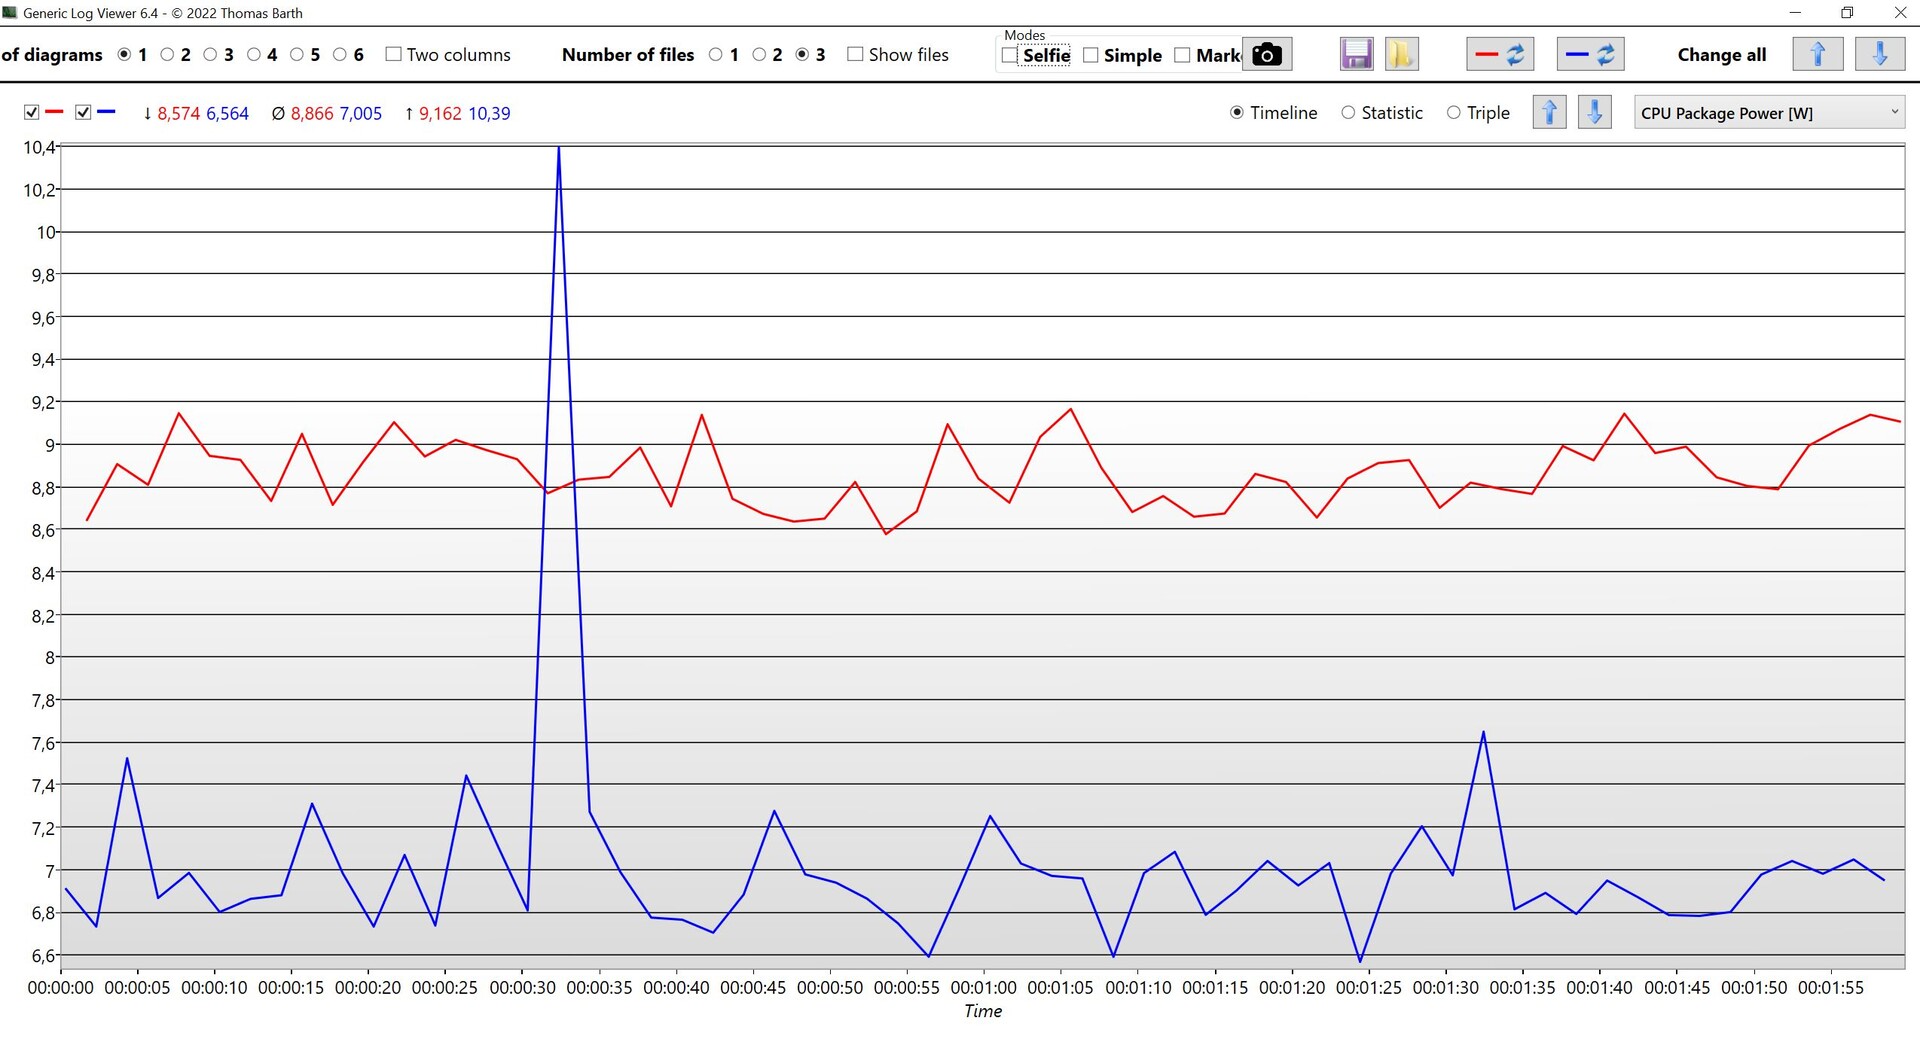
We hebben ook het stroomverbruik van de nieuwe Core i9-14900HX in inactieve modus vergeleken met dat van de AMD Ryzen 9 7945HX3Dwaarbij de prestatie-instellingen van beide modellen zo dicht mogelijk bij elkaar werden gehouden. Hier zagen we dat de Core i9-14900HX een licht voordeel had, en in een ideaal scenario op ongeveer 7 watt uitkwam. De Ryzen 9 7945HX3D met zijn chiplet ontwerp had daarentegen gemiddeld 8,9 watt nodig in ruststand.

CPU-pakketvermogen in inactieve modus (blauw: Core i9-14900HX, rood: Ryzen 9 7945HX3D)

Gamingprestaties

In tegenstelling tot de CPU-benchmarks wordt de processor natuurlijk niet altijd volledig belast tijdens het gamen, maar is er waarschijnlijk sprake van een mix van single/multi-core belasting. Een indicator hiervan is de CPU-score tijdens de 3DMark-tests en bij het vergelijken van de Time Spy resultaten zagen we een voordeel van 10% ten opzichte van de Core i9-13900HX en de nieuwe Core i9-14900HX zit op hetzelfde niveau als de Core i9-13980HX van vorig jaar.

3DMark - 2560x1440 Time Spy CPU
Lenovo Legion 9 16IRX8
Intel Core i9-13980HX, NVIDIA GeForce RTX 4090 Laptop GPU
17712 Points +4%
Alienware m18 R1
Intel Core i9-13980HX, NVIDIA GeForce RTX 4090 Laptop GPU
17525 Points +3%
MSI Raider GE78 HX 13VI
Intel Core i9-13980HX, NVIDIA GeForce RTX 4090 Laptop GPU
17026 Points 0%
SCHENKER XMG Neo 17 2024 Engineering Sample
Intel Core i9-14900HX, NVIDIA GeForce RTX 4090 Laptop GPU
16982 Points
Asus ROG Strix Scar 18 2023 G834JY-N6005W
Intel Core i9-13980HX, NVIDIA GeForce RTX 4090 Laptop GPU
15908 Points -6%
MSI Titan GT77 HX 13VI
Intel Core i9-13950HX, NVIDIA GeForce RTX 4090 Laptop GPU
15403 Points -9%
Lenovo Legion Pro 7 RTX4090
Intel Core i9-13900HX, NVIDIA GeForce RTX 4090 Laptop GPU
15066 Points -11%
Asus ROG Strix Scar 17 G733PYV-LL053X
AMD Ryzen 9 7945HX3D, NVIDIA GeForce RTX 4090 Laptop GPU
14131 Points -17%
SCHENKER Key 17 Pro (Early 23)
Intel Core i9-13900HX, NVIDIA GeForce RTX 4090 Laptop GPU
14048 Points -17%
Asus ROG Strix Scar 17 G733PY-XS96
AMD Ryzen 9 7945HX, NVIDIA GeForce RTX 4090 Laptop GPU
13140 Points -23%
Lenovo Legion Pro 5 16ARX8
AMD Ryzen 7 7745HX, NVIDIA GeForce RTX 4070 Laptop GPU
11477 Points -32%
Gemiddelde van klas
  (353 - 23721, n=2294)
7399 Points -56%

Gamingprestaties 1080p

Het is natuurlijk niet ideaal om de gamingprestaties van een processor met verschillende laptops te vergelijken, omdat er altijd kleine verschillen zullen zijn in hoe hun vermogenslimieten zijn geconfigureerd, zowel wat betreft de processor als de grafische kaarten. In de persdocumenten heeft Intel de resultaten weergegeven met hoge details op 1080p, wat naar onze mening niet erg realistisch is. Als u een resolutie van 1080p laat zien, dan wilt u op zijn minst de maximale details, want er wordt geen HX-processor aangeboden zonder een krachtige, speciale grafische kaart. Over het algemeen zijn de prestaties van de Core i9-14900HX goed, maar niet veel beter dan die van de voorgaande modellen. Upgraden van een vorige generatie Core i9 HX processor is zeker niet de moeite waard. In bepaalde games kan de AMD Ryzen 9 7945HX3D met zijn 3D-cache behoorlijk in het voordeel, waardoor het wederom de beste mobiele gaming CPU in totaal is.

The Witcher 3 - 1920x1080 Ultra Graphics & Postprocessing (HBAO+)
Alienware m18 R1
Intel Core i9-13980HX, NVIDIA GeForce RTX 4090 Laptop GPU
213.9 (205min) fps +9%
MSI Raider GE78 HX 13VI
Intel Core i9-13980HX, NVIDIA GeForce RTX 4090 Laptop GPU
213.4 (72.4P0.1, 144.6P1) fps +9%
Lenovo Legion 9 16IRX8
Intel Core i9-13980HX, NVIDIA GeForce RTX 4090 Laptop GPU
208.7 (191min) fps +7%
Asus ROG Strix Scar 17 G733PYV-LL053X
AMD Ryzen 9 7945HX3D, NVIDIA GeForce RTX 4090 Laptop GPU
207 fps +6%
SCHENKER Key 17 Pro (Early 23)
Intel Core i9-13900HX, NVIDIA GeForce RTX 4090 Laptop GPU
206 (176min) fps +5%
Asus ROG Strix Scar 17 G733PY-XS96
AMD Ryzen 9 7945HX, NVIDIA GeForce RTX 4090 Laptop GPU
203.8 (186min) fps +4%
Lenovo Legion Pro 7 RTX4090
Intel Core i9-13900HX, NVIDIA GeForce RTX 4090 Laptop GPU
200 (174min) fps +2%
MSI Titan GT77 HX 13VI
Intel Core i9-13950HX, NVIDIA GeForce RTX 4090 Laptop GPU
198.9 (190min, 191P1) fps +2%
SCHENKER XMG Neo 17 2024 Engineering Sample
Intel Core i9-14900HX, NVIDIA GeForce RTX 4090 Laptop GPU
195.8 (176min, 187P1) fps
Lenovo Legion Pro 5 16ARX8
AMD Ryzen 7 7745HX, NVIDIA GeForce RTX 4070 Laptop GPU
119.8 (114min) fps -39%
Gemiddelde van klas
  (1.2 - 328, n=2210)
59.1 fps -70%
GTA V - 1920x1080 Highest Settings possible AA:4xMSAA + FX AF:16x
Asus ROG Strix Scar 17 G733PYV-LL053X
AMD Ryzen 9 7945HX3D, NVIDIA GeForce RTX 4090 Laptop GPU
167.7 (1.87min, 111.1P1) fps +10%
SCHENKER XMG Neo 17 2024 Engineering Sample
Intel Core i9-14900HX, NVIDIA GeForce RTX 4090 Laptop GPU
151.8 (3.32min, 111.1P1) fps
Lenovo Legion 9 16IRX8
Intel Core i9-13980HX, NVIDIA GeForce RTX 4090 Laptop GPU
150.7 (3min, 111.1P1) fps -1%
Alienware m18 R1
Intel Core i9-13980HX, NVIDIA GeForce RTX 4090 Laptop GPU
149 (3.13min, 111.1P1) fps -2%
Lenovo Legion Pro 7 RTX4090
Intel Core i9-13900HX, NVIDIA GeForce RTX 4090 Laptop GPU
143.6 (4.39min, 100P1) fps -5%
SCHENKER Key 17 Pro (Early 23)
Intel Core i9-13900HX, NVIDIA GeForce RTX 4090 Laptop GPU
142.3 (4.44min, 100P1) fps -6%
MSI Raider GE78 HX 13VI
Intel Core i9-13980HX, NVIDIA GeForce RTX 4090 Laptop GPU
142 (2.92min, 90.9P1) fps -6%
Asus ROG Strix Scar 18 2023 G834JY-N6005W
Intel Core i9-13980HX, NVIDIA GeForce RTX 4090 Laptop GPU
141.3 (4.69min, 100P1) fps -7%
MSI Titan GT77 HX 13VI
Intel Core i9-13950HX, NVIDIA GeForce RTX 4090 Laptop GPU
140.9 (3.54min, 83.3P1) fps -7%
Lenovo Legion Pro 5 16ARX8
AMD Ryzen 7 7745HX, NVIDIA GeForce RTX 4070 Laptop GPU
119.9 (3.81min, 76.9P1) fps -21%
Asus ROG Strix Scar 17 G733PY-XS96
AMD Ryzen 9 7945HX, NVIDIA GeForce RTX 4090 Laptop GPU
112.6 (4.54min, 71.4P1) fps -26%
Gemiddelde van klas
  (2.1 - 182, n=1316)
62.6 fps -59%
Final Fantasy XV Benchmark - 1920x1080 High Quality
Alienware m18 R1
Intel Core i9-13980HX, NVIDIA GeForce RTX 4090 Laptop GPU
194.8 fps +7%
MSI Titan GT77 HX 13VI
Intel Core i9-13950HX, NVIDIA GeForce RTX 4090 Laptop GPU
187.4 fps +2%
MSI Raider GE78 HX 13VI
Intel Core i9-13980HX, NVIDIA GeForce RTX 4090 Laptop GPU
183.3 fps 0%
SCHENKER Key 17 Pro (Early 23)
Intel Core i9-13900HX, NVIDIA GeForce RTX 4090 Laptop GPU
183.1 fps 0%
SCHENKER XMG Neo 17 2024 Engineering Sample
Intel Core i9-14900HX, NVIDIA GeForce RTX 4090 Laptop GPU
182.9 fps
Lenovo Legion 9 16IRX8
Intel Core i9-13980HX, NVIDIA GeForce RTX 4090 Laptop GPU
181.3 fps -1%
Lenovo Legion Pro 7 RTX4090
Intel Core i9-13900HX, NVIDIA GeForce RTX 4090 Laptop GPU
181.2 fps -1%
Asus ROG Strix Scar 17 G733PYV-LL053X
AMD Ryzen 9 7945HX3D, NVIDIA GeForce RTX 4090 Laptop GPU
180 fps -2%
Asus ROG Strix Scar 18 2023 G834JY-N6005W
Intel Core i9-13980HX, NVIDIA GeForce RTX 4090 Laptop GPU
177.6 fps -3%
Asus ROG Strix Scar 17 G733PY-XS96
AMD Ryzen 9 7945HX, NVIDIA GeForce RTX 4090 Laptop GPU
163.9 fps -10%
Lenovo Legion Pro 5 16ARX8
AMD Ryzen 7 7745HX, NVIDIA GeForce RTX 4070 Laptop GPU
119.9 fps -34%
Gemiddelde van klas
  (0.84 - 237, n=1449)
63.8 fps -65%
Strange Brigade - 1920x1080 ultra AA:ultra AF:16
Asus ROG Strix Scar 17 G733PYV-LL053X
AMD Ryzen 9 7945HX3D, NVIDIA GeForce RTX 4090 Laptop GPU
420 (64.7min, 302P1) fps +12%
Lenovo Legion 9 16IRX8
Intel Core i9-13980HX, NVIDIA GeForce RTX 4090 Laptop GPU
387 (23.7min, 277P1) fps +3%
SCHENKER Key 17 Pro (Early 23)
Intel Core i9-13900HX, NVIDIA GeForce RTX 4090 Laptop GPU
378 (20.6min, 257P1) fps +1%
MSI Raider GE78 HX 13VI
Intel Core i9-13980HX, NVIDIA GeForce RTX 4090 Laptop GPU
378 (54.7min, 251P1) fps +1%
SCHENKER XMG Neo 17 2024 Engineering Sample
Intel Core i9-14900HX, NVIDIA GeForce RTX 4090 Laptop GPU
376 (106.6min, 279P1) fps
MSI Titan GT77 HX 13VI
Intel Core i9-13950HX, NVIDIA GeForce RTX 4090 Laptop GPU
373 (29.9min, 272P1) fps -1%
Alienware m18 R1
Intel Core i9-13980HX, NVIDIA GeForce RTX 4090 Laptop GPU
373 (73.3min, 273P1) fps -1%
Asus ROG Strix Scar 18 2023 G834JY-N6005W
Intel Core i9-13980HX, NVIDIA GeForce RTX 4090 Laptop GPU
366 (29.1min, 263P1) fps -3%
Lenovo Legion Pro 7 RTX4090
Intel Core i9-13900HX, NVIDIA GeForce RTX 4090 Laptop GPU
347 (87.7min, 252P1) fps -8%
Lenovo Legion Pro 5 16ARX8
AMD Ryzen 7 7745HX, NVIDIA GeForce RTX 4070 Laptop GPU
223 (89min, 167.8P1) fps -41%
Gemiddelde van klas
  (9.7 - 602, n=1189)
123.3 fps -67%
Dota 2 Reborn - 1920x1080 ultra (3/3) best looking
Asus ROG Strix Scar 17 G733PYV-LL053X
AMD Ryzen 9 7945HX3D, NVIDIA GeForce RTX 4090 Laptop GPU
220 (175min) fps +23%
Alienware m18 R1
Intel Core i9-13980HX, NVIDIA GeForce RTX 4090 Laptop GPU
194.2 (157.6min) fps +9%
Lenovo Legion 9 16IRX8
Intel Core i9-13980HX, NVIDIA GeForce RTX 4090 Laptop GPU
193.1 (162.4min) fps +8%
Asus ROG Strix Scar 18 2023 G834JY-N6005W
Intel Core i9-13980HX, NVIDIA GeForce RTX 4090 Laptop GPU
190.2 (160.9min) fps +6%
MSI Titan GT77 HX 13VI
Intel Core i9-13950HX, NVIDIA GeForce RTX 4090 Laptop GPU
185.9 (157.5min) fps +4%
SCHENKER Key 17 Pro (Early 23)
Intel Core i9-13900HX, NVIDIA GeForce RTX 4090 Laptop GPU
182.5 (149.3min) fps +2%
Lenovo Legion Pro 7 RTX4090
Intel Core i9-13900HX, NVIDIA GeForce RTX 4090 Laptop GPU
182.1 (154.2min) fps +2%
Lenovo Legion Pro 5 16ARX8
AMD Ryzen 7 7745HX, NVIDIA GeForce RTX 4070 Laptop GPU
182 (152.8min) fps +2%
MSI Raider GE78 HX 13VI
Intel Core i9-13980HX, NVIDIA GeForce RTX 4090 Laptop GPU
178.8 (148.8min) fps 0%
SCHENKER XMG Neo 17 2024 Engineering Sample
Intel Core i9-14900HX, NVIDIA GeForce RTX 4090 Laptop GPU
178.8 (152.1min) fps
Asus ROG Strix Scar 17 G733PY-XS96
AMD Ryzen 9 7945HX, NVIDIA GeForce RTX 4090 Laptop GPU
139 (118.5min) fps -22%
Gemiddelde van klas
  (4.6 - 268, n=1993)
86.1 fps -52%
X-Plane 11.11 - 1920x1080 high (fps_test=3)
Asus ROG Strix Scar 17 G733PYV-LL053X
AMD Ryzen 9 7945HX3D, NVIDIA GeForce RTX 4090 Laptop GPU
166.2 fps +23%
Alienware m18 R1
Intel Core i9-13980HX, NVIDIA GeForce RTX 4090 Laptop GPU
143.5 fps +6%
Asus ROG Strix Scar 18 2023 G834JY-N6005W
Intel Core i9-13980HX, NVIDIA GeForce RTX 4090 Laptop GPU
142.8 fps +6%
Lenovo Legion 9 16IRX8
Intel Core i9-13980HX, NVIDIA GeForce RTX 4090 Laptop GPU
140.1 fps +4%
SCHENKER Key 17 Pro (Early 23)
Intel Core i9-13900HX, NVIDIA GeForce RTX 4090 Laptop GPU
136.6 fps +1%
Lenovo Legion Pro 7 RTX4090
Intel Core i9-13900HX, NVIDIA GeForce RTX 4090 Laptop GPU
136.4 fps +1%
SCHENKER XMG Neo 17 2024 Engineering Sample
Intel Core i9-14900HX, NVIDIA GeForce RTX 4090 Laptop GPU
135.3 fps
MSI Titan GT77 HX 13VI
Intel Core i9-13950HX, NVIDIA GeForce RTX 4090 Laptop GPU
134.2 fps -1%
MSI Titan GT77 HX 13VI
Intel Core i9-13950HX, NVIDIA GeForce RTX 4090 Laptop GPU
134.1 fps -1%
MSI Raider GE78 HX 13VI
Intel Core i9-13980HX, NVIDIA GeForce RTX 4090 Laptop GPU
126.4 fps -7%
Lenovo Legion Pro 5 16ARX8
AMD Ryzen 7 7745HX, NVIDIA GeForce RTX 4070 Laptop GPU
117.8 fps -13%
Asus ROG Strix Scar 17 G733PY-XS96
AMD Ryzen 9 7945HX, NVIDIA GeForce RTX 4090 Laptop GPU
94.3 fps -30%
Gemiddelde van klas
  (2.65 - 188.1, n=1904)
58.6 fps -57%
Shadow of the Tomb Raider - 1920x1080 Highest Preset AA:T
Asus ROG Strix Scar 17 G733PYV-LL053X
AMD Ryzen 9 7945HX3D, NVIDIA GeForce RTX 4090 Laptop GPU
271 fps +28%
Asus ROG Strix Scar 17 G733PY-XS96
AMD Ryzen 9 7945HX, NVIDIA GeForce RTX 4090 Laptop GPU
228 fps +8%
MSI Raider GE78 HX 13VI
Intel Core i9-13980HX, NVIDIA GeForce RTX 4090 Laptop GPU
219 fps +3%
MSI Titan GT77 HX 13VI
Intel Core i9-13950HX, NVIDIA GeForce RTX 4090 Laptop GPU
214 fps +1%
SCHENKER XMG Neo 17 2024 Engineering Sample
Intel Core i9-14900HX, NVIDIA GeForce RTX 4090 Laptop GPU
212 fps
Lenovo Legion Pro 5 16ARX8
AMD Ryzen 7 7745HX, NVIDIA GeForce RTX 4070 Laptop GPU
168 fps -21%
Asus ROG Strix Scar 18 2023 G834JY-N6005W
Intel Core i9-13980HX, NVIDIA GeForce RTX 4090 Laptop GPU
143.7 fps -32%
Gemiddelde van klas
  (6 - 375, n=612)
100.8 fps -52%
F1 22 - 1920x1080 Ultra High Preset AA:T AF:16x
Alienware m18 R1
Intel Core i9-13980HX, NVIDIA GeForce RTX 4090 Laptop GPU
144.7 (124min, 94P1) fps +15%
MSI Titan GT77 HX 13VI
Intel Core i9-13950HX, NVIDIA GeForce RTX 4090 Laptop GPU
138.2 (118min, 84P1) fps +9%
MSI Raider GE78 HX 13VI
Intel Core i9-13980HX, NVIDIA GeForce RTX 4090 Laptop GPU
137.1 (115min, 79P1) fps +9%
Asus ROG Strix Scar 17 G733PYV-LL053X
AMD Ryzen 9 7945HX3D, NVIDIA GeForce RTX 4090 Laptop GPU
135.9 (118min, 98P1) fps +8%
Lenovo Legion 9 16IRX8
Intel Core i9-13980HX, NVIDIA GeForce RTX 4090 Laptop GPU
130.8 (95min, 78P1) fps +4%
Lenovo Legion Pro 7 RTX4090
Intel Core i9-13900HX, NVIDIA GeForce RTX 4090 Laptop GPU
129.2 (105min, 83P1) fps +2%
SCHENKER XMG Neo 17 2024 Engineering Sample
Intel Core i9-14900HX, NVIDIA GeForce RTX 4090 Laptop GPU
126.3 (109min, 83P1) fps
Asus ROG Strix Scar 18 2023 G834JY-N6005W
Intel Core i9-13980HX, NVIDIA GeForce RTX 4090 Laptop GPU
124.5 (107min, 87P1) fps -1%
Asus ROG Strix Scar 17 G733PY-XS96
AMD Ryzen 9 7945HX, NVIDIA GeForce RTX 4090 Laptop GPU
116.3 (86min, 73P1) fps -8%
Lenovo Legion Pro 5 16ARX8
AMD Ryzen 7 7745HX, NVIDIA GeForce RTX 4070 Laptop GPU
84.1 (71min, 59P1) fps -33%
Gemiddelde van klas
  (5.09 - 221, n=483)
60.8 fps -52%
F1 23 - 1920x1080 Ultra High Preset AA:T AF:16x
Asus ROG Strix Scar 17 G733PYV-LL053X
AMD Ryzen 9 7945HX3D, NVIDIA GeForce RTX 4090 Laptop GPU
132 (107min, 102P1) fps +11%
MSI Raider GE78 HX 13VI
Intel Core i9-13980HX, NVIDIA GeForce RTX 4090 Laptop GPU
129.8 (104min, 98P1) fps +9%
SCHENKER XMG Neo 17 2024 Engineering Sample
Intel Core i9-14900HX, NVIDIA GeForce RTX 4090 Laptop GPU
119.3 (95min, 90P1) fps
Gemiddelde van klas
  (5 - 226, n=200)
57.3 fps -52%
Far Cry 5 - 1920x1080 Ultra Preset AA:T
Asus ROG Strix Scar 17 G733PYV-LL053X
AMD Ryzen 9 7945HX3D, NVIDIA GeForce RTX 4090 Laptop GPU
218 fps +35%
SCHENKER XMG Neo 17 2024 Engineering Sample
Intel Core i9-14900HX, NVIDIA GeForce RTX 4090 Laptop GPU
162 fps
MSI Titan GT77 HX 13VI
Intel Core i9-13950HX, NVIDIA GeForce RTX 4090 Laptop GPU
160 fps -1%
Asus ROG Strix Scar 18 2023 G834JY-N6005W
Intel Core i9-13980HX, NVIDIA GeForce RTX 4090 Laptop GPU
158 (117min) fps -2%
Lenovo Legion 9 16IRX8
Intel Core i9-13980HX, NVIDIA GeForce RTX 4090 Laptop GPU
158 (102min) fps -2%
Asus ROG Strix Scar 17 G733PY-XS96
AMD Ryzen 9 7945HX, NVIDIA GeForce RTX 4090 Laptop GPU
145 (106min) fps -10%
Gemiddelde van klas
  (1 - 278, n=1015)
83.7 fps -48%
Far Cry 6 - 1920x1080 Ultra Graphics Quality + HD Textures AA:T
Asus ROG Strix Scar 17 G733PYV-LL053X
AMD Ryzen 9 7945HX3D, NVIDIA GeForce RTX 4090 Laptop GPU
167 fps +7%
SCHENKER XMG Neo 17 2024 Engineering Sample
Intel Core i9-14900HX, NVIDIA GeForce RTX 4090 Laptop GPU
156 fps
MSI Titan GT77 HX 13VI
Intel Core i9-13950HX, NVIDIA GeForce RTX 4090 Laptop GPU
144 fps -8%
Asus ROG Strix Scar 17 G733PY-XS96
AMD Ryzen 9 7945HX, NVIDIA GeForce RTX 4090 Laptop GPU
112 (91min) fps -28%
Lenovo Legion Pro 5 16ARX8
AMD Ryzen 7 7745HX, NVIDIA GeForce RTX 4070 Laptop GPU
110 (74min) fps -29%
Gemiddelde van klas
  (4.67 - 223, n=284)
95.4 fps -39%
Call of Duty Modern Warfare 2 2022 - 1920x1080 Extreme Quality Preset AA:T2X Filmic SM
Asus ROG Strix Scar 17 G733PYV-LL053X
AMD Ryzen 9 7945HX3D, NVIDIA GeForce RTX 4090 Laptop GPU
182 fps +8%
Asus ROG Strix Scar 17 G733PY-XS96
AMD Ryzen 9 7945HX, NVIDIA GeForce RTX 4090 Laptop GPU
180 (103min) fps +7%
MSI Raider GE78 HX 13VI
Intel Core i9-13980HX, NVIDIA GeForce RTX 4090 Laptop GPU
177 (102min) fps +5%
MSI Titan GT77 HX 13VI
Intel Core i9-13950HX, NVIDIA GeForce RTX 4090 Laptop GPU
176 fps +5%
Asus ROG Strix Scar 18 2023 G834JY-N6005W
Intel Core i9-13980HX, NVIDIA GeForce RTX 4090 Laptop GPU
170 (98P1) fps +1%
SCHENKER XMG Neo 17 2024 Engineering Sample
Intel Core i9-14900HX, NVIDIA GeForce RTX 4090 Laptop GPU
168 fps
Lenovo Legion Pro 5 16ARX8
AMD Ryzen 7 7745HX, NVIDIA GeForce RTX 4070 Laptop GPU
108 (61min) fps -36%
Gemiddelde van klas
  (12 - 285, n=120)
105.1 fps -37%
Cyberpunk 2077 1.6 - 1920x1080 Ultra Preset
Asus ROG Strix Scar 17 G733PYV-LL053X
AMD Ryzen 9 7945HX3D, NVIDIA GeForce RTX 4090 Laptop GPU
157 fps +21%
MSI Raider GE78 HX 13VI
Intel Core i9-13980HX, NVIDIA GeForce RTX 4090 Laptop GPU
135.14 (44.88min) fps +4%
MSI Titan GT77 HX 13VI
Intel Core i9-13950HX, NVIDIA GeForce RTX 4090 Laptop GPU
135 fps +4%
Asus ROG Strix Scar 17 G733PY-XS96
AMD Ryzen 9 7945HX, NVIDIA GeForce RTX 4090 Laptop GPU
133.8 (57.7min) fps +3%
Lenovo Legion 9 16IRX8
Intel Core i9-13980HX, NVIDIA GeForce RTX 4090 Laptop GPU
131.4 (23.8min) fps +1%
SCHENKER XMG Neo 17 2024 Engineering Sample
Intel Core i9-14900HX, NVIDIA GeForce RTX 4090 Laptop GPU
130 fps
Alienware m18 R1
Intel Core i9-13980HX, NVIDIA GeForce RTX 4090 Laptop GPU
127.92 (32.4min) fps -2%
Asus ROG Strix Scar 18 2023 G834JY-N6005W
Intel Core i9-13980HX, NVIDIA GeForce RTX 4090 Laptop GPU
119.7 (69min) fps -8%
Lenovo Legion Pro 5 16ARX8
AMD Ryzen 7 7745HX, NVIDIA GeForce RTX 4070 Laptop GPU
98.9 (35.5min) fps -24%
Gemiddelde van klas
  (5 - 241, n=374)
73.2 fps -44%
Cyberpunk 2077 2.0 Phantom Liberty - 1920x1080 Ultra Preset (FSR off)
Asus ROG Strix Scar 17 G733PYV-LL053X
AMD Ryzen 9 7945HX3D, NVIDIA GeForce RTX 4090 Laptop GPU
142.8 fps +16%
Lenovo Legion 9 16IRX8
Intel Core i9-13980HX, NVIDIA GeForce RTX 4090 Laptop GPU
131.22 (31.65min) fps +7%
MSI Raider GE78 HX 13VI
Intel Core i9-13980HX, NVIDIA GeForce RTX 4090 Laptop GPU
127 (36.47min) fps +4%
SCHENKER XMG Neo 17 2024 Engineering Sample
Intel Core i9-14900HX, NVIDIA GeForce RTX 4090 Laptop GPU
122.7 (16.4min) fps
Gemiddelde van klas
  (2.3 - 216, n=183)
72.5 fps -41%

Gamingprestaties QHD

Bij een QHD-resolutie wordt de invloed van de processor nog kleiner en geeft de GPU veel meer de doorslag. Ook hier deden de HX-processoren van Intel het allemaal even goed en alle i9-modellen zijn zeer geschikt voor gaming. De Ryzen 9 7945HX3D biedt nog steeds aanzienlijk meer prestaties bij het draaien van heel wat games, bijvoorbeeld Far Cry 5, GTA V of F1 2023.

Shadow of the Tomb Raider - 2560x1440 Highest Preset AA:T
Asus ROG Strix Scar 17 G733PYV-LL053X
NVIDIA GeForce RTX 4090 Laptop GPU, R9 7945HX3D, SK hynix PC801 HFS001TEJ9X101N
199 fps +13%
Asus ROG Strix Scar 17 G733PY-XS96
NVIDIA GeForce RTX 4090 Laptop GPU, R9 7945HX, SK hynix PC801 HFS001TEJ9X101N
190 fps +8%
MSI Titan GT77 HX 13VI
NVIDIA GeForce RTX 4090 Laptop GPU, i9-13950HX, Samsung PM9A1 MZVL22T0HBLB
187 fps +6%
Lenovo Legion Pro 7 RTX4090
NVIDIA GeForce RTX 4090 Laptop GPU, i9-13900HX, Samsung PM9A1 MZVL21T0HCLR
185 fps +5%
SCHENKER XMG Neo 17 2024 Engineering Sample
NVIDIA GeForce RTX 4090 Laptop GPU, i9-14900HX
176 fps
Alienware M18 R1 QHD
NVIDIA GeForce RTX 4090 Laptop GPU, i9-13900HX
175 fps -1%
Asus ROG Strix Scar 18 2023 G834JY-N6005W
NVIDIA GeForce RTX 4090 Laptop GPU, i9-13980HX, 2x Samsung PM9A1 MZVL21T0HCLR (RAID 0)
121.2 fps -31%
Lenovo Legion Pro 5 16ARX8
NVIDIA GeForce RTX 4070 Laptop GPU, R7 7745HX, Samsung PM9A1 MZVL21T0HCLR
110 fps -37%
Far Cry 5 - 2560x1440 Ultra Preset AA:T
Asus ROG Strix Scar 17 G733PYV-LL053X
NVIDIA GeForce RTX 4090 Laptop GPU, R9 7945HX3D, SK hynix PC801 HFS001TEJ9X101N
194 fps +24%
MSI Titan GT77 HX 13VI
NVIDIA GeForce RTX 4090 Laptop GPU, i9-13950HX, Samsung PM9A1 MZVL22T0HBLB
159 fps +1%
Lenovo Legion 9 16IRX8
NVIDIA GeForce RTX 4090 Laptop GPU, i9-13980HX, 2x SK Hynix HFS001TEJ9X115N (RAID 0)
157 (111min - 208max) fps 0%
SCHENKER XMG Neo 17 2024 Engineering Sample
NVIDIA GeForce RTX 4090 Laptop GPU, i9-14900HX
157 fps
Asus ROG Strix Scar 18 2023 G834JY-N6005W
NVIDIA GeForce RTX 4090 Laptop GPU, i9-13980HX, 2x Samsung PM9A1 MZVL21T0HCLR (RAID 0)
153 (107min - 197max) fps -3%
Asus ROG Strix Scar 17 G733PY-XS96
NVIDIA GeForce RTX 4090 Laptop GPU, R9 7945HX, SK hynix PC801 HFS001TEJ9X101N
142 (104min - 189max) fps -10%
Far Cry 6 - 2560x1440 Ultra Graphics Quality + HD Textures AA:T
Asus ROG Strix Scar 17 G733PYV-LL053X
NVIDIA GeForce RTX 4090 Laptop GPU, R9 7945HX3D, SK hynix PC801 HFS001TEJ9X101N
146 fps +4%
SCHENKER XMG Neo 17 2024 Engineering Sample
NVIDIA GeForce RTX 4090 Laptop GPU, i9-14900HX
141 fps
MSI Titan GT77 HX 13VI
NVIDIA GeForce RTX 4090 Laptop GPU, i9-13950HX, Samsung PM9A1 MZVL22T0HBLB
135 fps -4%
Alienware M18 R1 QHD
NVIDIA GeForce RTX 4090 Laptop GPU, i9-13900HX
128 (104min - 155max) fps -9%
Asus ROG Strix Scar 17 G733PY-XS96
NVIDIA GeForce RTX 4090 Laptop GPU, R9 7945HX, SK hynix PC801 HFS001TEJ9X101N
109 (88min - 120max) fps -23%
Lenovo Legion Pro 5 16ARX8
NVIDIA GeForce RTX 4070 Laptop GPU, R7 7745HX, Samsung PM9A1 MZVL21T0HCLR
88 (57min - 99max) fps -38%
Final Fantasy XV Benchmark - 2560x1440 High Quality
MSI Titan GT77 HX 13VI
NVIDIA GeForce RTX 4090 Laptop GPU, i9-13950HX, Samsung PM9A1 MZVL22T0HBLB
162.9 fps +6%
Alienware m18 R1
NVIDIA GeForce RTX 4090 Laptop GPU, i9-13980HX, SK hynix PC801 HFS001TEJ9X101N
159.5 fps +4%
Lenovo Legion 9 16IRX8
NVIDIA GeForce RTX 4090 Laptop GPU, i9-13980HX, 2x SK Hynix HFS001TEJ9X115N (RAID 0)
158.4 fps +3%
SCHENKER Key 17 Pro (Early 23)
NVIDIA GeForce RTX 4090 Laptop GPU, i9-13900HX, Samsung 990 Pro 2 TB MZVL72T0HDLB
156.4 fps +2%
Lenovo Legion Pro 7 RTX4090
NVIDIA GeForce RTX 4090 Laptop GPU, i9-13900HX, Samsung PM9A1 MZVL21T0HCLR
154 fps 0%
SCHENKER XMG Neo 17 2024 Engineering Sample
NVIDIA GeForce RTX 4090 Laptop GPU, i9-14900HX
153.5 fps
Asus ROG Strix Scar 17 G733PYV-LL053X
NVIDIA GeForce RTX 4090 Laptop GPU, R9 7945HX3D, SK hynix PC801 HFS001TEJ9X101N
151.2 fps -1%
Asus ROG Strix Scar 17 G733PY-XS96
NVIDIA GeForce RTX 4090 Laptop GPU, R9 7945HX, SK hynix PC801 HFS001TEJ9X101N
151 fps -2%
Asus ROG Strix Scar 18 2023 G834JY-N6005W
NVIDIA GeForce RTX 4090 Laptop GPU, i9-13980HX, 2x Samsung PM9A1 MZVL21T0HCLR (RAID 0)
146.7 fps -4%
Lenovo Legion Pro 5 16ARX8
NVIDIA GeForce RTX 4070 Laptop GPU, R7 7745HX, Samsung PM9A1 MZVL21T0HCLR
119.9 fps -22%
GTA V - 2560x1440 Highest Settings possible AA:4xMSAA + FX AF:16x
Asus ROG Strix Scar 17 G733PYV-LL053X
NVIDIA GeForce RTX 4090 Laptop GPU, R9 7945HX3D, SK hynix PC801 HFS001TEJ9X101N
160.6 (2.82min, 111.1P1 - 363max) fps +11%
Alienware m18 R1
NVIDIA GeForce RTX 4090 Laptop GPU, i9-13980HX, SK hynix PC801 HFS001TEJ9X101N
145.5 (2.46min, 111.1P1 - 281max) fps 0%
Lenovo Legion 9 16IRX8
NVIDIA GeForce RTX 4090 Laptop GPU, i9-13980HX, 2x SK Hynix HFS001TEJ9X115N (RAID 0)
145.3 (4.06min, 100P1 - 332max) fps 0%
SCHENKER XMG Neo 17 2024 Engineering Sample
NVIDIA GeForce RTX 4090 Laptop GPU, i9-14900HX
145.2 (2.65min, 100P1 - 265max) fps
SCHENKER Key 17 Pro (Early 23)
NVIDIA GeForce RTX 4090 Laptop GPU, i9-13900HX, Samsung 990 Pro 2 TB MZVL72T0HDLB
141.5 (28.6min, 100P1 - 268max) fps -3%
Asus ROG Strix Scar 18 2023 G834JY-N6005W
NVIDIA GeForce RTX 4090 Laptop GPU, i9-13980HX, 2x Samsung PM9A1 MZVL21T0HCLR (RAID 0)
139.1 (3.59min, 90.9P1 - 238max) fps -4%
MSI Titan GT77 HX 13VI
NVIDIA GeForce RTX 4090 Laptop GPU, i9-13950HX, Samsung PM9A1 MZVL22T0HBLB
138.5 (3.45min, 76.9P1 - 256max) fps -5%
Lenovo Legion Pro 7 RTX4090
NVIDIA GeForce RTX 4090 Laptop GPU, i9-13900HX, Samsung PM9A1 MZVL21T0HCLR
137.7 (3.84min, 90.9P1 - 304max) fps -5%
Asus ROG Strix Scar 17 G733PY-XS96
NVIDIA GeForce RTX 4090 Laptop GPU, R9 7945HX, SK hynix PC801 HFS001TEJ9X101N
114.8 (5.12min, 71.4P1 - 204max) fps -21%
Lenovo Legion Pro 5 16ARX8
NVIDIA GeForce RTX 4070 Laptop GPU, R7 7745HX, Samsung PM9A1 MZVL21T0HCLR
93.2 (3.72min, 62.5P1 - 175.2max) fps -36%
F1 22 - 2560x1440 Ultra High Preset AA:T AF:16x
Alienware m18 R1
NVIDIA GeForce RTX 4090 Laptop GPU, i9-13980HX, SK hynix PC801 HFS001TEJ9X101N
92.2 (79min, 74P1 - 106max) fps +4%
Asus ROG Strix Scar 17 G733PY-XS96
NVIDIA GeForce RTX 4090 Laptop GPU, R9 7945HX, SK hynix PC801 HFS001TEJ9X101N
92.1 (75min, 60P1 - 107max) fps +4%
Asus ROG Strix Scar 17 G733PYV-LL053X
NVIDIA GeForce RTX 4090 Laptop GPU, R9 7945HX3D, SK hynix PC801 HFS001TEJ9X101N
91.8 (78min, 76P1 - 105max) fps +3%
Lenovo Legion 9 16IRX8
NVIDIA GeForce RTX 4090 Laptop GPU, i9-13980HX, 2x SK Hynix HFS001TEJ9X115N (RAID 0)
90.9 (76min, 56P1 - 105max) fps +2%
Alienware M18 R1 QHD
NVIDIA GeForce RTX 4090 Laptop GPU, i9-13900HX
90.6 (77min, 72P1 - 106max) fps +2%
MSI Titan GT77 HX 13VI
NVIDIA GeForce RTX 4090 Laptop GPU, i9-13950HX, Samsung PM9A1 MZVL22T0HBLB
90.1 (78min, 71P1 - 104max) fps +2%
SCHENKER XMG Neo 17 2024 Engineering Sample
NVIDIA GeForce RTX 4090 Laptop GPU, i9-14900HX
88.7 (77min, 67P1 - 104max) fps
Lenovo Legion Pro 7 RTX4090
NVIDIA GeForce RTX 4090 Laptop GPU, i9-13900HX, Samsung PM9A1 MZVL21T0HCLR
85.2 (72min, 40P1 - 96max) fps -4%
Asus ROG Strix Scar 18 2023 G834JY-N6005W
NVIDIA GeForce RTX 4090 Laptop GPU, i9-13980HX, 2x Samsung PM9A1 MZVL21T0HCLR (RAID 0)
75 (23min, 32P1 - 96max) fps -15%
Lenovo Legion Pro 5 16ARX8
NVIDIA GeForce RTX 4070 Laptop GPU, R7 7745HX, Samsung PM9A1 MZVL21T0HCLR
54.8 (47min, 45P1 - 65max) fps -38%
F1 23 - 2560x1440 Ultra High Preset AA:T AF:16x
Asus ROG Strix Scar 17 G733PYV-LL053X
NVIDIA GeForce RTX 4090 Laptop GPU, R9 7945HX3D, SK hynix PC801 HFS001TEJ9X101N
85.1 (67min, 67P1 - 100max) fps +11%
SCHENKER XMG Neo 17 2024 Engineering Sample
NVIDIA GeForce RTX 4090 Laptop GPU, i9-14900HX
76.9 (59min, 61P1 - 94max) fps
Call of Duty Modern Warfare 2 2022 - 2560x1440 Extreme Quality Preset AA:T2X Filmic SM
Asus ROG Strix Scar 17 G733PYV-LL053X
NVIDIA GeForce RTX 4090 Laptop GPU, R9 7945HX3D, SK hynix PC801 HFS001TEJ9X101N
136 fps +10%
MSI Titan GT77 HX 13VI
NVIDIA GeForce RTX 4090 Laptop GPU, i9-13950HX, Samsung PM9A1 MZVL22T0HBLB
135 fps +9%
Asus ROG Strix Scar 17 G733PY-XS96
NVIDIA GeForce RTX 4090 Laptop GPU, R9 7945HX, SK hynix PC801 HFS001TEJ9X101N
135 (69min) fps +9%
Lenovo Legion Pro 7 RTX4090
NVIDIA GeForce RTX 4090 Laptop GPU, i9-13900HX, Samsung PM9A1 MZVL21T0HCLR
132 (67min) fps +6%
Alienware M18 R1 QHD
NVIDIA GeForce RTX 4090 Laptop GPU, i9-13900HX
132 (69min) fps +6%
Asus ROG Strix Scar 18 2023 G834JY-N6005W
NVIDIA GeForce RTX 4090 Laptop GPU, i9-13980HX, 2x Samsung PM9A1 MZVL21T0HCLR (RAID 0)
127 (65P1) fps +2%
SCHENKER XMG Neo 17 2024 Engineering Sample
NVIDIA GeForce RTX 4090 Laptop GPU, i9-14900HX
124 fps
Lenovo Legion Pro 5 16ARX8
NVIDIA GeForce RTX 4070 Laptop GPU, R7 7745HX, Samsung PM9A1 MZVL21T0HCLR
77 (39min) fps -38%
Cyberpunk 2077 1.6 - 2560x1440 Ultra Preset
Asus ROG Strix Scar 17 G733PYV-LL053X
NVIDIA GeForce RTX 4090 Laptop GPU, R9 7945HX3D, SK hynix PC801 HFS001TEJ9X101N
116 fps +22%
Asus ROG Strix Scar 17 G733PY-XS96
NVIDIA GeForce RTX 4090 Laptop GPU, R9 7945HX, SK hynix PC801 HFS001TEJ9X101N
104.3 (34.5min - 159.2max) fps +9%
Alienware m18 R1
NVIDIA GeForce RTX 4090 Laptop GPU, i9-13980HX, SK hynix PC801 HFS001TEJ9X101N
102.16 (48.9min - 193.9max) fps +7%
Alienware M18 R1 QHD
NVIDIA GeForce RTX 4090 Laptop GPU, i9-13900HX
102.16 (41.4min - 165.62max) fps +7%
Lenovo Legion Pro 7 RTX4090
NVIDIA GeForce RTX 4090 Laptop GPU, i9-13900HX, Samsung PM9A1 MZVL21T0HCLR
100.93 (30.73min - 162.33max) fps +6%
Lenovo Legion 9 16IRX8
NVIDIA GeForce RTX 4090 Laptop GPU, i9-13980HX, 2x SK Hynix HFS001TEJ9X115N (RAID 0)
98.8 (28.3min - 147.2max) fps +4%
MSI Titan GT77 HX 13VI
NVIDIA GeForce RTX 4090 Laptop GPU, i9-13950HX, Samsung PM9A1 MZVL22T0HBLB
98 fps +3%
SCHENKER XMG Neo 17 2024 Engineering Sample
NVIDIA GeForce RTX 4090 Laptop GPU, i9-14900HX
95.3 fps
Asus ROG Strix Scar 18 2023 G834JY-N6005W
NVIDIA GeForce RTX 4090 Laptop GPU, i9-13980HX, 2x Samsung PM9A1 MZVL21T0HCLR (RAID 0)
94.5 (72min - 127max) fps -1%
Lenovo Legion Pro 5 16ARX8
NVIDIA GeForce RTX 4070 Laptop GPU, R7 7745HX, Samsung PM9A1 MZVL21T0HCLR
58.1 (37.8min - 93.4max) fps -39%
Cyberpunk 2077 2.0 Phantom Liberty - 2560x1440 Ultra Preset (FSR off)
Asus ROG Strix Scar 17 G733PYV-LL053X
NVIDIA GeForce RTX 4090 Laptop GPU, R9 7945HX3D, SK hynix PC801 HFS001TEJ9X101N
93.4 fps +6%
Lenovo Legion 9 16IRX8
NVIDIA GeForce RTX 4090 Laptop GPU, i9-13980HX, 2x SK Hynix HFS001TEJ9X115N (RAID 0)
89.55 (28.01min - 139.33max) fps +2%
SCHENKER XMG Neo 17 2024 Engineering Sample
NVIDIA GeForce RTX 4090 Laptop GPU, i9-14900HX
88.2 (17.8min - 124.4max) fps

Verdict - De Core i9-14900HX is slechts een kleine update

De Intel Core i9-14900HX in de Schenker XMG Neo 17 (E24) getest. Testapparaat geleverd door Schenker Technologies.

Intel heeft zijn mobiele HX-processors een kleine update gegeven voor 2024, maar grote veranderingen of verbeteringen zijn niet te zien op de nieuwe Raptor-Lake-HX-Refresh-modellen. Over het algemeen is de line-up wat afgeslankt, omdat de fabrikant het aantal 13e-gen HX-modellen heeft teruggebracht van negen naar vijf. De Core i9-14900HX is nu het enige topmodel, met 24 cores en 32 threads. De maximale turboboost is verhoogd naar 5,8 GHz, wat leidt tot betere single-core prestaties. Intel is erin geslaagd om in een groot aantal tests de prestatiekroon terug te veroveren op Apple. De hogere prestaties zijn echter simpelweg het resultaat van een hoger verbruik, wat betekent dat de efficiëntie weer niet de beste is.

Wat betreft multi-core prestaties hangt het vooral af van de ingestelde vermogenslimieten van elke afzonderlijke laptop - over het algemeen onderscheidt de nieuwe Core i9-14900HX zich niet veel van de oude 13e generatie Core-i9-HX modellen. Tijdens het gamen profiteert de nieuwe Raptor Lake-HX Refresh ook van de verbeterde single-core prestaties in een flink aantal games, maar aan het eind van de dag merkt u nauwelijks verschil - vooral niet bij maximale kwaliteitsinstellingen en hoge resoluties. De vermogenslimieten van de processor en grafische kaarten spelen hierbij opnieuw een grote rol. AMD's Ryzen 9 7945HX3D met 3D V-Cache blijft behoorlijk wat sneller in sommige games en blijft daardoor de beste mobiele HX CPU als het aankomt op efficiëntie en gamingprestaties.

Intel heeft de maximale turboklok van de nieuwe Core i9-14900HX verhoogd, waardoor met name de single-core prestaties zijn verbeterd. De Raptor Lake-HX Refresh kan niet profiteren van andere verbeteringen, maar door de catastrofale beschikbaarheid van HX CPU's van AMD hoeft dat ook niet.

Tenminste, dat is de theorie, aangezien er momenteel praktisch geen laptops op de markt zijn die zijn uitgerust met de Ryzen 9 7945HX3D. De Core i9-14900HX daarentegen zal binnenkort beschikbaar zijn in elke high-end gaming/multimedialaptop, waardoor het een makkie wordt om de markt in 2024 te domineren. De processor is zeker niet slecht, maar Intel hoeft op dit gebied niet echt veel moeite te doen of grote verbeteringen aan te bieden. Upgraden van een 13e-gen Core-i9-HX model heeft absoluut geen zin, terwijl het misschien zinvoller is om over te stappen van een Alder-Lake chip zoals de Core i9-12900HX, omdat deze nog steeds de oude RTX-3000 gen van Nvidia gebruikt.

Please share our article, every link counts!
> Overzichten en testrapporten over laptops en mobieltjes > Testrapporten > Intel Raptor Lake-HX vernieuwingsanalyse - Core i9-14900HX met meer single-core prestaties
Andreas Osthoff, 2024-01-10 (Update: 2024-01-10)