Notebookcheck Logo

AMD Ryzen 9 7945HX3D Zen4-analyse - De snelste mobiele gamingprocessor dankzij 3D V-Cache

Betere prestaties in 1080p en QHD. Op het gebied van desktop-pc's bestaan AMD-processors met 3D-cache al geruime tijd, maar met de aankondiging van de Ryzen 9 7945HX3D komt de eerste mobiele processor met 3D V-cache op de markt. Volgens AMD is dit nu de snelste gamingprocessor - die we hebben geanalyseerd.

Begin april konden we de nieuwe Ryzen 9 7945HX mobiele processordie een directe concurrent is voor Intels high-end chip, deCore i9-13980HX. De resultaten waren overtuigend, want de multi-core prestaties waren hoger - maar de efficiëntie was de echte ster van de show. Terwijl de CPU's van Intel meer dan 170 watt verbruiken, biedt de Ryzen 9 7945HX vergelijkbare prestaties bij een verbruik van slechts 80 - 100 watt.

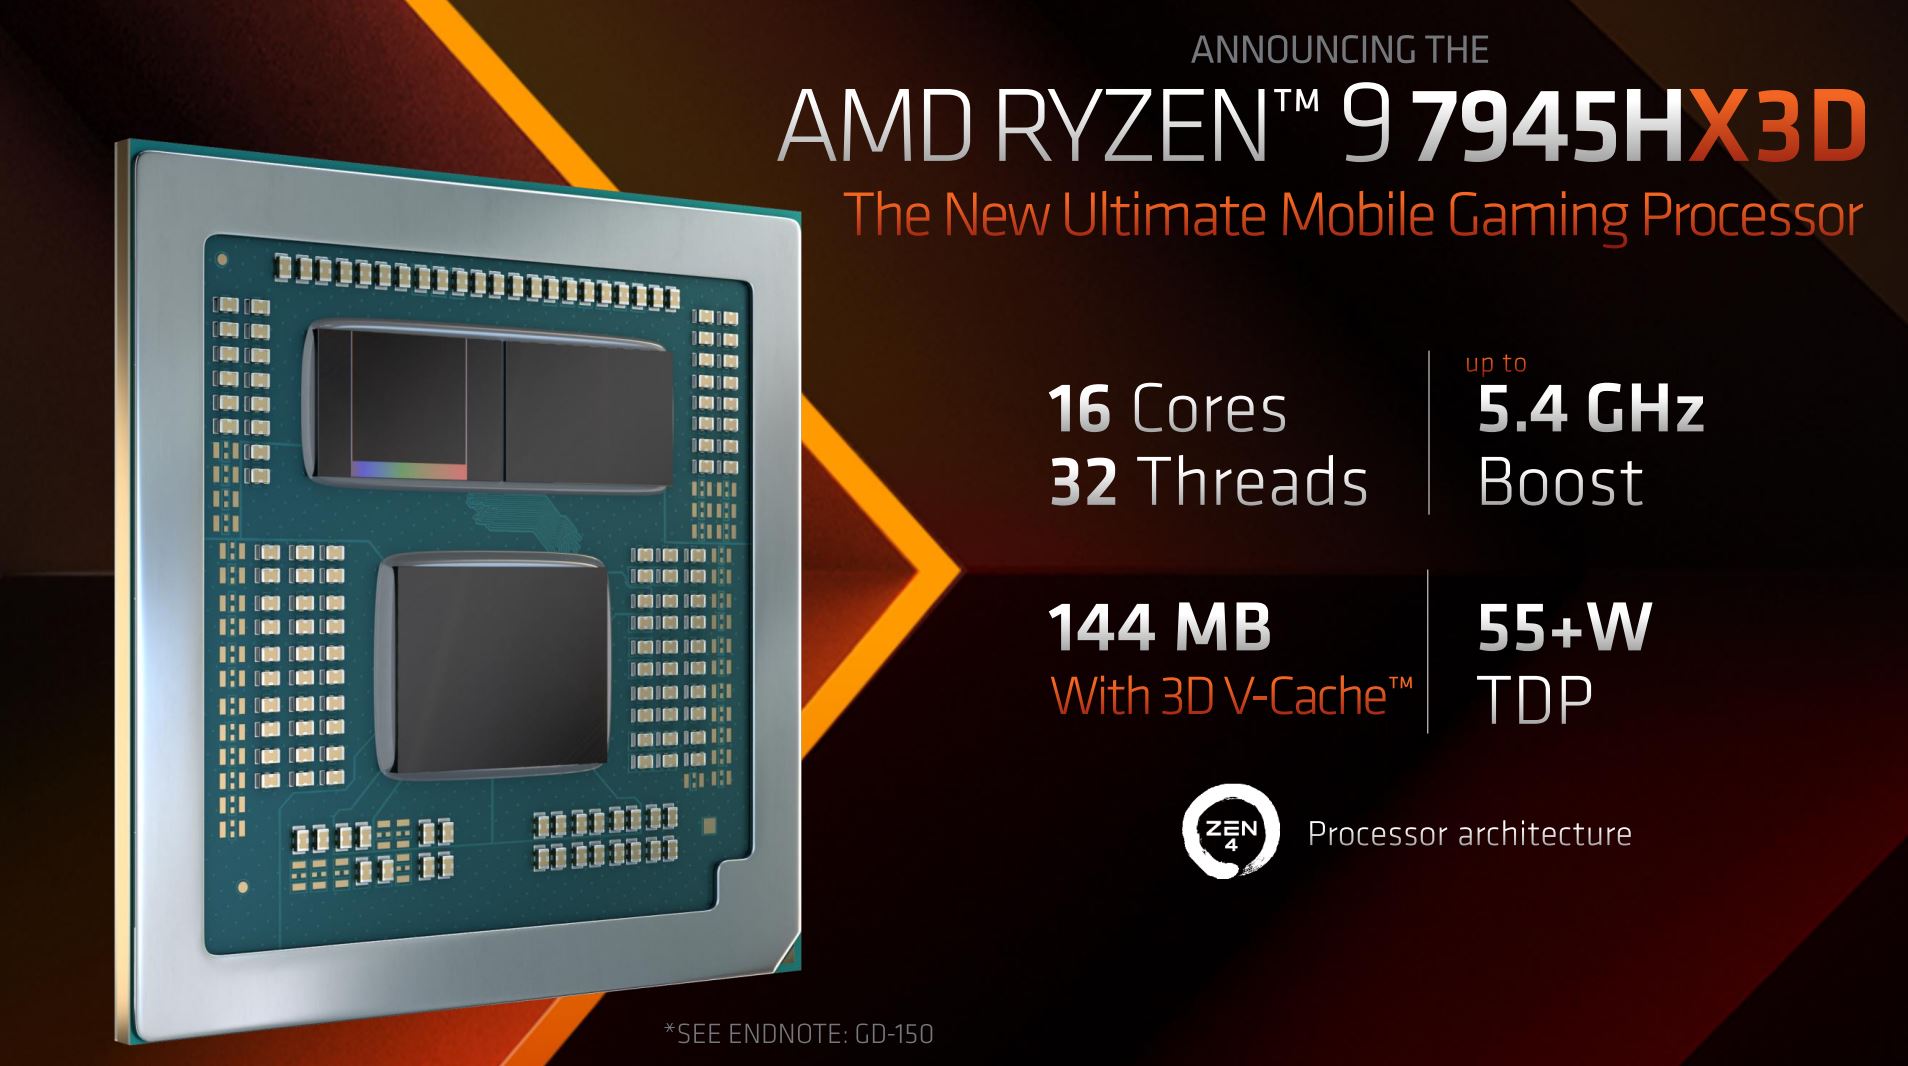
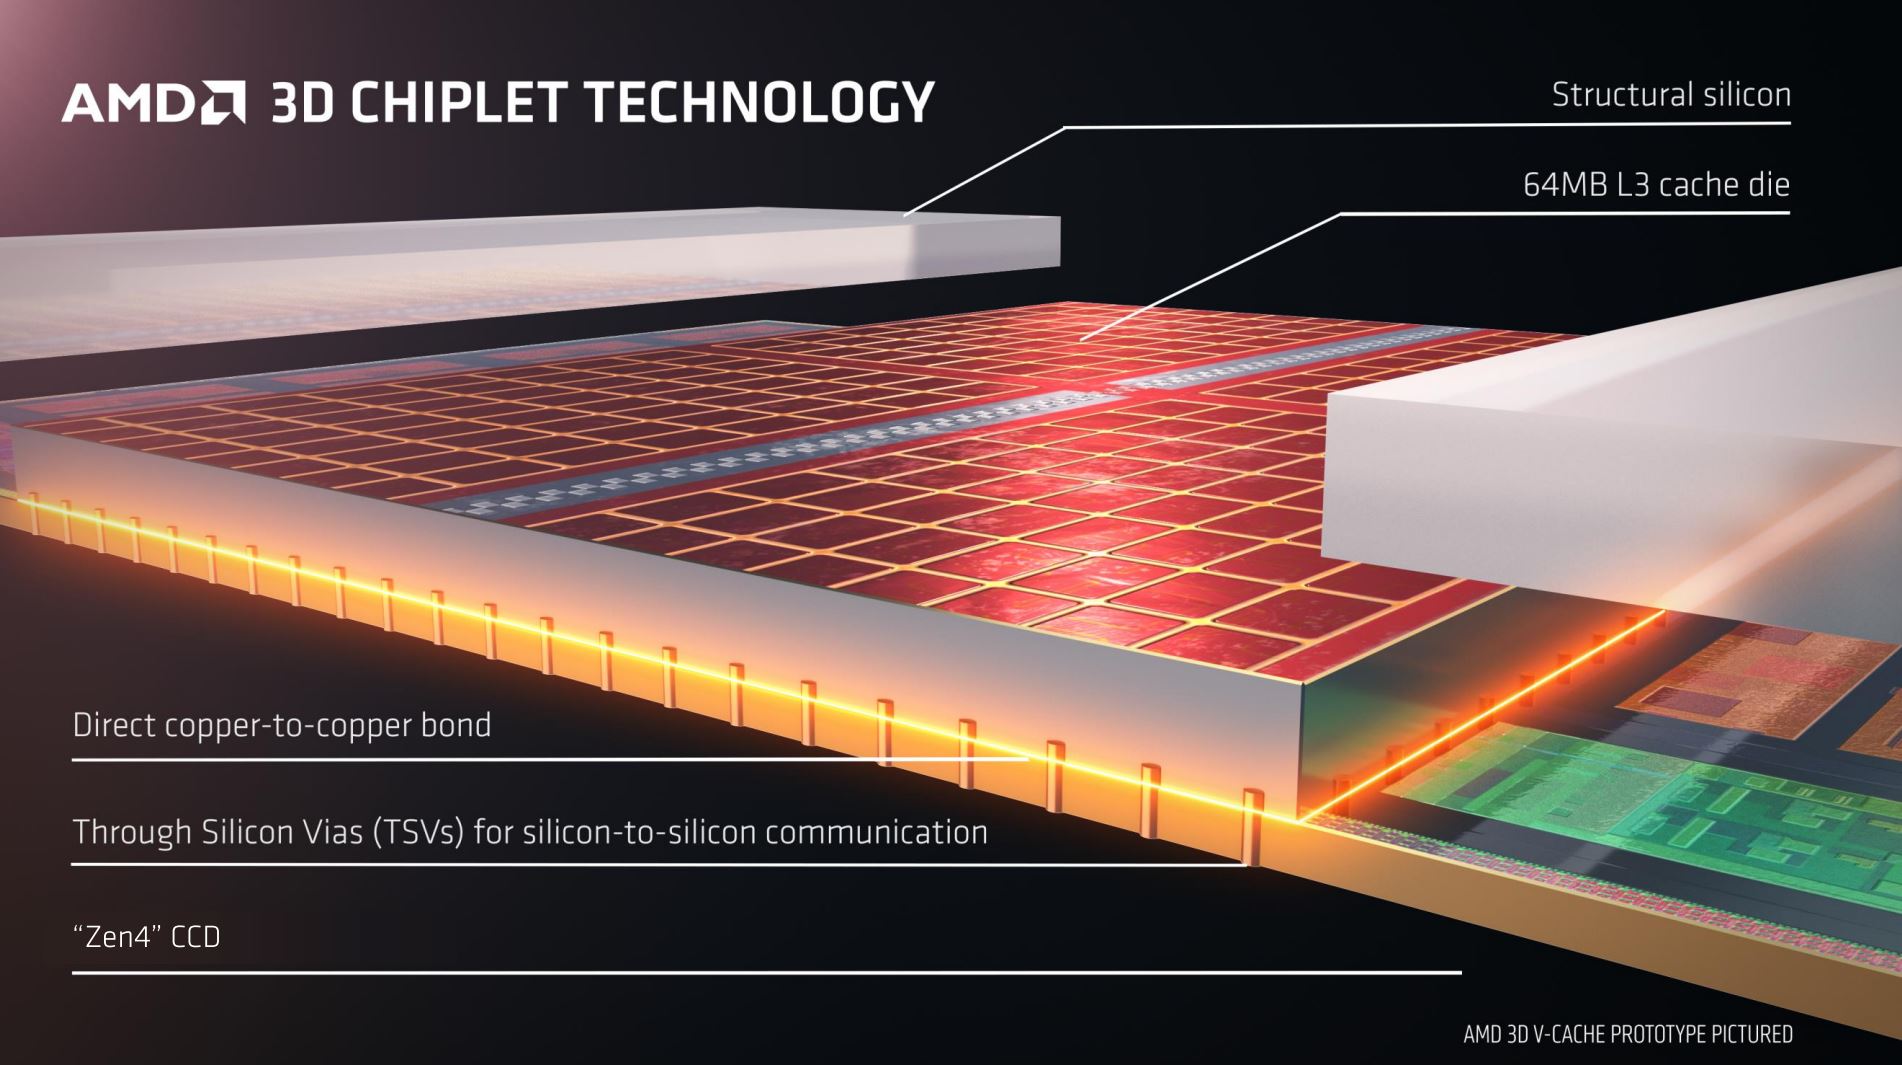
AMD biedt sinds vorig jaar al desktop CPU's met 3D V-Cache en nu is de Ryzen 9 7945HX3D de eerste mobiele processor die over deze technologie beschikt. Afgezien van de nieuwe 3D V-Cache (64 MB extra) zijn de specificaties identiek aan die van de gewone Ryzen 9 7945HX, wat betekent dat de processor 16 cores/32 threads heeft met een maximale klok van 5,4 GHz. In het geval van de 7945HX3D is de normale cache (80 MB L2/L3-cache) uitgebreid met nog eens 64 MB L3-cache. Daarbij bevindt de extra cache-module zich direct op de Zen4 CCD, die iets slanker is dan de gewone Zen4 CCD, wat leidt tot een identieke bouwhoogte. Naast de extra cache is deze ook voorzien van structurele siliconen, waardoor de koeleenheid het volledige oppervlak in beslag neemt. Vooral bij hoge framerates moet dit de prestaties verbeteren, omdat de toegangstijd kan worden verkort en nieuwe gegevens sneller kunnen worden aangeleverd.
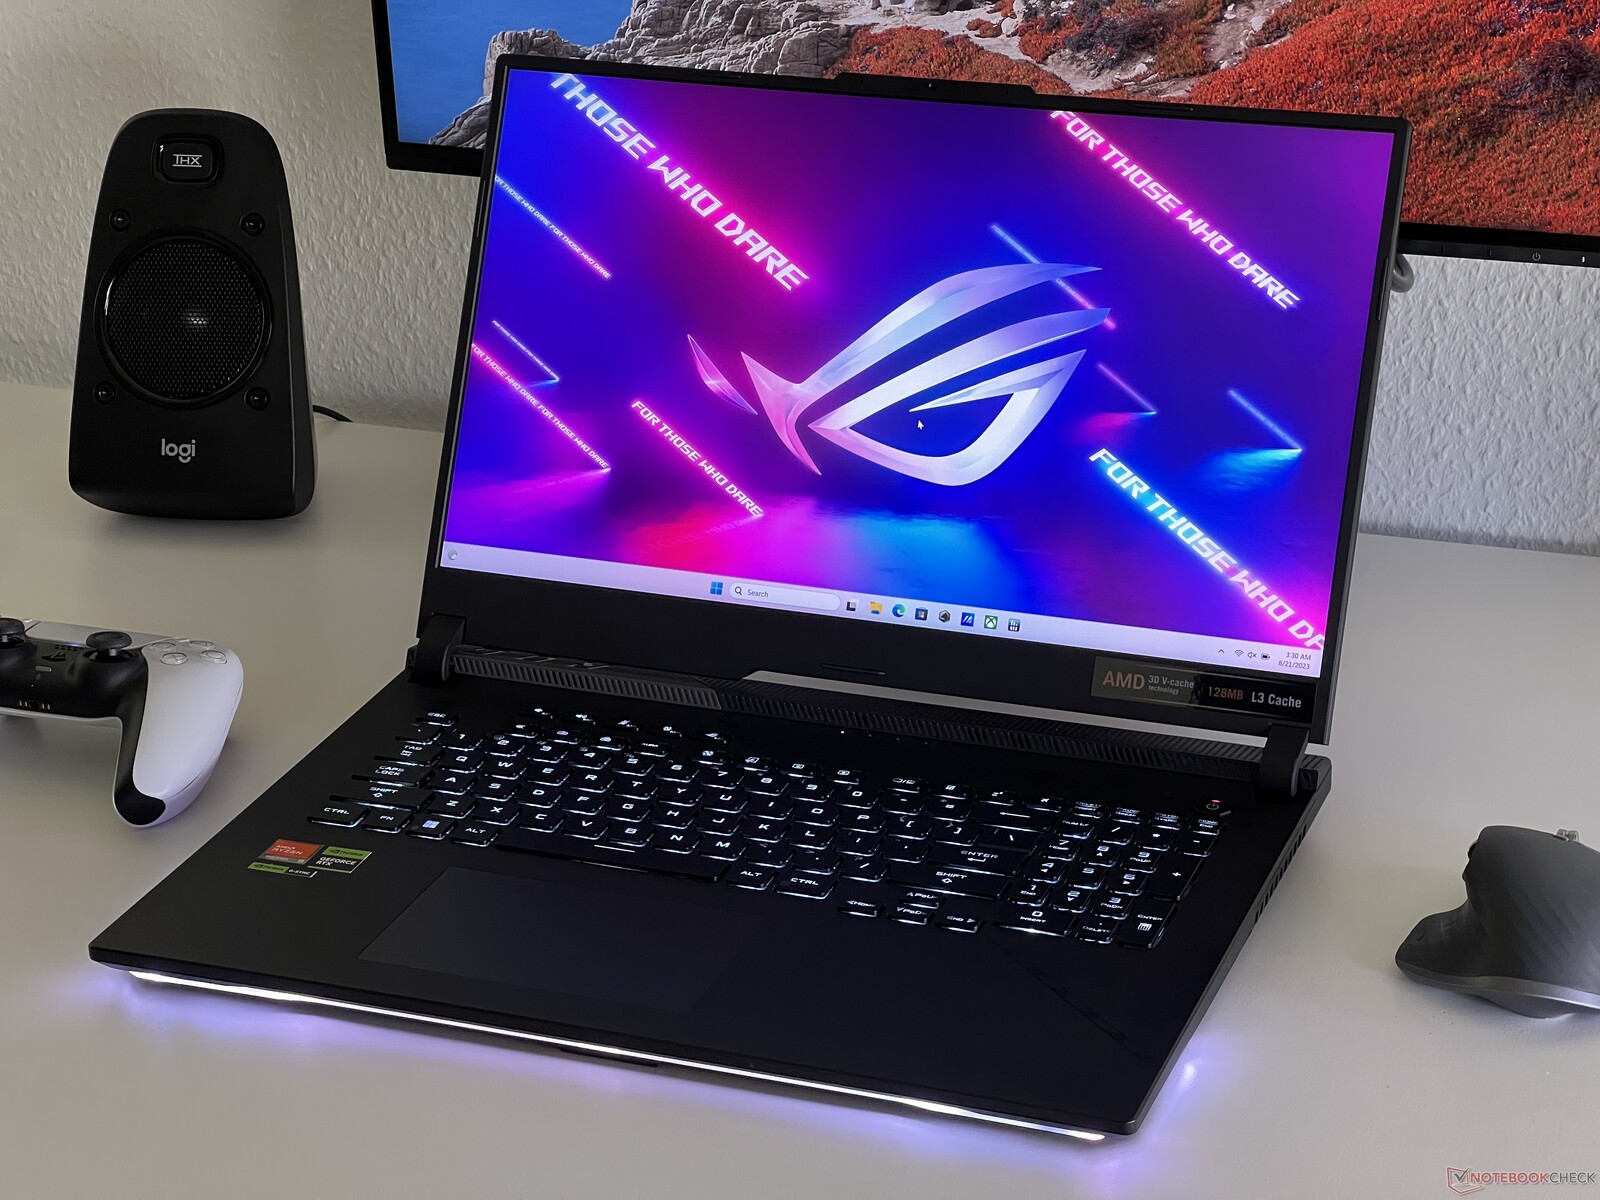
3D V-Cache (bron: AMD)

Testsysteem - Asus ROG Strix SCAR 17 X3D

Asus ROG Strix SCAR 17 X3D

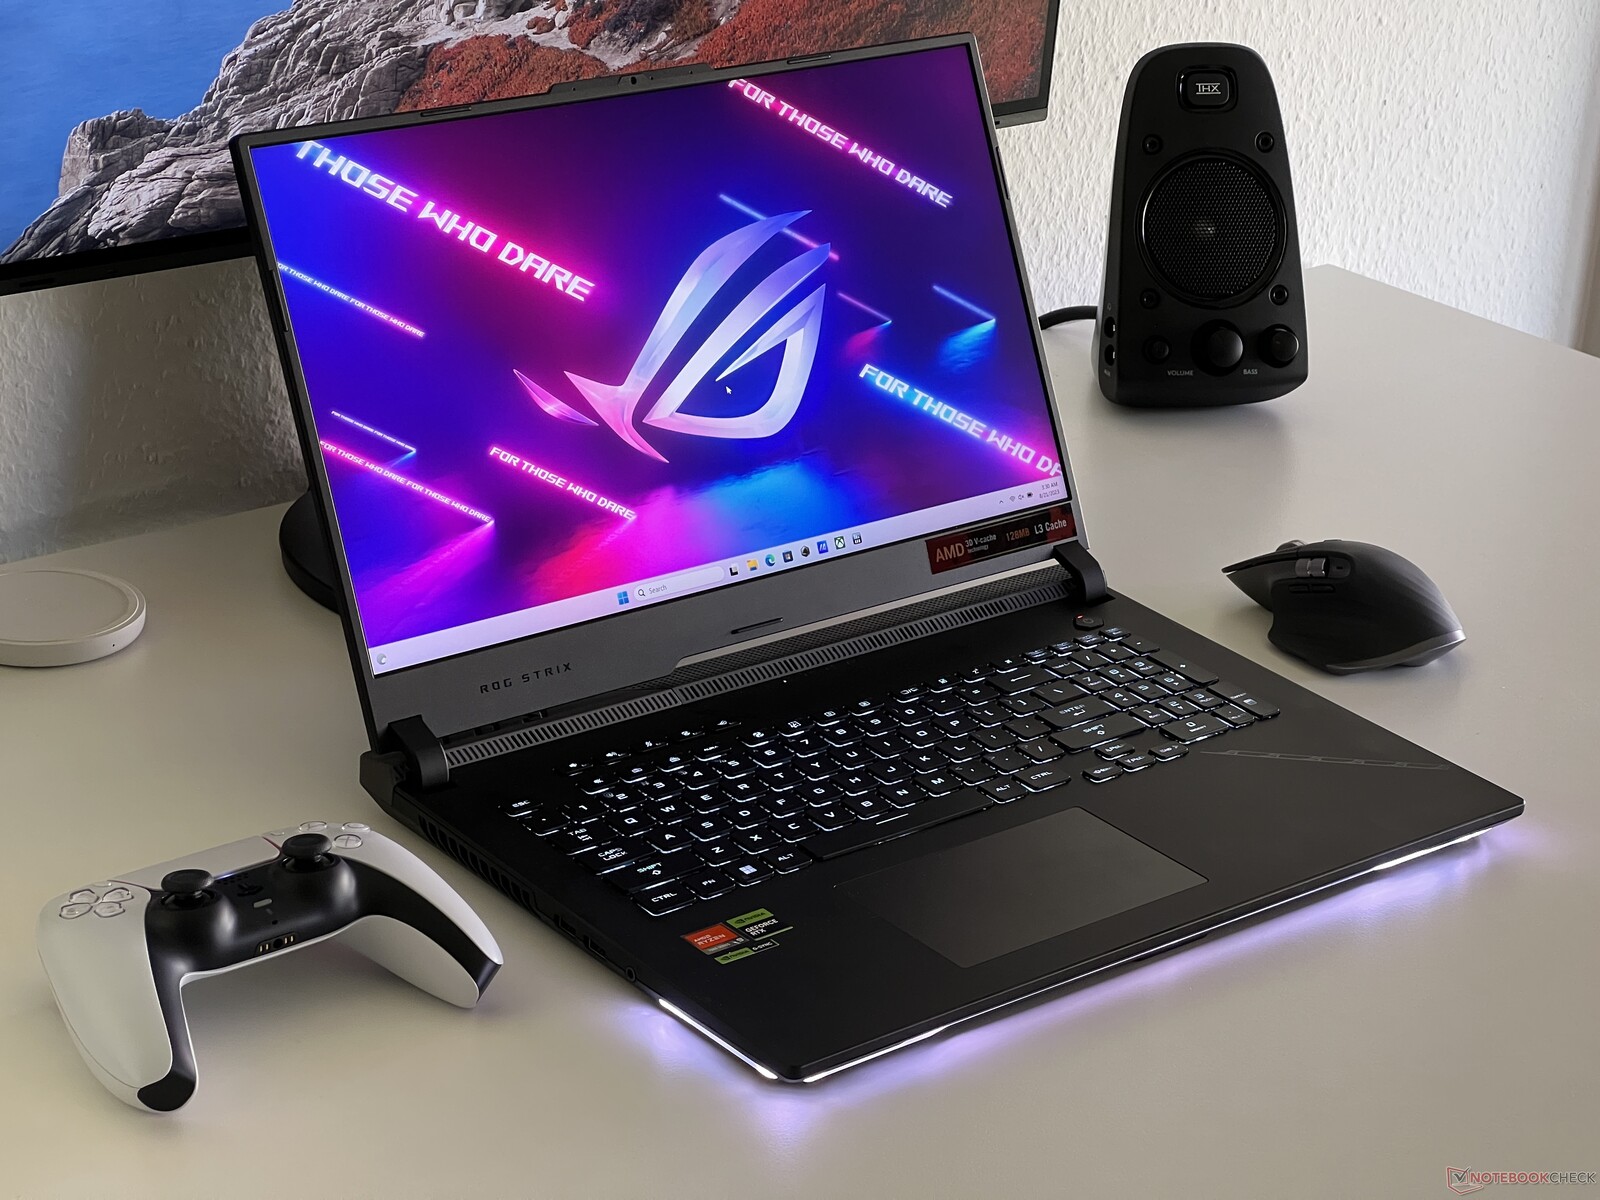
De Asus ROG Strix SCAR 17 X3D is momenteel de enige gaming laptop met de nieuwe Ryzen 9 7945HX3Dop de markt. We hebben de SCAR 17 al getest met de gewoneRyzen 9 7945HXen afgezien van de processor, is de configuratie met deGeForce RTX 4090 laptopen het 240-Hz QHD paneel identiek. Door de oppervlaktetextuur van de nieuwe processor kan Asus nu geen vloeibaar metaal gebruiken om warmte af te voeren - dit wordt duidelijk als je kijkt naar de waarden voor maximaal stroomverbruik. Op de Ryzen 9 7945HX3D neemt hij 115 watt op voor een zeer korte tijd, daarna balanceert hij uit op 100 watt.

Let op: Voor onze efficiëntiemeting hebben we de verbruikswaarden op een extern beeldscherm gebruikt om het interne beeldscherm als beïnvloedende factor uit te sluiten. Zoals al te zien was op de laatste ROG Strix SCAR 17, lopen alle beeldschermuitgangen via de dedicated GPU, die daardoor altijd actief is zodra je een extern beeldscherm gebruikt. Natuurlijk heeft dit tot op zekere hoogte invloed op de metingen, vooral als het gaat om de single-core efficiëntie.

Single-core prestaties

De single-core prestaties zijn vrijwel identiek aan de gewone Ryzen 9 7945HX en zijn op hun beurt aanzienlijk sneller dan de oude Zen3-modellen zoals deRyzen 9 6900HX. Intel'sCore i9-13900HXis ook vergelijkbaar - alleen deCore i9-13980HXprofiteert in totaal door zijn single-core turbo.

CPU Performance Rating: Percent
Cinebench R23: Single Core
Cinebench R20: CPU (Single Core)
Cinebench R15: CPU Single 64Bit
7-Zip 18.03: 7z b 4 -mmt1
Geekbench 5.5: Single-Core
CPU Performance Rating
Intel Core i9-13980HX
MSI Titan GT77 HX 13VI
98.5 pt
AMD Ryzen 9 7945HX3D
Asus ROG Strix Scar 17 G733PYV-LL053X
96 pt
Intel Core i9-13950HX
MSI Titan GT77 HX 13VI
95.4 pt
AMD Ryzen 9 7945HX
Asus Zephyrus Duo 16 GX650PY-NM006W
95.2 pt
Intel Core i9-13900HX
Lenovo Legion Pro 7 16IRX8H
94.7 pt
AMD Ryzen 9 7945HX
Asus ROG Strix G17 G713PI
94.6 pt
Intel Core i9-13900HX
SCHENKER XMG Neo 16 Raptor Lake
93 pt
AMD Ryzen 9 7945HX
Asus ROG Strix G17 G713PI
91.8 pt
Intel Core i9-13950HX
Razer Blade 16 Early 2023
88.2 pt
Intel Core i9-12900HX
MSI Titan GT77 12UHS
87.9 pt
AMD Ryzen 9 6900HX
SCHENKER XMG Neo 17 M22
75.3 pt
AMD Ryzen 9 6900HX
Asus ROG Zephyrus Duo 16 GX650RX
74.9 pt
Apple M2 Max -1!
Apple MacBook Pro 16 2023 M2 Max
74.9 pt
Cinebench R23 / Single Core
Intel Core i9-13980HX
MSI Titan GT77 HX 13VI
2169 Points +12%
Intel Core i9-13950HX
MSI Titan GT77 HX 13VI
2100 Points +9%
Intel Core i9-13900HX
SCHENKER XMG Neo 16 Raptor Lake
2055 Points +6%
Intel Core i9-13900HX
Lenovo Legion Pro 7 16IRX8H
2043 Points +6%
Intel Core i9-13950HX
Razer Blade 16 Early 2023
2029 Points +5%
AMD Ryzen 9 7945HX
Asus Zephyrus Duo 16 GX650PY-NM006W
1940 Points 0%
AMD Ryzen 9 7945HX
Asus ROG Strix G17 G713PI (Turbo Mode)
1936 Points 0%
AMD Ryzen 9 7945HX3D
Asus ROG Strix Scar 17 G733PYV-LL053X
1935 Points
Intel Core i9-12900HX
MSI Titan GT77 12UHS
1913 Points -1%
AMD Ryzen 9 7945HX
Asus ROG Strix G17 G713PI
1863 Points -4%
Apple M2 Max
Apple MacBook Pro 16 2023 M2 Max
1625 Points -16%
AMD Ryzen 9 6900HX
Asus ROG Zephyrus Duo 16 GX650RX
1566 Points -19%
AMD Ryzen 9 6900HX
SCHENKER XMG Neo 17 M22
1557 Points -20%
Cinebench R20 / CPU (Single Core)
Intel Core i9-13980HX
MSI Titan GT77 HX 13VI
825 Points +9%
Intel Core i9-13950HX
MSI Titan GT77 HX 13VI
803 Points +6%
Intel Core i9-13900HX
Lenovo Legion Pro 7 16IRX8H
788 Points +4%
Intel Core i9-13900HX
SCHENKER XMG Neo 16 Raptor Lake
756 Points 0%
AMD Ryzen 9 7945HX
Asus Zephyrus Duo 16 GX650PY-NM006W
756 Points 0%
AMD Ryzen 9 7945HX3D
Asus ROG Strix Scar 17 G733PYV-LL053X
755 Points
AMD Ryzen 9 7945HX
Asus ROG Strix G17 G713PI (Turbo Mode)
753 Points 0%
Intel Core i9-13950HX
Razer Blade 16 Early 2023
742 Points -2%
Intel Core i9-12900HX
MSI Titan GT77 12UHS
738 Points -2%
AMD Ryzen 9 7945HX
Asus ROG Strix G17 G713PI
712 Points -6%
AMD Ryzen 9 6900HX
SCHENKER XMG Neo 17 M22
605 Points -20%
AMD Ryzen 9 6900HX
Asus ROG Zephyrus Duo 16 GX650RX
595 Points -21%
Apple M2 Max
Apple MacBook Pro 16 2023 M2 Max
460 Points -39%
Cinebench R15 / CPU Single 64Bit
Intel Core i9-13980HX
MSI Titan GT77 HX 13VI
312 Points 0%
AMD Ryzen 9 7945HX3D
Asus ROG Strix Scar 17 G733PYV-LL053X
311 Points
AMD Ryzen 9 7945HX
Asus Zephyrus Duo 16 GX650PY-NM006W
307 Points -1%
Intel Core i9-13900HX
Lenovo Legion Pro 7 16IRX8H
301 Points -3%
AMD Ryzen 9 7945HX
Asus ROG Strix G17 G713PI (Turbo Mode)
301 Points -3%
Intel Core i9-13950HX
MSI Titan GT77 HX 13VI
300 Points -4%
Intel Core i9-13900HX
SCHENKER XMG Neo 16 Raptor Lake
295 Points -5%
Intel Core i9-13900HX
SCHENKER XMG Neo 16 Raptor Lake
294 Points -5%
AMD Ryzen 9 7945HX
Asus ROG Strix G17 G713PI
294 Points -5%
Intel Core i9-12900HX
MSI Titan GT77 12UHS
278 Points -11%
Intel Core i9-13950HX
Razer Blade 16 Early 2023
274 Points -12%
AMD Ryzen 9 6900HX
Asus ROG Zephyrus Duo 16 GX650RX
249 Points -20%
AMD Ryzen 9 6900HX
SCHENKER XMG Neo 17 M22
248 Points -20%
Apple M2 Max
Apple MacBook Pro 16 2023 M2 Max
239 Points -23%
7-Zip 18.03 / 7z b 4 -mmt1
AMD Ryzen 9 7945HX3D
Asus ROG Strix Scar 17 G733PYV-LL053X
7573 MIPS
AMD Ryzen 9 7945HX
Asus ROG Strix G17 G713PI (Turbo Mode)
7379 MIPS -3%
AMD Ryzen 9 7945HX
Asus ROG Strix G17 G713PI
7332 MIPS -3%
AMD Ryzen 9 7945HX
Asus Zephyrus Duo 16 GX650PY-NM006W
7319 MIPS -3%
Intel Core i9-13900HX
Lenovo Legion Pro 7 16IRX8H
7035 MIPS -7%
Intel Core i9-13980HX
MSI Titan GT77 HX 13VI
7018 MIPS -7%
Intel Core i9-13950HX
MSI Titan GT77 HX 13VI
6897 MIPS -9%
Intel Core i9-13900HX
SCHENKER XMG Neo 16 Raptor Lake
6800 MIPS -10%
Intel Core i9-13950HX
Razer Blade 16 Early 2023
6445 MIPS -15%
Intel Core i9-12900HX
MSI Titan GT77 12UHS
6256 MIPS -17%
AMD Ryzen 9 6900HX
SCHENKER XMG Neo 17 M22
5872 MIPS -22%
AMD Ryzen 9 6900HX
Asus ROG Zephyrus Duo 16 GX650RX
5727 MIPS -24%
Geekbench 5.5 / Single-Core
Intel Core i9-13980HX
MSI Titan GT77 HX 13VI
2139 Points 0%
AMD Ryzen 9 7945HX3D
Asus ROG Strix Scar 17 G733PYV-LL053X
2133 Points
AMD Ryzen 9 7945HX
Asus Zephyrus Duo 16 GX650PY-NM006W
2132 Points 0%
AMD Ryzen 9 7945HX
Asus ROG Strix G17 G713PI (Turbo Mode)
2103 Points -1%
AMD Ryzen 9 7945HX
Asus ROG Strix G17 G713PI
2053 Points -4%
Intel Core i9-13950HX
MSI Titan GT77 HX 13VI
2043 Points -4%
Intel Core i9-13900HX
Lenovo Legion Pro 7 16IRX8H
2025 Points -5%
Intel Core i9-13900HX
SCHENKER XMG Neo 16 Raptor Lake
2023 Points -5%
Apple M2 Max
Apple MacBook Pro 16 2023 M2 Max
1978 Points -7%
Intel Core i9-12900HX
MSI Titan GT77 12UHS
1923 Points -10%
Intel Core i9-13950HX
Razer Blade 16 Early 2023
1805 Points -15%
AMD Ryzen 9 6900HX
Asus ROG Zephyrus Duo 16 GX650RX
1594 Points -25%
AMD Ryzen 9 6900HX
SCHENKER XMG Neo 17 M22
1590 Points -25%
CPU Performance Rating: Percent
Cinebench R23: Single Core
Cinebench R20: CPU (Single Core)
Cinebench R15: CPU Single 64Bit
7-Zip 18.03: 7z b 4 -mmt1
Geekbench 5.5: Single-Core

Als we naar de resultaten kijken, mogen we niet vergeten dat de AMD Zen4 core ongeveer 27 watt verbruikt bij single-core belasting, terwijl de prestatiekern van de nieuwe Raptor Lake HX CPU's 34 - 36 watt verbruikt. Dit betekent dat de pure CPU-efficiëntie van AMD beter is dan die van Intel. Het feit dat de speciale Nvidia GPU actief was voor onze energieverbruiksmetingen met behulp van een externe monitor, vertekende natuurlijk onze resultaten - het is belangrijk om dit in gedachten te houden. Voor de volledigheid hebben we deze waarden toch opgenomen. Je zou dit eigenlijk als positief kunnen zien, want zelfs met de geactiveerde dGPU zat ons testapparaat met de nieuwe Ryzen 9 7945HX3D op hetzelfde niveau als de Intel Raptor Lake HX chips, die een inactieve iGPU hadden tijdens de metingen.

Power Consumption / Cinebench R23 Single Power Efficiency - external Monitor
Apple M2 Max
Apple MacBook Pro 16 2023 M2 Max
71.9 Points per Watt +167%
Intel Core i9-13950HX
MSI Titan GT77 HX 13VI
28.5 Points per Watt +6%
AMD Ryzen 9 7945HX
Asus ROG Strix G17 G713PI
28.2 Points per Watt +5%
Intel Core i9-12900HX
MSI Titan GT77 12UHS
27.8 Points per Watt +3%
AMD Ryzen 9 7945HX3D
Asus ROG Strix Scar 17 G733PYV-LL053X
26.9 Points per Watt
AMD Ryzen 9 7945HX
Asus ROG Strix G17 G713PI
26.8 Points per Watt 0%
AMD Ryzen 9 7945HX
Asus Zephyrus Duo 16 GX650PY-NM006W
26.4 Points per Watt -2%
Power Consumption / Cinebench R23 Single (external Monitor)
Intel Core i9-13950HX
MSI Titan GT77 HX 13VI
73.8 (69.8min, 70.2P1 - 100.2max) Watt * -3%
AMD Ryzen 9 7945HX
Asus Zephyrus Duo 16 GX650PY-NM006W
73.4 (69.8min, 69.9P1 - 99.9max) Watt * -2%
AMD Ryzen 9 7945HX
Asus ROG Strix G17 G713PI (Turbo Mode)
72.2 (62.6min, 63.8P1 - 92.5max) Watt * -0%
AMD Ryzen 9 7945HX3D
Asus ROG Strix Scar 17 G733PYV-LL053X
71.9 (70.8min, 71P1 - 86max) Watt *
Intel Core i9-12900HX
MSI Titan GT77 12UHS
68.7 (63.7min, 64.8P1 - 87.6max) Watt * +4%
AMD Ryzen 9 7945HX
Asus ROG Strix G17 G713PI
66.1 (57.7min, 58.2P1 - 93.6max) Watt * +8%
Apple M2 Max
Apple MacBook Pro 16 2023 M2 Max
22.6 (17.4min, 18.2P1 - 29.7max) Watt * +69%

* ... kleiner is beter

Multi-core prestaties

Tijdens de multi-core test werden we ons bewust van de ietwat zwakke koeling - hier wist de nieuwe Ryzen 9 7945HX3D ternauwernood te concurreren met de modellen met de gewone Ryzen 9 7945HX. In totaal lag de nieuwe Zen4 processor met 3D V-Cache nog steeds voor op zijn Intel concurrenten, die bovendien meer stroom verbruiken. Als je echter maximale CPU-prestaties nodig hebt, moet je gaan voor een apparaat met de gewone Ryzen 9 7945HX die vloeibaar metaal gebruikt.

CPU Performance Rating: Percent
Cinebench R23: Multi Core
Cinebench R20: CPU (Multi Core)
Cinebench R15: CPU Multi 64Bit
Blender: v2.79 BMW27 CPU
7-Zip 18.03: 7z b 4
Geekbench 5.5: Multi-Core
CPU Performance Rating
AMD Ryzen 9 7945HX
Asus ROG Strix G17 G713PI
91.8 pt
AMD Ryzen 9 7945HX
Asus Zephyrus Duo 16 GX650PY-NM006W
90.5 pt
AMD Ryzen 9 7945HX3D
Asus ROG Strix Scar 17 G733PYV-LL053X
89.4 pt
Intel Core i9-13950HX
MSI Titan GT77 HX 13VI
87.3 pt
Intel Core i9-13980HX
MSI Titan GT77 HX 13VI
86.3 pt
Intel Core i9-13900HX
Lenovo Legion Pro 7 16IRX8H
82.5 pt
AMD Ryzen 9 7945HX
Asus ROG Strix G17 G713PI
81.4 pt
Intel Core i9-13900HX
SCHENKER XMG Neo 16 Raptor Lake
80.3 pt
Intel Core i9-13950HX
Razer Blade 16 Early 2023
72.1 pt
Intel Core i9-12900HX
MSI Titan GT77 12UHS
60.7 pt
Apple M2 Max -2!
Apple MacBook Pro 16 2023 M2 Max
45.4 pt
AMD Ryzen 9 6900HX
Asus ROG Zephyrus Duo 16 GX650RX
35.9 pt
Cinebench R23 / Multi Core
AMD Ryzen 9 7945HX
Asus Zephyrus Duo 16 GX650PY-NM006W
34521 (32987.6min - 34521.3max) Points +5%
AMD Ryzen 9 7945HX
Asus ROG Strix G17 G713PI (Turbo Mode)
34202 Points +4%
Intel Core i9-13950HX
MSI Titan GT77 HX 13VI
33277 Points +2%
Intel Core i9-13980HX
MSI Titan GT77 HX 13VI
33052 Points +1%
AMD Ryzen 9 7945HX3D
Asus ROG Strix Scar 17 G733PYV-LL053X
32782 Points
AMD Ryzen 9 7945HX
Asus ROG Strix G17 G713PI
32379 Points -1%
Intel Core i9-13900HX
Lenovo Legion Pro 7 16IRX8H
30162 Points -8%
Intel Core i9-13900HX
SCHENKER XMG Neo 16 Raptor Lake
28707 (26191.7min - 28706.8max) Points -12%
Intel Core i9-13900HX
SCHENKER XMG Neo 16 Raptor Lake
28010 (26406.1min - 28009.8max) Points -15%
Intel Core i9-13900HX
SCHENKER XMG Neo 16 Raptor Lake
26703 Points -19%
Intel Core i9-13950HX
Razer Blade 16 Early 2023
26736 (22394.1min - 26736.1max) Points -18%
Intel Core i9-12900HX
MSI Titan GT77 12UHS
22982 Points -30%
Apple M2 Max
Apple MacBook Pro 16 2023 M2 Max
14767 Points -55%
AMD Ryzen 9 6900HX
Asus ROG Zephyrus Duo 16 GX650RX
14085 Points -57%
Cinebench R20 / CPU (Multi Core)
AMD Ryzen 9 7945HX
Asus ROG Strix G17 G713PI (Turbo Mode)
13769 Points +6%
AMD Ryzen 9 7945HX
Asus Zephyrus Duo 16 GX650PY-NM006W
13457 Points +3%
AMD Ryzen 9 7945HX3D
Asus ROG Strix Scar 17 G733PYV-LL053X
13033 Points
Intel Core i9-13950HX
MSI Titan GT77 HX 13VI
12648 Points -3%
Intel Core i9-13980HX
MSI Titan GT77 HX 13VI
12437 Points -5%
Intel Core i9-13900HX
Lenovo Legion Pro 7 16IRX8H
11500 Points -12%
Intel Core i9-13900HX
SCHENKER XMG Neo 16 Raptor Lake
11289 Points -13%
AMD Ryzen 9 7945HX
Asus ROG Strix G17 G713PI
10025 Points -23%
Intel Core i9-13950HX
Razer Blade 16 Early 2023
8697 Points -33%
Intel Core i9-12900HX
MSI Titan GT77 12UHS
8667 Points -33%
AMD Ryzen 9 6900HX
Asus ROG Zephyrus Duo 16 GX650RX
5489 Points -58%
Apple M2 Max
Apple MacBook Pro 16 2023 M2 Max
4044 Points -69%
Cinebench R15 / CPU Multi 64Bit
AMD Ryzen 9 7945HX
Asus ROG Strix G17 G713PI (Turbo Mode)
5663 Points +1%
AMD Ryzen 9 7945HX3D
Asus ROG Strix Scar 17 G733PYV-LL053X
5600 (5177.32min - 5599.89max) Points
AMD Ryzen 9 7945HX
Asus Zephyrus Duo 16 GX650PY-NM006W
5554 (5255.55min - 5554.01max) Points -1%
Intel Core i9-13950HX
MSI Titan GT77 HX 13VI
5227 (4889.98min - 5226.71max) Points -7%
AMD Ryzen 9 7945HX
Asus ROG Strix G17 G713PI
5205 (4749.47min - 5204.94max) Points -7%
Intel Core i9-13980HX
MSI Titan GT77 HX 13VI
5172 (4917.63min - 5171.97max) Points -8%
Intel Core i9-13900HX
SCHENKER XMG Neo 16 Raptor Lake
4913 Points -12%
Intel Core i9-13900HX
SCHENKER XMG Neo 16 Raptor Lake
4875 (4298.3min - 4875.08max) Points -13%
Intel Core i9-13900HX
Lenovo Legion Pro 7 16IRX8H
4819 (4429.68min - 4819.28max) Points -14%
Intel Core i9-13950HX
Razer Blade 16 Early 2023
4529 (4463.29min - 4528.99max) Points -19%
Intel Core i9-12900HX
MSI Titan GT77 12UHS
3570 (3259.45min - 3569.52max) Points -36%
AMD Ryzen 9 6900HX
Asus ROG Zephyrus Duo 16 GX650RX
2292 Points -59%
Apple M2 Max
Apple MacBook Pro 16 2023 M2 Max
2074 (2068.47min, 2068.57P1 - 2081.27max) Points -63%
Blender / v2.79 BMW27 CPU
AMD Ryzen 9 6900HX
Asus ROG Zephyrus Duo 16 GX650RX
220 Seconds * -132%
Intel Core i9-12900HX
MSI Titan GT77 12UHS
147 Seconds * -55%
Intel Core i9-13950HX
Razer Blade 16 Early 2023
114 Seconds * -20%
Intel Core i9-13900HX
SCHENKER XMG Neo 16 Raptor Lake
111 Seconds * -17%
Intel Core i9-13900HX
Lenovo Legion Pro 7 16IRX8H
105 Seconds * -11%
Intel Core i9-13980HX
MSI Titan GT77 HX 13VI
101 Seconds * -6%
Intel Core i9-13950HX
MSI Titan GT77 HX 13VI
100 Seconds * -5%
AMD Ryzen 9 7945HX
Asus ROG Strix G17 G713PI
100 Seconds * -5%
AMD Ryzen 9 7945HX
Asus ROG Strix G17 G713PI (Turbo Mode)
95 Seconds * -0%
AMD Ryzen 9 7945HX3D
Asus ROG Strix Scar 17 G733PYV-LL053X
95 Seconds *
AMD Ryzen 9 7945HX
Asus Zephyrus Duo 16 GX650PY-NM006W
93 Seconds * +2%
7-Zip 18.03 / 7z b 4
AMD Ryzen 9 7945HX
Asus ROG Strix G17 G713PI (Turbo Mode)
140471 MIPS +3%
AMD Ryzen 9 7945HX3D
Asus ROG Strix Scar 17 G733PYV-LL053X
136201 MIPS
AMD Ryzen 9 7945HX
Asus Zephyrus Duo 16 GX650PY-NM006W
135927 MIPS 0%
Intel Core i9-13950HX
MSI Titan GT77 HX 13VI
127295 MIPS -7%
Intel Core i9-13980HX
MSI Titan GT77 HX 13VI
125720 MIPS -8%
AMD Ryzen 9 7945HX
Asus ROG Strix G17 G713PI
123364 MIPS -9%
Intel Core i9-13900HX
Lenovo Legion Pro 7 16IRX8H
122254 MIPS -10%
Intel Core i9-13900HX
SCHENKER XMG Neo 16 Raptor Lake
118715 MIPS -13%
Intel Core i9-13950HX
Razer Blade 16 Early 2023
109330 MIPS -20%
Intel Core i9-12900HX
MSI Titan GT77 12UHS
86234 MIPS -37%
AMD Ryzen 9 6900HX
Asus ROG Zephyrus Duo 16 GX650RX
64457 MIPS -53%
Geekbench 5.5 / Multi-Core
Intel Core i9-13900HX
Lenovo Legion Pro 7 16IRX8H
21058 Points +6%
Intel Core i9-13900HX
SCHENKER XMG Neo 16 Raptor Lake
20784 Points +5%
Intel Core i9-13950HX
MSI Titan GT77 HX 13VI
20634 Points +4%
Intel Core i9-13980HX
MSI Titan GT77 HX 13VI
20329 Points +2%
AMD Ryzen 9 7945HX
Asus ROG Strix G17 G713PI (Turbo Mode)
19954 Points 0%
AMD Ryzen 9 7945HX3D
Asus ROG Strix Scar 17 G733PYV-LL053X
19875 Points
AMD Ryzen 9 7945HX
Asus Zephyrus Duo 16 GX650PY-NM006W
19583 Points -1%
AMD Ryzen 9 7945HX
Asus ROG Strix G17 G713PI
18372 Points -8%
Intel Core i9-13950HX
Razer Blade 16 Early 2023
18152 Points -9%
Intel Core i9-12900HX
MSI Titan GT77 12UHS
16250 Points -18%
Apple M2 Max
Apple MacBook Pro 16 2023 M2 Max
15348 Points -23%
AMD Ryzen 9 6900HX
Asus ROG Zephyrus Duo 16 GX650RX
10167 Points -49%
CPU Performance Rating: Percent
Cinebench R23: Multi Core
Cinebench R20: CPU (Multi Core)
Cinebench R15: CPU Multi 64Bit
Blender: v2.79 BMW27 CPU
7-Zip 18.03: 7z b 4
Geekbench 5.5: Multi-Core

* ... kleiner is beter

Als we kijken naar de efficiëntie, moeten we niet vergeten dat de dedicated GPU actief was. Door het hogere totale verbruik is de invloed hier kleiner dan tijdens de single-core tests. De nieuwe Ryzen 9 7945HX3D lag voor op beide gewone 7945HX CPU's in turbomodus, wat het enige resultaat is van de lagere vermogenslimieten. Als ze allebei dezelfde vermogenslimieten hadden (bijvoorbeeld 100 watt), dan zou de efficiëntie van beide modellen vergelijkbaar zijn. Hier zie je ook AMD's voordeel ten opzichte van Intel, wiens CPU's simpelweg meer energie nodig hebben om vergelijkbare prestaties te leveren. Apple met zijnM2 Max processorheeft een kleine voorsprong, maar biedt in totaal aanzienlijk lagere maximale prestaties.

Power Consumption / Cinebench R23 Multi Power Efficiency - external Monitor
Apple M2 Max
Apple MacBook Pro 16 2023 M2 Max
233 Points per Watt +13%
AMD Ryzen 9 7945HX3D
Asus ROG Strix Scar 17 G733PYV-LL053X
207 Points per Watt
AMD Ryzen 9 7945HX
Asus Zephyrus Duo 16 GX650PY-NM006W
194.4 Points per Watt -6%
AMD Ryzen 9 7945HX
Asus ROG Strix G17 G713PI
191.1 Points per Watt -8%
Intel Core i9-13950HX
Razer Blade 16 Early 2023 RTX 4090
144.1 Points per Watt -30%
Intel Core i9-13950HX
MSI Titan GT77 HX 13VI
135.3 Points per Watt -35%
Intel Core i9-12900HX
MSI Titan GT77 12UHS
122.6 Points per Watt -41%
Power Consumption / Cinebench R23 Multi (external Monitor)
Intel Core i9-13950HX
MSI Titan GT77 HX 13VI
246 (227min, 227P1 - 264max) Watt * -55%
Intel Core i9-13950HX
Razer Blade 16 Early 2023 RTX 4090
197.3 (191.9min, 192.7P1 - 200max) Watt * -24%
Intel Core i9-12900HX
MSI Titan GT77 12UHS
187.5 (166.8min, 167.1P1 - 230max) Watt * -18%
Intel Core i9-13900HX
SCHENKER XMG Neo 16 E23
182.4 (172.3min, 172.3P1 - 207max) Watt * -15%
AMD Ryzen 9 7945HX
Asus ROG Strix G17 G713PI (Turbo Mode)
179 (171.5min, 171.8P1 - 181.3max) Watt * -13%
AMD Ryzen 9 7945HX
Asus Zephyrus Duo 16 GX650PY-NM006W
177.6 (166.7min, 166.8P1 - 187.3max) Watt * -12%
AMD Ryzen 9 7945HX3D
Asus ROG Strix Scar 17 G733PYV-LL053X
158.5 (149.9min, 150.4P1 - 171.1max) Watt *
Intel Core i7-13700HX
Aorus 15X ASF
148.3 (116.3min, 116.3P1 - 185.2max) Watt * +6%
Apple M2 Max
Apple MacBook Pro 16 2023 M2 Max
63.5 (61.8min, 62.1P1 - 67.8max) Watt * +60%

* ... kleiner is beter

Prestaties met lagere vermogensgrenzen

We konden nieuwe vaste vermogenslimieten instellen voor de processor via de handmatige modus in de Armoury Crate software van het testapparaat - helaas waren we beperkter met de 7945HX3D. Vanwege de zwakkere koeling kon de processor niet eens de korte Cinebench R23 run voltooien met een vaste limiet van 115 watt - plus, deze keer stond de app slechts een minimale waarde van 65 watt toe. Beide resultaten bij 100 watt en 80 watt lagen ongeveer op hetzelfde niveau als de gewone Ryzen 9 7945HX. Hier kun je ook zeggen dat de Ryzen 9 7945HX3D betere prestaties levert bij 80 watt dan de Intel Core i9-13980HX kan bij 150 watt.

Cinebench R23 Multi
Vermogenslimiet Core i9-13900HX Core i9-13950HX Core i9-13980HX Ryzen 9 7945HX Ryzen 9 7945HX3D
170 watt 31.958 31.903
150 watt 30.655 30.623
130 watt 28,239 29,141 29,281 34,202
115 watt 27.369 28.199 28.073 33.361
100 watt 25.942 26.653 26.507 32.947 32.977
80 watt 23.216 23.950 23.766 30.907 30.804
55 watt 18.843 19.772 19.478 26.045

Gamingprestaties 1080p

Nu komen we bij de gaming benchmarks, waar we eerst hebben gekeken naar Full HD-resolutie. Hier was de nieuwe Ryzen 9 7945HX3D echt in staat om zijn voordelen te laten zien in een flink aantal games - we zagen zelfs dat hij soms met twee-cijferige procentpunten leidde. In Far Cry 5 zagen we een verbetering van maar liefst 36% ten opzichte van zowel de gewone Ryzen 9 7945HX als Intel's HX CPU's. In sommige games hebben we geen verbetering gemeten, zoals in The Witcher 3 en Call of Duty Modern Warfare 2.

The Witcher 3 - 1920x1080 Ultra Graphics & Postprocessing (HBAO+)
Alienware m18 R1
Intel Core i9-13980HX, NVIDIA GeForce RTX 4090 Laptop GPU
213.9 (205min) fps +3%
Asus ROG Strix Scar 17 G733PYV-LL053X
AMD Ryzen 9 7945HX3D, NVIDIA GeForce RTX 4090 Laptop GPU
207 fps
SCHENKER Key 17 Pro (Early 23)
Intel Core i9-13900HX, NVIDIA GeForce RTX 4090 Laptop GPU
206 (176min) fps 0%
Asus ROG Strix Scar 17 G733PY-XS96
AMD Ryzen 9 7945HX, NVIDIA GeForce RTX 4090 Laptop GPU
203.8 (186min) fps -2%
Lenovo Legion Pro 7 RTX4090
Intel Core i9-13900HX, NVIDIA GeForce RTX 4090 Laptop GPU
200 (174min) fps -3%
MSI Titan GT77 HX 13VI
Intel Core i9-13950HX, NVIDIA GeForce RTX 4090 Laptop GPU
198.9 (190min, 191P1) fps -4%
Lenovo Legion Pro 5 16ARX8
AMD Ryzen 7 7745HX, NVIDIA GeForce RTX 4070 Laptop GPU
119.8 (114min) fps -42%
Gemiddelde van klas Gaming
  (8.61 - 216, n=228, laatste 2 jaar)
117.2 fps -43%
GTA V - 1920x1080 Highest Settings possible AA:4xMSAA + FX AF:16x
Asus ROG Strix Scar 17 G733PYV-LL053X
AMD Ryzen 9 7945HX3D, NVIDIA GeForce RTX 4090 Laptop GPU
167.7 (1.87min, 111.1P1) fps
Alienware m18 R1
Intel Core i9-13980HX, NVIDIA GeForce RTX 4090 Laptop GPU
149 (3.13min, 111.1P1) fps -11%
Lenovo Legion Pro 7 RTX4090
Intel Core i9-13900HX, NVIDIA GeForce RTX 4090 Laptop GPU
143.6 (4.39min, 100P1) fps -14%
SCHENKER Key 17 Pro (Early 23)
Intel Core i9-13900HX, NVIDIA GeForce RTX 4090 Laptop GPU
142.3 (4.44min, 100P1) fps -15%
Asus ROG Strix Scar 18 2023 G834JY-N6005W
Intel Core i9-13980HX, NVIDIA GeForce RTX 4090 Laptop GPU
141.3 (4.69min, 100P1) fps -16%
MSI Titan GT77 HX 13VI
Intel Core i9-13950HX, NVIDIA GeForce RTX 4090 Laptop GPU
140.9 (3.54min, 83.3P1) fps -16%
Lenovo Legion Pro 5 16ARX8
AMD Ryzen 7 7745HX, NVIDIA GeForce RTX 4070 Laptop GPU
119.9 (3.81min, 76.9P1) fps -29%
Asus ROG Strix Scar 17 G733PY-XS96
AMD Ryzen 9 7945HX, NVIDIA GeForce RTX 4090 Laptop GPU
112.6 (4.54min, 71.4P1) fps -33%
Gemiddelde van klas Gaming
  (6.38 - 167.7, n=219, laatste 2 jaar)
107.6 fps -36%
Final Fantasy XV Benchmark - 1920x1080 High Quality
Alienware m18 R1
Intel Core i9-13980HX, NVIDIA GeForce RTX 4090 Laptop GPU
194.8 fps +8%
MSI Titan GT77 HX 13VI
Intel Core i9-13950HX, NVIDIA GeForce RTX 4090 Laptop GPU
187.4 fps +4%
SCHENKER Key 17 Pro (Early 23)
Intel Core i9-13900HX, NVIDIA GeForce RTX 4090 Laptop GPU
183.1 fps +2%
Lenovo Legion Pro 7 RTX4090
Intel Core i9-13900HX, NVIDIA GeForce RTX 4090 Laptop GPU
181.2 fps +1%
Asus ROG Strix Scar 17 G733PYV-LL053X
AMD Ryzen 9 7945HX3D, NVIDIA GeForce RTX 4090 Laptop GPU
180 fps
Asus ROG Strix Scar 18 2023 G834JY-N6005W
Intel Core i9-13980HX, NVIDIA GeForce RTX 4090 Laptop GPU
177.6 fps -1%
Asus ROG Strix Scar 17 G733PY-XS96
AMD Ryzen 9 7945HX, NVIDIA GeForce RTX 4090 Laptop GPU
163.9 fps -9%
Lenovo Legion Pro 5 16ARX8
AMD Ryzen 7 7745HX, NVIDIA GeForce RTX 4070 Laptop GPU
119.9 fps -33%
Gemiddelde van klas Gaming
  (9.13 - 194.9, n=229, laatste 2 jaar)
111.5 fps -38%
Strange Brigade - 1920x1080 ultra AA:ultra AF:16
Asus ROG Strix Scar 17 G733PYV-LL053X
AMD Ryzen 9 7945HX3D, NVIDIA GeForce RTX 4090 Laptop GPU
420 (64.7min, 302P1) fps
SCHENKER Key 17 Pro (Early 23)
Intel Core i9-13900HX, NVIDIA GeForce RTX 4090 Laptop GPU
378 (20.6min, 257P1) fps -10%
MSI Titan GT77 HX 13VI
Intel Core i9-13950HX, NVIDIA GeForce RTX 4090 Laptop GPU
373 (29.9min, 272P1) fps -11%
Alienware m18 R1
Intel Core i9-13980HX, NVIDIA GeForce RTX 4090 Laptop GPU
373 (73.3min, 273P1) fps -11%
Asus ROG Strix Scar 18 2023 G834JY-N6005W
Intel Core i9-13980HX, NVIDIA GeForce RTX 4090 Laptop GPU
366 (29.1min, 263P1) fps -13%
Lenovo Legion Pro 7 RTX4090
Intel Core i9-13900HX, NVIDIA GeForce RTX 4090 Laptop GPU
347 (87.7min, 252P1) fps -17%
Lenovo Legion Pro 5 16ARX8
AMD Ryzen 7 7745HX, NVIDIA GeForce RTX 4070 Laptop GPU
223 (89min, 167.8P1) fps -47%
Gemiddelde van klas Gaming
  (14.6 - 421, n=227, laatste 2 jaar)
207 fps -51%
Dota 2 Reborn - 1920x1080 ultra (3/3) best looking
Asus ROG Strix Scar 17 G733PYV-LL053X
AMD Ryzen 9 7945HX3D, NVIDIA GeForce RTX 4090 Laptop GPU
220 (175min) fps
Alienware m18 R1
Intel Core i9-13980HX, NVIDIA GeForce RTX 4090 Laptop GPU
194.2 (157.6min) fps -12%
Asus ROG Strix Scar 18 2023 G834JY-N6005W
Intel Core i9-13980HX, NVIDIA GeForce RTX 4090 Laptop GPU
190.2 (160.9min) fps -14%
MSI Titan GT77 HX 13VI
Intel Core i9-13950HX, NVIDIA GeForce RTX 4090 Laptop GPU
185.9 (157.5min) fps -15%
SCHENKER Key 17 Pro (Early 23)
Intel Core i9-13900HX, NVIDIA GeForce RTX 4090 Laptop GPU
182.5 (149.3min) fps -17%
Lenovo Legion Pro 7 RTX4090
Intel Core i9-13900HX, NVIDIA GeForce RTX 4090 Laptop GPU
182.1 (154.2min) fps -17%
Lenovo Legion Pro 5 16ARX8
AMD Ryzen 7 7745HX, NVIDIA GeForce RTX 4070 Laptop GPU
182 (152.8min) fps -17%
Gemiddelde van klas Gaming
  (26.9 - 220, n=239, laatste 2 jaar)
143 fps -35%
Asus ROG Strix Scar 17 G733PY-XS96
AMD Ryzen 9 7945HX, NVIDIA GeForce RTX 4090 Laptop GPU
139 (118.5min) fps -37%
X-Plane 11.11 - 1920x1080 high (fps_test=3)
Asus ROG Strix Scar 17 G733PYV-LL053X
AMD Ryzen 9 7945HX3D, NVIDIA GeForce RTX 4090 Laptop GPU
166.2 fps
Alienware m18 R1
Intel Core i9-13980HX, NVIDIA GeForce RTX 4090 Laptop GPU
143.5 fps -14%
Asus ROG Strix Scar 18 2023 G834JY-N6005W
Intel Core i9-13980HX, NVIDIA GeForce RTX 4090 Laptop GPU
142.8 fps -14%
SCHENKER Key 17 Pro (Early 23)
Intel Core i9-13900HX, NVIDIA GeForce RTX 4090 Laptop GPU
136.6 fps -18%
Lenovo Legion Pro 7 RTX4090
Intel Core i9-13900HX, NVIDIA GeForce RTX 4090 Laptop GPU
136.4 fps -18%
MSI Titan GT77 HX 13VI
Intel Core i9-13950HX, NVIDIA GeForce RTX 4090 Laptop GPU
134.2 fps -19%
MSI Titan GT77 HX 13VI
Intel Core i9-13950HX, NVIDIA GeForce RTX 4090 Laptop GPU
134.1 fps -19%
Lenovo Legion Pro 5 16ARX8
AMD Ryzen 7 7745HX, NVIDIA GeForce RTX 4070 Laptop GPU
117.8 fps -29%
Gemiddelde van klas Gaming
  (12.4 - 166.2, n=244, laatste 2 jaar)
102.2 fps -39%
Asus ROG Strix Scar 17 G733PY-XS96
AMD Ryzen 9 7945HX, NVIDIA GeForce RTX 4090 Laptop GPU
94.3 fps -43%
Shadow of the Tomb Raider - 1920x1080 Highest Preset AA:T
Asus ROG Strix Scar 17 G733PYV-LL053X
AMD Ryzen 9 7945HX3D, NVIDIA GeForce RTX 4090 Laptop GPU
271 fps
Asus ROG Strix Scar 17 G733PY-XS96
AMD Ryzen 9 7945HX, NVIDIA GeForce RTX 4090 Laptop GPU
228 fps -16%
MSI Titan GT77 HX 13VI
Intel Core i9-13950HX, NVIDIA GeForce RTX 4090 Laptop GPU
214 fps -21%
Lenovo Legion Pro 5 16ARX8
AMD Ryzen 7 7745HX, NVIDIA GeForce RTX 4070 Laptop GPU
168 fps -38%
Gemiddelde van klas Gaming
  (27 - 271, n=30, laatste 2 jaar)
161.3 fps -40%
Asus ROG Strix Scar 18 2023 G834JY-N6005W
Intel Core i9-13980HX, NVIDIA GeForce RTX 4090 Laptop GPU
143.7 fps -47%
F1 22 - 1920x1080 Ultra High Preset AA:T AF:16x
Alienware m18 R1
Intel Core i9-13980HX, NVIDIA GeForce RTX 4090 Laptop GPU
144.7 (124min, 94P1) fps +6%
MSI Titan GT77 HX 13VI
Intel Core i9-13950HX, NVIDIA GeForce RTX 4090 Laptop GPU
138.2 (118min, 84P1) fps +2%
Asus ROG Strix Scar 17 G733PYV-LL053X
AMD Ryzen 9 7945HX3D, NVIDIA GeForce RTX 4090 Laptop GPU
135.9 (118min, 98P1) fps
Lenovo Legion Pro 7 RTX4090
Intel Core i9-13900HX, NVIDIA GeForce RTX 4090 Laptop GPU
129.2 (105min, 83P1) fps -5%
Asus ROG Strix Scar 18 2023 G834JY-N6005W
Intel Core i9-13980HX, NVIDIA GeForce RTX 4090 Laptop GPU
124.5 (107min, 87P1) fps -8%
Asus ROG Strix Scar 17 G733PY-XS96
AMD Ryzen 9 7945HX, NVIDIA GeForce RTX 4090 Laptop GPU
116.3 (86min, 73P1) fps -14%
Lenovo Legion Pro 5 16ARX8
AMD Ryzen 7 7745HX, NVIDIA GeForce RTX 4070 Laptop GPU
84.1 (71min, 59P1) fps -38%
Gemiddelde van klas Gaming
  (13 - 144.7, n=109, laatste 2 jaar)
80.1 fps -41%
Far Cry 5 - 1920x1080 Ultra Preset AA:T
Asus ROG Strix Scar 17 G733PYV-LL053X
AMD Ryzen 9 7945HX3D, NVIDIA GeForce RTX 4090 Laptop GPU
218 fps
MSI Titan GT77 HX 13VI
Intel Core i9-13950HX, NVIDIA GeForce RTX 4090 Laptop GPU
160 fps -27%
Asus ROG Strix Scar 18 2023 G834JY-N6005W
Intel Core i9-13980HX, NVIDIA GeForce RTX 4090 Laptop GPU
158 (117min) fps -28%
Asus ROG Strix Scar 17 G733PY-XS96
AMD Ryzen 9 7945HX, NVIDIA GeForce RTX 4090 Laptop GPU
145 (106min) fps -33%
Gemiddelde van klas Gaming
  (14 - 218, n=126, laatste 2 jaar)
126.3 fps -42%
Far Cry 6 - 1920x1080 Ultra Graphics Quality + HD Textures AA:T
Asus ROG Strix Scar 17 G733PYV-LL053X
AMD Ryzen 9 7945HX3D, NVIDIA GeForce RTX 4090 Laptop GPU
167 fps
MSI Titan GT77 HX 13VI
Intel Core i9-13950HX, NVIDIA GeForce RTX 4090 Laptop GPU
144 fps -14%
Asus ROG Strix Scar 17 G733PY-XS96
AMD Ryzen 9 7945HX, NVIDIA GeForce RTX 4090 Laptop GPU
112 (91min) fps -33%
Lenovo Legion Pro 5 16ARX8
AMD Ryzen 7 7745HX, NVIDIA GeForce RTX 4070 Laptop GPU
110 (74min) fps -34%
Gemiddelde van klas Gaming
  (14.7 - 167, n=35, laatste 2 jaar)
98.8 fps -41%
Call of Duty Modern Warfare 2 2022 - 1920x1080 Extreme Quality Preset AA:T2X Filmic SM
Asus ROG Strix Scar 17 G733PYV-LL053X
AMD Ryzen 9 7945HX3D, NVIDIA GeForce RTX 4090 Laptop GPU
182 fps
Asus ROG Strix Scar 17 G733PY-XS96
AMD Ryzen 9 7945HX, NVIDIA GeForce RTX 4090 Laptop GPU
180 (103min) fps -1%
MSI Titan GT77 HX 13VI
Intel Core i9-13950HX, NVIDIA GeForce RTX 4090 Laptop GPU
176 fps -3%
Asus ROG Strix Scar 18 2023 G834JY-N6005W
Intel Core i9-13980HX, NVIDIA GeForce RTX 4090 Laptop GPU
170 (98P1) fps -7%
Gemiddelde van klas Gaming
  (15 - 182, n=39, laatste 2 jaar)
114.2 fps -37%
Lenovo Legion Pro 5 16ARX8
AMD Ryzen 7 7745HX, NVIDIA GeForce RTX 4070 Laptop GPU
108 (61min) fps -41%
Cyberpunk 2077 1.6 - 1920x1080 Ultra Preset
Asus ROG Strix Scar 17 G733PYV-LL053X
AMD Ryzen 9 7945HX3D, NVIDIA GeForce RTX 4090 Laptop GPU
157 fps
MSI Titan GT77 HX 13VI
Intel Core i9-13950HX, NVIDIA GeForce RTX 4090 Laptop GPU
135 fps -14%
Asus ROG Strix Scar 17 G733PY-XS96
AMD Ryzen 9 7945HX, NVIDIA GeForce RTX 4090 Laptop GPU
133.8 (57.7min) fps -15%
Alienware m18 R1
Intel Core i9-13980HX, NVIDIA GeForce RTX 4090 Laptop GPU
127.92 (32.4min) fps -19%
Asus ROG Strix Scar 18 2023 G834JY-N6005W
Intel Core i9-13980HX, NVIDIA GeForce RTX 4090 Laptop GPU
119.7 (69min) fps -24%
Lenovo Legion Pro 5 16ARX8
AMD Ryzen 7 7745HX, NVIDIA GeForce RTX 4070 Laptop GPU
98.9 (35.5min) fps -37%
Gemiddelde van klas Gaming
  (16.7 - 159.7, n=102, laatste 2 jaar)
86.7 fps -45%

Gamingprestaties QHD

In QHD-resolutie liet de nieuwe processor ook enkele voordelen zien, hoewel deze niet zo groot waren als in 1080p. Over het algemeen biedt de Ryzen 9 7945HX3D nog steeds betere prestaties dan zijn concurrenten - soms met wel twee cijfers.

Shadow of the Tomb Raider - 2560x1440 Highest Preset AA:T
Asus ROG Strix Scar 17 G733PYV-LL053X
NVIDIA GeForce RTX 4090 Laptop GPU, R9 7945HX3D, SK hynix PC801 HFS001TEJ9X101N
199 fps
Asus ROG Strix Scar 17 G733PY-XS96
NVIDIA GeForce RTX 4090 Laptop GPU, R9 7945HX, SK hynix PC801 HFS001TEJ9X101N
190 fps -5%
MSI Titan GT77 HX 13VI
NVIDIA GeForce RTX 4090 Laptop GPU, i9-13950HX, Samsung PM9A1 MZVL22T0HBLB
187 fps -6%
Lenovo Legion Pro 7 RTX4090
NVIDIA GeForce RTX 4090 Laptop GPU, i9-13900HX, Samsung PM9A1 MZVL21T0HCLR
185 fps -7%
Far Cry 5 - 2560x1440 Ultra Preset AA:T
Asus ROG Strix Scar 17 G733PYV-LL053X
NVIDIA GeForce RTX 4090 Laptop GPU, R9 7945HX3D, SK hynix PC801 HFS001TEJ9X101N
194 fps
MSI Titan GT77 HX 13VI
NVIDIA GeForce RTX 4090 Laptop GPU, i9-13950HX, Samsung PM9A1 MZVL22T0HBLB
159 fps -18%
Asus ROG Strix Scar 17 G733PY-XS96
NVIDIA GeForce RTX 4090 Laptop GPU, R9 7945HX, SK hynix PC801 HFS001TEJ9X101N
142 (104min - 189max) fps -27%
Far Cry 6 - 2560x1440 Ultra Graphics Quality + HD Textures AA:T
Asus ROG Strix Scar 17 G733PYV-LL053X
NVIDIA GeForce RTX 4090 Laptop GPU, R9 7945HX3D, SK hynix PC801 HFS001TEJ9X101N
146 fps
MSI Titan GT77 HX 13VI
NVIDIA GeForce RTX 4090 Laptop GPU, i9-13950HX, Samsung PM9A1 MZVL22T0HBLB
135 fps -8%
Asus ROG Strix Scar 17 G733PY-XS96
NVIDIA GeForce RTX 4090 Laptop GPU, R9 7945HX, SK hynix PC801 HFS001TEJ9X101N
109 (88min - 120max) fps -25%
Final Fantasy XV Benchmark - 2560x1440 High Quality
MSI Titan GT77 HX 13VI
NVIDIA GeForce RTX 4090 Laptop GPU, i9-13950HX, Samsung PM9A1 MZVL22T0HBLB
162.9 fps +8%
Alienware m18 R1
NVIDIA GeForce RTX 4090 Laptop GPU, i9-13980HX, SK hynix PC801 HFS001TEJ9X101N
159.5 fps +5%
SCHENKER Key 17 Pro (Early 23)
NVIDIA GeForce RTX 4090 Laptop GPU, i9-13900HX, Samsung 990 Pro 2 TB MZVL72T0HDLB
156.4 fps +3%
Lenovo Legion Pro 7 RTX4090
NVIDIA GeForce RTX 4090 Laptop GPU, i9-13900HX, Samsung PM9A1 MZVL21T0HCLR
154 fps +2%
Asus ROG Strix Scar 17 G733PYV-LL053X
NVIDIA GeForce RTX 4090 Laptop GPU, R9 7945HX3D, SK hynix PC801 HFS001TEJ9X101N
151.2 fps
Asus ROG Strix Scar 17 G733PY-XS96
NVIDIA GeForce RTX 4090 Laptop GPU, R9 7945HX, SK hynix PC801 HFS001TEJ9X101N
151 fps 0%
GTA V - 2560x1440 Highest Settings possible AA:4xMSAA + FX AF:16x
Asus ROG Strix Scar 17 G733PYV-LL053X
NVIDIA GeForce RTX 4090 Laptop GPU, R9 7945HX3D, SK hynix PC801 HFS001TEJ9X101N
160.6 (2.82min, 111.1P1 - 363max) fps
Alienware m18 R1
NVIDIA GeForce RTX 4090 Laptop GPU, i9-13980HX, SK hynix PC801 HFS001TEJ9X101N
145.5 (2.46min, 111.1P1 - 281max) fps -9%
SCHENKER Key 17 Pro (Early 23)
NVIDIA GeForce RTX 4090 Laptop GPU, i9-13900HX, Samsung 990 Pro 2 TB MZVL72T0HDLB
141.5 (28.6min, 100P1 - 268max) fps -12%
MSI Titan GT77 HX 13VI
NVIDIA GeForce RTX 4090 Laptop GPU, i9-13950HX, Samsung PM9A1 MZVL22T0HBLB
138.5 (3.45min, 76.9P1 - 256max) fps -14%
Lenovo Legion Pro 7 RTX4090
NVIDIA GeForce RTX 4090 Laptop GPU, i9-13900HX, Samsung PM9A1 MZVL21T0HCLR
137.7 (3.84min, 90.9P1 - 304max) fps -14%
Asus ROG Strix Scar 17 G733PY-XS96
NVIDIA GeForce RTX 4090 Laptop GPU, R9 7945HX, SK hynix PC801 HFS001TEJ9X101N
114.8 (5.12min, 71.4P1 - 204max) fps -29%
F1 22 - 2560x1440 Ultra High Preset AA:T AF:16x
Alienware m18 R1
NVIDIA GeForce RTX 4090 Laptop GPU, i9-13980HX, SK hynix PC801 HFS001TEJ9X101N
92.2 (79min, 74P1 - 106max) fps 0%
Asus ROG Strix Scar 17 G733PY-XS96
NVIDIA GeForce RTX 4090 Laptop GPU, R9 7945HX, SK hynix PC801 HFS001TEJ9X101N
92.1 (75min, 60P1 - 107max) fps 0%
Asus ROG Strix Scar 17 G733PYV-LL053X
NVIDIA GeForce RTX 4090 Laptop GPU, R9 7945HX3D, SK hynix PC801 HFS001TEJ9X101N
91.8 (78min, 76P1 - 105max) fps
MSI Titan GT77 HX 13VI
NVIDIA GeForce RTX 4090 Laptop GPU, i9-13950HX, Samsung PM9A1 MZVL22T0HBLB
90.1 (78min, 71P1 - 104max) fps -2%
Lenovo Legion Pro 7 RTX4090
NVIDIA GeForce RTX 4090 Laptop GPU, i9-13900HX, Samsung PM9A1 MZVL21T0HCLR
85.2 (72min, 40P1 - 96max) fps -7%
Call of Duty Modern Warfare 2 2022 - 2560x1440 Extreme Quality Preset AA:T2X Filmic SM
Asus ROG Strix Scar 17 G733PYV-LL053X
NVIDIA GeForce RTX 4090 Laptop GPU, R9 7945HX3D, SK hynix PC801 HFS001TEJ9X101N
136 fps
MSI Titan GT77 HX 13VI
NVIDIA GeForce RTX 4090 Laptop GPU, i9-13950HX, Samsung PM9A1 MZVL22T0HBLB
135 fps -1%
Asus ROG Strix Scar 17 G733PY-XS96
NVIDIA GeForce RTX 4090 Laptop GPU, R9 7945HX, SK hynix PC801 HFS001TEJ9X101N
135 (69min) fps -1%
Lenovo Legion Pro 7 RTX4090
NVIDIA GeForce RTX 4090 Laptop GPU, i9-13900HX, Samsung PM9A1 MZVL21T0HCLR
132 (67min) fps -3%
Cyberpunk 2077 1.6 - 2560x1440 Ultra Preset
Asus ROG Strix Scar 17 G733PYV-LL053X
NVIDIA GeForce RTX 4090 Laptop GPU, R9 7945HX3D, SK hynix PC801 HFS001TEJ9X101N
116 fps
Asus ROG Strix Scar 17 G733PY-XS96
NVIDIA GeForce RTX 4090 Laptop GPU, R9 7945HX, SK hynix PC801 HFS001TEJ9X101N
104.3 (34.5min - 159.2max) fps -10%
Alienware m18 R1
NVIDIA GeForce RTX 4090 Laptop GPU, i9-13980HX, SK hynix PC801 HFS001TEJ9X101N
102.16 (48.9min - 193.9max) fps -12%
Lenovo Legion Pro 7 RTX4090
NVIDIA GeForce RTX 4090 Laptop GPU, i9-13900HX, Samsung PM9A1 MZVL21T0HCLR
100.93 (30.73min - 162.33max) fps -13%
MSI Titan GT77 HX 13VI
NVIDIA GeForce RTX 4090 Laptop GPU, i9-13950HX, Samsung PM9A1 MZVL22T0HBLB
98 fps -16%

Gamingprestaties 4K

In 4K-resolutie biedt de nieuwe Ryzen 9 7945HX3D geen voordeel ten opzichte van de gewone Ryzen 9 7945HX of Intels mobiele HX-processors, hoewel alle modellen op een vergelijkbaar niveau presteerden.

Shadow of the Tomb Raider - 3840x2160 Highest Preset AA:T
Lenovo Legion Pro 7 RTX4090
NVIDIA GeForce RTX 4090 Laptop GPU, i9-13900HX, Samsung PM9A1 MZVL21T0HCLR
120 fps +15%
Asus ROG Strix Scar 17 G733PY-XS96
NVIDIA GeForce RTX 4090 Laptop GPU, R9 7945HX, SK hynix PC801 HFS001TEJ9X101N
104 fps 0%
Asus ROG Strix Scar 17 G733PYV-LL053X
NVIDIA GeForce RTX 4090 Laptop GPU, R9 7945HX3D, SK hynix PC801 HFS001TEJ9X101N
104 fps
MSI Titan GT77 HX 13VI
NVIDIA GeForce RTX 4090 Laptop GPU, i9-13950HX, Samsung PM9A1 MZVL22T0HBLB
103 fps -1%
Far Cry 5 - 3840x2160 Ultra Preset AA:T
MSI Titan GT77 HX 13VI
NVIDIA GeForce RTX 4090 Laptop GPU, i9-13950HX, Samsung PM9A1 MZVL22T0HBLB
113 fps +3%
Asus ROG Strix Scar 17 G733PYV-LL053X
NVIDIA GeForce RTX 4090 Laptop GPU, R9 7945HX3D, SK hynix PC801 HFS001TEJ9X101N
110 fps
Asus ROG Strix Scar 17 G733PY-XS96
NVIDIA GeForce RTX 4090 Laptop GPU, R9 7945HX, SK hynix PC801 HFS001TEJ9X101N
108 (97min - 124max) fps -2%
Far Cry 6 - 3840x2160 Ultra Graphics Quality + HD Textures AA:T
MSI Titan GT77 HX 13VI
NVIDIA GeForce RTX 4090 Laptop GPU, i9-13950HX, Samsung PM9A1 MZVL22T0HBLB
89 fps +1%
Asus ROG Strix Scar 17 G733PYV-LL053X
NVIDIA GeForce RTX 4090 Laptop GPU, R9 7945HX3D, SK hynix PC801 HFS001TEJ9X101N
88 fps
Asus ROG Strix Scar 17 G733PY-XS96
NVIDIA GeForce RTX 4090 Laptop GPU, R9 7945HX, SK hynix PC801 HFS001TEJ9X101N
82 (73min - 89max) fps -7%
Final Fantasy XV Benchmark - 3840x2160 High Quality
MSI Titan GT77 HX 13VI
NVIDIA GeForce RTX 4090 Laptop GPU, i9-13950HX, Samsung PM9A1 MZVL22T0HBLB
94.7 fps +11%
Asus ROG Strix Scar 17 G733PY-XS96
NVIDIA GeForce RTX 4090 Laptop GPU, R9 7945HX, SK hynix PC801 HFS001TEJ9X101N
93.3 fps +10%
Alienware m18 R1
NVIDIA GeForce RTX 4090 Laptop GPU, i9-13980HX, SK hynix PC801 HFS001TEJ9X101N
92.6 fps +9%
SCHENKER Key 17 Pro (Early 23)
NVIDIA GeForce RTX 4090 Laptop GPU, i9-13900HX, Samsung 990 Pro 2 TB MZVL72T0HDLB
91.9 fps +8%
Lenovo Legion Pro 7 RTX4090
NVIDIA GeForce RTX 4090 Laptop GPU, i9-13900HX, Samsung PM9A1 MZVL21T0HCLR
91.7 fps +8%
Asus ROG Strix Scar 17 G733PYV-LL053X
NVIDIA GeForce RTX 4090 Laptop GPU, R9 7945HX3D, SK hynix PC801 HFS001TEJ9X101N
85 fps
GTA V - 3840x2160 High/On (Advanced Graphics Off) AA:FX AF:8x
Asus ROG Strix Scar 17 G733PYV-LL053X
NVIDIA GeForce RTX 4090 Laptop GPU, R9 7945HX3D, SK hynix PC801 HFS001TEJ9X101N
182.7 (1.878min, 125P1 - 564max) fps
Alienware m18 R1
NVIDIA GeForce RTX 4090 Laptop GPU, i9-13980HX, SK hynix PC801 HFS001TEJ9X101N
176.4 (1.959min, 111.1P1 - 452max) fps -3%
MSI Titan GT77 HX 13VI
NVIDIA GeForce RTX 4090 Laptop GPU, i9-13950HX, Samsung PM9A1 MZVL22T0HBLB
175.7 (2.91min, 111.1P1 - 424max) fps -4%
Lenovo Legion Pro 7 RTX4090
NVIDIA GeForce RTX 4090 Laptop GPU, i9-13900HX, Samsung PM9A1 MZVL21T0HCLR
173.6 (2.41min, 111.1P1 - 427max) fps -5%
Asus ROG Strix Scar 17 G733PY-XS96
NVIDIA GeForce RTX 4090 Laptop GPU, R9 7945HX, SK hynix PC801 HFS001TEJ9X101N
170.5 (3.62min, 111.1P1 - 289max) fps -7%
SCHENKER Key 17 Pro (Early 23)
NVIDIA GeForce RTX 4090 Laptop GPU, i9-13900HX, Samsung 990 Pro 2 TB MZVL72T0HDLB
167.9 (3.06min, 111.1P1 - 495max) fps -8%
F1 22 - 3840x2160 Ultra High Preset AA:T AF:16x
Lenovo Legion Pro 7 RTX4090
NVIDIA GeForce RTX 4090 Laptop GPU, i9-13900HX, Samsung PM9A1 MZVL21T0HCLR
45.9 (39min, 37P1 - 53max) fps +2%
Asus ROG Strix Scar 17 G733PY-XS96
NVIDIA GeForce RTX 4090 Laptop GPU, R9 7945HX, SK hynix PC801 HFS001TEJ9X101N
45.8 (39min, 38P1 - 52max) fps +2%
Alienware m18 R1
NVIDIA GeForce RTX 4090 Laptop GPU, i9-13980HX, SK hynix PC801 HFS001TEJ9X101N
45.5 (38min, 37P1 - 52max) fps +1%
Asus ROG Strix Scar 17 G733PYV-LL053X
NVIDIA GeForce RTX 4090 Laptop GPU, R9 7945HX3D, SK hynix PC801 HFS001TEJ9X101N
45 (38min, 38P1 - 51max) fps
MSI Titan GT77 HX 13VI
NVIDIA GeForce RTX 4090 Laptop GPU, i9-13950HX, Samsung PM9A1 MZVL22T0HBLB
44.9 (38min, 37P1 - 52max) fps 0%
Call of Duty Modern Warfare 2 2022 - 3840x2160 Extreme Quality Preset AA:T2X Filmic SM
MSI Titan GT77 HX 13VI
NVIDIA GeForce RTX 4090 Laptop GPU, i9-13950HX, Samsung PM9A1 MZVL22T0HBLB
85 fps +2%
Asus ROG Strix Scar 17 G733PYV-LL053X
NVIDIA GeForce RTX 4090 Laptop GPU, R9 7945HX3D, SK hynix PC801 HFS001TEJ9X101N
83 fps
Asus ROG Strix Scar 17 G733PY-XS96
NVIDIA GeForce RTX 4090 Laptop GPU, R9 7945HX, SK hynix PC801 HFS001TEJ9X101N
82 (39min) fps -1%
Lenovo Legion Pro 7 RTX4090
NVIDIA GeForce RTX 4090 Laptop GPU, i9-13900HX, Samsung PM9A1 MZVL21T0HCLR
82 (38min) fps -1%
Cyberpunk 2077 1.6 - 3840x2160 Ultra Preset
MSI Titan GT77 HX 13VI
NVIDIA GeForce RTX 4090 Laptop GPU, i9-13950HX, Samsung PM9A1 MZVL22T0HBLB
56 fps +10%
Asus ROG Strix Scar 17 G733PYV-LL053X
NVIDIA GeForce RTX 4090 Laptop GPU, R9 7945HX3D, SK hynix PC801 HFS001TEJ9X101N
51 fps
Lenovo Legion Pro 7 RTX4090
NVIDIA GeForce RTX 4090 Laptop GPU, i9-13900HX, Samsung PM9A1 MZVL21T0HCLR
50.05 (28.38min - 104.95max) fps -2%
Alienware m18 R1
NVIDIA GeForce RTX 4090 Laptop GPU, i9-13980HX, SK hynix PC801 HFS001TEJ9X101N
49.99 (36.8min - 91.2max) fps -2%
Asus ROG Strix Scar 17 G733PY-XS96
NVIDIA GeForce RTX 4090 Laptop GPU, R9 7945HX, SK hynix PC801 HFS001TEJ9X101N
48.6 (32.3min - 68.3max) fps -5%

Verdict - De Ryzen 9 7945HX3D is de snelste gamingprocessor

De AMD Ryzen 9 7945HX3D in de nieuwe Asus ROG Strix SCAR 17 X3D

Na het uitvoeren van onze tests is het duidelijk dat AMD's nieuwe Ryzen 9 7945HX3D de snelste gaming processor is. De extra 3D V-Cache komt vooral tot zijn recht in Full HD-resolutie en biedt een aanzienlijk voordeel (soms twee-cijferige percentages) in veel games in vergelijking met de gewone Ryzen 9 7945HX en Intel's mobiele HX-processoren. Dit zijn behoorlijke prestaties, maar je moet je wel afvragen of gebruikers van een high-end gaming laptop echt games zullen spelen in 1080p resolutie. Het testapparaat Asus ROG Strix SCAR 17 heeft bijvoorbeeld een QHD-paneel en hoewel we nog steeds een voordeel merkten in een flink aantal games, wordt het verschil in vergelijking met andere processors kleiner. Gamen in 4K op zijn laatst biedt geen verbetering.

De nieuwe AMD Ryzen 9 7945HX3D is de snelste mobiele gaming CPU op de markt die bovendien 3D V-Cache biedt en een bijzonder groot voordeel heeft ten opzichte van zijn concurrenten als het aankomt op gamen in 1080p resolutie. Het voordeel wordt al beperkter in QHD-resolutie.

Al met al zijn de pure CPU prestaties identiek aan de gewone Ryzen 9 7945HX en vooral de multi-core efficiëntie in vergelijking met Intel's HX processors is fenomenaal. Zelfs met een vaste vermogenslimiet van 80 watt is de Ryzen nog steeds sneller dan Intels Core i9-13980HX bij 150 watt. Hetzelfde kan gezegd worden van de gewone Ryzen 9 7945HX zonder 3D V-Cache. De nieuwe processor heeft wel een nadeel: Door de oppervlaktestructuur van de HX3D processor kan er geen vloeibaar metaal worden gebruikt. De zwakkere koeling maakt dit merkbaar, aangezien de SCAR 17 met de normale Ryzen 9 7945HX een beetje in het voordeel is als het aankomt op maximale CPU prestaties.

Please share our article, every link counts!
> Overzichten en testrapporten over laptops en mobieltjes > Testrapporten > AMD Ryzen 9 7945HX3D Zen4-analyse - De snelste mobiele gamingprocessor dankzij 3D V-Cache
Redaktion, 2023-08-23 (Update: 2023-08-23)