Intel Core i5-8260U debuut: BMAX B5 Pro G7H8 mini PC review
Net als Chuwi is BMax gespecialiseerd in goedkope laptops, monitoren en mini-pc's die over het algemeen honderden dollars goedkoper zijn dan zelfs de meest eenvoudige SKU's van grotere en bekendere fabrikanten. Hun geheim is het gebruik van oudere generatie CPU's die de kosten van de apparaten aanzienlijk kunnen drukken
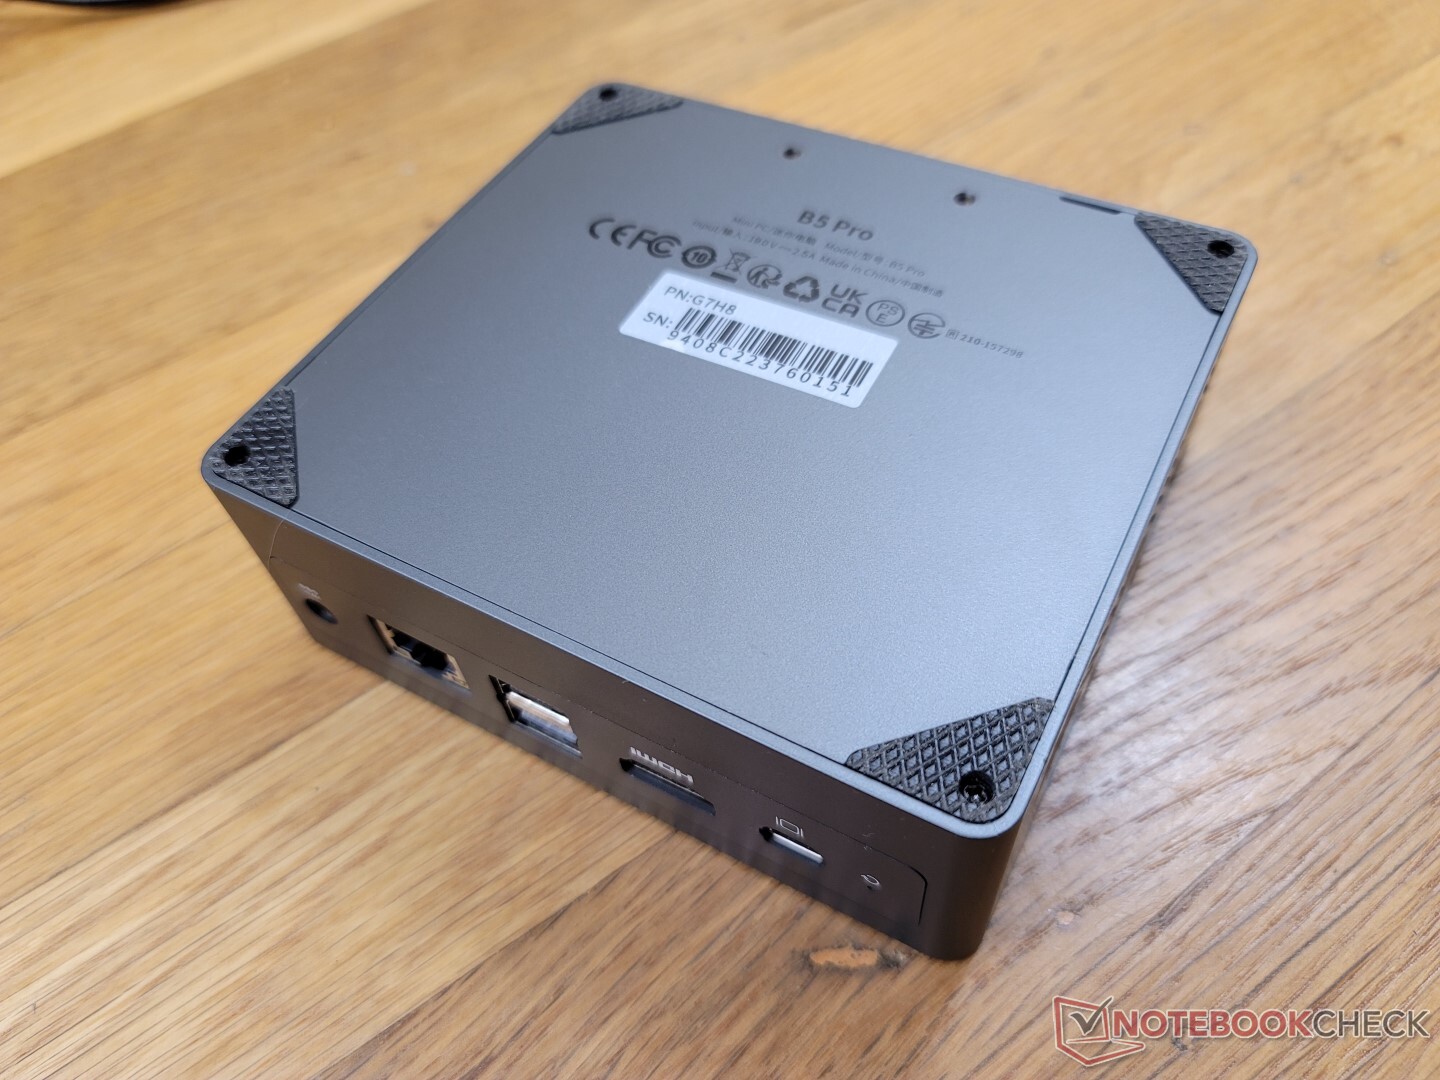
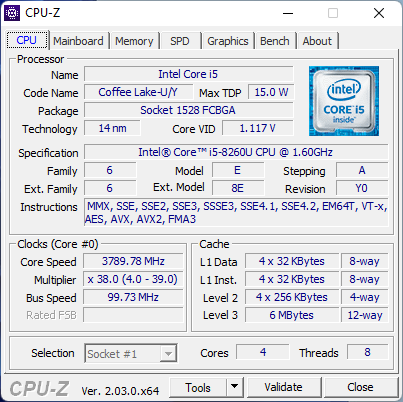
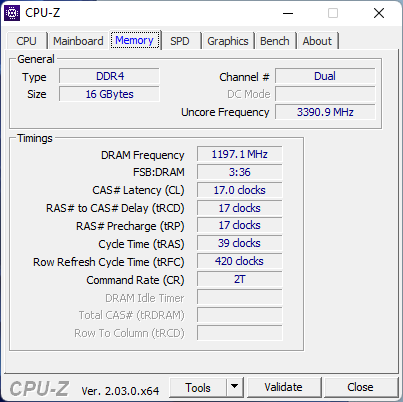
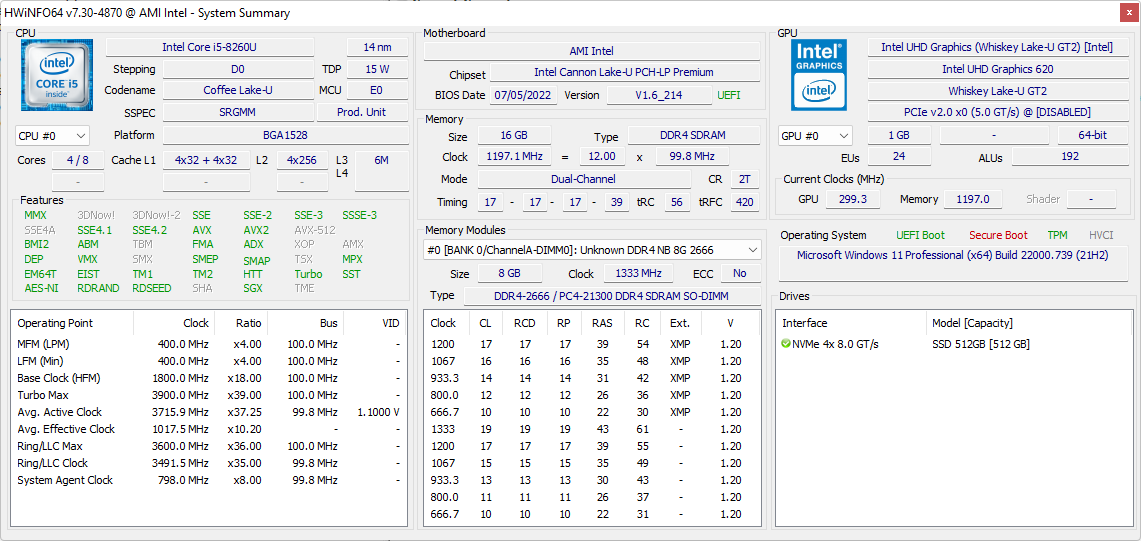
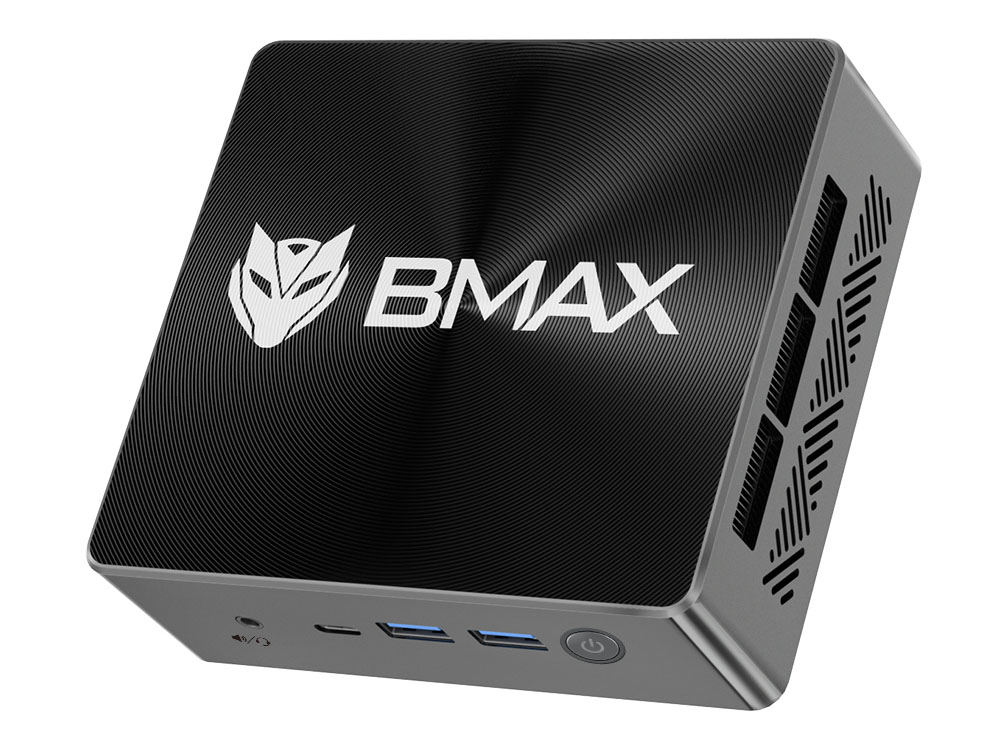
De BMax B5 Pro is de nieuwste mini PC van de fabrikant gericht op HTPC gebruikers met een kleiner budget. Opvallend is dat hij een oudere 8e generatie Intel Core U-serie CPU gebruikt, terwijl de nieuwste mini PC's 12e generatie opties gebruiken. Onze specifieke configuratie wordt geleverd met de ongebruikelijke Coffee Lake Core i5-8260U CPU met 16 GB RAM, 512 GB NVMe SSD, en Windows 11 vooraf geladen voor slechts $ 280 USD op het moment van schrijven. De B5 Pro concurreert rechtstreeks met andere goedkope mini-pc's zoals de Beelink SEi8 of de GMK NucBox 2.
Meer BMax reviews:
Potentiële concurrenten in vergelijking
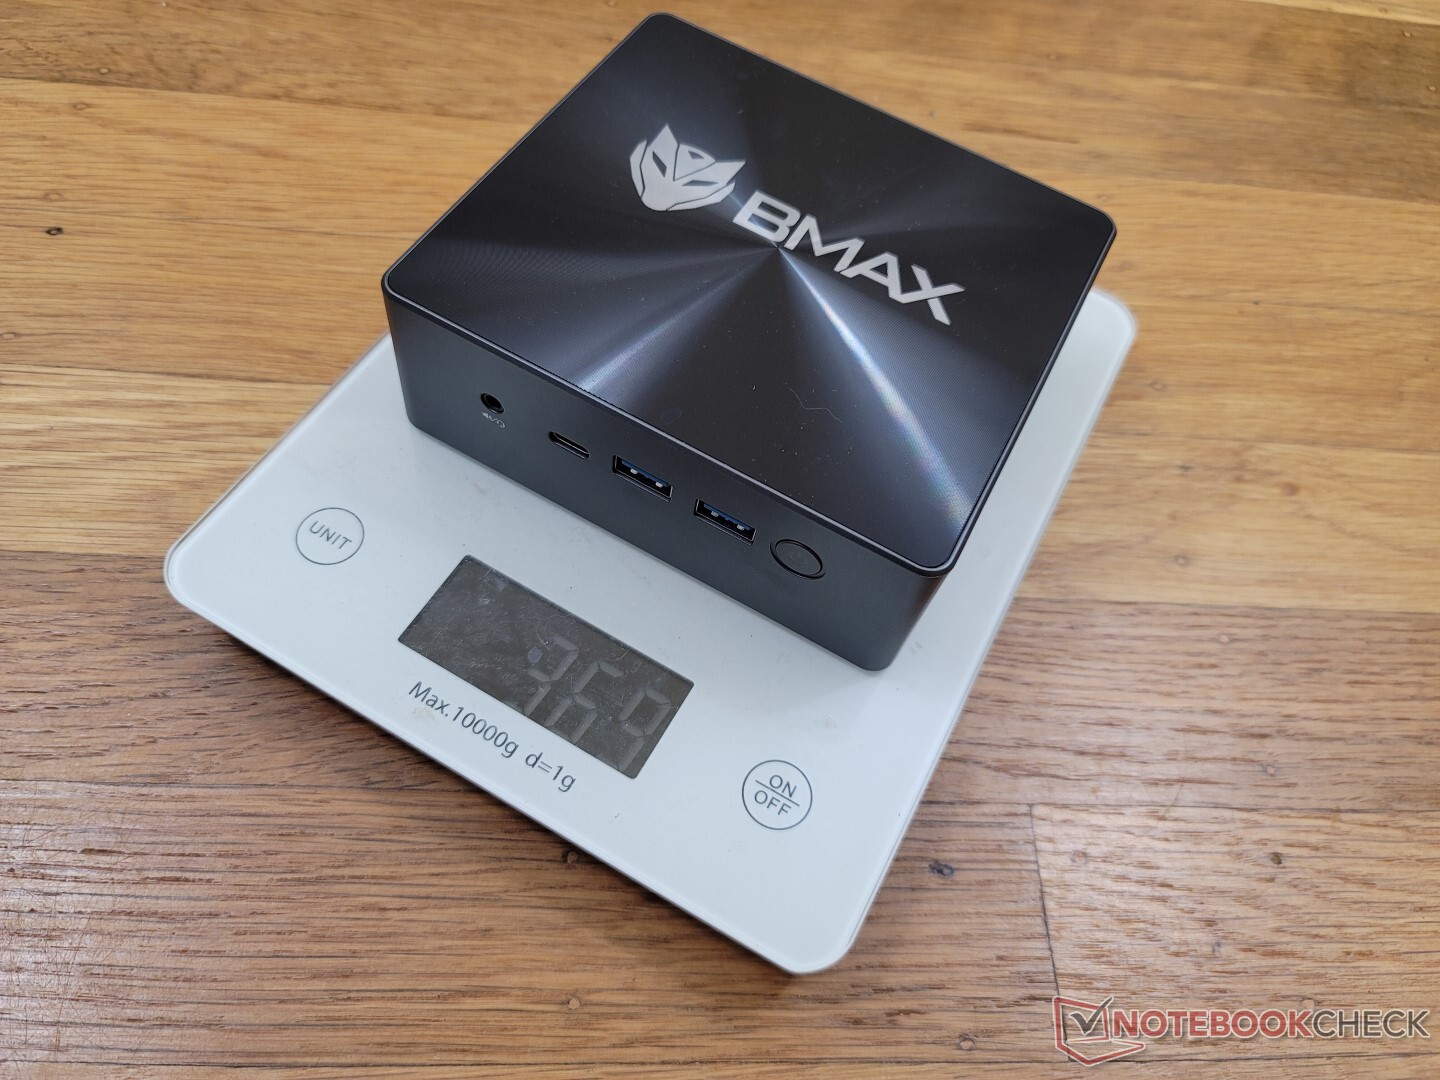
Evaluatie | Datum | Model | Gewicht | Hoogte | Formaat | Resolutie | Beste prijs |
|---|---|---|---|---|---|---|---|
v (old) | 11-2022 | BMAX B5 Pro G7H8 i5-8260U, UHD Graphics 620 | 369 g | 43.2 mm | x | ||
v (old) | 09-2022 | Beelink SEi11 Pro i5-11320H, Iris Xe G7 96EUs | 440 g | 40 mm | x | ||
v (old) | 09-2022 | Beelink U59 N5105 Celeron N5105, UHD Graphics (Jasper Lake 24 EU) | 320 g | 42 mm | x | ||
v (old) | 04-2022 | Beelink SEi8 i3-8109U, Iris Plus Graphics 655 | 346 g | 41 mm | x | ||
v (old) | 10-2022 | Beelink SER Pro Ryzen 5 5600H R5 5600H, Vega 7 | 498 g | 42 mm | x | ||
v (old) | 04-2021 | Intel NUC11TNKi5 i5-1135G7, Iris Xe G7 80EUs | 504 g | 37 mm | x |
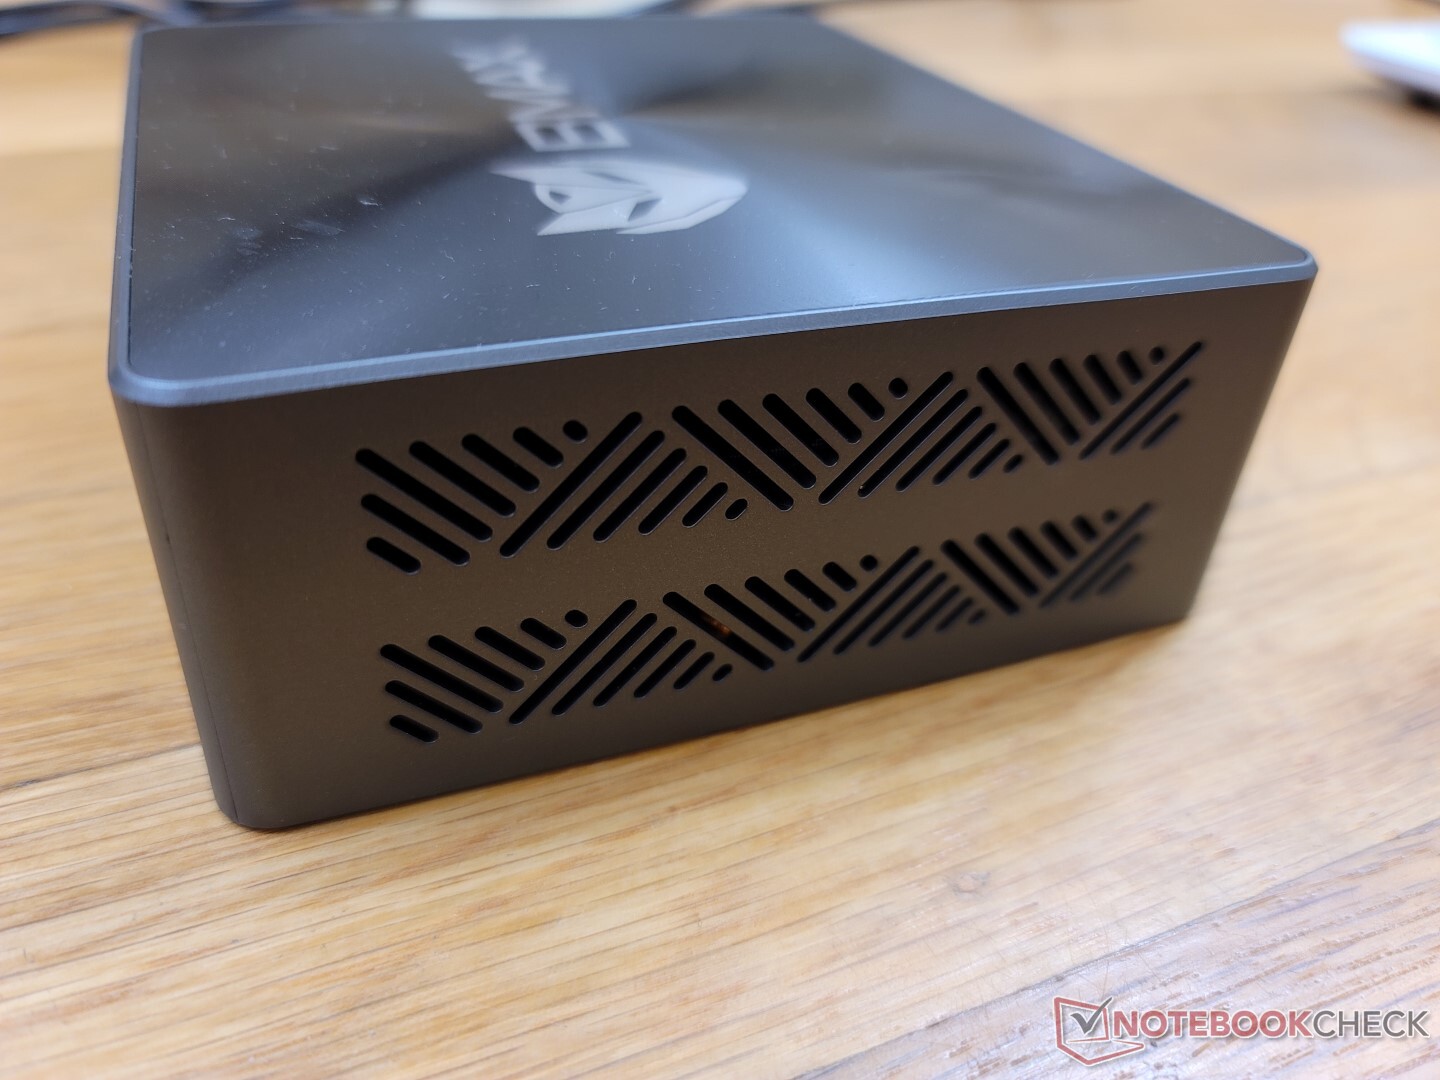
Zaak - Niets bijzonders
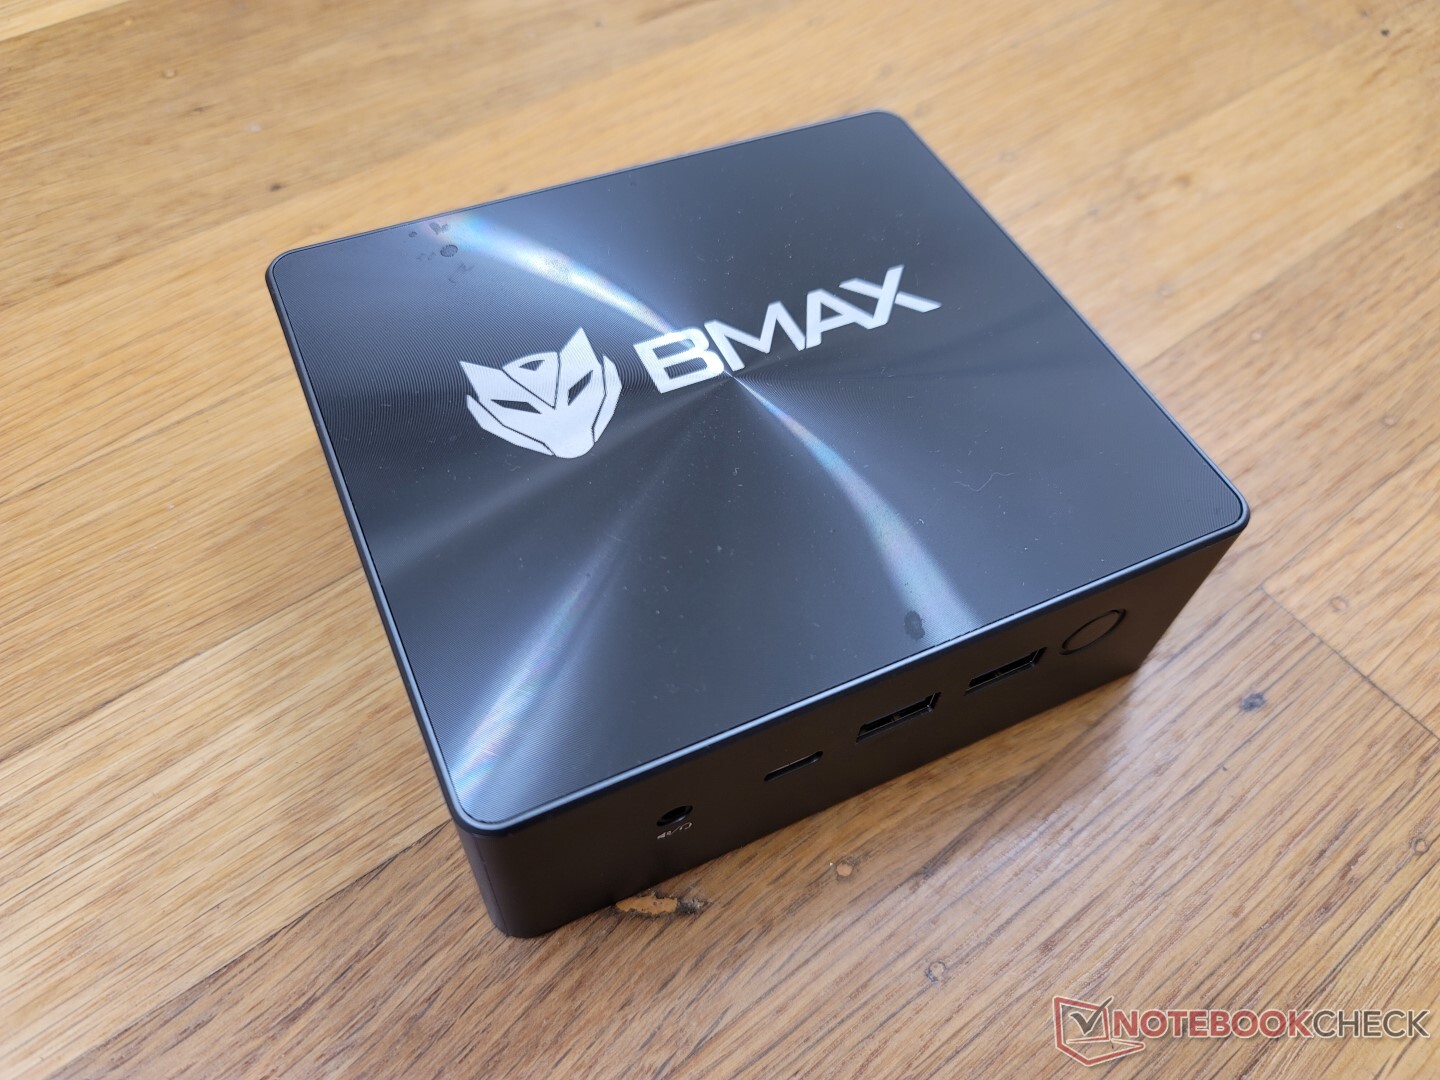
De behuizing is iets dikker dan de Intel NUC11TNKi5 om bijna identiek te zijn aan de Beelink SEi8. De stijfheid is sterk rond de randen en de bodem, aangezien deze gebieden van metaal zijn, terwijl de bovenkant van goedkoper plastic is en gevoeliger voor kromtrekken. Het is nog steeds een sterk ontwerp zonder duidelijke fouten, ook al is het niet zo zwaar als een Intel NUC.
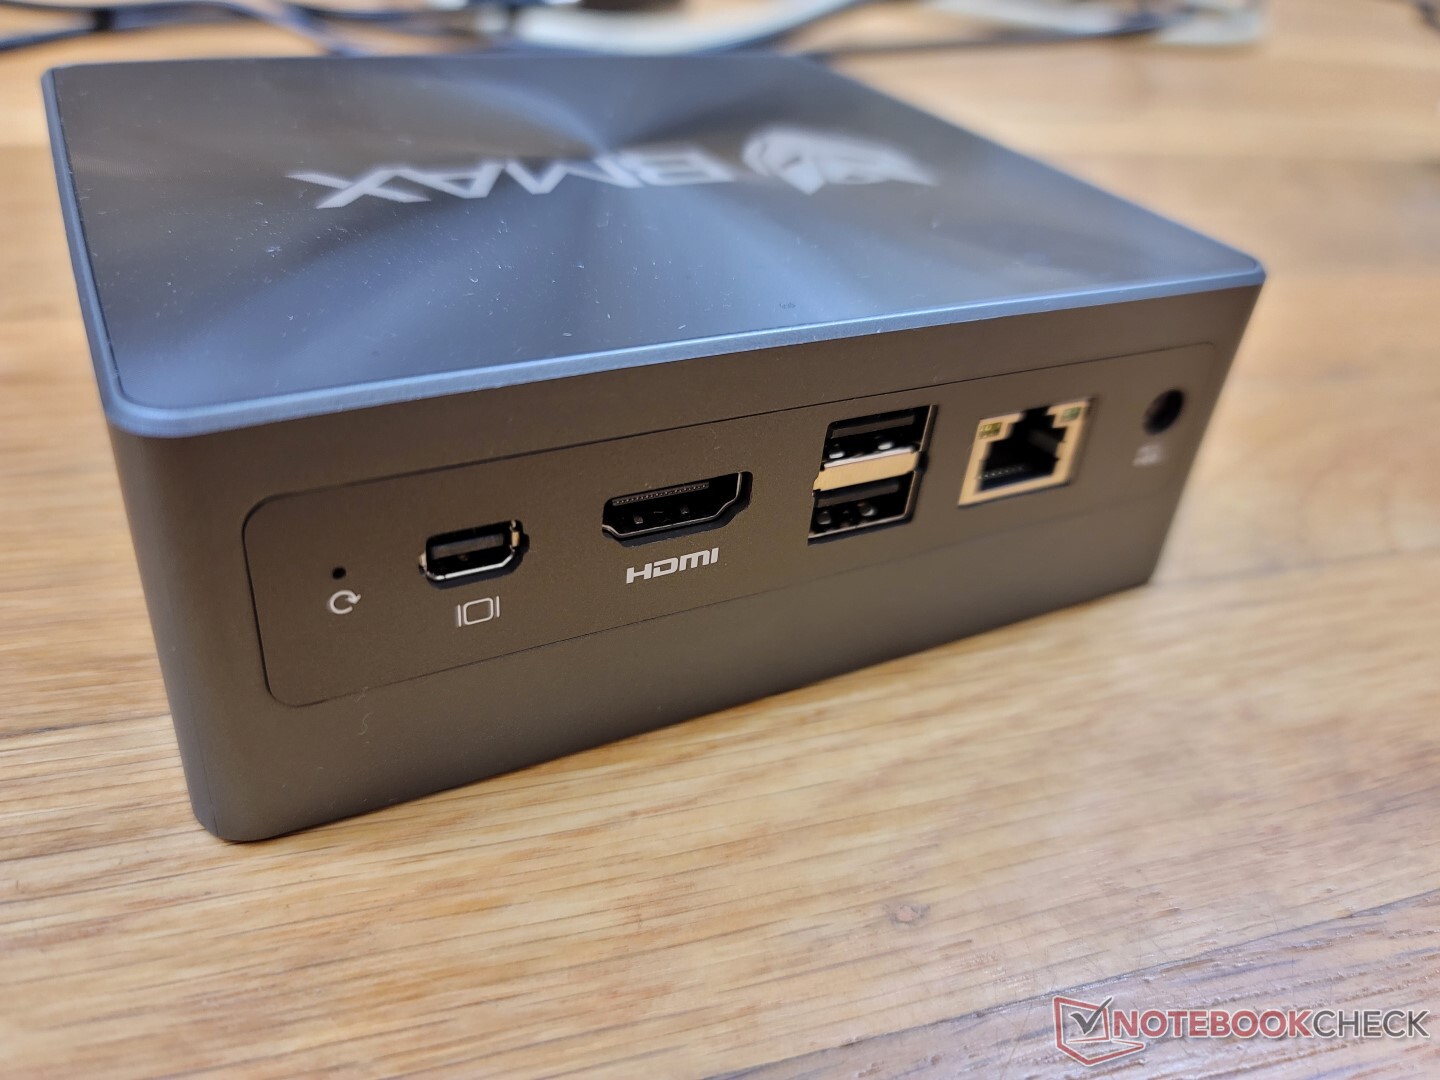
Connectiviteit - Geen Thunderbolt-ondersteuning
De meest opvallende poort op de B5 Pro is de mini DisplayPort, aangezien de meeste andere mini-pc's in deze prijsklasse helemaal geen mini DisplayPort hebben. 4K monitoren bij 60 Hz wordt niet ondersteund via HDMI.
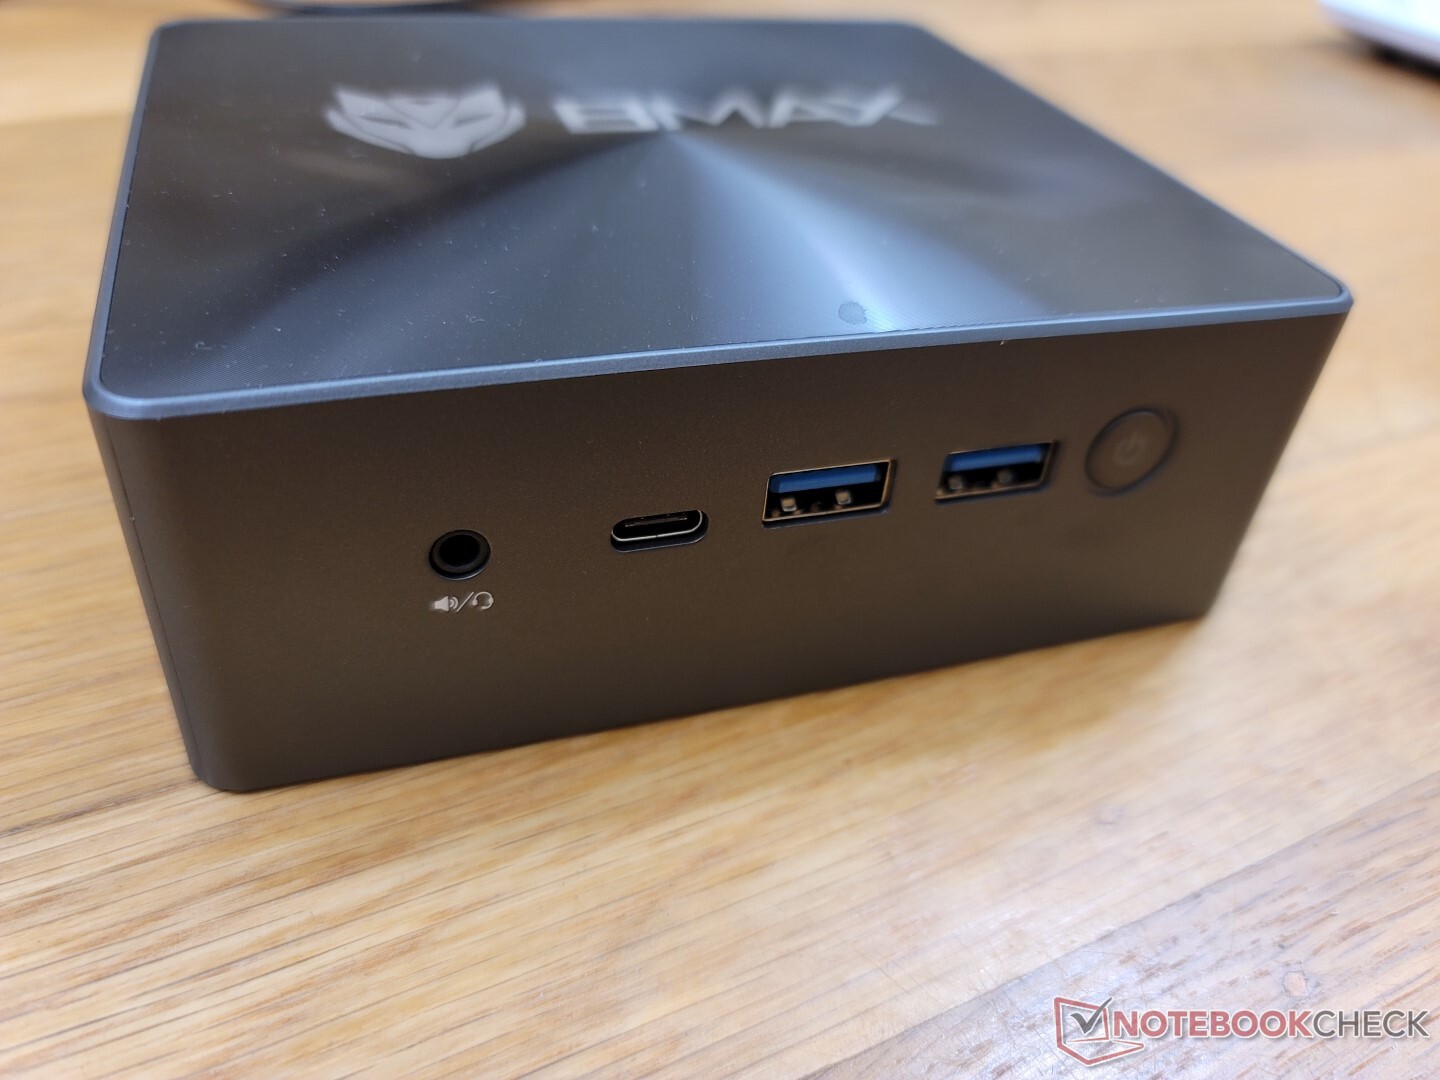
De USB-C poort aan de voorkant ondersteunt externe monitoren, maar geen Power-in of Thunderbolt.
Communicatie
Een RealTek RTL8852BE wordt standaard geleverd voor Wi-Fi 6 en Bluetooth 5.2 connectiviteit. Er is geen Wi-Fi 6E ondersteuning waarschijnlijk om kosten te besparen. Overdrachtssnelheden zijn verder stabiel en zonder problemen, ook al zijn ze lang niet zo snel als de meer gangbare Intel AX200/201 series.
| Networking | |
| iperf3 transmit AX12 | |
| Intel NUC11TNKi5 | |
| Beelink SEi8 | |
| iperf3 receive AX12 | |
| Intel NUC11TNKi5 | |
| Beelink SEi8 | |
| iperf3 receive AXE11000 6GHz | |
| Beelink SER Pro Ryzen 5 5600H | |
| Beelink SEi11 Pro | |
| iperf3 receive AXE11000 | |
| BMAX B5 Pro G7H8 | |
| Beelink U59 N5105 | |
| iperf3 transmit AXE11000 6GHz | |
| Beelink SER Pro Ryzen 5 5600H | |
| Beelink SEi11 Pro | |
| iperf3 transmit AXE11000 | |
| BMAX B5 Pro G7H8 | |
| Beelink U59 N5105 | |
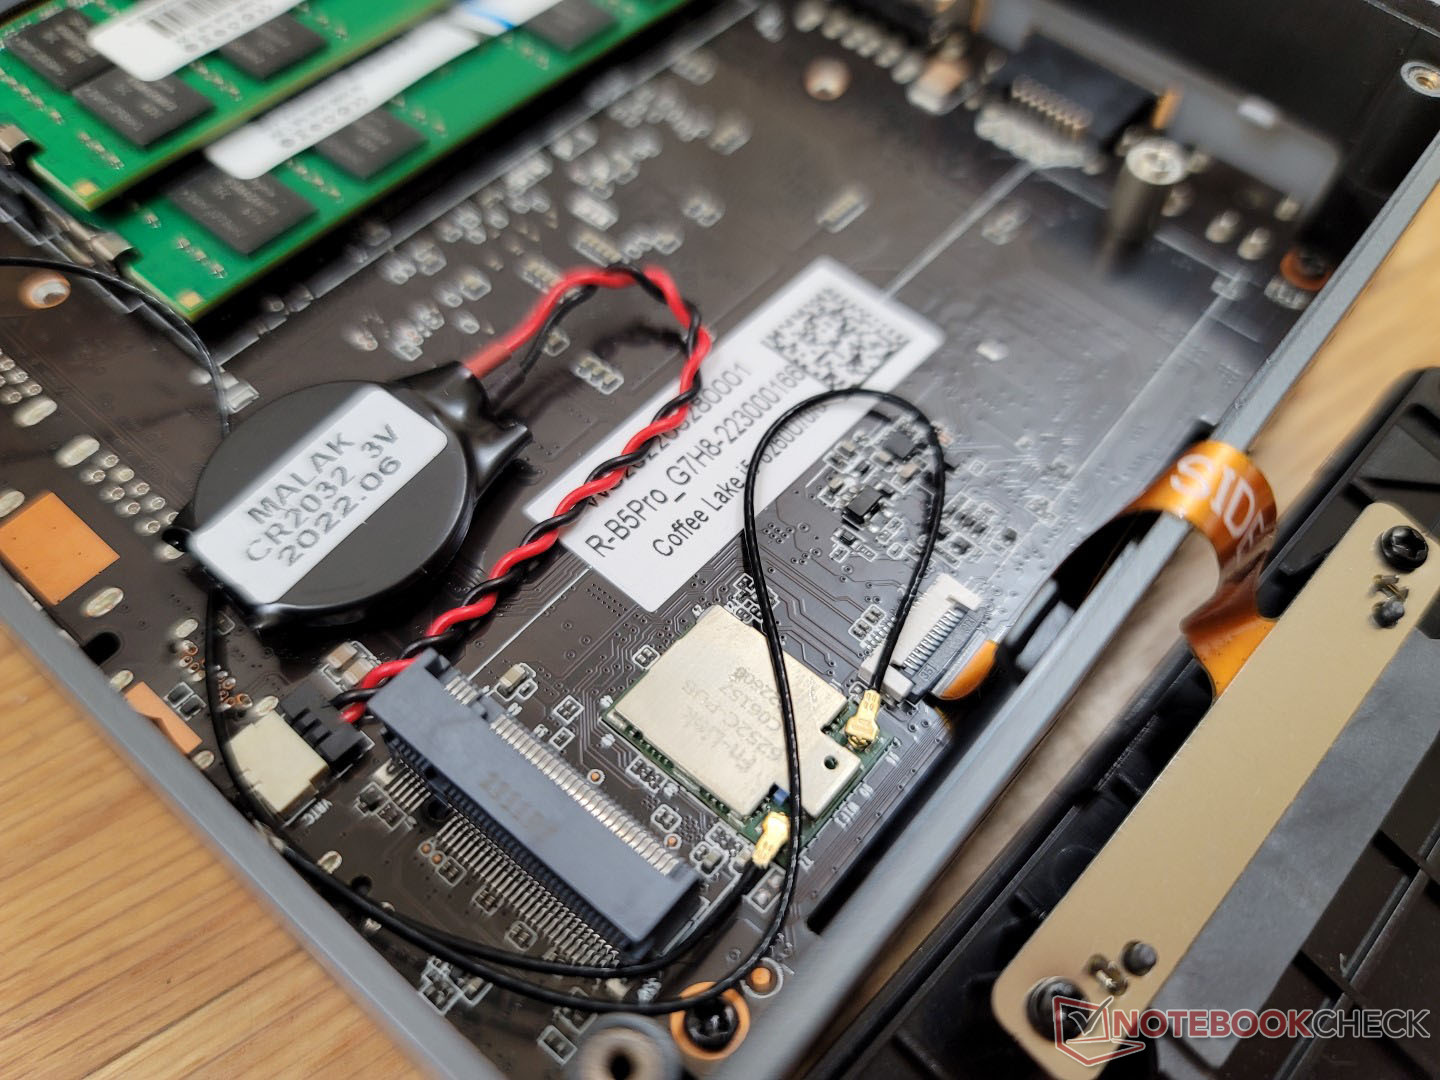
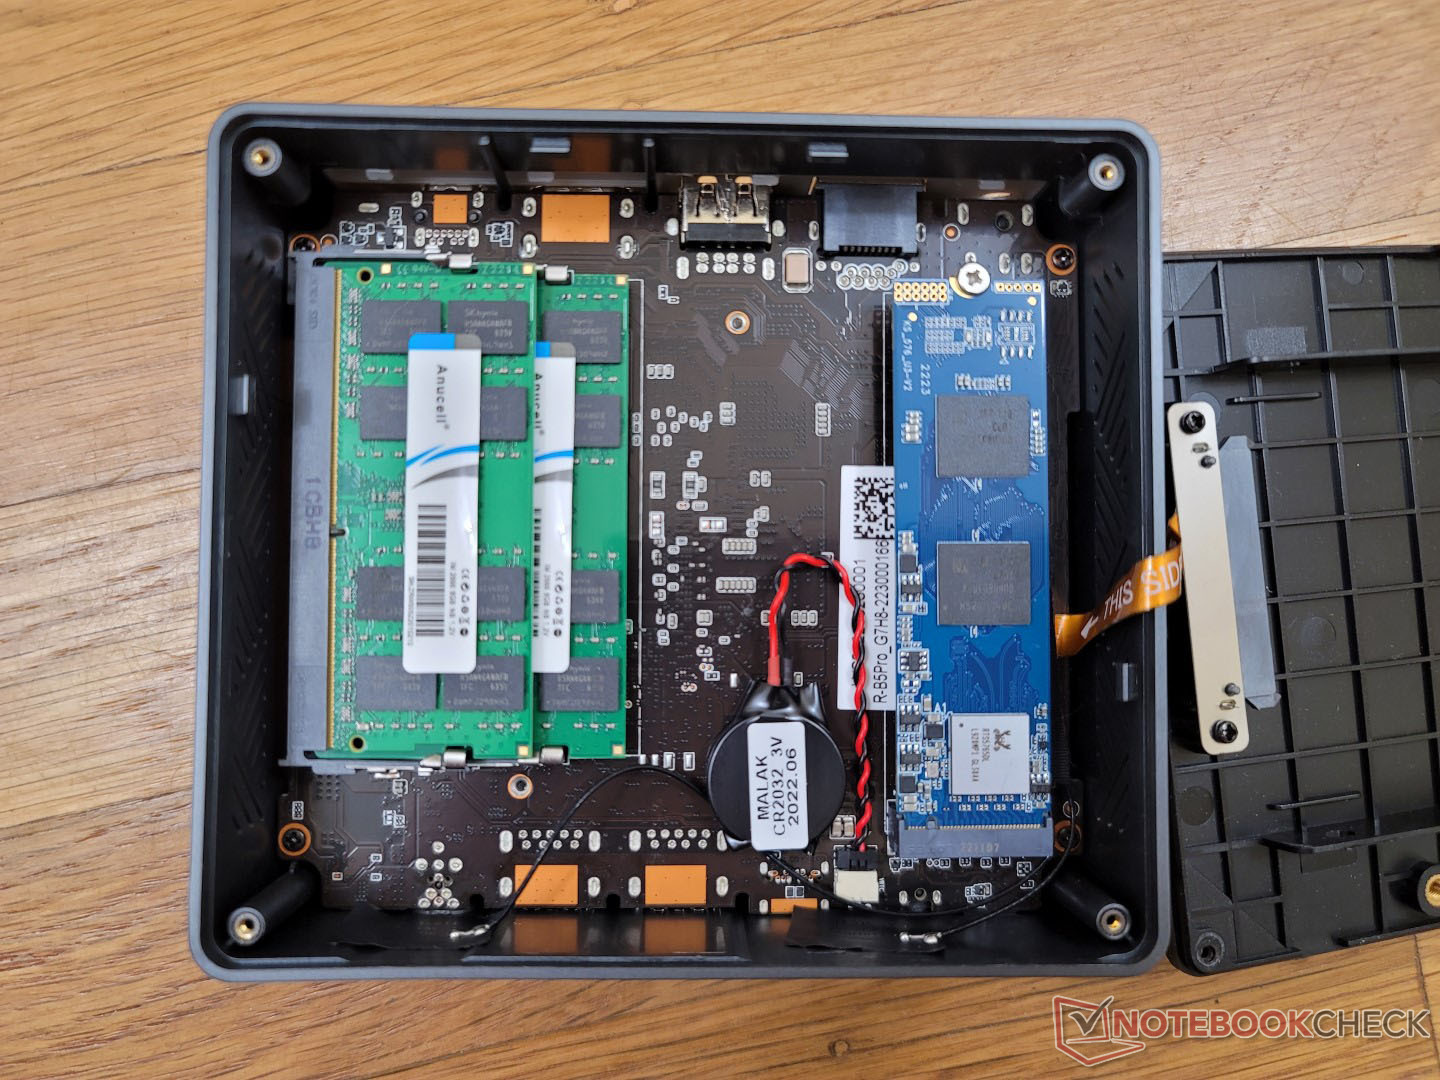
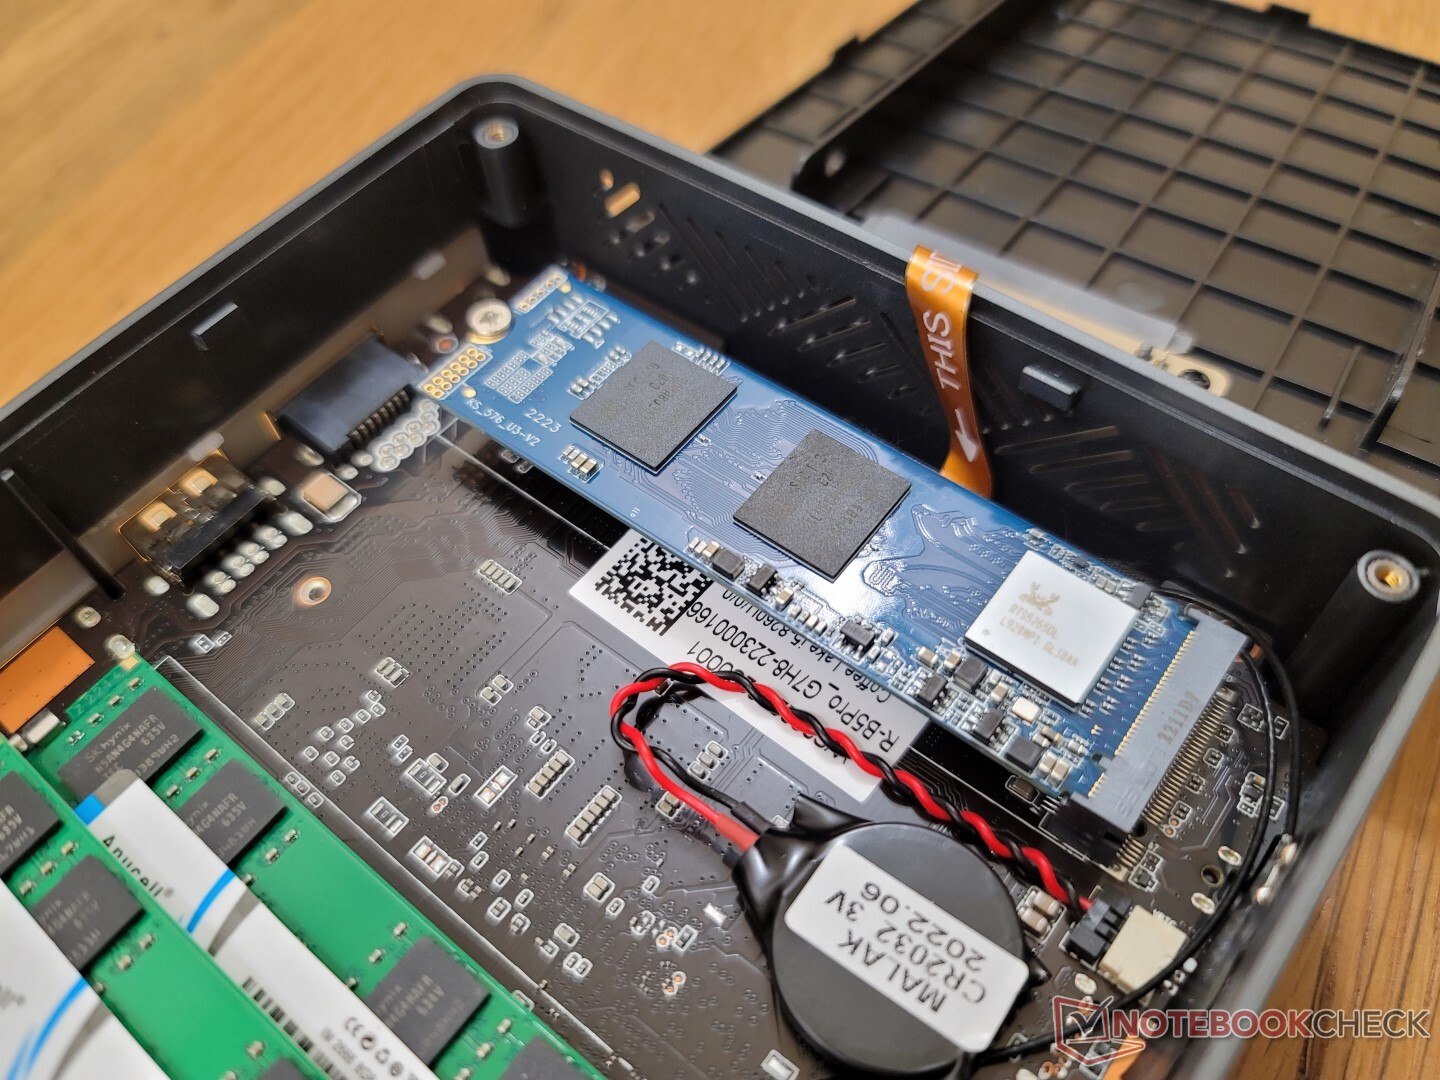
Onderhoud
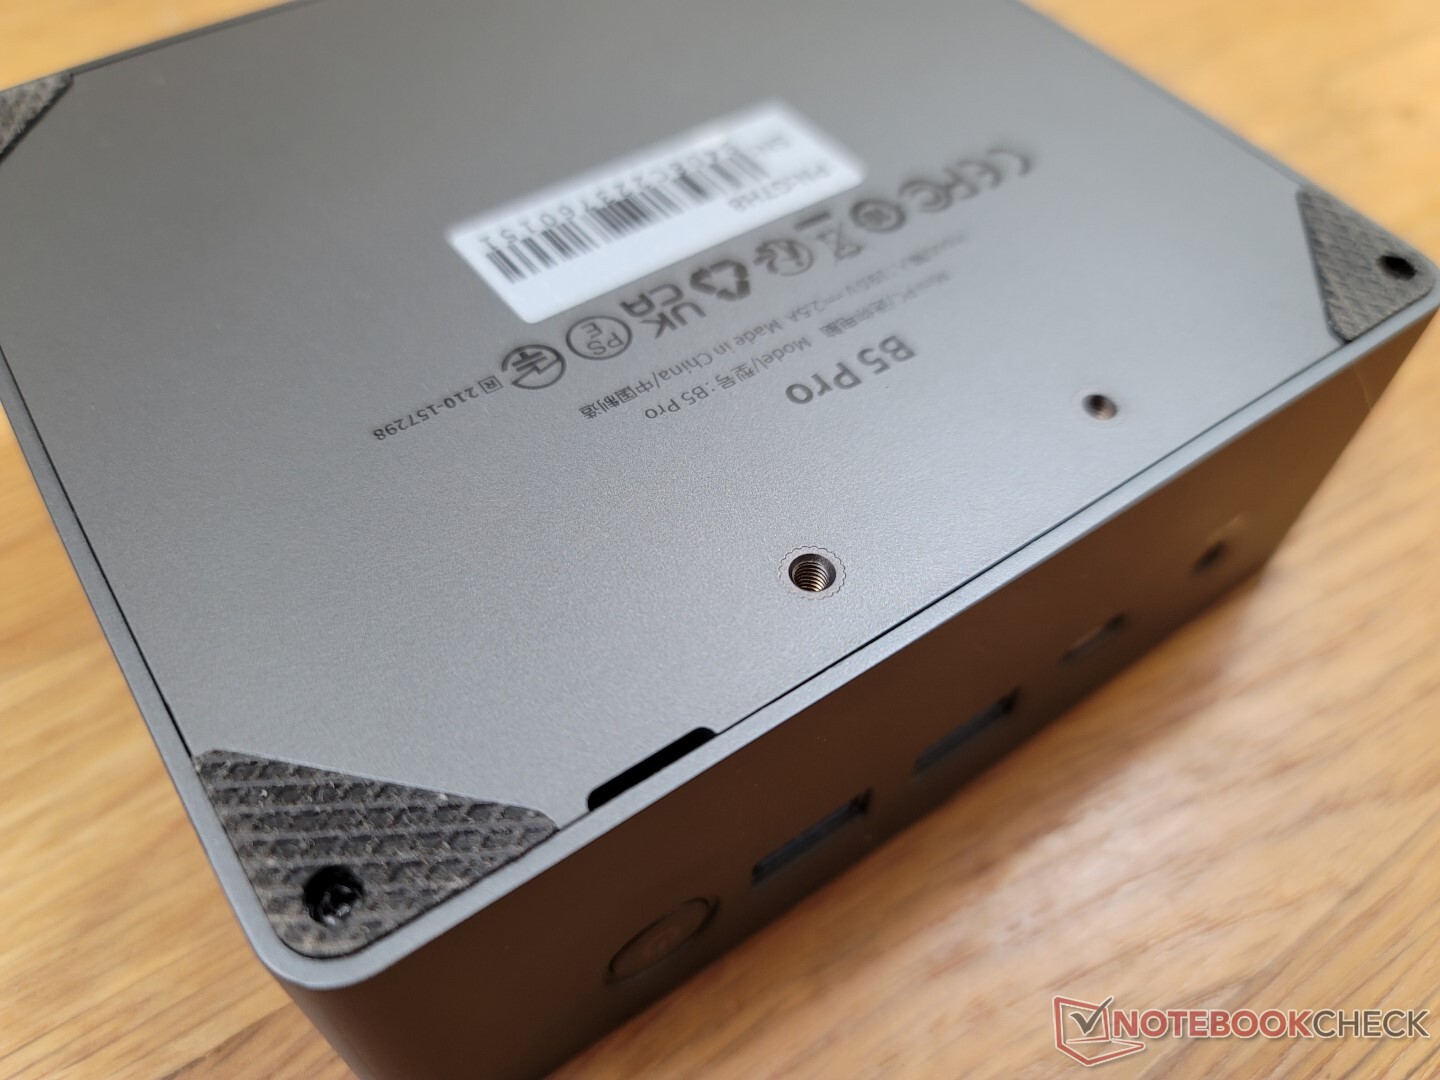
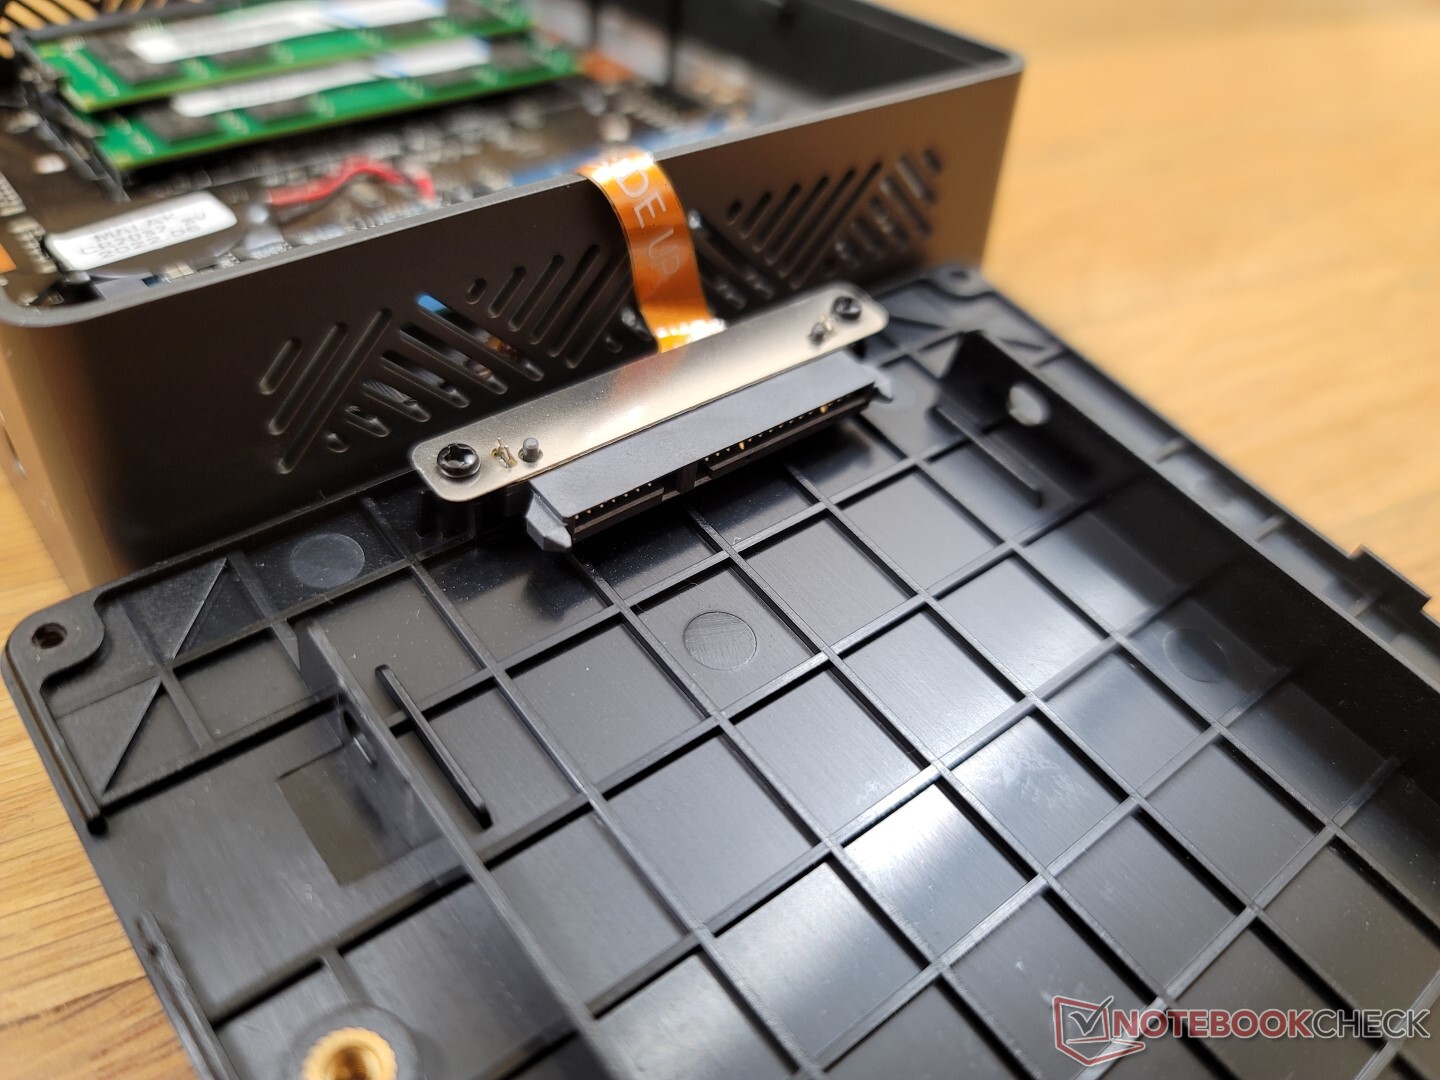
Het bodempaneel is bevestigd met vier Philips schroeven voor eenvoudig onderhoud. Anders dan bij de Beelink SEi8, heeft het bodempaneel van de BMax echter een kleine gleuf langs een rand voor gemakkelijker vastgrijpen en verwijderen
Gebruikers kunnen maximaal twee DDR4 SODIMM modules en maximaal twee opslagschijven installeren.
Accessoires en garantie
De verkoopverpakking bevat naast de AC-adapter een HDMI-kabel en een verwijderbare VESA-montagebeugel met schroeven. Bij aankoop in de VS geldt de standaard beperkte garantie van een jaar.
Prestaties - 8e Gen vs. 12 Gen
Testomstandigheden
We hebben ons toestel via Windows in de prestatiemodus gezet voordat we onderstaande benchmarks uitvoerden, voor de hoogst mogelijke scores. Er zijn geen vooraf geïnstalleerde toepassingen van de fabrikant voor een schone Windows gebruikerservaring.
Processor
De ruwe CPU-prestaties zijn over het algemeen vergelijkbaar met de 10e generatie Core i7-1065G7 ofCore i5-8259U. Hoewel veel langzamer dan de 11e generatie Core i5-1135G7 met maximaal 50 procent, het is nog steeds snel genoeg voor gemeenschappelijke multimedia doeleinden zoals surfen op het web, video streaming, en matige multi-tasking.
De 12e generatie Core i5-1235U, die enkele generaties voorloopt op onze Core i5-8260U, biedt ruwweg 60 procent en 80 procent snellere single-thread en multi-thread prestaties, respectievelijk.
De duurzaamheid van de prestaties is behoorlijk. Wanneer CineBench R15 xT in een lus wordt uitgevoerd, dalen de prestaties met ongeveer 11 procent na verloop van tijd.
Cinebench R15 Multi Loop
Cinebench R23: Multi Core | Single Core
Cinebench R15: CPU Multi 64Bit | CPU Single 64Bit
Blender: v2.79 BMW27 CPU
7-Zip 18.03: 7z b 4 | 7z b 4 -mmt1
Geekbench 5.5: Multi-Core | Single-Core
HWBOT x265 Benchmark v2.2: 4k Preset
LibreOffice : 20 Documents To PDF
R Benchmark 2.5: Overall mean
| Cinebench R23 / Multi Core | |
| Beelink SER Pro Ryzen 5 5600H | |
| Beelink SEi11 Pro | |
| Asus Vivobook 15 K513EQ | |
| Intel NUC11TNKi5 | |
| Geekom Mini IT8-GM08i5T | |
| Infinix INBook X2 | |
| BMAX B5 Pro G7H8 | |
| Beelink U59 N5105 | |
| Beelink SEi8 | |
| Cinebench R23 / Single Core | |
| Asus Vivobook 15 K513EQ | |
| Beelink SEi11 Pro | |
| Intel NUC11TNKi5 | |
| Beelink SER Pro Ryzen 5 5600H | |
| Infinix INBook X2 | |
| Beelink SEi8 | |
| BMAX B5 Pro G7H8 | |
| Beelink U59 N5105 | |
| Geekbench 5.5 / Multi-Core | |
| Beelink SER Pro Ryzen 5 5600H | |
| Beelink SEi11 Pro | |
| Intel NUC11TNKi5 | |
| Geekom Mini IT8-GM08i5T | |
| Fujitsu Lifebook U939 i5 | |
| Infinix INBook X2 | |
| Beelink U59 N5105 | |
| Beelink SEi8 | |
| BMAX B5 Pro G7H8 | |
| Geekbench 5.5 / Single-Core | |
| Beelink SEi11 Pro | |
| Beelink SER Pro Ryzen 5 5600H | |
| Intel NUC11TNKi5 | |
| Infinix INBook X2 | |
| Fujitsu Lifebook U939 i5 | |
| Geekom Mini IT8-GM08i5T | |
| Beelink SEi8 | |
| Beelink U59 N5105 | |
| BMAX B5 Pro G7H8 | |
* ... kleiner is beter
AIDA64: FP32 Ray-Trace | FPU Julia | CPU SHA3 | CPU Queen | FPU SinJulia | FPU Mandel | CPU AES | CPU ZLib | FP64 Ray-Trace | CPU PhotoWorxx
| Performance rating | |
| Beelink SER Pro Ryzen 5 5600H | |
| Beelink SEi11 Pro | |
| Intel NUC11TNKi5 | |
| BMAX B5 Pro G7H8 | |
| Beelink SEi8 | |
| Beelink U59 N5105 | |
| AIDA64 / FP32 Ray-Trace | |
| Beelink SER Pro Ryzen 5 5600H | |
| Beelink SEi11 Pro | |
| Intel NUC11TNKi5 | |
| BMAX B5 Pro G7H8 | |
| Beelink SEi8 | |
| Beelink U59 N5105 | |
| AIDA64 / FPU Julia | |
| Beelink SER Pro Ryzen 5 5600H | |
| Beelink SEi11 Pro | |
| Intel NUC11TNKi5 | |
| BMAX B5 Pro G7H8 | |
| Beelink SEi8 | |
| Beelink U59 N5105 | |
| AIDA64 / CPU SHA3 | |
| Beelink SER Pro Ryzen 5 5600H | |
| Beelink SEi11 Pro | |
| Intel NUC11TNKi5 | |
| BMAX B5 Pro G7H8 | |
| Beelink SEi8 | |
| Beelink U59 N5105 | |
| AIDA64 / CPU Queen | |
| Beelink SER Pro Ryzen 5 5600H | |
| Beelink SEi11 Pro | |
| Intel NUC11TNKi5 | |
| BMAX B5 Pro G7H8 | |
| Beelink SEi8 | |
| Beelink U59 N5105 | |
| AIDA64 / FPU SinJulia | |
| Beelink SER Pro Ryzen 5 5600H | |
| Beelink SEi11 Pro | |
| Intel NUC11TNKi5 | |
| BMAX B5 Pro G7H8 | |
| Beelink SEi8 | |
| Beelink U59 N5105 | |
| AIDA64 / FPU Mandel | |
| Beelink SER Pro Ryzen 5 5600H | |
| Beelink SEi11 Pro | |
| Intel NUC11TNKi5 | |
| BMAX B5 Pro G7H8 | |
| Beelink SEi8 | |
| Beelink U59 N5105 | |
| AIDA64 / CPU AES | |
| Beelink SER Pro Ryzen 5 5600H | |
| Beelink SEi11 Pro | |
| Intel NUC11TNKi5 | |
| Beelink U59 N5105 | |
| BMAX B5 Pro G7H8 | |
| Beelink SEi8 | |
| AIDA64 / CPU ZLib | |
| Beelink SER Pro Ryzen 5 5600H | |
| Intel NUC11TNKi5 | |
| Beelink SEi11 Pro | |
| BMAX B5 Pro G7H8 | |
| Beelink U59 N5105 | |
| Beelink SEi8 | |
| AIDA64 / FP64 Ray-Trace | |
| Beelink SER Pro Ryzen 5 5600H | |
| Beelink SEi11 Pro | |
| Intel NUC11TNKi5 | |
| BMAX B5 Pro G7H8 | |
| Beelink SEi8 | |
| Beelink U59 N5105 | |
| AIDA64 / CPU PhotoWorxx | |
| Beelink SEi11 Pro | |
| Beelink SER Pro Ryzen 5 5600H | |
| BMAX B5 Pro G7H8 | |
| Intel NUC11TNKi5 | |
| Beelink SEi8 | |
| Beelink U59 N5105 | |
Systeemprestaties
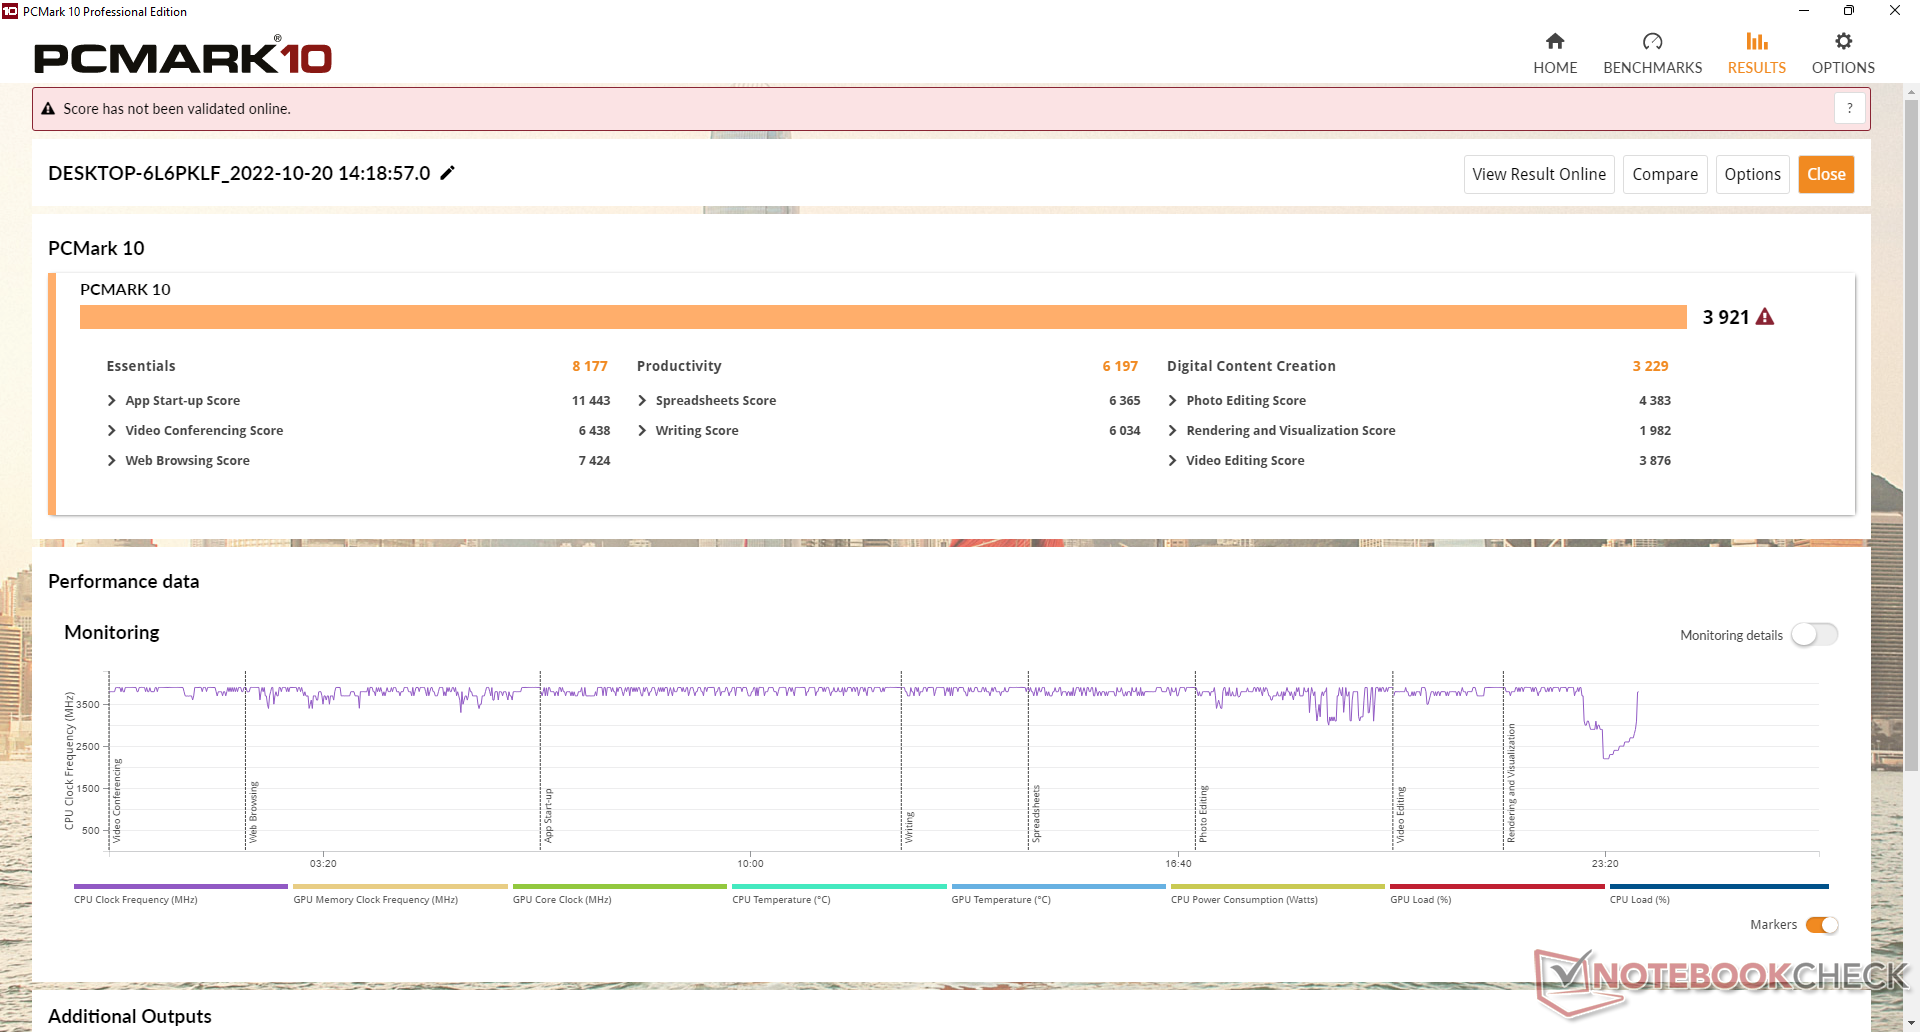
PCMark 10 resultaten zijn vergelijkbaar met de Beelink SEi8 die ook een oudere 8e generatie Core CPU gebruikt. Mini PC's met nieuwere 11e generatie CPU's zoals de Intel NUC11TNKi5 bieden aanzienlijk hogere Digital Content Creation scores vanwege hun snellere geïntegreerde GPU's.
CrossMark: Overall | Productivity | Creativity | Responsiveness
| PCMark 10 / Score | |
| Beelink SER Pro Ryzen 5 5600H | |
| Beelink SEi11 Pro | |
| Intel NUC11TNKi5 | |
| BMAX B5 Pro G7H8 | |
| Beelink SEi8 | |
| Beelink U59 N5105 | |
| PCMark 10 / Essentials | |
| Beelink SER Pro Ryzen 5 5600H | |
| Beelink SEi11 Pro | |
| Intel NUC11TNKi5 | |
| BMAX B5 Pro G7H8 | |
| Beelink SEi8 | |
| Beelink U59 N5105 | |
| PCMark 10 / Productivity | |
| Beelink SER Pro Ryzen 5 5600H | |
| Beelink SEi11 Pro | |
| BMAX B5 Pro G7H8 | |
| Intel NUC11TNKi5 | |
| Beelink SEi8 | |
| Beelink U59 N5105 | |
| PCMark 10 / Digital Content Creation | |
| Beelink SER Pro Ryzen 5 5600H | |
| Beelink SEi11 Pro | |
| Intel NUC11TNKi5 | |
| BMAX B5 Pro G7H8 | |
| Beelink SEi8 | |
| Beelink U59 N5105 | |
| CrossMark / Overall | |
| Beelink SEi11 Pro | |
| Beelink SER Pro Ryzen 5 5600H | |
| BMAX B5 Pro G7H8 | |
| Beelink U59 N5105 | |
| CrossMark / Productivity | |
| Beelink SEi11 Pro | |
| Beelink SER Pro Ryzen 5 5600H | |
| BMAX B5 Pro G7H8 | |
| Beelink U59 N5105 | |
| CrossMark / Creativity | |
| Beelink SER Pro Ryzen 5 5600H | |
| Beelink SEi11 Pro | |
| BMAX B5 Pro G7H8 | |
| Beelink U59 N5105 | |
| CrossMark / Responsiveness | |
| Beelink SEi11 Pro | |
| Beelink SER Pro Ryzen 5 5600H | |
| BMAX B5 Pro G7H8 | |
| Beelink U59 N5105 | |
| PCMark 10 Score | 3921 punten | |
Help | ||
| AIDA64 / Memory Copy | |
| Beelink SER Pro Ryzen 5 5600H | |
| Beelink SEi11 Pro | |
| Beelink SEi8 | |
| BMAX B5 Pro G7H8 | |
| Beelink U59 N5105 | |
| Intel NUC11TNKi5 | |
| AIDA64 / Memory Read | |
| Beelink SER Pro Ryzen 5 5600H | |
| Beelink SEi11 Pro | |
| BMAX B5 Pro G7H8 | |
| Beelink SEi8 | |
| Intel NUC11TNKi5 | |
| Beelink U59 N5105 | |
| AIDA64 / Memory Write | |
| Beelink SEi11 Pro | |
| Beelink SER Pro Ryzen 5 5600H | |
| BMAX B5 Pro G7H8 | |
| Beelink U59 N5105 | |
| Intel NUC11TNKi5 | |
| Beelink SEi8 | |
| AIDA64 / Memory Latency | |
| BMAX B5 Pro G7H8 | |
| Intel NUC11TNKi5 | |
| Beelink SEi11 Pro | |
| Beelink SER Pro Ryzen 5 5600H | |
| Beelink U59 N5105 | |
| Beelink SEi8 | |
* ... kleiner is beter
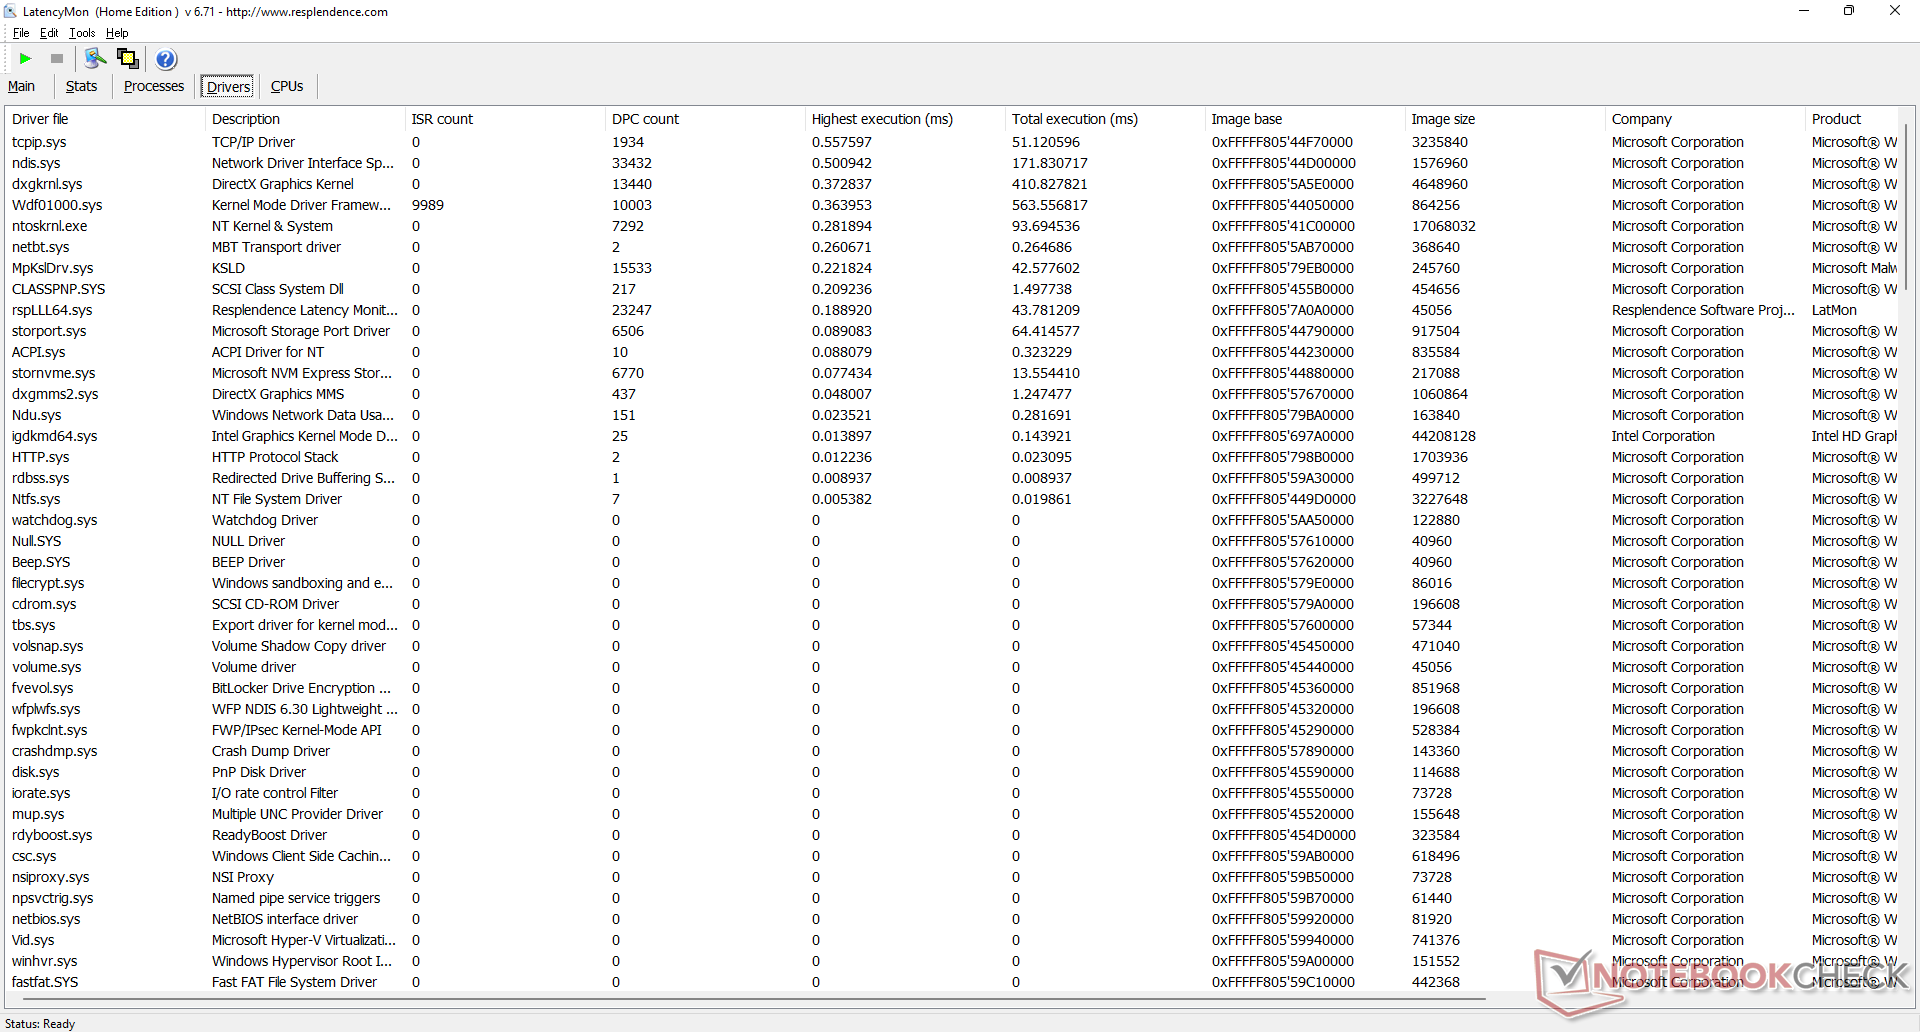
DPC latentie
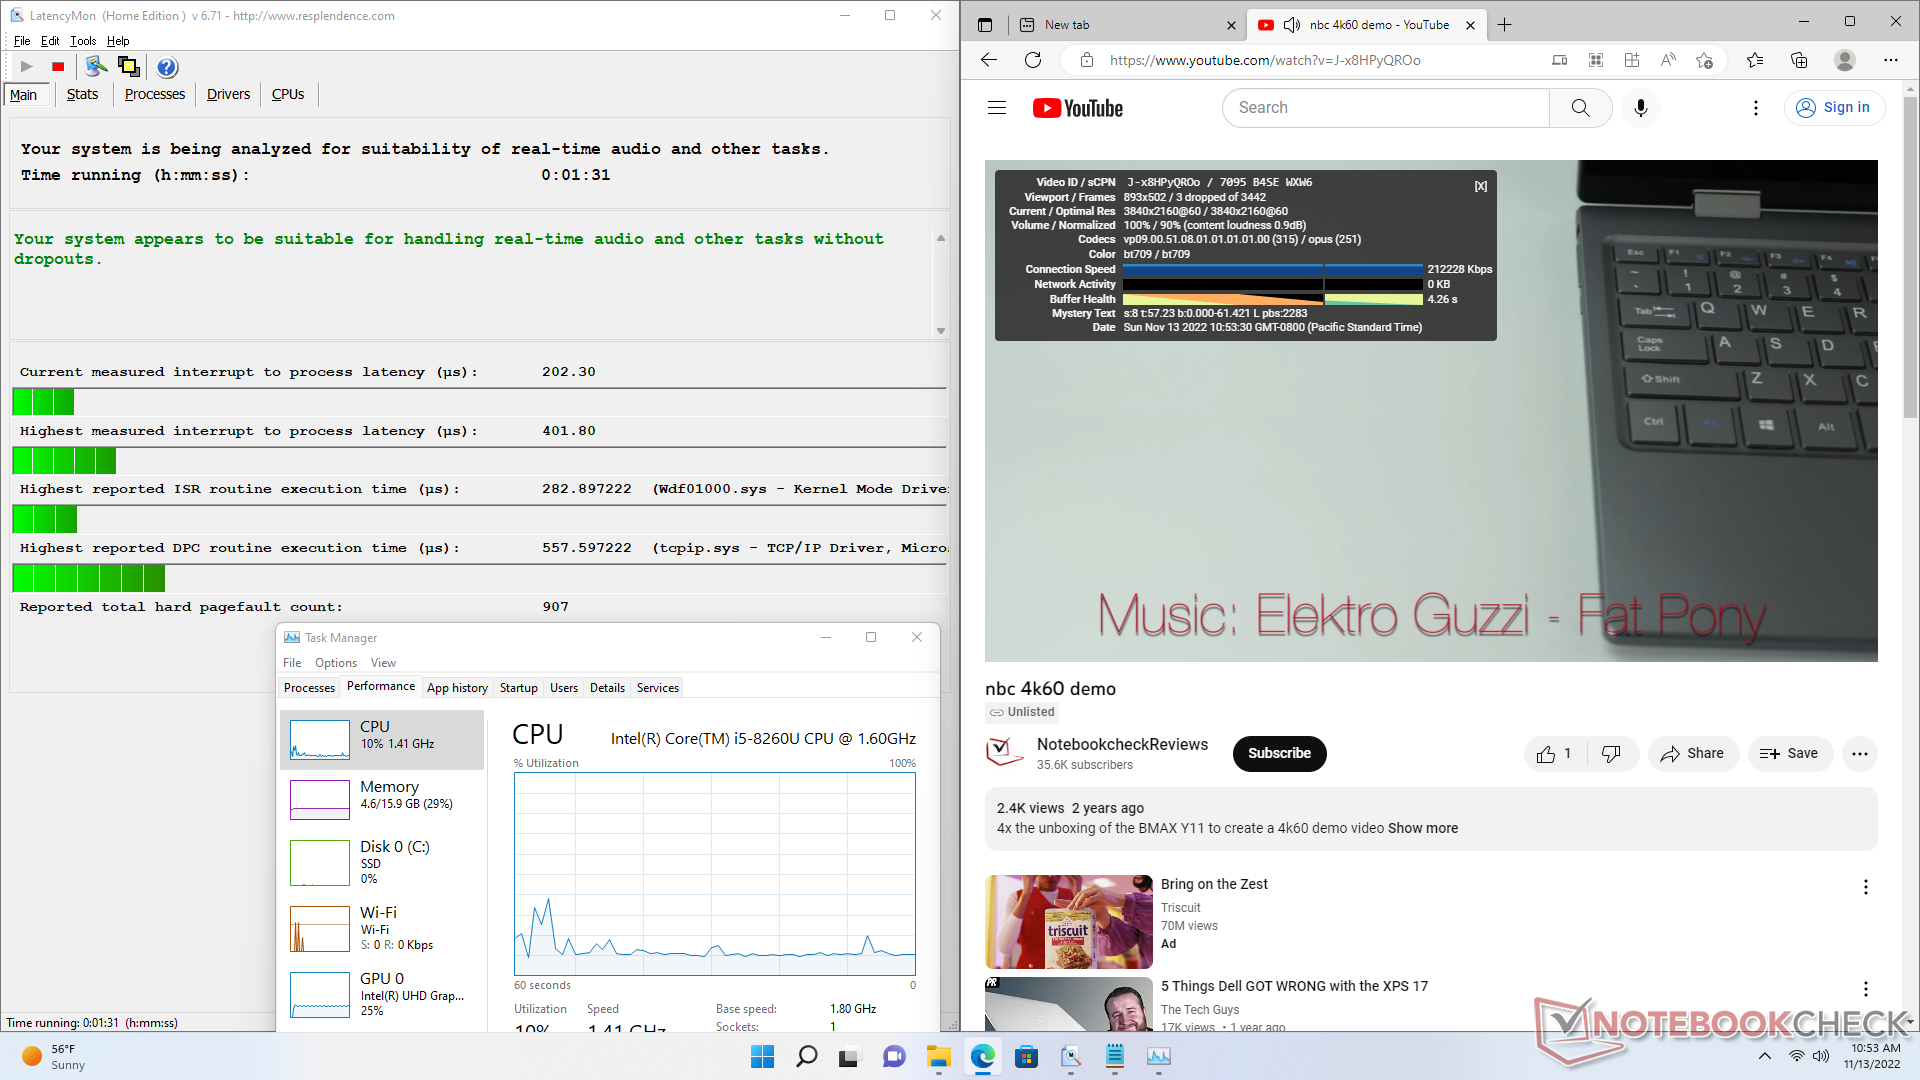
LatencyMon onthult geen grote DPC-problemen bij het surfen op het web. 4K video afspelen bij 60 FPS is ook uitstekend met slechts 3 dropped frames tijdens onze minutenlange playtest.
| DPC Latencies / LatencyMon - interrupt to process latency (max), Web, Youtube, Prime95 | |
| Beelink SEi8 | |
| Beelink U59 N5105 | |
| Beelink SER Pro Ryzen 5 5600H | |
| Intel NUC11TNKi5 | |
| BMAX B5 Pro G7H8 | |
| Beelink SEi11 Pro | |
* ... kleiner is beter
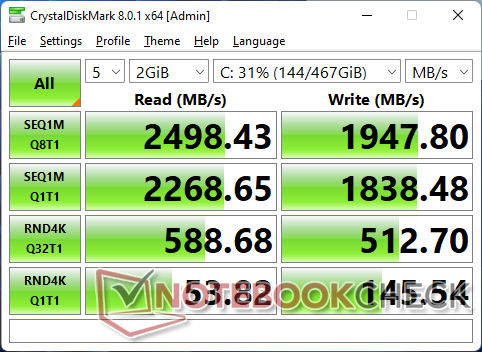
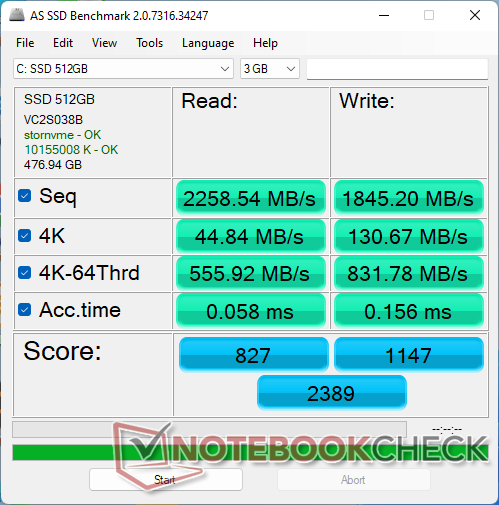
Opslagapparaten - Tot twee schijven
De B5 Pro maakt gebruik van een generieke M.2 PCIe3 x4 SSD met een RealTek RTS5763DL controller om kosten te besparen. De prestaties zijn echter niet optimaal, aangezien de leessnelheid daalt van het oorspronkelijke hoge niveau van ~2400 MB/s naar slechts ~1700 MB/s wanneer de schijf onder druk komt te staan.

| Drive Performance rating - Percent | |
| Beelink SER Pro Ryzen 5 5600H -11! | |
| BMAX B5 Pro G7H8 | |
| Beelink SEi11 Pro | |
| Beelink SEi8 | |
| Beelink U59 N5105 | |
| Intel NUC11TNKi5 | |
* ... kleiner is beter
Disk Throttling: DiskSpd Read Loop, Queue Depth 8
GPU-prestaties
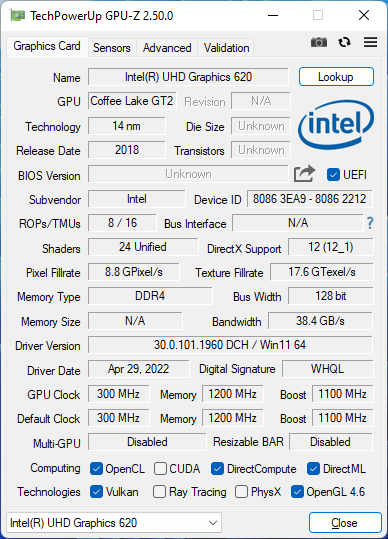
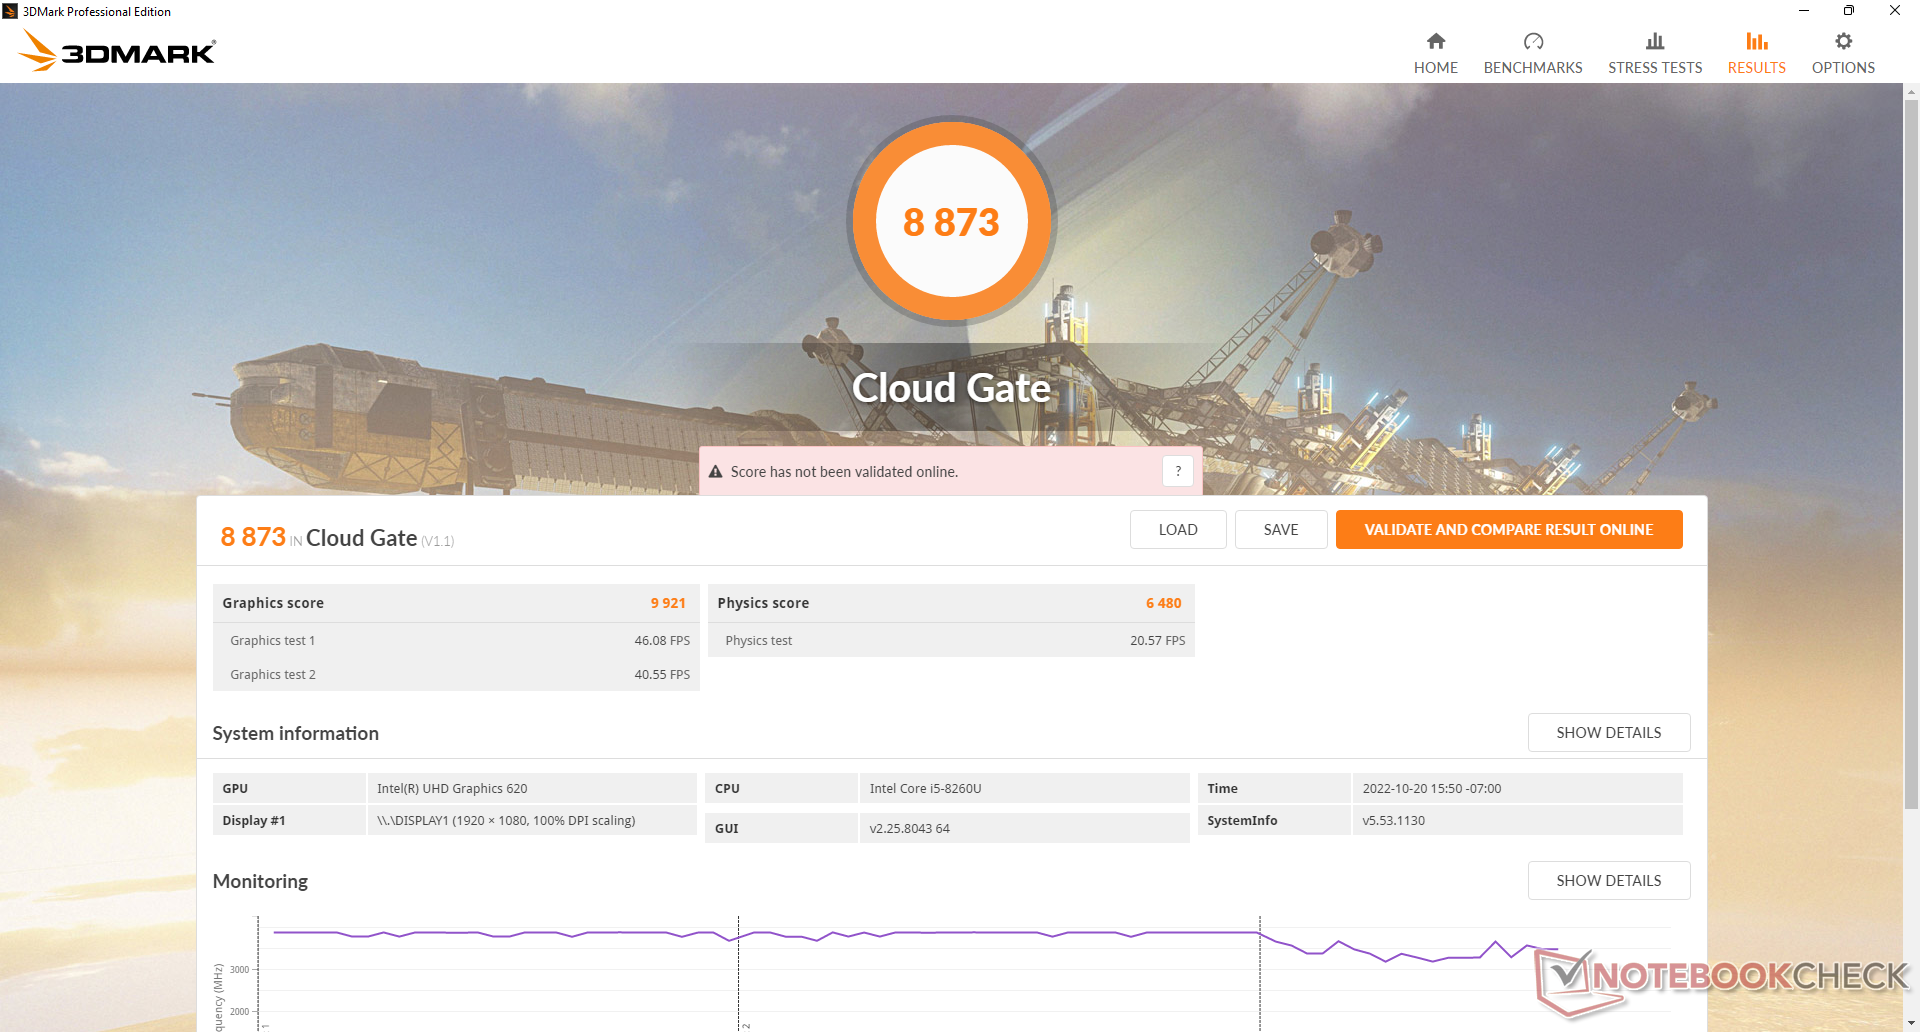
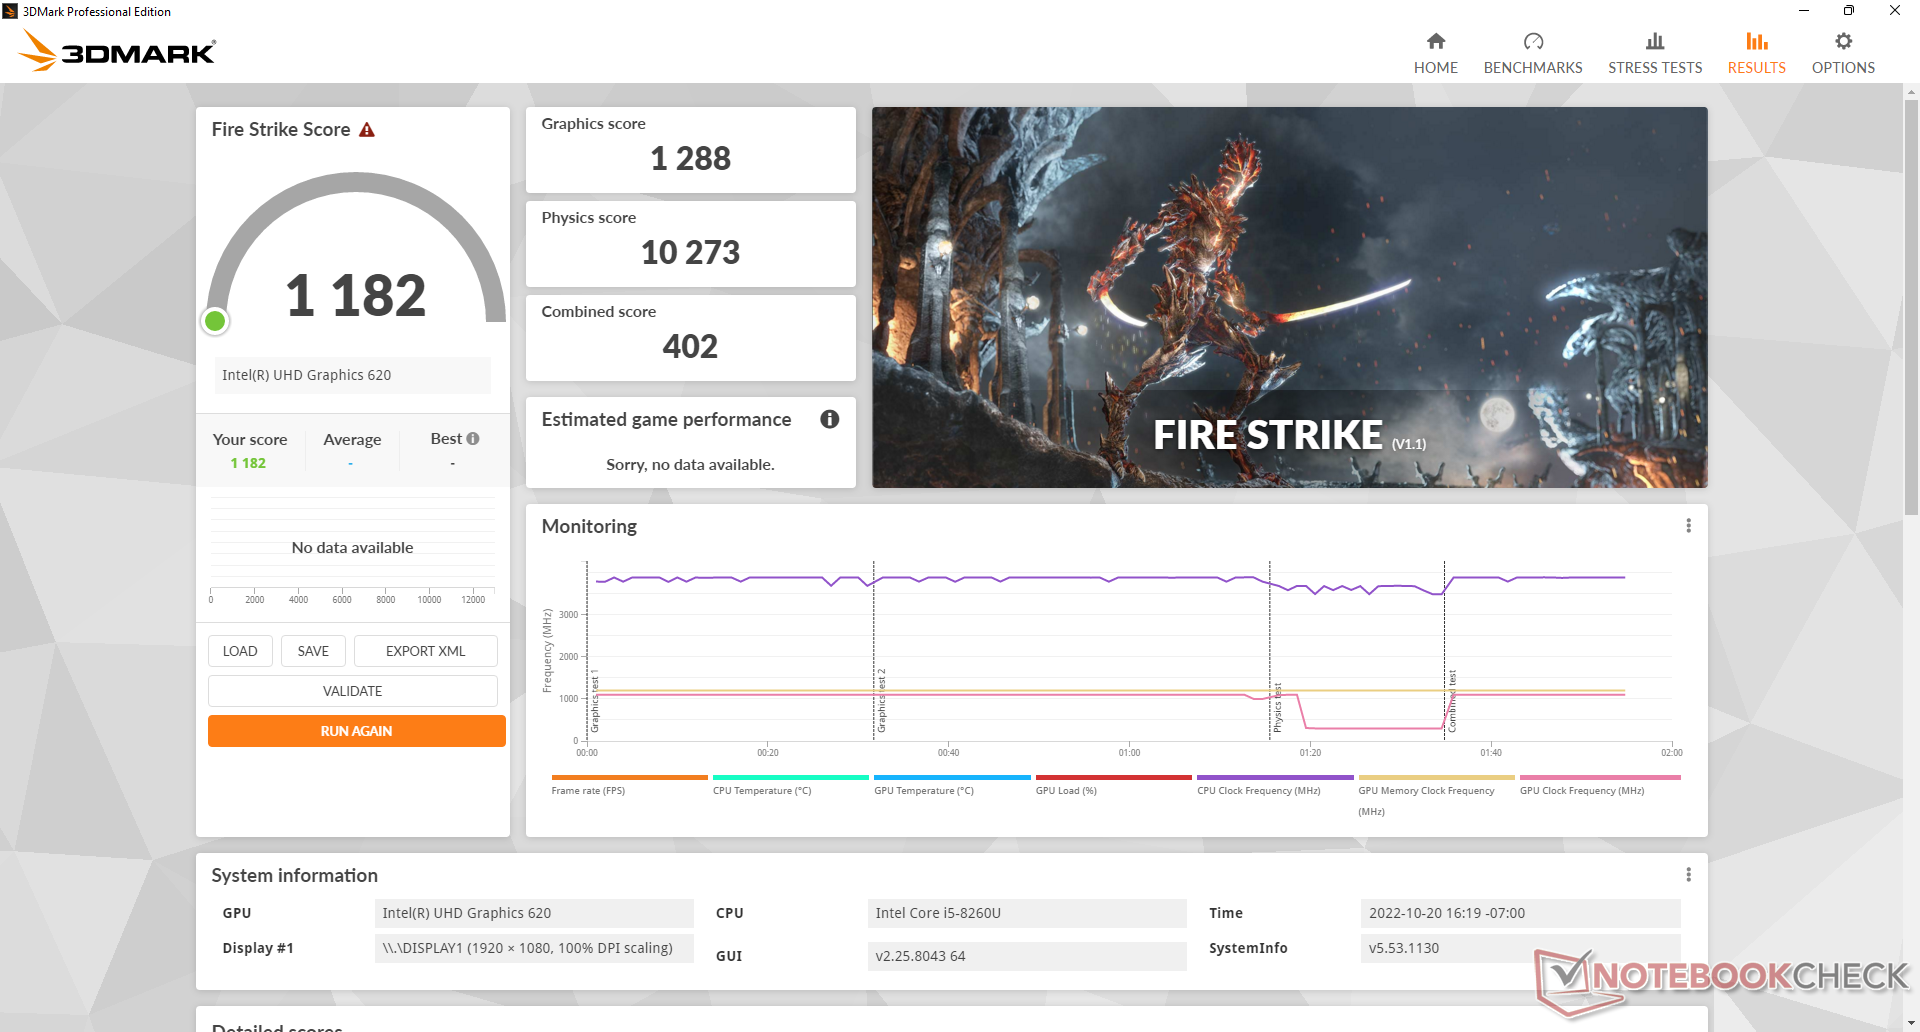
De grafische prestaties zijn naar huidige maatstaven slecht. De Iris Xe 80 EU in veel moderne Core i5 U-serie CPU's, bijvoorbeeld, biedt 2x tot 2,5x snellere prestaties dan onze ouder wordende UHD Graphics 620. De meeste spellen zijn onspeelbaar en sommige zouden niet eens starten met inbegrip van X-Plane.
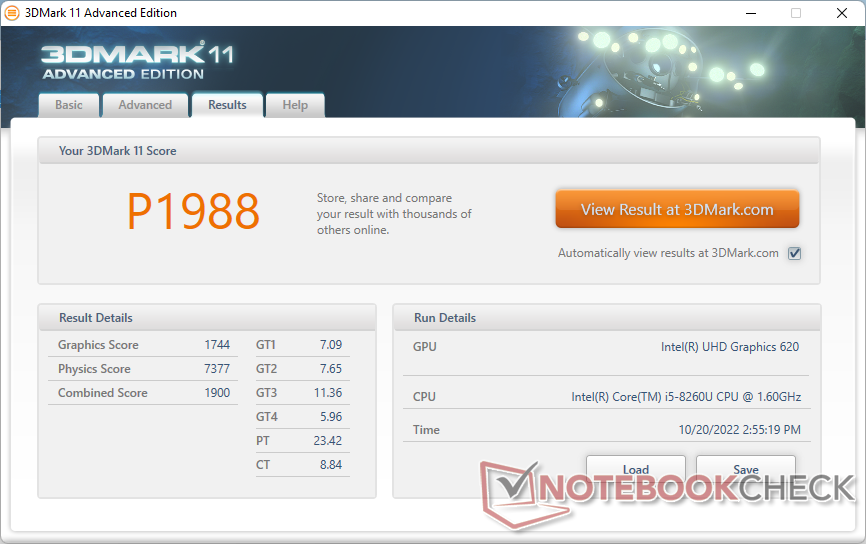
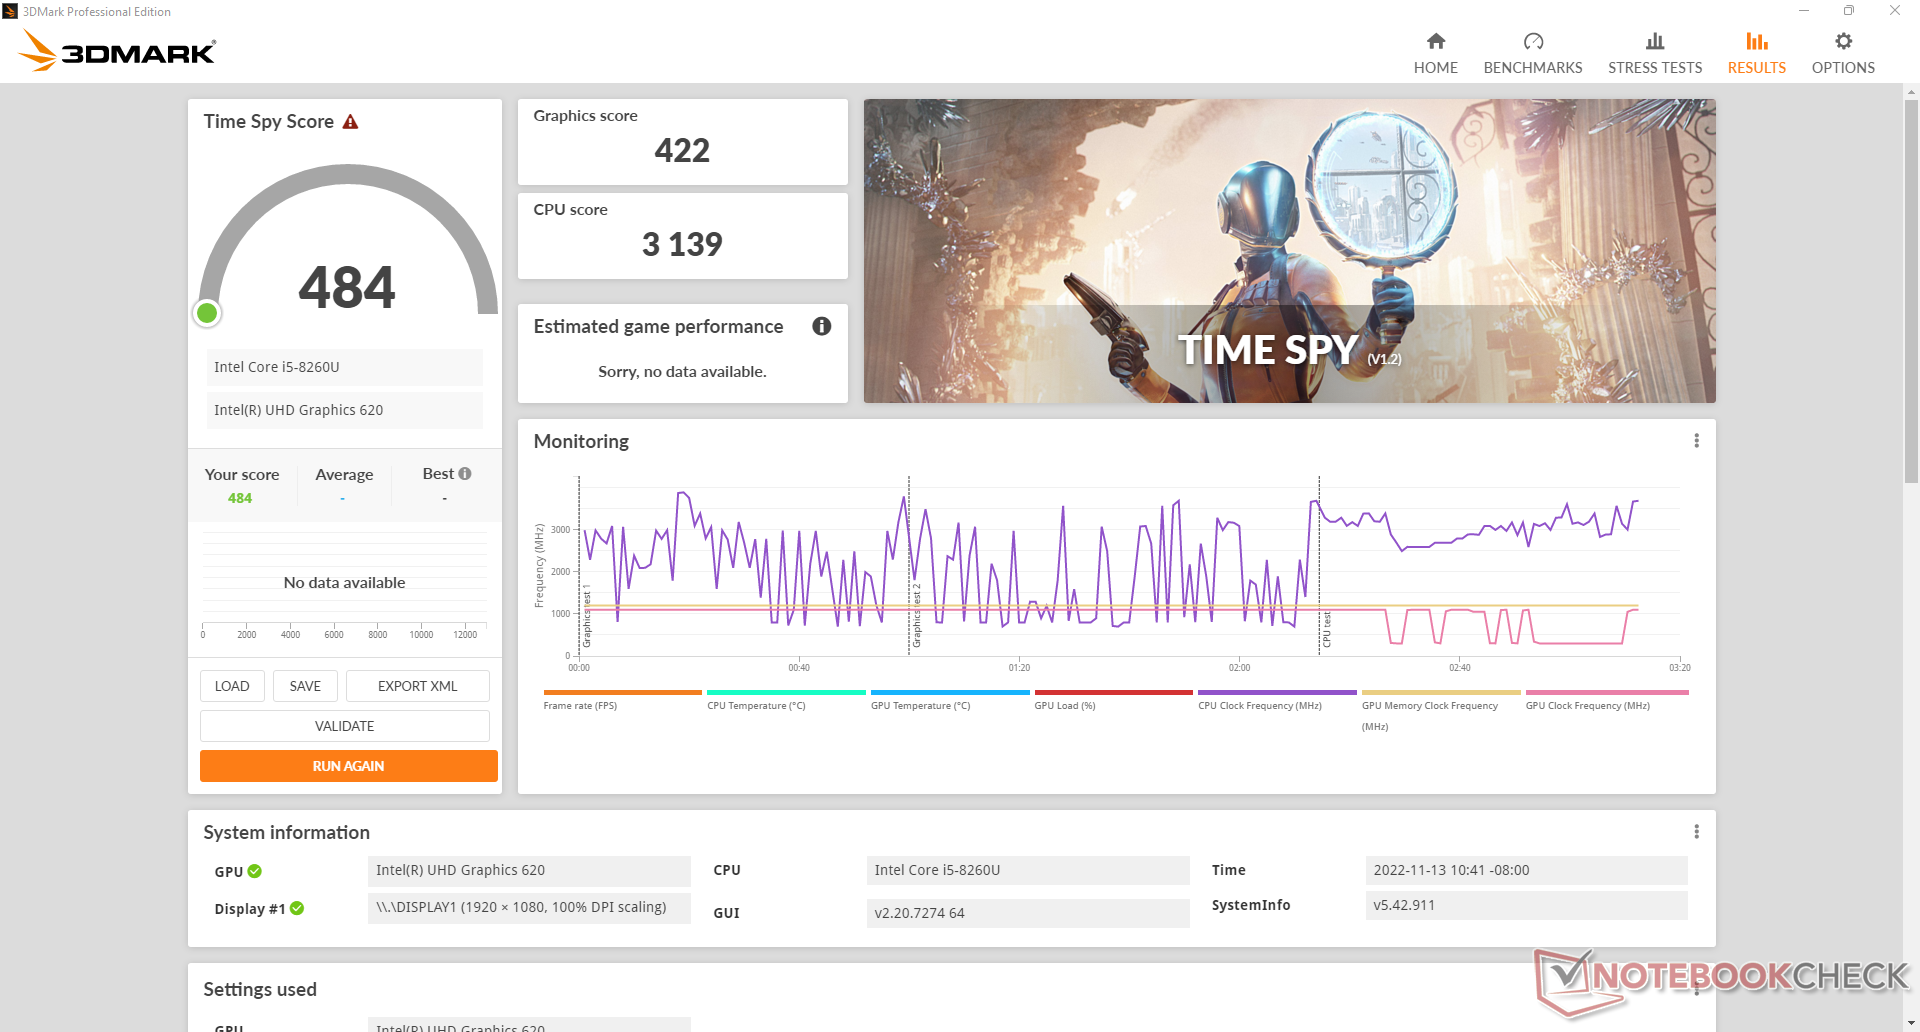
| 3DMark 11 Performance | 1988 punten | |
| 3DMark Cloud Gate Standard Score | 8873 punten | |
| 3DMark Fire Strike Score | 1182 punten | |
| 3DMark Time Spy Score | 484 punten | |
Help | ||
| Blender - v3.3 Classroom CPU (sorteer op waarde) | |
| BMAX B5 Pro G7H8 | |
| Beelink SEi11 Pro | |
| Beelink U59 N5105 | |
| Beelink SER Pro Ryzen 5 5600H | |
* ... kleiner is beter
| Performance rating - Percent | |
| Asus Vivobook 15 K513EQ | |
| Beelink SER Pro Ryzen 5 5600H | |
| Beelink SEi11 Pro -1! | |
| Intel NUC11TNKi5 -3! | |
| Infinix INBook X2 -2! | |
| Beelink SEi8 -3! | |
| Fujitsu Lifebook U939 i5 -4! | |
| Beelink U59 N5105 -3! | |
| BMAX B5 Pro G7H8 -5! | |
| The Witcher 3 - 1920x1080 Ultra Graphics & Postprocessing (HBAO+) | |
| Asus Vivobook 15 K513EQ | |
| Beelink SER Pro Ryzen 5 5600H | |
| Beelink SEi11 Pro | |
| Infinix INBook X2 | |
| Beelink U59 N5105 | |
| GTA V - 1920x1080 Highest AA:4xMSAA + FX AF:16x | |
| Asus Vivobook 15 K513EQ | |
| Beelink SER Pro Ryzen 5 5600H | |
| Final Fantasy XV Benchmark - 1920x1080 High Quality | |
| Beelink SEi11 Pro | |
| Asus Vivobook 15 K513EQ | |
| Beelink SER Pro Ryzen 5 5600H | |
| Intel NUC11TNKi5 | |
| Infinix INBook X2 | |
| Beelink SEi8 | |
| Strange Brigade - 1920x1080 ultra AA:ultra AF:16 | |
| Beelink SER Pro Ryzen 5 5600H | |
| Beelink SEi11 Pro | |
| Asus Vivobook 15 K513EQ | |
| Dota 2 Reborn - 1920x1080 ultra (3/3) best looking | |
| Asus Vivobook 15 K513EQ | |
| Beelink SER Pro Ryzen 5 5600H | |
| Beelink SEi11 Pro | |
| Intel NUC11TNKi5 | |
| Infinix INBook X2 | |
| Beelink SEi8 | |
| Fujitsu Lifebook U939 i5 | |
| Beelink U59 N5105 | |
| BMAX B5 Pro G7H8 | |
| X-Plane 11.11 - 1920x1080 high (fps_test=3) | |
| Asus Vivobook 15 K513EQ | |
| Beelink SEi11 Pro | |
| Beelink SER Pro Ryzen 5 5600H | |
| Intel NUC11TNKi5 | |
| Infinix INBook X2 | |
| Fujitsu Lifebook U939 i5 | |
| Beelink SEi8 | |
| Beelink U59 N5105 | |
| The Witcher 3 | |
| 1024x768 Low Graphics & Postprocessing | |
| Beelink SEi11 Pro | |
| Asus Vivobook 15 K513EQ | |
| Beelink SER Pro Ryzen 5 5600H | |
| Intel NUC11TNKi5 | |
| Infinix INBook X2 | |
| BMAX B5 Pro G7H8 | |
| Beelink U59 N5105 | |
| Fujitsu Lifebook U939 i5 | |
| 1366x768 Medium Graphics & Postprocessing | |
| Beelink SEi11 Pro | |
| Beelink SER Pro Ryzen 5 5600H | |
| Asus Vivobook 15 K513EQ | |
| Infinix INBook X2 | |
| Beelink U59 N5105 | |
| BMAX B5 Pro G7H8 | |
| 1920x1080 High Graphics & Postprocessing (Nvidia HairWorks Off) | |
| Asus Vivobook 15 K513EQ | |
| Beelink SEi11 Pro | |
| Beelink SER Pro Ryzen 5 5600H | |
| Infinix INBook X2 | |
| Beelink U59 N5105 | |
| BMAX B5 Pro G7H8 | |
| Final Fantasy XV Benchmark - 1280x720 Lite Quality | |
| Asus Vivobook 15 K513EQ | |
| Beelink SER Pro Ryzen 5 5600H | |
| Beelink SEi11 Pro | |
| Intel NUC11TNKi5 | |
| Infinix INBook X2 | |
| Geekom Mini IT8-GM08i5T | |
| Beelink SEi8 | |
| Beelink U59 N5105 | |
| BMAX B5 Pro G7H8 | |
Witcher 3 FPS Chart
| lage | gem. | hoge | ultra | |
|---|---|---|---|---|
| The Witcher 3 (2015) | 23.8 | 13.5 | 7.3 | |
| Dota 2 Reborn (2015) | 42.4 | 8.6 | 5.6 | 5.6 |
| Final Fantasy XV Benchmark (2018) | 5.61 |
Emissies
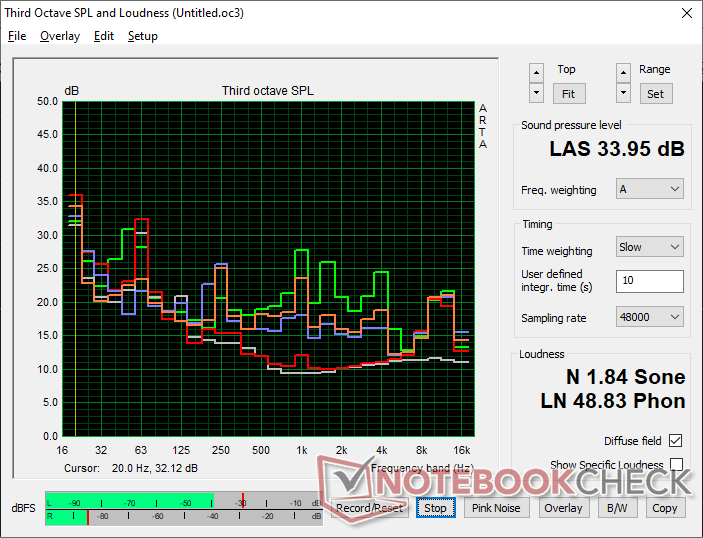
Systeemgeluid - helemaal niet luid
De interne ventilator is bijna altijd actief met ongeveer 25 dB(A) tegen een stille achtergrond van 23 dB(A), zelfs wanneer er geen toepassingen worden uitgevoerd. Gelukkig is dit lage bereik stil genoeg om in de meeste scenario's niet op te vallen. Hogere belastingen zoals games veroorzaken een ventilatorgeluid van 30 tot 34 dB(A), wat nog steeds erg stil is, vooral in HTPC-omgevingen.
Geluidsniveau
| Onbelast |
| 25.1 / 25.1 / 25.1 dB (A) |
| Belasting |
| 28.6 / 34 dB (A) |
 | ||
30 dB stil 40 dB(A) hoorbaar 50 dB(A) luid |
||
min: | ||
| BMAX B5 Pro G7H8 UHD Graphics 620, i5-8260U | Beelink SEi11 Pro Iris Xe G7 96EUs, i5-11320H, Kingston NV1 SNVS/500GCN | Beelink U59 N5105 UHD Graphics (Jasper Lake 24 EU), Celeron N5105, Silicon Motion AZW 512G NV428 | Beelink SEi8 Iris Plus Graphics 655, i3-8109U, Intel SSD 660p SSDPEKNW512G8 | Beelink SER Pro Ryzen 5 5600H Vega 7, R5 5600H, Kingston NV1 SNVS/500GCN | Intel NUC11TNKi5 Iris Xe G7 80EUs, i5-1135G7, Transcend M.2 SSD 430S TS512GMTS430S | |
|---|---|---|---|---|---|---|
| Noise | -5% | 14% | -14% | -7% | -32% | |
| uit / omgeving * (dB) | 23 | 22.8 1% | 21.5 7% | 24.5 -7% | 22.8 1% | 24.8 -8% |
| Idle Minimum * (dB) | 25.1 | 24.7 2% | 22.1 12% | 26.5 -6% | 26.1 -4% | 35.6 -42% |
| Idle Average * (dB) | 25.1 | 24.7 2% | 22.1 12% | 26.5 -6% | 26.1 -4% | 35.6 -42% |
| Idle Maximum * (dB) | 25.1 | 25.3 -1% | 22.1 12% | 31.1 -24% | 28.7 -14% | 35.6 -42% |
| Load Average * (dB) | 28.6 | 33.2 -16% | 23.9 16% | 37.7 -32% | 32.3 -13% | 36.2 -27% |
| Witcher 3 ultra * (dB) | 30.1 | 34.5 -15% | 24.4 19% | 32.8 -9% | 38 -26% | |
| Load Maximum * (dB) | 34 | 37.8 -11% | 26.8 21% | 37.5 -10% | 36.4 -7% | 47.6 -40% |
* ... kleiner is beter
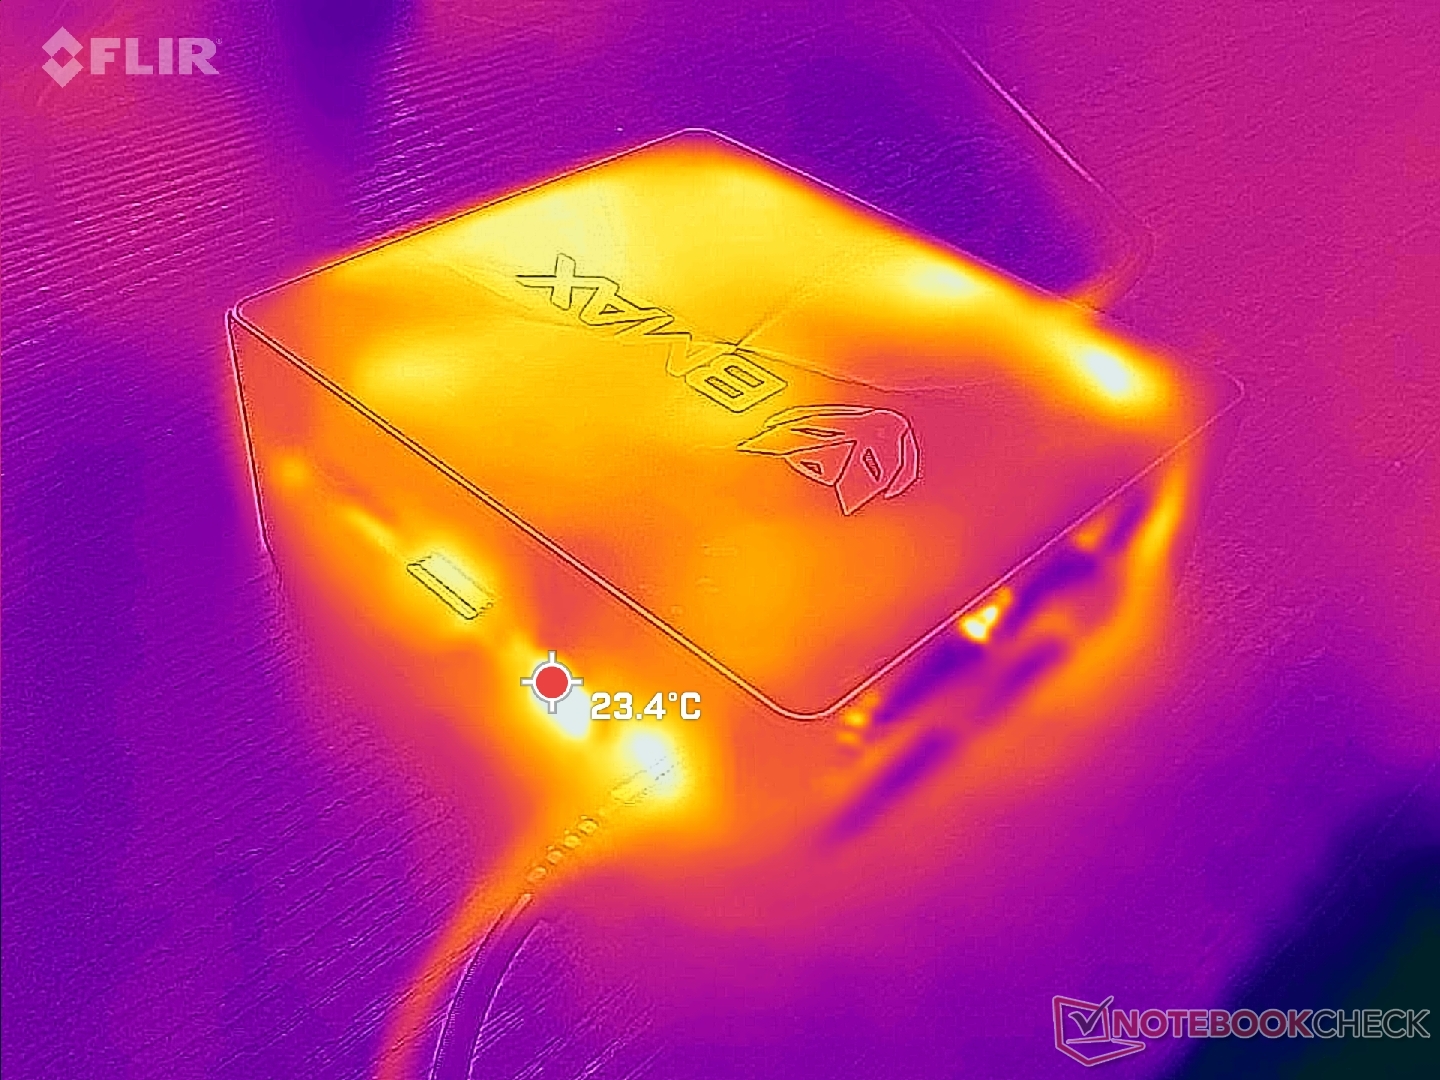
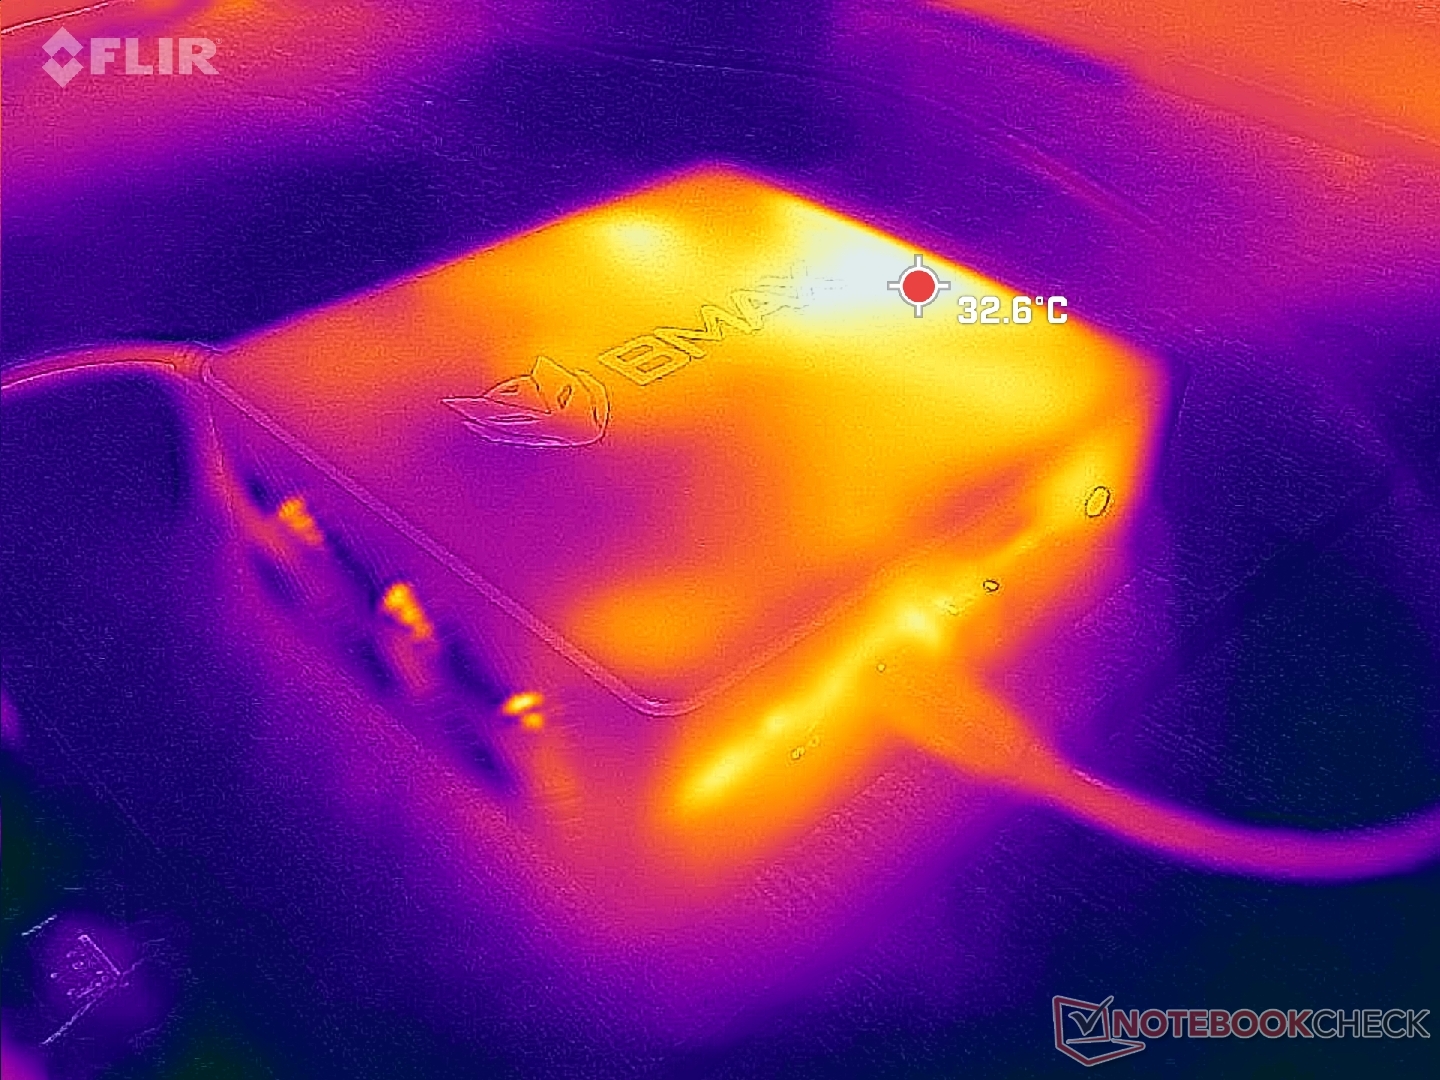
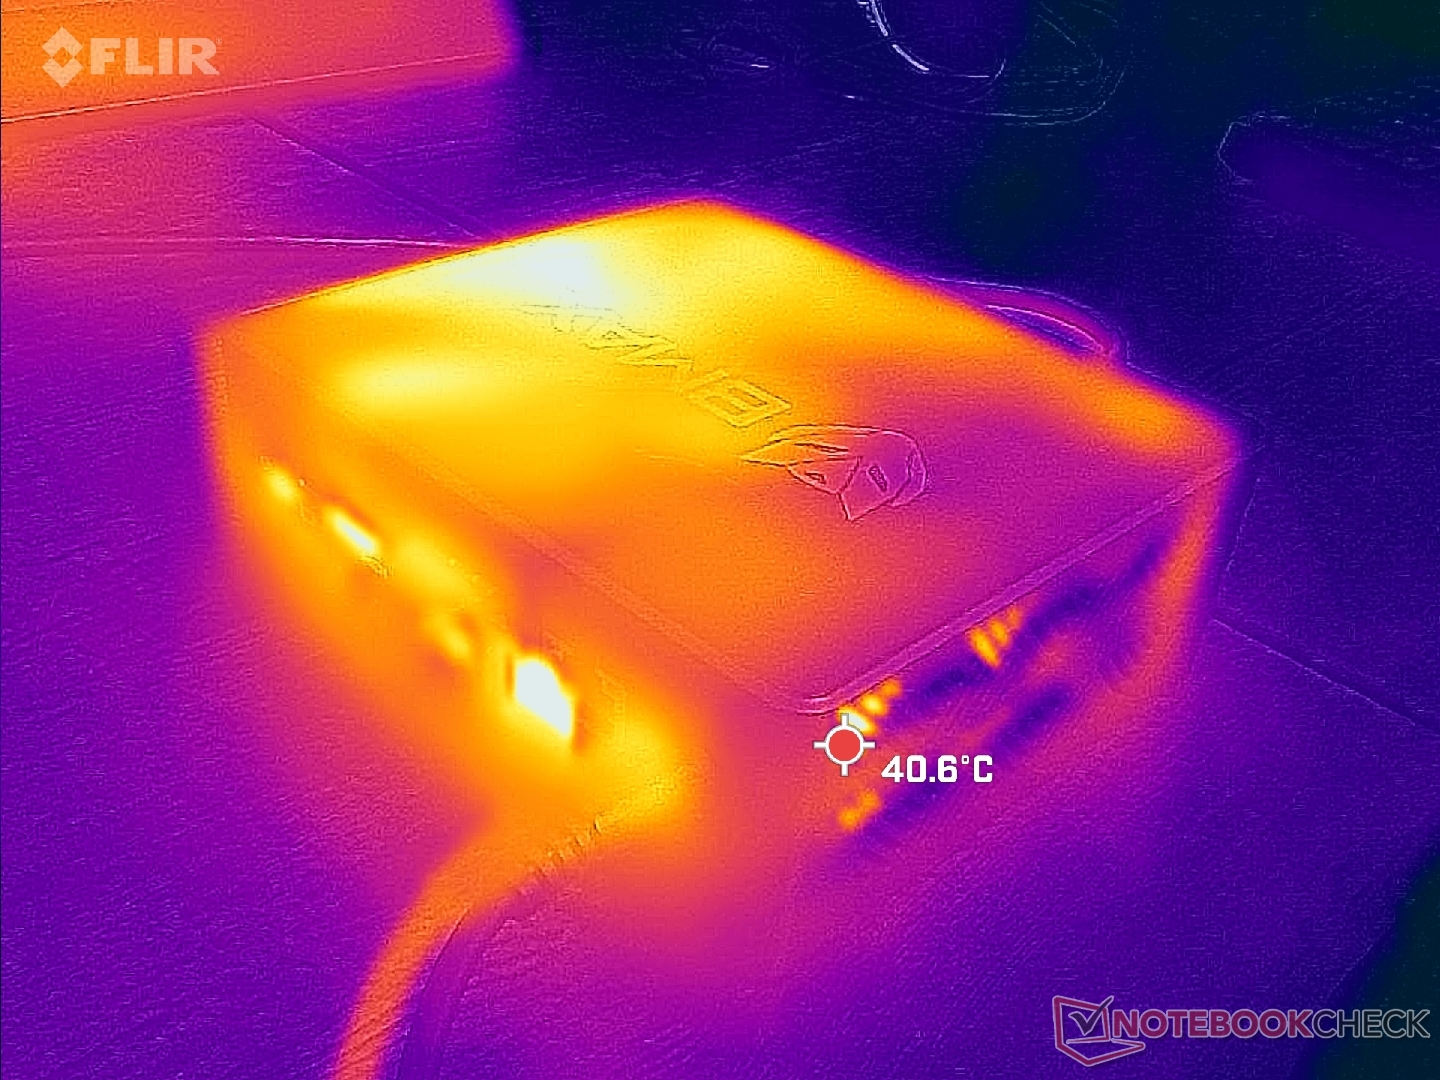
Temperatuur
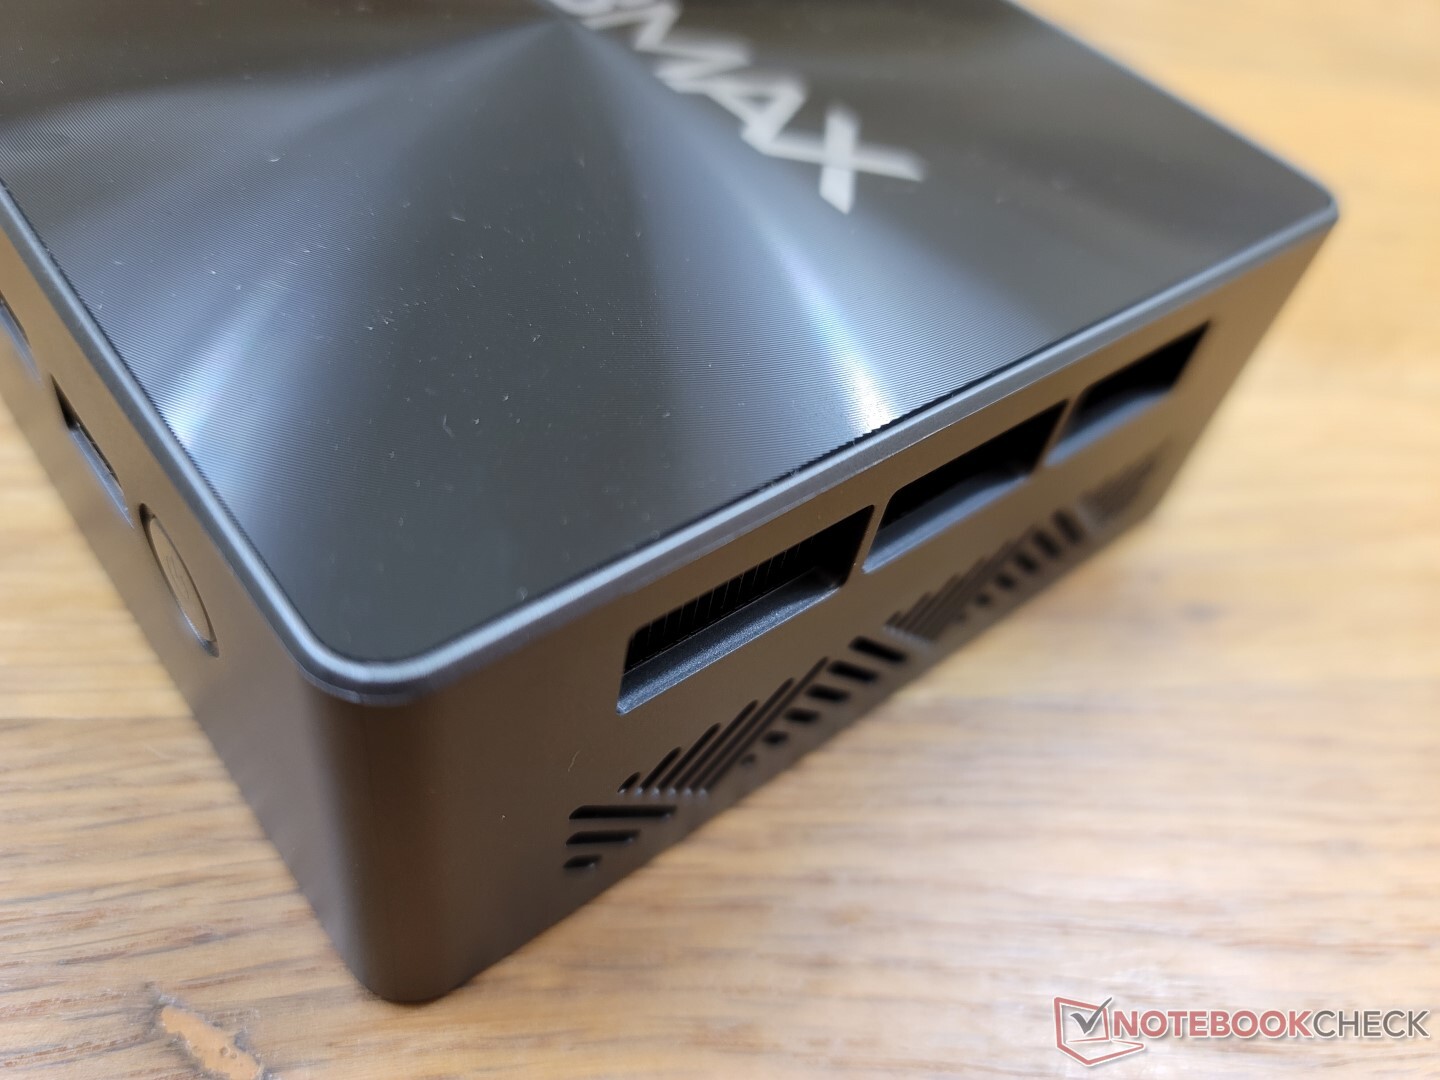
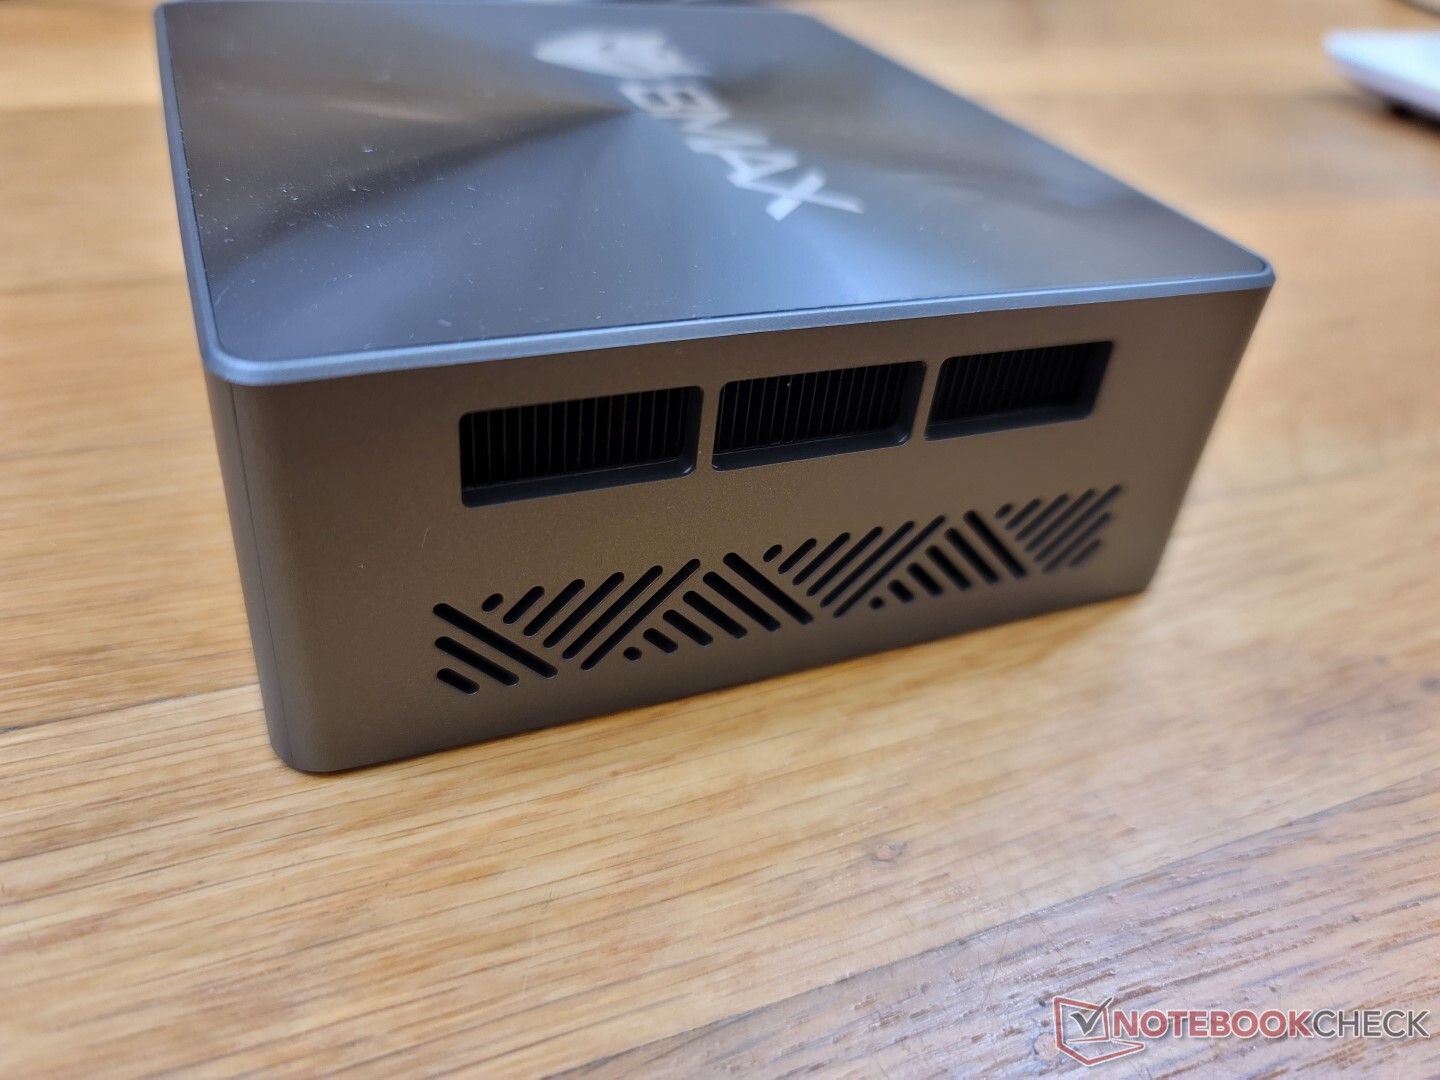
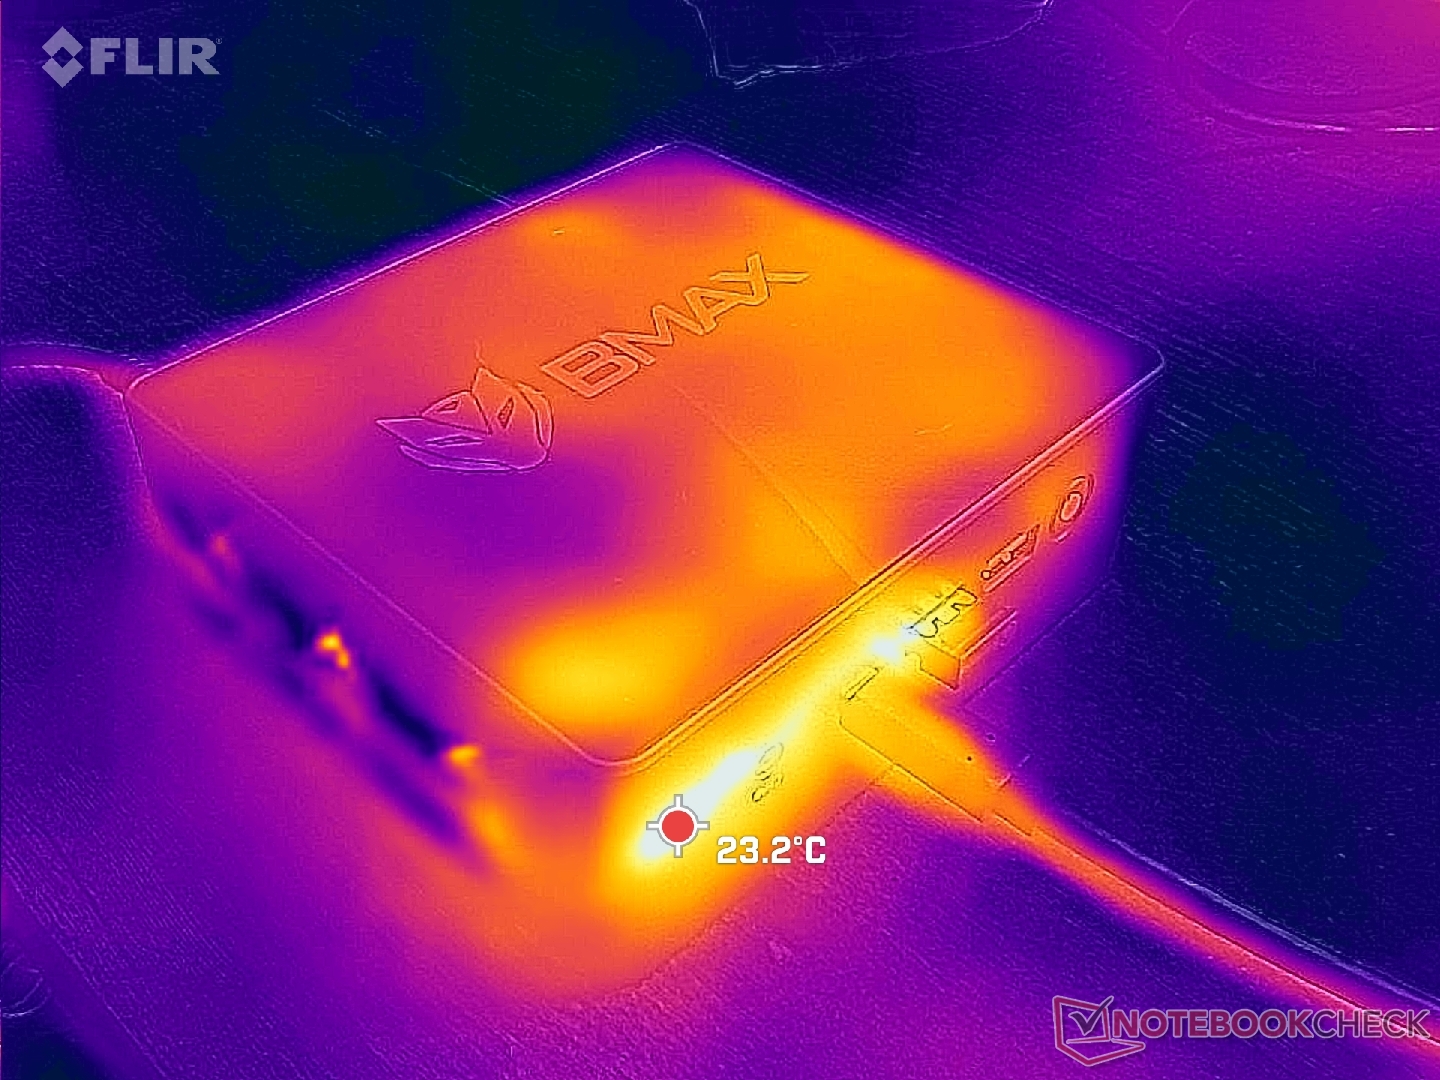
De oppervlaktetemperaturen zijn nooit onaangenaam warm. De hot spot aan de bovenkant bereikt bijvoorbeeld slechts ongeveer 33 C bij hoge verwerkingsbelasting. De warmte ontsnapt aan de rechterkant van het chassis, in tegenstelling tot de Intel NUC waar de warmte aan de achterkant ontsnapt
Items kunnen veilig bovenop het apparaat worden geplaatst, aangezien er daar geen ventilatieroosters zijn.
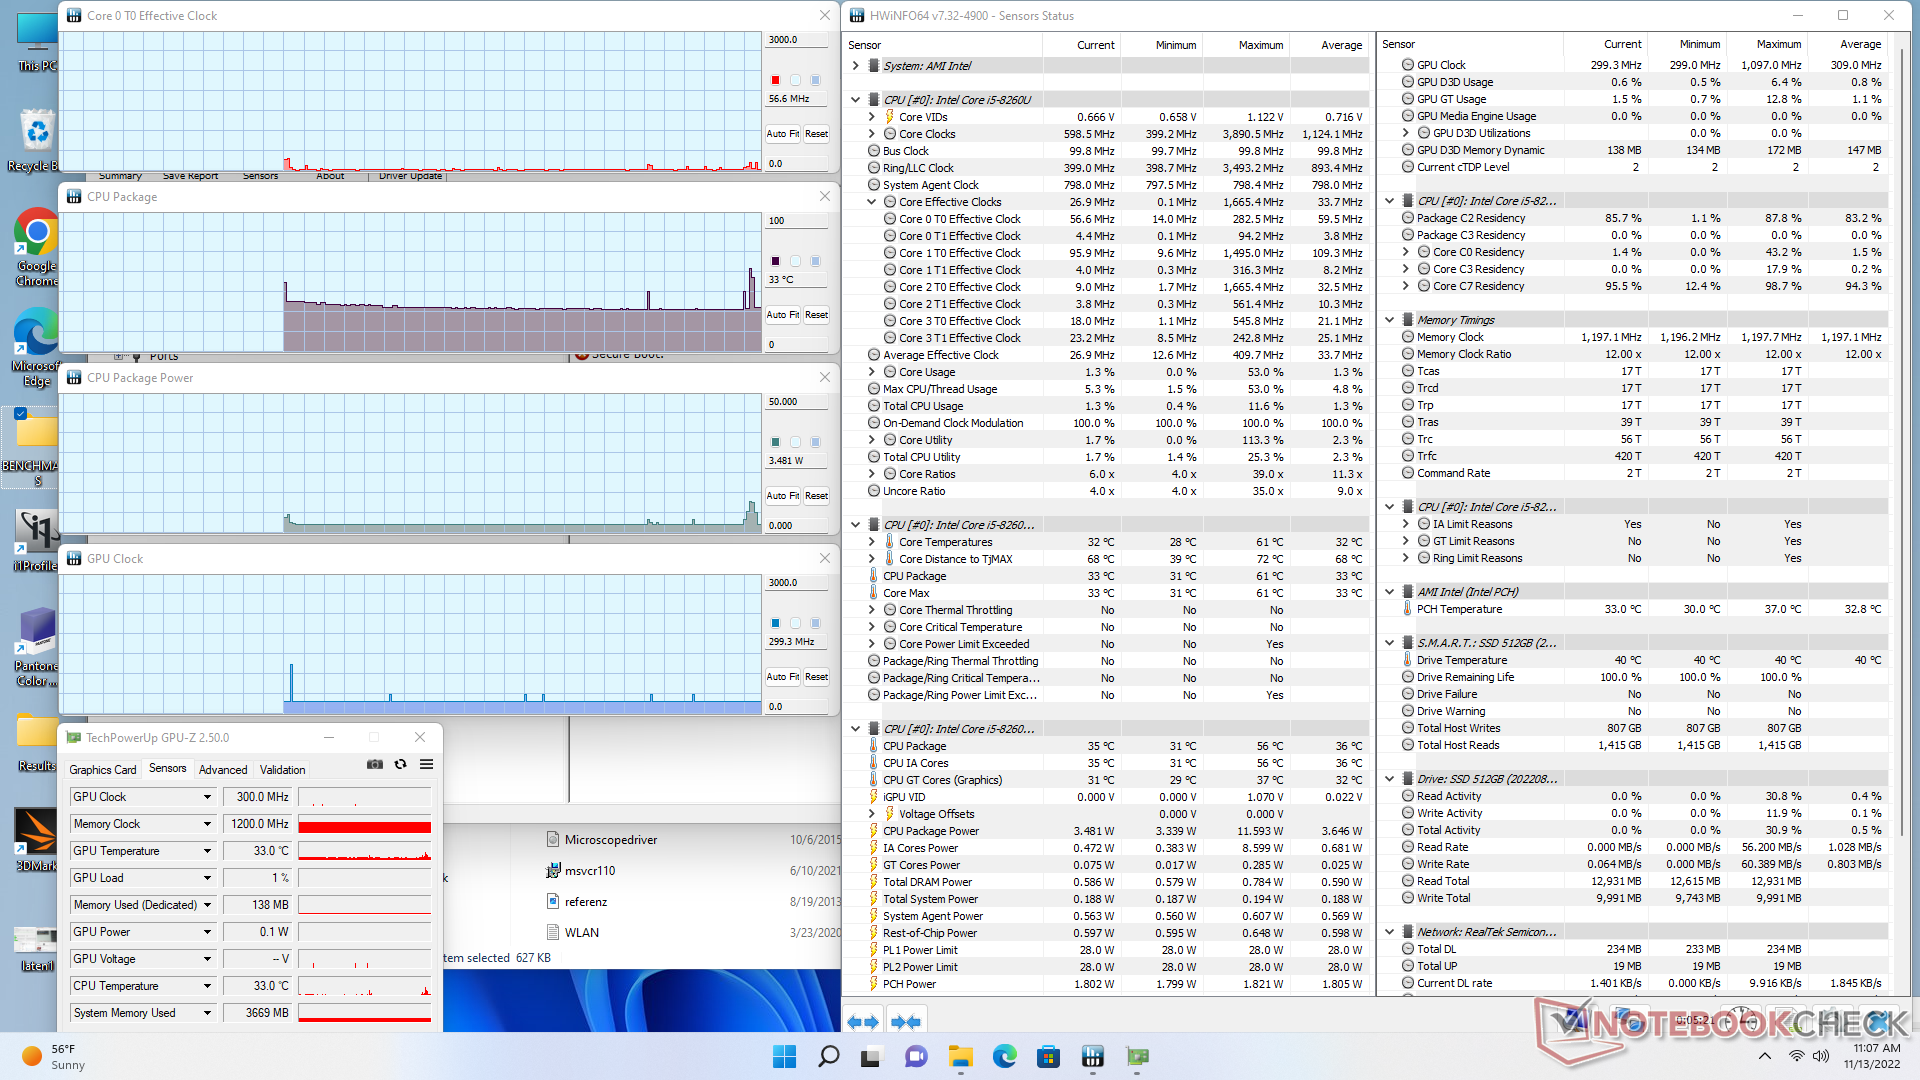
Stresstest
Bij belasting onder Prime95 zou de CPU opvoeren tot 2,8 GHz en 28 W gedurende ongeveer 20 seconden of totdat de kerntemperatuur 76 C bereikt. Kloksnelheden en stroomverbruik van de kaart zouden zich dan stabiliseren op respectievelijk 1,5 GHz en 12 W om een koelere kerntemperatuur van 60 C te handhaven Beelink SEi8 zou resulteren in snellere kernklokken en warmere temperaturen van respectievelijk 2,8 GHz en 80 C. Het Turbo Boost potentieel van de B5 Pro is dus beperkt, wat aansluit bij wat we tijdens onze CineBench stresstest hierboven hebben waargenomen.
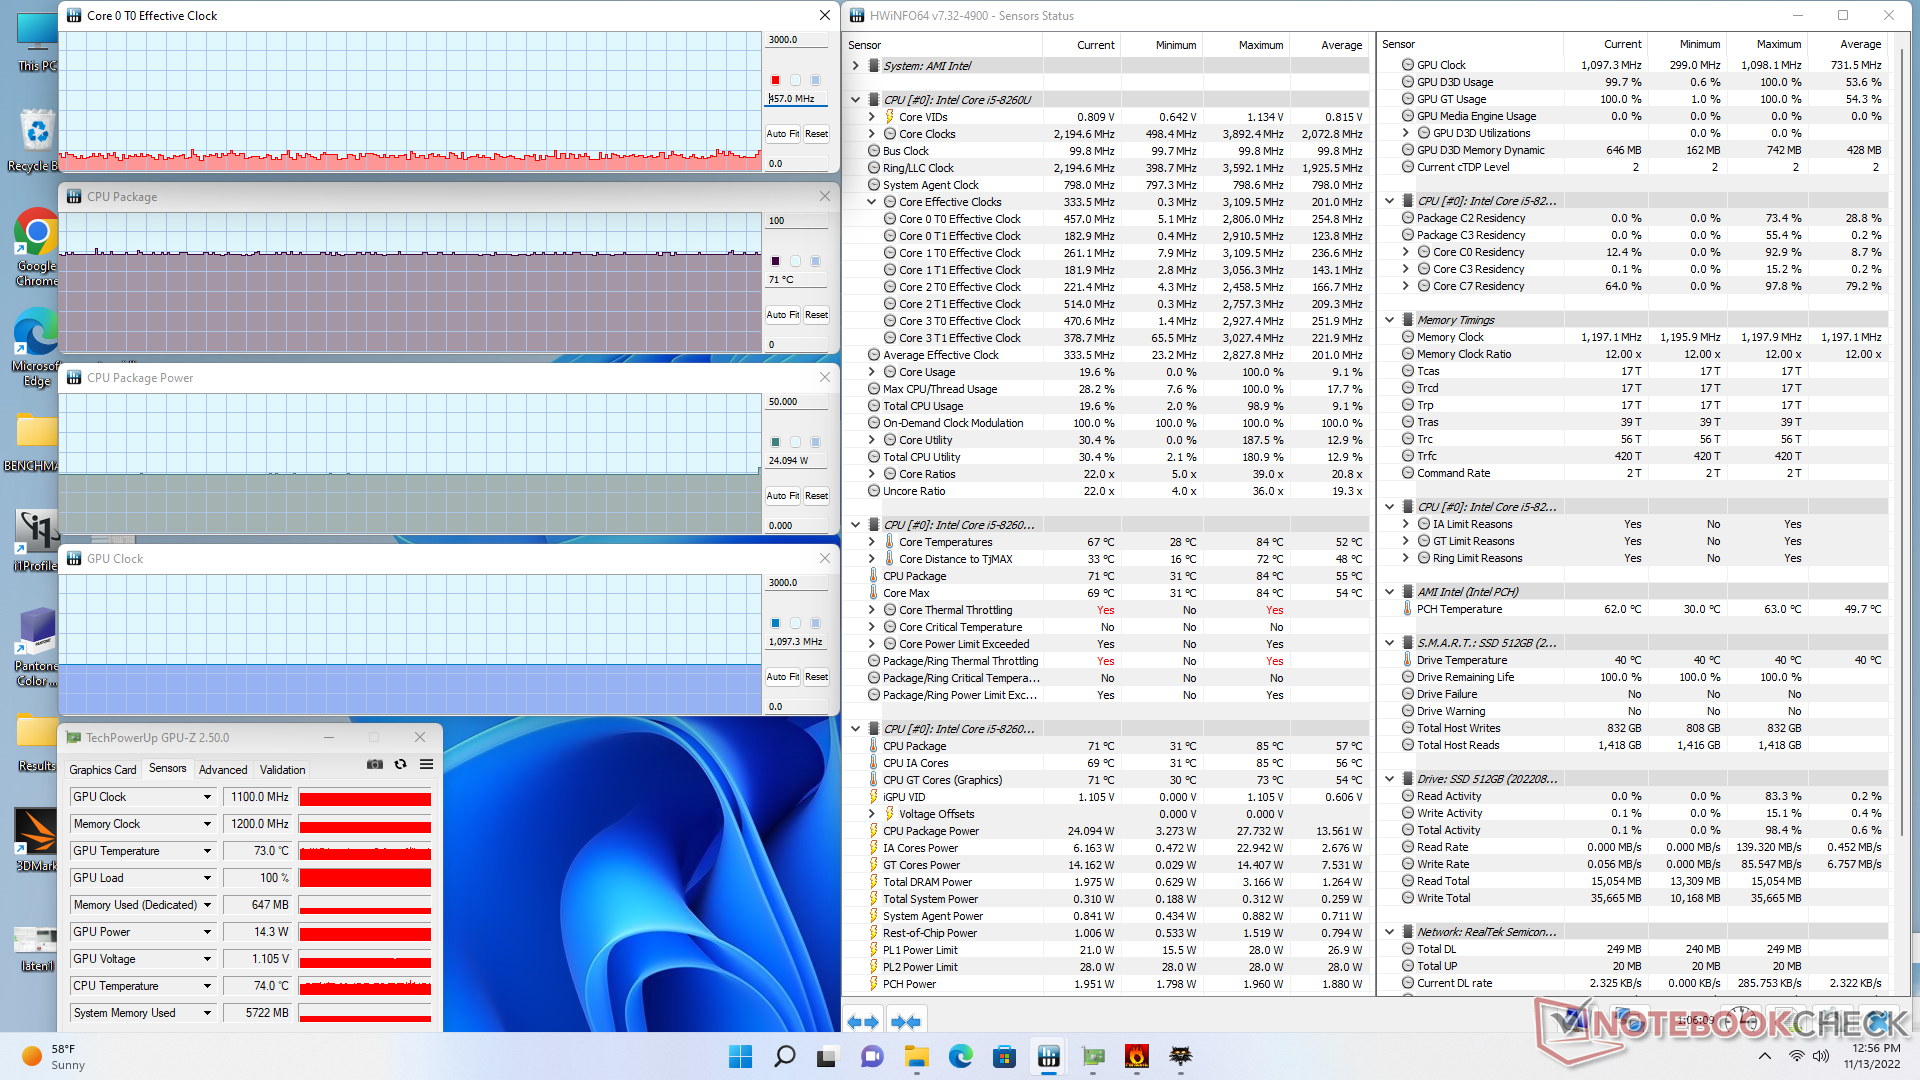
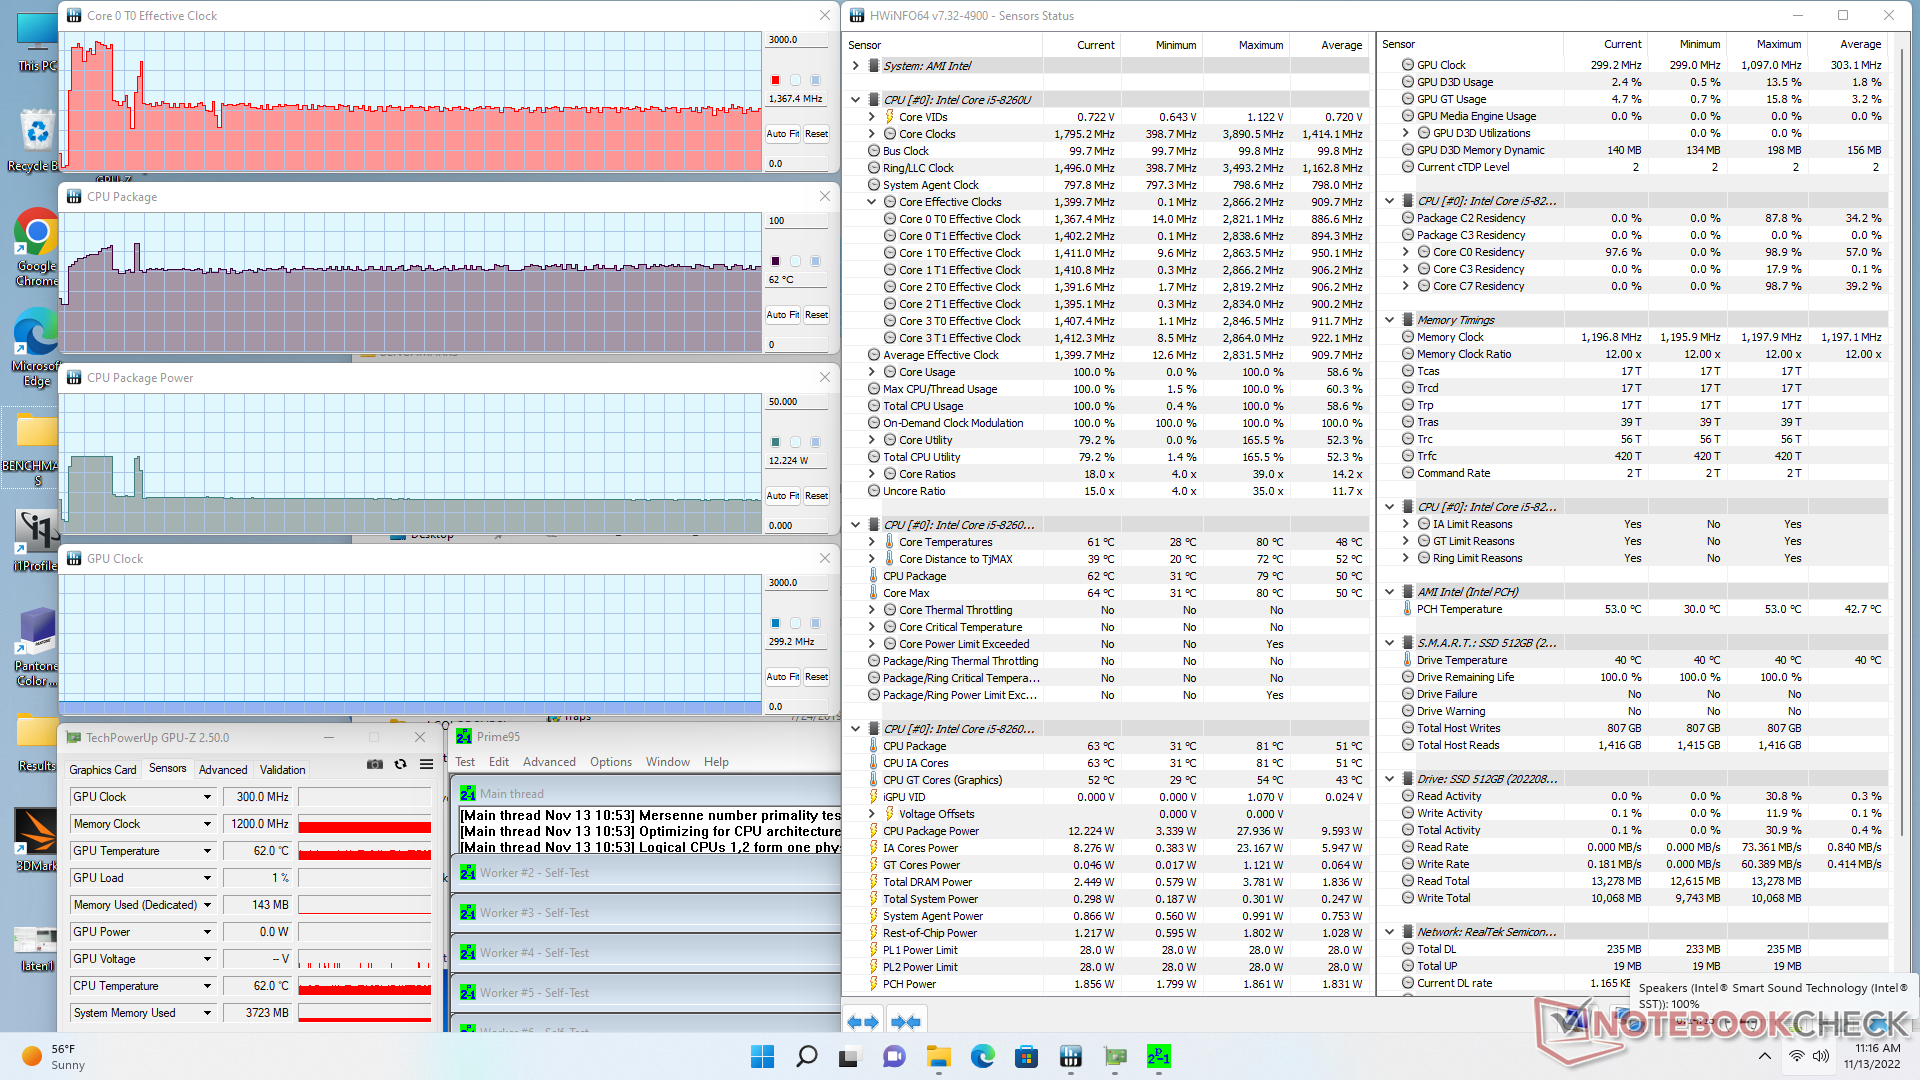
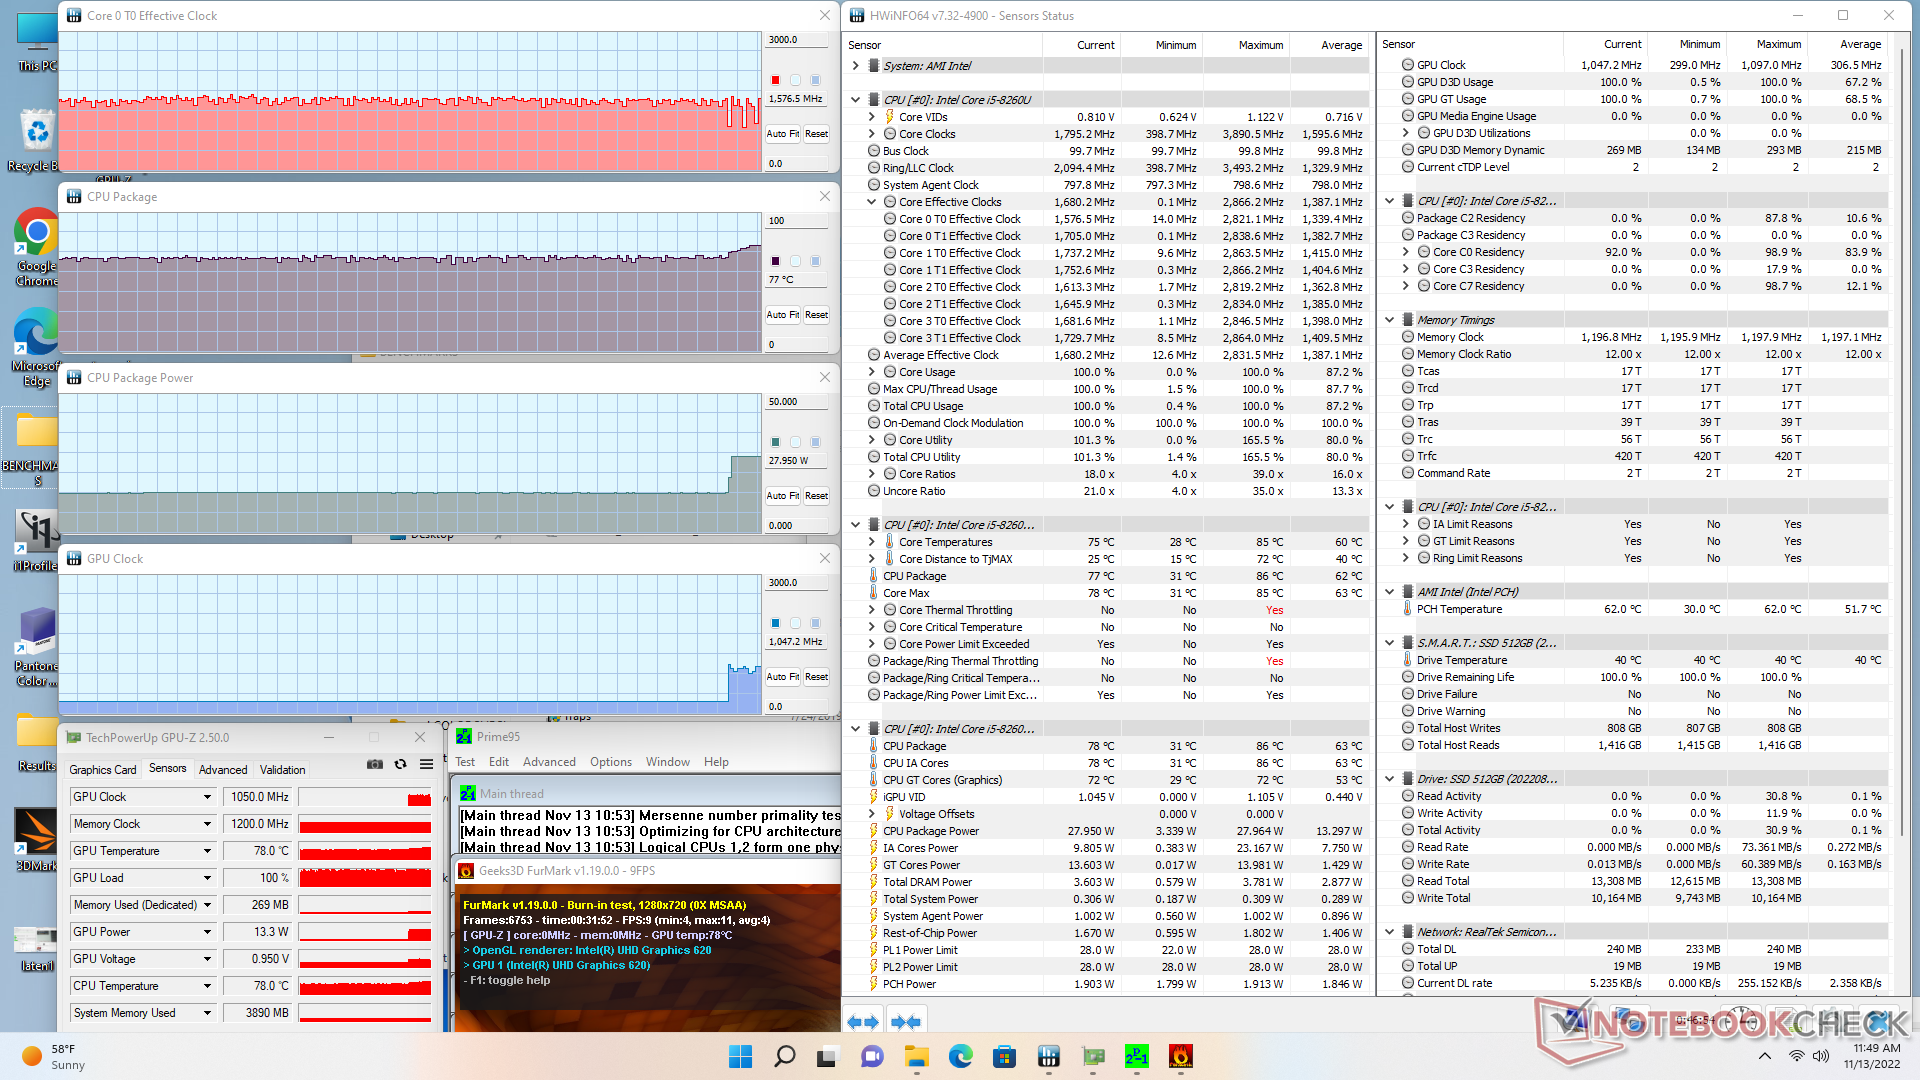
| CPU Klok (GHz) | GPU Klok (MHz) | Gemiddelde CPU Temperatuur (°C) | |
| Systeem Idle | -- | -- | 33 |
| Prime95 Stress | 1.3 | -- | 62 |
| Prime95 + FurMark Stress | 1.6 | 300 | 67 |
| Witcher 3 Stress | ~400 | 1100 | 71 |
Energiebeheer
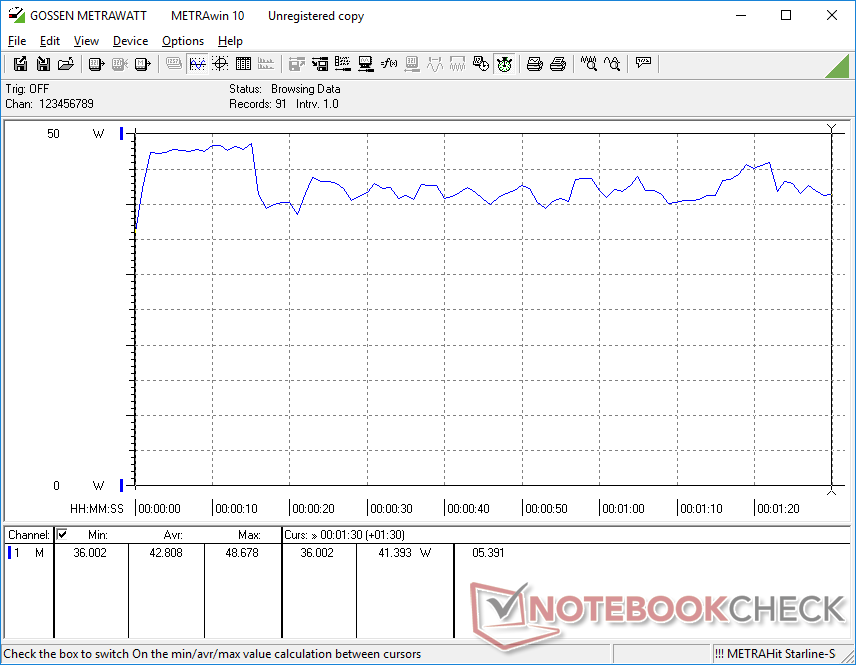
Energieverbruik - zeer weinig eisend
Het totale verbruik is lager dan bij veel mini-pc's met nieuwere CPU's zoals de Intel NUC11TNKi5 en zijn 11e generatie Core i5-1135G7. De prestaties per watt zijn echter in het voordeel van de laatste. Hoewel gebruikers een paar watt kunnen besparen met de BMax, kunnen mini-pc's met nieuwere generatie CPU's zoals de eerder genoemde NUC meer dan 2x de grafische prestaties of 50 procent hogere CPU-prestaties bieden
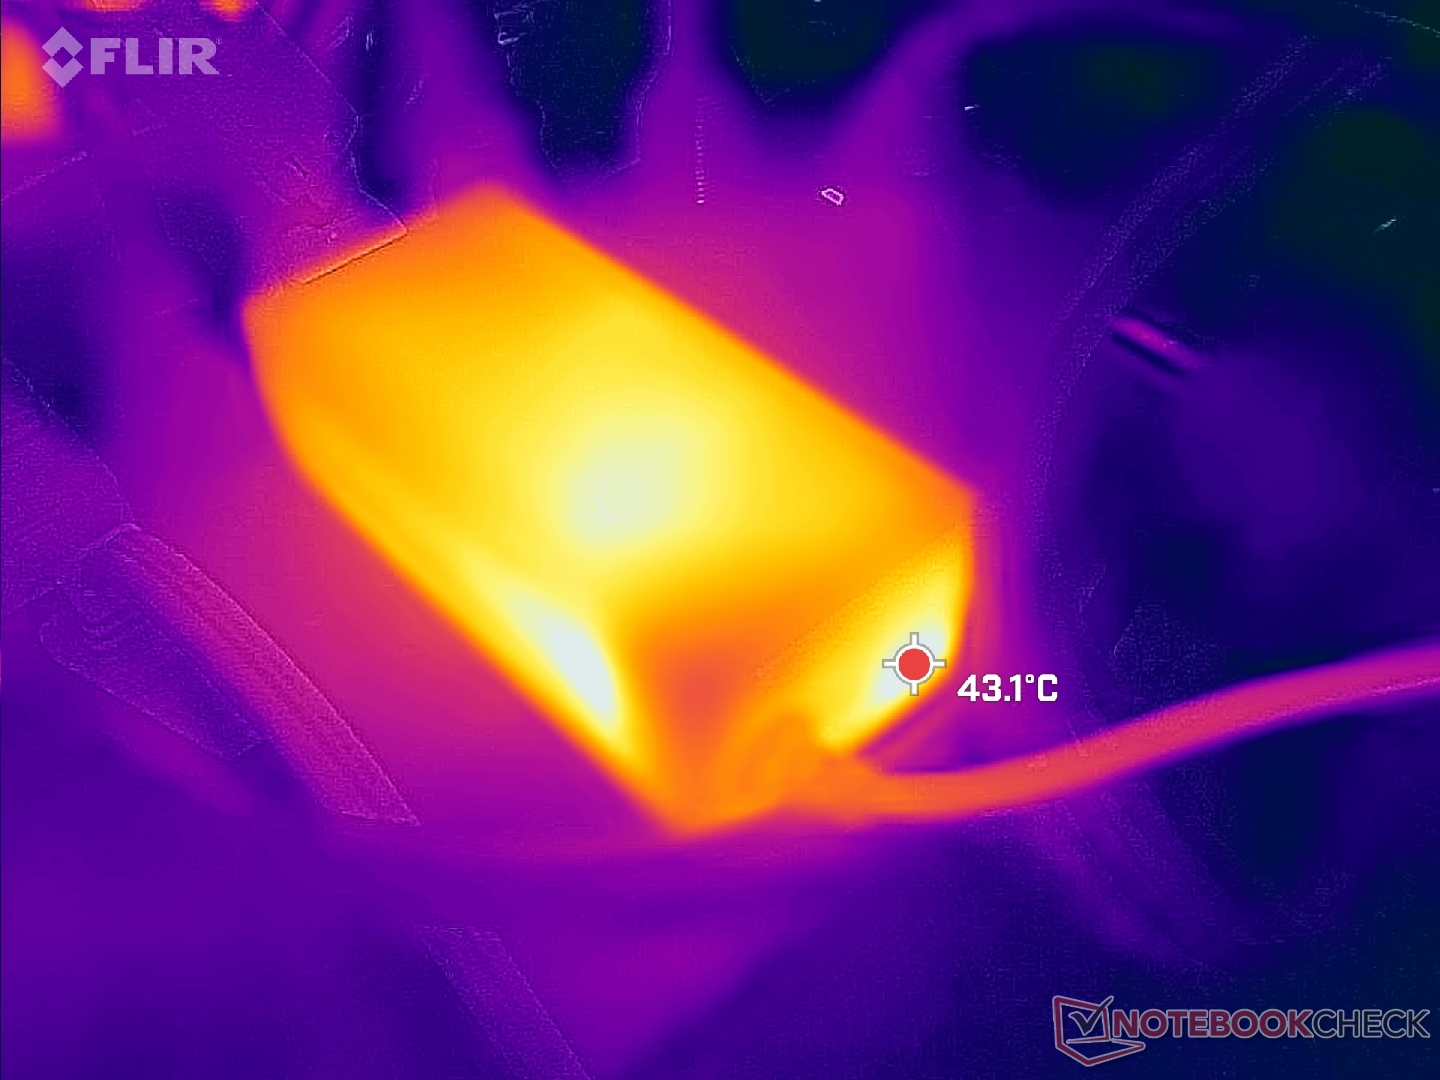
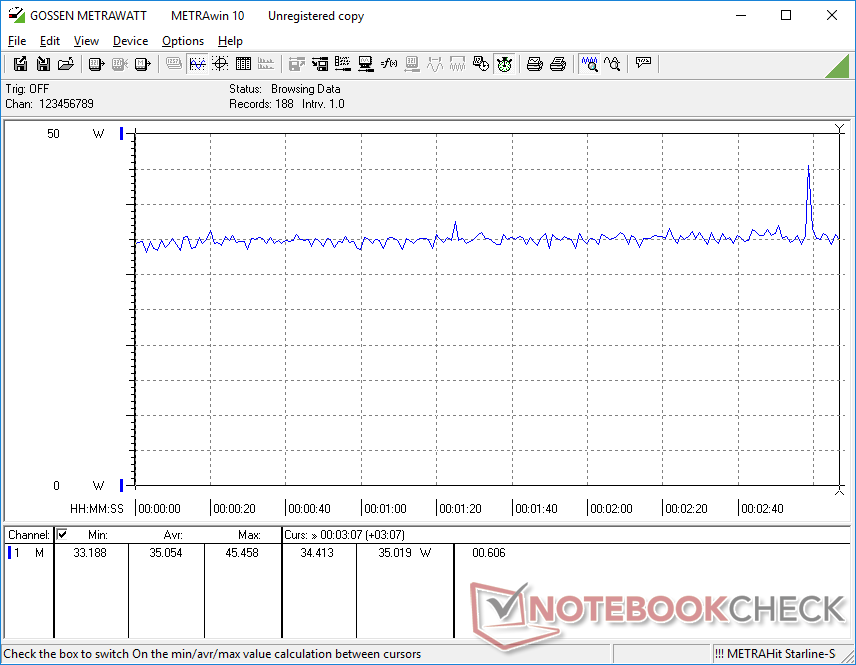
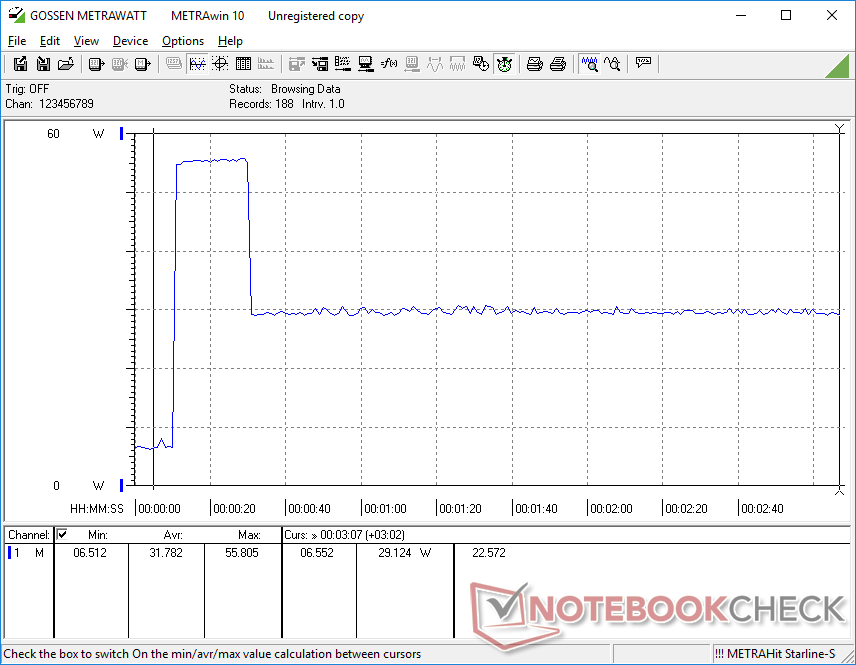
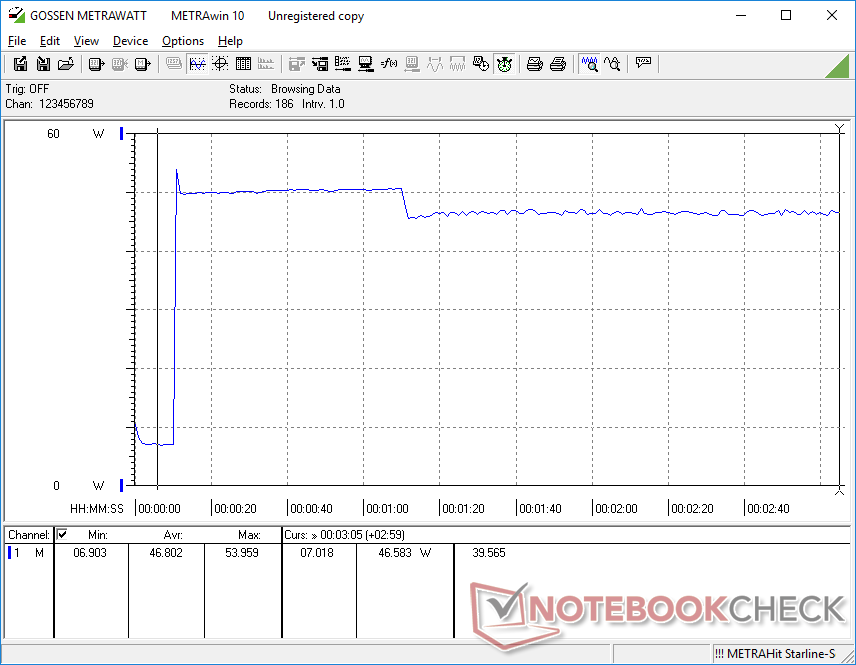
De kleine (~9,8 x 4,3 x 3,7 cm) 48 W AC-adapter trekt maximaal 55,9 W wanneer de CPU voor 100% wordt gebruikt. Dit is slechts tijdelijk, zoals blijkt uit onze onderstaande grafieken.
| Uit / Standby | |
| Inactief | |
| Belasting |
|
Key:
min: | |
| BMAX B5 Pro G7H8 i5-8260U, UHD Graphics 620, , , x, | Beelink SEi11 Pro i5-11320H, Iris Xe G7 96EUs, Kingston NV1 SNVS/500GCN, , x, | Beelink U59 N5105 Celeron N5105, UHD Graphics (Jasper Lake 24 EU), Silicon Motion AZW 512G NV428, , x, | Beelink SEi8 i3-8109U, Iris Plus Graphics 655, Intel SSD 660p SSDPEKNW512G8, , x, | Beelink SER Pro Ryzen 5 5600H R5 5600H, Vega 7, Kingston NV1 SNVS/500GCN, , x, | Intel NUC11TNKi5 i5-1135G7, Iris Xe G7 80EUs, Transcend M.2 SSD 430S TS512GMTS430S, , x, | |
|---|---|---|---|---|---|---|
| Power Consumption | -47% | 2% | -13% | -15% | -58% | |
| Idle Minimum * (Watt) | 6 | 9.8 -63% | 6.7 -12% | 7.5 -25% | 5.4 10% | 11.5 -92% |
| Idle Average * (Watt) | 6.2 | 10.3 -66% | 8.1 -31% | 7.6 -23% | 8.2 -32% | 12.4 -100% |
| Idle Maximum * (Watt) | 6.3 | 10.5 -67% | 11.6 -84% | 9.2 -46% | 8.3 -32% | 12.9 -105% |
| Load Average * (Watt) | 42.8 | 54.2 -27% | 23.9 44% | 41.1 4% | 49.3 -15% | 40.7 5% |
| Witcher 3 ultra * (Watt) | 35 | 53.1 -52% | 19.1 45% | 46.1 -32% | 43.9 -25% | |
| Load Maximum * (Watt) | 55.8 | 59 -6% | 28.8 48% | 41.4 26% | 50.2 10% | 73.5 -32% |
* ... kleiner is beter
Power Consumption Witcher 3 / Stresstest
Power Consumption external Monitor
Pro
Contra
Verdict - Goedkope optie voor basis HTPC doeleinden
Als u op zoek bent naar een maximaal rendement, dan zou de BMax B5 Pro bovenaan uw lijst moeten staan. Hij biedt een ruime 512 GB NVMe SSD, ruimte voor een tweede SSD, 16 GB verwisselbaar RAM, Windows 11 Pro reeds geïnstalleerd, een stille ventilator en een processor die vergelijkbaar is met de 10e generatie Core i7-1065G7 Core i7-1065G7 allemaal voor minder dan $300 USD. De Core i5-8260U loopt ronden over elke huidige Core i3, Celeron, Atom, of Ryzen 3 alternatief die al te vaak in deze prijsklasse.
De BMax B5 Pro is een compleet pakket voor bijna de helft van de prijs van een kale Intel NUC zonder genoegen te hoeven nemen met laagwaardige Celeron- of Atom-processoren.
Het belangrijkste nadeel van het model zijn de zwakke grafische prestaties, wat eigenlijk geen probleem zou moeten zijn omdat niemand de B5 Pro zou moeten kopen voor gaming doeleinden. De grafische prestaties zijn nog steeds voldoende voor comfortabele 4K60 streaming.
We zouden graag meer USB-C-poorten, ondersteuning voor USB-C Power Delivery en een HDMI 2.0-poort of beter zien op toekomstige revisies.
Prijs en beschikbaarheid
Amazon verzendt momenteel onze exacte BMax B5 Pro configuratie voor $380 USD of $280 USD na toepassing van de couponcode op het moment van publicatie.
Price comparison

