Verdict - Een enorme ruimtebespaarder voor op kantoor
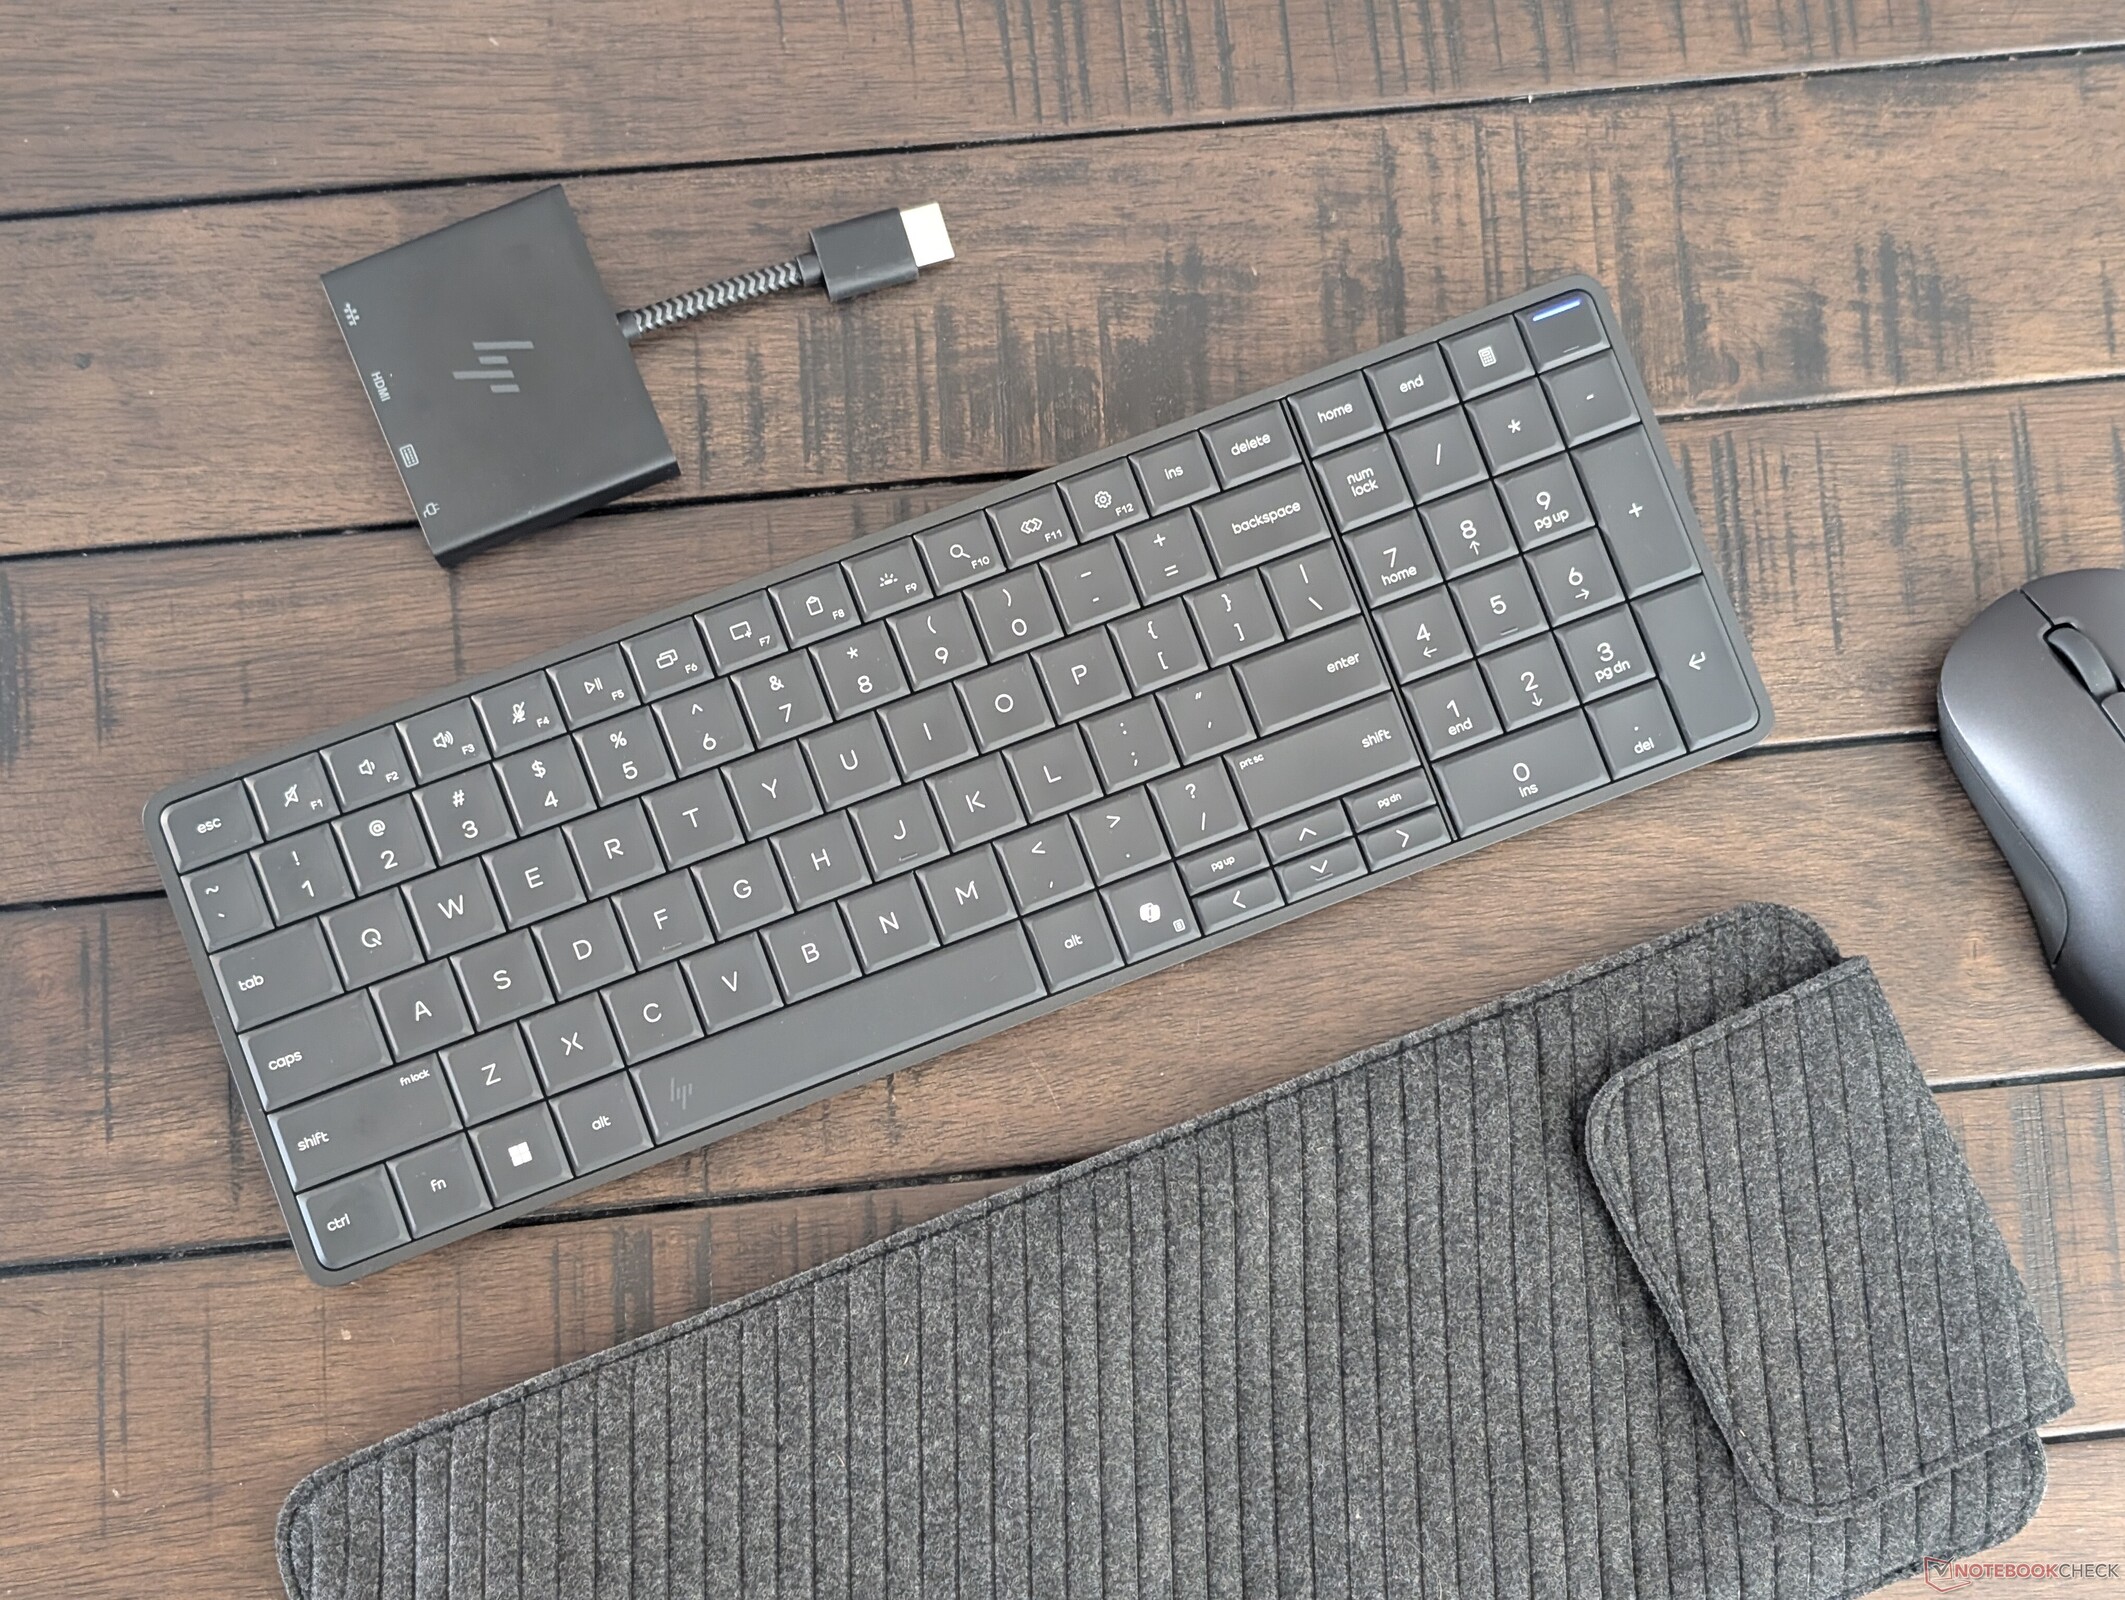
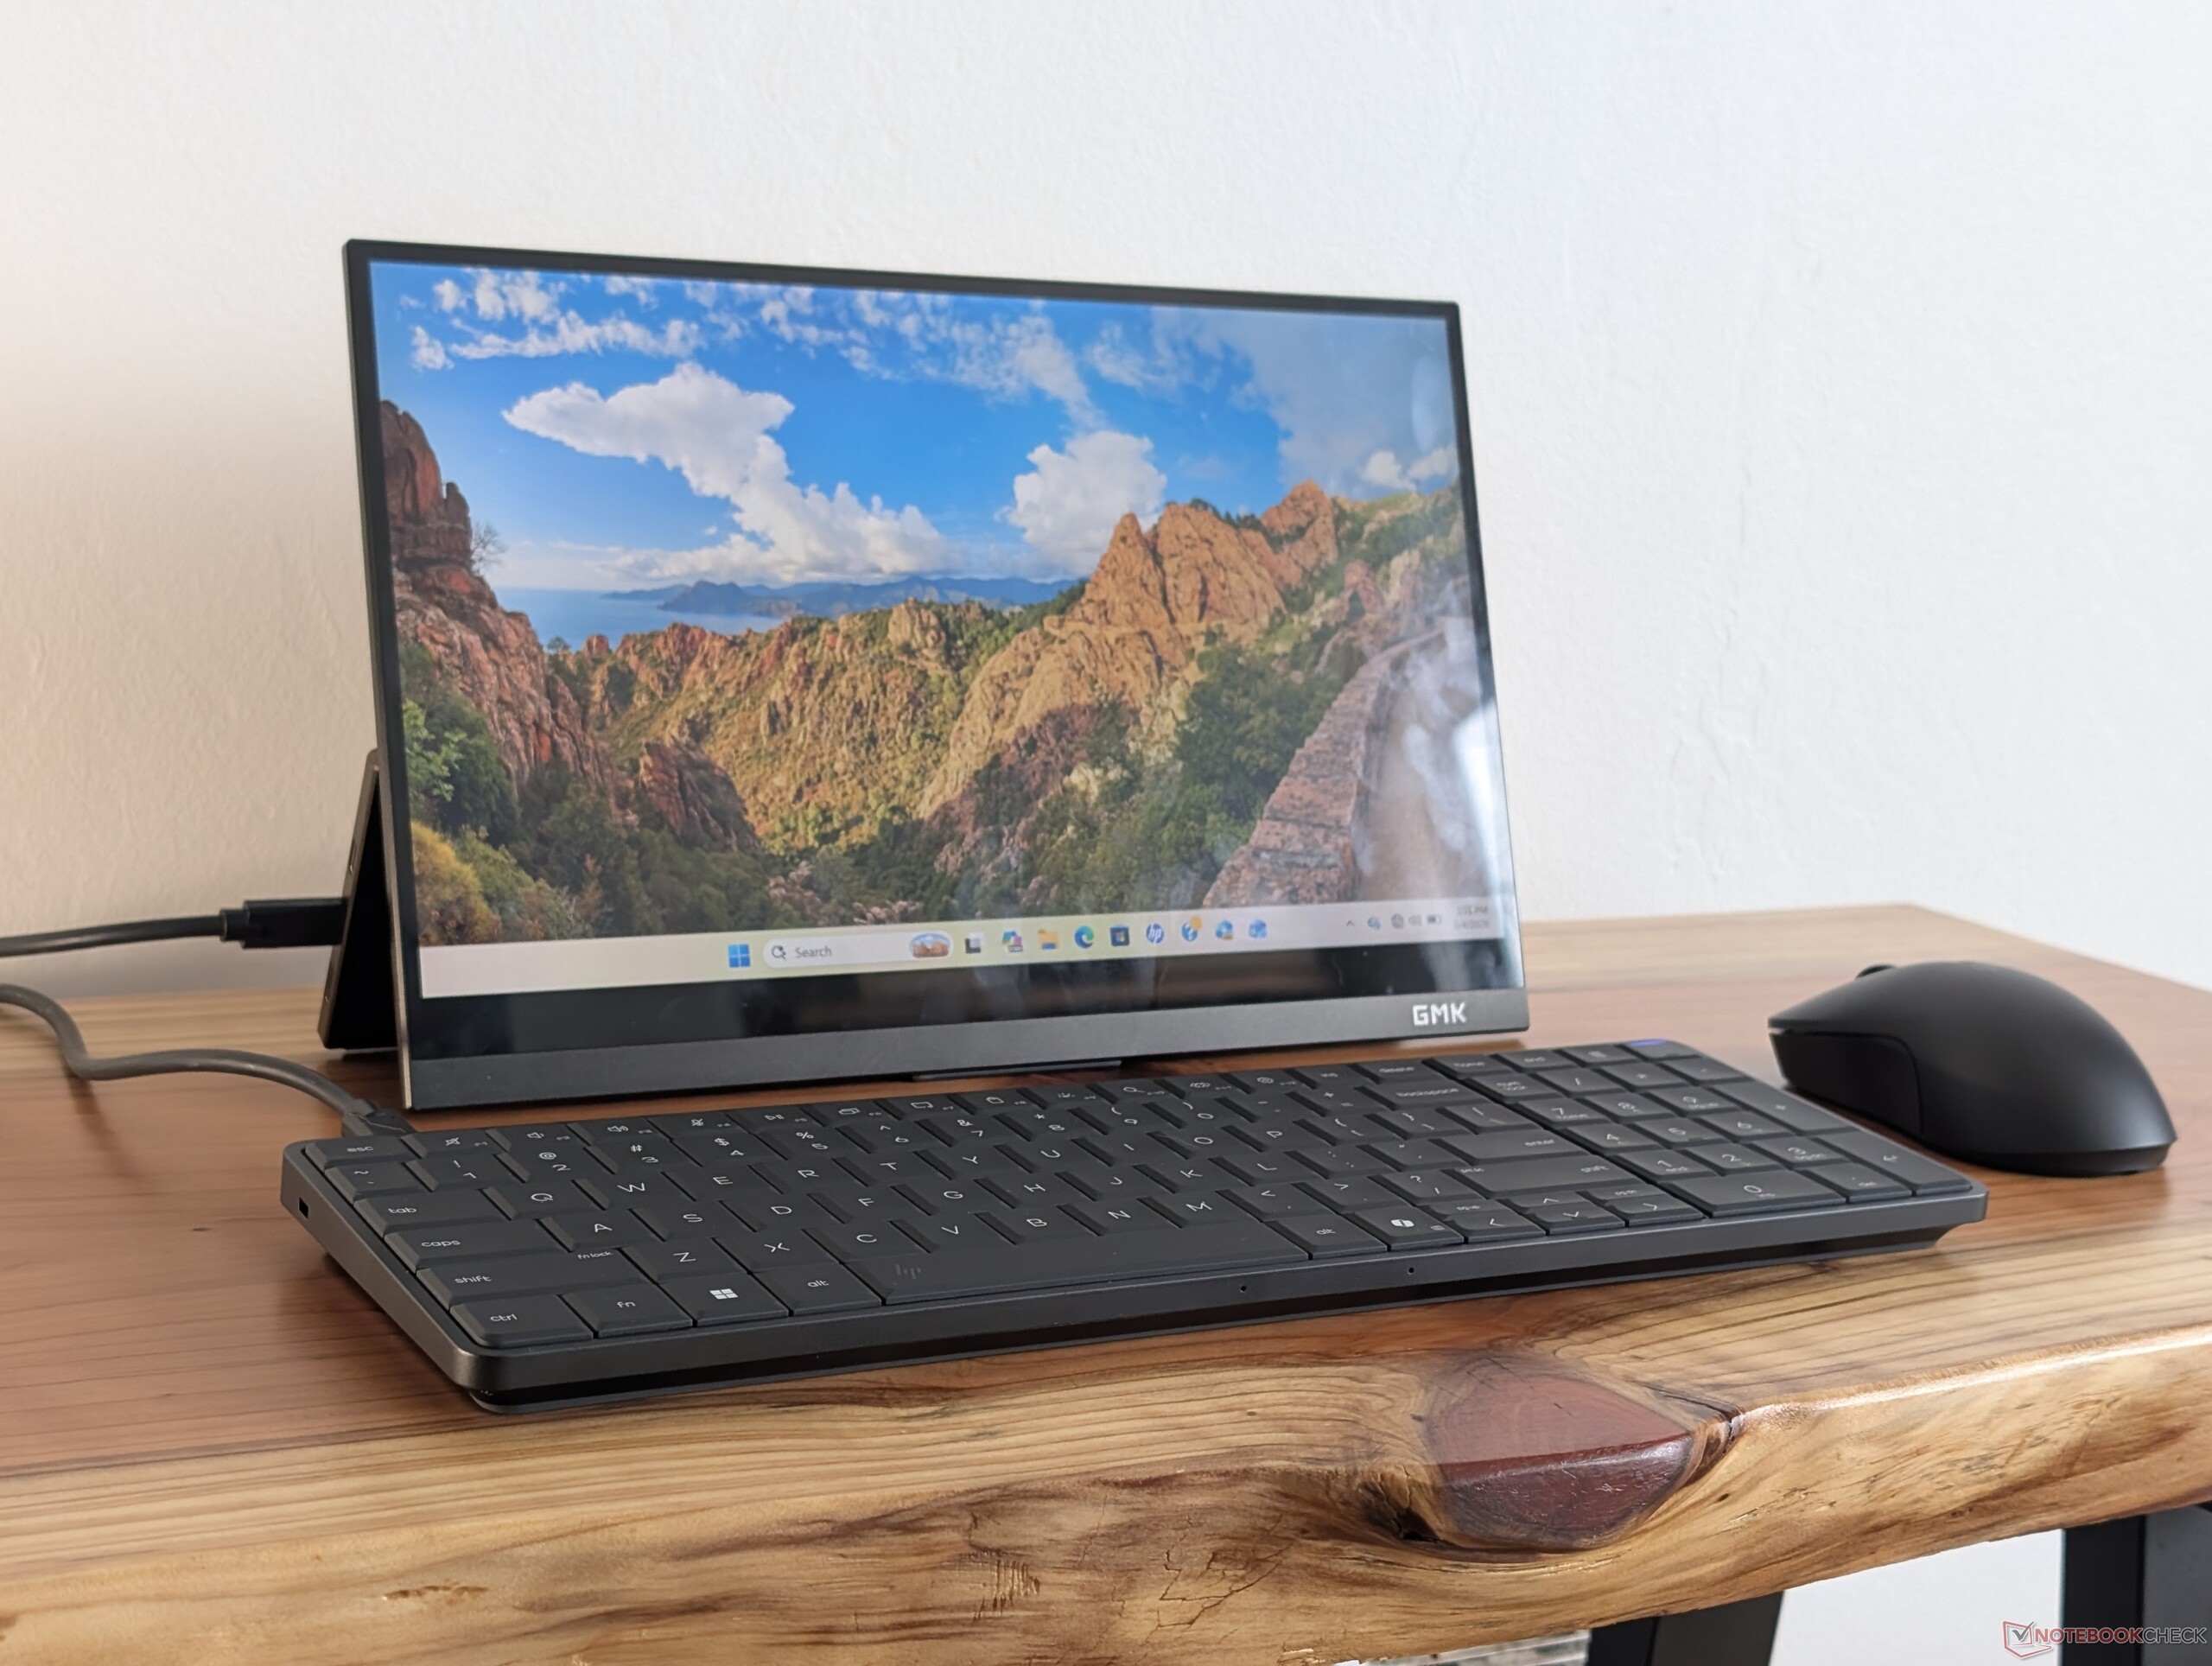
De beste manier om de EliteBoard G1a te ervaren is met een bestaande USB-C monitor om de kabelwarboel op een beperkt bureau te beperken. Het strakke plug-and-play-ontwerp met één kabel is misschien wel het meest aantrekkelijke aspect van het EliteBoard in vergelijking met traditionele mini-pc's of AIO's.
Voor gebruikers die voortdurend tussen werkplekken of terminals heen en weer schuifelen, kan het EliteBoard geconfigureerd worden met een kleine batterij, zodat er gereisd kan worden zonder dat er tussen elke plek eerst afgesloten moet worden. Een gewone laptop kan zeker vergelijkbare doelen bereiken, maar zonder de voordelen van een ergonomischer toetsenbord.
De twee slechtste aspecten van het EliteBoard zijn de beperkte poortopties en de krappe pijltjestoetsen. Voor een ontwerp dat dikker en breder is dan veel laptops, is het verbazingwekkend dat het EliteBoard minder poorten of kleinere pijltjestoetsen heeft dan populaire modellen zoals de Yoga Pro 9 16 of LG Gram. Zodra er USB-C adapters en HDMI aan te pas komen, verdwijnt de minimalistische opzet. Traditionele mini-pc's zoals de MSI Cubi NUC of GMK NucBox hebben in dit opzicht een streepje voor met hun native ondersteuning voor oudere HDMI-monitoren die in de meeste bedrijven nog steeds gangbaar zijn. Met andere woorden, we zouden een iets groter EliteBoard-ontwerp niet erg vinden als dat grotere toetsen, meer extra functies en extra geïntegreerde poorten zou betekenen.
Pro
Contra
Prijs en beschikbaarheid
De EliteBoard G1a is een eersteklas apparaat voor zakelijk gebruik en begint bij $1500 met de Ryzen AI 5 Pro 340 CPU, 16 GB RAM en 256 GB SSD.
De EliteBoard G1a AI is een PC-in-a-toetsenbord dat ontworpen is voor hybride werknemers en vereenvoudigde werkplekken. Het is in wezen een toetsenbord met een ingebouwde geminiaturiseerde pc, net als de originele Commodore 64. Voor deze eerste generatie heeft HP het model geconfigureerd met Ryzen AI 300 PRO serie CPU's om bedrijven en professionele toepassingen aan te spreken in plaats van de typische thuisgebruiker.
Ons testmodel wordt geleverd met de Ryzen AI 5 Pro 340 en 32 GB RAM voor ongeveer 1600 dollar. Andere configuraties zijn maximaal de Ryzen AI 7 Pro 350 met maximaal 24 GB RAM en 2 TB opslag.
Het EliteBoard is uniek omdat het de eerste in zijn soort is met een moderne CPU waarop Windows 11 draait. Toch concurreert het met traditionele mini-pc's die ontworpen zijn voor bedrijven, zoals de MSI Cubi NUC, Asus ExpertCenterof de GMK EVO-X1.
Meer HP beoordelingen:
Specificaties
Zaak
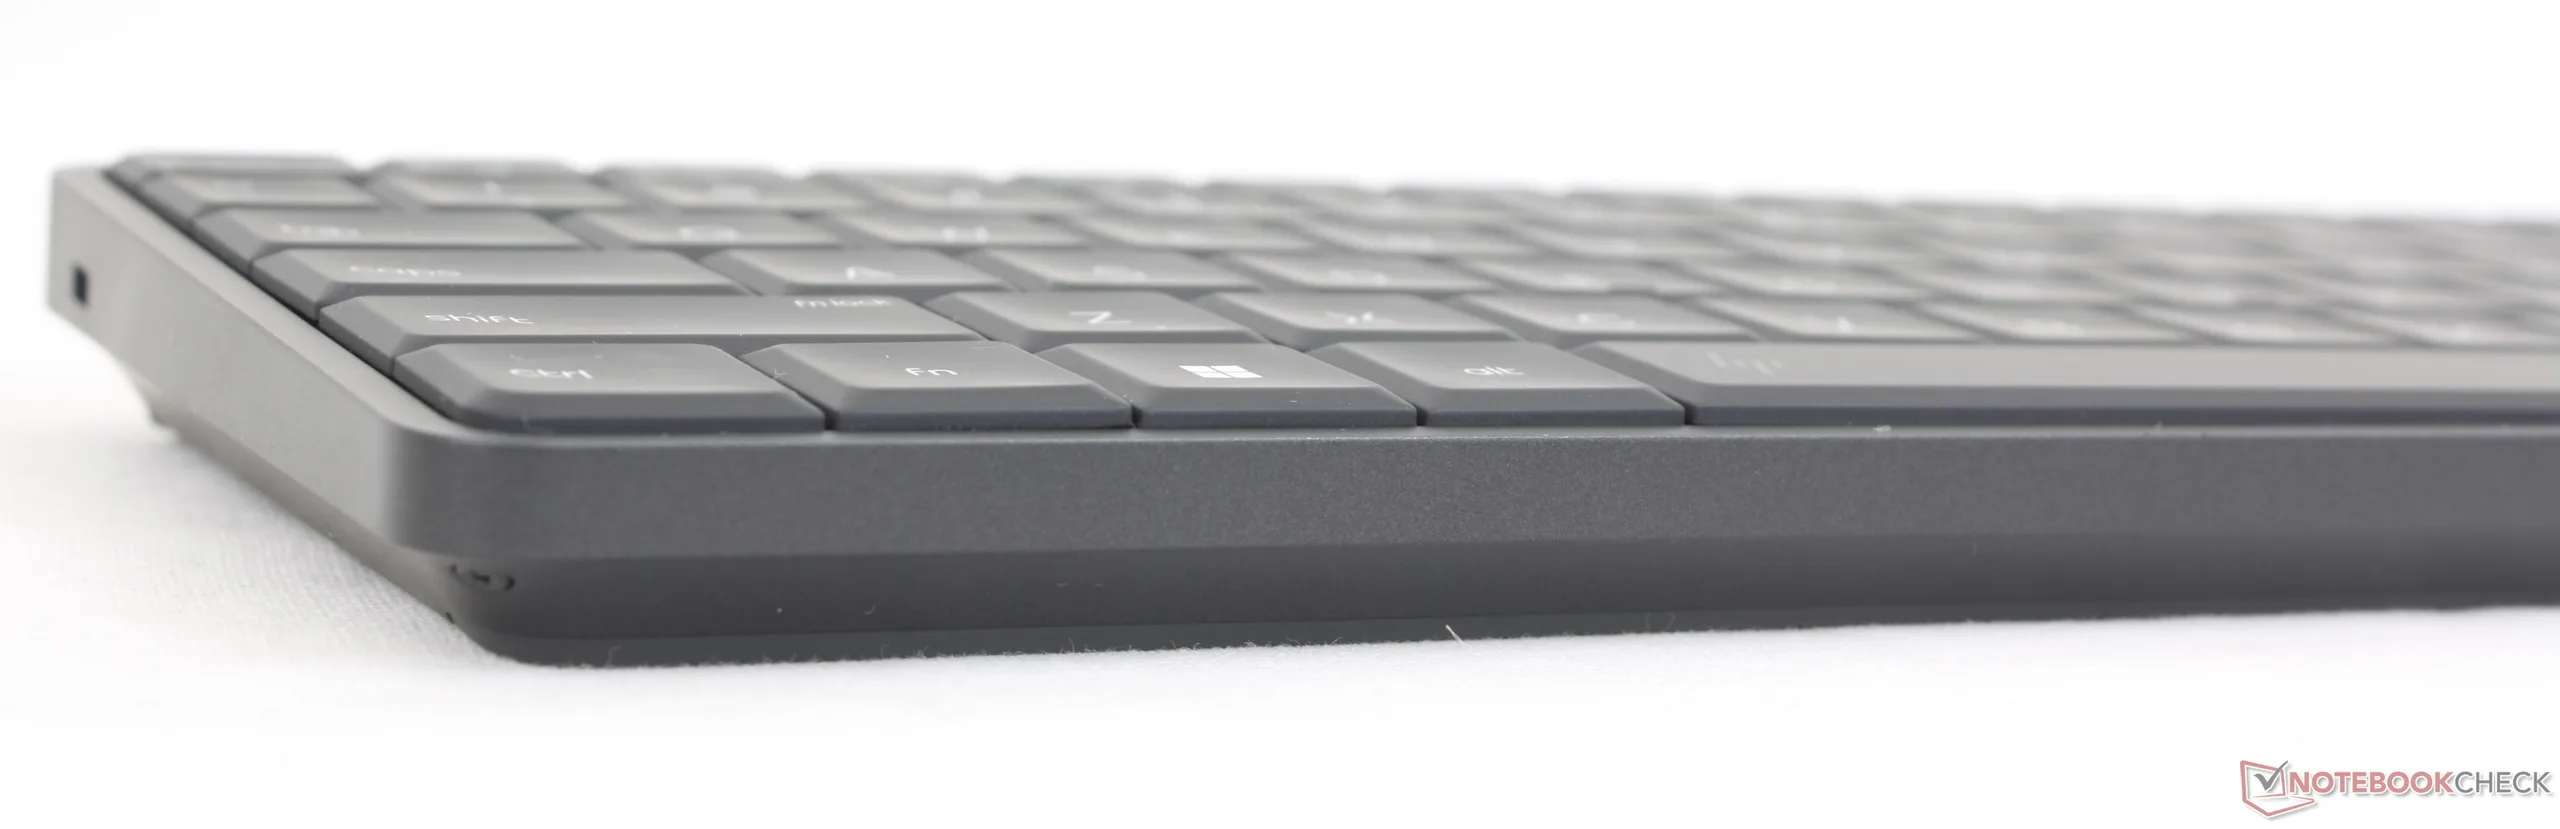
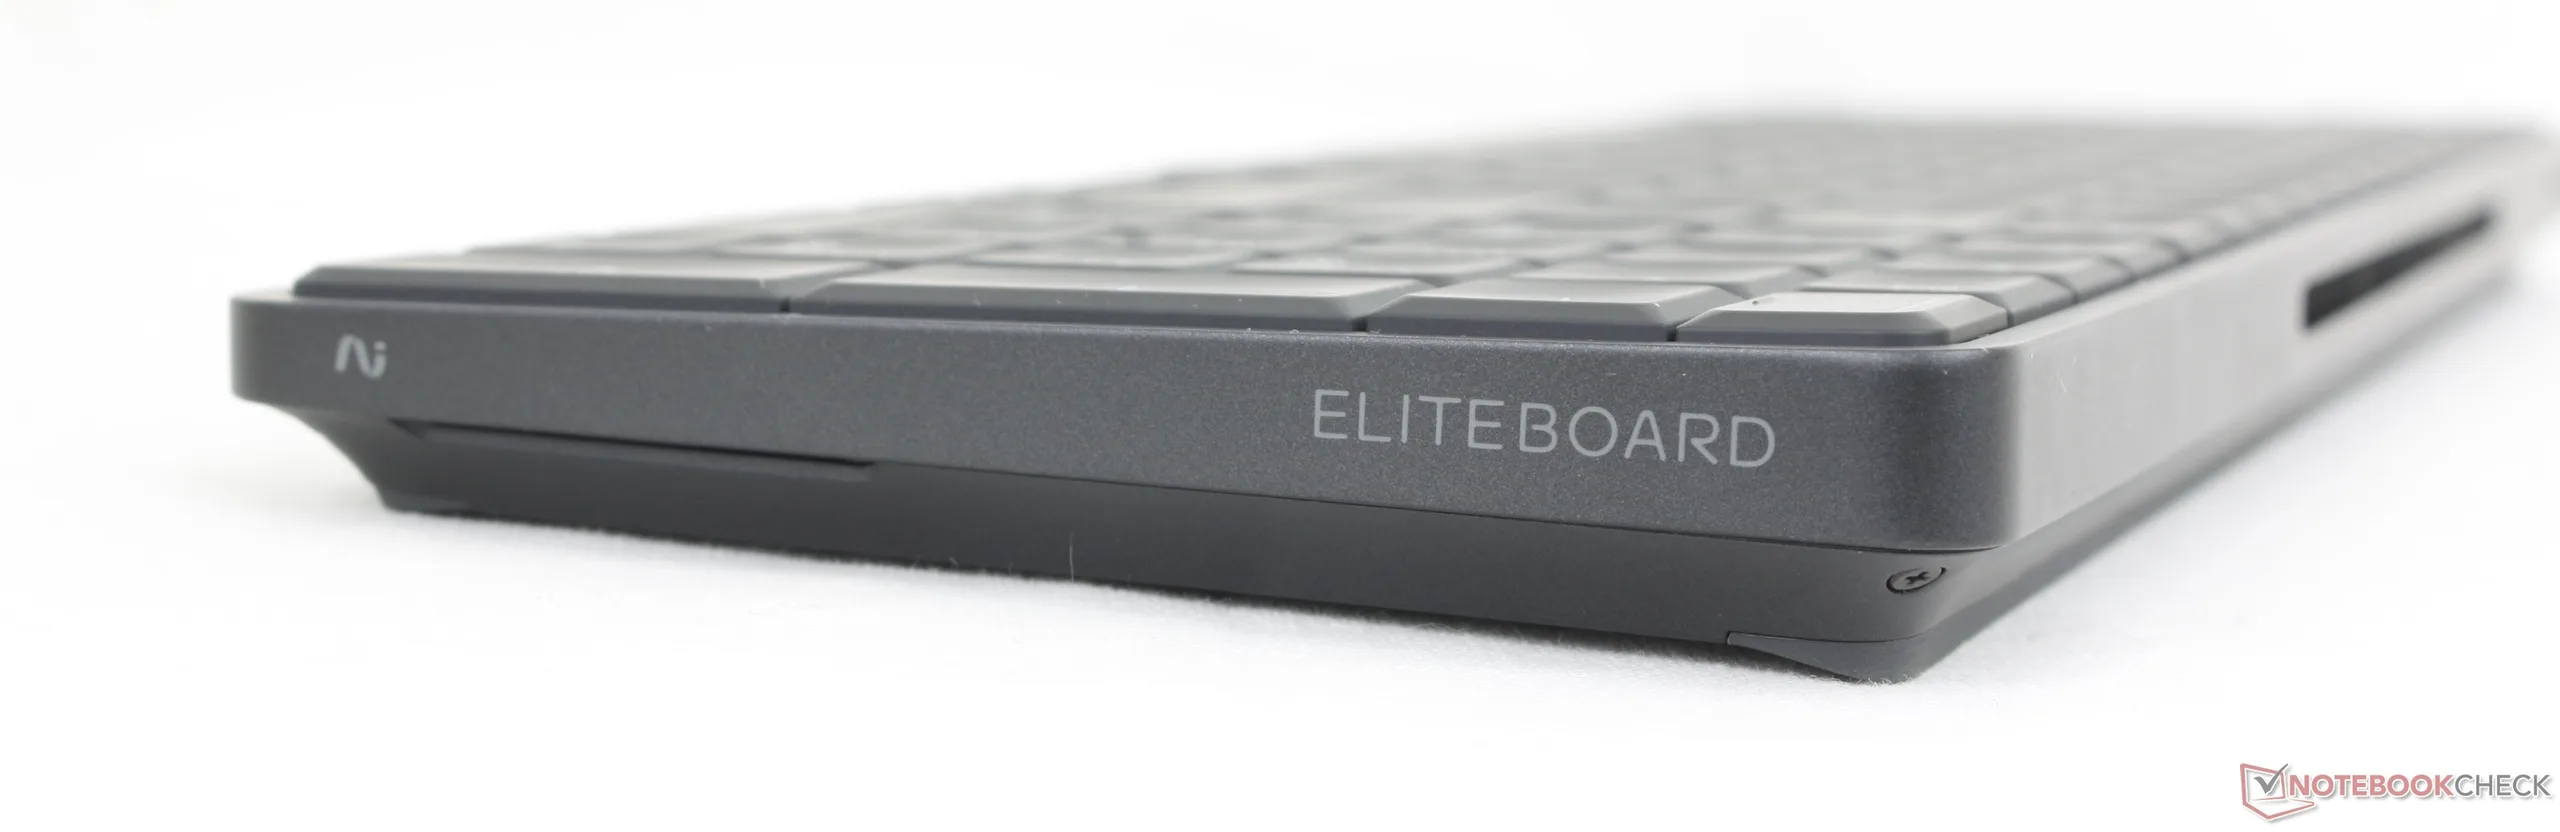
Het dikke plastic frame en de dichte PC-inwendige delen helpen het EliteBoard te verstevigen, zodat het sterker en steviger aanvoelt dan uw traditionele toetsenbord. Het bescheiden ontwerp ziet er niet eens uit alsof er een pc in zit, wat helpt bij de minimalistische aanpak.
Connectiviteit
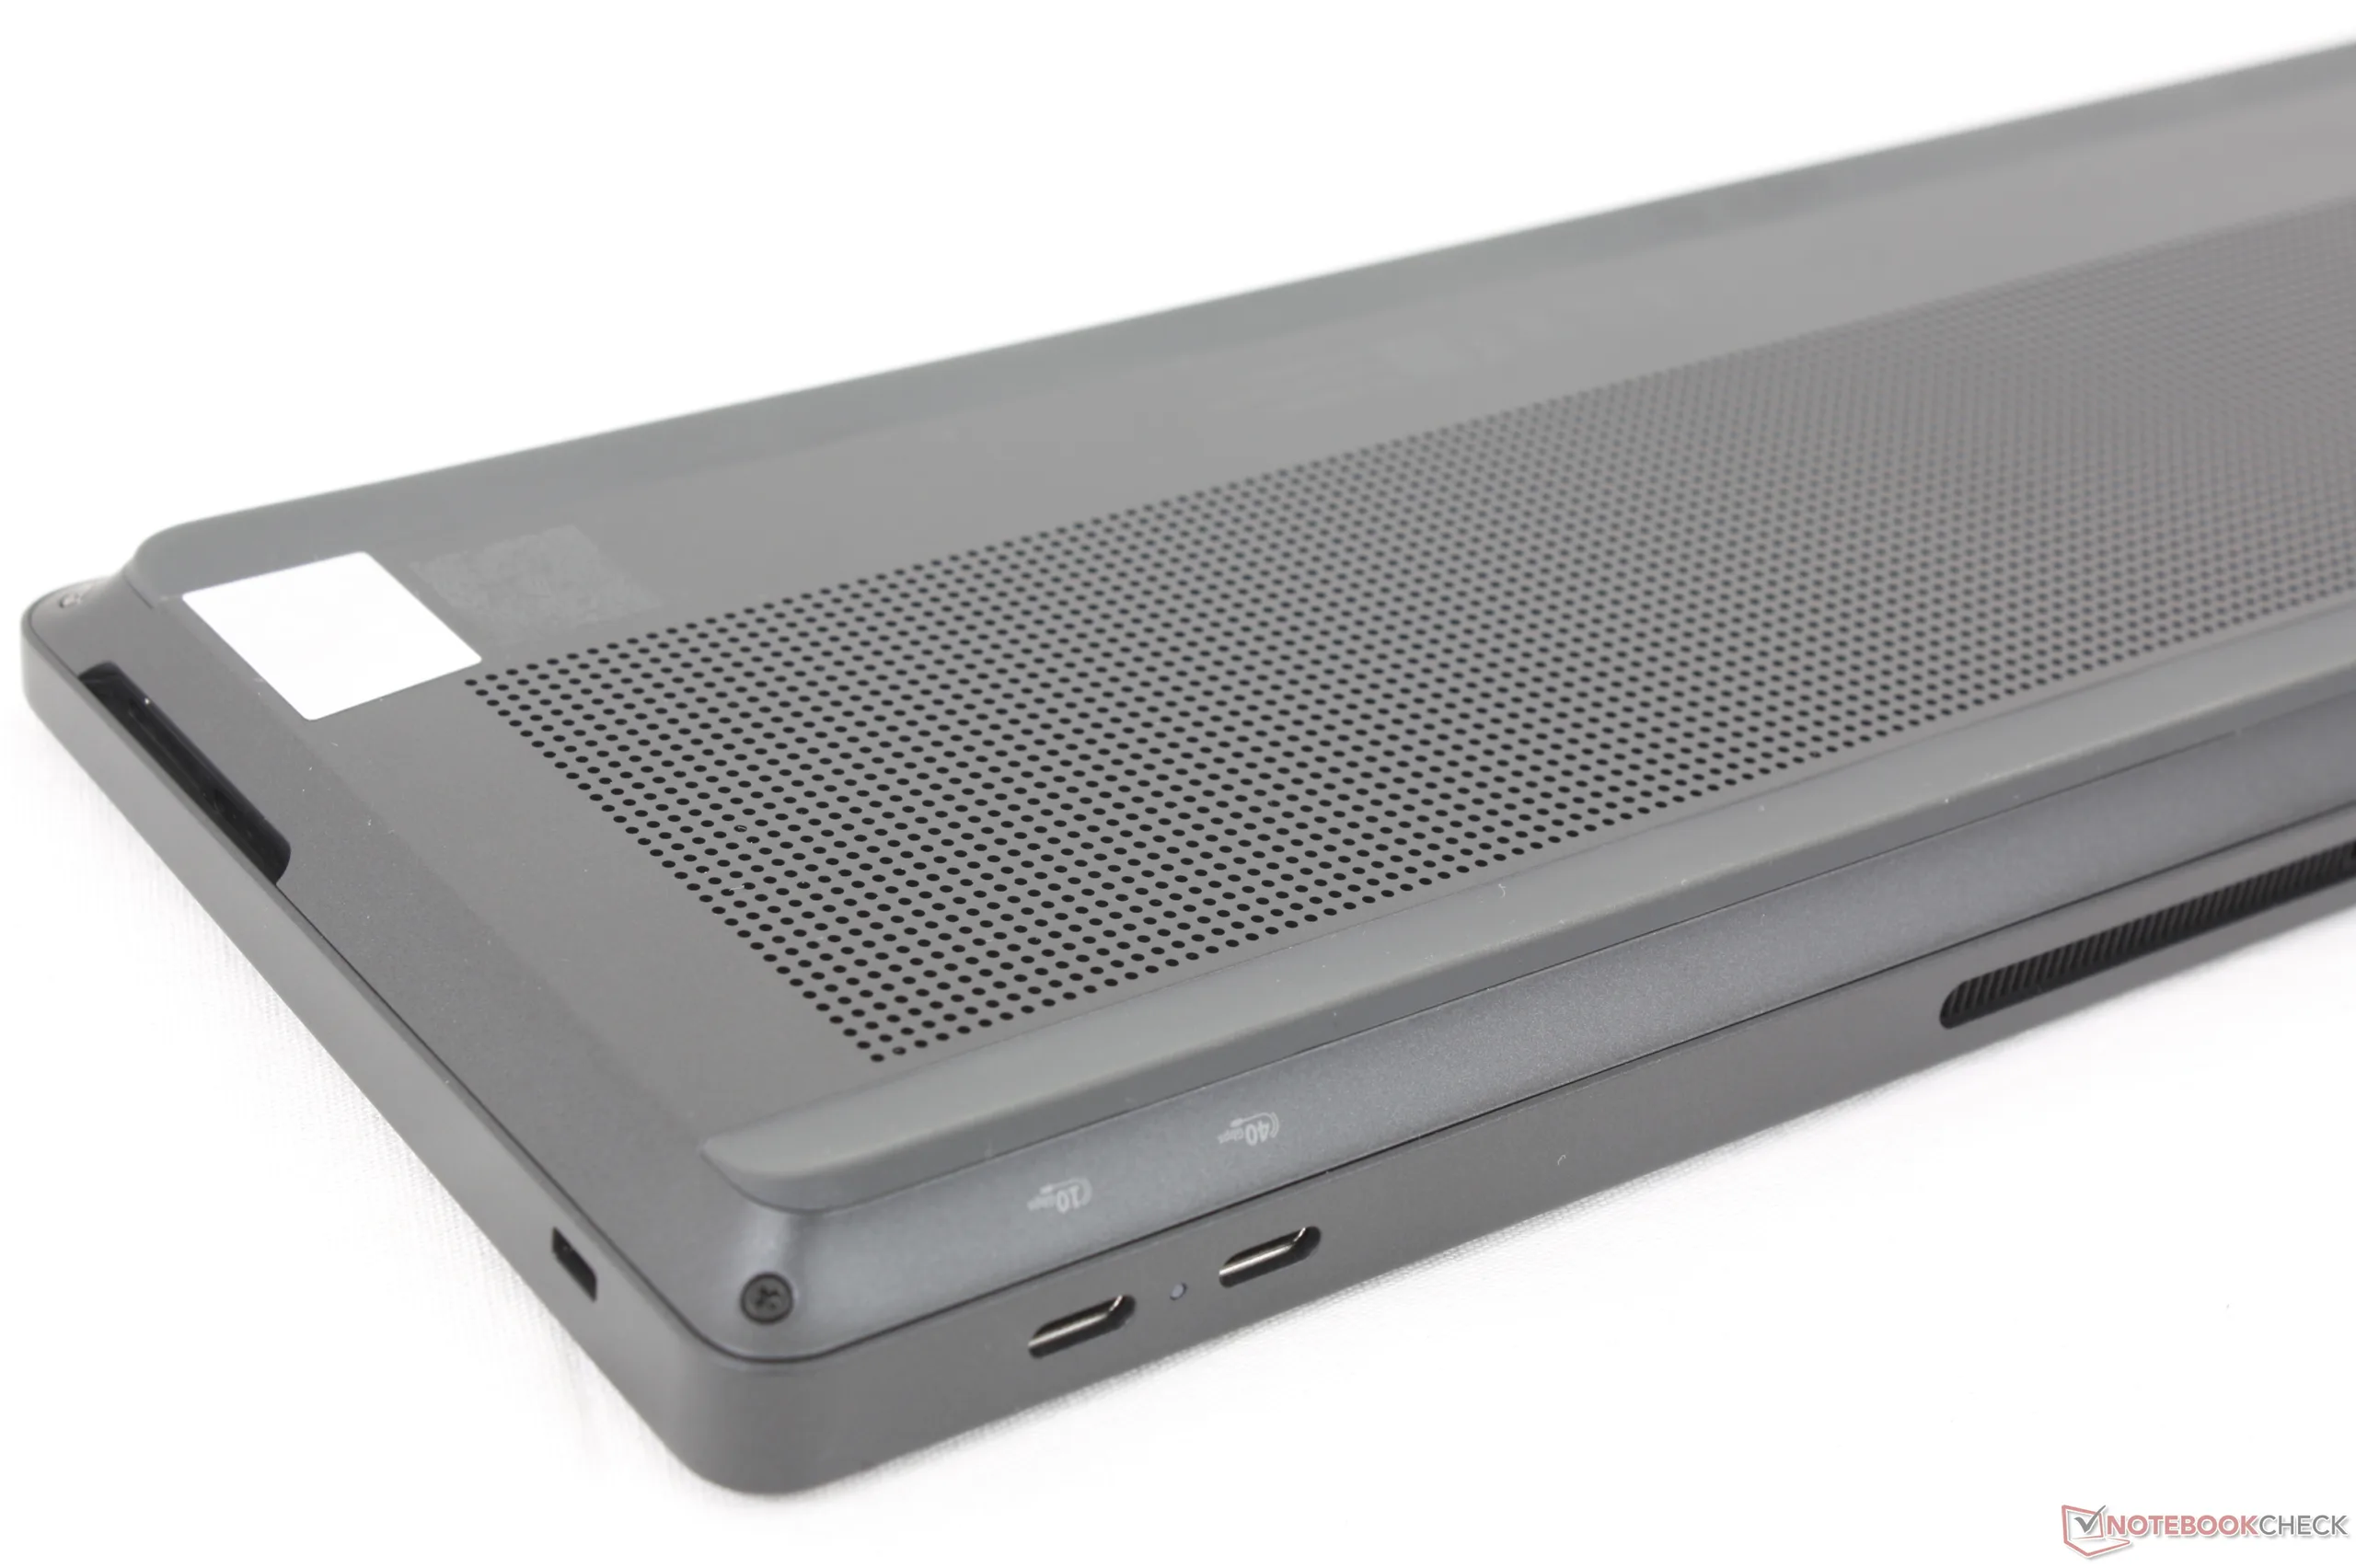
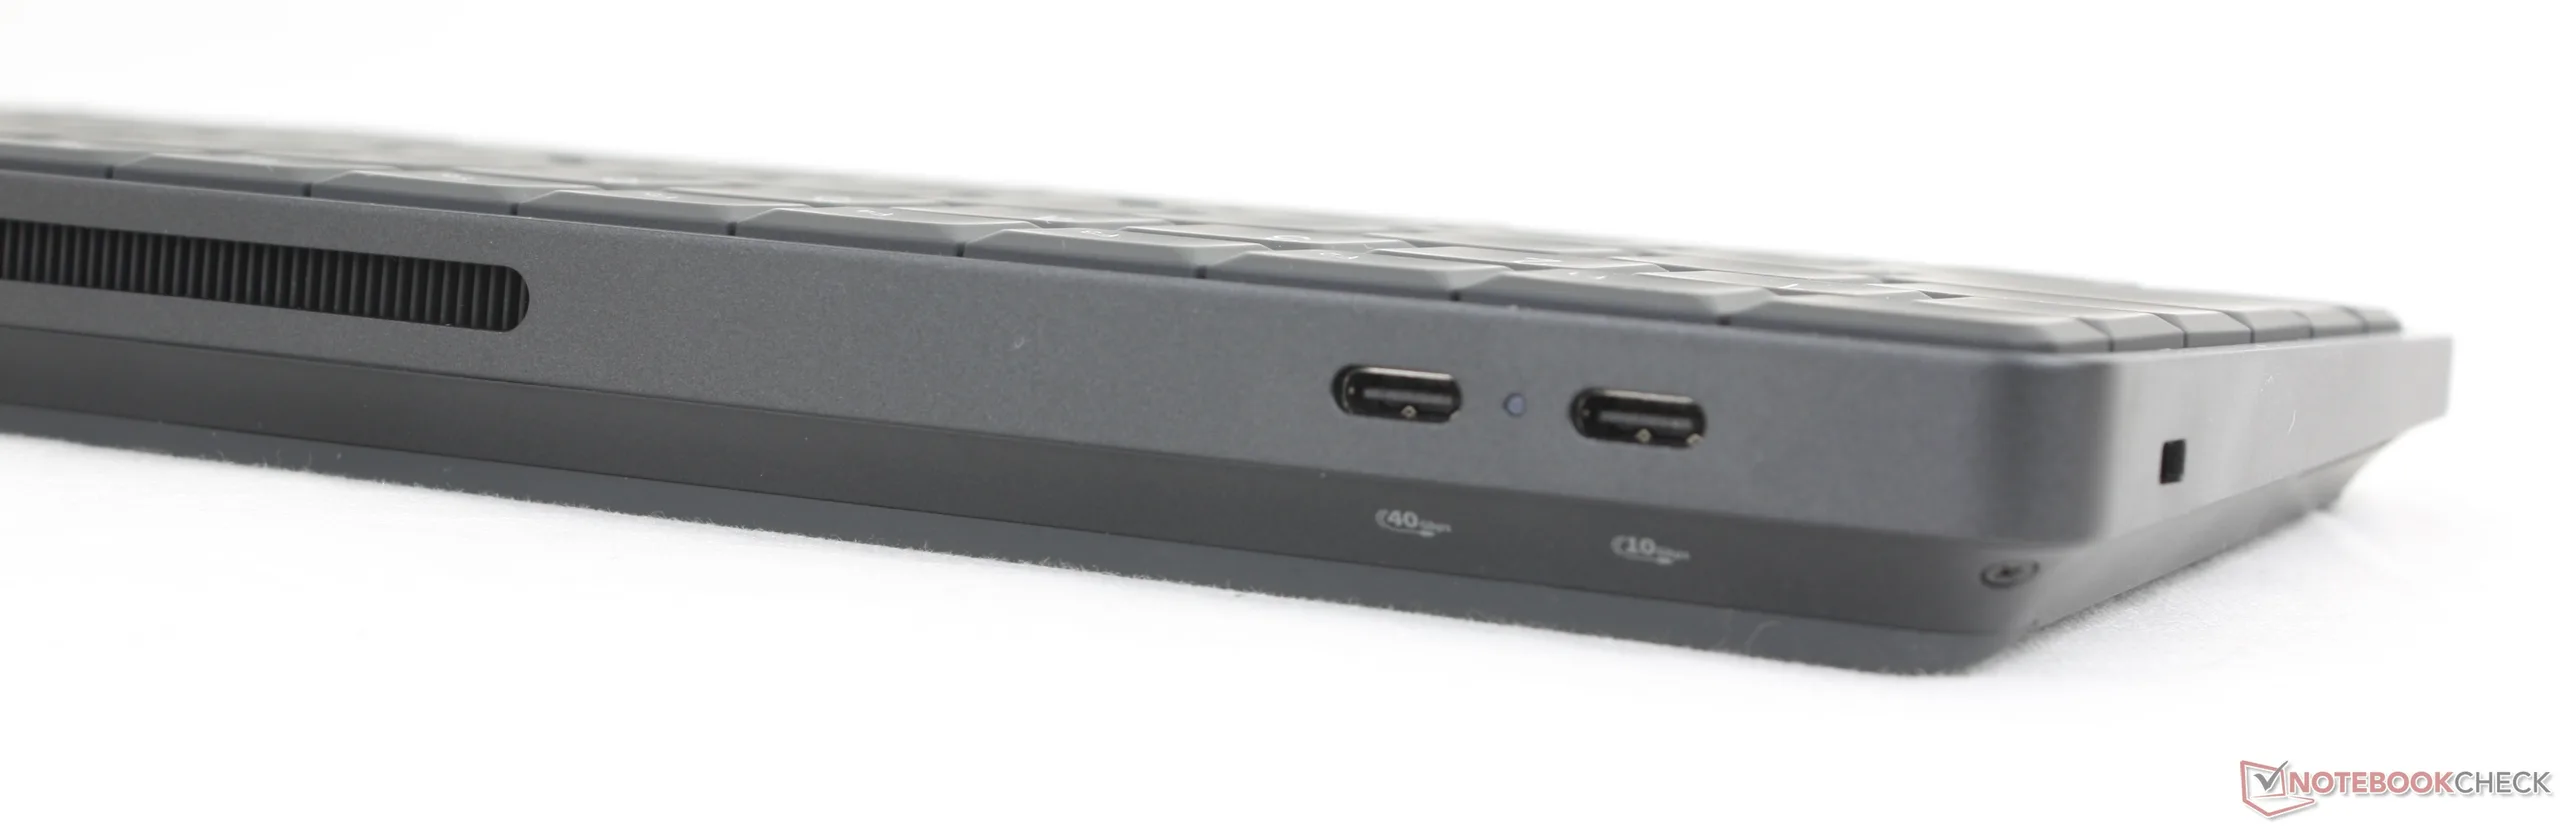
Er zijn slechts twee USB-C poorten om mee te werken voor een kaal gevoel. Idealiter hebben gebruikers al een bestaande monitor met USB-C video en Power Delivery passthrough voor een plug-and-play ervaring met één kabel. Anders moet u rekening houden met rommelige dongles en dockingstations om het EliteBoard goed in te stellen.
Vervelend genoeg zijn de twee USB-C poorten asymmetrisch, wat betekent dat slechts één poort USB4 of 40 Gbps ondersteunt, terwijl de andere alleen USB 3.2 Gen. 2 of 10 Gbps is, waarschijnlijk door de beperkingen van de AMD chipset.
Elke USB-C poort kan ook worden gebruikt om aangesloten apparaten zoals draagbare externe beeldschermen of smartphones op te laden of van stroom te voorzien, zij het slechts met maximaal 7,5 W.
Communicatie
| Networking | |
| iperf3 transmit AXE11000 | |
| Asus NUC 15 Pro+ | |
| HP EliteBoard G1a AI | |
| MSI Cubi NUC AI+ 2MG | |
| HP Pro Mini 400 G9-937U0EA | |
| Geekom A5 Pro | |
| GMK NucBox K13 | |
| iperf3 receive AXE11000 | |
| Asus NUC 15 Pro+ | |
| HP EliteBoard G1a AI | |
| MSI Cubi NUC AI+ 2MG | |
| HP Pro Mini 400 G9-937U0EA | |
| Geekom A5 Pro | |
| GMK NucBox K13 | |
| iperf3 transmit AXE11000 6GHz | |
| HP EliteBoard G1a AI | |
| Asus NUC 15 Pro+ | |
| HP Pro Mini 400 G9-937U0EA | |
| MSI Cubi NUC AI+ 2MG | |
| GMK NucBox K13 | |
| iperf3 receive AXE11000 6GHz | |
| HP EliteBoard G1a AI | |
| GMK NucBox K13 | |
| MSI Cubi NUC AI+ 2MG | |
| Asus NUC 15 Pro+ | |
| HP Pro Mini 400 G9-937U0EA | |
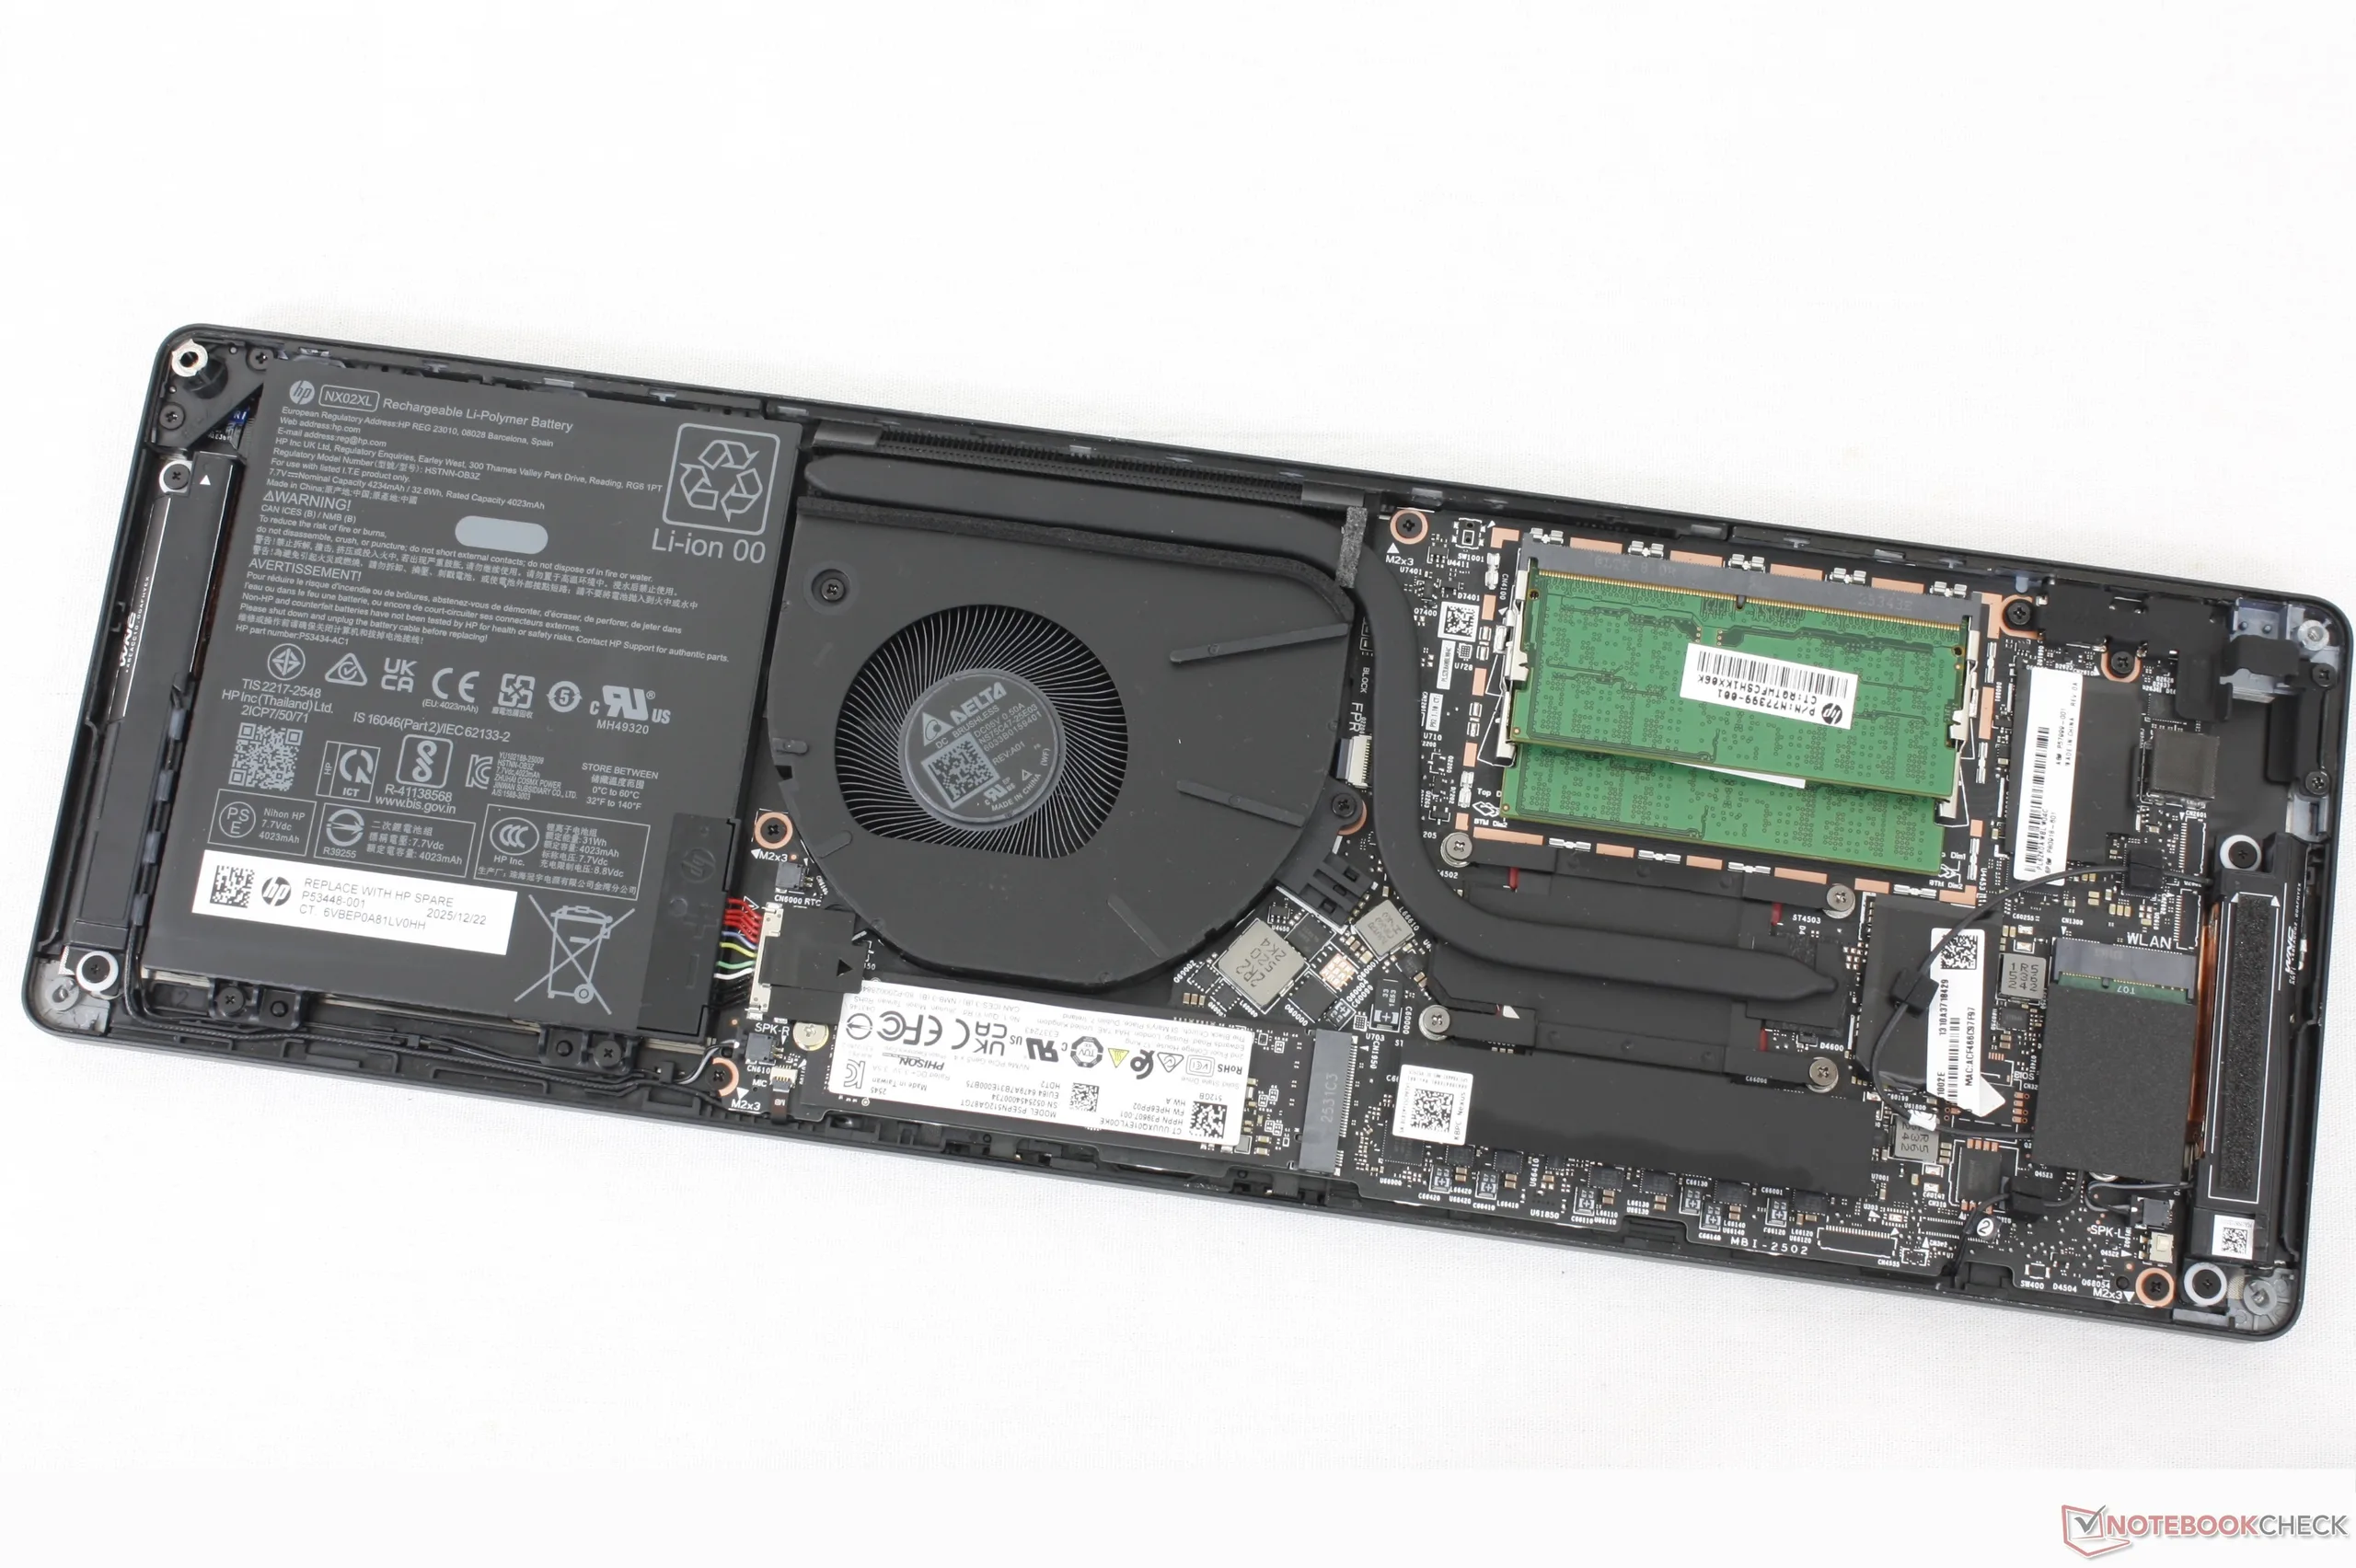
Onderhoud
Volgens de traditie van de Elite-serie is het EliteBoard gemakkelijk te onderhouden met twee toegankelijke DDR5 SODIMM-sleuven, een verwijderbare M.2 WLAN-module en een enkele M.2 2280 SSD-sleuf.
Duurzaamheid
Het systeem is gemaakt van gerecycled plastic en koper van respectievelijk 75% en 45%. De verpakking is plasticvrij en volledig recyclebaar.
Hoewel individuele sleutelkappen vervangbaar zijn, is het dek of de membraanlaag eronder niet ontworpen om gemakkelijk vervangen te kunnen worden.
Accessoires
De verkoopverpakking bevat een 65 W USB-C GaN AC-adapter, een USB-C kabel en een HP 675M Bluetooth muis met batterijen. Een soft-touch reisetui wordt alleen standaard meegeleverd bij configuratie met een batterijpack.
Merk op dat de AC-adapter niet nodig is voor gebruikers met bestaande monitoren die USB-C video en Power Delivery ondersteunen.
Optionele extra's zijn onder andere dockingstations en adapters voor oudere externe monitors die HDMI gebruiken voor video in plaats van USB-C.
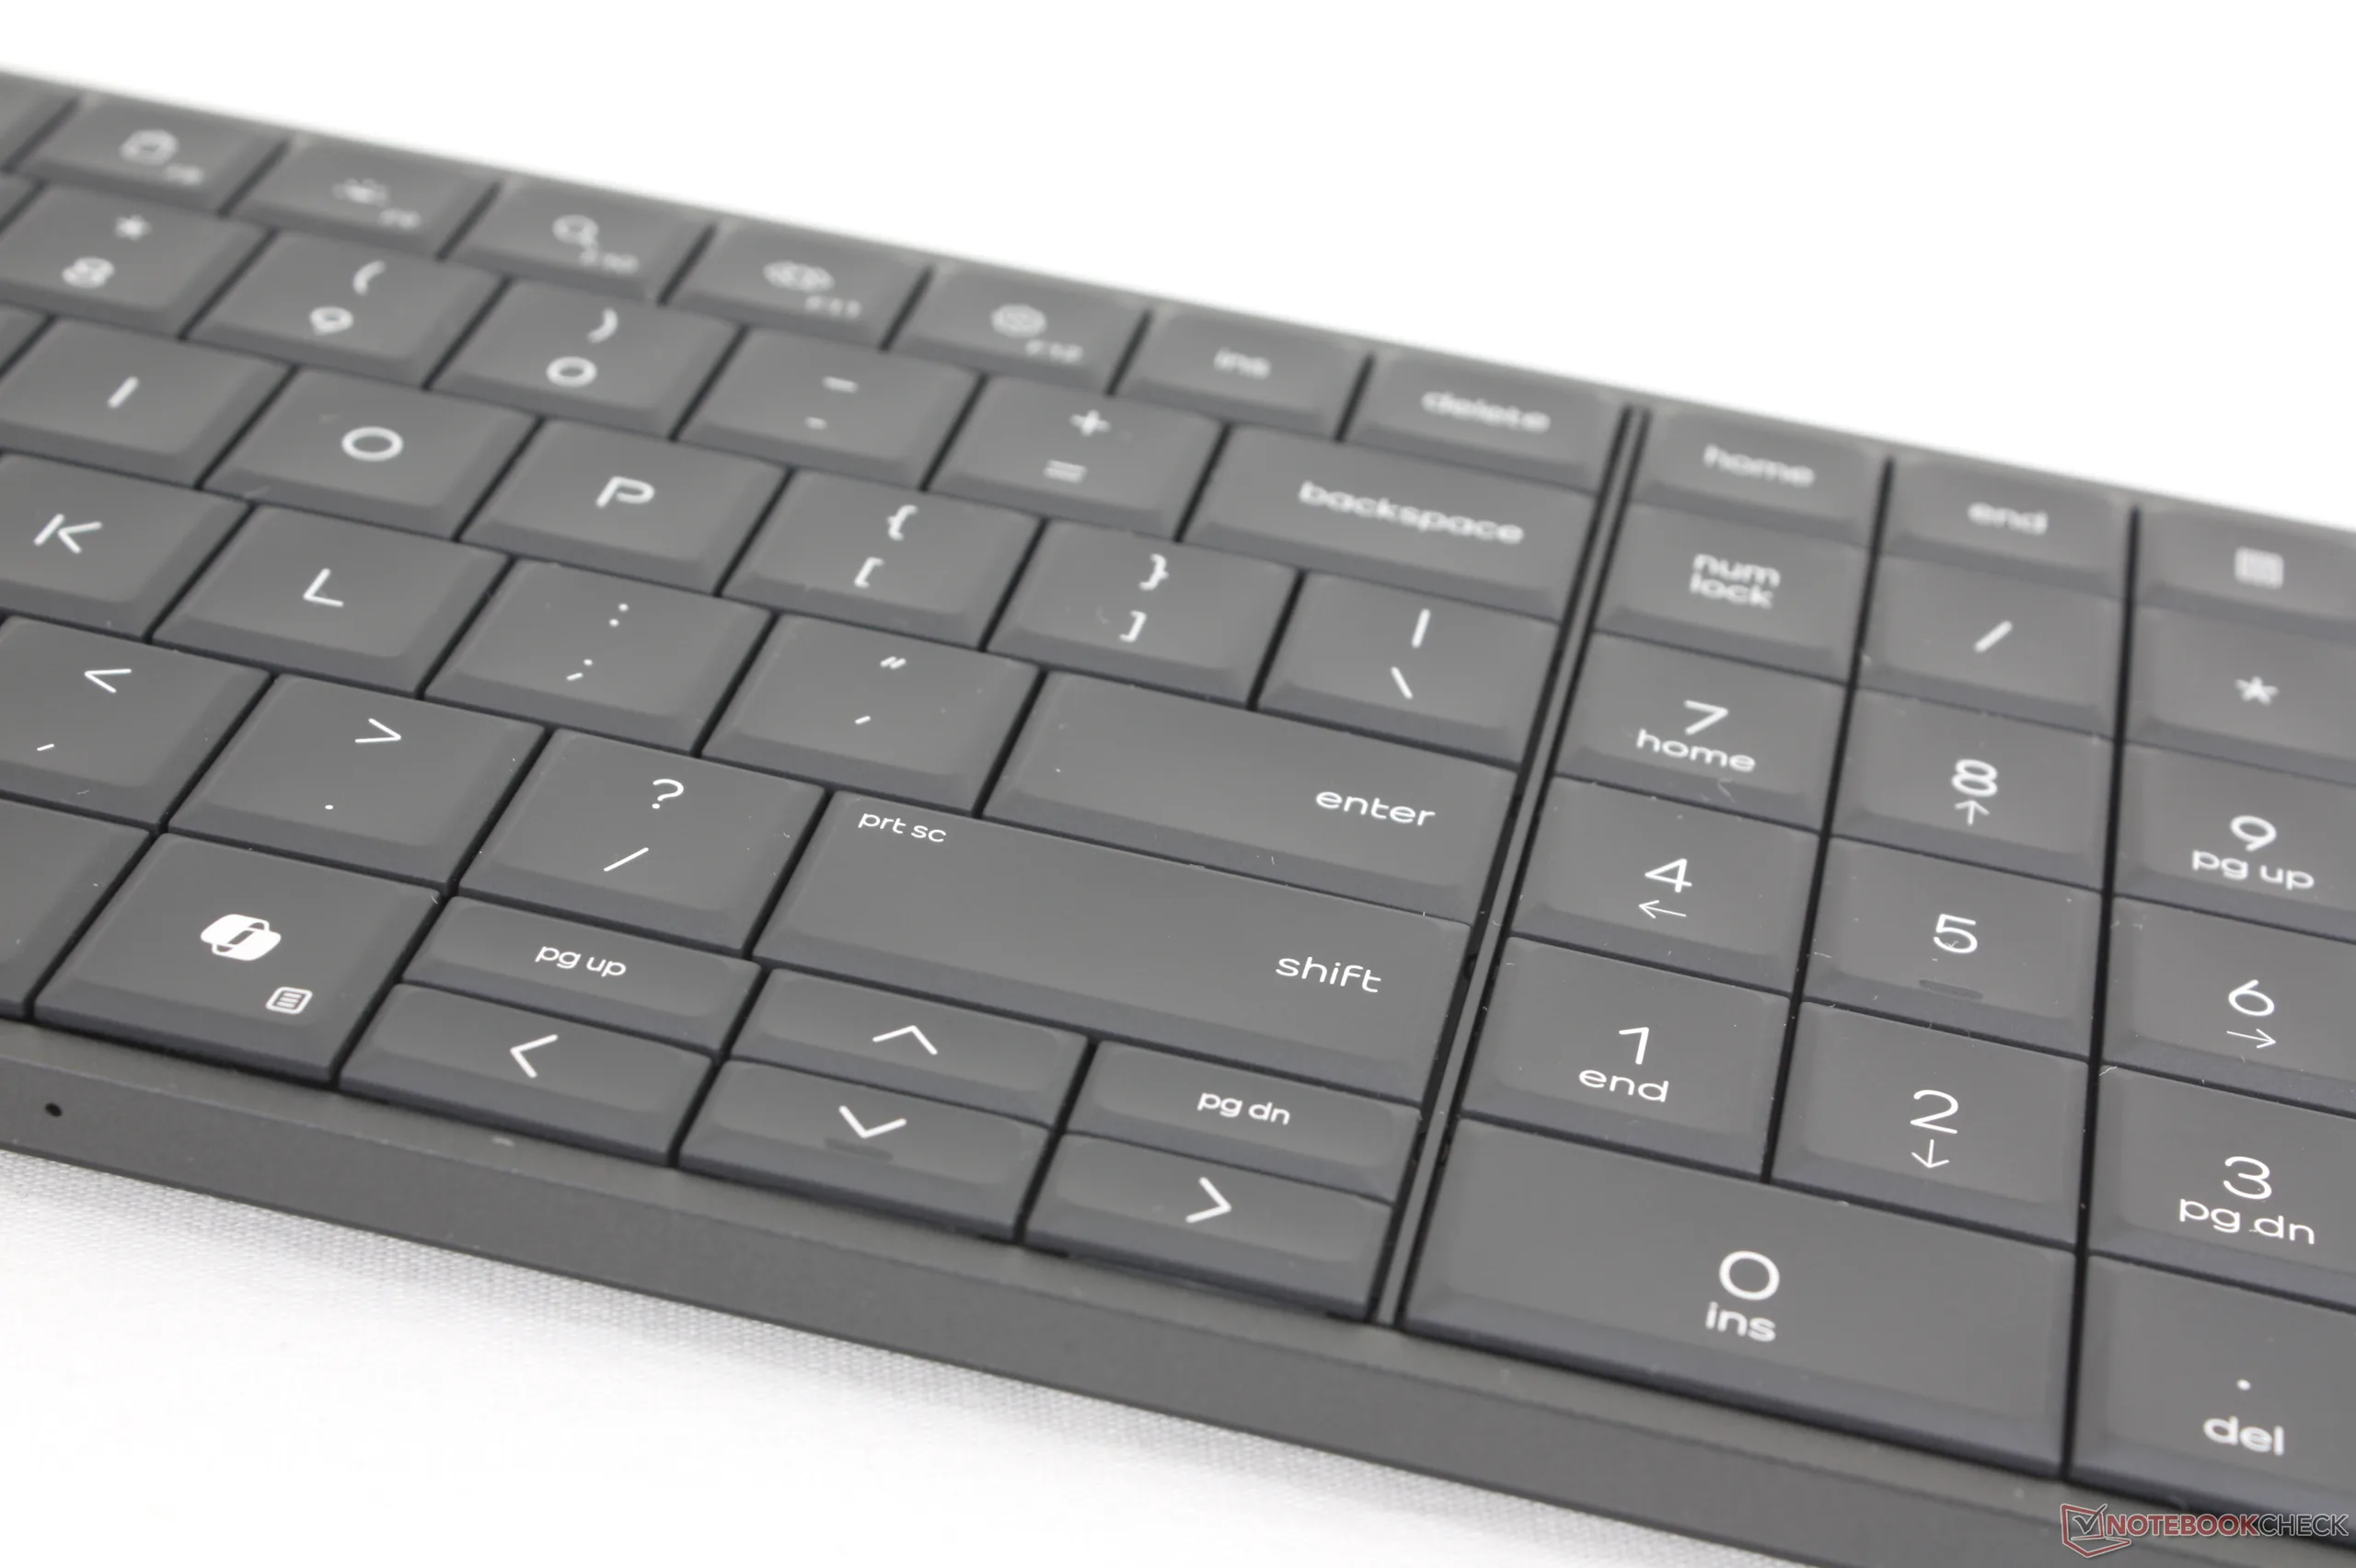
Invoerapparaten
Toetsenbord
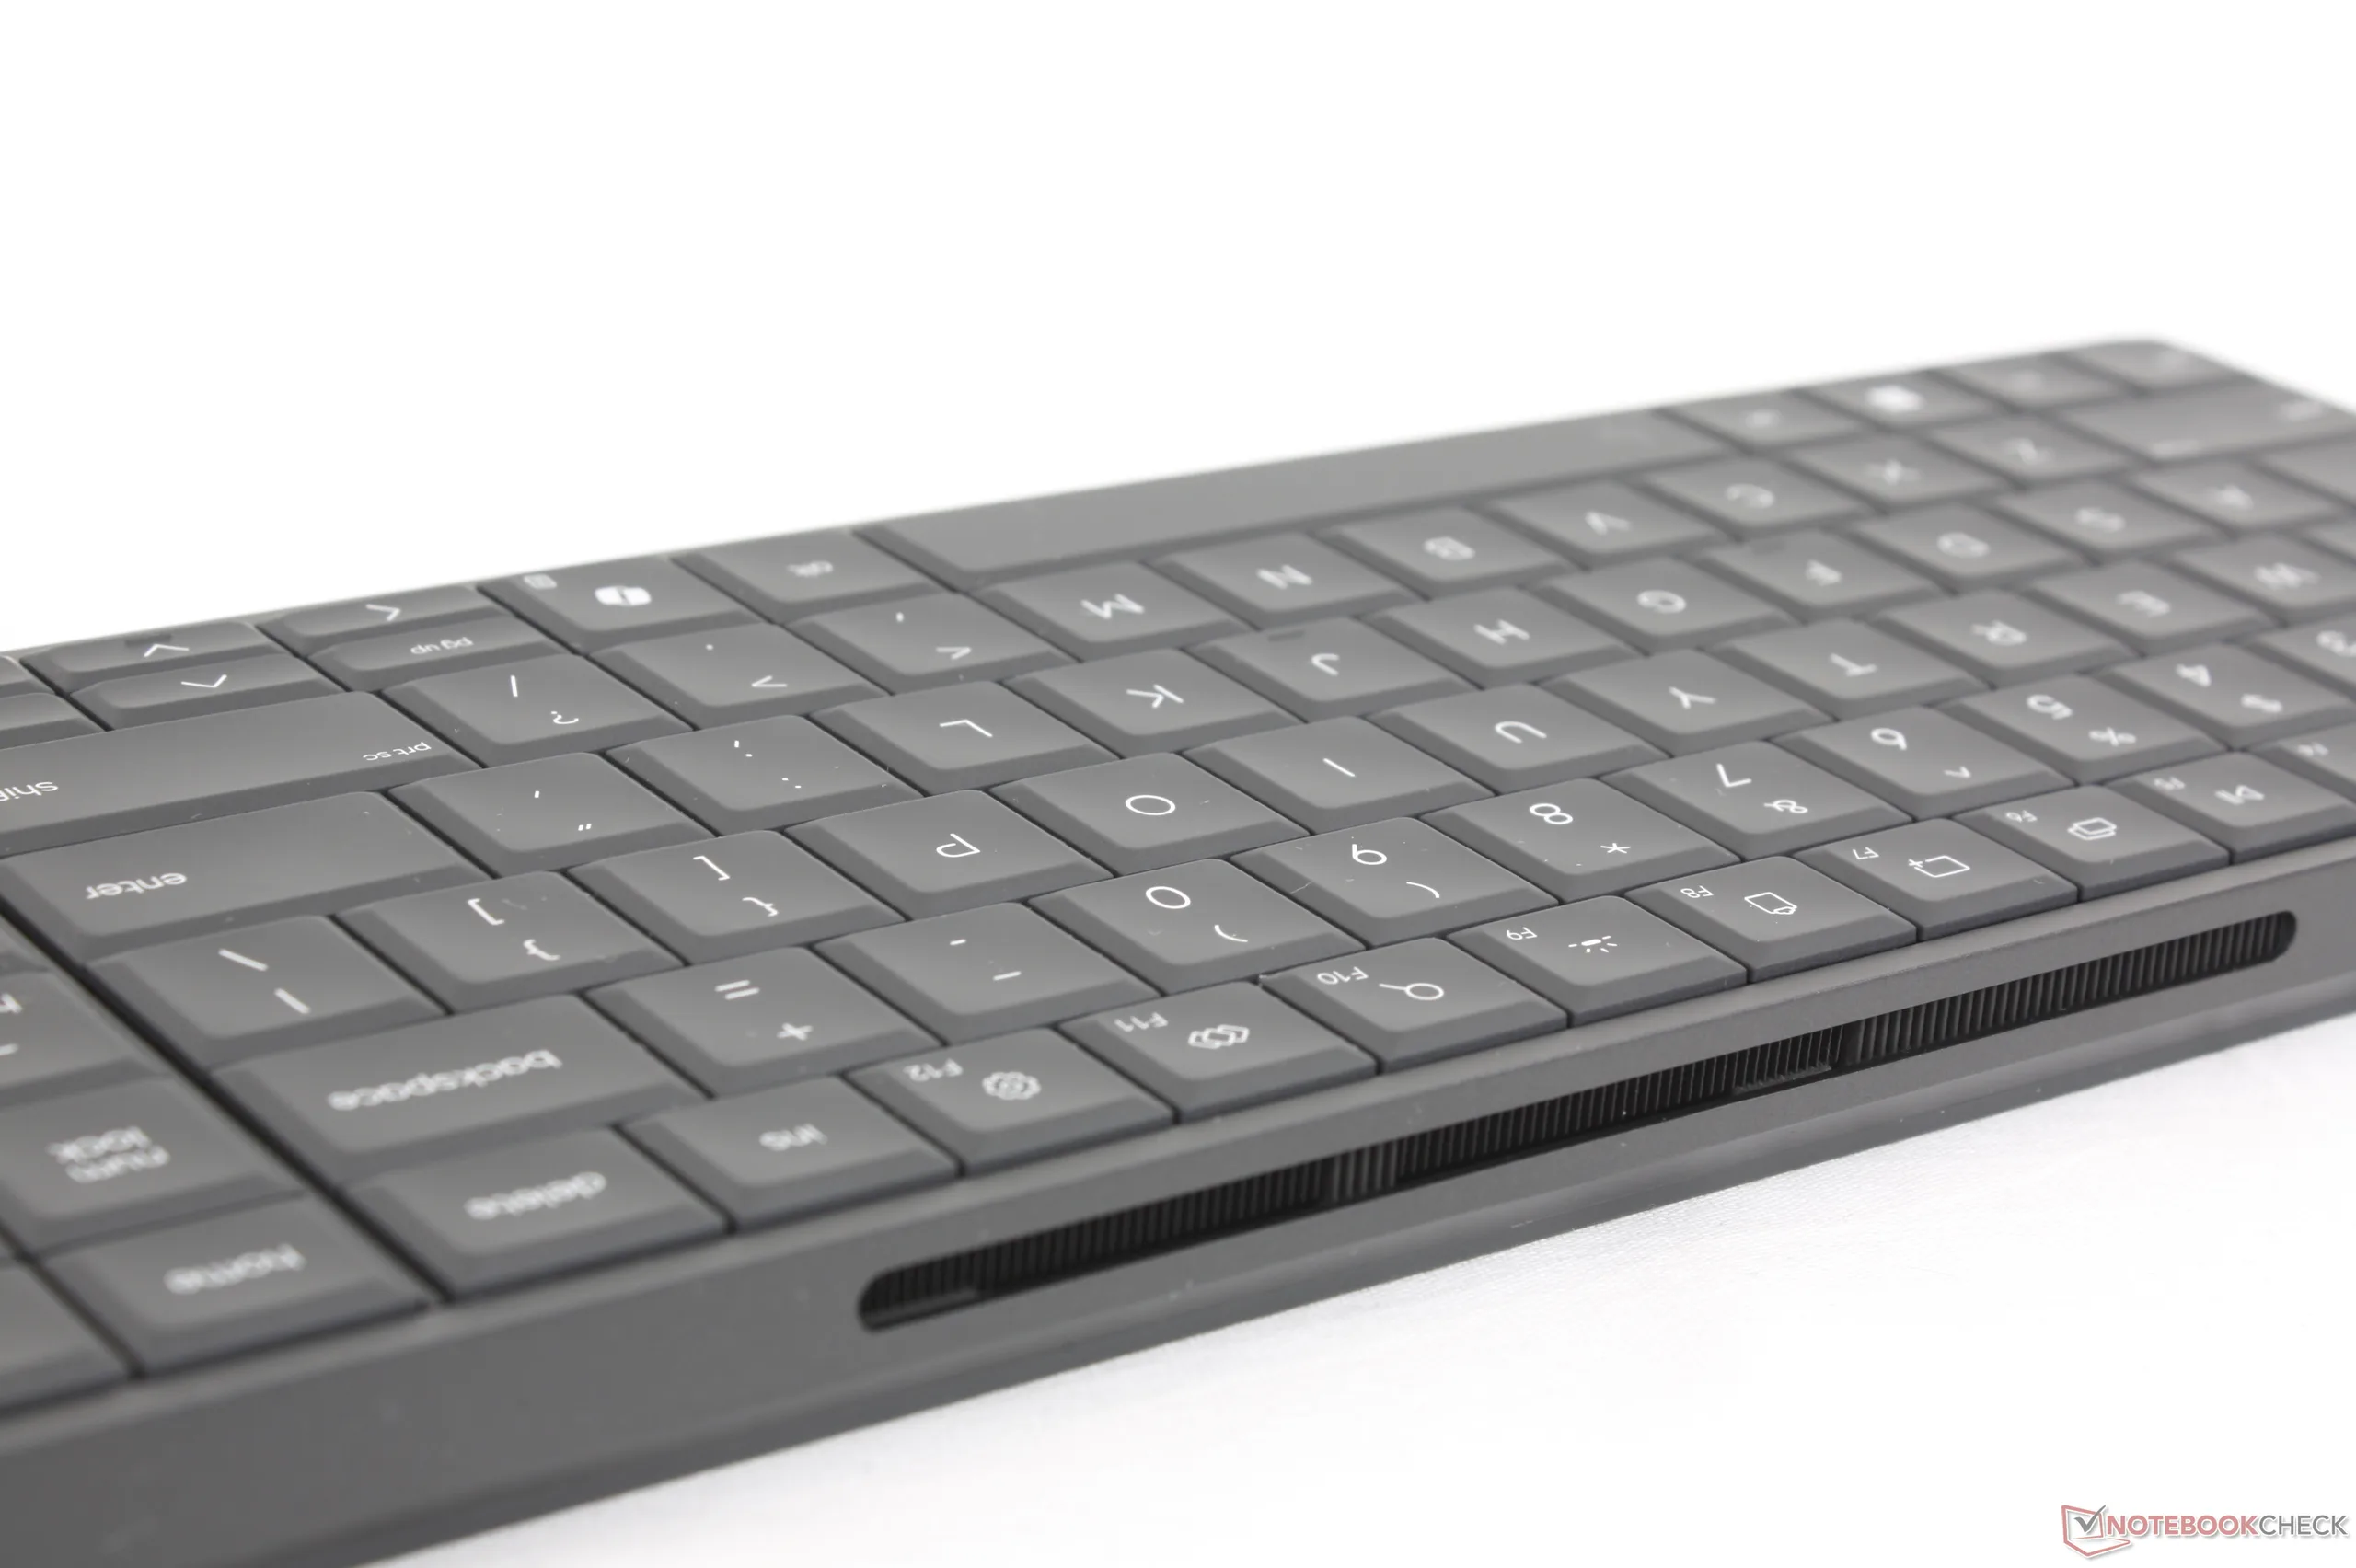
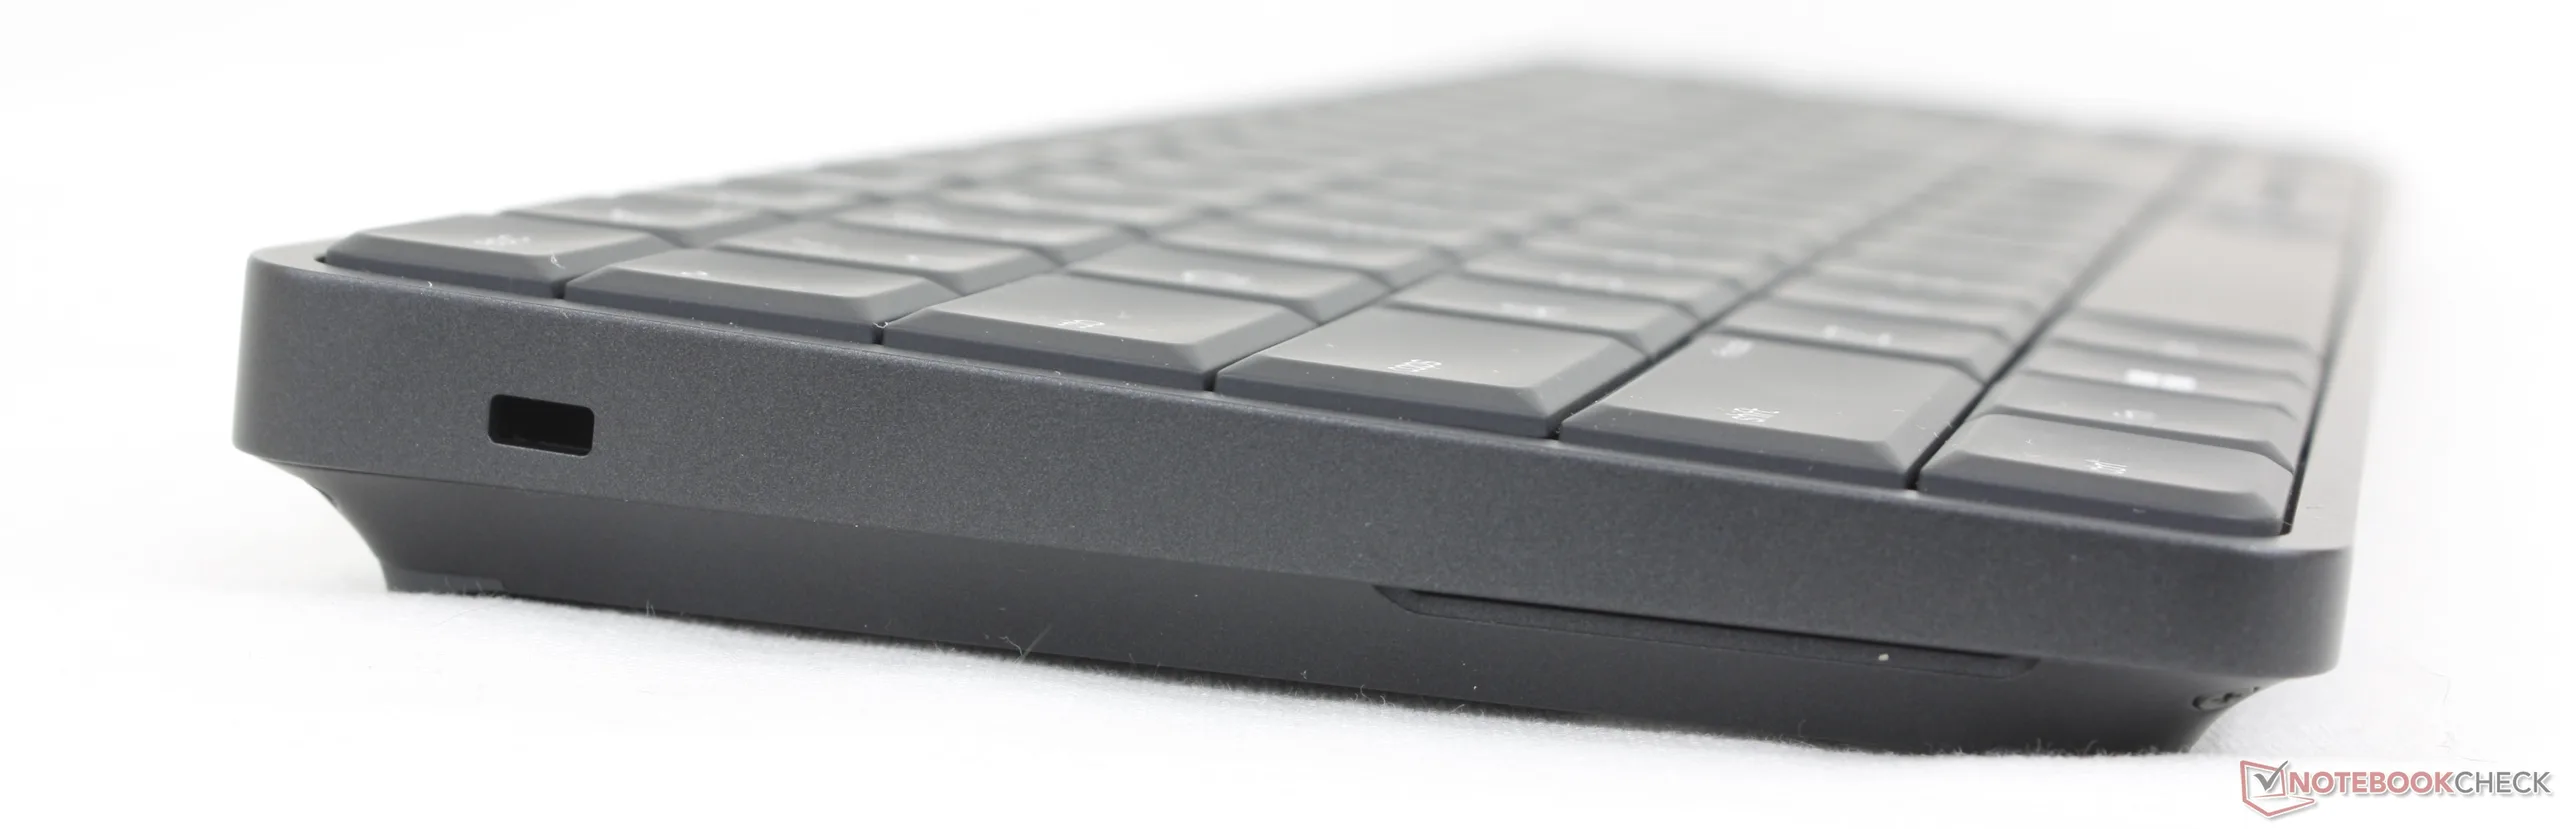
De veerweg van 2 mm is dieper dan bij de meeste laptoptoetsenborden, voor een type-ervaring die dichter bij een doorsnee bureautoetsenbord ligt. Hoewel we houden van de stevige feedback, het numpad van volledig formaat en het bijzonder stille gekletter van de toetsen, zijn de pijltjestoetsen kleiner dan de pijltjestoetsen op veel laptops. HP zegt dat dit met opzet is gedaan om aan strakke ontwerpspecificaties te voldoen.
Bovendien is het toetsenbord "gekoppeld" aan de EliteBoard PC, wat betekent dat het niet kan worden gebruikt om een andere computer te bedienen, in tegenstelling tot uw gewone desktoptoetsenbord.
Prestaties
Testomstandigheden
We hebben Windows in de modus Prestaties gezet voordat we de onderstaande benchmarks uitvoerden.
Processor
De Ryzen AI 5 PRO 340 presteert vergelijkbaar met de Lunar Lake Core Ultra 7 256V wat betreft ruwe prestaties. Hoewel hij niet bijzonder snel is, is het een duidelijke verbetering ten opzichte van oudere CPU's uit de U-serie, zoals de Ryzen 5 7530U of Core i7-1335U.
Upgraden naar de Ryzen AI 7 PRO 350 zal naar verwachting de multi-thread prestaties met ongeveer 50 procent verbeteren, gebaseerd op onze tijd met de Asus ExpertCenter dankzij het hogere aantal fysieke cores.
Cinebench R15 meervoudige lus
Cinebench R23: Multi Core | Single Core
Cinebench R20: CPU (Multi Core) | CPU (Single Core)
Cinebench R15: CPU Multi 64Bit | CPU Single 64Bit
Blender: v2.79 BMW27 CPU
7-Zip 18.03: 7z b 4 | 7z b 4 -mmt1
Geekbench 6.7: Multi-Core | Single-Core
Geekbench 5.5: Multi-Core | Single-Core
HWBOT x265 Benchmark v2.2: 4k Preset
LibreOffice : 20 Documents To PDF
R Benchmark 2.5: Overall mean
| CPU Performance rating | |
| Asus NUC 15 Pro+ | |
| Khadas Mind Pro | |
| Beelink GTI15 Ultra | |
| Asus ExpertCenter PN54-S70012NN | |
| Gemiddeld AMD Ryzen AI 5 PRO 340 | |
| HP EliteBoard G1a AI | |
| GMK NucBox K13 | |
| HP Pro Mini 400 G9-937U0EA | |
| MSI Cubi NUC AI+ 2MG | |
| Geekom A5 Pro | |
| Aoostar WTR Pro, N150 | |
| Cinebench R23 / Multi Core | |
| Asus NUC 15 Pro+ | |
| Khadas Mind Pro | |
| Beelink GTI15 Ultra | |
| Asus ExpertCenter PN54-S70012NN | |
| HP Pro Mini 400 G9-937U0EA | |
| HP EliteBoard G1a AI | |
| Gemiddeld AMD Ryzen AI 5 PRO 340 (n=1) | |
| GMK NucBox K13 | |
| MSI Cubi NUC AI+ 2MG | |
| Geekom A5 Pro | |
| Aoostar WTR Pro, N150 | |
| Cinebench R23 / Single Core | |
| Asus NUC 15 Pro+ | |
| Khadas Mind Pro | |
| Beelink GTI15 Ultra | |
| Asus ExpertCenter PN54-S70012NN | |
| MSI Cubi NUC AI+ 2MG | |
| GMK NucBox K13 | |
| HP Pro Mini 400 G9-937U0EA | |
| HP EliteBoard G1a AI | |
| Gemiddeld AMD Ryzen AI 5 PRO 340 (n=1) | |
| Geekom A5 Pro | |
| Aoostar WTR Pro, N150 | |
| Cinebench R20 / CPU (Multi Core) | |
| Asus NUC 15 Pro+ | |
| Khadas Mind Pro | |
| Beelink GTI15 Ultra | |
| Asus ExpertCenter PN54-S70012NN | |
| HP EliteBoard G1a AI | |
| Gemiddeld AMD Ryzen AI 5 PRO 340 (n=1) | |
| HP Pro Mini 400 G9-937U0EA | |
| GMK NucBox K13 | |
| MSI Cubi NUC AI+ 2MG | |
| Geekom A5 Pro | |
| Aoostar WTR Pro, N150 | |
| Cinebench R20 / CPU (Single Core) | |
| Asus NUC 15 Pro+ | |
| Beelink GTI15 Ultra | |
| Khadas Mind Pro | |
| Asus ExpertCenter PN54-S70012NN | |
| MSI Cubi NUC AI+ 2MG | |
| GMK NucBox K13 | |
| HP Pro Mini 400 G9-937U0EA | |
| HP EliteBoard G1a AI | |
| Gemiddeld AMD Ryzen AI 5 PRO 340 (n=1) | |
| Geekom A5 Pro | |
| Aoostar WTR Pro, N150 | |
| Cinebench R15 / CPU Multi 64Bit | |
| Asus NUC 15 Pro+ | |
| Khadas Mind Pro | |
| Asus ExpertCenter PN54-S70012NN | |
| Beelink GTI15 Ultra | |
| HP Pro Mini 400 G9-937U0EA | |
| HP EliteBoard G1a AI | |
| Gemiddeld AMD Ryzen AI 5 PRO 340 (n=1) | |
| GMK NucBox K13 | |
| MSI Cubi NUC AI+ 2MG | |
| Geekom A5 Pro | |
| Aoostar WTR Pro, N150 | |
| Cinebench R15 / CPU Single 64Bit | |
| Asus NUC 15 Pro+ | |
| Khadas Mind Pro | |
| Beelink GTI15 Ultra | |
| Asus ExpertCenter PN54-S70012NN | |
| MSI Cubi NUC AI+ 2MG | |
| GMK NucBox K13 | |
| HP EliteBoard G1a AI | |
| Gemiddeld AMD Ryzen AI 5 PRO 340 (n=1) | |
| HP Pro Mini 400 G9-937U0EA | |
| Geekom A5 Pro | |
| Aoostar WTR Pro, N150 | |
| Blender / v2.79 BMW27 CPU | |
| Aoostar WTR Pro, N150 | |
| Geekom A5 Pro | |
| MSI Cubi NUC AI+ 2MG | |
| GMK NucBox K13 | |
| HP Pro Mini 400 G9-937U0EA | |
| HP EliteBoard G1a AI | |
| Gemiddeld AMD Ryzen AI 5 PRO 340 (n=1) | |
| Asus ExpertCenter PN54-S70012NN | |
| Beelink GTI15 Ultra | |
| Khadas Mind Pro | |
| Asus NUC 15 Pro+ | |
| 7-Zip 18.03 / 7z b 4 | |
| Asus NUC 15 Pro+ | |
| Khadas Mind Pro | |
| Beelink GTI15 Ultra | |
| Asus ExpertCenter PN54-S70012NN | |
| HP Pro Mini 400 G9-937U0EA | |
| HP EliteBoard G1a AI | |
| Gemiddeld AMD Ryzen AI 5 PRO 340 (n=1) | |
| GMK NucBox K13 | |
| Geekom A5 Pro | |
| MSI Cubi NUC AI+ 2MG | |
| Aoostar WTR Pro, N150 | |
| 7-Zip 18.03 / 7z b 4 -mmt1 | |
| Khadas Mind Pro | |
| Beelink GTI15 Ultra | |
| Asus NUC 15 Pro+ | |
| HP Pro Mini 400 G9-937U0EA | |
| MSI Cubi NUC AI+ 2MG | |
| GMK NucBox K13 | |
| HP EliteBoard G1a AI | |
| Gemiddeld AMD Ryzen AI 5 PRO 340 (n=1) | |
| Asus ExpertCenter PN54-S70012NN | |
| Geekom A5 Pro | |
| Aoostar WTR Pro, N150 | |
| Geekbench 6.7 / Multi-Core | |
| Asus NUC 15 Pro+ | |
| Khadas Mind Pro | |
| Beelink GTI15 Ultra | |
| Asus ExpertCenter PN54-S70012NN | |
| Gemiddeld AMD Ryzen AI 5 PRO 340 (11409 - 11455, n=2) | |
| HP EliteBoard G1a AI | |
| GMK NucBox K13 | |
| HP Pro Mini 400 G9-937U0EA | |
| MSI Cubi NUC AI+ 2MG | |
| Geekom A5 Pro | |
| Aoostar WTR Pro, N150 | |
| Geekbench 6.7 / Single-Core | |
| Beelink GTI15 Ultra | |
| Asus ExpertCenter PN54-S70012NN | |
| Khadas Mind Pro | |
| GMK NucBox K13 | |
| MSI Cubi NUC AI+ 2MG | |
| Gemiddeld AMD Ryzen AI 5 PRO 340 (2640 - 2771, n=2) | |
| Asus NUC 15 Pro+ | |
| HP EliteBoard G1a AI | |
| HP Pro Mini 400 G9-937U0EA | |
| Geekom A5 Pro | |
| Aoostar WTR Pro, N150 | |
| Geekbench 5.5 / Multi-Core | |
| Khadas Mind Pro | |
| Asus NUC 15 Pro+ | |
| Beelink GTI15 Ultra | |
| Asus ExpertCenter PN54-S70012NN | |
| HP EliteBoard G1a AI | |
| Gemiddeld AMD Ryzen AI 5 PRO 340 (n=1) | |
| HP Pro Mini 400 G9-937U0EA | |
| GMK NucBox K13 | |
| MSI Cubi NUC AI+ 2MG | |
| Geekom A5 Pro | |
| Aoostar WTR Pro, N150 | |
| Geekbench 5.5 / Single-Core | |
| Beelink GTI15 Ultra | |
| Khadas Mind Pro | |
| Asus ExpertCenter PN54-S70012NN | |
| MSI Cubi NUC AI+ 2MG | |
| GMK NucBox K13 | |
| HP EliteBoard G1a AI | |
| Gemiddeld AMD Ryzen AI 5 PRO 340 (n=1) | |
| HP Pro Mini 400 G9-937U0EA | |
| Asus NUC 15 Pro+ | |
| Geekom A5 Pro | |
| Aoostar WTR Pro, N150 | |
| HWBOT x265 Benchmark v2.2 / 4k Preset | |
| Asus NUC 15 Pro+ | |
| Khadas Mind Pro | |
| Beelink GTI15 Ultra | |
| Asus ExpertCenter PN54-S70012NN | |
| HP EliteBoard G1a AI | |
| Gemiddeld AMD Ryzen AI 5 PRO 340 (n=1) | |
| GMK NucBox K13 | |
| MSI Cubi NUC AI+ 2MG | |
| HP Pro Mini 400 G9-937U0EA | |
| Geekom A5 Pro | |
| Aoostar WTR Pro, N150 | |
| LibreOffice / 20 Documents To PDF | |
| Aoostar WTR Pro, N150 | |
| HP EliteBoard G1a AI | |
| Gemiddeld AMD Ryzen AI 5 PRO 340 (n=1) | |
| Geekom A5 Pro | |
| Asus NUC 15 Pro+ | |
| GMK NucBox K13 | |
| Asus ExpertCenter PN54-S70012NN | |
| HP Pro Mini 400 G9-937U0EA | |
| Khadas Mind Pro | |
| MSI Cubi NUC AI+ 2MG | |
| Beelink GTI15 Ultra | |
| R Benchmark 2.5 / Overall mean | |
| Aoostar WTR Pro, N150 | |
| Geekom A5 Pro | |
| MSI Cubi NUC AI+ 2MG | |
| HP EliteBoard G1a AI | |
| Gemiddeld AMD Ryzen AI 5 PRO 340 (n=1) | |
| GMK NucBox K13 | |
| HP Pro Mini 400 G9-937U0EA | |
| Asus NUC 15 Pro+ | |
| Beelink GTI15 Ultra | |
| Khadas Mind Pro | |
| Khadas Mind Pro | |
| Asus ExpertCenter PN54-S70012NN | |
* ... kleiner is beter
AIDA64: FP32 Ray-Trace | FPU Julia | CPU SHA3 | CPU Queen | FPU SinJulia | FPU Mandel | CPU AES | CPU ZLib | FP64 Ray-Trace | CPU PhotoWorxx | CPU CheckMate
| Performance rating | |
| Asus NUC 15 Pro+ -1! | |
| HP EliteBoard G1a AI -1! | |
| Gemiddeld AMD Ryzen AI 5 PRO 340 -1! | |
| GMK NucBox K13 -1! | |
| HP Pro Mini 400 G9-937U0EA -1! | |
| MSI Cubi NUC AI+ 2MG -1! | |
| Geekom A5 Pro | |
| AIDA64 / FP32 Ray-Trace | |
| Asus NUC 15 Pro+ (v6.92.6600) | |
| HP EliteBoard G1a AI (v8.20.8100) | |
| Gemiddeld AMD Ryzen AI 5 PRO 340 (n=1) | |
| GMK NucBox K13 (v8.20.8100) | |
| MSI Cubi NUC AI+ 2MG (v6.92.6600) | |
| HP Pro Mini 400 G9-937U0EA (v6.92.6600) | |
| Geekom A5 Pro (v8.20.8100) | |
| Geekom A5 Pro (v6.92.6600) | |
| AIDA64 / FPU Julia | |
| Asus NUC 15 Pro+ (v6.92.6600) | |
| HP EliteBoard G1a AI (v8.20.8100) | |
| Gemiddeld AMD Ryzen AI 5 PRO 340 (n=1) | |
| GMK NucBox K13 (v8.20.8100) | |
| MSI Cubi NUC AI+ 2MG (v6.92.6600) | |
| HP Pro Mini 400 G9-937U0EA (v6.92.6600) | |
| Geekom A5 Pro (v8.20.8100) | |
| Geekom A5 Pro (v6.92.6600) | |
| AIDA64 / CPU SHA3 | |
| Asus NUC 15 Pro+ (v6.92.6600) | |
| GMK NucBox K13 (v8.20.8100) | |
| MSI Cubi NUC AI+ 2MG (v6.92.6600) | |
| HP Pro Mini 400 G9-937U0EA (v6.92.6600) | |
| HP EliteBoard G1a AI (v8.20.8100) | |
| Gemiddeld AMD Ryzen AI 5 PRO 340 (n=1) | |
| Geekom A5 Pro (v6.92.6600) | |
| Geekom A5 Pro (v8.20.8100) | |
| AIDA64 / CPU Queen | |
| HP Pro Mini 400 G9-937U0EA (v6.92.6600) | |
| Asus NUC 15 Pro+ (v6.92.6600) | |
| Geekom A5 Pro (v6.92.6600) | |
| MSI Cubi NUC AI+ 2MG (v6.92.6600) | |
| AIDA64 / FPU SinJulia | |
| HP EliteBoard G1a AI (v8.20.8100) | |
| Gemiddeld AMD Ryzen AI 5 PRO 340 (n=1) | |
| Asus NUC 15 Pro+ (v6.92.6600) | |
| Geekom A5 Pro (v6.92.6600) | |
| Geekom A5 Pro (v8.20.8100) | |
| HP Pro Mini 400 G9-937U0EA (v6.92.6600) | |
| GMK NucBox K13 (v8.20.8100) | |
| MSI Cubi NUC AI+ 2MG (v6.92.6600) | |
| AIDA64 / FPU Mandel | |
| Asus NUC 15 Pro+ (v6.92.6600) | |
| HP EliteBoard G1a AI (v8.20.8100) | |
| Gemiddeld AMD Ryzen AI 5 PRO 340 (n=1) | |
| GMK NucBox K13 (v8.20.8100) | |
| MSI Cubi NUC AI+ 2MG (v6.92.6600) | |
| Geekom A5 Pro (v6.92.6600) | |
| Geekom A5 Pro (v8.20.8100) | |
| HP Pro Mini 400 G9-937U0EA (v6.92.6600) | |
| AIDA64 / CPU AES | |
| Asus NUC 15 Pro+ (v6.92.6600) | |
| GMK NucBox K13 (v8.20.8100) | |
| HP Pro Mini 400 G9-937U0EA (v6.92.6600) | |
| HP EliteBoard G1a AI (v8.20.8100) | |
| Gemiddeld AMD Ryzen AI 5 PRO 340 (n=1) | |
| MSI Cubi NUC AI+ 2MG (v6.92.6600) | |
| Geekom A5 Pro (v6.92.6600) | |
| Geekom A5 Pro (v8.20.8100) | |
| AIDA64 / CPU ZLib | |
| Asus NUC 15 Pro+ (v6.92.6600) | |
| HP Pro Mini 400 G9-937U0EA (v6.92.6600) | |
| HP EliteBoard G1a AI (v8.20.8100) | |
| Gemiddeld AMD Ryzen AI 5 PRO 340 (n=1) | |
| GMK NucBox K13 (v8.20.8100) | |
| MSI Cubi NUC AI+ 2MG (v6.92.6600) | |
| Geekom A5 Pro (v6.92.6600) | |
| Geekom A5 Pro (v8.20.8100) | |
| AIDA64 / FP64 Ray-Trace | |
| Asus NUC 15 Pro+ (v6.92.6600) | |
| HP EliteBoard G1a AI (v8.20.8100) | |
| Gemiddeld AMD Ryzen AI 5 PRO 340 (n=1) | |
| GMK NucBox K13 (v8.20.8100) | |
| MSI Cubi NUC AI+ 2MG (v6.92.6600) | |
| HP Pro Mini 400 G9-937U0EA (v6.92.6600) | |
| Geekom A5 Pro (v8.20.8100) | |
| Geekom A5 Pro (v6.92.6600) | |
| AIDA64 / CPU PhotoWorxx | |
| GMK NucBox K13 (v8.20.8100) | |
| Asus NUC 15 Pro+ (v6.92.6600) | |
| MSI Cubi NUC AI+ 2MG (v6.92.6600) | |
| HP EliteBoard G1a AI (v8.20.8100) | |
| Gemiddeld AMD Ryzen AI 5 PRO 340 (n=1) | |
| HP Pro Mini 400 G9-937U0EA (v6.92.6600) | |
| Geekom A5 Pro (v6.92.6600) | |
| Geekom A5 Pro (v8.20.8100) | |
| AIDA64 / CPU CheckMate | |
| HP EliteBoard G1a AI (v8.20.8100) | |
| Gemiddeld AMD Ryzen AI 5 PRO 340 (n=1) | |
| GMK NucBox K13 (v8.20.8100) | |
| Geekom A5 Pro (v8.20.8100) | |
Systeemprestaties
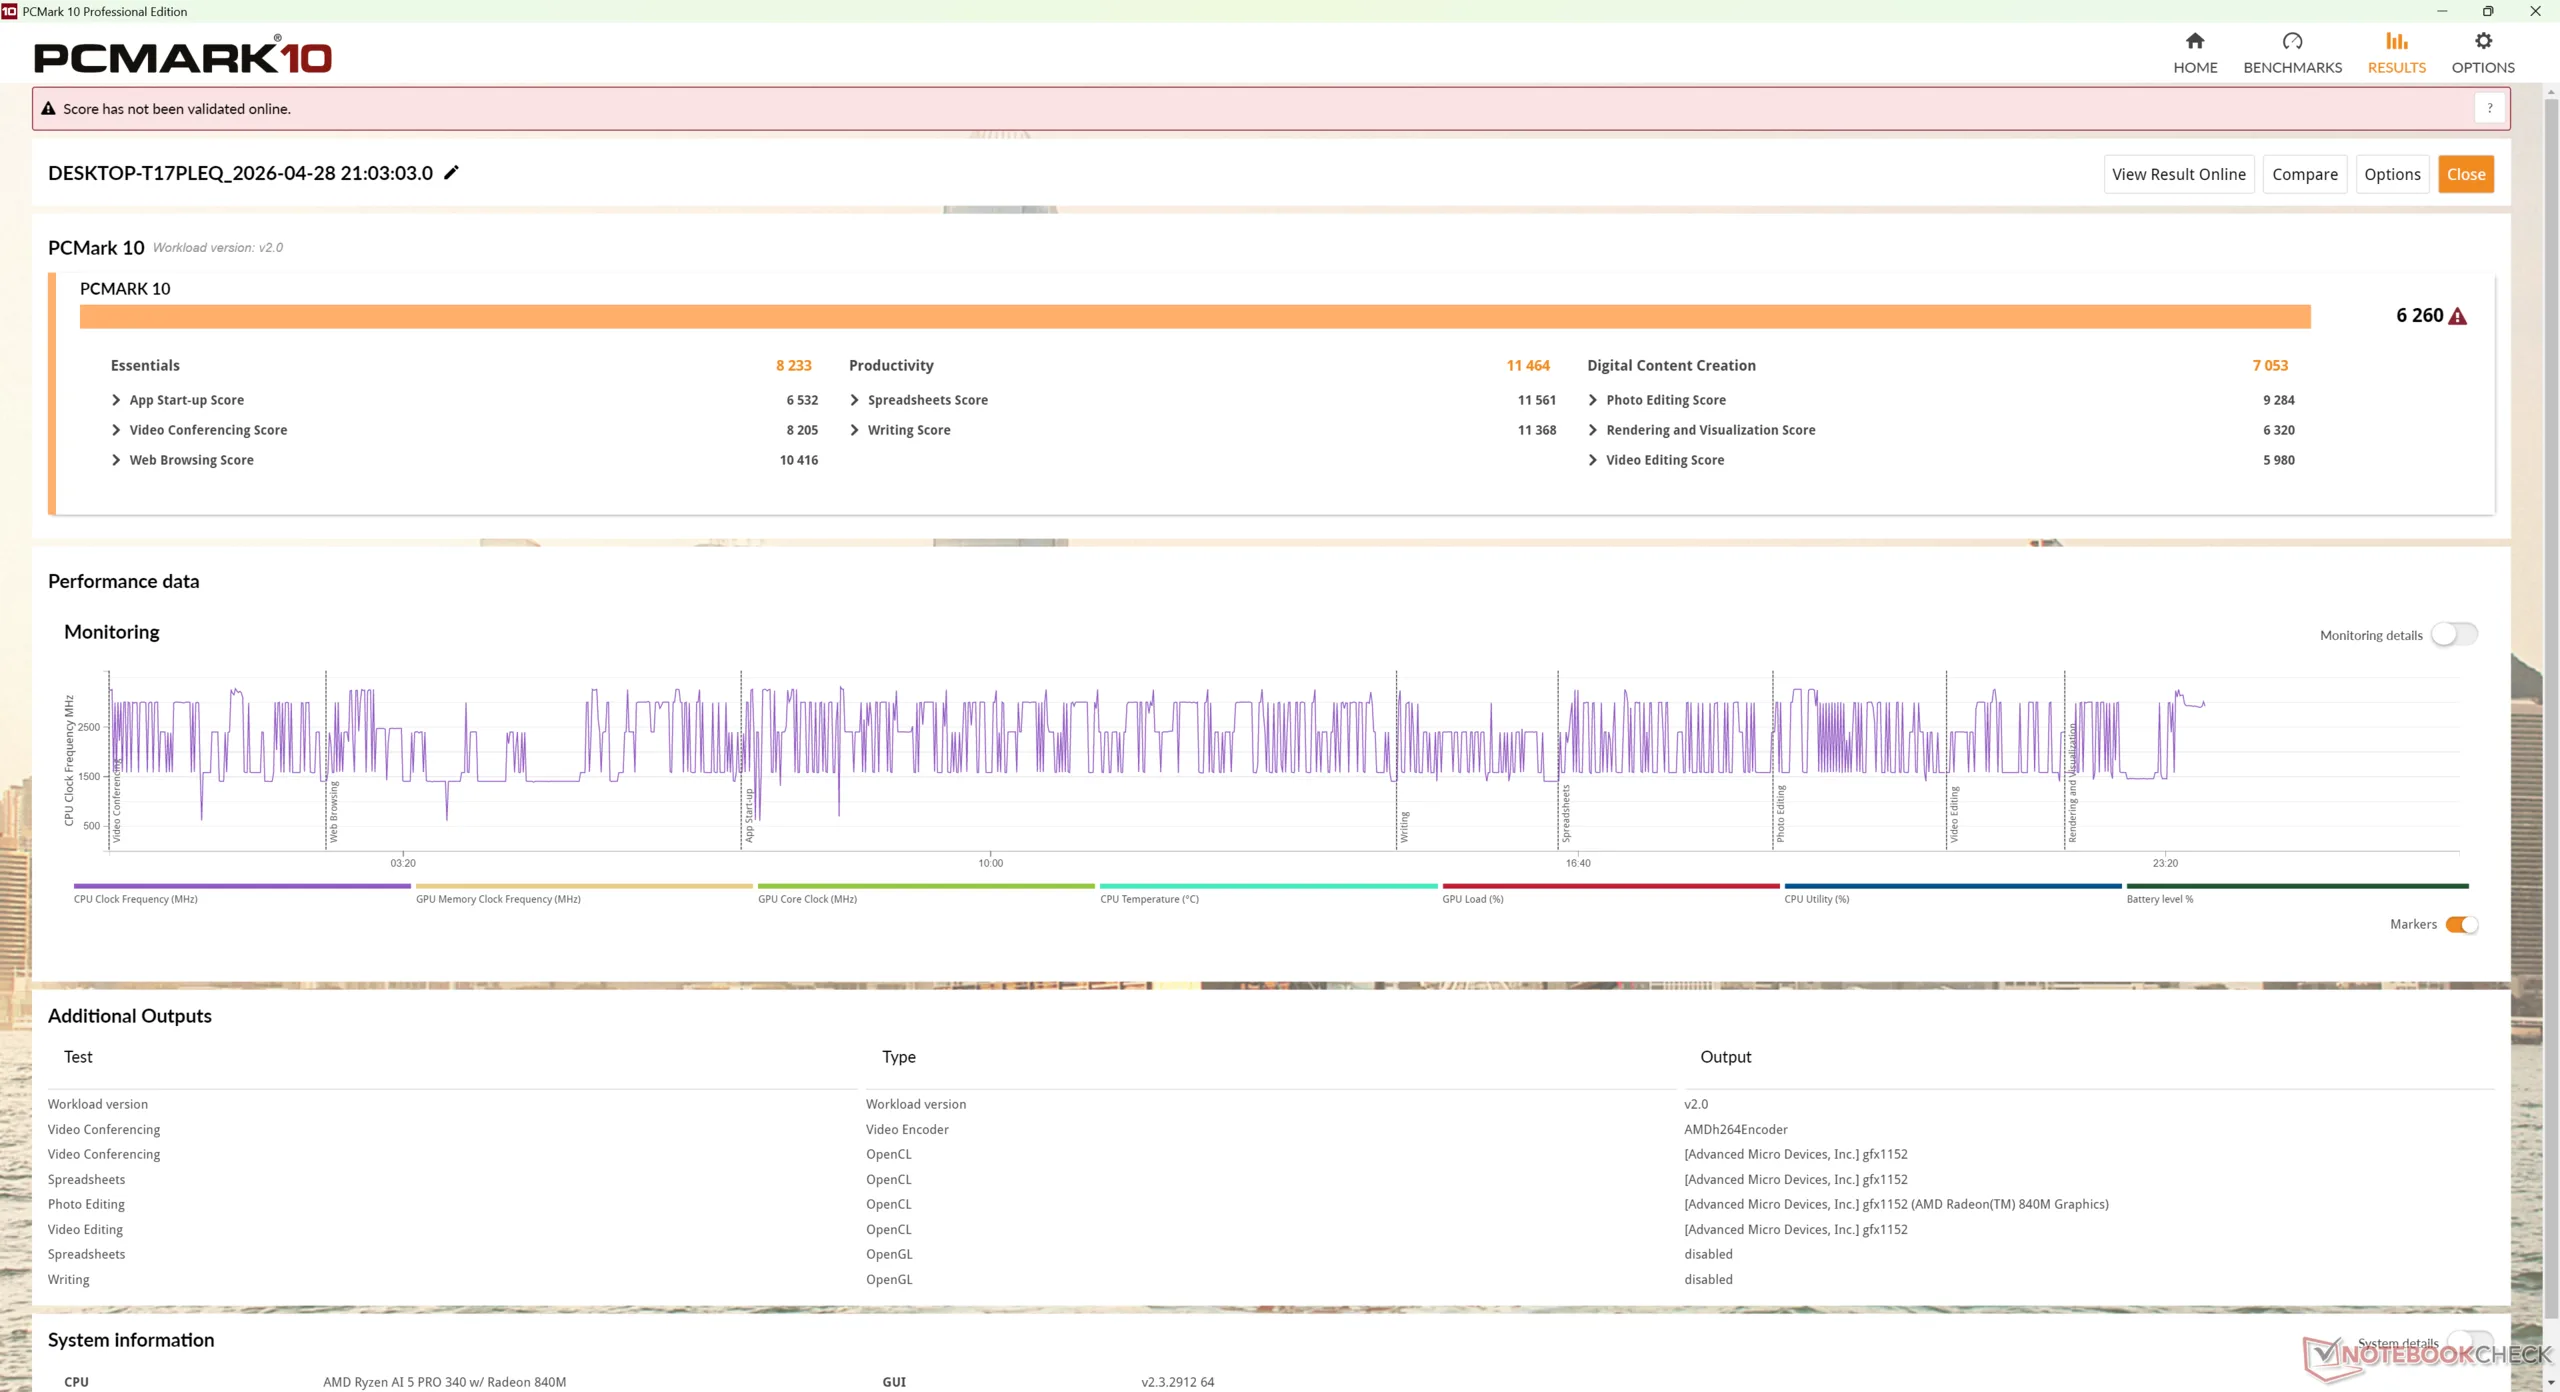
PCMark 10: Score | Essentials | Productivity | Digital Content Creation
CrossMark: Overall | Productivity | Creativity | Responsiveness
WebXPRT 3: Overall
WebXPRT 4: Overall
Mozilla Kraken 1.1: Total
Geekbench AI: Quantized GPU 1.7 | Half Precision GPU 1.7 | Single Precision GPU 1.7
| Performance rating | |
| MSI Cubi NUC AI+ 2MG | |
| GMK NucBox K13 | |
| Asus NUC 15 Pro+ | |
| HP EliteBoard G1a AI | |
| Gemiddeld AMD Ryzen AI 5 PRO 340, AMD Radeon 840M | |
| HP Pro Mini 400 G9-937U0EA -3! | |
| Geekom A5 Pro | |
| PCMark 10 / Score | |
| GMK NucBox K13 | |
| Asus NUC 15 Pro+ | |
| MSI Cubi NUC AI+ 2MG | |
| HP EliteBoard G1a AI | |
| Gemiddeld AMD Ryzen AI 5 PRO 340, AMD Radeon 840M (n=1) | |
| Geekom A5 Pro | |
| HP Pro Mini 400 G9-937U0EA | |
| PCMark 10 / Essentials | |
| MSI Cubi NUC AI+ 2MG | |
| GMK NucBox K13 | |
| Asus NUC 15 Pro+ | |
| HP Pro Mini 400 G9-937U0EA | |
| Geekom A5 Pro | |
| HP EliteBoard G1a AI | |
| Gemiddeld AMD Ryzen AI 5 PRO 340, AMD Radeon 840M (n=1) | |
| PCMark 10 / Productivity | |
| Geekom A5 Pro | |
| GMK NucBox K13 | |
| HP EliteBoard G1a AI | |
| Gemiddeld AMD Ryzen AI 5 PRO 340, AMD Radeon 840M (n=1) | |
| MSI Cubi NUC AI+ 2MG | |
| Asus NUC 15 Pro+ | |
| HP Pro Mini 400 G9-937U0EA | |
| PCMark 10 / Digital Content Creation | |
| Asus NUC 15 Pro+ | |
| GMK NucBox K13 | |
| MSI Cubi NUC AI+ 2MG | |
| HP EliteBoard G1a AI | |
| Gemiddeld AMD Ryzen AI 5 PRO 340, AMD Radeon 840M (n=1) | |
| HP Pro Mini 400 G9-937U0EA | |
| Geekom A5 Pro | |
| CrossMark / Overall | |
| Asus NUC 15 Pro+ | |
| GMK NucBox K13 | |
| HP EliteBoard G1a AI | |
| Gemiddeld AMD Ryzen AI 5 PRO 340, AMD Radeon 840M (n=1) | |
| MSI Cubi NUC AI+ 2MG | |
| HP Pro Mini 400 G9-937U0EA | |
| Geekom A5 Pro | |
| CrossMark / Productivity | |
| GMK NucBox K13 | |
| Asus NUC 15 Pro+ | |
| HP EliteBoard G1a AI | |
| Gemiddeld AMD Ryzen AI 5 PRO 340, AMD Radeon 840M (n=1) | |
| MSI Cubi NUC AI+ 2MG | |
| HP Pro Mini 400 G9-937U0EA | |
| Geekom A5 Pro | |
| CrossMark / Creativity | |
| Asus NUC 15 Pro+ | |
| HP EliteBoard G1a AI | |
| Gemiddeld AMD Ryzen AI 5 PRO 340, AMD Radeon 840M (n=1) | |
| GMK NucBox K13 | |
| MSI Cubi NUC AI+ 2MG | |
| HP Pro Mini 400 G9-937U0EA | |
| Geekom A5 Pro | |
| CrossMark / Responsiveness | |
| GMK NucBox K13 | |
| Asus NUC 15 Pro+ | |
| HP EliteBoard G1a AI | |
| Gemiddeld AMD Ryzen AI 5 PRO 340, AMD Radeon 840M (n=1) | |
| MSI Cubi NUC AI+ 2MG | |
| HP Pro Mini 400 G9-937U0EA | |
| Geekom A5 Pro | |
| WebXPRT 3 / Overall | |
| HP EliteBoard G1a AI | |
| Gemiddeld AMD Ryzen AI 5 PRO 340, AMD Radeon 840M (n=1) | |
| MSI Cubi NUC AI+ 2MG | |
| GMK NucBox K13 | |
| HP Pro Mini 400 G9-937U0EA | |
| Geekom A5 Pro | |
| Asus NUC 15 Pro+ | |
| WebXPRT 4 / Overall | |
| GMK NucBox K13 | |
| MSI Cubi NUC AI+ 2MG | |
| HP EliteBoard G1a AI | |
| Gemiddeld AMD Ryzen AI 5 PRO 340, AMD Radeon 840M (n=1) | |
| HP Pro Mini 400 G9-937U0EA | |
| Asus NUC 15 Pro+ | |
| Geekom A5 Pro | |
| Mozilla Kraken 1.1 / Total | |
| Geekom A5 Pro | |
| HP Pro Mini 400 G9-937U0EA | |
| MSI Cubi NUC AI+ 2MG | |
| HP EliteBoard G1a AI | |
| Gemiddeld AMD Ryzen AI 5 PRO 340, AMD Radeon 840M (n=1) | |
| Asus NUC 15 Pro+ | |
| GMK NucBox K13 | |
| Geekbench AI / Quantized GPU 1.7 | |
| MSI Cubi NUC AI+ 2MG | |
| Asus NUC 15 Pro+ | |
| GMK NucBox K13 | |
| HP EliteBoard G1a AI | |
| Gemiddeld AMD Ryzen AI 5 PRO 340, AMD Radeon 840M (n=1) | |
| Geekom A5 Pro | |
| Geekbench AI / Half Precision GPU 1.7 | |
| MSI Cubi NUC AI+ 2MG | |
| Asus NUC 15 Pro+ | |
| GMK NucBox K13 | |
| HP EliteBoard G1a AI | |
| Gemiddeld AMD Ryzen AI 5 PRO 340, AMD Radeon 840M (n=1) | |
| Geekom A5 Pro | |
| Geekbench AI / Single Precision GPU 1.7 | |
| MSI Cubi NUC AI+ 2MG | |
| Asus NUC 15 Pro+ | |
| GMK NucBox K13 | |
| HP EliteBoard G1a AI | |
| Gemiddeld AMD Ryzen AI 5 PRO 340, AMD Radeon 840M (n=1) | |
| Geekom A5 Pro | |
* ... kleiner is beter
| PCMark 10 Score | 6260 punten | |
Help | ||
| AIDA64 / Memory Copy | |
| MSI Cubi NUC AI+ 2MG | |
| GMK NucBox K13 | |
| Asus NUC 15 Pro+ | |
| HP EliteBoard G1a AI | |
| Gemiddeld AMD Ryzen AI 5 PRO 340 (n=1) | |
| Geekom A5 Pro | |
| Geekom A5 Pro | |
| HP Pro Mini 400 G9-937U0EA | |
| AIDA64 / Memory Read | |
| GMK NucBox K13 | |
| Asus NUC 15 Pro+ | |
| MSI Cubi NUC AI+ 2MG | |
| HP EliteBoard G1a AI | |
| Gemiddeld AMD Ryzen AI 5 PRO 340 (n=1) | |
| Geekom A5 Pro | |
| Geekom A5 Pro | |
| HP Pro Mini 400 G9-937U0EA | |
| AIDA64 / Memory Write | |
| MSI Cubi NUC AI+ 2MG | |
| GMK NucBox K13 | |
| HP EliteBoard G1a AI | |
| Gemiddeld AMD Ryzen AI 5 PRO 340 (n=1) | |
| Asus NUC 15 Pro+ | |
| Geekom A5 Pro | |
| Geekom A5 Pro | |
| HP Pro Mini 400 G9-937U0EA | |
| AIDA64 / Memory Latency | |
| HP EliteBoard G1a AI | |
| Gemiddeld AMD Ryzen AI 5 PRO 340 (n=1) | |
| Asus NUC 15 Pro+ | |
| GMK NucBox K13 | |
| Geekom A5 Pro | |
| Geekom A5 Pro | |
| MSI Cubi NUC AI+ 2MG | |
| HP Pro Mini 400 G9-937U0EA | |
* ... kleiner is beter
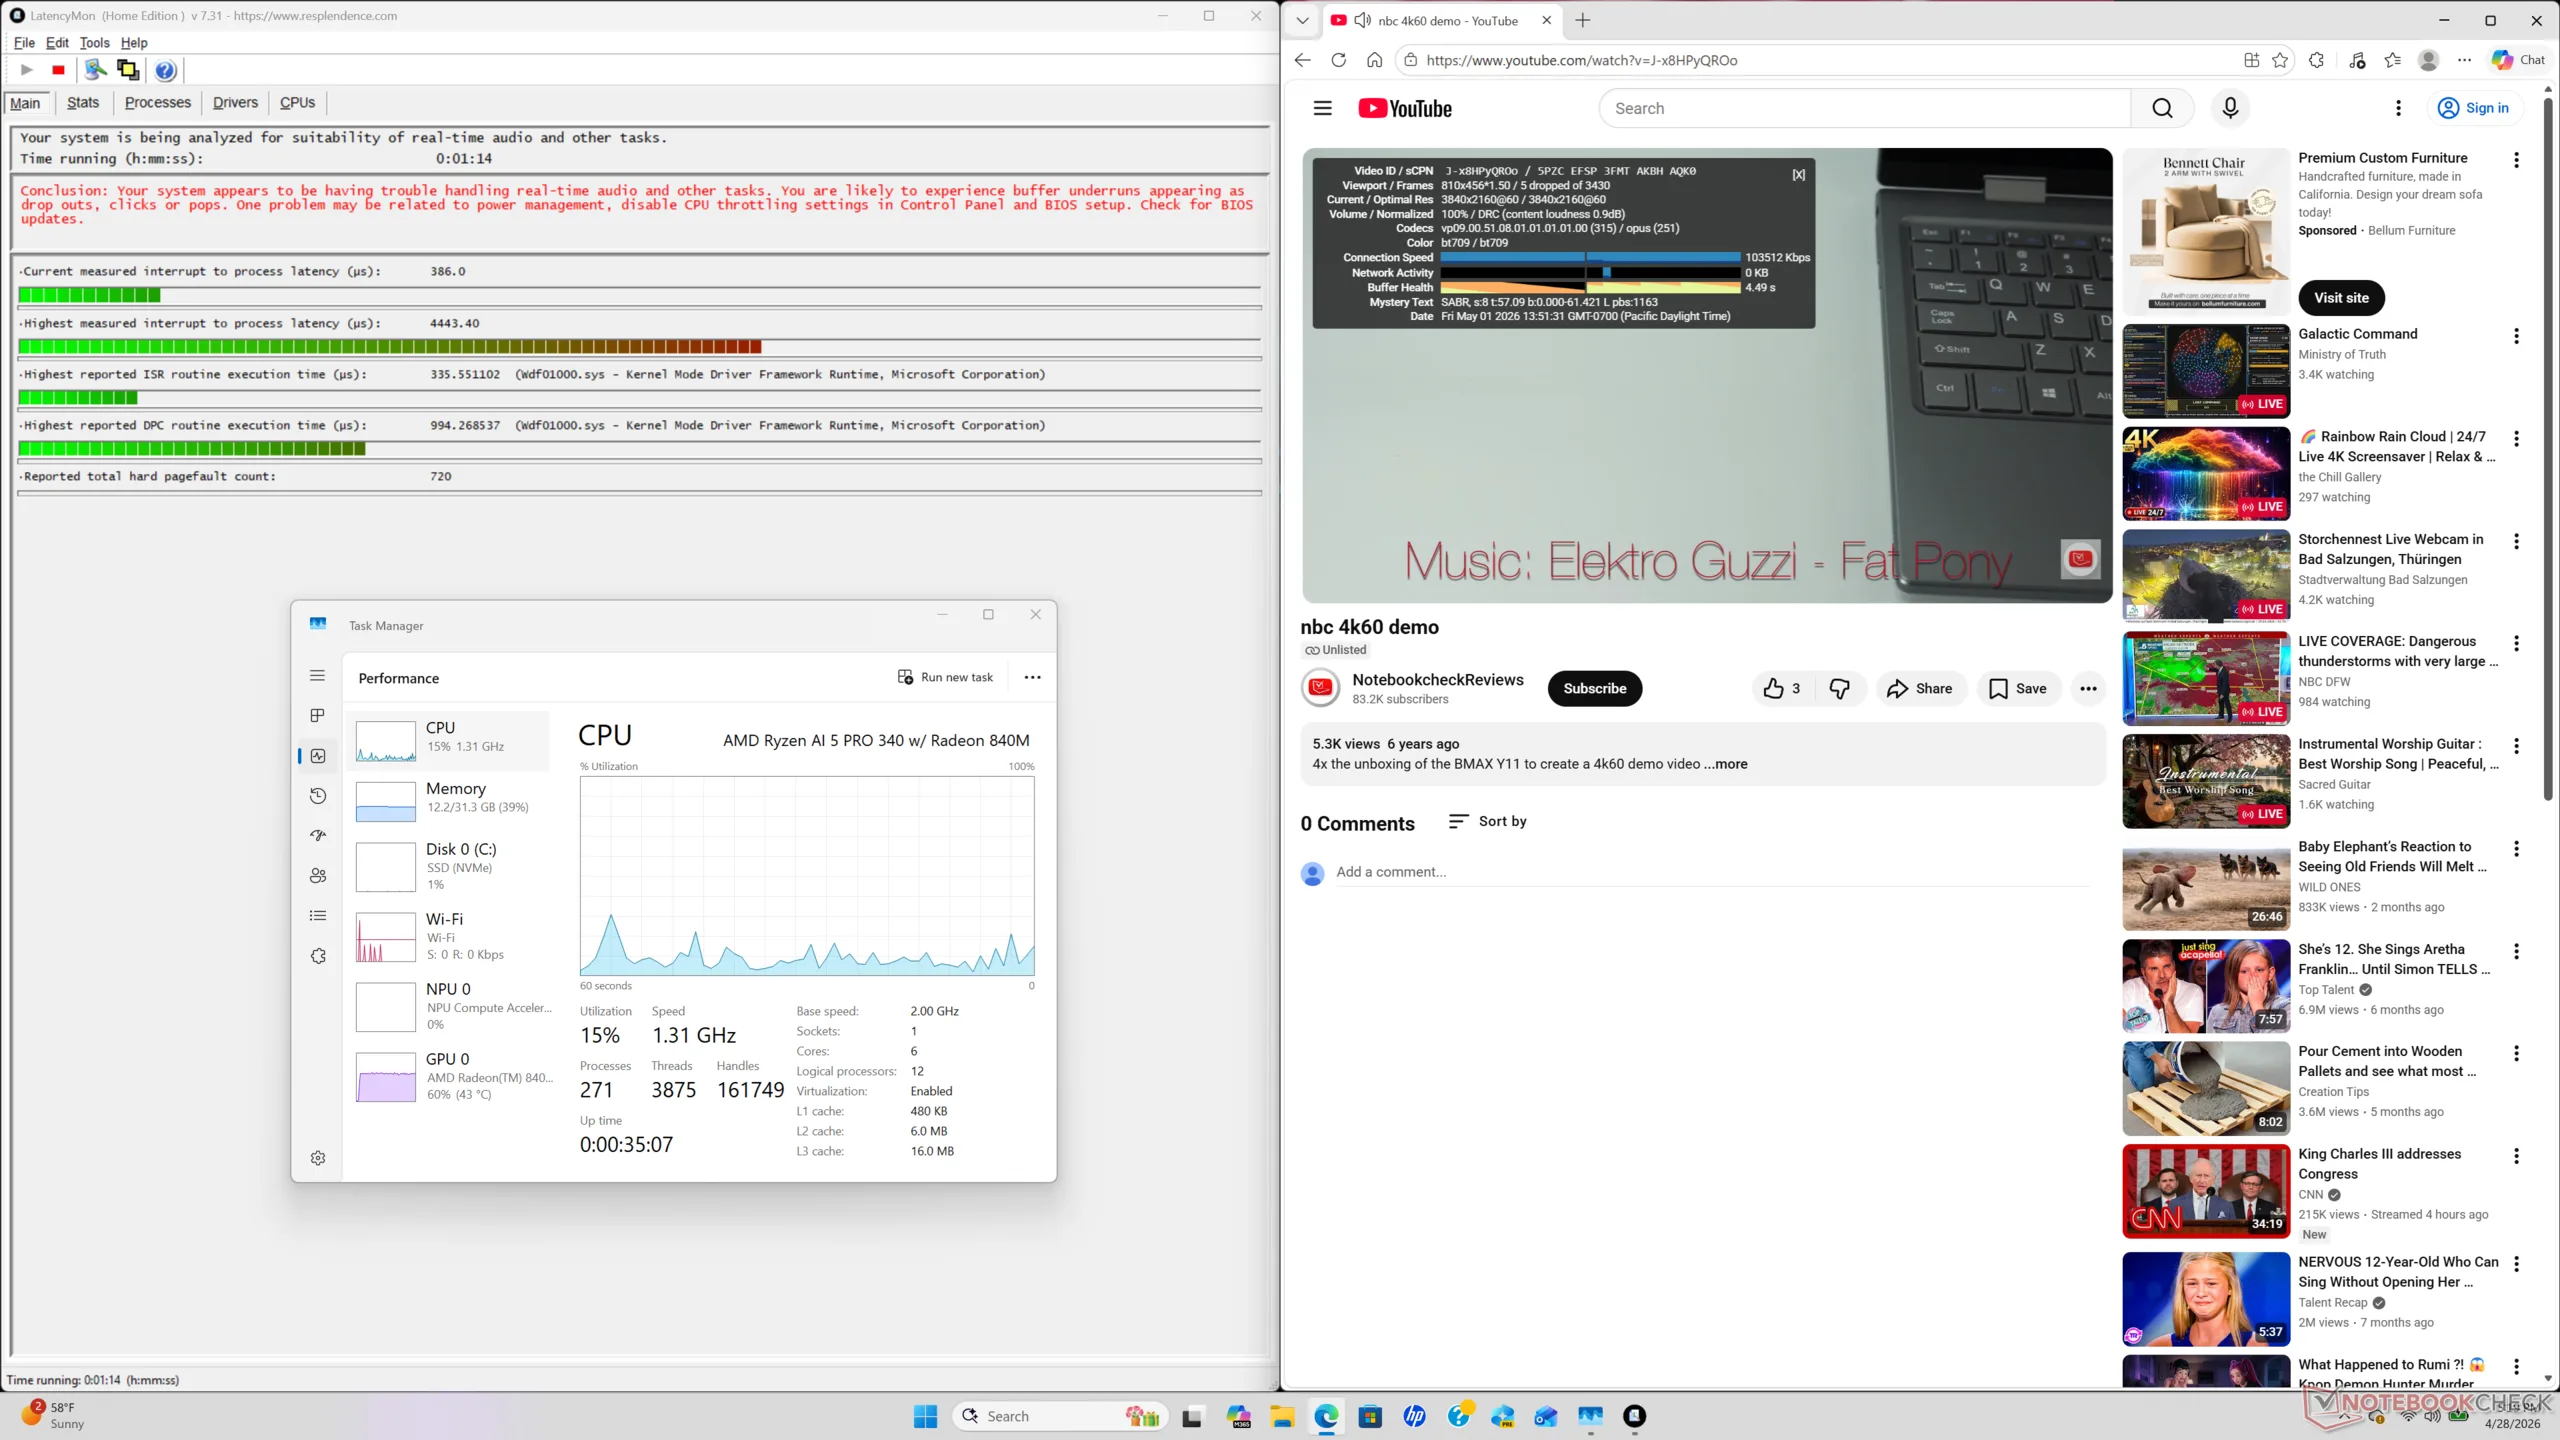
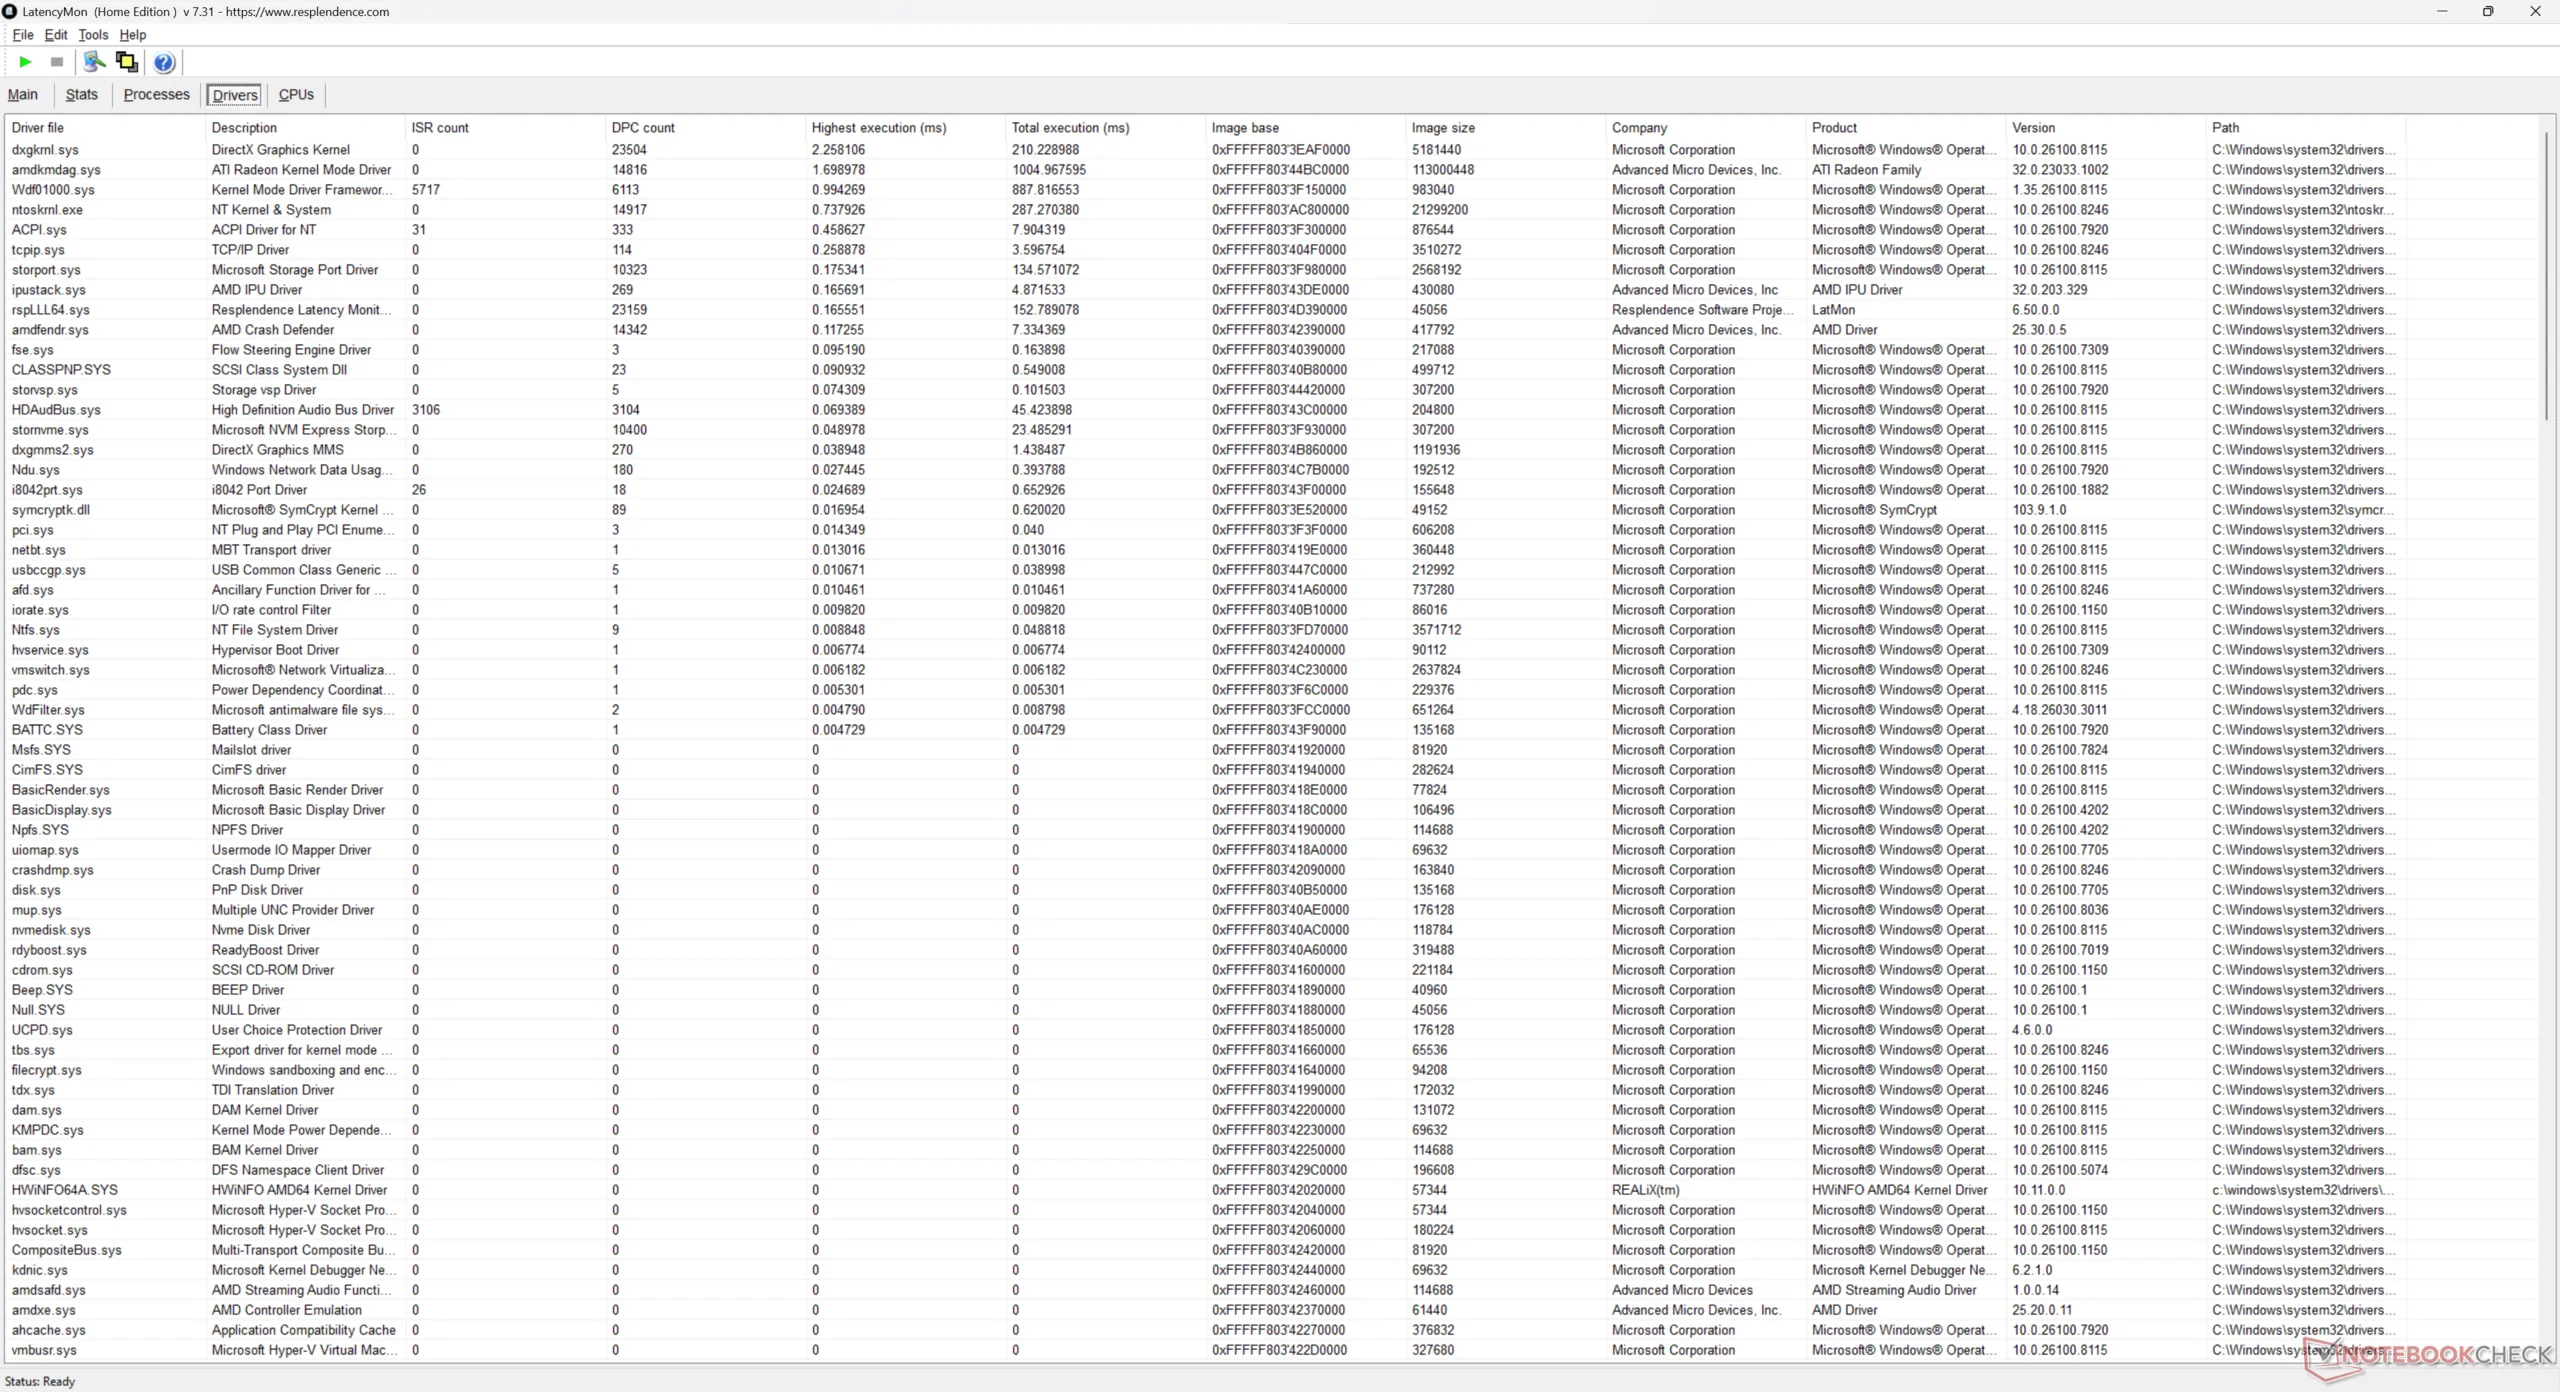
DPC latentie
LatencyMon onthult DPC-problemen en een klein handvol dropped frames bij het afspelen van 4K60 video-inhoud. De resultaten veranderden niet, zelfs niet na herhaalde tests met de nieuwste grafische stuurprogramma's en versie van Edge op het moment van publicatie. Hoewel de paar dropped frames bij het streamen van video's bijna onmerkbaar zijn, is het ideaal om er helemaal geen te hebben.
| DPC Latencies / LatencyMon - interrupt to process latency (max), Web, Youtube, Prime95 | |
| HP EliteBoard G1a AI | |
| GMK NucBox K13 | |
| Geekom A5 Pro | |
| HP Pro Mini 400 G9-937U0EA | |
| Asus NUC 15 Pro+ | |
| MSI Cubi NUC AI+ 2MG | |
* ... kleiner is beter
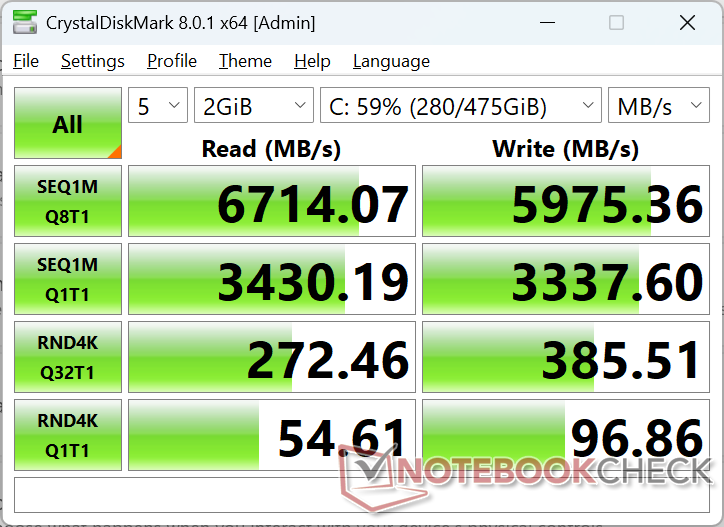
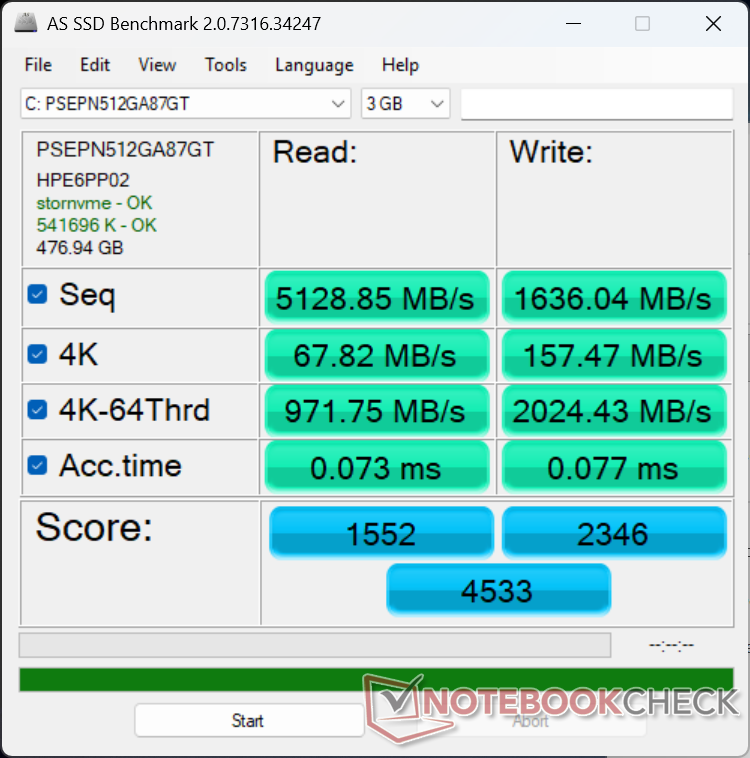
Opslagapparaten
Onze configuratie bevat een 512 GB Phison PSEPN512GA87GT PCIe4 x4 NVMe 2280 SSD, die consistente overdrachtsnelheden tot ~7000 MB/s biedt zonder te haperen, zelfs onder zware belasting. Dergelijke snelheden zijn waarschijnlijk overkill voor het type werkbelasting waarvoor het EliteBoard ontworpen is, maar de snelle prestaties zijn desondanks welkom.

| Drive Performance rating - Percent | |
| HP EliteBoard G1a AI | |
| Asus NUC 15 Pro+ | |
| Geekom A5 Pro | |
| MSI Cubi NUC AI+ 2MG | |
| GMK NucBox K13 | |
| HP Pro Mini 400 G9-937U0EA | |
* ... kleiner is beter
Schijf onderdrukken: DiskSpd Leeslus, wachtrijdiepte 8
GPU-prestaties
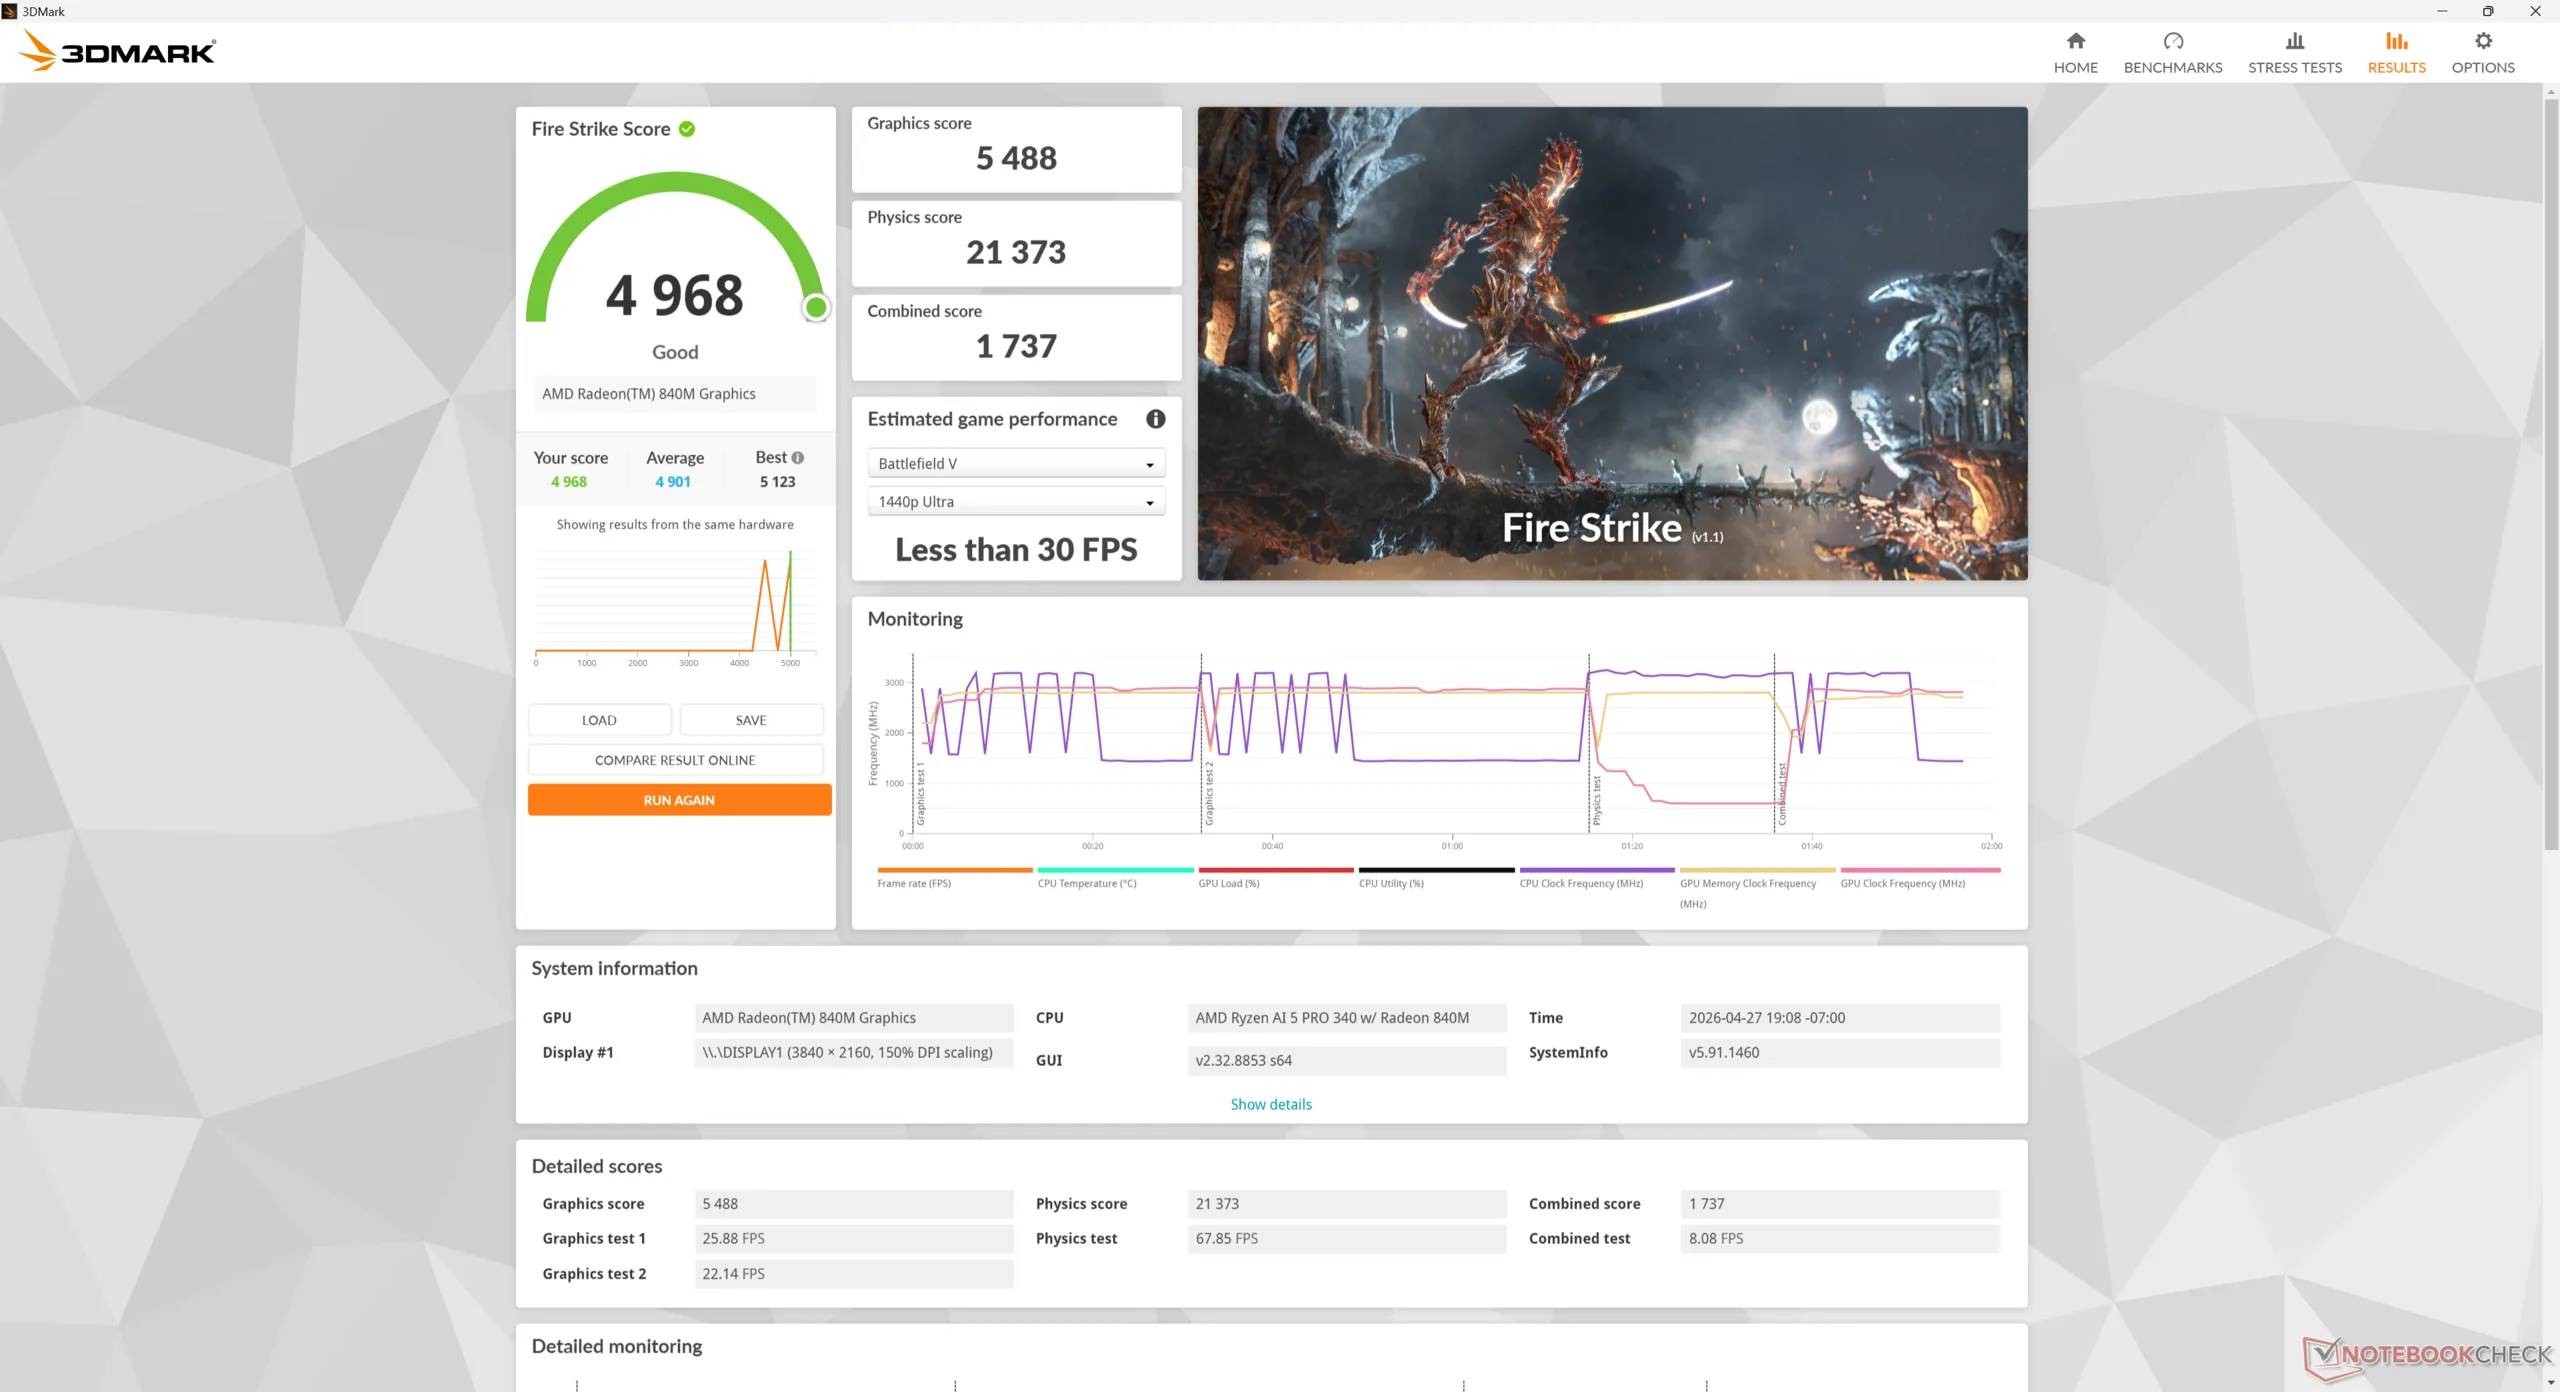
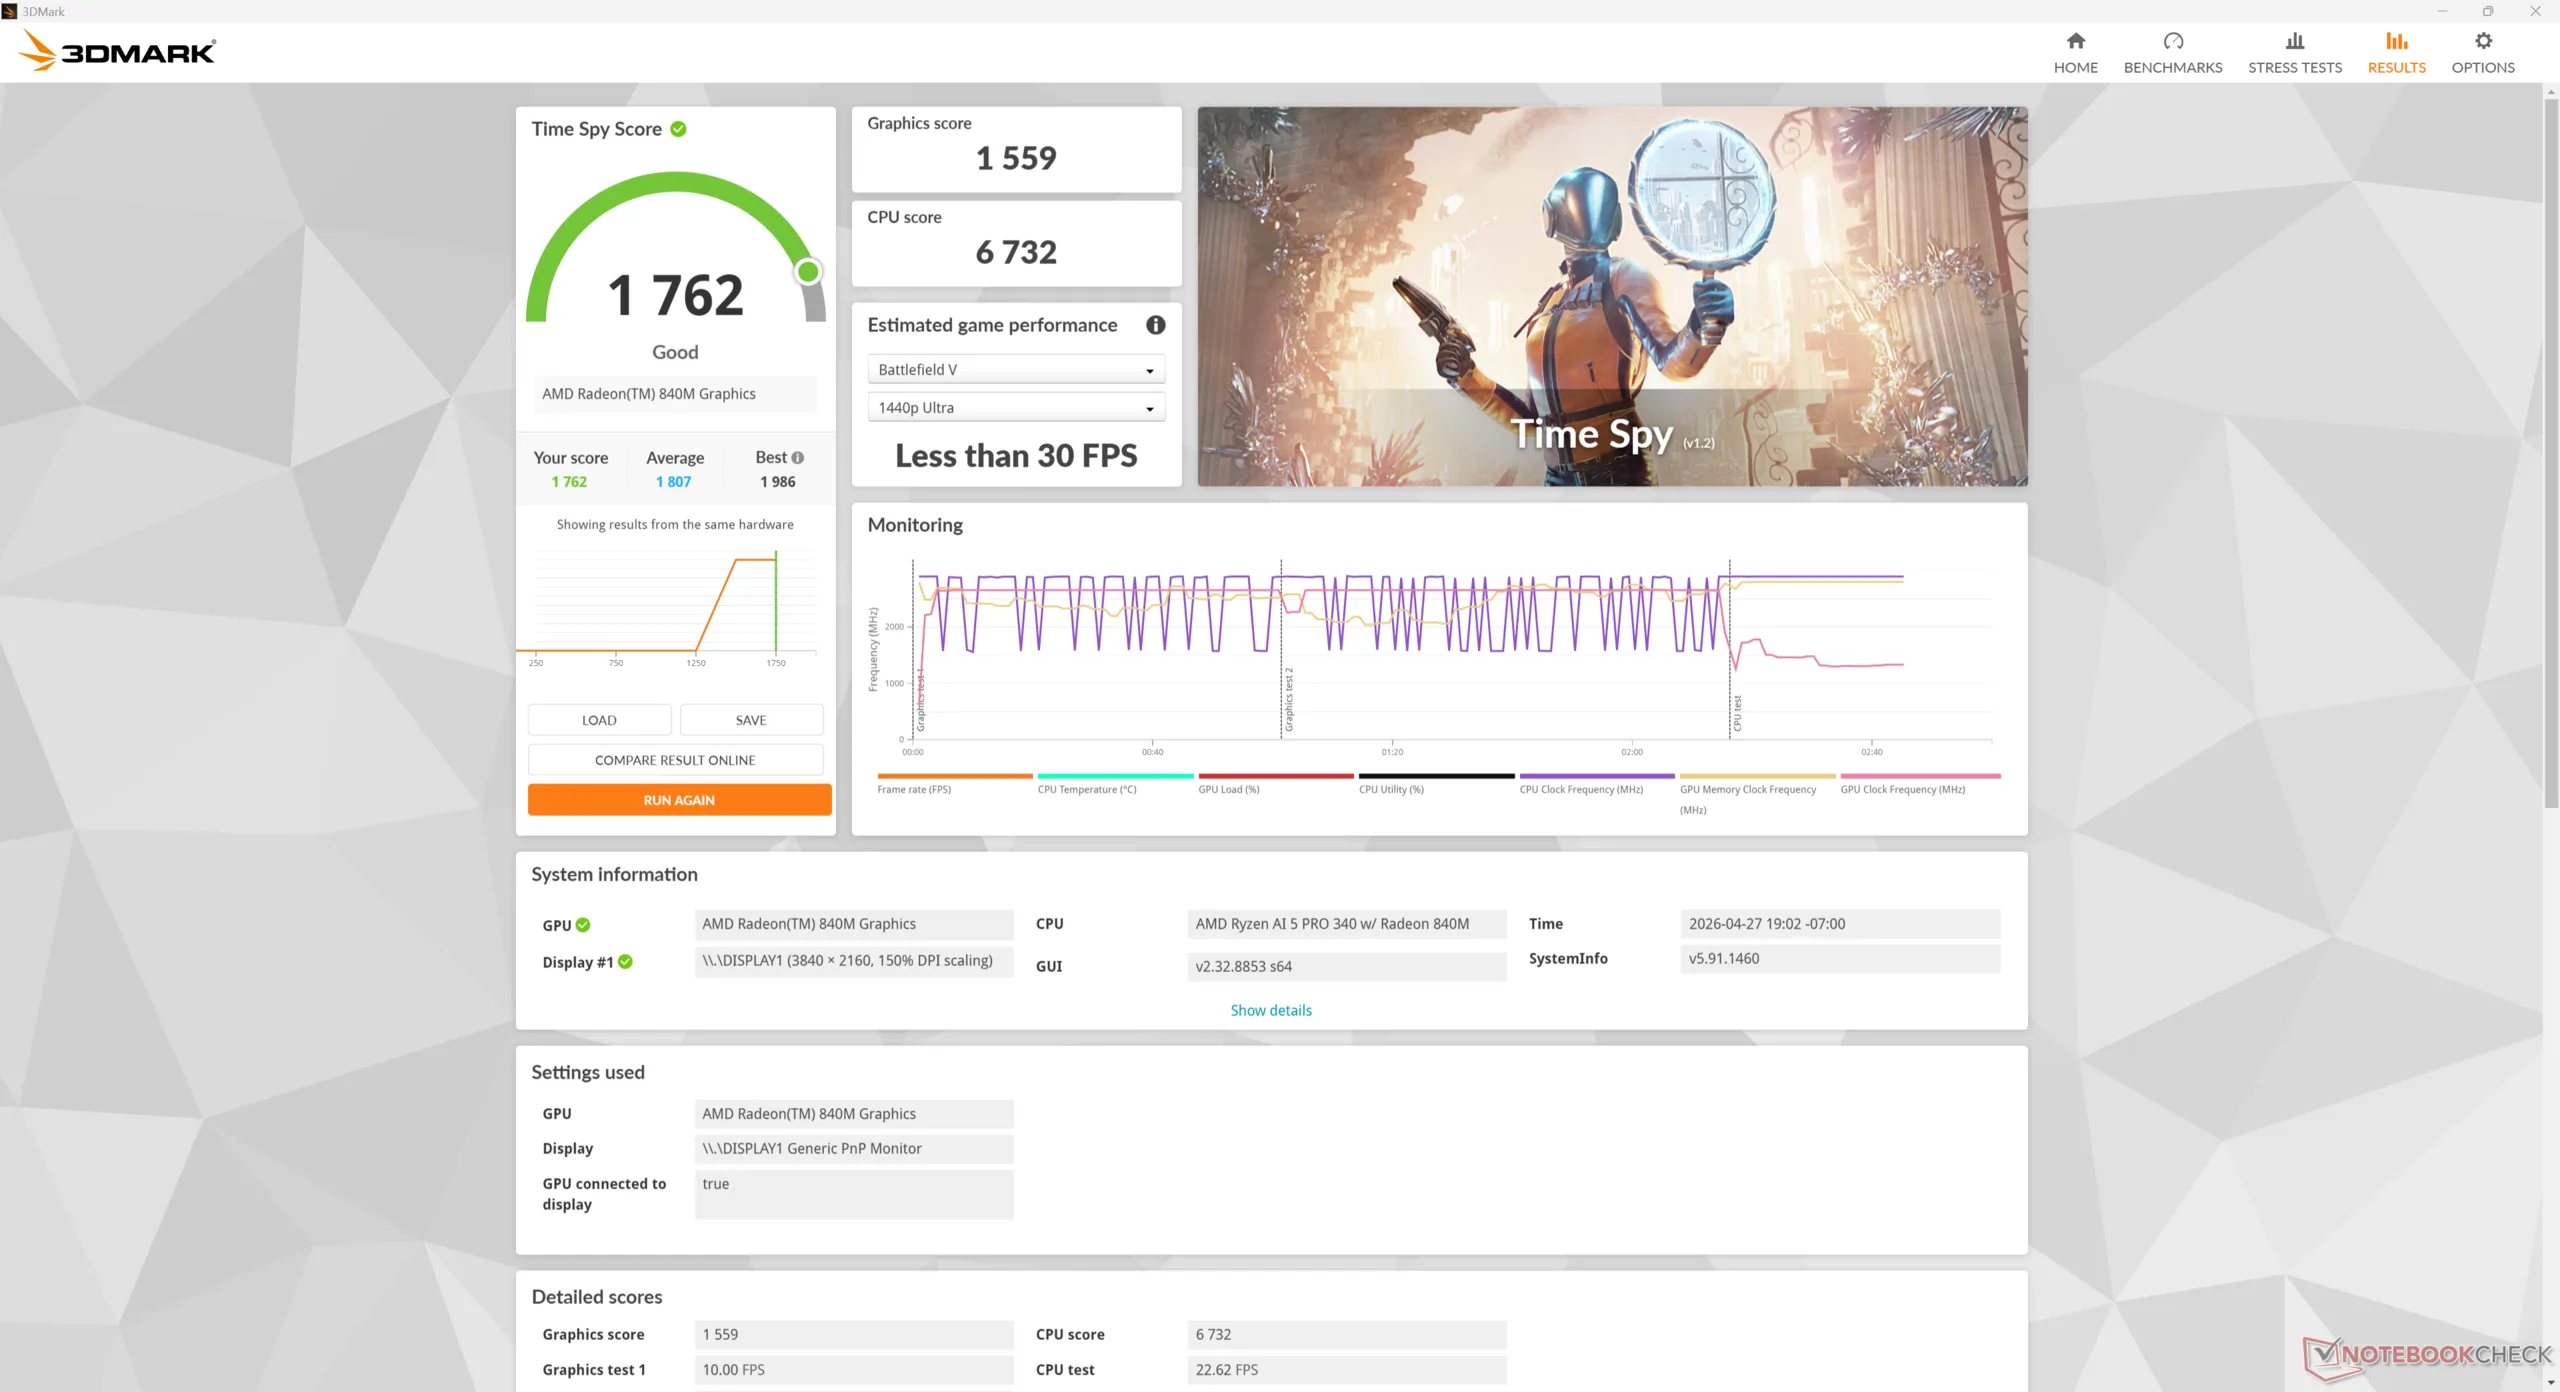
De geïntegreerde Radeon 840M is nek-aan-nek met de verouderende Iris Xe 96EUs die een paar jaar geleden nog populair was op subnotebooks. Terwijl upgraden naar de Ryzen AI 7 PRO 350 Radeon 860M SKU ook de grafische prestaties met wel 70 procent zou verbeteren, zouden de algehele prestaties nog steeds ongeschikt zijn voor de meeste GPU-intensieve taken. HP biedt helaas niet de voor gaming geschikte Radeon 880M of 890M.
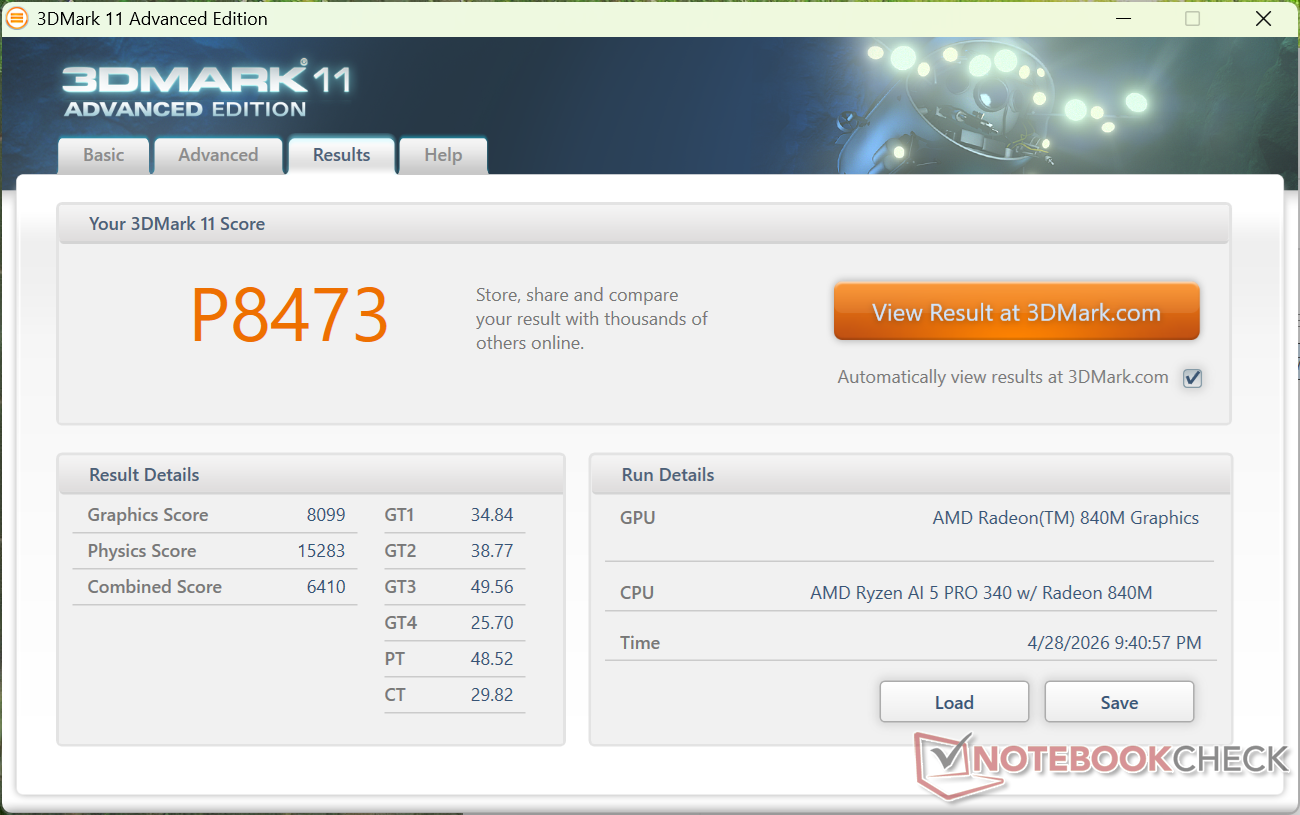
| 3DMark 11 Performance | 8473 punten | |
| 3DMark Cloud Gate Standard Score | 25064 punten | |
| 3DMark Fire Strike Score | 4968 punten | |
| 3DMark Time Spy Score | 1762 punten | |
Help | ||
* ... kleiner is beter
| Performance rating - Percent | |
| Asus NUC 15 Pro+ | |
| MSI Cubi NUC AI+ 2MG | |
| GMK NucBox K13 | |
| HP EliteBoard G1a AI | |
| Geekom A5 Pro -2! | |
| HP Pro Mini 400 G9-937U0EA -3! | |
| Cyberpunk 2077 - 1920x1080 Ultra Preset (FSR off) | |
| Asus NUC 15 Pro+ | |
| GMK NucBox K13 | |
| MSI Cubi NUC AI+ 2MG | |
| HP EliteBoard G1a AI | |
| Geekom A5 Pro | |
| HP Pro Mini 400 G9-937U0EA | |
| Baldur's Gate 3 - 1920x1080 Ultra Preset AA:T | |
| MSI Cubi NUC AI+ 2MG | |
| Asus NUC 15 Pro+ | |
| GMK NucBox K13 | |
| HP EliteBoard G1a AI | |
| GTA V - 1920x1080 Highest AA:4xMSAA + FX AF:16x | |
| MSI Cubi NUC AI+ 2MG | |
| GMK NucBox K13 | |
| HP EliteBoard G1a AI | |
| Asus NUC 15 Pro+ | |
| Geekom A5 Pro | |
| Final Fantasy XV Benchmark - 1920x1080 High Quality | |
| Asus NUC 15 Pro+ | |
| MSI Cubi NUC AI+ 2MG | |
| GMK NucBox K13 | |
| HP EliteBoard G1a AI | |
| Geekom A5 Pro | |
| HP Pro Mini 400 G9-937U0EA | |
| Strange Brigade - 1920x1080 ultra AA:ultra AF:16 | |
| MSI Cubi NUC AI+ 2MG | |
| Asus NUC 15 Pro+ | |
| GMK NucBox K13 | |
| HP EliteBoard G1a AI | |
| Dota 2 Reborn - 1920x1080 ultra (3/3) best looking | |
| Asus NUC 15 Pro+ | |
| GMK NucBox K13 | |
| HP EliteBoard G1a AI | |
| MSI Cubi NUC AI+ 2MG | |
| Geekom A5 Pro | |
| HP Pro Mini 400 G9-937U0EA | |
| X-Plane 11.11 - 1920x1080 high (fps_test=3) | |
| Asus NUC 15 Pro+ | |
| HP EliteBoard G1a AI | |
| MSI Cubi NUC AI+ 2MG | |
| Geekom A5 Pro | |
| GMK NucBox K13 | |
| HP Pro Mini 400 G9-937U0EA | |
Cyberpunk 2077 ultra FPS Grafiek
| lage | gem. | hoge | ultra | |
|---|---|---|---|---|
| GTA V (2015) | 164.1 | 115.1 | 52.4 | 22.7 |
| Dota 2 Reborn (2015) | 160.6 | 127.2 | 80.1 | 67.7 |
| Final Fantasy XV Benchmark (2018) | 57.3 | 27 | 20.4 | |
| X-Plane 11.11 (2018) | 63.1 | 46.7 | 39.1 | |
| Strange Brigade (2018) | 128.8 | 48.1 | 40.1 | 34.5 |
| Baldur's Gate 3 (2023) | 22.7 | 18.7 | 14.3 | 14.3 |
| Cyberpunk 2077 (2023) | 26.3 | 19.7 | 15.8 | 12.6 |
| F1 24 (2024) | 48.4 | 45 | 32.4 | 6.83 |
Uitstoot
Systeemgeluid
Ventilatorlawaai is over het algemeen meer merkbaar omdat gebruikers dichter bij hun toetsenbord zitten dan bij hun desktop of mini-pc. Als er zeer veeleisende belastingen worden uitgevoerd, kan het EliteBoard net zo luid zijn als sommige laptops onder vergelijkbare omstandigheden. De ventilator is verder bescheiden zonder grote pulserende problemen wanneer u gewoon op het web surft of niets doet.
Geluidsniveau
| Onbelast |
| 24.1 / 24.1 / 25.8 dB (A) |
| Belasting |
| 40.5 / 45.2 dB (A) |
 | ||
30 dB stil 40 dB(A) hoorbaar 50 dB(A) luid |
||
min: | ||
| HP EliteBoard G1a AI Ryzen AI 5 340, Radeon 840M | Geekom A5 Pro R5 7530U, Vega 7 | GMK NucBox K13 Core Ultra 7 256V, Arc 140V | Asus NUC 15 Pro+ Ultra 9 285H, Arc 140T | MSI Cubi NUC AI+ 2MG Core Ultra 7 258V, Arc 140V | HP Pro Mini 400 G9-937U0EA i5-14500T, UHD Graphics 770 | |
|---|---|---|---|---|---|---|
| Noise | 6% | -1% | -14% | -15% | 2% | |
| uit / omgeving * (dB) | 23.6 | 25 -6% | 23.3 1% | 25.3 -7% | 24.8 -5% | 24.8 -5% |
| Idle Minimum * (dB) | 24.1 | 26.6 -10% | 24.5 -2% | 25.4 -5% | 28 -16% | 26.9 -12% |
| Idle Average * (dB) | 24.1 | 26.6 -10% | 25 -4% | 25.5 -6% | 36.1 -50% | 26.9 -12% |
| Idle Maximum * (dB) | 25.8 | 26.7 -3% | 25.1 3% | 37.3 -45% | 36.1 -40% | 26.9 -4% |
| Load Average * (dB) | 40.5 | 33.5 17% | 40.1 1% | 44.4 -10% | 38.9 4% | 32.5 20% |
| Cyberpunk 2077 ultra * (dB) | 42.2 | 31.2 26% | 44.2 -5% | 46.2 -9% | 37 12% | 37.2 12% |
| Load Maximum * (dB) | 45.2 | 33.8 25% | 45.1 -0% | 52.7 -17% | 49.2 -9% | 37.2 18% |
| Witcher 3 ultra * (dB) | 31.2 | 47.7 |
* ... kleiner is beter
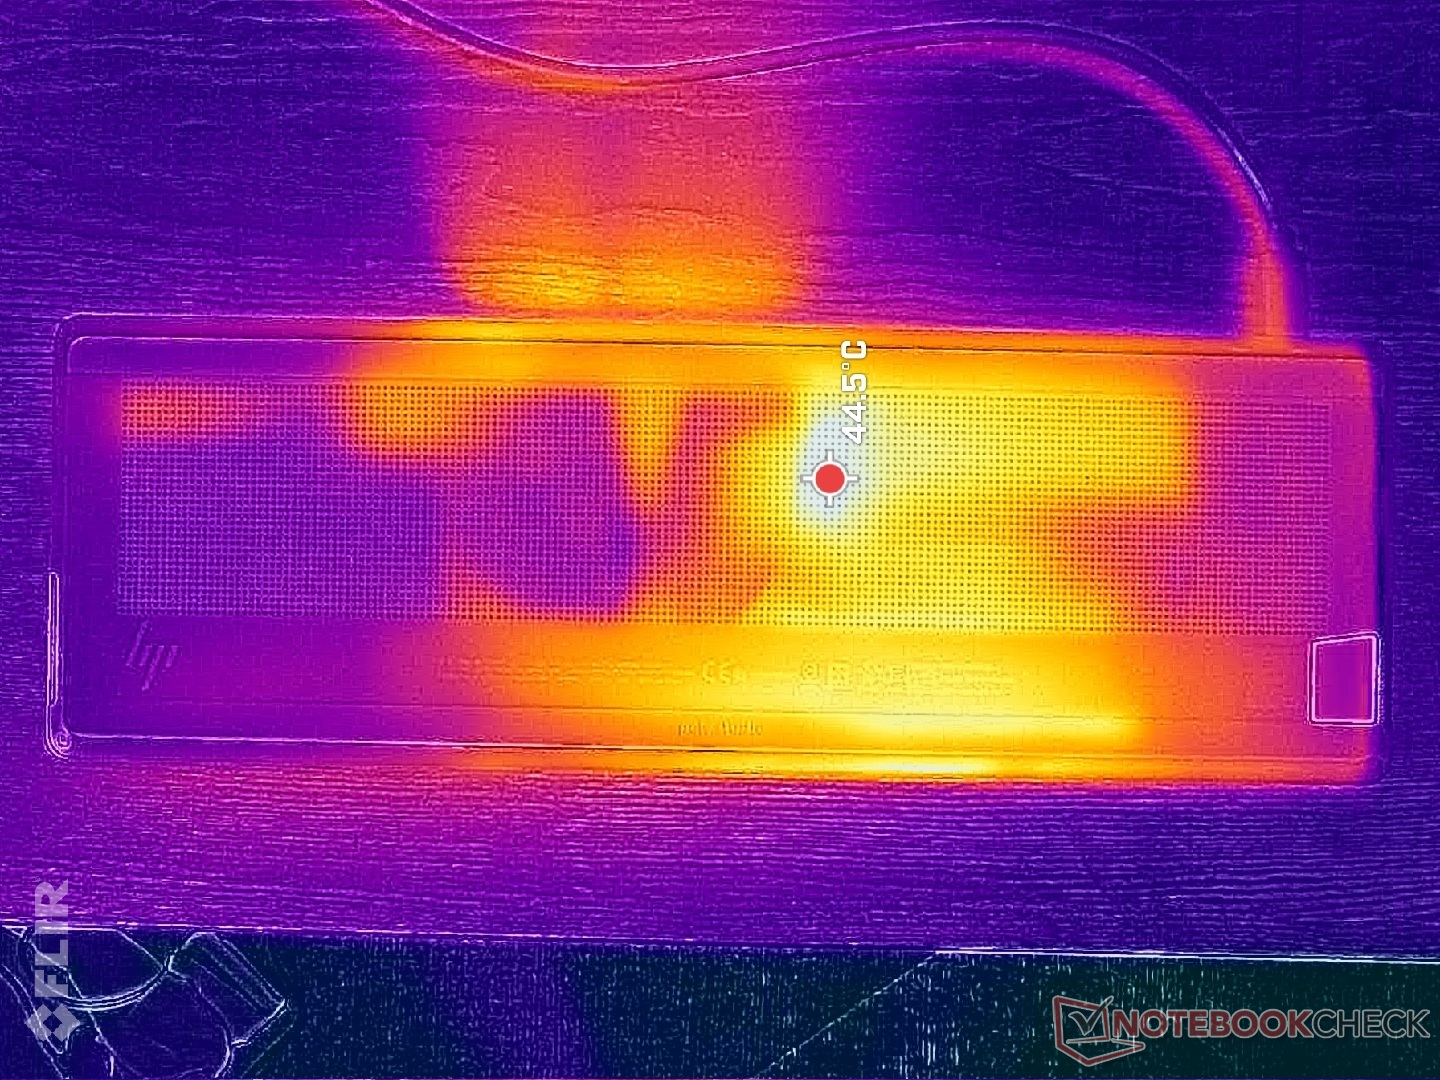
Temperatuur
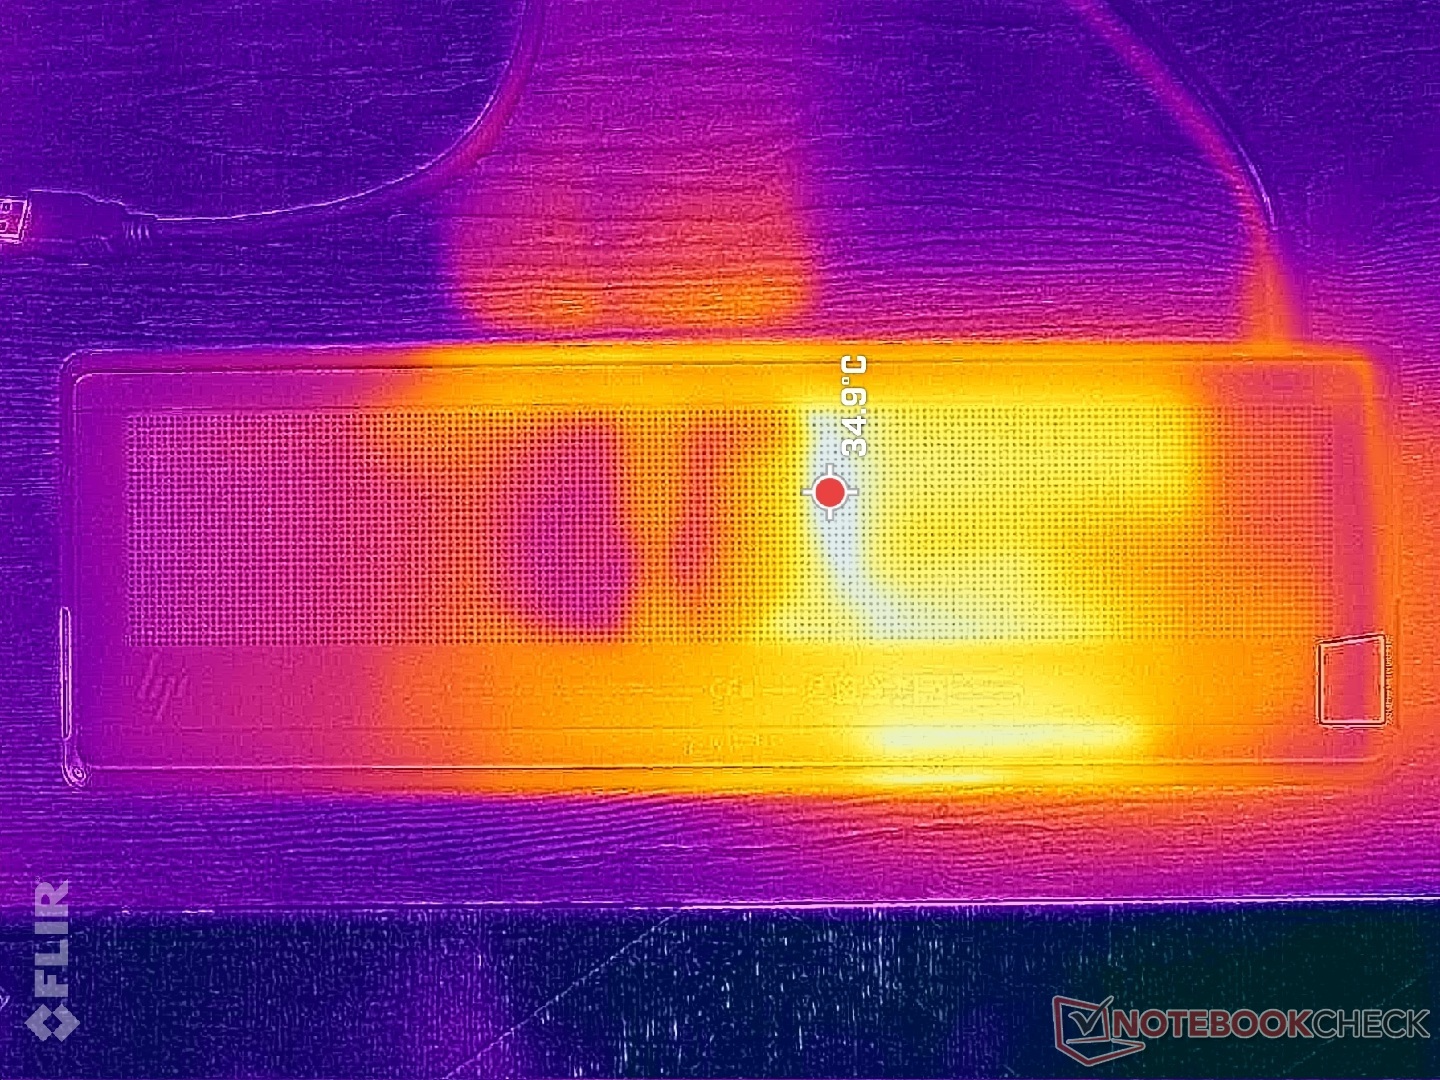
Hete plekken kunnen oplopen tot meer dan 39 C in het midden van het toetsenbord of 43 C aan de onderkant wanneer er lange tijd veeleisende belastingen worden uitgevoerd. Hoewel de warmte merkbaar is tijdens het typen, vonden we het nooit oncomfortabel warm omdat het contact met de vingertoppen minimaal is tijdens regelmatig gebruik.
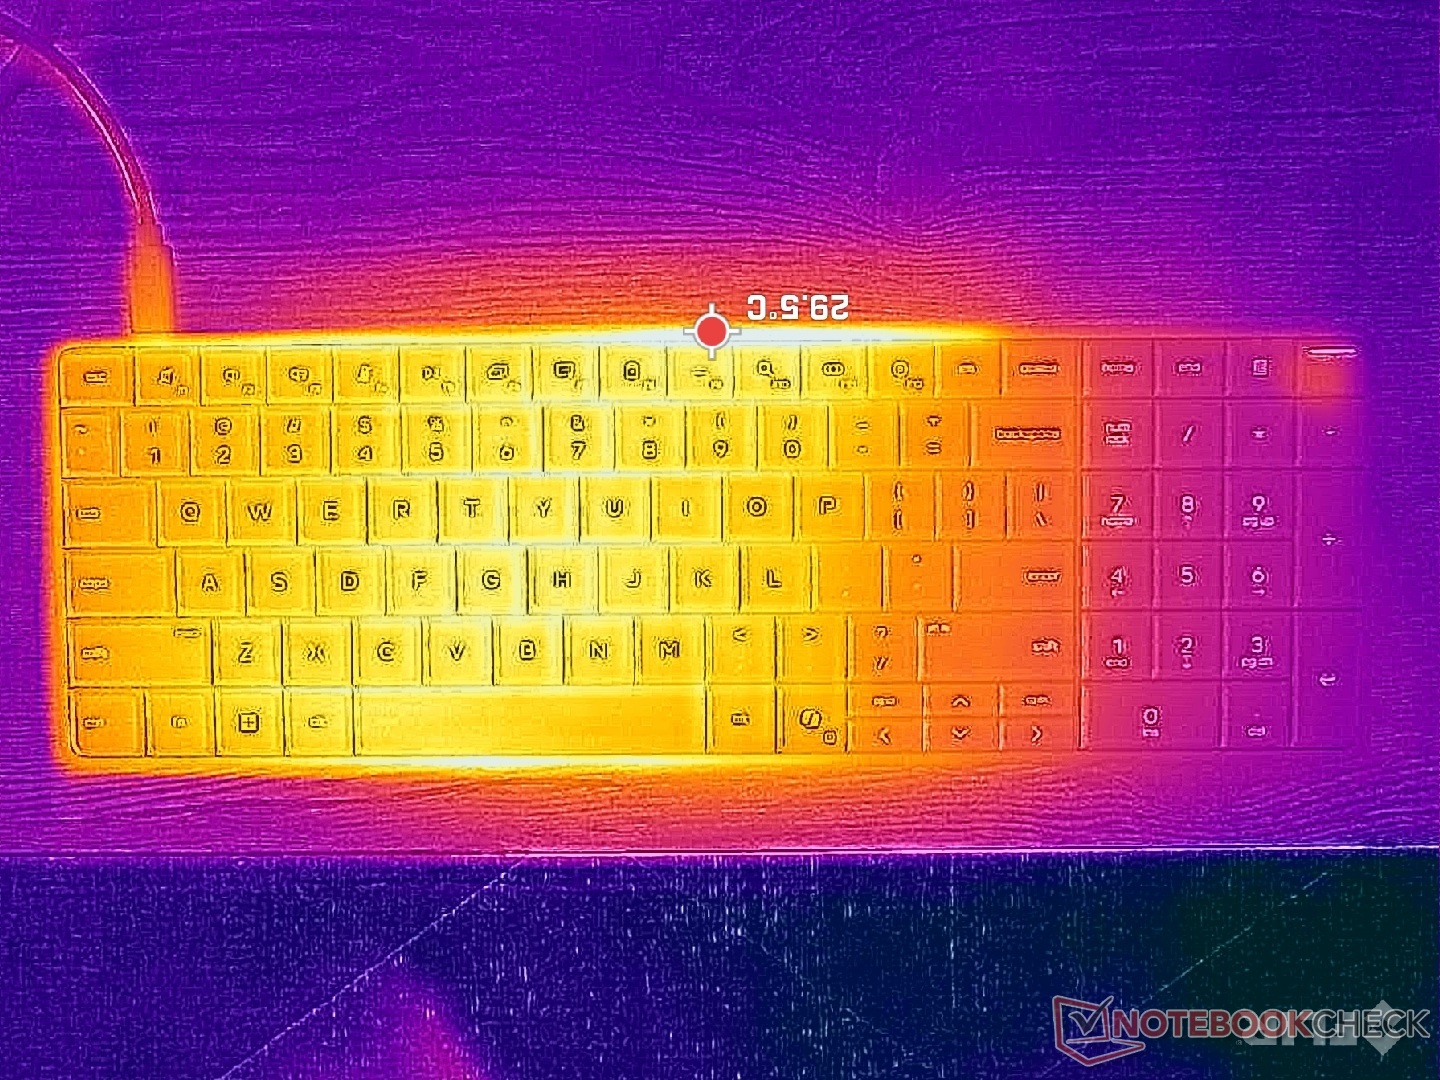
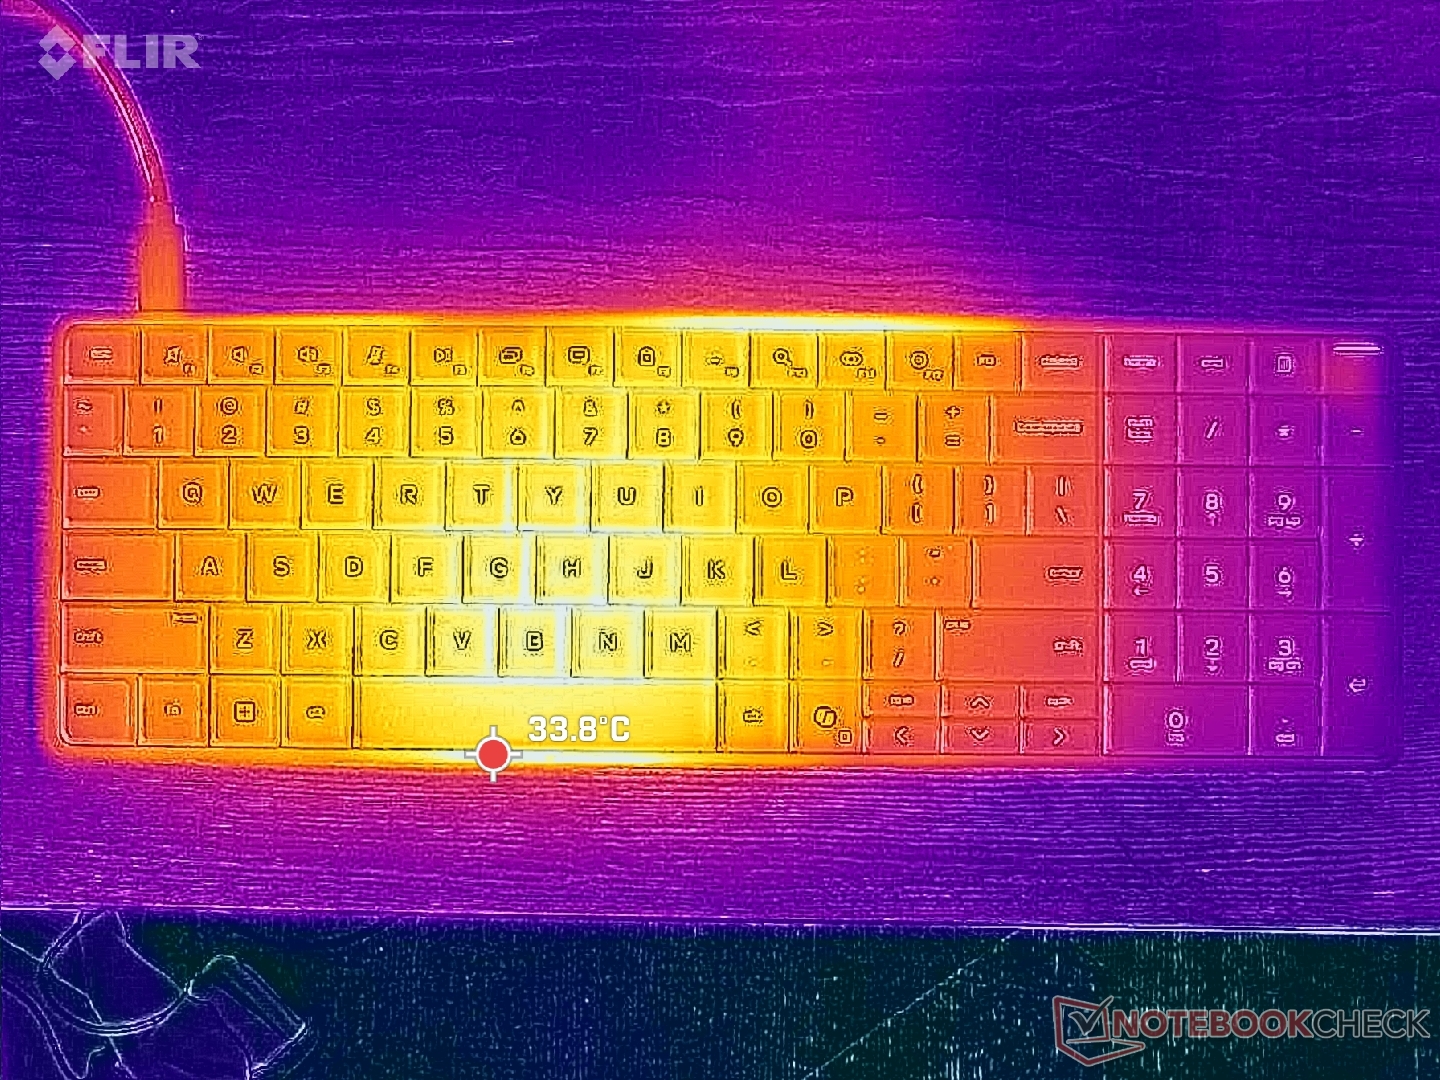
(+) De maximumtemperatuur aan de bovenzijde bedraagt 38.4 °C / 101 F, vergeleken met het gemiddelde van 35.4 °C / 96 F, variërend van 20.6 tot 69.5 °C voor de klasse Mini PC.
(±) De bodem warmt op tot een maximum van 42.6 °C / 109 F, vergeleken met een gemiddelde van 36.1 °C / 97 F
(+) Bij onbelast gebruik bedraagt de gemiddelde temperatuur voor de bovenzijde 30.4 °C / 87 F, vergeleken met het apparaatgemiddelde van 32.1 °C / 90 F.
| HP EliteBoard G1a AI Ryzen AI 5 340, Radeon 840M | Geekom A5 Pro R5 7530U, Vega 7 | GMK NucBox K13 Core Ultra 7 256V, Arc 140V | Asus NUC 15 Pro+ Ultra 9 285H, Arc 140T | MSI Cubi NUC AI+ 2MG Core Ultra 7 258V, Arc 140V | HP Pro Mini 400 G9-937U0EA i5-14500T, UHD Graphics 770 | |
|---|---|---|---|---|---|---|
| Heat | 16% | 7% | 4% | 26% | 11% | |
| Maximum Upper Side * (°C) | 38.4 | 36.7 4% | 31.6 18% | 42.2 -10% | 30.8 20% | 35.7 7% |
| Maximum Bottom * (°C) | 42.6 | 40.5 5% | 50.6 -19% | 31.3 27% | 26.4 38% | 39.6 7% |
| Idle Upper Side * (°C) | 32.4 | 23.1 29% | 27 17% | 34.9 -8% | 26.4 19% | 28.6 12% |
| Idle Bottom * (°C) | 34.6 | 25.1 27% | 31.2 10% | 32.2 7% | 25.4 27% | 29 16% |
* ... kleiner is beter
Stresstest
De CPU steeg naar 3,7 GHz en 54 W voordat hij snel daalde naar 3,3 GHz en 33 W voor een constante kerntemperatuur van 72 C. Het Turbo Boost-potentieel is beperkt, wat te verwachten is van een systeem dat meer draait om veelzijdigheid dan om rauwe prestaties. De gemiddelde temperatuur van 70 C bij veeleisende belastingen is normaal, zo niet iets koeler dan de meeste subnotebooks.
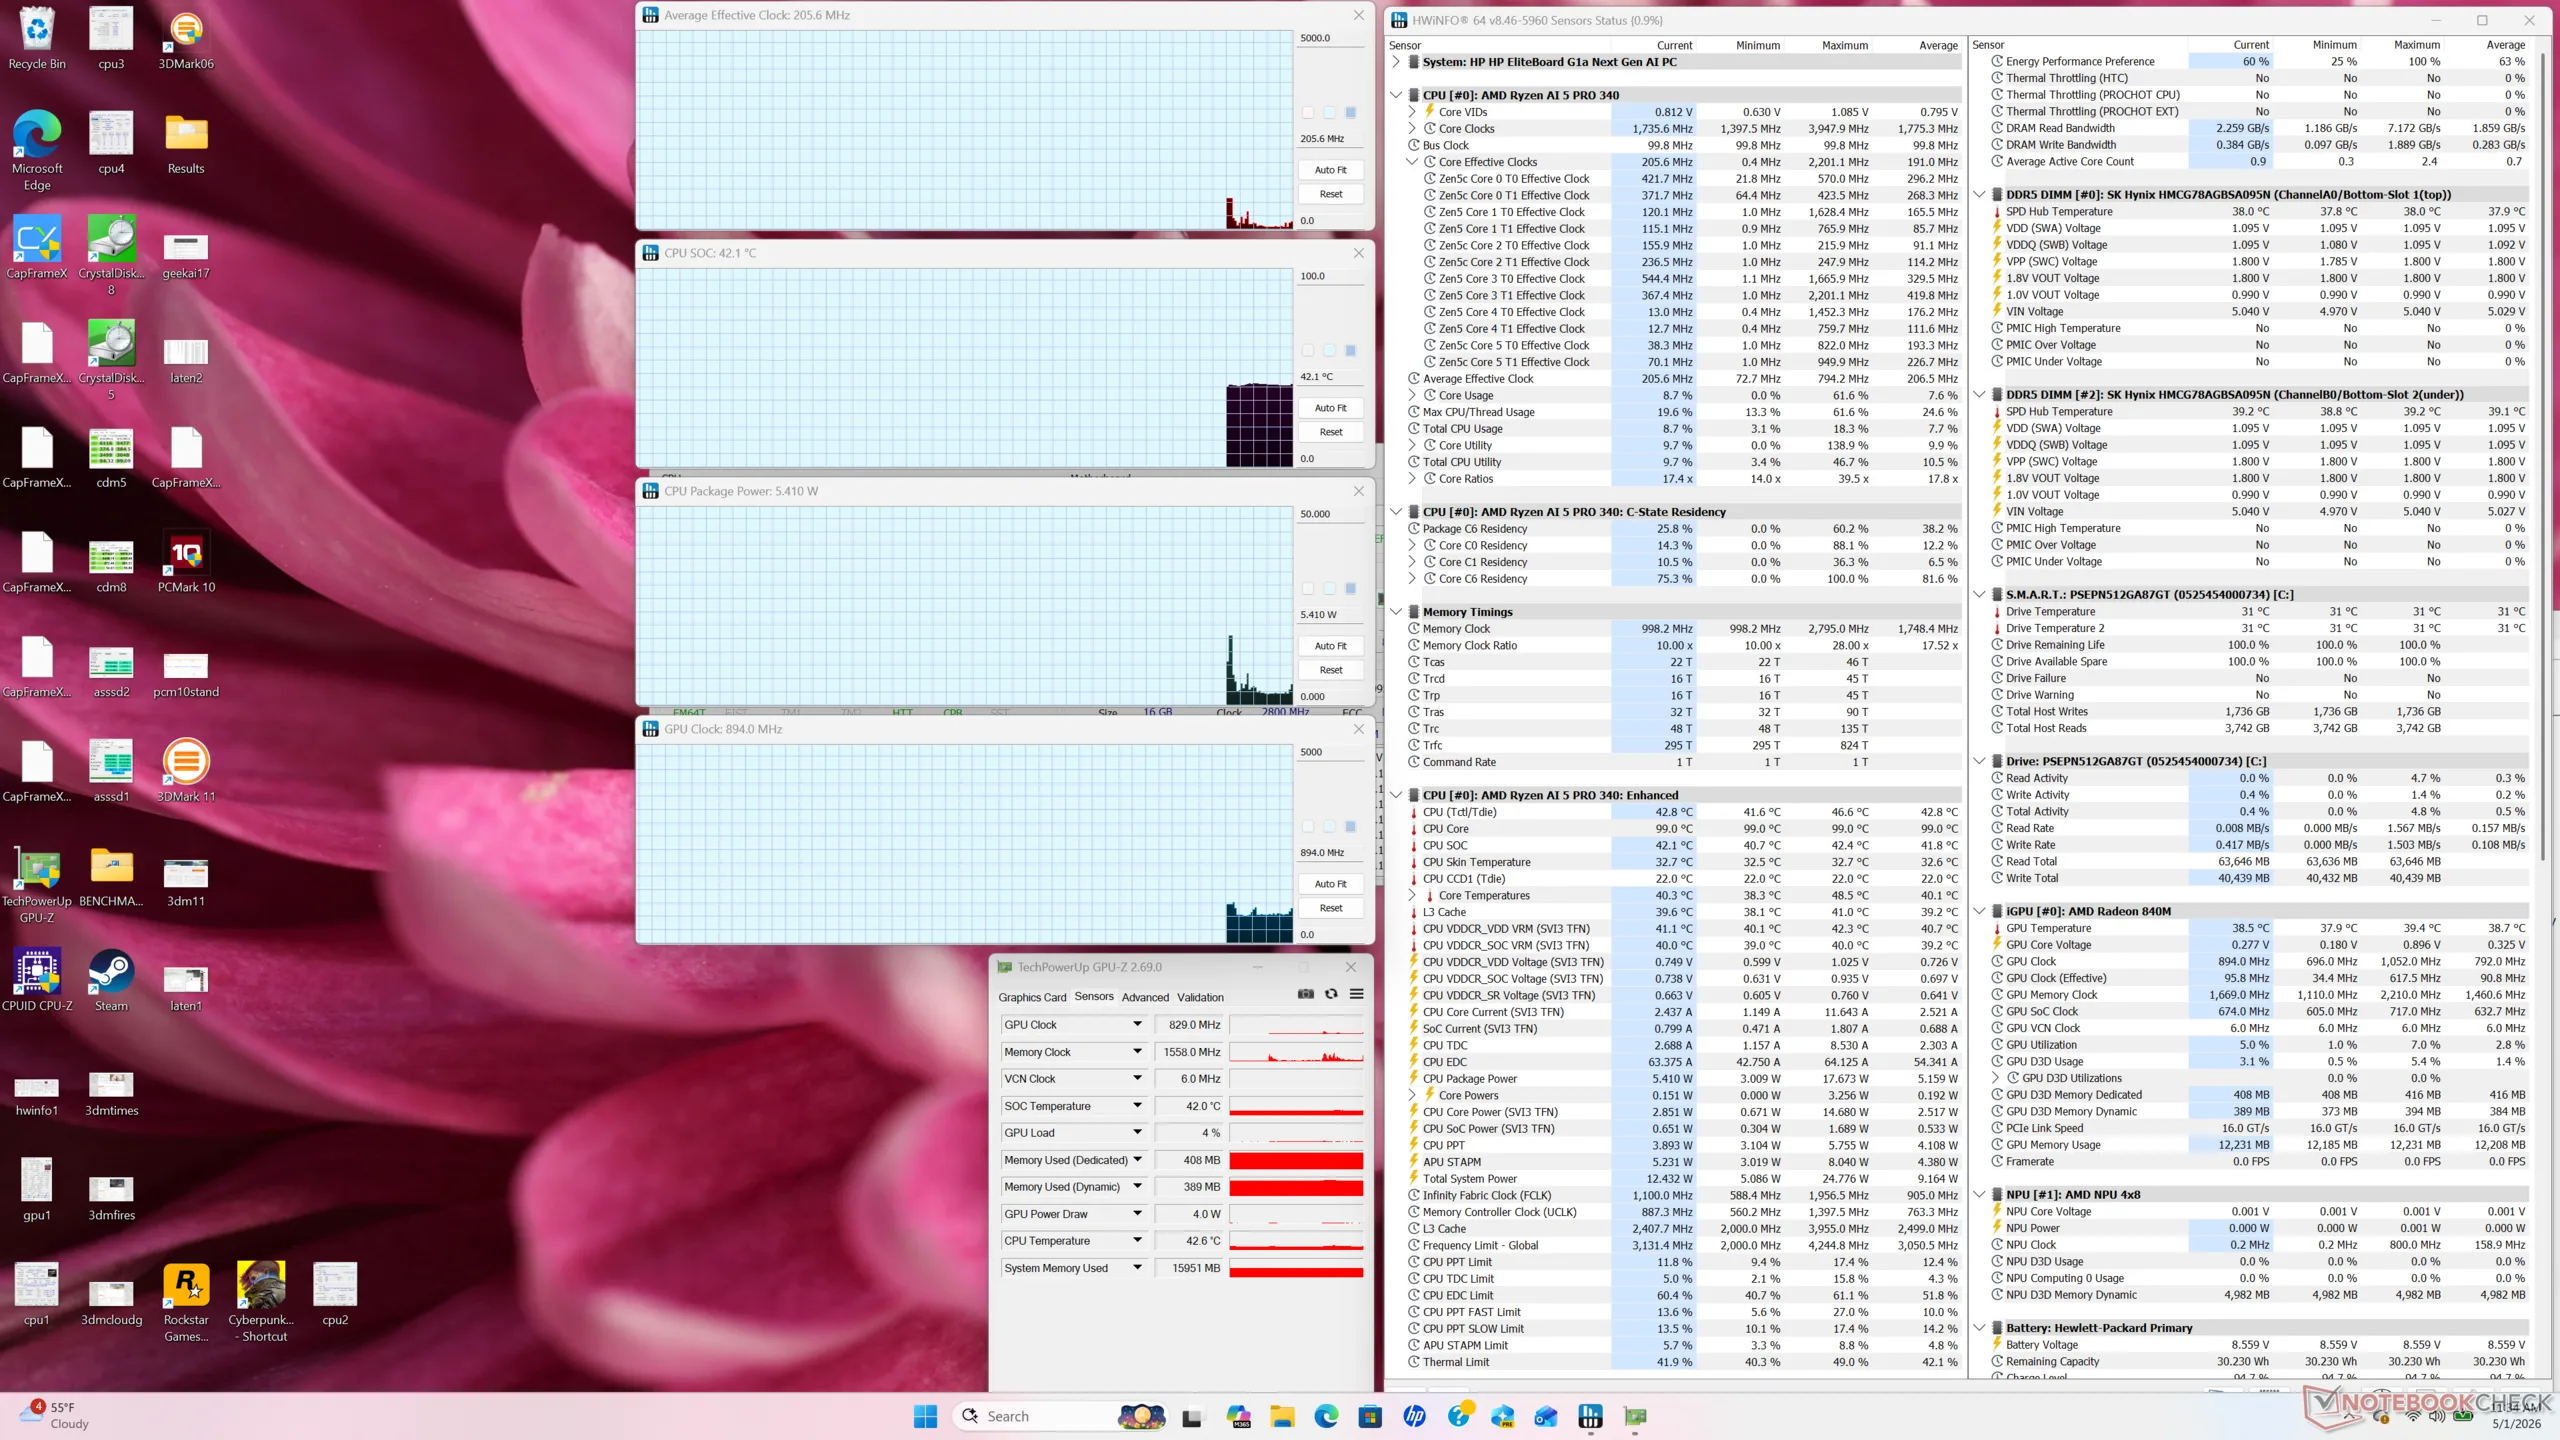
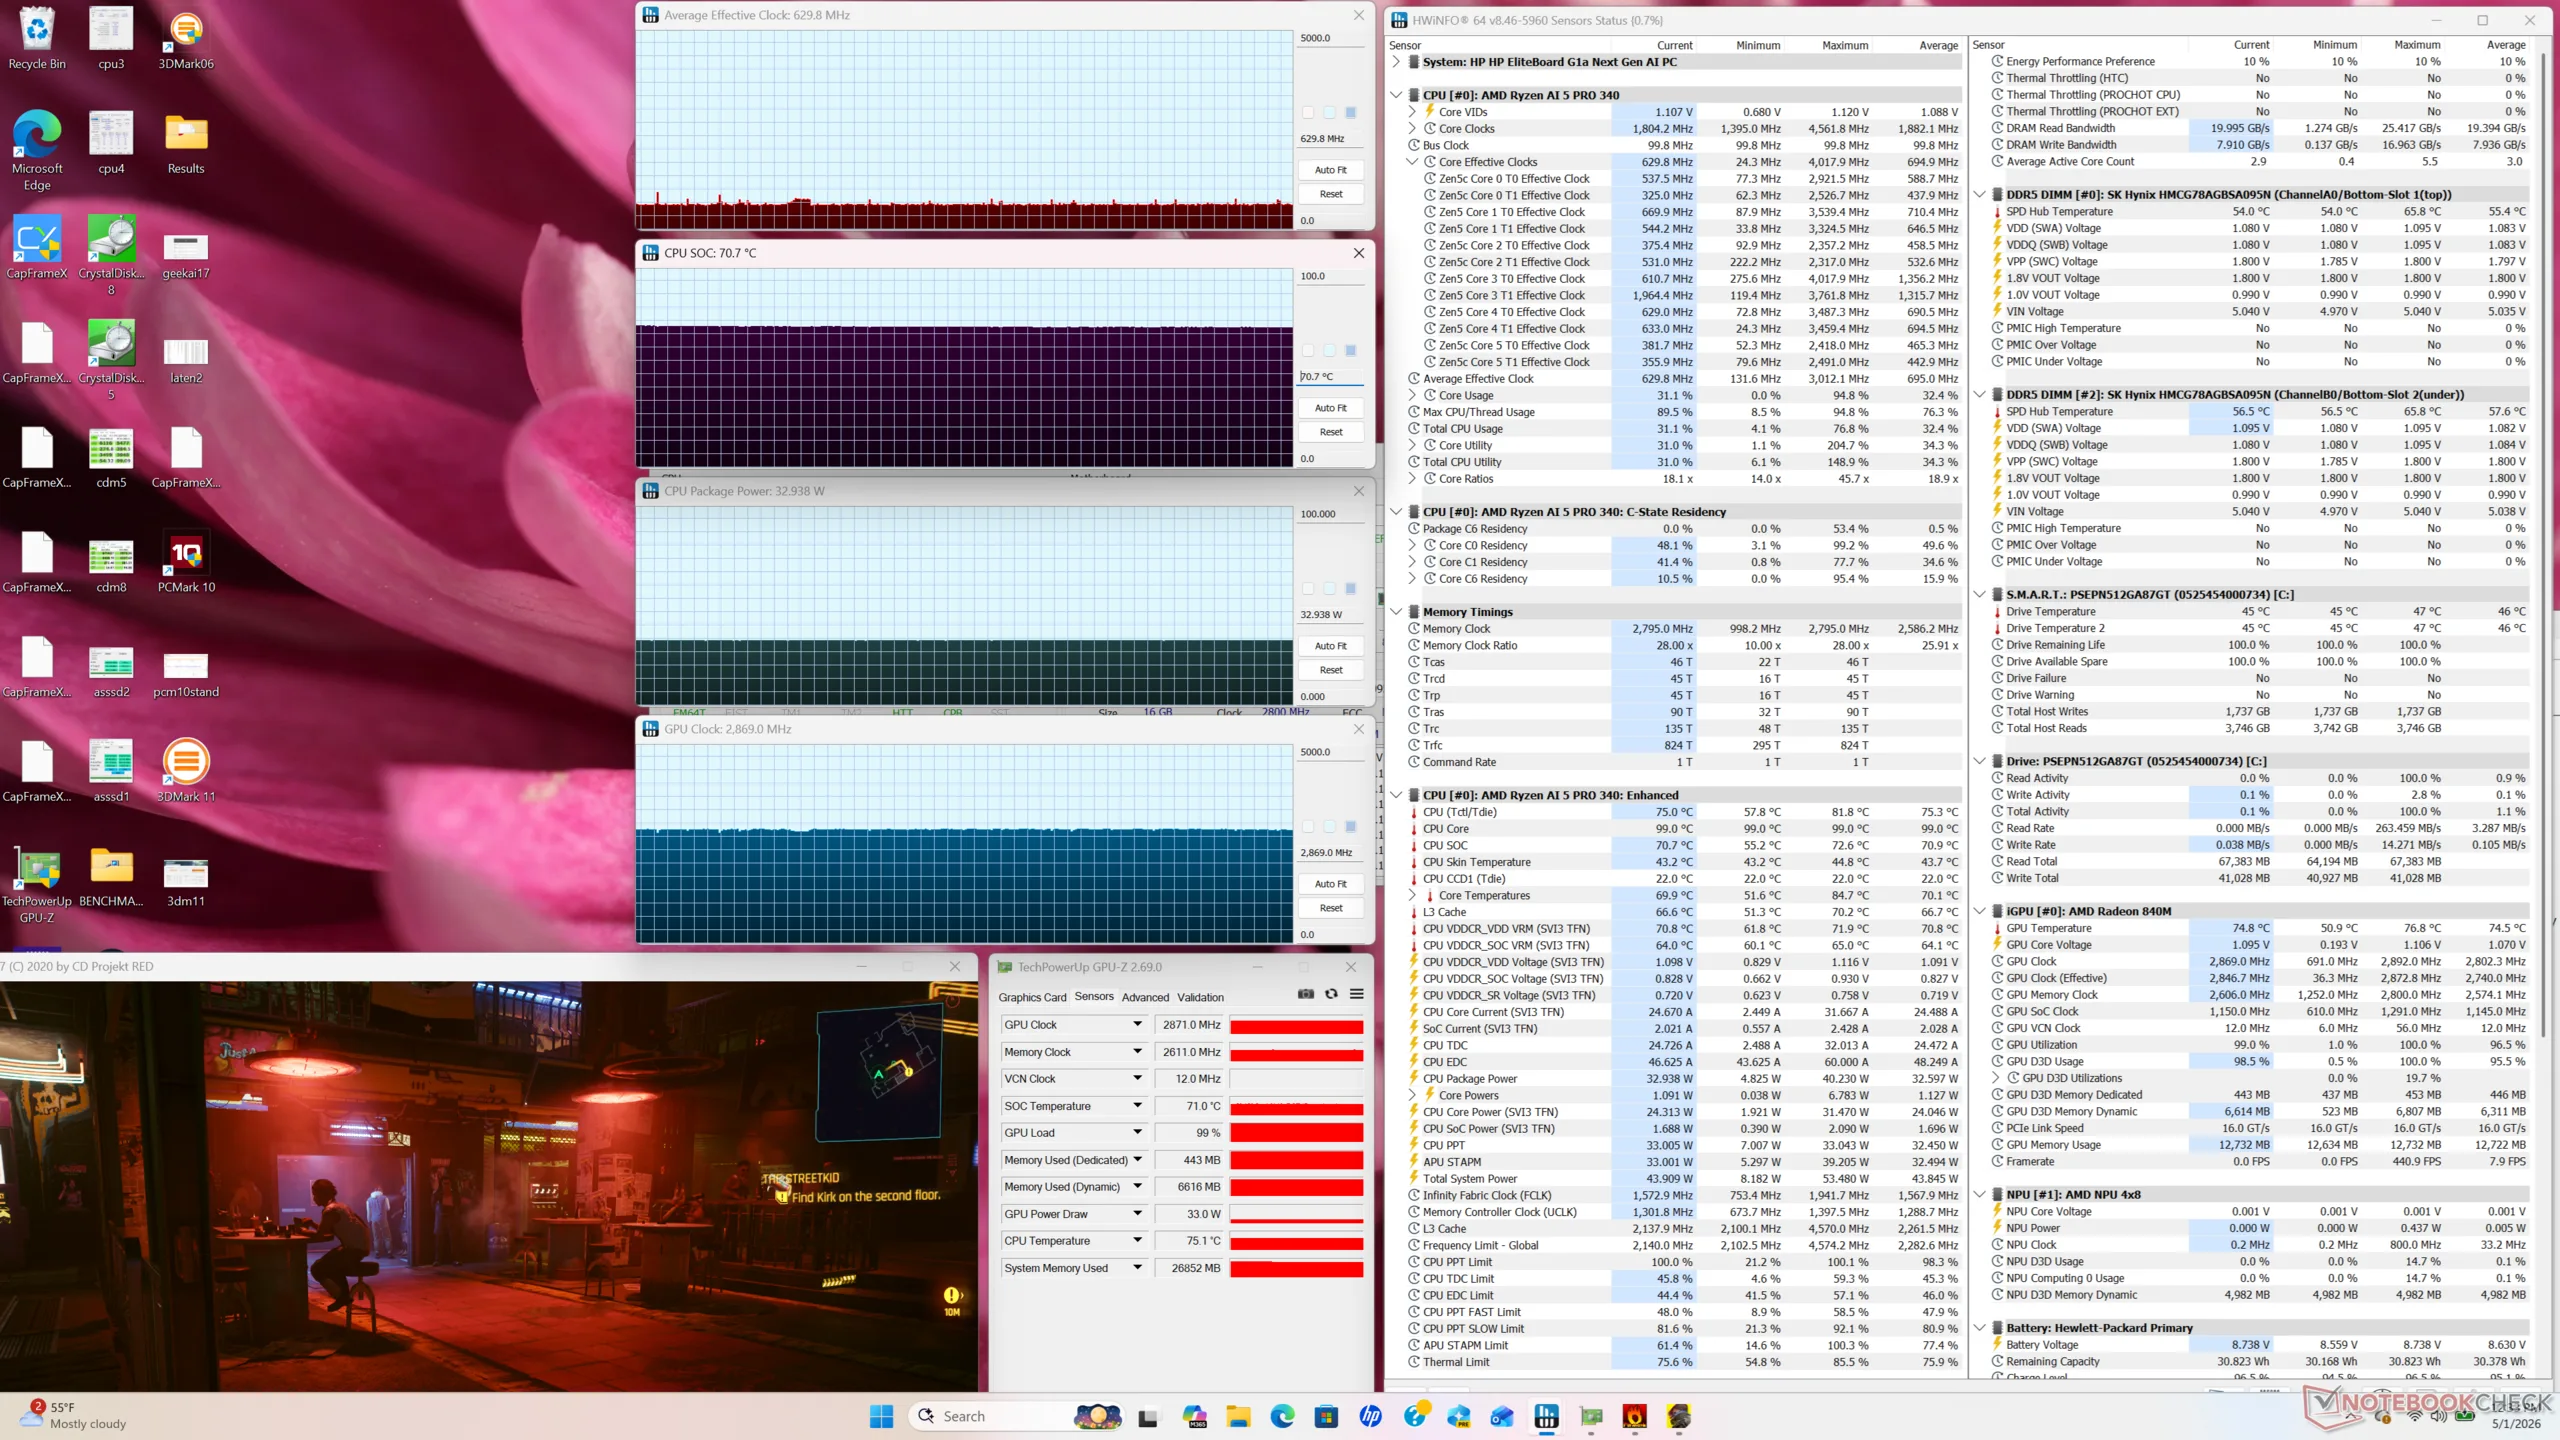
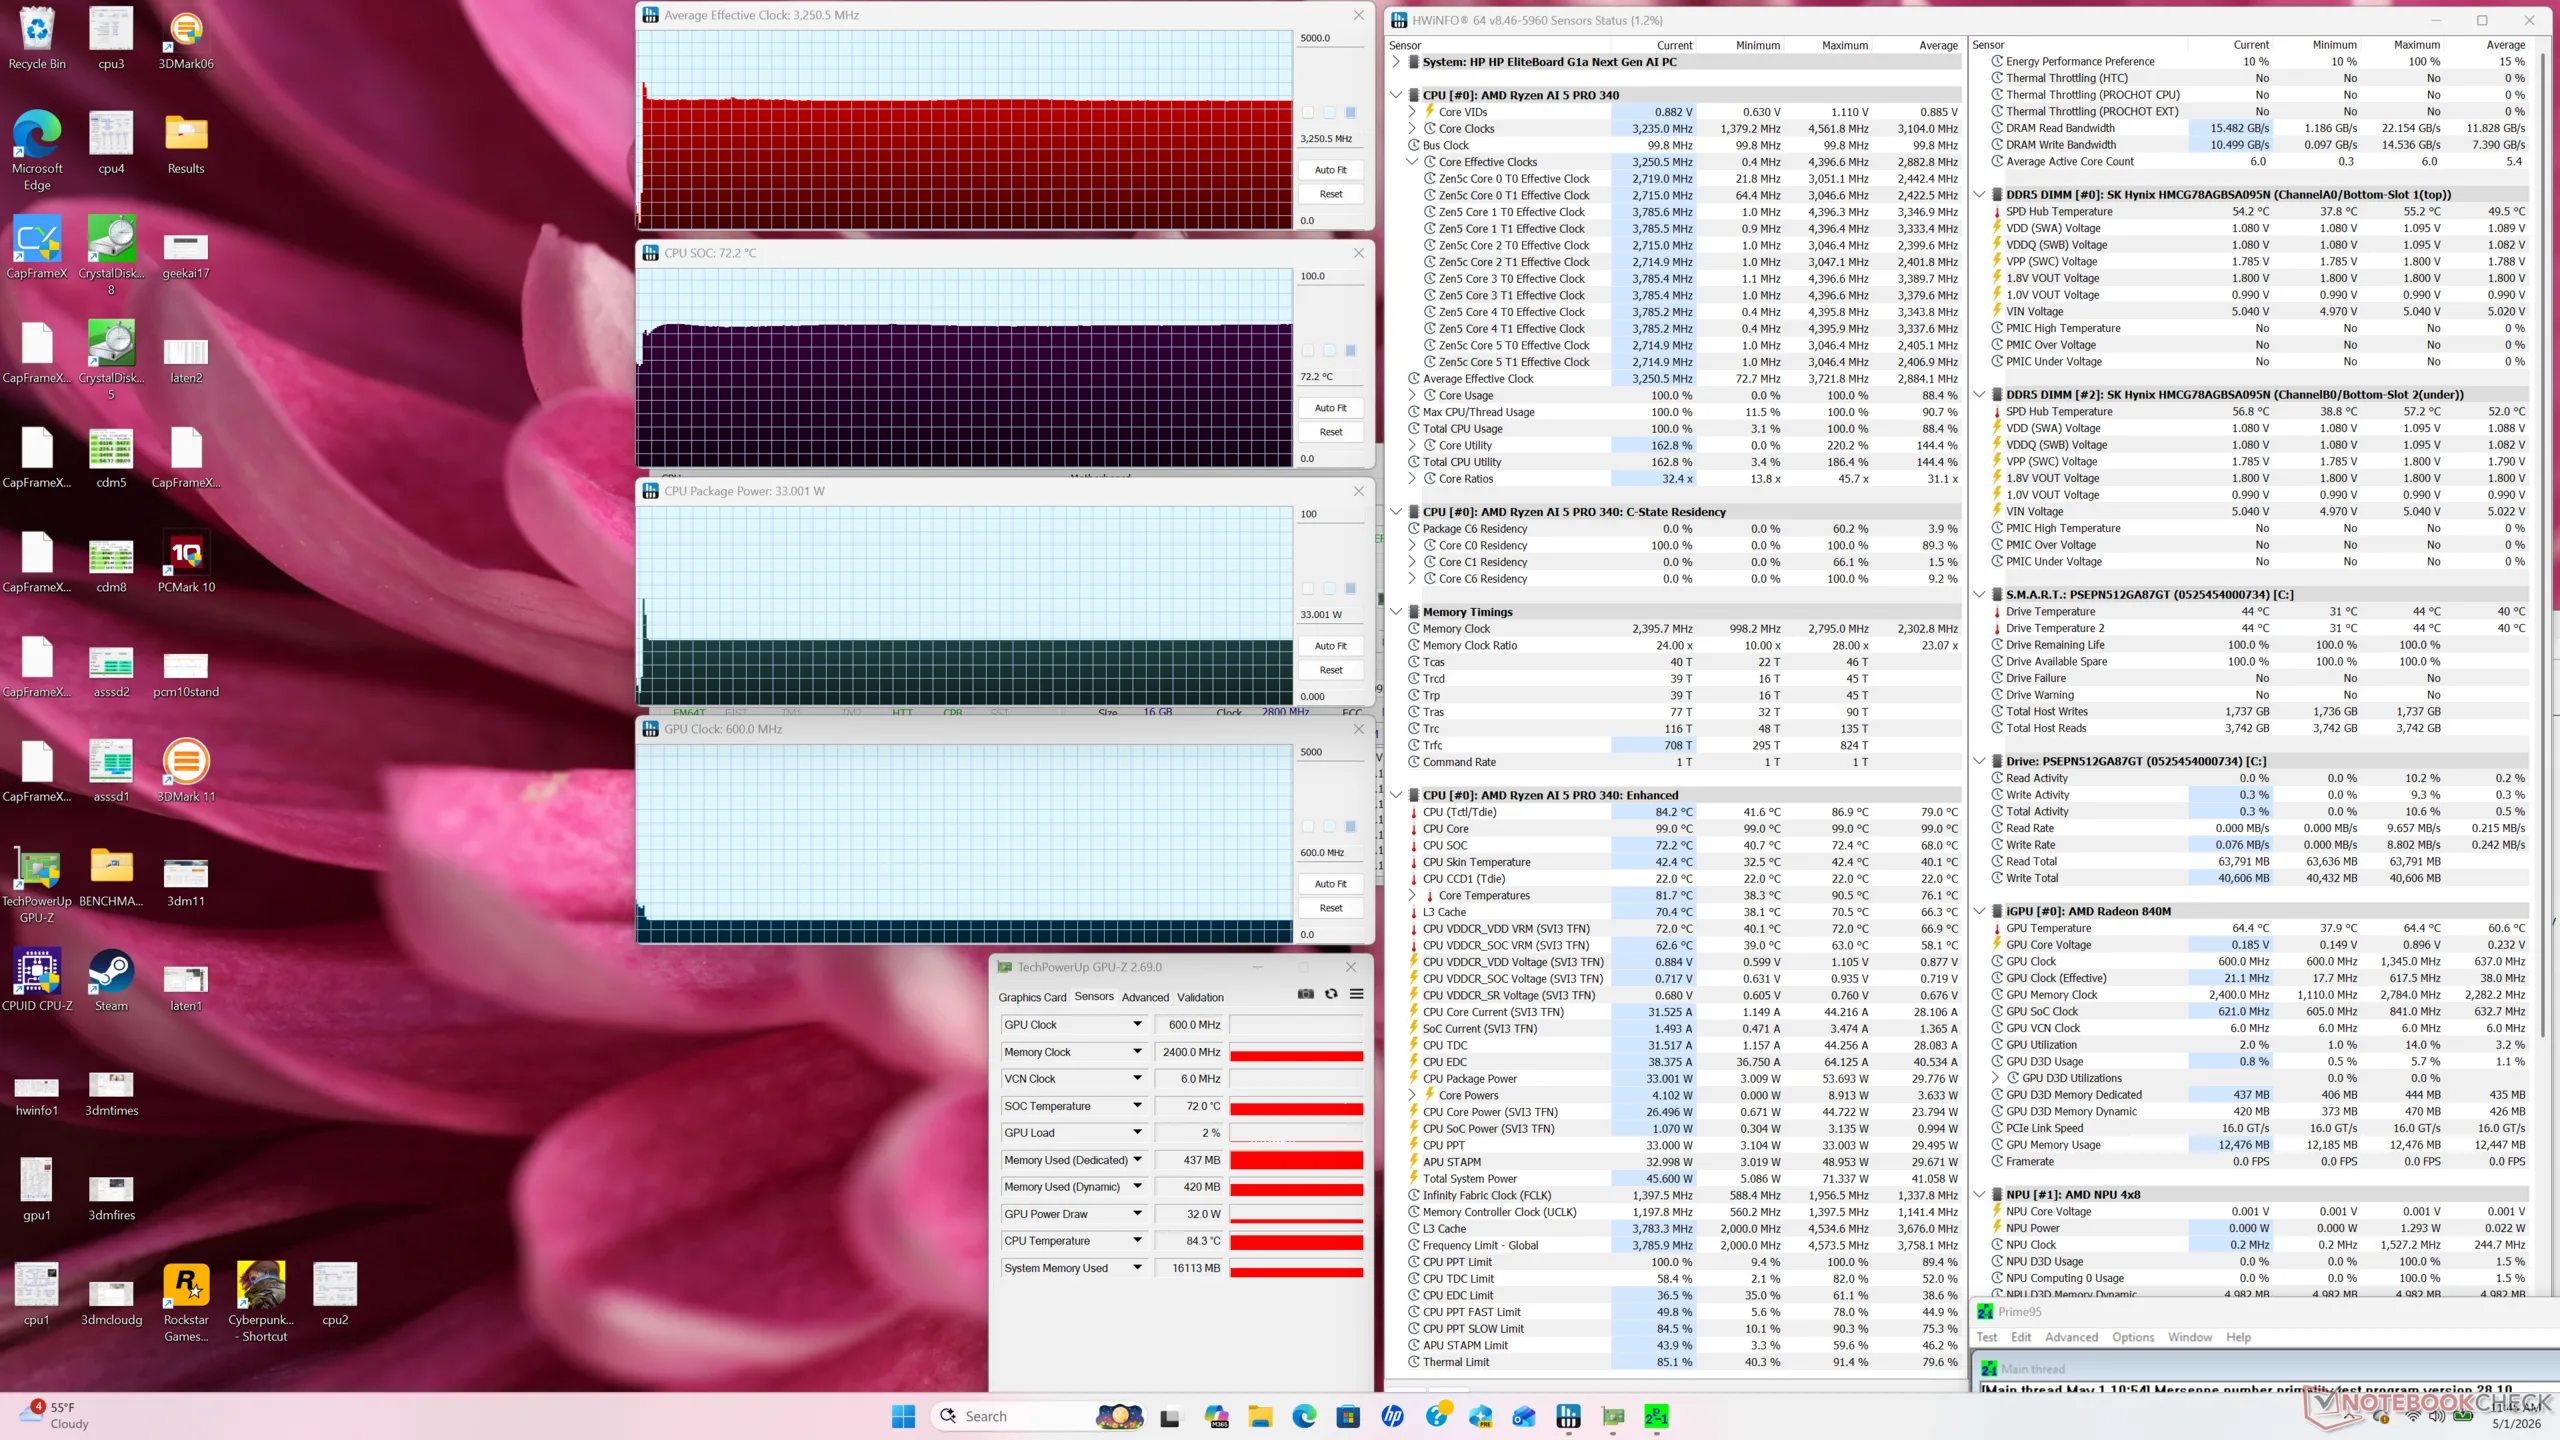
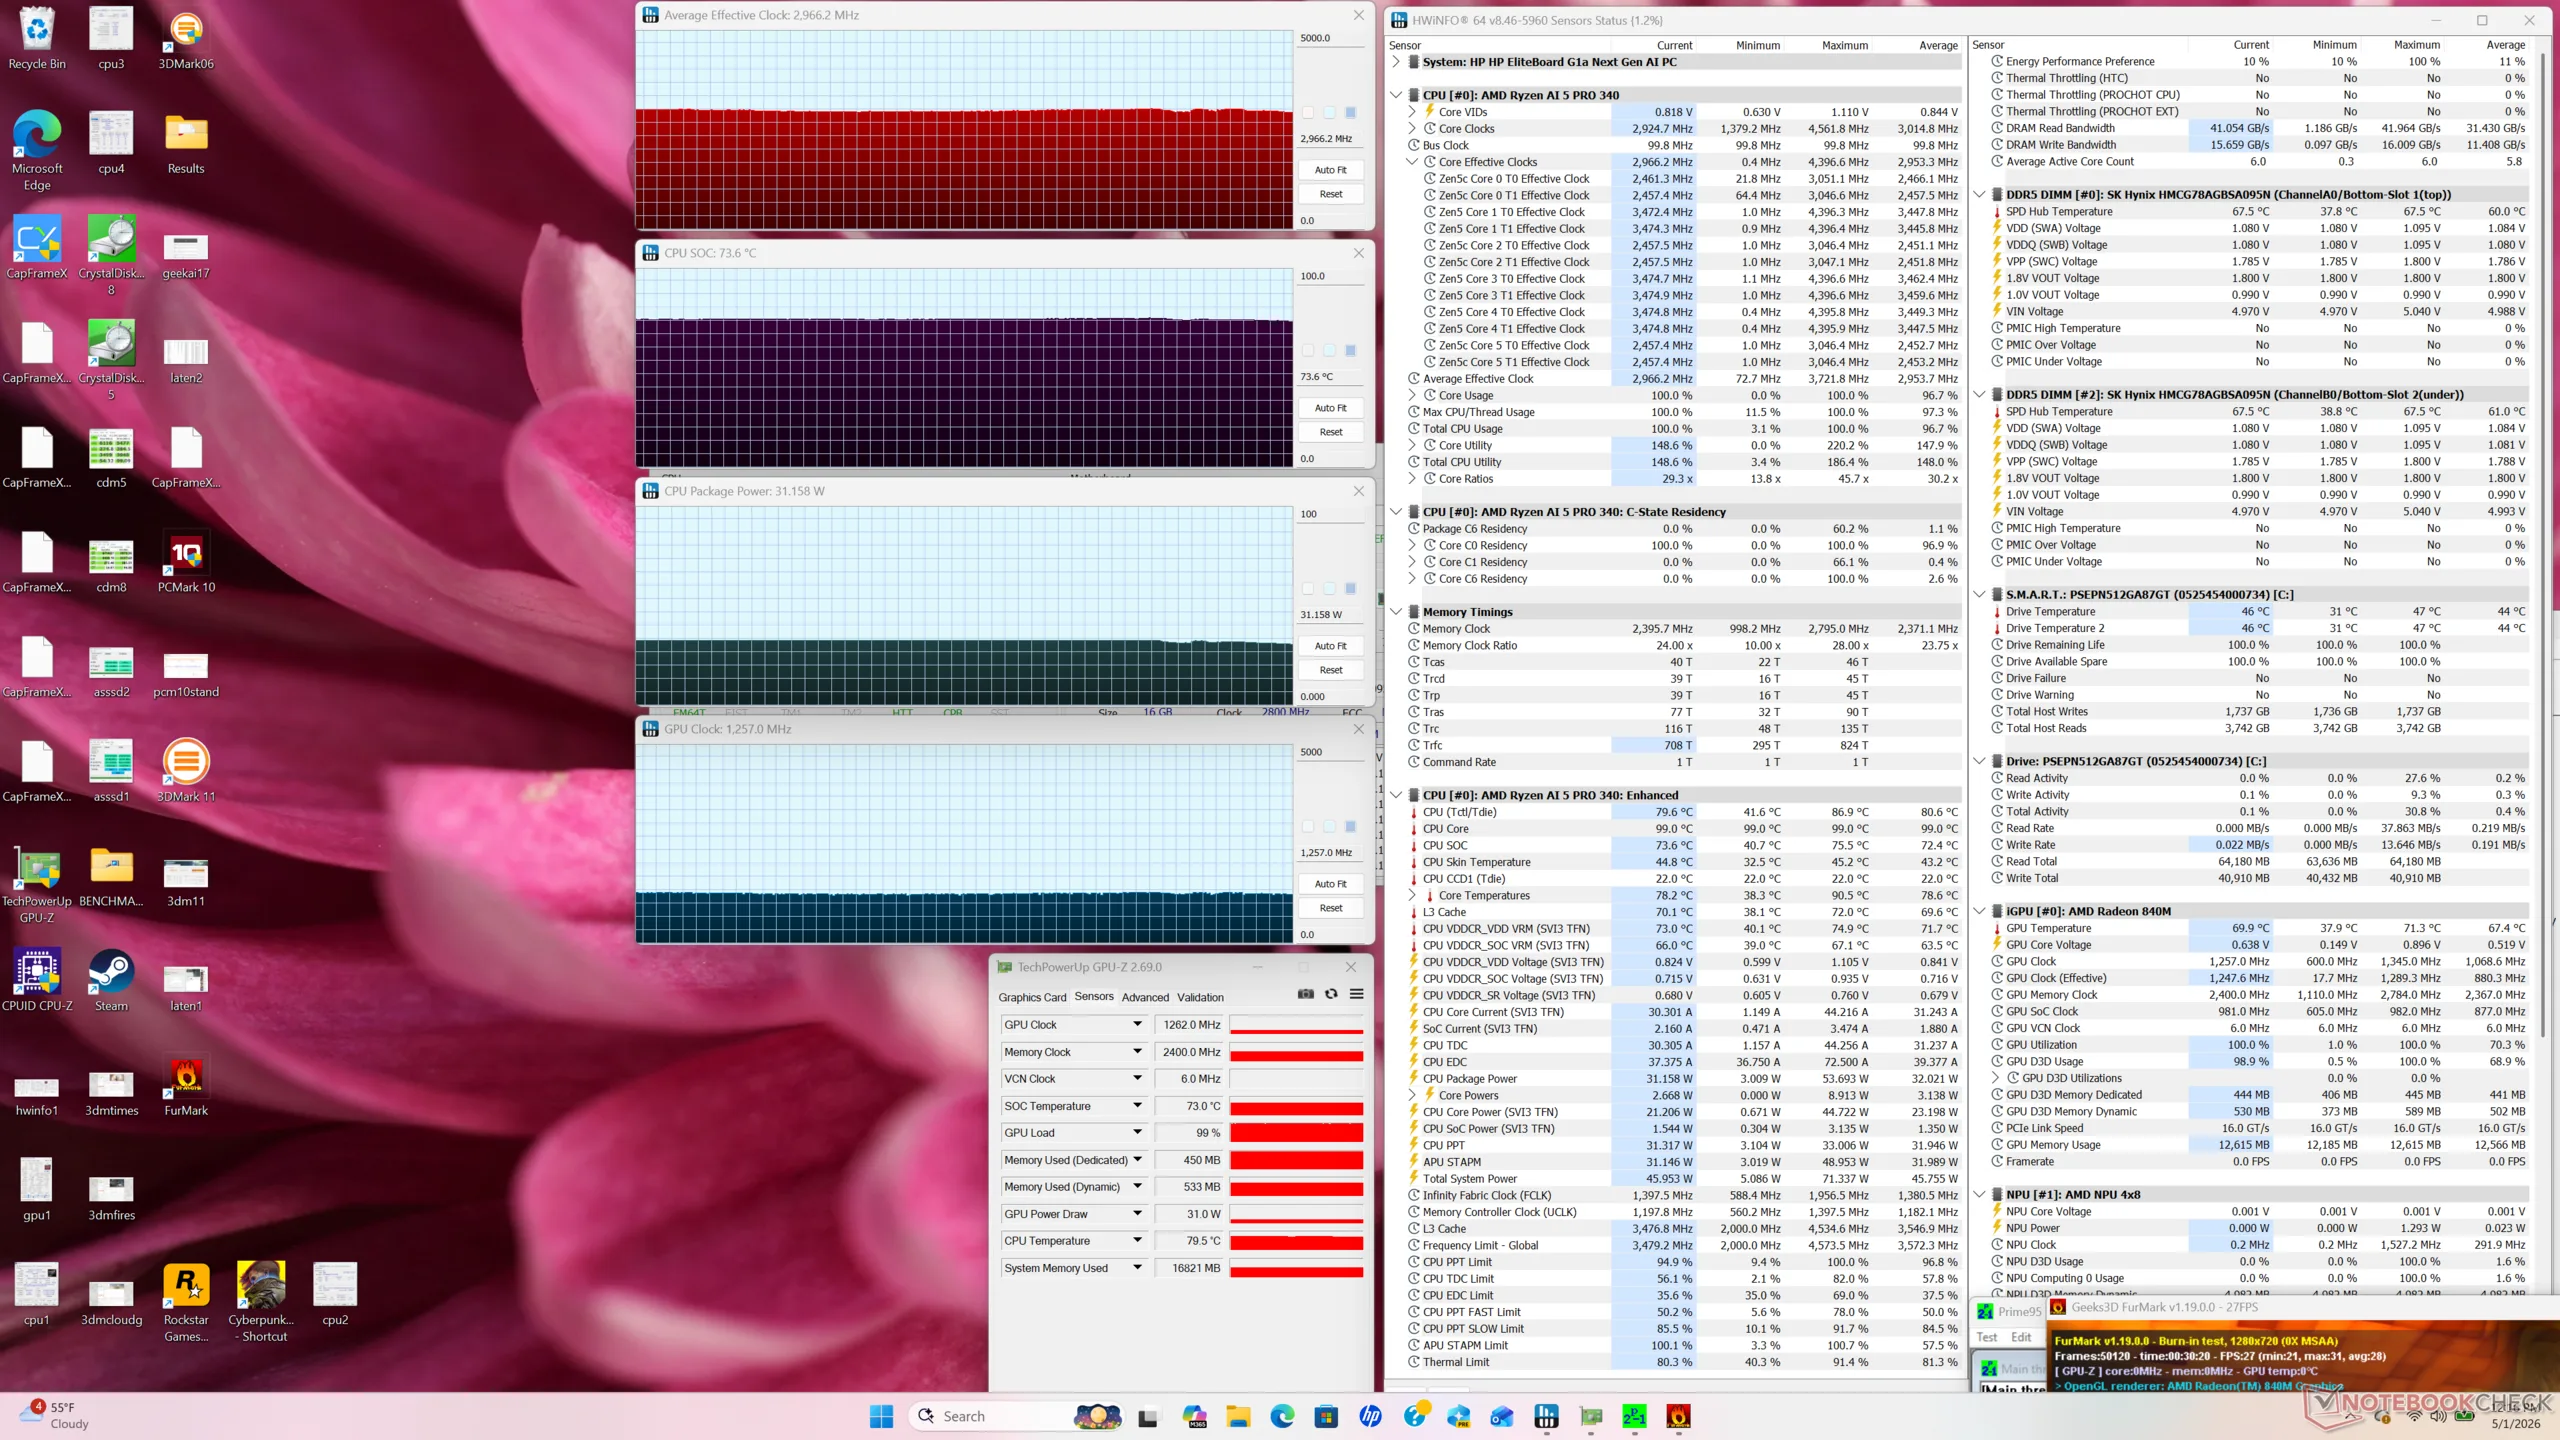
| Gemiddelde CPU-klok (GHz) | GPU-klok (MHz) | Gemiddelde CPU-temperatuur (°C) | |
| Inactief systeem | -- | 696 | 42 |
| Prime95 Stress | 3.3 | -- | 72 |
| Prime95 + FurMark Stress | 3.0 | 1257 | 74 |
| Cyberpunk 2077 Stress | 0.6 | 2869 | 71 |
Luidsprekers
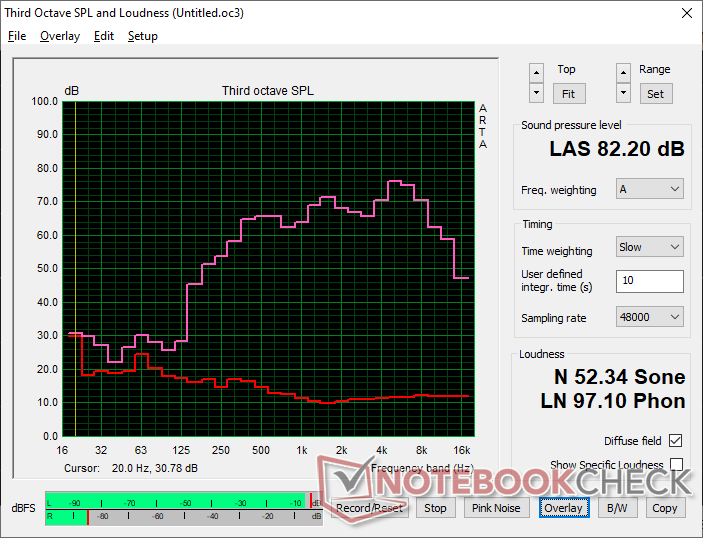
HP EliteBoard G1a AI audioanalyse
(+) | luidsprekers kunnen relatief luid spelen (82.2 dB)
Bas 100 - 315 Hz
(-) | bijna geen lage tonen - gemiddeld 21% lager dan de mediaan
(±) | lineariteit van de lage tonen is gemiddeld (11% delta ten opzichte van de vorige frequentie)
Midden 400 - 2000 Hz
(+) | evenwichtige middens - slechts 2.4% verwijderd van de mediaan
(+) | de middentonen zijn lineair (5.4% delta ten opzichte van de vorige frequentie)
Hoog 2 - 16 kHz
(±) | higher highs - on average 5.5% higher than median
(±) | lineariteit van de hoogtepunten is gemiddeld (7.2% delta ten opzichte van de vorige frequentie)
Algemeen 100 - 16.000 Hz
(±) | lineariteit van het totale geluid is gemiddeld (17.9% verschil met de mediaan)
Vergeleken met dezelfde klasse
» 21% van alle geteste apparaten in deze klasse waren beter, 7% vergelijkbaar, 71% slechter
» De beste had een delta van 13%, het gemiddelde was 24%, de slechtste was 64%
Vergeleken met alle geteste toestellen
» 37% van alle geteste apparaten waren beter, 8% gelijk, 55% slechter
» De beste had een delta van 4%, het gemiddelde was 24%, de slechtste was 134%
Apple MacBook Pro 16 2021 M1 Pro audioanalyse
(+) | luidsprekers kunnen relatief luid spelen (84.7 dB)
Bas 100 - 315 Hz
(+) | goede baars - slechts 3.8% verwijderd van de mediaan
(+) | de lage tonen zijn lineair (5.2% delta naar de vorige frequentie)
Midden 400 - 2000 Hz
(+) | evenwichtige middens - slechts 1.3% verwijderd van de mediaan
(+) | de middentonen zijn lineair (2.1% delta ten opzichte van de vorige frequentie)
Hoog 2 - 16 kHz
(+) | evenwichtige hoogtepunten - slechts 1.9% verwijderd van de mediaan
(+) | de hoge tonen zijn lineair (2.7% delta naar de vorige frequentie)
Algemeen 100 - 16.000 Hz
(+) | het totale geluid is lineair (4.6% verschil met de mediaan)
Vergeleken met dezelfde klasse
» 0% van alle geteste apparaten in deze klasse waren beter, 0% vergelijkbaar, 100% slechter
» De beste had een delta van 5%, het gemiddelde was 17%, de slechtste was 45%
Vergeleken met alle geteste toestellen
» 0% van alle geteste apparaten waren beter, 0% gelijk, 100% slechter
» De beste had een delta van 4%, het gemiddelde was 24%, de slechtste was 134%
Energiebeheer
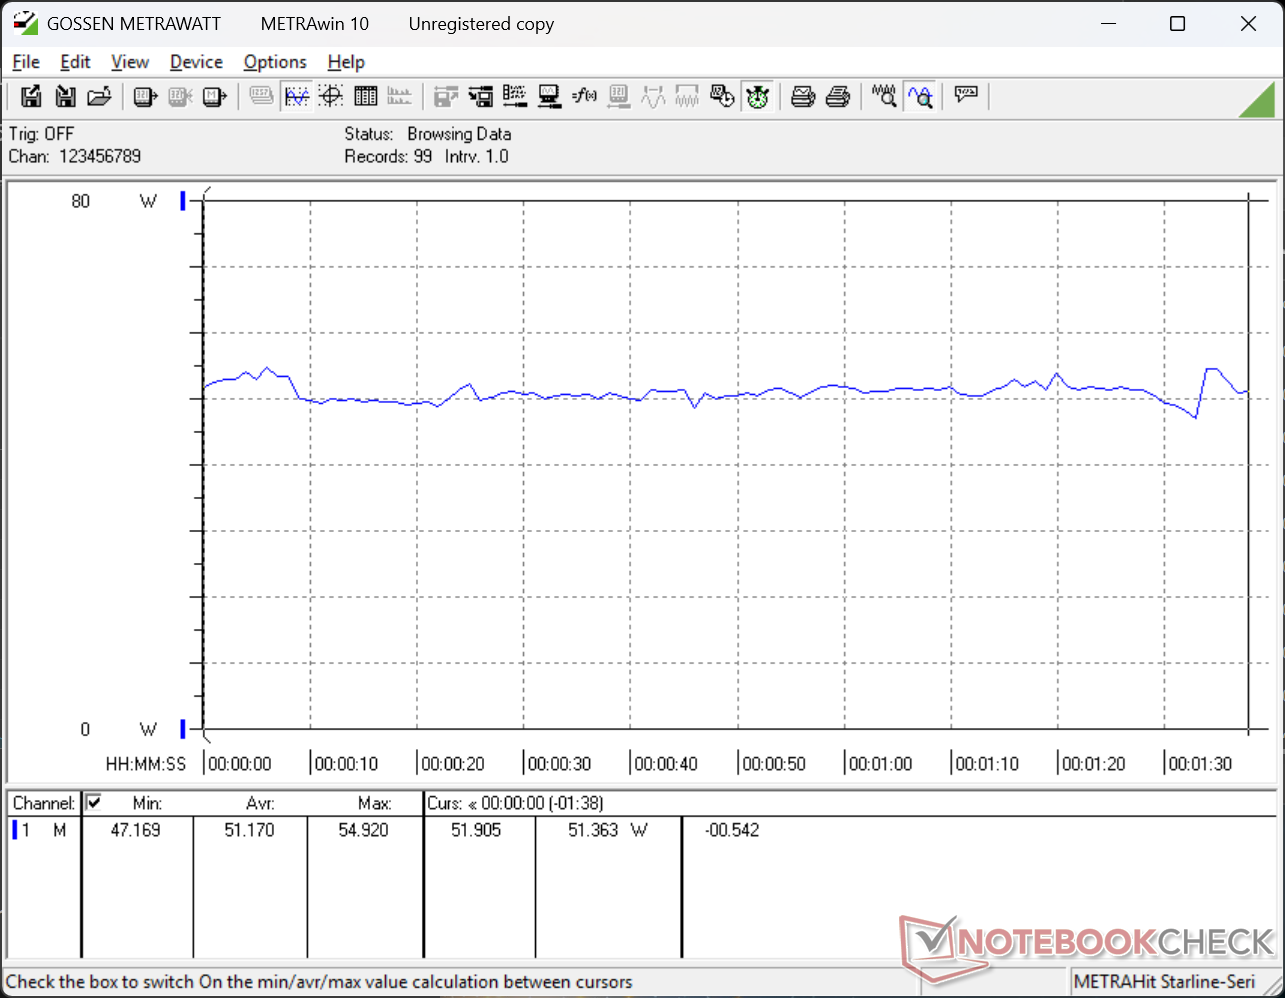
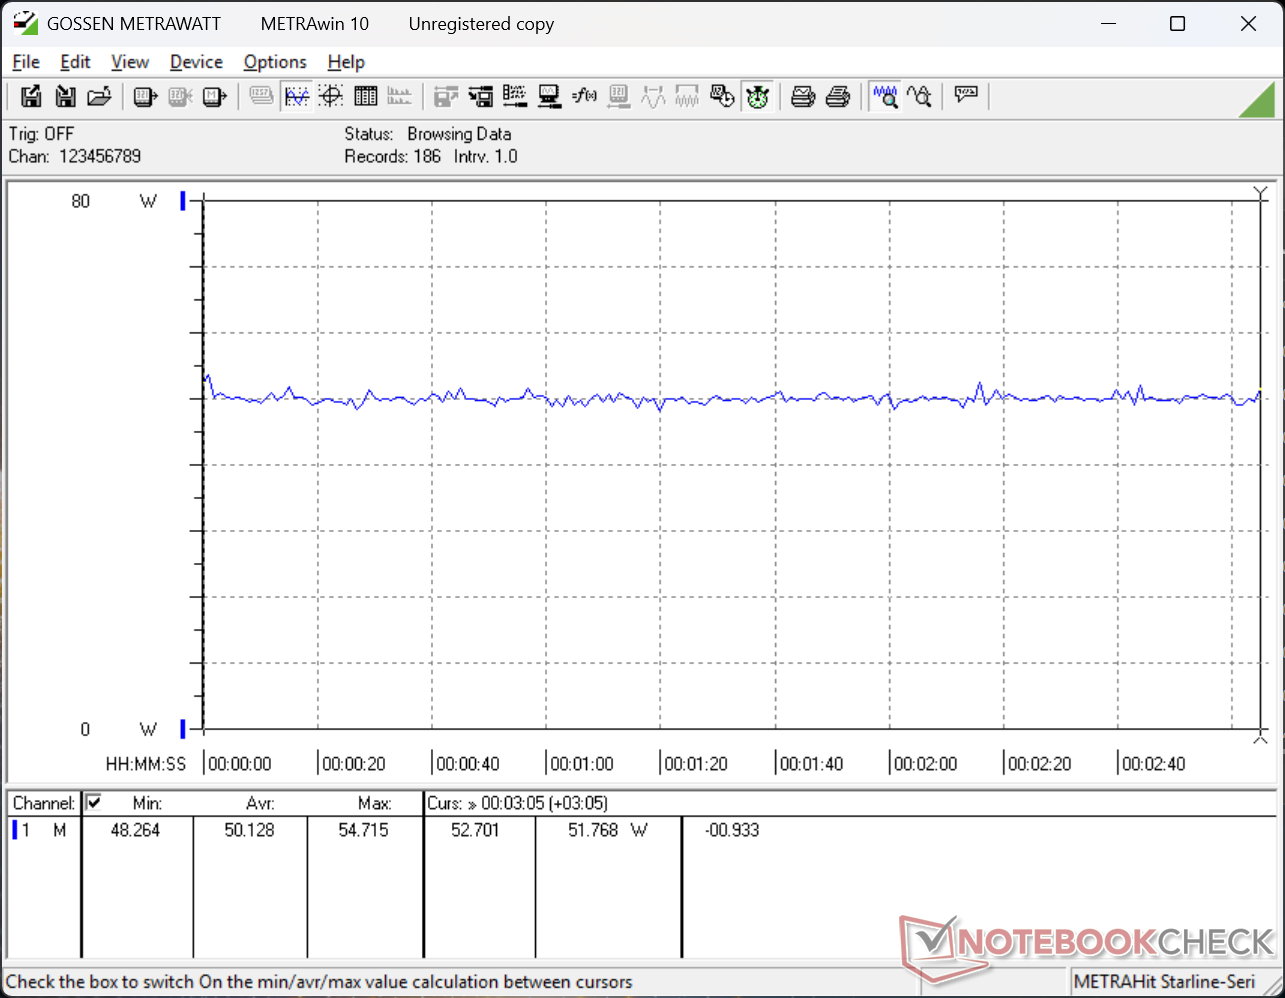
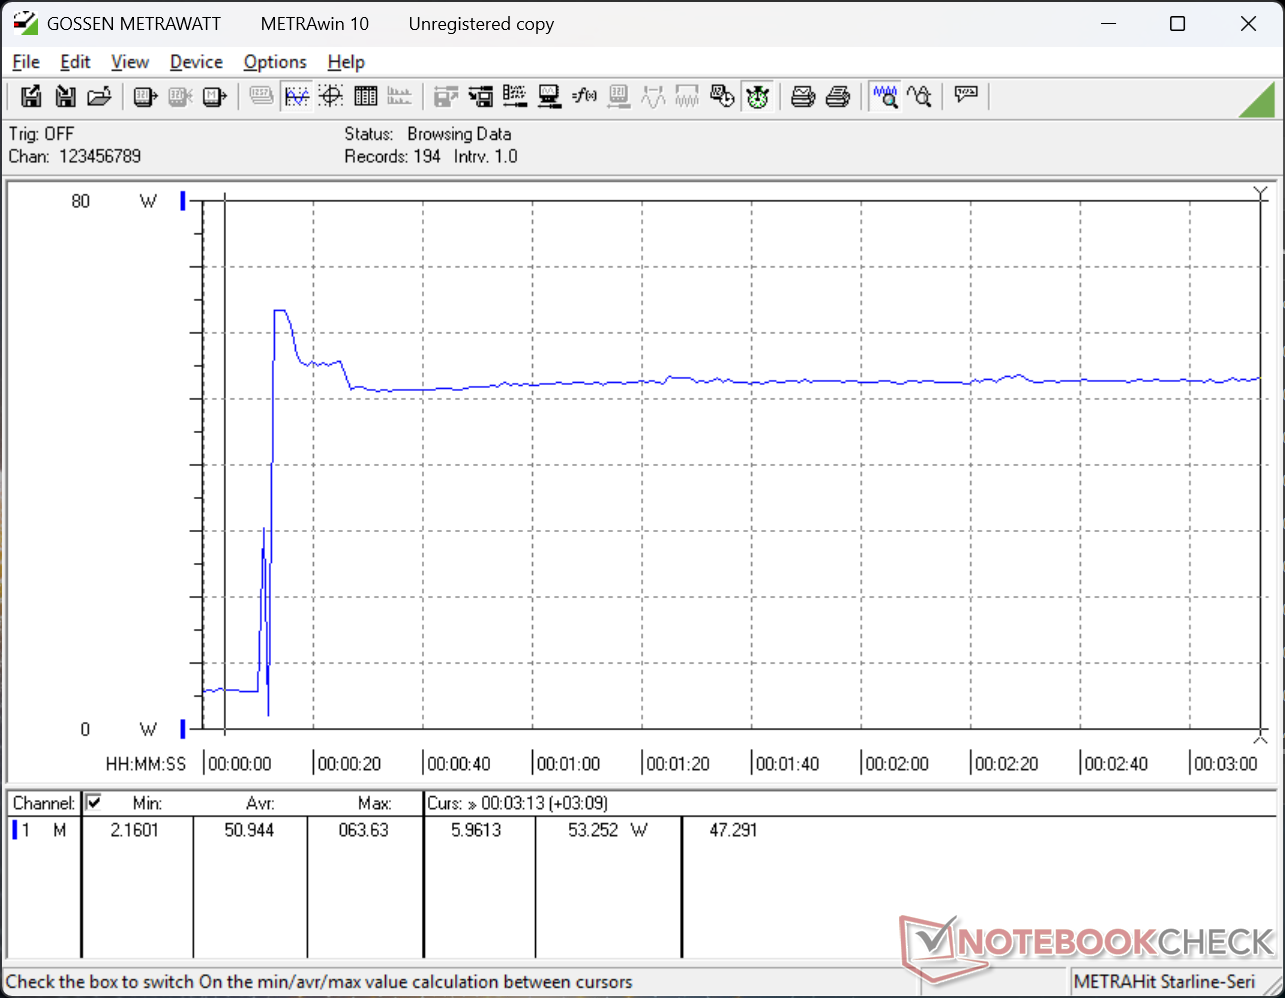
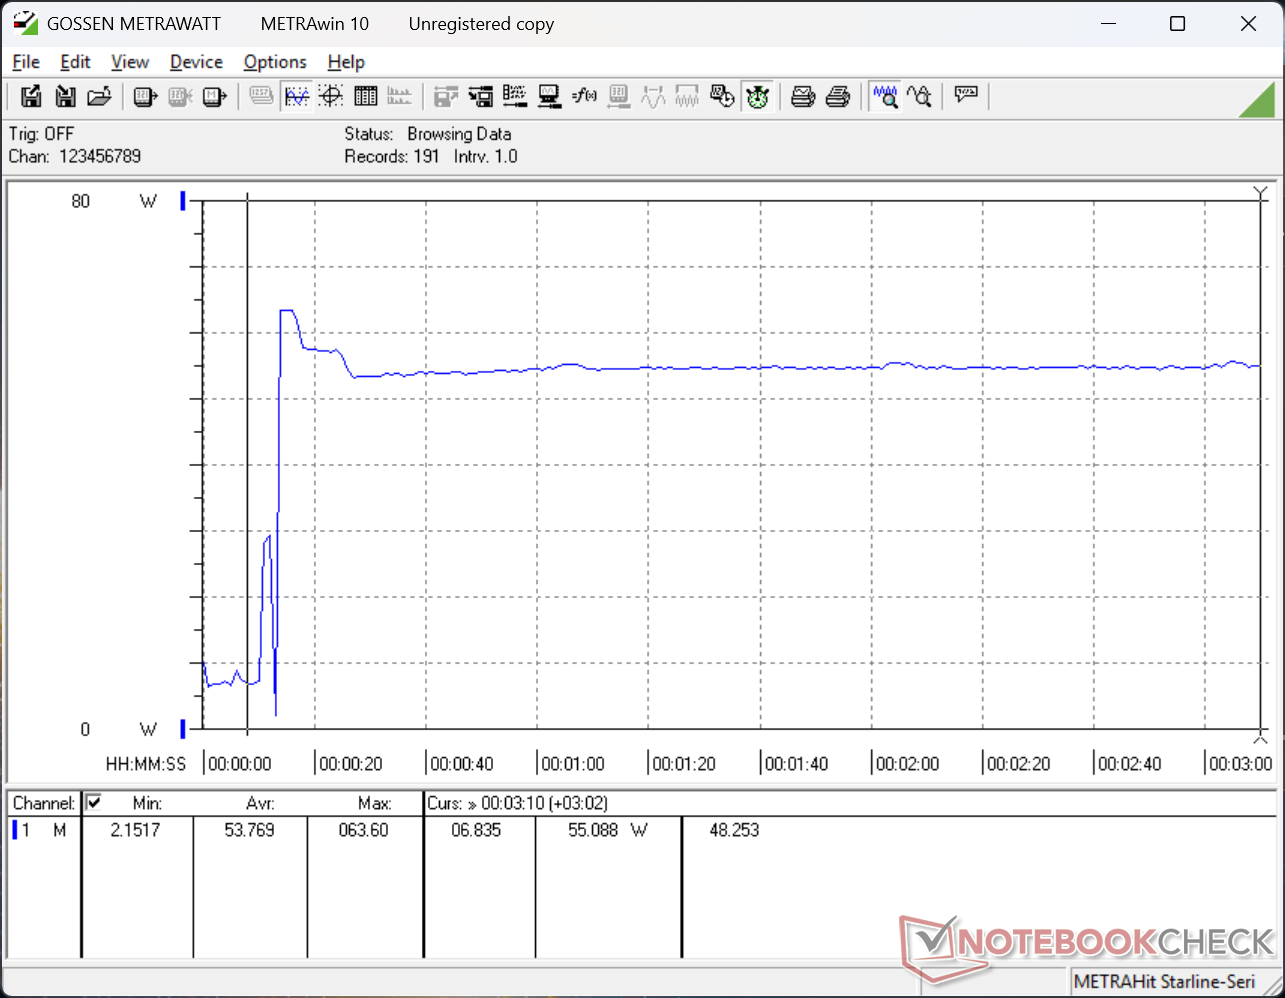
Stroomverbruik
Het verbruik kan oplopen tot meer dan 50 W bij belasting en is dus veeleisender dan Lunar Lake mini-pc's zoals de NucBox K13. Het lage tweeniveau komt echter vaker voor bij gewoon internetten of stationair draaien.
| Uit / Standby | |
| Inactief | |
| Belasting |
|
Key:
min: | |
| HP EliteBoard G1a AI Ryzen AI 5 340, Radeon 840M, , , x, | Geekom A5 Pro R5 7530U, Vega 7, Wodposit WPBSN4M8-1TGP, , x, | GMK NucBox K13 Core Ultra 7 256V, Arc 140V, Huawei eKitStor Xtreme 200e 1 TB, , x, | Asus NUC 15 Pro+ Ultra 9 285H, Arc 140T, Micron 3500 1TB MTFDKBA1T0TGD, , x, | MSI Cubi NUC AI+ 2MG Core Ultra 7 258V, Arc 140V, Phison 1 TB ESR01TBTCCZ-27J, , x, | HP Pro Mini 400 G9-937U0EA i5-14500T, UHD Graphics 770, HP PSEJN512GA87EC0, , x, | |
|---|---|---|---|---|---|---|
| Power Consumption | 33% | 39% | -32% | 9% | -22% | |
| Idle Minimum * (Watt) | 4.7 | 3.2 32% | 2.3 51% | 3.9 17% | 2.9 38% | 4.9 -4% |
| Idle Average * (Watt) | 5.4 | 4.3 20% | 3.6 33% | 6.1 -13% | 5.7 -6% | 8 -48% |
| Idle Maximum * (Watt) | 7.9 | 5.1 35% | 5.8 27% | 8.2 -4% | 10.2 -29% | 13.3 -68% |
| Load Average * (Watt) | 51.2 | 32.1 37% | 27.3 47% | 56.1 -10% | 38.7 24% | 44.6 13% |
| Cyberpunk 2077 ultra external monitor * (Watt) | 50.1 | 29.4 41% | 31.6 37% | 63.9 -28% | 41.1 18% | 49 2% |
| Load Maximum * (Watt) | 63.6 | 43.5 32% | 39.6 38% | 160.6 -153% | 60 6% | 81.3 -28% |
* ... kleiner is beter
Stroomverbruik Cyberpunk / Stresstest
Stroomverbruik externe monitor
Levensduur batterij
De kleine en optionele 32 Wh batterij kan ~8 uur constant WLAN-browsen aan wanneer deze is aangesloten op een HDMI-monitor. Bij aansluiting via USB-C met PD is de levensduur van de batterij geen probleem meer.
Notebookcheck Beoordeling
Een PC-in-a-keyboard, perfect voor kleinere werkruimtes of terminals waar een traditionele PC-toren overkill kan zijn. Het USB-C-only systeem is echter sterk afhankelijk van adapters.
HP EliteBoard G1a AI
- 05-05-2026 v8
Allen Ngo
 Total Sustainability Score:
 Potentiële concurrenten in vergelijking
Afbeelding | Model / recensie | prijs | Gewicht | Hoogte | Scherm |
|---|---|---|---|---|---|
1. 75.6%  | HP EliteBoard G1a AI AMD Ryzen AI 5 PRO 340 ⎘ AMD Radeon 840M ⎘ 32 GB Geheugen | Amazon: 1. $1,593.78 HP EliteBoard G1a Next Gen A... 2. HP EliteBoard G1a Next Gen A... 3. $1,964.80 HP EliteBook 6 G1a 16" Noteb... Catalogusprijs: 1800 USD | 771 g | 17.9 mm | x |
2. 72.6% 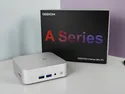 | Geekom A5 Pro AMD Ryzen 5 7530U ⎘ AMD Radeon RX Vega 7 ⎘ 16 GB Geheugen, 1024 GB SSD | Amazon: Catalogusprijs: 619€ | 423 g | 37 mm | x |
3. 77.4% 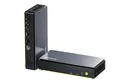 | GMK NucBox K13 Intel Core Ultra 7 256V ⎘ Intel Arc Graphics 140V ⎘ 16 GB Geheugen, 1000 GB SSD | Amazon: Catalogusprijs: 670 USD | 506 g | 36.6 mm | x |
4. 77.5% 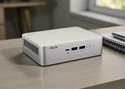 | Asus NUC 15 Pro+ Intel Core Ultra 9 285H ⎘ Intel Arc Graphics 140T ⎘ 32 GB Geheugen, 1024 GB SSD | Amazon: $1,642.00 Catalogusprijs: 991€ | 690 g | 42 mm | x |
5. 75.2% 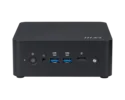 | MSI Cubi NUC AI+ 2MG Intel Core Ultra 7 258V ⎘ Intel Arc Graphics 140V ⎘ 32 GB Geheugen, 1000 GB SSD | Amazon: Catalogusprijs: 900 USD | 669 g | 50.1 mm | x |
6. 70.8% 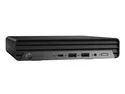 | HP Pro Mini 400 G9-937U0EA Intel Core i5-14500T ⎘ Intel UHD Graphics 770 ⎘ 16 GB Geheugen, 512 GB SSD | Amazon: 1. $399.99 HP Pro 400 G9 Mini PC Deskto... 2. $699.00 HP Pro Mini 400 G9 Tiny Desk... 3. $499.99 HP Pro 400 G9 Mini PC Deskto... Catalogusprijs: 870€ | 1.2 kg | 34 mm | x |
Transparantie
De selectie van te beoordelen apparaten wordt gemaakt door onze redactie. Het testexemplaar werd ten behoeve van deze beoordeling door de fabrikant of detailhandelaar in bruikleen aan de auteur verstrekt. De kredietverstrekker had geen invloed op deze recensie, noch ontving de fabrikant vóór publicatie een exemplaar van deze recensie. Er bestond geen verplichting om deze recensie te publiceren. Als onafhankelijk mediabedrijf is Notebookcheck niet onderworpen aan het gezag van fabrikanten, detailhandelaren of uitgevers.
[transparency_disclaimer]Dit is hoe Notebookcheck test
Elk jaar beoordeelt Notebookcheck onafhankelijk honderden laptops en smartphones met behulp van gestandaardiseerde procedures om ervoor te zorgen dat alle resultaten vergelijkbaar zijn. We hebben onze testmethoden al zo'n 20 jaar voortdurend ontwikkeld en daarbij de industriestandaard bepaald. In onze testlaboratoria wordt gebruik gemaakt van hoogwaardige meetapparatuur door ervaren technici en redacteuren. Deze tests omvatten een validatieproces in meerdere fasen. Ons complexe beoordelingssysteem is gebaseerd op honderden goed onderbouwde metingen en benchmarks, waardoor de objectiviteit behouden blijft. Meer informatie over onze testmethoden kunt u hier vinden.

