Acer Predator Orion 3000 desktop PC met Core i7-12700F en RTX 3070 in review
")
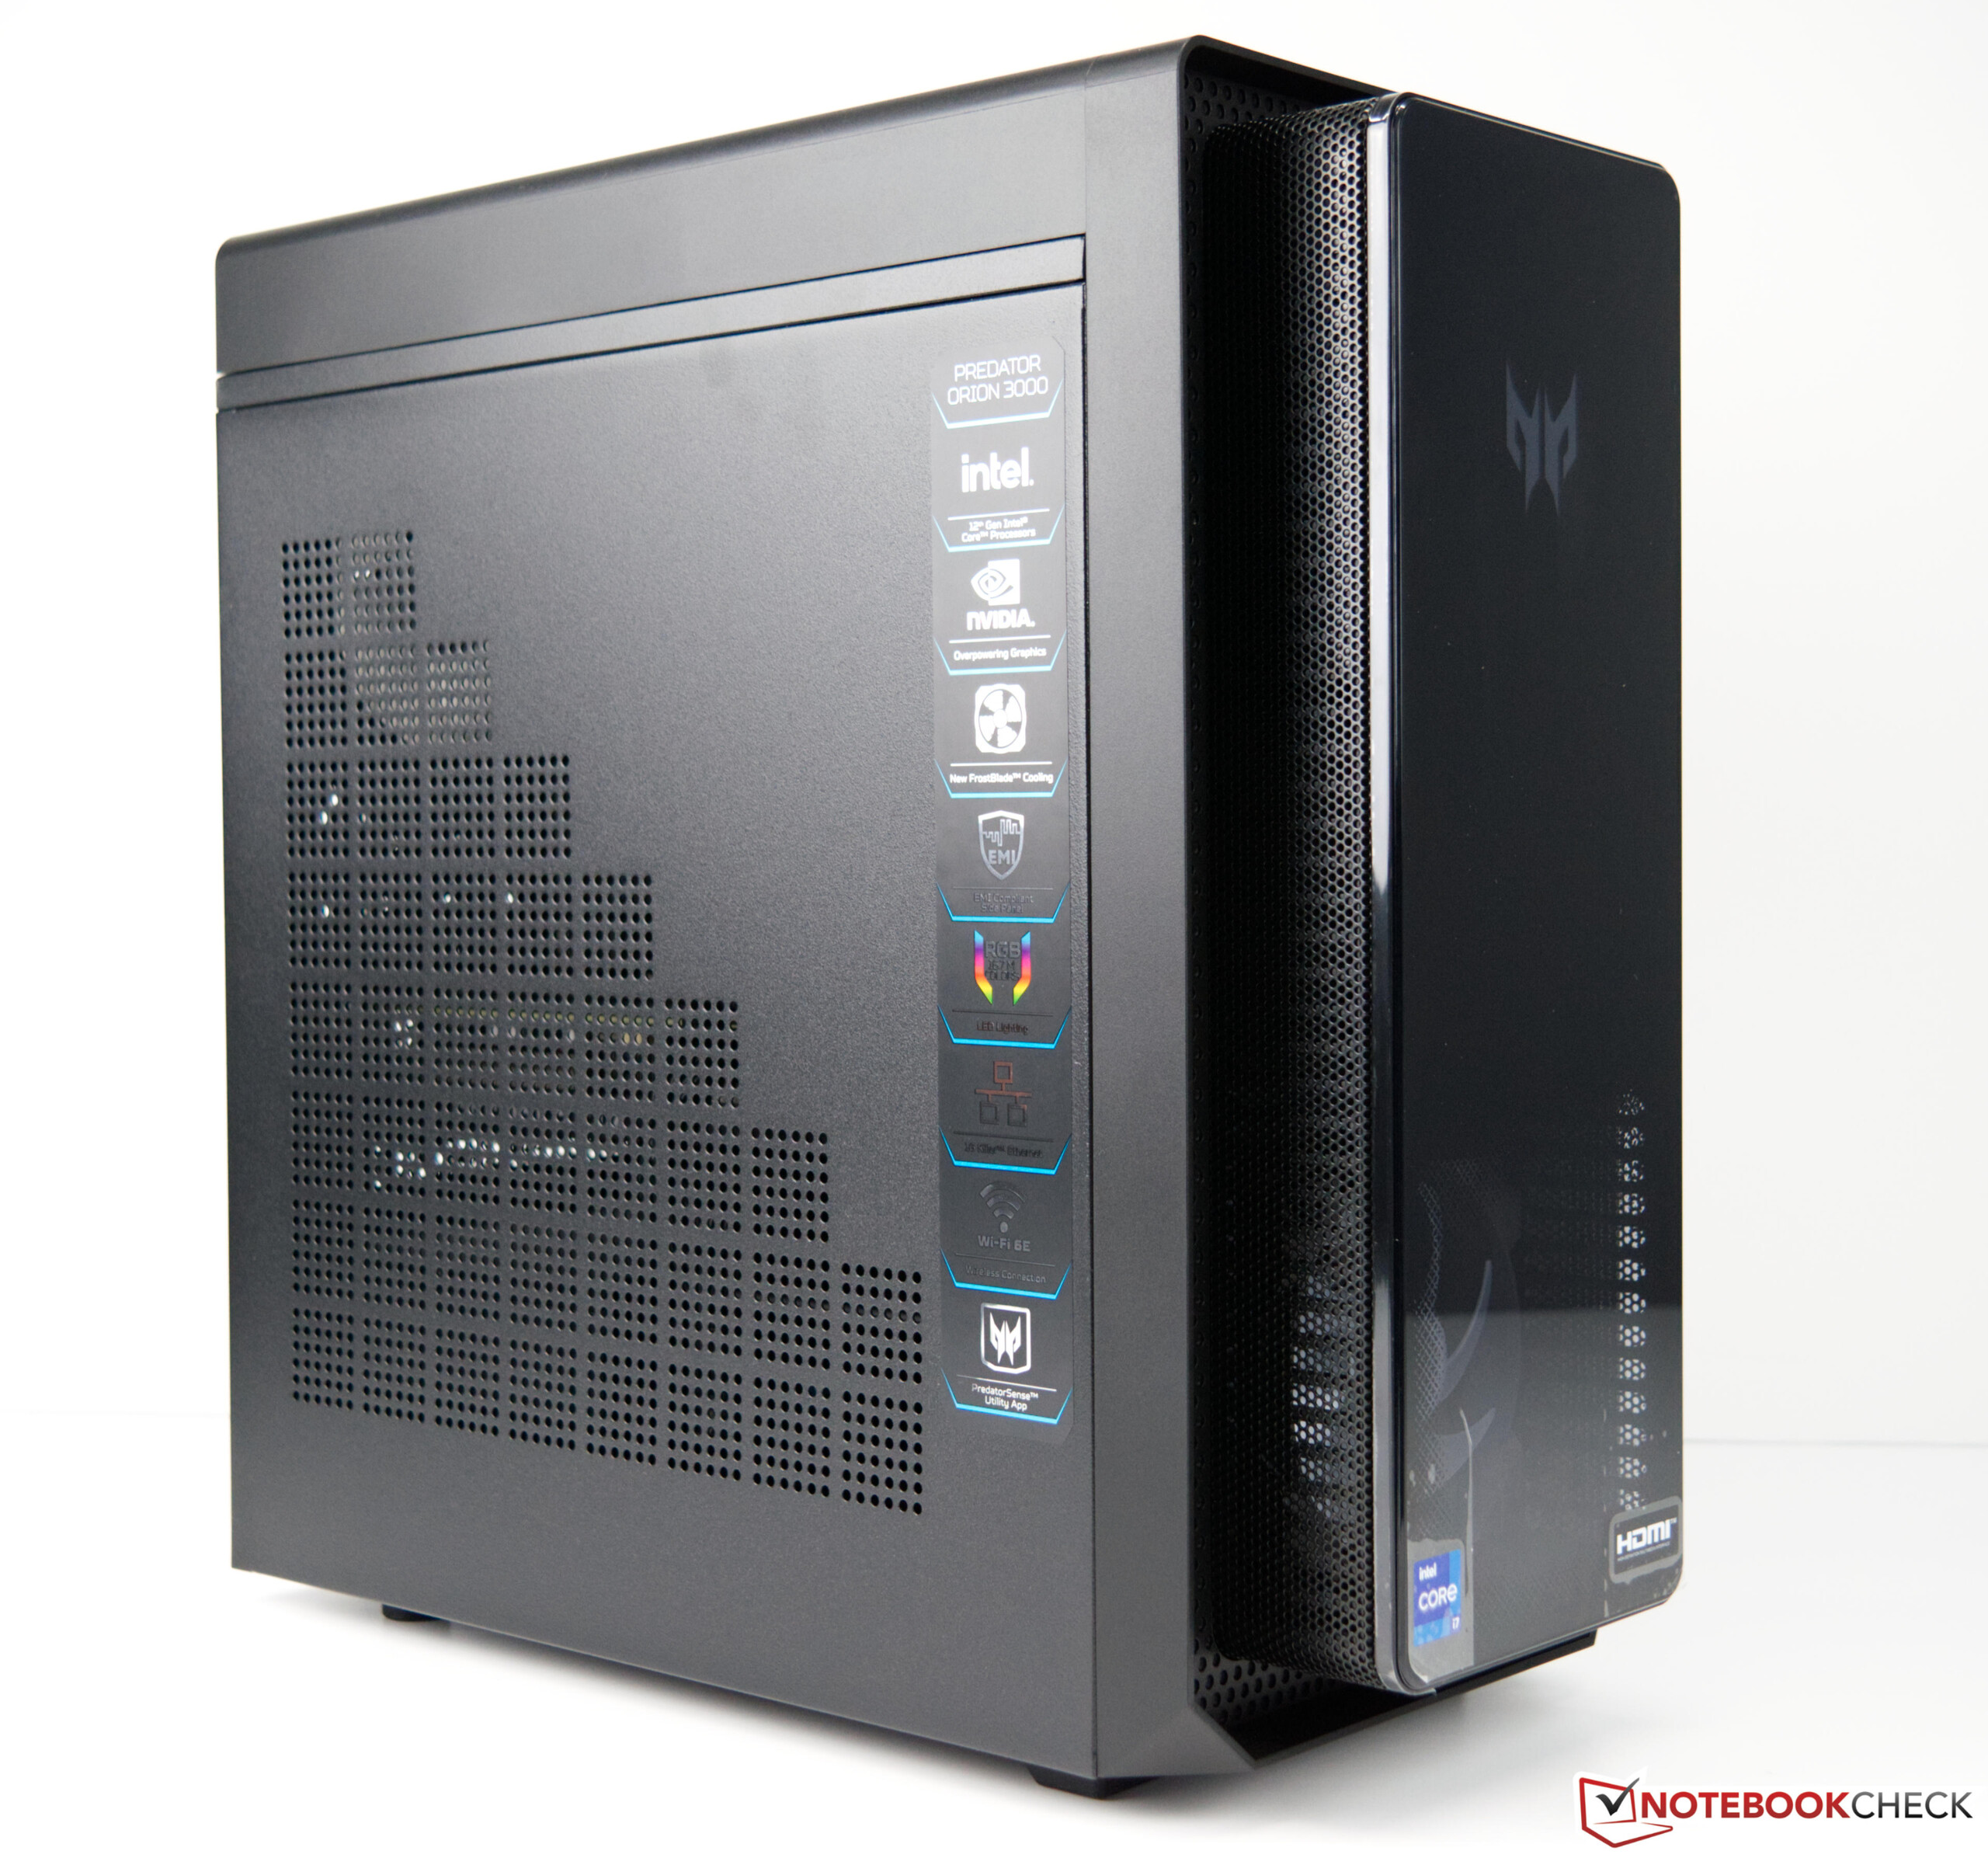
De Predator-serie van Acer bestaat al vele jaren en is vooral gericht op gamers. Er zijn verschillende modellen met deze benaming voor zowel laptops als desktop pc's. Met de huidige Predator Orion 3000 geeft de fabrikant niet alleen een update van het product, maar gebruikt hij ook een nieuwe behuizing ten opzichte van de oudere generatie.
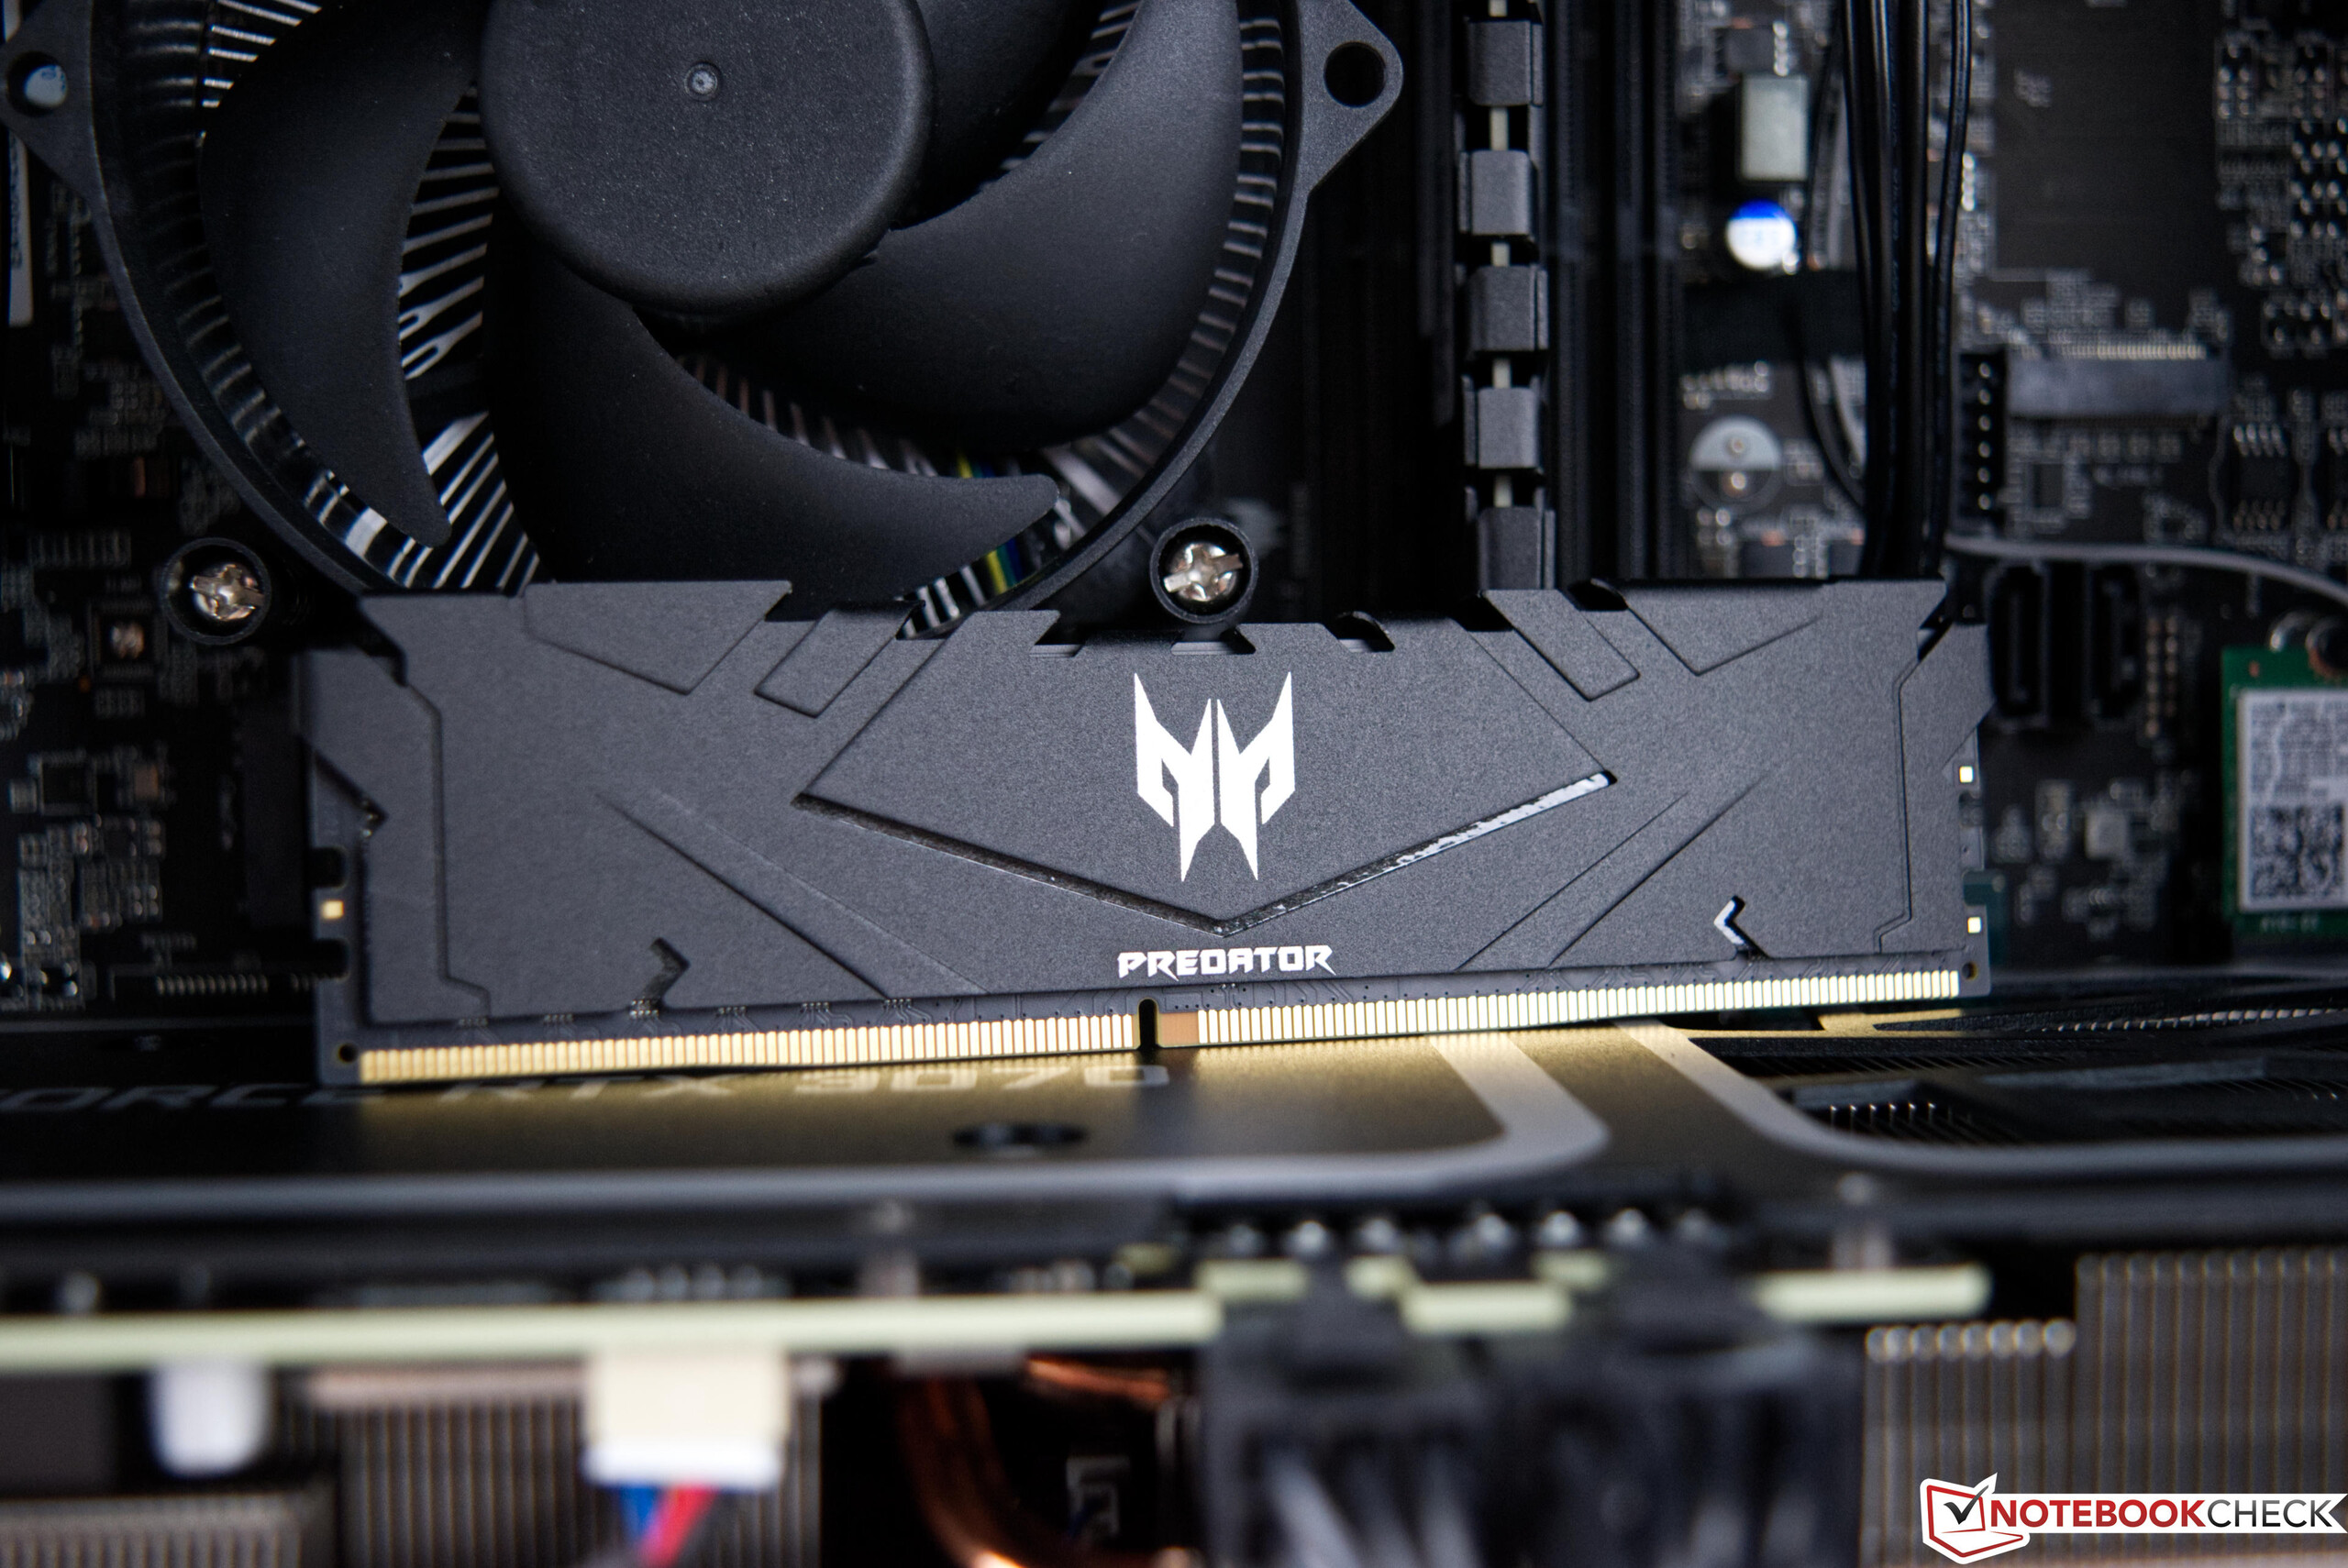
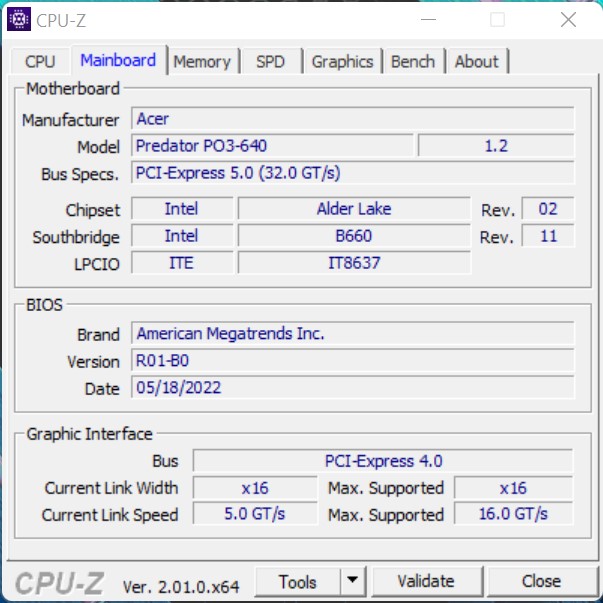
Als basis wordt steeds een Intel Core i7-12700 of een Intel Core i7-12700F gebruikt (Intel Core i7-12700F in ons voorbeeld). Er zijn echter verschillende modellen qua GPU-configuratie, hoewel deGeForce RTX 3070het topmodel in deze serie is. Qua werkgeheugen wordt altijd DDR4 RAM gebruikt. Toch kun je kiezen tussen 16 GB of 32 GB, afhankelijk van je budget. Hetzelfde geldt voor de opslag, die in ons systeem met 1 TB het minimum is dat Acer aanbiedt in de huidige Predator Orion 3000.
Potentiële concurrenten in vergelijking
Evaluatie | Datum | Model | Gewicht | Hoogte | Beste prijs |
|---|---|---|---|---|---|
v7 (old) | 09-2022 | Acer Predator Orion 3000 PO3-640 i7-12700F, GeForce RTX 3070 | 7.4 kg | 377 mm | |
v (old) | 12-2021 | Intel Beast Canyon NUC i9-11900KB, GeForce RTX 3060 | 189 mm | ||
v (old) | 06-2021 | Zotac Magnus One (ECM73070C) i7-10700, GeForce RTX 3070 | |||
v (old) | 05-2022 | Zotac ZBOX Magnus EN173070C i7-11800H, GeForce RTX 3070 Laptop GPU | 1.8 kg | 62.2 mm | |
v (old) | 04-2022 | Intel Dragon Canyon NUC - RTX 3060 i9-12900, GeForce RTX 3060 | 189 mm | ||
v (old) | 06-2020 | Zotac MEK Mini (RTX 2070 Super) i7-9700, GeForce RTX 2070 Super (Desktop) |
Acer Predator Orion 3000 PO3-640 in detail
Zaak
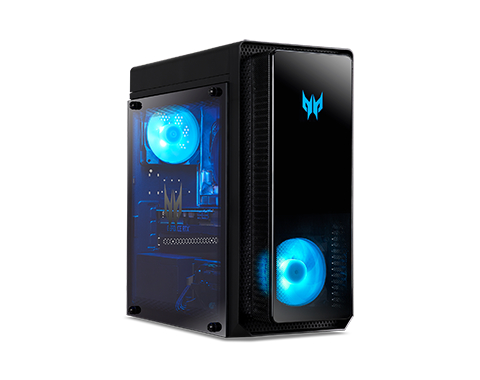
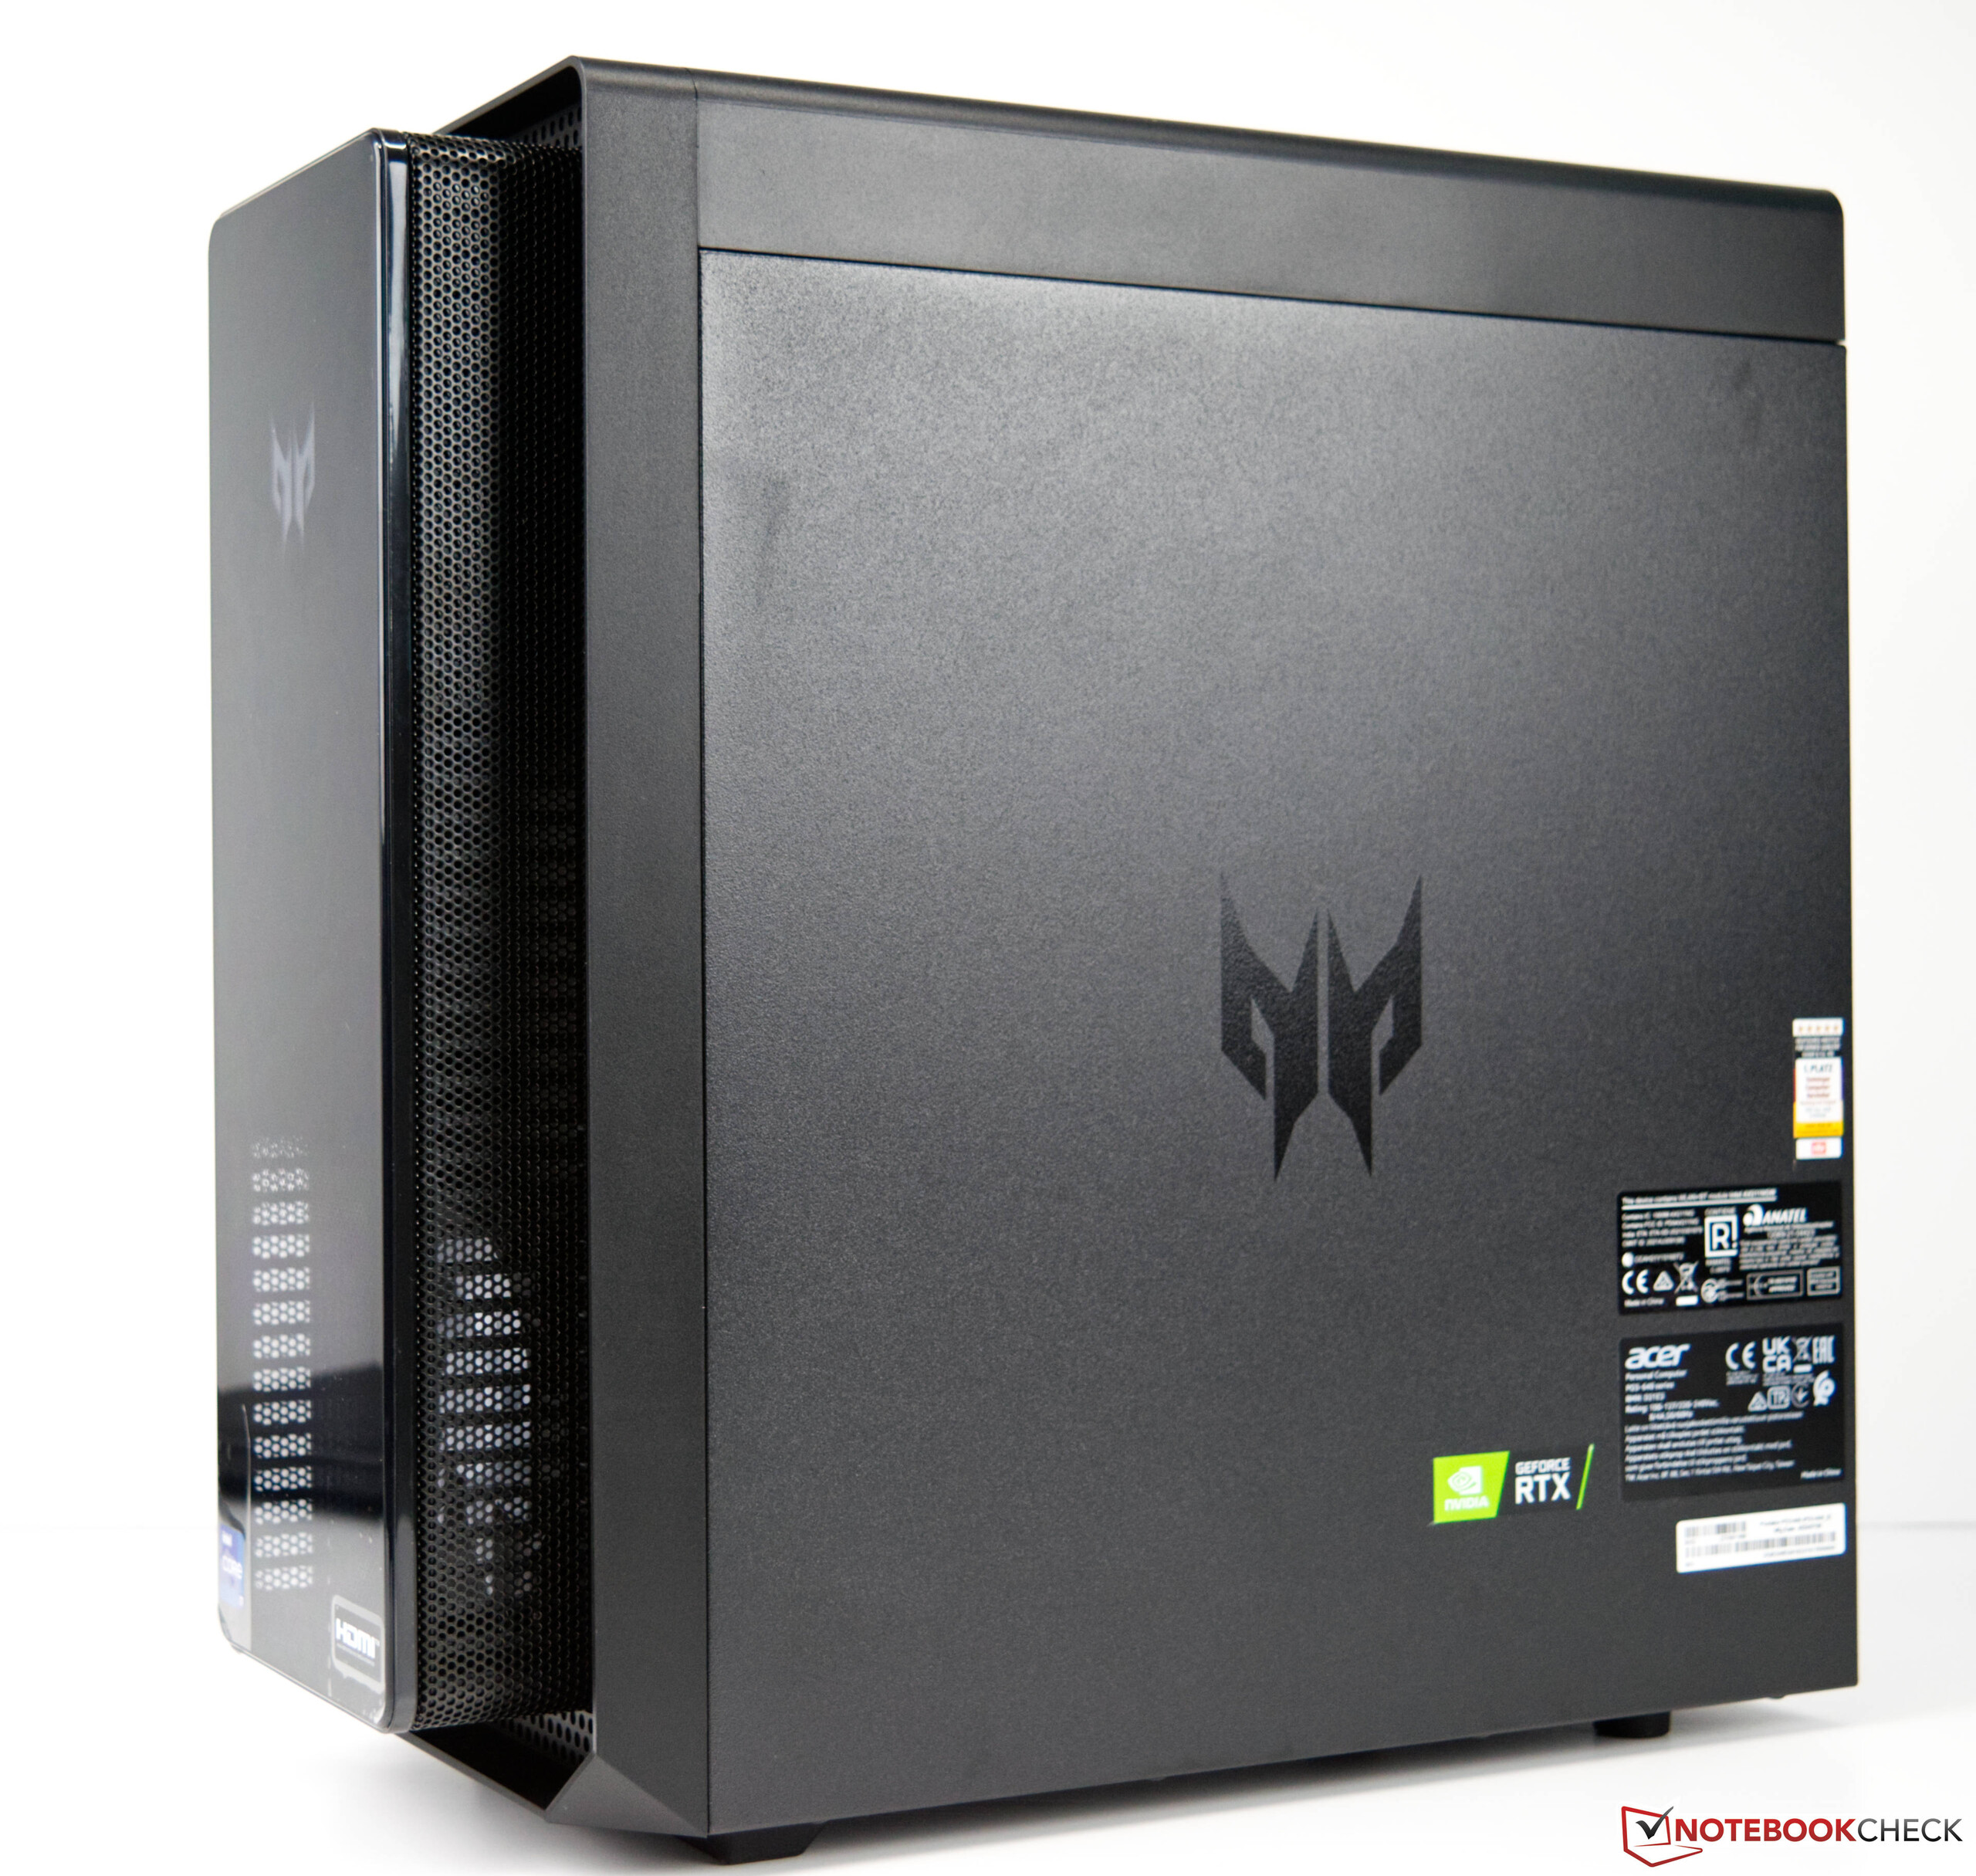
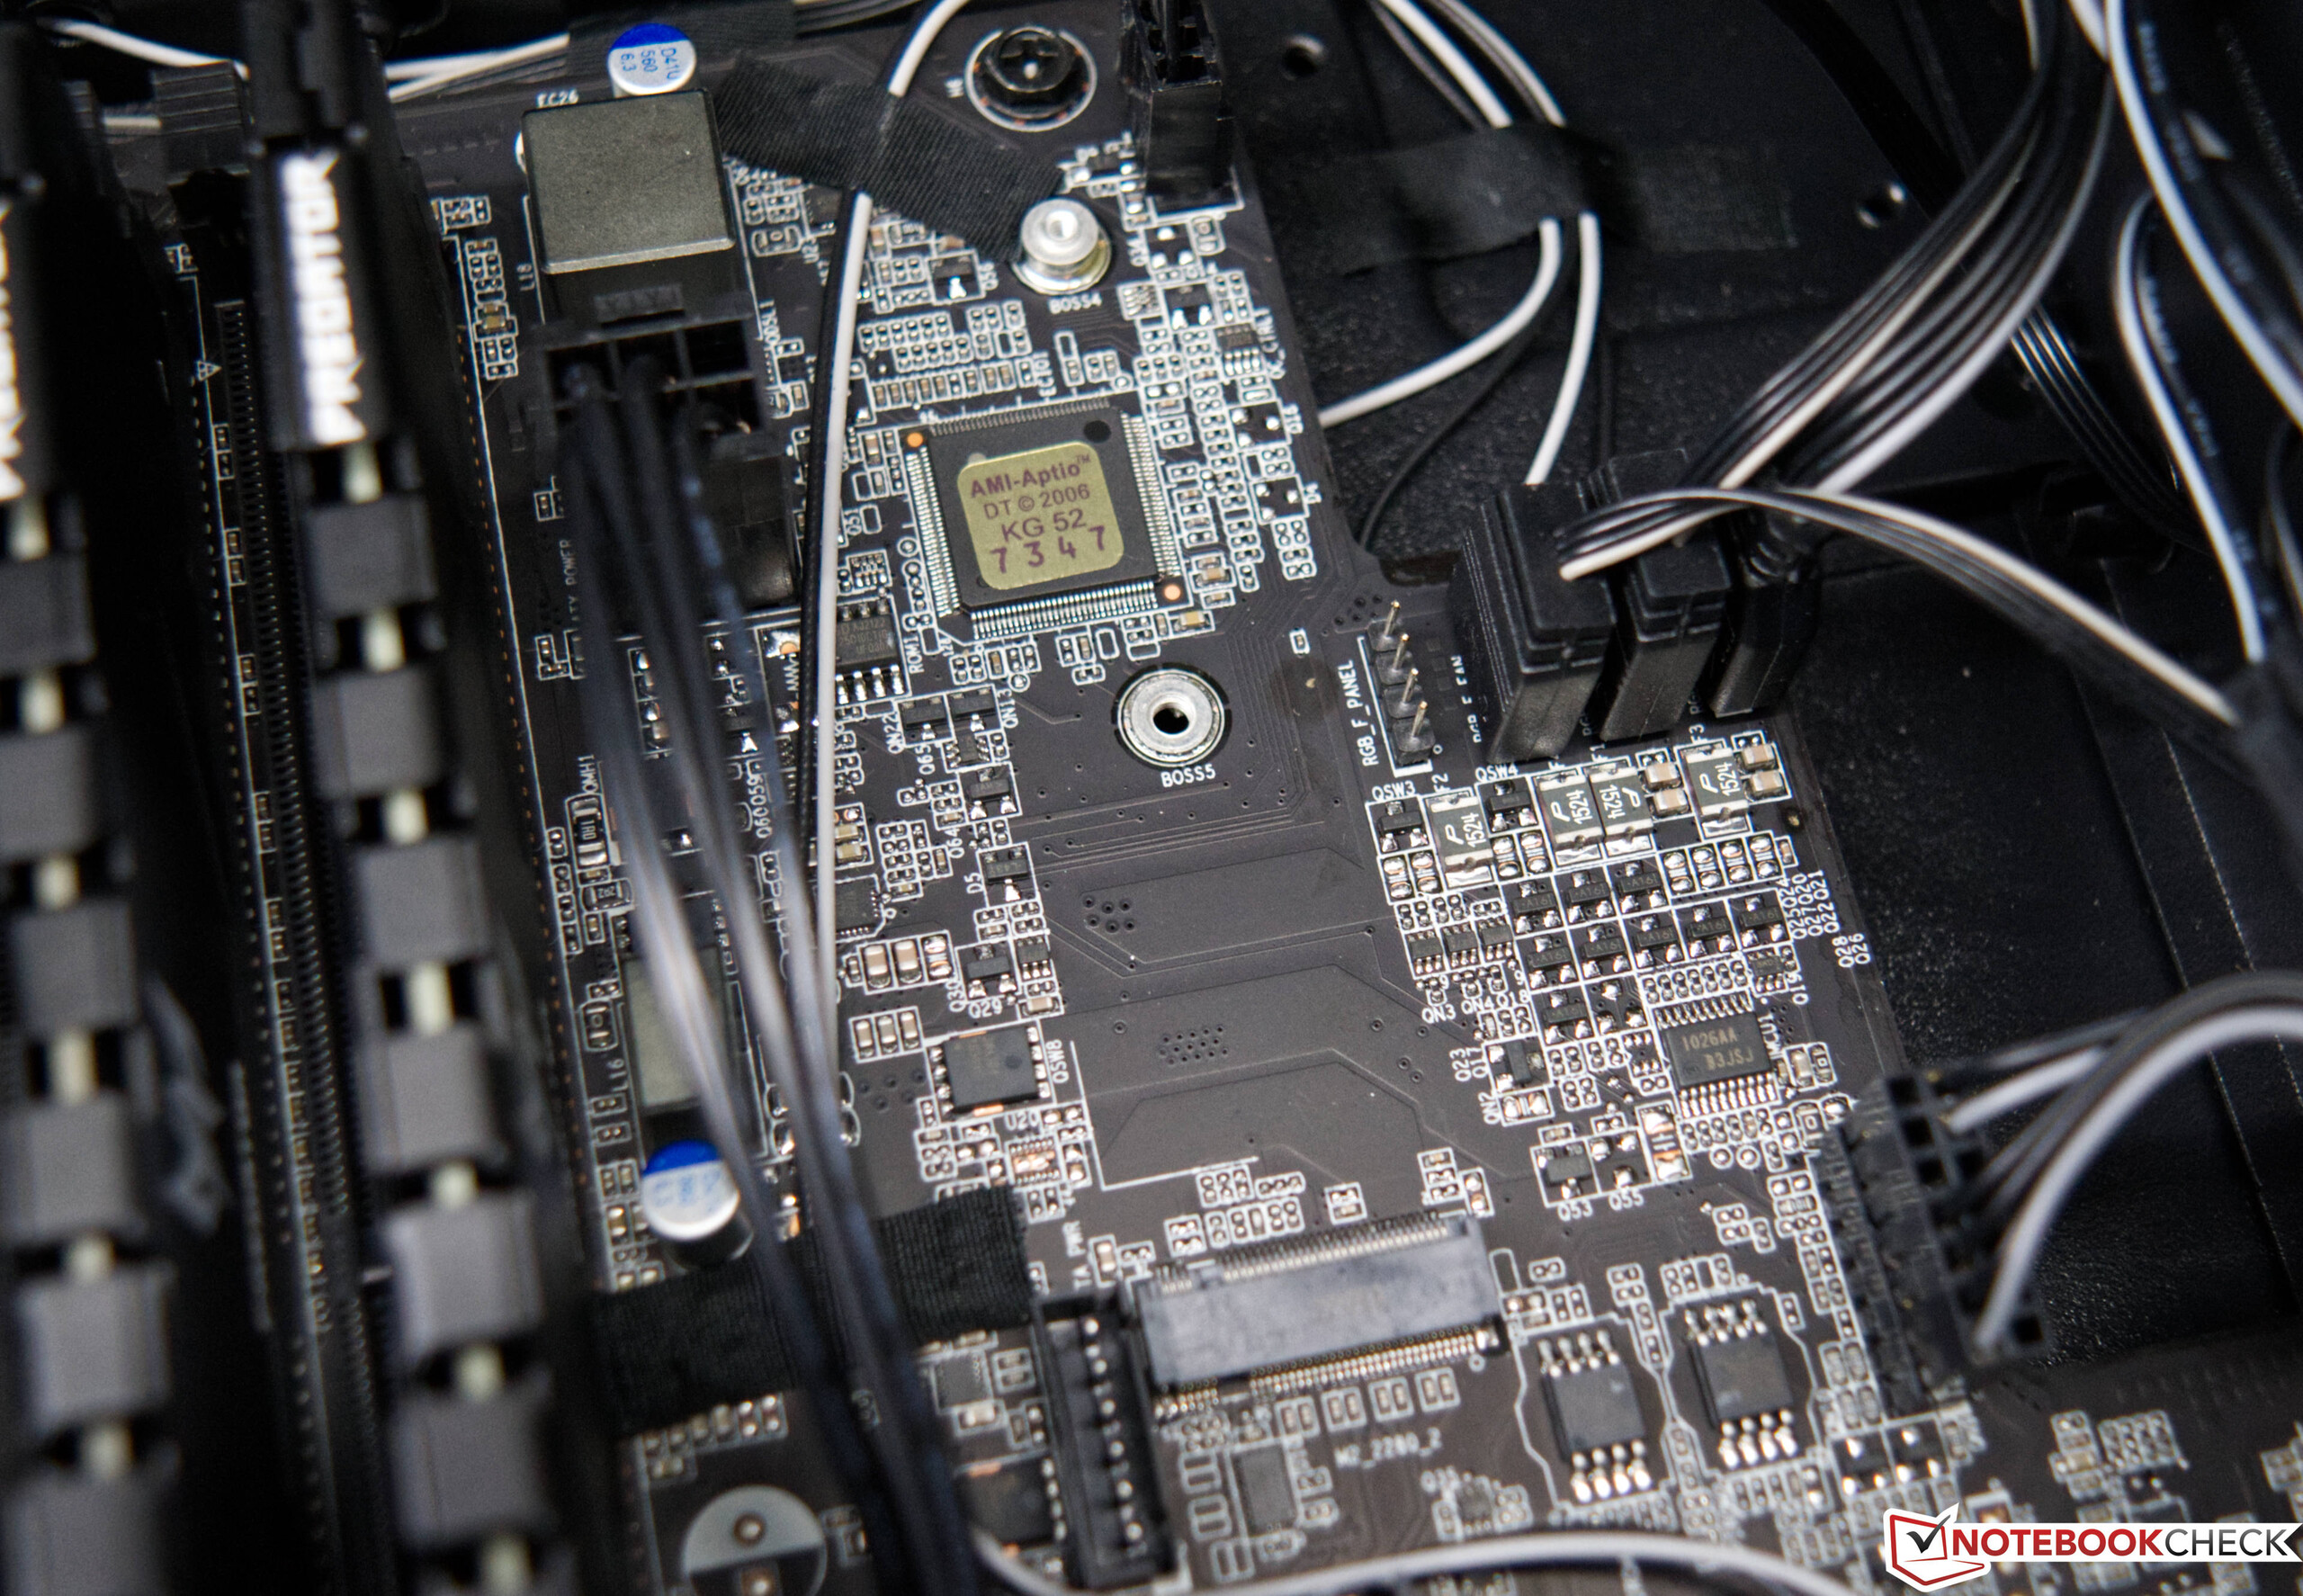
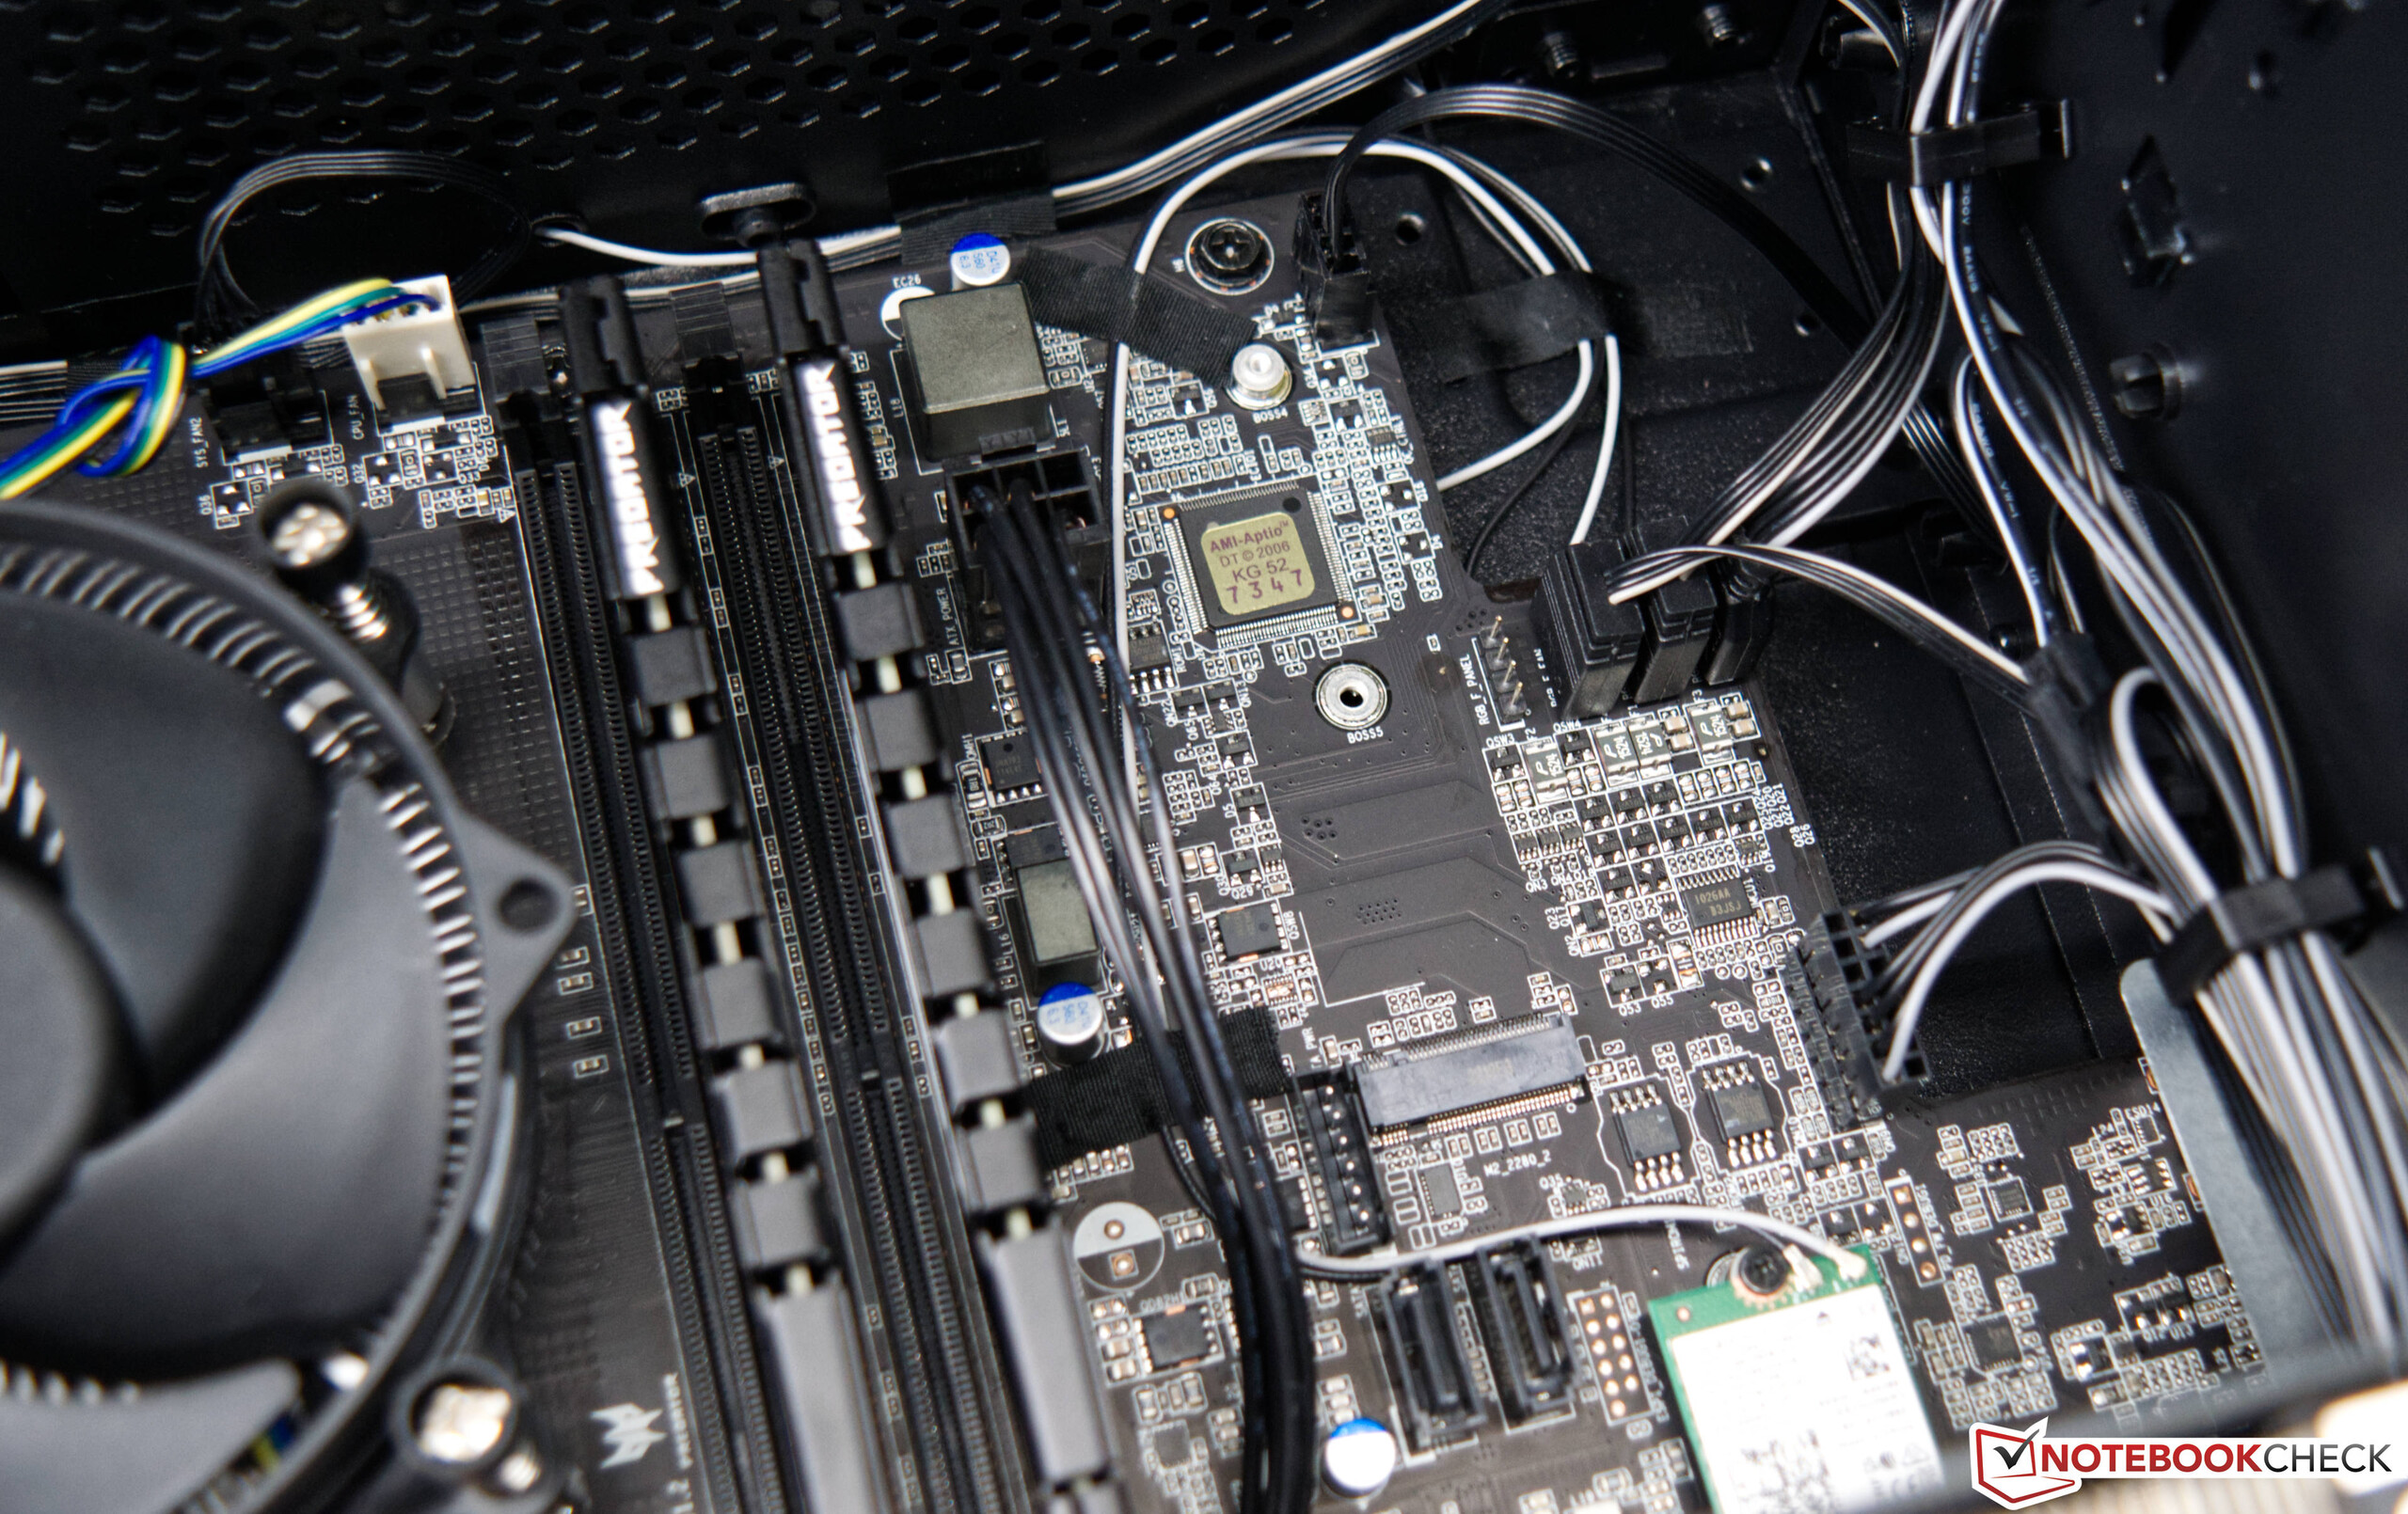
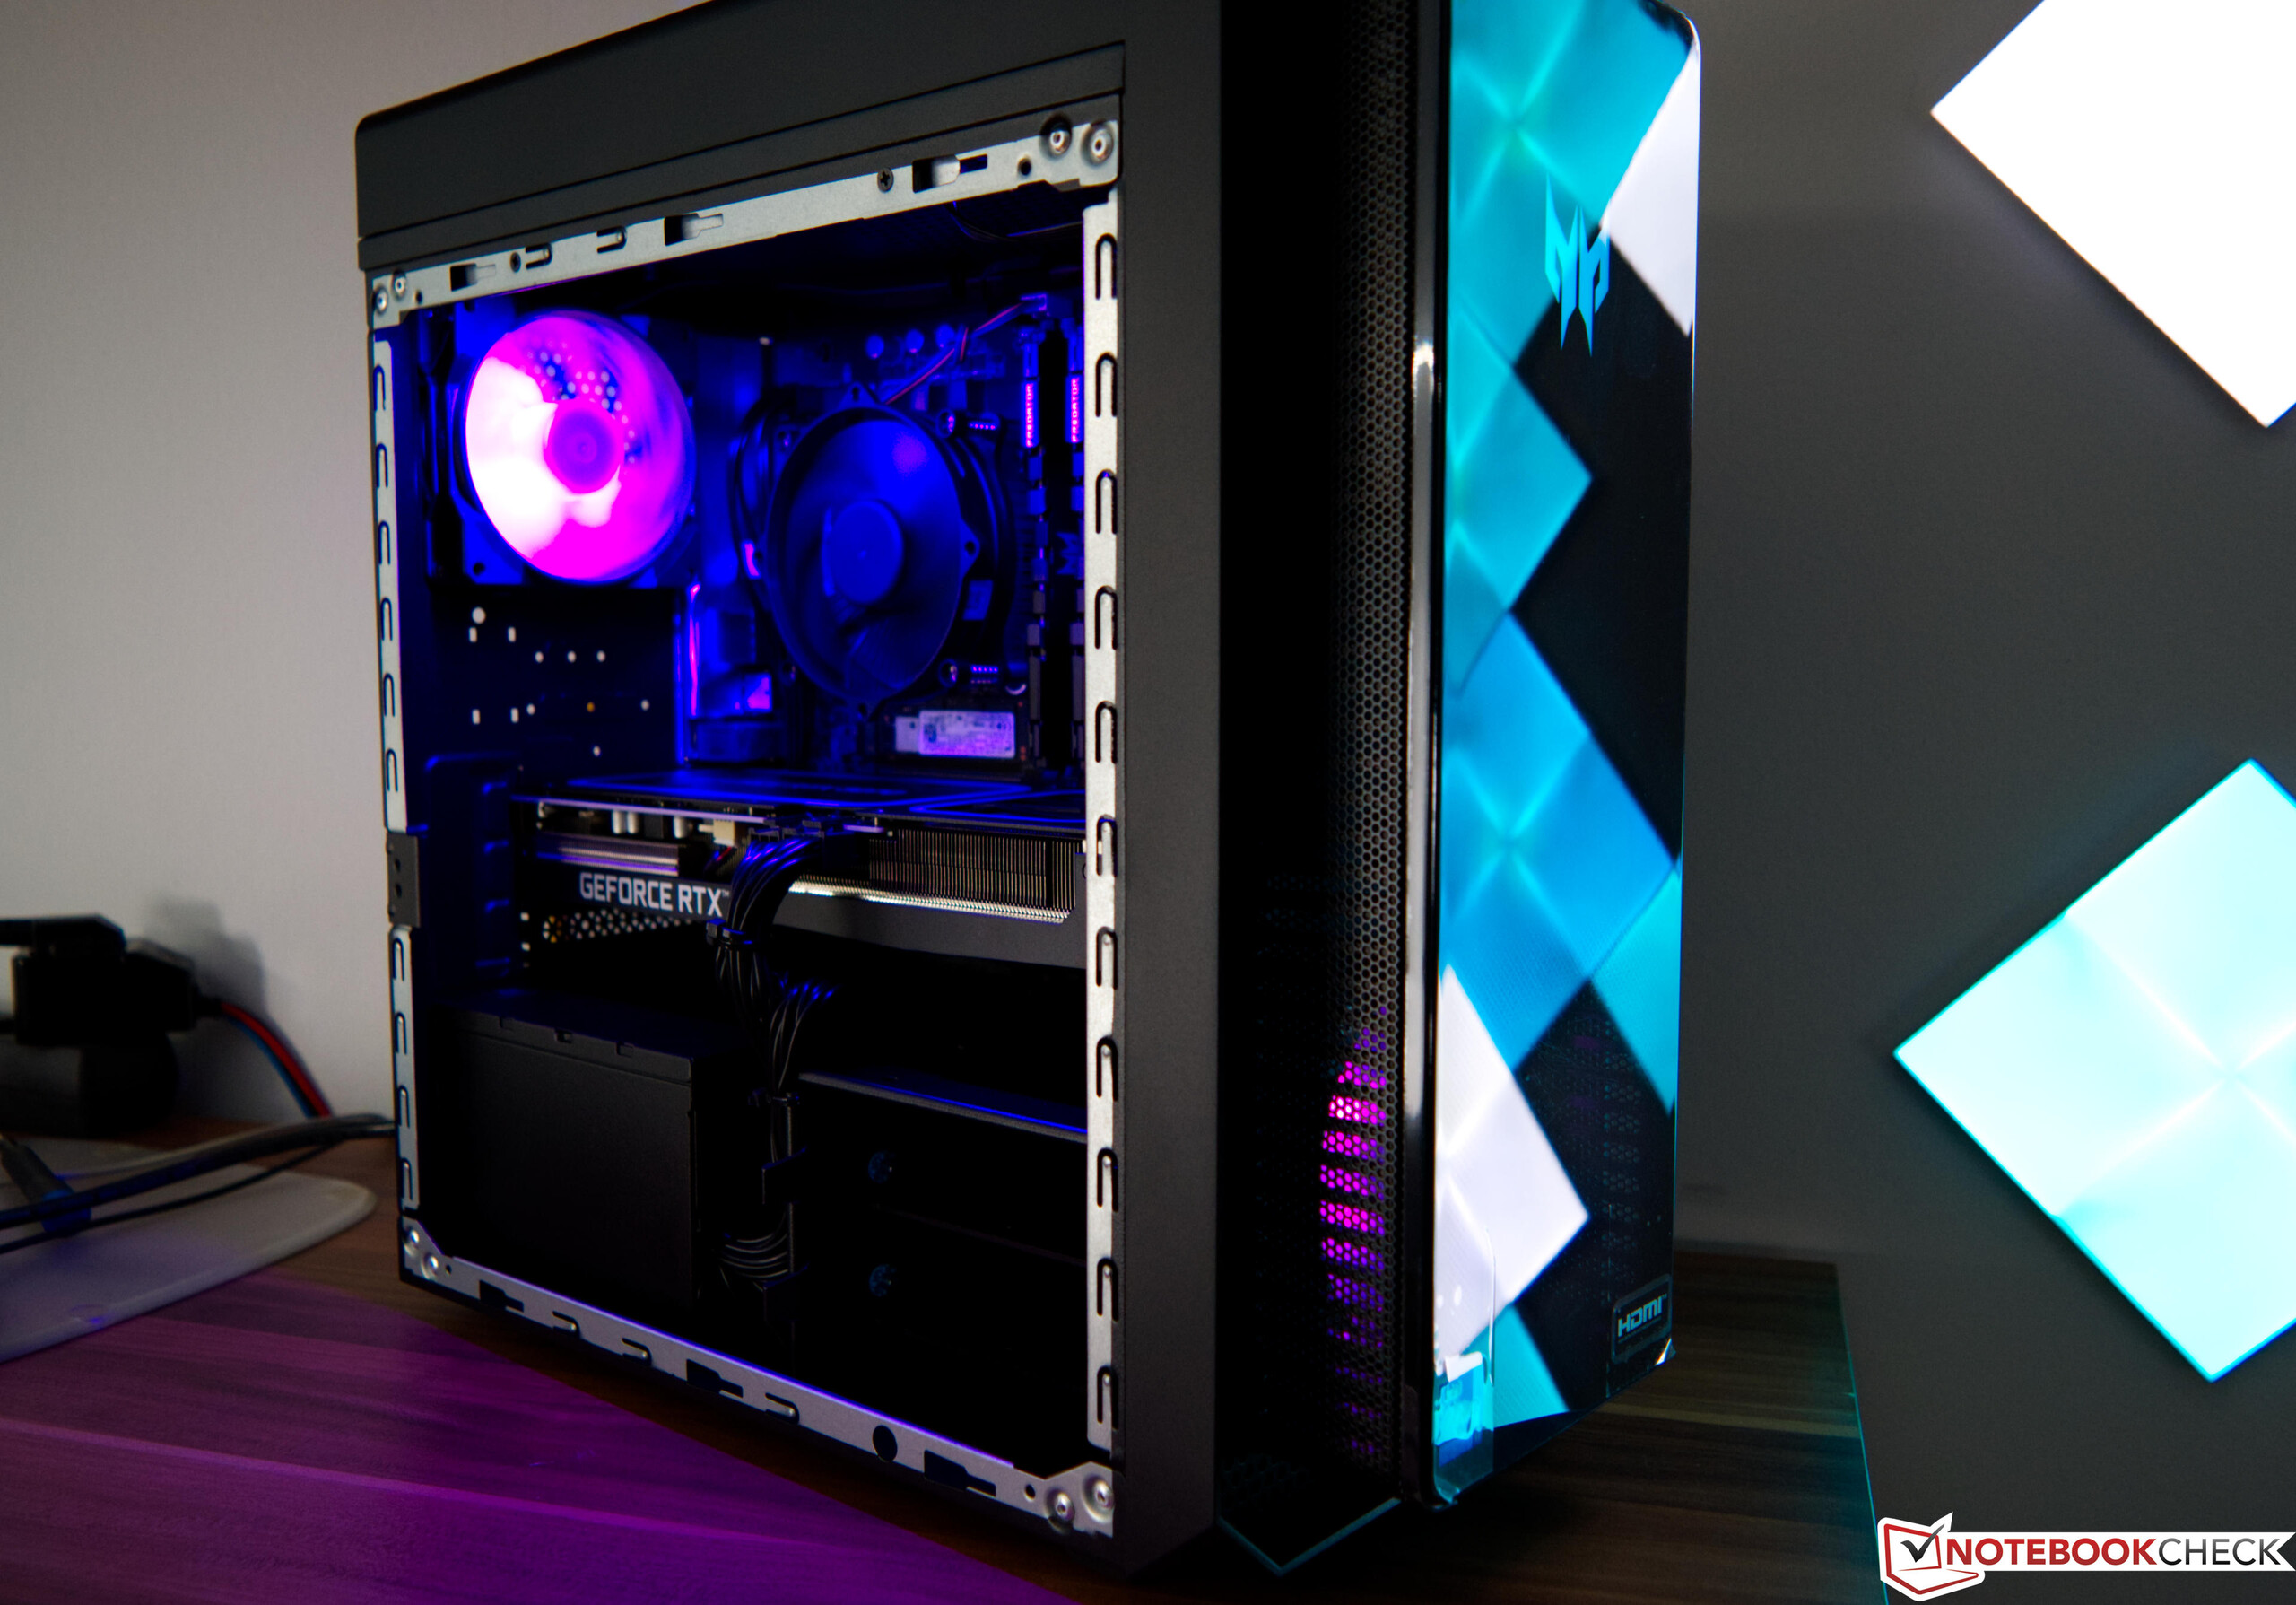
De behuizing van de Acer Predator Orion 3000 PO3-640 ziet er op het eerste gezicht uit als een standaard ATX-behuizing. De fabrikant wijkt hier echter af van de standaard omdat de frontconnectoren direct op het moederbord zitten en niet via een kabel met het moederbord zijn verbonden. Met dergelijke constructies is het vervangen van het moederbord bijna onmogelijk. Andere fabrikanten gaan echter soortgelijke wegen en installeren propriëtaire moederborden in propriëtaire kasten. De behuizing is goed vervaardigd, hoewel het uiterlijk echt een kwestie van smaak is. De levering omvat ook een zijpaneel met een kijkvenster om de geïnstalleerde componenten beter te laten zien. Vanwege de toch al zeer beperkte luchtstroom hebben we er echter van afgezien om het optisch chique zijpaneel tijdens de test te gebruiken. Het metalen deksel biedt tenminste een paar gaten om de frisse lucht aan te zuigen.
Apparatuur
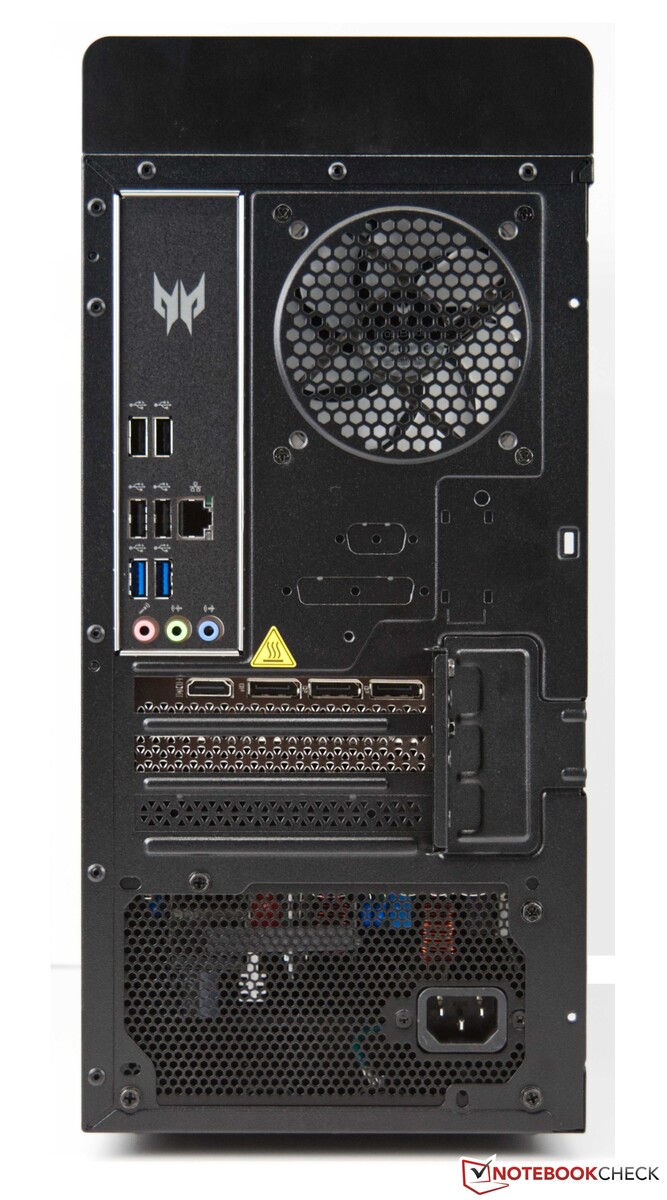
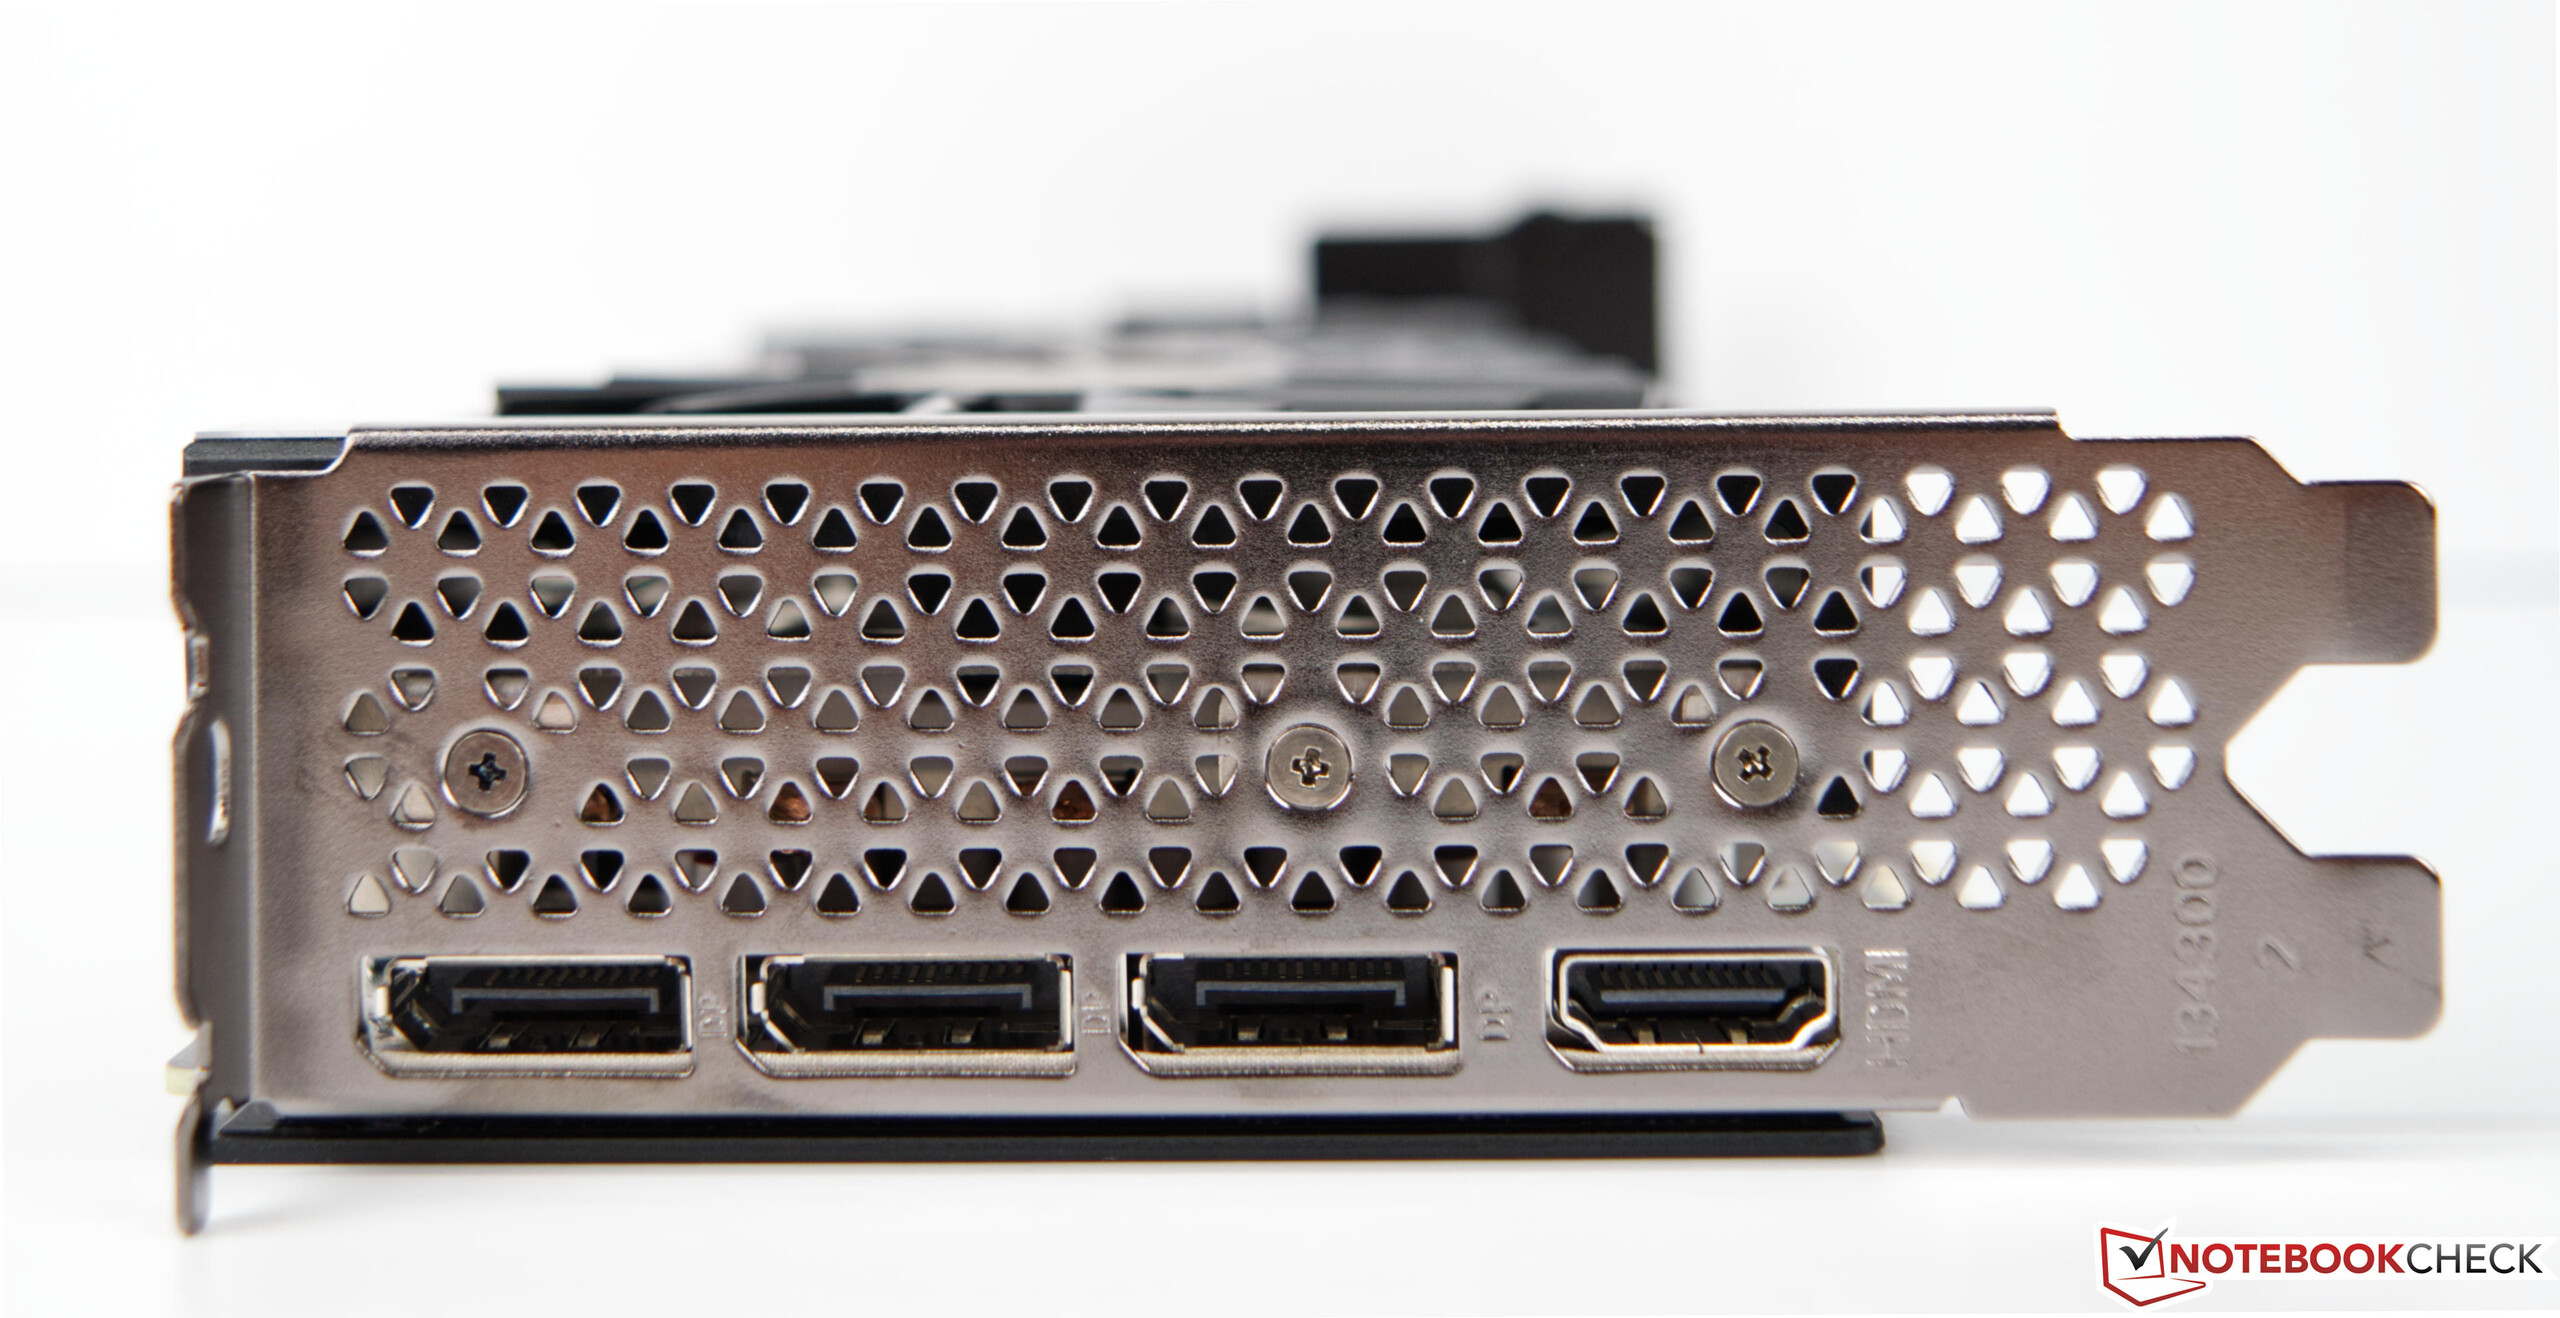
Er is niet veel aan te merken op de interface selectie. Er zijn in totaal 8 USB-poorten, die verdeeld zijn in 7 TypeA en 1x Type-C. De GPU biedt standaard 3x DisplayPort en HDMI. Er is echter alleen Gigabit LAN als netwerkinterface. We hadden hier een snellere 2,5G of 5G LAN-poort gewenst. Je moet het ook doen zonder een SD-kaartlezer. De verdeling van de poorten is typisch voor een apparaatklasse. Het is dus niet verwonderlijk dat de meeste interfaces aan de achterkant te vinden zijn. De USB-poorten aan de voorkant zijn echter wat moeilijk bereikbaar door de bouw van de behuizing.
Communicatie
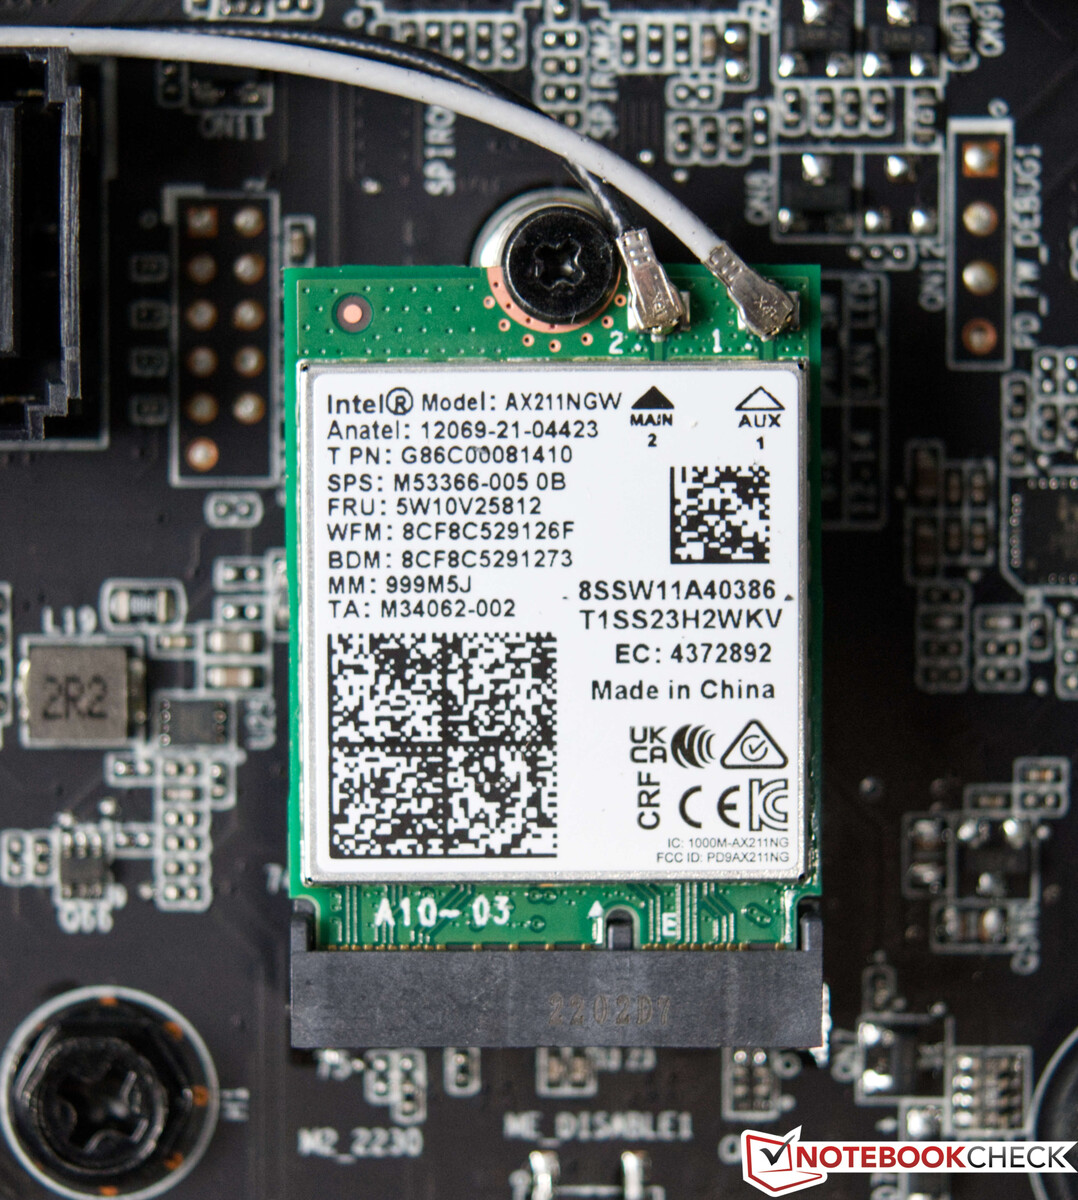
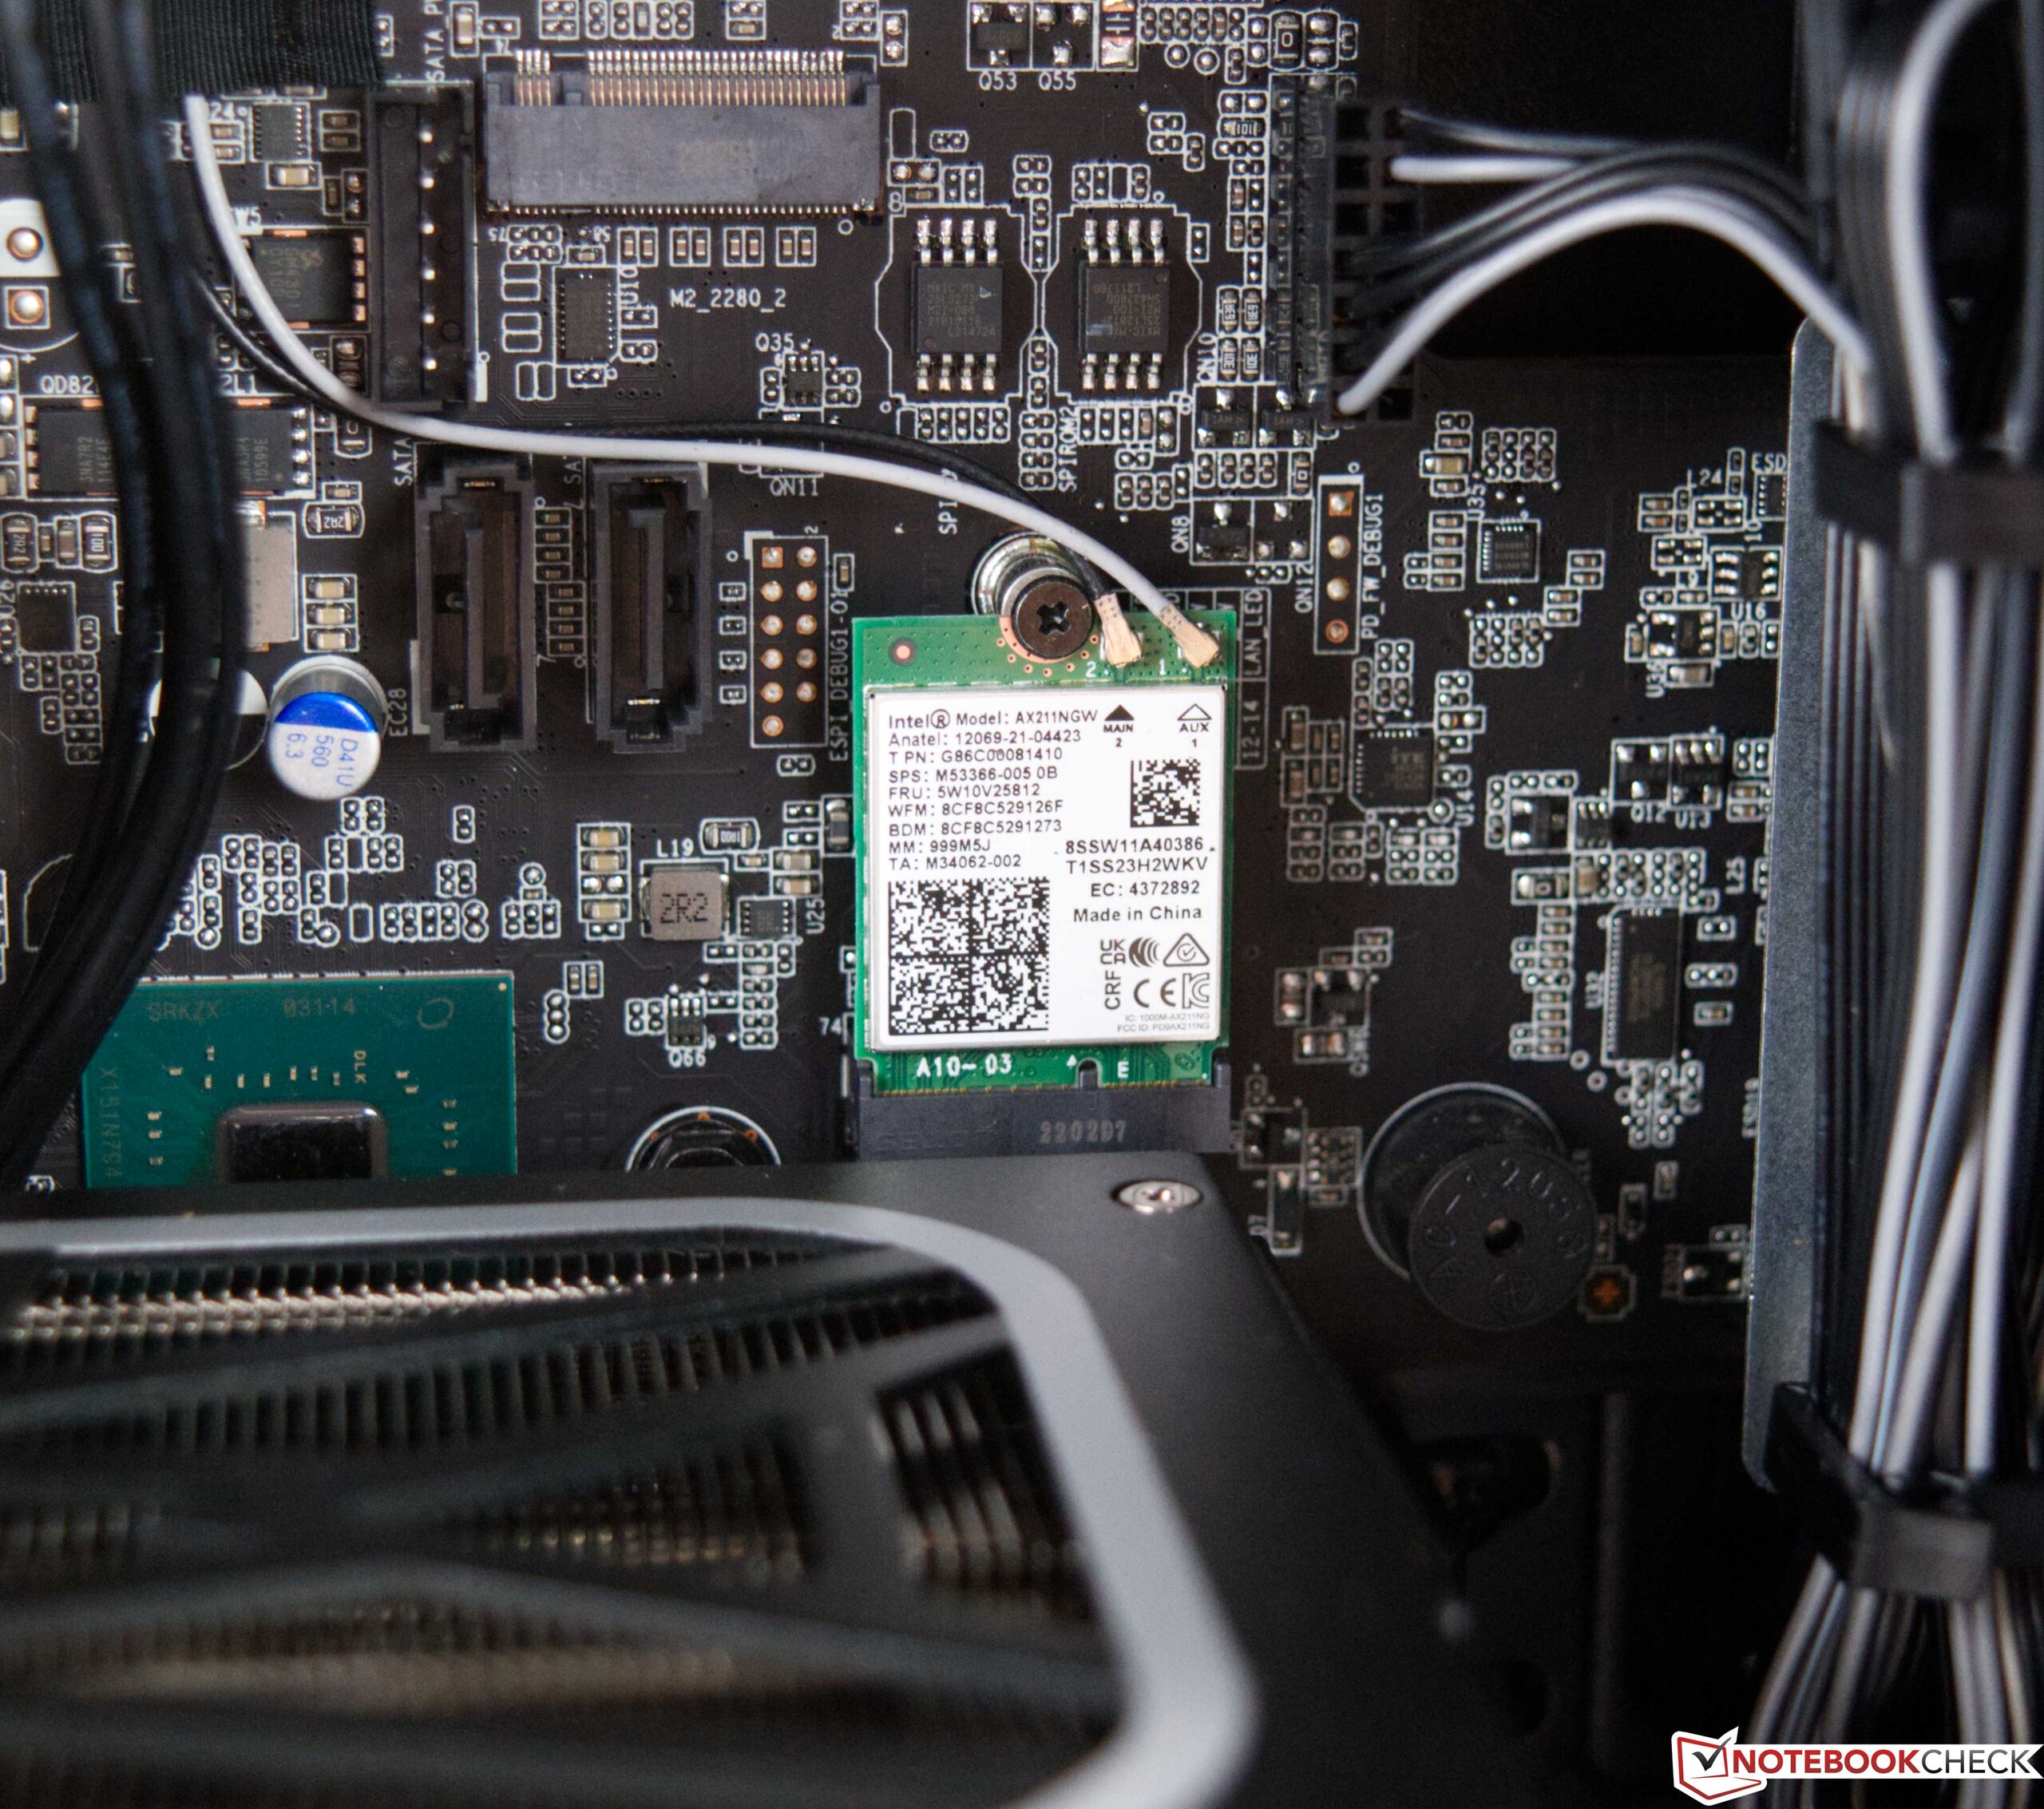
Acer rust de Predator ook uit met een Intel Wi-Fi 6E AX211 module. Deze bevindt zich als M.2 plug-in kaart direct op het moederbord en levert relatief goede overdrachtssnelheden. Toch kunnen de prestaties van de Intel Wi-Fi 6E AX211 bij de ontvangst van gegevens de goede overdrachtssnelheden niet bijhouden. De vergelijkingsapparaten leveren hier deels betere snelheden. Uit de dagelijkse test is echter gebleken dat je ook met de geïnstalleerde WLAN-module goed uit de voeten kunt. We hadden geen problemen met het gebruik van de draadloze verbinding. Als alternatief kan de gebruiker een RJ45-poort gebruiken die vertrouwt op een killer E2600-chip. Helaas biedt deze slechts een maximum van 1 GBit/s.
Accessoires
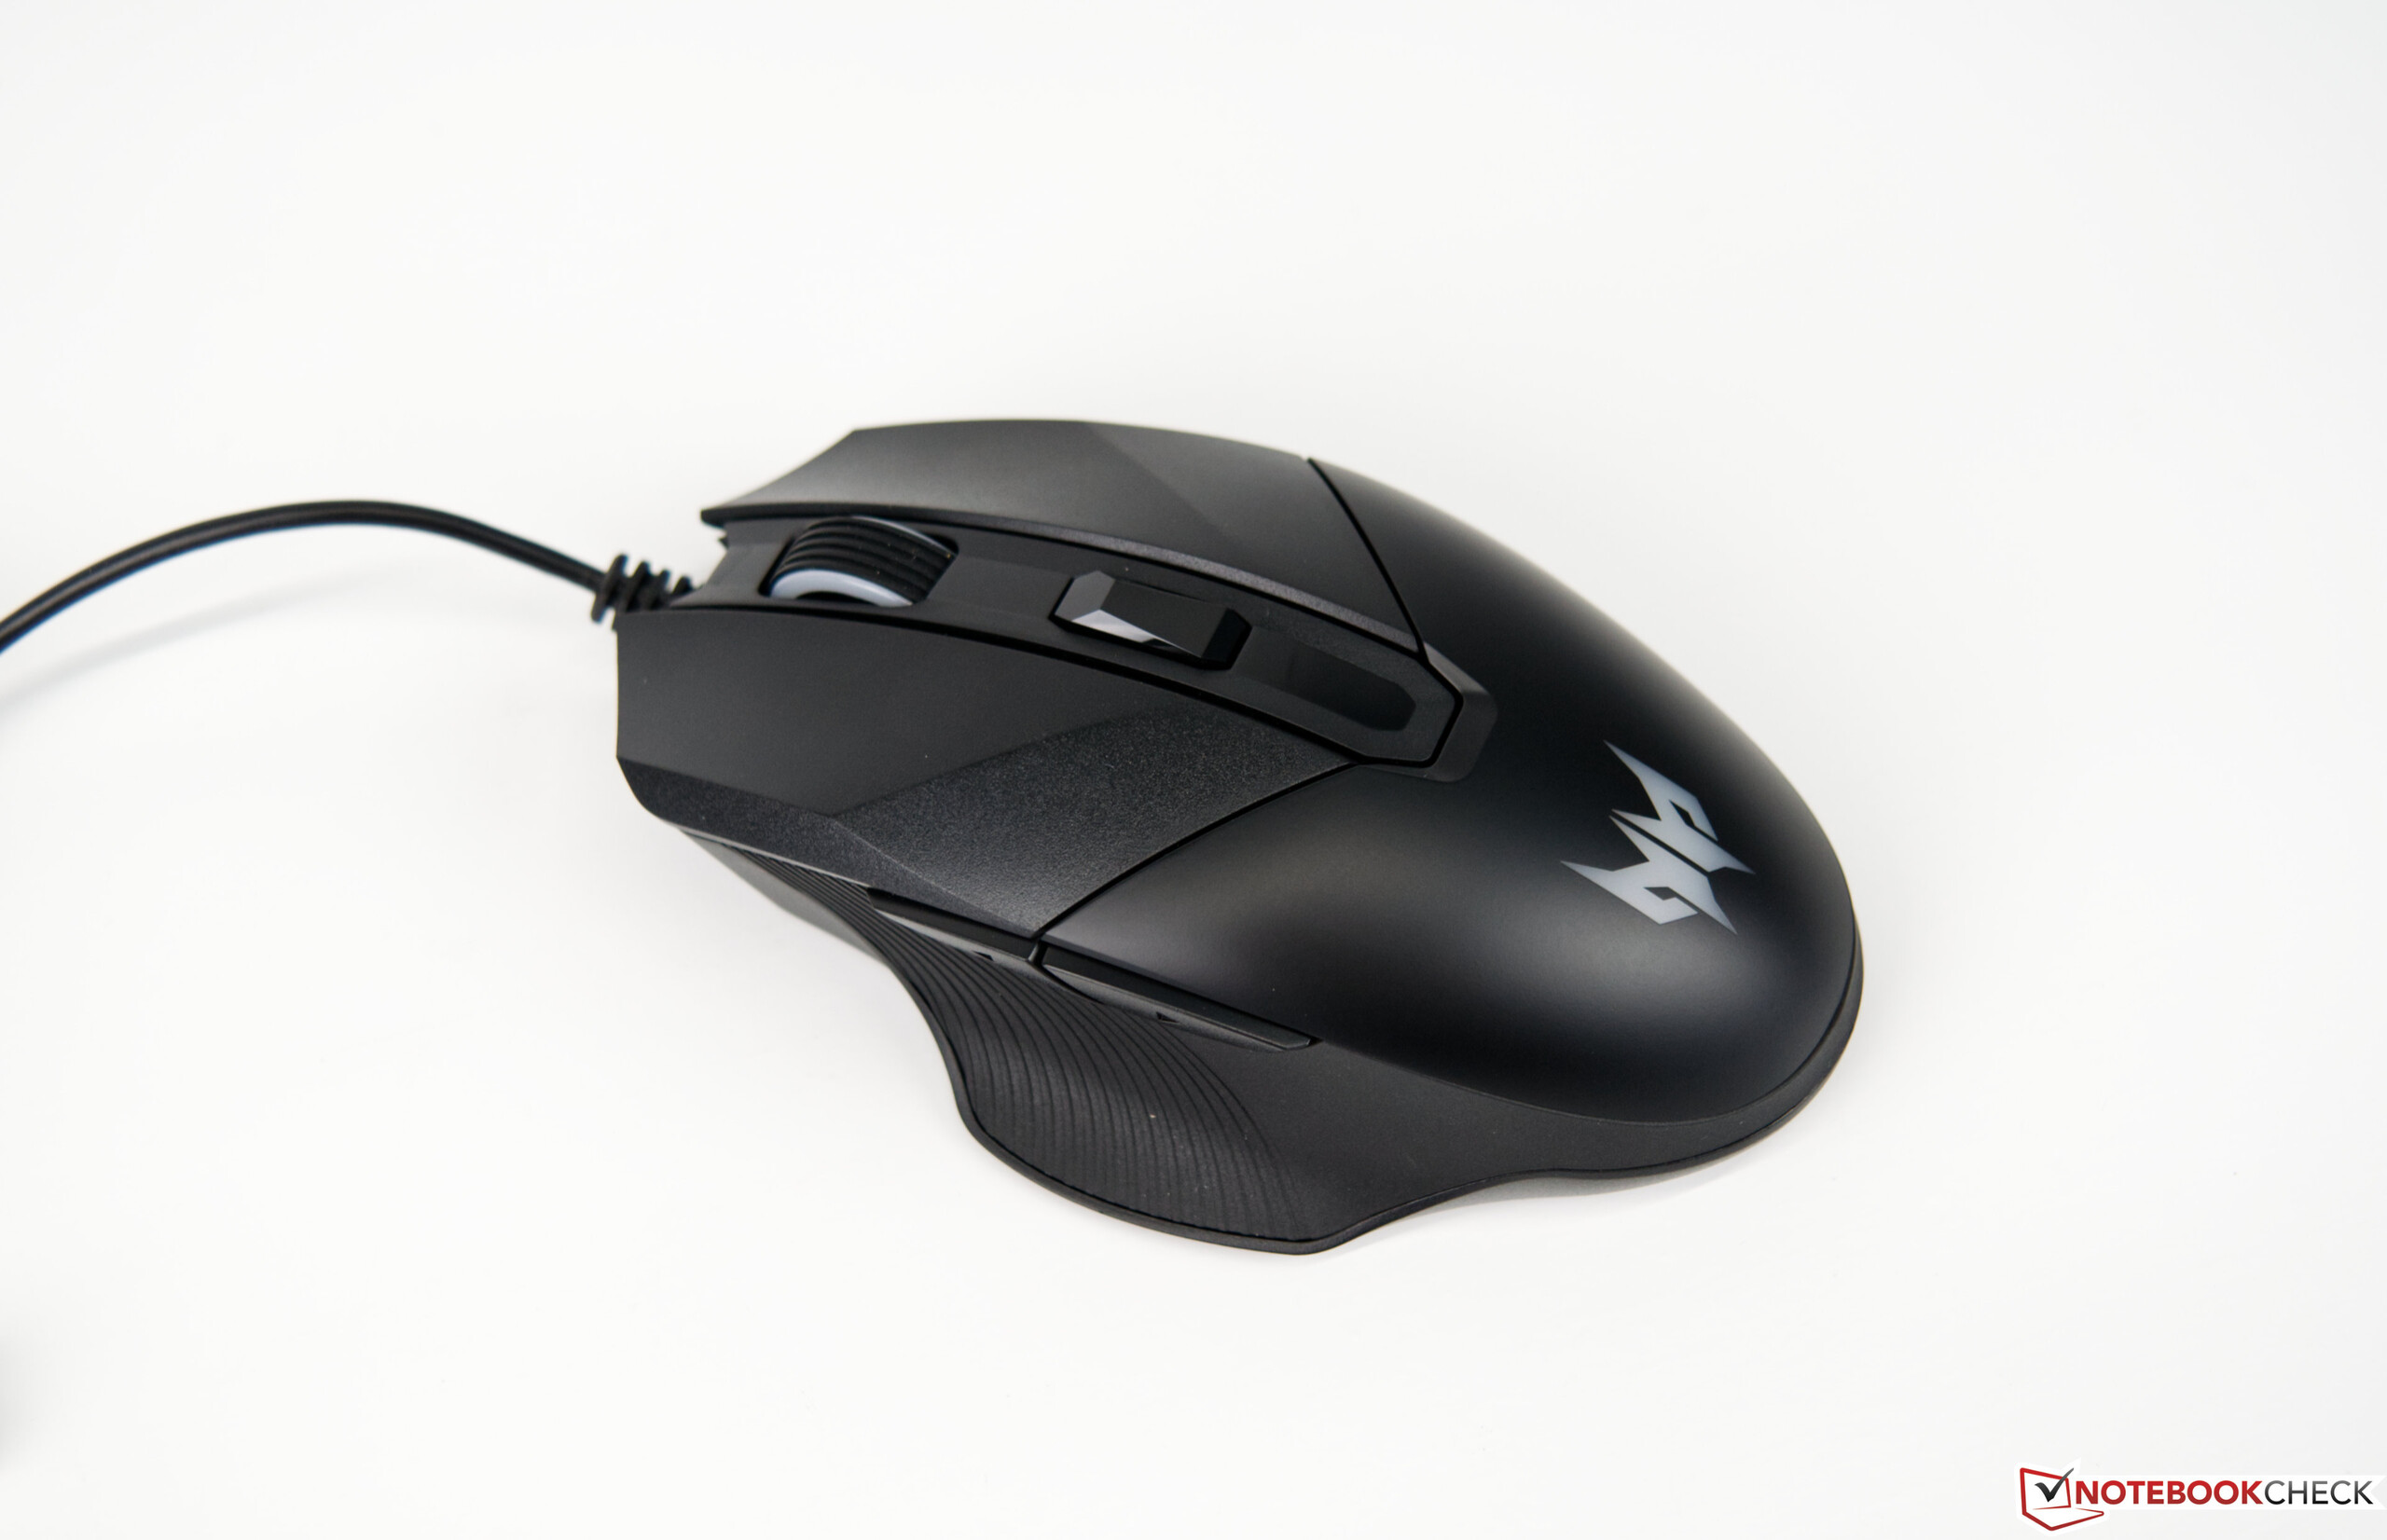
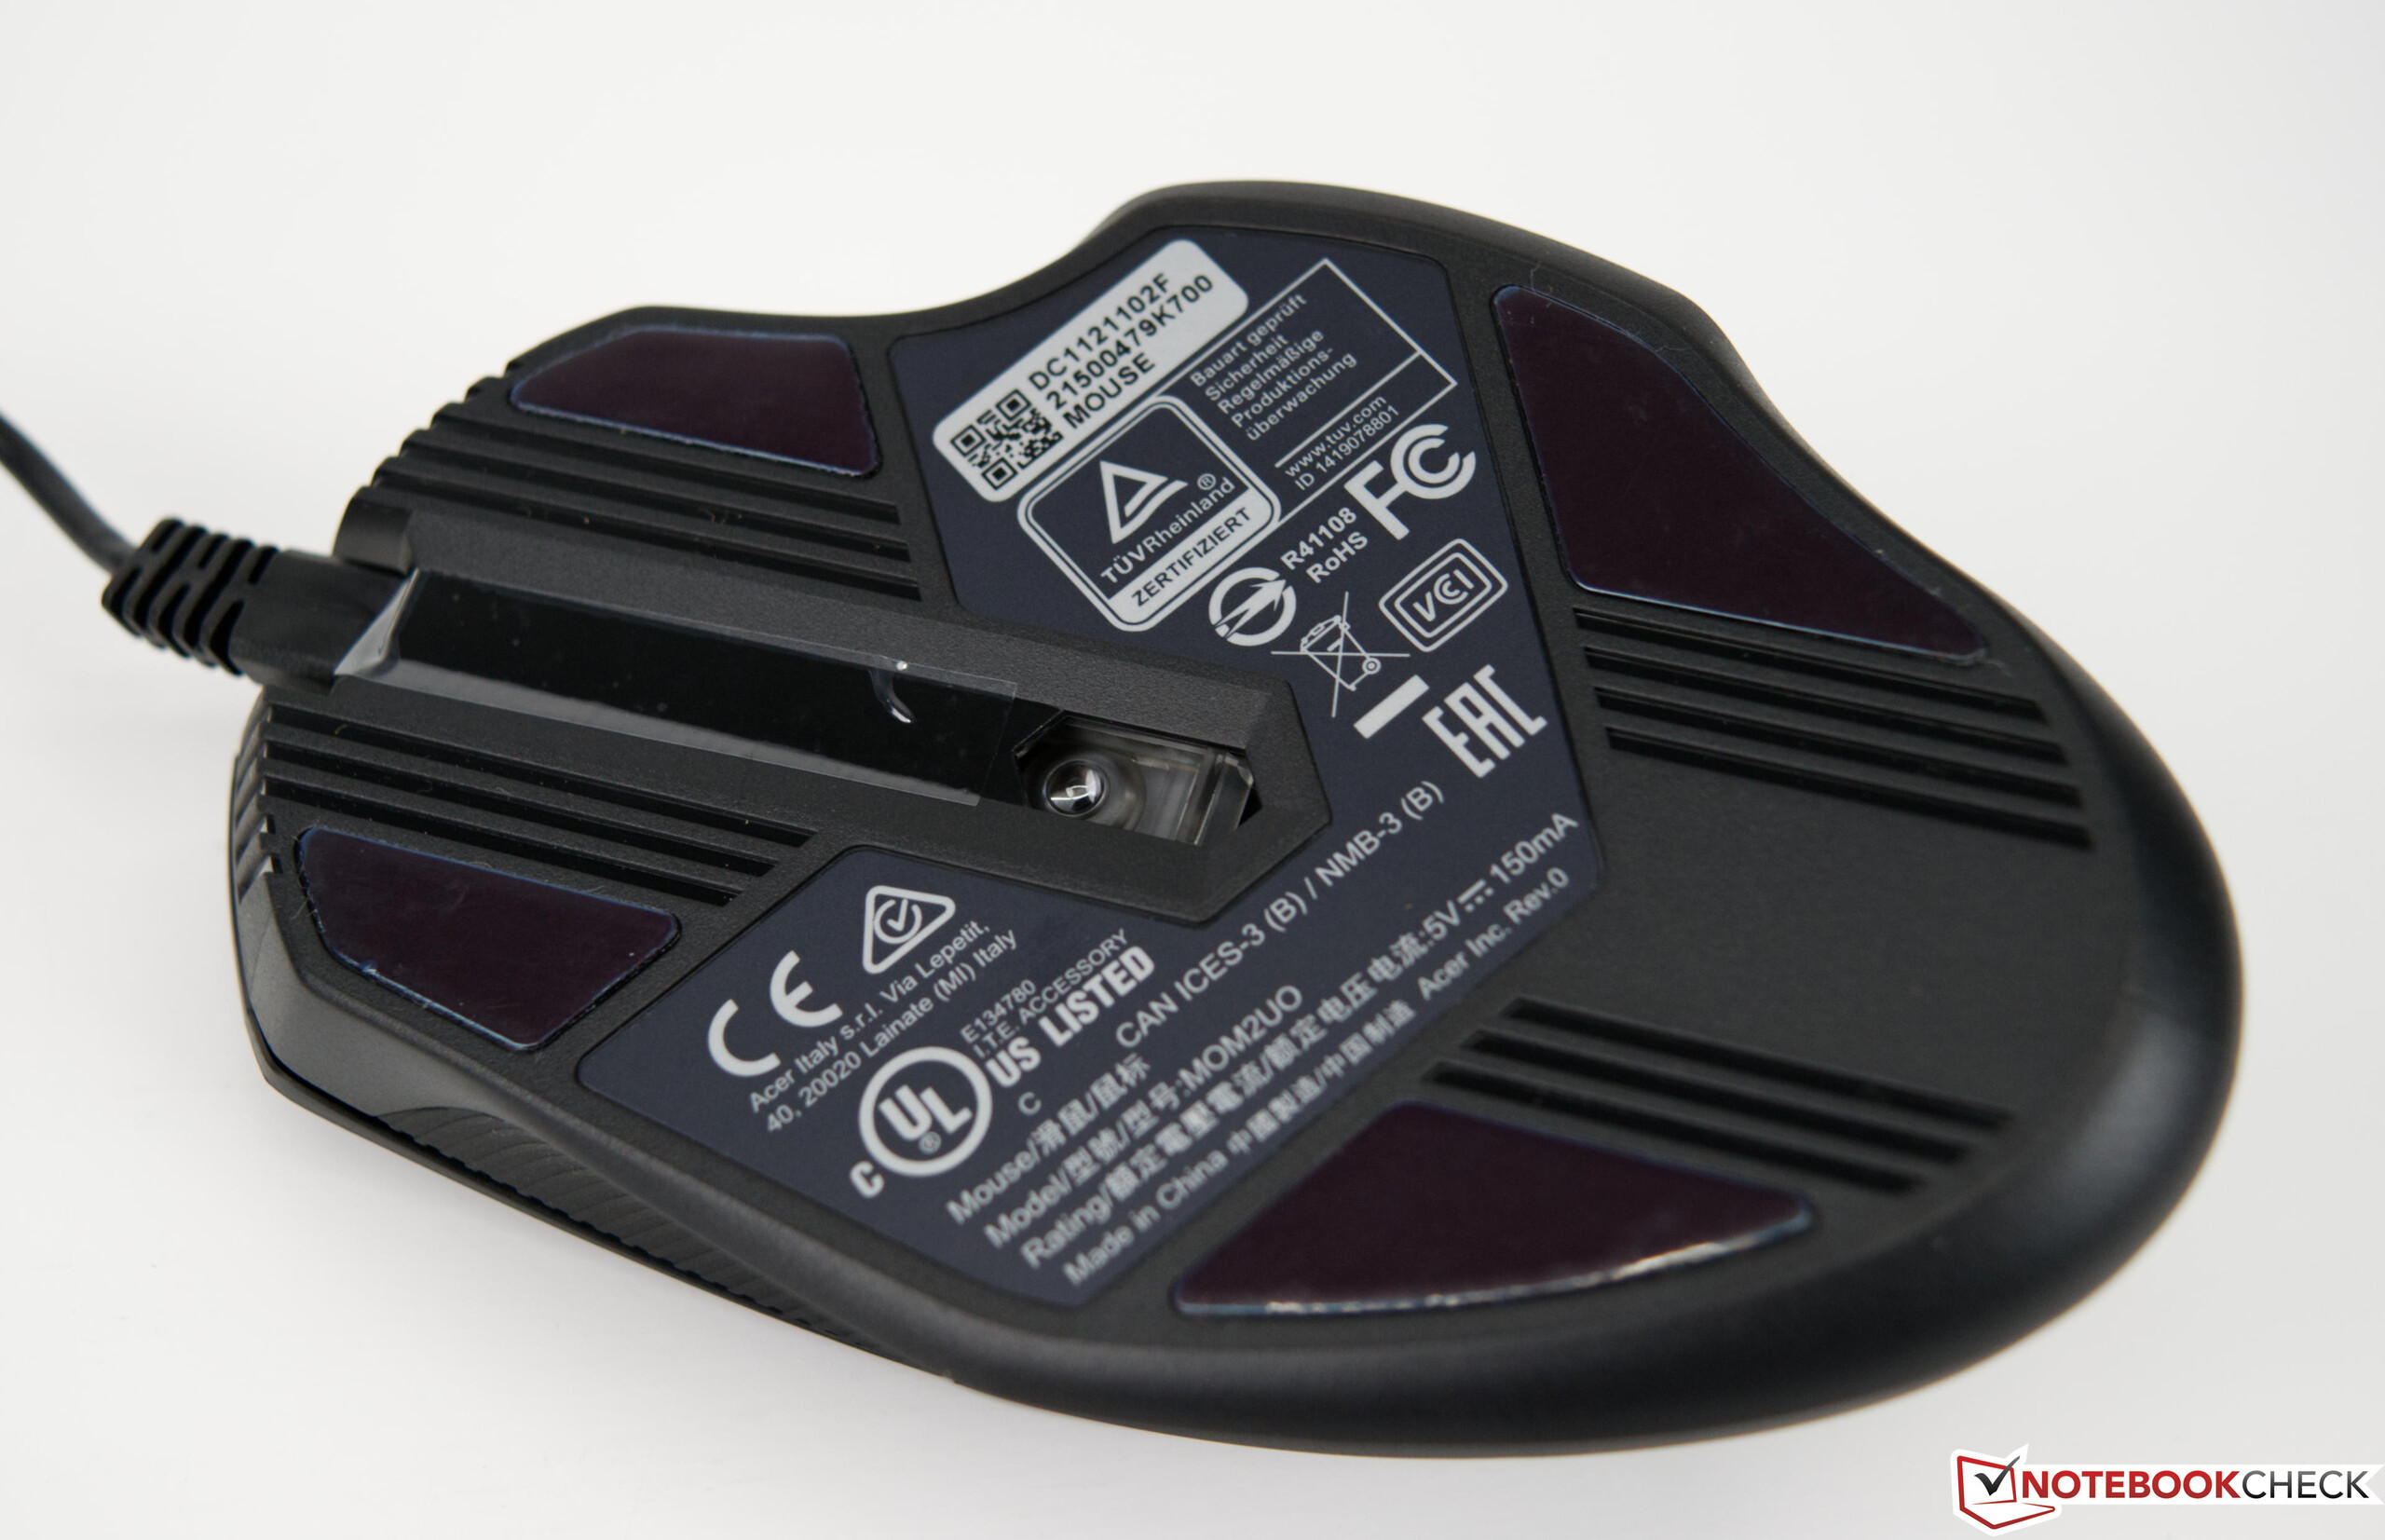
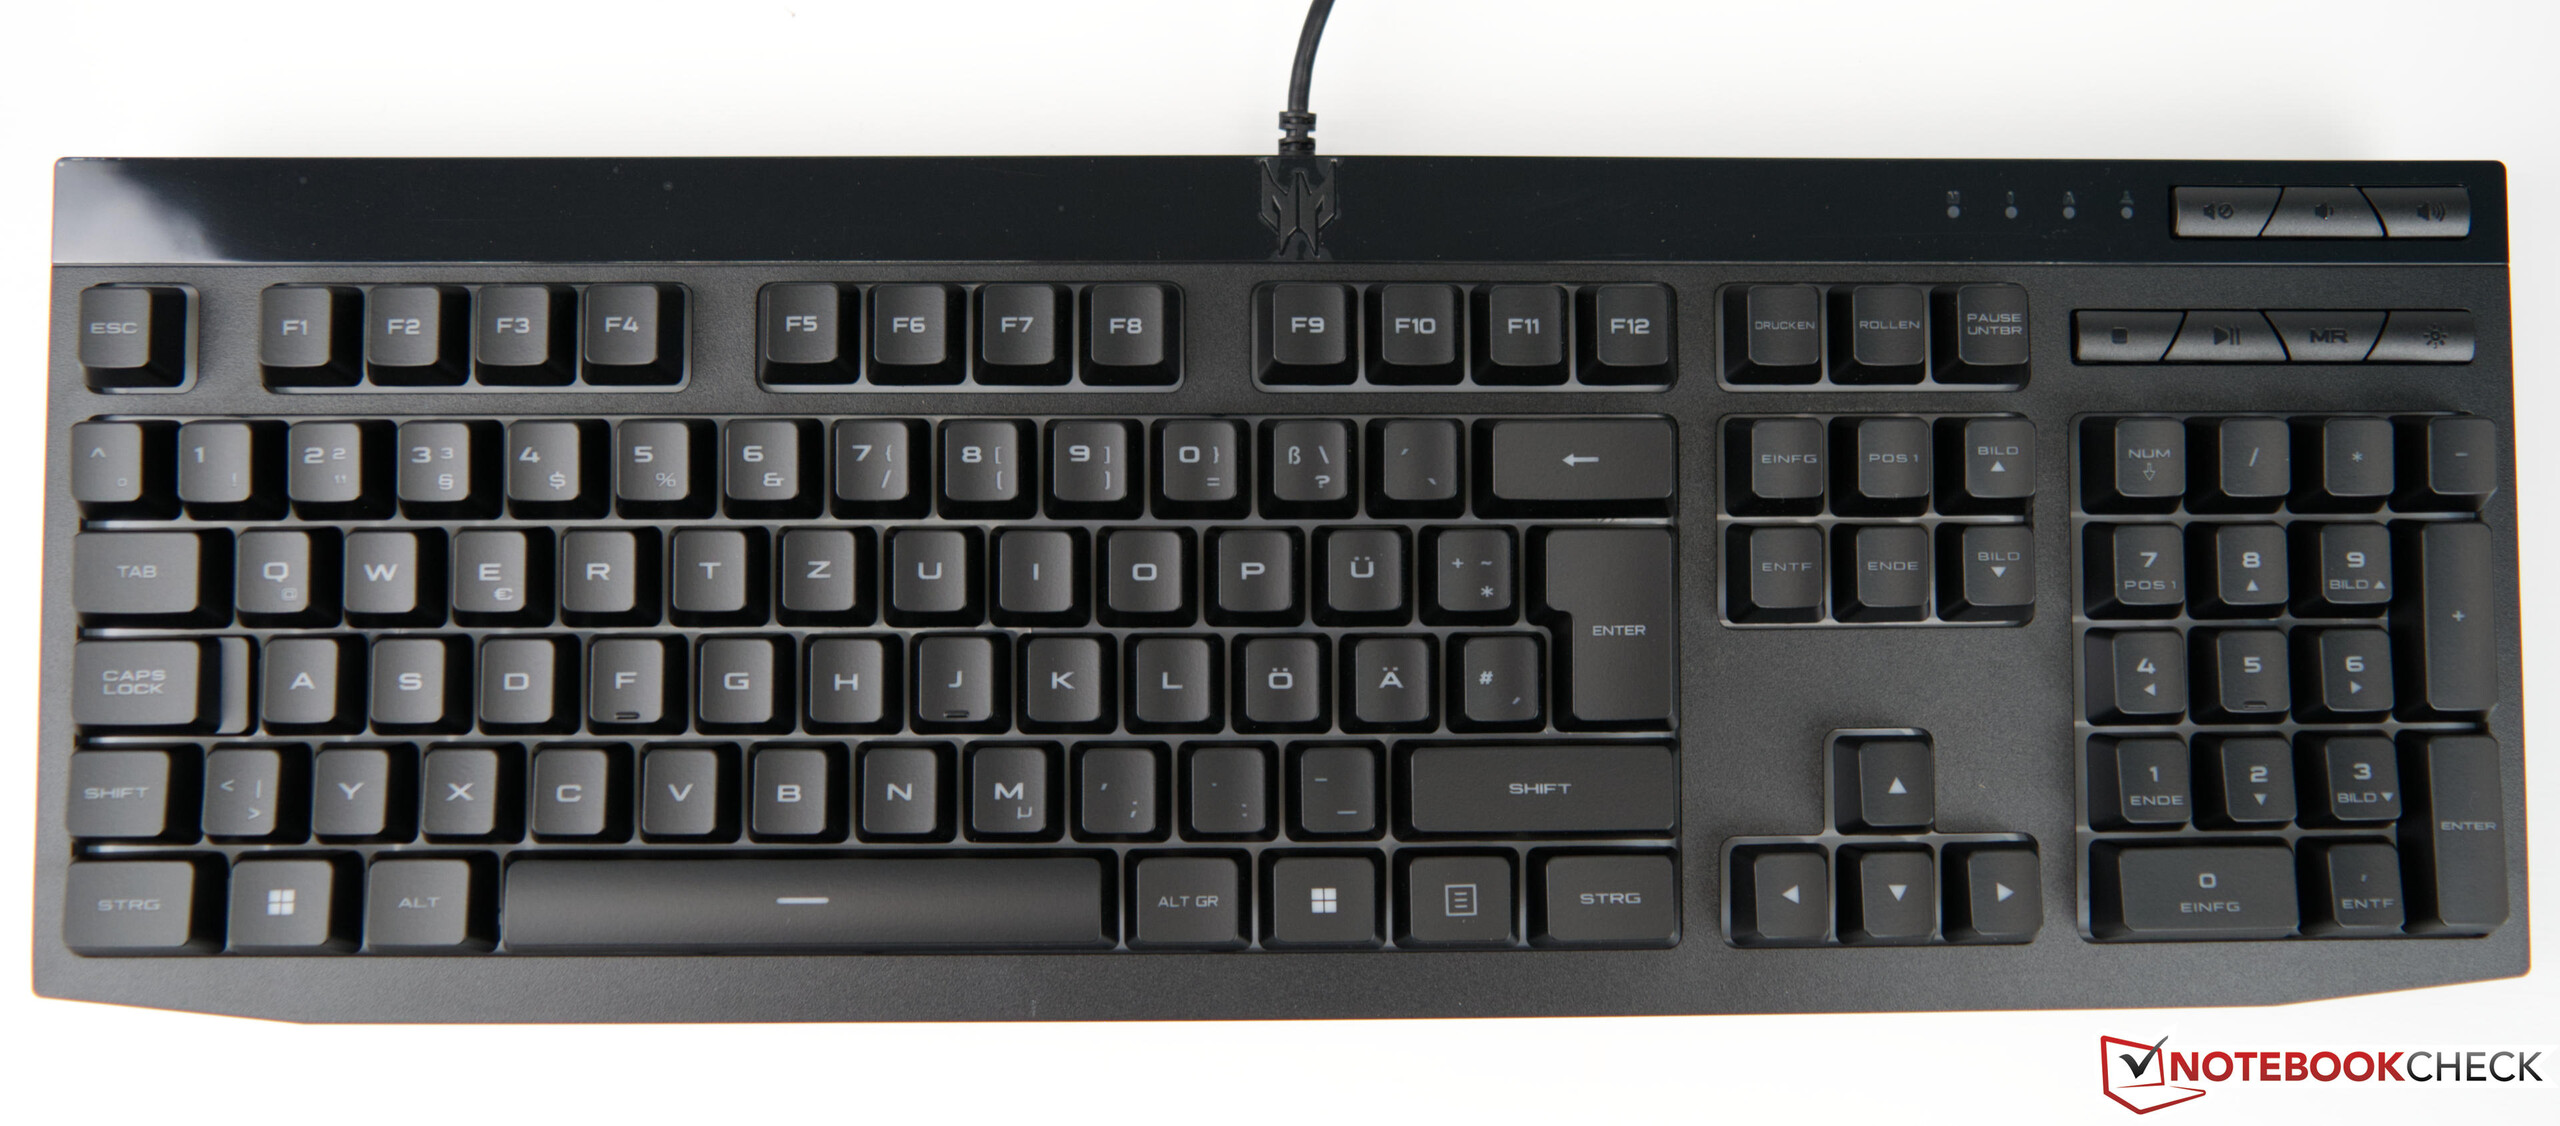
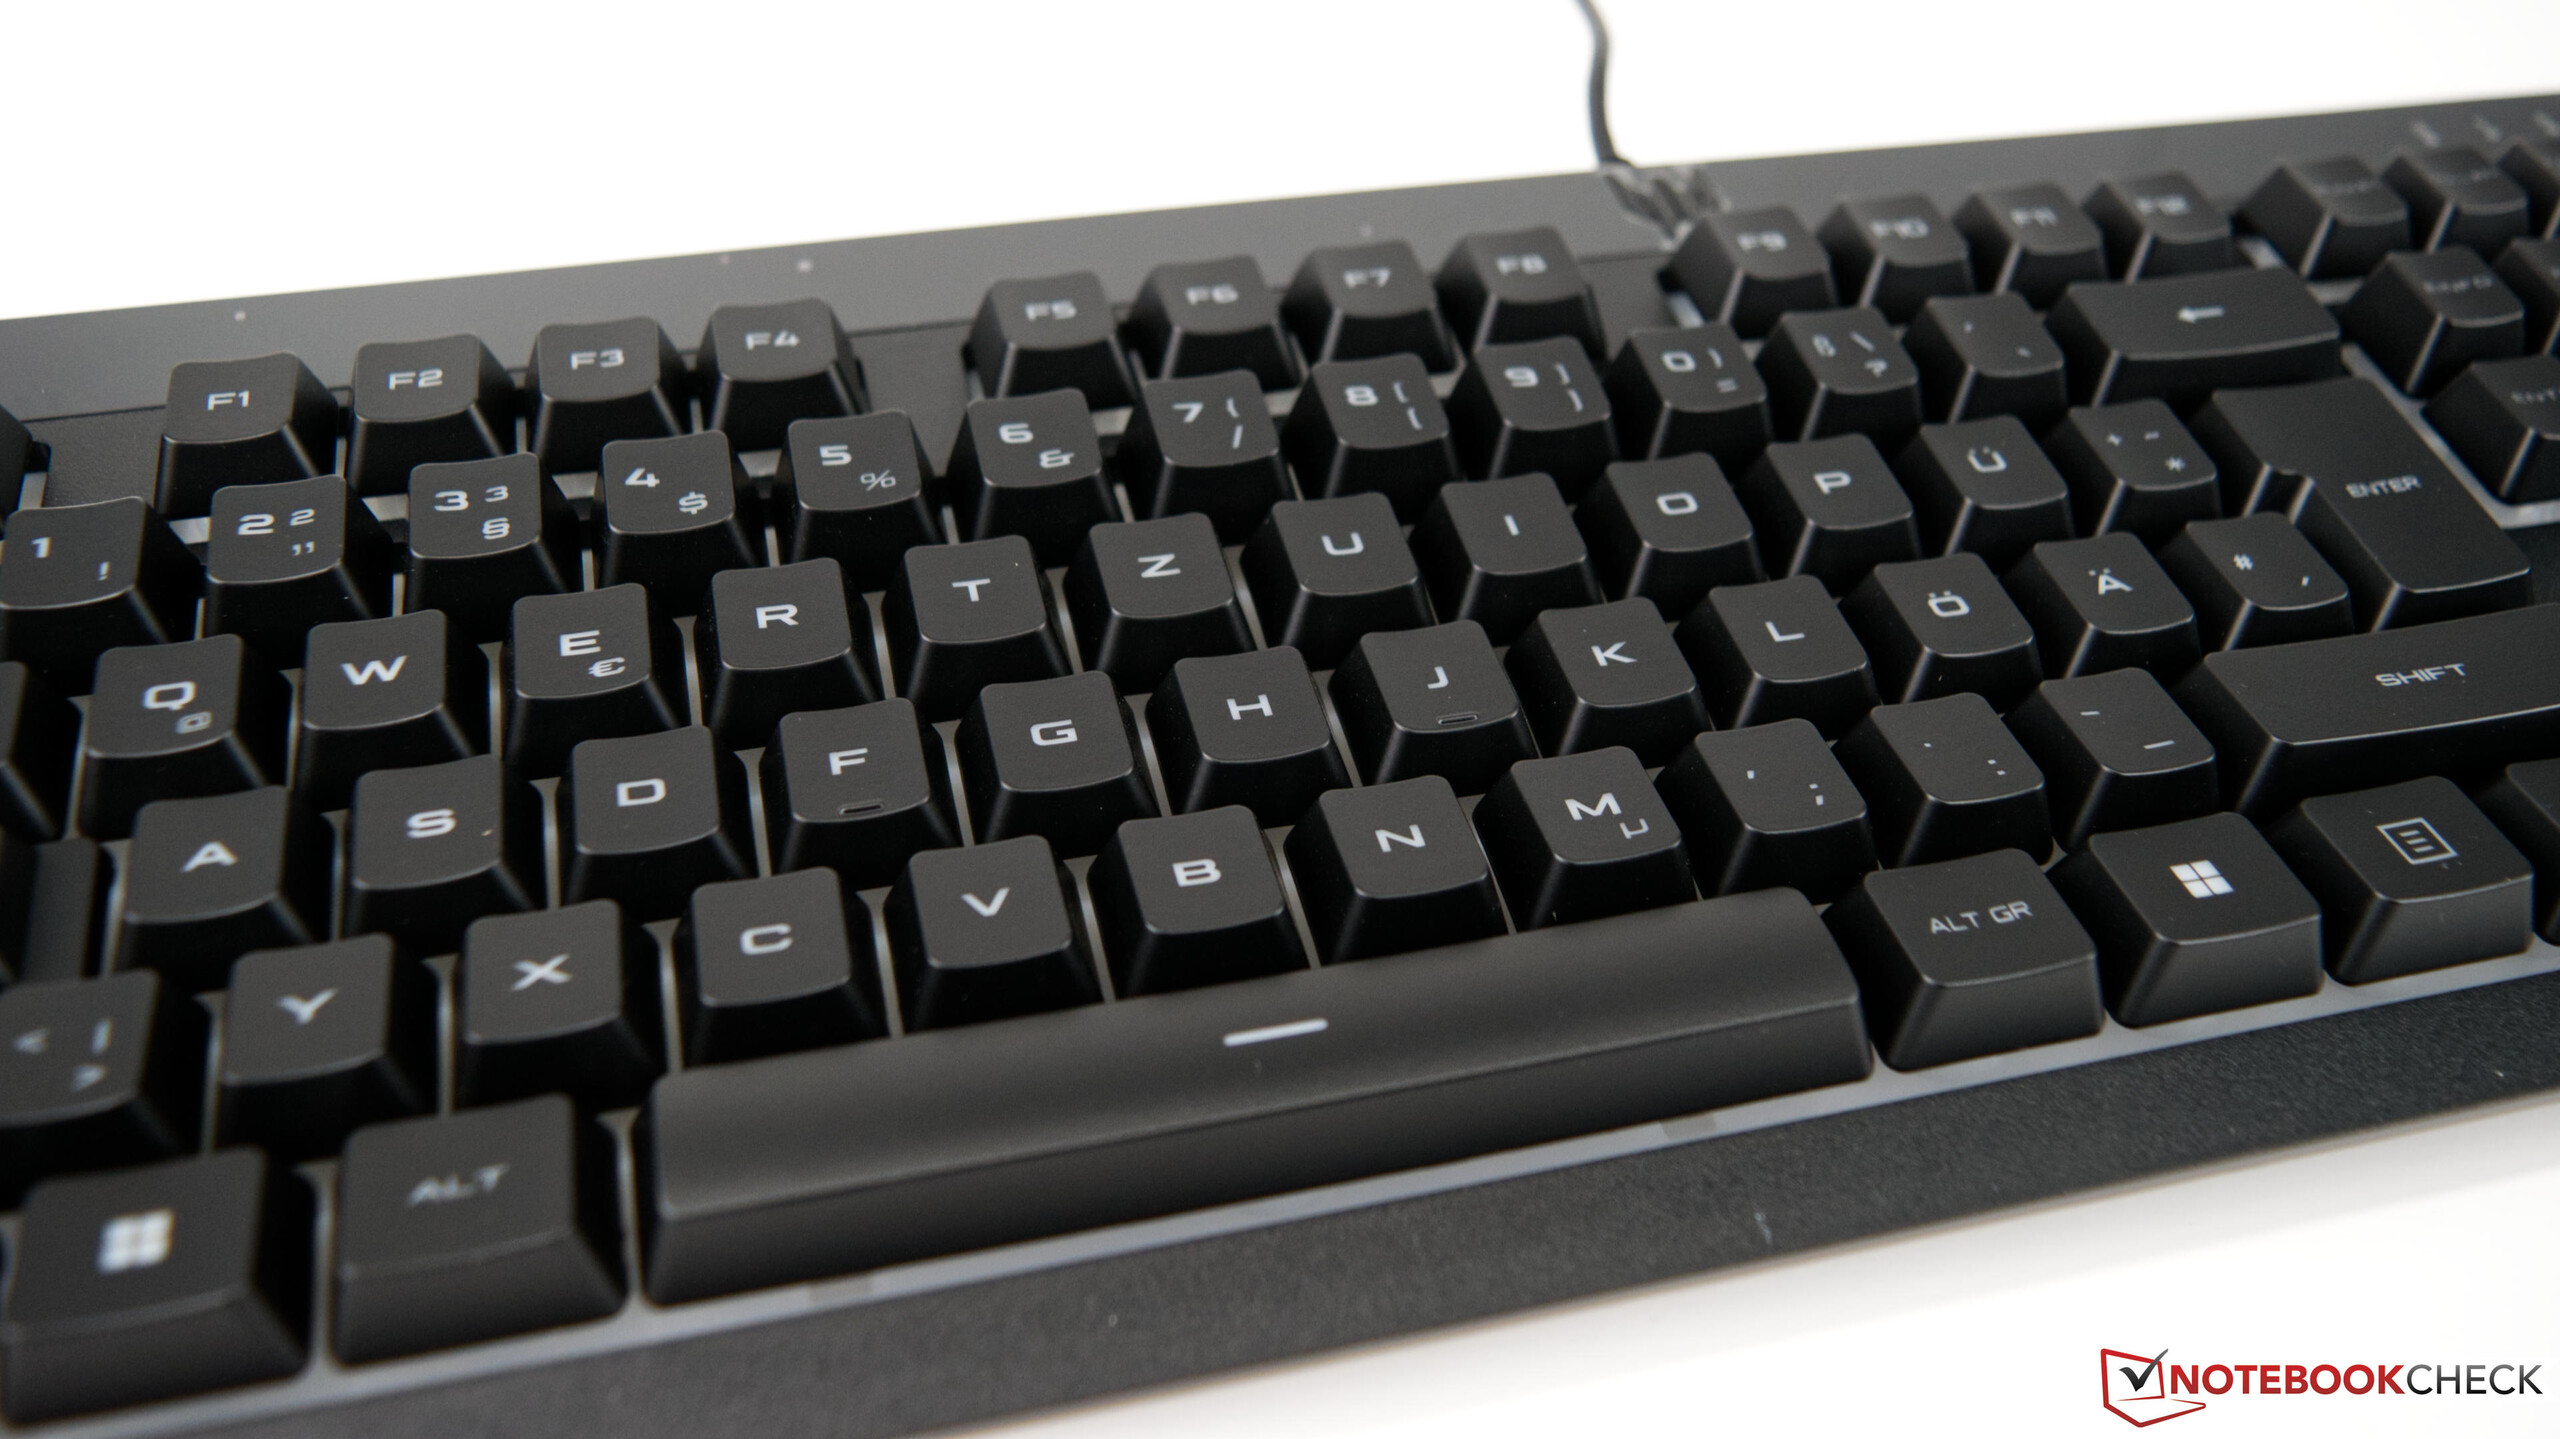
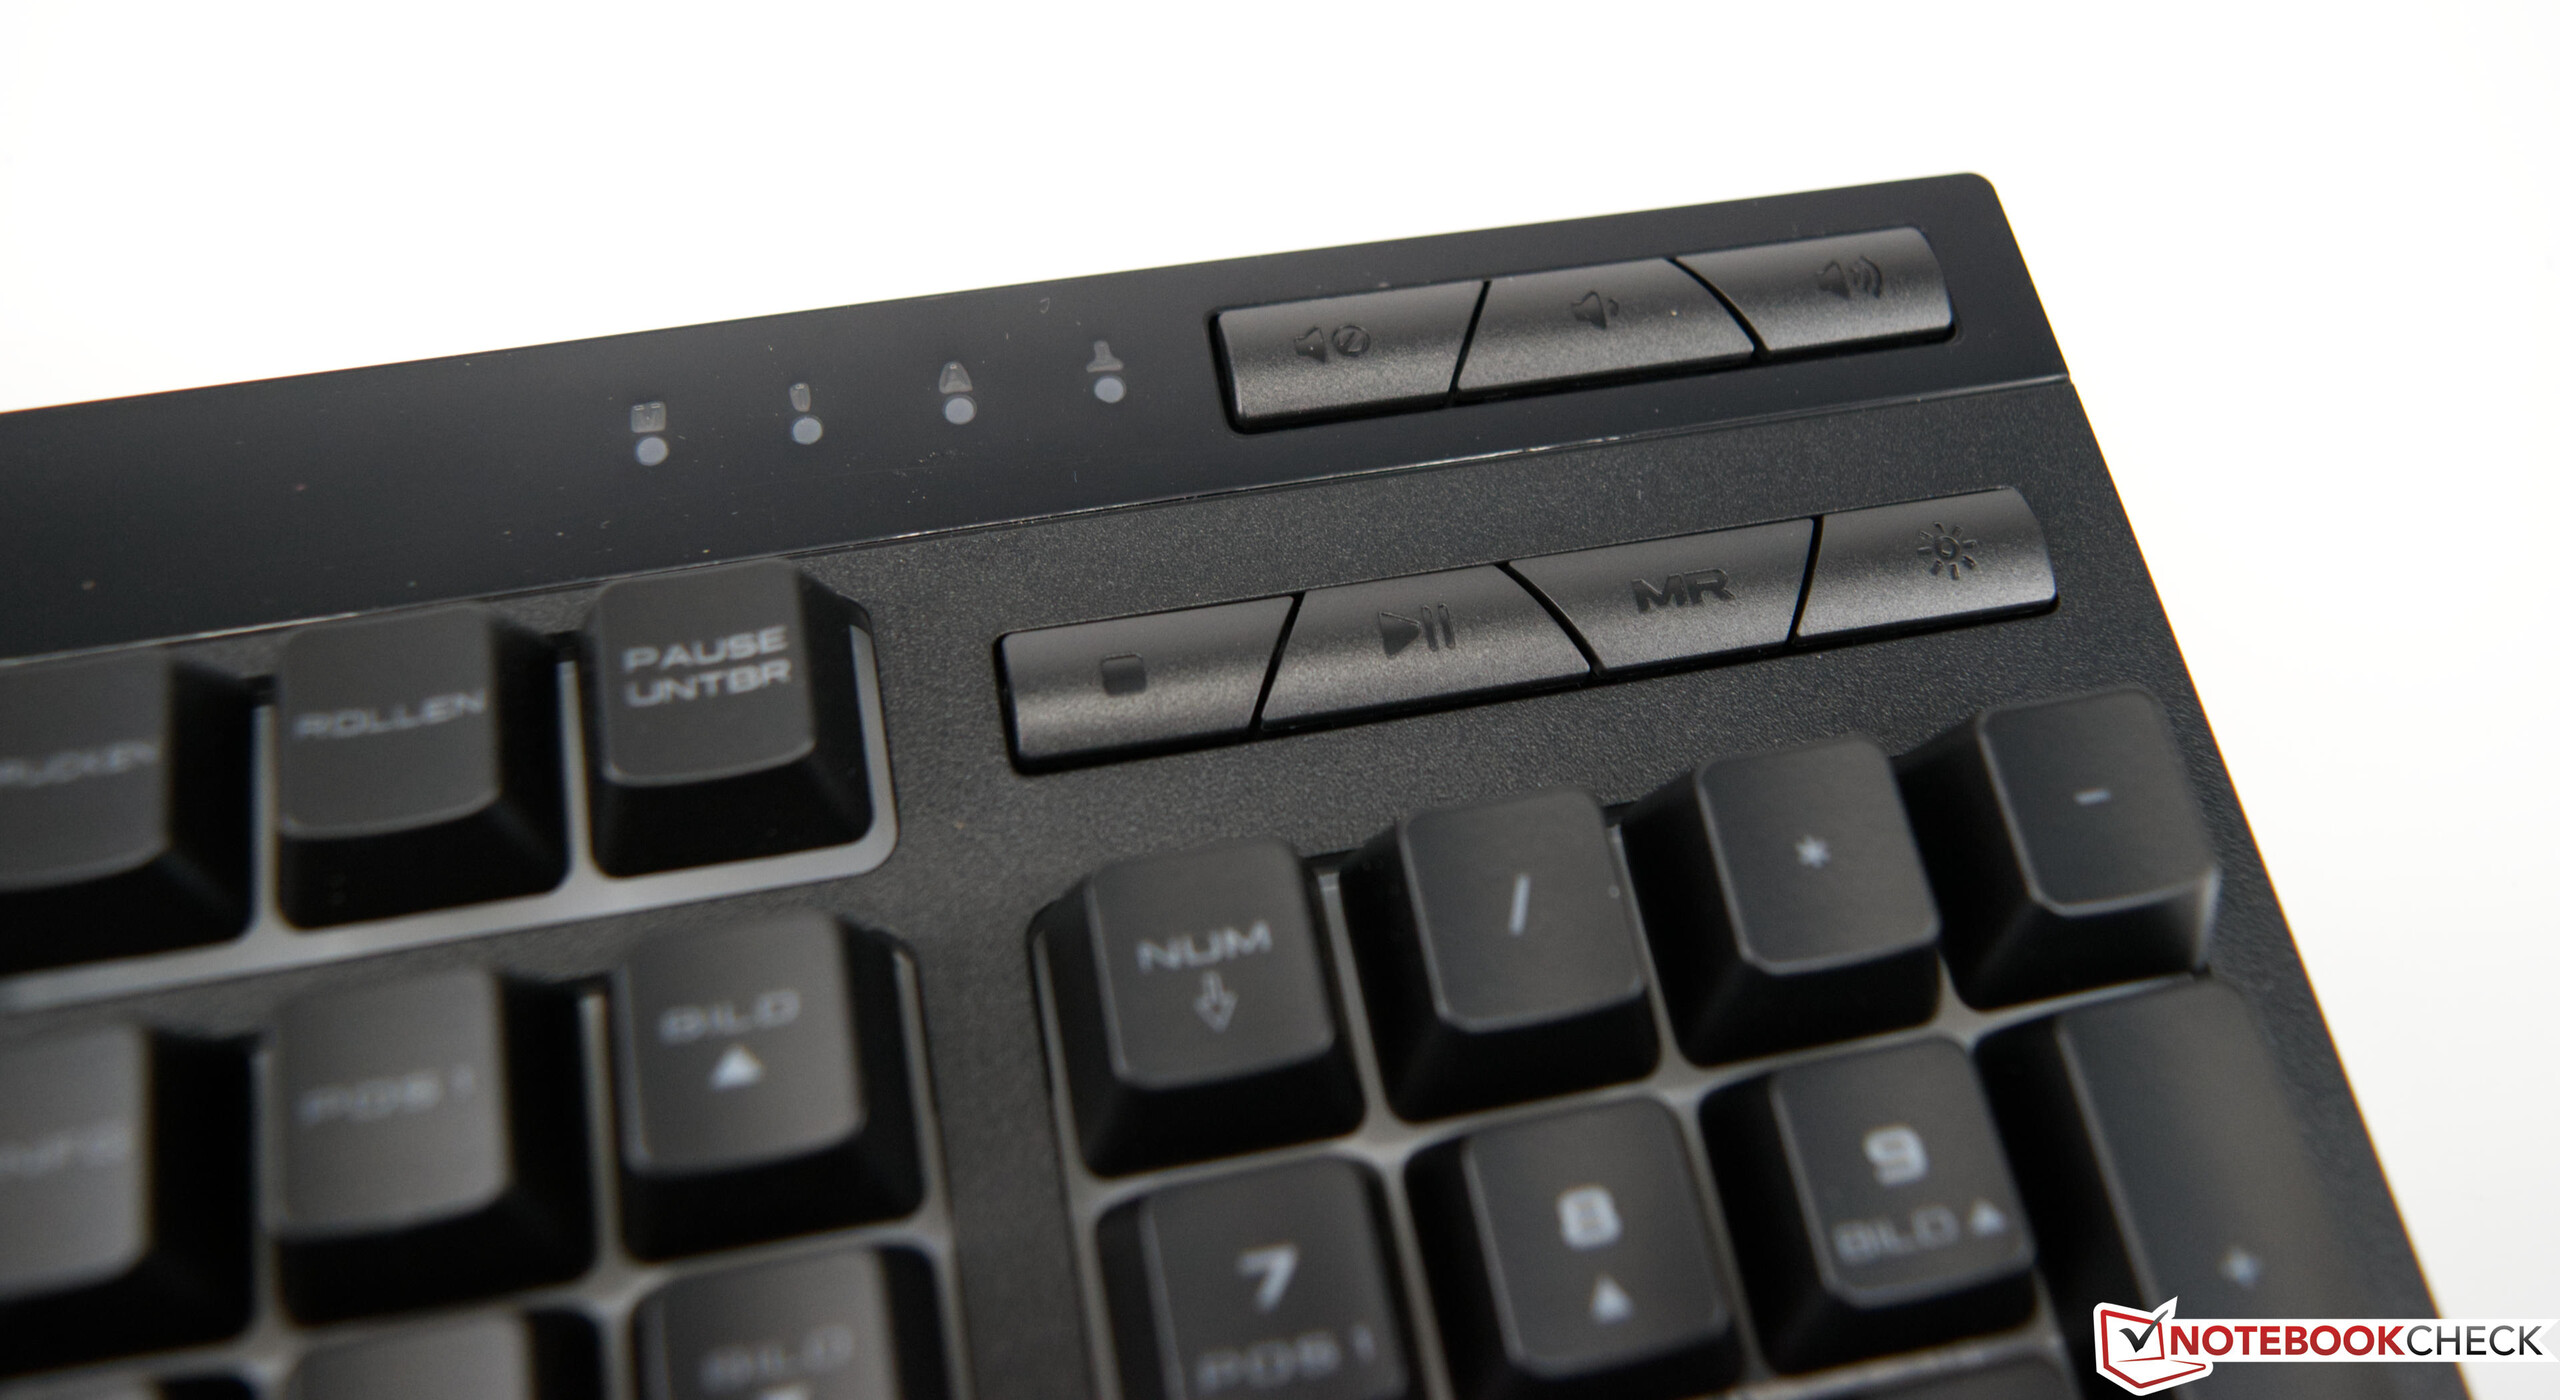
Als u een Acer Predator Orion 3000 koopt, krijgt u ook een optisch bijpassend toetsenbord en een gaming muis, die ook in Predator-stijl wordt geleverd. Zo ben je goed voorbereid aan de start en zorgt de hardware voor een coherente totaalindruk. De toren kan ook worden opgewaardeerd met het optionele zijpaneel inclusief kijkvenster. Hierdoor komt de ingebouwde RGB-verlichting beter tot zijn recht.
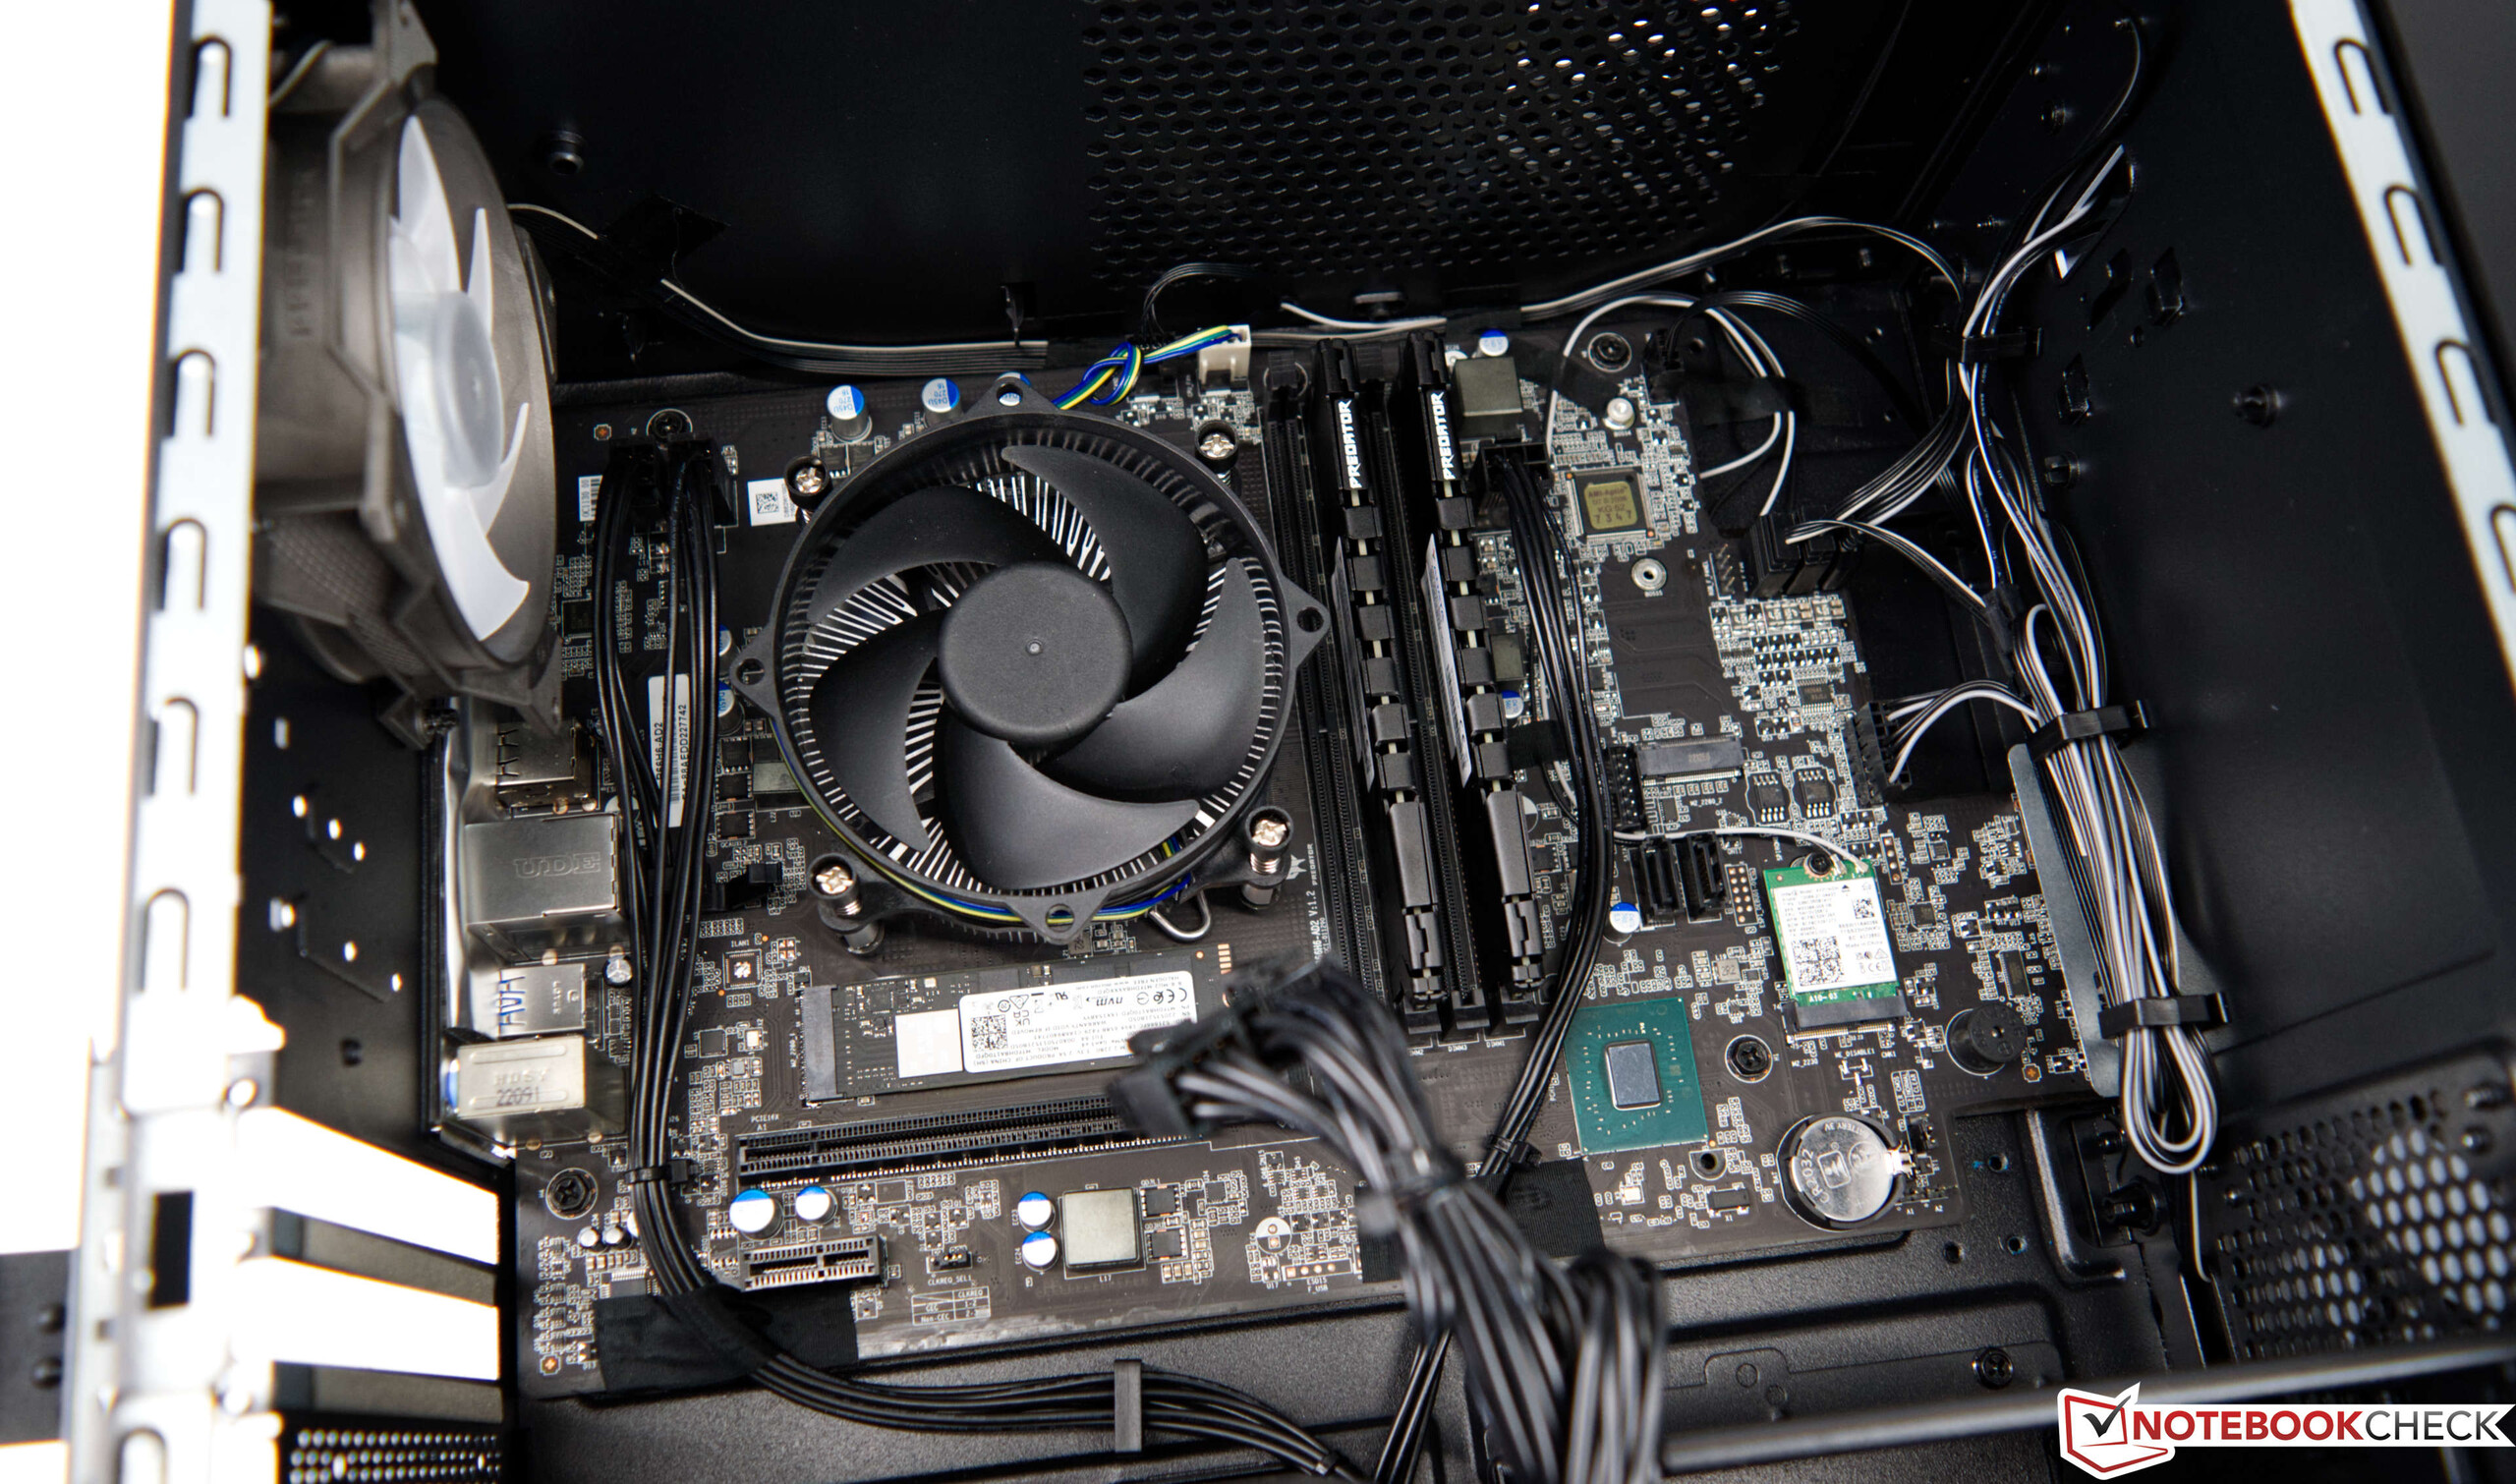
Onderhoud
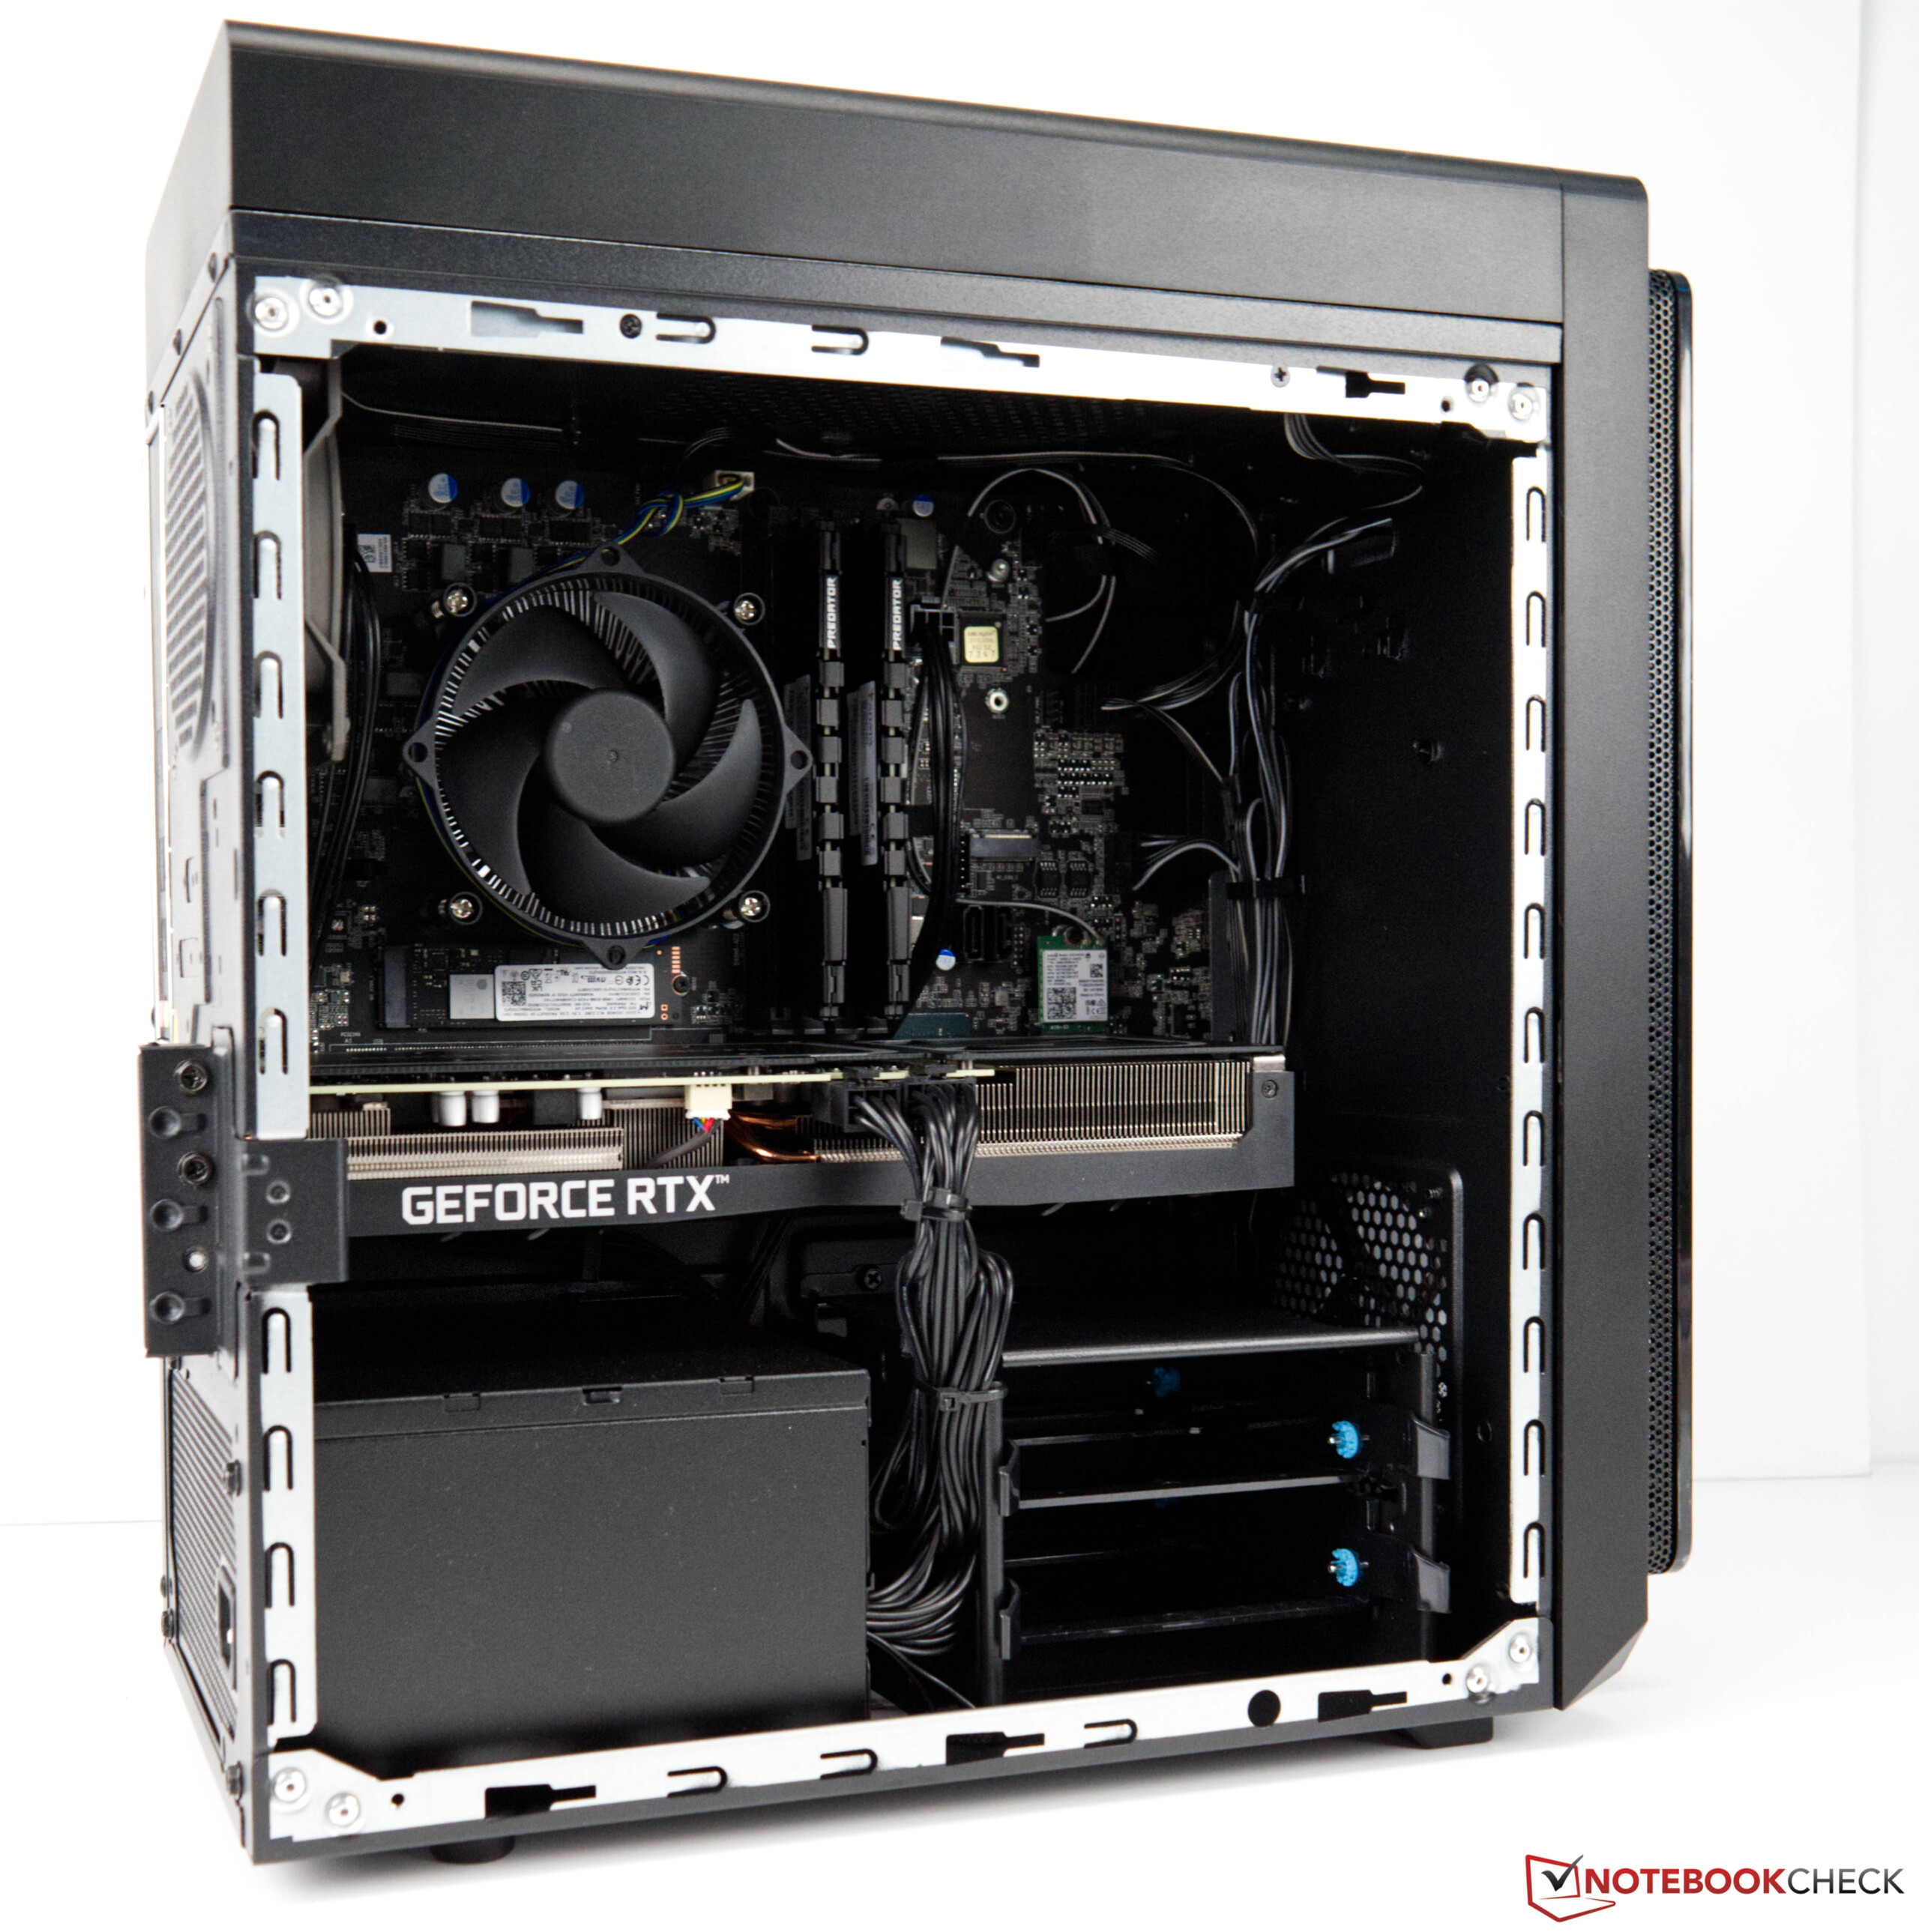
Onderhoud is geen groot probleem voor de Acer Predator Orion 3000. Het zijpaneel is bevestigd met twee schroeven en kan gemakkelijk worden verwijderd. De interne componenten zijn gemakkelijk toegankelijk. De massaopslag kan bijvoorbeeld worden uitgebreid met een tweede M.2-module. Als alternatief kunnen maximaal twee conventionele 3,5-inch harde schijven worden ondergebracht.
Prestaties - geremde Core i7-12700F
De huidige versie van Acer's Predator Orion 3000 is altijd uitgerust met een zuinige 65-watt CPU. Zo is het sterkste model uitgerust met de Intel Core i7-12700F. Deze biedt zeer goede prestaties en kan dankzij de hybride architectuur met E- en P-cores altijd de beste snelheid bieden voor de betreffende toepassing. In een goedkopere configuratie kun je ook de Predator Orion 3000 krijgen met een Intel Core i5-12400. Deze biedt ook goede gaming prestaties, maar moet het doen zonder de E-cores. Als grafische kaart krijg je minimaal een GeForce RTX 3060die ontworpen is voor 1080p gaming. Meer prestaties zijn beschikbaar met de GeForce RTX 3070waarmee je ook 1440p kunt gamen.
Testvoorwaarden
We hebben alle tests uitgevoerd met het energieprofiel maximale prestaties
. Ook hebben we het transparante zijpaneel in de kast niet gebruikt. De ventilatorsnelheden kunnen ook worden geconfigureerd via de Predator Sense
tool. We hebben de automatische instelling aangehouden om een goed compromis te bereiken tussen geluid en prestaties.
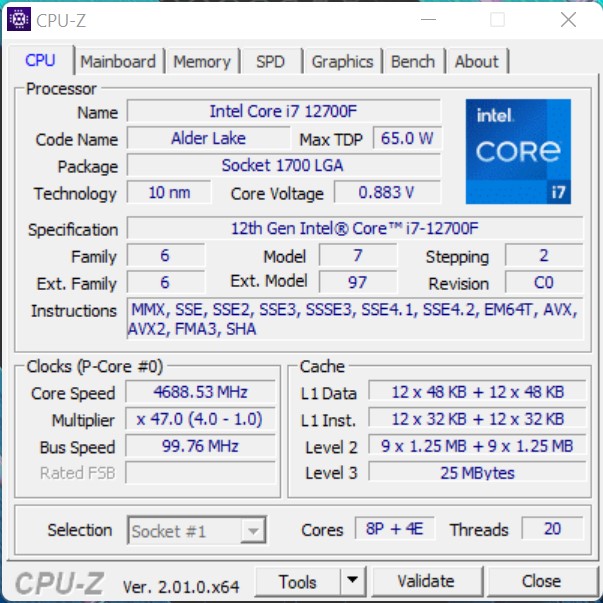
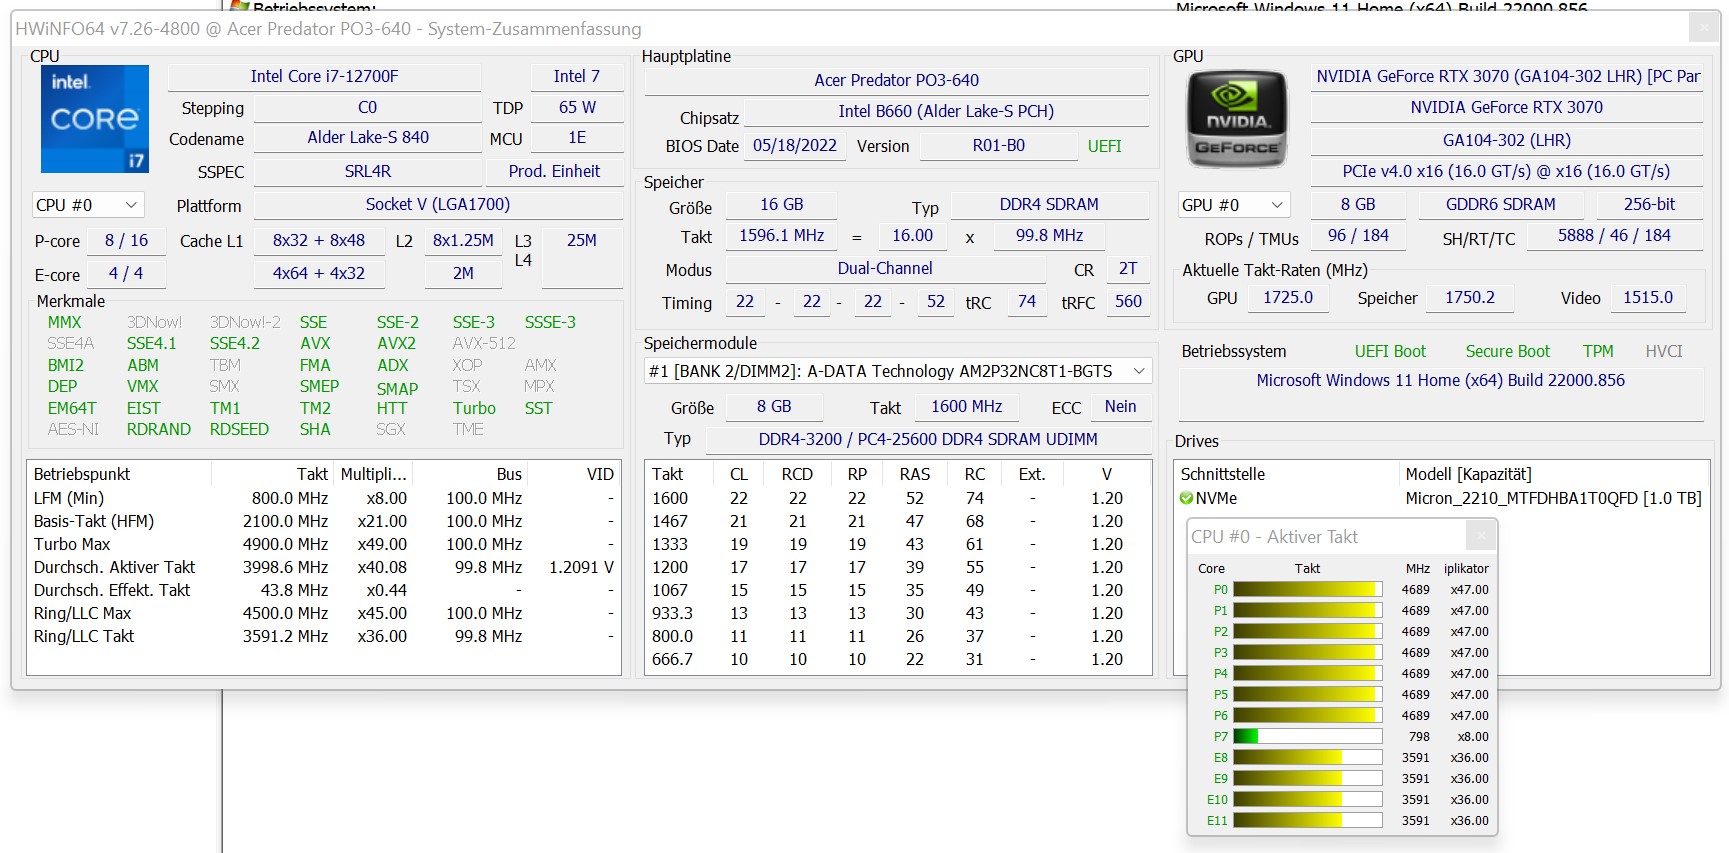
Processor
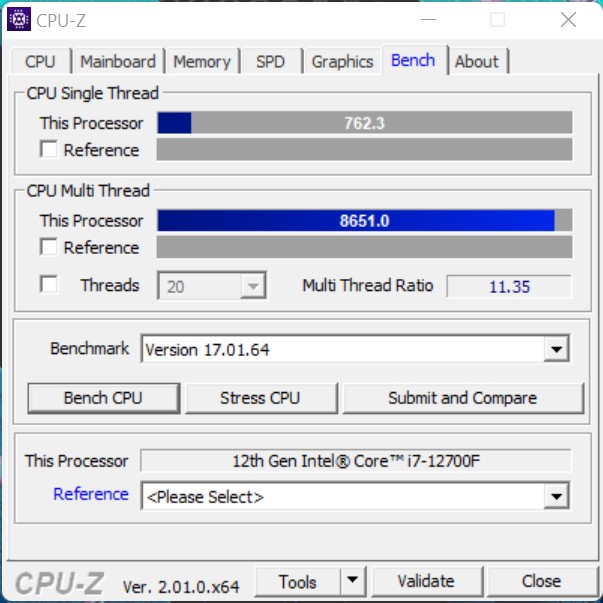
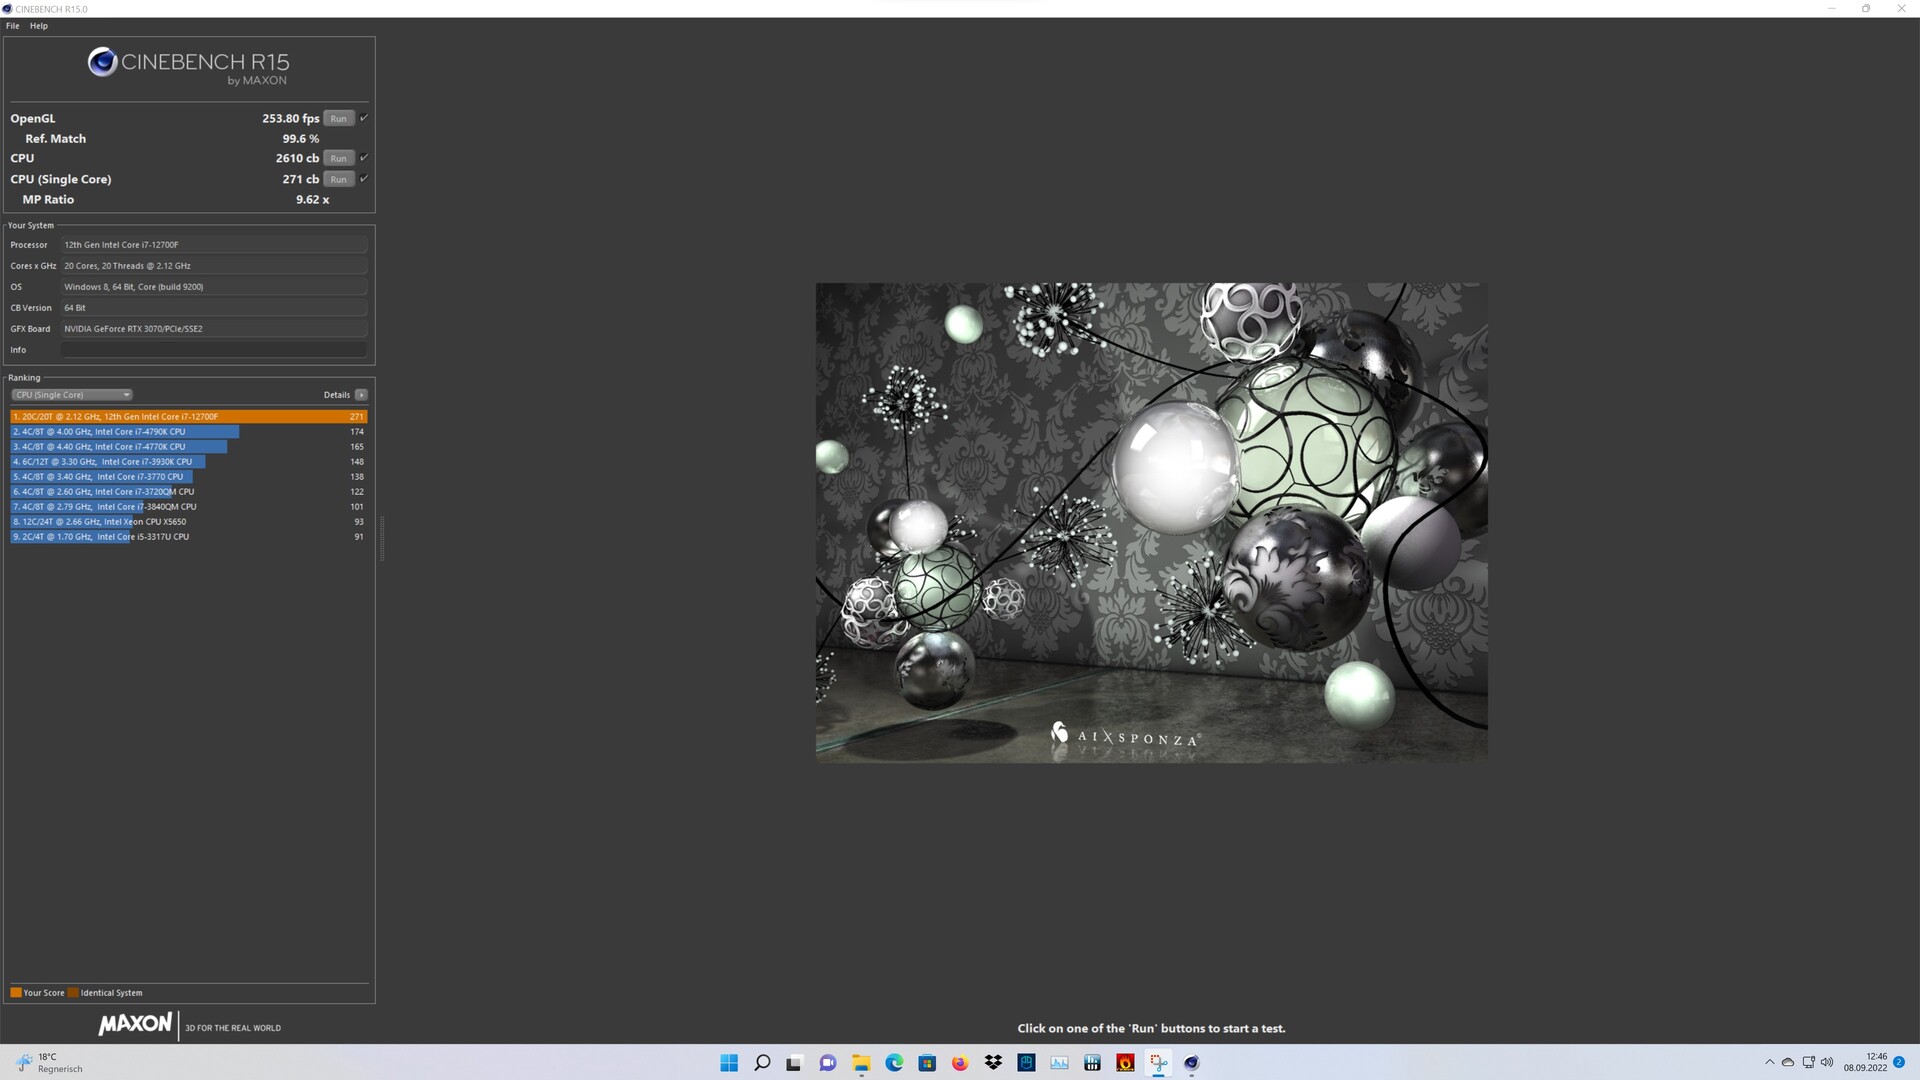
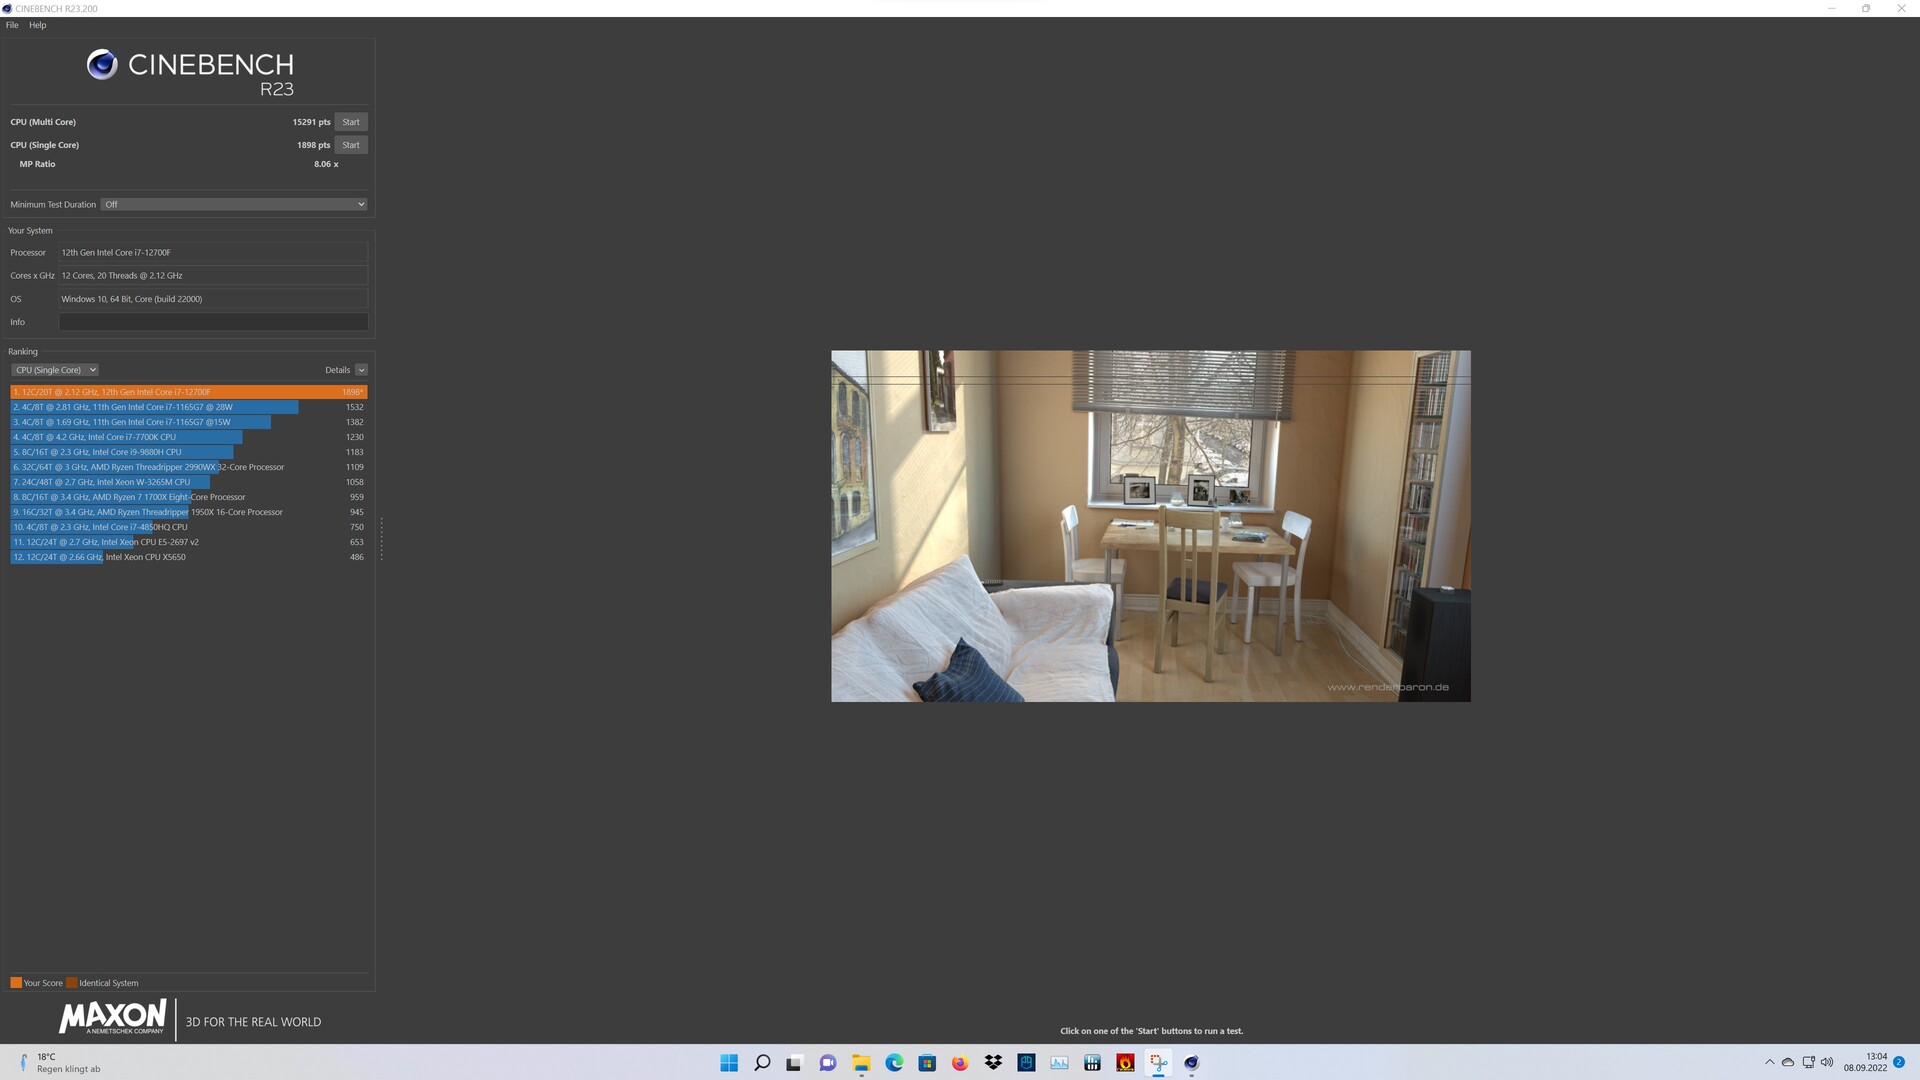
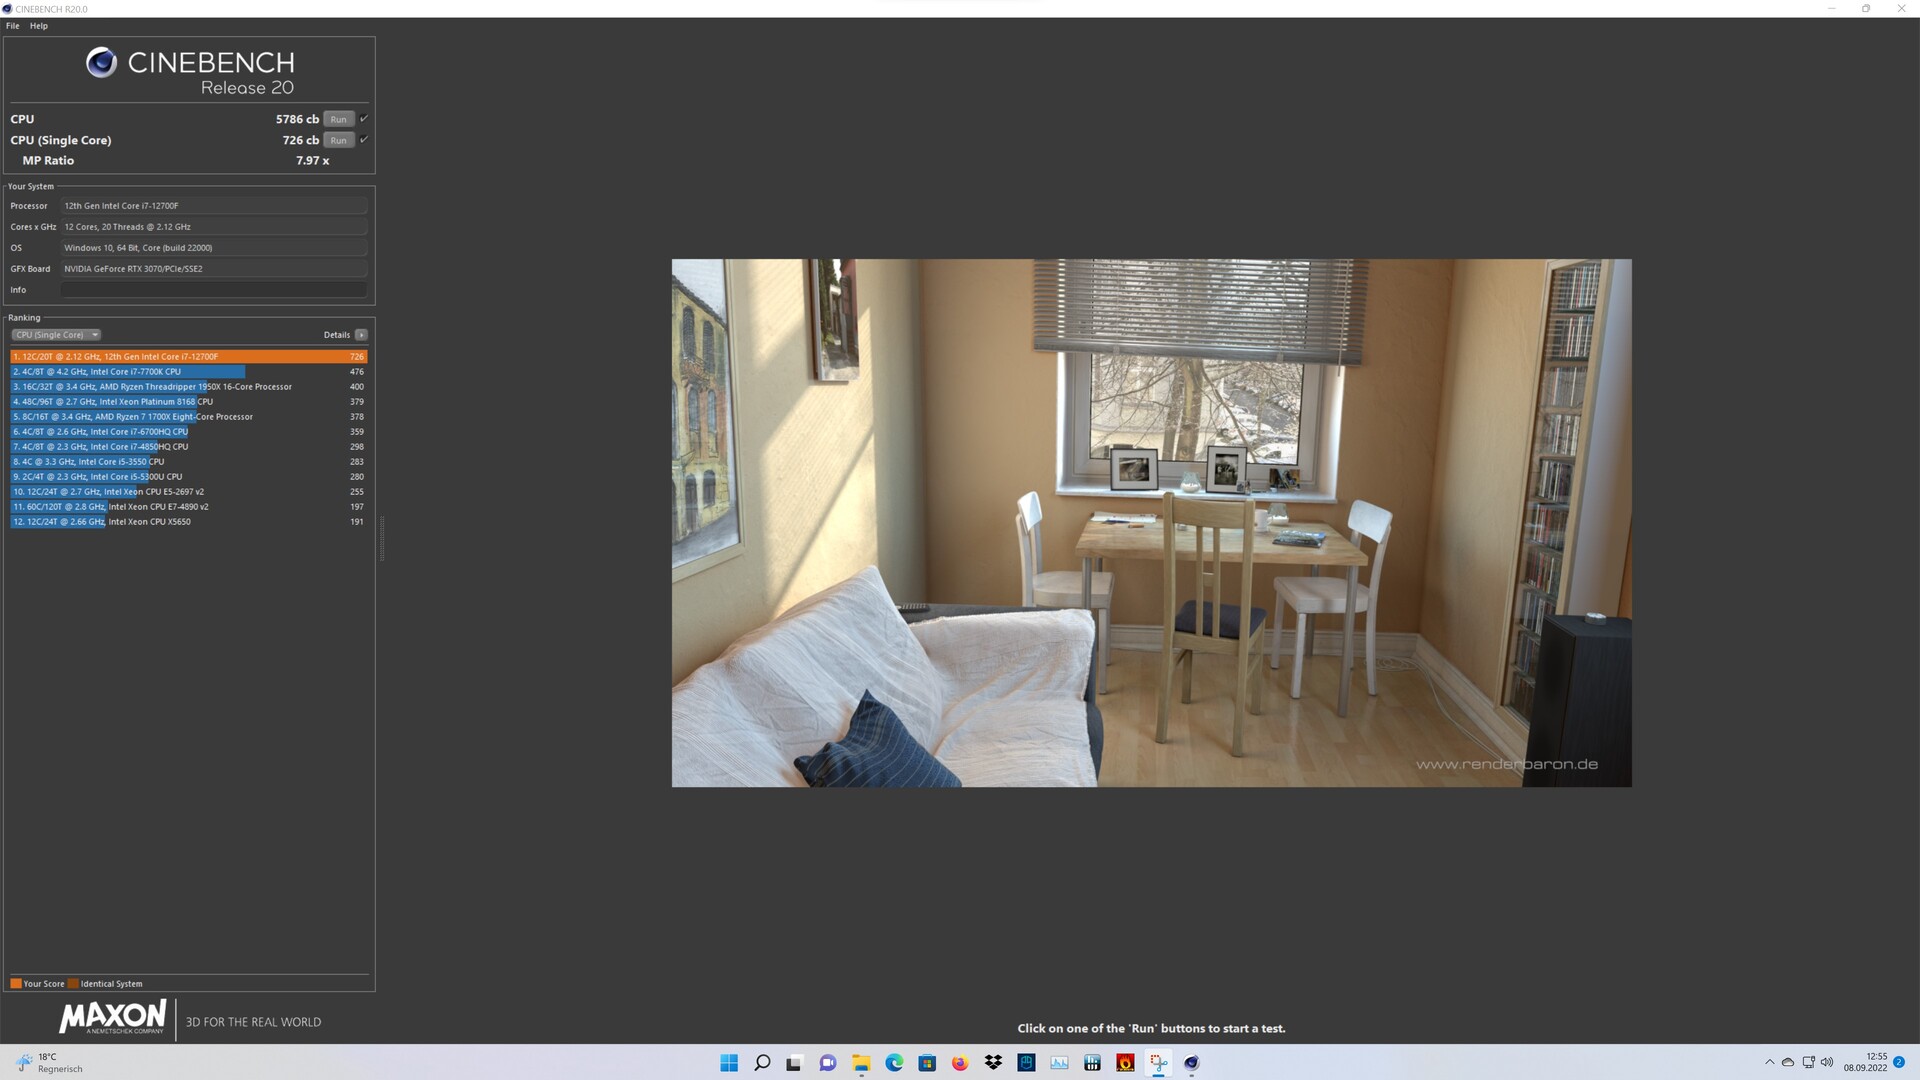
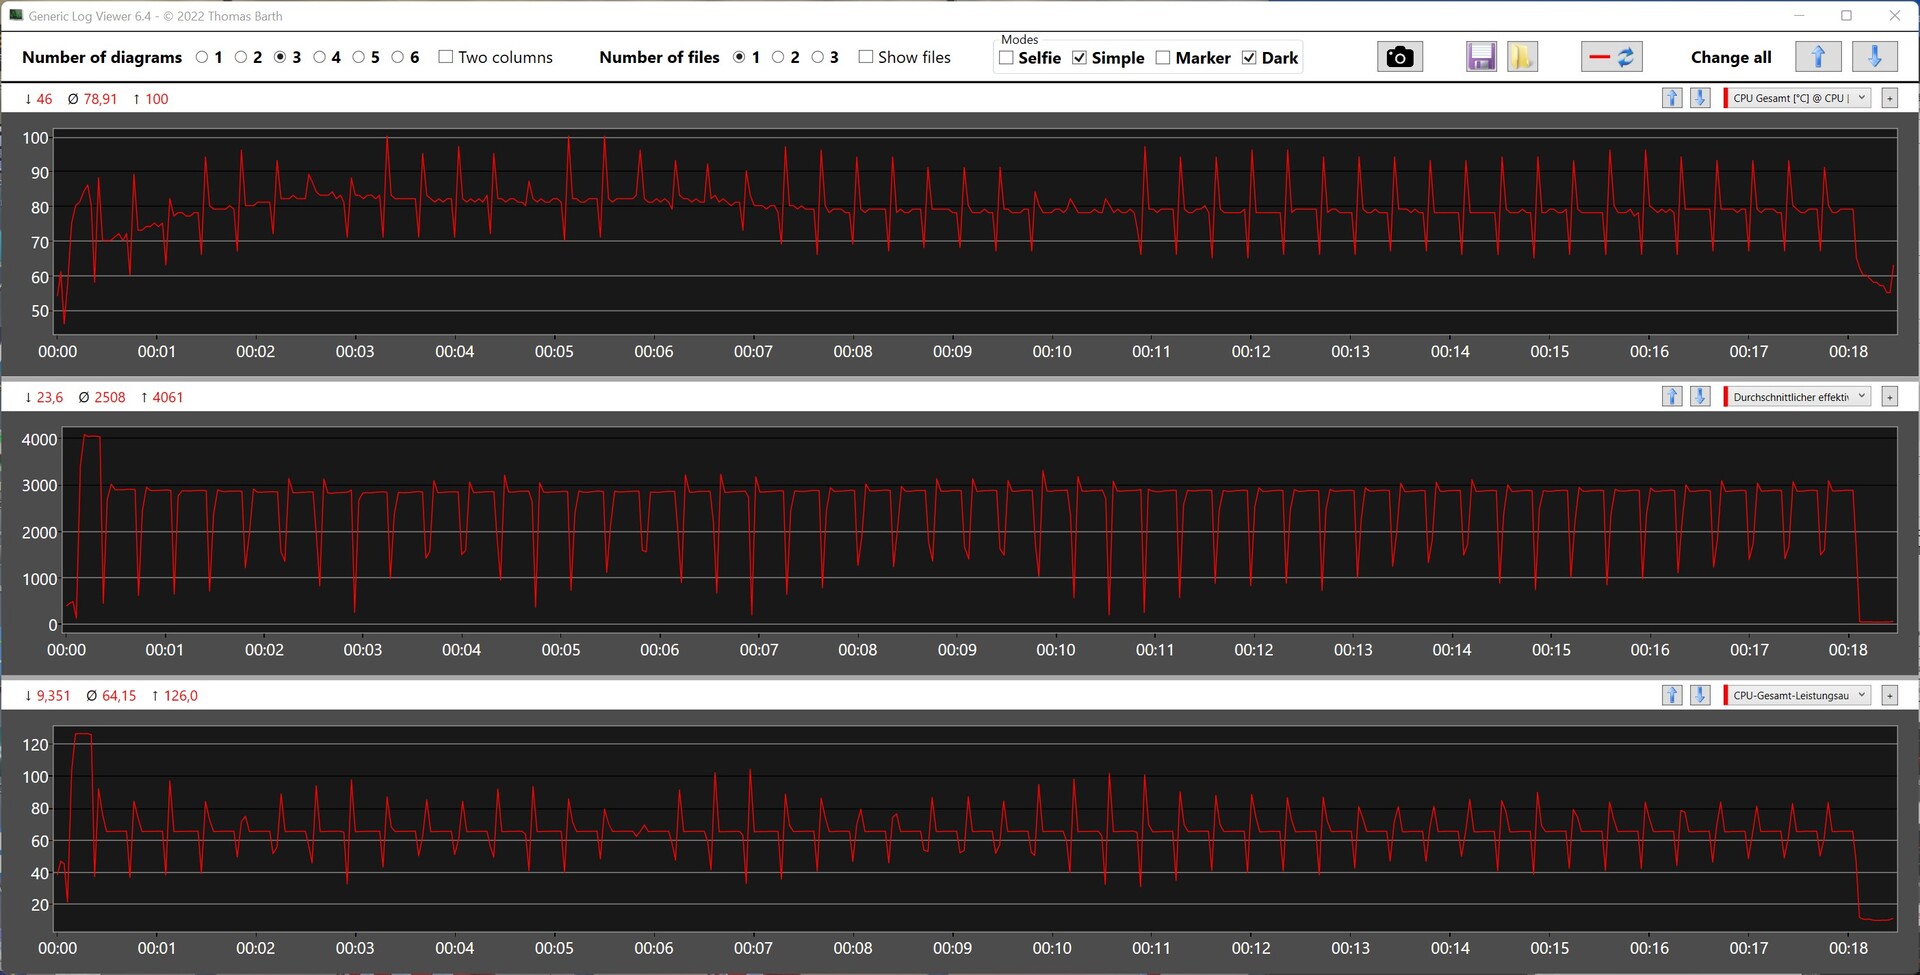
Met de Intel Core i7-12700Fis de Predator Orion 3000 in deze review uitgerust met het snelste model dat Acer voor deze pc aanbiedt. De 65-watt SoC biedt 8 P-cores en 4 E-cores, die samen tot 20 threads tegelijk kunnen verwerken. Acer beperkt de Intel Core i7-12700F echter enigszins als het gaat om maximaal vermogen, aangezien de PL2 normaal gesproken 180 watt is voor dit model. Acer daarentegen beperkt het maximale stroomverbruik hier op 126 watt gedurende maximaal 28 seconden. In vergelijking met de andere vergelijkingstoestellen kan de Acer Predator Orion 3000 nog steeds een goed resultaat neerzetten. Toch geeft de fabrikant prestaties weg voor een beter algemeen resultaat.
Voor verdere vergelijkingen en benchmarks verwijzen we naar onzeCPU vergelijkingstabel.
* ... kleiner is beter
AIDA64: FP32 Ray-Trace | FPU Julia | CPU SHA3 | CPU Queen | FPU SinJulia | FPU Mandel | CPU AES | CPU ZLib | FP64 Ray-Trace | CPU PhotoWorxx
Acer Predator Orion 3000 in de Cinebench R15 multi-loop
We krijgen een goed eerste inzicht in de efficiëntie in combinatie met de ingebouwde koeling tijdens de Cinebench R15 continue loop. Na de eerste run dalen de prestaties drastisch omdat de verhoogde PL2 alleen tijdens de eerste run langer kan worden volgehouden dan tijdens de verdere runs. De geregistreerde CPU metrieken tijdens de test laten dit goed zien.
Systeemprestaties
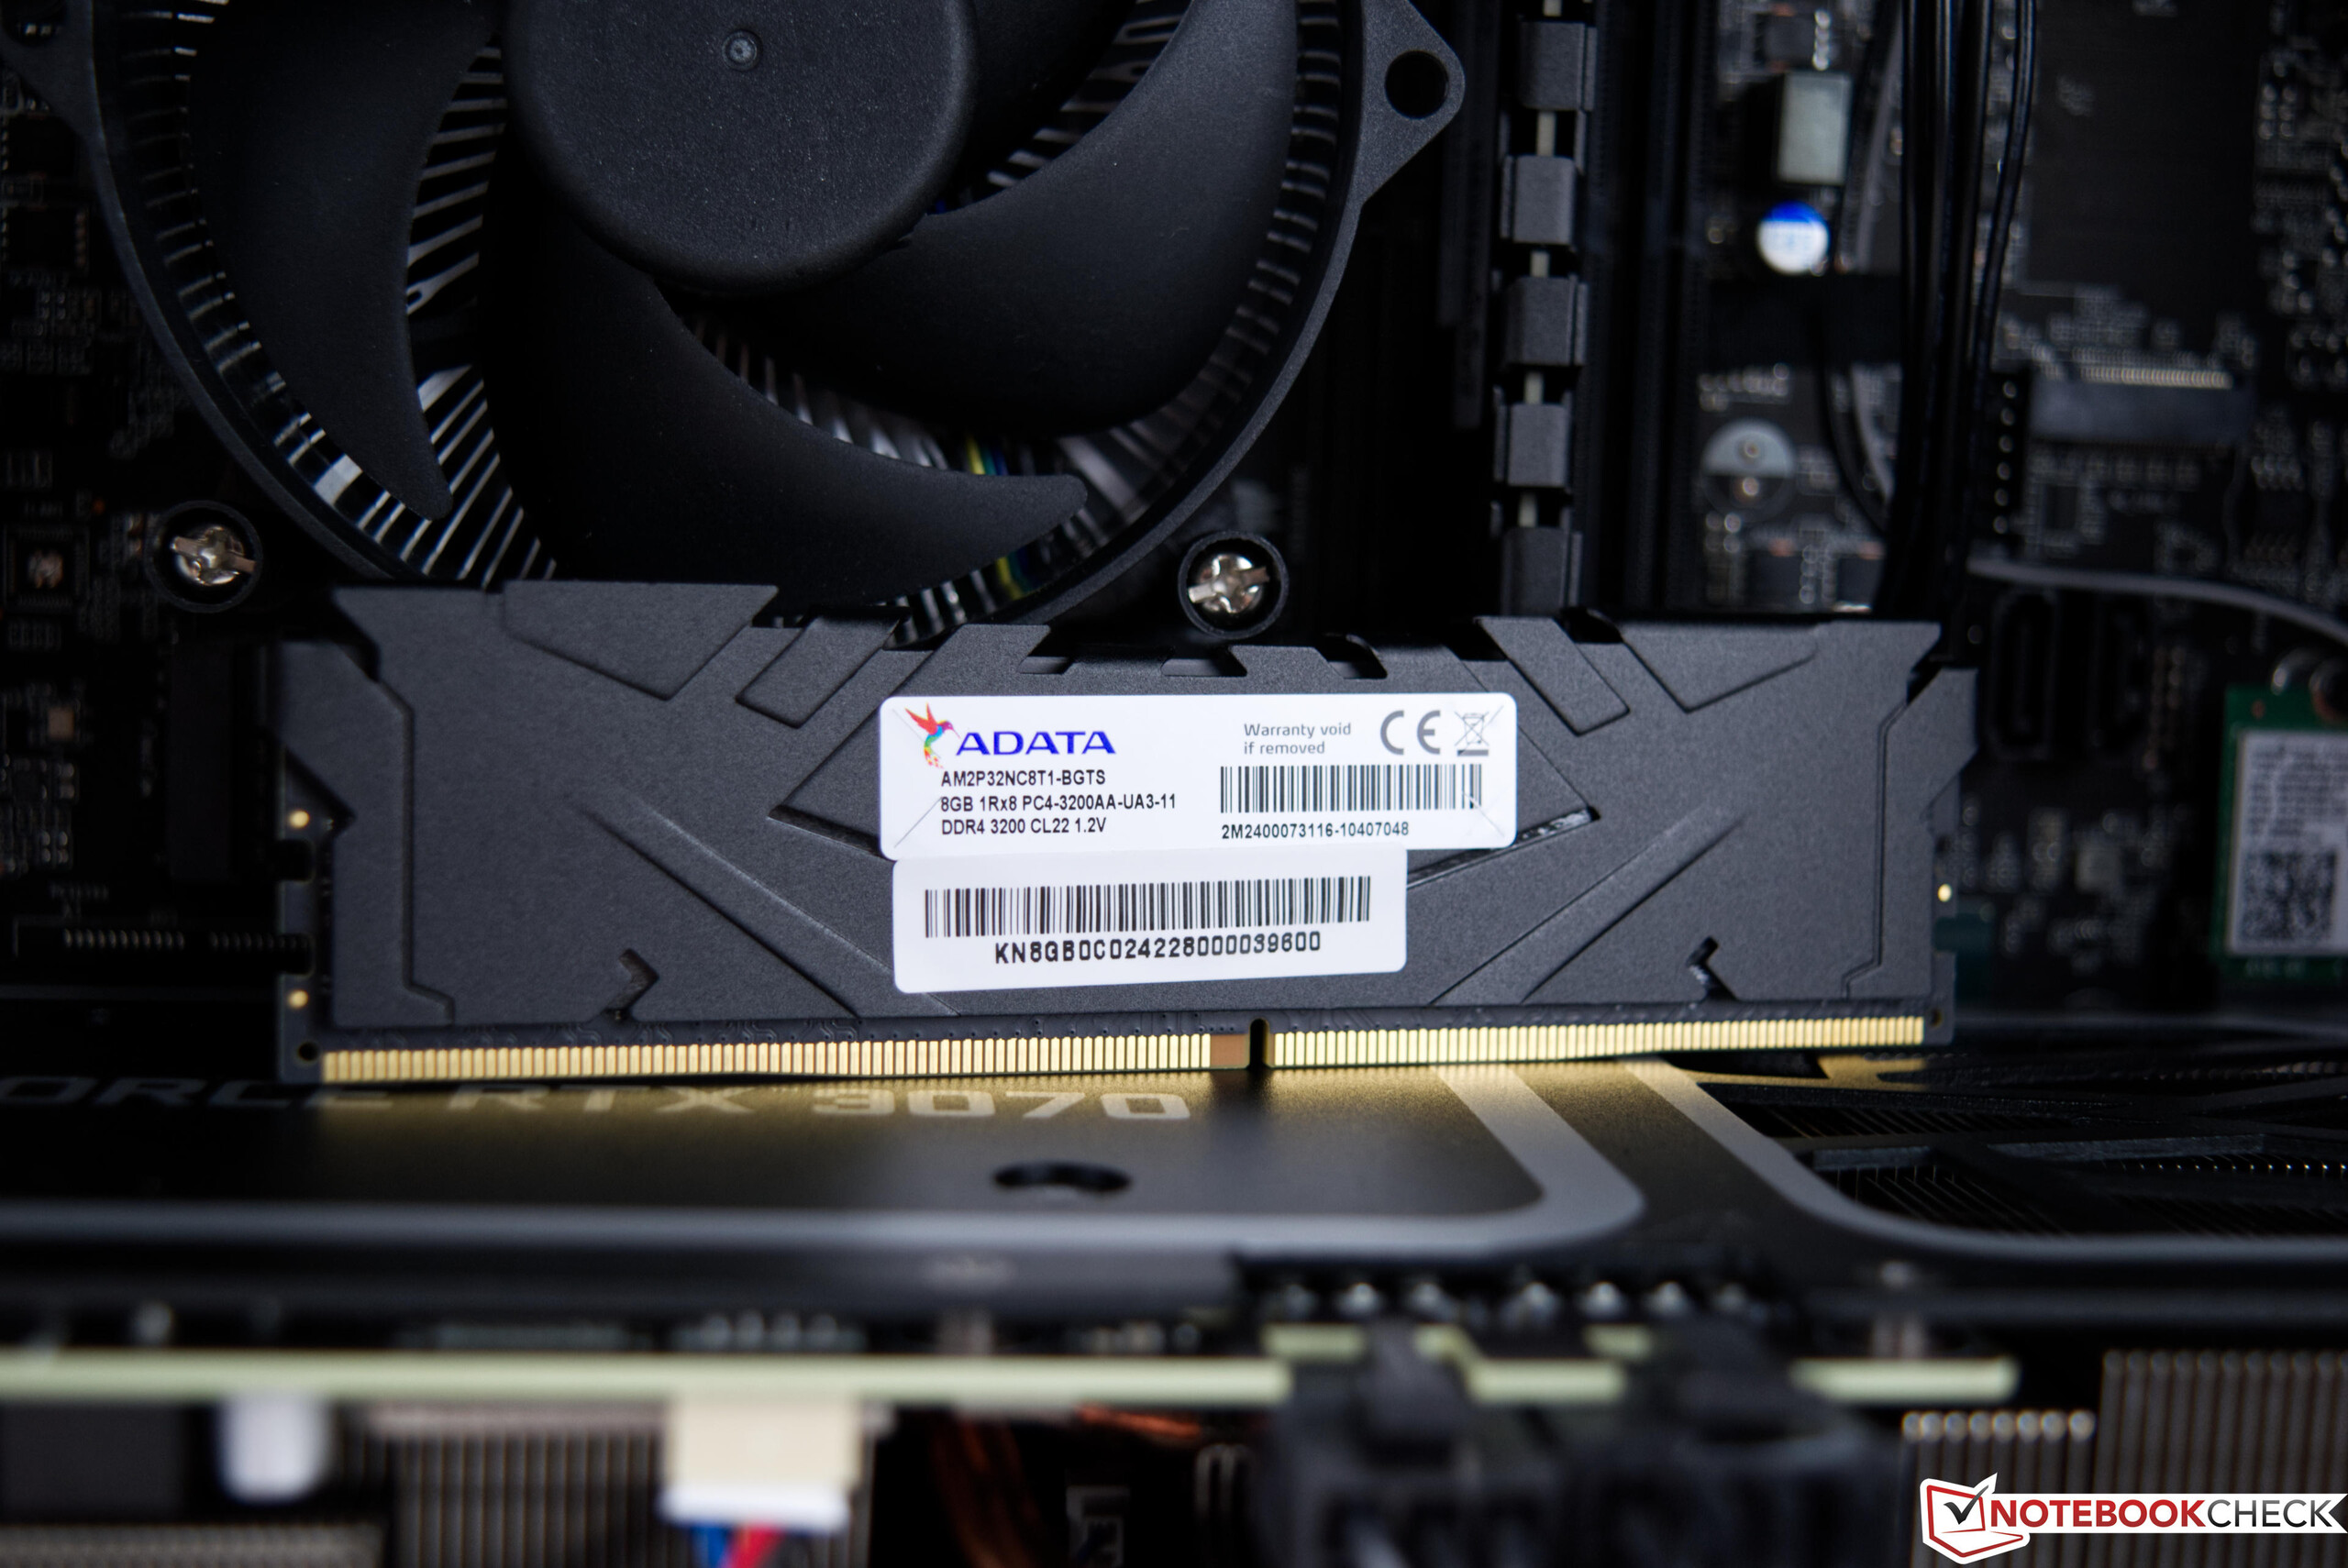
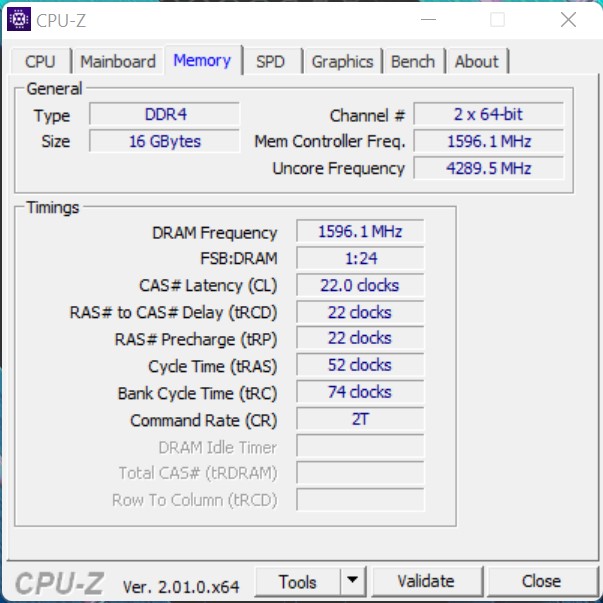
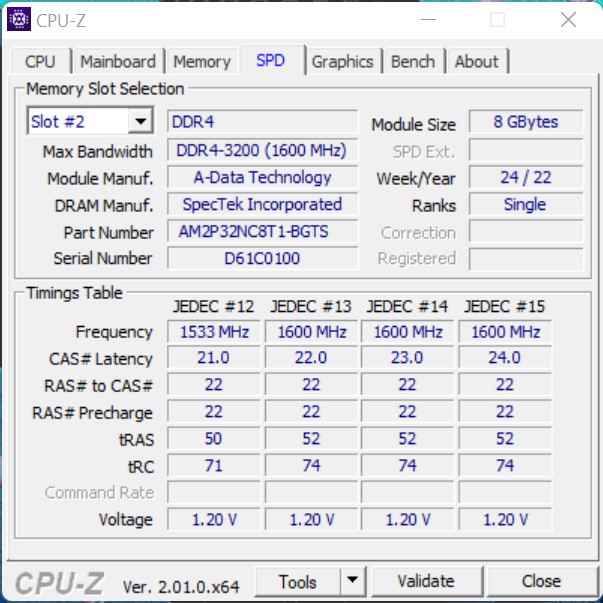
Het feit dat de benchmarks voor systeemprestaties niet permanent de volledige prestaties oproepen, komt de Acer Predator Orion 3000 duidelijk goed uit. De resultaten zijn goed en slechts enkele procentpunten slechter dan die van de Intel Dragon Canyon NUC met Intel Core i9-12900. Het werkgeheugen presteert vrij goed in vergelijking met de vergelijkingsapparaten hier in de test, hoewel een beetje meer prestaties zouden kunnen worden bereikt met sneller RAM en lagere latenties.
| AIDA64 / Memory Copy | |
| Gemiddelde van klas Desktop (54743 - 98416, n=21, laatste 2 jaar) | |
| Acer Predator Orion 3000 PO3-640 | |
| Gemiddeld Intel Core i7-12700F (n=1) | |
| Intel Beast Canyon NUC | |
| Intel Dragon Canyon NUC - RTX 3060 | |
| Zotac ZBOX Magnus EN173070C | |
| Zotac MEK Mini (RTX 2070 Super) | |
| AIDA64 / Memory Read | |
| Gemiddelde van klas Desktop (58375 - 110448, n=21, laatste 2 jaar) | |
| Zotac ZBOX Magnus EN173070C | |
| Acer Predator Orion 3000 PO3-640 | |
| Gemiddeld Intel Core i7-12700F (n=1) | |
| Intel Beast Canyon NUC | |
| Intel Dragon Canyon NUC - RTX 3060 | |
| Zotac MEK Mini (RTX 2070 Super) | |
| AIDA64 / Memory Write | |
| Gemiddelde van klas Desktop (60635 - 93889, n=21, laatste 2 jaar) | |
| Zotac ZBOX Magnus EN173070C | |
| Intel Beast Canyon NUC | |
| Intel Dragon Canyon NUC - RTX 3060 | |
| Acer Predator Orion 3000 PO3-640 | |
| Gemiddeld Intel Core i7-12700F (n=1) | |
| Zotac MEK Mini (RTX 2070 Super) | |
| AIDA64 / Memory Latency | |
| Gemiddelde van klas Desktop (68.5 - 168, n=21, laatste 2 jaar) | |
| Intel Beast Canyon NUC | |
| Intel Dragon Canyon NUC - RTX 3060 | |
| Zotac ZBOX Magnus EN173070C | |
| Acer Predator Orion 3000 PO3-640 | |
| Gemiddeld Intel Core i7-12700F (n=1) | |
| Zotac MEK Mini (RTX 2070 Super) | |
* ... kleiner is beter
DPC latenties
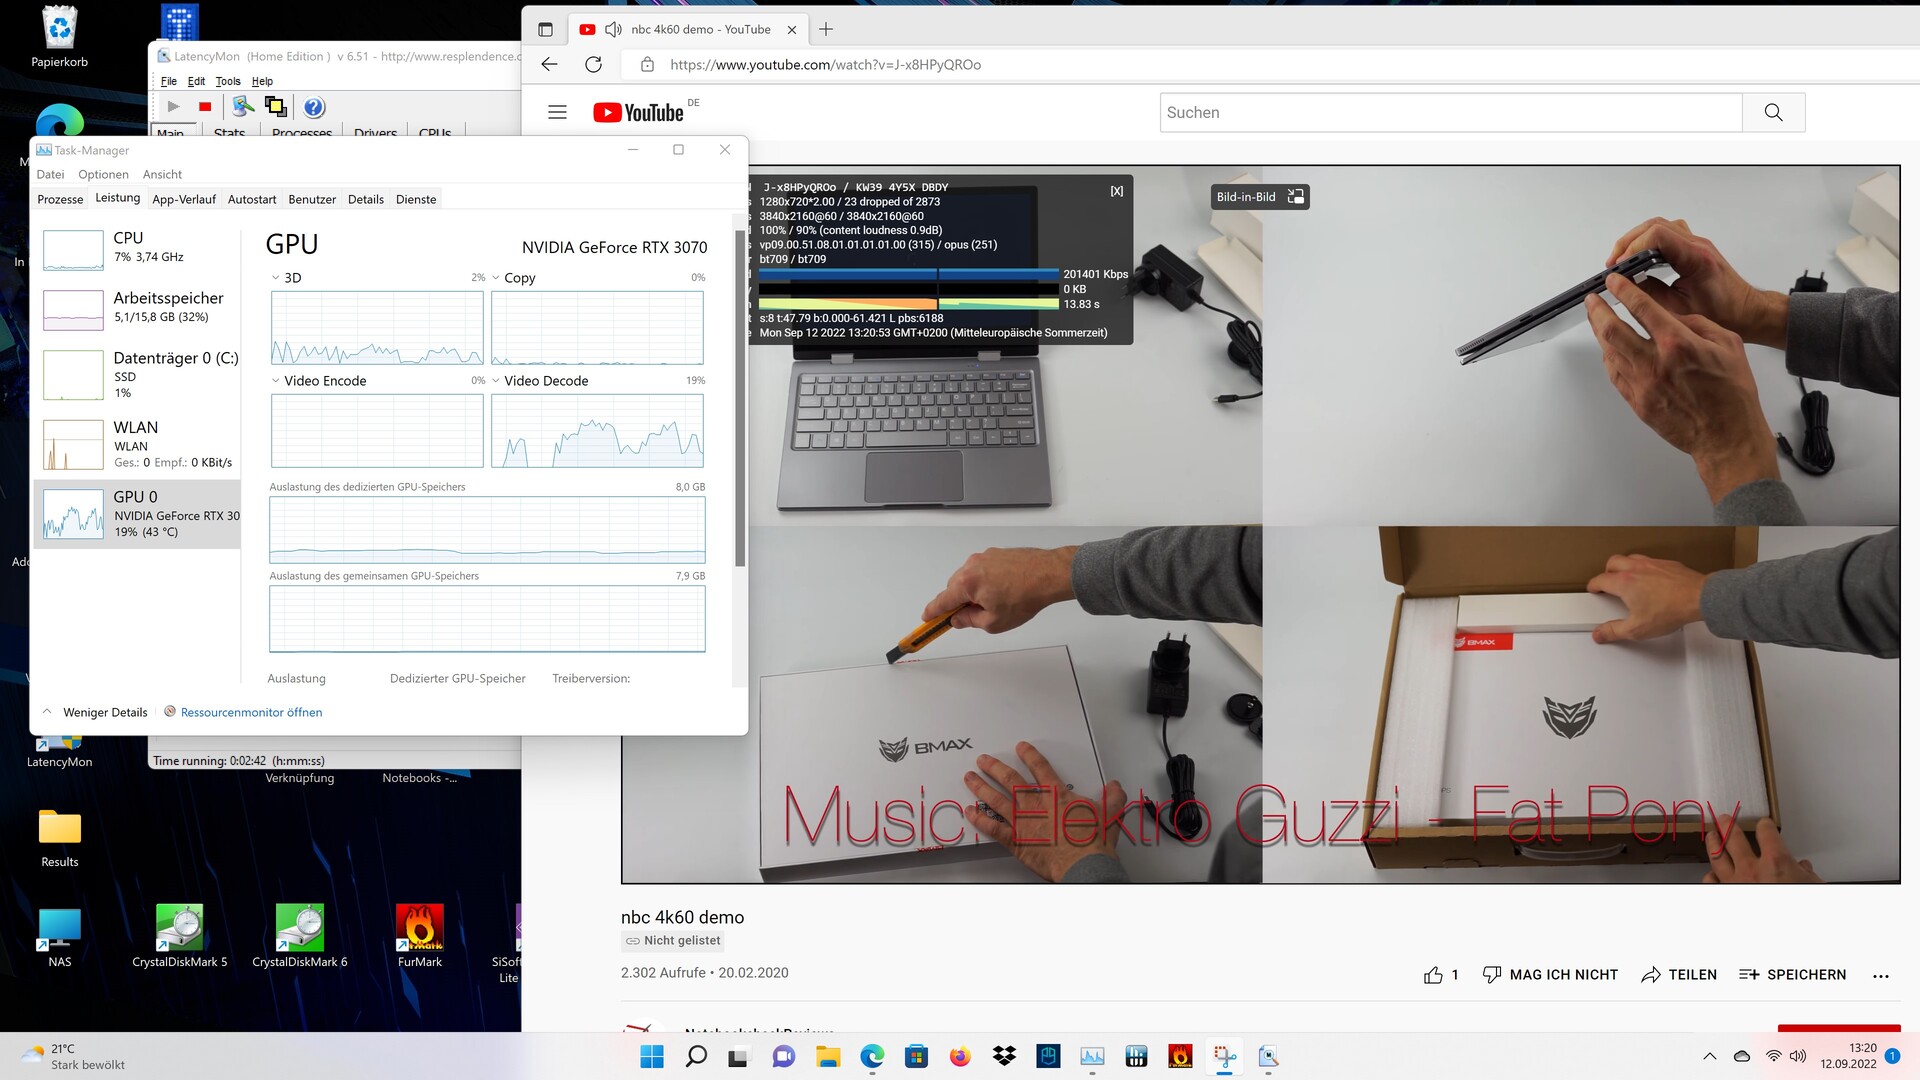
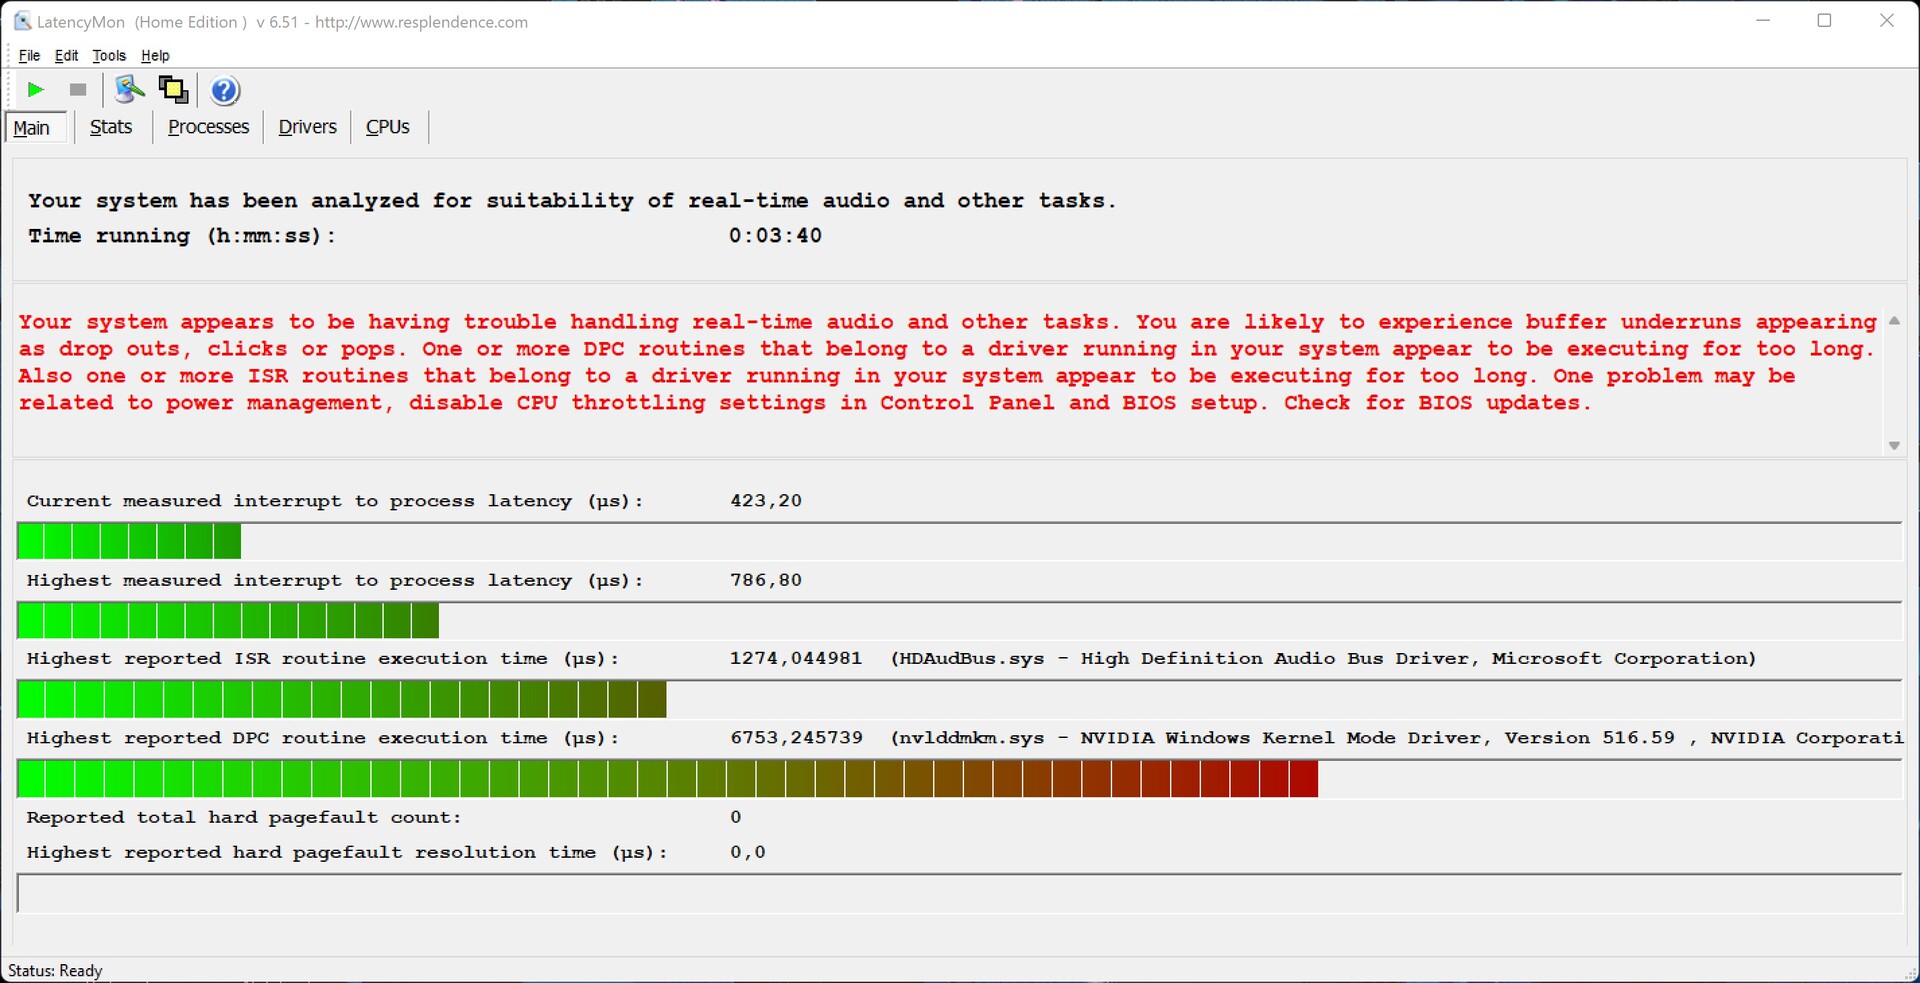
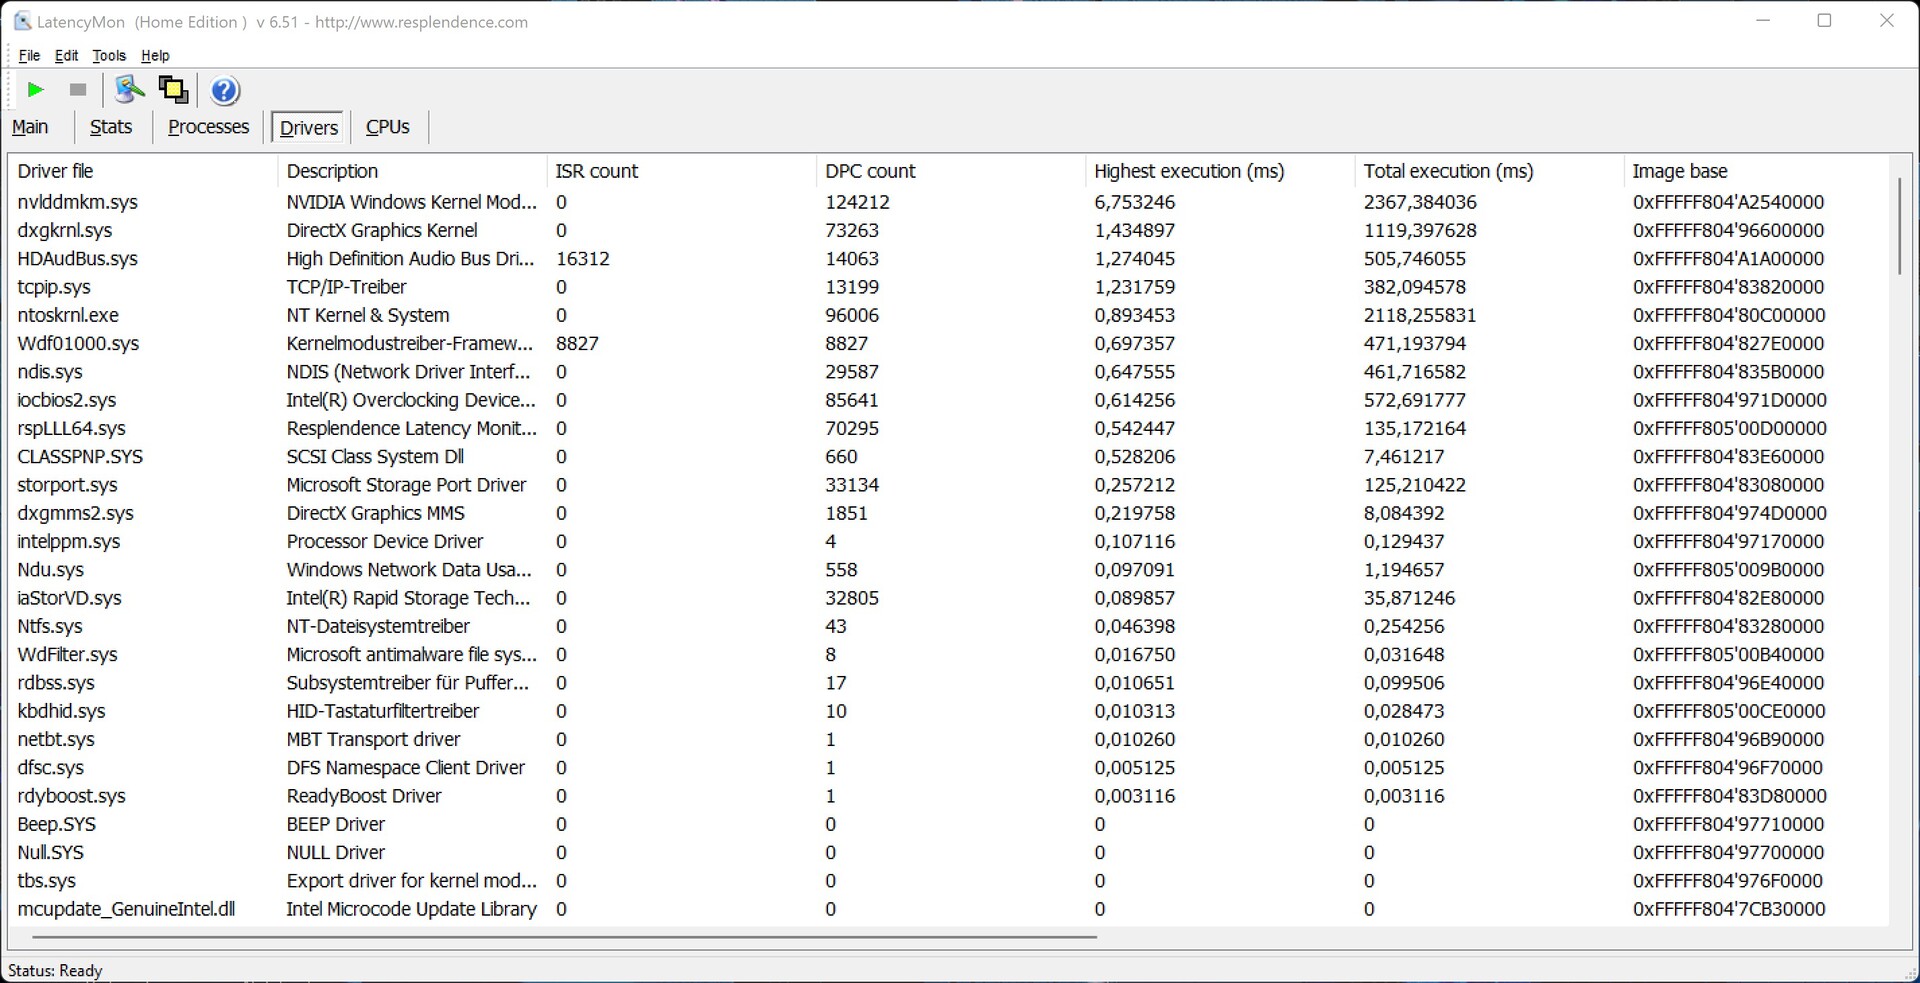
LatencyMon meldt al latency problemen bij het openen van meerdere tabbladen in Edge. De drivers lijken hier nog niet geoptimaliseerd te zijn.
| DPC Latencies / LatencyMon - interrupt to process latency (max), Web, Youtube, Prime95 | |
| Acer Predator Orion 3000 PO3-640, Intel Core i7-12700F | |
| Minisforum EliteMini B550, AMD Ryzen 7 5700G | |
| Asus ExpertCenter D9 SFF, Intel Core i7-11700 | |
| Zotac ZBOX Magnus EN173070C, Intel Core i7-11800H | |
| Minisforum EliteMini HX90, AMD Ryzen 9 5900HX | |
* ... kleiner is beter
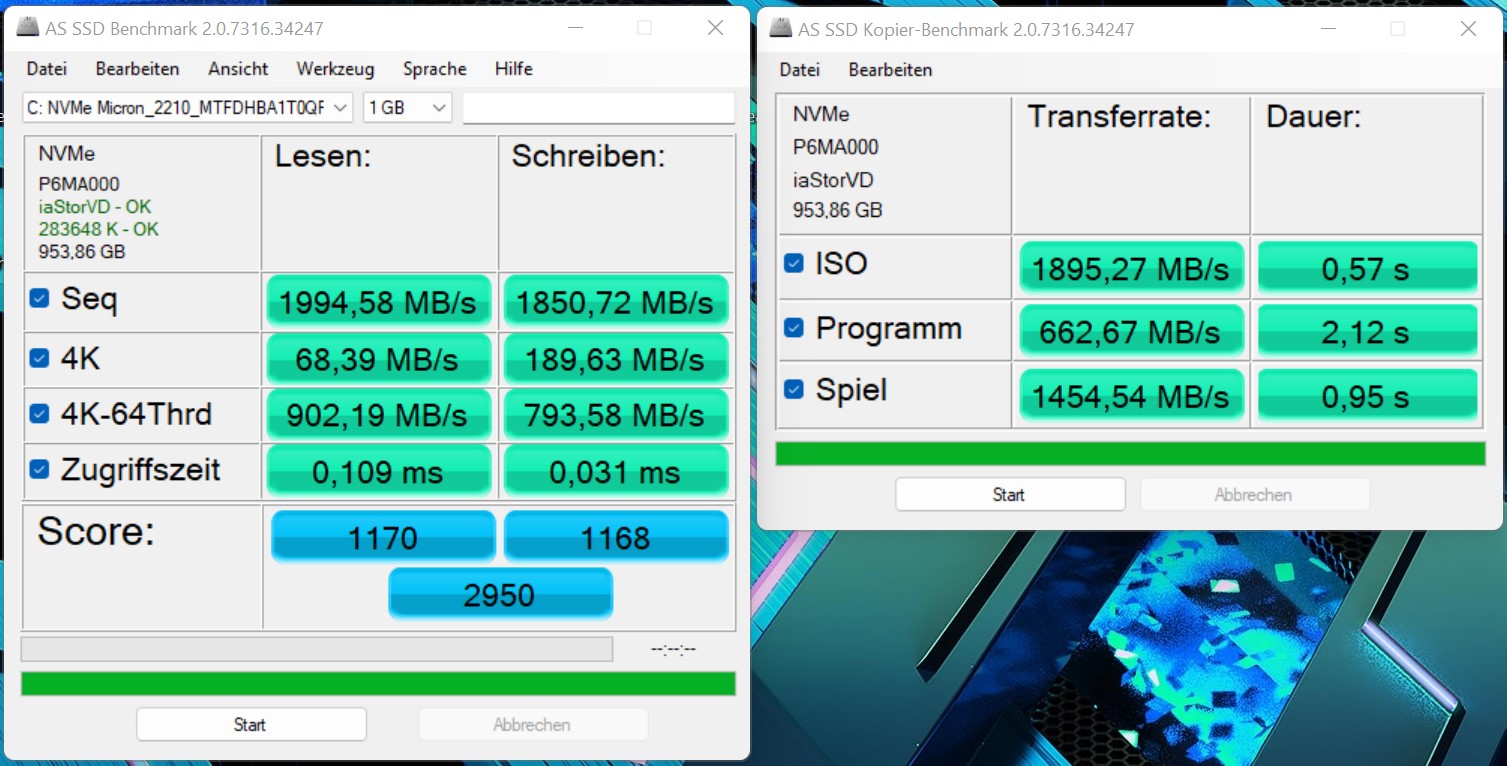
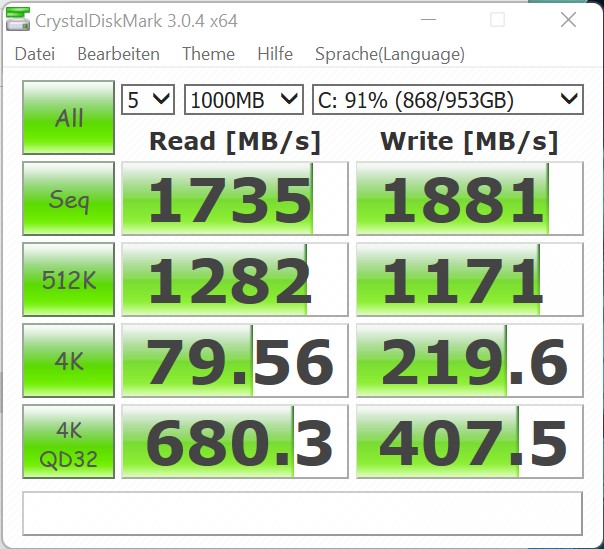
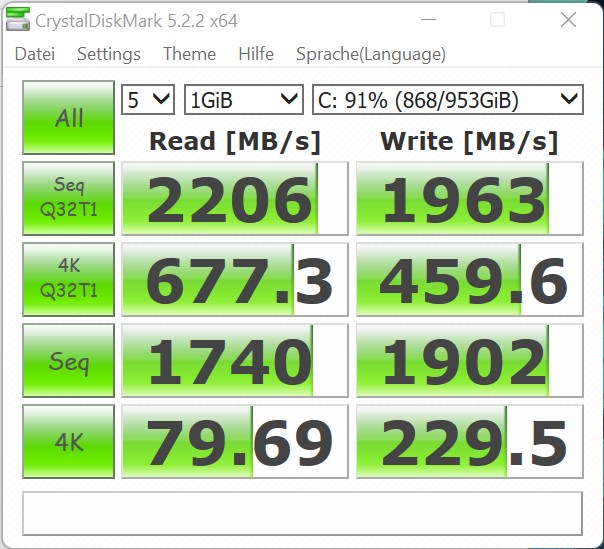
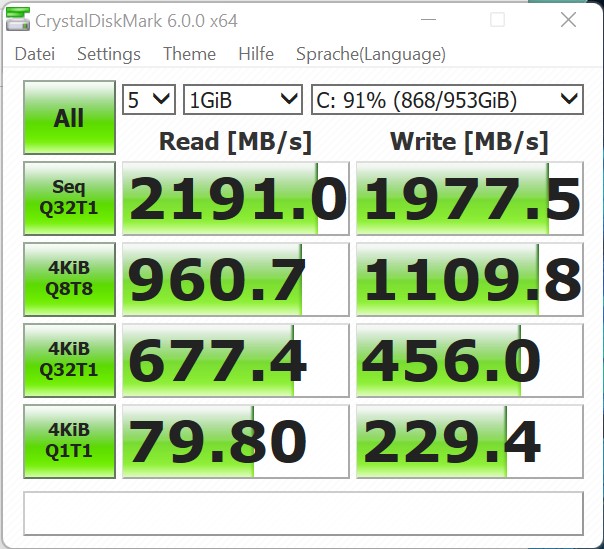
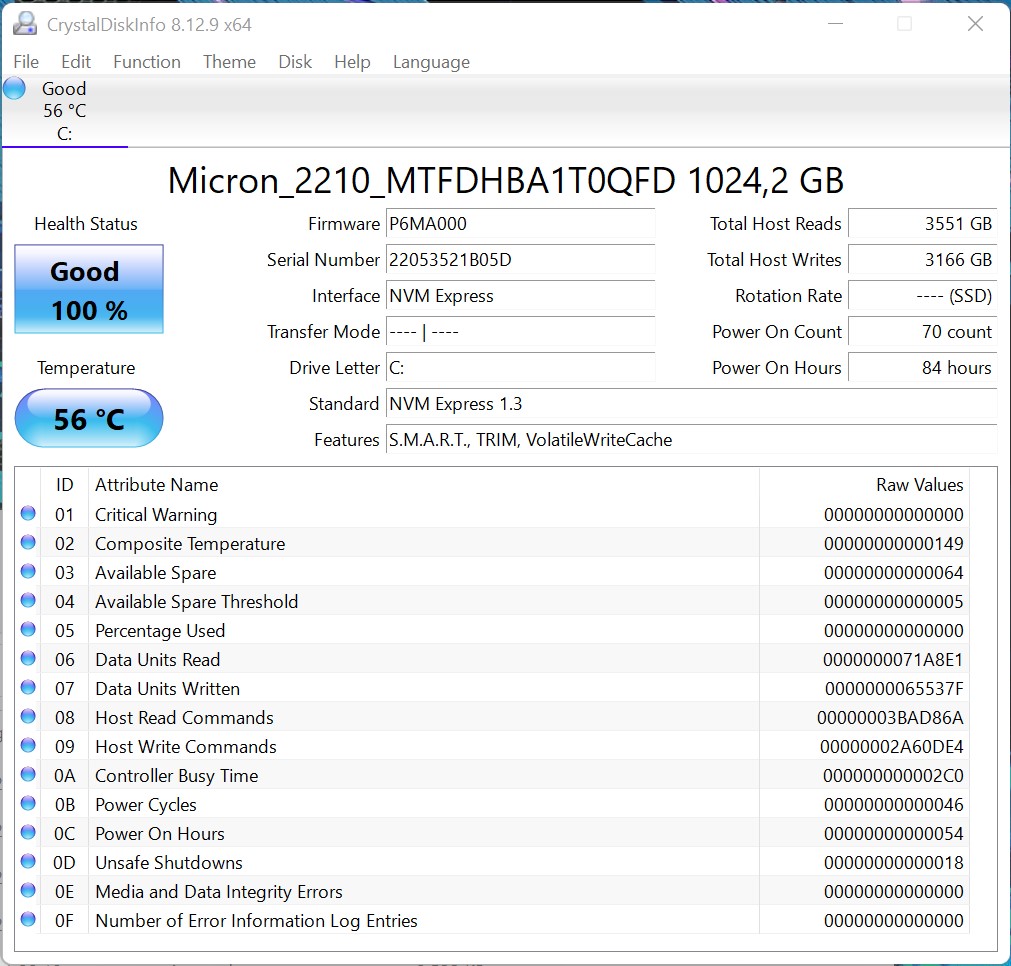
Massa-opslag
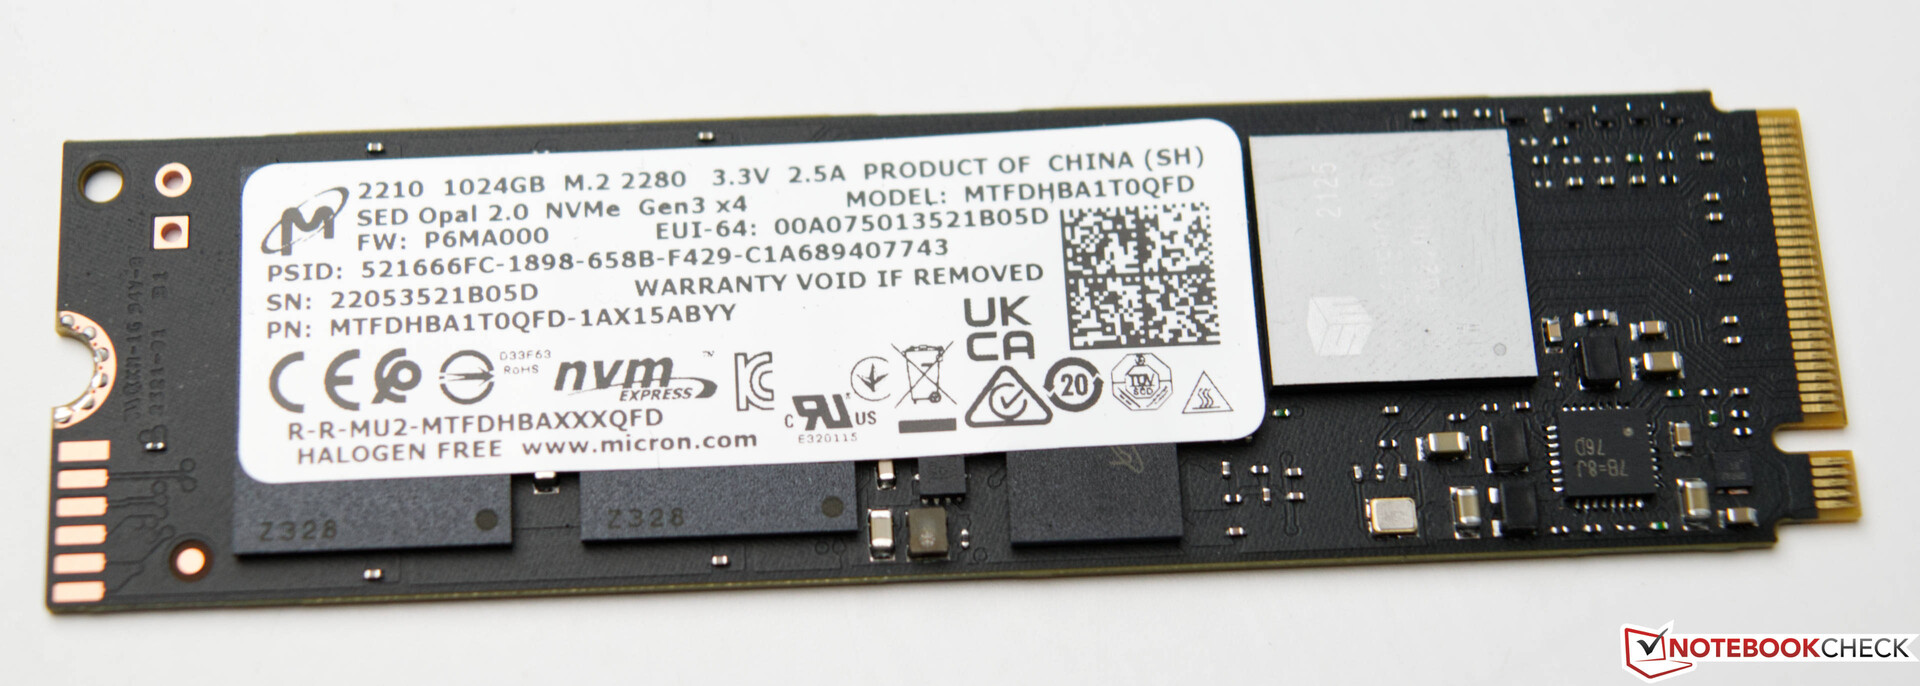
Ons testexemplaar is uitgerust met een 1 TB SSD van Micron. De M.2 module biedt goede overdrachtssnelheden, hoewel de maximale waarden de vergelijkingsapparaten niet helemaal kunnen bijbenen. Dit wordt echter nauwelijks opgemerkt bij dagelijks gebruik. De 4K-leessnelheid heeft bijvoorbeeld een veel grotere impact, wat erg goed uitpakt in de Acer Predator Orion 3000. De opslagcapaciteit van 1 TB is voldoende en zou naar onze mening niet kleiner mogen zijn voor een gaming apparaat. De massaopslag van de Acer Predator Orion 3000 kan relatief eenvoudig worden uitgebreid. Een tweede M.2 module kan op het moederbord worden geïnstalleerd. Verder is er ook ruimte voor twee 3,5-inch harde schijven in de behuizing. Alle benodigde aansluitkabels worden bij het apparaat meegeleverd
Voor verdere vergelijkingen en benchmarks verwijzen we naar onzeVergelijkingstabel.

* ... kleiner is beter
Disk Throttling: DiskSpd Read Loop, Queue Depth 8
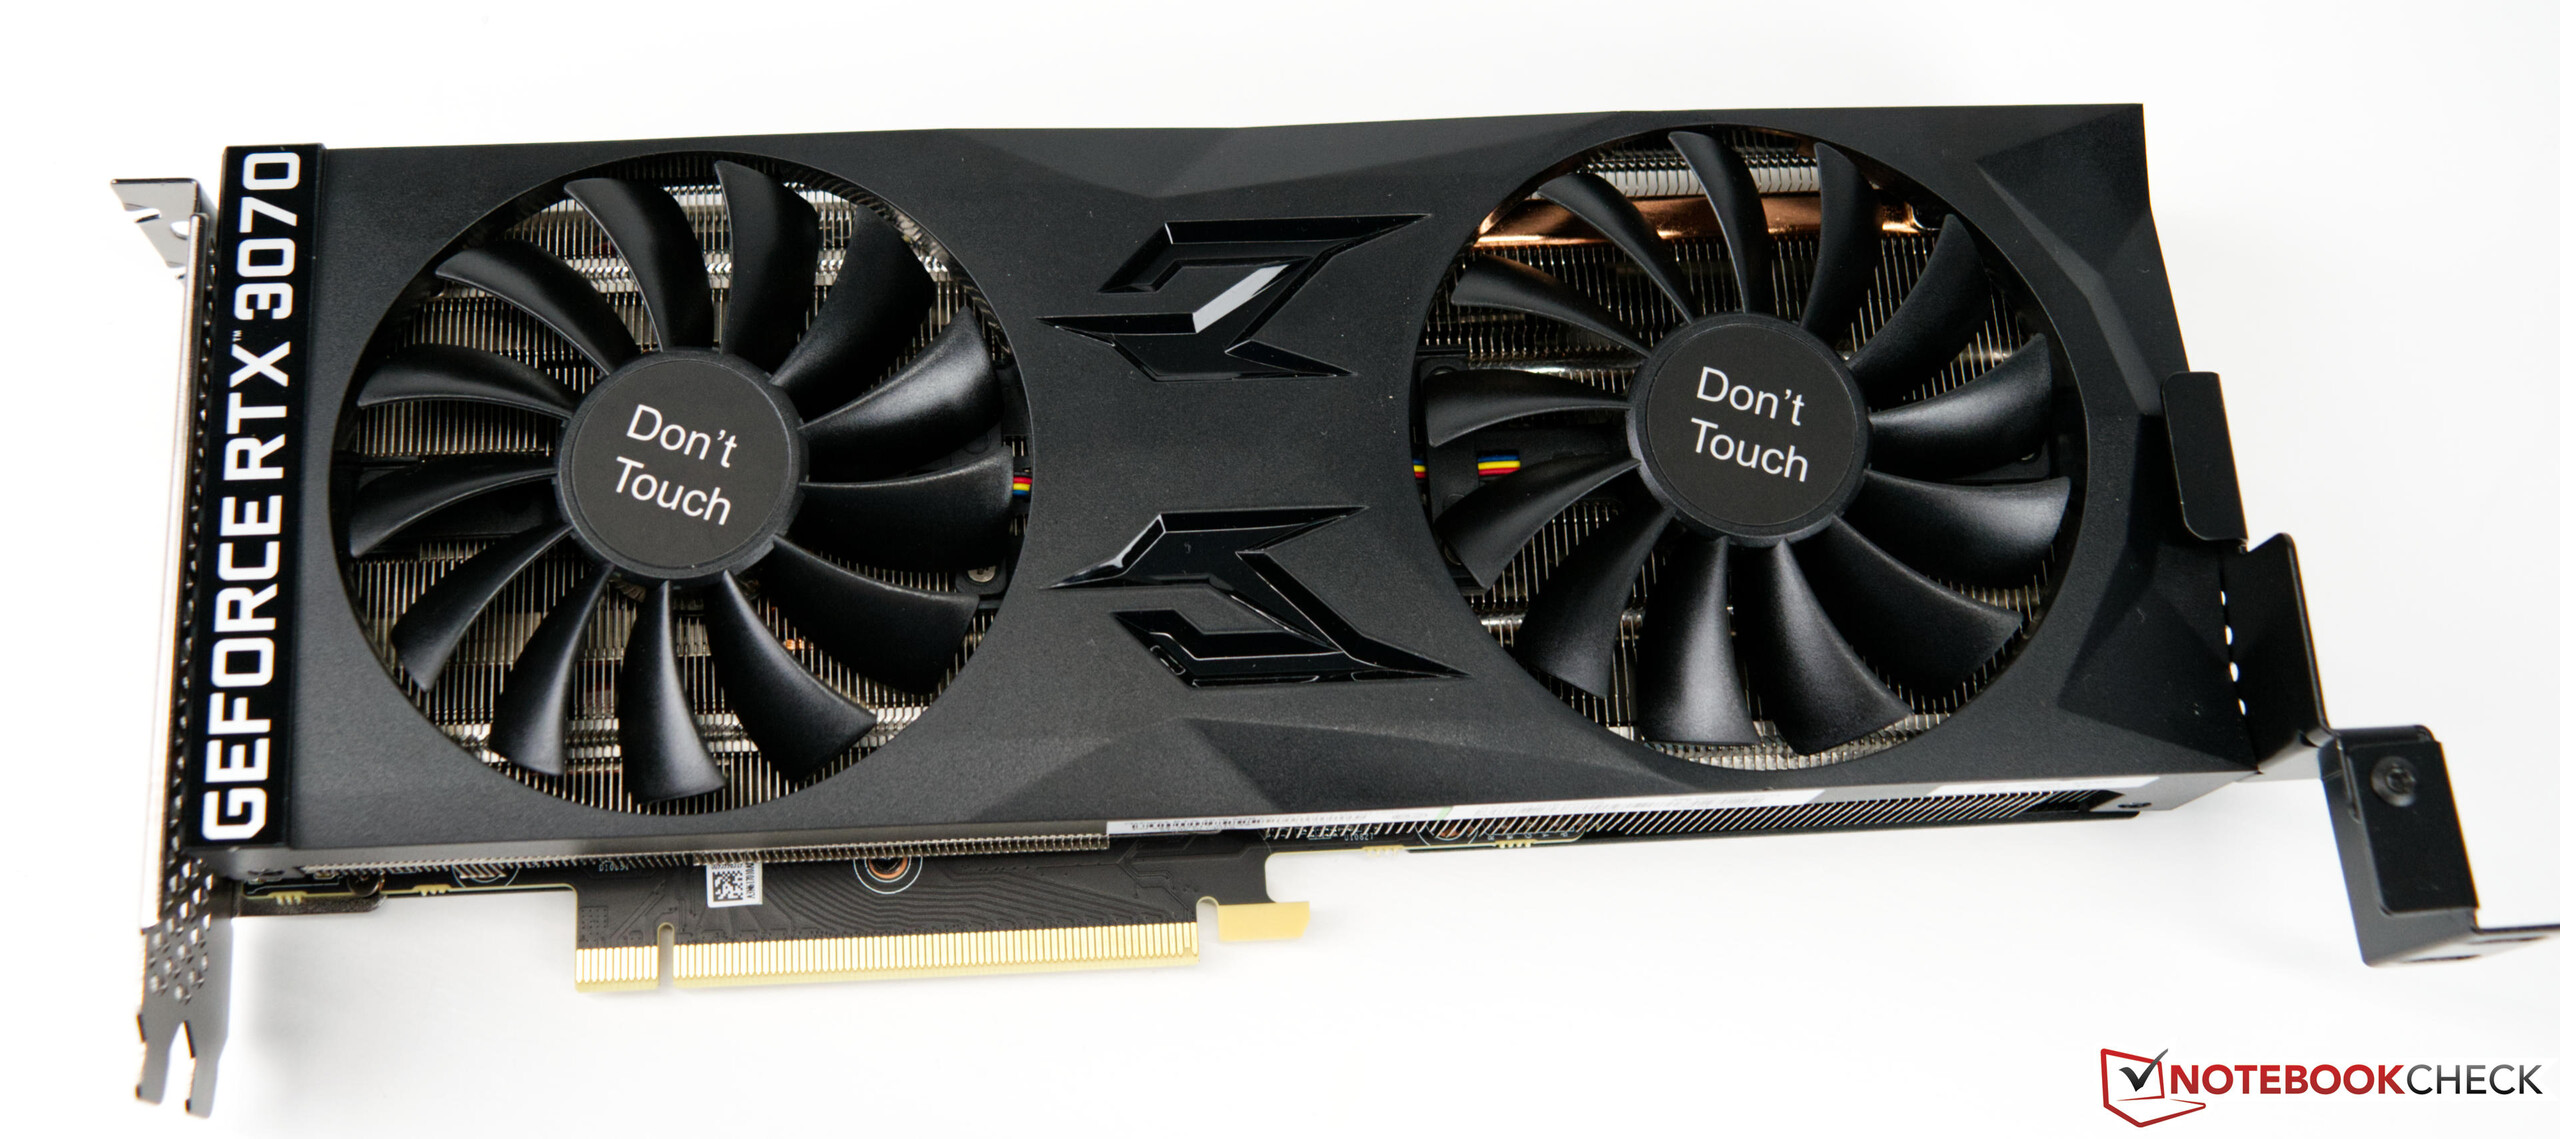
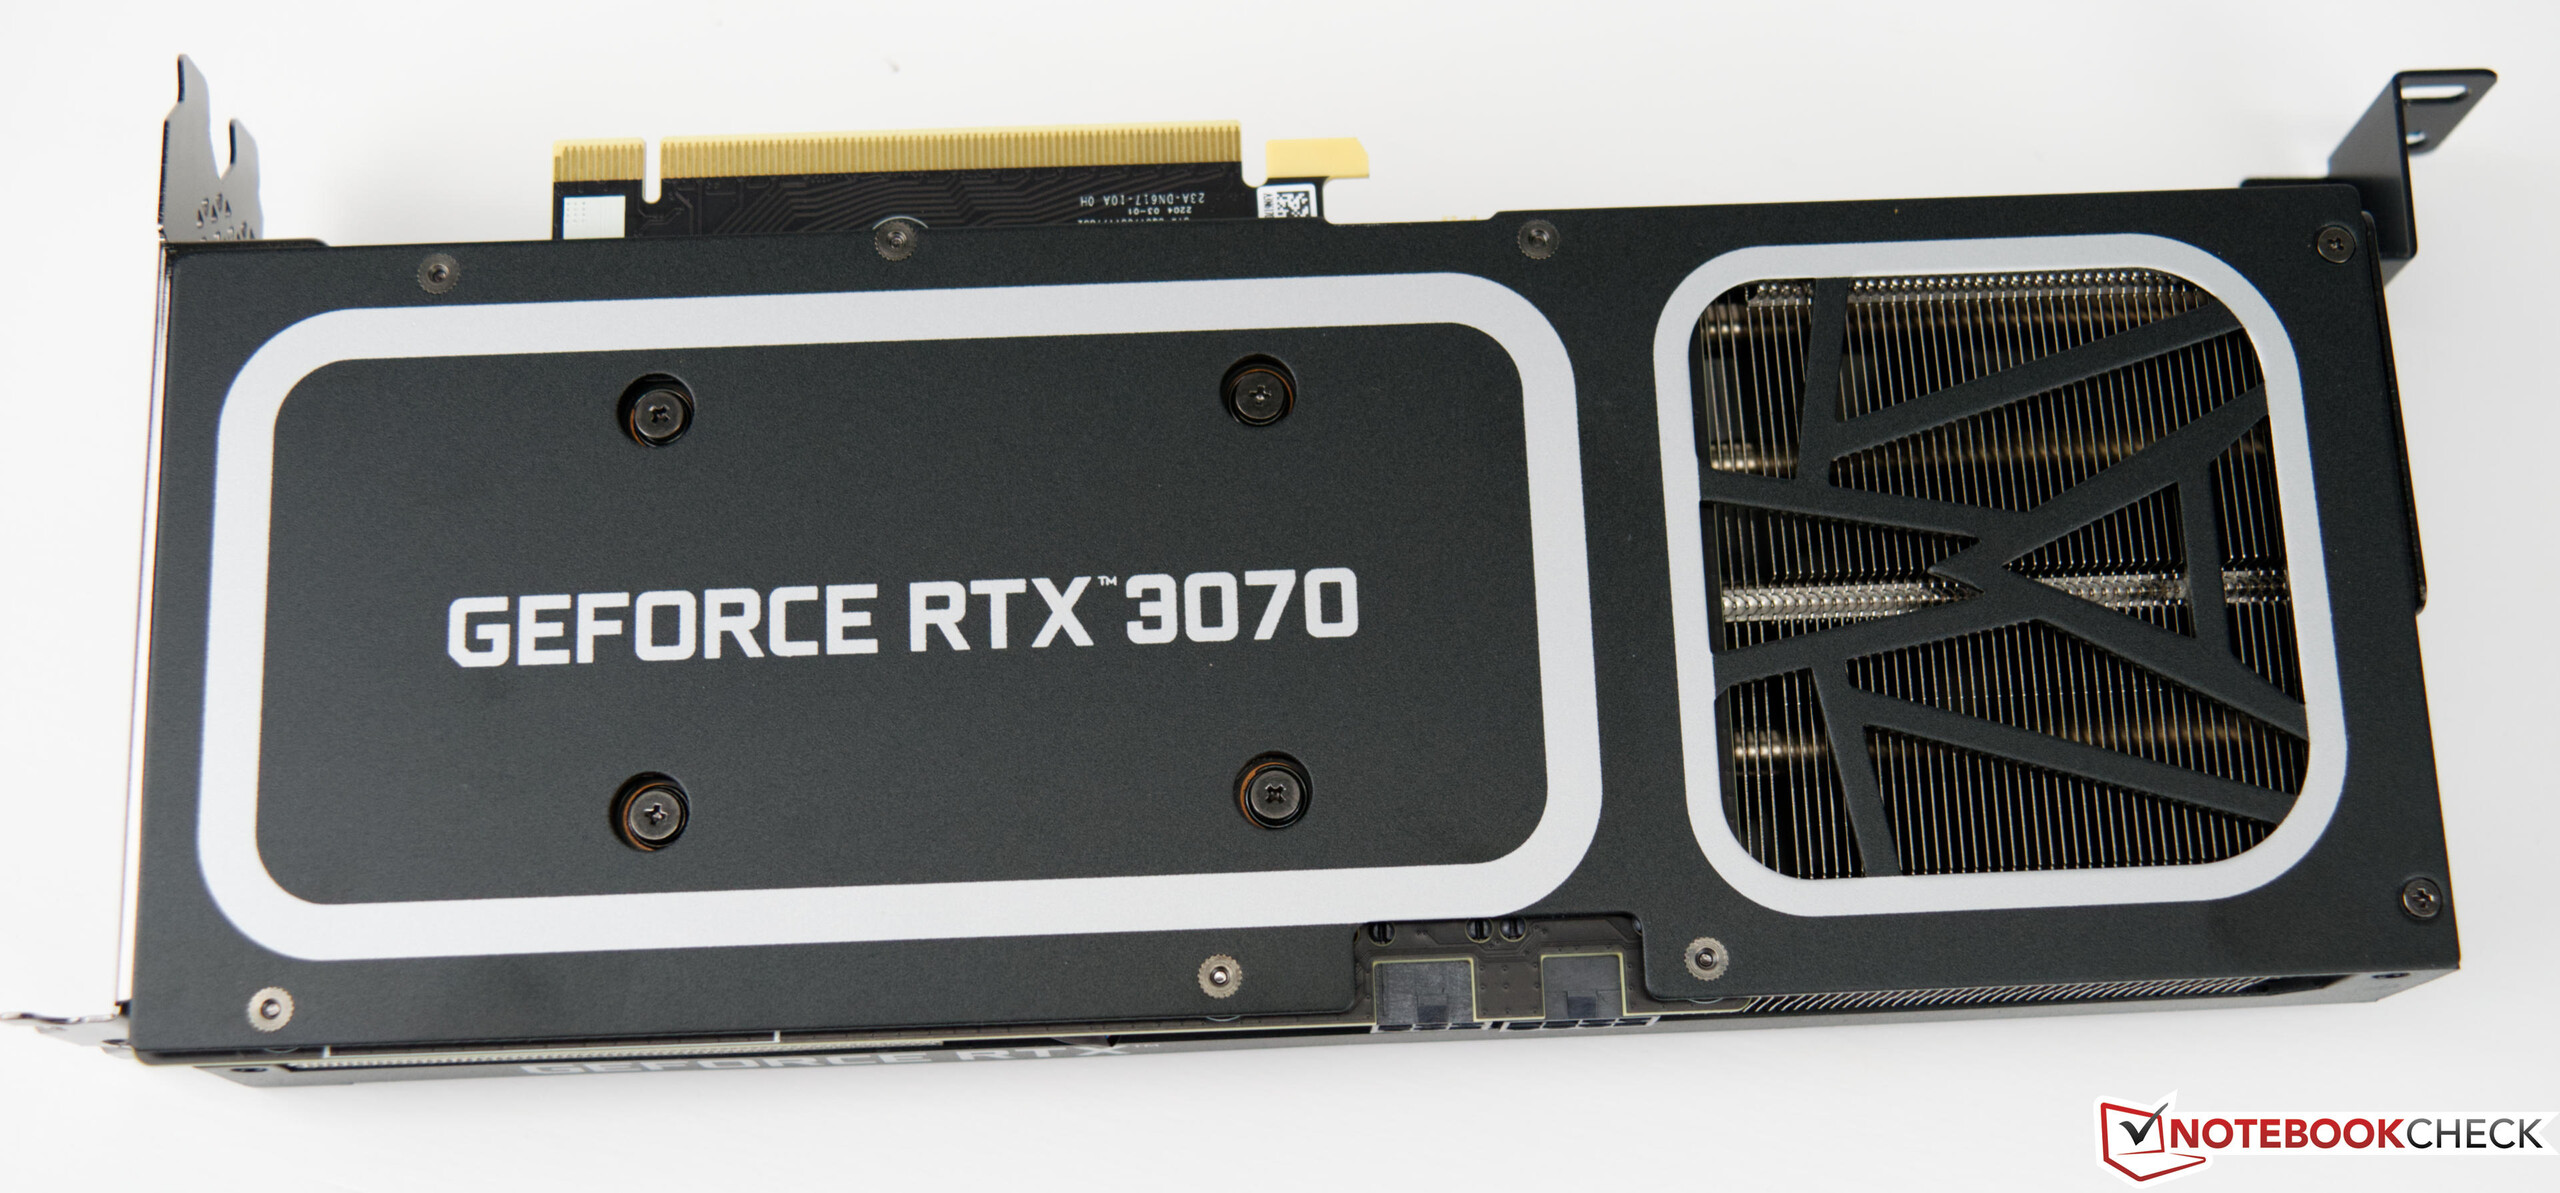
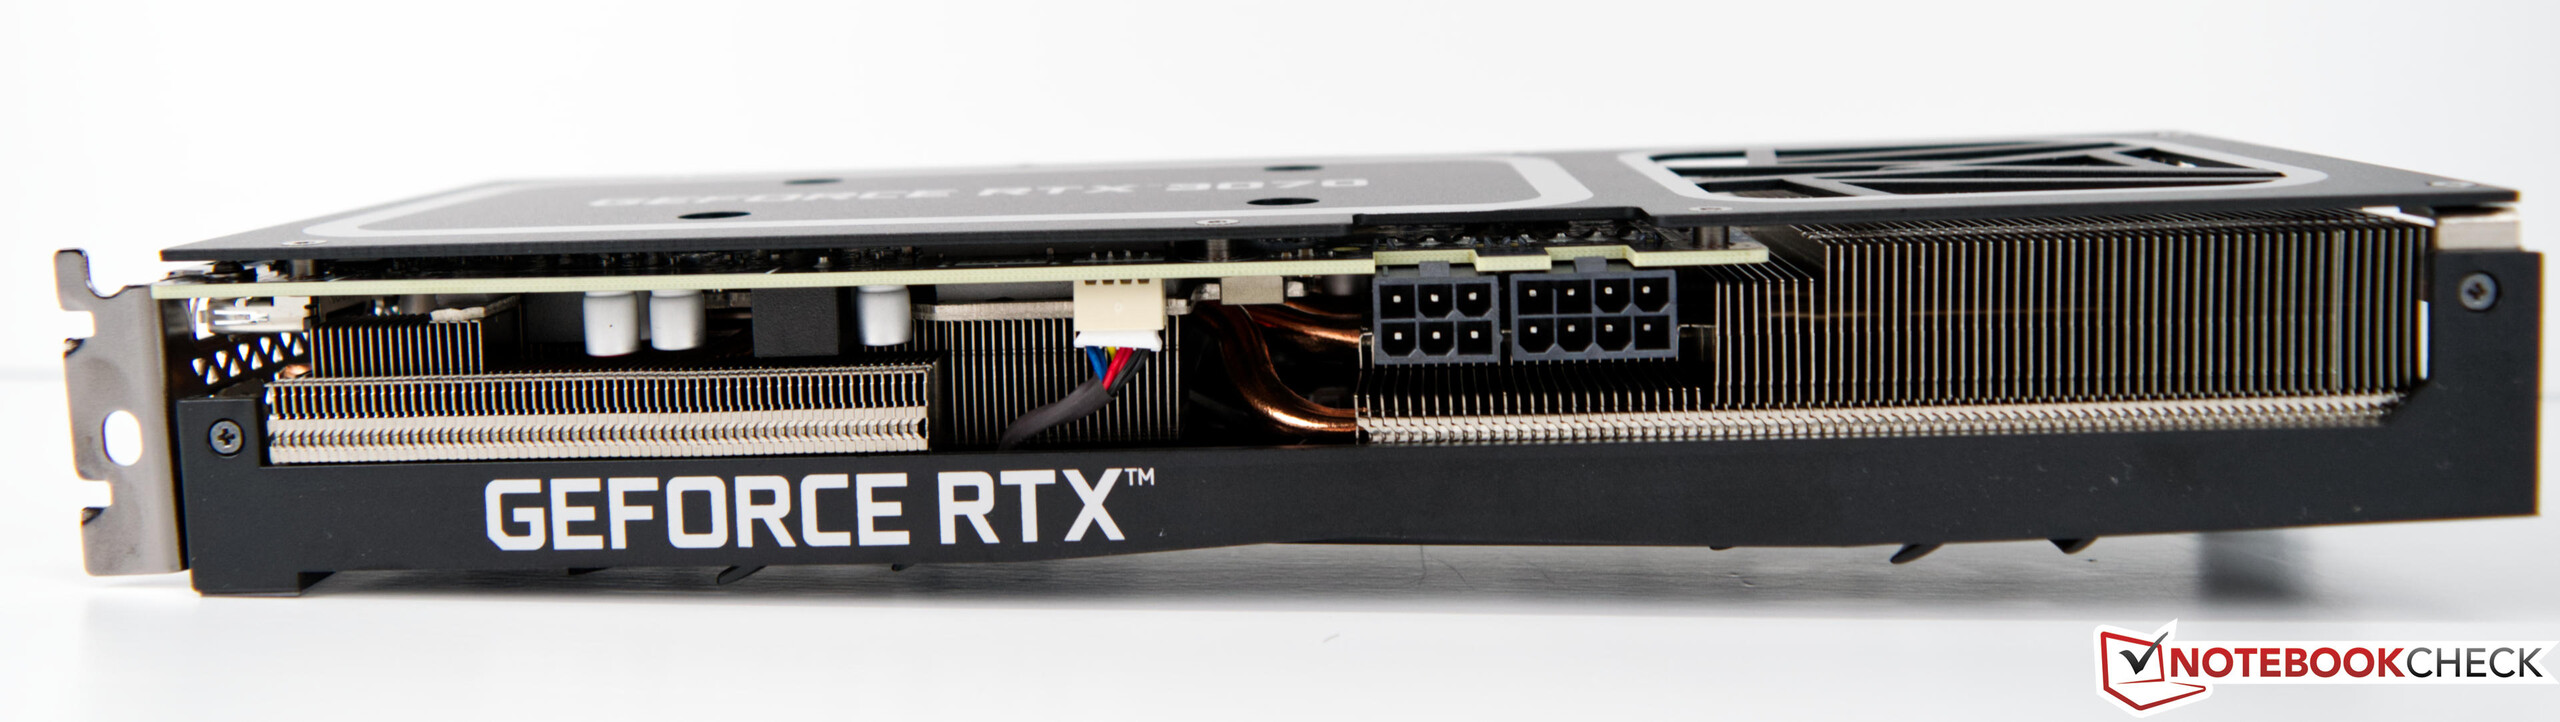
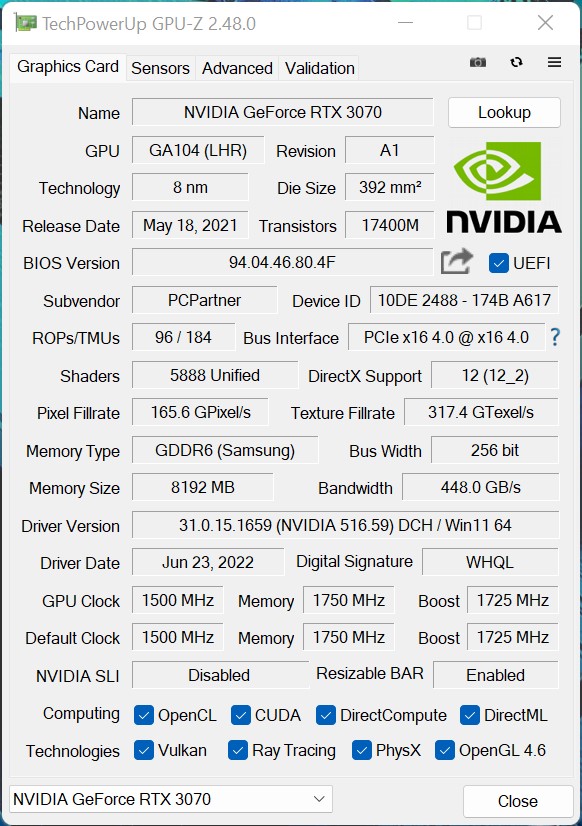
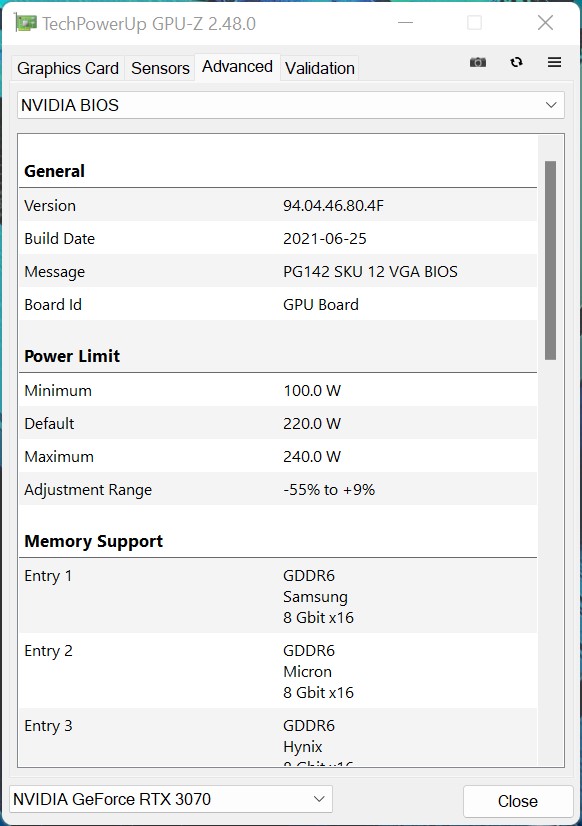
Grafische kaart
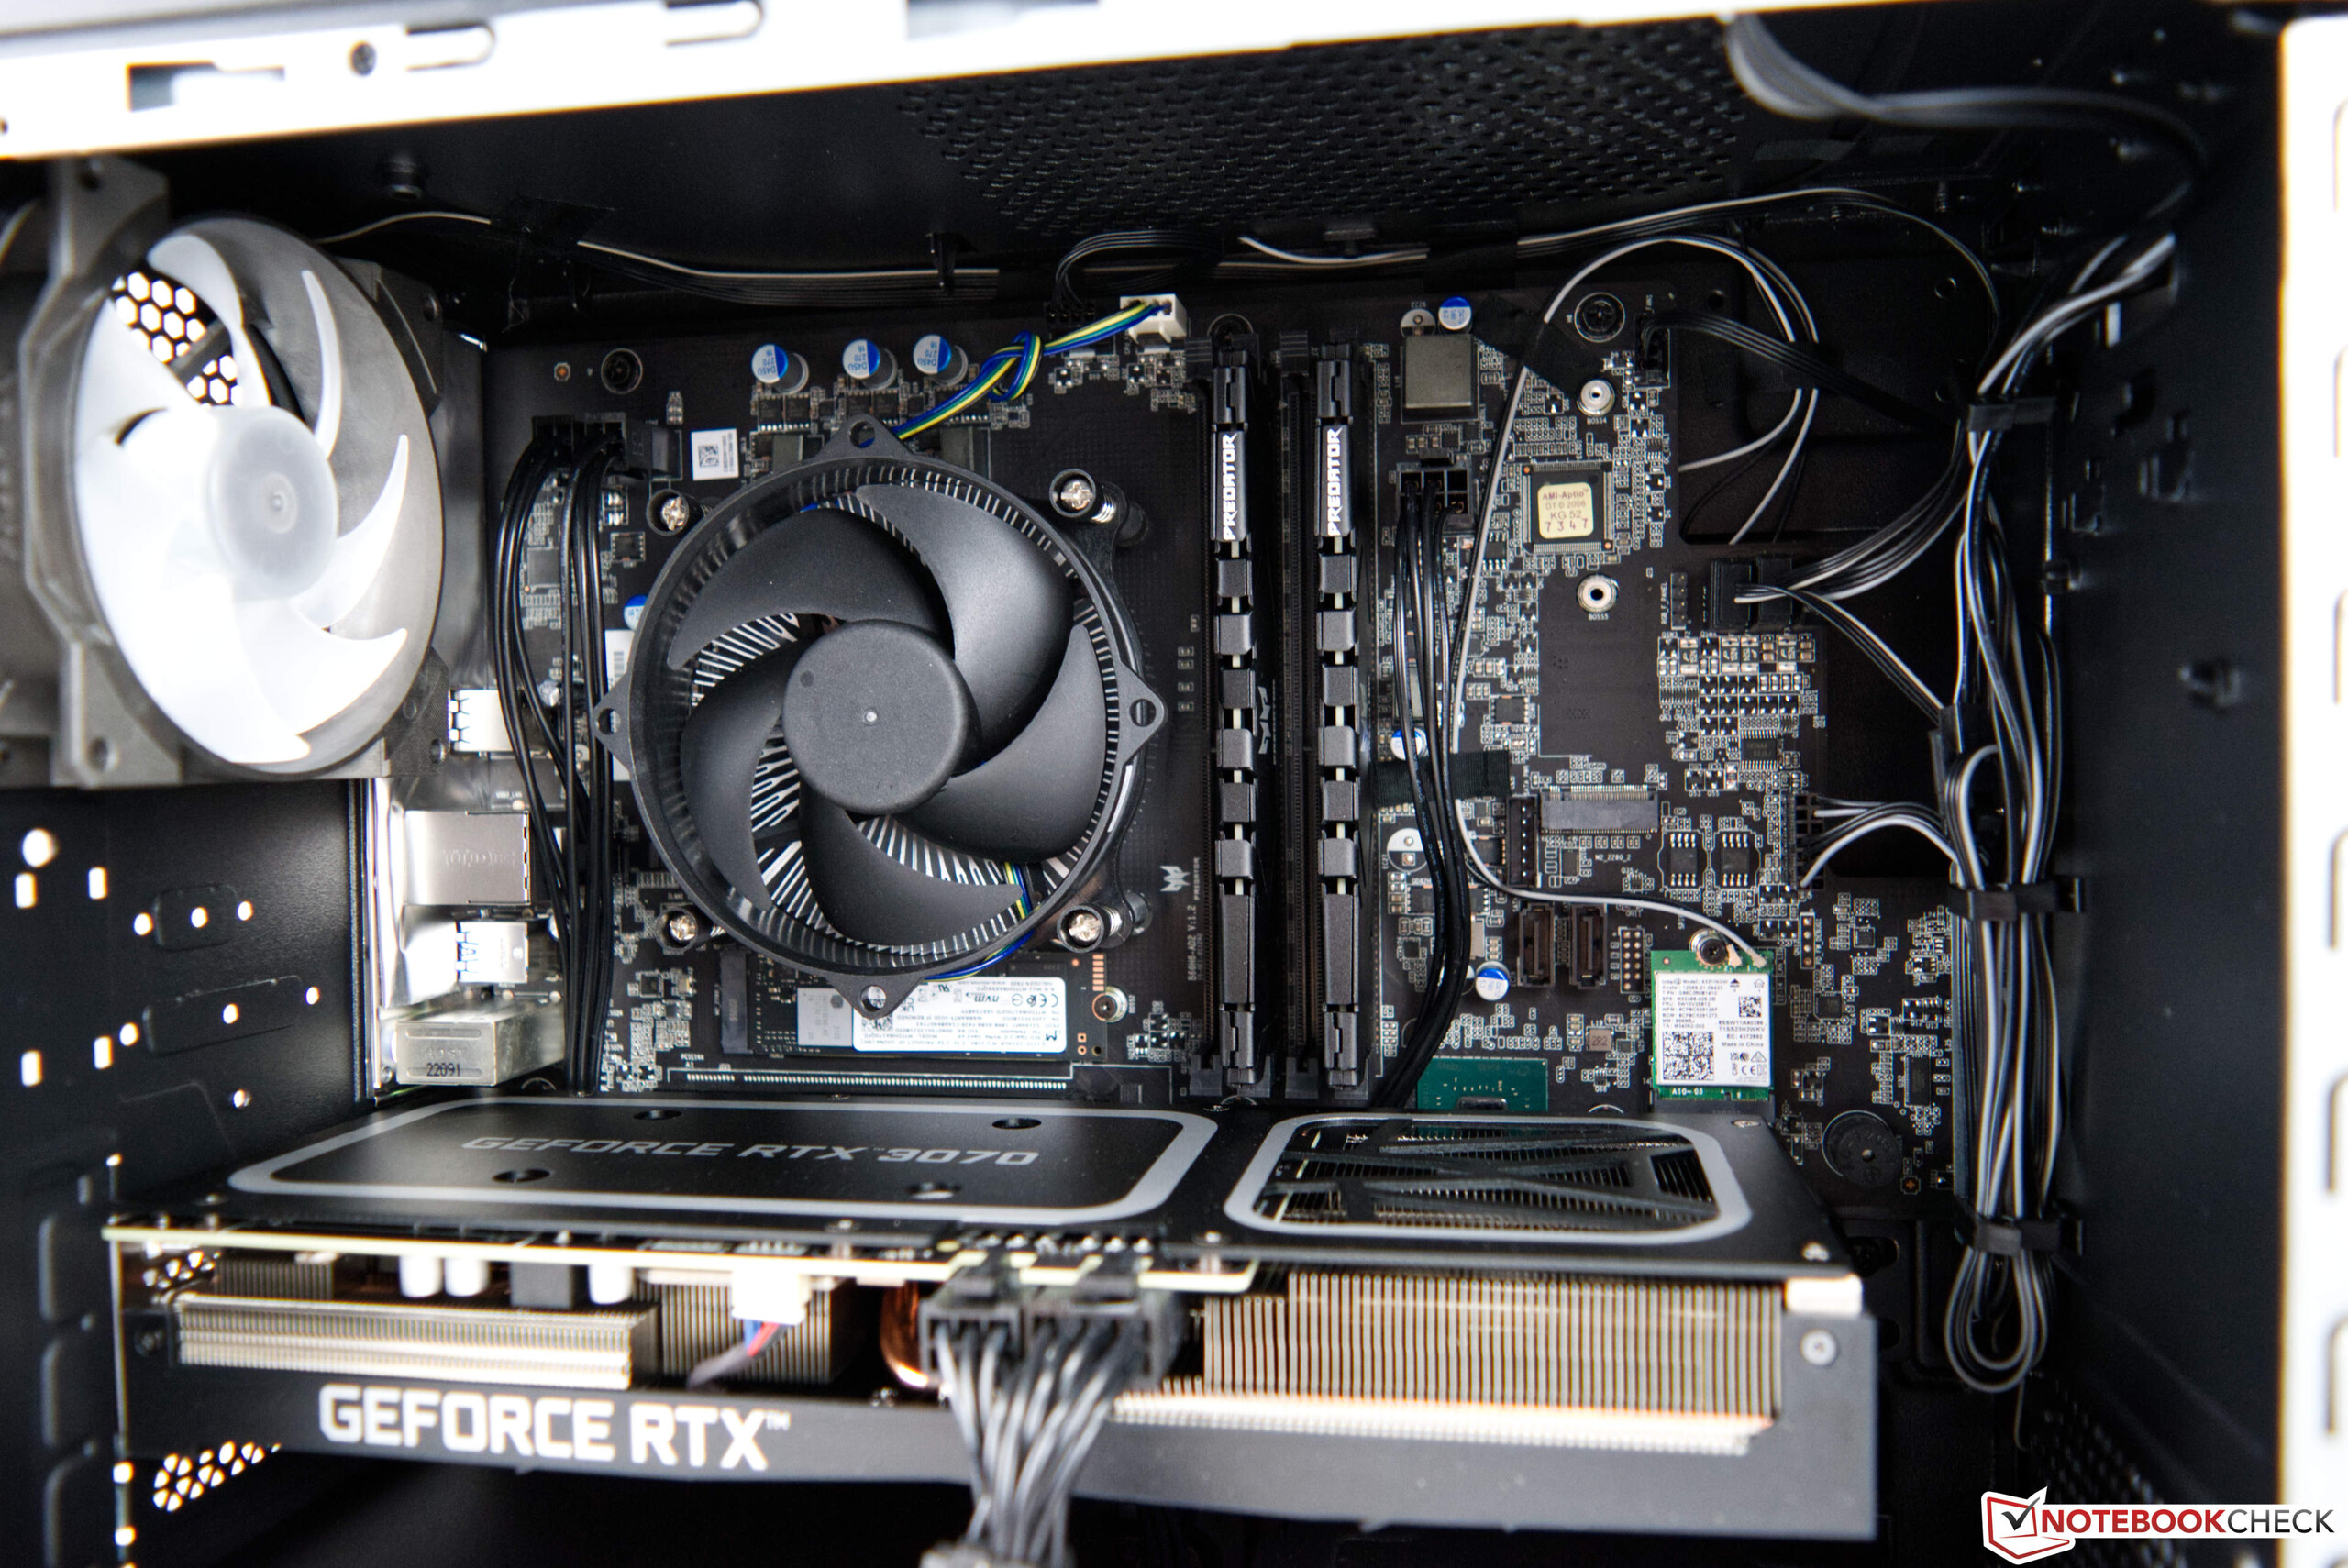
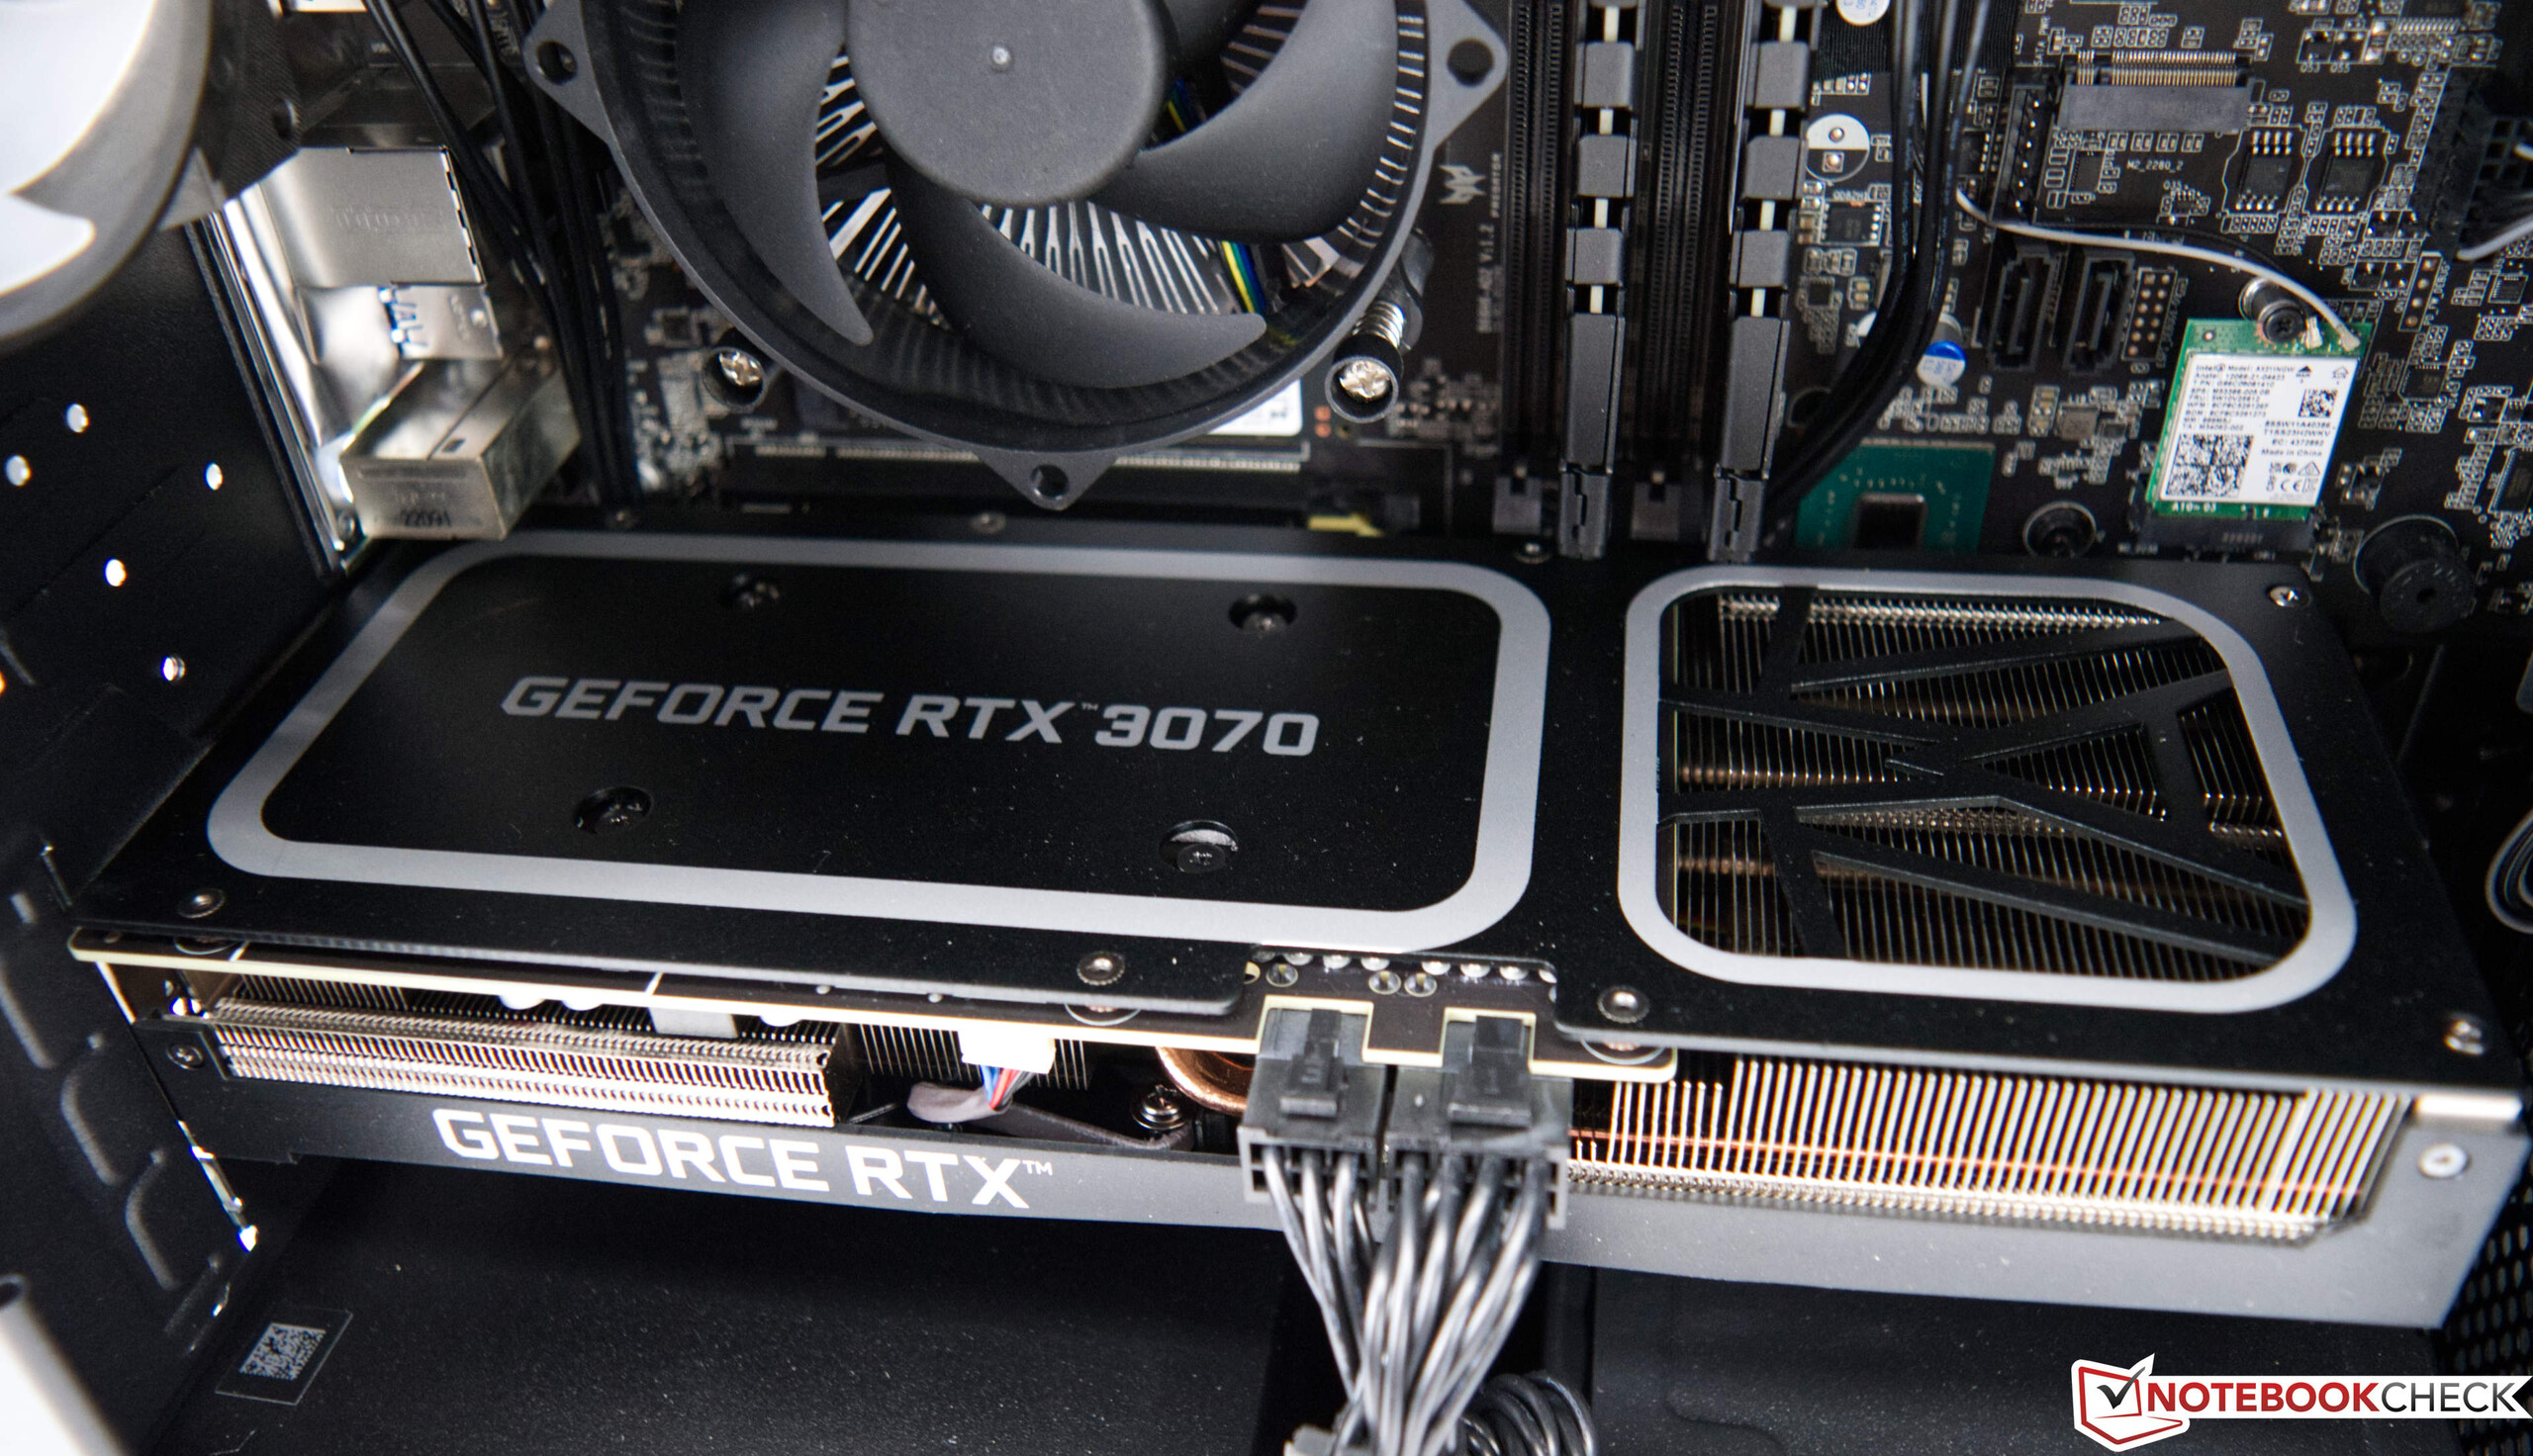
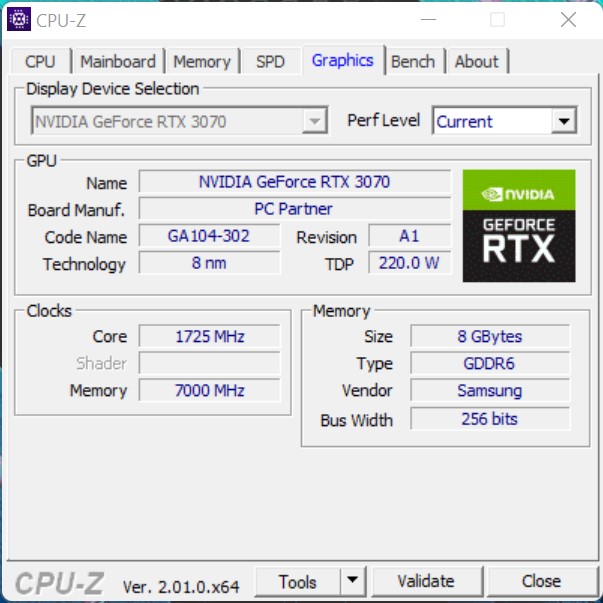
Met de Nvidia GeForce RTX 3070hebben we de Acer Predator Orion 3000 in de sterkste configuratie in de test. Gezien de enigszins throttled CPU prestaties, blijken de 3D prestaties in de synthetische tests erg goed. Het onbekende model van de GeForce RTX 3070 werkt precies volgens de door Nvidia opgegeven specificaties. Dat betekent een GPU-klok van 1.500 MHz, die in Boost met 1.750 MHz wordt gespecificeerd. Wat betreft het VRAM heeft de RTX 3070 typisch 8 GB GDDR6 en het totale stroomverbruik van het geïnstalleerde model is 220 watt. Vergeleken met de Zotac Magnus One kan de Acer Predator Orion 3000 de overhand krijgen door de betere CPU.
Meer benchmarks van de Nvidia GeForce RTX 3070 zijn te vindenhier
| Performance rating - Percent | |
| Acer Predator Orion 3000 PO3-640 | |
| Zotac Magnus One (ECM73070C) | |
| Zotac ZBOX Magnus EN173070C | |
| Intel Dragon Canyon NUC - RTX 3060 | |
| Intel Beast Canyon NUC | |
| Unigine Valley 1.0 | |
| 1920x1080 Extreme HD DirectX AA:x8 | |
| Acer Predator Orion 3000 PO3-640 | |
| Zotac Magnus One (ECM73070C) | |
| Zotac ZBOX Magnus EN173070C | |
| Intel Dragon Canyon NUC - RTX 3060 | |
| Intel Beast Canyon NUC | |
| 1920x1080 Extreme HD Preset OpenGL AA:x8 | |
| Acer Predator Orion 3000 PO3-640 | |
| Zotac Magnus One (ECM73070C) | |
| Zotac ZBOX Magnus EN173070C | |
| Intel Dragon Canyon NUC - RTX 3060 | |
| Intel Beast Canyon NUC | |
| 3DMark 05 Standard | 58568 punten | |
| 3DMark 06 Standard Score | 59134 punten | |
| 3DMark Vantage P Result | 91011 punten | |
| 3DMark 11 Performance | 36421 punten | |
| 3DMark Ice Storm Standard Score | 237580 punten | |
| 3DMark Cloud Gate Standard Score | 59231 punten | |
| 3DMark Fire Strike Score | 25739 punten | |
| 3DMark Fire Strike Extreme Score | 15841 punten | |
| 3DMark Time Spy Score | 12665 punten | |
Help | ||
Spelprestaties
De Acer Predator Orion 3000 profiteert zeer goed van de Alder Lake processor in de gaming tests. Deze biedt een zeer hoge prestatie per klok (IPC, Instructions per Cycle), wat leidt tot een behoorlijke boost tijdens het gamen. De Predator Orion 3000 kan dit zeer goed uitvoeren ondanks de TDP beperkingen, aangezien games vaak niet altijd het volledige CPU vermogen vereisen. Samen met deNvidia GeForce RTX 3070, kunnen zelfs de nieuwste games zonder problemen worden gespeeld. Je moet je beperken tot 1440p als maximale resolutie, hoewel de GeForce RTX 3070 ook veel games op 2160p de baas kan. Voor een overzicht van de prestaties van alle geteste games in vergelijking met andere modellen verwijzen we naar onze GPU-games lijst.
| GTA V | |
| 1920x1080 Highest AA:4xMSAA + FX AF:16x | |
| KFA2 GeForce RTX 3080 SG | |
| Acer Predator Orion 3000 PO3-640 | |
| Gemiddeld NVIDIA GeForce RTX 3070 (91.1 - 122.4, n=5) | |
| Zotac ZBOX Magnus EN173070C | |
| Intel Beast Canyon NUC | |
| Intel Dragon Canyon NUC - RTX 3060 | |
| Zotac Magnus One (ECM73070C) | |
| 1920x1080 High/On (Advanced Graphics Off) AA:2xMSAA + FX AF:8x | |
| KFA2 GeForce RTX 3080 SG | |
| Acer Predator Orion 3000 PO3-640 | |
| Intel Beast Canyon NUC | |
| Intel Dragon Canyon NUC - RTX 3060 | |
| Gemiddeld NVIDIA GeForce RTX 3070 (157 - 177.7, n=5) | |
| Zotac ZBOX Magnus EN173070C | |
| Zotac Magnus One (ECM73070C) | |
| The Witcher 3 | |
| 1920x1080 High Graphics & Postprocessing (Nvidia HairWorks Off) | |
| KFA2 GeForce RTX 3080 SG | |
| Acer Predator Orion 3000 PO3-640 | |
| Zotac Magnus One (ECM73070C) | |
| Gemiddeld NVIDIA GeForce RTX 3070 (100 - 264, n=8) | |
| Zotac ZBOX Magnus EN173070C | |
| Intel Dragon Canyon NUC - RTX 3060 | |
| Zotac MEK Mini (RTX 2070 Super) | |
| 1920x1080 Ultra Graphics & Postprocessing (HBAO+) | |
| KFA2 GeForce RTX 3080 SG | |
| Acer Predator Orion 3000 PO3-640 | |
| Zotac Magnus One (ECM73070C) | |
| Gemiddeld NVIDIA GeForce RTX 3070 (52.8 - 132.2, n=7) | |
| Zotac ZBOX Magnus EN173070C | |
| Zotac MEK Mini (RTX 2070 Super) | |
| Intel Dragon Canyon NUC - RTX 3060 | |
| lage | gem. | hoge | ultra | QHD | 4K | |
|---|---|---|---|---|---|---|
| GTA V (2015) | 184.7 | 181.6 | 177.7 | 122.4 | 113.1 | 125.9 |
| The Witcher 3 (2015) | 507 | 408 | 264 | 132.2 | 93.9 | |
| Dota 2 Reborn (2015) | 146.5 | 133.9 | 129.3 | 121.4 | 122.7 | |
| Rise of the Tomb Raider (2016) | 376 | 266 | 182.9 | 153.7 | 76.7 | |
| Final Fantasy XV Benchmark (2018) | 195.8 | 172.3 | 129.7 | 99.3 | 58.2 | |
| X-Plane 11.11 (2018) | 150.6 | 137.4 | 111.3 | 98.4 | ||
| Far Cry 5 (2018) | 179 | 159 | 151 | 141 | 125 | 72 |
| Strange Brigade (2018) | 466 | 328 | 268 | 233 | 173.2 | 98.7 |
| Shadow of the Tomb Raider (2018) | 194.8 | 173.8 | 166.8 | 157.1 | 114.8 | 62.6 |
| Far Cry New Dawn (2019) | 162 | 140 | 135 | 121 | 113 | 74 |
| Metro Exodus (2019) | 224 | 156.8 | 121.9 | 97.7 | 78.3 | 49.7 |
| Anno 1800 (2019) | 167.5 | 164.1 | 130.8 | 74.7 | 69.3 | 41.8 |
| Control (2019) | 240 | 167.7 | 124.9 | 81.3 | 40.6 | |
| Borderlands 3 (2019) | 171.5 | 144.7 | 127.9 | 108.9 | 82.9 | 46.3 |
| F1 2020 (2020) | 351 | 302 | 288 | 215 | 162.2 | 92.7 |
| Watch Dogs Legion (2020) | 125 | 123 | 109 | 89 | 67 | 37 |
| Dirt 5 (2020) | 248.1 | 191.8 | 157 | 122.1 | 99 | 65.3 |
| F1 2021 (2021) | 407 | 361 | 304 | 158 | 118 | 67.3 |
| New World (2021) | 166.9 | 139.5 | 128.3 | 117.5 | 95 | 48.9 |
| Far Cry 6 (2021) | 154.9 | 138.3 | 121.1 | 114.2 | 95.9 | 26.4 |
| Forza Horizon 5 (2021) | 247 | 171 | 160 | 115 | 100 | 73 |
| God of War (2022) | 142.3 | 140.5 | 117.8 | 83.5 | 69.3 | 49.8 |
| GRID Legends (2022) | 249 | 224 | 198 | 151 | 127 | 84 |
| Cyberpunk 2077 1.6 (2022) | 146.7 | 145.1 | 136 | 90.3 | 60.6 | 29 |
| Tiny Tina's Wonderlands (2022) | 248 | 204 | 145.8 | 113.9 | 80.7 | 44.4 |
| F1 22 (2022) | 258 | 249 | 228 | 81 | 52 | 25 |
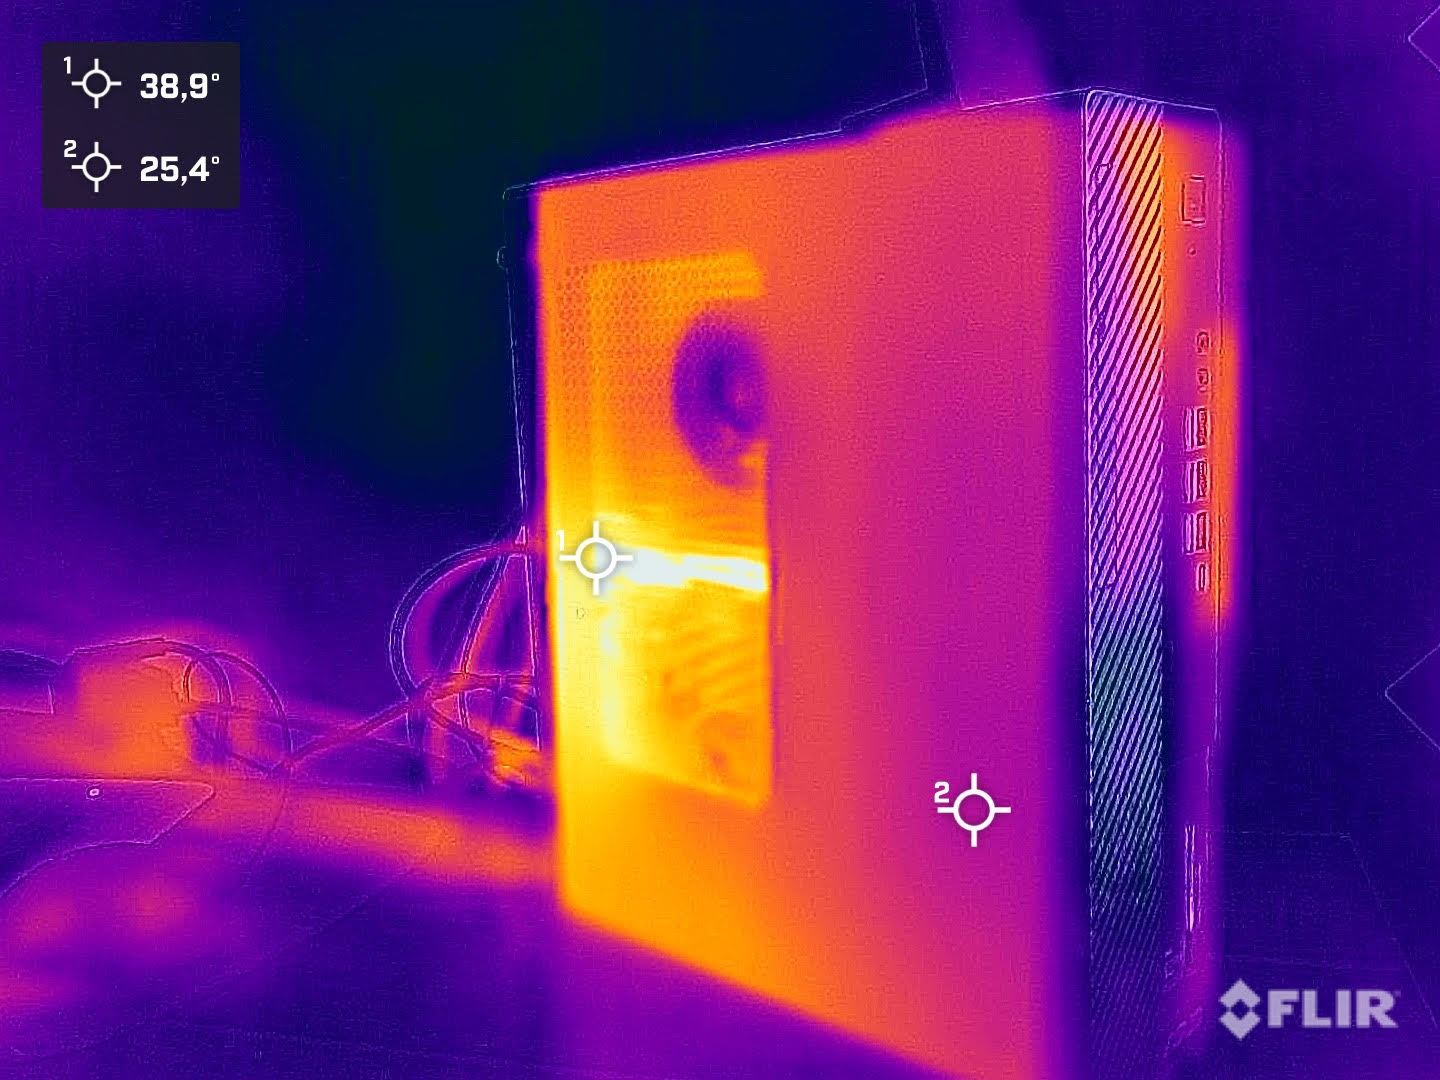
Emissies - Zwak koelsysteem
Geluidsemissies
Het koelsysteem van de Acer Predator Orion 3000 bestaat uit een ventilator aan de voorkant, die de verse lucht aanzuigt, en een ventilator aan de achterkant, die de warme lucht uit de kast moet transporteren. In theorie klinkt dit best goed, maar in de praktijk blijkt dit niet optimaal te zijn. Niet voor niets beperkt Acer het maximale stroomverbruik van de processor in de Predator Orion 3000. Toch valt de pc niet negatief op in de test met slechts 31,6 dB(A) in idle, ondanks de zeer kleine CPU-koeler. Het systeem is ook relatief stil onder belasting en bereikt ongeveer 38 dB(A) in de stress test. Als we de ventilatoren echter op volle snelheid laten draaien (via Predator Sense gaming mode), geeft ons meetapparaat 54 dB(A) aan.
Geluidsniveau
| Onbelast |
| 31.5 / 31.6 / 31.6 dB (A) |
| Belasting |
| 32.7 / 38.1 dB (A) |
 | ||
30 dB stil 40 dB(A) hoorbaar 50 dB(A) luid |
||
min: | ||
| Acer Predator Orion 3000 PO3-640 i7-12700F, GeForce RTX 3070 | Zotac Magnus One (ECM73070C) i7-10700, GeForce RTX 3070 | Zotac ZBOX Magnus EN173070C i7-11800H, GeForce RTX 3070 Laptop GPU | Intel Dragon Canyon NUC - RTX 3060 i9-12900, GeForce RTX 3060 | |
|---|---|---|---|---|
| Noise | -18% | -10% | -2% | |
| uit / omgeving * (dB) | 29.8 | 30 -1% | 30.7 -3% | 30.2 -1% |
| Idle Minimum * (dB) | 31.5 | 33.58 -7% | 32.7 -4% | 30.2 4% |
| Idle Average * (dB) | 31.6 | 32.8 -4% | 30.4 4% | |
| Idle Maximum * (dB) | 31.6 | 32.8 -4% | 30.8 3% | |
| Load Average * (dB) | 32.7 | 44.25 -35% | 41.7 -28% | |
| Load Maximum * (dB) | 38.1 | 48.72 -28% | 45.4 -19% | 45.1 -18% |
* ... kleiner is beter
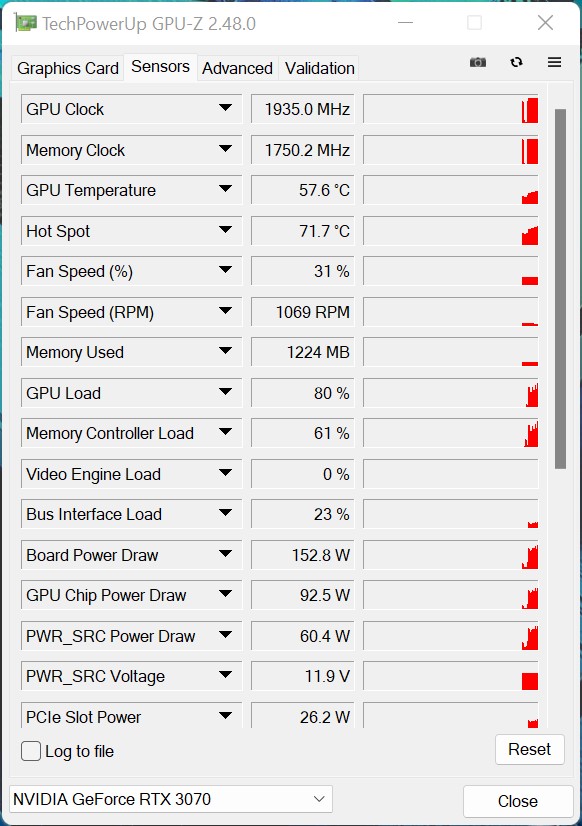
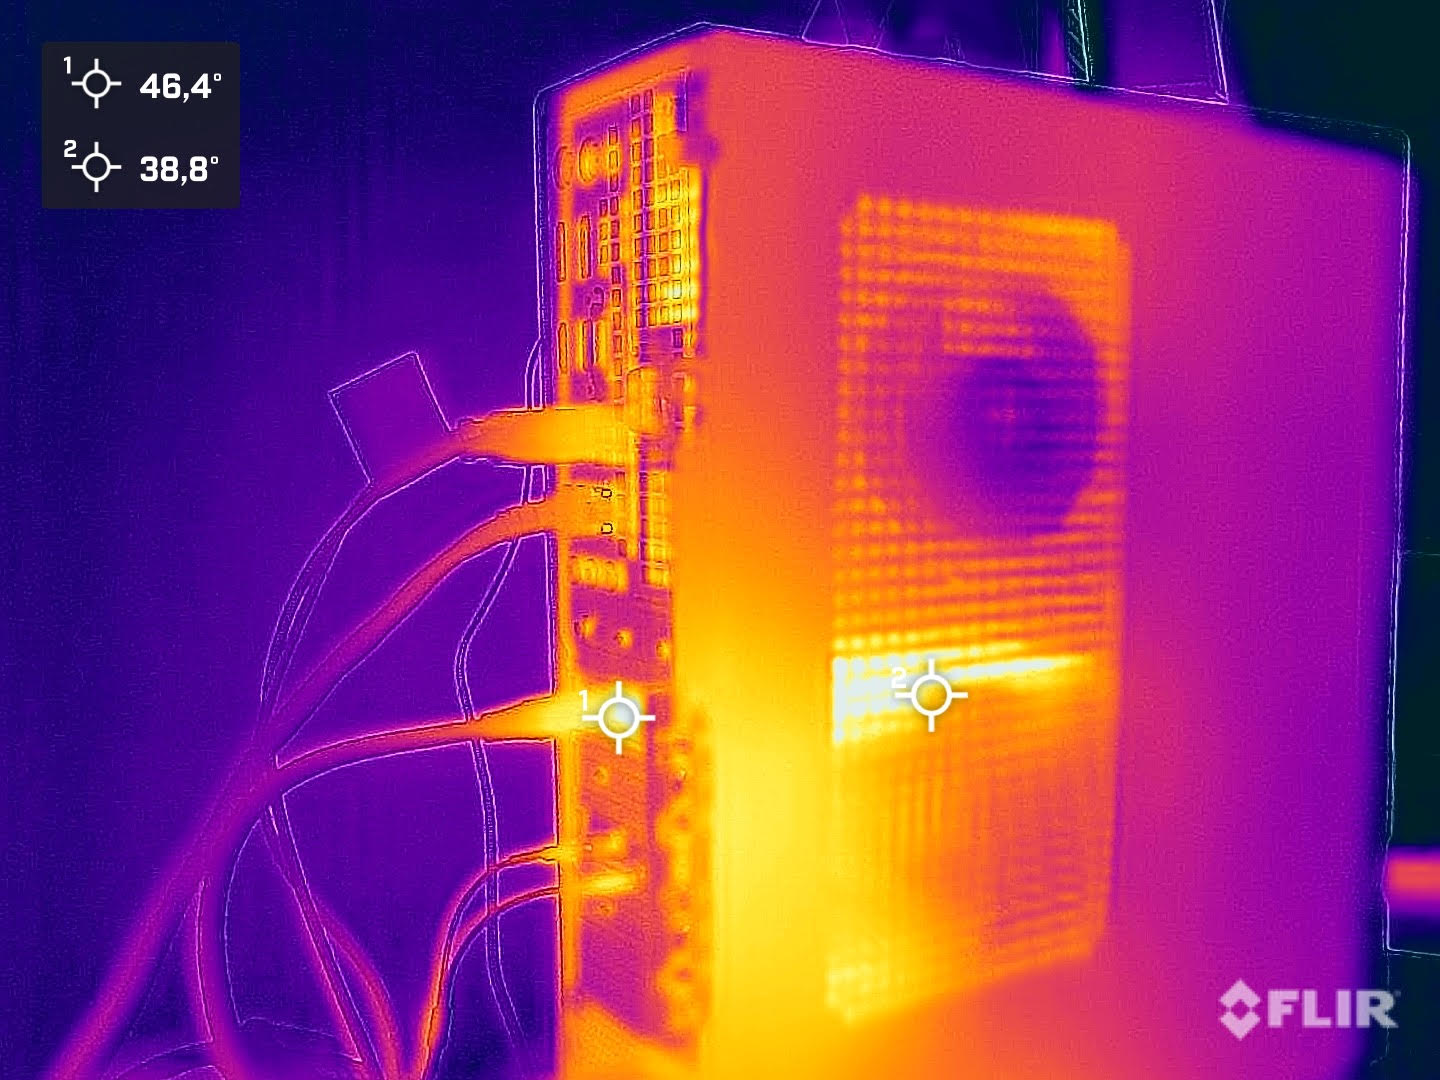
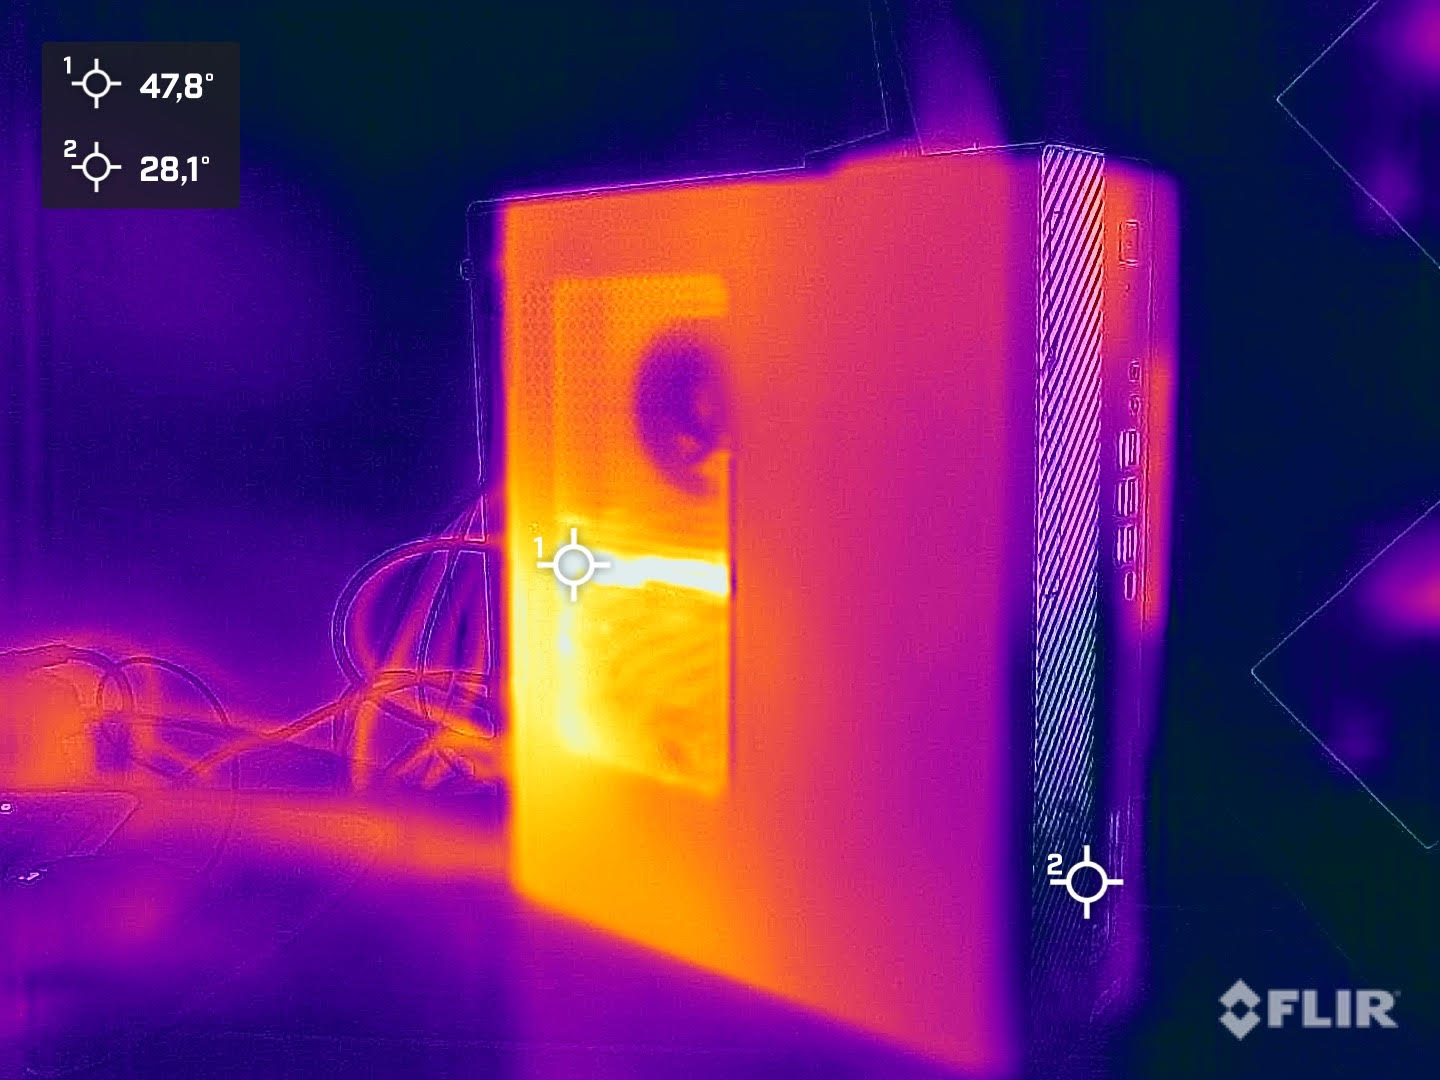
Temperatuur
De behuizing van de Acer Predator Orion 3000 warmt een beetje op onder belasting, maar dit is niet problematisch. De enkele ventilator aan de achterkant daarentegen schept erg warme lucht uit de kast. Een extra warmteafvoer naar boven toe zou hier nog effectiever zijn. We noteren de hoogste waarde van de processor van 98 °C onder belasting. Hieruit blijkt dat Acer al aan de limiet zit met de geïnstalleerde koeling, ook al is de Intel Core i7-12700F nog reserves zou hebben. Niettemin kon de Predator Orion 3000 nog steeds goede prestaties leveren in de test. De maximale temperatuur van de GPU ligt aanzienlijk lager op 70,5 °C
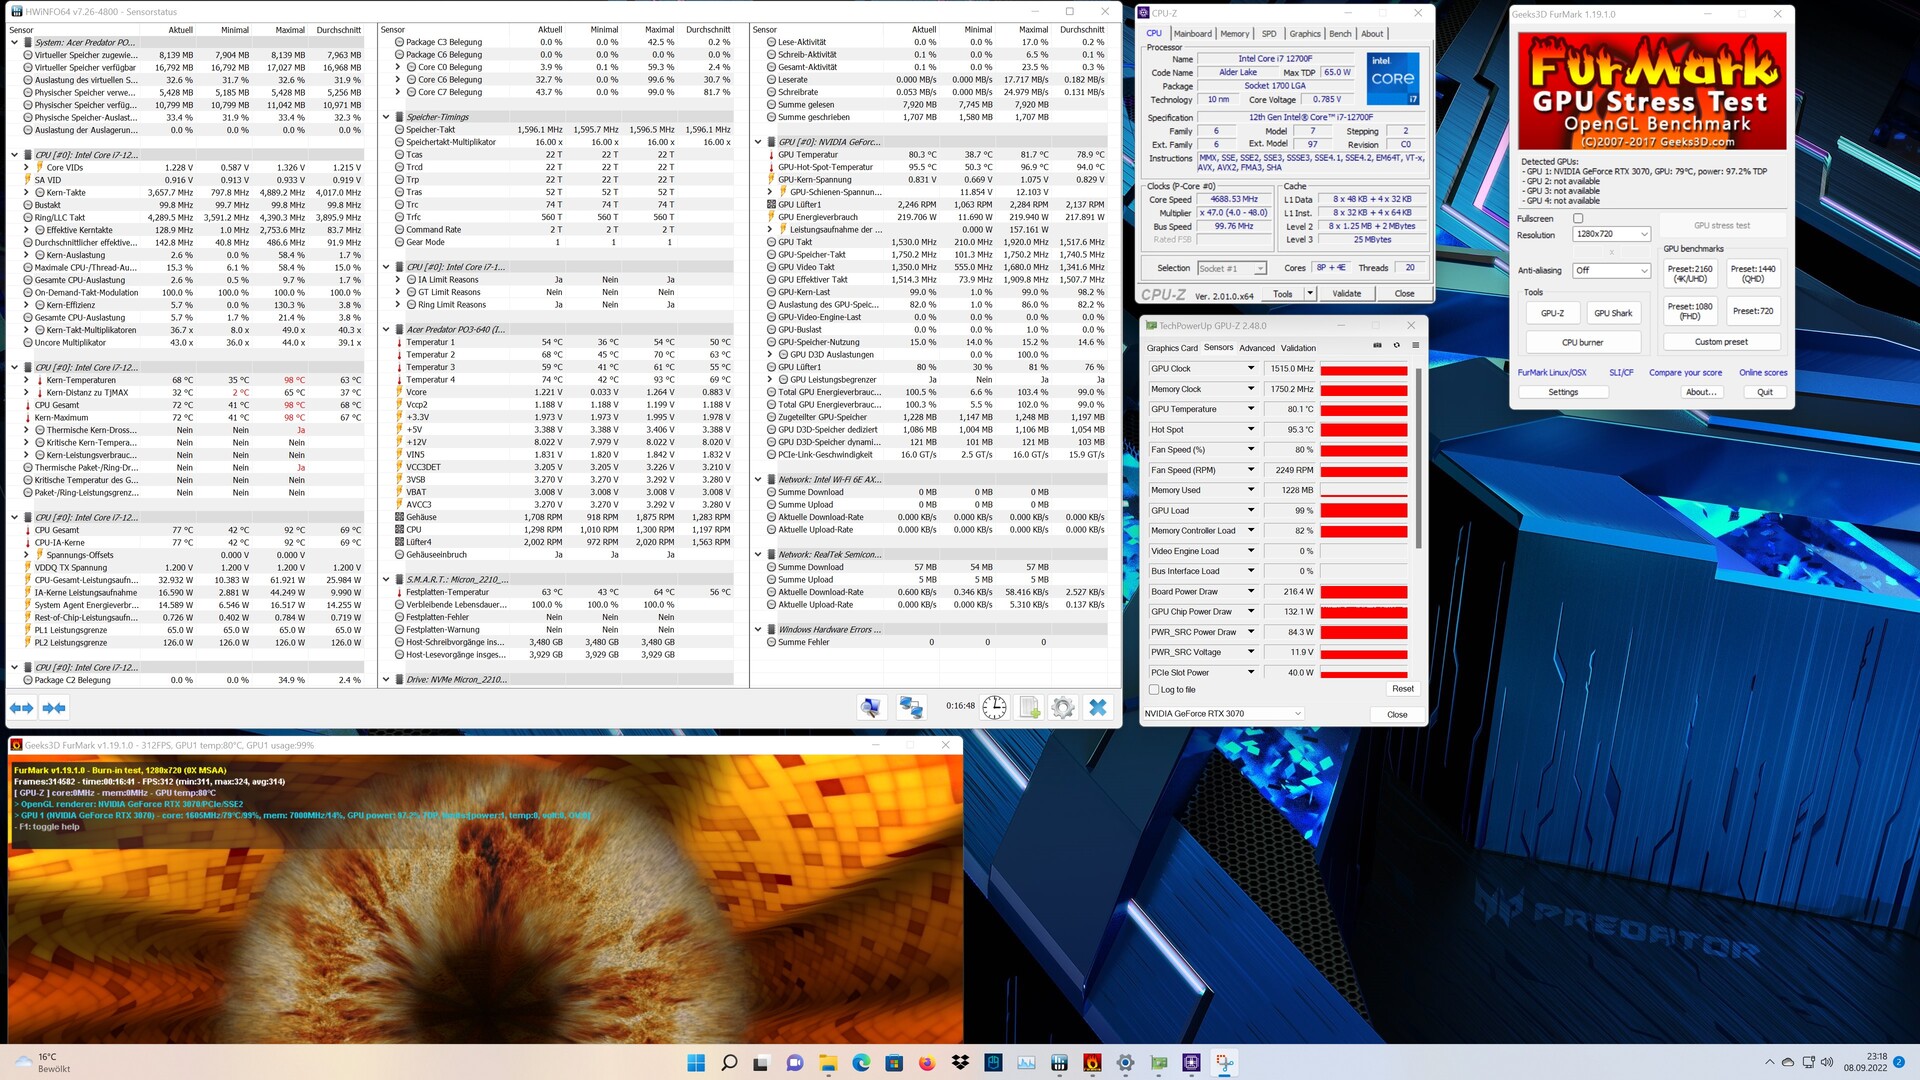
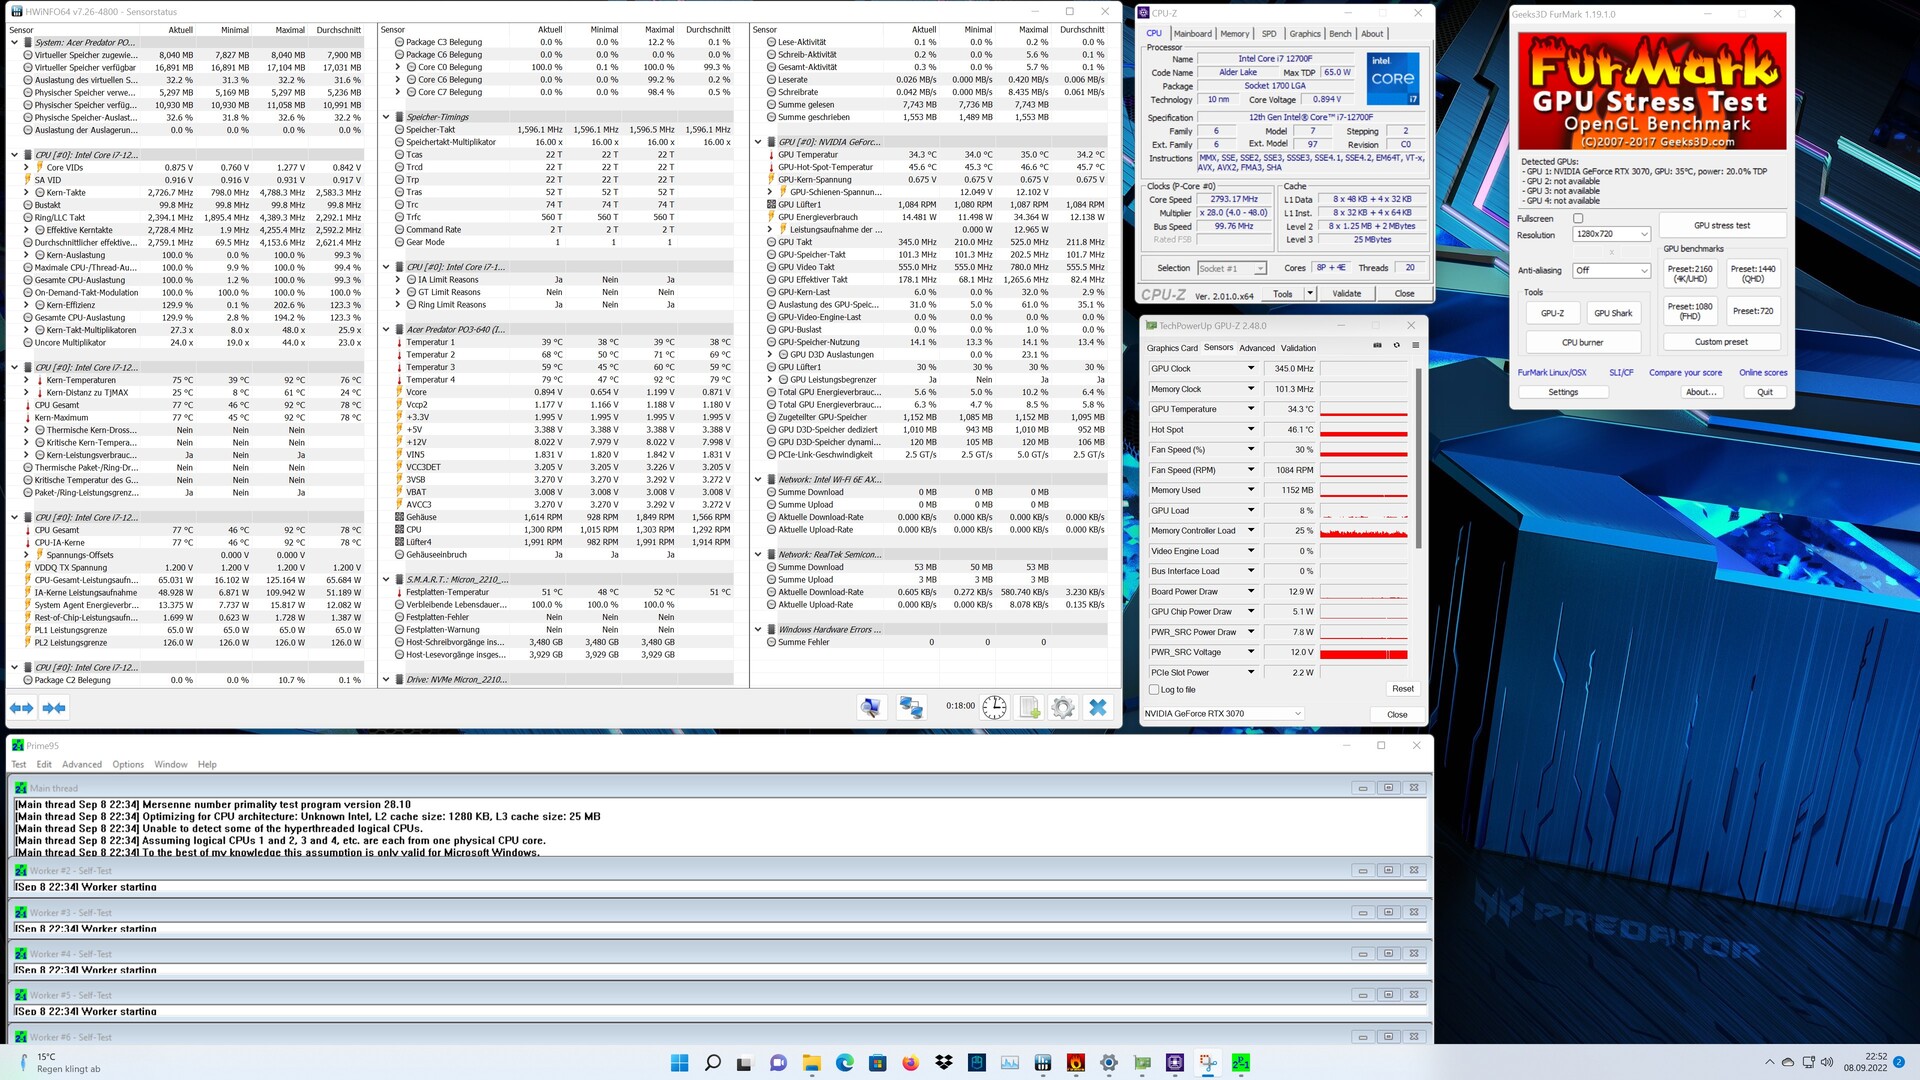
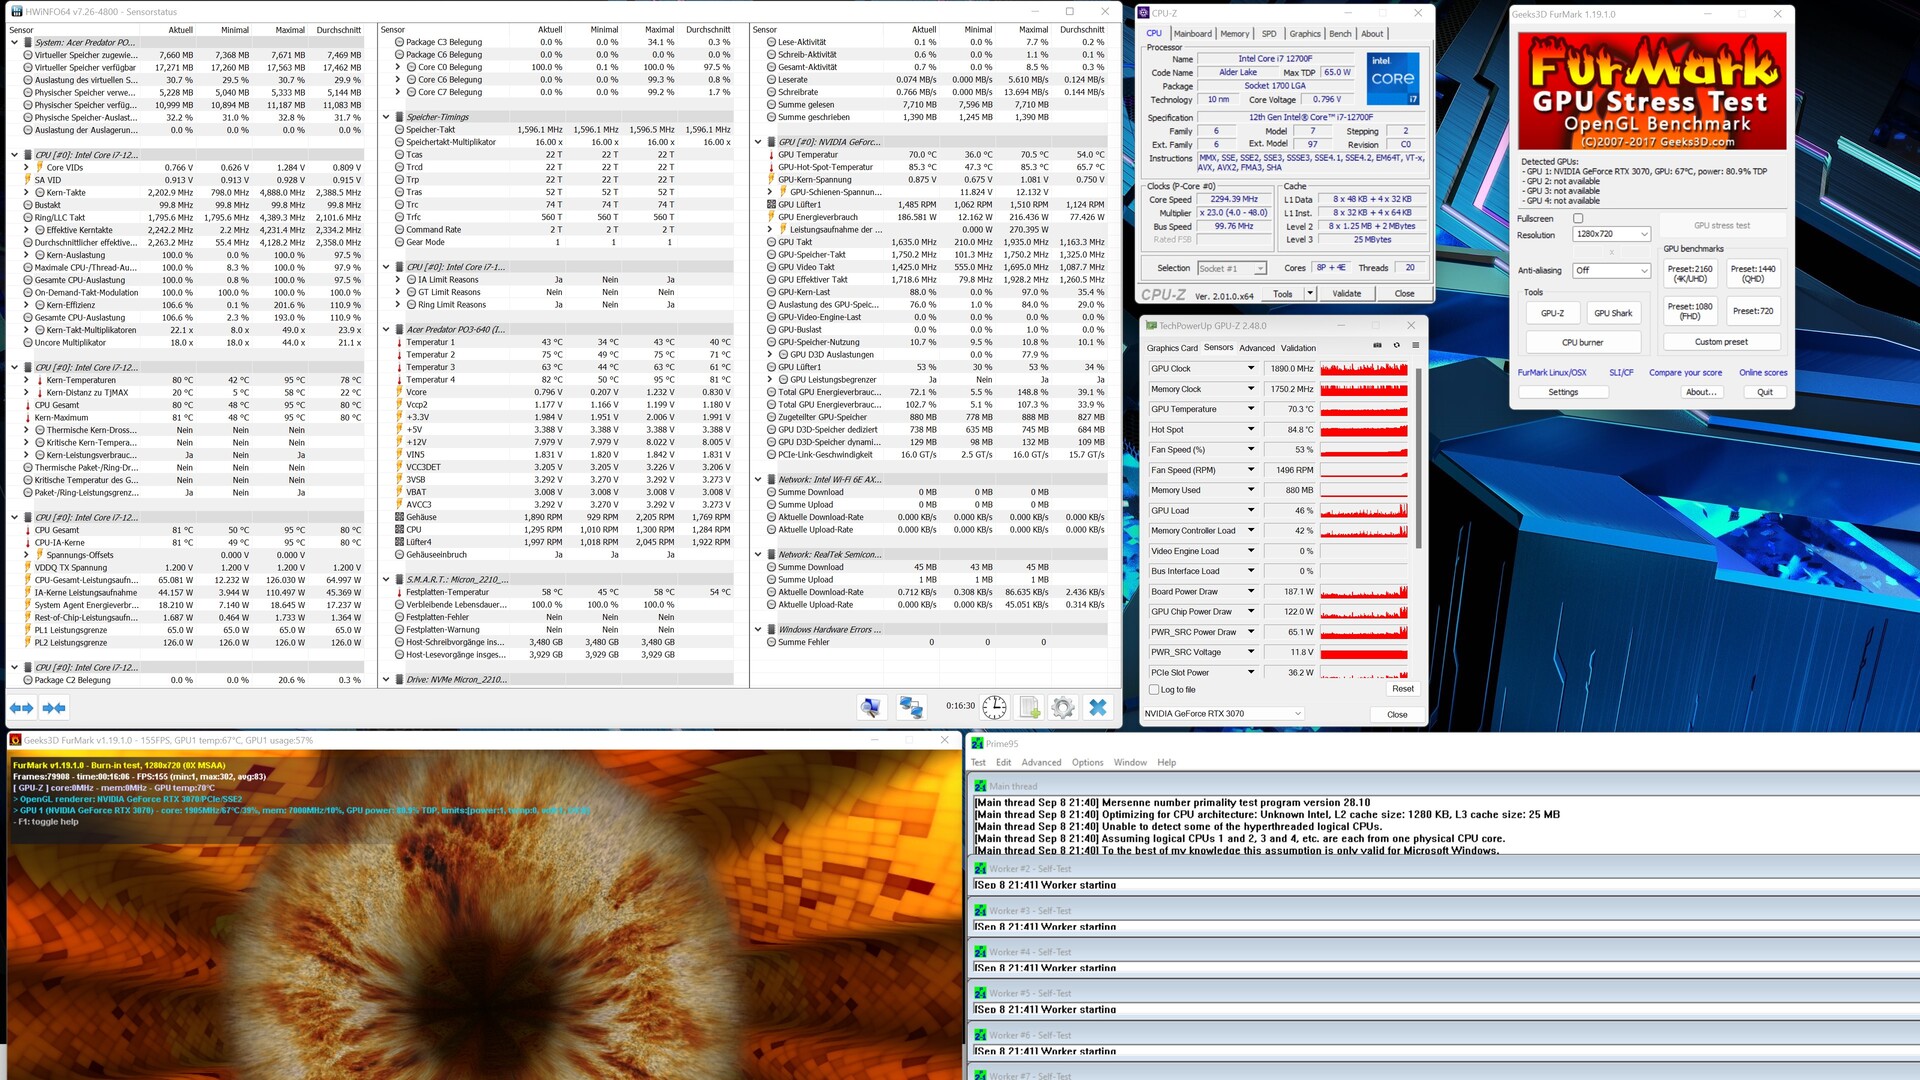
Energieverbruik
De Acer Predator Orion 3000 is verrassend zuinig bij stationair draaien en lage belasting. Onze meter toont slechts iets minder dan 30 watt. Het is tot 361 watt voor een korte tijd in de stress test, hoewel slechts 186 watt gemiddeld beschikbaar is. Dit komt door de PL2, die slechts maximaal 28 seconden is toegestaan. Het stroomverbruik van het systeem bedraagt gemiddeld 338 watt tijdens het gamen. We documenteerden kortstondige pieken tot 364 watt. Er is een 500-watt ATX voeding geïnstalleerd, die de hardwarevereisten aankan.
| Uit / Standby | |
| Inactief | |
| Belasting |
|
Key:
min: | |
| Acer Predator Orion 3000 PO3-640 i7-12700F, GeForce RTX 3070 | Zotac ZBOX Magnus EN173070C i7-11800H, GeForce RTX 3070 Laptop GPU | Gemiddeld NVIDIA GeForce RTX 3070 | Gemiddelde van klas Desktop | |
|---|---|---|---|---|
| Power Consumption | -27% | -93% | -4% | |
| Idle Minimum * (Watt) | 24.6 | 31.3 -27% | 56 ? -128% | 17.9 ? 27% |
| Idle Average * (Watt) | 24.6 | 35.1 -43% | 58.5 ? -138% | 37.2 ? -51% |
| Idle Maximum * (Watt) | 29.6 | 41.6 -41% | 70.5 ? -138% | 41.3 ? -40% |
| Load Average * (Watt) | 124.6 | 214 -72% | 122.1 ? 2% | 96.7 ? 22% |
| Witcher 3 ultra * (Watt) | 338.1 | 193.5 43% | ||
| Load Maximum * (Watt) | 186.1 | 231 -24% | 305 ? -64% | 141.6 ? 24% |
* ... kleiner is beter
Power Consumption with external Monitor
Pro
Contra
Conclusie - Snelle gaming PC met zwakke koeling

De Acer Predator Orion 3000 is een compacte gaming PC en is gebaseerd op Intels huidige CPU-generatie. De Intel Core i7-12700F biedt zeer goede prestaties en is snel genoeg om aan de eisen van de huidige games te voldoen, ondanks de PL2-beperking. Hier had meer bereikt kunnen worden met een betere koeling. Met de Nvidia GeForce RTX 3070krijg je een conventioneel model dat overeenkomt met de specificaties van Nvidia. Het model presteert echter goed en haalt vloeiende framerates met 1440p resolutie in huidige games. De rest van de configuratie is vrij standaard met een 1 TB SSD en 16 GB DDR4 RAM. Het gebruik van sneller DDR5 RAM zou hier toekomstbestendig zijn geweest.
Om het uiterlijk van de Acer Predator Orion 3000 te verbeteren, kan het linker zijpaneel worden vervangen door een zijpaneel met een kijkvenster. Dit maakt deel uit van de leveringsomvang. Er is ook een toetsenbord en een muis, die de Acer Predator look oppakken en zo voor een coherent totaalbeeld zorgen
Dankzij de Intel Core i7-12700F en de Nvidia GeForce RTX 3070 biedt de Acer Predator Orion 3000 een goede basis als gaming-pc. Helaas moet het koelsysteem enkele compromissen accepteren.
Het grootste punt van kritiek is de te kleine koeling van de processor. Toch is het verrassend dat de Acer Predator Orion 3000 niet ondraaglijk luid is. De fabrikant heeft het waarschijnlijk gedaan zonder hogere snelheden in de automatische modus ten koste van hogere temperaturen. Een zelfaangepaste ventilatorcurve kan zorgen voor iets betere temperaturen onder belasting. De lage geluidsemissies onder belasting zijn echter ook verleden tijd.
Prijzen en beschikbaarheid
De Acer Predator Orion 3000 is rechtstreeks verkrijgbaar bij Acer en kost in onze testconfiguratie 2.200 euro. Momenteel kunt u het apparaat ook krijgen bij Computer Universe voor slechts 1.900 euro.
Acer Predator Orion 3000 PO3-640
- 13-09-2022 v7 (old)
Sebastian Bade
Price comparison
