Notebookcheck Logo

NVIDIA GeForce RTX 3060 Ti Founders Edition Review: Vlaggenschip 1440p Ultra en sobere 4K-gaming voor 400 dollar

Voor de rest van ons. De NVIDIA RTX 3060 Ti zet Ampere's traditie voort van het distilleren van vorige generatie top-end prestaties tegen lagere prijspunten. De RTX 3060 Ti volgt in feite de RTX 2060 Super op, maar wil de kaart bij uitstek worden voor 1440p Ultra-gaming door in wezen RTX 2080 Super-prestaties te bieden voor 400 dollar. We nemen de NVIDIA RTX 3060 Ti Founders Edition onder de loep om te zien of dat ook echt het geval is.

Al in december 2020 kondigde NVIDIA officieel de GeForce RTX 3060 Ti aan, gericht op de overgrote meerderheid van 1080p en 1440p gamers. De RTX 3060 Ti is gebaseerd op dezelfde 8 nm GA104 GPU als de RTX 3070, maar maakt slechts 4.864 CUDA-kernen mogelijk.

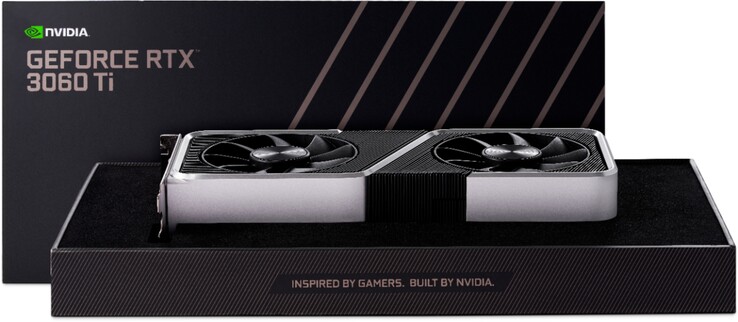
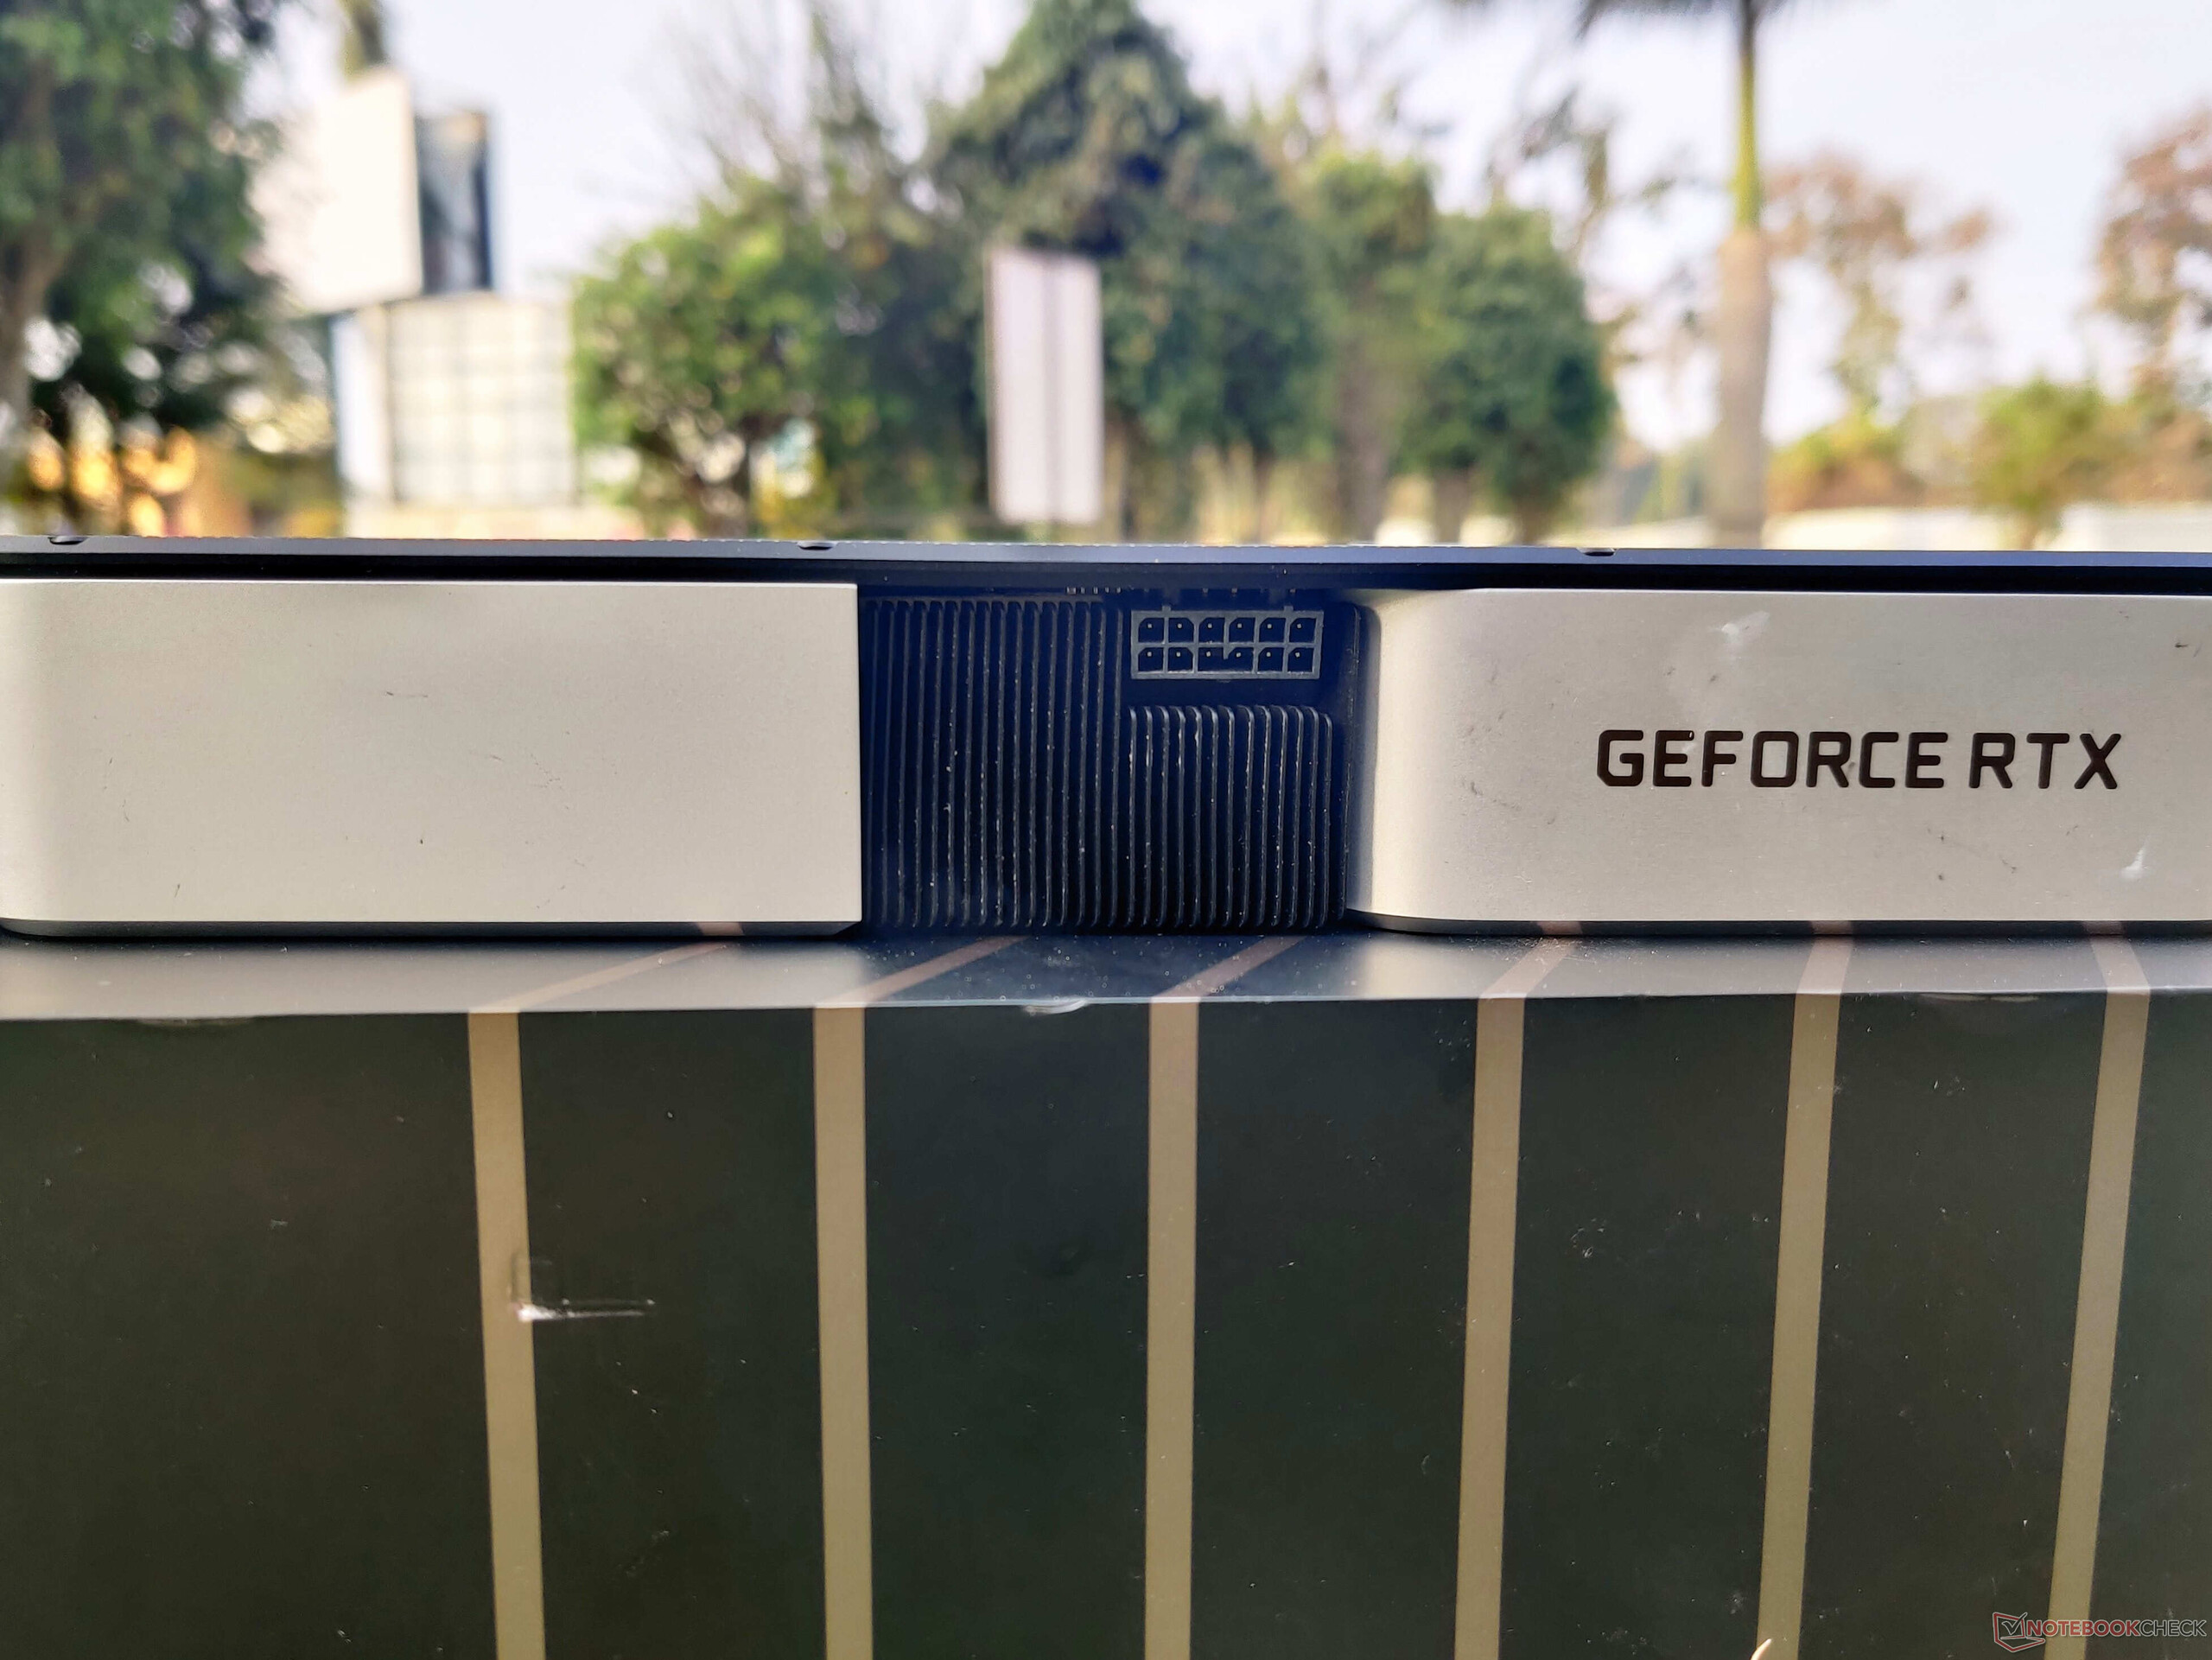
We hebben de RTX 3060 Ti Founders Edition (FE) kaart van NVIDIA bij ons voor een review. De RTX 3060 Ti FE heeft een vergelijkbaar ontwerp als de rest van de Ampere FE kaarten, inclusief het gebruik van een 12-pins Molex MicroFit 3.0 voedingsconnector. Echter, in tegenstelling tot de andere Ampere FE kaarten tot nu toe, krijgen we een heldere zilverachtige metallic afwerking te zien die een premium uitstraling geeft.

Met een MSRP van US$400 kan de RTX 3060 Ti worden beschouwd als de spirituele opvolger van de RTX 2060 Super. De kaart biedt echter meer dan RTX 2080 Super-prestaties voor een prijs die 300 dollar lager ligt, waardoor het in meer dan één opzicht een koopje is voor 1440p Ultra en 1080p gamers met een hoge verversingssnelheid.

In deze review testen we de RTX 3060 Ti FE en evalueren we of hij echt de 'bang for the buck' prestaties biedt die NVIDIA beweert dat hij biedt

Vergelijking van de RTX 3060 Ti met andere NVIDIA GPU's

Specificatie RTX3090 RTX3080 FE RTX3070 FE RTX3060 Ti FE TitanRTX RTX2080 Ti RTX2080 Super RTX2070 Super TITANX Pascal
Chip GA102 GA102 GA104 GA104 TU102 TU102 TU104 TU104 GP102
FinFET-proces 8 nm 8 nm 8nm 12 nm 12 nm 12 nm 16 nm
CUDA cores 10,496 8,704 5,888 4,864 4,608 4,352 3,072 2,560 3,584
Textureunits 328 272 184 152 288 272 192 160 224
Tensor cores 328 3e Gen. 272 3e Gen. 184 3e Gen. 1523e Gen. 576 2e Gen. 544 2e Gen. 384 2e Gen. 320 2e Gen. -
RTcores 82 68 46 38 72 68 48 40 -
GPU-basisklok: 1,395 MHz, 1,440 MHz, 1,500 MHz, 1,410 MHz, 1,350 MHz, 1,650 MHz, 1,605 MHz, 1,417 MHz
GPU boost klok 1.695 MHz 1.710 MHz 1.750 MHz 1.665 MHz 1.770 MHz 1.545 MHz 1.815 MHz 1.770 MHz 1.531 MHz
Memorybus 384-bit 320-bit 256-bit 256-bit 384-bit 352-bit 256-bit 256-bit 384-bit
Geheugenbandbreedte 936 GB/s 760 GB/s 448 GB/s 448GB/s 672 GB/s 616 GB/s 495,9 GB/s 448 GB/s 480,4 GB/s
Videogeheugen 24 GB GDDR6X 10 GB GDDR6X 8 GBGDDR6 24 GB GDDR6 11 GB GDDR6 8 GB GDDR6 12 GB GDDR5X
Energieverbruik 350 W 320 W 220 W 280W 250 W 250 W 215 W 250 W

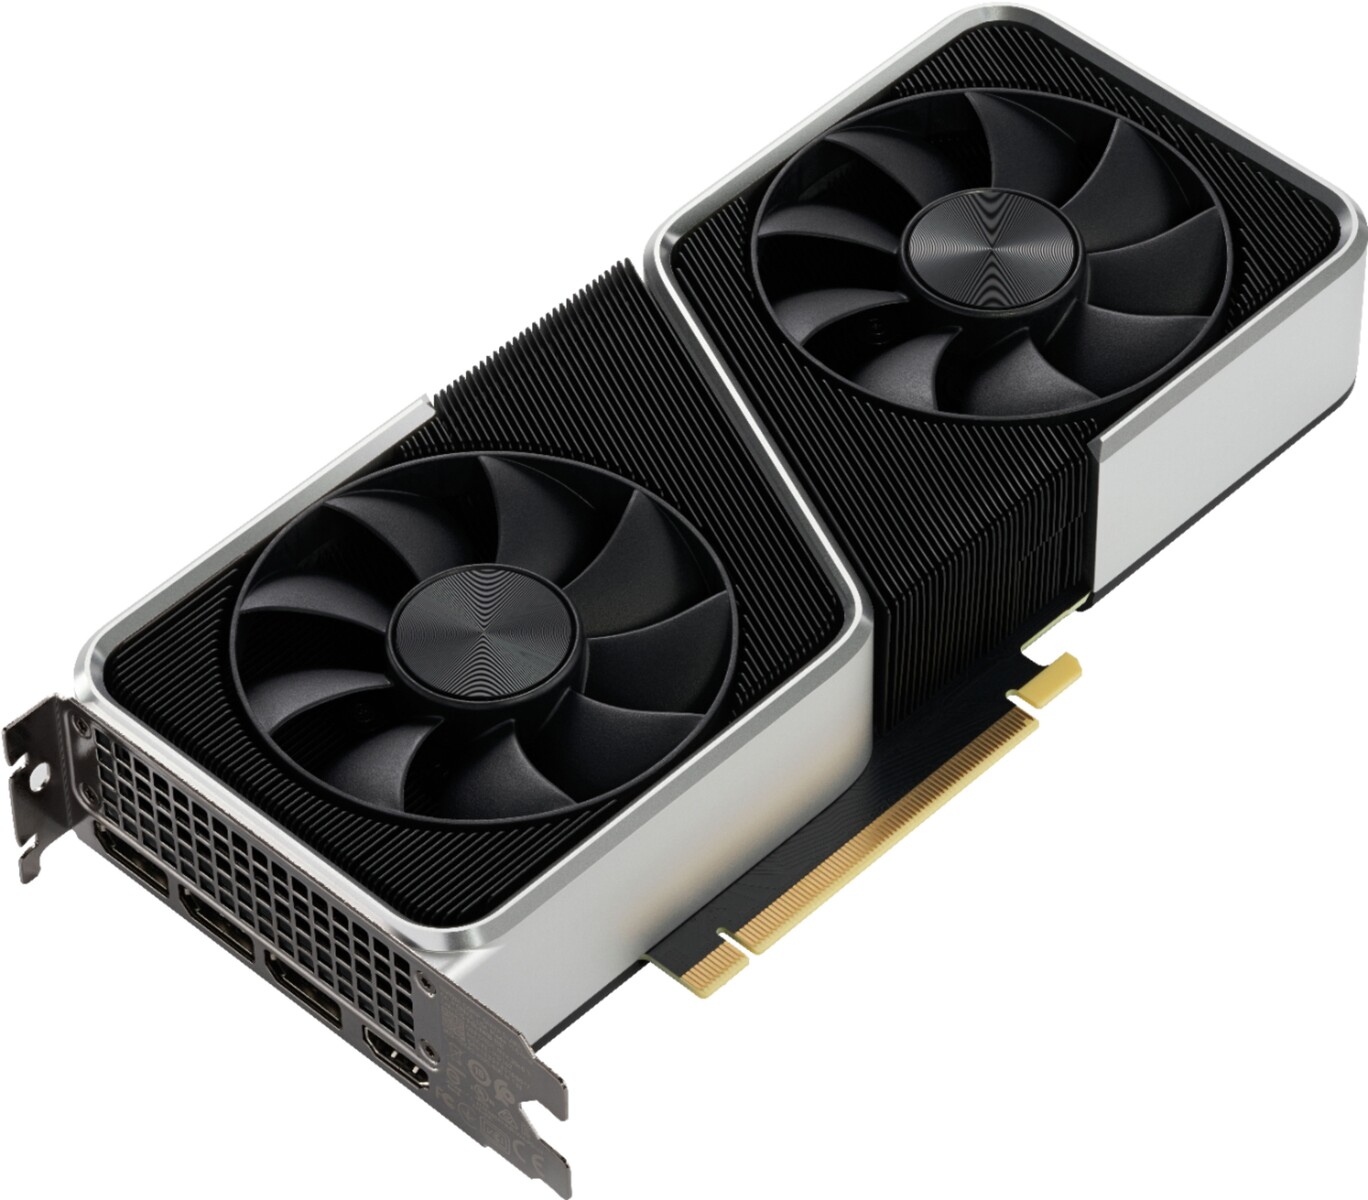
Een rondleiding door de NVIDIA GeForce RTX 3060 Ti Founders Edition

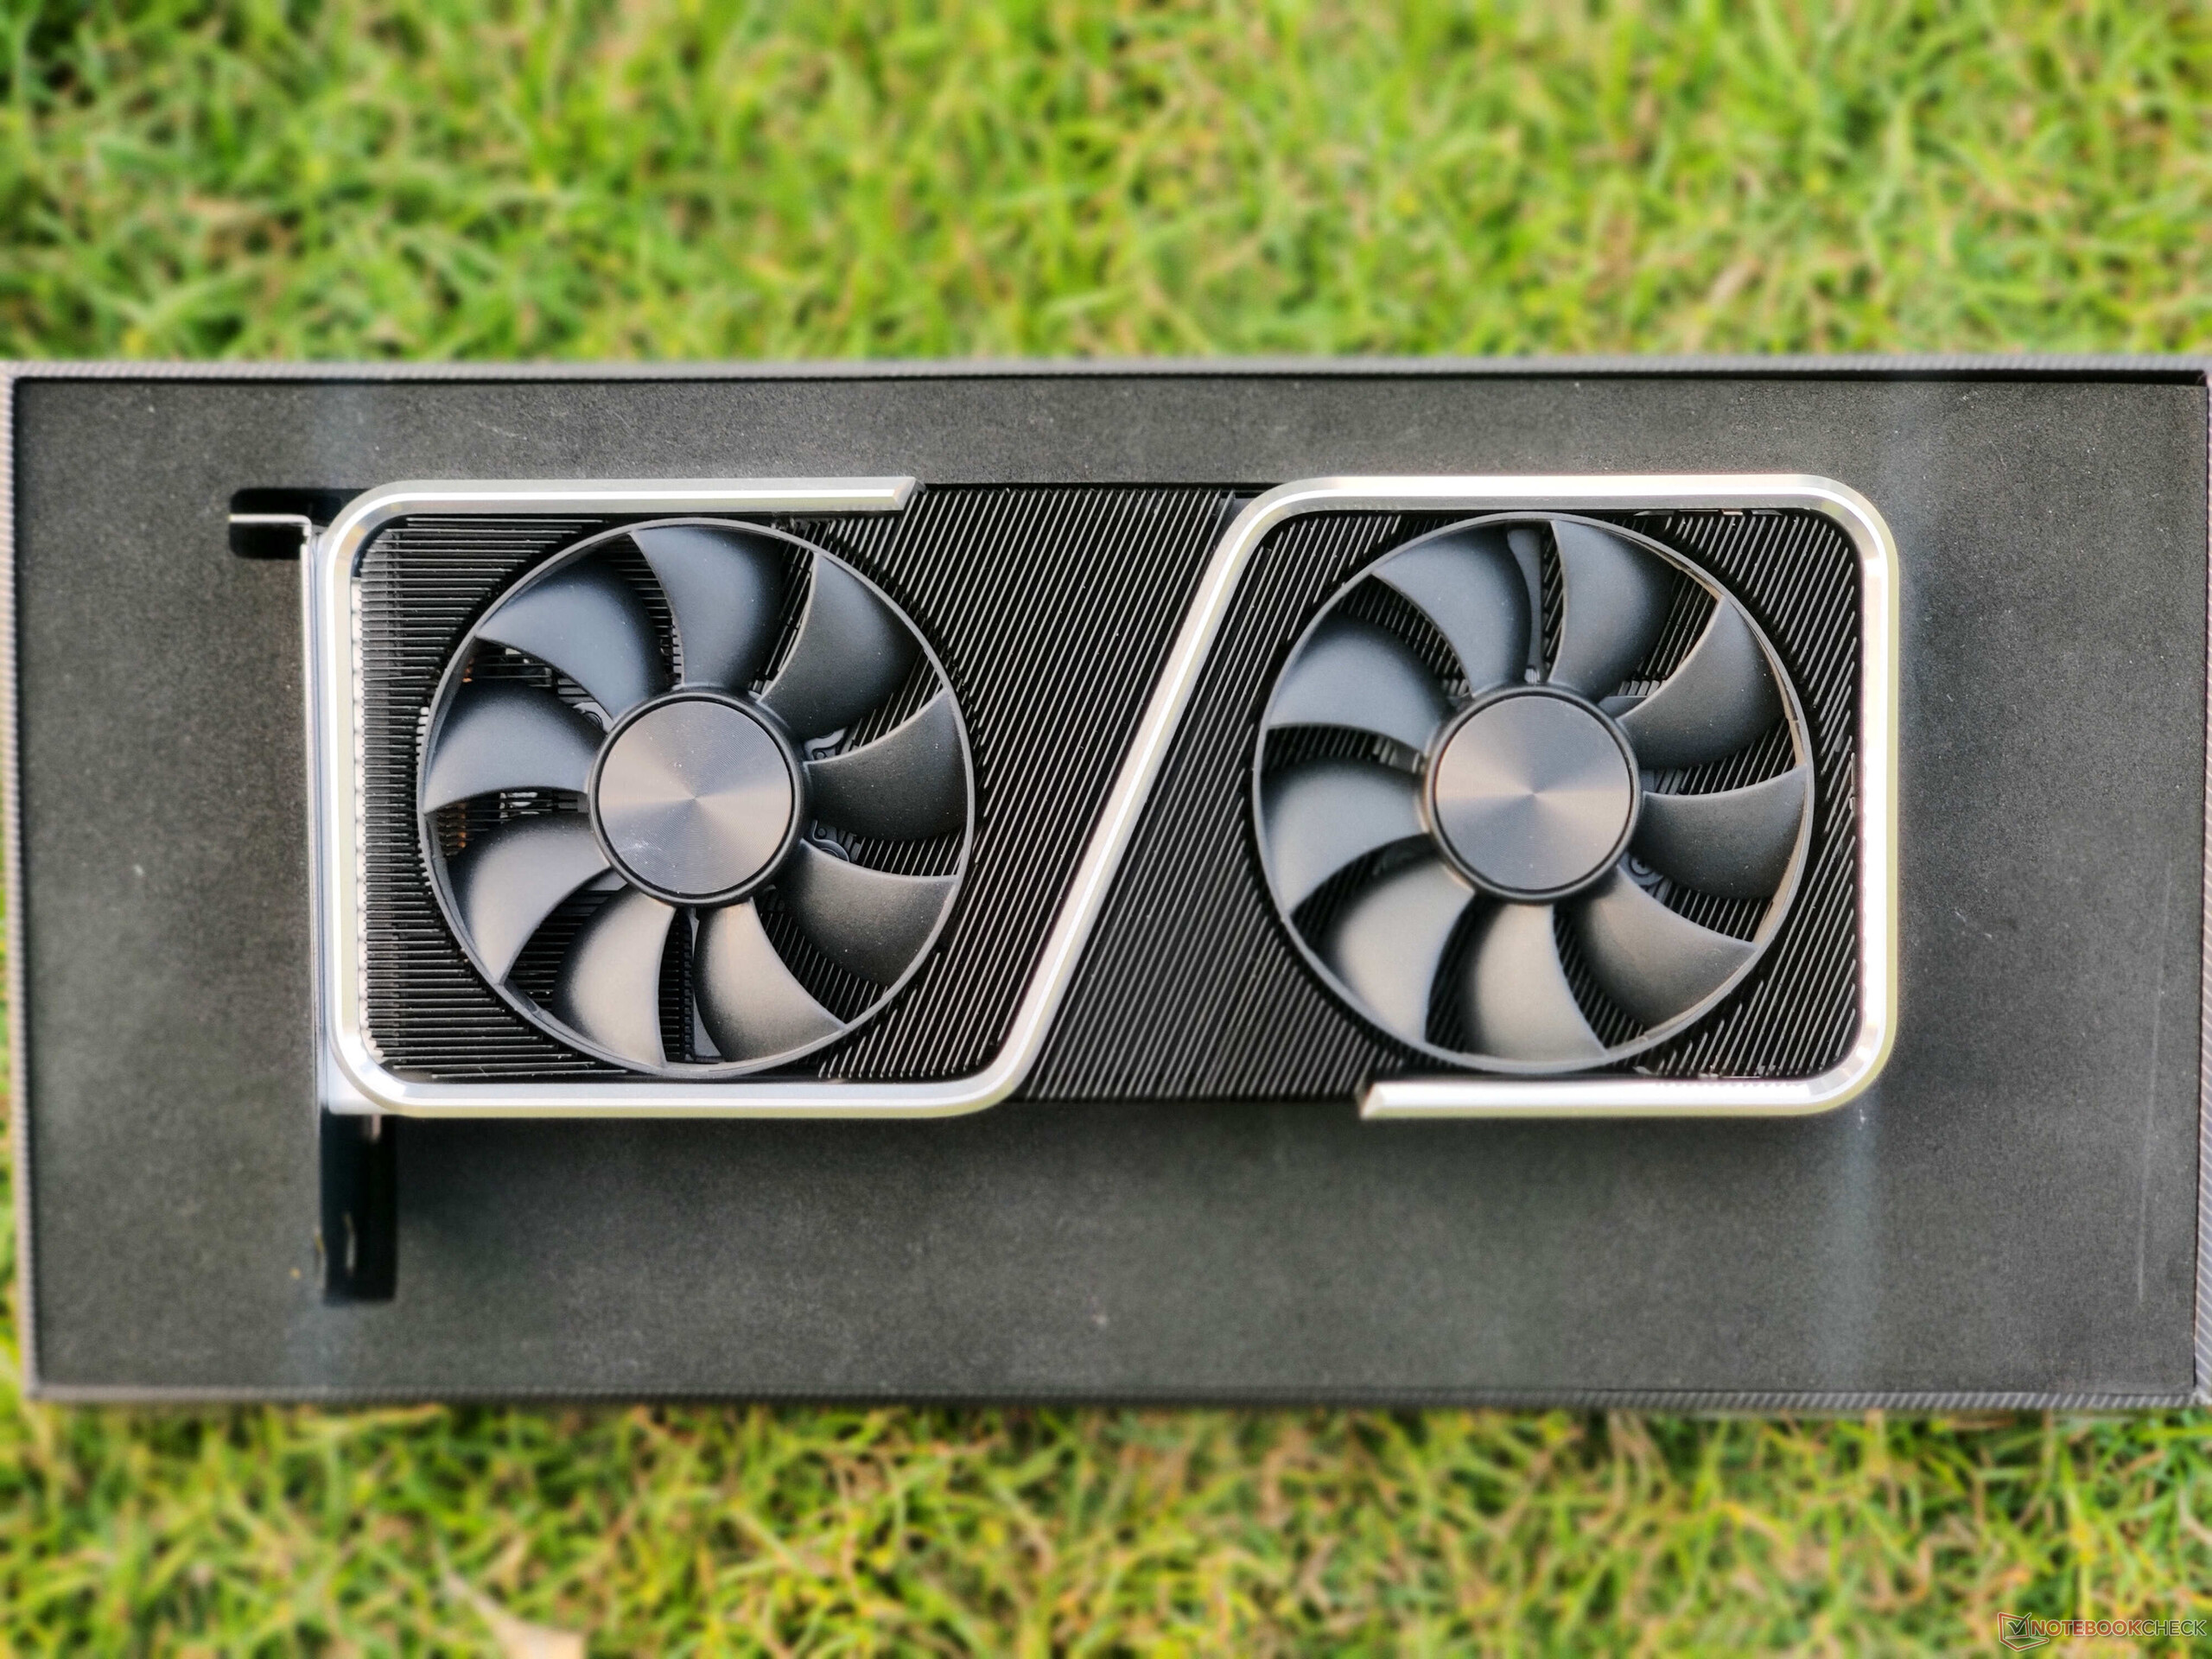
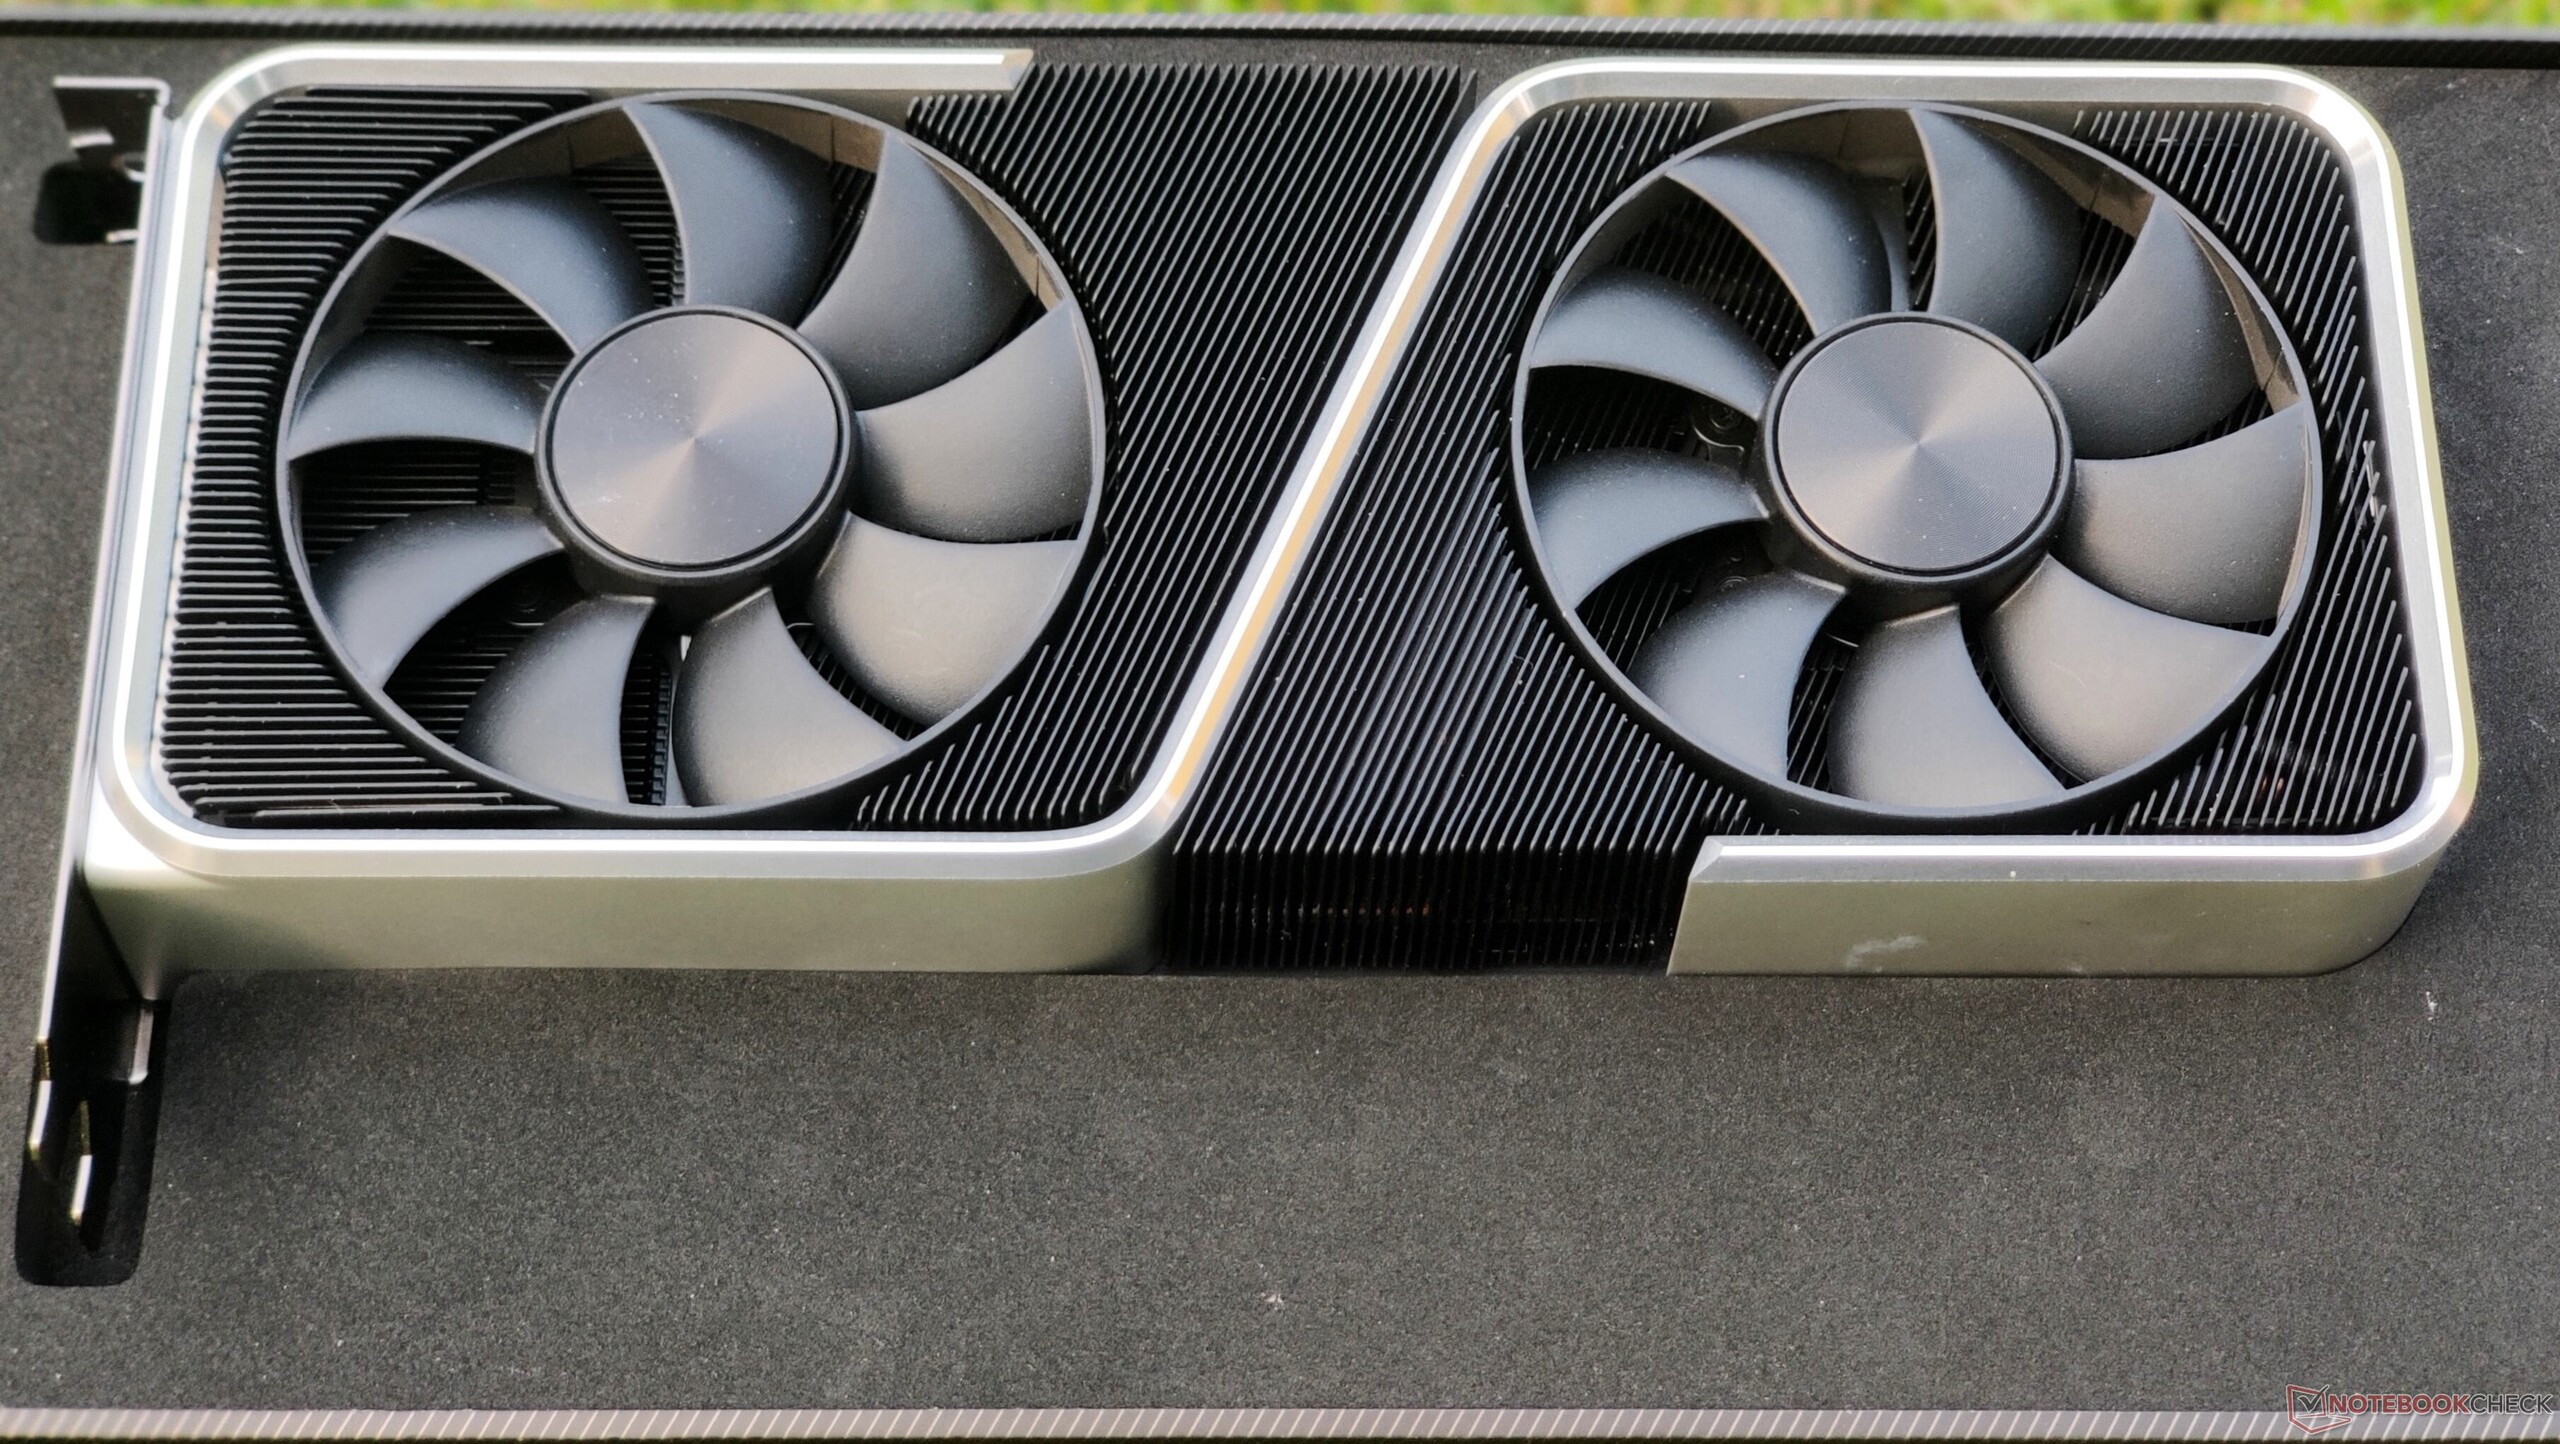
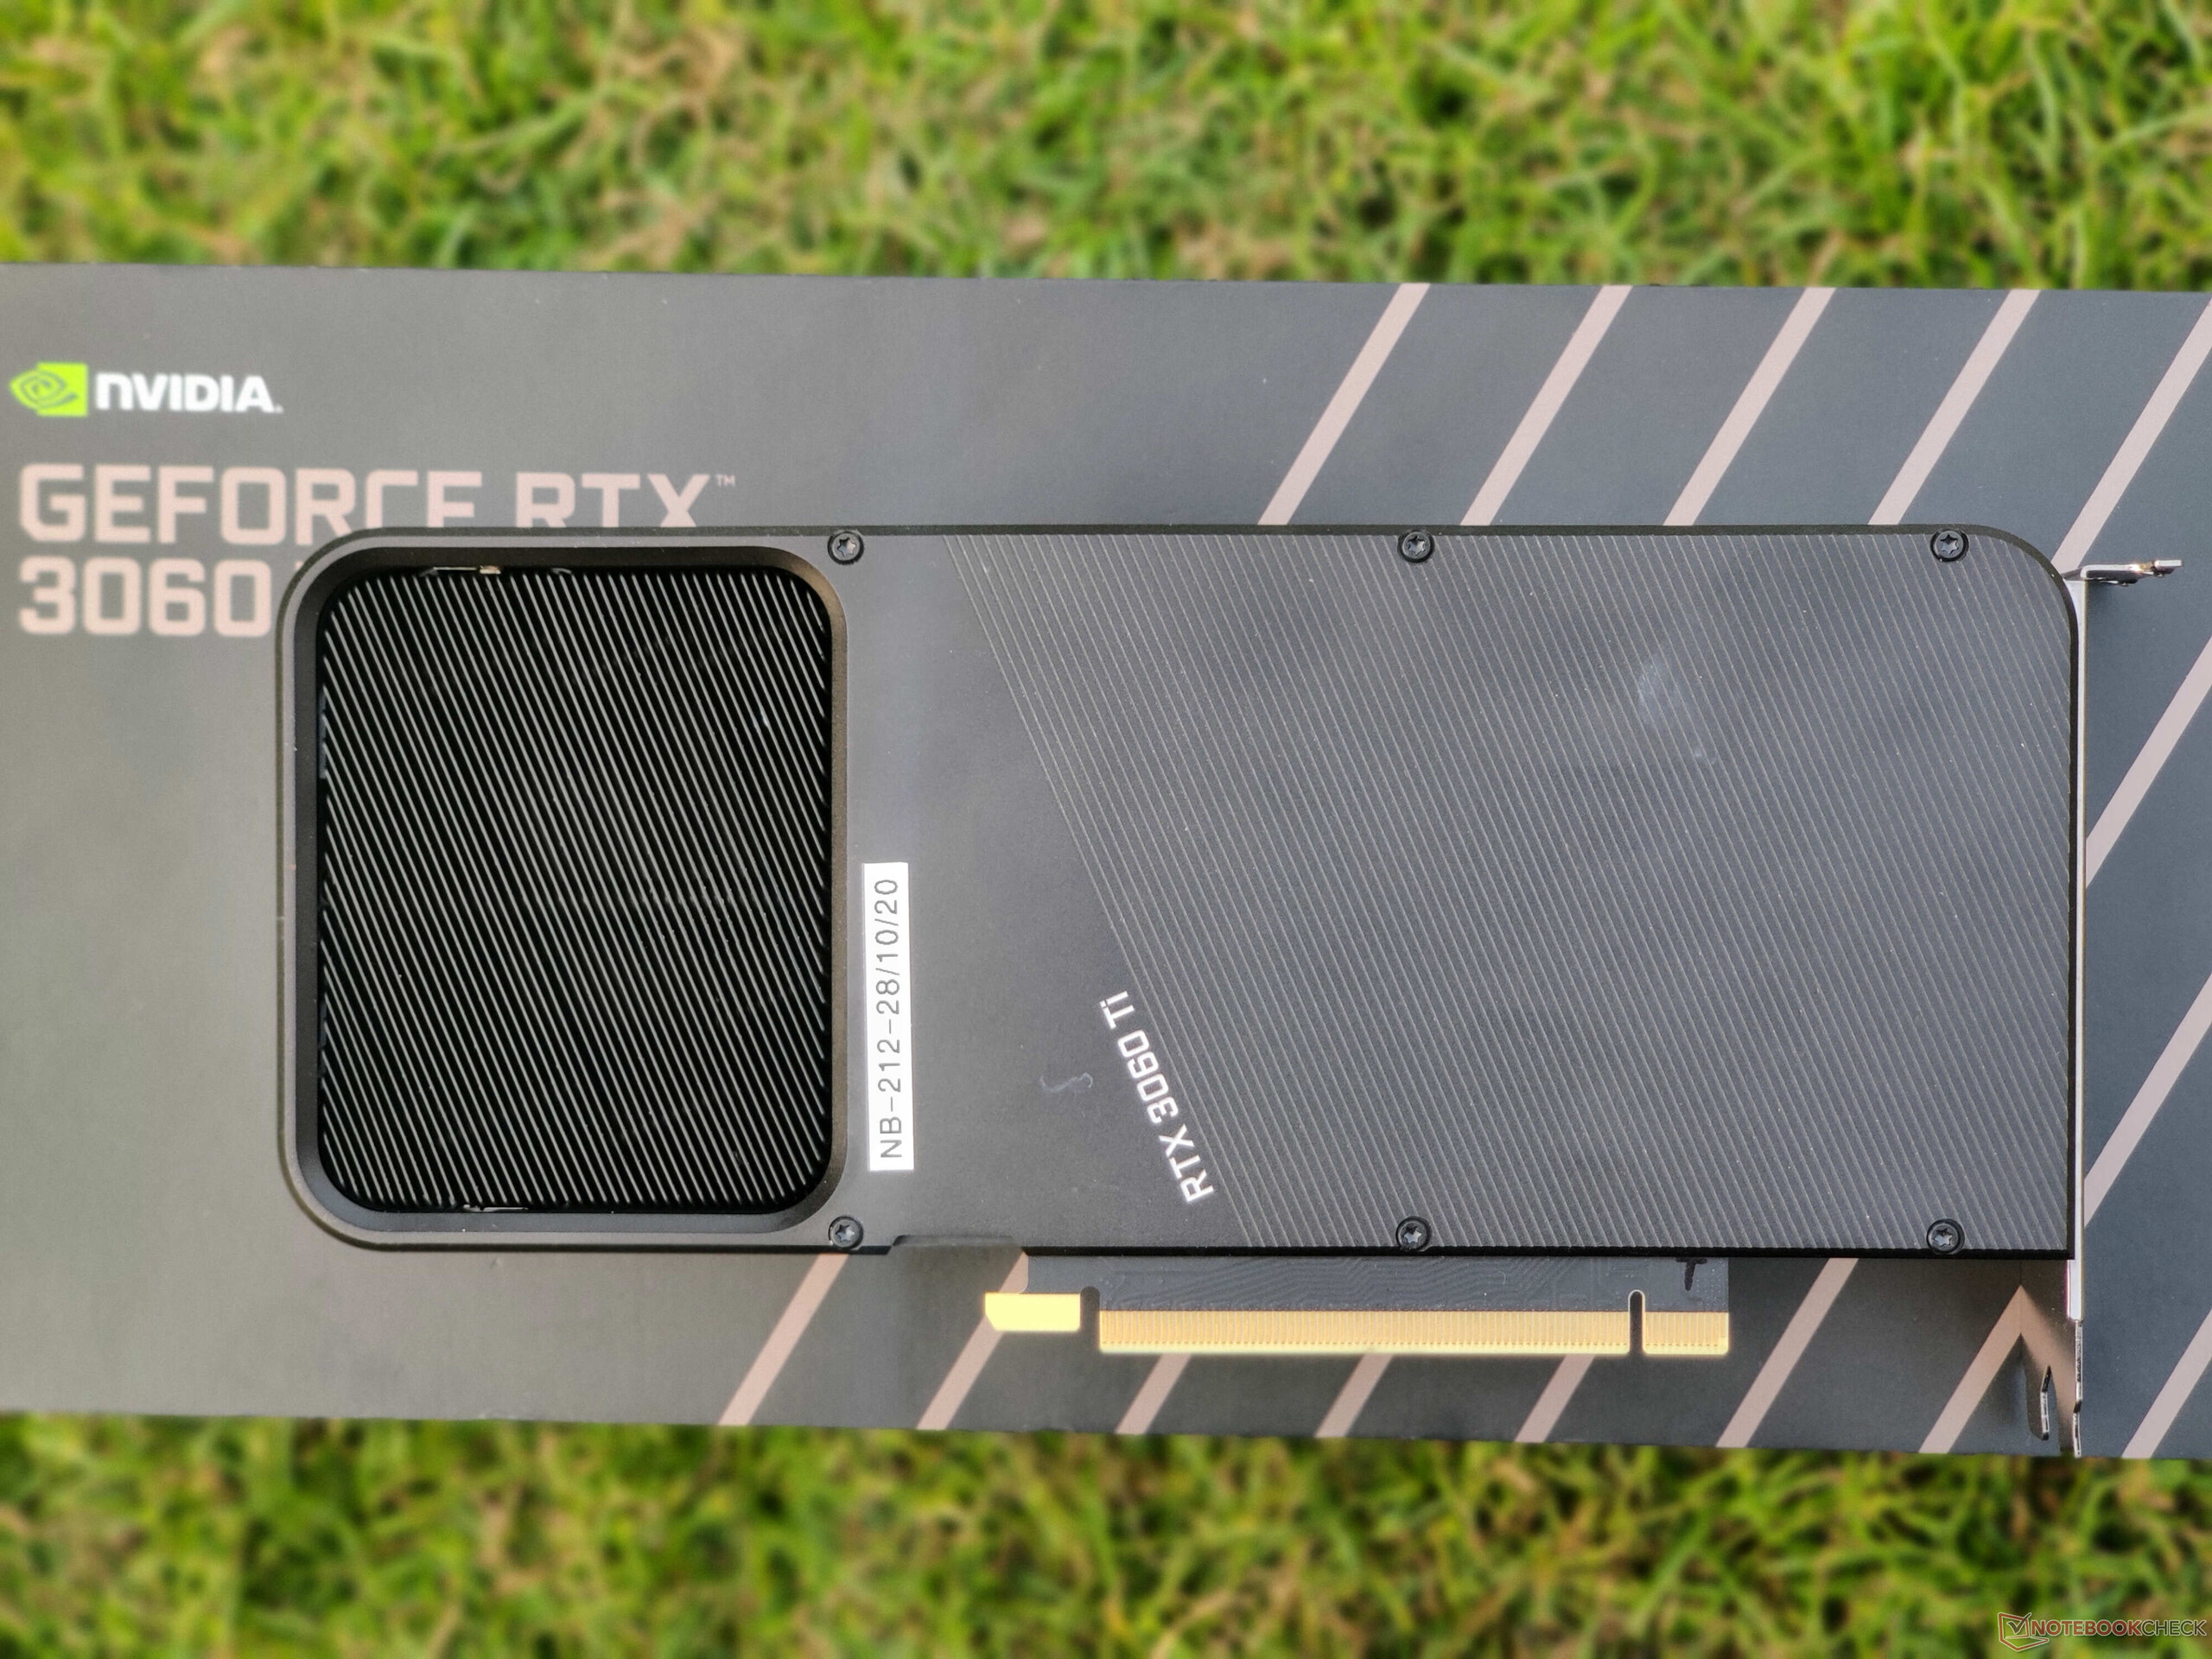
De RTX 3060 Ti Founders Edition belichaamt NVIDIA's nieuwe ontwerptaal die helpt bij een betere warmteafvoer en lage geluidsniveaus, althans in vergelijking met de vorige generatie FE-kaarten. De kaart ziet er vrij onopvallend uit, maar het helderzilveren metalen frame zorgt voor een premium uitstraling. Hij is goed gebouwd, zonder kronkels, kraken of dunne plastic omhulsels

Net als de rest van de NVIDIA Ampere Founders Edition kaarten, wordt ook de RTX 3060 Ti FE geleverd met een 12-pins Molex MicroFit 3.0 voedingsconnector die zich in het midden bevindt. NVIDIA levert een 8-pins naar 12-pins connector mee in de doos

De 12-pins connector lijkt hier enigszins overbodig en is een duidelijk minpunt op het esthetische front (om nog maar te zwijgen van kabelbeheerproblemen), aangezien de RTX 3060 Ti minder dan 300 W verbruikt en gemakkelijk kan volstaan met enkel de standaard 8-pins PSU connector.

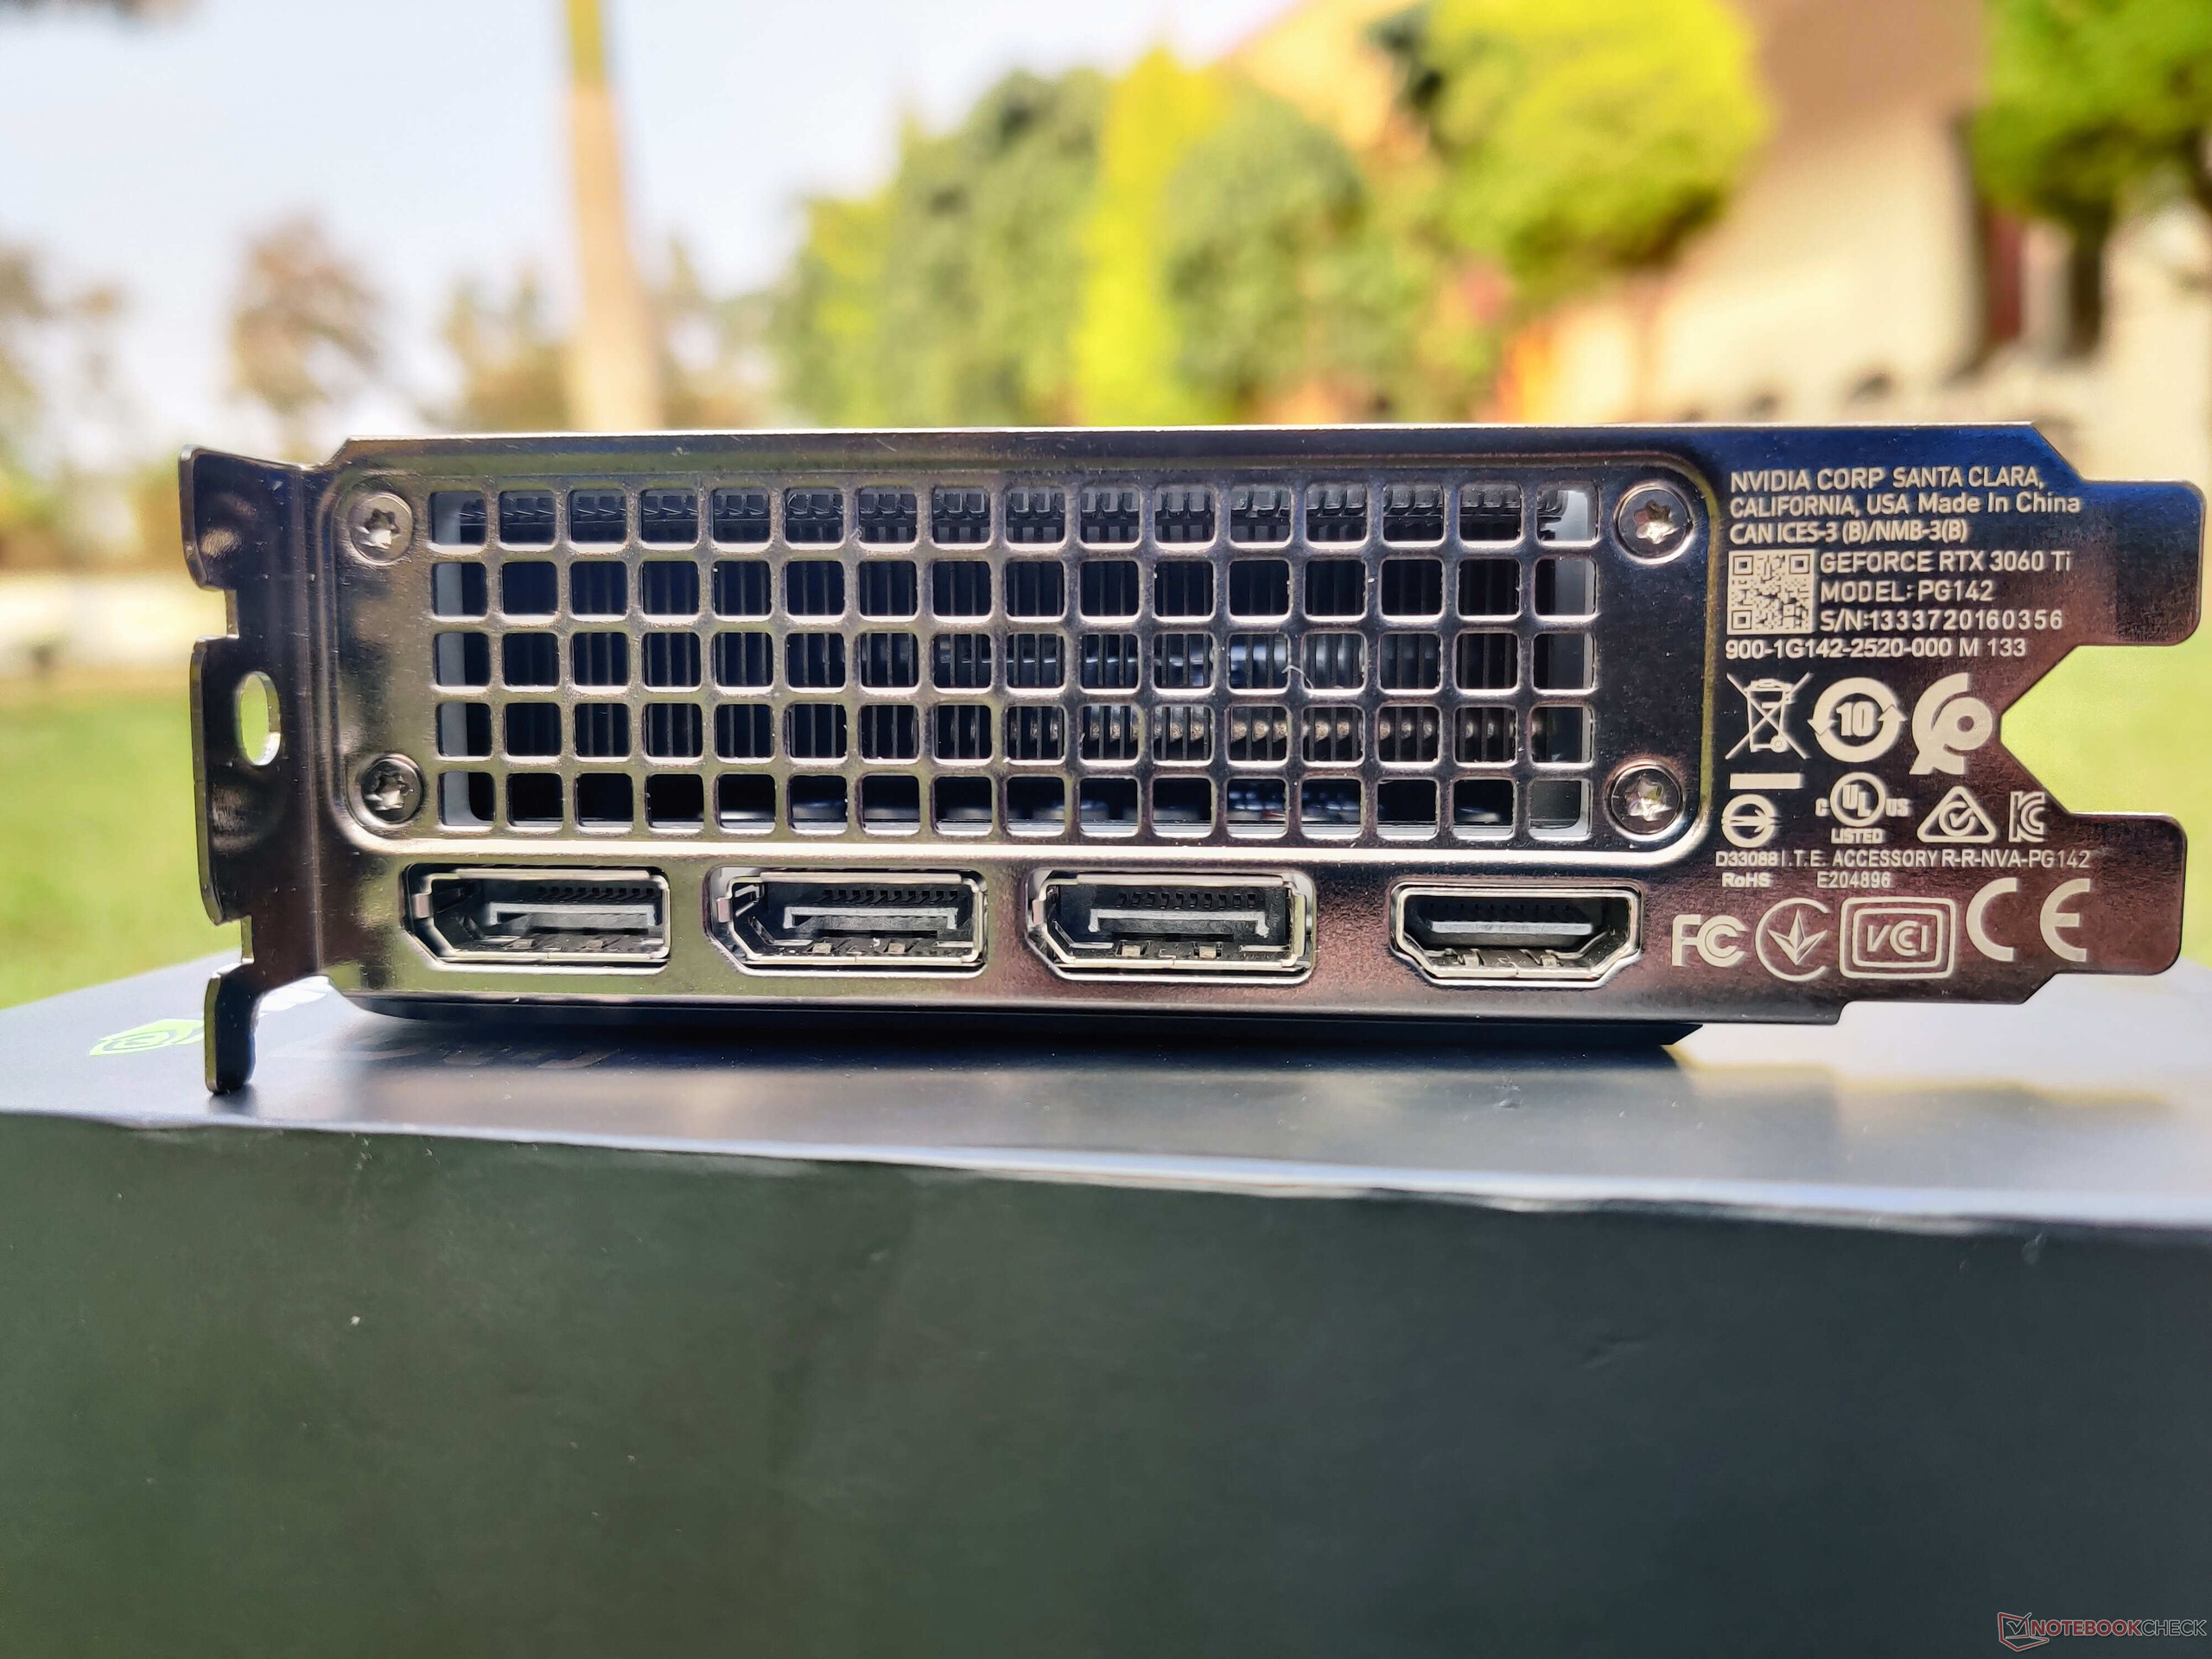
Connectiviteitsopties zijn standaard en omvatten drie DisplayPort 1.4a poorten en een HDMI 2.1. De dubbele 9-bladige ventilatoren bieden effectieve koeling en hebben een zeer goed geluidsprofiel onder belasting, zoals we later in de review zullen zien. Een metalen achterplaat is voorzien die niet alleen helpt bij de bescherming, maar ook is voorzien van een paar thermische pads aan de onderkant voor het afvoeren van warmte van de geheugen VRM's die op de achterkant van de PCB zijn geplaatst.

De NVIDIA GeForce RTX 3060 Ti Founders Edition wordt verkocht voor US$399,99 (₹35,900) en wordt geleverd met drie jaar garantie.

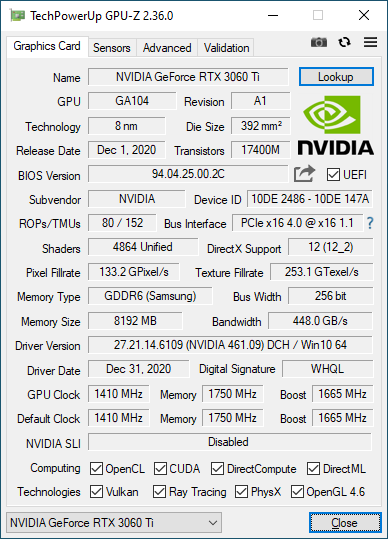
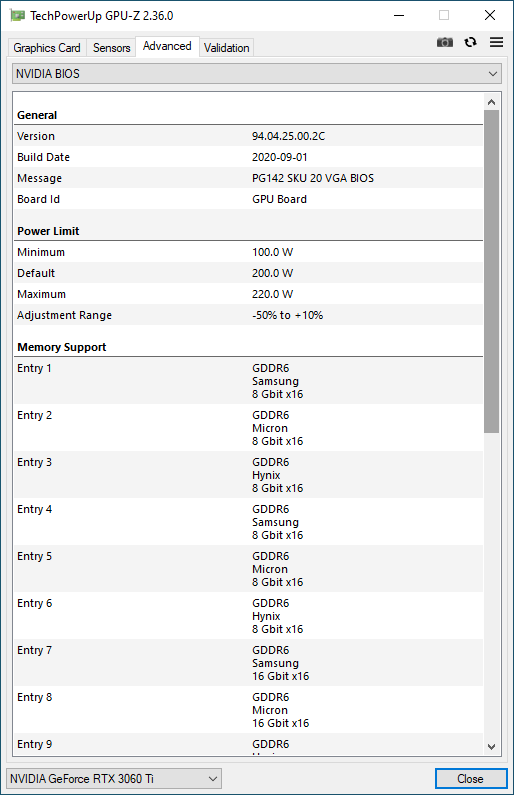
De RTX 3060 Ti FE biedt een basisklok van 1.410 MHz en kan opvoeren tot 1.665 MHz. Het is mogelijk om het beoogde vermogen van 200 W te verhogen met nog eens 20 W. Aangezien de kaart geen enkele vorm van RGB-verlichting heeft, wordt het extra vermogen voornamelijk gebruikt door de GPU zelf. Dit gezegd zijnde, is de werkelijke overklokruimte niet veel.

De RTX 3060 Ti biedt 8 GB GDDR6 VRAM op een 256-bit geheugenbus met een maximale bandbreedte van 448 GB/s. Hoewel dit laag lijkt in vergelijking met high-end aanbiedingen van NVIDIA en alle Radeon RX 6000 kaarten van AMD tot nu toe, gezien de mogelijkheden van de RTX 3060 Ti, zou de 8 GB VRAM voldoende moeten zijn, tenzij u zich bezighoudt met pro-applicaties of computerzware werkbelastingen die een hoger werkend videogeheugen vereisen. We zijn tijdens onze tests geen problemen tegengekomen met geheugenbeperkingen

De testbank

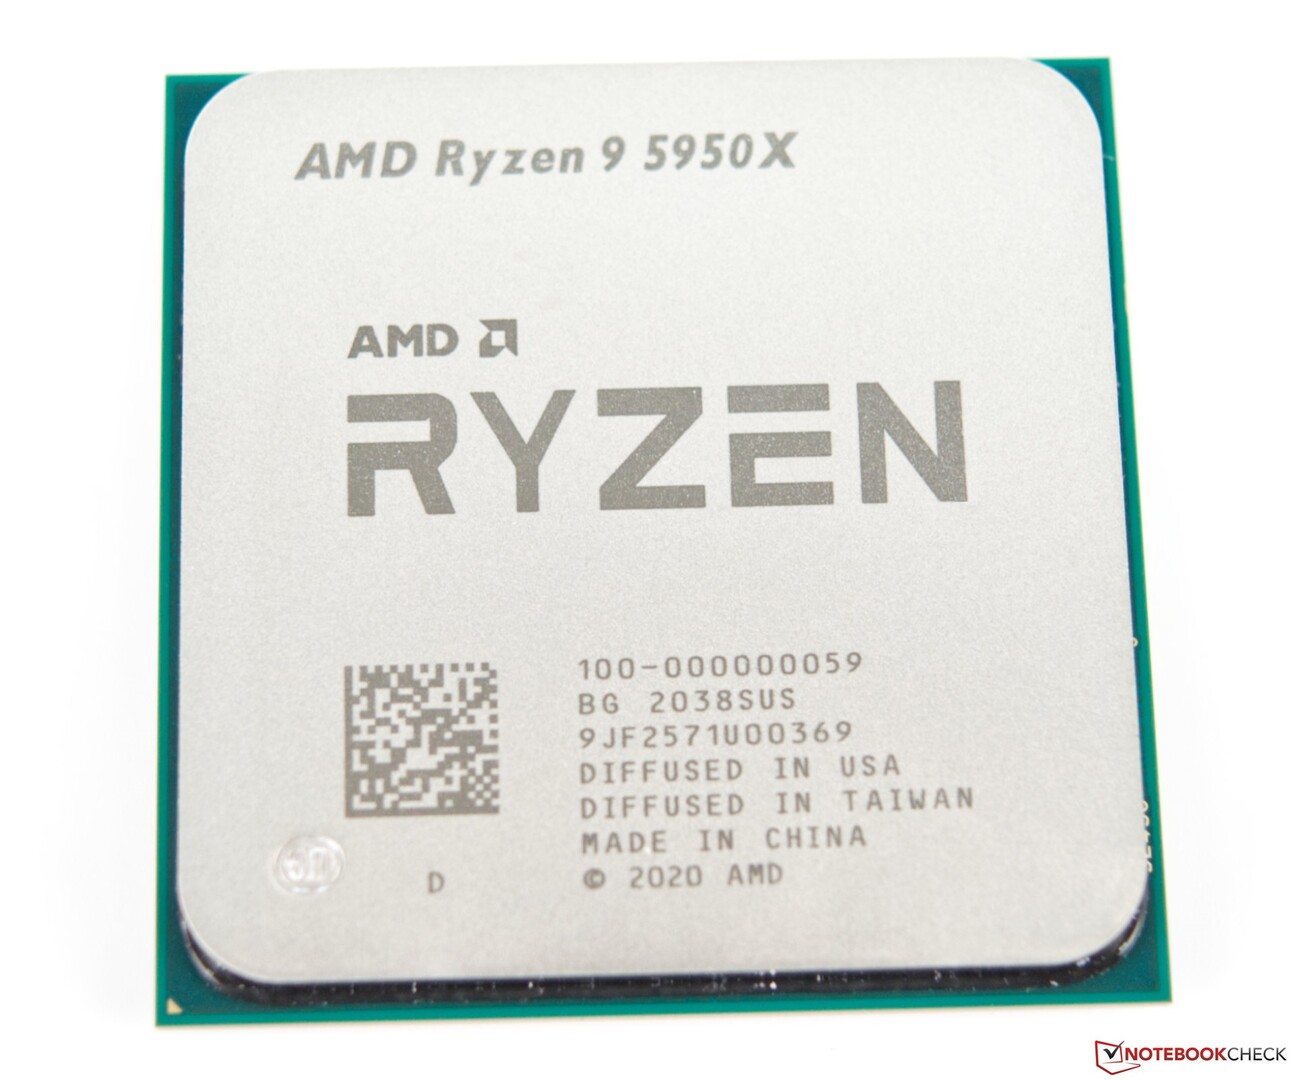
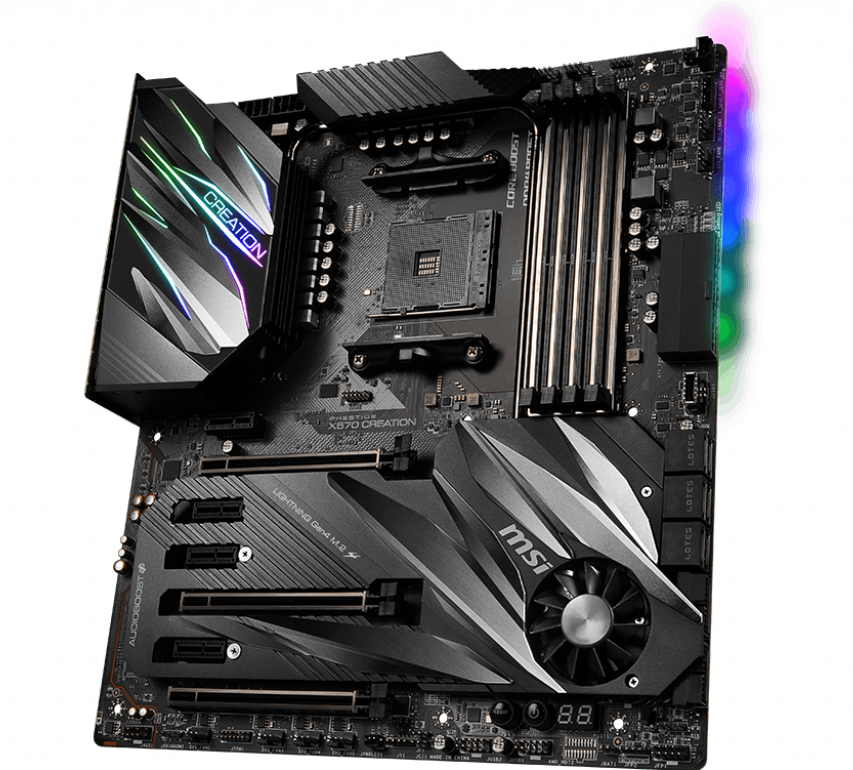
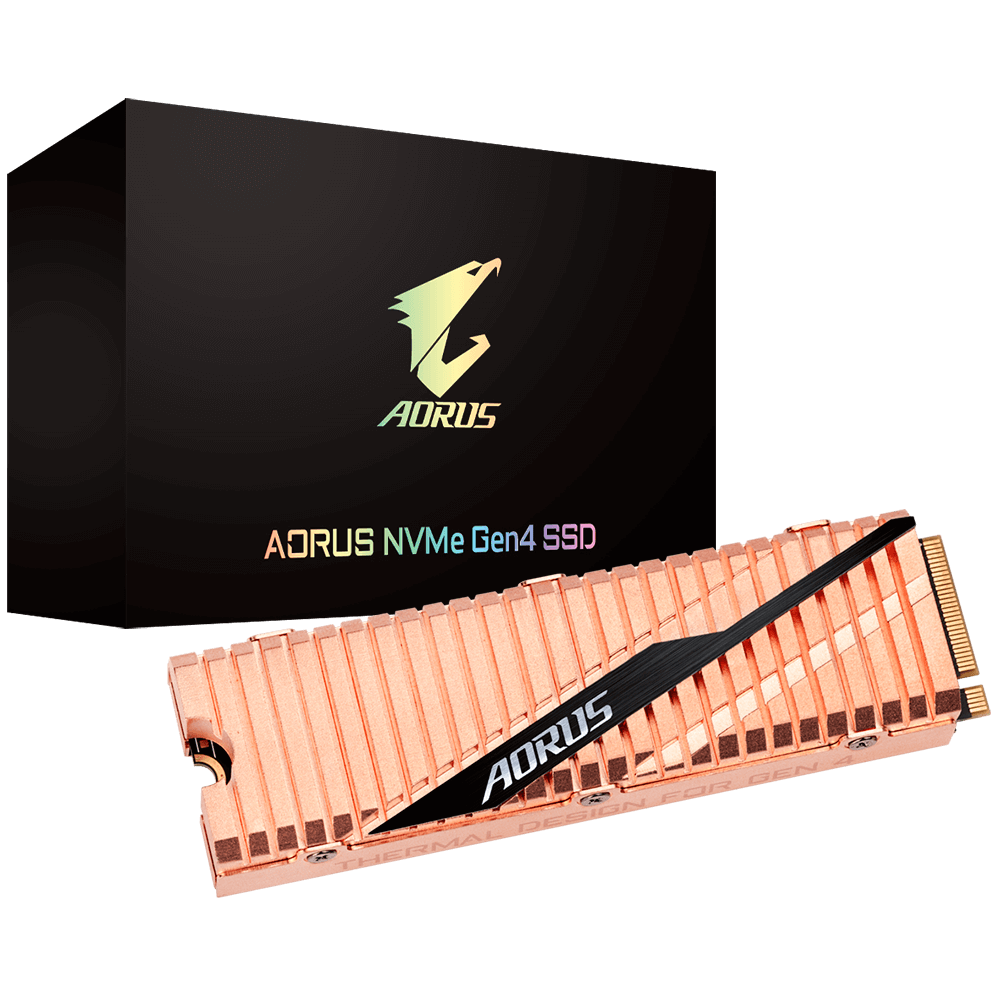
Onze test bank bestaat uit een AMD Ryzen 9 5950X 16-core 32-thread processor, MSI Prestige X570 Creation moederbord, 32 GB (16 GB x2) van G.SKILL Trident Z Neo DDR4-3200 RAM (timings 16-19-19-39), en een Gigabyte Aorus NVMe Gen4 1 TB SSD

Windows 10 20H2 met de laatste cumulatieve updates (Build 19041.746) werd geïnstalleerd op de Aorus NVMe Gen4 PCIe SSD, terwijl twee 1 TB Crucial MX500 SATA SSD's werden gebruikt voor het draaien van benchmarks en games.

Een Corsair iCUE H115i Elite Capellix AIO koeler hielp de mammoet Ryzen 9 5950X koel te houden. De hele build was ondergebracht in een Corsair iCUE 4000X RGB-behuizing met een Thermaltake Toughpower 850 W 80 Plus Gold als de voeding van keuze. We voerden alle tests uit met de behuizing gesloten om typisch gebruik weer te geven.

De RTX 3060 Ti FE werd gekoppeld aan een OnePlus U Series 55U1 smart TV die draaide op 4K 60 Hz. De kleurenuitvoer werd ingesteld op volledig 32-bits RGB in het NVIDIA-bedieningspaneel, terwijl Windows desktop scaling werd ingesteld op 100%.

We willen AMD bedanken voor het leveren van de Ryzen 9 5950X CPU, Corsair voor de iCUE Elite Capellix AIO koeler en iCUE 4000X case, en OnePlus voor de U serie 55U1 4K TV

AMD Ryzen 9 5950X CPU
MSI Prestige X570 Creation moederbord. (Afbeelding Bron: MSI)
Gigabyte Aorus NVMe Gen4 SSD. (Afbeelding bron: Gigabyte)
G.SKILL Trident Z Neo DDR4-3600 RAM. (Afbeelding bron: G.SKILL)

Synthetische benchmarks

De prestaties van de RTX 3060 Ti komen overeen met die van een RTX 2080 Super en kunnen oplopen tot 32% sneller zijn dan een RTX 2060 Super, terwijl hij in 3DMark-tests ongeveer 10% achterloopt op de RTX 3070.

Een soortgelijke trend zien we ook bij de Unigine Heaven en Valley benchmarks. We zien dat de prestatiedelta tussen de kaarten hoger is in DirectX-tests dan in OpenGL-tests. Terwijl de RTX 3060 Ti slechts ongeveer 8% sneller is dan de RTX 2080 Super in Heaven 4.0 DirectX, brengt Valley 1.0 DirectX dit verschil naar een significante 27%. Unigine Superposition laat zien dat de RTX 3060 Ti 12% tot 14% langzamer is dan de RTX 3070, maar vrijwel gelijk is aan de gemiddelde RTX 2080 Super in alle tests behalve 720p low

3DMark
2560x1440 Time Spy Graphics
MSI GeForce RTX 3090 Suprim X
NVIDIA GeForce RTX 3090, R9 5900X
19571 Points +69%
Gemiddeld NVIDIA GeForce RTX 3090
  (18685 - 20433, n=16)
19254 Points +66%
MSI GeForce RTX 3080 Gaming X Trio
NVIDIA GeForce RTX 3080, R9 5900X
17604 Points +52%
AMD Radeon RX 6800 XT
AMD Radeon RX 6800 XT, R9 5950X
17603 Points +52%
Gemiddeld NVIDIA GeForce RTX 3080
  (17467 - 17604, n=2)
17536 Points +51%
AMD Ryzen 9 5900X
NVIDIA Titan RTX, R9 5900X
15283 Points +32%
KFA2 GeForce RTX 2080 Ti EX
NVIDIA GeForce RTX 2080 Ti (Desktop), R9 3900X
13744 Points +19%
Zotac Gaming GeForce RTX 3070 Twin Edge
NVIDIA GeForce RTX 3070, R9 5950X
13024 Points +12%
Gemiddeld NVIDIA GeForce RTX 3070
  (11043 - 13579, n=7)
12616 Points +9%
NVIDIA GeForce RTX 3060 Ti FE
NVIDIA GeForce RTX 3060 Ti, R9 5950X
11590 Points
Nvidia GeForce RTX 2080 Super
NVIDIA GeForce RTX 2080 Super (Desktop), R7 2700X
11477 Points -1%
Gemiddeld NVIDIA GeForce RTX 2080 Super (Desktop)
  (11313 - 11542, n=4)
11439 Points -1%
Nvidia GeForce RTX 2070 Super
NVIDIA GeForce RTX 2070 Super (Desktop), R7 2700X
10094 Points -13%
Gemiddeld NVIDIA GeForce RTX 2070 Super (Desktop)
  (9564 - 10094, n=8)
9846 Points -15%
Nvidia GeForce RTX 2060 Super
NVIDIA GeForce RTX 2060 Super (Desktop), R7 2700X
8795 Points -24%
AMD Radeon RX 5700 XT
AMD Radeon RX 5700 XT (Desktop), R7 2700X
8673 Points -25%
Gemiddeld NVIDIA GeForce RTX 2060 Super (Desktop)
  (8396 - 8795, n=7)
8631 Points -26%
KFA 2 GeForce GTX 1660 Super
NVIDIA GeForce GTX 1660 Super (Desktop), R9 3900X
6021 Points -48%
KFA2 GeForce GTX 1650 Super EX One Click OC
NVIDIA GeForce GTX 1650 Super (Desktop), R9 5900X
4632 Points -60%
3840x2160 Fire Strike Ultra Graphics
AMD Radeon RX 6800 XT
AMD Radeon RX 6800 XT, R9 5950X
12626 Points +77%
MSI GeForce RTX 3090 Suprim X
NVIDIA GeForce RTX 3090, R9 5900X
12371 Points +74%
Gemiddeld NVIDIA GeForce RTX 3090
  (11613 - 12587, n=13)
12305 Points +73%
Gemiddeld NVIDIA GeForce RTX 3080
  (10645 - 10793, n=2)
10719 Points +50%
MSI GeForce RTX 3080 Gaming X Trio
NVIDIA GeForce RTX 3080, R9 5900X
10645 Points +49%
AMD Ryzen 9 5900X
NVIDIA Titan RTX, R9 5900X
8649 Points +21%
Gemiddeld NVIDIA GeForce RTX 3070
  (8043 - 8483, n=5)
8250 Points +16%
Zotac Gaming GeForce RTX 3070 Twin Edge
NVIDIA GeForce RTX 3070, R9 5950X
8043 Points +13%
KFA2 GeForce RTX 2080 Ti EX
NVIDIA GeForce RTX 2080 Ti (Desktop), R9 3900X
7925 Points +11%
NVIDIA GeForce RTX 3060 Ti FE
NVIDIA GeForce RTX 3060 Ti, R9 5950X
7126 Points
Gemiddeld NVIDIA GeForce RTX 2080 Super (Desktop)
  (6500 - 6700, n=3)
6585 Points -8%
Nvidia GeForce RTX 2080 Super
NVIDIA GeForce RTX 2080 Super (Desktop), R7 2700X
6500 Points -9%
AMD Radeon RX 5700 XT
AMD Radeon RX 5700 XT (Desktop), R7 2700X
5955 Points -16%
Nvidia GeForce RTX 2070 Super
NVIDIA GeForce RTX 2070 Super (Desktop), R7 2700X
5786 Points -19%
Gemiddeld NVIDIA GeForce RTX 2070 Super (Desktop)
  (2290 - 5882, n=7)
5313 Points -25%
Nvidia GeForce RTX 2060 Super
NVIDIA GeForce RTX 2060 Super (Desktop), R7 2700X
5175 Points -27%
Gemiddeld NVIDIA GeForce RTX 2060 Super (Desktop)
  (5067 - 5224, n=6)
5164 Points -28%
KFA 2 GeForce GTX 1660 Super
NVIDIA GeForce GTX 1660 Super (Desktop), R9 3900X
3088 Points -57%
KFA2 GeForce GTX 1650 Super EX One Click OC
NVIDIA GeForce GTX 1650 Super (Desktop), R9 5900X
2186 Points -69%
Fire Strike Extreme Graphics
AMD Radeon RX 6800 XT
AMD Radeon RX 6800 XT, R9 5950X
25015 Points +80%
Gemiddeld NVIDIA GeForce RTX 3090
  (22075 - 24730, n=13)
23822 Points +71%
MSI GeForce RTX 3090 Suprim X
NVIDIA GeForce RTX 3090, R9 5900X
23114 Points +66%
Gemiddeld NVIDIA GeForce RTX 3080
  (20007 - 20861, n=2)
20434 Points +47%
MSI GeForce RTX 3080 Gaming X Trio
NVIDIA GeForce RTX 3080, R9 5900X
20007 Points +44%
AMD Ryzen 9 5900X
NVIDIA Titan RTX, R9 5900X
17176 Points +24%
Gemiddeld NVIDIA GeForce RTX 3070
  (15503 - 16276, n=5)
15859 Points +14%
KFA2 GeForce RTX 2080 Ti EX
NVIDIA GeForce RTX 2080 Ti (Desktop), R9 3900X
15603 Points +12%
Zotac Gaming GeForce RTX 3070 Twin Edge
NVIDIA GeForce RTX 3070, R9 5950X
15503 Points +12%
NVIDIA GeForce RTX 3060 Ti FE
NVIDIA GeForce RTX 3060 Ti, R9 5950X
13898 Points
Gemiddeld NVIDIA GeForce RTX 2080 Super (Desktop)
  (12968 - 13551, n=3)
13172 Points -5%
Nvidia GeForce RTX 2080 Super
NVIDIA GeForce RTX 2080 Super (Desktop), R7 2700X
12968 Points -7%
AMD Radeon RX 5700 XT
AMD Radeon RX 5700 XT (Desktop), R7 2700X
12209 Points -12%
Gemiddeld NVIDIA GeForce RTX 2070 Super (Desktop)
  (11382 - 12044, n=7)
11850 Points -15%
Nvidia GeForce RTX 2070 Super
NVIDIA GeForce RTX 2070 Super (Desktop), R7 2700X
11634 Points -16%
Gemiddeld NVIDIA GeForce RTX 2060 Super (Desktop)
  (10182 - 10726, n=6)
10498 Points -24%
Nvidia GeForce RTX 2060 Super
NVIDIA GeForce RTX 2060 Super (Desktop), R7 2700X
10481 Points -25%
KFA 2 GeForce GTX 1660 Super
NVIDIA GeForce GTX 1660 Super (Desktop), R9 3900X
6935 Points -50%
KFA2 GeForce GTX 1650 Super EX One Click OC
NVIDIA GeForce GTX 1650 Super (Desktop), R9 5900X
5135 Points -63%
1920x1080 Fire Strike Graphics
AMD Radeon RX 6800 XT
AMD Radeon RX 6800 XT, R9 5950X
49735 Points +77%
Gemiddeld NVIDIA GeForce RTX 3090
  (41298 - 49282, n=16)
46854 Points +66%
MSI GeForce RTX 3090 Suprim X
NVIDIA GeForce RTX 3090, R9 5900X
42688 Points +52%
Gemiddeld NVIDIA GeForce RTX 3080
  (37604 - 40910, n=2)
39257 Points +39%
MSI GeForce RTX 3080 Gaming X Trio
NVIDIA GeForce RTX 3080, R9 5900X
37604 Points +34%
AMD Ryzen 9 5900X
NVIDIA Titan RTX, R9 5900X
34722 Points +23%
KFA2 GeForce RTX 2080 Ti EX
NVIDIA GeForce RTX 2080 Ti (Desktop), R9 3900X
32081 Points +14%
Zotac Gaming GeForce RTX 3070 Twin Edge
NVIDIA GeForce RTX 3070, R9 5950X
31252 Points +11%
Gemiddeld NVIDIA GeForce RTX 3070
  (20357 - 33270, n=7)
28949 Points +3%
NVIDIA GeForce RTX 3060 Ti FE
NVIDIA GeForce RTX 3060 Ti, R9 5950X
28145 Points
Gemiddeld NVIDIA GeForce RTX 2080 Super (Desktop)
  (26824 - 28968, n=4)
27647 Points -2%
Nvidia GeForce RTX 2080 Super
NVIDIA GeForce RTX 2080 Super (Desktop), R7 2700X
27075 Points -4%
AMD Radeon RX 5700 XT
AMD Radeon RX 5700 XT (Desktop), R7 2700X
25383 Points -10%
Gemiddeld NVIDIA GeForce RTX 2070 Super (Desktop)
  (22819 - 25799, n=8)
24645 Points -12%
Nvidia GeForce RTX 2070 Super
NVIDIA GeForce RTX 2070 Super (Desktop), R7 2700X
24151 Points -14%
Nvidia GeForce RTX 2060 Super
NVIDIA GeForce RTX 2060 Super (Desktop), R7 2700X
21970 Points -22%
Gemiddeld NVIDIA GeForce RTX 2060 Super (Desktop)
  (20522 - 22764, n=7)
21970 Points -22%
KFA 2 GeForce GTX 1660 Super
NVIDIA GeForce GTX 1660 Super (Desktop), R9 3900X
15498 Points -45%
KFA2 GeForce GTX 1650 Super EX One Click OC
NVIDIA GeForce GTX 1650 Super (Desktop), R9 5900X
11688 Points -58%
Unigine Heaven 4.0
Extreme Preset DX11
Gemiddeld NVIDIA GeForce RTX 3090
  (272 - 315, n=10)
299 fps +59%
MSI GeForce RTX 3090 Suprim X
NVIDIA GeForce RTX 3090, R9 5900X
283.5 fps +50%
MSI GeForce RTX 3080 Gaming X Trio
NVIDIA GeForce RTX 3080, R9 5900X
252.5 fps +34%
AMD Radeon RX 6800 XT
AMD Radeon RX 6800 XT, R9 5950X
247.9 fps +31%
Gemiddeld NVIDIA GeForce RTX 3080
  (233 - 253, n=2)
243 fps +29%
AMD Ryzen 9 5900X
NVIDIA Titan RTX, R9 5900X
237.1 fps +26%
KFA2 GeForce RTX 2080 Ti EX
NVIDIA GeForce RTX 2080 Ti (Desktop), R9 3900X
215.2 fps +14%
Zotac Gaming GeForce RTX 3070 Twin Edge
NVIDIA GeForce RTX 3070, R9 5950X
213.7 fps +13%
Gemiddeld NVIDIA GeForce RTX 3070
  (196.4 - 214, n=5)
206 fps +9%
NVIDIA GeForce RTX 3060 Ti FE
NVIDIA GeForce RTX 3060 Ti, R9 5950X
188.6 (43.6min - 434.5max) fps
Nvidia GeForce RTX 2080 Super
NVIDIA GeForce RTX 2080 Super (Desktop), R7 2700X
175.2 fps -7%
Gemiddeld NVIDIA GeForce RTX 2080 Super (Desktop)
  ()
175.2 fps -7%
Gemiddeld NVIDIA GeForce RTX 2070 Super (Desktop)
  (160.1 - 172.3, n=4)
167.1 fps -11%
Nvidia GeForce RTX 2070 Super
NVIDIA GeForce RTX 2070 Super (Desktop), R7 2700X
160.1 fps -15%
Gemiddeld NVIDIA GeForce RTX 2060 Super (Desktop)
  (140.4 - 146.1, n=4)
143.3 fps -24%
Nvidia GeForce RTX 2060 Super
NVIDIA GeForce RTX 2060 Super (Desktop), R7 2700X
141.7 fps -25%
AMD Radeon RX 5700 XT
AMD Radeon RX 5700 XT (Desktop), R7 2700X
132.5 fps -30%
KFA 2 GeForce GTX 1660 Super
NVIDIA GeForce GTX 1660 Super (Desktop), R9 3900X
98.3 fps -48%
KFA2 GeForce GTX 1650 Super EX One Click OC
NVIDIA GeForce GTX 1650 Super (Desktop), R9 5900X
71.9 fps -62%
Extreme Preset OpenGL
MSI GeForce RTX 3090 Suprim X
NVIDIA GeForce RTX 3090, R9 5900X
273.7 fps +59%
Gemiddeld NVIDIA GeForce RTX 3090
  (188.2 - 284, n=9)
268 fps +56%
MSI GeForce RTX 3080 Gaming X Trio
NVIDIA GeForce RTX 3080, R9 5900X
243.2 fps +41%
Gemiddeld NVIDIA GeForce RTX 3080
  (232 - 243, n=2)
238 fps +38%
AMD Ryzen 9 5900X
NVIDIA Titan RTX, R9 5900X
215.1 fps +25%
KFA2 GeForce RTX 2080 Ti EX
NVIDIA GeForce RTX 2080 Ti (Desktop), R9 3900X
204.4 fps +19%
AMD Radeon RX 6800 XT
AMD Radeon RX 6800 XT, R9 5950X
204 fps +18%
Gemiddeld NVIDIA GeForce RTX 3070
  (187.5 - 196.1, n=4)
192.5 fps +12%
NVIDIA GeForce RTX 3060 Ti FE
NVIDIA GeForce RTX 3060 Ti, R9 5950X
172.3 (11.4min - 371.5max) fps
Nvidia GeForce RTX 2080 Super
NVIDIA GeForce RTX 2080 Super (Desktop), R7 2700X
167.5 fps -3%
Gemiddeld NVIDIA GeForce RTX 2080 Super (Desktop)
  ()
167.5 fps -3%
Gemiddeld NVIDIA GeForce RTX 2070 Super (Desktop)
  (153.5 - 157.1, n=4)
155.4 fps -10%
Nvidia GeForce RTX 2070 Super
NVIDIA GeForce RTX 2070 Super (Desktop), R7 2700X
153.5 fps -11%
Gemiddeld NVIDIA GeForce RTX 2060 Super (Desktop)
  (132.3 - 133.9, n=4)
133.1 fps -23%
Nvidia GeForce RTX 2060 Super
NVIDIA GeForce RTX 2060 Super (Desktop), R7 2700X
132.3 fps -23%
AMD Radeon RX 5700 XT
AMD Radeon RX 5700 XT (Desktop), R7 2700X
110.2 fps -36%
KFA 2 GeForce GTX 1660 Super
NVIDIA GeForce GTX 1660 Super (Desktop), R9 3900X
92.2 fps -46%
KFA2 GeForce GTX 1650 Super EX One Click OC
NVIDIA GeForce GTX 1650 Super (Desktop), R9 5900X
68.9 fps -60%
Unigine Valley 1.0
1920x1080 Extreme HD DirectX AA:x8
Gemiddeld NVIDIA GeForce RTX 3090
  (184.2 - 245, n=10)
223 fps +46%
MSI GeForce RTX 3090 Suprim X
NVIDIA GeForce RTX 3090, R9 5900X
196 fps +28%
AMD Radeon RX 6800 XT
AMD Radeon RX 6800 XT, R9 5950X
190.6 fps +24%
MSI GeForce RTX 3080 Gaming X Trio
NVIDIA GeForce RTX 3080, R9 5900X
181.8 fps +19%
AMD Ryzen 9 5900X
NVIDIA Titan RTX, R9 5900X
180.1 fps +18%
Gemiddeld NVIDIA GeForce RTX 3080
  (176.2 - 181.8, n=2)
179 fps +17%
Zotac Gaming GeForce RTX 3070 Twin Edge
NVIDIA GeForce RTX 3070, R9 5950X
168.1 fps +10%
Gemiddeld NVIDIA GeForce RTX 3070
  (155.1 - 168.5, n=5)
161.2 fps +5%
KFA2 GeForce RTX 2080 Ti EX
NVIDIA GeForce RTX 2080 Ti (Desktop), R9 3900X
159.4 fps +4%
NVIDIA GeForce RTX 3060 Ti FE
NVIDIA GeForce RTX 3060 Ti, R9 5950X
153.2 (48.2min - 297.9max) fps
Gemiddeld NVIDIA GeForce RTX 2070 Super (Desktop)
  (113.7 - 127.4, n=4)
122.5 fps -20%
Nvidia GeForce RTX 2080 Super
NVIDIA GeForce RTX 2080 Super (Desktop), R7 2700X
120.2 fps -22%
Gemiddeld NVIDIA GeForce RTX 2080 Super (Desktop)
  ()
120.2 fps -22%
Nvidia GeForce RTX 2070 Super
NVIDIA GeForce RTX 2070 Super (Desktop), R7 2700X
113.7 fps -26%
Gemiddeld NVIDIA GeForce RTX 2060 Super (Desktop)
  (106.9 - 114.1, n=4)
111.3 fps -27%
Nvidia GeForce RTX 2060 Super
NVIDIA GeForce RTX 2060 Super (Desktop), R7 2700X
106.9 fps -30%
AMD Radeon RX 5700 XT
AMD Radeon RX 5700 XT (Desktop), R7 2700X
106.3 fps -31%
KFA 2 GeForce GTX 1660 Super
NVIDIA GeForce GTX 1660 Super (Desktop), R9 3900X
77.6 fps -49%
KFA2 GeForce GTX 1650 Super EX One Click OC
NVIDIA GeForce GTX 1650 Super (Desktop), R9 5900X
54.1 fps -65%
1920x1080 Extreme HD Preset OpenGL AA:x8
Gemiddeld NVIDIA GeForce RTX 3090
  (158.8 - 211, n=9)
201 fps +51%
MSI GeForce RTX 3090 Suprim X
NVIDIA GeForce RTX 3090, R9 5900X
187.8 fps +41%
MSI GeForce RTX 3080 Gaming X Trio
NVIDIA GeForce RTX 3080, R9 5900X
172 fps +29%
Gemiddeld NVIDIA GeForce RTX 3080
  (163.8 - 172, n=2)
167.9 fps +26%
AMD Ryzen 9 5900X
NVIDIA Titan RTX, R9 5900X
158.5 fps +19%
AMD Radeon RX 6800 XT
AMD Radeon RX 6800 XT, R9 5950X
158.2 fps +19%
KFA2 GeForce RTX 2080 Ti EX
NVIDIA GeForce RTX 2080 Ti (Desktop), R9 3900X
145.1 fps +9%
Gemiddeld NVIDIA GeForce RTX 3070
  (140.2 - 144.9, n=4)
142.7 fps +7%
NVIDIA GeForce RTX 3060 Ti FE
NVIDIA GeForce RTX 3060 Ti, R9 5950X
132.9 (48.3min - 236.1max) fps
Nvidia GeForce RTX 2080 Super
NVIDIA GeForce RTX 2080 Super (Desktop), R7 2700X
114.5 fps -14%
Gemiddeld NVIDIA GeForce RTX 2080 Super (Desktop)
  ()
114.5 fps -14%
Gemiddeld NVIDIA GeForce RTX 2070 Super (Desktop)
  (105.6 - 112, n=4)
109.5 fps -18%
Nvidia GeForce RTX 2070 Super
NVIDIA GeForce RTX 2070 Super (Desktop), R7 2700X
105.6 fps -21%
Gemiddeld NVIDIA GeForce RTX 2060 Super (Desktop)
  (97.6 - 101.5, n=4)
99.5 fps -25%
Nvidia GeForce RTX 2060 Super
NVIDIA GeForce RTX 2060 Super (Desktop), R7 2700X
98.3 fps -26%
AMD Radeon RX 5700 XT
AMD Radeon RX 5700 XT (Desktop), R7 2700X
89.1 fps -33%
KFA 2 GeForce GTX 1660 Super
NVIDIA GeForce GTX 1660 Super (Desktop), R9 3900X
70.4 fps -47%
KFA2 GeForce GTX 1650 Super EX One Click OC
NVIDIA GeForce GTX 1650 Super (Desktop), R9 5900X
51.1 fps -62%
Unigine Superposition
7680x4320 8k Optimized
MSI GeForce RTX 3090 Suprim X
NVIDIA GeForce RTX 3090, R9 5900X
7521 Points +85%
Gemiddeld NVIDIA GeForce RTX 3090
  (6969 - 7521, n=10)
7160 Points +77%
MSI GeForce RTX 3080 Gaming X Trio
NVIDIA GeForce RTX 3080, R9 5900X
6346 Points +56%
Gemiddeld NVIDIA GeForce RTX 3080
  (6243 - 6346, n=2)
6295 Points +55%
AMD Ryzen 9 5900X
NVIDIA Titan RTX, R9 5900X
5402 Points +33%
AMD Radeon RX 6800 XT
AMD Radeon RX 6800 XT, R9 5950X
5256 Points +30%
Gemiddeld NVIDIA GeForce RTX 3070
  (4587 - 4695, n=5)
4624 Points +14%
Zotac Gaming GeForce RTX 3070 Twin Edge
NVIDIA GeForce RTX 3070, R9 5950X
4602 Points +13%
NVIDIA GeForce RTX 3060 Ti FE
NVIDIA GeForce RTX 3060 Ti, R9 5950X
4056 Points
Gemiddeld NVIDIA GeForce RTX 2080 Super (Desktop)
  ()
3989 Points -2%
Gemiddeld NVIDIA GeForce RTX 2070 Super (Desktop)
  (3419 - 3435, n=3)
3429 Points -15%
Gemiddeld NVIDIA GeForce RTX 2060 Super (Desktop)
  (2873 - 2914, n=3)
2900 Points -29%
KFA 2 GeForce GTX 1660 Super
NVIDIA GeForce GTX 1660 Super (Desktop), R9 3900X
1964 Points -52%
KFA2 GeForce GTX 1650 Super EX One Click OC
NVIDIA GeForce GTX 1650 Super (Desktop), R9 5900X
1087 Points -73%
3840x2160 4k Optimized
MSI GeForce RTX 3090 Suprim X
NVIDIA GeForce RTX 3090, R9 5900X
16868 Points +83%
Gemiddeld NVIDIA GeForce RTX 3090
  (15794 - 16868, n=10)
16352 Points +77%
MSI GeForce RTX 3080 Gaming X Trio
NVIDIA GeForce RTX 3080, R9 5900X
14243 Points +54%
Gemiddeld NVIDIA GeForce RTX 3080
  (13984 - 14243, n=2)
14114 Points +53%
AMD Radeon RX 6800 XT
AMD Radeon RX 6800 XT, R9 5950X
13471 Points +46%
AMD Ryzen 9 5900X
NVIDIA Titan RTX, R9 5900X
12186 Points +32%
Zotac Gaming GeForce RTX 3070 Twin Edge
NVIDIA GeForce RTX 3070, R9 5950X
10704 Points +16%
Gemiddeld NVIDIA GeForce RTX 3070
  (10544 - 10755, n=5)
10667 Points +16%
Gemiddeld NVIDIA GeForce RTX 2080 Super (Desktop)
  ()
9338 Points +1%
NVIDIA GeForce RTX 3060 Ti FE
NVIDIA GeForce RTX 3060 Ti, R9 5950X
9224 Points
Gemiddeld NVIDIA GeForce RTX 2070 Super (Desktop)
  (8096 - 8111, n=3)
8101 Points -12%
Gemiddeld NVIDIA GeForce RTX 2060 Super (Desktop)
  (6747 - 6863, n=3)
6811 Points -26%
KFA 2 GeForce GTX 1660 Super
NVIDIA GeForce GTX 1660 Super (Desktop), R9 3900X
4755 Points -48%
KFA2 GeForce GTX 1650 Super EX One Click OC
NVIDIA GeForce GTX 1650 Super (Desktop), R9 5900X
3724 Points -60%
1920x1080 1080p Extreme
MSI GeForce RTX 3090 Suprim X
NVIDIA GeForce RTX 3090, R9 5900X
12694 Points +78%
Gemiddeld NVIDIA GeForce RTX 3090
  (11806 - 12694, n=10)
12227 Points +71%
MSI GeForce RTX 3080 Gaming X Trio
NVIDIA GeForce RTX 3080, R9 5900X
10822 Points +52%
Gemiddeld NVIDIA GeForce RTX 3080
  (10572 - 10822, n=2)
10697 Points +50%
AMD Radeon RX 6800 XT
AMD Radeon RX 6800 XT, R9 5950X
10046 Points +41%
AMD Ryzen 9 5900X
NVIDIA Titan RTX, R9 5900X
9056 Points +27%
Gemiddeld NVIDIA GeForce RTX 3070
  (8276 - 8507, n=5)
8354 Points +17%
Zotac Gaming GeForce RTX 3070 Twin Edge
NVIDIA GeForce RTX 3070, R9 5950X
8336 Points +17%
NVIDIA GeForce RTX 3060 Ti FE
NVIDIA GeForce RTX 3060 Ti, R9 5950X
7142 Points
Gemiddeld NVIDIA GeForce RTX 2080 Super (Desktop)
  ()
7080 Points -1%
Gemiddeld NVIDIA GeForce RTX 2070 Super (Desktop)
  (6161 - 6178, n=3)
6169 Points -14%
Gemiddeld NVIDIA GeForce RTX 2060 Super (Desktop)
  (5049 - 5143, n=3)
5105 Points -29%
KFA 2 GeForce GTX 1660 Super
NVIDIA GeForce GTX 1660 Super (Desktop), R9 3900X
3171 Points -56%
KFA2 GeForce GTX 1650 Super EX One Click OC
NVIDIA GeForce GTX 1650 Super (Desktop), R9 5900X
2305 Points -68%
1920x1080 1080p High
Gemiddeld NVIDIA GeForce RTX 3090
  (23626 - 27207, n=10)
25978 Points +68%
MSI GeForce RTX 3090 Suprim X
NVIDIA GeForce RTX 3090, R9 5900X
25953 Points +68%
AMD Radeon RX 6800 XT
AMD Radeon RX 6800 XT, R9 5950X
22265 Points +44%
MSI GeForce RTX 3080 Gaming X Trio
NVIDIA GeForce RTX 3080, R9 5900X
21912 Points +42%
Gemiddeld NVIDIA GeForce RTX 3080
  (21333 - 21912, n=2)
21623 Points +40%
AMD Ryzen 9 5900X
NVIDIA Titan RTX, R9 5900X
20315 Points +31%
Zotac Gaming GeForce RTX 3070 Twin Edge
NVIDIA GeForce RTX 3070, R9 5950X
17491 Points +13%
Gemiddeld NVIDIA GeForce RTX 3070
  (17054 - 17491, n=5)
17312 Points +12%
Gemiddeld NVIDIA GeForce RTX 2080 Super (Desktop)
  ()
15558 Points +1%
NVIDIA GeForce RTX 3060 Ti FE
NVIDIA GeForce RTX 3060 Ti, R9 5950X
15479 Points
Gemiddeld NVIDIA GeForce RTX 2070 Super (Desktop)
  (13655 - 13832, n=3)
13765 Points -11%
Gemiddeld NVIDIA GeForce RTX 2060 Super (Desktop)
  (11421 - 11785, n=3)
11649 Points -25%
KFA 2 GeForce GTX 1660 Super
NVIDIA GeForce GTX 1660 Super (Desktop), R9 3900X
8212 Points -47%
KFA2 GeForce GTX 1650 Super EX One Click OC
NVIDIA GeForce GTX 1650 Super (Desktop), R9 5900X
6468 Points -58%
1280x720 720p Low
Gemiddeld NVIDIA GeForce RTX 3090
  (33329 - 54879, n=9)
45093 Points +17%
AMD Ryzen 9 5900X
NVIDIA Titan RTX, R9 5900X
40994 Points +7%
Zotac Gaming GeForce RTX 3070 Twin Edge
NVIDIA GeForce RTX 3070, R9 5950X
39277 Points +2%
Gemiddeld NVIDIA GeForce RTX 2070 Super (Desktop)
  (26742 - 45424, n=3)
38495 Points 0%
NVIDIA GeForce RTX 3060 Ti FE
NVIDIA GeForce RTX 3060 Ti, R9 5950X
38414 Points
AMD Radeon RX 6800 XT
AMD Radeon RX 6800 XT, R9 5950X
36452 Points -5%
Gemiddeld NVIDIA GeForce RTX 2060 Super (Desktop)
  (26634 - 40961, n=3)
35859 Points -7%
Gemiddeld NVIDIA GeForce RTX 3070
  (27330 - 40007, n=5)
34576 Points -10%
MSI GeForce RTX 3090 Suprim X
NVIDIA GeForce RTX 3090, R9 5900X
33329 Points -13%
MSI GeForce RTX 3080 Gaming X Trio
NVIDIA GeForce RTX 3080, R9 5900X
32183 Points -16%
Gemiddeld NVIDIA GeForce RTX 3080
  (30851 - 32183, n=2)
31517 Points -18%
Gemiddeld NVIDIA GeForce RTX 2080 Super (Desktop)
  ()
26907 Points -30%
KFA 2 GeForce GTX 1660 Super
NVIDIA GeForce GTX 1660 Super (Desktop), R9 3900X
25313 Points -34%
KFA2 GeForce GTX 1650 Super EX One Click OC
NVIDIA GeForce GTX 1650 Super (Desktop), R9 5900X
22323 Points -42%
3DMark 11 Performance
33117 punten
3DMark Cloud Gate Standard Score
66922 punten
3DMark Fire Strike Score
27043 punten
3DMark Fire Strike Extreme Score
13790 punten
3DMark Time Spy Score
11520 punten
Help

Compute benchmarks

De RTX 3060 Ti FE biedt fatsoenlijke rekenprestaties met ongeveer 25% hogere scores in ComputeMark vergeleken met de gemiddelde RTX 2080 Super. LuxMark laat ook fatsoenlijke voordelen zien, waarbij de RTX 3060 Ti FE slechts ongeveer 6% langzamer is dan de gemiddelde RTX 3070.

ComputeMark v2.1
1024x600 Normal, QJuliaRayTrace
Gemiddeld NVIDIA GeForce RTX 3090
  (16403 - 18223, n=9)
17439 Points +73%
MSI GeForce RTX 3090 Suprim X
NVIDIA GeForce RTX 3090, R9 5900X
17058 Points +69%
MSI GeForce RTX 3080 Gaming X Trio
NVIDIA GeForce RTX 3080, R9 5900X
15508 Points +54%
Gemiddeld NVIDIA GeForce RTX 3080
  (14718 - 15508, n=2)
15113 Points +50%
Gemiddeld NVIDIA GeForce RTX 3070
  (11510 - 11816, n=3)
11665 Points +16%
AMD Radeon RX 6800 XT
AMD Radeon RX 6800 XT, R9 5950X
11304 Points +12%
NVIDIA GeForce RTX 3060 Ti FE
NVIDIA GeForce RTX 3060 Ti, R9 5950X
10072 Points
KFA2 GeForce RTX 2080 Ti EX
NVIDIA GeForce RTX 2080 Ti (Desktop), R9 3900X
9104 Points -10%
Nvidia GeForce RTX 2080 Super
NVIDIA GeForce RTX 2080 Super (Desktop), R7 2700X
7258 Points -28%
Gemiddeld NVIDIA GeForce RTX 2080 Super (Desktop)
  ()
7258 Points -28%
Gemiddeld NVIDIA GeForce RTX 2070 Super (Desktop)
  (6155 - 6158, n=2)
6157 Points -39%
Nvidia GeForce RTX 2070 Super
NVIDIA GeForce RTX 2070 Super (Desktop), R7 2700X
6155 Points -39%
AMD Radeon RX 5700 XT
AMD Radeon RX 5700 XT (Desktop), R7 2700X
5761 Points -43%
Nvidia GeForce RTX 2060 Super
NVIDIA GeForce RTX 2060 Super (Desktop), R7 2700X
5271 Points -48%
Gemiddeld NVIDIA GeForce RTX 2060 Super (Desktop)
  (5270 - 5271, n=2)
5271 Points -48%
KFA 2 GeForce GTX 1660 Super
NVIDIA GeForce GTX 1660 Super (Desktop), R9 3900X
3656 Points -64%
KFA2 GeForce GTX 1650 Super EX One Click OC
NVIDIA GeForce GTX 1650 Super (Desktop), R9 5900X
3419 Points -66%
1024x600 Normal, Mandel Scalar
MSI GeForce RTX 3090 Suprim X
NVIDIA GeForce RTX 3090, R9 5900X
11197 Points +84%
Gemiddeld NVIDIA GeForce RTX 3090
  (10650 - 11564, n=9)
11171 Points +84%
AMD Radeon RX 6800 XT
AMD Radeon RX 6800 XT, R9 5950X
10018 Points +65%
MSI GeForce RTX 3080 Gaming X Trio
NVIDIA GeForce RTX 3080, R9 5900X
9938 Points +63%
Gemiddeld NVIDIA GeForce RTX 3080
  (9554 - 9938, n=2)
9746 Points +60%
Gemiddeld NVIDIA GeForce RTX 3070
  (7042 - 7314, n=3)
7169 Points +18%
NVIDIA GeForce RTX 3060 Ti FE
NVIDIA GeForce RTX 3060 Ti, R9 5950X
6087 Points
KFA2 GeForce RTX 2080 Ti EX
NVIDIA GeForce RTX 2080 Ti (Desktop), R9 3900X
5679 Points -7%
AMD Radeon RX 5700 XT
AMD Radeon RX 5700 XT (Desktop), R7 2700X
4869 Points -20%
Nvidia GeForce RTX 2080 Super
NVIDIA GeForce RTX 2080 Super (Desktop), R7 2700X
4525 Points -26%
Gemiddeld NVIDIA GeForce RTX 2080 Super (Desktop)
  ()
4525 Points -26%
Nvidia GeForce RTX 2070 Super
NVIDIA GeForce RTX 2070 Super (Desktop), R7 2700X
3782 Points -38%
Gemiddeld NVIDIA GeForce RTX 2070 Super (Desktop)
  (3748 - 3782, n=2)
3765 Points -38%
Nvidia GeForce RTX 2060 Super
NVIDIA GeForce RTX 2060 Super (Desktop), R7 2700X
3185 Points -48%
Gemiddeld NVIDIA GeForce RTX 2060 Super (Desktop)
  (3169 - 3185, n=2)
3177 Points -48%
KFA 2 GeForce GTX 1660 Super
NVIDIA GeForce GTX 1660 Super (Desktop), R9 3900X
2149 Points -65%
KFA2 GeForce GTX 1650 Super EX One Click OC
NVIDIA GeForce GTX 1650 Super (Desktop), R9 5900X
1984 Points -67%
1024x600 Normal, Mandel Vector
Gemiddeld NVIDIA GeForce RTX 3090
  (8038 - 10097, n=9)
9437 Points +97%
AMD Radeon RX 6800 XT
AMD Radeon RX 6800 XT, R9 5950X
8399 Points +76%
MSI GeForce RTX 3090 Suprim X
NVIDIA GeForce RTX 3090, R9 5900X
8341 Points +74%
MSI GeForce RTX 3080 Gaming X Trio
NVIDIA GeForce RTX 3080, R9 5900X
7540 Points +58%
Gemiddeld NVIDIA GeForce RTX 3080
  (7148 - 7540, n=2)
7344 Points +54%
Gemiddeld NVIDIA GeForce RTX 3070
  (5364 - 6266, n=3)
5707 Points +19%
NVIDIA GeForce RTX 3060 Ti FE
NVIDIA GeForce RTX 3060 Ti, R9 5950X
4782 Points
KFA2 GeForce RTX 2080 Ti EX
NVIDIA GeForce RTX 2080 Ti (Desktop), R9 3900X
4695 Points -2%
AMD Radeon RX 5700 XT
AMD Radeon RX 5700 XT (Desktop), R7 2700X
4246 Points -11%
Nvidia GeForce RTX 2080 Super
NVIDIA GeForce RTX 2080 Super (Desktop), R7 2700X
3835 Points -20%
Gemiddeld NVIDIA GeForce RTX 2080 Super (Desktop)
  ()
3835 Points -20%
Nvidia GeForce RTX 2070 Super
NVIDIA GeForce RTX 2070 Super (Desktop), R7 2700X
3358 Points -30%
Gemiddeld NVIDIA GeForce RTX 2070 Super (Desktop)
  (3348 - 3358, n=2)
3353 Points -30%
Gemiddeld NVIDIA GeForce RTX 2060 Super (Desktop)
  (2939 - 2948, n=2)
2944 Points -38%
Nvidia GeForce RTX 2060 Super
NVIDIA GeForce RTX 2060 Super (Desktop), R7 2700X
2939 Points -39%
KFA 2 GeForce GTX 1660 Super
NVIDIA GeForce GTX 1660 Super (Desktop), R9 3900X
2169 Points -55%
KFA2 GeForce GTX 1650 Super EX One Click OC
NVIDIA GeForce GTX 1650 Super (Desktop), R9 5900X
2060 Points -57%
1024x600 Normal, Fluid 2DTexArr
MSI GeForce RTX 3090 Suprim X
NVIDIA GeForce RTX 3090, R9 5900X
4560 Points +74%
Gemiddeld NVIDIA GeForce RTX 3090
  (4344 - 4608, n=9)
4497 Points +72%
MSI GeForce RTX 3080 Gaming X Trio
NVIDIA GeForce RTX 3080, R9 5900X
4159 Points +59%
Gemiddeld NVIDIA GeForce RTX 3080
  (4087 - 4159, n=2)
4123 Points +57%
AMD Radeon RX 6800 XT
AMD Radeon RX 6800 XT, R9 5950X
3947 Points +51%
KFA2 GeForce RTX 2080 Ti EX
NVIDIA GeForce RTX 2080 Ti (Desktop), R9 3900X
3444 Points +32%
Gemiddeld NVIDIA GeForce RTX 3070
  (2666 - 2706, n=3)
2692 Points +3%
Nvidia GeForce RTX 2080 Super
NVIDIA GeForce RTX 2080 Super (Desktop), R7 2700X
2655 Points +1%
Gemiddeld NVIDIA GeForce RTX 2080 Super (Desktop)
  ()
2655 Points +1%
NVIDIA GeForce RTX 3060 Ti FE
NVIDIA GeForce RTX 3060 Ti, R9 5950X
2619 Points
Gemiddeld NVIDIA GeForce RTX 2070 Super (Desktop)
  (2331 - 2354, n=2)
2343 Points -11%
Nvidia GeForce RTX 2070 Super
NVIDIA GeForce RTX 2070 Super (Desktop), R7 2700X
2331 Points -11%
Gemiddeld NVIDIA GeForce RTX 2060 Super (Desktop)
  (2064 - 2101, n=2)
2083 Points -20%
Nvidia GeForce RTX 2060 Super
NVIDIA GeForce RTX 2060 Super (Desktop), R7 2700X
2064 Points -21%
AMD Radeon RX 5700 XT
AMD Radeon RX 5700 XT (Desktop), R7 2700X
1960 Points -25%
KFA 2 GeForce GTX 1660 Super
NVIDIA GeForce GTX 1660 Super (Desktop), R9 3900X
1488 Points -43%
KFA2 GeForce GTX 1650 Super EX One Click OC
NVIDIA GeForce GTX 1650 Super (Desktop), R9 5900X
1015 Points -61%
1024x600 Normal, Fluid 3DTex
Gemiddeld NVIDIA GeForce RTX 3090
  (5246 - 5520, n=9)
5444 Points +103%
MSI GeForce RTX 3090 Suprim X
NVIDIA GeForce RTX 3090, R9 5900X
5391 Points +101%
AMD Radeon RX 6800 XT
AMD Radeon RX 6800 XT, R9 5950X
5154 Points +92%
MSI GeForce RTX 3080 Gaming X Trio
NVIDIA GeForce RTX 3080, R9 5900X
4450 Points +66%
Gemiddeld NVIDIA GeForce RTX 3080
  (4417 - 4450, n=2)
4434 Points +65%
KFA2 GeForce RTX 2080 Ti EX
NVIDIA GeForce RTX 2080 Ti (Desktop), R9 3900X
3589 Points +34%
Gemiddeld NVIDIA GeForce RTX 3070
  (2749 - 2791, n=3)
2772 Points +3%
Nvidia GeForce RTX 2080 Super
NVIDIA GeForce RTX 2080 Super (Desktop), R7 2700X
2736 Points +2%
Gemiddeld NVIDIA GeForce RTX 2080 Super (Desktop)
  ()
2736 Points +2%
NVIDIA GeForce RTX 3060 Ti FE
NVIDIA GeForce RTX 3060 Ti, R9 5950X
2685 Points
Gemiddeld NVIDIA GeForce RTX 2070 Super (Desktop)
  (2456 - 2486, n=2)
2471 Points -8%
Nvidia GeForce RTX 2070 Super
NVIDIA GeForce RTX 2070 Super (Desktop), R7 2700X
2456 Points -9%
AMD Radeon RX 5700 XT
AMD Radeon RX 5700 XT (Desktop), R7 2700X
2349 Points -13%
Gemiddeld NVIDIA GeForce RTX 2060 Super (Desktop)
  (2289 - 2290, n=2)
2290 Points -15%
Nvidia GeForce RTX 2060 Super
NVIDIA GeForce RTX 2060 Super (Desktop), R7 2700X
2289 Points -15%
KFA 2 GeForce GTX 1660 Super
NVIDIA GeForce GTX 1660 Super (Desktop), R9 3900X
1636 Points -39%
KFA2 GeForce GTX 1650 Super EX One Click OC
NVIDIA GeForce GTX 1650 Super (Desktop), R9 5900X
1032 Points -62%
1024x600 Normal, Score
Gemiddeld NVIDIA GeForce RTX 3090
  (44948 - 49118, n=8)
47736 Points +82%
MSI GeForce RTX 3090 Suprim X
NVIDIA GeForce RTX 3090, R9 5900X
46547 Points +77%
MSI GeForce RTX 3080 Gaming X Trio
NVIDIA GeForce RTX 3080, R9 5900X
41594 Points +58%
Gemiddeld NVIDIA GeForce RTX 3080
  (39924 - 41594, n=2)
40759 Points +55%
AMD Radeon RX 6800 XT
AMD Radeon RX 6800 XT, R9 5950X
38823 Points +48%
Gemiddeld NVIDIA GeForce RTX 3070
  (29330 - 30581, n=3)
30004 Points +14%
KFA2 GeForce RTX 2080 Ti EX
NVIDIA GeForce RTX 2080 Ti (Desktop), R9 3900X
26510 Points +1%
NVIDIA GeForce RTX 3060 Ti FE
NVIDIA GeForce RTX 3060 Ti, R9 5950X
26245 Points
Nvidia GeForce RTX 2080 Super
NVIDIA GeForce RTX 2080 Super (Desktop), R7 2700X
21009 Points -20%
Gemiddeld NVIDIA GeForce RTX 2080 Super (Desktop)
  ()
21009 Points -20%
AMD Radeon RX 5700 XT
AMD Radeon RX 5700 XT (Desktop), R7 2700X
19184 Points -27%
Gemiddeld NVIDIA GeForce RTX 2070 Super (Desktop)
  (18083 - 18095, n=2)
18089 Points -31%
Nvidia GeForce RTX 2070 Super
NVIDIA GeForce RTX 2070 Super (Desktop), R7 2700X
18083 Points -31%
Gemiddeld NVIDIA GeForce RTX 2060 Super (Desktop)
  (15749 - 15776, n=2)
15763 Points -40%
Nvidia GeForce RTX 2060 Super
NVIDIA GeForce RTX 2060 Super (Desktop), R7 2700X
15749 Points -40%
KFA 2 GeForce GTX 1660 Super
NVIDIA GeForce GTX 1660 Super (Desktop), R9 3900X
11098 Points -58%
KFA2 GeForce GTX 1650 Super EX One Click OC
NVIDIA GeForce GTX 1650 Super (Desktop), R9 5900X
9510 Points -64%
LuxMark v2.0 64Bit
Room GPUs-only
Gemiddeld NVIDIA GeForce RTX 3090
  (5727 - 5974, n=8)
5881 Samples/s +45%
MSI GeForce RTX 3090 Suprim X
NVIDIA GeForce RTX 3090, R9 5900X
5727 Samples/s +42%
MSI GeForce RTX 3080 Gaming X Trio
NVIDIA GeForce RTX 3080, R9 5900X
5198 Samples/s +28%
Gemiddeld NVIDIA GeForce RTX 3080
  (5112 - 5198, n=2)
5155 Samples/s +27%
AMD Radeon RX 6800 XT
AMD Radeon RX 6800 XT, R9 5950X
5057 Samples/s +25%
KFA2 GeForce RTX 2080 Ti EX
NVIDIA GeForce RTX 2080 Ti (Desktop), R9 3900X
4429 Samples/s +9%
NVIDIA GeForce RTX 3060 Ti FE
NVIDIA GeForce RTX 3060 Ti, R9 5950X
4046 Samples/s
Gemiddeld NVIDIA GeForce RTX 3070
  (2187 - 4293, n=3)
3588 Samples/s -11%
Nvidia GeForce RTX 2080 Super
NVIDIA GeForce RTX 2080 Super (Desktop), R7 2700X
3430 Samples/s -15%
Gemiddeld NVIDIA GeForce RTX 2080 Super (Desktop)
  ()
3430 Samples/s -15%
Nvidia GeForce RTX 2070 Super
NVIDIA GeForce RTX 2070 Super (Desktop), R7 2700X
3404 Samples/s -16%
Gemiddeld NVIDIA GeForce RTX 2070 Super (Desktop)
  ()
3404 Samples/s -16%
Gemiddeld NVIDIA GeForce RTX 2060 Super (Desktop)
  (3274 - 3278, n=2)
3276 Samples/s -19%
Nvidia GeForce RTX 2060 Super
NVIDIA GeForce RTX 2060 Super (Desktop), R7 2700X
3274 Samples/s -19%
KFA 2 GeForce GTX 1660 Super
NVIDIA GeForce GTX 1660 Super (Desktop), R9 3900X
2286 Samples/s -43%
AMD Radeon RX 5700 XT
AMD Radeon RX 5700 XT (Desktop), R7 2700X
2104 Samples/s -48%
KFA2 GeForce GTX 1650 Super EX One Click OC
NVIDIA GeForce GTX 1650 Super (Desktop), R9 5900X
1405 Samples/s -65%
Sala GPUs-only
AMD Radeon RX 6800 XT
AMD Radeon RX 6800 XT, R9 5950X
28023 Samples/s +211%
Gemiddeld NVIDIA GeForce RTX 3090
  (14590 - 15088, n=8)
14908 Samples/s +65%
MSI GeForce RTX 3090 Suprim X
NVIDIA GeForce RTX 3090, R9 5900X
14590 Samples/s +62%
MSI GeForce RTX 3080 Gaming X Trio
NVIDIA GeForce RTX 3080, R9 5900X
12980 Samples/s +44%
Gemiddeld NVIDIA GeForce RTX 3080
  (12797 - 12980, n=2)
12889 Samples/s +43%
Gemiddeld NVIDIA GeForce RTX 3070
  (10096 - 10115, n=3)
10107 Samples/s +12%
KFA2 GeForce RTX 2080 Ti EX
NVIDIA GeForce RTX 2080 Ti (Desktop), R9 3900X
9999 Samples/s +11%
NVIDIA GeForce RTX 3060 Ti FE
NVIDIA GeForce RTX 3060 Ti, R9 5950X
9010 Samples/s
Nvidia GeForce RTX 2080 Super
NVIDIA GeForce RTX 2080 Super (Desktop), R7 2700X
7878 Samples/s -13%
Gemiddeld NVIDIA GeForce RTX 2080 Super (Desktop)
  ()
7878 Samples/s -13%
Nvidia GeForce RTX 2070 Super
NVIDIA GeForce RTX 2070 Super (Desktop), R7 2700X
7594 Samples/s -16%
Gemiddeld NVIDIA GeForce RTX 2070 Super (Desktop)
  ()
7594 Samples/s -16%
Gemiddeld NVIDIA GeForce RTX 2060 Super (Desktop)
  (6980 - 7010, n=2)
6995 Samples/s -22%
Nvidia GeForce RTX 2060 Super
NVIDIA GeForce RTX 2060 Super (Desktop), R7 2700X
6980 Samples/s -23%
AMD Radeon RX 5700 XT
AMD Radeon RX 5700 XT (Desktop), R7 2700X
6188 Samples/s -31%
KFA 2 GeForce GTX 1660 Super
NVIDIA GeForce GTX 1660 Super (Desktop), R9 3900X
4490 Samples/s -50%
KFA2 GeForce GTX 1650 Super EX One Click OC
NVIDIA GeForce GTX 1650 Super (Desktop), R9 5900X
2972 Samples/s -67%
Geekbench 5.5
OpenCL Score
Gemiddeld NVIDIA GeForce RTX 3090
  (199930 - 224611, n=19)
214008 Points +74%
MSI GeForce RTX 3090 Suprim X
NVIDIA GeForce RTX 3090, R9 5900X
212914 Points +73%
Gemiddeld NVIDIA GeForce RTX 3080
  (164477 - 192091, n=2)
178284 Points +45%
MSI GeForce RTX 3080 Gaming X Trio
NVIDIA GeForce RTX 3080, R9 5900X
164477 Points +34%
AMD Radeon RX 6800 XT
AMD Radeon RX 6800 XT, R9 5950X
159072 Points +29%
AMD Ryzen 9 5900X
NVIDIA Titan RTX, R9 5900X
149070 Points +21%
Gemiddeld NVIDIA GeForce RTX 3070
  (134961 - 138625, n=4)
136574 Points +11%
NVIDIA GeForce RTX 3060 Ti FE
NVIDIA GeForce RTX 3060 Ti, R9 5950X
123036 Points
Gemiddeld NVIDIA GeForce RTX 2080 Super (Desktop)
  (118695 - 127035, n=3)
122884 Points 0%
Gemiddeld NVIDIA GeForce RTX 2070 Super (Desktop)
  (102914 - 132850, n=2)
117882 Points -4%
Gemiddeld NVIDIA GeForce RTX 2060 Super (Desktop)
  ()
88698 Points -28%
KFA2 GeForce GTX 1650 Super EX One Click OC
NVIDIA GeForce GTX 1650 Super (Desktop), R9 5900X
54745 Points -56%
Vulkan Score
Gemiddeld NVIDIA GeForce RTX 3090
  (62516 - 168974, n=19)
128422 Points +45%
NVIDIA GeForce RTX 3060 Ti FE
NVIDIA GeForce RTX 3060 Ti, R9 5950X
88442 Points
MSI GeForce RTX 3080 Gaming X Trio
NVIDIA GeForce RTX 3080, R9 5900X
83486 Points -6%
AMD Radeon RX 6800 XT
AMD Radeon RX 6800 XT, R9 5950X
81098 Points -8%
Gemiddeld NVIDIA GeForce RTX 3080
  (76596 - 83486, n=2)
80041 Points -9%
Gemiddeld NVIDIA GeForce RTX 2080 Super (Desktop)
  (62324 - 91321, n=3)
78667 Points -11%
Gemiddeld NVIDIA GeForce RTX 2070 Super (Desktop)
  (76596 - 80530, n=2)
78563 Points -11%
AMD Ryzen 9 5900X
NVIDIA Titan RTX, R9 5900X
76596 Points -13%
Gemiddeld NVIDIA GeForce RTX 3070
  (27460 - 107958, n=4)
71908 Points -19%
Gemiddeld NVIDIA GeForce RTX 2060 Super (Desktop)
  ()
65260 Points -26%
MSI GeForce RTX 3090 Suprim X
NVIDIA GeForce RTX 3090, R9 5900X
62516 Points -29%
KFA2 GeForce GTX 1650 Super EX One Click OC
NVIDIA GeForce GTX 1650 Super (Desktop), R9 5900X
0 Points -100%

Professionele toepassingen

De GeForce kaarten zijn niet echt gericht op professionele werklasten zoals CAD/CAM, energie, auto-, of medische toepassingen. Deze beperking komt voornamelijk van de driver, aangezien NVIDIA het liefst zou willen dat professionals in deze velden de Quadro lineup zouden gebruiken. De Titan RTX weet zich echter wel staande te houden in SPECviewperf tests, ondanks het feit dat hij op gewone GeForce drivers draait

Als we kijken naar SPECviewperf 12 en 13 benchmarks, zien we dat de RTX 3060 Ti aanzienlijk achterblijft bij een Quadro RTX 5000 (laptop) in gespecialiseerde professionele workloads, ondanks dat de laatste in wezen een RTX 2080 TU104 chip is. Wie echter werkt aan 3D Studio Max en Maya projecten zal de RTX 3060 Ti een fatsoenlijke performer vinden.

SPECviewperf 2020 leek enigszins belastend voor de RTX 3060 Ti FE, omdat het een 4K benchmark is. De RTX 3080 en RTX 3090 laten duidelijke voordelen zien, maar de AMD Radeon RX 6800 XT is duidelijk de beter presterende mainstream GPU als het aankomt op pro-applicaties

NVIDIA GeForce RTX 3060 Ti Founders Edition
NVIDIA GeForce RTX 3060 Ti, R9 5950X
MSI GeForce RTX 3080 Gaming X Trio
NVIDIA GeForce RTX 3080, R9 5900X
MSI GeForce RTX 3090 Suprim X
NVIDIA GeForce RTX 3090, R9 5900X
Nvidia GeForce RTX 2080 Super
GeForce RTX 2080 Super (Desktop), R7 2700X
AMD Ryzen 9 5900X
NVIDIA Titan RTX, R9 5900X
AMD Radeon RX 6800 XT
Radeon RX 6800 XT, R9 5950X
Acer ConceptD 9 Pro
Quadro RTX 5000 (Laptop), i9-9980HK
SPECviewperf 12
1%
20%
-9%
312%
80%
296%
1900x1060 Solidworks (sw-03)
71.1
66
-7%
72.3
2%
70.8
0%
174.9
146%
150
111%
230.1
224%
1900x1060 Siemens NX (snx-02)
12.3
12.85
4%
14.91
21%
12.26
0%
273.2
2121%
45.07
266%
258.1
1998%
1900x1060 Showcase (showcase-01)
144
180
25%
236
64%
143.6
0%
191.1
33%
223
55%
126.4
-12%
1900x1060 Medical (medical-01)
59.4
36.93
-38%
42.91
-28%
45
-24%
90.7
53%
77.3
30%
109.3
84%
1900x1060 Maya (maya-04)
197
146
-26%
184
-7%
134.8
-32%
188.3
-4%
118
-40%
179
-9%
1900x1060 Energy (energy-01)
13.9
16.35
18%
20.41
47%
13.09
-6%
28.31
104%
28.39
104%
26
87%
1900x1060 Creo (creo-01)
57.8
65.6
13%
75.4
30%
52.7
-9%
173
199%
119
106%
172.1
198%
1900x1060 Catia (catia-04)
109
116
6%
134
23%
104.2
-4%
262.7
141%
238
118%
220
102%
1900x1060 3ds Max (3dsmax-05)
252
276
10%
322
28%
225.8
-10%
292.6
16%
167
-34%
235.8
-6%
SPECviewperf 13
25%
36%
-3%
290%
91%
270%
Solidworks (sw-04)
99.6
96.5
-3%
95.3
-4%
99.6
0%
196.4
97%
193
94%
203.8
105%
Siemens NX (snx-03)
22.3
24.26
9%
27.03
21%
21.94
-2%
493.4
2113%
81.4
265%
465.3
1987%
Showcase (showcase-02)
145
204
41%
241
66%
144.5
0%
190.5
31%
232
60%
127.1
-12%
Medical (medical-02)
72.2
99
37%
105
45%
71.6
-1%
90.8
26%
130
80%
133.4
85%
Maya (maya-05)
344
440
28%
469
36%
328.7
-4%
458
33%
348
1%
340.8
-1%
Energy (energy-02)
25.6
37.87
48%
45.21
77%
23.78
-7%
52
103%
58.4
128%
57.3
124%
Creo (creo-02)
225
295
31%
316
40%
220.1
-2%
346.5
54%
276
23%
319.8
42%
Catia (catia-05)
161
190
18%
206
28%
157.7
-2%
374.8
133%
412
156%
338.9
110%
3ds Max (3dsmax-06)
252
294
17%
298
18%
227.8
-10%
291.3
16%
284
13%
232.2
-8%
SPECviewperf 2020
58%
85%
300%
107%
3840x2160 Solidworks (solidworks-05)
109
158
45%
180
65%
153
40%
108
-1%
3840x2160 Siemens NX (snx-04)
18.2
19.8
9%
22.6
24%
347
1807%
81.7
349%
3840x2160 Medical (medical-03)
11.4
18.47
62%
21.19
86%
16.42
44%
27.84
144%
3840x2160 Maya (maya-06)
215
293
36%
330
53%
257
20%
224
4%
3840x2160 Energy (energy-03)
14.5
51.7
257%
61.1
321%
58.2
301%
60.8
319%
3840x2160 Creo (creo-03)
76.6
77.6
1%
85.1
11%
113
48%
65
-15%
3840x2160 CATIA (catia-06)
37.9
50
32%
56.6
49%
78.2
106%
42.4
12%
3840x2160 3ds Max (3dsmax-07)
80.1
100
25%
135
69%
108
35%
114
42%
Totaal Gemiddelde (Programma / Instellingen)
28% / 27%
47% / 46%
-6% / -6%
301% / 301%
93% / 92%
283% / 283%

Spel benchmarks

De RTX 3060 Ti FE presteert in de meeste games direct geweldig tot een QHD Ultra resolutie. eSports spelers die de voorkeur geven aan hogere framerates dan resolutie zullen deze kaart ook goed kunnen gebruiken bij 1080p om monitoren met hoge verversingsfrequenties aan te sturen. Het is ook mogelijk om te spelen met 60 fps+ in 4K Ultra in verschillende titels zoals Battlefield V, Far Cry New Dawn, Doom Eternal, en F1 2020. Een goede meerderheid van de titels kan ook op 60 fps+ in 4K worden gebracht door de in-game instellingen te tweaken zonder veel af te doen aan visuele getrouwheid.

Ray tracing (RT) prestaties zijn binnen 7% van een gemiddelde RTX 3070, zolang het spel geen RT gebruikt voor globale verlichting, zoals blijkt uit resultaten van Call of Duty: Black Ops Koude Oorlog en Watch Dogs Legion 1080p Ultra ray tracing benchmarks. Deze prestatiedelta verdubbelt in spellen die uitgebreid gebruik maken van ray traced-global illumination, zoals Metro: Exodus en Cyberpunk 2077

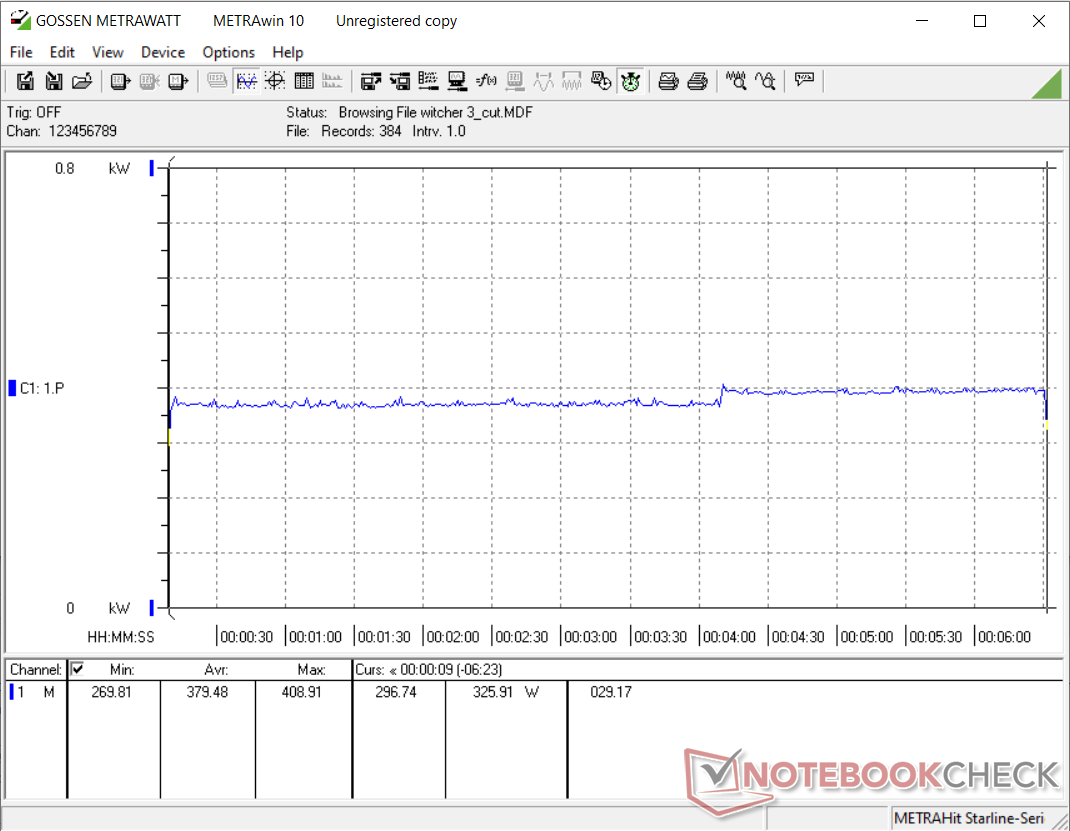
In de De Witcher 3 Ultra stress test blijkt de RTX 3060 Ti FE over het algemeen vrij stabiel te zijn. We zien wel dat de frames halverwege ongeveer 5 fps minder worden, maar de algehele ervaring wordt niet veel beïnvloed. Dit geeft aan dat de koeling van de kaart opgewassen is tegen zijn taak en in staat is om thermische throttling te voorkomen

0102030405060708090100110Tooltip
NVIDIA GeForce RTX 3060 Ti Founders Edition NVIDIA GeForce RTX 3060 Ti, R9 5950X: Ø108.8 (103-113)
The Witcher 3
1920x1080 Ultra Graphics & Postprocessing (HBAO+)
Gemiddeld NVIDIA GeForce RTX 3090
  (160 - 192.6, n=16)
179.9 fps +65%
MSI GeForce RTX 3090 Suprim X
NVIDIA GeForce RTX 3090, R9 5900X
160 (140min - 184max) fps +47%
AMD Radeon RX 6800 XT
AMD Radeon RX 6800 XT, R9 5950X
160 (138min - 179max) fps +47%
Gemiddeld NVIDIA GeForce RTX 3080
  (145 - 152, n=2)
148.5 fps +36%
MSI GeForce RTX 3080 Gaming X Trio
NVIDIA GeForce RTX 3080, R9 5900X
145 (123min - 154max) fps +33%
AMD Ryzen 9 5900X
NVIDIA Titan RTX, R9 5900X
141 (127min - 154max) fps +29%
KFA2 GeForce RTX 2080 Ti EX
NVIDIA GeForce RTX 2080 Ti (Desktop), R9 3900X
135 (118min - 158max) fps +24%
Zotac Gaming GeForce RTX 3070 Twin Edge
NVIDIA GeForce RTX 3070, R9 5950X
123 (120min, 121P1 - 126max) fps +13%
Nvidia GeForce RTX 2080 Super
NVIDIA GeForce RTX 2080 Super (Desktop), R7 2700X
109 (81min - 123max) fps 0%
NVIDIA GeForce RTX 3060 Ti FE
NVIDIA GeForce RTX 3060 Ti, R9 5950X
109 (103min, 105P1 - 113max) fps
Gemiddeld NVIDIA GeForce RTX 2080 Super (Desktop)
  ()
109 fps 0%
Gemiddeld NVIDIA GeForce RTX 3070
  (52.8 - 132.2, n=7)
106.1 fps -3%
Gemiddeld NVIDIA GeForce RTX 2070 Super (Desktop)
  (95.6 - 109.6, n=6)
100.9 fps -7%
Nvidia GeForce RTX 2070 Super
NVIDIA GeForce RTX 2070 Super (Desktop), R7 2700X
97 (83min - 109max) fps -11%
AMD Radeon RX 5700 XT
AMD Radeon RX 5700 XT (Desktop), R7 2700X
92 (79min - 99max) fps -16%
Gemiddeld NVIDIA GeForce RTX 2060 Super (Desktop)
  (79 - 91.1, n=5)
84.8 fps -22%
Nvidia GeForce RTX 2060 Super
NVIDIA GeForce RTX 2060 Super (Desktop), R7 2700X
79 (67min - 89max) fps -28%
KFA 2 GeForce GTX 1660 Super
NVIDIA GeForce GTX 1660 Super (Desktop), R9 3900X
59.5 (53min - 68max) fps -45%
KFA2 GeForce GTX 1650 Super EX One Click OC
NVIDIA GeForce GTX 1650 Super (Desktop), R9 5900X
43.6 fps -60%
3840x2160 High Graphics & Postprocessing (Nvidia HairWorks Off)
Gemiddeld NVIDIA GeForce RTX 3090
  (128 - 160.2, n=12)
151.5 fps +86%
MSI GeForce RTX 3090 Suprim X
NVIDIA GeForce RTX 3090, R9 5900X
128 (117min - 138max) fps +57%
Gemiddeld NVIDIA GeForce RTX 3080
  (114 - 115, n=2)
114.5 fps +41%
MSI GeForce RTX 3080 Gaming X Trio
NVIDIA GeForce RTX 3080, R9 5900X
114 (106min - 122max) fps +40%
AMD Radeon RX 6800 XT
AMD Radeon RX 6800 XT, R9 5950X
110 (97min - 117max) fps +35%
AMD Ryzen 9 5900X
NVIDIA Titan RTX, R9 5900X
104 (97min - 112max) fps +28%
KFA2 GeForce RTX 2080 Ti EX
NVIDIA GeForce RTX 2080 Ti (Desktop), R9 3900X
96 (87min - 109max) fps +18%
Zotac Gaming GeForce RTX 3070 Twin Edge
NVIDIA GeForce RTX 3070, R9 5950X
89.6 (81min, 81P1 - 96max) fps +10%
Gemiddeld NVIDIA GeForce RTX 3070
  (84 - 93.9, n=5)
89.3 fps +10%
NVIDIA GeForce RTX 3060 Ti FE
NVIDIA GeForce RTX 3060 Ti, R9 5950X
81.3 (74min, 74.57P1 - 88max) fps
Nvidia GeForce RTX 2080 Super
NVIDIA GeForce RTX 2080 Super (Desktop), R7 2700X
79 (71min - 87max) fps -3%
Gemiddeld NVIDIA GeForce RTX 2080 Super (Desktop)
  ()
79 fps -3%
Nvidia GeForce RTX 2070 Super
NVIDIA GeForce RTX 2070 Super (Desktop), R7 2700X
68 (61min - 74max) fps -16%
Gemiddeld NVIDIA GeForce RTX 2070 Super (Desktop)
  (65.5 - 71, n=5)
68 fps -16%
Gemiddeld NVIDIA GeForce RTX 2060 Super (Desktop)
  (57 - 61, n=4)
58.8 fps -28%
Nvidia GeForce RTX 2060 Super
NVIDIA GeForce RTX 2060 Super (Desktop), R7 2700X
57 (51min - 62max) fps -30%
AMD Radeon RX 5700 XT
AMD Radeon RX 5700 XT (Desktop), R7 2700X
52.1 (47min - 57max) fps -36%
KFA 2 GeForce GTX 1660 Super
NVIDIA GeForce GTX 1660 Super (Desktop), R9 3900X
40 (36min - 44max) fps -51%
KFA2 GeForce GTX 1650 Super EX One Click OC
NVIDIA GeForce GTX 1650 Super (Desktop), R9 5900X
29.5 fps -64%
3840x2160 Ultra Graphics & Postprocessing (HBAO+)
Gemiddeld NVIDIA GeForce RTX 3090
  (85.4 - 98.5, n=8)
93.4 fps +75%
MSI GeForce RTX 3080 Gaming X Trio
NVIDIA GeForce RTX 3080, R9 5900X
85.7 (80min - 93max) fps +60%
MSI GeForce RTX 3090 Suprim X
NVIDIA GeForce RTX 3090, R9 5900X
85.4 (79min - 92max) fps +60%
Gemiddeld NVIDIA GeForce RTX 3080
  (78 - 85.7, n=2)
81.9 fps +53%
KFA2 GeForce RTX 2080 Ti EX
NVIDIA GeForce RTX 2080 Ti (Desktop), R9 3900X
65 (59min - 71max) fps +21%
Gemiddeld NVIDIA GeForce RTX 3070
  (59 - 60.3, n=2)
59.7 fps +12%
Zotac Gaming GeForce RTX 3070 Twin Edge
NVIDIA GeForce RTX 3070, R9 5950X
59 (53min, 53.59P1 - 64max) fps +10%
Nvidia GeForce RTX 2080 Super
NVIDIA GeForce RTX 2080 Super (Desktop), R7 2700X
55.2 (49min - 61max) fps +3%
Gemiddeld NVIDIA GeForce RTX 2080 Super (Desktop)
  (55.2 - 55.2, n=2)
55.2 fps +3%
NVIDIA GeForce RTX 3060 Ti FE
NVIDIA GeForce RTX 3060 Ti, R9 5950X
53.5 (49min, 49P1 - 57max) fps
Gemiddeld NVIDIA GeForce RTX 2070 Super (Desktop)
  (46.3 - 49.3, n=4)
47.4 fps -11%
Nvidia GeForce RTX 2070 Super
NVIDIA GeForce RTX 2070 Super (Desktop), R7 2700X
46.3 (41min - 50max) fps -13%
AMD Radeon RX 5700 XT
AMD Radeon RX 5700 XT (Desktop), R7 2700X
39.7 (35min - 43max) fps -26%
Gemiddeld NVIDIA GeForce RTX 2060 Super (Desktop)
  (38.4 - 42.3, n=4)
39.6 fps -26%
Nvidia GeForce RTX 2060 Super
NVIDIA GeForce RTX 2060 Super (Desktop), R7 2700X
38.4 (32min - 42max) fps -28%
KFA 2 GeForce GTX 1660 Super
NVIDIA GeForce GTX 1660 Super (Desktop), R9 3900X
27 (24min - 31max) fps -50%
Shadow of the Tomb Raider
3840x2160 Highest Preset AA:T
Gemiddeld NVIDIA GeForce RTX 3090
  (89.3 - 99.7, n=12)
96.4 fps +72%
MSI GeForce RTX 3090 Suprim X
NVIDIA GeForce RTX 3090, R9 5900X
95.6 fps +71%
MSI GeForce RTX 3080 Gaming X Trio
NVIDIA GeForce RTX 3080, R9 5900X
87.9 fps +57%
Gemiddeld NVIDIA GeForce RTX 3080
  (83.9 - 87.9, n=2)
85.9 fps +53%
AMD Radeon RX 6800 XT
AMD Radeon RX 6800 XT, R9 5950X
79.6 fps +42%
AMD Ryzen 9 5900X
NVIDIA Titan RTX, R9 5900X
66.3 fps +18%
Gemiddeld NVIDIA GeForce RTX 3070
  (61 - 63.5, n=4)
62.3 fps +11%
Zotac Gaming GeForce RTX 3070 Twin Edge
NVIDIA GeForce RTX 3070, R9 5950X
62 fps +11%
KFA2 GeForce RTX 2080 Ti EX
NVIDIA GeForce RTX 2080 Ti (Desktop), R9 3900X
60 fps +7%
NVIDIA GeForce RTX 3060 Ti FE
NVIDIA GeForce RTX 3060 Ti, R9 5950X
56 fps
Nvidia GeForce RTX 2080 Super
NVIDIA GeForce RTX 2080 Super (Desktop), R7 2700X
49 fps -12%
Gemiddeld NVIDIA GeForce RTX 2080 Super (Desktop)
  (49 - 49, n=2)
49 fps -12%
Gemiddeld NVIDIA GeForce RTX 2070 Super (Desktop)
  (43 - 47.9, n=5)
45.5 fps -19%
Nvidia GeForce RTX 2070 Super
NVIDIA GeForce RTX 2070 Super (Desktop), R7 2700X
43 fps -23%
Gemiddeld NVIDIA GeForce RTX 2060 Super (Desktop)
  (36 - 40.2, n=4)
38.2 fps -32%
AMD Radeon RX 5700 XT
AMD Radeon RX 5700 XT (Desktop), R7 2700X
38 fps -32%
Nvidia GeForce RTX 2060 Super
NVIDIA GeForce RTX 2060 Super (Desktop), R7 2700X
36 fps -36%
KFA 2 GeForce GTX 1660 Super
NVIDIA GeForce GTX 1660 Super (Desktop), R9 3900X
26 fps -54%
KFA2 GeForce GTX 1650 Super EX One Click OC
NVIDIA GeForce GTX 1650 Super (Desktop), R9 5900X
19 fps -66%
2560x1440 Highest Preset AA:T
Gemiddeld NVIDIA GeForce RTX 3090
  (137 - 172.3, n=12)
165.6 fps +61%
MSI GeForce RTX 3090 Suprim X
NVIDIA GeForce RTX 3090, R9 5900X
162 fps +57%
MSI GeForce RTX 3080 Gaming X Trio
NVIDIA GeForce RTX 3080, R9 5900X
152 fps +48%
Gemiddeld NVIDIA GeForce RTX 3080
  (147 - 152, n=2)
149.5 fps +45%
AMD Radeon RX 6800 XT
AMD Radeon RX 6800 XT, R9 5950X
148 fps +44%
AMD Ryzen 9 5900X
NVIDIA Titan RTX, R9 5900X
120 fps +17%
Zotac Gaming GeForce RTX 3070 Twin Edge
NVIDIA GeForce RTX 3070, R9 5950X
114 fps +11%
Gemiddeld NVIDIA GeForce RTX 3070
  (108 - 116, n=4)
113.2 fps +10%
KFA2 GeForce RTX 2080 Ti EX
NVIDIA GeForce RTX 2080 Ti (Desktop), R9 3900X
108 fps +5%
NVIDIA GeForce RTX 3060 Ti FE
NVIDIA GeForce RTX 3060 Ti, R9 5950X
103 fps
Gemiddeld NVIDIA GeForce RTX 2080 Super (Desktop)
  (91 - 92, n=2)
91.5 fps -11%
Nvidia GeForce RTX 2080 Super
NVIDIA GeForce RTX 2080 Super (Desktop), R7 2700X
91 fps -12%
Gemiddeld NVIDIA GeForce RTX 2070 Super (Desktop)
  (81 - 89.6, n=5)
85.4 fps -17%
Nvidia GeForce RTX 2070 Super
NVIDIA GeForce RTX 2070 Super (Desktop), R7 2700X
81 fps -21%
AMD Radeon RX 5700 XT
AMD Radeon RX 5700 XT (Desktop), R7 2700X
76 fps -26%
Gemiddeld NVIDIA GeForce RTX 2060 Super (Desktop)
  (69 - 75.7, n=4)
72.3 fps -30%
Nvidia GeForce RTX 2060 Super
NVIDIA GeForce RTX 2060 Super (Desktop), R7 2700X
69 fps -33%
KFA 2 GeForce GTX 1660 Super
NVIDIA GeForce GTX 1660 Super (Desktop), R9 3900X
53 fps -49%
KFA2 GeForce GTX 1650 Super EX One Click OC
NVIDIA GeForce GTX 1650 Super (Desktop), R9 5900X
40 fps -61%
1920x1080 Highest Preset AA:T
Gemiddeld NVIDIA GeForce RTX 3090
  (145 - 240, n=14)
204 fps +41%
AMD Radeon RX 6800 XT
AMD Radeon RX 6800 XT, R9 5950X
194 fps +34%
MSI GeForce RTX 3090 Suprim X
NVIDIA GeForce RTX 3090, R9 5900X
188 fps +30%
Gemiddeld NVIDIA GeForce RTX 3080
  (177 - 185, n=2)
181 fps +25%
MSI GeForce RTX 3080 Gaming X Trio
NVIDIA GeForce RTX 3080, R9 5900X
177 fps +22%
AMD Ryzen 9 5900X
NVIDIA Titan RTX, R9 5900X
166 fps +14%
Gemiddeld NVIDIA GeForce RTX 3070
  (138 - 160, n=4)
151.3 fps +4%
Zotac Gaming GeForce RTX 3070 Twin Edge
NVIDIA GeForce RTX 3070, R9 5950X
150 fps +3%
NVIDIA GeForce RTX 3060 Ti FE
NVIDIA GeForce RTX 3060 Ti, R9 5950X
145 fps
KFA2 GeForce RTX 2080 Ti EX
NVIDIA GeForce RTX 2080 Ti (Desktop), R9 3900X
130 fps -10%
Gemiddeld NVIDIA GeForce RTX 2070 Super (Desktop)
  (104 - 131.1, n=5)
119.7 fps -17%
Gemiddeld NVIDIA GeForce RTX 2080 Super (Desktop)
  (110 - 118, n=2)
114 fps -21%
Nvidia GeForce RTX 2080 Super
NVIDIA GeForce RTX 2080 Super (Desktop), R7 2700X
110 fps -24%
AMD Radeon RX 5700 XT
AMD Radeon RX 5700 XT (Desktop), R7 2700X
110 fps -24%
Gemiddeld NVIDIA GeForce RTX 2060 Super (Desktop)
  (96 - 111.4, n=4)
105.2 fps -27%
Nvidia GeForce RTX 2070 Super
NVIDIA GeForce RTX 2070 Super (Desktop), R7 2700X
104 fps -28%
Nvidia GeForce RTX 2060 Super
NVIDIA GeForce RTX 2060 Super (Desktop), R7 2700X
96 fps -34%
KFA 2 GeForce GTX 1660 Super
NVIDIA GeForce GTX 1660 Super (Desktop), R9 3900X
80 fps -45%
KFA2 GeForce GTX 1650 Super EX One Click OC
NVIDIA GeForce GTX 1650 Super (Desktop), R9 5900X
63 fps -57%
Borderlands 3
3840x2160 Badass Overall Quality (DX11)
MSI GeForce RTX 3090 Suprim X
NVIDIA GeForce RTX 3090, R9 5900X
73.4 fps +91%
Gemiddeld NVIDIA GeForce RTX 3090
  (68 - 75.3, n=12)
72.8 fps +90%
MSI GeForce RTX 3080 Gaming X Trio
NVIDIA GeForce RTX 3080, R9 5900X
61.9 fps +61%
Gemiddeld NVIDIA GeForce RTX 3080
  (61.5 - 61.9, n=2)
61.7 fps +61%
AMD Radeon RX 6800 XT
AMD Radeon RX 6800 XT, R9 5950X
53.6 fps +40%
AMD Ryzen 9 5900X
NVIDIA Titan RTX, R9 5900X
46.7 fps +22%
Zotac Gaming GeForce RTX 3070 Twin Edge
NVIDIA GeForce RTX 3070, R9 5950X
44.5 fps +16%
Gemiddeld NVIDIA GeForce RTX 3070
  (42.7 - 46.3, n=5)
44.3 fps +15%
KFA2 GeForce RTX 2080 Ti EX
NVIDIA GeForce RTX 2080 Ti (Desktop), R9 3900X
43.6 fps +14%
NVIDIA GeForce RTX 3060 Ti FE
NVIDIA GeForce RTX 3060 Ti, R9 5950X
38.4 fps
Gemiddeld NVIDIA GeForce RTX 2080 Super (Desktop)
  ()
35.9 fps -7%
Gemiddeld NVIDIA GeForce RTX 2070 Super (Desktop)
  (29.5 - 32.7, n=5)
31.3 fps -18%
Gemiddeld NVIDIA GeForce RTX 2060 Super (Desktop)
  (26.3 - 27.8, n=4)
27.3 fps -29%
KFA 2 GeForce GTX 1660 Super
NVIDIA GeForce GTX 1660 Super (Desktop), R9 3900X
12 fps -69%
KFA2 GeForce GTX 1650 Super EX One Click OC
NVIDIA GeForce GTX 1650 Super (Desktop), R9 5900X
7.87 fps -80%
2560x1440 Badass Overall Quality (DX11)
Gemiddeld NVIDIA GeForce RTX 3090
  (105 - 131.6, n=12)
123.2 fps +75%
MSI GeForce RTX 3090 Suprim X
NVIDIA GeForce RTX 3090, R9 5900X
117 fps +67%
Gemiddeld NVIDIA GeForce RTX 3080
  (95.7 - 103, n=2)
99.4 fps +42%
MSI GeForce RTX 3080 Gaming X Trio
NVIDIA GeForce RTX 3080, R9 5900X
95.7 fps +36%
AMD Radeon RX 6800 XT
AMD Radeon RX 6800 XT, R9 5950X
93.6 fps +33%
AMD Ryzen 9 5900X
NVIDIA Titan RTX, R9 5900X
84.7 fps +21%
Zotac Gaming GeForce RTX 3070 Twin Edge
NVIDIA GeForce RTX 3070, R9 5950X
79 fps +13%
KFA2 GeForce RTX 2080 Ti EX
NVIDIA GeForce RTX 2080 Ti (Desktop), R9 3900X
78 fps +11%
Gemiddeld NVIDIA GeForce RTX 3070
  (75.1 - 82.9, n=5)
77.7 fps +11%
NVIDIA GeForce RTX 3060 Ti FE
NVIDIA GeForce RTX 3060 Ti, R9 5950X
70.2 fps
Gemiddeld NVIDIA GeForce RTX 2080 Super (Desktop)
  ()
65.5 fps -7%
Gemiddeld NVIDIA GeForce RTX 2070 Super (Desktop)
  (53.7 - 60.3, n=5)
57.3 fps -18%
Gemiddeld NVIDIA GeForce RTX 2060 Super (Desktop)
  (48.8 - 51.7, n=4)
50.2 fps -28%
KFA 2 GeForce GTX 1660 Super
NVIDIA GeForce GTX 1660 Super (Desktop), R9 3900X
33 fps -53%
KFA2 GeForce GTX 1650 Super EX One Click OC
NVIDIA GeForce GTX 1650 Super (Desktop), R9 5900X
23.3 fps -67%
1920x1080 Badass Overall Quality (DX11)
Gemiddeld NVIDIA GeForce RTX 3090
  (117 - 165, n=12)
149.1 fps +55%
MSI GeForce RTX 3090 Suprim X
NVIDIA GeForce RTX 3090, R9 5900X
135 fps +41%
Gemiddeld NVIDIA GeForce RTX 3080
  (117 - 128, n=2)
122.5 fps +28%
AMD Radeon RX 6800 XT
AMD Radeon RX 6800 XT, R9 5950X
120 fps +25%
AMD Ryzen 9 5900X
NVIDIA Titan RTX, R9 5900X
118 fps +23%
MSI GeForce RTX 3080 Gaming X Trio
NVIDIA GeForce RTX 3080, R9 5900X
117 fps +22%
Zotac Gaming GeForce RTX 3070 Twin Edge
NVIDIA GeForce RTX 3070, R9 5950X
104 fps +8%
KFA2 GeForce RTX 2080 Ti EX
NVIDIA GeForce RTX 2080 Ti (Desktop), R9 3900X
101.3 fps +6%
Gemiddeld NVIDIA GeForce RTX 3070
  (95.3 - 108.9, n=5)
100.6 fps +5%
NVIDIA GeForce RTX 3060 Ti FE
NVIDIA GeForce RTX 3060 Ti, R9 5950X
96 fps
Gemiddeld NVIDIA GeForce RTX 2080 Super (Desktop)
  ()
91 fps -5%
Gemiddeld NVIDIA GeForce RTX 2070 Super (Desktop)
  (74.3 - 86, n=5)
80.9 fps -16%
Gemiddeld NVIDIA GeForce RTX 2060 Super (Desktop)
  (68.6 - 74.1, n=4)
71.2 fps -26%
KFA 2 GeForce GTX 1660 Super
NVIDIA GeForce GTX 1660 Super (Desktop), R9 3900X
50 fps -48%
KFA2 GeForce GTX 1650 Super EX One Click OC
NVIDIA GeForce GTX 1650 Super (Desktop), R9 5900X
39.8 fps -59%
Call of Duty Black Ops Cold War
1920x1080 Highest Settings + Ultra Ray Tracing
AMD Ryzen 9 5900X
NVIDIA Titan RTX, R9 5900X
119 fps +79%
Gemiddeld NVIDIA GeForce RTX 3090
  (88.3 - 89, n=2)
88.7 fps +33%
MSI GeForce RTX 3090 Suprim X
NVIDIA GeForce RTX 3090, R9 5900X
88.3 (22.4min, 29.5P0.1, 44.8P1 - 267max) fps +33%
MSI GeForce RTX 3080 Gaming X Trio
NVIDIA GeForce RTX 3080, R9 5900X
81.9 (17.3min, 30.1P0.1, 42.6P1 - 248max) fps +23%
Gemiddeld NVIDIA GeForce RTX 3080
  ()
81.9 fps +23%
Zotac Gaming GeForce RTX 3070 Twin Edge
NVIDIA GeForce RTX 3070, R9 5950X
70.1 (23.8min, 27.5P0.1, 42.6P1 - 217max) fps +5%
NVIDIA GeForce RTX 3060 Ti FE
NVIDIA GeForce RTX 3060 Ti, R9 5950X
66.5 (32.4min, 39.6P0.1, 45.3P1 - 224max) fps
Gemiddeld NVIDIA GeForce RTX 3070
  (49.8 - 70.1, n=3)
62.8 fps -6%
Gemiddeld NVIDIA GeForce RTX 2080 Super (Desktop)
  ()
59 fps -11%
Gemiddeld NVIDIA GeForce RTX 2070 Super (Desktop)
  ()
55.6 fps -16%
Gemiddeld NVIDIA GeForce RTX 2060 Super (Desktop)
  ()
44.7 fps -33%
AMD Radeon RX 6800 XT
AMD Radeon RX 6800 XT, R9 5950X
21.8 (8.8min, 9.61P0.1, 16.2P1 - 49.5max) fps -67%
3840x2160 Highest Settings
MSI GeForce RTX 3090 Suprim X
NVIDIA GeForce RTX 3090, R9 5900X
76.1 (42.1min, 58.7P0.1, 61.9P1 - 221max) fps +69%
Gemiddeld NVIDIA GeForce RTX 3090
  (74.6 - 76.1, n=2)
75.4 fps +68%
MSI GeForce RTX 3080 Gaming X Trio
NVIDIA GeForce RTX 3080, R9 5900X
65.6 (13.8min, 17.5P0.1, 51.4P1 - 229max) fps +46%
Gemiddeld NVIDIA GeForce RTX 3080
  ()
65.6 fps +46%
AMD Radeon RX 6800 XT
AMD Radeon RX 6800 XT, R9 5950X
64 (10.8min, 11.6P0.1, 50.8P1 - 159max) fps +43%
Gemiddeld NVIDIA GeForce RTX 3070
  (43.8 - 74, n=3)
56 fps +25%
AMD Ryzen 9 5900X
NVIDIA Titan RTX, R9 5900X
52.9 fps +18%
NVIDIA GeForce RTX 3060 Ti FE
NVIDIA GeForce RTX 3060 Ti, R9 5950X
44.9 (17.1min, 19.2P0.1, 34.5P1 - 84.4max) fps
Zotac Gaming GeForce RTX 3070 Twin Edge
NVIDIA GeForce RTX 3070, R9 5950X
43.8 (16.7min, 17.4P0.1, 33.8P1 - 80.3max) fps -2%
Gemiddeld NVIDIA GeForce RTX 2080 Super (Desktop)
  (38 - 44.5, n=2)
41.3 fps -8%
Gemiddeld NVIDIA GeForce RTX 2070 Super (Desktop)
  ()
37.6 fps -16%
Gemiddeld NVIDIA GeForce RTX 2060 Super (Desktop)
  ()
17.3 fps -61%
KFA2 GeForce GTX 1650 Super EX One Click OC
NVIDIA GeForce GTX 1650 Super (Desktop), R9 5900X
2 fps -96%
2560x1440 Highest Settings
Gemiddeld NVIDIA GeForce RTX 3090
  (122 - 124.7, n=2)
123.4 fps +50%
MSI GeForce RTX 3090 Suprim X
NVIDIA GeForce RTX 3090, R9 5900X
122 (54.5min, 84.4P0.1, 93.9P1 - 258max) fps +49%
MSI GeForce RTX 3080 Gaming X Trio
NVIDIA GeForce RTX 3080, R9 5900X
104 (19.1min, 20.4P0.1, 77.7P1 - 258max) fps +27%
Gemiddeld NVIDIA GeForce RTX 3080
  ()
104 fps +27%
Gemiddeld NVIDIA GeForce RTX 3070
  (83 - 107, n=3)
93.2 fps +14%
Zotac Gaming GeForce RTX 3070 Twin Edge
NVIDIA GeForce RTX 3070, R9 5950X
89.5 (40.5min, 65.1P0.1, 70.3P1 - 219max) fps +9%
AMD Ryzen 9 5900X
NVIDIA Titan RTX, R9 5900X
87.6 fps +7%
NVIDIA GeForce RTX 3060 Ti FE
NVIDIA GeForce RTX 3060 Ti, R9 5950X
82.1 (38.4min, 57P0.1, 63.5P1 - 233max) fps
AMD Radeon RX 6800 XT
AMD Radeon RX 6800 XT, R9 5950X
80.4 (16.5min, 31.8P0.1, 64.3P1 - 285max) fps -2%
Gemiddeld NVIDIA GeForce RTX 2070 Super (Desktop)
  ()
67.7 fps -18%
Gemiddeld NVIDIA GeForce RTX 2080 Super (Desktop)
  (51 - 77.6, n=2)
64.3 fps -22%
Gemiddeld NVIDIA GeForce RTX 2060 Super (Desktop)
  ()
53.2 fps -35%
KFA2 GeForce GTX 1650 Super EX One Click OC
NVIDIA GeForce GTX 1650 Super (Desktop), R9 5900X
26 fps -68%
1920x1080 Highest Settings
Gemiddeld NVIDIA GeForce RTX 3090
  (161 - 161.1, n=2)
161.1 fps +46%
MSI GeForce RTX 3090 Suprim X
NVIDIA GeForce RTX 3090, R9 5900X
161 (59.8min, 96.1P0.1, 111P1 - 312max) fps +46%
AMD Ryzen 9 5900X
NVIDIA Titan RTX, R9 5900X
144 fps +31%
AMD Radeon RX 6800 XT
AMD Radeon RX 6800 XT, R9 5950X
144 (58.7min, 90.7P0.1, 105P1 - 365max) fps +31%
MSI GeForce RTX 3080 Gaming X Trio
NVIDIA GeForce RTX 3080, R9 5900X
127 (21.9min, 24.4P0.1, 83.5P1 - 285max) fps +15%
Gemiddeld NVIDIA GeForce RTX 3080
  ()
127 fps +15%
Zotac Gaming GeForce RTX 3070 Twin Edge
NVIDIA GeForce RTX 3070, R9 5950X
120 (49.7min, 76.4P0.1, 85.7P1 - 245max) fps +9%
Gemiddeld NVIDIA GeForce RTX 3070
  (95.7 - 122, n=3)
112.6 fps +2%
NVIDIA GeForce RTX 3060 Ti FE
NVIDIA GeForce RTX 3060 Ti, R9 5950X
110 (46.1min, 67.8P0.1, 79.3P1 - 288max) fps
Gemiddeld NVIDIA GeForce RTX 2070 Super (Desktop)
  ()
92.7 fps -16%
Gemiddeld NVIDIA GeForce RTX 2080 Super (Desktop)
  (59 - 106, n=2)
82.5 fps -25%
Gemiddeld NVIDIA GeForce RTX 2060 Super (Desktop)
  ()
73 fps -34%
KFA2 GeForce GTX 1650 Super EX One Click OC
NVIDIA GeForce GTX 1650 Super (Desktop), R9 5900X
37 fps -66%
Watch Dogs Legion
1920x1080 Ultra Preset + Ultra Ray Tracing (DX12)
MSI GeForce RTX 3090 Suprim X
NVIDIA GeForce RTX 3090, R9 5900X
78.2 (53.58min, 63.39P1 - 115.63max) fps +62%
Gemiddeld NVIDIA GeForce RTX 3090
  (75.7 - 78.2, n=2)
77 fps +59%
AMD Radeon RX 6800 XT
AMD Radeon RX 6800 XT, R9 5950X
71.4 (47.71min, 55.63P1 - 113.42max) fps +48%
MSI GeForce RTX 3080 Gaming X Trio
NVIDIA GeForce RTX 3080, R9 5900X
71.3 (24.22min, 56.02P1 - 112.08max) fps +48%
Gemiddeld NVIDIA GeForce RTX 3080
  (70.9 - 71.3, n=2)
71.1 fps +47%
Gemiddeld NVIDIA GeForce RTX 3070
  (51.7 - 61, n=4)
55.1 fps +14%
Zotac Gaming GeForce RTX 3070 Twin Edge
NVIDIA GeForce RTX 3070, R9 5950X
51.7 (15.03min, 25.28P1 - 71.97max) fps +7%
NVIDIA GeForce RTX 3060 Ti FE
NVIDIA GeForce RTX 3060 Ti, R9 5950X
48.3 (26.43min, 38.03P1 - 84.29max) fps
Gemiddeld NVIDIA GeForce RTX 2080 Super (Desktop)
  ()
45.4 fps -6%
Gemiddeld NVIDIA GeForce RTX 2070 Super (Desktop)
  ()
39.2 fps -19%
Gemiddeld NVIDIA GeForce RTX 2060 Super (Desktop)
  ()
33.7 fps -30%
KFA 2 GeForce GTX 1660 Super
NVIDIA GeForce GTX 1660 Super (Desktop), R9 3900X
11.7 (7.26min, 8.31P1 - 16.29max) fps -76%
3840x2160 Ultra Preset (DX12)
MSI GeForce RTX 3090 Suprim X
NVIDIA GeForce RTX 3090, R9 5900X
60.3 (34.68min, 51.05P1 - 78.14max) fps +83%
Gemiddeld NVIDIA GeForce RTX 3090
  (57.6 - 60.3, n=2)
59 fps +79%
Gemiddeld NVIDIA GeForce RTX 3080
  (53.5 - 54.1, n=2)
53.8 fps +63%
MSI GeForce RTX 3080 Gaming X Trio
NVIDIA GeForce RTX 3080, R9 5900X
53.5 (33.98min, 42.85P1 - 79.6max) fps +62%
AMD Radeon RX 6800 XT
AMD Radeon RX 6800 XT, R9 5950X
49.3 (32.85min, 41.54P1 - 76.12max) fps +49%
Zotac Gaming GeForce RTX 3070 Twin Edge
NVIDIA GeForce RTX 3070, R9 5950X
38.9 (22.74min, 31.31P1 - 54.01max) fps +18%
Gemiddeld NVIDIA GeForce RTX 3070
  (37 - 39.2, n=4)
38 fps +15%
Gemiddeld NVIDIA GeForce RTX 2080 Super (Desktop)
  ()
34.4 fps +4%
NVIDIA GeForce RTX 3060 Ti FE
NVIDIA GeForce RTX 3060 Ti, R9 5950X
33 (17.58min, 22.09P1 - 51.23max) fps
Gemiddeld NVIDIA GeForce RTX 2070 Super (Desktop)
  ()
29.2 fps -12%
Gemiddeld NVIDIA GeForce RTX 2060 Super (Desktop)
  ()
24.7 fps -25%
KFA 2 GeForce GTX 1660 Super
NVIDIA GeForce GTX 1660 Super (Desktop), R9 3900X
12.3 (6.74min, 8.44P1 - 72.77max) fps -63%
KFA2 GeForce GTX 1650 Super EX One Click OC
NVIDIA GeForce GTX 1650 Super (Desktop), R9 5900X
8.09 (4.22min, 5.13P1 - 78.77max) fps -75%
2560x1440 Ultra Preset (DX12)
MSI GeForce RTX 3090 Suprim X
NVIDIA GeForce RTX 3090, R9 5900X
89.7 (59.87min, 73.02P1 - 132.92max) fps +52%
Gemiddeld NVIDIA GeForce RTX 3090
  (88.3 - 89.7, n=2)
89 fps +51%
AMD Radeon RX 6800 XT
AMD Radeon RX 6800 XT, R9 5950X
84.5 (58.88min, 69.45P1 - 137.16max) fps +43%
Gemiddeld NVIDIA GeForce RTX 3080
  (81.1 - 81.6, n=2)
81.4 fps +38%
MSI GeForce RTX 3080 Gaming X Trio
NVIDIA GeForce RTX 3080, R9 5900X
81.1 (46.24min, 61.45P1 - 140.66max) fps +37%
Gemiddeld NVIDIA GeForce RTX 3070
  (65.3 - 67, n=4)
66.1 fps +12%
Zotac Gaming GeForce RTX 3070 Twin Edge
NVIDIA GeForce RTX 3070, R9 5950X
65.3 (41.29min, 53.17P1 - 88.97max) fps +10%
NVIDIA GeForce RTX 3060 Ti FE
NVIDIA GeForce RTX 3060 Ti, R9 5950X
59.1 (34.72min, 48.11P1 - 97.67max) fps
Gemiddeld NVIDIA GeForce RTX 2080 Super (Desktop)
  ()
57.3 fps -3%
Gemiddeld NVIDIA GeForce RTX 2070 Super (Desktop)
  ()
51.4 fps -13%
Gemiddeld NVIDIA GeForce RTX 2060 Super (Desktop)
  ()
43.7 fps -26%
KFA 2 GeForce GTX 1660 Super
NVIDIA GeForce GTX 1660 Super (Desktop), R9 3900X
23.5 (14.14min, 15.64P1 - 42max) fps -60%
KFA2 GeForce GTX 1650 Super EX One Click OC
NVIDIA GeForce GTX 1650 Super (Desktop), R9 5900X
14.3 (6.88min, 8.73P1 - 63.4max) fps -76%
1920x1080 Ultra Preset (DX12)
AMD Radeon RX 6800 XT
AMD Radeon RX 6800 XT, R9 5950X
112 (75.12min, 87.97P1 - 181.69max) fps +46%
Gemiddeld NVIDIA GeForce RTX 3090
  (103 - 107, n=2)
105 fps +37%
MSI GeForce RTX 3090 Suprim X
NVIDIA GeForce RTX 3090, R9 5900X
103 (30.26min, 75.96P1 - 155.81max) fps +34%
Gemiddeld NVIDIA GeForce RTX 3080
  (99.3 - 103, n=2)
101.2 fps +32%
MSI GeForce RTX 3080 Gaming X Trio
NVIDIA GeForce RTX 3080, R9 5900X
99.3 (13.98min, 73.29P1 - 167.32max) fps +30%
Zotac Gaming GeForce RTX 3070 Twin Edge
NVIDIA GeForce RTX 3070, R9 5950X
84.9 (55.86min, 67.74P1 - 127.49max) fps +11%
Gemiddeld NVIDIA GeForce RTX 3070
  (79 - 89, n=4)
84.7 fps +11%
NVIDIA GeForce RTX 3060 Ti FE
NVIDIA GeForce RTX 3060 Ti, R9 5950X
76.6 (48.47min, 62.15P1 - 115.84max) fps
Gemiddeld NVIDIA GeForce RTX 2080 Super (Desktop)
  ()
75.4 fps -2%
Gemiddeld NVIDIA GeForce RTX 2070 Super (Desktop)
  ()
68.3 fps -11%
Gemiddeld NVIDIA GeForce RTX 2060 Super (Desktop)
  ()
59.1 fps -23%
KFA 2 GeForce GTX 1660 Super
NVIDIA GeForce GTX 1660 Super (Desktop), R9 3900X
31.4 (16.64min, 21.23P1 - 82max) fps -59%
KFA2 GeForce GTX 1650 Super EX One Click OC
NVIDIA GeForce GTX 1650 Super (Desktop), R9 5900X
20.9 (10.71min, 12.73P1 - 75.52max) fps -73%
Metro Exodus
1920x1080 Ultra Quality DXR AF:16x
MSI GeForce RTX 3090 Suprim X
NVIDIA GeForce RTX 3090, R9 5900X
116 (59.68min - 166.06max) fps +64%
Gemiddeld NVIDIA GeForce RTX 3090
  (68.6 - 122.2, n=12)
111.4 fps +57%
MSI GeForce RTX 3080 Gaming X Trio
NVIDIA GeForce RTX 3080, R9 5900X
102 (54.36min - 150.53max) fps +44%
Gemiddeld NVIDIA GeForce RTX 3080
  (91.5 - 102, n=2)
96.8 fps +37%
AMD Ryzen 9 5900X
NVIDIA Titan RTX, R9 5900X
87.9 (49.32min - 136.76max) fps +24%
AMD Radeon RX 6800 XT
AMD Radeon RX 6800 XT, R9 5950X
85.5 (52.71min - 120.38max) fps +21%
Zotac Gaming GeForce RTX 3070 Twin Edge
NVIDIA GeForce RTX 3070, R9 5950X
82.1 (47.4min - 134.03max) fps +16%
Gemiddeld NVIDIA GeForce RTX 3070
  (80.4 - 83, n=5)
81.6 fps +15%
KFA2 GeForce RTX 2080 Ti EX
NVIDIA GeForce RTX 2080 Ti (Desktop), R9 3900X
78.6 (43min - 115max) fps +11%
NVIDIA GeForce RTX 3060 Ti FE
NVIDIA GeForce RTX 3060 Ti, R9 5950X
70.8 (38.7min - 118.79max) fps
Nvidia GeForce RTX 2080 Super
NVIDIA GeForce RTX 2080 Super (Desktop), R7 2700X
65 (37.62min - 97.62max) fps -8%
Gemiddeld NVIDIA GeForce RTX 2080 Super (Desktop)
  ()
65 fps -8%
Gemiddeld NVIDIA GeForce RTX 2070 Super (Desktop)
  (56.3 - 62.1, n=4)
58.5 fps -17%
Nvidia GeForce RTX 2070 Super
NVIDIA GeForce RTX 2070 Super (Desktop), R7 2700X
57.5 (34min - 85max) fps -19%
Gemiddeld NVIDIA GeForce RTX 2060 Super (Desktop)
  (50 - 53.3, n=3)
51.1 fps -28%
Nvidia GeForce RTX 2060 Super
NVIDIA GeForce RTX 2060 Super (Desktop), R7 2700X
50.1 (30min - 72max) fps -29%
3840x2160 Ultra Quality AF:16x
MSI GeForce RTX 3090 Suprim X
NVIDIA GeForce RTX 3090, R9 5900X
76.3 (45.25min - 131.44max) fps +79%
Gemiddeld NVIDIA GeForce RTX 3090
  (70.6 - 77.3, n=12)
75 fps +76%
MSI GeForce RTX 3080 Gaming X Trio
NVIDIA GeForce RTX 3080, R9 5900X
65.9 (38.48min - 122.03max) fps +54%
Gemiddeld NVIDIA GeForce RTX 3080
  (64.1 - 65.9, n=2)
65 fps +52%
AMD Radeon RX 6800 XT
AMD Radeon RX 6800 XT, R9 5950X
56.3 (40.14min - 64.28max) fps +32%
AMD Ryzen 9 5900X
NVIDIA Titan RTX, R9 5900X
54.9 (34.88min - 89.73max) fps +29%
Gemiddeld NVIDIA GeForce RTX 3070
  (48.3 - 49.7, n=5)
48.9 fps +15%
Zotac Gaming GeForce RTX 3070 Twin Edge
NVIDIA GeForce RTX 3070, R9 5950X
48.3 (29.65min - 105.2max) fps +13%
KFA2 GeForce RTX 2080 Ti EX
NVIDIA GeForce RTX 2080 Ti (Desktop), R9 3900X
47.5 (31min - 69max) fps +11%
NVIDIA GeForce RTX 3060 Ti FE
NVIDIA GeForce RTX 3060 Ti, R9 5950X
42.7 (25.98min - 91.32max) fps
Gemiddeld NVIDIA GeForce RTX 2080 Super (Desktop)
  (40 - 40.4, n=2)
40.2 fps -6%
Nvidia GeForce RTX 2080 Super
NVIDIA GeForce RTX 2080 Super (Desktop), R7 2700X
40 (25.84min - 59.35max) fps -6%
Gemiddeld NVIDIA GeForce RTX 2070 Super (Desktop)
  (35 - 38.1, n=5)
36.8 fps -14%
Nvidia GeForce RTX 2070 Super
NVIDIA GeForce RTX 2070 Super (Desktop), R7 2700X
35 (23min - 51max) fps -18%
Gemiddeld NVIDIA GeForce RTX 2060 Super (Desktop)
  (29.7 - 32.2, n=4)
30.9 fps -28%
Nvidia GeForce RTX 2060 Super
NVIDIA GeForce RTX 2060 Super (Desktop), R7 2700X
29.7 (20min - 42max) fps -30%
AMD Radeon RX 5700 XT
AMD Radeon RX 5700 XT (Desktop), R7 2700X
29.6 (20.7min - 36.64max) fps -31%
KFA 2 GeForce GTX 1660 Super
NVIDIA GeForce GTX 1660 Super (Desktop), R9 3900X
21 (13min - 29max) fps -51%
KFA2 GeForce GTX 1650 Super EX One Click OC
NVIDIA GeForce GTX 1650 Super (Desktop), R9 5900X
16.1 (9.6min - 26.07max) fps -62%
2560x1440 Ultra Quality AF:16x
Gemiddeld NVIDIA GeForce RTX 3090
  (102 - 118.2, n=12)
113.2 fps +71%
MSI GeForce RTX 3090 Suprim X
NVIDIA GeForce RTX 3090, R9 5900X
112 (58.69min - 182.42max) fps +69%
MSI GeForce RTX 3080 Gaming X Trio
NVIDIA GeForce RTX 3080, R9 5900X
97.4 (51.56min - 162.47max) fps +47%
Gemiddeld NVIDIA GeForce RTX 3080
  (92.2 - 97.4, n=2)
94.8 fps +43%
AMD Radeon RX 6800 XT
AMD Radeon RX 6800 XT, R9 5950X
94.6 (55.44min - 143.68max) fps +43%
AMD Ryzen 9 5900X
NVIDIA Titan RTX, R9 5900X
84.9 (46.03min - 152.65max) fps +28%
Gemiddeld NVIDIA GeForce RTX 3070
  (74.4 - 78.3, n=5)
75.8 fps +15%
Zotac Gaming GeForce RTX 3070 Twin Edge
NVIDIA GeForce RTX 3070, R9 5950X
75.4 (39.91min - 127.26max) fps +14%
KFA2 GeForce RTX 2080 Ti EX
NVIDIA GeForce RTX 2080 Ti (Desktop), R9 3900X
71.9 (40min - 108max) fps +9%
NVIDIA GeForce RTX 3060 Ti FE
NVIDIA GeForce RTX 3060 Ti, R9 5950X
66.2 (36.92min - 129.84max) fps
Gemiddeld NVIDIA GeForce RTX 2080 Super (Desktop)
  (61 - 65, n=2)
63 fps -5%
Nvidia GeForce RTX 2080 Super
NVIDIA GeForce RTX 2080 Super (Desktop), R7 2700X
61 (35.51min - 95.82max) fps -8%
Gemiddeld NVIDIA GeForce RTX 2070 Super (Desktop)
  (54.3 - 61.9, n=5)
57.6 fps -13%
AMD Radeon RX 5700 XT
AMD Radeon RX 5700 XT (Desktop), R7 2700X
54.5 (31.85min - 78.06max) fps -18%
Nvidia GeForce RTX 2070 Super
NVIDIA GeForce RTX 2070 Super (Desktop), R7 2700X
54.3 (32min - 83max) fps -18%
Gemiddeld NVIDIA GeForce RTX 2060 Super (Desktop)
  (46 - 52.2, n=4)
49 fps -26%
Nvidia GeForce RTX 2060 Super
NVIDIA GeForce RTX 2060 Super (Desktop), R7 2700X
46.5 (28min - 69max) fps -30%
KFA 2 GeForce GTX 1660 Super
NVIDIA GeForce GTX 1660 Super (Desktop), R9 3900X
32 (19min - 47max) fps -52%
KFA2 GeForce GTX 1650 Super EX One Click OC
NVIDIA GeForce GTX 1650 Super (Desktop), R9 5900X
28.5 (16.88min - 51.46max) fps -57%
1920x1080 Ultra Quality AF:16x
Gemiddeld NVIDIA GeForce RTX 3090
  (108 - 145, n=12)
135.3 fps +59%
MSI GeForce RTX 3090 Suprim X
NVIDIA GeForce RTX 3090, R9 5900X
132 (72.24min - 199.88max) fps +55%
MSI GeForce RTX 3080 Gaming X Trio
NVIDIA GeForce RTX 3080, R9 5900X
116 (56.76min - 185.19max) fps +37%
AMD Radeon RX 6800 XT
AMD Radeon RX 6800 XT, R9 5950X
115 (64.52min - 181.92max) fps +35%
Gemiddeld NVIDIA GeForce RTX 3080
  (111 - 116, n=2)
113.5 fps +34%
AMD Ryzen 9 5900X
NVIDIA Titan RTX, R9 5900X
106 (52.66min - 176.55max) fps +25%
Gemiddeld NVIDIA GeForce RTX 3070
  (91.3 - 97.7, n=5)
93.9 fps +11%
Zotac Gaming GeForce RTX 3070 Twin Edge
NVIDIA GeForce RTX 3070, R9 5950X
93.6 (45.01min - 161.08max) fps +10%
KFA2 GeForce RTX 2080 Ti EX
NVIDIA GeForce RTX 2080 Ti (Desktop), R9 3900X
89.7 (46min - 140max) fps +6%
NVIDIA GeForce RTX 3060 Ti FE
NVIDIA GeForce RTX 3060 Ti, R9 5950X
84.9 (43.89min - 144.89max) fps
Gemiddeld NVIDIA GeForce RTX 2080 Super (Desktop)
  (76 - 82, n=2)
79 fps -7%
Nvidia GeForce RTX 2080 Super
NVIDIA GeForce RTX 2080 Super (Desktop), R7 2700X
76 (38.54min - 122.4max) fps -10%
Gemiddeld NVIDIA GeForce RTX 2070 Super (Desktop)
  (67.8 - 79.1, n=5)
72.3 fps -15%
Nvidia GeForce RTX 2070 Super
NVIDIA GeForce RTX 2070 Super (Desktop), R7 2700X
67.8 (36min - 110max) fps -20%
Gemiddeld NVIDIA GeForce RTX 2060 Super (Desktop)
  (58 - 67.4, n=4)
62.3 fps -27%
AMD Radeon RX 5700 XT
AMD Radeon RX 5700 XT (Desktop), R7 2700X
61 (36.09min - 86.1max) fps -28%
Nvidia GeForce RTX 2060 Super
NVIDIA GeForce RTX 2060 Super (Desktop), R7 2700X
58.9 (32min - 92max) fps -31%
KFA 2 GeForce GTX 1660 Super
NVIDIA GeForce GTX 1660 Super (Desktop), R9 3900X
41 (23min - 61max) fps -52%
KFA2 GeForce GTX 1650 Super EX One Click OC
NVIDIA GeForce GTX 1650 Super (Desktop), R9 5900X
36.6 (20.42min - 76.72max) fps -57%
Cyberpunk 2077 1.0
1920x1080 Ray Tracing Ultra Preset (DLSS off)
Gemiddeld NVIDIA GeForce RTX 3090
  (59.6 - 65.4, n=2)
62.5 fps +73%
MSI GeForce RTX 3080 Gaming X Trio
NVIDIA GeForce RTX 3080, R9 5900X
56.6 (20.9min, 44.1P0.1, 48.3P1 - 98.2max) fps +56%
Gemiddeld NVIDIA GeForce RTX 3080
  ()
56.6 fps +56%
Gemiddeld NVIDIA GeForce RTX 3070
  (41.9 - 42.3, n=2)
42.1 fps +16%
Zotac Gaming GeForce RTX 3070 Twin Edge
NVIDIA GeForce RTX 3070, R9 5950X
41.9 (20.3min, 32.1P0.1, 35.3P1 - 74max) fps +16%
AMD Ryzen 9 5900X
NVIDIA Titan RTX, R9 5900X
40.4 fps +12%
NVIDIA GeForce RTX 3060 Ti FE
NVIDIA GeForce RTX 3060 Ti, R9 5950X
36.2 (20.3min, 29.8P0.1, 31.6P1 - 68.1max) fps
Gemiddeld NVIDIA GeForce RTX 2080 Super (Desktop)
  ()
33 fps -9%
Gemiddeld NVIDIA GeForce RTX 2070 Super (Desktop)
  ()
28.9 fps -20%
Gemiddeld NVIDIA GeForce RTX 2060 Super (Desktop)
  ()
21.3 fps -41%
3840x2160 Ultra Preset
Gemiddeld NVIDIA GeForce RTX 3090
  (41.5 - 45.3, n=2)
43.4 fps +80%
MSI GeForce RTX 3080 Gaming X Trio
NVIDIA GeForce RTX 3080, R9 5900X
38.9 (20.9min, 31.3P0.1, 34.3P1 - 86.6max) fps +61%
Gemiddeld NVIDIA GeForce RTX 3080
  ()
38.9 fps +61%
AMD Ryzen 9 5900X
NVIDIA Titan RTX, R9 5900X
30.9 fps +28%
Gemiddeld NVIDIA GeForce RTX 3070
  (26.6 - 27.9, n=2)
27.3 fps +13%
Zotac Gaming GeForce RTX 3070 Twin Edge
NVIDIA GeForce RTX 3070, R9 5950X
26.6 (19min, 20.8P0.1, 23.4P1 - 46.6max) fps +10%
NVIDIA GeForce RTX 3060 Ti FE
NVIDIA GeForce RTX 3060 Ti, R9 5950X
24.1 (16.8min, 19.8P0.1, 21.8P1 - 27.1max) fps
Gemiddeld NVIDIA GeForce RTX 2080 Super (Desktop)
  ()
24.1 fps 0%
Gemiddeld NVIDIA GeForce RTX 2070 Super (Desktop)
  ()
21.5 fps -11%
Gemiddeld NVIDIA GeForce RTX 2060 Super (Desktop)
  (17.3 - 17.5, n=2)
17.4 fps -28%
KFA2 GeForce GTX 1650 Super EX One Click OC
NVIDIA GeForce GTX 1650 Super (Desktop), R9 5900X
7 fps -71%
2560x1440 Ultra Preset
Gemiddeld NVIDIA GeForce RTX 3090
  (78.1 - 85.3, n=2)
81.7 fps +70%
MSI GeForce RTX 3080 Gaming X Trio
NVIDIA GeForce RTX 3080, R9 5900X
72.5 (22.2min, 46.6P0.1, 57.1P1 - 159max) fps +51%
Gemiddeld NVIDIA GeForce RTX 3080
  ()
72.5 fps +51%
AMD Ryzen 9 5900X
NVIDIA Titan RTX, R9 5900X
58.4 fps +22%
Gemiddeld NVIDIA GeForce RTX 3070
  (53.7 - 54.8, n=2)
54.3 fps +13%
Zotac Gaming GeForce RTX 3070 Twin Edge
NVIDIA GeForce RTX 3070, R9 5950X
53.7 (20min, 39.9P0.1, 45.2P1 - 102max) fps +12%
Gemiddeld NVIDIA GeForce RTX 2080 Super (Desktop)
  ()
49.1 fps +2%
NVIDIA GeForce RTX 3060 Ti FE
NVIDIA GeForce RTX 3060 Ti, R9 5950X
48 (21.3min, 34.3P0.1, 41.9P1 - 94.6max) fps
Gemiddeld NVIDIA GeForce RTX 2070 Super (Desktop)
  ()
43.7 fps -9%
Gemiddeld NVIDIA GeForce RTX 2060 Super (Desktop)
  (35.3 - 35.7, n=2)
35.5 fps -26%
KFA2 GeForce GTX 1650 Super EX One Click OC
NVIDIA GeForce GTX 1650 Super (Desktop), R9 5900X
18 fps -62%
1920x1080 Ultra Preset
Gemiddeld NVIDIA GeForce RTX 3090
  (108 - 109.7, n=2)
108.9 fps +48%
MSI GeForce RTX 3080 Gaming X Trio
NVIDIA GeForce RTX 3080, R9 5900X
103 (23.3min, 60.3P0.1, 75.7P1 - 176max) fps +40%
Gemiddeld NVIDIA GeForce RTX 3080
  ()
103 fps +40%
AMD Ryzen 9 5900X
NVIDIA Titan RTX, R9 5900X
82.3 fps +12%
Gemiddeld NVIDIA GeForce RTX 3070
  (80.6 - 81, n=2)
80.8 fps +10%
Zotac Gaming GeForce RTX 3070 Twin Edge
NVIDIA GeForce RTX 3070, R9 5950X
80.6 (19.6min, 58.2P0.1, 65.3P1 - 111max) fps +10%
NVIDIA GeForce RTX 3060 Ti FE
NVIDIA GeForce RTX 3060 Ti, R9 5950X
73.6 (21.2min, 53.8P0.1, 61.6P1 - 102max) fps
Gemiddeld NVIDIA GeForce RTX 2080 Super (Desktop)
  ()
72.1 fps -2%
Gemiddeld NVIDIA GeForce RTX 2070 Super (Desktop)
  ()
65.4 fps -11%
Gemiddeld NVIDIA GeForce RTX 2060 Super (Desktop)
  (52.1 - 54.2, n=2)
53.2 fps -28%
KFA2 GeForce GTX 1650 Super EX One Click OC
NVIDIA GeForce GTX 1650 Super (Desktop), R9 5900X
30 fps -59%
lage gem. hoge ultraQHD4K
The Witcher 3 (2015) 479 342 218 109 81.3
Shadow of the Tomb Raider (2018) 185 157 153 145 103 56
Forza Horizon 4 (2018) 246 200 196 173 150 103
Assassin´s Creed Odyssey (2018) 142 121 104 75 65 45
Battlefield V (2018) 181 145 124 114 97.9 64.9
Far Cry New Dawn (2019) 123 111 108 99 94 65
Metro Exodus (2019) 193 139 105 84.9 66.2 42.7
The Division 2 (2019) 225 172 142 109 77.3 43.7
Anno 1800 (2019) 134 135 94.1 54.2 40.6 34.4
Total War: Three Kingdoms (2019) 367.4 195.6 127.3 92.8 59 28.8
Control (2019) 240 147 110 71.9 36.1
Borderlands 3 (2019) 172 149 118 96 70.2 38.4
Red Dead Redemption 2 (2019) 170 154 108 69.9 57.3 37.5
Doom Eternal (2020) 508 320 283 274 219 122
Gears Tactics (2020) 332.3 208.8 162.4 128.9 91.9 49.4
F1 2020 (2020) 369 252 174 135 80
Horizon Zero Dawn (2020) 181 139 122 109 92 53
Mafia Definitive Edition (2020) 159 130 124 90.1 49.7
FIFA 21 (2020) 242 247 230
Watch Dogs Legion (2020) 124 122 109 76.6 59.1 33
Assassin´s Creed Valhalla (2020) 126 95 81 74 60 40
Call of Duty Black Ops Cold War (2020) 243 133 123 110 82.1 44.9
Immortals Fenyx Rising (2020) 166 119 110 101 84 57
Cyberpunk 2077 1.0 (2020) 122 101 85.2 73.6 48 24.1

Emissies

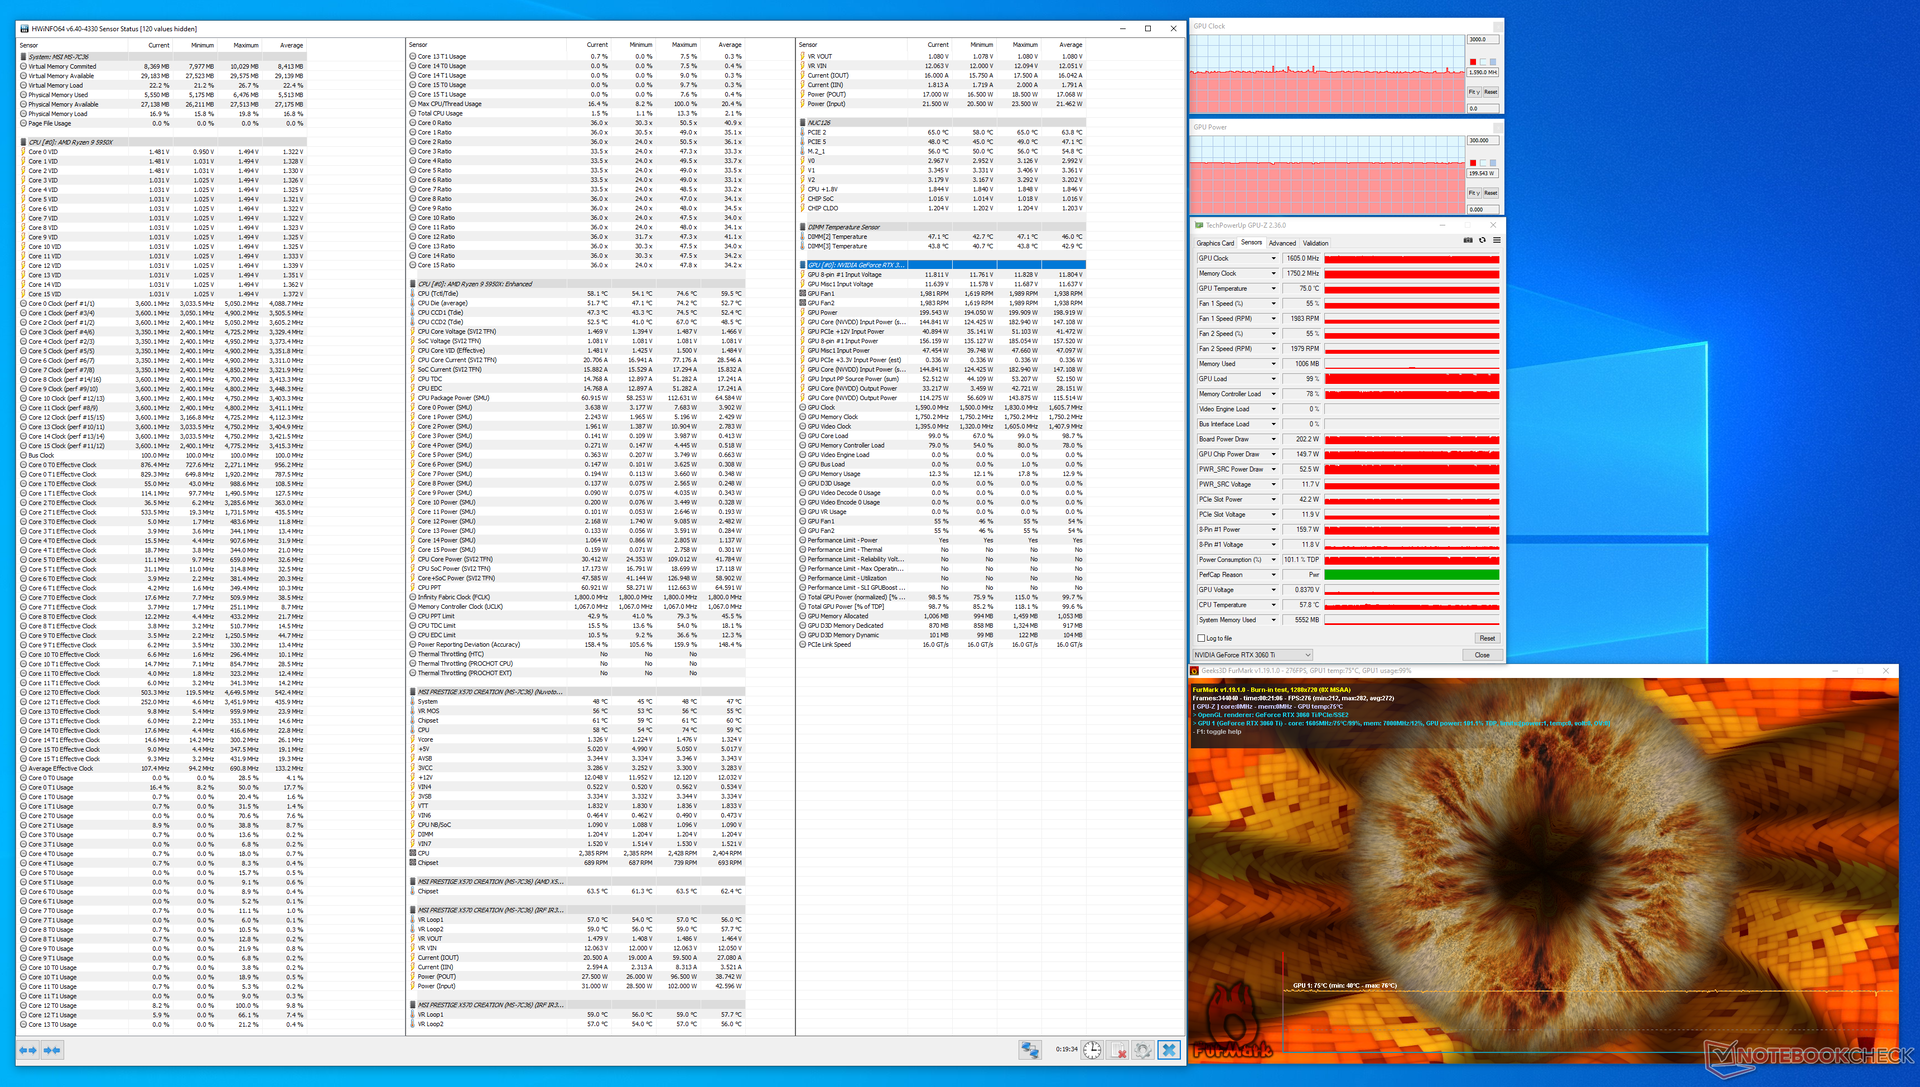
Dankzij NVIDIA's verbeterde koelerontwerp, presteert de RTX 3060 Ti FE uitstekend onder stress. Tijdens de FurMark stresstest zagen we dat de GPU kern een constante temperatuur van 75 °C behield en dat het stroomverbruik van het bord op het nominale TGP van 200 W lag.

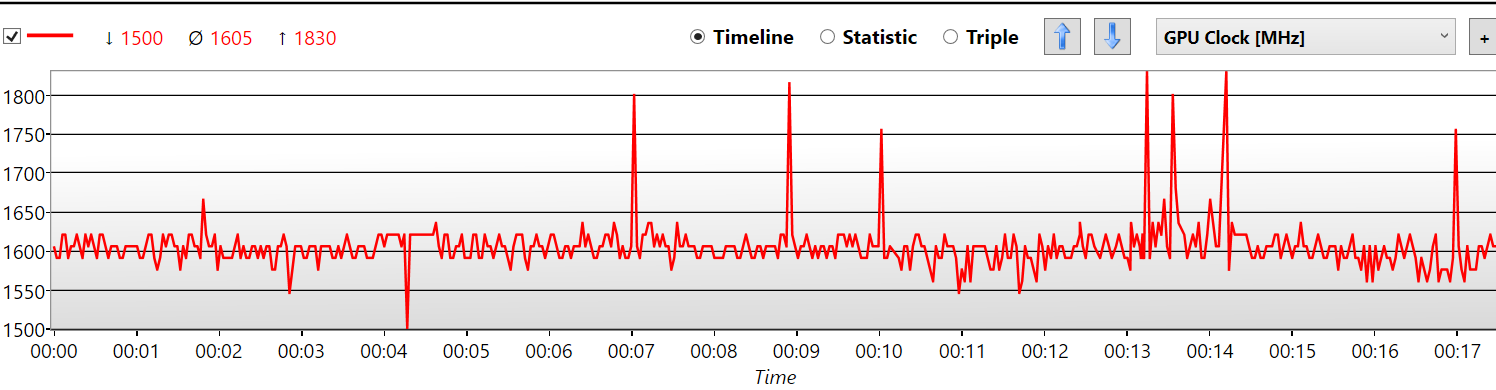
Voor het grootste deel van de stresstest werkt de RTX 3060 Ti FE in de buurt van de nominale boost klok van 1.665 MHz, hoewel we af en toe pieken zien tot 1.830 MHz

We gebruikten FurMark stress om de temperatuur en ruisniveaus te bepalen. Het totale stroomverbruik van het systeem werd bepaald tijdens het stressen met FurMark en The Witcher 3 op 1080p Ultra preset

FurMark stress
FurMark stress
GPU boost klokken tijdens FurMark stress

Temperatuur

NVIDIA RTX 3060 Ti FE warmtebeeldkaart

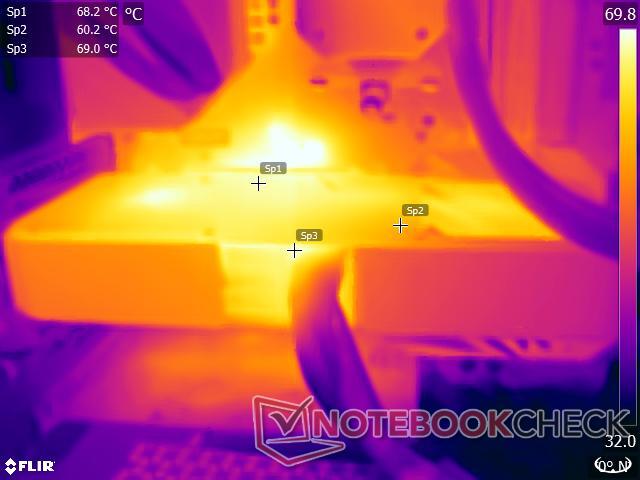
Hoewel NVIDIA's nieuwe koelsysteem voldoende prestaties levert om te voorkomen dat de kaart gaat throttlen, heeft de kaart zelf wel de neiging om behoorlijk warm te worden onder belasting. Tijdens de FurMark stresstest zagen we dat de oppervlaktetemperaturen in de buurt van de GPU en de voeding in de buurt van de 70 °C grens kwamen

Dit is te verwachten, aangezien de GPU kern zelf 75 °C kan bereiken onder belasting en de metalen constructie alleen maar dient om een groot deel van deze warmte naar het oppervlak over te brengen

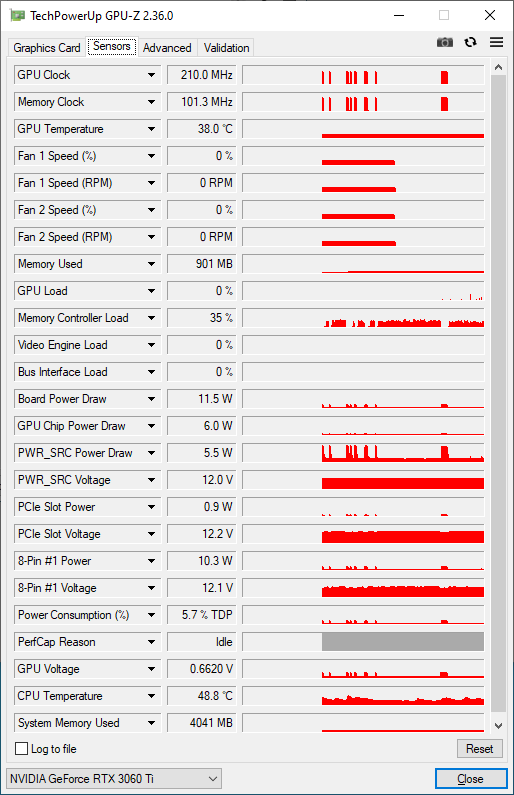
Het gebied bij de uitlaat van de achterste ventilator is met 60 °C ook behoorlijk warm, zoals je kunt zien op de warmtekaart. Dit gezegd zijnde, draait de GPU stationair tussen 38 °C en 42 °C, waarbij de ventilatoren volledig stoppen
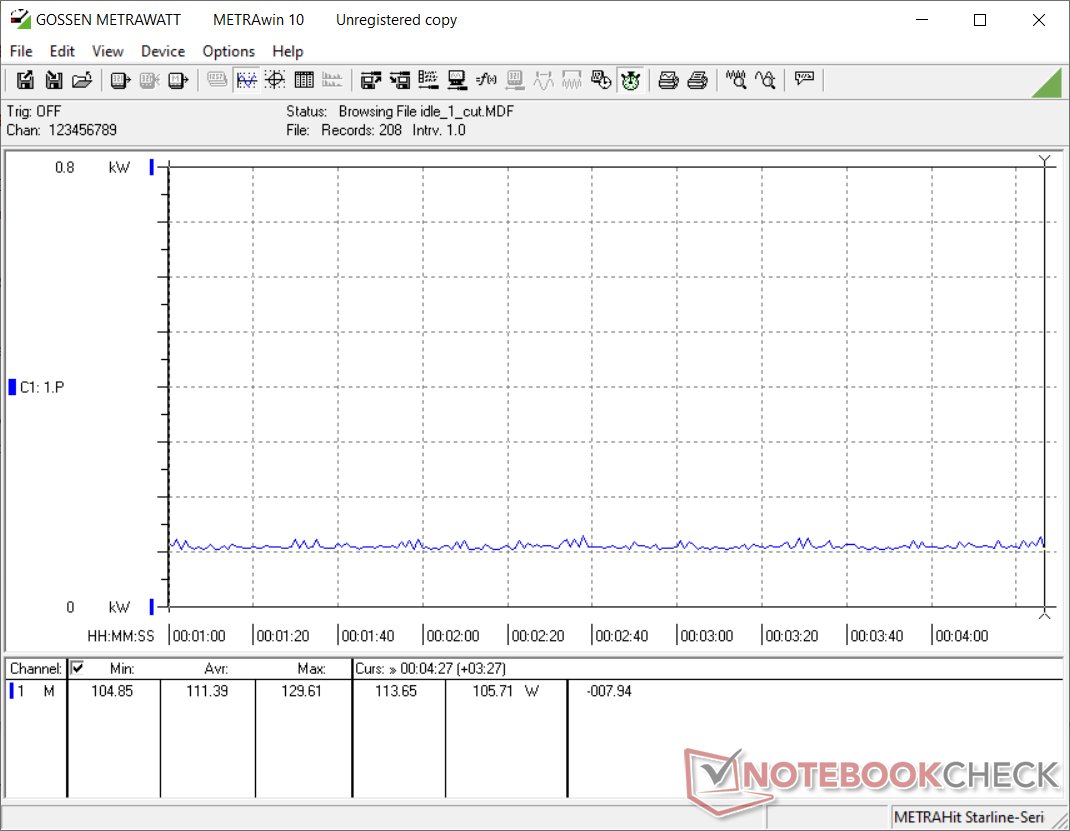
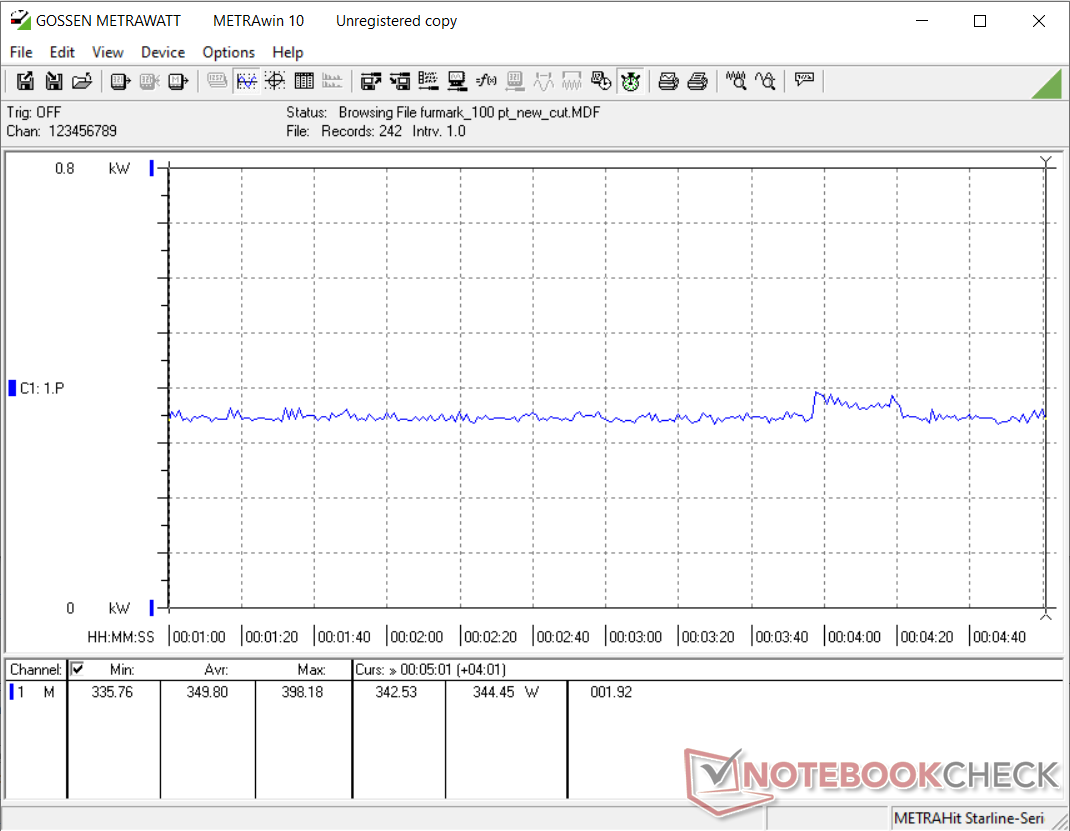
Stroomverbruik

Onze testbank verbruikt ongeveer 111 W in ruststand met alle RGB-verlichting uitgeschakeld en in totaal vijf ventilatoren (drie Corsair SP 120 mm kastventilatoren en twee Corsair ML 120 mm radiatorventilatoren) en de Elite Capellix AIO pomp draaiend in een Balanced profiel.

We zagen een gemiddeld totaal stroomverbruik van het systeem van 350 W en 379 W tijdens respectievelijk FurMark en The Witcher 3 Ultra stress

Zoals te zien is in de stroomverbruikgrafieken hieronder, is er een lichte toename in stroomverbruik waar te nemen rond de 4-minuten markering. Dit zou te wijten kunnen zijn aan de kortstondige verhoging van de boostklok die we eerder beschreven

Over het geheel genomen is de RTX 3060 Ti FE min of meer zuinig in vergelijking met de gemiddelde RTX 2080 Super als het gaat om stroomverbruik

Stroomverbruik systeem - Inactief
Energieverbruik van het systeem - FurMark stress
Stroomverbruik van het systeem - De Witcher 3 1080p Ultra voorinstelling
Power Consumption
1280x720 FurMark 1.19 GPU Stress Test (external Monitor)
MSI GeForce RTX 3090 Suprim X
NVIDIA GeForce RTX 3090, R9 5900X (Idle: 105.9 W)
551 (521min - 582max) Watt * -57%
Gemiddeld NVIDIA GeForce RTX 3080
  (Idle: 492 - 505, n=2 W)
499 Watt * -43%
MSI GeForce RTX 3080 Gaming X Trio
NVIDIA GeForce RTX 3080, R9 5900X (Idle: 103 W)
492 (485min - 514max) Watt * -41%
Gemiddeld NVIDIA GeForce RTX 3090
  (Idle: 281 - 551, n=8 W)
469 Watt * -34%
AMD Radeon RX 6800 XT
AMD Radeon RX 6800 XT, R9 5950X (Idle: 99.5 W)
447.9 (413min - 484max) Watt * -28%
KFA2 GeForce RTX 2080 Ti EX
NVIDIA GeForce RTX 2080 Ti (Desktop), R9 3900X (Idle: 100.5 W)
400.8 (354min - 432max) Watt * -15%
Zotac Gaming GeForce RTX 3070 Twin Edge
NVIDIA GeForce RTX 3070, R9 5950X (Idle: 114.96 W)
393 (384min, 385P1 - 406max) Watt * -12%
Zotac Gaming GeForce RTX 3070 Twin Edge
NVIDIA GeForce RTX 3070, R9 5950X (Idle: 114.96 W)
375 (365min, 366P1 - 421max) Watt * -7%
Nvidia GeForce RTX 2080 Super
NVIDIA GeForce RTX 2080 Super (Desktop), R7 2700X (Idle: 78.87 W)
376.8 (331min - 409max) Watt * -8%
Gemiddeld NVIDIA GeForce RTX 2080 Super (Desktop)
  (Idle: 328 - 414, n=4 W)
362 Watt * -3%
NVIDIA GeForce RTX 3060 Ti FE
NVIDIA GeForce RTX 3060 Ti, R9 5950X (Idle: 111.39 W)
350 (336min, 336P1 - 398max) Watt *
Gemiddeld NVIDIA GeForce RTX 3070
  (Idle: 281 - 393, n=6 W)
348 Watt * +1%
Gemiddeld NVIDIA GeForce RTX 2070 Super (Desktop)
  (Idle: 280 - 358, n=6 W)
329 Watt * +6%
AMD Radeon RX 5700 XT
AMD Radeon RX 5700 XT (Desktop), R7 2700X (239 fps, Idle: 69.8 W)
326.6 (313min - 351max) Watt * +7%
Nvidia GeForce RTX 2070 Super
NVIDIA GeForce RTX 2070 Super (Desktop), R7 2700X (283 fps, Idle: 80.5 W)
326 (315min - 348max) Watt * +7%
Gemiddeld NVIDIA GeForce RTX 2060 Super (Desktop)
  (Idle: 235 - 315, n=5 W)
290 Watt * +17%
Nvidia GeForce RTX 2060 Super
NVIDIA GeForce RTX 2060 Super (Desktop), R7 2700X (237 fps, Idle: 77.12 W)
281.4 (275min - 321max) Watt * +20%
KFA 2 GeForce GTX 1660 Super
NVIDIA GeForce GTX 1660 Super (Desktop), R9 3900X (Idle: 84.76 W)
247.6 (241min - 322max) Watt * +29%
KFA2 GeForce GTX 1650 Super EX One Click OC
NVIDIA GeForce GTX 1650 Super (Desktop), R9 5900X (Idle: 86.5 W)
228.7 (223min - 271max) Watt * +35%
1920x1080 The Witcher 3 ultra (external Monitor)
MSI GeForce RTX 3090 Suprim X
NVIDIA GeForce RTX 3090, R9 5900X (Idle: 105.9 W)
597 (577min - 618max) Watt * -58%
Gemiddeld NVIDIA GeForce RTX 3090
  (Idle: 464 - 597, n=17 W)
524 Watt * -38%
AMD Radeon RX 6800 XT
AMD Radeon RX 6800 XT, R9 5950X (Idle: 99.5 W)
505 (389min - 543max) Watt * -33%
Gemiddeld NVIDIA GeForce RTX 3080
  (Idle: 498 - 505, n=2 W)
502 Watt * -32%
MSI GeForce RTX 3080 Gaming X Trio
NVIDIA GeForce RTX 3080, R9 5900X (Idle: 103 W)
498.3 (487min - 523max) Watt * -31%
AMD Ryzen 9 5900X
NVIDIA Titan RTX, R9 5900X (Idle: 78.1 W)
439.6 (419min - 497max) Watt * -16%
KFA2 GeForce RTX 2080 Ti EX
NVIDIA GeForce RTX 2080 Ti (Desktop), R9 3900X (Idle: 100.5 W)
438.8 (431min - 463max) Watt * -16%
Zotac Gaming GeForce RTX 3070 Twin Edge
NVIDIA GeForce RTX 3070, R9 5950X (Idle: 114.96 W)
406 (397min, 399P1 - 421max) Watt * -7%
Gemiddeld NVIDIA GeForce RTX 3070
  (Idle: 317 - 550, n=5 W)
401 Watt * -6%
Nvidia GeForce RTX 2080 Super
NVIDIA GeForce RTX 2080 Super (Desktop), R7 2700X (Idle: 78.87 W)
382.8 (360min - 410max) Watt * -1%
NVIDIA GeForce RTX 3060 Ti FE
NVIDIA GeForce RTX 3060 Ti, R9 5950X (Idle: 111.39 W)
379 (270min, 364P1 - 409max) Watt *
Gemiddeld NVIDIA GeForce RTX 2080 Super (Desktop)
  (Idle: 336 - 416, n=5 W)
363 Watt * +4%
AMD Radeon RX 5700 XT
AMD Radeon RX 5700 XT (Desktop), R7 2700X (Idle: 69.8 W)
348.7 (341min - 359max) Watt * +8%
Nvidia GeForce RTX 2070 Super
NVIDIA GeForce RTX 2070 Super (Desktop), R7 2700X (96.8 fps, Idle: 80.5 W)
344.7 (335min - 370max) Watt * +9%
Gemiddeld NVIDIA GeForce RTX 2070 Super (Desktop)
  (Idle: 296 - 377, n=6 W)
342 Watt * +10%
Gemiddeld NVIDIA GeForce RTX 2060 Super (Desktop)
  (Idle: 246 - 331, n=5 W)
304 Watt * +20%
Nvidia GeForce RTX 2060 Super
NVIDIA GeForce RTX 2060 Super (Desktop), R7 2700X (82.7 fps, Idle: 77.12 W)
298.2 (293min - 322max) Watt * +21%
KFA 2 GeForce GTX 1660 Super
NVIDIA GeForce GTX 1660 Super (Desktop), R9 3900X (Idle: 84.76 W)
260.4 (255min - 277max) Watt * +31%
KFA2 GeForce GTX 1650 Super EX One Click OC
NVIDIA GeForce GTX 1650 Super (Desktop), R9 5900X (Idle: 86.5 W)
240.7 (237min - 247max) Watt * +36%

* ... kleiner is beter
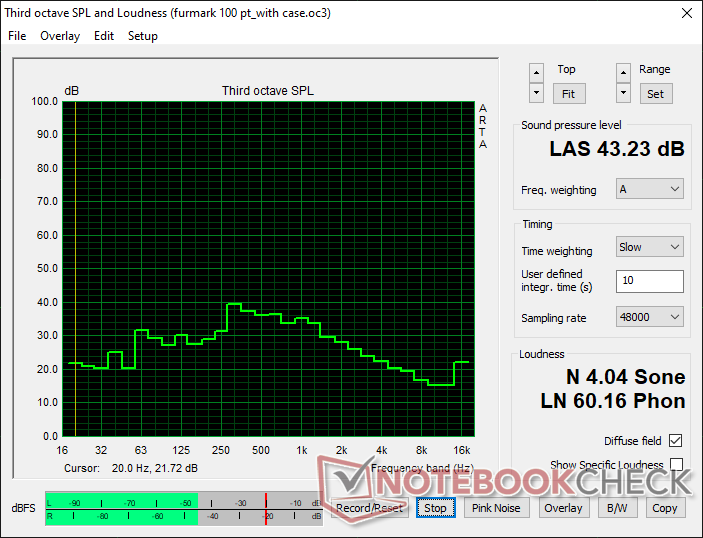
Geluidsniveaus

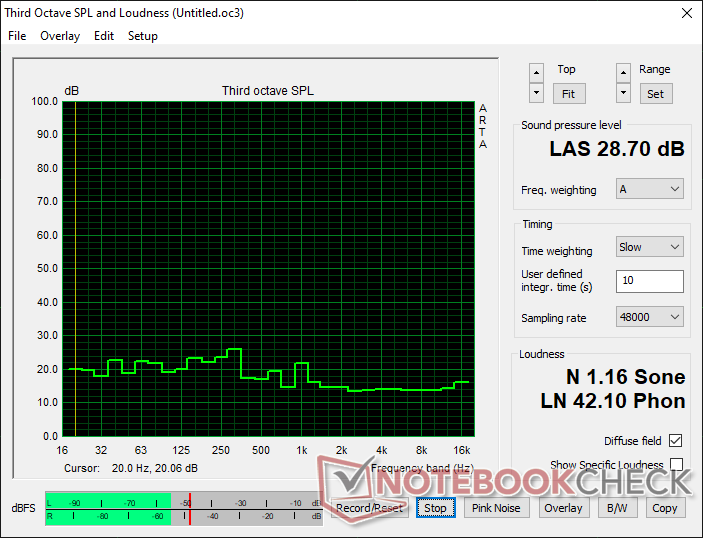
Een van de prettige bijkomstigheden van NVIDIA's nieuwe koelmechanisme is dat de geluidsniveaus van de ventilatoren goed onder controle worden gehouden

Omdat NVIDIA een volledige fan-stop modus heeft geïmplementeerd bij de Ampere FE kaarten, is het geluidsdrukniveau (SPL) in idle min of meer gelijk aan de omgevingswaarde van 28,70 db(A) op een afstand van 20 cm van de gesloten behuizing.

Het SPL steeg tot 43,23 db(A) tijdens de FurMark stresstest, wat zeer goed verdraagbaar is, vooral wanneer de behuizing gesloten is. Verdere fan-curve tuning kan mogelijk zijn door gebruik te maken van hulpprogramma's van derden, zoals MSI Afterburner

Geluidsniveaus - Stationair met casefans uit
Geluidsniveaus - FurMark stress met casusventilatoren uit

Pro

+ Stevige metalen constructie
+ Premium uitstraling
+ Metalen achterplaat
+ Prestaties op gelijke hoogte of iets hoger dan de RTX 2080 Super
+ Ondersteuning voor raytracing en DLSS 2.0 in compatibele games
+ Fatsoenlijke prestaties in professionele 3D-programma's
+ Minimale framedrops bij langdurige belasting
+ Volledige fan-stop in idle
+ Fatsoenlijke geluidsniveaus onder stress

Contra

- 12-pins connector voelt overbodig aan
- Beperkte overklokmogelijkheden
- Slechts 8 GB VRAM
- Hogere oppervlaktetemperaturen onder belasting
- Energieverbruik slechts marginaal beter dan de RTX 2080 Super
- Zeer beperkte voorraden

Uitspraak

NVIDIA GeForce RTX 3060 Ti Founders Edition. Reviewunit met dank aan NVIDIA India.

De NVIDIA GeForce RTX 3060 Ti Founders Edition doet een heleboel dingen goed. De kaart oogt en voelt premium aan, is goed gebouwd, en neemt een relatief compacte voetafdruk met 2 sleuven in beslag. De enige doorn in het oog is de centraal geplaatste 12-pins voedingsconnector, die geen enkele functionaliteit toevoegt maar het kabelbeheer juist omslachtig maakt

NVIDIA's nieuwe koelmechanisme biedt een duidelijk voordeel en met volledige fan-stop, kan de Founders Edition potentieel een beter koopje zijn vergeleken met add-in bord (AiB) varianten. We zagen een lager stroomverbruik (hoewel slechts marginaal) in vergelijking met de RTX 2080 Super, samen met beheersbare geluidsniveaus onder belasting, wat welkome ontwikkelingen zijn

De NVIDIA GeForce RTX 3060 Ti Founders Edition biedt RTX 2080 Super-prestaties voor US$ 399,99 (₹35.900) en bij een 50 W lager energieverbruik. Het heeft de potentie om een van de meest populaire GPU's van deze generatie te worden, maar de aanhoudende leveringsbeperkingen blijven de vooruitzichten temperen om er een te kopen tegen MSRP.

De RTX 3060 Ti FE zou de kaart bij uitstek moeten zijn als je voornamelijk in 1080p Ultra- en QHD Ultra-resoluties gamet. Vloeiende 4K-gaming is zeker mogelijk met een paar visuele aanpassingen. De Ray Tracing (RT) prestatieverbeteringen ten opzichte van de RTX 2080 Super zijn niet erg significant. DLSS 2.0 zou echter wel in staat moeten zijn om ondersteunde titels een duwtje in de rug te geven om speelbare frames te krijgen met RT ingeschakeld

De kaart is ook in staat tot fatsoenlijke reken- en 3D-modelleringsprestaties, maar is niet echt geschikt voor professionele CAD/CAM-, medische, auto-, of energiewerkprocessen

NVIDIA is erin geslaagd om RTX 2080 Super prestaties en een beetje meer te bieden voor US$300 minder en met een 50 W lagere TGP. Wie een GTX 1070 koopt, zal zien dat de RTX 3060 Ti FE het beste koopje is tegen MSRP-prijzen. Kopers die hun budget iets kunnen verruimen, zouden echter ook eens kunnen kijken naar de RTX 3070 FE als deze verkrijgbaar is voor US$499 MSRP.

Prijs en beschikbaarheid

De beschikbaarheid van de NVIDIA GeForce RTX 3060 Ti Founders Edition, inclusief die van partnerkaarten, is op het moment van schrijven van deze review nog onzeker. Op dit moment heeft alleen Best Buy deze kaart in de lijst staan voor de US$399,99 MSRP. Het zal u niet verbazen dat deze kaart op het moment van publicatie volledig is uitverkocht. We raden wel aan om de aangegeven link in de gaten te houden, aangezien de voorraad naar verwachting regelmatig aangevuld zal worden

Pricecompare

Please share our article, every link counts!
> Overzichten en testrapporten over laptops en mobieltjes > Testrapporten > NVIDIA GeForce RTX 3060 Ti Founders Edition Review: Vlaggenschip 1440p Ultra en sobere 4K-gaming voor 400 dollar
Vaidyanathan Subramaniam, 2021-02- 6 (Update: 2021-02- 6)