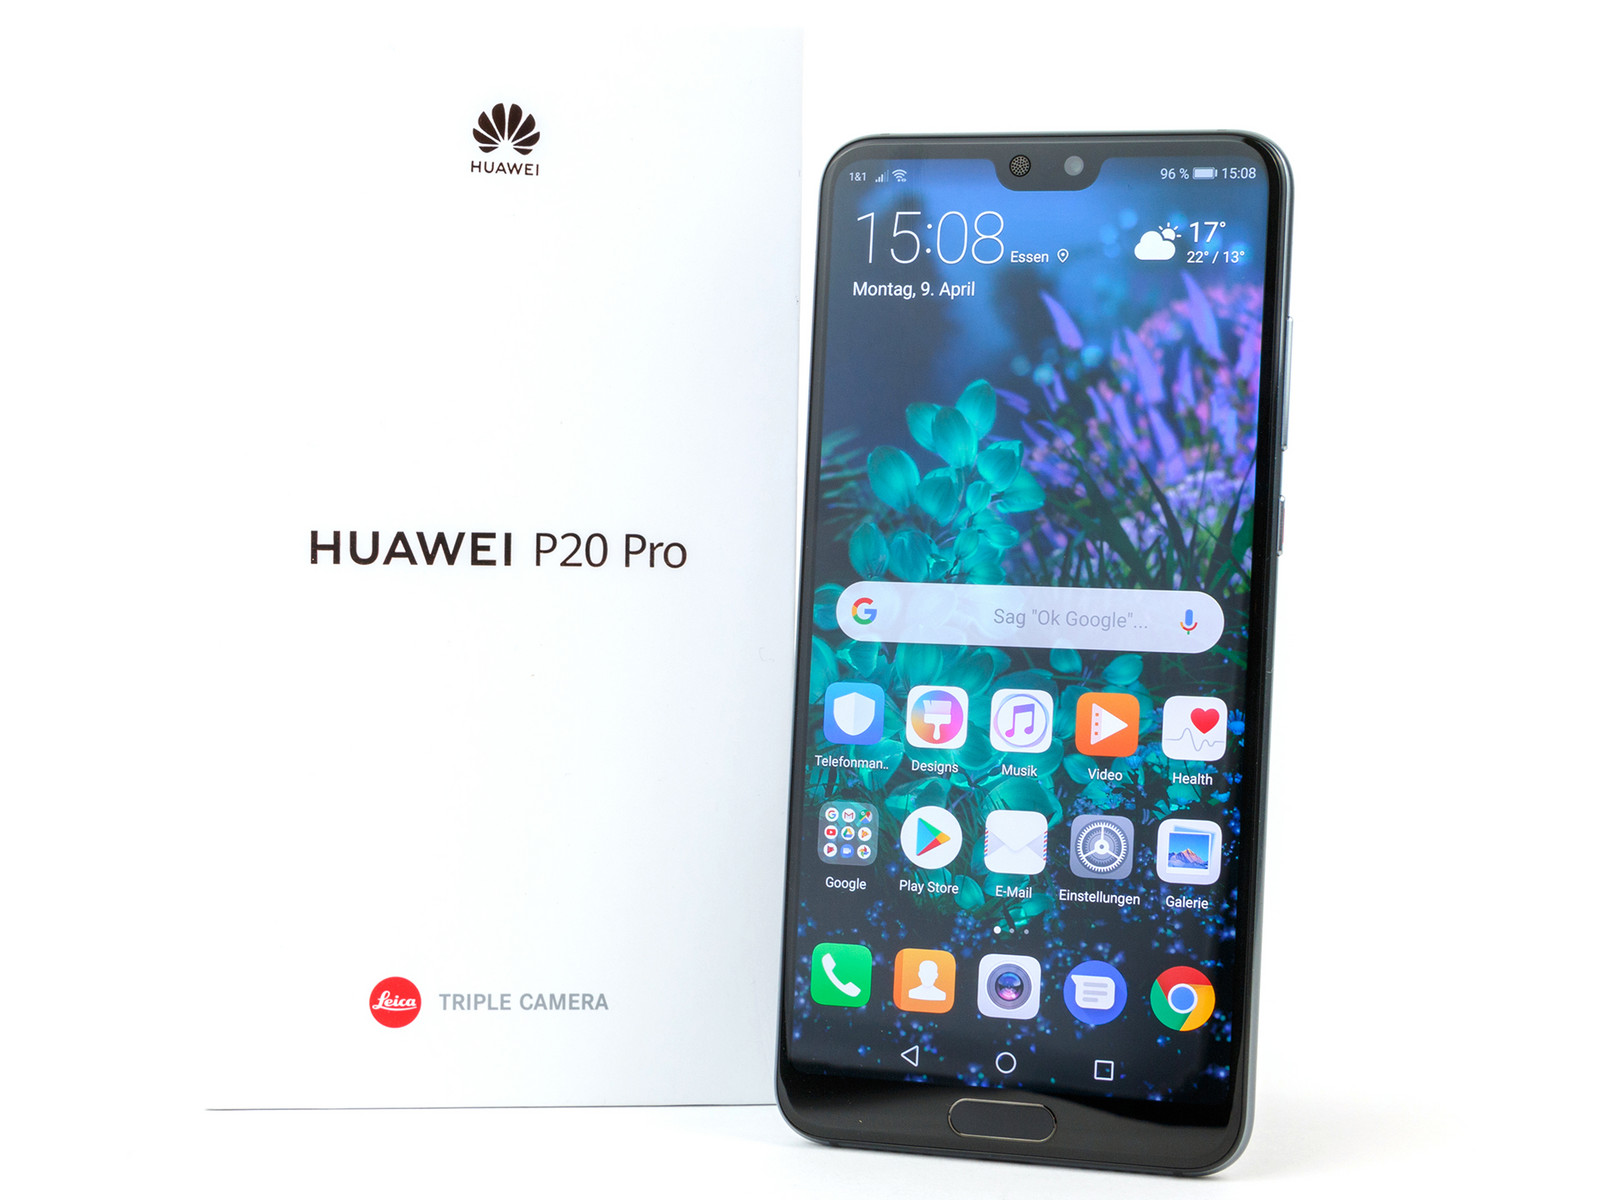
Kort testrapport Huawei P20 Pro Smartphone


| |||||||||||||||||||||||||
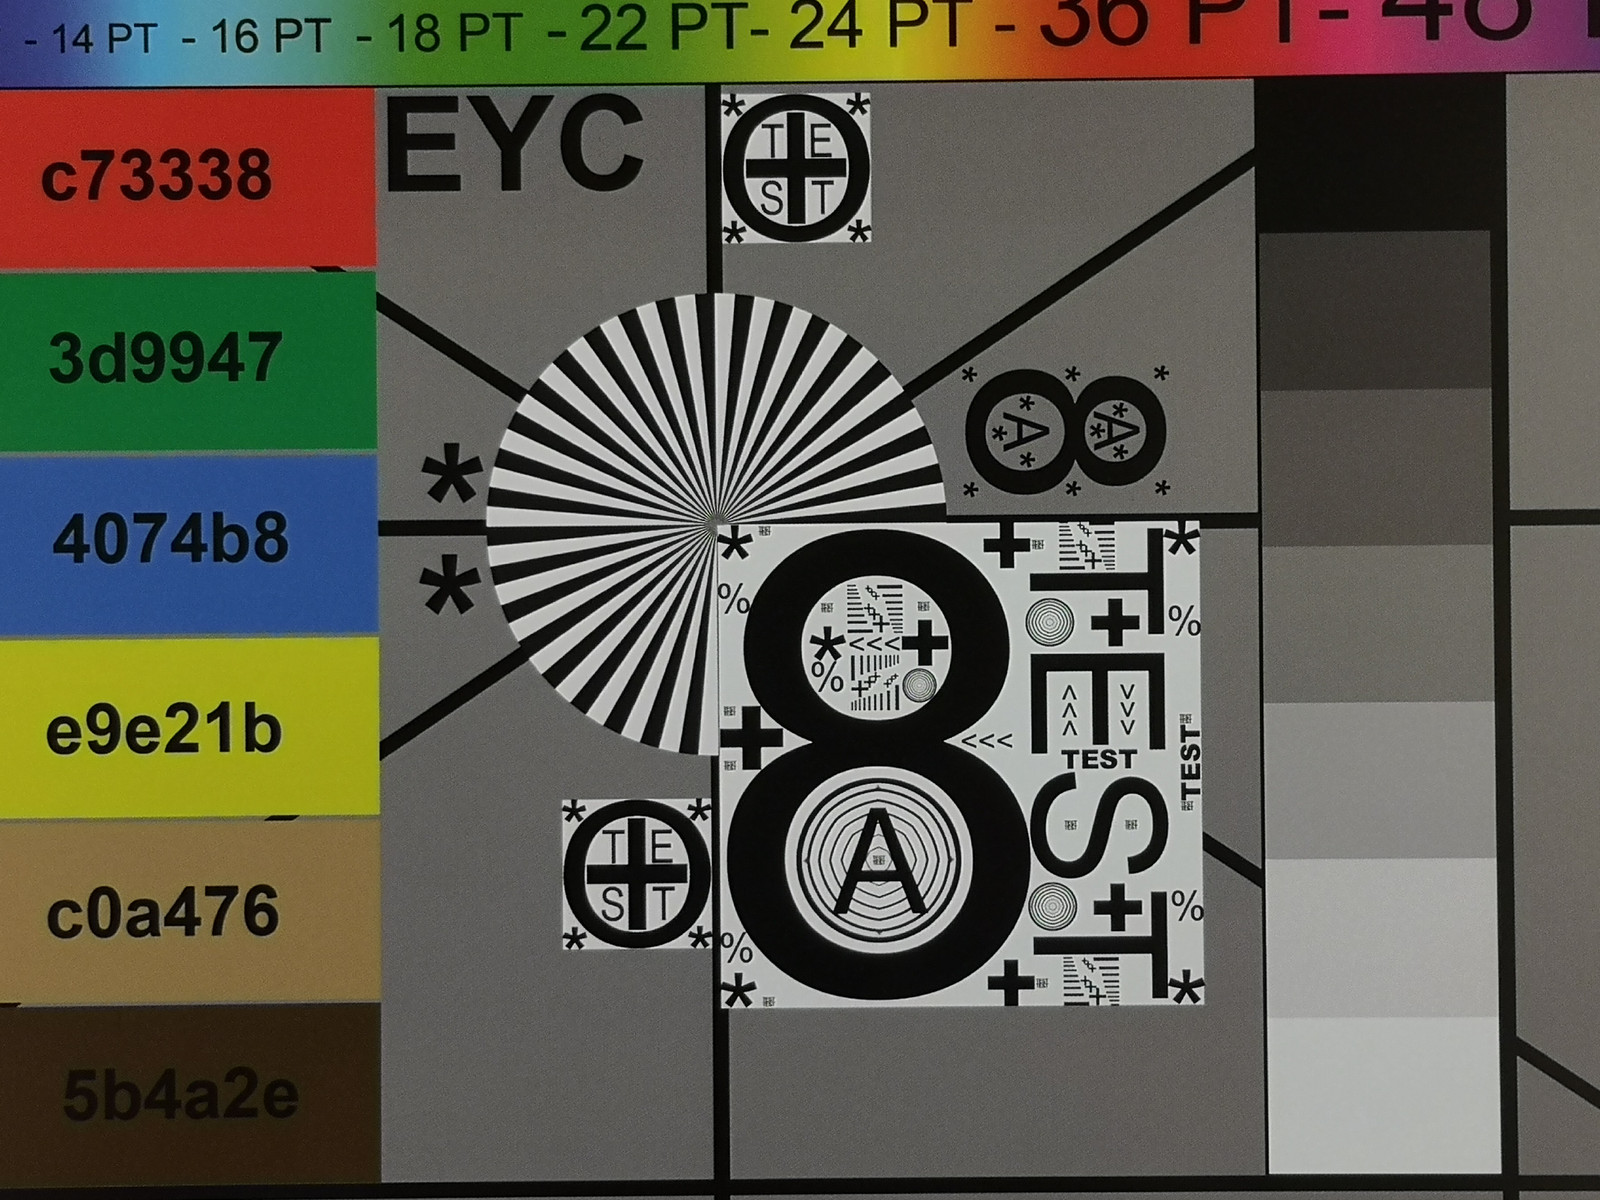
Helderheidsverdeling: 95 %
Helderheid in Batterij-modus: 569 cd/m²
Contrast: ∞:1 (Zwart: 0 cd/m²)
ΔE ColorChecker Calman: 1.3 | ∀{0.5-29.43 Ø4.73}
ΔE Greyscale Calman: 1.6 | ∀{0.09-98 Ø4.97}
Gamma: 2.31
CCT: 6401 K
| Huawei P20 Pro OLED, 2240x1080, 6.1" | Huawei P10 Plus LTPS, 2560x1440, 5.5" | Apple iPhone X Super AMOLED, 2436x1125, 5.8" | Samsung Galaxy S9 Plus Super AMOLED, 2960x1440, 6.2" | Google Pixel 2 XL P-OLED, 2880x1440, 6" | LG V30 OLED, 2880x1440, 6" | OnePlus 5T AMOLED, 2160x1080, 6" | HTC U11 Plus Super LCD 6, 2880x1440, 6" | |
|---|---|---|---|---|---|---|---|---|
| Screen | -38% | -4% | -38% | -64% | -136% | -39% | -55% | |
| Brightness middle (cd/m²) | 569 | 568 0% | 600 5% | 565 -1% | 415 -27% | 432 -24% | 425 -25% | 361 -37% |
| Brightness (cd/m²) | 578 | 562 -3% | 606 5% | 571 -1% | 420 -27% | 428 -26% | 423 -27% | 356 -38% |
| Brightness Distribution (%) | 95 | 92 -3% | 94 -1% | 96 1% | 87 -8% | 87 -8% | 92 -3% | 90 -5% |
| Black Level * (cd/m²) | 0.43 | 0.21 | ||||||
| Colorchecker dE 2000 * | 1.3 | 2.4 -85% | 1.2 8% | 2.3 -77% | 2.7 -108% | 4.18 -222% | 2.1 -62% | 2.5 -92% |
| Colorchecker dE 2000 max. * | 2.1 | 3.8 -81% | 3 -43% | 4.8 -129% | 4.3 -105% | 8.53 -306% | 3.4 -62% | 5.3 -152% |
| Greyscale dE 2000 * | 1.6 | 2.5 -56% | 1.6 -0% | 1.9 -19% | 3.3 -106% | 5.3 -231% | 2.5 -56% | 1.7 -6% |
| Gamma | 2.31 95% | 2.37 93% | 2.23 99% | 2.16 102% | 2.36 93% | 2.33 94% | 2.32 95% | 2.21 100% |
| CCT | 6401 102% | 6779 96% | 6707 97% | 6332 103% | 6787 96% | 7487 87% | 6455 101% | 6580 99% |
| Contrast (:1) | 1321 | 1719 |
* ... kleiner is beter
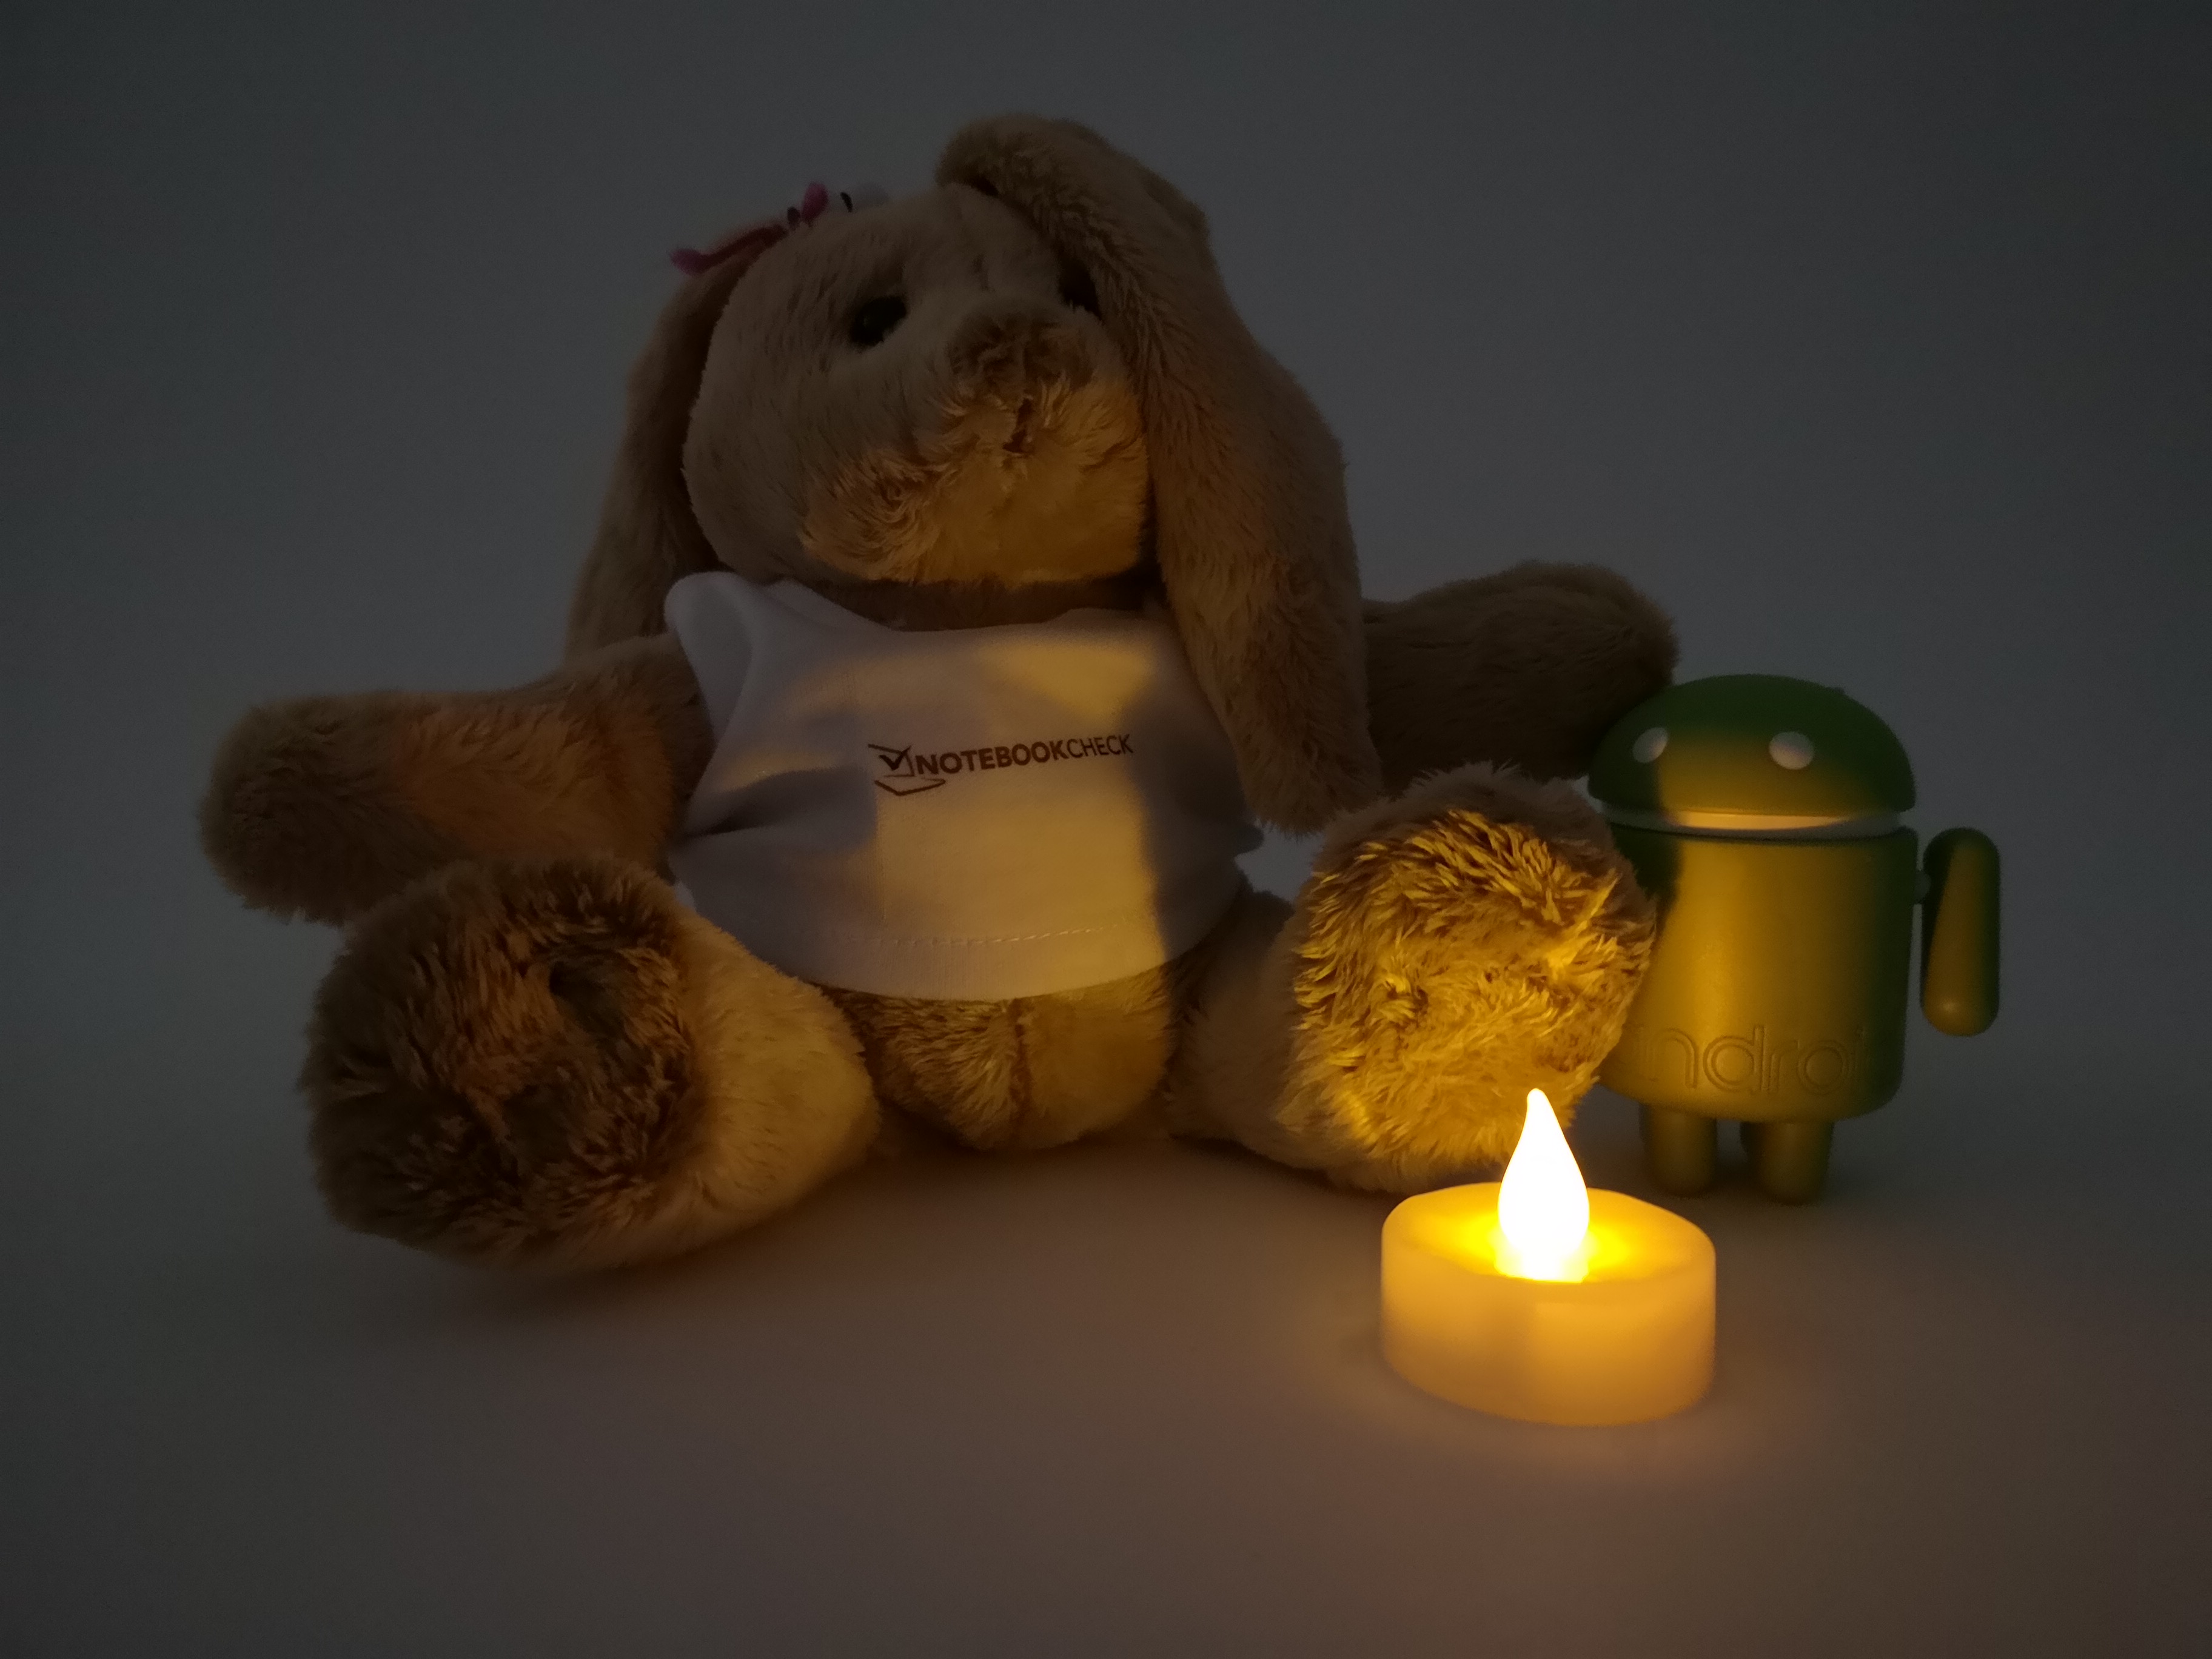
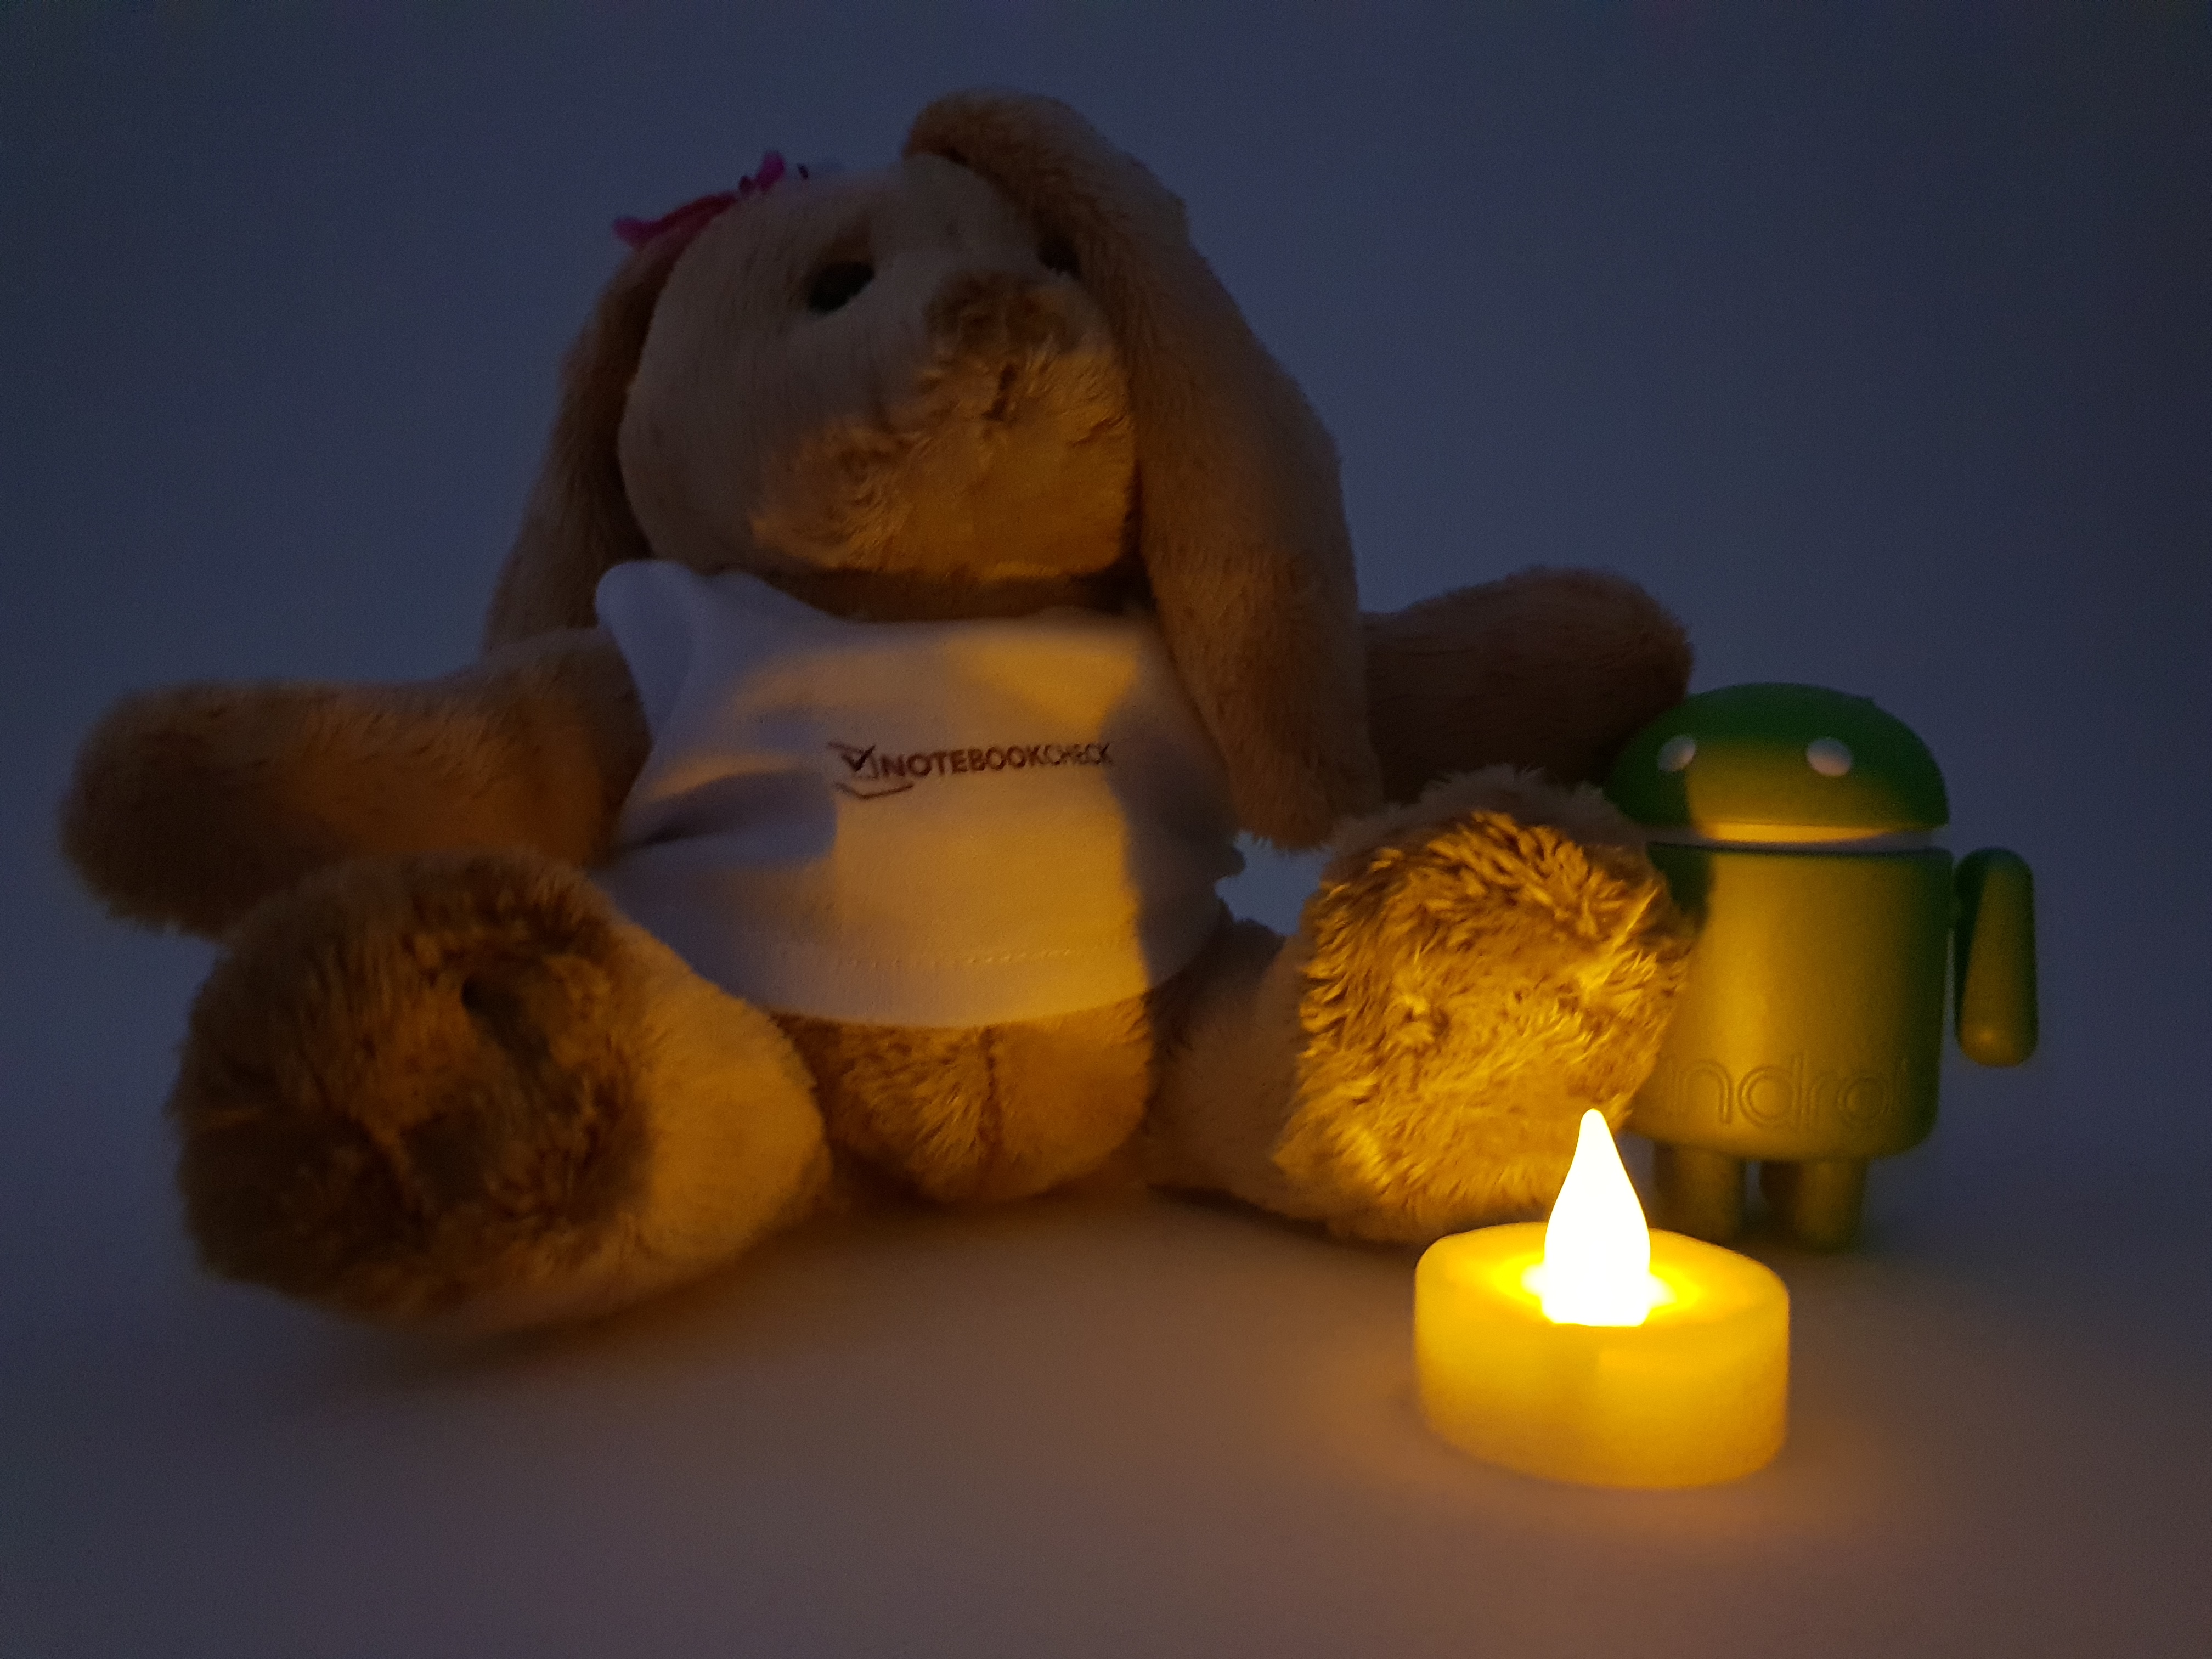
Screen Flickering / PWM (Pulse-Width Modulation)
| Screen flickering / PWM waargenomen | 238.1 Hz | 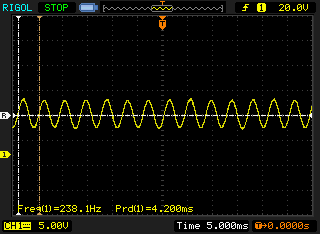 | |
De achtergrondverlichting van het scherm flikkert op 238.1 Hz (in het slechtste geval, bijvoorbeeld bij gebruik van PWM) . De frequentie van 238.1 Hz is redelijk laag en de meeste mensen die gevoelig zijn aan flickering kunnen dit dus waarnemen of geïrriteerde ogen krijgen (gebruikmakend van de vermelde helderheid en lager). Ter vergelijking: 52 % van alle geteste toestellen maakten geen gebruik van PWM om de schermhelderheid te verlagen. Als het wel werd gebruikt, werd een gemiddelde van 7798 (minimum: 5 - maximum: 343500) Hz waargenomen. | |||
Responstijd Scherm
| ↔ Responstijd Zwart naar Wit | ||
|---|---|---|
| 4 ms ... stijging ↗ en daling ↘ gecombineerd | ↗ 2 ms stijging | 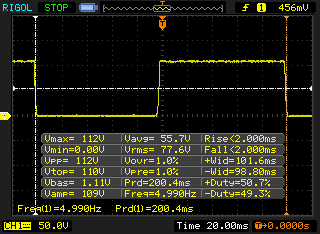 |
| ↘ 2 ms daling | ||
| Het scherm vertoonde erg snelle responstijden in onze tests en zou zeer geschikt moeten zijn voor snelle games. Ter vergelijking: alle testtoestellen variëren van 0.1 (minimum) tot 240 (maximum) ms. » 16 % van alle toestellen zijn beter. Dit betekent dat de gemeten responstijd beter is dan het gemiddelde (19.9 ms) van alle geteste toestellen. | ||
| ↔ Responstijd 50% Grijs naar 80% Grijs | ||
| 4 ms ... stijging ↗ en daling ↘ gecombineerd | ↗ 2 ms stijging | 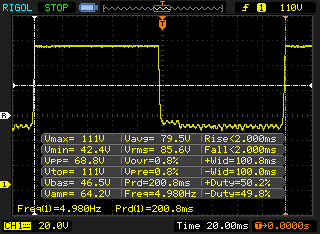 |
| ↘ 2 ms daling | ||
| Het scherm vertoonde erg snelle responstijden in onze tests en zou zeer geschikt moeten zijn voor snelle games. Ter vergelijking: alle testtoestellen variëren van 0.165 (minimum) tot 636 (maximum) ms. » 15 % van alle toestellen zijn beter. Dit betekent dat de gemeten responstijd beter is dan het gemiddelde (31.1 ms) van alle geteste toestellen. | ||
| Lightmark - 1920x1080 1080p (sorteer op waarde) | |
| Huawei P20 Pro | |
| Huawei Mate 10 Pro | |
| Samsung Galaxy S9 Plus | |
| HTC U11 Plus | |
| Google Pixel 2 XL | |
| Gemiddeld HiSilicon Kirin 970 (21.5 - 25.9, n=2) | |
| Basemark ES 3.1 / Metal - offscreen Overall Score (sorteer op waarde) | |
| Huawei P20 Pro | |
| Huawei Mate 10 Pro | |
| Samsung Galaxy S9 Plus | |
| Apple iPhone X | |
| HTC U11 Plus | |
| Google Pixel 2 XL | |
| Gemiddeld HiSilicon Kirin 970 (788 - 887, n=2) | |
| Gemiddelde van klas Smartphone (544 - 7731, n=24, laatste 2 jaar) | |
| JetStream 1.1 - 1.1 Total | |
| Apple iPhone X (IOS 11.1.1) | |
| Samsung Galaxy S9 Plus (Samsung Browser 7.0) | |
| OnePlus 5T (Chrome 63) | |
| HTC U11 Plus (Chrome 63) | |
| Google Pixel 2 XL (Chrome 62) | |
| Huawei P10 Plus | |
| Huawei P20 Pro (Chrome 65) | |
| Huawei Mate 10 Pro (Chrome 61) | |
| LG V30 (Chrome 62) | |
| Gemiddeld HiSilicon Kirin 970 (33.1 - 58.6, n=8) | |
| Octane V2 - Total Score | |
| Gemiddelde van klas Smartphone (2800 - 126661, n=157, laatste 2 jaar) | |
| Apple iPhone X (IOS 11.1.2) | |
| Samsung Galaxy S9 Plus (Samsung Browser 7.0) | |
| OnePlus 5T (Chrome 63) | |
| Huawei P20 Pro (Chrome 65) | |
| HTC U11 Plus (Chrome 63) | |
| Google Pixel 2 XL (Chrome 62) | |
| LG V30 (Chrome 62) | |
| Huawei Mate 10 Pro (Chrome 61) | |
| Huawei P10 Plus (Chrome 58.0.3029.83) | |
| Gemiddeld HiSilicon Kirin 970 (6692 - 11838, n=8) | |
| Mozilla Kraken 1.1 - Total | |
| Gemiddeld HiSilicon Kirin 970 (3591 - 6221, n=8) | |
| Huawei P20 Pro (Chrome 65) | |
| LG V30 (Chrome 62) | |
| Huawei Mate 10 Pro (Chrome 61) | |
| Google Pixel 2 XL (Chrome 62) | |
| HTC U11 Plus (Chrome 63) | |
| Huawei P10 Plus (Chrome 58.0.3029.83) | |
| OnePlus 5T (Chrome 63) | |
| Samsung Galaxy S9 Plus (Samsung Browser 7.0) | |
| Gemiddelde van klas Smartphone (257 - 28190, n=135, laatste 2 jaar) | |
| Apple iPhone X (IOS 11.1.2) | |
| WebXPRT 2015 - Overall | |
| Apple iPhone X (Safari Mobile 11.0) | |
| Google Pixel 2 XL (Chrome 62) | |
| Huawei P20 Pro (Chrome 65) | |
| OnePlus 5T (Chrome 63) | |
| HTC U11 Plus (Chrome 63) | |
| Gemiddeld HiSilicon Kirin 970 (119 - 187, n=8) | |
| Samsung Galaxy S9 Plus (Samsung Browser 7.0) | |
| Huawei Mate 10 Pro (Chrome 61) | |
| Huawei P10 Plus | |
| LG V30 (Chrome 62) | |
* ... kleiner is beter
| Huawei P20 Pro | Huawei P10 Plus | Samsung Galaxy S9 Plus | OnePlus 5T | Google Pixel 2 XL | LG V30 | Gemiddeld 128 GB UFS 2.1 Flash | Gemiddelde van klas Smartphone | |
|---|---|---|---|---|---|---|---|---|
| AndroBench 3-5 | -2% | -24% | -26% | -20% | -41% | 9% | 324% | |
| Sequential Read 256KB (MB/s) | 832 | 733 -12% | 819 -2% | 699 -16% | 760 -9% | 669 -20% | 762 ? -8% | 2251 ? 171% |
| Sequential Write 256KB (MB/s) | 196.7 | 182.6 -7% | 204.9 4% | 203.4 3% | 195.3 -1% | 193.2 -2% | 300 ? 53% | 1932 ? 882% |
| Random Read 4KB (MB/s) | 144.3 | 173.1 20% | 129.7 -10% | 138.1 -4% | 170.6 18% | 78.2 -46% | 154.7 ? 7% | 310 ? 115% |
| Random Write 4KB (MB/s) | 160.5 | 149.8 -7% | 22.74 -86% | 20 -88% | 17.84 -89% | 10.21 -94% | 131.1 ? -18% | 362 ? 126% |
| Real Racing 3 | |||
| Instellingen | Waarde | ||
| high | 51 fps | ||
| World of Tanks Blitz | |||
| Instellingen | Waarde | ||
| high, 0xAA, 0xAF | 60 fps | ||
| Shadow Fight 3 | |||
| Instellingen | Waarde | ||
| minimal | 60 fps | ||
(+) De maximumtemperatuur aan de bovenzijde bedraagt 35.6 °C / 96 F, vergeleken met het gemiddelde van 35.3 °C / 96 F, variërend van 21.9 tot 247 °C voor de klasse Smartphone.
(+) De bodem warmt op tot een maximum van 34.3 °C / 94 F, vergeleken met een gemiddelde van 34 °C / 93 F
(+) Bij onbelast gebruik bedraagt de gemiddelde temperatuur voor de bovenzijde 29.6 °C / 85 F, vergeleken met het apparaatgemiddelde van 32.9 °C / 91 F.
Huawei P20 Pro audioanalyse
(+) | luidsprekers kunnen relatief luid spelen (84.9 dB)
Bas 100 - 315 Hz
(-) | bijna geen lage tonen - gemiddeld 21% lager dan de mediaan
(±) | lineariteit van de lage tonen is gemiddeld (9.5% delta ten opzichte van de vorige frequentie)
Midden 400 - 2000 Hz
(±) | hogere middens - gemiddeld 5% hoger dan de mediaan
(±) | lineariteit van de middentonen is gemiddeld (7.2% delta ten opzichte van de vorige frequentie)
Hoog 2 - 16 kHz
(±) | higher highs - on average 5.6% higher than median
(+) | de hoge tonen zijn lineair (4.5% delta naar de vorige frequentie)
Algemeen 100 - 16.000 Hz
(±) | lineariteit van het totale geluid is gemiddeld (20.1% verschil met de mediaan)
Vergeleken met dezelfde klasse
» 33% van alle geteste apparaten in deze klasse waren beter, 9% vergelijkbaar, 58% slechter
» De beste had een delta van 11%, het gemiddelde was 34%, de slechtste was 134%
Vergeleken met alle geteste toestellen
» 52% van alle geteste apparaten waren beter, 8% gelijk, 40% slechter
» De beste had een delta van 4%, het gemiddelde was 24%, de slechtste was 134%
Samsung Galaxy S9 Plus audioanalyse
(+) | luidsprekers kunnen relatief luid spelen (85.6 dB)
Bas 100 - 315 Hz
(-) | bijna geen lage tonen - gemiddeld 22.8% lager dan de mediaan
(±) | lineariteit van de lage tonen is gemiddeld (12.2% delta ten opzichte van de vorige frequentie)
Midden 400 - 2000 Hz
(+) | evenwichtige middens - slechts 3.2% verwijderd van de mediaan
(+) | de middentonen zijn lineair (3.2% delta ten opzichte van de vorige frequentie)
Hoog 2 - 16 kHz
(+) | evenwichtige hoogtepunten - slechts 4.4% verwijderd van de mediaan
(+) | de hoge tonen zijn lineair (4.8% delta naar de vorige frequentie)
Algemeen 100 - 16.000 Hz
(±) | lineariteit van het totale geluid is gemiddeld (17.3% verschil met de mediaan)
Vergeleken met dezelfde klasse
» 12% van alle geteste apparaten in deze klasse waren beter, 8% vergelijkbaar, 80% slechter
» De beste had een delta van 11%, het gemiddelde was 34%, de slechtste was 134%
Vergeleken met alle geteste toestellen
» 32% van alle geteste apparaten waren beter, 8% gelijk, 59% slechter
» De beste had een delta van 4%, het gemiddelde was 24%, de slechtste was 134%
Apple iPhone X audioanalyse
(+) | luidsprekers kunnen relatief luid spelen (85.3 dB)
Bas 100 - 315 Hz
(±) | verminderde zeebaars - gemiddeld 14.9% lager dan de mediaan
(±) | lineariteit van de lage tonen is gemiddeld (9.4% delta ten opzichte van de vorige frequentie)
Midden 400 - 2000 Hz
(+) | evenwichtige middens - slechts 3.4% verwijderd van de mediaan
(+) | de middentonen zijn lineair (5.1% delta ten opzichte van de vorige frequentie)
Hoog 2 - 16 kHz
(±) | higher highs - on average 7.3% higher than median
(+) | de hoge tonen zijn lineair (4.6% delta naar de vorige frequentie)
Algemeen 100 - 16.000 Hz
(±) | lineariteit van het totale geluid is gemiddeld (19% verschil met de mediaan)
Vergeleken met dezelfde klasse
» 24% van alle geteste apparaten in deze klasse waren beter, 9% vergelijkbaar, 66% slechter
» De beste had een delta van 11%, het gemiddelde was 34%, de slechtste was 134%
Vergeleken met alle geteste toestellen
» 45% van alle geteste apparaten waren beter, 7% gelijk, 48% slechter
» De beste had een delta van 4%, het gemiddelde was 24%, de slechtste was 134%
| Uit / Standby | |
| Inactief | |
| Belasting |
|
Key:
min: | |
| Huawei P20 Pro 4000 mAh | Huawei P10 Plus 3750 mAh | Samsung Galaxy S9 Plus 3500 mAh | Apple iPhone X 2716 mAh | HTC U11 Plus 3930 mAh | Google Pixel 2 XL 3520 mAh | LG V30 3300 mAh | Gemiddeld HiSilicon Kirin 970 | Gemiddelde van klas Smartphone | |
|---|---|---|---|---|---|---|---|---|---|
| Power Consumption | -132% | -21% | -66% | -55% | -74% | -44% | -88% | -107% | |
| Idle Minimum * (Watt) | 0.84 | 1.03 -23% | 0.68 19% | 1.03 -23% | 0.51 39% | 1.28 -52% | 0.72 14% | 0.978 ? -16% | 0.875 ? -4% |
| Idle Average * (Watt) | 1.54 | 2.61 -69% | 0.95 38% | 2.4 -56% | 1.62 -5% | 1.87 -21% | 1.37 11% | 2.12 ? -38% | 1.47 ? 5% |
| Idle Maximum * (Watt) | 1.57 | 2.83 -80% | 1.09 31% | 2.6 -66% | 1.87 -19% | 1.89 -20% | 1.41 10% | 2.51 ? -60% | 1.659 ? -6% |
| Load Average * (Watt) | 2.47 | 7.03 -185% | 4.58 -85% | 2.96 -20% | 3.92 -59% | 3.73 -51% | 3.46 -40% | 5.01 ? -103% | 6.8 ? -175% |
| Load Maximum * (Watt) | 2.49 | 10.08 -305% | 5.16 -107% | 6.6 -165% | 8.27 -232% | 8.08 -224% | 7.83 -214% | 8.1 ? -225% | 11.3 ? -354% |
* ... kleiner is beter
| Huawei P20 Pro 4000 mAh | Huawei P10 Plus 3750 mAh | Samsung Galaxy S9 Plus 3500 mAh | HTC U11 Plus 3930 mAh | Apple iPhone X 2716 mAh | Google Pixel 2 XL 3520 mAh | LG V30 3300 mAh | OnePlus 5T 3300 mAh | Huawei Mate 10 Pro 4000 mAh | |
|---|---|---|---|---|---|---|---|---|---|
| Batterijduur | -14% | -25% | -16% | -29% | -13% | -1% | -7% | 11% | |
| Reader / Idle (h) | 28.8 | 27.6 -4% | 22.4 -22% | 27.1 -6% | 21.5 -25% | 28.4 -1% | 31.9 11% | 29.2 1% | 29.1 1% |
| H.264 (h) | 13.1 | 12.6 -4% | 11.2 -15% | 10.2 -22% | 10.6 -19% | 11.2 -15% | 13.7 5% | 13.3 2% | 15.5 18% |
| WiFi v1.3 (h) | 12.4 | 12.7 2% | 8.7 -30% | 10.1 -19% | 9.4 -24% | 9.7 -22% | 12.9 4% | 12 -3% | 13.6 10% |
| Load (h) | 5.8 | 2.9 -50% | 4 -31% | 4.9 -16% | 3 -48% | 5 -14% | 4.5 -22% | 4.3 -26% | 6.6 14% |
Pro
Contra
Voor het volledige, Engelse testrapport, klik hier.
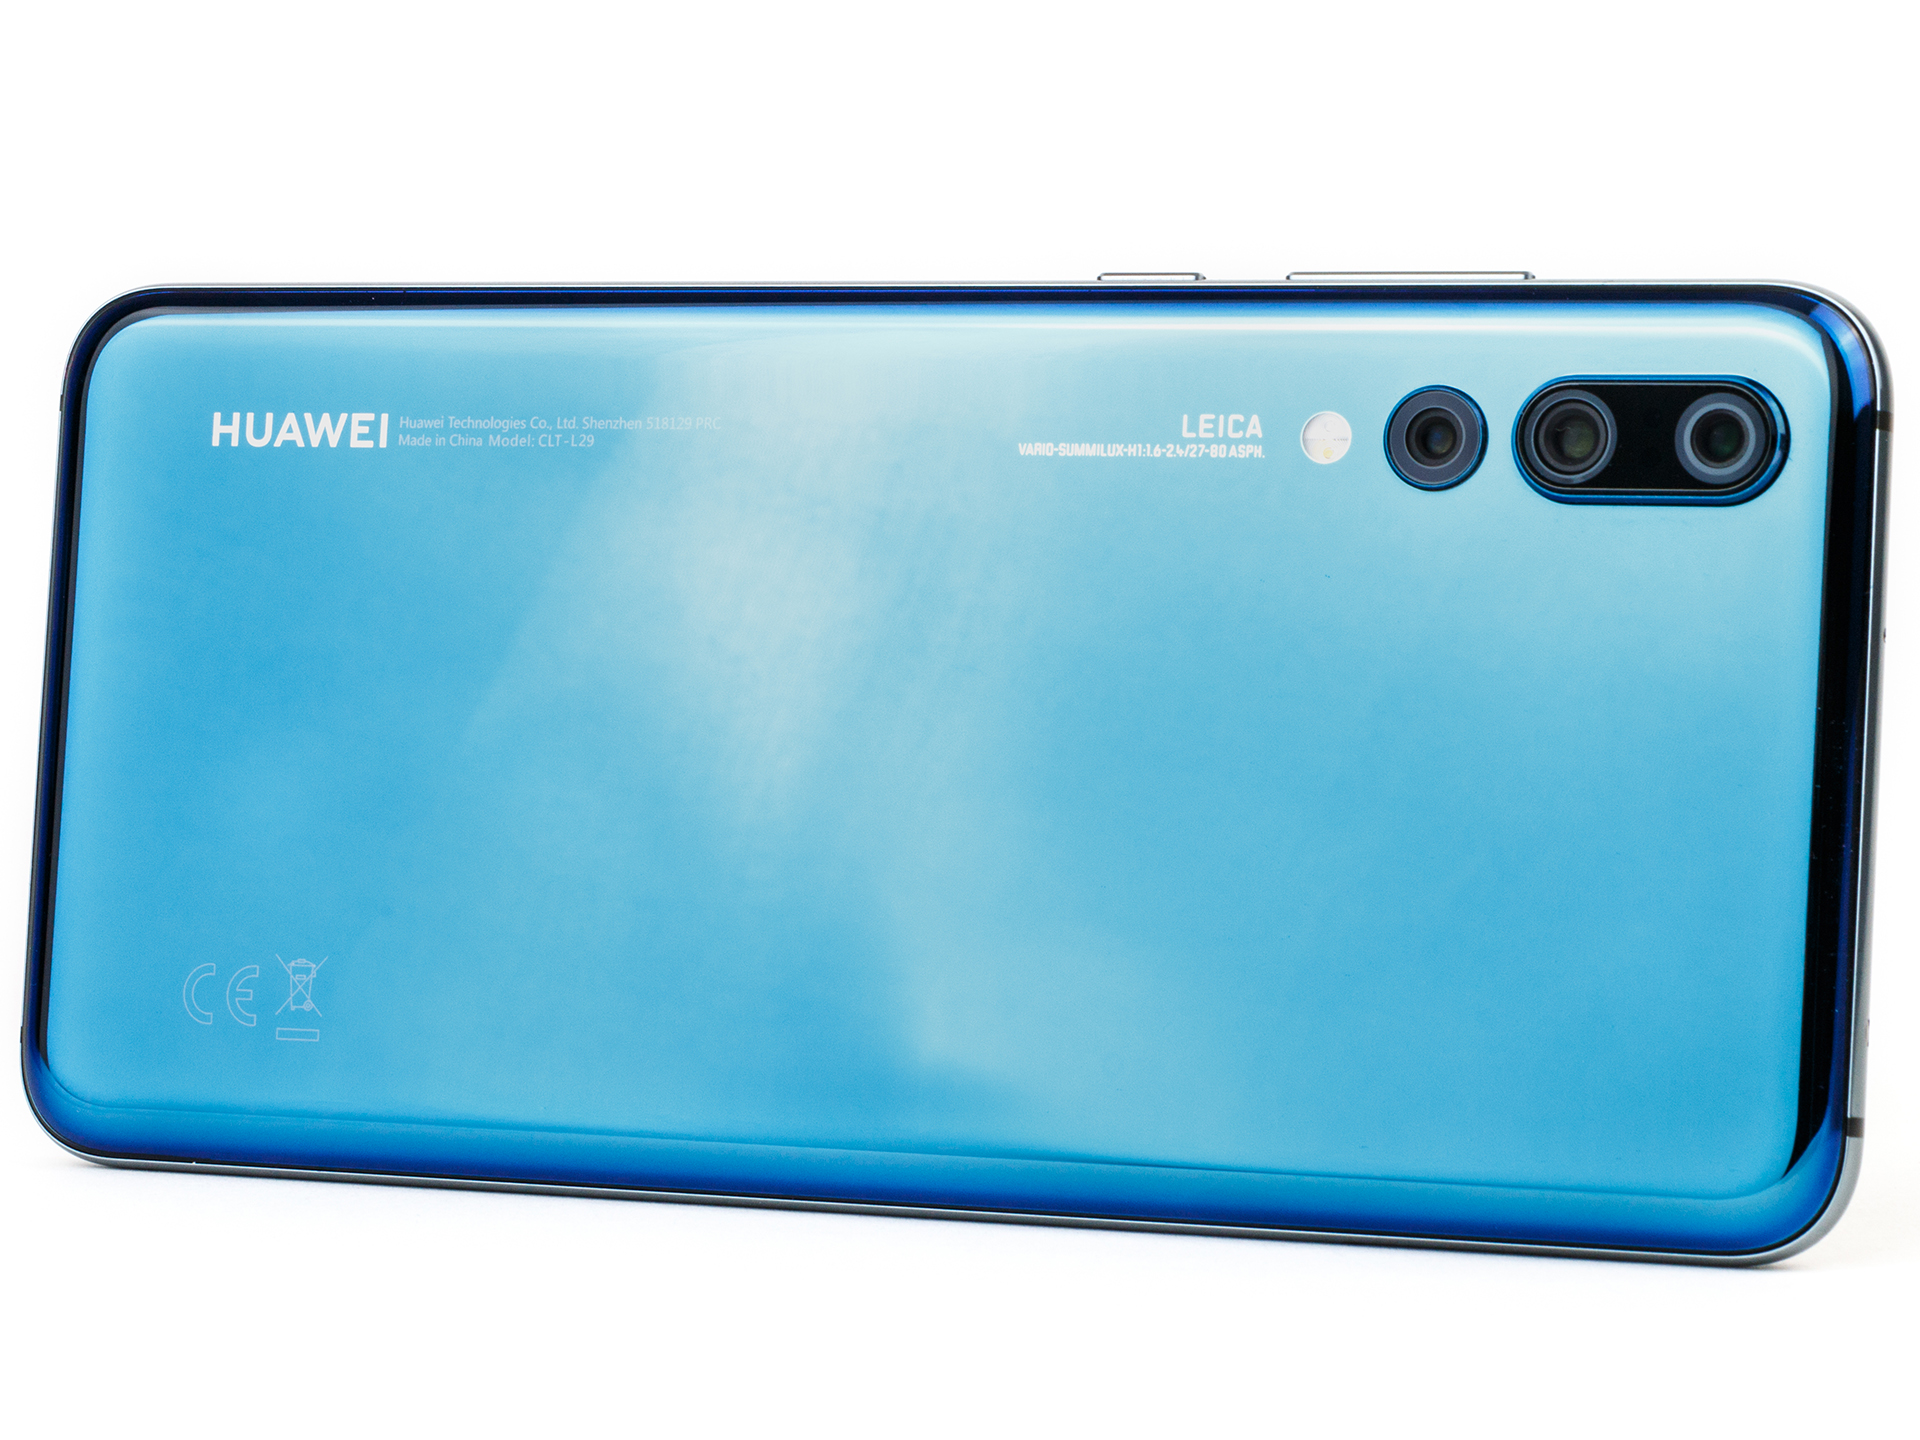
De Huawei P20 Pro is een uitstekende smartphone. Het apparaat is grotendeels gebaseerd op de Mate 10 Pro, welke een aantal voordelen heeft ten opzichte van de P20 Pro. De Mate 10 Pro heeft zo een stijlvoller ontwerp, langere looptijden en betere gesprekskwaliteit voor €250 minder. De grote troef van de P20 Pro is de Leica Triple Camera, waarmee uitzonderlijk mooie beelden gemaakt kunnen worden.
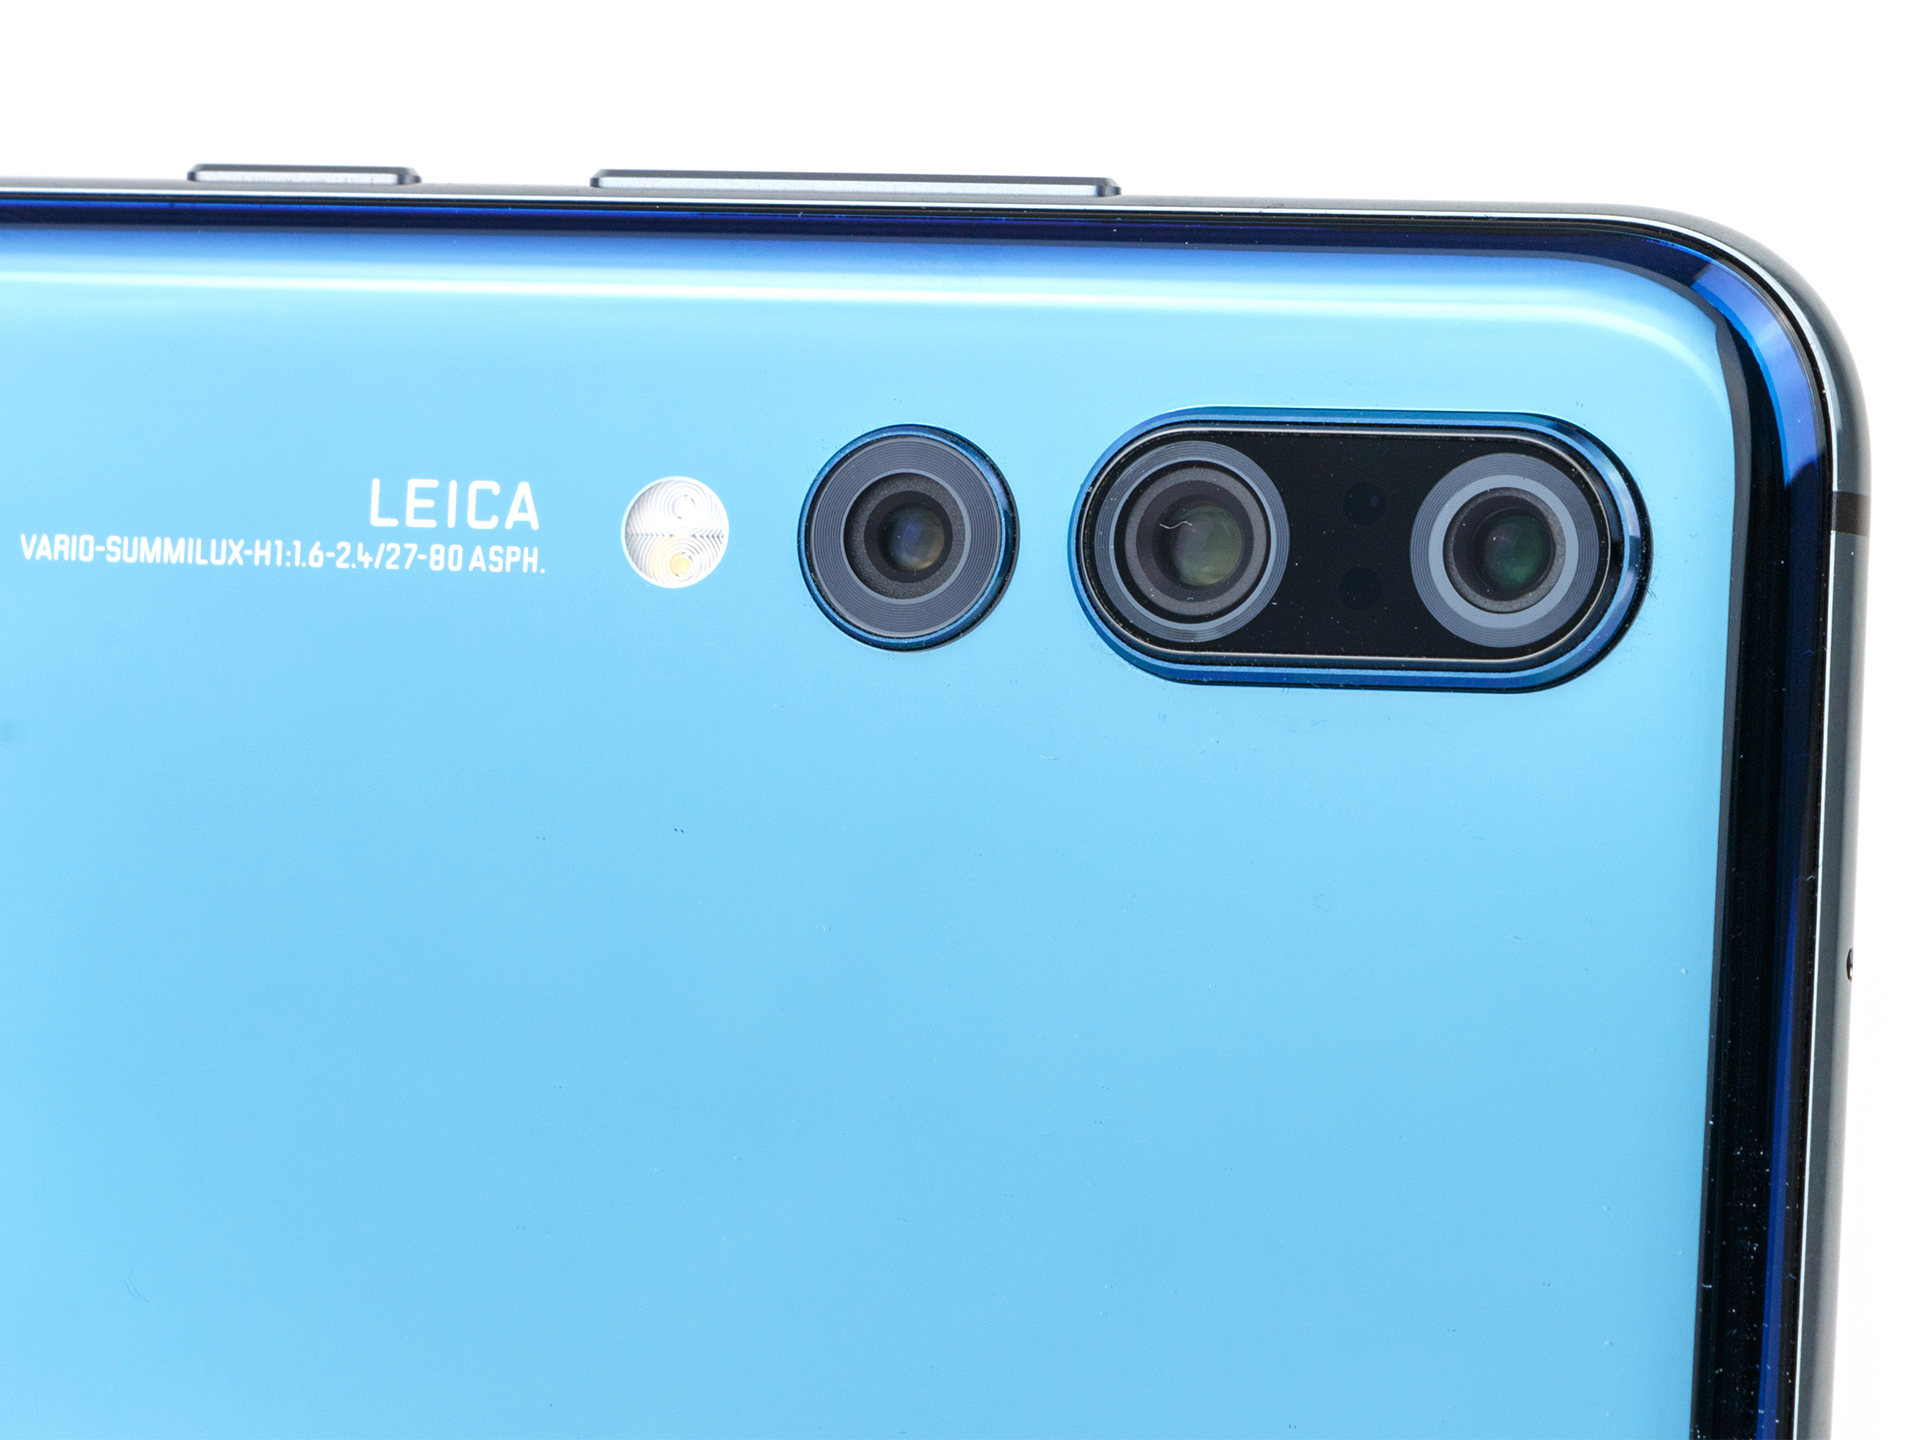
Huawei legt met de Leica Triple Camera de lat van mobiele fotografie hoger voor de concurrentie.
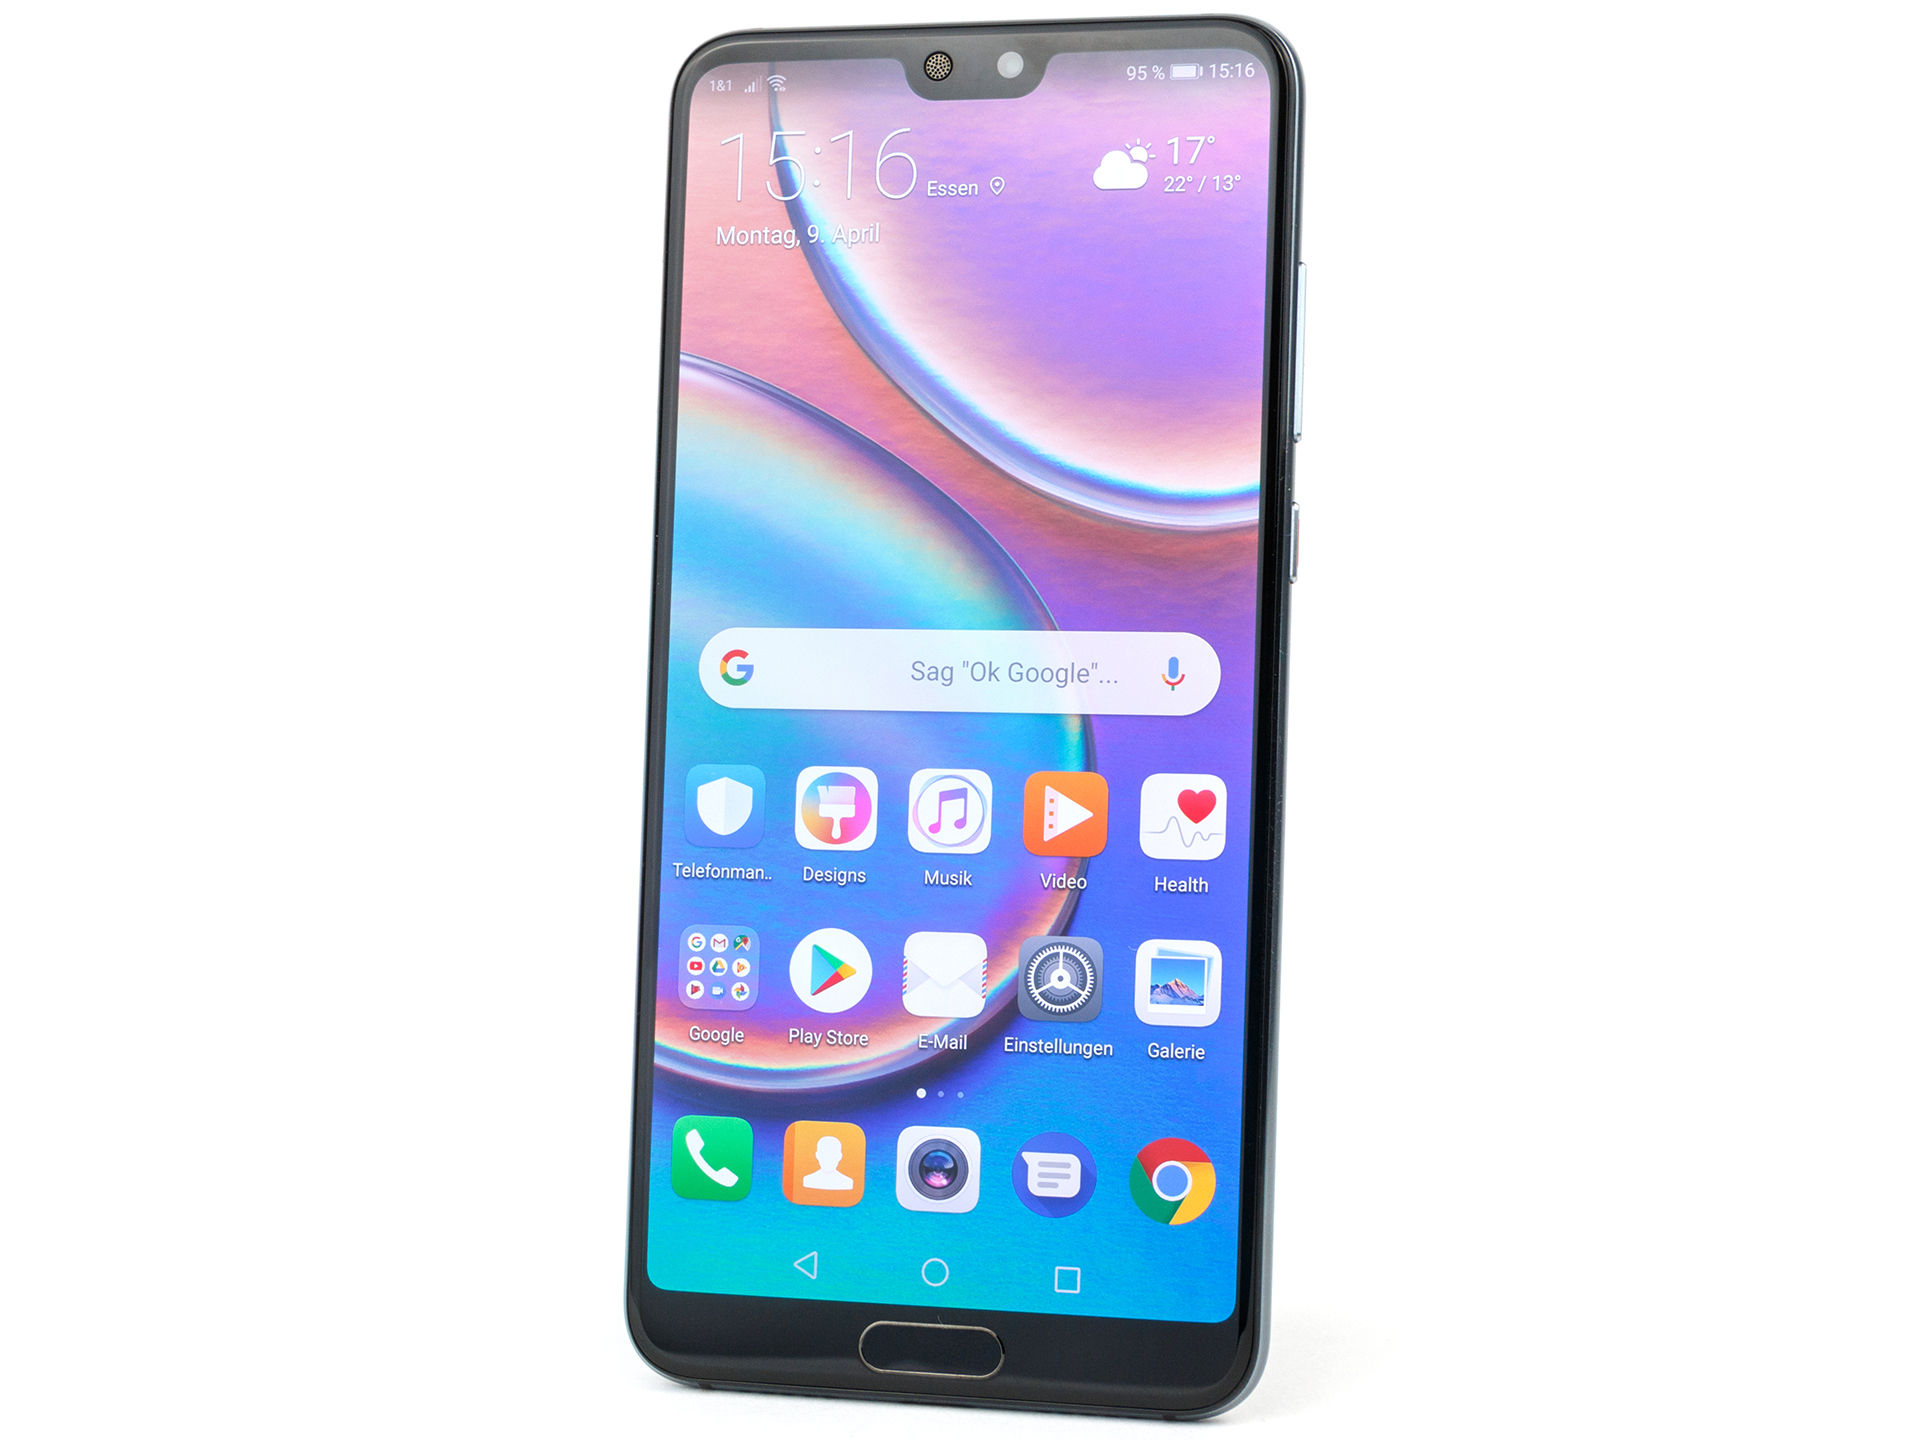
De Huawei P20 Pro heeft een naast de uitstekende camera nog meer hoogwaardige hardware. De Kirin 970 is een snelle SoC, er is ruim voldoende interne opslagruimte, het apparaat heeft een snelle USB poort, vlotte MIMO Wi-Fi, IP67 certificatie, sterke LTE prestaties en aptX HD ondersteuning. Dit pakket wordt afgerond door een grote 4000 mAh batterij en een indrukwekkend beeldscherm. Er zijn echter ook enkele nadelen het vermelden waard. De P20 Pro levert teleurstellende prestaties op een 2.4 GHz Wi-Fi netwerk en ook een 3.5 mm koptelefoon poort en uitbreidbaar geheugen zouden gewenst zijn. Ook verwachten we een 144op beeldscherm voor een apparaat in deze prijsklasse.
De kwaliteit van de Leica Triple Camera laat alle hierboven genoemde gebreken in het niet vallen. De P20 Pro maakt niet alleen geweldige beelden, maar de software is flexibel genoeg om in alle omstandigheden te presteren. Het opnemen van video´s laat ruimte over voor verbetering, hoewel dit van minder groot belang is. Zo kan de P20 Pro niet 60 FPS op Ultra HD resolutie opnemen en is ook de 60 FPS op Full HD resolutie niet indrukwekkend. Alles bij elkaar heeft de P20 Pro de beste camera van alle smartphones momenteel verkrijgbaar.
Huawei P20 Pro
- 19-04-2018 v6 (old)
Daniel Schmidt
Price comparison
