Kort testrapport Huawei P10 Plus Smartphone

| Networking | |
| iperf3 transmit AX12 | |
| Samsung Galaxy S8 Plus | |
| Huawei P10 | |
| OnePlus 3T | |
| LG G6 | |
| Huawei P10 Plus | |
| iperf3 receive AX12 | |
| Samsung Galaxy S8 Plus | |
| LG G6 | |
| Huawei P10 | |
| OnePlus 3T | |
| Huawei P10 Plus | |


| |||||||||||||||||||||||||
Helderheidsverdeling: 92 %
Helderheid in Batterij-modus: 568 cd/m²
Contrast: 1321:1 (Zwart: 0.43 cd/m²)
ΔE ColorChecker Calman: 2.4 | ∀{0.5-29.43 Ø4.71}
ΔE Greyscale Calman: 2.5 | ∀{0.09-98 Ø4.96}
Gamma: 2.37
CCT: 6779 K
| Huawei P10 Plus LTPS, 2560x1440, 5.5" | Apple iPhone 7 Plus IPS, 1920x1080, 5.5" | Huawei P10 LTPS, 1920x1080, 5.1" | OnePlus 3T Optic-AMOLED, 1920x1080, 5.5" | Samsung Galaxy S8 Plus Super AMOLED, 2960x1440, 6.2" | LG G6 IPS LCD, 2880x1440, 5.7" | Lenovo Moto Z AMOLED, 2560x1440, 5.5" | |
|---|---|---|---|---|---|---|---|
| Screen | 19% | -41% | -122% | 13% | -21% | -11% | |
| Brightness middle (cd/m²) | 568 | 557 -2% | 547 -4% | 421 -26% | 560 -1% | 646 14% | 485 -15% |
| Brightness (cd/m²) | 562 | 553 -2% | 556 -1% | 430 -23% | 562 0% | 611 9% | 490 -13% |
| Brightness Distribution (%) | 92 | 97 5% | 86 -7% | 84 -9% | 93 1% | 89 -3% | 92 0% |
| Black Level * (cd/m²) | 0.43 | 0.35 19% | 0.43 -0% | 0.23 47% | |||
| Contrast (:1) | 1321 | 1591 20% | 1272 -4% | 2809 113% | |||
| Colorchecker dE 2000 * | 2.4 | 1.4 42% | 4.8 -100% | 7.1 -196% | 1.7 29% | 4.5 -88% | 2.1 12% |
| Colorchecker dE 2000 max. * | 3.8 | 3.1 18% | 8.8 -132% | 15.3 -303% | 3.4 11% | 8.3 -118% | 5.5 -45% |
| Greyscale dE 2000 * | 2.5 | 1.3 48% | 4.5 -80% | 6.8 -172% | 1.6 36% | 6 -140% | 2.6 -4% |
| Gamma | 2.37 93% | 2.21 100% | 2.39 92% | 2.23 99% | 2.13 103% | 2.27 97% | 2.23 99% |
| CCT | 6779 96% | 6667 97% | 7194 90% | 7866 83% | 6435 101% | 7996 81% | 6843 95% |
| Color Space (Percent of AdobeRGB 1998) (%) | 63.1 | 81.57 | 67.74 | 88.14 | |||
| Color Space (Percent of sRGB) (%) | 99.83 | 99.87 | 99.05 | 100 |
* ... kleiner is beter
Screen Flickering / PWM (Pulse-Width Modulation)
| Screen flickering / PWM niet waargenomen | 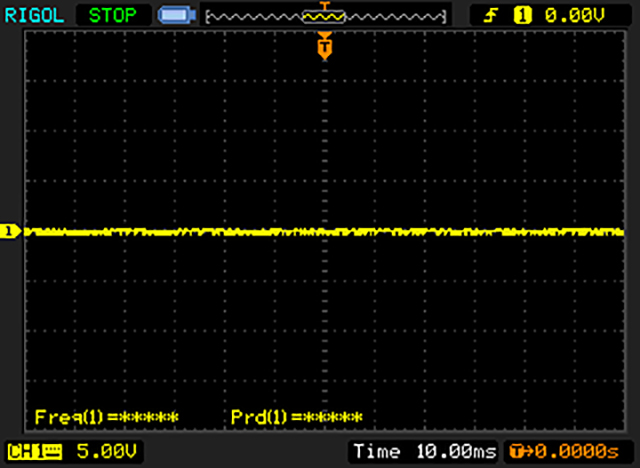 | ||
Ter vergelijking: 52 % van alle geteste toestellen maakten geen gebruik van PWM om de schermhelderheid te verlagen. Als het wel werd gebruikt, werd een gemiddelde van 7748 (minimum: 5 - maximum: 343500) Hz waargenomen. | |||
Responstijd Scherm
| ↔ Responstijd Zwart naar Wit | ||
|---|---|---|
| 17.6 ms ... stijging ↗ en daling ↘ gecombineerd | ↗ 5.2 ms stijging | 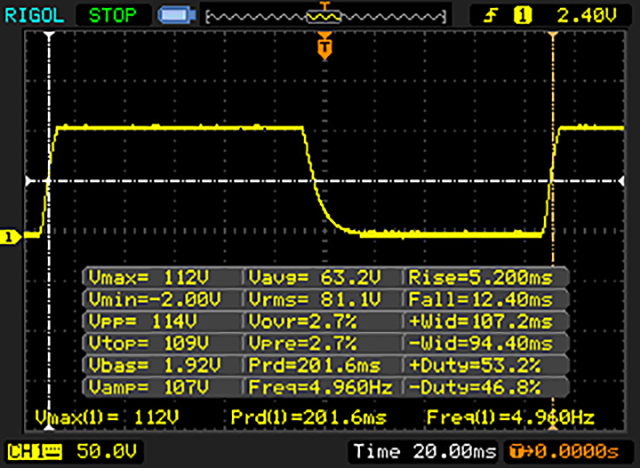 |
| ↘ 12.4 ms daling | ||
| Het scherm vertoonde prima responstijden in onze tests maar is misschien wat te traag voor competitieve games. Ter vergelijking: alle testtoestellen variëren van 0.1 (minimum) tot 240 (maximum) ms. » 40 % van alle toestellen zijn beter. Dit betekent dat de gemeten responstijd beter is dan het gemiddelde (19.8 ms) van alle geteste toestellen. | ||
| ↔ Responstijd 50% Grijs naar 80% Grijs | ||
| 38 ms ... stijging ↗ en daling ↘ gecombineerd | ↗ 17.6 ms stijging | 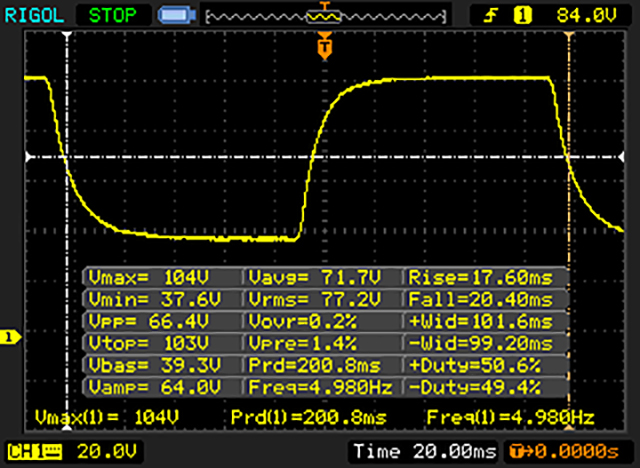 |
| ↘ 20.4 ms daling | ||
| Het scherm vertoonde trage responstijden in onze tests en is misschien te traag voor games. Ter vergelijking: alle testtoestellen variëren van 0.165 (minimum) tot 636 (maximum) ms. » 55 % van alle toestellen zijn beter. Dit betekent dat de gemeten responstijd slechter is dan het gemiddelde (30.9 ms) van alle geteste toestellen. | ||
| AnTuTu v6 - Total Score (sorteer op waarde) | |
| Huawei P10 Plus | |
| Apple iPhone 7 Plus | |
| Huawei P10 | |
| OnePlus 3T | |
| Samsung Galaxy S8 Plus | |
| LG G6 | |
| Lenovo Moto Z | |
| Geekbench 4.4 | |
| 64 Bit Single-Core Score (sorteer op waarde) | |
| Huawei P10 Plus | |
| Huawei P10 | |
| Samsung Galaxy S8 Plus | |
| LG G6 | |
| 64 Bit Multi-Core Score (sorteer op waarde) | |
| Huawei P10 Plus | |
| Huawei P10 | |
| Samsung Galaxy S8 Plus | |
| LG G6 | |
| GFXBench (DX / GLBenchmark) 2.7 | |
| T-Rex Onscreen (sorteer op waarde) | |
| Huawei P10 Plus | |
| Apple iPhone 7 Plus | |
| Huawei P10 | |
| OnePlus 3T | |
| Samsung Galaxy S8 Plus | |
| LG G6 | |
| Lenovo Moto Z | |
| 1920x1080 T-Rex Offscreen (sorteer op waarde) | |
| Huawei P10 Plus | |
| Apple iPhone 7 Plus | |
| Huawei P10 | |
| OnePlus 3T | |
| Samsung Galaxy S8 Plus | |
| LG G6 | |
| Lenovo Moto Z | |
| GFXBench 3.0 | |
| on screen Manhattan Onscreen OGL (sorteer op waarde) | |
| Huawei P10 Plus | |
| Apple iPhone 7 Plus | |
| Huawei P10 | |
| OnePlus 3T | |
| Samsung Galaxy S8 Plus | |
| LG G6 | |
| Lenovo Moto Z | |
| 1920x1080 1080p Manhattan Offscreen (sorteer op waarde) | |
| Huawei P10 Plus | |
| Apple iPhone 7 Plus | |
| Huawei P10 | |
| OnePlus 3T | |
| Samsung Galaxy S8 Plus | |
| LG G6 | |
| Lenovo Moto Z | |
| GFXBench 3.1 | |
| on screen Manhattan ES 3.1 Onscreen (sorteer op waarde) | |
| Huawei P10 Plus | |
| Apple iPhone 7 Plus | |
| Huawei P10 | |
| OnePlus 3T | |
| Samsung Galaxy S8 Plus | |
| LG G6 | |
| Lenovo Moto Z | |
| 1920x1080 Manhattan ES 3.1 Offscreen (sorteer op waarde) | |
| Huawei P10 Plus | |
| Apple iPhone 7 Plus | |
| Huawei P10 | |
| OnePlus 3T | |
| Samsung Galaxy S8 Plus | |
| LG G6 | |
| Lenovo Moto Z | |
| PCMark for Android - Work performance score (sorteer op waarde) | |
| Huawei P10 Plus | |
| Huawei P10 | |
| OnePlus 3T | |
| Samsung Galaxy S8 Plus | |
| LG G6 | |
| Lenovo Moto Z | |
| Octane V2 - Total Score (sorteer op waarde) | |
| Huawei P10 Plus | |
| Apple iPhone 7 Plus | |
| Huawei P10 | |
| OnePlus 3T | |
| Samsung Galaxy S8 Plus | |
| LG G6 | |
| Lenovo Moto Z | |
| Mozilla Kraken 1.1 - Total (sorteer op waarde) | |
| Huawei P10 Plus | |
| Apple iPhone 7 Plus | |
| Huawei P10 | |
| OnePlus 3T | |
| Samsung Galaxy S8 Plus | |
| LG G6 | |
| Lenovo Moto Z | |
| WebXPRT 2015 - Overall (sorteer op waarde) | |
| Huawei P10 Plus | |
| Apple iPhone 7 Plus | |
| Huawei P10 | |
| OnePlus 3T | |
| Samsung Galaxy S8 Plus | |
| LG G6 | |
| Lenovo Moto Z | |
| JetStream 1.1 - 1.1 Total (sorteer op waarde) | |
| Huawei P10 Plus | |
| Apple iPhone 7 Plus | |
| Huawei P10 | |
| OnePlus 3T | |
| Samsung Galaxy S8 Plus | |
| LG G6 | |
| Lenovo Moto Z | |
* ... kleiner is beter
| Huawei P10 Plus | Huawei P10 | OnePlus 3T | Samsung Galaxy S8 Plus | LG G6 | Lenovo Moto Z | |
|---|---|---|---|---|---|---|
| AndroBench 3-5 | 0% | -32% | -0% | -18% | -8% | |
| Sequential Read 256KB (MB/s) | 733 | 738 1% | 436.4 -40% | 788 8% | 428.7 -42% | 439.7 -40% |
| Sequential Write 256KB (MB/s) | 182.6 | 189.8 4% | 165.3 -9% | 194.2 6% | 122.8 -33% | 168.3 -8% |
| Random Read 4KB (MB/s) | 173.1 | 168.4 -3% | 123.6 -29% | 127.2 -27% | 95.2 -45% | 117.2 -32% |
| Random Write 4KB (MB/s) | 149.8 | 152.3 2% | 74.4 -50% | 15.27 -90% | 16.58 -89% | 74.9 -50% |
| Sequential Read 256KB SDCard (MB/s) | 54 | 54.2 0% | 71.1 32% | 77.6 44% | 78.5 45% | |
| Sequential Write 256KB SDCard (MB/s) | 33.61 | 32.19 -4% | 57.2 70% | 53.3 59% | 45.64 36% |
| Asphalt 8: Airborne | |||
| Instellingen | Waarde | ||
| high | 30 fps | ||
| very low | 30 fps | ||
| Dead Trigger 2 | |||
| Instellingen | Waarde | ||
| high | 56 fps | ||
(-) De maximumtemperatuur aan de bovenzijde bedraagt 49.1 °C / 120 F, vergeleken met het gemiddelde van 35.3 °C / 96 F, variërend van 21.9 tot 247 °C voor de klasse Smartphone.
(±) De bodem warmt op tot een maximum van 44.2 °C / 112 F, vergeleken met een gemiddelde van 34 °C / 93 F
(±) Bij onbelast gebruik bedraagt de gemiddelde temperatuur voor de bovenzijde 37.7 °C / 100 F, vergeleken met het apparaatgemiddelde van 33 °C / 91 F.
Huawei P10 Plus audioanalyse
(±) | luidspreker luidheid is gemiddeld maar goed (75.6 dB)
Bas 100 - 315 Hz
(-) | bijna geen lage tonen - gemiddeld 17.3% lager dan de mediaan
(±) | lineariteit van de lage tonen is gemiddeld (12.4% delta ten opzichte van de vorige frequentie)
Midden 400 - 2000 Hz
(+) | evenwichtige middens - slechts 3.1% verwijderd van de mediaan
(+) | de middentonen zijn lineair (6.9% delta ten opzichte van de vorige frequentie)
Hoog 2 - 16 kHz
(+) | evenwichtige hoogtepunten - slechts 1% verwijderd van de mediaan
(+) | de hoge tonen zijn lineair (3.9% delta naar de vorige frequentie)
Algemeen 100 - 16.000 Hz
(±) | lineariteit van het totale geluid is gemiddeld (16.8% verschil met de mediaan)
Vergeleken met dezelfde klasse
» 9% van alle geteste apparaten in deze klasse waren beter, 7% vergelijkbaar, 84% slechter
» De beste had een delta van 11%, het gemiddelde was 34%, de slechtste was 134%
Vergeleken met alle geteste toestellen
» 30% van alle geteste apparaten waren beter, 7% gelijk, 63% slechter
» De beste had een delta van 4%, het gemiddelde was 23%, de slechtste was 134%
Huawei P10 audioanalyse
(+) | luidsprekers kunnen relatief luid spelen (82.7 dB)
Bas 100 - 315 Hz
(-) | bijna geen lage tonen - gemiddeld 20.9% lager dan de mediaan
(±) | lineariteit van de lage tonen is gemiddeld (12.6% delta ten opzichte van de vorige frequentie)
Midden 400 - 2000 Hz
(+) | evenwichtige middens - slechts 4.2% verwijderd van de mediaan
(+) | de middentonen zijn lineair (6% delta ten opzichte van de vorige frequentie)
Hoog 2 - 16 kHz
(±) | higher highs - on average 5.4% higher than median
(+) | de hoge tonen zijn lineair (4.9% delta naar de vorige frequentie)
Algemeen 100 - 16.000 Hz
(±) | lineariteit van het totale geluid is gemiddeld (23.6% verschil met de mediaan)
Vergeleken met dezelfde klasse
» 54% van alle geteste apparaten in deze klasse waren beter, 8% vergelijkbaar, 38% slechter
» De beste had een delta van 11%, het gemiddelde was 34%, de slechtste was 134%
Vergeleken met alle geteste toestellen
» 71% van alle geteste apparaten waren beter, 6% gelijk, 23% slechter
» De beste had een delta van 4%, het gemiddelde was 23%, de slechtste was 134%
Apple iPhone 7 Plus audioanalyse
(±) | luidspreker luidheid is gemiddeld maar goed (81.4 dB)
Bas 100 - 315 Hz
(-) | bijna geen lage tonen - gemiddeld 24.1% lager dan de mediaan
(±) | lineariteit van de lage tonen is gemiddeld (7.4% delta ten opzichte van de vorige frequentie)
Midden 400 - 2000 Hz
(+) | evenwichtige middens - slechts 4.7% verwijderd van de mediaan
(±) | lineariteit van de middentonen is gemiddeld (7.6% delta ten opzichte van de vorige frequentie)
Hoog 2 - 16 kHz
(+) | evenwichtige hoogtepunten - slechts 4.3% verwijderd van de mediaan
(+) | de hoge tonen zijn lineair (6.9% delta naar de vorige frequentie)
Algemeen 100 - 16.000 Hz
(±) | lineariteit van het totale geluid is gemiddeld (22% verschil met de mediaan)
Vergeleken met dezelfde klasse
» 46% van alle geteste apparaten in deze klasse waren beter, 7% vergelijkbaar, 47% slechter
» De beste had een delta van 11%, het gemiddelde was 34%, de slechtste was 134%
Vergeleken met alle geteste toestellen
» 64% van alle geteste apparaten waren beter, 6% gelijk, 30% slechter
» De beste had een delta van 4%, het gemiddelde was 23%, de slechtste was 134%
| Uit / Standby | |
| Inactief | |
| Belasting |
|
Key:
min: | |
| Huawei P10 Plus 3750 mAh | Apple iPhone 7 Plus 2915 mAh | Huawei P10 3200 mAh | OnePlus 3T 3400 mAh | Samsung Galaxy S8 Plus 3500 mAh | LG G6 3300 mAh | Lenovo Moto Z 2600 mAh | |
|---|---|---|---|---|---|---|---|
| Power Consumption | 23% | 15% | 21% | 46% | 30% | 44% | |
| Idle Minimum * (Watt) | 1.03 | 0.77 25% | 0.83 19% | 0.61 41% | 0.68 34% | 0.62 40% | 0.66 36% |
| Idle Average * (Watt) | 2.61 | 2.04 22% | 2.1 20% | 1.77 32% | 1.13 57% | 1.43 45% | 1.01 61% |
| Idle Maximum * (Watt) | 2.83 | 2.24 21% | 2.18 23% | 1.81 36% | 1.16 59% | 1.48 48% | 1.09 61% |
| Load Average * (Watt) | 7.03 | 4.69 33% | 6.57 7% | 6.67 5% | 4.69 33% | 5.52 21% | 3.97 44% |
| Load Maximum * (Watt) | 10.08 | 8.66 14% | 9.32 8% | 10.98 -9% | 5.24 48% | 10.47 -4% | 8.34 17% |
* ... kleiner is beter
| Huawei P10 Plus 3750 mAh | Apple iPhone 7 Plus 2915 mAh | Huawei P10 3200 mAh | OnePlus 3T 3400 mAh | Samsung Galaxy S8 Plus 3500 mAh | LG G6 3300 mAh | Lenovo Moto Z 2600 mAh | |
|---|---|---|---|---|---|---|---|
| Batterijduur | 7% | -1% | 5% | 12% | 12% | 4% | |
| Reader / Idle (h) | 27.6 | 30.6 11% | 25.7 -7% | 23.7 -14% | 26.1 -5% | 29.8 8% | 22.9 -17% |
| H.264 (h) | 12.6 | 13.6 8% | 9.7 -23% | 13.5 7% | 12.4 -2% | 13 3% | 12.1 -4% |
| WiFi v1.3 (h) | 12.7 | 9.8 -23% | 16.1 27% | 8.2 -35% | 12.3 -3% | 11.5 -9% | 6.8 -46% |
| Load (h) | 2.9 | 3.8 31% | 2.9 0% | 4.7 62% | 4.6 59% | 4.2 45% | 5.3 83% |
Pro
Contra
Voor het volledige, Engelse testrapport, klik hier.
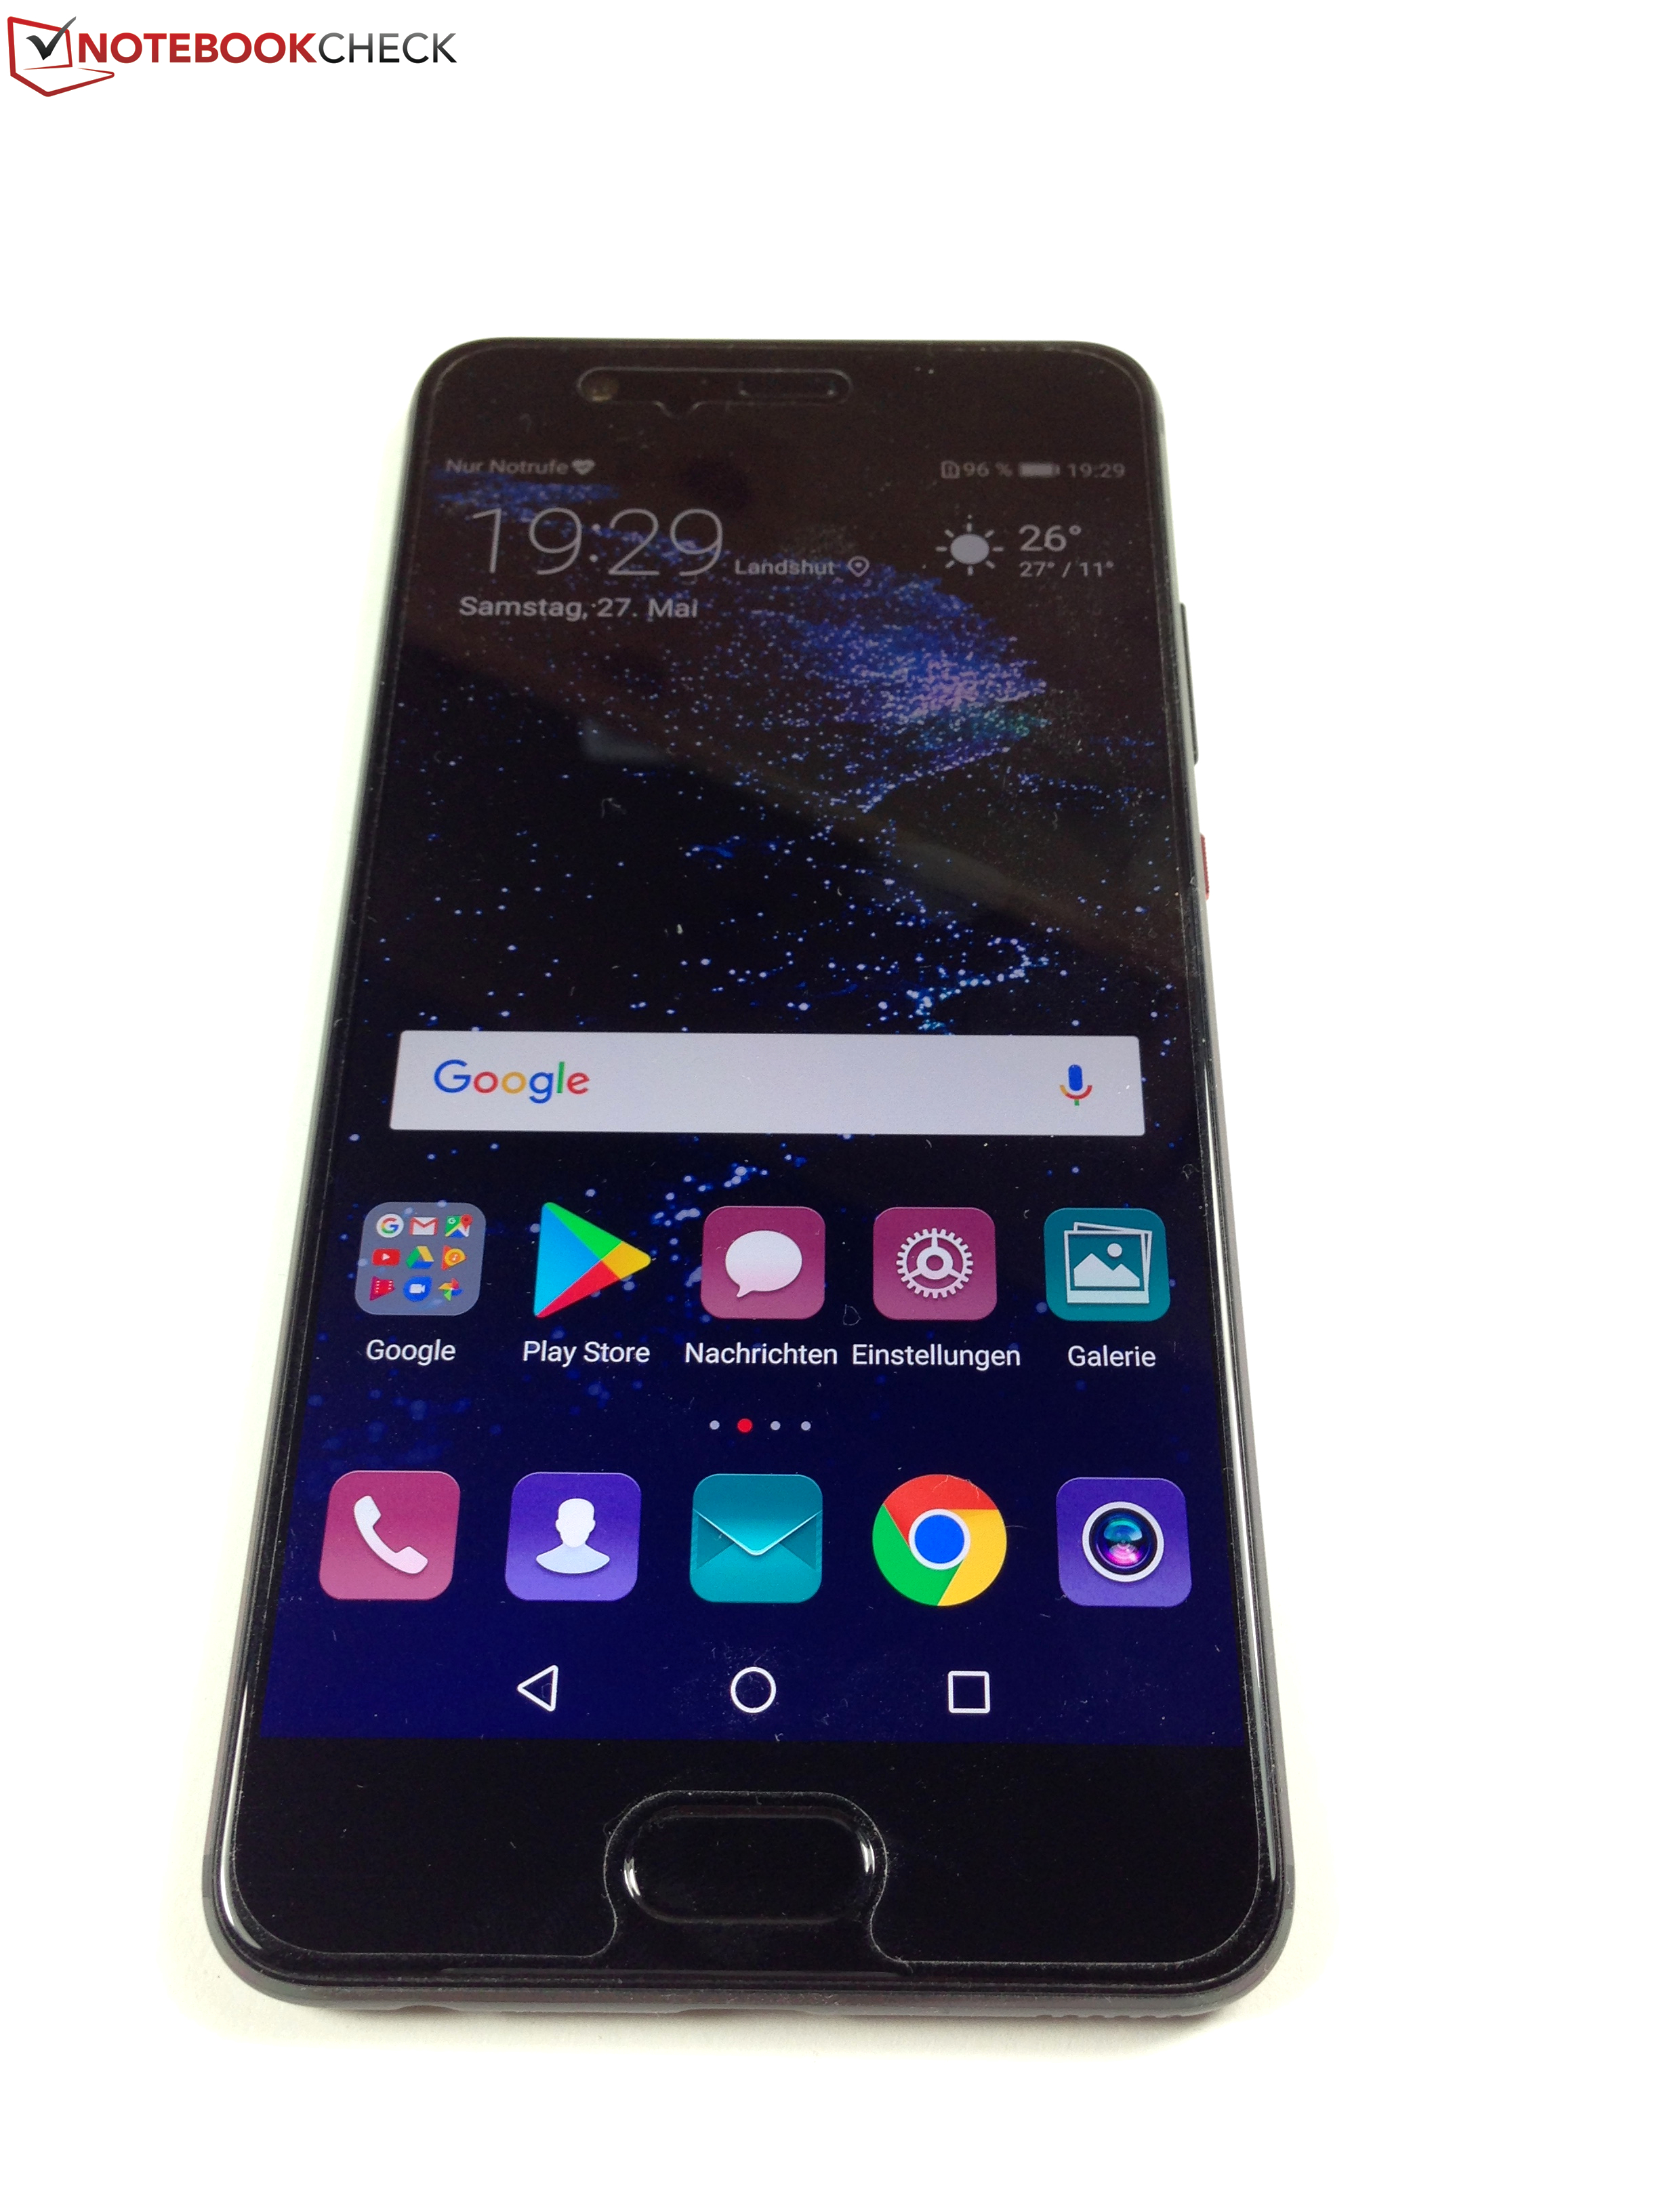
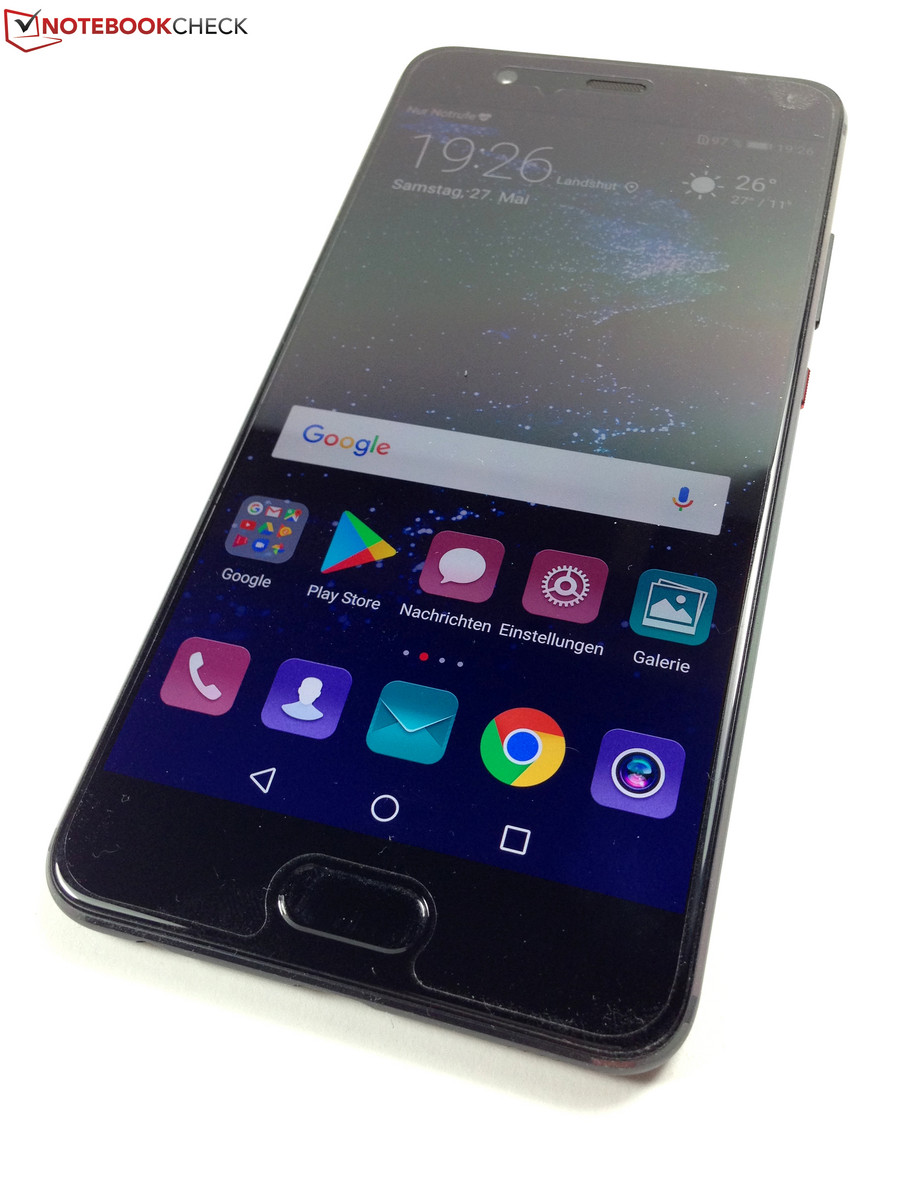
Net zoals de 5,1 inch Huawei's P10 heeft de grotere 5,5 inch Huawei P10 Plus voornamelijk positieve indrukken achtergelaten. De P10 Plus bevat vele hoogwaardige onderdelen, zoals de perfecte behuizing, de UFS 2.1 opslag, LTE Cat.12 en de snelle HiSilicon Kirin 960 SoC.
Zonder twijfel is de Huawei P10 Plus een uitstekende toptelefoon. Echter, het apparaat kan zich ondanks de hoogwaardige componenten niet goed onderscheiden van de goedkopere Huawei P10.
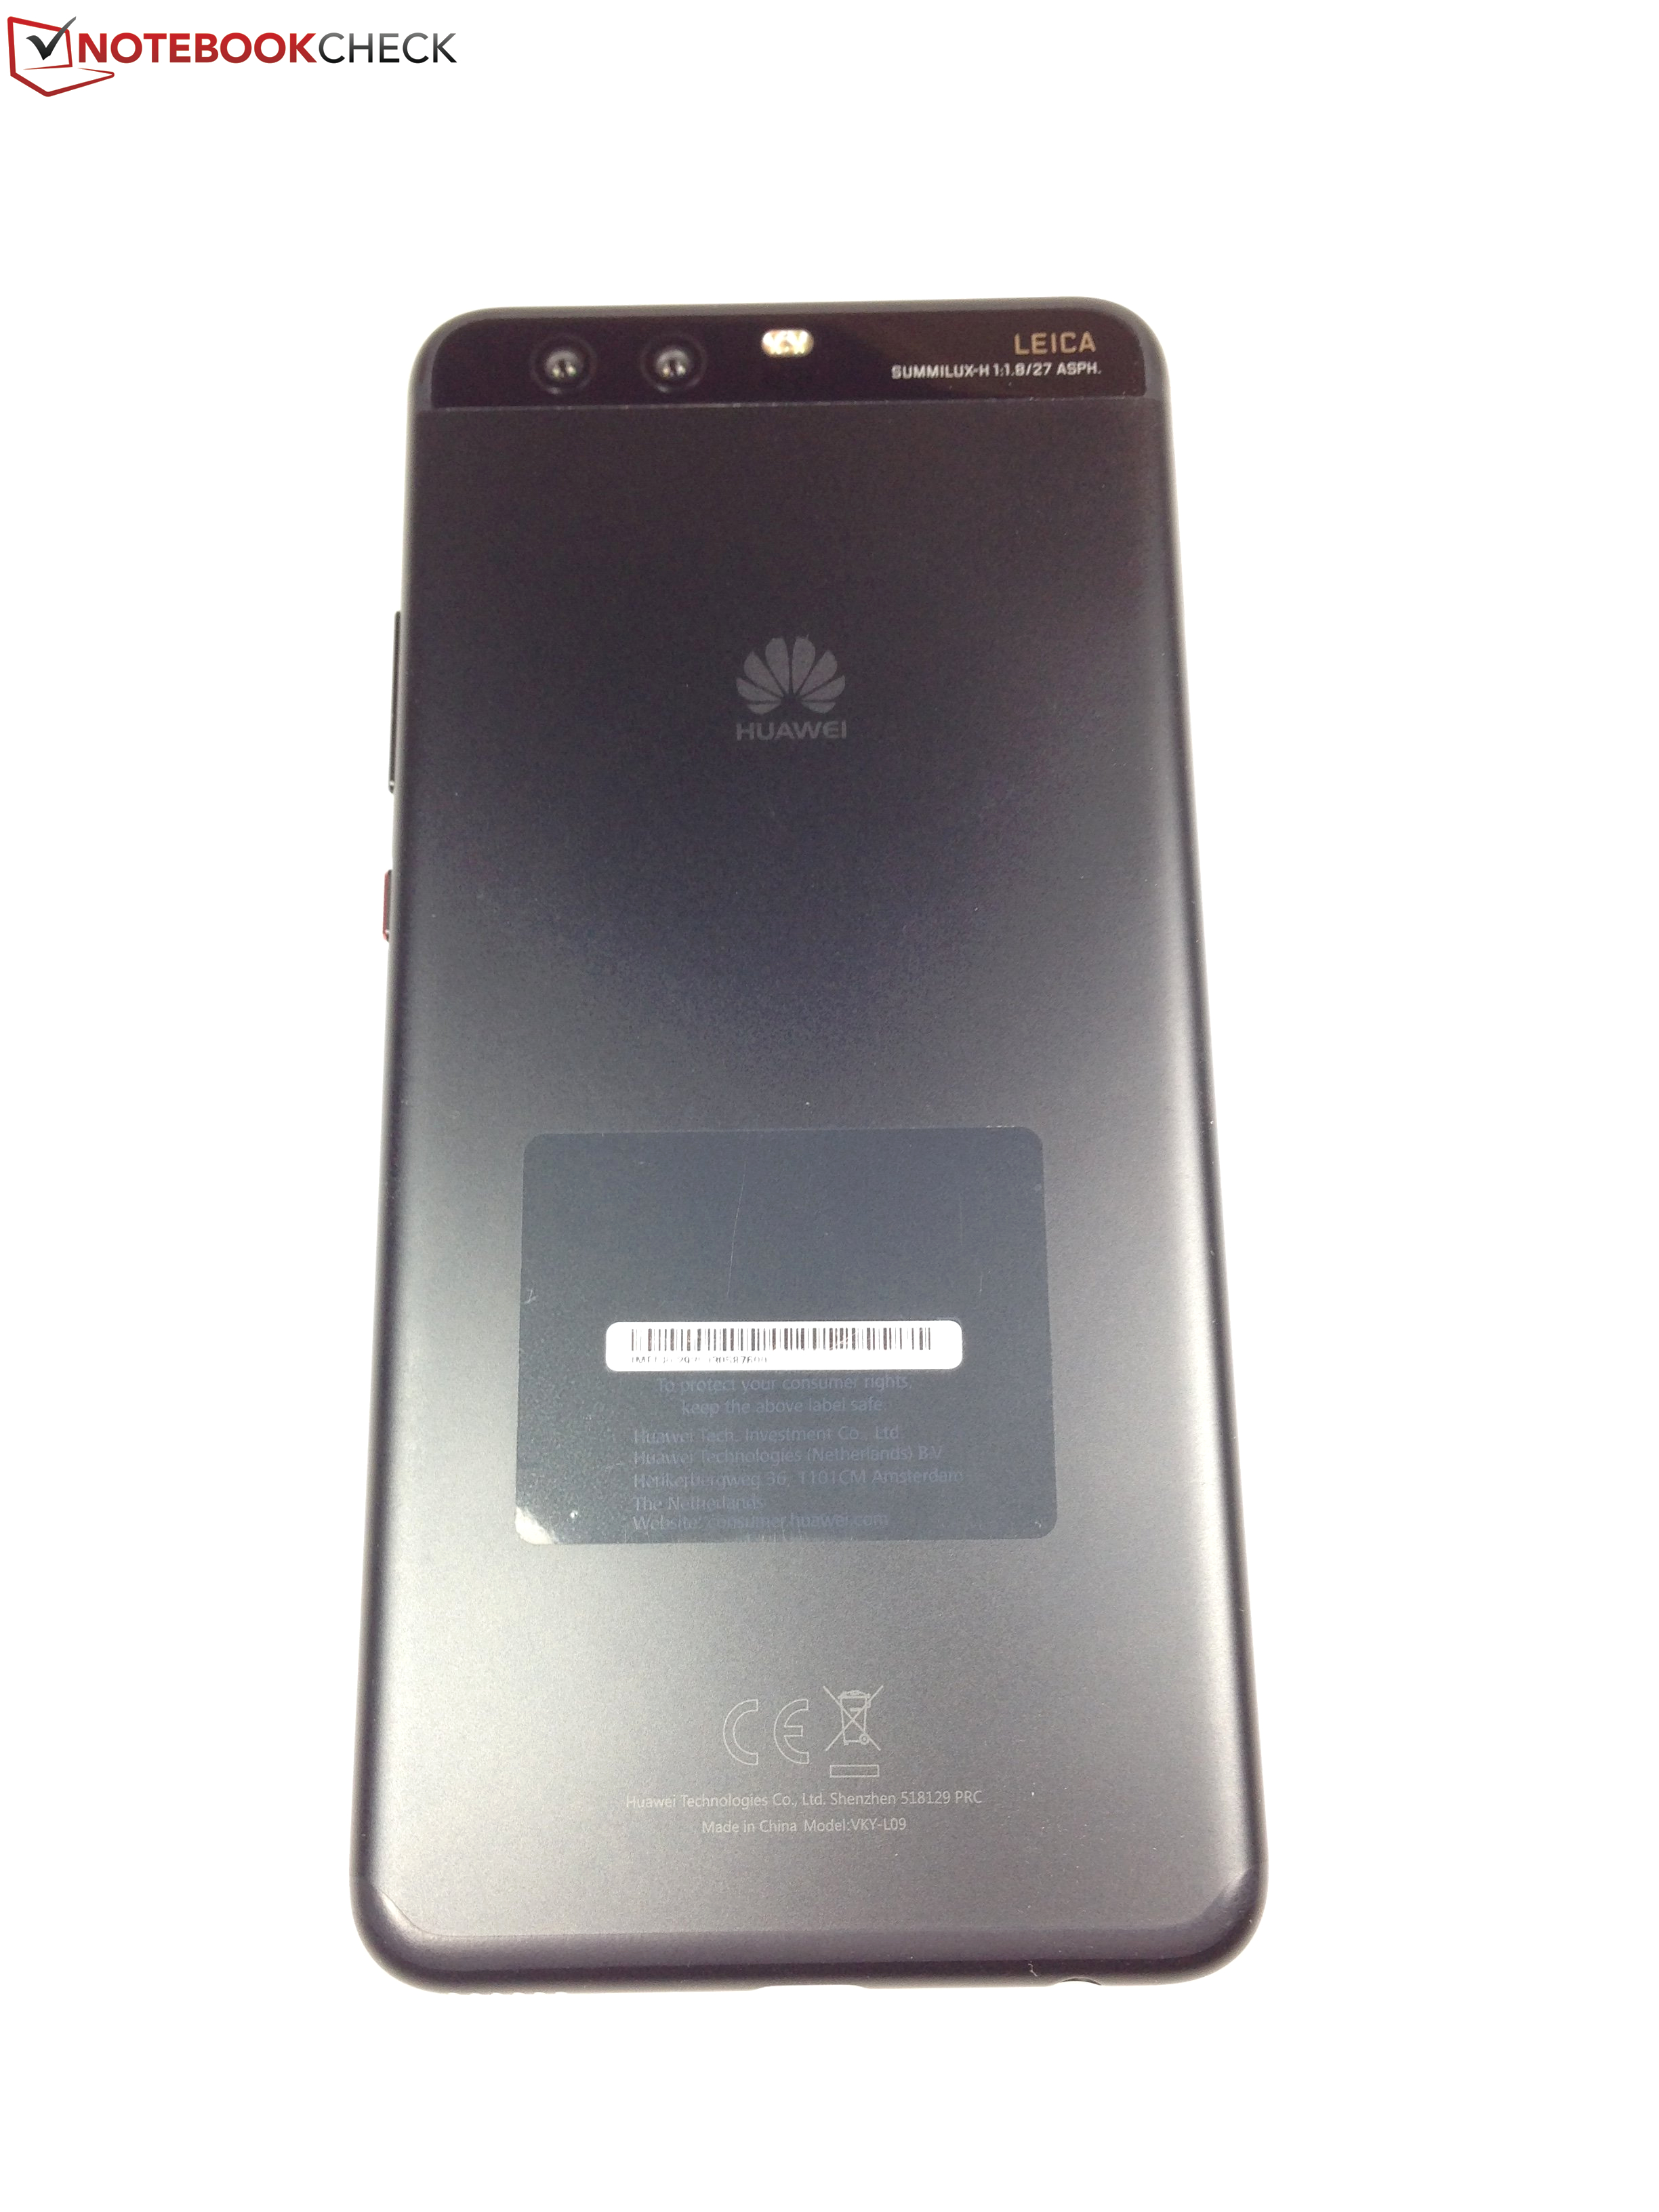
Voor de hogere adviesprijs van €749 in tegenstelling tot €600 voor de P10, wordt de P10 Plus uitgerust met 6 GB RAM, 128 GB opslagruimte, een WQHD resolutie beeldscherm (in plaats van Full HD), een sterkere batterij en een enigszins verbeterde dubbele Leica camera. Deze verbeteringen rechtvaardigen wellicht de hogere prijs op papier, maar in de praktijk zijn er nauwelijks verschillen merkbaar. Afgezien van de grotere afmetingen, zijn de verschillen uiteindelijk insignificant.
Wat over blijft is een zeer goede smartphone, die helaas wordt geteisterd door dezelfde tekortkomingen als de Huawei P10. De zwakke Wi-Fi module, langzame micro-SD kaartslot, suboptimale prestaties onder zware belasting, het grote aandeel van Firmware in de opslagruimte en het onbekende geheugentype zijn gemiste kansen om het apparaat te kunnen onderscheiden van de massa. Het blijft een gok of kopers een model krijgen met snel UFS geheugen of langzaam eMMC geheugen.
Huawei P10 Plus
- 06-06-2017 v6 (old)
Manuel Masiero