Kort testrapport Samsung Galaxy S9 Plus Smartphone


| |||||||||||||||||||||||||
Helderheidsverdeling: 96 %
Helderheid in Batterij-modus: 565 cd/m²
Contrast: ∞:1 (Zwart: 0 cd/m²)
ΔE ColorChecker Calman: 2.3 | ∀{0.5-29.43 Ø4.71}
ΔE Greyscale Calman: 1.9 | ∀{0.09-98 Ø4.96}
Gamma: 2.16
CCT: 6332 K
| Samsung Galaxy S9 Plus Super AMOLED, 2960x1440, 6.2" | Samsung Galaxy S8 Plus Super AMOLED, 2960x1440, 6.2" | Apple iPhone X Super AMOLED, 2436x1125, 5.8" | Huawei Mate 10 Pro OLED, 2160x1080, 6" | Google Pixel 2 XL P-OLED, 2880x1440, 6" | HTC U11 Plus Super LCD 6, 2880x1440, 6" | OnePlus 5T AMOLED, 2160x1080, 6" | |
|---|---|---|---|---|---|---|---|
| Screen | 11% | 19% | 8% | -24% | -15% | -8% | |
| Brightness middle (cd/m²) | 565 | 560 -1% | 600 6% | 629 11% | 415 -27% | 361 -36% | 425 -25% |
| Brightness (cd/m²) | 571 | 562 -2% | 606 6% | 636 11% | 420 -26% | 356 -38% | 423 -26% |
| Brightness Distribution (%) | 96 | 93 -3% | 94 -2% | 94 -2% | 87 -9% | 90 -6% | 92 -4% |
| Black Level * (cd/m²) | 0.21 | ||||||
| Colorchecker dE 2000 * | 2.3 | 1.7 26% | 1.2 48% | 1.7 26% | 2.7 -17% | 2.5 -9% | 2.1 9% |
| Colorchecker dE 2000 max. * | 4.8 | 3.4 29% | 3 37% | 3.6 25% | 4.3 10% | 5.3 -10% | 3.4 29% |
| Greyscale dE 2000 * | 1.9 | 1.6 16% | 1.6 16% | 2.4 -26% | 3.3 -74% | 1.7 11% | 2.5 -32% |
| Gamma | 2.16 102% | 2.13 103% | 2.23 99% | 2.15 102% | 2.36 93% | 2.21 100% | 2.32 95% |
| CCT | 6332 103% | 6435 101% | 6707 97% | 6337 103% | 6787 96% | 6580 99% | 6455 101% |
| Color Space (Percent of AdobeRGB 1998) (%) | 81.57 | ||||||
| Color Space (Percent of sRGB) (%) | 99.87 | ||||||
| Contrast (:1) | 1719 |
* ... kleiner is beter
Screen Flickering / PWM (Pulse-Width Modulation)
| Screen flickering / PWM waargenomen | 215.5 Hz | 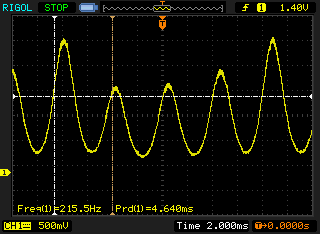 | |
De achtergrondverlichting van het scherm flikkert op 215.5 Hz (in het slechtste geval, bijvoorbeeld bij gebruik van PWM) . De frequentie van 215.5 Hz is redelijk laag en de meeste mensen die gevoelig zijn aan flickering kunnen dit dus waarnemen of geïrriteerde ogen krijgen (gebruikmakend van de vermelde helderheid en lager). Ter vergelijking: 52 % van alle geteste toestellen maakten geen gebruik van PWM om de schermhelderheid te verlagen. Als het wel werd gebruikt, werd een gemiddelde van 7754 (minimum: 5 - maximum: 343500) Hz waargenomen. | |||
![Grijsschalen (profiel: adaptief [geoptimaliseerd], kleurruimte: DCI-P3)](fileadmin/_processed_/b/b/csm_CalMAN_Anpassbar_Optimiert_Grayscale_P3_2a5e5d90e0.jpg)
![Gemengde kleuren (profiel: adaptief [geoptimaliseerd], kleurruimte: DCI-P3)](fileadmin/_processed_/f/9/csm_CalMAN_Anpassbar_Optimiert_ColorChecker_P3_3eca2185c3.jpg)
Responstijd Scherm
| ↔ Responstijd Zwart naar Wit | ||
|---|---|---|
| 6 ms ... stijging ↗ en daling ↘ gecombineerd | ↗ 3 ms stijging | 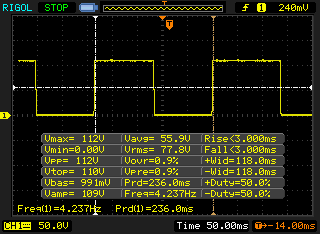 |
| ↘ 3 ms daling | ||
| Het scherm vertoonde erg snelle responstijden in onze tests en zou zeer geschikt moeten zijn voor snelle games. Ter vergelijking: alle testtoestellen variëren van 0.1 (minimum) tot 240 (maximum) ms. » 19 % van alle toestellen zijn beter. Dit betekent dat de gemeten responstijd beter is dan het gemiddelde (19.8 ms) van alle geteste toestellen. | ||
| ↔ Responstijd 50% Grijs naar 80% Grijs | ||
| 8 ms ... stijging ↗ en daling ↘ gecombineerd | ↗ 3 ms stijging | 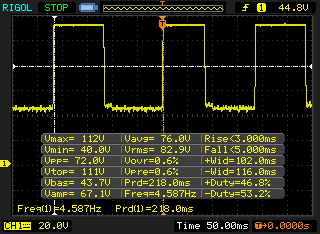 |
| ↘ 5 ms daling | ||
| Het scherm vertoonde snelle responstijden in onze tests en zou geschikt moeten zijn voor games. Ter vergelijking: alle testtoestellen variëren van 0.165 (minimum) tot 636 (maximum) ms. » 21 % van alle toestellen zijn beter. Dit betekent dat de gemeten responstijd beter is dan het gemiddelde (31 ms) van alle geteste toestellen. | ||
| AnTuTu v7 - Total Score (sorteer op waarde) | |
| Samsung Galaxy S9 Plus | |
| Apple iPhone X | |
| Huawei Mate 10 Pro | |
| Google Pixel 2 XL | |
| HTC U11 Plus | |
| OnePlus 5T | |
| Gemiddeld Samsung Exynos 9810 (236552 - 250577, n=3) | |
| Lightmark - 1920x1080 1080p (sorteer op waarde) | |
| Samsung Galaxy S9 Plus | |
| Samsung Galaxy S8 Plus | |
| Huawei Mate 10 Pro | |
| Google Pixel 2 XL | |
| HTC U11 Plus | |
| Gemiddeld Samsung Exynos 9810 (34 - 35.8, n=2) | |
| JetStream 1.1 - 1.1 Total | |
| Apple iPhone X (IOS 11.1.1) | |
| Samsung Galaxy S9 Plus (Samsung Browser 7.0) | |
| Motorola Moto Z2 Force (Chrome 63.0.3239.111) | |
| OnePlus 5T (Chrome 63) | |
| Gemiddeld Samsung Exynos 9810 (62.9 - 69.6, n=4) | |
| HTC U11 Plus (Chrome 63) | |
| Google Pixel 2 XL (Chrome 62) | |
| Samsung Galaxy S8 Plus (Samsung Browser 5.2) | |
| Huawei Mate 10 Pro (Chrome 61) | |
| LG V30 (Chrome 62) | |
| Octane V2 - Total Score | |
| Gemiddelde van klas Smartphone (2800 - 126661, n=142, laatste 2 jaar) | |
| Apple iPhone X (IOS 11.1.2) | |
| Samsung Galaxy S9 Plus (Samsung Browser 7.0) | |
| Gemiddeld Samsung Exynos 9810 (12933 - 15233, n=4) | |
| Samsung Galaxy S8 Plus (Samsung Browser 5.2) | |
| Motorola Moto Z2 Force (Chrome 63.0.3239.111) | |
| OnePlus 5T (Chrome 63) | |
| HTC U11 Plus (Chrome 63) | |
| Google Pixel 2 XL (Chrome 62) | |
| LG V30 (Chrome 62) | |
| Huawei Mate 10 Pro (Chrome 61) | |
| Mozilla Kraken 1.1 - Total | |
| LG V30 (Chrome 62) | |
| Huawei Mate 10 Pro (Chrome 61) | |
| Google Pixel 2 XL (Chrome 62) | |
| Motorola Moto Z2 Force (Chrome 63.0.3239.111) | |
| HTC U11 Plus (Chrome 63) | |
| OnePlus 5T (Chrome 63) | |
| Gemiddeld Samsung Exynos 9810 (2060 - 3189, n=4) | |
| Samsung Galaxy S8 Plus (Samsung Browser 5.2) | |
| Samsung Galaxy S9 Plus (Samsung Browser 7.0) | |
| Gemiddelde van klas Smartphone (257 - 28190, n=121, laatste 2 jaar) | |
| Apple iPhone X (IOS 11.1.2) | |
| WebXPRT 2015 - Overall | |
| Apple iPhone X (Safari Mobile 11.0) | |
| Google Pixel 2 XL (Chrome 62) | |
| OnePlus 5T (Chrome 63) | |
| HTC U11 Plus (Chrome 63) | |
| Gemiddeld Samsung Exynos 9810 (163 - 202, n=3) | |
| Samsung Galaxy S9 Plus (Samsung Browser 7.0) | |
| Motorola Moto Z2 Force (Chrome 63.0.3239.111) | |
| Huawei Mate 10 Pro (Chrome 61) | |
| Samsung Galaxy S8 Plus (Samsung Browser 5.2) | |
| LG V30 (Chrome 62) | |
* ... kleiner is beter
| Samsung Galaxy S9 Plus | Samsung Galaxy S8 Plus | LG V30 | HTC U11 Plus | Motorola Moto Z2 Force | Huawei P10 Plus | Gemiddeld 64 GB UFS 2.1 Flash | Gemiddelde van klas Smartphone | |
|---|---|---|---|---|---|---|---|---|
| AndroBench 3-5 | -12% | -28% | 77% | 38% | 81% | 40% | 654% | |
| Sequential Read 256KB (MB/s) | 819 | 788 -4% | 669 -18% | 728 -11% | 696 -15% | 733 -11% | 696 ? -15% | 2225 ? 172% |
| Sequential Write 256KB (MB/s) | 204.9 | 194.2 -5% | 193.2 -6% | 207.9 1% | 213.6 4% | 182.6 -11% | 224 ? 9% | 1903 ? 829% |
| Random Read 4KB (MB/s) | 129.7 | 127.2 -2% | 78.2 -40% | 132.4 2% | 148.8 15% | 173.1 33% | 137.2 ? 6% | 311 ? 140% |
| Random Write 4KB (MB/s) | 22.74 | 15.27 -33% | 10.21 -55% | 135.7 497% | 78.6 246% | 149.8 559% | 84.7 ? 272% | 358 ? 1474% |
| Sequential Read 256KB SDCard (MB/s) | 79.2 ? | 71.1 ? -10% | 62.8 -21% | 75.4 ? -5% | 77.4 ? -2% | 54 ? -32% | 68.6 ? -13% | |
| Sequential Write 256KB SDCard (MB/s) | 67.2 ? | 57.2 ? -15% | 47.2 -30% | 51.3 ? -24% | 54.7 ? -19% | 33.61 ? -50% | 52.2 ? -22% |
| Asphalt 8: Airborne | |||
| Instellingen | Waarde | ||
| high | 30 fps | ||
| Dead Trigger 2 | |||
| Instellingen | Waarde | ||
| high | 30 fps | ||
| Battle Bay | |||
| Instellingen | Waarde | ||
| full resolution | 60 fps | ||
| World of Tanks Blitz | |||
| Instellingen | Waarde | ||
| high, 0xAA, 0xAF | 59 fps | ||
| Arena of Valor | |||
| Instellingen | Waarde | ||
| high HD | 60 fps | ||
| Shadow Fight 3 | |||
| Instellingen | Waarde | ||
| high | 60 fps | ||
(+) De maximumtemperatuur aan de bovenzijde bedraagt 35.8 °C / 96 F, vergeleken met het gemiddelde van 35.3 °C / 96 F, variërend van 21.9 tot 247 °C voor de klasse Smartphone.
(+) De bodem warmt op tot een maximum van 37.9 °C / 100 F, vergeleken met een gemiddelde van 34 °C / 93 F
(+) Bij onbelast gebruik bedraagt de gemiddelde temperatuur voor de bovenzijde 22.4 °C / 72 F, vergeleken met het apparaatgemiddelde van 33 °C / 91 F.
Samsung Galaxy S9 Plus audioanalyse
(+) | luidsprekers kunnen relatief luid spelen (85.6 dB)
Bas 100 - 315 Hz
(-) | bijna geen lage tonen - gemiddeld 22.8% lager dan de mediaan
(±) | lineariteit van de lage tonen is gemiddeld (12.2% delta ten opzichte van de vorige frequentie)
Midden 400 - 2000 Hz
(+) | evenwichtige middens - slechts 3.2% verwijderd van de mediaan
(+) | de middentonen zijn lineair (3.2% delta ten opzichte van de vorige frequentie)
Hoog 2 - 16 kHz
(+) | evenwichtige hoogtepunten - slechts 4.4% verwijderd van de mediaan
(+) | de hoge tonen zijn lineair (4.8% delta naar de vorige frequentie)
Algemeen 100 - 16.000 Hz
(±) | lineariteit van het totale geluid is gemiddeld (17.3% verschil met de mediaan)
Vergeleken met dezelfde klasse
» 12% van alle geteste apparaten in deze klasse waren beter, 8% vergelijkbaar, 80% slechter
» De beste had een delta van 11%, het gemiddelde was 34%, de slechtste was 134%
Vergeleken met alle geteste toestellen
» 32% van alle geteste apparaten waren beter, 8% gelijk, 59% slechter
» De beste had een delta van 4%, het gemiddelde was 23%, de slechtste was 134%
Google Pixel 2 XL audioanalyse
(+) | luidsprekers kunnen relatief luid spelen (88.4 dB)
Bas 100 - 315 Hz
(-) | bijna geen lage tonen - gemiddeld 28.1% lager dan de mediaan
(±) | lineariteit van de lage tonen is gemiddeld (9.5% delta ten opzichte van de vorige frequentie)
Midden 400 - 2000 Hz
(+) | evenwichtige middens - slechts 3.2% verwijderd van de mediaan
(+) | de middentonen zijn lineair (5.5% delta ten opzichte van de vorige frequentie)
Hoog 2 - 16 kHz
(+) | evenwichtige hoogtepunten - slechts 3.1% verwijderd van de mediaan
(+) | de hoge tonen zijn lineair (4.2% delta naar de vorige frequentie)
Algemeen 100 - 16.000 Hz
(±) | lineariteit van het totale geluid is gemiddeld (19.6% verschil met de mediaan)
Vergeleken met dezelfde klasse
» 30% van alle geteste apparaten in deze klasse waren beter, 8% vergelijkbaar, 62% slechter
» De beste had een delta van 11%, het gemiddelde was 34%, de slechtste was 134%
Vergeleken met alle geteste toestellen
» 49% van alle geteste apparaten waren beter, 7% gelijk, 44% slechter
» De beste had een delta van 4%, het gemiddelde was 23%, de slechtste was 134%
Apple iPhone X audioanalyse
(+) | luidsprekers kunnen relatief luid spelen (85.3 dB)
Bas 100 - 315 Hz
(±) | verminderde zeebaars - gemiddeld 14.9% lager dan de mediaan
(±) | lineariteit van de lage tonen is gemiddeld (9.4% delta ten opzichte van de vorige frequentie)
Midden 400 - 2000 Hz
(+) | evenwichtige middens - slechts 3.4% verwijderd van de mediaan
(+) | de middentonen zijn lineair (5.1% delta ten opzichte van de vorige frequentie)
Hoog 2 - 16 kHz
(±) | higher highs - on average 7.3% higher than median
(+) | de hoge tonen zijn lineair (4.6% delta naar de vorige frequentie)
Algemeen 100 - 16.000 Hz
(±) | lineariteit van het totale geluid is gemiddeld (19% verschil met de mediaan)
Vergeleken met dezelfde klasse
» 24% van alle geteste apparaten in deze klasse waren beter, 9% vergelijkbaar, 66% slechter
» De beste had een delta van 11%, het gemiddelde was 34%, de slechtste was 134%
Vergeleken met alle geteste toestellen
» 45% van alle geteste apparaten waren beter, 7% gelijk, 47% slechter
» De beste had een delta van 4%, het gemiddelde was 23%, de slechtste was 134%
| Uit / Standby | |
| Inactief | |
| Belasting |
|
Key:
min: | |
| Samsung Galaxy S9 Plus 3500 mAh | Samsung Galaxy S8 Plus 3500 mAh | Google Pixel 2 XL 3520 mAh | Apple iPhone X 2716 mAh | Huawei Mate 10 Pro 4000 mAh | LG V30 3300 mAh | HTC U11 Plus 3930 mAh | OnePlus 5T 3300 mAh | |
|---|---|---|---|---|---|---|---|---|
| Power Consumption | -6% | -59% | -67% | -22% | -21% | -33% | -22% | |
| Idle Minimum * (Watt) | 0.68 | 0.68 -0% | 1.28 -88% | 1.03 -51% | 0.85 -25% | 0.72 -6% | 0.51 25% | 0.58 15% |
| Idle Average * (Watt) | 0.95 | 1.13 -19% | 1.87 -97% | 2.4 -153% | 1.15 -21% | 1.37 -44% | 1.62 -71% | 1.44 -52% |
| Idle Maximum * (Watt) | 1.09 | 1.16 -6% | 1.89 -73% | 2.6 -139% | 1.23 -13% | 1.41 -29% | 1.87 -72% | 1.53 -40% |
| Load Average * (Watt) | 4.58 | 4.69 -2% | 3.73 19% | 2.96 35% | 4.12 10% | 3.46 24% | 3.92 14% | 3.17 31% |
| Load Maximum * (Watt) | 5.16 | 5.24 -2% | 8.08 -57% | 6.6 -28% | 8.42 -63% | 7.83 -52% | 8.27 -60% | 8.54 -66% |
* ... kleiner is beter
| Samsung Galaxy S9 Plus 3500 mAh | Samsung Galaxy S8 Plus 3500 mAh | Google Pixel 2 XL 3520 mAh | Apple iPhone X 2716 mAh | Huawei Mate 10 Pro 4000 mAh | OnePlus 5T 3300 mAh | Motorola Moto Z2 Force 2730 mAh | LG V30 3300 mAh | |
|---|---|---|---|---|---|---|---|---|
| Batterijduur | 21% | 16% | -7% | 47% | 24% | 23% | 31% | |
| Reader / Idle (h) | 22.4 | 26.1 17% | 28.4 27% | 21.5 -4% | 29.1 30% | 29.2 30% | 27.2 21% | 31.9 42% |
| H.264 (h) | 11.2 | 12.4 11% | 11.2 0% | 10.6 -5% | 15.5 38% | 13.3 19% | 13.5 21% | 13.7 22% |
| WiFi v1.3 (h) | 8.7 | 12.3 41% | 9.7 11% | 9.4 8% | 13.6 56% | 12 38% | 8.9 2% | 12.9 48% |
| Load (h) | 4 | 4.6 15% | 5 25% | 3 -25% | 6.6 65% | 4.3 8% | 5.9 48% | 4.5 13% |
Pro
Contra

Voor het volledige, Engelse testrapport, klik hier.
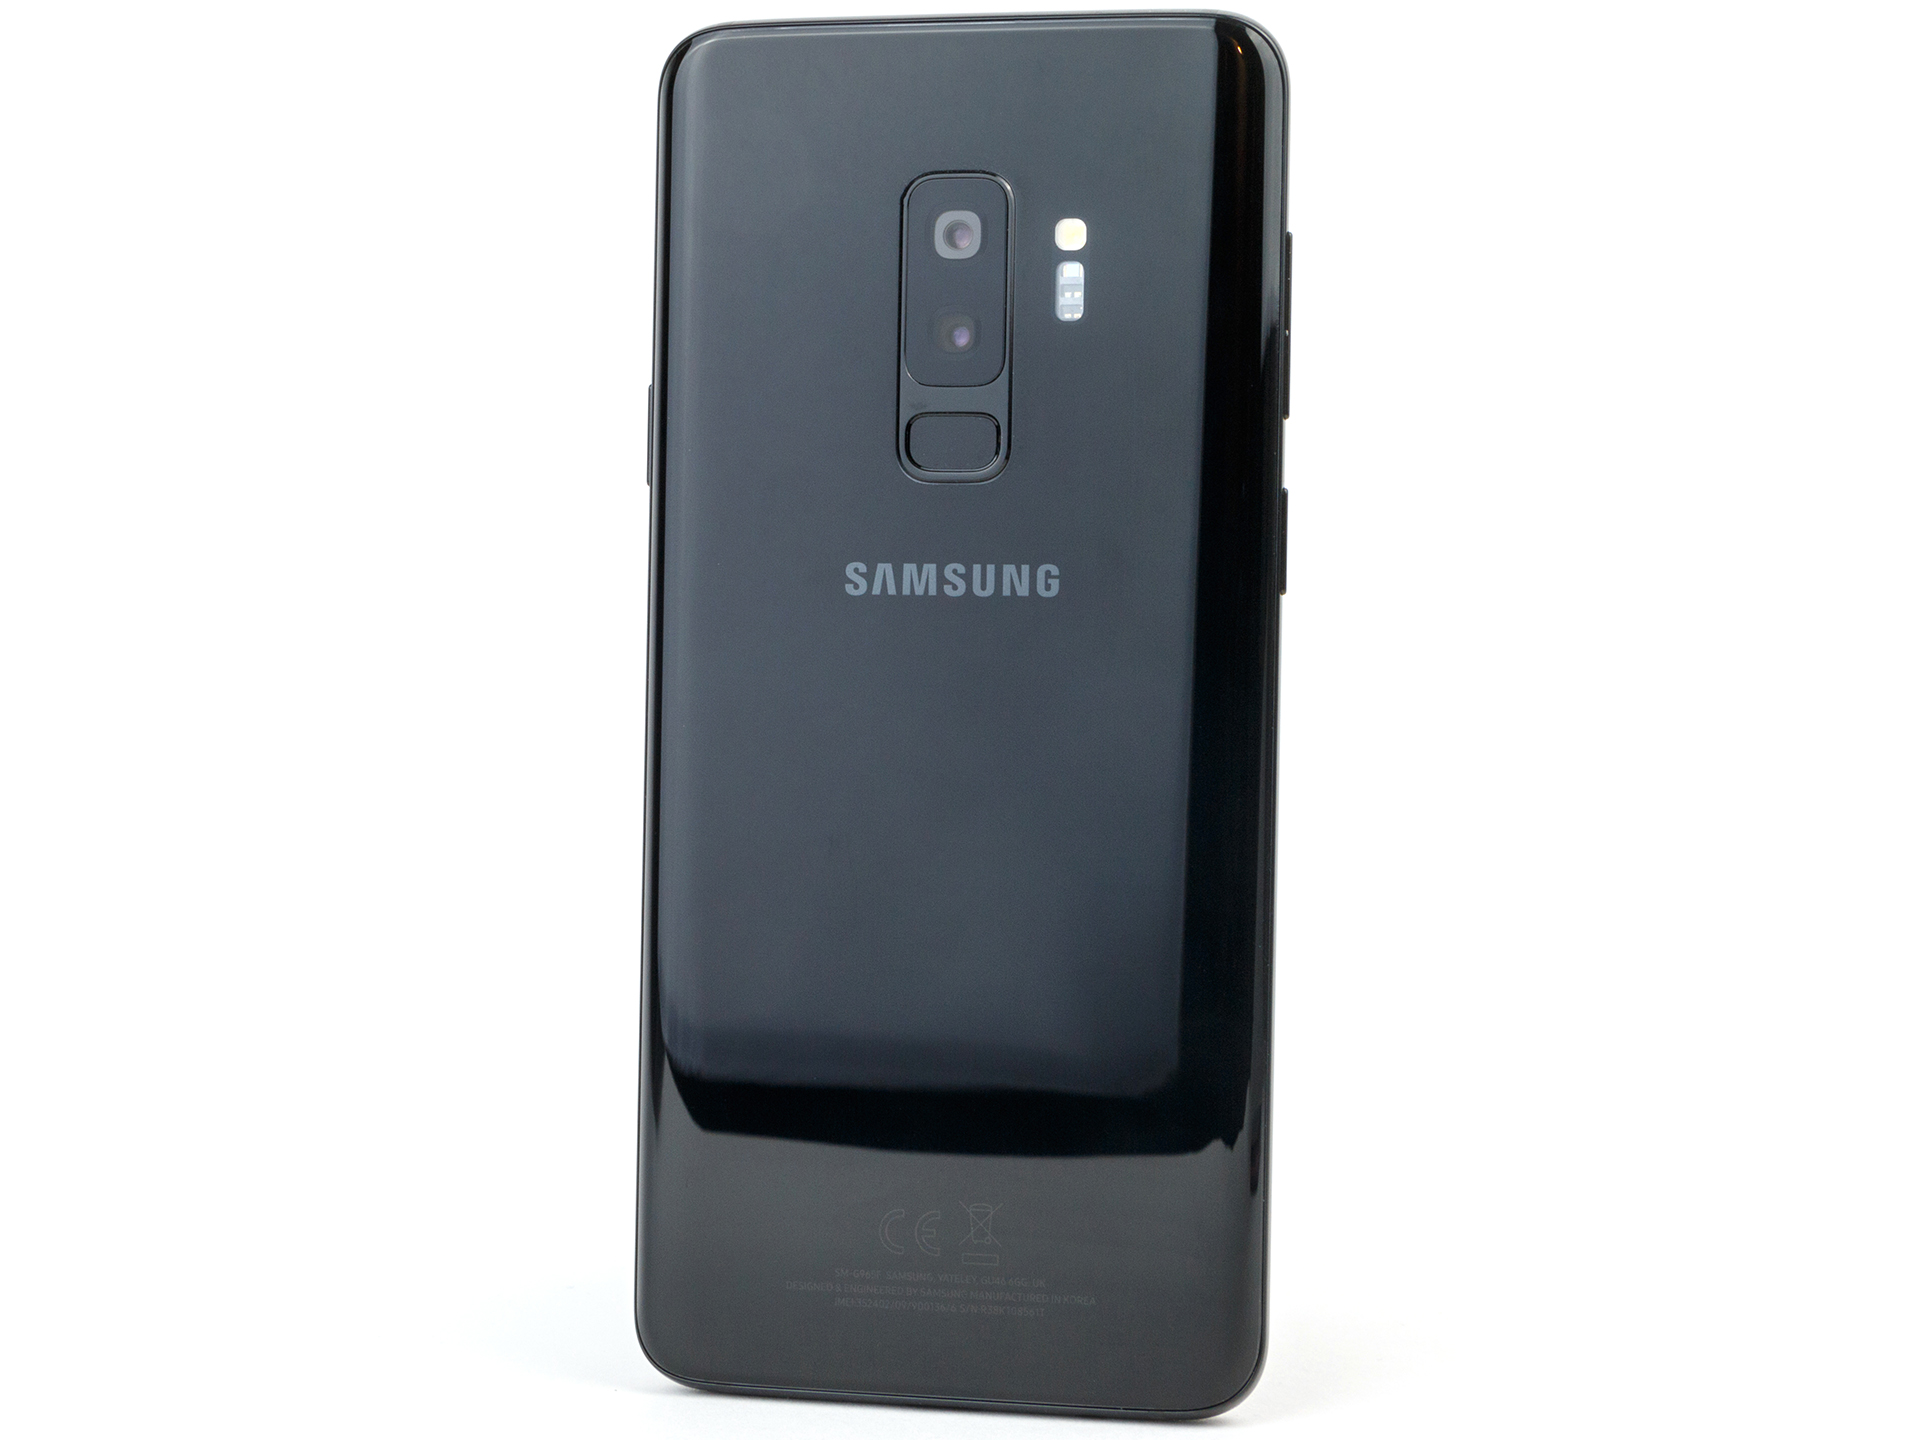
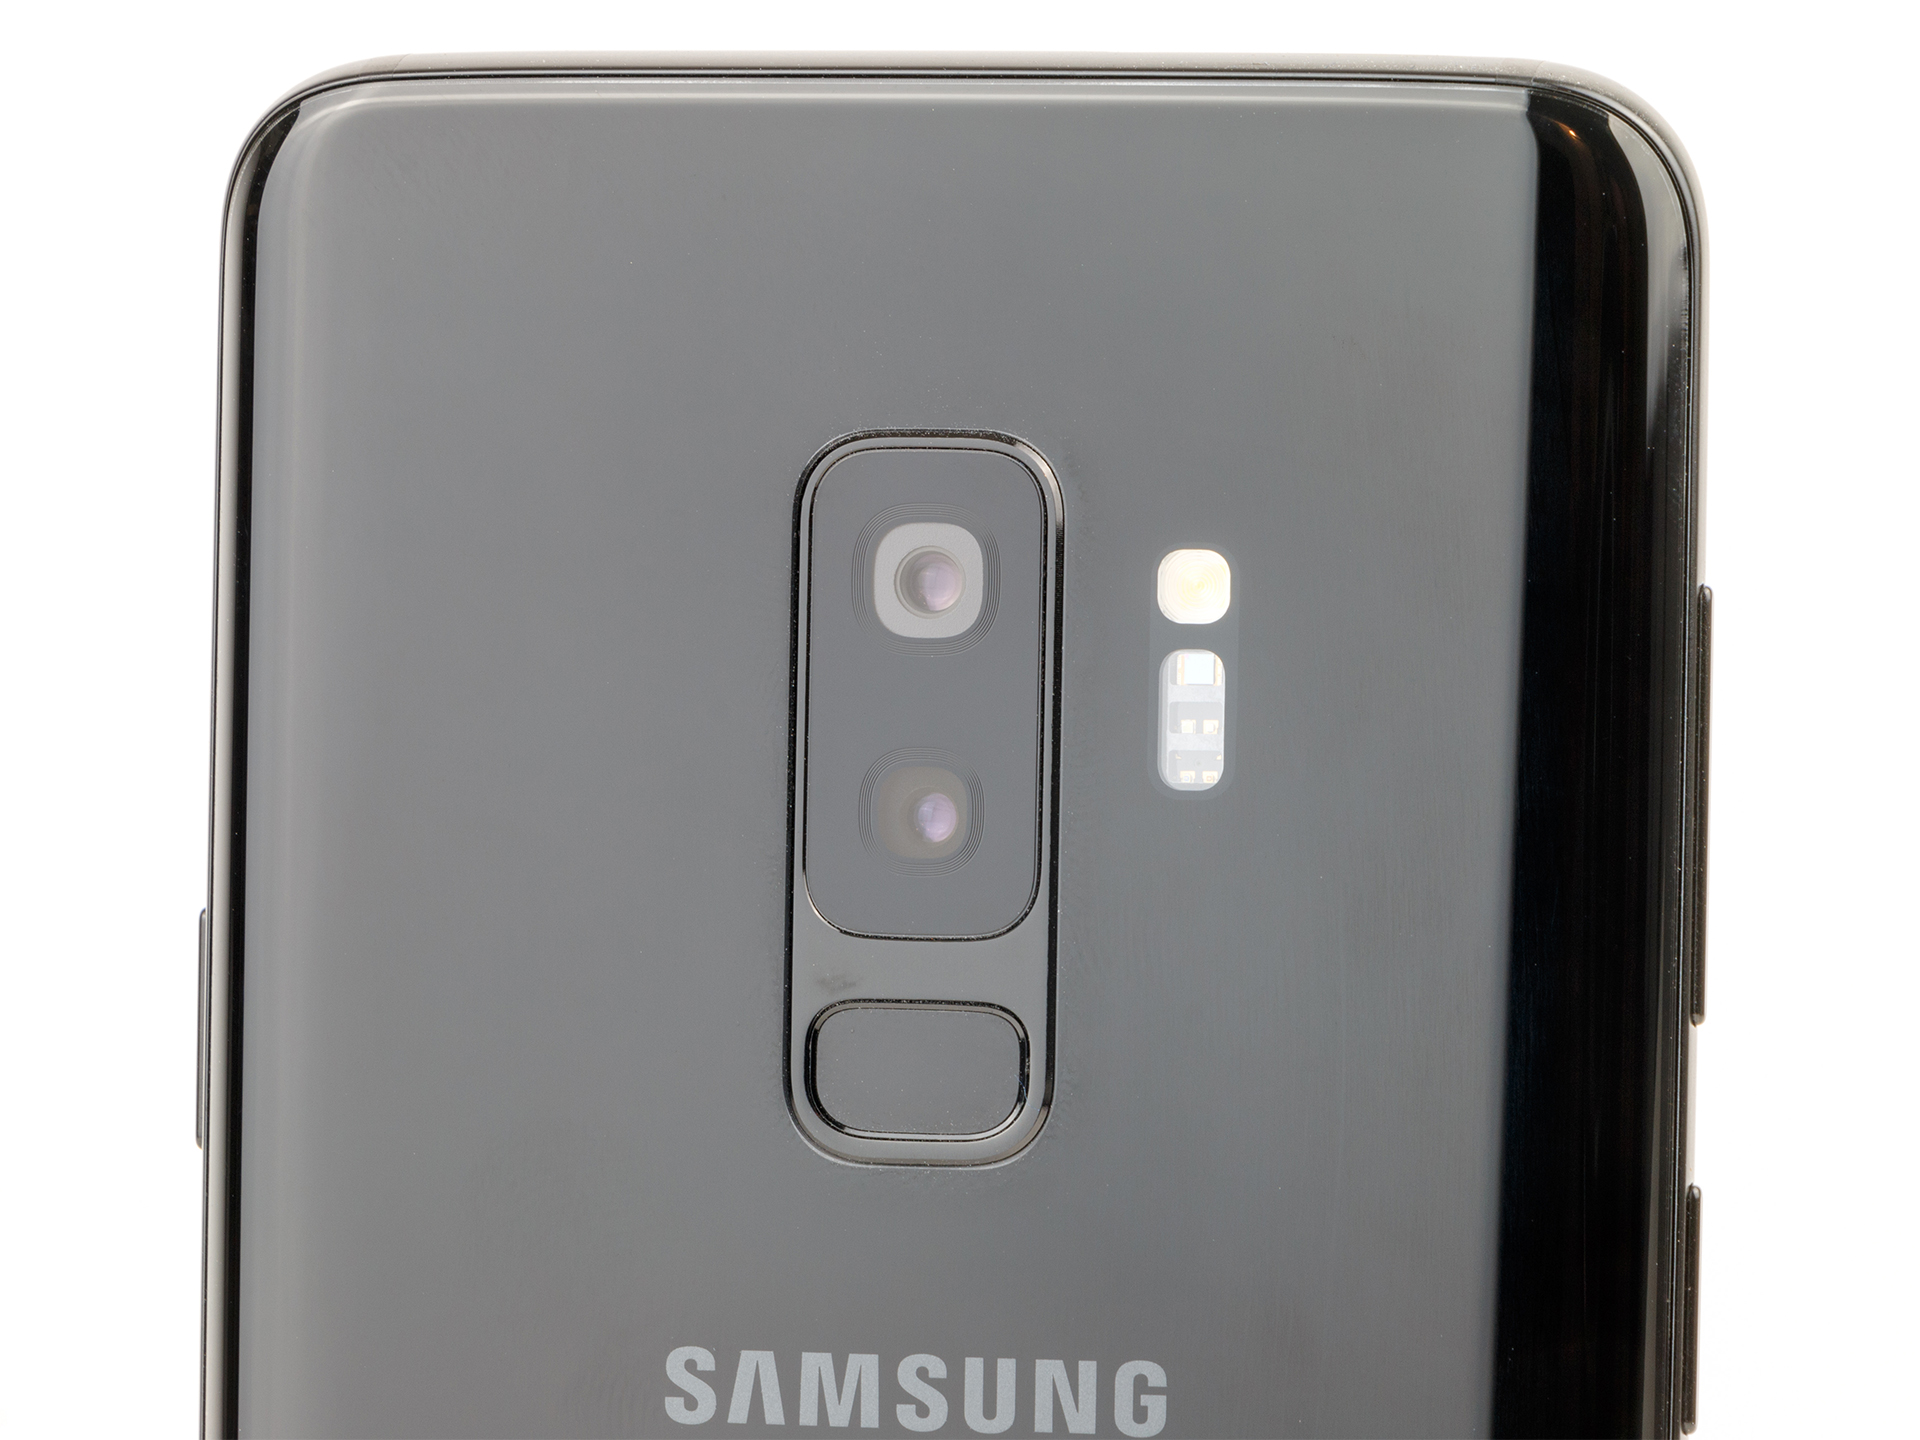
Met de Galaxy S9 Plus heeft Samsung weer een geweldige smartphone op de markt gebracht waarbij veel zinvolle verbeteringen zijn doorgevoerd, maar échte innovaties uitblijven. De dubbele camera komt zeker van pas; Samsung heeft de ook de beeldkwaliteit verder verbeterd. De Super Slow Motion modus werkt alleen fatsoenlijk met veel omgevingslicht en de resulterende beelden zijn op hun best geschikt voor sociale media. De AR emojis werken ook niet zo soepel. Enige overeenkomsten met de gelaatsuitdrukking van de gebruiker lijken puur toeval.
Hoe dan ook, de Koreaanse fabrikant heeft een magnifiek product geleverd. Een snelle processor, geweldig beeldscherm, beter geschikte positie voor de vingerafdrukscanner, eenvoudiger uit te breiden geheugen, goede stereo luidsprekers en bescherming tegen stof en water vormen een sterke lijst pluspunten. Er is zelfs een dual-SIM variant verkrijgbaar.
De Samsung Galaxy S9 Plus is een krachtige smartphone, maar wordt nog geplaagd door enkele kinderziektes.
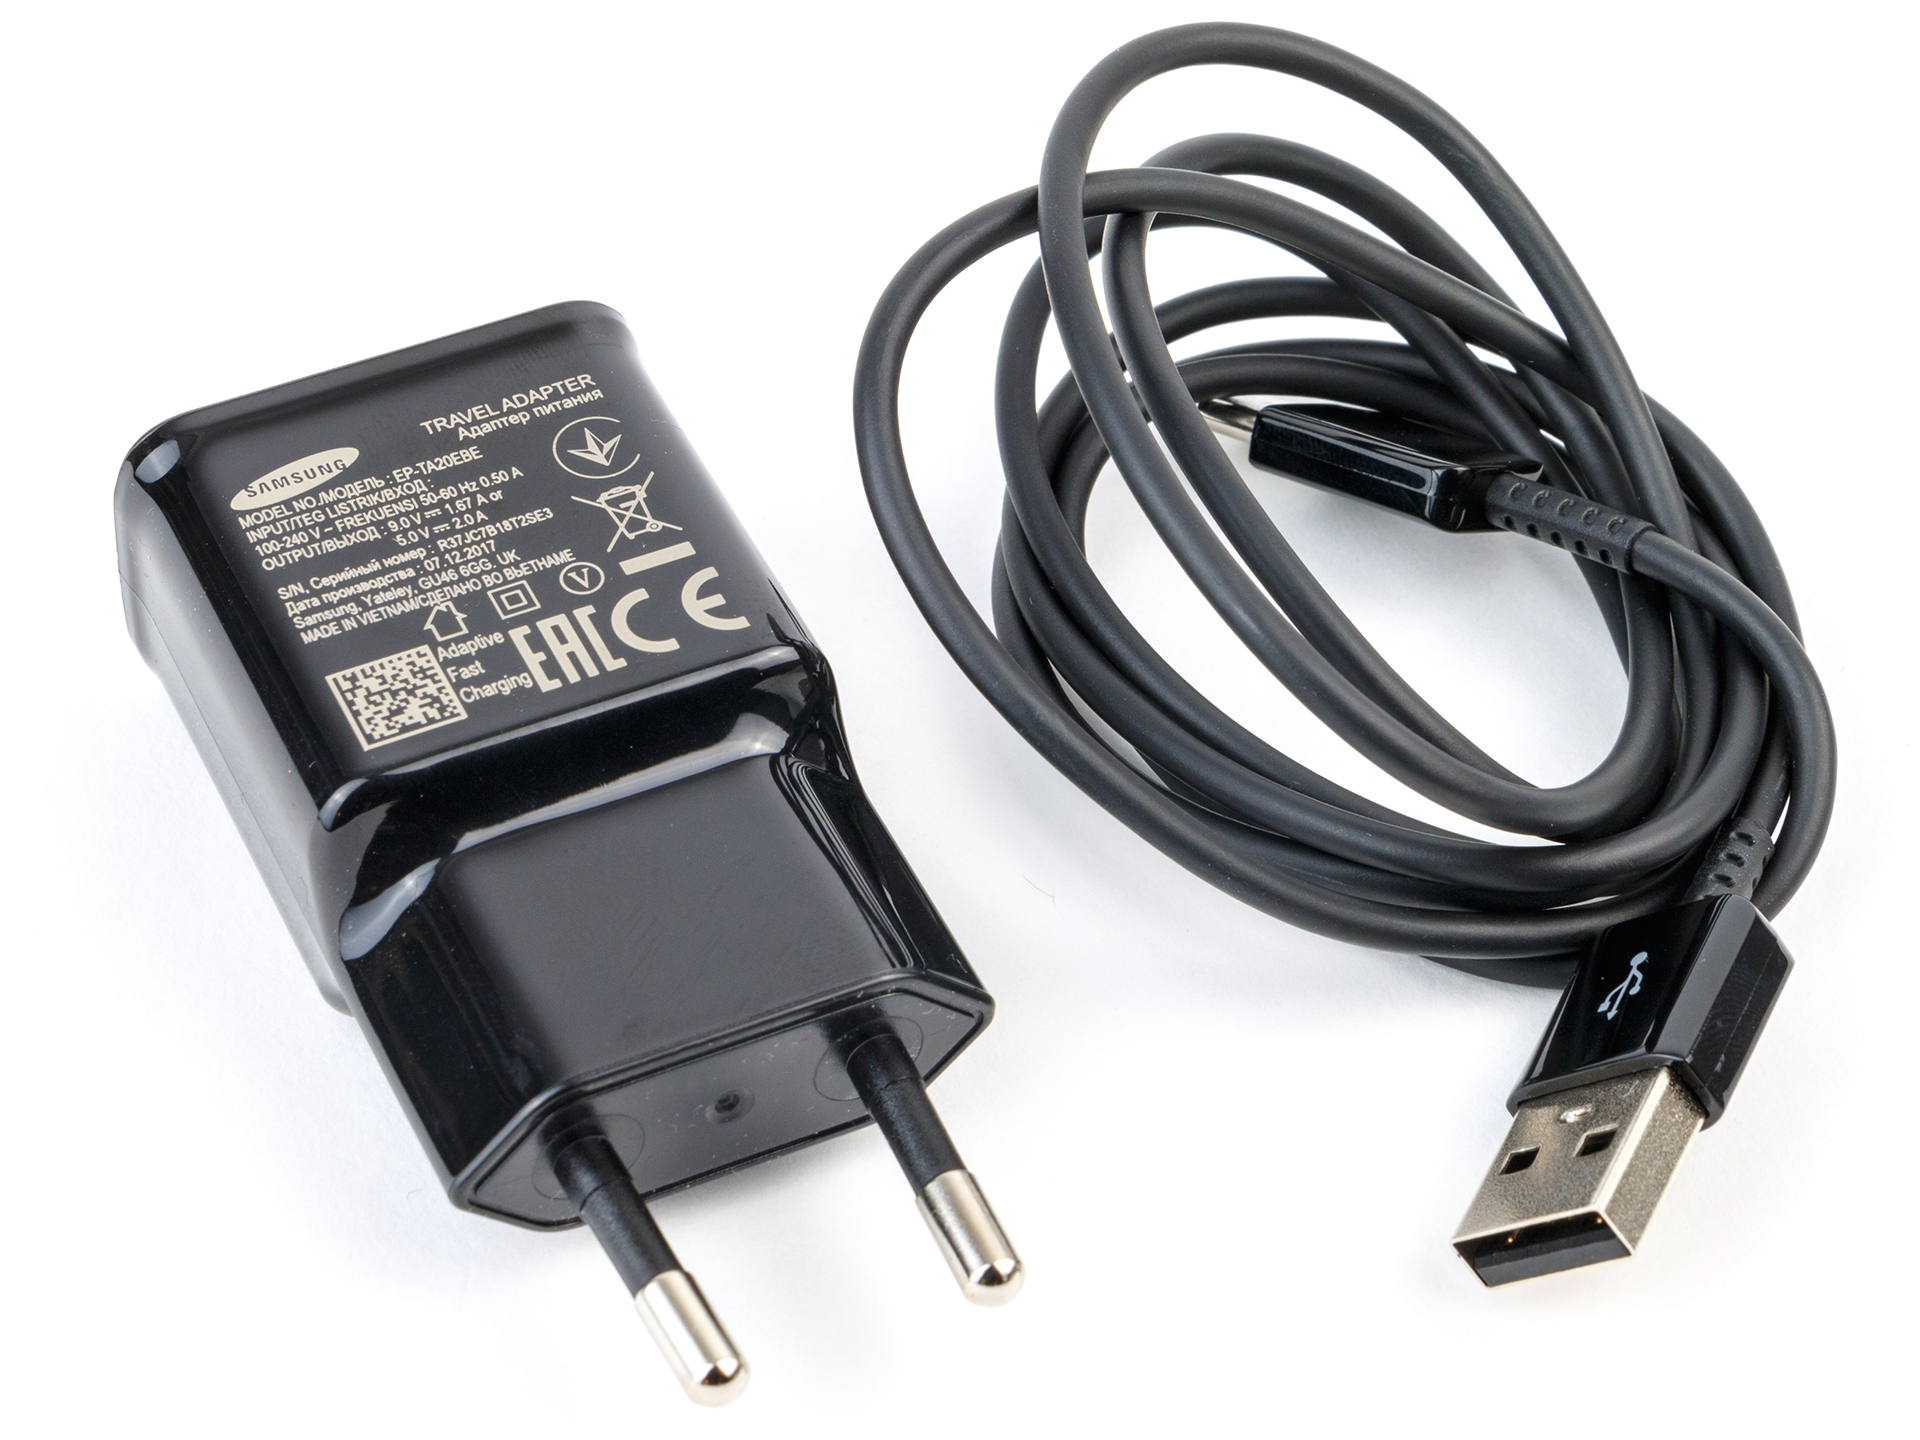
De Samsung smartphone is wat betreft batterijlevensduur minder overtuigend, aangezien er vergeleken met de voorganger zeker een stap terug is gedaan. Quick Charge werkte ook niet voor ons testmodel; het duurde langer dan 4 uur om de batterij volledig op te laden. Samsung zal deze gebreken hoogstwaarschijnlijk met updates aanpakken, maar het laat wel een bittere nasmaak na bij consumenten die het apparaat voor de volledige prijs hebben aangeschaft.
Als je al in bezit bent van een Galaxy S8+ is er geen acute reden om voor een upgrade te gaan. De verschillen bij alledaags gebruik zijn te klein om de hoge prijs te rechtvaardigen.
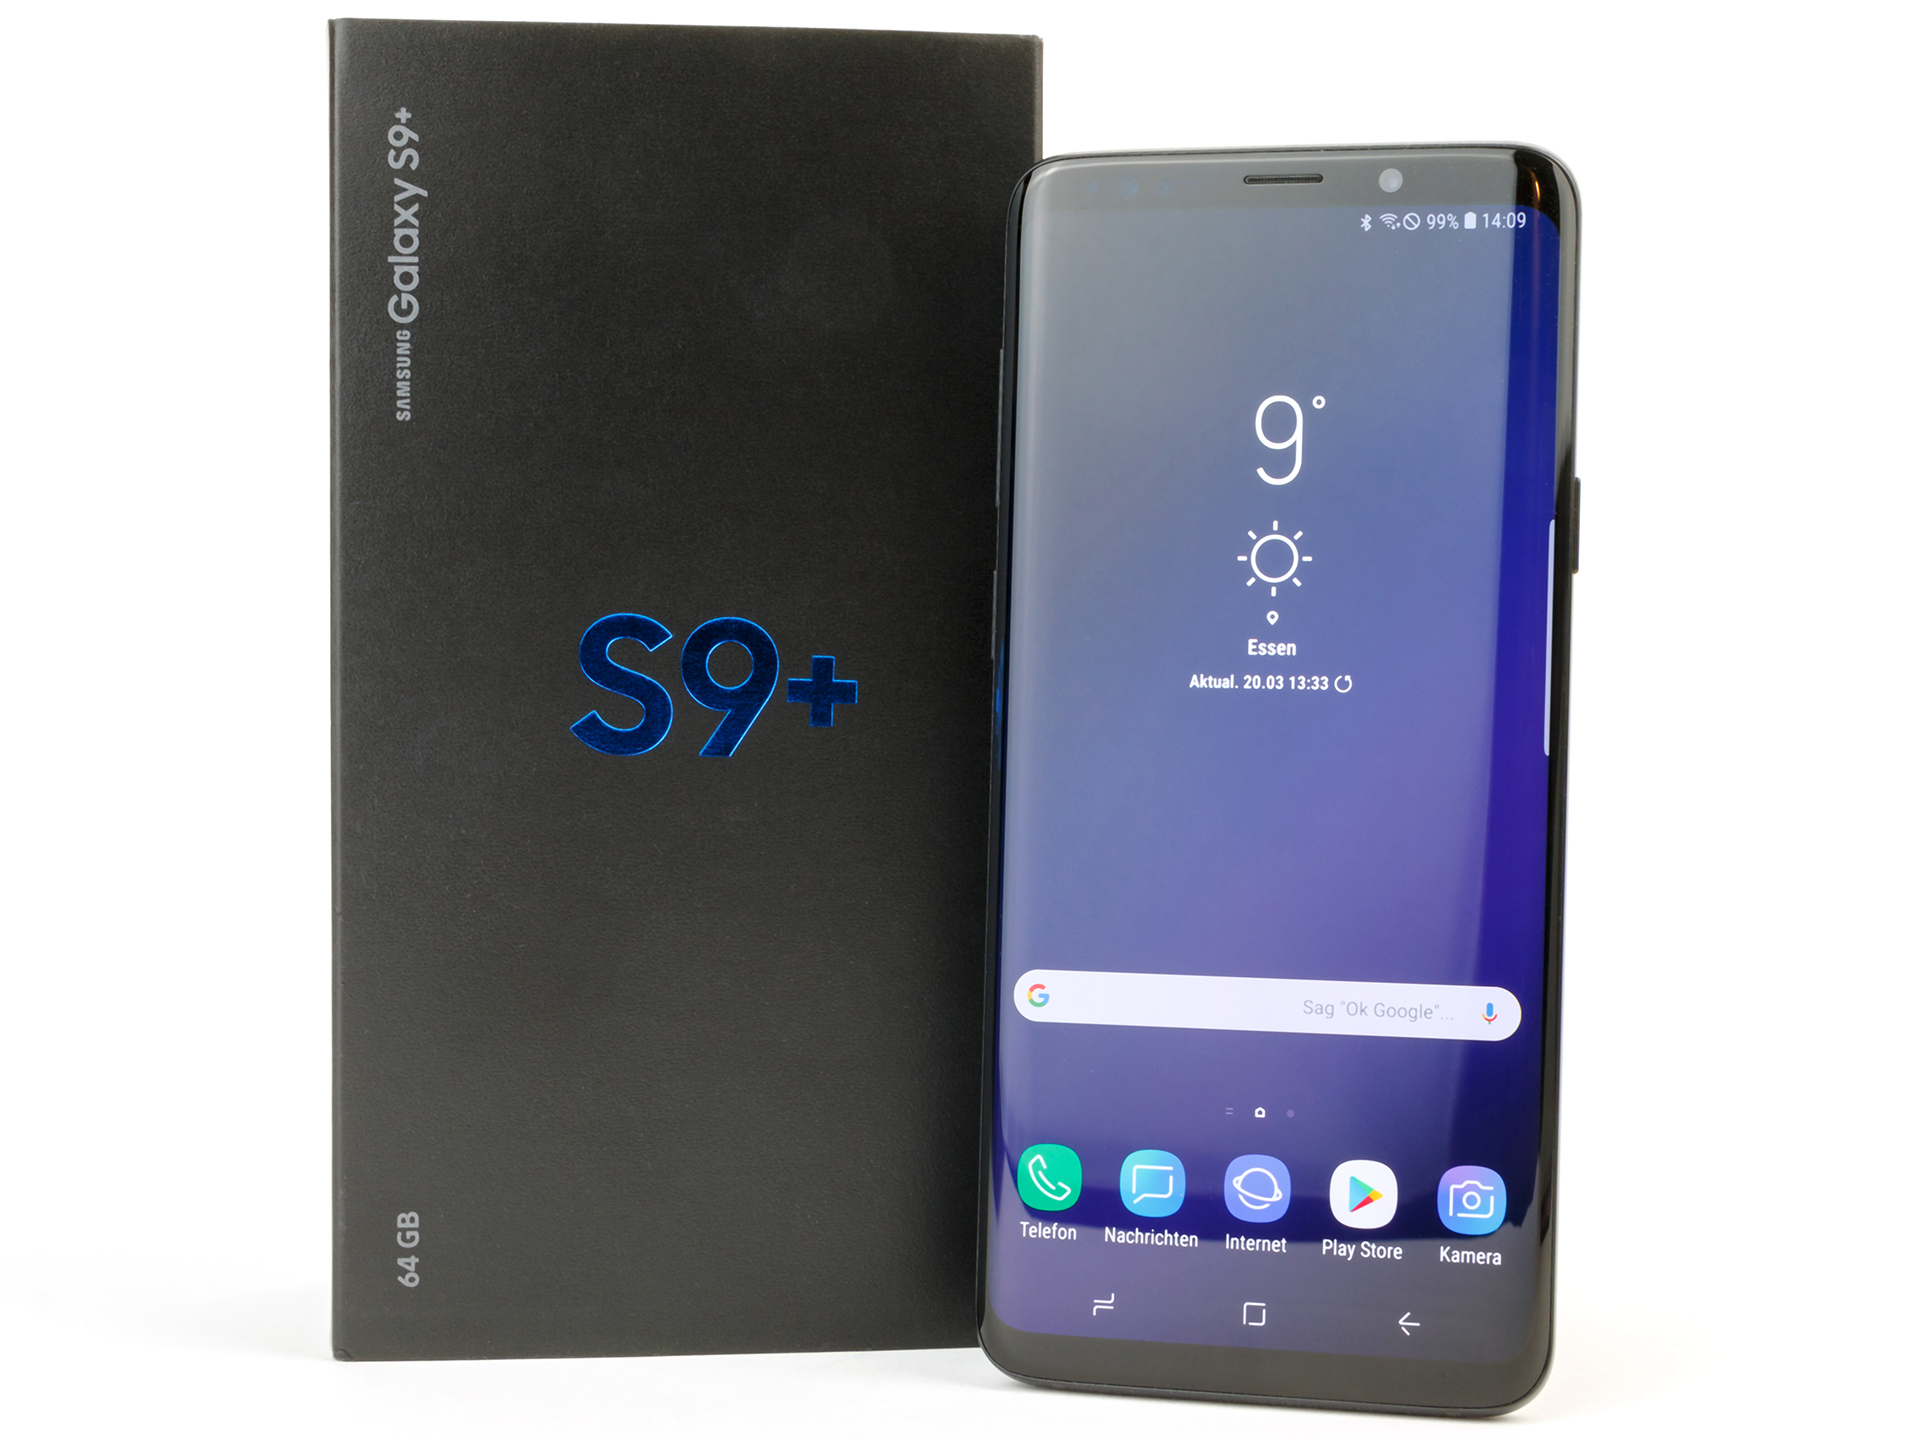
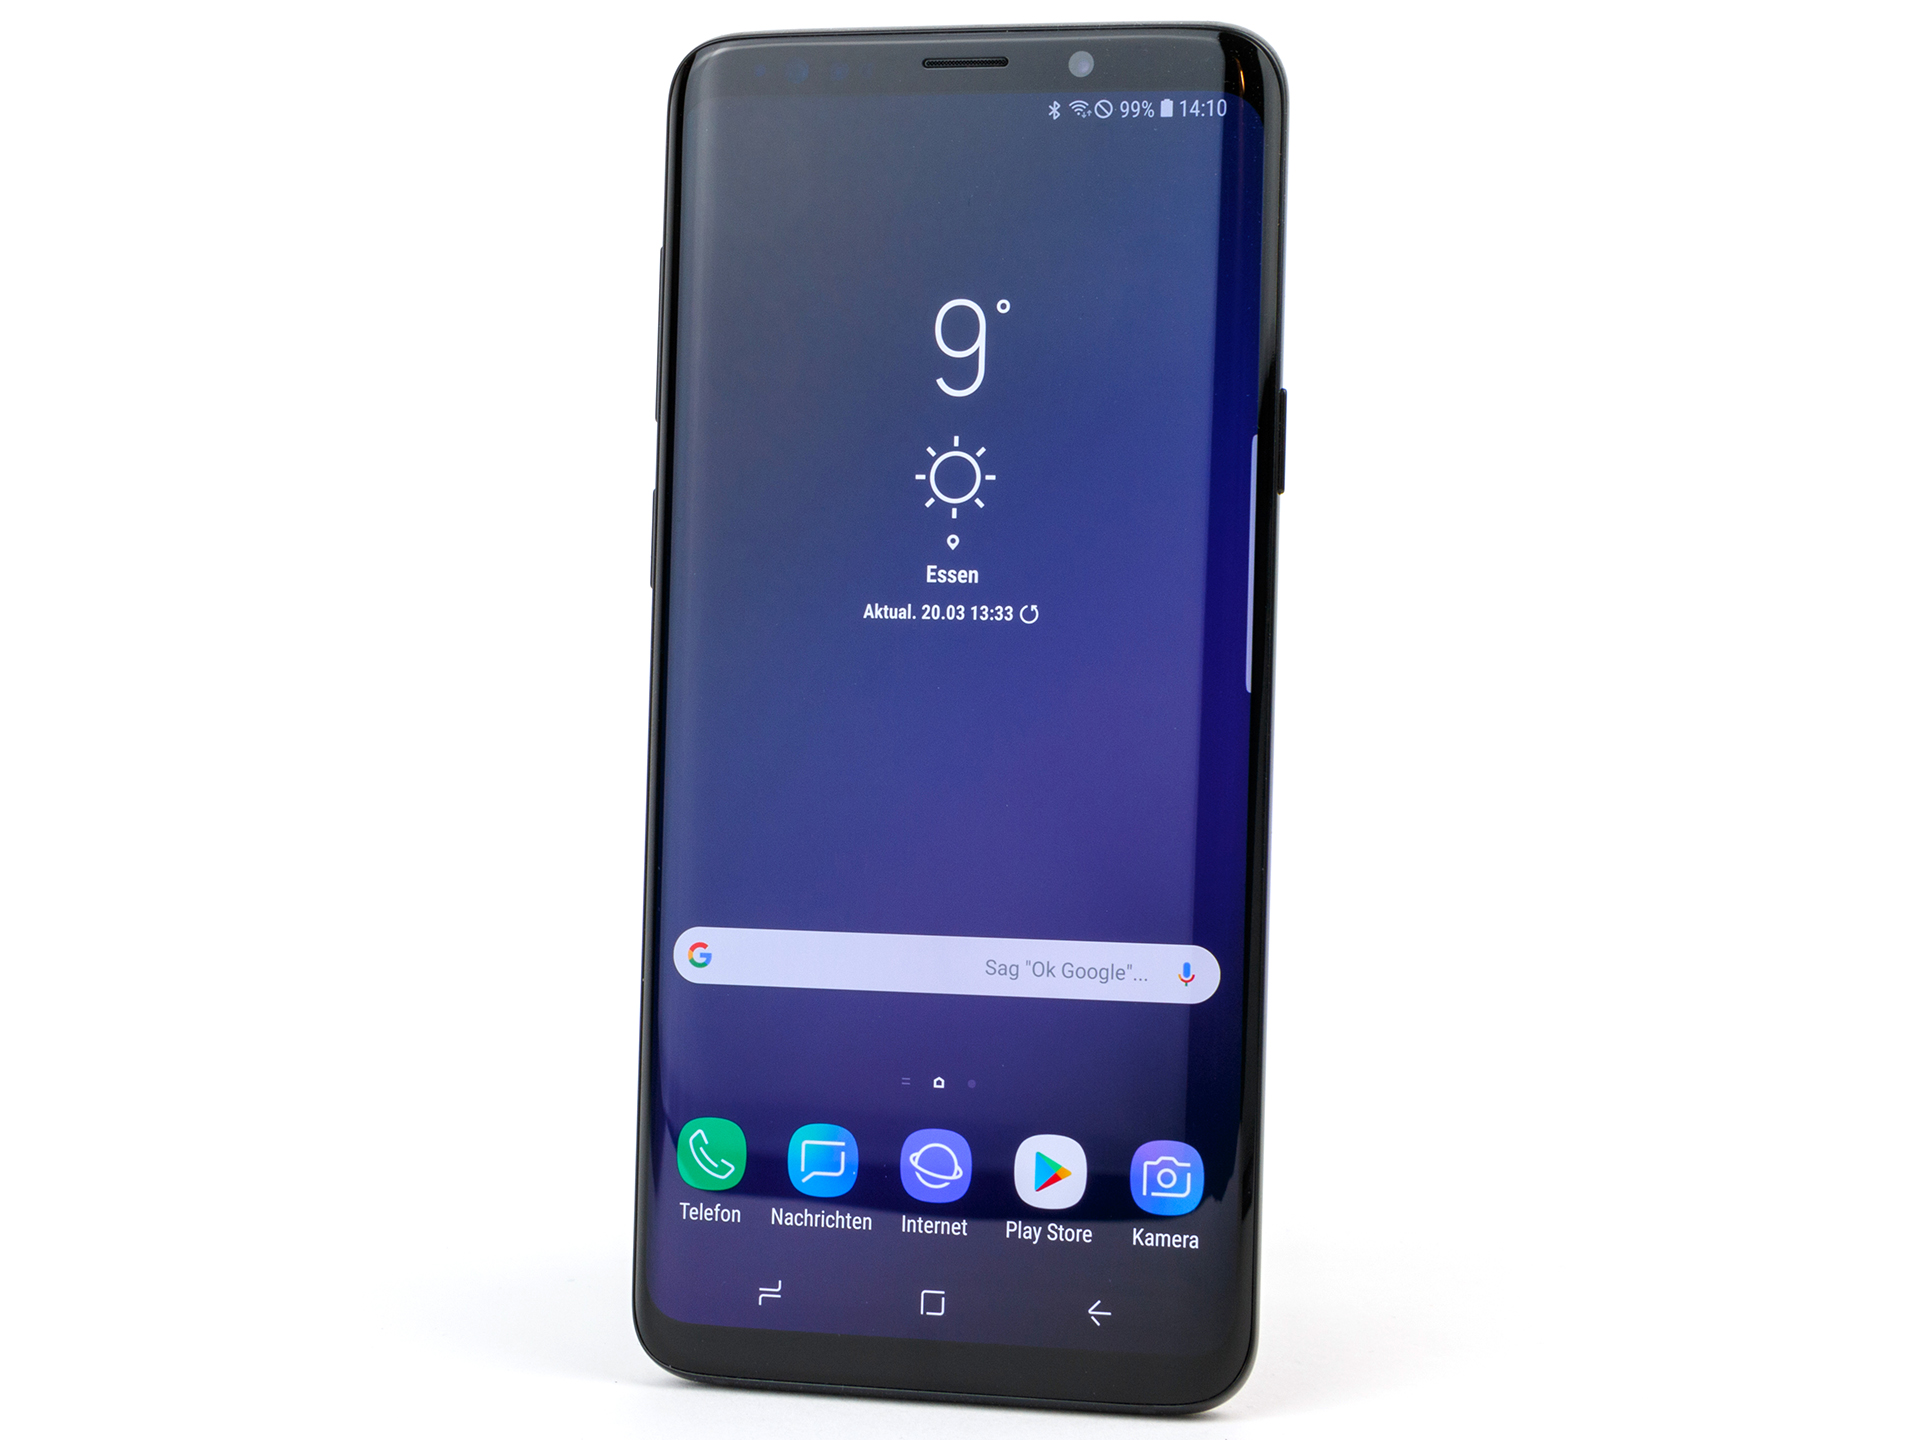
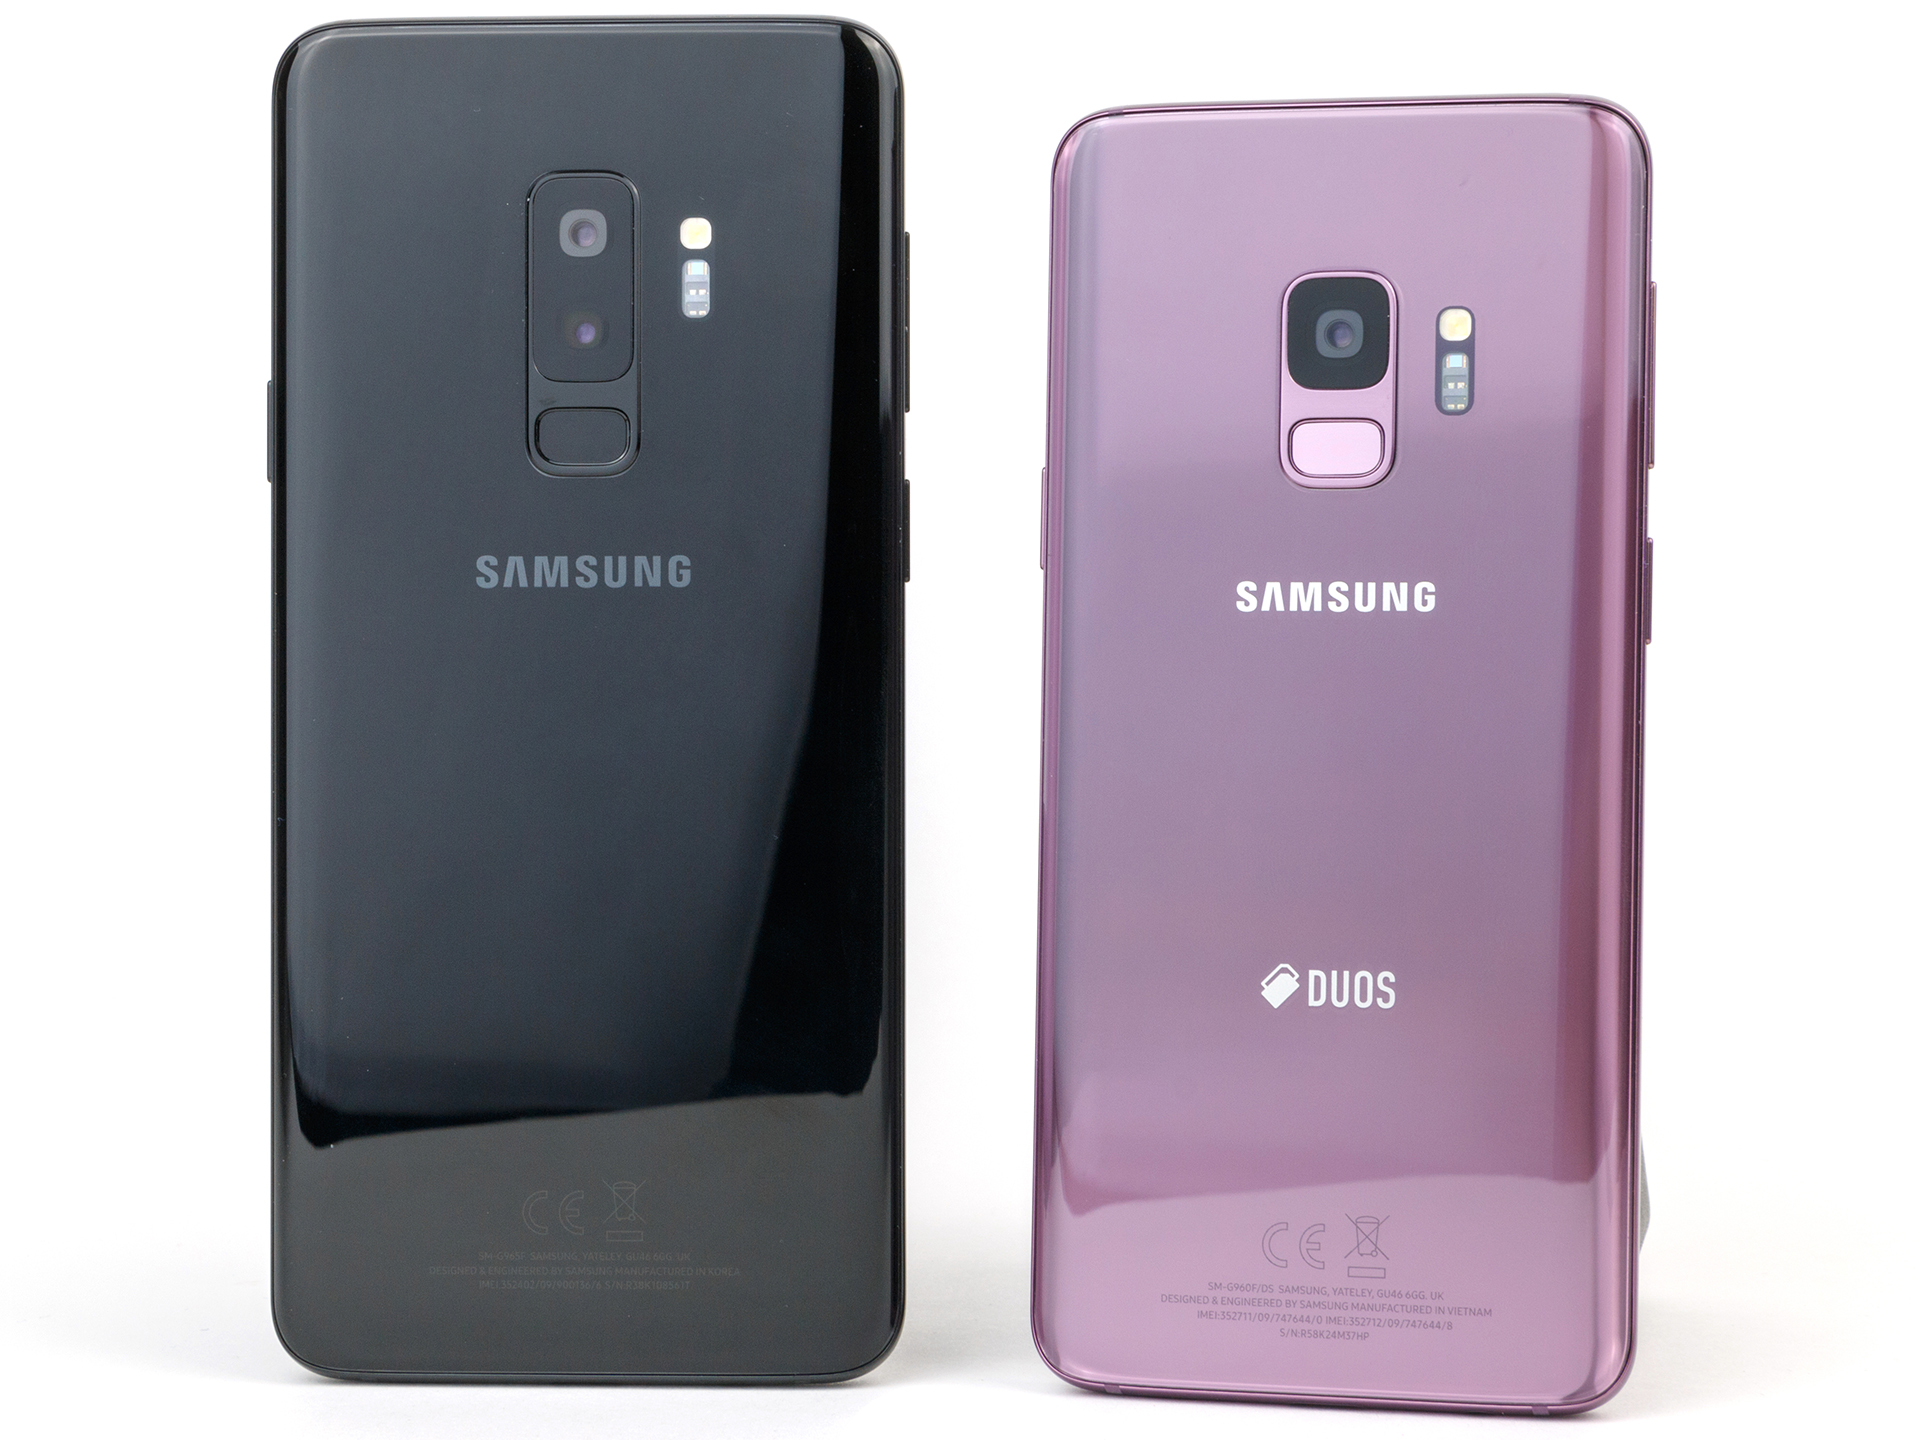
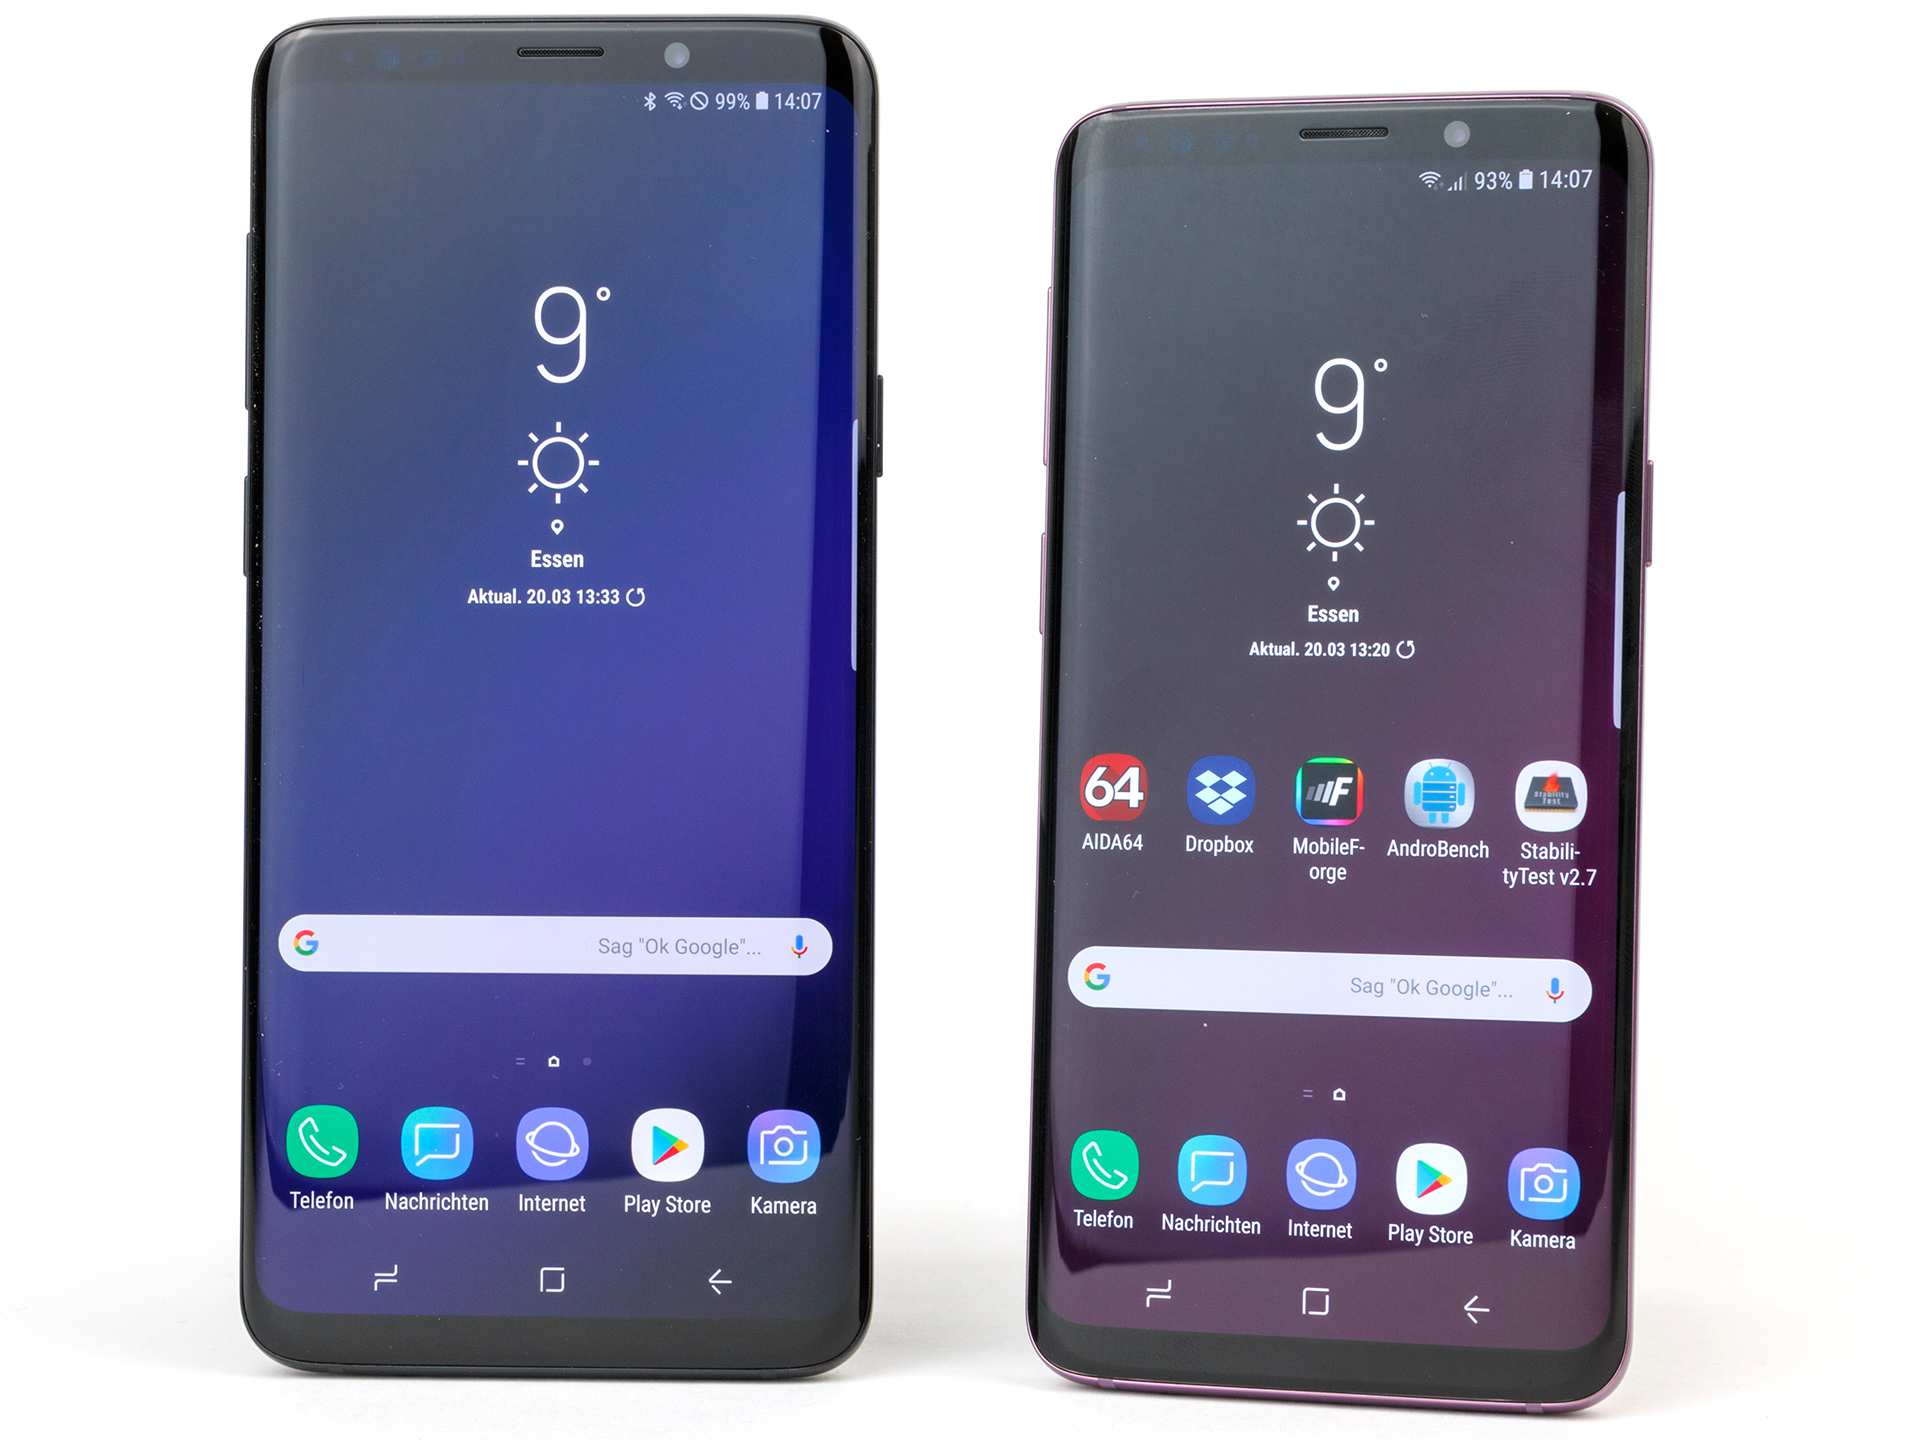
Samsung Galaxy S9 Plus
- 26-03-2018 v6 (old)
Daniel Schmidt