Impact Display Solutions IMP-3713-V2-16-500 ventilatorloze PC review
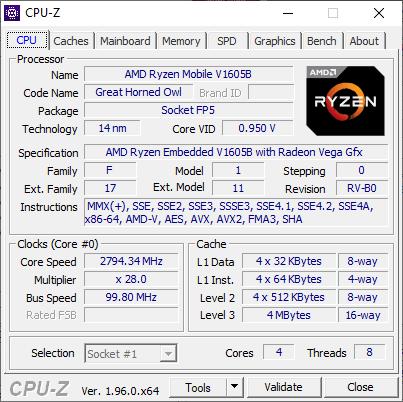
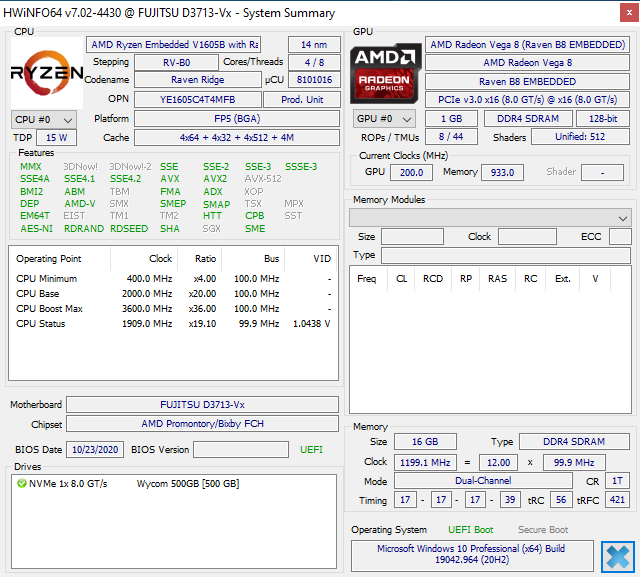
Impact Components is gespecialiseerd in het bouwen van industriële PC's met gespecialiseerde hardware en moederborden. Bepaalde modellen hebben actieve koeling, terwijl de review unit hier ventilatorloos is. Laten we het systeem belasten en benchmarken om te zien hoe een passief gekoeld chassis kan omgaan met een low-power 12 tot 25 W AMD Ryzen Embedded V1605B CPU
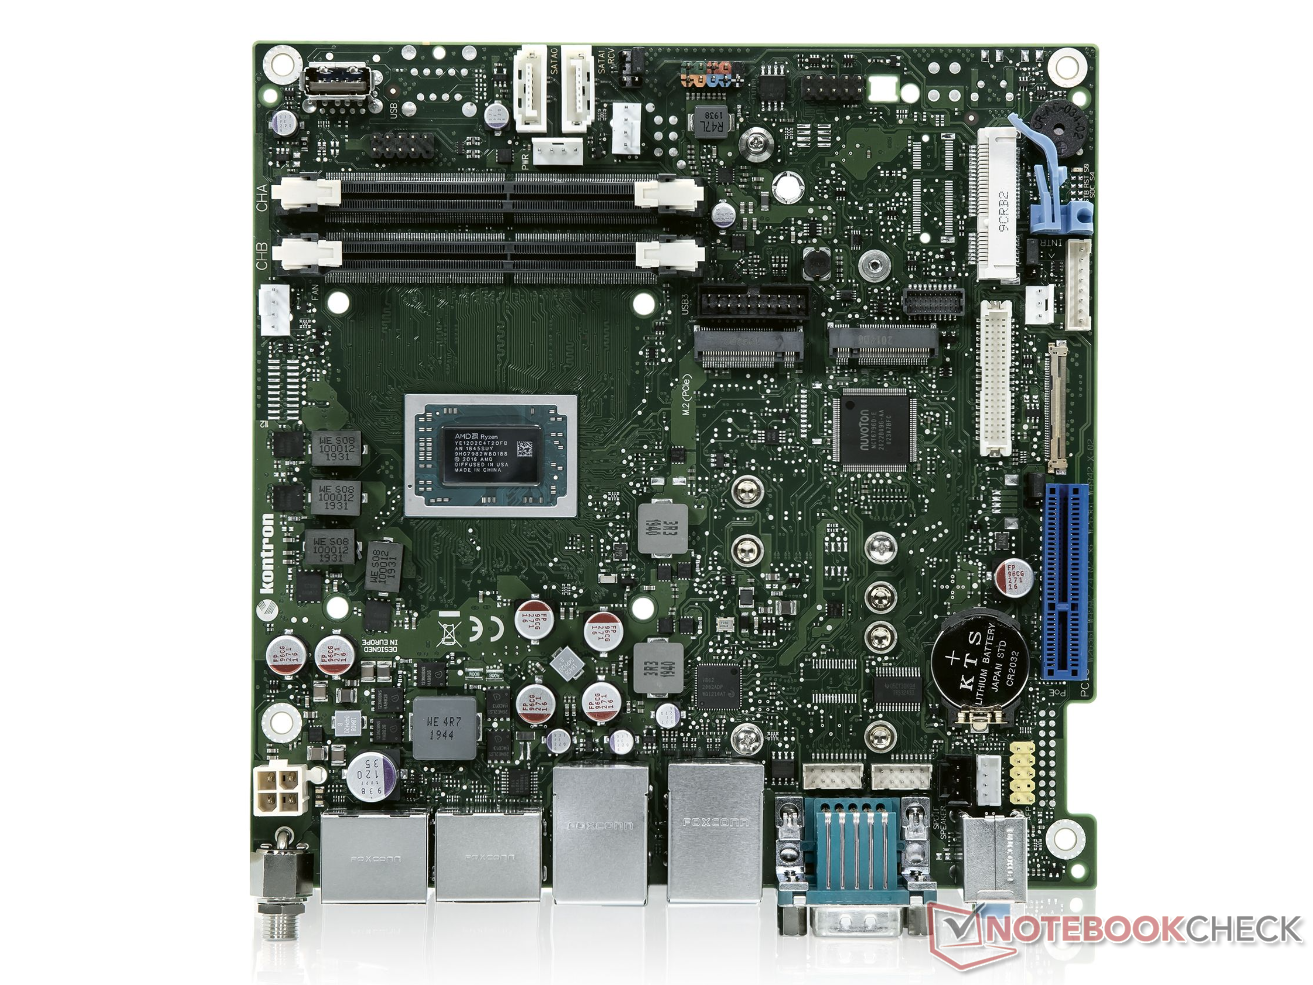
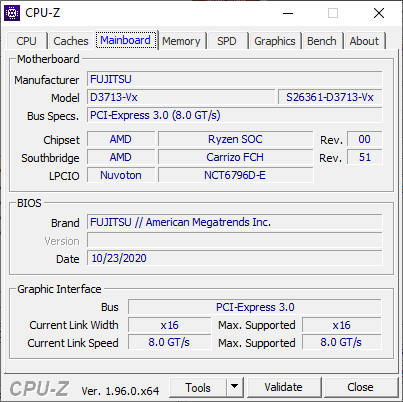
Meer gedetailleerde specificaties van de PC en zijn D3713-V/R mITX moederbord zijn te vinden via hun respectievelijke productpagina's.
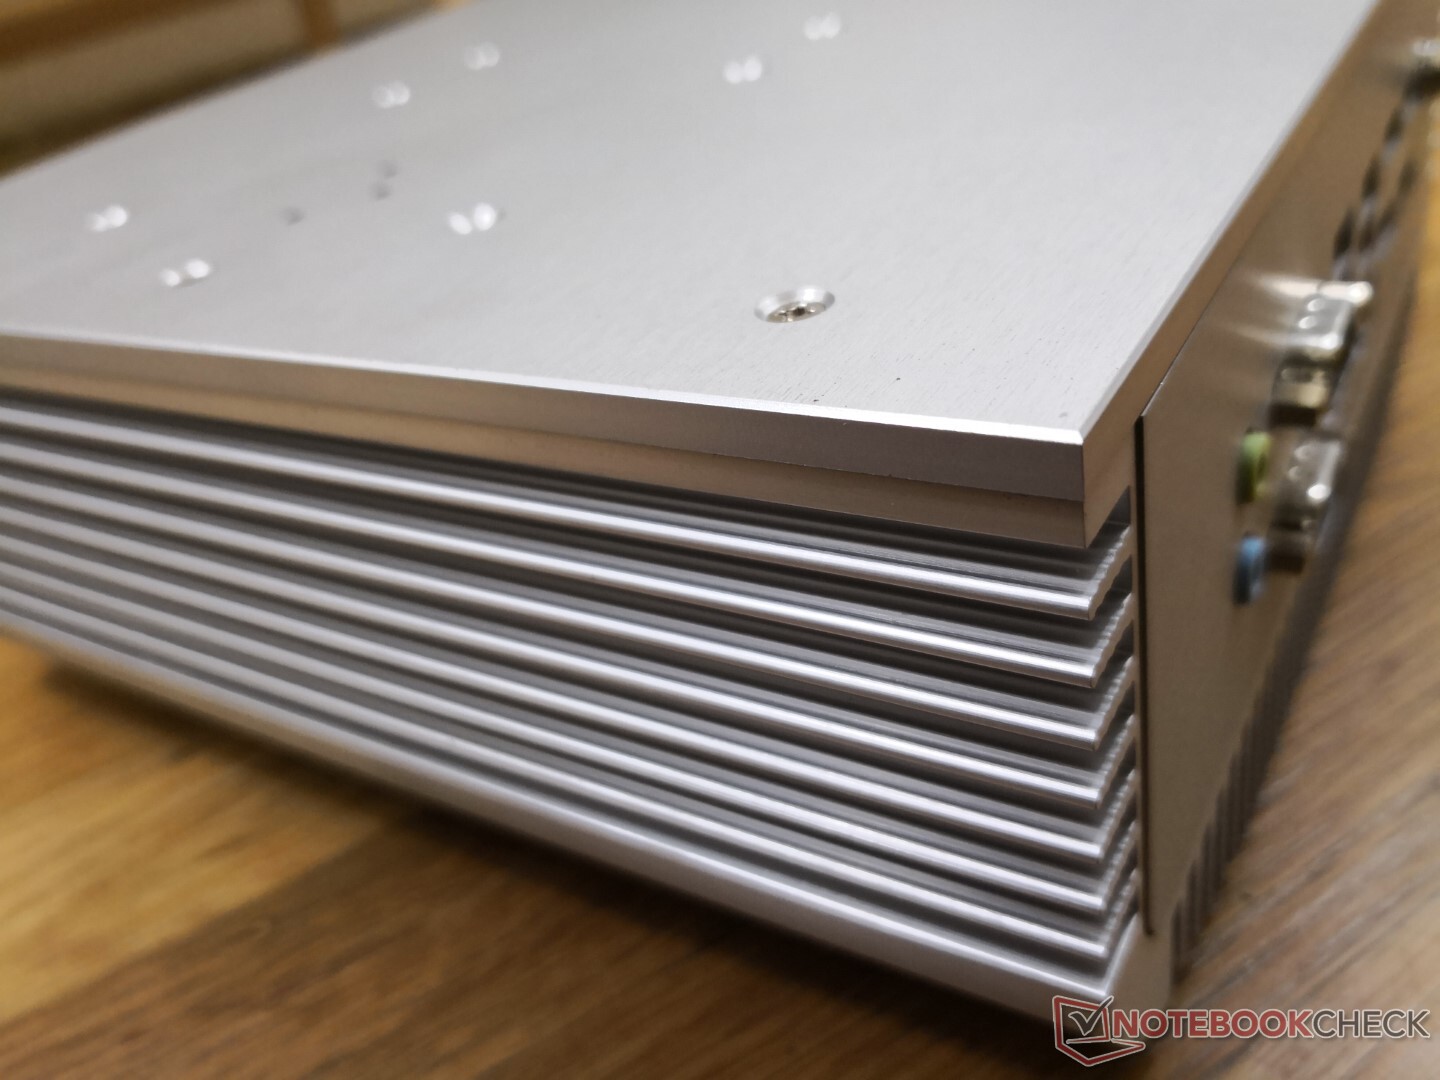
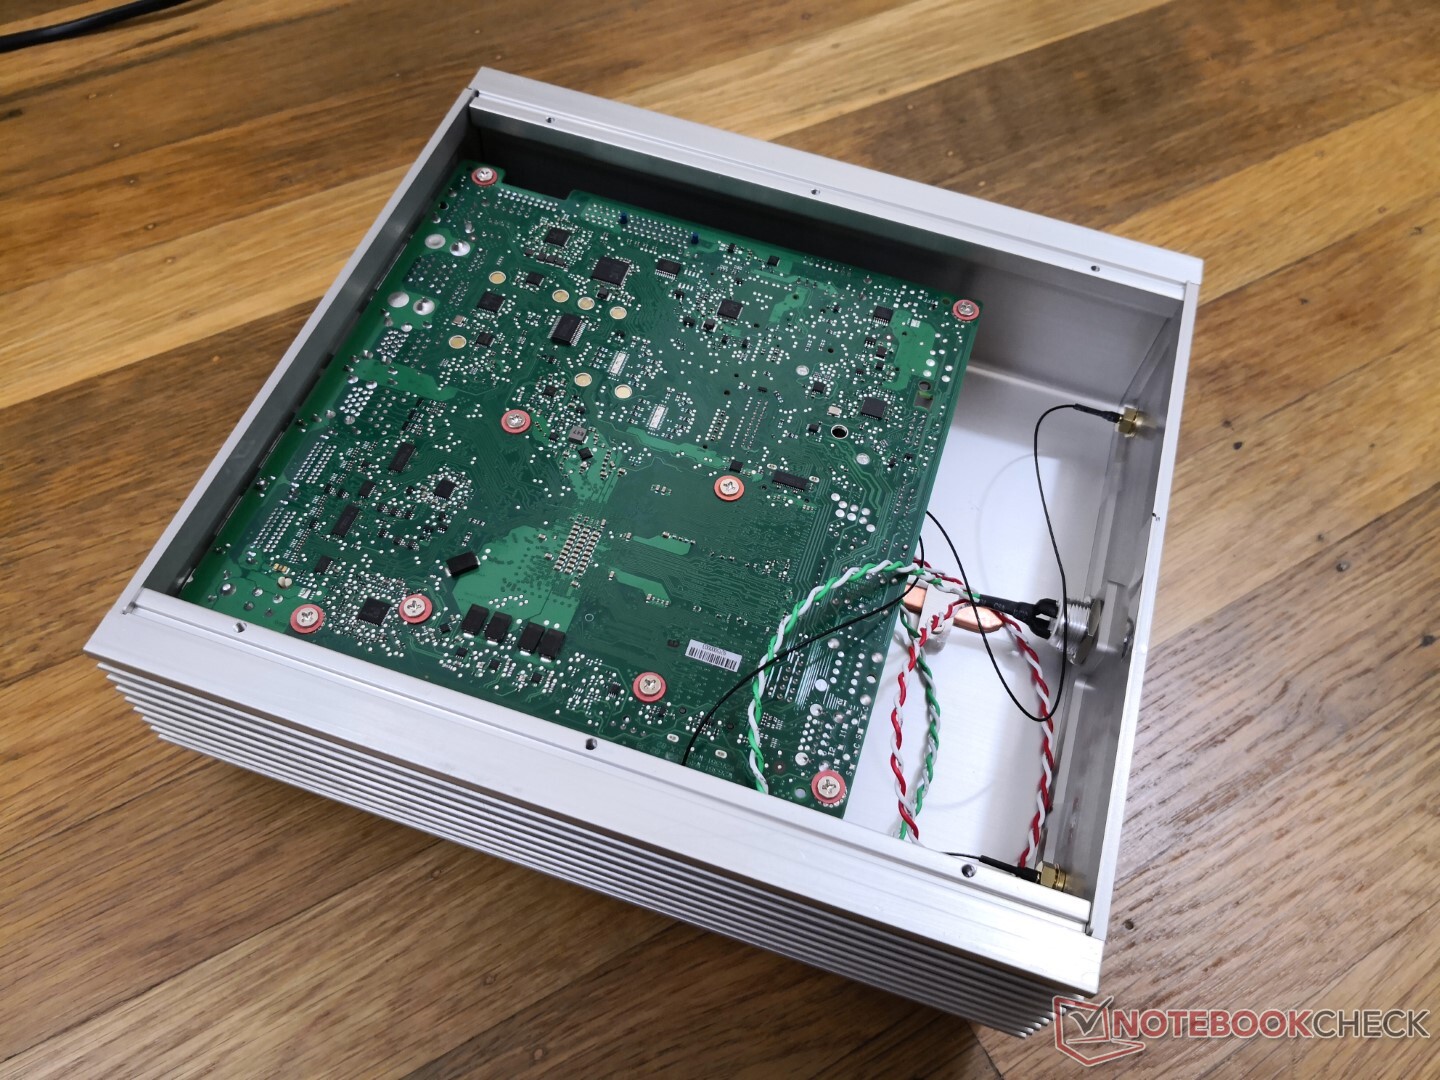
Zaak
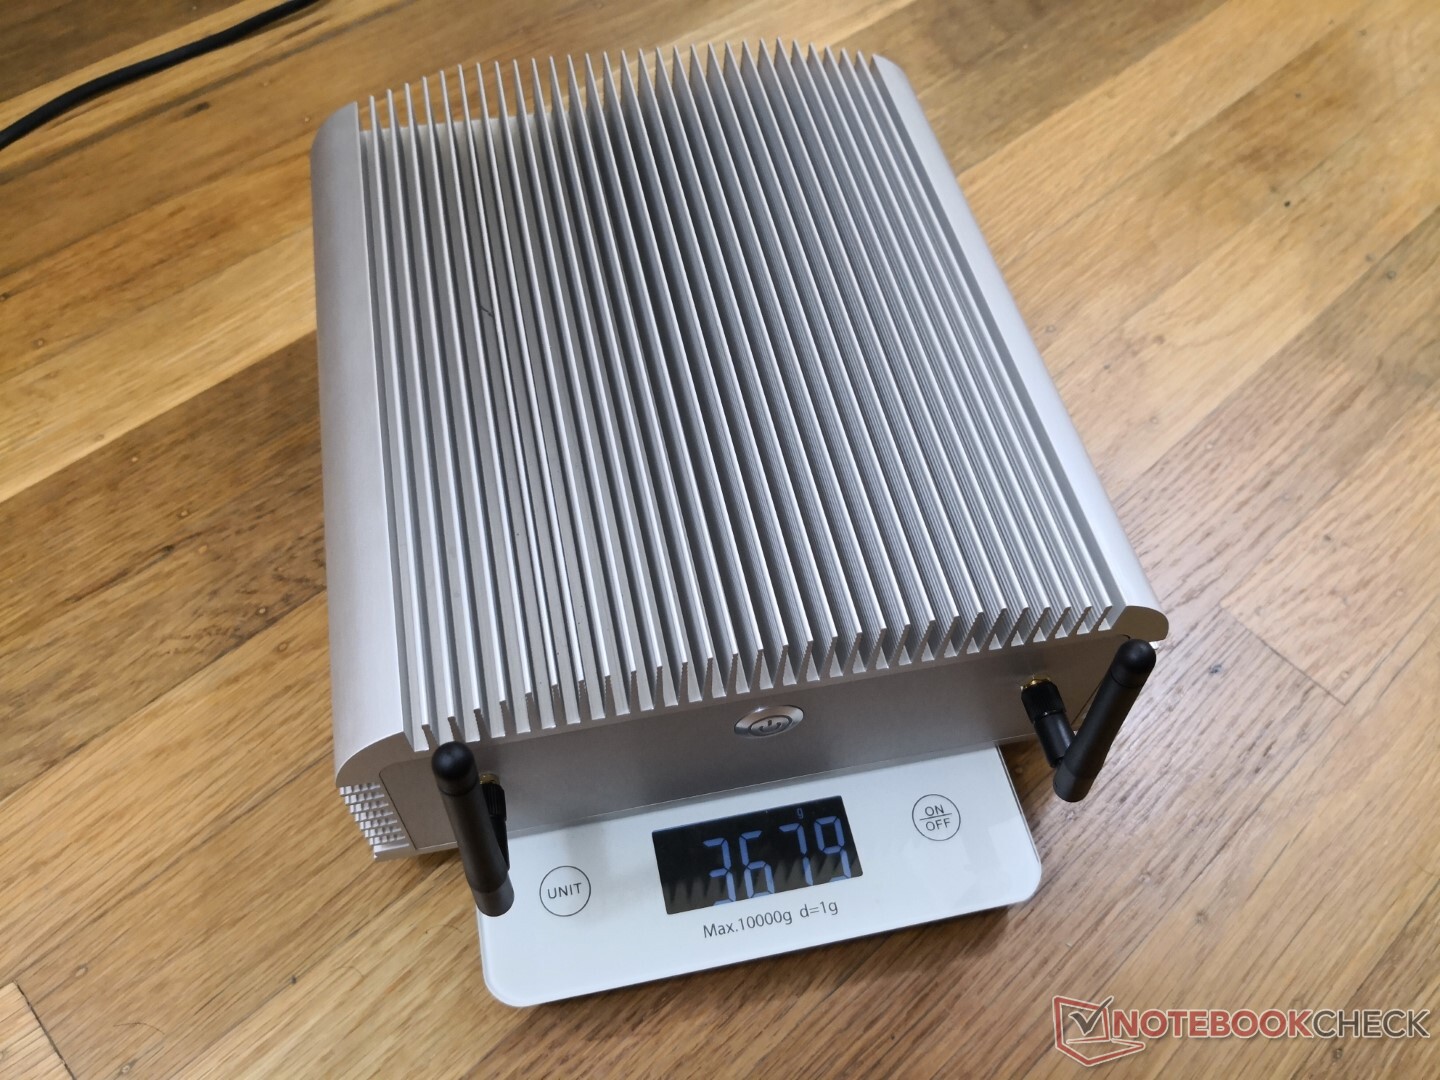
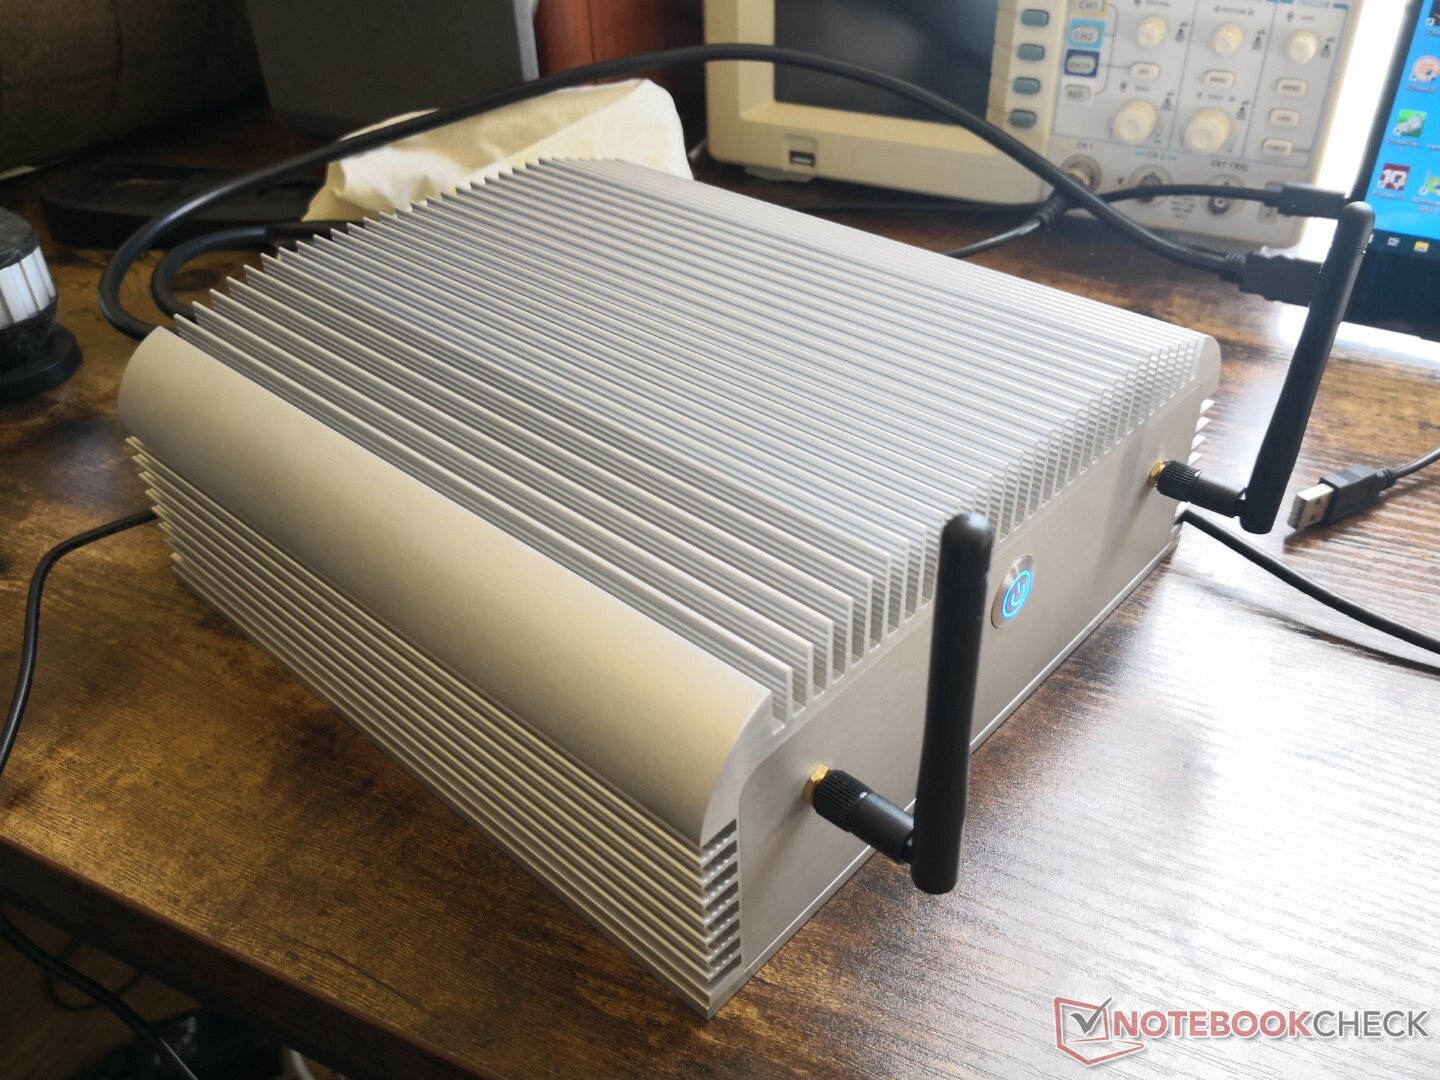
De hele behuizing is van boven tot onder geanodiseerd aluminium en IP50 gecertificeerd voor bescherming tegen stof, maar niet tegen water. Hij is aanzienlijk groter en zwaarder dan deIMP-3654-B1-R die we begin vorig jaar hebben bekeken, wat hopelijk moet leiden tot een betere koeling en een hogere thermische verzadiging.
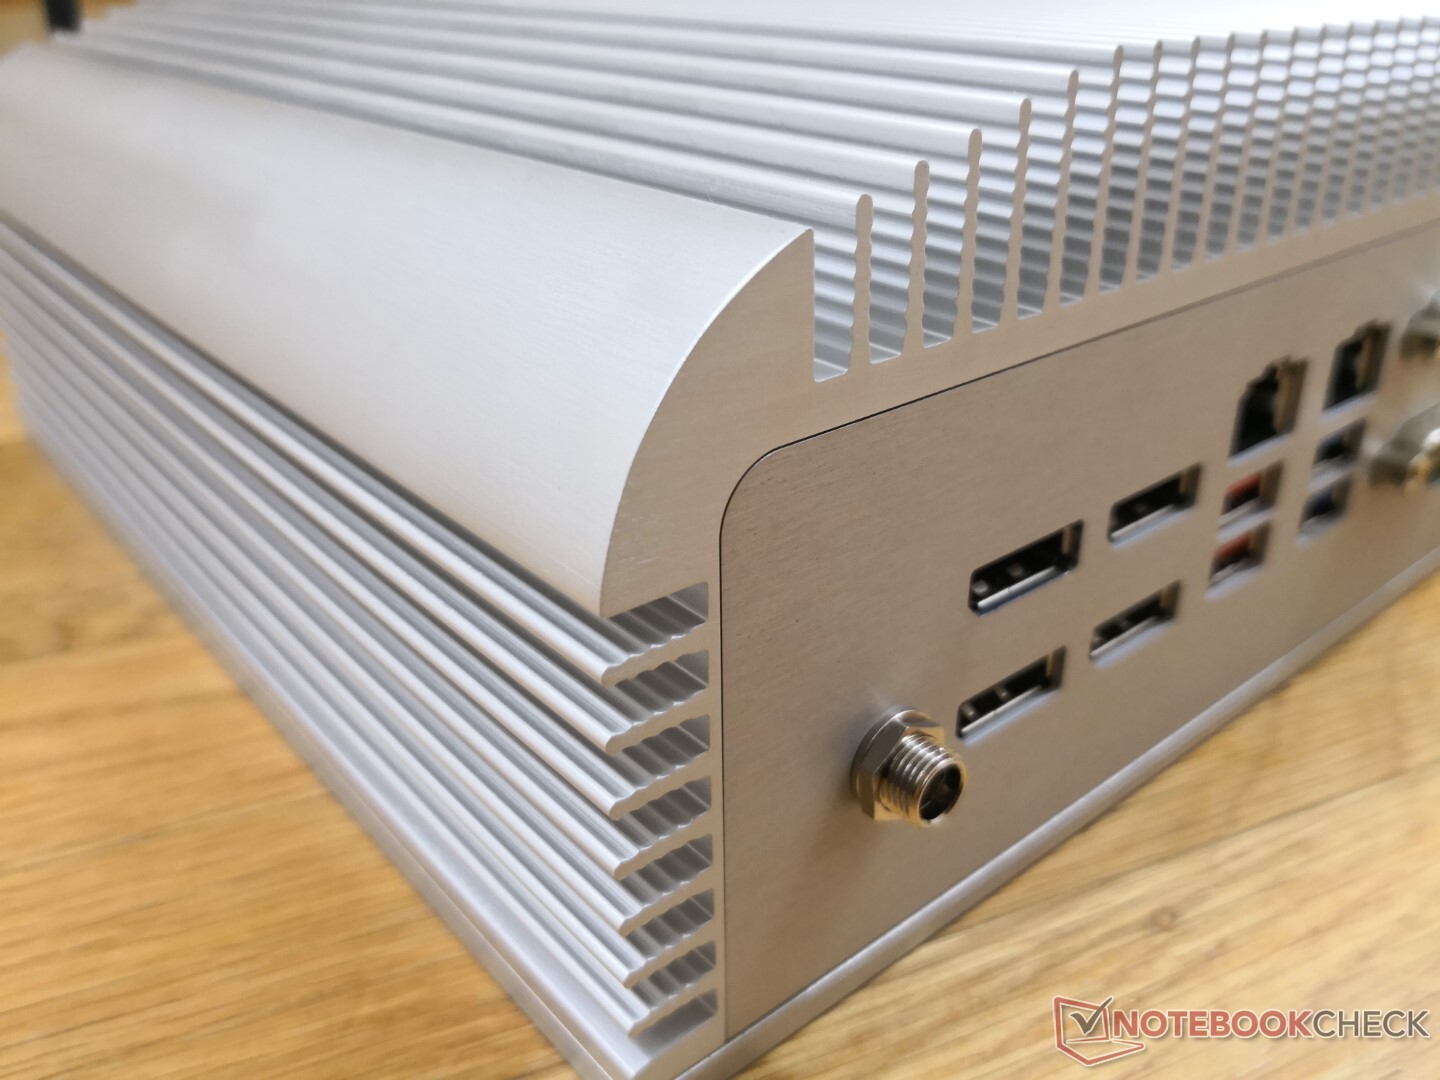
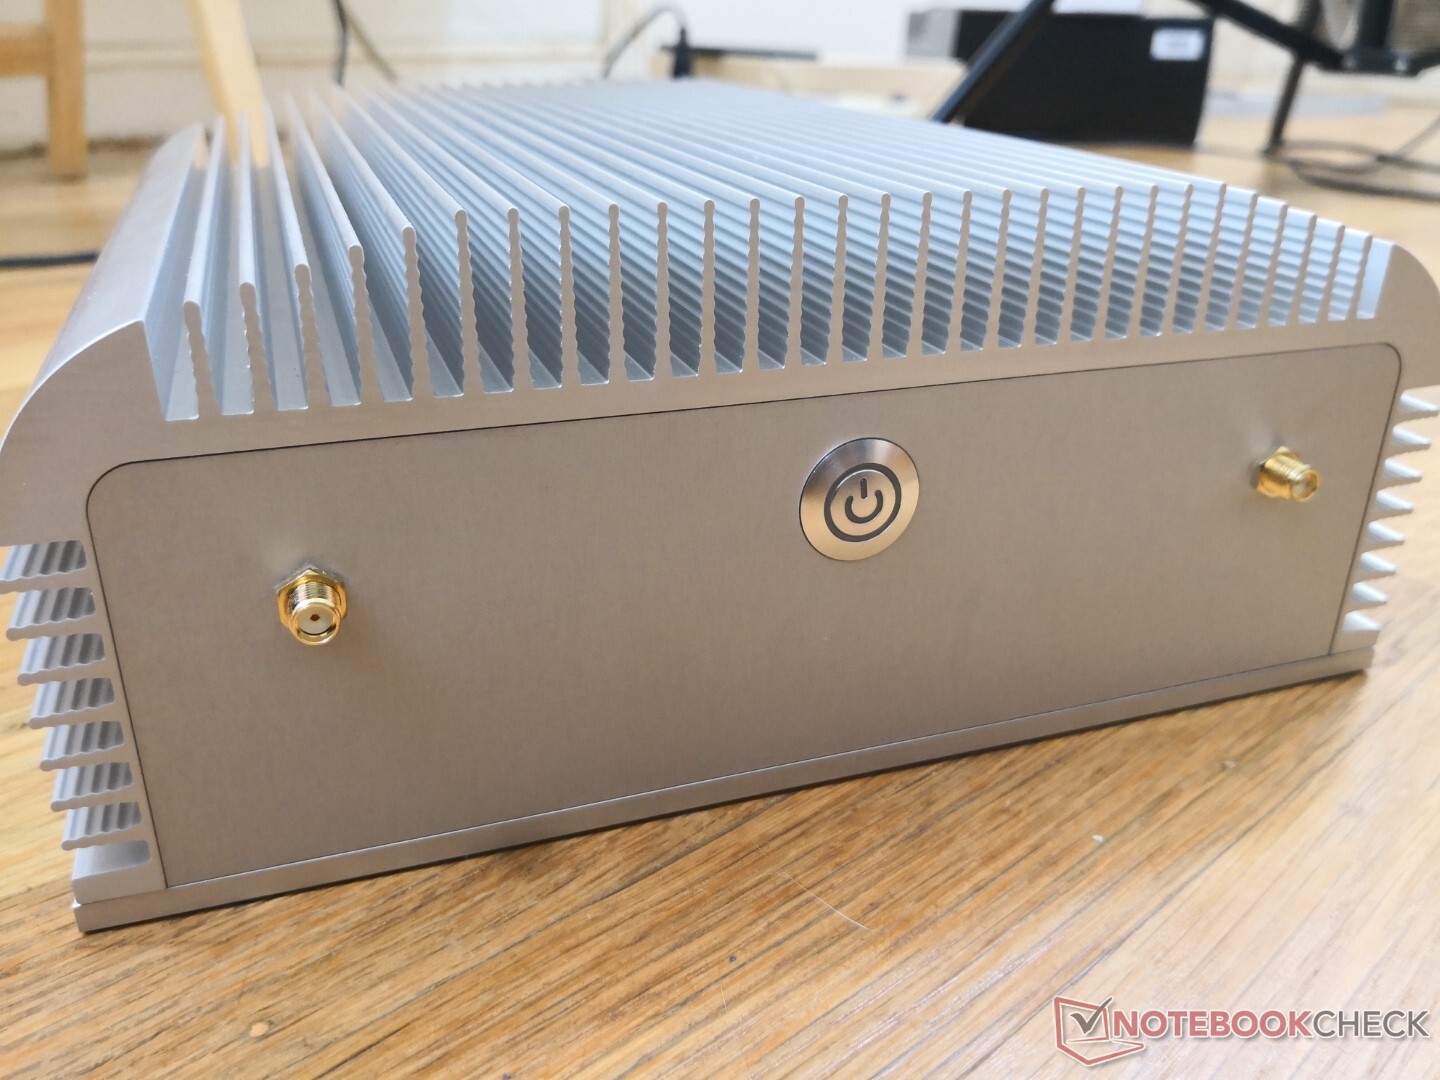
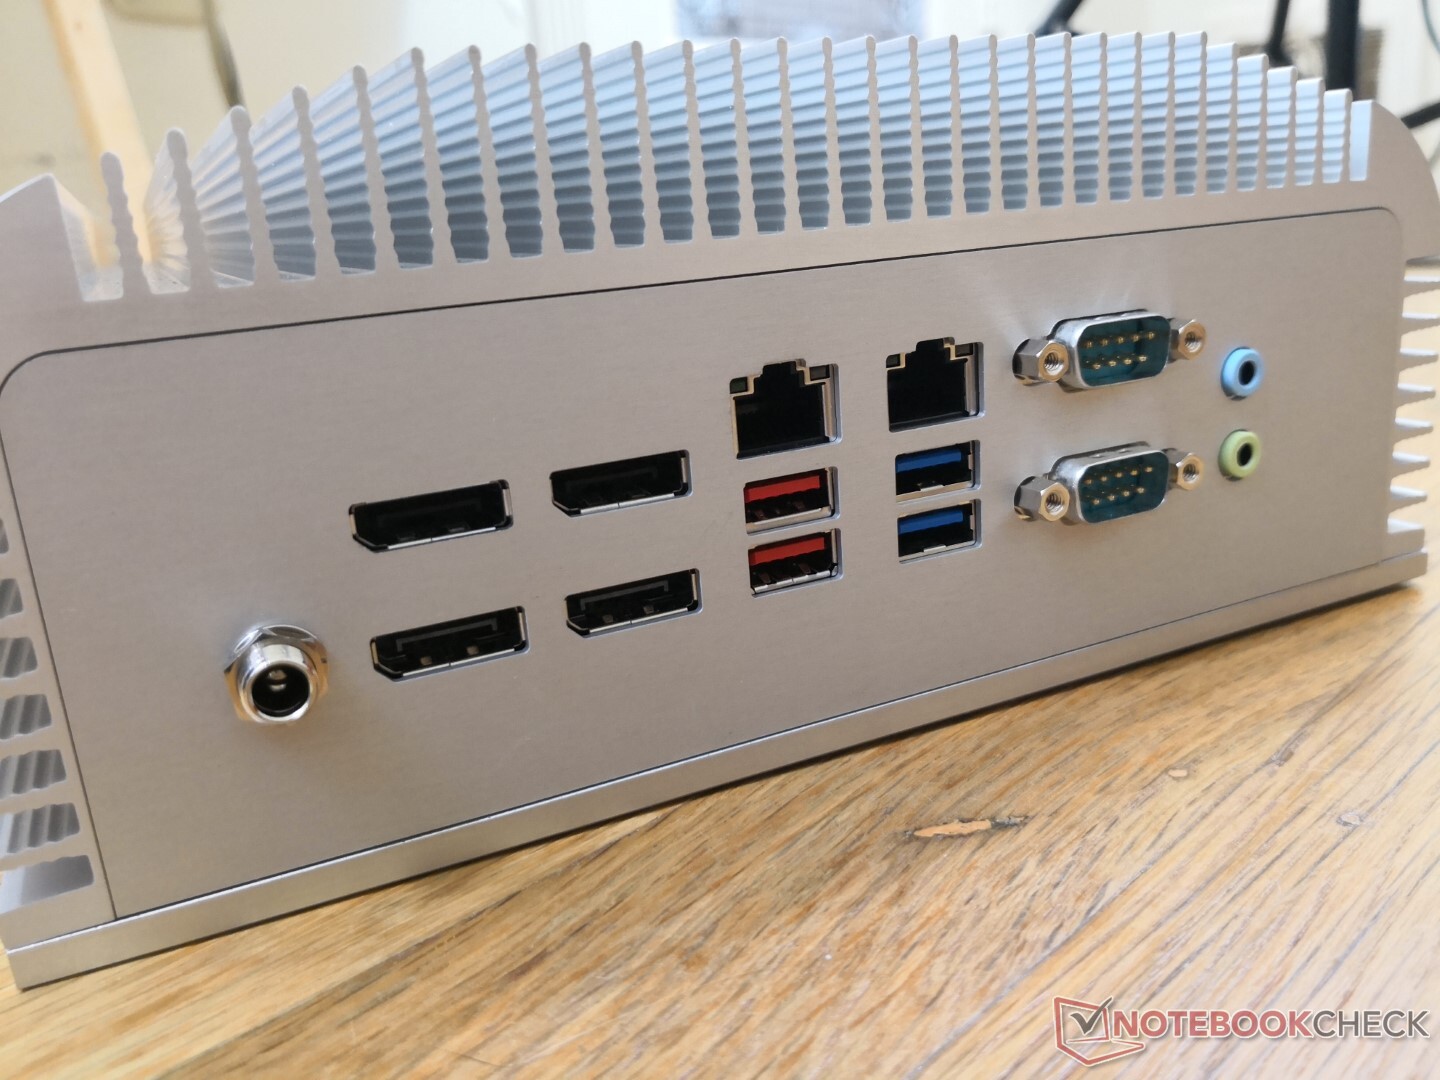
Connectiviteit
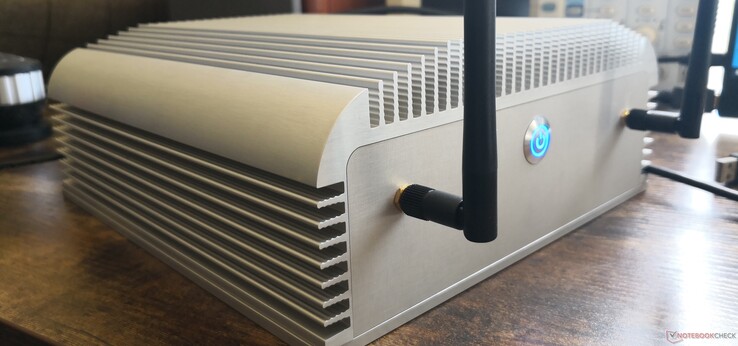
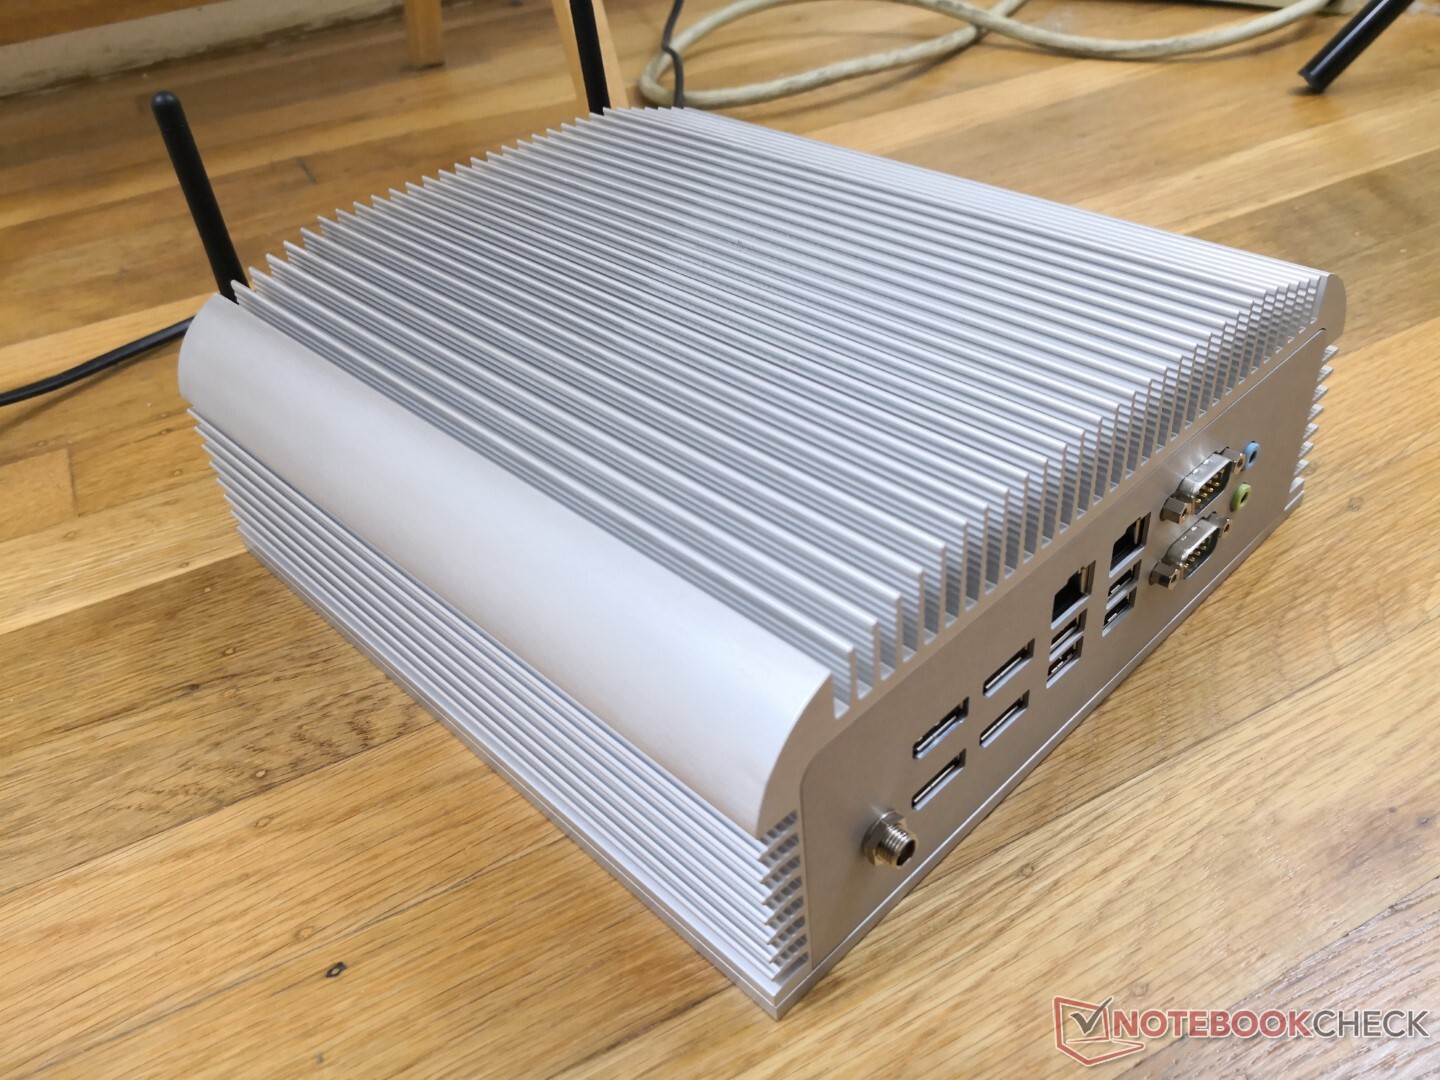
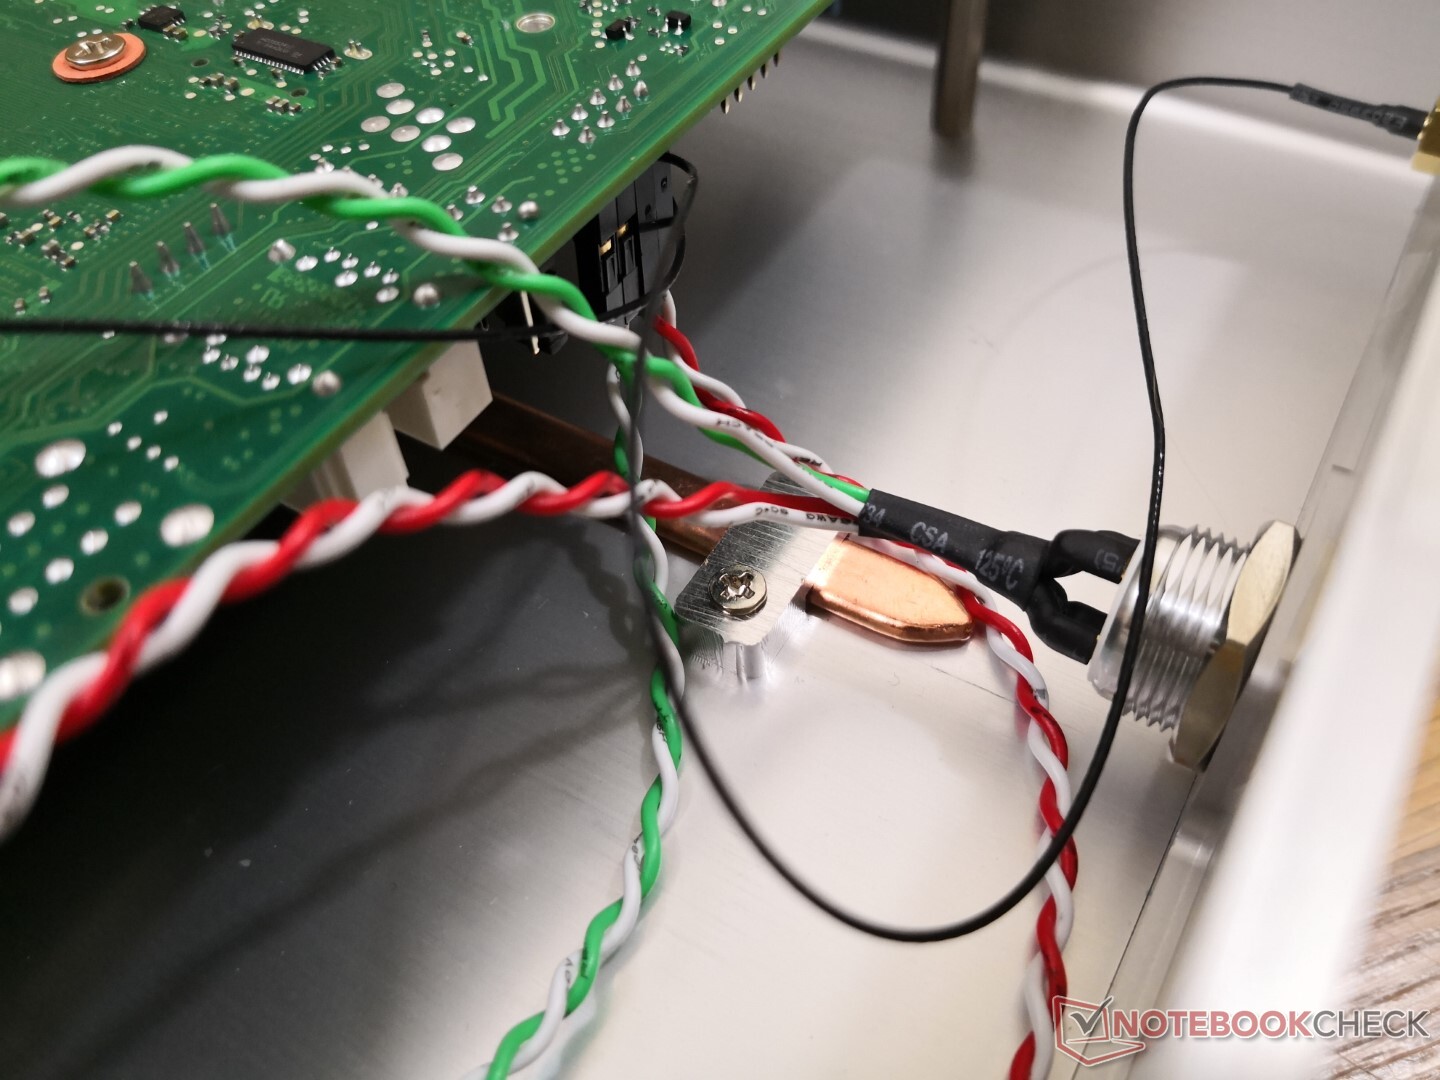
De twee antennes worden aan de voorkant van het toestel bevestigd in plaats van aan de achterkant. Vervelend genoeg zijn er geen HDMI- of USB-C-poorten.
Communicatie
Ingebouwde bedrade en draadloze communicatiemodules, alternatieve oplossingen beschikbaar (UMTS)?, Onregelmatigheden (radio-ontvangst)?
| Networking | |
| iperf3 transmit AX12 | |
| Intel NUC11PHKi7C | |
| Impact Display Solutions IMP-3713-V2-16-500 | |
| Intel NUC11PAQi7 | |
| Zotac ZBox MI643 | |
| Impact Display Solutions IMP-3654-B1-R Core i9-9900T | |
| iperf3 receive AX12 | |
| Impact Display Solutions IMP-3713-V2-16-500 | |
| Intel NUC11PHKi7C | |
| Intel NUC11PAQi7 | |
| Impact Display Solutions IMP-3654-B1-R Core i9-9900T | |
| Zotac ZBox MI643 | |
Onderhoud
Het bodempaneel is gemakkelijk te verwijderen met slechts een Philips schroevendraaier om de onderzijde van het moederbord te onthullen. Om toegang te krijgen tot de rest van het moederbord, is echter extra demontage nodig.
Accessoires en garantie
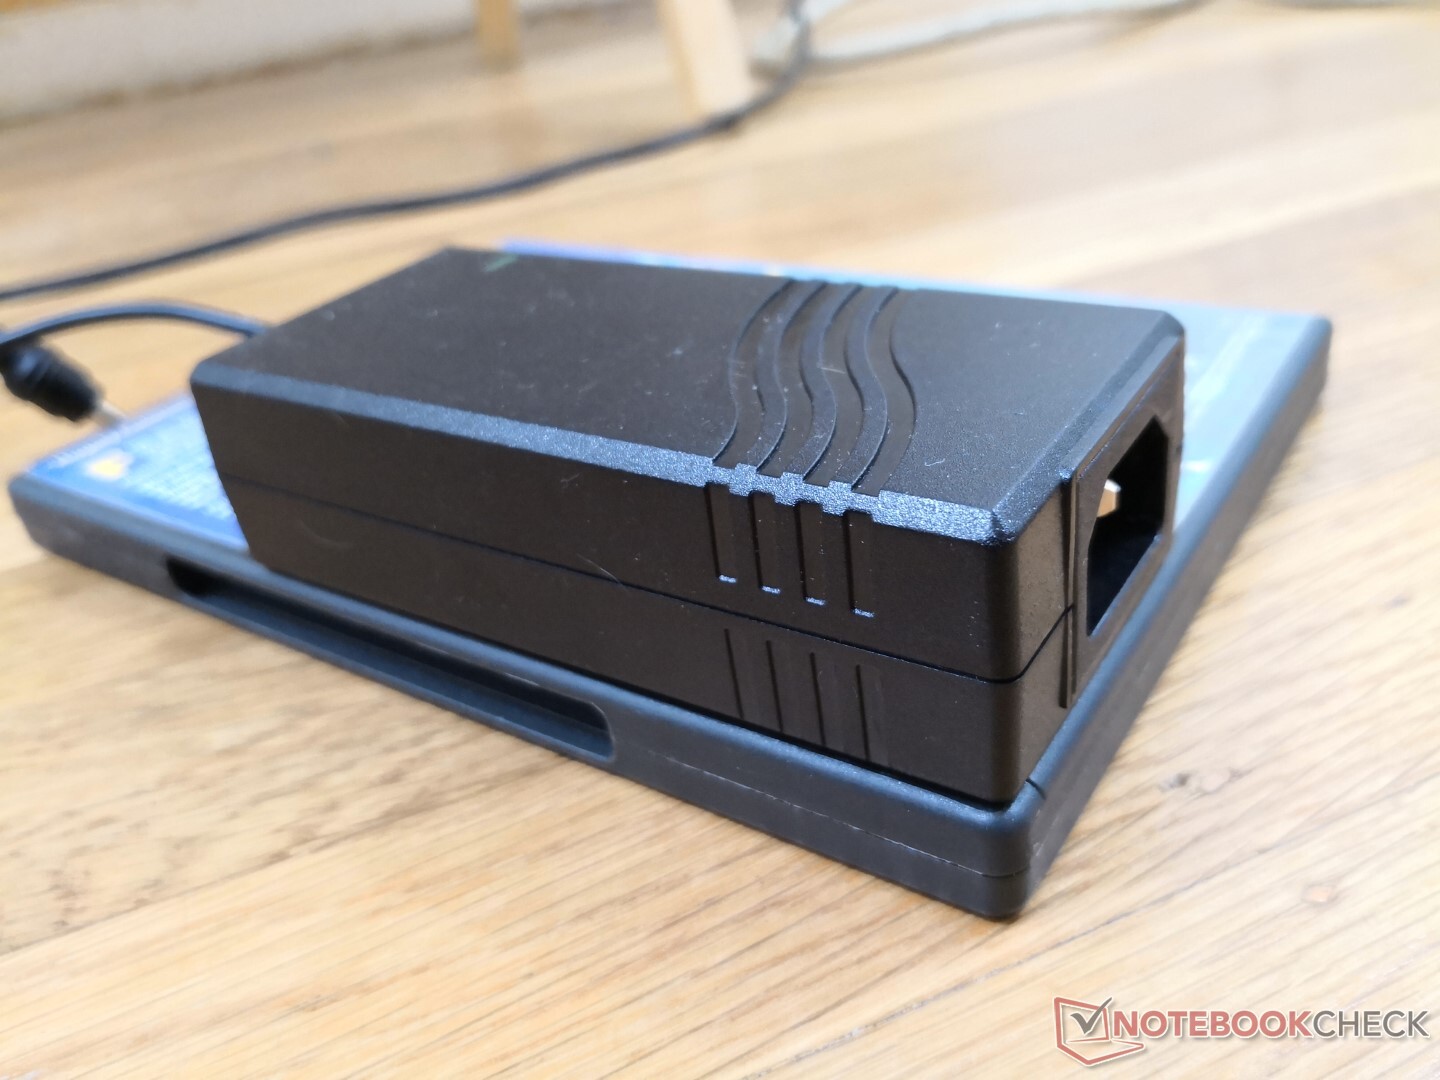
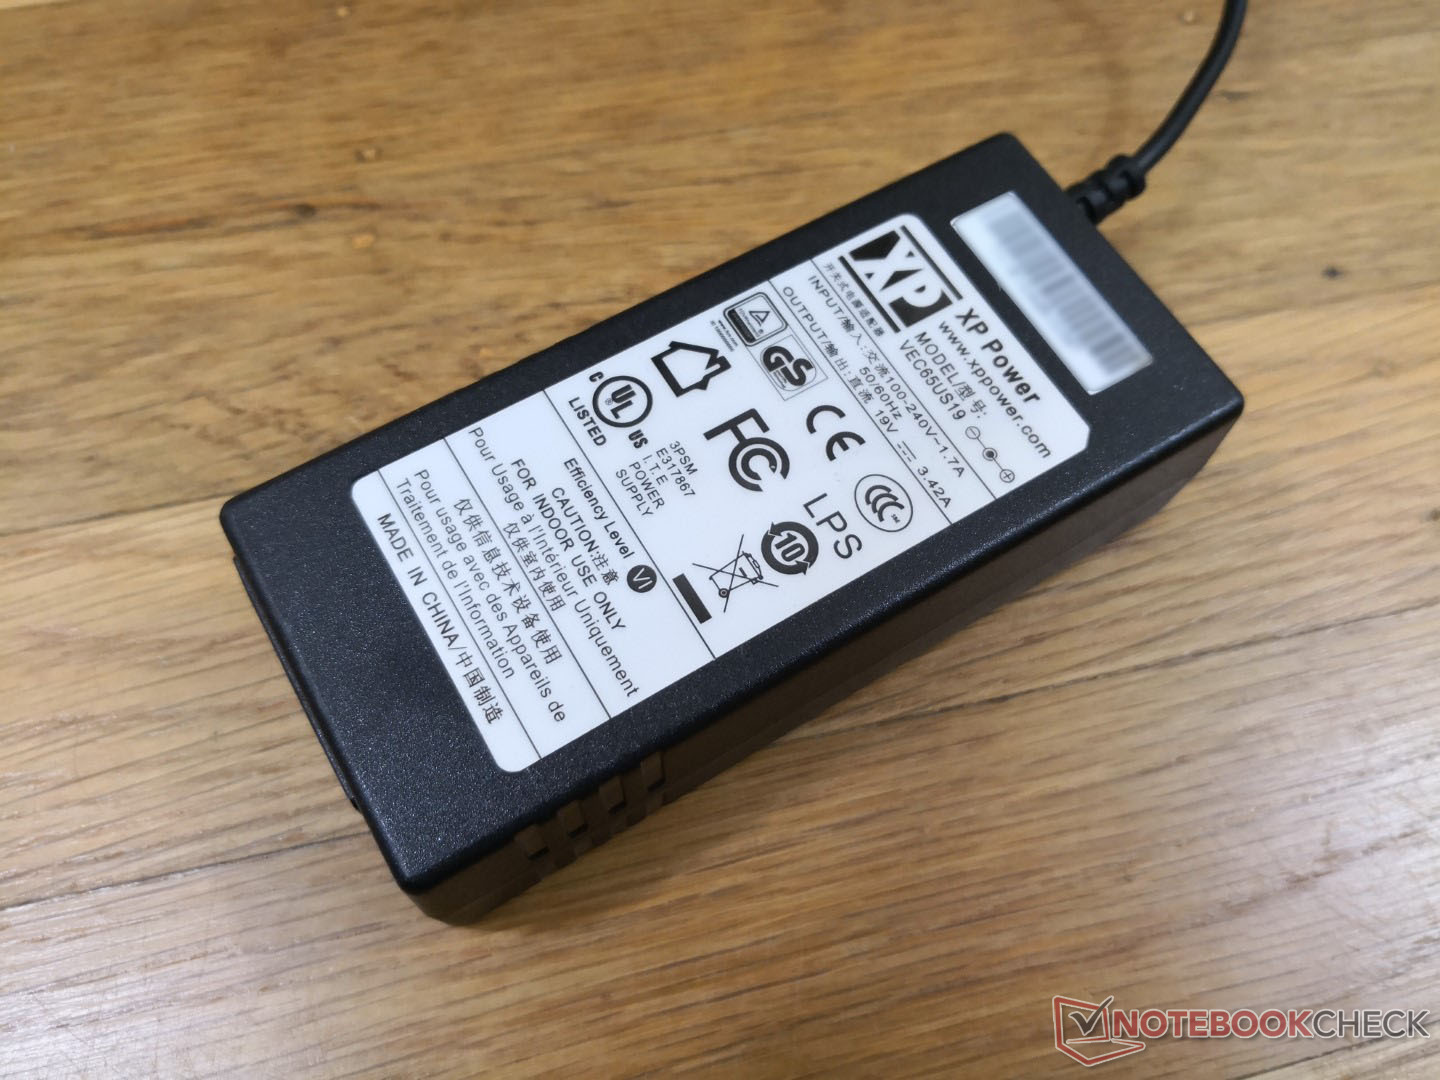
De doos bevat naast een wisselstroomadapter ook twee antennes. De standaard beperkte fabrieksgarantie van één jaar is van toepassing.
Prestaties
Processor
De ruwe CPU prestaties zijn ongeveer 14 procent en 22 procent langzamer dan de Ryzen 3 4300U in respectievelijk multi-thread en single-thread werkbelastingen, om een processor op instapniveau te vertegenwoordigen.
Cinebench R23: Multi Core | Single Core
Cinebench R15: CPU Multi 64Bit | CPU Single 64Bit
Blender: v2.79 BMW27 CPU
7-Zip 18.03: 7z b 4 -mmt1 | 7z b 4
Geekbench 5.5: Single-Core | Multi-Core
HWBOT x265 Benchmark v2.2: 4k Preset
LibreOffice : 20 Documents To PDF
R Benchmark 2.5: Overall mean
| Cinebench R23 / Multi Core | |
| Intel NUC11PAQi7 | |
| Intel NUC11PHKi7C | |
| Intel NUC11TNKi5 | |
| Honor MagicBook Pro 10210U | |
| Impact Display Solutions IMP-3713-V2-16-500 | |
| Cinebench R23 / Single Core | |
| Intel NUC11PHKi7C | |
| Intel NUC11TNKi5 | |
| Honor MagicBook Pro 10210U | |
| Impact Display Solutions IMP-3713-V2-16-500 | |
Cinebench R23: Multi Core | Single Core
Cinebench R15: CPU Multi 64Bit | CPU Single 64Bit
Blender: v2.79 BMW27 CPU
7-Zip 18.03: 7z b 4 -mmt1 | 7z b 4
Geekbench 5.5: Single-Core | Multi-Core
HWBOT x265 Benchmark v2.2: 4k Preset
LibreOffice : 20 Documents To PDF
R Benchmark 2.5: Overall mean
* ... kleiner is beter
Systeemprestaties
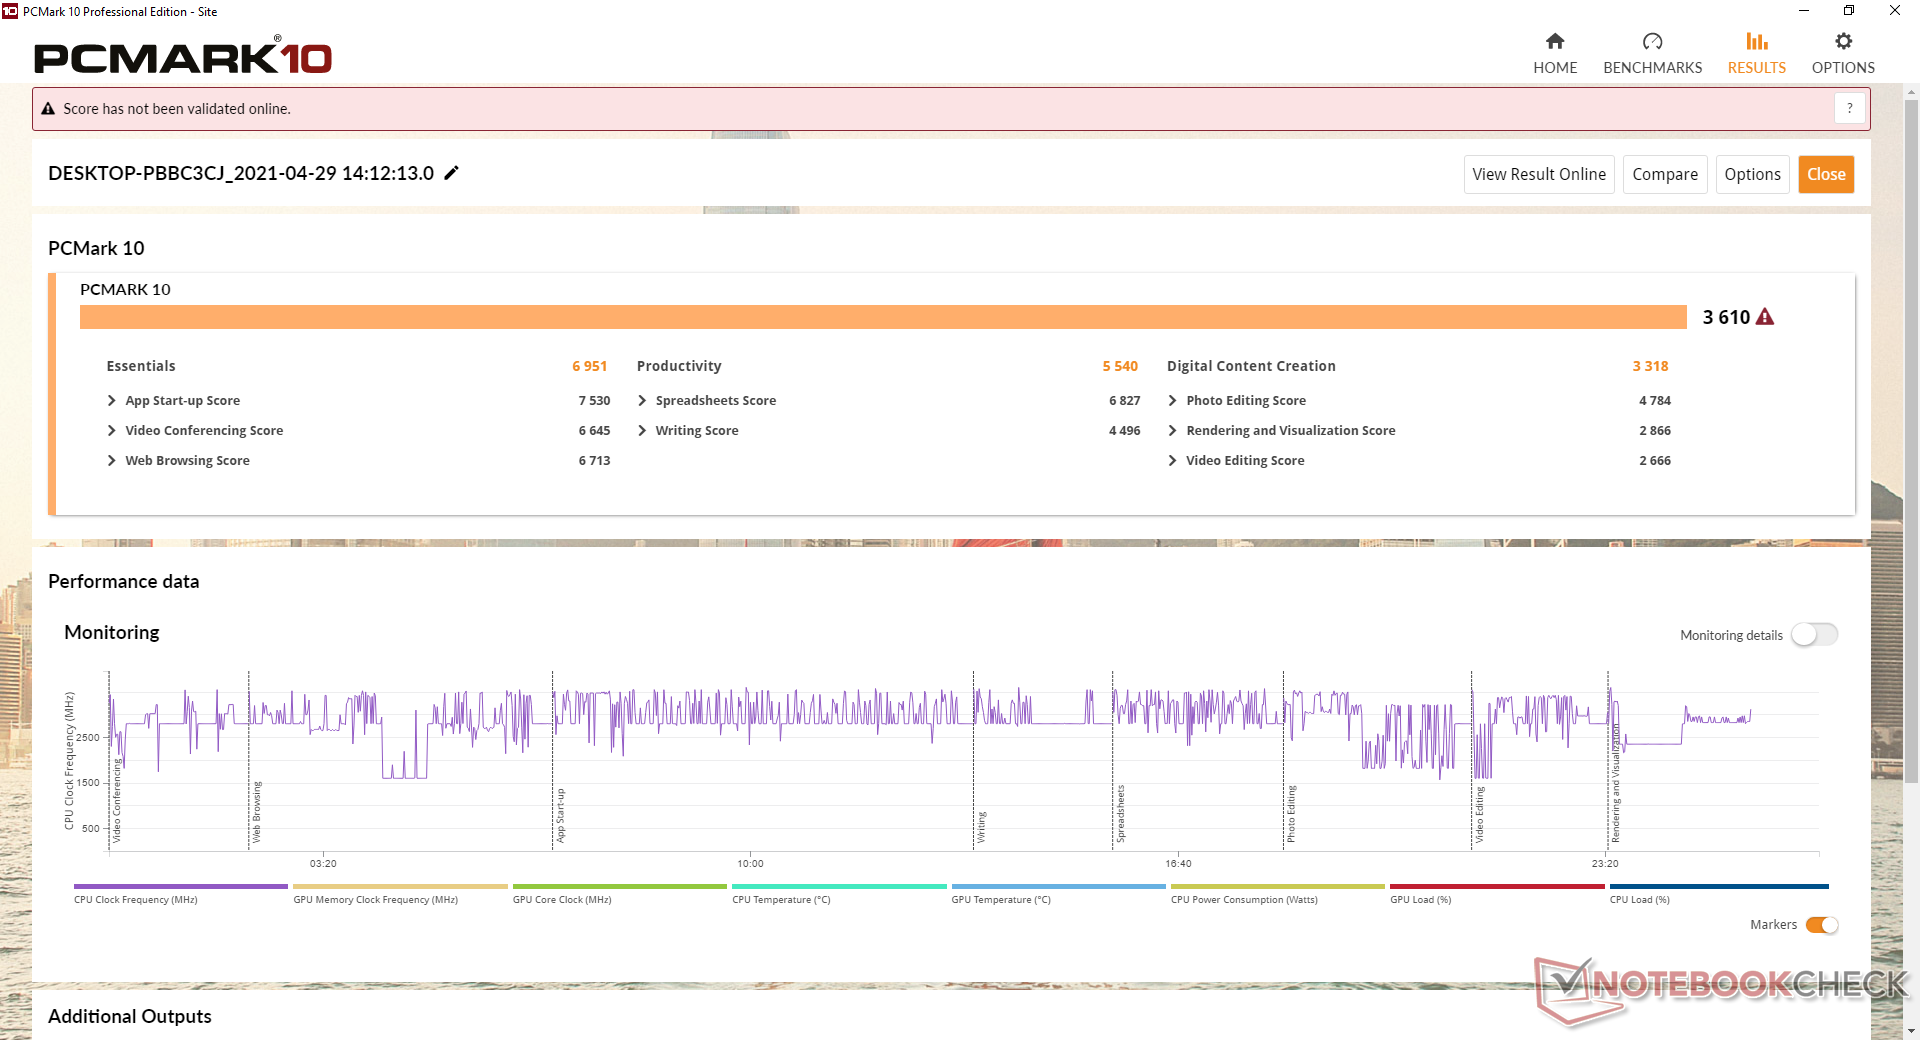
| PCMark 10 | |
| Score | |
| Intel NUC11PHKi7C | |
| Intel NUC11PAQi7 | |
| Zotac ZBox MI643 | |
| Impact Display Solutions IMP-3654-B1-R Core i9-9900T | |
| Impact Display Solutions IMP-3713-V2-16-500 | |
| Essentials | |
| Intel NUC11PAQi7 | |
| Zotac ZBox MI643 | |
| Intel NUC11PHKi7C | |
| Impact Display Solutions IMP-3654-B1-R Core i9-9900T | |
| Impact Display Solutions IMP-3713-V2-16-500 | |
| Productivity | |
| Intel NUC11PHKi7C | |
| Intel NUC11PAQi7 | |
| Impact Display Solutions IMP-3654-B1-R Core i9-9900T | |
| Zotac ZBox MI643 | |
| Impact Display Solutions IMP-3713-V2-16-500 | |
| Digital Content Creation | |
| Intel NUC11PHKi7C | |
| Intel NUC11PAQi7 | |
| Impact Display Solutions IMP-3654-B1-R Core i9-9900T | |
| Impact Display Solutions IMP-3713-V2-16-500 | |
| Zotac ZBox MI643 | |
| PCMark 10 Score | 3610 punten | |
Help | ||
DPC latentie
LatencyMon laat DPC latency problemen zien bij het openen van meerdere tabbladen op onze homepage of wanneer de CPU volledig wordt belast onder Prime95. Het afspelen van 4K UHD bij 60 FPS verloopt verder vloeiend, met slechts vier dropped frames tijdens onze videotest die een minuut duurde.
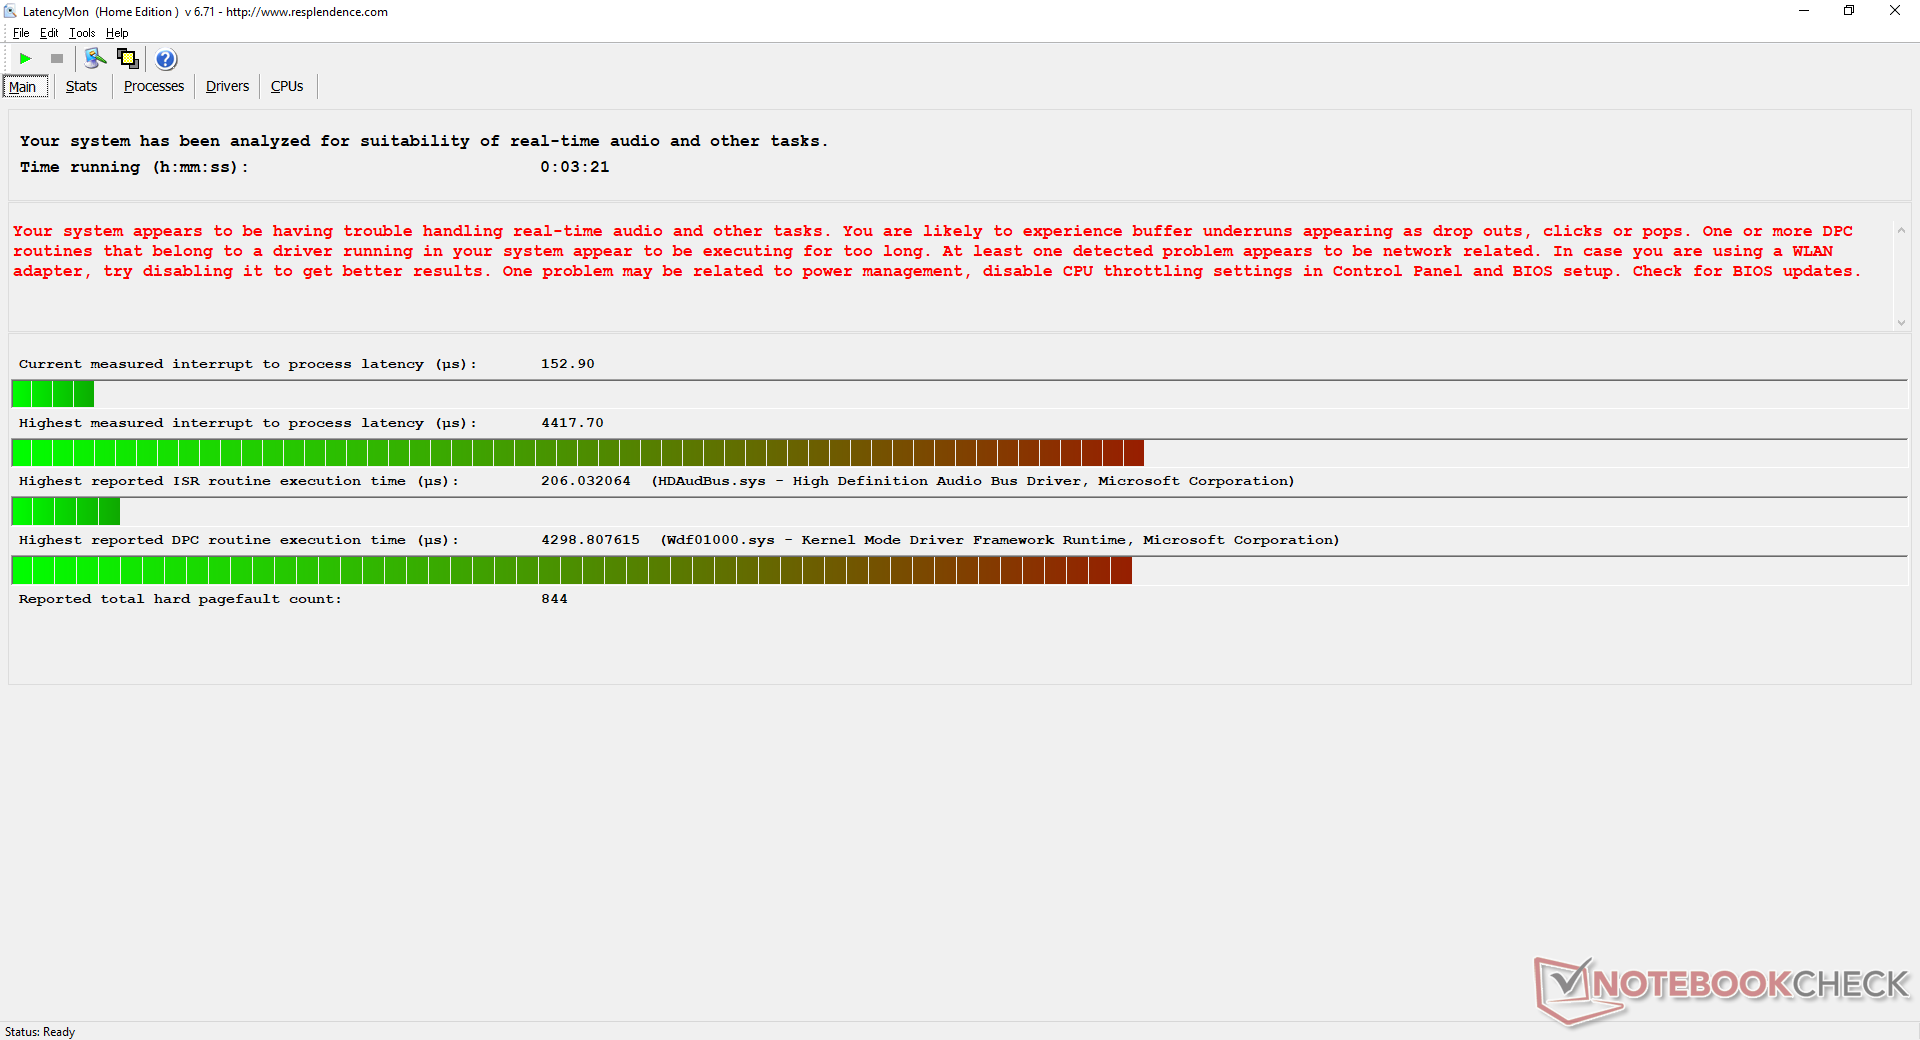
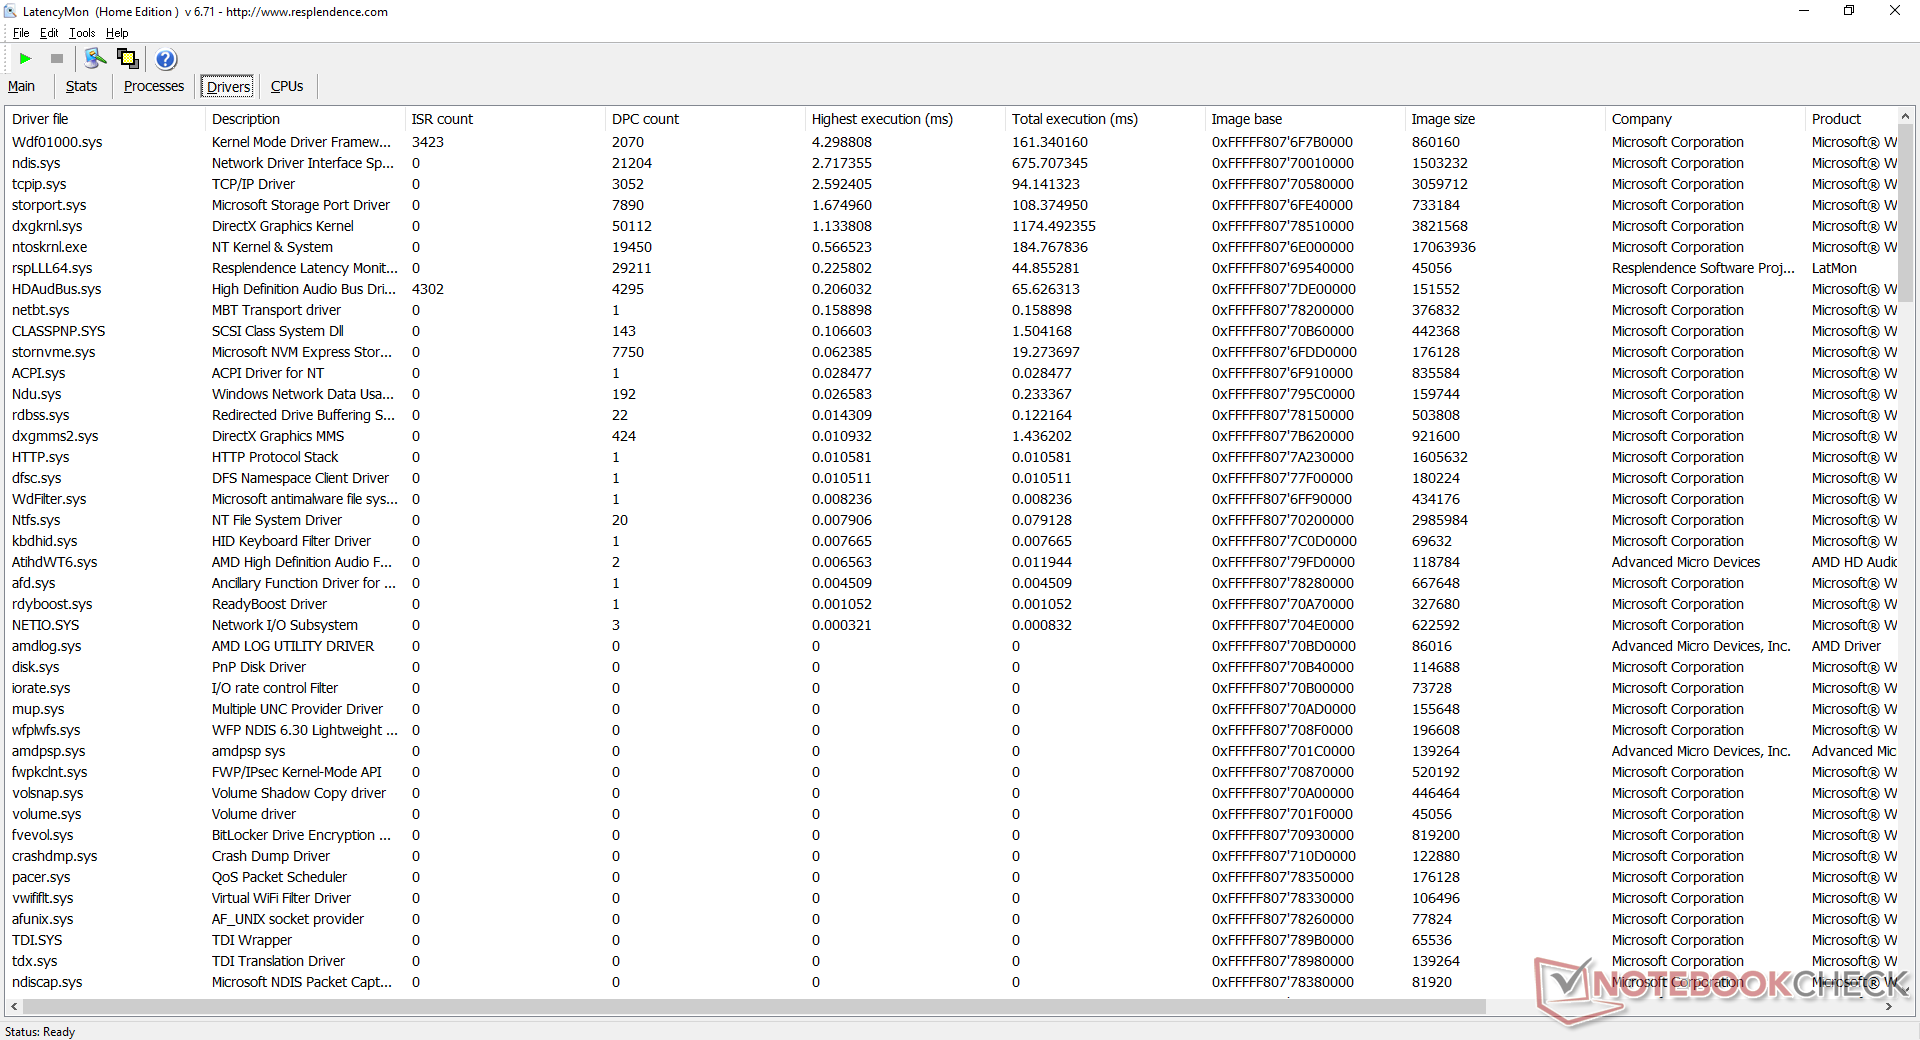
| DPC Latencies / LatencyMon - interrupt to process latency (max), Web, Youtube, Prime95 | |
| Impact Display Solutions IMP-3713-V2-16-500 | |
| HP Envy 13-ba0001ng | |
| Intel NUC11PAQi7 | |
* ... kleiner is beter
Opslagapparaten
De 500 GB Wycom SSD met Silicon Motion SM2262EN controller biedt hogere overdrachtsnelheden dan SATA III, maar ligt nog steeds ver onder de meeste andere NVMe SSD's. Sequentiële lees- en schrijfsnelheden komen uit in het 800 tot 900 MB/s-bereik, terwijl de meeste NVMe-schijven minstens twee keer zo snel zijn.
Tot twee M.2 SSD's worden ondersteund op het moederbord, maar slechts een van de twee slots is volledig PCIe x4, terwijl de andere PCIe x2 is.
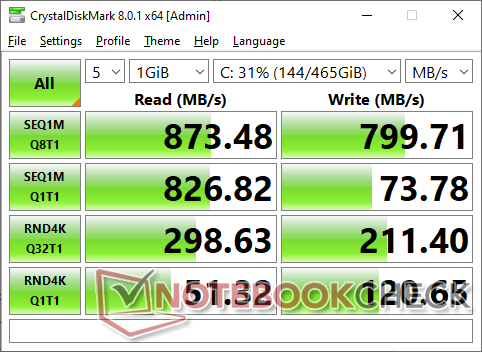
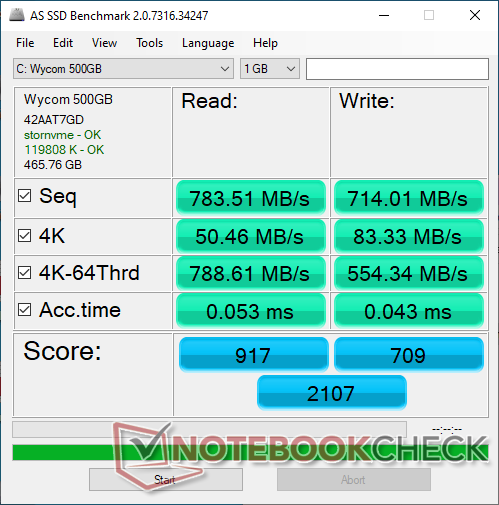
| Impact Display Solutions IMP-3713-V2-16-500 | Impact Display Solutions IMP-3654-B1-R Core i9-9900T EDGE NextGen SSD 1TB | HP Envy 13-ba0001ng Intel SSD 660p SSDPEKNW512G8 | LG Gram 17 17Z90N-V.AA77G Samsung PM981a MZVLB1T0HBLR | |
|---|---|---|---|---|
| AS SSD | -39% | 17% | 79% | |
| Seq Read (MB/s) | 784 | 1218 55% | 1587 102% | 2722 247% |
| Seq Write (MB/s) | 714 | 1306 83% | 709 -1% | 2649 271% |
| 4K Read (MB/s) | 50.5 | 25.97 -49% | 52 3% | 52.2 3% |
| 4K Write (MB/s) | 83.3 | 43.25 -48% | 144 73% | 132.4 59% |
| 4K-64 Read (MB/s) | 789 | 578 -27% | 322.8 -59% | 886 12% |
| 4K-64 Write (MB/s) | 554 | 520 -6% | 835 51% | 1074 94% |
| Access Time Read * (ms) | 0.053 | 0.118 -123% | 0.103 -94% | 0.041 23% |
| Access Time Write * (ms) | 0.043 | 0.286 -565% | 0.045 -5% | 0.03 30% |
| Score Read (Points) | 917 | 726 -21% | 533 -42% | 1211 32% |
| Score Write (Points) | 709 | 694 -2% | 1050 48% | 1471 107% |
| Score Total (Points) | 2107 | 1800 -15% | 1832 -13% | 3309 57% |
| Copy ISO MB/s (MB/s) | 1007 | 2082 107% | 1483 47% | 2096 108% |
| Copy Program MB/s (MB/s) | 386.3 | 422.8 9% | 730 89% | 395.6 2% |
| Copy Game MB/s (MB/s) | 705 | 1072 52% | 943 34% | 1096 55% |
| CrystalDiskMark 5.2 / 6 | 85% | 78% | 174% | |
| Write 4K (MB/s) | 36.03 | 111.8 210% | 146.3 306% | 162.8 352% |
| Read 4K (MB/s) | 58.5 | 56.8 -3% | 55.7 -5% | 51 -13% |
| Write Seq (MB/s) | 764 | 1148 50% | 949 24% | 2078 172% |
| Read Seq (MB/s) | 838 | 1522 82% | 1494 78% | 1991 138% |
| Write 4K Q32T1 (MB/s) | 210.7 | 399.7 90% | 408.5 94% | 440.1 109% |
| Read 4K Q32T1 (MB/s) | 298.9 | 570 91% | 304 2% | 450.1 51% |
| Write Seq Q32T1 (MB/s) | 798 | 1375 72% | 984 23% | 2998 276% |
| Read Seq Q32T1 (MB/s) | 879 | 1626 85% | 1779 102% | 3562 305% |
| Totaal Gemiddelde (Programma / Instellingen) | 23% /
6% | 48% /
39% | 127% /
113% |
* ... kleiner is beter

Disk Throttling: DiskSpd Read Loop, Queue Depth 8
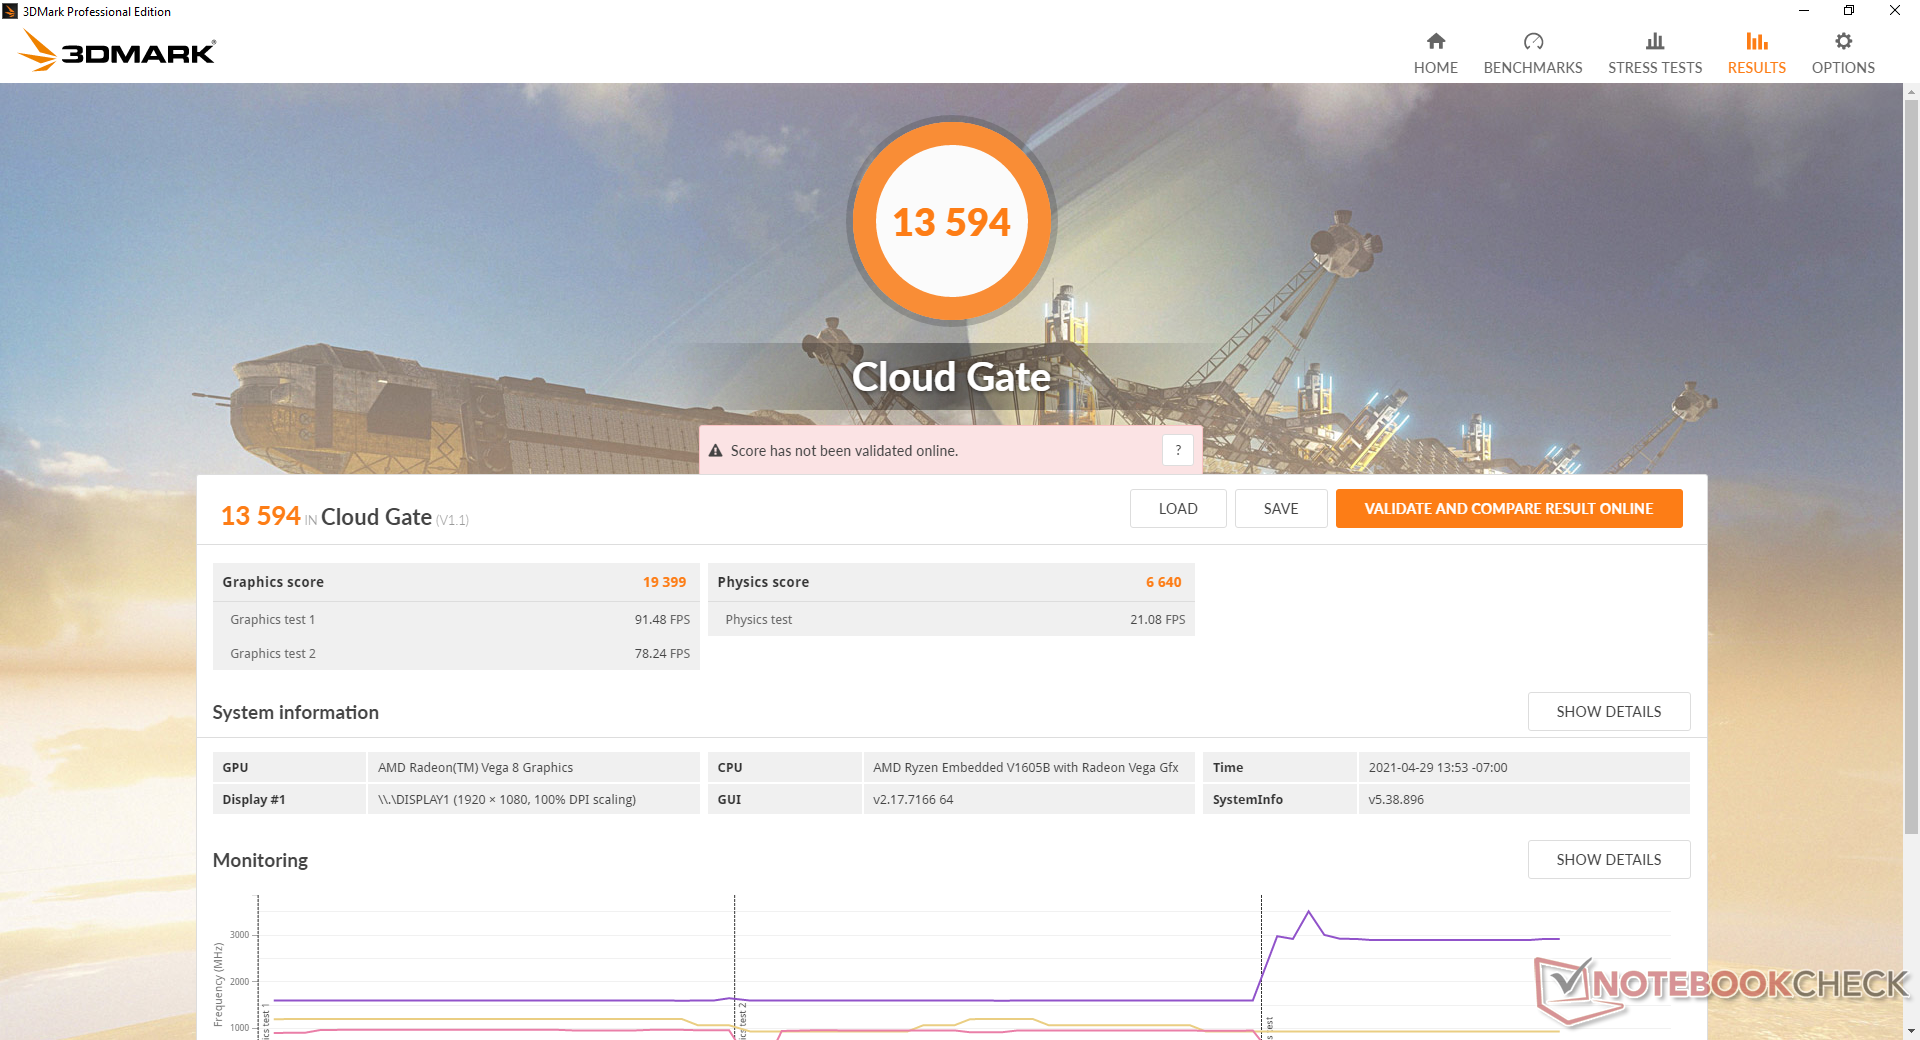
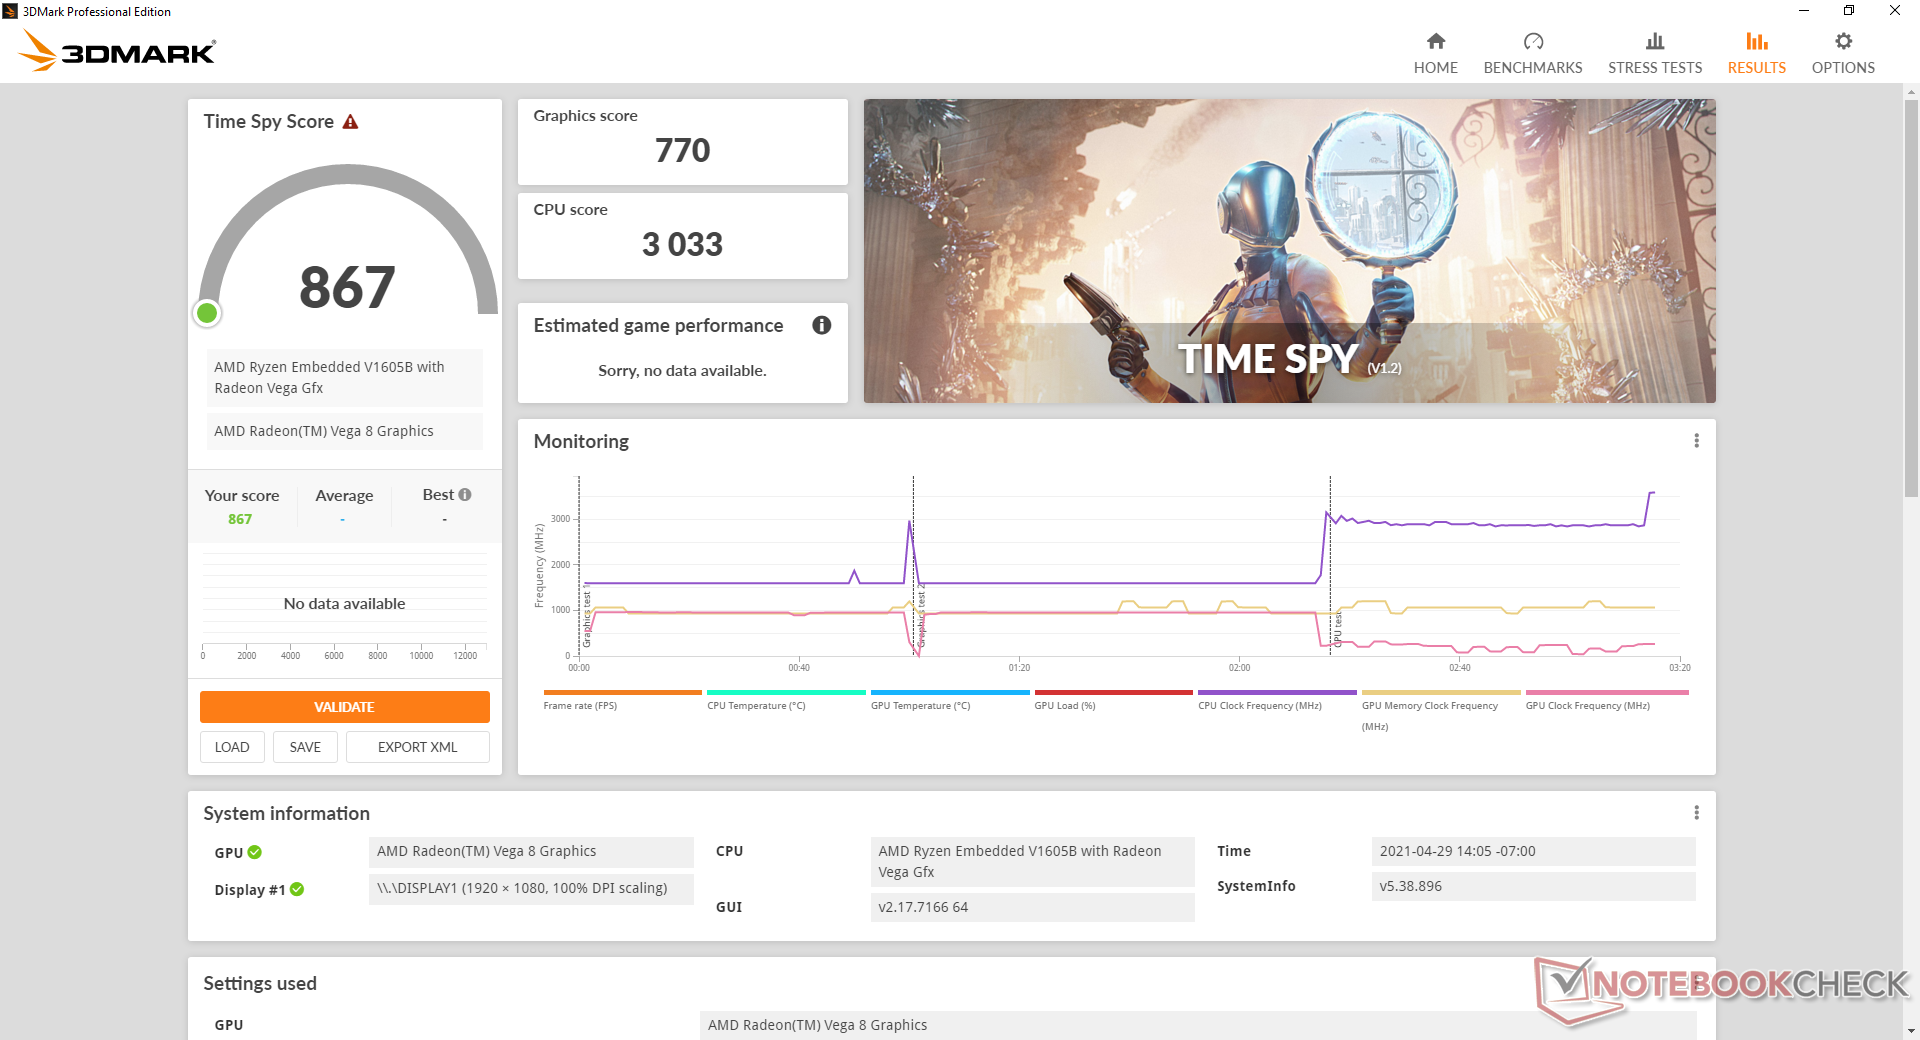
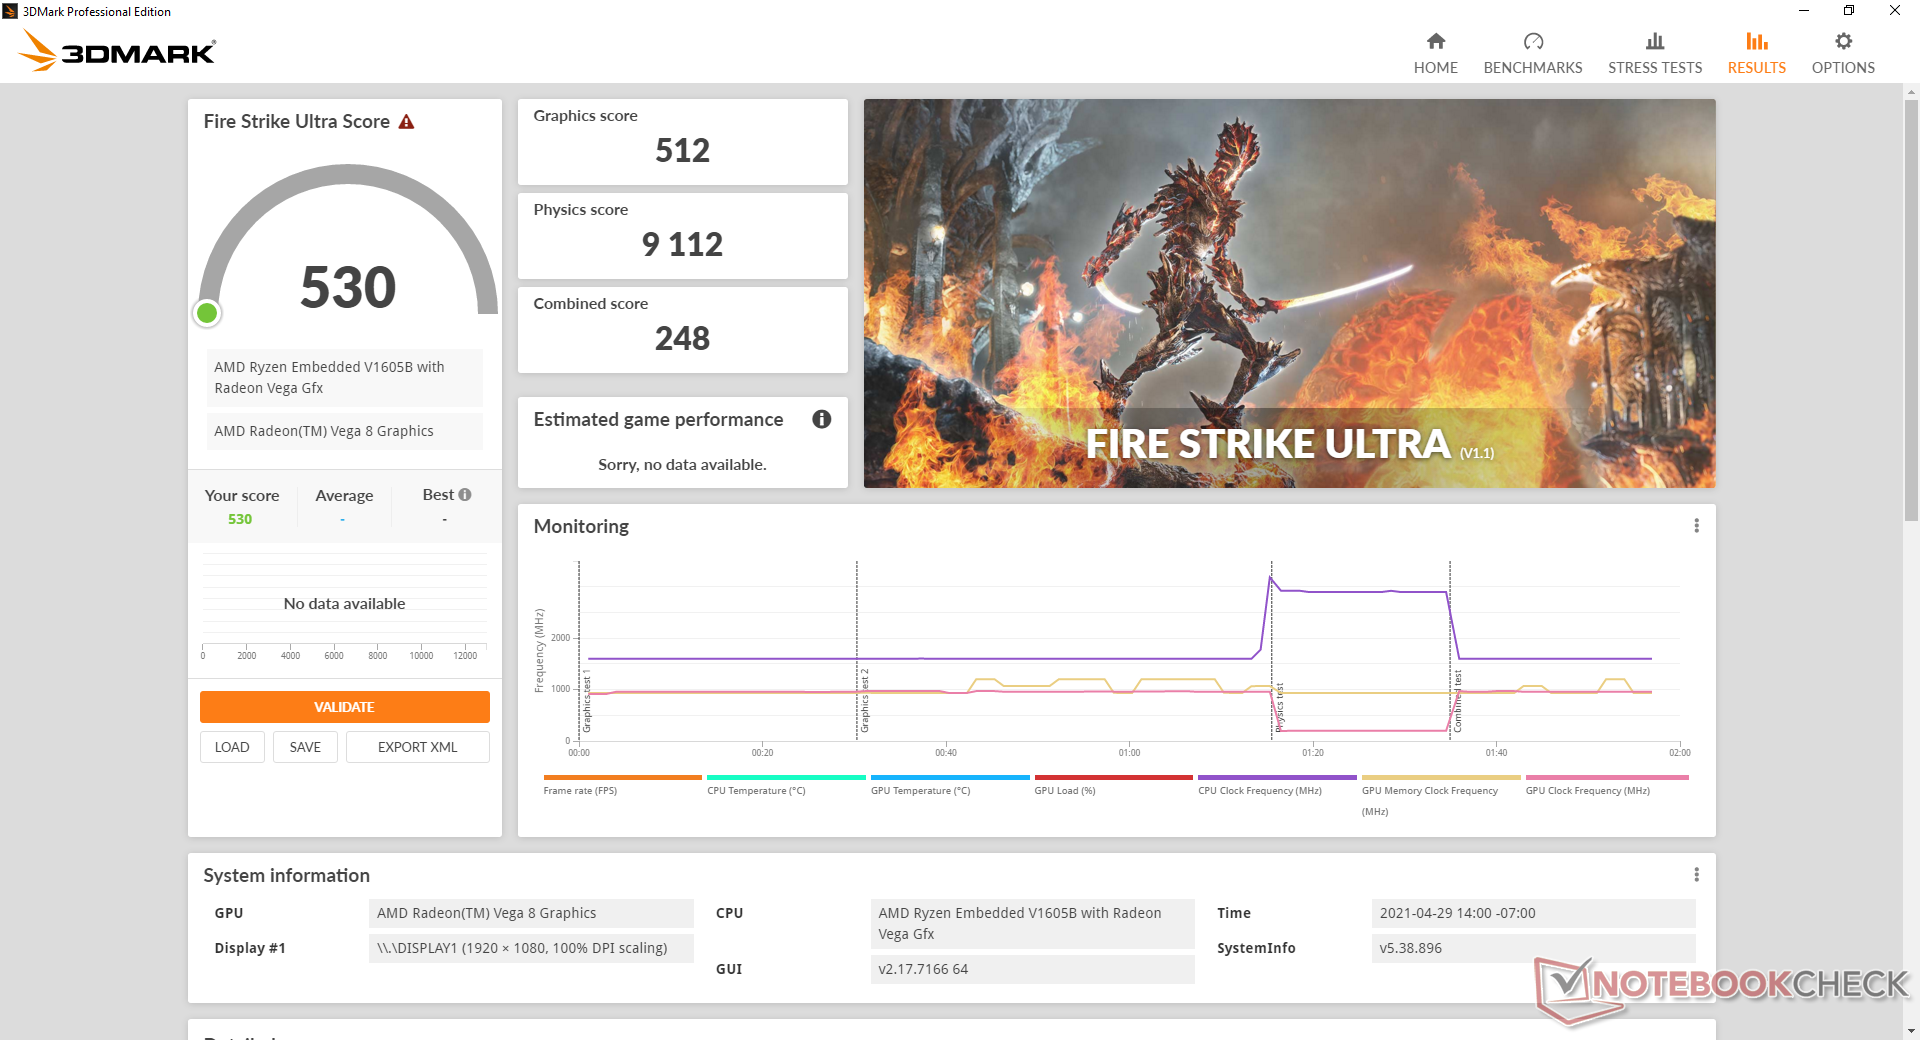
GPU prestatie
De geïntegreerde Radeon RX Vega 8 presteert waar we hem verwachten in vergelijking met laptops met Ryzen 2000U of 3000U serie CPU's. Hoewel het een enorme upgrade is van de oude Intel UHD 620 graphics, de meeste huidige Core i7 Iris Xe oplossingen onze ventilatorloze PC met 30 tot 50 procent overtreffen.
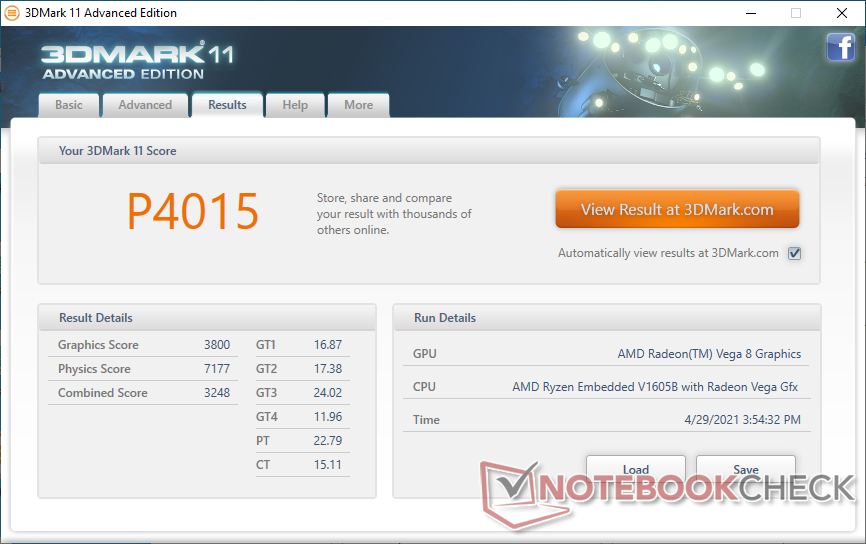
| 3DMark 11 Performance | 4015 punten | |
| 3DMark Cloud Gate Standard Score | 13594 punten | |
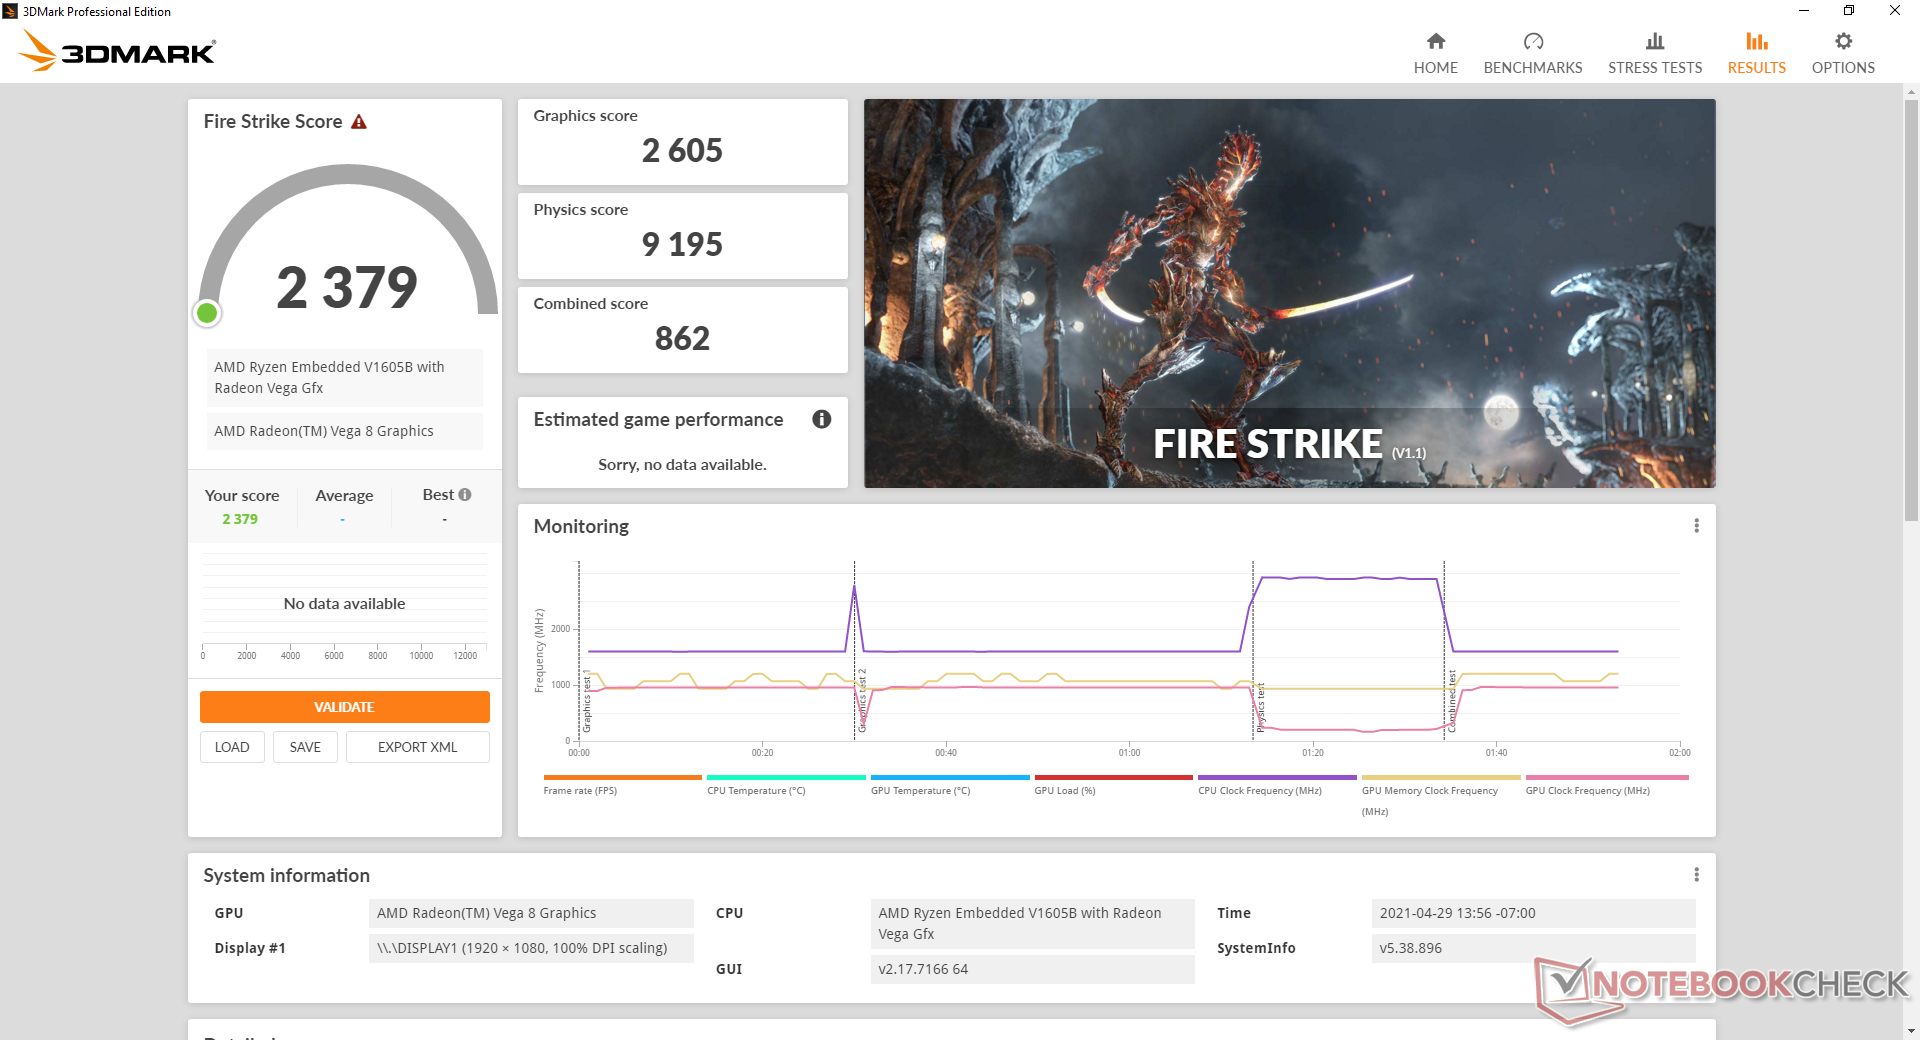
| 3DMark Fire Strike Score | 2379 punten | |
| 3DMark Time Spy Score | 867 punten | |
Help | ||
| lage | gem. | hoge | ultra | |
|---|---|---|---|---|
| The Witcher 3 (2015) | 23 | |||
| Dota 2 Reborn (2015) | 76.6 | 65.9 | 44.4 | 41.4 |
| Final Fantasy XV Benchmark (2018) | 26.4 | 13.6 | 9.22 | |
| X-Plane 11.11 (2018) | 21.2 | 21.2 | 15.9 |
Emissions
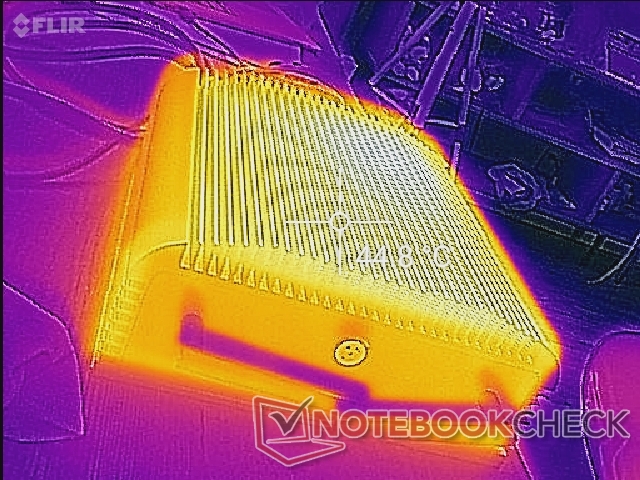
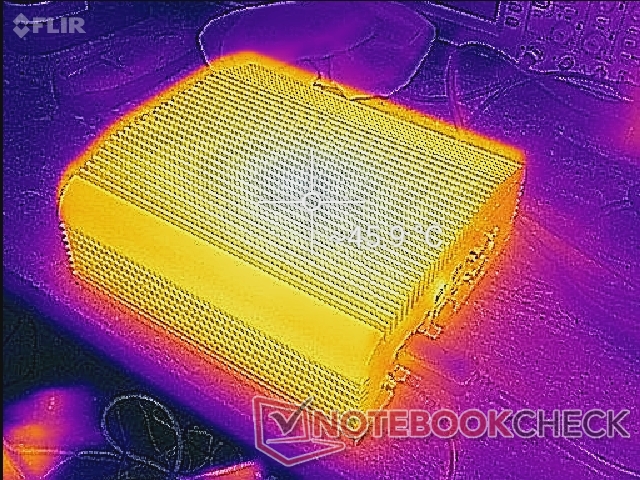
Temperatuur
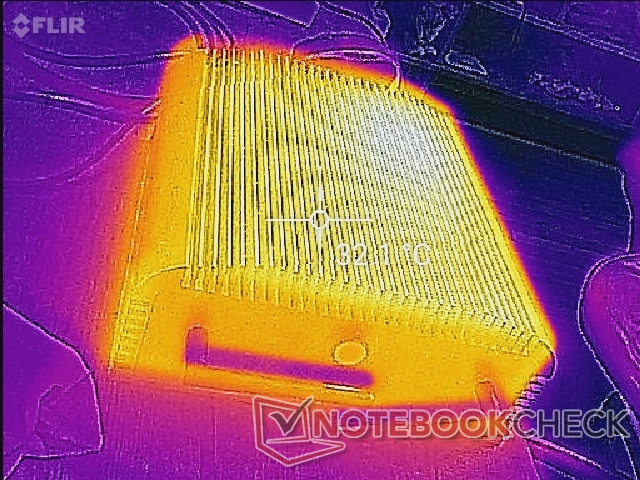
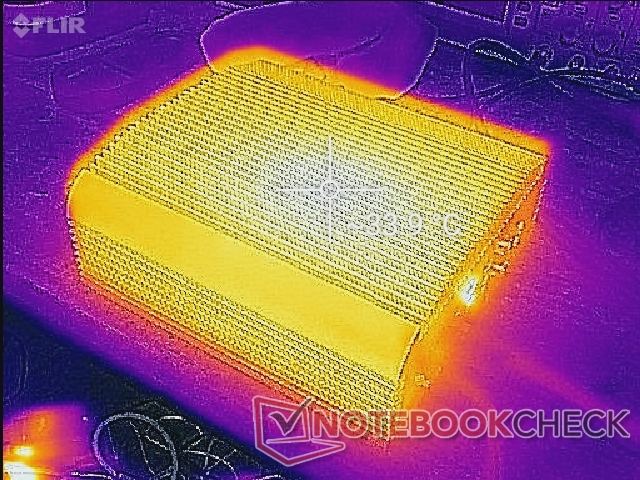
De oppervlaktetemperatuur bereikt een maximum van 46°C na meer dan een uur extreme belasting.
Stresstest
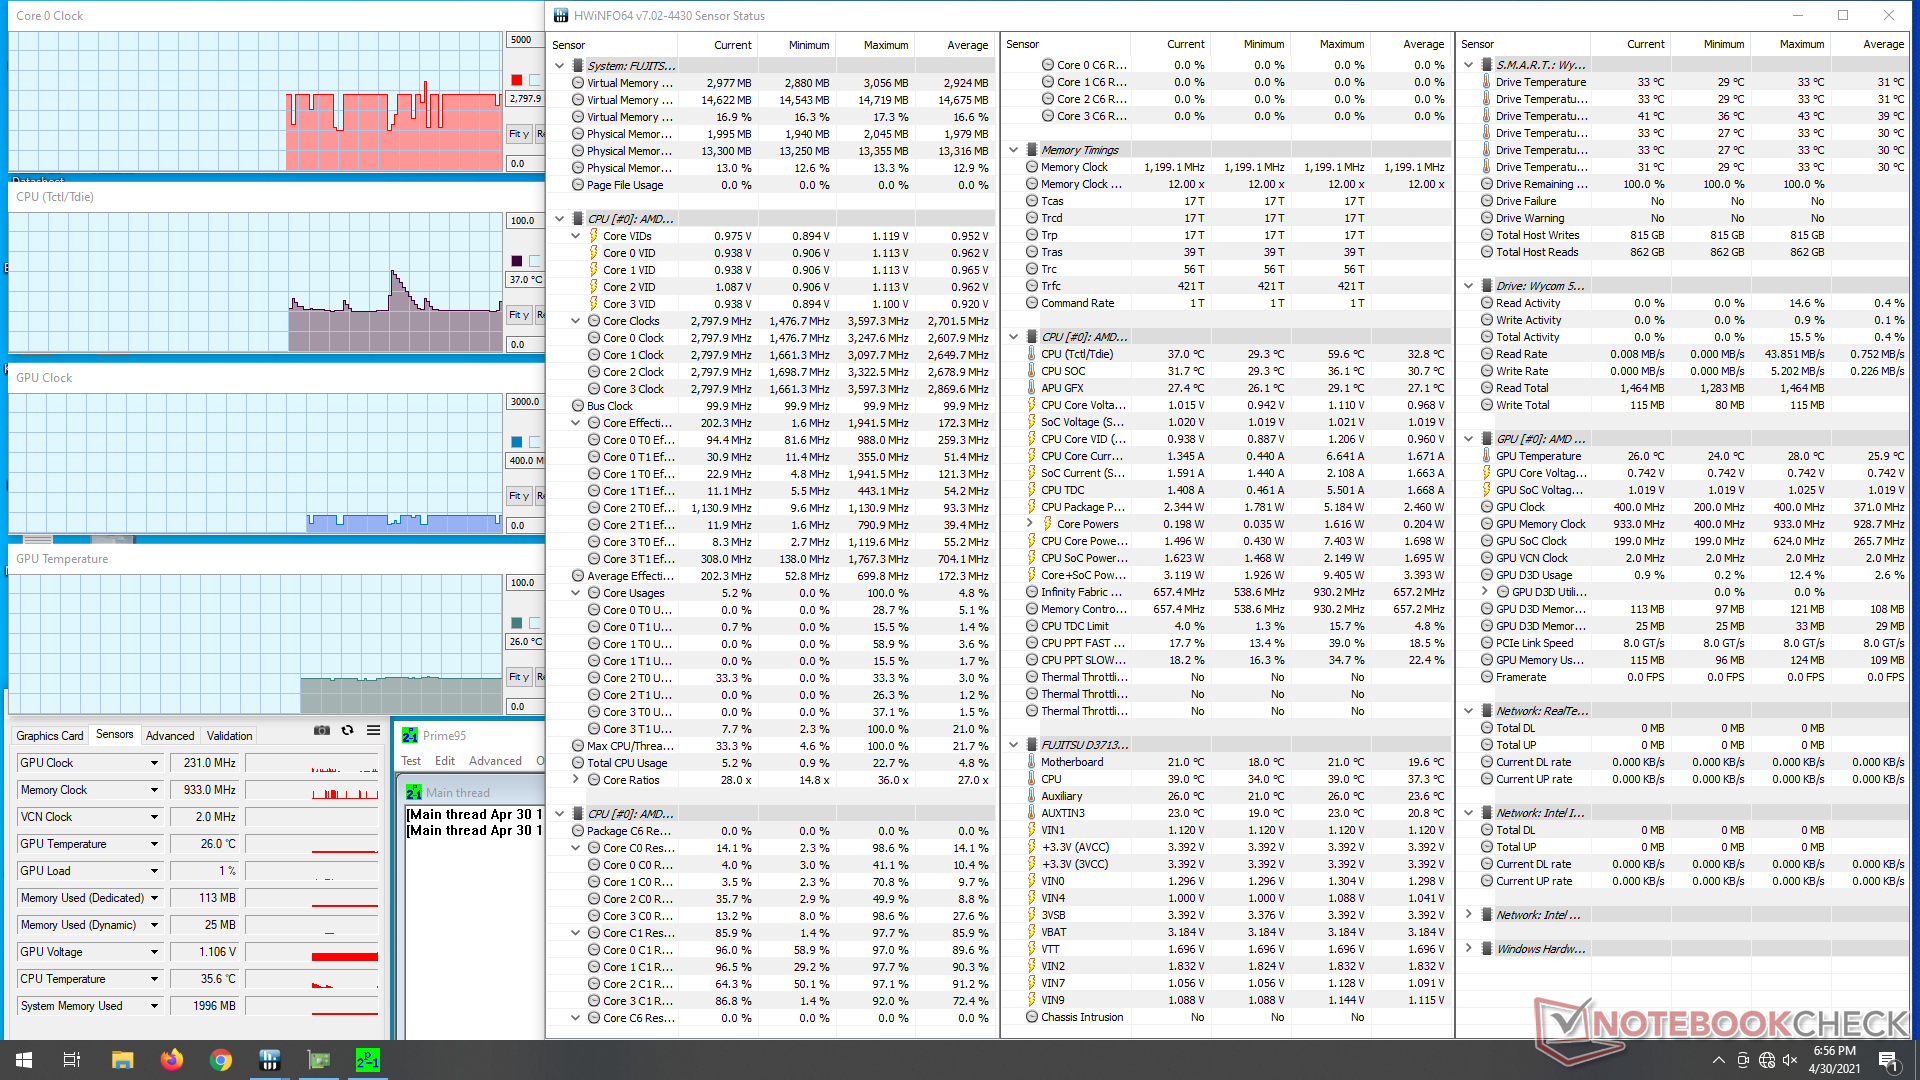
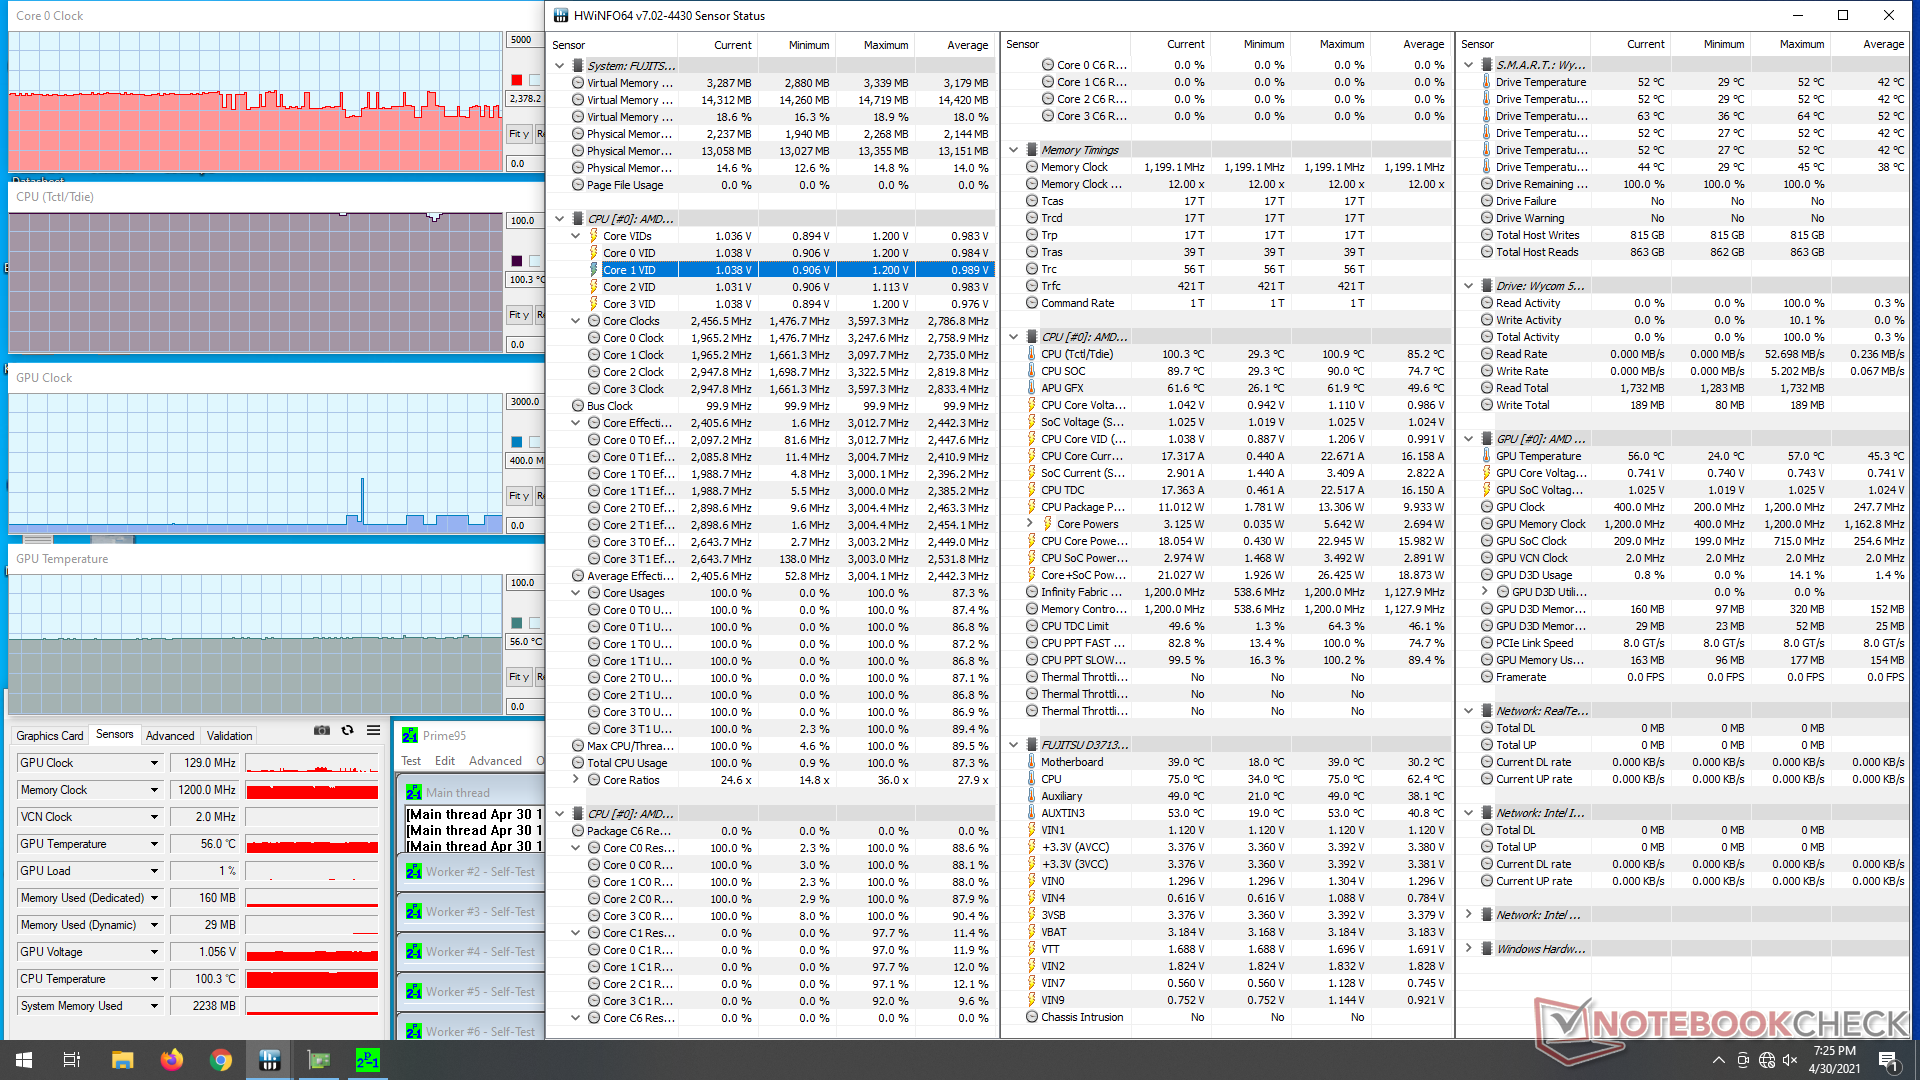
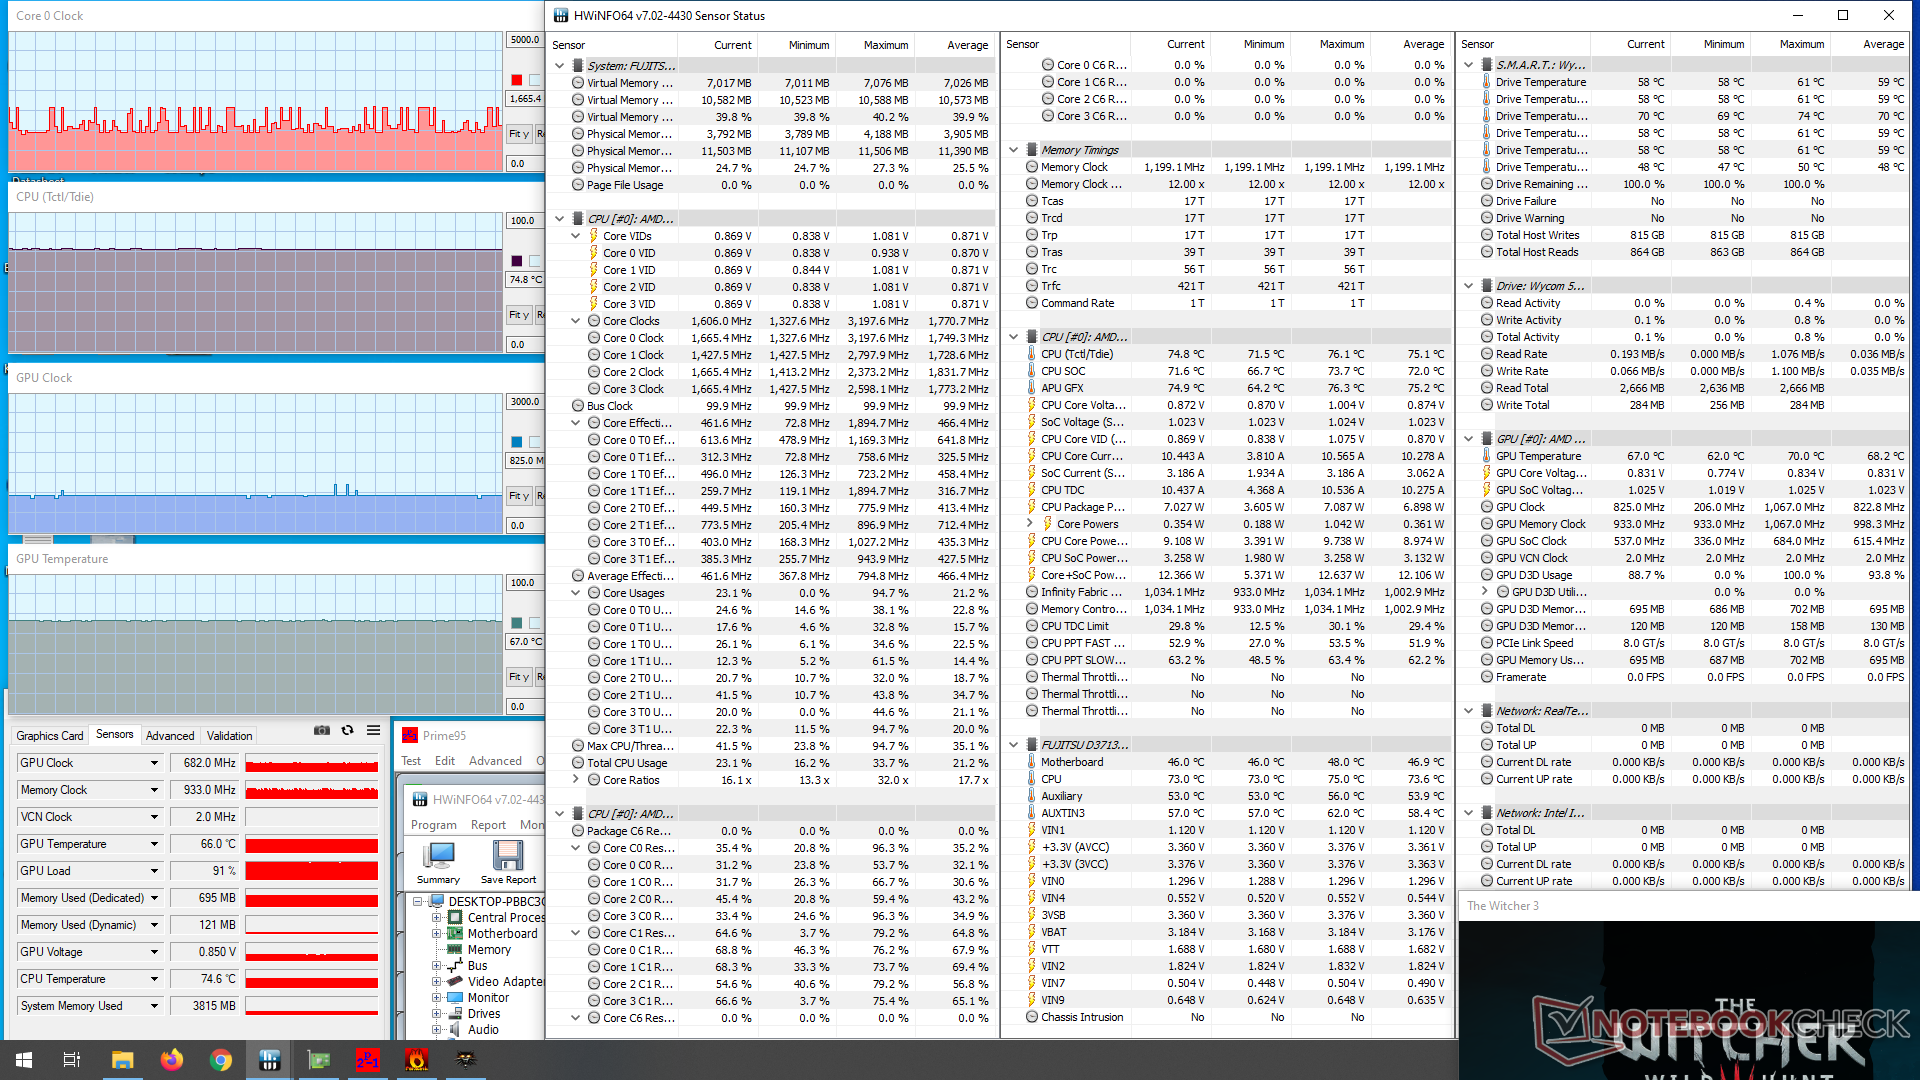
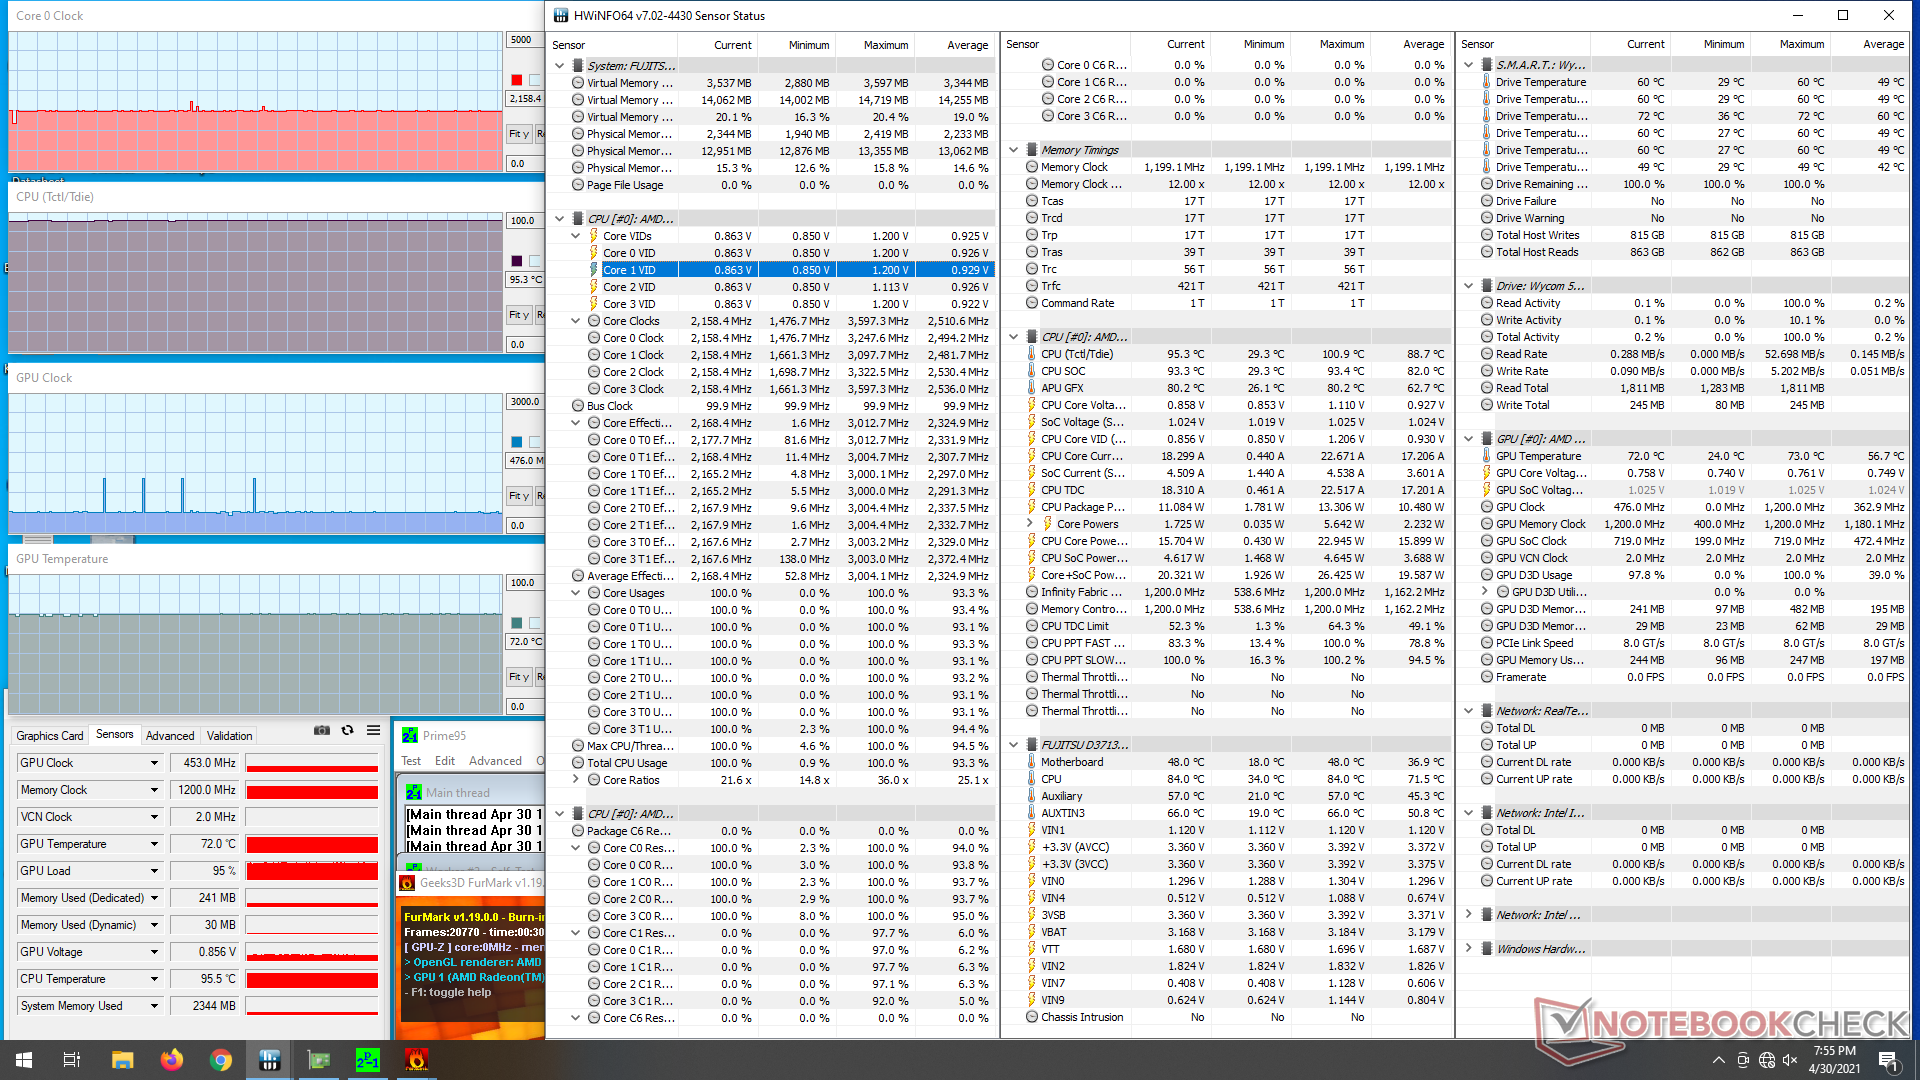
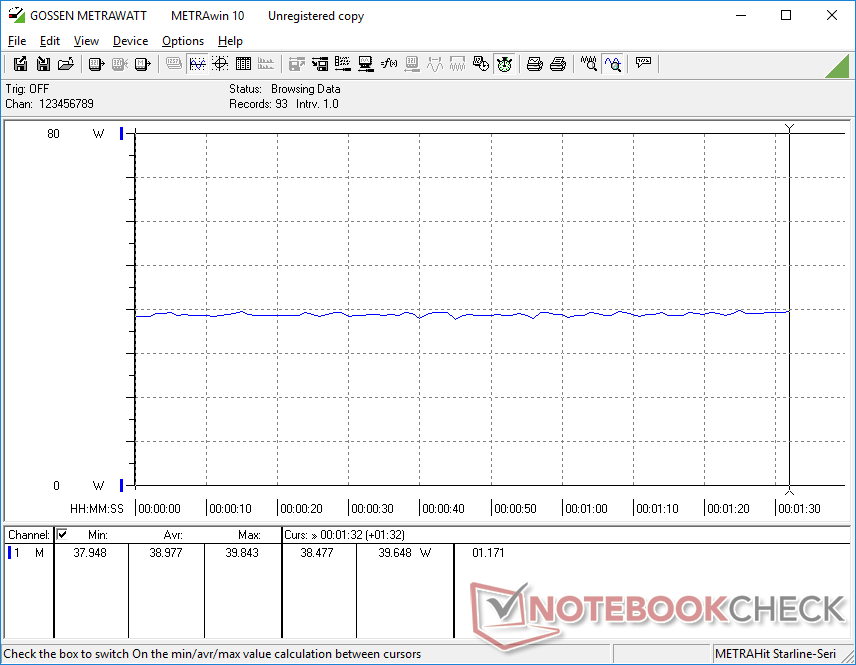
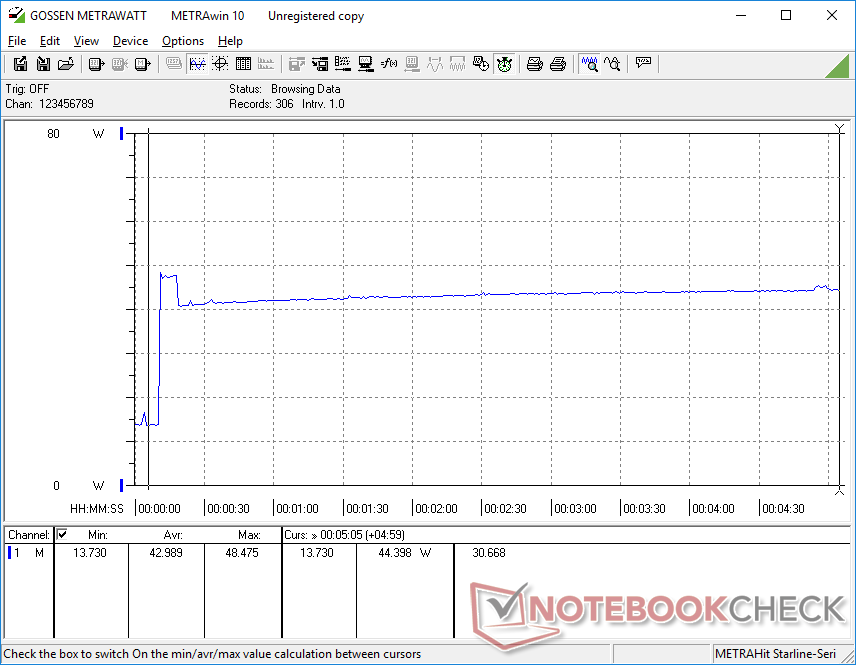
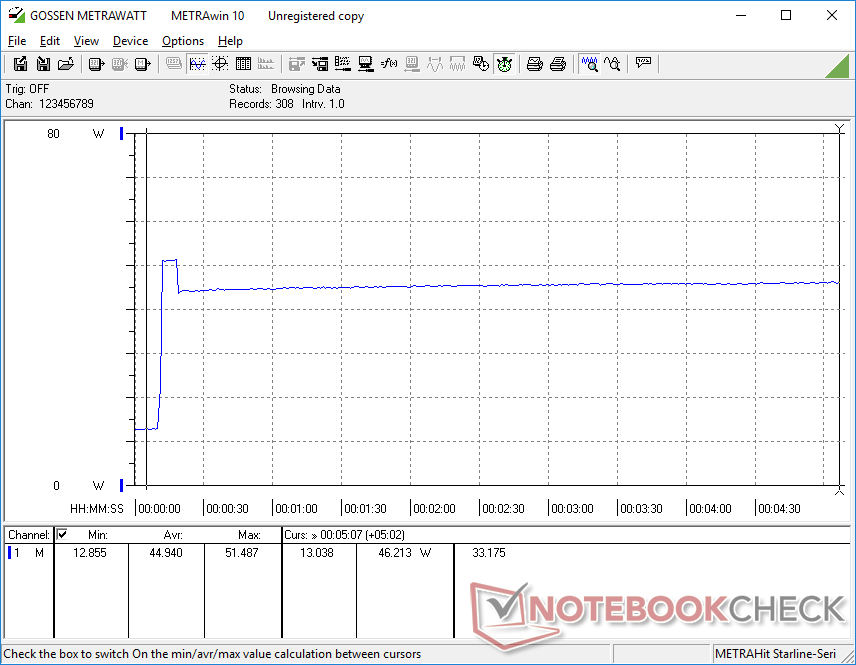
Tijdens het draaien van Prime95 om de CPU te belasten, werden de kloksnelheden gedurende slechts een paar seconden opgevoerd tot 2,9 GHz voordat ze iets daalden en stabiliseerden op 2,8 GHz. Na ongeveer 20 minuten bereikt de kerntemperatuur echter 100 C, waardoor de kloksnelheden veel steiler dalen naar 1,8 GHz tot 2,4 GHz, zoals de onderstaande screenshots laten zien
Het draaien van Witcher 3 is meer representatief voor belastingen in de echte wereld. In dit scenario blijft de kerntemperatuur stabiel op 75 C.
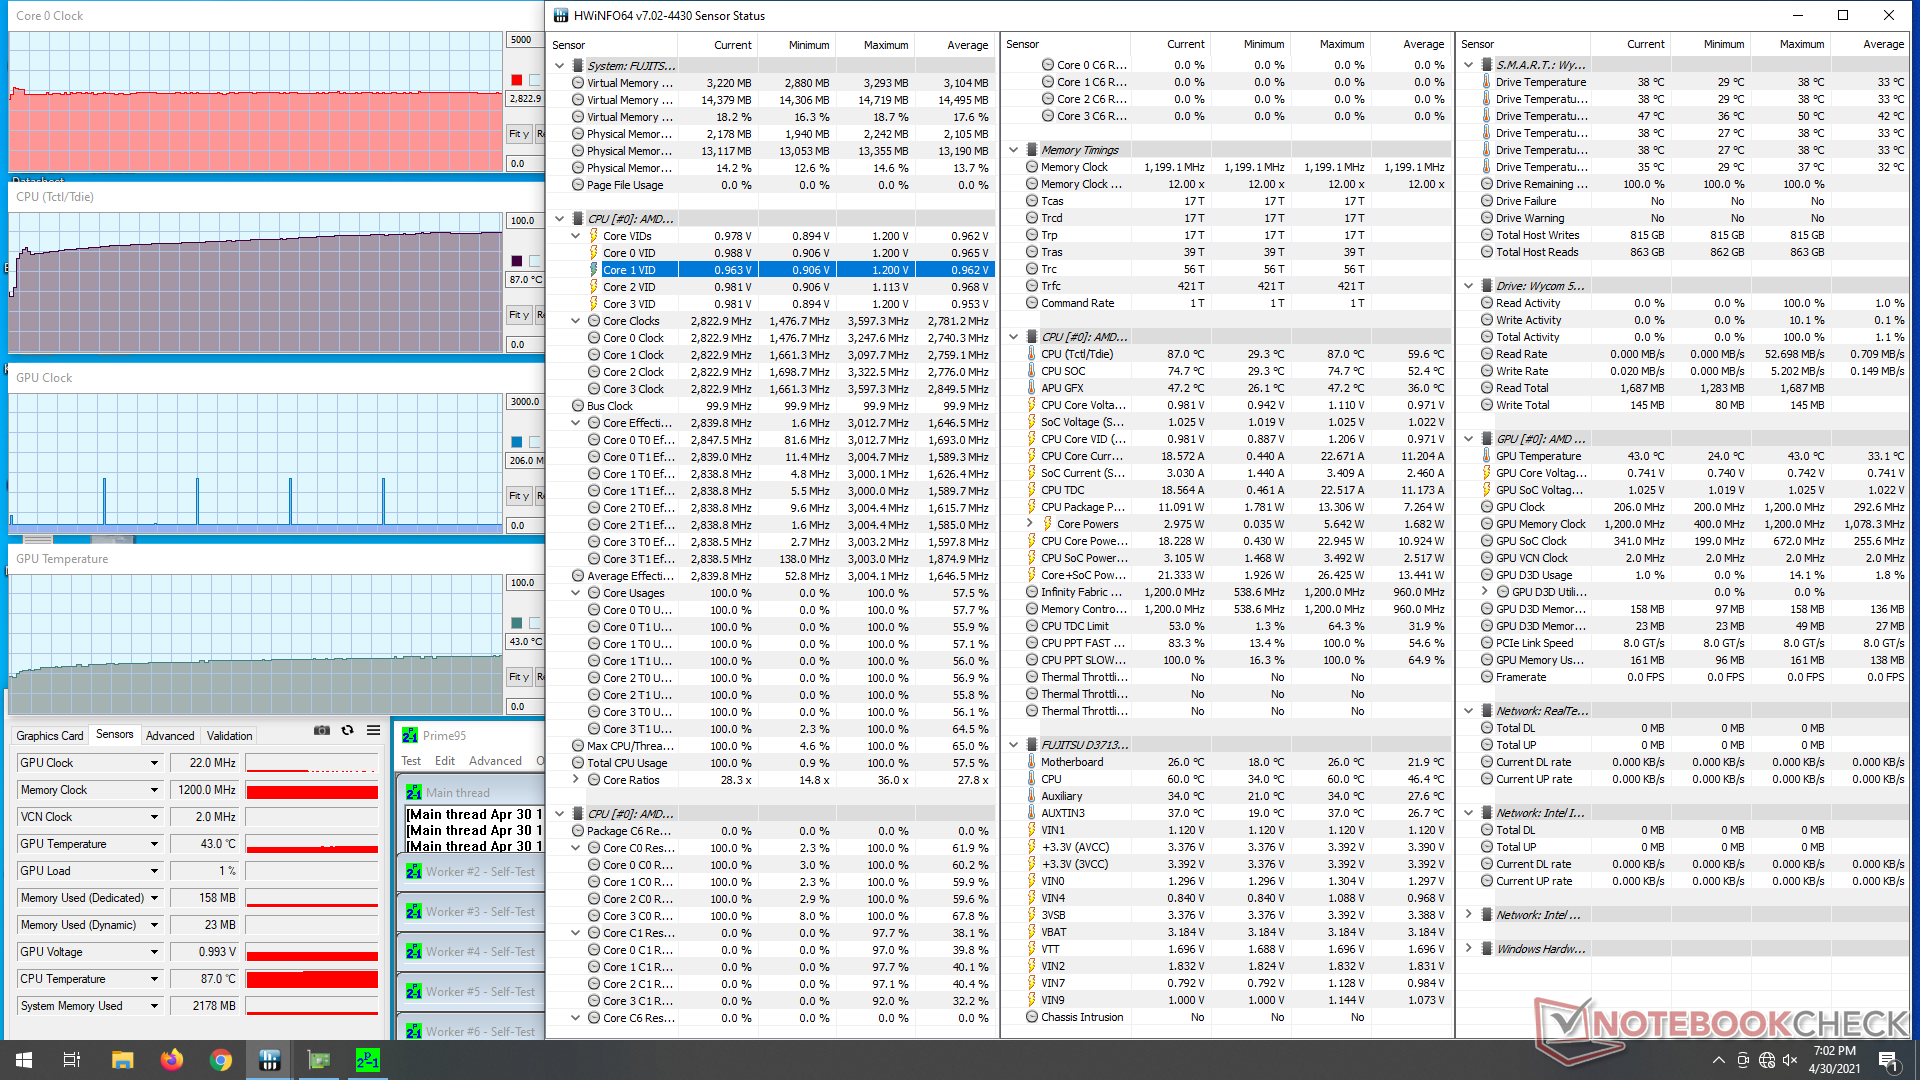
| CPUklok (GHz) GPUklok (MHz) GemiddeldeCPU temperatuur (°C) |
| Systeem Idle |
| Prime95 Stress |
| Prime95 + FurMark Stress |
| Witcher 3 Stress |
Energy Management
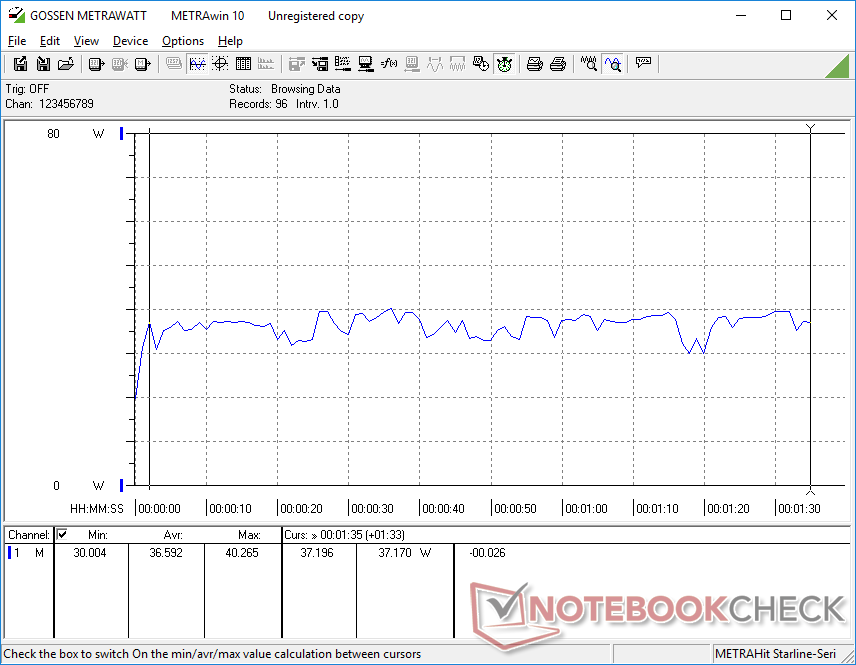
Stroomverbruik
De prestaties per watt zijn iets lager dan bij mini-pc's die op het nieuwste 11e generatie Intel-platform draaien. Stationair draaien op een desktop verbruikt bijvoorbeeld tussen 11 W en 13 W, vergeleken met slechts de helft daarvan op de Intel NUC11PAQi7. Hogere belastingen zoals games verbruiken ongeveer 36 W tot 39 W, vergeleken met 31 W tot 39 W op de eerder genoemde NUC, hoewel de GPU-prestaties op onze AMD PC merkbaar trager zijn.
| Uit / Standby | |
| Inactief | |
| Belasting |
|
Key:
min: | |
| Impact Display Solutions IMP-3713-V2-16-500 Ryzen V1605B, Vega 8, , , x, | Impact Display Solutions IMP-3654-B1-R Core i9-9900T i9-9900T, UHD Graphics 630, EDGE NextGen SSD 1TB, , x, | Intel NUC11PHKi7C i7-1165G7, GeForce RTX 2060 Mobile, Samsung SSD 980 Pro 500GB MZ-V8P500BW, , x, | Intel NUC11PAQi7 i7-1165G7, Iris Xe G7 96EUs, Samsung SSD 980 Pro 500GB MZ-V8P500BW, , x, | Zotac ZBox MI643 i5-10210U, UHD Graphics 620, Lexar NM610 1TB, , x, | |
|---|---|---|---|---|---|
| Power Consumption | 8% | -143% | 19% | 14% | |
| Idle Minimum * (Watt) | 11.5 | 6.6 43% | 5.8 50% | 5.6 51% | 7.5 35% |
| Idle Average * (Watt) | 12 | 8.3 31% | 5.9 51% | 5.6 53% | 9.2 23% |
| Idle Maximum * (Watt) | 12.4 | 8.8 29% | 20.7 -67% | 6 52% | 9.6 23% |
| Load Average * (Watt) | 36.6 | 46.2 -26% | 130.8 -257% | 31.4 14% | 34.4 6% |
| Witcher 3 ultra * (Watt) | 39 | 154.4 -296% | 39 -0% | ||
| Load Maximum * (Watt) | 51.5 | 69.7 -35% | 225.2 -337% | 80.5 -56% | 60.6 -18% |
* ... kleiner is beter
Pro
Contra
Uitspraak
Prime95 laat zien dat de passieve koeling van het chassis niet voldoende is om CPU Turbo kloksnelheden gedurende langere perioden volledig te ondersteunen. Kloksnelheden kunnen oplopen tot 2,9 GHz voordat ze onvermijdelijk dalen tot 1,8 GHz wanneer de kerntemperatuur onvermijdelijk 100 C bereikt. Het lijkt erop dat zelfs een massief aluminium koellichaam niet in staat is om de ULV CPU voor onbepaalde tijd op maximale prestaties te laten draaien. Lenovo biedt zijn eigen Intel-gebaseerde ventilatorloze mini PC die veel kleiner is dan onze AMD unit, maar met minder uitbreidbare functies
Prijs en beschikbaarheid
Prijsopgaven zijn rechtstreeks verkrijgbaar bij Impact Components
Price comparison

