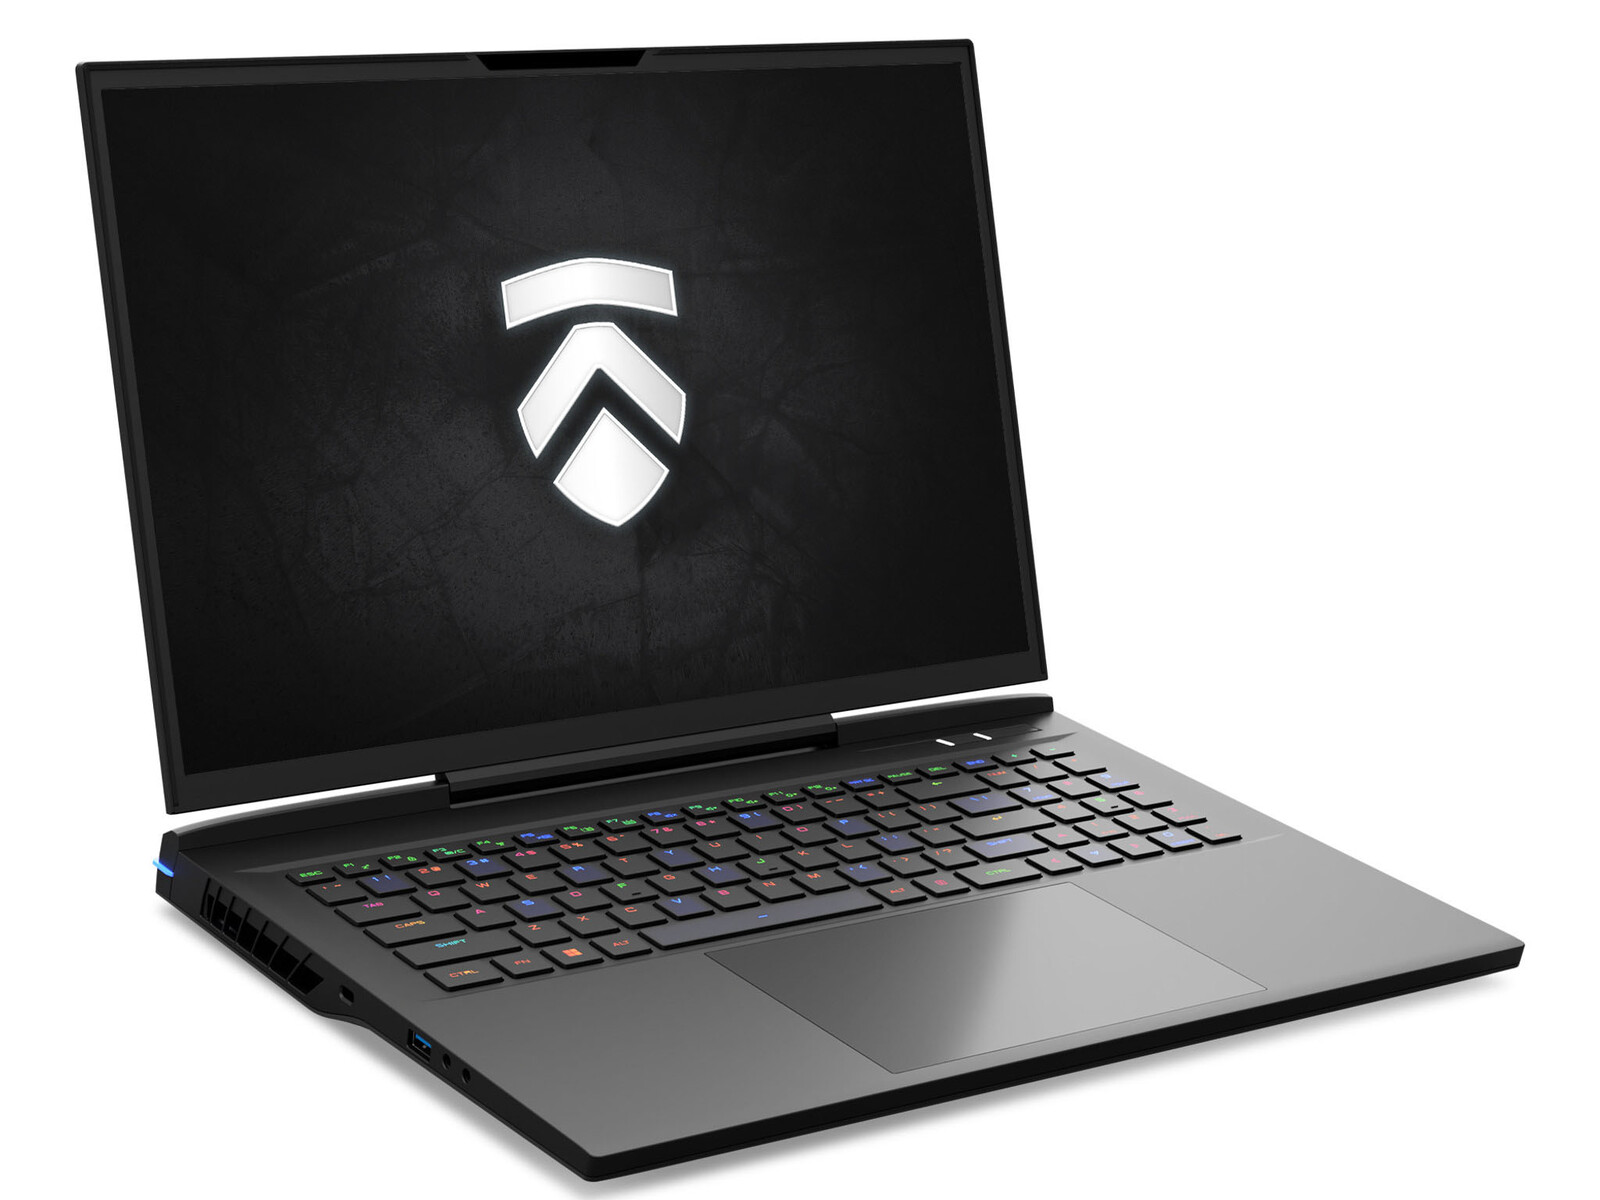
Eluktronics Mech-17 GP2 laptop review: MSI GT77 Titan prestaties zonder de grootte
De Eluktronics Mech-17 GP2 vervangt de Mech-17 GP van vorig jaar door de Intel 12e gen en Nvidia Ampere opties uit te wisselen voor respectievelijk Intel 13e gen en Nvidia Ada Lovelace. Het is opmerkelijk voor het aanbieden van Core HX-serie CPU's en 175 W GeForce RTX 4090 graphics, ondanks de kleine footprint ten opzichte van andere 17-inch gaming laptops.
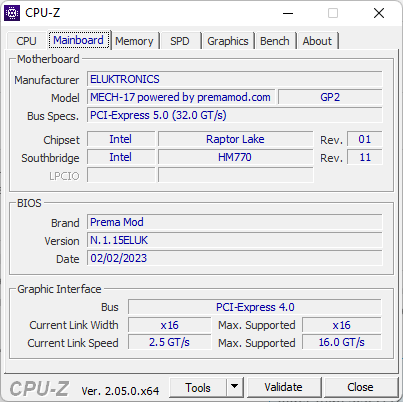
De Mech-17 GP2 is gebaseerd op een bijgewerkte versie van de vorig jaar door Uniwill ontworpen Schenker Neo 17 M22. Het is in wezen de Neo 17 E23, zij het onder de Eluktronics branding. Er zijn verschillende belangrijke veranderingen aan het moederbord dit jaar, die we hieronder in onze analyses zullen bespreken. Voor de rest blijft het uiterlijk identiek, dus we raden aan onze bestaande review van de Schenker Neo 17 M22 te bekijken om meer te weten te komen over de fysieke kenmerken van de Mech-17 GP2.
Onze besproken configuratie is volledig geconfigureerd met de Core i9-13900HX en RTX 4090 voor ongeveer 3400 USD. Kleinere SKU's zijn beschikbaar tot en met de RTX 4070, maar alle opties komen verder met dezelfde CPU en 240 Hz 2560 x 1600 IPS scherm.
Alternatieven voor de Mech-17 GP2 zijn andere high-end 17-inch gaming laptops zoals de Razer Blade 17, Alienware m17 R5, Asus Zephyrus S17, of de MSI Titan GT77.
Meer Eluktronics beoordelingen:
Potentiële concurrenten in vergelijking
Evaluatie | Datum | Model | Gewicht | Hoogte | Formaat | Resolutie | Beste prijs |
|---|---|---|---|---|---|---|---|
| 89.9 % v7 (old) | 03-2023 | Eluktronics Mech-17 GP2 i9-13900HX, GeForce RTX 4090 Laptop GPU | 2.9 kg | 27 mm | 17.00" | 2560x1600 | |
| 87.6 % v7 (old) | 09-2022 | Schenker XMG Neo 17 M22 R9 6900HX, GeForce RTX 3080 Ti Laptop GPU | 2.8 kg | 27 mm | 17.00" | 2560x1600 | |
| 82.1 % v7 (old) | 02-2023 | MSI Katana 17 B13VFK i7-13620H, GeForce RTX 4060 Laptop GPU | 2.8 kg | 25.2 mm | 17.30" | 1920x1080 | |
| 89 % v7 (old) | 02-2023 | MSI Titan GT77 HX 13VI i9-13950HX, GeForce RTX 4090 Laptop GPU | 3.5 kg | 23 mm | 17.30" | 3840x2160 | |
| 86.1 % v7 (old) | 01-2023 | Alienware m17 R5 (R9 6900HX, RX 6850M XT) R9 6900HX, Radeon RX 6850M XT | 3.4 kg | 26.7 mm | 17.00" | 3840x2160 | |
| 91.4 % v7 (old) | 02-2023 | Razer Blade 18 RTX 4070 i9-13950HX, GeForce RTX 4070 Laptop GPU | 3 kg | 21.9 mm | 18.00" | 2560x1600 |
Zaak
SD-kaartlezer
De SD-kaartlezer is traag in verhouding tot het hoge prijspunt van het model. De Razer Blade 18 en Dell XPS serie hebben 2x tot 3x snellere kaartlezers.
| SD Card Reader | |
| average JPG Copy Test (av. of 3 runs) | |
| Razer Blade 18 RTX 4070 (Angelibird AV Pro V60) | |
| MSI Titan GT77 HX 13VI (Angelibird AV Pro V60) | |
| Eluktronics Mech-17 GP2 (Angelibird AV Pro V60) | |
| Schenker XMG Neo 17 M22 (AV PRO microSD 128 GB V60) | |
| maximum AS SSD Seq Read Test (1GB) | |
| Razer Blade 18 RTX 4070 (Angelibird AV Pro V60) | |
| Eluktronics Mech-17 GP2 (Angelibird AV Pro V60) | |
| MSI Titan GT77 HX 13VI (Angelibird AV Pro V60) | |
Communicatie
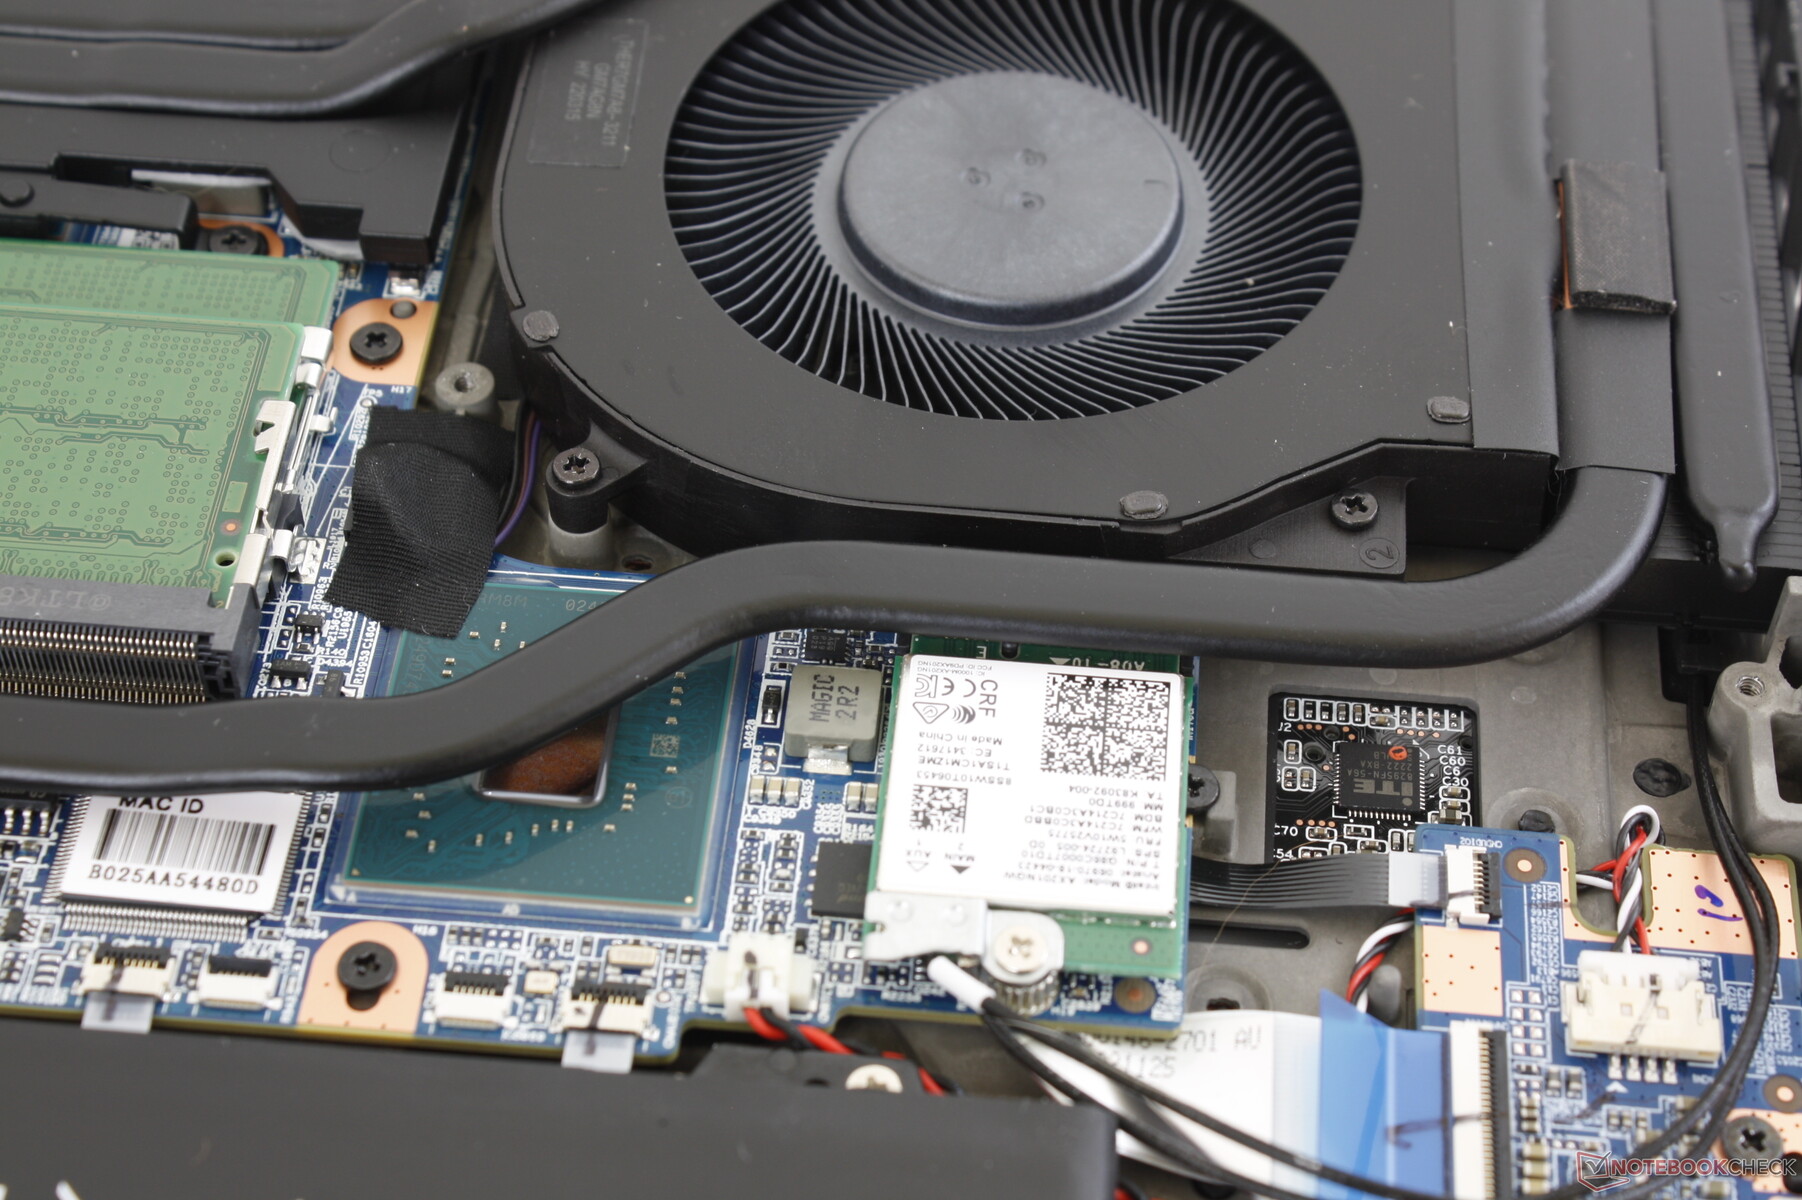
Een Intel AX201 wordt standaard geleverd voor Wi-Fi 6 en Bluetooth 5.2 connectiviteit. Toch hadden we gezien de prijs van het systeem een AX210/211 verwacht voor snellere Wi-Fi 6E-snelheden.
| Networking | |
| iperf3 transmit AXE11000 | |
| MSI Titan GT77 HX 13VI | |
| MSI Katana 17 B13VFK | |
| Eluktronics Mech-17 GP2 | |
| Razer Blade 18 RTX 4070 | |
| Alienware m17 R5 (R9 6900HX, RX 6850M XT) | |
| Schenker XMG Neo 17 M22 | |
| iperf3 receive AXE11000 | |
| MSI Katana 17 B13VFK | |
| MSI Titan GT77 HX 13VI | |
| Razer Blade 18 RTX 4070 | |
| Eluktronics Mech-17 GP2 | |
| Alienware m17 R5 (R9 6900HX, RX 6850M XT) | |
| Schenker XMG Neo 17 M22 | |
| iperf3 transmit AXE11000 6GHz | |
| Razer Blade 18 RTX 4070 | |
| iperf3 receive AXE11000 6GHz | |
| Razer Blade 18 RTX 4070 | |
Webcam
De 2 MP FHD webcam en IR komen standaard voor Hallo ondersteuning. Er is echter geen privacyschakelaar of sluiteroptie.


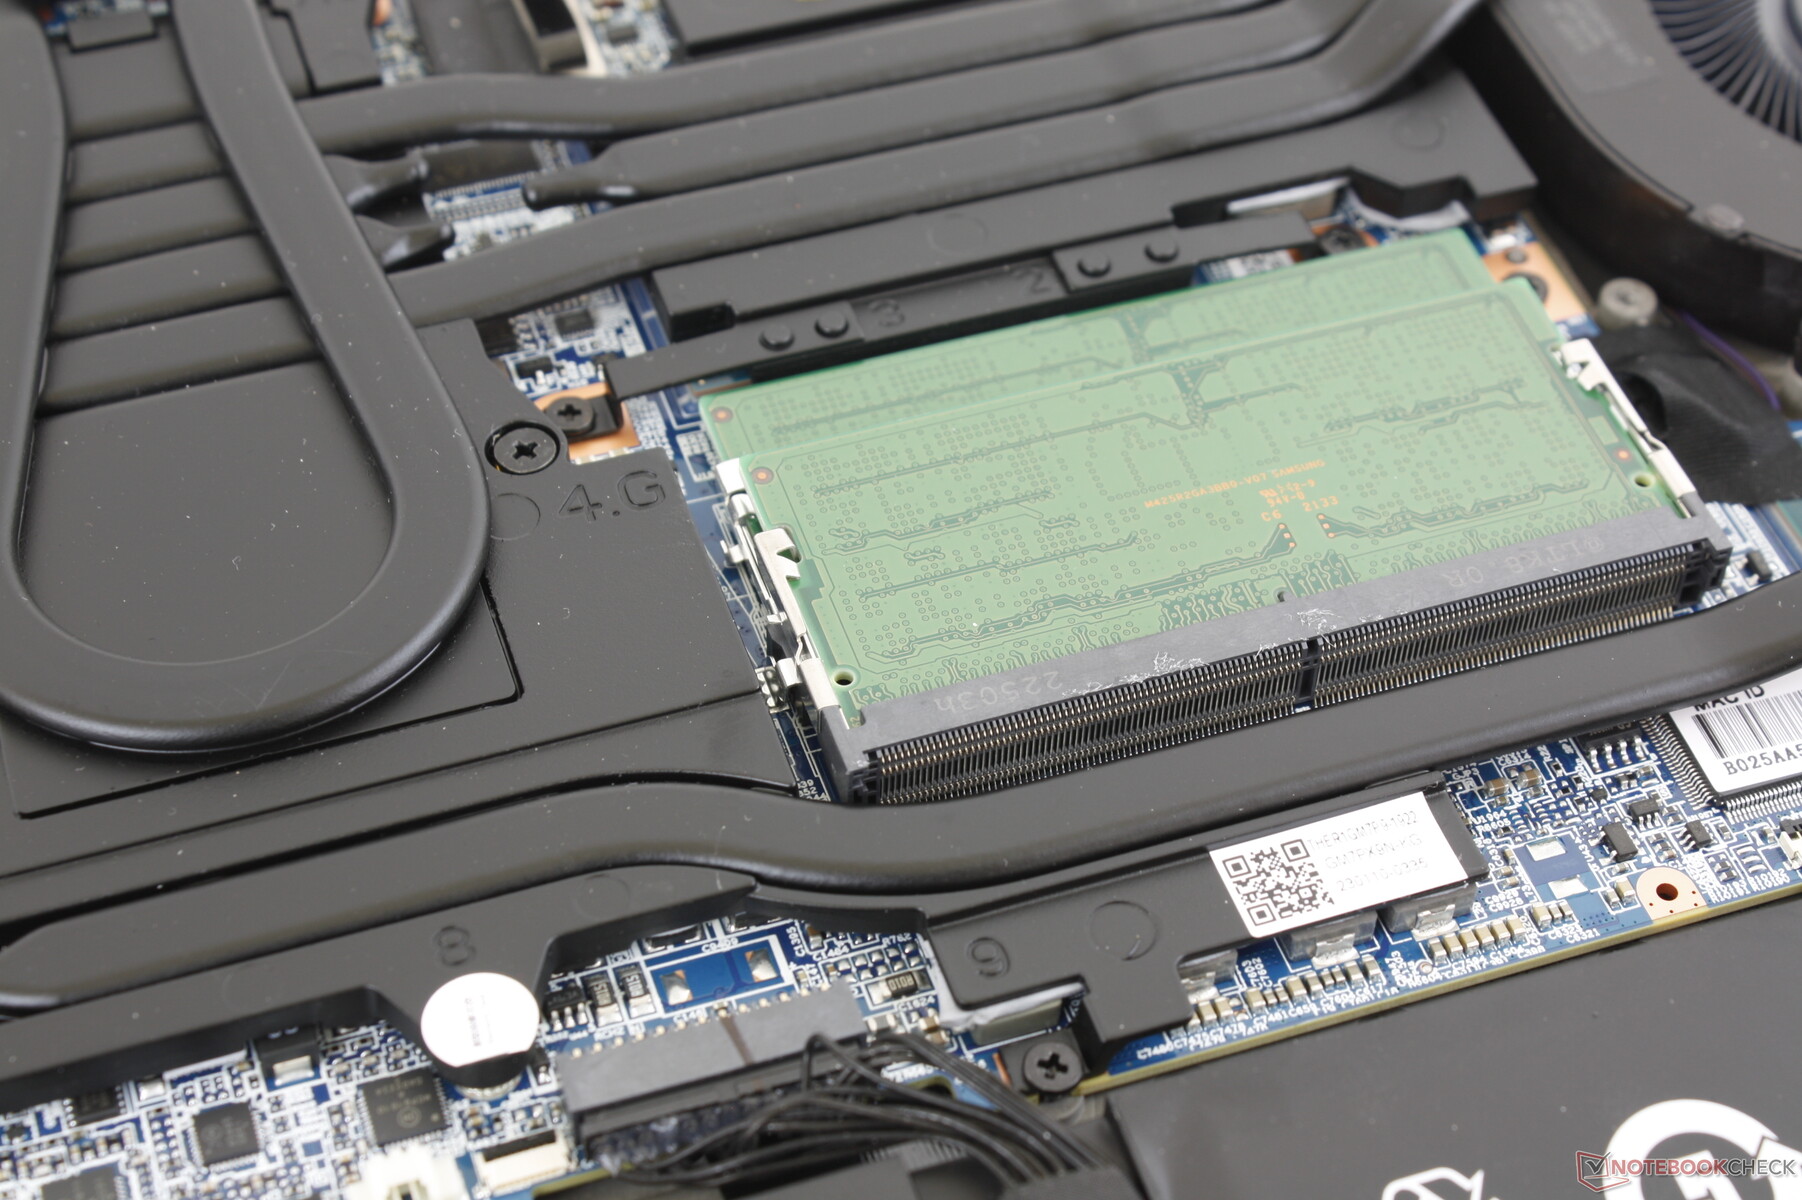
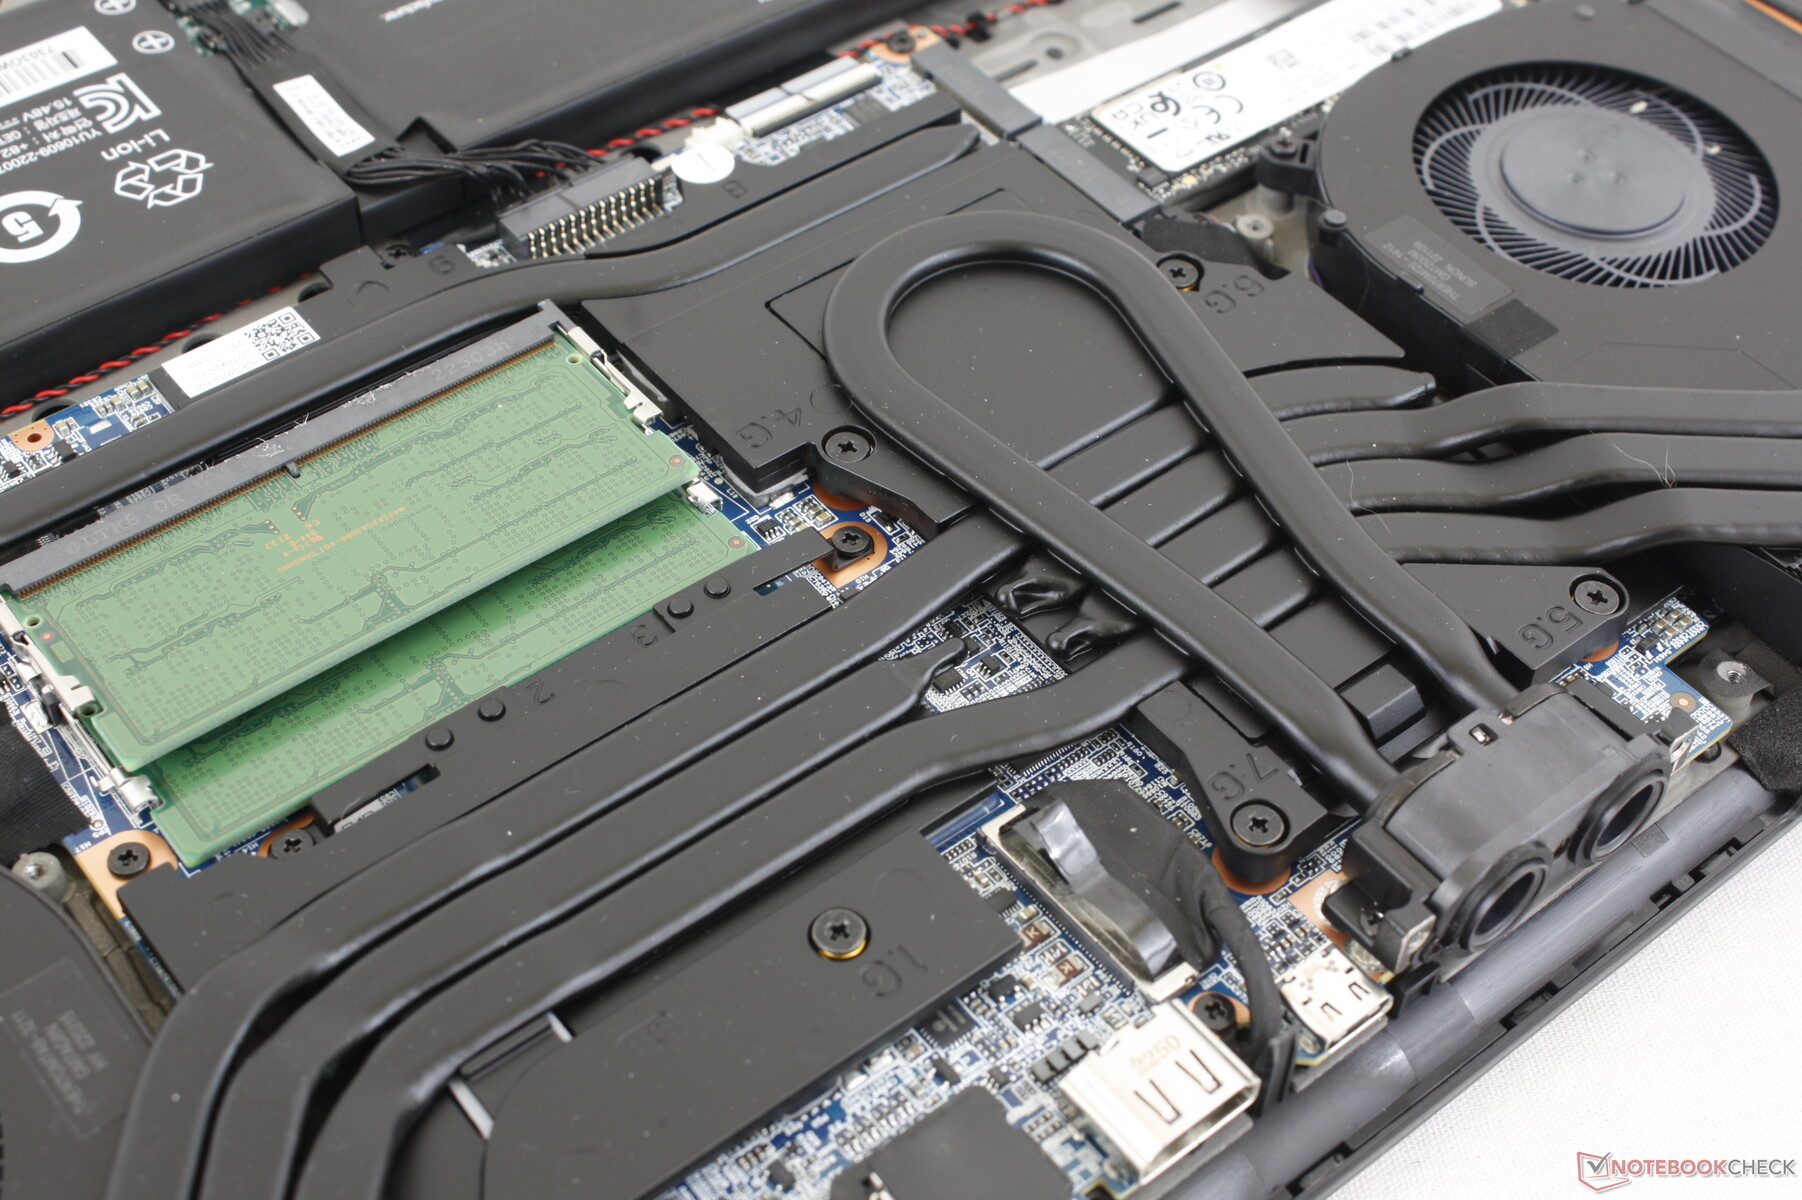
Onderhoud
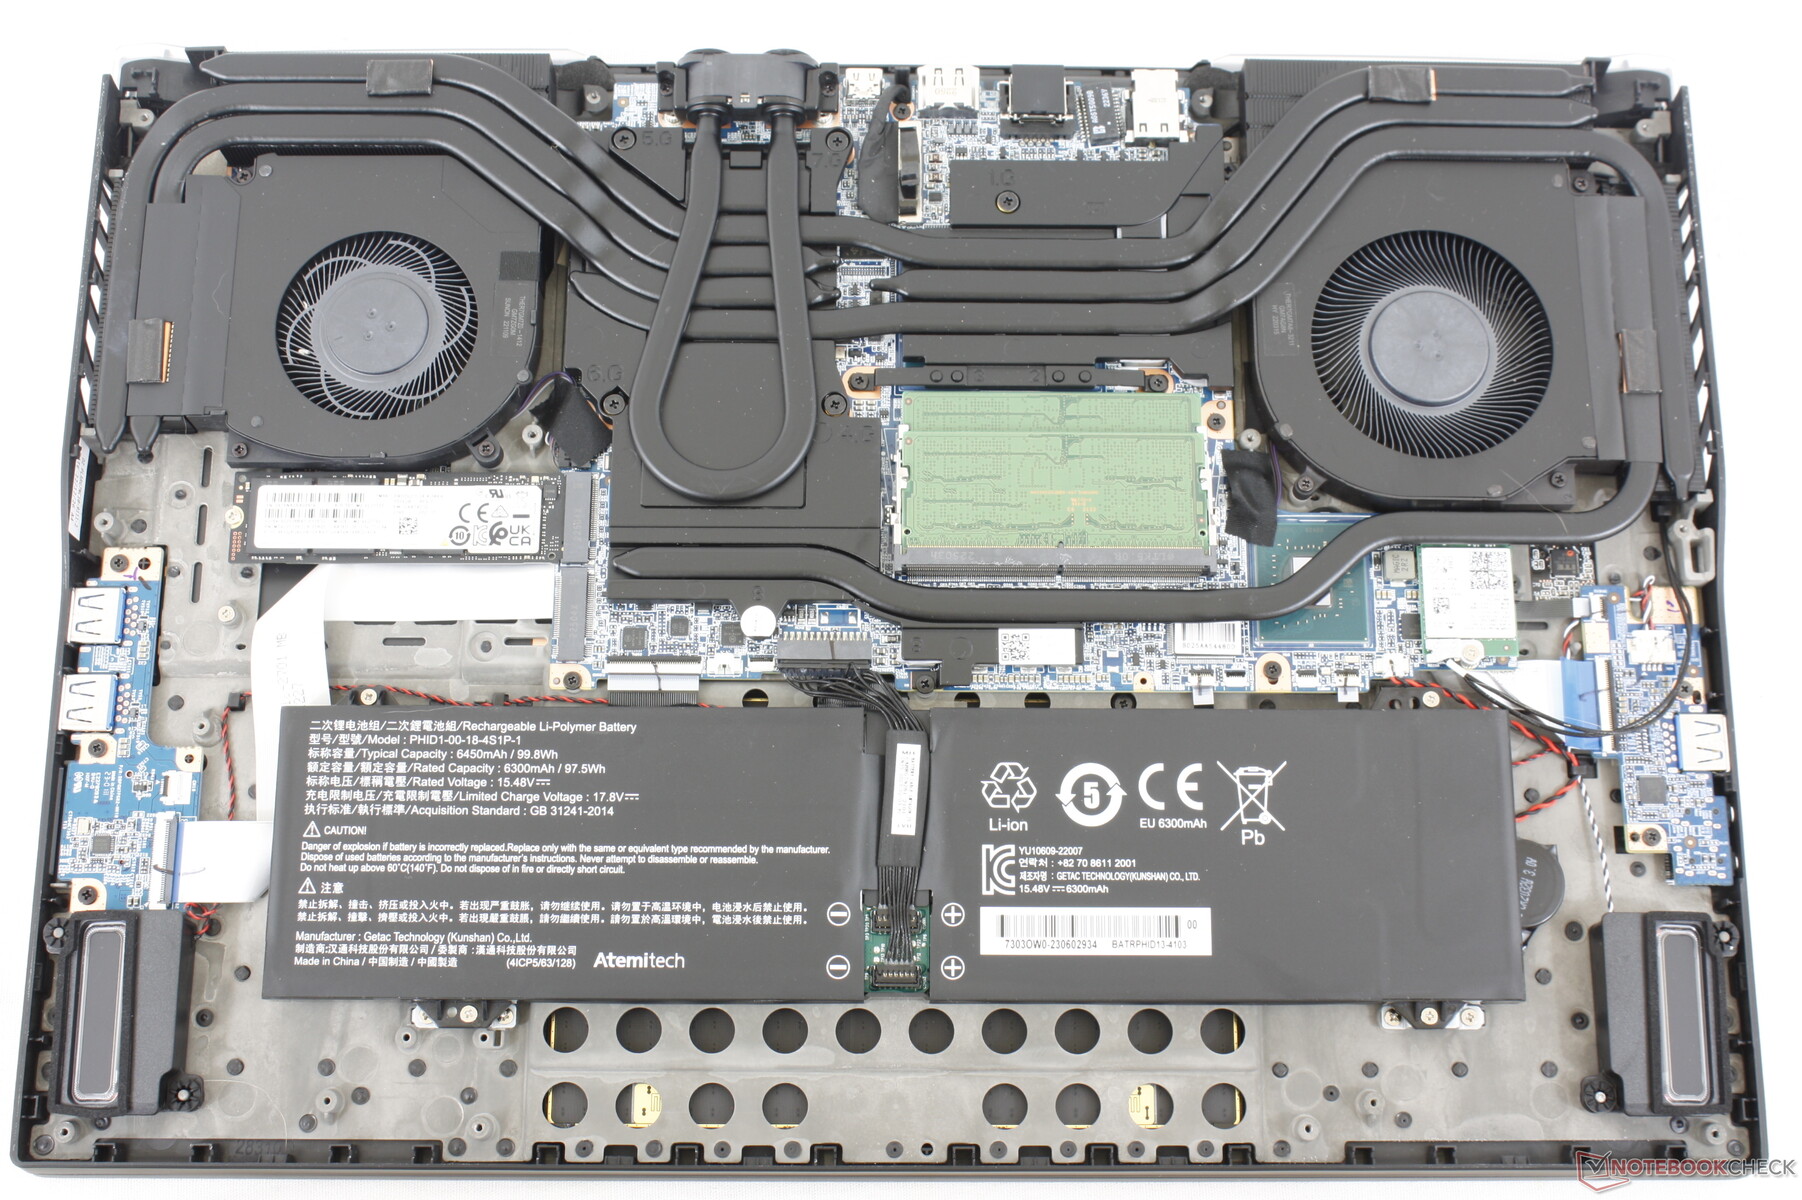
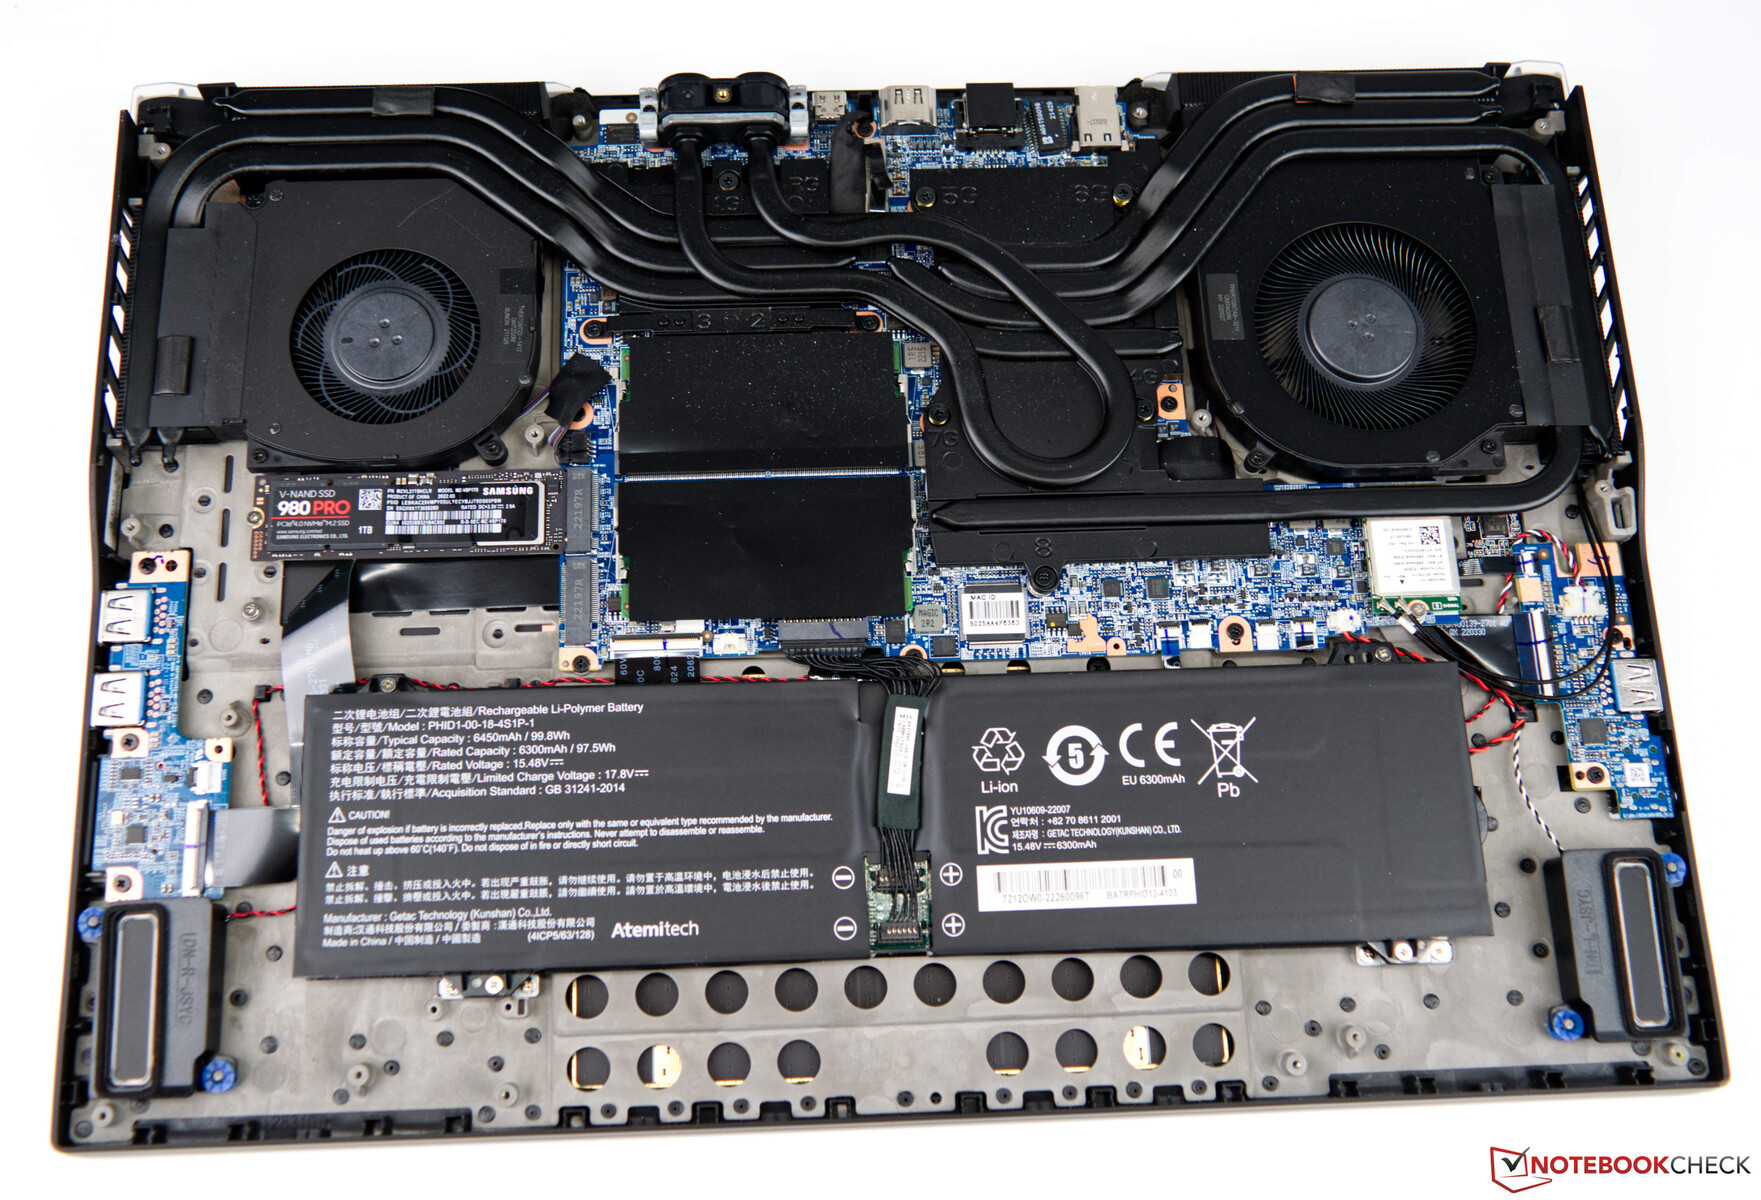
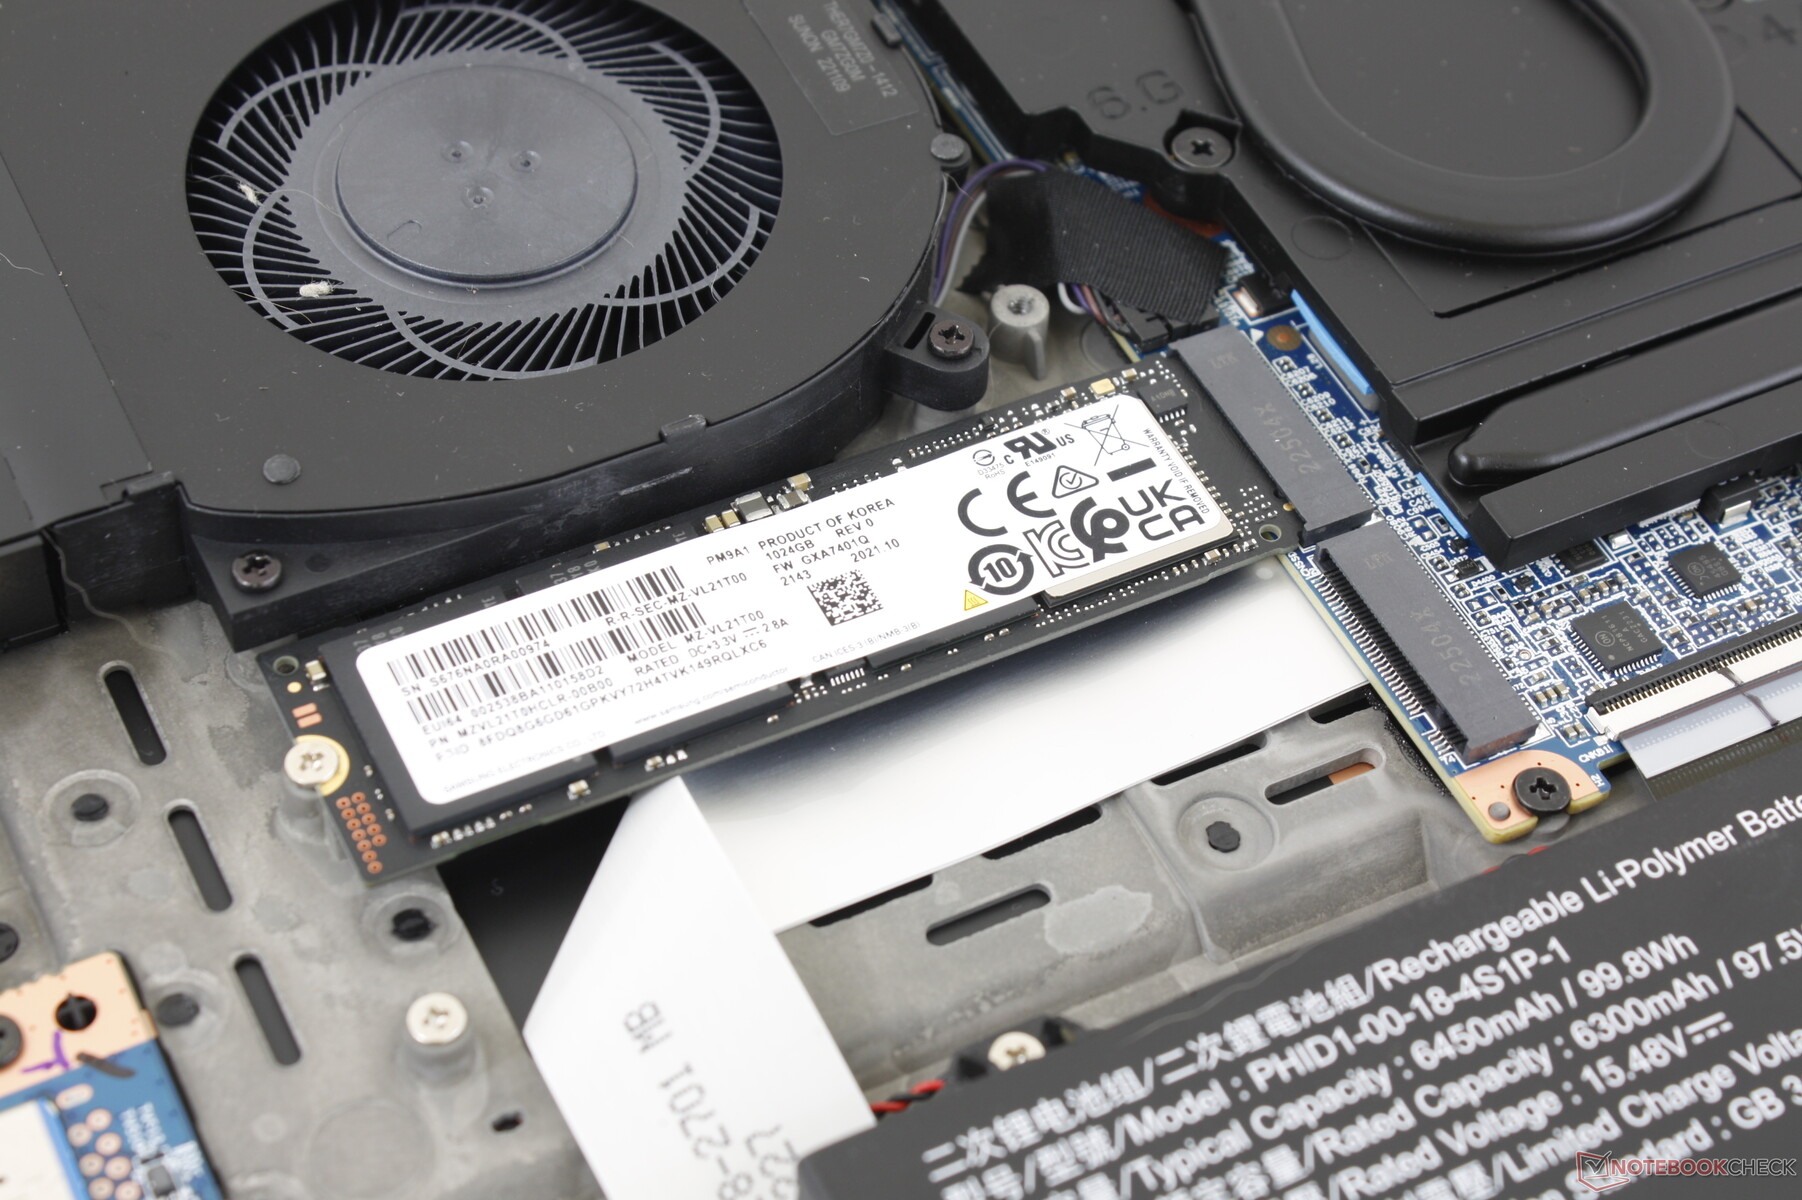
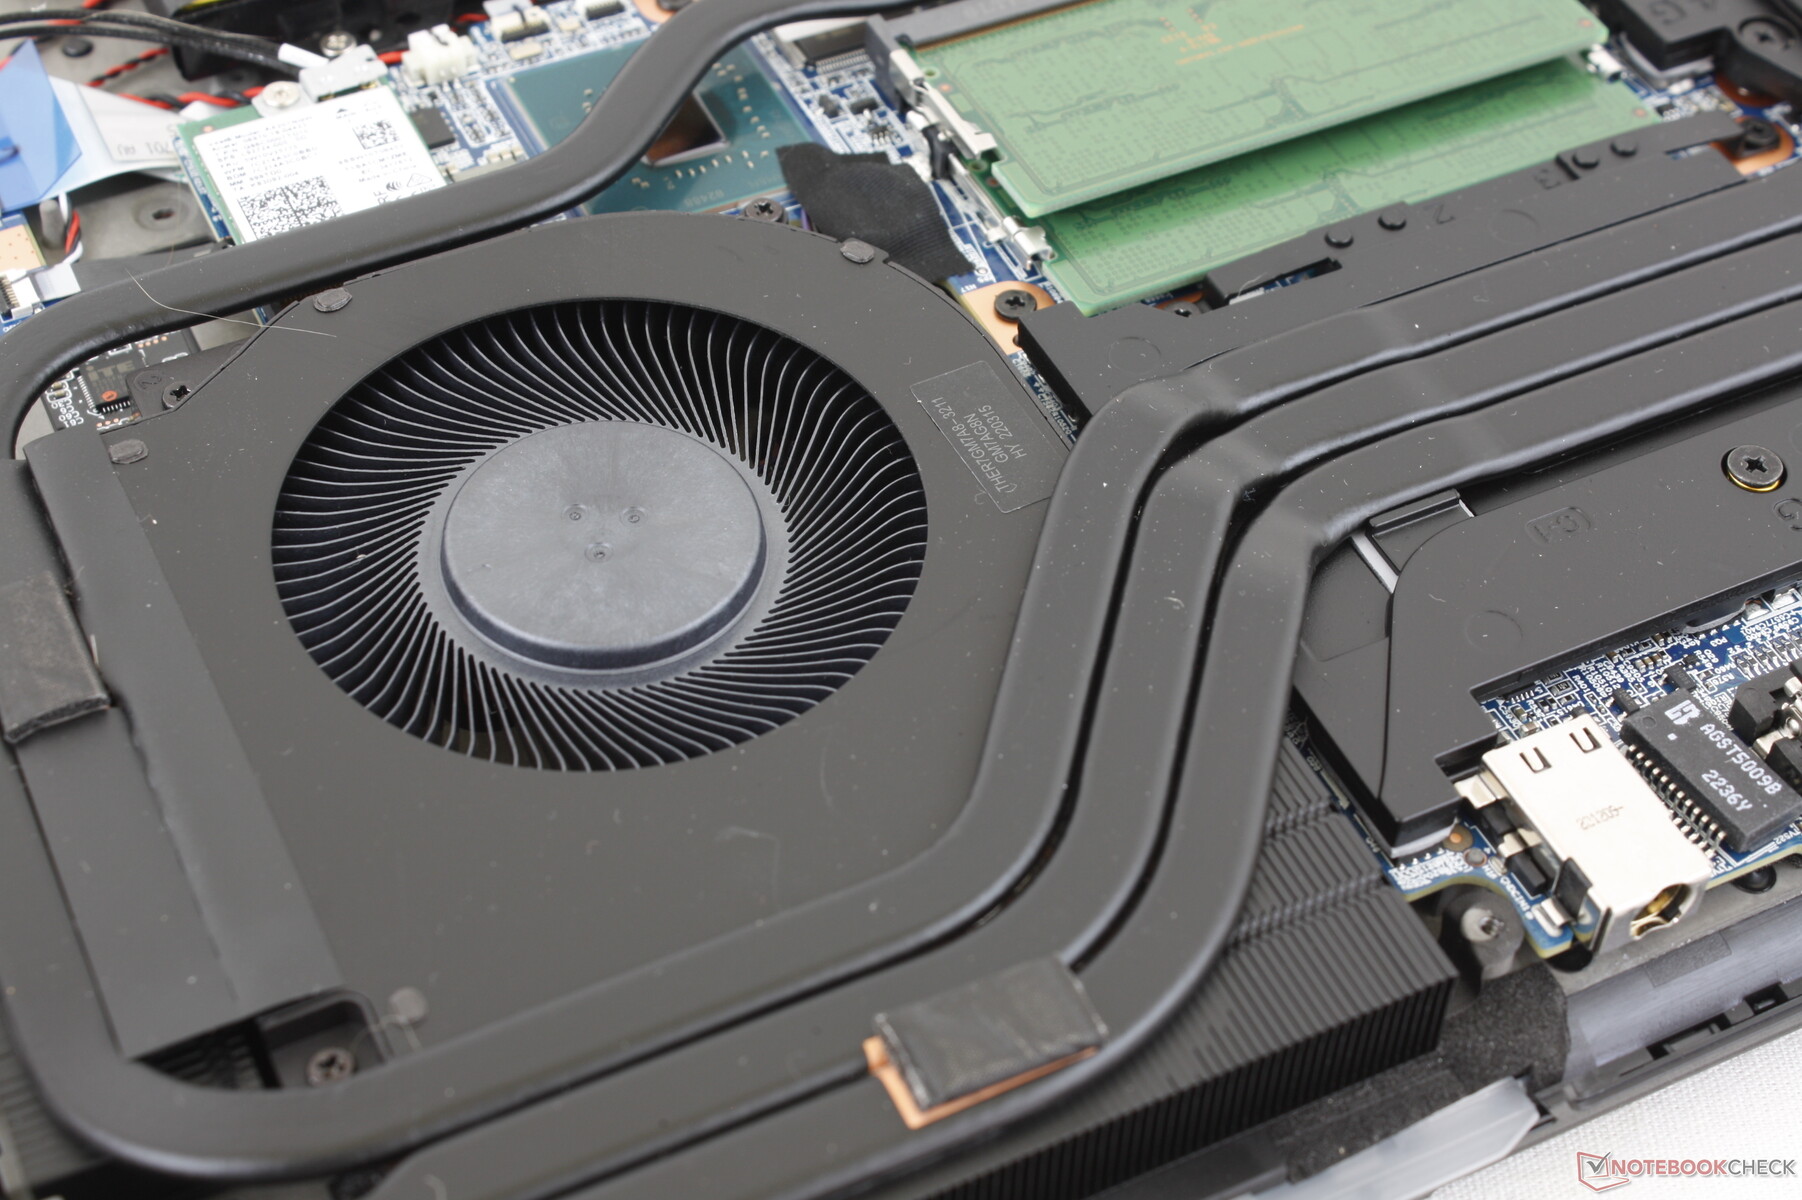
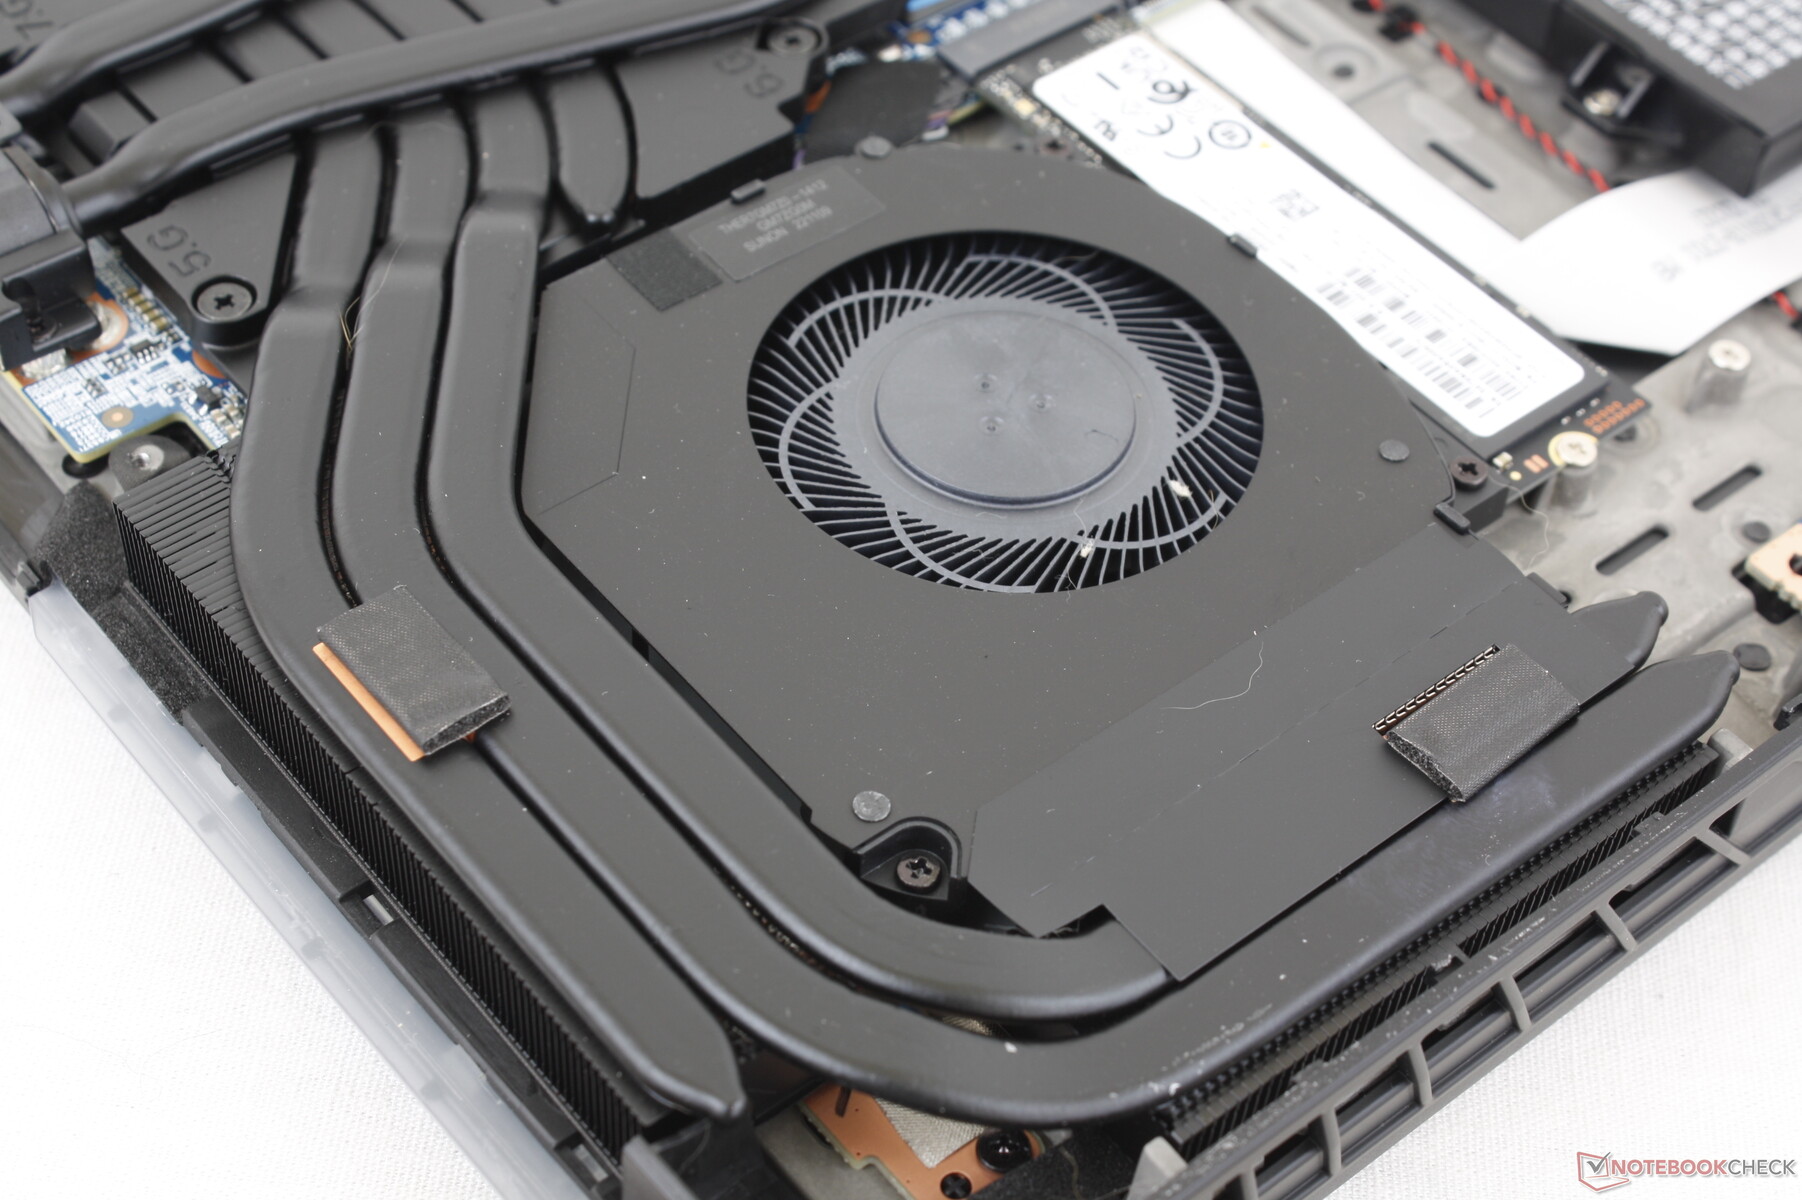
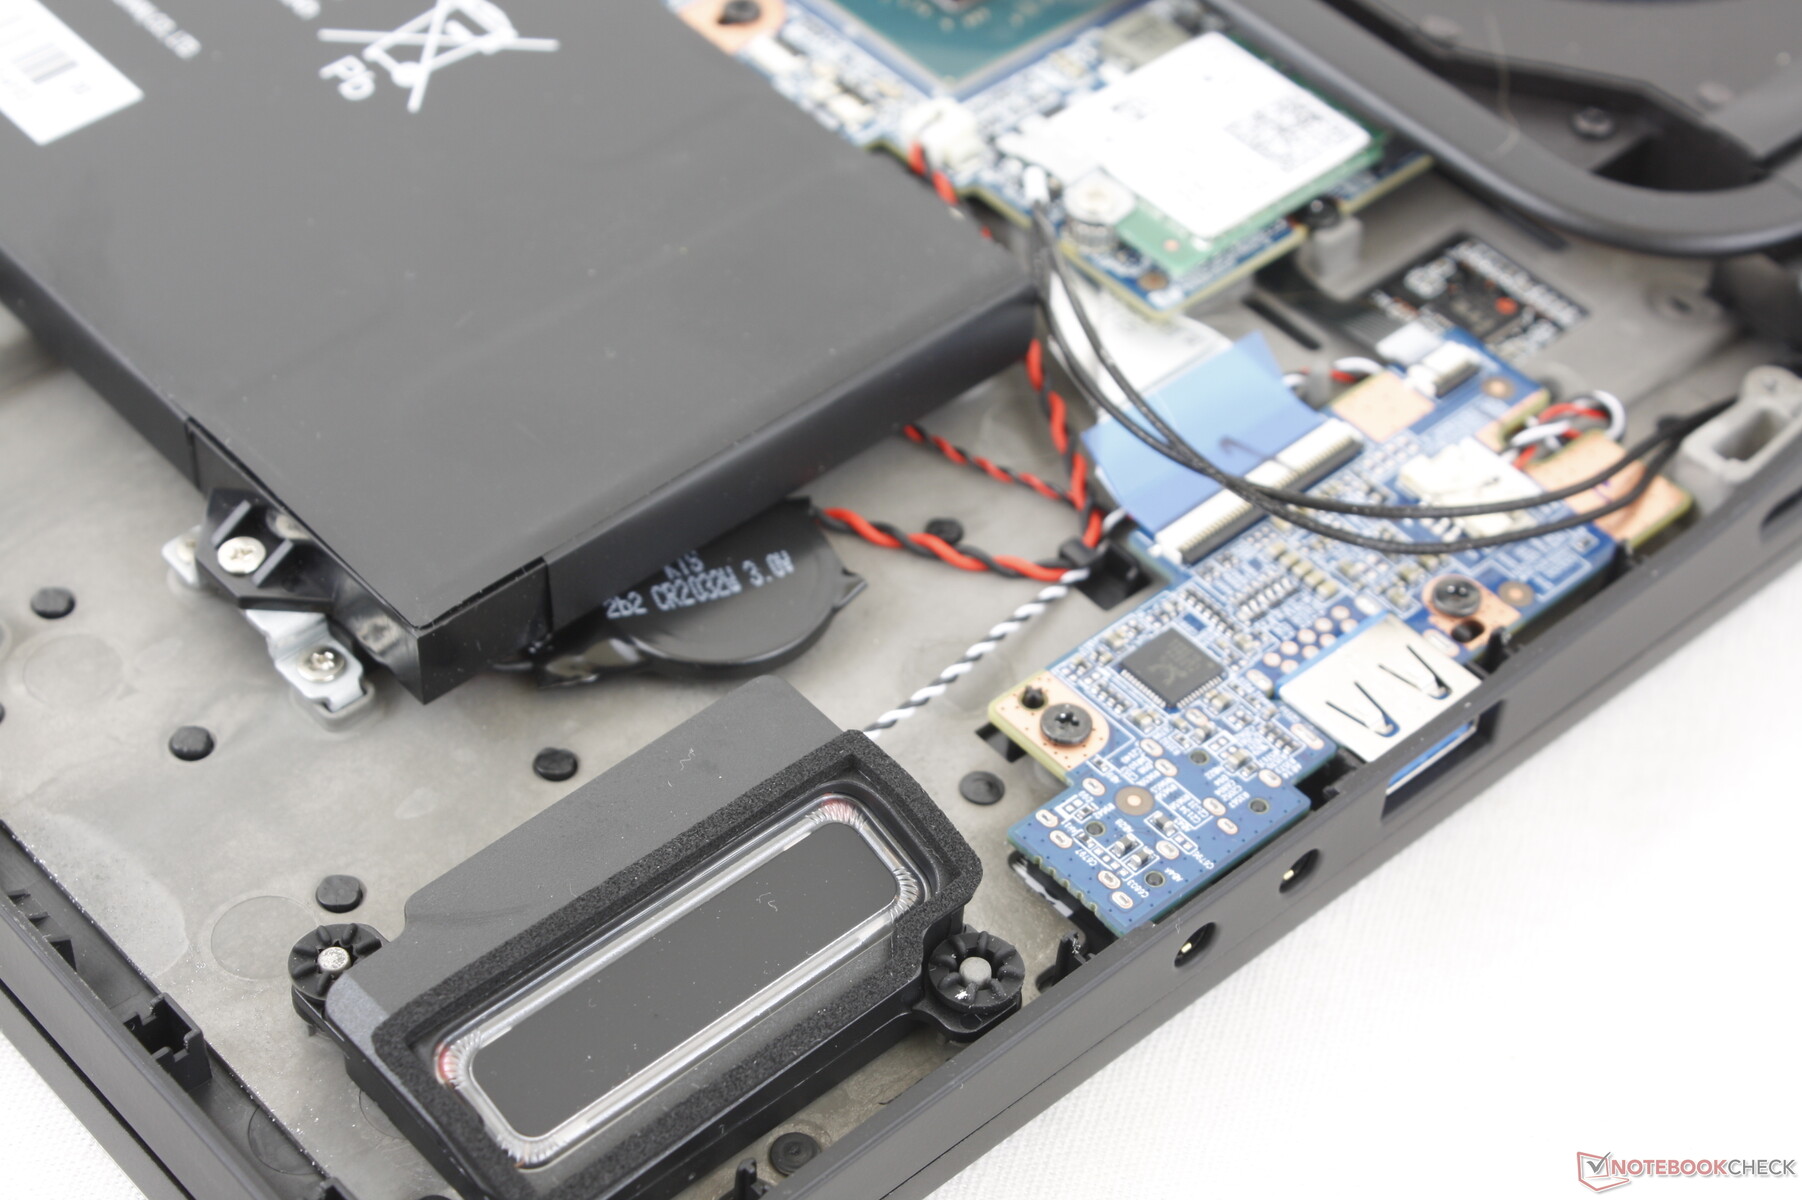
Het bodempaneel is bevestigd met 14 Philips-schroeven voor relatief eenvoudig onderhoud. De fabrikant heeft de interne onderdelen herzien in vergelijking met het model van vorig jaar, zoals hieronder te zien is, ook al blijven de externe ontwerpen identiek. De twee RAM modules zijn nu gestapeld om ruimte te besparen op het moederbord, terwijl de CPU en GPU van plaats zijn verwisseld.
Accessoires en garantie
Er zijn geen extra's in de doos behalve de wisselstroomadapter en het papierwerk. Het model is compatibel met de optionele tweede generatie Liquid Propulsion Package (LPP G2) externe koeler.
De standaard beperkte fabrieksgarantie van één jaar is van toepassing. Een upgrade naar drie jaar is beschikbaar voor 250 dollar extra.
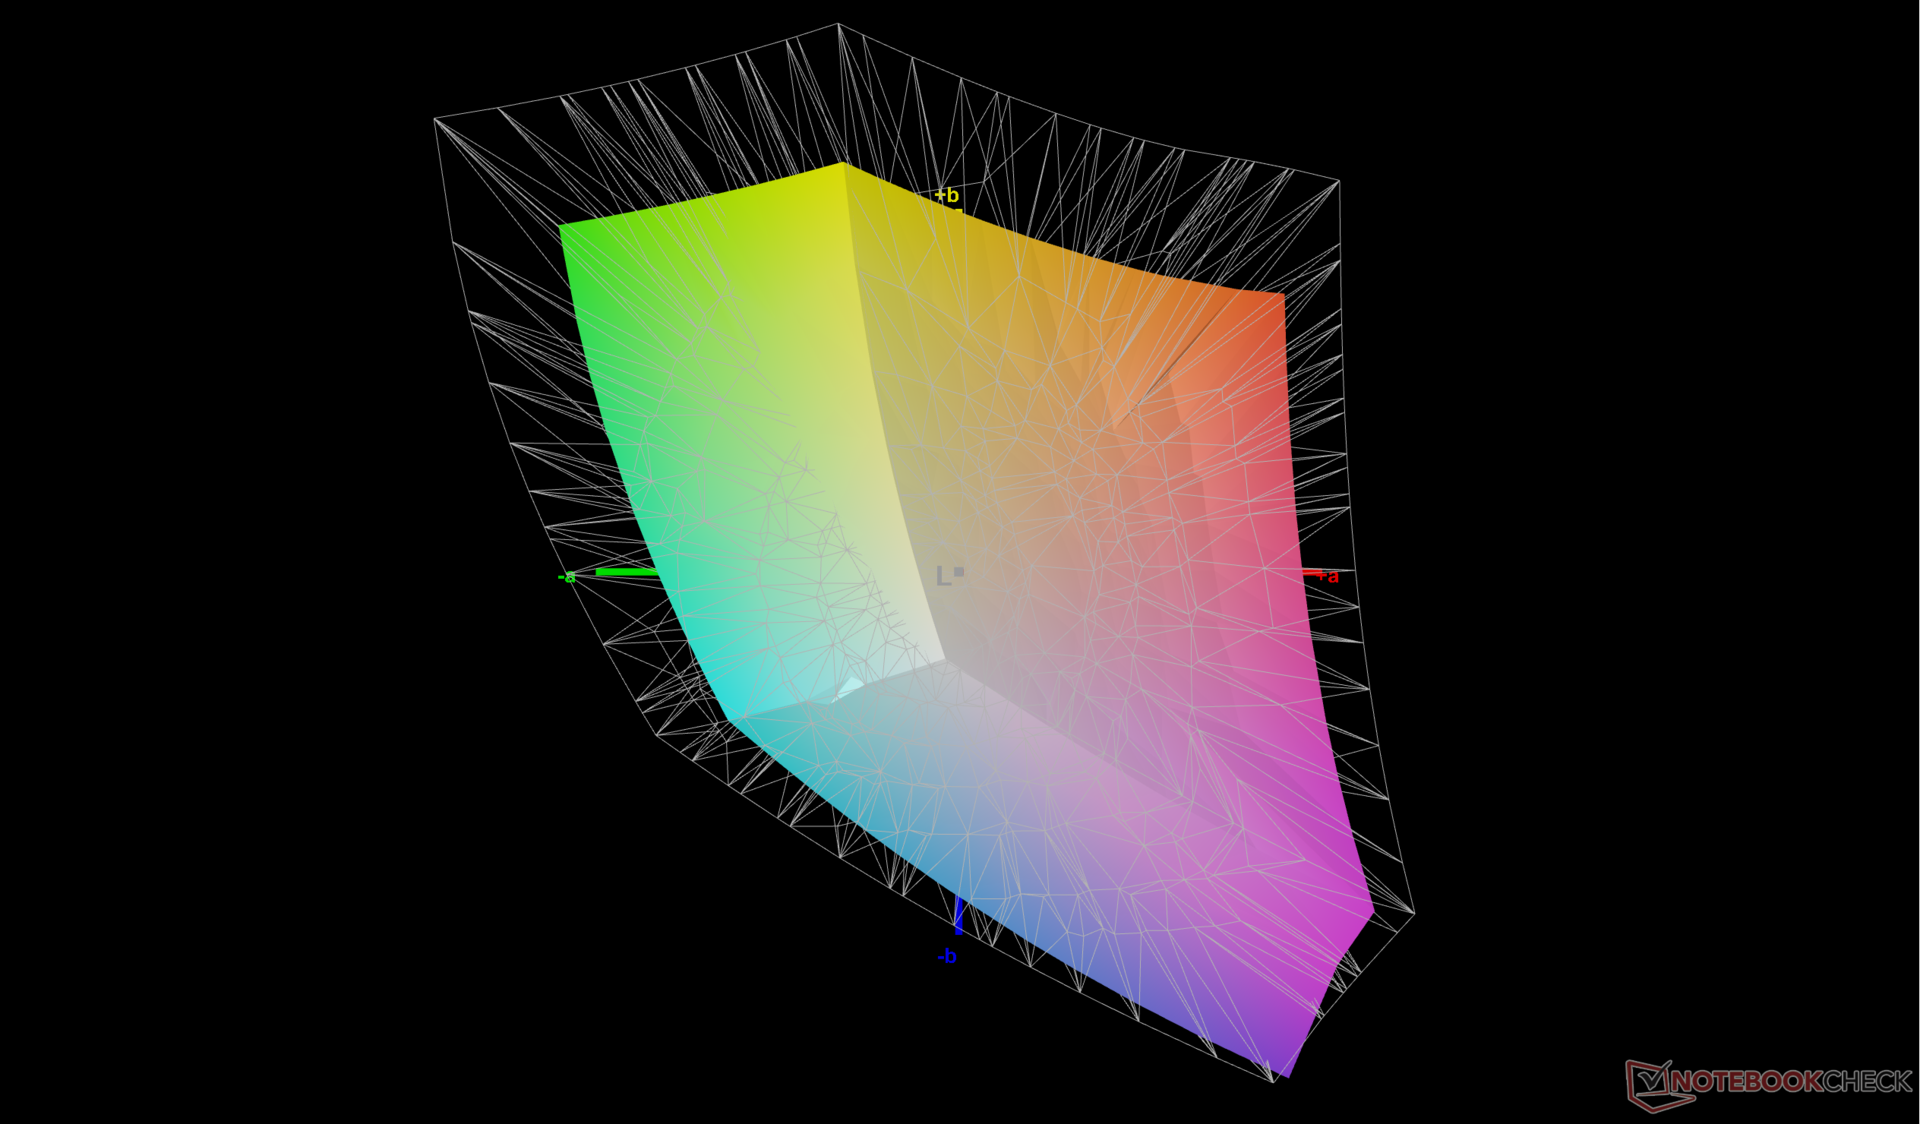
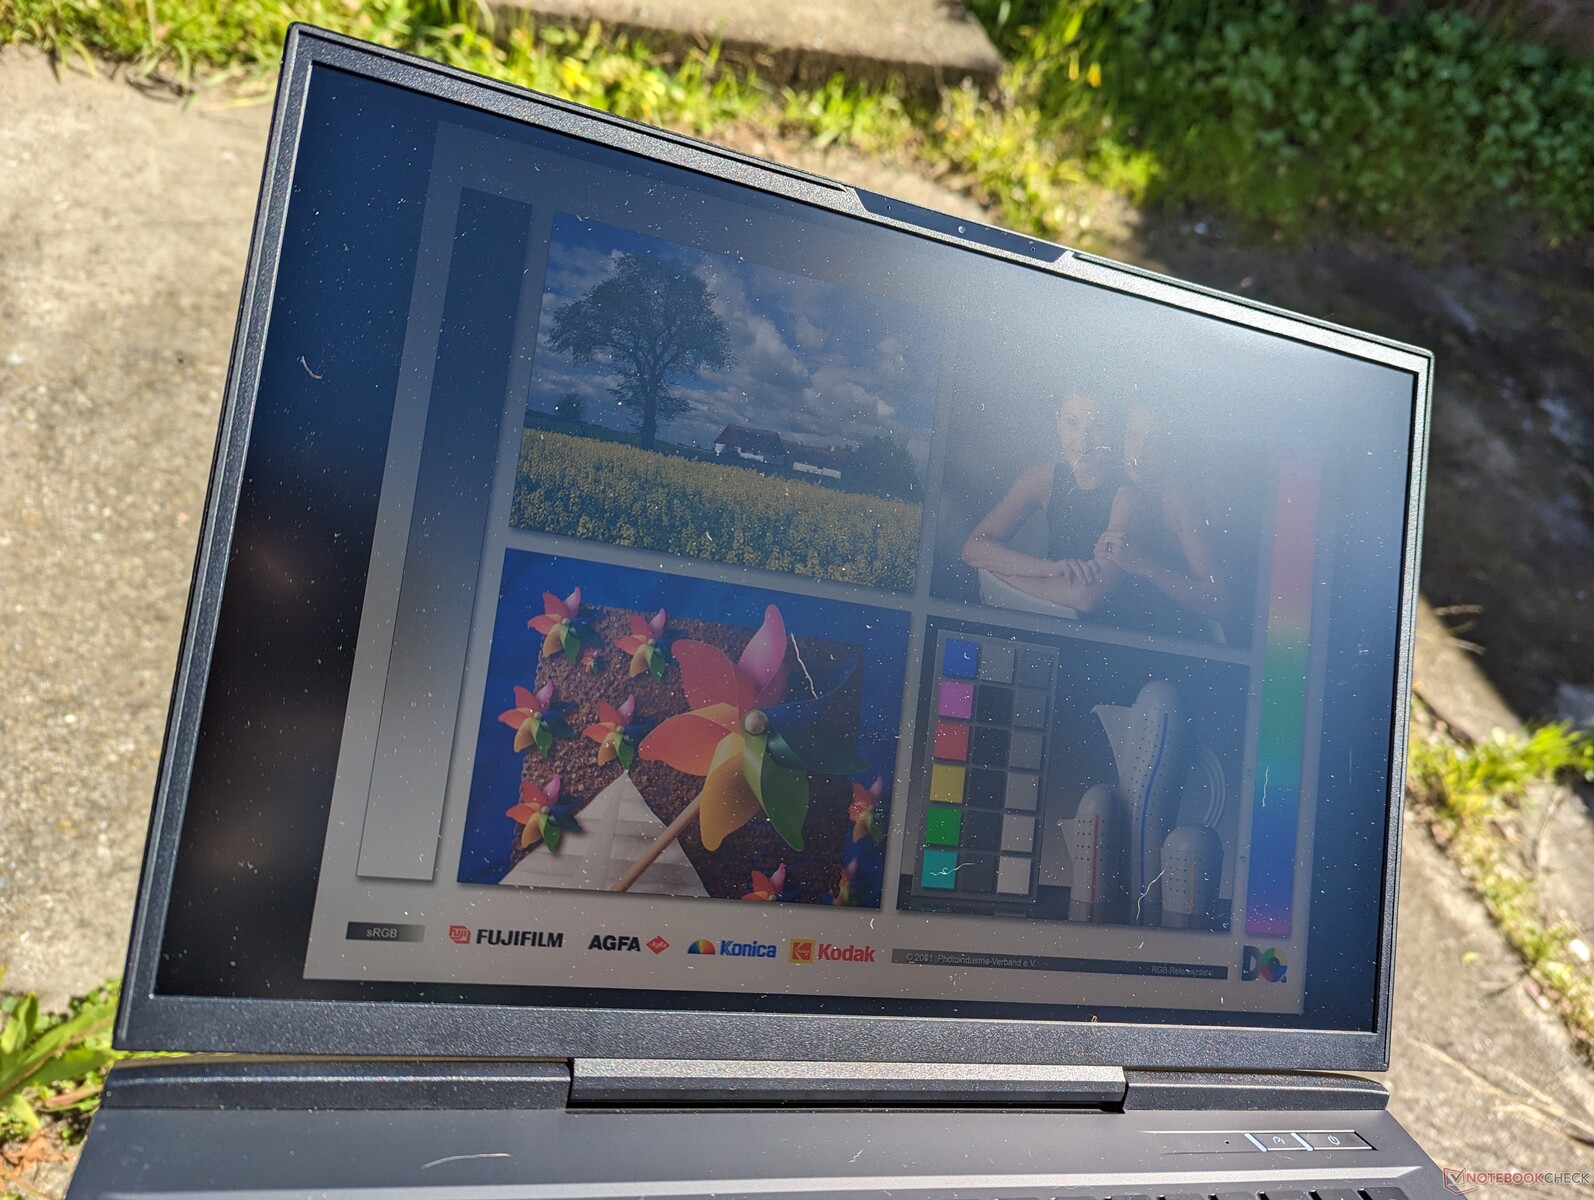
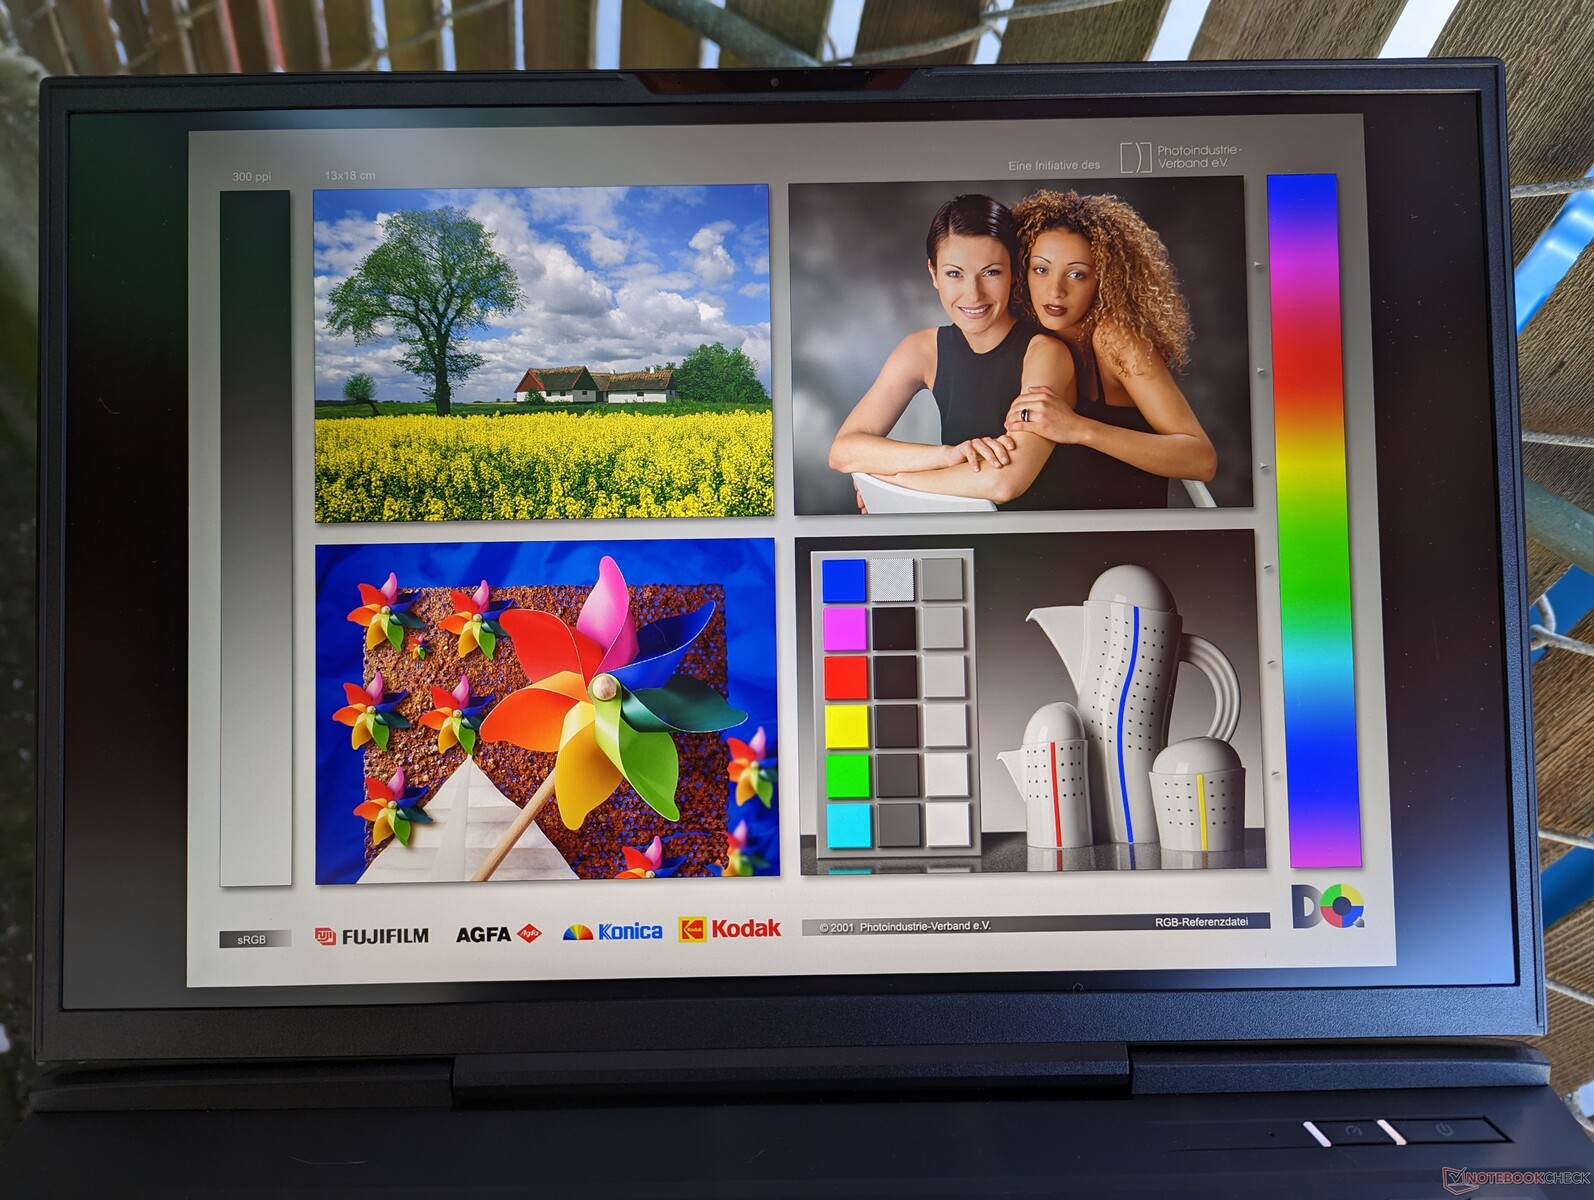
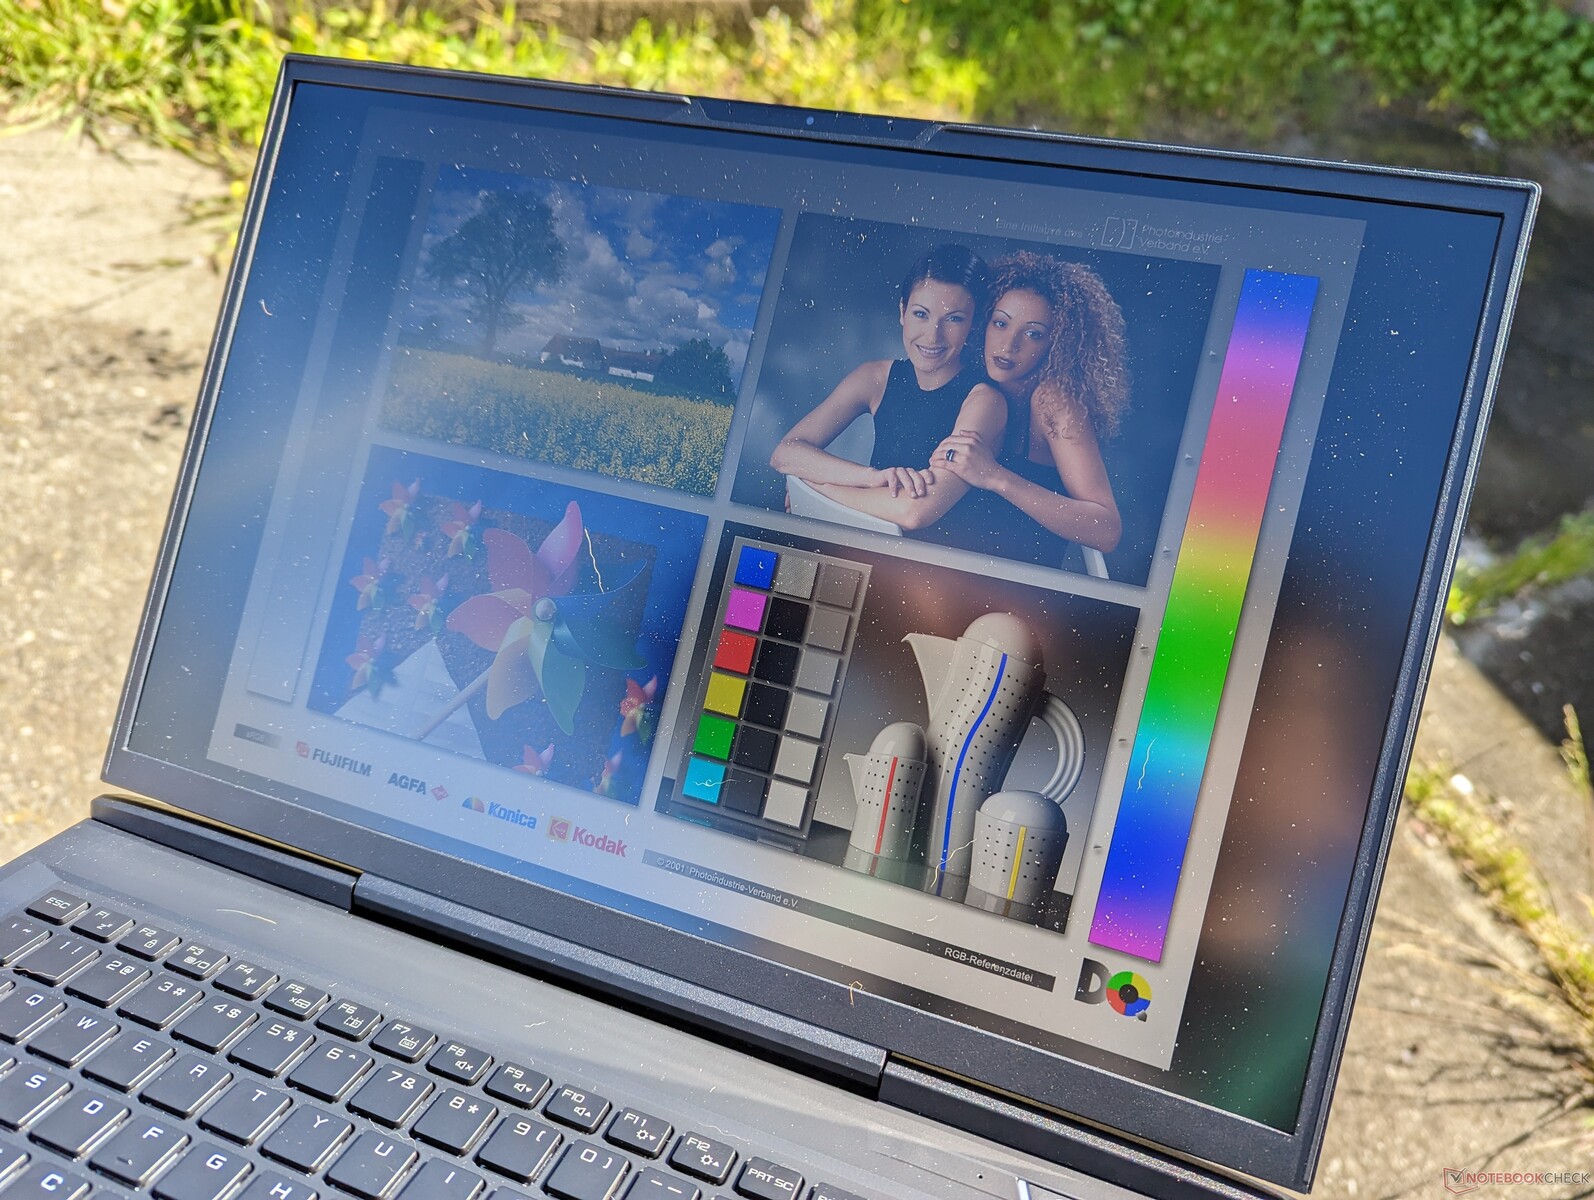
Display
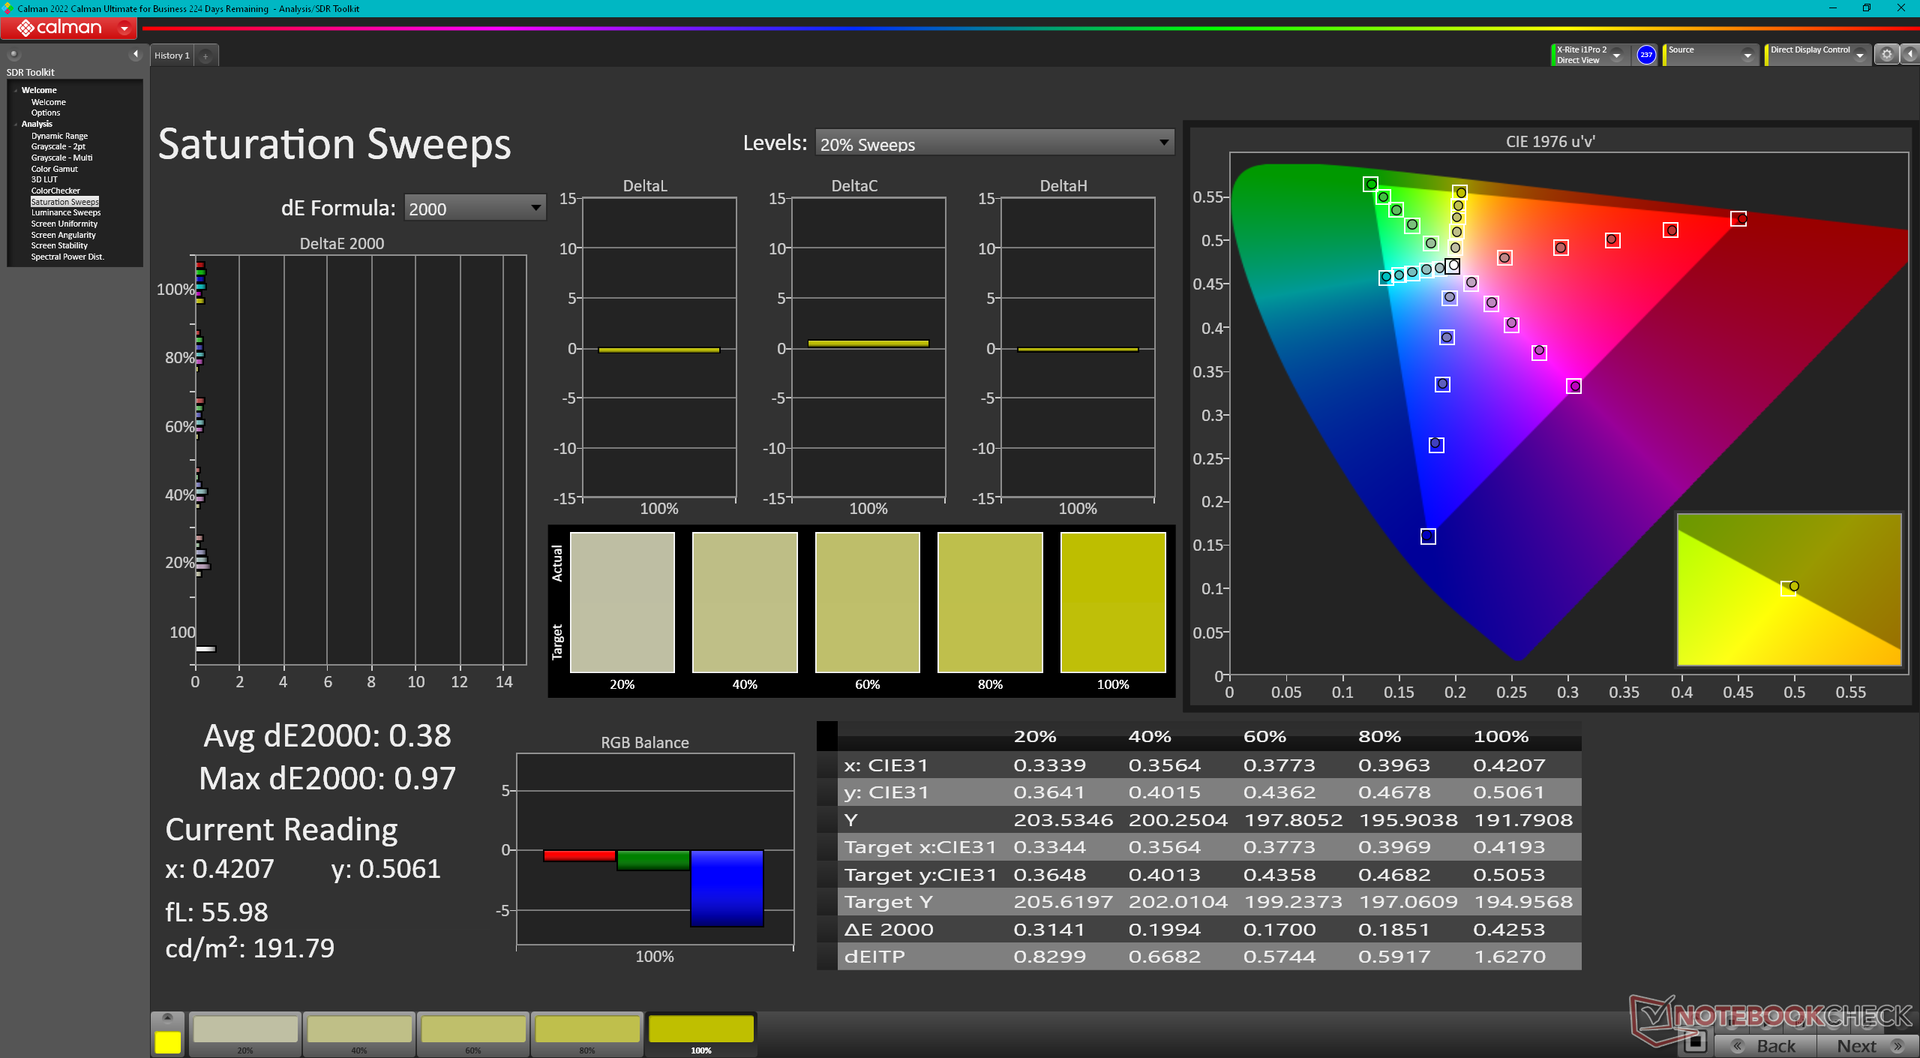
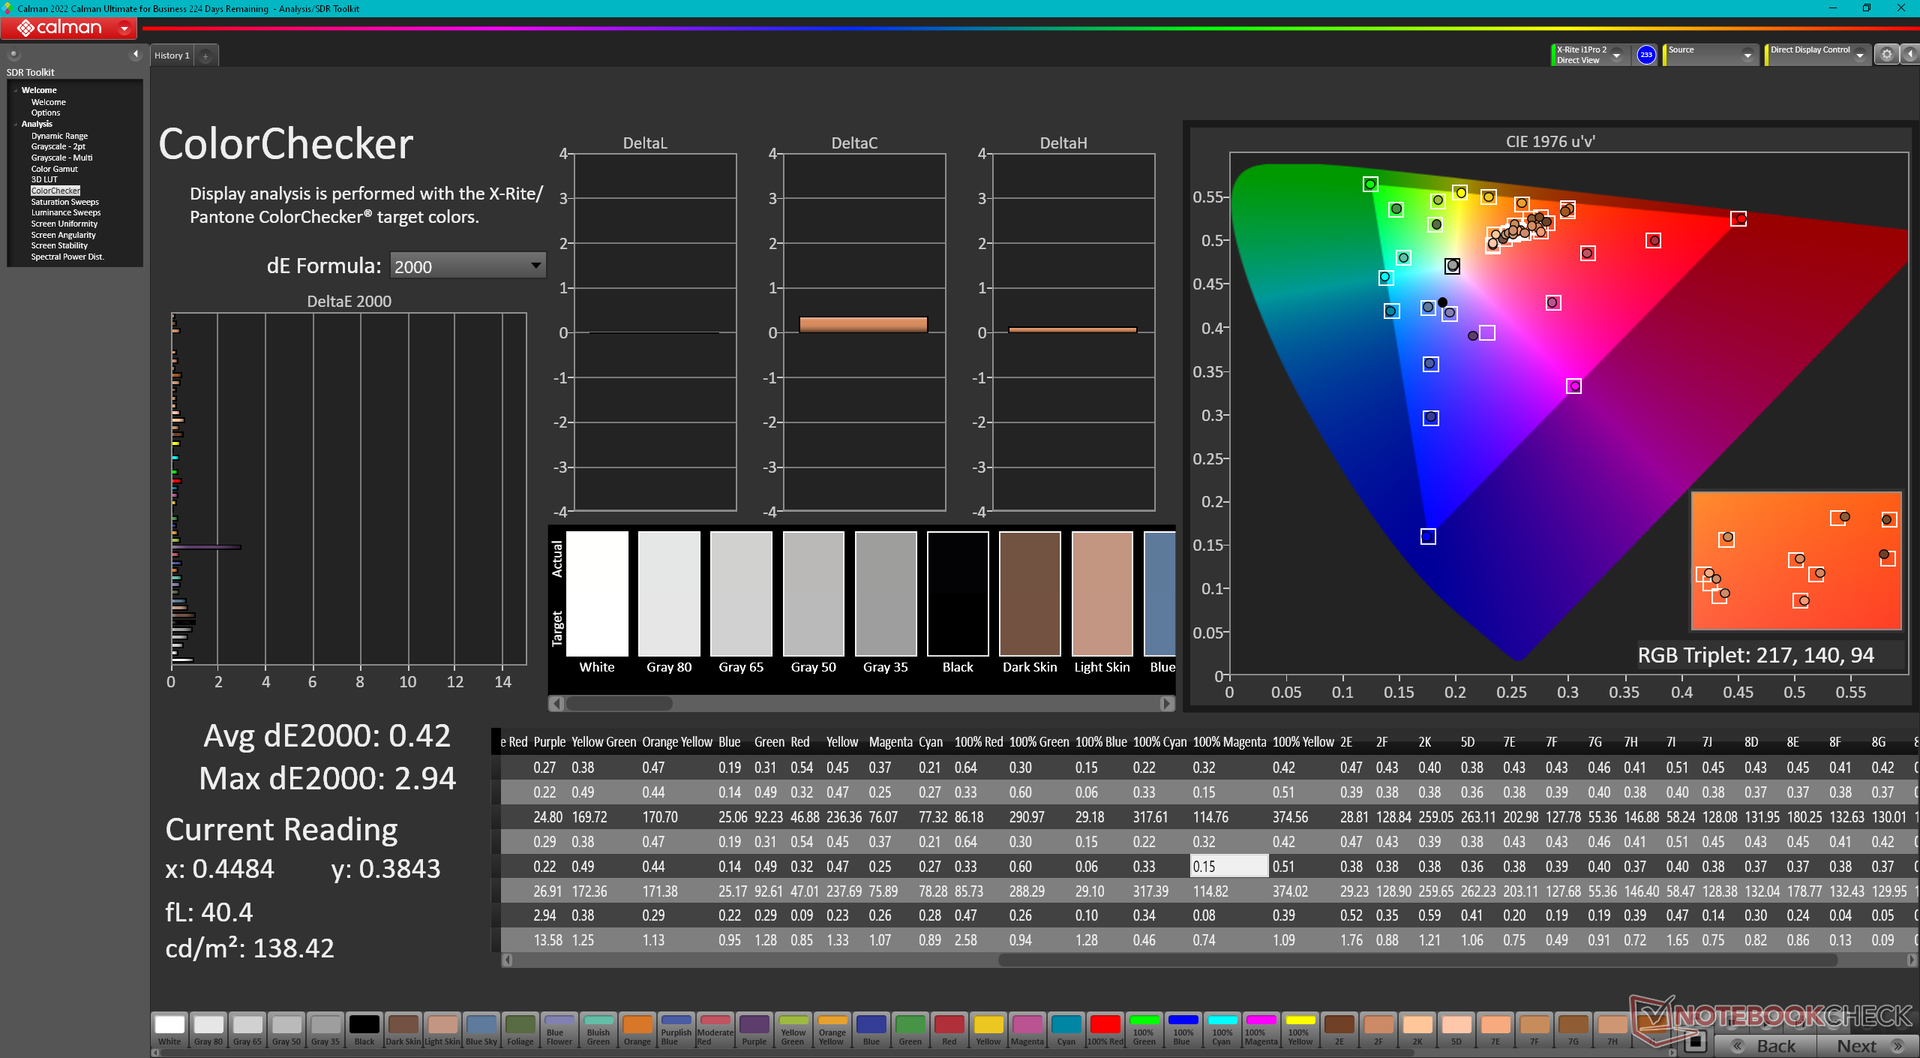
Ons vroege 2023 model gebruikt hetzelfde BOE NE170QDM-NZ1 paneel en BOE0A99 controller als op het 2022 model, wat betekent dat de visuele ervaring niet verschilt van jaar tot jaar. Onze metingen hieronder zijn dan ook vrijwel identiek tussen de modellen 2022 en 2023. Dit is echter nauwelijks een klacht, omdat het paneel bijna alles biedt wat we van een high-end gaming laptop zijn gaan verwachten, inclusief snelle verversingssnelheden, snelle responstijden, volledige sRGB dekking en G-Sync ondersteuning. Voor hogere resoluties en nog diepere P3 kleuren moet je echter elders kijken, zoals de MSI GT77 of Razer Blade 18.
| |||||||||||||||||||||||||
Helderheidsverdeling: 87 %
Helderheid in Batterij-modus: 417.3 cd/m²
Contrast: 994:1 (Zwart: 0.42 cd/m²)
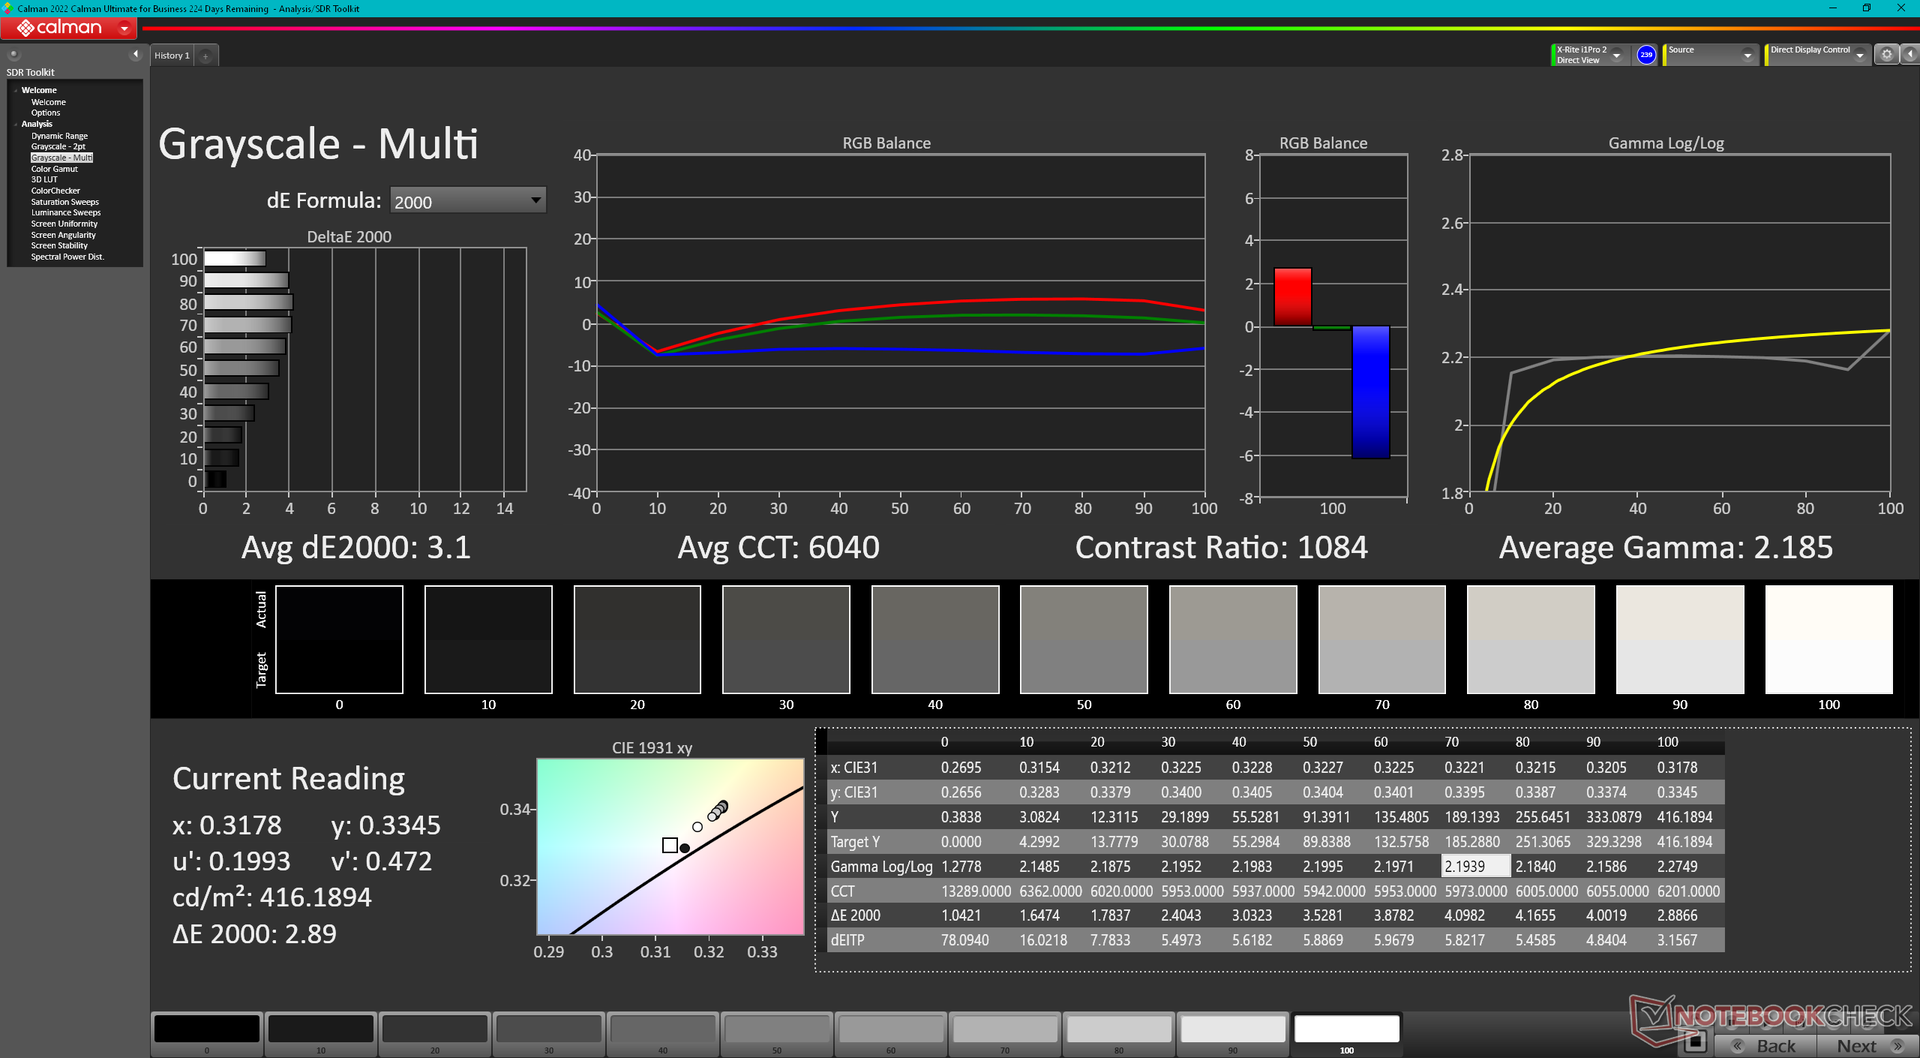
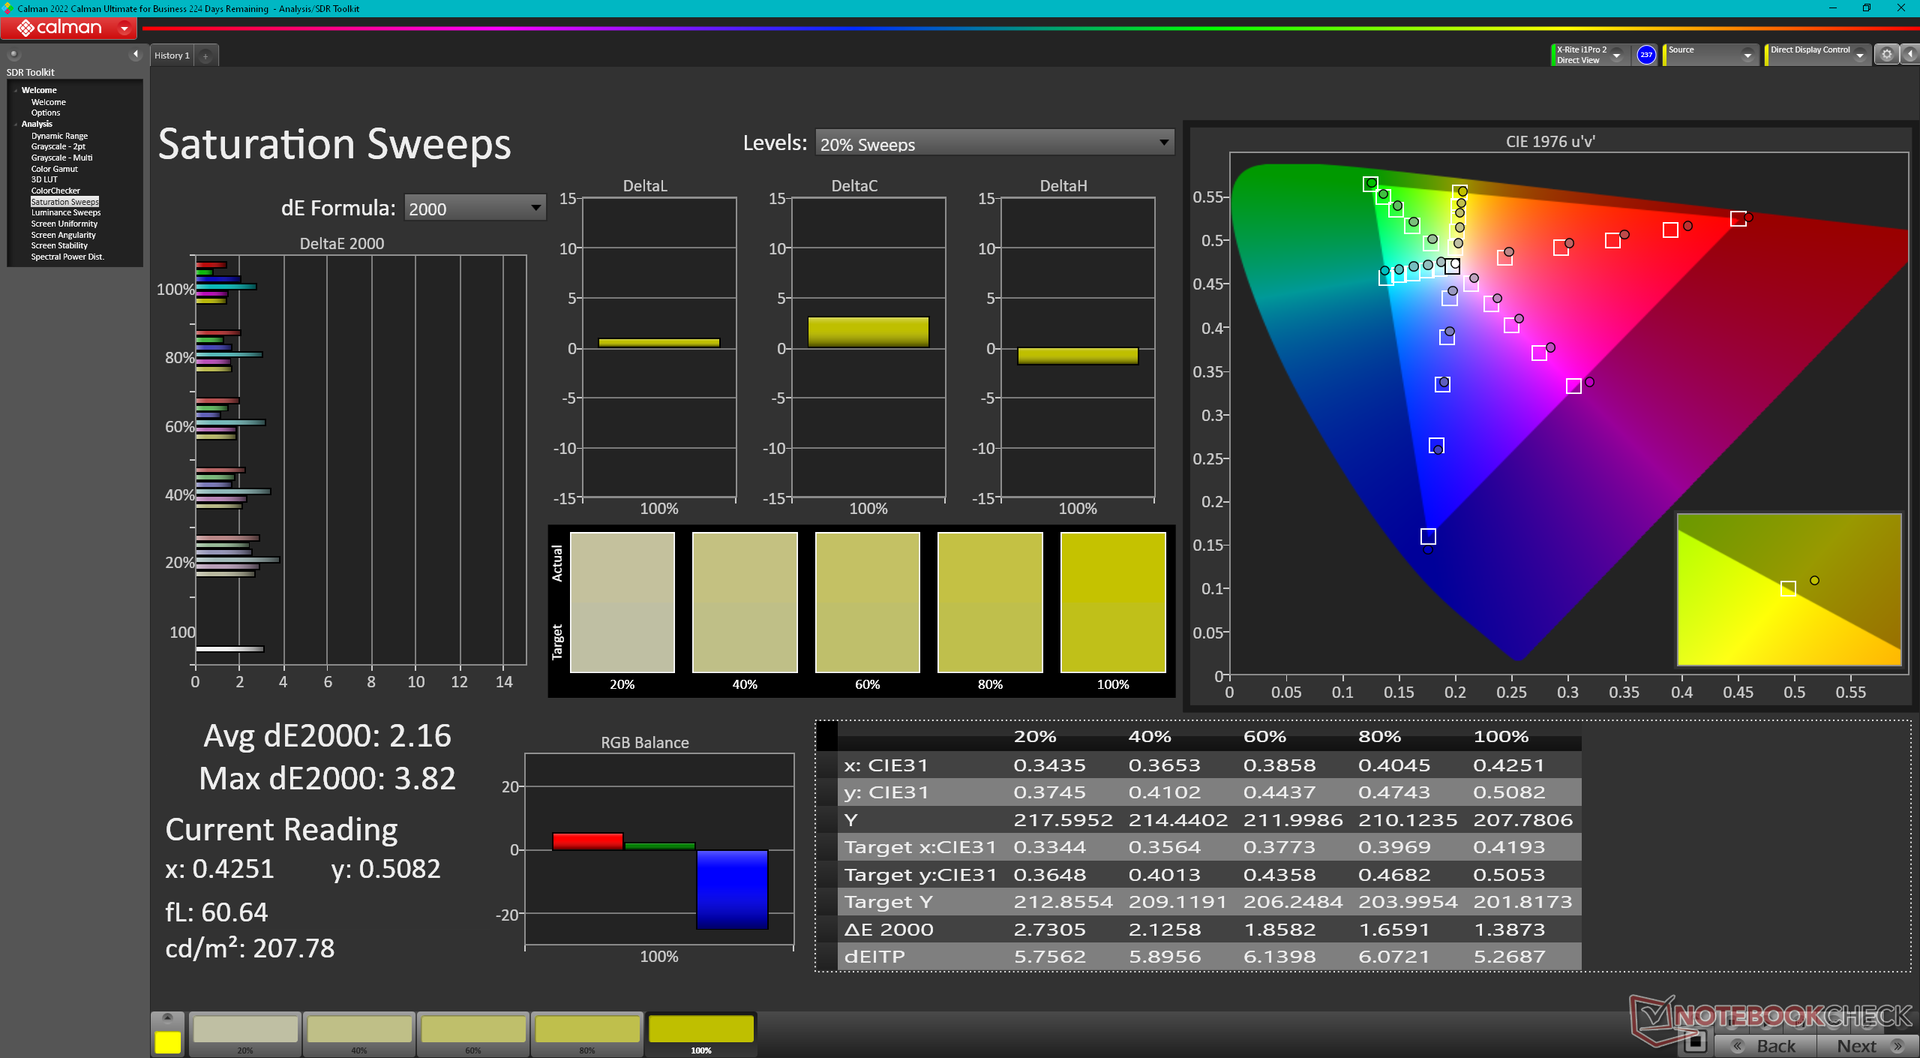
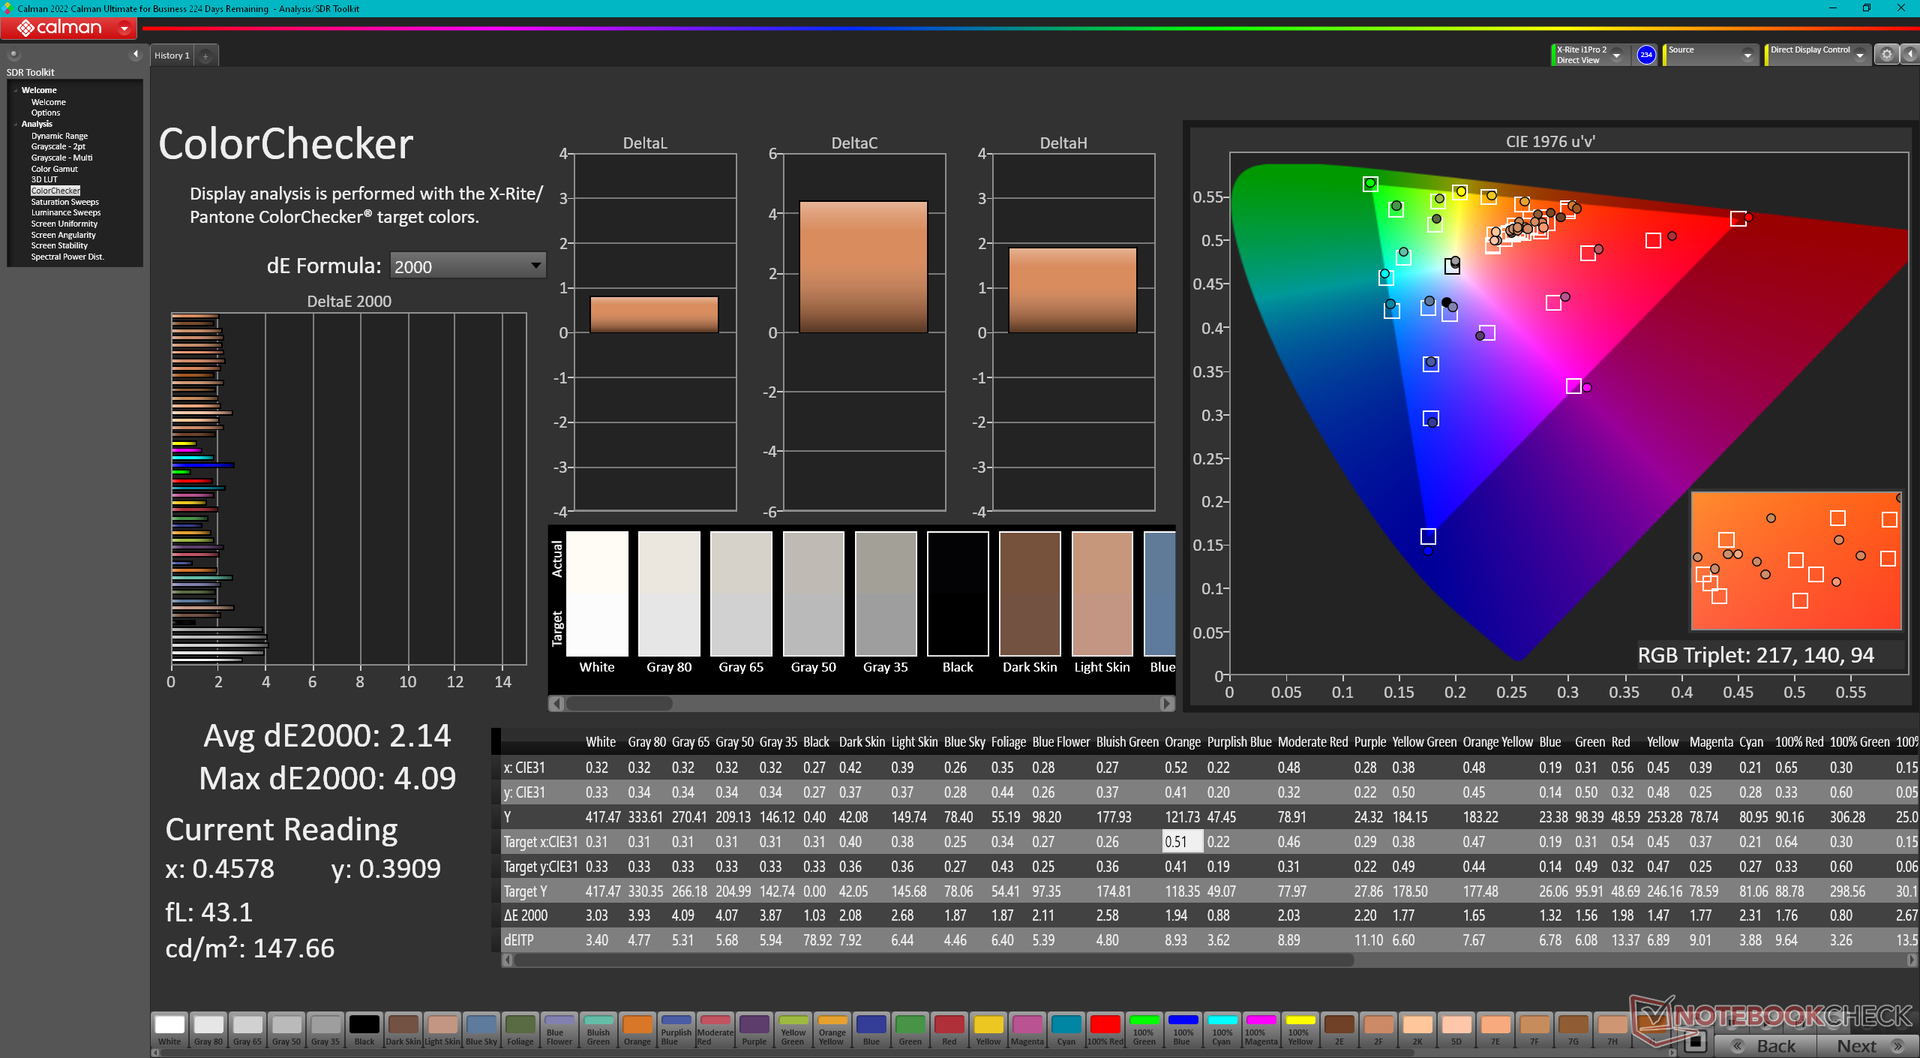
ΔE ColorChecker Calman: 2.14 | ∀{0.5-29.43 Ø4.73}
calibrated: 0.42
ΔE Greyscale Calman: 3.1 | ∀{0.09-98 Ø4.97}
69.8% AdobeRGB 1998 (Argyll 3D)
99.7% sRGB (Argyll 3D)
69.1% Display P3 (Argyll 3D)
Gamma: 2.19
CCT: 6040 K
| Eluktronics Mech-17 GP2 BOE NE170QDM-NZ1, IPS, 2560x1600, 17" | Schenker XMG Neo 17 M22 BOE0A99, IPS, 2560x1600, 17" | MSI Katana 17 B13VFK B173HAN04.9, IPS LED, 1920x1080, 17.3" | MSI Titan GT77 HX 13VI B173ZAN06.C, Mini-LED, 3840x2160, 17.3" | Alienware m17 R5 (R9 6900HX, RX 6850M XT) AU Optronics AUODBA3, IPS, 3840x2160, 17" | Razer Blade 18 RTX 4070 AU Optronics B180QAN01.0, IPS, 2560x1600, 18" | |
|---|---|---|---|---|---|---|
| Display | 0% | -40% | 23% | 23% | 21% | |
| Display P3 Coverage (%) | 69.1 | 69 0% | 40.8 -41% | 94.9 37% | 97.2 41% | 96.9 40% |
| sRGB Coverage (%) | 99.7 | 99.8 0% | 61 -39% | 99.9 0% | 99.6 0% | 99.8 0% |
| AdobeRGB 1998 Coverage (%) | 69.8 | 69.6 0% | 42.2 -40% | 92.4 32% | 88.4 27% | 85.3 22% |
| Response Times | 23% | -176% | -202% | -30% | 40% | |
| Response Time Grey 50% / Grey 80% * (ms) | 12 ? | 10.8 ? 10% | 33 ? -175% | 38.4 ? -220% | 16.4 ? -37% | 4.2 ? 65% |
| Response Time Black / White * (ms) | 9.4 ? | 6.1 ? 35% | 26 ? -177% | 26.6 ? -183% | 11.6 ? -23% | 8 ? 15% |
| PWM Frequency (Hz) | 2380 ? | |||||
| Screen | 1% | -158% | 67678% | -147% | -64% | |
| Brightness middle (cd/m²) | 417.3 | 415 -1% | 267 -36% | 606 45% | 484 16% | 549.6 32% |
| Brightness (cd/m²) | 387 | 399 3% | 256 -34% | 602 56% | 449 16% | 524 35% |
| Brightness Distribution (%) | 87 | 90 3% | 93 7% | 93 7% | 87 0% | 89 2% |
| Black Level * (cd/m²) | 0.42 | 0.43 -2% | 0.21 50% | 0.0001 100% | 0.55 -31% | 0.53 -26% |
| Contrast (:1) | 994 | 965 -3% | 1271 28% | 6060000 609558% | 880 -11% | 1037 4% |
| Colorchecker dE 2000 * | 2.14 | 1.44 33% | 4.7 -120% | 4.8 -124% | 4.8 -124% | 3.32 -55% |
| Colorchecker dE 2000 max. * | 4.09 | 2.33 43% | 20.4 -399% | 8.2 -100% | 7.48 -83% | 6.63 -62% |
| Colorchecker dE 2000 calibrated * | 0.42 | 0.89 -112% | 4.5 -971% | 1.8 -329% | 4.74 -1029% | 2.7 -543% |
| Greyscale dE 2000 * | 3.1 | 1.8 42% | 1.5 52% | 6.5 -110% | 5.5 -77% | 2 35% |
| Gamma | 2.19 100% | 2.132 103% | 2.12 104% | 2.63 84% | 2.42 91% | 2.29 96% |
| CCT | 6040 108% | 6327 103% | 6552 99% | 6596 99% | 6148 106% | 6319 103% |
| Totaal Gemiddelde (Programma / Instellingen) | 8% /
4% | -125% /
-135% | 22500% /
43484% | -51% /
-94% | -1% /
-31% |
* ... kleiner is beter
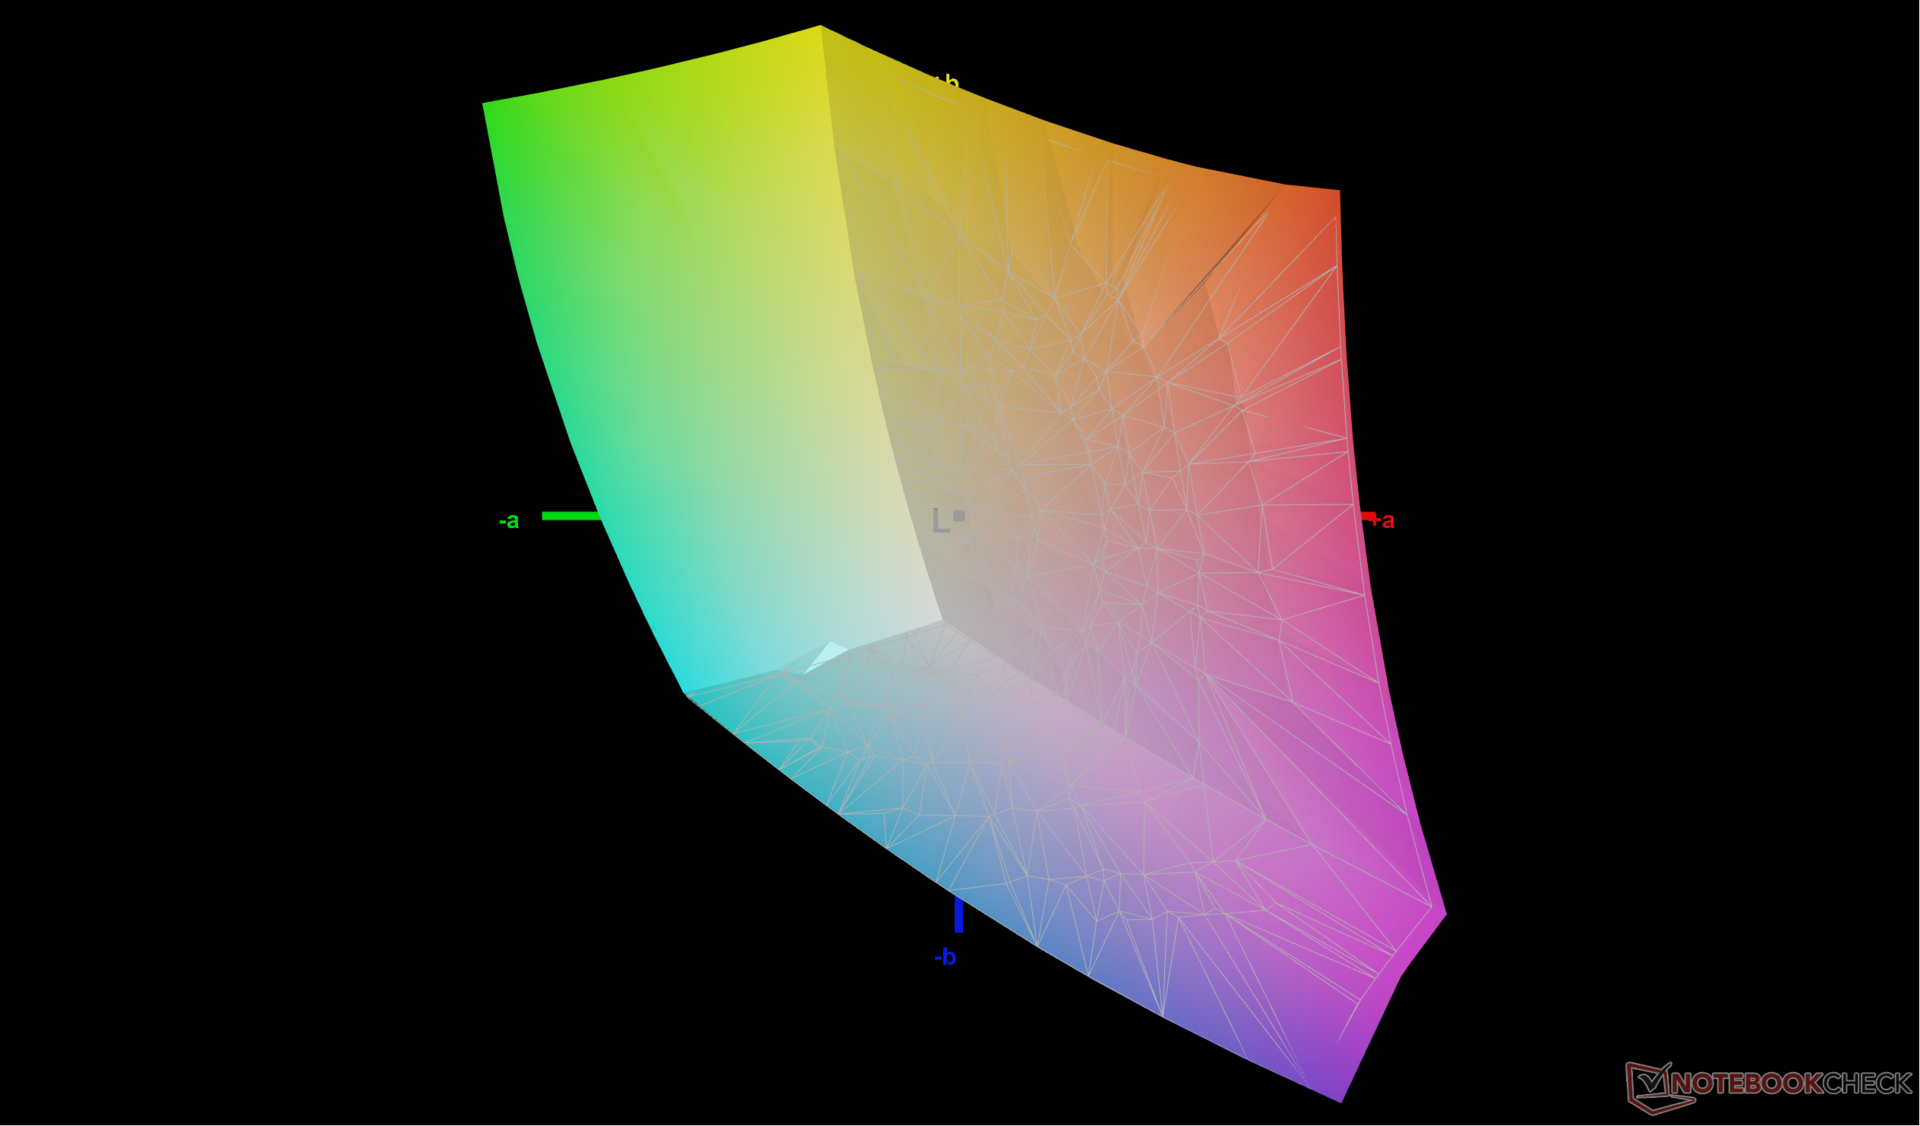
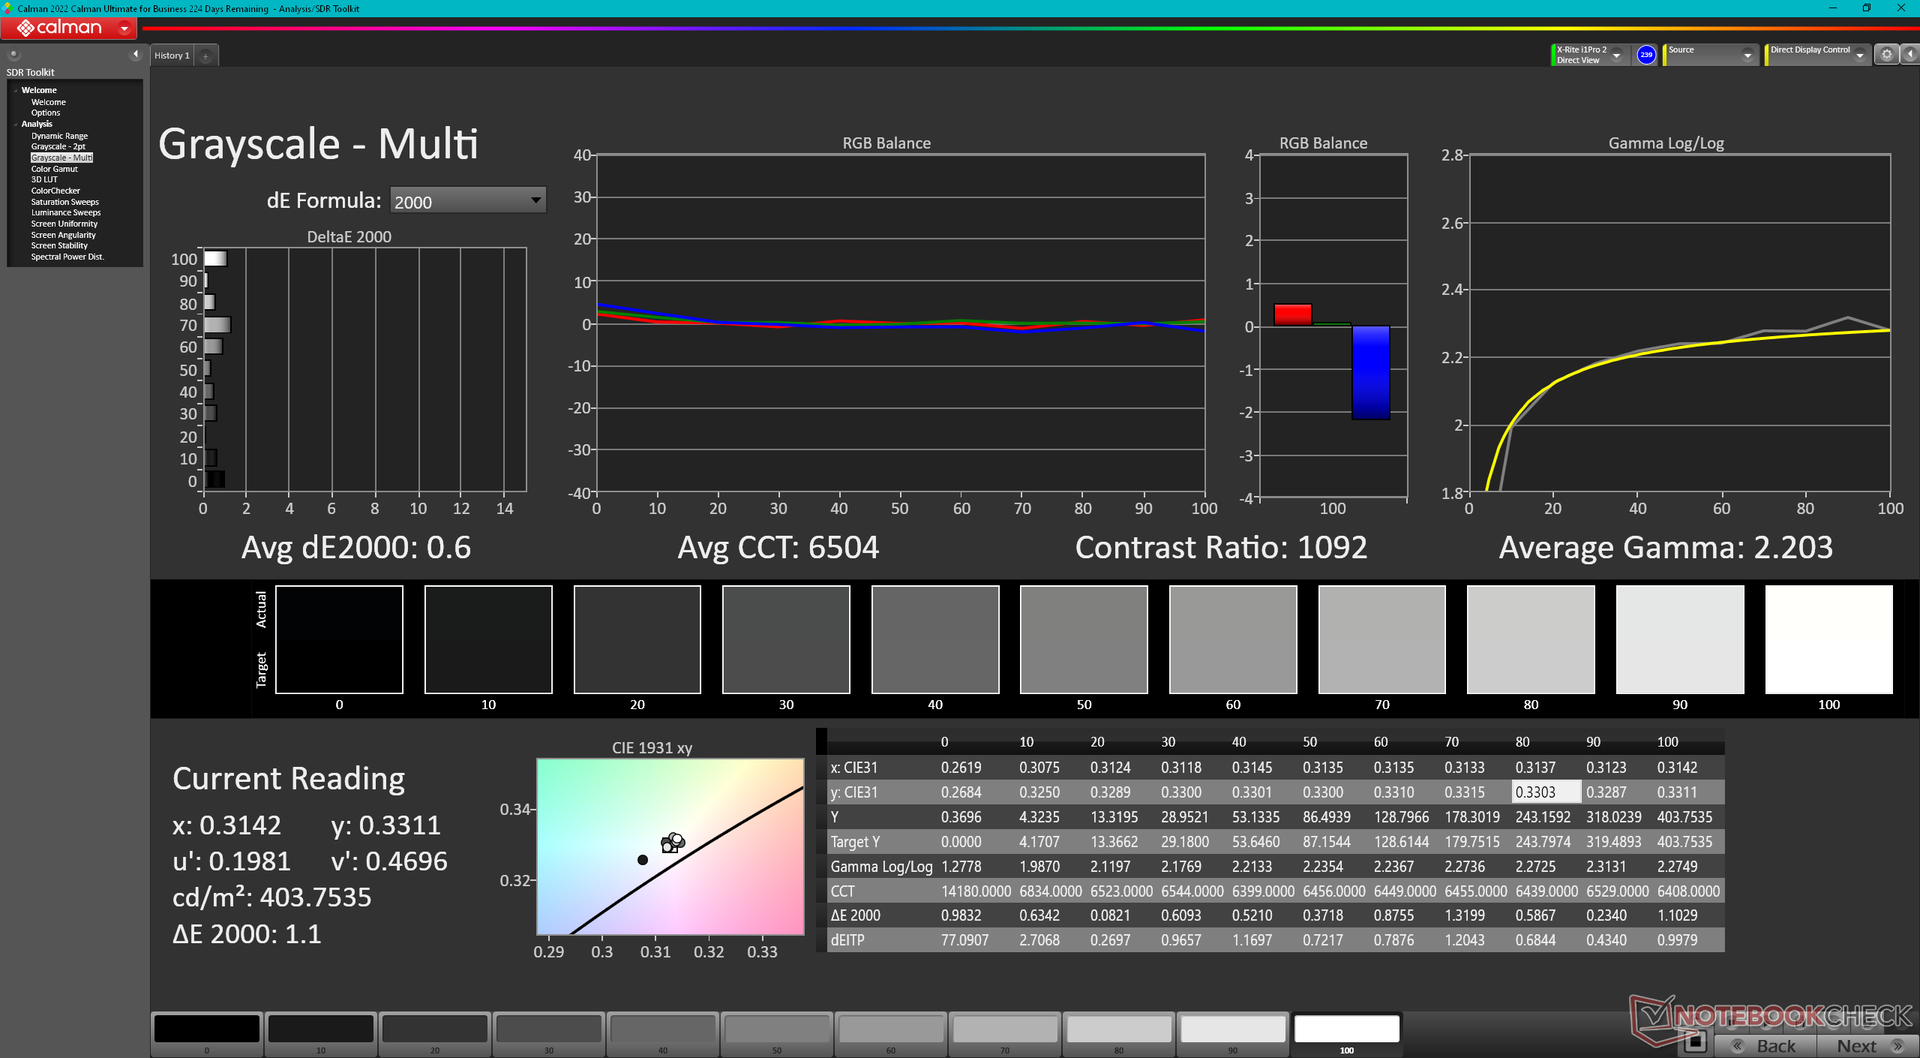
Het scherm is goed gekalibreerd uit de doos met gemiddelde grijswaarden en kleurendeltaE waarden van slechts 3,1 en 2,14, respectievelijk. Zelf kalibreren zou de deltaE-gemiddelden nog verder verbeteren tot slechts 0,6 en 0,42 ten opzichte van de sRGB-standaard. Ons gekalibreerde ICM-profiel hierboven is gratis te downloaden.
Responstijd Scherm
| ↔ Responstijd Zwart naar Wit | ||
|---|---|---|
| 9.4 ms ... stijging ↗ en daling ↘ gecombineerd | ↗ 4.9 ms stijging | 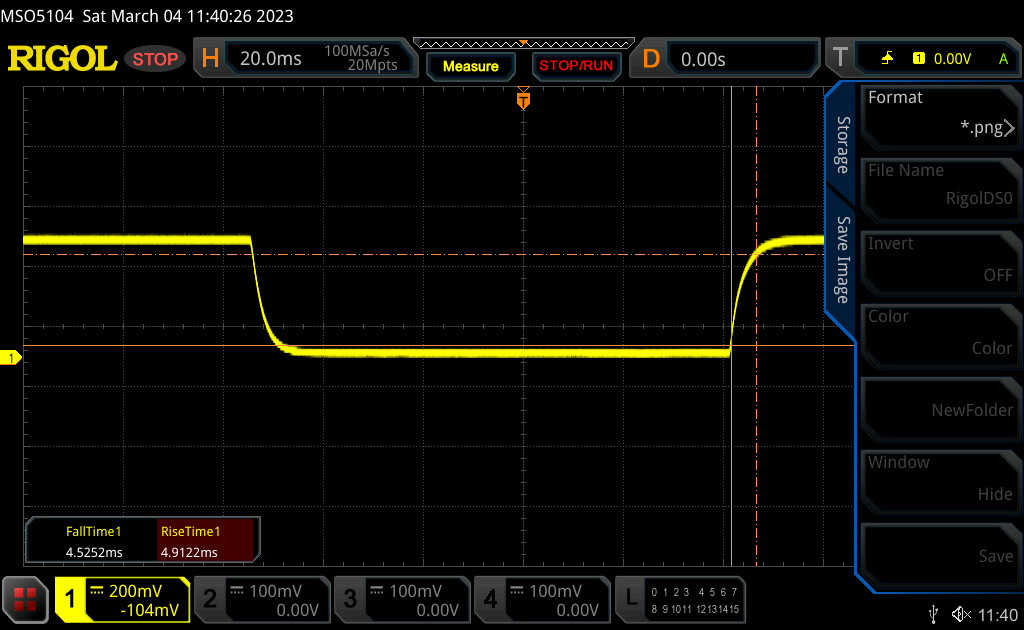 |
| ↘ 4.5 ms daling | ||
| Het scherm vertoonde snelle responstijden in onze tests en zou geschikt moeten zijn voor games. Ter vergelijking: alle testtoestellen variëren van 0.1 (minimum) tot 240 (maximum) ms. » 26 % van alle toestellen zijn beter. Dit betekent dat de gemeten responstijd beter is dan het gemiddelde (19.9 ms) van alle geteste toestellen. | ||
| ↔ Responstijd 50% Grijs naar 80% Grijs | ||
| 12 ms ... stijging ↗ en daling ↘ gecombineerd | ↗ 5.4 ms stijging | 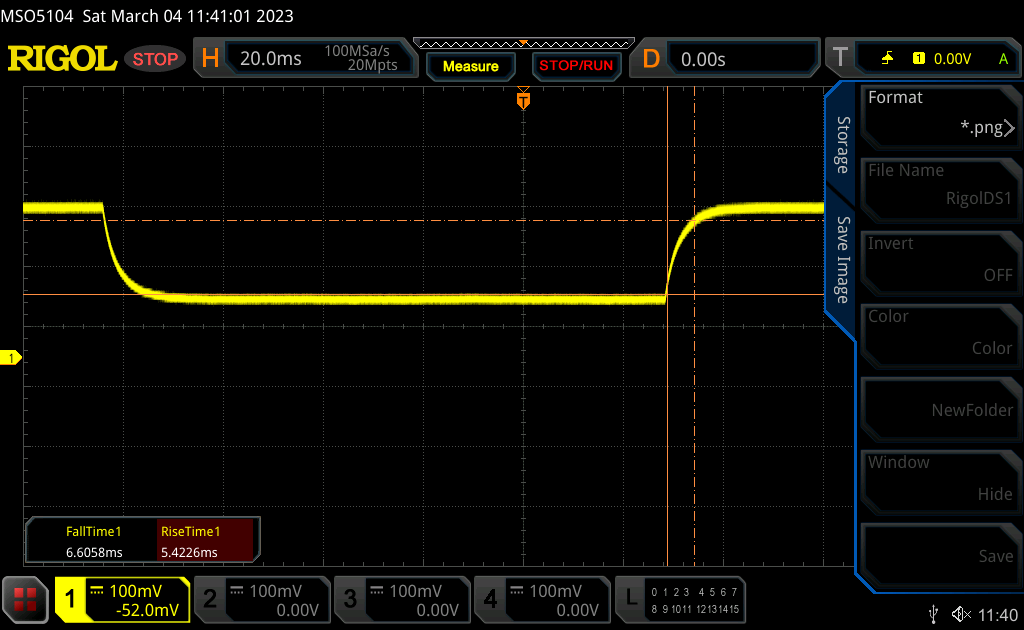 |
| ↘ 6.6 ms daling | ||
| Het scherm vertoonde prima responstijden in onze tests maar is misschien wat te traag voor competitieve games. Ter vergelijking: alle testtoestellen variëren van 0.165 (minimum) tot 636 (maximum) ms. » 25 % van alle toestellen zijn beter. Dit betekent dat de gemeten responstijd beter is dan het gemiddelde (31.1 ms) van alle geteste toestellen. | ||
Screen Flickering / PWM (Pulse-Width Modulation)
| Screen flickering / PWM niet waargenomen | 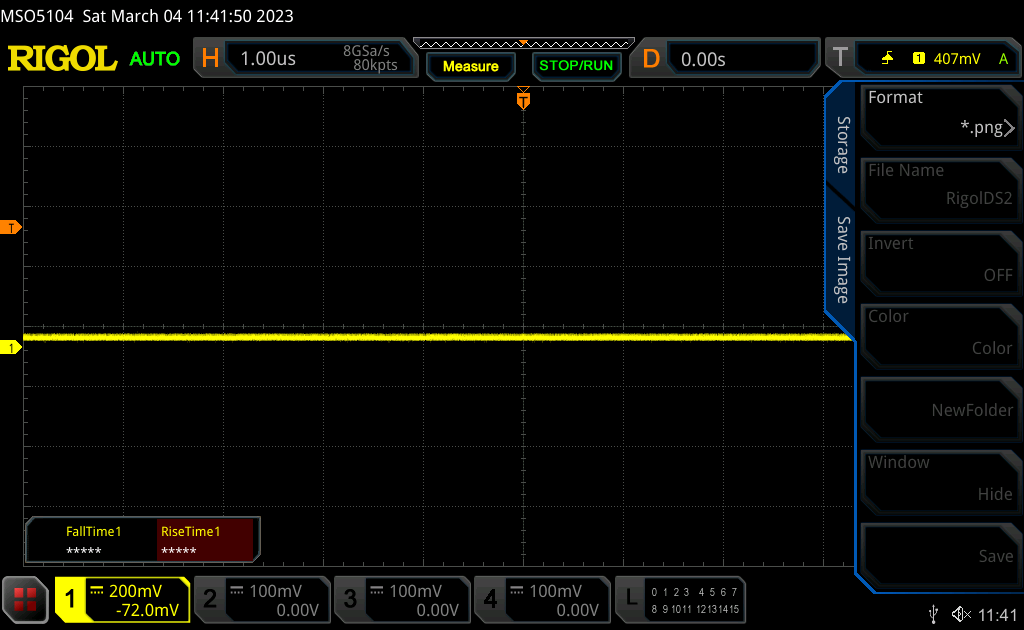 | ||
Ter vergelijking: 52 % van alle geteste toestellen maakten geen gebruik van PWM om de schermhelderheid te verlagen. Als het wel werd gebruikt, werd een gemiddelde van 7798 (minimum: 5 - maximum: 343500) Hz waargenomen. | |||
Prestaties
Testomstandigheden
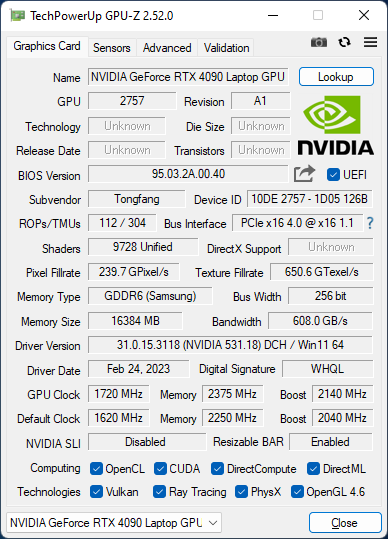
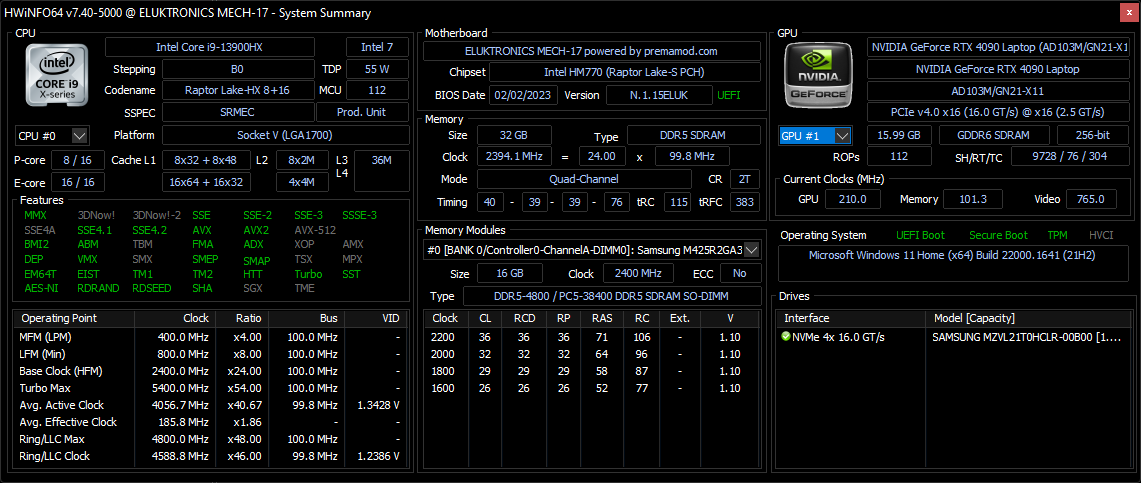
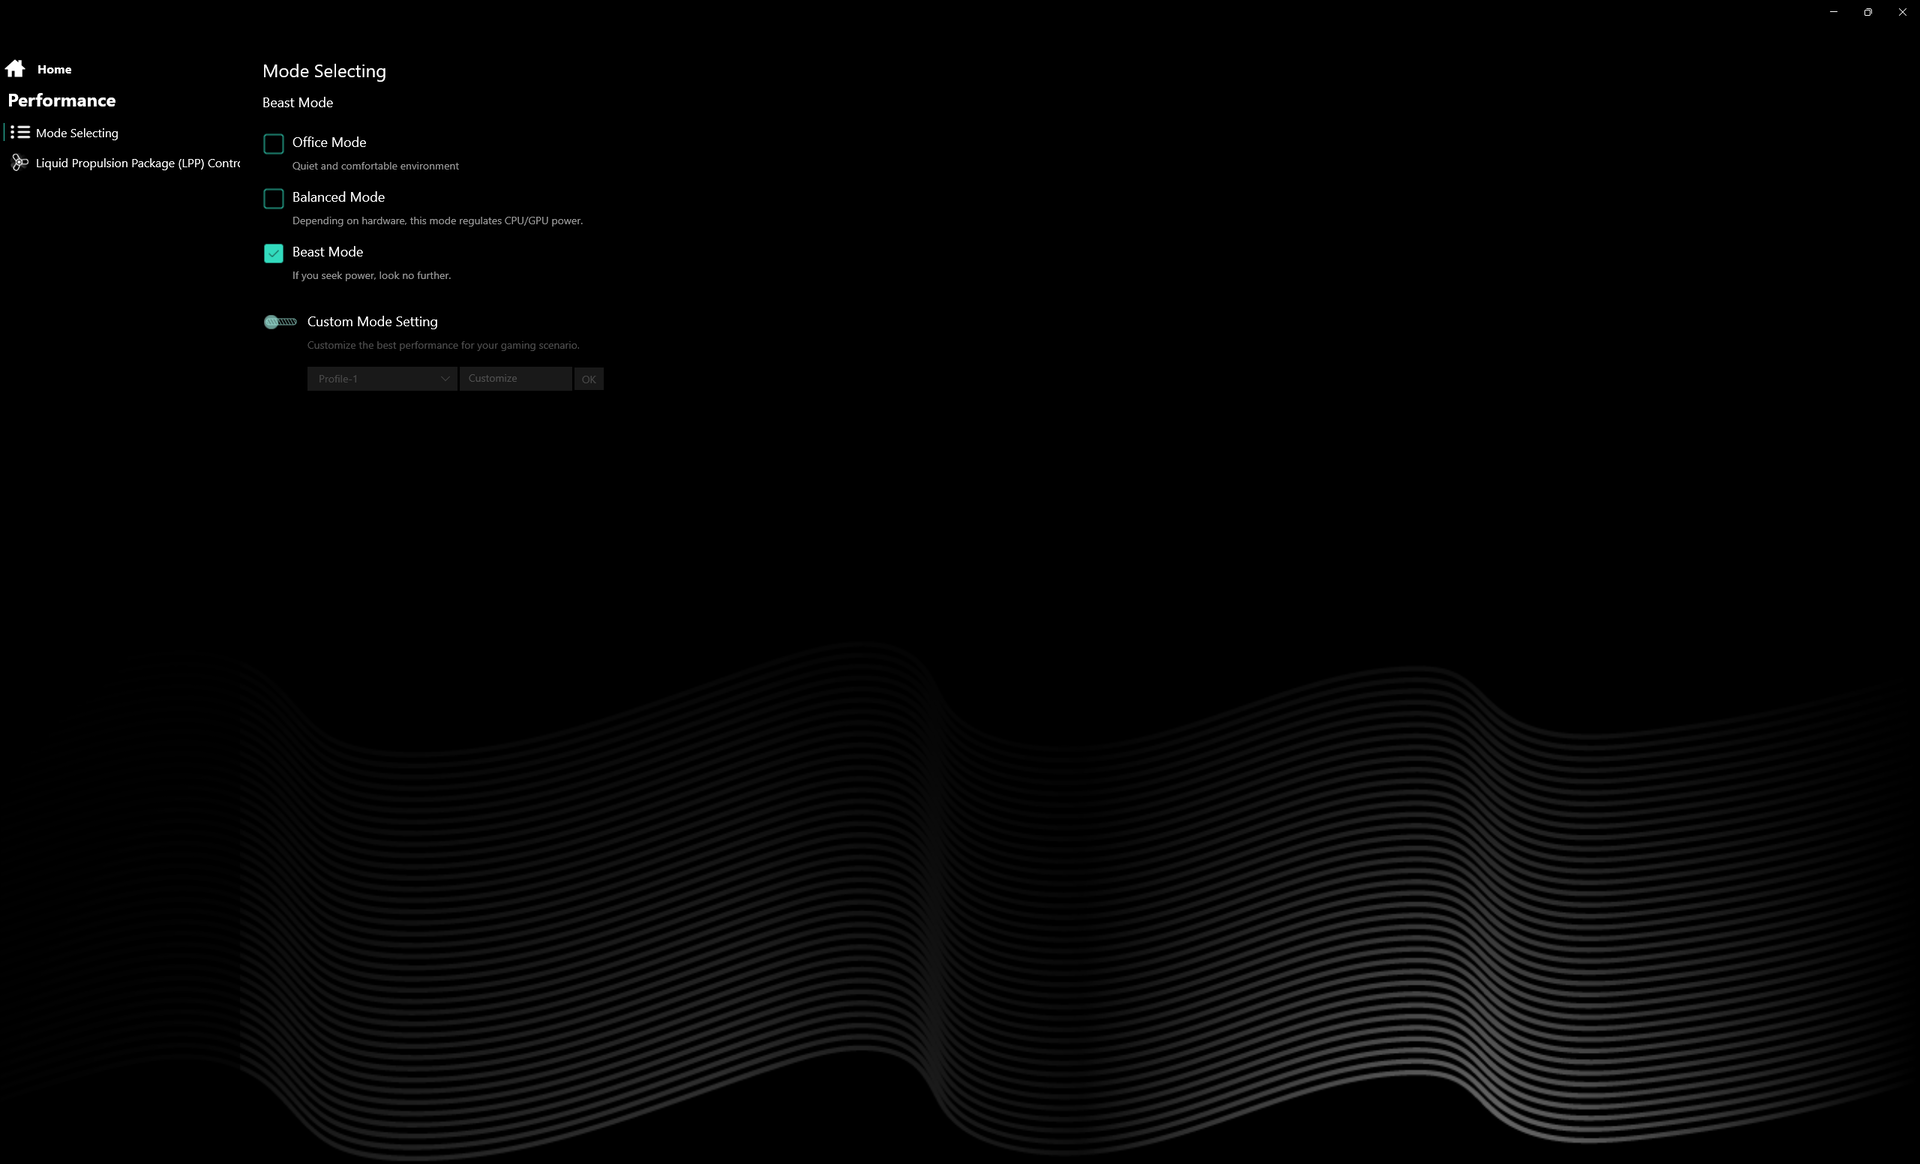
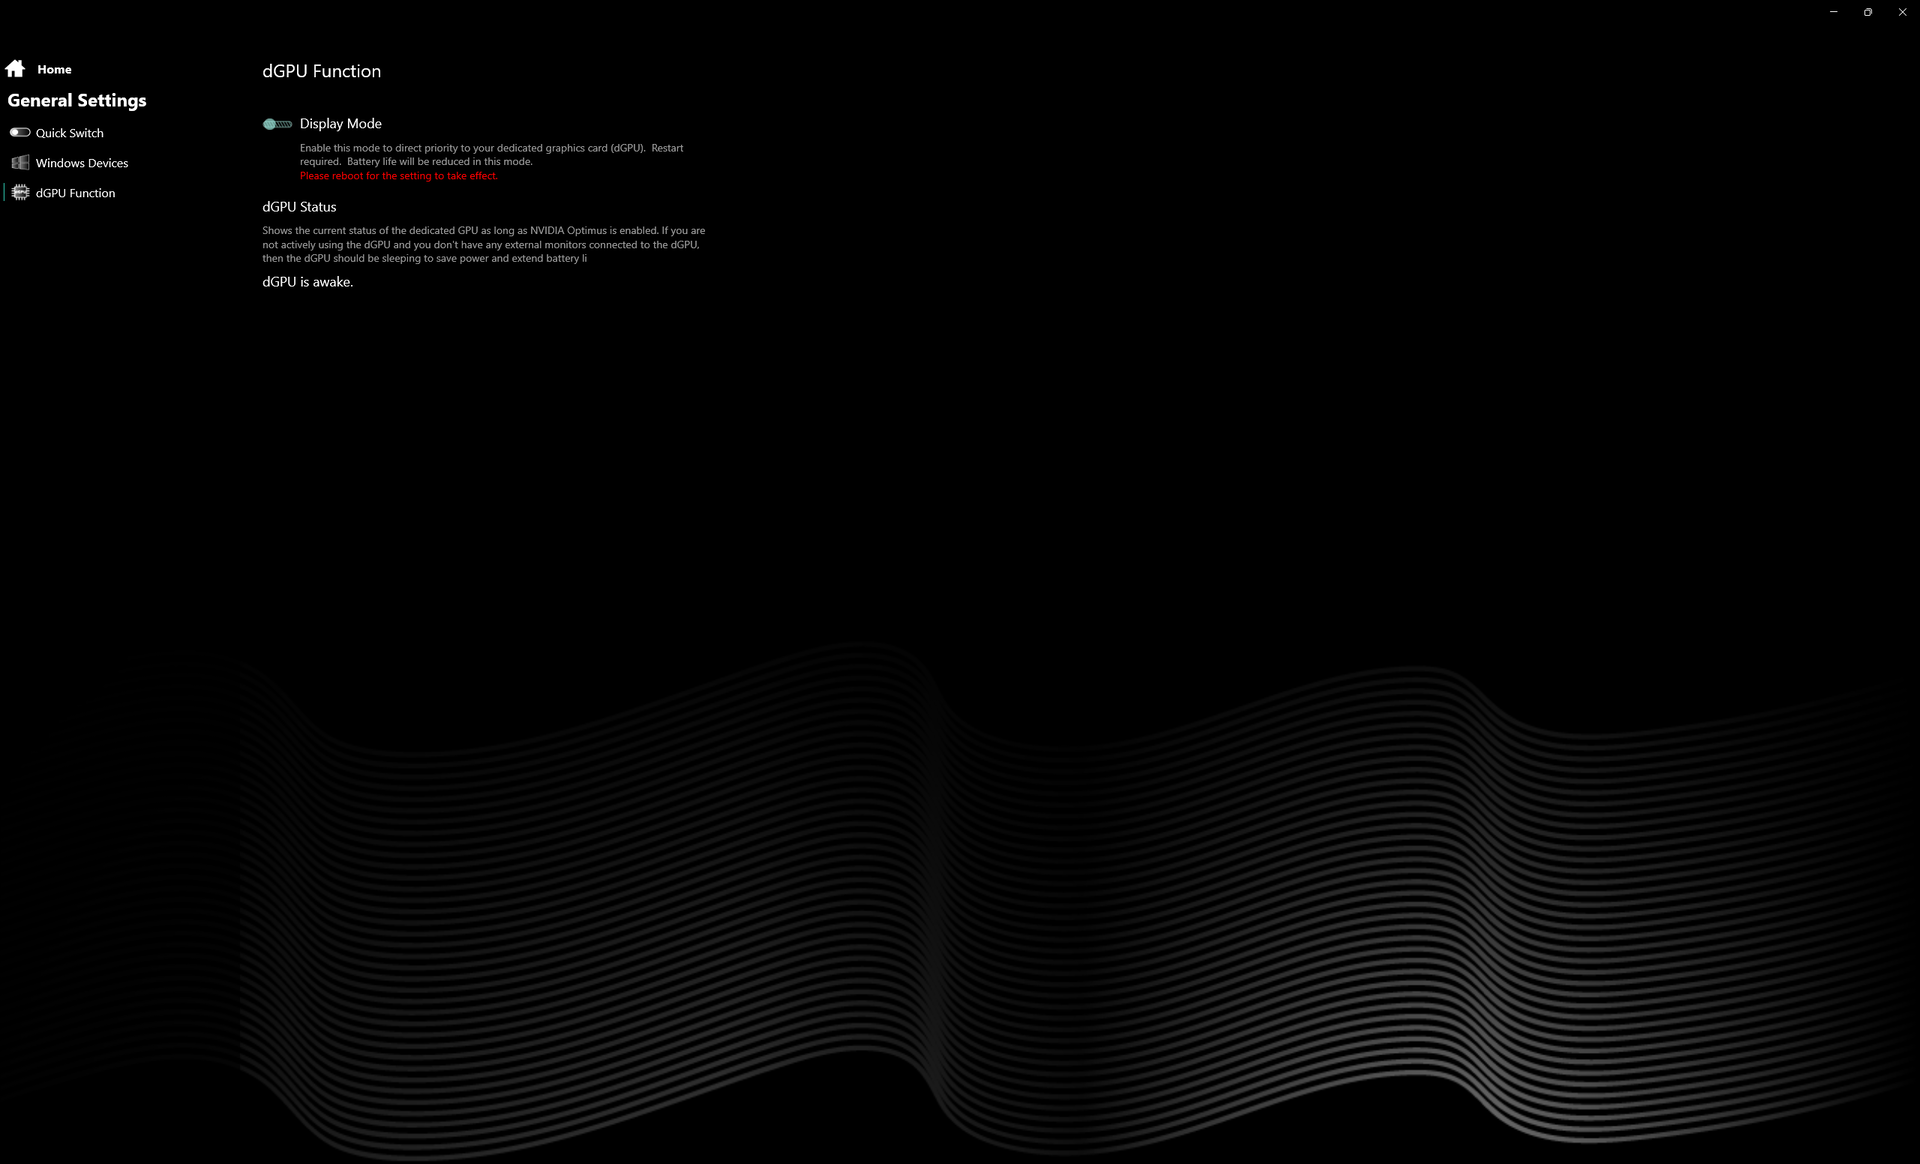
We hebben onze unit ingesteld op de Performance modus via Windows en "Beast Mode" via de vooraf geïnstalleerde Eluktronics Control Center software voordat we onderstaande benchmarks uitvoerden. We hebben het systeem ook op dGPU modus gezet via het Nvidia configuratiescherm. Eigenaars moeten vertrouwd raken met Control Center, omdat het de hub is voor het schakelen van modelspecifieke functies zoals RGB, batterijlaadmodi, prestatiemodi, vloeistofkoelingsmodus en meer. Advanced Optimus (MUX) wordt ondersteund.
We ondervonden een handvol problemen op onze testunit, waaronder lege opstartschermen, ten minste één bevriezing van het systeem tijdens het gamen, en automatische reboots wanneer de CPU en GPU voor langere tijd op maximaal gebruik staan. Het eerste probleem hebben we opgelost door Quick Boot in het BIOS menu uit te schakelen, maar dergelijke problemen zouden eigenlijk niet mogen voorkomen.
Processor
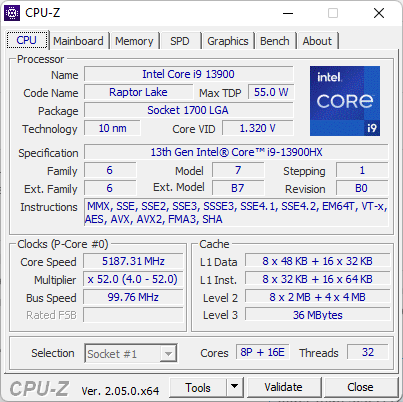
De ruwe CPU-prestaties liggen slechts 1 tot 2 procent achter op de 13e generatie Core i9-13950HX in de MSI Titan GT77 en dus kunnen ze net zo goed gelijkwaardig zijn in de meeste scenario's. Een sprong van de Ryzen 9 6900HX naar onze Core i9-13900HX verhoogt de multi-thread prestaties met een buitengewone 2x tot 2,5x. De 12e generatie Core i7-12700Hdie nog steeds gebruikelijk is op veel gaming laptops uit het hogere middensegment, is ongeveer 50 procent langzamer.
De prestatieduurzaamheid is uitstekend, zonder grote prestatiedips of cyclisch gedrag na verloop van tijd.
Cinebench R15 Multi Loop
Cinebench R23: Multi Core | Single Core
Cinebench R20: CPU (Multi Core) | CPU (Single Core)
Cinebench R15: CPU Multi 64Bit | CPU Single 64Bit
Blender: v2.79 BMW27 CPU
7-Zip 18.03: 7z b 4 | 7z b 4 -mmt1
Geekbench 5.5: Multi-Core | Single-Core
HWBOT x265 Benchmark v2.2: 4k Preset
LibreOffice : 20 Documents To PDF
R Benchmark 2.5: Overall mean
| Cinebench R20 / CPU (Multi Core) | |
| MSI Titan GT77 HX 13VI | |
| Eluktronics Mech-17 GP2 | |
| Razer Blade 18 RTX 4070 | |
| Gemiddeld Intel Core i9-13900HX (9152 - 12541, n=21) | |
| Corsair One i300 | |
| MSI Titan GT77 12UHS | |
| MSI Pulse GL76 12UGK | |
| MSI Katana 17 B13VFK | |
| Schenker XMG Neo 17 M22 | |
| HP Omen 16-n0033dx | |
| MSI GS76 Stealth 11UH | |
| Schenker XMG Core 17 (Early 2021) | |
| Cinebench R20 / CPU (Single Core) | |
| MSI Titan GT77 HX 13VI | |
| Eluktronics Mech-17 GP2 | |
| Razer Blade 18 RTX 4070 | |
| Gemiddeld Intel Core i9-13900HX (722 - 810, n=21) | |
| Corsair One i300 | |
| MSI Titan GT77 12UHS | |
| MSI Katana 17 B13VFK | |
| MSI Pulse GL76 12UGK | |
| MSI GS76 Stealth 11UH | |
| Schenker XMG Neo 17 M22 | |
| HP Omen 16-n0033dx | |
| Schenker XMG Core 17 (Early 2021) | |
| Cinebench R15 / CPU Multi 64Bit | |
| MSI Titan GT77 HX 13VI | |
| Eluktronics Mech-17 GP2 | |
| Gemiddeld Intel Core i9-13900HX (3913 - 4970, n=22) | |
| Razer Blade 18 RTX 4070 | |
| MSI Titan GT77 12UHS | |
| Corsair One i300 | |
| MSI Pulse GL76 12UGK | |
| MSI Katana 17 B13VFK | |
| Schenker XMG Neo 17 M22 | |
| HP Omen 16-n0033dx | |
| MSI GS76 Stealth 11UH | |
| Schenker XMG Core 17 (Early 2021) | |
| Cinebench R15 / CPU Single 64Bit | |
| MSI Titan GT77 HX 13VI | |
| Eluktronics Mech-17 GP2 | |
| Razer Blade 18 RTX 4070 | |
| Corsair One i300 | |
| Gemiddeld Intel Core i9-13900HX (247 - 304, n=22) | |
| MSI Titan GT77 12UHS | |
| MSI Katana 17 B13VFK | |
| MSI Pulse GL76 12UGK | |
| Schenker XMG Neo 17 M22 | |
| HP Omen 16-n0033dx | |
| MSI GS76 Stealth 11UH | |
| Schenker XMG Core 17 (Early 2021) | |
| HWBOT x265 Benchmark v2.2 / 4k Preset | |
| Eluktronics Mech-17 GP2 | |
| MSI Titan GT77 HX 13VI | |
| Razer Blade 18 RTX 4070 | |
| Gemiddeld Intel Core i9-13900HX (23.5 - 34.4, n=22) | |
| Corsair One i300 | |
| MSI Titan GT77 12UHS | |
| MSI Pulse GL76 12UGK | |
| Schenker XMG Neo 17 M22 | |
| MSI Katana 17 B13VFK | |
| HP Omen 16-n0033dx | |
| MSI GS76 Stealth 11UH | |
| Schenker XMG Core 17 (Early 2021) | |
| LibreOffice / 20 Documents To PDF | |
| HP Omen 16-n0033dx | |
| MSI Katana 17 B13VFK | |
| Schenker XMG Core 17 (Early 2021) | |
| Schenker XMG Neo 17 M22 | |
| MSI GS76 Stealth 11UH | |
| MSI Titan GT77 HX 13VI | |
| MSI Pulse GL76 12UGK | |
| Razer Blade 18 RTX 4070 | |
| Gemiddeld Intel Core i9-13900HX (32.8 - 51.1, n=21) | |
| MSI Titan GT77 12UHS | |
| Corsair One i300 | |
| Eluktronics Mech-17 GP2 | |
| R Benchmark 2.5 / Overall mean | |
| Schenker XMG Core 17 (Early 2021) | |
| MSI GS76 Stealth 11UH | |
| HP Omen 16-n0033dx | |
| Schenker XMG Neo 17 M22 | |
| MSI Pulse GL76 12UGK | |
| MSI Katana 17 B13VFK | |
| MSI Titan GT77 12UHS | |
| MSI Titan GT77 HX 13VI | |
| Gemiddeld Intel Core i9-13900HX (0.375 - 0.4564, n=22) | |
| Razer Blade 18 RTX 4070 | |
| Corsair One i300 | |
| Eluktronics Mech-17 GP2 | |
* ... kleiner is beter
AIDA64: FP32 Ray-Trace | FPU Julia | CPU SHA3 | CPU Queen | FPU SinJulia | FPU Mandel | CPU AES | CPU ZLib | FP64 Ray-Trace | CPU PhotoWorxx
| Performance rating | |
| Eluktronics Mech-17 GP2 | |
| MSI Titan GT77 HX 13VI | |
| Razer Blade 18 RTX 4070 | |
| Gemiddeld Intel Core i9-13900HX | |
| Schenker XMG Neo 17 M22 | |
| Alienware m17 R5 (R9 6900HX, RX 6850M XT) | |
| MSI Katana 17 B13VFK | |
| AIDA64 / FP32 Ray-Trace | |
| MSI Titan GT77 HX 13VI | |
| Eluktronics Mech-17 GP2 | |
| Razer Blade 18 RTX 4070 | |
| Gemiddeld Intel Core i9-13900HX (17589 - 27615, n=22) | |
| Alienware m17 R5 (R9 6900HX, RX 6850M XT) | |
| Schenker XMG Neo 17 M22 | |
| MSI Katana 17 B13VFK | |
| AIDA64 / FPU Julia | |
| MSI Titan GT77 HX 13VI | |
| Eluktronics Mech-17 GP2 | |
| Razer Blade 18 RTX 4070 | |
| Gemiddeld Intel Core i9-13900HX (88686 - 137015, n=22) | |
| Alienware m17 R5 (R9 6900HX, RX 6850M XT) | |
| Schenker XMG Neo 17 M22 | |
| MSI Katana 17 B13VFK | |
| AIDA64 / CPU SHA3 | |
| MSI Titan GT77 HX 13VI | |
| Eluktronics Mech-17 GP2 | |
| Razer Blade 18 RTX 4070 | |
| Gemiddeld Intel Core i9-13900HX (4362 - 7029, n=22) | |
| Alienware m17 R5 (R9 6900HX, RX 6850M XT) | |
| Schenker XMG Neo 17 M22 | |
| MSI Katana 17 B13VFK | |
| AIDA64 / CPU Queen | |
| Eluktronics Mech-17 GP2 | |
| MSI Titan GT77 HX 13VI | |
| Razer Blade 18 RTX 4070 | |
| Gemiddeld Intel Core i9-13900HX (125644 - 141385, n=22) | |
| Alienware m17 R5 (R9 6900HX, RX 6850M XT) | |
| Schenker XMG Neo 17 M22 | |
| MSI Katana 17 B13VFK | |
| AIDA64 / FPU SinJulia | |
| Eluktronics Mech-17 GP2 | |
| MSI Titan GT77 HX 13VI | |
| Razer Blade 18 RTX 4070 | |
| Gemiddeld Intel Core i9-13900HX (12334 - 17179, n=22) | |
| Alienware m17 R5 (R9 6900HX, RX 6850M XT) | |
| Schenker XMG Neo 17 M22 | |
| MSI Katana 17 B13VFK | |
| AIDA64 / FPU Mandel | |
| MSI Titan GT77 HX 13VI | |
| Eluktronics Mech-17 GP2 | |
| Razer Blade 18 RTX 4070 | |
| Gemiddeld Intel Core i9-13900HX (43850 - 69202, n=22) | |
| Alienware m17 R5 (R9 6900HX, RX 6850M XT) | |
| Schenker XMG Neo 17 M22 | |
| MSI Katana 17 B13VFK | |
| AIDA64 / CPU AES | |
| Eluktronics Mech-17 GP2 | |
| Gemiddeld Intel Core i9-13900HX (89413 - 237881, n=22) | |
| MSI Titan GT77 HX 13VI | |
| Schenker XMG Neo 17 M22 | |
| Razer Blade 18 RTX 4070 | |
| MSI Katana 17 B13VFK | |
| Alienware m17 R5 (R9 6900HX, RX 6850M XT) | |
| AIDA64 / CPU ZLib | |
| MSI Titan GT77 HX 13VI | |
| Eluktronics Mech-17 GP2 | |
| Razer Blade 18 RTX 4070 | |
| Gemiddeld Intel Core i9-13900HX (1284 - 1958, n=22) | |
| Alienware m17 R5 (R9 6900HX, RX 6850M XT) | |
| Schenker XMG Neo 17 M22 | |
| MSI Katana 17 B13VFK | |
| AIDA64 / FP64 Ray-Trace | |
| MSI Titan GT77 HX 13VI | |
| Eluktronics Mech-17 GP2 | |
| Razer Blade 18 RTX 4070 | |
| Gemiddeld Intel Core i9-13900HX (9481 - 15279, n=22) | |
| Alienware m17 R5 (R9 6900HX, RX 6850M XT) | |
| Schenker XMG Neo 17 M22 | |
| MSI Katana 17 B13VFK | |
| AIDA64 / CPU PhotoWorxx | |
| Razer Blade 18 RTX 4070 | |
| Gemiddeld Intel Core i9-13900HX (42994 - 51994, n=22) | |
| Eluktronics Mech-17 GP2 | |
| MSI Titan GT77 HX 13VI | |
| MSI Katana 17 B13VFK | |
| Alienware m17 R5 (R9 6900HX, RX 6850M XT) | |
| Schenker XMG Neo 17 M22 | |
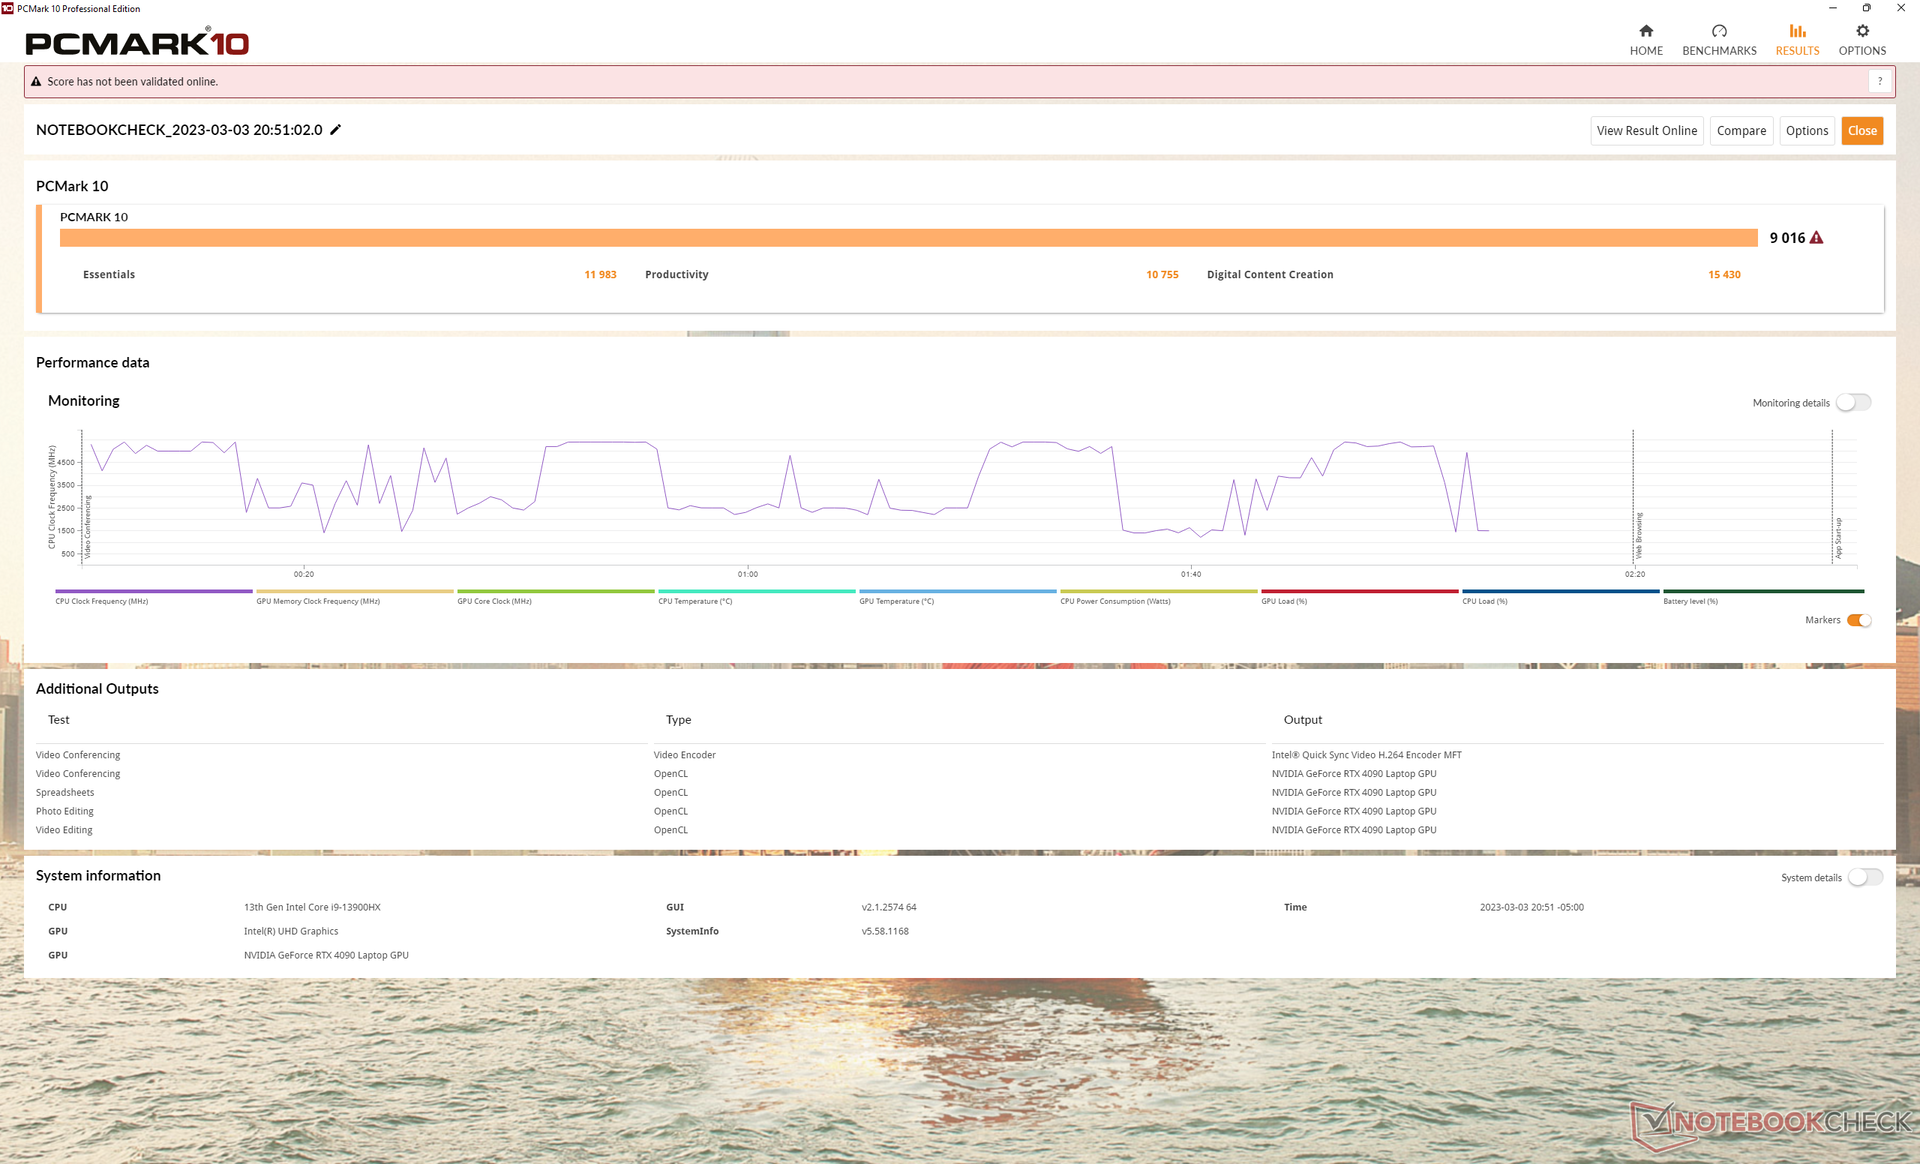
Systeemprestaties
PCMark scores zijn enkele van de hoogste in onze database die de MSI Titan GT77 evenaren. Vooral zijn Digital Content Creation score is bijna 70 procent hoger dan op het RTX 3080 Ti model van vorig jaar door de toename van de grafische prestaties.
CrossMark: Overall | Productivity | Creativity | Responsiveness
| PCMark 10 / Score | |
| Eluktronics Mech-17 GP2 | |
| MSI Titan GT77 HX 13VI | |
| Gemiddeld Intel Core i9-13900HX, NVIDIA GeForce RTX 4090 Laptop GPU (7690 - 9331, n=8) | |
| Razer Blade 18 RTX 4070 | |
| Alienware m17 R5 (R9 6900HX, RX 6850M XT) | |
| MSI Katana 17 B13VFK | |
| Schenker XMG Neo 17 M22 | |
| PCMark 10 / Essentials | |
| Eluktronics Mech-17 GP2 | |
| MSI Titan GT77 HX 13VI | |
| Razer Blade 18 RTX 4070 | |
| Gemiddeld Intel Core i9-13900HX, NVIDIA GeForce RTX 4090 Laptop GPU (10972 - 11983, n=8) | |
| MSI Katana 17 B13VFK | |
| Alienware m17 R5 (R9 6900HX, RX 6850M XT) | |
| Schenker XMG Neo 17 M22 | |
| PCMark 10 / Productivity | |
| Eluktronics Mech-17 GP2 | |
| Gemiddeld Intel Core i9-13900HX, NVIDIA GeForce RTX 4090 Laptop GPU (9038 - 11680, n=8) | |
| MSI Titan GT77 HX 13VI | |
| Razer Blade 18 RTX 4070 | |
| Schenker XMG Neo 17 M22 | |
| MSI Katana 17 B13VFK | |
| Alienware m17 R5 (R9 6900HX, RX 6850M XT) | |
| PCMark 10 / Digital Content Creation | |
| MSI Titan GT77 HX 13VI | |
| Eluktronics Mech-17 GP2 | |
| Gemiddeld Intel Core i9-13900HX, NVIDIA GeForce RTX 4090 Laptop GPU (10605 - 16395, n=8) | |
| Alienware m17 R5 (R9 6900HX, RX 6850M XT) | |
| Razer Blade 18 RTX 4070 | |
| MSI Katana 17 B13VFK | |
| Schenker XMG Neo 17 M22 | |
| CrossMark / Overall | |
| Eluktronics Mech-17 GP2 | |
| MSI Titan GT77 HX 13VI | |
| Razer Blade 18 RTX 4070 | |
| Gemiddeld Intel Core i9-13900HX, NVIDIA GeForce RTX 4090 Laptop GPU (1825 - 2295, n=8) | |
| MSI Katana 17 B13VFK | |
| Schenker XMG Neo 17 M22 | |
| Alienware m17 R5 (R9 6900HX, RX 6850M XT) | |
| CrossMark / Productivity | |
| Eluktronics Mech-17 GP2 | |
| MSI Titan GT77 HX 13VI | |
| Razer Blade 18 RTX 4070 | |
| Gemiddeld Intel Core i9-13900HX, NVIDIA GeForce RTX 4090 Laptop GPU (1666 - 2166, n=8) | |
| MSI Katana 17 B13VFK | |
| Schenker XMG Neo 17 M22 | |
| Alienware m17 R5 (R9 6900HX, RX 6850M XT) | |
| CrossMark / Creativity | |
| Eluktronics Mech-17 GP2 | |
| MSI Titan GT77 HX 13VI | |
| Razer Blade 18 RTX 4070 | |
| Gemiddeld Intel Core i9-13900HX, NVIDIA GeForce RTX 4090 Laptop GPU (2162 - 2514, n=8) | |
| MSI Katana 17 B13VFK | |
| Schenker XMG Neo 17 M22 | |
| Alienware m17 R5 (R9 6900HX, RX 6850M XT) | |
| CrossMark / Responsiveness | |
| Razer Blade 18 RTX 4070 | |
| MSI Titan GT77 HX 13VI | |
| Eluktronics Mech-17 GP2 | |
| Gemiddeld Intel Core i9-13900HX, NVIDIA GeForce RTX 4090 Laptop GPU (1441 - 2275, n=8) | |
| MSI Katana 17 B13VFK | |
| Schenker XMG Neo 17 M22 | |
| Alienware m17 R5 (R9 6900HX, RX 6850M XT) | |
| PCMark 10 Score | 9016 punten | |
Help | ||
| AIDA64 / Memory Copy | |
| Razer Blade 18 RTX 4070 | |
| Gemiddeld Intel Core i9-13900HX (67716 - 79193, n=22) | |
| Eluktronics Mech-17 GP2 | |
| MSI Titan GT77 HX 13VI | |
| MSI Katana 17 B13VFK | |
| Alienware m17 R5 (R9 6900HX, RX 6850M XT) | |
| Schenker XMG Neo 17 M22 | |
| AIDA64 / Memory Read | |
| Razer Blade 18 RTX 4070 | |
| Gemiddeld Intel Core i9-13900HX (73998 - 88462, n=22) | |
| Eluktronics Mech-17 GP2 | |
| MSI Titan GT77 HX 13VI | |
| MSI Katana 17 B13VFK | |
| Schenker XMG Neo 17 M22 | |
| Alienware m17 R5 (R9 6900HX, RX 6850M XT) | |
| AIDA64 / Memory Write | |
| Razer Blade 18 RTX 4070 | |
| Gemiddeld Intel Core i9-13900HX (65472 - 77045, n=22) | |
| Eluktronics Mech-17 GP2 | |
| MSI Titan GT77 HX 13VI | |
| Schenker XMG Neo 17 M22 | |
| Alienware m17 R5 (R9 6900HX, RX 6850M XT) | |
| MSI Katana 17 B13VFK | |
| AIDA64 / Memory Latency | |
| MSI Katana 17 B13VFK | |
| Alienware m17 R5 (R9 6900HX, RX 6850M XT) | |
| MSI Titan GT77 HX 13VI | |
| Schenker XMG Neo 17 M22 | |
| Eluktronics Mech-17 GP2 | |
| Gemiddeld Intel Core i9-13900HX (75.3 - 91.1, n=22) | |
| Razer Blade 18 RTX 4070 | |
* ... kleiner is beter
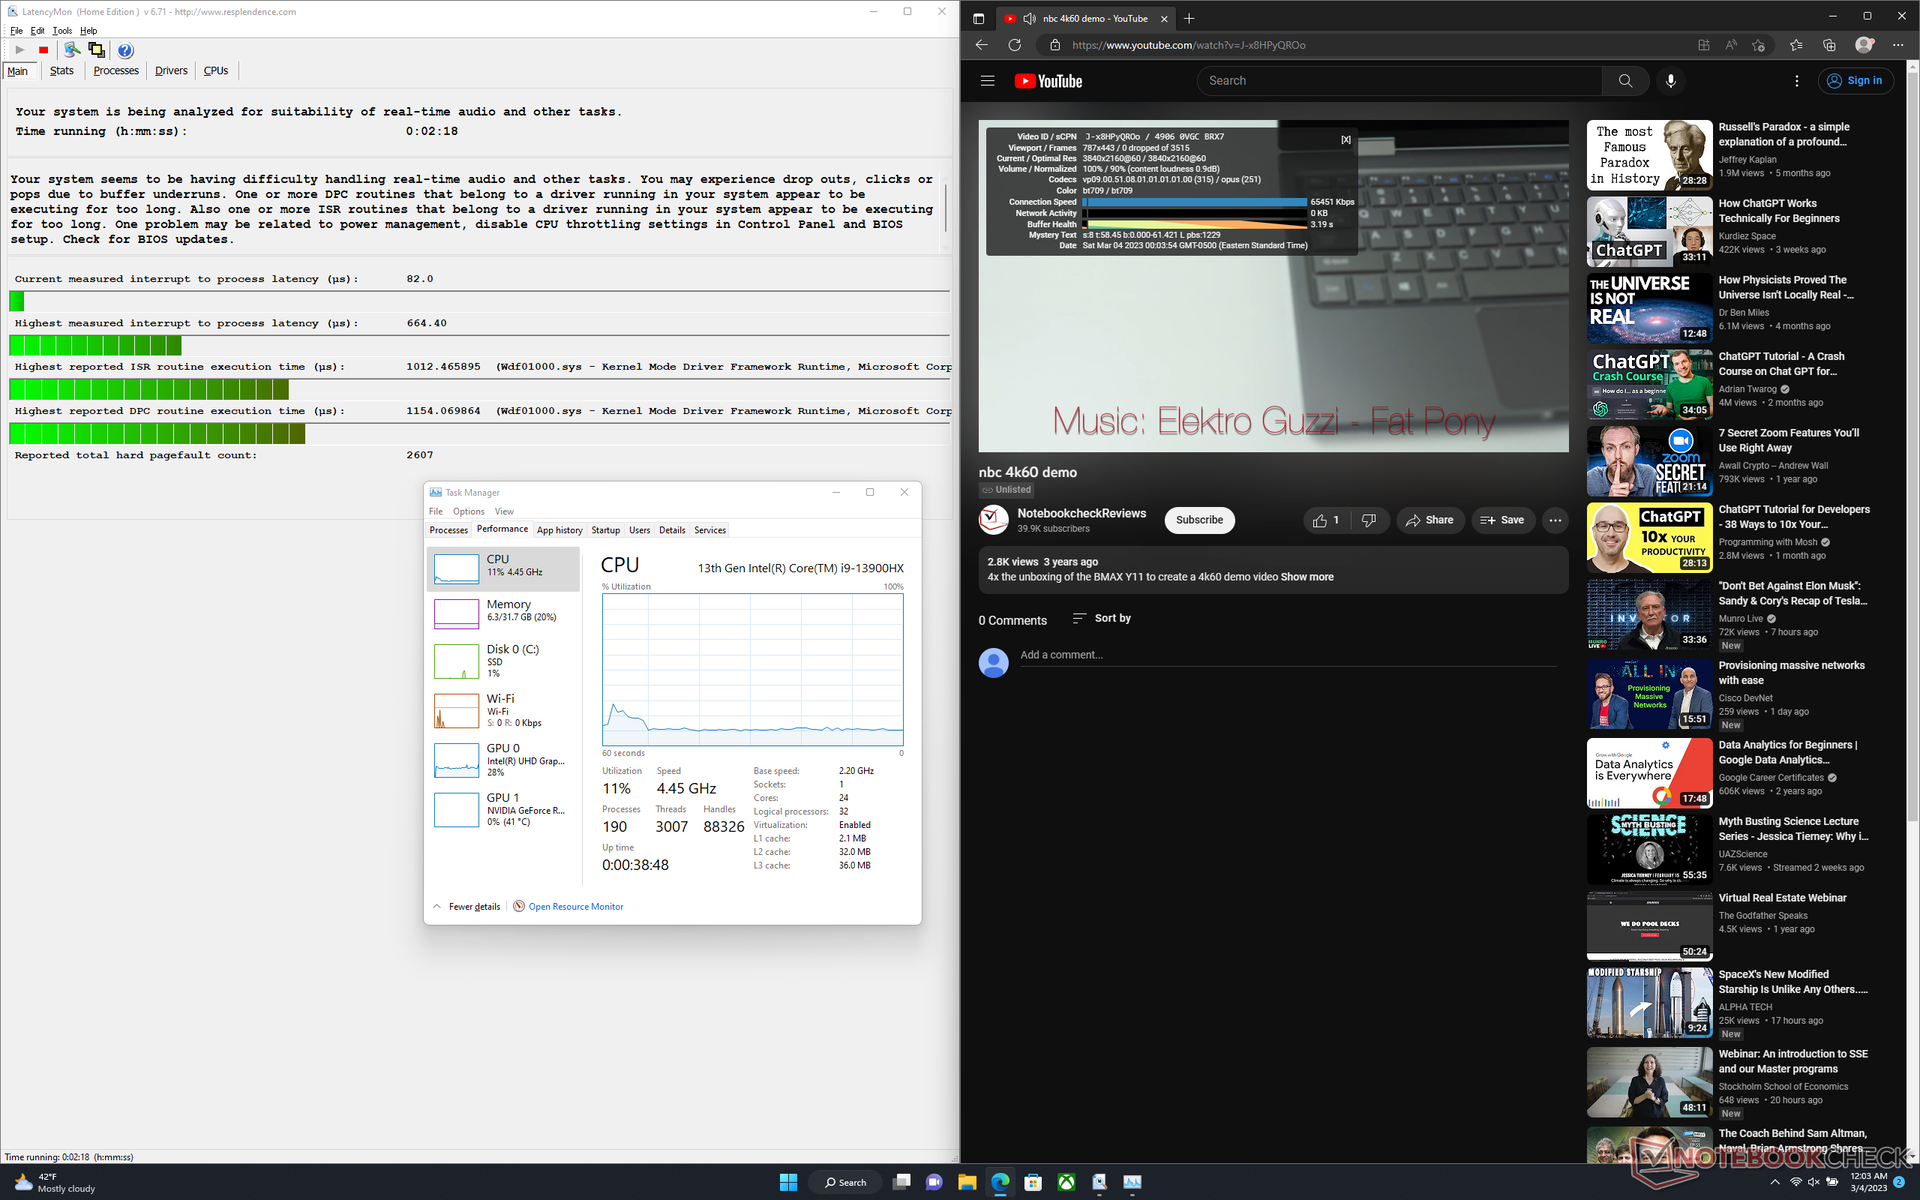
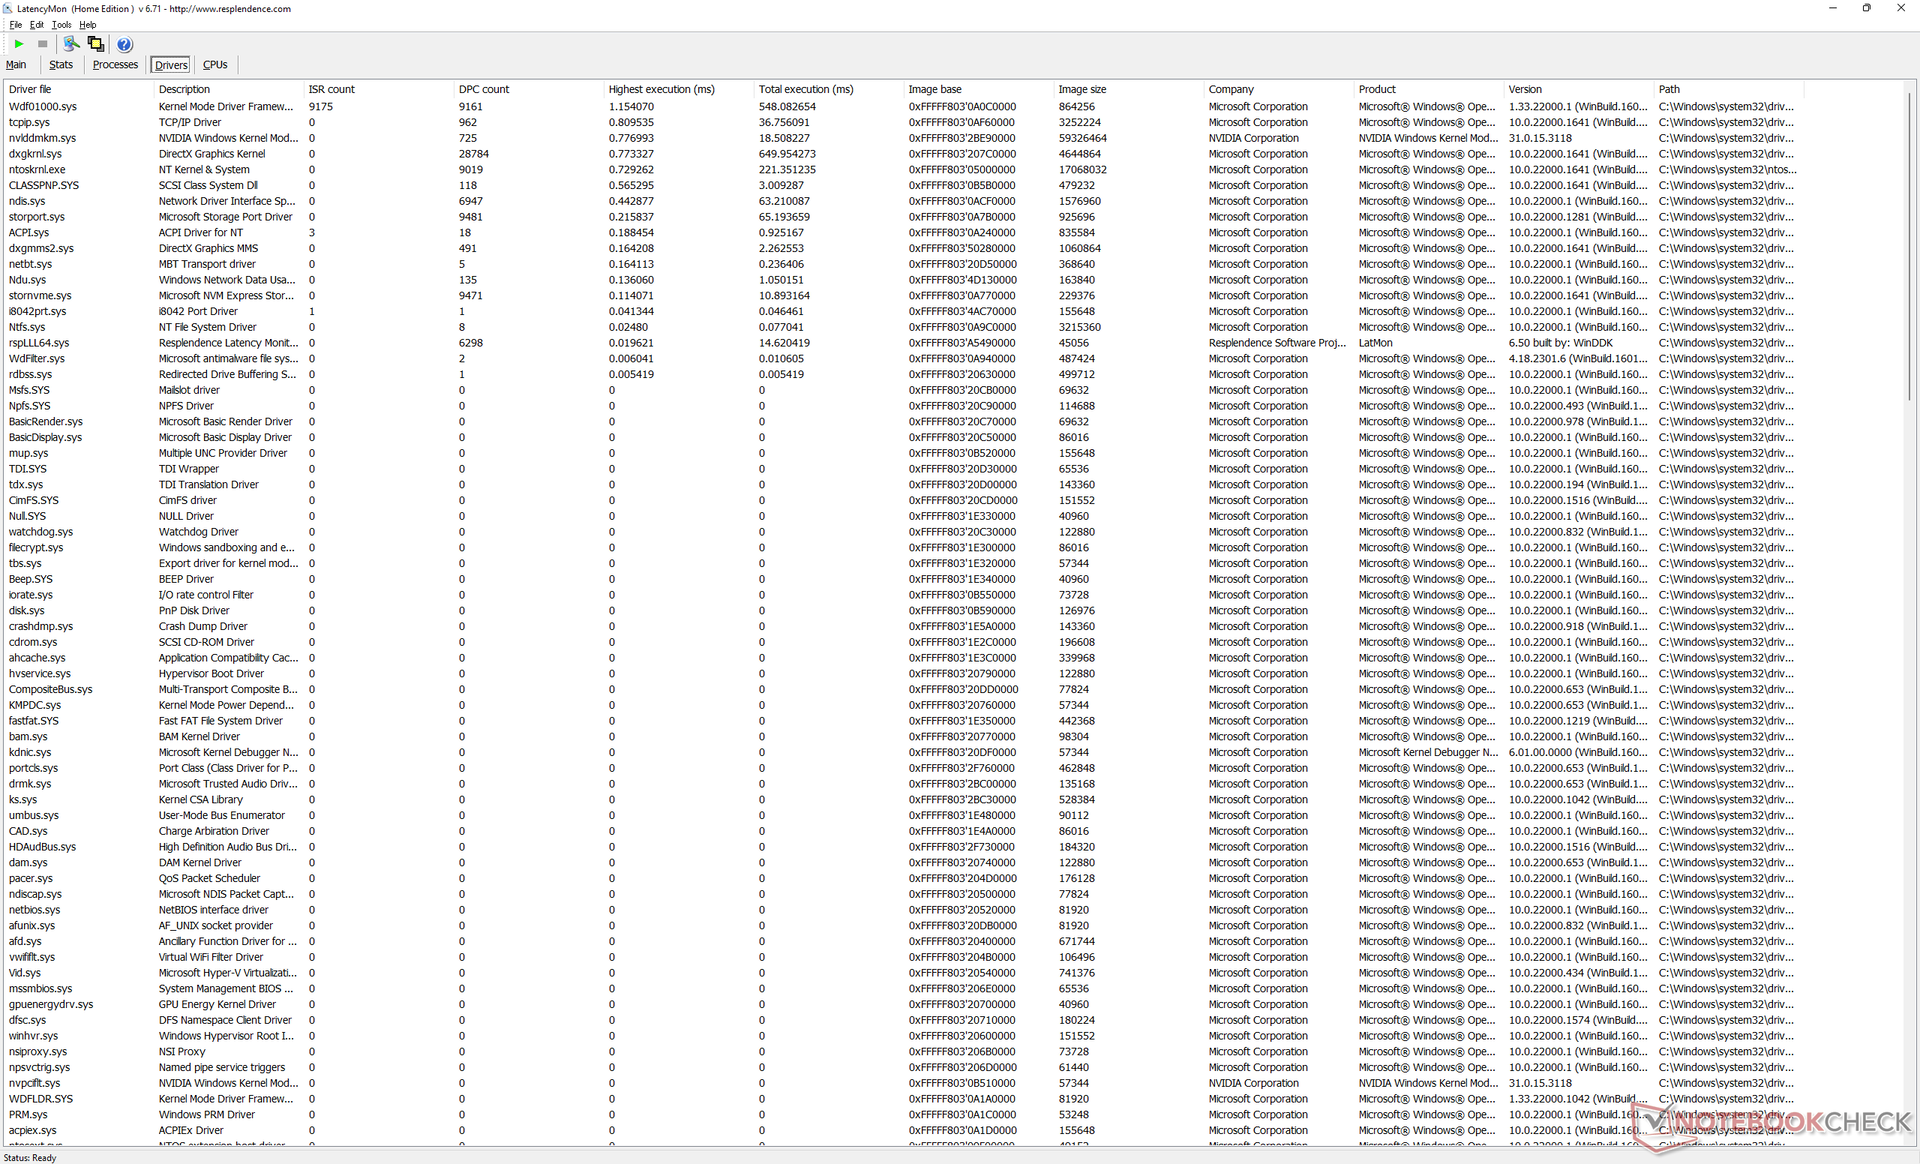
DPC latentie
LatencyMon onthult kleine DPC-problemen bij het openen van meerdere browsertabbladen van onze homepage. het afspelen van 4K-video's bij 60 FPS is verder perfect zonder dropped frames.
| DPC Latencies / LatencyMon - interrupt to process latency (max), Web, Youtube, Prime95 | |
| MSI Titan GT77 HX 13VI | |
| Schenker XMG Neo 17 M22 | |
| MSI Katana 17 B13VFK | |
| Alienware m17 R5 (R9 6900HX, RX 6850M XT) | |
| Razer Blade 18 RTX 4070 | |
| Eluktronics Mech-17 GP2 | |
* ... kleiner is beter
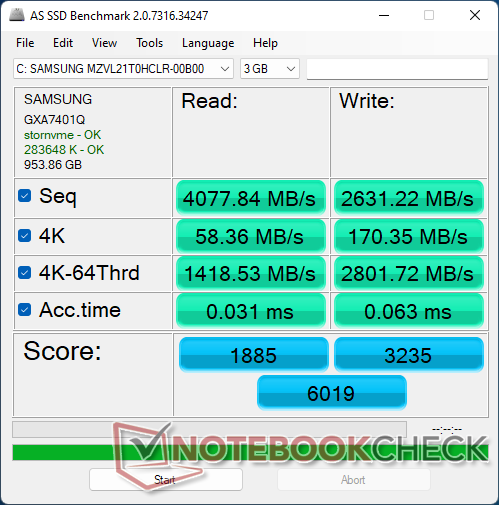
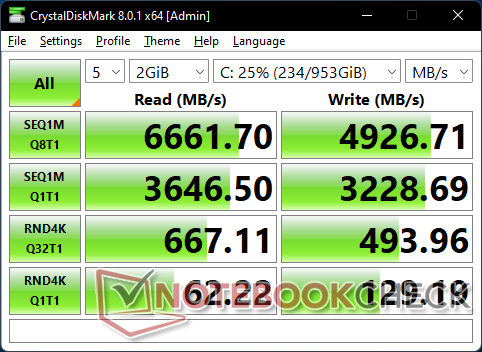
Opslagapparaten
Onze eenheid wordt geleverd met een 1 TB Samsung PM9A1 MZVL21T0HCLR dat is een van de snelste consumenten PCIe4 x4 NVMe SSD's die momenteel beschikbaar zijn. Helaas vertoont de schijf in onze eenheid problemen met het handhaven van maximale overdrachtssnelheden voor langere perioden, zoals blijkt uit onze stress test grafiek hieronder. Ter vergelijking, de Razer Blade 15 met dezelfde Samsung-schijf is in staat om overdrachtssnelheden van 6700 MB/s zonder problemen vol te houden.

| Drive Performance rating - Percent | |
| Schenker XMG Neo 17 M22 | |
| MSI Titan GT77 HX 13VI | |
| Razer Blade 18 RTX 4070 | |
| MSI Katana 17 B13VFK | |
| Eluktronics Mech-17 GP2 | |
| Alienware m17 R5 (R9 6900HX, RX 6850M XT) | |
* ... kleiner is beter
Disk Throttling: DiskSpd Read Loop, Queue Depth 8
GPU-prestaties
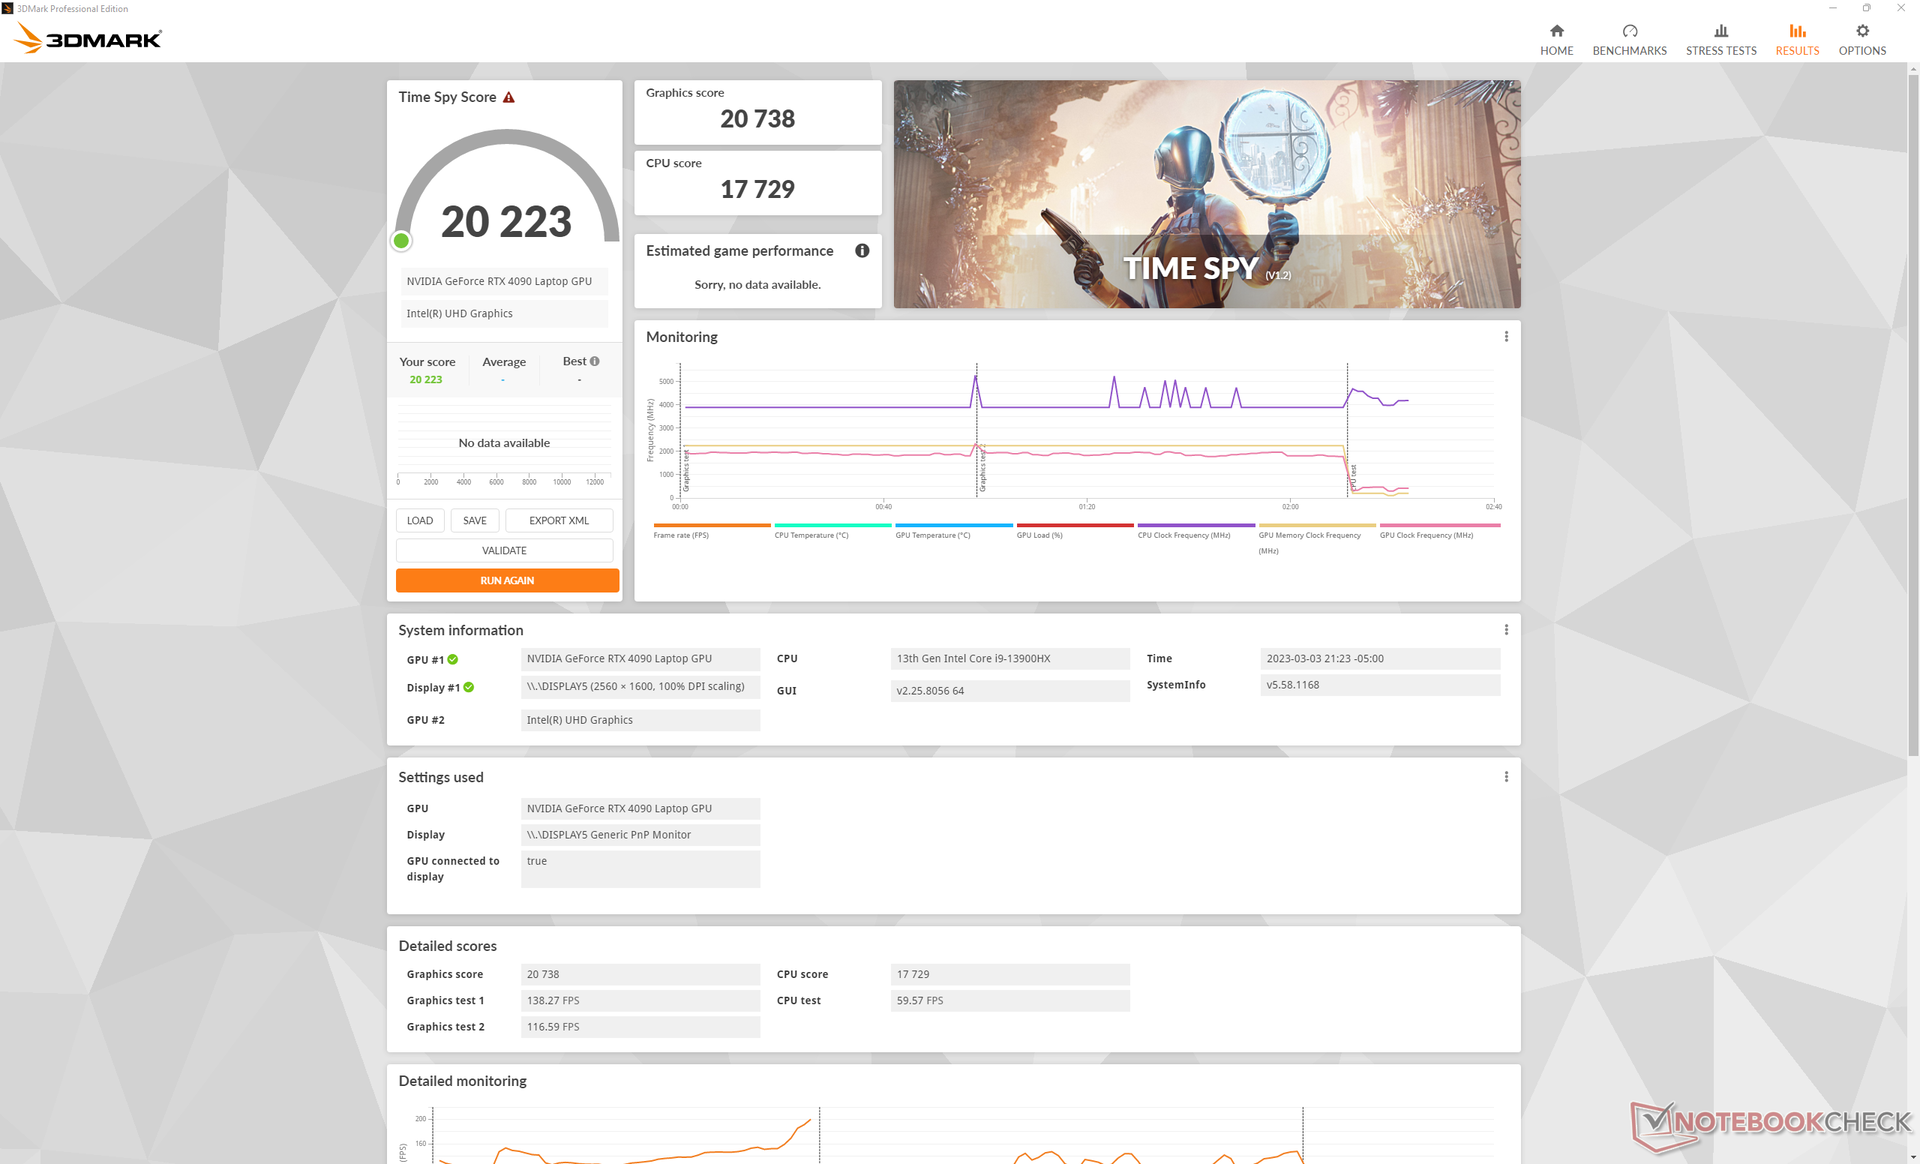
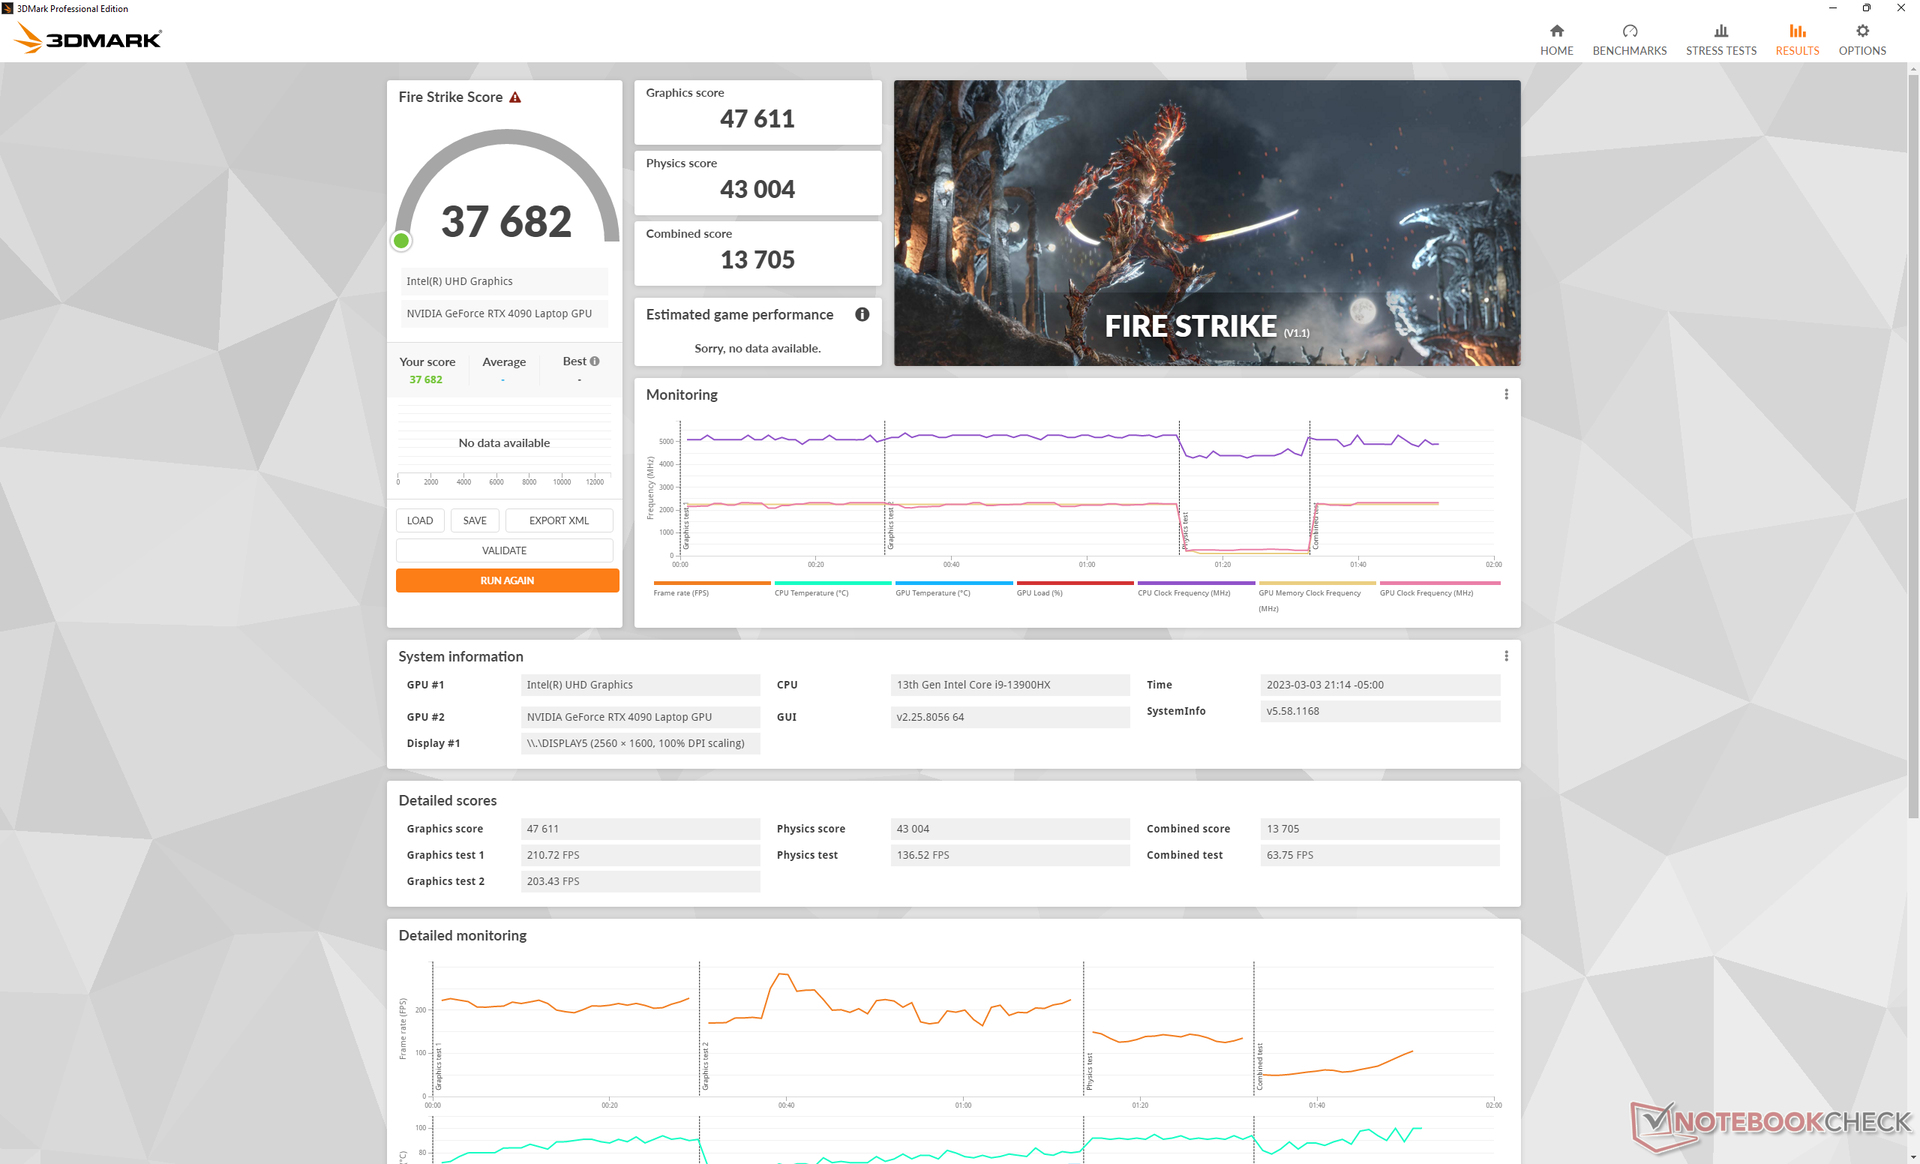
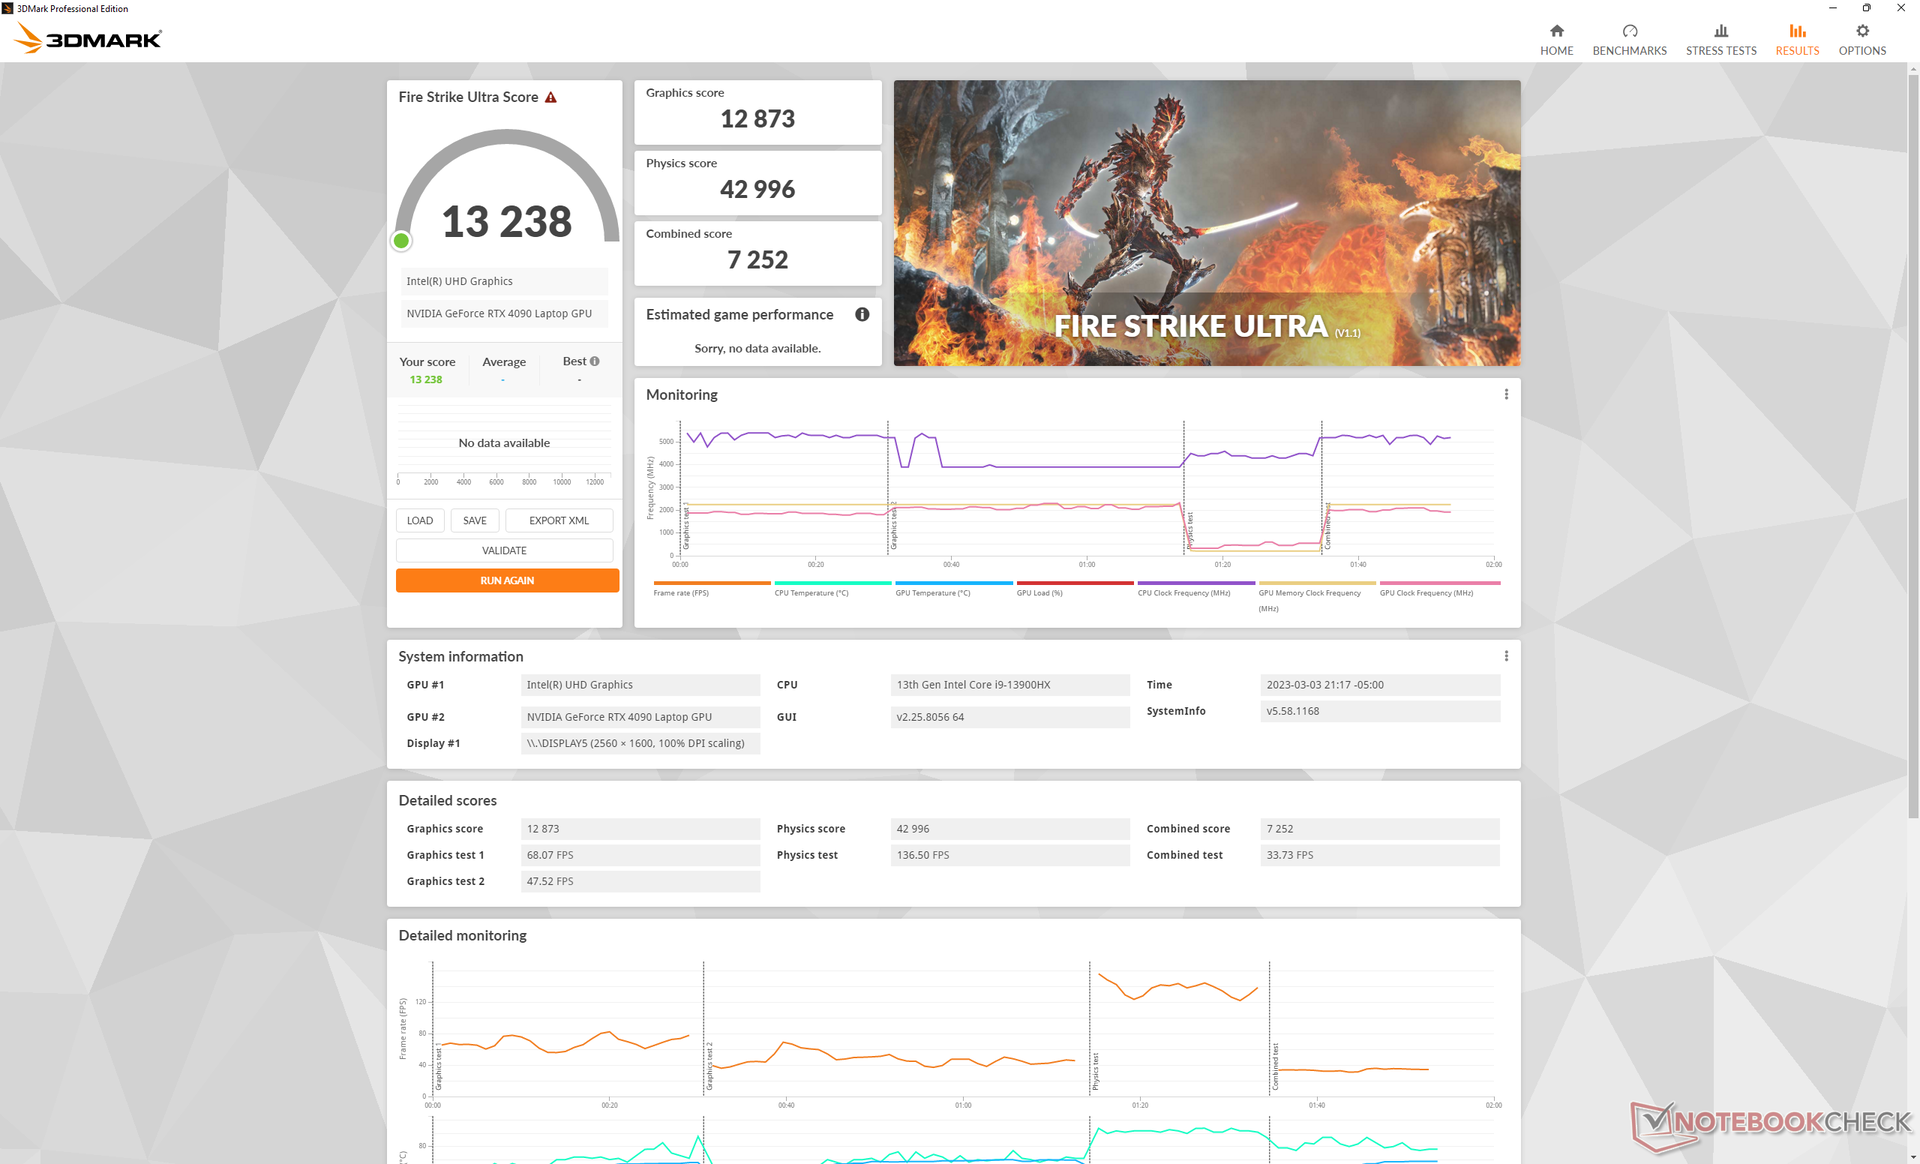
De totale prestaties zijn ongeveer 40 tot 60 procent sneller dan de mobiele RTX 3080 Ti om ongeveer op gelijke hoogte te komen met de desktop RTX 3080 Ti. Het inschakelen van DLSS 3 op ondersteunde titels verhoogt de prestaties zelfs met 2x tot 3x, zij het met mogelijke grafische artefacten.
De meeste games kunnen draaien op native 4K en 60 FPS als RT-effecten niet worden ondersteund of zijn uitgeschakeld. Uitzonderingen zijn zeer veeleisende titels zoals Cyberpunk 2077 of F1 22, waar framesnelheden in plaats daarvan in het bereik van 40 tot 50 FPS zouden zweven. In dit geval kunnen G-Sync en DLSS van pas komen om respectievelijk tearing te verminderen en de prestaties te verbeteren.
Kiezen voor de RTX 4080 of RTX 4070 configuratie in plaats van de RTX 4090 vermindert de grafische prestaties met respectievelijk 10 tot 15 procent en 40 tot 45 procent. De prestatie delta tussen de 4090 en 4080 is dus veel kleiner dan de prestatie delta tussen de 4080 en 4070, ook al is het prijsverschil een vaste 500 dollar tussen elke stap.
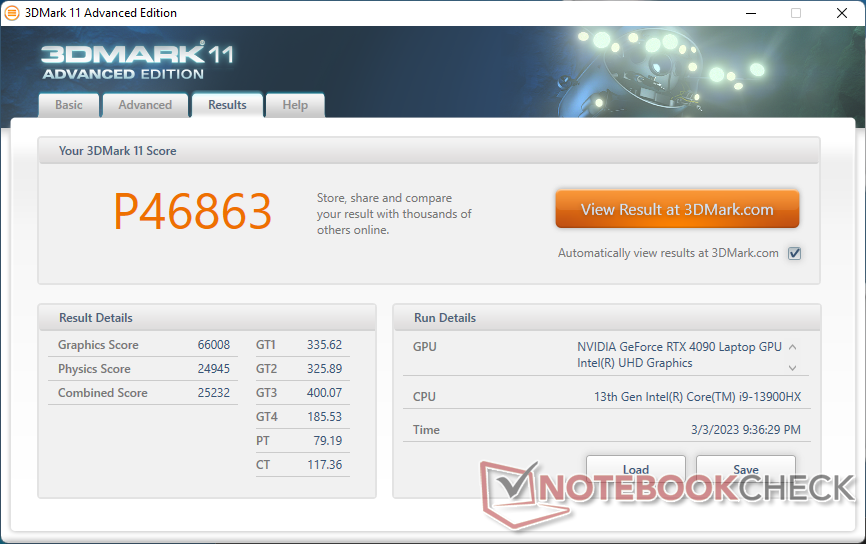
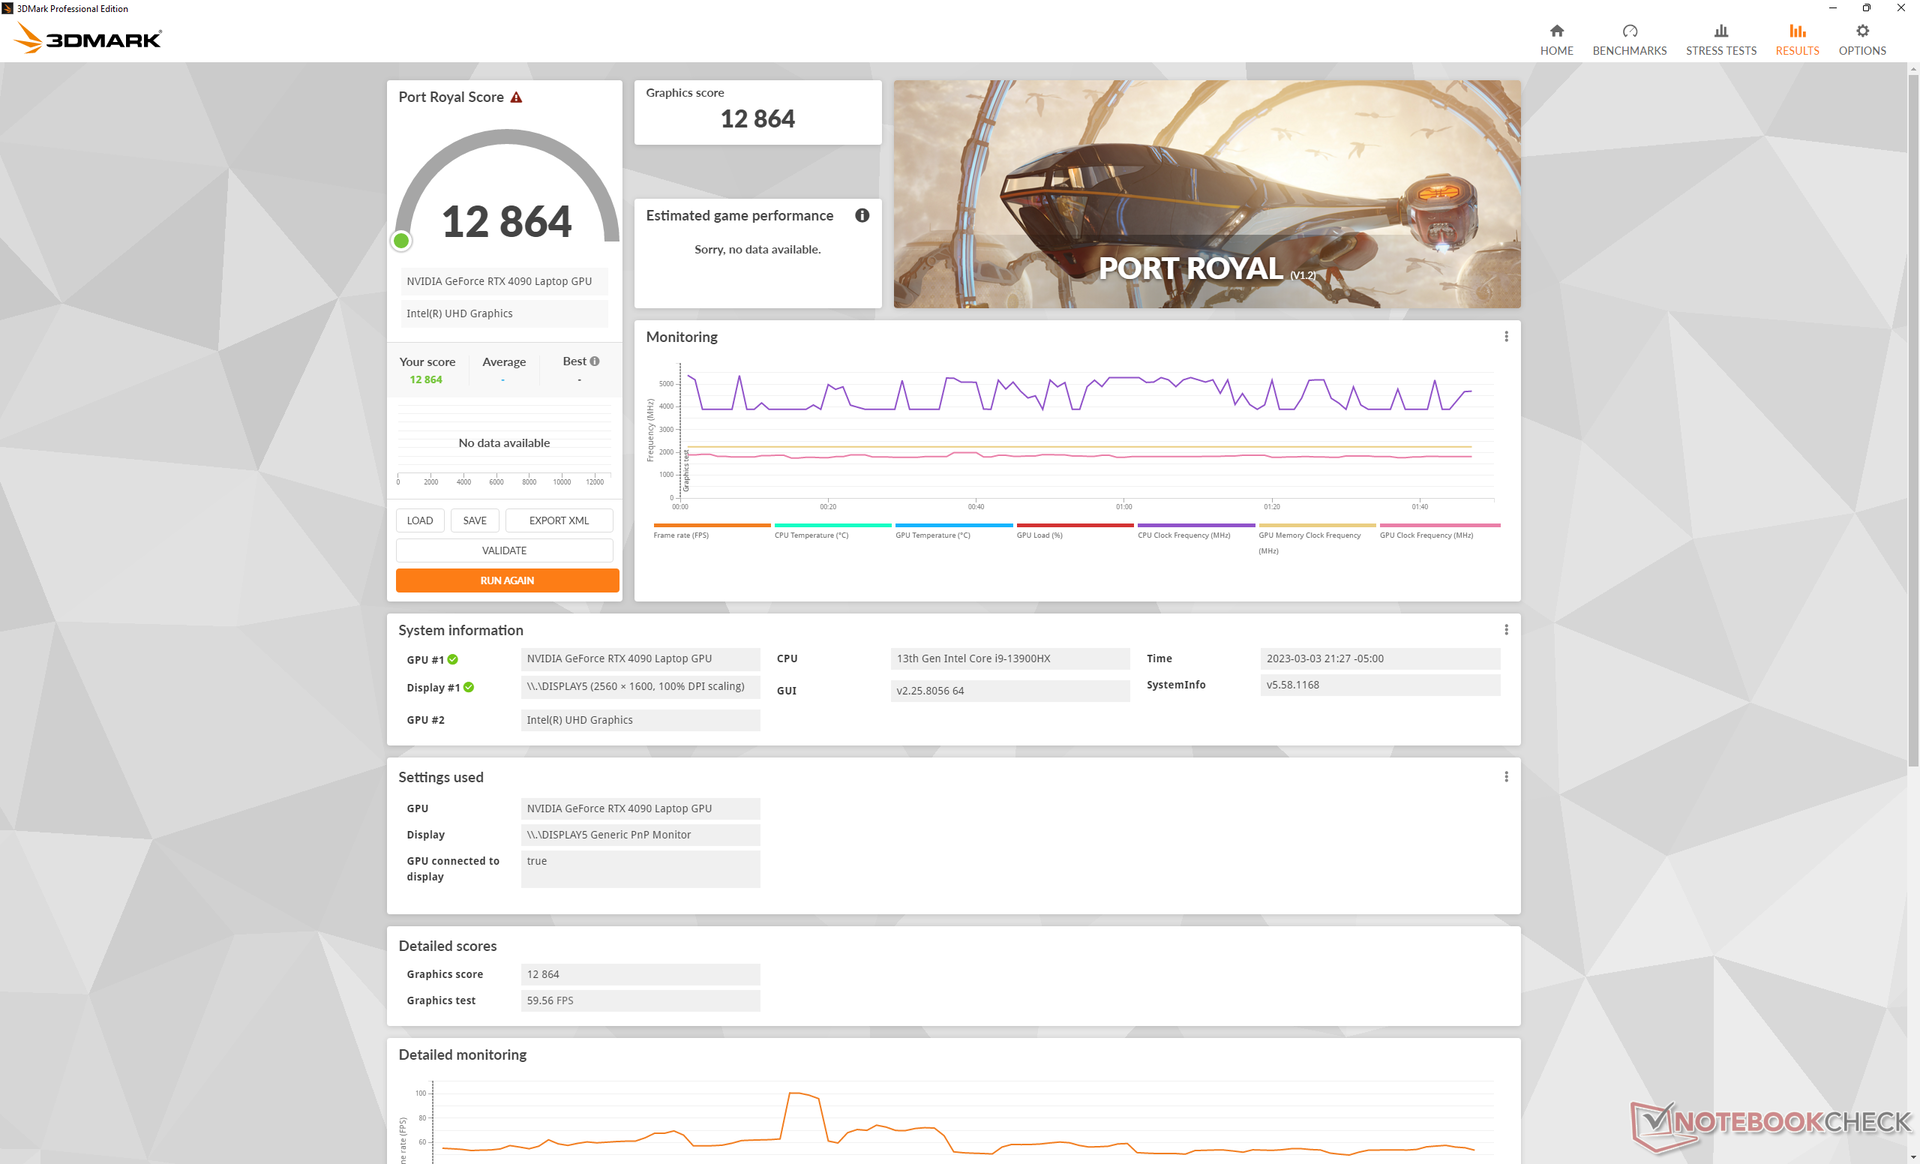
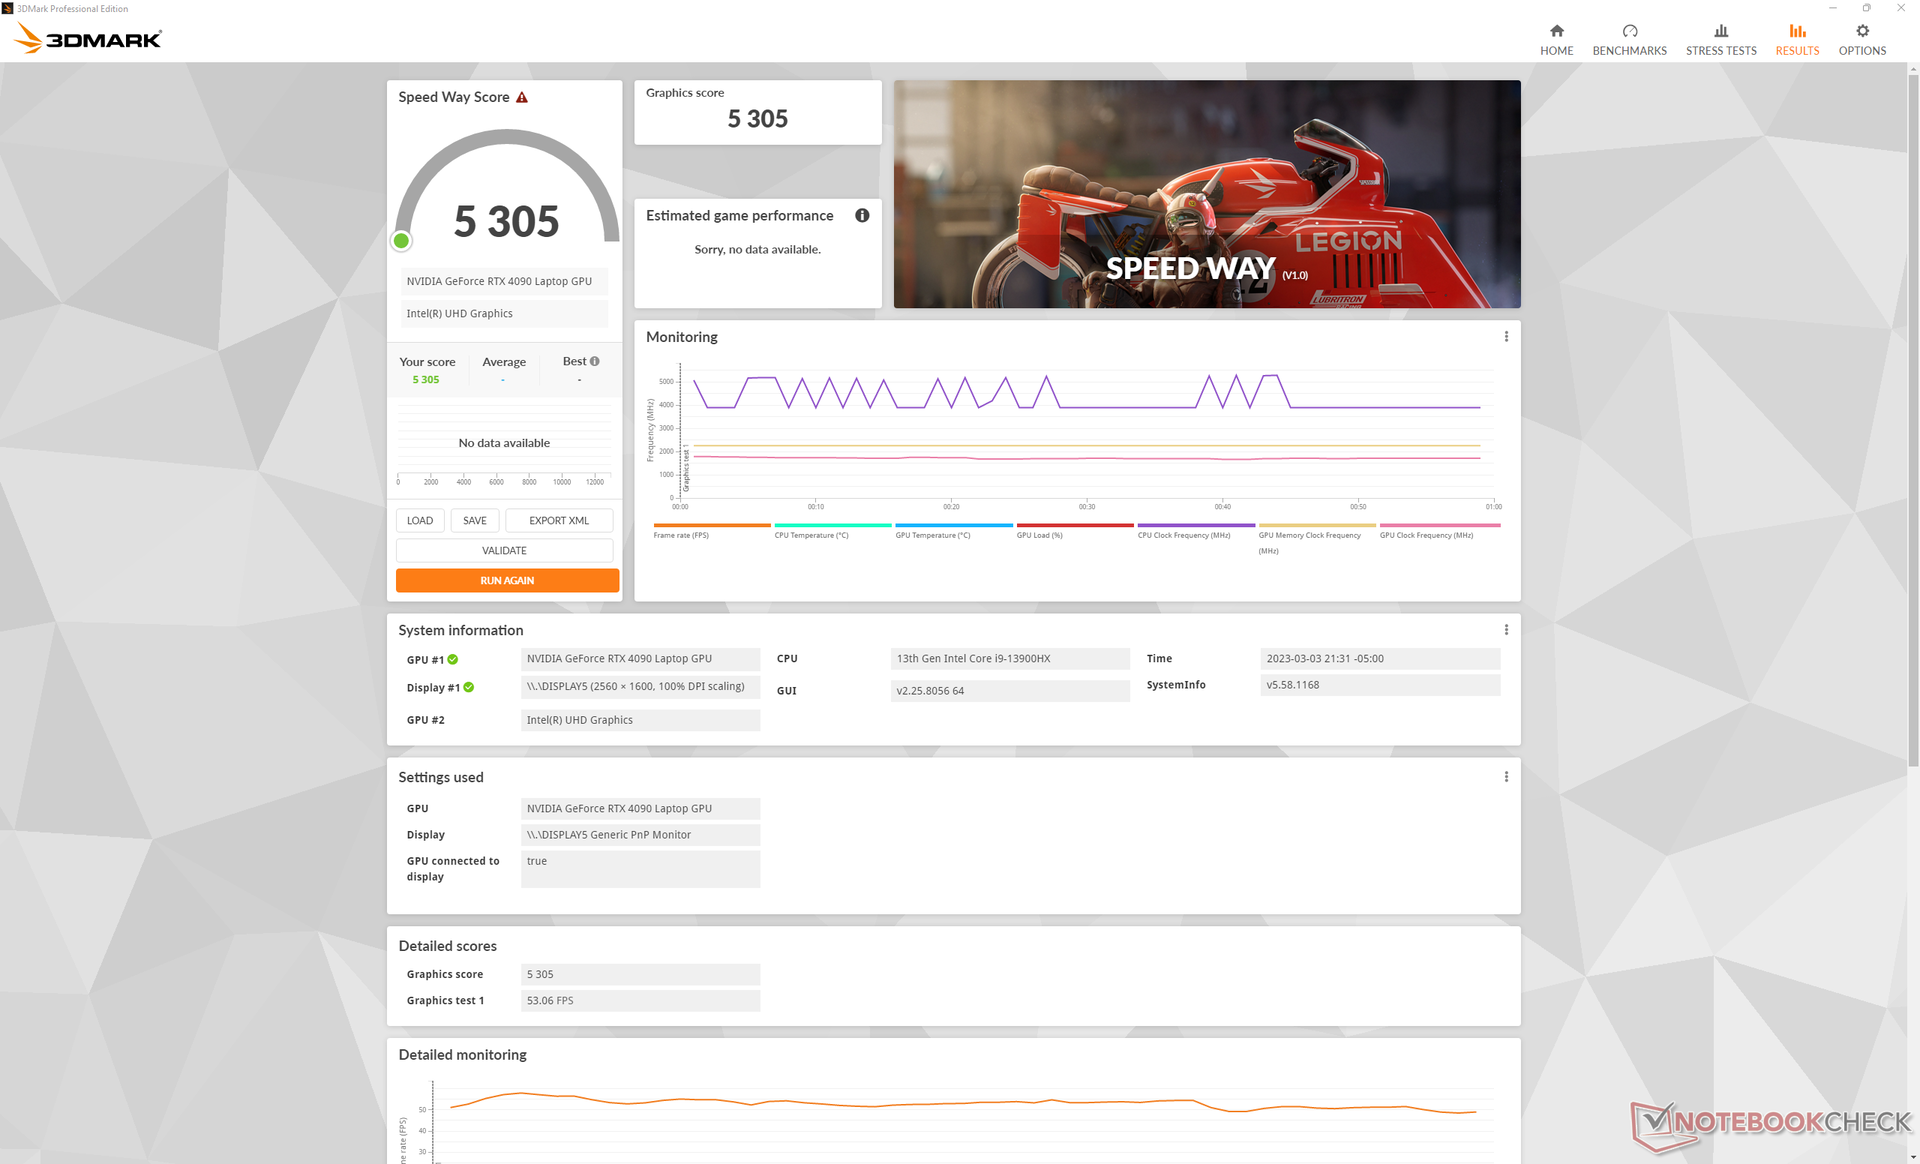
| 3DMark 11 Performance | 46863 punten | |
| 3DMark Fire Strike Score | 37682 punten | |
| 3DMark Time Spy Score | 20223 punten | |
Help | ||
* ... kleiner is beter
| The Witcher 3 - 1920x1080 Ultra Graphics & Postprocessing (HBAO+) | |
| Schenker XMG SECTOR, i9 13900K, RTX 4090 | |
| Eluktronics Mech-17 GP2 | |
| Corsair One i300 | |
| MSI Titan GT77 12UHS | |
| Schenker XMG Neo 17 M22 | |
| Razer Blade 18 RTX 4070 | |
| MSI Katana 17 B13VFK | |
| MSI GS76 Stealth 11UH | |
| MSI Pulse GL76 12UGK | |
| HP Omen 16-n0033dx | |
| Schenker XMG Core 17 (Early 2021) | |
| Cyberpunk 2077 1.6 - 1920x1080 Ultra Preset | |
| Schenker XMG SECTOR, i9 13900K, RTX 4090 | |
| Eluktronics Mech-17 GP2 | |
| MSI Titan GT77 12UHS | |
| Razer Blade 18 RTX 4070 | |
| MSI Katana 17 B13VFK | |
| MSI Pulse GL76 12UGK | |
| HP Omen 16-n0033dx | |
Witcher 3 FPS Chart
| lage | gem. | hoge | ultra | QHD | 4K | |
|---|---|---|---|---|---|---|
| GTA V (2015) | 187.5 | 187.2 | 186.5 | 149.8 | 146.3 | 180.2 |
| The Witcher 3 (2015) | 717.7 | 617.3 | 449 | 216.3 | 167.6 | |
| Dota 2 Reborn (2015) | 243 | 216 | 205 | 192.5 | 186.7 | |
| Final Fantasy XV Benchmark (2018) | 233 | 230 | 194.9 | 157.1 | 90.8 | |
| X-Plane 11.11 (2018) | 212 | 188.8 | 146.4 | 124.7 | ||
| Strange Brigade (2018) | 656 | 508 | 465 | 421 | 315 | 163.4 |
| Metro Exodus (2019) | 240.1 | 207.1 | 173.8 | 146.5 | 127.7 | 82.1 |
| Borderlands 3 (2019) | 284.2 | 269.7 | 238.5 | 179.7 | 129.4 | 72.2 |
| Cyberpunk 2077 1.6 (2022) | 191.1 | 178.6 | 166.9 | 159.7 | 101.3 | 47.8 |
| F1 22 (2022) | 375 | 358 | 322 | 140.6 | 91.8 | 45.3 |
Emissies
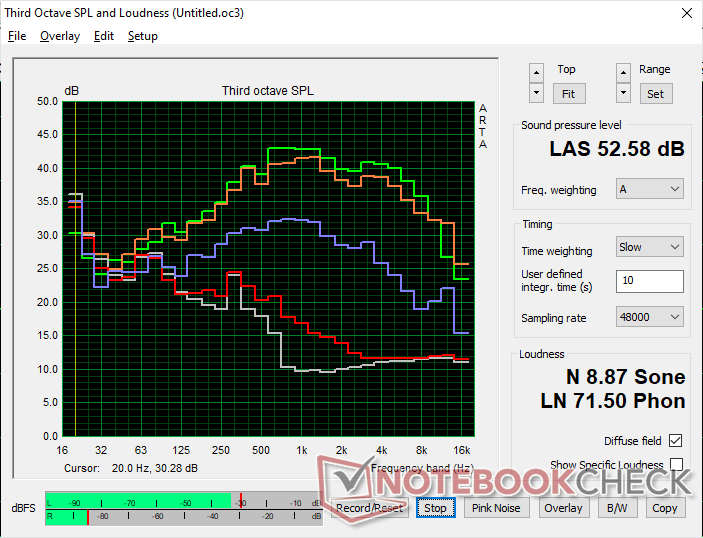
Systeemgeluid
Hoewel er aanpassingen zijn gedaan aan de koeloplossing in vergelijking met het model van vorig jaar, blijft het totale ventilatorgeluid ongeveer gelijk. De interne ventilatoren zijn altijd actief, ongeacht de instelling of belasting van het scherm. We raden de Office-modus of Balanced-modus aan als je geen intensieve toepassingen draait, omdat de ventilatoren dan merkbaar stiller en lustelozer worden.
Bij gamen in de modus Prestaties of "Beest", zou het ventilatorgeluid zich stabiliseren tussen 50 en 52 dB(A), wat vergelijkbaar is met de Alienware m17 R5 of Razer Blade 18 onder vergelijkbare omstandigheden. Een hoofdtelefoon is bijna een noodzaak voor ventilatorgeluid boven de 50 dB(A) tijdens het gamen.
Thermal Grizzly vloeibaar metaal wordt standaard geleverd op alle configuraties.
Geluidsniveau
| Onbelast |
| 28 / 28 / 30.4 dB (A) |
| Belasting |
| 41 / 52.6 dB (A) |
 | ||
30 dB stil 40 dB(A) hoorbaar 50 dB(A) luid |
||
min: | ||
| Eluktronics Mech-17 GP2 GeForce RTX 4090 Laptop GPU, i9-13900HX, Samsung PM9A1 MZVL21T0HCLR | Schenker XMG Neo 17 M22 GeForce RTX 3080 Ti Laptop GPU, R9 6900HX, Samsung SSD 980 Pro 1TB MZ-V8P1T0BW | MSI Katana 17 B13VFK GeForce RTX 4060 Laptop GPU, i7-13620H, Micron 2400 MTFDKBA1T0QFM | MSI Titan GT77 HX 13VI GeForce RTX 4090 Laptop GPU, i9-13950HX, Samsung PM9A1 MZVL22T0HBLB | Alienware m17 R5 (R9 6900HX, RX 6850M XT) Radeon RX 6850M XT, R9 6900HX, SSSTC CA6-8D1024 | Razer Blade 18 RTX 4070 GeForce RTX 4070 Laptop GPU, i9-13950HX, SSSTC CA6-8D1024 | |
|---|---|---|---|---|---|---|
| Noise | -8% | -6% | -7% | 10% | 9% | |
| uit / omgeving * (dB) | 25.2 | 26 -3% | 24.5 3% | 24.6 2% | 23 9% | 23.5 7% |
| Idle Minimum * (dB) | 28 | 26 7% | 24.5 12% | 29.2 -4% | 23 18% | 23.8 15% |
| Idle Average * (dB) | 28 | 29 -4% | 24.5 12% | 29.2 -4% | 28.11 -0% | 23.8 15% |
| Idle Maximum * (dB) | 30.4 | 40 -32% | 40 -32% | 29.2 4% | 28.11 8% | 26.8 12% |
| Load Average * (dB) | 41 | 47 -15% | 48.3 -18% | 50.7 -24% | 30.62 25% | 37.3 9% |
| Witcher 3 ultra * (dB) | 50.7 | 52 -3% | 56 -10% | 53.3 -5% | 49.75 2% | 48 5% |
| Load Maximum * (dB) | 52.6 | 54 -3% | 59.1 -12% | 61 -16% | 50.17 5% | 53.5 -2% |
* ... kleiner is beter
Temperatuur
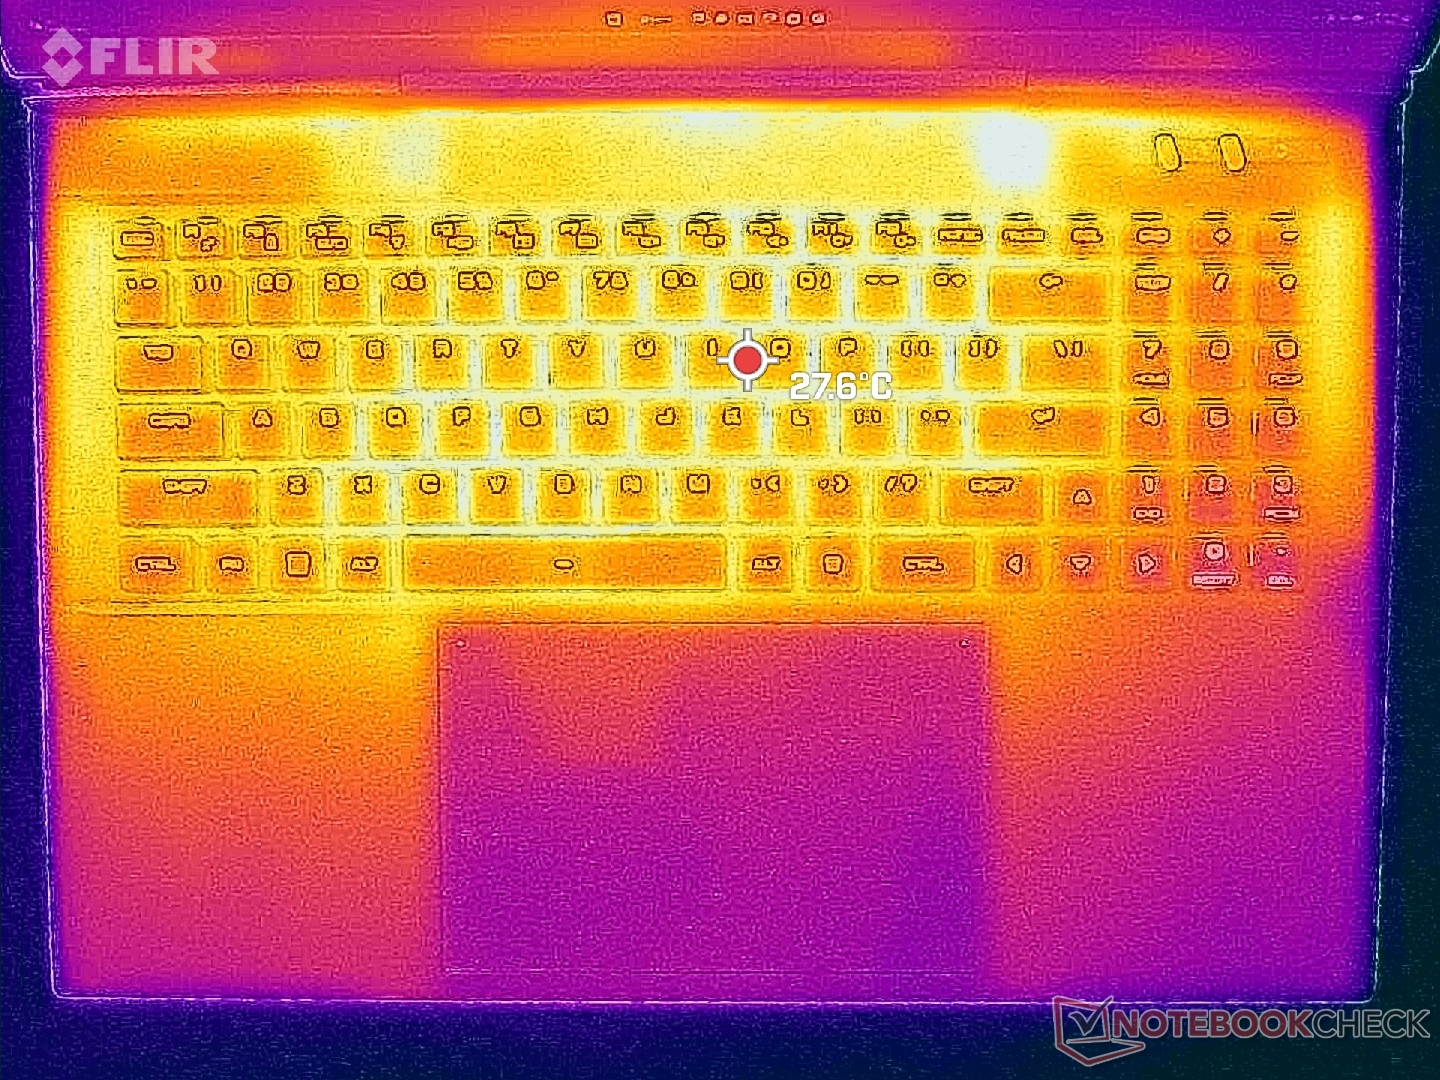
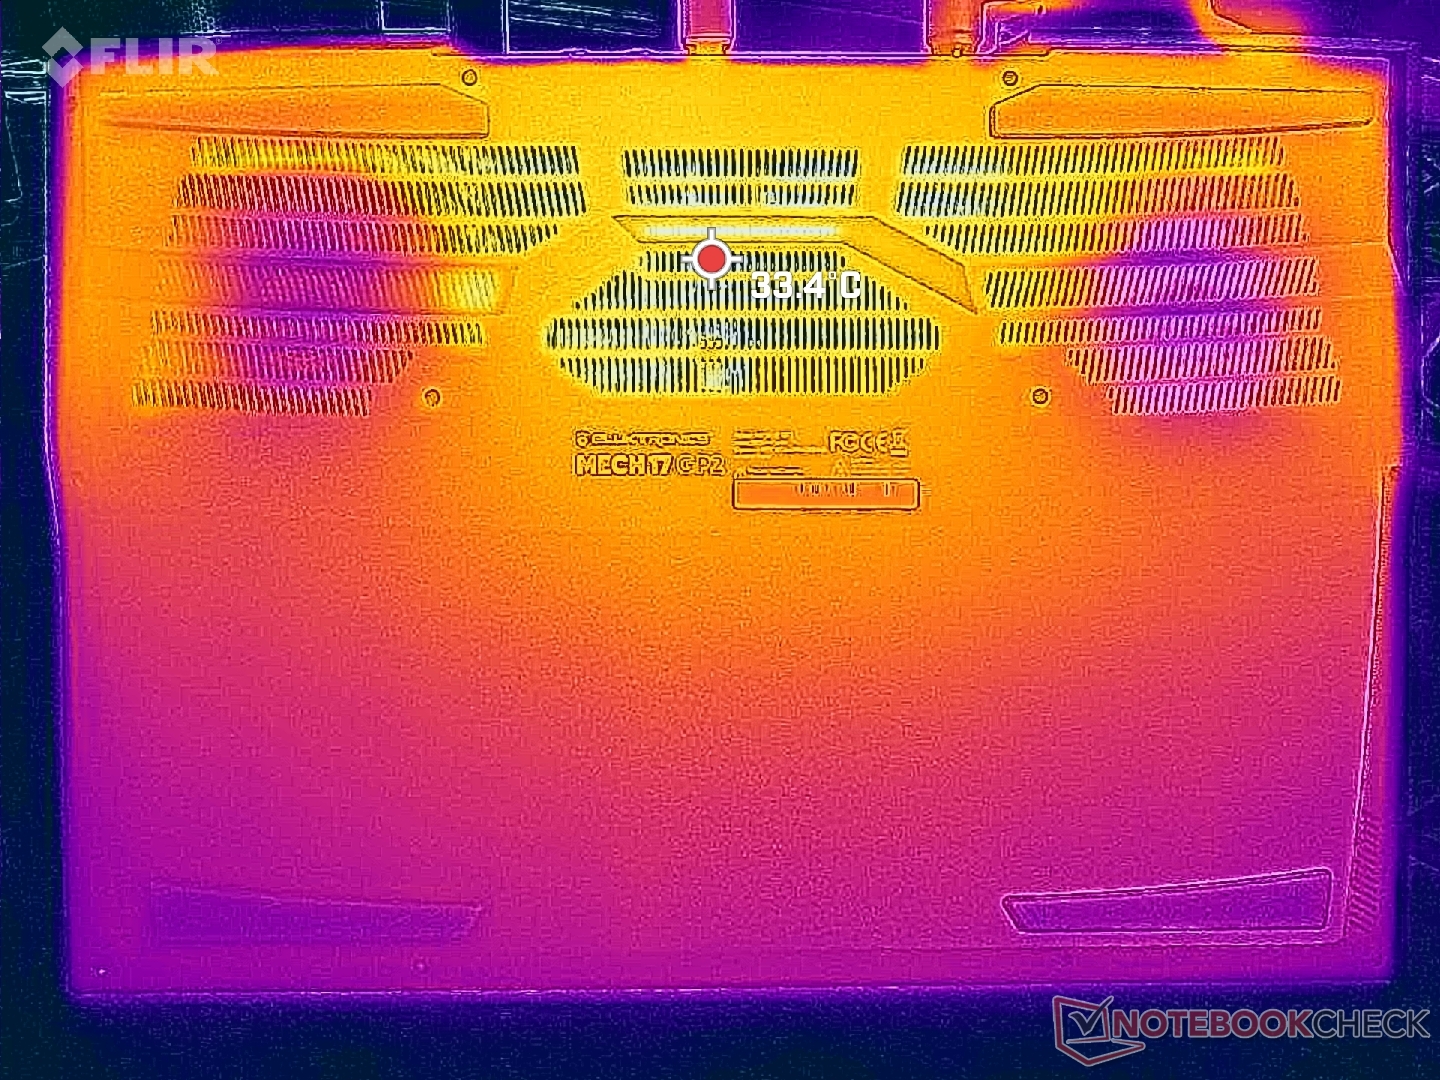
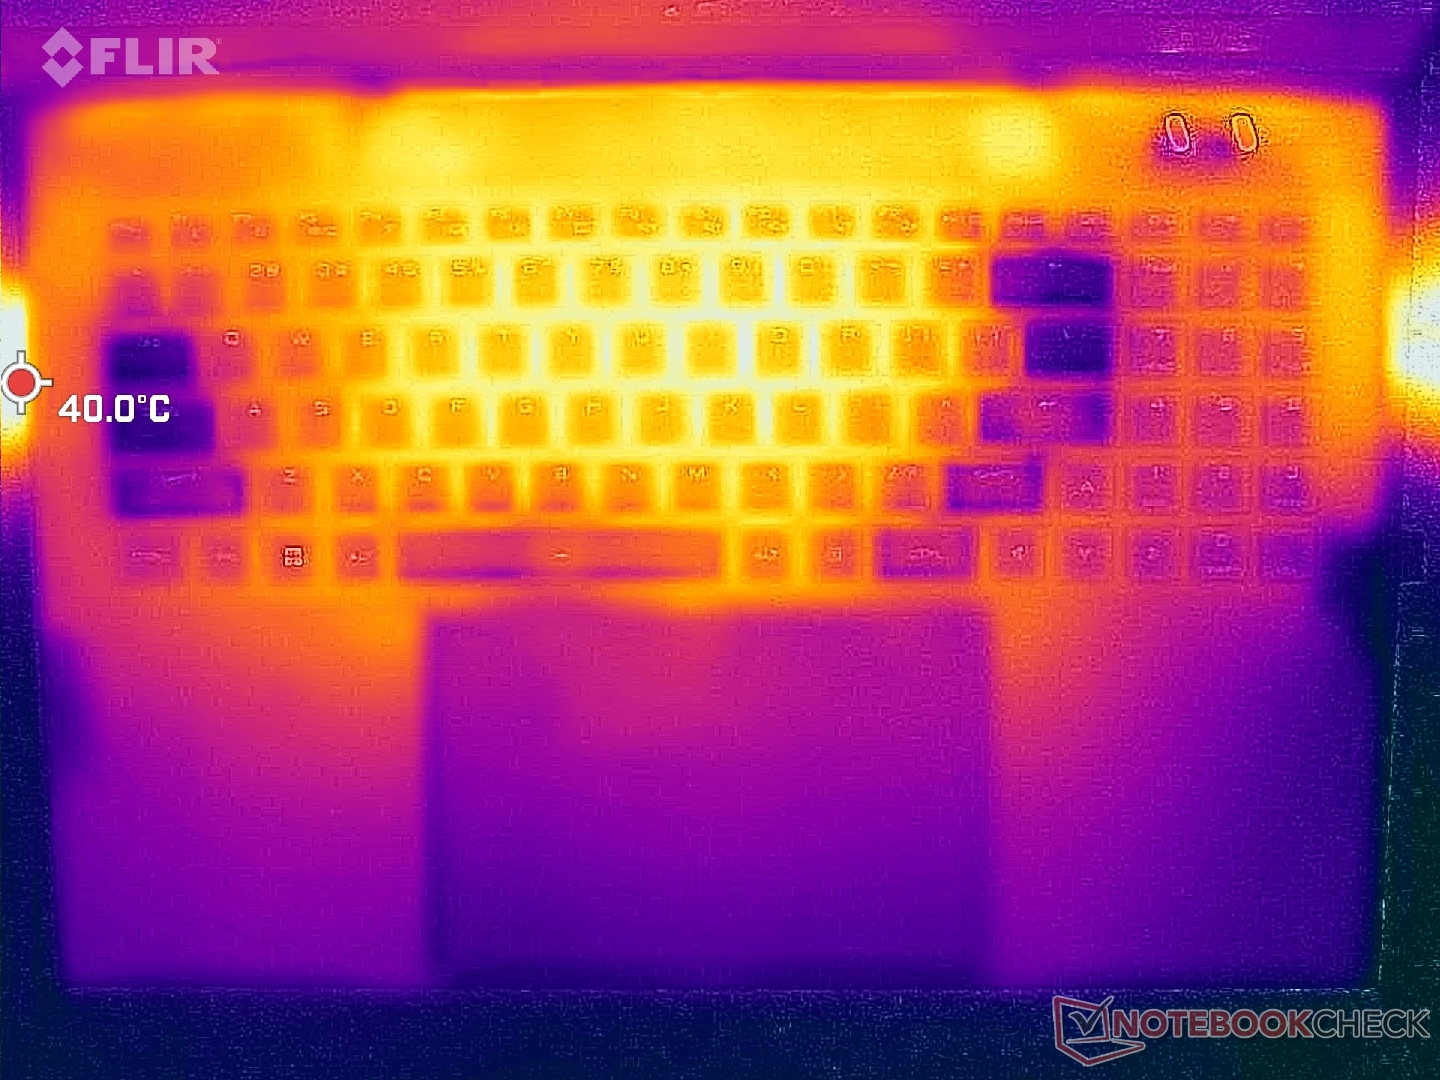
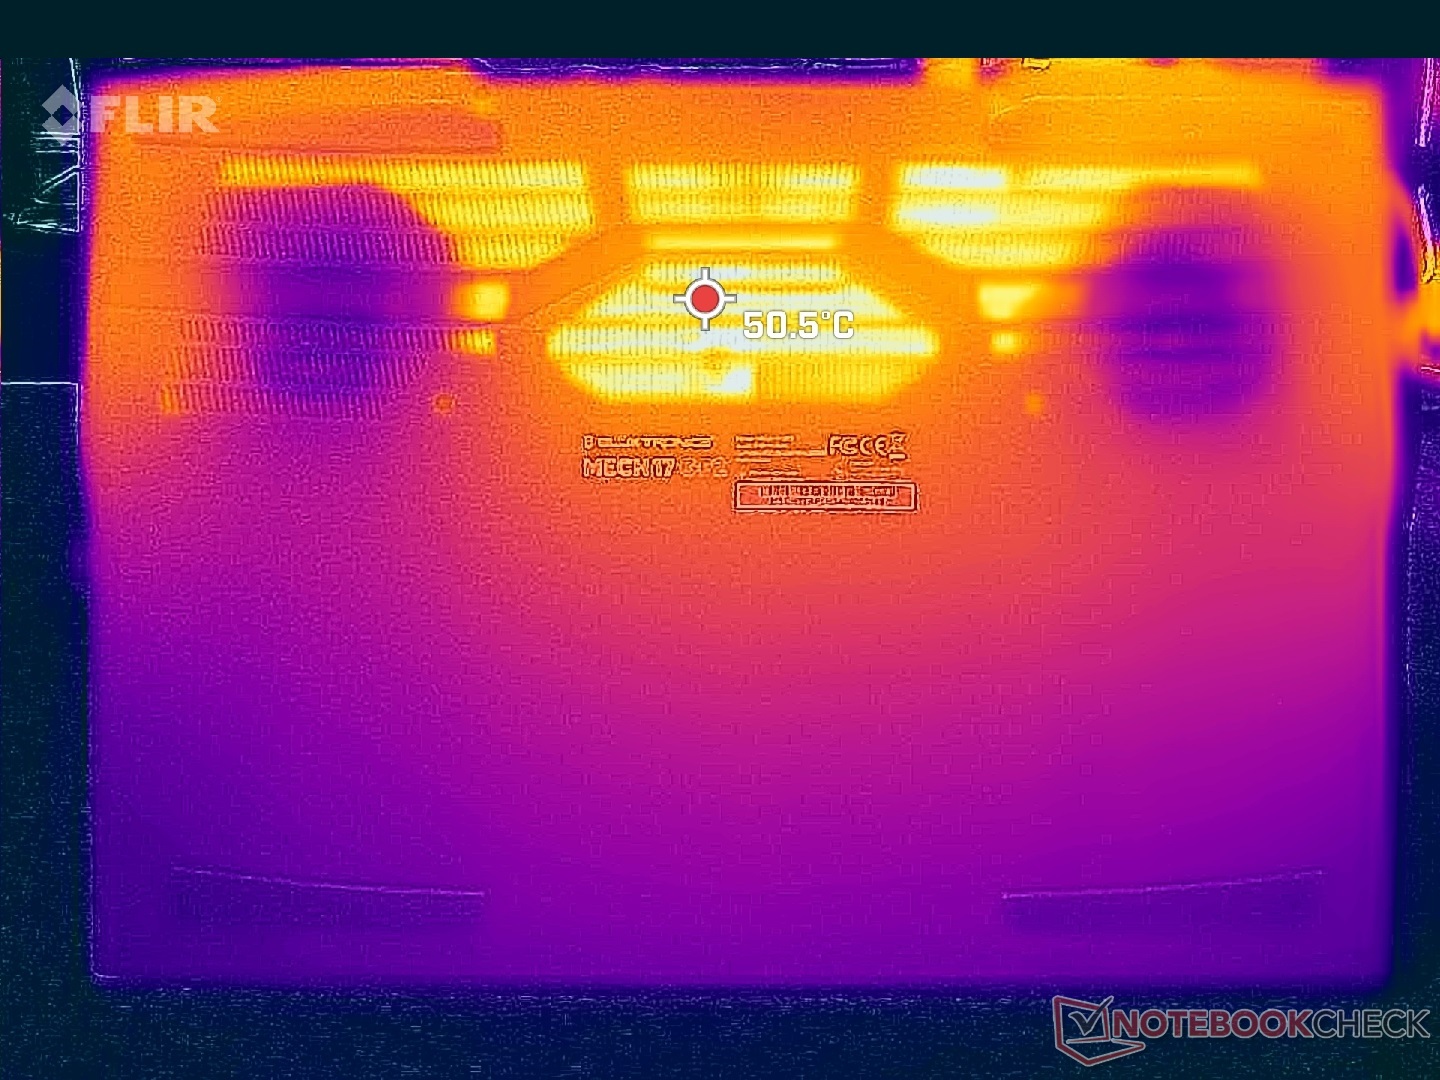
De oppervlaktetemperaturen zijn het warmst in het midden en het koelst langs de zijkanten van het toetsenbord en de palmsteunen. Er komt frisse lucht binnen via de WASD-toetsen om de vingers koel te houden tijdens het gamen. De warme plekken van 39 C tot 44 C zijn koeler dan wat we registreerden op de Alienware m17 R5 waar hot spots kunnen oplopen tot 50 C tot 57 C onder vergelijkbare gaming omstandigheden.
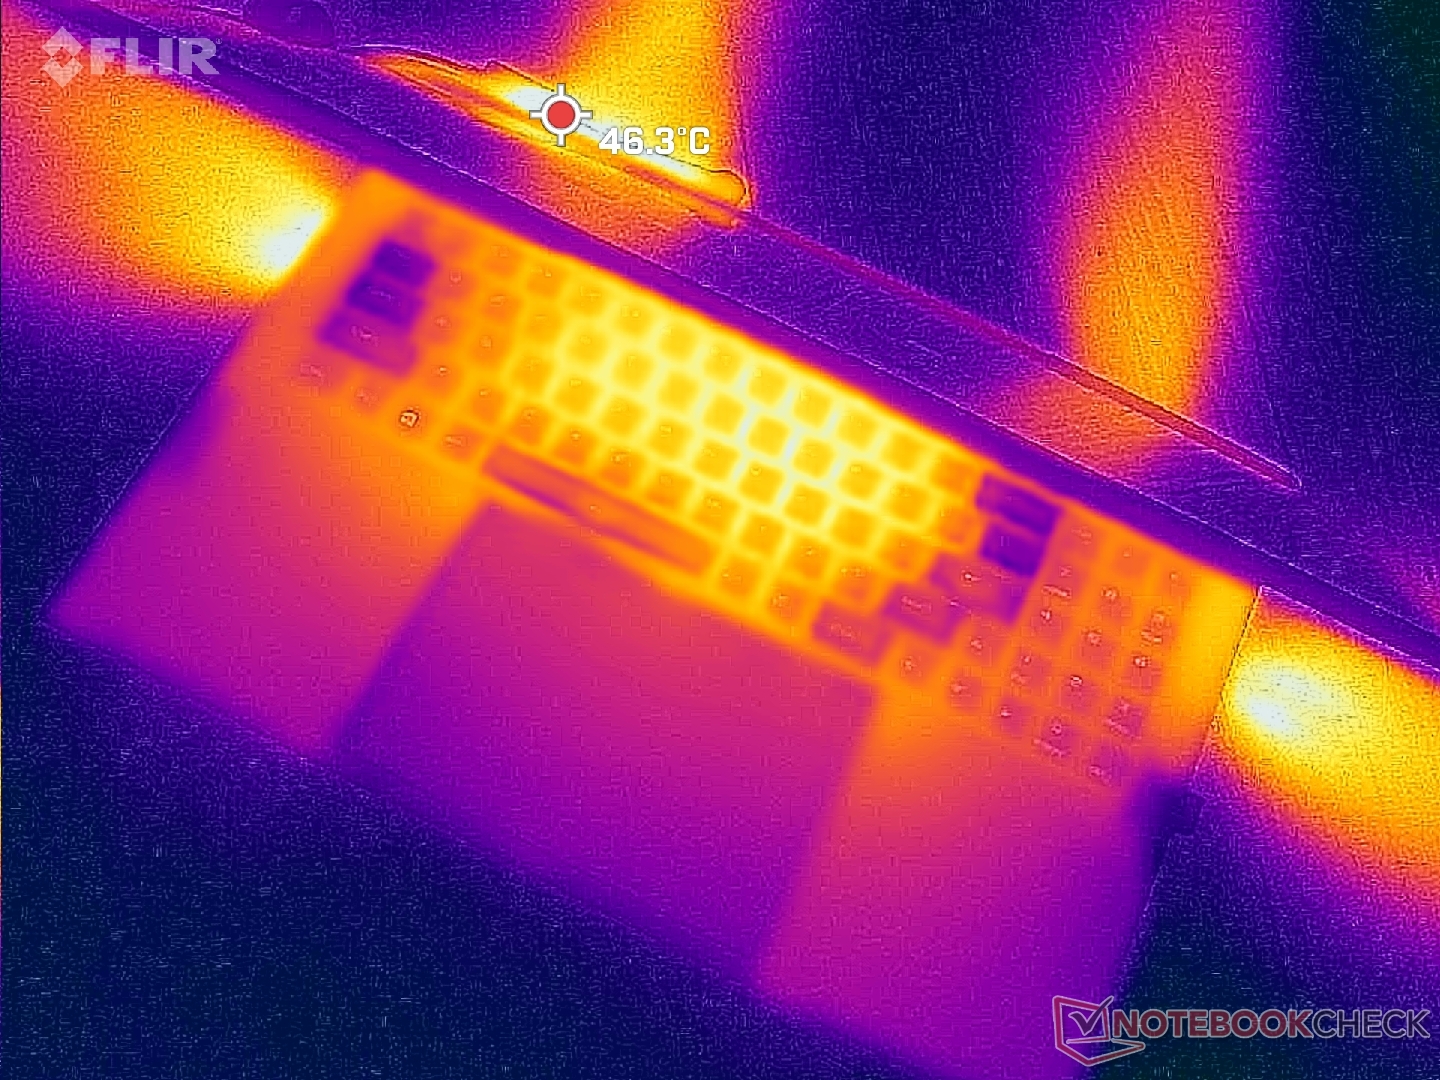
(+) De maximumtemperatuur aan de bovenzijde bedraagt 39 °C / 102 F, vergeleken met het gemiddelde van 40.4 °C / 105 F, variërend van 21.2 tot 68.8 °C voor de klasse Gaming.
(±) De bodem warmt op tot een maximum van 44 °C / 111 F, vergeleken met een gemiddelde van 43.2 °C / 110 F
(+) Bij onbelast gebruik bedraagt de gemiddelde temperatuur voor de bovenzijde 27.5 °C / 82 F, vergeleken met het apparaatgemiddelde van 33.9 °C / 93 F.
(+) De palmsteunen en het touchpad zijn met een maximum van ###max## °C / 77 F koeler dan de huidtemperatuur en voelen daarom koel aan.
(+) De gemiddelde temperatuur van de handpalmsteun van soortgelijke toestellen bedroeg 28.8 °C / 83.8 F (+3.8 °C / 6.8 F).
| Eluktronics Mech-17 GP2 Intel Core i9-13900HX, NVIDIA GeForce RTX 4090 Laptop GPU | Schenker XMG Neo 17 M22 AMD Ryzen 9 6900HX, NVIDIA GeForce RTX 3080 Ti Laptop GPU | MSI Katana 17 B13VFK Intel Core i7-13620H, NVIDIA GeForce RTX 4060 Laptop GPU | MSI Titan GT77 HX 13VI Intel Core i9-13950HX, NVIDIA GeForce RTX 4090 Laptop GPU | Alienware m17 R5 (R9 6900HX, RX 6850M XT) AMD Ryzen 9 6900HX, AMD Radeon RX 6850M XT | Razer Blade 18 RTX 4070 Intel Core i9-13950HX, NVIDIA GeForce RTX 4070 Laptop GPU | |
|---|---|---|---|---|---|---|
| Heat | -13% | -7% | 4% | -14% | 1% | |
| Maximum Upper Side * (°C) | 39 | 49 -26% | 41.6 -7% | 40.6 -4% | 53 -36% | 39.2 -1% |
| Maximum Bottom * (°C) | 44 | 52 -18% | 43.1 2% | 41.1 7% | 56 -27% | 35.6 19% |
| Idle Upper Side * (°C) | 31 | 30 3% | 32 -3% | 26.2 15% | 30 3% | 31.8 -3% |
| Idle Bottom * (°C) | 29.8 | 33 -11% | 35.8 -20% | 30.3 -2% | 29 3% | 33.2 -11% |
* ... kleiner is beter
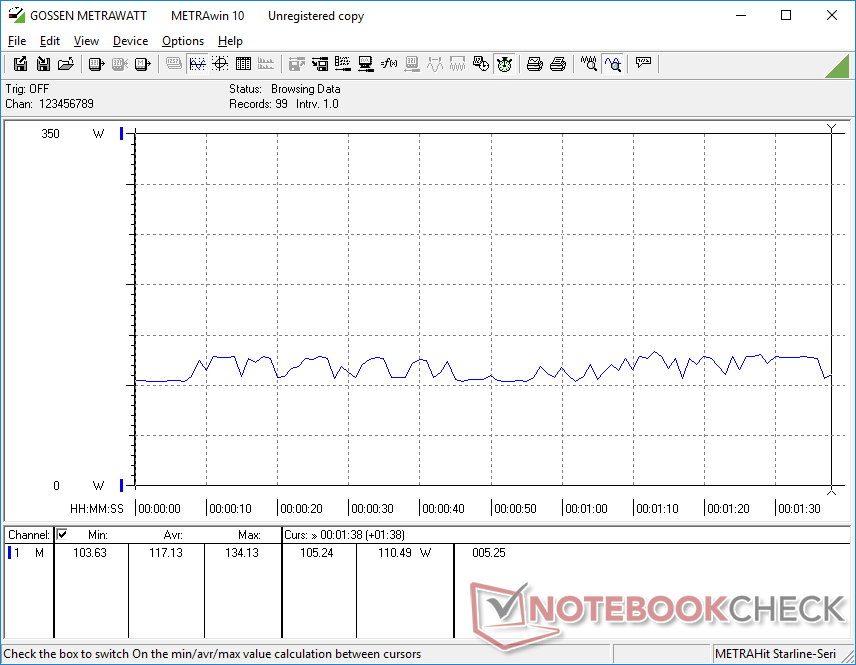
Stresstest
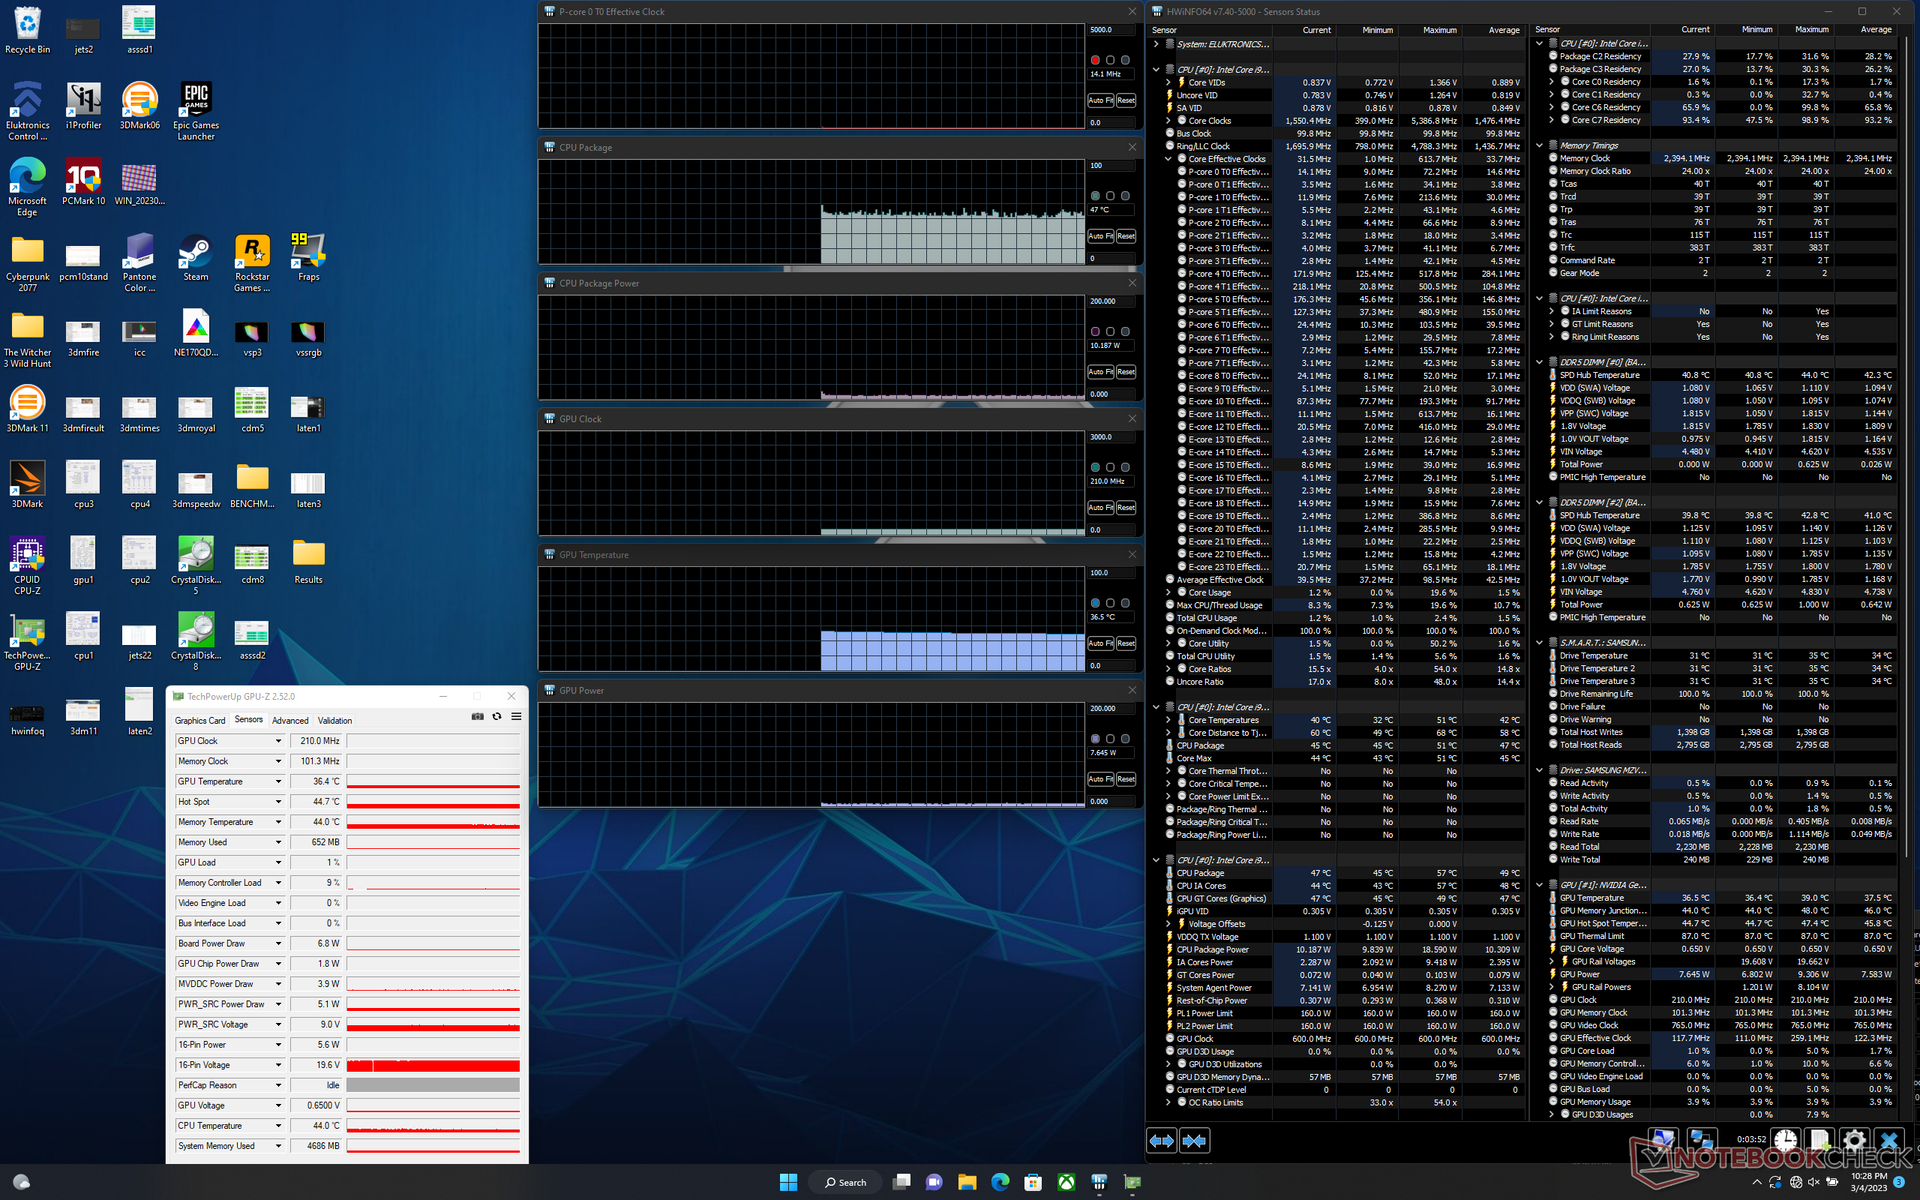
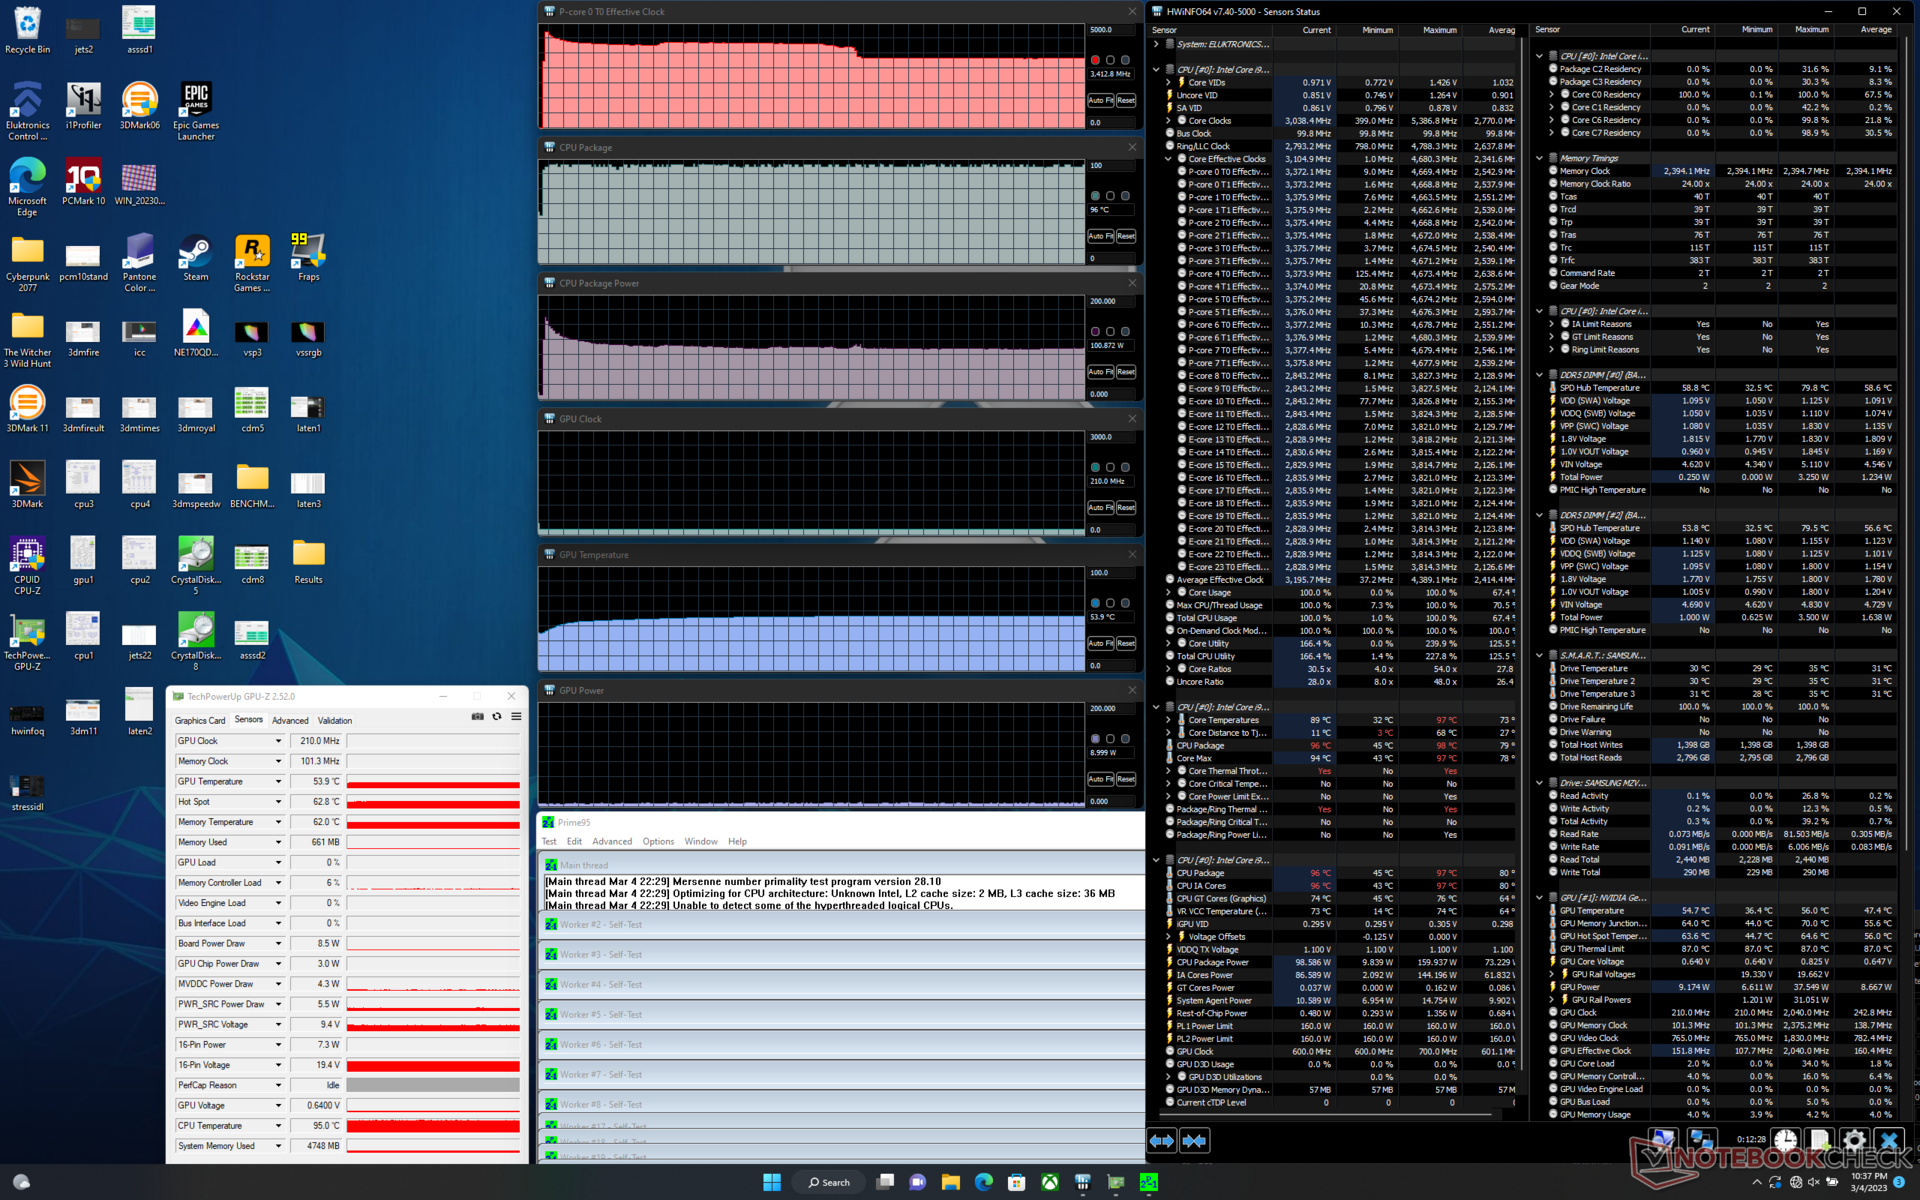
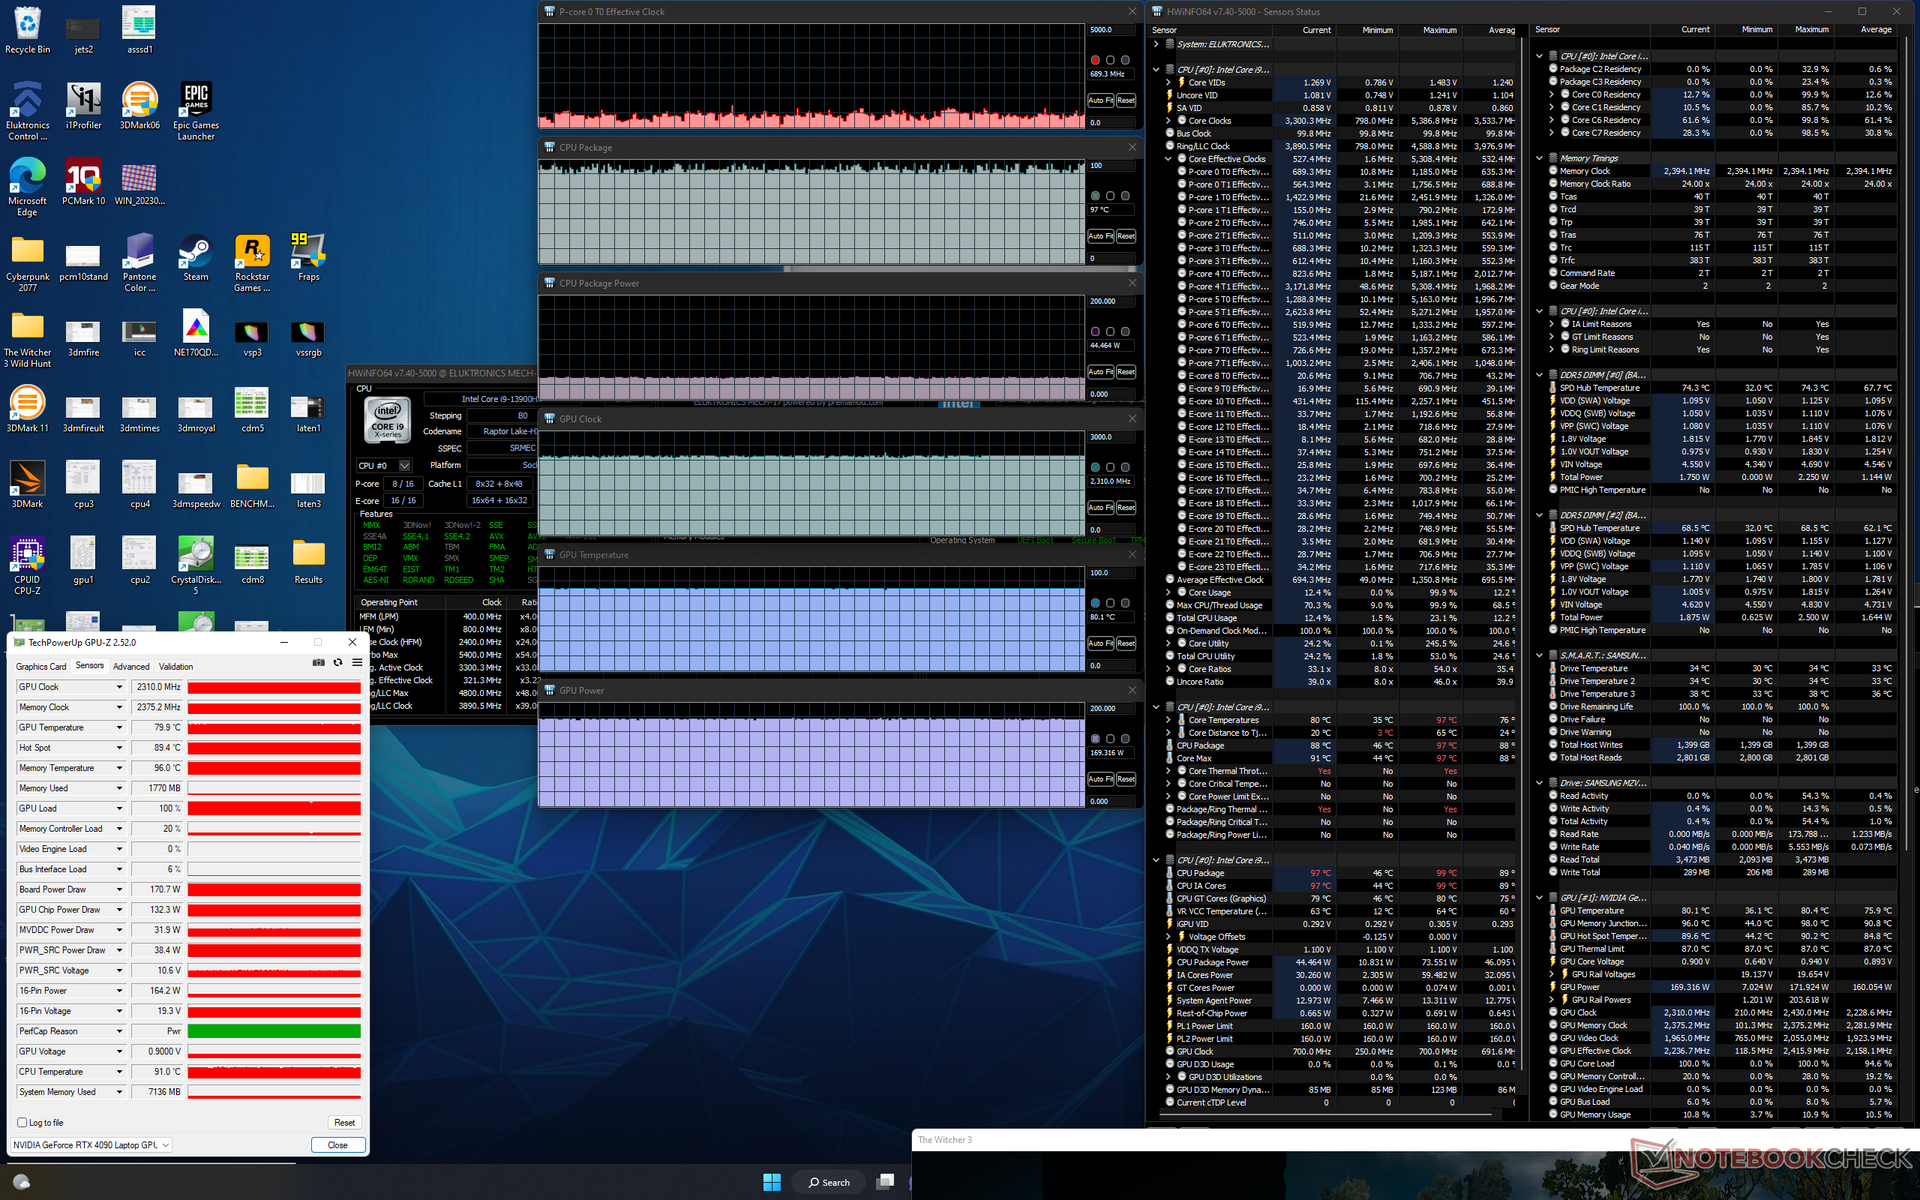
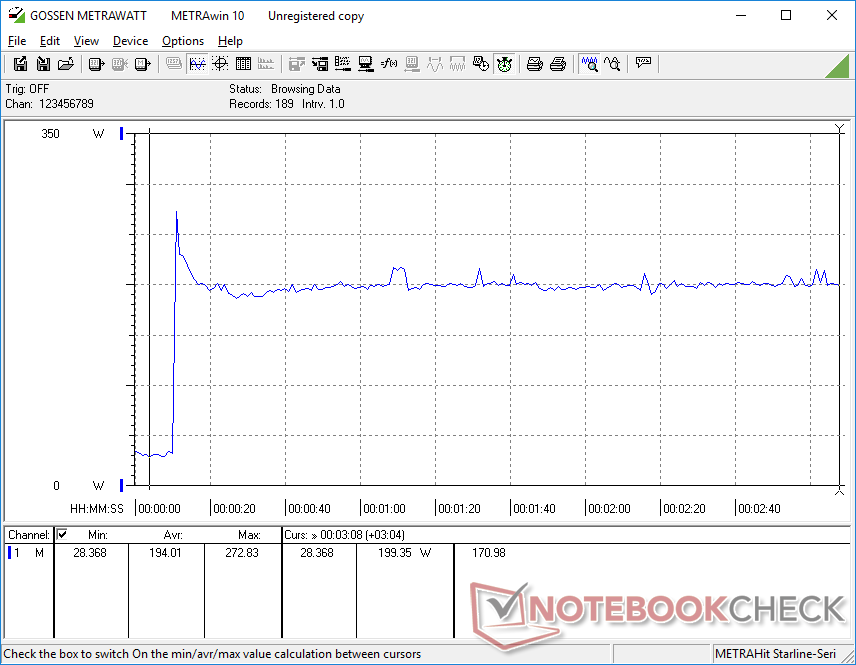
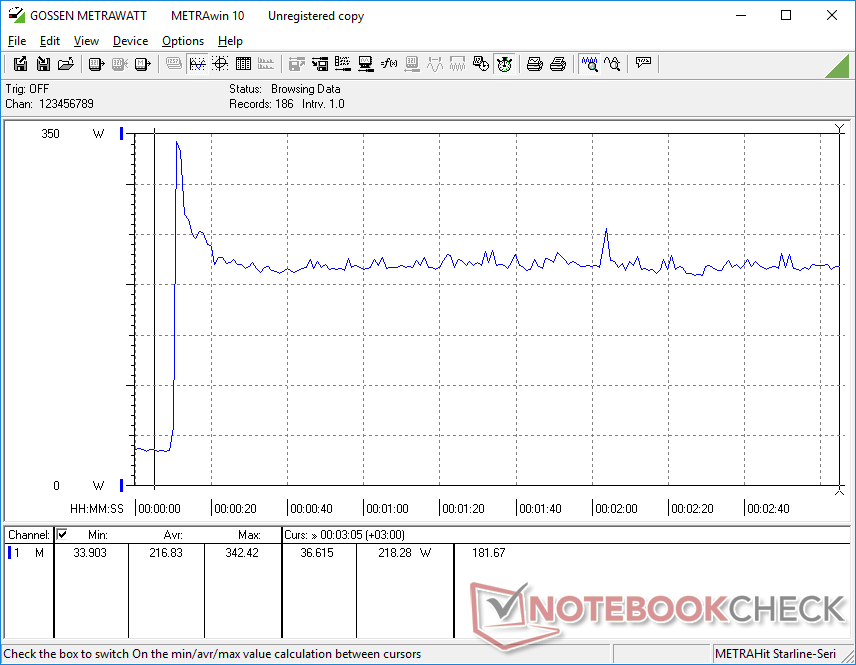
Bij belasting onder Prime95 zou de CPU opvoeren tot 4,7 GHz, 160 W, en 96 C voor slechts een seconde of twee, voordat hij onmiddellijk zou dalen tot 4,1 GHz en 107 W. De kerntemperatuur zou echter zeer hoog blijven op 96 C. Na nog een paar minuten zouden de kloksnelheden verder dalen tot 3,4 GHz met slechts minimale veranderingen in temperatuur en stroomverbruik.
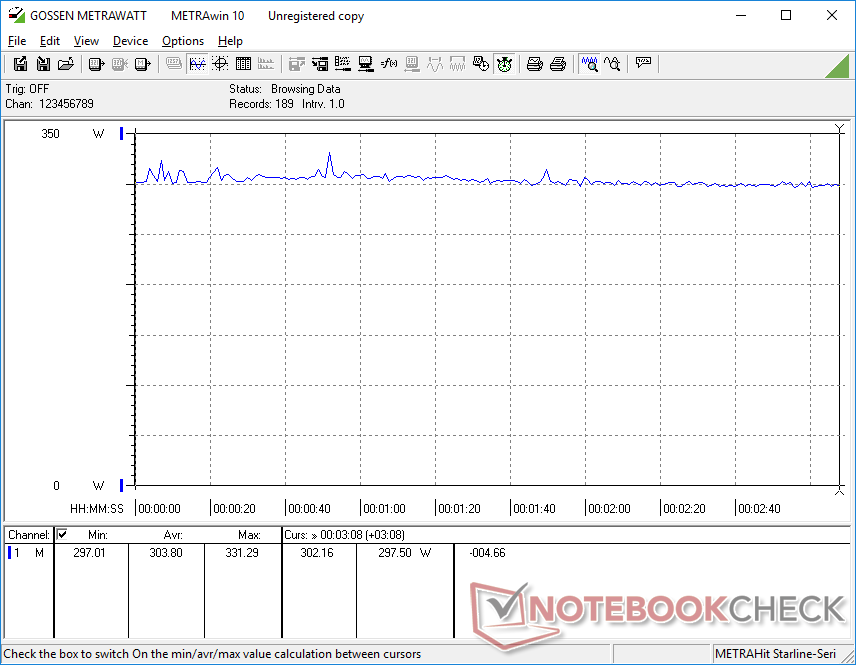
Kloksnelheid, temperatuur en stroomverbruik van de GPU stabiliseerden zich op respectievelijk 2310 MHz, 80 C en 169 W bij het draaien van Witcher 3. De GPU is berekend op een TGP van 175 W, dus het werkelijke stroomverbruik van 169 W komt heel dicht in de buurt. CPU temperatuur zou helaas hoog blijven op 96 C in vergelijking met 85 C of 66 C op de Razer Blade 18(RTX 4070) of de MSI GT77, respectievelijk.
Door Prime95 en FurMark langer dan enkele minuten gelijktijdig uit te voeren, crashte ons apparaat elke keer. We vermoeden dat de hoge kerntemperaturen verantwoordelijk zijn voor de automatische uitschakeling en herstart. De meeste andere laptops zouden de prestaties bij dergelijke extreme belastingen afremmen om crashen te voorkomen.
Werken op batterijen beperkt de prestaties aanzienlijk. Een Fire Strike test op batterijen levert Physics en Graphics scores op van respectievelijk 11430 en 11496 punten, vergeleken met 43004 en 47611 punten op netstroom.
| CPU-klok (GHz) | GPU-klok (MHz) | Gemiddelde CPU-temperatuur (°C) | Gemiddelde GPU-temperatuur (°C) | |
| Systeem Idle | -- | -- | 47 | 37 |
| Prime95 Stress | 3.4 | -- | 96 | 54 |
| Witcher 3 Stress | ~0.7 | 2310 | 97 | 80 |
Luidsprekers
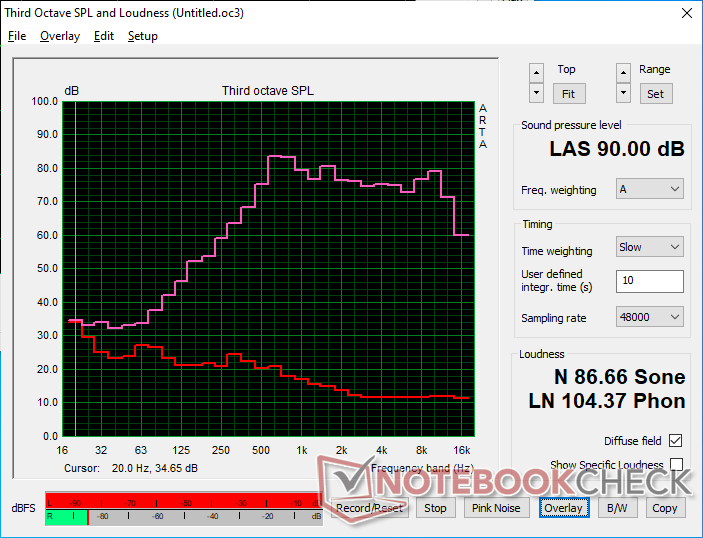
Eluktronics Mech-17 GP2 audioanalyse
(+) | luidsprekers kunnen relatief luid spelen (90 dB)
Bas 100 - 315 Hz
(-) | bijna geen lage tonen - gemiddeld 22.5% lager dan de mediaan
(±) | lineariteit van de lage tonen is gemiddeld (7.3% delta ten opzichte van de vorige frequentie)
Midden 400 - 2000 Hz
(+) | evenwichtige middens - slechts 4.4% verwijderd van de mediaan
(±) | lineariteit van de middentonen is gemiddeld (7.4% delta ten opzichte van de vorige frequentie)
Hoog 2 - 16 kHz
(+) | evenwichtige hoogtepunten - slechts 1.3% verwijderd van de mediaan
(+) | de hoge tonen zijn lineair (2.7% delta naar de vorige frequentie)
Algemeen 100 - 16.000 Hz
(±) | lineariteit van het totale geluid is gemiddeld (15% verschil met de mediaan)
Vergeleken met dezelfde klasse
» 32% van alle geteste apparaten in deze klasse waren beter, 6% vergelijkbaar, 62% slechter
» De beste had een delta van 6%, het gemiddelde was 18%, de slechtste was 132%
Vergeleken met alle geteste toestellen
» 20% van alle geteste apparaten waren beter, 4% gelijk, 75% slechter
» De beste had een delta van 4%, het gemiddelde was 24%, de slechtste was 134%
Apple MacBook Pro 16 2021 M1 Pro audioanalyse
(+) | luidsprekers kunnen relatief luid spelen (84.7 dB)
Bas 100 - 315 Hz
(+) | goede baars - slechts 3.8% verwijderd van de mediaan
(+) | de lage tonen zijn lineair (5.2% delta naar de vorige frequentie)
Midden 400 - 2000 Hz
(+) | evenwichtige middens - slechts 1.3% verwijderd van de mediaan
(+) | de middentonen zijn lineair (2.1% delta ten opzichte van de vorige frequentie)
Hoog 2 - 16 kHz
(+) | evenwichtige hoogtepunten - slechts 1.9% verwijderd van de mediaan
(+) | de hoge tonen zijn lineair (2.7% delta naar de vorige frequentie)
Algemeen 100 - 16.000 Hz
(+) | het totale geluid is lineair (4.6% verschil met de mediaan)
Vergeleken met dezelfde klasse
» 0% van alle geteste apparaten in deze klasse waren beter, 0% vergelijkbaar, 100% slechter
» De beste had een delta van 5%, het gemiddelde was 17%, de slechtste was 45%
Vergeleken met alle geteste toestellen
» 0% van alle geteste apparaten waren beter, 0% gelijk, 100% slechter
» De beste had een delta van 4%, het gemiddelde was 24%, de slechtste was 134%
Energiebeheer
Stroomverbruik
Het totale stroomverbruik is over de hele linie duidelijk hoger dan wat we registreerden op het 2022 AMD-Ampere model. Bijvoorbeeld, gewoon stationair draaien op de desktop zou tussen de 14 W en 37 W verbruiken, vergeleken met slechts 7 W tot 17 W op de 2022-versie. Gaming vraagt 37 procent meer stroom op onze 2023-eenheid, maar de prestaties per watt zijn nog steeds erg goed, omdat gebruikers 40 tot 60 procent meer grafische prestaties krijgen ten opzichte van de mobiele RTX 3080 Ti.
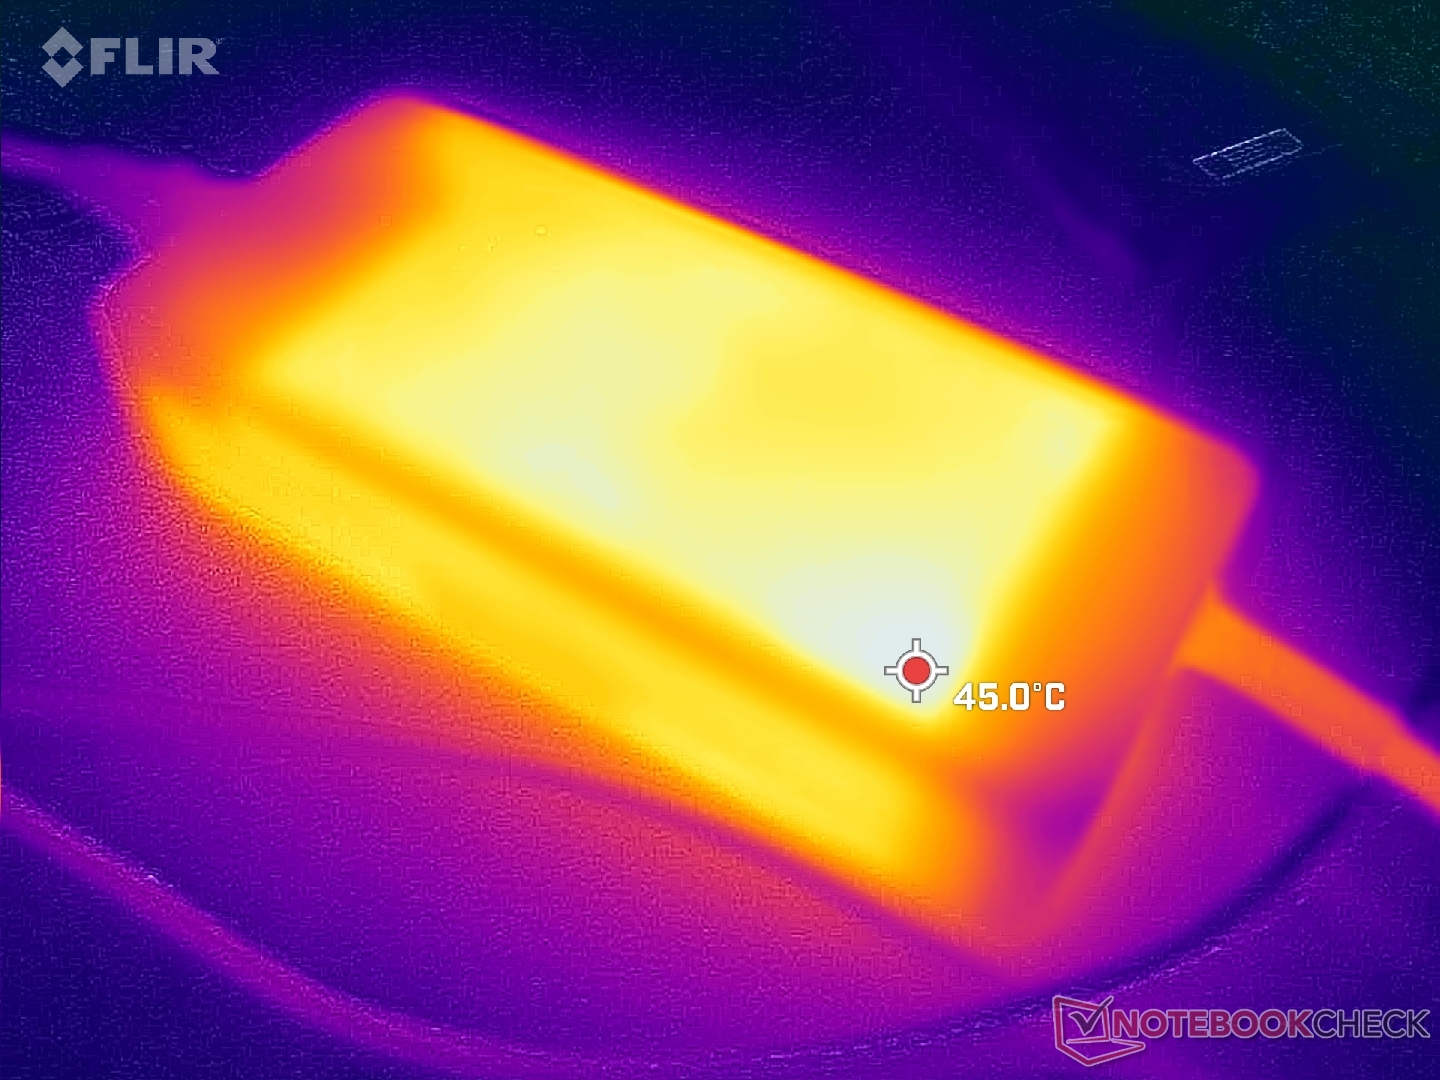
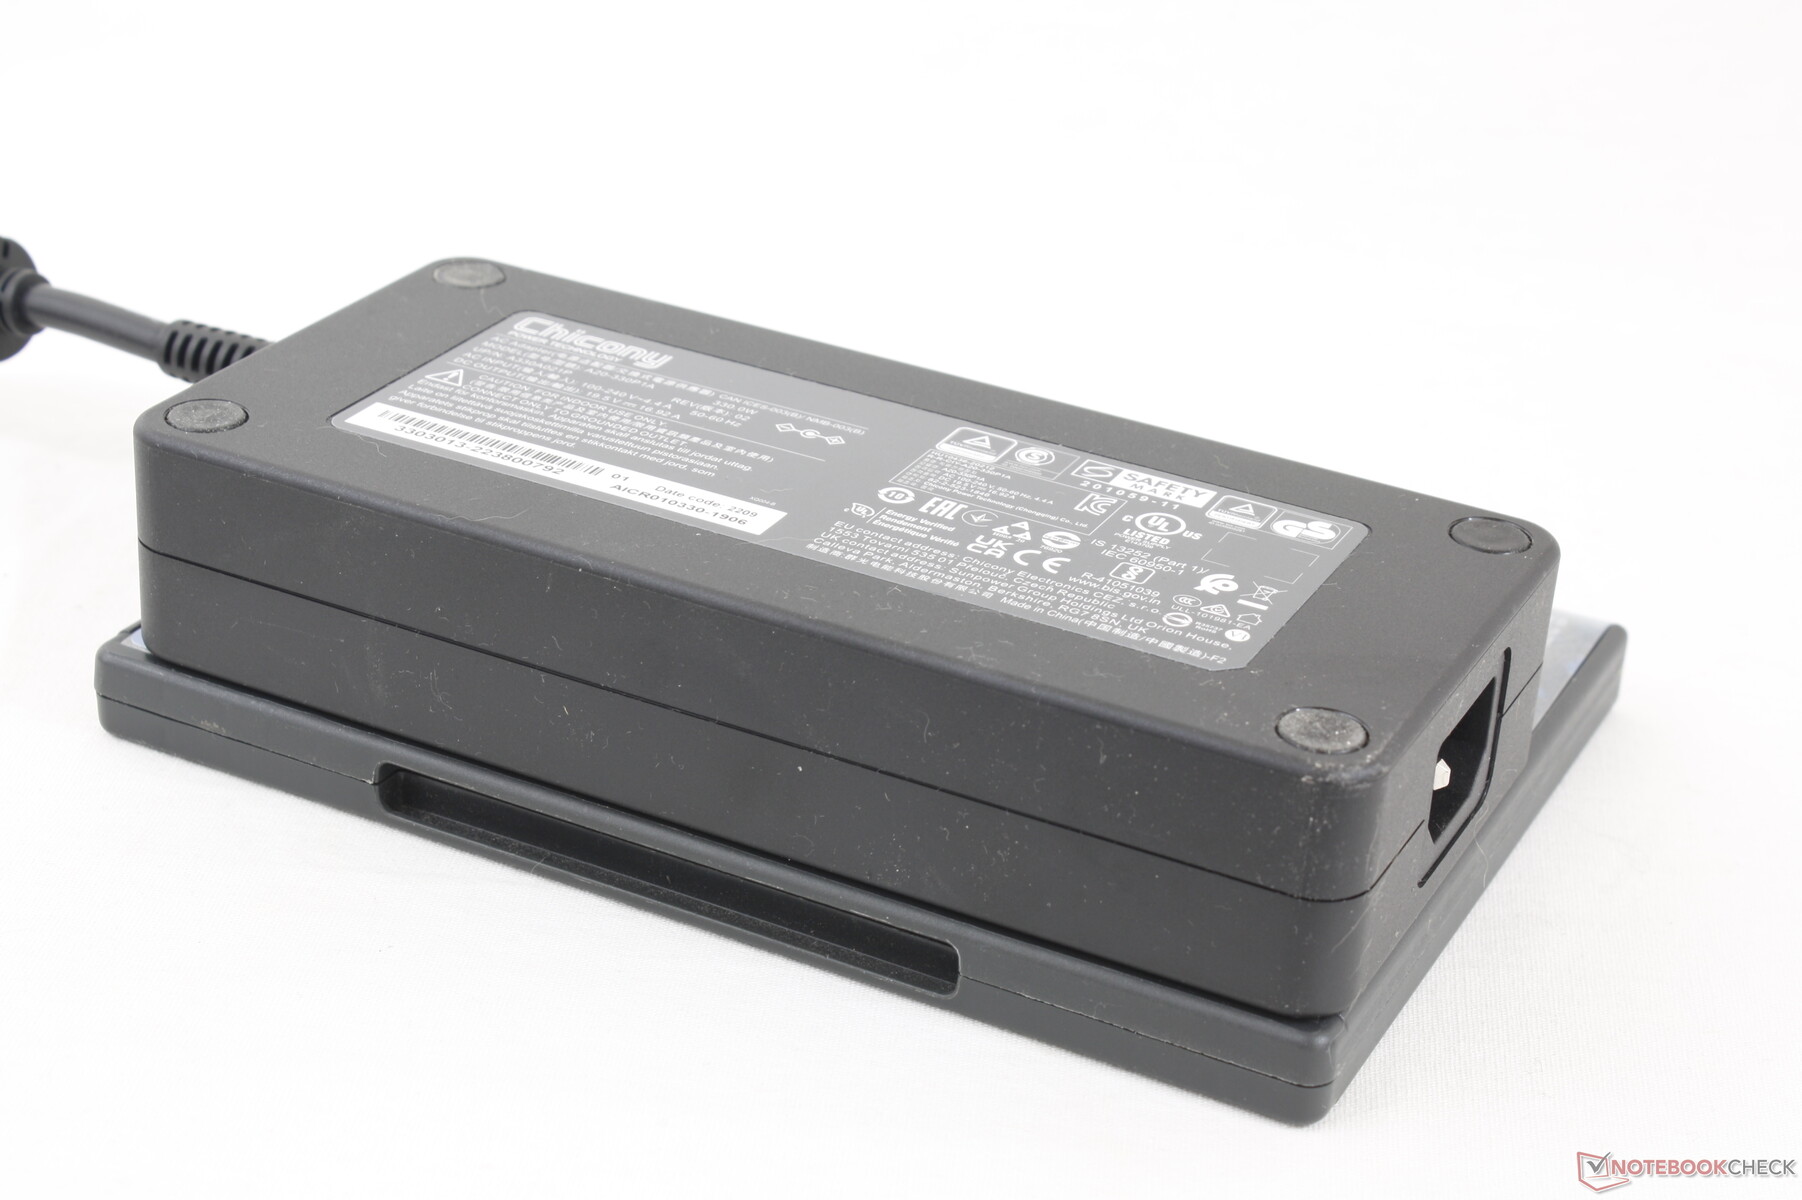
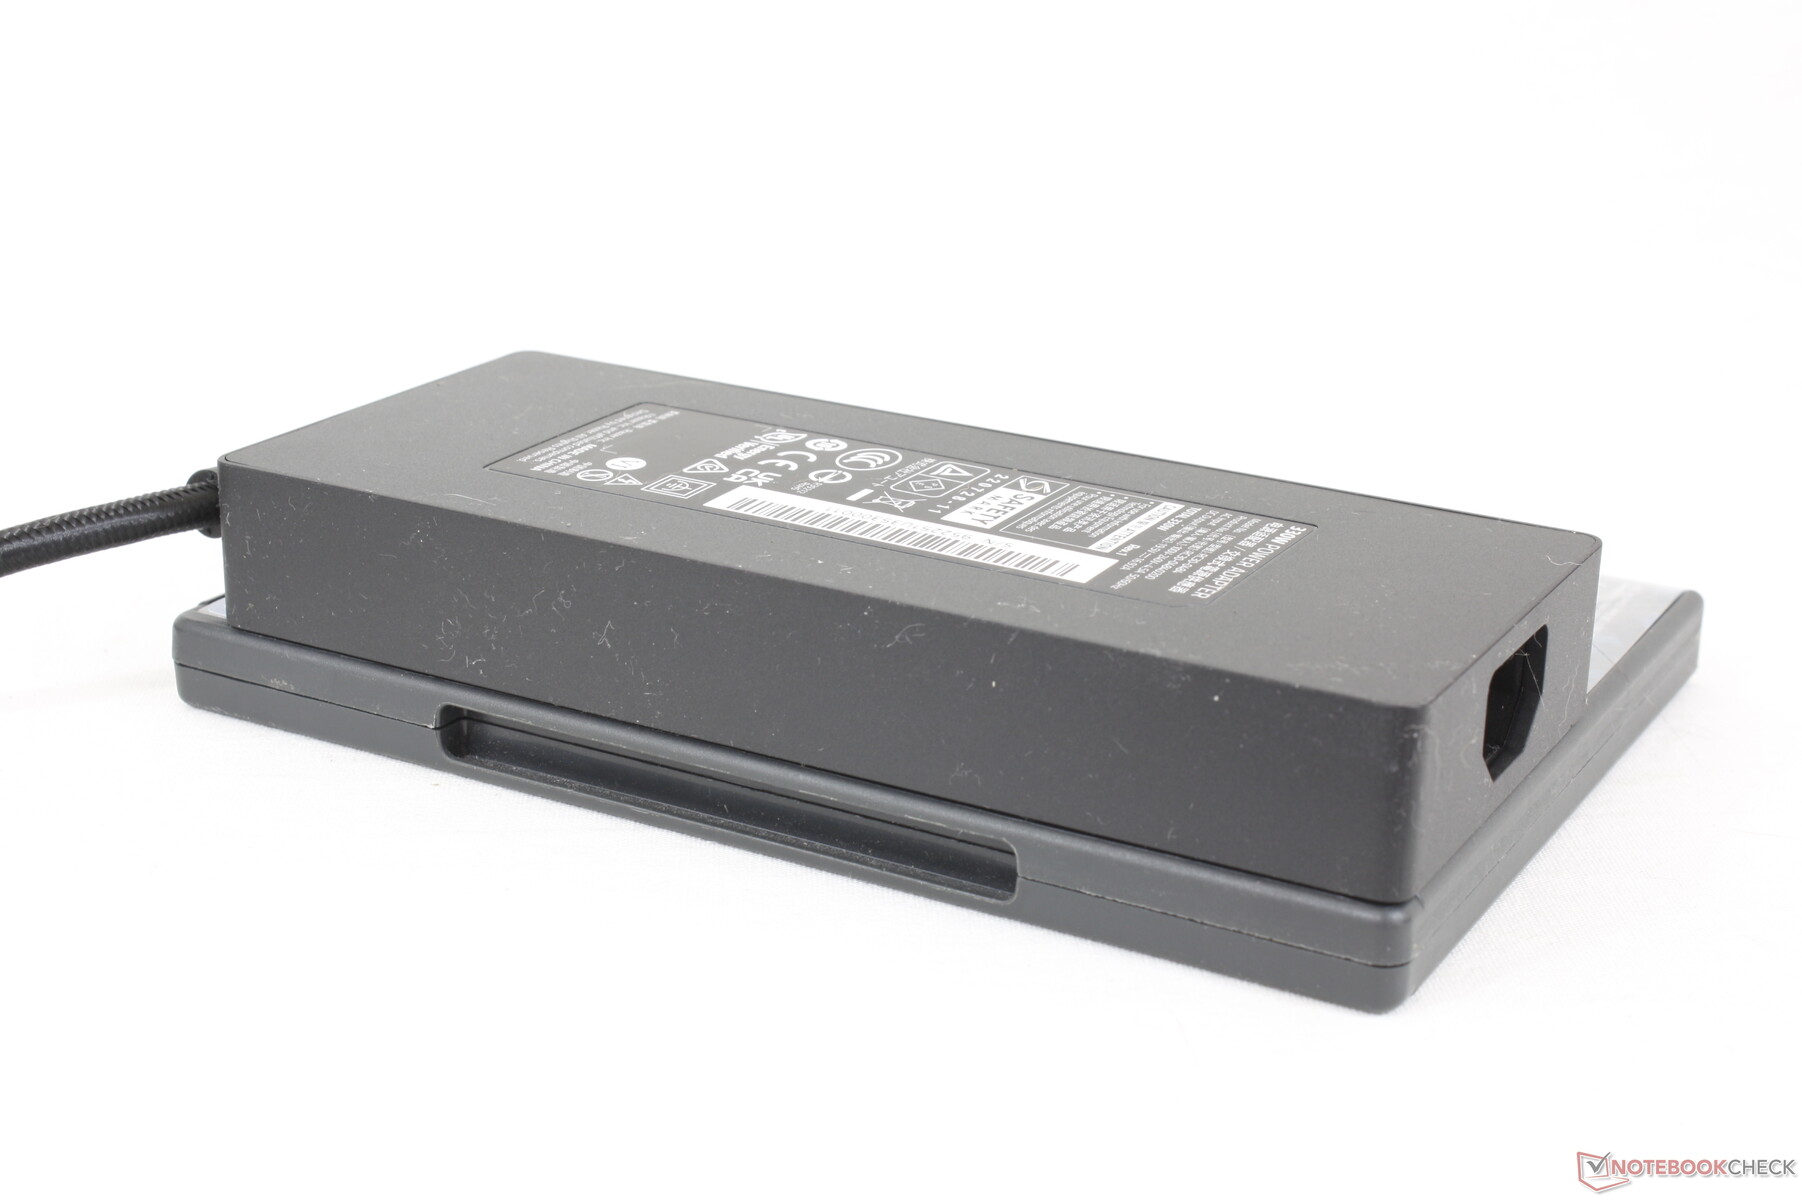
De 330 W AC-adapter is groter dan de 330 W AC-adapter voor de nieuwe Razer Blade (~18,5 x 8,5 x 3,6 cm vs. ~18 x 7,5 x 2,5 cm) aangezien Eluktronics en Uniwill nog niet zijn overgestapt op GaN opladen. We kunnen een tijdelijk maximaal verbruik van 343 W registreren wanneer de CPU en GPU elk op 100 procent gebruik zitten.
| Uit / Standby | |
| Inactief | |
| Belasting |
|
Key:
min: | |
| Eluktronics Mech-17 GP2 i9-13900HX, GeForce RTX 4090 Laptop GPU, Samsung PM9A1 MZVL21T0HCLR, IPS, 2560x1600, 17" | Schenker XMG Neo 17 M22 R9 6900HX, GeForce RTX 3080 Ti Laptop GPU, Samsung SSD 980 Pro 1TB MZ-V8P1T0BW, IPS, 2560x1600, 17" | MSI Katana 17 B13VFK i7-13620H, GeForce RTX 4060 Laptop GPU, Micron 2400 MTFDKBA1T0QFM, IPS LED, 1920x1080, 17.3" | MSI Titan GT77 HX 13VI i9-13950HX, GeForce RTX 4090 Laptop GPU, Samsung PM9A1 MZVL22T0HBLB, Mini-LED, 3840x2160, 17.3" | Alienware m17 R5 (R9 6900HX, RX 6850M XT) R9 6900HX, Radeon RX 6850M XT, SSSTC CA6-8D1024, IPS, 3840x2160, 17" | Razer Blade 18 RTX 4070 i9-13950HX, GeForce RTX 4070 Laptop GPU, SSSTC CA6-8D1024, IPS, 2560x1600, 18" | |
|---|---|---|---|---|---|---|
| Power Consumption | 35% | 35% | 1% | 24% | -24% | |
| Idle Minimum * (Watt) | 14 | 7 50% | 12.2 13% | 14 -0% | 13 7% | 24.5 -75% |
| Idle Average * (Watt) | 19.3 | 11 43% | 14.9 23% | 21.6 -12% | 16.5 15% | 34.1 -77% |
| Idle Maximum * (Watt) | 36.8 | 17 54% | 15.8 57% | 24.8 33% | 17 54% | 47.7 -30% |
| Load Average * (Watt) | 117.2 | 92 22% | 85.22 27% | 122.5 -5% | 93 21% | 140 -19% |
| Witcher 3 ultra * (Watt) | 304 | 221 27% | 151.1 50% | 265 13% | 239 21% | 202 34% |
| Load Maximum * (Watt) | 342.5 | 306 11% | 212.8 38% | 418 -22% | 251 27% | 261 24% |
* ... kleiner is beter
Power Consumption Witcher 3 / Stresstest
Power Consumption external Monitor
Levensduur van de batterij
De WLAN runtime is enkele uren korter dan op de AMD-aangedreven Neo 17 M22 van vorig jaar, voor een totaal van iets meer dan 5 uur. Beide testtoestellen werden ingesteld op het Balanced power profiel met Optimus actief op de iGPU.
Opladen van leeg naar volledig vermogen duurt tussen de 2 en 2,5 uur. Het systeem kan niet worden opgeladen via USB-C.
| Eluktronics Mech-17 GP2 i9-13900HX, GeForce RTX 4090 Laptop GPU, 99 Wh | Schenker XMG Neo 17 M22 R9 6900HX, GeForce RTX 3080 Ti Laptop GPU, 99 Wh | MSI Katana 17 B13VFK i7-13620H, GeForce RTX 4060 Laptop GPU, 53.5 Wh | MSI Titan GT77 HX 13VI i9-13950HX, GeForce RTX 4090 Laptop GPU, 99.9 Wh | Alienware m17 R5 (R9 6900HX, RX 6850M XT) R9 6900HX, Radeon RX 6850M XT, 97 Wh | Razer Blade 18 RTX 4070 i9-13950HX, GeForce RTX 4070 Laptop GPU, 91.7 Wh | |
|---|---|---|---|---|---|---|
| Batterijduur | 76% | -43% | 4% | -6% | -22% | |
| WiFi v1.3 (h) | 5.1 | 9 76% | 2.9 -43% | 5.3 4% | 4.8 -6% | 4 -22% |
| Reader / Idle (h) | 12 | 7 | ||||
| H.264 (h) | 6.6 | 6 | 4.9 | |||
| Load (h) | 1.8 | 1 | 1.4 | 1.8 | 1.3 |
Pro
Contra
Verdict - De warmte een beetje te letterlijk opvoeren
De Mech-17 GP2 is 7 procent kleiner en 17 procent lichter dan de MSI GT77 HX Titan terwijl hij bijna dezelfde prestaties levert. Het is dicht verpakt als gevolg, maar misschien door een beetje te veel. CPU temperaturen zijn extreem hoog, zelfs voor een gaming laptop bij het draaien van games. Hoewel de ~97 C range technisch gezien "veilig" is voor de Intel processor, is het toch warmer dan op het model van vorig jaar en niet bepaald geruststellend voor de eindgebruiker. De hoge kerntemperatuur kan misschien worden verlicht door gebruik te maken van het externe waterkoeler docking station, maar een laptop zou niet afhankelijk moeten zijn van een optioneel accessoire voor optimale koeling.
Hoge prestaties ten koste van hoge kerntemperaturen.
Naast de hoge prestaties-per-volume, is de prijs ook een onderscheidende factor van het model. De Mech-17 GP2 is een van de weinige GeForce 40 laptops die wordt geleverd met een barebones optie, wat betekent dat u honderden dollars kunt besparen als u uw eigen RAM, SSD en OS kunt leveren. $2999 USD voor een van de snelste gaming laptops op de markt is niet half slecht; zorg er alleen voor dat je die kerntemperaturen goed in de gaten houdt.
Prijs en beschikbaarheid
Amazon verscheept nu de Mech-17 GP2 met de RTX 4090 voor $4400 USD compleet met RAM en opslag. Als alternatief kunnen gebruikers rechtstreeks bij Eluktronics kopen.. voor meer configureerbare opties.
Eluktronics Mech-17 GP2
- 08-03-2023 v7 (old)
Allen Ngo
Transparantie
De selectie van te beoordelen apparaten wordt gemaakt door onze redactie. Het testexemplaar werd ten behoeve van deze beoordeling door de fabrikant of detailhandelaar in bruikleen aan de auteur verstrekt. De kredietverstrekker had geen invloed op deze recensie, noch ontving de fabrikant vóór publicatie een exemplaar van deze recensie. Er bestond geen verplichting om deze recensie te publiceren. Als onafhankelijk mediabedrijf is Notebookcheck niet onderworpen aan het gezag van fabrikanten, detailhandelaren of uitgevers.
[transparency_disclaimer]Dit is hoe Notebookcheck test
Elk jaar beoordeelt Notebookcheck onafhankelijk honderden laptops en smartphones met behulp van gestandaardiseerde procedures om ervoor te zorgen dat alle resultaten vergelijkbaar zijn. We hebben onze testmethoden al zo'n 20 jaar voortdurend ontwikkeld en daarbij de industriestandaard bepaald. In onze testlaboratoria wordt gebruik gemaakt van hoogwaardige meetapparatuur door ervaren technici en redacteuren. Deze tests omvatten een validatieproces in meerdere fasen. Ons complexe beoordelingssysteem is gebaseerd op honderden goed onderbouwde metingen en benchmarks, waardoor de objectiviteit behouden blijft. Meer informatie over onze testmethoden kunt u hier vinden.
Price comparison

