Prestatievergelijking Intel 8th gen Kaby Lake-R vs 7th gen Kaby Lake
| Super Pi mod 1.5 XS 1M - 1M | |
| Apple MacBook Pro 13 2017 Touchbar i5 | |
| Acer Spin 5 SP513-52N-566U | |
| Apple MacBook Pro 15 2017 (2.8 GHz, 555) | |
| Apple MacBook Pro 13 2017 | |
| WinRAR - Result | |
| Acer Spin 5 SP513-52N-566U | |
| Apple MacBook Pro 13 2017 | |
| Apple MacBook Pro 13 2017 Touchbar i5 | |
| Lenovo ThinkPad X1 Yoga 2017 20JD0015US | |
| Super Pi mod 1.5 XS 2M - 2M | |
| Apple MacBook Pro 13 2017 Touchbar i5 | |
| Acer Spin 5 SP513-52N-566U | |
| Apple MacBook Pro 13 2017 | |
| Apple MacBook Pro 15 2017 (2.8 GHz, 555) | |
| Apple MacBook Pro 15 2017 (2.8 GHz, 555) | |
| Super Pi Mod 1.5 XS 32M - 32M | |
| Apple MacBook Pro 13 2017 Touchbar i5 | |
| Acer Spin 5 SP513-52N-566U | |
| Apple MacBook Pro 15 2017 (2.8 GHz, 555) | |
| Apple MacBook Pro 13 2017 | |
* ... kleiner is beter
| Acer Spin 5 SP513-52N-566U i5-8250U, UHD Graphics 620, Micron 1100 MTFDDAV256TBN, , 1920x1080, 13.3" | Apple MacBook Pro 15 2017 (2.8 GHz, 555) i7-7700HQ, Radeon Pro 555, Apple SSD SM0256L, IPS, 2880x1800, 15.4" | Apple MacBook Pro 13 2017 Touchbar i5 i5-7267U, Iris Plus Graphics 650, Apple SSD AP0256, IPS, 2560x1600, 13.3" | Lenovo ThinkPad P51s 20HB000SGE i7-7600U, Quadro M520, Samsung SSD PM961 1TB M.2 PCIe 3.0 x4 NVMe (MZVLW1T0), IPS, 3840x2160, 15.6" | Microsoft Surface Pro (2017) i7 i7-7660U, Iris Plus Graphics 640, Samsung PM971 KUS040202M, IPS, 2736x1824, 12.3" | |
|---|---|---|---|---|---|
| Power Consumption | -108% | -58% | -45% | -30% | |
| Witcher 3 ultra Efficiency (external Monitor) (fps per Watt) | 0.2668 | ||||
| Witcher 3 ultra Efficiency (fps per Watt) | 0.2401 | ||||
| Cinebench R15 Multi Efficiency (external Monitor) (Points per Watt) | 18.8 | 11.9 -37% | 13 -31% | 10.7 -43% | 10.5 -44% |
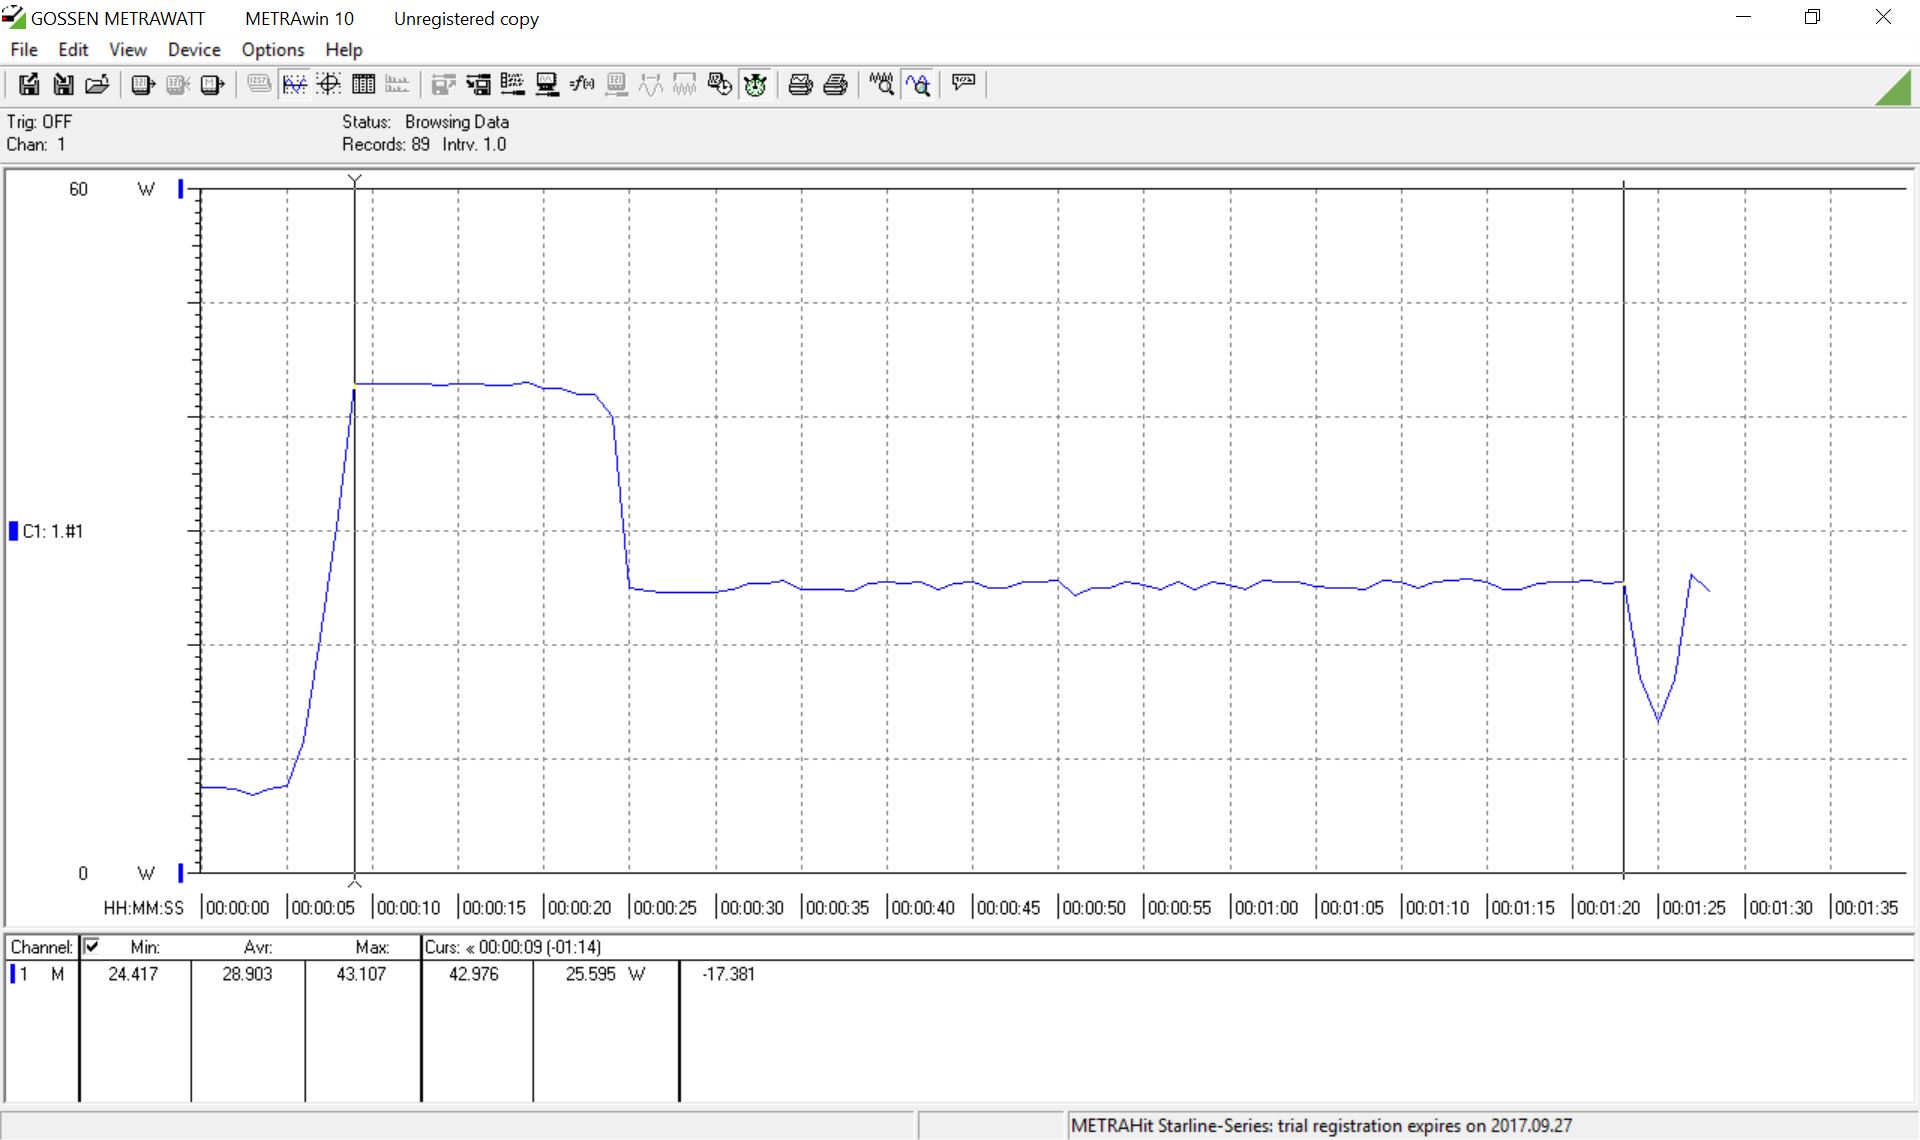
| Witcher 3 ultra * (Watt) | 30 | 57.9 -93% | 38.1 -27% | ||
| Prime95 V2810 Stress (external Monitor) * (Watt) | 27.5 | 72.6 ? -164% | 42.8 ? -56% | 42.3 -54% | 39.2 ? -43% |
| Cinebench R15 Multi (external Monitor) * (Watt) | 28.9 ? | 61.7 ? -113% | 29.5 ? -2% | 35.4 -22% | 39.2 ? -36% |
| 1280x720 FurMark 1.19 GPU Stress Test (external Monitor) * (Watt) | 26 ? | 61 ? -135% | 51.4 ? -98% | 34.6 ? -33% | 30.8 ? -18% |
| 1920x1080 The Witcher 3 ultra (external Monitor) * (Watt) | 25.1 ? | 52.1 ? -108% | 51.4 ? -105% | 43.4 ? -73% | 28 ? -12% |
| Power Consumption | -86% | -33% | -67% | -20% | |
| Idle Minimum * (Watt) | 3.6 | 3.4 6% | 2.8 22% | 5.8 -61% | 4.2 -17% |
| Idle Average * (Watt) | 9.5 | 13.9 -46% | 10.9 -15% | 10.4 -9% | 10.1 -6% |
| Idle Maximum * (Watt) | 9.5 | 17.6 -85% | 11.4 -20% | 13.5 -42% | 14 -47% |
| Load Average * (Watt) | 32.9 | 71.1 -116% | 55.4 -68% | 62.4 -90% | 37.4 -14% |
| Witcher 3 ultra * (Watt) | 30 | 57.9 -93% | 38.1 -27% | ||
| Load Maximum * (Watt) | 31.4 | 88.5 -182% | 57.5 -83% | 73.1 -133% | 34 -8% |
| Totaal Gemiddelde (Programma / Instellingen) | -97% /
-97% | -46% /
-46% | -56% /
-56% | -25% /
-25% |
* ... kleiner is beter
| 3DMark | |
| 1920x1080 Fire Strike Combined | |
| Acer Spin 5 SP513-52N-566U | |
| Asus Strix GL753VD-GC045T | |
| 1920x1080 Fire Strike Physics | |
| Asus Strix GL753VD-GC045T | |
| Acer Spin 5 SP513-52N-566U | |
| Lenovo ThinkPad X1 Yoga 2017 20JD0015US | |
| 1920x1080 Fire Strike Graphics | |
| Acer Spin 5 SP513-52N-566U | |
| Lenovo ThinkPad X1 Yoga 2017 20JD0015US | |
| Asus Strix GL753VD-GC045T | |
| 1920x1080 Fire Strike Score | |
| Acer Spin 5 SP513-52N-566U | |
| Lenovo ThinkPad X1 Yoga 2017 20JD0015US | |
| Asus Strix GL753VD-GC045T | |
| Sky Diver Stress Test | |
| Acer Spin 5 SP513-52N-566U | |
| 1280x720 Cloud Gate Standard Physics | |
| Asus Strix GL753VD-GC045T | |
| Acer Spin 5 SP513-52N-566U | |
| Lenovo ThinkPad X1 Yoga 2017 20JD0015US | |
| 1280x720 Cloud Gate Standard Graphics | |
| Asus Strix GL753VD-GC045T | |
| Acer Spin 5 SP513-52N-566U | |
| Lenovo ThinkPad X1 Yoga 2017 20JD0015US | |
| 1280x720 Cloud Gate Standard Score | |
| Asus Strix GL753VD-GC045T | |
| Acer Spin 5 SP513-52N-566U | |
| Lenovo ThinkPad X1 Yoga 2017 20JD0015US | |
| 1280x720 offscreen Ice Storm Unlimited Physics | |
| Acer Spin 5 SP513-52N-566U | |
| 1280x720 offscreen Ice Storm Unlimited Graphics Score | |
| Acer Spin 5 SP513-52N-566U | |
| 1280x720 offscreen Ice Storm Unlimited Score | |
| Acer Spin 5 SP513-52N-566U | |
| Dota 2 Reborn | |
| 1920x1080 high (2/3) | |
| Asus Strix GL753VD-GC045T | |
| Acer Spin 5 SP513-52N-566U | |
| 1366x768 med (1/3) | |
| Asus Strix GL753VD-GC045T | |
| Acer Spin 5 SP513-52N-566U | |
Samenvatting
Voor het volledige, Engelse testrapport, klik hier.
Een vermogenslimiet van 15 Watt geeft weinig reserves voor een quad-core CPU, maar Intel heeft zich ingezet om de nieuwe Kaby Lake-R chips ook bij deze beperkingen goede prestaties te laten leveren. De Kaby Lake-R gaat goed van pas komen bij de nieuwe generatie Ultrabooks en werkpaarden, aangezien de vermogenslimiet niet wordt overschreden en de volledige prestaties beschikbaar zijn.
De 7e generatie Kaby Lake 15 Watt CPU's zijn echter niet direct buitenspel gezet. De 40% toename in prestaties is namelijk niet letterlijk te vertalen naar merkbare verschillen bij alledaags gebruik. Maar diegenen die op zoek zijn naar een nieuwe Ultrabook, zouden zeker moeten wachten totdat de Kaby Lake-R chips meer gebruikt gaan worden. De prestaties-per-watt verbeteringen maken de chip het overwegen waard en producten zoals Apple's Macbook 13 serie zal veel baat hebben bij een Kaby Lake-R upgrade.
Alles bij elkaar lijkt het dat Intel de juiste keuzes heeft gemaakt voor de nieuwe generatie. Het feit dat deze chips baanbrekend presteren zelfs voordat de AMD Raven Ridge is geïntroduceerd en dat hun prestaties liggen tussen 7e generatie Kaby Lake U-serie en de HQ-serie, kan resulteren in een vergrote marktwaarde. Combineer deze CPU met een aparte GPU zoals de MX150 of GTX 1050 en mobiele prestaties zullen nooit meer hetzelfde zijn.
